Progress and Recent Advances in Solid Organ Transplantation
192
Edited by Progress and Recent Advances in Solid Organ Transplantation Charat Thongprayoon, Wisit Cheungpasitporn and Wisit Kaewput Printed Edition of the Special Issue Published in Journal of Clinical Medicine www.mdpi.com/journal/jcm
-
Upload
khangminh22 -
Category
Documents
-
view
1 -
download
0
Transcript of Progress and Recent Advances in Solid Organ Transplantation
Edited by
Progress and Recent Advances in Solid Organ Transplantation
Charat Thongprayoon, Wisit Cheungpasitporn and Wisit Kaewput
Printed Edition of the Special Issue Published in Journal of Clinical Medicine
www.mdpi.com/journal/jcm

Progress and Recent Advances in SolidOrgan Transplantation

Progress and Recent Advances in SolidOrgan Transplantation
Editors
Charat Thongprayoon
Wisit Cheungpasitporn
Wisit Kaewput
MDPI • Basel • Beijing • Wuhan • Barcelona • Belgrade • Manchester • Tokyo • Cluj • Tianjin
Editors
Charat Thongprayoon
Division of Nephrology and
Hypertension, Department of
Medicine, Mayo Clinic
USA
Wisit Cheungpasitporn
Division of Nephrology and
Hypertension, Department of
Medicine, Mayo Clinic
USA
Wisit Kaewput
Phramongkutklao College of
Medicine
Thailand
Editorial Office
MDPI
St. Alban-Anlage 66
4052 Basel, Switzerland
This is a reprint of articles from the Special Issue published online in the open access journal
Journal of Clinical Medicine (ISSN 2077-0383) (available at: https://www.mdpi.com/journal/jcm/
special issues/Solid Organ Transplantation).
For citation purposes, cite each article independently as indicated on the article page online and as
indicated below:
LastName, A.A.; LastName, B.B.; LastName, C.C. Article Title. Journal Name Year, Volume Number,
Page Range.
ISBN 978-3-0365-4007-8 (Hbk)
ISBN 978-3-0365-4008-5 (PDF)
© 2022 by the authors. Articles in this book are Open Access and distributed under the Creative
Commons Attribution (CC BY) license, which allows users to download, copy and build upon
published articles, as long as the author and publisher are properly credited, which ensures maximum
dissemination and a wider impact of our publications.
The book as a whole is distributed by MDPI under the terms and conditions of the Creative Commons
license CC BY-NC-ND.


Contents
About the Editors . . . . . . . . . . . . . . . . . . . . . . . . . . . . . . . . . . . . . . . . . . . . . . ix
Charat Thongprayoon, Wisit Kaewput, Pattharawin Pattharanitima
and Wisit Cheungpasitporn
Progress and Recent Advances in Solid Organ TransplantationReprinted from: J. Clin. Med. 2022, 11, 2112, doi:10.3390/jcm11082112 . . . . . . . . . . . . . . . . 1
Lisa B. Westenberg, Marco van Londen, Camilo G. Sotomayor, Cyril Moers, Robert C.
Minnee, Stephan J. L. Bakker and Robert A. Pol
The Association between Body Composition Measurements and Surgical Complications afterLiving Kidney DonationReprinted from: J. Clin. Med. 2021, 10, 155, doi:10.3390/jcm10010155 . . . . . . . . . . . . . . . . 5
Hans-Michael Hau, Nora Jahn, Sebastian Rademacher, Elisabeth Sucher, Jonas Babel,
Matthias Mehdorn, Andri Lederer, Daniel Seehofer, Uwe Scheuermann and Robert Sucher
The Value of Graft Implantation Sequence in Simultaneous Pancreas-Kidney Transplantationon the Outcome and Graft SurvivalReprinted from: J. Clin. Med. 2021, 10, 1632, doi:10.3390/jcm10081632 . . . . . . . . . . . . . . . . 17
Fernanda Guedes Rodrigues, J. Casper Swarte, Rianne M. Douwes, Tim J. Knobbe, Camilo
G. Sotomayor, Hans Blokzijl, Rinse K. Weersma, Ita P. Heilberg, Stephan J. L. Bakker, Martin
H. de Borst and TransplantLines Investigators
Exhaled Hydrogen as a Marker of Intestinal Fermentation Is Associated with Diarrhea inKidney Transplant RecipientsReprinted from: J. Clin. Med. 2021, 10, 2854, doi:10.3390/jcm10132854 . . . . . . . . . . . . . . . . 29
Napat Leeaphorn, Charat Thongprayoon, Pradeep Vaitla, Panupong Hansrivijit, Caroline C.
Jadlowiec, Shennen A. Mao, Api Chewcharat, Sreelatha Katari, Pattharawin Pattharanitima,
Boonphiphop Boonpheng, Wisit Kaewput, Michael A. Mao, Matthew Cooper and Wisit
Cheungpasitporn
Outcomes of Kidney Transplant Recipients with Sickle Cell Disease: An Analysis of the2000–2019 UNOS/OPTN DatabaseReprinted from: J. Clin. Med. 2021, 10, 3063, doi:10.3390/jcm10143063 . . . . . . . . . . . . . . . . 41
Gerold Tholking, Christian Schulte, Ulrich Jehn, Katharina Schutte-Nutgen, Hermann
Pavenstadt, Barbara Suwelack and Stefan Reuter
The Tacrolimus Metabolism Rate and Dyslipidemia after Kidney TransplantationReprinted from: J. Clin. Med. 2021, 10, 3066, doi:10.3390/jcm10143066 . . . . . . . . . . . . . . . . 55
Kai-Chieh Chang, Yao-Peng Hsieh, Huan-Nung Chao, Chien-Ming Lin, Kuo-Hua Lin,
Chun-Chieh Tsai, Chia-En Heish, Pei-Ru Lin, Chew-Teng Kor, Yao-Li Chen and Ping-Fang
Chiu
Association of Hematuria with Renal Progression and Survival in Patients Who UnderwentLiving Donor Liver TransplantReprinted from: J. Clin. Med. 2021, 10, 4345, doi:10.3390/jcm10194345 . . . . . . . . . . . . . . . . 65
Jules Weinhard, Johan Noble, Thomas Jouve, Paolo Malvezzi and Lionel Rostaing
Tocilizumab and Desensitization in Kidney Transplant Candidates: Personal Experience andLiterature ReviewReprinted from: J. Clin. Med. 2021, 10, 4359, doi:10.3390/jcm10194359 . . . . . . . . . . . . . . . . 75
vi
Yuri Battaglia, Luigi Zerbinati, Martino Belvederi Murri, Michele Provenzano, Pasquale
Esposito, Michele Andreucci, Alda Storari and Luigi Grassi
Exploring the Level of Post Traumatic Growth in Kidney Transplant Recipients via NetworkAnalysisReprinted from: J. Clin. Med. 2021, 10, 4747, doi:10.3390/jcm10204747 . . . . . . . . . . . . . . . . 85
Tsukasa Nakamura and Takayuki Shirouzu
Antibody-Mediated Rejection and Recurrent Primary Disease: Two Main Obstacles inAbdominal Kidney, Liver, and Pancreas TransplantsReprinted from: J. Clin. Med. 2021, 10, 5417, doi:10.3390/jcm10225417 . . . . . . . . . . . . . . . . 99
Ilias Zompolas, Robert Peters, Lutz Liefeldt, Lukas J. Lehner, Klemens Budde, Bernhard
Ralla, Irena Goranova, Andreas Maxeiner, Markus H. Lerchbaumer, Stephan R. Marticorena
Garcia, Martin Kanne, Thorsten Schlomm, Matthias R. G. Schulz and Frank Friedersdorff
Outcomes of Deceased Donor Kidney Transplantation in the Eurotransplant Senior Programwith A Focus on Recipients ≥75 YearsReprinted from: J. Clin. Med. 2021, 10, 5633, doi:10.3390/jcm10235633 . . . . . . . . . . . . . . . . 129
Aureliusz Kolonko, Patrycja Pokora, Natalia Słabiak-Błaz, Beata Czerwie nska, Henryk Karkoszka, Piotr Kuczera, Grzegorz Piecha and Andrzej WięcekThe Relationship between Initial Tacrolimus Metabolism Rate and Recipients Body Composition in Kidney TransplantationReprinted from: J. Clin. Med. 2021, 10, 5793, doi:10.3390/jcm10245793 . . . . . . . . . . . . . . . . 139
Ulrich Jehn, Anja Kortenhorn, Katharina Schutte-Nutgen, Gerold Tholking, Florian
Westphal, Markus Strauss, Dirk-Oliver Wennmann, Hermann Pavenstadt, Barbara
Suwelack, Dennis Gorlich and Stefan Reuter
The Influence of Parathyroidectomy on Osteoporotic Fractures in Kidney Transplant Recipients:Results from a Retrospective Single-Center TrialReprinted from: J. Clin. Med. 2022, 11, 654, doi:10.3390/jcm11030654 . . . . . . . . . . . . . . . . 149
Nasrin El-Bandar, Markus H. Lerchbaumer, Robert Peters, Andreas Maxeiner, Katja Kotsch,
Arne Sattler, Kurt Miller, Thorsten Schlomm, Bernd Hamm, Klemens Budde, Lutz Liefeldt,
Thomas Fischer and Frank Friedersdorff
Kidney Perfusion in Contrast-Enhanced Ultrasound (CEUS) Correlates with Renal Function inLiving Kidney DonorsReprinted from: J. Clin. Med. 2022, 11, 791, doi:10.3390/jcm11030791 . . . . . . . . . . . . . . . . 165
vii

About the Editors
Charat Thongprayoon is affiliated with the Mayo Clinic Hospital Rochester. Their research
interests include nephrology, electrolytes, acute kidney injury, renal replacement therapy,
epidemiology, and outcome studies.
Wisit Cheungpasitporn is American-board-certified in nephrology and internal medicine.
He completed his nephrology fellowship training at the Mayo Clinic, Rochester, Minnesota. Dr.
Cheungpasitporn also completed his additional training at Mayo and has become an expert on
kidney transplantation. He also enrolled and completed his postdoctoral diploma in the clinical
and translational science (CCaTS) program in 2015. Dr. Cheungpasitporn received the 2016 Donald
C. Balfour Research Award, given in recognition of outstanding research as a junior scientist
whose primary training is in a clinical field at the Mayo Clinic, Rochester, Minnesota, as well as
the 2016 William H. J. Summerskill Award, given in recognition of outstanding achievement in
research for a clinical fellow at the Mayo Clinic, Rochester, Minnesota. Dr. Cheungpasitporn has
been part of Division of Nephrology and Hypertension at the Mayo Clinic, Rochester, MN, since 2020.
Wisit Kaewput is affiliated with the Phramongkutklao College of Medicine, Bangkok, Thailand.
Their research interests include acute kidney injury, observational studies, statistical analysis, and
epidemiology.
ix

Citation: Thongprayoon, C.;
Kaewput, W.; Pattharanitima, P.;
Cheungpasitporn, W. Progress and
Recent Advances in Solid Organ
Transplantation. J. Clin. Med. 2022, 11,
2112. https://doi.org/10.3390/
jcm11082112
Received: 6 April 2022
Accepted: 8 April 2022
Published: 11 April 2022
Publisher’s Note: MDPI stays neutral
with regard to jurisdictional claims in
published maps and institutional affil-
iations.
Copyright: © 2022 by the authors.
Licensee MDPI, Basel, Switzerland.
This article is an open access article
distributed under the terms and
conditions of the Creative Commons
Attribution (CC BY) license (https://
creativecommons.org/licenses/by/
4.0/).
Journal of
Clinical Medicine
Editorial
Progress and Recent Advances in Solid Organ Transplantation
Charat Thongprayoon 1, Wisit Kaewput 2, Pattharawin Pattharanitima 3 and Wisit Cheungpasitporn 1,*
1 Division of Nephrology and Hypertension, Department of Medicine, Mayo Clinic, Rochester, MN 55905, USA;[email protected]
2 Department of Military and Community Medicine, Phramongkutklao College of Medicine,Bangkok 10400, Thailand; [email protected]
3 Department of Internal Medicine, Faculty of Medicine, Thammasat University, Pathum Thani 12120, Thailand;[email protected]
* Correspondence: [email protected]
Over the past decade, the number of organ transplants performed worldwide hassignificantly increased for patients with advanced organ failure [1–5]. In the United States,41,354 organ transplants were performed in 2021, increasing by 5.9% compared to 2020 [6].While there have been significant improvements in the short-term survival of solid or-gan transplant recipients due to advances in immunosuppression and transplant tech-niques [1,2,7], long-term graft and patient outcomes still lag behind and remain areas forimprovement in solid organ transplantation [2].
In this Special Issue, “Progress and Recent Advances in Solid Organ Transplantation”,researchers from different disciplines with different expertise and resources highlightedthe novelty of their recent investigations in the field of organ transplantation, includingissues related to donors, allografts, and patient survival [8–20]. While there have beensignificant advances in regional and national kidney paired-donation programs in matchingincompatible pairs, data suggest that there may be a role for desensitization in select casesto facilitate organ transplantation [21]. In this Special Issue, Weinhard et al. summarized theroles of tocilizumab and desensitization in kidney transplant candidates [18]. In additionto progress in desensitization and preoperative monitoring of donor-specific antibodies,this Special Issue also provided insights into the monitoring and management of chronicactive antibody-mediated rejection [17]. Furthermore, investigators also shed light onpost-transplant complication research, including osteoporotic fractures [9], diarrhea [15],psychological changes [19], and recurrent primary disease [17].
Immunosuppression management is essential for patient and graft survival in transplantrecipients [22–24], and studies have demonstrated the impacts of tacrolimus metabolism rateson outcomes after transplantation [25–27]. In this Special Issue, Kolonko et al. found thenovel findings of influences of body composition parameters assessed by bioimpedanceanalysis on the tacrolimus metabolism, which may potentially be useful in optimizing initialtacrolimus dosing [10]. Additionally, while fast tacrolimus metabolism is associated withlower renal function after kidney transplantation [26,27], in this Special Issue, Thölking et al.found no significant impact of fast tacrolimus metabolism on dyslipidemia parameters [13].
Better understanding of subgroups of transplant recipients, such as older transplant re-cipients and Black transplant recipients, can help the transplant community to identify indi-vidualized strategies to improve outcomes among these vulnerable populations [11,14,28].In this Special Issue, Zompolas et al. conducted a retrospective study to evaluate out-comes of 85 kidney transplant recipients aged ≥ 75 years in the Eurotransplant SeniorProgram from January 2010 to July 2018 at the Charité-Universitätsmedizin Berlin inGermany [11]. The investigators demonstrated comparable outcomes among older pa-tients compared to their younger counterparts [11], confirming excellent outcomes, includ-ing in patient and graft survival, in carefully selected older kidney transplant recipients
J. Clin. Med. 2022, 11, 2112. https://doi.org/10.3390/jcm11082112 https://www.mdpi.com/journal/jcm1
J. Clin. Med. 2022, 11, 2112
aged ≥ 75 years [29–31]. Lastly, in this Special Issue, we reported outcomes of kidney trans-plant recipients with sickle cell disease (SCD) from an analysis of the 2000–2019 UnitedNetwork for Organ Sharing (UNOS)/Organ Procurement and Transplantation NetworkDatabase [14]. In this study, we found that SCD was significantly associated with lowerpatient survival and death-censored graft survival compared to non-SCD recipients. Thefindings of our study suggest that urgent future studies are required to identify strate-gies to improve outcomes in SCD kidney recipients. Additionally, the assignment of riskadjustment for SCD patients should be considered.
In summary, the findings published in this Special Issue provide novelty and ad-ditional knowledge and may help the transplant community to ultimately improve themanagement and outcomes of patients with solid organ transplantation.
Author Contributions: C.T., W.K., P.P. and W.C. contributed to the outlines of the manuscript. W.C.and C.T. drafted the manuscript. All authors gave comments on the earlier versions of the manuscript.All authors have read and agreed to the published version of the manuscript.
Funding: This research received no external funding.
Conflicts of Interest: The authors declare no conflict of interest.
References
1. Lentine, K.L.; Smith, J.M.; Hart, A.; Miller, J.; Skeans, M.A.; Larkin, L.; Robinson, A.; Gauntt, K.; Israni, A.K.; Hirose, R.; et al.OPTN/SRTR 2020 Annual Data Report: Kidney. Am. J. Transplant. 2022, 22, 21–136. [CrossRef]
2. Thongprayoon, C.; Hansrivijit, P.; Leeaphorn, N.; Acharya, P.; Torres-Ortiz, A.; Kaewput, W.; Kovvuru, K.; Kanduri, S.R.;Bathini, T.; Cheungpasitporn, W. Recent Advances and Clinical Outcomes of Kidney Transplantation. J. Clin. Med. 2020, 9, 1193.[CrossRef]
3. Larpparisuth, N.; Cheungpasitporn, W.; Lumpaopong, A. Global Perspective on Kidney Transplantation: Thailand. Kidney3602021, 2, 1163–1165. [CrossRef] [PubMed]
4. Divard, G.; Goutaudier, V. Global Perspective on Kidney Transplantation: France. Kidney360 2021, 2, 1637–1640. [CrossRef][PubMed]
5. Zhang, Z.; Liu, Z.; Shi, B. Global Perspective on Kidney Transplantation: China. Kidney360 2021, 2, 364. [CrossRef] [PubMed]6. All-Time Records Again Set in 2021 for Organ Transplants, Organ Donation from Deceased Donors. Available online:
https://unos.org/news/2021-all-time-records-organ-transplants-deceased-donor-donation/#:~{}:text=In%202021%2C%2041%2C354%20organ%20transplants,and%20Transplantation%20Network%20under%20federal (accessed on 2 April 2022).
7. Thongprayoon, C.; Kaewput, W.; Kovvuru, K.; Hansrivijit, P.; Kanduri, S.R.; Bathini, T.; Chewcharat, A.; Leeaphorn, N.; Gonzalez-Suarez, M.L.; Cheungpasitporn, W. Promises of Big Data and Artificial Intelligence in Nephrology and Transplantation. J. Clin.Med. 2020, 9, 1107. [CrossRef]
8. El-Bandar, N.; Lerchbaumer, M.H.; Peters, R.; Maxeiner, A.; Kotsch, K.; Sattler, A.; Miller, K.; Schlomm, T.; Hamm, B.; Budde, K.; et al.Kidney Perfusion in Contrast-Enhanced Ultrasound (CEUS) Correlates with Renal Function in Living Kidney Donors. J. Clin.Med. 2022, 11, 791. [CrossRef]
9. Jehn, U.; Kortenhorn, A.; Schütte-Nütgen, K.; Thölking, G.; Westphal, F.; Strauss, M.; Wennmann, D.O.; Pavenstädt, H.;Suwelack, B.; Görlich, D.; et al. The Influence of Parathyroidectomy on Osteoporotic Fractures in Kidney Transplant Recipients:Results from a Retrospective Single-Center Trial. J. Clin. Med. 2022, 11, 654. [CrossRef]
10. Kolonko, A.; Pokora, P.; Słabiak-Błaz, N.; Czerwienska, B.; Karkoszka, H.; Kuczera, P.; Piecha, G.; Wiecek, A. The Relationshipbetween Initial Tacrolimus Metabolism Rate and Recipients Body Composition in Kidney Transplantation. J. Clin. Med. 2021, 10, 5793.[CrossRef]
11. Zompolas, I.; Peters, R.; Liefeldt, L.; Lehner, L.J.; Budde, K.; Ralla, B.; Goranova, I.; Maxeiner, A.; Lerchbaumer, M.H.;Marticorena Garcia, S.R.; et al. Outcomes of Deceased Donor Kidney Transplantation in the Eurotransplant Senior Programwith A Focus on Recipients ≥75 Years. J. Clin. Med. 2021, 10, 5633. [CrossRef]
12. Chang, K.C.; Hsieh, Y.P.; Chao, H.N.; Lin, C.M.; Lin, K.H.; Tsai, C.C.; Heish, C.E.; Lin, P.R.; Kor, C.T.; Chen, Y.L.; et al. Associationof Hematuria with Renal Progression and Survival in Patients Who Underwent Living Donor Liver Transplant. J. Clin. Med. 2021,10, 4345. [CrossRef] [PubMed]
13. Thölking, G.; Schulte, C.; Jehn, U.; Schütte-Nütgen, K.; Pavenstädt, H.; Suwelack, B.; Reuter, S. The Tacrolimus Metabolism Rateand Dyslipidemia after Kidney Transplantation. J. Clin. Med. 2021, 10, 3066. [CrossRef]
14. Leeaphorn, N.; Thongprayoon, C.; Vaitla, P.; Hansrivijit, P.; Jadlowiec, C.C.; Mao, S.A.; Chewcharat, A.; Katari, S.;Pattharanitima, P.; Boonpheng, B.; et al. Outcomes of Kidney Transplant Recipients with Sickle Cell Disease: An Analy-sis of the 2000-2019 UNOS/OPTN Database. J. Clin. Med. 2021, 10, 3063. [CrossRef]
2
J. Clin. Med. 2022, 11, 2112
15. Rodrigues, F.G.; Swarte, J.C.; Douwes, R.M.; Knobbe, T.J.; Sotomayor, C.G.; Blokzijl, H.; Weersma, R.K.; Heilberg, I.P.; Bakker, S.J.L.;de Borst, M.H.; et al. Exhaled Hydrogen as a Marker of Intestinal Fermentation Is Associated with Diarrhea in Kidney TransplantRecipients. J. Clin. Med. 2021, 10, 2854. [CrossRef] [PubMed]
16. Hau, H.M.; Jahn, N.; Rademacher, S.; Sucher, E.; Babel, J.; Mehdorn, M.; Lederer, A.; Seehofer, D.; Scheuermann, U.; Sucher, R.The Value of Graft Implantation Sequence in Simultaneous Pancreas-Kidney Transplantation on the Outcome and Graft Survival.J. Clin. Med. 2021, 10, 1632. [CrossRef] [PubMed]
17. Nakamura, T.; Shirouzu, T. Antibody-Mediated Rejection and Recurrent Primary Disease: Two Main Obstacles in AbdominalKidney, Liver, and Pancreas Transplants. J. Clin. Med. 2021, 10, 5417. [CrossRef]
18. Weinhard, J.; Noble, J.; Jouve, T.; Malvezzi, P.; Rostaing, L. Tocilizumab and Desensitization in Kidney Transplant Candidates:Personal Experience and Literature Review. J. Clin. Med. 2021, 10, 4359. [CrossRef]
19. Battaglia, Y.; Zerbinati, L.; Belvederi Murri, M.; Provenzano, M.; Esposito, P.; Andreucci, M.; Storari, A.; Grassi, L. Exploring theLevel of Post Traumatic Growth in Kidney Transplant Recipients via Network Analysis. J. Clin. Med. 2021, 10, 4747. [CrossRef]
20. Westenberg, L.B.; van Londen, M.; Sotomayor, C.G.; Moers, C.; Minnee, R.C.; Bakker, S.J.L.; Pol, R.A. The Association betweenBody Composition Measurements and Surgical Complications after Living Kidney Donation. J. Clin. Med. 2021, 10, 155.[CrossRef]
21. Kuppachi, S.; Axelrod, D.A. Desensitization strategies: Is it worth it? Transpl. Int. 2020, 33, 251–259. [CrossRef]22. Cheungpasitporn, W.; Lentine, K.L.; Tan, J.C.; Kaufmann, M.; Caliskan, Y.; Bunnapradist, S.; Lam, N.N.; Schnitzler, M.;
Axelrod, D.A. Immunosuppression Considerations for Older Kidney Transplant Recipients. Curr. Transplant. Rep. 2021, 8,100–110. [CrossRef] [PubMed]
23. Axelrod, D.A.; Cheungpasitporn, W.; Bunnapradist, S.; Schnitzler, M.A.; Xiao, H.; McAdams-DeMarco, M.; Caliskan, Y.; Bae, S.;Ahn, J.B.; Segev, D.L.; et al. Posttransplant Diabetes Mellitus and Immunosuppression Selection in Older and Obese KidneyRecipients. Kidney Med. 2022, 4, 100377. [CrossRef] [PubMed]
24. Lentine, K.L.; Cheungpasitporn, W.; Xiao, H.; McAdams-DeMarco, M.; Lam, N.N.; Segev, D.L.; Bae, S.; Ahn, J.B.; Hess, G.P.;Caliskan, Y.; et al. Immunosuppression Regimen Use and Outcomes in Older and Younger Adult Kidney Transplant Recipients:A National Registry Analysis. Transplantation 2021, 105, 1840–1849. [CrossRef]
25. Thongprayoon, C.; Hansrivijit, P.; Kovvuru, K.; Kanduri, S.R.; Bathini, T.; Pivovarova, A.; Smith, J.R.; Cheungpasitporn, W.Impacts of High Intra- and Inter-Individual Variability in Tacrolimus Pharmacokinetics and Fast Tacrolimus Metabolism onOutcomes of Solid Organ Transplant Recipients. J. Clin. Med. 2020, 9, 2193. [CrossRef] [PubMed]
26. Thölking, G.; Schütte-Nütgen, K.; Schmitz, J.; Rovas, A.; Dahmen, M.; Bautz, J.; Jehn, U.; Pavenstädt, H.; Heitplatz, B.; VanMarck, V.; et al. A Low Tacrolimus Concentration/Dose Ratio Increases the Risk for the Development of Acute CalcineurinInhibitor-Induced Nephrotoxicity. J. Clin. Med. 2019, 8, 1586. [CrossRef]
27. Thölking, G.; Siats, L.; Fortmann, C.; Koch, R.; Hüsing, A.; Cicinnati, V.R.; Gerth, H.U.; Wolters, H.H.; Anthoni, C.;Pavenstädt, H.; et al. Tacrolimus Concentration/Dose Ratio is Associated with Renal Function After Liver Transplantation. Ann.Transplant. 2016, 21, 167–179. [CrossRef]
28. Thongprayoon, C.; Jadlowiec, C.C.; Leeaphorn, N.; Bruminhent, J.; Acharya, P.C.; Acharya, C.; Pattharanitima, P.; Kaewput, W.;Boonpheng, B.; Cheungpasitporn, W. Feature Importance of Acute Rejection among Black Kidney Transplant Recipients byUtilizing Random Forest Analysis: An Analysis of the UNOS Database. Medicines 2021, 8, 66. [CrossRef]
29. Lønning, K.; Midtvedt, K.; Leivestad, T.; Reisæter, A.V.; Line, P.D.; Hartmann, A.; Heldal, K. Are Octogenarians With End-StageRenal Disease Candidates for Renal Transplantation? Transplantation 2016, 100, 2705–2709. [CrossRef]
30. Huang, E.; Poommipanit, N.; Sampaio, M.S.; Kuo, H.T.; Reddy, P.; Gritsch, H.A.; Pham, P.T.; Wilkinson, A.; Danovitch, G.;Bunnapradist, S. Intermediate-term outcomes associated with kidney transplantation in recipients 80 years and older: An analysisof the OPTN/UNOS database. Transplantation 2010, 90, 974–979. [CrossRef]
31. Ravichandran, B.R.; Sparkes, T.M.; Masters, B.M.; Thomas, B.; Demehin, M.; Bromberg, J.S.; Haririan, A. Survival benefit of renaltransplantation in octogenarians. Clin. Transplant. 2020, 34, e14074. [CrossRef]
3

Journal of
Clinical Medicine
Article
The Association between Body Composition Measurementsand Surgical Complications after Living Kidney Donation
Lisa B. Westenberg 1,2, Marco van Londen 2, Camilo G. Sotomayor 2, Cyril Moers 1, Robert C. Minnee 3, Stephan J.
L. Bakker 2 and Robert A. Pol 1,*
Citation: Westenberg, L.B.; van
Londen, M.; Sotomayor, C.G.; Moers,
C.; Minnee, R.C.; Bakker, S.J.L.; Pol,
R.A. The Association between Body
Composition Measurements and
Surgical Complications after Living
Kidney Donation. J. Clin. Med. 2021,
10, 155. https://doi.org/10.3390/
jcm10010155
Received: 6 December 2020
Accepted: 31 December 2020
Published: 5 January 2021
Publisher’s Note: MDPI stays neutral
with regard to jurisdictional claims in
published maps and institutional affil-
iations.
Copyright: © 2021 by the authors.
Licensee MDPI, Basel, Switzerland.
This article is an open access article
distributed under the terms and
conditions of the Creative Commons
Attribution (CC BY) license (https://
creativecommons.org/licenses/by/
4.0/).
1 Department of Surgery, University Medical Center Groningen, University of Groningen,9713 GZ Groningen, The Netherlands; [email protected] (L.B.W.); [email protected] (C.M.)
2 Division of Nephrology, Department of Internal Medicine, University Medical Center Groningen,University of Groningen, 9713 GZ Groningen, The Netherlands; [email protected] (M.v.L.);[email protected] (C.G.S.); [email protected] (S.J.L.B.)
3 Department of Surgery, Erasmus University Medical Center, Erasmus University Rotterdam,3015 CN Rotterdam, The Netherlands; [email protected]
* Correspondence: [email protected]; Tel.: +31-503613382
Abstract: Obesity is considered a risk factor for peri- and postoperative complications. Little isknown about this risk in overweight living kidney donors. The aim of this study was to assessif anthropometric body measures and/or surgical determinants are associated with an increasedincidence of peri- and postoperative complications after nephrectomy. We included 776 livingkidney donors who donated between 2008 and 2018 at the University Medical Center Groningen.Prenephrectomy measures of body composition were body mass index (BMI), body surface area (BSA),waist circumference, weight, and waist–hip ratio. Incidence and severity of peri- and postoperativecomplications were assessed using the Comprehensive Complication Index. Mean donor age was53 ± 11 years; 382 (49%) were male, and mean BMI at donor screening was 26.2 ± 3.41 kg/m2. In total,77 donors (10%) experienced peri- and postoperative complications following donor nephrectomy.Male sex was significantly associated with fewer surgical complications (OR 0.59, 0.37–0.96 95%CI,p = 0.03) in binomial logistic regression analyses. Older age (OR: 1.03, 1.01–1.05 95%CI, p = 0.02)and a longer duration of surgery (OR: 1.01, 1.00–1.01 95%CI, p = 0.02) were significantly associatedwith more surgical complications in binomial logistic regression analyses. Multinomial logisticregression analyses did not identify any prenephrectomy measure of body composition associatedwith a higher risk of surgical complications. This study shows that higher prenephrectomy BMI andother anthropometric measures of body composition are not significantly associated with peri- andpostoperative complications following living donor nephrectomy.
Keywords: living donation; nephrectomy; hand-assisted laparoscopic nephrectomy; body composi-tion; complications
1. Introduction
Transplantation of kidneys from living donors has many advantages in comparisonwith transplantation of deceased donor grafts. For patients with end-stage renal diseasethat undergo transplantation, patient and graft survival is better when transplanted witha graft from a living donor [1]. Although these findings support a need for more livingkidney donors, the total number of living donor transplantations in the United States hasremained constant since 2011 [2].
During screening for living kidney donation, body mass index (BMI) plays an impor-tant role in the assessment of a potential donor. A BMI ≥ 35 kg/m2 has been associated withan increased risk of peri- and postoperative complications such as surgical site infection,deep venous thrombosis development, and incisional hernia [3–5]. This risk of surgicalcomplications was not significant in individuals with a BMI < 30 kg/m2 [6]. Therefore,
J. Clin. Med. 2021, 10, 155. https://doi.org/10.3390/jcm10010155 https://www.mdpi.com/journal/jcm5
J. Clin. Med. 2021, 10, 155
many transplantation centres have decided that donors with a BMI ≥ 35 kg/m2 are notaccepted for donation, and those who are obese with a BMI between 30 and 35 kg/m2 areadvised to make lifestyle changes to reduce their weight [7,8]. Interestingly, studies onthe effect of BMI as a risk factor for surgical complications in living donor nephrectomiesreport contradictory results [9,10], and especially, little is known about this risk in donorswith a BMI between 30 and 35 kg/m2, who constitute a relatively large part of the livingkidney donor population. Confronted with a changing living kidney donor pool due tothe increasing prevalence of obesity worldwide [11] and the lack of a consensus on thethreshold of BMI for living kidney donation acceptance criteria, the aim of this study is toassess whether BMI and other anthropometric body measures that are easily obtained inclinics are associated with an increased incidence of peri- and postoperative complicationsafter nephrectomy.
2. Materials and Methods
2.1. Study Design
A total of 776 living kidney donors were included in this longitudinal prospectivecohort study. Donor nephrectomies took place between 2008 and 2018 in the UniversityMedical Center Groningen (The Netherlands). Potential donors were screened by a teamof medical experts consisting of nephrologists, surgeons, radiologists, psychologists, andsocial workers. The main inclusion criterion was age >18 years of age at the time ofdonation. The exclusion criteria for donation were in accordance with the Dutch Guide-lines for Evaluation of Potential Donors for Living Donor Kidney Transplantation from2008 (i.e., BMI > 35 kg/m2, unable to provide informed consent, manifested DiabetesMellitus, major cardiovascular risk factors, prior kidney disease or glomerular filtrationrate (GFR) of <60 mL/min × 1.73 m2, monokidney, pregnancy, recent or active malignan-cies, chronic/active infection (e.g., HIV, HCV, HTLV, HBV), hypertension with end organdamage, inadequately regulated hypertension, proteinuria (>0.5 g/24 h), microscopicalhaematuria, and bilateral nephrolithiasis on CT scan) [9]. Informed consent was obtainedfrom all participants.
Every donor underwent hand-assisted endoscopic donor nephrectomy, either la-paroscopic (hand-assisted laparoscopy (HALN)) or retroperitoneoscopic (hand-assistedretroperitoneal nephrectomy (HARN)). Our hospital’s hand-assisted donor nephrectomyprocedure has been described in detail in a previous publication [12]. All living kidneydonors donated to recipients >18 years of age. The study was approved by the institutionalethical review board (METc 2014/077). All procedures were conducted in accordance withthe Declarations of Helsinki.
2.2. Data Collection
Data were collected as part of the TransplantLines research project conducted at theUMCG [13]. During all visits, donors’ weight and height were measured by trained nurses.These measurements were used to calculate BMI (kg/m2) and body surface area (BSA); thelatter was calculated using the Du Bois and Du Bois equation [14], a method most widelyused in clinical practice. Waist and hip circumference were also measured at each visitof the donor as part of the TransplantLines study. Waist–hip ratio was calculated as thequotient of waist circumference and hip circumference.
Additional anthropometric, clinical, and laboratory measurements were extractedfrom the digital hospital registration system. Surgical complications were assessed us-ing the Comprehensive Complication Index (CCI) [15], a continuous scale that measuressurgical morbidity, considering all complications according to the Clavien–Dindo clas-sification [16]. The CCI considers the incidence of each complication, using a specificcalculation that results in a score between 0 and 100. Complications were prospectivelyrecorded, and for this study, a full description of the reported complication was retrievedfrom the complication registry of the surgical department or otherwise extracted from thedigital hospital registration system at our university hospital. As part of our follow-up
6
J. Clin. Med. 2021, 10, 155
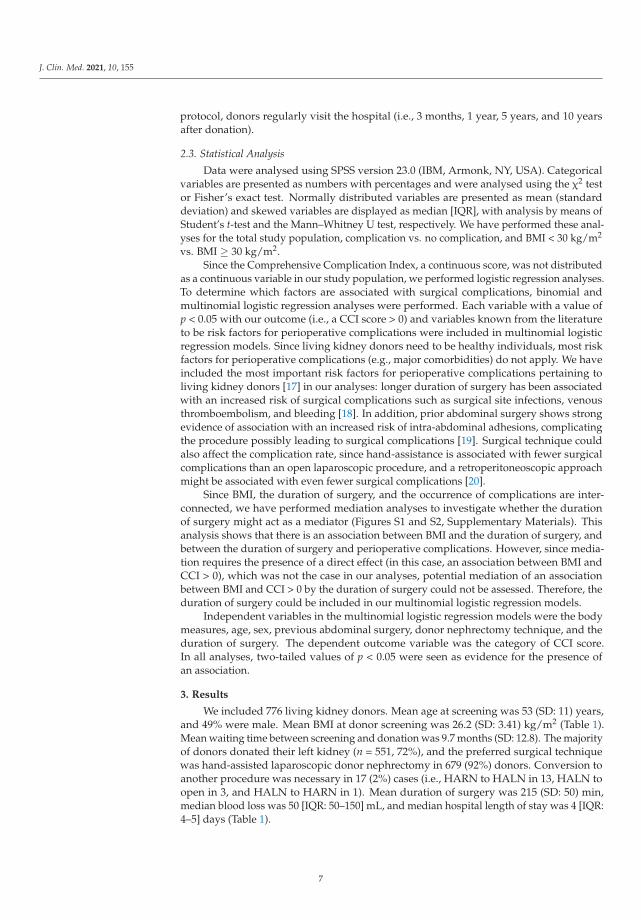
protocol, donors regularly visit the hospital (i.e., 3 months, 1 year, 5 years, and 10 yearsafter donation).
2.3. Statistical Analysis
Data were analysed using SPSS version 23.0 (IBM, Armonk, NY, USA). Categoricalvariables are presented as numbers with percentages and were analysed using the χ2 testor Fisher’s exact test. Normally distributed variables are presented as mean (standarddeviation) and skewed variables are displayed as median [IQR], with analysis by means ofStudent’s t-test and the Mann–Whitney U test, respectively. We have performed these anal-yses for the total study population, complication vs. no complication, and BMI < 30 kg/m2
vs. BMI ≥ 30 kg/m2.Since the Comprehensive Complication Index, a continuous score, was not distributed
as a continuous variable in our study population, we performed logistic regression analyses.To determine which factors are associated with surgical complications, binomial andmultinomial logistic regression analyses were performed. Each variable with a value ofp < 0.05 with our outcome (i.e., a CCI score > 0) and variables known from the literatureto be risk factors for perioperative complications were included in multinomial logisticregression models. Since living kidney donors need to be healthy individuals, most riskfactors for perioperative complications (e.g., major comorbidities) do not apply. We haveincluded the most important risk factors for perioperative complications pertaining toliving kidney donors [17] in our analyses: longer duration of surgery has been associatedwith an increased risk of surgical complications such as surgical site infections, venousthromboembolism, and bleeding [18]. In addition, prior abdominal surgery shows strongevidence of association with an increased risk of intra-abdominal adhesions, complicatingthe procedure possibly leading to surgical complications [19]. Surgical technique couldalso affect the complication rate, since hand-assistance is associated with fewer surgicalcomplications than an open laparoscopic procedure, and a retroperitoneoscopic approachmight be associated with even fewer surgical complications [20].
Since BMI, the duration of surgery, and the occurrence of complications are inter-connected, we have performed mediation analyses to investigate whether the durationof surgery might act as a mediator (Figures S1 and S2, Supplementary Materials). Thisanalysis shows that there is an association between BMI and the duration of surgery, andbetween the duration of surgery and perioperative complications. However, since media-tion requires the presence of a direct effect (in this case, an association between BMI andCCI > 0), which was not the case in our analyses, potential mediation of an associationbetween BMI and CCI > 0 by the duration of surgery could not be assessed. Therefore, theduration of surgery could be included in our multinomial logistic regression models.
Independent variables in the multinomial logistic regression models were the bodymeasures, age, sex, previous abdominal surgery, donor nephrectomy technique, and theduration of surgery. The dependent outcome variable was the category of CCI score.In all analyses, two-tailed values of p < 0.05 were seen as evidence for the presence ofan association.
3. Results
We included 776 living kidney donors. Mean age at screening was 53 (SD: 11) years,and 49% were male. Mean BMI at donor screening was 26.2 (SD: 3.41) kg/m2 (Table 1).Mean waiting time between screening and donation was 9.7 months (SD: 12.8). The majorityof donors donated their left kidney (n = 551, 72%), and the preferred surgical techniquewas hand-assisted laparoscopic donor nephrectomy in 679 (92%) donors. Conversion toanother procedure was necessary in 17 (2%) cases (i.e., HARN to HALN in 13, HALN toopen in 3, and HALN to HARN in 1). Mean duration of surgery was 215 (SD: 50) min,median blood loss was 50 [IQR: 50–150] mL, and median hospital length of stay was 4 [IQR:4–5] days (Table 1).
7
J. Clin. Med. 2021, 10, 155
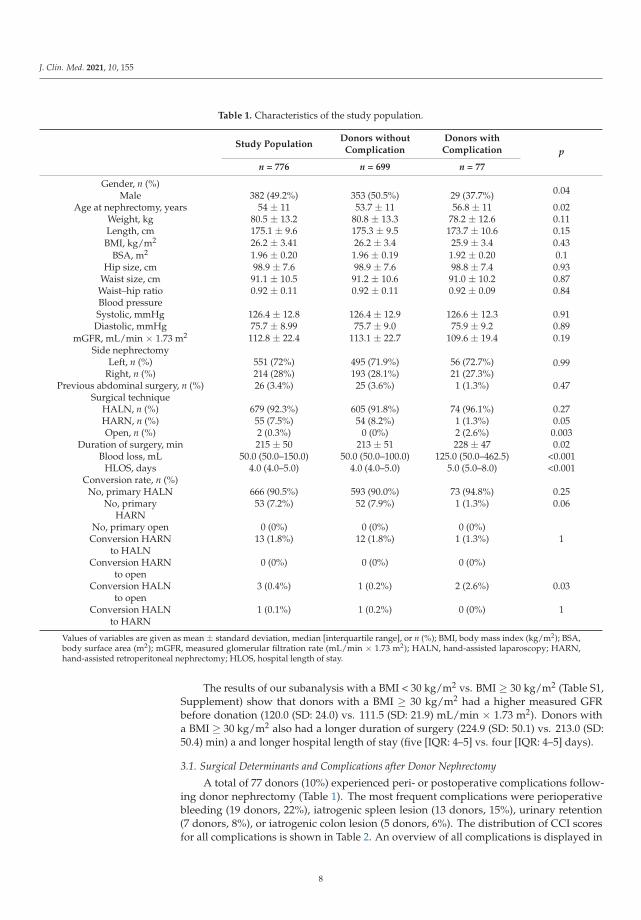
Table 1. Characteristics of the study population.
Study PopulationDonors without
ComplicationDonors withComplication p
n = 776 n = 699 n = 77
Gender, n (%)0.04Male 382 (49.2%) 353 (50.5%) 29 (37.7%)
Age at nephrectomy, years 54 ± 11 53.7 ± 11 56.8 ± 11 0.02Weight, kg 80.5 ± 13.2 80.8 ± 13.3 78.2 ± 12.6 0.11Length, cm 175.1 ± 9.6 175.3 ± 9.5 173.7 ± 10.6 0.15BMI, kg/m2 26.2 ± 3.41 26.2 ± 3.4 25.9 ± 3.4 0.43
BSA, m2 1.96 ± 0.20 1.96 ± 0.19 1.92 ± 0.20 0.1Hip size, cm 98.9 ± 7.6 98.9 ± 7.6 98.8 ± 7.4 0.93
Waist size, cm 91.1 ± 10.5 91.2 ± 10.6 91.0 ± 10.2 0.87Waist–hip ratio 0.92 ± 0.11 0.92 ± 0.11 0.92 ± 0.09 0.84Blood pressureSystolic, mmHg 126.4 ± 12.8 126.4 ± 12.9 126.6 ± 12.3 0.91Diastolic, mmHg 75.7 ± 8.99 75.7 ± 9.0 75.9 ± 9.2 0.89
mGFR, mL/min × 1.73 m2 112.8 ± 22.4 113.1 ± 22.7 109.6 ± 19.4 0.19Side nephrectomy
0.99Left, n (%) 551 (72%) 495 (71.9%) 56 (72.7%)Right, n (%) 214 (28%) 193 (28.1%) 21 (27.3%)
Previous abdominal surgery, n (%) 26 (3.4%) 25 (3.6%) 1 (1.3%) 0.47Surgical technique
HALN, n (%) 679 (92.3%) 605 (91.8%) 74 (96.1%) 0.27HARN, n (%) 55 (7.5%) 54 (8.2%) 1 (1.3%) 0.05Open, n (%) 2 (0.3%) 0 (0%) 2 (2.6%) 0.003
Duration of surgery, min 215 ± 50 213 ± 51 228 ± 47 0.02Blood loss, mL 50.0 (50.0–150.0) 50.0 (50.0–100.0) 125.0 (50.0–462.5) <0.001
HLOS, days 4.0 (4.0–5.0) 4.0 (4.0–5.0) 5.0 (5.0–8.0) <0.001Conversion rate, n (%)
No, primary HALN 666 (90.5%) 593 (90.0%) 73 (94.8%) 0.25No, primary 53 (7.2%) 52 (7.9%) 1 (1.3%) 0.06
HARNNo, primary open 0 (0%) 0 (0%) 0 (0%)
Conversion HARN 13 (1.8%) 12 (1.8%) 1 (1.3%) 1to HALN
Conversion HARN 0 (0%) 0 (0%) 0 (0%)to open
Conversion HALN 3 (0.4%) 1 (0.2%) 2 (2.6%) 0.03to open
Conversion HALN 1 (0.1%) 1 (0.2%) 0 (0%) 1to HARN
Values of variables are given as mean ± standard deviation, median [interquartile range], or n (%); BMI, body mass index (kg/m2); BSA,body surface area (m2); mGFR, measured glomerular filtration rate (mL/min × 1.73 m2); HALN, hand-assisted laparoscopy; HARN,hand-assisted retroperitoneal nephrectomy; HLOS, hospital length of stay.
The results of our subanalysis with a BMI < 30 kg/m2 vs. BMI ≥ 30 kg/m2 (Table S1,Supplement) show that donors with a BMI ≥ 30 kg/m2 had a higher measured GFRbefore donation (120.0 (SD: 24.0) vs. 111.5 (SD: 21.9) mL/min × 1.73 m2). Donors witha BMI ≥ 30 kg/m2 also had a longer duration of surgery (224.9 (SD: 50.1) vs. 213.0 (SD:50.4) min) a and longer hospital length of stay (five [IQR: 4–5] vs. four [IQR: 4–5] days).
3.1. Surgical Determinants and Complications after Donor Nephrectomy
A total of 77 donors (10%) experienced peri- or postoperative complications follow-ing donor nephrectomy (Table 1). The most frequent complications were perioperativebleeding (19 donors, 22%), iatrogenic spleen lesion (13 donors, 15%), urinary retention(7 donors, 8%), or iatrogenic colon lesion (5 donors, 6%). The distribution of CCI scoresfor all complications is shown in Table 2. An overview of all complications is displayed in
8
J. Clin. Med. 2021, 10, 155
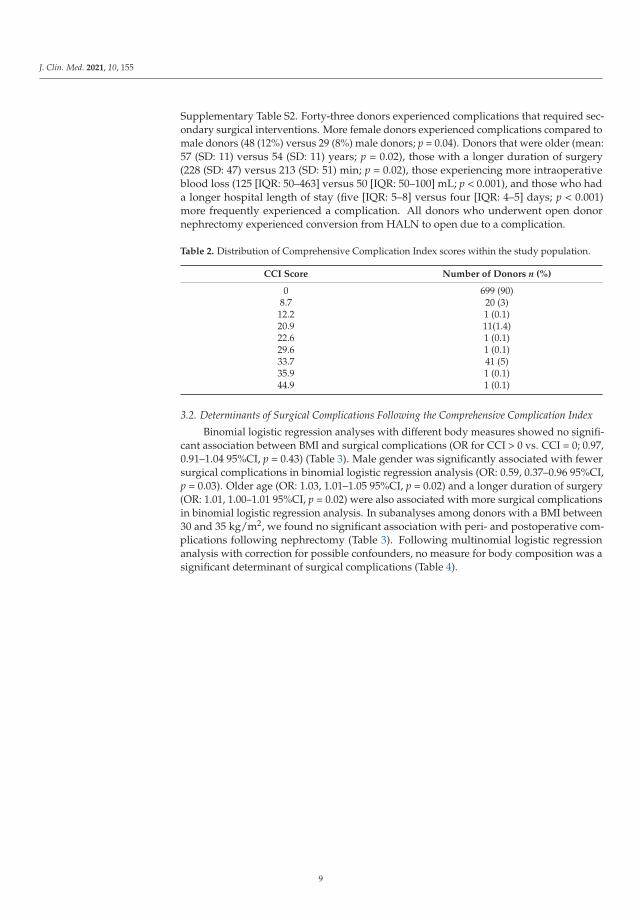
Supplementary Table S2. Forty-three donors experienced complications that required sec-ondary surgical interventions. More female donors experienced complications compared tomale donors (48 (12%) versus 29 (8%) male donors; p = 0.04). Donors that were older (mean:57 (SD: 11) versus 54 (SD: 11) years; p = 0.02), those with a longer duration of surgery(228 (SD: 47) versus 213 (SD: 51) min; p = 0.02), those experiencing more intraoperativeblood loss (125 [IQR: 50–463] versus 50 [IQR: 50–100] mL; p < 0.001), and those who hada longer hospital length of stay (five [IQR: 5–8] versus four [IQR: 4–5] days; p < 0.001)more frequently experienced a complication. All donors who underwent open donornephrectomy experienced conversion from HALN to open due to a complication.
Table 2. Distribution of Comprehensive Complication Index scores within the study population.
CCI Score Number of Donors n (%)
0 699 (90)8.7 20 (3)12.2 1 (0.1)20.9 11(1.4)22.6 1 (0.1)29.6 1 (0.1)33.7 41 (5)35.9 1 (0.1)44.9 1 (0.1)
3.2. Determinants of Surgical Complications Following the Comprehensive Complication Index
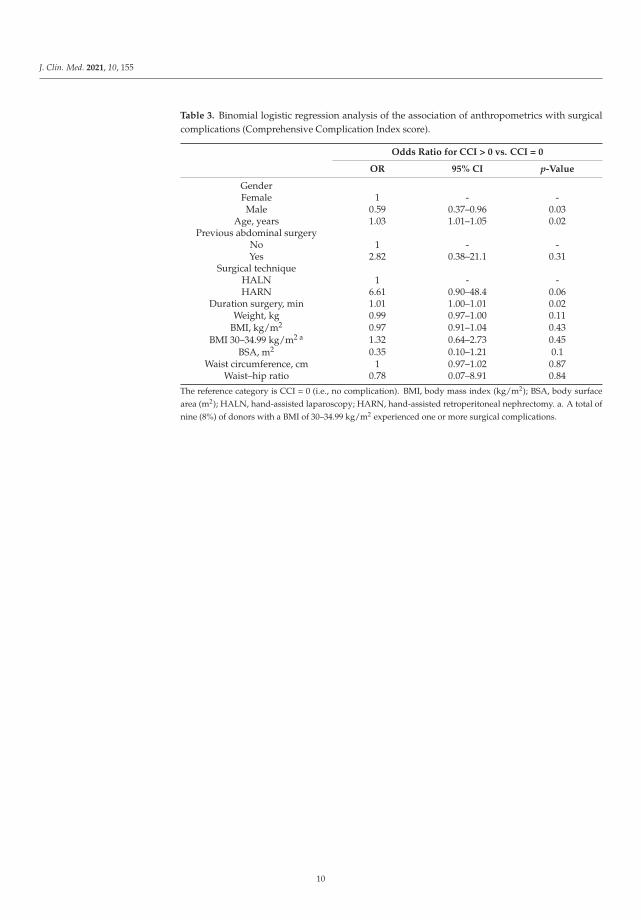
Binomial logistic regression analyses with different body measures showed no signifi-cant association between BMI and surgical complications (OR for CCI > 0 vs. CCI = 0; 0.97,0.91–1.04 95%CI, p = 0.43) (Table 3). Male gender was significantly associated with fewersurgical complications in binomial logistic regression analysis (OR: 0.59, 0.37–0.96 95%CI,p = 0.03). Older age (OR: 1.03, 1.01–1.05 95%CI, p = 0.02) and a longer duration of surgery(OR: 1.01, 1.00–1.01 95%CI, p = 0.02) were also associated with more surgical complicationsin binomial logistic regression analysis. In subanalyses among donors with a BMI between30 and 35 kg/m2, we found no significant association with peri- and postoperative com-plications following nephrectomy (Table 3). Following multinomial logistic regressionanalysis with correction for possible confounders, no measure for body composition was asignificant determinant of surgical complications (Table 4).
9
J. Clin. Med. 2021, 10, 155
Table 3. Binomial logistic regression analysis of the association of anthropometrics with surgicalcomplications (Comprehensive Complication Index score).
Odds Ratio for CCI > 0 vs. CCI = 0
OR 95% CI p-Value
GenderFemale 1 - -Male 0.59 0.37–0.96 0.03
Age, years 1.03 1.01–1.05 0.02Previous abdominal surgery
No 1 - -Yes 2.82 0.38–21.1 0.31
Surgical techniqueHALN 1 - -HARN 6.61 0.90–48.4 0.06
Duration surgery, min 1.01 1.00–1.01 0.02Weight, kg 0.99 0.97–1.00 0.11
BMI, kg/m2 0.97 0.91–1.04 0.43BMI 30–34.99 kg/m2 a 1.32 0.64–2.73 0.45
BSA, m2 0.35 0.10–1.21 0.1Waist circumference, cm 1 0.97–1.02 0.87
Waist–hip ratio 0.78 0.07–8.91 0.84
The reference category is CCI = 0 (i.e., no complication). BMI, body mass index (kg/m2); BSA, body surfacearea (m2); HALN, hand-assisted laparoscopy; HARN, hand-assisted retroperitoneal nephrectomy. a. A total ofnine (8%) of donors with a BMI of 30–34.99 kg/m2 experienced one or more surgical complications.
10

J. Clin. Med. 2021, 10, 155
Table 4. Multinomial logistic regression analysis of the association of anthropometrics with surgical complications (withComprehensive Complication Index score classified into categories).
CCI 0.1–20.0 CCI 20.1–30.0 CCI > 30.0
n = 21 n = 13 n = 43
OR (95%CI) p-Value OR (95%CI) p-Value OR (95%CI) p-Value
Weight, kgModel 1 0.99 (0.95–1.03) 0.59 1.01 (0.97–1.06) 0.61 0.99 (0.96–1.02) 0.56Model 2 0.99 (0.95–1.03) 0.51 1.02 (0.97–1.07) 0.46 0.98 (0.95–1.01) 0.27
BMI, kg/m2
Model 1 0.92 (0.81–1.06) 0.24 0.93 (0.79–1.10) 0.42 1.00 (0.92–1.10) 0.92Model 2 0.91 (0.79–1.04) 0.18 0.96 (0.82–1.14) 0.66 0.96 (0.86–1.06) 0.39BSA, m2
Model 1 0.77 (0.04–15.4) 0.87 13.4 (0.36–490.0) 0.16 0.40 (0.05–3.44) 0.4Model 2 0.71 (0.04–14.2) 0.82 14.2 (0.35–566.9) 0.16 0.31 (0.03–3.46) 0.34
Waist circumference, cmModel 1 1.00 (0.95–1.05) 0.89 0.99 (0.94–1.06) 0.82 1.01 (0.98–1.04) 0.57Model 2 0.99 (0.95–1.04) 0.74 1.01 (0.95–1.07) 0.69 0.99 (0.96–1.03) 0.72
Waist–hip ratioModel 1 1.38 (0.01–188.6) 0.9 0.03 (0.00–58.5) 0.37 3.73 (0.18–76.3) 0.39Model 2 0.88 (0.01–119.9) 0.96 0.36 (0.00–324.1) 0.77 1.98 (0.05–75.5) 0.71
The Comprehensive Complication Index (CCI) [15] score is classified into categories (CCI 0.1–20.0; CCI 20.1–30.0; CCI > 30.0) and comparedto the reference category of CCI = 0 (e.g., no complication). BMI, body mass index (kg/m2); BSA, body surface area (m2). Model 1 is age-and sex-adjusted. Model 2 is adjusted for age, sex, previous abdominal surgery, donor nephrectomy technique, and duration of surgery.
4. Discussion
This study showed that in our cohort of living donors, there was no significant associ-ation between BMI or other anthropometric body measures and peri- and postoperativecomplications.
Higher BMI has previously been associated with an increased risk of peri- and postop-erative complications in different study populations. Incidence of surgical site infectionincreases with increasing BMI in general surgery patients [3], possibly due to low regionalperfusion and oxygen tension resulting from excessive subcutaneous fat tissue impairingwound healing. Duration of surgery is also often prolonged in obese individuals [21],adding to the risk of surgical site infection [22]. Obese individuals were at increased riskof major postoperative complications following surgery for gastrointestinal malignancyand renal cancer [23,24]. Due to a larger BSA and more complex fluid management, riskof intraoperative hypothermia is increased in obese individuals, predisposing them tosurgical and thromboembolic complications [5,23]. In overweight and obese donors, alarger extraction incision is usually necessary due to the thicker layer of adipose tissue,leading to a higher risk for abdominal wall complications (e.g., incisional hernia and woundinfections) [6,25].
Different from the aforementioned studies, our results, from one of the largest prospec-tive cohorts, suggest no significant deleterious effect of high fat mass on peri- and post-operative complications following donation. A possible explanation might be that livingkidney donors differ significantly from other surgical populations in which they have littleto no comorbidities at the time of surgery [18]. Although the donor population in our studydid not allow an analysis of donors with a BMI ≥ 35 kg/m2, we found no evidence of anassociation between BMI and surgical complications following donation in subanalyses ofobese donors with a BMI between 30 and 35 kg/m2.
Whether BMI is the best way to measure obesity remains unclear. Various otheranthropometric measures, such as BSA, waist circumference, and waist–hip ratio, are alsofrequently used in clinical settings but with varying results with respect to each other.Cross-sectional surveys evaluating the predictive power of BMI and waist circumferencehave shown waist circumference to be a better predictor for obesity-related comorbidities
11
J. Clin. Med. 2021, 10, 155
than solely BMI [26,27]. In assessing obesity-related renal effects, waist–hip ratio appearsto be superior to both BMI and waist circumference [28].
We detected strong evidence of an association between longer duration of surgeryand peri- and postoperative complications following donor nephrectomy, which are, ofcourse, interconnected. Although the occurrence of a surgical complication might result ina prolonged duration of surgery, the likelihood of surgical complications such as surgicalsite infections, venous thromboembolism, bleeding, hematoma formation, and necrosisalso increases with prolonged duration of surgery [29]. A recent systematic review andmeta-analysis demonstrated that the risk of complications approximately doubled withprolonged operative duration and the risk of surgical complications increased by 14% forevery 30 min of additional operating time [29]. Although the underlying mechanisms arenot yet fully understood, a prolonged microbial exposure [30] and a diminishing efficacyof antimicrobial prophylaxis over time [31] appear to be contributing factors. Venousthromboembolism formation is more likely to occur with prolonged surgical proceduresdue to an increased risk of blood stasis, coagulation activation, and endothelial damage,also known as Virchow’s triad [32]. Obesity prolongs the duration of surgery and cantherefore also lead to a higher risk of aforementioned complications [22].
Living kidney donors are a unique group of surgical patients, given that a low comor-bidity burden is required to be eligible for donation. In current donor screening guidelines,BMI is a widely applied measure for assessing obesity [9]. It is, however, a poor estimate offat mass distribution. Muscular individuals or those with more subcutaneous fat can havea similar BMI to individuals with more visceral fat, but these different types of high BMIare associated with different disease risks [33]. Contradictory to what is generally knownabout obesity and its effect on disease and mortality risk, some studies show a protectiveeffect of high BMI in patients [34]. This apparent protective effect is often referred to asthe “obesity paradox” and also underlines that BMI poorly reflects the actual balance orimbalance in fat mass distribution and muscle volume. Therefore, we need to incorporatemore reliable tools to measure body composition when defining obesity and determiningits effect on postsurgical outcome. Bioelectrical impedance analysis (BIA) is a tool forassessing body composition by measuring the resistance of the body as a conductor to avery small alternating electrical current. This technique might provide a more detailed andreliable analysis of fat and muscle mass, enabling assessment of the association betweenthese two determinants of body composition and peri- and postoperative complicationsafter surgery. This method, however, is not yet sufficiently validated among living kidneydonors. Another promising technique to assess the risk of surgical complications followingdonor nephrectomy is a volumetric measurement of perirenal fat mass based on CT-scans,which shows a stronger correlation with outcome measures of laparoscopic donor nephrec-tomy than BMI alone [35]. Future studies, also by our group, should investigate otherparameters defining the outcome of donation based on body composition and BMI, such asslow or delayed graft function, long-term renal function, and development of comorbidity.There is also a call for more studies assessing obesity in living kidney donors with a varietyof ethnicities, especially since donors with an African background seem to more commonlybe obese and develop conditions such as chronic kidney disease, proteinuria, and nephroticsyndrome [36,37]. In addition, data on lifetime risk of chronic kidney disease and mortalityin young living kidney donors are sparse and should be a focus of future studies.
Our study has a few limitations that need to be addressed. Although our study consistsof a large cohort of living kidney donors and missing data for predonation body measureswas limited in this study, the exclusion criteria that were applied in donor screening [9](e.g., BMI > 35 kg/m2, manifested Diabetes Mellitus, major cardiovascular risk factors,proteinuria > 0.5 g/24 h) affected our results. Especially the exclusion of potential donorswith a BMI > 35 kg/m2 resulted in a narrow range of BMI, making our study populationa selection of the total group of living kidney donors, which might not be representativeto other kidney donor populations where this criterion is not applied in donor screeningguidelines. The incidence of complications in the subgroup with a BMI of 30–34.99 was low.
12
J. Clin. Med. 2021, 10, 155
Future studies with the inclusion of a larger number of donors with a BMI in this rangeare required to further investigate the effect of living kidney donation on the developmentof complications in this group. Although our study shows a similar complication rateto observations in the United States [22], complications might have been underreported,especially following procedures performed in the early years of our data collection, whichmight have influenced the results. Furthermore, living kidney donors are part of a highlyselected population. Therefore, our results cannot automatically be extrapolated to otherkinds of surgery and to other populations. We have used literature on living kidney donorswhen available but referred to other kinds of surgery or other study populations when thiswas lacking.
In conclusion, this study shows no strong evidence of an association between BMI andother anthropometric body measures and peri- and postoperative complications followingdonor nephrectomy and should therefore be no reason to refrain from surgery.
Supplementary Materials: The following are available online at https://www.mdpi.com/article/10.3390/jcm10010155/s1, Figure S1: Standardized Regression Coefficients and Odds Ratios for theRelationship Between Body Mass Index and Comprehensive Complications Index score above zeroas Mediated by Duration of Surgery, Figure S2: Standardized Regression Coefficients and OddsRatios for the Relationship Between Duration of Surgery and Comprehensive Complications Indexscore above zero as Mediated by Body Mass Index, Table S1: Characteristics of the study populationby BMI category, Table S2: Overview of complications.
Author Contributions: Conceptualization, L.B.W., M.v.L., S.J.L.B., and R.A.P.; data curation, L.B.W.;formal analysis, L.B.W.; methodology, L.B.W.; supervision, M.v.L., S.J.L.B., and R.A.P.; writing—original draft, L.B.W.; writing—review and editing, M.v.L., C.G.S., C.M., R.C.M., S.J.L.B., and R.A.P.All authors have read and agreed to the published version of the manuscript.
Funding: This research received no external funding.
Institutional Review Board Statement: The study was conducted according to the guidelines of theDeclaration of Helsinki, and approved by the Institutional Review Board (or Ethics Committee) ofUniversity Medical Center Groningen (METc 2014/077).
Informed Consent Statement: Informed consent was obtained from all subjects involved in thestudy.
Data Availability Statement: The data presented in this study are available on request from thecorresponding author. The data are not publicly available due to privacy restrictions.
Conflicts of Interest: The authors declare no conflict of interest.
References
1. Axelrod, D.; McCullough, K.; Brewer, E.; Becker, B.; Segev, D.; Rao, P. Kidney and Pancreas Transplantation in the United States,1999-2008: The Changing Face of Living Donation. Am. J. Transplant. 2010, 10, 987–1002. [CrossRef] [PubMed]
2. Hart, A.; Smith, J.; Skeans, M.; Gustafson, S.; Wilk, A.; Robinson, A. OPTN/SRTR 2016 Annual Data Report: Kidney. Am. J.Transplant. 2018, 18, 18–113. [CrossRef] [PubMed]
3. Tjeertes, E.; Hoeks, S.; Beks, S.; Valentijn, T.; Hoofwijk, A.; Stolker, R. Obesity—A Risk Factor for Postoperative Complications inGeneral Surgery? BMC Anesthesiol. 2015, 15, 112. [CrossRef] [PubMed]
4. Klovaite, J.; Benn, M.; Nordestgaard, B. Obesity as a causal risk factor for deep venous thrombosis: A Mendelian randomizationstudy. J. Intern. Med. 2014, 277, 573–584. [CrossRef] [PubMed]
5. Arfi, N.; Baldini, A.; Decaussin-Petrucci, M.; Ecochard, R.; Ruffion, A.; Paparel, P. Impact of Obesity on Complications ofLaparoscopic Simple or Radical Nephrectomy. Curr. Urol. 2014, 8, 149–155. [CrossRef]
6. Flancbaum, L.; Chobab, P.S. Surgical implications of obesity. Ann. Rev. Med. 1998, 49, 215–234. [CrossRef]7. Mandelbrot, D.; Pavlakis, M.; Danovitch, G.; Johnson, S.R.; Karp, S.J.; Khwaja, K.; Hanto, D.W.; Rodrigue, J.R. The Medical
Evaluation of Living Kidney Donors: A Survey of US Transplant Centers. Am. J. Transplant. 2007, 7, 2333–2343. [CrossRef]8. Landelijk Overleg Niertransplantatie; van der Heide, J.H. Nederlandse Richtlijn: Evaluatie Van Potentiële Donoren Voor Levende
Donor Niertransplantatie; NTV: Haarlem, The Netherlands, 2008; pp. 23–27.9. Heimbach, J.; Taler, S.; Prieto, M.; Cosio, F.G.; Textor, S.C.; Kudva, Y.C.; Chow, G.K.; Ishitani, M.B.; Larson, T.S.; Stegall, M.D.
Obesity in Living Kidney Donors: Clinical Characteristics and Outcomes in the Era of Laparoscopic Donor Nephrectomy. Am. J.Transplant. 2005, 5, 1057–1064. [CrossRef]
13
J. Clin. Med. 2021, 10, 155
10. Unger, L.; Feka, J.; Sabler, P.; Rasoul-Rockenshaub, S.; Gyori, G.; Holfmann, M.; Schwarz, C.; Soliman, T.; Bohmig, G.; Kains, A.High BMI and male sex as risk factor for increased short-term renal impairment in living kidney donors—Retrospective analysisof 289 consecutive cases. IJS 2017, 46, 172–177. [CrossRef]
11. Taler, S.J.; Messersmith, E.E.; Leichtman, A.B.; Gillespie, B.W.; Kew, C.E.; Stegall, M.D.; Merion, R.M.; Matas, A.J.; Ibrahim, H.N.Demographic, Metabolic, and Blood Pressure Characteristics of Living Kidney Donors Spanning Five Decades. Am. J. Transplant.2013, 13, 390–398. [CrossRef]
12. Zorgdrager, M.; van Londen, M.; Westenberg, L.; Nieuwenhuijs-Moeke, G.J.; Lange, J.F.M.; Borst, M.H.; Bakker, S.J.L.; Leu-venink,H.G.D.; Pol, R.A. Chronic pain after hand-assisted laparoscopic donor nephrectomy. BJS 2019, 106, 711–719. [CrossRef] [PubMed]
13. Eisenga, M.; Gomes-Neto, A.; van Londen, M.; Ziengs, A.; Douwes, R.M.; Stam, S.P.; Osté, M.C.J.; Knobbe, T.J.; Hessels, N.R.;Buunk, A.M. Rationale and design of TransplantLines: A prospective cohort study and biobank of solid organ transplantrecipients. BMJ Open 2018, 8, e024502. [CrossRef]
14. Du Bois, D.; Du Bois, E. A formula to estimate the approximate surface area if height and weight be known. Nutrition 1989, 5,303–311. [PubMed]
15. Slankamenac, K.; Graf, R.; Barkun, J.; Puhan, M.A.; Clavien, P.-A. The Comprehensive Complication Index. Ann. Surg. 2013, 258,1–7. [CrossRef] [PubMed]
16. Dindo, D.; Demartines, N.; Clavien, P. Classification of Surgical Complications. Ann. Surg. 2004, 240, 205–213. [CrossRef]17. Alberts, V.; Idu, M.M.; Minnee, R.C. Risk factors for perioperative complications in hand-assisted laparoscopic donor nephrectomy.
Prog. Transplant. 2014, 24, 192–198. [CrossRef]18. Patel, S.; Cassuto, J.; Orloff, M.; Tsoulfas, G.; Zand, M.; Kashyap, R.; Jain, A.; Bozorgzadeh, A.; Abt, P. Minimizing Morbidity of
Organ Donation: Analysis of Factors for Perioperative Complications After Living-Donor Nephrectomy in the United States.Transplantation 2008, 85, 561–565. [CrossRef]
19. Menzies, D. Peritoneal adhesions. Incidence, cause, and prevention. Surg. Annu. 1992, 24, 27–45.20. Özdemir-van Brunschot, D.M.; Koning, G.G.; van Laarhoven, K.C.; Ergün, M.; van Horne, S.B.; Rovers, M.M.; Warlé, M.C.
A comparison of technique modifications in laparoscopic donor nephrectomy: A systematic review and meta-analysis. PLoS ONE2015, 10, e0121131. [CrossRef]
21. Ri, M.; Aikou, S.; Seto, Y. Obesity as a surgical risk factor. Ann. Gastroenterol. Surg. 2017, 2, 13–21. [CrossRef]22. Kurmann, A.; Vorburger, S.; Candinas, D.; Beldi, G. Operation time and body mass index are significant risk factors for surgical
site infection in laparoscopic sigmoid resection: A multicenter study. Surg. Endosc. 2011, 25, 3531–3534. [CrossRef] [PubMed]23. STARSurg Collaborative; Bhangu, A.; Drake, T.; Nepogodiev, D. Multicentre prospective cohort study of body mass index and
postoperative complications following gastrointestinal surgery. BJS 2016, 103, 1157–1172.24. Kurzer, E.; Leveillee, R.; Bird, V. Obesity as a Risk Factor for Complications During Laparoscopic Surgery for Renal Cancer:
Multivariate Analysis. J. Endourol. 2006, 20, 794–799. [CrossRef] [PubMed]25. Barlas, I.; Aydogdu, I.; Sinangil, A.; Zuhal, A.U.; Yeney, K.; Tevfik, E.; Emin, B.A. Hand-Assisted Nephrectomy Predisposes
Incisional Herniation in Obese Living Donors. Transplant. Proc. 2019, 51, 2210–2214. [CrossRef]26. Janssen, I.; Katzmarzyk, P.T.; Ross, R. Waist circumference and not body mass index explains obesity-related health risk. Am. J.
Clin. Nutr. 2004, 79, 379–384. [CrossRef]27. Rexrode, K.M.; Carey, V.J.; Hennekens, C.H.; Walters, E.E.; Colditz, G.A.; Stampfer, M.J.; Willett, W.C.; Manson, J.E. Abdominal
Adiposity and Coronary Heart Disease in Women. JAMA 1998, 280, 1843–1848. [CrossRef]28. Stefansson, V.T.N.; Schei, J.; Jenssen, T.G.; Melsom, T.; Eriksen, B.O. Central obesity associates with renal hyperfiltration in the
non-diabetic general population: A cross-sectional study. BMC Nephrol. 2016, 17, 1–10. [CrossRef]29. Cheng, H.; Clymer, J.; Po-Han Chen, B.; Sadeghirad, B.; Ferko, N.C.; Cameron, C.G.; Hinoul, P. Prolonged operative duration is
associated with complications: A systematic review and meta-analysis. J. Sur. Res. 2018, 229, 134–144. [CrossRef]30. Korol, E.; Johnston, K.; Waser, N.; Sifakis, F.; Jafri, H.S.; Lo, M.; Kyaw, M.H. A Systematic Review of Risk Factors Associated with
Surgical Site Infections among Surgical Patients. PLoS ONE 2013, 8, e83743. [CrossRef]31. Campbell, D.; Henderson, W.; Englesbe, M.; Hall, B.L.; O’Reilly, M.; Bratzler, D.; Dellinger, E.P.; Neumayer, L.; Bass, B.L.; Hutter,
M.M. Surgical Site Infection Prevention: The Importance of Operative Duration and Blood Transfusion—Results of the FirstAmerican College of Surgeons–National Surgical Quality Improvement Pro-gram Best Practices Initiative. J. Am. Coll. Surg. 2008,207, 810–820. [CrossRef]
32. Kim, J.; Khavanin, N.; Rambachan, A. Surgical Duration and Risk of Venous Thromboembolism. JAMA Surg. 2015, 150, 110.[CrossRef] [PubMed]
33. Forouzanfar, M.; Alexander, L.; Anderson, H.; GBD 2015 Risk Factors Collaborators. Global, regional, and national comparativerisk assessment of 79 behavioural, environmental and occupational, and metabolic risks or clusters of risks in 188 countries,1990–2013: A systematic analysis for the Global Burden of Disease Study. Lancet 2015, 386, 2287–2323. [CrossRef]
34. Hainer, V.; Aldhoon-Hainerova, I. Obesity Paradox Does Exist. Diabetes Care 2013, 36, S276–S281. [CrossRef] [PubMed]35. Lafranca, J.; Prens, L.; Moelker, A.; Koek, M.; Niessen, W.; IJzermans, J.; Dor, F. Perirenal and Intra-Abdominal Fat Mass is
Superior to BMI in Predicting Outcome of Laparoscopic Donor Nephrectomy. Transplantation 2014, 98, 612. [CrossRef]36. Lentine, K.L.; Schnitzler, M.A.; Garg, A.X.; Xiao, H.; Axelrod, D.; Tuttle-Newhall, J.E.; Brennan, D.C.; Segev, D.L.R. Relationship
and Renal Diagnoses after Living Kidney Donation. Transplantation 2015, 99, 1723–1729. [CrossRef]
14
J. Clin. Med. 2021, 10, 155
37. Locke, J.E.; Reed, R.D.; Massie, A.; MacLennan, P.A.; Sawinski, D.; Kumar, V.; Mehta, S.; Mannon, R.; Gaston, R.; Lewis, C.E.Obesity increases the risk of end-stage renal disease among living kidney donors. Kidney Int. 2017, 99, 699–703. [CrossRef]
15


Journal of
Clinical Medicine
Article
The Value of Graft Implantation Sequence in SimultaneousPancreas-Kidney Transplantation on the Outcome andGraft Survival
Hans-Michael Hau 1,2,*,†, Nora Jahn 3,†, Sebastian Rademacher 1, Elisabeth Sucher 4, Jonas Babel 1,
Matthias Mehdorn 1, Andri Lederer 1, Daniel Seehofer 1, Uwe Scheuermann 1,‡ and Robert Sucher 1,‡
Citation: Hau, H.-M.; Jahn, N.;
Rademacher, S.; Sucher, E.; Babel, J.;
Mehdorn, M.; Lederer, A.; Seehofer,
D.; Scheuermann, U.; Sucher, R. The
Value of Graft Implantation Sequence
in Simultaneous Pancreas-Kidney
Transplantation on the Outcome and
Graft Survival. J. Clin. Med. 2021, 10,
1632. https://doi.org/10.3390/
jcm10081632
Academic Editor:
Charat Thongprayoon
Received: 2 March 2021
Accepted: 7 April 2021
Published: 12 April 2021
Publisher’s Note: MDPI stays neutral
with regard to jurisdictional claims in
published maps and institutional affil-
iations.
Copyright: © 2021 by the authors.
Licensee MDPI, Basel, Switzerland.
This article is an open access article
distributed under the terms and
conditions of the Creative Commons
Attribution (CC BY) license (https://
creativecommons.org/licenses/by/
4.0/).
1 Department of Visceral, Transplantation, Vascular and Thoracic Surgery, University Hospital of Leipzig,04103 Leipzig, Germany; [email protected] (S.R.);[email protected] (J.B.); [email protected] (M.M.);[email protected] (A.L.); [email protected] (D.S.);[email protected] (U.S.); [email protected] (R.S.)
2 Department of Visceral, Thoracic and Vascular Surgery, University Hospital and Faculty of Medicine CarlGustav Carus, Technische Universität Dresden, 01307 Dresden, Germany
3 Department of Anesthesiology and Intensive Medicine, University Hospital of Leipzig,04103 Leipzig, Germany; [email protected]
4 Department of Gastroenterology, Section of Hepatology, University Hospital of Leipzig,04103 Leipzig, Germany; [email protected]
* Correspondence: [email protected];Tel.: +49-(0)351/-458-18703; Fax: +49-(0)351/-458-4395
† Both authors contributed equally to this work and share first authorship.‡ Both authors contributed equally to this work and share senior authorship.
Abstract: Background/Objectives: The sequence of graft implantation in simultaneous pancreas-kidney transplantation (SPKT) warrants additional study and more targeted focus, since little isknown about the short- and long-term effects on the outcome and graft survival after transplantation.Material and methods: 103 patients receiving SPKT in our department between 1999 and 2015 wereincluded in the study. Patients were divided according to the sequence of graft implantation intopancreas-first (PF, n = 61) and kidney-first (KF, n = 42) groups. Clinicopathological characteristics,outcome and survival were reviewed retrospectively. Results: Donor and recipient characteristicswere similar. Rates of post-operative complications and graft dysfunction were significantly higher inthe PF group compared with the KF group (episodes of acute rejection within the first year after SPKT:11 (18%) versus 2 (4.8%); graft pancreatitis: 18 (18%) versus 2 (4.8%), p = 0.04; vascular thrombosis ofthe pancreas: 9 (14.8%) versus 1 (2.4%), p = 0.03; and delayed graft function of the kidney: 12 (19.6%)versus 2 (4.8%), p = 0.019). The three-month pancreas graft survival was significantly higher in the KFgroup (PF: 77% versus KF: 92.1%; p = 0.037). No significant difference was observed in pancreas graftsurvival five years after transplantation (PF: 71.6% versus KF: 84.8%; p = 0.104). Kidney graft survivalwas similar between the two groups. Multivariate analysis revealed order of graft implantation as anindependent prognostic factor for graft survival three months after SPKT (HR 2.6, 1.3–17.1, p = 0.026)and five years (HR 3.7, 2.1–23.4, p = 0.040). Conclusion: Our data indicates that implantation of thepancreas prior to the kidney during SPKT has an influence especially on the early-post-operativeoutcome and survival rate of pancreas grafts.
Keywords: simultaneous pancreas-kidney transplantation; immunosuppression; graft order; se-quence; outcome; survival
J. Clin. Med. 2021, 10, 1632. https://doi.org/10.3390/jcm10081632 https://www.mdpi.com/journal/jcm17
J. Clin. Med. 2021, 10, 1632
1. Introduction
Simultaneous pancreas-kidney transplantation (SPKT) is an established therapy forpatients with insulin-dependent diabetes mellitus, complicated by end-stage renal disease.Successful SPKT leads to euglycemia, which could slow the progression of diabetic mi-crovascular and macrovascular complications and it improves survival rates and recipients’quality of life compared with patients on dialysis or patients after kidney transplantationalone [1–9].
However, its success depends on several factors such as the profiles of donors andrecipients, methods of implantation techniques, and graft harvesting such as effects ofischemia-reperfusion injuries (IRI) on graft damages [6,9–11].
In this context, pancreas transplantation is associated with a high incidence of post-operative complications and up to 15% graft losses within the first year after SPKT [6,9–11].
Implantation of the pancreas before the kidney seems reasonable to avoid prolongedcold ischemic time and subsequent ischemic reperfusion injury of the pancreas graft,especially since kidney grafts can tolerate cold ischemia better than pancreas grafts [12].However, there is currently no consensus on the best sequence of graft implantation duringSPKT and in most cases the choice of the order is only made by the surgeon.
Therefore, the aim of this study was to determine the impact of graft implantationorder on the outcome and survival after SPKT. We analyzed post-transplant outcomecharacteristics, survival rates, and risk factors for graft failures in SPKT depending on graftimplantation order.
2. Material and Methods
2.1. Data Collection and Study Population
After approval by the local ethics committee [AZ-Nr: 111-16-14032016] medical datafrom all patients undergoing SPKT at the University Hospital of Leipzig between 1999 and2015 were retrospectively analyzed from a prospectively collected electronic data base.
Patients were divided into two groups according to the order of graft implantation:(1) pancreas first (PF) and (2) kidney first (KF). The transplantation order was determinedbased on the ischemia times and implantation time points from the transplantation proto-cols.
2.2. Outcome Measures
Special emphasis was placed on patient and graft characteristics, postoperative com-plications, metabolic outcomes, renal function, and causes of graft failure depending ongraft implantation order.
Characteristics included donor and recipient age, gender, and body mass index (BMI,weight in kg/height in m2), cytomegalovirus (CMV)-status, donor cause of death, durationof insulin dependent diabetes mellitus, duration of dialysis, and time on the waiting list.Peri- and post-transplant data included information on cold ischemia time (CIT) and warmischemia time (WIT) of the grafts, immunosuppressive therapy as well as organ graftfunction: Duration of operation, rates of re-operation, infectious complications, numberof rejection episodes, and delayed graft function (DGF). CIT is defined as time the organspent in cold preservation solution after removal from the donor. WIT is the time fromcross-clamping until cold perfusion, plus the time of implantation (organ out of ice untilreperfusion). Surgical complications were defined as the need for relaparotomy within thefirst three months after transplantation.
Acute rejection episodes were suspected if there was an abrupt increase in serumamylase/lipase and/or serum glucose levels, together with a significant drop in serumC-peptide level and/or increased serum creatinine levels and missing diuresis as wellas abdominal pain associated with sonographic swelling of the graft. If possible, the di-agnosis was confirmed from endoscopic biopsies of the duodenal segment of the graft.Biopsies of the kidney graft were performed to confirm rejection. Pancreatic biopsieswere not performed. Treatment of acute cellular rejection consisted of pulsed steroids
18
J. Clin. Med. 2021, 10, 1632
(500 mg methylprednisolone on three consecutive days) or administration of 8 mg per kgbodyweight anti-thymocyte globulin (ATG) in parallel with increased baseline immuno-suppression.
DGF of the kidney was defined as the requirement of dialysis in the first week follow-ing transplantation [13].
Pancreas graft failure was defined as resumed insulin therapy, removed pancreas,re-transplantation, or patient death.
Kidney graft failure was defined as the need for dialysis, removed kidney, re-transplantation, or patient death.
Postoperative mortality was considered as in-hospital mortality in all cases.Laboratory parameters of ischemia-reperfusion-injury: Peak of C-reactive protein
(CRP, mg/L) and serum lipase (mmol/L) within the first three days; endocrine function:low-density lipoprotein (LDL)-cholesterol/high density lipoprotein (HDL)-cholesterolratio, HbA1C (%), C-peptide (ng/mL), and renal function: Creatinine (mmol/L) and urea(mmol/L) were analyzed up to five years after transplantation.
2.3. Organ Procurement and Transplantation
The procurement and transplantation of pancreas and kidney allografts were per-formed according to international standards and guidelines as describedpreviously [6,10,14–18].
In short, the pancreas was transplanted into the right iliac fossa using a standard tech-nique with an intraperitoneal location in the right iliac fossa. The Y-graft was anastomosedto the recipient’s common iliac artery, the portal vein was connected to the inferior venacava of the recipient. Exocrine drainage was carried out with a hand-sutured side-to-sideduodenojejunostomy 40 cm beyond the flexure of Treitz [10,18]. The exocrine drainagewas always accomplished immediately after reperfusion, to decrease the risk of donorduodenum distension and trigger of consecutive graft pancreatitis. The main reason whythe kidney transplant was performed before the pancreas transplant was the possibilityof working in two teams. One was responsible for the back-table preparation, one teamwas responsible for the recipient operation and transplant procedure. Since the back-tablepreparation of the kidney is less time consuming, the preparation of the kidney was alwaysperformed first. Once completed the kidney was immediately handed over to the implantsurgeons for transplant.
2.4. Immunosuppression
Immunosuppressive therapy comprised an induction therapy with the interleukin-2receptor antagonist basiliximab or antithymocyte globulin, followed by a triple mainte-nance immunosuppression consisting of calcineurin inhibitors (tacrolimus or cyclosporine),and/or antimetabolites (mycofenolate mofetil or sirolimus) and tapered steroids (pred-nisolone).
2.5. Statistical Analysis
Baseline data are presented as mean values with the standard deviation (SD) such asthe proportion percentage (%). For comparison between the two groups, the appropriatestatistical significance test including the Student’s t-test, χ2, analysis of variance (ANOVA),Kruskal–Wallis, and Wilcoxon–Mann–Whitney test was used. Survival rates were calcu-lated using the Kaplan–Meier analysis and the log-rank test was applied to test statisticalsignificance. Graft survival was calculated as the time from initial transplant to graft failure,censoring for death with a functioning graft, and grafts still functioning at time of analysis.Patient survival is defined as time from transplant to patient death, censoring for patientsstill alive at time of analysis. If a recipient was alive or lost to follow-up at time of lastcontact, then survival time was censored at time of last contact. Multivariate analysiswas performed with logistic regression analysis. Variables to be entered into the multiplelogistic regression analysis were chosen on the basis of the results of univariate analysis.
19
J. Clin. Med. 2021, 10, 1632
p values < 0.05 were regarded as significant. All statistical analyses were performed byusing IBM SPSS Statistics 24.0 (IBM Corporation, Armonk, NY, USA).
3. Results
3.1. Baseline Characteristics
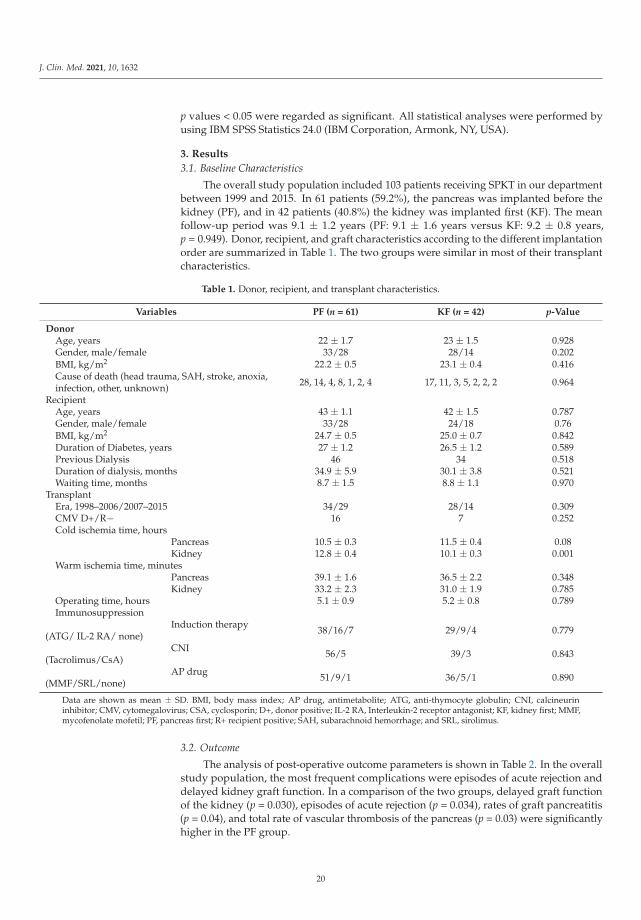
The overall study population included 103 patients receiving SPKT in our departmentbetween 1999 and 2015. In 61 patients (59.2%), the pancreas was implanted before thekidney (PF), and in 42 patients (40.8%) the kidney was implanted first (KF). The meanfollow-up period was 9.1 ± 1.2 years (PF: 9.1 ± 1.6 years versus KF: 9.2 ± 0.8 years,p = 0.949). Donor, recipient, and graft characteristics according to the different implantationorder are summarized in Table 1. The two groups were similar in most of their transplantcharacteristics.
Table 1. Donor, recipient, and transplant characteristics.
Variables PF (n = 61) KF (n = 42) p-Value
DonorAge, years 22 ± 1.7 23 ± 1.5 0.928Gender, male/female 33/28 28/14 0.202BMI, kg/m2 22.2 ± 0.5 23.1 ± 0.4 0.416Cause of death (head trauma, SAH, stroke, anoxia,infection, other, unknown) 28, 14, 4, 8, 1, 2, 4 17, 11, 3, 5, 2, 2, 2 0.964
RecipientAge, years 43 ± 1.1 42 ± 1.5 0.787Gender, male/female 33/28 24/18 0.76BMI, kg/m2 24.7 ± 0.5 25.0 ± 0.7 0.842Duration of Diabetes, years 27 ± 1.2 26.5 ± 1.2 0.589Previous Dialysis 46 34 0.518Duration of dialysis, months 34.9 ± 5.9 30.1 ± 3.8 0.521Waiting time, months 8.7 ± 1.5 8.8 ± 1.1 0.970
TransplantEra, 1998–2006/2007–2015 34/29 28/14 0.309CMV D+/R− 16 7 0.252Cold ischemia time, hours
Pancreas 10.5 ± 0.3 11.5 ± 0.4 0.08Kidney 12.8 ± 0.4 10.1 ± 0.3 0.001
Warm ischemia time, minutesPancreas 39.1 ± 1.6 36.5 ± 2.2 0.348Kidney 33.2 ± 2.3 31.0 ± 1.9 0.785
Operating time, hours 5.1 ± 0.9 5.2 ± 0.8 0.789Immunosuppression
Induction therapy(ATG/ IL-2 RA/ none) 38/16/7 29/9/4 0.779
CNI(Tacrolimus/CsA) 56/5 39/3 0.843
AP drug(MMF/SRL/none) 51/9/1 36/5/1 0.890
Data are shown as mean ± SD. BMI, body mass index; AP drug, antimetabolite; ATG, anti-thymocyte globulin; CNI, calcineurininhibitor; CMV, cytomegalovirus; CSA, cyclosporin; D+, donor positive; IL-2 RA, Interleukin-2 receptor antagonist; KF, kidney first; MMF,mycofenolate mofetil; PF, pancreas first; R+ recipient positive; SAH, subarachnoid hemorrhage; and SRL, sirolimus.
3.2. Outcome
The analysis of post-operative outcome parameters is shown in Table 2. In the overallstudy population, the most frequent complications were episodes of acute rejection anddelayed kidney graft function. In a comparison of the two groups, delayed graft functionof the kidney (p = 0.030), episodes of acute rejection (p = 0.034), rates of graft pancreatitis(p = 0.04), and total rate of vascular thrombosis of the pancreas (p = 0.03) were significantlyhigher in the PF group.
20
J. Clin. Med. 2021, 10, 1632
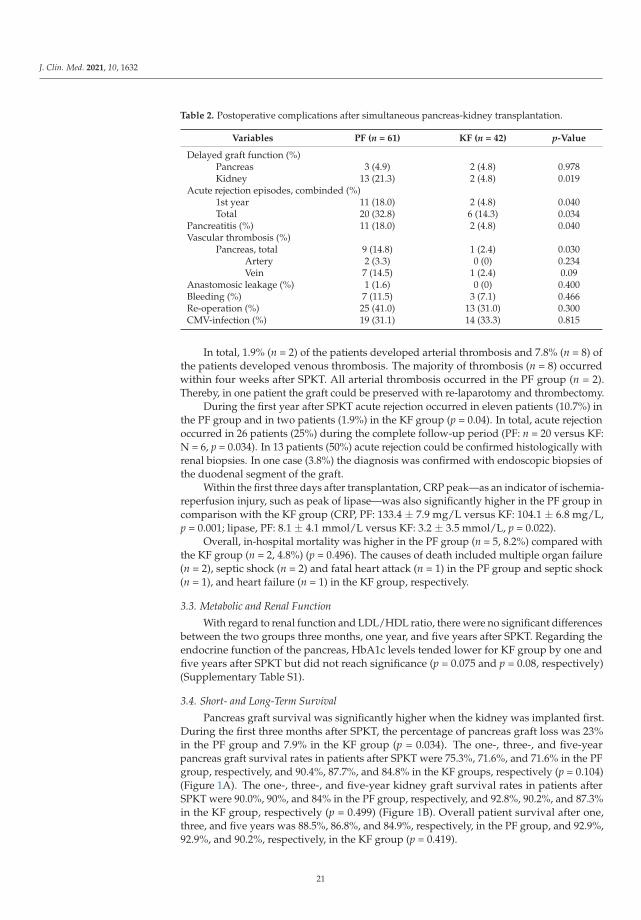
Table 2. Postoperative complications after simultaneous pancreas-kidney transplantation.
Variables PF (n = 61) KF (n = 42) p-Value
Delayed graft function (%)Pancreas 3 (4.9) 2 (4.8) 0.978Kidney 13 (21.3) 2 (4.8) 0.019
Acute rejection episodes, combinded (%)1st year 11 (18.0) 2 (4.8) 0.040Total 20 (32.8) 6 (14.3) 0.034
Pancreatitis (%) 11 (18.0) 2 (4.8) 0.040Vascular thrombosis (%)
Pancreas, total 9 (14.8) 1 (2.4) 0.030Artery 2 (3.3) 0 (0) 0.234Vein 7 (14.5) 1 (2.4) 0.09
Anastomosic leakage (%) 1 (1.6) 0 (0) 0.400Bleeding (%) 7 (11.5) 3 (7.1) 0.466Re-operation (%) 25 (41.0) 13 (31.0) 0.300CMV-infection (%) 19 (31.1) 14 (33.3) 0.815
In total, 1.9% (n = 2) of the patients developed arterial thrombosis and 7.8% (n = 8) ofthe patients developed venous thrombosis. The majority of thrombosis (n = 8) occurredwithin four weeks after SPKT. All arterial thrombosis occurred in the PF group (n = 2).Thereby, in one patient the graft could be preserved with re-laparotomy and thrombectomy.
During the first year after SPKT acute rejection occurred in eleven patients (10.7%) inthe PF group and in two patients (1.9%) in the KF group (p = 0.04). In total, acute rejectionoccurred in 26 patients (25%) during the complete follow-up period (PF: n = 20 versus KF:N = 6, p = 0.034). In 13 patients (50%) acute rejection could be confirmed histologically withrenal biopsies. In one case (3.8%) the diagnosis was confirmed with endoscopic biopsies ofthe duodenal segment of the graft.
Within the first three days after transplantation, CRP peak—as an indicator of ischemia-reperfusion injury, such as peak of lipase—was also significantly higher in the PF group incomparison with the KF group (CRP, PF: 133.4 ± 7.9 mg/L versus KF: 104.1 ± 6.8 mg/L,p = 0.001; lipase, PF: 8.1 ± 4.1 mmol/L versus KF: 3.2 ± 3.5 mmol/L, p = 0.022).
Overall, in-hospital mortality was higher in the PF group (n = 5, 8.2%) compared withthe KF group (n = 2, 4.8%) (p = 0.496). The causes of death included multiple organ failure(n = 2), septic shock (n = 2) and fatal heart attack (n = 1) in the PF group and septic shock(n = 1), and heart failure (n = 1) in the KF group, respectively.
3.3. Metabolic and Renal Function
With regard to renal function and LDL/HDL ratio, there were no significant differencesbetween the two groups three months, one year, and five years after SPKT. Regarding theendocrine function of the pancreas, HbA1c levels tended lower for KF group by one andfive years after SPKT but did not reach significance (p = 0.075 and p = 0.08, respectively)(Supplementary Table S1).
3.4. Short- and Long-Term Survival
Pancreas graft survival was significantly higher when the kidney was implanted first.During the first three months after SPKT, the percentage of pancreas graft loss was 23%in the PF group and 7.9% in the KF group (p = 0.034). The one-, three-, and five-yearpancreas graft survival rates in patients after SPKT were 75.3%, 71.6%, and 71.6% in the PFgroup, respectively, and 90.4%, 87.7%, and 84.8% in the KF groups, respectively (p = 0.104)(Figure 1A). The one-, three-, and five-year kidney graft survival rates in patients afterSPKT were 90.0%, 90%, and 84% in the PF group, respectively, and 92.8%, 90.2%, and 87.3%in the KF group, respectively (p = 0.499) (Figure 1B). Overall patient survival after one,three, and five years was 88.5%, 86.8%, and 84.9%, respectively, in the PF group, and 92.9%,92.9%, and 90.2%, respectively, in the KF group (p = 0.419).
21
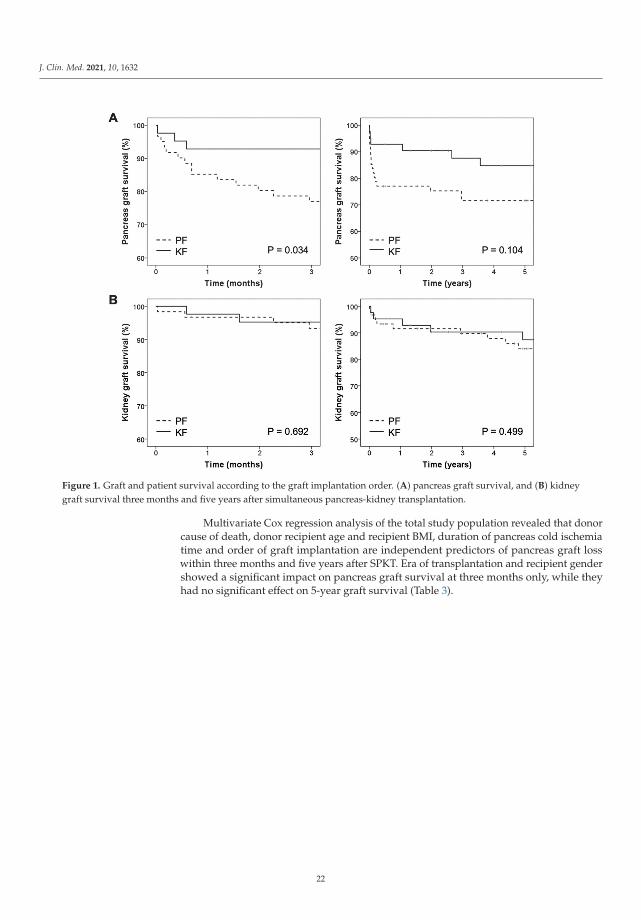
J. Clin. Med. 2021, 10, 1632
Figure 1. Graft and patient survival according to the graft implantation order. (A) pancreas graft survival, and (B) kidneygraft survival three months and five years after simultaneous pancreas-kidney transplantation.
Multivariate Cox regression analysis of the total study population revealed that donorcause of death, donor recipient age and recipient BMI, duration of pancreas cold ischemiatime and order of graft implantation are independent predictors of pancreas graft losswithin three months and five years after SPKT. Era of transplantation and recipient gendershowed a significant impact on pancreas graft survival at three months only, while theyhad no significant effect on 5-year graft survival (Table 3).
22

J. Clin. Med. 2021, 10, 1632
Ta
ble
3.
Mul
tiva
riat
eC
oxre
gres
sion
anal
ysis
ofpr
edic
tors
ofpa
ncre
asgr
aftl
oss
thre
em
onth
san
dfiv
eye
ars
afte
rsi
mul
tane
ous
panc
reas
-kid
ney
tran
spla
ntat
ion.
Va
ria
ble
s
Tim
ea
fte
rS
PK
T
3M
on
ths
5Y
ea
rs
Un
iva
ria
teA
na
lysi
sM
ult
iva
ria
teA
na
lysi
sU
niv
ari
ate
An
aly
sis
Mu
ltiv
ari
ate
An
aly
sis
HR
95
%C
Ip-
Va
lue
HR
95
CI
p-V
alu
eH
R9
5C
Ip-
Va
lue
HR
95
CI
p-V
alu
e
Don
orA
ge1.
071.
03–1
.11
0.00
11.
051.
02–1
.09
0.00
21.
057
1.02
–1.0
90.
002
1.05
21.
01–1
.09
0.00
4G
ende
r(m
ale
vers
usfe
mal
e)2.
40.
75–7
.10.
12.
30.
87–6
.32
0.09
BMI
1.21
1.03
–1.4
10.
015
1.24
71.
052–
1.47
80.
011
1.20
1.05
–1.3
80.
011.
180
1.02
3–1.
361
0.02
3C
ause
ofde
ath
(Non
-tra
uma
vers
ustr
aum
a)12
.67
1.65
–97.
60.
0110
.755
1.37
6–84
.082
0.01
86.
91.
57–
30.9
60.
0111
.81.
532–
92.0
10.
024
Rec
ipie
nt
Age
1.08
1.02
–1.1
40.
008
1.12
61.
050–
1.20
80.
001
1.05
31.
005–
1.10
40.
003
1.09
31.
035–
1.15
40.
001
Gen
der
(mal
eve
rsus
fem
ale)
0.32
0.10
–0.9
10.
030
0.30
20.
105–
0.86
60.
026
0.34
0.11
–0.9
90.
040.
426
0.18
0–1.
088
0.05
2BM
I1.
131.
03–1
.23
0.00
61.
117
1.04
1–1.
331
0.01
01.
211.
10–1
.32
<0.0
011.
195
1.07
8–1.
325
0.00
1Tr
ansp
lant
Era
(199
8–20
06ve
rsus
2007
–201
5)9.
491.
26–7
1.6
0.02
98.
11.
1–61
.50.
042.
830.
96–8
.34
0.05
War
mis
chem
iati
me
Panc
reas
0.99
60.
68–1
.45
0.98
51.
010.
23–5
.20.
967
Kid
ney
1.1
0.75
–1.7
90.
495
1.08
0.21
–6.4
20.
89C
IT,h
ours
Panc
reas 0–
8R
ef.
0.00
5R
ef0.
007
Ref
.0.
001
Ref
.0.
005
8–12
0.58
0.04
–9.3
60.
710.
560.
03–8
.93
0.68
10.
880.
14–5
.29
0.88
91.
030.
17–6
2.3
0.60
1
>12
8.6
1.13
–64
.99
0.03
7.97
1.05
–60.
430.
045
5.82
1.34
–25
.17
0.01
85.
431.
24–2
3.69
0.02
4
Kid
ney 0–
8R
ef.
0.06
Ref
.0.
029
Ref
.0.
027
8–12
0.56
0.05
–6.2
90.
650.
210.
03–1
.23
0.08
0.19
0.03
–1.1
70.
074
>12
2.97
0.39
–22
.59
0.29
1.47
0.43
–5.0
70.
531.
40.
41–4
.95
0.56
8
Gra
ftim
plan
tatio
nor
der
(PF
vers
usK
F)3.
71.
06–
12.9
60.
038
2.6
1.3–
17.1
0.02
62.
30.
92–5
.96
0.09
3.7
2.1–
23.4
0.04
Imm
unos
uppr
essi
onIn
duct
ion
ther
apy
Non
eR
ef.
0.27
2R
ef.
0.34
2A
TG0.
420.
11–1
.59
0.20
50.
580.
16–2
.08
0.40
8IL
–2R
A0.
890.
22–3
.56
0.87
01.
10.
29–4
.18
0.88
0C
NI(
Tac
vers
usC
SA)
0.36
0.10
–1.2
80.
10.
440.
13–1
.51
0.19
AP
drug
Non
eR
ef.
0.31
9R
ef.
0.29
2M
MF
0.32
0.04
–2.2
90.
247
0.4
0.54
–2.9
80.
371
SRL
0.11
0.01
–1.9
0.13
30.
180.
01–1
.78
0.12
1
95C
I,95
%co
nfide
nce
inte
rval
;HR
,haz
ard
rati
o;an
dTa
c,ta
crol
imus
.
23
J. Clin. Med. 2021, 10, 1632
4. Discussion
The current study showed that the implantation of the kidney graft before the pancreasgraft during SPKT is associated with reduced rates of post-operative complications andsignificantly better pancreas graft survival in the early post-operative course.
The most frequent postoperative complication after SPKT and subsequent pancreasgraft loss remain pancreas graft thrombosis. In our study, the average pancreas graft throm-bosis rate was 9.7% (1.9% arterial and 7.8% venous, respectively), which is comparable topublished data [19,20]. There are a number of well-described donor and recipient risk fac-tors associated with thrombosis in pancreas transplantation, such as donor age and obesity,cause of death [19]. However, none of these risk factors were different between the twogroups (Table 1). Furthermore, in our cohort rates of acute rejection, delayed graft kidneyfunction as well as overall graft survival are comparable with previous publications [6,21].
To our knowledge, only two other studies have previously examined the effect of graftimplantation order on short- and long-term outcomes in SPKT. In a retrospective single-center analysis of 151 patients after SPKT, Salzedas–Netto et al. showed a significantlyhigher three-month pancreas graft survival when the kidney was implanted first (pancreasgraft survival in three months, PF: 74.1 versus KF: 89.4%, p = 0.022) [22]. In accordancewith our data, post-operative complications primarily occurred in the PF group and had aparticular influence on the early post-operative outcome. However, a further comparisonto our study is virtually impossible due to lack of detailed data.
In contrast, in a 2016 published register (Scientific Registry of Transplant Recipients)data analysis of 12,700 patients by Niclauss et al., the rate of pancreas graft loss within threemonths after SPKT was significantly lower in the PF group (PF: 9.4% versus KF: 10.8%,p = 0.011). Additionally, the frequency of technical graft failures was significantly lower inthis group (PF: 5.6% versus KF: 6.9%, p = 0.005) [23]. Beyond three months, no significantdifferences were observed in graft survival between the two groups.
The reasons for an increased rate of complications and early graft loss in the PFgroup of our study remains speculative. One reason could be the mechanical stress aftergraft positioning and surgical retractor adjustment for the consecutive kidney transplantprocedure. Salzedas–Netto et al. assumed that implantation of the kidney before thepancreas graft could reduce the risk of intra-operative damage from retractors to thepancreas and pancreatic edema. Unfortunately, no details on intraoperative findingsand rector problems are available to us, that could support this thesis. Furthermore,different surgical access routes and procedures were used in the studies. In the studyby Salzedas–Netto et al., organs were implanted intra-peritoneally (pancreas), as wellas extra-peritoneally (kidney) by two surgical teams. In our analysis and the study bySalzedas–Netto et al., all patients underwent systemic drainage with side-to-side entericanastomoses [22]. In contrast, in the study by Niclauss et al., exocrine pancreas secretiondrainage was realized either enterically or into the bladder. However, influence of bladderdrainage (44.7% of PF and 37.1% of KF) on graft survival and association with complicationrates (especially vascular thrombosis) were not examined [23]. We recently introducedan intraoperative no touch real time monitoring technique for kidney and pancreas graftparenchyma evaluation using hyperspectral imaging (HSI) [24,25]. We believe that thisnovel procedure might be a useful tool to investigate on our hypothesis that mechanicalstress to the organ implanted first during transplantation of the second organ might affectgraft performance. In this context, HSI is well suited to detect venous congestion whichwould predominantly be detected by decreased perfusion indices and increased organhemoglobin indices of the affected organ.
Prolonged CIT has a negative impact on pancreas graft survival and frequency ofpost-operative complications [23,26–29]. Therefore, transplanting pancreas grafts firstseems to be reasonable as pancreas grafts tolerate cold ischemia worse than kidneys [12,30].The study by Niclauss et al. revealed total pancreas preservation times of 12.2 ± 0.1 in thepancreas first and 14.3 ± 0.1 in the kidney first group, which were significantly longer whencompared to pancreas preservation times in our patient groups [23]. In our analysis, Cox
24
J. Clin. Med. 2021, 10, 1632
regression analysis showed that prolonged pancreas CIT (above 12 h) is an independentrisk factor for pancreas graft survival at three months and at five years after SPKT, whilecold ischemia time of the kidney graft had no significant impact on pancreas graft survival(Table 3). In our analysis, total pancreas CIT was relatively short and did not show asignificant difference between the two groups (CIT pancreas KF: 11.5 h versus PF: 10.5 h,p = 0.08). Moreover, the time difference between the implantation of both organs waslower in the KF group (PF: 2.3 h versus KF: 1.4 h, Table 1). The study by Niclauss et al.could demonstrate that when kidney grafts are implanted first, prolonged surgery timebetween kidney and pancreas graft implantation mainly above two hours is associatedwith reduced pancreas graft survival in comparison with patients in the PF group [23].Both time factors (relatively short pancreas CIT and time gap between organ implantation)may have contributed to the good outcome in the KF group in our cohort.
4.1. Remote Ischemic Preconditioning—Potential Pathophysiology Linked to ImplantationSequence
Remote ischemic preconditioning (RIP) is the phenomenon whereby brief episodes ofischemia and reperfusion applied in distant tissues like the lower extremity render organssubject to transplantation, more resistant to ischemia. The underlying mechanism of RIPare not fully understood, however, experimental studies suggest that a combination ofcirculating mediators and neuronal signaling might be responsible for conditioning of thetargeted organ [31,32]. Further clinical studies in kidney and lung transplant recipientssuggest that RIP prior transplantation may be beneficial or at least not harmful to thetransplanted organ [33].
In the event of simultaneous pancreas-kidney transplantation the successive implanta-tion of both organs requires a sequential (two-step) temporary clamping of external iliacvessels and by nature, imitate the procedure of RIP for the second organ to be transplanted.The assumption that pancreatic allografts may benefit from RIP if transplanted second to akidney is highly speculative but spurs further research.
4.2. Limiting Factors
There are some limiting factors of this study. First, the low number of patients ineach group and the retrospective non-randomized design should be mentioned. Second,the long investigation period and different surgical teams restricted data evaluation, thusmaking further controlled and prospective studies necessary.
5. Conclusions
In conclusion, our results suggest that the sequence of graft implantation during SPKTinfluences the early post-operative course. In our analysis, KF patients seem to have aslight advantage compared with patients receiving PF during SPKT. We would recommenda kidney first transplant if two parallel working teams are available, one doing the back-table preparation, one doing the transplant procedure. If one team is responsible for bothback-table and the transplant procedure we would recommend a pancreas transplantfirst, since the pancreas is more sensitive to ischemia and one or two hours might matter.However, we also recommend a careful surgical retractor adjustment not to compromisethe pancreas allograft. Further investigation is required in larger series to determine howthe order of graft implantation correlates with post-transplant graft function. Our two mainfloated hypotheses, that (1) mechanical stress may harm the first and (2) remote ischemicpreconditioning may have beneficial effects on the second organ subject to transplantation.Both assumptions may stimulate further investigation.
Supplementary Materials: The following are available online at https://www.mdpi.com/article/10.3390/jcm10081632/s1, Supplementary Table S1. Metabolic outcome during the first 5 years aftersimultaneous pancreas-kidney transplantation.
25

J. Clin. Med. 2021, 10, 1632
Author Contributions: U.S., N.J., H.-M.H. and R.S. were responsible for the study conception anddesign; H.-M.H., N.J., S.R., E.S. and R.S. were responsible for data acquisition; U.S., H.-M.H., S.R.,and R.S. analyzed and interpreted the data; U.S., H.-M.H., S.R. and R.S. drafted the manuscript; andN.J., E.S., J.B., M.M., A.L. and D.S. critically revised the manuscript. All authors have read and agreedto the published version of the manuscript.
Funding: Open Access Funding by the Publication Fund of the TU Dresden. The funders hadno role in study design, data collection and analysis, decision to publish, or preparation of themanuscript. The funders had no role in study design, data collection and analysis, decision topublish, or preparation of the manuscript. There are no potential conflicts of interest arising fromassociations with commercial or corporate interests in connection with the work submitted.
Institutional Review Board Statement: The study was conducted according to the guidelines of theDeclaration of Helsinki, and approved by the local ethical commission board from the University ofLeipzig (AZ EK: 111-16-14032016).
Informed Consent Statement: Written informed consent from any patient for data collection in aprospectively collected data base is available. However, written informed consent to the study waswaived by the local Ethics Committee (Ethics Committee of the first affliated University Hospital ofLeipzig University) in view of the retrospective design of the study, accordingly the national andlocal guidelines such as the fact that all clinical/ laboratory measurements and procedures were partof the routine care.
Data Availability Statement: Our database contains highly sensible data which may provide insightin clinical and personnel information about our patients and lead to identification of these patients.Therefore, according to organizational restrictions and regulations these data cannot be made publi-cally available. However, the datasets used and/or analyzed during the current study are availablefrom the corresponding author on reasonable request.
Conflicts of Interest: The authors declare that they have no conflict of interest.
Abbreviations
BMI Body mass indexCIT Cold ischemia timeCMV CytomegalovirusDGF Delayed graft functionKF Kidney-firstMMF Mycophenolate mofetilPF Pancreas-firstRIC Remote ischemic conditioningSD Standard deviationSPKT Simultaneous pancreas-kidney transplantationWIT Warm ischemia timeHSI Hyperspectral ImagingRIP Remote ischemic preconditioning
References
1. Dean, P.G.; Kudva, Y.C.; Stegall, M.D. Long-term benefits of pancreas transplantation. Curr. Opin. Organ Transplant. 2008, 13,85–90. [CrossRef] [PubMed]
2. Pera, P.I.; Vasallo, J.M.; Rabasa, A.T.; Salinas, F.O.; Pérez, L.F.C.; Brulles, M.J.R. Quality of life in simultaneous pancreas-kidneytransplant recipients. Clin. Transplant. 2009, 23, 600–605. [CrossRef] [PubMed]
3. Scheuermann, U.; Rademacher, S.; Jahn, N.; Sucher, E.; Seehofer, D.; Sucher, R.; Hau, H.-M. Impact of pre-transplant dialysismodality on the outcome and health-related quality of life of patients after simultaneous pancreas-kidney transplantation. HealthQual. Life Outcomes 2020, 18, 1–9. [CrossRef]
4. Khairoun, M.; De Koning, E.J.P.; Berg, B.M.V.D.; Lievers, E.; De Boer, H.; Schaapherder, A.F.M.; Mallat, M.J.K.; Rotmans, J.I.; VanDer Boog, P.J.M.; Van Zonneveld, A.J.; et al. Microvascular Damage in Type 1 Diabetic Patients Is Reversed in the First Year AfterSimultaneous Pancreas-Kidney Transplantation. Arab. Archaeol. Epigr. 2013, 13, 1272–1281. [CrossRef]
5. Rajkumar, T.; Mazid, S.; Vucak-Dzumhur, M.; Sykes, T.M.; Elder, G.J. Health-related quality of life following kidney andsimultaneous pancreas kidney transplantation. Nephrology 2018, 24, 975–982. [CrossRef]
26
J. Clin. Med. 2021, 10, 1632
6. Sollinger, H.W.; Odorico, J.S.; Becker, Y.T.; D’Alessandro, A.M.; Pirsch, J.D. One Thousand Simultaneous Pancreas-KidneyTransplants at a Single Center With 22-Year Follow-Up. Ann. Surg. 2009, 250, 618–630. [CrossRef]
7. White, S.A.; Shaw, J.A.; Sutherland, D.E. Pancreas transplantation. Lancet 2009, 373, 1808–1817. [CrossRef]8. Jenssen, T.; Hartmann, A.; Birkeland, K.I. Long-term diabetes complications after pancreas transplantation. Curr. Opin. Organ
Transplant. 2017, 22, 382–388. [CrossRef] [PubMed]9. Mohan, P.; Safi, K.; Little, D.M.; Donohoe, J.; Conlon, P.; Walshe, J.J.; O’Kelly, P.; Thompson, C.J.; Hickey, D.P. Improved patient
survival in recipients of simultaneous pancreas–kidney transplant compared with kidney transplant alone in patients with type 1diabetes mellitus and end-stage renal disease. BJS 2003, 90, 1137–1141. [CrossRef] [PubMed]
10. Sollinger, H.W.; Odorico, J.S.; Knechtle, S.J.; D’Alessandro, A.M.; Kalayoglu, M.; Pirsch, J.D. Experience With 500 SimultaneousPancreas-Kidney Transplants. Ann. Surg. 1998, 228, 284–296. [CrossRef]
11. Lindahl, J.P.; Hartmann, A.; Horneland, R.; Holdaas, H.; Reisæter, A.V.; Midtvedt, K.; Leivestad, T.; Øyen, O.; Jenssen, T. Improvedpatient survival with simultaneous pancreas and kidney transplantation in recipients with diabetic end-stage renal disease.Diabetology 2013, 56, 1364–1371. [CrossRef]
12. Krezdorn, N.; Tasigiorgos, S.; Wo, L.; Turk, M.; Lopdrup, R.; Kiwanuka, H.; Win, T.-S.; Bueno, E.; Pomahac, B. Tissue conservationfor transplantation. Innov. Surg. Sci. 2017, 2, 171–187. [CrossRef] [PubMed]
13. Siedlecki, A.; Irish, W.; Brennan, D.C. Delayed Graft Function in the Kidney Transplant. Arab. Archaeol. Epigr. 2011, 11, 2279–2296.[CrossRef] [PubMed]
14. Eurotransplant. Chapter 9: The Donor. In Eurotransplant Manual; Eurotransplant: Leiden, The Netherlands, 2017.15. Ladurner, R.; Steurer, W. Technik der Multiorganentnahme. Viszeralchirurgie 2004, 39, 439–442. [CrossRef]16. Sucher, R.; Rademacher, S.; Jahn, N.; Brunotte, M.; Wagner, T.; Alvanos, A.; Sucher, E.; Seehofer, D.; Scheuermann, U.; Hau, H.-M.
Effects of simultaneous pancreas-kidney transplantation and kidney transplantation alone on the outcome of peripheral vasculardiseases. BMC Nephrol. 2019, 20, 1–10. [CrossRef]
17. Hau, H.-M.; Jahn, N.; Brunotte, M.; Lederer, A.A.; Sucher, E.; Rasche, F.M.; Seehofer, D.; Sucher, R. Short and long-term metabolicoutcomes in patients with type 1 and type 2 diabetes receiving a simultaneous pancreas kidney allograft. BMC Endocr. Disord.2020, 20, 1–13. [CrossRef] [PubMed]
18. Dholakia, S.; Mittal, S.; Quiroga, I.; Gilbert, J.; Sharples, E.J.; Ploeg, R.J.; Friend, P.J. Pancreas Transplantation: Past, Present, Future.Am. J. Med. 2016, 129, 667–673. [CrossRef] [PubMed]
19. Daga, J.A.P.; Rodriguez, R.P.; Santoyo, J. Immediate post-operative complications (I): Post-operative bleeding; vascular origin:Thrombosis pancreatitis. World J. Transplant. 2020, 10, 415–421. [CrossRef]
20. Schenker, P.; Vonend, O.; Ertas, N.; Wunsch, A.; Schaeffer, M.; Rump, L.-C.; Viebahn, R. Incidence of pancreas graft thrombosisusing low-molecular-weight heparin. Clin. Transplant. 2009, 23, 407–414. [CrossRef]
21. Israni, A.K.; Feldman, H.I.; Propert, K.J.; Leonard, M.; Mange, K.C. Impact of Simultaneous Kidney-Pancreas Transplant andTiming of Transplant on Kidney Allograft Survival. Arab. Archaeol. Epigr. 2005, 5, 374–382. [CrossRef]
22. Salzedas-Netto, A.; Linhares, M.; Lopes-Filho, G.; Melaragno, C.; De Sa, J.; Rangel, E.; Goncalves, M.; Pestana, J.; Gonzalez, A.Simultaneous Pancreas-Kidney Transplantation: Which Organ Should Be Transplanted First? Transplant. Proc. 2010, 42, 2647–2649.[CrossRef] [PubMed]
23. Niclauss, N.; Bédat, B.; Morel, P.; Andres, A.; Toso, C.; Berney, T. Impact of graft implantation order on graft survival insimultaneous pancreas-kidney transplantation. Transpl. Int. 2016, 29, 627–635. [CrossRef] [PubMed]
24. Sucher, R.; Wagner, T.; Köhler, H.; Sucher, E.; Guice, H.; Recknagel, S.; Lederer, A.; Hau, H.M.; Rademacher, S.; Schneeberger, S.;et al. Hyperspectral Imaging (HSI) of Human Kidney Allografts. Ann. Surg. 2020. [CrossRef]
25. Sucher, R.; Scheuermann, U.; Rademacher, S.; Lederer, A.; Sucher, E.; Hau, H.M.; Brandacher, G.; Schneeberger, S.; Gockel, I.S.D.Intraoperative reperfusion assessment of human pancreas allografts using hyperspectral imaging (HSI). Hepatobiliary Surg. Nutr.2021. [CrossRef]
26. Gruessner, A.C. 2011 Update on Pancreas Transplantation: Comprehensive Trend Analysis of 25,000 Cases Followed Up Over theCourse of Twenty-Four Years at the International Pancreas Transplant Registry (IPTR). Rev. Diabet. Stud. 2011, 8, 6–16. [CrossRef][PubMed]
27. Humar, A.; Kandaswamy, R.; Drangstveit, M.B.; Parr, E.; Gruessner, A.G.; Sutherland, D.E. Prolonged preservation increasessurgical complications after pancreas transplants. Surgery 2000, 127, 545–551. [CrossRef] [PubMed]
28. Humar, A.; Ramcharan, T.; Kandaswamy, R.; Gruessner, R.W.; Gruessner, A.C.; Sutherland, D.E. Technical Failures after PancreasTransplants: Why Grafts Fail and the Risk Factors—A Multivariate Analysis. Transplantation 2004, 78, 1188–1192. [CrossRef][PubMed]
29. Finger, E.B.; Radosevich, D.M.; Dunn, T.B.; Chinnakotla, S.; Sutherland, D.E.R.; Matas, A.J.; Pruett, T.L.; Kandaswamy, R. AComposite Risk Model for Predicting Technical Failure in Pancreas Transplantation. Arab. Archaeol. Epigr. 2013, 13, 1840–1849.[CrossRef]
30. Rudolph, E.N.; Dunn, T.B.; Kandaswamy, R.; Finger, E.B.; Sutherland, D.E. Optimizing outcomes in pancreas transplantation:Impact of organ preservation time. Clin. Transplant. 2017, 31, e13035. [CrossRef] [PubMed]
31. Heusch, G.; Bøtker, H.E.; Przyklenk, K.; Redington, A.; Yellon, D. Remote Ischemic Conditioning. J. Am. Coll. Cardiol. 2015, 65,177–195. [CrossRef]
27
J. Clin. Med. 2021, 10, 1632
32. Hausenloy, D.J.; Yellon, D.M. Remote ischaemic preconditioning: Underlying mechanisms and clinical application. Cardiovasc.Res. 2008, 79, 377–386. [CrossRef] [PubMed]
33. Farooqui, W.; Pommergaard, H.C.; Rasmussen, A. Remote ischemic preconditioning of transplant recipients to reduce graftischemia and reperfusion injuries: A systematic review. Transplant. Rev. 2018, 32, 10–15. [CrossRef] [PubMed]
28
Journal of
Clinical Medicine
Article
Exhaled Hydrogen as a Marker of Intestinal Fermentation IsAssociated with Diarrhea in Kidney Transplant Recipients
Fernanda Guedes Rodrigues 1,2,*, J. Casper Swarte 1,3, Rianne M. Douwes 1, Tim J. Knobbe 1,
Camilo G. Sotomayor 1, Hans Blokzijl 3, Rinse K. Weersma 3, Ita P. Heilberg 2,4, Stephan J. L. Bakker 1, Martin H. de
Borst 1 and TransplantLines Investigators †
Citation: Rodrigues, F.G.; Swarte,
J.C.; Douwes, R.M.; Knobbe, T.J.;
Sotomayor, C.G.; Blokzijl, H.;
Weersma, R.K.; Heilberg, I.P.; Bakker,
S.J.L.; de Borst, M.H.; et al. Exhaled
Hydrogen as a Marker of Intestinal
Fermentation Is Associated with
Diarrhea in Kidney Transplant
Recipients. J. Clin. Med. 2021, 10, 2854.
https://doi.org/10.3390/jcm
10132854
Academic Editors:
Wisit Cheungpasitporn,
Charat Thongprayoon and
Wisit Kaewput
Received: 19 May 2021
Accepted: 24 June 2021
Published: 28 June 2021
Publisher’s Note: MDPI stays neutral
with regard to jurisdictional claims in
published maps and institutional affil-
iations.
Copyright: © 2021 by the authors.
Licensee MDPI, Basel, Switzerland.
This article is an open access article
distributed under the terms and
conditions of the Creative Commons
Attribution (CC BY) license (https://
creativecommons.org/licenses/by/
4.0/).
1 Department of Nephrology, University Medical Center Groningen, University of Groningen,9700 RB Groningen, The Netherlands; [email protected] (J.C.S.); [email protected] (R.M.D.);[email protected] (T.J.K.); [email protected] (C.G.S.); [email protected] (S.J.L.B.);[email protected] (M.H.d.B.)
2 Nutrition Post Graduation Program, Universidade Federal de São Paulo, São Paulo 04023-062, Brazil;[email protected]
3 Department of Gastroenterology and Hepatology, University Medical Center Groningen,University of Groningen, 9700 RB Groningen, The Netherlands; [email protected] (H.B.);[email protected] (R.K.W.)
4 Division of Nephrology, Universidade Federal de São Paulo, São Paulo 04023-062, Brazil* Correspondence: [email protected]† TransplantLines Biobank and Cohort Study, UMC Groningen Transplant Center, University of Groningen,
9700 RB Groningen, The Netherlands.
Abstract: Background: Diarrhea is common among kidney transplant recipients (KTR). Exhaledhydrogen (H2) is a surrogate marker of small bowel dysbiosis, which may drive diarrhea. Westudied the relationship between exhaled H2 and diarrhea in KTR, and explored potential clinical anddietary determinants. Methods: Clinical, laboratory, and dietary data were analyzed from 424 KTRparticipating in the TransplantLines Biobank and Cohort Study (NCT03272841). Fasting exhaledH2 concentration was measured using a model DP Quintron Gas Chromatograph. Diarrhea wasdefined as fast transit time (types 6 and 7 according to the Bristol Stool Form Scale, BSFS) of 3 or moreepisodes per day. We studied the association between exhaled H2 and diarrhea with multivariablelogistic regression analysis, and explored potential determinants using linear regression. Results:KTR (55.4 ± 13.2 years, 60.8% male, mean eGFR 49.8 ± 19.1 mL/min/1.73 m2) had a median exhaledH2 of 11 (5.0–25.0) ppm. Signs of small intestinal bacterial overgrowth (exhaled H2 ≥ 20 ppm)were present in 31.6% of the KTR, and 33.0% had diarrhea. Exhaled H2 was associated with anincreased risk of diarrhea (odds ratio 1.51, 95% confidence interval 1.07–2.14 per log2 ppm, p = 0.02).Polysaccharide intake was independently associated with higher H2 (std. β 0.24, p = 0.01), and a trendfor an association with proton-pump inhibitor use was observed (std. β 0.16 p = 0.05). Conclusion:Higher exhaled H2 is associated with an increased risk of diarrhea in KTR. Our findings set the stagefor further studies investigating the relationship between dietary factors, small bowel dysbiosis, anddiarrhea after kidney transplantation.
Keywords: kidney transplantation; hydrogen; diarrhea; small intestinal bacterial overgrowth
1. Introduction
Kidney transplantation is the preferred treatment for end-stage kidney disease (ESKD) [1].Given the advances in surgical techniques and immunosuppressive therapy in parallelwith prophylaxis and treatment of infectious complications in the past decades, patientand graft short-term outcomes have considerably improved [2,3]. However, the qualityof life of many outpatient kidney transplant recipients (KTR) is adversely affected by latecomplications, including diabetes, malignancies, risk of opportunistic infections due tomaintenance immunosuppressive therapy, and gastrointestinal (GI) complaints [4,5]. GI
J. Clin. Med. 2021, 10, 2854. https://doi.org/10.3390/jcm10132854 https://www.mdpi.com/journal/jcm29

J. Clin. Med. 2021, 10, 2854
complaints affect 30 to 40% of these patients, with chronic diarrhea impacting the qualityof life of 20% of otherwise stable KTR during the first year after kidney transplantation [6].
It has recently been shown that KTR are commonly affected by an unbalanced gutmicrobiome, i.e., gut dysbiosis, characterized by a diminished microbial diversity [7,8].Emerging evidence indicates that changes in gut microbiota following kidney transplan-tation may play a key role in the development of GI symptoms and diarrhea [7,9]. Smallintestinal bacterial overgrowth is a form of gut dysbiosis characterized by an excessivenumber of coliform bacteria in the upper part of the small bowel, which has been impli-cated in driving GI complaints such as diarrhea, abdominal pain, and bloating [10]. Inthe presence of small bowel dysbiosis, the conversion of substrates into short-chain fattyacids (SCFA) is shifted to a higher production of intestinal gases such as hydrogen (H2),carbon dioxide (CO2), and methane (CH4) [11]. Exhaled hydrogen (H2) can be used asa non-invasive surrogate marker for small intestinal bacterial overgrowth [12]. Whetherexhaled H2 is associated with the risk of diarrhea in KTR is currently unknown, and therole of post-kidney transplant medication regimens (e.g., maintenance immunosuppressivetherapy and proton-pump inhibitors) and diet composition as potential determinants ofexhaled H2 have not been investigated.
Therefore, in the current study we assessed exhaled H2 in a large KTR cohort, tostudy its relationship with diarrhea and to investigate its potential clinical and dietarydeterminants.
2. Materials and Methods
This is a cross-sectional study based on data from the TransplantLines Biobank andCohort Study (ClinicalTrials.gov identifier: NCT03272841), conducted at the outpatientclinic of the University Medical Centre Groningen (Groningen, The Netherlands), whichinvestigates all different types of solid organ transplant recipients [1]. A detailed descriptionof the study design, inclusion and exclusion criteria has been described previously [1].The study protocol has been approved by the Institutional Review Board (METc 2014/077)(METc UMCG), adheres to the local UMCG Biobank Regulations, and is in accordance withthe WMA Declaration of Helsinki and the Declaration of Istanbul [2]. KTR with availablebreath test data were included in the present study and all participants signed an informedconsent prior to their TransplantLines visit. A flowchart diagram is presented in Figure 1.
Figure 1. Flowchart diagram. Abbreviations: H2, hydrogen; KTR, kidney transplant recipients; BSFS,Bristol Stool Form Scale.
2.1. Clinical Data
Clinical data were collected according to a detailed protocol, as described elsewhere [1].Patients were recruited between January 2017 and June 2019. Patients taking antihyper-tensive drugs were classified as having hypertension [3]. Diabetes mellitus was definedaccording to the guidelines of the American Diabetes Association [4]. Body mass index(BMI) was calculated as weight in kilograms divided by height in meters squared (kg/m2).Body surface area (BSA) was calculated using the formula of Du Bois and Du Bois [5].Estimated glomerular filtration rate (eGFR) was calculated using the CKD EpidemiologyCollaboration (CKD-EPI) creatinine equation [6]. Body composition was determined using
30
J. Clin. Med. 2021, 10, 2854
a multifrequency bioelectrical impedance device (BIA, Quadscan 4000, Bodystat, Douglas,British Isles) at 5, 50, 100, and 200 Hz, which allows us to distinguish between lean massand fat mass (expressed as body fat percentage) taking into account differences in volumestatus [7].
2.2. Breath H2 Measurement
Breath samples were collected in a 50 cc syringe with a hole of 6 mm at approximately40 cc with a 3-way-stopcock. Patients were fasting (and therefore did not ingest anycarbohydrates) for at least eight hours and were not allowed to smoke for at least onehour before the sample collection [12]. The study subject inhaled normally and exhaledmaximally in this syringe with the stamper set at 50 cc and the 3-way stopcock open. Afterfull expiration, the hole was immediately closed by the study participant, the stamper wasset to 30 cc, and the 3-way stopcock was closed. Breath samples were analyzed within12 h after sample collection using a model DP Quintron Gas Chromatograph (QuintronInstrument Company, Milwaukee, WI, USA). H2 results were automatically corrected forCO2 in order to reduce the chance of dilution by environmental air. A fasting basal (i.e.,without the ingestion of test sugar) exhaled H2 concentration above 20 parts per million(ppm) was considered suggestively positive for small intestinal bacterial overgrowth (SIBO)as suggested elsewhere [8–11].
2.3. Stool Water Content Measurement
One day before the study visit, participants had collected a stool sample at homewith a FaecesCatcher (TAG Hemi VOF, Zeijen, The Netherlands) [1]. The sample wascollected in a tube and immediately frozen. At arrival, the sample was immediately storedat −80 ◦C (−112 ◦F) until further use. For analysis, samples were defrosted up to ~0 ◦Cand homogenized. Then, a minimum of 1 g and preferably 5 g of every sample was put ina 15 mL tube for stool water content measurement. Prior to filling, two holes were piercedin the lid to allow water sublimation during freeze-drying. Subsequently, samples werefreeze-dried for 48 h under 0.5 bar at −50 ◦C [13]. The samples were weighed before andafter freeze-drying to calculate the dry weight as shown in the equation below [14].
Equation: Percentage of dry matter stool samples.
Dry matter % =(Dry f illed tube − empty tube)(Wet f illed tube − empty tube)
× 100%
2.4. Diarrhea Classification
The stool form and consistency were graded using the Bristol Stool Form Scale(BSFS) [15]. The scale is structured from 1 to 7 according to form and consistency, from thehardest (type 1) to the most fluid kind (type 7). KTR classified as slow transit time (type-1and -2 feces in the Bristol scale) and normal transit time (types 3, 4, and 5) were clustered ashaving no diarrhea, and those with fast transit time (types 6 and 7) with 3 or more episodesper day, as having diarrhea.
2.5. Dietary Assessment
Dietary intake was assessed using a validated self-administered food frequency ques-tionnaire (FFQ) [16]. A trained researcher checked the FFQ for completeness on the day ofthe visit to the outpatient clinic. The FFQ inquired about consumption of 177 food itemsduring the past month, taking seasonal variations into account, and included 7 fruit itemsand 18 vegetable items. Frequency was recorded in times per day, week, or month, andservings were expressed as natural units or household measures. The FFQ was linked tothe Dutch Food Composition Table (NEVO) in order to calculate total energy intake andnutrients [17]. Adjustment for total energy intake according to the residual method wasperformed to calculate nutrients intake [18].
31
J. Clin. Med. 2021, 10, 2854
2.6. Statistical Analyses
Statistical analyses were performed using IBM SPSS version 23.0 (SPSS Inc., Chicago,IL, USA). In all analyses, p < 0.05 was considered significant. Variable distribution wasevaluated by Kolmogorov–Smirnov test. Categorical variables are presented as n (%),normally distributed variables as mean ± standard deviation (SD), and non-normallydistributed variables as median (interquartile range). We divided patients into three groupsaccording to exhaled hydrogen. The highest group was defined as >20 ppm (suggestive forSIBO [8–11]). We divided the remaining patients (exhaled H2 < 20 ppm) into two groupsusing the rank tool in SPSS software. Comparison of categorical variables was performedusing a Chi-square test. Differences in groups of exhaled H2 were tested through analysisof variance (ANOVA) with Bonferroni post hoc tests for normally distributed variables andthe Kruskal–Wallis test for non-normal distribution. Possible determinants of exhaled H2were studied using univariable linear regression. Since we aimed to explore the potentialrelevance of any clinical or nutritional factor as potential determinant of exhaled H2, wetested all available variables in individual univariable regression analysis. Subsequently,all variables with a p < 0.05 were included in a multivariable linear regression model toidentify independent determinants of exhaled H2 production. Residuals were checked fornormality and variables were natural log-transformed when appropriate. Multivariablelogistic regression was performed to determine the potential relationship between exhaledH2 and diarrhea. Variables of known clinical importance for diarrhea in KTR, such as age,sex, eGFR, transplant vintage, immunosuppressive use [19,20], and H2 determinants, suchas use of PPI and polysaccharides intake, were used in the model.
3. Results
3.1. Clinical Parameters
A total of 424 KTR (55.4 ± 13.2 years, 258 (60.8%) male) were included in the study.The median transplant vintage was 1.8 (1.0–7.2) years, and 16.3% had a history of allograftrejection. With respect to comorbidities, 19.3% and 73.3% of patients had diabetes andhypertension, respectively. The mean eGFR was 49.8 ± 19.1 mL/min/1.73 m2. Accordingto the BSFS, 33% of KTR had diarrhea. Further clinical and laboratory characteristicsare shown in Table 1. KTR were divided into three groups according to exhaled H2concentration (G1, 1.0–6.9 ppm, n = 151; G2, 7.0–19.9 ppm, n = 139; G3, ≥20.0 ppm, n = 134).One-hundred thirty-four (134) out of 424 patients (31.6%) were considered positive forsmall intestinal bacterial overgrowth (H2 ≥ 20 ppm). KTR in the highest H2 group hadlower BMI (26.8 ± 3.9 kg/m2 vs. 28.2 ± 5.6 kg/m2, p = 0.02) and body fat percentage(29.3 ± 9.0% vs. 32.3 ± 10.3%, p = 0.02) when compared to the lowest H2 group. Patientsin the highest H2 group also had lower waist circumference when compared to both thelowest and intermediate group (96.9 ± 12.1 cm vs. 100.8 ± 13.6 cm and 100.8 ± 13.4 cm,p = 0.03).
32
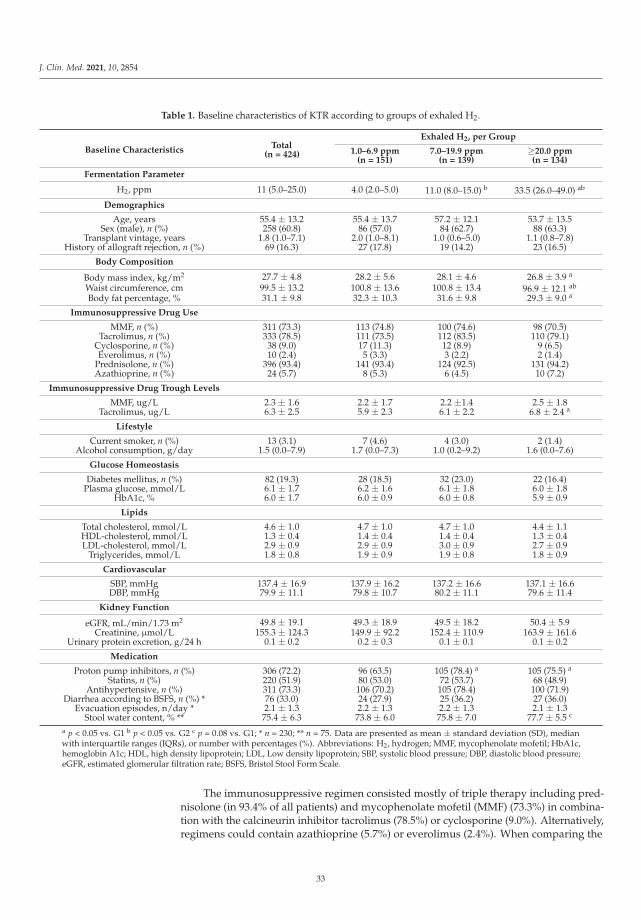
J. Clin. Med. 2021, 10, 2854
Table 1. Baseline characteristics of KTR according to groups of exhaled H2.
Baseline CharacteristicsTotal
(n = 424)
Exhaled H2, per Group
1.0–6.9 ppm(n = 151)
7.0–19.9 ppm(n = 139)
≥20.0 ppm(n = 134)
Fermentation Parameter
H2, ppm 11 (5.0–25.0) 4.0 (2.0–5.0) 11.0 (8.0–15.0) b 33.5 (26.0–49.0) ab
Demographics
Age, years 55.4 ± 13.2 55.4 ± 13.7 57.2 ± 12.1 53.7 ± 13.5Sex (male), n (%) 258 (60.8) 86 (57.0) 84 (62.7) 88 (63.3)
Transplant vintage, years 1.8 (1.0–7.1) 2.0 (1.0–8.1) 1.0 (0.6–5.0) 1.1 (0.8–7.8)History of allograft rejection, n (%) 69 (16.3) 27 (17.8) 19 (14.2) 23 (16.5)
Body Composition
Body mass index, kg/m2 27.7 ± 4.8 28.2 ± 5.6 28.1 ± 4.6 26.8 ± 3.9 a
Waist circumference, cm 99.5 ± 13.2 100.8 ± 13.6 100.8 ± 13.4 96.9 ± 12.1 ab
Body fat percentage, % 31.1 ± 9.8 32.3 ± 10.3 31.6 ± 9.8 29.3 ± 9.0 a
Immunosuppressive Drug Use
MMF, n (%) 311 (73.3) 113 (74.8) 100 (74.6) 98 (70.5)Tacrolimus, n (%) 333 (78.5) 111 (73.5) 112 (83.5) 110 (79.1)
Cyclosporine, n (%) 38 (9.0) 17 (11.3) 12 (8.9) 9 (6.5)Everolimus, n (%) 10 (2.4) 5 (3.3) 3 (2.2) 2 (1.4)
Prednisolone, n (%) 396 (93.4) 141 (93.4) 124 (92.5) 131 (94.2)Azathioprine, n (%) 24 (5.7) 8 (5.3) 6 (4.5) 10 (7.2)
Immunosuppressive Drug Trough Levels
MMF, ug/L 2.3 ± 1.6 2.2 ± 1.7 2.2 ±1.4 2.5 ± 1.8Tacrolimus, ug/L 6.3 ± 2.5 5.9 ± 2.3 6.1 ± 2.2 6.8 ± 2.4 a
Lifestyle
Current smoker, n (%) 13 (3.1) 7 (4.6) 4 (3.0) 2 (1.4)Alcohol consumption, g/day 1.5 (0.0–7.9) 1.7 (0.0–7.3) 1.0 (0.2–9.2) 1.6 (0.0–7.6)
Glucose Homeostasis
Diabetes mellitus, n (%) 82 (19.3) 28 (18.5) 32 (23.0) 22 (16.4)Plasma glucose, mmol/L 6.1 ± 1.7 6.2 ± 1.6 6.1 ± 1.8 6.0 ± 1.8
HbA1c, % 6.0 ± 1.7 6.0 ± 0.9 6.0 ± 0.8 5.9 ± 0.9
Lipids
Total cholesterol, mmol/L 4.6 ± 1.0 4.7 ± 1.0 4.7 ± 1.0 4.4 ± 1.1HDL-cholesterol, mmol/L 1.3 ± 0.4 1.4 ± 0.4 1.4 ± 0.4 1.3 ± 0.4LDL-cholesterol, mmol/L 2.9 ± 0.9 2.9 ± 0.9 3.0 ± 0.9 2.7 ± 0.9
Triglycerides, mmol/L 1.8 ± 0.8 1.9 ± 0.9 1.9 ± 0.8 1.8 ± 0.9
Cardiovascular
SBP, mmHg 137.4 ± 16.9 137.9 ± 16.2 137.2 ± 16.6 137.1 ± 16.6DBP, mmHg 79.9 ± 11.1 79.8 ± 10.7 80.2 ± 11.1 79.6 ± 11.4
Kidney Function
eGFR, mL/min/1.73 m2 49.8 ± 19.1 49.3 ± 18.9 49.5 ± 18.2 50.4 ± 5.9Creatinine, μmol/L 155.3 ± 124.3 149.9 ± 92.2 152.4 ± 110.9 163.9 ± 161.6
Urinary protein excretion, g/24 h 0.1 ± 0.2 0.2 ± 0.3 0.1 ± 0.1 0.1 ± 0.2
Medication
Proton pump inhibitors, n (%) 306 (72.2) 96 (63.5) 105 (78.4) a 105 (75.5) a
Statins, n (%) 220 (51.9) 80 (53.0) 72 (53.7) 68 (48.9)Antihypertensive, n (%) 311 (73.3) 106 (70.2) 105 (78.4) 100 (71.9)
Diarrhea according to BSFS, n (%) * 76 (33.0) 24 (27.9) 25 (36.2) 27 (36.0)Evacuation episodes, n/day * 2.1 ± 1.3 2.2 ± 1.3 2.2 ± 1.3 2.1 ± 1.3
Stool water content, % ** 75.4 ± 6.3 73.8 ± 6.0 75.8 ± 7.0 77.7 ± 5.5 c
a p < 0.05 vs. G1 b p < 0.05 vs. G2 c p = 0.08 vs. G1; * n = 230; ** n = 75. Data are presented as mean ± standard deviation (SD), medianwith interquartile ranges (IQRs), or number with percentages (%). Abbreviations: H2, hydrogen; MMF, mycophenolate mofetil; HbA1c,hemoglobin A1c; HDL, high density lipoprotein; LDL, Low density lipoprotein; SBP, systolic blood pressure; DBP, diastolic blood pressure;eGFR, estimated glomerular filtration rate; BSFS, Bristol Stool Form Scale.
The immunosuppressive regimen consisted mostly of triple therapy including pred-nisolone (in 93.4% of all patients) and mycophenolate mofetil (MMF) (73.3%) in combina-tion with the calcineurin inhibitor tacrolimus (78.5%) or cyclosporine (9.0%). Alternatively,regimens could contain azathioprine (5.7%) or everolimus (2.4%). When comparing the
33
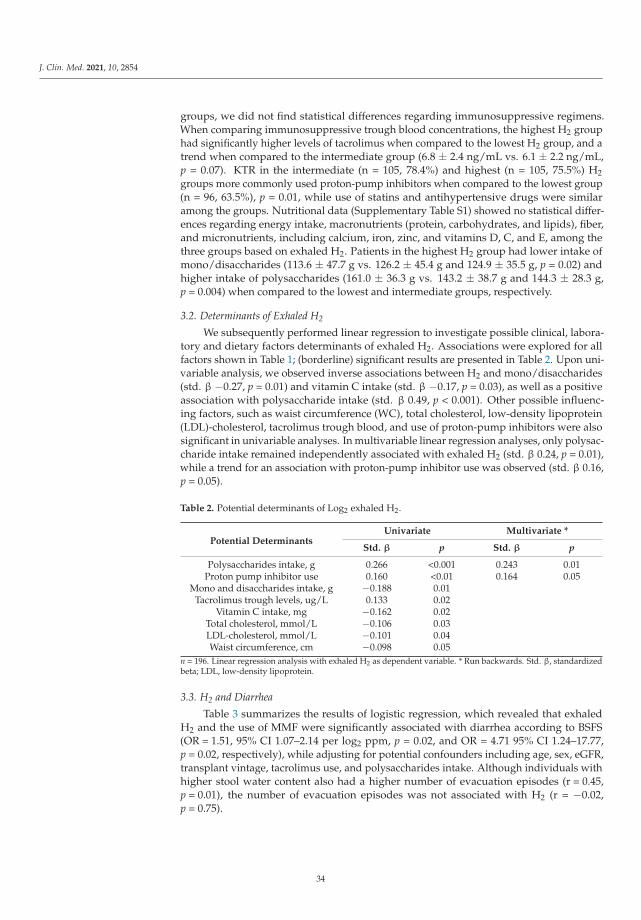
J. Clin. Med. 2021, 10, 2854
groups, we did not find statistical differences regarding immunosuppressive regimens.When comparing immunosuppressive trough blood concentrations, the highest H2 grouphad significantly higher levels of tacrolimus when compared to the lowest H2 group, and atrend when compared to the intermediate group (6.8 ± 2.4 ng/mL vs. 6.1 ± 2.2 ng/mL,p = 0.07). KTR in the intermediate (n = 105, 78.4%) and highest (n = 105, 75.5%) H2groups more commonly used proton-pump inhibitors when compared to the lowest group(n = 96, 63.5%), p = 0.01, while use of statins and antihypertensive drugs were similaramong the groups. Nutritional data (Supplementary Table S1) showed no statistical differ-ences regarding energy intake, macronutrients (protein, carbohydrates, and lipids), fiber,and micronutrients, including calcium, iron, zinc, and vitamins D, C, and E, among thethree groups based on exhaled H2. Patients in the highest H2 group had lower intake ofmono/disaccharides (113.6 ± 47.7 g vs. 126.2 ± 45.4 g and 124.9 ± 35.5 g, p = 0.02) andhigher intake of polysaccharides (161.0 ± 36.3 g vs. 143.2 ± 38.7 g and 144.3 ± 28.3 g,p = 0.004) when compared to the lowest and intermediate groups, respectively.
3.2. Determinants of Exhaled H2
We subsequently performed linear regression to investigate possible clinical, labora-tory and dietary factors determinants of exhaled H2. Associations were explored for allfactors shown in Table 1; (borderline) significant results are presented in Table 2. Upon uni-variable analysis, we observed inverse associations between H2 and mono/disaccharides(std. β −0.27, p = 0.01) and vitamin C intake (std. β −0.17, p = 0.03), as well as a positiveassociation with polysaccharide intake (std. β 0.49, p < 0.001). Other possible influenc-ing factors, such as waist circumference (WC), total cholesterol, low-density lipoprotein(LDL)-cholesterol, tacrolimus trough blood, and use of proton-pump inhibitors were alsosignificant in univariable analyses. In multivariable linear regression analyses, only polysac-charide intake remained independently associated with exhaled H2 (std. β 0.24, p = 0.01),while a trend for an association with proton-pump inhibitor use was observed (std. β 0.16,p = 0.05).
Table 2. Potential determinants of Log2 exhaled H2.
Potential DeterminantsUnivariate Multivariate *
Std. β p Std. β p
Polysaccharides intake, g 0.266 <0.001 0.243 0.01Proton pump inhibitor use 0.160 <0.01 0.164 0.05
Mono and disaccharides intake, g −0.188 0.01Tacrolimus trough levels, ug/L 0.133 0.02
Vitamin C intake, mg −0.162 0.02Total cholesterol, mmol/L −0.106 0.03LDL-cholesterol, mmol/L −0.101 0.04Waist circumference, cm −0.098 0.05
n = 196. Linear regression analysis with exhaled H2 as dependent variable. * Run backwards. Std. β, standardizedbeta; LDL, low-density lipoprotein.
3.3. H2 and Diarrhea
Table 3 summarizes the results of logistic regression, which revealed that exhaledH2 and the use of MMF were significantly associated with diarrhea according to BSFS(OR = 1.51, 95% CI 1.07–2.14 per log2 ppm, p = 0.02, and OR = 4.71 95% CI 1.24–17.77,p = 0.02, respectively), while adjusting for potential confounders including age, sex, eGFR,transplant vintage, tacrolimus use, and polysaccharides intake. Although individuals withhigher stool water content also had a higher number of evacuation episodes (r = 0.45,p = 0.01), the number of evacuation episodes was not associated with H2 (r = −0.02,p = 0.75).
34
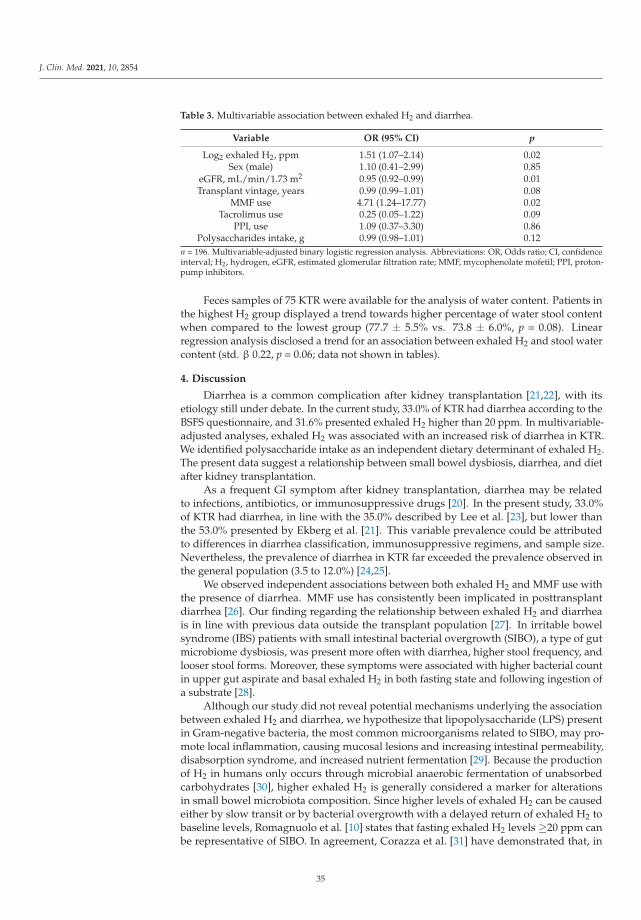
J. Clin. Med. 2021, 10, 2854
Table 3. Multivariable association between exhaled H2 and diarrhea.
Variable OR (95% CI) p
Log2 exhaled H2, ppm 1.51 (1.07–2.14) 0.02Sex (male) 1.10 (0.41–2.99) 0.85
eGFR, mL/min/1.73 m2 0.95 (0.92–0.99) 0.01Transplant vintage, years 0.99 (0.99–1.01) 0.08
MMF use 4.71 (1.24–17.77) 0.02Tacrolimus use 0.25 (0.05–1.22) 0.09
PPI, use 1.09 (0.37–3.30) 0.86Polysaccharides intake, g 0.99 (0.98–1.01) 0.12
n = 196. Multivariable-adjusted binary logistic regression analysis. Abbreviations: OR, Odds ratio; CI, confidenceinterval; H2, hydrogen, eGFR, estimated glomerular filtration rate; MMF, mycophenolate mofetil; PPI, proton-pump inhibitors.
Feces samples of 75 KTR were available for the analysis of water content. Patients inthe highest H2 group displayed a trend towards higher percentage of water stool contentwhen compared to the lowest group (77.7 ± 5.5% vs. 73.8 ± 6.0%, p = 0.08). Linearregression analysis disclosed a trend for an association between exhaled H2 and stool watercontent (std. β 0.22, p = 0.06; data not shown in tables).
4. Discussion
Diarrhea is a common complication after kidney transplantation [21,22], with itsetiology still under debate. In the current study, 33.0% of KTR had diarrhea according to theBSFS questionnaire, and 31.6% presented exhaled H2 higher than 20 ppm. In multivariable-adjusted analyses, exhaled H2 was associated with an increased risk of diarrhea in KTR.We identified polysaccharide intake as an independent dietary determinant of exhaled H2.The present data suggest a relationship between small bowel dysbiosis, diarrhea, and dietafter kidney transplantation.
As a frequent GI symptom after kidney transplantation, diarrhea may be relatedto infections, antibiotics, or immunosuppressive drugs [20]. In the present study, 33.0%of KTR had diarrhea, in line with the 35.0% described by Lee et al. [23], but lower thanthe 53.0% presented by Ekberg et al. [21]. This variable prevalence could be attributedto differences in diarrhea classification, immunosuppressive regimens, and sample size.Nevertheless, the prevalence of diarrhea in KTR far exceeded the prevalence observed inthe general population (3.5 to 12.0%) [24,25].
We observed independent associations between both exhaled H2 and MMF use withthe presence of diarrhea. MMF use has consistently been implicated in posttransplantdiarrhea [26]. Our finding regarding the relationship between exhaled H2 and diarrheais in line with previous data outside the transplant population [27]. In irritable bowelsyndrome (IBS) patients with small intestinal bacterial overgrowth (SIBO), a type of gutmicrobiome dysbiosis, was present more often with diarrhea, higher stool frequency, andlooser stool forms. Moreover, these symptoms were associated with higher bacterial countin upper gut aspirate and basal exhaled H2 in both fasting state and following ingestion ofa substrate [28].
Although our study did not reveal potential mechanisms underlying the associationbetween exhaled H2 and diarrhea, we hypothesize that lipopolysaccharide (LPS) presentin Gram-negative bacteria, the most common microorganisms related to SIBO, may pro-mote local inflammation, causing mucosal lesions and increasing intestinal permeability,disabsorption syndrome, and increased nutrient fermentation [29]. Because the productionof H2 in humans only occurs through microbial anaerobic fermentation of unabsorbedcarbohydrates [30], higher exhaled H2 is generally considered a marker for alterationsin small bowel microbiota composition. Since higher levels of exhaled H2 can be causedeither by slow transit or by bacterial overgrowth with a delayed return of exhaled H2 tobaseline levels, Romagnuolo et al. [10] states that fasting exhaled H2 levels ≥20 ppm canbe representative of SIBO. In agreement, Corazza et al. [31] have demonstrated that, in
35
J. Clin. Med. 2021, 10, 2854
bacterial overgrowth patients, fasting exhaled H2 values were significantly higher than inhealthy volunteers (14.7 ± 14.0 ppm vs. 5.8 ± 3.1 ppm, p < 0.001) [31]. Perman et al. [32]observed a fasting exhaled H2 of 2.0 ± 2.5 ppm after a dinner meal in healthy subjects, withno value exceeding 11.0 ppm, whereas exhaled H2 after an identical meal in patients withbacterial overgrowth exceeded 48 ppm [32]. These studies support that elevated values offasting H2 can be considered suggestive of SIBO, potentially connecting higher exhaled H2with the observed increased risk of diarrhea.
In addition, patients with higher exhaled H2 tended to have higher stool water contentand the percentage of stool water content was positively associated with both exhaled H2and the number of evacuation episodes. An experimental study has disclosed that greatergastro-intestinal H2 content shortened colonic transit time by 47% in the proximal colon,and by 10% in the distal colon [33]. These data suggest that there might be an associationbetween an accelerated intestinal transit causing diarrhea and the H2 production.
A recent meta-analysis suggested that the use of proton-pump inhibitors (PPI) canmoderately increase the risk of SIBO [34]. Since gastric acid is an important barrier thatprevents bacterial colonization of the stomach and small intestine, PPI therapy may promotesmall intestinal microbiota growth, through chronic acid suppression and subsequenthypochlorhydria [35]. In the current study, we observed a significantly higher use of PPIamong individuals in the highest group of exhaled H2, with a trend for an associationwith H2 in multiple linear regression, which is in line with the notion that exhaled H2 isassociated with small intestinal microbiota overgrowth.
A complex interplay exists between diet, GI transit, and gut microbiota [36]. In thepresent study, we identified polysaccharide intake as an independent determinant ofexhaled H2. Polysaccharides are complex carbohydrates that can be divided into starchand non-starch [37]. Since there was no difference in fiber intake between the H2 groups,we assume higher starch intake as the main cause of higher polysaccharide intake. Somestarch, known as resistant starch (RS), escapes digestion in the small intestine and, uponreaching the large intestine, acts similarly to dietary fiber, fermenting and incorporatingwater [37]. Our findings are at least partly in line with a previous study suggesting thatSIBO resulted from differences in fiber intake [38]. In the current cohort, the suggestivepresence of SIBO could further promote starch malabsorption, which in turn could bea conceivable explanation for the higher water content in stool due to osmotic activity,subsequently causing diarrhea [39,40]. At the same time, there is limited evidence thatSIBO is the primary driver of GI symptoms or that it is influenced by dietary factors.
RS and other types of starch that escape digestion in the small intestine may be quan-titatively more important as substrates of fermentation than non-starch polysaccharidesin the colon [41]. While the human genome does not encode adequate gastrointestinalenzymes that metabolize some polysaccharides, RS undergoes fermentation by members ofthe gut microbiota, resulting in the production of SCFAs, mainly butyrate [42,43]. Recently,our group has been able to show that the gut microbiome of KTR contained less butyrate-producing bacteria, more Proteobacteria, and fewer Actinobacteria [44]. Starch-utilizingbacteria in the gut include many members of the Bacteroides and various Firmicutes [45]. Astudy in KTR demonstrated that the phylum Bacteroidetes and its derivative Bacteroides,as well as Ruminococcus, Coprococcus, and Dorea, were significantly reduced in fecal spec-imens from patients with diarrhea [23,45]. These observations suggest that changes instarch-degrading bacteria in KTR could decrease carbohydrate fermentation in coloniclumen, promoting reduced nutrient absorption and watery stool.
Another important fact to be highlighted is that the elimination of the H2 produced bybacterial fermentation depends significantly on methanogenic and sulfate-reducing bacteriathat convert H2 to methane and hydrogen sulfide [46]. We recently demonstrated thatcolonic presence of the methanogen Methanobrevibacter smithii, which plays an importantrole upon removing the end-product H2 from bacterial fermentation, was reduced inKTR [47]. These findings may indicate that diminished abundance of methanogens after
36
J. Clin. Med. 2021, 10, 2854
kidney transplantation could lead to less H2 metabolization, also contributing to a rise inthe gas levels in the breath test.
To the best of our knowledge, this is the first study to evaluate the relationship betweenexhaled H2 and diarrhea in a large-scale cohort of KTR. The breath test we used is widelyavailable, safe, inexpensive, and noninvasive, advantages that make it ideal for daily clinicalpractice employment. Limitations of the present study include the cross-sectional nature,precluding conclusions on causality, the single H2 measurement, which does not necessarilyreflect the entire post-transplant period, and the lack of information regarding the courseand duration of diarrhea (acute or chronic). Since our study population consisted almostentirely of Caucasians, our results cannot be extrapolated to different populations. Thepurpose of performing the breath test was to investigate exhaled H2 in KTR under fastingbasal conditions (i.e., without using substrates like glucose, lactulose, lactose, or fructose).Although some investigators suggest that the use of fasting hydrogen is insufficient forSIBO diagnosis [48], fasting hydrogen overproduction has been consistently found withbacterial overgrowth in several studies [8,10,32,33]. Finally, no direct tests such as duodenalaspirate cultures have been performed to detect changes in the gut microbiota colonizationof small bowel.
In conclusion, a fasting exhaled H2 higher than 20 ppm was present in 31.6% ofKTR, which was associated with increased risk of diarrhea. Polysaccharide intake wasan independent determinant of exhaled H2. The present results suggest that diarrhea inKTR may reflect an altered small bowel gut microbial composition, at least partly underdietary control. These data encourage future studies to validate our findings; to furtherinvestigate the associations between the diet, small bowel dysbiosis, and post-kidneytransplant diarrhea; and to explore whether lowering polysaccharide intake or correctionof SIBO may reduce diarrhea in KTR. Characterizing small intestinal bacterial overgrowthin post-transplant patients with GI symptoms could support more focused antibacterial ordietary therapeutic approaches.
Supplementary Materials: The following are available online at https://www.mdpi.com/article/10.3390/jcm10132854/s1, Table S1: Nutritional Data; Table S2: Multivariate binary logistic regressionresults using exhaled H2 (≥ or <20 ppm) as dependent variable.
Author Contributions: F.G.R. conducted data analyses, research design and wrote the manuscript.J.C.S., R.M.D., T.J.K. conducted the study and data collection. C.G.S. conducted data analysis andreviewed the manuscript. H.B. and R.K.W. discussed and enriched the manuscript. I.P.H., S.J.L.B.and M.H.d.B. supervised and reviewed the manuscript. All authors have read and agreed to thepublished version of the manuscript.
Funding: Fernanda Guedes Rodrigues is supported by a doctoral study scholarship from Coorde-nação de Aperfeiçoamento de Pessoal de Nível Superior (CAPES).
Institutional Review Board Statement: For this study we used data from the TransplantLinesBiobank and Cohort Study (ClinicalTrials.gov identifier: NCT03272841).The study protocol has beenapproved by the Institutional Review Board (METc 2014/077) (METc UMCG), adheres to the UMCGBiobank Regulation, and is in accordance with the WMA Declaration of Helsinki and the Declarationof Istanbul.
Informed Consent Statement: Informed consent was obtained from all subjects involved in the study.
Conflicts of Interest: The authors declare no conflict of interest. The funder had no role in the designof the study; in the collection, analyses, or interpretation of data, in the writing of the manuscript, orin the decision to publish the results.
37
J. Clin. Med. 2021, 10, 2854
Abbreviations
BMI Body Mass IndexBSFS Bristol Stool Form ScaleCH4 MethaneCKD Chronic Kidney DiseaseeGFR Estimated glomerular filtration rateFFQ Food Frequency QuestionnaireGI GastrointestinalH2 HydrogenIBS Irritable bowel syndromeKTR Kidney Transplant RecipientsMMF Mycophenolate mofetilPPI Proton-pump inhibitorsRS Resistant starchSCFA Short-chain Fatty AcidsSIBO Small Intestinal Bacterial Overgrowth
References
1. Eisenga, M.F.; Gomes-Neto, A.W.; Van Londen, M.; Ziengs, A.L.; Douwes, R.M.; Stam, S.P.; Osté, M.C.J.; Knobbe, T.J.; Hessels,N.R.; Buunk, A.M.; et al. Rationale and design of TransplantLines: A prospective cohort study and biobank of solid organtransplant recipients. BMJ Open 2018, 8, e024502. [CrossRef] [PubMed]
2. U.S. National Library Medicine. TransplantLines: The Transplantation Biobank. 2015. Available online: https://clinicaltrials.gov/ct2/show?term=transplantlines&rank=1 (accessed on 20 April 2021).
3. Corpa, M.V.N.; Soares, V. Systemic hypertension in patients with glomerulonephritis. Renal. Fail. 2002, 24, 347–352. [CrossRef][PubMed]
4. American Diabetes Association. Report of the Expert Committee on the Diagnosis and Classification of Diabetes Mellitus. DiabetesCare 2003, 26 (Suppl. 1), S5–S20. [CrossRef]
5. Du Bois, D.; Du Bois, E.F. A formula to estimate the approximate surface area if height and weight be known. 1916. Nutrition1989, 5, 303. [PubMed]
6. Levey, A.S.; Stevens, L.A.; Schmid, C.H.; Zhang, Y.L.; Castro, A.F., 3rd; Feldman, H.I.; Kusek, J.W.; Eggers, P.; Van Lente, F.;Greene, T.; et al. A new equation to estimate glomerular filtration rate. Ann. Intern. Med. 2009, 150, 604–612. [CrossRef]
7. Kyle, U.G.; Bosaeus, I.; De Lorenzo, A.D.; Deurenberg, P.; Elia, M.; Gómez, J.M.; Heitmann, B.L.; Kent-Smith, L.; Melchior,J.-C.; Pirlich, M.; et al. Bioelectrical impedance analysis—part II: Utilization in clinical practice. Clin. Nutr. 2004, 23, 1430–1453.[CrossRef]
8. Sabaté, J.-M.; Jouët, P.; Harnois, F.; Mechler, C.; Msika, S.; Grossin, M.; Coffin, B. High Prevalence of Small Intestinal BacterialOvergrowth in Patients with Morbid Obesity: A Contributor to Severe Hepatic Steatosis. Obes. Surg. 2008, 18, 371–377. [CrossRef]
9. Saad, R.J.; Chey, W.D. Breath Testing for Small Intestinal Bacterial Overgrowth: Maximizing Test Accuracy. Clin. Gastroenterol.Hepatol. 2014, 12, 1964–1972. [CrossRef]
10. Romagnuolo, J.; Schiller, D.; Bailey, R.J. Using breath tests wisely in a gastroenterology practice: An evidence-based review ofindications and pitfalls in interpretation. Am. J. Gastroenterol. 2002, 97, 1113–1126. [CrossRef]
11. Kerckhoffs, A.P.M.; Visser, M.R.; Samsom, M.; Van Der Rest, M.E.; De Vogel, J.; Harmsen, W.; Akkermans, L.M.A. CriticalEvaluation of Diagnosing Bacterial Overgrowth in the Proximal Small Intestine. J. Clin. Gastroenterol. 2008, 42, 1095–1102.[CrossRef]
12. Levitt, M.; Hirsh, P.; Fetzer, C.; Sheahan, M.; Levine, A. H2 excretion after ingestion of complex carbohydrates. Gastroenterology1987, 92, 383–389. [CrossRef]
13. Ohno, H.; Murakami, H.; Tanisawa, K.; Konishi, K.; Miyachi, M. Validity of an observational assessment tool for multifacetedevaluation of faecal condition. Sci. Rep. 2019, 9, 3760. [CrossRef] [PubMed]
14. Hinnant, R.T.; Kothmann, M.M. Collecting, Drying, and Preserving Feces for Chemical and Microhistological Analysis. J. RangeManag. 1988, 41, 168. [CrossRef]
15. Heaton, K.W.; Radvan, J.; Cripps, H.; Mountford, R.A.; Braddon, F.E.; Hughes, A.O. Defecation frequency and timing, and stoolform in the general population: A prospective study. Gut 1992, 33, 818–824. [CrossRef] [PubMed]
16. van den Berg, E.; Engberink, M.F.; Brink, E.J.; van Baak, M.; Gans, R.; Navis, G.; Bakker, S.J.L. Dietary protein, blood pressure andrenal function in renal transplant recipients. Br. J. Nutr. 2012, 109, 1463–1470. [CrossRef] [PubMed]
17. Netherlands Nutrition Center. Dutch Food Composition Table 2006 NEVO-Tabel. 2006. Available online: https://www.rivm.nl/nederlands-voedingsstoffenbestand (accessed on 23 April 2021).
18. Willett, W.C.; Howe, G.R.; Kushi, L.H. Adjustment for total energy intake in epidemiologic studies. Am. J. Clin. Nutr. 1997, 65(Suppl. 4), 1220S–1228S. [CrossRef] [PubMed]
38
J. Clin. Med. 2021, 10, 2854
19. Bunnapradist, S.; Neri, L.; Wong, W.; Lentine, K.L.; Burroughs, T.E.; Pinsky, B.W.; Takemoto, S.K.; Schnitzler, M.A. Incidence andRisk Factors for Diarrhea Following Kidney Transplantation and Association With Graft Loss and Mortality. Am. J. Kidney Dis.2008, 51, 478–486. [CrossRef]
20. Aulagnon, F.; Scemla, A.; DeWolf, S.; Legendre, C.; Zuber, J. Diarrhea After Kidney Transplantation: A new look at a frequentsymptom. Transplantation 2014, 98, 806–816. [CrossRef]
21. Ekberg, H.; Kyllonen, L.; Madsen, S.; Grave, G.; Solbu, D.; Holdaas, H. Increased prevalence of gastrointestinal symptomsassociated with impaired quality of life in renal transplant recipients. Transplantation 2007, 83, 282–289. [CrossRef]
22. Shin, H.S.; Chandraker, A. Causes and management of postrenal transplant diarrhea: An underappreciated cause of transplant-associated morbidity. Curr. Opin. Nephrol. Hypertens. 2017, 26, 484–493. [CrossRef]
23. Lee, J.R.; Magruder, M.; Zhang, L.; Westblade, L.F.; Satlin, M.J.; Robertson, A.; Edusei, E.; Crawford, C.; Ling, L.; Taur, Y.; et al.Gut microbiota dysbiosis and diarrhea in kidney transplant recipients. Am. J. Transplant. 2019, 19, 488–500. [CrossRef]
24. Zinsmeister, A.R.; Herrick, L.M.; Saito Loftus, Y.A.; Schleck, C.D.; Talley, N.J. Identification and validation of functionalgastrointestinal disorder subtypes using latent class analysis: A population-based study. Scand. J. Gastroenterol. 2017, 53, 549–558.[CrossRef]
25. Scallan, E.; Majowicz, S.; Hall, G.; Banerjee, A.; Bowman, C.; Daly, L.; Jones, T.F.; Kirk, M.D.; Fitzgerald, M.; Angulo, F.J. Prevalenceof diarrhoea in the community in Australia, Canada, Ireland, and the United States. Int. J. Epidemiol. 2005, 34, 454–460. [CrossRef]
26. Knight, S.R.; Russell, N.K.; Barcena, L.; Morris, P.J. Mycophenolate Mofetil Decreases Acute Rejection and may Improve GraftSurvival in Renal Transplant Recipients When Compared with Azathioprine: A Systematic Review. Transplantation 2009, 87,785–794. [CrossRef]
27. Ghoshal, U.C. How to Interpret Hydrogen Breath Tests. J. Neurogastroenterol. Motil. 2011, 17, 312–317. [CrossRef]28. Ghoshal, U.C.; Srivastava, D.; Ghoshal, U.; Misra, A. Breath tests in the diagnosis of small intestinal bacterial overgrowth in
patients with irritable bowel syndrome in comparison with quantitative upper gut aspirate culture. Eur. J. Gastroenterol. Hepatol.2014, 26, 753–760. [CrossRef] [PubMed]
29. Pyleris, E.; Giamarellos-Bourboulis, E.J.; Tzivras, D.; Koussoulas, V.; Barbatzas, C.; Pimentel, M. The Prevalence of Overgrowth byAerobic Bacteria in the Small Intestine by Small Bowel Culture: Relationship with Irritable Bowel Syndrome. Dig. Dis. Sci. 2012,57, 1321–1329. [CrossRef] [PubMed]
30. Sahakian, A.B.; Jee, S.-R.; Pimentel, M. Methane and the Gastrointestinal Tract. Dig. Dis. Sci. 2009, 55, 2135–2143. [CrossRef]31. Corazza, G.R.; Strocchi, A.; Gasbarrini, G. Fasting breath hydrogen in celiac disease. Gastroenterology 1987, 93, 53–58. [CrossRef]32. Perman, J.A.; Modler, S.; Barr, R.G.; Rosenthal, P. Fasting breath hydrogen concentration: Normal values and clinical application.
Gastroenterology 1984, 87, 1358–1363. [CrossRef]33. Jahng, J.; Jung, I.S.; Choi, E.J.; Conklin, J.L.; Park, H. The effects of methane and hydrogen gases produced by enteric bacteria on
ileal motility and colonic transit time. Neurogastroenterol. Motil. 2011, 24, 185-e92. [CrossRef]34. Su, T.; Lai, S.; Lee, A.; He, X.; Chen, S. Meta-analysis: Proton pump inhibitors moderately increase the risk of small intestinal
bacterial overgrowth. J. Gastroenterol. 2017, 53, 27–36. [CrossRef] [PubMed]35. Laine, L.; Ahnen, D.; McClain, C.; Solcia, E.; Walsh, J.H. Review article: Potential gastrointestinal effects of long-term acid
suppression with proton pump inhibitors. Aliment. Pharmacol. Ther. 2000, 14, 651–668. [CrossRef] [PubMed]36. Kashyap, P.C.; Marcobal, A.; Ursell, L.K.; Larauche, M.; Duboc, H.; Earle, K.A.; Sonnenburg, E.D.; Ferreyra, J.A.; Higginbottom,
S.K.; Million, M.; et al. Complex Interactions Among Diet, Gastrointestinal Transit, and Gut Microbiota in Humanized Mice.Gastroenterology 2013, 144, 967–977. [CrossRef] [PubMed]
37. Slavin, J.L. Carbohydrates, Dietary Fiber, and Resistant Starch in White Vegetables: Links to Health Outcomes. Adv. Nutr. 2013, 4,351S–355S. [CrossRef] [PubMed]
38. Saffouri, G.B.; Shields-Cutler, R.R.; Chen, J.; Yang, Y.; Lekatz, H.R.; Hale, V.L.; Cho, J.M.; Battaglioli, E.J.; Bhattarai, Y.; Thompson,K.J.; et al. Small intestinal microbial dysbiosis underlies symptoms associated with functional gastrointestinal disorders. Nat.Commun. 2019, 10, 1–11. [CrossRef] [PubMed]
39. Levitt, M.D. Malabsorption of starch: A normal phenomenon. Gastroenterology 1983, 85, 769–770. [CrossRef]40. Hammer, H.F.; Hammer, J. Diarrhea Caused By Carbohydrate Malabsorption. Gastroenterol. Clin. N. Am. 2012, 41, 611–627.
[CrossRef]41. Bello-Perez, L.A.; Flores-Silva, P.C.; Agama-Acevedo, E.; Tovar, J. Starch digestibility: Past, present, and future. J. Sci. Food Agric.
2018, 100, 5009–5016. [CrossRef]42. Ho Do, M.; Seo, Y.S.; Park, H.-Y. Polysaccharides: Bowel health and gut microbiota. Crit. Rev. Food Sci. Nutr. 2021, 61, 1212–1224.
[CrossRef]43. DeMartino, P.; Cockburn, D.W. Resistant starch: Impact on the gut microbiome and health. Curr. Opin. Biotechnol. 2020, 61, 66–71.
[CrossRef] [PubMed]44. Swarte, J.C.; Douwes, R.M.; Hu, S.; Vila, A.V.; Eisenga, M.F.; Van Londen, M.; Gomes-Neto, A.W.; Weersma, R.K.; Harmsen,
H.J.; Bakker, S.J. Characteristics and Dysbiosis of the Gut Microbiome in Renal Transplant Recipients. J. Clin. Med. 2020, 9, 386.[CrossRef]
45. Lee, J.R.; Muthukumar, T.; Dadhania, D.; Toussaint, N.C.; Ling, L.; Pamer, E.; Suthanthiran, M. Gut Microbial CommunityStructure and Complications After Kidney Transplantation. Transplantation 2014, 98, 697–705. [CrossRef] [PubMed]
39
J. Clin. Med. 2021, 10, 2854
46. Lin, H.C. Small intestinal bacterial overgrowth: A framework for understanding irritable bowel syndrome. JAMA 2004, 292,852–858. [CrossRef] [PubMed]
47. Knobbe, T.J.; Douwes, R.M.; Kremer, D.; Swarte, J.C.; Eisenga, M.F.; Gomes-Neto, A.W.; Van Londen, M.; Peters, F.T.M.; Blokzijl,H.; Nolte, I.M.; et al. Altered Gut Microbial Fermentation and Colonization with Methanobrevibacter smithii in Renal TransplantRecipients. J. Clin. Med. 2020, 9, 518. [CrossRef]
48. Rezaie, A.; Buresi, M.; Lembo, A.; Lin, H.; McCallum, R.; Rao, S.; Schmulson, M.; Valdovinos, M.; Zakko, S.; Pimentel, M.Hydrogen and Methane-Based Breath Testing in Gastrointestinal Disorders: The North American Consensus. Am. J. Gastroenterol.2017, 112, 775–784. [CrossRef] [PubMed]
40
Journal of
Clinical Medicine
Article
Outcomes of Kidney Transplant Recipients with Sickle CellDisease: An Analysis of the 2000–2019 UNOS/OPTN Database
Napat Leeaphorn 1, Charat Thongprayoon 2,*, Pradeep Vaitla 3, Panupong Hansrivijit 4, Caroline C. Jadlowiec 5,
Shennen A. Mao 6, Api Chewcharat 7, Sreelatha Katari 1, Pattharawin Pattharanitima 8,9,*,
Boonphiphop Boonpheng 10, Wisit Kaewput 11, Michael A. Mao 12, Matthew Cooper 13 and
Wisit Cheungpasitporn 2,*
Citation: Leeaphorn, N.;
Thongprayoon, C.; Vaitla, P.;
Hansrivijit, P.; Jadlowiec, C.C.; Mao,
S.A.; Chewcharat, A.; Katari, S.;
Pattharanitima, P.; Boonpheng, B.;
et al. Outcomes of Kidney Transplant
Recipients with Sickle Cell Disease:
An Analysis of the 2000–2019
UNOS/OPTN Database. J. Clin. Med.
2021, 10, 3063. https://doi.org/
10.3390/jcm10143063
Academic Editor: Magdi Yaqoob
Received: 3 June 2021
Accepted: 9 July 2021
Published: 11 July 2021
Publisher’s Note: MDPI stays neutral
with regard to jurisdictional claims in
published maps and institutional affil-
iations.
Copyright: © 2021 by the authors.
Licensee MDPI, Basel, Switzerland.
This article is an open access article
distributed under the terms and
conditions of the Creative Commons
Attribution (CC BY) license (https://
creativecommons.org/licenses/by/
4.0/).
1 Renal Transplant Program, University of Missouri-Kansas City School of Medicine, Saint Luke’s HealthSystem, Kansas City, MO 64111, USA; [email protected] (N.L.); [email protected] (S.K.)
2 Division of Nephrology and Hypertension, Department of Medicine, Mayo Clinic, Rochester, MN 59005, USA3 Division of Nephrology, University of Mississippi Medical Center, Jackson, MS 39216, USA; [email protected] Department of Internal Medicine, University of Pittsburgh Medical Center Pinnacle,
Harrisburg, PA 17101, USA; [email protected] Division of Transplant Surgery, Mayo Clinic, Phoenix, AZ 85054, USA; [email protected] Division of Transplant Surgery, Mayo Clinic, Jacksonville, FL 32224, USA; [email protected] Department of Medicine, Mount Auburn Hospital, Harvard Medical School, Cambridge, MA 02138, USA;
[email protected] Department of Internal Medicine, Faculty of Medicine, Thammasat University, Pathum Thani 12120, Thailand9 Department of Medicine, Icahn School of Medicine at Mount Sinai, New York, NY 10029, USA10 Department of Medicine, David Geffen School of Medicine, University of California,
Los Angeles, CA 90095, USA; [email protected] Department of Military and Community Medicine, Phramongkutklao College of Medicine,
Bangkok 10400, Thailand; [email protected] Division of Nephrology and Hypertension, Mayo Clinic, Jacksonville, FL 32224, USA;
[email protected] Medstar Georgetown Transplant Institute, Georgetown University School of Medicine,
Washington, DC 20007, USA; [email protected]* Correspondence: [email protected] (C.T.); [email protected] (P.P.);
[email protected] (W.C.)
Abstract: Background: Lower patient survival has been observed in sickle cell disease (SCD) patientswho go on to receive a kidney transplant. This study aimed to assess the post-transplant outcomes ofSCD kidney transplant recipients in the contemporary era. Methods: We used the OPTN/UNOSdatabase to identify first-time kidney transplant recipients from 2010 through 2019. We comparedpatient and allograft survival between recipients with SCD (n = 105) vs. all other diagnoses (non-SCD,n = 146,325) as the reported cause of end-stage kidney disease. We examined whether post-transplantoutcomes improved among SCD in the recent era (2010–2019), compared to the early era (2000–2009).Results: After adjusting for differences in baseline characteristics, SCD was significantly associatedwith lower patient survival (HR 2.87; 95% CI 1.75–4.68) and death-censored graft survival (HR 1.98;95% CI 1.30–3.01), compared to non-SCD recipients. The lower patient survival and death-censoredgraft survival in SCD recipients were consistently observed in comparison to outcomes of recipientswith diabetes, glomerular disease, and hypertension as the cause of end-stage kidney disease. Therewas no significant difference in death censored graft survival (HR 0.99; 95% CI 0.51–1.73, p = 0.98)and patient survival (HR 0.93; 95% CI 0.50–1.74, p = 0.82) of SCD recipients in the recent versus earlyera. Conclusions: Patient and allograft survival in SCD kidney recipients were worse than recipientswith other diagnoses. Overall SCD patient and allograft outcomes in the recent era did not improvefrom the early era. The findings of our study should not discourage kidney transplantation for ESKDpatients with SCD due to a known survival benefit of transplantation compared with remaining ondialysis. Urgent future studies are needed to identify strategies to improve patient and allograftsurvival in SCD kidney recipients. In addition, it may be reasonable to assign risk adjustment forSCD patients.
J. Clin. Med. 2021, 10, 3063. https://doi.org/10.3390/jcm10143063 https://www.mdpi.com/journal/jcm41
J. Clin. Med. 2021, 10, 3063
Keywords: sickle cell disease; sickle cell; kidney transplantation; transplantation; outcomes; big data
1. Introduction
Sickle cell disease (SCD) is the most common inherited blood disorder in the UnitedStates, affecting approximately 100,000 Americans [1–4]. SCD occurs in one out of every365 African-American births and 1 out of every 16,300 Hispanic-American births [1–3].Patients with SCD are at risk for progressive kidney disease, initially manifesting as mi-croalbuminuria and urine-concentrating defects in childhood with subsequent progressionto overt proteinuria and progressive decline in kidney function after age 20 [1–4]. Almosthalf of SCD patients with HbSS genotype develop chronic kidney disease; the prevalenceof end stage kidney disease (ESKD) ranges from 5% up to 18% with a median age of23 years [1,5–7]. Despite the prevalence of ESKD in SCD, few of these individuals receive akidney transplant [8–10].
Ongoing unequal access to kidney transplantation for SCD is a reflection of the trans-plant community’s concerns related to increased mortality risk for SCD patients comparedto ESKD patients from other causes [11,12]. Nonetheless, despite having an increased risk,SCD ESKD patients receive a survival benefit following kidney transplantation similarto non-SCD ESKD patients [8,9]. Despite improvement in survival after transplantationin SCD patients [8,9], there are still concerns regarding worse outcomes among kidneytransplant recipients with SCD compared to non-SCD recipients [8,10]. Data from prior to2000 [8,10] including data from United States Renal Data System (USRDS) and the UnitedNetwork for Organ Sharing (UNOS) databases demonstrated that kidney transplant recipi-ents with SCD had reduced allograft and patient survival compared to non-SCD kidneytransplant recipients [8,10]. Despite these concerns, a previous study using UNOS databasedemonstrated improved patient survival among SCD recipients over time (from years1988–1999 to 2000–2011) [13].
Immunosuppression and kidney transplant care have significantly advanced in thepast decades [14–17], and overall kidney transplantation outcomes have significant im-proved in the recent era [18,19]. In addition to emerging immunosuppressing agents,advances in human leukocyte antigen (HLA)/epitope matching, infection prevention, pre-transplant apolipoprotein L1 gene (APOL1), screening standardization of pre-transplantpreparation for SCD patients, use of post-transplant SCD disease modifying therapy mayimpact transplant outcomes of patients with SCD [20–22]. The outcomes of kidney trans-plant for SCD ESKD recipients in the current transplant era remain underreported. Weconducted this study using the UNOS database with the aim to (1) compare patient andallograft survival between recipients with SCD vs. non-SCD in the recent era (2010–2019),and to (2) examine outcomes of SCD recipients in the recent era (2010–2019), compared tothe early era (2000–2009).
2. Methods
2.1. Data Source and Study Population
This study used the Organ Procurement and Transplantation Network (OPTN) /UNOSdatabase. The OPTN/UNOS contains patient-level data of all United States transplantevents. Institutional review board approval was waived due to publicly available nature ofthe de-identified OPTN/UNOS database.
The primary cohort includes pediatric and adult solitary first kidney transplant re-cipients occurring from 2010 to 2019. Patient and allograft survival between recipientswith SCD ESKD were compared to recipients with all other diagnoses (non-SCD ESKD). Inaddition, we compared post-transplant outcomes of SCD recipients with the three mostcommon causes of end-stage kidney disease: diabetes mellitus (DM), glomerular disease,and hypertension.
42
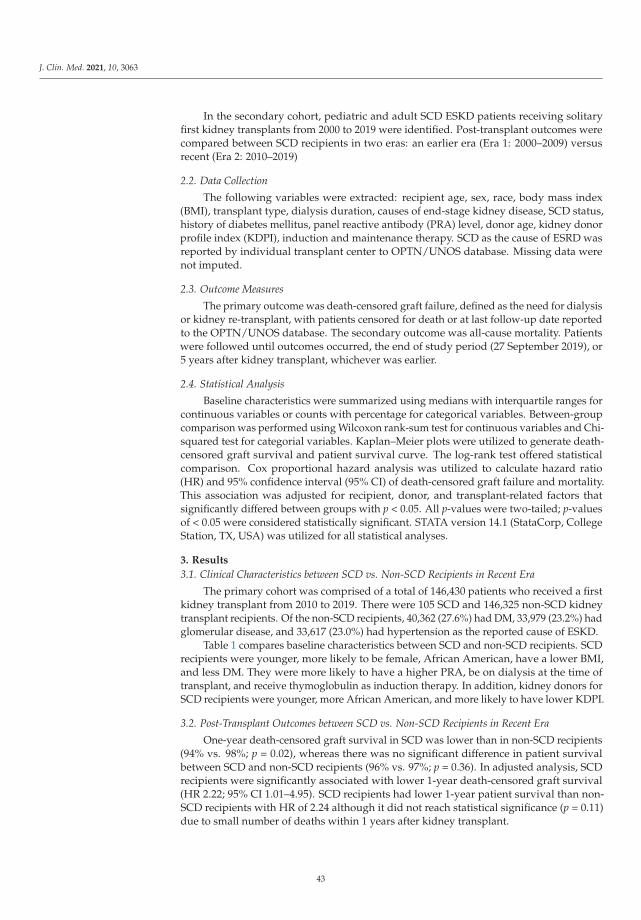
J. Clin. Med. 2021, 10, 3063
In the secondary cohort, pediatric and adult SCD ESKD patients receiving solitaryfirst kidney transplants from 2000 to 2019 were identified. Post-transplant outcomes werecompared between SCD recipients in two eras: an earlier era (Era 1: 2000–2009) versusrecent (Era 2: 2010–2019)
2.2. Data Collection
The following variables were extracted: recipient age, sex, race, body mass index(BMI), transplant type, dialysis duration, causes of end-stage kidney disease, SCD status,history of diabetes mellitus, panel reactive antibody (PRA) level, donor age, kidney donorprofile index (KDPI), induction and maintenance therapy. SCD as the cause of ESRD wasreported by individual transplant center to OPTN/UNOS database. Missing data werenot imputed.
2.3. Outcome Measures
The primary outcome was death-censored graft failure, defined as the need for dialysisor kidney re-transplant, with patients censored for death or at last follow-up date reportedto the OPTN/UNOS database. The secondary outcome was all-cause mortality. Patientswere followed until outcomes occurred, the end of study period (27 September 2019), or5 years after kidney transplant, whichever was earlier.
2.4. Statistical Analysis
Baseline characteristics were summarized using medians with interquartile ranges forcontinuous variables or counts with percentage for categorical variables. Between-groupcomparison was performed using Wilcoxon rank-sum test for continuous variables and Chi-squared test for categorial variables. Kaplan–Meier plots were utilized to generate death-censored graft survival and patient survival curve. The log-rank test offered statisticalcomparison. Cox proportional hazard analysis was utilized to calculate hazard ratio(HR) and 95% confidence interval (95% CI) of death-censored graft failure and mortality.This association was adjusted for recipient, donor, and transplant-related factors thatsignificantly differed between groups with p < 0.05. All p-values were two-tailed; p-valuesof < 0.05 were considered statistically significant. STATA version 14.1 (StataCorp, CollegeStation, TX, USA) was utilized for all statistical analyses.
3. Results
3.1. Clinical Characteristics between SCD vs. Non-SCD Recipients in Recent Era
The primary cohort was comprised of a total of 146,430 patients who received a firstkidney transplant from 2010 to 2019. There were 105 SCD and 146,325 non-SCD kidneytransplant recipients. Of the non-SCD recipients, 40,362 (27.6%) had DM, 33,979 (23.2%) hadglomerular disease, and 33,617 (23.0%) had hypertension as the reported cause of ESKD.
Table 1 compares baseline characteristics between SCD and non-SCD recipients. SCDrecipients were younger, more likely to be female, African American, have a lower BMI,and less DM. They were more likely to have a higher PRA, be on dialysis at the time oftransplant, and receive thymoglobulin as induction therapy. In addition, kidney donors forSCD recipients were younger, more African American, and more likely to have lower KDPI.
3.2. Post-Transplant Outcomes between SCD vs. Non-SCD Recipients in Recent Era
One-year death-censored graft survival in SCD was lower than in non-SCD recipients(94% vs. 98%; p = 0.02), whereas there was no significant difference in patient survivalbetween SCD and non-SCD recipients (96% vs. 97%; p = 0.36). In adjusted analysis, SCDrecipients were significantly associated with lower 1-year death-censored graft survival(HR 2.22; 95% CI 1.01–4.95). SCD recipients had lower 1-year patient survival than non-SCD recipients with HR of 2.24 although it did not reach statistical significance (p = 0.11)due to small number of deaths within 1 years after kidney transplant.
43
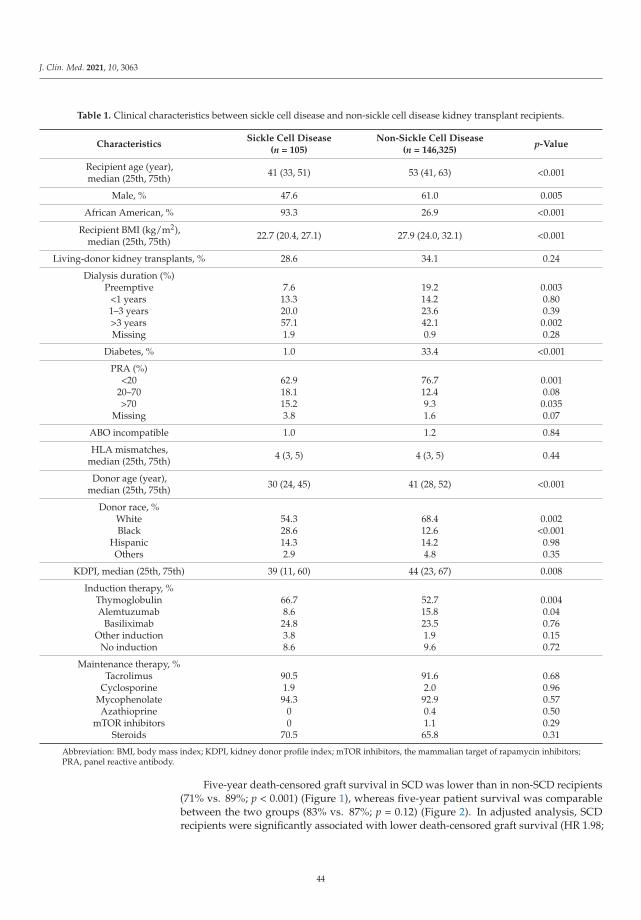
J. Clin. Med. 2021, 10, 3063
Table 1. Clinical characteristics between sickle cell disease and non-sickle cell disease kidney transplant recipients.
CharacteristicsSickle Cell Disease
(n = 105)Non-Sickle Cell Disease
(n = 146,325)p-Value
Recipient age (year),median (25th, 75th) 41 (33, 51) 53 (41, 63) <0.001
Male, % 47.6 61.0 0.005
African American, % 93.3 26.9 <0.001
Recipient BMI (kg/m2),median (25th, 75th)
22.7 (20.4, 27.1) 27.9 (24.0, 32.1) <0.001
Living-donor kidney transplants, % 28.6 34.1 0.24
Dialysis duration (%)Preemptive
<1 years1–3 years>3 yearsMissing
7.613.320.057.11.9
19.214.223.642.10.9
0.0030.800.390.0020.28
Diabetes, % 1.0 33.4 <0.001
PRA (%)<20
20–70>70
Missing
62.918.115.23.8
76.712.49.31.6
0.0010.080.0350.07
ABO incompatible 1.0 1.2 0.84
HLA mismatches,median (25th, 75th) 4 (3, 5) 4 (3, 5) 0.44
Donor age (year),median (25th, 75th) 30 (24, 45) 41 (28, 52) <0.001
Donor race, %WhiteBlack
HispanicOthers
54.328.614.32.9
68.412.614.24.8
0.002<0.001
0.980.35
KDPI, median (25th, 75th) 39 (11, 60) 44 (23, 67) 0.008
Induction therapy, %ThymoglobulinAlemtuzumab
BasiliximabOther induction
No induction
66.78.624.83.88.6
52.715.823.51.99.6
0.0040.040.760.150.72
Maintenance therapy, %Tacrolimus
CyclosporineMycophenolateAzathioprine
mTOR inhibitorsSteroids
90.51.994.3
00
70.5
91.62.092.90.41.165.8
0.680.960.570.500.290.31
Abbreviation: BMI, body mass index; KDPI, kidney donor profile index; mTOR inhibitors, the mammalian target of rapamycin inhibitors;PRA, panel reactive antibody.
Five-year death-censored graft survival in SCD was lower than in non-SCD recipients(71% vs. 89%; p < 0.001) (Figure 1), whereas five-year patient survival was comparablebetween the two groups (83% vs. 87%; p = 0.12) (Figure 2). In adjusted analysis, SCDrecipients were significantly associated with lower death-censored graft survival (HR 1.98;
44
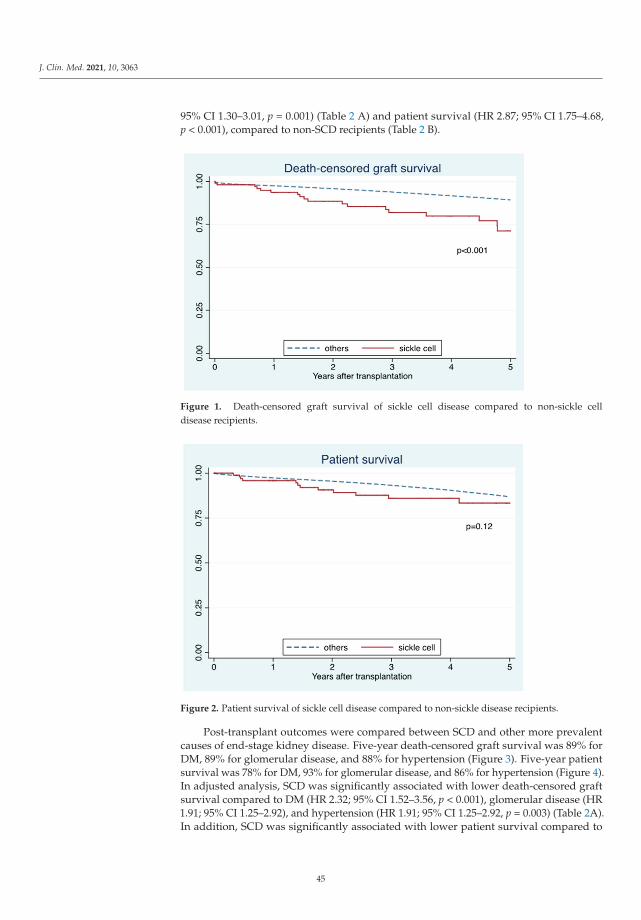
J. Clin. Med. 2021, 10, 3063
95% CI 1.30–3.01, p = 0.001) (Table 2 A) and patient survival (HR 2.87; 95% CI 1.75–4.68,p < 0.001), compared to non-SCD recipients (Table 2 B).
Figure 1. Death-censored graft survival of sickle cell disease compared to non-sickle celldisease recipients.
Figure 2. Patient survival of sickle cell disease compared to non-sickle disease recipients.
Post-transplant outcomes were compared between SCD and other more prevalentcauses of end-stage kidney disease. Five-year death-censored graft survival was 89% forDM, 89% for glomerular disease, and 88% for hypertension (Figure 3). Five-year patientsurvival was 78% for DM, 93% for glomerular disease, and 86% for hypertension (Figure 4).In adjusted analysis, SCD was significantly associated with lower death-censored graftsurvival compared to DM (HR 2.32; 95% CI 1.52–3.56, p < 0.001), glomerular disease (HR1.91; 95% CI 1.25–2.92), and hypertension (HR 1.91; 95% CI 1.25–2.92, p = 0.003) (Table 2A).In addition, SCD was significantly associated with lower patient survival compared to
45
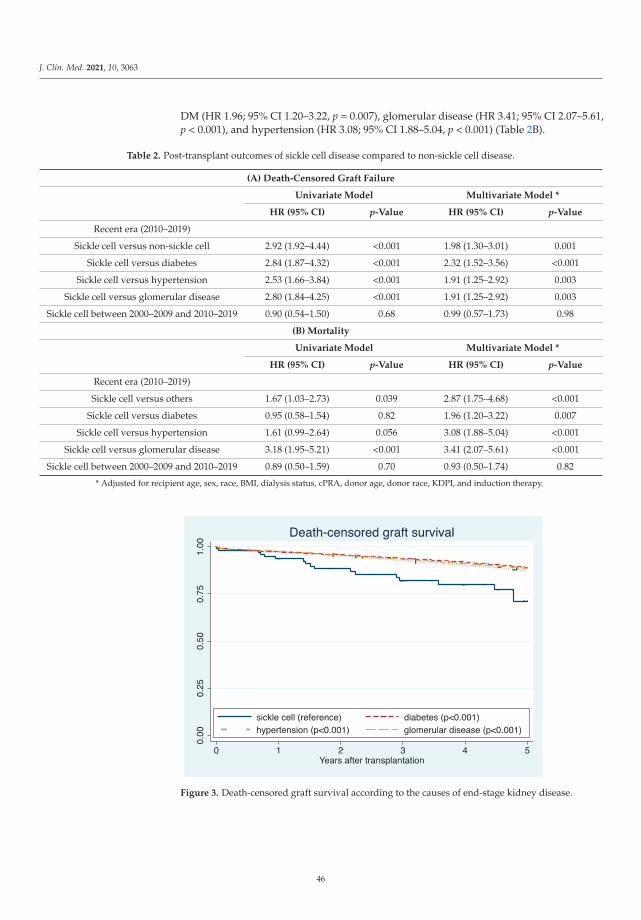
J. Clin. Med. 2021, 10, 3063
DM (HR 1.96; 95% CI 1.20–3.22, p = 0.007), glomerular disease (HR 3.41; 95% CI 2.07–5.61,p < 0.001), and hypertension (HR 3.08; 95% CI 1.88–5.04, p < 0.001) (Table 2B).
Table 2. Post-transplant outcomes of sickle cell disease compared to non-sickle cell disease.
(A) Death-Censored Graft Failure
Univariate Model Multivariate Model *
HR (95% CI) p-Value HR (95% CI) p-Value
Recent era (2010–2019)
Sickle cell versus non-sickle cell 2.92 (1.92–4.44) <0.001 1.98 (1.30–3.01) 0.001
Sickle cell versus diabetes 2.84 (1.87–4.32) <0.001 2.32 (1.52–3.56) <0.001
Sickle cell versus hypertension 2.53 (1.66–3.84) <0.001 1.91 (1.25–2.92) 0.003
Sickle cell versus glomerular disease 2.80 (1.84–4.25) <0.001 1.91 (1.25–2.92) 0.003
Sickle cell between 2000–2009 and 2010–2019 0.90 (0.54–1.50) 0.68 0.99 (0.57–1.73) 0.98
(B) Mortality
Univariate Model Multivariate Model *
HR (95% CI) p-Value HR (95% CI) p-Value
Recent era (2010–2019)
Sickle cell versus others 1.67 (1.03–2.73) 0.039 2.87 (1.75–4.68) <0.001
Sickle cell versus diabetes 0.95 (0.58–1.54) 0.82 1.96 (1.20–3.22) 0.007
Sickle cell versus hypertension 1.61 (0.99–2.64) 0.056 3.08 (1.88–5.04) <0.001
Sickle cell versus glomerular disease 3.18 (1.95–5.21) <0.001 3.41 (2.07–5.61) <0.001
Sickle cell between 2000–2009 and 2010–2019 0.89 (0.50–1.59) 0.70 0.93 (0.50–1.74) 0.82
* Adjusted for recipient age, sex, race, BMI, dialysis status, cPRA, donor age, donor race, KDPI, and induction therapy.
Figure 3. Death-censored graft survival according to the causes of end-stage kidney disease.
46
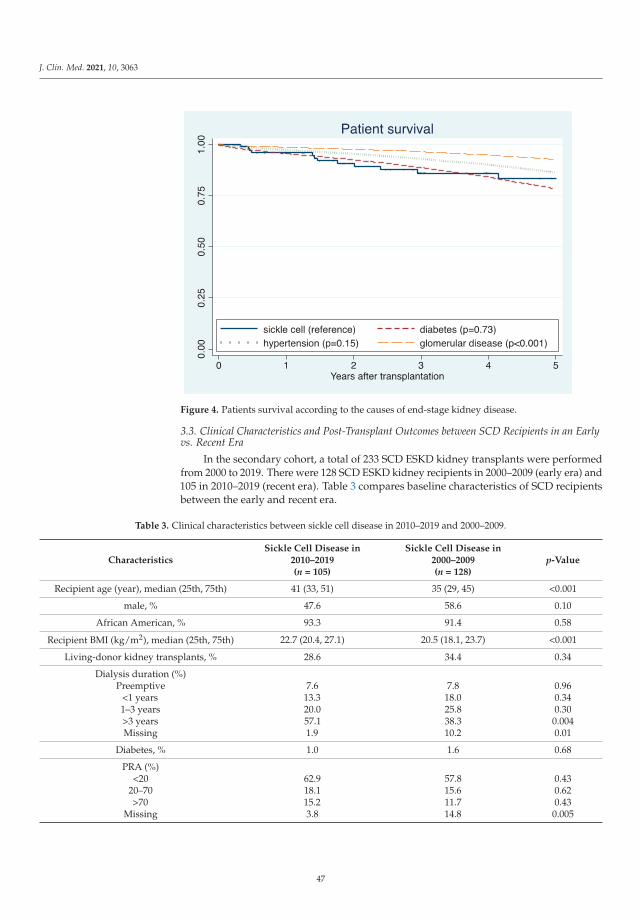
J. Clin. Med. 2021, 10, 3063
Figure 4. Patients survival according to the causes of end-stage kidney disease.
3.3. Clinical Characteristics and Post-Transplant Outcomes between SCD Recipients in an Earlyvs. Recent Era
In the secondary cohort, a total of 233 SCD ESKD kidney transplants were performedfrom 2000 to 2019. There were 128 SCD ESKD kidney recipients in 2000–2009 (early era) and105 in 2010–2019 (recent era). Table 3 compares baseline characteristics of SCD recipientsbetween the early and recent era.
Table 3. Clinical characteristics between sickle cell disease in 2010–2019 and 2000–2009.
CharacteristicsSickle Cell Disease in
2010–2019(n = 105)
Sickle Cell Disease in2000–2009(n = 128)
p-Value
Recipient age (year), median (25th, 75th) 41 (33, 51) 35 (29, 45) <0.001
male, % 47.6 58.6 0.10
African American, % 93.3 91.4 0.58
Recipient BMI (kg/m2), median (25th, 75th) 22.7 (20.4, 27.1) 20.5 (18.1, 23.7) <0.001
Living-donor kidney transplants, % 28.6 34.4 0.34
Dialysis duration (%)Preemptive
<1 years1–3 years>3 yearsMissing
7.613.320.057.11.9
7.818.025.838.310.2
0.960.340.30
0.0040.01
Diabetes, % 1.0 1.6 0.68
PRA (%)<20
20–70>70
Missing
62.918.115.23.8
57.815.611.714.8
0.430.620.43
0.005
47
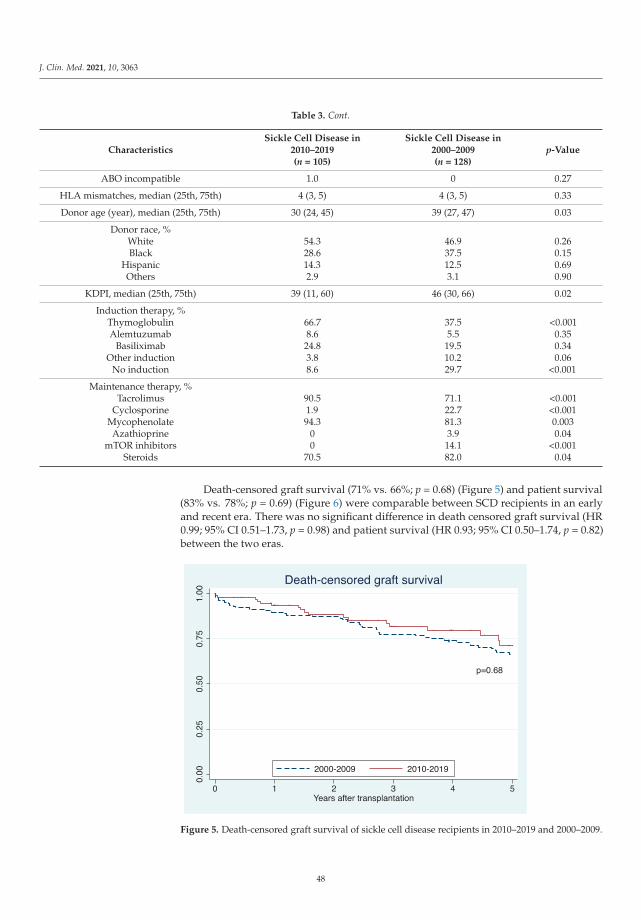
J. Clin. Med. 2021, 10, 3063
Table 3. Cont.
CharacteristicsSickle Cell Disease in
2010–2019(n = 105)
Sickle Cell Disease in2000–2009(n = 128)
p-Value
ABO incompatible 1.0 0 0.27
HLA mismatches, median (25th, 75th) 4 (3, 5) 4 (3, 5) 0.33
Donor age (year), median (25th, 75th) 30 (24, 45) 39 (27, 47) 0.03
Donor race, %WhiteBlack
HispanicOthers
54.328.614.32.9
46.937.512.53.1
0.260.150.690.90
KDPI, median (25th, 75th) 39 (11, 60) 46 (30, 66) 0.02
Induction therapy, %ThymoglobulinAlemtuzumab
BasiliximabOther induction
No induction
66.78.6
24.83.88.6
37.55.5
19.510.229.7
<0.0010.350.340.06
<0.001
Maintenance therapy, %Tacrolimus
CyclosporineMycophenolateAzathioprine
mTOR inhibitorsSteroids
90.51.994.3
00
70.5
71.122.781.33.914.182.0
<0.001<0.0010.0030.04
<0.0010.04
Death-censored graft survival (71% vs. 66%; p = 0.68) (Figure 5) and patient survival(83% vs. 78%; p = 0.69) (Figure 6) were comparable between SCD recipients in an earlyand recent era. There was no significant difference in death censored graft survival (HR0.99; 95% CI 0.51–1.73, p = 0.98) and patient survival (HR 0.93; 95% CI 0.50–1.74, p = 0.82)between the two eras.
Figure 5. Death-censored graft survival of sickle cell disease recipients in 2010–2019 and 2000–2009.
48
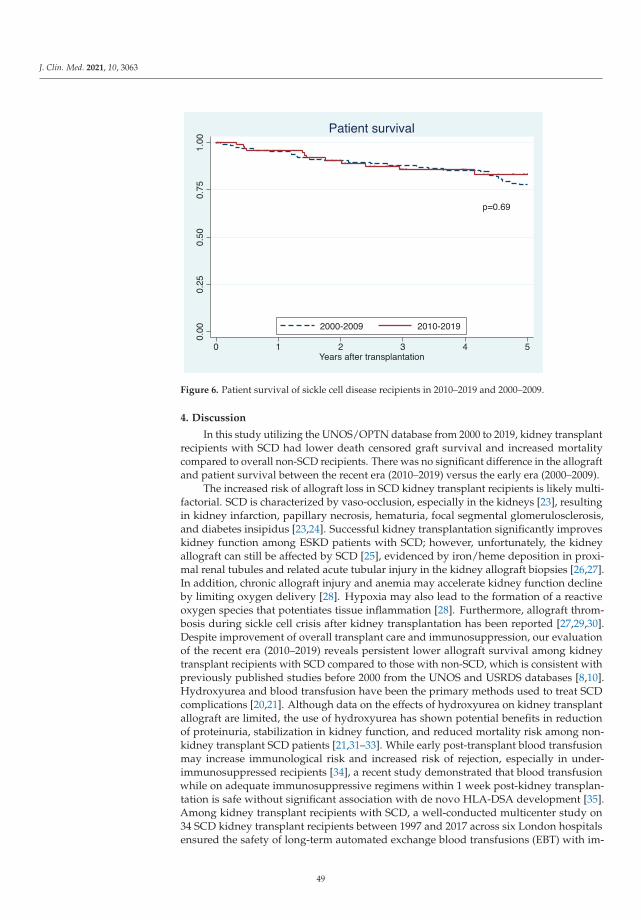
J. Clin. Med. 2021, 10, 3063
Figure 6. Patient survival of sickle cell disease recipients in 2010–2019 and 2000–2009.
4. Discussion
In this study utilizing the UNOS/OPTN database from 2000 to 2019, kidney transplantrecipients with SCD had lower death censored graft survival and increased mortalitycompared to overall non-SCD recipients. There was no significant difference in the allograftand patient survival between the recent era (2010–2019) versus the early era (2000–2009).
The increased risk of allograft loss in SCD kidney transplant recipients is likely multi-factorial. SCD is characterized by vaso-occlusion, especially in the kidneys [23], resultingin kidney infarction, papillary necrosis, hematuria, focal segmental glomerulosclerosis,and diabetes insipidus [23,24]. Successful kidney transplantation significantly improveskidney function among ESKD patients with SCD; however, unfortunately, the kidneyallograft can still be affected by SCD [25], evidenced by iron/heme deposition in proxi-mal renal tubules and related acute tubular injury in the kidney allograft biopsies [26,27].In addition, chronic allograft injury and anemia may accelerate kidney function declineby limiting oxygen delivery [28]. Hypoxia may also lead to the formation of a reactiveoxygen species that potentiates tissue inflammation [28]. Furthermore, allograft throm-bosis during sickle cell crisis after kidney transplantation has been reported [27,29,30].Despite improvement of overall transplant care and immunosuppression, our evaluationof the recent era (2010–2019) reveals persistent lower allograft survival among kidneytransplant recipients with SCD compared to those with non-SCD, which is consistent withpreviously published studies before 2000 from the UNOS and USRDS databases [8,10].Hydroxyurea and blood transfusion have been the primary methods used to treat SCDcomplications [20,21]. Although data on the effects of hydroxyurea on kidney transplantallograft are limited, the use of hydroxyurea has shown potential benefits in reductionof proteinuria, stabilization in kidney function, and reduced mortality risk among non-kidney transplant SCD patients [21,31–33]. While early post-transplant blood transfusionmay increase immunological risk and increased risk of rejection, especially in under-immunosuppressed recipients [34], a recent study demonstrated that blood transfusionwhile on adequate immunosuppressive regimens within 1 week post-kidney transplan-tation is safe without significant association with de novo HLA-DSA development [35].Among kidney transplant recipients with SCD, a well-conducted multicenter study on34 SCD kidney transplant recipients between 1997 and 2017 across six London hospitalsensured the safety of long-term automated exchange blood transfusions (EBT) with im-
49
J. Clin. Med. 2021, 10, 3063
provement in allograft and patient outcomes and no increase in antibody formation orallograft rejection [20]. However, data on the use of hydroxyurea and blood transfusion arelimited in the OPTN/UNOS database. Thus, future studies are needed to assess the impactof hydroxyurea, EBT, and perioperative management on outcomes of kidney transplantrecipients with SCD. Furthermore, there are now new medications recently made availablethat are expected to be of significant benefit among SCD patients [36–39], which requirefuture studies in kidney transplant recipients.
In our study of immunosuppression in the recent era, we also found a significantlyreduced patient survival among kidney transplant recipients with SCD compared to non-SCD recipients. This is similar to the higher mortality found in SCD kidney recipientsfrom published older era studies [8,10,13]. While a previous study utilizing the UNOSdatabase demonstrated improved patient survival among SCD recipients from 2000–2011compared with an earlier cohort of SCD recipients (1988–1999) [13], we did not find asignificant improvement in patient survival and death-censored graft survival of SCDrecipients in years 2010–2019 when compared to years 2000–2009. Furthermore, comparedto other causes of ESKD, including diabetes, glomerular disease, and hypertension, ouradjusted analysis showed that SCD was associated with the lower patient survival anddeath-censored graft survival. While patient survival in the prior era (2000–2011) wascomparable among SCD recipients and diabetic recipients [13], our study shows betterpatient survival among diabetic recipients compared with SCD recipients. Given that thereis no difference between patient survival among SCD in years 2010–2019 when compared toyears 2000–2009, this finding likely reflects a significant improvement in diabetes care postkidney transplantation for the past decade [40–42]. Kidney transplant recipients with SCDstill have complications of SCD post-transplant [20–22]. Since SCD is a systemic disease,it can result in extra-renal manifestations, such as pulmonary hypertension, thromboticevents, infections, cardiomyopathy and cirrhosis [43,44]. Unfortunately, the findings fromour study suggest a lack in similar improvement in SCD care post-transplantation whencompared to other causes of ESKD including diabetes. Future studies are required toidentify effective strategies to improve care for kidney transplant recipients with SCD suchas care in a multi-center system and long-term follow-up in tertiary care centers.
Kidney transplantation improves survival in patients with SCD after kidney trans-plant when compared to SCD patients on maintenance dialysis [9]. However, SCD patientshave lower rates of waitlisting and transplantation rate after listing despite survival benefitwith transplantation [9]. Thus, our study should not discourage kidney transplantation forESKD patients with SCD. Rather, our findings highlight the urgent need for strategies toimprove transplant outcomes among SCD kidney transplant recipients. Multidisciplinarysubspecialty coordination likely offers the most benefit for management of kidney trans-plant recipients with SCD. Furthermore, SCD patients are less likely to be waitlisted ortransplanted when compared to patients of similar age with other causes of ESKD [9]. Thisis potentially due to increased risk for graft loss and mortality after transplantation [8,10],or racial disparities in kidney transplantation [45,46], representing a potential “blind spot”regarding racial disparities in access and health outcomes [47]. Transplant centers aremonitored for outcomes and may be sanctioned if transplant outcomes do not meet ex-pected outcomes over a period of time. Expected outcomes are calculated based on patientpopulation and comorbidities, which include primary diagnosis at transplant. Risk isadjusted for recipients with diabetes mellitus, hypertension and glomerular disease [48];however, SCD is currently not considered for risk adjustment. Based on our data andprevious reports [9,10], SCD recipients experience increased an risk of graft failure andmortality compared to the control group. SCD patients benefit from kidney transplant,despite increased morbidity and mortality, thus, it is reasonable to assign risk adjustmentfor SCD patients. This will reduce the disincentive for transplant centers and increaseaccess to life-saving kidney transplantation in the SCD patient population [45,46].
Our study has some limitations. Firstly, information on non-renal SCD-related organinjuries/complications was not available to review in the OPTN/UNOS database, thus we
50
J. Clin. Med. 2021, 10, 3063
were unable to account for the effects of severity of SCD on transplant outcomes. Secondly,data on SCD genotype, comorbidity of SCD recipients, the frequency of vaso-occlusivecrises, blood transfusion, the development of de novo HLA-DSA and RBC alloantibodies,treatment regimen for SCD, causes of death or kidney allograft failure in SCD recipi-ents were unavailable. Consequently, despite adjusting for available confounders, wedetermined that patient survival was not significantly different between the recent era(2010–2019) and the early era (2000–2009), but we did not have information to understandthe reason for the lack of improvement in post-transplant outcomes in SCD recipients.With the above noted limitations on SCD severity data, we cannot conclude that there wasno difference in the advances of SCD kidney transplant recipients’ care. Physicians mayhave a lower threshold to offer kidney transplantation to SCD patients with more SCD-related organ involvements in the recent era, which could have affected patient outcomes.Future studies evaluating the effects of SCD severity and frequency of vaso-occlusivecrises on outcomes of kidney transplant recipients with SCD are required. Finally, thereare limited data on emerging treatments for SCD in the OPTN/UNOS database. Bonemarrow transplantation has recently emerged as a novel treatment for SCD [49], and thebeneficial effects of bone marrow transplantation in improving target organ damage havebeen reported [12,50,51]. Nevertheless, successful bone marrow transplant has only beenreported in a limited number of dialysis and kidney transplant patients with SCD [50,52,53].Additional studies are needed to assess its potential effects on clinical outcomes of SCDkidney transplant recipients [12]. In addition, while genetic approaches against SCD suchas CRISPR gene correction therapy are promising, investigation in this area is still in theearly stages [54].
5. Conclusions
In conclusion, patient and allograft survival in SCD kidney recipients were worsethan that of recipients with other diagnoses. Overall SCD patient and allograft outcomesin the recent era did not improve from the early era. The findings of our study shouldnot discourage kidney transplantation for ESKD patients with SCD due to the knownsurvival benefits of transplantation compared with remaining on dialysis. Future studiesare urgently needed to identify strategies to improve patient and allograft survival in SCDkidney recipients. In addition, it is reasonable to assign risk adjustment for SCD patients.
Author Contributions: Conceptualization, N.L., C.T., P.V., P.H., C.C.J., S.A.M., A.C., S.K., P.P., B.B.,W.K., M.A.M., M.C. and W.C.; data curation, N.L. and C.T.; formal analysis, N.L.; investigation, N.L.,C.T., P.H., P.P. and W.C.; methodology, N.L., C.T., C.C.J., S.A.M., P.P., B.B., M.A.M. and W.C.; projectadministration, S.K.; resources, N.L.; software, N.L.; supervision, P.V., S.A.M., W.K., M.A.M., M.C.and W.C.; validation, C.T. and W.C.; visualization, N.L.; writing—original draft, N.L., C.T. and W.C.;writing—review and editing, N.L., C.T., P.V., P.H., C.C.J., S.A.M., A.C., S.K., P.P., B.B., W.K., M.A.M.,M.C. and W.C. All authors have read and agreed to the published version of the manuscript.
Funding: This research received no external funding.
Institutional Review Board Statement: Ethical review and approval were waived for this study, dueto the use of publicly available de-identified data.
Informed Consent Statement: Patient consent was waived due to the minimal risk nature of obser-vational study design.
Data Availability Statement: Data is available upon reasonable request to corresponding author.
Acknowledgments: The interpretation and reporting of this data are the responsibility of the authorsand in no way should be seen as an official policy of or interpretation by the OPTN or the UnitedStates government.
Conflicts of Interest: The authors deny any conflict of interest.
51

J. Clin. Med. 2021, 10, 3063
References
1. Maigne, G.; Ferlicot, S.; Galacteros, F.; Belenfant, X.; Ulinski, T.; Niaudet, P.; Ronco, P.; Godeau, B.; Durrbach, A.; Sahali, S.; et al.Glomerular lesions in patients with sickle cell disease. Medicine 2010, 89, 18–27. [CrossRef]
2. Nath, K.A.; Hebbel, R.P. Sickle cell disease: Renal manifestations and mechanisms. Nat. Rev. Nephrol. 2015, 11, 161–171. [CrossRef]3. Warady, B.A.; Sullivan, E.K. Renal transplantation in children with sickle cell disease: A report of the North American Pediatric
Renal Transplant Cooperative Study (NAPRTCS). Pediatr. Transplant. 1998, 2, 130–133.4. Ataga, K.I.; Zhou, Q.; Derebail, V.K.; Saraf, S.L.; Hankins, J.S.; Loehr, L.R.; Garrett, M.E.; Ashley-Koch, A.E.; Cai, J.; Telen, M.J.
Rapid decline in estimated glomerular filtration rate in sickle cell anemia: Results of a multicenter pooled analysis. Haematologica2020. [CrossRef]
5. Gosmanova, E.O.; Zaidi, S.; Wan, J.Y.; Adams-Graves, P.E. Prevalence and progression of chronic kidney disease in adult patientswith sickle cell disease. J. Investig. Med. 2014, 62, 804–807. [CrossRef] [PubMed]
6. Powars, D.R.; Elliott-Mills, D.D.; Chan, L.; Niland, J.; Hiti, A.L.; Opas, L.M.; Johnson, C. Chronic renal failure in sickle cell disease:Risk factors, clinical course, and mortality. Ann. Intern. Med. 1991, 115, 614–620. [CrossRef] [PubMed]
7. Viner, M.; Zhou, J.; Allison, D.; Han, J.; Molokie, R.E.; Jain, S.; Gowhari, M.; Gordeuk, V.R.; Calip, G.; Saraf, S.L. The morbidityand mortality of end stage renal disease in sickle cell disease. Am. J. Hematol. 2019, 94, E138–E141. [CrossRef]
8. Ojo, A.O.; Govaerts, T.C.; Schmouder, R.L.; Leichtman, A.B.; Leavey, S.F.; Wolfe, R.A.; Held, P.J.; Port, F.K.; Agodoa, L.Y. Renaltransplantation in end-stage sickle cell nephropathy. Transplantation 1999, 67, 291–295. [CrossRef] [PubMed]
9. Bae, S.; Johnson, M.; Massie, A.B.; Luo, X.; Haywood, C., Jr.; Lanzkron, S.M.; Grams, M.E.; Segev, D.L.; Purnell, T.S. Mortality andaccess to kidney transplantation in patients with sickle cell disease-associated kidney failure. Clin. J. Am. Soc. Nephrol. 2021, 16,407–414. [CrossRef] [PubMed]
10. Bleyer, A.J.; Donaldson, L.A.; McIntosh, M.; Adams, P.L. Relationship between underlying renal disease and renal transplantationoutcome. Am. J. Kidney Dis. 2001, 37, 1152–1161. [CrossRef] [PubMed]
11. Abbott, K.C.; Hypolite, I.O.; Agodoa, L.Y. Sickle cell nephropathy at end-stage renal disease in the United States: Patientcharacteristics and survival. Clin. Nephrol. 2002, 58, 9–15. [CrossRef]
12. Okafor, U.H.; Aneke, E. Outcome and challenges of kidney transplant in patients with sickle cell disease. J. Transplant. 2013,2013, 614610. [CrossRef] [PubMed]
13. Huang, E.; Parke, C.; Mehrnia, A.; Kamgar, M.; Pham, P.T.; Danovitch, G.; Bunnapradist, S. Improved survival among sickle cellkidney transplant recipients in the recent era. Nephrol. Dial. Transplant. 2013, 28, 1039–1046. [CrossRef] [PubMed]
14. Wiseman, A.C. Induction therapy in renal transplantation: Why? What agent? What dose? We may never know. Clin. J. Am. Soc.Nephrol. 2015, 10, 923–925. [CrossRef] [PubMed]
15. Thongprayoon, C.; Hansrivijit, P.; Leeaphorn, N.; Acharya, P.; Torres-Ortiz, A.; Kaewput, W.; Kovvuru, K.; Kanduri, S.R.;Bathini, T.; Cheungpasitporn, W. Recent Advances and Clinical Outcomes of Kidney Transplantation. J. Clin. Med. 2020, 9, 1193.[CrossRef]
16. Cheungpasitporn, W.; Lentine, K.L.; Tan, J.C.; Kaufmann, M.; Caliskan, Y.; Bunnapradist, S.; Lam, N.N.; Schnitzler, M.; Axelrod,D.A. Immunosuppression Considerations for Older Kidney Transplant Recipients. Curr. Transplant. Rep. 2021, 8, 100–110.[CrossRef] [PubMed]
17. Lentine, K.L.; Cheungpasitporn, W.; Xiao, H.; McAdams-DeMarco, M.; Lam, N.N.; Segev, D.L.; Bae, S.; Ahn, J.B.; Hess, G.P.;Caliskan, Y.; et al. Immunosuppression Regimen Use and Outcomes in Older and Younger Adult Kidney Transplant Recipients:A National Registry Analysis. Transplantation 2020. [CrossRef]
18. Arend, S.M.; Mallat, M.J.; Westendorp, R.J.; van der Woude, F.J.; van Es, L.A. Patient survival after renal transplantation; morethan 25 years follow-up. Nephrol. Dial. Transplant. 1997, 12, 1672–1679. [CrossRef]
19. Meier-Kriesche, H.U.; Ojo, A.O.; Port, F.K.; Arndorfer, J.A.; Cibrik, D.M.; Kaplan, B. Survival improvement among patientswith end-stage renal disease: Trends over time for transplant recipients and wait-listed patients. J. Am. Soc. Nephrol. 2001, 12,1293–1296. [CrossRef]
20. Willis, J.C.; Awogbade, M.; Howard, J.; Breen, C.; Abbas, A.; Harber, M.; Shendi, A.M.; Andrews, P.A.; Galliford, J.; Thuraisingham,R.; et al. Outcomes following kidney transplantation in patients with sickle cell disease: The impact of automated exchange bloodtransfusion. PLoS ONE 2020, 15, e0236998. [CrossRef]
21. Sharpe, C.C.; Thein, S.L. How I treat renal complications in sickle cell disease. Blood 2014, 123, 3720–3726. [CrossRef]22. Freedman, B.I.; Moxey-Mims, M.M.; Alexander, A.A.; Astor, B.C.; Birdwell, K.A.; Bowden, D.W.; Bowen, G.; Bromberg, J.; Craven,
T.E.; Dadhania, D.M.; et al. APOL1 Long-term Kidney Transplantation Outcomes Network (APOLLO): Design and Rationale.Kidney Int. Rep. 2020, 5, 278–288. [CrossRef] [PubMed]
23. Pham, P.T.; Pham, P.C.; Wilkinson, A.H.; Lew, S.Q. Renal abnormalities in sickle cell disease. Kidney Int. 2000, 57, 1–8. [CrossRef]24. Scheinman, J.I. Sickle cell disease and the kidney. Nat. Clin. Pract. Nephrol. 2009, 5, 78–88. [CrossRef] [PubMed]25. Miner, D.J.; Jorkasky, D.K.; Perloff, L.J.; Grossman, R.A.; Tomaszewski, J.E. Recurrent sickle cell nephropathy in a transplanted
kidney. Am. J. Kidney Dis. 1987, 10, 306–313. [CrossRef]26. Wang, Y.; Doshi, M.; Khan, S.; Li, W.; Zhang, P.L. Utility of iron staining in identifying the cause of renal allograft dysfunction in
patients with sickle cell disease. Case Rep. Transplant. 2015, 2015, 528792. [CrossRef]27. O’Rourke, E.J.; Laing, C.M.; Khan, A.U.; Hussain, R.; Standish, R.A.; Buscombe, J.R.; Hilson, A.J.; Harber, M. The case. Allograft
dysfunction in a patient with sickle cell disease. Kidney Int. 2008, 74, 1219–1220. [CrossRef]
52
J. Clin. Med. 2021, 10, 3063
28. Nangaku, M. Chronic hypoxia and tubulointerstitial injury: A final common pathway to end-stage renal failure. J. Am. Soc.Nephrol. 2006, 17, 17–25. [CrossRef]
29. Fischer, G.B.; da Rosa, A.C. Thrombosis after kidney transplantation. Blood Coagul. Fibrinolysis 2009, 20, 456–457. [CrossRef]30. Kim, L.; Garfinkel, M.R.; Chang, A.; Kadambi, P.V.; Meehan, S.M. Intragraft vascular occlusive sickle crisis with early renal
allograft loss in occult sickle cell trait. Hum. Pathol. 2011, 42, 1027–1033. [CrossRef] [PubMed]31. Laurin, L.P.; Nachman, P.H.; Desai, P.C.; Ataga, K.I.; Derebail, V.K. Hydroxyurea is associated with lower prevalence of
albuminuria in adults with sickle cell disease. Nephrol. Dial. Transplant. 2014, 29, 1211–1218. [CrossRef]32. Alvarez, O.; Miller, S.T.; Wang, W.C.; Luo, Z.; McCarville, M.B.; Schwartz, G.J.; Thompson, B.; Howard, T.; Iyer, R.V.; Rana, S.R.;
et al. Effect of hydroxyurea treatment on renal function parameters: Results from the multi-center placebo-controlled BABY HUGclinical trial for infants with sickle cell anemia. Pediatr. Blood Cancer 2012, 59, 668–674. [CrossRef]
33. Steinberg, M.H.; Barton, F.; Castro, O.; Pegelow, C.H.; Ballas, S.K.; Kutlar, A.; Orringer, E.; Bellevue, R.; Olivieri, N.;Eckman, J.; et al. Effect of hydroxyurea on mortality and morbidity in adult sickle cell anemia: Risks and benefits up to 9 years oftreatment. JAMA 2003, 289, 1645–1651. [CrossRef]
34. Ferrandiz, I.; Congy-Jolivet, N.; Del Bello, A.; Debiol, B.; Trébern-Launay, K.; Esposito, L.; Milongo, D.; Dörr, G.; Rostaing, L.;Kamar, N. Impact of early blood transfusion after kidney transplantation on the incidence of donor-specific Anti-HLA antibodies.Am. J. Transplant. 2016, 16, 2661–2669. [CrossRef]
35. Jalalonmuhali, M.; Carroll, R.P.; Tsiopelas, E.; Clayton, P.; Coates, P.T. Development of de novo HLA donor specific antibodies(HLA-DSA), HLA antibodies (HLA-Ab) and allograft rejection post blood transfusion in kidney transplant recipients. Hum.Immunol. 2020, 81, 323–329. [CrossRef]
36. Vichinsky, E.; Hoppe, C.C.; Ataga, K.I.; Ware, R.E.; Nduba, V.; El-Beshlawy, A.; Hassab, H.; Achebe, M.M.; Alkindi, S.; Brown,R.C.; et al. A phase 3 randomized trial of voxelotor in sickle cell disease. N. Engl. J. Med. 2019, 381, 509–519. [CrossRef]
37. Niihara, Y.; Miller, S.T.; Kanter, J.; Lanzkron, S.; Smith, W.R.; Hsu, L.L.; Gordeuk, V.R.; Viswanathan, K.; Sarnaik, S.; Osunkwo, I.;et al. A phase 3 trial of l-glutamine in sickle cell disease. N. Engl. J. Med. 2018, 379, 226–235. [CrossRef] [PubMed]
38. Han, J.; Saraf, S.L.; Gordeuk, V.R. Systematic review of crizanlizumab: A new parenteral option to reduce vaso-occlusive paincrises in patients with sickle cell disease. Pharmacotherapy 2020, 40, 535–543. [CrossRef] [PubMed]
39. Han, J.; Saraf, S.L.; Gordeuk, V.R. Systematic review of voxelotor: A first-in-class sickle hemoglobin polymerization inhibitor formanagement of sickle cell disease. Pharmacotherapy 2020, 40, 525–534. [CrossRef] [PubMed]
40. Chowdhury, T.A.; Wahba, M.; Mallik, R.; Peracha, J.; Patel, D.; De, P.; Fogarty, D.; Frankel, A.; Karalliedde, J.; Mark, P.B.; et al.Association of British Clinical Diabetologists and Renal Association guidelines on the detection and management of diabetes postsolid organ transplantation. Diabet. Med. 2021, e14523. [CrossRef]
41. Sharif, A.; Hecking, M.; de Vries, A.P.; Porrini, E.; Hornum, M.; Rasoul-Rockenschaub, S.; Berlakovich, G.; Krebs, M.; Kautzky-Willer, A.; Schernthaner, G.; et al. Proceedings from an international consensus meeting on posttransplantation diabetes mellitus:Recommendations and future directions. Am. J. Transplant. 2014, 14, 1992–2000. [CrossRef]
42. 2. Classification and Diagnosis of Diabetes: Standards of Medical Care in Diabetes-2021. Diabetes Care 2021, 44 (Suppl. 1), S15–S33.[CrossRef]
43. Darbari, D.S.; Kple-Faget, P.; Kwagyan, J.; Rana, S.; Gordeuk, V.R.; Castro, O. Circumstances of death in adult sickle cell diseasepatients. Am. J. Hematol. 2006, 81, 858–863. [CrossRef]
44. Manci, E.A.; Culberson, D.E.; Yang, Y.M.; Gardner, T.M.; Powell, R.; Haynes, J., Jr.; Shah, A.K.; Mankad, V.N. Causes of death insickle cell disease: An autopsy study. Br. J. Haematol. 2003, 123, 359–365. [CrossRef]
45. Ku, E.; McCulloch, C.E.; Adey, D.B.; Li, L.; Johansen, K.L. Racial disparities in eligibility for preemptive waitlisting for kidneytransplantation and modification of eGFR thresholds to equalize waitlist time. J. Am. Soc. Nephrol. 2021, 32, 677–685. [CrossRef]
46. Fox, M. Barriers to kidney transplantation in racial/ethnic minorities. Clin. J. Am. Soc. Nephrol. 2021, 16, 177–178. [CrossRef]47. Wang, J.Y.; Lederer, S.E.; Ross, L.F. African-Americans with end stage renal disease in the early years of kidney transplantation. J.
Natl. Med. Assoc. 2019, 111, 352–362. [CrossRef]48. Weinhandl, E.; Snyder, J.; Israni, A.; Kasiske, B. Effect of comorbidity adjustment on CMS criteria for kidney transplant center
performance. Am. J. Transplant. 2009, 9, 506–516. [CrossRef]49. Saraf, S.L.; Ghimire, K.; Patel, P.; Sweiss, K.; Gowhari, M.; Molokie, R.E.; Gordeuk, V.R.; Rondelli, D. Improved health care
utilization and costs in transplanted versus non-transplanted adults with sickle cell disease. PLoS ONE 2020, 15, e0229710.[CrossRef]
50. Knüppel, E.; Medinger, M.; Stehle, G.; Infanti, L.; Halter, J.; Burkhalter, F.; Mujagic, E.; Heim, D.; Passweg, J. Haploidenticalhematopoietic bone marrow transplantation followed by living kidney transplantation from the same donor in a sickle celldisease patient with end-stage renal failure. Ann. Hematol. 2017, 96, 703–705. [CrossRef]
51. Bunin, N.; Guzikowski, V.; Rand, E.R.; Goldfarb, S.; Baluarte, J.; Meyers, K.; Olthoff, K.M. Solid organ transplants followinghematopoietic stem cell transplant in children. Pediatr. Transplant. 2010, 14, 1030–1035. [CrossRef]
52. Horwitz, M.E.; Spasojevic, I.; Morris, A.; Telen, M.; Essell, J.; Gasparetto, C.; Sullivan, K.; Long, G.; Chute, J.; Chao, N.; et al.Fludarabine-based nonmyeloablative stem cell transplantation for sickle cell disease with and without renal failure: Clinicaloutcome and pharmacokinetics. Biol. Blood Marrow Transplant. 2007, 13, 1422–1426. [CrossRef] [PubMed]
53
J. Clin. Med. 2021, 10, 3063
53. van Besien, K.; Bartholomew, A.; Stock, W.; Peace, D.; Devine, S.; Sher, D.; Sosman, J.; Chen, Y.H.; Koshy, M.; Hoffman, R.Fludarabine-based conditioning for allogeneic transplantation in adults with sickle cell disease. Bone Marrow Transplant. 2000, 26,445–449. [CrossRef] [PubMed]
54. Abbasi, J. Promising strategies for sickle cell disease and β-Thalassemia. JAMA 2021, 325, 121. [PubMed]
54
Journal of
Clinical Medicine
Article
The Tacrolimus Metabolism Rate and Dyslipidemia afterKidney Transplantation
Gerold Thölking 1,2,*, Christian Schulte 1, Ulrich Jehn 2, Katharina Schütte-Nütgen 2, Hermann Pavenstädt 2,
Barbara Suwelack 2 and Stefan Reuter 2
Citation: Thölking, G.; Schulte, C.;
Jehn, U.; Schütte-Nütgen, K.;
Pavenstädt, H.; Suwelack, B.; Reuter,
S. The Tacrolimus Metabolism Rate
and Dyslipidemia after Kidney
Transplantation. J. Clin. Med. 2021, 10,
3066. https://doi.org/10.3390/
jcm10143066
Academic Editors:
Charat Thongprayoon,
Wisit Cheungpasitporn and
Wisit Kaewput
Received: 1 June 2021
Accepted: 7 July 2021
Published: 11 July 2021
Publisher’s Note: MDPI stays neutral
with regard to jurisdictional claims in
published maps and institutional affil-
iations.
Copyright: © 2021 by the authors.
Licensee MDPI, Basel, Switzerland.
This article is an open access article
distributed under the terms and
conditions of the Creative Commons
Attribution (CC BY) license (https://
creativecommons.org/licenses/by/
4.0/).
1 Department of Internal Medicine and Nephrology, University Hospital of Münster Marienhospital Steinfurt,48565 Steinfurt, Germany; [email protected]
2 Department of Medicine D, Division of General Internal Medicine, Nephrology and Rheumatology,University Hospital of Münster, 48149 Münster, Germany; [email protected] (U.J.);[email protected] (K.S.-N.); [email protected] (H.P.);[email protected] (B.S.); [email protected] (S.R.)
* Correspondence: [email protected]; Tel.: +49-2552-791226; Fax: +49-2552-791181
Abstract: Fast tacrolimus (Tac) metabolism is associated with reduced survival rates after renaltransplantation (RTx), mainly due to cardiovascular events. Because dyslipidemia is a leading causeof cardiovascular death, we hypothesized that most RTx patients do not achieve recommendedtarget low-density lipoprotein cholesterol (LDL-C) levels (European cardiology society guidelines)and that fast Tac metabolizers have higher dyslipidemia rates. This study included RTx recipientswho received initial immunosuppression with immediate-release tacrolimus (IR-Tac), mycopheno-late, and prednisolone. Patients were grouped according to their Tac concentration-to-dose ratio(C/D ratio) 3 months after RTx. Dyslipidemia parameters were analyzed at RTx, 3 months, and12 months after RTx. Statin use and renal function were documented in a 12-month follow-up,and death was documented in a 60-month follow-up. Ninety-six RTx recipients were divided intotwo groups: 31 fast Tac metabolizers (C/D ratio < 1.05 ng/mL·1/mg) and 65 slow metabolizers(C/D ratio ≥ 1.05 ng/mL·1/mg). There were no differences in triglyceride or cholesterol levelsbetween groups at RTx, 3, and 12 months after RTx. A total of 93.5% of fast and 95.4% of slowmetabolizers did not achieve target LDL-C levels (p = 0.657). Fast metabolizers developed lower renalfunction compared to slow metabolizers 12 months after RTx (p = 0.009). Fast metabolizers showeda 60 month survival rate of 96.8% compared to 94.7% in the slow metabolizer group (p = 0.811).As most RTx recipients do not reach recommended target LDL-C levels, individualized nutritionalcounseling and lipid-lowering therapy must be intensified. Fast Tac metabolism is associated withlower renal function after RTx, but does not play a significant role in dyslipidemia.
Keywords: kidney transplantation; tacrolimus; metabolism; C/D ratio; cholesterol; dyslipidemia;LDL-C
1. Introduction
Renal transplantation (RTx) is the preferred renal replacement procedure compared todialysis [1]. Nevertheless, many RTx recipients are considered high-risk patients for cardio-vascular (CV) events [2]. Firstly, most RTx recipients do not reach estimated glomerularfiltration rates (eGFRs) compared with healthy controls, which is important because theeGFR has an inverse relationship with cardiovascular disease [3,4]. Secondly, immunosup-pression with corticosteroids or calcineurin inhibitors (CNIs) is often associated with thedevelopment of dyslipidemia. Thirdly, CV risk associated with cholesterol levels tendedto be higher in transplant recipients than in the Framingham Heart Study populationin [5]. Recently, the European Society of Cardiology (ESC) published target low-densitylipoprotein cholesterol (LDL-C) levels for different CV risk groups [2]. Individuals at mod-erate CV risk are recommended to achieve LDL-C levels < 100 mg/dL, high-risk patients
J. Clin. Med. 2021, 10, 3066. https://doi.org/10.3390/jcm10143066 https://www.mdpi.com/journal/jcm55
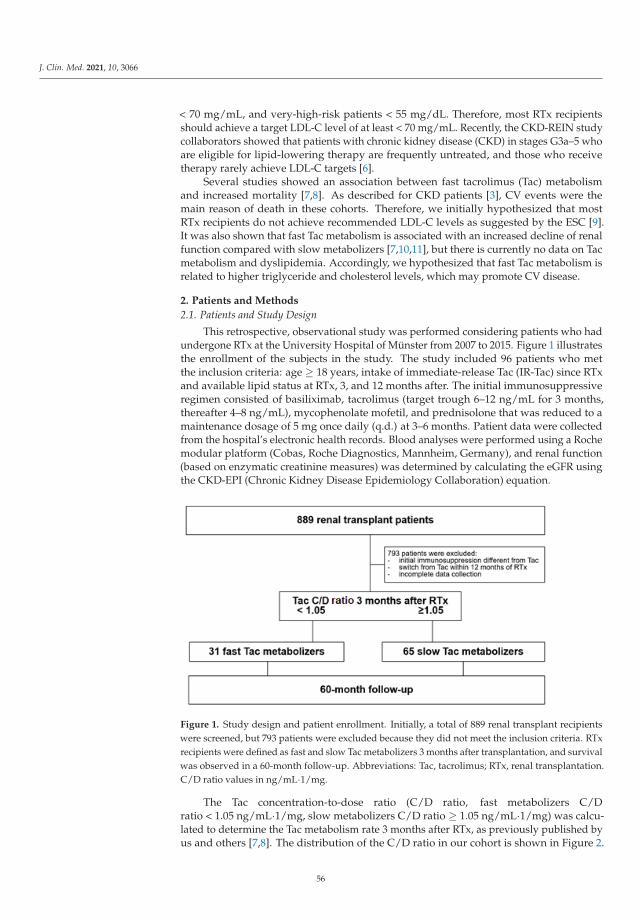
J. Clin. Med. 2021, 10, 3066
< 70 mg/mL, and very-high-risk patients < 55 mg/dL. Therefore, most RTx recipientsshould achieve a target LDL-C level of at least < 70 mg/mL. Recently, the CKD-REIN studycollaborators showed that patients with chronic kidney disease (CKD) in stages G3a–5 whoare eligible for lipid-lowering therapy are frequently untreated, and those who receivetherapy rarely achieve LDL-C targets [6].
Several studies showed an association between fast tacrolimus (Tac) metabolismand increased mortality [7,8]. As described for CKD patients [3], CV events were themain reason of death in these cohorts. Therefore, we initially hypothesized that mostRTx recipients do not achieve recommended LDL-C levels as suggested by the ESC [9].It was also shown that fast Tac metabolism is associated with an increased decline of renalfunction compared with slow metabolizers [7,10,11], but there is currently no data on Tacmetabolism and dyslipidemia. Accordingly, we hypothesized that fast Tac metabolism isrelated to higher triglyceride and cholesterol levels, which may promote CV disease.
2. Patients and Methods
2.1. Patients and Study Design
This retrospective, observational study was performed considering patients who hadundergone RTx at the University Hospital of Münster from 2007 to 2015. Figure 1 illustratesthe enrollment of the subjects in the study. The study included 96 patients who metthe inclusion criteria: age ≥ 18 years, intake of immediate-release Tac (IR-Tac) since RTxand available lipid status at RTx, 3, and 12 months after. The initial immunosuppressiveregimen consisted of basiliximab, tacrolimus (target trough 6–12 ng/mL for 3 months,thereafter 4–8 ng/mL), mycophenolate mofetil, and prednisolone that was reduced to amaintenance dosage of 5 mg once daily (q.d.) at 3–6 months. Patient data were collectedfrom the hospital’s electronic health records. Blood analyses were performed using a Rochemodular platform (Cobas, Roche Diagnostics, Mannheim, Germany), and renal function(based on enzymatic creatinine measures) was determined by calculating the eGFR usingthe CKD-EPI (Chronic Kidney Disease Epidemiology Collaboration) equation.
Figure 1. Study design and patient enrollment. Initially, a total of 889 renal transplant recipientswere screened, but 793 patients were excluded because they did not meet the inclusion criteria. RTxrecipients were defined as fast and slow Tac metabolizers 3 months after transplantation, and survivalwas observed in a 60-month follow-up. Abbreviations: Tac, tacrolimus; RTx, renal transplantation.C/D ratio values in ng/mL·1/mg.
The Tac concentration-to-dose ratio (C/D ratio, fast metabolizers C/Dratio < 1.05 ng/mL·1/mg, slow metabolizers C/D ratio ≥ 1.05 ng/mL·1/mg) was calcu-lated to determine the Tac metabolism rate 3 months after RTx, as previously published byus and others [7,8]. The distribution of the C/D ratio in our cohort is shown in Figure 2.
56
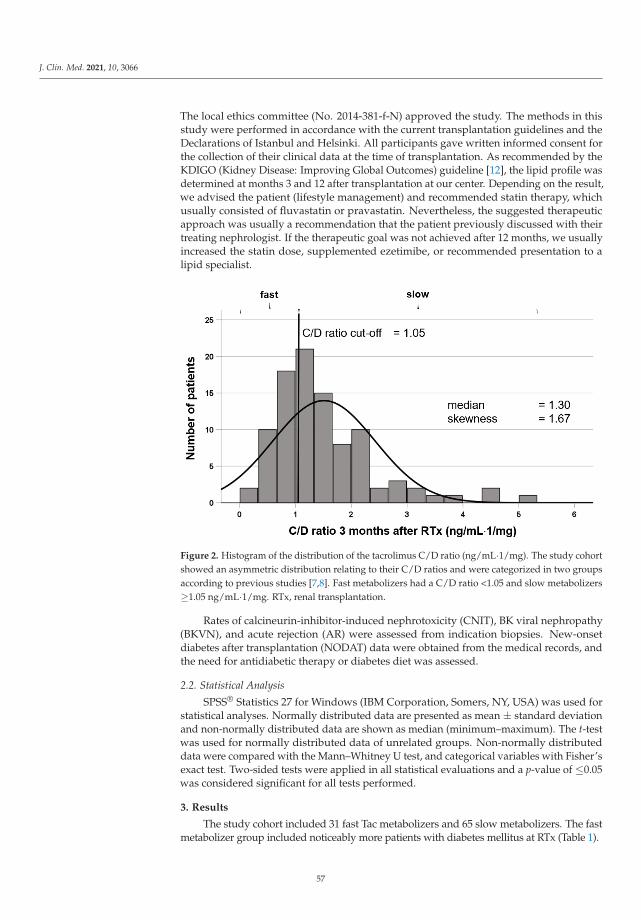
J. Clin. Med. 2021, 10, 3066
The local ethics committee (No. 2014-381-f-N) approved the study. The methods in thisstudy were performed in accordance with the current transplantation guidelines and theDeclarations of Istanbul and Helsinki. All participants gave written informed consent forthe collection of their clinical data at the time of transplantation. As recommended by theKDIGO (Kidney Disease: Improving Global Outcomes) guideline [12], the lipid profile wasdetermined at months 3 and 12 after transplantation at our center. Depending on the result,we advised the patient (lifestyle management) and recommended statin therapy, whichusually consisted of fluvastatin or pravastatin. Nevertheless, the suggested therapeuticapproach was usually a recommendation that the patient previously discussed with theirtreating nephrologist. If the therapeutic goal was not achieved after 12 months, we usuallyincreased the statin dose, supplemented ezetimibe, or recommended presentation to alipid specialist.
Figure 2. Histogram of the distribution of the tacrolimus C/D ratio (ng/mL·1/mg). The study cohortshowed an asymmetric distribution relating to their C/D ratios and were categorized in two groupsaccording to previous studies [7,8]. Fast metabolizers had a C/D ratio <1.05 and slow metabolizers≥1.05 ng/mL·1/mg. RTx, renal transplantation.
Rates of calcineurin-inhibitor-induced nephrotoxicity (CNIT), BK viral nephropathy(BKVN), and acute rejection (AR) were assessed from indication biopsies. New-onsetdiabetes after transplantation (NODAT) data were obtained from the medical records, andthe need for antidiabetic therapy or diabetes diet was assessed.
2.2. Statistical Analysis
SPSS® Statistics 27 for Windows (IBM Corporation, Somers, NY, USA) was used forstatistical analyses. Normally distributed data are presented as mean ± standard deviationand non-normally distributed data are shown as median (minimum–maximum). The t-testwas used for normally distributed data of unrelated groups. Non-normally distributeddata were compared with the Mann–Whitney U test, and categorical variables with Fisher’sexact test. Two-sided tests were applied in all statistical evaluations and a p-value of ≤0.05was considered significant for all tests performed.
3. Results
The study cohort included 31 fast Tac metabolizers and 65 slow metabolizers. The fastmetabolizer group included noticeably more patients with diabetes mellitus at RTx (Table 1).
57
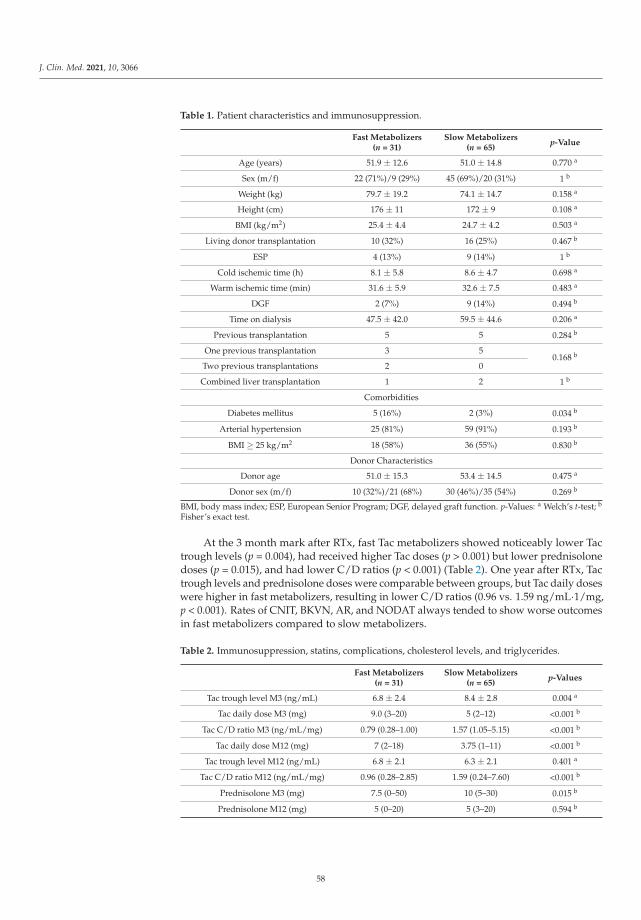
J. Clin. Med. 2021, 10, 3066
Table 1. Patient characteristics and immunosuppression.
Fast Metabolizers(n = 31)
Slow Metabolizers(n = 65)
p-Value
Age (years) 51.9 ± 12.6 51.0 ± 14.8 0.770 a
Sex (m/f) 22 (71%)/9 (29%) 45 (69%)/20 (31%) 1 b
Weight (kg) 79.7 ± 19.2 74.1 ± 14.7 0.158 a
Height (cm) 176 ± 11 172 ± 9 0.108 a
BMI (kg/m2) 25.4 ± 4.4 24.7 ± 4.2 0.503 a
Living donor transplantation 10 (32%) 16 (25%) 0.467 b
ESP 4 (13%) 9 (14%) 1 b
Cold ischemic time (h) 8.1 ± 5.8 8.6 ± 4.7 0.698 a
Warm ischemic time (min) 31.6 ± 5.9 32.6 ± 7.5 0.483 a
DGF 2 (7%) 9 (14%) 0.494 b
Time on dialysis 47.5 ± 42.0 59.5 ± 44.6 0.206 a
Previous transplantation 5 5 0.284 b
One previous transplantation 3 50.168 b
Two previous transplantations 2 0
Combined liver transplantation 1 2 1 b
Comorbidities
Diabetes mellitus 5 (16%) 2 (3%) 0.034 b
Arterial hypertension 25 (81%) 59 (91%) 0.193 b
BMI ≥ 25 kg/m2 18 (58%) 36 (55%) 0.830 b
Donor Characteristics
Donor age 51.0 ± 15.3 53.4 ± 14.5 0.475 a
Donor sex (m/f) 10 (32%)/21 (68%) 30 (46%)/35 (54%) 0.269 b
BMI, body mass index; ESP, European Senior Program; DGF, delayed graft function. p-Values: a Welch’s t-test; b
Fisher’s exact test.
At the 3 month mark after RTx, fast Tac metabolizers showed noticeably lower Tactrough levels (p = 0.004), had received higher Tac doses (p > 0.001) but lower prednisolonedoses (p = 0.015), and had lower C/D ratios (p < 0.001) (Table 2). One year after RTx, Tactrough levels and prednisolone doses were comparable between groups, but Tac daily doseswere higher in fast metabolizers, resulting in lower C/D ratios (0.96 vs. 1.59 ng/mL·1/mg,p < 0.001). Rates of CNIT, BKVN, AR, and NODAT always tended to show worse outcomesin fast metabolizers compared to slow metabolizers.
Table 2. Immunosuppression, statins, complications, cholesterol levels, and triglycerides.
Fast Metabolizers(n = 31)
Slow Metabolizers(n = 65)
p-Values
Tac trough level M3 (ng/mL) 6.8 ± 2.4 8.4 ± 2.8 0.004 a
Tac daily dose M3 (mg) 9.0 (3–20) 5 (2–12) <0.001 b
Tac C/D ratio M3 (ng/mL/mg) 0.79 (0.28–1.00) 1.57 (1.05–5.15) <0.001 b
Tac daily dose M12 (mg) 7 (2–18) 3.75 (1–11) <0.001 b
Tac trough level M12 (ng/mL) 6.8 ± 2.1 6.3 ± 2.1 0.401 a
Tac C/D ratio M12 (ng/mL/mg) 0.96 (0.28–2.85) 1.59 (0.24–7.60) <0.001 b
Prednisolone M3 (mg) 7.5 (0–50) 10 (5–30) 0.015 b
Prednisolone M12 (mg) 5 (0–20) 5 (3–20) 0.594 b
58
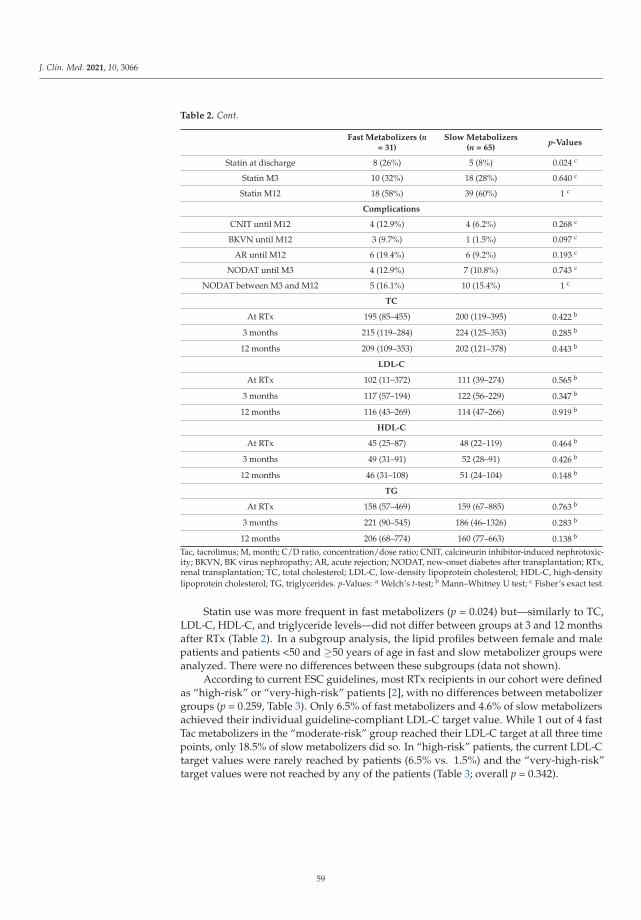
J. Clin. Med. 2021, 10, 3066
Table 2. Cont.
Fast Metabolizers (n= 31)
Slow Metabolizers(n = 65)
p-Values
Statin at discharge 8 (26%) 5 (8%) 0.024 c
Statin M3 10 (32%) 18 (28%) 0.640 c
Statin M12 18 (58%) 39 (60%) 1 c
Complications
CNIT until M12 4 (12.9%) 4 (6.2%) 0.268 c
BKVN until M12 3 (9.7%) 1 (1.5%) 0.097 c
AR until M12 6 (19.4%) 6 (9.2%) 0.193 c
NODAT until M3 4 (12.9%) 7 (10.8%) 0.743 c
NODAT between M3 and M12 5 (16.1%) 10 (15.4%) 1 c
TC
At RTx 195 (85–455) 200 (119–395) 0.422 b
3 months 215 (119–284) 224 (125–353) 0.285 b
12 months 209 (109–353) 202 (121–378) 0.443 b
LDL-C
At RTx 102 (11–372) 111 (39–274) 0.565 b
3 months 117 (57–194) 122 (56–229) 0.347 b
12 months 116 (43–269) 114 (47–266) 0.919 b
HDL-C
At RTx 45 (25–87) 48 (22–119) 0.464 b
3 months 49 (31–91) 52 (28–91) 0.426 b
12 months 46 (31–108) 51 (24–104) 0.148 b
TG
At RTx 158 (57–469) 159 (67–885) 0.763 b
3 months 221 (90–545) 186 (46–1326) 0.283 b
12 months 206 (68–774) 160 (77–663) 0.138 b
Tac, tacrolimus; M, month; C/D ratio, concentration/dose ratio; CNIT, calcineurin inhibitor-induced nephrotoxic-ity; BKVN, BK virus nephropathy; AR, acute rejection; NODAT, new-onset diabetes after transplantation; RTx,renal transplantation; TC, total cholesterol; LDL-C, low-density lipoprotein cholesterol; HDL-C, high-densitylipoprotein cholesterol; TG, triglycerides. p-Values: a Welch’s t-test; b Mann–Whitney U test; c Fisher’s exact test.
Statin use was more frequent in fast metabolizers (p = 0.024) but—similarly to TC,LDL-C, HDL-C, and triglyceride levels—did not differ between groups at 3 and 12 monthsafter RTx (Table 2). In a subgroup analysis, the lipid profiles between female and malepatients and patients <50 and ≥50 years of age in fast and slow metabolizer groups wereanalyzed. There were no differences between these subgroups (data not shown).
According to current ESC guidelines, most RTx recipients in our cohort were definedas “high-risk” or “very-high-risk” patients [2], with no differences between metabolizergroups (p = 0.259, Table 3). Only 6.5% of fast metabolizers and 4.6% of slow metabolizersachieved their individual guideline-compliant LDL-C target value. While 1 out of 4 fastTac metabolizers in the “moderate-risk” group reached their LDL-C target at all three timepoints, only 18.5% of slow metabolizers did so. In “high-risk” patients, the current LDL-Ctarget values were rarely reached by patients (6.5% vs. 1.5%) and the “very-high-risk”target values were not reached by any of the patients (Table 3; overall p = 0.342).
59
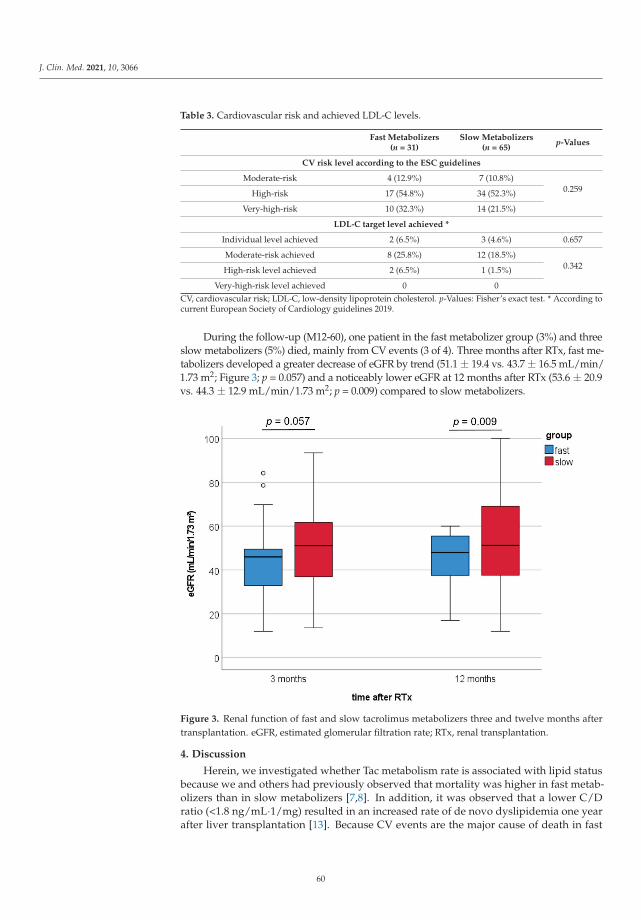
J. Clin. Med. 2021, 10, 3066
Table 3. Cardiovascular risk and achieved LDL-C levels.
Fast Metabolizers(n = 31)
Slow Metabolizers(n = 65)
p-Values
CV risk level according to the ESC guidelines
Moderate-risk 4 (12.9%) 7 (10.8%)0.259High-risk 17 (54.8%) 34 (52.3%)
Very-high-risk 10 (32.3%) 14 (21.5%)
LDL-C target level achieved *
Individual level achieved 2 (6.5%) 3 (4.6%) 0.657
Moderate-risk achieved 8 (25.8%) 12 (18.5%)0.342High-risk level achieved 2 (6.5%) 1 (1.5%)
Very-high-risk level achieved 0 0CV, cardiovascular risk; LDL-C, low-density lipoprotein cholesterol. p-Values: Fisher’s exact test. * According tocurrent European Society of Cardiology guidelines 2019.
During the follow-up (M12-60), one patient in the fast metabolizer group (3%) and threeslow metabolizers (5%) died, mainly from CV events (3 of 4). Three months after RTx, fast me-tabolizers developed a greater decrease of eGFR by trend (51.1 ± 19.4 vs. 43.7 ± 16.5 mL/min/1.73 m2; Figure 3; p = 0.057) and a noticeably lower eGFR at 12 months after RTx (53.6 ± 20.9vs. 44.3 ± 12.9 mL/min/1.73 m2; p = 0.009) compared to slow metabolizers.
Figure 3. Renal function of fast and slow tacrolimus metabolizers three and twelve months aftertransplantation. eGFR, estimated glomerular filtration rate; RTx, renal transplantation.
4. Discussion
Herein, we investigated whether Tac metabolism rate is associated with lipid statusbecause we and others had previously observed that mortality was higher in fast metab-olizers than in slow metabolizers [7,8]. In addition, it was observed that a lower C/Dratio (<1.8 ng/mL·1/mg) resulted in an increased rate of de novo dyslipidemia one yearafter liver transplantation [13]. Because CV events are the major cause of death in fast
60
J. Clin. Med. 2021, 10, 3066
metabolizers and dyslipidemia is clearly associated with mortality in a severity-dependentmanner, we conducted the present study [2,14].
The Tac metabolism rate is associated with renal function after transplantation [15].One year after RTx, fast metabolizers showed lower eGFR values than slow metabolizers.This is in line with recent studies and potentially related to increased rejection rates, BKvirus nephropathy, and CNI nephrotoxicity [7,10,16–18]. Rates of CNIT, BKVN, and ARalways displayed worse outcomes in fast metabolizers as was previously shown in largercohorts, but the differences did not reach significance in our study cohort, most likelybecause of small patient numbers [10,17,19]. Renal function after RTx is strongly associatedwith patient and graft survival [20]. For example, patients with lower eGFR show higherblood pressure values and poorer blood pressure control despite the increased number ofantihypertensive medications [21]. However, in this study cohort, the diagnosis of arterialhypertension did not differ between groups. This could be related to the fact that a verylarge number of patients (>80%) in both groups required blood pressure treatment, whichis not unusual because hypertension is common in RTx patients [22].
Interestingly, the rate of diabetes before transplantation was higher in the fast metabo-lizer group, while the rate of NODAT at three and twelve months after RTx only tended tobe higher in the fast metabolizer group (Table 2). This could be important because diabetesinfluences dyslipidemia [2]. However, diabetic metabolism and dyslipidemia are not al-ways revealed because LDL-C levels may be within the normal range. More typical resultsare elevated TGs or low HDL-C. Similar findings for dyslipidemia are described in relationto renal function, which was lower in fast metabolizers in our cohort [2]. Interestingly, threeand twelve months after RTx, higher TG levels were found more often in fast than in slowmetabolizers, whereas the other lipid parameters were relatively similar between groups.Consistent with data from other cohorts of CKD patients who did not achieve target LDL-Clevels [6], most RTx recipients in our study also did not achieve their individual goals setby current or previous ESC guidelines [2,23].
CNIs and steroids are known to impact lipid metabolism [24]. However, cyclosporineA appears to be less effective than Tac, as it has been shown that switching from cy-closporine A to Tac can improve dyslipidemia [25–27]. The reduction in serum LDL-C afterswitching to Tac may be (partly) caused by removing the inhibitory effect of cyclosporin Aon LDL-C receptor production. Interestingly, LDL-C reduction was found only in patientswho were not treated with statins [25]. Furthermore, lowering Tac trough levels from 9.5 to6.4 ng/mL (a Tac level range comparable to that of our patients) did not significantly lowerTC, LDL-C, or TG levels in renal transplant recipients, in contrast to steroid withdrawal,which resulted in a slight improvement in lipids [28]. Others found no correlation betweenTac trough level, exposure, or Tac dosage and the lipid parameters [29,30]. Unfortunately,we cannot comment on the influence of Tac AUC values in this regard, but we and othershave previously shown that Tac AUC is comparable in fast and slow metabolizers [16,31].The choice of the 3 month time point for the calculation of the C/D ratio was a compromise.We already know from previous analyses that the calculation of the C/D ratio at veryearly time points (postoperative day 1–10) is not able to predict the metabolism type atall [32]. However, we found acceptable correlations between the 3 month time point andthe calculation at 1 month or 6 months [7]. Jouve et al. analyzed the C/D ratio at 3, 6,and 12 months using the same cut-off (1.05 ng/mL·1/mg) and observed no statistically orclinically significant intrapatient evolution of the C/D ratio over time [8]. Rostaing et al.observed that from the third month after transplantation, the C/D ratio was relativelyconstant over time [33]. The choice of the C/D ratio cut off level can be very relevant [34].In our first study on the C/D ratio, we assessed the outcomes of three different C/D ratiogroups (<1.05, ≥1.05 and <1.54, and ≥1.55 ng/mL·1/mg). Since kidney transplant recipi-ents with a C/D ratio between 1.05 and 1.54 ng/mL·1/mg showed comparable results topatients with a CD ratio ≥1.55 ng/mL·1/mg, we chose to combine both groups in lateranalyses. However, others chose different C/D ratio cut-off values, which may lead todifferent definitions and outcomes [18,35].
61
J. Clin. Med. 2021, 10, 3066
Consistent with the literature on Tac and lipid metabolism, in the present study weexcluded relevant effects of Tac metabolic type on lipid metabolism within 12 months after RTx.
The strengths of the current study included the complete data set of each patientand the use of real-world data that better reflected the reality of treatment. Limitationsof this study included (i) the retrospective nature of the study, (ii) the small number ofpatients, (iii) the lack of adherence data, (iv) the low achievement of therapeutic lipidtargets based on current guidelines, and (v) the lack of clear differentiation between effectsof renal function, Tac, or co-medication on lipids. However, a prospective multicenter studyfocusing on the C/D ratio would be desirable to prospectively validate the hypothesesobtained from retrospective studies.
In conclusion, although dyslipidemia after RTx is common (at least at our center),treatment according to current guidelines is suboptimal and individualized nutritionalcounseling and lipid-lowering therapy must be intensified. The Tac metabolism typedoes not seem to be a crucial parameter regarding dyslipidemia after RTx. This study isintended to raise awareness of lipid management under real-life conditions and to call for(re-)evaluation of the procedure for individual centers.
Author Contributions: Conceptualization, G.T. and S.R.; data curation, C.S.; formal analysis, C.S.,U.J., K.S.-N., and G.T.; methodology, G.T. and S.R.; resources, H.P. and B.S.; supervision, G.T.;writing—original draft, G.T. and S.R.; writing—review and editing, K.S.-N., H.P., and B.S. All authorshave read and agreed to the published version of the manuscript.
Funding: The APC was funded by the Open Access Fund of the University of Münster.
Institutional Review Board Statement: The study was conducted according to the guidelines of theDeclaration of Helsinki, and approved by the Institutional Ethics Committee (Ethik Kommissionder Ärztekammer Westfalen-Lippe und der Medizinischen Fakultät der Westfälischen Wilhelms-Universität, No. 2014-390-f-N).
Informed Consent Statement: Informed consent was obtained from all subjects involved in thestudy.
Conflicts of Interest: The authors declare no conflict of interest. The funders had no role in the designof this study; in the collection, analysis, or interpretation of data; in the writing of the manuscript; orin the decision to publish the results.
References
1. Wolfe, R.A.; Ashby, V.B.; Milford, E.L.; Ojo, A.O.; Ettenger, R.E.; Agodoa, L.Y.; Held, P.J.; Port, F.K. Comparison of mortality in allpatients on dialysis, patients on dialysis awaiting transplantation, and recipients of a first cadaveric transplant. N. Engl. J. Med.1999, 341, 1725–1730. [CrossRef] [PubMed]
2. Task Force Members; ESC Committee for Practice Guidelines (CPG); ESC National Cardiac Societies. 2019 ESC/EAS guidelinesfor the management of dyslipidaemias: Lipid modification to reduce cardiovascular risk. Atherosclerosis 2019, 290, 140–205.[CrossRef] [PubMed]
3. Go, A.S.; Chertow, G.M.; Fan, D.; McCulloch, C.E.; Hsu, C.Y. Chronic kidney disease and the risks of death, cardiovascular events,and hospitalization. N. Engl. J. Med. 2004, 351, 1296–1305. [CrossRef] [PubMed]
4. Chronic Kidney Disease Prognosis Consortium; Matsushita, K.; van der Velde, M.; Astor, B.C.; Woodward, M.; Levey, A.S.; deJong, P.E.; Coresh, J.; Gansevoort, R.T. Association of estimated glomerular filtration rate and albuminuria with all-cause andcardiovascular mortality in general population cohorts: A collaborative meta-analysis. Lancet 2010, 375, 2073–2081. [CrossRef]
5. Kasiske, B.L.; Chakkera, H.A.; Roel, J. Explained and unexplained ischemic heart disease risk after renal transplantation. J. Am.Soc. Nephrol. 2000, 11, 1735–1743. [CrossRef]
6. Massy, Z.A.; Ferrieres, J.; Bruckert, E.; Lange, C.; Liabeuf, S.; Velkovski-Rouyer, M.; Stengel, B.; Collaborators, C.-R. Achievementof Low-Density Lipoprotein Cholesterol Targets in CKD. Kidney Int. Rep. 2019, 4, 1546–1554. [CrossRef]
7. Schutte-Nutgen, K.; Tholking, G.; Steinke, J.; Pavenstadt, H.; Schmidt, R.; Suwelack, B.; Reuter, S. Fast Tac Metabolizers at Risk—Itis Time for a C/D Ratio Calculation. J. Clin. Med. 2019, 8, 587. [CrossRef]
8. Jouve, T.; Fonrose, X.; Noble, J.; Janbon, B.; Fiard, G.; Malvezzi, P.; Stanke-Labesque, F.; Rostaing, L. The TOMATO study(TacrOlimus MetabolizAtion in kidney TransplantatiOn): Impact of the concentration-dose ratio on death-censored graft survival.Transplantation 2019. [CrossRef]
62
J. Clin. Med. 2021, 10, 3066
9. Mach, F.; Baigent, C.; Catapano, A.L.; Koskinas, K.C.; Casula, M.; Badimon, L.; Chapman, M.J.; De Backer, G.G.; Delgado, V.;Ference, B.A.; et al. 2019 ESC/EAS Guidelines for the management of dyslipidaemias: Lipid modification to reduce cardiovascularrisk. Eur. Heart J. 2020, 41, 111–188. [CrossRef]
10. Tholking, G.; Fortmann, C.; Koch, R.; Gerth, H.U.; Pabst, D.; Pavenstadt, H.; Kabar, I.; Husing, A.; Wolters, H.; Reuter, S.; et al.The tacrolimus metabolism rate influences renal function after kidney transplantation. PLoS ONE 2014, 9, e111128. [CrossRef]
11. Thongprayoon, C.; Hansrivijit, P.; Kovvuru, K.; Kanduri, S.R.; Bathini, T.; Pivovarova, A.; Smith, J.R.; Cheungpasitporn, W.Impacts of High Intra- and Inter-Individual Variability in Tacrolimus Pharmacokinetics and Fast Tacrolimus Metabolism onOutcomes of Solid Organ Transplant Recipients. J. Clin. Med. 2020, 9, 2193. [CrossRef]
12. Kasiske, B.; Zeier, M.; Craig, J.; Ekberg, H.; Garvey, C.; Green, M.; Abariga, S. Kidney Disease: Improving Global OutcomesTransplant Work Group. KDIGO clinical practice guideline for the care of kidney transplant recipients. Am. J. Transplant. 2009, 9(Suppl. 3), S1–S155. [CrossRef]
13. Bardou, F.N.; Guillaud, O.; Erard-Poinsot, D.; Chambon-Augoyard, C.; Thimonier, E.; Vallin, M.; Boillot, O.; Dumortier, J.Tacrolimus exposure after liver transplantation for alcohol-related liver disease: Impact on complications. Transpl. Immunol. 2019,56, 101227. [CrossRef] [PubMed]
14. Matas, A.J.; Gillingham, K.J.; Humar, A.; Kandaswamy, R.; Sutherland, D.E.; Payne, W.D.; Dunn, T.B.; Najarian, J.S. 2202 kidneytransplant recipients with 10 years of graft function: What happens next? Am. J. Transplant. 2008, 8, 2410–2419. [CrossRef]
15. Schutte-Nutgen, K.; Tholking, G.; Suwelack, B.; Reuter, S. Tacrolimus—Pharmacokinetic Considerations for Clinicians. Curr.Drug Metab. 2018, 19, 342–350. [CrossRef] [PubMed]
16. Tholking, G.; Schutte-Nutgen, K.; Schmitz, J.; Rovas, A.; Dahmen, M.; Bautz, J.; Jehn, U.; Pavenstadt, H.; Heitplatz, B.; VanMarck, V.; et al. A Low Tacrolimus Concentration/Dose Ratio Increases the Risk for the Development of Acute CalcineurinInhibitor-Induced Nephrotoxicity. J. Clin. Med. 2019, 8, 1586. [CrossRef] [PubMed]
17. Tholking, G.; Schmidt, C.; Koch, R.; Schuette-Nuetgen, K.; Pabst, D.; Wolters, H.; Kabar, I.; Husing, A.; Pavenstadt, H.; Reuter, S.;et al. Influence of tacrolimus metabolism rate on BKV infection after kidney transplantation. Sci. Rep. 2016, 6, 32273. [CrossRef]
18. Nowicka, M.; Gorska, M.; Nowicka, Z.; Edyko, K.; Edyko, P.; Wislicki, S.; Zawiasa-Bryszewska, A.; Strzelczyk, J.; Matych, J.;Kurnatowska, I. Tacrolimus: Influence of the Posttransplant Concentration/Dose Ratio on Kidney Graft Function in a Two-YearFollow-Up. Kidney Blood Press Res. 2019, 44, 1075–1088. [CrossRef]
19. Egeland, E.J.; Robertsen, I.; Hermann, M.; Midtvedt, K.; Storset, E.; Gustavsen, M.T.; Reisaeter, A.V.; Klaasen, R.; Bergan, S.;Holdaas, H.; et al. High Tacrolimus Clearance Is a Risk Factor for Acute Rejection in the Early Phase After Renal Transplantation.Transplantation 2017, 101, e273–e279. [CrossRef]
20. Schnitzler, M.A.; Johnston, K.; Axelrod, D.; Gheorghian, A.; Lentine, K.L. Associations of renal function at 1-year after kidneytransplantation with subsequent return to dialysis, mortality, and healthcare costs. Transplantation 2011, 91, 1347–1356. [CrossRef]
21. Jehn, U.; Schutte-Nutgen, K.; Strauss, M.; Kunert, J.; Pavenstadt, H.; Tholking, G.; Suwelack, B.; Reuter, S. AntihypertensiveTreatment in Kidney Transplant Recipients-A Current Single Center Experience. J. Clin. Med. 2020, 9, 3969. [CrossRef]
22. Weir, M.R.; Burgess, E.D.; Cooper, J.E.; Fenves, A.Z.; Goldsmith, D.; McKay, D.; Mehrotra, A.; Mitsnefes, M.M.; Sica, D.A.; Taler,S.J. Assessment and management of hypertension in transplant patients. J. Am. Soc. Nephrol. 2015, 26, 1248–1260. [CrossRef][PubMed]
23. Reiner, Z.; Catapano, A.L.; De Backer, G.; Graham, I.; Taskinen, M.R.; Wiklund, O.; Agewall, S.; Alegria, E.; Chapman, M.J.;Durrington, P.; et al. ESC/EAS Guidelines for the management of dyslipidaemias: The Task Force for the management ofdyslipidaemias of the European Society of Cardiology (ESC) and the European Atherosclerosis Society (EAS). Eur. Heart J. 2011,32, 1769–1818. [CrossRef]
24. Marchetti, P.; Navalesi, R. The metabolic effects of cyclosporin and tacrolimus. J. Endocrinol. Investig. 2000, 23, 482–490. [CrossRef]25. Artz, M.A.; Boots, J.M.; Ligtenberg, G.; Roodnat, J.I.; Christiaans, M.H.; Vos, P.F.; Blom, H.J.; Sweep, F.C.; Demacker, P.N.;
Hilbrands, L.B. Improved cardiovascular risk profile and renal function in renal transplant patients after randomized conversionfrom cyclosporine to tacrolimus. J. Am. Soc. Nephrol. 2003, 14, 1880–1888. [CrossRef] [PubMed]
26. McCune, T.R.; Thacker, L.R., II; Peters, T.G.; Mulloy, L.; Rohr, M.S.; Adams, P.A.; Yium, J.; Light, J.A.; Pruett, T.; Gaber, A.O.; et al.Effects of tacrolimus on hyperlipidemia after successful renal transplantation: A Southeastern Organ Procurement Foundationmulticenter clinical study. Transplantation 1998, 65, 87–92. [CrossRef]
27. Claes, K.; Meier-Kriesche, H.U.; Schold, J.D.; Vanrenterghem, Y.; Halloran, P.F.; Ekberg, H. Effect of different immunosuppressiveregimens on the evolution of distinct metabolic parameters: Evidence from the Symphony study. Nephrol. Dial. Transplant. 2012,27, 850–857. [CrossRef]
28. Boots, J.M.; van Duijnhoven, E.M.; Christiaans, M.H.; Wolffenbuttel, B.H.; van Hooff, J.P. Glucose metabolism in renal transplantrecipients on tacrolimus: The effect of steroid withdrawal and tacrolimus trough level reduction. J. Am. Soc. Nephrol. 2002, 13,221–227. [CrossRef] [PubMed]
29. Ciftci, H.S.; Ayna, T.K.; Caliskan, Y.K.; Turkmen, A.; Gurtekin, M. Lipid parameters, doses and blood levels of calcineurininhibitors in renal transplant patients. Indian J. Clin. Biochem. 2013, 28, 164–168. [CrossRef]
30. Kuypers, D.R.; Claes, K.; Evenepoel, P.; Maes, B.; Vanrenterghem, Y. Clinical efficacy and toxicity profile of tacrolimus andmycophenolic acid in relation to combined long-term pharmacokinetics in de novo renal allograft recipients. Clin. Pharmacol.Ther. 2004, 75, 434–447. [CrossRef]
63
J. Clin. Med. 2021, 10, 3066
31. Kuypers, D.R.; Naesens, M.; de Jonge, H.; Lerut, E.; Verbeke, K.; Vanrenterghem, Y. Tacrolimus dose requirements and CYP3A5genotype and the development of calcineurin inhibitor-associated nephrotoxicity in renal allograft recipients. Ther. Drug Monit.2010, 32, 394–404. [CrossRef]
32. Bartmann, I.; Schutte-Nutgen, K.; Suwelack, B.; Reuter, S. Early postoperative calculation of the tacrolimus concentration-to-doseratio does not predict outcomes after kidney transplantation. Transpl. Int. 2020, 33, 689–691. [CrossRef] [PubMed]
33. Rostaing, L.; Bunnapradist, S.; Grinyo, J.M.; Ciechanowski, K.; Denny, J.E.; Silva, H.T., Jr.; Budde, K.; Envarsus Study, G. NovelOnce-Daily Extended-Release Tacrolimus Versus Twice-Daily Tacrolimus in De Novo Kidney Transplant Recipients: Two-YearResults of Phase 3, Double-Blind, Randomized Trial. Am. J. Kidney Dis. 2016, 67, 648–659. [CrossRef] [PubMed]
34. Tholking, G.; Reuter, S. Alternative Viewpoint on Tacrolimus Concentration-to-Dose Ratios in Kidney Transplant Recipients andRelationship to Clinical Outcomes. Pharmacotherapy 2019, 39, 1036–1037. [CrossRef]
35. Bartlett, F.E.; Carthon, C.E.; Hagopian, J.C.; Horwedel, T.A.; January, S.E.; Malone, A. Tacrolimus Concentration-to-Dose Ratios inKidney Transplant Recipients and Relationship to Clinical Outcomes. Pharmacotherapy 2019, 39, 827–836. [CrossRef] [PubMed]
64
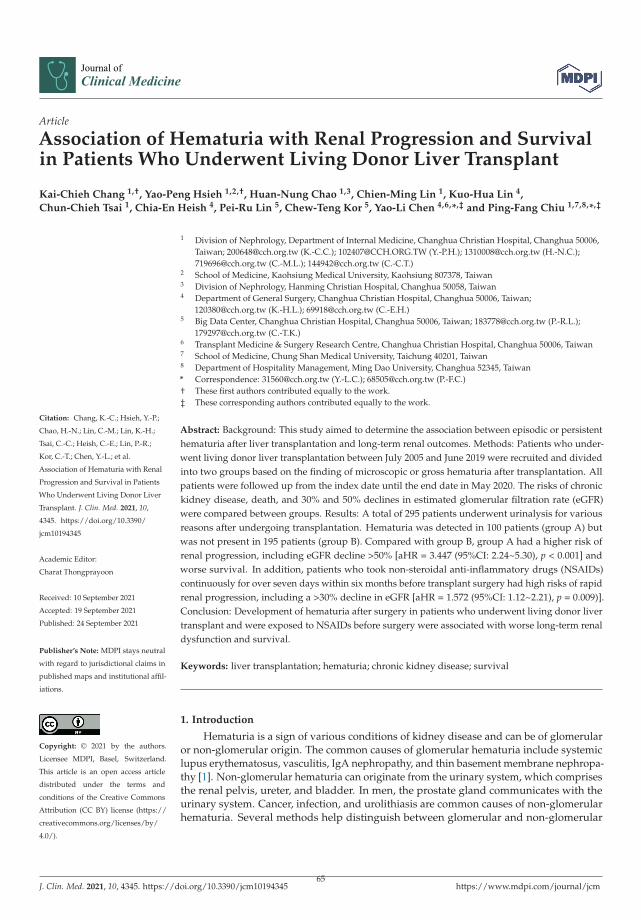
Journal of
Clinical Medicine
Article
Association of Hematuria with Renal Progression and Survivalin Patients Who Underwent Living Donor Liver Transplant
Kai-Chieh Chang 1,†, Yao-Peng Hsieh 1,2,†, Huan-Nung Chao 1,3, Chien-Ming Lin 1, Kuo-Hua Lin 4,
Chun-Chieh Tsai 1, Chia-En Heish 4, Pei-Ru Lin 5, Chew-Teng Kor 5, Yao-Li Chen 4,6,*,‡ and Ping-Fang Chiu 1,7,8,*,‡
Citation: Chang, K.-C.; Hsieh, Y.-P.;
Chao, H.-N.; Lin, C.-M.; Lin, K.-H.;
Tsai, C.-C.; Heish, C.-E.; Lin, P.-R.;
Kor, C.-T.; Chen, Y.-L.; et al.
Association of Hematuria with Renal
Progression and Survival in Patients
Who Underwent Living Donor Liver
Transplant. J. Clin. Med. 2021, 10,
4345. https://doi.org/10.3390/
jcm10194345
Academic Editor:
Charat Thongprayoon
Received: 10 September 2021
Accepted: 19 September 2021
Published: 24 September 2021
Publisher’s Note: MDPI stays neutral
with regard to jurisdictional claims in
published maps and institutional affil-
iations.
Copyright: © 2021 by the authors.
Licensee MDPI, Basel, Switzerland.
This article is an open access article
distributed under the terms and
conditions of the Creative Commons
Attribution (CC BY) license (https://
creativecommons.org/licenses/by/
4.0/).
1 Division of Nephrology, Department of Internal Medicine, Changhua Christian Hospital, Changhua 50006,Taiwan; [email protected] (K.-C.C.); [email protected] (Y.-P.H.); [email protected] (H.-N.C.);[email protected] (C.-M.L.); [email protected] (C.-C.T.)
2 School of Medicine, Kaohsiung Medical University, Kaohsiung 807378, Taiwan3 Division of Nephrology, Hanming Christian Hospital, Changhua 50058, Taiwan4 Department of General Surgery, Changhua Christian Hospital, Changhua 50006, Taiwan;
[email protected] (K.-H.L.); [email protected] (C.-E.H.)5 Big Data Center, Changhua Christian Hospital, Changhua 50006, Taiwan; [email protected] (P.-R.L.);
[email protected] (C.-T.K.)6 Transplant Medicine & Surgery Research Centre, Changhua Christian Hospital, Changhua 50006, Taiwan7 School of Medicine, Chung Shan Medical University, Taichung 40201, Taiwan8 Department of Hospitality Management, Ming Dao University, Changhua 52345, Taiwan* Correspondence: [email protected] (Y.-L.C.); [email protected] (P.-F.C.)† These first authors contributed equally to the work.‡ These corresponding authors contributed equally to the work.
Abstract: Background: This study aimed to determine the association between episodic or persistenthematuria after liver transplantation and long-term renal outcomes. Methods: Patients who under-went living donor liver transplantation between July 2005 and June 2019 were recruited and dividedinto two groups based on the finding of microscopic or gross hematuria after transplantation. Allpatients were followed up from the index date until the end date in May 2020. The risks of chronickidney disease, death, and 30% and 50% declines in estimated glomerular filtration rate (eGFR)were compared between groups. Results: A total of 295 patients underwent urinalysis for variousreasons after undergoing transplantation. Hematuria was detected in 100 patients (group A) butwas not present in 195 patients (group B). Compared with group B, group A had a higher risk ofrenal progression, including eGFR decline >50% [aHR = 3.447 (95%CI: 2.24~5.30), p < 0.001] andworse survival. In addition, patients who took non-steroidal anti-inflammatory drugs (NSAIDs)continuously for over seven days within six months before transplant surgery had high risks of rapidrenal progression, including a >30% decline in eGFR [aHR = 1.572 (95%CI: 1.12~2.21), p = 0.009)].Conclusion: Development of hematuria after surgery in patients who underwent living donor livertransplant and were exposed to NSAIDs before surgery were associated with worse long-term renaldysfunction and survival.
Keywords: liver transplantation; hematuria; chronic kidney disease; survival
1. Introduction
Hematuria is a sign of various conditions of kidney disease and can be of glomerularor non-glomerular origin. The common causes of glomerular hematuria include systemiclupus erythematosus, vasculitis, IgA nephropathy, and thin basement membrane nephropa-thy [1]. Non-glomerular hematuria can originate from the urinary system, which comprisesthe renal pelvis, ureter, and bladder. In men, the prostate gland communicates with theurinary system. Cancer, infection, and urolithiasis are common causes of non-glomerularhematuria. Several methods help distinguish between glomerular and non-glomerular
J. Clin. Med. 2021, 10, 4345. https://doi.org/10.3390/jcm10194345 https://www.mdpi.com/journal/jcm65
J. Clin. Med. 2021, 10, 4345
hematuria; these include the presence of dysmorphic red blood cells or nephrotic pro-teinuria. However, regardless of its origin, hematuria has been reported to influencepatient outcomes and renal function in the general population. Hematuria is associatedwith the incidence of acute kidney injury (AKI) [2] and chronic kidney disease (CKD) [3].Moreover, a long-term follow-up study revealed that persistent asymptomatic hematuriacorrelated with increased risk of renal progression [4]. In patients who underwent kidneytransplantation, the frequent incidence of urothelial malignancy may be attributed to animmunocompromised status and the underlying etiology of end-stage renal disease (ESRD).On the other hand, in adult patients who have undergone liver transplantation, no studyhas focused on the effects of hematuria on renal outcomes. Accordingly, we conducted thepresent study to investigate the effects of hematuria on urinalysis and renal outcomes.
2. Materials and Methods
Patients who underwent living donor liver transplant at Changhua Christian Hospitalbetween July 2005 and June 2019 were enrolled. These patients had either liver failureor hepatocellular carcinoma that fulfilled the Milan criteria for liver transplantation. Theindex date was defined as the date of achieving stable renal function after surgery, aroundthree months after transplantation. Patients who died during the hospitalization fortransplantation and those who developed AKI immediately or within a short period aftersurgery and recovered with an estimated glomerular filtration rate (eGFR) of <90% werealso excluded. This study was approved by the institutional review board of ChanghuaChristian Hospital, Taiwan (IRB 210131).
The enrolled patients were divided into two groups: those who had persistent orepisodic hematuria on their urinalyses after the index date (group A) and those who didnot have hematuria (group B). The diagnostic criteria for hematuria were defined as fiveor more red blood cells/HPF (high-power field, X 400) in the urinary sediment sample.The following variables were compared between the groups: age; comorbidity; previousexposure to medications; and laboratory data, including complete blood count, albuminlevel, baseline liver and renal function test results, and electrolytes. All patients werefollowed up from the index date until the end of May 2020. In addition, the risks of CKD(eGFR < 60 mL/min/1.73 m2) occurrence, death, and eGFR decline by 30% or 50% werecompared between groups. The endpoints, including 30% and 50% decline of eGFR, weredefined as surrogate outcomes, because few patients progressed to ESRD. Both surrogateendpoints that were applied simultaneously were practical for the enrolled patients whopresented with varying renal function trajectories, especially the acute on CKD pattern [5].In addition, the risk factors for the renal outcomes were evaluated. Sensitivity analysis wasconducted for subgroups of patients who had no CKD (eGFR ≥ 60 mL/min/1.73 m2) andthose in whom the identified causes of hematuria were urinary tract infection (UTI) andurolithiasis.
Data are presented as mean ± standard deviation for continuous variables and asnumbers (percentages) for categorical variables. Student’s t-test and χ2 test were used tocompare the continuous and categorical variables, respectively, between the two groups.The survival curves of one of the outcomes (i.e., decline in eGFR over time) in groups Aand B were estimated using the Simon and Makuch method, which is an alternative to theKaplan–Meier estimation, because the cases in group A included a time-varying exposure.Mantel and Bayer’s tests was used to compare the survival curves between the groups.Considering the immortal time bias for group A and the competing risk of death, we usedtime-dependent Cox models to determine the association between infections and renalfunction decline. The results were reported as hazard ratios (HRs) with 95% confidenceintervals (CIs). Confounders, which were the variables with p < 0.05, were selected on thebasis of crude HRs that were adjusted for in the multivariate Cox analysis to estimate theadjusted HRs (aHRs). All statistical analyses were conducted using the statistical packageSPSS (v20; IBM Corporation, Chicago, IL, USA). Values with two-sided p < 0.05 wereconsidered statistically significant.
66
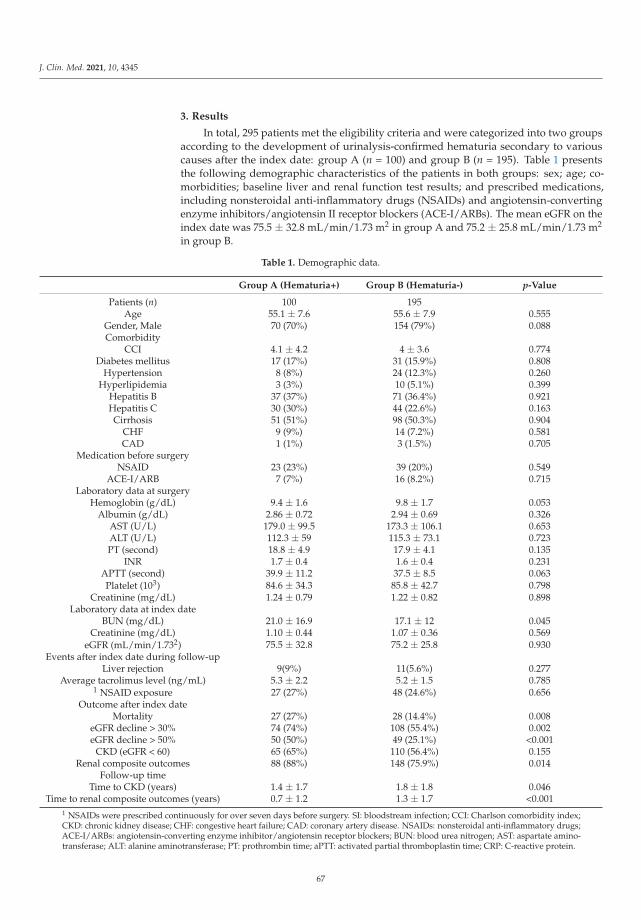
J. Clin. Med. 2021, 10, 4345
3. Results
In total, 295 patients met the eligibility criteria and were categorized into two groupsaccording to the development of urinalysis-confirmed hematuria secondary to variouscauses after the index date: group A (n = 100) and group B (n = 195). Table 1 presentsthe following demographic characteristics of the patients in both groups: sex; age; co-morbidities; baseline liver and renal function test results; and prescribed medications,including nonsteroidal anti-inflammatory drugs (NSAIDs) and angiotensin-convertingenzyme inhibitors/angiotensin II receptor blockers (ACE-I/ARBs). The mean eGFR on theindex date was 75.5 ± 32.8 mL/min/1.73 m2 in group A and 75.2 ± 25.8 mL/min/1.73 m2
in group B.
Table 1. Demographic data.
Group A (Hematuria+) Group B (Hematuria-) p-Value
Patients (n) 100 195Age 55.1 ± 7.6 55.6 ± 7.9 0.555
Gender, Male 70 (70%) 154 (79%) 0.088Comorbidity
CCI 4.1 ± 4.2 4 ± 3.6 0.774Diabetes mellitus 17 (17%) 31 (15.9%) 0.808
Hypertension 8 (8%) 24 (12.3%) 0.260Hyperlipidemia 3 (3%) 10 (5.1%) 0.399
Hepatitis B 37 (37%) 71 (36.4%) 0.921Hepatitis C 30 (30%) 44 (22.6%) 0.163Cirrhosis 51 (51%) 98 (50.3%) 0.904
CHF 9 (9%) 14 (7.2%) 0.581CAD 1 (1%) 3 (1.5%) 0.705
Medication before surgeryNSAID 23 (23%) 39 (20%) 0.549
ACE-I/ARB 7 (7%) 16 (8.2%) 0.715Laboratory data at surgery
Hemoglobin (g/dL) 9.4 ± 1.6 9.8 ± 1.7 0.053Albumin (g/dL) 2.86 ± 0.72 2.94 ± 0.69 0.326
AST (U/L) 179.0 ± 99.5 173.3 ± 106.1 0.653ALT (U/L) 112.3 ± 59 115.3 ± 73.1 0.723PT (second) 18.8 ± 4.9 17.9 ± 4.1 0.135
INR 1.7 ± 0.4 1.6 ± 0.4 0.231APTT (second) 39.9 ± 11.2 37.5 ± 8.5 0.063Platelet (103) 84.6 ± 34.3 85.8 ± 42.7 0.798
Creatinine (mg/dL) 1.24 ± 0.79 1.22 ± 0.82 0.898Laboratory data at index date
BUN (mg/dL) 21.0 ± 16.9 17.1 ± 12 0.045Creatinine (mg/dL) 1.10 ± 0.44 1.07 ± 0.36 0.569
eGFR (mL/min/1.732) 75.5 ± 32.8 75.2 ± 25.8 0.930Events after index date during follow-up
Liver rejection 9(9%) 11(5.6%) 0.277Average tacrolimus level (ng/mL) 5.3 ± 2.2 5.2 ± 1.5 0.785
1 NSAID exposure 27 (27%) 48 (24.6%) 0.656Outcome after index date
Mortality 27 (27%) 28 (14.4%) 0.008eGFR decline > 30% 74 (74%) 108 (55.4%) 0.002eGFR decline > 50% 50 (50%) 49 (25.1%) <0.001
CKD (eGFR < 60) 65 (65%) 110 (56.4%) 0.155Renal composite outcomes 88 (88%) 148 (75.9%) 0.014
Follow-up timeTime to CKD (years) 1.4 ± 1.7 1.8 ± 1.8 0.046
Time to renal composite outcomes (years) 0.7 ± 1.2 1.3 ± 1.7 <0.0011 NSAIDs were prescribed continuously for over seven days before surgery. SI: bloodstream infection; CCI: Charlson comorbidity index;CKD: chronic kidney disease; CHF: congestive heart failure; CAD: coronary artery disease. NSAIDs: nonsteroidal anti-inflammatory drugs;ACE-I/ARBs: angiotensin-converting enzyme inhibitor/angiotensin receptor blockers; BUN: blood urea nitrogen; AST: aspartate amino-transferase; ALT: alanine aminotransferase; PT: prothrombin time; aPTT: activated partial thromboplastin time; CRP: C-reactive protein.
67
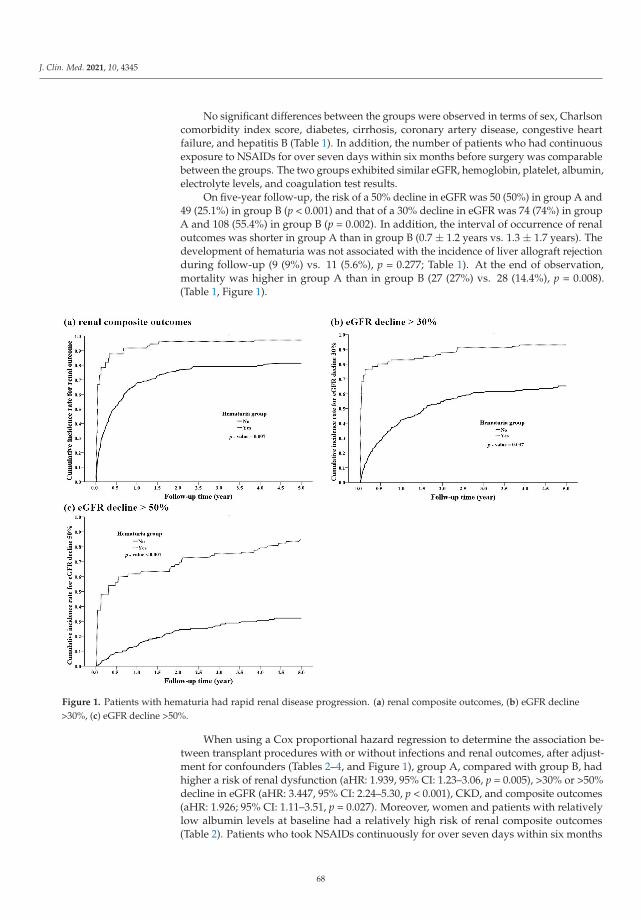
J. Clin. Med. 2021, 10, 4345
No significant differences between the groups were observed in terms of sex, Charlsoncomorbidity index score, diabetes, cirrhosis, coronary artery disease, congestive heartfailure, and hepatitis B (Table 1). In addition, the number of patients who had continuousexposure to NSAIDs for over seven days within six months before surgery was comparablebetween the groups. The two groups exhibited similar eGFR, hemoglobin, platelet, albumin,electrolyte levels, and coagulation test results.
On five-year follow-up, the risk of a 50% decline in eGFR was 50 (50%) in group A and49 (25.1%) in group B (p < 0.001) and that of a 30% decline in eGFR was 74 (74%) in groupA and 108 (55.4%) in group B (p = 0.002). In addition, the interval of occurrence of renaloutcomes was shorter in group A than in group B (0.7 ± 1.2 years vs. 1.3 ± 1.7 years). Thedevelopment of hematuria was not associated with the incidence of liver allograft rejectionduring follow-up (9 (9%) vs. 11 (5.6%), p = 0.277; Table 1). At the end of observation,mortality was higher in group A than in group B (27 (27%) vs. 28 (14.4%), p = 0.008).(Table 1, Figure 1).
Figure 1. Patients with hematuria had rapid renal disease progression. (a) renal composite outcomes, (b) eGFR decline>30%, (c) eGFR decline >50%.
When using a Cox proportional hazard regression to determine the association be-tween transplant procedures with or without infections and renal outcomes, after adjust-ment for confounders (Tables 2–4, and Figure 1), group A, compared with group B, hadhigher a risk of renal dysfunction (aHR: 1.939, 95% CI: 1.23–3.06, p = 0.005), >30% or >50%decline in eGFR (aHR: 3.447, 95% CI: 2.24–5.30, p < 0.001), CKD, and composite outcomes(aHR: 1.926; 95% CI: 1.11–3.51, p = 0.027). Moreover, women and patients with relativelylow albumin levels at baseline had a relatively high risk of renal composite outcomes(Table 2). Patients who took NSAIDs continuously for over seven days within six months
68
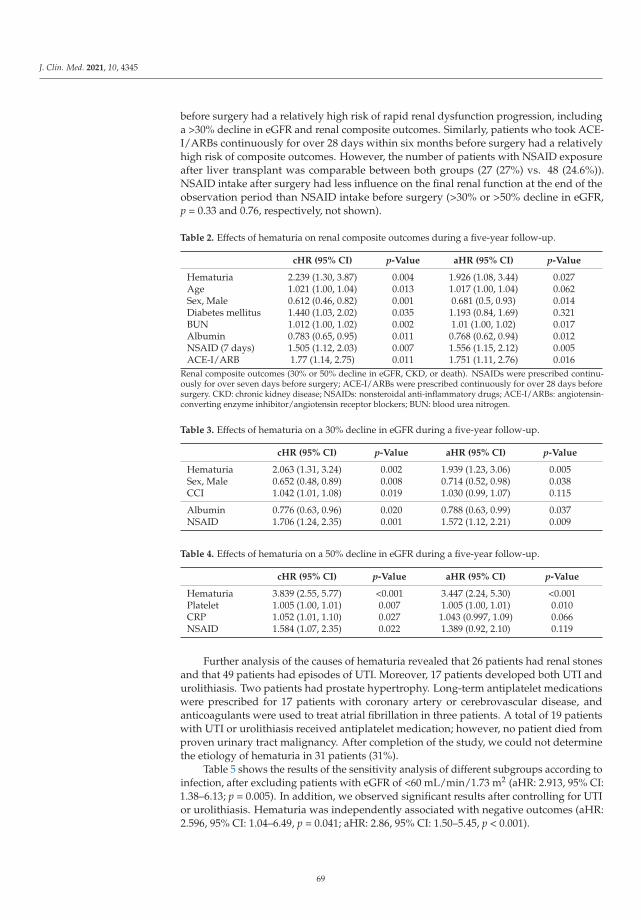
J. Clin. Med. 2021, 10, 4345
before surgery had a relatively high risk of rapid renal dysfunction progression, includinga >30% decline in eGFR and renal composite outcomes. Similarly, patients who took ACE-I/ARBs continuously for over 28 days within six months before surgery had a relativelyhigh risk of composite outcomes. However, the number of patients with NSAID exposureafter liver transplant was comparable between both groups (27 (27%) vs. 48 (24.6%)).NSAID intake after surgery had less influence on the final renal function at the end of theobservation period than NSAID intake before surgery (>30% or >50% decline in eGFR,p = 0.33 and 0.76, respectively, not shown).
Table 2. Effects of hematuria on renal composite outcomes during a five-year follow-up.
cHR (95% CI) p-Value aHR (95% CI) p-Value
Hematuria 2.239 (1.30, 3.87) 0.004 1.926 (1.08, 3.44) 0.027Age 1.021 (1.00, 1.04) 0.013 1.017 (1.00, 1.04) 0.062Sex, Male 0.612 (0.46, 0.82) 0.001 0.681 (0.5, 0.93) 0.014Diabetes mellitus 1.440 (1.03, 2.02) 0.035 1.193 (0.84, 1.69) 0.321BUN 1.012 (1.00, 1.02) 0.002 1.01 (1.00, 1.02) 0.017Albumin 0.783 (0.65, 0.95) 0.011 0.768 (0.62, 0.94) 0.012NSAID (7 days) 1.505 (1.12, 2.03) 0.007 1.556 (1.15, 2.12) 0.005ACE-I/ARB 1.77 (1.14, 2.75) 0.011 1.751 (1.11, 2.76) 0.016
Renal composite outcomes (30% or 50% decline in eGFR, CKD, or death). NSAIDs were prescribed continu-ously for over seven days before surgery; ACE-I/ARBs were prescribed continuously for over 28 days beforesurgery. CKD: chronic kidney disease; NSAIDs: nonsteroidal anti-inflammatory drugs; ACE-I/ARBs: angiotensin-converting enzyme inhibitor/angiotensin receptor blockers; BUN: blood urea nitrogen.
Table 3. Effects of hematuria on a 30% decline in eGFR during a five-year follow-up.
cHR (95% CI) p-Value aHR (95% CI) p-Value
Hematuria 2.063 (1.31, 3.24) 0.002 1.939 (1.23, 3.06) 0.005Sex, Male 0.652 (0.48, 0.89) 0.008 0.714 (0.52, 0.98) 0.038CCI 1.042 (1.01, 1.08) 0.019 1.030 (0.99, 1.07) 0.115
Albumin 0.776 (0.63, 0.96) 0.020 0.788 (0.63, 0.99) 0.037NSAID 1.706 (1.24, 2.35) 0.001 1.572 (1.12, 2.21) 0.009
Table 4. Effects of hematuria on a 50% decline in eGFR during a five-year follow-up.
cHR (95% CI) p-Value aHR (95% CI) p-Value
Hematuria 3.839 (2.55, 5.77) <0.001 3.447 (2.24, 5.30) <0.001Platelet 1.005 (1.00, 1.01) 0.007 1.005 (1.00, 1.01) 0.010CRP 1.052 (1.01, 1.10) 0.027 1.043 (0.997, 1.09) 0.066NSAID 1.584 (1.07, 2.35) 0.022 1.389 (0.92, 2.10) 0.119
Further analysis of the causes of hematuria revealed that 26 patients had renal stonesand that 49 patients had episodes of UTI. Moreover, 17 patients developed both UTI andurolithiasis. Two patients had prostate hypertrophy. Long-term antiplatelet medicationswere prescribed for 17 patients with coronary artery or cerebrovascular disease, andanticoagulants were used to treat atrial fibrillation in three patients. A total of 19 patientswith UTI or urolithiasis received antiplatelet medication; however, no patient died fromproven urinary tract malignancy. After completion of the study, we could not determinethe etiology of hematuria in 31 patients (31%).
Table 5 shows the results of the sensitivity analysis of different subgroups according toinfection, after excluding patients with eGFR of <60 mL/min/1.73 m2 (aHR: 2.913, 95% CI:1.38–6.13; p = 0.005). In addition, we observed significant results after controlling for UTIor urolithiasis. Hematuria was independently associated with negative outcomes (aHR:2.596, 95% CI: 1.04–6.49, p = 0.041; aHR: 2.86, 95% CI: 1.50–5.45, p < 0.001).
69
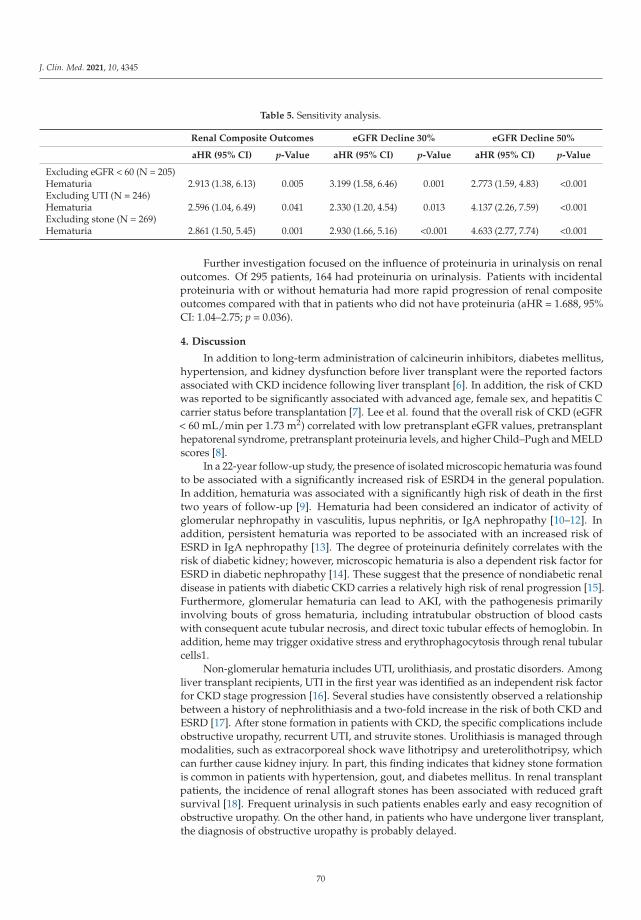
J. Clin. Med. 2021, 10, 4345
Table 5. Sensitivity analysis.
Renal Composite Outcomes eGFR Decline 30% eGFR Decline 50%
aHR (95% CI) p-Value aHR (95% CI) p-Value aHR (95% CI) p-Value
Excluding eGFR < 60 (N = 205)Hematuria 2.913 (1.38, 6.13) 0.005 3.199 (1.58, 6.46) 0.001 2.773 (1.59, 4.83) <0.001Excluding UTI (N = 246)Hematuria 2.596 (1.04, 6.49) 0.041 2.330 (1.20, 4.54) 0.013 4.137 (2.26, 7.59) <0.001Excluding stone (N = 269)Hematuria 2.861 (1.50, 5.45) 0.001 2.930 (1.66, 5.16) <0.001 4.633 (2.77, 7.74) <0.001
Further investigation focused on the influence of proteinuria in urinalysis on renaloutcomes. Of 295 patients, 164 had proteinuria on urinalysis. Patients with incidentalproteinuria with or without hematuria had more rapid progression of renal compositeoutcomes compared with that in patients who did not have proteinuria (aHR = 1.688, 95%CI: 1.04–2.75; p = 0.036).
4. Discussion
In addition to long-term administration of calcineurin inhibitors, diabetes mellitus,hypertension, and kidney dysfunction before liver transplant were the reported factorsassociated with CKD incidence following liver transplant [6]. In addition, the risk of CKDwas reported to be significantly associated with advanced age, female sex, and hepatitis Ccarrier status before transplantation [7]. Lee et al. found that the overall risk of CKD (eGFR< 60 mL/min per 1.73 m2) correlated with low pretransplant eGFR values, pretransplanthepatorenal syndrome, pretransplant proteinuria levels, and higher Child–Pugh and MELDscores [8].
In a 22-year follow-up study, the presence of isolated microscopic hematuria was foundto be associated with a significantly increased risk of ESRD4 in the general population.In addition, hematuria was associated with a significantly high risk of death in the firsttwo years of follow-up [9]. Hematuria had been considered an indicator of activity ofglomerular nephropathy in vasculitis, lupus nephritis, or IgA nephropathy [10–12]. Inaddition, persistent hematuria was reported to be associated with an increased risk ofESRD in IgA nephropathy [13]. The degree of proteinuria definitely correlates with therisk of diabetic kidney; however, microscopic hematuria is also a dependent risk factor forESRD in diabetic nephropathy [14]. These suggest that the presence of nondiabetic renaldisease in patients with diabetic CKD carries a relatively high risk of renal progression [15].Furthermore, glomerular hematuria can lead to AKI, with the pathogenesis primarilyinvolving bouts of gross hematuria, including intratubular obstruction of blood castswith consequent acute tubular necrosis, and direct toxic tubular effects of hemoglobin. Inaddition, heme may trigger oxidative stress and erythrophagocytosis through renal tubularcells1.
Non-glomerular hematuria includes UTI, urolithiasis, and prostatic disorders. Amongliver transplant recipients, UTI in the first year was identified as an independent risk factorfor CKD stage progression [16]. Several studies have consistently observed a relationshipbetween a history of nephrolithiasis and a two-fold increase in the risk of both CKD andESRD [17]. After stone formation in patients with CKD, the specific complications includeobstructive uropathy, recurrent UTI, and struvite stones. Urolithiasis is managed throughmodalities, such as extracorporeal shock wave lithotripsy and ureterolithotripsy, whichcan further cause kidney injury. In part, this finding indicates that kidney stone formationis common in patients with hypertension, gout, and diabetes mellitus. In renal transplantpatients, the incidence of renal allograft stones has been associated with reduced graftsurvival [18]. Frequent urinalysis in such patients enables early and easy recognition ofobstructive uropathy. On the other hand, in patients who have undergone liver transplant,the diagnosis of obstructive uropathy is probably delayed.
70

J. Clin. Med. 2021, 10, 4345
Patients on antithrombotic agents may have increased incidence of gross hema-turia [19]. Anticoagulants and their corresponding medical conditions are commonlyreferred to as anticoagulant-related nephropathy, which was found to be correlated withthe progression of kidney dysfunction [20]. Moreover, the incidence of microscopic hema-turia was found to be elevated in elderly patients who received regular doses of aspirin [21],a low dose aspirin may play a role in renal progression in patients with CKD [22]. However,contrasting results were observed in patients who were older [23] or had diabetes [24]. Afurther cohort study is ongoing to clarify this issue [25].
Rare etiologies of hematuria have been reported in patients who have received organtransplants. In a liver transplant recipient, hemorrhagic cystitis was reported to havedeveloped secondary to BK virus infection [26]. In our study, although hematuria hasseveral causes, its appearance was consistently shown to predict renal outcomes in patientswho received living donor liver transplants. Routine urinalysis and early surveillance ofthe underlying disease in such patients were the essential tasks. In this study, the long-termrenal outcomes were affected by hypoalbuminemia and continuous exposure to NSAIDswithin seven days before surgery or to ACE-I/ARBs within 28 days before surgery, inaddition to the hematuria-related disorders. Development of adverse renal outcomes withNSAID use after liver transplant is well known. However, exposure to NSAIDs or ACE-I/ARBs before the associated poor renal outcomes was an interesting finding. Perhapspatients with liver failure are always in a state of low effective intravascular volume.ACE-I/ARBs and NSAIDs may cause further deterioration of the renal injury. Male sexappeared to be a protective factor in patients who received a living donor liver transplant;this finding may be attributed to the higher mean eGFR on the index date in men than inwomen (77.3 ± 26.6 vs. 68.9 ± 32.5; p = 0.029). One review showed that asymptomatichematuria in adults had unknown etiology in 43%–68% [27]; for these 31 patients (31%)without determinate etiology, regular and close follow-up every three to six months maybe considered.
The current study had several limitations. First, this was a single-center study thatenrolled a limited number of patients. Second, we were unable to further distinguishbetween gross and microscopic hematuria because of patient subjectivity. Quantitativeanalysis of proteinuria (proteinuria-creatinine ratio or 24 h urine sample) was not monitoredroutinely. Third, we surveyed surrogate outcomes instead of definite outcomes (i.e., death,ESRD, and renal transplant), because only few patients achieved these solid endpoints.Fourth, the data of deceased patients who had received liver transplant were not consideredin this study because of the various conditions that may have been acquired from thedonors.
5. Conclusions
The appearance of hematuria consistently predicted the renal outcomes and survivalof patients who underwent living donor liver transplant. Routine urinalysis and earlysurveillance of the underlying disease is essential for such patients.
Author Contributions: K.-C.C., Y.-P.H. and P.-F.C. contributed to the design of the study and wrotethe manuscript. C.-T.K. and P.-R.L. contributed to the analysis of the statistics. Y.-L.C. and K.-H.L.,H.-N.C. participated in the implementation of the research. C.-M.L., C.-C.T. and C.-E.H. providedideas and directed consultations. All authors provided critical feedback on the manuscript. Allauthors have read and agreed to the published version of the manuscript.
Funding: This study was funded by grants 109-CCH-IRP-020 and 110-CCH-IRP-027 from theChanghua Christian Hospital Research Foundation.
Institutional Review Board Statement: This study was approved by the institutional review boardof Changhua Christian Hospital, Taiwan (IRB 210131).
71
J. Clin. Med. 2021, 10, 4345
Informed Consent Statement: Patient consent was waived due to the type of study being a retro-spective analysis, which did not require us to carry out any extraordinary interventions differentfrom usual practice and no patient interviews were required. Personal data were codified in order toguarantee confidentiality.
Data Availability Statement: The data presented in this study are available on request from thecorresponding author.
Conflicts of Interest: The authors declare no conflict of interest.
References
1. Moreno, J.A.; Sevillano, Á.; Gutiérrez, E.; Guerrero-Hue, M.; Vázquez-Carballo, C.; Yuste, C.; Herencia, C.; García-Caballero,C.; Praga, M.; Egido, J. Glomerular Hematuria: Cause or Consequence of Renal Inflammation? Int. J. Mol. Sci. 2019, 20, 2205.[CrossRef] [PubMed]
2. Moreno, J.A.; Martín-Cleary, C.; Gutierrez, J.A.M.; Toldos, O.; Blanco-Colio, L.M.; Praga, M.; Ortiz, A.; Egido, J. AKI Associatedwith Macroscopic Glomerular Hematuria: Clinical and Pathophysiologic Consequences. Clin. J. Am. Soc. Nephrol. 2012, 7,175–184. [CrossRef] [PubMed]
3. Kim, H.; Lee, M.; Cha, M.-U.; Nam, K.H.; An, S.Y.; Park, S.; Jhee, J.H.; Yun, H.-R.; Kee, Y.K.; Park, J.T.; et al. Microscopic hematuriais a risk factor of incident chronic kidney disease in the Korean general population: A community-based prospective cohort study.Qjm Int. J. Med. 2018, 111, 389–397. [CrossRef] [PubMed]
4. Vivante, A.; Afek, A.; Frenkel-Nir, Y.; Tzur, D.; Farfel, A.; Golan, E.; Chaiter, Y.; Shohat, T.; Skorecki, K.; Calderon-Margalit, R.Persistent Asymptomatic Isolated Microscopic Hematuria in Israeli Adolescents and Young Adults and Risk for End-Stage RenalDisease. JAMA 2011, 306, 729–736. [CrossRef]
5. Rosansky, S.J.; Glassock, R.J. Is a decline in estimated GFR an appropriate surrogate end point for renoprotection drug trials?Kidney Int. 2014, 85, 723–727. [CrossRef]
6. Bahirwani, R.; Reddy, K.R. Outcomes after liver transplantation: Chronic kidney disease. Liver Transplant. 2009, 15, S70–S74.[CrossRef]
7. Ojo, A.O.; Held, P.J.; Port, F.K.; Wolfe, R.A.; Leichtman, A.B.; Young, E.W.; Arndorfer, J.; Christensen, L.; Merion, R.M. ChronicRenal Failure after Transplantation of a Nonrenal Organ. N. Engl. J. Med. 2003, 349, 931–940. [CrossRef]
8. Lee, J.P.; Heo, N.J.; Joo, K.W.; Yi, N.J.; Suh, K.S.; Moon, K.C.; Kim, S.G.; Kim, Y.S. Risk factors for consequent kidney impairmentand differential impact of liver transplantation on renal function. Nephrol. Dial. Transplant. 2010, 25, 2772–2785. [CrossRef]
9. Orlandi, P.F.; Fujii, N.; Roy, J.; Chen, H.Y.; Hamm, L.L.; Sondheimer, J.H.; He, J.; Fischer, M.J.; Rincon-Choles, H.; Krishnan,G.; et al. Hematuria as a risk factor for progression of chronic kidney disease and death: Findings from the Chronic RenalInsufficiency Cohort (CRIC) Study. BMC Nephrol. 2018, 19, 150. [CrossRef]
10. Ding, J.Y.; Ibañez, D.; Gladman, D.D.; Urowitz, M.B. Isolated hematuria and sterile pyuria may indicate systemic lupuserythematosus activity. J. Rheumatol. 2015, 42, 437–440. [CrossRef]
11. Rhee, R.L.; Davis, J.C.; Ding, L.; Fervenza, F.C.; Hoffman, G.S.; Kallenberg, C.G.; Langford, C.A.; McCune, W.J.; Monach, P.A.;Seo, P.; et al. The Utility of Urinalysis in Determining the Risk of Renal Relapse in ANCA-Associated Vasculitis. Clin. J. Am. Soc.Nephrol. 2018, 13, 251–257. [CrossRef]
12. Berthoux, F.; Mohey, H.; Laurent, B.; Mariat, C.; Afiani, A.; Thibaudin, L. Predicting the Risk for Dialysis or Death in IgANephropathy. J. Am. Soc. Nephrol. 2011, 22, 752–761. [CrossRef] [PubMed]
13. Coppo, R.; Fervenza, F.C. Persistent Microscopic Hematuria as a Risk Factor for Progression of IgA Nephropathy: New Floodlighton a Nearly Forgotten Biomarker. J. Am. Soc. Nephrol. 2017, 28, 2831–2834. [CrossRef]
14. Okada, S.; Samejima, K.-I.; Matsui, M.; Morimoto, K.; Furuyama, R.; Tanabe, K.; Eriguchi, M.; Akai, Y.; Saito, Y.; Tsuruya, K.Microscopic hematuria is a risk factor for end-stage kidney disease in patients with biopsy-proven diabetic nephropathy. BMJOpen Diabetes Res. Care 2020, 8, e001863. [CrossRef]
15. Lin, H.Y.-H.; Niu, S.-W.; Kuo, I.-C.; Lim, L.-M.; Hwang, D.-Y.; Lee, J.-J.; Hwang, S.-J.; Chen, H.-C.; Hung, C.-C. Hematuria andRenal Outcomes in Patients with Diabetic Chronic KidneyDisease. Am. J. Med Sci. 2018, 356, 268–276. [CrossRef]
16. Sánchez, M.P.R.; Rubio, D.C.A.; Luna, I.M.; Padilla, P.K.G.; Villamizar, K.M.C.; González, C.A.G.; Trejos, J.A.P. Impact ofComplicated Urinary Tract Infection on Renal Graft Function. Transpl. Proc. 2020, 52, 1173–1177. [CrossRef]
17. Keddis, M.T.; Rule, A.D. Nephrolithiasis and loss of kidney function. Curr. Opin. Nephrol. Hypertens. 2013, 22, 390–396. [CrossRef]18. Rezaee-Zavareh, M.S.; Ajudani, R.; Binabaj, M.R.; Heydari, F.; Einollahi, B. Kidney Allograft Stone after Kidney Transplantation
and its Association with Graft Survival. Int. J. Organ Transplant. Med. 2015, 6, 114–118.19. Bhatt, N.R.; Davis, N.F.; Nolan, W.J.; Flynn, R.J.; McDermott, T.; Thomas, A.Z.; Manecksha, R.P. Incidence of Visible Hematuria
among Antithrombotic Agents: A Systematic Review of Over 175,000 Patients. Urology 2018, 114, 27–32. [CrossRef] [PubMed]20. Brodsky, S.; Eikelboom, J.; Hebert, L.A. Anticoagulant-Related Nephropathy. J. Am. Soc. Nephrol. 2018, 29, 2787–2793. [CrossRef]
[PubMed]21. Moudi, E.; Hosseini, S.R.; Bijani, A. Higher rate of microscopic hematuria in elderly patients who take regular doses of aspirin:
Result from AHAP Study. Casp. J. Intern. Med. 2016, 7, 278–282.
72
J. Clin. Med. 2021, 10, 4345
22. Kim, A.J.; Lim, H.J.; Ro, H.; Ko, K.P.; Han, S.Y.; Chang, J.H.; Lee, H.H.; Chung, W.; Jung, J.Y. Low-Dose Aspirin for Prevention ofCardiovascular Disease in Patients with Chronic Kidney Disease. PLoS ONE 2014, 9, e104179.
23. Akinwusi, P.; Oluyombo, R.; Ogunro, P.S.; Adeniji, A.; Okunola, O.O.; Ayodele, O.E. Low dose aspirin therapy and renal functionin elderly patients. Int. J. Gen. Med. 2013, 6, 19–24. [CrossRef] [PubMed]
24. Gaede, P.; Hansen, H.P.; Parving, H.H.; Pedersen, O. Impact of low-dose acetylsalicylic acid on kidney function in type 2 diabeticpatients with elevated urinary albumin excretion rate. Nephrol. Dial. Transplant. 2003, 18, 539–542. [CrossRef]
25. Violi, F.; Targher, G.; Vestri, A.; Carnevale, R.; Averna, M.; Farcomeni, A.; Lenzi, A.; Angelico, F.; Cipollone, F.; Pastori, D.Effect of aspirin on renal disease progression in patients with type 2 diabetes: A multi-center, double-blind, placebo-controlled,randomized trial. The renaL disEase progression by aspirin in diabetic pAtients (LEDA) trial. Rationale and study design. Am.Heart J. 2017, 189, 120–127. [CrossRef] [PubMed]
26. Kamal, F.; Ali, B.; Barnes, M.; Kamal, S.; Nair, S.; Gonzalez, H. Hemorrhagic Cystitis in a Liver Transplant Recipient Secondary toBK Virus. ACG Case Rep. J. 2017, 4, e67. [CrossRef] [PubMed]
27. Sharp, V.J.; Barnes, K.T.; Erickson, B. Assessment of asymptomatic microscopic hematuria in adults. Am. Fam. Physician 2013, 88,747–754. [PubMed]
73

Journal of
Clinical Medicine
Review
Tocilizumab and Desensitization in Kidney TransplantCandidates: Personal Experience and Literature Review
Jules Weinhard 1, Johan Noble 1, Thomas Jouve 1,2, Paolo Malvezzi 1 and Lionel Rostaing 1,2,*
Citation: Weinhard, J.; Noble, J.;
Jouve, T.; Malvezzi, P.; Rostaing, L.
Tocilizumab and Desensitization in
Kidney Transplant Candidates:
Personal Experience and Literature
Review. J. Clin. Med. 2021, 10, 4359.
https://doi.org/10.3390/
jcm10194359
Academic Editors: Wisit
Cheungpasitporn, Charat
Thongprayoon and Wisit Kaewput
Received: 30 August 2021
Accepted: 20 September 2021
Published: 24 September 2021
Publisher’s Note: MDPI stays neutral
with regard to jurisdictional claims in
published maps and institutional affil-
iations.
Copyright: © 2021 by the authors.
Licensee MDPI, Basel, Switzerland.
This article is an open access article
distributed under the terms and
conditions of the Creative Commons
Attribution (CC BY) license (https://
creativecommons.org/licenses/by/
4.0/).
1 Service de Néphrologie, Hémodialyse, Aphérèses, et Transplantation Rénale, CHU Grenoble-Alpes,38700 Grenoble, France; [email protected] (J.W.); [email protected] (J.N.);[email protected] (T.J.); [email protected] (P.M.)
2 Faculté de Médecine, Université Grenoble-Alpes, 38700 Grenoble, France* Correspondence: [email protected]; Tel.: +33-476-768-945
Abstract: Desensitization (DES) allows kidney transplantation for highly HLA-sensitized subjects.Due to the central role of IL-6 in the immunological response, tocilizumab may improve DES efficacy.Thus, we conducted a PubMed systematic review using the MeSH terms tocilizumab, interleukin-6,kidney transplantation, and desensitization. Tocilizumab (TCZ) was first studied for DES as thesecond-line treatment after failure of a standard DES protocol (SP) (apheresis, rituximab +/− IVIg).Although TCZ (as a monotherapy) attenuated anti-HLA antibody rates, it did not permit transplanta-tion. However, lymphocyte immuno-phenotyping has shown that TCZ hinders B-cell maturationand thus could improve the long-term efficacy of DES by limiting anti-HLA rebound and so avoidantibody-mediated rejection. This hypothesis is supported by a recent study where clazakizumab, amonoclonal antibody directed against IL-6, was continued after kidney transplantation in associationwith an SP. Nine out of ten patients were then eligible for transplantation, and there were no donor-specific antibodies at 6 months post-transplantation. In association with an SP, tocilizumab does notseem to significantly improve kidney-allograft access (short-term efficacy) vs. a SP only. However, itcould improve the long-term prognosis of HLA-incompatible transplantation by hindering B-cellmaturation and, thereby, avoiding donor-specific antibody rebounds post-transplantation.
Keywords: tocilizumab; clazakizumab; desensitization; kidney transplantation; anti-HLA alloantibody
1. Introduction
Kidney transplantation is recognized as the best replacement therapy for end-stagerenal disease in terms of survival and quality of life, but also from a medical and economicstandpoint [1–3]. However, a shortage of kidney grafts increases time on a waiting list,and human leukocyte antigen (HLA)-sensitized kidney transplant candidates (KTCs) arethe most affected. As these subjects have developed anti-HLA antibodies during previousallogeneic exposures due to solid-organ transplantation, pregnancy, or blood transfusion,the number of potentially compatible grafts is limited. To improve access to transplantation,a desensitization (DES) protocol can be undertaken to eliminate anti-HLA antibodies andto block their production.
Initially developed in the context of HLA- and ABO-incompatible living donations,DES is now considered to increase the chances of obtaining a graft from a deceased donor.The current standard protocol (SP) for DES has been empirically developed and validatedby studies [4–6] that describe combining apheresis (plasma exchange, double-filtrationplasmapheresis, semispecific immunoadsorption), rituximab (anti-CD20 monoclonal anti-body), conventional triple immunosuppression (anti-calcineurin, mycophenolic acid, andsteroids), and possibly intravenous polyvalent immunoglobulin (IVIg).
The results of these DES protocols are primarily supported in the living donor trans-plant setting, and much less so in the deceased donor setting. Montgomery et al. have
J. Clin. Med. 2021, 10, 4359. https://doi.org/10.3390/jcm10194359 https://www.mdpi.com/journal/jcm75
J. Clin. Med. 2021, 10, 4359
shown that HLA-incompatible recipients who underwent a DES protocol and received agraft from a living donor had better survival than highly sensitized patients who remainedon dialysis or eventually obtained a compatible graft from a deceased donor [7]. The resultsfrom this single-center study were supported by a larger multicenter study confirming asurvival benefit at 8 years [8]. Both studies used a US-based population. In contrast, in aUK-based study, Manook et al. showed no survival benefit in highly sensitized patientswho received an HLA-incompatible living donor transplant compared with patients re-maining on dialysis while waiting for a compatible graft from a deceased donor [9]. Thisdifference between the US and UK studies may be explained by the decreased survivalrates of dialysis subjects in the US compared to those in the UK. Nevertheless, the resultsof Manook et al. can be seen from two different angles: the absence of improved survivalby the practice of HLA-incompatible transplantation and the absence of excess mortality inDES protocols, which allow improved access to transplantation for highly HLA-sensitizedpatients and therefore improved quality of life.
In some patients, these DES protocols do not succeed in decreasing the level ofanti-HLA antibodies sufficiently to allow the transplantation of grafts carrying the corre-sponding HLA specificities. One of the hypotheses explaining this is the absence (with thecurrent protocols) of action on plasma cells, particularly on memory plasma cells. Withrituximab, this may seem obvious since it is an anti-CD20 monoclonal antibody, and thisCD20 marker is no longer expressed by plasma cells. Perry et al. have shown in vitro thatrituximab as well as IVIg and anti-thymocyte globulin (ATG; used as a transplant inductiontherapy) were not able to induce plasma cell apoptosis or block antibody production [10].Vo et al. showed that in their cohort of 600 highly sensitized patients who received anIVIg + rituximab desensitization protocol, DES failure was more frequent in patients witha high level of memory plasma cells with anti-HLA specificities [11]. Therefore, the ideaarose to use treatments that could better target plasma cells.
First, bortezomib was studied, as an analogy to the treatment of myeloma (preciselydue to the monoclonal proliferation of plasma cells). In vivo, in highly sensitized primates,bortezomib decreased the level of antibody-producing cells and CD38 + CD19 + CD20plasma cells in the bone marrow. However, it did not decrease the level of donor-specificantibodies (DSAs) [12]. In vivo, bortezomib has been shown to decrease DSA levels inhighly sensitized patients, but without achieving cross-match negativity through microlym-phocytotoxicity, and therefore without improving access to transplantation [13,14]. Due toa lack of evidence of major efficacy and a poor safety profile, bortezomib has not found itsplace in the field of DES.
In the challenge of finding a molecule that could better target all facets of the immuneresponse responsible for the production of anti-HLA antibodies, the study of the IL-6blockade is relevant because this cytokine plays a central role in the regulation of thehumoral and cellular immune responses. Therefore, we carried out a literature review ofstudies that specify the place of the anti-IL-6R monoclonal antibody tocilizumab (TCZ) inDES protocols. We first present the studies that justify a pathophysiological rationale forthe use of TCZ, and then detail the recent clinical studies that assess TCZ’s efficacy andsafety as a DES treatment.
2. Materials and Methods
We performed a systematic review of the literature using PubMed with the followingMeSH terms: tocilizumab, interleukin-6, kidney transplantation, desensitization.
3. Results and Discussion
3.1. Pathophysiological Rationale: IL-6 and the Immune Response
Interleukin-6 (IL-6) is a pleiotropic cytokine whose sites of action are as numerous asthe possible therapeutic effects of tocilizumab: impact on hematopoiesis (anemia caused byinflammatory syndrome), osteoclast differentiation (osteoporosis), keratocyte proliferation(psoriasis and skin disorders of the scleroderma), and regulation of the hypothalamo–
76
J. Clin. Med. 2021, 10, 4359
hypophyseal axis [15]. IL-6’s role in the immune response is also decisive. It is interestingto note that it was the ability of IL-6 to induce antibody production by B cells that led toits discovery in 1985 [16]. It was then called B-cell stimulating factor 2 (BSF-2) or B celldifferentiation factor (BCDF). IL-6’s central role in both the innate and adaptive immuneresponse is now well documented.
3.1.1. IL-6 and the Innate Immune Response
In the early phases of the innate immune system response, IL-6 is released by mono-cytes, macrophages, lymphocytes, endothelial cells, and dendritic cells after recognition ofthe danger signals sent out by the toll-like receptors(TLRs). These signals can be induced byan aggressive infection (pathogen-associated molecular patterns) or not (danger-associatedmolecular patterns). IL-6 also stimulates the hepatocyte production of inflammation pro-teins such as C-reactive protein, serum amyloid A protein, haptoglobin, and fibrinogen.
3.1.2. IL-6 and the Humoral Adaptive Immune Response: B-Cell Response
IL-6 plays a role in the differentiation of a mature B cell into a cell capable of secretingantibodies. It promotes the differentiation of CD4+ T cells into the T follicular helper(Tfh) cells, which release the IL-21 necessary for the differentiation of mature B cells intoplasma cells [17,18]. It has been shown that plasmablasts have the capacity to produceIL-6 and thus to generate numerous T follicular helper cells. Moreover, circulating levelsof these two cell populations are not only higher in patients with rheumatoid arthritisthan in the general population, but they are also lower after initiation of tocilizumab [19].Furthermore, a study in mutated mice that do not express the IL-6 gene showed a cleardecline in the immune B-cell response with decreases of blood IgG1, IgG2a, and IgG3rates [20]. Thus, it is clear that IL-6 is essential for antibody production through inducingplasma cell differentiation, and it plays a role in the generation and regulation of memoryB cells. Indeed, the IL-6 blockade by TCZ in rheumatoid arthritis is associated with asignificant decrease in pre-switch (IgM+) and post-switch (IgG+) memory B cells [21,22].IL-6 has also been shown in vivo in mice to participate in the survival of the long-livedplasma cells nested in the bone marrow [23].
3.1.3. IL-6 and the Cellular Adaptive Immune Response: T-Cell Response
Naive CD4+ T cells differentiate into one or another of these effectors (Th1, Th2, Th17,or Treg), each of which will have a different role, depending on the cytokine environment:IL-12 shifts towards a Th1 profile; IL-4 shifts towards a Th2 profile; TGF-β shifts towards aTreg profile (regulatory T cells) profile; and the association of TGF-β and IL-6 shifts towardsa Th17 profile [24]. It has also been shown that the orientation towards Th17 or Treg is‘mutually exclusive.’ Whereas Treg generation requires the exclusive presence of TGF-β,the presence of IL-6 in association with TGF-β will orient towards a Th17 profile whilepreventing differentiation into Treg [25]. Yet, while Tregs induce immune-tolerance anddecrease autoimmune and alloimmune responses, Th17 is associated with the developmentof autoimmune and chronic inflammatory diseases. It also seems to be involved in thepathophysiology of acute T-cell-mediated rejection after kidney transplantation and inchronic rejection after cardiac transplantation [24,26,27].
The differentiation of CD8+ T cells into cytotoxic T cells is also promoted by IL-6 [28,29]. In addition, the importance of IL-6 in the differentiation and survival of long-termmemory T cells has also been demonstrated [30]. Thus, the use of TCZ as a treatment fordesensitization could be relevant because of the centrality of IL-6 in the adaptive immuneresponse on both the humoral and cellular levels.
3.2. Tocilizumab and Kidney Transplantation3.2.1. Tocilizumab
Tocilizumab (TCZ) is a monoclonal antibody that is specifically directed against theIL-6 receptor, either the membrane-bound or the soluble form. It was initially approved
77

J. Clin. Med. 2021, 10, 4359
for the treatment of rheumatoid arthritis and systemic juvenile idiopathic arthritis. Dueto the multiple sites of action of IL-6 and a favorable safety profile in early rheumatologycohorts, tocilizumab has been studied for many other indications over the past 15 years,including refractory Takayasu disease [31], systemic lupus erythematosus [32], giant cellarteritis [33], highly relapsing neuromyelitis optica spectrum disorder [34], acute graft-versus-host disease after hematopoietic stem-cell transplantation [35], and even morerecently in severe acute respiratory syndrome coronavirus 2 pneumonia [36].
3.2.2. Tocilizumab and Antibody-Mediated Rejection
In the field of kidney transplantation, TCZ was first studied in antibody-mediatedrejection (AMR). Chronic active antibody-mediated rejection (cAMR) is a major therapeuticissue in kidney transplantation, as it is one of the main causes of graft loss. However,no treatment has been proven to be superior. Choi et al. used tocilizumab in 36 patientswith cAMR who failed the SOC and obtained encouraging results: there was 91% patientsurvival (overall survival) and 80% graft survival at 6 years, associated with a decreasein DSAs and stable kidney function at 2 years post-transplantation [37]. The researchersobserved four instances of cAMR-related graft loss. These occurred in four patients forwhom TCZ had been stopped prematurely (one for medical reasons and three for financialreasons), suggesting a rebound effect related to the accumulation of IL-6 under treatmentby blocking its receptor with TCZ [38]. To avoid this, clazakizumab, a monoclonal antibodythat directly inhibits IL-6, was tested in a randomized controlled trial in 20 patients withlate active or chronic active antibody-mediated rejection [39]. After 12 weeks of treatment,the clazakizumab group had a significant decrease in DSA mean fluorescence intensity anda smaller decline in graft function compared to the placebo group. However, the safetyanalysis (primary endpoint) showed severe infectious complications in five patients (25%)and complicated colonic diverticulitis in two patients (10%). The encouraging efficacy datamust be contrasted with the results from a series of nine patients with SOC-resistant cAMRtreated with tocilizumab: compared with a historical cohort on SOC alone, tocilizumab didnot significantly improve graft function or reduce histological damage [40].
To determine whether the potentially beneficial effect of tocilizumab described byChoi et al. requires prior exposure to other immunosuppressive therapies, Lavacca et al.used tocilizumab as a first-line therapy in 15 kidney transplant patients with severe cAMR(60% with transplant glomerulopathy classified as cg3 according to Banff classification)with satisfactory results. Over a follow-up period of 20.7 months, there was a stabilizationof renal function, increased proteinuria, a significant decrease in DSAs, improvement ofmicrovascular inflammation lesions on systematic biopsy at 6 months, and stabilization ofother histological lesions [41]. However, data on the use of tocilizumab to treat acute activehumoral rejection are limited [42].
Chandran et al. performed a randomized controlled trial that included 30 patientswith stable graft function, with subclinical inflammation defined on routine biopsy asmoderate interstitial inflammation (Banff classification i or ti 1–2 and t0) [43]. Subjects wererandomized between a treatment group (tocilizumab 8 mg/kg monthly, 6 injections) anda placebo group. The authors showed a significant decrease in interstitial inflammationassociated with an increased level of Tregs in 62.5% of the subjects treated with tocilizumabversus 21.4% in the control group (p = 0.03). Given this study’s results, tocilizumabcould be of interest for use in the early stages of graft inflammation and even before therejection stage.
3.2.3. Tocilizumab and Desensitization
Few studies have focused on the use of TCZ in DES protocols in highly sensitized KTCs.An in vivo study in HLA-incompatible (HLA-A2) skin graft sensitized mice suggested thatTCZ not only decreases the level of anti-HLA-A2 antibodies, but also the number of plasmacells producing these antibodies in the bone marrow and spleen [44,45]. In humans, Voet al. tested TCZ as a second-line DES therapy in 10 highly sensitized KTCs who had failed
78
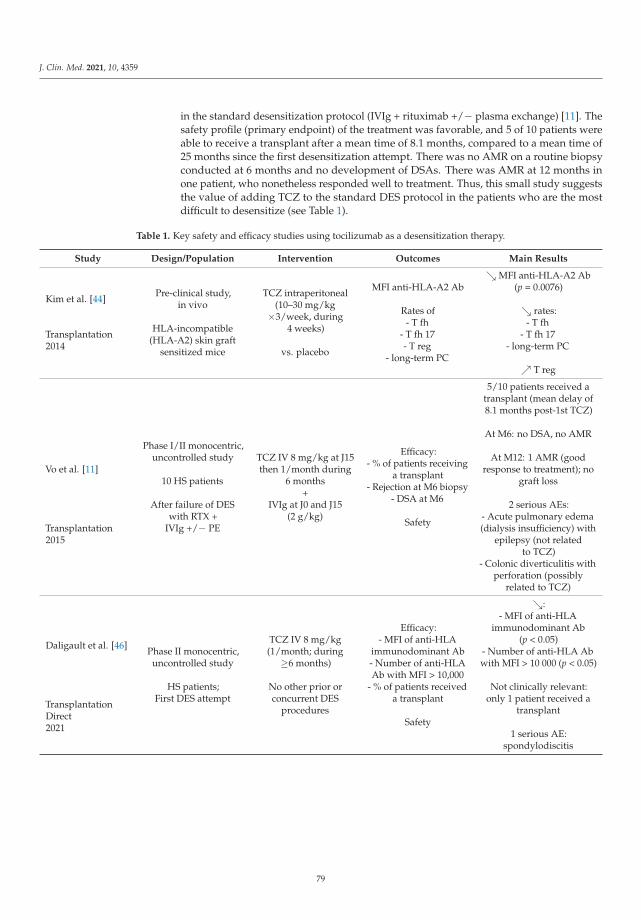
J. Clin. Med. 2021, 10, 4359
in the standard desensitization protocol (IVIg + rituximab +/− plasma exchange) [11]. Thesafety profile (primary endpoint) of the treatment was favorable, and 5 of 10 patients wereable to receive a transplant after a mean time of 8.1 months, compared to a mean time of25 months since the first desensitization attempt. There was no AMR on a routine biopsyconducted at 6 months and no development of DSAs. There was AMR at 12 months inone patient, who nonetheless responded well to treatment. Thus, this small study suggeststhe value of adding TCZ to the standard DES protocol in the patients who are the mostdifficult to desensitize (see Table 1).
Table 1. Key safety and efficacy studies using tocilizumab as a desensitization therapy.
Study Design/Population Intervention Outcomes Main Results
Kim et al. [44]
Transplantation2014
Pre-clinical study,in vivo
HLA-incompatible(HLA-A2) skin graft
sensitized mice
TCZ intraperitoneal(10–30 mg/kg
×3/week, during4 weeks)
vs. placebo
MFI anti-HLA-A2 Ab
Rates of- T fh
- T fh 17- T reg
- long-term PC
↘ MFI anti-HLA-A2 Ab(p = 0.0076)
↘ rates:- T fh
- T fh 17- long-term PC
↗ T reg
Vo et al. [11]
Transplantation2015
Phase I/II monocentric,uncontrolled study
10 HS patients
After failure of DESwith RTX +
IVIg +/− PE
TCZ IV 8 mg/kg at J15then 1/month during
6 months+
IVIg at J0 and J15(2 g/kg)
Efficacy:- % of patients receiving
a transplant- Rejection at M6 biopsy
- DSA at M6
Safety
5/10 patients received atransplant (mean delay of8.1 months post-1st TCZ)
At M6: no DSA, no AMR
At M12: 1 AMR (goodresponse to treatment); no
graft loss
2 serious AEs:- Acute pulmonary edema(dialysis insufficiency) with
epilepsy (not relatedto TCZ)
- Colonic diverticulitis withperforation (possibly
related to TCZ)
Daligault et al. [46]
TransplantationDirect2021
Phase II monocentric,uncontrolled study
HS patients;First DES attempt
TCZ IV 8 mg/kg(1/month; during
≥6 months)
No other prior orconcurrent DES
procedures
Efficacy:- MFI of anti-HLA
immunodominant Ab- Number of anti-HLAAb with MFI > 10,000
- % of patients receiveda transplant
Safety
↘:- MFI of anti-HLA
immunodominant Ab(p < 0.05)
- Number of anti-HLA Abwith MFI > 10 000 (p < 0.05)
Not clinically relevant:only 1 patient received a
transplant
1 serious AE:spondylodiscitis
79
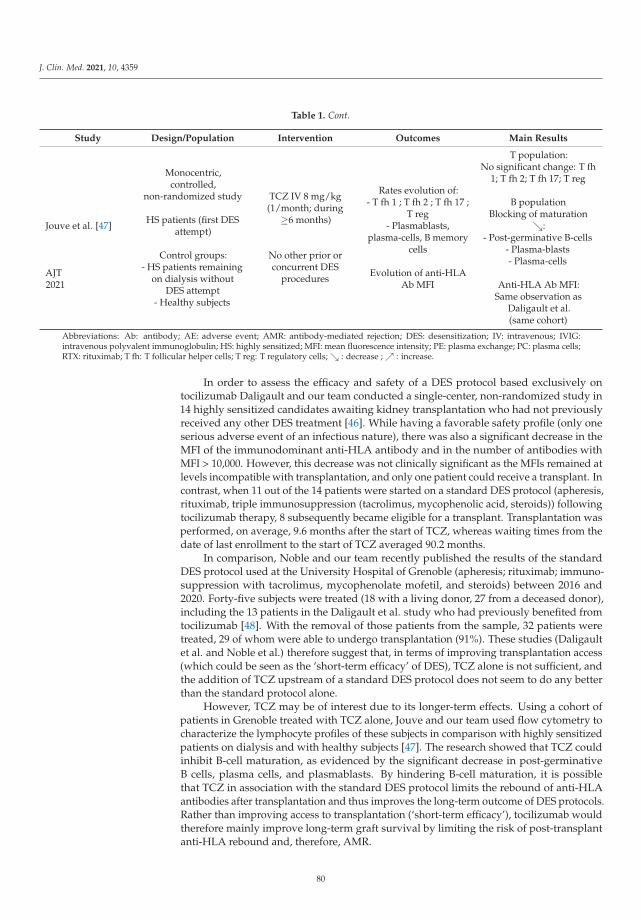
J. Clin. Med. 2021, 10, 4359
Table 1. Cont.
Study Design/Population Intervention Outcomes Main Results
Jouve et al. [47]
AJT2021
Monocentric,controlled,
non-randomized study
HS patients (first DESattempt)
Control groups:- HS patients remaining
on dialysis withoutDES attempt
- Healthy subjects
TCZ IV 8 mg/kg(1/month; during
≥6 months)
No other prior orconcurrent DES
procedures
Rates evolution of:- T fh 1 ; T fh 2 ; T fh 17 ;
T reg- Plasmablasts,
plasma-cells, B memorycells
Evolution of anti-HLAAb MFI
T population:No significant change: T fh
1; T fh 2; T fh 17; T reg
B populationBlocking of maturation
↘:- Post-germinative B-cells
- Plasma-blasts- Plasma-cells
Anti-HLA Ab MFI:Same observation as
Daligault et al.(same cohort)
Abbreviations: Ab: antibody; AE: adverse event; AMR: antibody-mediated rejection; DES: desensitization; IV: intravenous; IVIG:intravenous polyvalent immunoglobulin; HS: highly sensitized; MFI: mean fluorescence intensity; PE: plasma exchange; PC: plasma cells;RTX: rituximab; T fh: T follicular helper cells; T reg: T regulatory cells; ↘ : decrease ; ↗ : increase.
In order to assess the efficacy and safety of a DES protocol based exclusively ontocilizumab Daligault and our team conducted a single-center, non-randomized study in14 highly sensitized candidates awaiting kidney transplantation who had not previouslyreceived any other DES treatment [46]. While having a favorable safety profile (only oneserious adverse event of an infectious nature), there was also a significant decrease in theMFI of the immunodominant anti-HLA antibody and in the number of antibodies withMFI > 10,000. However, this decrease was not clinically significant as the MFIs remained atlevels incompatible with transplantation, and only one patient could receive a transplant. Incontrast, when 11 out of the 14 patients were started on a standard DES protocol (apheresis,rituximab, triple immunosuppression (tacrolimus, mycophenolic acid, steroids)) followingtocilizumab therapy, 8 subsequently became eligible for a transplant. Transplantation wasperformed, on average, 9.6 months after the start of TCZ, whereas waiting times from thedate of last enrollment to the start of TCZ averaged 90.2 months.
In comparison, Noble and our team recently published the results of the standardDES protocol used at the University Hospital of Grenoble (apheresis; rituximab; immuno-suppression with tacrolimus, mycophenolate mofetil, and steroids) between 2016 and2020. Forty-five subjects were treated (18 with a living donor, 27 from a deceased donor),including the 13 patients in the Daligault et al. study who had previously benefited fromtocilizumab [48]. With the removal of those patients from the sample, 32 patients weretreated, 29 of whom were able to undergo transplantation (91%). These studies (Daligaultet al. and Noble et al.) therefore suggest that, in terms of improving transplantation access(which could be seen as the ‘short-term efficacy’ of DES), TCZ alone is not sufficient, andthe addition of TCZ upstream of a standard DES protocol does not seem to do any betterthan the standard protocol alone.
However, TCZ may be of interest due to its longer-term effects. Using a cohort ofpatients in Grenoble treated with TCZ alone, Jouve and our team used flow cytometry tocharacterize the lymphocyte profiles of these subjects in comparison with highly sensitizedpatients on dialysis and with healthy subjects [47]. The research showed that TCZ couldinhibit B-cell maturation, as evidenced by the significant decrease in post-germinativeB cells, plasma cells, and plasmablasts. By hindering B-cell maturation, it is possiblethat TCZ in association with the standard DES protocol limits the rebound of anti-HLAantibodies after transplantation and thus improves the long-term outcome of DES protocols.Rather than improving access to transplantation (‘short-term efficacy’), tocilizumab wouldtherefore mainly improve long-term graft survival by limiting the risk of post-transplantanti-HLA rebound and, therefore, AMR.
80
J. Clin. Med. 2021, 10, 4359
Therefore, the question could arise as to the value of continuing tocilizumab afterHLA-incompatible transplantation. To investigate this, a study was conducted using claza-kizumab, a monoclonal antibody directed directly against IL-6 and studied in rheumatoidarthritis (not yet marketed) [49]. Vo et al. used clazakizumab as a DES therapy in 10 highlysensitized KTCs receiving IVIg and plasma exchange in parallel. While having a favorablesafety profile, a significant decrease in anti-HLA antibodies was observed between the begin-ning and end of the treatment in 9 out of 10 patients, all of whom could then undergo trans-plantation. Clazakizumab was continued after transplantation and none of the patients hada DSA at 6 months post-transplantation. In addition, these patients had a significant increaseof FoxP3-expressing Tregs at 6 months post-transplantation, suggesting that clazakizumabcould orient the T-cell response towards a tolerogenic profile [50]. Moreover, Jouve et al.noted no significant increase in this lymphocyte population with tocilizumab [47].
4. Conclusions
Continued research into new treatments and DES procedures is a major challengetowards improving access to transplantation for highly sensitized subjects while guarantee-ing not only safety, but also efficacy. The efficacy of DES has to be judged at the individuallevel (access to transplantation, long-term graft function) and at the collective level (respectfor the principle of utility) Desensitization is sufficiently effective such that offering a graftto a highly sensitized subject does not shorten the graft’s lifespan compared to that expectedin a non-sensitized subject. Tocilizumab is a relevant candidate because of the centralityof IL-6 in the regulation of a cellular and humoral immune response. When used as asingle agent without any other DES treatment, tocilizumab reduces anti-HLA antibodies,but this is not sufficient to allow transplantation. However, the TCZ-induced blockage ofB-cell maturation suggests that its addition to the standard DES protocol could improvethe long-term outcome of HLA-incompatible transplants by decreasing post-transplantantibody rebound. The continuation of TCZ after transplantation could then be justified todecrease the risk of humoral rejection. The efficacy and safety of such a procedure remainto be demonstrated in a study that compares this strategy to the standard DES protocol.
Author Contributions: J.W. conducted the literature screening and the literature analysis, in additionto writing the initial draft. J.N. and T.J. conceptualized the study. Review and editing were conductedby P.M. and L.R. All authors have read and agreed to the published version of the manuscript.
Funding: This research received no external funding.
Conflicts of Interest: The authors declare no conflict of interest.
References
1. Port, F.K.; Wolfe, R.A.; Mauger, E.A.; Berling, D.P.; Jiang, K. Comparison of Survival Probabilities for Dialysis Patients vsCadaveric Renal Transplant Recipients. JAMA 1993, 270, 1339–1343. [CrossRef]
2. Laupacis, A.; Keown, P.; Pus, N.; Krueger, H.; Ferguson, B.; Wong, C.; Muirhead, N. A study of the quality of life and cost-utilityof renal transplantation. Kidney Int. 1996, 50, 235–242. [CrossRef]
3. Wong, G.; Howard, K.; Chapman, J.R.; Chadban, S.; Cross, N.; Tong, A.; Webster, A.; Craig, J. Comparative Survival and EconomicBenefits of Deceased Donor Kidney Transplantation and Dialysis in People with Varying Ages and Co-Morbidities. PLoS ONE2012, 7, e29591. [CrossRef]
4. Jordan, S.C.; Tyan, D.; Stablein, D.; McIntosh, M.; Rose, S.; Vo, A.; Toyoda, M.; Davis, C.; Shapiro, R.; Adey, D.; et al. Evaluation ofIntravenous Immunoglobulin as an Agent to Lower Allosensitization and Improve Transplantation in Highly Sensitized AdultPatients with End-Stage Renal Disease: Report of the NIH IG02 Trial. J. Am. Soc. Nephrol. 2004, 15, 3256–3262. [CrossRef]
5. Vo, A.A.; Choi, J.; Cisneros, K.; Reinsmoen, N.; Haas, M.; Ge, S.; Toyoda, M.; Kahwaji, J.; Peng, A.; Villicana, R.; et al. Benefits ofRituximab Combined with Intravenous Immunoglobulin for Desensitization in Kidney Transplant Recipients. Transplantation2014, 98, 312–319. [CrossRef]
6. Loupy, A.; Suberbielle-Boissel, C.; Zuber, J.; Anglicheau, D.; Timsit, M.-O.; Martinez, F.; Thervet, E.; Bruneval, P.; Charron, D.;Hill, G.S.; et al. Combined Posttransplant Prophylactic IVIg/Anti-CD 20/Plasmapheresis in Kidney Recipients with PreformedDonor-Specific Antibodies: A Pilot Study. Transplantation 2010, 89, 1403–1410. [CrossRef] [PubMed]
7. Montgomery, R.A.; Lonze, B.E.; King, K.E.; Kraus, E.S.; Kucirka, L.M.; Locke, J.E. Desensitization in HLA-incompatible kidneyrecipients and survival. N. Engl. J. Med. 2011, 365, 318. [CrossRef] [PubMed]
81
J. Clin. Med. 2021, 10, 4359
8. Orandi, B.J.; Luo, X.; Massie, A.B.; Garonzik-Wang, J.M.; Lonze, B.; Ahmed, R.; Van Arendonk, K.J.; Stegall, M.D.; Jordan, S.C.;Oberholzer, J.; et al. Survival Benefit with Kidney Transplants from HLA-Incompatible Live Donors. N. Engl. J. Med. 2016, 374,940–950. [CrossRef] [PubMed]
9. Manook, M.; Koeser, L.; Ahmed, Z.; Robb, M.; Johnson, R.; Shaw, O.; Kessaris, N.; Dorling, A.; Mamode, N. Post-listing survivalfor highly sensitised patients on the UK kidney transplant waiting list: A matched cohort analysis. Lancet 2017, 389, 727–734.[CrossRef]
10. Perry, D.K.; Burns, J.M.; Pollinger, H.S.; Amiot, B.P.; Gloor, J.M.; Gores, G.J.; Stegall, M.D. Proteasome Inhibition Causes Apoptosisof Normal Human Plasma Cells Preventing Alloantibody Production. Am. J. Transplant. 2009, 9, 201. [CrossRef]
11. Vo, A.A.; Choi, J.; Kim, I.; Louie, S.; Cisneros, K.; Kahwaji, J.; Toyoda, M.; Ge, S.; Haas, M.; Puliyanda, D.; et al. A Phase I/IITrial of the Interleukin-6 Receptor–Specific Humanized Monoclonal (Tocilizumab) + Intravenous Immunoglobulin in Difficult toDesensitize Patients. Transplantation 2015, 99, 2356–2363. [CrossRef]
12. Kwun, J.; Burghuber, C.; Manook, M.; Iwakoshi, N.; Gibby, A.; Hong, J.J.; Knechtle, S. Humoral Compensation after BortezomibTreatment of Allosensitized Recipients. J. Am. Soc. Nephrol. 2017, 28, 1991–1996. [CrossRef] [PubMed]
13. Gonzales, M.A.M.; Gandhi, M.J.; Schinstock, C.A.; Moore, N.A.; Smith, B.H.; Braaten, N.Y.; Stegall, M.D. 32 Doses of Bortezomibfor Desensitization Is Not Well Tolerated and Is Associated with Only Modest Reductions in Anti-HLA Antibody. Transplantation2017, 101, 1222–1227. [CrossRef] [PubMed]
14. Guthoff, M.; Schmid-Horch, B.; Weisel, K.C.; Häring, H.-U.; Königsrainer, A.; Heyne, N. Proteasome inhibition by bortezomib:Effect on HLA-antibody levels and specificity in sensitized patients awaiting renal allograft transplantation. Transpl. Immunol.2012, 26, 171–175. [CrossRef]
15. Tanaka, T.; Kishimoto, T. Targeting Interleukin-6: All the Way to Treat Autoimmune and Inflammatory Diseases. Int. J. Biol. Sci.2012, 8, 1227–1236. [CrossRef]
16. Hirano, T.; Yasukawa, K.; Harada, H.; Taga, T.; Watanabe, Y.; Matsuda, T.; Kashiwamura, S.-I.; Nakajima, K.; Koyama, K.;Iwamatsu, A.; et al. Complementary DNA for a novel human interleukin (BSF-2) that induces B lymphocytes to produceimmunoglobulin. Nature 1986, 324, 73–76. [CrossRef]
17. Kishimoto, T. IL-6: From its discovery to clinical applications. Int. Immunol. 2010, 22, 347–352. [CrossRef] [PubMed]18. Dienz, O.; Eaton, S.M.; Bond, J.P.; Neveu, W.; Moquin, D.; Noubade, R.; Briso, E.M.; Charland, C.; Leonard, W.J.; Ciliberto, G.;
et al. The induction of antibody production by IL-6 is indirectly mediated by IL-21 produced by CD4+ T cells. J. Exp. Med. 2009,206, 69–78. [CrossRef] [PubMed]
19. Chavele, K.-M.; Merry, E.; Ehrenstein, M.R. Cutting Edge: Circulating Plasmablasts Induce the Differentiation of Human TFollicular Helper Cells via IL-6 Production. J. Immunol. 2015, 194, 2482–2485. [CrossRef]
20. Jones, S.A. Directing Transition from Innate to Acquired Immunity: Defining a Role for IL-6. J. Immunol. 2005, 175, 3463–3468.[CrossRef] [PubMed]
21. Roll, P.; Muhammad, K.; Schumann, M.; Kleinert, S.; Einsele, H.; Dörner, T.; Tony, H.-P. In vivo effects of the anti-interleukin-6receptor inhibitor tocilizumab on the B cell compartment. Arthritis Rheum. 2011, 63, 1255–1264. [CrossRef]
22. Muhammad, K.; Roll, P.; Seibold, T.; Kleinert, S.; Einsele, H.; Dörner, T.; Tony, H.-P. Impact of IL-6 receptor inhibition on humanmemory B cells in vivo: Impaired somatic hypermutation in preswitch memory B cells and modulation of mutational targeting inmemory B cells. Ann. Rheum. Dis. 2011, 70, 1507–1510. [CrossRef] [PubMed]
23. Cassese, G.; Arce, S.; Hauser, A.E.; Lehnert, K.; Moewes, B.; Mostarac, M.; Muehlinghaus, G.; Szyska, M.; Radbruch, A.; Manz,R.A. Plasma Cell Survival Is Mediated by Synergistic Effects of Cytokines and Adhesion-Dependent Signals. J. Immunol. 2003,171, 1684–1690. [CrossRef] [PubMed]
24. Afzali, B.; Lombardi, G.; Lechler, R.I.; Lord, G. The role of T helper 17 (Th17) and regulatory T cells (Treg) in human organtransplantation and autoimmune disease. Clin. Exp. Immunol. 2007, 148, 32–46. [CrossRef] [PubMed]
25. Bettelli, E.; Carrier, Y.; Gao, W.; Korn, T.; Strom, T.B.; Oukka, M.; Weiner, H.L.; Kuchroo, V.K. Reciprocal developmental pathwaysfor the generation of pathogenic effector TH17 and regulatory T cells. Nature 2006, 441, 235–238. [CrossRef]
26. Faust, S.M.; Lu, G.; Marini, B.L.; Zou, W.; Gordon, D.; Iwakura, Y.; Laouar, Y.; Bishop, D.K. Role of T Cell TGFβ Signaling andIL-17 in Allograft Acceptance and Fibrosis Associated with Chronic Rejection. J. Immunol. 2009, 183, 7297–7306. [CrossRef]
27. Van Kooten, C.; Boonstra, J.G.; Paape, M.E.; Fossiez, F.; Banchereau, J.; Lebecque, S. Interleukin-17 activates human renal epithelialcells in vitro and is expressed during renal allograft rejection. J. Am. Soc. Nephrol. 1998, 9, 1526–1534. [CrossRef]
28. Kimura, A.; Kishimoto, T. IL-6: Regulator of Treg/Th17 balance. Eur. J. Immunol. 2010, 40, 1830–1835. [CrossRef]29. Sarantopoulos, A.; Tselios, K.; Gkougkourelas, I.; Pantoura, M.; Georgiadou, A.-M.; Boura, P. Tocilizumab Treatment Leads to
a Rapid and Sustained Increase in Treg Cell Levels in Rheumatoid Arthritis Patients: Comment on the Article by Thiolat et al.Arthritis Rheumatol. 2014, 66, 2638. [CrossRef]
30. Rochman, I.; Paul, W.E.; Ben-Sasson, S.Z. IL-6 Increases Primed Cell Expansion and Survival. J. Immunol. 2005, 174, 4761–4767.[CrossRef]
31. Nakaoka, Y.; Isobe, M.; Tanaka, Y.; Ishii, T.; Ooka, S.; Niiro, H.; Tamura, N.; Banno, S.; Yoshifuji, H.; Sakata, Y.; et al. Long-termefficacy and safety of tocilizumab in refractory Takayasu arteritis: Final results of the randomized controlled phase 3 TAKT study.Rheumatology 2020, 59, 2427–2434. [CrossRef] [PubMed]
82
J. Clin. Med. 2021, 10, 4359
32. Illei, G.G.; Shirota, Y.; Yarboro, C.H.; Daruwalla, J.; Tackey, E.; Takada, K.; Fleisher, T.; Balow, J.E.; Lipsky, P.E. Tocilizumab insystemic lupus erythematosus: Data on safety, preliminary efficacy, and impact on circulating plasma cells from an open-labelphase I dosage-escalation study. Arthritis Rheum. 2010, 62, 542–552. [CrossRef] [PubMed]
33. Calderón-Goercke, M.; Castañeda, S.; Aldasoro, V.; Villa, I.; Prieto-Peña, D.; Atienza-Mateo, B.; Patiño, E.; Moriano, C.; Romero-Yuste, S.; Narvaez, J.; et al. Tocilizumab in giant cell arteritis: Differences between the GiACTA trial and a multicentre series ofpatients from the clinical practice. Clin. Exp. Rheumatol. 2020, 38 (Suppl. 124), 32441643.
34. Zhang, C.; Zhang, M.; Qiu, W.; Ma, H.; Zhang, X.; Zhu, Z.; Yang, C.-S.; Jia, D.; Zhang, T.-X.; Yuan, M.; et al. Safety andefficacy of tocilizumab versus azathioprine in highly relapsing neuromyelitis optica spectrum disorder (TANGO): An open-label,multicentre, randomised, phase 2 trial. Lancet Neurol. 2020, 19, 391–401. [CrossRef]
35. Ganetsky, A.; Frey, N.V.; Hexner, E.O.; Loren, A.W.; Gill, S.I.; Luger, S.M.; Mangan, J.K.; Martin, M.E.; Babushok, D.V.; Drobyski,W.R.; et al. Tocilizumab for the treatment of severe steroid-refractory acute graft-versus-host disease of the lower gastrointestinaltract. Bone Marrow Transplant. 2019, 54, 212–217. [CrossRef]
36. Salama, C.; Han, J.; Yau, L.; Reiss, W.G.; Kramer, B.; Neidhart, J.D.; Criner, G.J.; Kaplan-Lewis, E.; Baden, R.; Pandit, L.; et al.Tocilizumab in Patients Hospitalized with COVID-19 Pneumonia. N. Engl. J. Med. 2021, 384, 20–30. [CrossRef]
37. Choi, J.; Aubert, O.; Vo, A.; Loupy, A.; Haas, M.; Puliyanda, D.; Kim, I.; Louie, S.; Kang, A.; Peng, A.; et al. Assessment ofTocilizumab (Anti-Interleukin-6 Receptor Monoclonal) as a Potential Treatment for Chronic Antibody-Mediated Rejection andTransplant Glomerulopathy in HLA-Sensitized Renal Allograft Recipients. Arab. Archaeol. Epigr. 2017, 17, 2381–2389. [CrossRef]
38. Nishimoto, N.; Terao, K.; Mima, T.; Nakahara, H.; Takagi, N.; Kakehi, T. Mechanisms and pathologic significances in increasein serum interleukin-6 (IL-6) and soluble IL-6 receptor after administration of an anti–IL-6 receptor antibody, tocilizumab, inpatients with rheumatoid arthritis and Castleman disease. Blood 2008, 112, 3959–3964. [CrossRef]
39. Doberer, K.; Duerr, M.; Halloran, P.F.; Eskandary, F.; Budde, K.; Regele, H.; Reeve, J.; Borski, A.; Kozakowski, N.; Reindl-Schwaighofer, R.; et al. A Randomized Clinical Trial of Anti–IL-6 Antibody Clazakizumab in Late Antibody-Mediated KidneyTransplant Rejection. J. Am. Soc. Nephrol. 2021, 32, 708–722. [CrossRef] [PubMed]
40. Massat, M.; Congy-Jolivet, N.; Hebral, A.; Esposito, L.; Marion, O.; Delas, A.; Colombat, M.; Faguer, S.; Kamar, N.; Del Bello, A.Do anti-IL-6R blockers have a beneficial effect in the treatment of antibody-mediated rejection resistant to standard therapy afterkidney transplantation? Am. J. Transplant. 2021, 21, 1641–1649. [CrossRef]
41. Lavacca, A.; Presta, R.; Gai, C.; Mella, A.; Gallo, E.; Camussi, G.; Abbasciano, I.; Barreca, A.; Caorsi, C.; Fop, F.; et al. Early effectsof first-line treatment with anti-interleukin-6 receptor antibody tocilizumab for chronic active antibody-mediated rejection inkidney transplantation. Clin. Transplant. 2020, 34, e13908. [CrossRef]
42. Pottebaum, A.A.; Venkatachalam, K.; Liu, C.; Brennan, D.C.; Murad, H.; Malone, A.F.; Alhamad, T. Efficacy and Safety ofTocilizumab in the Treatment of Acute Active Antibody-mediated Rejection in Kidney Transplant Recipients. Transplant. Direct2020, 6, e543. [CrossRef] [PubMed]
43. Chandran, S.; Leung, J.; Hu, C.; Laszik, Z.G.; Tang, Q.; Vincenti, F.G. Interleukin-6 blockade with tocilizumab increases Tregs andreduces T effector cytokines in renal graft inflammation: A randomized controlled trial. Am. J. Transplant. 2021, 21, 2543–2554.[CrossRef] [PubMed]
44. Kim, I.; Wu, G.; Chai, N.-N.; Klein, A.S.; Jordan, S. Anti–Interleukin 6 Receptor Antibodies Attenuate Antibody Recall Responsesin a Mouse Model of Allosensitization. Transplantation 2014, 98, 1262–1270. [CrossRef] [PubMed]
45. Wu, G.; Chai, N.; Kim, I.; Klein, A.; Jordan, S. Monoclonal anti-interleukin-6 receptor antibody attenuates donor-specific antibodyresponses in a mouse model of allosensitization. Transpl. Immunol. 2013, 28, 138–143. [CrossRef] [PubMed]
46. Daligault, M.; Bardy, B.; Noble, J.; Bourdin, A.; Masson, D.; Bennani, H.N.; Bugnazet, M.; Malvezzi, P.; Rostaing, L.; Jouve, T.Marginal Impact of Tocilizumab Monotherapy on Anti-HLA Alloantibodies in Highly Sensitized Kidney Transplant Candidates.Transplant. Direct 2021, 7, e690. [CrossRef]
47. Jouve, T.; Laheurte, C.; Noble, J.; Weinhard, J.; Daligault, M.; Renaudin, A.; Bennani, H.N.; Masson, D.; Gravelin, E.; Bugnazet,M.; et al. Immune responses following tocilizumab therapy to desensitize HLA-sensitized kidney transplant candidates. Am. J.Transplant. 2021. [CrossRef]
48. Noble, J.; Metzger, A.; Bennani, H.N.; Daligault, M.; Masson, D.; Terrec, F.; Imerzoukene, F.; Bardy, B.; Fiard, G.; Marlu, R.;et al. Apheresis Efficacy and Tolerance in the Setting of HLA-Incompatible Kidney Transplantation. J. Clin. Med. 2021, 10, 1316.[CrossRef]
49. Vo, A.; Ammerman, N.; Huang, E.; Toyoda, M.; Ge, S.; Peng, A.; Najjar, R.; Williamson, S.; Myers, C.; Sethi, S.; et al. Clazakizumab®
(Anti-Il-6) For Desensitization of Highly-Hla Sensitized Patients Awaiting Kidney Transplant (Nct03380962). Transplantation 2020,104, S104–S105. [CrossRef]
50. Jordan, S.; Ge, S.; Ammerman, N.; Toyoda, M.; Huang, E.; Peng, A.; Najjar, R.; Sethi, S.; Williamson, S.; Myers, K.; et al.Clazakizumab (Anti-Il-6) Induces Foxp3+ Tregs In Highly Hla Sensitized Patients Receiving HLAI Kidney Transplantation(NCT03380962). Transplantation 2020, 104, S105. [CrossRef]
83

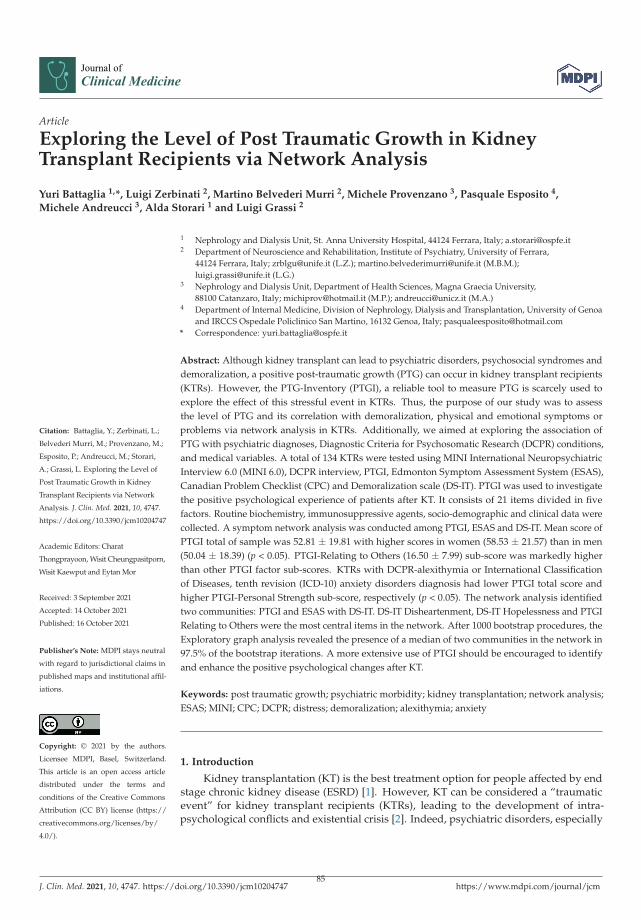
Journal of
Clinical Medicine
Article
Exploring the Level of Post Traumatic Growth in KidneyTransplant Recipients via Network Analysis
Yuri Battaglia 1,*, Luigi Zerbinati 2, Martino Belvederi Murri 2, Michele Provenzano 3, Pasquale Esposito 4,
Michele Andreucci 3, Alda Storari 1 and Luigi Grassi 2
Citation: Battaglia, Y.; Zerbinati, L.;
Belvederi Murri, M.; Provenzano, M.;
Esposito, P.; Andreucci, M.; Storari,
A.; Grassi, L. Exploring the Level of
Post Traumatic Growth in Kidney
Transplant Recipients via Network
Analysis. J. Clin. Med. 2021, 10, 4747.
https://doi.org/10.3390/jcm10204747
Academic Editors: Charat
Thongprayoon, Wisit Cheungpasitporn,
Wisit Kaewput and Eytan Mor
Received: 3 September 2021
Accepted: 14 October 2021
Published: 16 October 2021
Publisher’s Note: MDPI stays neutral
with regard to jurisdictional claims in
published maps and institutional affil-
iations.
Copyright: © 2021 by the authors.
Licensee MDPI, Basel, Switzerland.
This article is an open access article
distributed under the terms and
conditions of the Creative Commons
Attribution (CC BY) license (https://
creativecommons.org/licenses/by/
4.0/).
1 Nephrology and Dialysis Unit, St. Anna University Hospital, 44124 Ferrara, Italy; [email protected] Department of Neuroscience and Rehabilitation, Institute of Psychiatry, University of Ferrara,
44124 Ferrara, Italy; [email protected] (L.Z.); [email protected] (M.B.M.);[email protected] (L.G.)
3 Nephrology and Dialysis Unit, Department of Health Sciences, Magna Graecia University,88100 Catanzaro, Italy; [email protected] (M.P.); [email protected] (M.A.)
4 Department of Internal Medicine, Division of Nephrology, Dialysis and Transplantation, University of Genoaand IRCCS Ospedale Policlinico San Martino, 16132 Genoa, Italy; [email protected]
* Correspondence: [email protected]
Abstract: Although kidney transplant can lead to psychiatric disorders, psychosocial syndromes anddemoralization, a positive post-traumatic growth (PTG) can occur in kidney transplant recipients(KTRs). However, the PTG-Inventory (PTGI), a reliable tool to measure PTG is scarcely used toexplore the effect of this stressful event in KTRs. Thus, the purpose of our study was to assessthe level of PTG and its correlation with demoralization, physical and emotional symptoms orproblems via network analysis in KTRs. Additionally, we aimed at exploring the association ofPTG with psychiatric diagnoses, Diagnostic Criteria for Psychosomatic Research (DCPR) conditions,and medical variables. A total of 134 KTRs were tested using MINI International NeuropsychiatricInterview 6.0 (MINI 6.0), DCPR interview, PTGI, Edmonton Symptom Assessment System (ESAS),Canadian Problem Checklist (CPC) and Demoralization scale (DS-IT). PTGI was used to investigatethe positive psychological experience of patients after KT. It consists of 21 items divided in fivefactors. Routine biochemistry, immunosuppressive agents, socio-demographic and clinical data werecollected. A symptom network analysis was conducted among PTGI, ESAS and DS-IT. Mean score ofPTGI total of sample was 52.81 ± 19.81 with higher scores in women (58.53 ± 21.57) than in men(50.04 ± 18.39) (p < 0.05). PTGI-Relating to Others (16.50 ± 7.99) sub-score was markedly higherthan other PTGI factor sub-scores. KTRs with DCPR-alexithymia or International Classificationof Diseases, tenth revision (ICD-10) anxiety disorders diagnosis had lower PTGI total score andhigher PTGI-Personal Strength sub-score, respectively (p < 0.05). The network analysis identifiedtwo communities: PTGI and ESAS with DS-IT. DS-IT Disheartenment, DS-IT Hopelessness and PTGIRelating to Others were the most central items in the network. After 1000 bootstrap procedures, theExploratory graph analysis revealed the presence of a median of two communities in the network in97.5% of the bootstrap iterations. A more extensive use of PTGI should be encouraged to identifyand enhance the positive psychological changes after KT.
Keywords: post traumatic growth; psychiatric morbidity; kidney transplantation; network analysis;ESAS; MINI; CPC; DCPR; distress; demoralization; alexithymia; anxiety
1. Introduction
Kidney transplantation (KT) is the best treatment option for people affected by endstage chronic kidney disease (ESRD) [1]. However, KT can be considered a “traumaticevent” for kidney transplant recipients (KTRs), leading to the development of intra-psychological conflicts and existential crisis [2]. Indeed, psychiatric disorders, especially
J. Clin. Med. 2021, 10, 4747. https://doi.org/10.3390/jcm10204747 https://www.mdpi.com/journal/jcm85
J. Clin. Med. 2021, 10, 4747
anxiety and depression, are presented in KTRs with a prevalence from 10% to 40%, de-pending on the measures used, such as the International Classification of Diseases (ICD)or the Diagnostic and Statistical manual for Mental disorders (DSM) and cut-off pointsadopted [3–5].
Furthermore, other clinically significant psychosocial syndromes, not diagnosablewith traditional psychiatric tools, were found in about 65% of KTRs. More specifically,abnormal illness behavior, irritability, alexithymia and somatization were the most frequentsyndromes assessed by Diagnostic Criteria for Psychosomatic Research (DCPR), a usefulinterview for identifying sub-threshold or undetected syndromes [6].
Recently, demoralization, a psychological syndrome distinct from depression [7],has been diagnosed in a high percentage of medically ill patients [8], particularly witha high prevalence of up to 86% in KTRs [9]. That is a condition described as a state ofexistential distress, characterized by loss of meaning and purpose in life, hopelessness andhelplessness and feelings of “being trapped” because of persistently being unable to copewith a particular stressful situation [10].
On the other hand, the stressful event of KT can promote positive psychologicalchanges, which are at the basis of concept of post-traumatic growth (PTG). According toTedeschi and Calhun [11], PTG is defined as a positive cognitive effect due to an extremecrisis, and not merely a coping mechanism in ordinary stress condition. Basically, PTG,induced by the activation of latent intrapersonal resources of the subject, might increasethe level of mental functioning after a serious experience. In order to assess and screenthe PTG, a specific psychometric tool, PTG Inventory (PTGI) has been developed [12].It is able to capture five psychological dimensions: relating to others, new possibilities,personal strength, spiritual change and appreciation of life. Notably, although PTGI hasbeen extensively used in traumatized healthy people [13], it has been also validated inseveral settings of medicine, such as psycho-oncology [14], neurology [15], hematopoieticstem cell [16] or liver transplantation [17] and dialysis [18]. Demoralization and PTG canbe conceptualized as opposite reactions to a stressful event and, to date, little is knownabout the relationship between these two dimensions [9]. Thus, a network approach topsychopathology represents an intriguing option to investigate the associations betweenthese two dimensions [19,20]. Rather than seeing mental disorders as the cause of differentsymptoms, this theory conceptualizes them as systems arising from the complex andmutual interaction of different symptoms [21,22]. This approach can be furtherly expandedwith the use of Exploratory Graph Analysis (EGA) [23], allowing the identification ofclusters of symptoms (“communities”) that are more related to each other.
To date, only few studies [24,25] have been focused on the use of PTGI in KTRs;thus, the primary aim of our study was to evaluate the levels of PTG and to examine therelationship of PTG dimensions with demoralization, physical and emotional symptoms orproblems via network analysis in KTRs. The secondary aim was to assess any associationof the PTGI with psychiatric diagnoses, DCPR conditions and medical variables.
2. Materials and Methods
Ongoing KTRs, followed by the Nephrology Unit of the Ferrara University-Hospital,were enrolled in the study, during one of their routine follow up nephrological visits.Inclusion criteria were: (1) being a recipient of kidney from cadaveric or living donor and(2) age ≥ 18 years. Exclusion criteria were: (1) Karnofsky Performance Status Scale (KPS),indicating an insufficient level of autonomy (score < 50), and (2) presence of cognitivedisorders (Mini Mental State Examination < 24). All patients gave their written informedconsent, and the research protocol obtained the ethical approval from the Hospital EthicsCommittee for Human Research (Code: 151297, on 17 March 2016). The procedures agreedwith the Declaration of Helsinki. The same psychiatrist of the Consultation-Liaison Psy-chiatric Service, University Psychiatry Unit of the same Hospital tested each KTR. Twoindividual interviews, such as Mini-International Neuropsychiatric Interview (MINI6.0)and Diagnostic Criteria for Psychosomatic Research Interview (DCPR), as well as four
86
J. Clin. Med. 2021, 10, 4747
self-report tools, including Post-Traumatic Growth Inventory (PTGI), Edmonton SymptomAssessment System (ESAS-Revised) and Canadian Problem Checklist (CPC) within theCOMPASS (Comprehensive Problem and Symptom Screening) tool [26] and Italian versionof Demoralization Scale (DS-IT), were administered.
2.1. PTGI
It is a screening measurement tool used to investigate the positive changes experiencedin the aftermath of a traumatic event [27]. It consists of 21 items divided in five factors: NewPossibilities, Relating to Others, Personal Strength, Spiritual Change and Appreciation ofLife. Each item scored on 6-point Likert scale from 0 (I did not experience this change as aresult of my crisis) to 5 (I experienced this change to a very great degree as a result of mycrisis). A total score of posttraumatic growth was calculated [28].
2.2. Other Instruments
• The Mini International Neuropsychiatric Interview (MINI 6.0) [29,30] is a diagnosticinterview, expensively validated for DSM diagnoses and for ICD-10 diagnoses. Inorder to formulate a psychiatric diagnosis, the ICD-10 classification was used inthis study.
• The Diagnostic Criteria for Psychosomatic Research Structured Interview (DCPR-SI) [31,32] is a semi-structured interview used to evaluate a set of 12 syndromesgrouped in 3 different clusters: abnormal illness behavior (i.e., disease phobia, thanato-phobia, health anxiety, illness denial); somatization and its different expressions (i.e.,persistent somatization, functional somatic symptoms secondary to a psychiatric dis-order, conversion symptoms, anniversary reaction); irritability (i.e., irritable mood andtype A behavior), and in two clinical constructs (i.e., demoralization and alexithymia).It is able to identify psychological dimensions to a much greater extent than the DSMor ICD criteria [6,33].
• The Edmonton Symptom Assessment System (ESAS-Revised) [34,35] is a reliableassessment tool to explore the severity of six physical (i.e., pain, tiredness, nausea,drowsiness, lack of appetite, shortness of breath), three psychological (i.e., depression,anxiety, feeling of not being well) and one optional symptom (i.e., emotional distresscorresponding to the Distress Thermometer) [36,37]. The Global Distress score (ESAS-TOTAL) was obtained by summing up all the scores on the single ESAS symptoms.Analogously, a physical distress sub-score (ESAS-PHYS) and a psychological distresssub-score (ESAS-EMOTIONAL) were computed as a sum of scores for the six phys-ical symptoms and for the four psychological symptoms, respectively. The Italianversion shows an acceptable level of validity and good psychometric properties inKTRs [38,39].
• The Canadian Problem Checklist (CPC) [40] is a useful instrument used to screena list of 21 problems the patient has to deal with. It is divided into six categories(practical, social/family, emotional, spiritual, informational and physical problems)and the severity of each problem is rated in a yes/no (0–1) format.
• The Italian Version of the Demoralization Scale (DS-IT) [41] is a widely valid tool formeasuring the demoralization in medical setting and also more recently in KTRs, overthe past 2 weeks [9]. It consists in 24 items which compose four subscales: loss ofmeaning and purpose, dysphoria, disheartenment, and sense of failure. Each itemranges on 6-point Likert scale (0 = never; 5 = all the time) and the sum of the singlesubscales scores provides a total score.
Demographic data, clinical characteristics and routine biochemistry, determined usingstandard auto analyzer techniques, were collected.
2.3. Statistical Analysis
Categorical variables were shown as frequencies (%). Continuous variables werereported as either mean ± standard deviation (SD) or median and interquartile range
87
J. Clin. Med. 2021, 10, 4747
(IQR) based on their distribution. T-test and chi-square test were employed to determinethe associations of PTGI groups with DCPR/ICD-10 diagnosis, ESAS/CPC scores andclinical variables.
Exploratory Graph Analysis
Exploratory graph analysis (EGA) was used to estimate the number of dimensions inmultivariate data using undirected network models [23]. EGA first applied a network esti-mation method followed by a community detection algorithm for weighted networks [42].
• Network Estimation Method.
This study applied the graphical least absolute shrinkage and selection operator [43],which estimated a Gaussian Graphical Model [44] where nodes (circles) represented vari-ables and edges (lines) represented the conditional dependence (or partial correlations)between nodes given all other nodes in the network. The ratio of the minimum andmaximum λλ was set to 0.1 in order to control the sparsity of the network in the LASSO.EBICglasso was applied using the qgraph package in R and γγ was set to 0.5 [45]
• Community Detection Algorithm.
The Walktrap algorithm was applied to detect the community and was implementedusing the igraph package in R [46].
• Data Analysis.
EGA was applied using the EGAnet package (version 0.9.8) in R (version 4.0.3) and itsassociated results were visualized using the GGally (version 2.1.1), ggplot2 (version 3.3.3),and qgraph (version 1.6.5) packages in R [47].
• Bootstrap Exploratory Graph Analysis.
Bootstrap exploratory graph analysis (bootEGA) was used to estimate and to evaluatethe dimensional structure estimated using EGA. The parametric bootstrap procedure wasimplemented in this study. The procedure begun by estimating a network using EGAand then generating new replicate data from a multivariate normal distribution (with thesame number of cases as the original data). EGA was then applied to the replicate data,continuing iteratively until the desired number of samples was achieved (e.g., 1000). Theresult was a sampling distribution of EGA networks. From this sampling distribution,descriptive statistics, namely median number of dimensions, 95% confidence intervalsaround the median and the number of times a certain number of dimensions replicates,were obtained. In addition, a median (or typical) network structure was estimated bycomputing the median value of each edge across the replicate networks, resulting ina single network. Such a network represented the “typical” network structure of thesampling distribution. The community detection algorithm was then applied, resultingin dimensions that would be expected for a typical network from the EGA samplingdistribution. BootEGA was applied using the EGAnet package (version 0.9.8) in R (version4.0.3) and its associated results were visualized using the GGally (version 2.1.1) and ggplot2(version 3.3.3) packages in R [48].
3. Results
3.1. Characteristics of the Sample
In total, 134 consecutive KTRs were included in this study; nine patients declinedto participate (six for work or family reasons and three because of health reasons) andnone was excluded. Ninety patients were men, and the average age was 56.1 (SD = 12)years. The median time since transplantation was 85 months (ranged from 34 months to178 months). Almost all patients (94%) received kidney from cadaveric donor and a shorttime in dialysis before KT (median = 22; IQR = 3–166 months) was found. More than halfof KTRs (83) were on triple antirejection agents, including steroids (84.3%), calcineurininhibitors (90.3%), mycophenolate (67.7%), mTOR inhibitors (8.3%), azathioprine (10.4%).
88
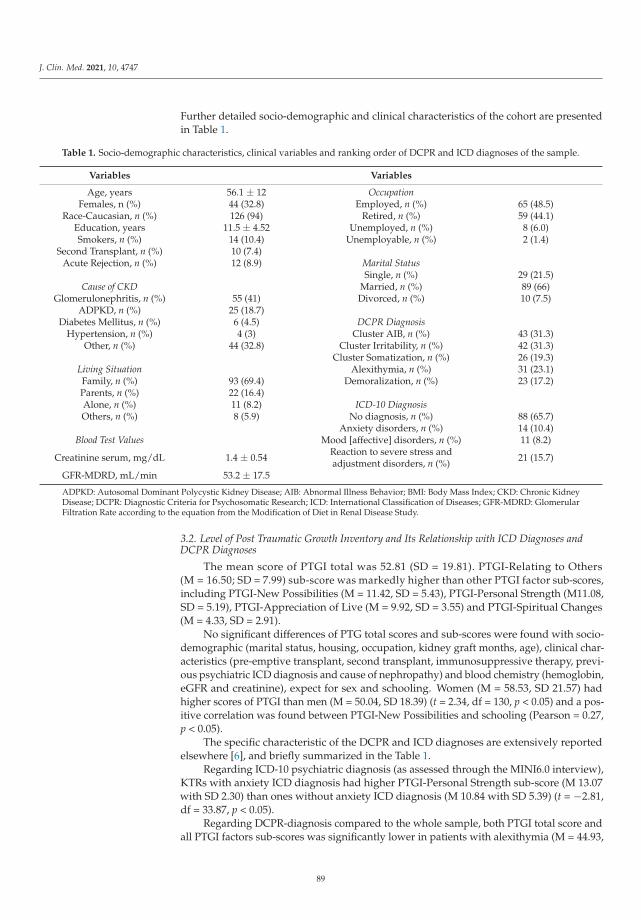
J. Clin. Med. 2021, 10, 4747
Further detailed socio-demographic and clinical characteristics of the cohort are presentedin Table 1.
Table 1. Socio-demographic characteristics, clinical variables and ranking order of DCPR and ICD diagnoses of the sample.
Variables Variables
Age, years 56.1 ± 12 OccupationFemales, n (%) 44 (32.8) Employed, n (%) 65 (48.5)
Race-Caucasian, n (%) 126 (94) Retired, n (%) 59 (44.1)Education, years 11.5 ± 4.52 Unemployed, n (%) 8 (6.0)Smokers, n (%) 14 (10.4) Unemployable, n (%) 2 (1.4)
Second Transplant, n (%) 10 (7.4)Acute Rejection, n (%) 12 (8.9) Marital Status
Single, n (%) 29 (21.5)Cause of CKD Married, n (%) 89 (66)
Glomerulonephritis, n (%) 55 (41) Divorced, n (%) 10 (7.5)ADPKD, n (%) 25 (18.7)
Diabetes Mellitus, n (%) 6 (4.5) DCPR DiagnosisHypertension, n (%) 4 (3) Cluster AIB, n (%) 43 (31.3)
Other, n (%) 44 (32.8) Cluster Irritability, n (%) 42 (31.3)Cluster Somatization, n (%) 26 (19.3)
Living Situation Alexithymia, n (%) 31 (23.1)Family, n (%) 93 (69.4) Demoralization, n (%) 23 (17.2)Parents, n (%) 22 (16.4)Alone, n (%) 11 (8.2) ICD-10 DiagnosisOthers, n (%) 8 (5.9) No diagnosis, n (%) 88 (65.7)
Anxiety disorders, n (%) 14 (10.4)Blood Test Values Mood [affective] disorders, n (%) 11 (8.2)
Creatinine serum, mg/dL 1.4 ± 0.54 Reaction to severe stress andadjustment disorders, n (%) 21 (15.7)
GFR-MDRD, mL/min 53.2 ± 17.5
ADPKD: Autosomal Dominant Polycystic Kidney Disease; AIB: Abnormal Illness Behavior; BMI: Body Mass Index; CKD: Chronic KidneyDisease; DCPR: Diagnostic Criteria for Psychosomatic Research; ICD: International Classification of Diseases; GFR-MDRD: GlomerularFiltration Rate according to the equation from the Modification of Diet in Renal Disease Study.
3.2. Level of Post Traumatic Growth Inventory and Its Relationship with ICD Diagnoses andDCPR Diagnoses
The mean score of PTGI total was 52.81 (SD = 19.81). PTGI-Relating to Others(M = 16.50; SD = 7.99) sub-score was markedly higher than other PTGI factor sub-scores,including PTGI-New Possibilities (M = 11.42, SD = 5.43), PTGI-Personal Strength (M11.08,SD = 5.19), PTGI-Appreciation of Live (M = 9.92, SD = 3.55) and PTGI-Spiritual Changes(M = 4.33, SD = 2.91).
No significant differences of PTG total scores and sub-scores were found with socio-demographic (marital status, housing, occupation, kidney graft months, age), clinical char-acteristics (pre-emptive transplant, second transplant, immunosuppressive therapy, previ-ous psychiatric ICD diagnosis and cause of nephropathy) and blood chemistry (hemoglobin,eGFR and creatinine), expect for sex and schooling. Women (M = 58.53, SD 21.57) hadhigher scores of PTGI than men (M = 50.04, SD 18.39) (t = 2.34, df = 130, p < 0.05) and a pos-itive correlation was found between PTGI-New Possibilities and schooling (Pearson = 0.27,p < 0.05).
The specific characteristic of the DCPR and ICD diagnoses are extensively reportedelsewhere [6], and briefly summarized in the Table 1.
Regarding ICD-10 psychiatric diagnosis (as assessed through the MINI6.0 interview),KTRs with anxiety ICD diagnosis had higher PTGI-Personal Strength sub-score (M 13.07with SD 2.30) than ones without anxiety ICD diagnosis (M 10.84 with SD 5.39) (t = −2.81,df = 33.87, p < 0.05).
Regarding DCPR-diagnosis compared to the whole sample, both PTGI total score andall PTGI factors sub-scores was significantly lower in patients with alexithymia (M = 44.93,
89
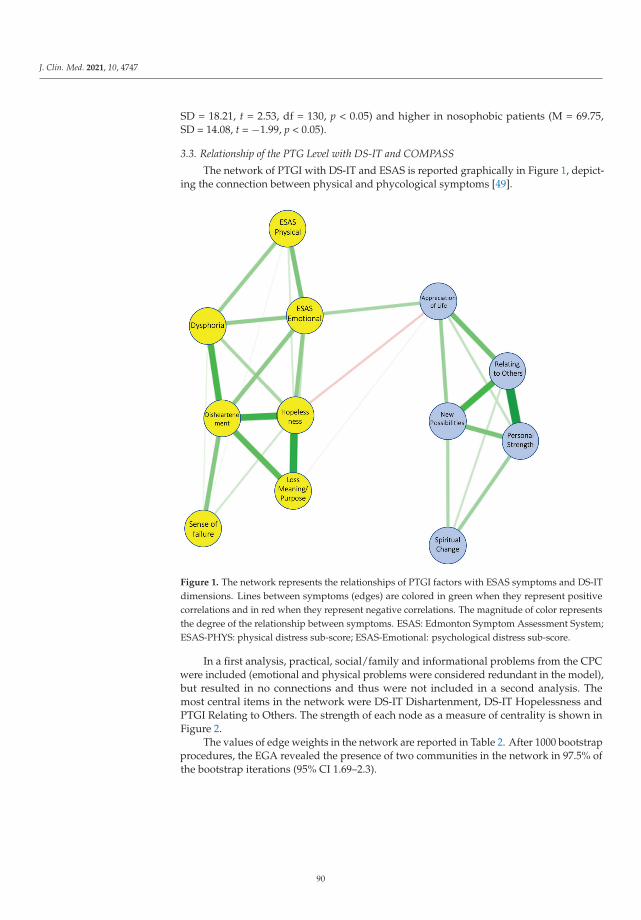
J. Clin. Med. 2021, 10, 4747
SD = 18.21, t = 2.53, df = 130, p < 0.05) and higher in nosophobic patients (M = 69.75,SD = 14.08, t = −1.99, p < 0.05).
3.3. Relationship of the PTG Level with DS-IT and COMPASS
The network of PTGI with DS-IT and ESAS is reported graphically in Figure 1, depict-ing the connection between physical and phycological symptoms [49].
Figure 1. The network represents the relationships of PTGI factors with ESAS symptoms and DS-ITdimensions. Lines between symptoms (edges) are colored in green when they represent positivecorrelations and in red when they represent negative correlations. The magnitude of color representsthe degree of the relationship between symptoms. ESAS: Edmonton Symptom Assessment System;ESAS-PHYS: physical distress sub-score; ESAS-Emotional: psychological distress sub-score.
In a first analysis, practical, social/family and informational problems from the CPCwere included (emotional and physical problems were considered redundant in the model),but resulted in no connections and thus were not included in a second analysis. Themost central items in the network were DS-IT Dishartenment, DS-IT Hopelessness andPTGI Relating to Others. The strength of each node as a measure of centrality is shown inFigure 2.
The values of edge weights in the network are reported in Table 2. After 1000 bootstrapprocedures, the EGA revealed the presence of two communities in the network in 97.5% ofthe bootstrap iterations (95% CI 1.69–2.3).
90
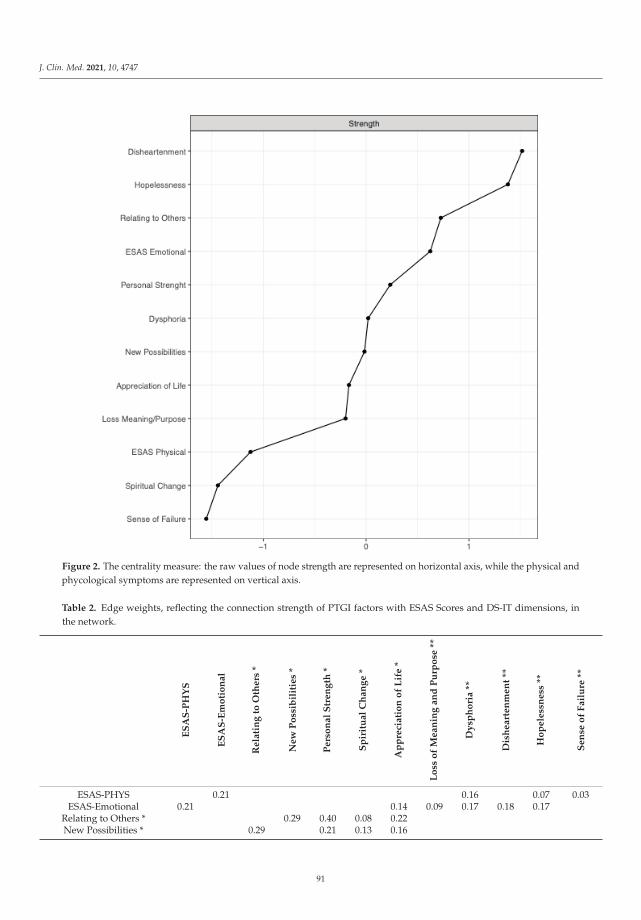
J. Clin. Med. 2021, 10, 4747
Figure 2. The centrality measure: the raw values of node strength are represented on horizontal axis, while the physical andphycological symptoms are represented on vertical axis.
Table 2. Edge weights, reflecting the connection strength of PTGI factors with ESAS Scores and DS-IT dimensions, inthe network.
ES
AS
-PH
YS
ES
AS
-Em
oti
on
al
Re
lati
ng
toO
the
rs*
Ne
wP
oss
ibil
itie
s*
Pe
rso
na
lS
tre
ng
th*
Sp
irit
ua
lC
ha
ng
e*
Ap
pre
cia
tio
no
fL
ife
*
Lo
sso
fM
ea
nin
ga
nd
Pu
rpo
se**
Dy
sph
ori
a**
Dis
he
art
en
me
nt
**
Ho
pe
less
ne
ss**
Se
nse
of
Fa
ilu
re**
ESAS-PHYS 0.21 0.16 0.07 0.03ESAS-Emotional 0.21 0.14 0.09 0.17 0.18 0.17
Relating to Others * 0.29 0.40 0.08 0.22New Possibilities * 0.29 0.21 0.13 0.16
91
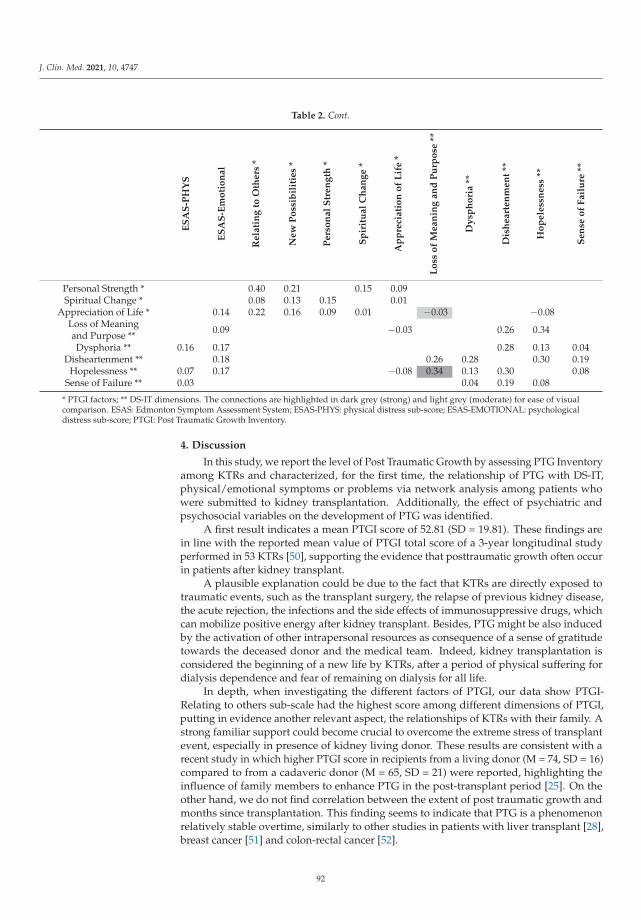
J. Clin. Med. 2021, 10, 4747
Table 2. Cont.
ES
AS
-PH
YS
ES
AS
-Em
oti
on
al
Re
lati
ng
toO
the
rs*
Ne
wP
oss
ibil
itie
s*
Pe
rso
na
lS
tre
ng
th*
Sp
irit
ua
lC
ha
ng
e*
Ap
pre
cia
tio
no
fL
ife
*
Lo
sso
fM
ea
nin
ga
nd
Pu
rpo
se**
Dy
sph
ori
a**
Dis
he
art
en
me
nt
**
Ho
pe
less
ne
ss**
Se
nse
of
Fa
ilu
re**
Personal Strength * 0.40 0.21 0.15 0.09Spiritual Change * 0.08 0.13 0.15 0.01
Appreciation of Life * 0.14 0.22 0.16 0.09 0.01 −0.03 −0.08Loss of Meaningand Purpose ** 0.09 −0.03 0.26 0.34
Dysphoria ** 0.16 0.17 0.28 0.13 0.04Disheartenment ** 0.18 0.26 0.28 0.30 0.19
Hopelessness ** 0.07 0.17 −0.08 0.34 0.13 0.30 0.08Sense of Failure ** 0.03 0.04 0.19 0.08
* PTGI factors; ** DS-IT dimensions. The connections are highlighted in dark grey (strong) and light grey (moderate) for ease of visualcomparison. ESAS: Edmonton Symptom Assessment System; ESAS-PHYS: physical distress sub-score; ESAS-EMOTIONAL: psychologicaldistress sub-score; PTGI: Post Traumatic Growth Inventory.
4. Discussion
In this study, we report the level of Post Traumatic Growth by assessing PTG Inventoryamong KTRs and characterized, for the first time, the relationship of PTG with DS-IT,physical/emotional symptoms or problems via network analysis among patients whowere submitted to kidney transplantation. Additionally, the effect of psychiatric andpsychosocial variables on the development of PTG was identified.
A first result indicates a mean PTGI score of 52.81 (SD = 19.81). These findings arein line with the reported mean value of PTGI total score of a 3-year longitudinal studyperformed in 53 KTRs [50], supporting the evidence that posttraumatic growth often occurin patients after kidney transplant.
A plausible explanation could be due to the fact that KTRs are directly exposed totraumatic events, such as the transplant surgery, the relapse of previous kidney disease,the acute rejection, the infections and the side effects of immunosuppressive drugs, whichcan mobilize positive energy after kidney transplant. Besides, PTG might be also inducedby the activation of other intrapersonal resources as consequence of a sense of gratitudetowards the deceased donor and the medical team. Indeed, kidney transplantation isconsidered the beginning of a new life by KTRs, after a period of physical suffering fordialysis dependence and fear of remaining on dialysis for all life.
In depth, when investigating the different factors of PTGI, our data show PTGI-Relating to others sub-scale had the highest score among different dimensions of PTGI,putting in evidence another relevant aspect, the relationships of KTRs with their family. Astrong familiar support could become crucial to overcome the extreme stress of transplantevent, especially in presence of kidney living donor. These results are consistent with arecent study in which higher PTGI score in recipients from a living donor (M = 74, SD = 16)compared to from a cadaveric donor (M = 65, SD = 21) were reported, highlighting theinfluence of family members to enhance PTG in the post-transplant period [25]. On theother hand, we do not find correlation between the extent of post traumatic growth andmonths since transplantation. This finding seems to indicate that PTG is a phenomenonrelatively stable overtime, similarly to other studies in patients with liver transplant [28],breast cancer [51] and colon-rectal cancer [52].
92
J. Clin. Med. 2021, 10, 4747
In relation to the network developed, the results reveal the presence of two distinctcommunities. More specifically, ESAS physical/emotional symptoms with DS-IT dimen-sions and PTGI factors were the first and second cluster, respectively. The symptomassociations are not equally strong in the network and the edges between symptoms withineach community were higher than edges between communities. DS-IT Appreciation oflife, DS-IT Hopelessness and ESAS-Emotional were the three symptoms which moderatelyconnected the two communities. These findings seem to indicate that KTRs with highburden of physiological symptoms, including distress, in the presence of low levels ofhopelessness, are able to develop a higher level of appreciation of life after the kidneytransplant. However, the relationship of distress with PTG is still debated in literature.Although many studies supported an inverse correlation between distress and PTG, thepresence of distress symptoms could enhance or reduce the changes in the personality-related domains on the base of the time elapsed since traumatic event and the type of event(acute vs. chronic disease) [53].
Furthermore, our data seem to suggest that interventions aimed to promote apprecia-tion of life could increase PTGI and decrease demoralization: interventions with a focus onvalued-living are gaining importance, as the two dimensions might have possible commonunderlying processes; also, valued living has been shown to be correlated with PTGI-Appreciation of Life [54]. Other approaches might include those derived from positivepsychology, like well-being therapy, which has been shown to increase PTGI in traumatizedpatients [55].
Other intriguing results emerged when the relationship of PTGI with ICD-10 wasassessed. Paradoxically, the diagnosis of ICD-10 anxiety was positively associated withhigh PTGI-Personal Strength score. This result might be interpreted by the fact that higherself-awareness to handle difficulties is induced by anxiety. This cognitive state could beconsidered as a positive response of patients to the new organ’s integration [56]. However,this finding is in contrast with a previous report in which a persistent state of anxiety, dueto the partial psychological integration of kidney, contributed to reduce the level of PTG.In addition, lower PTGI score was a significant predictor of graft rejection episodes at3 years in cadaveric kidney transplant recipients (Odds Ratio = 0.963, 95% CI = 0.929–0.999,p < 0.05). In other words, the higher the psychological growing after KT, the lower rates ofgraft rejection [49].
On the other hand, it is worth noting that the presence of DCPR alexithymia, shownin about one-quarter of KTRs and in almost two-third of KTRs with another DCPR diag-nosis [6], was a strong predictor of low PTGI score. Alexithymia is characterized by theinability to recognize and express own emotions [57]. This lack of symbolizing the feelings,a defense mechanism against a traumatic event as kidney transplant [58], could play a rolein reducing the development of positive changes after KT. These data are consistent withthe only other study, recently published, in which the levels of alexithymia, assessed byusing TAS20 questionnaire [59], were negatively and moderately associated with PTGItotal score and sub-scores, such as changes in self-perception and appreciation of life, incadaveric donor recipients [50].
The strength of this study is that it evaluated, in KTRs, the level of the post-traumaticgrowth level as well as its correlations with DS-IT and emotional symptoms, using PTGI andnetwork analysis, respectively. This research helps to promote the use of PTGI after the expe-rience of kidney transplantation, as proved in heart, lung and liver transplantation [60–62].Furthermore, the network analysis, a consolidated approach in psychopathology, representsan innovative technique in the kidney transplant research.
The limitations of our study are: (1) the small sample size of our population that doesnot allow us to generalize our results and (2) the lack of control group of patients withother kidney conditions. Further multicenter studies on larges cohort of KTRs could beconducted using a short form of PTGI [8,63,64], after its validation in the kidney transplantsetting. Furthermore, (3) in our cohort the main cause of CKD was quite different fromother investigated populations, however this variable seems not to be correlated with
93
J. Clin. Med. 2021, 10, 4747
PTG score [24,25]. Another limit (4) is the use of the old version of DCPR-SI, due to theabsence of the new version (DCRP-R) when the study started. In addition, although theadministration of vitamin D is associated with an improvement of mental health [65,66],(5) we did not evaluate the effect of vitamin D on PTG. Additionally, (6) we did notconsider the intensity of physical activity, a rising variable which can modify psychosocialand physical risks factors [67–70].
5. Conclusions
This study showed a moderate level of PTG in kidney transplant recipients, sug-gesting that health professionals responsible for treatment of KTRs should be sensitive topromote the awareness of these complex psychological changes after kidney transplant intheir patients.
Furthermore, the network analysis identified two communities, ESAS physical/emotional symptoms with DS-IT dimensions and PTGI factors, which were morestrongly connected within-cluster than between-clusters. This result suggests that a psy-chological intervention could be an appropriate means of addressing psychological distress,reducing hopelessness and improving the appreciation of life, among kidney transplantrecipients. However, the connection between these three relevant dimensions, should beconsidered for further research to better define this relationship and its consequence interm of outcomes in KTRs.
Author Contributions: Conceptualization Y.B.; drafting of the manuscript Y.B. and L.Z.; formalanalysis Y.B. and L.Z.; methodology M.P. and M.B.M.; supervision, P.E., M.A. and A.S.; validation,L.G. All authors have read and agreed to the published version of the manuscript.
Funding: This research did not receive funding.
Institutional Review Board Statement: The study was conducted according to the guidelines ofthe Declaration of Helsinki and approved by the Hospital Ethics Committee for Human Research(Code: 151297, on 17 March 2016).
Informed Consent Statement: Informed consent was obtained from all subjects involved in the study.
Data Availability Statement: The data are not publicly available due to privacy restrictions.
Conflicts of Interest: The authors declare no conflict of interest.
References
1. Abecassis, M.; Bartlett, S.T.; Collins, A.J.; Davis, C.L.; Delmonico, F.L.; Friedewald, J.; Hays, R.; Howard, A.; Jones, E.; Leichtman,A.B.; et al. Kidney transplantation as primary therapy for end-stage renal disease: A National Kidney Foundation/KidneyDisease Outcomes Quality Initiative (NKF/KDOQITM) conference. Clin. J. Am. Soc. Nephrol. 2008, 3, 471–480. [CrossRef][PubMed]
2. Müller, H.H.; Englbrecht, M.; Wiesener, M.S.; Titze, S.; Heller, K.; Groemer, T.W.; Schett, G.; Eckardt, K.U.; Kornhuber, J.; Maler,J.M. Depression, Anxiety, Resilience and Coping Pre and Post Kidney Transplantation—Initial Findings from the PsychiatricImpairments in Kidney Transplantation (PI-KT)-Study. PLoS ONE 2015, 10, e0140706. [CrossRef]
3. Chilcot, J.; Spencer, B.W.J.; Maple, H.; Mamode, N. Depression and Kidney Transplantation. Transplantation 2014, 97, 717–721.[CrossRef] [PubMed]
4. Fukunishi, I.; Sugawara, Y.; Takayama, T.; Makuuchi, M.; Kawarasaki, H.; Surman, O.S. Psychiatric disorders before and afterliving-related transplantation. Psychosomatics 2001, 42, 337–343. [CrossRef] [PubMed]
5. Noohi, S.; Khaghani-Zadeh, M.; Javadipour, M.; Assari, S.; Najafi, M.; Ebrahiminia, M.; Pourfarziani, V. Anxiety and DepressionAre Correlated With Higher Morbidity after Kidney Transplantation. Transplant. Proc. 2007, 39, 1074–1078. [CrossRef] [PubMed]
6. Battaglia, Y.; Martino, E.; Piazza, G.; Cojocaru, E.; Massarenti, S.; Peron, L.; Storari, A.; Grassi, L. Abnormal Illness Behavior,Alexithymia, Demoralization, and Other Clinically Relevant Psychosocial Syndromes in Kidney Transplant Recipients: AComparative Study of the Diagnostic Criteria for Psychosomatic Research System versus ICD-10 Psychiatric Nosology. Psychother.Psychosom. 2018, 87, 375–376.
7. Murri, M.B.; Caruso, R.; Ounalli, H.; Zerbinati, L.; Berretti, E.; Costa, S.; Recla, E.; Folesani, F.; Kissane, D.; Nanni, M.G.; et al.The relationship between demoralization and depressive symptoms among patients from the general hospital: Network andexploratory graph analysis. J. Affect. Disord. 2020, 276, 137–146. [CrossRef]
94
J. Clin. Med. 2021, 10, 4747
8. Belvederi Murri, M.; Zerbinati, L.; Ounalli, H.; Kissane, D.; Casoni, B.; Leoni, M.; Rossi, G.; Dall’Olio, R.; Caruso, R.; Nanni, M.G.;et al. Assessing demoralization in medically ill patients: Factor structure of the Italian version of the demoralization scale anddevelopment of short versions with the item response theory framework. J. Psychosom. Res. 2020, 128, 109889. [CrossRef]
9. Battaglia, Y.; Zerbinati, L.; Piazza, G.; Martino, E.; Massarenti, S.; Provenzano, M.; Esposito, P.; Andreucci, M.; Storari, A.; Grassi,L. The Use of Demoralization Scale in Italian Kidney Transplant Recipients. J. Clin. Med. 2020, 9, 2119. [CrossRef]
10. Kissane, D.W.; Clarke, D.M.; Street, A.F. Demoralization syndrome: A relevant psychiatric diagnosis for palliative care. J. Palliat.Care 2001, 17, 12–21. [CrossRef]
11. Tedeschi, R.G.; Calhoun, L.G. Clinical approach to growth after traumatic experiences. In Positive Psychology in Practice; Linley,P.A., Joseph, S., Eds.; Polish Scientific Publishers PWN: Warszawa, Poland, 2007; Volume 25, pp. 230–248.
12. Schubert, C.F.; Schmidt, U.; Rosner, R. Posttraumatic Growth in Populations with Posttraumatic Stress Disorder-A SystematicReview on Growth-Related Psychological Constructs and Biological Variables. Clin. Psychol. Psychother. 2016, 23, 469–486.[CrossRef]
13. Pollard, C.; Kennedy, P. A longitudinal analysis of emotional impact, coping strategies and post-traumatic psychological growthfollowing spinal cord injury: A 10-year review. Br. J. Health Psychol. 2007, 12 Pt 3, 347–362. [CrossRef]
14. Gori, A.; Topino, E.; Sette, A.; Cramer, H. Pathways to post-traumatic growth in cancer patients: Moderated mediation and singlemediation analyses with resilience, personality, and coping strategies. J. Affect. Disord. 2021, 279, 692–700. [CrossRef] [PubMed]
15. Kelly, G.; Morris, R.; Shetty, H. Predictors of post-traumatic growth in stroke survivors. Disabil. Rehabil. 2018, 40, 2916–2924.[CrossRef] [PubMed]
16. Dyer, G.; Gilroy, N.; Brice, L.; Kabir, M.; Gottlieb, D.; Huang, G.; Hogg, M.; Brown, L.; Greenwood, M.; Larsen, S.R.; et al. Asurvey of infectious diseases and vaccination uptake in long-term hematopoietic stem cell transplant survivors in Australia.Transpl. Infect. Dis. 2019, 21, e13043. [CrossRef]
17. Martín-Rodríguez, A.; Pérez-San-Gregorio, M.Á.; Avargues-Navarro, M.L.; Borda-Mas, M.; Pérez-Bernal, J.; Gómez-Bravo, M.Á.How Thinking About the Donor Influences Post-traumatic Growth in Liver Transplant Recipients. Transplant. Proc. 2018, 50,610–612. [CrossRef] [PubMed]
18. de Alegría, B.R.; Basabe, N.; De Lorenzo, E. Evolution of post-traumatic growth during the first 12 months of dialysis: Alongitudinal study. J. Ren. Care 2017, 43, 108–113. [CrossRef]
19. Cramer, A.; Waldorp, L.; Van der Maas, H.; Borsboom, D. Comorbidity: A network perspective. Behav. Brain Sci. 2010, 33, 137–150.[CrossRef]
20. Fried, E.I. Problematic assumptions have slowed down depression research: Why symptoms, not syndromes are the way forward.Front. Psychol. 2015, 6, 309. [CrossRef]
21. Contreras, A.; Nieto, I.; Valiente, C.; Espinosa, R.; Vazquez, C. The Study of Psychopathology from the Network AnalysisPerspective: A Systematic Review. Psychother. Psychosom. 2019, 88, 71–83. [CrossRef]
22. Borsboom, D. A network theory of mental disorders. World Psychiatry 2017, 16, 5–13. [CrossRef]23. Golino, H.F.; Epskamp, S. Exploratory Graph Analysis: A new approach for estimating the number of dimensions in psychological
research. PLoS ONE 2017, 12, e0174035. [CrossRef] [PubMed]24. Yucetin, L.; Bozoklar, C.A.; Yanik, O.; Tekin, S.; Tuncer, M.; Demirbas, A. An Investigation of Post-Traumatic Growth Experiences
Among Living Kidney Donors. Transplant. Proc. 2015, 47, 1287–1290. [CrossRef] [PubMed]25. Tomaszek, A.; Wróblewska, A.; Zdankiewicz-Scigała, E.; Rzonca, P.; Gałazkowski, R.; Gozdowska, J.; Lewandowska, D.;
Kosson, D.; Kosieradzki, M.; Danielewicz, R. Post-Traumatic Growth among Patients after Living and Cadaveric Donor KidneyTransplantation: The Role of Resilience and Alexithymia. Int. J. Environ. Res. Public Health 2021, 18, 2164. [CrossRef] [PubMed]
26. Howell, D.; Keshavarz, H.; Esplen, M.J.; Hack, T.; Hamel, M.; Howes, J.; Jones, J.; Li, M.; Manii, D.; McLeod, D.; et al. A PanCanadian Practice Guideline: Screening, Assessment and Care of Psychosocial Distress, Depression, and Anxiety in Adultswith Cancer. In The Canadian Association of Psychosocial Oncology (CAPO), 2nd ed.; Canadian Association of PsychosocialOncology: Toronto, ON, Canada, 2015. Available online: https://www.capo.ca/resources/Documents/Guidelines/3APAN-~1.PDF (accessed on 1 May 2016).
27. Prati, G.; Pietrantoni, L. Italian Adaptation and Confirmatory Factor Analysis of the Full and the Short Form of the PosttraumaticGrowth Inventory. J. Loss Trauma 2014, 19, 12–22. [CrossRef]
28. Pérez-San-Gregorio, M.Á.; Martín-Rodríguez, A.; Borda-Mas, M.; Avargues-Navarro, M.L.; Pérez-Bernal, J.; Conrad, R.; Gómez-Bravo, M.Á. Post-traumatic growth and its relationship to quality of life up to 9 years after liver transplantation: A cross-sectionalstudy in Spain. BMJ Open 2017, 7, e017455. [CrossRef]
29. Faravelli, C.; Abrardi, L.; Bartolozzi, D.; Cecchi, C.; Iacono, B.L.; Ravaldi, C.; Scarpato, M.A.; Truglia, E.; Prodi, P.M.R.; Rosi, S.;et al. The Sesto Fiorentino study: Point and one-year prevalences of psychiatric disorders in an Italian community sample usingclinical interviewers. Psychother. Psychosom. 2004, 73, 226–234. [CrossRef]
30. Rossi, A.; Alberio, R.; Porta, A.; Sandri, M.; Tansella, M.; Amaddeo, F. The reliability of the Mini-International NeuropsychiatricInterview–Italian version. J. Clin. Psychopharmacol. 2004, 24, 561–563. [CrossRef]
31. Porcelli, P.; Rafanelli, C. Criteria for Psychosomatic Research (DCPR) in the Medical Setting. Curr. Psychiatry Rep. 2010, 12,246–254. [CrossRef]
32. Grassi, L.; Sabato, S.; Rossi, E.; Biancosino, B.; Marmai, L. The use of the Diagnostic Criteria for Psychosomatic Research (DCPR)in oncology. Psychother. Psychosom. 2005, 74, 100–107. [CrossRef]
95

J. Clin. Med. 2021, 10, 4747
33. Battaglia, Y.; Zerbinati, L.; Martino, E.; Piazza, G.; Massarenti, S.; Storari, A.; Grassi, L. Psychosocial Dimensions in HemodialysisPatients on Kidney Transplant Waiting List: Preliminary Data. Transplantology 2020, 1, 123–134. [CrossRef]
34. Bruera, E.; Kuehn, N.; Miller, M.J.; Selmser, P.; Macmillan, K. The Edmonton Symptom Assessment System (ESAS): A SimpleMethod for the Assessment of Palliative Care Patients. J. Palliat. Care 1991, 7, 6–9. [CrossRef] [PubMed]
35. Davison, S.N.; Jhangri, G.S.; Johnson, J.A. Longitudinal validation of a modified Edmonton symptom assessment system (ESAS)in haemodialysis patients. Nephrol. Dial. Transplant. 2006, 21, 3189–3195. [CrossRef] [PubMed]
36. Ma, X.; Zhang, J.; Zhong, W.; Shu, C.; Wang, F.; Wen, J.; Zhou, M.; Sang, Y.; Jiang, Y.; Liu, L. The diagnostic role of a short screeningtool—The distress thermometer: A meta-analysis. Support. Care Cancer 2014, 22, 1741–1755. [CrossRef] [PubMed]
37. Donovan, K.A.; Grassi, L.; McGinty, H.L.; Jacobsen, P.B. Validation of the distress thermometer worldwide: State of the science.Psychooncology 2014, 23, 241–250. [CrossRef]
38. Moro, C.; Brunelli, C.; Miccinesi, G.; Fallai, M.; Morino, P.; Piazza, M.; Labianca, R.; Ripamonti, C. Edmonton SymptomAssessment Scale (ESAS): Italian validation in two palliative care settings. Support. Care Cancer 2006, 14, 30–37. [CrossRef]
39. Battaglia, Y.; Zerbinati, L.; Piazza, G.; Martino, E.; Provenzano, M.; Esposito, P.; Massarenti, S.; Andreucci, M.; Storari, A.; Grassi,L. Screening Performance of Edmonton Symptom Assessment System in Kidney Transplant Recipients. J. Clin. Med. 2020, 9, 995.[CrossRef]
40. Lucas, A.R.; Bass, M.B.; Rothrock, N.E.; O’Connor, M.L.; Sorkin, M.R.; Nawyn, J.; Albinali, F.; Wagner, L.I. Development ofan eHealth System to Capture and Analyze Patient Sensor and Self-Report Data: Mixed-Methods Assessment of PotentialApplications to Improve Cancer Care Delivery. JMIR Med. Inform. 2018, 6, e46. [CrossRef]
41. Grassi, L.; Costantini, A.; Kissane, D.; Brunetti, S.; Caruso, R.; Piazza, G.; Marchetti, P.; Sabato, S.; Nanni, M.G. The factor structureand use of the Demoralization Scale (DS-IT) in Italian cancer patients. Psychooncology 2017, 26, 1965–1971. [CrossRef]
42. Lancichinetti, A.; Kivelä, M.; Saramäki, J.; Fortunato, S. Characterizing the community structure of complex networks. PLoS ONE2010, 5, e11976. [CrossRef]
43. Friedman, J.; Hastie, T.; Tibshirani, R. Sparse inverse covariance estimation with the graphical lasso. Biostatistics 2008, 9, 432–441.[CrossRef]
44. Lauritzen, S. Graphical Models; Oxford University Press: Oxford, UK, 1996.45. Epskamp, S.; Cramer, A.O.; Waldorp, L.J.; Schmittmann, V.D.; Borsboom, D. qgraph: Network visualizations of relationships in
psychometric data. J. Stat. Softw. 2012, 48, 1–18. [CrossRef]46. Pons, P.; Latapy, M. Computing communities in large networks using random walks. J. Graph Algorithms Appl. 2006, 10, 191.
[CrossRef]47. Epskamp, S.; Fried, E.I. A tutorial on regularized partial correlation networks. Psychol. Methods. 2018, 23, 617–634. [CrossRef]
[PubMed]48. Christensen, A.P.; Gross, G.M.; Golino, H.F.; Silvia, P.J.; Kwapil, T.R. Exploratory Graph Analysis of the Multidimensional
Schizotypy Scale. Schizophr. Res. 2019, 206, 43–51. [CrossRef] [PubMed]49. Fonseca-Pedrero, E. Network analysis: A new way of understanding psychopathology? Rev. Psiquiatr. Salud. Ment. 2017, 10, 206.
(In English); (In Spanish) [CrossRef] [PubMed]50. Látos, M.; Devecsery, A.; Lázár, G.; Horváth, Z.; Szederkényi, E.; Szenohradszky, P.; Csabai, M. The role of body image integrity
and posttraumatic growth in kidney transplantation: A 3-year longitudinal study. Health Psychol. Open 2015, 2, 2055102915581214.[CrossRef]
51. Esparza, T.; Martínez, T.; Leibovich de Figueroa, N. Longitudinal study of posttraumatic growth and quality of life in women’sbreast cancer survivors. Psicooncología 2015, 12, 303–314.
52. Occhipinti, S.; Chambers, S.K.; Lepore, S.; Aitken, J.; Dunn, J. A longitudinal study of post-traumatic growth and psychologicaldistress in colorectal cancer survivor. PLoS ONE 2015, 10, e0139119. [CrossRef]
53. Barskova, T.; Oesterreich, R. Post-traumatic growth in people living with a serious medical condition and its relations to physicaland mental health: A systematic review. Disabil Rehabil. 2009, 31, 1709–1733. [CrossRef]
54. Baseotto, M.C.; Morris, P.G.; Gillespie, D.C.; Trevethan, C.T. Post-traumatic growth and value-directed living after acquired braininjury. Neuropsychol. Rehabil. 2020, 27, 1–20. [CrossRef] [PubMed]
55. Radstaak, M.; Hüning, L.; Bohlmeijer, E.T. Well-Being Therapy as Rehabilitation Therapy for Posttraumatic Stress DisorderSymptoms: A Randomized Controlled Trial. J. Trauma. Stress 2020, 33, 813–823. [CrossRef] [PubMed]
56. Joralemon, D. Organ wars: The battle for body parts. Med. Anthropol. Q. 1995, 9, 335–356. [CrossRef] [PubMed]57. Helmes, E.; McNeill, P.D.; Holden, R.R.; Jackson, C. The construct of alexithymia: Associations with defense mechanisms. J. Clin.
Psychol. 2008, 64, 318–331. [CrossRef]58. Lumley, M.A.; Neely, L.C.; Burger, A.J. The assessment of alexithymia in medical settings: Implications for understanding and
treating health problems. J. Pers. Assess. 2007, 89, 230–246. [CrossRef]59. Bagby, R.M.; Parker, J.D.; Taylor, G.J. The twenty-item Toronto Alexithymia Scale-I. Item selection and cross-validation of the
factor structure. J. Psychosom. Res. 1994, 38, 23–32. [CrossRef]60. Anand-Kumar, V.; Kung, M.; Painter, L.; Broadbent, E. Impact of organ transplantation in heart, lung and liver recipients:
Assessment of positive life changes. Psychol. Health 2014, 29, 687–697. [CrossRef] [PubMed]
96
J. Clin. Med. 2021, 10, 4747
61. Goetzmann, L.; Lieberherr, M.; Krombholz, L.; Ambühl, P.; Boehler, A.; Noll, G.; Muellhaupt, B.; Wagner, R.; Buddeberg, C.;Klaghofer, R. Subjective experiences following organ transplantation—A qualitative study of 120 heart, lung, liver, and kidneyrecipients. Z. Psychosom. Med. Psychother. 2010, 56, 268–282.
62. Goetzmann, L.; Ruegg, L.; Stamm, M.; Ambühl, P.; Boehler, A.; Halter, J.; Muellhaupt, B.; Noll, G.; Schanz, U.; Wagner-Huber, R.;et al. Psychosocial profiles after transplantation: A 24-month follow-up of heart, lung, liver, kidney and allogeneic bone-marrowpatients. Transplantation 2008, 86, 662–668. [CrossRef] [PubMed]
63. Cann, A.; Calhoun, L.G.; Tedeschi, R.G.; Taku, K.; Vishnevsky, T.; Triplett, K.N.; Danhauer, S.C. A short form of the PosttraumaticGrowth Inventory. Anxiety Stress Coping 2010, 23, 127–137. [CrossRef]
64. Kaur, N.; Porter, B.; LeardMann, C.A.; Tobin, L.E.; Lemus, H.; Luxton, D.D. Millennium Cohort Study Team. Evaluation of amodified version of the Posttraumatic Growth Inventory-Short Form. BMC Med. Res. Methodol. 2017, 17, 69. [CrossRef] [PubMed]
65. Battaglia, Y.; Cojocaru, E.; Fiorini, F.; Granata, A.; Esposito, P.; Russo, L.; Bortoluzzi, A.; Storari, A.; Russo, D. Vitamin D in kidneytransplant recipients. Clin. Nephrol. 2020, 93, 57–64. [CrossRef] [PubMed]
66. Jamilian, H.; Amirani, E.; Milajerdi, A.; Kolahdooz, F.; Mirzaei, H.; Zaroudi, M.; Ghaderi, A.; Asemi, Z. The effects of vitamin Dsupplementation on mental health, and biomarkers of inflammation and oxidative stress in patients with psychiatric disorders: Asystematic review and meta-analysis of randomized controlled trials. Prog. Neuropsychopharmacol. Biol. Psychiatry 2019, 94, 109651.[CrossRef]
67. Aucella, F.; Battaglia, Y.; Bellizzi, V.; Bolignano, D.; Capitanini, A.; Cupisti, A. Physical exercise programs in CKD: Lights, shadesand perspectives. J. Nephrol. 2015, 28, 143–150. [CrossRef] [PubMed]
68. Belvederi Murri, M.; Folesani, F.; Zerbinati, L.; Nanni, M.G.; Ounalli, H.; Caruso, R.; Grassi, L. Physical Activity Promotes Healthand Reduces Cardiovascular Mortality in Depressed Populations: A Literature Overview. Int. J. Environ. Res. Public Health 2020,17, 5545. [CrossRef] [PubMed]
69. Morgado, F.F.D.R.; do Vale, W.S.; Lopes, C.S.; Maranhão Neto, G.A.; Lattari, E.; Mediano, M.F.F.; Rostila, M.; Griep, R.H.; Machado,S.; Penna, T.A.; et al. Psychosocial determinants of physical activity among workers: An integrative review. Rev. Bras. Med. Trab.2021, 18, 472–487. [CrossRef]
70. Aucella, F.; Gesuete, A.; Battaglia, Y. A “Nephrological” Approach to Physical Activity. Kidney Blood Press. Res. 2014, 39, 189–196.[CrossRef]
97


Journal of
Clinical Medicine
Review
Antibody-Mediated Rejection and Recurrent Primary Disease:Two Main Obstacles in Abdominal Kidney, Liver,and Pancreas Transplants
Tsukasa Nakamura 1,* and Takayuki Shirouzu 2
Citation: Nakamura, T.; Shirouzu, T.
Antibody-Mediated Rejection and
Recurrent Primary Disease: Two
Main Obstacles in Abdominal Kidney,
Liver, and Pancreas Transplants. J.
Clin. Med. 2021, 10, 5417. https://
doi.org/10.3390/jcm10225417
Academic Editor:
Charat Thongprayoon
Received: 10 October 2021
Accepted: 18 November 2021
Published: 19 November 2021
Publisher’s Note: MDPI stays neutral
with regard to jurisdictional claims in
published maps and institutional affil-
iations.
Copyright: © 2021 by the authors.
Licensee MDPI, Basel, Switzerland.
This article is an open access article
distributed under the terms and
conditions of the Creative Commons
Attribution (CC BY) license (https://
creativecommons.org/licenses/by/
4.0/).
1 Department of Organ Transplantation and General Surgery, Kyoto Prefectural University of Medicine,Kajii-cho 465, Kamigyo-ku, Kyoto 602-8566, Japan
2 Molecular Diagnositcs Division, Wakunaga Pharmaceutical Co., Ltd., 13-4 Arakicho, shinjyuku-ku,Tokyo 160-0007, Japan; [email protected]
* Correspondence: [email protected]; Tel.: +81-752-515-532
Abstract: The advances in acute phase care have firmly established the practice of organ transplanta-tion in the last several decades. Then, the next issues that loom large in the field of transplantationinclude antibody-mediated rejection (ABMR) and recurrent primary disease. Acute ABMR is adaunting hurdle in the performance of organ transplantation. The recent progress in desensitizationand preoperative monitoring of donor-specific antibodies enables us to increase positive outcomes.However, chronic active ABMR is one of the most significant problems we currently face. On theother hand, recurrent primary disease is problematic for many recipients. Notably, some recipients,unfortunately, lost their vital organs due to this recurrence. Although some progress has beenachieved in these two areas, many other factors remain largely obscure. In this review, these twotopics will be discussed in light of recent discoveries.
Keywords: antibody-mediated rejection; recurrent primary disease; renal transplantation;liver transplantation; pancreas transplantation
1. Introduction
From the late 20th century to the beginning of the 21st century, significant progresshas been achieved in acute phase care for transplant patients. These advances firmly placeorgan transplantation into firmly established therapeutic procedures for organ failurepatients. However, the better outcomes in the acute phase become, the more other issuesare exposed. Firstly, donor specific anti-human leukocyte antigen (HLA) antibodies (DSA),resulting in chronic antibody-mediated rejection (ABMR), are recognized as major obstaclesthat we have yet to conquer. Organ transplantation is haunted by DSA unless we changegraft sources or develop a new technology. Secondly, controlling the recurrence of theprimary disease will continue to be a major issue in many diseases as long as we continueto use live organs and not machines.
The primary purpose of this review is to deepen the understanding of these two issuesand to improve graft survival and patient survival after the acute phase of transplants.
2. Methods
We have written this review by focusing on two major issues: ABMR due to denovo DSA (dnDSA) and recurrence of primary disease. In preparing this review, English-language abstracts cited in PubMed were selected. Citations were chosen based on theirrelevance to each section. In Section 3, articles related with dnDSA, not preforming DSA,were selected. As recent dnDSA studies in kidney transplantation are summarized in atable, the most recent randomized trials or prospective cohort studies using representativedrugs were selected as much as possible. Since the number of related studies is scarce in
J. Clin. Med. 2021, 10, 5417. https://doi.org/10.3390/jcm10225417 https://www.mdpi.com/journal/jcm99
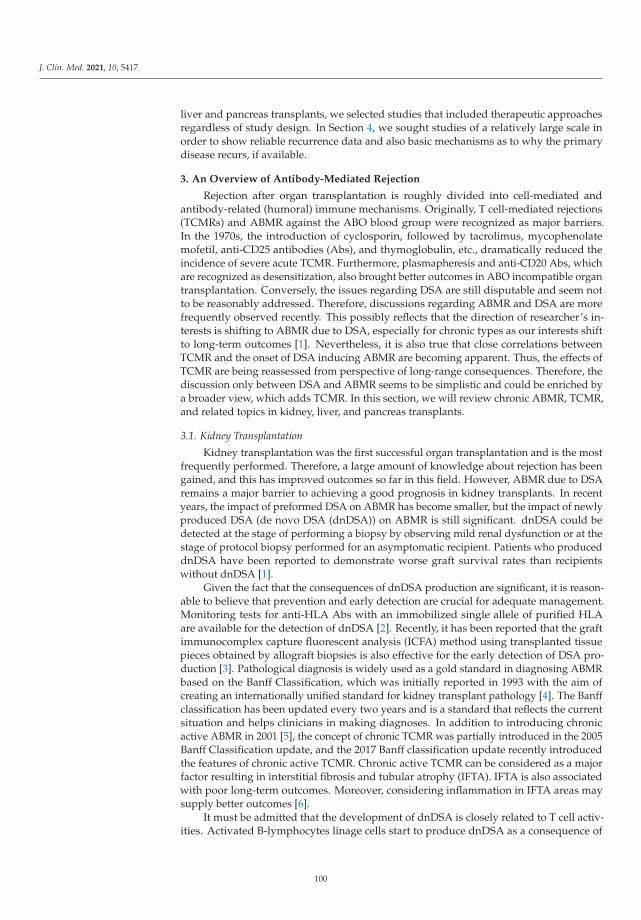
J. Clin. Med. 2021, 10, 5417
liver and pancreas transplants, we selected studies that included therapeutic approachesregardless of study design. In Section 4, we sought studies of a relatively large scale inorder to show reliable recurrence data and also basic mechanisms as to why the primarydisease recurs, if available.
3. An Overview of Antibody-Mediated Rejection
Rejection after organ transplantation is roughly divided into cell-mediated andantibody-related (humoral) immune mechanisms. Originally, T cell-mediated rejections(TCMRs) and ABMR against the ABO blood group were recognized as major barriers.In the 1970s, the introduction of cyclosporin, followed by tacrolimus, mycophenolatemofetil, anti-CD25 antibodies (Abs), and thymoglobulin, etc., dramatically reduced theincidence of severe acute TCMR. Furthermore, plasmapheresis and anti-CD20 Abs, whichare recognized as desensitization, also brought better outcomes in ABO incompatible organtransplantation. Conversely, the issues regarding DSA are still disputable and seem notto be reasonably addressed. Therefore, discussions regarding ABMR and DSA are morefrequently observed recently. This possibly reflects that the direction of researcher’s in-terests is shifting to ABMR due to DSA, especially for chronic types as our interests shiftto long-term outcomes [1]. Nevertheless, it is also true that close correlations betweenTCMR and the onset of DSA inducing ABMR are becoming apparent. Thus, the effects ofTCMR are being reassessed from perspective of long-range consequences. Therefore, thediscussion only between DSA and ABMR seems to be simplistic and could be enriched bya broader view, which adds TCMR. In this section, we will review chronic ABMR, TCMR,and related topics in kidney, liver, and pancreas transplants.
3.1. Kidney Transplantation
Kidney transplantation was the first successful organ transplantation and is the mostfrequently performed. Therefore, a large amount of knowledge about rejection has beengained, and this has improved outcomes so far in this field. However, ABMR due to DSAremains a major barrier to achieving a good prognosis in kidney transplants. In recentyears, the impact of preformed DSA on ABMR has become smaller, but the impact of newlyproduced DSA (de novo DSA (dnDSA)) on ABMR is still significant. dnDSA could bedetected at the stage of performing a biopsy by observing mild renal dysfunction or at thestage of protocol biopsy performed for an asymptomatic recipient. Patients who produceddnDSA have been reported to demonstrate worse graft survival rates than recipientswithout dnDSA [1].
Given the fact that the consequences of dnDSA production are significant, it is reason-able to believe that prevention and early detection are crucial for adequate management.Monitoring tests for anti-HLA Abs with an immobilized single allele of purified HLAare available for the detection of dnDSA [2]. Recently, it has been reported that the graftimmunocomplex capture fluorescent analysis (ICFA) method using transplanted tissuepieces obtained by allograft biopsies is also effective for the early detection of DSA pro-duction [3]. Pathological diagnosis is widely used as a gold standard in diagnosing ABMRbased on the Banff Classification, which was initially reported in 1993 with the aim ofcreating an internationally unified standard for kidney transplant pathology [4]. The Banffclassification has been updated every two years and is a standard that reflects the currentsituation and helps clinicians in making diagnoses. In addition to introducing chronicactive ABMR in 2001 [5], the concept of chronic TCMR was partially introduced in the 2005Banff Classification update, and the 2017 Banff classification update recently introducedthe features of chronic active TCMR. Chronic active TCMR can be considered as a majorfactor resulting in interstitial fibrosis and tubular atrophy (IFTA). IFTA is also associatedwith poor long-term outcomes. Moreover, considering inflammation in IFTA areas maysupply better outcomes [6].
It must be admitted that the development of dnDSA is closely related to T cell activ-ities. Activated B-lymphocytes linage cells start to produce dnDSA as a consequence of
100
J. Clin. Med. 2021, 10, 5417
the interaction between B cells and CD4 T cells through direct, indirect, and semidirectpathways [2]. Thus, TCMR theoretically appears to have an important role in subsequentABMR, although limited evidence exists. In a recent prospective study, the reported inci-dence of TCMR in the first year after transplant was around twice as high as in recipientswho developed dnDSA compared with patients without dnDSA. The presence of dnDSAwas associated with the severity of TCMR and subsequent graft loss. Furthermore, patientswith dnDSA, accompanied by more severe tubulointerstitial inflammation, were moreprone to recurrent TCMR [7]. Another study demonstrated that recipients with dnDSA ac-companied by a prior history of TCMR showed inferior graft outcomes [8]. Taken together,these studies suggest that dnDSA-related ABMR is preceded by T cell involvement andalso that TCMR affects graft outcomes through ABMR.
The risks of dnDSA development may vary according to an individual’s immunologi-cal background. The rates of dnDSA development have been reported as being around10% at 12 months after transplant under standard immunosuppressants [9,10]. However,recipients with high immunological risks (highly sensitized patients with high-titer ofpreformed DSA) are more susceptible to this particular development than those withlow-risk, although preformed DSA became undetectable at 12 months after surgery withappropriate preparations [11]. In terms of immunosuppression, it is true, theoretically,that the levels of calcineurin inhibitors (CNI), mTOR inhibitors [12], antimetabolites [13],steroid, and several other monoclonal and polyclonal antibodies are related to the occur-rence of dnDSA. Among them, CNI is one of the main immunosuppressants used to controldnDSA. High tacrolimus variability (instability) may well result in dnDSA production inpediatric recipients [14]. It can be admitted that this study has highlighted the importanceof medication adherence. Furthermore, complete withdrawal from CNI by using mTORinhibitors seems to favor dnDSA development [12,15]. Regarding steroid administration,this still plays an important role in controlling ABMR due to dnDSA [16]. On the otherhand, there was a study that examined the effects of steroid withdrawal at 7 days post-transplant, and no negative effects on dnDSA were observed [17]. However, the latterstudy applied thymoglobulin induction for all recipients, which might alter immunologicalreactions. Therefore, the CNI and steroid-free strategies could involve immunological risks,although these approaches are attractive from the persepctive of medication side effects. Itcan be argued that the minimization of CNI by using mTOR inhibitors does prevent CNItoxicity. However, mTOR inhibitors without CNI or complete withdrawal from steroidadministration pose a higher risk of DSA for recipients with standard induction therapy.
A variety of therapeutic approaches have been implemented, owing to the recent de-velopment of synthetic antibodies, in addition to orthodox therapeutic modalities. Severalinstitutions applied steroid pulse, plasmapheresis, and intravenous immunoglobulin ther-apy (IVIG), combined with anti-CD 20 Abs administration for dnDSA mediated ABMR [18].Other than these conventional therapies, several monoclonal Abs including eculizumab(anti-C5), tocilizumab, and clazakizumab (anti-interleukin 6) have recently been introducedin this field, although a proteasome inhibitor (bortezomib) failed to show therapeutic ef-fects [19]. A pilot study to investigate the role of complement by using eculizumab showeda slight stabilization of renal function due to a terminal complement inhibitor, albeit with anunderpowered design (treatment group n = 10) [20]. Choi et al. reported 80% graft survivalat 6-year post-introduction in tocilizumab-treated patients for whom IVIG and rituximab,with or without plasma exchange, did not succeed [21]. Several other investigations oftocilizumab and clazakizumab followed and showed a significant reduction in dnDSA [22]and a suppression of eGFR decline, respectively [23]. However, these studies indicatethat a certain population of patients did not show the efficacy of these treatments. Thus,patient selection for dnDSA treatment would be another key issue in this field. On the otherhand, belatacept-based immunosuppression clearly prevented the development of dnDSA,compared with an ordinal cyclosporin-based treatment regimen [24]. These results remindus of the importance of suppressing dnDSA development. Furthermore, in addition to the
101
J. Clin. Med. 2021, 10, 5417
introduction of novel medications, it is also pivotal to seek optimal regimens with existingtherapeutic modalities for dnDSA mediated ABMR.
3.2. Liver Transplantation
Despite the significant effects on graft survival of ABO blood type-related ABMR, therole of dnDSA in liver transplant remains largely unknown. There are many studies thatdemonstrate serum dnDSA (s-DSA) and graft outcomes. These studies demonstrated thatthe existence of s-DSA is not necessarily related with poor outcomes [25], which is contraryto the facts in kidney transplant. In other words, it is not wise to assess ABMR of liverallografts only by s-DSA. In fact, clinically, the Banff working group advocates diagnosticcriteria that consist of (1) pathological findings, (2) positivity of DSA, (3) C4d positivity, and(4) excluding other causative factors [26]. These studies, regarding dnDSA, possibly includes-DSA positive but intra-graft DSA (g-DSA) negative cases (i.e., the circumstance whereallografts are free from damages due to s-DSA). It is important to distinguish these casesclinically, although limited availability of DSA examination hinders routine investigationsof g-DSA. In fact, our recent study showed that g-DSA was closely associated with graftrejection and could be a more reliable indicator for the graft outcomes [27]. On the otherhand, other research studies suggest that DSA clearance by Kupffer cells [28], release ofHLA from liver in soluble form [29], allografts size [30], and liver regenerative abilitiesprevent harming liver allografts [31]. Thus, believing the information regarding s-DSAonly without questioning may misconstrue the truth of what happens in liver allografts.
With the minimization of immunosuppressants, it is often observed that liver trans-plant recipients also developed dnDSA in serum, with the tendency of this belonging toclass II rather than class I [25,32]. In terms of the relation between dnDSA and TCMR,the prevalence of dnDSA was clearly higher in recipients who experienced TCMR, al-beit without a correlation with frequency and severity [33]. With regard to the effectsof dnDSA development, the correlation between dnDSA and more severe fibrosis wasobserved [34,35]. These studies also demonstrated that rejection signs existed more fre-quently in the dnDSA positive group. Interestingly, s-DSA positivity in subclinical TCMRtended to be associated with more severe inflammation and fibrosis, while s-DSA negativesubclinical TCMR resulted in no histological rejection, supported by gene transcriptionalevidence [36]. In a relatively large study, the relation between dnDSA and fibrosis can alsobe observed by looking at 61 dnDSA positive patients among a total of 749 liver transplantrecipients, albeit without pathological insights and HLA–C/DP information [37]. In thisretrospective study, the most frequent target of HLA was the DQ locus (85%, 52 out of61 patients). Cyclosporin usage rather than tacrolimus and low CNI levels (tacrolimus< 3 ng/mL, cyclosporin < 75 ng/mL in the first year) were detected as risk factors ofdeveloping dnDSA. On the other hand, high model for end-stage liver disease (MELD)scores and advanced recipient age (>60) functioned as protective factors. These findingsappear to be consistent with immunological theories, i.e., deteriorating or elderly patientsmay exhibit milder immunological reactions.
Given the fact that the existence of dnDSA does not necessarily indicate the onsetof ABMR, it is still unclear whether we should make interventions against the status ofpositive dnDSA. Conversely, it is better to seek remedies if ABMR is confirmed based on theBanff criteria. To address ABMR due to dnDSA, several therapeutic strategies have beenapplied so far. Simple reinforcement of immunosuppressants appears to be the first choice.Several cases showed a reduction in s-DSA MFI [32]. In addition, several institutions seemto apply other therapies for ABMR just as in renal transplant: anti-CD 20 Abs, IVIG, andplasmapheresis [38,39]. However, it seems to be rare to reverse the severe fibrotic changesafter the onset of chronic ABMR. Thus, at present, it is of vital importance to prevent thedevelopment of dnDSA and subsequent ABMR.
102
J. Clin. Med. 2021, 10, 5417
3.3. Pancreas Transplantation
Due to improvements in surgical techniques and immunosuppression protocols, thegraft survival of pancreas transplant has greatly improved. Similarly to other organs, withthe pancreas, it is true that our attention has been shifting from these acute issues to ABMR.However, the association between dnDSA and graft outcomes is not well understood.Several studies have demonstrated the negative impact of ABMR on pancreas graft survival.However, many of these studies were limited by retrospective styles, small sample size,or lack of histological assessment. Among them, de Kort et al. initially investigated27 pancreas transplant patients according to their s-DSA and biopsy findings. Graftsurvival largely depended on s-DSA positivity accompanied by complement activation(C4d positivity) [40]. Furthermore, they revealed that ABMR played a significant role inearly graft loss < 1 year after transplant, especially in the setting of thrombotic cases [41].Without histological assessment, a larger study consisting of 167 pancreas transplantrecipients showed that about 15% (26/167) recipients developed s-DSA during a nine-yearfollow-up and resulted in significantly inferior outcomes: graft survival dropped around30% and 20% from recipients without anti HLA Abs and DSA, respectively [42].
Regarding the class of DSA, a large part of dnDSA belonged to class II [43], especiallyDQ [44]. These results are also consistent with findings of kidney and liver transplants.Considering the recent developments in HLA matching, a more sophisticated approachshould also become possible in the field of pancreas transplant. This approach demon-strated that the development of dnDSA after pancreas transplant was associated with thenumber of predicted indirectly recognizable HLA epitopes (PIRCHE) II [45]. Practically,it seems to be difficult to consider all information regarding HLA prior to deceased or-gan transplant. Nonetheless, it would be plausible to cater tailored immunosuppressionbased on their immunological status, provided that details of donors’ HLA information aresupplied.
Although there is no research focusing on the optimal treatment for ABMR in pan-creas transplant, the ABMR of pancreas grafts seems also to be managed by additionalanti-humoral therapies with reinforcement of standard immunosuppressants [40,42,43].However, it is controversial to initiate preemptive treatments for dnDSA positive cases with-out ABMR signs. Uva et al. added Belatacept to the maintenance of immunosuppressantsfor selected patients, although they denied universal preemptive interventions [46].
Overall, ABMR in pancreas transplant remains relatively unclear compared to otherfields. Given the fact that many pancreas transplants have been conducted togetherwith kidney transplants, research on ABMR in pancreas transplant would progress withthe knowledge of kidney transplants. Indeed, there are criteria for ABMR of pancreasgrafts [47]. Due to the hesitancy regarding pancreas graft biopsies, it must be admittedthat an accurate assessment of rejection in pancreas graft is limited on several occasions.In addition to pancreas biopsies, there is a different approach: Duodenal graft biopsieshave been taken [48]. This procedure may additionally shed light on pancreas graft ABMRaccording to intestinal transplantation and could improve outcomes. Limited knowledgeof pancreas ABMR demands large prospective cohorts in the future.
Recent studies regarding chronic ABMR due to dnDSA in each field are summarizedin Table 1.
103
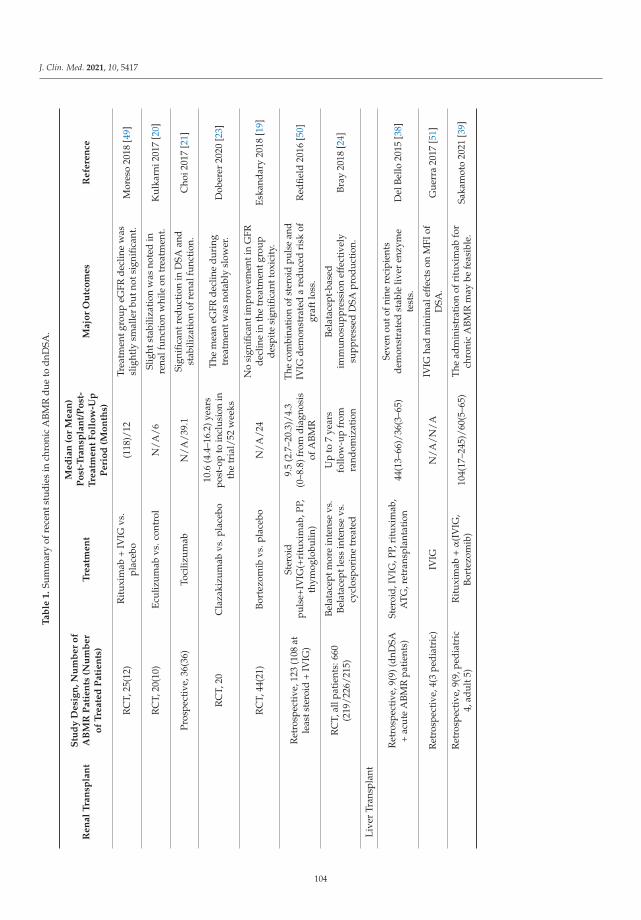
J. Clin. Med. 2021, 10, 5417
Ta
ble
1.
Sum
mar
yof
rece
ntst
udie
sin
chro
nic
ABM
Rdu
eto
dnD
SA.
Re
na
lT
ran
spla
nt
Stu
dy
De
sig
n,
Nu
mb
er
of
AB
MR
Pa
tie
nts
(Nu
mb
er
of
Tre
ate
dP
ati
en
ts)
Tre
atm
en
t
Me
dia
n(o
rM
ea
n)
Po
st-T
ran
spla
nt/
Po
st-
Tre
atm
en
tF
oll
ow
-Up
Pe
rio
d(M
on
ths)
Ma
jor
Ou
tco
me
sR
efe
ren
ce
RC
T,25
(12)
Rit
uxim
ab+
IVIG
vs.
plac
ebo
(118
)/12
Trea
tmen
tgro
upeG
FRde
clin
ew
assl
ight
lysm
alle
rbu
tnot
sign
ifica
nt.
Mor
eso
2018
[49]
RC
T,20
(10)
Ecul
izum
abvs
.con
trol
N/A
/6Sl
ight
stab
iliza
tion
was
note
din
rena
lfun
ctio
nw
hile
ontr
eatm
ent.
Kul
karn
i201
7[2
0]
Pros
pect
ive,
36(3
6)To
ciliz
umab
N/A
/39.
1Si
gnifi
cant
redu
ctio
nin
DSA
and
stab
iliza
tion
ofre
nalf
unct
ion.
Cho
i201
7[2
1]
RC
T,20
Cla
zaki
zum
abvs
.pla
cebo
10.6
(4.4
–16.
2)ye
ars
post
-op
toin
clus
ion
inth
etr
ial/
52w
eeks
The
mea
neG
FRde
clin
edu
ring
trea
tmen
twas
nota
bly
slow
er.
Dob
erer
2020
[23]
RC
T,44
(21)
Bort
ezom
ibvs
.pla
cebo
N/A
/24
No
sign
ifica
ntim
prov
emen
tin
GFR
decl
ine
inth
etr
eatm
entg
roup
desp
ite
sign
ifica
ntto
xici
ty.
Eska
ndar
y20
18[1
9]
Ret
rosp
ecti
ve,1
23(1
08at
leas
tste
roid
+IV
IG)
Ster
oid
puls
e+IV
IG(+
ritu
xim
ab,P
P,th
ymog
lobu
lin)
9.5
(2.7
–20.
3)/4
.3(0
–8.8
)fro
mdi
agno
sis
ofA
BMR
The
com
bina
tion
ofst
eroi
dpu
lse
and
IVIG
dem
onst
rate
da
redu
ced
risk
ofgr
aftl
oss.
Red
field
2016
[50]
RC
T,al
lpat
ient
s:66
0(2
19/2
26/2
15)
Bela
tace
ptm
ore
inte
nse
vs.
Bela
tace
ptle
ssin
tens
evs
.cy
clos
pori
netr
eate
d
Up
to7
year
sfo
llow
-up
from
rand
omiz
atio
n
Bela
tace
pt-b
ased
imm
unos
uppr
essi
onef
fect
ivel
ysu
ppre
ssed
DSA
prod
ucti
on.
Bray
2018
[24]
Live
rTr
ansp
lant
Ret
rosp
ecti
ve,9
(9)(
dnD
SA+
acut
eA
BMR
pati
ents
)St
eroi
d,IV
IG,P
P,ri
tuxi
mab
,A
TG,r
etra
nspl
anta
tion
44(1
3–66
)/36
(3–6
5)Se
ven
outo
fnin
ere
cipi
ents
dem
onst
rate
dst
able
liver
enzy
me
test
s.D
elBe
llo20
15[3
8]
Ret
rosp
ectiv
e,4(
3pe
diat
ric)
IVIG
N/A
/N/A
IVIG
had
min
imal
effe
cts
onM
FIof
DSA
.G
uerr
a20
17[5
1]
Ret
rosp
ecti
ve,9
(9,p
edia
tric
4,ad
ult5
)R
itux
imab
+α
(IV
IG,
Bort
ezom
ib)
104(
17–2
45)/
60(5
–65)
The
adm
inis
trat
ion
ofri
tuxi
mab
for
chro
nic
ABM
Rm
aybe
feas
ible
.Sa
kam
oto
2021
[39]
104
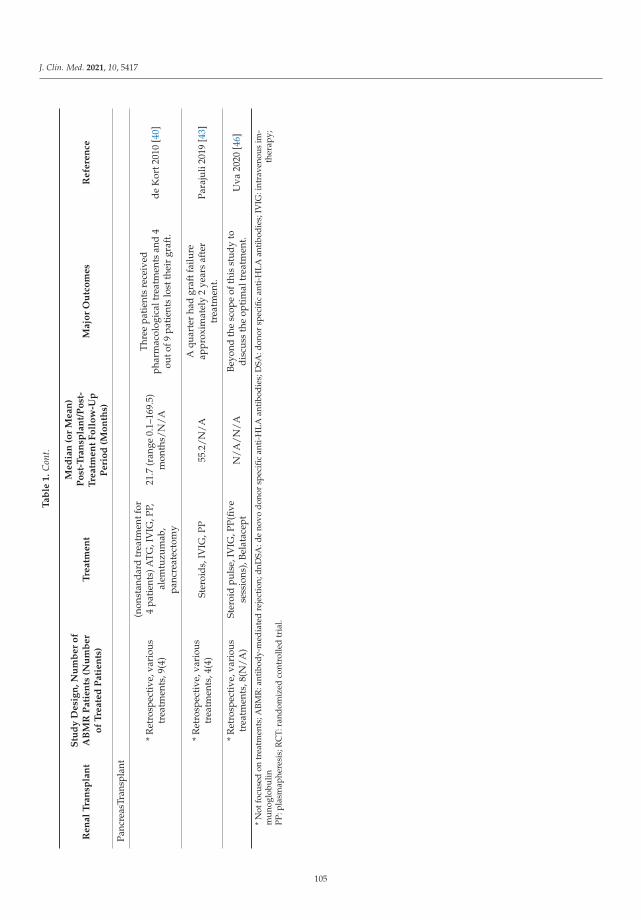
J. Clin. Med. 2021, 10, 5417
Ta
ble
1.
Con
t.
Re
na
lT
ran
spla
nt
Stu
dy
De
sig
n,
Nu
mb
er
of
AB
MR
Pa
tie
nts
(Nu
mb
er
of
Tre
ate
dP
ati
en
ts)
Tre
atm
en
t
Me
dia
n(o
rM
ea
n)
Po
st-T
ran
spla
nt/
Po
st-
Tre
atm
en
tF
oll
ow
-Up
Pe
rio
d(M
on
ths)
Ma
jor
Ou
tco
me
sR
efe
ren
ce
Panc
reas
Tran
spla
nt
*R
etro
spec
tive
,var
ious
trea
tmen
ts,9
(4)
(non
stan
dard
trea
tmen
tfor
4pa
tien
ts)A
TG,I
VIG
,PP,
alem
tuzu
mab
,pa
ncre
atec
tom
y
21.7
(ran
ge0.
1–16
9.5)
mon
ths/
N/A
Thre
epa
tien
tsre
ceiv
edph
arm
acol
ogic
altr
eatm
ents
and
4ou
tof9
pati
ents
lost
thei
rgr
aft.
deK
ort2
010
[40]
*R
etro
spec
tive
,var
ious
trea
tmen
ts,4
(4)
Ster
oids
,IV
IG,P
P55
.2/N
/AA
quar
ter
had
graf
tfai
lure
appr
oxim
atel
y2
year
saf
ter
trea
tmen
t.Pa
raju
li20
19[4
3]
*R
etro
spec
tive
,var
ious
trea
tmen
ts,8
(N/A
)St
eroi
dpu
lse,
IVIG
,PP(
five
sess
ions
),Be
lata
cept
N/A
/N/A
Beyo
ndth
esc
ope
ofth
isst
udy
todi
scus
sth
eop
tim
altr
eatm
ent.
Uva
2020
[46]
*N
otfo
cuse
don
trea
tmen
ts;A
BMR
:ant
ibod
y-m
edia
ted
reje
ctio
n;dn
DSA
:de
novo
dono
rsp
ecifi
can
ti-H
LAan
tibo
dies
;DSA
:don
orsp
ecifi
can
ti-H
LAan
tibo
dies
;IV
IG:i
ntra
veno
usim
-m
uno
glob
ulin
ther
apy;
PP:p
lasm
aphe
resi
s;R
CT:
rand
omiz
edco
ntro
lled
tria
l.
105
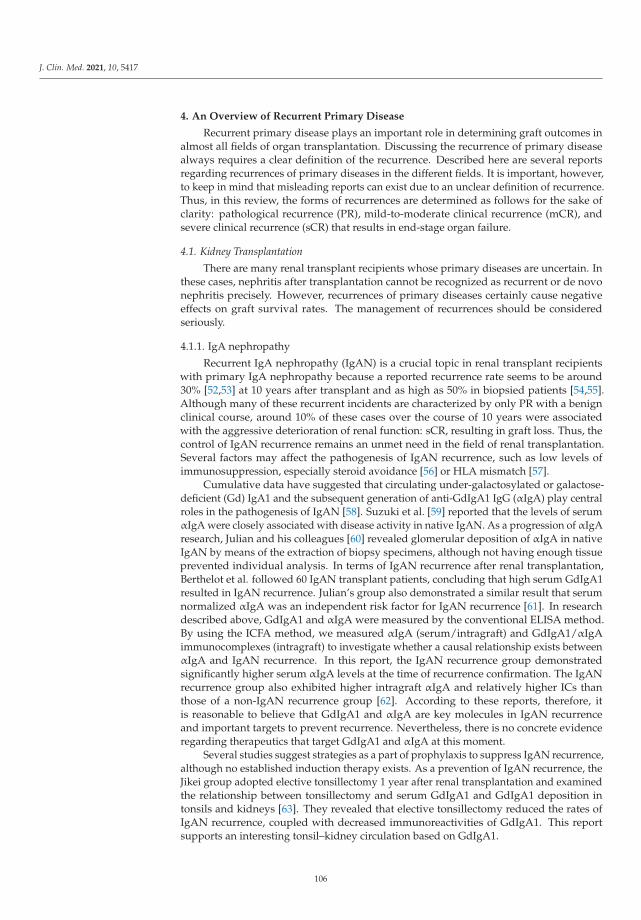
J. Clin. Med. 2021, 10, 5417
4. An Overview of Recurrent Primary Disease
Recurrent primary disease plays an important role in determining graft outcomes inalmost all fields of organ transplantation. Discussing the recurrence of primary diseasealways requires a clear definition of the recurrence. Described here are several reportsregarding recurrences of primary diseases in the different fields. It is important, however,to keep in mind that misleading reports can exist due to an unclear definition of recurrence.Thus, in this review, the forms of recurrences are determined as follows for the sake ofclarity: pathological recurrence (PR), mild-to-moderate clinical recurrence (mCR), andsevere clinical recurrence (sCR) that results in end-stage organ failure.
4.1. Kidney Transplantation
There are many renal transplant recipients whose primary diseases are uncertain. Inthese cases, nephritis after transplantation cannot be recognized as recurrent or de novonephritis precisely. However, recurrences of primary diseases certainly cause negativeeffects on graft survival rates. The management of recurrences should be consideredseriously.
4.1.1. IgA nephropathy
Recurrent IgA nephropathy (IgAN) is a crucial topic in renal transplant recipientswith primary IgA nephropathy because a reported recurrence rate seems to be around30% [52,53] at 10 years after transplant and as high as 50% in biopsied patients [54,55].Although many of these recurrent incidents are characterized by only PR with a benignclinical course, around 10% of these cases over the course of 10 years were associatedwith the aggressive deterioration of renal function: sCR, resulting in graft loss. Thus, thecontrol of IgAN recurrence remains an unmet need in the field of renal transplantation.Several factors may affect the pathogenesis of IgAN recurrence, such as low levels ofimmunosuppression, especially steroid avoidance [56] or HLA mismatch [57].
Cumulative data have suggested that circulating under-galactosylated or galactose-deficient (Gd) IgA1 and the subsequent generation of anti-GdIgA1 IgG (αIgA) play centralroles in the pathogenesis of IgAN [58]. Suzuki et al. [59] reported that the levels of serumαIgA were closely associated with disease activity in native IgAN. As a progression of αIgAresearch, Julian and his colleagues [60] revealed glomerular deposition of αIgA in nativeIgAN by means of the extraction of biopsy specimens, although not having enough tissueprevented individual analysis. In terms of IgAN recurrence after renal transplantation,Berthelot et al. followed 60 IgAN transplant patients, concluding that high serum GdIgA1resulted in IgAN recurrence. Julian’s group also demonstrated a similar result that serumnormalized αIgA was an independent risk factor for IgAN recurrence [61]. In researchdescribed above, GdIgA1 and αIgA were measured by the conventional ELISA method.By using the ICFA method, we measured αIgA (serum/intragraft) and GdIgA1/αIgAimmunocomplexes (intragraft) to investigate whether a causal relationship exists betweenαIgA and IgAN recurrence. In this report, the IgAN recurrence group demonstratedsignificantly higher serum αIgA levels at the time of recurrence confirmation. The IgANrecurrence group also exhibited higher intragraft αIgA and relatively higher ICs thanthose of a non-IgAN recurrence group [62]. According to these reports, therefore, itis reasonable to believe that GdIgA1 and αIgA are key molecules in IgAN recurrenceand important targets to prevent recurrence. Nevertheless, there is no concrete evidenceregarding therapeutics that target GdIgA1 and αIgA at this moment.
Several studies suggest strategies as a part of prophylaxis to suppress IgAN recurrence,although no established induction therapy exists. As a prevention of IgAN recurrence, theJikei group adopted elective tonsillectomy 1 year after renal transplantation and examinedthe relationship between tonsillectomy and serum GdIgA1 and GdIgA1 deposition intonsils and kidneys [63]. They revealed that elective tonsillectomy reduced the rates ofIgAN recurrence, coupled with decreased immunoreactivities of GdIgA1. This reportsupports an interesting tonsil–kidney circulation based on GdIgA1.
106
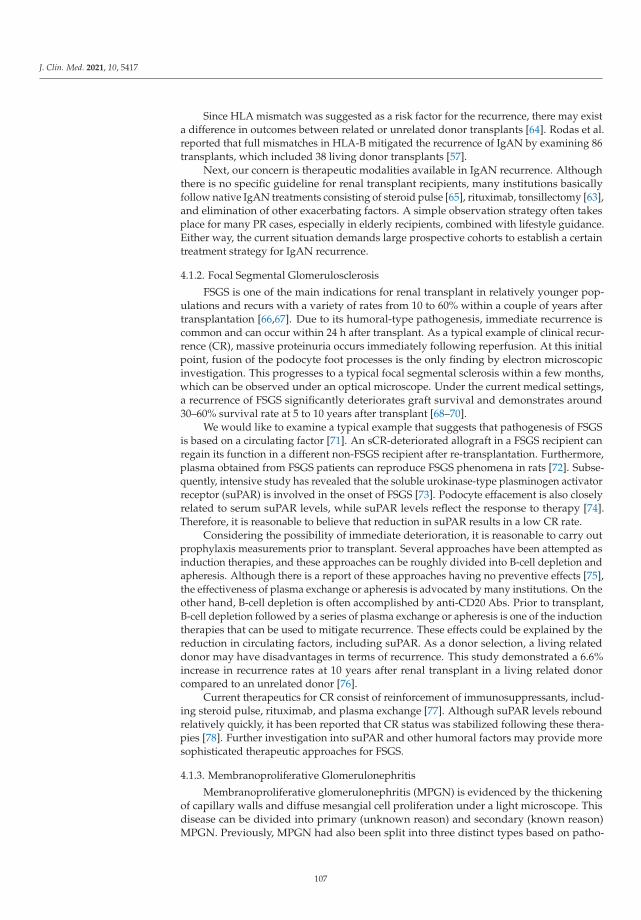
J. Clin. Med. 2021, 10, 5417
Since HLA mismatch was suggested as a risk factor for the recurrence, there may exista difference in outcomes between related or unrelated donor transplants [64]. Rodas et al.reported that full mismatches in HLA-B mitigated the recurrence of IgAN by examining 86transplants, which included 38 living donor transplants [57].
Next, our concern is therapeutic modalities available in IgAN recurrence. Althoughthere is no specific guideline for renal transplant recipients, many institutions basicallyfollow native IgAN treatments consisting of steroid pulse [65], rituximab, tonsillectomy [63],and elimination of other exacerbating factors. A simple observation strategy often takesplace for many PR cases, especially in elderly recipients, combined with lifestyle guidance.Either way, the current situation demands large prospective cohorts to establish a certaintreatment strategy for IgAN recurrence.
4.1.2. Focal Segmental Glomerulosclerosis
FSGS is one of the main indications for renal transplant in relatively younger pop-ulations and recurs with a variety of rates from 10 to 60% within a couple of years aftertransplantation [66,67]. Due to its humoral-type pathogenesis, immediate recurrence iscommon and can occur within 24 h after transplant. As a typical example of clinical recur-rence (CR), massive proteinuria occurs immediately following reperfusion. At this initialpoint, fusion of the podocyte foot processes is the only finding by electron microscopicinvestigation. This progresses to a typical focal segmental sclerosis within a few months,which can be observed under an optical microscope. Under the current medical settings,a recurrence of FSGS significantly deteriorates graft survival and demonstrates around30–60% survival rate at 5 to 10 years after transplant [68–70].
We would like to examine a typical example that suggests that pathogenesis of FSGSis based on a circulating factor [71]. An sCR-deteriorated allograft in a FSGS recipient canregain its function in a different non-FSGS recipient after re-transplantation. Furthermore,plasma obtained from FSGS patients can reproduce FSGS phenomena in rats [72]. Subse-quently, intensive study has revealed that the soluble urokinase-type plasminogen activatorreceptor (suPAR) is involved in the onset of FSGS [73]. Podocyte effacement is also closelyrelated to serum suPAR levels, while suPAR levels reflect the response to therapy [74].Therefore, it is reasonable to believe that reduction in suPAR results in a low CR rate.
Considering the possibility of immediate deterioration, it is reasonable to carry outprophylaxis measurements prior to transplant. Several approaches have been attempted asinduction therapies, and these approaches can be roughly divided into B-cell depletion andapheresis. Although there is a report of these approaches having no preventive effects [75],the effectiveness of plasma exchange or apheresis is advocated by many institutions. On theother hand, B-cell depletion is often accomplished by anti-CD20 Abs. Prior to transplant,B-cell depletion followed by a series of plasma exchange or apheresis is one of the inductiontherapies that can be used to mitigate recurrence. These effects could be explained by thereduction in circulating factors, including suPAR. As a donor selection, a living relateddonor may have disadvantages in terms of recurrence. This study demonstrated a 6.6%increase in recurrence rates at 10 years after renal transplant in a living related donorcompared to an unrelated donor [76].
Current therapeutics for CR consist of reinforcement of immunosuppressants, includ-ing steroid pulse, rituximab, and plasma exchange [77]. Although suPAR levels reboundrelatively quickly, it has been reported that CR status was stabilized following these thera-pies [78]. Further investigation into suPAR and other humoral factors may provide moresophisticated therapeutic approaches for FSGS.
4.1.3. Membranoproliferative Glomerulonephritis
Membranoproliferative glomerulonephritis (MPGN) is evidenced by the thickeningof capillary walls and diffuse mesangial cell proliferation under a light microscope. Thisdisease can be divided into primary (unknown reason) and secondary (known reason)MPGN. Previously, MPGN had also been split into three distinct types based on patho-
107

J. Clin. Med. 2021, 10, 5417
logical findings: sub-endothelial and mesangial immune deposits (type I, most common,mainly secondary MPGN); dense-deposit disease associated with the deposition of com-plement C3 without immunoglobulin deposition (type II); and a mixture of sub-epithelialand sub-endothelial immune deposits (type III, subtype of type I) [79]. Recently, thiscategorization has been replaced by a pathogenesis-based classification: (1) alternativecomplement pathway activation and (2) immunoglobulin-related type. C3 glomerulopathybelongs to classification (1) and is determined where glomerulonephritis is accompaniedonly by C3 deposition without C1q or C4 deposition. C3 glomerulopathy has two forms:dense-deposit diseases and another C3-deposited glomerulopathy, which were previouslycategorized in type I and III [80,81].
Recurrence rates at 11.8%, 15.6%, and 18.9% at 5, 10, and 15 years, respectively, afterrenal transplantation have been reported [70]. More prominently, C3 glomerulopathyexhibits higher than 80% recurrence rates in a small case series (19 patients) [82]. About50 to 70% high rates of graft failure within 5 years after recurrence were observed inMPGN recurrent cases, especially in dense-deposit disease [70,82]. Thus, it is pivotal toexplain these serious outcomes after recurrence for renal transplant candidates in advance.Furthermore, we should seek circumstances where recurrence is less likely to occur. AnIsraeli group reported that 19% recipients of MPGN type I recurred over a 118 ± 61 monthsfollow-up period, and HLA B49 and DR4 were considered to be risk alleles. This researchalso suggests that an unrelated donor is preferred for transplant due to MPGN, based onthe finding that higher rates (25%) of living related to donor renal transplant recipientsrecurred MPGN rather than to unrelated donor transplant (0%), although another studydenied the participation of donor category in recurrent MPGN [76]. In addition, recurrentMPGN, again, clearly showed worse graft survival [83]. Although an optimal inductiontherapy has not been determined, a B-cell targeted immunosuppressive approach appearsto be logical.
The strategies for recurrence of MPGN are also similar to those for the primarydisease, which consist of plasma exchange, rituximab, steroid pulse, or eculizumab [84].Nevertheless, given the significant rates of recurrence and graft failure, it is crucial to informpatients of the outcomes of renal transplantation and to establish effective therapeuticstrategies.
4.1.4. Membranous Nephropathy
Membranous nephropathy (MN) occurs as a pure glomerular-specific autoimmunedisease, as well as a secondary disease due to a systemic condition such as infections,malignant disorders, autoimmune diseases, etc. This entity is induced by immunocomplexdeposition in the sub-epithelial area of the glomerular basement membrane [85]. Theprimary cause seems to be a development of Abs against podocytes. The major Abs thathave been identified include anti-phospholipase A2 receptor antibodies (PLA2R) [86] andthrombospondin type-1 domain-containing 7A antibodies (THSD7A) [87].
Recurrence rates at 10% (5-year), 16% (10-year), and 18% (15-year) were observed,which are similar to those of MPGN discussed above. The recurrence rates could be higher(up to 40%) when including PR found by a protocol biopsy [88]. PR is likely to occur within1 year after transplant and has a possibility of recurring as early as 2 weeks post-transplant.The secondary MN displayed relatively low rates of recurrence, provided that the primarydiseases were well controlled. The recurring MN could result in notable graft failure ratesof up to 60% [70]. A lack of consistency in the graft failure rates in recurring cases wouldindicate that the studied population was not heterogenous.
Regarding recurrence and autoantibody levels, Kattal et al. investigated 26 MN re-cipients according to their anti-PLA2R levels and revealed that anti-PLA2R levels were83% and 42% of the positive and negative predictive values, respectively, for recurrent MNafter transplant [89]. In addition, anti-THSD7A also could induced a recurrence of MN, asevidenced in a case report accompanying an investigation into a murine MN model [90].
108
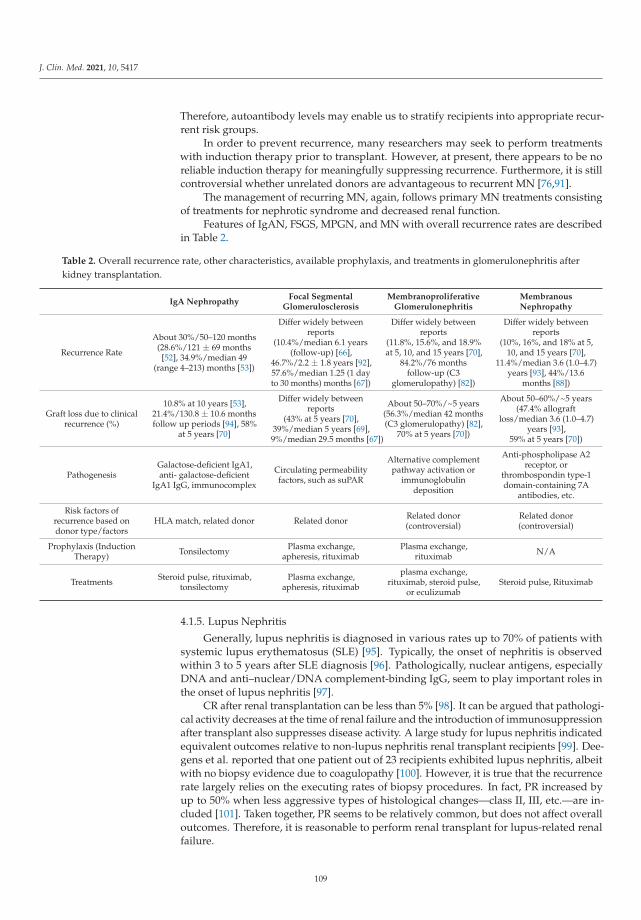
J. Clin. Med. 2021, 10, 5417
Therefore, autoantibody levels may enable us to stratify recipients into appropriate recur-rent risk groups.
In order to prevent recurrence, many researchers may seek to perform treatmentswith induction therapy prior to transplant. However, at present, there appears to be noreliable induction therapy for meaningfully suppressing recurrence. Furthermore, it is stillcontroversial whether unrelated donors are advantageous to recurrent MN [76,91].
The management of recurring MN, again, follows primary MN treatments consistingof treatments for nephrotic syndrome and decreased renal function.
Features of IgAN, FSGS, MPGN, and MN with overall recurrence rates are describedin Table 2.
Table 2. Overall recurrence rate, other characteristics, available prophylaxis, and treatments in glomerulonephritis afterkidney transplantation.
IgA NephropathyFocal Segmental
GlomerulosclerosisMembranoproliferative
GlomerulonephritisMembranousNephropathy
Recurrence Rate
About 30%/50–120 months(28.6%/121 ± 69 months
[52], 34.9%/median 49(range 4–213) months [53])
Differ widely betweenreports
(10.4%/median 6.1 years(follow-up) [66],
46.7%/2.2 ± 1.8 years [92],57.6%/median 1.25 (1 dayto 30 months) months [67])
Differ widely betweenreports
(11.8%, 15.6%, and 18.9%at 5, 10, and 15 years [70],
84.2%/76 monthsfollow-up (C3
glomerulopathy) [82])
Differ widely betweenreports
(10%, 16%, and 18% at 5,10, and 15 years [70],
11.4%/median 3.6 (1.0–4.7)years [93], 44%/13.6
months [88])
Graft loss due to clinicalrecurrence (%)
10.8% at 10 years [53],21.4%/130.8 ± 10.6 monthsfollow up periods [94], 58%
at 5 years [70]
Differ widely betweenreports
(43% at 5 years [70],39%/median 5 years [69],9%/median 29.5 months [67])
About 50–70%/~5 years(56.3%/median 42 months(C3 glomerulopathy) [82],
70% at 5 years [70])
About 50–60%/~5 years(47.4% allograft
loss/median 3.6 (1.0–4.7)years [93],
59% at 5 years [70])
PathogenesisGalactose-deficient IgA1,anti- galactose-deficient
IgA1 IgG, immunocomplex
Circulating permeabilityfactors, such as suPAR
Alternative complementpathway activation or
immunoglobulindeposition
Anti-phospholipase A2receptor, or
thrombospondin type-1domain-containing 7A
antibodies, etc.
Risk factors ofrecurrence based ondonor type/factors
HLA match, related donor Related donor Related donor(controversial)
Related donor(controversial)
Prophylaxis (InductionTherapy) Tonsilectomy Plasma exchange,
apheresis, rituximabPlasma exchange,
rituximab N/A
Treatments Steroid pulse, rituximab,tonsilectomy
Plasma exchange,apheresis, rituximab
plasma exchange,rituximab, steroid pulse,
or eculizumabSteroid pulse, Rituximab
4.1.5. Lupus Nephritis
Generally, lupus nephritis is diagnosed in various rates up to 70% of patients withsystemic lupus erythematosus (SLE) [95]. Typically, the onset of nephritis is observedwithin 3 to 5 years after SLE diagnosis [96]. Pathologically, nuclear antigens, especiallyDNA and anti–nuclear/DNA complement-binding IgG, seem to play important roles inthe onset of lupus nephritis [97].
CR after renal transplantation can be less than 5% [98]. It can be argued that pathologi-cal activity decreases at the time of renal failure and the introduction of immunosuppressionafter transplant also suppresses disease activity. A large study for lupus nephritis indicatedequivalent outcomes relative to non-lupus nephritis renal transplant recipients [99]. Dee-gens et al. reported that one patient out of 23 recipients exhibited lupus nephritis, albeitwith no biopsy evidence due to coagulopathy [100]. However, it is true that the recurrencerate largely relies on the executing rates of biopsy procedures. In fact, PR increased byup to 50% when less aggressive types of histological changes—class II, III, etc.—are in-cluded [101]. Taken together, PR seems to be relatively common, but does not affect overalloutcomes. Therefore, it is reasonable to perform renal transplant for lupus-related renalfailure.
109
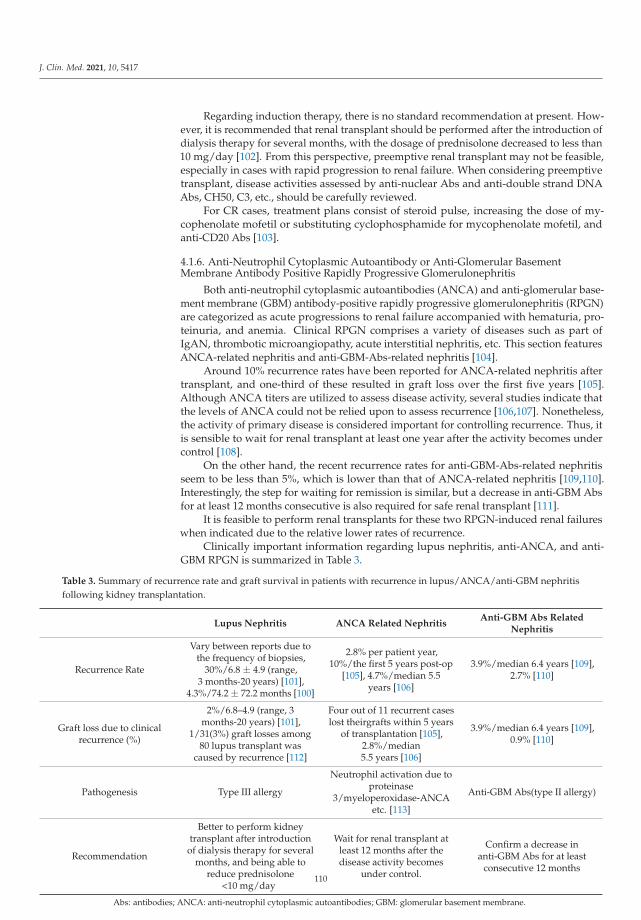
J. Clin. Med. 2021, 10, 5417
Regarding induction therapy, there is no standard recommendation at present. How-ever, it is recommended that renal transplant should be performed after the introduction ofdialysis therapy for several months, with the dosage of prednisolone decreased to less than10 mg/day [102]. From this perspective, preemptive renal transplant may not be feasible,especially in cases with rapid progression to renal failure. When considering preemptivetransplant, disease activities assessed by anti-nuclear Abs and anti-double strand DNAAbs, CH50, C3, etc., should be carefully reviewed.
For CR cases, treatment plans consist of steroid pulse, increasing the dose of my-cophenolate mofetil or substituting cyclophosphamide for mycophenolate mofetil, andanti-CD20 Abs [103].
4.1.6. Anti-Neutrophil Cytoplasmic Autoantibody or Anti-Glomerular BasementMembrane Antibody Positive Rapidly Progressive Glomerulonephritis
Both anti-neutrophil cytoplasmic autoantibodies (ANCA) and anti-glomerular base-ment membrane (GBM) antibody-positive rapidly progressive glomerulonephritis (RPGN)are categorized as acute progressions to renal failure accompanied with hematuria, pro-teinuria, and anemia. Clinical RPGN comprises a variety of diseases such as part ofIgAN, thrombotic microangiopathy, acute interstitial nephritis, etc. This section featuresANCA-related nephritis and anti-GBM-Abs-related nephritis [104].
Around 10% recurrence rates have been reported for ANCA-related nephritis aftertransplant, and one-third of these resulted in graft loss over the first five years [105].Although ANCA titers are utilized to assess disease activity, several studies indicate thatthe levels of ANCA could not be relied upon to assess recurrence [106,107]. Nonetheless,the activity of primary disease is considered important for controlling recurrence. Thus, itis sensible to wait for renal transplant at least one year after the activity becomes undercontrol [108].
On the other hand, the recent recurrence rates for anti-GBM-Abs-related nephritisseem to be less than 5%, which is lower than that of ANCA-related nephritis [109,110].Interestingly, the step for waiting for remission is similar, but a decrease in anti-GBM Absfor at least 12 months consecutive is also required for safe renal transplant [111].
It is feasible to perform renal transplants for these two RPGN-induced renal failureswhen indicated due to the relative lower rates of recurrence.
Clinically important information regarding lupus nephritis, anti-ANCA, and anti-GBM RPGN is summarized in Table 3.
Table 3. Summary of recurrence rate and graft survival in patients with recurrence in lupus/ANCA/anti-GBM nephritisfollowing kidney transplantation.
Lupus Nephritis ANCA Related NephritisAnti-GBM Abs Related
Nephritis
Recurrence Rate
Vary between reports due tothe frequency of biopsies,
30%/6.8 ± 4.9 (range,3 months-20 years) [101],
4.3%/74.2 ± 72.2 months [100]
2.8% per patient year,10%/the first 5 years post-op
[105], 4.7%/median 5.5years [106]
3.9%/median 6.4 years [109],2.7% [110]
Graft loss due to clinicalrecurrence (%)
2%/6.8–4.9 (range, 3months-20 years) [101],
1/31(3%) graft losses among80 lupus transplant was
caused by recurrence [112]
Four out of 11 recurrent caseslost theirgrafts within 5 years
of transplantation [105],2.8%/median5.5 years [106]
3.9%/median 6.4 years [109],0.9% [110]
Pathogenesis Type III allergy
Neutrophil activation due toproteinase
3/myeloperoxidase-ANCAetc. [113]
Anti-GBM Abs(type II allergy)
Recommendation
Better to perform kidneytransplant after introduction
of dialysis therapy for severalmonths, and being able to
reduce prednisolone<10 mg/day
Wait for renal transplant atleast 12 months after thedisease activity becomes
under control.
Confirm a decrease inanti-GBM Abs for at least
consecutive 12 months
Abs: antibodies; ANCA: anti-neutrophil cytoplasmic autoantibodies; GBM: glomerular basement membrane.
110
J. Clin. Med. 2021, 10, 5417
4.1.7. Amyloidosis and Mimickers
Amyloidosis is a systemic disease and a relatively rare entity for renal transplantation.Amyloid deposition is observed under the electron microscopy at around 5–12 nm fibrils,which are β-pleated sheets [114]. In addition, a positive Congo red stain and an apple-greenbirefringence with polarized light are often used for confirmation [115]. Mass spectrometrybecame a useful tool for distinguishing the following subtypes [116].
AL (fibrils due to immunoglobulin light chain clonal production); AA (serum amyloidA congregation, secondary amyloidosis); ATTR (hereditary amyloidosis, genetic mutationof misfolding-prone protein (mainly transthyretin)); and ATTRwt (wild-type transthyretinmisfolding). Responsible proteins of ATTR include apolipoprotein A-I, A-II, lysozyme,fibrinogen, and cystatin C, etc., in addition to transthyretin [117,118].
Although amyloidosis negatively impacted the patients’ graft survival, the overalloutcomes were equivalent with diabetes mellitus (DM) or elderly (>65 years) recipientsafter renal transplantation. Around 15% recurrence rates had been reported, dependingon the subtype of amyloidosis, and significantly affected patients’ survival. RegardingAL amyloidosis, a complete hematologic response seems to be key in achieving bettersurvival [119] and acceptable outcomes (median duration to graft loss: 10.4 years), whilstpatients with partial or no response demonstrated inferior outcomes (5.5 years) [120].Apolipoprotein A-I and lysozyme amyloidosis showed better graft survival, with 13.1 yearsat median [119]. These studies suggest that renal transplant outcomes largely rely on thetype of primary amyloidosis. Therefore, at least, it is reasonable to evaluate patientscarefully and manage the primary amyloidosis appropriately in order to mitigate the riskof recurrence when considering renal transplant for amyloidosis.
On the other hand, as a mimicker, fibrillary glomerulonephritis (FGN) shares severalcommon characteristics both clinically and histologically: nephrotic or nephrotic syndrome,deposits of 12–24 nm fibrils, and occasionally positive Congo red stain (4%). FGN ischaracterized by DnaJ homolog subfamily B member 9 as an auto-antigen [121] andpossibly recurs after transplant with the rate at around 20% [122]. Thus, it is pivotalto make a correct diagnosis in confusing cases by using mass spectrometry.
In addition to recipients diagnosed with amyloidosis, it is essential to keep renal amy-loidosis in mind in cases of new-onset proteinuria or nephrotic syndrome following renaltransplantation for an unknown primary disease, since a routine pathological screeningmay not identify the early signs of recurrent amyloidosis.
4.2. Liver Transplantation
After liver transplantation, a variety of medical problems might occur, such as renaldamage, new onset of DM, etc., in addition to rejection and infection. Furthermore, primarydisease recurrences are another significant issue. There are at least three major mechanismsby which a primary disease recurs in liver grafts. The first category is a recurrence in thesame manner as the primary disease, for example, primary biliary cholangitis or primarysclerosing cholangitis. Secondly, a recurrence of hepatitis due to a virus that is responsiblefor the primary hepatitis belongs to this category. Third, this category contains recurrencesof tumors in liver graft. It can be recognized as primary tumor metastases to liver grafts.
4.2.1. Viral Hepatitis
Although viral hepatitis B and C have been the leading reasons for adult liver trans-plants [123], a recent rapid increase in nonalcoholic steatohepatitis has rearranged thistrend [124].
Regarding hepatitis B virus (HBV) reactivation following transplant, there are twomain distinctive situations. The first instance is HBV hepatitis in HBsAg (hepatitis Bsurface antigen)-positive recipients, whereas HBV transfer from a donor who is HBsAg-negative/hepatitis B core antibodies (anti-HBc Abs)-positive is another example. From theperspective of recurrence, former conditions will be discussed here.
111

J. Clin. Med. 2021, 10, 5417
For recipients with HBV infection, inappropriate prophylaxis results in HBV reinfec-tion of liver grafts. Following the removal of the infected liver, the reinfection is establishedwith HBV remaining in the recipient’s blood stream. This trend seems to be more appar-ent in recipients with preoperative HBV-DNA positive than HBV-DNA and hepatitis B eantigen (HBeAg) double-negative cases. Eighty-three percent of preoperative HBV-DNApositive recipients had serums that became HBsAg-positive after surgery. Nevertheless,HBV-DNA and HBeAg double-negative cases also showed an HBsAg resurgence in 58%of recipients [125]. Therefore, HBV exists in recipients, albeit with negative results forHBV-DNA. It is well known that the outcomes of HBV reinfection have significant nega-tive effects on liver grafts: rapid progression to cirrhosis [126]. As prophylaxis strategies,initially, hepatitis B immunoglobulin or lamivudine administration had been implemented.However, higher than 30% reactivation was confirmed despite prophylaxis [125,127]. There-after, it was proved that hepatitis B immunoglobulin and lamivudine coadministration waseffective enough to suppress reactivation, with a rate of 0–10% [128,129]. Consequently, itbecame a standard practice to apply preoperative lamivudine treatment, intraoperativehepatitis B immunoglobulin IV, and postoperative coadministration.
Although hepatitis C virus (HCV) has spread worldwide, the introduction of direct-acting antivirals (DAA) has completely changed its management after liver transplan-tation [130]. In addition, DAA provides an opportunity to expand a donor pool to theHCV-positive population [131]. As a natural course of liver transplant for HCV, the rates ofHCV-recurrent infection are significantly high and typically occur soon after surgery, whileonly 5% of recipients may escape from recurrence. In many cases, HCV RNA becomesdetectable two to four weeks after transplant. Subsequently, many recipients show histolog-ical chronic hepatitis [132,133]. Before the introduction of DAA, it was believed that thesefactors might affect the overall outcomes of liver transplants. Surprisingly, these negativeinfluences may be limited to slight-to-moderate inferior outcomes in 5-year patient survivalrates [134]. Conversely, several studies have reported that HCV recurrence possibly causedserious outcomes, such as fibrosing cholestatic hepatitis [135], immediate progression tocirrhosis [136], or deteriorated patient survival [137].
Before the emergence of DAA, several treatment strategies were reported. Fromthe 1990s, interferon therapy commenced [138]. Ribavirin was added in the 2000s [139]and was later improved by Peg-interferon [140]. However, the sustained virologicalresponse (SVR) after transplant remained only around 10–40%, which was far belowacceptable rates [141,142]. In 2011, telaprevir was approved as a first-generation proteinaseinhibitor and established as a triple-drug treatment [143]. The second generation simeprevir,emerged in 2013, and the regimen further improved [144].
Next, in 2014, the interferon-free DAAs, asunaprevir, and daclatasvir were developedwith successfully high SVRs [145]. Conversely, it is true that candidates for liver trans-plant may have belonged to a category where preoperative treatment was ineffective orimpossible due to refractory mutated HCV or patients’ other conditions. Thus, SVRs aftertransplant were inevitably lower than those of native HCV patients [146].
Considering these serious consequences, the effective DAA introduction was signifi-cant, especially after the emergence of sofosbuvir and ledipasvir. As the SVRs had reachednearly 100% both in native HCV and liver transplant patients [147,148], DAA introductionafter liver transplant became a standard therapy. Furthermore, for recipients with renalfailure, cirrhosis, or prior DAA failure, the effectiveness of glecaprevir and pibrentasvirhas been reported [149].
4.2.2. Malignant Tumor
Liver transplantation is indicated for end-stage liver disease with tumors or unre-sectable malignant liver tumors under certain conditions. Hepatocellular carcinoma (HCC)is a representative tumor that is most frequently indicated for liver transplantation. Origi-nally, it is well known that the outcomes of liver transplantation for HCC without stagingwere inferior to those of other primary diseases without HCC [150]. This is primarily
112

J. Clin. Med. 2021, 10, 5417
because HCC recurs in transplanted liver grafts in immunocompromised patients. Thus,liver transplantation should proceed in circumstances where HCC is not disseminatedto the outside of the liver. To overcome the recurrence of HCC, the Milan criteria wasclinically introduced worldwide [151]. However, a certain patient group demonstrated theequivalent outcomes, albeit with deviation from the Milan criteria. The criteria were thenmodestly expanded to the University of California, San Francisco (UCSF) criteria, whichshowed a 75% survival rate in 5 years [152]. The Kyoto group also expanded the eligibilityfor liver transplantation with an excellent survival rate of 82% and a low recurrence rateof 7% at 5-years post-transplant [153]. It is noteworthy that the Kyoto group not onlyapplied tumor size and numbers, but also serum des-gamma-carboxy prothrombin levelsas an assessment for tumor activities. Recently, there have been further efforts to establishseveral other safer models, such as the hazard associated with liver transplantation forhepatocellular carcinoma which incorporates a dynamic α–fetoprotein response [154].
Early stage unresectable cholangiocarcinoma is also considered as an indication forliver transplantation. Cholangiocarcinoma is the second most common liver cancer andpathophysiologically divided into two different groups: extrahepatic cholangiocarcinomaand intrahepatic cholangiocarcinoma. Among extrahepatic cholangiocarcinoma, perihilarcholangiocarcinoma may be an indication for liver transplantation, whilst liver transplanta-tion is not indicated for distal cholangiocarcinoma given its location [155]. LT can only bea valid treatment plan if it can promise a better survival rate compared to liver resection.In order to achieve this, the Mayo Clinic protocol that was originally reported in 2000 hasbeen supported. In summary, liver transplantation is performed following neoadjuvantchemoradiotherapy, which consists of extra-beam and transcatheter radiation therapy andintravenous 5-FU administration [156]. Based on experience, elevated CA19-9, encasedportal vein, and non-radical resection were identified as predictors of recurrence followingliver transplantation [157]. On the other hand, several initial studies regarding intrahep-atic cholangiocarcinoma seem to be difficult to interpret since the pathological conditionsof recipients were not sufficient. However, recent studies show that liver transplanta-tion for very early intrahepatic cholangiocarcinoma—a single tumor measuring less than2 cm—promises acceptable outcomes, with a 73% 5-year patient survival rate [158]. Insummary, these results were obtained from incidental pathological findings in recipientswith cirrhosis or initial misinterpretation as HCC. Thus, initial diagnosis such as very earlyintrahepatic cholangiocarcinoma should first be considered for liver resection. However,if liver resection is not an option, as with portal hypertension, etc., liver transplantationmight be the last resort.
4.2.3. Primary Biliary Cholangitis
Primary biliary cholangitis (PBC) is categorized as a cholestatic liver disease accom-panied by autoimmune features. These features comprise anti-mitochondrial Abs (AMA)positivity (>90% of patients), targeting anti-E2 domain of pyruvate dehydrogenase complexAbs [159], and meaningful overlap with other autoimmune disorders, such as Sjogren’ssyndrome and thyroiditis, etc. [160]. Thus, PBC is recognized as part of a systemic au-toimmune condition. Histologically, PBC is characterized by a chronic destructive form ofnonsuppurative granulomatous lesions with or without lymphocytes-infiltrate cholangitisin small-sized and medium-sized biliary trees [161].
With the introduction of ursodeoxycholic acid (UDCA) in the early stages of PBC, theresulting rates of liver transplant or death improved to 6% and 22% at 10 and 20 years, re-spectively, after the onset of PBC [162]. The outcomes of liver transplant are generally good,with around 80% and 70% survival rates reported at 5 and 10 years, respectively [163,164].Interestingly, similar outcomes have been reported with deceased and living liver trans-plant donors [165]. The rates of recurrent PBC appear to vary depending on whetherrecipients received prophylactic UDCA administration and the frequency of liver biop-sies. Recurrence rates at 10% to 20% have been reported in recipients with prophylaxisduring an approximately 10-year follow-up period [166,167], whereas patients without
113
J. Clin. Med. 2021, 10, 5417
prophylaxis have demonstrated greater than 30% recurrence rates over the same timeperiod [168,169]. These studies support that UDCA is effective for the majority of patientswith recurrence, but there were no significant improvements in histological changes andpatients’ survival [169].
Diagnosis of recurrent PBC is largely reliant on histological findings, since only around10% of recurrent PBC patients demonstrate classic symptoms of PBC, i.e., pruritis, jaun-dice, xerostomia, or keratoconjunctivitis sicca, etc. In order to standardize recurrent PBC,pathological features combined with the existence of AMA and elevated IgM are oftenadopted clinically. Pathological features include the following four findings: 1. epithe-lioid granulomas called florid lesions, 2. lymphoplasmacytic infiltration, 3. lymphocytesaggregation, and 4. bile duct injury. Definite recurrent PBC is defined by having all 3–4pathological features, while conditions meeting 2/4 criteria are considered as probablerecurrent PBC [170].
Citing definite risk factors for recurrence of PBC is still controversial, although severalstudies suggest that immunosuppressants, HLA alleles, HLA mismatch, recipient/donorage, and gender play a role, which appear to be feasible from the perspective of thebehavior of autoimmune nature. Manousou et al. reported that therapy with cyclosporinand azathioprine in combination had preventive effects on the recurrence of PBC, althoughcyclosporin and tacrolimus alone had minimal influence [168]. Egawa et al. also suggestthat there is superiority in conversion to cyclosporin from tacrolimus within 1 year todecrease the risk of recurrence, albeit with a disadvantage of cyclosporin as a primarycalcineurin inhibitor [171]. This research enumerated several other risk factors: serum IgM554 mg/dL or higher and donor-recipient sex mismatch. Recent meta-analysis from sixretrospective studies showed tacrolimus inferiority and UDCA protective effects for therecurrence of PBC [172].
Regarding disease activity of recurrent PBC, it basically exhibits an indolent stylethat barely requires re-transplantation and tends not to affect long-term outcomes. AJapanese multicenter study showed that PBC recurrence rarely became an indicationfor re-transplantation after analyzing seven re-transplant cases from 516 liver transplantrecipients of PBC [173], while Charatcharoenwitthaya et al. reported that two out of thirty-eight recurrent cases required re-transplantation [169]. Taken together, it can be arguedthat PBC recurrence seldom results in graft loss.
4.2.4. Primary Sclerosing Cholangitis
Primary sclerosing cholangitis (PSC) is characterized by both intra-hepatic and extra-hepatic multiple or diffuse bile duct stenoses, which result in a chronic cholestatic condi-tions associated with cirrhosis. Pathogenesis of PSC remains unclear, but, as with othermultifactorial diseases, genetic factors along with environmental factors may play a role inits onset. Notable findings include a strong association of up to 80% with inflammatorybowel disease, especially ulcerative colitis [174]. In addition, PSC increases the risk ofprimary liver cancer, especially cholangiocarcinoma, by up to 1500 times compared withthe general population and increases the annual morbidity rate by 0.5% [175]. At present,liver transplantation is the only established therapy for PSC. The overall survival rateswithout liver transplant in PSC patients were 78 and 60% at 10 and 20 years, respectively,following the onset of PSC [176].
The outcomes of liver transplantation for PSC differ from relatively poor to acceptablegraft survival rates. From the European Liver Transplant Registry, 80, 69, and 57% graftsurvival rates at 1, 5, and 10 years, respectively, were reported [163], while U.S. data showed86.5, 78, and 71.5% for the same time periods [164]. Although several discrepancies exist,the outcomes are generally worse than those for liver transplants for other cholestaticdiseases. It can be argued that recurrent PSC in transplanted livers is one of the reasons forthe worse outcomes.
Periductal concentric fibrosis (onion skin fibrosis) accompanied with lymphocyteinfiltration is a well-known histological finding. However, this typical feature is not often
114

J. Clin. Med. 2021, 10, 5417
observed in PSC clinically. In order to diagnose PSC, cholangiography is considered themost important step. A beaded or “pruned tree” appearance and band-like strictures arecharacteristic features of PSC. Recurrent PSC is determined in PSC recipients who demon-strate these cholangiography findings or pathologies, with the exception of cases of hepaticartery thrombosis or other similar conditions [177]. Pathological features are consideredparticularly important in the diagnosis. Recurrence rates of around 20% have been reported,especially when less than a median of 5 years has passed since transplant [178–180].
The discrepancies in the reported incidences of recurrence may reveal some riskfactors, although several risk factors have been reported from various institutions. Theserisk factors are considered to be possible issues for grafts, recipients–donor relations andrecipients. Regarding liver grafts, marginal or extended donor criteria grafts may exhibit ahigher incidence of recurrence [179]. Meaningful insights can also be obtained from livingdonor liver transplants. Notably, related (parent/child) pairs may show higher recurrencerates, and this tendency is clearer if recipients are followed-up longer: The hazard ratiois 3.12 (>12 months follow-up) [181]. Another study suggested higher recurrence rates inliving donor liver transplants, compared to deceased donor transplant [182]. However,a multi-center cohort study denied the impact of donor type, albeit without collectingadequate HLA data [183].
In relation to recipient issues, several factors have been discussed, such as inflamma-tory bowel disease, rejection/immunosuppressants, younger age, and high MELD scores,etc. Of these, topics regarding inflammatory bowel disease are often discussed. Given the“leaky gut” hypothesis, unchanged bowel bacterial flora or substances from those aftertransplant may evoke the same pathological condition in transplanted liver grafts [184].Thus, pretransplant colectomy with a remission of inflammatory bowel disease may conferPSC pathogenesis-free circumstances. Rejection, especially a refractory one, also imposes ahigher risk of recurrence that may be explained by the fact that PSC and rejection share thesame immunological pathways [185]. Taken together, several institutions seem to applythe following as clinically acceptable strategies: (1) avoidance of a first-degree relative as adonor and reliance on a deceased donor, if trusting the results that showed living donorinferiority, and (2) minimal withdrawal of immunosuppression.
Recurrent PSC tends to demonstrate CR style and demonstrates inferior outcomes(graft loss) that require re-transplantation with high probabilities (30–70%) compared torecurrent PBC or autoimmune hepatitis [181,183]. These results suggest that recurrent PSCprogresses vehemently to graft loss. As with native PSC, no standard therapy has yet beenestablished for recurrent PSC except for re-transplantation, although biliary tract drainagecan be attempted in several cases as rescue therapy.
4.2.5. Autoimmune Hepatitis
Autoimmune hepatitis (AIH) is an inflammatory, basically progressive, autoimmunedisease that mainly affects middle-aged women (but possibly all ages and both genders)due to uncertain causes. The disease progression seems to rely on environmental triggersand genetic factors [186]. Although no disease-specific markers have been identified,several autoantibodies have been recognized in AIH: anti-nuclear, anti-smooth muscle,anti-liver kidney microsome, and anti-liver cytosol antigen type I. Based on these serologicalmarkers, AIH can be separated into type I (anti-nuclear or anti-smooth muscle Abs, orboth) and II (anti-liver kidney microsome Abs) AIH [187]. In addition, the existence oftype III AIH (anti-soluble liver antigens Abs) has been advocated [188], although thecharacteristic of this entity overlaps with type I AIH [187]. AIH is also characterized bymildly elevated serum IgG levels and interface hepatitis or plasma-lymphocytic infiltration.In terms of treatment, the first recommendation is corticosteroids followed by azathioprineand mycophenolate mofetil in that order [189]. If appropriate therapies are provided,the long-term outcome of AIH generally provides sufficient life expectancy. However,compared to other chronic liver diseases, the lack of these interventions results in relativelyrapid progression to cirrhosis and liver failure, which requires liver transplant [190].
115
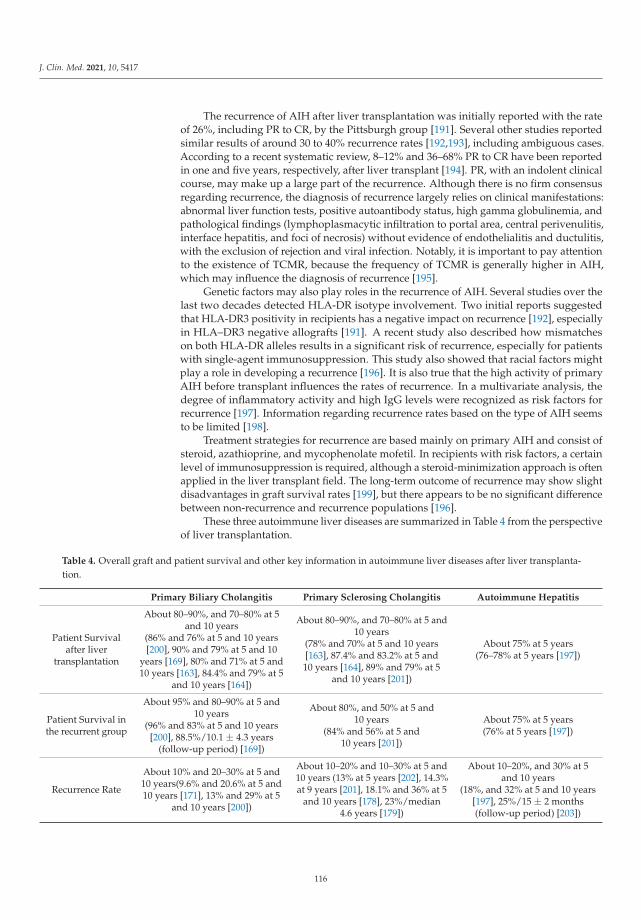
J. Clin. Med. 2021, 10, 5417
The recurrence of AIH after liver transplantation was initially reported with the rateof 26%, including PR to CR, by the Pittsburgh group [191]. Several other studies reportedsimilar results of around 30 to 40% recurrence rates [192,193], including ambiguous cases.According to a recent systematic review, 8–12% and 36–68% PR to CR have been reportedin one and five years, respectively, after liver transplant [194]. PR, with an indolent clinicalcourse, may make up a large part of the recurrence. Although there is no firm consensusregarding recurrence, the diagnosis of recurrence largely relies on clinical manifestations:abnormal liver function tests, positive autoantibody status, high gamma globulinemia, andpathological findings (lymphoplasmacytic infiltration to portal area, central perivenulitis,interface hepatitis, and foci of necrosis) without evidence of endothelialitis and ductulitis,with the exclusion of rejection and viral infection. Notably, it is important to pay attentionto the existence of TCMR, because the frequency of TCMR is generally higher in AIH,which may influence the diagnosis of recurrence [195].
Genetic factors may also play roles in the recurrence of AIH. Several studies over thelast two decades detected HLA-DR isotype involvement. Two initial reports suggestedthat HLA-DR3 positivity in recipients has a negative impact on recurrence [192], especiallyin HLA–DR3 negative allografts [191]. A recent study also described how mismatcheson both HLA-DR alleles results in a significant risk of recurrence, especially for patientswith single-agent immunosuppression. This study also showed that racial factors mightplay a role in developing a recurrence [196]. It is also true that the high activity of primaryAIH before transplant influences the rates of recurrence. In a multivariate analysis, thedegree of inflammatory activity and high IgG levels were recognized as risk factors forrecurrence [197]. Information regarding recurrence rates based on the type of AIH seemsto be limited [198].
Treatment strategies for recurrence are based mainly on primary AIH and consist ofsteroid, azathioprine, and mycophenolate mofetil. In recipients with risk factors, a certainlevel of immunosuppression is required, although a steroid-minimization approach is oftenapplied in the liver transplant field. The long-term outcome of recurrence may show slightdisadvantages in graft survival rates [199], but there appears to be no significant differencebetween non-recurrence and recurrence populations [196].
These three autoimmune liver diseases are summarized in Table 4 from the perspectiveof liver transplantation.
Table 4. Overall graft and patient survival and other key information in autoimmune liver diseases after liver transplanta-tion.
Primary Biliary Cholangitis Primary Sclerosing Cholangitis Autoimmune Hepatitis
Patient Survivalafter liver
transplantation
About 80–90%, and 70–80% at 5and 10 years
(86% and 76% at 5 and 10 years[200], 90% and 79% at 5 and 10
years [169], 80% and 71% at 5 and10 years [163], 84.4% and 79% at 5
and 10 years [164])
About 80–90%, and 70–80% at 5 and10 years
(78% and 70% at 5 and 10 years[163], 87.4% and 83.2% at 5 and10 years [164], 89% and 79% at 5
and 10 years [201])
About 75% at 5 years(76–78% at 5 years [197])
Patient Survival inthe recurrent group
About 95% and 80–90% at 5 and10 years
(96% and 83% at 5 and 10 years[200], 88.5%/10.1 ± 4.3 years
(follow-up period) [169])
About 80%, and 50% at 5 and10 years
(84% and 56% at 5 and10 years [201])
About 75% at 5 years(76% at 5 years [197])
Recurrence Rate
About 10% and 20–30% at 5 and10 years(9.6% and 20.6% at 5 and10 years [171], 13% and 29% at 5
and 10 years [200])
About 10–20% and 10–30% at 5 and10 years (13% at 5 years [202], 14.3%at 9 years [201], 18.1% and 36% at 5
and 10 years [178], 23%/median4.6 years [179])
About 10–20%, and 30% at 5and 10 years
(18%, and 32% at 5 and 10 years[197], 25%/15 ± 2 months(follow-up period) [203])
116
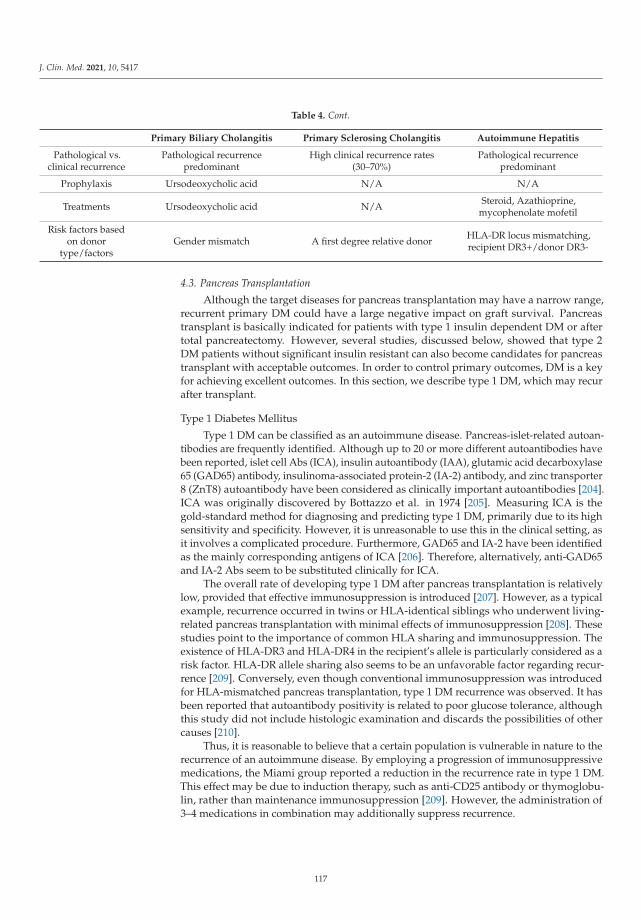
J. Clin. Med. 2021, 10, 5417
Table 4. Cont.
Primary Biliary Cholangitis Primary Sclerosing Cholangitis Autoimmune Hepatitis
Pathological vs.clinical recurrence
Pathological recurrencepredominant
High clinical recurrence rates(30–70%)
Pathological recurrencepredominant
Prophylaxis Ursodeoxycholic acid N/A N/A
Treatments Ursodeoxycholic acid N/A Steroid, Azathioprine,mycophenolate mofetil
Risk factors basedon donor
type/factorsGender mismatch A first degree relative donor HLA-DR locus mismatching,
recipient DR3+/donor DR3-
4.3. Pancreas Transplantation
Although the target diseases for pancreas transplantation may have a narrow range,recurrent primary DM could have a large negative impact on graft survival. Pancreastransplant is basically indicated for patients with type 1 insulin dependent DM or aftertotal pancreatectomy. However, several studies, discussed below, showed that type 2DM patients without significant insulin resistant can also become candidates for pancreastransplant with acceptable outcomes. In order to control primary outcomes, DM is a keyfor achieving excellent outcomes. In this section, we describe type 1 DM, which may recurafter transplant.
Type 1 Diabetes Mellitus
Type 1 DM can be classified as an autoimmune disease. Pancreas-islet-related autoan-tibodies are frequently identified. Although up to 20 or more different autoantibodies havebeen reported, islet cell Abs (ICA), insulin autoantibody (IAA), glutamic acid decarboxylase65 (GAD65) antibody, insulinoma-associated protein-2 (IA-2) antibody, and zinc transporter8 (ZnT8) autoantibody have been considered as clinically important autoantibodies [204].ICA was originally discovered by Bottazzo et al. in 1974 [205]. Measuring ICA is thegold-standard method for diagnosing and predicting type 1 DM, primarily due to its highsensitivity and specificity. However, it is unreasonable to use this in the clinical setting, asit involves a complicated procedure. Furthermore, GAD65 and IA-2 have been identifiedas the mainly corresponding antigens of ICA [206]. Therefore, alternatively, anti-GAD65and IA-2 Abs seem to be substituted clinically for ICA.
The overall rate of developing type 1 DM after pancreas transplantation is relativelylow, provided that effective immunosuppression is introduced [207]. However, as a typicalexample, recurrence occurred in twins or HLA-identical siblings who underwent living-related pancreas transplantation with minimal effects of immunosuppression [208]. Thesestudies point to the importance of common HLA sharing and immunosuppression. Theexistence of HLA-DR3 and HLA-DR4 in the recipient’s allele is particularly considered as arisk factor. HLA-DR allele sharing also seems to be an unfavorable factor regarding recur-rence [209]. Conversely, even though conventional immunosuppression was introducedfor HLA-mismatched pancreas transplantation, type 1 DM recurrence was observed. It hasbeen reported that autoantibody positivity is related to poor glucose tolerance, althoughthis study did not include histologic examination and discards the possibilities of othercauses [210].
Thus, it is reasonable to believe that a certain population is vulnerable in nature to therecurrence of an autoimmune disease. By employing a progression of immunosuppressivemedications, the Miami group reported a reduction in the recurrence rate in type 1 DM.This effect may be due to induction therapy, such as anti-CD25 antibody or thymoglobu-lin, rather than maintenance immunosuppression [209]. However, the administration of3–4 medications in combination may additionally suppress recurrence.
117
J. Clin. Med. 2021, 10, 5417
5. Feature Perspective and Concluding Remarks
ABMR and a recurrence of primary disease are looming subjects that hinder theachievement of excellent long-term graft survival. It has been considered that ABMR isprominent in renal transplant rather than liver and pancreas transplants. Nevertheless, asa development of immunological assessments, the identification of ABMR in liver and pan-creas transplants has become more apparent than before. Due to the fact that there seemsto be common immunological reactions in these different organs, integrated approachesfrom different fields could accelerate the understanding of ABMR. Furthermore, knowingthe nature of the primary disease would also facilitate tailoring immunosuppression tomitigate the risk of recurrence.
Lowering immunosuppression under a certain threshold could trigger the onset ofthese two distinctive conditions. Thus, it would be ideal to find more precise thresholdsfor each case by monitoring the recipients’ immunological status. Regarding inductiontherapies, a single induction at pre-transplant or peri-transplant may be unfeasible withrespect to maintaining the condition free from both ABMR and recurrence in the long term,because the recovery of immunity occurs over the course of post-transplant. However,more specific tolerance induction or complete remission from the primary disease couldalleviate the risk of both entities or realize a better condition. ABMR and recurrence ofprimary diseases have their own preferences regarding donor immunological backgrounds,which would be contrary to each other. Donor selection could be arranged by estimatingthe advantages and disadvantages. Adjustment of these factors could result in improvedoutcomes in organ transplantation.
Author Contributions: Conceptualization, T.N.; writing—original draft preparation, T.N. and T.S.;writing—review and editing, T.N. and T.S.; funding acquisition, T.N. and T.S. All authors have readand agreed to the published version of the manuscript.
Funding: The APC was funded by JSPS KAKENHI Grant Number 19K18066.
Conflicts of Interest: The authors declare no conflict of interest.
Abbreviations
ABMR antibody-mediated rejectionAbs antibodiesAIH autoimmune hepatitisAMA anti-mitochondrial antibodiesANCA anti-neutrophil cytoplasmic autoantibodiesanti-HBc Abs anti-hepatitis B core antibodiesCNI calcineurin inhibitorsCR clinical recurrenceDAA direct-acting antiviralsDM diabetes mellitusdnDSA de novo donor specific anti-HLA antibodiesDSA donor specific anti-HLA antibodiesFGN fibrillary glomerulonephritisFSGS focal segmental glomerulosclerosisg-DSA intra-graft DSAGAD65 glutamic acid decarboxylase 65GBM anti-glomerular basement membraneGdIgA1 galactose-deficient IgA1HBeAg hepatitis B e antigenHBsAg hepatitis B surface antigenHBV hepatitis B virusHCC hepatocellular carcinomaHCV hepatitis C virus
118
J. Clin. Med. 2021, 10, 5417
HLA human leukocyte antigenIAA insulin autoantibodyIA-2 insulinoma-associated protein-2ICA islet cell antibodiesIFTA interstitial fibrosis and tubular atrophyIgAN IgA nephropathyIVIG intravenous immunoglobulin therapymCR mild-to-moderate clinical recurrenceMELD model for end-stage liver diseaseMN membranous nephropathyMPGN membranoproliferative glomerulonephritismTOR mammalian target of rapamycinPBC primary biliary cholangitisPLA2R anti-phospholipase A2 receptor antibodiesPR pathological recurrencePSC primary sclerosing cholangitisRPGN rapidly progressive glomerulonephritiss-DSA serum DSAsCR severe clinical recurrenceSLE systemic lupus erythematosussuPAR soluble urokinase type plasminogen activator receptorSVR sustained virological responseTCMR T cell-mediated rejectionTHSD7A thrombospondin type-1 domain-containing 7A antibodiesUDCA ursodeoxycholic acidZnT8 zinc transporter 8αIgA anti-GdIgA1 IgG
References
1. Wiebe, C.; Gibson, I.W.; Blydt-Hansen, T.D.; Karpinski, M.; Ho, J.; Storsley, L.J.; Goldberg, A.; Birk, P.E.; Rush, D.N.; Nickerson,P.W. Evolution and clinical pathologic correlations of de novo donor-specific HLA antibody post kidney transplant. Am. J.Transplant. 2012, 12, 1157–1167. [CrossRef] [PubMed]
2. Nakamura, T.; Shirouzu, T.; Nakata, K.; Yoshimura, N.; Ushigome, H. The Role of Major Histocompatibility Complex in OrganTransplantation-Donor Specific Anti-Major Histocompatibility Complex Antibodies Analysis Goes to the Next Stage. Int. J. Mol.Sci. 2019, 20, 4544. [CrossRef] [PubMed]
3. Nakamura, T.; Ushigome, H.; Watabe, K.; Imanishi, Y.; Masuda, K.; Matsuyama, T.; Harada, S.; Koshino, K.; Iida, T.; Nobori, S.;et al. Graft Immunocomplex Capture Fluorescence Analysis to Detect Donor-Specific Antibodies and HLA Antigen Complexes inthe Allograft. Immunol. Investig. 2017, 46, 295–304. [CrossRef]
4. Solez, K.; Axelsen, R.A.; Benediktsson, H.; Burdick, J.F.; Cohen, A.H.; Colvin, R.B.; Croker, B.P.; Droz, D.; Dunnill, M.S.; Halloran,P.F.; et al. International standardization of criteria for the histologic diagnosis of renal allograft rejection: The Banff workingclassification of kidney transplant pathology. Kidney Int. 1993, 44, 411–422. [CrossRef] [PubMed]
5. Racusen, L.C.; Colvin, R.B.; Solez, K.; Mihatsch, M.J.; Halloran, P.F.; Campbell, P.M.; Cecka, M.J.; Cosyns, J.P.; Demetris, A.J.;Fishbein, M.C.; et al. Antibody-mediated rejection criteria—An addition to the Banff 97 classification of renal allograft rejection.Am. J. Transplant. 2003, 3, 708–714. [CrossRef] [PubMed]
6. Mannon, R.B.; Matas, A.J.; Grande, J.; Leduc, R.; Connett, J.; Kasiske, B.; Cecka, J.M.; Gaston, R.S.; Cosio, F.; Gourishankar, S.; et al.Inflammation in areas of tubular atrophy in kidney allograft biopsies: A potent predictor of allograft failure. Am. J. Transplant.2010, 10, 2066–2073. [CrossRef]
7. Cherukuri, A.; Mehta, R.; Sharma, A.; Sood, P.; Zeevi, A.; Tevar, A.D.; Rothstein, D.M.; Hariharan, S. Post-transplant donorspecific antibody is associated with poor kidney transplant outcomes only when combined with both T-cell-mediated rejectionand non-adherence. Kidney Int. 2019, 96, 202–213. [CrossRef] [PubMed]
8. Devos, J.M.; Gaber, A.O.; Teeter, L.D.; Graviss, E.A.; Patel, S.J.; Land, G.A.; Moore, L.W.; Knight, R.J. Intermediate-term graft lossafter renal transplantation is associated with both donor-specific antibody and acute rejection. Transplantation 2014, 97, 534–540.[CrossRef] [PubMed]
9. Heilman, R.L.; Nijim, A.; Desmarteau, Y.M.; Khamash, H.; Pando, M.J.; Smith, M.L.; Chakkera, H.A.; Huskey, J.; Valdez, R.;Reddy, K.S. De novo donor-specific human leukocyte antigen antibodies early after kidney transplantation. Transplantation 2014,98, 1310–1315. [CrossRef] [PubMed]
10. Everly, M.J.; Rebellato, L.M.; Haisch, C.E.; Ozawa, M.; Parker, K.; Briley, K.P.; Catrou, P.G.; Bolin, P.; Kendrick, W.T.; Kendrick,S.A.; et al. Incidence and impact of de novo donor-specific alloantibody in primary renal allografts. Transplantation 2013, 95,410–417. [CrossRef] [PubMed]
119

J. Clin. Med. 2021, 10, 5417
11. Wan, S.S.; Chadban, S.J.; Watson, N.; Wyburn, K. Development and outcomes of de novo donor-specific antibodies in low,moderate, and high immunological risk kidney transplant recipients. Am. J. Transplant. 2020, 20, 1351–1364. [CrossRef] [PubMed]
12. De Fijter, J.W.; Holdaas, H.; Øyen, O.; Sanders, J.S.; Sundar, S.; Bemelman, F.J.; Sommerer, C.; Pascual, J.; Avihingsanon, Y.;Pongskul, C.; et al. Early Conversion From Calcineurin Inhibitor- to Everolimus-Based Therapy Following Kidney Transplantation:Results of the Randomized ELEVATE Trial. Am. J. Transplant. 2017, 17, 1853–1867. [CrossRef] [PubMed]
13. Filler, G.; Todorova, E.K.; Bax, K.; Alvarez-Elías, A.C.; Huang, S.H.; Kobrzynski, M.C. Minimum mycophenolic acid levels areassociated with donor-specific antibody formation. Pediatr. Transplant. 2016, 20, 34–38. [CrossRef]
14. Solomon, S.; Colovai, A.; Del Rio, M.; Hayde, N. Tacrolimus variability is associated with de novo donor-specific antibodydevelopment in pediatric renal transplant recipients. Pediatr. Nephrol. 2020, 35, 261–270. [CrossRef] [PubMed]
15. Croze, L.E.; Tetaz, R.; Roustit, M.; Malvezzi, P.; Janbon, B.; Jouve, T.; Pinel, N.; Masson, D.; Quesada, J.L.; Bayle, F.; et al.Conversion to mammalian target of rapamycin inhibitors increases risk of de novo donor-specific antibodies. Transpl. Int. 2014,27, 775–783. [CrossRef]
16. Bertrand, D.; Gatault, P.; Jauréguy, M.; Garrouste, C.; Sayegh, J.; Bouvier, N.; Caillard, S.; Lanfranco, L.; Galinier, A.; Laurent,C.; et al. Protocol Biopsies in Patients With Subclinical De Novo Donor-specific Antibodies After Kidney Transplantation: AMulticentric Study. Transplantation 2020, 104, 1726–1737. [CrossRef] [PubMed]
17. Delgado, J.C.; Fuller, A.; Ozawa, M.; Smith, L.; Terasaki, P.I.; Shihab, F.S.; Eckels, D.D. No occurrence of de novo HLA antibodiesin patients with early corticosteroid withdrawal in a 5-year prospective randomized study. Transplantation 2009, 87, 546–548.[CrossRef] [PubMed]
18. Nakamura, T.; Ushigome, H.; Shirouzu, T.; Yoshimura, N. Donor Specific anti-HLA Antibodies in Organ Transplantation—Transitionfrom Serum DSA to Intra-Graft DSA, November 5th 2018 ed.; Mahdi, B.M., Ed.; Intech: London, UK, 2019; pp. 19–41.
19. Eskandary, F.; Regele, H.; Baumann, L.; Bond, G.; Kozakowski, N.; Wahrmann, M.; Hidalgo, L.G.; Haslacher, H.; Kaltenecker,C.C.; Aretin, M.B.; et al. A Randomized Trial of Bortezomib in Late Antibody-Mediated Kidney Transplant Rejection. J. Am. Soc.Nephrol. JASN 2018, 29, 591–605. [CrossRef] [PubMed]
20. Kulkarni, S.; Kirkiles-Smith, N.C.; Deng, Y.H.; Formica, R.N.; Moeckel, G.; Broecker, V.; Bow, L.; Tomlin, R.; Pober, J.S. EculizumabTherapy for Chronic Antibody-Mediated Injury in Kidney Transplant Recipients: A Pilot Randomized Controlled Trial. Am. J.Transplant 2017, 17, 682–691. [CrossRef]
21. Choi, J.; Aubert, O.; Vo, A.; Loupy, A.; Haas, M.; Puliyanda, D.; Kim, I.; Louie, S.; Kang, A.; Peng, A.; et al. Assessment ofTocilizumab (Anti-Interleukin-6 Receptor Monoclonal) as a Potential Treatment for Chronic Antibody-Mediated Rejection andTransplant Glomerulopathy in HLA-Sensitized Renal Allograft Recipients. Am. J. Transplant. 2017, 17, 2381–2389. [CrossRef][PubMed]
22. Shin, B.H.; Everly, M.J.; Zhang, H.; Choi, J.; Vo, A.; Zhang, X.; Huang, E.; Jordan, S.C.; Toyoda, M. Impact of Tocilizumab (Anti-IL-6R) Treatment on Immunoglobulins and Anti-HLA Antibodies in Kidney Transplant Patients With Chronic Antibody-mediatedRejection. Transplantation 2020, 104, 856–863. [CrossRef]
23. Doberer, K.; Duerr, M.; Halloran, P.F.; Eskandary, F.; Budde, K.; Regele, H.; Reeve, J.; Borski, A.; Kozakowski, N.; Reindl-Schwaighofer, R.; et al. A Randomized Clinical Trial of Anti-IL-6 Antibody Clazakizumab in Late Antibody-Mediated KidneyTransplant Rejection. J. Am. Soc. Nephrol. JASN 2021, 32, 708–722. [CrossRef] [PubMed]
24. Bray, R.A.; Gebel, H.M.; Townsend, R.; Roberts, M.E.; Polinsky, M.; Yang, L.; Meier-Kriesche, H.U.; Larsen, C.P. De novodonor-specific antibodies in belatacept-treated vs cyclosporine-treated kidney-transplant recipients: Post hoc analyses of therandomized phase III BENEFIT and BENEFIT-EXT studies. Am. J. Transplant. 2018, 18, 1783–1789. [CrossRef] [PubMed]
25. Vandevoorde, K.; Ducreux, S.; Bosch, A.; Guillaud, O.; Hervieu, V.; Chambon-Augoyard, C.; Poinsot, D.; André, P.; Scoazec, J.Y.;Robinson, P.; et al. Prevalence, Risk Factors, and Impact of Donor-Specific Alloantibodies After Adult Liver Transplantation. LiverTransplant. 2018, 24, 1091–1100. [CrossRef] [PubMed]
26. Demetris, A.J.; Bellamy, C.; Hubscher, S.G.; O’Leary, J.; Randhawa, P.S.; Feng, S.; Neil, D.; Colvin, R.B.; McCaughan, G.; Fung, J.J.;et al. 2016 Comprehensive Update of the Banff Working Group on Liver Allograft Pathology: Introduction of Antibody-MediatedRejection. Am. J. Transplant. 2016, 16, 2816–2835. [CrossRef]
27. Nakamura, T.; Shirouzu, T.; Kawai, S.; Sugimoto, R.; Harada, S.; Yoshikawa, M.; Nobori, S.; Ushigome, H. Intra–Liver AllograftC3d–Binding Donor Specific anti–HLA Antibodies Predict Rejection after Liver Transplantation. Transplant. Proc. 2022, in press.
28. Gugenheim, J.; Le Thai, B.; Rouger, P.; Gigou, M.; Gane, P.; Vial, M.C.; Charpentier, B.; Reynes, M.; Bismuth, H. Relation-ship between the liver and lymphocytotoxic alloantibodies in inbred rats. Specific absorption by nonparenchymal liver cells.Transplantation 1988, 45, 474–478. [CrossRef] [PubMed]
29. Chauhan, B.; Phelan, D.L.; Marsh, J.W.; Mohanakumar, T. Characterization of antiidiotypic antibodies to donor HLA that developafter liver transplantation. Transplantation 1993, 56, 443–448. [CrossRef]
30. Astarcioglu, I.; Cursio, R.; Reynes, M.; Gugenheim, J. Increased risk of antibody-mediated rejection of reduced-size liver allografts.J. Surg. Res. 1999, 87, 258–262. [CrossRef] [PubMed]
31. Liu, X.; Xu, J.; Brenner, D.A.; Kisseleva, T. Reversibility of Liver Fibrosis and Inactivation of Fibrogenic Myofibroblasts. Curr.Pathobiol. Rep. 2013, 1, 209–214. [CrossRef] [PubMed]
32. Feng, S.; Bucuvalas, J.C.; Mazariegos, G.V.; Magee, J.C.; Sanchez-Fueyo, A.; Spain, K.M.; Lesniak, A.; Kanaparthi, S.; Perito, E.;Venkat, V.L.; et al. Efficacy and Safety of Immunosuppression Withdrawal in Pediatric Liver Transplant Recipients: MovingToward Personalized Management. Hepatology 2021, 73, 1985–2004. [CrossRef] [PubMed]
120
J. Clin. Med. 2021, 10, 5417
33. Schluckebier, D.; Cousin, V.L.; Petit, L.M.; Belli, D.; Wildhaber, B.; Rougemont, A.L.; Villard, J.; Ferrari-Lacraz, S.; McLin, V.A.Preformed and de novo DSA are associated with T-cell-mediated rejection in pediatric liver transplant recipients requiringclinically indicated liver biopsy. Pediatr. Transplant. 2020, 24, e13611. [CrossRef] [PubMed]
34. Miyagawa-Hayashino, A.; Yoshizawa, A.; Uchida, Y.; Egawa, H.; Yurugi, K.; Masuda, S.; Minamiguchi, S.; Maekawa, T.; Uemoto,S.; Haga, H. Progressive graft fibrosis and donor-specific human leukocyte antigen antibodies in pediatric late liver allografts.Liver Transplant. 2012, 18, 1333–1342. [CrossRef] [PubMed]
35. Del Bello, A.; Congy-Jolivet, N.; Muscari, F.; Lavayssière, L.; Esposito, L.; Cardeau-Desangles, I.; Guitard, J.; Dörr, G.; Suc, B.;Duffas, J.P.; et al. Prevalence, incidence and risk factors for donor-specific anti-HLA antibodies in maintenance liver transplantpatients. Am. J. Transplant. 2014, 14, 867–875. [CrossRef] [PubMed]
36. Höfer, A.; Jonigk, D.; Hartleben, B.; Verboom, M.; Hallensleben, M.; Hübscher, S.G.; Manns, M.P.; Jaeckel, E.; Taubert, R. DSA AreAssociated With More Graft Injury, More Fibrosis, and Upregulation of Rejection-associated Transcripts in Subclinical Rejection.Transplantation 2020, 104, 551–561. [CrossRef] [PubMed]
37. Kaneku, H.; O’Leary, J.G.; Banuelos, N.; Jennings, L.W.; Susskind, B.M.; Klintmalm, G.B.; Terasaki, P.I. De novo donor-specificHLA antibodies decrease patient and graft survival in liver transplant recipients. Am. J. Transplant. 2013, 13, 1541–1548. [CrossRef][PubMed]
38. Del Bello, A.; Congy-Jolivet, N.; Danjoux, M.; Muscari, F.; Lavayssière, L.; Esposito, L.; Cardeau-Desangles, I.; Guitard, J.; Dörr, G.;Milongo, D.; et al. De novo donor-specific anti-HLA antibodies mediated rejection in liver-transplant patients. Transpl. Int. 2015,28, 1371–1382. [CrossRef] [PubMed]
39. Sakamoto, S.; Akamatsu, N.; Hasegawa, K.; Ohdan, H.; Nakagawa, K.; Egawa, H. The efficacy of rituximab treatment forantibody-mediated rejection in liver transplantation: A retrospective Japanese nationwide study. Hepatol. Res. 2021, 51, 990–999.[CrossRef]
40. De Kort, H.; Munivenkatappa, R.B.; Berger, S.P.; Eikmans, M.; van der Wal, A.; de Koning, E.J.; van Kooten, C.; de Heer, E.; Barth,R.N.; Bruijn, J.A.; et al. Pancreas allograft biopsies with positive c4d staining and anti-donor antibodies related to worse outcomefor patients. Am. J. Transpl. 2010, 10, 1660–1667. [CrossRef] [PubMed]
41. De Kort, H.; Mallat, M.J.; van Kooten, C.; de Heer, E.; Brand-Schaaf, S.H.; van der Wal, A.M.; Roufosse, C.; Roelen, D.L.; Bruijn,J.A.; Claas, F.H.; et al. Diagnosis of early pancreas graft failure via antibody-mediated rejection: Single-center experience with 256pancreas transplantations. Am. J. Transpl. 2014, 14, 936–942. [CrossRef]
42. Cantarovich, D.; De Amicis, S.; Akl, A.; Devys, A.; Vistoli, F.; Karam, G.; Soulillou, J.P. Posttransplant donor-specific anti-HLAantibodies negatively impact pancreas transplantation outcome. Am. J. Transpl. 2011, 11, 2737–2746. [CrossRef] [PubMed]
43. Parajuli, S.; Alagusundaramoorthy, S.; Aziz, F.; Garg, N.; Redfield, R.R.; Sollinger, H.; Kaufman, D.; Djamali, A.; Odorico, J.;Mandelbrot, D. Outcomes of Pancreas Transplant Recipients with De Novo Donor-specific Antibodies. Transplantation 2019, 103,435–440. [CrossRef]
44. Ladowski, J.M.; Mullins, H.; Romine, M.; Kloda, D.; Young, C.; Hauptfeld-Dolejsek, V.; Houp, J.; Locke, J. Eplet mismatch scoresand de novo donor-specific antibody development in simultaneous pancreas-kidney transplantation. Hum. Immunol. 2021, 82,139–146. [CrossRef] [PubMed]
45. Chaigne, B.; Geneugelijk, K.; Bédat, B.; Ahmed, M.A.; Hönger, G.; De Seigneux, S.; Demuylder-Mischler, S.; Berney, T.; Spierings,E.; Ferrari-Lacraz, S.; et al. Immunogenicity of Anti-HLA Antibodies in Pancreas and Islet Transplantation. Cell Transpl. 2016, 25,2041–2050. [CrossRef] [PubMed]
46. Uva, P.D.; Quevedo, A.; Roses, J.; Toniolo, M.F.; Pilotti, R.; Chuluyan, E.; Casadei, D.H. Anti-Hla donor-specific antibodymonitoring in pancreas transplantation: Role of protocol biopsies. Clin. Transpl. 2020, 34, e13998. [CrossRef] [PubMed]
47. Drachenberg, C.B.; Torrealba, J.R.; Nankivell, B.J.; Rangel, E.B.; Bajema, I.M.; Kim, D.U.; Arend, L.; Bracamonte, E.R.; Bromberg,J.S.; Bruijn, J.A.; et al. Guidelines for the diagnosis of antibody-mediated rejection in pancreas allografts-updated Banff gradingschema. Am. J. Transpl. 2011, 11, 1792–1802. [CrossRef] [PubMed]
48. Gunther Brockmann, J.; Butt, A.; AlHussaini, H.F.; AlMana, H.; AlSaad, K.; Al-Awwami, M.; Clemens Broering, D.; Ali, T. ProtocolDuodenal Graft Biopsies Aid Pancreas Graft Surveillance. Transplantation 2019, 103, 622–629. [CrossRef]
49. Moreso, F.; Crespo, M.; Ruiz, J.C.; Torres, A.; Gutierrez-Dalmau, A.; Osuna, A.; Perello, M.; Pascual, J.; Torres, I.B.; Redondo-Pachon, D.; et al. Treatment of chronic antibody mediated rejection with intravenous immunoglobulins and rituximab: Amulticenter, prospective, randomized, double-blind clinical trial. Am. J. Transplant. 2018, 18, 927–935. [CrossRef]
50. Redfield, R.R.; Ellis, T.M.; Zhong, W.; Scalea, J.R.; Zens, T.J.; Mandelbrot, D.; Muth, B.L.; Panzer, S.; Samaniego, M.; Kaufman,D.B.; et al. Current outcomes of chronic active antibody mediated rejection—A large single center retrospective review using theupdated BANFF 2013 criteria. Hum. Immunol. 2016, 77, 346–352. [CrossRef]
51. Guerra, M.R.; Naini, B.V.; Scapa, J.V.; Reed, E.F.; Busuttil, R.W.; Cheng, E.Y.; Farmer, D.G.; Vargas, J.H.; Venick, R.S.; McDiarmid,S.V.; et al. Obliterative portal venopathy: A histopathologic finding associated with chronic antibody-mediated rejection inpediatric liver allografts. Pediatr. Transplant. 2018, 22, e13124. [CrossRef] [PubMed]
52. Kawabe, M.; Yamamoto, I.; Komatsuzaki, Y.; Yamakawa, T.; Katsumata, H.; Katsuma, A.; Mafune, A.; Nakada, Y.; Kobayashi, A.;Tanno, Y.; et al. Recurrence and graft loss after renal transplantation in adults with IgA vasculitis. Clin. Exp. Nephrol. 2017, 21,714–720. [CrossRef]
53. Ponticelli, C.; Traversi, L.; Feliciani, A.; Cesana, B.M.; Banfi, G.; Tarantino, A. Kidney transplantation in patients with IgAmesangial glomerulonephritis. Kidney Int. 2001, 60, 1948–1954. [CrossRef]
121
J. Clin. Med. 2021, 10, 5417
54. Di Vico, M.C.; Messina, M.; Fop, F.; Barreca, A.; Segoloni, G.P.; Biancone, L. Recurrent IgA nephropathy after renal transplantationand steroid withdrawal. Clin. Transplant. 2018, 32, e13207. [CrossRef] [PubMed]
55. Mousson, C.; Charon-Barra, C.; Funes de la Vega, M.; Tanter, Y.; Justrabo, E.; Martin, L.; Rifle, G. Recurrence of IgA nephropathywith crescents in kidney transplants. Transplant. Proc. 2007, 39, 2595–2596. [CrossRef]
56. Clayton, P.; McDonald, S.; Chadban, S. Steroids and recurrent IgA nephropathy after kidney transplantation. Am. J. Transplant.2011, 11, 1645–1649. [CrossRef] [PubMed]
57. Rodas, L.M.; Ruiz-Ortiz, E.; Garcia-Herrera, A.; Pereira, A.; Blasco, M.; Ventura-Aguiar, P.; Viñas Gomis, O.; Egri, N.; De Sousa,E.; Palou, E.; et al. IgA Nephropathy Recurrence after Kidney Transplantation: Role of Recipient Age and Human LeukocyteAntigen-B Mismatch. Am. J. Nephrol. 2020, 51, 357–365. [CrossRef]
58. Suzuki, H.; Fan, R.; Zhang, Z.; Brown, R.; Hall, S.; Julian, B.A.; Chatham, W.W.; Suzuki, Y.; Wyatt, R.J.; Moldoveanu, Z.; et al.Aberrantly glycosylated IgA1 in IgA nephropathy patients is recognized by IgG antibodies with restricted heterogeneity. J. Clin.Investig. 2009, 119, 1668–1677. [CrossRef] [PubMed]
59. Suzuki, Y.; Matsuzaki, K.; Suzuki, H.; Okazaki, K.; Yanagawa, H.; Ieiri, N.; Sato, M.; Sato, T.; Taguma, Y.; Matsuoka, J.; et al. Serumlevels of galactose-deficient immunoglobulin (Ig) A1 and related immune complex are associated with disease activity of IgAnephropathy. Clin. Exp. Nephrol. 2014, 18, 770–777. [CrossRef]
60. Rizk, D.V.; Saha, M.K.; Hall, S.; Novak, L.; Brown, R.; Huang, Z.Q.; Fatima, H.; Julian, B.A.; Novak, J. Glomerular Immunodepositsof Patients with IgA Nephropathy Are Enriched for IgG Autoantibodies Specific for Galactose-Deficient IgA1. J. Am. Soc. Nephrol.JASN 2019, 30, 2017–2026. [CrossRef] [PubMed]
61. Berthoux, F.; Suzuki, H.; Mohey, H.; Maillard, N.; Mariat, C.; Novak, J.; Julian, B.A. Prognostic Value of Serum Biomarkers ofAutoimmunity for Recurrence of IgA Nephropathy after Kidney Transplantation. J. Am. Soc. Nephrol. JASN 2017, 28, 1943–1950.[CrossRef]
62. Nakamura, T.; Shirouzu, T.; Harada, S.; Sugimoto, R.; Nobori, S.; Yoshikawa, M.; Ushigome, H.; Kawai, S. The Abundance ofAnti-Galactose-deficient IgA1 Autoantibodies Results in Glomerular Deposition and IgA Nephropathy Recurrence after RenalTransplantation. Transplantation 2021, 105. in press. [CrossRef]
63. Kawabe, M.; Yamamoto, I.; Yamakawa, T.; Katsumata, H.; Isaka, N.; Katsuma, A.; Nakada, Y.; Kobayashi, A.; Koike, K.; Ueda, H.;et al. Association Between Galactose-Deficient IgA1 Derived From the Tonsils and Recurrence of IgA Nephropathy in PatientsWho Underwent Kidney Transplantation. Front. Immunol. 2020, 11, 2068. [CrossRef]
64. Okumi, M.; Okada, D.; Unagami, K.; Kakuta, Y.; Iizuka, J.; Takagi, T.; Shirakawa, H.; Omoto, K.; Ishida, H.; Tanabe, K. Higherimmunoglobulin A nephropathy recurrence in related-donor kidney transplants: The Japan Academic Consortium of KidneyTransplantation study. Int. J. Urol. 2019, 26, 903–909. [CrossRef]
65. Messina, M.; di Vico, M.C.; Ariaudo, C.; Mazzucco, G.; Fop, F.; Segoloni, G.P.; Biancone, L. Treatment protocol with pulse and oralsteroids for IgA Nephropathy after kidney transplantation. J. Nephrol. 2016, 29, 575–583. [CrossRef]
66. Jiang, S.H.; Kennard, A.L.; Walters, G.D. Recurrent glomerulonephritis following renal transplantation and impact on graftsurvival. BMC Nephrol. 2018, 19, 344. [CrossRef]
67. Alasfar, S.; Matar, D.; Montgomery, R.A.; Desai, N.; Lonze, B.; Vujjini, V.; Estrella, M.M.; Manllo Dieck, J.; Khneizer, G.; Sever, S.;et al. Rituximab and Therapeutic Plasma Exchange in Recurrent Focal Segmental Glomerulosclerosis Postkidney Transplantation.Transplantation 2018, 102, e115–e120. [CrossRef]
68. Francis, A.; Trnka, P.; McTaggart, S.J. Long-Term Outcome of Kidney Transplantation in Recipients with Focal SegmentalGlomerulosclerosis. Clin. J. Am. Soc. Nephrol. CJASN 2016, 11, 2041–2046. [CrossRef]
69. Uffing, A.; Pérez-Sáez, M.J.; Mazzali, M.; Manfro, R.C.; Bauer, A.C.; de Sottomaior Drumond, F.; O’Shaughnessy, M.M.; Cheng,X.S.; Chin, K.K.; Ventura, C.G.; et al. Recurrence of FSGS after Kidney Transplantation in Adults. Clin. J. Am. Soc. Nephrol. CJASN2020, 15, 247–256. [CrossRef]
70. Allen, P.J.; Chadban, S.J.; Craig, J.C.; Lim, W.H.; Allen, R.D.M.; Clayton, P.A.; Teixeira-Pinto, A.; Wong, G. Recurrent glomeru-lonephritis after kidney transplantation: Risk factors and allograft outcomes. Kidney Int. 2017, 92, 461–469. [CrossRef]
71. Gallon, L.; Leventhal, J.; Skaro, A.; Kanwar, Y.; Alvarado, A. Resolution of recurrent focal segmental glomerulosclerosis afterretransplantation. N. Engl. J. Med. 2012, 366, 1648–1649. [CrossRef]
72. Sharma, M.; Sharma, R.; Reddy, S.R.; McCarthy, E.T.; Savin, V.J. Proteinuria after injection of human focal segmental glomeru-losclerosis factor. Transplantation 2002, 73, 366–372. [CrossRef] [PubMed]
73. Wei, C.; El Hindi, S.; Li, J.; Fornoni, A.; Goes, N.; Sageshima, J.; Maiguel, D.; Karumanchi, S.A.; Yap, H.K.; Saleem, M.; et al.Circulating urokinase receptor as a cause of focal segmental glomerulosclerosis. Nat. Med. 2011, 17, 952–960. [CrossRef]
74. Alachkar, N.; Wei, C.; Arend, L.J.; Jackson, A.M.; Racusen, L.C.; Fornoni, A.; Burke, G.; Rabb, H.; Kakkad, K.; Reiser, J.; et al.Podocyte effacement closely links to suPAR levels at time of posttransplantation focal segmental glomerulosclerosis occurrenceand improves with therapy. Transplantation 2013, 96, 649–656. [CrossRef]
75. Verghese, P.S.; Rheault, M.N.; Jackson, S.; Matas, A.J.; Chinnakotla, S.; Chavers, B. The effect of peri-transplant plasmapheresis inthe prevention of recurrent FSGS. Pediatr. Transplant. 2018, 22, e13154. [CrossRef]
76. Kennard, A.L.; Jiang, S.H.; Walters, G.D. Increased glomerulonephritis recurrence after living related donation. BMC Nephrol.2017, 18, 25. [CrossRef]
122
J. Clin. Med. 2021, 10, 5417
77. Lanaret, C.; Anglicheau, D.; Audard, V.; Büchler, M.; Caillard, S.; Couzi, L.; Malvezzi, P.; Mesnard, L.; Bertrand, D.; Martinez,F.; et al. Rituximab for recurrence of primary focal segmental glomerulosclerosis after kidney transplantation: Results of anationwide study. Am. J. Transplant. 2021, 21, 3021–3033. [CrossRef] [PubMed]
78. Staeck, O.; Slowinski, T.; Lieker, I.; Wu, K.; Rudolph, B.; Schmidt, D.; Brakemeier, S.; Neumayer, H.H.; Wei, C.; Reiser, J.; et al.Recurrent Primary Focal Segmental Glomerulosclerosis Managed With Intensified Plasma Exchange and Concomitant Monitoringof Soluble Urokinase-Type Plasminogen Activator Receptor-Mediated Podocyte β3-integrin Activation. Transplantation 2015, 99,2593–2597. [CrossRef]
79. Sethi, S.; Nester, C.M.; Smith, R.J. Membranoproliferative glomerulonephritis and C3 glomerulopathy: Resolving the confusion.Kidney Int. 2012, 81, 434–441. [CrossRef]
80. Fakhouri, F.; Le Quintrec, M.; Frémeaux-Bacchi, V. Practical management of C3 glomerulopathy and Ig-mediated MPGN: Factsand uncertainties. Kidney Int. 2020, 98, 1135–1148. [CrossRef]
81. Sethi, S.; Fervenza, F.C. Membranoproliferative glomerulonephritis: Pathogenetic heterogeneity and proposal for a new classifica-tion. Semin. Nephrol. 2011, 31, 341–348. [CrossRef]
82. Regunathan-Shenk, R.; Avasare, R.S.; Ahn, W.; Canetta, P.A.; Cohen, D.J.; Appel, G.B.; Bomback, A.S. Kidney Transplantation inC3 Glomerulopathy: A Case Series. Am. J. Kidney Dis. 2019, 73, 316–323. [CrossRef]
83. Green, H.; Rahamimov, R.; Rozen-Zvi, B.; Pertzov, B.; Tobar, A.; Lichtenberg, S.; Gafter, U.; Mor, E. Recurrent membranopro-liferative glomerulonephritis type I after kidney transplantation: A 17-year single-center experience. Transplantation 2015, 99,1172–1177. [CrossRef]
84. Gonzalez Suarez, M.L.; Thongprayoon, C.; Hansrivijit, P.; Kovvuru, K.; Kanduri, S.R.; Aeddula, N.R.; Pivovarova, A.I.;Chewcharat, A.; Bathini, T.; Mao, M.A.; et al. Treatment of C3 Glomerulopathy in Adult Kidney Transplant Recipients: ASystematic Review. Med. Sci. 2020, 8, 44. [CrossRef] [PubMed]
85. Moszczuk, B.; Kiryluk, K.; Paczek, L.; Mucha, K. Membranous Nephropathy: From Research Bench to Personalized Care. J. Clin.Med. 2021, 10, 1205. [CrossRef]
86. Beck, L.H., Jr.; Bonegio, R.G.; Lambeau, G.; Beck, D.M.; Powell, D.W.; Cummins, T.D.; Klein, J.B.; Salant, D.J. M-type phospholipaseA2 receptor as target antigen in idiopathic membranous nephropathy. N. Engl. J. Med. 2009, 361, 11–21. [CrossRef]
87. Tomas, N.M.; Beck, L.H., Jr.; Meyer-Schwesinger, C.; Seitz-Polski, B.; Ma, H.; Zahner, G.; Dolla, G.; Hoxha, E.; Helmchen, U.;Dabert-Gay, A.S.; et al. Thrombospondin type-1 domain-containing 7A in idiopathic membranous nephropathy. N. Engl. J. Med.2014, 371, 2277–2287. [CrossRef]
88. Sprangers, B.; Lefkowitz, G.I.; Cohen, S.D.; Stokes, M.B.; Valeri, A.; Appel, G.B.; Kunis, C.L. Beneficial effect of rituximab in thetreatment of recurrent idiopathic membranous nephropathy after kidney transplantation. Clin. J. Am. Soc. Nephrol. CJASN 2010,5, 790–797. [CrossRef]
89. Kattah, A.; Ayalon, R.; Beck, L.H., Jr.; Sethi, S.; Sandor, D.G.; Cosio, F.G.; Gandhi, M.J.; Lorenz, E.C.; Salant, D.J.; Fervenza,F.C. Anti-phospholipase A2 receptor antibodies in recurrent membranous nephropathy. Am. J. Transplant. 2015, 15, 1349–1359.[CrossRef] [PubMed]
90. Tomas, N.M.; Hoxha, E.; Reinicke, A.T.; Fester, L.; Helmchen, U.; Gerth, J.; Bachmann, F.; Budde, K.; Koch-Nolte, F.; Zahner, G.;et al. Autoantibodies against thrombospondin type 1 domain-containing 7A induce membranous nephropathy. J. Clin. Investig.2016, 126, 2519–2532. [CrossRef] [PubMed]
91. Batal, I.; Vasilescu, E.R.; Dadhania, D.M.; Adel, A.A.; Husain, S.A.; Avasare, R.; Serban, G.; Santoriello, D.; Khairallah, P.; Patel, A.;et al. Association of HLA Typing and Alloimmunity With Posttransplantation Membranous Nephropathy: A Multicenter CaseSeries. Am. J. Kidney Dis. 2020, 76, 374–383. [CrossRef] [PubMed]
92. Hickson, L.J.; Gera, M.; Amer, H.; Iqbal, C.W.; Moore, T.B.; Milliner, D.S.; Cosio, F.G.; Larson, T.S.; Stegall, M.D.; Ishitani, M.B.;et al. Kidney transplantation for primary focal segmental glomerulosclerosis: Outcomes and response to therapy for recurrence.Transplantation 2009, 87, 1232–1239. [CrossRef]
93. Yang, W.L.; Bose, B.; Zhang, L.; McStea, M.; Cho, Y.; Fahim, M.; Hawley, C.M.; Pascoe, E.M.; Johnson, D.W. Long-term outcomes ofpatients with end-stage kidney disease due to membranous nephropathy: A cohort study using the Australia and New ZealandDialysis and Transplant Registry. PLoS ONE 2019, 14, e0221531. [CrossRef] [PubMed]
94. Choy, B.Y.; Chan, T.M.; Lo, S.K.; Lo, W.K.; Lai, K.N. Renal transplantation in patients with primary immunoglobulin Anephropathy. Nephrol. Dial. Transplant. 2003, 18, 2399–2404. [CrossRef]
95. Tamirou, F.; Houssiau, F.A. Management of Lupus Nephritis. J. Clin. Med. 2021, 10, 670. [CrossRef] [PubMed]96. Seligman, V.A.; Lum, R.F.; Olson, J.L.; Li, H.; Criswell, L.A. Demographic differences in the development of lupus nephritis: A
retrospective analysis. Am. J. Med. 2002, 112, 726–729. [CrossRef]97. Hoffman, I.E.; Peene, I.; Meheus, L.; Huizinga, T.W.; Cebecauer, L.; Isenberg, D.; De Bosschere, K.; Hulstaert, F.; Veys, E.M.; De
Keyser, F. Specific antinuclear antibodies are associated with clinical features in systemic lupus erythematosus. Ann. Rheum. Dis.2004, 63, 1155–1158. [CrossRef]
98. Contreras, G.; Mattiazzi, A.; Guerra, G.; Ortega, L.M.; Tozman, E.C.; Li, H.; Tamariz, L.; Carvalho, C.; Kupin, W.; Ladino, M.; et al.Recurrence of lupus nephritis after kidney transplantation. J. Am. Soc. Nephrol. JASN 2010, 21, 1200–1207. [CrossRef] [PubMed]
99. Bunnapradist, S.; Chung, P.; Peng, A.; Hong, A.; Chung, P.; Lee, B.; Fukami, S.; Takemoto, S.K.; Singh, A.K. Outcomes of renaltransplantation for recipients with lupus nephritis: Analysis of the Organ Procurement and Transplantation Network database.Transplantation 2006, 82, 612–618. [CrossRef]
123
J. Clin. Med. 2021, 10, 5417
100. Deegens, J.K.; Artz, M.A.; Hoitsma, A.J.; Wetzels, J.F. Outcome of renal transplantation in patients with systemic lupus erythe-matosus. Transpl. Int. 2003, 16, 411–418. [CrossRef]
101. Goral, S.; Ynares, C.; Shappell, S.B.; Snyder, S.; Feurer, I.D.; Kazancioglu, R.; Fogo, A.B.; Helderman, J.H. Recurrent lupus nephritisin renal transplant recipients revisited: It is not rare. Transplantation 2003, 75, 651–656. [CrossRef]
102. Ponticelli, C.; Moroni, G. Renal transplantation in lupus nephritis. Lupus 2005, 14, 95–98. [CrossRef]103. Rovin, B.H.; Furie, R.; Latinis, K.; Looney, R.J.; Fervenza, F.C.; Sanchez-Guerrero, J.; Maciuca, R.; Zhang, D.; Garg, J.P.; Brunetta, P.;
et al. Efficacy and safety of rituximab in patients with active proliferative lupus nephritis: The Lupus Nephritis Assessment withRituximab study. Arthritis Rheum. 2012, 64, 1215–1226. [CrossRef] [PubMed]
104. Moroni, G.; Ponticelli, C. Rapidly progressive crescentic glomerulonephritis: Early treatment is a must. Autoimmun. Rev. 2014, 13,723–729. [CrossRef] [PubMed]
105. Göçeroglu, A.; Rahmattulla, C.; Berden, A.E.; Reinders, M.E.; Wolterbeek, R.; Steenbergen, E.J.; Hilbrands, L.B.; Noorlander,I.; Berger, S.P.; Peutz-Kootstra, C.J.; et al. The Dutch Transplantation in Vasculitis (DUTRAVAS) Study: Outcome of RenalTransplantation in Antineutrophil Cytoplasmic Antibody-associated Glomerulonephritis. Transplantation 2016, 100, 916–924.[CrossRef] [PubMed]
106. Little, M.A.; Hassan, B.; Jacques, S.; Game, D.; Salisbury, E.; Courtney, A.E.; Brown, C.; Salama, A.D.; Harper, L. Renaltransplantation in systemic vasculitis: When is it safe? Nephrol. Dial. Transplant. 2009, 24, 3219–3225. [CrossRef]
107. Nachman, P.H.; Segelmark, M.; Westman, K.; Hogan, S.L.; Satterly, K.K.; Jennette, J.C.; Falk, R. Recurrent ANCA-associated smallvessel vasculitis after transplantation: A pooled analysis. Kidney Int. 1999, 56, 1544–1550. [CrossRef] [PubMed]
108. Kluth, D.C.; Rees, A.J. Anti-glomerular basement membrane disease. J. Am. Soc. Nephrol. JASN 1999, 10, 2446–2453. [CrossRef]109. Singh, T.; Kharadjian, T.B.; Astor, B.C.; Panzer, S.E. Long-term outcomes in kidney transplant recipients with end-stage kidney
disease due to anti-glomerular basement membrane disease. Clin. Transplant. 2021, 35, e14179. [CrossRef]110. Tang, W.; McDonald, S.P.; Hawley, C.M.; Badve, S.V.; Boudville, N.C.; Brown, F.G.; Clayton, P.A.; Campbell, S.B.; de Zoysa, J.R.;
Johnson, D.W. Anti-glomerular basement membrane antibody disease is an uncommon cause of end-stage renal disease. KidneyInt. 2013, 83, 503–510. [CrossRef]
111. Netzer, K.O.; Merkel, F.; Weber, M. Goodpasture syndrome and end-stage renal failure–to transplant or not to transplant? Nephrol.Dial. Transplant. 1998, 13, 1346–1348. [CrossRef]
112. Lochhead, K.M.; Pirsch, J.D.; D’Alessandro, A.M.; Knechtle, S.J.; Kalayoglu, M.; Sollinger, H.W.; Belzer, F.O. Risk factors for renalallograft loss in patients with systemic lupus erythematosus. Kidney Int. 1996, 49, 512–517. [CrossRef] [PubMed]
113. Jennette, J.C.; Nachman, P.H. ANCA Glomerulonephritis and Vasculitis. Clin. J. Am. Soc. Nephrol. CJASN 2017, 12, 1680–1691.[CrossRef]
114. Ronco, P.M.; Aucouturier, P. The molecular bases of plasma cell dyscrasia-related renal diseases. Nephrol. Dial. Transplant. 1999,14 (Suppl. S1), 4–8. [CrossRef]
115. Röcken, C.; Sletten, K. Amyloid in surgical pathology. Virchows Arch. 2003, 443, 3–16. [CrossRef]116. Vrana, J.A.; Gamez, J.D.; Madden, B.J.; Theis, J.D.; Bergen, H.R., 3rd; Dogan, A. Classification of amyloidosis by laser microdis-
section and mass spectrometry-based proteomic analysis in clinical biopsy specimens. Blood 2009, 114, 4957–4959. [CrossRef][PubMed]
117. Abe, R.; Katoh, N.; Takahashi, Y.; Takasone, K.; Yoshinaga, T.; Yazaki, M.; Kametani, F.; Sekijima, Y. Distribution of amyloidosissubtypes based on tissue biopsy site—Consecutive analysis of 729 patients at a single amyloidosis center in Japan. Pathol. Int.2021, 71, 70–79. [CrossRef]
118. Westermark, P.; Benson, M.D.; Buxbaum, J.N.; Cohen, A.S.; Frangione, B.; Ikeda, S.; Masters, C.L.; Merlini, G.; Saraiva, M.J.;Sipe, J.D. Amyloid: Toward terminology clarification. Report from the Nomenclature Committee of the International Society ofAmyloidosis. Amyloid 2005, 12, 1–4. [CrossRef] [PubMed]
119. Pinney, J.H.; Lachmann, H.J.; Sattianayagam, P.T.; Gibbs, S.D.; Wechalekar, A.D.; Venner, C.P.; Whelan, C.J.; Gilbertson, J.A.;Rowczenio, D.; Hawkins, P.N.; et al. Renal transplantation in systemic amyloidosis-importance of amyloid fibril type andprecursor protein abundance. Am. J. Transplant. 2013, 13, 433–441. [CrossRef]
120. Angel-Korman, A.; Stern, L.; Sarosiek, S.; Sloan, J.M.; Doros, G.; Sanchorawala, V.; Havasi, A. Long-term outcome of kidneytransplantation in AL amyloidosis. Kidney Int. 2019, 95, 405–411. [CrossRef]
121. Andeen, N.K.; Yang, H.Y.; Dai, D.F.; MacCoss, M.J.; Smith, K.D. DnaJ Homolog Subfamily B Member 9 Is a Putative Autoantigenin Fibrillary GN. J. Am. Soc. Nephrol. JASN 2018, 29, 231–239. [CrossRef]
122. El Ters, M.; Bobart, S.A.; Cornell, L.D.; Leung, N.; Bentall, A.; Sethi, S.; Fidler, M.; Grande, J.; Hernandez, L.H.; Cosio, F.G.; et al.Recurrence of DNAJB9-Positive Fibrillary Glomerulonephritis After Kidney Transplantation: A Case Series. Am. J. Kidney Dis.2020, 76, 500–510. [CrossRef] [PubMed]
123. Kim, W.R.; Terrault, N.A.; Pedersen, R.A.; Therneau, T.M.; Edwards, E.; Hindman, A.A.; Brosgart, C.L. Trends in waiting listregistration for liver transplantation for viral hepatitis in the United States. Gastroenterology 2009, 137, 1680–1686. [CrossRef]
124. Younossi, Z.M.; Stepanova, M.; Ong, J.; Trimble, G.; AlQahtani, S.; Younossi, I.; Ahmed, A.; Racila, A.; Henry, L. NonalcoholicSteatohepatitis Is the Most Rapidly Increasing Indication for Liver Transplantation in the United States. Clin. Gastroenterol.Hepatol. 2021, 19, 580–589.e5. [CrossRef] [PubMed]
125. Samuel, D.; Muller, R.; Alexander, G.; Fassati, L.; Ducot, B.; Benhamou, J.P.; Bismuth, H. Liver transplantation in Europeanpatients with the hepatitis B surface antigen. N. Engl. J. Med. 1993, 329, 1842–1847. [CrossRef]
124
J. Clin. Med. 2021, 10, 5417
126. Todo, S.; Demetris, A.J.; Van Thiel, D.; Teperman, L.; Fung, J.J.; Starzl, T.E. Orthotopic liver transplantation for patients withhepatitis B virus-related liver disease. Hepatology 1991, 13, 619–626.
127. Mutimer, D.; Pillay, D.; Dragon, E.; Tang, H.; Ahmed, M.; O’Donnell, K.; Shaw, J.; Burroughs, N.; Rand, D.; Cane, P.; et al.High pre-treatment serum hepatitis B virus titre predicts failure of lamivudine prophylaxis and graft re-infection after livertransplantation. J. Hepatol. 1999, 30, 715–721. [CrossRef]
128. Markowitz, J.S.; Martin, P.; Conrad, A.J.; Markmann, J.F.; Seu, P.; Yersiz, H.; Goss, J.A.; Schmidt, P.; Pakrasi, A.; Artinian, L.; et al.Prophylaxis against hepatitis B recurrence following liver transplantation using combination lamivudine and hepatitis B immuneglobulin. Hepatology 1998, 28, 585–589. [CrossRef]
129. Degertekin, B.; Lok, A.S. What is the optimal regimen for preventing hepatitis B recurrence after liver transplantation? Nat. Clin.Pract. Gastroenterol. Hepatol. 2009, 6, 68–69. [CrossRef] [PubMed]
130. Cotter, T.G.; Paul, S.; Sandıkçı, B.; Couri, T.; Bodzin, A.S.; Little, E.C.; Sundaram, V.; Charlton, M. Improved Graft Survival AfterLiver Transplantation for Recipients With Hepatitis C Virus in the Direct-Acting Antiviral Era. Liver Transplant. 2019, 25, 598–609.[CrossRef] [PubMed]
131. Bethea, E.; Arvind, A.; Gustafson, J.; Andersson, K.; Pratt, D.; Bhan, I.; Thiim, M.; Corey, K.; Bloom, P.; Markmann, J.; et al.Immediate administration of antiviral therapy after transplantation of hepatitis C-infected livers into uninfected recipients:Implications for therapeutic planning. Am. J. Transplant. 2020, 20, 1619–1628. [CrossRef]
132. Bizollon, T.; Ducerf, C.; Trepo, C.; Mutimer, D. Hepatitis C virus recurrence after liver transplantation. Gut 1999, 44, 575–578.[CrossRef] [PubMed]
133. Teixeira, R.; Pastacaldi, S.; Papatheodoridis, G.V.; Burroughs, A.K. Recurrent hepatitis C after liver transplantation. J. Med. Virol.2000, 61, 443–454. [CrossRef]
134. Ghobrial, R.M.; Farmer, D.G.; Baquerizo, A.; Colquhoun, S.; Rosen, H.R.; Yersiz, H.; Markmann, J.F.; Drazan, K.E.; Holt, C.;Imagawa, D.; et al. Orthotopic liver transplantation for hepatitis C: Outcome, effect of immunosuppression, and causes ofretransplantation during an 8-year single-center experience. Ann. Surg. 1999, 229, 824–831, discussion 831–823. [CrossRef]
135. Verna, E.C.; Abdelmessih, R.; Salomao, M.A.; Lefkowitch, J.; Moreira, R.K.; Brown, R.S., Jr. Cholestatic hepatitis C following livertransplantation: An outcome-based histological definition, clinical predictors, and prognosis. Liver Transplant. Off. Publ. Am.Assoc. Study Liver Dis. Int. Liver Transplant. Soc. 2013, 19, 78–88. [CrossRef]
136. Neumann, U.P.; Berg, T.; Bahra, M.; Seehofer, D.; Langrehr, J.M.; Neuhaus, R.; Radke, C.; Neuhaus, P. Fibrosis progression afterliver transplantation in patients with recurrent hepatitis C. J. Hepatol. 2004, 41, 830–836. [CrossRef]
137. Mutimer, D.J.; Gunson, B.; Chen, J.; Berenguer, J.; Neuhaus, P.; Castaing, D.; Garcia-Valdecasas, J.C.; Salizzoni, M.; Moreno,G.E.; Mirza, D. Impact of donor age and year of transplantation on graft and patient survival following liver transplantation forhepatitis C virus. Transplantation 2006, 81, 7–14. [CrossRef]
138. Omata, M.; Yokosuka, O.; Takano, S.; Kato, N.; Hosoda, K.; Imazeki, F.; Tada, M.; Ito, Y.; Ohto, M. Resolution of acute hepatitis Cafter therapy with natural beta interferon. Lancet 1991, 338, 914–915. [CrossRef]
139. Berg, T.; Hoffmann, R.M.; Teuber, G.; Leifeld, L.; Lafrenz, M.; Baumgarten, R.; Spengler, U.; Zeuzem, S.; Pape, G.R.; Hopf, U.Efficacy of a short-term ribavirin plus interferon alpha combination therapy followed by interferon alpha alone in previouslyuntreated patients with chronic hepatitis C: A randomized multicenter trial. Liver 2000, 20, 427–436. [CrossRef] [PubMed]
140. Carrat, F.; Bani-Sadr, F.; Pol, S.; Rosenthal, E.; Lunel-Fabiani, F.; Benzekri, A.; Morand, P.; Goujard, C.; Pialoux, G.; Piroth, L.; et al.Pegylated interferon alfa-2b vs standard interferon alfa-2b, plus ribavirin, for chronic hepatitis C in HIV-infected patients: Arandomized controlled trial. JAMA 2004, 292, 2839–2848. [CrossRef] [PubMed]
141. Terrault, N.A. Prophylactic and preemptive therapies for hepatitis C virus-infected patients undergoing liver transplantation.Liver Transplant. 2003, 9, S95–S100. [CrossRef]
142. Bzowej, N.; Nelson, D.R.; Terrault, N.A.; Everson, G.T.; Teng, L.L.; Prabhakar, A.; Charlton, M.R. PHOENIX: A randomizedcontrolled trial of peginterferon alfa-2a plus ribavirin as a prophylactic treatment after liver transplantation for hepatitis C virus.Liver Transplant. 2011, 17, 528–538. [CrossRef] [PubMed]
143. Kumada, H.; Toyota, J.; Okanoue, T.; Chayama, K.; Tsubouchi, H.; Hayashi, N. Telaprevir with peginterferon and ribavirin fortreatment-naive patients chronically infected with HCV of genotype 1 in Japan. J. Hepatol. 2012, 56, 78–84. [CrossRef] [PubMed]
144. Fried, M.W.; Buti, M.; Dore, G.J.; Flisiak, R.; Ferenci, P.; Jacobson, I.; Marcellin, P.; Manns, M.; Nikitin, I.; Poordad, F.; et al. Once-daily simeprevir (TMC435) with pegylated interferon and ribavirin in treatment-naïve genotype 1 hepatitis C: The randomizedPILLAR study. Hepatology 2013, 58, 1918–1929. [CrossRef] [PubMed]
145. Manns, M.; Pol, S.; Jacobson, I.M.; Marcellin, P.; Gordon, S.C.; Peng, C.Y.; Chang, T.T.; Everson, G.T.; Heo, J.; Gerken, G.; et al.All-oral daclatasvir plus asunaprevir for hepatitis C virus genotype 1b: A multinational, phase 3, multicohort study. Lancet 2014,384, 1597–1605. [CrossRef]
146. Ikegami, T.; Ueda, Y.; Akamatsu, N.; Ishiyama, K.; Goto, R.; Soyama, A.; Kuramitsu, K.; Honda, M.; Shinoda, M.; Yoshizumi, T.;et al. Asunaprevir and daclatasvir for recurrent hepatitis C after liver transplantation: A Japanese multicenter experience. Clin.Transplant. 2017, 31, e13109. [CrossRef] [PubMed]
147. Bourlière, M.; Bronowicki, J.P.; de Ledinghen, V.; Hézode, C.; Zoulim, F.; Mathurin, P.; Tran, A.; Larrey, D.G.; Ratziu, V.; Alric, L.;et al. Ledipasvir-sofosbuvir with or without ribavirin to treat patients with HCV genotype 1 infection and cirrhosis non-responsiveto previous protease-inhibitor therapy: A randomised, double-blind, phase 2 trial (SIRIUS). Lancet. Infect. Dis. 2015, 15, 397–404.[CrossRef]
125

J. Clin. Med. 2021, 10, 5417
148. Elfeki, M.A.; Abou Mrad, R.; Modaresi Esfeh, J.; Zein, N.N.; Eghtesad, B.; Zervos, X.; Hanouneh, I.A.; O’Shea, R.; Carey, W.D.;Alkhouri, N. Sofosbuvir/Ledipasvir Without Ribavirin Achieved High Sustained Virologic Response for Hepatitis C RecurrenceAfter Liver Transplantation: Two-Center Experience. Transplantation 2017, 101, 996–1000. [CrossRef]
149. Ueda, Y.; Kobayashi, T.; Ikegami, T.; Miuma, S.; Mizuno, S.; Akamatsu, N.; Takaki, A.; Ishigami, M.; Takatsuki, M.; Sugawara, Y.;et al. Efficacy and safety of glecaprevir and pibrentasvir treatment for 8 or 12 weeks in patients with recurrent hepatitis C afterliver transplantation: A Japanese multicenter experience. J. Gastroenterol. 2019, 54, 660–666. [CrossRef] [PubMed]
150. Figueras, J.; Jaurrieta, E.; Valls, C.; Benasco, C.; Rafecas, A.; Xiol, X.; Fabregat, J.; Casanovas, T.; Torras, J.; Baliellas, C.; et al.Survival after liver transplantation in cirrhotic patients with and without hepatocellular carcinoma: A comparative study.Hepatology 1997, 25, 1485–1489. [CrossRef]
151. Mazzaferro, V.; Regalia, E.; Doci, R.; Andreola, S.; Pulvirenti, A.; Bozzetti, F.; Montalto, F.; Ammatuna, M.; Morabito, A.; Gennari,L. Liver transplantation for the treatment of small hepatocellular carcinomas in patients with cirrhosis. N. Engl. J. Med. 1996, 334,693–699. [CrossRef] [PubMed]
152. Yao, F.Y.; Ferrell, L.; Bass, N.M.; Watson, J.J.; Bacchetti, P.; Venook, A.; Ascher, N.L.; Roberts, J.P. Liver transplantation forhepatocellular carcinoma: Expansion of the tumor size limits does not adversely impact survival. Hepatology 2001, 33, 1394–1403.[CrossRef] [PubMed]
153. Kaido, T.; Ogawa, K.; Mori, A.; Fujimoto, Y.; Ito, T.; Tomiyama, K.; Takada, Y.; Uemoto, S. Usefulness of the Kyoto criteria asexpanded selection criteria for liver transplantation for hepatocellular carcinoma. Surgery 2013, 154, 1053–1060. [CrossRef]
154. Halazun, K.J.; Rosenblatt, R.E.; Mehta, N.; Lai, Q.; Hajifathalian, K.; Gorgen, A.; Brar, G.; Sasaki, K.; Doyle, M.B.M.; Tabrizian, P.;et al. Dynamic α-Fetoprotein Response and Outcomes After Liver Transplant for Hepatocellular Carcinoma. JAMA Surg. 2021,156, 559–567. [CrossRef] [PubMed]
155. Razumilava, N.; Gores, G.J. Cholangiocarcinoma. Lancet 2014, 383, 2168–2179. [CrossRef]156. De Vreede, I.; Steers, J.L.; Burch, P.A.; Rosen, C.B.; Gunderson, L.L.; Haddock, M.G.; Burgart, L.; Gores, G.J. Prolonged disease-free
survival after orthotopic liver transplantation plus adjuvant chemoirradiation for cholangiocarcinoma. Liver Transplant. 2000, 6,309–316. [CrossRef] [PubMed]
157. Darwish Murad, S.; Kim, W.R.; Therneau, T.; Gores, G.J.; Rosen, C.B.; Martenson, J.A.; Alberts, S.R.; Heimbach, J.K. Predictors ofpretransplant dropout and posttransplant recurrence in patients with perihilar cholangiocarcinoma. Hepatology 2012, 56, 972–981.[CrossRef]
158. Sapisochin, G.; Rodríguez de Lope, C.; Gastaca, M.; Ortiz de Urbina, J.; Suarez, M.A.; Santoyo, J.; Castroagudín, J.F.; Varo,E.; López-Andujar, R.; Palacios, F.; et al. “Very early” intrahepatic cholangiocarcinoma in cirrhotic patients: Should livertransplantation be reconsidered in these patients? Am. J. Transplant. 2014, 14, 660–667. [CrossRef]
159. Jones, D.E. Autoantigens in primary biliary cirrhosis. J. Clin. Pathol. 2000, 53, 813–821. [CrossRef]160. Chalifoux, S.L.; Konyn, P.G.; Choi, G.; Saab, S. Extrahepatic Manifestations of Primary Biliary Cholangitis. Gut Liver 2017, 11,
771–780. [CrossRef]161. Nakanuma, Y. Distribution of B lymphocytes in nonsuppurative cholangitis in primary biliary cirrhosis. Hepatology 1993, 18,
570–575. [CrossRef]162. Corpechot, C.; Carrat, F.; Bahr, A.; Chrétien, Y.; Poupon, R.E.; Poupon, R. The effect of ursodeoxycholic acid therapy on the
natural course of primary biliary cirrhosis. Gastroenterology 2005, 128, 297–303. [CrossRef]163. Adam, R.; Karam, V.; Delvart, V.; O’Grady, J.; Mirza, D.; Klempnauer, J.; Castaing, D.; Neuhaus, P.; Jamieson, N.; Salizzoni,
M.; et al. Evolution of indications and results of liver transplantation in Europe. A report from the European Liver TransplantRegistry (ELTR). J. Hepatol. 2012, 57, 675–688. [CrossRef] [PubMed]
164. Singal, A.K.; Guturu, P.; Hmoud, B.; Kuo, Y.F.; Salameh, H.; Wiesner, R.H. Evolving frequency and outcomes of liver transplanta-tion based on etiology of liver disease. Transplantation 2013, 95, 755–760. [CrossRef] [PubMed]
165. Kashyap, R.; Safadjou, S.; Chen, R.; Mantry, P.; Sharma, R.; Patil, V.; Maloo, M.; Ryan, C.; Marroquin, C.; Barry, C.; et al. Livingdonor and deceased donor liver transplantation for autoimmune and cholestatic liver diseases–an analysis of the UNOS database.J. Gastrointest. Surg. 2010, 14, 1362–1369. [CrossRef] [PubMed]
166. Bosch, A.; Dumortier, J.; Maucort-Boulch, D.; Scoazec, J.Y.; Wendum, D.; Conti, F.; Morard, I.; Rubbia-Brandt, L.; Terris, B.;Radenne, S.; et al. Preventive administration of UDCA after liver transplantation for primary biliary cirrhosis is associated with alower risk of disease recurrence. J. Hepatol. 2015, 63, 1449–1458. [CrossRef] [PubMed]
167. Kogiso, T.; Egawa, H.; Teramukai, S.; Taniai, M.; Hashimoto, E.; Tokushige, K.; Sakisaka, S.; Sakabayashi, S.; Yamamoto, M.;Umeshita, K.; et al. Risk factors for recurrence of primary biliary cholangitis after liver transplantation in female patients: AJapanese multicenter retrospective study. Hepatol. Commun. 2017, 1, 394–405. [CrossRef]
168. Manousou, P.; Arvaniti, V.; Tsochatzis, E.; Isgro, G.; Jones, K.; Shirling, G.; Dhillon, A.P.; O’Beirne, J.; Patch, D.; Burroughs,A.K. Primary biliary cirrhosis after liver transplantation: Influence of immunosuppression and human leukocyte antigen locusdisparity. Liver Transplant. 2010, 16, 64–73. [CrossRef] [PubMed]
169. Charatcharoenwitthaya, P.; Pimentel, S.; Talwalkar, J.A.; Enders, F.T.; Lindor, K.D.; Krom, R.A.; Wiesner, R.H. Long-term survivaland impact of ursodeoxycholic acid treatment for recurrent primary biliary cirrhosis after liver transplantation. Liver Transplant.2007, 13, 1236–1245. [CrossRef]
170. Neuberger, J. Recurrent primary biliary cirrhosis. Liver Transplant. 2003, 9, 539–546. [CrossRef] [PubMed]
126
J. Clin. Med. 2021, 10, 5417
171. Egawa, H.; Sakisaka, S.; Teramukai, S.; Sakabayashi, S.; Yamamoto, M.; Umeshita, K.; Uemoto, S. Long-Term Outcomes ofLiving-Donor Liver Transplantation for Primary Biliary Cirrhosis: A Japanese Multicenter Study. Am. J. Transplant. 2016, 16,1248–1257. [CrossRef]
172. Li, X.; Peng, J.; Ouyang, R.; Yang, Y.; Yu, C.; Lin, H. Risk factors for recurrent primary biliary cirrhosis after liver transplantation:A systematic review and meta-analysis. Dig. Liver Dis. 2021, 53, 309–317. [CrossRef]
173. Egawa, H.; Nakanuma, Y.; Maehara, Y.; Uemoto, S.; Eguchi, S.; Sato, Y.; Shirabe, K.; Takatsuki, M.; Mori, A.; Yamamoto, M.; et al.Disease recurrence plays a minor role as a cause for retransplantation after living-donor liver transplantation for primary biliarycirrhosis: A multicenter study in Japan. Hepatol. Res. 2013, 43, 502–507. [CrossRef]
174. Chapman, R.; Fevery, J.; Kalloo, A.; Nagorney, D.M.; Boberg, K.M.; Shneider, B.; Gores, G.J. Diagnosis and management ofprimary sclerosing cholangitis. Hepatology 2010, 51, 660–678. [CrossRef]
175. Burak, K.; Angulo, P.; Pasha, T.M.; Egan, K.; Petz, J.; Lindor, K.D. Incidence and risk factors for cholangiocarcinoma in primarysclerosing cholangitis. Am. J. Gastroenterol. 2004, 99, 523–526. [CrossRef]
176. Boonstra, K.; Weersma, R.K.; van Erpecum, K.J.; Rauws, E.A.; Spanier, B.W.; Poen, A.C.; van Nieuwkerk, K.M.; Drenth, J.P.;Witteman, B.J.; Tuynman, H.A.; et al. Population-based epidemiology, malignancy risk, and outcome of primary sclerosingcholangitis. Hepatology 2013, 58, 2045–2055. [CrossRef]
177. Graziadei, I.W.; Wiesner, R.H.; Marotta, P.J.; Porayko, M.K.; Hay, J.E.; Charlton, M.R.; Poterucha, J.J.; Rosen, C.B.; Gores, G.J.;LaRusso, N.F.; et al. Long-term results of patients undergoing liver transplantation for primary sclerosing cholangitis. Hepatology1999, 30, 1121–1127. [CrossRef] [PubMed]
178. Hildebrand, T.; Pannicke, N.; Dechene, A.; Gotthardt, D.N.; Kirchner, G.; Reiter, F.P.; Sterneck, M.; Herzer, K.; Lenzen, H.; Rupp,C.; et al. Biliary strictures and recurrence after liver transplantation for primary sclerosing cholangitis: A retrospective multicenteranalysis. Liver Transplant. 2016, 22, 42–52. [CrossRef] [PubMed]
179. Alabraba, E.; Nightingale, P.; Gunson, B.; Hubscher, S.; Olliff, S.; Mirza, D.; Neuberger, J. A re-evaluation of the risk factors for therecurrence of primary sclerosing cholangitis in liver allografts. Liver Transplant. 2009, 15, 330–340. [CrossRef] [PubMed]
180. Campsen, J.; Zimmerman, M.A.; Trotter, J.F.; Wachs, M.; Bak, T.; Steinberg, T.; Kam, I. Clinically recurrent primary sclerosingcholangitis following liver transplantation: A time course. Liver Transplant. 2008, 14, 181–185. [CrossRef]
181. Egawa, H.; Ueda, Y.; Ichida, T.; Teramukai, S.; Nakanuma, Y.; Onishi, S.; Tsubouchi, H. Risk factors for recurrence of primarysclerosing cholangitis after living donor liver transplantation in Japanese registry. Am. J. Transplant 2011, 11, 518–527. [CrossRef][PubMed]
182. Kashyap, R.; Mantry, P.; Sharma, R.; Maloo, M.K.; Safadjou, S.; Qi, Y.; Jain, A.; Maliakkal, B.; Ryan, C.; Orloff, M. Comparativeanalysis of outcomes in living and deceased donor liver transplants for primary sclerosing cholangitis. J. Gastrointest. Surg. 2009,13, 1480–1486. [CrossRef]
183. Gordon, F.D.; Goldberg, D.S.; Goodrich, N.P.; Lok, A.S.; Verna, E.C.; Selzner, N.; Stravitz, R.T.; Merion, R.M. Recurrent primarysclerosing cholangitis in the Adult-to-Adult Living Donor Liver Transplantation Cohort Study: Comparison of risk factorsbetween living and deceased donor recipients. Liver Transplant. 2016, 22, 1214–1222. [CrossRef]
184. Dhillon, A.K.; Kummen, M.; Trøseid, M.; Åkra, S.; Liaskou, E.; Moum, B.; Vesterhus, M.; Karlsen, T.H.; Seljeflot, I.; Hov, J.R.Circulating markers of gut barrier function associated with disease severity in primary sclerosing cholangitis. Liver Int. 2019, 39,371–381. [CrossRef]
185. Martinez, M.; Perito, E.R.; Valentino, P.; Mack, C.L.; Aumar, M.; Broderick, A.; Draijer, L.G.; Fagundes, E.D.T.; Furuya, K.N.;Gupta, N.; et al. Recurrence of Primary Sclerosing Cholangitis after Liver Transplant in Children: An International ObservationalStudy. Hepatology 2021, 74, 2047–2057. [CrossRef] [PubMed]
186. Krawitt, E.L. Autoimmune hepatitis. N. Engl. J. Med. 2006, 354, 54–66. [CrossRef] [PubMed]187. EASL Clinical Practice Guidelines: Autoimmune hepatitis. J. Hepatol. 2015, 63, 971–1004. [CrossRef]188. Manns, M.; Gerken, G.; Kyriatsoulis, A.; Staritz, M.; Meyer zum Büschenfelde, K.H. Characterisation of a new subgroup of
autoimmune chronic active hepatitis by autoantibodies against a soluble liver antigen. Lancet 1987, 1, 292–294. [CrossRef]189. Tanaka, A. Autoimmune Hepatitis: 2019 Update. Gut Liver 2020, 14, 430–438. [CrossRef] [PubMed]190. Czaja, A.J. Rapidity of treatment response and outcome in type 1 autoimmune hepatitis. J. Hepatol. 2009, 51, 161–167. [CrossRef]191. Wright, H.L.; Bou-Abboud, C.F.; Hassanein, T.; Block, G.D.; Demetris, A.J.; Starzl, T.E.; Van Thiel, D.H. Disease recurrence and
rejection following liver transplantation for autoimmune chronic active liver disease. Transplantation 1992, 53, 136–139. [CrossRef][PubMed]
192. Narumi, S.; Hakamada, K.; Sasaki, M.; Freise, C.E.; Stock, P.G.; Roberts, J.P.; Ascher, N.L. Liver transplantation for autoimmunehepatitis: Rejection and recurrence. Transplant. Proc. 1999, 31, 1955–1956. [CrossRef]
193. Milkiewicz, P.; Hubscher, S.G.; Skiba, G.; Hathaway, M.; Elias, E. Recurrence of autoimmune hepatitis after liver transplantation.Transplantation 1999, 68, 253–256. [CrossRef] [PubMed]
194. Montano-Loza, A.J.; Bhanji, R.A.; Wasilenko, S.; Mason, A.L. Systematic review: Recurrent autoimmune liver diseases after livertransplantation. Aliment. Pharm. 2017, 45, 485–500. [CrossRef] [PubMed]
195. Milkiewicz, P.; Gunson, B.; Saksena, S.; Hathaway, M.; Hubscher, S.G.; Elias, E. Increased incidence of chronic rejection inadult patients transplanted for autoimmune hepatitis: Assessment of risk factors. Transplantation 2000, 70, 477–480. [CrossRef][PubMed]
127
J. Clin. Med. 2021, 10, 5417
196. McCabe, M.; Rush, N.; Lammert, C.; Patidar, K.R.; Nephew, L.; Saxena, R.; Ekser, B.; Salven, J.; Kubal, C.; Ghabril, M. HLA-DRMismatch and Black Race Are Associated With Recurrent Autoimmune Hepatitis After Liver Transplantation. Transpl. Direct2021, 7, e714. [CrossRef]
197. Montano-Loza, A.J.; Mason, A.L.; Ma, M.; Bastiampillai, R.J.; Bain, V.G.; Tandon, P. Risk factors for recurrence of autoimmunehepatitis after liver transplantation. Liver Transplant. 2009, 15, 1254–1261. [CrossRef]
198. Cattan, P.; Berney, T.; Conti, F.; Calmus, Y.; Homberg, J.C.; Houssin, D.; Soubrane, O. Outcome of orthotopic liver transplantationin autoimmune hepatitis according to subtypes. Transpl. Int. 2002, 15, 34–38. [CrossRef]
199. De Quadros Onofrio, F.; Neong, E.; Adebayo, D.; Kollmann, D.; Adeyi, O.A.; Fischer, S.; Hirschfield, G.M.; Hansen, B.E.; Bhat,M.; Galvin, Z.; et al. Single-Center North American Experience of Liver Transplantation in Autoimmune Hepatitis: InfrequentIndication but Good Outcomes for Patients. J. Can. Assoc. Gastroenterol. 2021, 4, 137–144. [CrossRef] [PubMed]
200. Montano-Loza, A.J.; Wasilenko, S.; Bintner, J.; Mason, A.L. Cyclosporine A protects against primary biliary cirrhosis recurrenceafter liver transplantation. Am. J. Transplant. 2010, 10, 852–858. [CrossRef]
201. Ravikumar, R.; Tsochatzis, E.; Jose, S.; Allison, M.; Athale, A.; Creamer, F.; Gunson, B.; Iyer, V.; Madanur, M.; Manas, D.; et al.Risk factors for recurrent primary sclerosing cholangitis after liver transplantation. J. Hepatol. 2015, 63, 1139–1146. [CrossRef][PubMed]
202. Cholongitas, E.; Shusang, V.; Papatheodoridis, G.V.; Marelli, L.; Manousou, P.; Rolando, N.; Patch, D.; Rolles, K.; Davidson, B.;Burroughs, A.K. Risk factors for recurrence of primary sclerosing cholangitis after liver transplantation. Liver Transplant. 2008, 14,138–143. [CrossRef]
203. Reich, D.J.; Fiel, I.; Guarrera, J.V.; Emre, S.; Guy, S.R.; Schwartz, M.E.; Miller, C.M.; Sheiner, P.A. Liver transplantation forautoimmune hepatitis. Hepatology 2000, 32, 693–700. [CrossRef] [PubMed]
204. Sørgjerd, E.P. Type 1 Diabetes-related Autoantibodies in Different Forms of Diabetes. Curr. Diabetes Rev. 2019, 15, 199–204.[CrossRef]
205. Bottazzo, G.F.; Florin-Christensen, A.; Doniach, D. Islet-cell antibodies in diabetes mellitus with autoimmune polyendocrinedeficiencies. Lancet 1974, 2, 1279–1283. [CrossRef]
206. Månsson, L.; Törn, C.; Landin-Olsson, M. Islet cell antibodies represent autoimmune response against several antigens. Int. J. Exp.Diabetes Res. 2001, 2, 85–90. [CrossRef] [PubMed]
207. Sutherland, D.E.; Goetz, F.C.; Sibley, R.K. Recurrence of disease in pancreas transplants. Diabetes 1989, 38 (Suppl. S1), 85–87.[CrossRef] [PubMed]
208. Sutherland, D.E.; Sibley, R.; Xu, X.Z.; Michael, A.; Srikanta, A.M.; Taub, F.; Najarian, J.; Goetz, F.C. Twin-to-twin pancreastransplantation: Reversal and reenactment of the pathogenesis of type I diabetes. Trans. Assoc. Am. Physicians 1984, 97, 80–87.[PubMed]
209. Vendrame, F.; Hopfner, Y.Y.; Diamantopoulos, S.; Virdi, S.K.; Allende, G.; Snowhite, I.V.; Reijonen, H.K.; Chen, L.; Ruiz, P.;Ciancio, G.; et al. Risk Factors for Type 1 Diabetes Recurrence in Immunosuppressed Recipients of Simultaneous Pancreas-KidneyTransplants. Am. J. Transpl. 2016, 16, 235–245. [CrossRef]
210. Esmatjes, E.; Rodríguez-Villar, C.; Ricart, M.J.; Casamitjana, R.; Martorell, J.; Sabater, L.; Astudillo, E.; Fernández-Cruz, L.Recurrence of immunological markers for type 1 (insulin-dependent) diabetes mellitus in immunosuppressed patients afterpancreas transplantation. Transplantation 1998, 66, 128–131. [CrossRef]
128
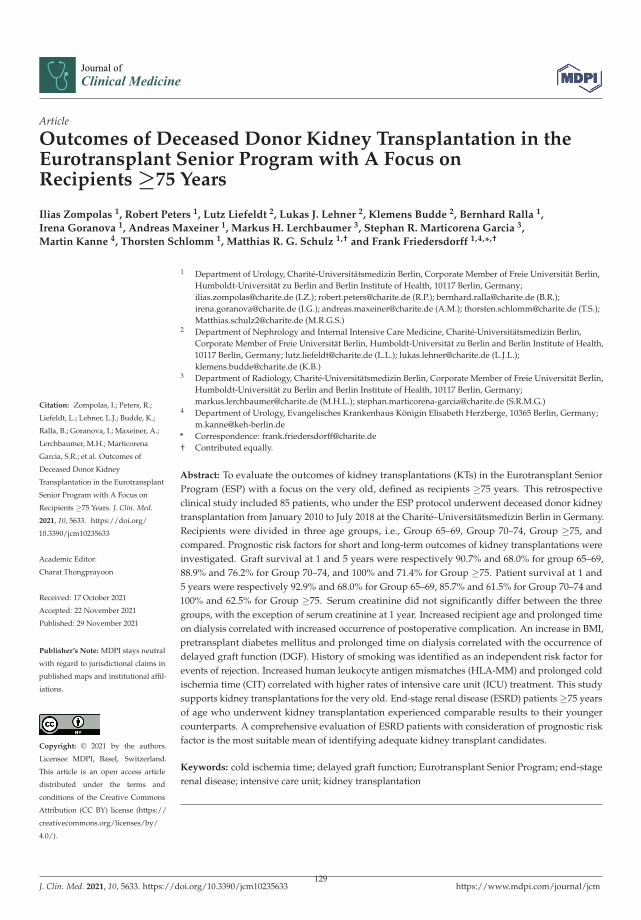
Journal of
Clinical Medicine
Article
Outcomes of Deceased Donor Kidney Transplantation in theEurotransplant Senior Program with A Focus onRecipients ≥75 Years
Ilias Zompolas 1, Robert Peters 1, Lutz Liefeldt 2, Lukas J. Lehner 2, Klemens Budde 2, Bernhard Ralla 1,
Irena Goranova 1, Andreas Maxeiner 1, Markus H. Lerchbaumer 3, Stephan R. Marticorena Garcia 3,
Martin Kanne 4, Thorsten Schlomm 1, Matthias R. G. Schulz 1,† and Frank Friedersdorff 1,4,*,†
Citation: Zompolas, I.; Peters, R.;
Liefeldt, L.; Lehner, L.J.; Budde, K.;
Ralla, B.; Goranova, I.; Maxeiner, A.;
Lerchbaumer, M.H.; Marticorena
Garcia, S.R.; et al. Outcomes of
Deceased Donor Kidney
Transplantation in the Eurotransplant
Senior Program with A Focus on
Recipients ≥75 Years. J. Clin. Med.
2021, 10, 5633. https://doi.org/
10.3390/jcm10235633
Academic Editor:
Charat Thongprayoon
Received: 17 October 2021
Accepted: 22 November 2021
Published: 29 November 2021
Publisher’s Note: MDPI stays neutral
with regard to jurisdictional claims in
published maps and institutional affil-
iations.
Copyright: © 2021 by the authors.
Licensee MDPI, Basel, Switzerland.
This article is an open access article
distributed under the terms and
conditions of the Creative Commons
Attribution (CC BY) license (https://
creativecommons.org/licenses/by/
4.0/).
1 Department of Urology, Charité-Universitätsmedizin Berlin, Corporate Member of Freie Universität Berlin,Humboldt-Universität zu Berlin and Berlin Institute of Health, 10117 Berlin, Germany;[email protected] (I.Z.); [email protected] (R.P.); [email protected] (B.R.);[email protected] (I.G.); [email protected] (A.M.); [email protected] (T.S.);[email protected] (M.R.G.S.)
2 Department of Nephrology and Internal Intensive Care Medicine, Charité-Universitätsmedizin Berlin,Corporate Member of Freie Universität Berlin, Humboldt-Universität zu Berlin and Berlin Institute of Health,10117 Berlin, Germany; [email protected] (L.L.); [email protected] (L.J.L.);[email protected] (K.B.)
3 Department of Radiology, Charité-Universitätsmedizin Berlin, Corporate Member of Freie Universität Berlin,Humboldt-Universität zu Berlin and Berlin Institute of Health, 10117 Berlin, Germany;[email protected] (M.H.L.); [email protected] (S.R.M.G.)
4 Department of Urology, Evangelisches Krankenhaus Königin Elisabeth Herzberge, 10365 Berlin, Germany;[email protected]
* Correspondence: [email protected]† Contributed equally.
Abstract: To evaluate the outcomes of kidney transplantations (KTs) in the Eurotransplant SeniorProgram (ESP) with a focus on the very old, defined as recipients ≥75 years. This retrospectiveclinical study included 85 patients, who under the ESP protocol underwent deceased donor kidneytransplantation from January 2010 to July 2018 at the Charité–Universitätsmedizin Berlin in Germany.Recipients were divided in three age groups, i.e., Group 65–69, Group 70–74, Group ≥75, andcompared. Prognostic risk factors for short and long-term outcomes of kidney transplantations wereinvestigated. Graft survival at 1 and 5 years were respectively 90.7% and 68.0% for group 65–69,88.9% and 76.2% for Group 70–74, and 100% and 71.4% for Group ≥75. Patient survival at 1 and5 years were respectively 92.9% and 68.0% for Group 65–69, 85.7% and 61.5% for Group 70–74 and100% and 62.5% for Group ≥75. Serum creatinine did not significantly differ between the threegroups, with the exception of serum creatinine at 1 year. Increased recipient age and prolonged timeon dialysis correlated with increased occurrence of postoperative complication. An increase in BMI,pretransplant diabetes mellitus and prolonged time on dialysis correlated with the occurrence ofdelayed graft function (DGF). History of smoking was identified as an independent risk factor forevents of rejection. Increased human leukocyte antigen mismatches (HLA-MM) and prolonged coldischemia time (CIT) correlated with higher rates of intensive care unit (ICU) treatment. This studysupports kidney transplantations for the very old. End-stage renal disease (ESRD) patients ≥75 yearsof age who underwent kidney transplantation experienced comparable results to their youngercounterparts. A comprehensive evaluation of ESRD patients with consideration of prognostic riskfactor is the most suitable mean of identifying adequate kidney transplant candidates.
Keywords: cold ischemia time; delayed graft function; Eurotransplant Senior Program; end-stagerenal disease; intensive care unit; kidney transplantation
J. Clin. Med. 2021, 10, 5633. https://doi.org/10.3390/jcm10235633 https://www.mdpi.com/journal/jcm129
J. Clin. Med. 2021, 10, 5633
1. Introduction
Kidney transplantation is considered the treatment of choice in ESRD, increasing lifeexpectancy and quality of life even for recipients aged ≥65 years [1–4]. The shortage of renalallograft donors combined with an increased demand from an ever-ageing populationhas led to the use of expanded criteria donor (ECD) kidneys. ECD kidneys, despitebeing of lower quality than standard criteria donor (SCD) kidneys, minimize waitlistedtime for recipients while providing a survival advantage compared wait-listed dialysispatients [3–6]. The Eurotransplant Senior Program implemented in 1999, aimed to optimizethe allocation of ECD kidneys from deceased donors aged ≥65 to recipients aged ≥65based on waiting time and blood type compatibility, disregarding HLA matchmakingwhile minimizing cold ischemia time. Although good results have been reported inrecipients aged ≥65 years, only few studies have focused on the potential benefits ofkidney transplantations (KTs) in the very old [3–9]. Studies that evaluated renal allograftrecipients over 70 years compared to a waitlisted group or younger counterparts revealedthat ≥70-year recipients benefited from the procedure [10–12].
However, no scientific research has explicitly assessed the KTs of patients ≥75 yearsof age thus far. This age group of patients is destined to become clinically more relevant asthe number of people aged 75 to 84 years in the EU is projected to increase by 56.1% from2019 to 2050 [13].
Primary objective of the present study was to evaluate the outcomes of KTs performedunder the ESP protocol and to investigate the age limits in recipients. Secondary objectivewas to identify prognostic factors influencing the short and long-term outcomes of thosetransplantations with the prospect to improve the pretransplant evaluation.
2. Patients and Methods
2.1. Study Design
The present retrospective clinical study included 85 patients aged ≥65 years whoreceived a deceased donor kidney transplant from donors ≥65 years allocated throughESP. Recipients were divided into three groups with respect to their age at the time ofKT in years as following: Group 65–69, Group 70–74, and Group ≥75. The KTs wereconducted by experienced urologic transplant surgeons between January 2010 and July 2018at the Charité-Universitätsmedizin Berlin. All patients received a renal allograft for thefirst time and were followed up until death or the end of study (26 May 2020). Theimmunosuppression protocol after KT was identical for all patients and consisted oftacrolimus, mycophenolate mofetil (MMF) and prednisolone.
This entire analysis was conducted in adherence with the correct scientific researchwork terms of the Charité Medical University of Berlin, including full anonymization ofpatient data. All the patients included in the analysis provided written informed consent.
2.2. Data Collection and Outcome Measures
Demographic data, medical history, and postoperative follow-up information wereextracted through the electronic database Tbase2. Graft characteristics included donorage, number of HLA-mismatches and cold ischemia time (CIT). Specifics of the operationsincluded the side of transplantation, duration of surgery and warm ischemia time (WIT).Serum creatinine levels and glomerular filtration rate (GFR) were used to estimate therenal function of the patients. Short-term outcomes consisted of inpatient stay, occurrenceof postoperative complications, Clavien–Dindo classification, DGF, number of dialysispostoperatively, number of days in the ICU, occurrence of rejection and if ICU treatmentwas required. Long-term outcomes consisted of serum creatinine levels (mg/dl), graftsurvival, and patient survival at one, three, and five years, death with functioning graft,and patient mortality at last follow-up.
130
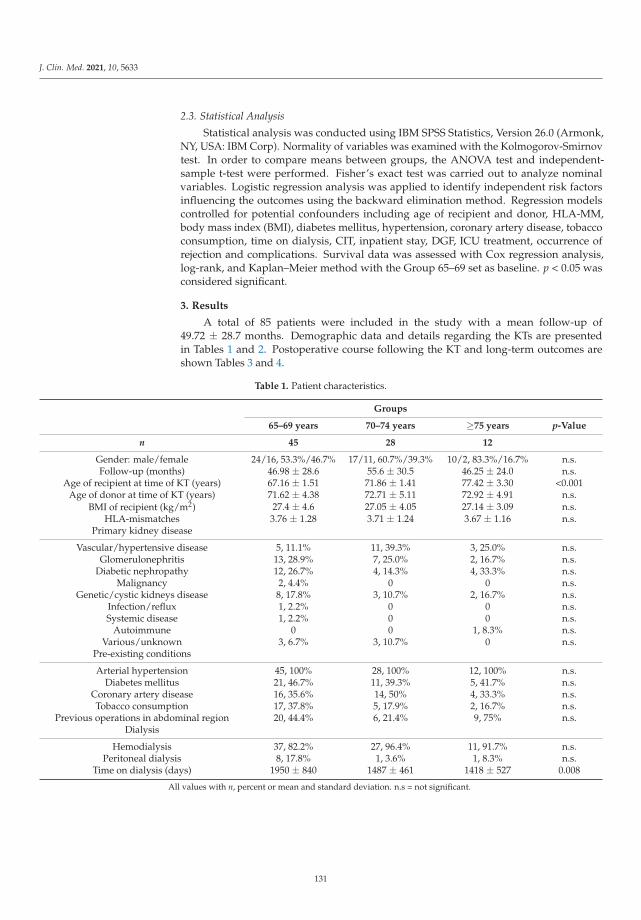
J. Clin. Med. 2021, 10, 5633
2.3. Statistical Analysis
Statistical analysis was conducted using IBM SPSS Statistics, Version 26.0 (Armonk,NY, USA: IBM Corp). Normality of variables was examined with the Kolmogorov-Smirnovtest. In order to compare means between groups, the ANOVA test and independent-sample t-test were performed. Fisher’s exact test was carried out to analyze nominalvariables. Logistic regression analysis was applied to identify independent risk factorsinfluencing the outcomes using the backward elimination method. Regression modelscontrolled for potential confounders including age of recipient and donor, HLA-MM,body mass index (BMI), diabetes mellitus, hypertension, coronary artery disease, tobaccoconsumption, time on dialysis, CIT, inpatient stay, DGF, ICU treatment, occurrence ofrejection and complications. Survival data was assessed with Cox regression analysis,log-rank, and Kaplan–Meier method with the Group 65–69 set as baseline. p < 0.05 wasconsidered significant.
3. Results
A total of 85 patients were included in the study with a mean follow-up of49.72 ± 28.7 months. Demographic data and details regarding the KTs are presentedin Tables 1 and 2. Postoperative course following the KT and long-term outcomes areshown Tables 3 and 4.
Table 1. Patient characteristics.
Groups
65–69 years 70–74 years ≥75 years p-Value
n 45 28 12
Gender: male/female 24/16, 53.3%/46.7% 17/11, 60.7%/39.3% 10/2, 83.3%/16.7% n.s.Follow-up (months) 46.98 ± 28.6 55.6 ± 30.5 46.25 ± 24.0 n.s.
Age of recipient at time of KT (years) 67.16 ± 1.51 71.86 ± 1.41 77.42 ± 3.30 <0.001Age of donor at time of KT (years) 71.62 ± 4.38 72.71 ± 5.11 72.92 ± 4.91 n.s.
BMI of recipient (kg/m2) 27.4 ± 4.6 27.05 ± 4.05 27.14 ± 3.09 n.s.HLA-mismatches 3.76 ± 1.28 3.71 ± 1.24 3.67 ± 1.16 n.s.
Primary kidney disease
Vascular/hypertensive disease 5, 11.1% 11, 39.3% 3, 25.0% n.s.Glomerulonephritis 13, 28.9% 7, 25.0% 2, 16.7% n.s.
Diabetic nephropathy 12, 26.7% 4, 14.3% 4, 33.3% n.s.Malignancy 2, 4.4% 0 0 n.s.
Genetic/cystic kidneys disease 8, 17.8% 3, 10.7% 2, 16.7% n.s.Infection/reflux 1, 2.2% 0 0 n.s.Systemic disease 1, 2.2% 0 0 n.s.
Autoimmune 0 0 1, 8.3% n.s.Various/unknown 3, 6.7% 3, 10.7% 0 n.s.
Pre-existing conditions
Arterial hypertension 45, 100% 28, 100% 12, 100% n.s.Diabetes mellitus 21, 46.7% 11, 39.3% 5, 41.7% n.s.
Coronary artery disease 16, 35.6% 14, 50% 4, 33.3% n.s.Tobacco consumption 17, 37.8% 5, 17.9% 2, 16.7% n.s.
Previous operations in abdominal region 20, 44.4% 6, 21.4% 9, 75% n.s.Dialysis
Hemodialysis 37, 82.2% 27, 96.4% 11, 91.7% n.s.Peritoneal dialysis 8, 17.8% 1, 3.6% 1, 8.3% n.s.
Time on dialysis (days) 1950 ± 840 1487 ± 461 1418 ± 527 0.008
All values with n, percent or mean and standard deviation. n.s = not significant.
131

J. Clin. Med. 2021, 10, 5633
Table 2. Surgery details.
Groups65–69 years 70–74 years ≥75 years p-Value
Side of transplantation: fossa iliaca dextra/sinistra 26/19, 57.8%/42.2% 16/12, 57.1%/42.9% 6/6, 50%/50% n.s.Operation time (minutes) 203 ± 52.7 202 ± 46.9 235 ± 33.7 n.s.
Cold ischemia time (hours) 10.05 ± 3.78 9.46 ± 3.29 9.11 ± 2.96 n.s.Warm ischemia time (minutes) 48.1 ± 10.7 52.6 ± 14.5 49.8 ± 10.0 n.s.
All values with n, percent, or mean and standard deviation; n.s = not significant.
Table 3. Postoperative course.
Groups
65–69 years 70–74 years ≥75 years p-Value
Inpatient stay (days) 22.1 ± 13.0 21.5 ± 15.6 19.3 ± 10.2 n.s.Occurrence of postoperative complications 12, 26.7% 10, 35.7% 2, 16.7% n.s.
Clavien–Dindo classificationClavien–Dindo 1 7, 15.6% 8, 28.6% n.a.Clavien–Dindo 2 n.a. n.a. n.a.Clavien–Dindo 3 5, 11.1% 2, 7.1% 2, 16.7%
Delayed graft function 27, 60% 14, 50% 5, 41.7% n.s.Number of dialysis postoperatively 6.44 ± 7.63 2.57 ± 2.10 4.80 ± 3.96 n.s.
ICU required 12, 26.7% 6, 21.4% 3, 25.0% n.s.ICU duration (days) 1.58 ± 0.9 4 ± 3.58 3.0 ± 1.73 n.s.
Occurrence of rejection 10, 22.2% 5, 17.9% 1, 8.3% n.s.Cause of rejection
Acute rejection 4, 8.9% 2, 7.1% 1, 8.3%Chronic rejection 4, 8.9% 2, 7.1% 0
Vascular complications 1, 2.2% 0 0Tumor 1, 2.2% 0 0
Infection 0 1, 3.6% 0
All values with n, percent or mean and standard deviation. n.a. = not applicable; n.s = not significant.
The logistic regression analysis controlled for potential confounders. The manifes-tation of postoperative complications correlated with an increase in age of recipient (re-gression coefficient B = −0.31, odds ratio Exp(B) = 0.74, p = 0.049), the occurrence ofDGF (B = −3.70, Exp(B) = 0.25, p = 0.001), and an increased time on dialysis (B = −0.002,Exp(B) = 0.998, p = 0.042). The event of rejection correlated with a history of smoking(B = −1.392, Exp(B) = 0.249, p = 0.028) and DGF (B = −2.145, Exp(B) = 0.117, p = 0.009).Requirement of ICU treatment correlated with an increase in HLA-MM (B = −2.633,Exp(B) = 0.72, p = 0.045) and an increase in cold ischemia time (B = 1.916, Exp(B) = 6.80,p = 0.031). Occurrence of DGF correlated with increase in BMI (B = 0.146, Exp(B) = 1.157,p = 0.045), longer period on dialysis (B = 0.01, Exp(B) = 1.001, p = 0.008), manifestation ofperioperative complications (B = 2.423, Exp(B) = 11.28, p = 0.001), and diabetes mellitus(B = 1.586, Exp(B) = 4.88, p = 0.007). The occurrence of rejection correlated with graft failure(χ2 (1, N = 85) = 26.73 p < 0.001). There were no significant differences between the threegroups after KT regarding serum creatinine, except for creatinine at 1 year (see Figure 1).
132
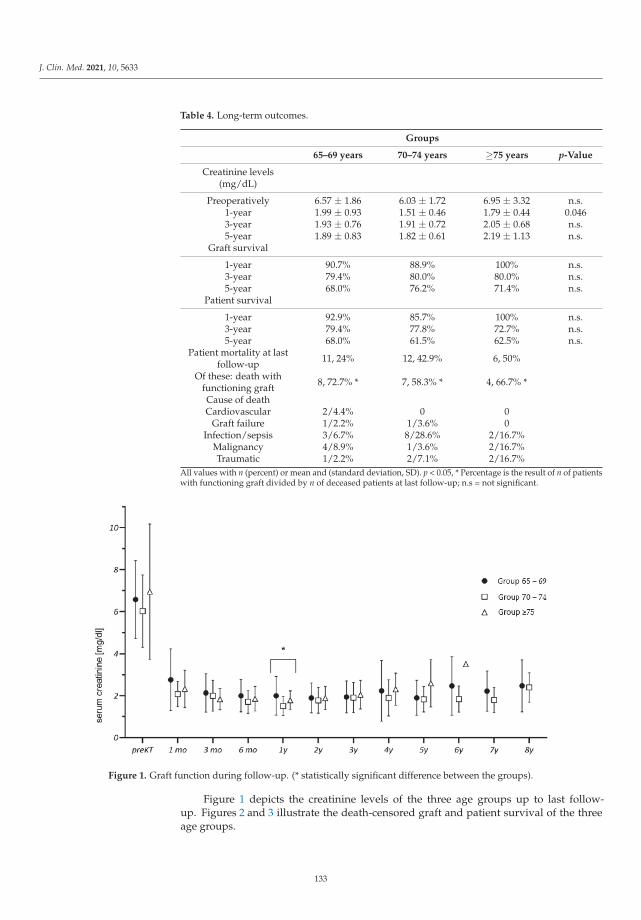
J. Clin. Med. 2021, 10, 5633
Table 4. Long-term outcomes.
Groups
65–69 years 70–74 years ≥75 years p-Value
Creatinine levels(mg/dL)
Preoperatively 6.57 ± 1.86 6.03 ± 1.72 6.95 ± 3.32 n.s.1-year 1.99 ± 0.93 1.51 ± 0.46 1.79 ± 0.44 0.0463-year 1.93 ± 0.76 1.91 ± 0.72 2.05 ± 0.68 n.s.5-year 1.89 ± 0.83 1.82 ± 0.61 2.19 ± 1.13 n.s.
Graft survival
1-year 90.7% 88.9% 100% n.s.3-year 79.4% 80.0% 80.0% n.s.5-year 68.0% 76.2% 71.4% n.s.
Patient survival
1-year 92.9% 85.7% 100% n.s.3-year 79.4% 77.8% 72.7% n.s.5-year 68.0% 61.5% 62.5% n.s.
Patient mortality at lastfollow-up 11, 24% 12, 42.9% 6, 50%
Of these: death withfunctioning graft 8, 72.7% * 7, 58.3% * 4, 66.7% *
Cause of deathCardiovascular 2/4.4% 0 0
Graft failure 1/2.2% 1/3.6% 0Infection/sepsis 3/6.7% 8/28.6% 2/16.7%
Malignancy 4/8.9% 1/3.6% 2/16.7%Traumatic 1/2.2% 2/7.1% 2/16.7%
All values with n (percent) or mean and (standard deviation, SD). p < 0.05, * Percentage is the result of n of patientswith functioning graft divided by n of deceased patients at last follow-up; n.s = not significant.
Figure 1. Graft function during follow-up. (* statistically significant difference between the groups).
Figure 1 depicts the creatinine levels of the three age groups up to last follow-up. Figures 2 and 3 illustrate the death-censored graft and patient survival of the threeage groups.
133

J. Clin. Med. 2021, 10, 5633
Figure 2. Kaplan–Meier survival plot demonstrating death-censored graft survival. There were nosignificant differences in the graft survival time between groups (p = 0.673 for Gr. 70–74, p = 0.814for Gr. 75+).
Figure 3. Kaplan–Meier survival plot demonstrating death-censored patient survival. There wereno significant differences in the patient survival time between the groups (p = 0.149 for Gr. 7074,p = 0.438 for Gr. 75+).
4. Discussion
To the best of our knowledge, this is the first study to investigate the clinical outcomesof KT in patients ≥75 years of age. The most important finding is that there were nostatistically significant differences in graft and patient survival between the age groups.Recipients aged ≥75 years showed no disadvantages regarding short and long-term out-comes when compared to those aged 65–69 years and 70–74 years. Regarding patientcharacteristics, pre-existing conditions and ischemia time, no significant differences wereestablished between the three groups except for pre-transplant time on dialysis. Thus, anadequate comparison was possible.
134

J. Clin. Med. 2021, 10, 5633
Serum creatinine levels were similar across the three groups up to 5 years of follow-up, suggesting that allograft function was equivalent between the groups. One notableexception was serum creatine levels at 1 year after transplantation, but that difference didnot persist.
Overall, recipient and allograft characteristics of this study were similar to those incohorts examined in recent studies evaluating ESP outcomes [7–9]. Quast et al. conducteda single-center retrospective analysis of 217 KTs with a focus on donor age while Badheet al. focused on prognostic factors for KTs. Graft and patient survival at 1 and 5 yearsof Quast, Bahde, and Jacobi et al. were comparable to those in groups 70–74 and ≥75despite recipients in this study being significantly older (7–9) (see Table 5). These resultssupport KT for ESRD patients ≥75 as biological age does not appear to influence the graftor survival of these patients.
Table 5. Comparison of death-censored graft and patient survival in the Eurotransplant Senior Program.
Quast(9) Bahde(7) Jacobi(8) Our Resultsn = 217 n = 89 n = 89 Group 65–69 Group 70–74 Group ≥75
Age ofrecipients at KT 68.1 ± 3.8 72.2
(70–77) 68.2 ± 3.2 67.16 ± 1.51 71.86 ± 1.41 77.42 ± 3.30
Graftsurvival
1-year 76.4% n.a. 87% 90.7% 88.9% 100%5-year 57.3% 77% 63% 68.0% 76.2% 71.4%Patient
survival
1-year 88.2% n.a 87% 92.9% 85.7% 100%5-year 71.8% 69.8% 63% 68.0% 61.5% 62.5%
Age of recipient values are given in years and expressed as mean and SD or median and interquartile ranges.
Postoperative complications were common with an overall rate of 28.2% and withincreased age, DGF, and time on dialysis identified as independent risk factors. Results byQuast and Bahde showed comparable postoperative complication rates at 23.2% and 22.5%,respectively. Jacobi et al., reported 46% of combined peri- and postoperative complications.Inconsistent definition of postoperative complications limits the accuracy of comparisonsthat can be made. Therefore, this study encourages the adoption of the more objectiveClavien–Dindo classification in surgical literature to improve future evaluations.
Independent risk factors for the development of DGF were pre-transplant diabetes,high BMI, longer time on dialysis, and occurrence of perioperative complications. Theseresults are supported by Badhe et al. who identified BMI ≥ 25 kg/m2 as a risk factor forDGF and by Parekh et al., who determined pre-transplant diabetes as an independent riskfactor in the analysis of 25,523 KTs [7,14]. Previous publications also found that prolongedCIT contributed to a higher incidence of DGF [6,7,11]. However, in this study CIT was keptto a minimum across all groups. This could be the reason that no significant correlationwas established between DGF and elongated CIT.
Similarly to previous reports, our analysis identified delayed graft function to mean-ingfully associated with event of rejection [15,16]. Events of rejection strongly correlatedwith loss of graft. Preventing such events through adequate selection of transplant candi-dates and later through well-adjusted immunosuppression is critical.
Nogueira et al. analysis of 997 KT cases found that rejections at 1-year after KT weresignificantly higher in smokers [17]. This aligns with the results of this study as historyof tobacco use correlated with events of rejections. Furthermore, this study establishedan association of ICU hospitalization with longer CIT and increased HLA-mismatches. Itis unclear why HLA-mismatches correlate with higher incidents of ICU hospitalizationbut not simultaneously with higher incidents of rejection. The current kidney transplantallocation in the ESP with patients over 60 years of age does not take into consideration
135
J. Clin. Med. 2021, 10, 5633
the HLA mismatches between donor and recipient. A revised model of kidney allocationthat considers for HLA compatibility without compromising CIT can prove beneficial inreducing the need for ICU treatment. A reduction in patients requiring ICU is predomi-nantly of value in the ongoing SARS-CoV-2 pandemic, where ICU availability can swiftlybecome limited.
The proportion of recipients who died with a functioning graft was 65.5%. This isconsistent with the findings of Giessing and Boesmueller et al., who described death as themain cause of graft loss [11,18]. The high proportion of patients dying with a functioninggraft suggest that even suboptimal allografts can provide adequate function up to the endof the recipient’s life.
The major limitation of this study is its relatively small sample size. Recipients ≥75 yearsadequate to undergo KT are scarce mainly due to the prolonged waiting time on dialysis.Hence, the assembly of a broader cohort remains challenging. An expansion of the donorpool combined with an increase in kidney donor availability could reduce the waitlistedtime and allow for higher rates of transplantation in very old recipients. Additional multi-center studies with bigger cohorts are encouraged to confirm or challenge the results ofthis study.
5. Conclusions
In conclusion, graft and patient survival of recipients ≥75 years was comparable toGroup 65–69 and Group 70–74. Therefore, recipients ≥75 years are appropriate candidatesfor KT and should not be discriminated with respect to their chronological age. An attentivepre-transplant evaluation with consideration of independent risk factors identified asincreased time on dialysis, BMI ≥ 25 kg/m2, history of smoking, and diabetes mellitus iscrucial for transplant outcomes.
Author Contributions: Conceptualization, I.Z., F.F. and M.R.G.S.; methodology, I.Z., F.F., M.R.G.S.,L.L. and M.H.L.; software, I.Z. and M.R.G.S.; validation, F.F., R.P., K.B. and L.J.L.; formal analysis, I.Z.and M.R.G.S.; investigation, I.Z.; data curation, I.Z.; writing—original draft preparation, I.Z.; writing—review and editing, all authors; visualization, I.Z., M.R.G.S., M.H.L. and S.R.M.G.; supervision,F.F., B.R., I.G., A.M., M.K. and T.S. All authors have read and agreed to the published version ofthe manuscript.
Funding: This research received no external funding.
Institutional Review Board Statement: Ethical review and approval were waived for this study, dueto its retrospective nature.
Informed Consent Statement: Informed consent was obtained from all subjects involved in the study.
Data Availability Statement: Data of this study will be in the public archive of Charité-UniversitätsmedizinBerlin, Germany.
Conflicts of Interest: The authors declare no conflict of interest.
References
1. Rebollo, P.; Ortega, F.; Baltar, J.M.; Diaz-Corte, C.; Navascués, R.A.; Naves, M.; Ureña, A.; Badía, X.; Alvarez-Ude, F.; Alvarez-Grande, J. Health-related quality of life (HRQOL) in end stage renal disease (ESRD) patients over 65 years. Geriatr. Nephrol. Urol.1998, 8, 85–94. [CrossRef] [PubMed]
2. Laupacis, A.; Keown, P.; Pus, N.; Krueger, H.; Ferguson, B.; Wong, C.; Muirhead, N. A study of the quality of life and cost-utilityof renal transplantation. Kidney Int. 1996, 50, 235–242. [CrossRef] [PubMed]
3. Wolfe, R.A.; Ashby, V.B.; Milford, E.L.; Ojo, A.O.; Ettenger, R.E.; Agodoa, L.Y.C.; Held, P.J.; Port, F.K. Comparison of Mortality inAll Patients on Dialy-sis, Patients on Dialysis Awaiting Transplantation, and Recipients of a First Cadaveric Transplant. N. Engl.J. Med. 1999, 341, 1725–1730. [CrossRef] [PubMed]
4. Medin, C.; Elinder, C.; Hylander, B.; Blom, B.; Wilczek, H. Survival of patients who have been on a waiting list for renaltransplan-tation. Nephrol. Dial. Transplant. 2000, 15, 701–704. [CrossRef] [PubMed]
5. Cohen, B.; Smits, J.M.; Haase, B.; Persijn, G.; Vanrenterghem, Y.; Frei, U. Expanding the donor pool to increase renal transplantation.Nephrol. Dial. Transplant. 2005, 20, 34–41. [CrossRef] [PubMed]
136
J. Clin. Med. 2021, 10, 5633
6. Frei, U.; Noeldeke, J.; Machold-Fabrizii, V.; Arbogast, H.; Margreiter, R.; Fricke, L.; Voiculescu, A.; Kliem, V.; Ebel, H.;Albert, U.; et al. Prospective Age-Matching in Elderly Kidney Transplant Recipients—A 5-Year Analysis of the EurotransplantSenior Program. Arab. Archaeol. Epigr. 2007, 8, 50–57. [CrossRef] [PubMed]
7. Bahde, R.; Vowinkel, T.; Unser, J.; Anthoni, C.; Holzen, J.P.; Suwelack, B. Prognostic factors for kidney allograft survival in theEuro-transplant Senior Program. Ann. Transplant. 2014, 19, 201–209. [PubMed]
8. Jacobi, J.; Beckmann, S.; Heller, K.; Hilgers, K.F.; Apel, H.; Spriewald, B.; Amann, K.U. Deceased Donor Kidney Transplantationin the Euro-transplant Senior Program (ESP): A Single-Center Experience from 2008 to 2013. Ann. Transplant. 2016, 21, 94–104.[CrossRef] [PubMed]
9. Quast, L.S.; Grzella, S.; Lengenfeld, T.; Pillokeit, N.; Hummels, M.; Zgoura, P.; Westhoff, T.H.; Viebahn, R.; Schenker, P. Outcomeof Kidney Transplantation Using Or-gans From Brain-dead Donors Older Than 75 Years. Transplant. Proc. 2020, 52, 119–126.[CrossRef] [PubMed]
10. Heldal, K.; Hartmann, A.; Grootendorst, D.C.; de Jager, D.J.; Leivestad, T.; Foss, A.; Midtvedt, K. Benefit of kidney transplantationbeyond 70 years of age. Nephrol. Dial. Transplant. 2010, 25, 1680–1687. [CrossRef] [PubMed]
11. Boesmueller, C.; Biebl, M.; Scheidl, S.; Oellinger, R.; Margreiter, C.; Pratschke, J.; Margreiter, R.; Schneeberger, S. Long-TermOutcome in Kidney Transplant Recipients Over 70 Years in the Eurotransplant Senior Kidney Transplant Program: A SingleCenter Experience. Transplantation 2011, 92, 210–216. [CrossRef] [PubMed]
12. Rao, P.S.; Merion, R.M.; Ashby, V.B.; Port, F.K.; Wolfe, R.A.; Kayler, L.K. Renal Transplantation in Elderly Patients Older Than 70 Yearsof Age: Results From the Scientific Registry of Transplant Recipients. Transplantation 2007, 83, 1069–1074. [CrossRef] [PubMed]
13. European Commission. Statistical Office of the European Union. Ageing Europe: Looking at the Lives of Older People in the EU:2019 Edition. [Internet]. LU: Publications Office. 2019. Available online: https://data.europa.eu/doi/10.2785/811048 (accessedon 22 May 2021).
14. Parekh, J.; Bostrom, A.; Feng, S. Diabetes Mellitus: A Risk Factor for Delayed Graft Function after Deceased Donor KidneyTransplantation. Arab. Archaeol. Epigr. 2010, 10, 298–303. [CrossRef] [PubMed]
15. Wu, W.K.; Famure, O.; Li, Y.; Kim, S.J. Delayed graft function and the risk of acute rejection in the modern era of kidneytransplan-tation. Kidney Int. 2015, 88, 851–858. [CrossRef] [PubMed]
16. Weber, S.; Dienemann, T.; Jacobi, J.; Eckardt, K.-U.; Weidemann, A. Delayed graft function is associated with an increased rate ofrenal allograft rejection: A retrospective single center analysis. PLoS ONE 2018, 13, e0199445. [CrossRef]
17. Nogueira, J.M.; Haririan, A.; Jacobs, S.C.; Cooper, M.; Weir, M.R. Cigarette Smoking, Kidney Function, and Mortality After LiveDonor Kidney Transplant. Am. J. Kidney Dis. 2010, 55, 907–915. [CrossRef] [PubMed]
18. Giessing, M.; Fuller, T.F.; Friedersdorff, F.; Deger, S.; Wille, A.; Neumayer, H.-H.; Schmidt, D.; Budde, K.; Liefeldt, L. Outcomes ofTransplanting Deceased-Donor Kidneys between Elderly Donors and Recipients. J. Am. Soc. Nephrol. 2009, 20, 37–40. [CrossRef] [PubMed]
137

Journal of
Clinical Medicine
Article
The Relationship between Initial Tacrolimus Metabolism Rateand Recipients Body Composition in Kidney Transplantation
Aureliusz Kolonko *, Patrycja Pokora, Natalia Słabiak-Błaz , Beata Czerwienska, Henryk Karkoszka, Piotr Kuczera,
Grzegorz Piecha and Andrzej Wiecek
Citation: Kolonko, A.; Pokora, P.;
Słabiak-Błaz, N.; Czerwienska, B.;
Karkoszka, H.; Kuczera, P.; Piecha, G.;
Wiecek, A. The Relationship between
Initial Tacrolimus Metabolism Rate
and Recipients Body Composition in
Kidney Transplantation. J. Clin. Med.
2021, 10, 5793. https://doi.org/
10.3390/jcm10245793
Academic Editor:
Wisit Cheungpasitporn
Received: 20 October 2021
Accepted: 9 December 2021
Published: 10 December 2021
Publisher’s Note: MDPI stays neutral
with regard to jurisdictional claims in
published maps and institutional affil-
iations.
Copyright: © 2021 by the authors.
Licensee MDPI, Basel, Switzerland.
This article is an open access article
distributed under the terms and
conditions of the Creative Commons
Attribution (CC BY) license (https://
creativecommons.org/licenses/by/
4.0/).
Department of Nephrology, Transplantation and Internal Medicine, Medical University of Silesia,Francuska 20/24, 40-027 Katowice, Poland; [email protected] (P.P.); [email protected] (N.S.-B.);[email protected] (B.C.); [email protected] (H.K.); [email protected] (P.K.);[email protected] (G.P.); [email protected] (A.W.)* Correspondence: [email protected]; Tel.: +48-322591429
Abstract: There are several premises that the body composition of kidney transplant recipientsmay play a role in tacrolimus metabolism early after transplantation. The present study aimed atanalyzing the relationship between the body composition parameters assessed by bioimpedanceanalysis (BIA) and initial tacrolimus metabolism. Immediately prior to transplantation, BIA usingInBody 770 device was performed in 122 subjects. Tacrolimus concentration-to-dose (C/D) ratiowas calculated based on the first blood trough level measurement. There was no difference in phaseangle, visceral fat area, lean body mass index (LBMI) and the proportion of lean mass as a percentageof total body mass between the subgroups of slow and fast metabolizers. However, subjects withLBMI ≥ median value of 18.7 kg/m2, despite similar initial tacrolimus dose per kg of body weight,were characterized by a significantly lower tacrolimus C/D ratio (median 1.39 vs. 1.67, respectively;p < 0.05) in comparison with the subgroup of lower LBMI. Multivariate regression analysis confirmedthat age (rpartial = 0.322; p < 0.001) and LBMI (rpartial = −0.254; p < 0.01) independently influenced thetacrolimus C/D ratio. A LBMI assessed by BIA may influence the tacrolimus metabolism in the earlypost-transplant period and can be a useful in the optimization of initial tacrolimus dosing.
Keywords: bioimpedance analysis; drug dosing; lean body mass index; pharmacokinetics; tacrolimusC/D ratio
1. Introduction
Nowadays, the calcineurin inhibitor tacrolimus is the primary therapeutic optionfor patients after kidney transplantation. However, due to its substantial intra- and inter-patient variability in metabolism rate the accurate dosing is still challenging [1–3]. More-over, many external factors also influence the tacrolimus blood trough level, makingthe frequent drug therapeutic monitoring mandatory [4–6]. As an inappropriately highor low tacrolimus level in the early post-transplant period can result in delayed graftfunction, acute rejection, diabetes mellitus, serious infections or even thrombotic microan-giopathy [7–9], the precise initial dose tailoring is especially important to achieve the firstpost-transplant tacrolimus trough level within the therapeutic range, i.e., 5–15 ng/mL [10].
To date, several different approaches were proposed in order to optimize the initialtacrolimus dosing, including clinical factors and CYP3A5 genotyping [11–13] as well ascomputerized dose individualization [14], however not all were successfully validatedbased on the independent cohort [15]. Taking into account that older and overweightrecipients are more prone to develop supratherapeutic first tacrolimus blood levels post-transplant [4,5,16], one could expect that the baseline proportion of fat and lean massof the recipient may play a role in the post-transplant tacrolimus metabolism [17] andtherefore may be another parameter to take into account in the sophisticated process ofpre-transplant tacrolimus initial dose calculation. Interestingly, Han et al. reported higher
J. Clin. Med. 2021, 10, 5793. https://doi.org/10.3390/jcm10245793 https://www.mdpi.com/journal/jcm139
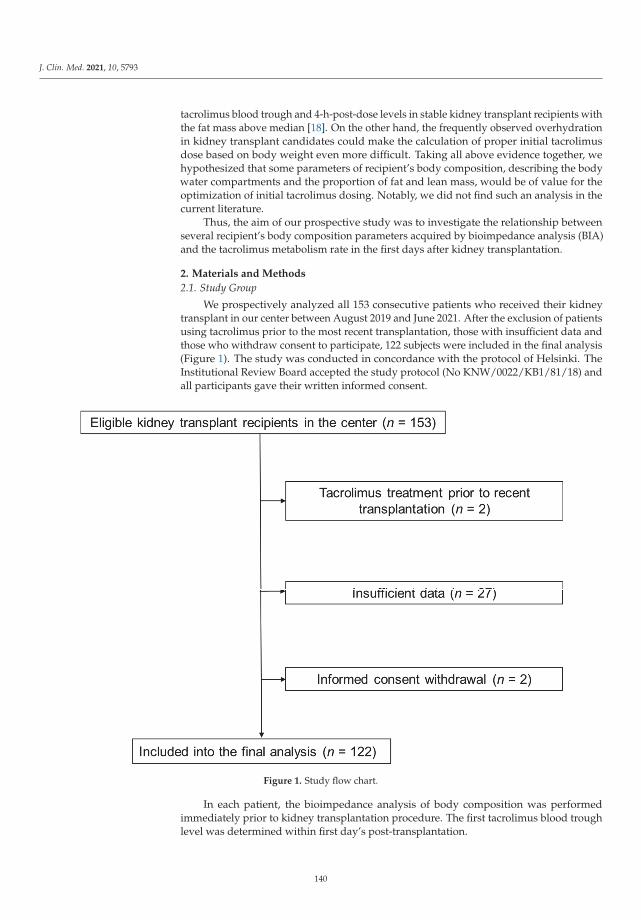
J. Clin. Med. 2021, 10, 5793
tacrolimus blood trough and 4-h-post-dose levels in stable kidney transplant recipients withthe fat mass above median [18]. On the other hand, the frequently observed overhydrationin kidney transplant candidates could make the calculation of proper initial tacrolimusdose based on body weight even more difficult. Taking all above evidence together, wehypothesized that some parameters of recipient’s body composition, describing the bodywater compartments and the proportion of fat and lean mass, would be of value for theoptimization of initial tacrolimus dosing. Notably, we did not find such an analysis in thecurrent literature.
Thus, the aim of our prospective study was to investigate the relationship betweenseveral recipient’s body composition parameters acquired by bioimpedance analysis (BIA)and the tacrolimus metabolism rate in the first days after kidney transplantation.
2. Materials and Methods
2.1. Study Group
We prospectively analyzed all 153 consecutive patients who received their kidneytransplant in our center between August 2019 and June 2021. After the exclusion of patientsusing tacrolimus prior to the most recent transplantation, those with insufficient data andthose who withdraw consent to participate, 122 subjects were included in the final analysis(Figure 1). The study was conducted in concordance with the protocol of Helsinki. TheInstitutional Review Board accepted the study protocol (No KNW/0022/KB1/81/18) andall participants gave their written informed consent.
Figure 1. Study flow chart.
In each patient, the bioimpedance analysis of body composition was performedimmediately prior to kidney transplantation procedure. The first tacrolimus blood troughlevel was determined within first day’s post-transplantation.
140
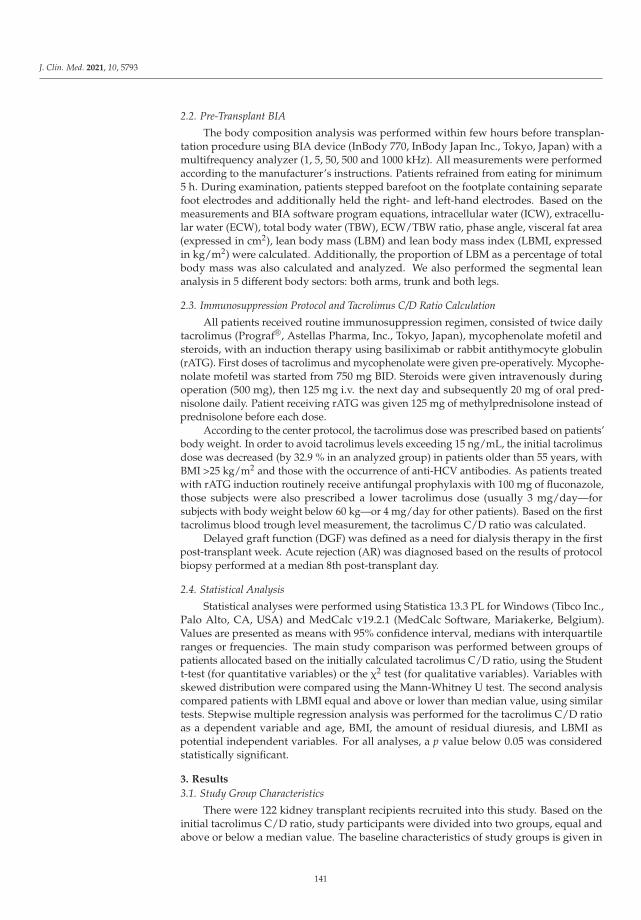
J. Clin. Med. 2021, 10, 5793
2.2. Pre-Transplant BIA
The body composition analysis was performed within few hours before transplan-tation procedure using BIA device (InBody 770, InBody Japan Inc., Tokyo, Japan) with amultifrequency analyzer (1, 5, 50, 500 and 1000 kHz). All measurements were performedaccording to the manufacturer’s instructions. Patients refrained from eating for minimum5 h. During examination, patients stepped barefoot on the footplate containing separatefoot electrodes and additionally held the right- and left-hand electrodes. Based on themeasurements and BIA software program equations, intracellular water (ICW), extracellu-lar water (ECW), total body water (TBW), ECW/TBW ratio, phase angle, visceral fat area(expressed in cm2), lean body mass (LBM) and lean body mass index (LBMI, expressedin kg/m2) were calculated. Additionally, the proportion of LBM as a percentage of totalbody mass was also calculated and analyzed. We also performed the segmental leananalysis in 5 different body sectors: both arms, trunk and both legs.
2.3. Immunosuppression Protocol and Tacrolimus C/D Ratio Calculation
All patients received routine immunosuppression regimen, consisted of twice dailytacrolimus (Prograf®, Astellas Pharma, Inc., Tokyo, Japan), mycophenolate mofetil andsteroids, with an induction therapy using basiliximab or rabbit antithymocyte globulin(rATG). First doses of tacrolimus and mycophenolate were given pre-operatively. Mycophe-nolate mofetil was started from 750 mg BID. Steroids were given intravenously duringoperation (500 mg), then 125 mg i.v. the next day and subsequently 20 mg of oral pred-nisolone daily. Patient receiving rATG was given 125 mg of methylprednisolone instead ofprednisolone before each dose.
According to the center protocol, the tacrolimus dose was prescribed based on patients’body weight. In order to avoid tacrolimus levels exceeding 15 ng/mL, the initial tacrolimusdose was decreased (by 32.9 % in an analyzed group) in patients older than 55 years, withBMI >25 kg/m2 and those with the occurrence of anti-HCV antibodies. As patients treatedwith rATG induction routinely receive antifungal prophylaxis with 100 mg of fluconazole,those subjects were also prescribed a lower tacrolimus dose (usually 3 mg/day—forsubjects with body weight below 60 kg—or 4 mg/day for other patients). Based on the firsttacrolimus blood trough level measurement, the tacrolimus C/D ratio was calculated.
Delayed graft function (DGF) was defined as a need for dialysis therapy in the firstpost-transplant week. Acute rejection (AR) was diagnosed based on the results of protocolbiopsy performed at a median 8th post-transplant day.
2.4. Statistical Analysis
Statistical analyses were performed using Statistica 13.3 PL for Windows (Tibco Inc.,Palo Alto, CA, USA) and MedCalc v19.2.1 (MedCalc Software, Mariakerke, Belgium).Values are presented as means with 95% confidence interval, medians with interquartileranges or frequencies. The main study comparison was performed between groups ofpatients allocated based on the initially calculated tacrolimus C/D ratio, using the Studentt-test (for quantitative variables) or the χ2 test (for qualitative variables). Variables withskewed distribution were compared using the Mann-Whitney U test. The second analysiscompared patients with LBMI equal and above or lower than median value, using similartests. Stepwise multiple regression analysis was performed for the tacrolimus C/D ratioas a dependent variable and age, BMI, the amount of residual diuresis, and LBMI aspotential independent variables. For all analyses, a p value below 0.05 was consideredstatistically significant.
3. Results
3.1. Study Group Characteristics
There were 122 kidney transplant recipients recruited into this study. Based on theinitial tacrolimus C/D ratio, study participants were divided into two groups, equal andabove or below a median value. The baseline characteristics of study groups is given in
141
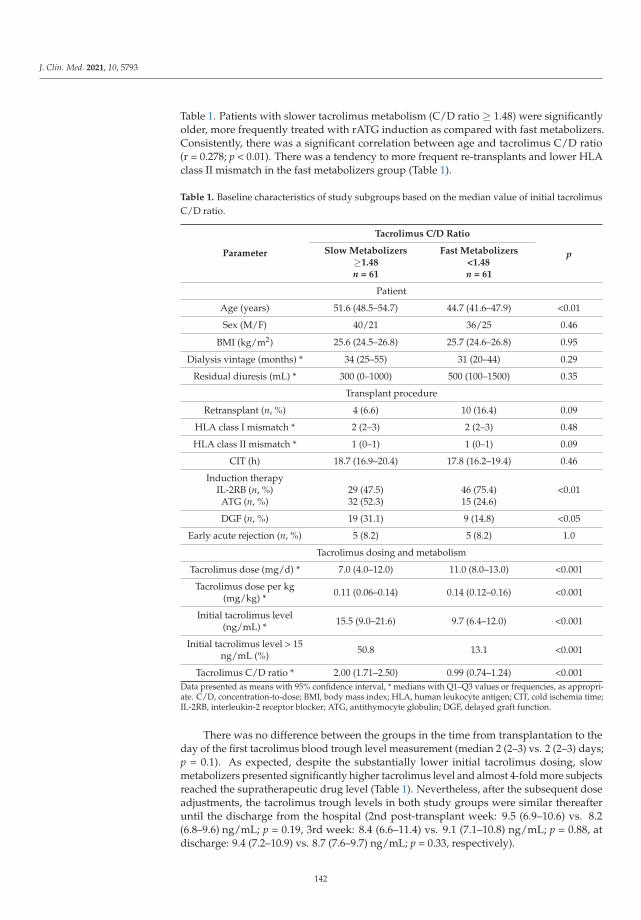
J. Clin. Med. 2021, 10, 5793
Table 1. Patients with slower tacrolimus metabolism (C/D ratio ≥ 1.48) were significantlyolder, more frequently treated with rATG induction as compared with fast metabolizers.Consistently, there was a significant correlation between age and tacrolimus C/D ratio(r = 0.278; p < 0.01). There was a tendency to more frequent re-transplants and lower HLAclass II mismatch in the fast metabolizers group (Table 1).
Table 1. Baseline characteristics of study subgroups based on the median value of initial tacrolimusC/D ratio.
Parameter
Tacrolimus C/D Ratio
pSlow Metabolizers≥1.48n = 61
Fast Metabolizers<1.48n = 61
Patient
Age (years) 51.6 (48.5–54.7) 44.7 (41.6–47.9) <0.01
Sex (M/F) 40/21 36/25 0.46
BMI (kg/m2) 25.6 (24.5–26.8) 25.7 (24.6–26.8) 0.95
Dialysis vintage (months) * 34 (25–55) 31 (20–44) 0.29
Residual diuresis (mL) * 300 (0–1000) 500 (100–1500) 0.35
Transplant procedure
Retransplant (n, %) 4 (6.6) 10 (16.4) 0.09
HLA class I mismatch * 2 (2–3) 2 (2–3) 0.48
HLA class II mismatch * 1 (0–1) 1 (0–1) 0.09
CIT (h) 18.7 (16.9–20.4) 17.8 (16.2–19.4) 0.46
Induction therapyIL-2RB (n, %) 29 (47.5) 46 (75.4) <0.01ATG (n, %) 32 (52.3) 15 (24.6)
DGF (n, %) 19 (31.1) 9 (14.8) <0.05
Early acute rejection (n, %) 5 (8.2) 5 (8.2) 1.0
Tacrolimus dosing and metabolism
Tacrolimus dose (mg/d) * 7.0 (4.0–12.0) 11.0 (8.0–13.0) <0.001
Tacrolimus dose per kg(mg/kg) * 0.11 (0.06–0.14) 0.14 (0.12–0.16) <0.001
Initial tacrolimus level(ng/mL) * 15.5 (9.0–21.6) 9.7 (6.4–12.0) <0.001
Initial tacrolimus level > 15ng/mL (%) 50.8 13.1 <0.001
Tacrolimus C/D ratio * 2.00 (1.71–2.50) 0.99 (0.74–1.24) <0.001Data presented as means with 95% confidence interval, * medians with Q1–Q3 values or frequencies, as appropri-ate. C/D, concentration-to-dose; BMI, body mass index; HLA, human leukocyte antigen; CIT, cold ischemia time;IL-2RB, interleukin-2 receptor blocker; ATG, antithymocyte globulin; DGF, delayed graft function.
There was no difference between the groups in the time from transplantation to theday of the first tacrolimus blood trough level measurement (median 2 (2–3) vs. 2 (2–3) days;p = 0.1). As expected, despite the substantially lower initial tacrolimus dosing, slowmetabolizers presented significantly higher tacrolimus level and almost 4-fold more subjectsreached the supratherapeutic drug level (Table 1). Nevertheless, after the subsequent doseadjustments, the tacrolimus trough levels in both study groups were similar thereafteruntil the discharge from the hospital (2nd post-transplant week: 9.5 (6.9–10.6) vs. 8.2(6.8–9.6) ng/mL; p = 0.19, 3rd week: 8.4 (6.6–11.4) vs. 9.1 (7.1–10.8) ng/mL; p = 0.88, atdischarge: 9.4 (7.2–10.9) vs. 8.7 (7.6–9.7) ng/mL; p = 0.33, respectively).
142
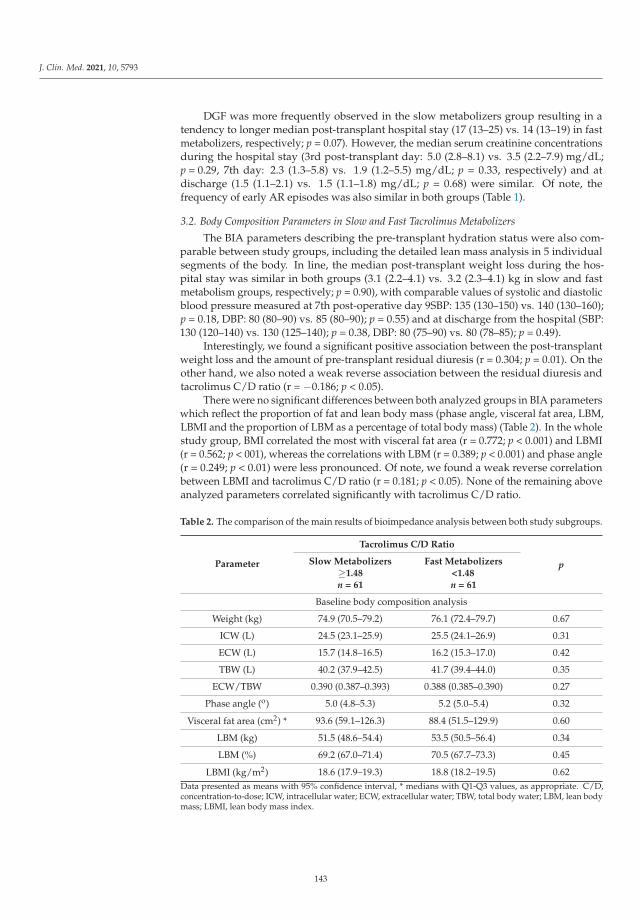
J. Clin. Med. 2021, 10, 5793
DGF was more frequently observed in the slow metabolizers group resulting in atendency to longer median post-transplant hospital stay (17 (13–25) vs. 14 (13–19) in fastmetabolizers, respectively; p = 0.07). However, the median serum creatinine concentrationsduring the hospital stay (3rd post-transplant day: 5.0 (2.8–8.1) vs. 3.5 (2.2–7.9) mg/dL;p = 0.29, 7th day: 2.3 (1.3–5.8) vs. 1.9 (1.2–5.5) mg/dL; p = 0.33, respectively) and atdischarge (1.5 (1.1–2.1) vs. 1.5 (1.1–1.8) mg/dL; p = 0.68) were similar. Of note, thefrequency of early AR episodes was also similar in both groups (Table 1).
3.2. Body Composition Parameters in Slow and Fast Tacrolimus Metabolizers
The BIA parameters describing the pre-transplant hydration status were also com-parable between study groups, including the detailed lean mass analysis in 5 individualsegments of the body. In line, the median post-transplant weight loss during the hos-pital stay was similar in both groups (3.1 (2.2–4.1) vs. 3.2 (2.3–4.1) kg in slow and fastmetabolism groups, respectively; p = 0.90), with comparable values of systolic and diastolicblood pressure measured at 7th post-operative day 9SBP: 135 (130–150) vs. 140 (130–160);p = 0.18, DBP: 80 (80–90) vs. 85 (80–90); p = 0.55) and at discharge from the hospital (SBP:130 (120–140) vs. 130 (125–140); p = 0.38, DBP: 80 (75–90) vs. 80 (78–85); p = 0.49).
Interestingly, we found a significant positive association between the post-transplantweight loss and the amount of pre-transplant residual diuresis (r = 0.304; p = 0.01). On theother hand, we also noted a weak reverse association between the residual diuresis andtacrolimus C/D ratio (r = −0.186; p < 0.05).
There were no significant differences between both analyzed groups in BIA parameterswhich reflect the proportion of fat and lean body mass (phase angle, visceral fat area, LBM,LBMI and the proportion of LBM as a percentage of total body mass) (Table 2). In the wholestudy group, BMI correlated the most with visceral fat area (r = 0.772; p < 0.001) and LBMI(r = 0.562; p < 001), whereas the correlations with LBM (r = 0.389; p < 0.001) and phase angle(r = 0.249; p < 0.01) were less pronounced. Of note, we found a weak reverse correlationbetween LBMI and tacrolimus C/D ratio (r = 0.181; p < 0.05). None of the remaining aboveanalyzed parameters correlated significantly with tacrolimus C/D ratio.
Table 2. The comparison of the main results of bioimpedance analysis between both study subgroups.
Parameter
Tacrolimus C/D Ratio
pSlow Metabolizers≥1.48n = 61
Fast Metabolizers<1.48n = 61
Baseline body composition analysis
Weight (kg) 74.9 (70.5–79.2) 76.1 (72.4–79.7) 0.67
ICW (L) 24.5 (23.1–25.9) 25.5 (24.1–26.9) 0.31
ECW (L) 15.7 (14.8–16.5) 16.2 (15.3–17.0) 0.42
TBW (L) 40.2 (37.9–42.5) 41.7 (39.4–44.0) 0.35
ECW/TBW 0.390 (0.387–0.393) 0.388 (0.385–0.390) 0.27
Phase angle (o) 5.0 (4.8–5.3) 5.2 (5.0–5.4) 0.32
Visceral fat area (cm2) * 93.6 (59.1–126.3) 88.4 (51.5–129.9) 0.60
LBM (kg) 51.5 (48.6–54.4) 53.5 (50.5–56.4) 0.34
LBM (%) 69.2 (67.0–71.4) 70.5 (67.7–73.3) 0.45
LBMI (kg/m2) 18.6 (17.9–19.3) 18.8 (18.2–19.5) 0.62Data presented as means with 95% confidence interval, * medians with Q1-Q3 values, as appropriate. C/D,concentration-to-dose; ICW, intracellular water; ECW, extracellular water; TBW, total body water; LBM, lean bodymass; LBMI, lean body mass index.
143
J. Clin. Med. 2021, 10, 5793
3.3. Body Composition Parameters in Groups Depending on the LBMI
In additional analysis, in which all study patients were assigned into two groupsbased on the value of BIA-derived LBMI equal and above or lower than median value,both groups were comparable in recipient age (49.0 (45.8–52.2) vs. 47.4 (44.1–50.8) years,respectively; p = 0.50), but the subjects with LBMI ≥ 18.7 kg/m2 had significantly greaterBMI (27.4 (26.5–28.4) vs. 23.7 (22.6–24.8) kg/m2; p < 0.001) and residual diuresis (median600 (250–1500) vs. 175 (0–1000) mL; p < 0.01) than subjects with LBMI below medianvalue. They also presented significantly greater phase angle (5.4 (4.8–5.9) vs. 4.7 (4.2–5.3);p < 0.001), greater percentage of pre-transplant hydration measured in 5 different bodycompartments and greater median body weight reduction during the first post-transplanthospitalization (5.3 (2.8–6.3) vs. 1.9 (0.5–3.3) kg; p < 0.001).
At baseline, there were no differences in dialysis vintage, CIT, ECW/TBW, and visceralfat area between those groups. However, despite similar initial tacrolimus dose per kgof body weight (median 0.13 (0.09–0.15) vs. 0.14 (0.07–0.15) mg/kg/day; p = 0.94), thegroup of patients with LBMI ≥ 18.7 kg/m2 had a significantly lower tacrolimus C/Dratio (median 1.39 (0.94–1.79) vs. 1.67 (1.00–2.28), respectively; p < 0.05) in comparisonwith the other group. As a consequence, regardless of the significantly higher initialtacrolimus dosing in subjects with the LBMI ≥ 18.7 kg/m2 (median 12.0 (7.0–13.0) vs. 8.0(4.0–10.0) mg/day; p < 0.001), the first tacrolimus blood trough level was similar in bothgroups (median 11.8 (7.8–18.5) vs. 10.4 (7.4–15.8) ng/mL, respectively; p = 0.32). Multipleregression analysis revealed that age (rpartial = 0.322; p < 0.001) and LBMI (rpartial = −0.254;p < 0.01) independently influence the tacrolimus C/D ratio.
4. Discussion
To our best knowledge, this is the first study which analyze the association be-tween various parameters of body composition and the early post-transplant tacrolimusmetabolism in kidney transplant patients. Hereby, we showed the independent associationbetween the lean body mass index, calculated based on the bioimpedance measurementand the first post-transplant C/D ratio. This finding is of potential importance as it maybe useful for the more precise tacrolimus dose determination immediately prior to kidneytransplantation.
It is worth to noticing that tacrolimus C/D ratio calculated at 3-month or 6-monthpost-transplant time-point was previously shown to be a risk factor for significantly worsepatient survival, worse kidney graft function and survival, higher rejection rate and thedevelopment of calcineurin inhibitor nephrotoxicity and BK nephropathy [19–21]. Of note,in our study we used tacrolimus C/D ratio calculated in the first day’s post-transplant asa surrogate marker for tacrolimus metabolism. Interestingly, some metabolic differencesdefined based on C/D ratio were noted between LCP-tacrolimus and immediate-releasetacrolimus during the early post-transplant period [22], however in our study all subjectswere treated with an immediate-release drug formulation.
Recently, an increasing interest is observed in the literature in the role of bodycomposition-based pharmacokinetic analyses in an effort to reduce severe drug toxicity.Particularly sarcopenia and body composition in cancer is being studied extensively, result-ing in the emergence of body composition-tailored drug administration schemes [23]. As itwas shown that dose per kilogram of LBM of the carboplatin was a significant predictor ofsevere hematologic toxicity, taking body composition into account was proposed for doseindividualization of chemotherapeutic agents [24]. In line, computed tomography-derivedbody composition parameters were correlated with toxicity, dose reduction and terminationof the treatment in patients with diffuse lymphoma receiving immunochemotherapy [25].Moreover, based on cancer research, body composition-based dosing regimens were alsoproposed for quinolones [26] and anti-tumor necrosis factor medications [27].
In our transplant center, based on clinical observations and previous reports, westarted to reduce the initial tacrolimus dose from 0.2 to 0.1–0.15 mg/kg/day in older andoverweight/obese patients since 2011. However, as we summarized our experience, we
144

J. Clin. Med. 2021, 10, 5793
found that such a policy did not decrease the percentage of subjects with supratherapeuticfirst tacrolimus level substantially [28]. The present study protocol was designed to findpotential parameters, which may be obtained prior to transplantation procedure and mayhelp in the optimization of the initial tacrolimus dose. Finally, we confirmed that thebioimpedance body composition analysis of the potential kidney transplant candidatemight be useful in such a dose tailoring, as the LBMI was found to be associated withthe first post-transplant tacrolimus level independently of age and BMI. In line, of allanthropometric variables tested, a stepwise multiple regression analysis revealed thatLBM was the only determinant of antipyrine clearance in apparently healthy subjects [29].Moreover, LBM was found to best describe the average reported relationship betweendrug clearance and TBW in literature meta-analysis [30]. Interestingly, in chronic dialysispatients treated with vancomycin, the drug volume of distribution correlated best withLBM [31]. It was also shown in peritoneal dialysis patients that bioimpedance analysis canbe used to estimate TBW and LBM with a correlation coefficient of 0.87 and 0.93, whenusing Deurenberg’s formula [32].
Among the study limitations it should be noticed that the bioimpedance measurementswere performed around the clock, when the potential recipients of a kidney from deceaseddonors were arriving to the transplant center. However, they abstained from eatingfor a minimum of 5–6 h prior to the examination, as they were aware of the plannedtransplantation and the pre-transplant dialysis session was performed. Another limitationis the lack of CYP3A5 genotyping in our patients. However, Polish Caucasian populationis rather homogenic, with the vast majority of subjects (approximately 90%) being slowcalcineurin inhibitor metabolizers [33]. Moreover, to date, CYP3A5 genotyping is neitherrecommended nor routinely performed prior to transplantation; thus, it cannot be used forinitial tacrolimus dose calculation in daily clinical practice. Furthermore, according to somereports, the optimization of initial tacrolimus dose using pharmacogenetics testing waspoorly predictive of tacrolimus clearance and did not improve clinical outcomes [15,34,35].
5. Conclusions
To conclude, in our present study we found the independent influence of LBMI onthe very early tacrolimus C/D ratio post kidney transplantation. Thus, one could expectthat based on this immediately assessed, non-invasive body composition parameter it willbe possible to more precisely adjust the initial tacrolimus dose in order to minimize itspotential toxicity. However, the clinical utility of this novel covariate for the optimizationof tacrolimus dosing is still to be proven and needs the prospective validation in therandomized study.
Author Contributions: Conceptualization, A.K.; methodology, A.K.; formal analysis, A.K.; investi-gation, A.K., P.P., N.S.-B., B.C., H.K., P.K., G.P.; writing—original draft preparation, A.K.; writing—review and editing, G.P., N.S.-B., P.K, A.W.; supervision, A.K. and A.W. All authors have read andagreed to the published version of the manuscript.
Funding: This work was supported by a grant from Medical University of Silesia No PCN-1-021-N/0/K.
Institutional Review Board Statement: The Institutional Review Board accepted the study protocol(No KNW/0022/KB1/81/18).
Informed Consent Statement: All study participants gave their written informed consent.
Data Availability Statement: The datasets generated and/or analyzed during the current study arenot publicly available due to limitations of ethical approval involving the patient data and anonymitybut are available from the corresponding author on reasonable request.
Conflicts of Interest: The authors declare no conflict of interest.
145
J. Clin. Med. 2021, 10, 5793
References
1. Bentata, Y. Tacrolimus: 20 years of use in adult kidney transplantation. What we should know about its nephrotoxicity. Artif.Organs. 2020, 44, 140–152. [CrossRef] [PubMed]
2. Saint-Marcoux, F.; Woillard, J.B.; Jurado, C.; Marquet, P. Lessons from routine dose adjustment of tacrolimus in renal transplantpatients based on global exposure. Ther. Drug Monit. 2013, 35, 322–327. [CrossRef] [PubMed]
3. Staatz, C.E.; Tett, S.E. Clinical pharmacokinetics and pharmacodynamics of tacrolimus in solid organ transplantation. Clin.Pharmacokinet. 2004, 43, 623–653. [CrossRef] [PubMed]
4. Stratta, P.; Quaglia, M.; Cena, T.; Antoniotti, R.; Fenoglio, R.; Menegotto, A.; Ferrante, D.; Genazzani, A.; Terrazzino, S.; Magnani,C. The interactions of age, sex, body mass index, genetics, and steroid weight-based doses on tacrolimus dosing requirement afteradult kidney transplantation. Eur. J. Clin. Pharmacol. 2012, 68, 671–680. [CrossRef] [PubMed]
5. Krzyzowska, K.; Kolonko, A.; Giza, P.; Chudek, J.; Wiecek, A. Which Kidney Transplant Recipients Can Benefit from the InitialTacrolimus Dose Reduction? Biomed Res. Int. 2018, 30, 4573452. [CrossRef]
6. Vavic, N.; Rancic, N.; Dragojevic-Simic, V.; Draskovic-Pavlovic, B.; Bokonjic, D.; Ignjatovic, L.; Mikov, M. The influence ofcomedication on tacrolimus blood concentration in patients subjected to kidney transplantation: A retrospective study. Eur. J.Drug Metab. Pharmacokinet. 2014, 39, 243–253. [CrossRef]
7. Ro, H.; Jeong, J.C.; Kong, J.M.; Min, J.W.; Park, S.K.; Lee, J.; Koo, T.Y.; Yang, J.; Kim, M.S.; Hwang, S.; et al. The tacrolimusmetabolism affect post-transplant outcome mediating acute rejection and delayed graft function: Analysis from Korean OrganTransplantation Registry data. Transpl. Int. 2021, 34, 163–174. [CrossRef] [PubMed]
8. Rodrigo, E.; de Cos, M.A.; Fernández-Fresnedo, G.; Sánchez, B.; Ruiz, J.C.; Piñera, C.; Palomar, R.; Cotorruelo, J.G.; Gómez-Alamillo, C.; de Castro, S.S.; et al. Higher initial tacrolimus blood levels and concentration-dose ratios in kidney transplantrecipients who develop diabetes mellitus. Transpl. Proc. 2005, 37, 3819–3820. [CrossRef]
9. Saito, M.; Satoh, S.; Kagaya, H.; Tsuruta, H.; Obara, T.; Kumazawa, T.; Inoue, T.; Inoue, K.; Miura, M.; Yuasa, T.; et al. Thromboticmicroangiopathy developing in early stage after renal transplantation with a high trough level of tacrolimus. Clin. Exp. Nephrol.2008, 12, 312–315. [CrossRef]
10. Schiff, J.; Cole, E.; Cantarovich, M. Therapeutic monitoring of calcineurin inhibitors for the nephrologist. Clin. J. Am. Soc. Nephrol.2007, 2, 374–384. [CrossRef] [PubMed]
11. Wang, P.; Mao, Y.; Razo, J.; Zhou, X.; Wong, S.T.; Patel, S.; Elliott, E.; Shea, E.; Wu, A.H.; Gaber, A.O. Using genetic and clinicalfactors to predict tacrolimus dose in renal transplant recipients. Pharmacogenomics 2010, 11, 1389–1402. [CrossRef]
12. Passey, C.; Birnbaum, A.K.; Brundage, R.C.; Oetting, W.S.; Israni, A.K.; Jacobson, P.A. Dosing equation for tacrolimus usinggenetic variants and clinical factors. Br. J. Clin. Pharmacol. 2011, 72, 948–957. [CrossRef] [PubMed]
13. Åsberg, A.; Midtvedt, K.; van Guilder, M.; Størset, E.; Bremer, S.; Bergan, S.; Jelliffe, R.; Hartmann, A.; Neely, M.N. Inclusion ofCYP3A5 genotyping in a nonparametric population model improves dosing of tacrolimus early after transplantation. Transpl. Int.2013, 26, 1198–1207. [CrossRef]
14. Størset, E.; Åsberg, A.; Skauby, M.; Neely, M.; Bergan, S.; Bremer, S.; Midtvedt, K. Improved Tacrolimus Target ConcentrationAchievement Using Computerized Dosing in Renal Transplant Recipients—A Prospective, Randomized Study. Transplantation2015, 99, 2158–2166. [CrossRef] [PubMed]
15. Boughton, O.; Borgulya, G.; Cecconi, M.; Fredericks, S.; Moreton-Clack, M.; MacPhee, I.A. A published pharmacogeneticalgorithm was poorly predictive of tacrolimus clearance in an independent cohort of renal transplant recipients. Br. J. Clin.Pharmacol. 2013, 76, 425–431. [CrossRef] [PubMed]
16. Rodrigo, E.; de Cos, M.A.; Sánchez, B.; Ruiz, J.C.; Piñera, C.; Fernández-Fresnedo, G.; Palomar, R.; Pérez-Ceballos, M.A.;Cotorruelo, J.G.; Zubimendi, J.A.; et al. High initial blood levels of tacrolimus in overweight renal transplant recipients. Transpl.Proc. 2005, 37, 1453–1454. [CrossRef] [PubMed]
17. St-Onge, M.-P.; Gallagher, D. Body composition changes with aging: The cause or the result of alterations in metabolic rate andmacronutrient oxidation? Nutrition 2010, 26, 152–155. [CrossRef] [PubMed]
18. Han, S.S.; Kim, D.H.; Lee, S.M.; Han, N.Y.; Oh, J.M.; Ha, J.; Kim, Y.S. Pharmacokinetics of tacrolimus according to bodycomposition in recipients of kidney transplants. Kidney Res. Clin. Pract. 2012, 31, 157–162. [CrossRef] [PubMed]
19. Tholking, G.; Fortmann, C.; Koch, R.; Gerth, H.U.; Pabst, D.; Pavenstadt, H.; Kabar, I.; Husing, A.; Wolters, H.; Reuter, S.; et al.The tacrolimus metabolism rate influences renal function after kidney transplantation. PLoS ONE 2014, 9, e111128. [CrossRef][PubMed]
20. Nowicka, M.; Górska, M.; Nowicka, Z.; Edyko, K.; Edyko, P.; Wislicki, S.; Zawiasa-Bryszewska, A.; Strzelczyk, J.; Matych, J.;Kurnatowska, I. Tacrolimus: Influcnce of the posttransplant concentration/dose ratio on kidney graft function in a two-yearfollow-up. Kidney Blood Press Res. 2019, 44, 1075–1088. [CrossRef]
21. Schutte-Nutgen, K.; Tholking, G.; Steinke, J.; Pavenstadt, H.; Schmidt, R.; Suwelack, B.; Reuter, S. Fast Tac metabolizers at risk—Itis time for a C/D ratio calculation. J. Clin. Med. 2019, 8, 587. [CrossRef] [PubMed]
22. Suwelack, B.; Bunnapradist, S.; Meier-Kriesche, U.; Stevens, D.R.; Procaccianti, C.; Morganti, R.; Budde, K. Effect of concentra-tion/dose ratio in de novo kidney transplant recipients receiving LCP-tacrolimus or immediate-release tacrolimus: Post hocanalysis of a phase 3 clinical trial. Ann. Transpl. 2020, 25, e923278. [CrossRef] [PubMed]
146
J. Clin. Med. 2021, 10, 5793
23. Hilmi, M.; Jouinot, A.; Burns, R.; Pigneur, F.; Mounier, R.; Gondin, J.; Neuzillet, C.; Goldwasser, F. Body composition andsarcopenia: The next-generation of personalized oncology and pharmacology? Pharmacol. Ther. 2019, 196, 135–159. [CrossRef][PubMed]
24. Sjøblom, B.; Benth, J.Š.; Grønberg, B.H.; Baracos, V.E.; Sawyer, M.B.; Fløtten, Ø.; Hjermstad, M.J.; Aass, N.; Jordhøy, M. DrugDose Per Kilogram Lean Body Mass Predicts Hematologic Toxicity from Carboplatin-Doublet Chemotherapy in AdvancedNon-Small-Cell Lung Cancer. Clin. Lung Cancer. 2017, 18, e129–e136. [CrossRef] [PubMed]
25. Guo, J.; Cai, P.; Li, P.; Cao, C.; Zhou, J.; Dong, L.; Yang, Y.; Xuan, Q.; Wang, J.; Zhang, Q. Body Composition as a Predictor ofToxicity and Prognosis in Patients with Diffuse Large B-Cell Lymphoma Receiving R-CHOP Immunochemotherapy. Curr. Oncol.2021, 23, 1325–1337. [CrossRef] [PubMed]
26. Jiao, Y.; Kim, T.H.; Tao, X.; Kinzig, M.; Landersdorfer, C.B.; Drescher, S.K.; Sutaria, D.S.; Moya, B.; Holzgrabe, U.; Sörgel, F.; et al.First population pharmacokinetic analysis showing increased quinolone metabolite formation and clearance in patients withcystic fibrosis compared to healthy volunteers. Eur. J. Pharm. Sci. 2018, 123, 416–428. [CrossRef]
27. Ding, N.S.; Malietzis, G.; Lung, P.F.C.; Penez, L.; Yip, W.M.; Gabe, S.; Jenkins, J.T.; Hart, A. The body composition profileis associated with response to anti-TNF therapy in Crohn’s disease and may offer an alternative dosing paradigm. Aliment.Pharmacol. Ther. 2017, 46, 883–891. [CrossRef] [PubMed]
28. Krzyzowska, K.; Kolonko, A.; Giza, P.; Chudek, J.; Wiecek, A. No Significant Influence of Reduced Initial Tacrolimus Dose onRisk of Underdosing and Early Graft Function in Older and Overweight Kidney Transplant Recipients. Transpl. Proc. 2018, 50,1755–1759. [CrossRef] [PubMed]
29. Nawaratne, S.; Brien, J.E.; Seeman, E.; Fabiny, R.; Zalcberg, J.; Cosolo, W.; Angus, P.; Morgan, D.J. Relationships among liver andkidney volumes, lean body mass and drug clearance. Br. J. Clin. Pharmacol. 1998, 46, 447–452. [CrossRef]
30. McLeay, S.C.; Morrish, G.A.; Kirkpatrick, C.M.; Green, B. The relationship between drug clearance and body size: Systematicreview and meta-analysis of the literature published from 2000 to 2007. Clin. Pharm. 2012, 51, 319–330. [CrossRef]
31. Hartinger, J.M.; Šíma, M.; Hronová, K.; Halouzková, B.A.; Szonowská, B.; Polakovic, V.; Bednárová, V.; Hladinová, Z.; Tesar,V.; Slanar, O. Vancomycin pharmacokinetics in patients treated with intermittent haemodialysis based on therapeutic drugmonitoring. J. Chemother. 2021, 23, 1–8. [CrossRef] [PubMed]
32. De Fijter, W.M.; de Fijter, C.W.; Oe, P.L.; Ter Wee, P.M.; Donker, A.J. Assessment of total body water and lean body massfrom anthropometry, Watson formula, creatinine kinetics, and body electrical impedance compared with antipyrine kinetics inperitoneal dialysis patients. Nephrol Dial. Transpl. 1997, 12, 151–156. [CrossRef] [PubMed]
33. Grenda, R.; Prokurat, S.; Ciechanowicz, A.; Piatosa, B.; Kalicinski, P. Evaluation of the genetic background of standard-immunosuppressant-related toxicity in a cohort of 200 paediatric renal allograft recipients—A retrospective study. Ann. Transpl.2009, 14, 18–24.
34. Pallet, N.; Etienne, I.; Buchler, M.; Bailly, E.; Hurault de Ligny, B.; Choukroun, G.; Colosio, C.; Thierry, A.; Vigneau, C.; Moulin,B.; et al. Long-Term Clinical Impact of Adaptation of Initial Tacrolimus Dosing to CYP3A5 Genotype. Am. J. Transpl. 2016, 16,2670–2675. [CrossRef] [PubMed]
35. Niioka, T.; Kagaya, H.; Saito, M.; Inoue, T.; Numakura, K.; Habuchi, T.; Satoh, S.; Miura, M. Capability of utilizing CYP3A5polymorphisms to predict therapeutic dosage of tacrolimus at early stage post-renal transplantation. Int. J. Mol. Sci. 2015, 16,1840–1854. [CrossRef] [PubMed]
147


Citation: Jehn, U.; Kortenhorn,
A.; Schütte-Nütgen, K.; Thölking,
G.; Westphal, F.; Strauss, M.;
Wennmann, D.-O.; Pavenstädt, H.;
Suwelack, B.; Görlich, D.; et al. The
Influence of Parathyroidectomy on
Osteoporotic Fractures in Kidney
Transplant Recipients: Results from a
Retrospective Single-Center Trial. J.
Clin. Med. 2022, 11, 654. https://
doi.org/10.3390/jcm11030654
Academic Editors: Wisit
Cheungpasitporn, Charat
Thongprayoon and Wisit Kaewput
Received: 31 December 2021
Accepted: 26 January 2022
Published: 27 January 2022
Publisher’s Note: MDPI stays neutral
with regard to jurisdictional claims in
published maps and institutional affil-
iations.
Copyright: © 2022 by the authors.
Licensee MDPI, Basel, Switzerland.
This article is an open access article
distributed under the terms and
conditions of the Creative Commons
Attribution (CC BY) license (https://
creativecommons.org/licenses/by/
4.0/).
Journal of
Clinical Medicine
Article
The Influence of Parathyroidectomy on Osteoporotic Fracturesin Kidney Transplant Recipients: Results from a RetrospectiveSingle-Center Trial
Ulrich Jehn 1,*,†, Anja Kortenhorn 1,†, Katharina Schütte-Nütgen 1, Gerold Thölking 1, Florian Westphal 1,
Markus Strauss 2, Dirk-Oliver Wennmann 1, Hermann Pavenstädt 1, Barbara Suwelack 1, Dennis Görlich 3
and Stefan Reuter 1
1 Department of Medicine D, Division of General Internal Medicine, Nephrology and Rheumatology,University Hospital of Muenster, 48149 Muenster, Germany; [email protected] (A.K.);[email protected] (K.S.-N.); [email protected] (G.T.);[email protected] (F.W.); [email protected] (D.-O.W.);[email protected] (H.P.); [email protected] (B.S.);[email protected] (S.R.)
2 Department of Medicine C, Division of Cardiology and Angiology, University Hospital of Muenster,48149 Muenster, Germany; [email protected]
3 Institute of Biostatistics and Clinical Research, University of Muenster, 48149 Muenster, Germany;[email protected]
* Correspondence: [email protected]; Tel.: +49-251-83-47540; Fax: +49-251-83-56973† These authors contributed equally to this work.
Abstract: Kidney transplant (KTx) recipients are a high-risk population for osteoporotic fractures.We herein aim to identify the role of pre-transplant parathyroidectomy (PTX) and other modifiablefactors associated with osteoporotic fractures in KTx recipients. We conducted a retrospective studyinvolving 711 adult patients (4608 patient-years) who were transplanted at our center between January2007 and June 2015. Clinical data were extracted from patients’ electronic medical records. Differentlaboratory and clinical parameters for mineral bone disease (MBD) and osteoporosis, includingmedication, were evaluated. We chose fracture events unrelated to malignancies or adequate traumaas the primary endpoint. Osteoporotic fractures occurred in 47 (6.6%) patients (median 36.7 months,IQR 45.9) after KTx (fracture incidence of 10 per 1000 person-years). Prior to KTx, subtotal PTX wasperformed in 116 patients (16.3%, median time 4.2 years before KTx, IQR 5.0). Of the patients withfracture (n = 47), only one (2.2%) patient had previously undergone PTX. After adjusting for theknown fracture risk factors MBD and osteoporosis, PTX remained a protective factor against fractures(HR 0.134, CI 0.018–0.991, p = 0.049). We observed a reduced risk for pathological fractures in KTxpatients who underwent PTX, independent from elevated parathyroid hormone at the time of KTxor afterwards.
Keywords: kidney transplantation; chronic kidney disease; mineral bone disorder; parathyroidec-tomy; parathyroid hormone; osteoporosis; bone fractures
1. Introduction
Kidney transplant (KTx) recipients are a high-risk population for osteoporotic fractures,yet their environment combines a number of risk factors that lead to mineral bone disorder(MBD) and osteoporosis. Osteoporotic fractures increase morbidity and mortality in elderlypatients; therefore, their prevention is an important issue [1].
Since the majority of patients after KTx show impaired renal function/chronic kid-ney disease (CKD) and present a long history of end-stage renal disease (ESRD), CKD-related MBD also plays an important role in KTx recipients. It refers to CKD-MBD afterkidney transplantation. Both high FGF-23 levels and hyperparathyroidism are present
J. Clin. Med. 2022, 11, 654. https://doi.org/10.3390/jcm11030654 https://www.mdpi.com/journal/jcm149

J. Clin. Med. 2022, 11, 654
post-transplant, contributing to hypophosphatemia and hypercalcemia [2]. Secondaryhyperparathyroidism (sHPT) and uremic toxin accumulation enhance osteoclast-mediatedbone resorption with increased release of calcium and phosphate [2].
After KTx, further transplantation-related factors associated with MBD and osteoporo-sis occur. In addition to electrolyte imbalances (such as hypophosphatemia, hypomagne-semia and hypercalciuria), reduced physical activity, sarcopenia, and immunosuppressivemedication, which usually includes corticosteroids and calcineurin-inhibitors (CNI), in-crease bone resorption [3–5]. Therefore, KTx recipients have a significantly lower bonemineral density (BMD) compared to the general population [5].
Treatment of hyperparathyroidism (HPT) and MBD is primarily based on the assess-ments of laboratory values of phosphate, calcium, PTH level, alkaline phosphatase, andvitamin D. The primary therapeutic approach is drug-based and aims primarily to identifyand treat long-term trends. PTX is indicated for ESRD patients with HPT who do notrespond adequately to medical or pharmacologic therapy [6].
New pharmacological approaches with calcimimetics have significantly reduced thefrequency of PTXs in ESRD patients [7]. However, improvements in mortality rate andbone metabolism with the use of calcimimetics have not been consistently confirmed.
In patients with primary hyperparathyroidism, Yeh et al. demonstrated that PTX isassociated with a reduced risk of fractures [8]. In chronic hemodialysis patients with sHPT,Rudser et al. observed a reduced fracture risk in patients after PTX.
For patients after KTx who have secondary or tertiary HPT, data regarding fracturerisk is sparse, and it is unclear to date whether PTX affects the risk of osteoporotic fracturesin this particular setting. Thus, we aimed to clarify the effect of PTX and other factorsavailable for retrospective analysis associated with MBD on osteoporotic bone fractures inKTx recipients.
2. Materials and Methods
2.1. Study Design and Population
We conducted a retrospective study involving 711 adult patients with a follow-up of4608 patient-years transplanted at our center between January 2007 and June 2015. Thefollow-up period ended on 25 June 2019. Transplanted patients under the age of 18 yearswere excluded. Patients were censored for loss of allograft function and death with afunctioning allograft. Patient demographic and clinical characteristics were recorded at thetime of KTx. Informed written consent was obtained from all patients to collect their dataat the time of transplantation. Patient data were anonymized before analysis. Regardingpatients with PTX, we only considered those patients who received PTX before KTx. Sevenpatients in our collective who had PTX surgery after KTx were excluded. This study wasperformed in accordance with the Declaration of Helsinki and the International Conferenceon Harmonization Good Clinical Practice guidelines and approved by the local ethicscommittee (Ethik Kommission der Ärztekammer Westfalen-Lippe und der MedizinischenFakultät der Westfälischen Wilhelms-Universität, 2014-381-f-N). Data were extracted fromthe electronic patient records. Induction therapy was chosen according to immunologicrisks. One gram mycophenolate mofetil was given twice a day; the dosage was reduced ifadverse events occurred. Prednisolone was started with 500 mg intravenously (i.v.) beforeKTx, followed by 100 mg for three days; then the dose was reduced by 20 mg/day. Adosage of 20 mg/day was maintained until day 30 and then slowly reduced to 5 mg/day.Maintenance immunosuppressive therapy usually consisted of a calcineurin inhibitor(tacrolimus), mycophenolate sodium or mycophenolate mofetil, and prednisolone. m-TOR-inhibitor-based immunosuppression after KTx was chosen only in a minority of patients,usually when they were enrolled in clinical trials.
2.2. Analyzed Markers and Parameters
To characterize the bone metabolism of the study subjects, we evaluated differ-ent laboratory markers and parameters, including intact PTH (iPTH) (normal range
150
J. Clin. Med. 2022, 11, 654
15.6–65 pg/mL), total serum calcium levels, ionized calcium levels, medication with nativeand active vitamin D preparations, vitamin D analogues, bisphosphonates, calcimimeticsand IgG2-anti-RANKL-antibodies (denosumab).
Each of the laboratory parameters was evaluated three months and one year after KTx.PTH was also evaluated immediately pre KTx. Medication was evaluated one, two, andthree years after KTx.
We chose fracture events unrelated to malignancies or adequate trauma as the pri-mary endpoint.
The primary endpoint was ascertained by reviewing all patient files manually. To eval-uate a potential association of tacrolimus metabolism and MBD, we calculated the concen-tration/dose (C/D) ratio three months after KTx. The C/D ratio allows the classification ofpatients into slow (C/D ratio ≥ 1.05) and fast tacrolimus metabolizers (C/D ratio < 1.05) [9].
2.3. Statistical Analysis
The data were analyzed with IBM SPSS Statistics 27 (IBM Corp., Armonk, NY, USA).The results are expressed as a median with interquartile range (IQR) or mean with standarddeviation (SD). Non-continuous parameters were analyzed by Fisher’s exact tests andchi-square tests and the continuous parameters were analyzed by a Mann–Whitney U-testand Kruskal–Wallis test, respectively, where appropriate. A p-value ≤ 0.05 was consideredstatistically significant.
Repeated measures ANOVA was applied to compare courses of PTH (before KTx, at3 months, at 12 months) between different groups.
We analyzed the probability for fracture-free survival after KTx by Kaplan–Meieranalysis and a log-rank test. To further, estimate the effect of PTX on the fracture incidence,we considered death as a competing risk. Cumulative incidence functions were estimatedfor both competing outcomes (death and fracture) and PTX groups were compared usingGray’s test.
Univariate Cox proportional hazard models were fitted to identify the potential pre-dictors for fracture events. Death was considered censored in this analysis; i.e., the modelcorresponds to a cause-specific hazard model. Variables that were considered statisticallynoticeable by univariate analysis were used for multivariable Cox proportional hazardregression analysis to identify independent prediction factors for fracture events. Besidesthese, the two well-known influencing factors on bone mineral disease, female sex and dial-ysis vintage were added to the multivariable Cox proportional hazard regression analysis.
We analyzed the effect of the estimated glomerular filtration rate (eGFR) at differenttime points after KTx on fracture risk in Cox proportional hazard models using a landmarkapproach. We fitted five Cox proportional hazard models, starting at 12 months, 24, 36,48, and 60 months. Within each analysis, only patients who lived without a fracture at thelandmark time point were included with their eGFR values, respectively. Event times wererecalculated starting from the landmark time point. Thus, each model evaluates the eGFRas a risk factor for new fractures after the respective time point. Results are presented as aforest plot.
For all Cox proportional hazard models, hazard ratios (HR) and 95% confidenceintervals (CI) were reported.
3. Results
3.1. Baseline Characteristics
Baseline characteristics of the study populations are given in Table 1. Median age attransplantation was 53.0 years (range 17.8–78.4), 430 (60.5%) were male, and 204 (28.7%)received a living donor transplant.
Induction therapy was performed using basiliximab in 588 (83.6%) cases. A total of37 (5.3%) of the patients received thymoglobuline (Table 1).
151
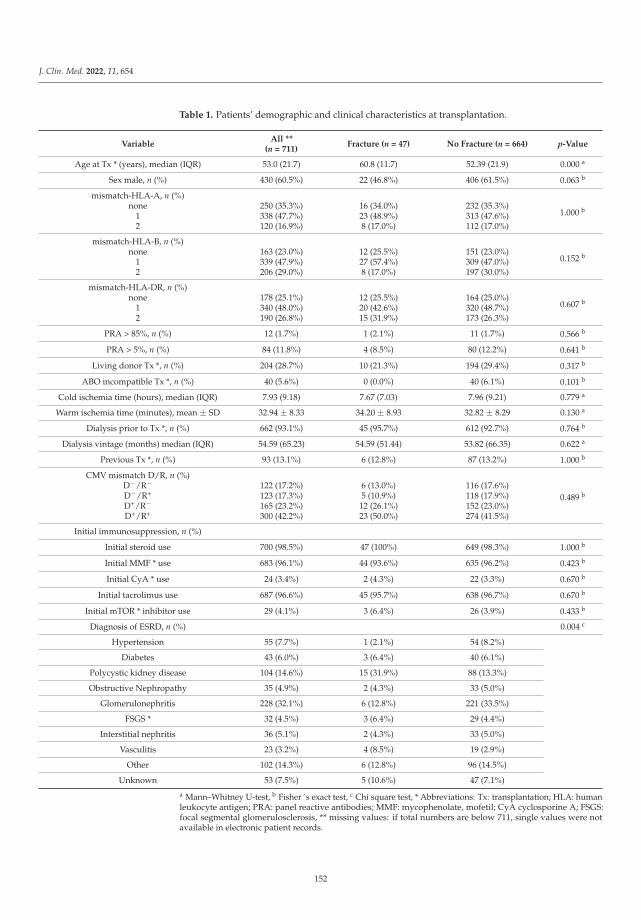
J. Clin. Med. 2022, 11, 654
Table 1. Patients’ demographic and clinical characteristics at transplantation.
VariableAll **
(n = 711)Fracture (n = 47) No Fracture (n = 664) p-Value
Age at Tx * (years), median (IQR) 53.0 (21.7) 60.8 (11.7) 52.39 (21.9) 0.000 a
Sex male, n (%) 430 (60.5%) 22 (46.8%) 406 (61.5%) 0.063 b
mismatch-HLA-A, n (%)
1.000 bnone 250 (35.3%) 16 (34.0%) 232 (35.3%)1 338 (47.7%) 23 (48.9%) 313 (47.6%)2 120 (16.9%) 8 (17.0%) 112 (17.0%)
mismatch-HLA-B, n (%)
0.152 bnone 163 (23.0%) 12 (25.5%) 151 (23.0%)1 339 (47.9%) 27 (57.4%) 309 (47.0%)2 206 (29.0%) 8 (17.0%) 197 (30.0%)
mismatch-HLA-DR, n (%)
0.607 bnone 178 (25.1%) 12 (25.5%) 164 (25.0%)1 340 (48.0%) 20 (42.6%) 320 (48.7%)2 190 (26.8%) 15 (31.9%) 173 (26.3%)
PRA > 85%, n (%) 12 (1.7%) 1 (2.1%) 11 (1.7%) 0.566 b
PRA > 5%, n (%) 84 (11.8%) 4 (8.5%) 80 (12.2%) 0.641 b
Living donor Tx *, n (%) 204 (28.7%) 10 (21.3%) 194 (29.4%) 0.317 b
ABO incompatible Tx *, n (%) 40 (5.6%) 0 (0.0%) 40 (6.1%) 0.101 b
Cold ischemia time (hours), median (IQR) 7.93 (9.18) 7.67 (7.03) 7.96 (9.21) 0.779 a
Warm ischemia time (minutes), mean ± SD 32.94 ± 8.33 34.20 ± 8.93 32.82 ± 8.29 0.130 a
Dialysis prior to Tx *, n (%) 662 (93.1%) 45 (95.7%) 612 (92.7%) 0.764 b
Dialysis vintage (months) median (IQR) 54.59 (65.23) 54.59 (51.44) 53.82 (66.35) 0.622 a
Previous Tx *, n (%) 93 (13.1%) 6 (12.8%) 87 (13.2%) 1.000 b
CMV mismatch D/R, n (%)
0.489 bD−/R− 122 (17.2%) 6 (13.0%) 116 (17.6%)D−/R+ 123 (17.3%) 5 (10.9%) 118 (17.9%)D+/R− 165 (23.2%) 12 (26.1%) 152 (23.0%)D+/R+ 300 (42.2%) 23 (50.0%) 274 (41.5%)
Initial immunosuppression, n (%)
Initial steroid use 700 (98.5%) 47 (100%) 649 (98.3%) 1.000 b
Initial MMF * use 683 (96.1%) 44 (93.6%) 635 (96.2%) 0.423 b
Initial CyA * use 24 (3.4%) 2 (4.3%) 22 (3.3%) 0.670 b
Initial tacrolimus use 687 (96.6%) 45 (95.7%) 638 (96.7%) 0.670 b
Initial mTOR * inhibitor use 29 (4.1%) 3 (6.4%) 26 (3.9%) 0.433 b
Diagnosis of ESRD, n (%) 0.004 c
Hypertension 55 (7.7%) 1 (2.1%) 54 (8.2%)
Diabetes 43 (6.0%) 3 (6.4%) 40 (6.1%)
Polycystic kidney disease 104 (14.6%) 15 (31.9%) 88 (13.3%)
Obstructive Nephropathy 35 (4.9%) 2 (4.3%) 33 (5.0%)
Glomerulonephritis 228 (32.1%) 6 (12.8%) 221 (33.5%)
FSGS * 32 (4.5%) 3 (6.4%) 29 (4.4%)
Interstitial nephritis 36 (5.1%) 2 (4.3%) 33 (5.0%)
Vasculitis 23 (3.2%) 4 (8.5%) 19 (2.9%)
Other 102 (14.3%) 6 (12.8%) 96 (14.5%)
Unknown 53 (7.5%) 5 (10.6%) 47 (7.1%)
a Mann–Whitney U-test, b Fisher´s exact test, c Chi square test, * Abbreviations: Tx: transplantation; HLA: humanleukocyte antigen; PRA: panel reactive antibodies; MMF: mycophenolate, mofetil; CyA cyclosporine A; FSGS:focal segmental glomerulosclerosis, ** missing values: if total numbers are below 711, single values were notavailable in electronic patient records.
152
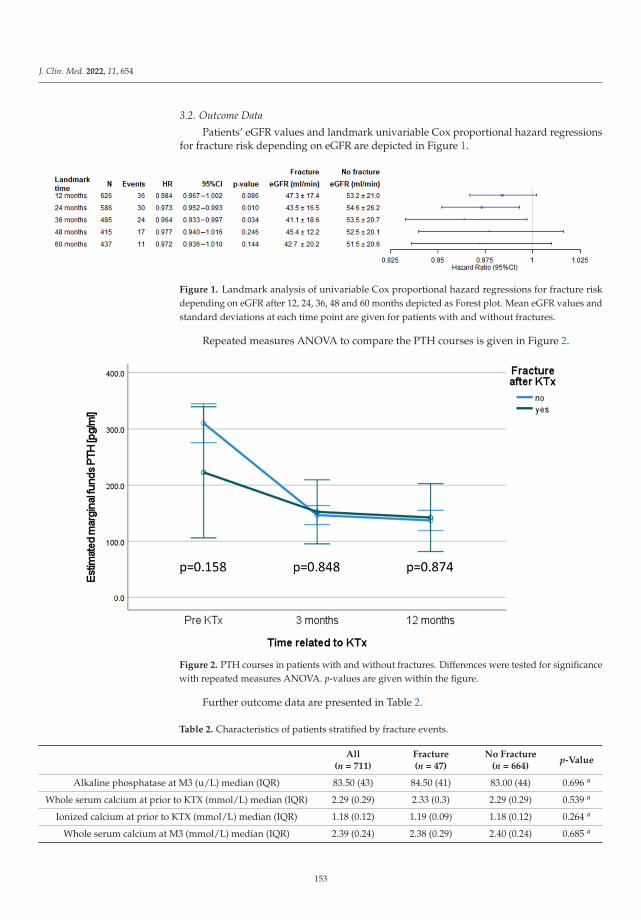
J. Clin. Med. 2022, 11, 654
3.2. Outcome Data
Patients’ eGFR values and landmark univariable Cox proportional hazard regressionsfor fracture risk depending on eGFR are depicted in Figure 1.
Figure 1. Landmark analysis of univariable Cox proportional hazard regressions for fracture riskdepending on eGFR after 12, 24, 36, 48 and 60 months depicted as Forest plot. Mean eGFR values andstandard deviations at each time point are given for patients with and without fractures.
Repeated measures ANOVA to compare the PTH courses is given in Figure 2.
Figure 2. PTH courses in patients with and without fractures. Differences were tested for significancewith repeated measures ANOVA. p-values are given within the figure.
Further outcome data are presented in Table 2.
Table 2. Characteristics of patients stratified by fracture events.
All(n = 711)
Fracture(n = 47)
No Fracture(n = 664)
p-Value
Alkaline phosphatase at M3 (u/L) median (IQR) 83.50 (43) 84.50 (41) 83.00 (44) 0.696 a
Whole serum calcium at prior to KTX (mmol/L) median (IQR) 2.29 (0.29) 2.33 (0.3) 2.29 (0.29) 0.539 a
Ionized calcium at prior to KTX (mmol/L) median (IQR) 1.18 (0.12) 1.19 (0.09) 1.18 (0.12) 0.264 a
Whole serum calcium at M3 (mmol/L) median (IQR) 2.39 (0.24) 2.38 (0.29) 2.40 (0.24) 0.685 a
153
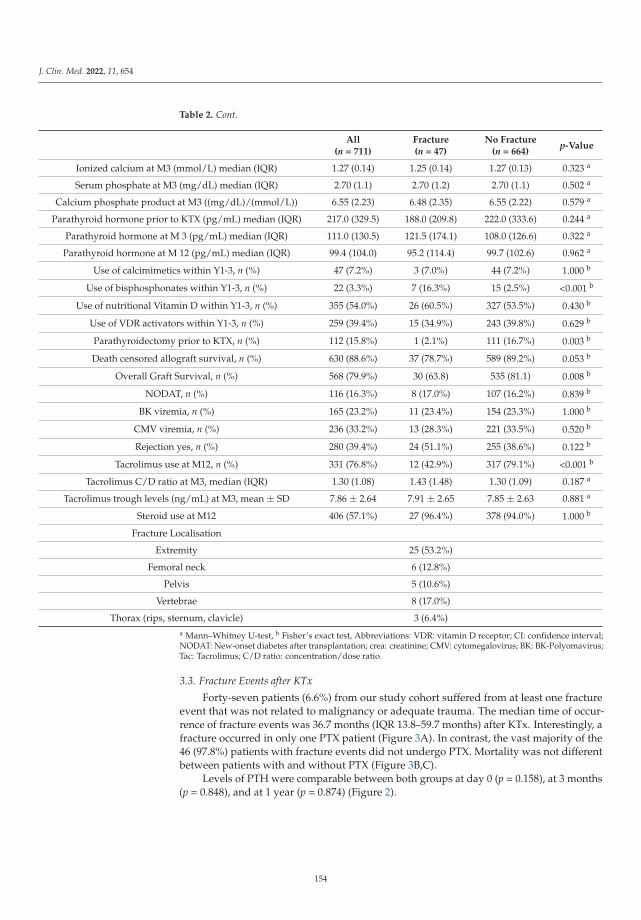
J. Clin. Med. 2022, 11, 654
Table 2. Cont.
All(n = 711)
Fracture(n = 47)
No Fracture(n = 664)
p-Value
Ionized calcium at M3 (mmol/L) median (IQR) 1.27 (0.14) 1.25 (0.14) 1.27 (0.13) 0.323 a
Serum phosphate at M3 (mg/dL) median (IQR) 2.70 (1.1) 2.70 (1.2) 2.70 (1.1) 0.502 a
Calcium phosphate product at M3 ((mg/dL)/(mmol/L)) 6.55 (2.23) 6.48 (2.35) 6.55 (2.22) 0.579 a
Parathyroid hormone prior to KTX (pg/mL) median (IQR) 217.0 (329.5) 188.0 (209.8) 222.0 (333.6) 0.244 a
Parathyroid hormone at M 3 (pg/mL) median (IQR) 111.0 (130.5) 121.5 (174.1) 108.0 (126.6) 0.322 a
Parathyroid hormone at M 12 (pg/mL) median (IQR) 99.4 (104.0) 95.2 (114.4) 99.7 (102.6) 0.962 a
Use of calcimimetics within Y1-3, n (%) 47 (7.2%) 3 (7.0%) 44 (7.2%) 1.000 b
Use of bisphosphonates within Y1-3, n (%) 22 (3.3%) 7 (16.3%) 15 (2.5%) <0.001 b
Use of nutritional Vitamin D within Y1-3, n (%) 355 (54.0%) 26 (60.5%) 327 (53.5%) 0.430 b
Use of VDR activators within Y1-3, n (%) 259 (39.4%) 15 (34.9%) 243 (39.8%) 0.629 b
Parathyroidectomy prior to KTX, n (%) 112 (15.8%) 1 (2.1%) 111 (16.7%) 0.003 b
Death censored allograft survival, n (%) 630 (88.6%) 37 (78.7%) 589 (89.2%) 0.053 b
Overall Graft Survival, n (%) 568 (79.9%) 30 (63.8) 535 (81.1) 0.008 b
NODAT, n (%) 116 (16.3%) 8 (17.0%) 107 (16.2%) 0.839 b
BK viremia, n (%) 165 (23.2%) 11 (23.4%) 154 (23.3%) 1.000 b
CMV viremia, n (%) 236 (33.2%) 13 (28.3%) 221 (33.5%) 0.520 b
Rejection yes, n (%) 280 (39.4%) 24 (51.1%) 255 (38.6%) 0.122 b
Tacrolimus use at M12, n (%) 331 (76.8%) 12 (42.9%) 317 (79.1%) <0.001 b
Tacrolimus C/D ratio at M3, median (IQR) 1.30 (1.08) 1.43 (1.48) 1.30 (1.09) 0.187 a
Tacrolimus trough levels (ng/mL) at M3, mean ± SD 7.86 ± 2.64 7.91 ± 2.65 7.85 ± 2.63 0.881 a
Steroid use at M12 406 (57.1%) 27 (96.4%) 378 (94.0%) 1.000 b
Fracture Localisation
Extremity 25 (53.2%)
Femoral neck 6 (12.8%)
Pelvis 5 (10.6%)
Vertebrae 8 (17.0%)
Thorax (rips, sternum, clavicle) 3 (6.4%)a Mann–Whitney U-test, b Fisher’s exact test, Abbreviations: VDR: vitamin D receptor; CI: confidence interval;NODAT: New-onset diabetes after transplantation; crea: creatinine; CMV: cytomegalovirus; BK: BK-Polyomavirus;Tac: Tacrolimus; C/D ratio: concentration/dose ratio.
3.3. Fracture Events after KTx
Forty-seven patients (6.6%) from our study cohort suffered from at least one fractureevent that was not related to malignancy or adequate trauma. The median time of occur-rence of fracture events was 36.7 months (IQR 13.8–59.7 months) after KTx. Interestingly, afracture occurred in only one PTX patient (Figure 3A). In contrast, the vast majority of the46 (97.8%) patients with fracture events did not undergo PTX. Mortality was not differentbetween patients with and without PTX (Figure 3B,C).
Levels of PTH were comparable between both groups at day 0 (p = 0.158), at 3 months(p = 0.848), and at 1 year (p = 0.874) (Figure 2).
154
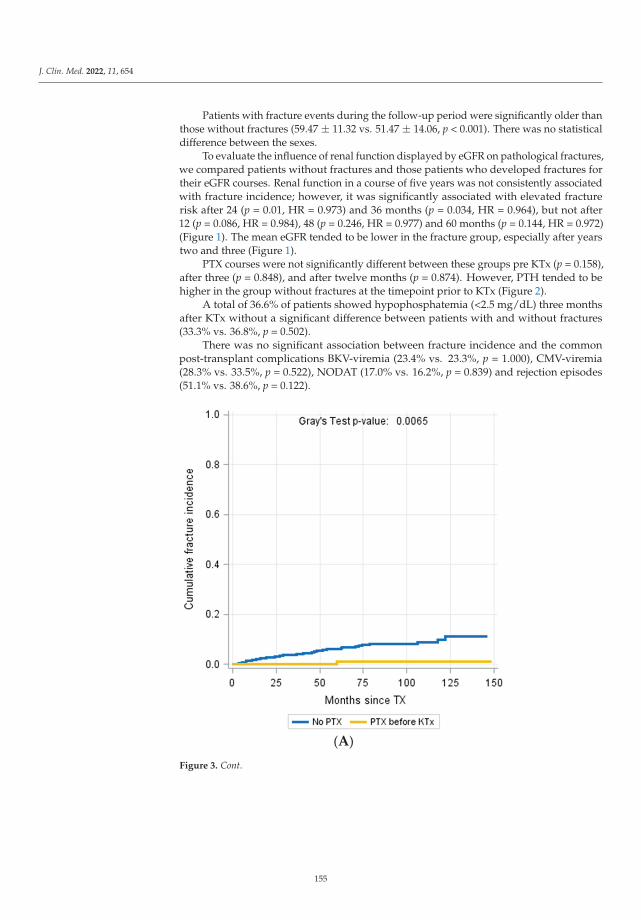
J. Clin. Med. 2022, 11, 654
Patients with fracture events during the follow-up period were significantly older thanthose without fractures (59.47 ± 11.32 vs. 51.47 ± 14.06, p < 0.001). There was no statisticaldifference between the sexes.
To evaluate the influence of renal function displayed by eGFR on pathological fractures,we compared patients without fractures and those patients who developed fractures fortheir eGFR courses. Renal function in a course of five years was not consistently associatedwith fracture incidence; however, it was significantly associated with elevated fracturerisk after 24 (p = 0.01, HR = 0.973) and 36 months (p = 0.034, HR = 0.964), but not after12 (p = 0.086, HR = 0.984), 48 (p = 0.246, HR = 0.977) and 60 months (p = 0.144, HR = 0.972)(Figure 1). The mean eGFR tended to be lower in the fracture group, especially after yearstwo and three (Figure 1).
PTX courses were not significantly different between these groups pre KTx (p = 0.158),after three (p = 0.848), and after twelve months (p = 0.874). However, PTH tended to behigher in the group without fractures at the timepoint prior to KTx (Figure 2).
A total of 36.6% of patients showed hypophosphatemia (<2.5 mg/dL) three monthsafter KTx without a significant difference between patients with and without fractures(33.3% vs. 36.8%, p = 0.502).
There was no significant association between fracture incidence and the commonpost-transplant complications BKV-viremia (23.4% vs. 23.3%, p = 1.000), CMV-viremia(28.3% vs. 33.5%, p = 0.522), NODAT (17.0% vs. 16.2%, p = 0.839) and rejection episodes(51.1% vs. 38.6%, p = 0.122).
(A)
Figure 3. Cont.
155

J. Clin. Med. 2022, 11, 654
(B)
(C)
Figure 3. Patients who underwent PTX showed a significantly reduced fracture incidence during thefollow-up period (Gray´s test p = 0.0065) (A). Mortality incidence (Gray´s Test p = 0.2574, (B)) andfracture-free survival probability were not different between patients with and without fractures(Log-Rank p = 0.4703, (C)).
156
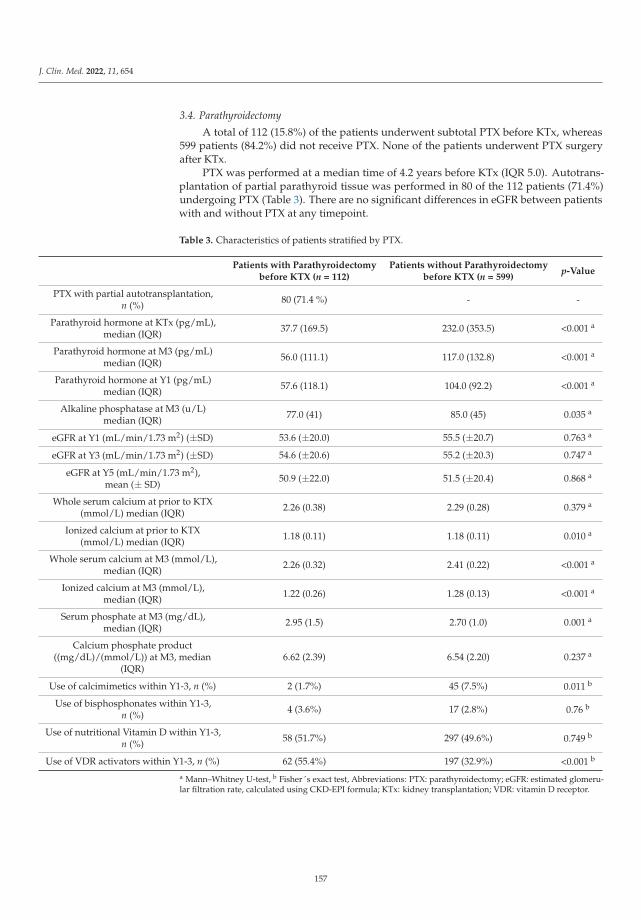
J. Clin. Med. 2022, 11, 654
3.4. Parathyroidectomy
A total of 112 (15.8%) of the patients underwent subtotal PTX before KTx, whereas599 patients (84.2%) did not receive PTX. None of the patients underwent PTX surgeryafter KTx.
PTX was performed at a median time of 4.2 years before KTx (IQR 5.0). Autotrans-plantation of partial parathyroid tissue was performed in 80 of the 112 patients (71.4%)undergoing PTX (Table 3). There are no significant differences in eGFR between patientswith and without PTX at any timepoint.
Table 3. Characteristics of patients stratified by PTX.
Patients with Parathyroidectomybefore KTX (n = 112)
Patients without Parathyroidectomybefore KTX (n = 599)
p-Value
PTX with partial autotransplantation,n (%) 80 (71.4 %) - -
Parathyroid hormone at KTx (pg/mL),median (IQR) 37.7 (169.5) 232.0 (353.5) <0.001 a
Parathyroid hormone at M3 (pg/mL)median (IQR) 56.0 (111.1) 117.0 (132.8) <0.001 a
Parathyroid hormone at Y1 (pg/mL)median (IQR) 57.6 (118.1) 104.0 (92.2) <0.001 a
Alkaline phosphatase at M3 (u/L)median (IQR) 77.0 (41) 85.0 (45) 0.035 a
eGFR at Y1 (mL/min/1.73 m2) (±SD) 53.6 (±20.0) 55.5 (±20.7) 0.763 a
eGFR at Y3 (mL/min/1.73 m2) (±SD) 54.6 (±20.6) 55.2 (±20.3) 0.747 a
eGFR at Y5 (mL/min/1.73 m2),mean (± SD)
50.9 (±22.0) 51.5 (±20.4) 0.868 a
Whole serum calcium at prior to KTX(mmol/L) median (IQR) 2.26 (0.38) 2.29 (0.28) 0.379 a
Ionized calcium at prior to KTX(mmol/L) median (IQR) 1.18 (0.11) 1.18 (0.11) 0.010 a
Whole serum calcium at M3 (mmol/L),median (IQR) 2.26 (0.32) 2.41 (0.22) <0.001 a
Ionized calcium at M3 (mmol/L),median (IQR) 1.22 (0.26) 1.28 (0.13) <0.001 a
Serum phosphate at M3 (mg/dL),median (IQR) 2.95 (1.5) 2.70 (1.0) 0.001 a
Calcium phosphate product((mg/dL)/(mmol/L)) at M3, median
(IQR)6.62 (2.39) 6.54 (2.20) 0.237 a
Use of calcimimetics within Y1-3, n (%) 2 (1.7%) 45 (7.5%) 0.011 b
Use of bisphosphonates within Y1-3,n (%) 4 (3.6%) 17 (2.8%) 0.76 b
Use of nutritional Vitamin D within Y1-3,n (%) 58 (51.7%) 297 (49.6%) 0.749 b
Use of VDR activators within Y1-3, n (%) 62 (55.4%) 197 (32.9%) <0.001 b
a Mann–Whitney U-test, b Fisher´s exact test, Abbreviations: PTX: parathyroidectomy; eGFR: estimated glomeru-lar filtration rate, calculated using CKD-EPI formula; KTx: kidney transplantation; VDR: vitamin D receptor.
157
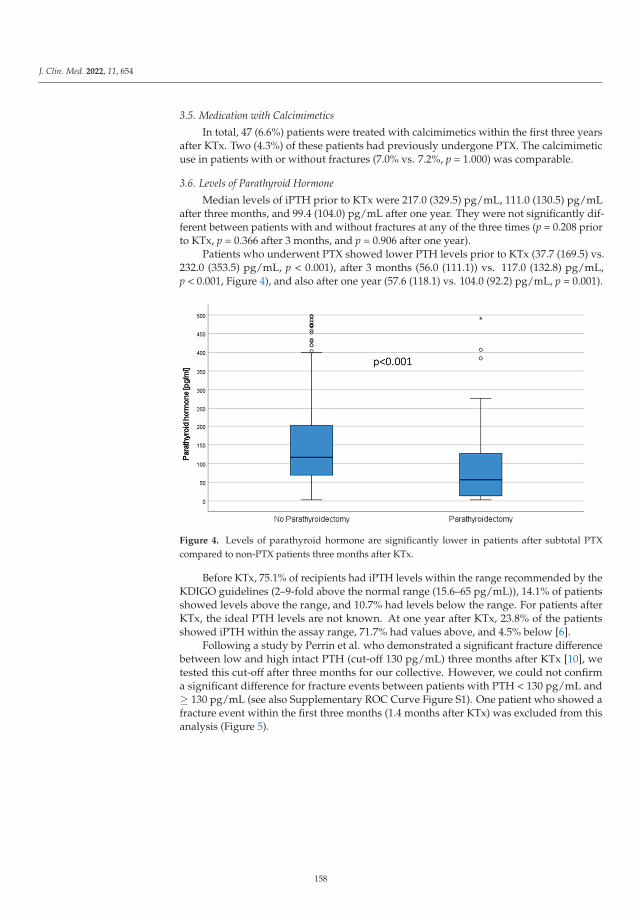
J. Clin. Med. 2022, 11, 654
3.5. Medication with Calcimimetics
In total, 47 (6.6%) patients were treated with calcimimetics within the first three yearsafter KTx. Two (4.3%) of these patients had previously undergone PTX. The calcimimeticuse in patients with or without fractures (7.0% vs. 7.2%, p = 1.000) was comparable.
3.6. Levels of Parathyroid Hormone
Median levels of iPTH prior to KTx were 217.0 (329.5) pg/mL, 111.0 (130.5) pg/mLafter three months, and 99.4 (104.0) pg/mL after one year. They were not significantly dif-ferent between patients with and without fractures at any of the three times (p = 0.208 priorto KTx, p = 0.366 after 3 months, and p = 0.906 after one year).
Patients who underwent PTX showed lower PTH levels prior to KTx (37.7 (169.5) vs.232.0 (353.5) pg/mL, p < 0.001), after 3 months (56.0 (111.1)) vs. 117.0 (132.8) pg/mL,p < 0.001, Figure 4), and also after one year (57.6 (118.1) vs. 104.0 (92.2) pg/mL, p = 0.001).
Figure 4. Levels of parathyroid hormone are significantly lower in patients after subtotal PTXcompared to non-PTX patients three months after KTx.
Before KTx, 75.1% of recipients had iPTH levels within the range recommended by theKDIGO guidelines (2–9-fold above the normal range (15.6–65 pg/mL)), 14.1% of patientsshowed levels above the range, and 10.7% had levels below the range. For patients afterKTx, the ideal PTH levels are not known. At one year after KTx, 23.8% of the patientsshowed iPTH within the assay range, 71.7% had values above, and 4.5% below [6].
Following a study by Perrin et al. who demonstrated a significant fracture differencebetween low and high intact PTH (cut-off 130 pg/mL) three months after KTx [10], wetested this cut-off after three months for our collective. However, we could not confirma significant difference for fracture events between patients with PTH < 130 pg/mL and≥ 130 pg/mL (see also Supplementary ROC Curve Figure S1). One patient who showed afracture event within the first three months (1.4 months after KTx) was excluded from thisanalysis (Figure 5).
158
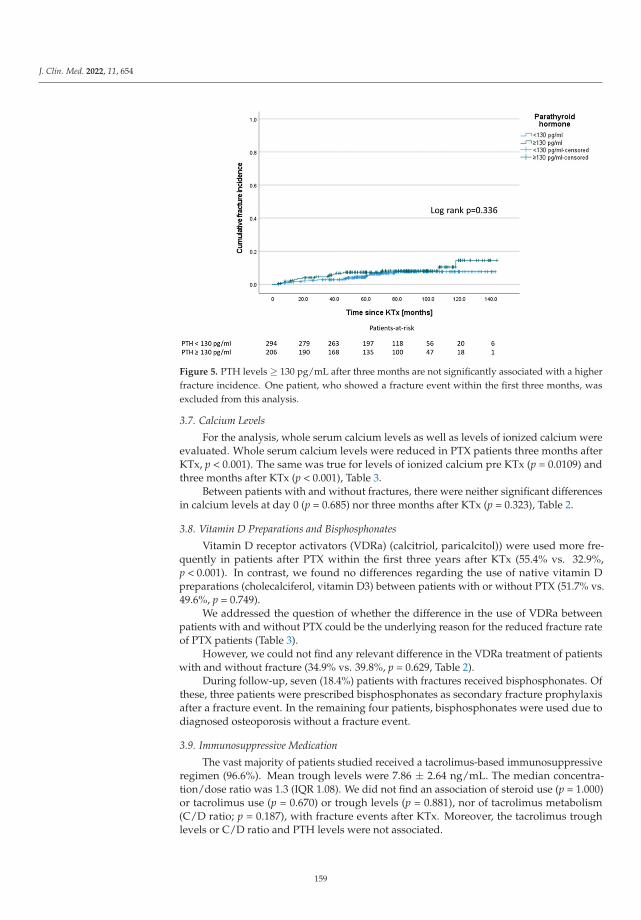
J. Clin. Med. 2022, 11, 654
Figure 5. PTH levels ≥ 130 pg/mL after three months are not significantly associated with a higherfracture incidence. One patient, who showed a fracture event within the first three months, wasexcluded from this analysis.
3.7. Calcium Levels
For the analysis, whole serum calcium levels as well as levels of ionized calcium wereevaluated. Whole serum calcium levels were reduced in PTX patients three months afterKTx, p < 0.001). The same was true for levels of ionized calcium pre KTx (p = 0.0109) andthree months after KTx (p < 0.001), Table 3.
Between patients with and without fractures, there were neither significant differencesin calcium levels at day 0 (p = 0.685) nor three months after KTx (p = 0.323), Table 2.
3.8. Vitamin D Preparations and Bisphosphonates
Vitamin D receptor activators (VDRa) (calcitriol, paricalcitol)) were used more fre-quently in patients after PTX within the first three years after KTx (55.4% vs. 32.9%,p < 0.001). In contrast, we found no differences regarding the use of native vitamin Dpreparations (cholecalciferol, vitamin D3) between patients with or without PTX (51.7% vs.49.6%, p = 0.749).
We addressed the question of whether the difference in the use of VDRa betweenpatients with and without PTX could be the underlying reason for the reduced fracture rateof PTX patients (Table 3).
However, we could not find any relevant difference in the VDRa treatment of patientswith and without fracture (34.9% vs. 39.8%, p = 0.629, Table 2).
During follow-up, seven (18.4%) patients with fractures received bisphosphonates. Ofthese, three patients were prescribed bisphosphonates as secondary fracture prophylaxisafter a fracture event. In the remaining four patients, bisphosphonates were used due todiagnosed osteoporosis without a fracture event.
3.9. Immunosuppressive Medication
The vast majority of patients studied received a tacrolimus-based immunosuppressiveregimen (96.6%). Mean trough levels were 7.86 ± 2.64 ng/mL. The median concentra-tion/dose ratio was 1.3 (IQR 1.08). We did not find an association of steroid use (p = 1.000)or tacrolimus use (p = 0.670) or trough levels (p = 0.881), nor of tacrolimus metabolism(C/D ratio; p = 0.187), with fracture events after KTx. Moreover, the tacrolimus troughlevels or C/D ratio and PTH levels were not associated.
159
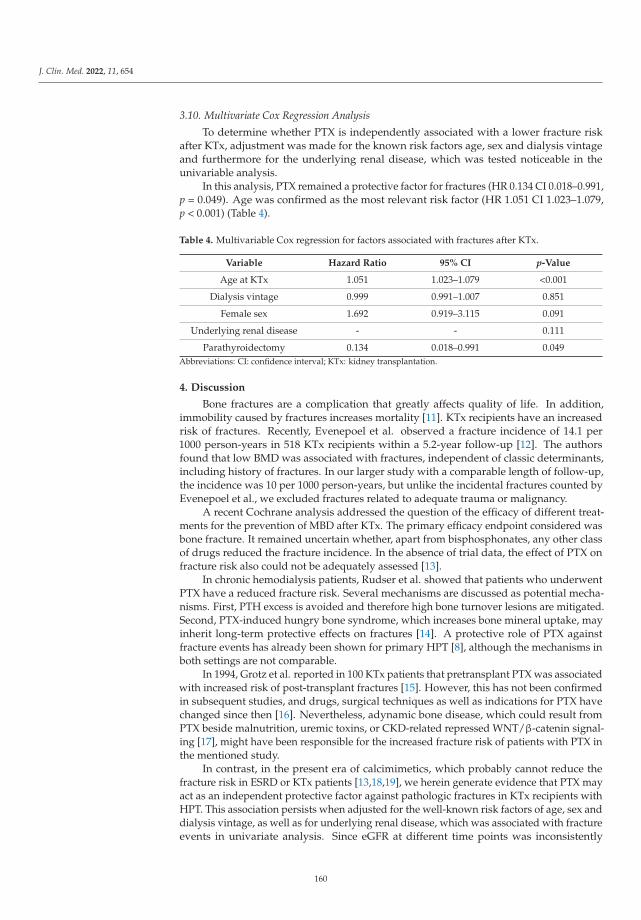
J. Clin. Med. 2022, 11, 654
3.10. Multivariate Cox Regression Analysis
To determine whether PTX is independently associated with a lower fracture riskafter KTx, adjustment was made for the known risk factors age, sex and dialysis vintageand furthermore for the underlying renal disease, which was tested noticeable in theunivariable analysis.
In this analysis, PTX remained a protective factor for fractures (HR 0.134 CI 0.018–0.991,p = 0.049). Age was confirmed as the most relevant risk factor (HR 1.051 CI 1.023–1.079,p < 0.001) (Table 4).
Table 4. Multivariable Cox regression for factors associated with fractures after KTx.
Variable Hazard Ratio 95% CI p-Value
Age at KTx 1.051 1.023–1.079 <0.001
Dialysis vintage 0.999 0.991–1.007 0.851
Female sex 1.692 0.919–3.115 0.091
Underlying renal disease - - 0.111
Parathyroidectomy 0.134 0.018–0.991 0.049Abbreviations: CI: confidence interval; KTx: kidney transplantation.
4. Discussion
Bone fractures are a complication that greatly affects quality of life. In addition,immobility caused by fractures increases mortality [11]. KTx recipients have an increasedrisk of fractures. Recently, Evenepoel et al. observed a fracture incidence of 14.1 per1000 person-years in 518 KTx recipients within a 5.2-year follow-up [12]. The authorsfound that low BMD was associated with fractures, independent of classic determinants,including history of fractures. In our larger study with a comparable length of follow-up,the incidence was 10 per 1000 person-years, but unlike the incidental fractures counted byEvenepoel et al., we excluded fractures related to adequate trauma or malignancy.
A recent Cochrane analysis addressed the question of the efficacy of different treat-ments for the prevention of MBD after KTx. The primary efficacy endpoint considered wasbone fracture. It remained uncertain whether, apart from bisphosphonates, any other classof drugs reduced the fracture incidence. In the absence of trial data, the effect of PTX onfracture risk also could not be adequately assessed [13].
In chronic hemodialysis patients, Rudser et al. showed that patients who underwentPTX have a reduced fracture risk. Several mechanisms are discussed as potential mecha-nisms. First, PTH excess is avoided and therefore high bone turnover lesions are mitigated.Second, PTX-induced hungry bone syndrome, which increases bone mineral uptake, mayinherit long-term protective effects on fractures [14]. A protective role of PTX againstfracture events has already been shown for primary HPT [8], although the mechanisms inboth settings are not comparable.
In 1994, Grotz et al. reported in 100 KTx patients that pretransplant PTX was associatedwith increased risk of post-transplant fractures [15]. However, this has not been confirmedin subsequent studies, and drugs, surgical techniques as well as indications for PTX havechanged since then [16]. Nevertheless, adynamic bone disease, which could result fromPTX beside malnutrition, uremic toxins, or CKD-related repressed WNT/β-catenin signal-ing [17], might have been responsible for the increased fracture risk of patients with PTX inthe mentioned study.
In contrast, in the present era of calcimimetics, which probably cannot reduce thefracture risk in ESRD or KTx patients [13,18,19], we herein generate evidence that PTX mayact as an independent protective factor against pathologic fractures in KTx recipients withHPT. This association persists when adjusted for the well-known risk factors of age, sex anddialysis vintage, as well as for underlying renal disease, which was associated with fractureevents in univariate analysis. Since eGFR at different time points was inconsistently
160
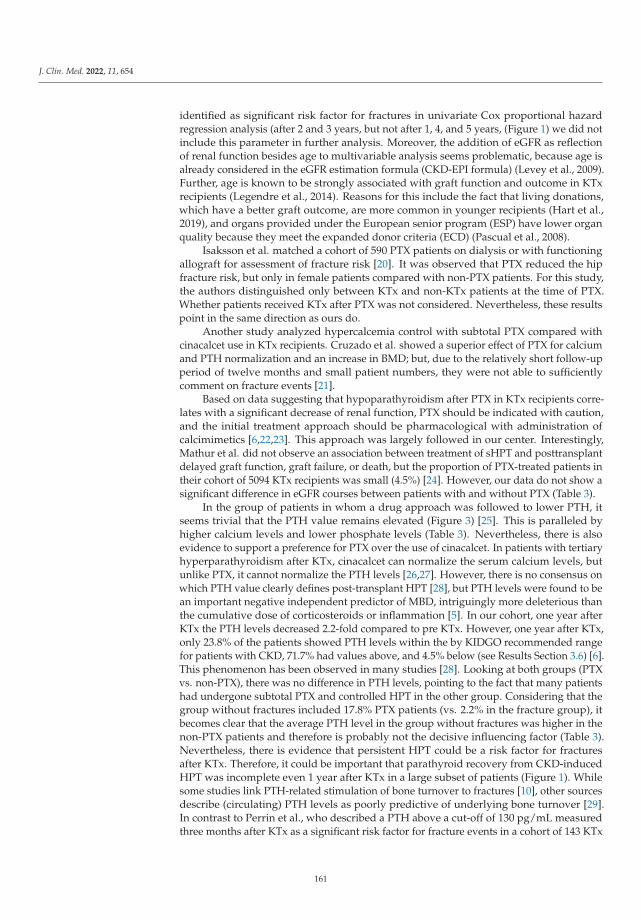
J. Clin. Med. 2022, 11, 654
identified as significant risk factor for fractures in univariate Cox proportional hazardregression analysis (after 2 and 3 years, but not after 1, 4, and 5 years, (Figure 1) we did notinclude this parameter in further analysis. Moreover, the addition of eGFR as reflectionof renal function besides age to multivariable analysis seems problematic, because age isalready considered in the eGFR estimation formula (CKD-EPI formula) (Levey et al., 2009).Further, age is known to be strongly associated with graft function and outcome in KTxrecipients (Legendre et al., 2014). Reasons for this include the fact that living donations,which have a better graft outcome, are more common in younger recipients (Hart et al.,2019), and organs provided under the European senior program (ESP) have lower organquality because they meet the expanded donor criteria (ECD) (Pascual et al., 2008).
Isaksson et al. matched a cohort of 590 PTX patients on dialysis or with functioningallograft for assessment of fracture risk [20]. It was observed that PTX reduced the hipfracture risk, but only in female patients compared with non-PTX patients. For this study,the authors distinguished only between KTx and non-KTx patients at the time of PTX.Whether patients received KTx after PTX was not considered. Nevertheless, these resultspoint in the same direction as ours do.
Another study analyzed hypercalcemia control with subtotal PTX compared withcinacalcet use in KTx recipients. Cruzado et al. showed a superior effect of PTX for calciumand PTH normalization and an increase in BMD; but, due to the relatively short follow-upperiod of twelve months and small patient numbers, they were not able to sufficientlycomment on fracture events [21].
Based on data suggesting that hypoparathyroidism after PTX in KTx recipients corre-lates with a significant decrease of renal function, PTX should be indicated with caution,and the initial treatment approach should be pharmacological with administration ofcalcimimetics [6,22,23]. This approach was largely followed in our center. Interestingly,Mathur et al. did not observe an association between treatment of sHPT and posttransplantdelayed graft function, graft failure, or death, but the proportion of PTX-treated patients intheir cohort of 5094 KTx recipients was small (4.5%) [24]. However, our data do not show asignificant difference in eGFR courses between patients with and without PTX (Table 3).
In the group of patients in whom a drug approach was followed to lower PTH, itseems trivial that the PTH value remains elevated (Figure 3) [25]. This is paralleled byhigher calcium levels and lower phosphate levels (Table 3). Nevertheless, there is alsoevidence to support a preference for PTX over the use of cinacalcet. In patients with tertiaryhyperparathyroidism after KTx, cinacalcet can normalize the serum calcium levels, butunlike PTX, it cannot normalize the PTH levels [26,27]. However, there is no consensus onwhich PTH value clearly defines post-transplant HPT [28], but PTH levels were found to bean important negative independent predictor of MBD, intriguingly more deleterious thanthe cumulative dose of corticosteroids or inflammation [5]. In our cohort, one year afterKTx the PTH levels decreased 2.2-fold compared to pre KTx. However, one year after KTx,only 23.8% of the patients showed PTH levels within the by KIDGO recommended rangefor patients with CKD, 71.7% had values above, and 4.5% below (see Results Section 3.6) [6].This phenomenon has been observed in many studies [28]. Looking at both groups (PTXvs. non-PTX), there was no difference in PTH levels, pointing to the fact that many patientshad undergone subtotal PTX and controlled HPT in the other group. Considering that thegroup without fractures included 17.8% PTX patients (vs. 2.2% in the fracture group), itbecomes clear that the average PTH level in the group without fractures was higher in thenon-PTX patients and therefore is probably not the decisive influencing factor (Table 3).Nevertheless, there is evidence that persistent HPT could be a risk factor for fracturesafter KTx. Therefore, it could be important that parathyroid recovery from CKD-inducedHPT was incomplete even 1 year after KTx in a large subset of patients (Figure 1). Whilesome studies link PTH-related stimulation of bone turnover to fractures [10], other sourcesdescribe (circulating) PTH levels as poorly predictive of underlying bone turnover [29].In contrast to Perrin et al., who described a PTH above a cut-off of 130 pg/mL measuredthree months after KTx as a significant risk factor for fracture events in a cohort of 143 KTx
161
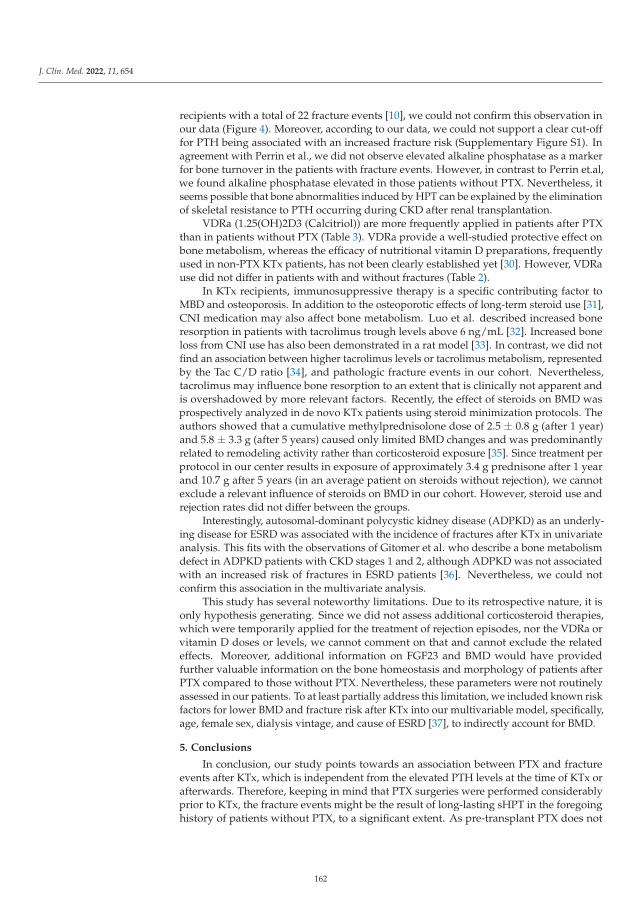
J. Clin. Med. 2022, 11, 654
recipients with a total of 22 fracture events [10], we could not confirm this observation inour data (Figure 4). Moreover, according to our data, we could not support a clear cut-offfor PTH being associated with an increased fracture risk (Supplementary Figure S1). Inagreement with Perrin et al., we did not observe elevated alkaline phosphatase as a markerfor bone turnover in the patients with fracture events. However, in contrast to Perrin et.al,we found alkaline phosphatase elevated in those patients without PTX. Nevertheless, itseems possible that bone abnormalities induced by HPT can be explained by the eliminationof skeletal resistance to PTH occurring during CKD after renal transplantation.
VDRa (1.25(OH)2D3 (Calcitriol)) are more frequently applied in patients after PTXthan in patients without PTX (Table 3). VDRa provide a well-studied protective effect onbone metabolism, whereas the efficacy of nutritional vitamin D preparations, frequentlyused in non-PTX KTx patients, has not been clearly established yet [30]. However, VDRause did not differ in patients with and without fractures (Table 2).
In KTx recipients, immunosuppressive therapy is a specific contributing factor toMBD and osteoporosis. In addition to the osteoporotic effects of long-term steroid use [31],CNI medication may also affect bone metabolism. Luo et al. described increased boneresorption in patients with tacrolimus trough levels above 6 ng/mL [32]. Increased boneloss from CNI use has also been demonstrated in a rat model [33]. In contrast, we did notfind an association between higher tacrolimus levels or tacrolimus metabolism, representedby the Tac C/D ratio [34], and pathologic fracture events in our cohort. Nevertheless,tacrolimus may influence bone resorption to an extent that is clinically not apparent andis overshadowed by more relevant factors. Recently, the effect of steroids on BMD wasprospectively analyzed in de novo KTx patients using steroid minimization protocols. Theauthors showed that a cumulative methylprednisolone dose of 2.5 ± 0.8 g (after 1 year)and 5.8 ± 3.3 g (after 5 years) caused only limited BMD changes and was predominantlyrelated to remodeling activity rather than corticosteroid exposure [35]. Since treatment perprotocol in our center results in exposure of approximately 3.4 g prednisone after 1 yearand 10.7 g after 5 years (in an average patient on steroids without rejection), we cannotexclude a relevant influence of steroids on BMD in our cohort. However, steroid use andrejection rates did not differ between the groups.
Interestingly, autosomal-dominant polycystic kidney disease (ADPKD) as an underly-ing disease for ESRD was associated with the incidence of fractures after KTx in univariateanalysis. This fits with the observations of Gitomer et al. who describe a bone metabolismdefect in ADPKD patients with CKD stages 1 and 2, although ADPKD was not associatedwith an increased risk of fractures in ESRD patients [36]. Nevertheless, we could notconfirm this association in the multivariate analysis.
This study has several noteworthy limitations. Due to its retrospective nature, it isonly hypothesis generating. Since we did not assess additional corticosteroid therapies,which were temporarily applied for the treatment of rejection episodes, nor the VDRa orvitamin D doses or levels, we cannot comment on that and cannot exclude the relatedeffects. Moreover, additional information on FGF23 and BMD would have providedfurther valuable information on the bone homeostasis and morphology of patients afterPTX compared to those without PTX. Nevertheless, these parameters were not routinelyassessed in our patients. To at least partially address this limitation, we included known riskfactors for lower BMD and fracture risk after KTx into our multivariable model, specifically,age, female sex, dialysis vintage, and cause of ESRD [37], to indirectly account for BMD.
5. Conclusions
In conclusion, our study points towards an association between PTX and fractureevents after KTx, which is independent from the elevated PTH levels at the time of KTx orafterwards. Therefore, keeping in mind that PTX surgeries were performed considerablyprior to KTx, the fracture events might be the result of long-lasting sHPT in the foregoinghistory of patients without PTX, to a significant extent. As pre-transplant PTX does not
162
J. Clin. Med. 2022, 11, 654
influence eGFR after KTx and offers protective effects on fracture risk in our study, our datasupports a more generous indication for PTX in ESRD patients with HPT waiting for KTx.
Supplementary Materials: The following supporting information can be downloaded at: https://www.mdpi.com/article/10.3390/jcm11030654/s1, Figure S1: ROC-analysis for PTH levels threemonths after KTx.
Author Contributions: U.J. and A.K. did research and wrote the paper; K.S.-N., G.T., F.W., M.S.and D.-O.W. did research and revised the paper; B.S. and H.P. revised the paper; D.G. performedstatistical analyses and revised the paper; S.R. designed the research and wrote the paper; U.J. and A.K.contributed equally. All authors have read and agreed to the published version of the manuscript.
Funding: This study was supported by a grant from Innovative Medizinische Forschung, MedicalFaculty, University of Münster, to U.J. The APC was funded by the Open Access Publication Fund ofUniversity of Münster.
Institutional Review Board Statement: This study was performed in accordance with the Declara-tion of Helsinki and the International Conference on Harmonization Good Clinical Practice guidelinesand approved by the local ethics committee (Ethik Kommission der Ärztekammer Westfalen-Lippeund der Medizinischen Fakultät der Westfälischen Wilhelms-Universität, 2014-381-f-N).
Informed Consent Statement: Informed consent was obtained from all subjects involved in the study.
Data Availability Statement: The datasets generated during and/or analyzed during the currentstudy are available from the corresponding author on reasonable request.
Conflicts of Interest: The authors have declared that no competing interest exist.
References
1. Center, J.R.; Nguyen, T.V.; Schneider, D.; Sambrook, P.N.; Eisman, J.A. Mortality after all major types of osteoporotic fracture inmen and women: An observational study. Lancet 1999, 353, 878–882. [CrossRef]
2. Hou, Y.-C.; Lu, C.-L.; Lu, K.-C. Mineral bone disorders in chronic kidney disease. Nephrology 2018, 23 (Suppl. 4), 88–94. [CrossRef][PubMed]
3. Bozkaya, G.; Nart, A.; Uslu, A.; Onman, T.; Aykas, A.; Dogan, M.; Karaca, B. Impact of calcineurin inhibitors on bone metabolismin primary kidney transplant patients. Transplant. Proc. 2008, 40, 151–155. [CrossRef] [PubMed]
4. Nitta, K.; Yajima, A.; Tsuchiya, K. Management of Osteoporosis in Chronic Kidney Disease. Intern. Med. 2017, 56, 3271–3276.[CrossRef] [PubMed]
5. Matei, A.; Bilha, S.C.; Constantinescu, D.; Pavel-Tanasa, M.; Cianga, P.; Covic, A.; Branisteanu, D.D. Body composition, adipokines,FGF23-Klotho and bone in kidney transplantation: Is there a link? J. Nephrol. 2021. Ahead of print. [CrossRef]
6. KDIGO 2017 Clinical Practice Guideline Update for the Diagnosis, Evaluation, Prevention, and Treatment of Chronic KidneyDisease-Mineral and Bone Disorder (CKD-MBD). Kidney Int. Suppl. 2017, 7, 1–59. [CrossRef]
7. Tominaga, Y.; Matsuoka, S.; Uno, N.; Sato, T. Parathyroidectomy for secondary hyperparathyroidism in the era of calcimimetics.Ther. Apher. Dial. 2008, 12 (Suppl. 1), S21–S26. [CrossRef]
8. Yeh, M.W.; Zhou, H.; Adams, A.L.; Ituarte, P.H.G.; Li, N.; Liu, I.-L.A.; Haigh, P.I. The Relationship of Parathyroidectomy andBisphosphonates with Fracture Risk in Primary Hyperparathyroidism: An Observational Study. Ann. Intern. Med. 2016, 164,715–723. [CrossRef]
9. Schütte-Nütgen, K.; Thölking, G.; Steinke, J.; Pavenstädt, H.; Schmidt, R.; Suwelack, B.; Reuter, S. Fast Tac Metabolizers at Risk—Itis Time for a C/D Ratio Calculation. J. Clin. Med. 2019, 8, 587. [CrossRef]
10. Perrin, P.; Caillard, S.; Javier, R.M.; Braun, L.; Heibel, F.; Borni-Duval, C.; Muller, C.; Olagne, J.; Moulin, B. Persistent hyper-parathyroidism is a major risk factor for fractures in the five years after kidney transplantation. Am. J. Transplant. 2013, 13,2653–2663. [CrossRef]
11. Bliuc, D.; Nguyen, N.D.; Milch, V.E.; Nguyen, T.V.; Eisman, J.A.; Center, J.R. Mortality risk associated with low-trauma osteoporoticfracture and subsequent fracture in men and women. JAMA 2009, 301, 513–521. [CrossRef]
12. Evenepoel, P.; Claes, K.; Meijers, B.; Laurent, M.R.; Bammens, B.; Naesens, M.; Sprangers, B.; Pottel, H.; Cavalier, E.; Kuypers, D.Bone mineral density, bone turnover markers, and incident fractures in de novo kidney transplant recipients. Kidney Int. 2019, 95,1461–1470. [CrossRef] [PubMed]
13. Palmer, S.C.; Chung, E.Y.; McGregor, D.O.; Bachmann, F.; Strippoli, G.F. Interventions for preventing bone disease in kidneytransplant recipients. Cochrane Database Syst. Rev. 2019, 10, CD005015. [CrossRef] [PubMed]
14. Rudser, K.D.; de Boer, I.H.; Dooley, A.; Young, B.; Kestenbaum, B. Fracture risk after parathyroidectomy among chronichemodialysis patients. J. Am. Soc. Nephrol. 2007, 18, 2401–2407. [CrossRef] [PubMed]
163
J. Clin. Med. 2022, 11, 654
15. Grotz, W.H.; Mundinger, F.A.; Gugel, B.; Exner, V.; Kirste, G.; Schollmeyer, P.J. Bone fracture and osteodensitometry with dualenergy X-ray absorptiometry in kidney transplant recipients. Transplantation 1994, 58, 912–915. [CrossRef] [PubMed]
16. O’Shaughnessy, E.A.; Dahl, D.C.; Smith, C.L.; Kasiske, B.L. Risk factors for fractures in kidney transplantation. Tranplantation2002, 74, 362–366. [CrossRef]
17. Haarhaus, M.; Evenepoel, P. Differentiating the causes of adynamic bone in advanced chronic kidney disease informs osteoporosistreatment. Kidney Int. 2021, 100, 546–558. [CrossRef]
18. Zu, Y.; Lu, X.; Song, J.; Yu, L.; Li, H.; Wang, S. Cinacalcet Treatment Significantly Improves All-Cause and Cardiovascular Survivalin Dialysis Patients: Results from a Meta-Analysis. Kidney Blood Press. Res. 2019, 44, 1327–1338. [CrossRef]
19. Moreno, P.; Coloma, A.; Torregrosa, J.V.; Montero, N.; Francos, J.; Codina, S.; Manonelles, A.; Bestard, O.; García-Barrasa, A.;Melilli, E.; et al. Long-term results of a randomized study comparing parathyroidectomy with cinacalcet for treating tertiaryhyperparathyroidism. Clin. Transplant. 2020, 34, e13988. [CrossRef]
20. Isaksson, E.; Ivarsson, K.; Akaberi, S.; Muth, A.; Sterner, G.; Karl-Göran, P.; Clyne, N.; Almquist, M. The Effect of Parathyroidec-tomy on Risk of Hip Fracture in Secondary Hyperparathyroidism. World J. Surg. 2017, 41, 2304–2311. [CrossRef]
21. Cruzado, J.M.; Moreno, P.; Torregrosa, J.V.; Taco, O.; Mast, R.; Gómez-Vaquero, C.; Polo, C.; Revuelta, I.; Francos, J.; Torras, J.; et al.A Randomized Study Comparing Parathyroidectomy with Cinacalcet for Treating Hypercalcemia in Kidney Allograft Recipientswith Hyperparathyroidism. J. Am. Soc. Nephrol. 2016, 27, 2487–2494. [CrossRef] [PubMed]
22. Evenepoel, P.; Claes, K.; Kuypers, D.; Maes, B.; Vanrenterghem, Y. Impact of parathyroidectomy on renal graft function, bloodpressure and serum lipids in kidney transplant recipients: A single centre study. Nephrol. Dial. Transplant. 2005, 20, 1714–1720.[CrossRef] [PubMed]
23. Lau, W.L.; Obi, Y.; Kalantar-Zadeh, K. Parathyroidectomy in the Management of Secondary Hyperparathyroidism. Clin. J. Am.Soc. Nephrol. 2018, 13, 952–961. [CrossRef] [PubMed]
24. Mathur, A.; Sutton, W.; Ahn, J.B.; Prescott, J.D.; Zeiger, M.A.; Segev, D.L.; McAdams-DeMarco, M. Association Between Treatmentof Secondary Hyperparathyroidism and Posttransplant Outcomes. Transplantation 2021, 105, e366–e374. [CrossRef]
25. Koh, E.Y.; van der Plas, W.Y.; Dulfer, R.R.; Pol, R.A.; Kruijff, S.; Rotmans, J.I.; Appelman-Dijkstra, N.; Schepers, A.; de Borst,M.H.; Hoorn, E.J.; et al. Outcomes of parathyroidectomy versus calcimimetics for secondary hyperparathyroidism and kidneytransplantation: A propensity-matched analysis. Langenbecks Arch. Surg. 2020, 405, 851–859. [CrossRef]
26. Dulfer, R.R.; Koh, E.Y.; van der Plas, W.Y.; Engelsman, A.F.; van Dijkum, E.J.M.N.; Pol, R.A.; Vogt, L.; de Borst, M.H.; Kruijff, S.;Schepers, A.; et al. Parathyroidectomy versus cinacalcet for tertiary hyperparathyroidism; a retrospective analysis. LangenbecksArch. Surg. 2019, 404, 71–79. [CrossRef]
27. Finnerty, B.M.; Chan, T.W.; Jones, G.; Khader, T.; Moore, M.; Gray, K.D.; Beninato, T.; Watkins, A.C.; Zarnegar, R.; Fahey, T.J.Parathyroidectomy versus Cinacalcet in the Management of Tertiary Hyperparathyroidism: Surgery Improves Renal TransplantAllograft Survival. Surgery 2019, 165, 129–134. [CrossRef]
28. Delos Santos, R.; Rossi, A.; Coyne, D.; Maw, T.T. Management of Post-transplant Hyperparathyroidism and Bone Disease. Drugs2019, 79, 501–513. [CrossRef]
29. KDIGO clinical practice guideline for the diagnosis, evaluation, prevention, and treatment of Chronic Kidney Disease-Mineraland Bone Disorder (CKD-MBD). Kidney Int. Suppl. 2009, 76, S1–S2. [CrossRef]
30. Kramer, H.; Berns, J.S.; Choi, M.J.; Martin, K.; Rocco, M.V. 25-Hydroxyvitamin D testing and supplementation in CKD: AnNKF-KDOQI controversies report. Am. J. Kidney Dis. 2014, 64, 499–509. [CrossRef]
31. Buckley, L.; Humphrey, M.B. Glucocorticoid-Induced Osteoporosis. N. Engl. J. Med. 2018, 379, 2547–2556. [CrossRef] [PubMed]32. Luo, L.; Shi, Y.; Bai, Y.; Zou, Y.; Cai, B.; Tao, Y.; Lin, T.; Wang, L. Impact of tacrolimus on bone metabolism after kidney
transplantation. Int. Immunopharmacol. 2012, 13, 69–72. [CrossRef] [PubMed]33. Kanda, J.; Izumo, N.; Furukawa, M.; Shimakura, T.; Yamamoto, N.; Takahashi, H.E.; Asakura, T.; Wakabayashi, H. Effects of
the calcineurin inhibitors cyclosporine and tacrolimus on bone metabolism in rats. Biomed. Res. 2018, 39, 131–139. [CrossRef][PubMed]
34. Schutte-Nutgen, K.; Tholking, G.; Suwelack, B.; Reuter, S. Tacrolimus—Pharmacokinetic Considerations for Clinicians. Curr.Drug Metab. 2018, 19, 342–350. [CrossRef]
35. Evenepoel, P.; Claes, K.; Meijers, B.; Laurent, M.R.; Bammens, B.; Naesens, M.; Sprangers, B.; Cavalier, E.; Kuypers, D. Naturalhistory of mineral metabolism, bone turnover and bone mineral density in de novo renal transplant recipients treated with asteroid minimization immunosuppressive protocol. Nephrol. Dial. Transplant. 2020, 35, 697–705. [CrossRef]
36. Gitomer, B.; Pereira, R.; Salusky, I.B.; Stoneback, J.W.; Isakova, T.; Cai, X.; Dalrymple, L.S.; Ofsthun, N.; You, Z.; Malluche, H.H.;et al. Mineral bone disease in autosomal dominant polycystic kidney disease. Kidney Int. 2021, 99, 977–985. [CrossRef]
37. Iseri, K.; Carrero, J.J.; Evans, M.; Felländer-Tsai, L.; Berg, H.E.; Runesson, B.; Stenvinkel, P.; Lindholm, B.; Qureshi, A.R. Fracturesafter kidney transplantation: Incidence, predictors, and association with mortality. Bone 2020, 140, 115554. [CrossRef]
164
Citation: El-Bandar, N.; Lerchbaumer,
M.H.; Peters, R.; Maxeiner, A.; Kotsch,
K.; Sattler, A.; Miller, K.; Schlomm, T.;
Hamm, B.; Budde, K.; et al. Kidney
Perfusion in Contrast-Enhanced
Ultrasound (CEUS) Correlates with
Renal Function in Living Kidney
Donors. J. Clin. Med. 2022, 11, 791.
https://doi.org/10.3390/jcm11030791
Academic Editors:
Wisit Cheungpasitporn,
Charat Thongprayoon and
Wisit Kaewput
Received: 26 December 2021
Accepted: 30 January 2022
Published: 1 February 2022
Publisher’s Note: MDPI stays neutral
with regard to jurisdictional claims in
published maps and institutional affil-
iations.
Copyright: © 2022 by the authors.
Licensee MDPI, Basel, Switzerland.
This article is an open access article
distributed under the terms and
conditions of the Creative Commons
Attribution (CC BY) license (https://
creativecommons.org/licenses/by/
4.0/).
Journal of
Clinical Medicine
Article
Kidney Perfusion in Contrast-Enhanced Ultrasound (CEUS)Correlates with Renal Function in Living Kidney Donors
Nasrin El-Bandar 1,†, Markus H. Lerchbaumer 2,†, Robert Peters 1, Andreas Maxeiner 1, Katja Kotsch 3,
Arne Sattler 3, Kurt Miller 1, Thorsten Schlomm 1, Bernd Hamm 2, Klemens Budde 4, Lutz Liefeldt 4,
Thomas Fischer 2 and Frank Friedersdorff 1,5,*
1 Department of Urology, Charité–Universitätsmedizin Berlin, Corporate Member of Freie Universität Berlin,Humboldt-Universität zu Berlin and Berlin Institute of Health, 10117 Berlin, Germany;[email protected] (N.E.-B.); [email protected] (R.P.); [email protected] (A.M.);[email protected] (K.M.); [email protected] (T.S.)
2 Department of Radiology, Charité–Universitätsmedizin Berlin, Corporate Member of Freie Universität Berlin,Humboldt-Universität zu Berlin and Berlin Institute of Health, 10117 Berlin, Germany;[email protected] (M.H.L.); [email protected] (B.H.); [email protected] (T.F.)
3 Department of General, Visceral and Vascular Surgery, Charité–Universitätsmedizin Berlin, CorporateMember of Freie Universität Berlin, Humboldt-Universität zu Berlin and Berlin Institute of Health,10117 Berlin, Germany; [email protected] (K.K.); [email protected] (A.S.)
4 Department of Nephrology and Internal Intensive Care Medicine, Charité–Universitätsmedizin Berlin,Corporate Member of Freie Universität Berlin, Humboldt-Universität zu Berlin and Berlin Institute of Health,10117 Berlin, Germany; [email protected] (K.B.); [email protected] (L.L.)
5 Department of Urology, Evangelisches Krankenhaus Königin Elisabeth Herzberge, 10365 Berlin, Germany* Correspondence: [email protected]† These authors contributed equally to this work.
Abstract: Contrast-enhanced ultrasound (CEUS) is a widely used diagnostic tool for analyzingperfusion and characterizing lesions in several organs. However, to date, it has not been sufficientlyinvestigated whether there is an association between CEUS findings and kidney function. This studyaimed at identifying the potential relationship between kidney function and the renal perfusion statusdetermined by CEUS in living kidney donors. A total of 30 living kidney donors examined betweenApril 2018 and March 2020 were included in the study. All patients underwent various diagnosticprocedures for evaluation of renal function. CEUS was performed in all 30 donors one day beforenephrectomy. Kidney perfusion was quantified using a postprocessing tool (VueBox, Bracco Imaging).Various perfusion parameters were subsequently analyzed and compared with the results of theother methods used to evaluate kidney function. Of all parameters, mean signal intensity (MeanLin)had the strongest correlation, showing significant correlations with eGFR (CG) (r = −0.345; p = 0.007)and total kidney volume (r = −0.409; p = 0.001). While there was no significant correlation betweenany perfusion parameter and diethylenetriaminepentaacetic acid (DTPA), we detected a significantcorrelation between MeanLin and DTPA (r = −0.502; p = 0.005) in the subgroup of normal-weightdonors. The results indicate that signal intensity in CEUS is associated with kidney function innormal-weight individuals. Body mass index (BMI) may be a potential confounder of signal intensityin CEUS. Thus, more research is needed to confirm these results in larger study populations.
Keywords: Contrast-enhanced ultrasound; kidney perfusion; kidney function; kidney transplanta-tion; kidney donation
1. Introduction
Evaluation of kidney function is crucial in living donor candidates, who should notbe exposed to avoidable health impairments. The Amsterdam Guidelines recommend aglomerular filtration rate (GFR) ≥80 as an essential prerequisite for living kidney dona-tion [1]. Accurate assessment and verification of adequate kidney function is essential
J. Clin. Med. 2022, 11, 791. https://doi.org/10.3390/jcm11030791 https://www.mdpi.com/journal/jcm165
J. Clin. Med. 2022, 11, 791
during evaluation of a potential kidney donor [1]. Several methods are currently in clinicaluse for assessment of kidney function with differences in accuracy, complexity and dura-tion [2]. However, accurate assessment of kidney function is not only needed in the contextof living kidney donation. More importantly, it is needed whenever impairment of kidneyfunction is suspected.
In routine clinical practice, the most frequently used method is measurement ofserum creatinine. Determination of serum creatinine for assessment of renal function islimited by the fact that an increase only becomes evident after 50 % of kidney functionis lost [2]. Estimated glomerular filtration rate (eGFR) is also widely used and providesa more accurate assessment of kidney function using one of the established formulas,such as “modification of diet in renal disease“ (MDRD), “Cockcroft–Gault“ (CG) or the“chronic kidney disease epidemiology collaboration equation“ (CKD-EPI) [3–6]. Especiallyin the context of living kidney donation, use of an estimation formula for assessing kidneyfunction is widely considered as imprecise and not appropriate [1,7–10]. Radioisotopictechniques provide more accurate information on kidney function and are widely usedto measure split and total renal function [10,11]. Radiotracers that are used as exogenousfiltration markers to measure GFR include 51Cr-ethylenediaminetetraacetic acid (EDTA),99mTc-diethylenetriaminepentaacetic acid (DTPA), 99mTc-mercaptoacetyltriglycine (MAG3)and 125I-iothalamate [2,10].
Besides the widely used and established methods for the evaluation of kidney func-tion, various imaging techniques have been reported to significantly correlate with kidneyfunction—including measurement of cortical volume or total kidney volume on computedtomography (CT), measurement of kidney length in ultrasound (US) and assessment of kid-ney function in dynamic contrast-enhanced magnetic resonance imaging (MRI) [10,12–14].However, it has not been sufficiently investigated if there is a relationship between kidneyperfusion in contrast-enhanced US (CEUS) and kidney function. Since hyperperfusion canbe considered an early sign of glomerular injury, kidney perfusion in CEUS could possiblyprovide information for detection of early kidney injury—especially when kidney functionappears to be normal [15–17]. Thus, a proportion of the patients may be spared an invasiveprocedure for histological confirmation of kidney injury.
To date, CEUS has been primarily performed to characterize focal renal lesions andassess perfusion patterns based on microvascularization following administration of astrictly intravascular contrast agent [18,19]. Since CEUS has not yet been sufficientlyinvestigated in the context of whole-organ perfusion and kidney function, this pilot studywas conducted to analyze the potential relationship between kidney function and CEUS inliving kidney donors.
2. Material and Methods
2.1. Study Design and Patient Population
The study was designed as a feasibility study to investigate a potential relationshipbetween kidney function and kidney perfusion in CEUS. For this reason, 30 living kidneydonors underwent CEUS one day prior to donor nephrectomy. Overall, 60 kidneys wereexamined between April 2018 and March 2020. The study was approved by the local institu-tional review board (Ethical Committee of Charité Universitätsmedizin Berlin) (EA1/406/16)and conformed to the amended Declaration of Helsinki. All donors were informed aboutthe procedure and possible risks 24 h before the examination and provided written informedconsent. The results of this study were not used to guide clinical management.
All living kidney donor candidates invariably undergo evaluation of total and splitrenal function using radioisotopic techniques prior to nephrectomy in our hospital. DTPAclearance was determined for assessment of total kidney function and MAG3-scintigraphywas used for evaluation of split renal function. Additional examination of kidney perfu-sion by CEUS enabled a direct comparison between CEUS-derived perfusion parametersand various established methods for evaluation of kidney function in individuals withhealthy kidneys.
166
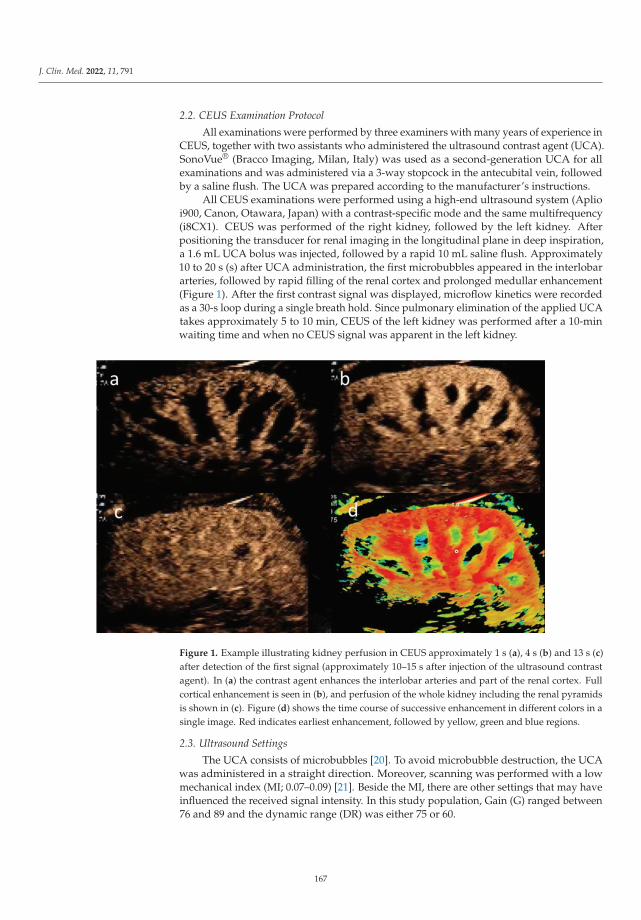
J. Clin. Med. 2022, 11, 791
2.2. CEUS Examination Protocol
All examinations were performed by three examiners with many years of experience inCEUS, together with two assistants who administered the ultrasound contrast agent (UCA).SonoVue® (Bracco Imaging, Milan, Italy) was used as a second-generation UCA for allexaminations and was administered via a 3-way stopcock in the antecubital vein, followedby a saline flush. The UCA was prepared according to the manufacturer’s instructions.
All CEUS examinations were performed using a high-end ultrasound system (Aplioi900, Canon, Otawara, Japan) with a contrast-specific mode and the same multifrequency(i8CX1). CEUS was performed of the right kidney, followed by the left kidney. Afterpositioning the transducer for renal imaging in the longitudinal plane in deep inspiration,a 1.6 mL UCA bolus was injected, followed by a rapid 10 mL saline flush. Approximately10 to 20 s (s) after UCA administration, the first microbubbles appeared in the interlobararteries, followed by rapid filling of the renal cortex and prolonged medullar enhancement(Figure 1). After the first contrast signal was displayed, microflow kinetics were recordedas a 30-s loop during a single breath hold. Since pulmonary elimination of the applied UCAtakes approximately 5 to 10 min, CEUS of the left kidney was performed after a 10-minwaiting time and when no CEUS signal was apparent in the left kidney.
Figure 1. Example illustrating kidney perfusion in CEUS approximately 1 s (a), 4 s (b) and 13 s (c)after detection of the first signal (approximately 10–15 s after injection of the ultrasound contrastagent). In (a) the contrast agent enhances the interlobar arteries and part of the renal cortex. Fullcortical enhancement is seen in (b), and perfusion of the whole kidney including the renal pyramidsis shown in (c). Figure (d) shows the time course of successive enhancement in different colors in asingle image. Red indicates earliest enhancement, followed by yellow, green and blue regions.
2.3. Ultrasound Settings
The UCA consists of microbubbles [20]. To avoid microbubble destruction, the UCAwas administered in a straight direction. Moreover, scanning was performed with a lowmechanical index (MI; 0.07–0.09) [21]. Beside the MI, there are other settings that may haveinfluenced the received signal intensity. In this study population, Gain (G) ranged between76 and 89 and the dynamic range (DR) was either 75 or 60.
167
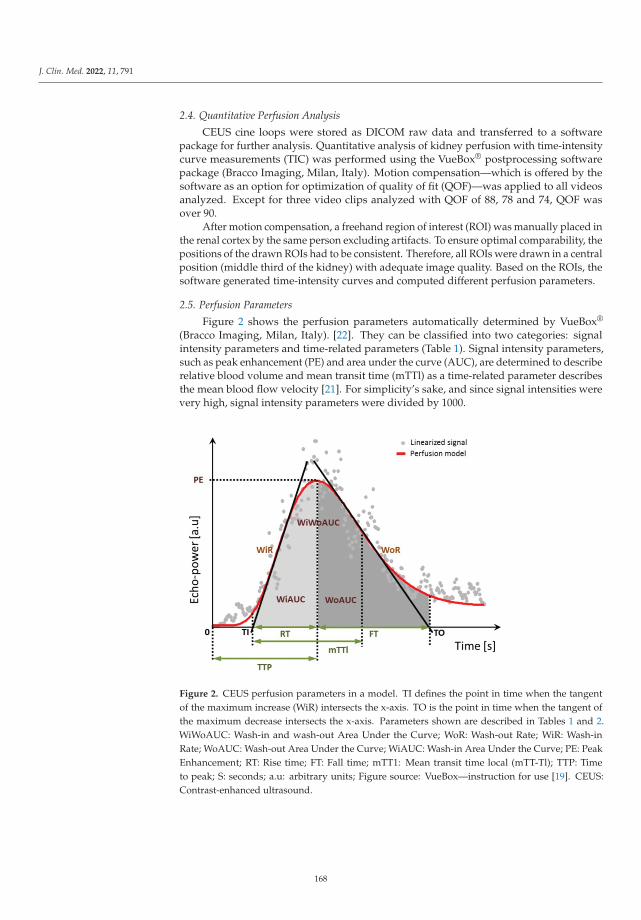
J. Clin. Med. 2022, 11, 791
2.4. Quantitative Perfusion Analysis
CEUS cine loops were stored as DICOM raw data and transferred to a softwarepackage for further analysis. Quantitative analysis of kidney perfusion with time-intensitycurve measurements (TIC) was performed using the VueBox® postprocessing softwarepackage (Bracco Imaging, Milan, Italy). Motion compensation—which is offered by thesoftware as an option for optimization of quality of fit (QOF)—was applied to all videosanalyzed. Except for three video clips analyzed with QOF of 88, 78 and 74, QOF wasover 90.
After motion compensation, a freehand region of interest (ROI) was manually placed inthe renal cortex by the same person excluding artifacts. To ensure optimal comparability, thepositions of the drawn ROIs had to be consistent. Therefore, all ROIs were drawn in a centralposition (middle third of the kidney) with adequate image quality. Based on the ROIs, thesoftware generated time-intensity curves and computed different perfusion parameters.
2.5. Perfusion Parameters
Figure 2 shows the perfusion parameters automatically determined by VueBox®
(Bracco Imaging, Milan, Italy). [22]. They can be classified into two categories: signalintensity parameters and time-related parameters (Table 1). Signal intensity parameters,such as peak enhancement (PE) and area under the curve (AUC), are determined to describerelative blood volume and mean transit time (mTTl) as a time-related parameter describesthe mean blood flow velocity [21]. For simplicity’s sake, and since signal intensities werevery high, signal intensity parameters were divided by 1000.
Figure 2. CEUS perfusion parameters in a model. TI defines the point in time when the tangentof the maximum increase (WiR) intersects the x-axis. TO is the point in time when the tangent ofthe maximum decrease intersects the x-axis. Parameters shown are described in Tables 1 and 2.WiWoAUC: Wash-in and wash-out Area Under the Curve; WoR: Wash-out Rate; WiR: Wash-inRate; WoAUC: Wash-out Area Under the Curve; WiAUC: Wash-in Area Under the Curve; PE: PeakEnhancement; RT: Rise time; FT: Fall time; mTT1: Mean transit time local (mTT-Tl); TTP: Timeto peak; S: seconds; a.u: arbitrary units; Figure source: VueBox—instruction for use [19]. CEUS:Contrast-enhanced ultrasound.
168
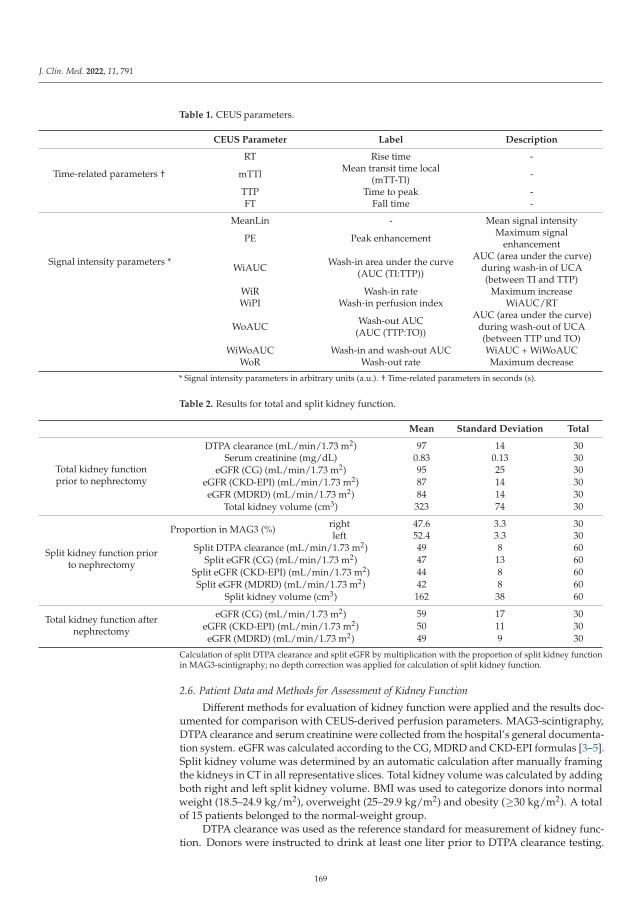
J. Clin. Med. 2022, 11, 791
Table 1. CEUS parameters.
CEUS Parameter Label Description
Time-related parameters †
RT Rise time -
mTTl Mean transit time local(mTT-Tl) -
TTP Time to peak -FT Fall time -
Signal intensity parameters *
MeanLin - Mean signal intensity
PE Peak enhancement Maximum signalenhancement
WiAUC Wash-in area under the curve(AUC (TI:TTP))
AUC (area under the curve)during wash-in of UCA(between TI and TTP)
WiR Wash-in rate Maximum increaseWiPI Wash-in perfusion index WiAUC/RT
WoAUC Wash-out AUC(AUC (TTP:TO))
AUC (area under the curve)during wash-out of UCA(between TTP und TO)
WiWoAUC Wash-in and wash-out AUC WiAUC + WiWoAUCWoR Wash-out rate Maximum decrease
* Signal intensity parameters in arbitrary units (a.u.). † Time-related parameters in seconds (s).
Table 2. Results for total and split kidney function.
Mean Standard Deviation Total
Total kidney functionprior to nephrectomy
DTPA clearance (mL/min/1.73 m2) 97 14 30Serum creatinine (mg/dL) 0.83 0.13 30
eGFR (CG) (mL/min/1.73 m2) 95 25 30eGFR (CKD-EPI) (mL/min/1.73 m2) 87 14 30eGFR (MDRD) (mL/min/1.73 m2) 84 14 30
Total kidney volume (cm3) 323 74 30
Split kidney function priorto nephrectomy
Proportion in MAG3 (%) right 47.6 3.3 30left 52.4 3.3 30
Split DTPA clearance (mL/min/1.73 m2) 49 8 60Split eGFR (CG) (mL/min/1.73 m2) 47 13 60
Split eGFR (CKD-EPI) (mL/min/1.73 m2) 44 8 60Split eGFR (MDRD) (mL/min/1.73 m2) 42 8 60
Split kidney volume (cm3) 162 38 60
Total kidney function afternephrectomy
eGFR (CG) (mL/min/1.73 m2) 59 17 30eGFR (CKD-EPI) (mL/min/1.73 m2) 50 11 30eGFR (MDRD) (mL/min/1.73 m2) 49 9 30
Calculation of split DTPA clearance and split eGFR by multiplication with the proportion of split kidney functionin MAG3-scintigraphy; no depth correction was applied for calculation of split kidney function.
2.6. Patient Data and Methods for Assessment of Kidney Function
Different methods for evaluation of kidney function were applied and the results doc-umented for comparison with CEUS-derived perfusion parameters. MAG3-scintigraphy,DTPA clearance and serum creatinine were collected from the hospital’s general documenta-tion system. eGFR was calculated according to the CG, MDRD and CKD-EPI formulas [3–5].Split kidney volume was determined by an automatic calculation after manually framingthe kidneys in CT in all representative slices. Total kidney volume was calculated by addingboth right and left split kidney volume. BMI was used to categorize donors into normalweight (18.5–24.9 kg/m2), overweight (25–29.9 kg/m2) and obesity (≥30 kg/m2). A totalof 15 patients belonged to the normal-weight group.
DTPA clearance was used as the reference standard for measurement of kidney func-tion. Donors were instructed to drink at least one liter prior to DTPA clearance testing.
169

J. Clin. Med. 2022, 11, 791
DTPA clearance was determined using the Fleming formula [23]. MAG3 scintigraphy wasperformed to determine the proportion of split renal function for each kidney based ontubular extraction rate (TER) according to Bubeck [24]. Split DTPA clearance was calculatedby multiplying the proportion of split kidney function derived from MAG3-scintigraphywith absolute DTPA clearance. Split eGFR was also calculated by multiplication with theresult of MAG3-scintigraphy.
2.7. Statistical Analysis
First, established methods for evaluation of total kidney function prior to nephrectomywere compared with each other as a basis for comparing the results of these methods withCEUS-derived parameters and determining the degree of correlation. We analyzed whetherCEUS parameters were related to (1) total kidney function prior to nephrectomy, (2) splitkidney function prior to nephrectomy and (3) total kidney function after nephrectomy.For analysis of a potential relationship between CEUS parameters and postoperativetotal kidney function, CEUS parameters derived from the retained kidney before donornephrectomy were used. Finally, confounders that could have an influence on CEUSparameters were analyzed. To investigate potential relationships between kidney functionand renal perfusion in CEUS, Pearson correlations were carried out. Descriptive results arepresented as mean +/− standard deviation.
A two-sided significance level of α = 0.05 was defined to indicate statistical signif-icance. All statistical analyses were performed using the SPSS software package (IBMCorp. Released 2016. IBM SPSS Statistics for Windows, Version 26.0. Armonk, NY, USA:IBM Corp.).
3. Results
3.1. Epidemiology and Descriptive Presentation of Kidney Function Data
Donors had a mean age of 54 +/− 9 years with a range of 37–75. The majority werefemale (76.7%), and mean BMI in the study population was 26 kg/m2 (+/−4 kg/m2).
Table 2 provides an overview of the kidney function tests performed both before andafter nephrectomy. Prior to nephrectomy, mean DTPA clearance was 97 mL/min/1.73 m2
(+/−14). Estimation of GFR yielded lower values than DTPA clearance. Among allestimation formulas, the CG formula yielded the mean value closest to that obtained bydetermination of DTPA clearance; however, scatter was also greatest with a standarddeviation of 25 mL/min/1.73 m2.
3.2. CEUS Parameters
Table 3 compiles the CEUS-derived values assessing signal intensity and time. Overall,there was large scatter of signal intensity parameters. All signal intensity parameterscorrelated strongly and significantly with MeanLin as a representative signal intensityparameter (r = 0.930 to r = 0.984; p < 0.001). In addition, CEUS-derived, time-relatedparameters also showed strong and significant correlation with each other. For correlationof time-related parameters, rise time (RT)—as a marker of arterial inflow—was chosen as arepresentative parameter.
170
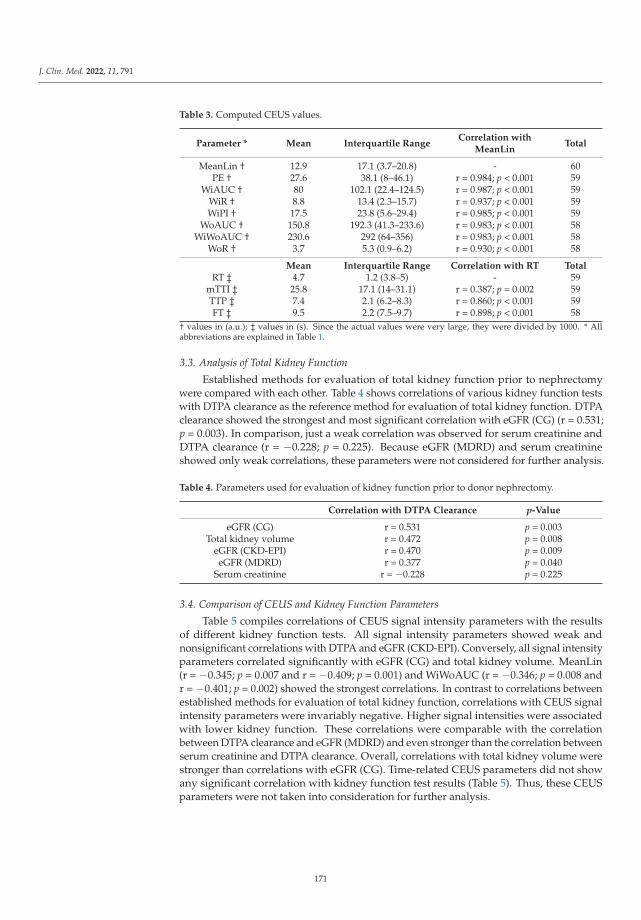
J. Clin. Med. 2022, 11, 791
Table 3. Computed CEUS values.
Parameter * Mean Interquartile RangeCorrelation with
MeanLinTotal
MeanLin † 12.9 17.1 (3.7–20.8) - 60PE † 27.6 38.1 (8–46.1) r = 0.984; p < 0.001 59
WiAUC † 80 102.1 (22.4–124.5) r = 0.987; p < 0.001 59WiR † 8.8 13.4 (2.3–15.7) r = 0.937; p < 0.001 59WiPI † 17.5 23.8 (5.6–29.4) r = 0.985; p < 0.001 59
WoAUC † 150.8 192.3 (41.3–233.6) r = 0.983; p < 0.001 58WiWoAUC † 230.6 292 (64–356) r = 0.983; p < 0.001 58
WoR † 3.7 5.3 (0.9–6.2) r = 0.930; p < 0.001 58
Mean Interquartile Range Correlation with RT TotalRT ‡ 4.7 1.2 (3.8–5) - 59
mTTI ‡ 25.8 17.1 (14–31.1) r = 0.387; p = 0.002 59TTP ‡ 7.4 2.1 (6.2–8.3) r = 0.860; p < 0.001 59FT ‡ 9.5 2.2 (7.5–9.7) r = 0.898; p < 0.001 58
† values in (a.u.); ‡ values in (s). Since the actual values were very large, they were divided by 1000. * Allabbreviations are explained in Table 1.
3.3. Analysis of Total Kidney Function
Established methods for evaluation of total kidney function prior to nephrectomywere compared with each other. Table 4 shows correlations of various kidney function testswith DTPA clearance as the reference method for evaluation of total kidney function. DTPAclearance showed the strongest and most significant correlation with eGFR (CG) (r = 0.531;p = 0.003). In comparison, just a weak correlation was observed for serum creatinine andDTPA clearance (r = −0.228; p = 0.225). Because eGFR (MDRD) and serum creatinineshowed only weak correlations, these parameters were not considered for further analysis.
Table 4. Parameters used for evaluation of kidney function prior to donor nephrectomy.
Correlation with DTPA Clearance p-Value
eGFR (CG) r = 0.531 p = 0.003Total kidney volume r = 0.472 p = 0.008
eGFR (CKD-EPI) r = 0.470 p = 0.009eGFR (MDRD) r = 0.377 p = 0.040
Serum creatinine r = −0.228 p = 0.225
3.4. Comparison of CEUS and Kidney Function Parameters
Table 5 compiles correlations of CEUS signal intensity parameters with the resultsof different kidney function tests. All signal intensity parameters showed weak andnonsignificant correlations with DTPA and eGFR (CKD-EPI). Conversely, all signal intensityparameters correlated significantly with eGFR (CG) and total kidney volume. MeanLin(r = −0.345; p = 0.007 and r = −0.409; p = 0.001) and WiWoAUC (r = −0.346; p = 0.008 andr = −0.401; p = 0.002) showed the strongest correlations. In contrast to correlations betweenestablished methods for evaluation of total kidney function, correlations with CEUS signalintensity parameters were invariably negative. Higher signal intensities were associatedwith lower kidney function. These correlations were comparable with the correlationbetween DTPA clearance and eGFR (MDRD) and even stronger than the correlation betweenserum creatinine and DTPA clearance. Overall, correlations with total kidney volume werestronger than correlations with eGFR (CG). Time-related CEUS parameters did not showany significant correlation with kidney function test results (Table 5). Thus, these CEUSparameters were not taken into consideration for further analysis.
171

J. Clin. Med. 2022, 11, 791
Table 5. Correlation of CEUS parameters with different methods for evaluation of preoperative totalkidney function.
Correlationwith DTPA
Correlationwith eGFR(CKD-EPI)
Correlationwith eGFR (CG)
Correlationwith Total
Kidney Volume
MeanLin r = −0.170;p = 0.194
r = −0.179;p = 0.172
r = −0.345;p = 0.007
r = −0.409;p = 0.001
PE r = −0.162;p = 0.221
r = −0.182;p = 0.169
r = −0.322;p = 0.013
r = −0.392;p = 0.002
WiAUC r = −0.189;p = 0.152
r = −0.214;p = 0.104
r = −0.339;p = 0.009
r = −0.402;p = 0.002
WiR r = −0.112;p = 0.399
r = −0.111;p = 0.401
r = −0.274;p = 0.036
r = −0.357;p = 0.005
WiPI r = −0.160;p = 0.225
r = −0.177;p = 0.179
r = −0.319;p = 0.014
r = −0.391;p = 0.014
WoAUC r = −0.174;p = 0.192
r = −0.197;p = 0.138
r = −0.321;p = 0.014
r = −0.403;p = 0.002
WiWoAUC r = −0.160;p = 0.229
r = −0.214;p = 0.106
r = −0.346;p = 0.008
r = −0.401;p = 0.002
WoR r = −0.123;p = 0.356
r = −0.155;p = 0.245
r = −0.306;p = 0.019
r = −0.355;p = 0.006
RT r = 0.037;p = 0.782
r = −0.118;p = 0.374
r = −0.084;p = 0.528
r = −0.018;p = 0.893
mTTl r = −0.160;p = 0.226
r = 0.024;p = 0.860
r = 0.045;p = 0.733
r = −0.015;p = 0.913
TTP r = −0.007;p = 0.959
r = −0.216;p = 0.100
r = −0.178;p = 0.178
r = −0.092;p = 0.489
FT r = 0.113;p = 0.398
r = −0.105;p = 0.433
r = −0.047;p = 0.724
r = −0.013;p = 0.923
The strongest correlations are indicated in bold. MeanLin—analyzed as a representative parameter of signalintensity—shows the strongest correlations as a representative parameter of signal intensity.
In the assessment of preoperative split kidney function, split kidney volume and spliteGFR (CG) also correlated with signal intensity parameters in CEUS (Table 6). Similarly,postoperative kidney function—to be precise eGFR (CG)—significantly correlated withCEUS intensity parameters of the remaining kidney (Table 6). For both preoperative splitkidney function and postoperative kidney function correlation values were close to thosefor total kidney function.
Table 6. Correlation of CEUS-based signal intensity parameters with preoperative split kidneyfunction and postoperative kidney function in donors.
Correlationwith Split
DTPA
Correlationwith Split eGFR
(CKD-EPI)
Correlationwith Split eGFR
(CG)
Correlationwith Split
Kidney Volume
Preoperative split kidney function
MeanLin r = −0.150;p = 0.253
r = −0.176;p = 0.179
r = −0.331;p = 0.010
r = −0.398;p = 0.002
WiWoAUC r = −0.151;p = 0.258
r = −0.216;p = 0.104
r = −0.338;p = 0.009
r = −0.389;p = 0.003
Postoperative kidney function
MeanLin n.A. r = −0.133;p = 0.483
r = −0.399;p = 0.029
n.A.
WiWoAUC n.A. r = −0.148;p = 0.436
r = −0.393;p = 0.032
n.A.
The strongest correlations are indicated in bold. n.A.: not available.
172
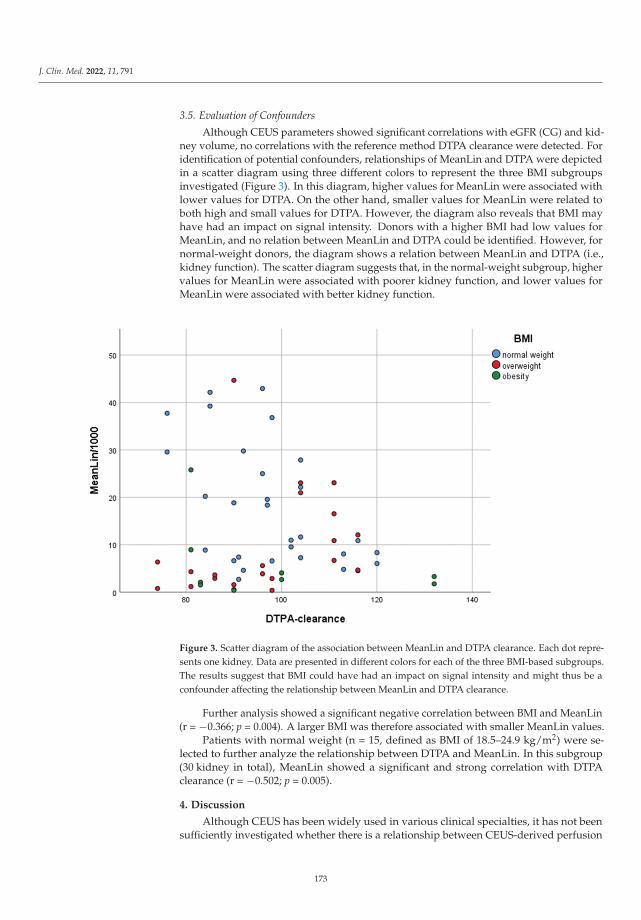
J. Clin. Med. 2022, 11, 791
3.5. Evaluation of Confounders
Although CEUS parameters showed significant correlations with eGFR (CG) and kid-ney volume, no correlations with the reference method DTPA clearance were detected. Foridentification of potential confounders, relationships of MeanLin and DTPA were depictedin a scatter diagram using three different colors to represent the three BMI subgroupsinvestigated (Figure 3). In this diagram, higher values for MeanLin were associated withlower values for DTPA. On the other hand, smaller values for MeanLin were related toboth high and small values for DTPA. However, the diagram also reveals that BMI mayhave had an impact on signal intensity. Donors with a higher BMI had low values forMeanLin, and no relation between MeanLin and DTPA could be identified. However, fornormal-weight donors, the diagram shows a relation between MeanLin and DTPA (i.e.,kidney function). The scatter diagram suggests that, in the normal-weight subgroup, highervalues for MeanLin were associated with poorer kidney function, and lower values forMeanLin were associated with better kidney function.
Figure 3. Scatter diagram of the association between MeanLin and DTPA clearance. Each dot repre-sents one kidney. Data are presented in different colors for each of the three BMI-based subgroups.The results suggest that BMI could have had an impact on signal intensity and might thus be aconfounder affecting the relationship between MeanLin and DTPA clearance.
Further analysis showed a significant negative correlation between BMI and MeanLin(r = −0.366; p = 0.004). A larger BMI was therefore associated with smaller MeanLin values.
Patients with normal weight (n = 15, defined as BMI of 18.5–24.9 kg/m2) were se-lected to further analyze the relationship between DTPA and MeanLin. In this subgroup(30 kidney in total), MeanLin showed a significant and strong correlation with DTPAclearance (r = −0.502; p = 0.005).
4. Discussion
Although CEUS has been widely used in various clinical specialties, it has not beensufficiently investigated whether there is a relationship between CEUS-derived perfusion
173
J. Clin. Med. 2022, 11, 791
and kidney function. To our knowledge, this is the first standardized and prospectivestudy to analyze the potential relationship between kidney function and CEUS-basedperfusion parameters in individuals with healthy kidneys. Our study revealed signifi-cant correlations between different methods for evaluating kidney function and CEUSsignal intensity parameters. However, no correlations were identified with time-relatedCEUS parameters. MeanLin was analyzed as a representative signal intensity parameterand showed the strongest correlations, which were similar for preoperative total kidneyfunction, preoperative split kidney function and postoperative kidney function.
Significant correlations were only identified for total kidney volume and eGFR (CG),but not for the reference method—DTPA clearance. Because of the importance of thecorrelation between CEUS and the reference method for evaluation of kidney function, weanalyzed potential confounders for their effects on the relation between DTPA clearanceand signal intensity in CEUS.
Since greater penetration depth can attenuate the signal in CEUS, BMI was analyzedas a potential confounder [21]. Indeed, there was a strong correlation between MeanLinand DTPA clearance (r = −0.502; p = 0.005) in the normal-weight subgroup.
While MeanLin did not correlate significantly with DTPA clearance in the total studypopulation, it showed significant correlation with eGFR (CG). The estimation formula usedfor calculation of eGFR (CG) is the only formula that incorporates information on bodyweight [5]. This may explain why MeanLin, as a parameter that can be influenced by BMIand thus by body weight, was found to significantly correlate with eGFR (CG).
There was a large scatter for all signal intensity parameters. BMI and kidney depthmay have contributed to the large scatter. However, the failure to use consistent USsystem settings may also have contributed to differences in signal intensities. Mechanicalindex (MI), frames per second (fps), gain (G) and dynamic range (DR) varied between theCEUS examinations performed in our study population. The fact that ultrasound systemsettings, in general, affect signal intensity, and may both attenuate and enhance it, hamperscomparison of absolute signal intensities [21,25].
Participation of three different examiners may also have contributed to the observedvariability in signal intensities. Both inter- and intra-observer variability have been de-scribed for CEUS before [26]. However, the fact that CEUS was performed by differentexaminers alone cannot explain the large scatter.
Another potential confounder of signal intensity is the amount of fluid intake prior toa CEUS examination. In our hospital, patients scheduled for radioisotopic measurement areinstructed to drink one liter of water before the examination since the amount of drinkingmay influence results. In contrast, no recommendation was made regarding fluid intakeprior to the CEUS examination in this pilot study. As a result, fluid intake may haveinfluenced signal intensities in CEUS.
According to our results, kidney volume may also influence signal intensities in CEUS.A large kidney appears to attenuate the CEUS signal. The underlying mechanism shouldbe addressed in future studies.
To our knowledge, two studies have been published that investigated possible associ-ations between renal function and perfusion in CEUS [17,27]. Both studies were conductedin patients with diabetic kidney disease (DKD) in comparison to control groups. Similarto our study, patient groups were small, with 33 and 55 patients with diabetic nephropa-thy. One of these studies, conducted by Ma et al., showed a positive correlation betweenGFR and the area under the curve (AUC) determined as a signal intensity parameter inCEUS [27]. Wang et al. also reported a significantly increased area under the ascendingcurve for patients with early-stage DKD (eGFR (MDRD) ≥90 mL/min/1.73 m2) comparedto patients with moderate DKD (30–90 mL/min/1.73 m2) [17]. In contrast, our resultsshowed a negative correlation between kidney function and CEUS-derived signal inten-sity parameters. However, we only investigated kidney function in individuals withoutunderlying kidney disease, while the two earlier studies analyzed kidney function andCEUS-based perfusion in patients with DKD.
174

J. Clin. Med. 2022, 11, 791
Future studies should consider comparison of absolute values with scintigraphic re-sults as presented by Krumm et al. for contrast-enhanced MRI [27]. In general, ultrasoundcontrast agents are associated with very low adverse event rates and do not interact withrenal function or lead to contrast-agent nephropathy [28]. Moreover, microbubble-basedcontrast agents do not interact with thyroid function as they do not contain iodine. Ul-trasound contrast agents are proven as strictly intravascular, allowing the assessment oforgan perfusion on microcirculation level. [21] This advantage, combined with a dynamicexamination, settles a further argument for CEUS compared to CT and MRI, since iodinatedand gadolinium-based contrast media are known to be not strictly intravascular. Never-theless, CEUS and US are known to be operator-dependent, especially in image/cineloopacquisition for parametric measurements. Although CEUS and US, in general, possessadvantages, such as the absence of radiation, lower costs and high availability (nearly everymid-range system contains CEUS specific software), both tomographic modalities (i.e.,CT, MRI) are more standardized in the assessment of scans or sequences. Thus, a volumedataset and not a single plane alone (as in US) can be used for whole organ perfusion.Our results demonstrated the potential influence of BMI or body weight on the parametricassessment of renal perfusion in CEUS (driven by lower image quality at higher penetrationdepth). These confounders may not affect image quality and parametric evaluation oforgan perfusion in tomographic imaging.
Limitations
The most important limitation of this study is the small number of subjects includedin this pilot study. Moreover, the lack of use of consistent US system settings and theinvolvement of several examiners could have affected our results. Additionally, sinceonly patients in the subgroup of normal-weight donors showed a strong and significantcorrelation between MeanLin and DTPA clearance, a broad usage of CEUS is not applicable.Future studies are needed to analyze confounders and correlations in a larger populationto enable a broad and standardized usage of this method.
5. Conclusions
This pilot study, for the first time, demonstrated a significant relationship betweenkidney perfusion in CEUS and kidney function in living kidney donors. However, itssignificance is limited to patients of normal weight and BMI, and the US settings appear toaffect renal perfusion quantified by TIC measurements on CEUS. This pilot study providesimportant new insights and supports the role of CEUS in assessing whole organ perfusion.Future research should analyze the relationships and potential confounders identified herein a larger population.
Author Contributions: Conceptualization, N.E.-B., F.F. and T.F.; methodology, N.E.-B. and M.H.L.;software, N.E.-B.; validation, F.F., T.F. and B.H.; formal analysis, N.E.-B.; investigation, N.E.-B., M.H.L.and T.F.; data curation, N.E.-B., L.L. and F.F.; writing—original draft preparation, N.E.-B.; writing—review and editing, all authors; visualization, R.P.; supervision, F.F., T.F., M.H.L., T.S., K.K., A.S., K.B.,K.M. and A.M. All authors have read and agreed to the published version of the manuscript.
Funding: This research received no external funding.
Institutional Review Board Statement: “The study was conducted in accordance with the Declara-tion of Helsinki, and approved by the Institutional Ethics Committee) of Charité UniversitätsmedizinBerlin (protocol code EA1/406/16, 26.01.2017)”.
Informed Consent Statement: Informed consent was obtained from all subjects involved in the study.
Acknowledgments: The authors thank Bettina Herwig for language editing of the manuscript,Annette Aigner for statistical advice and Christian Greis (Bracco Imaging) for scientific advice.
Conflicts of Interest: The authors declare no conflict of interest. Markus H. Lerchbaumer reports havingreceived consultancy honoraria from Siemens Healthineers. Thomas Fischer reports having receivedconsultancy honoraria from Siemens Healthineers, Bracco Imaging and Canon Medical Imaging.
175

J. Clin. Med. 2022, 11, 791
References
1. Delmonico, F. A Report of the Amsterdam Forum On the Care of the Live Kidney Donor: Data and Medical Guidelines.Transplantation 2005, 79, S53–S66. [PubMed]
2. Durand, E.; Müller-Suur, R. Zur Messung der Nierenfunktion durch Clearancebestimmungen: Methoden und Indikationen—EinUpdate. Der Nukl. 2010, 33, 145–153. [CrossRef]
3. Levey, A.S.; Stevens, L.A.; Schmid, C.H.; Zhang, Y.L.; Castro, A.F., III; Feldman, H.I.; Kusek, J.W.; Eggers, P.; Van Lente, F.; Greene,T.; et al. A new equation to estimate glomerular filtration rate. Ann. Intern. Med. 2009, 150, 604–612. [CrossRef] [PubMed]
4. Levey, A.S.; Bosch, J.P.; Lewis, J.B.; Greene, T.; Rogers, N.; Roth, D. A more accurate method to estimate glomerular filtration ratefrom serum creatinine: A new prediction equation. Modification of Diet in Renal Disease Study Group. Ann. Intern. Med. 1999,130, 461–470. [CrossRef]
5. Cockcroft, D.W.; Gault, M.H. Prediction of creatinine clearance from serum creatinine. Nephron 1976, 16, 31–41. [CrossRef]6. Levey, A.S.; Inker, L.A.; Coresh, J. GFR estimation: From physiology to public health. Am. J. Kidney Dis. 2014, 63, 820–834.
[CrossRef]7. Lentine, K.L.; Kasiske, B.L.; Levey, A.S.; Adams, P.L.; Alberú, J.; Bakr, M.A.; Gallon, L.; Garvey, C.A.; Guleria, S.; Li, P.K.-T.; et al.
Summary of Kidney Disease: Improving Global Outcomes (KDIGO) Clinical Practice Guideline on the Evaluation and Care ofLiving Kidney Donors. Transplantation 2017, 101, 1783–1792. [CrossRef]
8. Abramowicz, D.; Cochat, P.; Claas, F.H.; Heemann, U.; Pascual, J.; Dudley, C.; Harden, P.; Hourmant, M.; Maggiore, U.; Salvadori,M.; et al. European Renal Best Practice Guideline on kidney donor and recipient evaluation and perioperative care. Nephrol. Dial.Transplant. 2015, 30, 1790–1797. [CrossRef]
9. Andrews, P.A.; Burnapp, L.; Manas, D.; Bradley, J.A.; Dudley, C. Summary of the British Transplantation Society/RenalAssociation U.K. guidelines for living donor kidney transplantation. Transplantation 2012, 93, 666–673. [CrossRef]
10. Halleck, F.; Diederichs, G.; Koehlitz, T.; Slowinski, T.; Engelken, F.; Liefeldt, L.; Friedersdorff, F.; Fuller, T.F.; Magheli, A.;Neumayer, H.-H.; et al. Volume matters: CT-based renal cortex volume measurement in the evaluation of living kidney donors.Transpl. Int. 2013, 26, 1208–1216. [CrossRef]
11. Brar, A.; Jindal, R.M.; Abbott, K.C.; Hurst, F.P.; Salifu, M.O. Practice patterns in evaluation of living kidney donors in UnitedNetwork for Organ Sharing-approved kidney transplant centers. Am. J. Nephrol. 2012, 35, 466–473. [CrossRef]
12. Poggio, E.D.; Hila, S.; Stephany, B.; Fatica, R.; Krishnamurthi, V.; Del Bosque, C.; Goldfarb, D.; Herts, B.; Dennis, V.W.; Heeger,P.S.; et al. Donor kidney volume and outcomes following live donor kidney transplantation. Am. J. Transplant. 2006, 6, 616–624.[CrossRef] [PubMed]
13. Paleologo, G.; Abdelkawy, H.; Barsotti, M.; Basha, A.; Bernabini, G.; Bianchi, A.; Caprio, F.; Emad, A.; Grassi, G.; Nerucci, B.;et al. Kidney dimensions at sonography are correlated with glomerular filtration rate in renal transplant recipients and in kidneydonors. Transplant. Proc. 2007, 39, 1779–1781. [CrossRef]
14. Buckley, D.L.; Shurrab, A.E.; Cheung, C.M.; Jones, A.P.; Mamtora, H.; Kalra, P.A. Measurement of single kidney function usingdynamic contrast-enhanced MRI: Comparison of two models in human subjects. J. Magn. Reson. Imaging 2006, 24, 1117–1123.[CrossRef]
15. Raptis, A.E.; Viberti, G. Pathogenesis of diabetic nephropathy. Exp. Clin. Endocrinol. Diabetes 2001, 109 (Suppl. 2), S424–S437.[CrossRef] [PubMed]
16. Hughson, M.D.; Johnson, K.; Young, R.J.; Hoy, W.E.; Bertram, J.F. Glomerular size and glomerulosclerosis: Relationships to diseasecategories, glomerular solidification, and ischemic obsolescence. Am. J. Kidney Dis. 2002, 39, 679–688. [CrossRef] [PubMed]
17. Wang, L.; Wu, J.; Cheng, J.F.; Liu, X.-Y.; Ma, F.; Guo, L.-H.; Xu, J.-M.; Wu, T.; Mohan, C.; Peng, A.; et al. Diagnostic value ofquantitative contrast-enhanced ultrasound (CEUS) for early detection of renal hyperperfusion in diabetic kidney disease. J.Nephrol. 2015, 28, 669–678. [CrossRef] [PubMed]
18. Sidhu, P.S.; Cantisani, V.; Dietrich, C.F.; Gilja, O.H.; Saftoiu, A.; Bartels, E.; Bertolotto, M.; Calliada, F.; Clevert, D.A.; Cosgrove,D.; et al. The EFSUMB Guidelines and Recommendations for the Clinical Practice of Contrast-Enhanced Ultrasound (CEUS) inNon-Hepatic Applications: Update 2017 (Short Version). Ultraschall Med. 2018, 39, 154–180. [CrossRef]
19. Spiesecke, P.; Fischer, T.; Maxeiner, A.; Hamm, B.; Lerchbaumer, M.H. Contrast-enhanced ultrasound (CEUS) reliably rules outneoplasm in developmental renal pseudotumor. Acta Radiol. 2020, 62, 821–829. [CrossRef]
20. Greis, C. Ultrasound contrast agents as markers of vascularity and microcirculation. Clin. Hemorheol. Microcirc. 2009, 43, 1–9.[CrossRef]
21. Greis, C. Quantitative evaluation of microvascular blood flow by contrast-enhanced ultrasound (CEUS). Clin. Hemorheol. Microcirc.2011, 49, 137–149. [CrossRef] [PubMed]
22. Bracco. User Manual|CEUS—Contrast Enhanced Ultrasound: Bracco Suisse SA; Copyright© 2019 Bracco Suisse SA All RightsReserved. Available online: https://www.contrastultrasound-modality.com/quantification-software/support/user-manual(accessed on 22 December 2020).
23. Fleming, J.S.; Persaud, L.; Zivanovic, M.A. A general equation for estimating glomerular filtration rate from a single plasmasample. Nucl. Med. Commun. 2005, 26, 743–748. [CrossRef] [PubMed]
24. Bubeck, B. Renal clearance determination with one blood sample: Improved accuracy and universal applicability by a newcalculation principle. Semin. Nucl. Med. 1993, 23, 73–86. [CrossRef]
176
J. Clin. Med. 2022, 11, 791
25. Dietrich, C.F.; Averkiou, M.; Nielsen, M.B.; Barr, R.G.; Burns, P.N.; Calliada, F.; Cantisani, V.; Choi, B.; Chammas, M.C.; Clevert,D.A.; et al. How to perform Contrast-Enhanced Ultrasound (CEUS). Ultrasound Int. Open 2018, 4, E2–E15. [CrossRef] [PubMed]
26. Kunz, P.; Kiesl, S.; Groß, S.; Kauczor, H.-U.; Schmidmaier, G.; Fischer, C. Intra-observer and Device-Dependent Inter-observerReliability of Contrast-Enhanced Ultrasound for Muscle Perfusion Quantification. Ultrasound Med. Biol. 2020, 46, 275–285.[CrossRef]
27. Krumm, P.; Hupka, T.; Haußmann, F.; Dittmann, H.; Mühlbacher, T.; Nadalin, S.; Königsrainer, A.; Nikolaou, K.; Heyne, N.;Kramer, U.; et al. Contrast-enhanced MRI for simultaneous evaluation of renal morphology and split renal function in livingkidney donor candidates. Eur. J. Radiol. 2021, 142, 109864. [CrossRef]
28. Tang, C.; Fang, K.; Guo, Y.; Li, R.; Fan, X.; Chen, P.; Chen, Z.; Liu, Q.; Zou, Y. Safety of Sulfur Hexafluoride Microbubbles inSonography of Abdominal and Superficial Organs: Retrospective Analysis of 30,222 Cases. J. Ultrasound Med. 2017, 36, 531–538.[CrossRef]
177

MDPISt. Alban-Anlage 66
4052 BaselSwitzerland
Tel. +41 61 683 77 34Fax +41 61 302 89 18
www.mdpi.com
Journal of Clinical Medicine Editorial OfficeE-mail: [email protected]
www.mdpi.com/journal/jcm


MDPI
St. Alban-Anlage 66
4052 Basel
Switzerland
Tel: +41 61 683 77 34
Fax: +41 61 302 89 18
www.mdpi.com ISBN 978-3-0365-4008-5