Professor Kratchman Finance 302
8
[Type text] Professor Kratchman Finance 302 February 22, 2012 Hansson Private Label, Inc.: A Case Study Through our analysis we have deemed that the proposed expansion of Hansson Private Label will benefit the company through added revenue, profit, and market share. The following are our findings to further explain our decision. The strategic implications of company’s expansion proposal are simple. First, increasing profits through expansion of production and of sales. Second and most important, is an increase in market share by driving both new customers and existing customers away from competitors. Also, an increase in production to drive the company’s growing market share. We feel that Gates’ projections are realistic for the company’s expansion. The projections are viable because they have an above 75% chance of returning a positive net present value (NPV) in addition to a solid internal rate of return (IRR) and would expand the relationships of the company with
Transcript of Professor Kratchman Finance 302

[Type text]
Professor Kratchman
Finance 302
February 22, 2012
Hansson Private Label, Inc.: A Case Study
Through our analysis we have deemed that the proposed
expansion of Hansson Private Label will benefit the company
through added revenue, profit, and market share. The
following are our findings to further explain our decision.
The strategic implications of company’s expansion
proposal are simple. First, increasing profits through
expansion of production and of sales. Second and most
important, is an increase in market share by driving both
new customers and existing customers away from competitors.
Also, an increase in production to drive the company’s
growing market share.
We feel that Gates’ projections are realistic for the
company’s expansion. The projections are viable because they
have an above 75% chance of returning a positive net present
value (NPV) in addition to a solid internal rate of return
(IRR) and would expand the relationships of the company with

[Type text]
its competitors and clients. A Sharpe ratio of 0.946 also
suggests a positive return in relationship to the added risk
assuming ours is higher than other projects’.
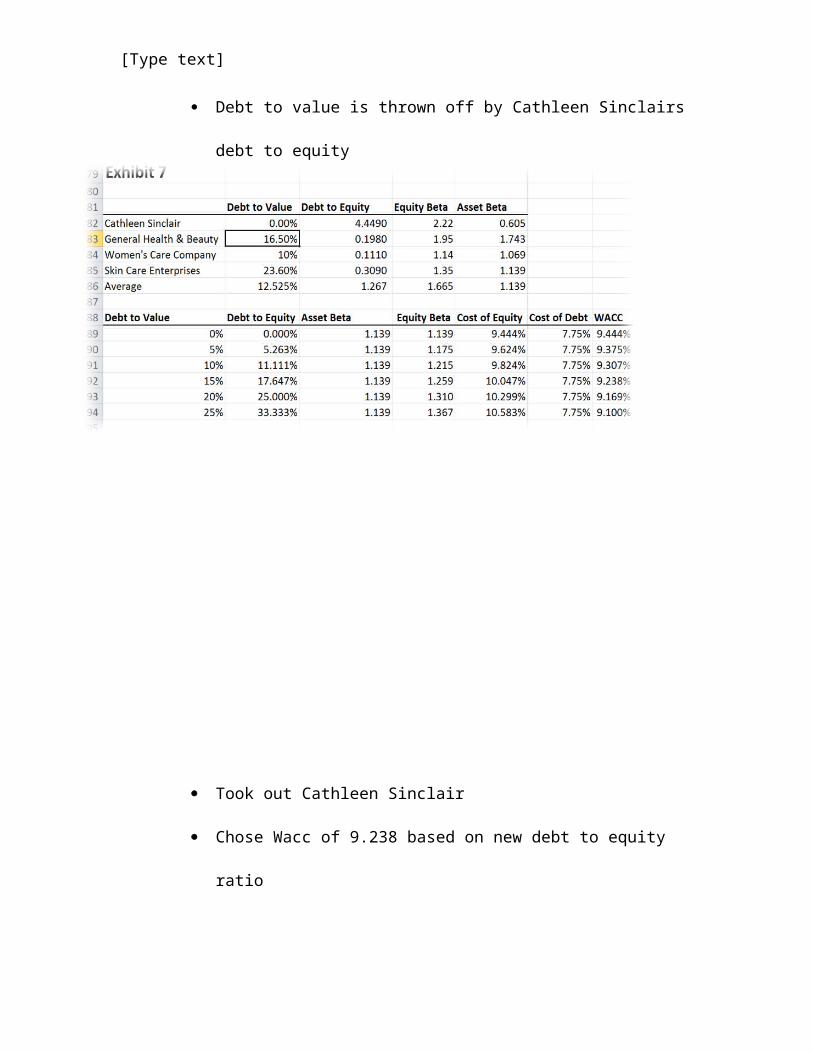
After our analysis of both the project and industry we
chose a WACC of 9.238%. This WACC value was chosen as it was
most in line with the market’s debt-to-value ratio. This
project would increase both capital structure and risk;
however according to the Sharpe ratio the increase in
capital structure justifies the risk.
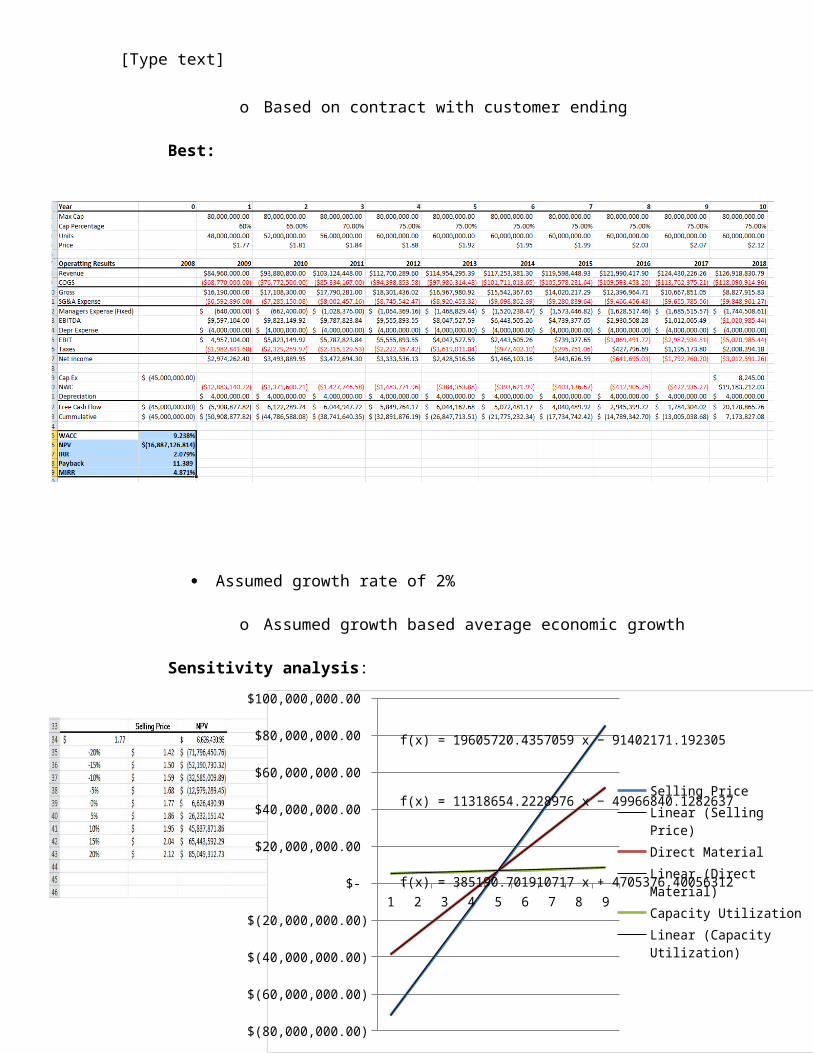
Through our sensitivity analysis we have deemed the
selling price to be more sensitive to a change in net
present value than direct material costs. This was found via
a difference in slope. As for any long-term inflation rates,
we have deemed them negligible compared to Gates’
predictions as inflation affects the market and industry as
a whole and not just our company.
Based upon previous years’ income and market share for
HPL we decided upon a consistent 5% capacity increase until
it reached 85% in 2014. We see this as an appropriate
[Type text]
assumption due to the production reaching its maturity in
its sixth year.
In conclusion, through our extensive analysis we have
decided that it would be within the company’s best interest
to proceed with the investment and proposal. We would
maintain positive relationship and positive growth within
our respective market.
APPENDIX

[Type text]
HCL Ratios:
Filled out ratios
WACC calculation:
[Type text]
Debt to value is thrown off by Cathleen Sinclairs
debt to equity
Took out Cathleen Sinclair
Chose Wacc of 9.238 based on new debt to equity
ratio

[Type text]
Base Case:
Assumed capacity growth of 5% per year
o Based on previous revenues and projection of
more demand from customers
Worst:
Assumed units stayed consistent after year 4
[Type text]
o Based on contract with customer ending
Best:
Assumed growth rate of 2%
o Assumed growth based average economic growth
Sensitivity analysis:
1 2 3 4 5 6 7 8 9
$(80,000,000.00)
$(60,000,000.00)
$(40,000,000.00)
$(20,000,000.00)
$-
$20,000,000.00
$40,000,000.00
$60,000,000.00
$80,000,000.00
$100,000,000.00
f(x) = 19605720.4357059 x − 91402171.192305
f(x) = 11318654.2228976 x − 49966840.1282637
f(x) = 385190.701910717 x + 4705376.40056312
Selling PriceLinear (Selling Price)Direct MaterialLinear (Direct Material)Capacity UtilizationLinear (Capacity Utilization)

[Type text]
Slope of lines suggest what variables are more
sensitive to NPV
o Selling price is most sensitive
o Capacity utilization is least sensitive