Influence of incidence angle on detecting flooded forests using C-HH synthetic aperture radar data

Processes driving soil solution chemistry in a flooded
rice-cropped vertisol: analysis of long-time
monitoring data
P. Boivin a,*, F. Favre a, C. Hammecker b, J.L. Maeght b,J. Delariviere b, J.C. Poussin c, M.C.S. Wopereis d
aPedology Laboratory, LPE-ISTE-ENAC, Ecole Polytechnique Federale de Lausanne,
CH-1015 Lausanne, SwitzerlandbInstitut de Recherche pour le Developpement (IRD), BP 1386 Dakar, Senegal
cInstitut de Recherche pour le Developpement (IRD), BP 5045, 34032 Montpellier Cedex 1, FrancedWest African Rice Development Association (WARDA/ADRAO), 01 BP 2551, Bouake, Ivory Coast
Received 11 September 2001; received in revised form 28 May 2002; accepted 12 July 2002
Abstract
Senegal river water has positive alkalinity (0.55 meq l� 1) and positive calcite-residual alkalinity
(0.30 meq l� 1). Without leaching, this water presents a possible alkalinization and sodication hazard
for the soil. The effect of flooding on soil solution chemistry in an irrigated nondrained vertisol under
rice was monitored during 3 years in northern Senegal. During flooding, soil solution redox potential
dropped to about � 0.15 V, and alkalinity increased to 15 meq l� 1. Mg content increased as well,
from about 1 to 5 meq l� 1, whereas Cl and SO4 contents decreased to very low levels at the end of
the growing season (0.05 meq l� 1). After the fallow, nonflooded period between two crop cycles,
the soil solution composition returned to its initial neutral sulfate and chloride composition. The
observed cycle in soil solution chemistry could not be explained by water and solute transfer because
infiltration rates were very low, due to air entrapment in the soil profile. Geochemical control by
calcite and gypsum was excluded during irrigation. Mossbauer spectroscopy showed that iron oxides
were both well- and poorly crystallized goethite. Goethite dissolution was assessed by pH–Eh
stability diagrams.
We explained the increase in alkalinity and Mg concentration in the soil solution partly by the
composition of the irrigation water, and partly by the reduction and dissolution of Fe oxides, and
Fe2 + fixation on exchange sites of the clay minerals. These processes were reversed as soon as the
soil oxidized. The decline in Cl concentration was attributed to geochemical control through the
formation of a GR-Cl� mineral around the porous cups. In that case, Cl should not be used as a
0016-7061/02/$ - see front matter D 2002 Elsevier Science B.V. All rights reserved.
PII: S0016 -7061 (02 )00226 -4
* Corresponding author. Fax: +41-21-6935-670.
E-mail address: [email protected] (P. Boivin).
www.elsevier.com/locate/geoderma
Geoderma 110 (2002) 87–107

natural tracer. Carbonates accumulate in soil solution not only due to iron reduction, but also because
of the positive residual alkalinity of the irrigation water. When the soil dries at the end of crop cycle,
the carbonate concentration of topsoil will increase and calcite will precipitate. This ongoing process
may result in calcium control and ultimately soil alkalinization over the years.
D 2002 Elsevier Science B.V. All rights reserved.
Keywords: Vertisol; Irrigation; Water logging; Soil solution; Oxidoreduction; Salinization
1. Introduction
Rice, wheat and maize supply more than 50% of all calories consumed by the entire
human population (IRRI, 1993). In West Africa, rice (Oryza sativa L.) is rapidly gaining
importance, a development driven by changing consumer preferences and higher con-
sumption levels in urban centers. It is the major crop grown under irrigation in West
African Sahelian countries, where surface water resources are scarce in relation to arable
land. A major concern in these potentially high yielding (e.g. Hafele et al., 2000) systems
in an arid climate is the danger of soil degradation due to soil salinization processes
(Boivin, 1997; Wopereis et al., 1998). Soil salinization is induced by evaporation, poor
drainage and low water quality. It is considered to affect more than 10% of irrigated lands
(Cheverry and Robert, 1998; Rhoades, 1997; Szabolcs, 1994).
In West Africa, irrigated rice cultivation has been linked directly with soil salinization
(Madeley, 1993). However, Ceuppens and Wopereis (1999) showed that rice actually
decreases salinity in naturally saline soils in the Senegal river delta. More insight is still
needed into potential soil alkalinization and sodication processes under irrigated rice in the
arid climate of the West African Sahel. But these processes are generally slow and may
interact with many others. Simulating and foreseeing soil evolution in time is, thus, very
complex.
Irrigated rice is cropped on clayey soils. In dry periods, clayey soils and particularly
vertisols shrink and often crack at low water content (Wilding and Puentes, 1988). During
land preparation and flooding, cracks allow preferential or bypass flow to occur (Favre et
al., 1997; Mitchell and Genuchten, 1993; Tuong et al., 1996; Van Stiphout et al., 1987).
Favre et al. (1997) demonstrated very rapid crack closure under irrigation or simulated
rain. Shallow water table and surge flooding may cause air entrapment (Dixon and Linden,
1972) potentially blocking infiltration (Touma, 1984). Under prolonged flooding, the
topsoil may become reduced, leading to reduction of iron oxides and iron in the clay
structure (FeStr), which can greatly modify proton and cation balances and CEC (e.g. Favre
et al., 2002; Stucki, 1988). These processes are not well known or even observed under
field conditions. They are neglected in most solute and water transfer simulation models.
Nutrient uptake by rice is very important in root zone, particularly for Si, N, P, Cl andMg,
Cl being a balance ion (Matsuo et al., 1995; Yoshida, 1981). Plant available nutrients are to a
large extent determined by the extent of soil reduction upon flooding. Cations are released
through adsorption of ferrous iron on the exchange complex (Brinkman, 1970; Genon et al.,
1994; Ponnamperuma, 1965). Phosphorus is released by dissolution of oxides (Husin et al.,
1987). NO3� turns into NH4
+ upon reduction, and NH4+ can be fixed on the soil’s cation
P. Boivin et al. / Geoderma 110 (2002) 87–10788

exchange complex (Ernstsen, 1996; Schneiders and Sherer, 1998). Khaled and Stucki (1991)
showed irreversible fixation of potassium on reduced iron bearing smectites.
The evolution of soil quality underirrigation, therefore, results from complex interactions
between a lot of processes. Field monitoring should address water and solute transfer,
precipitation and dissolution of salts, cation exchange, geochemical equilibria, redox
reactions and plant uptake. Most of these phenomena are related to rapid changes in
temperature, microbial activity or plant growth. Only a few studies have reported extensive
data sets. Soil solution evolution is generally investigated through simplified laboratory soil
models, and only a reduced number of factors are taken into account. Ponnamperuma (1972)
focused on redox processes, providing little information on geochemical equilibria or
transfer processes. Other studies discussed plant nutritional aspects (e.g. Husin et al., 1987;
Narteh and Sahrawat, 1999) in laboratory experiments, or described soil solution evolution
without interpretation at process level (Ferreyra and Coelho, 1984). The study reported here
was carried out on an irrigated rice cropped vertisol in the Senegal River Valley,West Africa,
as part of a multiyear research program on the evolution of sahelian soils under irrigation.
The objectives of this study were to (1) monitor the changes in soil solution chemistry
under irrigated rice over a period of 3 years, (2) check the matching between observations
and current knowledge on related soils and processes and (3) discuss the relative
importance of solute transfer, geochemistry, redox processes and plant nutrient uptake
on soil solution composition changes.
2. Material and methods
2.1. Study site and soil
Field experiments were conducted in an irrigated laser-leveled, but undrained paddy
field, representative for rice growing conditions in the Senegal valley, near Donaye, Podor,
northern Senegal (16j40VN, 15j00VW). Farmers have grown two crops of rice per year on
this field since 1986. The first crop is sown during the hot dry season (DS, from March to
June) and the second crop during the wet season (WS, from July to October). Experiments
were conducted in 1996, 1997 and 1998. During this period, the farmer used transplanting as
the crop establishment method and short-duration cultivar Sahel108 (IR13240-108-2-2-3).
The area has an arid climate with an average rainfall of about 280 mm, 95% of which
falls between July and November (Albergel et al., 1993). Average Class A pan evaporation
exceeds average rainfall in each month and by over 2000 mm annually (Brunel and
Bourron, 1992). The soil is an arid vertisol (INRA, 1998), Xerert (USDA, 1998), locally
known as Hollalde soil.
Rice fields are flooded for more than 100 days during each growth cycle (Boivin et al.,
1995). Irrigation water from the Senegal River is supplied to the field by gravity from an
elevated channel using siphons. Farmers commonly apply about 200 kg urea ha� 1 and
100 kg diammonium phosphate (18% N, 20% P) ha� 1, but no potassium fertilizer
(Wopereis et al., 1999).
The main soil characteristics of the Ap horizon (0–25 cm depth) at the experimental
site are given in Table 1. Soil texture, CEC, total carbon content and pH values are close to
P. Boivin et al. / Geoderma 110 (2002) 87–107 89

average values for vertisols (Ahmad, 1983). Topsoil bulk density was about 1.5 g cm � 3
when dry and 1.3 g cm� 3 when saturated. The clay fraction was composed of smectite
(about 70%) and kaolinite (about 30%). Dithionite extractable Fe content ranged from 41.4
to 46.0 cmol Fe kg� 1 of air-dried soil. The FeStr content of smectite was 114.0 cmol Fe
kg� 1 of smectite and Fe oxides are goethite, part of it being poorly crystallized (Favre et
al., 2002).
2.2. Water quality and water balance
Water of the major Sahelian rivers has a low salt content (class conductivity 1; sodium
hazard 1), according to Richards (1954), but upon concentration it may become hazardous
(Valles et al., 1989), as it often possesses a positive residual alkalinity. The composition of
Senegal River water was analyzed weekly during 1997.
At the study site, the soil surface is cracked prior to first irrigation, but cracks close very
quickly after irrigation, as described in a neighboring site by Favre et al. (1997). Between
two crop cycles, Boivin et al. (1999) estimated the in situ saturated hydraulic conductivity
of the field-dried topsoil, using suction infiltrometer to avoid preferential flow in the
cracks. Saturated hydraulic conductivity values ranged from 3 to 30 mm day � 1. However,
Boivin (1997) and Boivin et al. (1998a,b) established the water balance of the field and
found that after crack closure, the soil infiltration rate was less than 1 mm day � 1. We used
the same methods as Boivin et al. (1998a) to determine field water balance components.
Fluctuations in pounded water depth are determined by evapotranspiration and irrigation
rates. Water delivery was calculated from direct measurement of siphon inflow rate and by
calculation of water volume in the field from sloping gauge readings and krigged estimates
of field topography. Depth of flooding water was monitored twice daily, and before and
after irrigation. The shallow water table fluctuates from 1.8 m depth to topsoil, due to
Senegal river raw in rainy season (Diaw, 1996).
2.3. Soil solution monitoring
The chemical composition of the soil solution was monitored daily during the 1996
WS, the 1997 WS and the 1998 DS, using porous cups installed at 0.2 m depth. To
evaluate the influence of water and solute transport processes on soil solution chemistry, a
second set of porous cups was installed. Vertical and lateral water fluxes to and from these
cups were blocked by a polyethylene film inserted horizontally in the soil, 0.2 m below the
Table 1
Main soil characteristics at 0–25-cm depth: texture, total carbon, CEC and pH
Clay (%) Fine silt
(%)
Coarse
silt (%)
Fine sand
(%)
Coarse
sand (%)
C total
(mg/g)
N total
(mg/g)
57.4 15.9 15.2 11.4 1 5.28 0.46
CEC (cmolc/kg) Exchangeable cations (cmolc/kg) pH
Ca Mg Na K H2O KCl
26.6 13.2 10.5 0.8 0.4 6.8 5.5
P. Boivin et al. / Geoderma 110 (2002) 87–10790

porous cup and at a distance of 0.3 m all around. This second set was monitored during the
1996 WS and 1997 WS only. Soil solution was collected every 2 days, stored at 4 jC,filtered and analyzed for EC, pH, Al, Si, K, Mg, Ca, Na, NO3, HPO4, HCO3, CO3, SO4
and Cl. HCl titration was used for carbonates; ICP, capillary electrophoresis and
absorption spectrophotometer for cations; and ionic chromatography and capillary electro-
phoresis for anions. Data from porous cups where water transfer was blocked are referred
to as NT (no transfer) observations; others are referred to as T observations. Alkalinity was
equal to HCO3 +CO3 in the collected solutions. Fe2 + in the porous cups was not
measured due to difficulties in preventing reoxidation during sampling. Fe2 + was,
however, measured by Besson (2001) on the soil solution extracted from soil samples
using centrifugation under nitrogen atmosphere. Centrifugation was chosen to prevent
sharp changes in pCO2, and Besson (2001) found Fe2 + concentrations ranging from 0.3 to
0.9 meq l � 1 for Eh values ranging from 0.15 to 0.05 V.
2.4. Soil reduction monitoring
Soil reduction status was monitored in situ during the 1998 DS as redox potential (Eh),
pH and FeII/FeIII ratio. Because of the high FeStr content, CEC was also measured during
soil reduction. The Eh was monitored using platinum probes (Schott Gerate Metal
Elektrode PT 1800) at 0.2 and 0.4 m depth. Three probes were placed at each depth
and the Eh was then measured daily throughout the whole crop cycle. In situ soil pH was
monitored daily using pH combination glass membrane probes with a Calomel internal
reference system (Schott Gerate, pH Einstabmesskette H 9080) at 0.2 and 0.4 m depth.
Two probes were installed at each depth. The pH probes allowed periodic renewal of the
internal solution during monitoring, without removing the probe. The CEC and FeII/FeIII
ratio changes upon reduction were analyzed on soil samples collected at different Eh
during the cropping cycle. Methods and results of this experiment are presented in Favre et
al. (2002). In situ redox potential and pH measurements were continued after the 1998 DS,
i.e. during the ‘interseason’ (the fallow period between two crops) and the 1998 WS.
2.5. Mineral equilibria
The KINDIS (Made, 1991) and PHREEQC (Parkhurst and Appelo, 1999) programs
were used to calculate mineral equilibria for soil solutions taken during the 1998 DS. Ionic
speciation was evaluated by an iterative procedure and ionic activity calculated from the
extended Debye–Huckel relation. The ionic product (Q) was then calculated and
compared to the solubility product (K) of each of the following minerals: calcite, gypsum,
magnesite and for some silicates: i.e. sepiolite, kaolinite and beidellite. The two latter
minerals are present in the soil profile.
Eh–pH stability Pourbaix diagrams were built for goethite (aFeOOH), using the
following equilibrium reaction and logK value:
aFeOOH þ 3Hþ þ e�ZFe2þ þ 2H2O
logK = 14.44 (Cornell and Schwertmann, 1996).
P. Boivin et al. / Geoderma 110 (2002) 87–107 91

Eh and pCO2 of the soil solutions may change when sampling with the porous cups
prior to analysis. Therefore, we also discussed equilibrium with green rusts (GR) because
it is very sensitive to pH. Because chloride and carbonates were the major anions, Cl-GR
and CO3-GR equilibrium was considered using the reactions given by Genin et al. (1998):
Cl-GR:
4Fe2þ þ Cl� þ 8H2OZFeII3 FeIIIðOHÞ8Clþ 8Hþ þ e� : log KCl�GR ¼ 46
CO3-GR:
(a) 6Fe2+ +HCO3� + 12H2OZFe4
IIFe2III(OH)12CO3 + 13H
+ + 2e�: logKCO3-GR= 34
(b) 6Fe2+ +H2CO3 + 12H2OZFe4IIFe2
III(OH)12CO3 + 14H+ + 2e�: logKCO3-GR
= 37.5
with pe = Eh(V)/0.05916.
2.6. Crop growth
Crop components were monitored each cropping season. Crop yields were 6.3, 5.5 and
6.4 t ha� 1 of paddy for the 1996 WS, the 1997 WS and the 1998 DS, respectively.
3. Results
3.1. Water balance study
Cumulated water delivery was about 1000 mm during the wet season, and about 1500
mm during the dry season. Fig. 1 shows fluctuations in pounded water depth during the
Fig. 1. Fluctuations in pounded water depth (1998 DS).
P. Boivin et al. / Geoderma 110 (2002) 87–10792

1998 DS. The field was left to dry during 5 days at the beginning of the crop cycle, i.e. at
around 20 days after transplanting (DAT) for weed control. During the growth cycle,
pounded water depth gradually increased from 2 to about 15 cm in the reproductive phase
of the rice crop. Sudden increases in pounded water depth are due to renewed irrigation. In
accordance with Boivin et al. (1998b), cumulated evapotranspiration equalled cumulated
irrigation, as infiltration and surface water losses were negligible. A mean topsoil
gravimetric water content of 60% was reached after 8 days of flooding (data not shown).
Irrigation water quality remained nearly constant over time. An average analysis is
presented in Table 2, showing positive alkalinity (0.55 meq l � 1) and positive calcite-
residual alkalinity (0.30 meq l� 1). Without leaching, this water presents an alkalinization
and sodication hazard for the soil.
3.2. Soil solution monitoring
Evolution of electrical conductivity (Ec), Mg, Ca, Na and K during the three cropping
seasons at 0.2 m depth are shown in Fig. 2. Evolution of alkalinity, Cl and SO4 at the same
depth are presented in Fig. 3. Correlation coefficients between Ec, Eh, cations and anions
are reported in Table 3. No significant differences were observed between T and NT
sampling sites.
Ec increased with duration of flooding. At the beginning of the cropping cycle, Ec
ranged from 0.3 (1998 DS) to 0.5 dS m� 1 (1997 WS). At the end of the cropping cycle,
Ec ranged from 0.9 (1996 and 1998) to 1.2 dS m� 1 (1997). Ec increased rapidly to 1.4 dS
m � 1 at the beginning of 1997 WS, and remained constant afterwards, probably due to
rainfall that diluted flooding water during this time period. Mg was significantly correlated
with Ec; it increased more rapidly, from about 1 to 5 meq l � 1 at the end of the growing
season. Ca and Na were poorly correlated with Ec except during the 1998 DS. In 1996 and
1997, Ca values fluctuated between 0.5 and 6 meq l� 1 without a clear trend and Na values
remained relatively constant with time. K values were very low and tended to decrease
Table 2
Irrigation water quality: average values and standard deviations for 18 analyses (1997)
Average values S.D.
pH 7.26 0.3
EC (dS/m) 0.06 0.02
Cl� (mmolc/l) 0.06 0.05
SO42� (mmolc/l) 0.02 0.01
NO3� (mmolc/l) 0.01 0.01
HPO42� (mmolc/l) 0.00 0.00
Alkalinity (mmolc/l) 0.55 –
Ca2 + (mmolc/l) 0.25 0.04
Mg2 + (mmolc/l) 0.21 0.04
Na + (mmolc/l) 0.11 0.04
K + (mmolc/l) 0.07 0.03
SiO2 (mg/l) 1.01 2.00
Al (mg/l) 5.65 2.60
P. Boivin et al. / Geoderma 110 (2002) 87–107 93
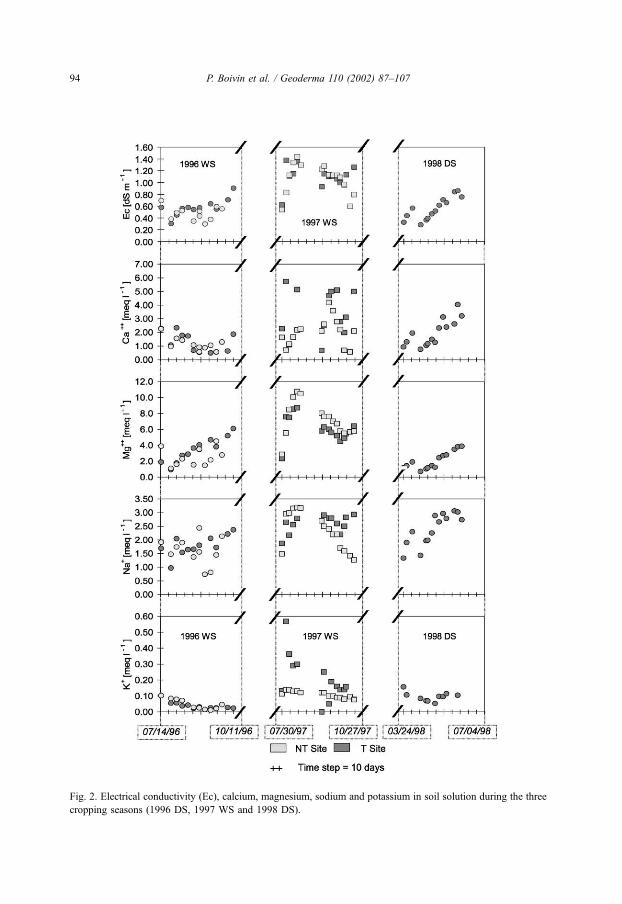
Fig. 2. Electrical conductivity (Ec), calcium, magnesium, sodium and potassium in soil solution during the three
cropping seasons (1996 DS, 1997 WS and 1998 DS).
P. Boivin et al. / Geoderma 110 (2002) 87–10794

with time. Alkalinity behaved like magnesium, increasing over time from about 2 to about
15 meq l � 1, and strongly correlated with Ec.
Cl and SO4 values decreased with time. Cl values decreased strongly from a maximum
value of 2 meq l � 1 to a minimum value close to 0. The soil solution cannot be sampled
between two crop cycles, but Cl content at the beginning of each crop cycle was back to
values higher than 1 meq l � 1 and the soil solution content seemed to run in cycles (Figs. 2
and 3). The changes observed in soil solution composition during one crop cycle were,
therefore, reversible and this was true for both the T and NT sites. Boivin et al. (1998b)
made similar observations on the same site for the 1994 WS and DS, and for two other rice
fields in the region (unpublished results). The decrease in Cl content is surprising because
it suggests that chloride is adsorbed or fixed; now chloride is usually considered as a
nonfixed reference element in soils and, thus, used as a tracer or for calculating water
concentration ratio in many experiments. This result will be discussed below.
Fig. 3. Alkalinity, chloride and sulfate in soil solution during the three cropping seasons (1996 DS, 1997 WS and
1998 DS).
P. Boivin et al. / Geoderma 110 (2002) 87–107 95

3.3. Eh and pH monitoring
In situ Eh and pH values monitored at 0.2-m depth during the 1998 DS, 1998 WS and
the fallow period in-between are presented in Fig. 4. All probes showed the same trends.
Slight differences are probably due to short-range spatial Eh variability, a common
observation in rice fields (Ponnamperuma, 1965). The in situ Eh decreased during
flooding to values indicating the onset and continuation of reduced soil conditions (Fig.
4). The three Ap horizon probes (0.2 m) showed a drop in Eh with duration of flooding,
from 0.6 to � 0.15 V. The Eh in the AB horizon, (0.4-m depth) also decreased with time,
to values ranging from 0.26 to � 0.07 V (data not shown). At these Eh, nitrate and oxides
of Fe and Mn will be reduced (Van Breemen, 1988). The Ap horizon was more rapidly
reduced. This is most likely due to the fact that rice roots mainly develop in the Ap
horizon, leading to higher root and microbial activity (Sharma et al., 1994).
Upon flooding, in situ soil pH decreased rapidly as well, and stabilised to approx-
imately 5–5.5 for Eh values below 0.45 V. The low pH values are due to high pCO2. The
soil solution pH values raised to alkaline values (close to 8) in a few hours when
equilibrated with atmosphere.
Fig. 5 shows the Eh–pH stability diagram. Stability areas are calculated for pFe2 + = 3.
This activity value is common in rice fields (e.g. Genon et al., 1994; Ponnamperuma et al.,
1967). It was actually measured in the same field at the end of cropping season 2000
(unpublished results) and is close to values found by Besson (2001). The data points are
distributed in two clouds corresponding respectively to fallow and irrigation period. The
fallow period (Eh>0.45 V) shows positive correlation between Eh and pH, with increasing
Eh and pH values with time (Fig. 4) in the goethite aFeOOH stability zone. The irrigation
period contains the reduced samples, in the goethite and Fe2 + stability zone. It shows no
correlation between Eh and pH. Eh drops, while pH remains constant. In the lower Eh
values, many points are located on the goethite equilibrium line, and a few others are
below the line in the Fe2 + zone. This is in agreement with the results of Favre et al.
(2002), who found using Mossbauer spectra (Fig. 6 and Table 4) that Fe oxides were
constituted of poorly crystallized goethite and using transmission electron microscopy
observations that Fe oxides were almost completely dissolved in the more reduced
samples. The geochemistry of iron should, therefore, be mainly ruled by the aFeOOH–
Table 3
Correlation coefficients between EC, Eh, cations and anions during three crop seasons (1996, 1997 and 1998) on
T and NT sites
Ions Eh EC
1998 T 1996 T 1996 NT 1997 T 1997 NT 1998 T
Ca2 + � 0.780 0.014 0.485 0.565 0.439 0.975
Mg2 + � 0.848 0.888 0.755 0.839 0.878 0.957
Na + � 0.879 0.823 0.557 0.678 0.750 0.895
K + � 0.623 0.369 0.478 0.553 0.373 0.098
Alc � 0.826 0.958 0.640 0.947 0.915 0.972
Cl� 0.874 � 0.209 0.654 � 0.307 0.284 � 0.734
SO42� 0.933 � 0.497 � 0.235 � 0.668 � 0.711 � 0.815
P. Boivin et al. / Geoderma 110 (2002) 87–10796

Fig. 4. In situ redox potentials and pH values monitored at 0.2 m depth in 1998.
P. Boivin et al. / Geoderma 110 (2002) 87–107 97

Fig. 6. Mossbauer spectra of oxidized soil sample from Favre et al. (2002).
Fig. 5. Eh–pH stability diagram. Stability area of goethite relative to Eh, pH and an aqueous Fe2 + activity of 1
mmol at 25 jC. Open triangles: fallow period. Black points: irrigation period (1998).
P. Boivin et al. / Geoderma 110 (2002) 87–10798

Fe2 + system in the irrigation period and a negative correlation between Eh and pH was,
thus, expected. The null correlation between Eh and pH can be due to (i) increasing pCO2
that drops pH upon flooding, (ii) nonequilibrium continuous dissolution of goethite slowly
converging to goethite–Fe2 + equilibrium under high pCO2 conditions and (iii) FeStrreduction. Chemical nonequilibrium is very common in such soils (Condom, 2000).
Goethite is generally not considered by authors (Genon et al., 1994) for temporarily
waterlogged soils. Note that goethite and lepidocrocite form by oxidation GR (Genin et al.,
1998). Reductive dissolution of goethite occurs at lower Eh, for a given pH and pFe2 +
value, than ferric or ferrosoferric hydroxides reductive dissolution. In this soil, Favre et al.
(2002) showed that FeStr in the smectite and iron in oxides are simultaneously reduced
with time. However, the redox potential for FeStr reduction and the Eh–pH relation for
these reactions are not documented. Since the FeStr content of the soil equals the oxide iron
content (Favre et al., 2002), part of the observed Eh–pH relation might be explained by
continuous reduction of FeStr in smectite. This should be documented in further research.
3.4. Soil solution mineral equilibria
Evolution of saturation index Q/K for some common minerals during the cropping
period have been calculated using both in situ (Fig. 7) and laboratory pH (Fig. 8) values.
Soil solution is continuously oversaturated with respect to kaolinite and beidellite, both
being present in soil. In field conditions where high pCO2 values induce a low pH, soil
solution is mostly undersaturated with respect to other minerals likely to crystallize in these
conditions (like sepiolite, calcite, magnesite). However, when laboratory pH (i.e. lower
pCO2) values are considered in calculations (Fig. 8), soil solution concentrations were near
to saturation with respect to calcite and sepiolite. When the soil profile dries up and
reoxidizes, pCO2 drops and these minerals probably crystallize and accumulate in the soil
profile during fallow period. This is in agreement with calcite precipitation observed on
TEM images of the surface of test minerals reported by Audergon (2000) for the same field.
In field conditions with low pH values, soil solution is oversaturated towards CO3-GR
due to high HCO3� concentration (results not shown). Nevertheless, Legrand et al. (2001)
showed that the CO3-GR synthesised by Genin et al. (1998) probably does not precipitate
under natural conditions. As we observed continuous increase in alkalinity with time, we,
therefore, think that this CO3-GR does not precipitate in the soil. However, vacuum was
applied when collecting the soil solution. Then pCO2 dropped to low values and pH
Table 4
Hyperfine parameters of Mossbauer spectra of oxidized soil sample from Favre et al. (2002)
Iron form da relative fer
a (mm s� 1)
H (kOe)b DEQc (mm s� 1) RAd (%)
C1 1.57 2.59 2
C2 0.49 0.47 57
C3 0.48 490 � 0.25 41
a Isomer shift with respect to metallic a-Fe at room temperature.b Hyperfine field.c Quadrupole splitting.d Relative area.
P. Boivin et al. / Geoderma 110 (2002) 87–107 99

increased, as studied by Suarez (1987). Evolution of Cl-GR saturation index with time is
illustrated in Fig. 9 for 1998 DS. Saturation index are calculated for field and laboratory
pH, for pFe values of 4. Saturation index values for pFe = 3 are also presented for the last
three sampled points where Eh reached the lowest values. Due to low field pH values, the
soil solution is undersaturated with respect to Cl-GR. At laboratory pH however,
Fig. 8. Evolution of saturation index for calcite, magnesite, gypsum, sepiolite, kaolinite and beidellite in soil
solution collected by porous cups during 1998 dry cropping season (DS), using laboratory-measured pH.
Fig. 7. Evolution of saturation index for calcite, magnesite, gypsum, sepiolite, kaolinite and beidellite in soil
solution collected by porous cups during 1998 dry cropping season (DS), using field-monitored pH.
P. Boivin et al. / Geoderma 110 (2002) 87–107100

calculated pCO2 ranged from 10� 2.5 to 10� 3.5 atm. and the soil solution is oversaturated
at beginning of cropping season if pFe = 4 and at end of cropping season if pFe = 3. The
pFe value of 4 is probably too high for beginning of cropping season, but in the porous cup
samplers, pCO2 drops to values lower than 10� 5. At this pCO2 values, all solutions are
highly oversaturated with respect to Cl-GR for pFe = 4 or 5 (data not shown). It is,
therefore, likely that Cl-GR had precipitated in the soil around the porous cups when
vacuum was applied. Green colour due to Cl-GR was, however, not observed on the
porous cups, which were not removed from the soil during the experiment. The Fe2 +
content of the soil is buffered by exchangeable Fe2 + and the chloride content is not
buffered. Therefore, the drop in chloride content may be explained by an artifact due to
wick sampling and resulting Cl-GR precipitation.
For the same reasons, calcite might have precipitated around and in the porous cups,
thus, limiting alkalinity and Ca measured values. However, oversaturation towards calcite
is common, and calcite precipitation is low. We observed continuous increase in alkalinity
and we, thus, assume that calcite precipitation did not occur during irrigation period.
4. Discussion
The observed cyclic changes in soil solution composition may result from a combi-
nation of water and solute transfers, water and solute supply with irrigation water, nutrient
uptake by rice and chemical reactions in the soil.
Fig. 9. Evolution of saturation index for GR-Cl in soil solution during 1998 DS, using in situ pH values at
pFe2 + = 4 (black squares), laboratory pH values at pFe2 + = 4 (opened circles) and laboratory pH values at
pFe2 + = 3 (triangles) (end of cropping season).
P. Boivin et al. / Geoderma 110 (2002) 87–107 101

4.1. Water transfers
Water transfers can occur downward during flooding, and upward between two
cropping cycles upon drying of the soil. We found no significant differences in soil
solution composition between T and NT sites, indicating that the influence of water and
solute transfers is negligible. Infiltration rates were much lower than saturated hydraulic
conductivity. Favre et al. (1997) showed that crack closure allowed air entrapment in the
AB horizon of the soil, which was confirmed by air bubbling even one month after
flooding. We conclude that the very low infiltration rate is due to air entrapment, induced
by surge flooding and shallow water table. Air entrapment lowers or even stops infiltration
(Touma, 1984) and changes in soil solution composition are not influenced by water and
solute fluxes. This conclusion is in agreement with the low drop in redox potential in the
AB horizon (0.4 m depth), and with results of Dommergues (1961) and Moureaux (1968),
who showed that under natural flooding, the microbial activity in the AB horizons of those
soils remained aerobic even after 40 days of flooding. Hammecker et al. (in press) came to
the same conclusion using tensiometer readings and modelling in the same field.
4.2. Rice uptake and ions balance
If water transfer is blocked, solutes supplied by the irrigation water accumulate in the
top soil. Assuming that irrigation water does not infiltrate deeper than 0.3 m, we have
reported in Table 5 the amount of cations and anions brought into the topsoil per hectare
and per irrigation cycle. The amount of cations per hectare that are present in the soil
solution can be estimated, considering a mean gravimetric water content of 60% in topsoil
during flooding. The difference between mean soil solution composition at the beginning
and at the end of crop cycles was then calculated and reported in Table 5.
Nutrient uptake by rice has been widely studied (DeDatta, 1981; Matsuo et al., 1995;
Yoshida, 1981). It depends, among others, on rice variety and yield. Table 5 shows the
Table 5
Comparison between nutrient uptake, nutrient supply by irrigation and changes in soil solution composition
Nutrient Chloride
uptake in
monitored
field (Besson,
2001) (mol/ha)
Total uptake for
variety IR8 and
6 t h� 1 paddy
yield (Yoshida,
1981) (mol/ha)
Total uptake for
variety Peta and
6 t h� 1 paddy
yield (Yoshida,
1981) (mol/ha)
Average
difference
in soil
solutiona
(mol/ha)
Supply by
irrigation
(1998 DS)
(mol/ha)
Supply by
irrigation
(1996 and
1997 WS)
(mol/ha)
N 8100 10071 n.m. – –
P 1001 1095 n.m. – –
K 5450 7770 � 162 1050 700
Ca 470 730 0 1875 1250
Mg 985 1306 5400 1575 1050
S 317 517 � 450 150 100
Cl >340 to < 990 1895 3250 � 1800 900 600
Si 21800 35680 0 – –
Na n.m. n.m. 0 1650 1100
a Difference=(mean values in soil solution at the end of the three monitored cropping seasons)� (mean
values in soil solution at the beginning of the three monitored cropping seasons).
P. Boivin et al. / Geoderma 110 (2002) 87–107102

amount of nutrient taken up by rice straws and panicles at the end of the growing season,
for a 6 t ha� 1 paddy yield, and using literature data on nutrient content of two rice
cultivars (Yoshida, 1981). Besson (2001) found Cl uptakes ranging from 340 mol ha� 1 in
the monitored field to 990 mol ha� 1 in more saline fields of the same region for 6 t ha� 1
of paddy.
Table 5 allows, therefore, comparison of changes in soil solution, nutrient supply from the
irrigation water and nutrient uptake by the rice plant. For Si, K, Cl and S, rice uptake exceeds
supply by the irrigation water. Si is present in unlimited quantity in the soil, and K is
available as an exchangeable cation. Cl and S are only present in the soil solution. Chloride is
mainly fixed in rice straws and roots (Matsuo et al., 1995; Yoshida, 1981). But Cl uptake is
passive, i.e. it is dependent on soil solution content and evapotranspiration rate. The amount
of Cl removed from soil solution can be estimated at 1800 mol ha� 1 (Table 5), and the
amount of Cl brought in by irrigationwater is about 900mol ha� 1 in dry season and 600mol
ha� 1 in wet season. The total amount of Cl removed ranges, therefore, from 2400 to 2700
mol ha� 1. This is compatible with the higher uptakes reported in the literature, but not in
agreement with the observed Sahel108 chloride content. In addition, Cl content drops
regularly during the crop cycle, whereas 90% of nutrients uptake occurs before flowering
(DeDatta, 1981), that is to say before the 65th day of the rice crop. We, therefore, conclude
that Cl decrease in soil solution cannot be explained by rice uptake.
Ca and Mg supply by the irrigation water was larger than calculated plant uptake. This
would imply that Ca concentration would increase. However, it remained about constant
over time, while Mg increased much faster (Fig. 2). As discussed before, it is possible that
calcite precipitated in the porous cups, which would explain the low Ca concentration in
our analyses. But the increase in Mg concentration and in alkalinity remain unexplained
and are discussed below.
4.3. Oxydoreduction and exchanges
Oxidation–reduction reactions and cation exchanges on clays should also be taken in
account. As reported in Favre et al. (2002), CEC increased upon reduction, due to both
oxide coatings dissolution and FeStr reduction. Iron reduction increases soil alkalinity (Van
Breemen, 1988) and adsorption of Fe2 + on the exchangeable sites is considered to replace
exchangeable cations (e.g. Brinkman, 1970; Narteh and Sahrawat, 1999). It may be the
case for Mg if the selectivity coefficient of the clay for Fe2 + is higher than for Mg, as
exchangeable Mg is very high (Table 1). This is, however, not documented. The cation
release is, however, limited due to CEC increase, and is reversible because CEC increase is
reversible when FeStr oxidises (Favre et al., 2002). This is different from ferrolysis
(Brinkman, 1970) because the release of cations is limited, and because no leaching of the
released cations occurs during flooding. Ferrolysis probably cannot occur in such clayey
and shrinking soils. Reduction of iron forms is similarly responsible for the high increase
in alkalinity observed, though in situ pH values remained constant due to high pCO2
values.
Rice straw from the previous harvest is generally burned before land preparation, and
consequently K and Cl are returned to the soil. Iron oxidation releases protons and
consequently reduces alkalinity. This may partly explain the chemical cycles observed.
P. Boivin et al. / Geoderma 110 (2002) 87–107 103

The cyclic evolution of the soil solution is due to combination of (i) air entrapment
blocking infiltration, (ii) nutrient uptake by rice, and release when straw is burned and (iii)
oxidation–reduction cycles and exchanges with clays. It is, thus, difficult to determine if a
general trend occurs. Favre et al. (2002) reported a general weathering of the soil when
studying iron forms during crop cycles. Carbonates are accumulating in soil solution not
only due to iron reduction, but also because of the positive residual alkalinity of Senegal
river water. When the soil dries at the end of the crop cycle, the topsoil pCO2 will decrease,
the carbonate concentration will increase and calcite will precipitate. This ongoing process
may, thus, result in calcium control and ultimately soil alkalinization over the years.
5. Conclusions
Changes in soil solution chemistry were cyclic from one cropping season to the other.
The soil solution had a neutral sulfate and chloride composition at the beginning of the
cropping season, and an alkaline composition at the end, but was back to neutral at the
beginning of the next cropping season. Chloride content decreased sharply upon flooding.
This was not induced by transfers, because infiltration rates were very low or null, due to
air entrapment.
In situ Eh and pH monitoring showed that the soil solution reached the Fe2 + stability
zone during irrigation period, in good agreement with previously reported results. In
contradiction with other studies, the iron system was ruled by Goethite dissolution, but
showed non equilibrium in part of the flooding time, due to continuous increase in pCO2.
The high pCO2 pressure lowered in situ soil pH though the soil solution alkalinity
increased sharply. The part of structural iron reduction in Eh–pH relation should be further
documented.
The decrease in Cl was not explained by rice nutrient uptake. We hypothesized that
unstable Cl-GR formed in the soil around the porous cups during solution collection and
resulting drop in pCO2. Hence, Cl should not be used as a reference element for
calculating concentration ratios of water when sampled under vacuum atmosphere in
partly reduced soils. Moreover, Cl control in soils with low pCO2 might occur without
vacuum apply, and should, therefore, be tested.
The processes driving soil solution chemistry described here are related to flooding and
redox processes but are different from ferrolysis. An accumulation of carbonates and
resulting alkalinization of the topsoil is likely to occur if irrigation is maintained without
leaching or reclamation.
References
Ahmad, N., 1983. Vertisols. In: LP, W., NE, S., GF, H. (Eds.), Pedogenesis and Soil Taxonomy: II. The Soil
Orders. Elsevier, Amsterdam.
Albergel, J., Bader, J.C., Lamagat, J.P., Seguis, L., 1993. Crues et secheresses sur un grand fleuve tropical de
l’Ouest africain: application a la gestion de la crue du fleuve Senegal. Secheresse 4, 143–152.
Audergon, A., 2000. Evolution de vermiculites tests impoatnees dans un sol rizicultive par submersion au
Senegal. EPFL, Lausanne.
P. Boivin et al. / Geoderma 110 (2002) 87–107104

Besson, E., 2001. Interaction entre oxydoreduction et dynamique saline dans un vertisol irrigue par submersion.
Rapport interne, IRD, Dakar.
Boivin, P., 1997. Soil degradation in irrigation schemes in the Senegal river middle valley: mechanisms, character-
ization methods and actual situation. In: Miezan, K., Wopereis, M., Dingkhun, M., Deckers, J., Randolph, T.
(Eds.), Irrigated Rice in the Sahel: Prospects for Sustainable Development. WARDA, Bouake, pp. 37–49.
Boivin, P., et al., 1995. Nianga, laboratoire de l’agriculture irriguee dans la moyenne vallee du fleuve Senegal.
Orstom, Paris.
Boivin, P., Favre, F., Maeght, J.L., 1998a. Les sols de la moyenne vallee du fleuve Senegal: caracteristiques et
evolution sous irrifation. Etude et gestion des sols 5 (4), 235–246.
Boivin, P., Maeght, J.L., Hammecker, C., Barbiero, L., Favre, F., Wopereis, M., 1998b. Evolution of irrigated
soils in the Senegal river valley: alcaline or neutral salinisation process? ISSS, 16eme congres mondial de
science du sol, symposium 29, poster 1260, volume II, p. 541.
Boivin, P., Favre, F., Hammecker, C., Saejjew, A., Tessier, D., 1999. Ion transfers, iron reduction and minera-
logical implications in irrigated fields: new results for soil and water quality management under irrigation. In:
Hydram, E. (Ed.), 2nd International Conference on Environment—Water, Lausanne.
Brinkman, R., 1970. Ferrolysis: a hydromorphic soil forming process. Geoderma 10, 199–206.
Brunel, J.P., Bourron, B., 1992. Evaporation des nappes d’eau libre en Afrique sahelienne et tropicale. ORSTOM-
CIEH, Montpellier.
Ceuppens, J., Wopereis, M.C.S., 1999. Impact of non-drained irrigated rice cropping on soil salinization in the
Senegal River Delta. Geoderma 92, 125–140.
Cheverry, C., Robert, M., 1998. La degradation des sols irrigues et de la ressource en eau: une menace pour
l’avenir de l’agriculture et pour l’environnement au sud de la Mediterranee? Etude et Gestion des Sols 5 (4),
217–226.
Condom, N., 2000. Analyse et modelisation couplee des processus hydro-geochimiques de la salinisation des
sols. Application aux sols rizicoles irrigues de l’Office du Niger (Mali). Ecole Nationale Agronomique de
Montpellier, Montpellier.
Cornell, R.M., Schwertmann, U., 1996. The iron oxides. Structure, Properties, Reactions, Occurence and Uses.
VCH, Weinheim, 573 pp.
DeDatta, S.I., 1981. Principles and Practices of Rice Production Wiley, New York.
Diaw, E., 1996. Modelisation du transfert d’eau en milieu poreux non sature: Application a l’etude de la recharge
des nappes d’eaux souterraines en region Soudano-Sahelienne. These de doctorat Thesis, Universite Louis
Pasteur, Strasbourg.
Dixon, R., Linden, M., 1972. Soil air pressure and water infiltration under border irrigation. Soil Science Society
of America Process 36, 948–953.
Dommergues, Y., 1961. Contribution a l’etude de la dynamique microbienne des sols en zone semi-aride et en
zone tropicale seche. No. 5265 horizon database. ORSTOM, Paris.
Ernstsen, V., 1996. Reduction of nitrate by Fe2 + in clay minerals. Clays and Clay Minerals 44, 599–608.
Favre, F., Boivin, P., Wopereis, M., 1997. Water movement and soil swelling in a dry, cracked vertisol. Geoderma
78, 113–123.
Favre, F., et al., 2002. Iron reduction and changes in cation exchange capacity in intermittently waterlogged soil.
European Journal of Soil Science 53 (2), 175–183.
Ferreyra, H., Coelho, M., 1984. Variations in salt concentration of soil solution from a vertic torrifluvent soil in
rice growing plot. Revista Brasileira de Ciencia do Solo 8, 69–76.
Genin, J., et al., 1998. Thermodynamic equilibria in aqueous suspensions of synthetic and natural Fe(II) –Fe(III)
Green rusts: occurrences of the mineral in hydromorphic soil. Environmental Science and Technology 32,
1058–1068.
Genon, J., deHepcee, N., Delvaux, B., Dufey, J., Hennebert, P., 1994. Redox conditions and iron chemistry in
highland swamps of Burundi. Plant and Soil 166, 165–171.
Hafele, S., Johnson, D., Diallo, S., Wopereis, M., Janin, I., 2000. Improved soil fertility and weed management is
profitable for irrigated rice farmers in Sahelian Africa. Field Crops Research 66, 101–113.
Hammecker, C., Antonino, A., Maeght, J., Boivin, P., in press. Experimental study and numerical modeling of the
water transfers in an irrigated plot in northern Senegal: evidence of air entrapment. European Journal of Soil
Science.
P. Boivin et al. / Geoderma 110 (2002) 87–107 105

Husin, A., Caldwell, A., Mengel, B., Peterson, F., 1987. Effects of natural and artificially induced reduction on
soil solution phosphorus in rice soils. Plant and Soil 102, 171–175.
INRA, 1998. A Sound Reference Base for Soils. INRA, Paris 322 pp.
IRRI, 1993. Rice Almanac. IRRI, Manila, Philippines.
Khaled, E., Stucki, J., 1991. Iron oxidation state effect on cation fixation in smectites. Soil Science Society of
America Journal 55, 554–560.
Legrand, L., Abdelmoula, M., Gehin, A., Chausse, A., Genin, J., 2001. Electrochemical formation of a new
Fe(II)–Fe(III) hydroxy-carbonate green rust: characterization and morphology. Electrochimica Acta 46 (12),
1815–1822.
Made, B., 1991. Modelisation thermodynamique et cinetique des reactions geochimiques dans les interactions
eau-roche. Universite Louis Pasteur, Strasbourg.
Madeley, J., 1993. Will rice turn the Sahel to salt? New Scientist, 35–37.
Matsuo, T., Kumazawa, K., Ishii, R., Ishihara, K., Hirata, H., 1995. Science of the rice plant. Physiology, vol. II.
Food and Agriculture Policy Research Center, Tokyo.
Mitchell, R., Genuchten, M.V., 1993. Flood irrigation of a cracked soil. Soil Science Society of America Journal
57, 490–497.
Moureaux, C., 1968. Etudes microbiologiques en sols hydromorphes de la vallee du fleuve Senegal. ORSTOM,
Paris, 20532.
Narteh, L., Sahrawat, K., 1999. Influence of flooding on electrochemical and chemical properties of West African
soils. Geoderma 87, 179–207.
Parkhurst, D.L., Appelo, C.A.J., 1999. User’s guide to phreeqc (v.2)—a computer program for speciation, batch
reaction, one-dimensional transport, and inverse geochemical calculations. Water Resources Investigations
Report 99-4259. USGS, Denver, Colorado, 305 pp.
Ponnamperuma, F., 1965. Dynamic aspects of flooded soils and the nutrition of the rice plant. In: IRRI (Ed.), The
Mineral Nutrition of the Rice Plant. Johns Hopkins Univ. Press, Baltimore, pp. 295–328.
Ponnamperuma, F., 1972. The chemistry of submerged soils. Advances in Agronomy 24, 29–96.
Ponnamperuma, F., Tiango, E., Loy, T., 1967. Redox equilibria in flooded soils: I. The iron hydroxides systems.
Soil Science 103, 374–382.
Rhoades, J.D., 1997. Sustainability of irrigation: an overview of salinity problems and control strategies. Foot-
prints of Humanity: Reflections on 50 Years of Water Resource Developments. 1997 Ann Conf, Can Wat Res
Assoc, Lethbridge, Alberta, Canada, June 3–6 1997, 1–42.
Richards, L., 1954. Diagnosis and improvement of saline and alkali soils. In: USDA (Ed.), Agricultural Hand-
book, Washington.
Schneiders, M., Sherer, H.W., 1998. Fixation and release of ammonium in flooded rice soils as affected by redox
potential. European Journal of Agronomy 8, 181–189.
Sharma, P., Pantuwan, G., Ingram, K., DeDatta, S., 1994. Rainfed lowland rice roots: soil and hydrological
effects. In: GJD, K. (Ed.), Rice Roots Nutrient and Water Use. IRRI, Manila, pp. 55–66.
Stucki, J.W., 1988. Structural iron in smectite. In: Stucki, J.W., Goodman, B.A., Schwetermann, U. (Eds.), Iron in
Soils and Clay Minerals (NATO ASI series, series C: Mathematical and Physical Sciences, Reidel D Publish-
ing Company: Dordrecht), 625–675.
Suarez, D., 1987. Prediction of pH errors in soil –water extractors due to degassing. Soil Science Society of
America Journal 51, 64–67.
Szabolcs, I., 1994. Prospects of soil salinity for the 21st Century. ISSS, 15th World Congress of Soil Science, vol.
1, pp. 123–141, Acapulco.
Touma, J., 1984. Etude critique de la caracterisation hydrodynamique de sols non satures: role de l’air influence
de l’ecoulement multidimensionnel de l’eau. These de doctorat Thesis, Universite Scientifique et Medicale et
Institut National Polytechnique de Grenoble, Grenoble.
Tuong, T., Cabangon, R., Wopereis, M., 1996. Quantifying flow processes during land soaking of dry, cracked
and previously puddled rice soils. Soil Science Society of America Journal 60, 872–875.
USDA, 1998. Keys to Soil Taxonomy. USDA, Krieger, FLA, 325 pp.
Valles, V., Bertrand, R., Bourgeat, F., N’Diaye, K., 1989. Le concept d’alcalinite residuelle generalisee et
l’irrigation des sols sodiques. Application aux sols du Kouroumari (Mali) et de la vallee de l’oued Medjerdah
(Tunisie). Agronomie Tropicale 44 (3), 157–163.
P. Boivin et al. / Geoderma 110 (2002) 87–107106

Van Breemen, N., 1988. Effect of seasonal redox processes involving iron on the chemistry of periodically
reduced soils. In: Stucki, J., Goodman, B., Schwertmann, U. (Eds.), Iron in Soils and Clay Minerals. NATO
ASI Series, Series C: Mathematical and Physical Sciences. Reidel Publishing, Dordrecht, pp. 797–809.
Van Stiphout, T., Van Lanen, H., Boersma, O., Bouma, J., 1987. The effect of bypass flow and internal catchment
of rain on the water regime in a clay loam grassland soil. Journal of Hydrology 95, 1–11.
Wilding, L., Puentes, R., 1988. Vertisols: Their Distribution, Properties, Classification and Management. Texas
A&M University Printing Center.
Wopereis, M., Ceuppens, J., Boivin, P., N’diaye, A., Kane, A., 1998. Preserving soil quality under irrigation in the
Senegal River Valley. Netherlands Journal of Agricultural Science 46, 97–107.
Wopereis, M., Donovan, C., Nebie, B., Guindo, B., N’Diaye, M., 1999. Soil fertility management in irrigated rice
systems in the Sahel and Savanna regions of West Africa: Part I. Agronomic analysis. Field Crops Research
61, 125–145.
Yoshida, S., 1981. Fundamentals of Rice Crop Science. IRRI, Los Banos.
P. Boivin et al. / Geoderma 110 (2002) 87–107 107
Copyright © 2022 FDOKUMEN