
proceedings-piping-land-disturbances-2017.pdf - SANDRP
102
-
Upload
khangminh22 -
Category
Documents
-
view
4 -
download
0
Transcript of proceedings-piping-land-disturbances-2017.pdf - SANDRP


Book Design Godfrey’s Graphics
Edited by
G. Sankar Tomson J.K.
Organizing SecretaryDr. D. S. Suresh Babu

Foreword 01
Changing face of Western Ghats, Kerala and its Implication on Land Disturbances 07
Land disturbances due to Soil piping in the Western Ghats region of Kerala 11
Geotechnical Investigations and mitigation worksin the Soil Piping Affected Land Subsidence Sites in Kerala, India 39
Synthesis on Microwave Remote Sensing: Potential Application of Insar and Dinsar Techniques for Soil Piping 53
Soil piping in Kolari Village, Irritty TalukaKannur district, Kerala 64
Understanding thresholds for soil erosion and debris slide through Empirical Studies. 77
Chemical weathering of Deccan Bole beds around Pune- Mahabaleshwar of Western India: implications on their origin and climatic reconstruction 90
About Soil Piping and Pipeflow in Western Ghats 98
Contents


K erala state sandwiched between the Western Ghats and the Arabian sea is known as God’s own country, endowed with natural beauty and natural resources but is also a multi-
hazard prone State. The two monsoons (SW and NE) bring good rains as well as landslides and floods which frequent with monsoon in the highlands along with sea erosion in the western coast. A survey conducted by NCESS has indicated that nearly 70-80 people lose their life due to lightning every year. Last decade also witnessed a number of land subsidences in the Western Ghats during rains. Large scale subsidences were first identified by CESS in 2005 in northern Kerala. These studies indicated that this subsidence has occurred due to a type of subsurface soil erosion known as “soil piping” or Tunnel erosion. Since then a number of incidences were reported or discovered by NCESS. Considering the seriousness of the problem, NDMA has funded a research programme initiated jointly by NCESS and SEOC Govt. of Kerala. I am happy to mention that the recommendations given by NCESS were approved by the State Government which declared “Soil piping” as a state specific hazard. In order to address this issue with a wider audience from different streams, it was decided to hold a National Level Workshop on this topic which is not much deliberated. This workshop is aimed at bringing together scientists, faculties and students from all over India to discuss the problem of soil piping in the Western Ghats, with lead talks delivered by eminent scientists and several poster and video presentations. I am glad that the NDMA and KSDMA have come forward to support this important initiative.
Dr. N. Purnchandra Rao Director, National Centre for Earth Science Studies
Foreword


Introduction
Global environmental change is a matter of great concern. Dynamics of global environmental change can be systemic directly impacting globally functioning system like climate, and cumulative which impacts either through accumulation of spatial distribution of changes like that of biodiversity loss, deforestation, industrial toxic pollutants, groundwater pollution and depletion, and soil depletion of prime agricultural lands. Global studies indicates that climate change, rate of biodiversity loss and human interference with the nitrogen cycle have already crossed their respective boundary limits. It is necessary to take note of these changes at the regional and sub-regional level to devise appropriate mitigation measures and governance system because origins of most of these changes are anthropocentric. There is a general consensus in both science and policy that the present economic and social development paths are not sustainable in the long run and human intervention is a major driver of environmental change. We shall discuss here some of the changes in case of the Western Ghats in Kerala particularly related to land management.
High risk biodiversity hotspot
The Western Ghats occupying the eastern part of the State form southern segment of the Sahyadri or the Great Indian Escarpment. This unique landform assemblage with its mighty presence plays a very important ecologic, hydrologic, economic and cultural role. The environmental resource base which underpins the globally acknowledged Kerala mode of development is largely controlled by the Western Ghats, which is identified as one of the 25 biodiversity hotspots in the World and one of the three biodiversity hot spots with most elevated risks due to high concentration of population. Concern about Western Ghats figured at the highest level in the Government. The first initiative was in early 1980s, and in recent years there were two panels of experts to look into various issues concerning ecology of Western Ghats and development challenges. Little over 13,000 km2 area has been identified as ecologically sensitive area, which constitutes around 34% of total area of Kerala.
Changing face of Western Ghats, Kerala and its Implication on Land Disturbances
Srikumar Chattopadhyay Scientist (Retired), ESSO-National Centre for Earth Science Studies, Thiruvananthapuram
e-mail: [email protected]

8 Changing face of Western Ghats, Kerala and its Implication on Land Disturbances
Landscape assemblage
The Western Ghats represents the edge of an up-raised and disrupted continental block with date of formation during the early Miocene. Composed of mostly Precambrian crystalline rocks the Western Ghats, topographically, is characterized by plateau surfaces at different altitudinal levels, scarp slopes, deep valleys, ridges and peaks. The highest peak in Peninsular India is Anamudi peak (2695m) located in Kerala. The Palghat gap at an altitudinal range of 100 to 300 m drained by the Bharathapuzha is a major break within the Western Ghats ranges. Two prominent tectonic blocks of Wayanad and Anamalai are located in the northern and southern segments of Palghat gap respectively. The important landscape units to the north of the Palghat gap are Wayanad Plateau, Kunda hills, Silent valley and Attapadi valley adjoining Nilgiris, where the Eastern Ghats merges with the Western Ghats to the northeast of the Palghat gap. The part of the Western Ghats extending from south of the Palghat gap to Trivandrum-Nagercoil is considered as Southern Ghat or southern Sahyadri. The important land units are Nelliampathi plateau, Munnar plateau, Periyar plateau, Peermade plateau, and Ponmudi- Agasthamalai ridge section. The Agasthamalai (1809m) is another high peak in the southern end of the Western Ghats in Kerala. Width of the Western Ghats narrows down in the Khondalite belt to the south of Achankovil-Kallada shear zone. Western Ghats receives good rainfall for 8 to 9 months. Rainfall is high in the windward slopes and the highest rainfall (>400cm) is noted at Nariamangalam located in the foothills. Rainfall drops down to <100cm in the rain shadow area towards east. High rainfall, deep soil and geologically relatively stable condition provided conducive environment for growth of high statured rich tropical rainforest with the highest diversity. Based on biophysical characteristics and degree of human intervention the Western Ghats region can be divided into five units.
Vulnerable slopes and soil erosion
All these land units are surrounded by steep scarp slopes. Forty two per cent area of Kerala lies above 100m altitude. From slope point of Kerala has 24% area in the category of > 35% slope, another 16% area falling between 25% to 35% slope and 4% area as scarp slope. Slopes of the Western Ghats are steep, weathering is deep and intensive, soils developed along the sloping surfaces are prone to erosion and rainfall is high. High intensity rainfall accelerates the soil erosion of an area where the soil texture is sandy, and contains water repellent material eroded from hill slopes. Rainfall is the single most important triggering mechanism for land disturbances in the Western Ghats. Dense vegetation cover of tropical rainforest with thick undergrowth used to protect the land. Human intervention has disturbed this delicate balance.Average annual soil rate of loss from the Western Ghats is around 22tons ha-1yr-1. Sample studies indicated the rate of erosion in some pockets is even >200tons ha-1yr-1. Intensity of problem can be well gauged when these figures are compared with the estimated average annual soil loss of 5tons ha-1yr-1 for dense forest (>40% Canopy). Problem of soil erosion in the Western Ghats has been recognized since long. There are several soil conservation programmes under Western Ghat Development Programme being executed by the Government of Kerala. Nevertheless, accelerated soil erosion, landslides, rock fall, mudflow and soil piping are widely reported from the Western Ghats and majority of them are related to human induced factors.
Human intervention
Due to rich biodiversity, medicinal plants, and availability of spices that has world market human footprint in the Western Ghats may be traced even before CE. Encroachment within the forest areas has a long history. Kerala was traditionally well known for spices, most of which are hill products. With increase in demand of black pepper in the global market in the historical past,

Srikumar Chattopadhyay 9
there were efforts to raise black pepper vines replacing forest vegetation. However, these were controlled steps and all efforts were there not to disturb the forest ecosystem, as forest products provided the main resource base. The situation changed over the years with growing population and increasing resource demand.Introduction of agriculture by clearing forests began by early nineteenth century under the patronage of Tranvancore Government. The state monopoly of cardamom cultivation came to an end by 1896. Almost 100 years before, in 1798, the first coffee plantation was introduced by the Europeans, although actual spread of coffee plantation started by 1830s in Wayanad and 1860s by clearing forest vegetation. Teak plantation began in 1842 in the Malabar region. The first phase of teak plantation in Travancore area was started by 1860s. There were several initiatives by the Travancore state and also at the British Government level to expand cultivation and settlements within the forest area providing various incentives. Waste Land Rules (1861), granting ownership rights to the tenants in the government lands and similar incentives promoted expansion of non forest activities within the forest area. This was intensified over the years. Even the taungya system developed in Burma in the middle of the 19th century was tried in Travancore in 1915. The period between 1928 and 1932 witnessed a boon in encroachment and registration. During colonial period, tea and coffee plantations sprung up deep within the forest area of Western Ghats. Agriculture- forest boundary has been pushed deep inside the Western Ghats. The Western Ghats received a stream of migration from lowlands and midlands. From 1901 to 1991 highland recorded a population growth rate of 1343% against state average of 345%. The maximum growth rate occurred during 1940-50 coinciding with grow more food campaign.
Trend of Change
The Western Ghats is experiencing climate change, which is potent to affect agriculture, water resources, biodiversity and the overall ecosystem. Rainfall has reduced by 15 to 20% in some parts and increase in the average maximum temperature varies from 0.01 to 0.04oC/year. Dry spells are increasing. At present there are four types of agricultural typology: namely, (i) Tea, coffee, and rubber estates; (ii) Cardamom and other spices; (iii) Annual crops-based farming consisting of mainly paddy, vegetables, pulses, tuber crops and (iv) Homestead farming. All these will be variously affected due to climate change. The agricultural production, particularly of homestead farming, which is an important component of local economy in the Western Ghats is suffering due to these changes.It was estimated that forest cover of Kerala came down from 44% in 1905 to 17% in 1973. Kerala experienced an average annual rate of depletion at the rate of 0.27% between 1905 and 1965, 1.33% in the period 1965 -1973 and 0.29% during 1973-1983 (Chattopadhyay, 1985, and Chattopadhyay et al, 1986). Prasad et al (1998) suggested an annual rate of deforestation in the order of 0.5% during 1920-1973 and 0.9% for the period 1961-1989. An image based study on Agasthamalai brought out that between 1995 and 2000 about 19.5% of vegetation with crown density of 20% was lost. Forests are fragmented thus affecting regeneration, contributing to rise in temperature, restricting movement of wild lives and increasing threats to the ecosystem. Quality of vegetation is deteriorating over the years. Forest area has been diverted to non forestry purposes. Altogether there are 2628km2 area given to accommodate forest plantation, river valley projects, rock quarry, settlements, encroachments and leased to other departments. Road length within the forests is more than 4500km.
Implication on land disturbances
Change in land use/ land cover, constructions of roads, impounding of reservoirs, land shaping and any opening within the dense forests destabilize slope, increase surface runoff, create temporary base levels and also open new galleries for water infiltration. All these cause land disturbances;

10 Changing face of Western Ghats, Kerala and its Implication on Land Disturbances
changes hydrological cycle and affect ecological set up. The well laid out plantation increases the risk of land disturbances due to exposing bare soils to rain splash, increased infiltration beyond the limit of water bearing capacity of soils, and destruction of natural drainage system along the hill slopes. Similarly in the first generation forest plantations part of the stem and roots are left at the time of harvest to save cost. The left out vegetative matters decomposed over the years due to high rainfall are conduits of water infiltration, which removes the fine earth materials particularly in a laterite soil column and initiates the process of sub surface soil and water movement eventually leading to piping. Land disturbances are closely associated with human activities. It is important to take note of these issues, treat problems of Western Ghats from anthropogenic point of view and recognize that ‘Crisis in Western Ghats is Crisis of Governance’.

Abstract
The “Soil piping”, also known as “tunnel erosion” is the subsurface erosion of soil by percolating waters to produce pipe-like conduits below ground especially in non-lithified earth materials. In Kerala except Thiruvananthapuram, Kollam and Alappuzha all other districts reported occurrence of soil piping in some form or the other. Subsurface tunnelling is wide spread in the affected localities and their size varies from few centimeters to couple of meters. In many localities tunnelling due to soil piping has affected the infrastructure facilities such as roads and buildings. The State Government (KSDMA) has declared soil piping as a state specific hazard. A classification scheme of the tunnels based on its size was suggested. Multi electrode resistivity surveys are found to be useful in detecting the presence of subsurface tunnelling. It is a well-known fact that chemical and physical characteristics of soil are responsible for soil piping. The Saprolite clay associated with laterite profiles in the shoulder slopes of the highlands are found to be prone to soil piping in the Western Ghats. If the exchangeable sodium available in the clay is more than 6% the clay tend to become dispersive clay when interact with percolating water. It is also observed that the Kaolinite clay with gibbsite containing the exchangeable sodium is prime target for soil erosion. Chemical amelioration with gypsum or dehydrated lime and dewatering techniques are the best options for controlling or mitigating the soil piping. Keywords: Soil piping, Tunnel erosion, Western Ghats
Introduction
The State of Kerala falls within the realm of tropical climate and the dominent feature is the monsoon. The extremely fragile Western Ghats region is highly prone to natural calamities such as lan dslides, floods, lightning etc. Last decade witnessed a number of land subsidence incidences
Land disturbances due to Soil piping in the Western Ghats region of Kerala
G. Sankar1, Ajay K. Varma1, Sekhar L. Kuriakose 2, Prasobh P. Rajan1, Deepa C1., Eldhose K. 1 1. ESSO-National Centre for Earth Science Studies, Thiruvananthapuram
2. State Emergency Operations Center (SEOC), Govt.of Kerala, Thiruvananthapuram

12 Land disturbances due to Soil piping in the Western Ghats region of Kerala
in the highlands of Kerala. These subsidences are due to the collapse of the roof of the subsurface tunnel formed due to a process known as soil piping.The “Soil piping”( tunnel erosion) is the subsurface erosion of soil by percolating waters to produce pipe-like conduits (Figure 1) below ground especially in non-lithified earth materials. Soil piping or “tunnel erosion” is the formation of subsurface tunnels due to subsurface soil erosion. Piping is an insidious and enigmatic process involving the hydraulic removal of subsurface soil causing the formation of an underground passage (Ingles, 1968). During rains the percolating waters carries finer silt and clay particles and forms passage ways. The resulting „pipes“ are commonly a few millimetres to a few centimetres in size, but can grow to a meter or more in diameter. They may lie very close to the ground surface or extend several meters below ground. Once initiated they become cumulative with time, the conduits expand due to subsurface erosion leading to roof collapse (Figure 1) and subsidence features on surface. Since it happens in the underground, in many cases the phenomenon goes unnoticed. The cavities or pipes developed below the ground grow with respect to time and affect large extents of land in the form of subsidence thereby making it not suitable for cultivation. Occasionally the subsurface flow of water can result in conduits (or pipes) through relatively insoluble clastic deposits. The piping results in caving and collapse of surficial conduits (Figure 1a and 2) . This is an important process in the head ward extension of gullies, especially in arid semi-arid regions. The eroded sediments are dischrged through the outlets of the pipes which are usually located on the lower slopes / failed slopes or valleys.
Figure 1 Soil piping effects (a) Land subsidence, (b) Tunnel formation and (c) Outlet

G. Sankar, Ajay K. Varma, Sekhar L. Kuriakose, Prasobh P. Rajan, Deepa C., Eldhose K 13
Formation
The cavities and pipes developed below the ground grow with respect to time and affect large extents of land in the form of subsidence thereby making it useless for cultivation or such activities During rain percolating waters carries finer silt and clay particles and forms passage ways. The resulting “pipes”, are commonly a few millimeters to a few centimeters in size, (Figure.2) but can grow to a meter or more in diameter. They may lie very close to the ground surface or extend several meters below ground. Once initiated they become cumulative with time, the conduits expand due to subsurface erosion leading to roof collapse and subsidence features on surface.
Figure 2. Different stages of typical soil piping
Factors of Soil piping
Physical factors such as development of cracks in the soil.Expansive soils contain minerals such as smectite clays that are capable of absorbing water. When they absorb water they increase in volume. The more water they absorb the more their volume increases. Expansions of ten percent or more are common. Expansive soils will also shrink when they dry out. This shrinkage can remove support from buildings or other structures and result in damaging subsidence. Fissures in the soil can also develop. These fissures can facilitate the deep penetration of water when moist conditions or runoff occurs. This produces a cycle of shrinkage and swelling that places repetitive stress on structures. (www.geology.com). The soil aggregates easily dispersed when it was immersed with water. Hence the soil can be treated as a dispersive soil. Dispersion is an indicator of sodic soil as it occurs when sodium is present.

14 Land disturbances due to Soil piping in the Western Ghats region of Kerala
An erodable soil structure. Soil structure is the aggregation of individual soil particles into larger aggregates of identifiable shape. Well-developed soil structure promotes a network of cracks and large pores that accommodate infiltrating water, resulting in reduced erosion due to decreased runoff. Good aggregation also holds particles together, enabling the soil to resist the detachment forces of water and raindrop impact.Horizontal layer with lower permeability in the soil profile. Permeability is a measure of the rate at which water percolates through a soil. A subsurface horizon that is slowly permeable to water can cause a perched water table to develop during a large storm or irrigation event. When even a highly permeable soil is saturated because of a perched water table, infiltration slows down and surface runoff becomes a major path for hydrologic flow, increasing soil erosion.
Distribution
Piping (Figure 4) is far more widespread than has often been assumed, forming in virtually all climates, in organic and mineral soils, on undisturbed and agricultural land and in certain unconsolidated sediments and bedrock ( Jones, 1981; Dunne, 1990; Bryan and Jones, 1997). Soil pipes have been reported in a wide range of environments on every continent except Antarctica, from the tropical rain forest (Elsenbeer and Lack, 1996; Putty and Prasad, 2000) to periglacial regions with permafrost (Gibson et al., 1993; Quinton and Marsh, 1998; Carey and Woo, 2000; 2002). Piping appears to be of greatest geomorphological and hydrological significance in three environments: in organic soils on humid uplands, in badland areas in arid and semiarid environments, and in degraded semiarid rangelands (Bryan and Jones, 1997). Piping in Histosols and Gleysols seems to require a humid temperate climate. In a literature review, Jones (1994)
found that 60% of the studied sites with piping occurred in humid regions . On the other hand, dispersive- type pipes occur in a Mediterranean or semiarid context. In a wetter climate, sodium is lost so rapidly from the materials by leaching that the dispersive role on the clay complex does not persist (Churchman and Weissman, 1995; Faulkner, 2006). Also, in humid climates, the organic matter remains a structuring agent within the topsoil. In drier climates, clay is frequently the only structuring agent, so its dispersion has a dramatic impact (Faulkner, 2006). Both a reasonable water supply and some desiccation effects are needed, which gives peaks in the in the occurrence of piping in the semiarid and temperate marine environments (Bryan and Jones, 1997). During the last decade many piping incidences were reported by the Revenue and disaster management department from different places in Kerala. In the beginning it was believed that this process is also due to landslides. In 2002 in the Palakkayam locality of Mannarkkad taluk a localised
Figure 4 A soil piping affected reion in Australia(Photo - Department of Agrl.and food.W.Australia)

G. Sankar, Ajay K. Varma, Sekhar L. Kuriakose, Prasobh P. Rajan, Deepa C., Eldhose K 15
subsidence was reported by CESS (now NCESS). In 2005, CESS has investigated (Sankar 2005) land- subsidence in the Chattivayal locality (Figure 5) of Thirumeni village, Kannur, Kerala. It was found out to be due to soil piping. This was the first major incidence reported by NCESS on soil piping. At that time it was thought that it may be an isolated incidence. But subsequently such incidences were reported from many places in Kannur, Kozhikode and Idukki. After investigating the incidences reported from places (Figure 6) like Chattivayal (Taliparamba taluk, Kannur district), Niranganpara, Iritty taluk, Kannur district, Pasukkadavu (Vadakara taluk, Kozhikode district), Padinjareathara and Kunnamangalam Vayal (Vythiri taluk, Wayanad district), Venniyani mala (Todupuzha taluk, Idukki district) Perngasseri , Tattekkani Upputara, and Karuppilangad (Thodupuzha Taluk, Idukki district)
Figure 5 Tunnel roof collapse at Chattivayal, Cherupuzha
Figure 6: Piping events in various Talukas

16 Land disturbances due to Soil piping in the Western Ghats region of Kerala
Table 1 Status of the districts of Kerala regarding soil piping
Sl No. Districts Soil piping related land degradation Remarks
1 Kasaragod Affected Severe
2 Kannur Affected Severe
3 Idukki Affected Wide spread
4 Wayanad Affected Wide spread
5 Palakkad Affected Sporadic
6 Pathanamthitta Affected Sporadic
7 Kozhikode Affected Sporadic
8 Malappuram Affected Least
9 Kottayam Affected Least
10 Thrissur Affected Least
11 Ernakulam Affected Least
12 Alappuzha No reports
13 Kollam No Reports
14 Trivandrum No reports
Udayagiri (Udumanchola taluk, Idukki) it was confirmed this process needs detailed studies. Subsurface soil erosion due to piping often results in land degradation. The cavities and pipes developed below the ground grow with respect to time and affect large extents of land in the form of subsidence, thereby making it not suitable for cultivation and related activities. In short erosion due to piping in an area is like cancer affecting the human body. If unattended, it will spread and destroy vast amounts of valuable land (Table 1) in the State.

G. Sankar, Ajay K. Varma, Sekhar L. Kuriakose, Prasobh P. Rajan, Deepa C., Eldhose K 17
Figure 7. Map of Kerala showing land subsidence areas due to soil piping
Geologically, Kerala is occupied by Pre Cambrian crystalline, acid to ultra-basic intrusives of user Archaean to Proterozoic age, Tertiary (Mio Pliocene) sedimentary rocks and Quaternary sediments of fluvial and marine origin (GSI,2005), where major units of the Archaean continental crust, such as granulites, granites, gneisses and green stones are preserved. Southern part of the State, south of Achankovil shear zone, exposes an assemblage of migmatised meta sedimentary and meta igneous rocks ( Khondalite- Charnockite assemblage From north of the Achankovil shear zone upto the southern flank of the Palaghat Gap, the rocks are predominantly charnockites, charnockitic gneisses and a variety of other gneisses with occasional assemblages of metasediments in the Idukki-Munnar region representing the western continuation of the Madurai block in Tamil Nadu. Within the southern part of the Palaghat Gap, charnockite patches and hornblende biotite-gneisses are predominate. Towards the central and northern part of the Gap, migmatitic gneisses (hornblende biotite gneisses) and occasional patches of amphibolites, calc-granulite and granites are observed. Northern flank of the gap consists of a meta sedimentary sequence of khondalite and calc-granulite with crystalline lime stone bands. Granulites, schists, and gneisses, intruded by acid and alkaline plutons constitute the northern most part of the State (Soman,

18 Land disturbances due to Soil piping in the Western Ghats region of Kerala
2002; Figure 7). Khondalites are essentially garnet silliminite gneisses containing varying amount of graphite. These group of rocks are in abundance in areas south of Achankoil shear zone in the Thiruvananthapuram and Kollam districts. The data base indicates that the piping incidents rare in areas south of Achankovil where Khodalites are in abundance. Where as in areas dominated by Sargur group in Wayanad and Southern Karnataka soil piping incidences are prominent. The incidences are reported from areas where there is thick formation of laterites over the base crystalline rocks. Such incidences are reported from Idukki, Kozhikode districts. Soil piping incidences are not reported from Tertiaries or recent sediments in Kerala.
Types of soil pipes in Kerala
In nature, soil pipes are formed by the process of subsurface erosion; these kinds of pipes are stable or unstable, which depend upon, geomorphology, soil type, hydrogeology etc. Different types of pipes are observed in the high lands and each pipes having its own characteristics. The classification is mainly depending on the size of common soil pipes observed in the state. In many places these pipes are exisiting in combination. Many places it is like underground drainage network like dendritic network. Based on the size pipe are classified in to four stages of formation. The following classification has been arrived. This classification has been arrived based on the samples from Kerala occurrences.
Micro pipes (Juvenile pipe)
Micro pipes or juvenile pipe (Figure 8) are the initial stage of piping. The diameter of pipe is <5cm. Clayey and lateritic soils are favorable for the formation of juvenile pipes. These pipes often saturate the laterite cutting Mulanthuruthy (Figure 8b). These pipes are responsible for saturating the soil profile during rains there by lowering the factor of safety causing toppling. The failure of the railway cutting occurred during 2012 near Mulanthuruthy near Ernakulam is a typical failure affected by such juvenile pipes. The juvenile pipes when present in large numbers in an area indicates the susceptible nature of the soil to soil piping.
Figure 8 Micro ( Juvenile) pipes
Small pipes (Younger pipe)
Small pipes (Figure 9) are the second stage of development of the soil pipe. The diameter of pipe is ranges from 5cm - 30cm; It may combine together or individually developed as the formation of small pipe. This type of pipe is indicative of the dispersive soils occurring in that area. The presence of these pipes indicates that the terrain is very susceptible to piping. Laterite cuttings often fail during heavy rains due to saturation by these secondary pores.

G. Sankar, Ajay K. Varma, Sekhar L. Kuriakose, Prasobh P. Rajan, Deepa C., Eldhose K 19
a b
Figure 9: Small (Younger) pipes
Typical pipes (Mature pipe)
Mature pipe (Figure 10) is the third stage of development of pipe. The diameter of pipe ranges from 30cm to 5m. It may have an outlet; it acts as an underground drainage. This is the common pipes seen in the Western Ghats. The land subsidence is often caused by the growth of these pipes. This often branches in to smaller pipes giving an appearance of dendritic pattern. The size of the tunnel reduces towards the outlet attaining an overall shape of a funnel. The outlet of these pipes is often located in the lower side slopes or the valley. Here the water comes out as a fountain rather than a spring. These kinds of pipes are common in the affected localities. In Kerala Kottathalachi mala, Iritty (Kannur), Tattekanni (Idukki) are typical examples.
Figure 10: Typical pipes (Mature pipe)
Oversized pipes (Huge pipe)
It is next stage of pipe after development of a typical pipe. The diameter of huge pipe (Figure 11) is >5m. It will also have an outlet. It acts as an underground drainage, it has no definite shape. These pipes often associate with their lower versions such as typical / matuare pipes. These pipes are almost stable, the water erosion is very less and the walls of pipes are so hard Huge pipes are located in the Kasaragod (Kuttikol / Nelliyadukkam) and Kannur (Umrampoyil) districts.

20 Land disturbances due to Soil piping in the Western Ghats region of Kerala
Figure 11: Oversized pipes (huge pipes)
Piping materials and the process
Soil piping (Tunnel erosion ) results from a complex interaction of chemical and physical processes associated with clay dispersion, mechanical scouring, entrainment and mass wasting. The tunnel erosion process was first described by Downes (1946) and more recently by Boucher (1990) and Vacher et al. (2004b). Occasionally the subsurface flow of water can result in conduits (pipes) through relatively insoluble clastic deposits. The piping results in caving and collapse of sacrificial conduits (Figure 12). This is an important process in the head ward extension of gullies, especially in arid semi–arid regions .The materials most subject to Piping includes loess, tuff, volcanic ash, fine- grained alluvium or colluviums, and some rocks (especially clay stone, mudstone and siltstone). Piping takes many forms and performs a variety of functions. But most fundamentally for both geomorphology and hydrology it provides a rapid means of subsurface flow, erosion and runoff generation. Ritchie (1963) describes 3 forms of tunnel erosion (i) field tunnelling, (ii) tunnelling in earthworks i.e. ‘piping’ in dams, and (iii) tunnelling in strongly self- mulching clays. The first 2 forms of tunnelling are regarded as ‘true’ tunnelling, which result from the dispersion of sodic subsoils, while
Figure 12 Schematic of subsurface piping as a mechanism of gully formation Billard et al.,1993)

G. Sankar, Ajay K. Varma, Sekhar L. Kuriakose, Prasobh P. Rajan, Deepa C., Eldhose K 21
the third form of tunnelling is thought to be a purely mechanical process associated with water movement through large soil cracks. United States Department of the Interior (1960) and Vacher et al. (2004a, 2004b) have also reported the existence of tunnel erosion process in non-dispersive material resulting from the liquefaction of non-cohesive soils and mine spoil containing high silt and sand content.Field tunnel erosion may be initiated by a range of processes including loss or disturbance of vegetation resulting in the development of soil cracks and generation of surface runoff (Downes 1946; Crouch 1976; Laffan and Cutler 1977), formation of gully erosion which provides an outlet for water flow (Boucher and Powell 1994), increased infiltration due to ponding (Vacher et al. 2004a, 2004b), or disturbance and poor consolidation of dispersive clays (Ritchie 1965, 1963; Richley 1992). Overland flow with low electrolyte concentration enters the soil via desiccation cracks, resulting in the dispersion of sodic clay subsoil’s (Crouch 1976; Laffan and Cutler 1977). Provided the soil matrix has sufficient permeability to minimise pore blockages (Vacher et al. 2004b), dispersed soil material moves down slope through soil cracks, leaving behind a small tunnel or cavity (Richley 1992). Further rainfall events entrain and translocate more dispersed soil material, resulting in both head ward and tail ward linking of cavities into a continuous tunnel system (Laffan and Cutler 1977; Boucher and Powell 1994; Zhu 2003). Tunnel expansion enables flowing water to scour the base and undercut sidewalls, resulting in tunnel expansion through mass wasting (Laffan and Cutler 1977; Zhu 2003). Eventually undermining reaches an extent where complete roof collapse occurs and gullies form (Laffan and Cutler 1977). The general similarity of this process to karsts formation (involving mainly solution) has led to “pseudokarst” being used for landforms that originate by piping.
Figure 13 Diagram illustrating the process of piping (Boucher, 1990)
Piping most commonly occurs where dams and dikes, or deep, pumped, excavations below the water table have created large hydraulic head differentiate over relatively short distances. Such differences in head can become competent to transport disaggregated clastic rock particles ,such as sand grains ,in suspension through the more permeable parts of a permeable formation. By this kind of subterranean erosion pipes are formed; the surficial expression of this process is commonly

22 Land disturbances due to Soil piping in the Western Ghats region of Kerala
called “boiling” ( Jumikis,1962). Such pipes usually develop called in sand, sand and gravel, or in fine grained materials such as silt and clay. They will, unless controlled, undermine foundations and cause collapse of overlying structures. Piping with which engineers are most familiar is a direct result of man made changes in hydraulic head in the ground water system at a construction site. However, exactly the same kind of piping can develop in nature without man’s interference or help. Piping occurs on hillside slopes (Figure 13), on the crowns and the sides of mountain chains, miniature badlands mountains, and in badland ravine or gully channels, valley floor, flood plain, terrace etc. However in all cases, the basic essentials are all the same: (1) Water enough to saturate some part of the soil or bedrock above base level; (2) hydraulic head to move the water through a subterranean route; (3) presence of a permeable ,erodible soil or bedrock above the base level ;and (4) an outlet for flow.The studies conducted by NCESS (Sankar et.al 2016) shows that in Kerala Soil piping is reported from the Western Ghats and its foot hills only.The lateritic side slopes and the rolling lateritic hills in the foot hills are the most affected. The saprolite clay layer below the laterite overlying the hard granulitic basement , is usually affected by this process. Depending on the size of the clay layer the resultant tunnel is formed.
Soil texture
Considerable emphasis has been placed upon textural analyses in literature, despite the fact that properties such as structure, porosity, erodibility and drainage are of more direct relevance to the development of piping ( Jones, 1981). Nevertheless, the best developed piping occurs in soils with high silt-clay content, which may favour piping by providing cracking potential, easily eluviated particles and stronger roofing to prevent destruction ( Jones, 1981). Furthermore, the clay mineralogy plays a role in the susceptibility to piping of dispersive material. The specific mineralogy and the particular arrangements of the clay platelets will determine how ‘active’ they are in terms of physical changes (e.g. deflocculating) (e.g. Sumner, 1992; Sumner and Naidu, 1997; Faulkner, 2006; Impermeable soil layer Decreasing water permeability in the subsoil is an important factor for piping as pipes are often reported to develop at significant subsurface textural discontinuities in so called ‘duplex’ soils or texture-contrast soils (e.g. Rooyani, 1985; López Bermúdez and Romero Díaz, 1989; Fitzpatrick et al., 1995). Soil horizons with slightly differing clay content will experience differential swelling and shrinkage (Imeson and Kwaad, 1980). This differential swelling causes stresses and creates macropores, hence focusing through flow and pipe enlargement in particular horizons (Faulkner, 2006). Additionally, the occurrence of a highly permeable stratum underlain by impermeable strata is often reported as a requirement for piping (e.g. Parker and Jenne, 1967; Bryan and Yair, 1982; Farifteh and Soeters, 1999). Fletcher et al. (1954) stated that for piping to occur, a surface infiltration capacity greater than the subsoil permeability is needed, unless rodents or ploughing break the less permeable surface.
Human activity and land use change
Human activity has been blamed for the development of piping erosion in many parts of the world. According to Jones (1981), the problematic human activities can be divided into two categories: those which affect soil stability and those which affect the local water balance. The most commonly cited elements of human interference have been clearing land for agriculture and overgrazing, but also irrigation and construction works ( Jones, 1981). Reduced protection of the soil by vegetation loss and livestock trampling leads to Irregular infiltration, which favours piping erosion (Downes, 1946; Parker, 1963; Bryan and Jones, 1997). In the Western Ghats of Kerala the population density is much higher than other hilly tracts of the Country. Large scale human migration has taken place during mid nineties. Massive deforestation was taken place to promote Plantation crops such as tea, coffee, cardamam, rubber etc has become

G. Sankar, Ajay K. Varma, Sekhar L. Kuriakose, Prasobh P. Rajan, Deepa C., Eldhose K 23
prominent landuse in the Western Ghats .Steep slopes were tilled and benched for plantations promoting large scale infiltration of rain water. Such interventions have promoted large scale land disturbances in the form of Landslides ( Thampi et al 1998). Cutting of trees without the removal of tap roots, burrowing of rodants,making of rain water harvesting in steep slopes etc will act like secondary pores to import large quantity of storm water in to the side slope area.
Chemical properties
Structural stability of a soil is affected by its salt and sodium content. In addition, cementing agents in sands and silts are lime (CaCO3) and sesquioxides (Al- and Fe-oxides). Assessment of the risk of mineral clogging of drainpipes as a result of the chemical composition of the soil requires knowledge of the cation exchange capacity, and the salinity and sodicity of the soil.The pH of soil is the measure of hydrogen ions activity and depends on relative amounts of the absorbed hydrogen and metallic ions. It measures the acidity and alkalinity of a soil water suspension and provides good information about the soil properties such as phosphorous availability, base status and so on. Most of the soils that are prone to soil piping have pH values lying between 4 and 8.The most significant effect of piping appears to be in the acidification of surface streams. Piping reduces the buffering of acid rainfall by reducing residence times and by directing flow through the upper organic horizons, reducing contact with weathering mineral surfaces ( Jones and Hyett, 1987; Gee and Stoner, 1989). It may also encourage the release of sulphates and organic acids from the peaty horizons by draining and aerating sections of the hillside ( Jones, 1997b).Electrical conductivity of the soil is a numerical expression of the ability of a soil-water mixture to carry an electrical current which depends on the total concentration of the ionized substances dissolved in the soil-water mixture. In soils, most of the focus has been on the effect of ESP and electrolyte concentration (EC) on excessive swelling and dispersion, and on the subsequent effects on hydraulic conductivity and crust formation on drying. Quirk and Schofield (1955) and many others since that time (Quirk 2001) have used plots of ESP against electrolyte concentration to define regions of stable versus reducing hydraulic conductivity or soil flocculation versus deflocculation / dispersion. They investigated the permeability of a soil to solutions of different SAR and EC.Where comparatively low EC water is allowed to move through potentially dispersive soils, the leaching of salts out of the profile may produce spontaneous dispersion leading to the formation of tunnels. Hence, Hosking (1967, quoted by Crouch, 1976) concluded that the only practical way of preventing tunnel development is to divert water away from the catchment areas of the tunnels.Soils may contain slightly soluble salts such as lime and gypsum and highly soluble salts such as sodium chloride and sodium sulphate. The anions predominantly present in salty soils are Cl- and SO42-, yet some HCO3- at pH values of 6-8 and CO32- at pH values higher than 8.5 may be found. Na+, Ca2+ and Mg2+ are the predominant cations. The total dissolved solids (TDS) can be accessed from measuring the electrical conductivity (EC). The EC-value and TDS are linearly related (Richards, 1954).Dispersive soils, or sodic soils, collapse or disperse to form dissolved slurry when in contact with fresh water (rain).These soils are highly prone to erosion often leading to tunnel or gully erosion .Unlike other forms of erosion, dispersion and tunnel erosion result from an imbalance in soil chemistry.1 Tunnel erosion results from a combination of both chemical dispersion and physical transport
of dispersed clay particles.2 Soils with greater than 6% exchangeable sodium are prone to dispersion. The investigating

24 Land disturbances due to Soil piping in the Western Ghats region of Kerala
team shall carry out physical, chemical and geotechnical analysis of the soil in the affected areas to understand the causes of piping. The subsurface mapping /investigation would require equipment such as, imaging resistivity meters and vibration sensing equipment. Tracer studies will also be conducted to determine the pipe layout and GPR studies shall be initiated wherever required. Also come up with site specific mitigation measures to minimize/ arrest the process.
Soil piping is not an instant or as sudden process; it takes years depending on the area and type of soil present over there. Rosewell (1970) identified two preconditions that required for the formation of piping erosion (1) the soil must disperse into the water that moves through the soil and (2) the soil must have sufficient permeability in either the soil matrix or macro pores to enable the movement of dispersed clay particles without blockage. The physical properties which favors for the cause of piping are slope, elevation, rate of flow of underground water, structure, texture, porosity, and permeability of erodible material, chemical properties of soil like, clay mineralogy, pH, sodic soils, and electrical conductivity of soils. Until and unless these factors are not favorable, the soil may not be eroded and piping may not occur.No single factor or group of factors is universally responsible for the development of piping ( Jones, 1981), but the initiating factors vary in different situations. The conditions essential for piping listed by Parker (1963) are• Sufficient water to saturate some part of the soil or rock above base level.• Sufficient hydraulic head to remove the water through the subterranean route.• A susceptible medium (Sacrificial deposit or rock) to convey the water through the subterranean
route.• An outlet for the flow.Added to this in Kerala highlands soil piping is observed only where thick laterite cover is there. Dispersive clays associated with the saprolite layer below the laterite column is the ideal loci for soiling piping processes. The input of water may be from animal burrows or wilted region of long tap roots or infiltration pits etc.
Physical and chemical parameters of the affected Soils in Western Ghats
Soil Sampling Nearly 100 soil samples were collected from the localities affected by soil piping and unaffected localities to determine various parameters. The measurement of pH, EC, and TDS were conducted at the time of sample collection in the field itself.
Table 2 Soil Sample locations (part)
Sl No.
Sample No
Sample Code Location
Co-OrdinatesElevation
(m) Sample TypeLattitude Longitude
1 I1 6/1/PRY-A
Peringas-sery
9⁰52‘08.4‘‘N 76⁰51‘24.2‘‘E 271Soil ( outside the
pipe)
2 I2 6/1/PRY-E 9⁰52‘08.4‘‘N 76⁰51‘24.2‘‘E 270Soil ( outside the
pipe)
3 I3 6/1/PRY-B 9⁰52‘08.4‘‘N 76⁰51‘24.2‘‘E 268 Soil (outside the pipe)
4 I4 6/1/PRY-Ei 9⁰52‘2.9‘‘N 76⁰51‘28.4‘‘E 263 Soil (Inside the pipe )
5 I5 6/1/PRY-Ci 9⁰52‘2.9‘‘N 76⁰51‘28.4‘‘E 262 Soil (Inside the pipe )

G. Sankar, Ajay K. Varma, Sekhar L. Kuriakose, Prasobh P. Rajan, Deepa C., Eldhose K 25
-
-
-
91 W68 11/4/WAY-1Padinjare-
thara 11°43‘52.9“N 75°49‘52.7“E 817 Soil (Non piping)
92 W69 11/4/WAY Banasuram 11°40‘25.3“N 75°58‘04.0“E 736 Soil (outside the pipe)
93 W70 11/4/WAY-6 Banasuram 11°40‘25.3“N 75°58‘04.0“E 736 Soil (outside the pipe)
Where, 6- Idukki district, 13- Kannur district, 14- Kasaragod, 11- Wayanad, 1, 2and 3 -Sample locations, PRY- Peringassery, TK- Thattekanni, VM- Venniyanimala, KTM- Kottathalachimala, Tb- Tabor, Ch- Chattivayal, KTL- Kuttikol, WAY- Wayanad, A, B, C, and E- Soil horizons
Figure14 Soil Sample collecting from Piping and Non piping Area

26 Land disturbances due to Soil piping in the Western Ghats region of Kerala
Soil chemistry and Sedimentological studies
The soil samples were prepared for analytical tests following Hesse P R, (1971) method. The samples were dried as rapidly as possible. Drying is carefully carried out to avoid secondary reaction. Large lumps of soil were crushed and roots of plants were removed and the sieved fine soil was used for the analytical experiments. The chemical parameters like pH, electrical conductivity, total dissolved solids, Organic carbon and other organic matter were estimated and XRD and XRF analysis were carried out in selected samples. Soil texture analysis was also conducted. Dispersion test (Figure15) has been conducted to know about the dispersive property of the soil.
Figure15 Soil dispersion test
pH
PH of soil is the measure of hydrogen ions activity and depends on relative amounts of the absorbed hydrogen and metallic ions. It measures the acidity and alkalinity of a soil water suspension and provides good information about the soil properties such as phosphorous availability, base status and so on. The pH of the soil was determined using 1:10 soil-water (w/v) suspension. 10 g of the air dried soil was mixed with 100 ml distilled water in a beaker. The soil-water mixture was stirred at least 5 times over a 30 minutes interval to allow for soil and water to reach equilibrium. After reaching the equilibrium, the pH of the mixture was measured using the glass electrode after thorough mixing. pH meter was calibrated using buffer solution before the measurements were done.

G. Sankar, Ajay K. Varma, Sekhar L. Kuriakose, Prasobh P. Rajan, Deepa C., Eldhose K 27
Electrical Conductivity (EC)
Electrical Conductivity of the soil is a numerical expression of the ability of a soil-water mixture to carry an electrical current which depends on the total concentration of the ionized substances dissolved in the soil-water mixture and the temperature at which the measurement was done. Conductivity is a good criterion of the degree of mineralization and soluble salts in the soil. It depends upon the ratio of the soil to water ratio. The EC of the soil was determined using 1:10 soil-water (w/v) suspension. 10 g of the air dried soil was mixed with 100 mL distilled water in a beaker. The soil-water mixture was stirred at least 5 times over a 30 minutes interval to allow for soil and water to reach equilibrium. The mixture was left overnight in order to obtain a clear supernatant solution into which conductivity electrode was dipped for EC measurement.
Total Dissolved Solids (TDS)
Total Dissolved Solids is a measure of the combined content of all inorganic and organic substances contained in a soil water mixture. The TDS of the soil was determined using 1:10 soil-water (w/v) suspension. 10 g of the air dried soil was mixed with 100 mL distilled water in a beaker. The soil-water mixture was stirred at least 5 times over a 30 minutes interval to allow for soil and water to reach equilibrium. Then mixture was left undisturbed for few minutes to obtain a clear supernatant solution into which conductivity electrode was dipped for TDS measurement.
Analytical report –Idukki
Table 3 Analytical report of soil samples from Idukki locations
SL. NO Sample Taken from Sample No. pH Electrical
Conductivity (μs/m)Total DissolvedSolids
(ppm)
1
Piping Area
I1 5.84 5.32 3.77
2 I2 6.98 3.82 2.65
3 I3 6.68 4.18 3.05
4 I4 5.85 7.33 5.22
5 I6 5.91 5.49 3.95
6 I7 5.55 7.35 5.24
7 I8 5.56 8.2 5.91
8 I10 6.21 4.43 3.06
9 I11 5.8 8.21 5.9
10 I14 6.55 4.8 3.41
11 I16 6.29 3.8 2.42
12 I-17 5.63 10.85 7.70
13 I-18 5.74 13.22 9.38
14 I-19 5.96 5.22 3.70
15 I-20 6.02 10.16 7.21
16 I-21 5.71 6.66 4.72
17 I-22 6.00 3.84 2.72
18
Non-Piping Area
I9 5.91 5.26 3.6
19 I12 5.71 5.13 3.54
20 I13 6.7 5.21 3.75
21 I15 6.14 6.76 4.68

28 Land disturbances due to Soil piping in the Western Ghats region of Kerala
The pH values of the samples (Table 3) from Idukki range from 5.00 - 6.98. The samples collected from Peringassery (Sample- I2) records highest pH reading (6.98), whereas the sample Sample-I17 (collected from Upputhara, Idukki) records the lowest reading (5.63). pH shows below 7 ranges it should be acidic in nature, above 7 shows alkaline in nature. The change in pH affects the degree of dissociation of weak acids and bases. The soil samples collected from, piping and non-piping area was showed in low pH values therefore all the samples are acidic in nature (Table 3).The maximum of values EC and TDS is at 13.22μs/m and 9.38ppm is respectively from the samples collected from Upputhara (1-18 ) .
Analytical report –Kannur
Table 4 Analytical report of soil samples from Kannur locations
SL.NO Sample code pH Electrical Conductivi-ty(μs/m) Total Dissolved Solids (ppm)
1 K1 5.69 5.14 3.72 K2 5.7 8.24 6.13 K5 4.31 44.22 32.284 K6 5.36 15.88 11.685 K7 5.72 11.18 8.196 K10 6.02 4.73 3.637 K12 5.96 5.14 3.78 K13 6.33 4.23 3.169 K14 6.52 5.86 4.2310 K16 6.88 4.33 3.2811 K17 6.11 4.23 3.0812 K18 6.45 5.36 3.9613 K19 6.84 5.78 4.3914 K20 6.3 5.31 3.9915 K53 6.32 27.4 21.7616 K54 6.54 19.56 15.3317 K55 6.58 8.41 6.5618 K56 6.53 14.86 11.4119 K57 6.29 21.84 16.1720 K58 6.54 34.58 26.6821 K59 6.9 12.89 9.9422 K60 6.54 18.7 14.6623 K61 6.5 25.02 18.8924 K62 6.74 8.38 6.525 K63 6.74 11.4 8.8126 K64 6.95 17.98 14.39

G. Sankar, Ajay K. Varma, Sekhar L. Kuriakose, Prasobh P. Rajan, Deepa C., Eldhose K 29
The pH values of the soil samples from Kannur at different piping locations is ranges from 4.31 -6.95 (Table 4). The samples collected from K-64 records highest pH (6.95) while that from K-5 records the lowest (4.31). The change in pH affects the degree of dissociation of weak acids and bases. All the samples show acidic in nature. There was a huge variation in EC (4.23 μs/m to 34.58) and TDS (3.16 to 26.68) in the piping area at Kannur compare to Idukki piping area. The results shows that the parameters like EC and TDS of soil samples collected from Soil Idukki district is less than that from the Kannur district. Which is collected from inside the pipe, this result indicate that lowest PH value indicate the piping area is in oxidising environment. So the chemical erosion is prominent in this region.
ORGANIC CARBON AND ORGANIC MATTER
Organic Carbon
Carbon occurs in the soil in elemental form in the inorganic forms of carbonate, hydrogen carbonate and carbon dioxide and organically as plant and animal matter, their immediate decomposition products and more resistant humus. Wet digestion method or Walkley-Black method (rapid dichromate oxidation technique) was used for the estimation of organic carbon. For the wet combustion of organic matter soil was heated with potassium dichromate as the oxidizing agent and sulphuric acid to convert all forms of carbon into carbon dioxide. The potassium dichromate in excess after oxidation of carbon was titrated against ferrous ammonium sulphate. 0.5 g air dried sieved soil was added with 1N potassium dichromate solution and swirled gently to disperse the soil. To this, 20 ml of concentrated sulphuric acid was added and swirled for one minute. The sulphuric acid used contains containing 1.25 % silver sulphate to precipitate chloride as silver chloride so that chloride does not contribute to oxidation of the organic matter. The solution was allowed to stand for half an hour to make the reaction complete. After half an hour the solution was diluted with distilled water and added with 10 drops of diphenyl amine indicator. Then it was titrated with 0.5 M Ferrous ammonium sulphate solution. The end point is indicated by the colour change of the solution from yellow to red with an intermediate green colour formation. The blank determination of organic carbon content was measured as above without soil. The organic carbon content of the soil was calculated in percentage by the formula.
Organic carbon (%) = 10(B-T)/ B *0.003*100/SWhere,
B -Volume of ferrous ammonium sulphate required for blank titration in ml. T -Volume of ferrous ammonium sulphate required for soil sample in ml. S –Weight of soil in gram Organic matter (%) = % Organic carbon *1.724
Organic matter
The term soil organic matter embraces the non-mineral fractions of the soil such as any vegetable or animal matter of the sample. Organic matters contribute to the physical condition of a soil by holding moisture and by affecting the structure. It is the direct source of plant nutrient elements, the release of which depends on the microbial activity and by affecting the action exchange capacity, organic matter is directly involved in the availability of nutrient elements. Soil organic matter is estimated from its organic carbon content.

30 Land disturbances due to Soil piping in the Western Ghats region of Kerala
Table 5 Estimation of soil organic carbon and matter
SL. NO Sample Organic Carbon (%) Organic Matter (%)
1 I-1 1.83 3.15
2 I-2 0.84 1.44
3 I-3 1.02 1.75
4 I-4 0.75 1.29
5 I-5 0.69 1.18
6 I-9 0.48 0.82
7 I-11 0.09 0.16
8 I-14 0.01 0.02
9 I-15 0.96 1.97
10 I-17 2.49 4.3
11 I-18 2.04 3.52
12 I-19 0.97 1.67
13 I-20 2.98 5.14
14 I-21 3.4 5.87
15 I-22 2.49 4.3
16 K-1 0.36 0.62
17 K-2 0.33 0.57
18 K-5 0.06 0.1
19 K-6 0.37 0.63
20 K-10 0.21 0.36
21 K-12 1.05 1.81
22 K-13 1.11 1.89
23 K-15 0.63 1.08
24 K-19 0.57 0.98
25 K-20 0.93 1.6
Analysis of organic Carbon and organic matter (Table 5) shows the lowest range 0.10% and 0.02%, samples were collected from I-14 (inside the piping). Sample I-21 shows an organic carbon percentage of 3.40 % and organic matter percentage of 5.87%. This soil sample was collected from a depth of 50 cm with an elevation of 877m.soil samples were collected from Upputhara near Nalaam mile (inside the piping). Occurrences of organic matter in tropics where high temperature and abundant precipitation are prevalent laterite soils in general, do not accumulate organic matter except under special conditions like swamping or forest vegetation. But on a review of the data obtained by many workers, it is revealed that no characteristic limit can be fixed for it, in general, since it appears to fluctuate between 0.1 to 17% as in the case of some soils. The Lowest

G. Sankar, Ajay K. Varma, Sekhar L. Kuriakose, Prasobh P. Rajan, Deepa C., Eldhose K 31
range of organic carbon and organic matter indicated that the sampling areas become eroded. Lowest range of organic carbon and organic matter which increase the soil erosion activity, leads to reducing the soil stability.The table 5 shows organic carbon and organic matter percentage of soil samples collected Upputhara near Nalaam mile, Peringassery and Venniyanimala in Idukki district. In the Sample I-9 shows a relatively less organic carbon percentage (0.48%) and organic matter (0.82%). This sample was collected from a piping affected locality with an elevation of 492m. In general vertical distribution of organic carbon in soil is decreasing as depth increases. By comparing piping and non-piping area, organic carbon is rich in non-piping area and low in piping area.
X-ray diffractogram (XRD)
The XRD analysis shows (Figure.16) Gibbsite and Kaolinite is more dominant followed by Quartz. Gibbsite indicates prominent leaching material which confirms the erosional activity in that region.
Figure 16 X-ray diffractogram of clay fraction
Sample which shows presence of Zeolite. It is having the property of high porosity indicates the ability of storing water within its pores and in conditions if the pores are completely saturated by water they start eroding. Kaolinite which is high in its acidic nature, Gibbsite which is commonly found in lateritic conditions, Vermiculite which can expand in high extent, all these properties of the minerals are clearly driving for the cause of soil piping.
Detection of subsurface tunnels
Usually the subsurface cave and tunnels produced by soil piping in the Western Ghats are located at a depth range of less than a meter to couple of meters such as 30 to 40 meters. The depth of the tunnel will depend on the topography as well as the depth of the laterite column. Often geophysical techniques are used to detect these tunnels and caves. Both Ground Penetrating Radars (GPR) and Multi -electrode Resistivity Surveys are found useful in such surveys.Due to non-availability of GPRs for the present study electrical Resistivity surveys were carried out to locate the tunnels. An electrical resistivity survey will be effective only if the target of interest has a resistivity contrast with the surrounding medium. For example, underground void spaces, buried rock boulders, hard rock basements etc. exhibit high resistivity values and therefore will be in contrast with the surrounding medium. Similarly, water saturated sub-surface layers,

32 Land disturbances due to Soil piping in the Western Ghats region of Kerala
filled pot-holes; metallic objects etc exhibit lower resistivity values and hence offer a contrast with the surrounding medium. In such circumstances, electrical resistivity method could succeed in delineating the subsurface structures. This is the basis of selecting electrical resistivity methods for the present study. However, it is to be understood with caution that a resistivity contrast could be similar for different features and therefore, the inferences from geological evidences or multiple geophysical methods are extremely important for the clarity and confirmation of the results.
Multi -Electrode Electrical Resistivity Surveys
The electrical resistivity profiles were laid almost perpendicular to the suspected alignment of the soil pipes with the probable location of pipes as the centre point. The maximum length of the profile was depending on the electrode separation; 60 electrode was using with aWDZJ-4 switcher box i.e., A multi-function Digital DC Resistivity/IP Meter is having a WDJD-4main frame, WDZJ-4 switcher box (Multiplex Electrode Converter), 12V rechargeable battery as a transmitting power source developed by BTSK/WTS Limited, electrodes, multi-electrode cables etc. The data so gathered is processed and interpreted using RES2DINV Software. (www.wtsgeo.com/wdjdj-3.html/3.05.2015).2D electrical resistivity tomography profiling (surface electrode arrays) is used for subsurface cavity investigations as a means of identifying the ravel zone i.e, the underlying void or cavity. Field investigations were carried out using Electrical Resistivity Imaging technique at piping affected localities of Kottathalachimal and Nelliyadukkam in Kannur and Kasaragod district respectively.
Electrical Resistivity Surveys at Kannur
Experiments using Electrical Resistivity Survey techniques were conducted at Kottathalachimala near Cherupuzha, Kannur district across the alignment of a known soil pipe (Figure 17, 18) by using the Multi-function instrument. Electrical resistivity tomography has been carried out over five mutually parallel profiles using a 60 electrode-setup. A minimum of 0.25m to a maximum of 2.0m spacing has been used as electrode configuration. The five survey profiles were laid in the West-East direction. Profiles are laid above the existing soil pipe. The terrain gently slopes towards north hence the elevation gradually decreases from profile 1 to profile 5 (Figure 16). ERT at profile 1 is carried out using five different electrode spacing. Out of five profiles laid across the piping alignment the most reliable results were d below (Figure 19).
Figure: 17 & 18 The layout sketch of electrical resistivity survey at Kannur
Profile 2 & 3 were laid almost parallel to profile 1 at a distance of about 27m north of it. The central electrode for profile 2 is about 8m east of central electrode of profile 3. Profile 2a and 2b

G. Sankar, Ajay K. Varma, Sekhar L. Kuriakose, Prasobh P. Rajan, Deepa C., Eldhose K 33
correspond to electrode spacing of 0.50m and 1.00m respectively. Profile 3a and 3b correspond to electrode spacing of 1.50m and 2.00m respectively. Profile 4 was laid further towards north at a distance of about 18m from profile 2 & 3. The electrode spacing used for profile 4a and 4b are 1.00m and 1.50m respectively. Profile 5 was laid in the NW-SE direction with the first electrode towards north-west. Electrode spacing of 1.00m and 1.50m has been used for profile 5a and 5b respectively.
Figure: 19 Electrical Resistivity Tomograph of 1m electrode spacing
Profiles laid with an electrode spacing of 1.0m. It is observed that Schlumberger and Wenner were not given the clear picture of the tunnel cross-section. Both the configurations showed the tunnel extending indefinitely with depth. The two configurations fail to map the tunnel bottom even though from physical observations it is known that the actual vertical extent of the tunnel is lesser than the interpreted depth of the two arrays. The dipole-dipole array clearly brings out the entire tunnel cross-section. There was an asymmetry in the tunnel cross-section, with eastward (rightward) extension of the high resistive zone and the absence of the same in the westward direction. This feature was observed in all the three configurations (Figure 19) for 1.0m, spacing. This could be an indication of the presence of another tunnel like feature, smaller as compared to the soil pipe under study, located parallel and towards east (right) of the original tunnel. In the dipole-dipole setup (Figure 19c) detect a low resistivity zone adjacent to the west (left) wall of the tunnel but about 2m to 3m below the soil pipe. The true resistivity value is very low and can possibly be corresponding to a water saturated zone. The variation of resistivity from the different arrays clearly depict to soil pipe and related geological features. The unique response of Schlumberger array type can hence be of importance in distinguishing a tunnel from a region of high resistivity such as a buried boulder. Although Schlumberger and Wenner array fails to map the vertical extent of the soil pipe, it provides a better lateral resolution compared to the dipole-dipole configuration.

34 Land disturbances due to Soil piping in the Western Ghats region of Kerala
Electrical Resistivity Surveys at Kasaragod
Figure: 20 The layout sketch of electrical resistivity survey at Nelliyedukkam, Kasaragod district)
Survey line 1 (S1): These profiles are directly above the pipes and the possible orientation of pipes at these locations is known. The total depth of information obtained from the figure 21 is 23m. The resistivity value changes from 36.4 to 1510Ωm. The presence of high resistive zone vertically below the central electrode is strengthened from the Geoelectrical sections of profile. The tunnel roof was observed at a depth of about 3.98m from the surface in all three electrode configurations. While the Schlumberger (Figure 21a) and Wenner (Figure 21b) configurations helped us in determining the tunnel roof, the high resistivity zone could be seen extending at a depth of 3.98 to 10.5m, in the schlumberger configuration. The data generated by schlumberger configuration was more accurate than Dipole-Dipole (Figure 21c) and Wenner array mode.
Figure: 21 Electrical Resistivity Tomograph of 1m electrode spacing

G. Sankar, Ajay K. Varma, Sekhar L. Kuriakose, Prasobh P. Rajan, Deepa C., Eldhose K 35
Mitigation Usually locals fill the subsided area to mitigate the soil piping like the one in Banasurasagar road Padinjarethara, Wayanad(Figure.22). But filling with same earth will not solve the problem and it will reappear after some time. Since soil piping is a chemical erosion caused subsurface water, it can be addressed in two ways. One is by dewatering the affected area as shown in figure 23 and 24, which is an experiment being conducted at Banasurasagar . The other is chemically neutralisng the dispersiveness of the soil. Besides Chemical amelioration the piping process could be mitigated by diverting water flowing through the affected area, Introduce earth- filling using soil from a non-piping locality, Filters can be introduced in the pipes to arrest the soil transport.
Figure 22. Subsidence at Banasurasagar, Vythiri taluk Wayanad 1.Before filling subsided area 2006 2. After filling subsided area2014
Dewatering is often suggested to mitigate the piping related problems in an affected area. The plan is given in figure 23 is for the same site at Padinjarethara in Wayanad. It is proposed to collect water coming from upslope direction on a well like structure the it should be be diverted to lower levels to save the house.
Figure 23:Suggested dewatering plan is to mitigate the piping in Banasurasagar dam

36 Land disturbances due to Soil piping in the Western Ghats region of Kerala
Figure 24:Side view and cross-sectional of dewatering plan
The plan and cross sectional drawings are shown in figure 24 . The well is 7m in depth with a effective inside length and breadth of 3.5m x 3.5m . The structure will have an out flow section of 1m in diameter. Since the soil thickness is very high construction of barriers might not yield desired results. If the intervention is carried out the government then the well could be used as a community well for the locals.
Conclusions
Land subsidence due to soil piping is at present observed mainly from the lateritic side slopes in the Western Ghats of Kerala. Excepting districts of Alappuzha, Kollam and Trivandrum all other districts are affected by the soil piping problem. Studies suggested that many infrastructure facilities especially communications line like roads have been affected by tunnel formation due to soil piping. Data of the affected sites indicate that they are confined to the shoulder slope break of the highlands. The Kaolinite clay with gibbsite present in the saprolite layer beneath the laterite bordering the impermeable bedrock is the vulnerable to soil piping. These clays are always contain dispersible Na with quantities more than 5% are ideal for soil piping erosion. Multi electrode electrical resistivity surveys are best suited to identify the sub surface tunnels and voids formed by the soil piping. However with this technique it is unable to map the Juvenile and small voids/tunnels which are less than 30cm in diameter. Chemical amelioration and dewatering are found be the appropriate methods for controlling soil piping. As immediate remedial measure it is better to adopt dewatering techniques using some engineering measures like diversion of underground flow channels and construction of underground barriers etc.
ReferencesBillard et al., 1993 A. Billard, T. Muxart, E. Derbyshire, J.T. Wang, T.A. Dijkstra Landsliding and land use in the loess of Gansu
Province, China Zeitschrift für Geomorphologie, 87 (1993), pp. 117–131Boucher SC (1990) Field tunnel erosion, its characteristics and amelioration. Dept. of Conservation and Environment, Land Protection
Division, Victoria, East MelbourneBoucher SC, Powell JM (1994) Gullying and tunnel erosion in Victoria. Australian Geographical Studies 32, 17–26.Bryan, R.B., Jones, J.A.A., (1997). The significant of soil piping processes: inventory and prospect. Geomorphology. Page no. 209-218Bryan, R., Yair, A., 1982. Badland geomorphology and piping. Geo Books (Geo Abstracts Ltd).Carey s. k, woo, m. k., (2000), The role of soil pipes is a slope runoff mechanism. Subarctic Yukon, Canada. Journal of Hydrology, vol.
no: 233(2000)206-222., page no. 206-221, Churchman, G.J. and Weissmann, D.A. (1995) Separation of sub-micron particles from soils and sediments without mechanical
disturbance. Clays and Clay Minerals, 43, 85-91.Crouch, R.J., 1976. Field tunnel erosion—a review. Soil Conservation Journal, Wagga. Research Centre, pp. 98–111

G. Sankar, Ajay K. Varma, Sekhar L. Kuriakose, Prasobh P. Rajan, Deepa C., Eldhose K 37
Downes, R.G., 1946. Tunnelling erosion in North-Eastern Victoria. Journal of Comm. Science and Ind. Res. 19, 283-292.Dunne, 1990., Hydrology, mechanics, and geomorphic implications of erosion by subsurface flow in: C.G. Higgins, D.R. Coates
(Eds.), Groundwater Geomorphology, the Role of Subsurface Water in Earth-Surface Processes and Landforms, Geol. Soc. Am. Spec. Pap., 252 (1990), pp. 1–28
Elsenbeer, H., and A. Lack (1996), Hydrometric and hydro chemical evidence for fast flow paths at La Cuenca, western Amazonia, J. Hydrol., 180, 237– 250.
Farifteh, J., Soeters, R., 1999. Factors underlying piping in the Basilicata region, southern Italy. Geomorphology 26, 239-251.Faulkner, H., 2006. Piping Hazard on Collapsible and Dispersive Soils in Europe. In: Boardman, J., Poesen, J. (Eds.), Soil Erosion in
Europe. Wiley ( J.), Chichester, pp. 537-562.Fitzpatrick, R.W., Boucher, S.C., Naidu, R., Fritsch, E. 1995. Environmental consequence of soil sodicity. In: Naidu, R., Sumner,
M.E., Rengasamy, P. (Eds.) Australian Sodic Soils: Distribution, Properties and Management. CSIRO Publications, Melbourne; 163–176.
Fletcher, J.E., Harris, K., Peterson, H.G., Chandler, V.N., 1954. Piping. Trans. Am. Geophys. Union 35, 258-263. Gee AS, Stoner JH. 1989. A review of the causes and effects of acidification of surface waters in Wales and potential mitigating
techniques. Archives of Environmental Contamination and Toxicology 18: 121–130.Gibson JJ, Edwards TWD, Prowse TD. 1993. Runoff generation in a high boreal wetland in northern Canada. Nordic Hydrology 24:
213–224Hesse P.R. (1971) A Textbook of Soil Chemical Analysis. Murray, London. Hosking PL 1967: Tunneling erosion in New Zealand. Journal of Soil and Water Conservation 22, 149-151 http://soildegradation.weebly.com/impacts-on-our-environment.htmlhttp://www.geology.comImeson, A.C., Kwaad, F.J.P.M., 1980. Gully types and gully prediction. Koninklijk Nederlands Aardrijkskundig Geografisch Tijdschrift
14, 430-441.Ingles, O.G., 1968: Soil chemistry relevant to the engineering behaviour of soils. In Lee, I.K. (ed.) Soil Mechanics - Selected Topics.
Butterworths, Sydney, 1-57. Jones J. A. A (1994) Soil piping and its Hydro geomorphic functions, University of Wales Aberystwyth.Jones JAA, Hyett GA. 1987. The effect of natural pipeflow solutes on the quality of upland streamwater in Wales. Abstracts, 19th
General Assembly of the International Union of Geodesy and Geophysics, Vancouver, 3, 998.Jones, J.A.A., 1981. The Nature of Soil Piping, a Review of Research. Geo Books,NorwichJones, J.A.A., 1997b. The role of natural pipeflow in hillslope drainage and erosion: extrapolating from the Maesnant data. Physics and
Chemistry of the Earth 22, 303-308.Jumikis, A. R. (1962). Soil mechanics; Van NOSTRAND Publ. Co., Princeton, N.J., 791p Laffan, M.D., Cutler, E.J.B., 1977. Landscapes, Soils, and Erosion of A Catchment in Wither Hills, Marlborough .2. Mechanism of
Tunnel-Gully Erosion in Wither Hill Soils from Loessial Drift and Comparison with Other Loessial Soils in South Island. New Zealand Journal of Science 20, 279-289.
López Bermúdez, F., Romero Díaz, M.A., 1989. Piping erosion and badland development in southeast Spain. Catena Suppl. 14, 59-73.O’Geen, A.T., R. Elkins, and D. J. Lewis, 2005. Erodibility of agricultural soils in Lake and Mendocino Counties UC-DANR Series
publication #8194. Parker, G.G., 1963. Piping, a geomorphic agent in land-form development of the drylands. In: Land Erosion, Precipitation,
Hydrometry, Soil Moisture. pp. 103-113.Parker, G.G., Jenne, E.A., 1967. Structural failure of western highways caused by piping. Highway Research RecordPutty, M.R.Y., Prasad, R., 2000a. Understanding runoff processes using a watershed model – A case study in the Western Ghats in
South India. Journal of Hydrology 228(2000), 215-227. Putty, M.R.Y., Prasad, R., 2000b. Runoff processes in head water catchments – an experimental study in Western Ghats, South India.
Journal of Hydrology 235, 63-71.Quinton, W. L. and P. Marsh, 1998b. Meltwater fluxes, hillslope runoff and mmflow in an arctic permafrost basin. 7th International
Conference on Permah June 1998, Yellowknife, NWT. 92 1 -926.Quinton, W. L. and P. Marsh. 1998a. The influence of mineral earth hummocks on subsufice drainage in the continuous permafrost
zone. Permqht and Periglucial Processes, 9.2 1 3-228. Quirk, J.P. (2001). The significance of the threshold and turbidity concentrations in relation to sodicity and microstructure. Australian
Journal of Soil Research 39, 1185-1217.Quirk, J.P., Schofield, R.K., 1955. The effect of electrolyte concentration on soil permeability. Australian Journal of Soil Research 6,
163-178.Richley LR (1992) Minimising erosion hazard due to installation of an optical fibre cable through dispersible clay soils. Australian
Journal of Soil and Water Conservation 5, 35-38.Ritchie JA (1963) Earthwork tunnelling and the application of soil-testing procedure. Journal of the Soil Conservation Service of New
South Wales 19, 111–129. Ritchie JA (1965) Investigations into earthwork tunnelling and mechanical control measures using small scale dams. Journal of the Soil
Conservation Service of New South Wales 21, 81–89. Rooyani, F., 1985. A Note on Soil Properties Influencing Piping At the Contact Zone Between Albic and Argillic Horizons of Certain
Duplex Soils (Aqualfs) in Lesotho, Southern Africa. Soil Science 139, 517-522.

38 Land disturbances due to Soil piping in the Western Ghats region of Kerala
Rosewell, C.J. (1970). Investigation into the control of earthwork tunnelling. Journal Soil Conservation New South Wales 26, 188-203.Sankar.G.,(2005).,Investigation of the land subsidence in Chattivayal locality of Cherupuzha Grama panchayath.,Taliparamba taluk,
Kannur district., Centre for Earth Science Studies, Thiruvanathapuram. Sankar G., Dr. Ajay K. Varma, Dr. Sekhar L. Kuriakose, Prasobh P. Rajan, Deepa C., and Eldhose K., 2016., Studies on soil piping
in the highlands and foot hills of Kerala to avoid the disaster, National Centre for Erath Science Studies, Report submitted to National Disaster Management Authority, New Delhi
Sumner, M.E. 1992. The electrical double layer and soil dispersion. In: Sumner, M. E., Stewart, B.A. (Eds), Soil Crusting: Chemical and Physical Processes. Lewis, Boca Raton; 1–34
Sumner, M.E., Naidu, R., 1997. Sodic Soils. Oxford University Press, New York, NY.Thampi, P.K., John, M., Sankar, G., and Sidharthan, S. (1998) Evaluation Study in terms of landslide mitigation in parts of Western
Ghats, Kerala. Report submitted to the Ministry of Agriculture, Govt. of India.Vacher, C. A., Loch, R. J., Raine, S. R., 2004a. Identification and management of dispersive mine spoils. Australian Centre of Mining
Environmental Research, Landloch Pty Ltd.Vacher, C.A., Raine, S.R., Loch, R.J., 2004b. Testing procedures to characterize tunnelling risk on spoil materials. In: Conserving Soil
and Water for Society: Sharing Solutions.Zhu, T.X., 2003. Tunnel development over a 12 year period in a semi-arid catchment of the Loess Plateau, China. Earth Surf. Process.
Landforms 28, 507-525.

Abstract
An assessment of the geotechnical parameters in the Soil piping affected region in the Kasaragod district of Kerala, India is presented. Undisturbed samples were collected, analyzed and a comparative study of various geotechnical properties was done in the piping and non-piping region of Kasaragod district and the non-piping region of Kozhikode district. Sieve analysis, Atterberg’s limits, specific gravity, permeability and direct shear tests were carried out on the samples. It was found out that in the piping region the permeability was high at the top surface, having a value of 1.2x10-
3 cm/s and decreased with depth, obtained a value of 3.5x10⁻⁵ cm/s at the bottom, which causes easy draining of water from top and accumulation at the bottom surface. The bottom layers consist of clayey soils (Saprolite) which are eroded and leads to the formation of huge cavities. A high plasticity index value of 23.8% was observed at the wall of piping region reflects the presents of high dispersible sodium. The comparative study shows that the visual classification, Atterberg’s limits, and particle size analysis do not provide sufficient basis to differentiate between dispersive clays and ordinary erosion resistant clays. High rainfall and sloping nature of study area are found to have great impact in piping erosion to occur, so that water is the main culprit. The piping erosion has affected the foundation of a house under construction in the study area. The mitigation works suggested in the area are dewatering techniques along with renovation of the damaged foundation by underpinning using polyurethane resins.The study of evaluation of dispersive nature of soil using double hydrometer test shows that the Idukki soils are highly dispersive in nature comparing to samples of other sites having a range of 13.11 – 27.21 %. Samples collected from the pipe wall were found to be more dispersive than that collected from the soil profile outside piping region. The dispersion rate in Kerala is found to be relatively low, still it causes piping erosion. Stabilization of dispersive soils at the piping region has been suggested using lime. Stabilization results on the sample collected from piping region of Kannur district shows that the optimum percentage of lime to be added to reduce dispersion potential is 1%. Above that percentage, the results shows an increasing trend in dispersion potential. Keywords: Soil Piping Erosion, Engineering properties, Index properties, Soil Piping Mitigation, Dewatering technique.
Geotechnical Investigations and mitigation works in the Soil Piping Affected Land Subsidence
Sites in Kerala, IndiaPanjami K1, Sankar G2 , Anupam Mital3
1. M.Tech student,Civil Engineering Department, NIT Kurukshetra,Haryana2. Senior Consultant, ESSO-National Centre for Earth Science Studies, Thiruvananthapuram
3. Professor, Civil Engineering department, NIT Kurukshetra, HaryanaEmail: [email protected], [email protected], [email protected]

40 Geotechnical Investigations and mitigation works in the Soil Piping Affected Land Subsidence Sites in Kerala, India
1. Introduction
The word soil piping refers to the insidious and enigmatic process involving the hydraulic removal of subsurface soil, causing the formation of an underground passage in landscape (Boucher 1995). Soil piping erosion has become a serious issue from the last few years in various parts of Kerala. Even though the frequency of occurrence of this phenomenon has shown an increasing trend in the last few years in the various parts of the state, there are few works carried out on this topic to find the exact reason behind its formation. Some works had been conducted recently by various geologists to find out the physical, chemical, topographical and hydrological factors controlling the spatial distribution of soil piping. But little works had done to find out how the geotechnical properties of the soil affect this phenomenon. It still remains a mystery that why only some parts of the state are affected by this phenomenon and what is the common character of the soil in these areas.It became a major concern in Kerala recently with the advent of soil piping in the Chattivayal region Kannur by NCESS (Sankar 2005), but it was a common discussion topic in between the worldwide geologists for so many years. The soil piping erosion or tunnel erosion process was first described by Downes (1946, 1949).The study area of Downes was northeastern Victoria. Later it has been modified by a number of authors including Rosewell (1970), Floyd (1974), Crouch(1976), Laffan and Cutler(1977), Broucher(1990) and Vacher et al.(2004). The various studies conducted describe the clear role of geological control on the hill slope. The other factors derived which affects piping erosion were duplex nature of the soil, and some chemical and physical properties of the soil. It has been observed in many climates, with wide varieties in temperature, rainfall and seasonality of rainfall. Studies show that it occurs on a variety of soil types, ranging from the duplex, loess and uniform heavy clays. Piping has developed in both highly expansive montmorillonite and kaolinite and in both impermeable and highly permeable soils (Crouch et al.1986; Raine and Loch 2003). Rosewell (1970) identified two preconditions that required for the formation of piping erosion (1) the soil must disperse into the water that moves through the soil and (2) the soil must have sufficient permeability in either the soil matrix or macro pores to enable the movement of dispersed clay particles without blockage. Dispersive clays are highly erodible in nature than ordinary erosion resistant clays. The presence of dispersive clays is identified by the presence of sodium. Whereas ordinary clays have a preponderance of calcium, potassium and magnesium cations in the pore water (Knodel, 1988). The factors which initiates field erosion may be a range of process including loss or disturbance of vegetation resulting in the development of soil cracks and generation of surface runoff (Downes 1946; Crouch 1970; Laffan and Cutler 1977), formation of gully erosion which provides an outlet for water flow (Boucher and Powell 1994), increased infiltration due to ponding (Vacher et al.2004a, 2004b) or disturbance and poor consolidation of dispersive clays(Ritchie 1965,1963;Ritchley 1992). After the initiation of piping erosion, further rainfall and excess surface runoff entrains more dispersed clay particles, resulting in both head-ward and tail-ward expansion of cavities until a continuous pipe is formed (Zhu 2003; Laffan and Cutler 1977). At last piping may reach to an extent where complete roof collapse occurs and erosion gullies form (Laffan and Cutler 1977).Geochemical analysis conducted by NCESS (Sankar 2015) indicates that the presence of dispersible sodium has a main role in piping erosion to occur. A soil with more than 5% dispersible sodium is considered as dispersible soil (Sankar 2015).The high sodium content associated with the physical process of soil dispersion and clay and aggregate swelling. The reason for the above process is disruption of binding between clay particles in the presence of large sodium ions, and this separation will cause the expansion of clay particles. From certain soils in the tropical regions of Africa it was reported that hard crust will be formed due to higher sodium content in the soil column. The dispersion of soil causes clay particles to plug soil pores, resulting in the reduction of soil permeability and the repeated wetting and drying of soil and clay dispersion the

Panjami K, Sankar G , Anupam Mital 41
strata reformed and solidified into almost cement- like soil. The soil of this type will reduce the infiltration and hydraulic conductivity and cause surface crusting. And this is the reason for the run off to find out alternative subsurface paths for the flow. The studies depict that a combination of physical, chemical, hydrological and tectonic factors that develops the soil piping in the area. The rainfall exceeding 5 cm per hour, soil matrix with high sodium content and low calcium and magnesium, soil having the cohesionless texture at sub-surface layer and area subjected to high removal of shrubs and trees, sloping terrain are found out to be the threshold factors in developing soil piping.
2. Experimental Program
2.1 Geotechnical Investigation
Study area
Kasaragod is one of the 14 districts of Kerala state, India situated in the northern part of Kerala with an area of 1992 km2.It is bordered by Karnataka to the north and east, Kannur district to the south and the Arabian Sea to the west. The current study area is Nelliyadukkam locality, Karindalam panchayath, Kinanur village, Vellarikundu taluk of Kasrgod district (Fig.1), which is situated 12 Km east of Nileswaram town. Soil piping incident in this area has occurred in 2014 August 2, the subsided area is located adjacent to the house of Mr.Balan V.K. The foundation of the house under construction has damaged by the soil piping phenomenon (Fig.2).
Geographical location
The total area of Nelliyadukkam lies in the toposheet number 48P/3 with a latitude of 12˚15’N and longitude of 75˚0’E.The current study area, from which samples collected have the co-ordinates:12˚17.5’N and 75˚13’E. Nelliyadukkam is located 12 Km east of Nileswaram town. There is a river called Madikkal puzha flowing near to the piping area. A clay mine is present by the Kerala clays and ceramic limited in the adjacent area. Large quantities of alumina-silica rich laterites are being transported from the mine area to different cement industries.
Fig.1 study area Fig.2 Damaged foundation(Sankar 2015)

42 Geotechnical Investigations and mitigation works in the Soil Piping Affected Land Subsidence Sites in Kerala, India
Geo environmental setup
The entire district can be physiographically divided into three units as coastal areas, midlands, and highlands. The main four types of soils present in the area are sandy, sandy loam, laterite, and forest soil. The present study area Nelliyadukkam locality of Karindalam panchayath lies in the midland regions. Midland regions are generally sloped in nature and consist of laterite soil. The laterite hillocks are present up to Malappuram district towards south and Karnataka towards the north. The area falls within the realm of tropical climate and summer monsoon is active in this region than winter monsoon (Sijinkumar et al, 2014). The main cultivation seen in these areas are cashew nut, coconut, and rubber plantations. The laterite present in the study area is rich in alumina and is being used as a raw material in the cement industries. Presently laterite mine is undergoing at this area by Kerala clays and ceramic Ltd. Exposed laterite profiles can be seen in these areas along roadsides. Humus zone laterite is porous pitted clay like the rock with red yellow, brown gray and mottled colors depending on some measures on the composition. It has a hard protective limonite crust on the exposed surface which is generally irregular and rough when the fresh rock is exposed to air it is quickly dehydrated and becomes quite hard (Sijinkumar et al, 2014).Soil profileThe vertical section of strata exposing a set of soil horizons termed as a soil profile.The entire soil profile consists of O,A,E,B,C horizons.The physical characteristics of each horizon differ from above and below horizons.The top O-horizon consists of humus organic deposit with a little layer of plant residues.The surface A-horizon consists of organic soils mixed with mineral water.They are typically more coarse(less clay) compared to underlying horizons.Most of the plant routes lies in this region. B-horizon consists of mostly laterite soil part and contains a small portion of plant routes.C-horizon consists of a saprolite portion. In the current study area the O, A, B, C horizons were present and the sampling done from A, B and C horizons.
Fig 3.Soil profile of the study area
Hydrology
The water table of the area is moderately deeper and has an average value of nearly 32 feet. The water depth is around 9.20 m and the water level lowers and becomes turbid during the summer season (Sijin Kumar et al, 2014). The yield of the dug wells in the locality is very low even in monsoon season due to the presence of subsurface drainage channels due to piping.

Panjami K, Sankar G , Anupam Mital 43
Sample Collection
The field study was conducted in the month of September 2015. Undisturbed soil samples were collected from a piping and non-piping region of Kasargod district and a non-piping region of Calicut district. A set of five undisturbed samples were collected from the piping area (Nelliyadukkam locality, Kasaragod district Kerala with co-ordinates of 12˚17’58.1” N and 75˚13’02.7” E) and five undisturbed samples collected from the non-piping area (Nelliyadukkam locality, Kasargod district, Kerala with co-ordinates 12˚17’55.5” N and 75˚13’01.2” E) at various depths. The geotechnical properties of these samples were compared with properties of samples collected from the non-piping region of Calicut district (IIM-Kozhikode, 11˚17’40.9”N and 075˚52’26.8”E). Core cutter sampler having size 10.5 cm diameter and 22 cm deep were used for collecting undisturbed samples. From the piping region of Kasaragod district, the sampling was done from A, B, and C horizons. In which sample 1, 2 and 3 consists of laterite soils and was on the surface of the piping area, the soil was red in color. Samples 4 and 5 was from the wall of piping erosion, which consist of the soil of clay in nature and lies in C-horizon, the soil was having a mixed color of red, yellow and white and the white color shows the presents of saprolite content. From the non-piping region of the same study area sampling was done from different horizons of A, B and C. Samples 6 and 7 from A-horizon, 8 and 9 from B- horizon and 10 from C horizon. A total of 10 samples collected from the Nelliyadukkam locality and carried to the geotechnical lab for the lab test. Geomorphological parameters like nature of topography, slope, physical nature of soil and soil profile, water table level, latitude and longitude details were observed and recorded in a datasheet. The geotechnical tests conducted include sieve analysis, Atterberg limit, specific gravity tests, permeability, and direct shear tests.
Analysis of Various Geotechnical Properties
The undisturbed samples from the site were carried to the geotechnical lab and various geotechnical lab tests were conducted. The tests include specific gravity test(G), grain size analysis, Atterberg’s limits(i.e. liquid limit, plastic limit and shrinkage limit), bulk density, moisture content, permeability, and shear strength characteristics(i.e. cohesion and angle of internal friction). All the tests were conducted in accordance with IS standards. Results obtained in this study were subjected to further statistical analysis, from which conclusions were made. A total of 14 samples were tested in the laboratory.The Atterberg’s limits do not directly helps to identify the soils of highly erodible nature but the higher the values of liquid limit, plastic limit, and plasticity index, the higher is the resistance to disperse in water. High plasticity index tends to be clayey and thus have low infiltration rates. Hence, more water requirement gives the material a certain degree of stability in certain situations (Rienks et al 2000).The increasing trend of liquid limit and plasticity index shows an increase of clay content and high ion exchange capacity, or a combination thereof.Watts et al. (1996) found the critical amount of water needed for dispersion to be close to the plasticity limit. The shrink/swell potential of clayey soils can be identified by the shrinkage characteristics (Cerato and Lutenegger, 2000).Particle size distribution data mainly used in the classification of soils. The information obtained from the grain size analysis can be used to predict soil water movement although permeability tests are widely used for this purpose. Soil classification according to Indian Standards is used here.Bulk density is an indicator of soil compaction and its health. The bulk density of a soil affects the infiltration, root depth, soil porosity, available water capacity and soil microorganism activity, which influence the key soil process and productivity. It is dependent on soil organic matter, soil texture, the density of soil mineral (sand, silt, and clay) and their packing arrangement. Bulk density usually increases with the soil depth since the subsurface layers are more in more compacted form

44 Geotechnical Investigations and mitigation works in the Soil Piping Affected Land Subsidence Sites in Kerala, India
and have less organic matter. If for a soil bulk density is low it indicates the low porosity and low compaction.The permeability of the soil is the property of soil to transmit water and air. Piping erosion will increase the permeability, but the soils susceptible to piping are of low permeable, increased gradients and pore pressure build up. For clean sands and gravel mixtures, the hydraulic conductivity varies from 10-1 to 10-3 cm/s, whereas for very fine sands to homogeneous clays the permeability value varies from 10-4 to 10-9 cm/s (Lambe 1951).
2.2 . Evaluation of dispersive potential
Visual classification, Atterberg’s limits and particle size analysis do not provide a basis for the differentiation between dispersive and ordinary erosion resistant clays( J K Mitchel,1993). The four special laboratory tests most popular in India and United state of America(USA), for the identification of dispersive nature of soil are Sherard’s pin hole test, Crumb test, SCS double hydrometer test and chemical analysis of pore water. Studies on this various tests shows that none of these tests truly identify the dispersive nature of soil. Pin hole erosion test developed by Sherard and its later modifications are to be more reliable. By taking the following factors like extent of reliability of the test, applicability of the test in field conditions and other related factors viz. soluble salts in pore water, mineralogy etc. into consideration, a realistic assessment is done in the identification of dispersive characteristics. Dispersive clays can be of any color, but black colored soils with high amount of organic content has not been found to be dispersive. From the surface, the soil might seems to be strong but at the bottom portion there are chances for dispersion to occur and if there is no excavations made in those areas there will be no evidence that the underlying soil is eroding. The areas of steep topography where dispersive soils exist are found to be having high sodium content and low amount of calcium and magnesium ions. In Kerala the XRD analysis of samples from the affected sites indicated that Kaolinite as the major clay .
Laboratory Methods to Identify Dispersive Soils
Among various tests available for finding out the dispersive nature of soils no tests satisfies under all conditions. It is suggested that, for the civil engineering works a range of chemical and physical tests to be adopted rather than relying on a single analysis. The important thing to be noted is all the specimens should be maintained and tested at their natural water content since there are chances for altering the dispersive nature characteristics of soil while drying especially oven drying. Crumb test, pin hole erosion test and double hydrometer tests are the conventional physical tests performed to determine the dispersive clays.
The crumb test(Emerson, 1967)
Crumb test is a simple test developed to identify the dispersive soils in the field. In this method cubical specimens of about 15 mm on sides are prepared at their natural water content and about equal volume. This specimen have to be carefully placed in 250 ml distilled water. Observe the cloudiness as the crumb begins to hydrate. Results interpreted at various time intervals. Potential erodibility of clay soils can be easily identified by this method however a dispersive soils sometimes gives no dispersive reaction in crumb test. The complete procedure for determining dispersive nature of soils is given in USBR 5400(Dixit M and Gupta S L,2011, Hardie M,2009).
Double hydrometer test(Volk, 1937)
Double hydrometer test also known as SCS ( Soil Conservation Service) laboratory dispersion test has been identified as one of the most appropriate tests for classifying the dispersive soils. The test is carrying out its natural water content. It evaluates the dispersibility of a soil by measuring the tendency of clay fraction to go into suspension in water. Using standard hydrometer test

Panjami K, Sankar G , Anupam Mital 45
the particle size distribution is determined for the specimen which dispersed in distilled water with strong mechanical agitation and chemical dispersant. A parallel hydrometer test is then conducted on a duplicate soil specimen without chemical dispersant and mechanical agitation. Dispersion ratio is defined as the quantity of particles finer than 0.005 mm in the parallel test to that of standard test ( Walker, 1997). Soils with greater than 50% dispersion ratio are considered as highly dispersive, between 30% and 50% are moderately dispersive, between 15% and 30% are slightly dispersive and less than 15% are non-dispersive( Elges, 1985). There are similar system with different ranges utilized by Gerber and Hames(1987) and Walker(1997).
pin hole test(Sherard et al, 1976)
This method was developed to directly measure the dispersivity of compacted fine soils in which water is allowed to flow through a small hole in the soil specimen. The water flow through the small hole simulates the water flow through a crack or other concentrated leakage channels through the structures other structure. Soil specimen prepared for the test is of 25 mm long and 35 mm diameter cylindrical specimen. Distilled water is allowed to flow through it under various heads. Sherard classifies the dispersive nature of soil under a flow caused by 50 mm head of distilled water. Soils erodes at a head of 50 mm or 180 mm classified as intermediate category, whereas nondispersive soils are supposed to produce no colloidal erosion under 380 mm or 1020 mm head of water. Detailed test procedure of this is outlined in USBR 5410, Determining dispersivity of clayey soils by pin hole test method. Pin hole test to be considered as the accurate method but care has to be taken to properly simulate the field conditions( J K Mitchel, 1993).
Study area
For the present study disturbed soil samples were collected from three main piping districts of Kerala including Idukki, Kannur and Wayanad. Main localities from which Samples collected are Thirumeni and Kottathalachimala localities of Kannur district, Vythiri taluk of Wayanad district, Peringassery, Thattekanni and Neendapara localities of Idukki districts.
3. Results and Discussion
3.1 Geotechnical InvestigationThe details of various samples collected from various depths of piping and non-piping region are shown in Table 1. Samples were collected from three different regions, the piping and non-piping regions of Kasaragod and from non-piping area of Calicut. Comparisons were done between the soil properties at 3 various regions of piping and non-piping region of Kasaragod district and non-piping region of Kozhikode district. The soils of all these regions were basically laterite in nature.
Table 1 Details of samples from various regions
Piping region-kasaragod Elevation(m) Non-piping region-
kasaragod Elevation(m) Non-piping region-Kozhikode Elevation(m)
Sample 1 30 m Sample 6 63.6 m Sample 11 100.94
Sample 2 28.7 m Sample 7 61.4 m Sample 12 100.73
Sample 3 27.7 m Sample 8 61 m Sample 13 102
Sample 4 26.5 m Sample 9 60 m Sample 14 98.6
Sample 5 26 m Sample 10 57.4 m

46 Geotechnical Investigations and mitigation works in the Soil Piping Affected Land Subsidence Sites in Kerala, India
Results of various engineering properties of undisturbed samples, collected from the various depths of the piping region and the non-piping region of Nelliyadukkam locality has been summarized in the following tables. A detailed geotechnical investigation was done on this soil samples. Various geotechnical properties tested in the piping and non-piping region of Kasaragod district is shown Table 2 and properties of soils at non-piping region of Kozhikode shown in Table 3.
Table 2 Summary of laboratory results of soil at piping and non-piping region
(Kasaragod Nelliyadukkam locality)
piping region(kasaragod) non piping region(Kasaragod)
S 1 S 2 S 3 S 4 S 5 S 6 S 7 S 8 S 9 S 10
ɤ(g/cc) 2.116 1.77 1.817 1.57 1.57 1.36 1.56 1.543 1.544 1.47
w(%) 19.89 17.54 18.74 37.93 43.15 45.6 39.006 29.725 36.605 32.75
ɤd 1.77 1.506 1.53 1.14 1.097 0.934 1.122 1.189 1.13 1.107
LL(%) 45 45 42 46 46.5 47.5 45 40 50 51
PL(%) 33.77 31.14 21.84 28.37 22.7 35 37.2 24.17 29.38 30.66
PI(%) 11.23 13.86 20.16 17.63 23.8 12.5 7.8 15.83 20.62 20.34
SL(%) 16.61 21.31 16.98 26.7 16.34 25.11 25.48 18.89 24.19 25.49
Specific gravity 2.6 2.7 2.495 2.525 2.311 2.75 2.582 2.28 2.13 2.268
c(kpa) 100 60 45 15 50 50 65 10 5 20
ɤ 18.53 26.57 21.06 24.71 34.99 21.8 22.62 35.37 23 28.93
class GP-GM
GW-GM GW GW-
GMGW-GC
GW-GM
GW-GC
GW-GM
GW-GM
GW-GM
Cu 1.8 18.33 8.7 200 11 71.4 85.7 114.29 736.84 388.23
Cc 0.83 2.64 2.37 2.79 2.33 2.31 3.1 2.161 8.2 6.2
G(%) 91.19 84.4 86.33 60.03 78.54 75.9 65 46.29 35.57 51.46
S(%) 3.18 9.64 12.05 25.11 14.96 14.63 23.85 40.19 22.92 19.2
M(%) 5.32 3.94 0.91 9.94 1.77 5.64 5.42 10.55 31.49 23.92
C(%) 0.32 2.02 0.71 4.92 4.73 3.83 5.73 2.97 10.02 5.42
K(cm/s) 1.2x10⁻³ 2x10⁻³ 1x10⁻³ 3.7x10⁻⁴ 3.5x10⁻⁵ 3x10⁻³ 2x10⁻³ 2x10⁻³ 7x10⁻⁴ 2x10⁻³
e 0.47 0.79 0.63 1.21 1.11 1.94 1.32 0.92 0.88 1.05
S(%) 98 59.94 74.21 79.15 89.84 64.64 76.31 73.67 88.6 70.74
In the piping region, the soil strata were hard and compacted at the top surface and become loose at the bottom. Compactness of strata at the top surface is shown by the bulk density results. Bulk density evaluated at top surface of the piping region was 2.116 g/cc and was 1.57 at the wall of piping region. The water content increases with depth at the piping region which indicates the easy draining of top surface and accumulation of water at the bottom strata. The permeability results

Panjami K, Sankar G , Anupam Mital 47
verify the above statement i.e. the permeability of the top surface is high and which decreases with depth. The permeability value at the top surface was found to be 1.2x10⁻³ cm/s and at bottom it was found to be 3.5x10⁻⁵ cm/s. Sieve analysis has conducted on various samples to separate the fractions, and the results reflect the presence of saprolite at the wall of piping erosion. The gravel percentage was more than 50 % at every depth, but the percentage value decreased with depth. This indicates that the soil became less coarse with depth. Presence of the high amount of sand and silt at the wall of piping gives a conclusion that the clay content may be dispersed into the water and lost. Lost of clay content increased the void ratio of the soil. The classification of the soil samples was done as per IS classification system according to the particle fractions and consistency limits. The soil classifications of various soils are included in Table 2. Soils of dark colors or low clay accumulation content are found to be having low tunnel erosion potential, here the surface soil at the piping region is blackish red and as going to the bottom the color changes to yellowish red.From the geotechnical test results, it is obtained that water easily infiltrates into the A horizon during rainfall and get accumulated in the B horizon. Thus, a perched water table is assumed to be formed in the boundary. The lateral subsurface flow which is formed at the contact zone is the reason for the formation of soil pipes. Plasticity index value found at the wall of piping was 23.8% and which is comparatively a high value. High plasticity index values at the wall of piping region reflect the positive correlation of sodium adsorption ratio and plasticity index as the sodium content was found to be high at this region by the previous studies of NCESS. In the non-piping region of Kasaragod district, the strata were almost uniform in density. Percentage of fines was found to be high in the non-piping region of Kasaragod and gravel percentage was comparatively low than the piping area. As the percentage of clay is higher the liquid limit and plastic limit values were high for the samples collected. Plasticity values increase with the decrease of particles size (increase in total surface area). The chances of sub surface erosion are low in the non-piping region because the permeability is uniform in each layer and no chances for the accumulation of water at lower layers. As there was not a high difference in permeability at various depths of the non-piping region the water content obtained at different depths were almost same. Thus in non-piping region the water can easily drains into the underground.Particle size distributions of samples collected from the various regions of Kasaragod were shown in fig 4 and the plasticity charts were shown in fig 5.
Fig 4.Particle size distribution graph (a) piping region (Kasargod) (b) non-piping region (Kasaragod)

48 Geotechnical Investigations and mitigation works in the Soil Piping Affected Land Subsidence Sites in Kerala, India
Fig 5.Plasticity chart (a)piping region(Kasaragod) (b) non-piping region(Kasaragod)
The co-efficient of uniformity and co-efficient of curvature values obtained for different soil samples are included in table 2. The values help in the classification of soil. The samples collected were well graded in nature with a slight variation in the dominance of clay and silt content at bottom. In the piping region, the clay is assumed to be lost due to dispersion. As the soil is well sorted it is understood that the particle size distribution is not the factor which makes the soil unstable.From the comparison of geotechnical properties of the soils at the piping and non-piping region of Nelliyadukkam locality of Kasaragod district, the parameters found to have an effect in piping erosion was obtained as the difference in the permeability of strata at various depth of the same region, increase of fine content at bottom and comparatively higher plasticity index at bottom. Rests of the properties were insufficient to decide whether the soil is of piping susceptible (dispersible) or not.
Table 3. Summary of laboratory results of soil non-piping region
(Kozhikode IIM Site)
Non-piping region(Calicut)
S 11 S 12 S 13 S 14
ɤ(g/cc) 1.5 1.86 1.79 1.4
w(%) 40 27.10 38.1 50.8
ɤd 1.07 1.40 1.30 0.928
LL(%) 59 42 46 60
PL(%) 37.99 35 32.4 38
PI(%) 21.01 7 13.6 22
SL(%) 35.08 34 26.55 35.5
Specific gravity 2.68 2.54 2.65 2.70
C(kpa) 40 15 40 35
ɤ 25 39.23 26.56 35.53
class GW-GC GW-GM GW-GM GW-GM
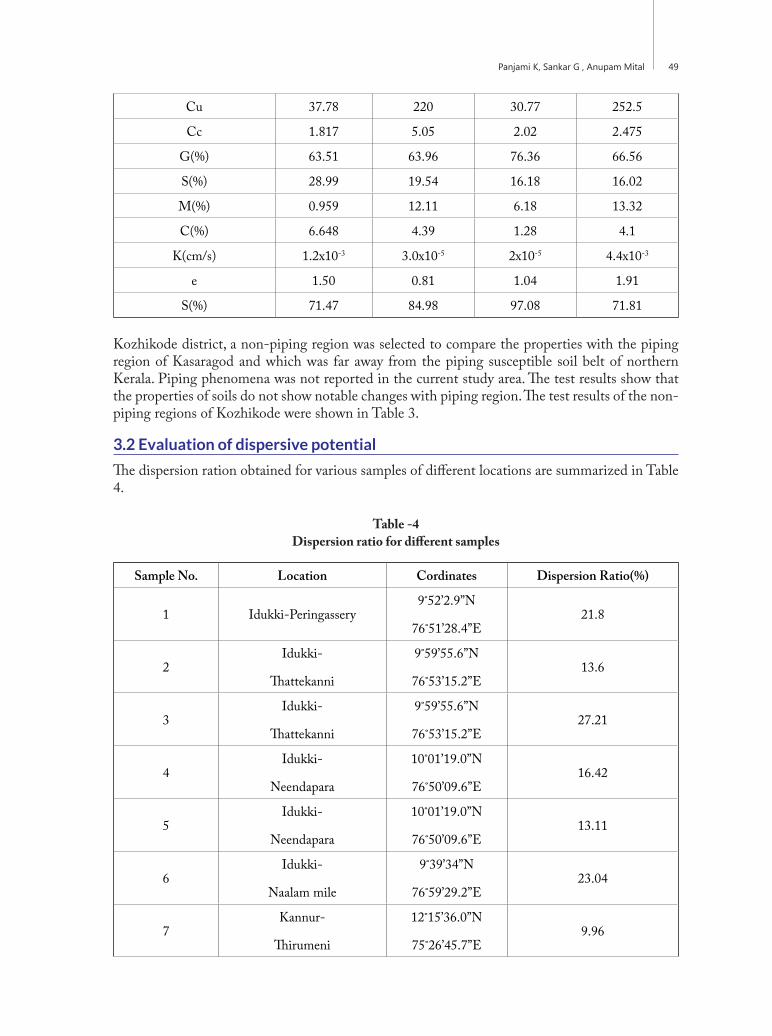
Panjami K, Sankar G , Anupam Mital 49
Cu 37.78 220 30.77 252.5
Cc 1.817 5.05 2.02 2.475
G(%) 63.51 63.96 76.36 66.56
S(%) 28.99 19.54 16.18 16.02
M(%) 0.959 12.11 6.18 13.32
C(%) 6.648 4.39 1.28 4.1
K(cm/s) 1.2x10⁻³ 3.0x10⁻⁵ 2x10⁻⁵ 4.4x10⁻³
e 1.50 0.81 1.04 1.91
S(%) 71.47 84.98 97.08 71.81
Kozhikode district, a non-piping region was selected to compare the properties with the piping region of Kasaragod and which was far away from the piping susceptible soil belt of northern Kerala. Piping phenomena was not reported in the current study area. The test results show that the properties of soils do not show notable changes with piping region. The test results of the non-piping regions of Kozhikode were shown in Table 3.
3.2 Evaluation of dispersive potential
The dispersion ration obtained for various samples of different locations are summarized in Table 4.
Table -4 Dispersion ratio for different samples
Sample No. Location Cordinates Dispersion Ratio(%)
1 Idukki-Peringassery9˚52’2.9”N
76˚51’28.4”E21.8
2Idukki-
Thattekanni
9˚59’55.6”N
76˚53’15.2”E13.6
3Idukki-
Thattekanni
9˚59’55.6”N
76˚53’15.2”E27.21
4Idukki-
Neendapara
10˚01’19.0”N
76˚50’09.6”E16.42
5Idukki-
Neendapara
10˚01’19.0”N
76˚50’09.6”E13.11
6Idukki-
Naalam mile
9˚39’34”N
76˚59’29.2”E23.04
7Kannur-
Thirumeni
12˚15’36.0”N
75˚26’45.7”E9.96

50 Geotechnical Investigations and mitigation works in the Soil Piping Affected Land Subsidence Sites in Kerala, India
8Kannur-
Kottathalachimala
12˚16’16.3”N
75˚25’48.8”E8.33
9Kannur-
Kottathalachimala
12˚16’16.3”N
75˚25’48.8”E7.97
10Kannur-
Kottathalachimala
12˚16’16.3”N
75˚25’48.8”E14.43
11Wayanad-
Kappundikkal
11˚40’26.0”N
75˚58’04.0”E9.55
12Wayanad-
Kappundikkal
11˚40’25.5”N
75˚58’03.8”E10.12
Among the samples collected from Idukki, samples 1,2,3 and 6 were from the pipe wall and Samples 4 and 5 were from soil profile outside the pipe wall. All the samples collected from Kannur are from the wall of pipe erosion but from various depths. Sample 11 of Wayanad district was from pipe wall and 12 was from surface of piping region.
Chart -1: Dispersion ratios of different samples
4. Conclusion
The areas subjected to piping erosion were found to be laterite soils. Field investigation and laboratory results show that the visual classification, Atterberg’s limits and particle size analysis do not provide sufficient basis to differentiate between dispersive clays and ordinary erosion resistant clays. The soils at both piping and non-piping region were found to be well graded soils, which show that the particle size distribution is not the factor which makes the soil unstable. Presence of high dispersible sodium content makes the soil erodible and for such soils the plasticity index found to be high. Here the plasticity index of the piping region was high and which proves this

Panjami K, Sankar G , Anupam Mital 51
positive correlation of plasticity index and presence of sodium content. At the piping region as the permeability of the top strata was high and decreased with bottom, it results in the accumulation of water at the bottom layers and leads to lateral subsurface flows. The current study area was of sloping nature and which was situated almost middle of the hill top. The rainfall at the region was found to be high by the weather forecasting results. And this water is found to be playing the main role in the piping erosion phenomena. The properties of soil were almost same in all regions but the soil at piping region becomes dispersible at presents of water. The mitigation works suggested in the area are proper dewatering technique along with renovation of damaged foundation by underpinning using polyurethane resins.While comparing the results obtained from double hydrometer test on various samples, the Idukki samples were found to be having more dispersion ratio having a range of 13.11 – 27.21 %. Samples collected from the pipe wall was found to be more dispersive than that collected from the soil profile outside piping region. Expected range of dispersion ratio on the pipe wall was more than 30%. The reason for the lower value is assumed to be the loss of dispersive clay by the pipe erosion in those areas, as the samples were collected from the eroded pipe region. Samples collected from Kannur districts was found to be having dispersion ratio in the range of 8.33 – 14.43%. Since all the samples of this district collected from the pipe wall can conclude that the loss of dispersive clays can be the reason for this low values. While comparing the results of sample 8 ,9 and 10 these were samples of same region at different depths. Sample 8 was collected from a depth of 300 cm from the pipe wall, sample 9 from a depth of 400 cm from the pipe wall and sample 10 from a depth of 500 cm from the pipe wall. The test results shows that at greater depth the dispersion is more and top dispersion is low. The reason behind is same as explained above that is the surface dispersive soil already eroded in presence of water. From Wayanad district samples were obtained from both pipe wall and hard surface portion of piping region. The region at this area was recently undergone high rate of piping erosion.
References Abdelkader Belarbi, Abdeldjalil Zadjaoui, Abdelmalek Bekkouche (2013). Dispersive Clay: Influence of Physical and Chemical
Properties on Dispersion Degree. Vol .118 (2013), Bund.H.Adukam Veedu Sijinkumar, Kizhur Sandeep, Nazar Shinu, Vaniya Megha,Chandran Shyamini, Koottalakal Raghavan Sreeni,
Kadakam Suvarna (2014). A preliminary assessment of environmental impacts due to bauxite and laterite mining in Karindalam and Kinanur, Southern India. International journal of conservation science, ISSN: 2067-533X, Volume 5 issue 2, April-June 2014:235-242.
Aginam C.H. Nwakaire Chidozie, Nwajuaku A.I (2015). Engineering properties of lateritic soils from Anambra central zone, Nigeria. International journal of soft computing and engineering (IJSCE), ISSN: 2231-2307, VOLUME-4 IISUE-6, January 2015.
Al-Khafaji A.W.N and Andersland, O. B. (1992). Equations for compression index approximation. J.Geotech Engg., ASCE, 118(1), 148-153.
Boucher SC (1990). Field tunnel erosion, its characteristics and amelioration. Dept.of conservation and environment, Land Protection Division,Victoria, East Melbourne.
Boucher SC (1994). Gullying and tunnel erosion in Victoria. Australian Geographical studies 32, 17-26.Bowels,J.E.(1990). Physical and Geotechnical properties of soil (2nd Ed.). Mc Graw-Hill, Inc.p.478.Cerato A B and Lutenegger A J (2006). Shrinkage of clays: in proceedings of the 4th International Conference on Unsaturated
soils:Phoenix AZ,April 2-6.GSP No.147.1;1097-1108.Chikwelu E.and Ogbuagu F U (2014). Geotechnical investigation of soil around Mbaukwu gully erosion sites,sout-east part of
Nigeria. IOSR journal of applied geology and geophysics (IOSR-JAGG),e-ISSN:2321-0990,p-ISSN:2321-0982.Volume 2,Issue 4( July-Aug.2014),PP 06-17.
Crouch RJ (1976). Field tunnel erosion-A review. Journal of the soil conservation service of New South Wales 32, 98-111.Downes RG (1946). Tunneling erosion in North Eastern Victoria. Journal of council of science industry and research 1,283-292.Floyd EJ (1974). Tunnel erosion a field studies in the Riverina. Journal of the soil conservation service of New South Wales 30, 145-
156.G.Sankar, Deepa.C, Prasobh.P.Rajan, Ajay.K.Varma, Sekhar.L.Kuriakose, Eldose.K Land Subsidence in the Highlands of Kerala:
Causes and Mitigation. Poster in National Workshop on Continental Crust and Cover Sequences in the Evolution of the Indian Sub-Continent January 20-21, 2015, pp-24-26.
K .Hannah Jyothirmayi, T. Gnanananda, K.Suresh (2015). Prediction of compaction characteristics of soil using plastic limit. IJRET: International Journal of Research in Engineering and Technology Eissn: 2319-1163/Pissn: 2321-7308.

52 Geotechnical Investigations and mitigation works in the Soil Piping Affected Land Subsidence Sites in Kerala, India
Laffan MD, Cutler EJB (1977). Landscapes, soils and erosion of a catchment in the Wither hills,Marlborough. New Zealand Journal of science 20,279-289.
M.A.Hardie, W.E. Cotching,and P.R. Zund(2007). Rehabilitation of field tunnel erosion using techniques developed for construction with dispersive soils. Australian journal of soil research, 2007, 45,280-287.
NCESS Report to ‘The National Disaster Management Authority, New Delhi’ (2012 August-2015 July).Richley LR (1992). Minimising erosionhazard due to installation of an optical fiber cable through dispersible clay soils. Australian
Journal of soil and water conservation 5, 35-38.Richley LR (2000). Treatment of tunnel erosion in Tasmania. Natural Resource Management 3, 31-34.Rienks SM, Botha GA, Hughes JC (2000). Some physical and chemical properties of sediments exposed in a gully (donga) in northern
Kwazulu-Natal, South Africa and their relationship to the erodibility of the colluvial layers. Catena 39:11-31.Ritchie JA (1963). Investigation into the earthwork tunneling and mechanical control measures using small scale dams. Journal of the
soil conservation service of New South Wales 26,188-203.Rosewell CJ (1970). Investigations into the control of earthwork tunneling. Journal of the soil conservation service of New South
Wales 26,188-203.Sankar.G (2005). Investigation of the land subsidence in Chattivayal Locality of Cherupuzha Gram Panchayat, Taliparamba Taluk,
Kannur District. Investigation report submitted to Govt. of Kerala. CESS, Trivandrum.S. Bhagyalakshmi, Mahesh Mohan, K Sreedharan (2015). Evaluation of the factors controlling the spatial distribution of soil piping:
a case study from the southern Western Ghats, India. Arab J Geosci (2015)8: 8055-8067.DOI:10.1007/s12517-015-1793-8.Thomas Keller and Anthony R Dexter (2012). Plastic limits of agricultural soils as functions of soil texture and organic matter content.
Soil research 50(1) 7-17 http://dx.doi.org/10.1071/SR11174.Umesha, T. S. Dinesh, S. V. and Sivapullaiah, P. V. (2011). Characterization of Dispersive Soils. Materials Sciences and Applications
2, pp 629-633.Vacher CA, Raine SR, Loch RJ (2004a). Strategies to reduce tunneling on dispersive mine soil materials’, in ‘ISCO 13th International
Soil Conservation Organization Conference’. Brisbane, Qld, paper 139, pp.1-6.Vacher CA, Loch RJ, Raine SR (2004b). Identification and management of dispersive mine soils. Final report for Australian Centre
for Mining Environmental Research, Kenmore, Queesland.Zhu TX (2003). Tunnel development over a 12 year period in a semi-arid catchment of the Loess plateau, China. Earth Surface
Process and Landforms 28,507-525.doi:10.1002/esp.455.

Introduction
Remote Sensing is being actively applied to the earth and environmental observation. Remote sensing (RS) applications have been found advantageous in many areas. Any location/area of interest or any natural hazard can be assessed based on RS data without reaching out to the locality especially when the region is inaccessible. It also plays a major role in monitoring temporal activities linked to natural hazards. The basic objective here is to introduce the basics of SAR Interferometry and its applications for assimilating surface deformation studies like earthquakes, landslides, subsidence, etc. Considering a relative upcoming field in remote sensing, an attempt is made here to introduce briefly on the optical remote sensing followed by microwave remote sensing. The subsequent sections will deal on Synthetic Aperture Radar (SAR), Interferometric SAR (InSAR), Differential Interferometric SAR (DInSAR) and their applications to understand the surface deformation. The discussion part sketches the potential of this technique for soil piping concerning to some of the basic characteristics of tunneling. This working paper also provides a brief prelude to historical and existing satellite missions along with their sensors capable of SAR Interferometry.Remote Sensing in general can be defined as “the science and art of obtaining information about an object, area, or phenomenon through the analysis of data acquired by a device that is not in contact with the object, area, or phenomenon under investigation”. By the way the above definition summarizes inclusive concept of remote sensing system. If we consider our eyes acting as the sensor responding to the variations in the light energy reflected back from the different words or data in this manuscript forms our basic understanding of remote sensing. By defining it as a system, remote sensing requires a source of energy to get reflected back from a surface which in real life is any light source or in earth studies we say it as Sun. The electromagnetic (EM) radiation or the light energy emitted will interact with the target and gets reflected back. This reflected energy is being captured by our eyes whereas in the case of earth observation, they are called as sensors and satellites. The reflected energy detected by our eyes is
Synthesis on Microwave Remote Sensing: Potential Application of Insar and Dinsar
Techniques for Soil PipingVincent A. Ferrer and K.K. Ramachandran
Central Geomatics Lab, ESSO-National Centre for Earth Science Studies, Thiruvananthapuram

54 Synthesis on Microwave Remote Sensing: Potential Application of Insar and Dinsar Techniques for Soil Piping
being processed by our brain as dark patterns and white regions thus recognizing the letters on the page. Similarly, a ground station established collects all the data sent by satellite to process and finally an output will be given to the user in the form of satellite images and other data formats to be used in all geoscience applications (Lillisand et. al., 2004).The very primary requirement for remote sensing is the source of energy to illuminate the target which will be in the form of electromagnetic radiation. It is well known that the electromagnetic radiation has a wide range of spectrum (Figure 1) and in order to capture them remote sensing sensors are designed based on the requirement and applications.
Fig 1. Electromagnetic spectrum
The most commonly used portion of the EM wave is the visible range as our eyes are capable of distinguishing within this range of wavelength. The wavelength ranges of the visible part of EMR ranges from 400 to 700 nanometers (nm). This method of remote sensing using the visible wavelength range is called as optical remote sensing. This method can also be defined as multispectral meaning the wavelength range within 400 to 700 nm is split into different small wavelength ranges to collect data in every corresponding wavelength range as individual bands. Since sun is the source of EM radiation, the optical remote sensing is otherwise classified as passive remote sensing. Then what comes as antonym to this technique is the microwave (MW) remote sensing using the microwave portion of the spectra (Figure 2) of the EMR (1 mm to 1m). This works mainly on the principle of RADAR (Radio Detection and Ranging), the system consisting of a transmitter acting as the source of MW pulses, a receiver to receive the pulses backscattered from the target, an antenna to synthesize the outgoing pulse into a beam and an electronics system to process and record the data. The time delay between the transmitted pulse and the reception of the same backscattered pulse is calculated along with the distance from the target thus determining their respective location. A two – dimensional image will be generated by this process as the platform or satellite moves forward along their pre-defined orbit. The microwave spectrum being a wide one compared to that of visible and IR, the bands or channels used for remote sensing purposes are defined in alphabets. Also with a longer wavelength compared to visible, transmitted microwaves remain uninterrupted by the atmosphere as compared to visible spectrum wherein the image generated by an optical sensor is masked with clouds. Microwaves

Vincent A. Ferrer and K.K. Ramachandran 55
penetrate virtually all atmospheric conditions like haze, light rain and snow, clouds and smoke. Also being an active sensor with the source of EM energy within the satellite itself, they are capable of night imaging also unlike the visible one wherein image acquisition is possible only when sun light is available.
Fig 2. Microwave EM spectrum
Synthetic Aperture Radar
The imaging principle of Radar is quite complicated though based on a very simple principle of two-way travel of the emitted MW pulse. The pulse will illuminate over a small target region and depending on the size of the objects and energy backscattered from them, the image will be formed. Relatively, when a single pulse illuminates a region perpendicularly from above (nadir) with two different objects of same size, the backscattered signal will be the same for both objects and hence there is a possibility that the sensor maps it as a single scattering object with high backscatter. Hence in order to overcome this issue, the sensors are designed in such a manner that the radar beam illuminates the objects from one side being defined as Side Looking Radar (SLR). The area covered by a single beam when converted to a ground resolution cell in the image or the spatial resolution of the SLR can be defined as Range resolution or across track resolution (perpendicular to the flight direction) and azimuth resolution or along track resolution (parallel to flight path). The Range resolution is a function of incidence angle and pulse duration. The azimuth

56 Synthesis on Microwave Remote Sensing: Potential Application of Insar and Dinsar Techniques for Soil Piping
resolution is a product of ground range and beam width. The beam width (ɤ) of the SLR antennae is directly proportional to the wavelength (ɤ) of the transmitted pulse and inversely proportional to the length of the antennae (L).
ɤ = ɤ/LHence for a given wavelength, the nominal antennae beam width can be determined only by controlling the physical length of the antennae. Therefore, in order to have a narrow beam width the antennae length needs to be increased which is practically not feasible in space borne systems. This led to the introduction of the technology of synthesizing the size of the antennae maintaining its physical size as constant called as Synthetic Aperture Radar (SAR). These systems consist of a short physical antenna but by modifying the data recording and processing methods, an illusion of an increased antennae length is created. This results in a very narrow effective antennae beam width even with a short operating wavelength at far ranges. Finally, by a process called focusing, the signals are converted into interpretable data. The data after focusing is called as a Single Look Complex (SLC). Each pixel or the radar signal forming a single pixel of the SLC data is formed of two properties: the amplitude and phase thus forming a complex pixel with a real part and imaginary part thus defining the name complex image. The real part contains the amplitude of the backscattered pulse and the phase change of the pulse is recorded as the imaginary part. The amplitude corresponds to the energy of the backscattered signal depending on the type of material the radar pulse is incident. If the target material is hard then the backscatter will be high and soft material will show less backscatter. The major amplitude based applications of SAR data include diverse fields starting from land to water which are analogous to optical remote sensing. In land, SAR data can be used for crop monitoring by estimating the yield and the advantage of cloud free data makes it a demanding one for forest and other vegetation studies in the tropical regions. Due to specular reflection, the water bodies appear smooth with very dark tone making the best use of SAR data for flood mapping. In meteorology and oceanography, the SAR data can be used for different applications like wind speed and direction, wave height and direction retrieval, surface velocity measurements etc. Above all, the main potential of SAR data is exploiting the phase information measured by the sensor in the form of Interferometry and the change in the polarization of the backscattered energy due to interactions with the target. SAR Interferometry and SAR Polarimetry are two robust remote sensing techniques having good application potential. This section is dealing with the Interferometry part as the application is mainly focused on soil piping.
SAR Interferometry
As discussed in the previous section, SAR interferometry makes use of the second component which is the phase (imaginary part in SAR pixel) of the backscattered energy from the target. Apart from the amplitude values, the phase values recorded by the radar systems are key elements for any interferometric measurement which mainly represents the distance of the sensor from the target. The radar signals being operated in a particular frequency range they can be represented as sinusoidal waves for which one complete cycle (–π to +π) corresponds to the wavelength. However, the pixel recorded phase will be a combination of three contributions mainly the two-way travel between the sensor and the target which is about hundreds of kilometers, the phase change caused by the interaction of the MW with the target materials and finally the phase change induced by the instrument that implements the focusing of the data. Hence the phase as it is from a single SAR SLC data will be of no use in practical. But in contradiction, when two SAR images can be acquired from a slightly different viewing angle, the phase difference between the two SAR images can be efficiently applied to generate the Digital Elevation Models (DEM) which in turn can be further used to measure any deformations or minute displacements on the earth’s surface.

Vincent A. Ferrer and K.K. Ramachandran 57
The technique of Radar Interferometry was introduced in the early 1970s (Graham 1974, Richman, 1971, Bamler, 1998), continued by its successful application to observation of the moving moon, (Shapiro, et. al., 1972; Zisk, 1972a, b; Stacy and Campbell, 1993), Venus (Campbell, et. al., 1970) and airborne radars (Graham, 1974; Massonet, 1998). However, the first results on terrestrial applications were reported only during the 1980s (Gabriel and Goldstein 1988; Gabriel, et. al., 1989; Goldstein, et. al., 1989; Goldstein and Zebker, 1987; Goldstein, et. al., 1988; Prati, et. al., 1989; Zebker and Goldstein, 1986) with the induction of the Seasat into space in 1978. Today SAR Interferometry has been appreciated as one of the extremely powerful tool for surface monitoring – earthquakes, landslides, volcanoes, subsidence/upliftment, structural deformations etc.A spaceborne SAR is capable of observing the same area from slightly different look angles which can be achieved simultaneously (specifically with two radars mounted on the same platform) or at different times by exploiting orbits of the same satellite i.e., by generating an interferogram of SAR images acquired by two different passes of the same satellite. The former method of generating an interferogram is called as single pass interferometry and the latter is defined as repeat pass interferometry. In other cases, a constellation of two or more satellites revolving at more or less the same orbit with certain time difference can also be used for generating interferograms (Figure 3).
Fig. 3 InSAR and DInSAR Principle
The distance between the two satellites in the plane perpendicular to the orbit is the InSAR baseline and the line perpendicular to the slant range can be defined as the perpendicular baseline. Mathematically, the SAR interferogram can be created by cross-multiplying the first complex SAR image (master) with the complex conjugate of the second SAR image (slave). Thus the amplitude of the generated interferogram is the amplitude of the first image multiplied by that of the second one whereas the interferometric phase is the phase difference between the two images.
Interferometric Phase to Terrain Altitude:
The procedure of generating a good quality InSAR-DEM involved various procedures including co-registration, complex interferogram generation, phase unwrapping, flattening, orbital phase removal, phase to height conversion in SAR coordinates and ortho-rectification. The variation of the path difference Δr initiated by a point scatterer resulting in passing from a reference pixel to another can be expressed as a function of the geometric parameters like perpendicular baseline

58 Synthesis on Microwave Remote Sensing: Potential Application of Insar and Dinsar Techniques for Soil Piping
(Bn), the radar – target distance (R), the displacement between the resolution cells perpendicular to slant range (qs). The path difference Δr is given as
The interferometric phase variation Δɤ can be represented as a function of Δr and the transmitted wavelength ɤ as
Fig 4. Terrain Altitude from SAR Interferometry
The phase difference is proportional to the path difference between the two antennas and a resolution cell. Hence, the InSAR phase depends on the ground – range distance and the surface elevation in addition to the radar wavelength and the antennae separation. Then the phase variation Δɤ is given as
where ɤ is the incidence angle of radar pulse with respect to the reference, q is the altitude difference between the point targets, and s is their slant range displacement. With the knowledge of the perpendicular baseline from the precise orbital data, the second phase term can be computed and subtracted from the InSAR phase, this function otherwise termed as interferogram flattening.

Vincent A. Ferrer and K.K. Ramachandran 59
The resultant will be the phase map proportional to the relative terrain altitude. The altitude of ambiguity is the altitude difference that generates an interferometric phase change of 2π after interferogram flatterning which is inversely proportional to the perpendicular baseline. Hence the accuracy of the elevation measurement increases with increase in baseline however, increasing the baseline beyond a threshold can lead to decorrelation of the interferometric signals and hence no fringes will be formed. For this reason, it is recommended that the datasets being selected for InSAR analysis must satisfy the baseline criteria before venturing into any analytical steps. Due to the 2π cyclic nature of the interferometric phase, the computed InSAR phase will be wrapped or folded within the interval of 0 to 2π called the wrapped phase. This causes an ambiguity within the flattened interferogram. The phase variation between two points on the flattened interferogram or the principal phase can be computed after deleting any integer number of altitudes of ambiguity. This process of retrieving the principal phase from the wrapped phase by adding the correct integer multiple of 2π to the interferometric fringes is called phase unwrapping. Various phase unwrapping algorithms exist namely path following algorithm, least square algorithm which is further classified as unweighted robust technique, weighted least square technique and Picard iteration technique. Though InSAR technology has been well developed as on date and used operationally, the technique of phase unwrapping is still under research and a detailed account of the techniques can be referred from Ghiglia and Pritt (1998). Once the interferometric phases are unwrapped and the absolute phase is achieved by adding the exact multiples of 2π, an elevation map in the SAR coordinates is obtained. This elevation phase needs to converted to the real height for which various models exist like Normal baseline model, integrated incidence angle model and Baseline rotation model wherein the final elevation (DEM) will be obtained which has to be then orthorectified to the ground coordinates (Figure 4).
Differential Interferometry
A detailed discussion of generating a DEM by InSAR technique is discussed in the previous section assuming that the point scatterer is stable and has not undergone any movement. Suppose let us consider a situation in which some of the point scatterers on the ground slightly changed their relative position in the time interval between two SAR image acquisitions. This could be caused mainly due to any natural disaster like earthquake, landslide or any slow hazards like land subsidence/uplift. In such a situation, a new additive phase change term in addition to the topographic, orbital and temporal phase will be included in the generated SAR interferogram. This additive phase combined with the absolute phase after interferogram flattening can be given by the expression
where, d is the relative scatterer displacement projected on the slant range direction.Following all the processing steps of InSAR DEM generation, the resultant phase will have the topographic and the displacement component in the slant range direction. With the help of an available DEM the topographic component can be removed by generating a synthetic interferogram which contains only the topographic phase from the SAR derived interferometric phase. This interferogram is called as differential interferogram and the phase contains only the terrain motion component alone. In case an external DEM is not available, two SAR images before the disaster event (earthquake, landslide etc.) can be used for InSAR processing to generate the DEM and the third image acquired after the event can be used to generate the

60 Synthesis on Microwave Remote Sensing: Potential Application of Insar and Dinsar Techniques for Soil Piping
interferogram which has the phase due to deformation. Consequently the DEM interferogram and the deformation interferogram may be processed to generate the differential interferogram which can be used to estimate the deformation of the surface. A simple flowchart of a three pass InSAR to estimate surface deformation is shown below (Figure 5):
Fig 5. Displacement by Differential Interferometry
After topographic removal, the interferometric phase related to the surface displacement is independent of the baseline but is a function of the wavelength of the incident MW pulse. In short the accuracy of DInSAR is of the order of a half the radar wavelength, provided the baseline and topographic components are properly removed and a displacement above half the wavelength will not be mapped by the interferogram.
DInSAR Applications
DInSAR is being used for various applications like measuring deformations due to earthquakes, landslides, glacier movements, subsidence etc. The first experimental outcomes were reported by Gabriel and Goldstein (1988), using the SEASAT-SAR data for detecting small elevation change caused by increased soil moisture by irrigation in the agricultural fields of California. The first study on earthquake used the ERS-1 SAR data over the Landers earthquake, California in 1992 (Massonnet, et. al., 1993; Massonnet, et. al., 1994; Zebker, et. al., 1994) and the study on glacier flow by JPL (Goldstein, et. al., 1993). Later, studies on surface deformation by volcanic activity (Rosen, et. al., 1996; Pritchard & Simons, 2002), landslides (Strozzi, et. al., 2003) land subsidence due to groundwater exploitation (Motagh et. al., 2008; Akbari & Motagh, 2012; Quiroz, et. al., 2009), surface deformation due to dam construction, underground excavation etc. have been attempted. Though surface deformation due to earthquake is a swift incident, there are various slow processes like subsidence due to groundwater exploitation or some of the slow moving debris flow and landslides. This requires long term measurement of multiple co-registered SAR images. There are various reported methods which include, Persistant Scatterer Interferometry (PsInSAR), Small Baseline Subset (SBAS), Coherence Pixel Technique (CPT), SqueeSARTM, Quasi-PS technique (QPS) etc. A detailed review of the various methods and techniques of time series InSAR analysis is reported in Osmanog˘lu, et. al., (2016) and Crosetto, et. al., (2016).

Vincent A. Ferrer and K.K. Ramachandran 61
Case of Soil Piping
Soil piping can be defined as any sub-surface flow of clay due to over saturation of water in the soil. The characteristic of this phenomena is that the flow initiates at one point and flows underground which normally doesn’t show any such symptoms on the surface which finally opens up in another location after a short distance. This can cause sink holes in the location of initiation and plausible deformation over the flow region like slides or subsidence phenomena. Hence, considering the application potential of DInSAR, it is open for the research community to bring out the efficiency of this robust technique in mapping and quantification of the surface deformation caused by this phenomenon.
Satellites & sensors
Various satellites have been launched since 1978 from SeaSAT to the latest Sentinels. All the satellites have provided a huge quantum of data from two pass to time series InSAR analysis (Figure 6). Yet, India doesn’t have a SAR sensor capable of interferometric processing. Off late we are progressing on a new mission called the NASA ISRO SAR mission (NISAR) which is having combination of L and S band radar. Though India’s major focus is on vegetation studies using NISAR mission, the acquisitions are also expected to provide data for disaster and hazard studies like landslides, subsidence, etc.
Fig 6. SAR Satellite Missions
The latest developments by the International missions like European Space Agency have come up with a new memorandum by which all satellite data may be provided free of cost for all data users. As per the mission, all the satellite data under the new Sentinel mission are provided free of cost especially the Sentinel 1A SAR launched in 2015. It has been providing good quality SAR datasets till date at an interval of 12-day revisit and the historical mission of ENVISAT which ended by 2012 after a long 10 year functioning since 2002 has also made data available free of cost for the users. Yet the users in India will have an issue with data availability as all the satellite sensors
62 Synthesis on Microwave Remote Sensing: Potential Application of Insar and Dinsar Techniques for Soil Piping
belong to foreign countries, as the priority for data acquisition covering India remains minimum which is the main constrain for the availability of continuous datasets. Hence, RS community is eagerly looking forward to the new NISAR mission so that the Indian Research using SAR data can have good leap forward to ponder on and come out with cutting edge research outputs.
Acknowledgement
This document has been prepared as a simple introductory note for the beginners in microwave remote sensing who aim at working on SAR interferometry applications. The content provided in this document including the figures has been taken from various journal publications and published tutorials which have been vividly mentioned under the references section. The authors of this document greatly acknowledge the contributions of those authors cited in the references. The intention of this document is only educational in purposes.
ReferencesAkbari, V., Motagh, M., 2012. Improved ground subsidence monitoring using small baseline SAR interferograms and a weighted least
square inversion algorithm. IEEE Geosci. Remote Sens. Lett., 9, 437 – 441.Bamler, R., Hartl, P., 1998. Synthetic Aperture Radar Interferometry, Topical Review. Inverse Problems, 14, R1 – R54.Campbell, D.B., Dyce, R.B., Harris, F.S., Jurgens, R.F., Pettengill, G.H., 1970. Radar interferometric observations of Venus at 70 –
centimeter wavelength. Science, 170, 1090 – 1092.Crosetto, M., Monserrat, O., Gonzalez, M.C., Devanthery, N., Crippa, B., 2016. Persistent Scatterer Interferometry: A review, ISPRS
journal of Photogrammetry and Remote Sensing. 115, 78 – 89.Fundamentals of Remote Sensing, A Canada Centre for Remote Sensing, Remote Sensing Tutorial.Gabriel, A.K., Goldstein, R.M., 1988. Crossed orbit interferometry: Theory and experimental results from SIR-B. International
Journal of Remote Sensing, 9, 857 – 872.Gabriel, A.K., Goldstein, R.M., Zebker, H.A., 1989. Mapping small elevation changes over large area: Differential radar Interferometry.
Journal of Geophysical Research, 94, 9183 – 9191.Goldstein, R.M., Barnett, T.P., Zebker, H.A., 1989. Remote Sensing of Ocean. Current Science, 246, 1282 – 1285.Goldstein, R.M., Engelhardt, H., Kamb, B., Frolich, R.M., 1993. Satellite radar interferometry for monitoring ice sheet motion:
Application to an Antarctic ice stream. Science, 262, 1525 – 1530.Goldstein, R.M., Zebker, H.A., 1987. Interferometric radar measurement of ocean surface current. Nature, 328, 707 – 709.Goldstein, R.M., Zebker, H.A., Werner, C.L., 1988. Satellite radar Interferometry: Two – Dimensional phase wrapping. Radio
Science, 23, 713 – 720.Graham, L.C., 1974. Synthetic interferometer radar for topographic mapping. Proc. IEEE, 62, 763 – 768.InSAR Principles: Guidelines for SAR Interferometry: Processing and Interpretation. TM-19, February 2007.Interferometric Synthetic Aperture Radar, http://www.ga.gov.au/scientific-topics/positioning-navigation/geodesy/geodetic-
techniques/interferometric-synthetic-aperture-radar (Accessed 17 June 2017).Lillisand, T.M., Kiefer, R.W., Chipman, J.W., 2004. Remote Sensing and Image Interpretation, Fifth Edition, John Wiley & Sons.Lopez-Quiroz, P., Doin, M.P., Tupin, F., Briole, P., Nicolas, J.M., 2009. Time series analysis of Mexico City subsidence constrained by
radar interferometry. J. Apply. Geophys., 69, 1 – 15.Massonnet, D., Feigl, K., Rossi, M., Adragna, F., 1994. Radar interferometric mapping of deformation in the year after the Landers
earthquake. Nature, 369, 337 – 230.Massonnet, D., Feigl, K.L., 1998. Radar Interferometry and its Application to Changes in the Earth’s Surface. Reviews of Geophysics,
36(4), 441 – 500.Massonnet, D., Rossi, M., Carmona, C., Adragna, F., Peltzer, G., Feigl, K., Rabaute, T., 1993. The displacement field of the Landers
earthquake mapped by radar interferometry. Nature, 364, 138 – 142.Microwave remote sensing applications with special emphasis on RISAT – 1, Reading material, 26 August – 6 September, 2013.Motagh, M., Walter, T.R., Shariff, M.A., Fielding, E., Schenk, A., Anderssohn, A., Zschau, J., 2008. Land subsidence in Iran caused
by widespread water reservoir over-extraction. Geophys. Res. Lett., doi:10.1029/2008GL033814Osmanoglu, B., Sunar, F., Wdowinski, S., Cano, E.C., 2016. Time series analysis of InSAR data: Methods and trends, ISPRS journal
of Photogrammetry and Remote Sensing. 115, 90 – 102.Ouchi, K., 2013. Recent Trends and Advance of Synthetic Aperture Radar with selected Topics, Remote Sens., 5, 716 – 807.Prati, C., Rocca, F., Guanieri, A.M., 1989. Effects of speckle and additive noise on the Altimetric resolution of interferometric SAR
(ISAR) surveys. International Geoscience and Remote Sensing Symposium, IGARSS’89 (Vancouver), pp. 2469 – 2472.Pritchard, M.E., Simons, M.A., 2002. satellite geodetic survey of large-scale deformation of volcanic centres in the central Andes.
Nature, 418, 167 – 171.Richman, D., 1971. Three Dimensional Azimuth-correcting Mapping Radar (USA: United Technologies Corporation).Rosen, P.A., Hensley, S., Zebker, H.A., Webb, F.H., Fielding, E.J., 1996. Surface deformation and coherence measurements of Kilauea

Vincent A. Ferrer and K.K. Ramachandran 63
volcano, Hawaii, from SIR-C radar interferometry. J. Geophys. Res., 101, 23109 – 23125.Shapiro, I.I., Zisk, S.H., Rogers, A.E.E., Slade, M.A., Thompson, T.W., 1972. Lunar topography: Global determination by radar.
Science, 178, 939-948.Sinkholes and Cavern Collapse: NISAR application white paper.Stacy, N.J.S., Campbell, D.B., 1993. Earth-based measurement of lunar topography using delayed radar. Proc. Lunar Planet. Sci. Conf.,
24(3), 1343 – 1344.Strozzi, T., Wegmuller, U., Werner, C.L., Wiesmann, A., Spreckels, V., 2003. JERS SAR interferometry for land subsidence monitoring.
IEEE Trans. Geosci. Remote Sens., 41, 1702 – 1708.Zebker, H., Rosen, P.A., Goldstein, R.M., Gabriel, A., Werner, C.L., 1994. On the derivation of co-seismic displacement fields using
differential radar interferometry: The Landers earthquake. J. Geophys. Res., 99, 19617 – 19634.Zebker, H.A., Goldstein, R.M., 1986. Topographic mapping from interferometric synthetic aperture radar observations. Journal of
Geophysical Research, 91, 4993 – 4999.Zisk, S.H., 1972a. A new, Earth-based radar technique for the measurement of lunar topography. Moon, 4, 296 – 306. Zisk, S.H., 1972b. Lunar topography: First radar-interferometer measurements of the Alphonsus-Ptolemaeus-Arzachel Region.
Science, 178, 977 – 980.

Abstract
In the South-Western Ghats, Kerala Soil piping is another natural hazard after landslides. Every year, a series of such incidence is being reported in Kerala during the monsoon period. The soil piping is a subsurface phenomenon that converts the residential and agriculture land into bad land, and creates economic loss. The present paper deals with the occurrence of soil piping, its data set of such an event that happened in the Kolari village in Kannur district, Kerala. The resistivity survey was performed to analyze the nature of the pipe (branching or single) in terms of its extent and orientation. The results show that the minimum length of the pipe is ~50 m and it has branches oriented in N-S direction. Key words: Soil piping, Resistivity survey, Kerala
Introduction
The Soil-piping or tunnel erosion is a very common phenomena in the lateritic terrain (Parker and Higgins, 1990; Guti6rrez et al., 1997), where climate presents with strong seasonal contrasts and especially, high rainfall variability ( Jones, 1981; Bryan and Yair, 1982; Selby, 1993). The major cause of the subsurface soil erosion is due to the percolating waters especially in non-lithified earth materials lead to form the soil-pipes with different diameter size varies from a few mm to few cm and exceptionally can grow up to a meter scale (Sankar, 2016). They may lie very close to the ground surface or may occur several meters beneath the ground surface. This process results from complex and multivariate combination of different factors such as hydraulic gradient, topography (Fletcher and Carrol, 1948; Jones, 1981) and the subsurface flow energy ( Jones, 1990), mineralogy (type of clay) (Parker and Jenne, 1967), cement (Parker and Higgins, 1990), stability of clay aggregates (Evans, 1980), and exchangeable sodium content (Heede, 1971), pH value (Heede, 1971). Soil piping cumulates with time, leading to land subsidence and roof collapse. Soil
Soil piping in Kolari Village, Irritty Taluka, Kannur district, Kerala
Mayank Joshi, Padma Rao B, Prasobh P Rajan, Eldhose K, Rajappan S, Alka Gond ESSO-National Centre for Earth Science Studies, Thiruvananthapuram

Dr. Mayank Joshi, Dr. Padma Rao B, Mr. Prasobh P Rajan, Mr. Eldose, Mr. Rajappan S, Ms. Alka Gond 65
pipes have been reported in a wide range of environments from the tropical rain forest (Elsenbeer and Lack, 1996; Putty and Prasad, 2000) to periglacial regions with permafrost (Gibson et al., 1993; Quinton and Marsh, 1998; Carey and Woo, 2000; 2002). In India, the Kerala is the home for the soil piping phenomena (Sankar ,2005, 2016). A number of text book examples are present here. Every year, a number of such events are being reported by common persons especially in the central and northern Kerala regions (Sankar, 2016). One new event was reported by villagers in Kolari Village, Irrtty Taluka in Kannur district, Kerala (Fig. 1).
Fig. 1: Map shows the location of the pipe affected area at Kolari village.
The pipe locality was exposed during the land excavation. The excavated soil dumped in the nearby area and due to the overburden, roof of the tunnel collapsed and whole heap of the soil moved inside (Fig. 2, 3). To study this case, geophysical survey has been carried out in this area.
Fig. 2: Panoramic view of the soil pipe location at Mr. Sharif ’s land. Note the excavated loose laterite soil in the foreground.

66 Soil piping in Kolari Village, Irritty Taluka, Kannur district, Kerala
Fig. 3: Exposed view of the Soil pipe. Note the loose material at the mouth of the pipe.
Geology and geomorphology of the areaThe area falls in the Kannur district in Kerala (Fig. 1). The geological formations are of Archean and recent age. Archean formations comprises of gneisses and charnokites. alluvium and laterite are of Quaternary age. The basic charnokites, foliated hornblende-biotite gneiss forms the midland and highland regions of the district (Fig. 4). The remaining portions in the coastal area are covered by laterite, alluvium, lime-shies, lignified woods, etc. Laterites are developed on a limited scale along the coastal areas.Kannur district can be divided into three distinct geomorphologic units viz. the coastal plains and lowlands in the western part, the central undulatory terrain comprising the midland region and the eastern highland region. The study area is falls in the midland region. The area forms a plateau land at certain places covered by a thick cover of laterite. This is immediately to the east of the coastal strip, rising from 40 to 100 m above the Mean Sea Level (MSL). At the pipe location, the rocks are capped with a thick laterite cap (>20 m) with a very undulating topography. The area is lying at middle of the drainage basin and bounded by small mound in the NW and SE direction. The area is having mainly rubber plantation with moderate vegetation. Some paddy fields are also present in the area.

Dr. Mayank Joshi, Dr. Padma Rao B, Mr. Prasobh P Rajan, Mr. Eldose, Mr. Rajappan S, Ms. Alka Gond 67
Fig. 4: Geological map of the Kannur area.
Nature of the event and Geophysical techniques
The study shows that the land subsidence was due to the soil piping. The closer examination of the exposed part indicate that the pipe is circular in nature with a radius of 0.3 m and having a subsurface extension (Fig. 3). Since it is a subsurface structure therefore the geophysical methods are very useful to know its nature in terms of extension and direction of the soil pipe. For mapping subsurface features like sinkholes, cavities and soil piping, geophysical techniques such as Ground Penetrating Radar (GPR), Multi Electrode Resistivity Surveys (MERS), Induced Polarization (IP) imaging, Microgravity and Seismic Refraction surveys are useful. The details of each geophysical methods are described below:
(a) Ground Penetrating Radar (GPR):
In Ground Penetrating Radar (GPR) surveys, electromagnetic waves having the frequencies in between 50 MHz and 2.5 GHz are utilized, these signals are transmitted into the ground. When the transmitted energy encounters the features having significat contrast in dielectric properties, the energy is reflected back to the surface. A radio wave transmitter (T) placed at the surface is utilized to generate a short (<20 ns) pulse of radio waves which penetrate into the subsurface. Some of the energy carried by these waves is transmitted to greater and greater depths, while some of the energy is reflected back towards the surface receiver (R) whenever a contrast in dielectric properties is encountered. The amount of reflected energy is mainly dependent on the contrast in electrical properties encountered by the radio waves.

68 Soil piping in Kolari Village, Irritty Taluka, Kannur district, Kerala
In this, the receiver measures the variation in the reflected signals strength with respect to the time. The 1D representation of the subsurface beneath the antena/profile is called a scan. To make a 2D section of the subsurface, the antena is traversed across the survey area to collect a number of adjacent scans, this 2D section is called as a radargram. Conversions to the depth sections may provide the sufficient information related to the dielectric properties of the materials surveyed.The collected GPR data can be processed and presented as a 2D cross-sections of the subsurface (radargrams). Modern softwares are capable of doing the adjacent radargrams stacking and the contruction of the 3D data cubes. The horizontal slices or the time slices of the data at the desired depth enbles us to visualisation of the strength of the reflection across the survey area. This is one of the most important tecniques for the detection and tracing of linear features such as pipes, walls and the complex 3D structures.
(b) Electrical Resistivity Imaging:
The subsurface electrical properties vary with the ground material, the saturation level & the existence of fluids and the presence of buired objects. The electrical techniques describes the distribution of these properties as a function of horizontal distance and the depth. The most popularly known electrical technique is the Electrical Resistivity Imaging. In this method, ground resistance is measured by introducing an electric current into the subsurface through two current electrodes planted into the ground. The injucted current passing through the ground and creates the distribution of electrical potential in the subsurface. The electrical potential difference between the two potential electrodes is measures as a voltage. By utilizing the Ohm’s law, the measured voltage can be converted into a resistance reading for the ground between the two potential electrodes. For the cross-sectional image of the ground resistance, a number of connected electrodes are planted along a stright line with an inter electrode spacing of x. Once a ground resistance measured for one set of four electrodes, the next set is automatically selects and it calculates the ground resistance and this process is continuous until the end of the profile. The profile is then re-surveyed with an intra-electrode spacing of 2x, 3x, etc., this increase in intra-electrode spacing increases the depth of the survey. The measured resistance values are then converted into apparent resistivity (ohm-meter), this can be utilized to model the true subsurface resistivity distribution. Based on this section, subsurface features (soil piping, cave systems, etc.) can be indetified.
(c) Induced Polarization Imaging:
A complementary method/technique to the electrical resistivity imaging is the Induced polarization (IP) imaging and it deleas with the subsurface capacitance. The main difference between the electrical resistivity imaging and the IP imaging is that the resistivity techninue measures the how much energy is dissipate (resistance) and the IP technique measures how much energy is stored (capacitance) because the subsurface has the capability to do both dissipate and storage of the energy associated with electrical current flowing through subsurface. When a current passes through the subsurface, a minor charge is stored and makes subsurface as charged. This charge is decays with respect to the time after turning off the current, this decay can be observed in the recorded potentials. Further, the subsurface chargability is measured by calculating the delay rate. Eventhough the two materials having the same resistivity, they can give the contrasting chargeabilities. Therefore, IP imaging can provide additional discrimination of subsurface features. The instrument used for the IP is similar to the instrument used for the elctrical resistivity, with measurements being made of both the chargeability and the resistivity of the subsurface. Thus, this method is also useful to indentify the soil piping.
(d) Microgravity:
Microgravity survey is basicaly detects the contrasting or anomalous density areas by measuring

Dr. Mayank Joshi, Dr. Padma Rao B, Mr. Prasobh P Rajan, Mr. Eldose, Mr. Rajappan S, Ms. Alka Gond 69
the surface readings of the Earth’s gravitational filed since different sugsurface features having different densities. Gravity meater is a highly sensitive instrument, which measures the acceleration due to gravity. Over the dense material, it gives the positive gravity anomaly and over the low density features like an air filled cavity, it gives the negative gravity anomaly. The gravity anomalies arising from natural as well as manmade subsurface features like voids and cavities are superimposed on much larger variations because of the height, latitude and variations of regional geology. In this, careful data acquisition and processing is essential. Basically the microgravity surveys are sensitive to the data collection and care must be taken on site selction and enironmental conditions. Further, it is essential to correct the factors which influences the data such as earth tides, instrument drift and other time variant efects and also apply the corrections like latitude elevation, local terrain and large length scale influences from regional geology. The result of this method is the micro-gravity anomaly map, which is helful to calculate the location, depth density contrast and by using this, we can map the subsurface features like soil piping, sink holes, etc.
(e) Seismic Refraction:
The seismic refraction technique works based on the seismic energy refraction at the interfaces between the subsurface layers of different velocities. The seismic refraction method utilizes the geophones in an array and a seismic source. The seismic waves propagating from a source travels along the surface as a direct wave. However, this seismic wave encounters an interface between the two different soil/rock layers, a part of the energy is reflected and the remaining energy will travel through the layer boundary at a reflected angle. The wave is critically refracted at the critical angle of incidence and it travels parallel to the interface at the speed equivalent to the underlying layer. The refracted wave reaches the surface in the form of head waves, which may record at distant geophones before the direct wave. By analyzing the travel times of the first arrival at each geophone, a travel time vs distance graph along the profile can me generated. The gradients of the line in travel time vs distance plots gives the subsurface layer velocities. The final outcome of this survey is the velocity/ depth profiles for the refractors. By using these kind of depth profiles, it is easy to identify the subsurface features such as sink holes, soil piping, etc.Out of these five geophysical methods, one of the simple and promising techniques for the identification and quantification of soil piping phenomenon is the Multi Electrode Resistivity Survey (MERS) technique, especially is proven very useful in the lateritic terrainof Kerala region (Sankar 2005, 2016). Resistivity Tomography (RESTOM) is the output of the resistivity survey, which is a proven imaging technique. Therefore in the present study, Multi Electrode Resistivity Survey was used to know the nature and extent of the soil piping. Five profiles were taken across the possible extent in the region to understand the subsurface soil piping phenomenon.
Data and methodology
Field investigations were carried out at the piping affected localities of mattanoor in Kannur district, during the period of 09/09/2016 to 11/09/2016. The geophysical investigation (electrical resistivity survey) was conducted using multi electrode digital Resistivity/IP equipment model WDJD-4 (Fig. 5). With the acquisition analysis, processing and interpretation of field work data employing two dimensional electrical resistivity profiling became a possibility. The data so gathered is processed and interpreted using RES2DINV Software. Five resistivity profiles (P1-P5) were laid perpendicular to the suspected alignment of soil pipe with the probable location of pipes as the centre point (Fig. 6).

70 Soil piping in Kolari Village, Irritty Taluka, Kannur district, Kerala
Fig. 5: A field view of the 60 m resistivity profile with 1 m electrode spacing. The vertical bars indicate the electrodes.
Fig. 6: The Google Earth image shows the 5 profile sections and the inferred direction of the soil pipe. Star indicates the exposed part of pipe.
The length of the profiles were 60 m with 1 m electrode spacing and 120 m with 2 m electrode spacing. The profiles 1, 2 and 3 were laid over the suspected soil pipe with 1 m electrode spacing. The 4 and 5 profiles were away i.e., upside of the soil pipe with 2 m and 1 m electrode spacing respectively. The maximum profile length achieved is 120 m when the electrode separation is 2 m and the same is only 60 m for the electrode separation of 1 m. In order to nullify the contact resistance, if any, at the electrodes, Grounding Resistance (Rg) was initially measured for the set of electrodes by setting the desirable maximum limit of Rg to 10 KΩ considering the requirement of improving the signal to noise ratio. On switching for Rg measurements the instrument automatically highlights the electrode number where the Rg is higher than 10 KΩ. For such electrodes, corrective measures have to be taken to improve the ground contact by tight pegging of the electrode and/or by pouring saline water. After ensuring that all the electrodes are well

Dr. Mayank Joshi, Dr. Padma Rao B, Mr. Prasobh P Rajan, Mr. Eldose, Mr. Rajappan S, Ms. Alka Gond 71
grounded without contact resistance beyond the desirable limit, the switcher box is connected and measurement mode initiated. The instrument is facilitated to measure Wenner, Schlumberger and Dipole-Dipole arrays. The instrument generates the resistivity data for various combinations and layers and is stored in the WDJD-4 mainframe which could be transferred to an external computer facility. The gathered data is interpreted using a RES2DINV Software to generate the Electrical Resistivity Tomographic images. In order to do the interpretation using this software, the data gathered and stored is converted to a compatible format using WDAFC.EXE program and subsequently interpreted.
Result
Survey line 1 (P1)The figure 7a,b,c shows electrical resistivity tomographic sections of Schlumberger, Wenner and Dipole-Dipole array along the profile. This profile is laid near to the exposed part of the soil pipe. The survey line is oriented in the SE-NW direction and the depth resolution is ~16.9 m. The inverse model resistivity section, prima facie indicates a highly anisotropy in the entire section. A 3.5 m wide high resistivity zone present in between 1.35 and 5.23 m depth, near to the 32th electrode position. The high resistivity in this region is may be due to the pipe. The moderate resistivity with lateral and vertical variation in between 1st and 30th electrode indicates the hard resistive rock boulders with different layers of weathering conditions. In Dp-Dp array, the soil pipe is clearly visible beneath the 32th electrode. In between 30th and 60th electrode of the profile exhibits relatively lower resistivity in comparison to the nearby zones, which is the indicative of more promising recharge zone. From the surface of the low resistivity area, high resistivity layer up to the depth of 2.70 m was indicates the instability of the soil layer.
Fig. 7a: Electricity resistivity tomograph of Schlumberger array with 1m electrode spacing.
Fig. 7b: Electricity resistivity tomograph of Wenner array with 1m electrode spacing.

72 Soil piping in Kolari Village, Irritty Taluka, Kannur district, Kerala
Fig. 7c: Electricity resistivity tomograph of Dipole-Dipole array with 1m electrode spacing.
Survey line 2 (P2) In this profile laid 15 m from the profile P1 and oriented in E-W direction. This resistivity section covers upto a depth of almost 17 m (Fig. 8a,b,c). In between the electrodes 19 and 25th , a ~4 m thick low resistivity zone is present, this indicates water saturated zone and this area denoting the subsurface channel. Further increasing resistivity at depth is due to the presence of bedrock. In this profile the location of soil pipe is not clear.
Fig. 8a: Electricity resistivity tomograph of Schlumberger array with 1m electrode spacing.
Fig. 8b: Electricity resistivity tomograph of Wenner array with 1m electrode spacing.

Dr. Mayank Joshi, Dr. Padma Rao B, Mr. Prasobh P Rajan, Mr. Eldose, Mr. Rajappan S, Ms. Alka Gond 73
Fig. 8c: Electricity resistivity tomograph of Dipole-Dipole array with 1m electrode spacing.
Survey line 3 (P3)
This profile laid in 6 m from the profile P1 with E-W configuration and it is in the down slope direction. In entire profile, the top 1.5 m high resistivity was due to road filling (Fig. 9a,b,c). In between electrodes 25 and 35th, a high resistivity zones were observed in all configurations. The field data suggests that it is due to the road cutting. It was clearly seen in the dipole-dipole array. There is a saturated zone in between 11 and 20th electrodes with resistivity > 300 Ωm. Below this zone, there was horizontally stratified layers of highly saturated zone with moderately low resistance (i.e., >500 Ωm), which representing natural ground water table.
Fig. 9a: Electricity resistivity tomograph of Schlumberger array with 1m electrode spacing.
Fig. 9b: Electricity resistivity tomograph of Wenner array with 1m electrode spacing.

74 Soil piping in Kolari Village, Irritty Taluka, Kannur district, Kerala
Fig. 9c: Electricity resistivity tomograph of Dipole-Dipole array with 1m electrode spacing.
Survey line 4 (P4)
The profile P4 is laid upside 25 m from the subsided area in the W-E configuration. This profile has having electrode spacing of 2 m with profile length of 120 m (Fig. 10a,b,c). The 30th electrode is taken as the midpoint near to the orientation of the suspected soil pipe. The resistivity section of profile P4 indicates a difference in resistivity at eastern (1st electrode) and western portions (60th electrode). The eastern section exhibits a moderate resistivity zone due to the weathered/fractured horizon.
Fig. 10a: Electricity resistivity tomograph of Schlumberger array with 2m electrode spacing.
Fig. 10b: Electricity resistivity tomograph of Wenner array with 2m electrode spacing.

Dr. Mayank Joshi, Dr. Padma Rao B, Mr. Prasobh P Rajan, Mr. Eldose, Mr. Rajappan S, Ms. Alka Gond 75
Fig. 10c: Electricity resistivity tomograph of Dipole-Dipole array with 2m electrode spacing.
Survey line 5 (P5)
To get the clear picture of soil pipe in profile P4, we carried out a profiling with less electrode spacing (1 m spacing). In that survey, the midpoint placed in the middle of that saturated zone (Fig. 11a,b,c). In the entire profile, the top ~2 m high resistivity is due to the road filling. In the western side in between the 40 and 45th electrodes, a high resistivity zone is due to the presence of high resistivity rock. The layers of low resistance at depth of ~5.0 m between electrodes 16 and 46th indicate the water level in that area.
Fig. 11a: Electricity resistivity tomograph of Schlumberger array with 1m electrode spacing.
Fig. 11b: Electricity resistivity tomograph of Wenner array with 1m electrode spacing.

76 Soil piping in Kolari Village, Irritty Taluka, Kannur district, Kerala
Fig. 11c: Electricity resistivity tomograph of Dipole-Dipole array with 1m electrode spacing.
Conclusion
Soil pipes are the most important features of the hillslope–hydrology, which affecting mechanistic processes like erosion, subsurface drainage, stream flow, hillslope stability, and rain fall discharge response. However, in situ characterization of this pathways/soil pipes having a limited capacity, a major limitation for process-based understanding. In this context, the resistivity survey is very much useful to identify such structures. In the present study, five profiles were taken across the suspected pipe orientation. The results show that the length of the pipe is at least ~50 m with N-S direction (Fig. 6). The low resistivity zone in some profiles was due to the presence of water table. A shallow water table of depth ~6.0 m was observed in the field as well. The in situ analysis water samples shows that the water is acidic in nature.
ReferencesBryan, R., & Yair, A. (Eds.). (1982). Badland geomorphology and piping (Vol. 573). Geo Books. Carey, S. K., & Woo, M. K. (2000). The role of soil pipes as a slope runoff mechanism, Subarctic Yukon, Canada. Journal of
Hydrology, 233(1), 206-222.Carey, S. K., & Woo, M. K. (2002). Hydrogeomorphic relations among soil pipes, flow pathways, and soil detachments within a
permafrost hillslope. Physical Geography, 23(2), 95-114.Elsenbeer, H., & Lack, A. (1996). Hydrometric and hydrochemicai evidence for fast flowpaths at La Cuenca, Western Amazonia. Journal
of Hydrology, 180(1-4), 237-250.Fletcher, J. E., & Carroll, P. H. (1948, January). Some properties of soils associated with piping in Southern Arizona. In Proceedings
Soil Science Society of America (Vol. 13, pp. 545-547).Gibson, J. J., Edwards, T. W. D., & Prowse, T. D. (1993). Runoff generation in a high boreal wetland in northern Canada. Hydrology
Research, 24(2-3), 213-224. García-Ruiz, J., Lasanta, T., & Alberto, F. (1997). Soil erosion by piping in irrigated fields. Geomorphology, 20(3-4), 269-278.Heede, B. H. (1971). Characteristics and processes of soil piping in gullies. Characteristics and processes of soil piping in gullies.Jones, J.A.A., 1981. The Nature of Soil Piping, A Review of Research. Geobooks, Norwich.Parker, G.G., Higgins, C., 1990. Piping and pseudokarst in dry lands. In: Higgins, C., Coates, D. (Eds.), Groundwater Geomorphology.
The Role of subsurface Water in Earth Surface Processes and Landforms: Geological Society of America Special Paper, 252, pp. 77–110.
Parker, G. G., & Jenne, E. A. (1967). Structural failure of Western highways caused by piping. Highway Research Record, (203).Putty, M. R. Y., & Prasad, R. (2000). Runoff processes in headwater catchments—an experimental study in Western Ghats, South
India. Journal of Hydrology, 235(1), 63-71.Quinton, W. L., & Marsh, P. (1998). The influence of mineral earth hummocks on subsurface drainage in the continuous permafrost
zone. Permafrost and Periglacial Processes, 9(3), 213-228.Sankar.G.,(2005).,Investigation of the land subsidence in Chattivayal locality of Cherupuzha Grama panchayath.,Taliparamba taluk,
Kannur district., Centre for Earth Science Studies, Thiruvanathapuram. Sankar,. G., (2016). Studies on soil piping in the highlands and foot hills of Kerala to avoid the disaster, pp 200Selby MJ. 1993. Hillslope Materials and Processes. Oxford University Press: Oxford; 451.

Abstract:
Soil erosion and debris slide are studied with continuous monitoring and experiment. Soil erosion assumes to be slow and continuous event but experiment shows that it initiates after attaining some threshold factors. Debris slide also occurs after attaining threshold steepness, height and rainfall. Proper management requires to maintain the system below threshold limits.Key words: Sheet wash, Channel erosion, Debris slide, Threshold.
1. Introduction
Empirical observation and experiments accord a special privilege to earth science especially in understanding cause-effect relation. Cause-effect analysis has its origin in the concept of Plato and Socrates, who did not believe in “appearance” of things but put emphasis in assessing the hidden causal mechanism between the structural units that give rise to that “appearances”. Definite and worth knowing cause – effect relationship underlies all things and events. Proper understanding of cause-effect relation that give rise to observable appearance is important in understanding processes leading to landslide and erosion. Soil erosion and landslide are the observable expression of the processes that underlie as hidden structure. Efforts are made to understand the processes leading to soil erosion and landslide by continuous observation and experiment.
2. Methods
Observation and experiments are followed in the present attempt as these has ontological privilege that observational statement and experimental result make a direct reference to real world. Epistemological privilege these methods are that observational statements experimental outcomes are declared to be true and do not require any reference to theoretical statement for proving the truth or falsity. The results of such study are claimed to be “neutral, objective, value
Understanding thresholds for soil erosion and debris slide through Empirical Studies.
Ramkrishna Maiti Professor, Department of Geography and Environment Management, Vidyasagar University, Medinipur
West Bengal, e-mail: [email protected]

78 Understanding thresholds for soil erosion and debris slide through Empirical Studies.
free” and the “facts speak for themselves” (Gregory, 1981). A thing (geographical phenomenon; Landslide and soil erosion for instance ) was studied from two distinct perspectives. Real structure (realism) of a thing is considered to be its causal mechanism that has to be studied through theories, models and techniques. Real structure exists independently of experience. Causal-laws are developed through “generative mechanism of nature,” (empirical) and “ways of acting of things”. Experienced (empirical) Structure is the structure of an event understood through empiricism (direct observation and experiment). Real structure (causal mechanism) may not be manifested clearly. In any event causal laws may be hidden under surface of a thing (Peet, 1998). Mode of investigation is followed in two steps. At first, things are divided into basic elements. Next, the process of interactions is accounted for in order to understand ‘structural relations among elementary units to describe ‘mode of organisation’ (Sayer, 1984) (Figure 1& 2).
Threshold Rain under variable exposure
Sheet Wash Channel Erosion
Management with checkdam
Design of checkdam Assessing
performance of checkdam
Initiation of channel Elongation &
elaboration of channel
Soil Erosion
Figure 1: Mode of investigation on Soil Erosion: At first, things are divided into basic elements and then, the process of interactions is accounted for.
Nature Man
Excavation Displacement of
materials Mining
Rainfall threshold
Slope steepness threshold
Slope height threshold
Slope
o Contour length o Steepness o Slope Height Soil
o Wet Soil Density o Thickness of Top Soil o Thickness of Saturated Soil Geotechnical Properties
of Soil & Rock o Cohesion o Angle of internal friction Hydrological
o Density of water o Up-slope contributing area
Debris Slide
Figure 2: Mode of investigation on Debris Slide: At first, Phenomena is divided into basic elements and then, the process of interactions is accounted for.

Ramkrishna Maiti 79
3. Study on Soil Erosion
3.1: Study 1: Understanding Threshold for Soil erosion under variable exposure (Shit and Maiti, 2013)Aim: Study aims to understand the impact of rainfall in initiating soil erosion under variable vegetation coverage.
Procedure:
Five plots of 2m x 2.5m dimension have been constructed with locally available materials from five locations with a variable steepness of 9-13 degree (Fig. 3). Plots are designed to facilitate collection of water and sediment discharge into a bucket through PVC pipe. These plots allowed for vegetation growth. After the fuller growth, plants are trimmed to have varying exposure ( Figure 4). Median Grain size of constituent materials are calculated after necessary laboratory analysis (Table 1 ). Rain intensity has been calculated by measuring the rainfall and careful record of duration (Table 2 ). Discharge of water and sediment collected at each plot has been linked with rainfall, constituent materials and nature of exposure.
Table 1 Constituent matter and steepness of plots (Shit and Maiti, 2013).
Exper-imental
Plots
Slope gradient in
degree
Sand (>0.06 mm)
(in %) (Mean val-
ues±SD)
Silt loam (0.002-
0.06mm) (in %) (Mean values±SD)
Clay (<0.002mm) (in %) (Mean values±SD)
Bulk density (g/cm3) (Mean
values±SD)
Median Grain Size
(mm)
P1 12 48.33±5.68 33.00±2.64 18.66±6.11 1.16±0.47 0.0562
P2 13 45.00±3.00 36.33±3.51 18.66±5.77 1.23±0.15 0.0481
P3 9 46.00±3.46 37.00±2.64 17.00±6.08 1.40±0.40 0.0514
P4 14 41.33±2.88 32.00±2.64 26.66±0.57 1.43±0.15 0.0436
P5 10 45.66±0.57 38.66±2.08 15.66±2.51 1.46±0.25 0.0508

80 Understanding thresholds for soil erosion and debris slide through Empirical Studies.
Figure 3: Measuring Infiltration within the plots (Shit and Maiti, 2013)
A B
Figure 4: Plots with varied exposure: A- 25% exposure; B – 100% Vegetation Coverage (Shit and Maiti 2013)
Discussion: Critical shear stress under variable constituent materials for initiating erosion are calculated after Shields (1936) and Hickin (1995).Ʈcr= Kg(Ʈs- Ʈ)D (Shields, 1936; Hickin, 1995) ------ (Equation 1)ɤcr = 0.045x9.80665m/ sq sec x (2.65-0.0098)g/cubic cm x D in m ɤcr- Critical Shear Stress (Newton/Sq m) ( Newton= Kgxm/Sq Sec)K – Constantg – Gravitational Accelerationɤs- Density of sediment (2.65g/cubic cm) (Knighton,1998)

Ramkrishna Maiti 81
ɤ – Density of Water (0.998/cubic cm) (Knighton,1998)D –Median Grain Size in m
Table 2 Duration and Intensity of Rainfall under period of investigation (Shit and Maiti, 2013).
Phase Dates Rain in mm Duration (Hr ) Avg. Intensity(mm/Hr)
I
6.08.11 5 1 5
7.08.11 30 4 7.5
8.08.11 23 4 5.75
9.08.11 3 1 3
10.08.11 60 7 8.6
11.08.11 41 5 8.2
12.08.11 13 3 4.33
13.08.11 2 1 2
14.08.11 2 1 2
II16.08.11 20 3 6.6
17.08.11 13 3 4.33
III
25.08.11 15 5 3
26.08.11 5.5 1 5.5
27.08.11 1 1 1
28.08.11 9 2 4.5
29.08.11 2 1 2
IV31.08.11 10 2 5
01.09.11 15 4 3.75
V03.09.11 15 3 5
04.09.11 15 4 3.75
VI07.09.11 8 2 4
08.09.11 6.8 2 3.4
VI
13.09.11 6.8 2 3.4
14.09.11 13 3 4.33
15.09.11 15 3 5

82 Understanding thresholds for soil erosion and debris slide through Empirical Studies.
Table 3 Critical Shear Stress in relation to grain size.
Plot No Median Grain Size (mm) Critical Shear Stress(Newton/Sq m)
1 0.0562 0.04373
2 0.0481 0.3643
3 0.0514 0.03999
4 0.0436 0.03393
5 0.0508 0.0395
Conclusion : Critical shear stress required for soil erosion is positively related to grain size. From rainfall – discharge relation it has been observed that erosion starts after attainment of 4mm/hr rain intensity from exposed soil.
3.2 Study 2: Understanding Threshold for Channel Erosion (Shit and Maiti, 2012)
Aim:
The present experiment aimed to understand the threshold of initiation of channel erosion under controlled rainfall.
Equipment:
Unconsolidated red soil has been collected from the field and kept in a 1m x 1m wooden box set at 20o slope under natural condition for 6 months for sufficient compaction. Arrangements for artificial rain has been made with a pipeline of sufficient length and a shower fixed at its end. Shower has been set at 5m height over head. An automatic rain gauge was fixed to record the rain intensity. The constant rate of 8mm/hr rain was maintained (Fig. 5).
Figure 5 : Experimental Setup (Shit & Maiti, 2012 )

Ramkrishna Maiti 83
Procedure:
After the setup was complete, artificial rain was allowed to fall at a constant rate that was measured by automatic rain gauge. Developments were constantly observed through photography. Measurements of geometric properties were recorded.
Results:
Photographic records of the results of the experiments were presented in figure 6. It was observed that after continuous runoff for two hours, a depression was initiated at the lower most segment, where runoff concentrates. This depression was extended head ward and gradually turned into a channel that further concentrated runoff. New channels were included from either sides at suitable locations. Thus gradually a network developed, through head ward growth. Stream junctions migrated downstream. No further extension of network was observed after critical competition of the runoff contributing area was reached.
Figure 6: Initiation and Modification of Channel Network under Artificial Rain (Shit & Maiti, 2012 )
Discussion:
Measurements were made carefully specially in maintaining the constant rain, measuring the length and width of channels, and migration of junctions. Experiment could be improved in a fixed laboratory setup where monitoring and measurements are done more precisely through electronic device. Under Natural conditions, micro-relief, vegetation, variation of soil and rocks develop varied situation that might bring minor deviation from the results observed.

84 Understanding thresholds for soil erosion and debris slide through Empirical Studies.
Conclusion:
The present experiment validates Glock’s (1931) theory of drainage development by headward erosion. After two hours of constant rain of 8mm/hr, Channel erosion starts, this may be taken as the threshold of erosion.
4. Study on Debris Slide
4.1 Evolution of Slide Scars Continuous monitoring during February, 2000 to January, 2006 on debris slides at mining pit1 and 2 on Himalayan Slope of Tindharia Cricket Colony, Kurseong, Darjiling shows that temporal evolution is the result of effective combination of both natural and anthropogenic processes leading to the development of threshold. After attaining threshold, sliding occurs that results in the spatial increment of mining scars which gradually creep upward bringing more and more area under this destructive operation (Basu and Maiti, 2001, Maiti, 2015). After sliding, steepness and length of the slope are reduced to attain temporary stability (Fig. 7).
Figure 7: Evolution of Debris slides on Mining Pits in Plan and in Section (Maiti 2015)

Ramkrishna Maiti 85
The thickness of the soil and that of the saturated soil during monsoon are measured as 4.5m (Mining Pit-1) and 7.25m (Mining Pit-2) and 1.28m (Mining Pit-1) and 1.30m (Mining Pit-2) respectively at the back wall. The value of wet soil buck density are found to be 1.96 g/cc and density of water becomes 1.07 g/cc. The angle of internal friction varies from 190 to 230 with an average of 210. The saturated conductivity of the soil varies from 10 –2 m s –1 for the soil depth less than 0.5m to 10-5 m s-1 for soil depth between 1 to 2 m [Fenti (1992), Freeze and Cherry(1979) and Bedinent et al. (2008)]. Based on these and other data, Matteotti (1996) estimated the transmissivity (T) of saturated soil to lie between 5 and 30 m day –1, with a mean value of 15 m day –1 (Borga et al. 1998). For a soil depth of 5m Vieira and Fernandes (2003) estimated the variation of saturated hydraulic conductivity between 1.0 x 10⁻⁶ – 9.0 x 10⁻⁵ m/sec measured by Guelph Permeameter. The field observation on the near vertical mining scar face during heavy rain shows an average of 12 cm/hr vertical penetration of water with a considerable variation in different soil horizons. Considering this observed rate, the estimated Transmissibility value becomes 12.96 and 20.80 m day –1 respectively for Pit1 and Pit 2 respectively, that corresponds to Fenti (1992); Freeze and Cherry (1979); Matteotti (1996); Vieira and Fernandes (2003) and Bedinent et.al. (2008). Result of the geotechnical analysis shows that the constituent materials are mainly cohesionless partially consolidated debris.
4.2. Calculation of Threshold values for Debris slide
The investigation on the temporal change in the slide scar reveals that the slope evolution here is subjected to a complex interaction between physical and anthropogenic processes. Human action of mining through back cutting leads to the development of geomorphic threshold in the form of slope steepness and slope height which causes slope failure in saturation condition during monsoon. Thus it is important to estimate the threshold condition in terms of steepness, slope height and critical rainfall.
4.2.1 Threshold Slope Angle
The steepening of slope at the back wall of the mining scar by back cutting, excavation and tunneling is mainly responsible for instability, as the slope on the marginal escarpment of scar becomes greater than the angle of repose. The stability equation (Equation-2; Table-4) for a mass of loose, friable cohesion less debris after Jumikis (1967), Melnikov, Chesnokov, Fienberg (1969) describes that angle of repose must be greater or equal to the slope on scar face for attaining unconditional stability. Carson (1975) introduced pore water pressure to estimate critical angle of slope failure (Equation-3; Table-4). Pore water pressure is calculated by Jumikis (1967) and Terzaghi (1962) (Equation-4; Table-4 ). The ‘dh’ i.e. hydraulic head is measured is field during rainfall in the field from the boreholes and ‘dl’ i.e. horizontal distance between two boreholes are measured with measuring tape. The other indefinite slope stability model (Equation-5; Table-4) for cohesion less material and slope parallel seepage after (Borga et al. 1998) also supports the view of Jumikis (1967) and Melnikov et.al.(1969). All the stability equations consider angle of internal friction as the most important factor of instability that depends on the material quality and amount of moisture. The resistance to movement is guided mainly by coefficient of internal friction. The resistance declines as the moisture content of the material increases and seepage pressure increases. The average steepness on marginal escarpment of the mining pit1 and 2 are 530 20/ and 480 20/ respectively which outweigh the angle of repose. In the present study the angle of repose in sun dry condition for the concerned material varies from 21 - 260. The basic requirement for the short term stability of the slope at marginal escarpment of mining pits is to maintain the steepness nearer or less than 210 (Table-4). But in maximum cases, during mining season the escarpment slope becomes twice or some times thrice to that required for stability and thus geomorphic threshold generates and the steep slope declines by slope failure to an angle of repose to attain short term stability (Wallace, 1977).

86 Understanding thresholds for soil erosion and debris slide through Empirical Studies.
Table-4 The Critical Slope Angle to initiate Debris Slide (Maiti 2015).
Methods Jumikis (1967), Melnikov, Chesnokov, Fienberg (1969)
Carson,1975 Borga et. al. 1998
Formulae
(W Cosɤ Tanɤ) / W Sinɤ >1-----(2)or, qf ≥
(Dry Condition)
Tan ɤ = Co-efficient of friction
φ = Angle of reposeW = Weight of Soilɤ = Slope on Scar face
Tan ɤ = (1-u/ ɤz Cos2 ɤ) Tan ɤ------- (3)
(Introducing Pore wa-ter pressure in saturated condition)
ɤ= Threshold angle of Failureu=Pore water pressure on potential sliding surfacez= depth of potential shear planeɤ=Bulk unit weight of the sliding materials
dldhrwu /= --------(4)Jumikis (1967) and Ter-zaghi (1936)u = seepage pressure, rw =unit weight of water, dh/dl = hydraulic gradi-ent.
11 >
−=
fq
TanTan
PwPs
zh
----- (5)(Dry Condition)h – Thickness of Total Soil z – Thickness of Saturated Soil Ps – Wet Soil Density Pw – Density of Water ɤ - Angle of Repose ɤ - Slope on Scar Face.
Thresh-old Slope Angle
ɤ=21 - 260 ɤ= 9o 51/ ɤ=21 - 260
4.2.2 Threshold Slope Height
Cullman, 1866 and Carson, 1971 attempted for the calculation of critical slope height consisting of the materials having cohesion (c/ ), angle of internal friction(ɤ ) and unit weight of materials (ɤ) with certain steepness (ɤ) (Equation- 6; Table-5). The critical heights for initiation of slide are 5.89m and 7.80m respectively (Table-5) for mining Pit – 1 and mining Pit – 2. Terzaghi (1962) defined critical slope height as a ratio between compressive strength of the rocks (Sc ) and unit weight of the rocks (W) (Equation-7; Table-5) and the value for the study area becomes 9.30m (Table-5). Skempton (1953) and Skempton and Hutchinson(1969) in their experience in the development of steep slope and its evolution through slides in the glacial till of County Durham found a critical slope height of 45 m at 30-350 steepness. The present experience reveals that in saturated condition, unconsolidated materials collapses before attaining critical height.
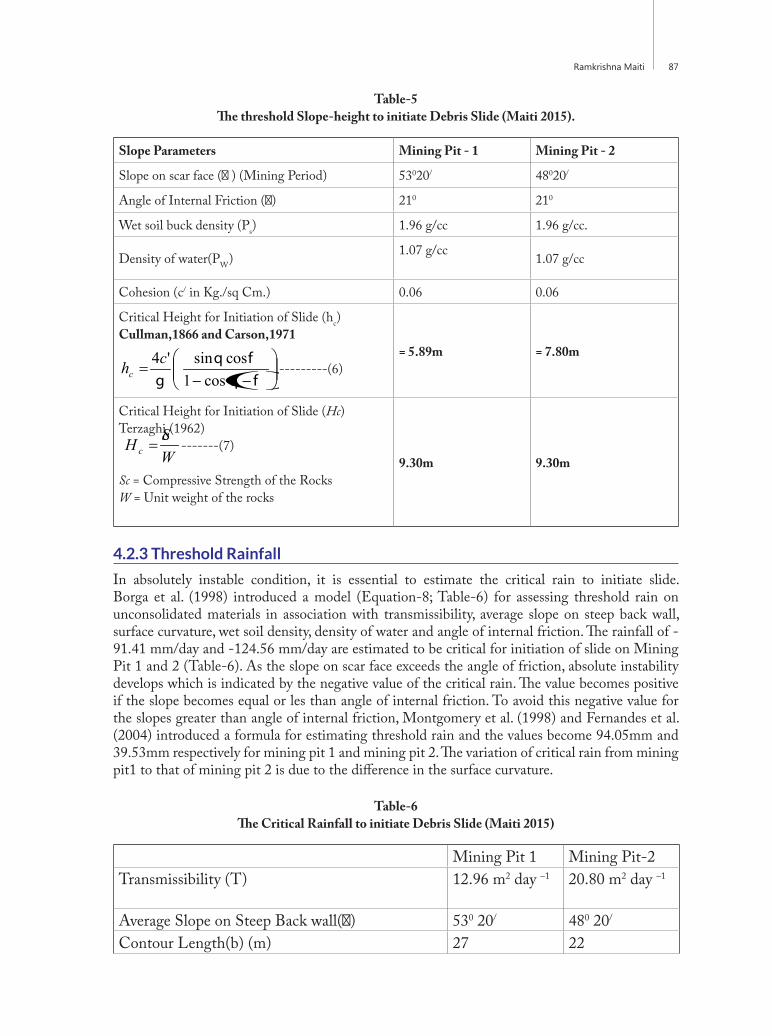
Ramkrishna Maiti 87
Table-5 The threshold Slope-height to initiate Debris Slide (Maiti 2015).
Slope Parameters Mining Pit - 1 Mining Pit - 2
Slope on scar face (ɤ ) (Mining Period) 53020/ 48020/
Angle of Internal Friction (ɤ) 210 210
Wet soil buck density (Ps) 1.96 g/cc 1.96 g/cc.
Density of water(PW) 1.07 g/cc 1.07 g/cc
Cohesion (c/ in Kg./sq Cm.) 0.06 0.06
Critical Height for Initiation of Slide (hc)Cullman,1866 and Carson,1971
()
−−
=fq
fqg cos1
cossin'4chc ---------(6)= 5.89m = 7.80m
Critical Height for Initiation of Slide (Hc)Terzaghi (1962)
WScH c = -------(7)
Sc = Compressive Strength of the RocksW = Unit weight of the rocks
9.30m 9.30m
4.2.3 Threshold Rainfall
In absolutely instable condition, it is essential to estimate the critical rain to initiate slide. Borga et al. (1998) introduced a model (Equation-8; Table-6) for assessing threshold rain on unconsolidated materials in association with transmissibility, average slope on steep back wall, surface curvature, wet soil density, density of water and angle of internal friction. The rainfall of - 91.41 mm/day and -124.56 mm/day are estimated to be critical for initiation of slide on Mining Pit 1 and 2 (Table-6). As the slope on scar face exceeds the angle of friction, absolute instability develops which is indicated by the negative value of the critical rain. The value becomes positive if the slope becomes equal or les than angle of internal friction. To avoid this negative value for the slopes greater than angle of internal friction, Montgomery et al. (1998) and Fernandes et al. (2004) introduced a formula for estimating threshold rain and the values become 94.05mm and 39.53mm respectively for mining pit 1 and mining pit 2. The variation of critical rain from mining pit1 to that of mining pit 2 is due to the difference in the surface curvature.
Table-6 The Critical Rainfall to initiate Debris Slide (Maiti 2015)
Mining Pit 1 Mining Pit-2Transmissibility (T) 12.96 m2 day –1 20.80 m2 day –1
Average Slope on Steep Back wall(ɤ) 530 20/ 480 20/
Contour Length(b) (m) 27 22

88 Understanding thresholds for soil erosion and debris slide through Empirical Studies.
Runoff Contributing area (a)(m2) 1404 968Wet soil Density (ps ) 1.96 g/cc 1.96 g/ccDensity of Water (pw) 1.07 g/cc 1.07 g/ccAngle of Internal Friction (φ) 210 210
Critical rainfall for setting instability (mm/day) (Borga et.al., 1998)
−=
fq
qTanTan
PwPs
abTrcr 1sin ------(8)
Critical rainfall for setting instability ( Qc in mm/day) (Montgomery and Deitrich, 1994; Deitrich and Montgomery, 1998; Fernandes et al., 2004)
[
−+=
fq
fqrq
TanTan
PwPs
gzC
ab
TQ
W
C 1tancos
'sin 2--------(7)
- 91.41
94.05
-124.56
39.53
The Selim Hill Tea Estate situated 250m North West of the study area registered 52 days having more than the critical rain fall to initiate threshold condition during last six years between 2000-2006 (Table-6). The calculation shows that 91.41 mm/day and 124.56 mm/day rainfall are the threshold rain for mining pit-1 and 2 respectively and the analysis of return period shows that 128.507 mm daily rain has a recurrence interval of 2 years with 5% probability following Chow, 1954. That means there is every possibility for the generation of Geomorphic threshold for initiation of slide due to hydrologic factor in every alternate year (Maiti 2015)..
5.Conclusion
Both soil erosion and debris slide are not continuous but are episodic in nature, that start after attaining critical energy or threshold conditions. Proper management of both of these two potential hazards requires understanding of the threshold. Effective management has to ensure keeping available energy or dominant factors below their threshold value. In case of soil erosion under sheet flow or rain drop impact, the threshold of 4mm rain intensity is very common in the area under study. In this circumstance, attempts are to be made to maintain vegetation coverage of more than 75% to restrict soil erosion. For channel erosion, closely spaced earthen check dams may be effective solution for controlling rill-gully extension. In debris slide, anthropogenic actions make the slope steeper, destabilise the materials, and increase the concavity of surface by removal of overburden and favours infiltration through dissected slope. This infiltration increases the depth of saturated soil. Density of wet soils becomes an important factor of instability, although pore water pressure or seepage pressure is negligible due to immediate drainage through porous medium. The rainfall character of the study area shows the possibility of attaining the threshold rainfall limit in every alternate year. The study indicates that the primary condition of stability is to maintain the steepness of scar face and margin at or below the angle of repose. The most important triggering factor thus seems to be the steepness of back wall that are more that twice of the threshold gradient. The study shows that the back wall collapses before attaining critical slope height due to its excessive steepness. The natural processes responds to such change in slope, soil

Ramkrishna Maiti 89
and water and try to get equilibrium by reducing the height and steepness of slope along scar’s margin by self-organised homeostatic adjustment. After every debris slide the slope on the scar face attains its steepness ranging from 200 – 240, with an average of 220 that is nearer to that of repose angle. Thus in the process of evolution, the concerned slope experience a seasonal rhythm of instability through mining and subsequent homeostatic adjustment through sliding. The back wall mining scars can not be allowed to cross 210 steepness and the height has to be restricted to 5 m.
REFERENCES Basu, S. R. and Ghatowar, L. 1988. Mining and Environment : A case study in the Lish basin of Eastern Himalaya, Mining and
Environment, Himalayan Research group, 318 – 325. Basu, S. R. and Maiti, R. K. 2001. Unscientific mining and degradation of slopes in the Darjeeling Himalayas, In S.R. Basu, Proceeding:
International Seminar on Changing Env. Scenerio of the Indian Subcontinent (pp. 390 – 399). Bedinent, P.B, Huber W.C. and Vieux,B.E. 2008. Hydrology and Floodplain Analysis, Upper Saddle River, NJ: Prentice HallBorga, M., Fontana D., G. Ros. D. D. and Marchi, L. 1998. Shallow landslide hazard assessment using physically based model and
digital elevation data, Environmental Geology, 35 ( 2 – 3), pp. 81 – 88. Carson, M. A. 1971. Application of the Concept of Threshold Slopes to the Laramie Mountains, Wyoming, Inst. Br. Geogr. Spec.
Publ. 3, 31-48. Carson, M. A. 1975. Threshold and characteristic angles of straight slopes, Proceedings of the 4th Guelph Symposium on Geomorphology,
Norwich Geo Books,19-34.Cullman, C. 1866. Graphische Statik, Zurich.Dietrich, W.E. and Montgomery, D.R. 1998. SHALSTAB: A Digital Terrain Model for Mapping Shallow Landslide Potential.
NATIONAL Council of the Paper Industryfor Air and stream improvement. Technical Report.Fenti, V. 1992. Indagini geologico-tecniche sull’area del dispositivo di misura (in Italian) in Marchi L. (ed)II Basino attrezzato del Rio
Cordon, Quaderni di Ricerca, n. 13, Regione Veneto. Dipartimento Foreste, Venezia Mestre: (pp.109-122).Fernandes, N F..; Guimaraes, R.F.; Gomes, R.A.T.;Vieira,B.C.; Montgomery, D.R.and Greengerg H. 2004. Topographic Controls of
landslides in Rio de Janerio: field evidences and modeling,Catena, 55, 163-181.Freeze, R.A. and Cherry, J.A. 1979. Ground Water, Englewood Cliff, N.J: Prentice Hall.Glock, W.S. (1931) The Development of Drainage Systems:asynoptic view. Geographical Review 21.pp.74-83.Gregory, D. (1981) Human Agency and Human Geography. Transactions of the Institute of British Geographers, NS 6, pp.1-18.Hickin, J.E. 1995 River geomorphology, Wiley, 255 pagesJumikis, A.R.. 1967. Soil Mechanics, Prinston, New Jersey, D. Nostrand Company, Inc.Maiti, 2015 . Thresholds for the Evolution of Mining Scars on Himalayan Slope at Darjiling, West Bengal, Journal of Indian
Geomorphology, Volume 2, Indian Institute of Geomorphologists (IGI), pp. 71-81. ISSN 2320-0731Matteotti, G. 1996. Valutazione del rischio di franosita per unbacino di tipo alpino (in Italian), Ph. D. Dissertation, University of
Padova, Italy. Melnikov, M. and Chesnokov, M. and Fienberg, H. 1969. Safety in Opencast Mining, Moscow: Mir Publications. Montgomery, D.R. and Dietrich, W.E. 1994. A physically based model for the topographic control on shallow land sliding, Water
Resources (30), 1153-1171.Montgomery, D.R. Sullivan, K. Greenberg, M.H.1998. Regional test of a model for shallow landslide, Hydrological Processes, 12,
943-955. Peet, R. (1998) Modern Geographical Thought, Oxford, Blackwell, 342p.Sayer, A. (1984) Method in Social Science:a realist approach. London, Hutchinson, 271p.Shield, N.D. 1936. Anwendung der ahnlickeit Mechanik under Turbulenzforschung auf die Geschiebelerwegung, Mitt. Preoss
Versuchanstalt fur Wasserbau und Schiffbau, vol. 26.Shit, P.K. and Maiti, R.K. (2012) Rill-Gully Erosion in Badland Topography, LAP LAMBERT Academic Publishing, Deutschland,
Germany, 117p.Shit, P.K. and Maiti, R.K. (2013) Assessing the Performance of Check Dams to Control Rill Gully Erosion: Small Catchment Scale
study, International Journal of Current Research, Vol. 5, Issue 3, pp. 899-906 (ISSN 0975-833X)Shit, P.K. and Maiti, R.K. (2013) Management Techniques of Rill-Gully Erosion in Badland Topography, LAP LAMBERT Academic
Publishing, Deutschland, Germany, 133p.Skempton, A.W. 1953. Soil Mechanics in relation to Geology, Proc. Yorks. Geol. Soc. 29, 33-42.Skempton, A.W. and Hutechinson, J.N. 1969. Stability of natural slopes and Embankment section, Proc. 7th int. cong. Soil Mech. Eng,
Mexicom 291-340.Terzaghi, K. 1962. Stability of Steep Slopes on Hard Unweathered Rock, Geothnique, 12, 251-70.Vieira and Fernandes (2003Wallace, R.E.1977. Profiles and ages of young fault scarps, North-Central Navada, Bulletin of Geological Society of Amarica, 88, 1276-81.

Abstract
The timing of Deccan volcanic episodic marks an important phase of earth history, coinciding with extensive volcanism and mass extinction during the Late Cretaceous- Early Tertiary time frame. Understanding the climate and weathering pattern during the Deccan volcanic activity is possible based on the geochemical study of Bole beds developed during the quiescence of volcanic eruptions episodes.Sequence of basalt flows commonly include spectacular red interflow starta widely known as ‘Bole bed’, which serve as the marker beds, in between two basaltic flows. Boles are made up of friable earthy clay and are derived from the weathering of the neighbouring basalts and volcanic ashes. The colour and texture of bole bed suggests intense processes of chemical weathering similar to what is observed in case of pedogenesis of basalts. The geochemistry of bole beds and associated rocks suggest that many of the boles may be of weathered pyroclasts. At some places boles are characterized by polygonal structures, indicating shrinkage features developed as a result of fluid loss after deposition.This paper presents the geochemical observations on various bole beds for interpreting the origin of bole beds and their relationship with the basalts and climatic reconstruction during the volcanic activities in Deccan.
Introduction:
Chemical weathering is such a phenomenon occurring since the millions of era and it is responsible for many of the facts such as soil formation, development of clays/phyllosilicates, climate change, development of economic mineral resource etc. Chemical alteration helps in one way by supporting soil development and controls climate change phenomenon where as in the other hand it initiates loose sediments and triggering to landslide and landslips etc. Pioneering work suggest that the
Chemical weathering of Deccan Bole beds around Pune- Mahabaleshwar of Western India: implications
on their origin and climatic reconstructionR. Islam1 and M. R. G. Sayeed2
1.Wadia Institute of Himalayan Geology, Dehradun2. Dept. of Geology, Poona college, Pune

R. Islam and M. R. G. Sayeed 91
weathering of basaltic material causes the formation of phyllosilicates under neutral to alkaline nature (Michalski and Noe Dobrea, 2007). Peretyazhko et al. (2016) established that the basalt weathering takes place in slightly acidic conditions (pH~4). The Deccan Volcanic Province (DVP) from Central India and Western Ghats is one of the largest continental flood basalt provinces in the world. These basaltic flows are dominantly tholeiitic in composition and are demarcated by interflow strata widely known as “bole bed”, which serve as the marker beds, in between two basaltic flows. The weathering of the neighbouring basalts and volcanic ashes make the materials for Boles beds (Wilkins et al., 1994). In some cases, red boles are similar to lateritic soils in appearance (color) but differ in this in chemical composition from the present day laterite found in the area, whereas green bole bed can be considered as an equivalent of andosols (volcanic ash soil). The bole beds in Deccan Traps are so prominent that they indeed form excellent marker horizons aiding and guiding the systematic geologist in his task of establishing the flow stratigraphy and thereby to locate the sources of the flows and sets of flows from different sources (Inamdar and Kumar, 1994). Flow contacts in Deccan basalts are always marked by prominent red to chocolate brown, earthy brown, green, purple, grey beds which are an admixture of clay, silt and sand sized grains forming what is popularly known as bole beds. These vary in thickness from less than 0.5 m to 2 m though sections of 3 m and above are not uncommon. Pascoe (1973) summarized the bole beds as partly due to deposition from water with plant and vegetable matter and also as relics of intertrappean lateritisation, the red colour in the latter case having been assumed much before the superjacent lava covered it. Green earth has been described by Fermor and Fox (1916) and Fermor (1927) as partly inter trappean. Deshpande (1964) rejected the idea of baking as irregular veins, lenses, stringers of bole in the interior of the flow are as common as boles enclosing residual grains, pebbles and even boulders of trap rock. Agashe and Gupta (1968) also applied the term intertrappean but believe that boles were formed due to normal weathering of purple varieties of basalt and baking is not essential. It may be attributed that the enrichment of iron oxides from basalt to bole as a factor for its origin. The present paper is about the study of chemical alteration of basaltic rocks of Deccan volcanics of Central India vis a vis an attempt has been made to understand the chemical behaviour in bole beds. The study area is located around Mahad-Mahabaleshwar region in and around Pune in western India (Fig. 1). The basaltic stratigraphy of the area was comprised of 47 horizontal flows, interspersed with red bole beds at places (Sukheswala and Poldervaart, 1958; Beane et al.,1986). Selected nine outcrops around the Pune is used for present study is shown in Fig. 1. In Fig. 2, the nature and position of bole beds in relationship with the basaltic beds and exposures of the bole outcrops are illustrated. The bole beds are located at: Katraj, Chandani Chowk (Kothrud), Pisoli, Bapdev Ghat, Saswad and Dive Ghat around Pune. In present paper two profiles are discussed for various geochemical purposes.

92 Chemical weathering of Deccan Bole beds around Pune- Mahabaleshwar of Western India: implications on their origin and climatic reconstruction
Figure 1: Location map of the study area after Ghosh et al., 2006.
Figure 2: An intrabasaltic red bole horizon showing weathered overlying and underlying basalts
Methodology:
The collected samples from the profiles were crushed into a fine powder (-200 mesh size) and were analysed for their major elements, trace and rare-earth elements at the National Geophysical Research Institute, Hyderabad (India). The major elemental compositions were determined using the Philips Magi X PRO Model PW 2440 XRF coupled with a single goniometer based measuring channel. The trace elements and REE concentration in the sample were measured using ICP-MS (Perkin-Elmer Sciex ELAN DRC II), and the results were compared with an in house rock standard and a JB-2 basalt standard. A few selected samples (H2, H (R) and H (G)) were analysed using a SIEMENS SRS 3000 sequential X-ray spectrophotometer with an end-

R. Islam and M. R. G. Sayeed 93
window Rh X-ray tube at the Wadia Institute of Himalayan Geology, Dehradun (India). The standards used for the analysis were BR, BE-N, BHVO-1, AGV-1, PCC-1, JN1-a, JP-a, JP-1, JA-2 and MB-H (WIHG). Matrix correction procedures provided by Lucas-Tooth and Pyne (1964) were followed for final calculation.
General Geochemical characteristics:
Major elements:
The TiO2 content ranges from 1.17 (Green bole) to 3.97% (underlying Basalt), Al2O3 varies from 8.36 (Green bole) to 16.96% (Overlying Basalt), total Fe2O3 varies between 8.05 (Overlying Basalt) to 20.1% (Red bole), SiO2 varies between 46.13 (Green bole) to 64.29% (Green bole), MgO ranges from 3.91 (Red bole) to 7.22 (Overlying Basalt), CaO varies from 1.79 (Green bole) to 11.33 (Overlying Basalt), Na2O varying between 0.00 (Red bole) to 2.29 (Overlying Basalt), K2O ranges from 0.14 (Red bole) to 3.88 (Overlying Basalt), MnO is between 0.04 (Green bole) to 0.21 (underlying Basalt), P2O5 varies between 0.02 (Red bole and Green bole) to 0.27 (Overlying Basalt). The CaO abundances in the boles were low relative to the basalt, indicates Ca removal during basalt weathering (Fig. 3(B)). The higher Fe2O3 content over lower concentrations of alkali elements differentiates as boles from that of basalts and hence provides evidence for the presence of oxidizing environment during the weathering process. The lower concentrations of K2O, Na2O, CaO, MnO indicates that these elements have mobilised during the weathering processes. The high concentration of SiO2 in the green bole samples relative to the red boles are observed whereas the concentration of Fe2O3 in the red boles is relatively higher as compared to the green boles (Fig. 3(D)). The relative enrichment of the refractory elements such as Ti and Al, was absent in case of the bole samples, probably due to addition of ash, remnants of which are not preserved or may be possible mobility of Ti and Al during the weathering process.

94 Chemical weathering of Deccan Bole beds around Pune- Mahabaleshwar of Western India: implications on their origin and climatic reconstruction
Trace elements:
The trace element Zr increases its concentrations with the lowering of WI values or with the increase of weathering. The Cu is most similar to that of Zr with significant enrichment observed in the red boles compared to basalts. However, the behaviour of Zr, Nb and Y in green boles are different and show apparent loss of these elements. The concentration of Th is higher in the green boles compared to the basaltic parents. Sr behaved in a similar manner as Ca. A significant drop in Sr concentration was observed in boles compared to basalt. This might suggest an interaction of meteoric water during the genesis of bole, where net removal of Ca and Sr from basalt is proportional. Both Rb and K2O concentrations in the bole beds and adjacent basalt exhibit simultaneous enrichment (relatively small) which can be related to potassium metasomatism (Rye and Holland, 2000). Less/no significant depletion of K2O observed in the basalt samples near the contact between the boles with basalts, (the likely source of K and Rb is may be from wind-borne dust particles or during pedogenic activities).
Rare Earth Elements:
The chondrite normalized REE abundance among the two different kinds of bole markers and possible precursor (basalt or ash fall deposits) are shown in a binary plot (Fig. 4). The REE pattern observed in the case of the red boles are similar to the adjoining basalt whereas the green bole samples closely match up with the ash fall deposits from Barren Island (Capaccioni et al. 2004).
Figure4: Chondrite normalized REE distribution in Sai red boles and the average Deccan Basalt
Discussion:
A large similarity in the major element compositions of red boles collected from the different locations suggests a similar degree of weathering of the basalts. Bole beds contain incipient soil due to probability of formation soon after the eruption event. Considering red boles as weathered components of the underlying basalt, quantitative approach to estimate an extent of the weathering processes is used (Morey and Setterholm, 1997; Hill et al., 2000). The weathering index (WI) parameter suggested by Parker (1970) and recently by Patino et al. (2003) are used in view of the fact that it is more sensitive to chemical variations in the early stages of alteration. It also utilizes the molecular proportion of alkali and alkaline-earth elements, which are significantly different for basalt and bole samples. The formula of weathering index (WI) is: WI=(2XNa2O/0.350)+(MgO/09)(2XK2O/025)+(CaOX0.7)X100, WI decreases with an increase in weathering intensity; WI of the overlying basalts are higher than the boles whereas the underlying basalts are relatively more weathered as indicated by WI values. The green bole beds are slightly higher in the trend. The

R. Islam and M. R. G. Sayeed 95
combined mobile alkali and alkali earth elements (CaO+Na2O+K2O), their relationship with WI infers an extensive leaching of Ca, Na and K in the boles as compared to basalts. In contrast, concentrations of Al and Ti show little effect during weathering. FeO dissolved during weathering of basalt was oxidized and immediately converted to Fe2O3, and remains in-situ in the boles. The indication that the bole bed was derived from basalt can be observed in relationship between WI and oxides of ferro-magnesium elements. Fe2O3(T)+FeO(T)+MgO concentrations in the bole beds were higher than the under and overlying basalts. A lower abundance of Al2O3 was observed in the bole samples compared to the basalt, indicating a mobile behaviour of Al during the process of the weathering of basalt. The green bole beds are distinctly different with higher WI and low TiO2 contents compared to the red bole bed samples. The disagreement of the chemical composition between samples of the green and red bole material suggests different primary rock, similar to the basalt but with a low Ti content. The boles are also characterized by a high H2O content as compared to the basalt. Thus, various geochemical measures, such as WI, indicate that both the red and green bole beds are the weathered residue, with a relative enrichment of H2O and Fe2O3. The red bole bed samples are relatively more weathered than the green boles but formed by a similar process. We attribute lesser intensity of weathering of the green boles to its fine-grained character. This ALSO suggests that in oxidising environment samples get easily altered as compared to reducing settings. The fine-grained character, low TiO2 and high SiO2 allows the green bole to be classified as weathered ash tuff.In terms of immobile trace elements (e.g. Zr) suggests retention of Zr with progressive weathering of the parent material (basalt). A similar behaviour is established for Nb and Y, where a majority of the red boles revealed a high concentration of Y. However, the behaviour of Zr, Nb and Y in green boles are different and show apparent loss of these elements. The significant drop in Ca and Sr suggest an interaction of meteoric water during the genesis of bole, where net removal of Ca and Sr from basalt is proportional.REE distributions in red and green bole beds therefore suggest an involvement of a slightly different precursor material for their genesis. Green bole beds probably represent remnants of mixtures of basalt and ash deposition during the Deccan volcanic eruption, whereas red bole beds are a primary derivative of weathered basalts (modified due to the interaction with meteoric water) and resemble the signature of host basalts.Process of lateritization: The basalt and bole beds are more susceptible for immediate exposure to the climate and infilteraion causing causative mobilization of elements and forming weak zones. Continuous infilteration may cause higher chemical alteration and hence pace for easy formation of soils. The overall study implicates that the basalt like rocks are very susceptible for chemical alteration and usually, basalt decomposition is faster (11 times more) than other rock types such as granites under laboratory conditions (Vyshnavi et al., 2015). The bole beds are the weathering product of their respective underlying basalt (Ghosh et al., 2006; Roy et al., 2001; Wilkins et al., 1994). Although all three bole beds exhibit similar elemental compositions (Ghosh et al., 2006), they have very different mineralogy.It can be also observed in A-CN-K triangular diagram (Fig. 5A). A ternary plot of SiO2-Al2O3-Fe2O3 is plotted to understand the process of lateritization in bole beds (Fig. 5B). While the yellow and green samples have been grouped together in the red bole beds due to their common Fe2+ content compared to higher Fe3+. Along with their stratigraphic positions relative to each other, this suggests a possible transformation of the basalt into the celadonite/nontronite green bole beds most likely via deuteric alteration and/or low-temperature hydrothermalism (Wise and Eugster, 1964; Scheidegger and Stakes, 1977; Seyfried et al., 1978), then further weathering of the green bole beds into the montmorillonite/hematite red bole beds.

96 Chemical weathering of Deccan Bole beds around Pune- Mahabaleshwar of Western India: implications on their origin and climatic reconstruction
Figure 5: A-CN-K and SiO2–Al2O3–Fe2O3 triangular plot indicating extent of lateritization (after Schellmann, 1986).
Conclusions:
Basalt alters to laterite and is very much susceptible to weathering due to chemical action. This present paper demonstrates that the overall alteration of basalt to bole bed is due to chemical weathering processes. This kind of alteration holds good in lateritic terrain which are more prone to landslips. This paper also adds the important parameter that the lithology and successive soil formation and infiltration lead to the day to day land slips. Further, the study may incorporate the possible identification of weak zones due to infiltration and seepage causing landslips in western India sector. Lithology holds prime responsibility of fast alteration and subsequent landslips.Acknowledgement: We thank organisers for giving us an opportunity to demonstrate our finding of western India in the workshop.
References:Agashe L V and Gupte R B 1968 Some significant features of Deccan Traps; Geol. Soc. India Memoir 2 309–311.Beane, J.E., Turner, C.A., Hooper, P.R., Subbarao, K.V., Walsh, J.M., 1986. Stratigraphy, composition and form of the Deccan basalts,
western Ghats, India. Bull. Volcanol. 48, 61–83.Capaccioni, B., Chandrasekhram, D., Vaselli, O., Manetti, P., Alam, M.A., Tassi, F., Santo, A.P., 2004. Barren Island (Andaman Sea,
Indian Ocean); Volcanological Features of the only Indian Active Volcano, 32nd IGC, Florence, Italy.Deshpande, M. G., (1964). Red boles in Deccan Traps. Journ. University of Po on a, Pune No.26. pp.21-23.Fermor L L 1927 On the basaltic lava flows penetrated by deep boring for coal at Bhusawal, Bombay Presidency; Rec. Geol. Surv. India
58 95–240.Fermor and Fox (1916).Ghosh Prosenjit, Sayyed M R G, Islam R and Hundekari S M 2006 Inter-basaltic clay (bole bed) horizons from Deccantraps of
India: Implications for palaeo-weathering and palaeo-climate during Deccan volcanism; Palaeogeogr. Palaeoclimatol. Paleoecol. 242 90–109.
Hill, I.G., Worden, R.H., Meighan, I.G., 2000. Yttrium: the immobility–mobility transition during basaltic weathering. Geology 28, 923–926.
Inamdar P M and Darshan Kumar 1994 On the origin of bole beds in Deccan Traps; J. Geol. Soc. India 44 331–334.Lucas-Tooth, Pyne, 1964. Adv. X-ray Anal. 7, 523.Michalski, J., Noe Dobrea, E., 2007. Evidence for a sedimentary origin of phyllosilicate minerals in the Mawrth Vallis region, Mars.
Geology 35, 951–954.Morey, G.B., Setterholm, D.R., 1997. Rare earth elements in weathering profiles and sediments of Minnesota: implications for
provenances studies. J. Sediment. Res. 67 (1), 105–115.Parker, A., 1970. An index of weathering for silicate rocks. Geol. Mag. 107, 501–504.Pascoe (1973) Pascoe E H 1973 A manual of geology of India and Burma, V.3, Govt. of India Publication, 1361p.

R. Islam and M. R. G. Sayeed 97
Patino, L.C., Velbel, M.A., Price, J.R., Wade, J.A., 2003. Trace element mobility during spheroidal weathering of basalts and andesites in Hawaii and Guetamala. Chem. Geol. 202, 343–364.
Peretyazhko, T.S., Sutter, B., Morris, R.V., Agresti, D.G., Le, L., Ming, D.W., 2016. Fe/Mg smectite formation under acidic conditions on early Mars. Geochim. Cosmochim. Acta 173, 37–49.
Roy, A., Chatterjee, A.K., Pal, D.K., Srivastava, P., 2001. Geology, chemistry and mineralogy of some bole beds of the eastern Deccan volcanic province. Geol. Surv. Ind. Spl. Pub. 64, 543–551.
Rye, R., Holland, H.D., 2000. Geology and geochemistry of palaeosols developed on the Hekpoort basalt, Pretoria group, South Africa. Am. J. Sci. 300, 85–141.
Scheidegger, K., Stakes, D., 1977. Mineralogy, chemistry and crystallization sequence of clay minerals in altered tholeiitic basalts from the Peru Trench. Earth Planet. Sci. Lett. 36, 413–422.
Schellmann W 1986 A new definition of Laterite; In: Lateritization Processes (ed.) Banerji P K, Geol. Surv. India Memoir 120 I1–I7.Seyfried, W., Jr., Shanks, I.I.I., W., Dibble, Jr, W., 1978. Clay formation in DSDP Leg 34 basalt. Earth Planet. Sci. Lett. 41, 265–276.Sukheswala, R.N., Poldervaart, A., 1958. Deccan basalts of the Bombay area, India. Geol. Soc. Amer. Bull. 69, 1475–1494.S. Vyshnavi, R. Islam, and Y. P. Sundriyal. Comparative study of soil profiles developed on metavolcanic (basaltic) rocks in two different
watersheds of Garhwal Himalaya Current Science, 108(4), 25.Wilkins, A., Subbarao, K.V., Walsh, G., 1994. Weathering regimes in Deccan basalts. In: Subbarao, K.V. (Ed.), Volcanism. Wiley
Eastern Ltd, New Delhi, pp. 217–232.Wise, W.S., Eugster, H.P., 1964. Celadonite: synthesis, thermal stability and occurrence. Am. Mineral. 49, 1031–1083.

Abstract
Despite being situated in the tropics and characterized by heavy rainfall, the Western Ghat regions of South India experience rain intensities that are only moderate. The region is underlain by very old Igneous rocks. Due this rare combination, the Western Ghats are host to a very thick soil mantle, going up to over 50 m on forested slopes. As a result of this unique combination of characteristics, the runoff processes in the region are different from the commonly known Overland flow and base flow. Rather, the flow from Saturated areas in the valleys and Subsurface flows dominate the streamflow in the region. A very unique feature of the subsurface flow in the very heavy rainfall areas of the region is the flow through pipes. Pipes are conduits formed in the soil mantle, as a result of continuous flow of water in the preferential paths, initiated due to decaying of roots and burrowing of animals. Pipes of size varying from a few mm to over a Metre have been have been observed in the region of Kodagu in Karnataka. This paper gives details concerning the formation and network of pipes and presents response of the pipeflow to rainfall and discusses their influence on the Hydrology of the region. Research needs concerning pipeflow are also highlighted.
Mysooru R. Yadupathi Putty Professor, Dept. of Civil Engineering, National Institute of Engineering, Mysuru, Karnataka
About Soil Piping and Pipeflow in Western Ghats