
Proceedings of the third Radiation Physics Conference. Vol. 1
333
f\J \ ^ - 'ti O OOS EG9700069 Proceedings 4- Third Radiation Physics Conference Organized by Atomic Coorgy Aothorlty - National Network of Hadlatioo Physics led __________________ AHflnla Onlverslty, Egypt______ 2>*UJJ ^tij| —tJ| Speosorod by Arab Atomic Energy Agency, Tools Noclosr Eesearch Center, Lybla National Inetltote of Standards, Egypt. To be held at Faculty of Sdenco, A14Hala University AHDnla • Egypt W%L 2 8 fa & ' 13 • IT Wot. 198*_________ coNnaENce bonorahv cbjubmjln Prof. Bleb am Fooad Aly Prof. Samel Abe AJ-Makarim Bisk Preeldent, Atomic Energy Authority President, Al-Mlnie Univereity POOR QUALITY I ORIGINAL |
-
Upload
khangminh22 -
Category
Documents
-
view
1 -
download
0
Transcript of Proceedings of the third Radiation Physics Conference. Vol. 1
f\J \ ^ - 'ti O OOS
EG9700069
Proceedings 4-Third Radiation Physics Conference
Organized by
Atomic Coorgy Aothorlty - National Network of Hadlatioo Physicsled
__________________ AHflnla Onlverslty, Egypt______
2>*UJJ ^tij| —tJ|
Speosorod byArab Atomic Energy Agency, Tools
Noclosr Eesearch Center, Lybla National Inetltote of Standards, Egypt.
To be held atFaculty of Sdenco, A14Hala University
AHDnla • Egypt
W%L 2 8 fa & ' 13 • IT Wot. 198*_________
coNnaENce bonorahv cbjubmjlnProf. Bleb am Fooad Aly Prof. Samel Abe AJ-Makarim Bisk
Preeldent, Atomic Energy Authority President, Al-Mlnie Univereity
POOR QUALITY I ORIGINAL |

HN*P
t&yy\.
Proceedings -r-Third Badlatlon Physics Confmoei
Orgulad by
JUomlc biiyy Aethority • Watlocal Betwoik el Isdlotloe PhysicsAid
________________AI4Palo Oalssrslty. Egypt_______________
2^*11 Utttll2+«yJIU«*It VuU* t» £*•
•peeeeredhyAfsb Alemle tsergy Ageecy, Teele
Nodes* leeeaich Ceeter, LyWe Metleesl IesUtete cl Blaadaids, Irot
Te he held sifacelty el Seleses, AMOele Oelseislty
AHOala-Egypt
11:11 HW* Ittl
CONmOICK E0N01A1T CNAIMAM Prof. Elsham Peead Aly Pro#, damsl Abe AHIakaxim BiskPmldont, Atom' .orgy Authority Pnotdont, AJ-Wnl* Unlvonity

COMFEBOICE HONOBABY BQkBDProf. Semite M. MotelWc# • Preaident, Atomic Energy AuthorityPro!. Mahmeed Foaad Baraka!Dirac. Gen. Arab Atomic Energy Agency
Pro!. Maher Moaetafa KamelVice Preaident, At-MInla Univeraity
Prof. Mohammad M. B- BeamyDirector, Nuclear Reaearch Center
Prof. Mohammad Abdel Halim O-FIklChairman, National Inatltute of Standarde.
CQHrtBCTCI CBAIBMCT
Prof. Mohammad A. Gomaa Prof Fonad T. Abdel- HaleemAtomic Energy Auiborily Dean Faculty of Science101 Kasr El-Elnl St, Al-Minia UniversityCairo, Egypt Al-Minia. Egypt
OBBAMIIIMB CDMBTWB
AWmk .linm-ftilhtdttProf. Amin Zaki El-Behay Prof. Caber M. Hasslb Prof. Anas M. El-Naggar
ftHUnh BnlrfnttiProf. Abe El-Pottoeh LMoorad Prof. Abdel Rahmae A. Ahmad Prof. Kama! A. Mohammad
uacAh wwmhhot WHMrmai
Kamal Abdel-Hady Mohammad I Tharwat Glrgis Abdel-MalalcMemdouh A. Abdel- Rahman | AM Mohammad All El-Sayed________________________ Amr Mohammad Abn EHfnsseln_____________
jflmrmciaiMMnTg
Prof. Mohammad A. GomaaProf. Amin Z. El-Behay Prof. Gaber M. Hasslb Prof. Anas M. El-Naggar
Prof. Fonad T. Abdel Halim Prof Abo El- Fotonh E. MonradProf. Abdel- Rahman A. Ahmad Prof Kamal A. Mohammad
Aril Mm*1? Pf—ft aa,BCTOr. Saleh El-Mashry
Modoor BooiHB ClBW iilMlOr. Yehla S. Khrlblsh
Bnilooel loetttoto of SteedetdoProf Mohammad A. El-Flkl
Bedooel Network of BidlillOH PtlTllCTProf Samira M. Rable Prof Amr M. L Kanl
*
)

Third Radiation Physica Conf* Al-Minia, 13-17 Nov., 1996
Chairman Co- Chairman
GL1
GL2
Chairman Co- Chairman
GL3
GENERAL LECTURESI Dale 13/11/96
Time 11:30 -13; 30 Hall-A
Prof. Hiaham F. Aly Prof. Anas El Naggar
FOUR DECADES OF ATOMIC ENERGY R&D ACrTVITIES IN EGYPT
Prof. Hiaham F. Aly
CHERNOBYL ACCIDENT, THE AFTERMATH Prof. Anas M. El- Naggar
Time 173ftHall--A
Prof. Mahmoud F. Barakal Prof. Ahmad A. El-Kady
MONITORING AND VERIFICATION IN RELATION TO RECENT NON-PROLIFERATION AND
DISARMANENT MEASURES
Prof. F. H. Hammad

Third Radiation Phytic* Conf* Al-Minia, 13-17 Nov., 1996Proc
SCIENTIFIC SESSION (1) Hall (P)
Dale: 13/11/96
Time: 15:30.-17:30
ChairmaniCo-Chairman
Prof. Kamal A. Mohammad Prof. Amin Z. El-Behay
IONIZ. AND NON- IONIZ. RADIATION SOURCES
1.1. EFFECT OF IONIZING AND NONIONIZING RADIATION ON MECHANICAL PROPERTIES OF CELLULOSE
TRIACETATE POLYMER
M. M. Sail am, H.M. Eisea*, S. A. El- Fiki, and S. A. Nooh
1.2. MULTIPLY CHARGED IONS PRODUCED IN 3D ATOMS AND THEIR IONS AS RESULT OF INNER-SHELL
VACANCY CREATION
A. El-Shemi
1.3. SELECTION OF IRRADIATOR FOR POTATO PRESERVATION
Abdul Raheem A. Kinaara, Abdul Ghani Melaibari, Waleed H. Abulfara), Abdel Megjd Mamoon, and Sal ah El-Din M Kamal
1.4. SELF IONIZATION PROBABILITIES IN ATOMS AND IONS AS RESULTOF INNER - SHELL IONIZATION
A. El-Shemi
1.5. ECONOMIC FEASIBILITY STUDY OF POTATO PRESERVATION BY IRRADIATION IN SAUDI ARABIA
Abdul Raheem A. Kinsara, Waleed H. Abulfaraj, Abdel Megid Mamoon,and Salah El-Din M. Kamal

I
Proc Third Radiation Phytic* Conf* Ai-Minia, 13-17 Nov., 1996
SCIENTIFIC SESSION (2) HalLC
Pale; 13/11/96
Time 15 JO - 17i3Q
Chairman . Prof. Anas M. El Naggar Co-Chairman Prof. Eugenia I. Stepanova
BIOLOGICAL EFFECTS
2.1. CHILDREN EXPOSED IN UTERO AFTER CHERNOBYL NUCLEAR ACCIDENT HEALTH SURVEY RESULTS STATUS SUMMARISATION TEN YEARS
Eugenia I. Stepanova, Valentina G. Kondraahova, Tatyana Y. GalychanskayaVitaly U. Vdovenko
2JZ. CYTOGENETIC INVESTIGATION OF INDIVIDUALS LIVING IN AREAS OF UKRAINE CONTAMINATED BY CHERNOBYL REACTOR ACCIDENT FALLOUT
Alexandra Yu. Bondar, Vital! P Zamostian
23. NON- LINEAR BEHAVIOUR OF POWER DENSITYAND EXPOSURE TIME OF ARGON LASER ON
THE RETINAL FUNCTION
E. M. El- Sayed, MS. Talaat, and E.F. Salem.
2.4. UPTAKE AND RELEASE OF 134Cs AND 137 Ce AND ITS RELATION TO WK CONCENTRATION IN RATS.
M. W.A. Esea, H. H. M. Hussein A.T. Abdel Fatlah, and W.M. Abd El Baky
5
PrOC Third Radiation Phytica Confv Al-Minia, 13-17 Nov„ 1996
SCIENTIFIC— SESSION (3) Hall B
Dale 14/11/ 96 ]
Time 1130-1330
Chairman Prof. Mohammad lemail El-Gohary ^Co-Chairman Prof. Mohammad Kh. Fayek
| RADIATION EFFECTS
3.1 THERMAL DECOMPOSITION OF IRRADIATEDCASEIN MOLECULES
Maha A. AIL and Anwar A. Elsayed
3.2 TEMPERATURE DEPENDENCE OF FREE VOLUME IN MODIFIEDPOLYVINYL CHLORIDE STUDIED BY POSITRON LIFETIME
SPECTROSCOPY
I. Y. AL- Qaradawi *, A. M. A. B-Sayed**, and R R Abdel- Hady*
3.3 STUDY OF RECOVERY IN PLASTICALLY DEFORMED Al-Li-BASBD ALLOY BY POSITRON ANNIHILATION
M. A. Abdel- Rahman
Physics Dept, Faculty of Science, Ht-Mlnla University, Al-Mlnla - Egypt
3.4 ESTIMATION OF DISLOCATION CONCENTRATION INPLASTICALLY DEFORMED SILVER BY POSITRON ANNIHILATION
M. A. Abdel-Rahman, E. A. BadawL and S. K. Abdel-Raheem
3.5 DEPENDENCE OF TRAPPING (CROSS - SECTION EFFICIENCY) AND MEAN LIFETIME ON THE BURGER'S VECTOR IN METALS
Emad Badawai

Thifd Radiation Phytic% Conf* Al-Minia, 13 - 17 Nov., 1996
KEYNOTE LECTURES (D Hall A
Date: 14/11/96 Time: 9:00 - 11:00
> Chairman Co-Chairman
Prof. Fawzy H. Hammad Prof. Abd El-Rahman A. Ahmad
KL 1 MATERIAL RESEARCH PROGRAMME USING NUCLEAR RADIATION AT THE INSTITUTE
OF ATOMIC ENERGY, POLAND
J. J. Mttczarek
K.L 2 LATTICE DEFORMATION STUDIES IN HIGH ENERGY IONS IMPLANTED SILICON BY MEANS OF
VARIOUS X-RAY METHODS
K. Wleteska , W. Wierzchowskl , and W. Graeff
K.L 3 ENERGY SITUATION AND NUCLEAR POWER
R. M. Megahid

Third Radiation Phytic* Conf* Al-Minia, 13-17 Nov* 1996
3.6 GAMMA-IRRADIATION EFFECT OF THE EPR SPECTRA OFStMoO^Mo5*
Mahmoud A. Hefni, and R. M. Mahfouz
3.7 THE EFFECT OF GAMMA-RAYS ON THE OPTICAL PROPERTIES OFZINC PHOSPHATE GLASSES DOPED WITH EUROPIUM OXIDE.
A. S. El- Joundi, and A. A. Higazy
I
Proc Third Radiation Phytic* Confr Al-Minia, 13-17 Nov., 1996
SCIENTIFIC__ SESSION (4) Hall C
Dale: 14/11/ 96
Time:. 1130 -1330
Chairman Prof. Anwar A. El-Sayed Co-Chairman Prof. Sarwat G. Abdel - Malak
APPLIED RADIATION PHYSICS
4.1 ELEMENTAL ANALYSIS OF BRAZING ALLOY SAMPLES BY NEUTRON ACTIVATION TECHNIQUE
E. A. Eissa , N.B. Rofail, A. El-Shershaby , N. Walley El- Dineand A. M. Haaean
4.2 DETERMINATION OF MOISTURE CONTENT ANDNATURAL RADIOACTIVITY IN SOILS
USING GAMMA SPECTROSCOPY
E. E. Abdel-Hady , A. M.A. El- Sayed , and H. B. Alaa
4.3 TRACE ELEMENT CONCENTRATION VALUES INSOME DOMESTIC ALUMINIUM SAMPLES
A. S. Abdel-Haleem , N. Abdel-Basset , M. Abdel-Wahab,and A.M. Hassan
4.4 MATERIALS TESTING BY COMPUTERIZED TOMOGRAPHY WITH NEUTRONS AND GAMMA-RAYS
A. M. El- Ghobaiy, F. A. Bakkoush and R. M. Megahid
4.5 MQSSBAUER INVESTIGATION OF ETHMID (STIMMI)
Y. S. Mrayed, M. S. Ellid, and F. A. Fallagh
4.6 BACKGROUND LEVELS OF SOME TRACE ELEMENTS IN EGYPTIAN SOILS DETERMINED BY NEUTRON ACTIVATION
ANALYSIS
M. F. Abdel-Sabour , A. S. Abdel- Haleem E.E. Zohny , A. Sroor, and R. Zaghloul
Third Radiation Physica Conf* Al-Minia, 13-17 Nov* 1996
SCIENTIFIC SESSION (5) HalLB
Pate 14/11/96
Time; 153Q-.17;30
Chairman Prof. Mohammad El-Garhi Co-Chairman Prof. Alef Allan
P RADON MEASUREMENTS |
Keynote Lecture
MEASUREMENTS OF RADON IN WATER AND GROSS GAMMA RADIOACTIVITY AT SITES OF TOURISTIC INTEREST IN EGYPT
B. Sanson! , A. Allan
Contributed Papers
5.1 APPLICATION OF SOLID STATE NUCLEAR TRACK DETECTORS IN MEASUREMENT OF NATURAL ALPHA- RADIOACTIVITY
IN ENVIRONMENT
A. F. Maged, A. Z. El Behay, and E. Borham
5.2 A STUDY ON THORON DECAY PRODUCTS IN AIR
A. A. Ahmed, A. Abul- Hussein, and M. Mahmoud
5.3 THE EVALUATION OF RADON CONCENTRATIONAND WORKING LEVELS USING SSNTD IN THE U-EXPLORATION
GALLERIES IN THE EASTERN DESERT, EGYPT
A.I. Abdel-Hafez , A.A. Abdel-Monem , H.M. Eissa, S.A., El-Fikl, Y.A. Abdel-Razek, and Anas M. El-Naggar
5.4 CELLULAR DOSIMETRY FOR RADON PROGENY ALPHA PARTICLESIN BRONCHIAL TISSUE
A. A. Ahmad, M.A. Abdel-Rahman, A. Mohammad
I
Third Radiation Physic* Confy Al-Minia, 13-17 Nov., 1996
SCIENTIFIC SESSION (6) Hall C
Date: 14/11/ 96
Time; 15d0 - 17flQ
^ Chairman Prof. Abdel Hady El-Kamel Co-Chairman Prof. Riad Megahid
6.1
SHIELDING
CALCULATION OF A CONCRETE SHIELD FOR AN ILU-8 D ELECTRON ACCELERATOR
Adel Helal , and Mahmoud Imam
6.2 INHOMGENEITY OF NEUTRON AND GAMMA-RAY ATTENUATION IN BIOLOGICAL SHIELDS
F. A. El- Bakkoush, A.M. El-Ghobary, and R. M. Megahid
6.3 SHIELDING ASSESSMENT OF THE ET-RR-1REACTOR UNDER POWER UPGRADING.
Ensherah E. Ahmad
6.4 A CONCEPTUAL GAMMA SHIELD DESIGN USINGTHE DRP MODEL COMPUTATION
Ensherah E. Ahmad , and F A. Rahman
6.5 ESTIMATION OF RADIOACTIVITY INSTRUCTURAL MATERIALS OF ET-RR-1 REACTOR
Mahmoud Imam
6.6. UTILIZATION OF IRRADIATION FACILITIES AT TNRCFOR SHIELDING RESEARCHES
AND RELATED TOPICS
T. S. Akki

Third Radiation Phytics Conf* Al-Minia, IS -17 Nov., 1996
6.7 HOW GAMMA RAYS GO ROUNDEFFICIENT SHIELDS
J. Ghassoun, A. Sabir, A. KhanouchL M. Boulkheir, R. Ichaoui.and A. Jehouani
6.8 _ THE VACUUM GEOMETRY EFFECT ON NEUTRONTRANSMISSION
A Khanoucht A. Sabir, J. Ghassoun, and A. Jehouani
6.9 SPATIAL RESOLUTION OF NEUTRONTRANSMISSION
A. KhanouchL A. Sabir, J. Ghassoun, and A. Jehouan)
6.10 EFFECT OF VACUUM CHANNEL OPENINGIN SHIELDS
A. KhanouchL A. Sabir, J. Ghassoun, and A. Jehouani
Third Radiation Phytic* ConfAl-Minia, 13-17 Nov., 1996
KEYNOTE LECTURES (2)
Date: 16/11/ 96
Time: &00 -U;00
Chairman Prof. Mohammad N. Comsan Co-Chairman Prof. E. A. Krasavin
K.L. 4- STATUS REPORT OF INSHAS CYCLOTRON
M. N. H. Comsan
K.L 5- HIGH ENERGY PARTICLE ACCELERATORSAS RADIATION SOURCES
Mohamed E. Abdelaziz
K.L 6- ACCELERATORS OF THE JINR ANDRADIOBIOLOGICAL RESEARCH
E. A. Krasavin
K.L.7- DESIGN PRINCIPLES AND CLINICAL POSSIBILITIES WITH A NEW GENERATION OF RADIATION
THERAPY EQUIPMENT
Hall A
t
B.P Rudin
Third Radiation Physics Confr Al-Minia, 13-17 Nov* 1996
GENERAL LECTURESGLl FOUR DECADES OF ATOMIC ENERGY R&D
ACTIVITIES IN EGYPT
Prof. Hiaham F. Aly
Chairman, Atomic Energy Authority, Egypt
ABSTRACT
The research and development activities of the Atomic Energy Authorityin Egypt are reviewed in a comprehensive manner.The main features of the R & D actvities of the various disciplines of Nuclear sciences and their peaceful applications are highlighted. Aspects of Nuclear Technology development are also indicated.
CHERNOBYL ACCIDENT, THE AFTERMATHGL2
Anas M. El- Naggar
Atomic Energy Authority, Cairo, Egypt
ABSTRACT
On April 26,1986, Unit 4 of the Chernobyl power complex in the Ukraine Republic of the former USSR suffered a major accident which resulted in the release of substantial amounts of radioactive material to the atomosphere. This resulted in very serious radiological, health, and socioeconomic consequences on the former Soviet Union Republics of Belarus, the Russian Federation, and Ukraine. About 50000 Km2 of agricultural land, and 100000 Km2 of forests were put out of use. The impact of the accident was severe, and there remains potentials of risk. The impact outside Europe is very low. However, the accident enhanced global public apprehension on the risks associated with nuclear energy. In this treatise, a synthetic consensus overview of the accident, the countermeasures, the impacts and future perspectives are discussed.

PrOC Third Radiation Phytic* Con/v Al-Minia, 13-17 Nov., 1996
GL3 MONITORING AND VERIFICATION IN RELATION TO RECENT NON-PROLIFERATION
AND DISARMANENT MEASURES
Prof. F. H. Hammad
Atomic Energy Authority, Egypt
ABSTRACT
Significant development have taken place in safeguards and disarmament since the end of the cold war. These include the IAEA 93+2 programme to strengthen Safeguards, the chemical weapons conventions, the establishment of more nuclear weapon free zones, and the comprehensive test ban treaty. Monitoring and verification are the corner stone of non-proliferation, or counter proliferation and disarmament measures. This paper reviews these important developments and their international and regional implications. The scientific community in Egypt should perceive these issues and establish a forum for discussion of these important problems.
15

Third Radiation Phytic* Confv Al-Minia, 13-17 Nov., 1996
SCIENTIFIC SESSION (11
IONIZ. AND NON- IONIZ. RADIATION SOURCES
EFFECT OF IONIZING AND NONIONIZING RADIATION ON MECHANICAL PROPERTIES OF CELLULOSE
TRIACETATE POLYMER
M. M. Sail am, H.M. Eisaa*, S. A. El- Fild, and S. A. Nooh
Fhytlci Department, Faculty of Science, Ain Shams Univ. •Natioiud Institute for Standards
ABSTRACT
Several quantities including modulus of elasticity, fracture stress, fracture strain, yield stress and yield strain, were calculated for cellulose triacetate polymer. These samples were exposed to different gamma doses in the range from (32Kgy), and different energies of infrared pulsated laser of 5 Watt power in the range (Zero to 9 J/cm2). The changes In these parameters were found to be due to changes in degree of crystalinity of polymers.
MULTIPLY CHARGED IONS PRODUCED IN 3D ATOMS AND THEIR IONS AS RESULT OF INNER-SHELL VACANCY CREATION
A. El-Shemi
Physics Department, Faculty of Science, Al- Minis University, Egypt
ABSTRACTThe ionization of inner-shell electron following photoionization and
charged particles impact ionization, leaves the atomic system in a very unstable electronic configuration which may decay either by a radiative (x - ray) or nonradiative (Auger electron) transitions. In addition to these two principal sources of ionization, secondary ionzation known as electron shake off process accompanies sudden change in the atomic potential which results from the
inner shell ionization.
When the secondary ionization takes place, the number of vacancies will increase. In radiative transition, the vacancy moves to an outer shell under
Third Radiation Physic* Con/* Al-Minia, 13-17 NovH 1996
emission of characteristic X-ray; while in Auger transition, an Auger electron is ejected and an additional vacancy Is created. This atomic transition may result in a new vacancy in the L-shell and higher shells in atoms and ions which can then be filled by further radiative and nonradiative transitions. This atomic reorganization may in turn be filled by further radiative and nonradiative processes until ail vacancies reach the outermost occupied shells and many photons and/or Auger electrons may be emitted. Therefore very high charge states are ultimately produced. The charge states in 3d atoms and their ions after K-shell ionization following photoionization are calculated using Monte Carlo simulation which depends on input data for radiative and nonradiative transitions and electron shake off probabilities in single ionized atoms and ions. This atomic data have been obtained under Dirac Fock Slater (DFS) wave functions.
SELECTION OF IRRADIATOR FOR POTATO PRESERVATION
Abdul Raheem A. Klnsara, Abdul Ghanl Melaibari, Waleed H. Abulfaraj, Abdel Megid Mamoon, and Salah El-Dln M. Kamal
Nuclear Engineering Department Faculty of Engineering,King Abdulazix University
P.O. Box 9027, Jeddah - 21413, Saudi Arabia
ABSTRACT
A formal decision methodology is a sound approach for assisting in decision making needed for the selection of irradiators for potato preservation. A formal analysis Is preferred over an informal intuitive analysis which has limitations. This will focus on substantial issues and provide the basis for a compromise between conflicting objectives. All critical issues in selection of irradiators for potato preservation can be addressed within the decision analysis framework. Of special significance is the treatment of the uncertainty associated with consequences of a decision and the preferences of the experts. A decision theory is employed in providing a strategy for implementation of the irradiator selection for food preservation for Saudi Arabia. To select a suitable decision methodology for the present case, a detailed survey of available decision methods was conducted. These methods have been developed and applied with varying degrees of success to many diverse areas of interest in several fields. Based on detailed surveys, the Analytic Hierarchy Process (AHP) was selected to evaluate the various irradiators for potato
PrOC Third Radiation Phytic* Confv Al-Minia, 13 - 17 Nov., 1996
It is found that the electron shake off probabilities for the electron in outer shells are larger than that in inner shells. Results are shown as function of atomic number for neutral atoms and of ionization degree for ions.
The change of the wave functions in ions which occur by the change in the effective charge after the ejection of several electrons from the atomic configuration are considered in the calculations. The electron shake off probabilities are decreased with increase of the atomic number and ionization.
ECONOMIC FEASIBILITY STUDY OF POTATO PRESERVATION BY IRRADIATION IN SAUDI ARABIA
Abdul Raheem A. Kinsara, Waleed H. Abulfaraj, Abdel Megid Mamoon,and Salah El-Din M. Kamal
* Nuclear Engineering Department Faculty of Engineering, King Abdulaziz UniversityJeddah, Saudi Arabia
ABSTRACT
Comprehensive studies were carried out to investigate the economic feasibility of the preservation of potato crop by Cobalt-60 gamma irradiation. Sprout inhibition by potato irradiation was approved by international organization and concerned authorities in many countries. The dose level range authorized for potato sprout inhibition extends from about 80-150 Gy depending on potato variety, time of irradiation after harvest, and post irradiation storage temperature. Sprout inhibition is most effective by irradiation after harvest, and after healing of any inflicted Injuries, that is when the potatoes are dormant. Irradiation at the recommended doses minimizes storage losses of potatoes that are refrigerated or stored on shelves.
Despite the limited data available, an attempt was made to quantify the monetary value of preserving potato by irradiation. With economy scale taken in consideration, potato preservation by irradiation is economically feasible
since at the local consumption rates there will be lot of potatoes that need storage for off season use.

Third Radiation Physics Cottf* Al-Minia, 13-17 Novv 1996
irradiation. These are electron accelerators, X-ray irradiators, and gamma irradiators. The purpose was to determine the optimal choice. The set of factors impacting Irradiator selection were developed and defined to provide comprehensive and realistic variables that judge the represented irradiator alternatives. The factors developed are economic considerations, technical considerations, safety aspects, and compatibility with local environment. The AHP computer program was developed to computerize the tedious complicated computations towards implementing the AHP systematic procedures to solve the present problem. The program was developed using FOXPRO. Based upon the available data, and employing the APH computer program, the results show superiority of 60Co gamma-ray irradiator over other irradiators for Saudi Arabia's present circumstances.
SELF IONIZATION PROBABILITIES IN ATOMS AND IONS AS RESULT OFINNER - SHELL IONIZATION
A. El-Shemi
Physics Department, Faculty of Science, Al- Mlnla University, Egypt
ABSTRACT
Through a sudden change of the atomic potential, atomic electrons in the same atom have a small probability that they are ionized to the continuum. Usually, this monopoly transition is marked as self ionization or electron shake off process. After the inner shell Ionization by ionization processes such as photoionization or charged particles impact, the central potential of the atom changes due to the ionization of an atomic electron during rearrangement of electron cloud. When the incident energy of the photon which produce the inner-shell vacancy is high, the sudden change approximation is valid.
The electron shake off probabilities in atoms and their ions with atomic number between Z ■ 10 to 36 have been claculated in sudden change approximation that result from inner-shell photo ionization. The calculations are made by using Dirac Fock Slater (DFS) wave functions in the overlapping integral between the wave functions of the initial state and final state.
iation Phytic* Confa Al-Minia, 13-17 Nov„ 1996
EFFECT OF IONIZING AND NONIONIZING RADIATIONS ON THE MECHANICAL PROPERTIES
OF CELLULOSE TRIACETATE POLYMER
M.M. SALLAM, H.M. E1SSA+, S.A. ELFIKi, S.A. NOOHPhysics Department, Faculty of Science, Ain Shams University
* National Institute for Standards
Abstract:Several quantities including modulus of elasticity, fracture
stress, fracture strain, yield stress and yield strain, were calculated for cellulose triacetate polymer (C.T.A.). These samples were exposed to different gamma doses in the range from (zero to 32 KGY) and different energies of infrared pulsated laser of 5 watt power in the range (zero to 9 J/cm2). It was found that the Young’s modulus changes due to the change in the degree of crystallinity.
Introduction:Deep chemical and physical changes occur in polymers under
the action of ionizing radiation, regardless of their kind (1,2). Such radiations can therefore break bonds in a chain, but this does not always occur because of the redistribution and dissipation of energy (1).
Ionizing radiation directly produce ionized and excited molecules and electrons. Some excited molecules may be deexcited through the emission of radiation or through nonradiative transitions. Excitation energy can also be transferred from one molecule to another. Electrons are trapped at various sites, or can combine with molecules to form negative ions, or recombine with positive ions yielding excited molecules. Both ions and excited

PrOC Third Radiation Phytict Conf* Al-Minia, 13-17 Nov* 1996
molecules may acquire considerable vibrational energy and undergo bond rupture to form a complex array of stable molecules, free radicals, ionized molecules and radical ions. High energy radiations cause degradation, cross linking of polymers, an increase in the unsaturation of the molecular chains and breaking up of the crystalline structures (3,4). This paper deals with the investigation of the effect of gamma and laser irradiation on the mechanical properties of the C.T.A. Polymer aiming to introduce the bases in constructing a simple sensor for gamma and laser radiations.
Experimental:The C.T.A. polymer samples used in this study are in the form
of sheets of 0.2 mm thick (manufactured by EASTMAN KODAK
Company, ROCHESTER, NEW YORK). The specimens in the form of strips were obtained from these sheets. These samples were irradiated with different doses of gamma in the range (0-32 KGY) by cobalt source of dose rate of 275.6 rad/min at 4 cm. Also irradiated by infrared pulsated laser of 5 watt power manufactured by INFORMATION UNLIMITED, Box 716 AMHERST. N.H. 03031. The units is capable of producing 2000 pulse per second with pulse duration 200 nanoseconds at 9040A. All the mechanical measurements of all samples were carried out at room temperature using the 200 Newton Load Cell the speed was selected as 0.1 mm/sec
Results and Discussion:(a) Gamma radiationTable (1) represents the calculated values for yield stress,
fracture stress, fracture strain, fracture time and Young’s modulus
Third Radiation Phytict Confv Al-Minia, 13-17 Nov* 1996
for non irradiated and irradiated samples up to 32 KGY. The dependence of fracture strain, ef on the gamma dose is clear in fig. (la) in which the fracture strain increases with increasing the gamma dose till reaches a maximum value of 35.6% around 8 KGY due to degradation, then it decreases with increasing the gamma dose till a minimum value of 22.8% around 15.1 KGY. By increasing the gamma dose up to 32 KGY it increased again. The behaviour of £f depends on the choosed rate of strain, temperature and on the chemical structure and physical properties of the material under test.
The same behavior could be obtained for the change of both fracture stress and fracture time with gamma doses where they showed an increase following by a decrease with increasing gamma doses as shown in figs. (lb,lc).
Figure (2a) illustrates the dose dependence of the yield stress, Gy. It showed by increasing the gamma dose, it began to increase up to 4.4 Kg/mm2 for the sample irradiated with 1.3 KGY and then decreases to 3.73 Kg/mm2 for the 8 KGY sample. Increasing the gamma dose above 8 KGY the yield stress showed an increase till a maximum value of 4.28 Kg/mm2 around 13 KGY followed by a decrease till a minimum value of 3.76 kg/mm2 around 15.1 KGY. Increasing the gamma dose up to 32 KGY the yield stress showed an increase again indicating an increase in elasticity. This increase in the yield stress may be attributed to the fact that high stresses enhance the flow mechanism by increasing the mobility of the macromolecular chains to yield higher flexibility. The dose dependence of the elastic modulus is shown in fig. (2b). This

Proc Third Radiation Phytic* Con/* Al-Minia, 13-17 Nov* 1996
modulus was calculated from a separate graph at very low strain and is not shown here. It is observed that, the modulus decreases with the gamma dose from 101.6 Kg/mm2 for the non irradiated sample to 89.6 for the 1.3 KGY sample. This drop in modulus means that the samples are more flexible in this dose range. Above 1.3 KGY the modulus increased up to 97.7 Kg/mm2 for the 6.5 KGY sample due to crosslinking and then decreased to 87.2 Kg/mm2 for
' the sample irradiated with 8 KGY. Increasing the gamma dose from 8 KGY to 32 KGY lead to an increase in the modulus value up to 99.2 Kg/mm2 for the 14 KGY sample followed by a decrease to 95.2 for the sample irradiated with 32 KGY. The decrease in modulus, resulting simply from the decrease in interatomic force constants due to degradation. Also the increase in gamma dose tends to allow the onset of rather localized rotational motions in many parts of the polymer molecules and these motions are reflected in a decrease in the elastic modulus. Also, the decrease in the modulus is due to the change in the degree of crystallinity and in the crystallite morphology(5).
(b) Infrared pulsated laserTable (2) represents the calculated values for yield stress,
fracture stress, fracture strain, fracture time and Young’s modulus for non irradiated and irradiated infrared pulsated laser. The dependence of the fracture strain, ef on the laser dose is clear in fig. (3a), in which the fracture strain increases from 20.4% for the non exposed sample to a maximum value of 30% for the sample exposed to 6 J/cm2. Increasing the laser dose above 6 J/cm2. and up to 9 J/cm2 lead to a increase in the Ef values, fig. (3b) shows the dependence of the fracture stress, af on the laser dose. The value of
Third Radiation Physics ConfH Al-Minia, 13-17 Nov., 1996
Of was found to be 4.28 Kg/mm2 for the non exposed sample. By exposure to laser pulses, the value of Of increased up to a maximum value of 5.08 Kg/mm2 around 6 J/cm2 and then decreased with increasing the laser dose up to 9 J/cm2. The same behavior could be obtained for the dependence of the durability (fracture time) on the laser dose as shown in fig. (3c), where it showed an increase with the laser dose up to 75 sec. For the sample exposed to 6 J/cm2 followed by a decrease with increasing the laser dose up to 9 J/cm2. Figure (4a) illustrates the dependence of the yield stress, ay on the laser dose. The Oy value was found to be 4.12 Kg/mm2 for the non exposed sample. By exposure to 0.25 J/cm2 the value of the yield stress increased up to 4.57 Kg mm2. Increasing the laser dose, it showed a decrease till a minimum value of 4.27 Kg/mm2 around 3 J/cm2 followed by an increase with increasing the no. of laser pulses indicating higher flexibility. Fig. (4b) shows the laser dose dependence of the elastic modulus. This modulus was calculated from a separate graph at very low strain and is not shown here. It is observed that, by exposure to 0.25 J/cm2, the value of the modulus decreased from 101.6 Kg/mm2 for the non exposed sample to 81.4 Kg/mm2. This decrease in the modulus resulting simply from the decrease in interatomic force constants. Also, this decrease in the modulus may be due to the change in the degree of crystallinity and to changes in the crystallite morphology brought out by the thermal treatment (6). Caused by the heating effect of the laser. Above 0.25 J/cm2 it showed an increase up to a maximum value of 87.1 Kg/mm2 around 3 J/cm indicating that the samples are less flexible and then decreased with increasing the exposure dose. This indicated that the Young's modulus changed according to the
PrOC Third Radiation Phytic* Confv Al-Minia, 13-17 Nov* 1996
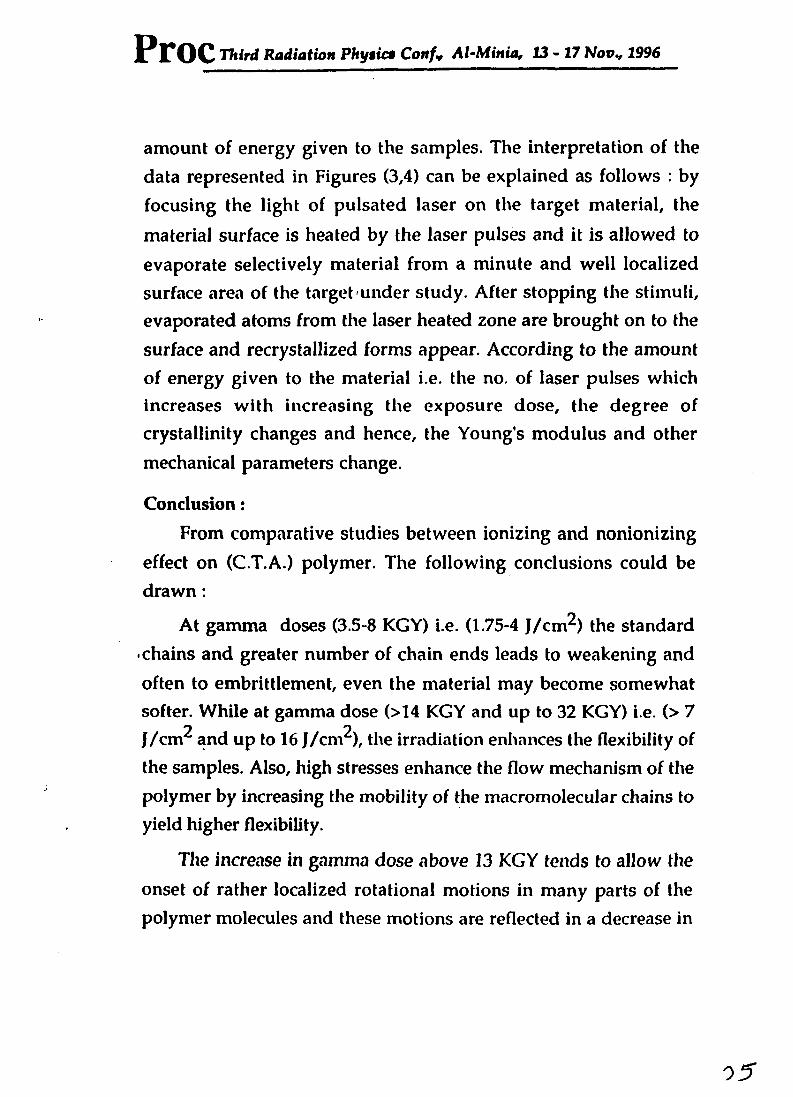
amount of energy given to the samples. The interpretation of the data represented in Figures (3,4) can be explained as follows : by focusing the light of pulsated laser on the target material, the material surface is heated by the laser pulses and it is allowed to evaporate selectively material from a minute and well localized surface area of the target under study. After stopping the stimuli, evaporated atoms from the laser heated zone are brought on to the surface and recrystallized forms appear. According to the amount of energy given to the material i.e. the no. of laser pulses which increases with increasing the exposure dose, the degree of crystallinity changes and hence, the Young's modulus and other mechanical parameters change.
Conclusion:From comparative studies between ionizing and nonionizing
effect on (C.T.A.) polymer. The following conclusions could be drawn:
At gamma doses (3.5-8 KGY) i.e. (1.75-4 J/cm^) the standard •chains and greater number of chain ends leads to weakening and often to embrittlement, even the material may become somewhat softer. While at gamma dose (>14 KGY and up to 32 KGY) i.e. (> 7 J/cm and up to 16 J/cm ), the irradiation enhances the flexibility of the samples. Also, high stresses enhance the flow mechanism of the polymer by increasing the mobility of the macromolecular chains to yield higher flexibility.
The increase in gamma dose above 13 KGY tends to allow the onset of rather localized rotational motions in many parts of the polymer molecules and these motions are reflected in a decrease in
95

Third Radiation Phy»ic$ ConfH Al-Minia, 13-17 Nov* 1996
elastic modulus. On the other hand exposing the polymer to different doses of infrared pulsated laser, the Young's modulus changes due to the change in the degree of crystallinity and in the crystallite morphology.
References:1- V.N. Kulezner and Shershnev 'The chemistry and physics of
polymers". Chapter 16, p. 259, p. 264,1990.' 2- Parkison, W.W. "Encycloedia of polymer science and technology
11,783, (1969).3- Hartmann B. and Jarzyski J.J. Appl. Phys. 43,4304, (1972).4- Keller A. In Developments in crystalline polymers, vol. 1 (Edited
by Bassett D C ), p. 37 Applied Science, London, (1982).5- Charlesby, A., "Atomic radiation and polymers, (Oxford :
Pergamon), (1960).6- M L. Williams, R.F. Landel and J.D> Ferry, J. Am. Chem. Soc. 77,
3701, (1955).

Third Radiation Phytic* Conf* Al-Minia, 13-17 Nov* 1996
Table (1) : Values of the mechanical parameters as a function of gamma dose.
Gamma Yield Fracture Fracture Fracture Young's
dose, stress stress, Of strain, Ef time, tf modulus
KGY (Kg/mm2) (Kg/mm2) % , sec. (Kg/mm2)
0.0 4.12 4.28 20.4 51.0 101.60.5 4.27 4.75 20.8 52.0 100.71.3 4.40 5.01 22.6 56.5 89.93.5 4.27 5.20 28.8 69.5 94.65.0 3.96 5.26 30.2 75.5 96.06.5 3.88 5.17 336 84.0 97.78.0 3.73 5.33 35.6 89.0 87.211.0 3.95 5.27 33.6 84.0 90.613.0 4.28 4.44 17.2 43.0 93.814.0 394 4.75 29.2 73.0 99.215.1 3.76 4.24 22.8 57.0 98.920.0 3.87 4.44 23.0 57.5 98.232.0 4.20 5.00 26.2 65.5 95.2
Table (2): Values of the mechanical parameters of exposed and non exposedsamples as a function of laser dose.
Laserdose,
(J/cm2)
Yieldstress
(Kg/mm2)
Fracture stress, Of
(Kg/mm2)
Fracture strain, £f
%
Fracture time, If
, sec.
Young'smodulus
(Kg/mm2)
0.00 4.12 4.28 20.4 51 101.60.25 4.57 4.78 20.0 50 81.40.50 4.56 - - - 82.51.00 4.48 - - - 84.61.50 4.43 4.80 22.0 55 85.2300 4.27 4.65 24.0 60 87.14.50 4.32 4.82 26.0 65 80.66.00 4.38 5.08 30.0 75 63.57.50 4.42 4.93 26.0 65 76.89.00 4.44 4.69 23.6 59 73.5
0“3

PrOC Third Radiation Phytic* Conf* Al-Minia, 13 - 17 Nov„ 1996
Figures Caption
Fig. (1) : The dependence of fracture strain, fracture stress and fracture time on gamma dose.
Fig. (2): The dependence of yield stress, and Young's modulus on the gamma dose.
Fig. (3) : The dependence of fracture strain, fracture stress and fracture time on the laser dose.
Fig. (4): The dependence of yield stress, and Young's modulus on the laser dose.

Frac
ture
tim
e tf (
sec.
) Fractore •
trts
s, (k9/m
m )
noct
ure
PrOC Third Radiation Phytic* Conf* Al-Minia, 13-17 Nov* 1996
Gamma dose, KOY

Vov
nyv m
oduf
us,Y
(kg/
maf
j Yi
eld
stres
s jsy
)
Third Radiation Phytics Conf» Al-Minia, 13-17 Novv 2996
8 12 16 Gamma dosa, KGY

Pl-O
C T
hird
Rad
iatio
n Ph
ysic
* Con
fv Al
-Min
ia, 13
-17
Nov
* 199
6Fracture time,tf fsec.) Fracture stress, o^( kg/mm2; Fracture rtra'/n, E f./e

You
ng’s m
odul
us^k
g/m
m3)
Y
ietf s
tress
,Oy(
kg/m
mj
PfOC TWrd Radiation Phytic* Cottf* Al-Minia, 13-17 Nop* 1996
Laser exposure dost (Jfcm2)

Proc Third Radiation Phytic* Conf'r Al-Mini
Selection of Irradiator for Potato Preservation
Abdul Rahecm A. Kinsara.Abdul Ghani Mclaibari, Walccd H. Abulfaraj.Abdel Mcgid Mamoon and Salah El-Din M. Kainal
Nuclear Engineering Department, Faculty of Engineering, King Abdutaziz University P.O.Box 9027. Jeddah - 21413. Saudi Arabia
Summary:A formal decision methodology is a sound approach for assisting in decision
making needed tor the selection of irradiators for potato preservation. Such a formal analysis will focus on substantive issues and provide the basis for developing a compromise between conflicting objectives. All the critical issues in the selection of irradiators for potato preservation can be addressed within the decision analysis framework with special significance of the uncertainty associated with consequences of a decision .
For the selection of irradiator for potato preservation for Saudi Arabia, the Analytic Hierarchy Process (AHP) is selected and employed to evaluate three potential irradiators. These are electron accelerators, X-ray irradiators and gamma irradiators. The purpose is to determine the optimal choice between a se{ of factors impacting irradiator selection, it is developed and defined in order to assure the uniqueness of each factor so as to avoid confused Interpretation and to eliminate double counting. The developed factors are economic considerations, technical considerations, safety aspects and compatibility with local environment.
The AHP computer program was developed to computerize the tedious complicated computation towards implementing the AHP systematic procedures to solve the present problem. Based upon the available data, and employing the AHP computer program, the results show superiority of ®°Co gamma-ray irradiator over other irradiators tor Saudi Arabia's present circumstances.
1. INTRODUCTION :
The use of Irradiation has proved to be technologically feasible tor a large number of food products. The proper application of the irradiation technology implies selection of an Irradiator. To evaluate three potential irradiators that the investigators considered.( electron accelerators, X-ray irradiators and gamma irradiators ) for selection process of the most suitable type of irradiator, tour factors regarding economic, technical and safety aspects, as ewtl as, compatibility with local environment have been defined in order to assure the uniqueness of each factor so as to avoid confused interpretation and to eliminate double counting. The factors have a relative importance in comparing with three types of irradiators to evaluate the irradiator for selecting a best irradiator for potato irradiation in Saudi Arabia.. An analytical decision analysis method is needed .to determination of the optimal choice between a set of facto impacting irradiator selection. There are many available

Third Radiation Phytica Conf* Al-Minia, 13-17 Nov., 1996
decision analysis methods used in selection process applied to several alternatives under uncertainties [ 1-19 ]. Among them are : the determinisic approach, sensitivity analysis, logic trees, dynamic programming, simulation and Mont Carlo approach, ranking and weighing, target rate approach, simple ranking and scoring approaches, Bayes decision approach, verbal rating, decision making in a fuzzy environment, multiattribute utility approach and Analytic Hierarchy Process ( AHP ).
The Analytic Hierarchy Process ( AHP ) was adapted as a formal decision methodology to the selection of irradiator for potato irradiation in Saudi Arabia. The
' AHP has been shown to be effective in evalation problems involving multiple and diverse criteria, measurement of trade-offs, and situations with limited data. The AHP exhibits flexibility in dealing with both the qualitative and quantitative factors in a multicriteria evaluation problem. The analytic hierarchy modeling and measurement process [ 20,21 ] is a recent addition to the various approaches used to determine the relative importance of a set of activities or criteria. Furthermore, it provides methodological framework within which the inconsistency in judging the relative importance of factors in the decision analysis can be detected and corrected. A survey of the AHP method and its applications was conducted by Zahedi ( 22 J. Also, the AHP computer program was developed by Abulfaraj el al [23]
Based upon the available data, the Analytic Hierarchy Process (AHP) have been provided a framework and methodology for the determination of a number of items corporate in decision of the irradiator selection. Employing the AHP computer program; which has been developed by Abulfaraj el al (23), showed the superiority of 60Co gamma-ray irradiator over other irradiators for Saudi Arabia's present circumstances.
2 -Factors Affecting Irradiator Selection
2.1 Economic Considerations Of Irradiators:The cost analysis can be discussed in terms of source power (io. kW or Ci) as
well as mass throughput (i.e. Kg/hr or Kg/year). In this study the cost information presented on machine sources and Co-60 is based on a literature search. The reported prices for the machine sources generally include the cost of the machine itself, necessary controls, power suppliers, manufacturers* startup, testing services and warranty. The level of manufacturer's services to purchaser can have a significant impact on the cost of machine sources.
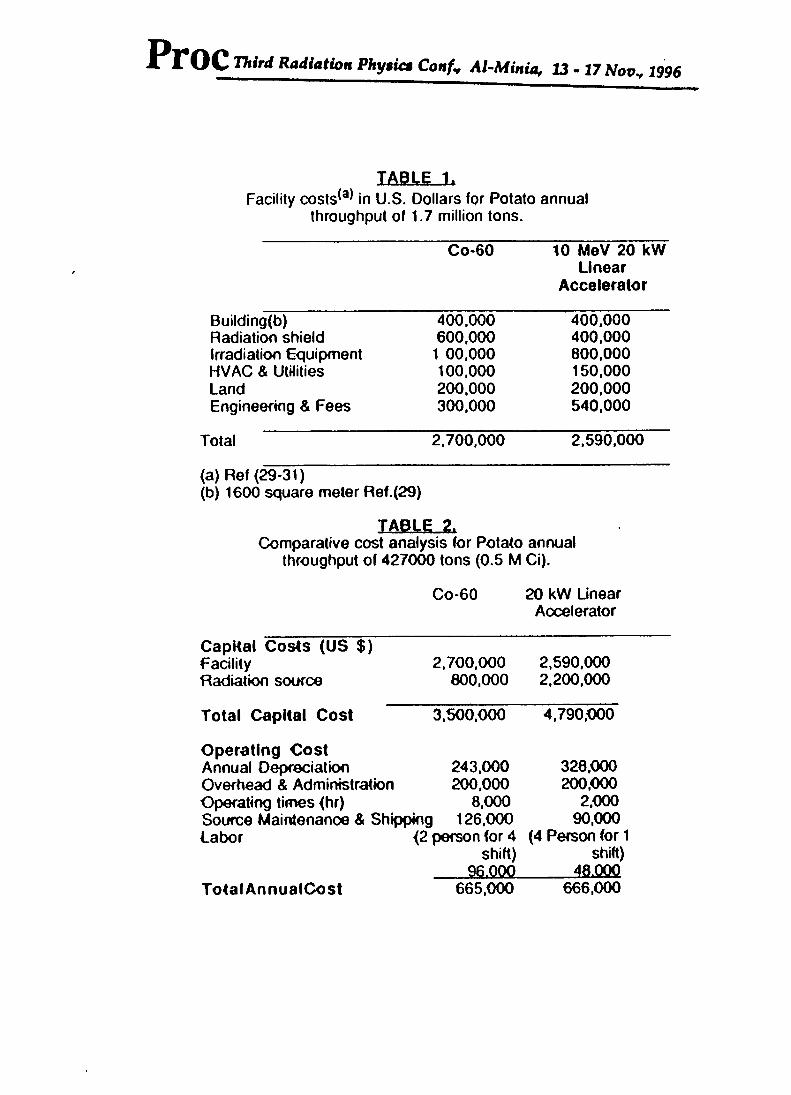
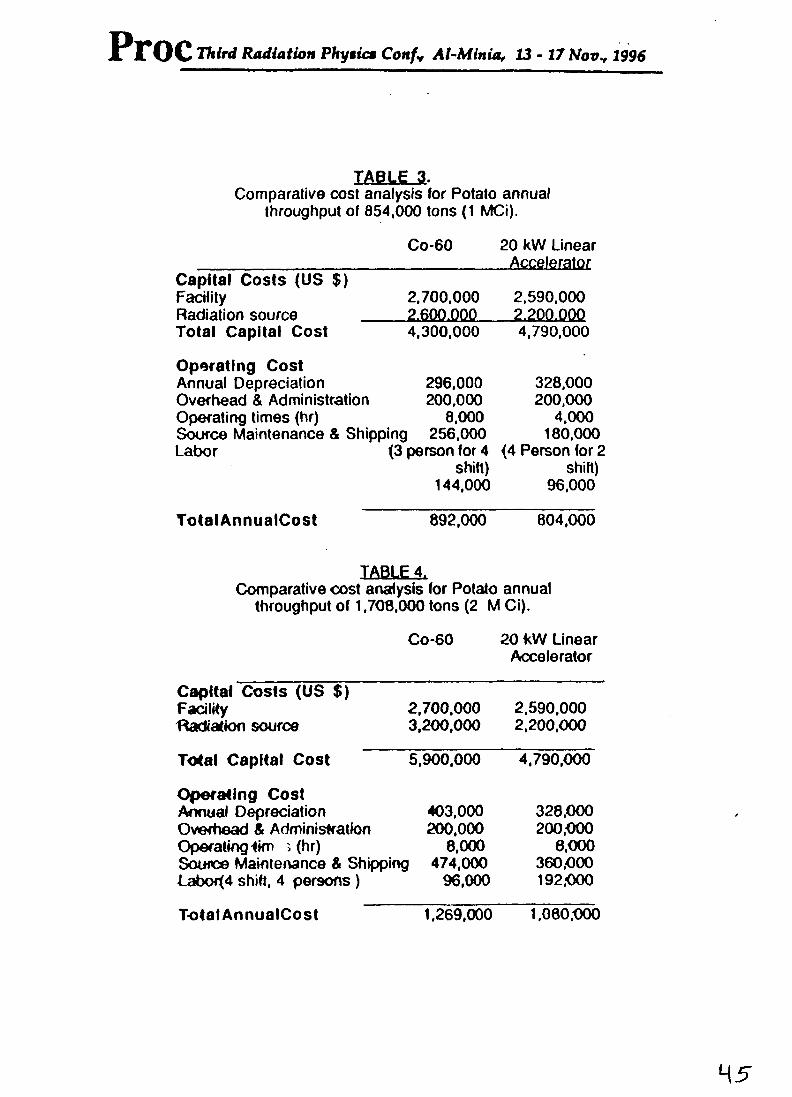
To compare facility cost for an isotope and a machine source, cost estimates are given for a 20 kW, 10 Mev accelerator plant and an isotope irradiator. The annual throughput for both isotope source and machine source are equal. The facility costs are estimated as shown in Table 1. Capital and operating cost estimates are listed in Tables 2, 3 and 4 for a large gamma irradiation facility running continuously at three capacity levels requiring 0.5, 1, and 2 MCi of Co-60, respectively., and for the above- mentioned accelerator plant.
The calculation are based on the assumption of an annual throughputs of427,000 tons, 854,000 tons, and 1,706,000 tons of potatos requiring 0.5 MCi, 1 MCi,
Third Radiation Phytic* Confv Al-Minia, 13-17 Nov., 1996
coolant ) of the 5-Mev X-ray machine and complex systems requirement. Also the conversion efficiency plays a major role in the cost since only 6 to 8 percent of the electron beam energy will be converted to X-rays [ 26 ]
2.2 Technical Aspects Of IrradiatorsIrradiation technology in general has three types of irradiators that can be used
to deliver the needed doses. These are electron accelerators, X-ray sources and isotope sources mainly 60Co and 137Cs. The radiation outputs from these sources vary with respect to type nt radiation delivered, its energy, dose rates and several other variables. These variations in properties of the emitted radiation sometimes favor one type of Irradiators over the others for a certain type of irradiation treatment. { 32 ]. Comparative study of these radiation sources can be summarized in the fohowiog points:1. Radiation penetrability and the reliability of emission isotope sources give more penetrating radiations and are more reliable than machine sources. Machine sources can have interruption of output due to one reason or another.2. With regard to power emission and utilization efficiency, electron accelerators are rated superior because of the electron beam being focused and the high degree of energy absorption.3. Regarding operation and maintenance of the source, the isotope sources are almost problem free. No highly technical operators are needed as compared with machine sources and almost no repairs are required.4. Regarding source supply and accessories. All the sources are equivalent in this respect, in the sense that they all are assured of adequate supply of source or accessories.5. Regarding radiation Intensity, it is highest with electron beam sources since radiation Is directed while it is low with respect to isotope sources since radiation is isotropic and moderate for X-ray sources. So the shortest exposure time to-deliver a certain dose is in the case of electron accelerators.6. There are delays in product handling in the case of isotope sources as compared with machine sources, hence more time is consumed between irradiations using isotope sources.7. Much more experience has been acquired with isotope sources than with machine sources because of the relatively longer time using them.8. Regarding dose rates available from the sources, of course very high dose rates can be obtained from electron beam sources compared to isotope sources. Hence electron sources are capable of high throughputs.9. With regard to package size and density, isotope sources can accommodate wide range of package sizes and densities more than with X-ray sources and much more than with electron beam sources. Average density thickness of potato is 0.6 g/cm2.Packages of 50 om in dimension ( 30 g/cm2) are possible.10. Monitoring requirement is least with respect to isotope source * since dose rate once determined will remain stable during the usual period o. irradiation white frequent monitoring of dose should be done with machine sources because of possible needed adjustments during irradiations of machine power, conveyor beltspeed ...etc. .11. While shielding is needed all the time during storage of isotope source or during its operation, shielding for machine sources is a must of course only during operation of
Third Radiation Phytic* Conf* Al-Minia, 13-17 Nov., 1996
and 2 MCi respectively. The required dose is decided to be 0.1 KGy, while the utilization factor is estimated to be 0.2. Assumptions are made tor the cost of Co-60 ($1.6 /Ci delivered to the site) and the appropriate linear accelerator at a sum of $ 2,200,000.
In the case of linear accelerator plant the conveyor system can be relatively simple and inexpensive because it moves individual boxes or packages rather than pallet-size or tote-size loads as is the case with Co-60 processing facility. Also the tact that only a single or double pass by the source will be needed in the case of linear accelerator makes the cost of irradiation less than that of Co-60 facility which requires multiple passes.
The source replenishment rate is 12% per year plus $30000 for transportation and loading, while the operating cost of the linear accelerator is $ 45/hr including the cost of electricity, replacement of parts, and maintenance.
The administration and overhead costs were estimated from figures reported for similar facilities and from local investigations. Salaries for one administrator and one clerk, dosimetry lab, general supplies, office supplies, telephone costs,... etc., are items included in the overhead cost.
Operating personnel costs assume 4 employees per fully-loaded work shift accounting for 2000 hours of operation at annual cost of $48,000 per shift, including fringe benefits and lost time.
Depreciation costs are calculated based on a 10 years amortization of equipment, 15 years amortization of Cobalt-60 and 25 years amortization of buildings [ 24 ]. The operating expenses can be minimized by running the accelerator only when needed.
Tables 2,3 and 4 show that capital cost of Cobalt-60 increases linearly with its power output while the cost of an electron accelerator is determined primarily by its energy level and only secondarily by its power rating. More closely, we can notice that the annual operating cost of an accelerator plant would be dose to that of gamma facility at a level slightly larger than 0.5 MCi and become progressively nore expensive than Co-60 as the throughput capacity decreases.
The oost of the Co-60 source ( Table 1 ) -is much higher than the accelerator because the source replenishment in this case is higher than electricity demand and maintenance for the accelerator. Maintenance is costly for linear accelerator because an inventory of spare parts is required.
The economy of scale is evident since the oost per Kg of product decrease as the throughput capacity increase for both Co-60 and accelerator. The results is comparable with that obtained by another study (25) published in 1988. However in that study, the comparison was extended to cover a 5 MeV X-ray machine source. As a result they concluded that the use of X-ray and electron beam machines becomes economically feasible when compared with Co-60 at source levels greater than a 4 MCi and 1 MCi, respectively. This implies (according to CH2M Hill) that for annual throughput less than 850,000 tons, Co-60 facility is the most economical one.
Actually capital, operation and maintenance costs for X-ray facilities are higher than that of electron-beam facilities due to high power consumption ( and the need for
Third Radiation Physic* Conf* Al-Minia, 13-17 Nov., 1996
the source.12. The power equivalence of the radiation sources can be stated as follows:
I MCi 60Co = 10 kW electron beam- 150 kW electron beam operated in the X-ray mode.
Hence in conclusion, it can be stated that although the machine sources are superior to the isotope sources in certain few respects, yet the isotope sources are obviously better technically with respect to most other factors.
2.3 Safety Aspects of IrradiatorsThe issue of safety is the most prominent concern of governmental regulatory
authorities before approving the introduction of any technology. Clearance of any technology could not be granted before the process has been proved to be safe. Acceptable standards, good manufacturing practice, hygienic quality and procedures for control will contribute to trust in the selected technology.
The safety of radiation sources should be achieved by high quality in design and construction and careful management of operation. The safety criteria must be checked before selecting the irradiation source. Licensing and introduction of the irradiator can then follow.
In this study, three type of irradiation facilities are considered: 1] Gamma Irradiation ., 2] Electron Beam Irradiation , and 3] X-ray Irradiation .
In general, the isotope handling, licensing and inspection require strict compliance with all the National Competent Authority Regulations. For registration with the authorities, justification of a practice with regard to radiation protection is a prerequisite for use of isotope sources. If source use provides a net benefit to society, then it may be allowed by the National Competent Authority. In contrast, electron beam machines do not emit radiation when the electricity is shut off. Therefore, the National Competent Authority can license the machine but requirements are <ess stringent than gamma facilities. For x-ray sources, no need for National Competent Authority licensing, only the standard safety requirements.
Since the isotope source emission is continuous, therefore, -biological shielding must be provided for both operation and storage modes. The radiation source is stored in a dear-water pool 6 to 7 meters deep. Concrete wall barrier is interposed between the sealed radiation source and human access areas. The thickness of concrete wall depends on the source strength and energy level of radiation. For gamma irradiation facilities, typical thickness is between 1.5 and 2 meters. Sufficient shielding must be present along the conveyor path to absorb the scattered radiation.
Electron beam machines can be turned off when not in use and do not require a separate shielded storage position. Bremsstrahkmg is important for shielding, so low atomic number materials should be used as much as possible for structures that are exposed to electron beams, to minimize its generation. In shielding calculations, we assume that electron beam with maximum energy and maximum current will be absorbed by the heaviest element that it may bombard.
If an electron accelerator is operating under poor vacuum condition, -dark current in the accelerator tube occurs and it generates x-rays. To attenuate the neutron produced by the interaction of the high energy electron, three shielding materials (earth, ordinary concrete and steel) should be employed after careful study.
X-ray sources are to be considered as controlled items due to sufficient attenuating material housing the tube, but it requires a primary and secondary barriers of lead and concrete walls. Concrete equivalent materials can be used for partitions

Third Radiation Phytic* Confv Al-Minia, 13 - 17 Nov., 1996
and doors in the irradiation chamber to prevent the penetration of stray radiation. Interlocks must be provided and quality control procedures must be reviewed and checked before operation.
Essentially all sources of radiation give rise to direct and scattered exposures. In the irradiation volume, very high dose rates occur and a lethal dose can be delivered minutes or seconds leading to fatalities for any person present during irradiation process.
, In the case of isotope source also gamma dose rate can be very high and cangive lethal dose also within minutes or seconds. All workers therefore, entering controlled areas shall carry appropriate personal dosimeters and in addition, at least one audible personal alarm equipment. The results of personal monitoring measurements shall be recorded and reported as required by the competent authority. Initial access to the radiation room after termination shall be made by a qualified operator who shall use a portable monitor to determine the ambient radiation Hevefs. Ozone (03) and oxides of nitrogen are produced by radiolysis. The irradiation plantshould be designed to prevent the exit of ozone produced in an irradiator into areas occupied frequently.
Electron beam machines produce neutrons by the interaction of the high energy electron with product and walls, therefore, neutron meter, as well as, gamma-beta monitor are needed on entering the irradiation area.. Special movable shielding are needed for shielding stray mixed radiation fields. Therefore here also, movable shielding, mechanical, and electrical interlock system will be needed to ensure operator safety.
2.4 Compatibility Aspects of Irradiators
Although there may be ample justification based on economic, technical and safety grounds, for a certain t.vpe of irradiator yet there remains an important overall consideration that can not be neglected. This is the compatibility of the chosen irradiator with the prevailing technical, economic and social characteristics of the "home" environment.
Now when the irradiators investigated are compared on grounds such as compatibility with regard to the product to be irradiated (Potato), with regard to energy demand, and with regard to the focal technical infrastructure needed tor installation and operation of the irradiator, the irradiator using isotope source were found to be more compatible with the local conditions as well as with respect to most other elements of comparison versus the machine source irradiator.
3. Analytic Hierarchy Process :
The analytic hierarchy modeling and measurement process ( 20,21 ] is a recent addition to the various approaches used to determine the relative importance of a set of activities or criteria. The novel aspect anc tajor distinction of this approach is that it structures any complex, multiperson, multicriterion, and multiperiod problem hierarchically. Using a method for scaling the weights of the elements in each level of the hierarchy with respect to an element (e g.., criterion) of the next higher level, a matrix of pairwise comparisons of the activities can be constructed where the entries indicate the strength with which one element dominates another with respect to a given criterion. This scaling formulation is translated into a largest eigenvalue problem
Third Radiation Phytic* Conf* Al-Minia, 13-17 Nov., 1996
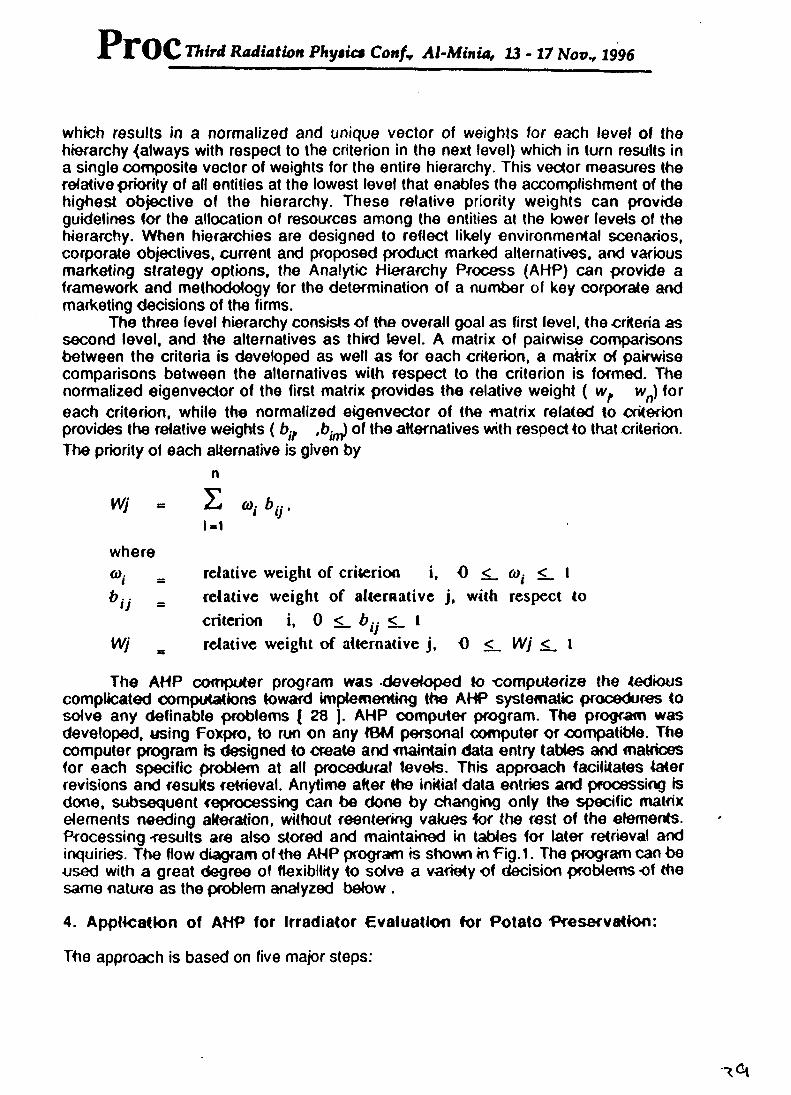
which results in a normalized and unique vector of weights for each level of the hierarchy (always with respect to the criterion in the next level) which in turn results in a single composite vector of weights for the entire hierarchy. This vector measures the relative priority of all entities at the lowest level that enables the accomplishment of the highest objective of the hierarchy. These relative priority weights can provide guidelines for the allocation of resources among the entities at the lower levels of the hierarchy. When hierarchies are designed to reflect likely environmental scenarios, corporate objectives, current and proposed product marked alternatives, and various marketing strategy options, the Analytic Hierarchy Process (AHP) can provide a framework and methodology for the determination of a number of key corporate and marketing decisions of the firms.
The three level hierarchy consists of the overall goal as first level, the criteria as second level, and the alternatives as third level. A matrix of pairwise comparisons between the criteria is developed as well as for each criterion, a matrix of pairwise comparisons between the alternatives with respect to the criterion is formed. The normalized eigenvector of the first matrix provides the relative weight ( wf wn) for each criterion, while the normalized eigenvector of the matrix related to criterion provides the relative weights ( bjf ,b/m) of the alternatives with respect to that criterion. The priority of each alternative is given by
n
Wj = 2^ ct>. by,
1-1where
= relative weight of criterion i, 0 <_ 0)i <_ 1»,y - relative weight of alternative j, with
criterion i, 0 <_ by <_ lrespect to
Wj , relative weight of alternative j. 0 < Wj <L 1
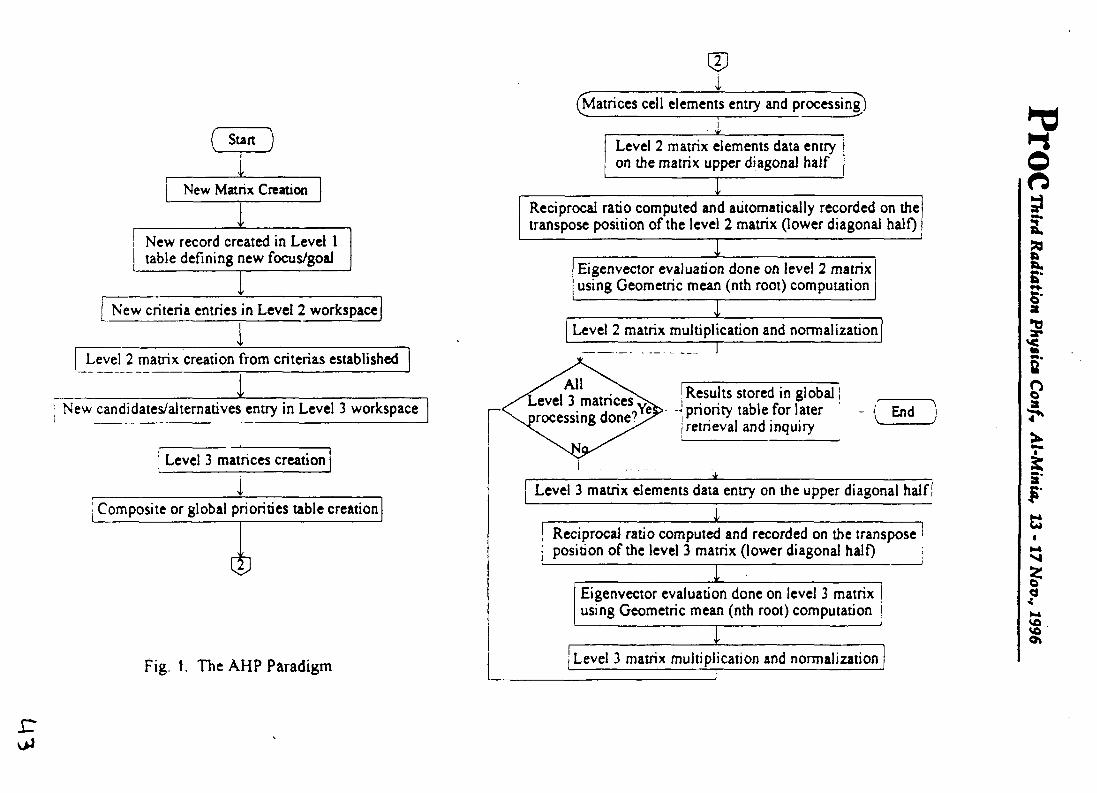
The AHP computer program was -developed to -computerize the tedious complicated computations toward implementing the AHP systematic procedures to solve any definable problems ( 28 j. AHP computer program. The program was developed, using Foxpro, to run on any IBM personal computer or compatible. The computer program is designed to create and maintain data entry tables and matrices for each specific problem at all procedural levels. This approach facilitates later revisions and results retrieval. Anytime after the initial data entries and processing is done, subsequent reprocessing can be done by changing only the specific matrix elements needing alteration, without reentering values tor the rest of the elements. Processing -results are also stored and maintained in tables for later retrieval and inquiries. The flow diagram of the AHP program is shown in 'Fig. 1. The program can be used with a great degree of flexibility to solve a variety of decision problems of the same nature as the problem analyzed below .
4. Application of AHP for Irradiator Evaluation for Potato Preservation:
The approach is based on five major steps:
ThirdRadiation Phytic* Conf* Al-Minia, 13 - 17 Nov., 1996Proc
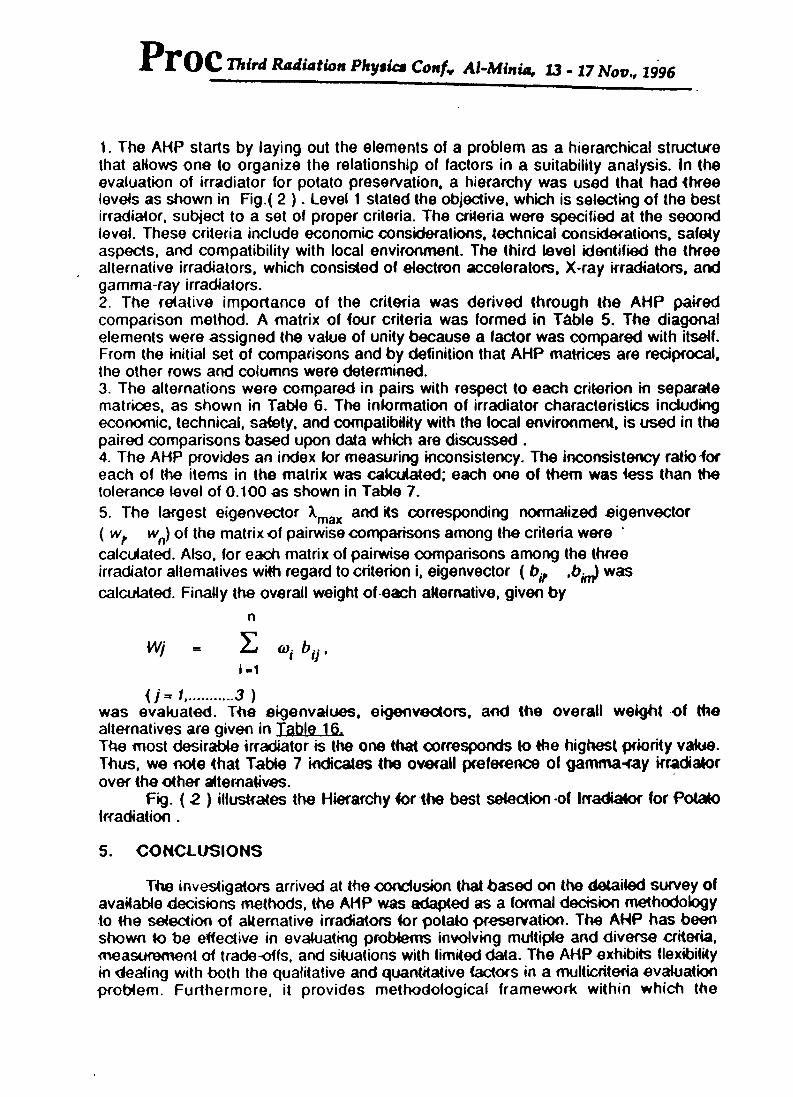
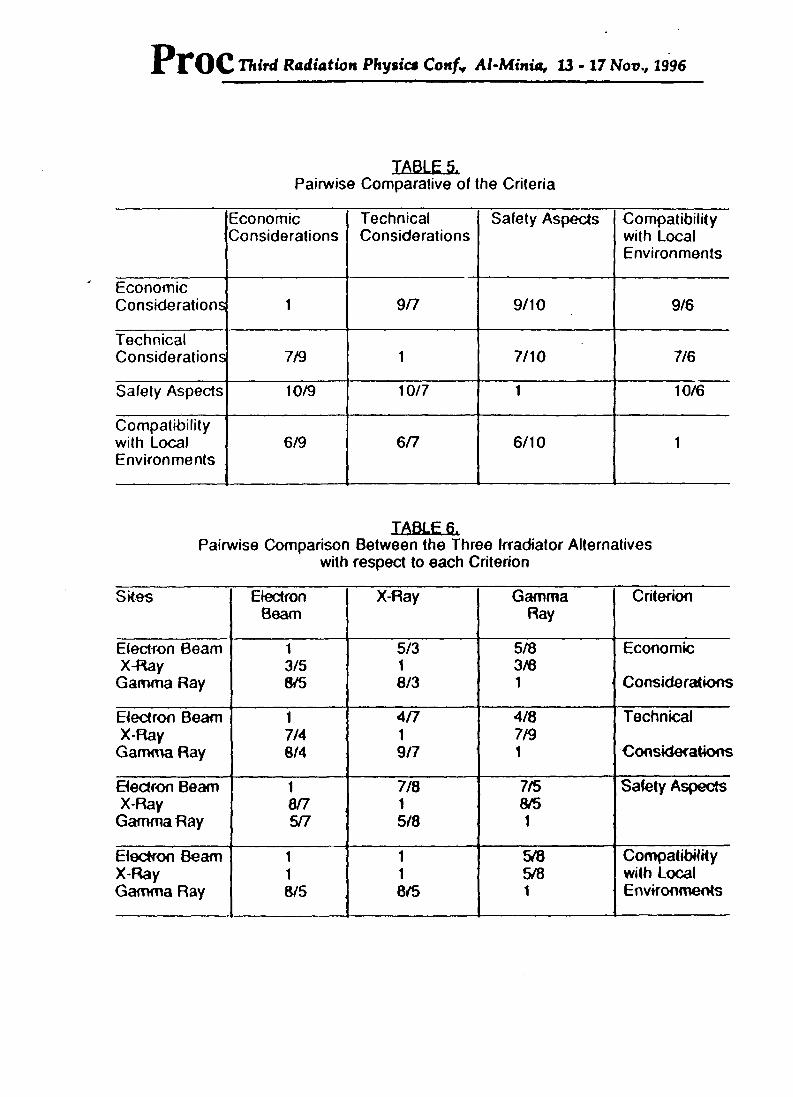
1. The AHP starts by laying out the elements of a problem as a hierarchical structure that allows one to organize the relationship of factors in a suitability analysis. In the evaluation of irradiator for potato preservation, a hierarchy was used that had three levels as shown in Fig.( 2 ). Level 1 stated the objective, which is selecting of the best irradiator, subject to a set of proper criteria. The criteria were specified at the second level. These criteria include economic considerations, technical considerations, safety aspects, and compatibility with local environment. The third level identified the three alternative irradiators, which consisted of electron accelerators, X-ray irradiators, and gamma-ray irradiators.2. The relative importance of the criteria was derived through the AHP paired comparison method. A matrix of four criteria was formed in Table 5. The diagonal elements were assigned the value of unity because a factor was compared with itself. From the initial set of comparisons and by definition that AHP matrices are reciprocal, the other rows and columns were determined.3. The alternations were compared in pairs with respect to each criterion in separate matrices, as shown in Table 6. The information of irradiator characteristics including economic, technical, safety, and compatibility with the local environment, is used in the paired comparisons based upon data which are discussed .4. The AHP provides an index for measuring inconsistency. The inconsistency ratio -for each of the items in the matrix was calculated; each one of them was less than the tolerance level of 0.100 as shown in Table 7.5. The largest eigenvector Xmax and its corresponding normalized eigenvector ( wf wn) of the matrix of pairwise comparisons among the criteria were calculated. Also, for each matrix of pairwise comparisons among the three irradiator alternatives with regard to criterion i, eigenvector ( bf/ ,b^) wascalculated. Finally the overall weight of each alternative, given by
nWj = /C <o- by.
i-1
</= 1............3 )was evaluated. The eigenvalues, eigenvectors, and the overall weight of the alternatives are given in Table 16.The most desirable irradiator is the one that corresponds to the highest priority value. Thus, we note that Table 7 indicates the overall preference of gamma-ray irradiator over the other alternatives.
Fig. (2 ) illustrates the Hierarchy for the best selection of Irradiator for Potato Irradiation .
5. CONCLUSIONS
The investigators arrived at the conclusion that based on the detailed survey of available decisions methods, the AMP was adapted as a formal decision methodology to the selection of alternative irradiators for potato preservation. The AHP has been shown to be effective in evaluating problems involving multiple and diverse criteria, measurement of trade-offs, and situations with limited data. The AHP exhibits flexibility in dealing with both the qualitative and quantitative factors in a multicriteria evaluation problem. Furthermore, it provides methodological framework within which the

Third Radiation Phytic* Conf* Al-Minia, 13-17 Nov., 1996Proc
inconsistency in judging the relative importance of factors in the decision analysis can be detected and corrected.
The AHP establishes a hierarchical structure that allows one to organize the relationship of factors in suitability analysis. The interrelationship of factors at each level of the hierarchy was analyzed with respect to each factor at its preceding level. Thereby, the relationship among objective criteria and alternatives was taken into account.
The specific objective of the decision-making process considered in the present case is the selection of a best appropriate irradiators site to meet the country's needs for potato preservation. The objective is structured into definite factors to evaluate the best alternative. These factors are developed to assure the uniqueness of each, to avoid confused interpretation, and to eliminate double counting, furthermore, they are selected to provide a comprehensive and realistic variable to judge the represented irradiator alternatives. The developed factors are economic considerations, technical considerations, safety aspects, and compatibility with local environments.
Decicion analysis helped the investigators in selection of the suitable irradiation sources that is best for irradiating the potatoes passing on pallet type container, namely 60Co and the required activity .
6. ACKNOWLEDGEMENTThe authors would like to thank the Scientific Research Council, King abdulaziz
University for the encouragement and financing of this work through the project number 48/413.
7. REFERENCES1 ] A. Cornell, "The Decision-Makers Handbook". Prentice Hall, Inc.,
Englewood Cliffs, New Jersey, 1980.2 ] R.L. Keeney and H.Raiffa, "Decisions With Multiple Objectives:
Preferences and Value Tradeoffs", John Wiley & Sons, 1nc., 1976.3 ] A.F. Abdul-Fattah; A.A.Husseiny, "Multi-attribute Decision Analysis of
Desalination Plant Engineering Management Options With ApplicationsTo Saudi Arabia", Desalination, 28 pp. 253^282 (1979).
4 ] R.D. Luce and H. Raiffa, " Games and Decisions, Introduction and CriticalSurvey", WHey, New York, 1969.
5 ] Robert Schlaifer, "Analysis of Decisions under Uncertainty". McGraw-Hill,New York, 1969.
6 ] H. Raiffa, "Decision Analysis, Introduction Lectures on Choices UnderUncertainty", Addison-Wesley, Reading Mass., 1968.
7 ] R. L. Keeney, "Multiplicative Utility Functions", Operations Research, 22(1) (1974)22-34.
8 ] W. Edward, "Social Utilities" in Proceedings of the Sixth TriennialSymposium, June 19-20,1971, US. Naval Academy, Annapolis,Maryland, 1972, pp. I 19-129
9 j R. L. Keeney, "Utility Independence and Preferences lor MultiattributedConsequences", Operations Research, 4 (1971) 875-893.
10] 8. E. Smith, "Introduction to Decision Theory", in Proceedings of the SixthTriennial Symposium, U.S.Naval Academy, Annapolis, Maryland, 1972,pp.l-17.
11] C. S. Spetzler and R. M. Zamora, "Decision Analysis of a Facilities
Third Radiation Phytic* Confr Al-Minia, 13-17 Novv 1996
Investment and Expansion Problems, in Proceedings of the Sixth Triennial Symposium", U. S.Naval Academy, Annapolis, Maryland, 1972, pp.27-5 1.
12] W.H.Abulfaraj, "Development and Application of a Decision Methodology for the Planning of Nuclear Research and Development in Saudi Arabia", Ph D. Thesis, Depapartment of Nuclear Engineering, Iowa State University, U S A., 1983.
13] Raiffa, "Decision Analysis", Addison-Wesley, Reading, MA., U S A., 196814] R.GeHman, "Dynamic Programming", Princeton University Press,
Princeton, NJ, U S A., 1957.15] A N.Maker and G.W. Dean, "Decision Under Uncertainty with Research
Applications", Southwestern, Cincinati, U S A., 1971.16] A.P.Abdul-Fattah, and W.H.AbuKarah, "Siting of Nuclear Power Plants in
Saudi Arabia Using Fuzzy Decision Analysis", Nuclear Technology, Volume 58, No.3, September, 1982.
17] B.R. Graines, "Foundations of Fuzzy Reasoning", International Journal of Man-Maoh. Stud., 8. 623, (1976).
16] S R. Watson, J.J.Weiss, and M.L.Oonnetl, "Fuzzy Decision Analysis", IEEE Trans, on Systems, Man, and Cybernetics, vol. SMC-9, No. 1, p. I, Jan, 1979.
19] O.V.Wintedeldt and G.W.Frscher, "Multi-Attribute Utility Theory: Models and Assessment Procedures", pp. 46-85 in "Utility, Probability, and Human Decision Making", Selected Proceedings of an Inter-disciplinary Research Conference (Vol.H) Rome, 3-6 Sept., 1973, Edited by D. Wendt and C.VIek, D.Reidal Publishing Company, 1975.
20 B.J.Prothero, "Retirement: Expectations and Intentions", PhD. Dissertation, University of Washington, U . S A., 1 98 1.
21] R.Banai-Kashani, "A New Method for Site Suitability Analysis: The Analytic Hierarchy Process", Environmental Management, 13, 6, 685 (1989).
22] F. Zahedi, "The Analytic Hierarchy Process - A Survey of the Method and Its Applications", Interfaces, 16, 4,96 (1986)
23] W.Abulfaraj and A. Garcia, "A Computer Program for AHP Analysis," Faculty of Engineering- King Abdutaziz University, Jeddah - Saudi Arabia (1993).
24] Kunstadt, P., Steeves, C. and Beaulieu, O. “Economics of Food Irradiation" Nordion International. Proceedings of International Meeting on Radiation Processing, Beijing September, 1992.
25] CH2M HILL, 1988. "Machine Sources for Food Irradiation". Prepared for U S. Department of Energy, January 1988.
25] Cfeland, M R. and Pageau, G.M. 185. Electrons versus Gamma Rays -Alternative Sources for Irradiation Processes" Presented at Symoosium on Food Irradiation Processing, Washington, D C. March, 1985.
32] " Traditional and Specialized Forms", Ministry of Agriculture & Water,Department of Economic Studies and Statistics, Saudi Arabia, 1986 - 1990.
( Stan )
| New Matrix Creation1
New record created in Level 1 table defining new focus/goal
New criteria entries in Level 2 workspace1
Level 2 matrix creation from criterias established
' '! New candidates/altematives entry in Level 3 workspace
I Level 3 matrices creationI
| Composite or global priorities table creation
dp
Fig. 1. The AHP Paradigm
ITvi
i(Matrices cell elements entry and processing)
Level 2 matrix elements data entry on the matrix upper diagonal half
Reciprocal ratio computed and automatically recorded on the transpose position of the level 2 matrix (lower diagonal half)
Alllevel 3 matrices'!
processing done?!1 Results stored in global
-1 priority table for later | retrieval and inquiry 1 End )
Level 3 matrix elements data entry on the upper diagonal half!-------------------------------------------------------- Jc---------------------------------------------------------------------- 1Reciprocal ratio computed and recorded on the transpose 1 position of the level 3 matrix (lower diagonal half)
T• ~ ;Eigenvector evaluation done on level 3 matrix using Geometric mean (nth root) computation
ILevel 3 matrix multiplication and normalization
Third Radiation Physics ConfY Al-M
inia, 13-17 N
ov., 1996
Third Radiation Physic* Confy Al-Minia, 13 - 17 Nov., 1996
TABLE. .LFacility costs*3* in U S. Dollars fqr Potato annual
throughput of 1.7 million tons.
Co-60 10 MeV 20 kW Linear
Accelerator
Building(b) 400.000 400,000Radiation shield 600,000 400,000Irradiation Equipment 1 00,000 800,000HVAC & Utilities 100,000 150,000Land 200,000 200,000Engineering & Fees 300,000 540,000
Total 2,700,000 2,590,000
(a) Ref (29-31)(b) 1600 square meter Ref.(29)
TABLE-2.Comparative cost analysis for Potato annual
throughput of 427000 tons (0.5 M Ci).
Co-60 20 kW LinearAccelerator
Capital Costs (US $)Facility 2,700,000 2,590,000Radiation source 800,000 2,200,000
Total Capital Cost 3,500,000 4,790,000
Operating CostAnnual Depreciation 243,000 328,000Overhead & Administration 200,000 200,000Operating times (hr) 8,000 2,000Source Maintenance & Shipping 126,000 90,000Labor <2 person for 4 (4 Person for 1
shift) shift)96.000 48.000
Total AnnualCost 665,000 666,000
Third Radiation Phytics Conf* Al-Minia, 13-17 Nov., 1996
TABLE 3.Comparative cost analysis for Potato annual
throughput of 854,000 tons (1 MCI).
Co-60 20 kW LinearAccelerator
Capital Costs (US $) Facility 2,700,000 2,590,000Radiation source 2.600.000 2.200.000Total Capital Cost 4,300,000 4,790,000
Operating CostAnnual Depreciation 296,000 328,000Overhead & Administration 200,000 200,000Operating times (hr) 8,000 4.000Source Maintenance & Shipping 256,000 180,000Labor (3 person for 4 (4 Person for 2
shift) shift)144,000 96,000
TotalAnnualCost 892,000 804,000
TABLE 4.Comparative cost analysis for Potato annual
throughput of 1,708,000 tons (2 M Ci).
Co-60 20 kW LinearAccelerator
Capital Costs (US $) Facility 2,700,000 2,590,000Radiation source 3,200,000 2,200,000
Total Capital Cost 5,900,000 4,790,000
Operating CostAnnual Depreciation 403,000 328,000Overhead & Administration 200,000 200,000Operating tkn ; (hr) 8,000 8,000Source Maintenance & Shipping 474,000 360,000Labor%4 shift, 4 persons ) 96,000 192,000
TotalAnnualCost 1,269,000 1,080,000
H5
Third Radiation Physics Conf* Al-Minia, 13-17 Nor., 1996
TABLE 5.Pairwise Comparative of the Criteria
EconomicConsiderations
TechnicalConsiderations
Safety Aspects Compatibility with Local Environments
EconomicConsiderations 1 9/7 9/10 9/6
TechnicalConsiderations 7/9 1 7/10 7/6
Safety Aspects 10/9 10/7 1 10/6
Compatibility with Local Environments
6/9 6/7 6/10 1
TABLE 6.Pairwise Comparison Between the Three Irradiator Alternatives
with respect to each Criterion
Sites ElectronBeam
X-Ray GammaRay
Criterion
Electron Beam 1 5/3 5/8 EconomicX-Ray 3/5 1 3/6
Gamma Ray 8/5 8/3 1 Considerations
Electron Beam 1 4/7 4/8 TechnicalX-Ray 7/4 1 7/9
Gamma Ray 8/4 9/7 1 Considerations
Electron Beam 1 7/8 7/5 Safety AspectsX-Ray 0/7 1 8/5
Gamma Ray 5/7 5/8 1
Electron Beam 1 1 5/8 CompatibilityX-Ray 1 1 5/8 with LocalGamma Ray 8/5 8/5 1 Environments

Thit-d Radiation Phytic* Conf^ Al-Minia, 13 - 17 Nov., 1996
lABLE-ZvEigenvectors and Preference Among the Irradiators for Potato Irradiation
Criterion ElectronBeam
X-ray ' 3ammaRay
zsry - '(l) 1 y Xma>
‘ c.i C.R
EconomicConsiderations
0.3125 0.1875 0.5000 0.2813 3.00 0.001 0.001
TechnicalConsiderations 0,1999 0.3500 0.4500 0.2188 3.00 0.001 0.001
Safety Aspects 0.3500 0.4000 0.2500 0.3125 3.00 0.002 0.002
Compatibility with Local Environments
0.2778 0.2778 0.4441 0.1874 3.00 0.001 0.001
IrradiatorPriority 0.2931 0.3064 0.4005
IrradiatorRank 3 2 1
u*3

Thir
d Ra
diat
ion
Phys
ic* C
onfv
Al-M
inia
, 13 -
17 N
ov., 1
996
Level 1: Objective Best Selection of Irradiator for Potato Irradiation
Level 2: Criteria
EconomicConsiderations
TechnicalConsiderations
I Compatibility with : Local Environment:Safety Aspects
Level 3: Alternatives Electron Accelerator Gamma Ray
Fig. 2. Hierarchy for the best selection of Irradiator for Potato Irradiation
Proc Third Radiation Physics Conf* Al-Minia, 13-17 Nov* 1996
-EG970OO72
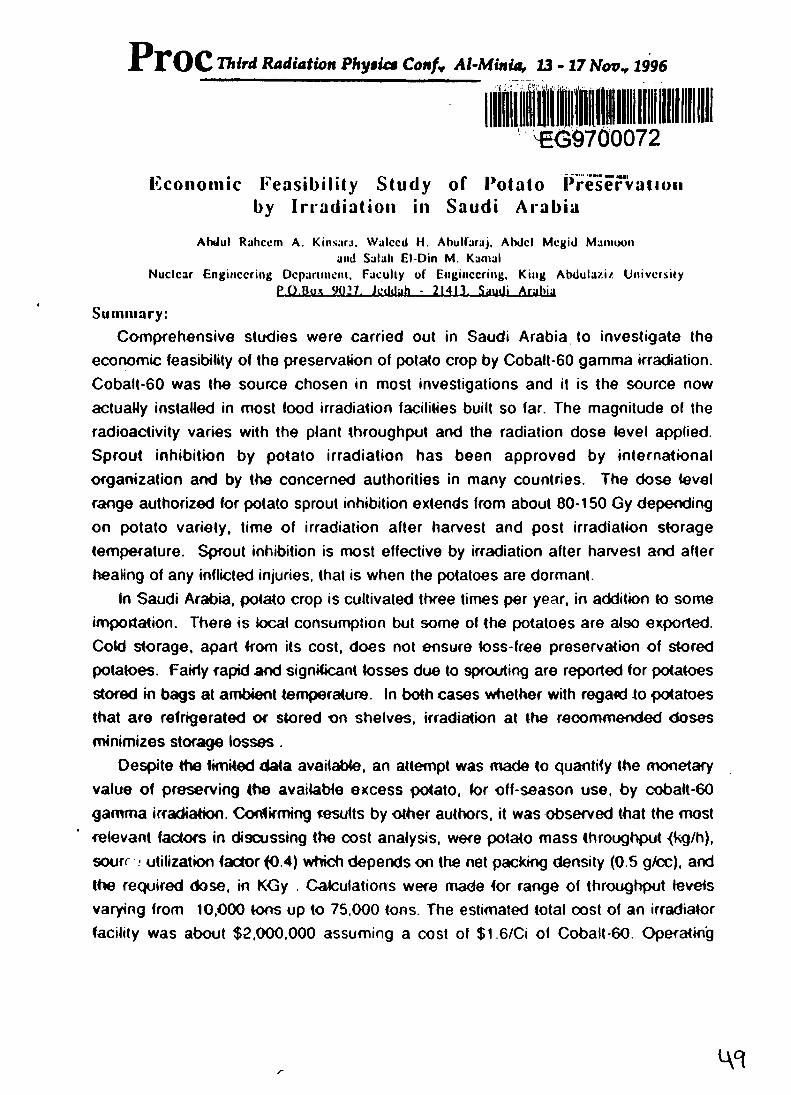
Economic Feasibility Study of Potato Preservation by Irradiation in Saudi Arabia
Abdul Rahccm A. Kinsarj. Wulccd H. Abullaruj, Abdel Mcgitl Mamoon and Salali El-Din M. Kamal
Nuclear Engineering Dcparuncni. Faculty of Engineering. King Abdulaziz. University P.O.Box 9027. Jeddah - 21413. Saudi Arabia
Summary:Comprehensive studies were carried out in Saudi Arabia to investigate the
economic feasibility of the preservation of potato crop by Cobalt-60 gamma irradiation. Cobalt-60 was the source chosen in most investigations and it is the source now actually installed in most food irradiation facilities built so far. The magnitude of the radioactivity varies with the plant throughput and the radiation dose level applied. Sprout inhibition by potato irradiation has been approved by international organization and by the concerned authorities in many countries. The dose level range authorized for potato sprout inhibition extends from about 80-150 Gy depending on potato variety, time of irradiation after harvest and post irradiation storage temperature. Sprout inhibition is most effective by irradiation after harvest and after healing of any inflicted injuries, that is when the potatoes are dormant.
In Saudi Arabia, potato crop is cultivated three times per year, in addition to some importation. There is local consumption but some of the potatoes are also exported. Cold storage, apart from its cost, does not ensure toss-free preservation of stored potatoes, f airly rapid and significant losses due to sprouting are reported for potatoes stored in bags at ambient temperature. In both cases whether with regard to potatoes that are refrigerated or stored on shelves, irradiation at the recommended doses minimizes storage losses .
Despite the limited data available, an attempt was made to quantify the monetary value of preserving the available excess potato, for off-season use, by cobalt-60 gamma irradiation. Confirming results by other authors, it was observed that the most relevant factors in discussing the cost analysis, were potato mass throughput <kg/h), sourr • utilization factor <0.4) which depends on the net packing density (0.5 g/cc), and the required dose, in KGy . Calculations were made for range of throughput levels varying from 10,000 tons up to 75,000 tons. The estimated total cost of an irradiator facility was about $2,000,000 assuming a cost of $1 6/Ci of Cobalt-60. Operating
r
Third Radiation Physic* Conf* Al-Minia, 13-17 Novv 1996
personnel cost assumes 2 operators for a fully loaded work shift amounting to 2000 hours of operation at annual cost of $30,000 per shift including fringe benefits and lost time.
For each assumed throughput of potatoes that need to be stored, an estimation of the gamma processing costs are included in the capital and operating costs. Capital costs included costs of irradiator, auxiliary equipments, radioactive source, containers' rental, land, radiation shields, building construction, shipping, project management and start up costs. Operating costs included salaries, utilities, maintenance, source replenishments and operational supplies. The costs are estimated for an assumed life span for the irradiator of ten years, and fifteen years for land and buildings.
The variation of unit processing cost for different throughputs has indicated that the unit cost ( Halala/Kg. 1 U S dollar =376 Hafafa) decreases exponentially with increasing the throughput, whereas the needed activity in curies, increase linearly. The unit processing cost ranges between 23-3.7 Halala/Kg for throughput of 1,000-75,000 tons respectively, with an average unit cost of 10.34 Hatafa/Kg and an average throughput of 33,000 tons.
With economy of scale taken in consideration, potato preservation by irradiation is economically feasible since at the local consumption rates there will be lot of potatoes that need storage for off season use.
1. INTRODUCTION :
As the world population increases the interest in finding different food preservation methods also increases rapidly. Ionizing radiation is used as one technique for this purpose. A joint FAO/IAEA/WHO expert committee ( 1 ] recognized irradiated potatoes as " unconditionally safe for human consumption". This clearance for human consumption opens the way for extensive economic feasibility studies in potential commercial-scale radiation processing.
So far in Saudi Arabia no irradiation facility has yet been commercially operated, but some experiences with installations for sterilization of medical products are available.
The requirements for building a commercial scale irradiator includes shielding structures, conveyor machinery and source material. These requirements need high
Third Radiation Physics Conf* Al-Minia, 13-17 Novv 1996
investments because large quantities ot food must be treated to achieve reasonable average unit costs. The relationship between unit cost and the size of the plant is known as economics of scale. If unit cost falls as the size of the irradiator increases, the economics ot scale exists.
Accordingly, the question of importance facing the introduction of food irradiation technology is how big the size of the irradiator and its corresponding throughput need to be, for the average cost of the treatment to be economical.
The most important assumptions underlying the estimated unit costs are discussed in different studies [2 and 3) which are the following:
1. Irradiators do not operate continuously since downtime must be aHowed for maintenance and source loading.
2. The percent of emitted energy absorbed in the product (net utilization efficiency of the ^Co) must be calculated.
3. Fixed cost: Building, biological shielding, radioactive source and mechanical installation.
4. Operating cost: Cost of labour, utilities and radiation dosimeters.5. Yearly replenishment of the decayed portion of Co is assumed.
In a study prepared by Kunstadt [ 4 ], he identified the parameters required to study the economics of food irradiation as follows :1) Applied doses: which depend on the effect required (i.e. sprout inhibitation doses are below 15 Krad, while disinfestation doses range up to 75 krad).2) Packing densities of food: This restricts the equipment manufacturers with regard to structural designs .3) Dose uniformity: That the equipment must be able to deliver the minimum effective dose m a uniforme way, while at the same time not exceeding regulatory limit or product tolerance doses.
2. OPERATIONAL COSTS CALCULATIONS
The most elective factor in discussing the cost analysis is the mass throughout (kg/h). The number of product handlers is based on the assumption that each person can handle 800 kg/h. Depreciation costs are calculated based on a 10 years
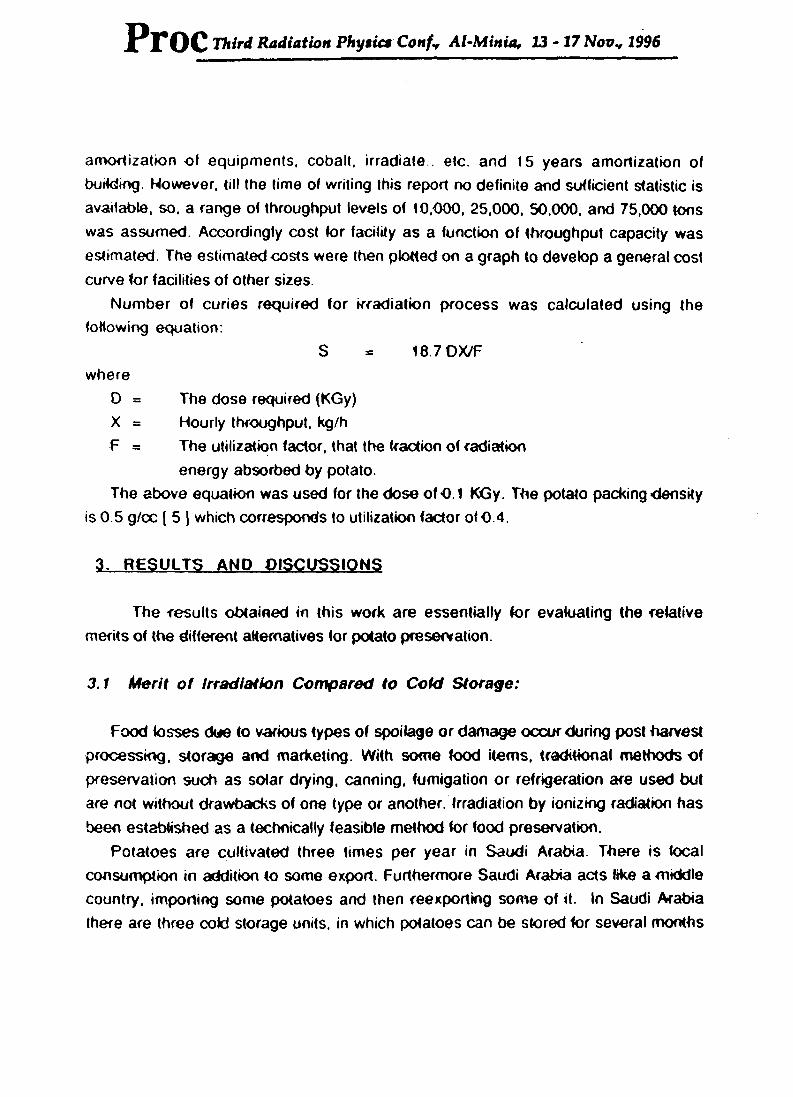
PrOC Third Radiation Phytic* Confr Al-Minia, 13 - 17 Nov* 1996
amortization of equipments, cobalt, irradiate . etc. and 15 years amortization of budding. However, till the time of writing this report no definite and sufficient statistic is available, so, a range of throughput levels of 10,000, 25,000, 50,000, and 75,000 tons was assumed. Accordingly cost for facility as a function of throughput capacity was estimated. The estimated costs were then plotted on a graph to develop a general cost curve for facilities of other sizes.
Number of curies required for irradiation process was calculated using the following equation:
S = 18.7 OX/Fwhere
D = The dose required (KGy)X = Hourly throughput, kg/hF = The utilization factor, that the fraction of radiation
energy absorbed by potato.The above equation was used for the dose of 0.1 KGy. The potato packing density
is 0.5 g/cc l 5 ] which corresponds to utilization factor of 0.4.
3. RESULTS AND DISCUSSIONS
The results obtained in this work are essentially tor evaluating the relative merits of the different alternatives for potato preservation.
3.1 Merit of Irradiation Compared to Cold Storage:
Food fosses due to various types of spoilage or damage occur during post harvest processing, storage and marketing. With some food items, traditional methods of preservation such as solar drying, canning, fumigation or refrigeration are used but are not without drawbacks of one type or another. Irradiation by ionizing radiation has been established as a technically feasible method for food preservation.
Potatoes are cultivated three times per year in Saudi Arabia. There is focal consumption in addition to some export. Furthermore Saudi Arabia acts like a middle country, importing some potatoes and then reexporting some of it. In Saudi Arabia there are three cold storage units, in which potatoes can be stored tor several months

Third Radiation Physics Confv Al-Minia, 13-17 Nov* 2996
at 2 °C. However not all the harvested crops or imported potatoes, that are not used fresh, get to be preserved by cold storage. Some are stored in bags on shelves at ambient temperature which results in significant losses due to sprouting, rotting, moisture loss...etc. But even in cold storage there is at least about 5% normal loss. Further losses coutd occur due to power failures or voltage fluctuations affecting the cooling quality.
3.2 Local Production Volumes
Table 1.Local production volumes of potato
Year Total Production (1000 Kg)
1986 27,6711987 35,7001988 36,3681989 37,2331990 63,6381991 78,1071992 96,0001993 167,0001994 238000
It is obvious from these data in table 1. that the volume of production is not small and that the consumption is increasing over the years. Eventually, the need for long term storage will materialize in the future, when the trends in production and consumption are taken in consideration.
It is thus apparent from the annual increase in local potato production that there is reasonable expectation that this increase will continue over the coming years. It would seem then that eventually production will reat levels that necessitates prolonged storage with attendant losses due to sprouting , if the storage is done without adopting some sprout inhibition treatment whether by chemicals, refrigeration or by irradiation.

Third Radiation Phytics Conf* Al-Minia, 13 - 17 Nov * 1996
3.3 Imported Volumes: [6 - 8)
The obtained data for imported volumes of potato are presented in Table 2. , the imported volume was estimated to be 49416 tons and 134860 tons in the years 1987 and 1989 respectively, while inyear 1991 it decreased to level of 122069 tons.
Table 2.Imported and Exported Potatoes [ 6 - 8 |
Year(Ton)
Imports(Ton)
Ex,Local(Ton)
DortImport(Ton)
1974 -76 15692 -• - -
1977 - 79 36388 -- --
1980 - 82 1542 8231983 - 86 83285 38541987 49414 165 35251988 114852 539 7721989 134860 67 3311990 125386 275 18281991 122069 1619 3450
3.4 Potato Consumption in Saudi Arabia: [ 6-8 )
Table3. shows the developments of the consumption of potato in Saudi Arabia for the years' 1980-1993. Th consumption of potato has been increasing drastically. The years 1984-1986 show decrease in the local consumption that oould be due to lower incomes and higher prices for exporting the potato. The years 1987 to 1993 show again trends of continued increase in the consumption of potatoes; in 1988 it was 149910 tons which compared with 1987 it shows an increase by 84%.
The trend of the increase will continue towards the following years to reach 251733 tons in 1993. We believe this trend will continue as the taste of the young consumer has apparently been changing towards fast food chain restaurants which are growing in number and concerning that the youth generation (age 18 year and lower) is about 80% of the total population.
The total consumption was calculated by the following equation:Total consumption = Domestic production + Imports - Exports
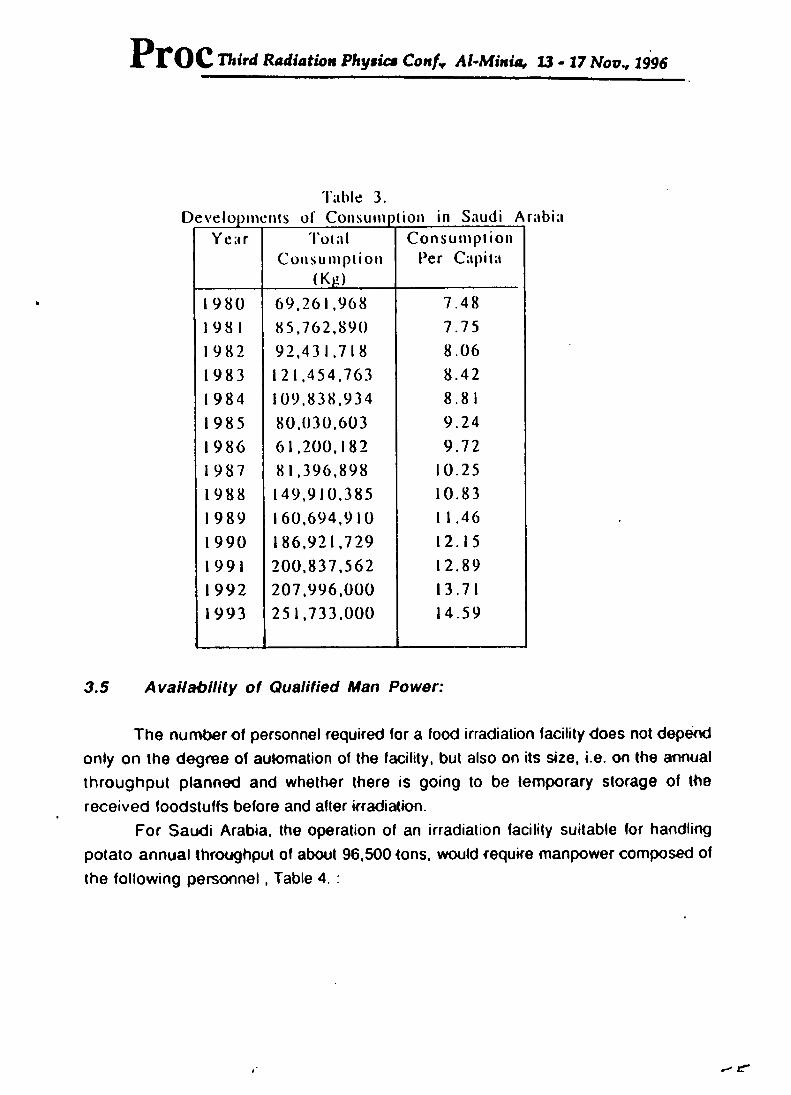
Third Radiation Physics Conf* Al-Minia, 13-17 Novv 2996
Table 3.trabia
Year TotalConsumption
(Kj!)
Consumption Per Capita
1980 69,261,968 7.481 98 1 85,762,890 7.751 982 92,431,718 8.061983 121,454,763 8.421 984 109,838,934 8.811985 80,030,603 9.241986 61,200,182 9.721987 81,396,898 10.251988 149,910,385 10.831 989 160,694,910 1 1.461990 186,921,729 12.151991 200,837,562 12.891992 207,996,000 13.711993 251,733,000 14.59
3.5 Availability of Qualified Man Power:
The number of personnel required for a food irradiation facility does not depend only on the degree of automation of the facility, but also on its size, i.e. on the annual throughput planned and whether there is going to be temporary storage of the received foodstuffs before and after irradiation.
For Saudi Arabia, the operation of an irradiation facility suitable for handling potato annual throughput of about 96,500 tons, would require manpower composed of the following personnel, Table 4. :
tr

Third Radiation Phytics Confv Al-Minia, 13-17 Nov., 1996
Table 4.Required Manpower
Function Number |
- Manager:preferably with technical in addition to the 1managerial qualifications
- Scientific assistants/Technicians 6- Accountants 2- Food technologist/microbiologist 1
(on part time basis or as Consultant)- Skilled laborers 6- Health physicist/Radiation protection 3
officer- General attendants/Security officers 6- Drivers 3
3.6 Capital and operating costs :
Capital and operating costs estimates are listed in Tables ( 5 ), for a large gamma irradiation facility running continuously at four different throughput levels of 10.000, 25,000, 50,000 and 75,000 tons of Potato. Table ( 6 ) summarizes these results based on unit processing cost for the different throughputs. The table shows that the production of potato will continue to increase.
In this study the unit processing cost was defined as the annual total processing cost divided by the annual throughput in kg. They conclude that the unit processing costs decrease rapidly with initial increase of throughput. Food products, applied doses, desired effects packing densities, throughputs, special handling, logistical requirements and local conditions are to be considered in selecting food irradiation equipment and establishing unit processing costs. Exact cost can only be obtained from equipment and Cobalt 60 suppliers after specific irradiation design has been determined.
The estimated cost of irradiator is $2,000,000 at $1 6/Ci of CO-60 [ 9 and 10] . The administration and operating costs were estimated from figures reported for similar facilities and also from local investigation. Operating personnel cost assume 2 operators per fully loaded work shift accounting for 2000 h of operation at annual cost of $30,000 per shift including fringe benefits and lost time.

Thinl Radiation Phytic* Conf* Al-Minia, 13 - 17 Nov* 1996Proc
Table 5.Estimate of Gamma Processing Costs : Carrier Irradiator, Product . Potato
Throughput ( Ions): 10,000 25,000 50,000 75,000Capital Costs (U.S.$) (U.S $ ) (U.S.$) (U.S$)
1. Irradiator 2,000,000 2,000,000 2,000,000 2,000,0002. Auxiliary Equipments 120,000 120,000 120,000 120.0003. CO-60 (12.000Cix$1.6) (30.000Ci x $1 6) (60,0000 x $16) (90,0000 x $1.6)
19,200 48,000 96,000 144,0004. Container Rental ($2000x1) ($2000x1) ($2000x2) ($2000x2)
2.000 2,000 4,000 4.0005. Land 5000m2x$50 250,000 250,000 250,000 250,0006. Radiation Shield 300,000 300,000 300,000 300,000
1500 m3 x$2007. Building 1600 m2 720,000 720,000 720,000 720,000
@ 400 / m28. Shipping 32,000 32,000 32,000 32,0009. Project Management 80,000 80.000 80.000 80,00010.Start-up Cost 3D.00Q .3Q.0QQ 30.000 30.00,0
Total $ 3,583,200 $ 3,582,000 $ 3,632.000 $ 3,680,000
Operating Costs (U.S.$) (U.S.$) (U.S.$) ( U.S.$)
1. Salaries :Management 42.000 42,000 42.000 42.000Radiation Safety Officer 30,000 30,000 30.000 30,000Six Operators 90,000 90,000 90,000 90,000<S> $ 15,000Nine Product 32,400 43.200 86,400 129,600Handlers <§> $ 3,600
2. Utilities 15,000 15,000 15,000 15,0003. Maintenance 40,000 40,000 40.000 40,0004. Co-60 (1S,000Cix$1.6) (3,7500 x $1 .6) (7,5000 x $16) (l1,250Cix$1.6)
Replenishments 2,400 6,000 12,000 18,0005. Operational Supplies mm 40.000 40.000 40.000
Total $291,800 $ 306,200 $ 355.400 $ 404,600
Depreciation of Capital: ( U.S.$ ) ( U.S.$ ) (U.S.$) (U.S.$)
10 Years : for Irradiator 258,320 261,200 266,200 271,000Equipments,C0-60 andShielding .15 Years : for Land & Buildings 64.666 64.666 64,666
Total $ 322.986 $ 325.866 $ 330,866 $ 335,666
r- ~7

Third Radiation Physica Co#/., Al-Minia, 13-17 Nor., 1996
Table 5. ( Continued )
Processing Cost (US.$) (US.$) (U.S$) (U.S.$)
Depreciation of Capital: Operatining Cost
Total
322,986291.800
$614,786
325,866306.200
$ 632,066
330,866 355.400
$ 686,266
335,666 404.600
$ 740,600
SR. 2,305,447 2,370,248 2,573,497 2,775.997
Throughput ( tons ) : Unit cost
10,000 S.B.2.3Q5.4AZ- .10,000,000 kg
2305/ton (23 Halala / kg)
25,000 S.R.2.370.24825,000,000 kg
94 81 / ton (9.5 Halala / kg)
50,000 S.R.2.5Z3..42Z50,000,000 kg
51 5/Ion (5.15 Halala / kg)
75,000 S.R.2.775.99775,000,000 kg
37 013 / ton (3.7 Halala / kg)
4, CONCLUSION
The investigators arrived at the conclusion of this work that economic analysis of the various parameters pertaining to potato preservation by the different methods revealed that potato preservation by irradiation will be economical, with the current local potato production and consumption rates, in the near future.
Irradiation preservation of potatoes for storage and off season consumption is now accepted world wide. As long as the dose received does not exceed the limit agreed upon internationally by WHO, FAO/ IAEA there is universal agreement that the wholesomeness of the irradiated potatoes has not been affected.
The variation of unit processing cost for different throughputs has indicated that the unit cost ( Halata/Kg, 1 U S.dollar =376 Halala) decreases exponentially with increasing the throughput, whereas the needed activity in curies, increase linearly. The unit processing cost ranges between 23-3.7 Halala/Kg for throughput of 1,000-75,000 tons respectively, with an average unit cost of 10 34 Halala/Kg and an

Third Radiation Phytict Conf* Al-Minia, 13-17 JVouv 1996
average throughput of 33,000 tons.With economy of scale taken in consideration, potato preservation by irradiation is
economically feasible since at the local consumption rates there will be lot of potatoes that need storage for off season use.
5. REFERENCES
1 | World Health Organization, Joint FAO/IAEA/WHO Expert Committee Report on the Wholesomeness of irradiated Foods, Technical Reports Series No. 659, WHO, Geneva, 1980.
21 Mahmoud A M and Roushdy H M, "Economic Evaluation of Radiation Inhibition of Potatoes Sprouting in Egypt", International Atomic Energy Agency, IAEA, Proc.Series,Vienna," Food Preservation Proseccing " p47-54 (1985).
3 j Morrison R.M " Economics of Scale in Single Purpose Food Irradiators" IAEA,Proc. Series, 1985.
4J Kunstadt, P . Sleeves, C. and Beaulieu, D. "Economics of FoodIrradiation" Nordion International. Proceedings of International Meeting on Radiation Processing, Beijing September, 1992.
5J iCGFI, " Code of Good Irradiation Practicefor Sprout Inhibition of Bulb and Tuber Crops", Vienna, 1991.
6j " Traditional and Specialized Forms", Ministry of Agriculture &Water, Department of Economic Studies and Statistics, Saudi Arabia, 1986 - 1990.
71 " Food Balance Sheets for the Period 1987 - 1990 ".Ministry ofAgriculture & Water, Department of Economic Studies and Statistics, Saudi Arabia
81 Van der Zaag D E , " The Potato Crop in Saudi Arabia ", Saudi Potato Development Programme, Riyadh, 1991
9j Kunstadt P, “ Economics of Food Irradiation “ , NORDION International Inc., 1994
ACKNOWLEDGEMENT
The authors would like to thank the Scientific Research Council, King ahdulaziz University for the encouragement ami financing of this work through the project U 48/413.

PrOC Third Radiation Phytic* Conf* Al-Minia, 13 - 17 Nov* 1996
SCIENUflC .SESSION (2)
BIOLOGICAL EFFECTS
CHILDREN EXPOSED IN UTERO AFTER CHERNOBYL NUCLEAR ACCIDENT HEALTH SURVEY RESULTS STATUS SUMMARISATION TEN YEARS
Eugenia I. Stepanova, Valentina G. Kondrashova, Tatyana Y. GalychanskayaVitaly U. Vdovenko
Radiation Medicine Scientific Center of Ukrainian Medical Sciences Academy,Kiev- Ukraine
ABSTRACT
The dynamics health status of 1, 144 children exposed to radiation IN UTERO was estimated after the Chernobyl nuclear power plant accident The thyroid exposure doses ranged from 0.0 to 334.0 mGy, and total body exposure doses from 0.1 to 37.6 mSv.
The decrease in child adaptation capacity was observed with general somatic pathology. Higher incidence of thyroid echostructure and function disorders was observed in children of study group compared to control group. Normal haemoglobin levels were rare in children irradiated IN UTERO. The leucopenias with blood cells ultrastructure surfadal architectonics alterations were more frequent. The metabolism of hemopoetic elements during early, post-accident years was peculiar with enegry production activation through all paths of energy reception initially with glycoloc enzymes level increase. During further years, all the intracellular enzymes activity decreased(except add phosphatase). Energy depots exhaustion accomapanled with ultrastructural changes, neutrophyles functional capadty and specific functions depression
were revealed.
Estimation of the intellectual level indicated that equal numbers of children showed medium mental development both in main study and control groups. However a tendency of decrease In numbers of high IQ, and an increase in numbers of low IQ was observed among children exposed in utero
compared to control.

PrOC Third Radiation Phytics Cow/v Al-Minia, 13 - 17 JVorv 1996
The PC analysis of data obtained enabled to determine the presence of
interconnection between some body systems disorders, radiation effects phenomenon and health status as a whole, and to reveal the further deterioration risk level. The average absorbed dose levels in regions of residence was of substantial significance in risk level mentioned.
CYTOGENETIC INVESTIGATION OF INDIVIDUALS LIVING IN AREAS OF UKRAINE CONTAMINATED BY CHERNOBYL REACTOR ACCIDENT FALLOUT
Alexandra Yu. Bondar, Vital! P. Zamostian
Research Center for Radiation Medicine, Kiev, Ukraine
ABSTRACT
A number of areas in Ukraine were severely contaminated by fallout from Chernobyl Nuclear Power Plant Reactor accident in April 1986. The purpose of the study described here was to determine whether the exposures received by individuals In these areas were sufficiently high to produce measurable increase in chromosomal aberrations. The individuals studied were selected from the Koselets, Chernigov, Narodichi, and Ovruch regions, specifically the districts of Chernigov and the districts of Jltomir. Indication of radiation exposure was based on an increase of total frequency of aberrant cells and frequency of aberration of chromosomal type. All cytogenetic abnormalities in metaphases were examined, and results compared between exposed groups and non-exposed controls.
The highest cytogenetic effect was observed in individuals from Ovruch and Narodichi regions, for which the mean levels of chromosome aberration were 1.88 and 1.29 per 100 cells, respectively. Among individuals living in Narodichi region, the observed frequency of dicentric and centric rings was 0.40 and for double minutes was 0.87 per 100 cells. Among all exposed groups, the frequency of chromatid type was approximately the same.
The results of the study of subjects with effective dose equivalent below 10 cSv show that the mean frequency of chromosomal type aberrations (i.e. dicentric, centric, and acentric rings) among individuals living in different
/i
PrOC Third Radiation Physics Confv Al-Minia, 13-17 Novv 1996
contaminated regions of Ukraine was significantly higher that the mean population indices. Moreover, individuals exposed to long-lived radionuclides such as Cs137 and Sr90 were observed as having higher chromosome aberration
frequency when compared with individuals exposed to short-lived iodine radionuclides. Continued observation on high-risk individuals who live in the contaminated areas is recommended.
Similarly, there is a need for objective criteria to define when further monitoring of the genetic effects among the exposed adults and children in the Ukraine is appropriate. These criteria should be based on sound scientific principles, consistently but sensitively applied.
NON- LINEAR BEHAVIOUR OF POWER DENSITY AND EXPOSURE TIME OF ARGON LASER ON
THE RETINAL FUNCTION
E. M. El- Sayed, MS. Talaat, and E.F. Salem.
Physics Department, Faculty of Science, Ain Shams University, Cairo, Egypt
ABSTRACT
In ophthalmology, the thermal effect of argon laser is the most widely used category of laser - tissue interaction. The rise in tissue temperature has to exceed a threshold value for photocoagulation of retinal blood vessels. This value mainly depends on the laser dose. The most suitable argon Laser power P and exposure time (t) which would be more effective for thermal and electrical behaviour of chicken eye was studied. This was achieved by measuring the variations in ocular temperature in electroretinogram (ERG) records under the effect of argon experiment, while power density (P) and exposure time (t) were varried in four different ways for each dose (Pt). Results indicated that for the same laser dose, the temperature distribution of the eye, using low power density and high exposure time was higher than that using high power density and low exposure time, indicating non-linearity of the laser dose. This finding was confirmed by ERG records which showed similar variations in b-wave latency, amplitude and duration, for the same laser exposure conditions. This indicates variations in retinal function due to laser-dependent temperature variations.

Third Radiation Physic* Confv AI-Minia, 13-17 Nov., 1996
UPTAKE AND RELEASE OF 134Cs AND 137 Cs AND ITS RELATION TO*°K CONCENTRATION IN RATS.
M. W.A. Essa, H. H. M. Hussein A.T. Abdel Fallah, and W.M. Abd El Baky
• Nuclear Research Center, Atomic Energy Authority
ABSTRACT
Studies were performed to examine the effect of accumulation of Cs-134 & Cs-137 on the concentration of K-40 in white rats. Five male and Five female rats were fed with normal diet for four weeks. After that, the ten rats were fed with macaroni contaminated with Cs-134 (116 Bq/ Kg) and Cs- 137 (318 Bq/Kg), besides the normal diet. Animal whole body counting was done once weekly for four months using HFGe and multichannel analyzer. The results showed that the uptake of cesium increases until saturation was reached after about one month to values 60,65 Bq/Kg for Cs-134, and 200, 240 Bq/ Kg for Cs-137. Results show a decrease in K-40 concentration due to the replacement of potassium ions by cesium ions in the cell. After saturation, feeuing with radioactive diet was replaced by normal diet. A release of Cs-134 & Cs-137 was noticed with increase of K-40 concentration.

Third Radiation Phytic* Conf* EG9700073TEN-YEAR OBSERVATIONS ON HEALTH STATUS WLh 1L L> K£ [n
IRRADIATED IN UTERO AS A RESULT OF THE CHERNOBYLACCIDENT
Stepanova E.I., Kondrashova V.G., Galichanskaya T.Ya., Kolpakov I.Ye., Davidenko O A, Vdovenko V.Yu., Stakhurskaya NA, Kolesnikov Yu A.
Radiation Medicine Scientific Centre of UMSA, Melnikova str. 53, Kiev, Ukraine, 254050, fax ( 044 ) 213-72-02
ABSTRAKTThe health status dynamics of 1104 children exposed to radiation IN
UTERO was estimated after the Chernobyl nuclear power plant accident. The thyroid doses ranged from 0.00 to 3340.00 mGy, and total body doses from 1.00 to 376.00 mZv. The decrease in child adaptation capacity was observed with general somatic pathology and higher incidence of thyroid echostructure and function disorders. The leucopenias with blood cells ultrastructure surfacial architectonics alterations were more frequent. The metabolism of hemopoetic elements during early, post-accident years was peculiar with energy production activation through all paths of energy reception. During further years the intracellular enzymes activity decreased. Energy depots exhaustion accompanied with ultrastructural changes, neutro- phyles functional capacity and specific functions depression were revealed. The PC analysis of data obtained enabled to determine the presence of interconnection between some body systems disorders, radiation effects phenomenon and health status as a whole, and to reveal the further deterioration risk level.
KEY WORDS: ionizing radiation, fetus, children, health status.

Pl*OC Third Radiation Phyticw Confr Al-Minia, 13-17 Nov* 1996
INTRODUCTIONIt is well known that an extreme radiosensitivity is characteristic for
the organism during its development and differentiation by stages. Therefore children are critical group of the population suffering from the radiation accidents to the greatest degree especially if the effect of ionizing radiation is going on antenatal period of ontogenesis ( 1 ).
At present the biological regularity of the early fetal reactions and the development of postpone pathology have been established ( 2 ). It has been demonstrated that the postnatal changes in children irradiated in utero could be shown as the functional disorders of different organs and tissues. Since the first days of children postnatal life the signs of defective compensation and intense mechanisms of homeostasis maintenance were shown ( 3 ). With increasing the dose-rate radiation intensity these changes may be transformed into the more stable disorders of vegetative ( 4 ), immune ( 5 ), thyroid status with an early realization of thyroid cancers ( 6 ), somatosexual development with the formation of original symptocomplex - "Chernobyl syndrome" ( 7, 8 ).
MATERIALS AND METHODSIn dynamics of postaccident period of the Chernobyl EAPP a com
plex estimation of health status in children bom in 1986, the purposeful contingent formed in 1986-1988 including in the number that consisted of 3 groups:
I group - children bom in pregnant women that were evacuated from Pripyat' city at the moment of the accident ( 340 patients ).
II group - children bom in pregnant women which left to live in a zone of strict radiation control at the moment of accident ( 169 patients ).
III control group - children that were bom and were living in a safe region according to radiation situation ( 595 patienta ).
Dose loading to the fetal thyroid ranged from 0.00 to 3340.00 mGy. In dependence on gestational age the mean doses of the fetal thyroid gland composited: 0.00 mGy - before 8 weeks; 311.40 mGy - from 8 to 15 weeks; 844.90 mGy - from 16 to 25 weeks; 623.00 mGy - more than 25
Third Radiation Physics Confr Al-Minia, 13-17 Nov., 1996
weeks. Doses of total irradiation varied from 5.00 to 376.00 mZv in the 1st group and from 1.00 to 33.00 mZv - in the 2nd group.
Them medical documentation was studied in detail. All-round clinical investigations with the estimation of the physical development and analysis of peripheral blood content were carried out. For the estimation of neutrophile characteristics the activity of acidic ( AcPh ) and alcaline phosphatases ( AlPh ), mieloperoxidase ( MP ), NADH2 and NADPH2 of dehydrogenases ( DH ), lipide ( LP ) and glycogen ( GL ) contents ( 9 ); parameters of absorbtive function ( per cent of phagocytosis (PPh), phagocytosis number (PhN)) (10); indices of HCT test in spontaneous and stimulated variants ( per cent of formasanepositive cells ( PFPC ) average cyto- chemical index of tetrazole reduced activity ( ACITA )) ( 11 ).
The methods of scanning ( SEM ) and transmissing electron microscopy ( TEM ) were used for the estimation of superficial membrane and cell ultrastructure (electronic microscope “Joile”, Japan).
Population and subpopulation contents of immunocompetent cells were studied by the method of flowing cytofluorometry on cell lazer flowing sorter FACStar PLUS, firm "BECTON DICKINSON" with usage of monoclonal antibodies of LT serie ( Moscow SRI of Immunology ). The level of immune serum globulins of principal classes A, M, G, was determined by the classical method Manchini of simple radial immunodiffusion in agar gel.
The examination of thyroid structure was realized with ultrasonic apparatus "Aloka-SSD-500" (Japan) supplied with a holder of image, electronic measuring instruments and linear sensor operating on a scale of real time.
A complex of the mathematical methods on that are based the calculations of individual doses in children exposed to prenatal irradiation and the determination of a risk of health worsening were used in our work too.
RESULTS AND DISCUSSIONNo important differences between the conditions of intrauteri ne de
velopment and course of adaptation processes in neonatal period of children from groups I and II were revealed by data observed during the study of
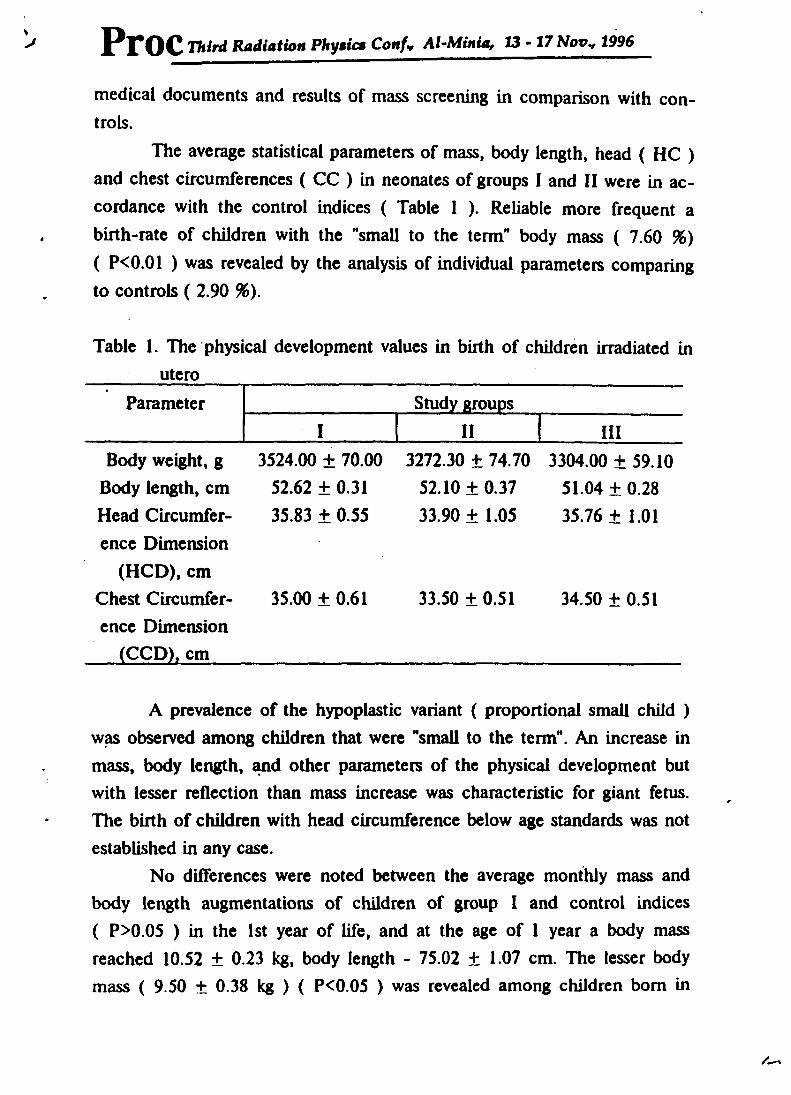
PlTOC Third Radiation Physic* Conf* Al-Minia, 13 - 17 Nov* 1996
medical documents and results of mass screening in comparison with controls.
The average statistical parameters of mass, body length, head ( HC ) and chest circumferences ( CC ) in neonates of groups I and II were in accordance with the control indices ( Table 1 ). Reliable more frequent a birth-rate of children with the "small to the term" body mass ( 7.60 %) ( P<0.01 ) was revealed by the analysis of individual parameters comparing to controls ( 2.90 %).
Table 1. The physical development values in birth of children irradiated inutero
Parameter Study groupsI II III
Body weight, g 3524.00 ± 70.00 3272.30 ± 74.70 3304.00 ± 59.10Body length, cm 52.62 ± 0.31 52.10 ±0.37 51.04 ± 0.28Head Circumference Dimension
(HCD), cm
35.83 ± 0.55 33.90 ± 1.05 35.76 ± 1.01
Chest Circumference Dimension
(CCD), cm
35.00 ± 0.61 33.50 ±0.51 34.50 ± 0.51
A prevalence of the hypoplastic variant ( proportional small child ) was observed among children that were "small to the term". An increase in mass, body length, and other parameters of the physical development but with lesser reflection than mass increase was characteristic for giant fetus. The birth of children with head circumference below age standards was not established in any case.
No differences were noted between the average monthly mass and body length augmentations of children of group I and control indices ( P>0.05 ) in the 1st year of life, and at the age of 1 year a body mass reached 10.52 ± 0.23 kg, body length - 75.02 ± 1.07 cm. The lesser body mass ( 9.50 ± 0.38 kg ) ( P<0.05 ) was revealed among children bom in

zones of the strict radiation control at the age of 1 year whereas their body length did not differ from that of control group ( 74.72 ± 1.02 cm ) ( P>0.05 ). In children of comparative group these indices were follows: body mass - 10.31 ± 25 kg, body length - 76.81 ± 0.48 cm. The psychomotor development of the majority children in the 1st year of life was in accordance with the age.
The structure of pathology revealed in infants was the same as in children of control group. However among children exposed to ionizing radiation in utero the more numerous group with frequently ill children began to form in the 1st year of life comparing to controls.
The average indices of physical development did not significantly differ from age norm in pre-school aged children of groups I and II. The disharmonious development in some children ( 18.90 - 19.30 %) was mainly associated with deficient or excessive body mass.
The evaluation of somatic status in the next years of life revealed the more frequent functional disorders and pathological processes on the side of respiratory, digestive organs, hemopoietic, immunocompetent, nervous and cardiovascular systems and a number of practically healthy children in population decreased with more quick time in the 1st and 2nd groups than in choldren of control group. The more intensive process was observed in children irradiated in early terms of pregnancy ( Fig. 1 ).
The thyroid size was more frequently registered within the limits of1-A and 1-B degrees in children irradiated in utero ( Table 2 ).
Table 2. The thyroid inlargement frequency in post-accident period (in %)
PrOC Third Radiation Phytic* Confy AUMinia, 13 - 17 Nov* 1996
dynamics among children irradiated in uteroGaiter 1st group 2 nd group Controldegrel 1989 1991 1993 1995 1989 1991 1993 1995 1989 1991 1993 1995
0 72.3 60.7 11.4 10.2 87.0 57.7 16.1 15.1 92.6 87.0 83.6 54.5I-A 26.8 37.9 80.4 75.2 12.5 39.7 72.1 70.2 7.4 13.0 13.2 34.0I-B 0.9 1.4 8.2 14.6 0.5 2.6 11.8 14.7 0.0 0.0 3.2 11.5II 0.0 0.0 0.0 0.0 0.0 0.0 0.0 0.0 0.0 0,0 0.0 0.0

Third Radiation Phytict Confv Al-Minia, 13-17 Novv 1996
During ultrasonic examination of the thyroid gland an increased echogeneity of tissue was visualized in 23 % children, a decreased one - in 10 % children ( in controls - in 10 and 13 % children respectively ). Echostructural heterogeneity ( at the expense of presence of echopositive or small hydrophilic incorporations ) was detected in 34 % children ( in controls - in 15 % children ).
Deviations of thyrotrophic hormone from the normal level were determined in 5.20 % children in 1989. and - in 8.60 % children in 1994.
Children irradiated in utero had rarely an optimum hemoglobin level at all the terms of observations ( Fig. 2 ) in comparison with the control group that was established during the estimation of blood system. A tendency to the more decreased number of lymphocytes was characteristic for them ( Fig. 3 ) were more frequently registered in chidren of the 2nd group.
The significant changes were shown on the side of superficial architectonics in blood cells. So. among erythrocytes of peripheral blood a number of discocytes was decreased during all the terms of observations and ranged within the limits of 62.50 - 59.80 % ( in controls - betweem 89.00 and 94.00 %. p<0.01) with simultaneous increase in a number of transitional and prehemolytic forms. The cells with degcnerativelly changed and superficial pathological form were appeared. A number of lymphocytes with relatively smooth and villiferous reliefs was decreased but a number of cells with complicated superficial type such as folds, ruffles, bubbles, deepenings. interstitial configurations of cytomcmbrane was increased.
The evaluation of ultrastructural composition in blood cells revealed the cells with decreased volume and with gemmation of cytoplasmic sections among erythrocytes according to the type of the "apoptosic body" formation, focal lysis or membrane infiltrations. A number of lymphocytes with morphologic signs of the functional activity including euchromatin prevalence over heterochromatin, the presence of active nucleolus in the nucleus and protein synthetic apparatus of cytoplasm, market activity of cell surface was increased. A numerous number of cells with nuclei of the fantastic form, often with expansion of perinuclear space, doubled formation of vesicles and membrane microclasmatosis was often obtained. Mitochondrias with clear
Third Radiation Physics Confr Al-Minia, 13-17 Nov., 1996
matrix and partial disorganization of crysts were frequently detected. A number of "active" neutrophiles with increased content of microvilli and mi- crogrowthes with expressed variegation of granular cytoplasmatic complex were frequently discovered. The signs of autophagocytosis with the presence of cytoplasmic parts in phagocytic vacuoles were noted.
In 1988 - 1989. neutrophile metabolism of children irradiated in utero was characterized by activation of AlPh ( 127.25 ± 6.40 units, in controls - 79.08 ± 3.63 units. P<0.001 ); AcPh ( 156.37 ± 5.92 units, in controls - 88.08 ± 3.45 units. P<0.001 ); NADH2-DH ( 9.47 ± 1.81 granules cell-1. in controls - 4.83 ± 0.27 granules cell-1. P<0.001 ) and NADPH2-DH (3.38 ± 0.47 granules cell-1, in controls - 1.93 ± 0.11 granules cell-1. PC0.001 ); increased content of LP ( 276.44 ± 7.71 units, in controls 240.17 ± 6.48 units. P<0.001 ); increased content of LP ( 276.44 ± 7.71 units, in controls - 240.17 ± 6.48 units. P<0.001) anf GL ( 274.00 ± 4.68 units, in controls - 249.75 ± 2.30 units. P<0.05 ). Clear exposure of non-stability in neutrophile function characterizing by suppression of phagocytic and tetra- solereducing activities ( Fig. 4 ) was found out against a background of a decreased level of intracellular enzymes ( excluding acidic phosphatase ) and a number of cytochemical substances detected during preservation of ultra- structural changes next years ( 1993 - 1995 ).
No significant differences in average statistical parameters that are characteristic for the state of cell and humoral links of immunity in children from basic and control groups were noted. However deviations in individual indices exceeded the bounds of physical variations were more frequent in children irradiated in utero ( Table 3 ).
Symptoms of vegetative dysfunction were found in 73.30 % children of the 1st group and in 53.40 % children of the 2nd group. Clinical picture was characterized by symptoms of headache, dizziness, motion disease in transport, increased fatiguability. pain in lower extremities. Excessive sweating. hyperhidrosis of hands and feet, mottled skin integuments were noted. Diverse neurological microsymptomatology was revealed such as asymmetry of tendinous reflexes, painfulness at point palpation in projection of sympathetic ganglions, points of trigeminal nerve entrance, asymmetry of facial

Third Radiation Physics Confr Al-Minia, 13-17 Novv 1996
muscles, width of lid slits, lateral nystagmus at marginal lead of eyes. These children differed by the emotional instability.
Table 3. Incidence of deviations from age norm in immunological indices ofchildren of basic and control groups (%)
Groups of children examinedIndices Group I Group II Group III P.-3 P2.1
CD 3+ cells 44 55 18 >0,05 < 0,05CD 4+ cells 38 52 12 < 0,05 < 0,05CD 8+ cells 53 58 17 < 0,05 < 0,05CD 16+ cells. 40 54 17 > 0,05 < 0,05CD 72+ cells 48 58 15 < 0,05 < 0,05IgG 24 24 13 > 0,05 > 0,05Ig A 38 34 9 < 0,05 < 0,05Ig M 30 34 9 <0.05 < 0,05
The results of intellect studies ( Fig. 5 ) revealed that a number of children with mean level of mental faculties were identical in all the groups. No significant differences were detected among these groups in accordance with a number of children of various mental defects.
CONCLUSIONSThus, the multicomponent effect of factors of The Chernobyl acci
dent on body during antenatal period of ontogenesis caused worsening of health status in children. Shortening of the number of practically healthy children in population from 35.70 to 5.00 % in 1987 and 1995 respectively is an integral index reflecting these unfavourable changes.

PrOC Third Radiation Phyaica Confy Al-Minio, 13-17 Novy 1996
LIST OF TABLE AND FIGURE CAPTIONS Table 1. The physical development values in birth of children irradiated in utero.Table 2. The thyroid inlargement frequency in post-accident period (in %) dynamics among children irradiated in utero.Table 3. Incidence of deviations from age norm in immunological indices of children of basic and control groups (%).Fig. 1. The age-related health status dynamics in children of main study group and that of comparison one.Fig. 2. Distribution of children irradiated in utero at the age of 2 years (%) by number of hemoglobin.Fig. 3. Distribution of children irradiated in utero at the age of 2 years by number of leucocytes (%).Fig. 4. Functional parameters of neutrophiles in children irradiated in utero and children of comparative group.Fig. 5. Percent distribution of children, irradiated in utero. according to date of total intellect

PrOC Third Radiation Physics Couf» Al-Minia, 13-17 Nov., 1996
REFERENCES1. Effect of ionizing radiation on fetus. Materialy 34 sesii NKDAR
OON ( WHO ). Vienna. June 10-15. 1984. Vienne 107-197 (1985).2. Otake M. and Schull. W.J.. Radial. Res.. 92. 574-595 (1984).3. Furasho. Toshiyuki. Otake. Masanori. Int. J. Radiol. Biol.. 46. 6.
18-43 (1980).4. Glazunov I S. and Tereshcenko. N.Ya.. Br. J. Radiol.. 68. 1438-
1445 (1968).5. Nold J.B.. Banjamin. S.A.. Miller. G.K. Radial. Res.. 115. 3. 472-
480 (1988).6. Allen B. and Benson. Ph D. “Hanford Radioactive Fallout”. High
Impact Press. New York p.119 (1989).7. Stepanova E.I.. Chayalo. P.P.. Condrashova. V.G. et al. Pediatria.
12. 8-13 (1991).8. Stepanova. E.I. Heals status of children irradiated in utero. In:
Chernobyl: never again, proceedings of the International round table. Venice. Italy. 4-5 July. 1994. ROSTE .Venice. 57-64 (1994).
9. Cheichou Ph.G.J. and Quaglino. D. “Hematological cytochemistry”. Medicina. Moskow p. 320 (1983).
10. Shatrov V.A.. Kusnetsova. L.V.. Belyavskaya. T.N. Lab. delo.. 1. 17-18 (1985).
11. Gordienko. S.M. “Evaluation of cell immunity in clinical practice”. Metodicheskie rekomendatsii. Barnaul, p. 19 (1983).

The p
ract
ical
ly h
ealth
y pe
rson
s quo
teL<
Group of comparion
Main study group
Fig.l. The age-related health status dynamics in children of main study group and that of comparison one
PrOC
Third Radiation Phy$ica Confy Al-M
inia, 13 - 17 Nov., 1996
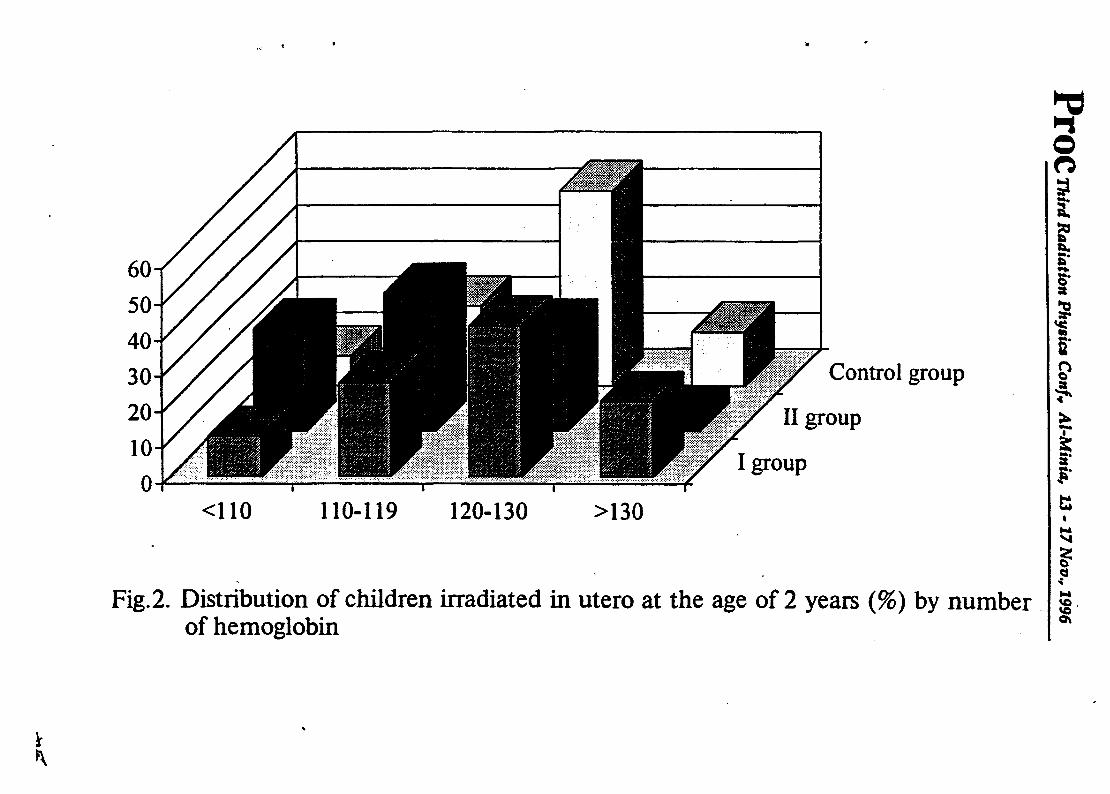
Fig.2. Distribution of children irradiated in utero at the age of 2 years (%) by number of hemoglobin
Third Radiation Physics Cottf* Al-Mittia, 13 - 17 N
ov., 1996

L
Fig. 3. Distribution of children irradiated in utero at the age of 2 years by number of
leucocytes (%).
PrOC
Third Radiation Phytic* Conf» Al-Minia, 13-17
Novv 1996

I
PPh PhN PFPC-SP ACITA-SP PFPC-ST ACITA-ST
Fig.4. Functional parameters of neutrophiles in children irradiated in utero and children of comparative group.
PrOC
Third Radiation Physics Conf* Al-Minia, 13-17 N
ovv 1996

67
• - - Children of 1st group----- Children of 2nd group----- Controls
71-90 91-11030-70 111-140 141-170
Fig 5. Percent distribution of children, irradiated in utero. according to date of total intellect
Third Radiation Phytic* Confy Ai-M
inia, 13-17 Nov., 1996

X
1(59700074PrOC Third Radiation Phytict Confy Al-Minia,
A Cytogenetic Investigation of Individuals Living in Areas of the Ukraine Contaminated by Fallout from the Chernobyl Reactor Accident
Alexandra Bondar, Vitaliy Zamostian, Andrey Noschenko
(Scientific Center for Radiation Medicine of AMS of the Ukraine, Kiev)
Abstract
Peripheral blood lymphocytes of healthy individuals, living in the areas of the
Ukraine severely contaminated by fallout from the Chernobyl Nuclear Power Reactor
accident in April 1986, were isolated in February and April 1988. The purpose was to
determine whether exposures received by individuals in these areas were of sufficient magnitude to produce a measurable increase in chromosome aberrations. The individuals studied were selected from the low dose districts of Koselets and Chernigov within the
Chernigov region, and the high dose districts of Narodichi and Ovruch located in the
Jitomir region. There was an increase in stable and unstable chromosome abnormalities in
the high dose areas. These areas also exhibited increased cesium and strontium exposure (long-lived isotopes). There was also an increase in chromosome aberrations in the low dose regions, but increase was not as pronounced. We will measure the frequencies of dicentrics, centric rings, and double fragments and establish their correlation to the estimated dose in each region.
Introduction
The accident at Chernobyl exposed a large number of individuals to low level of
ionizing radiation, and defined the need to determine the biologic consequences of such
exposure. It is well known that carcinogenesis is closely connected with the process of
mutagenesis, and one of the commonly recognized mutagenic effects is the occurrence of
chromosomal aberrations. Moreover, an increased frequency of chromosome aberrations
has been described in populations occupationally exposed to ionizing radiation (Balasem
l-XI
PrOC Third Radiation Physics Conf* Al-Minia, 13-17 Nov* 1996
et al.( 1992; Barquinero et al., 1993), living in areas with high levels of environmental radioactivity (Pohl-Ruling et al., 1991; Bender et al., 1988), or in those with additionalexposure due to the Chernobyl accident (Stephan and Oestreicher, 1989; Oestreicher et !> !al., 1990; Pohl-Ruling et al., 1991; Braselmann et al., 1992; Stephan and Oestreicher, 1993). In some of these studies a linear dose effect response was found for the presence of !
dicentric and ring chromosomes, but this relationship is difficult to observe for doses below 100 mSv.
While the health implications of an increase in chromosome aberrations remain poorly understood, the study of chromosome aberations in peripheral lymfphocytes is at present the best biologic method for estimating the dose of radiation received by an ; individual as well as the possible continuing action of radiation. In contrast to chromosome analysis of long term stable chromosome abnormalities, short term transient analysis may provide a better means to evaluate lower dose of radiation exposure (less than 50 cGy). Such investigations are particularly useful when carried out within the
framework of population cytogenetics. This enables one to substantiate the putative damage in the populations residing in the contaminated zones. Here, we describe the results of cytogenetic studies using peripheral lymphocytes derived from adult individuals in the contaminated areas in the Ukraine.
ExperimentalThe subjects and territories in the Ukraine chosen for study were selected because -
they were known to have been exposed to different levels and qualities of radioactivematerials. In the Koselets and Chernigov districts (Chernigov region), for example, the -doses stemmed mainly from exposure to short-lived radionuclides and there was
*
comparatively little contamination by Sr-90 and Cs-137. The radiation received in 1986 was mainly due to the precipitation of 1-131.
All of the study subjects from the contaminated areas were transported to the Ukrainian Scientific Center of Radiological Medicine in Kiev for medical examination.
A
Pl*OC Third Radiation Phytics Conf» Al-Minia, 13-17 Novv 1996
At that time, blood samples were obtained and doses of internal radiation were measuredafter selection by interview. The study areas and average doses of the subjects are as follows:
Contaminated areas
The first study group consisted of people of both sexes, age 18 - 40 years, from the Koselets region, Chernigov district. The estimated average contamination in this district was 11,1 cBq/m*of Cs-137 and 9,25 cBq/m£of Sr-90. The total dose for this group has
been estimated to be 0,95 cSv. Here and elsewhere, the effective equivalent dose was
calculated as the sum of external and internal exposures to 137-Cs. The samples of blood were taken within 24 month after the Chernobyl accident. The second group of subjects are inhabitants of the Chernigov district, Chernigov region. The contamination here amounted to 22,1 cBq/iri* of Cs-137 and 18,53 cBq/mf of Sr-90. The effective equivalent
dose of this group, between the time of the accident and the drawing of blood samples, is
estimated to be 1,27 cSv. The samples of blood were also taken within 24 month after the accident The previous 2 districts, Koselets and Chernigov, are in the Chernigov region. The third group was selected from Narodichi district, Jitomir region. Contamination in this region amounted to 632,7 cBq/m* of Cs-137 and 44,4 cBq/m* of
Sr-90. The estimated effective equivalent dose in this group, from the time of the accident until the samples of blood were obtained, is 8,58 cSv. The samples of blood were obtained within 23 month after the accident.
The fourth group of subjects were drawn from the Ovruch district, Jitomir region. Estimated contamination in this region is 666,0 cBq/mtof Cs-137 and 25,9 cBq/nf of Sr-
90. Effective equivalent dose, again from the accident to the blood letting, is 8,92 cSv. The blood samples in this group were obtained within 22 month after the accident.
Individuals living in the district of Moscow were chosen as controls. They were selected at a poultry farm in the Moscow region. The samples of blood were obtained at the same time as those in the four exposed group.
3

PrOC Third Radiation Phytic* Confr Al-Minia, 13-17 Nov., 1996
All individuals were asked to indicate their prior exposure to potentially clastogenic
pharmaceuticals and viral infections on a questionnaire. Those individuals asserting such
exposures were excluded from the study group in order to avoid confusing chromosome
breakage attributable to such agents with that ascribable to ionising radiation. Donors
were solely selected from individuals who denied a possible contact with known or
supposed mutagens (with the exception of ionizing radiation). Control and exposed
groups were selected on the basis of sex, age, absence of disease in the previous three
months (determined anamnestically), and quantity of diagnostic radiation received during the previous year.
Short term chromosome analysis was perform on isolated peripheral blood
lymphocytes. Blood samples were obtained by venipuncture and collected in heparinized
tubes. Cultures were made in RPMI-1640 supplemented with 10 % fetal calf serum, an
antibiotic, and phytohemagglutinin (PHA). Earch culture was incubated at 37 ° C for 48
hours. 0,3 g/ml of colcemid was added two hours before harvesting. Chromosome
analysis was carried out exclusively on first division metaphases containing no less than
45 and no more than 47 centromeres. All abnormal metaphases were analyzed by two
investigators. 300 - 500 metaphases were studied on each individual.
The following criteria had to be met in the metaphase plate: (1) there could be no
chromosomes that have already entered the colchicine phase; (2) there could be no
longitudinal superposition of large and middle-sized chromosomes. If the cell failed any
one of these criteria, it was not used for analysis. The following types of chromosome
aberrations were scored: acentric double fragments, intra-chromosomal exchanges (ring
chromosomes, acentric rings, pericentric inversions) and inter-chromosomal exchanges
(dicentric chromosome, symmetric translocations), and aberrations of the chromatid type
(single chromosome breaks). For the ring chromosomes and dicentric (in the first division
cell), one accompanyinjg double acentric fragment was assumed. Interstitial deletions and
acentric rings were considered as one type of aberrations. Statistical analyses were carried
4
PrOC Third Radiation Phytict ConfH Al-Minia, 13-17 Novv 1996
out using correlation or regression methods. Evidence of radiation effect was contingent
upon the demonstration of an increase in the frequency of aberrant cells and the frequency
of chromosomal aberrations (dicentric and ring chromosomes, interstitial deletions, acentric rings, double acentric fragments) in comparison with the control and the mean
population level.
Results
In accordance with the time of blood sampling, the frequency of structural j chromosome aberrations as determined for individual living in the different contaminated ;
areas and in the control area. The following indicators were studied for every individual:
quantity of aberrant metaphases per 100 cells, frequency of structural aberrations per 100
metaphases.The frequency of dicentric chromosomes in control group is 0,1 per 100, and that of
double acentric fragments - 0,29 per 100 metaphases. Increasing of chromosome damages
for the group of Ovruch district can be related mainly to the aberrations of chromosome
type. Besides of prevalence of double acentric fragments (0,91 per 100 metaphases),
dicentrics (0,44 per 100 cells) are found. In group of those who live in Narodichi district
(this territory was radiated mainly by long living nuclide Cs-137) the obsedved frequency j of chromosome aberrations is 1,07 per 100 metaphases. 0,67 of them are double acentric
fragments and 0,40 nis the frequency of dicentrics in studied group. In third group
prevailing was the short-time living radionuclide 1-131. 0,47 per 100 of chromosome type aberrations is the frequency of double acentric fragments, 0,15 per 100 cells is the
frequency of dicentrics and rings.
In group of individuals living in Koselets district - Chernigov region cytogenetic
results are identical to those described just above. Radioecological situation of this region
is practically the same as for Chernigov district.The highest cytogenetic effect is revealed for Ovruch and Narodichi regions. Here
the mean group level of chromosome type aberrations is 1,35 and 1,07 per 100
335

jPl^OO Third Radiation Phytic» Confv Al-Minia, 13-17 Nov„ 1996
metaphases respectively, and the frequency of dicentrics is 0,44 and 0,40 respectively i.e. it exeeds 4 times the frequency of general control of genetic monitoring laboratory and 3 times the mean populative frequency which is accepted as 0,13 per 100 metaphases. In all groups of exposed regions the frequency of chromatide type aberrations was
approximately the same. 1,80 in Narodichi region, up to 2,04 in Chernigov region, but it
didn’t differ of the value in control region (p>0,05). We also carried out analysis of
aberrant cells of different type. This enabled us to reason about the character of mutagenic
action under influence of different factors of external environment as well as to make an approximate estimation of radiation doses by radiation actions. The values of dicentric
and ring chromosomes for Ovruch and Narodichi districts for certain differences of these for control region while these values for Chernigov and Koselcts districts arc statistically
at the control level. Acentric double fragments distribution obtained by means of
dispersion analysis. The total effective equivalent dose for which the groups from
Narodichi and Ovruch areas have been exposed during three years, has an influence on
the total frequency of dicentrics and rings and the double acentric fragments. At the same
time the frequency of chromatide aberrations and total frequency of aberrant metaphases
is for certain the same in all regions and shows no dependence of radiation dose.Discussion
After the reactor accident in Chernobyl the chromosomes of individuals living in different areas of a contamination were investigated. Several authors have described an insrease in structural chromosome abnormalities in populations exposed to ionizing
radiation. The dose ranges of some of these studies were 100-500 mSv (Lloyd et al.,
1980). Bigatti et al. (1988) observed an increased frequency of metaphases with chromosome - type abnormalities in workers of hospital exposed to doses 1,5 mSv/year.
Barquinero et al. (1993) also observed an increased frequency of metaphases with
structural chromosome-type aberrations in analogical contingent of hospital workers exposed to dose 16,00-42,71 mSv. Increased frequencies of dicentrics and acentric
6
PlTOC Third Radiation Phytic* Conf» Al-Minia, 33-17 Nop„ 1996
fragments have also been observed in populations exposed to high levels of natural
radioactivity (Pohl-Ruling et al., 1991, Natarajan et al., 1991). Balasem et al., (1992)
observed higher yields of chromosome fragments and total aberrations in radiation
workers exposed to accumulated dose ranges of 25-330 mSv. Analysis of essential
principles of development of researches on estimations of influence of ionizing radiation
on the ancestral development of a human we way conclude that the level and types of
damages of somatic cells chromosomes depends on the dose and type of radiation and
may be considered as indicators of possible mutagenic effects of radiation. It is to be
noted that the study of radiaton damages in vivo shows the value of dose based on the
frequency of chromosome aberrations is in a good corellation with doses obtained by
means of dosimeters under construction. While regression analysis was performed a
number of regression models were achieved for linear model; this yields the linear
character between increasing of dose of radiation action and increasing of frequency of
separate chromosome aberration types. As long as individuals from all the regions were
studied 22-29 month after accident, a question rises: what is the character of damagind
acting we reveal in these cases. It is ascertained that after the action of radiation there is
observed a prolonged persistence in lymphocytes of blood for aberative cells with
chromosome aberrations of chromosome type (dicentrics, cenric, rings) are unstable aberrations, but nevertheless they are registrated some decades after atomic
bombardment. This suggests that there are the stable damages in cells, so called
repliciring instabilities which evidently in one hand may be the consequences of a stable
' violation of chromosome structure and appearance of clones of mutant cells and in the
other hand these instabilities may serve as indicators of continuing action of radiation
incident factors. Appearance of these violations from time to time after the accident may
be also a result of continuing action of factors of radiation incident.
The different degree of high level of cytogenetic discoders in studied regions can
serve as a sign for biological dosimetry.

PrOC Third Radiation Phytict Co#/v Al-Minia, 13-17 Not>v 1996
Reference
1. Balasem, A. N., A. S-K Ali, M. S. Mosa and K. O. Husain, Mutation Res., (London),271,209-211 (1992).
2. Barquinero, J. F., L. Barrios, M. R. Caballin, M. Ribas, A. Tubias and J. Equscue,Mutation Res., (London), 286, 275-279 (1993).
3. Rohl-Ruling, J., O. Haas, A. Borgger, G. Obe, M. Lettner, F. Daschil, C. Altzmiller,
D. Lloyd, R. Kibiak and A. T. Natarajan, Mutation Res., (London), 262, 209-217 (1991).
4. Bender, M. A., A. A. Awa, A. L. Brooks, M. J. Evans, P. G. Groer, L. G. Littlefield,
C. Pereiro, R. J. Preston and B. W. Wacholz, Mutation Res., (London), 196, 103-
159(1988).
5. Stephan, G., and U. Oestreicher, Mutation Res., (London), 223, 7-12 (1989).6. Oestreicher, U., G. Stephan and M. Glatzel, Mutation Res., (London), 242, 271-277
(1990).
7. Braselmann, M., E. Schmid and M. Bauchinger, Mutation Res., (London), 283, 221-
225(1992).
8. Stephan, G., and U. Oestreicher, Mutation Res., (London), 319, 189-196 (1993).
9. Lloyd, D. C., R. J. Purrot and E. J. Reeder, Mutation Res., (London), 72, 523-532
(1980).
10. Bigatti, P., L. Lambert!, G. Ardiito and F. Armellino, Mutation Res., (London),
204, 343-347(1988).11. Natarajan, A. T., R. C. Vyas, J. Wiegant and M. P. Curado, Mutation Res.,
(London), 247, 103-111 (1991).
8

Third Radiation Phytica Conf» Al-Min
Nonlinear Behaviour of Power Density and Exposure Time of Argon Laser on
Ocular Tissues
E.M. El-Sayed, M.S. Talaat and E.F. Salem.Physics Dept., Faculty of Science, Ain Shams University, Abbas- sia, Cairo, Egypt
Abstract:The behaviour of ocular tissues under the effect of 488nm Ar
gon laser was Investigated. Two constant doses of 7.2x10= and 260x10-= R.s/mma, were used. These doses were achieved by varying both the laser power density P and exposure time t in different ways in order to check the effect of reciprocal relation of P and t on the ocular tissues behaviour. The intraocular temperature distribution and electroretinogram (ERG) were examined under such laser conditions. Consequently,the thermal conductivities of cornea, lens and retina were calculated and their values were found to be 0.5+0.007, 0.364+ 0.003 and 0.073+0.005 H/m°C respectively.The obtained results indicated that the intraocular temperature
distribution and ERG records were strongly temperature dependent and they mainly affected by the laser total dose. However, when the dose was kept constant, the number of laser shots, the exposure time, as well as the power density were found to be important factors for determining the magnitude of ocular temperature rise and ERG parameters. Moreover, these variation^ were wore pronounced when the exposure times were prolonged for small power densities such that P.t was always constant. This indicates a non -linear behaviour of argon laser effects on intraocular temperature rise and ERG records which controls the degree of the required photocoagulation and reflects the retinal functional state after laser treatments. Generally, it could be concluded that, during retinal treatments with argon laser, using 1-5 laser shots, the retinal temperature was raised by 1-8°C and accordingly, the b-wave amplitude and duration were raised stepwise with retinal temperature averaging 110 + 10 uV/”C and 0.2 + 0.01sec/**C respectively. Moreover, these changes of intraocular temperature and function are nonlinear laser dose effects .
This work clearly indicated that, in retinal treatments using the temperature of all intraocular tissues would beargon laser

Thtrd Radiation Phytic* Conf„ Al-Minia, 13 - 17 Nov„ 1996
raised and the ERG is a good indicator of this rise and also of the eye functional state during this treatment. So, this work recommended that, during medical treatments of the eye it is important to record ERG simultaneously during retinal treatment. This could help the operator to know when to stop laser shots during treatments.Introduction:Argon laser which emits two lines at 488 and 515 nm is usually
used in medical treatments of the eye. The laser tissue interactions are most often thermal and the temperature rise is a function of laser exposure time and energy and it depends on thermal properties of the eye (Puliafito and Steinert, 1985). The study of laser thermal interaction has been attempted to explain the quantity and shape of coagulation which attend laser tissue interaction. McKenzie, 1990 and Carruth & McKenzie, 1986 reported that laser absorption creates a substantial increase in temperature of 10-20 °C, above normal, and heat is conducted to adjacent parts for photocoagulation. Eichler et al.,1978 and Beilina and Seto,1980 showed isotherms below a surface Irradiated by a laser beam. Detailed Knowledge of the temperature changes in the eye, resulting from laser exposure is required. There is still continuing uncertainty over the relation between laser thermal interaction and its operating conditions and parameters (Smiddy et al., 1989). In most studies, which aimed to optimize laser conditions for retinal photocoagulation, the total dose was considered the main variable with respect to the thermal effects of irradiation (Van Breugel and Dop Bar,1992). Uptil now only few experiments have been performed to study the individual effects of laser power density and exposure time. In this work, limits have been set for the power density (P) and exposure time(t) of argon laser (488nm) in which the reciprocal relations of using lower power density levels and longer exposure duration (at constant laser dose) were tested. That is, a constant radiation exposure dose according to guide lines of diabetic retinopathy treatments (personal communication, Massoud W.H.) is required by varying both P and t of laser beam In different ways (dose=P.t). The effects of using the above mentioned laser conditions on the thermal and electrical behaviour of eye tissues would be the main aim of this work. To achieve this aim, some steps should be carried
out: at first, normal temperature distribution inside the eye
PrOC Third Radiation Phytic* Conf¥ Al-Minia, 13-17 Nov* 1996------------------------v ---------- --------------------------------------------------------------------
should be measured (immediately after decapitation and after a certain time of decapitation) then, the temperature distribution, during heating and cooling of the eye, would be, accordingly, investigated. From the obtained results the thermal conductivities of the different ocular tissues would be calculated. These steps were important in order to be ready for achieving our main purpose - which concentrate on the heating effect of laser irradiation. This effect would be studied by recording the intraocular temperature distribution during laser irradiation of different P and and t such that P.t was always kept constant. In the same time, the ERG would be recorded, in normal, heated, cooled and laser irradiated eyes to check the ERG sensitivity for temperature variations. This would reflect the eye function under such conditions.Materials and Methods
Before laser irradiation, preliminary experiments were carried out to study the temperature distribution and ERG records of the eye, at normal steady state and under heating (25-4*™C) and cooling conditions (down to 1 *»C). The experiments were carried out, in vitro, on dark adapted eyes of chicken (25-30 days old). After bird decapitation, the eyes were enucleated and moisted with Ringer's solution at room temperature. They were placed in a special chamber, used as an incubator for maintaining the eye temperature constant. A simple system has been developed so that the cornea could be heated up to 44**C or cooled down to 1e,C by passing water at the desired temperature above the cornea. The chamber contains a number of holes for the inference of laser beam, water bath, thermocouples for measuring the ocular temperature and electrodes for ERG records. A schematic representation of the experimental set up Is shown in fig. 1.
The temperatures of the main structures of the eye, cornea, lens, and retina, that are critical In relation to the subject of thermal and optical effects (Lagendijk,1982), were measured using a mini thermocouple (copper-constantain, 0.3 mm outer diameter), connected to thermometer(RO-1310) and inserted through a specific hole in the eye chamber and then advanced, using a micromanu- pulator, at a certain direction (along line A in fig.1), into the sclera to the vitreous humor. Another thermocouple is fixed above the cornea to measure the temperature of the water bath. Many different temperature distributions could be obtained,with an ac-

I lOC Third Radiation Physics Conf* Al-Minia, 13-17 Nov* 1996
curacy of about > 1°C, by varying the water bath temperature (5 eyes for each condition). Thermal parameters of eye tissues were calculated, in these experiments, and compared with those obtained during laser irradiation.
For ERG records, a well established ERG system was used. It consists of two Ag-AgCl active and reference electrodes, as well as preamplifier, low drift DC amplifier, and computer system for recording, storage and printout of experimental data (for further details see El-Sayed et al 1993). ERG records were carried out for eyes subjected to different temperatures, and also to laser irradiation of different conditions.
In the present work, argon laser beam (488nm, Spectra Physics, model 165) was used. The power of the incident beam was varied directly from the laser set up system while the accurate power was measured at the surface of the eye by a power meter. The beam width was adjusted at 300 urn and kept constant all-over the experiments. This size was controlled by diverging the beam with an appropriate lens. The final beam was reflected by a mirror to enter the eye chamber from the top. Laser arrangement, and position of the eye chamber were kept constant for all experiments while P and t could be chosen freely for each experiment.
Laser experiments were done in which the laser doses were kept constant at 7.2 x 10~a and 260 x 10~3 W.s/mma. These doses were selected as guided by Massoud W.H. (personal communications) and achieved in four different ways by varying both P & t in the following manner: 0.048, 0.024, 0.012, & 0.006 H/mm* for first dose, and 1.73, .087, 0.43, & 0.21 W/mma for second dose, during times 0.15, 0.3, 0.6 & 1.2 S for each power respectively.The temperature distribution and ERG records of irradiated eyes
were measured for each laser irradiation condition (5 eyes for each condition plus five control ). These records were carried out for one laser shot as well as for five shots. The data was statistically analyzed and represented as mean + SO.
Results and discussion:1-Temperature distribution and ERG records of normal, heated, andcooled eyes:The normal temperature of the cornea, vitreous humor (behind
the lens, B.L.) and retina were measured in room temperature (24 ♦ 1 °C). A small hole was made in the sclera, through which the
PrOC Third Radiation Phyiict Confv Al-Minia, 13 - 17 Nov* 1996
thermocouple was introduced in the eye using a micromanupulator. In this way, it was possible to measure the temperature at any place in the vitreous humor without disturbing the eye. The obtained results have indicated isothermal patterns at the retinal region after progressing the thermocouple 0.1 cm from the sclera while the equithermal level of B.L. and cornea were found at depths of 0.9 and 1.7 cm, respectively.
The measured isothermal patterns of normal chicken eye, immediately after decapitation, at room temperature, is shown in fig 2. From this figure it is obvious that the cornea temperature was almost exactly equal to room temperature and as we proceed inside the eye, the temperature increased. The measured temperatures of the cornea, B.L. and retina showed a marked decrease with time after decapitation (fig 3) and then they became constant. This is achieved after 30+ 5 min. For this reason, all records were carried out after the passage of this period.The temperature-time relationship (fig 3) could be exploited for the determination of the thermal conductivities of the Investigated ocular tissues as follows:The heat flowing in unit time (dQ/dt) into a tissue of cross sectional area A and thickness dx is simply given by:
K A dTsr (1)
where K is the thermal conductivity of the tissue, dx is its thickness and dT is the temperature change across the tissue thickness.After the eye dissection, the temperature of each ocular tissue declined with time due to the loss of heat from the tissue to the surrounding (fig 3) and the quantity of heat loss is given by:
Q = m c dT (2)
where dT is the temperature difference between the tissue and its surroundings, m and c are respectively the mass and heat capacity of tissue under investigation. The mass m is calculated from the equation: m = Q/3"C ra .dx ( El-Behairy, 1992) where r is the radius of the eye (considering the eye is a sphere of radius r) and P is the tissue density.Therefore, equation (1) can be written in the form:

Third Radiation Physics Confr Al-Minia, 13-17 Nov., 1996
me dTdt K A dT
dx (3)
Using the obtained data(table 1), the slope dT/dt, and the values of specific heat c and density of ocular tissues, f , suggested by Lagendi jk, 1982 and Scott, 1988 (table 1), K could be calculated and given in the table.
Table (1) : eye parameters used for calculating the thermal conductivity (K) of ocular tissues.m. A, dx, c and f are respectively, the mass, cross- sectional area, thickness, specific heat and density of ocular tissues.
Parameter cornea lens retinac(J/g°C) 4.178 3.997 4.178 (Lagendijk,1982)f(g/m3) 1050 1050 1050 (Scott,1988)■ (g) 0.22 0.195 0.134dT/dt(°C/sec) 0.35 0.25 0.17A (cm3) 0.47 0.31 0.62dx (u) 350 400 250dT/dx(°C/u) 0.0016 0.0015 0.006K (W/m“C) 0.5+0.007 0.364+0.003 0.073+0.005
The obtained results of K are in agreement with those given by Lagendijk 1982 and Scott 1988 for rabbit and human eyes. This finding greatly supports the validity of the present method and accordingly, it could be used to detect any changes in the ocular temperature distribution when the eye is exposed to any thermal effect as that in case of argon laser.
After 30 min of the bird decapitation, the temperature distribution in the heated( 25-44aC) and cooled (down to 1 °C) eyes was measured. Fig 4 showed the variation of the measured intraocular temperature from the normal values. From this figure, it is clear that the corneal temperature was an important factor for determining the magnitude of intraocular temperature rises since the cornea was in close contact tiith the water bath, and its temperature was exactly equal to its temperature while the change in other intraocular temperature occurred due to conduction.
Using equation (3), it was also possible to calculate the thermal conductivity of ocular tissues from the measured temperature distribution of the heated eyes by studying the temperature decay measured after the heating water bath has been stopped while the cornea 1 temperature was maintained at room temperature (fig 5). In this figure the temperatures initially falls sharply, and the normal temperature distribution restored after about 30 min. In

this case,the obtained results of thermal conductivity ot cornea, lens, and retina are respectively 0.51, 0.365 & 0.077 W/m°C which are closely equal to those calculated in the last section (table 1 ) and again supports the sensitivity of the present method. The results also indicated that the intraocular temperature distribution are greatly affected by the surrounding temperature. These temperature variations would essentially been expected to disturb retinal neurons and glial cells and their functional interactions via synapses and this disturbance must therefore reflected on the ERG records. Accordingly, the next step will concentrate on checking the eye functional state by studying the characteristic parameters of ERG records under such temperature variations.
Pig 6 showed typical examples of ERG records of normal, heated, and cooled eyes at a range of temperatures from 25-42°C for heating conditions and 25-1. 8°C for cooling conditions. It is clear that the b-wave amplitude, duration and latency were strongly temperature dependent as demonstrated in Fig 7 & 8. The b-wave amplitude and duration increased with temperature rise over room temperature until 38°C and then it declined for higher temperatures while the latency showed a systematic decline with tem- peraure. This behaviour was similar to those found in isolate carp retina by Armington and Adolf, 1984 and in rat retina by Ahmed et al 1989 and have reflected temperature effects on the inner retinal neurons and/or Muller cells activity from which the b-wave originates.The obtained results have indicted that the b-wave of the ERG
is a temperature dependent: its amplitude, duration and latency are quite sensitive to temperature variations of the eye. This finding will be exploited for the detection of the laser thermal effects on the retina under different conditions of P and t at constant dose, as mentioned above. This would, certainly help for exploring the linearity behaviour of the reciprocal variations of P and t at constant laser dose.2- Ocular temperature distribution and ERG records during laserirradiation:Table 2 summarized the temperatures, measured at cornea (T0),
behind lens (Tat.) and ret ina(T,), for normal control and laser irradiated eye, at constant doses of 7.2x10= & 260x10= W.s/mm= with different values of laser power densities(P) and exposure time (t), in case of one and five laser shots. Each temperature
J71 UL Third Radiation Physics ConfH Al-Minia, 13 -17 Nov* 1996
o »*■*

value in the table represents a mean o£ those measured from five eyes with a standard deviation in the range of ± (0.002-0.005 °C). From these results it is clear that, although the laser dose was constant, there was a pronounced temperature variations in intraocular tissue with P and t. The temperature rise is more pronounced in case of retinal tissue, while no significant change was found in cornea temperature. This is due to the fact that the argon laser is completely absorbed in the pigment epithelium which Is in close contact with the retina ( Mackenzie, 1990). The elevation of lens temperature is due to heat conduction from retinal tissue to other adjacent ocular tissues. Accordingly, from the obtained results it was clearly noticed that the intraocular temperature rises, in case of laser irradiation, are mainly depended on laser total dose. However, when the dose is kept constant, then the number of shots, the exposure time as well as the power density are found to be important factors for determining the magnitude of temperature rise which is found to be highly affected by the exposure time. This Indicates a nonlinear behaviour of argon laser effects on intraocular temperature rise.
Table 2The temperature of cornea(T„), behind lens (TDl) and retina (T«-) of normal control and laser irradiated eyes at constant doses of 7.2 x 10⁻³ & 260 x 10-3 which was achieved using different power densities (P) and exposure time (t) in case of one and five laser shots.
PlTOC Third Radiation Physics Conf* Al-Minia, 13 - 17 Nov* 1996
one shot f ive shotsDose P t To Tdl Tr Tbl T,W.s/mm3 (W/mm3 ) (s) “»C) <”C) *°C) <0C) «"C)control — - 23 23.5 25 23.5 257.2 x 10"3 .048 . 15 23 23.5 25 24.1 26
.024 .3 23.05 23.7 25.8 24.2 26.3
.012 .6 23.1 23.8 26 24.25 26.45
.006 1.2 23.15 23.29 26.5 21.4 26.65260 x10⁻³ 1 .73 . 15 23.08 24 26.8 24.2 27.8
.87 .3 23.11 24.05 27.3 24.4 29.3
.43 .6 23.13 24.11 27.8 24.6 30.8
.21 1.2 23.14 24.15 28.3 24.7 32.1
PlTOC Third Radiation Physic* Conf* Al-Minia, 13 - 17 Nov* 1996
Based on the above finding, and in case of argon laser irradiation, determination of thermal conductivities of ocular tissues could be possible.The control equation which describes one dimensional radial heat flow in an homogeneous medium is:
T 1 -fcT 1 -bT7> ra r %r o- T>t
where T is the temperature at time t and position r and is the thermal diffusivity.This equation, first suggested by Pennes (1948) and modified for heat transfer in biological tissues by LagendiJk,1982, Wilson and Spence, 1988 and Liang et al., 1991 ) is still used to get the thermal conductivity of the biological tissues. Here, we use the equation of Liang et al., 1991 because of its simplicity for application in case of ocular tissues.When the medium has uniform initial temperature T* and a constant power q is applied to the center line source, equation (4) gives:
T-Ti q4 rr K E. r”
4 o<-1 (5)
where K is the thermal conductivity of medium and Ei(- r*/4 t) is the exponential integral function.Equation (5) may be approximated with an error of less than 1% by the following expression:
T-Ti = g_3^_[ln(!^) _ % ] (6)
where % = 0.5772 (Euler constant).By the differentiation of equation (6), we get
= 4& dTd in(t) ) (7)
From equation (7) and using the results of the present work represented in table 2, a linear relationship between temperature and In t was constructed ,for each laser dose, as shown in fig. 9 A 10. From the slope of these curves, K can be calculated for the lens and retina and found to be, respectively, 0.373 +. 0.002 A 0.077 + 0.001 W/m°C and which are very close to those previously obtained in case of normal and heated eyes.

The obtained results clearly Indicated that, during laser irradiation of the eye, the retinal temperature was raised from 1-8 °C above normal. In order to check the retinal functional state accompanying these effects, the ERG was recorded under such laser conditions. These records, together with temperature measurements of the retina, will help for achieving the aim of the present work of determining whether the exposure time or the power density of laser be the most important parameter which could heat the retina to the desired temperature suitable for photocoagulation and still keep the retinal function well, after treatments. This will throw light on the previous finding (last section) for proving the nonlinear behaviour of P and t at constant laser dose. Accordingly, the ERG records and retinal temperature are measured during exposure of the eye to laser irradiation at constant doses of 7.2x 10-" and 260x10-" W.s/mm" using different P and t, as mentioned above. The variations of the b wave amplitude and durations recorded from laser irradiated eyes with the used laser parameters, are given in table 3. From these data, it is clear that the variations of b wave amplitude and durations depend on the total laser dose energy. However, a marked increase of both amplitude and duration was found when t was prolonged while using a small P such that P.t is always constant. Such behaviour of changes of b-wave amplitude and duration with P and t at a constant laser dose energy is consistent with that of the above mentioned variations of intraocular temperature when applying the same laser exposure conditions (Table 2). This finding, again, verifies the non-linear behaviour of argon laser effects on retinal activity and so on its function when using laser doses similar to those used in retinal diabetic retinopathy.
Taking together these findings of the variations of b-wave amplitude and duration with P and t (at constant laser dose) and that of retinal temperature (table 2), at the same conditions, one can deduce a relation between the changes in b-wave amplitude or duration and retinal temperature changes (fig. 11 A 12). This leads to the conclusion that, during retinal treatments with argon laser (1-5 shots) using exposure parameters, in a manner simulating treatments of diabetic retinopathy, the retinal temperature was raised by 1-8°C and accordingly the b-wave amplitude and duration were raised stepwise with retinal temperature averaging 110 ♦ 10 uV/°C and 0.2 ♦ 0.01 sec /°C respectively.
JT rOC Third Radiation Phytic* Conf* Al-Minia, 13 - 17 Nov * 1996
\ •>1
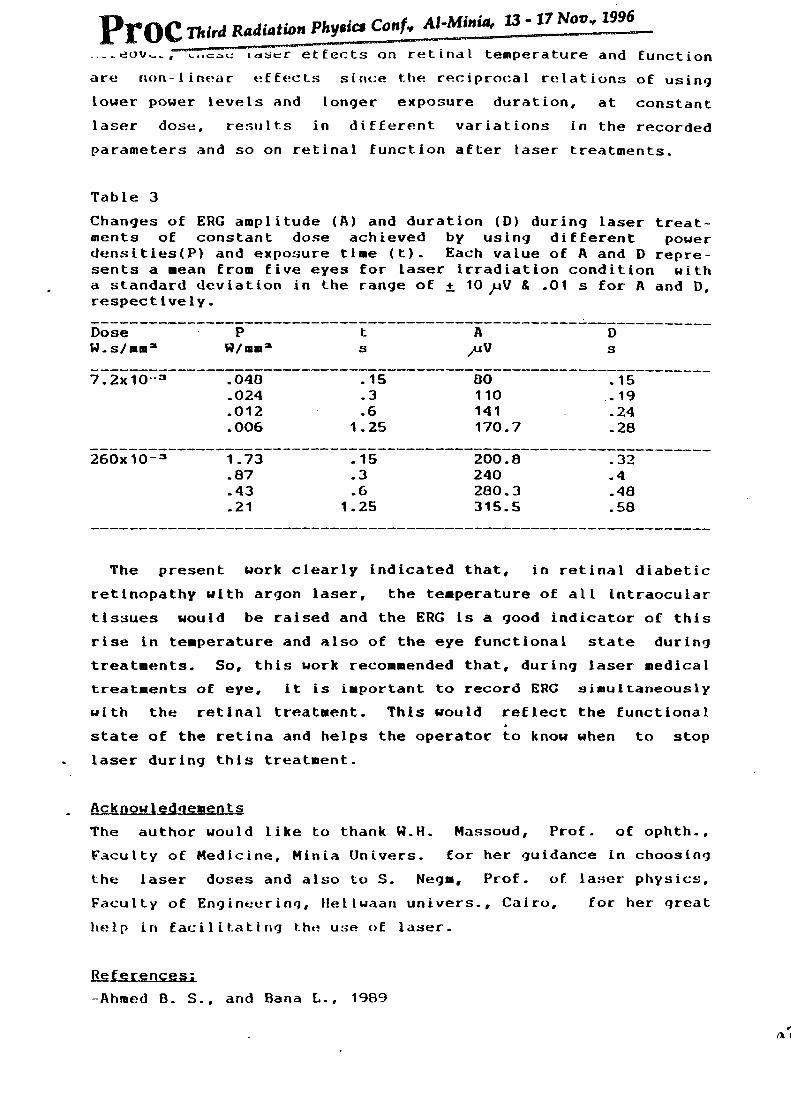
....eoVv.. , Cucau laser effects on retinal temperature and function are non-1inear effects since the reciprocal relations of using lower power levels and longer exposure duration, at constant laser dose, results in different variations in the recorded parameters and so on retinal function after laser treatments.
PrOC Third Radiation Phytic* Conf, Al-Minia, 13 - 17 Nou, 1996
Table 3Changes of ERG amplitude (A) and duration (D) during laser treatments of constant dose achieved by using different power densities(P) and exposure time (t). Each value of A and D represents a mean from five eyes for laser irradiation condition with a standard deviation in the range of + 10 yuV & .01 s for A and D, respectively.Dose P t A DW. s/mm31 W/iuma s /iV s7.2x10 3 .040 . 15 00 . 15
.024 .3 110 .19
.012 .6 141 .24
.006 1.25 170.7 .28260x10-= 1 .73 .15 200.8 .32
.87 .3 240 .4
.43 • 6 280.3 .48
.21 1.25 315.5 .58
The present Work clearly indicated that, in retinal diabetic retinopathy with argon laser, the temperature of all intraocular tissues would be raised and the ERG is a good indicator of this rise in temperature and also of the eye functional state during treatments. So, this work recommended that, during laser medical treatments of eye, it is important to record ERG simultaneously with the retinal treatment. This would reflect the functional state of the retina and helps the operator to know when to stop laser during this treatment.
AcknowledgementsThe author would like to thank W.H. Massoud, Prof. of ophth-, Faculty of Medicine, Minia Univers. for her guidance in choosing the laser doses and also to S. Negm, Prof. of laser physics, Faculty of Engineering, Hellwaan univers., Cairo, for her great help in facilitating the use of laser.
References:-Ahmed B. S., and Bana L., 1989
JP^fOQ Third Radiation Phytics Confv Al-Minia, 13 • 17 Nov* 1996
Effect of elevation of body temperature on the electroretinogram of the rat.Int. J Hyperthermia, 5, 6, 675-682.
-Armington J.C. and Adolph A.R. 1984 Temperature effects on the e1ectroretinogram of the isolated carp retina.Acta ophthal. 62,498-509.-Beilina J.H. and Seto Y.J. 1980 Pathological and physical investigation into C02 laser- tissue interaction with specific emphasis on cervical interaepithelial neop1 asmLasers Surg. Med. 1 47-69
-Carruth J A S and Mckenzie A.L., 1986 Medical lasers. Science and Clinical applications Adam Hilger Ltd., Bristol and Boston.-Eichler J., Knof J., Lenz H., Salk J. and Schafer G., 1978 Temperature distribution in tissue during laser irradiation Rad. and Environm. Biophys. 15, 277-287 -El-Behairy, 1992Reinforced concrete design handbook Faculty of engineering, Ain shams edit.
-El-Sayed E.M., Talaat, M.S. and Sal lam S.M. 1993 Safety with laser during retinal therapy:an electroretinographic study.Egypt. J. Physic. 24, 1-2, 87-100 -Lagendijk J.J.W 1982A mathematical model to calculate temperature distributions in human and rabbit eyes during hyperthermic treatment.Phys. Med. Biol.. 27, 11, 1301-1311 -Liang X. G., Zhang Y.P., and Wang G.J. 1991 A convenient method of measuring the thermal conductivity of biological tissue.Phys. Med. Biol. 36,12, 1599-1605 -Mackenzie, A. L. 1990Physics of thermal processes in laser - tissue interaction Phys. Med. Biol., 35.9, 1175-1209-Massoud, W.H. Department of ophthalmology. Faculty of medicine, El- Minia Uni vers. (Personal communication)Pennes H. A. 1948J. Appl. Physiol. 1, 93-122
PrOC Third Radiation Phytica Comfy Al-Minia, 13-17 Nov., 1996^ ^ ^ ■■■■■ „ . „ 1k «• 41 ■ i • i yo
Lasers in ophthalmology: An update Laser Focus/Electro-Optics, 76,(84-103)
-Scott J.A. 1988A finite element model of heat transport in the human eye Phys. Med. Biol. 33, 2, 227-241-Smiddy W.L, Fine S.L. and Quigley II.A. 1989 Retinal laser photocoagulation. Effect of energy rate Retina,9,3, 193-198-Van Breugel H.F.I. and Dop Bar ,1992 Power density and exposure time of He-Ne Laser Irradiation Are more important than total energy dose in photo-biomodulation of human fibroblasts in vitro Lasers in Surg, and Med. 12, 528-537
-Wilson S.B. and Spence V. A., 1988 A tissue heat transfer model for relating dynamic skin temperature changes to physiological parameters.Phys. Med. Biol., 33,8, 895-912
Figure CaptionsFig. 1: Representation of the experimental set up.
Fig.2: Isothermal patterns measured from normal chicken eye immediately after decapitation.
Fig.3: Temperature variations of cornea (c), behind lens (B. 1.. ) and retina (r) with time after decapitation, each point represents a mean from 5 eyes at room temperature of 23°C.
Fig.4: Temperature variations of intraocular tissues, from their normal values( pointed as 0), in case of heating or cooling of the eye. The negative sign indicates a decrease from normal values.
Fig.5 Temperature decay of eye tissues measured after the heating water - bath has been stopped while the cornea was maintained at room temperature of 23 °C.
Fig.6 Examples from dark adapted ERG records with variations in eye temperature.

PrOC Third Radiation Physics Confy Al-Minia, 13-17 Novv 1996
Fig.7 Changes of b wave amplitude with variations in eye tern perature.
Fig.8 Changes of b-wave duration and latency with variations in temperature of the eye.
Fig.9 Relationship of temperature and In(t) for each laser doi in case of lens.
Fig.10 Relationship of temperature and ln(t) for each laser dos in case of retina.
Fig. 11 Changes of b-wave amplitude and duration with retinal temperature at one shot of laser dose 7.2 x 10-= W.s/mm=
Fig.12 Changes of b-wave amplitude and duration with retinal tern perature at one shot of leaser dose 260 x 10= W.s/mm=.

PrOC Third Radiation Physics Conf* Al-Minia, 13-17 Nov., 1996
Argon laser source diaphragm
interface unitwater outlet
thermocouple for measuring corneal temp
recording electrode
chicken eve rubber film
incubator Line A
Ag - AgCI reference electrode
Computer system
Fig (I) : Experimental setup

P^rOC Third Radiation Physics Conf* Al-Mittia, 13 - 17 Nov., 1996
Cornea
Retina
Fig. ( 2) : Equithermal state of the chicken eye immediately after decapitation.
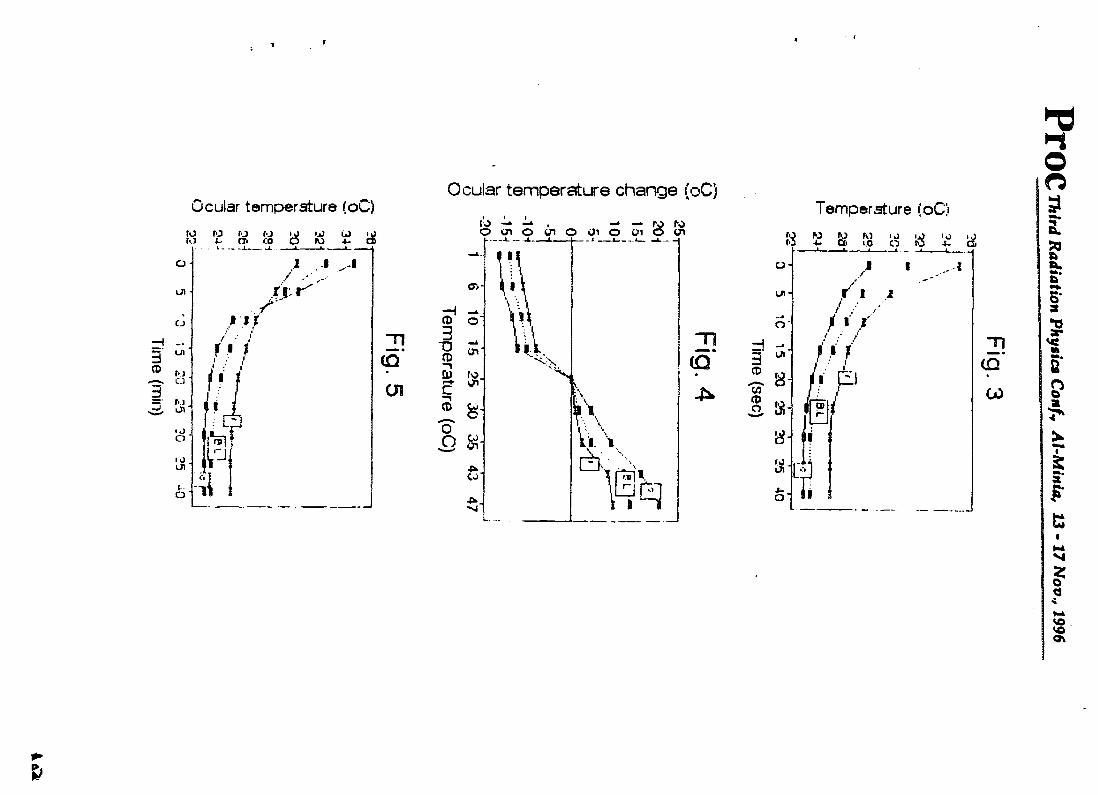
Time (m
in)
Ocular temperature (oC)
18 fOt- & a Id w ao -ui *CJ
UI ' ft)aK-
31cp*
01
Ocular temperature change (oC)
ro — — . -‘—MM0ui0ijl0 0i0 0ic5vi
L. ...
Temperature (oC)
S £ K % a 'rd d a1 ■ —L.
31<p"
w
&
Pl*OC
TAW
Radiation Physics Confr Al-Minia, 13-17 Nov., 1996

PrOC Third Radiation Physics Coi»/v Al-Minia, 13 - 17 Nov., 1996
References(1) Doerfel H. and Piesch E . Radiation protection Dosimetry . 19 (4): 233 - 234: (1987).(2) Mellon J.W, "Inorganic and theoretical chemistry " Text book, William Clowes and Sons Ltd , London Vol.2 -(I960).(3) Kernan R.P. , Cell Potassium , Appelton Century Crofts New York (1966) in : (IAEA - SM -158 / 28) (1973).(4) Ahman B. and Ahman G. Health Physics 66 (5). 503-512; (1994)(5) Anderson , E C. Ann. N Y Acad. Sci. 110: 189 (1963).(6) Rundo , J. Angers France 26-28 Nov. (1986 )
" Development in Nuclear Medicine" V 13 (1987) 19-027177(7) Lan,- C.Y , Weng , - P S. Health physics . V.57 (5) P.743-746. (Nov 1989)(8) Lebedeva G.D. Radiology 6, 556- 559 (1966).v9) Srivastava A., Denschlag H O Kelgerg O. and Urish K. Journal of radioanalytical and nuclr-ear chemistry , Articles , Vol. 138 , n° 1,165 -170 (1990).(10) Lengemann F.W. and CL, Comar . "Agricultural and public-health Aspects of Radioactive Contamination in Normal and Emergency Situations " . (1964)
'-sics Confy Al-Minia, 13-17 Nov., 1996
UPTAKE AND RELEASE OF 134Cs AND 137 Cs AND ITS RELATION TO«°K CONCENTRATION IN RATS.
M. W.A. Essa, H. H. M. Hussein A.T. Abdel Fattah, and W.M. Abd El Baky
• Nuclear Research Center, Atomic Energy Authority
ABSTRACT
Studies were performed to examine the effect of accumulation of Cs-134 & Cs-137 on the concentration of K-40 in white rats. Five male and Five female rats were fed with normal diet for four weeks. After that, the ten rats were fed with macaroni contaminated with Cs-134 (116 Bq/ Kg) and Cs- 137 (318 Bq/Kg), besides the normal diet. Animal whole body counting was done once weekly for four months using HPGe and multichannel analyzer. The results showed that the uptake of cesium increases until saturation was reached after about one month to values 60, 65 Bq/Kg for Cs-134, and 200, 240 Bq/ Kg for Cs-137. Results show a decrease in K-40 concentration due to the replacement of potassium ions by cesium ions in the cell. After saturation, ietuing with radioactive diet was replaced by normal diet. A release of Cs-134 & Cs-137 was noticed with increase of K-40 concentration.
I
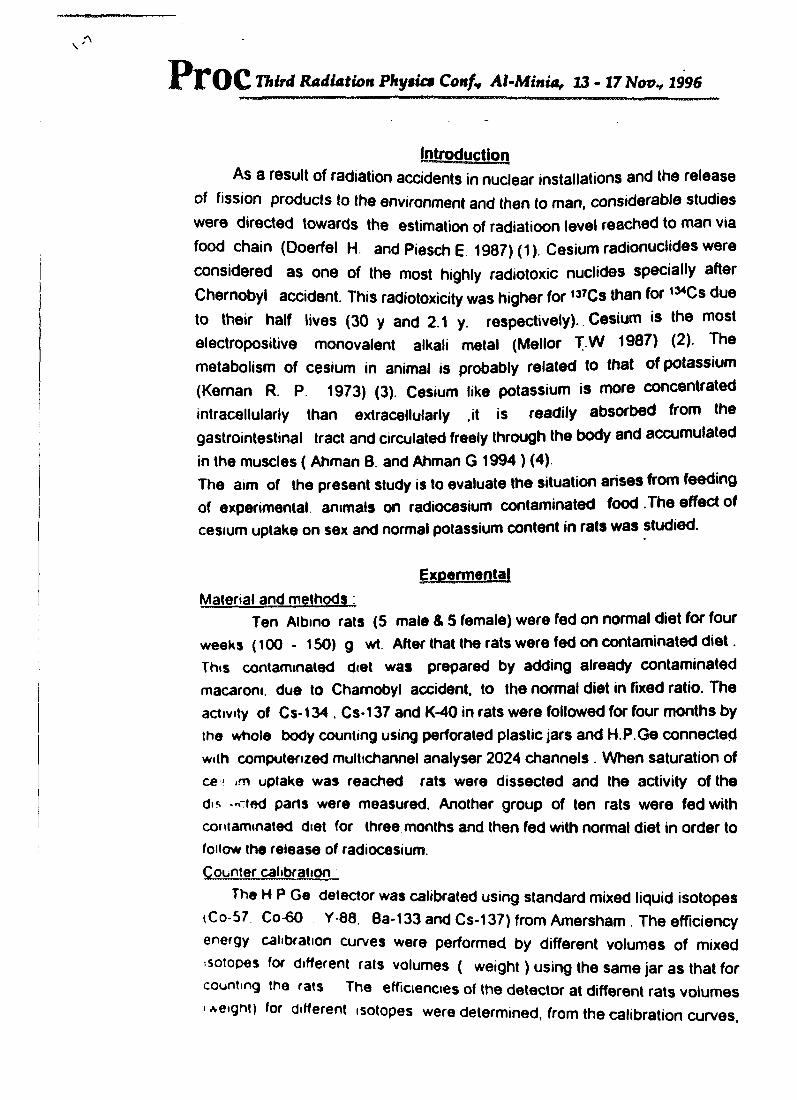
Third Radiation Phytict Conf* Al-Minia, 13-17 Nov* 1996
IntroductionAs a result of radiation accidents in nuclear installations and the release
of fission products to the environment and then to man, considerable studies were directed towards the estimation of radiatioon level reached to man via food chain (Doerfel H and Piesch E 1987) (1). Cesium radionuclides were considered as one of the most highly radiotoxic nuclides specially after Chernobyl accident. This radiotoxicity was higher for ,37Cs than for 134Cs due to their half lives (30 y and 2.1 y. respectively). Cesium is the most electropositive monovalent alkali metal (Mellor T.W 1987) (2). The metabolism of cesium in animal is probably related to that of potassium (Kernan R. P 1973) (3). Cesium like potassium is more concentrated intracellularly than extracellularly .it is readily absorbed from the gastrointestinal tract and circulated freely through the body and accumulated in the muscles ( Ahman 0. and Ahman G 1994 ) (4).The aim of the present study is to evaluate the situation arises from feeding of experimental animals on radiocesium contaminated food The effect of cesium uptake on sex and normal potassium content in rats was studied.
ExpermentalMaterial and methods ;
Ten Albino rats (5 male & 5 female) were fed on normal diet for four weeks (100 - 150) g wt After that the rats were fed on contaminated diet This contaminated diet was prepared by adding already contaminated macaroni, due to Chamobyl accident, to the normal diet in fixed ratio. The activity of Cs-134 . Cs-137 and K-40 in rats were followed for four months by the whole body counting using perforated plastic jars and H.P.Ge connected with computerized multichannel analyser 2024 channels . When saturation of ce - .m uptake was reached rats were dissected and the activity of the dis Tied pans were measured. Another group of ten rats were fed with contaminated diet for three months and then fed with normal diet in order to follow the release of radiocesium.Counter calibration
The H P Ge detector was calibrated using standard mixed liquid isotopes (Co-57 Co-60 Y 88 Ba-133 and Cs-137) from Amersham . The efficiency energy calibration curves were performed by different volumes of mixed isotopes for different rats volumes ( weight) using the same jar as that for counting the rats The efficiencies of the detector at different rats volumes -Aeignt) for different isotopes were determined, from the calibration curves,

Third Radiation Physics Confy Al-Minia, 13-17 Nov., 1996
and the absolute activity of different radioisotopes can be calculated as follows :
Cps
Efficiency x Intensity x rat wt in Kg
Results and Discussion
The concentration of ,34Cs , 137Cs and *°K in the diet and control rats are shown in table (1).
Table(1)
Activity Bq/Kg Cs-134 Cs-137 K-40
Contaminated dietControl rats
116 ± 10 318 ±21 73 ± 18107 ± 17
Uptake of Cs-134 & Cs-137 bv Albino rats.Fig. (1) showes the relation between the concentration of Cs-134 &
Cs-137 and K-40 with time for male and female rats during the feeding with radiocesium contaminated food. The results illustrate an increase in concentration of both cesium (134 & 137) linearly with time at the 1SL 20 days which are in agreement with the results obtained by Anderson E C. (1963)(5) that the concentration of potassium in the total body increases linearly from birth to 10 y for girl and 18 y for boys . After that cesium concentration increases slowly till it reaches saturation in male within about 60 days but in female it reaches maximum value at about 40 days and then decreases to saturation after 60 days. This maximum is due to the increase of biological H.L of cesium in female associated with prepubertal hormonal change Rundo, J. (1986). (6). At saturation the uptake of Cs-134 and Cs-137 in male is greater than that in female this is confirmed with the results obtained by Lan , C.Y. et al. (1989) (7). In the same time K-40 concentration decreases with time opposite to the uptake of cesium this might be due to the replacement of potassium by cesium This result is found to be in agreement

Third Radiation Phytic* Con/* Al-Minia, 13-17 Novv 1996
with Lebedeva G O. (1966) (8). and Srivastava et. al (1990) (9) that there is an inverse relation in the balance of cesium and potassium in water.The 134Cs and 137Cs contents in the different dissected organs are illustrated in table (2). These results indicate that kidney get maximum concentration of cesium mainly due to its function as the excreting organs , which agree with the results obtained by Lengeman F.W. et al . 1963 (10) , while fur get minimum cesium concentration.
Table (2)134Cs and 137Cs concentration in different
■ dissected organs i Bo/Ko )
Activity Bq/KgHeart Liver Lung Kidney Spleen Fur Limbs
Cs-134 147 75 74 174 120 11 134Cs-137 546 225 243 596 455 191 463
Release of Cs-134 & Cs-137 bv Albino rats:Bio-elimination curves of Cs-134 & Cs-137 for whole body rats are shown
in fig ( 2) . The results show that the effective half lives 22.55d & 22d for Cs-137 & Cs-134 respectively. The biological half life as calculated from the effective half life of 134Cs and 137Cs was found to be nearly the same (22.6 d). This result is in agreement with that obtained for cows, 20 d , by Lengeman F.W. et al. 1963 (10). Fig. (3) shows the increase in K-40 concentration (Bq/Kg) in rats as a result of Cs-134 & Cs-137 release by rats .
ConclusionExperimental results confirmed the metabolic relationship between
cesium and potasium in the rats There is an inverse relation in the balance of cesium & potassium concentration in body during the uptake and release of radiocesium by rats.lt was found that sex had a noticeable effect on the uptake and release of Cs-134, Cs-137 and K-40 . Cs-134 and Cs-137 were released by rats with the same biological H.L. 22 d.

Act
ivity
(Bq/
Kg)
Pl!*OC Third Radiation Physic* ConfH Al-Minia, 13-17 Nov., 1996
Time In day
Flg.(1): Radiation level (Cs-134, Cs-137and K-40) In Rats during Uptake process from Cntaminated food (q male and o female).

PrOC Third Radiation Phytic* Conf* Al-Minia, 13 - 17 Nov* 1996
-6-
Fig. (2): Release of Radiocesium in Rats
Time in day
Fig (3): K-40 Concentration in Rats during the Release of Radiocesium.

b-w
ave a
mpl
itude
chan
ges
b-w
ave a
mpl
itude
chan
ges
PrOC Third Radiation Physics Confy Al-Minia, 13-17 Nov., 1996
180170-160-150-140-130120
110-1100
go„i
Fig. 11Laser close 2.7 x 10⁻³ W s mm2
j duration
, amplitude
80 105 135 170.7
r028
-028
-024
022
0 2
013
-019l■*01 4
Retinal temperature changes
u)
Fig. 12Laser dose 260 x 10-3 W s/mm2
320i
300-
280-
260-
240-
220-
200-
arnpiitude U'1"
/r
y-/
md1.8 23 28
T*31
-0 55
-0 5
■045
0 4
■0 35
0 3
Retinal temperature changes
b-w
ave d
urat
ion
chan
ges
b-w
ave d
urat
ion
chan
ge;
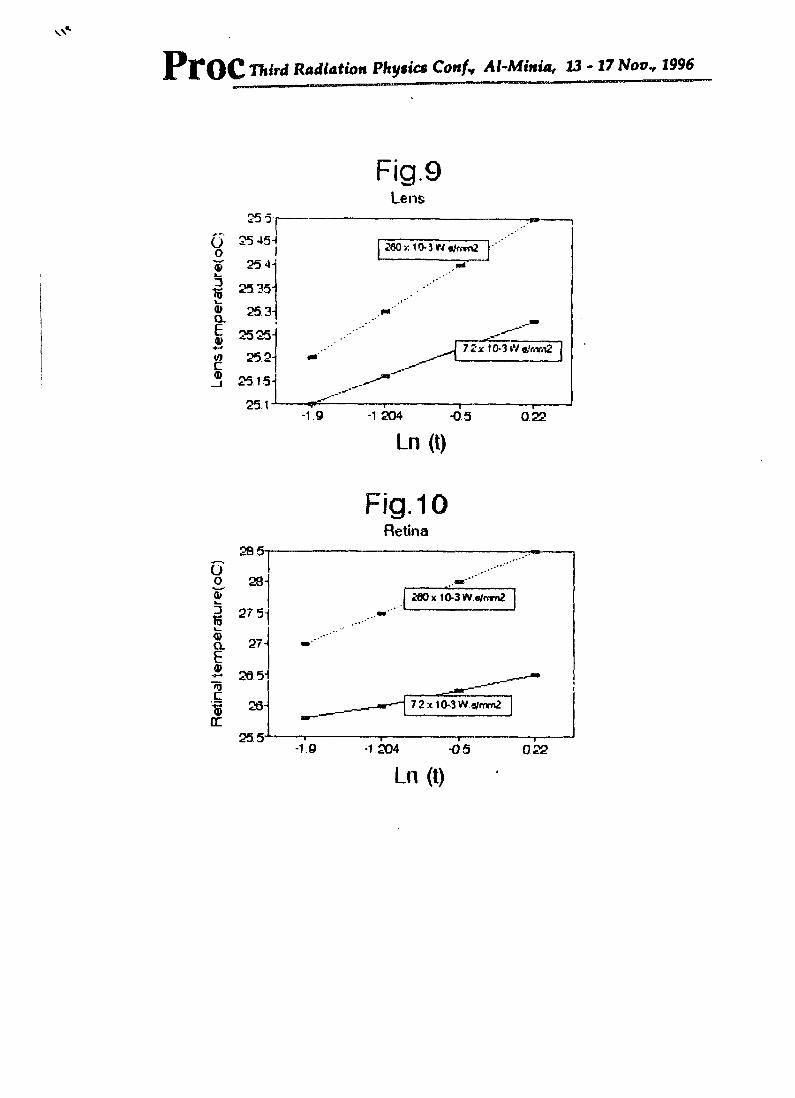
V'v
PrOC Third Radiation Physics Conf, Al-Minia, 13-17 Nov, 1996
Fig.9Lens
25 45
2525-17 2x 10⁻³ iVft'nviT2
252-
2515-
-1 204
Fig. 10Retina
200 x 10-3 W.«/mm22751
72x10-3Ws/mm2
-1 204
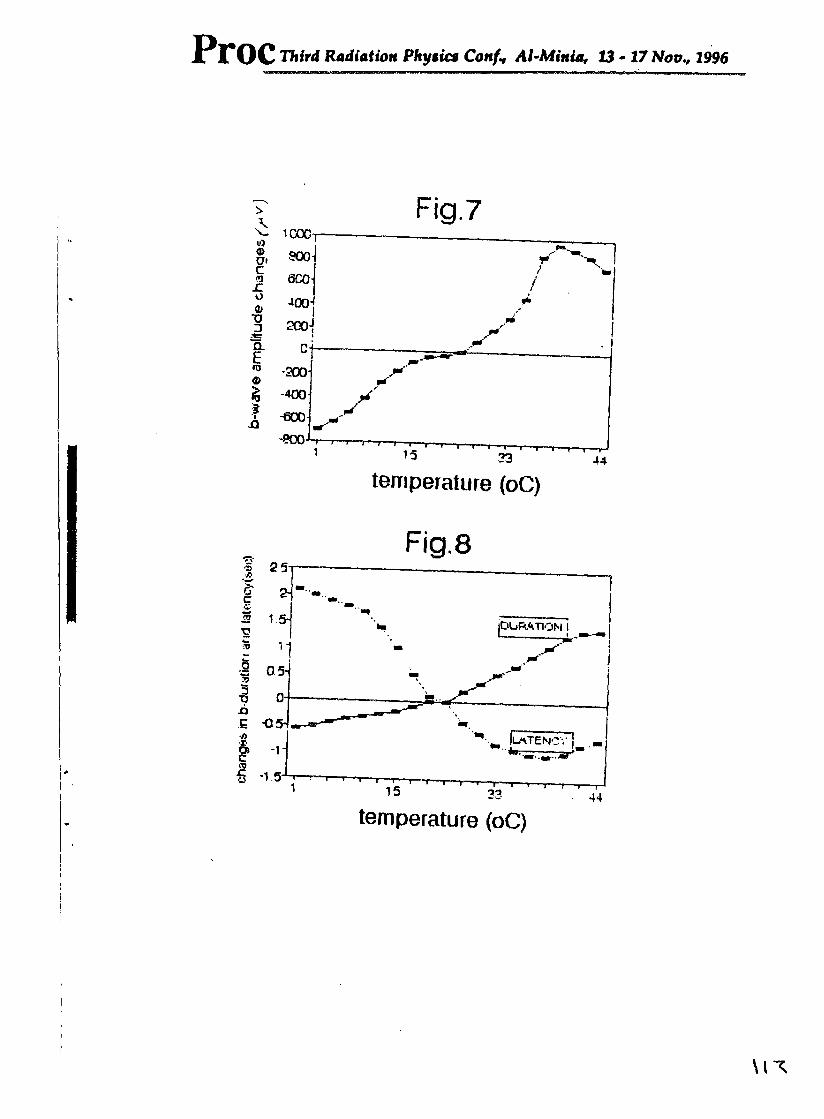
chan
ges i
n b-
dura
tion a
nd la
tenc
y (se
c)
Third Radiation Physics ConfH Al-Minia, 13-17 Nov., 1996
Av>©
-CO©
3
I©
Fig.71000! ----------------- —sj 7^
:i y ,
n-i------------------ J* ■
-200-
-4004 S-600
-800-wt
' '5 33 ' ' ' ' ' 4<
temperature (oC)
Fig.82 5
*'■_ (latency j•1-
temperature (oC)

Proc Third Radiation Physics Conf* At-Minia, 13-17 Novv 1996
500 uV0.5 sec
25 °C
FIG.6
uV
sec
25 =c
19 "C
5.8 "
1.8 °C

PrOC Third Radiation Physics Conf* Al-Minia, 13 - 17 Nov* 1996
STRUCTURAL CHANGES OF COTTON SEEDS DUE TO FAST NEUTRONS-IRRADIATION
, w.G. OsirisBiophysics Department, Faculty of Science, Cairo University,
Giza, Egypt.
ABSTRACT
The effect of irradiation with different fast neutron fluences in the range 105-100 n/cm2 were studied on one Egyptian cotton seeds (Dandara, Giza 31).
Both pre- and post-irradiated seeds were implanted and the effects of fast neutrons on the first generation were investigated through the use of: X-ray fluorescence analysis. Infrared spectral, combustion technique, analysis as well as scanning electron microscopy. The changes in cellulose and hemecellulose contents in the seeds relative to the unirradiated one were also detected
From the obtained results, it was found that significant structural changes are indicated which may be attributed to the variation in the internal mechanisms that occurred by the radiation effect on the structure of the seeds. In conclusion, irradiation with fast neutrons may cause genetic changes in seeds
v \ tc

PrOC Third Radiation Physics Conf* Al-Minia, 13 - 17 Nov., 1996
2
INTRODUCTION
The growth and development of plant Is dependent on light for either photosynthesis or photomorphogenesis which are facilitated by pigments in the tissues that absorb radiation of particular wavelength. In recent years, one of the interesting research work studied was the effect of ionizing radiation on higher plants.
Cotton represents one of the most important crops in Egypt. Also, it represents an important source of food protein and its textile fibres used by man despite the expanding use of synthetic fibres. Therefore, the economic interest in cultivation could be very great*1-2*.
Many investigators reported the biological effects of radiation on plants(3-5) and influence plant development and also affect plant tissue in culture*6-11). Little information are available on the effect of fast neutrons*12'1^)
The aim of the present work is to investigate the effect of fast neutron on the structure and elemental content of the first generation of cotton seeds through. X-ray fluorescence analysis, infrared spectral analysis, combustion technique, cellulose and hemecellulose contents as well as scanning electron micrography.
EXPERIMENTAL WORE
Air dried cotton seeds were taken from the first product of unirradiated pure Dandara (Giza 3D seeds which were grown in Upper Egypt. The seeds were obtained from the Agricultural Research Centre, Cotton Institute, Giza, Egypt. The seeds were screened for uniformity of size and irradiated with fast neutron fluences in the range lO^-io8 n/cm2
from 252cf spontaneous fission neutron source (manufactured by Radiochemical Centre, Amersham, England) with energy about 2 MeV at the Biophysics Department, Faculty of Science, Cairo University, Egypt. Immediately after irradiation, the irradiated seeds and the control ones

PrOC Third Radiation Physic» Con/v Al-Minia, 13-17 Nov* 1996
3
were implanted in the field. After harvest, seeds of uniform and nearly equal in size were taken for the used of different analyses.
For X-ray fluorescence analysis, dried samples were ground to a fine powder in agate mill, 500 mg from each was then compressed into a pellet under 15 tons/inch2 with boric add as backing material. An Or tec 6110 Tube Excited Fluorescence Analyzer (TEFA) was used for this analysis.
For infrared analysis, the samples were ground with 10:1000 times its bulk of pure KBr and the mixture pressed into a disc using a special mould and a hydraulic press. A PYE Unicam Spectrophotometer SP/100 (England) covers the range 4000-400 cm-1 was used.
For combustion technique and to determine the Carbon, hydrogen and oxygen percentage contents in the sample, a CHN-2400 P-E (Perkin - Elmer, USA) apparatus with accuracy ± 0 25% was used. The calculation of the percentages of carbon, hydrogen and oxygen in the samples from the combustion data were detected using the empirical formulae reported in Ref . (16).
For determination of the contents of cellulose, hemecellulose. ADF (cellulose + legnin) and NDF (cellulose + hemecellulose + legnin) in the seeds, a Micro Kjeldahl apparatus was used
The seeds from the first generation were cut in the middle by using very thin knife and the surfaces of their cross-sections were examined. The samples were attached to metal holders with an adhering substance and coated with gold in vacuum coating. For study of the microstructural characteristics of the seeds, a Scanning Electron Microscope (SEM) model Jeol 100S (Japan) was used. The SEM has a resolution power of 50 & and operating at accelerating voltage of 60 kV.

PrOC Third Radiation Physic* Confy Al-Minia, 13 - 17 Nov* 1996
4
RESULTS AND DISCUSSION
Table (1) represents the elemental concentration levels of aluminium (Al), phosphorous (P), sulphur (S), potassium (K), calcium (Ca), iron (Fe), copper (Cu) and zinc (Zn), expressed in count per second (cps) for the control (unirradiated) and irradiated seeds with 2 06 x 106 and 1.10 x 10® n/cm2 from the first generation. The percentage changes in the concentration levels of the detected elements in the seeds were also included in Table (1). The results indicated that, pronounced increase in Al, S, Ca, Cu and Zn together with remarkable decrease in P, K and Fe were detected. These increase and decrease In the concentration levels of the elements may be attributed to genetic changes may occur after the irradiation and implanted of the cotton seeds. In addition, membrane permeability of roots during growth may changed.
The infrared (IR) spectra of both the control and irradiated seeds from the first generation are represented in Fig. (1). The IR assigned groups*17) were recorded in the region from 4000 to 400 cm-1 and were given in Table (2). From the figure it is clear that fast neutron damage was reflected in band areas without or nearly little changes in band positions. The essential groups: C-H stretching at 2930 cm1, carbonyl group (C=H stretching vibration) at 1740 cm1 and N-H bending (amide III) at 1240 cm1, behave differently toward fast neutron irradiation. The damage is indicated by the changes in the optical density values (OD.) (Ref. 17), Table (3). (OJ). = log I0/I , where I0 and I are the total and recorded transmission % from the base line).
It is noticed from Table (3) that when the seeds irradiated with 3.46 x 10® n/cm2, the OJ). values decrease and then increase with increasing the neutron fluences up to 2.41 x 10⁷ n/cm2 in groups at band positions 2930 and 1740 cm-1 and then decrease toward the original values. At the band position 1240 cm1 for the N-H bending group, theO.D. values decrease firstly with fluence 3.46 x 10) n/cm2 and then gradually increase with fluences up to 1.1 x 10® n/cm2.

PrOC Third Radiation Physics Confv Al-Minia, 13-17 Nov* 1996
5
Table (4) represents the calculation of the percentage concentrations of carbon, hydrogen and oxygen from combustion data of the seeds from the first generation. Fig. (2) shows the variation of the percentage changes in carbon, hydrogen and oxygen as functions of neutron fluences. It is clear from Table (4) and Fig. (2) that the carbon and hydrogen percents increase while oxygen percent decreases, with neutron fluences up to 2 00 x 10* n/cm2. Reverse directions were observed and the values of carbon, hydrogen and oxygen percents return towards the control ones. The observed changes in the combustion data confirm the changes obtained and observed in Fig. (2) and Table (3) which means that change in the composition of the cells may cause and this indicate genetic changes may occur.
Table (5) illustrates the cellulose, hemecellulose, ADF and NDF percentage contents In the seeds from the first generation. Fig. (3) shows the variation of the percentage changes in cellulose, hemecellulose and NDF percents as functions of neutron fluences. It is noticed from the table and the figure that, legnin % equals zero in all samples, and the hemecellulose and NDF percents firstly increase by about 57.5 and 12.0%, respectively, when the seeds were irradiated before implanted with fluences up to 2.00 x 10⁶ n/cm2. With increasing the fast neutron fluences up to 1.1 x 10⁸ n/cm2 about 44.1, 34.1 and 41.9% in cellulose, hemecellulose and NDF percents were detected, respectively.
Figure (4) shows the scanning electron micrographs of the cross section surfaces of the first generation seeds. It is clear that serious changes can be observed and less densities with different shapes were also shown The control seeds shows homogeneous distribution while the irradiated seeds indicate random distribution (2.08 x 10⁶ n/cm2) and the structure is opened for sample with fast neutron fluence 11 x 108
n/cm2. It is also indicated that from the SEM photos, significant structural change was observed and confirmed the observed data shown in Table (5) This may be attributed to variation of the internal mechanisms that occurred by the effect of radiation on the structure of the seeds.
PrOC Third Radiation Physics Conf* Ai-Minia, 13 - 17 Nov* 1996
6
CONCLUSION
From toe results obtained, it may be concluded that
1. Changes in toe capability of toe functional group due to toe effect of fast neutrons up to 106 n/cm2 were occurred. So, enhancement of photosynthesis process was caused. Therefore, increase in some elemental concentration levels and decrease in another elements (Table 1) as well as increase in toe values of the optical densities (Table 3) were obtained. Besides, changes in carbon, hydrogen and oxygen percents; cellulose and hemecellulose percents contents were also detected (Tables 4 and $)
2. When the neutron fluences increase up to 108 n/cm2, deformation of seeds may present and breakdown of enzymes and cellulose percent as well as inhibition of photosynthesis process and, also, change in toe membrane permeability in toe absorption of water through toe roots, were occurred.
3. The SEM photos show that fast neutron fluences may cause an improvement of some chemical properties of the produced seeds. Significant structural changes were also shown and variation in the macro- and micromolecular structure may occur.
PrOC Third Radiation Phytic* Conf» Al-Minia, 13-17 Nov-, 1996
7
REFERENCES
(1) L. Verschracge, Cotton Fibre Impurities, Interscience Publishers, Inc., N Y , Vol. 3U949).
(2) J.H. Martin, W.H. Leonard and D.L. Stamp. Principles of Field Crop Production, MacMillan Publishing Co., Inc., N Y. (1976), Ch. 33.
(3) R D. Brock, Radiation Botany 10,209 (1970).
(4) V. Kovacs, E. Viragh, E. Kocsis and St.B Gyurjan, Biochem. et Biophys. 12(1), 49(1977).
(5) SM. Xu and WN. Zhao, Application of Atomic Energy in Agriculture, No 4, 34 (1964).
(6) T. Murashige, Ann. Rev. Plant Physiol. 25, 135 (1974).
(7) YM. Atta, MA Megahed and M. El-Moghazi, Agricultural Research Review 60(9), 33 (1962) and references therein.
(6) N. Gopalaswamy, S. Subramanian and S. Palaniappan, Madras Agricultural Journal 73(5), 250 (1966).
(9) S.S. Duhoon and P V Verma, Indian J. of Agricultural Sciences 56(3), 164(1966).
(10) A. Nigmanov, V.M. Pak and ON. Kuznetsova, Uzbekiston -Biologi j a - Zurnali,No. 2, 3(1969).
(11) V.V. Gulin, VA. Kalchenko, Kh.-Yu. Saidov, MJt. Mirzaev and LT. Tsupina, Genetika (USSR), 25(2), 321 (1969)
(12) MA. Fadel, HA. Ashry and SA. Ali, Effect of Fast Neutrons on the Growth of the Broad Bean Seeds, Proc. of the l$t Int. Conf. on Low Cost Experiments in Biophysics, 18-20 Dec , Cairo University, Egypt (1989), p. 113

PrOC Third Radiation Physics Conf* Al-Minia, 13 • 17 Nov„ 1996
6
(13) u.M Elshihy and A S Monem, Production Salt Tolerant Line Through Plant Protoplasts Exposed to Fast Neutrons, Proc. of the 1st Int Conf. on Low Cost Experiments in Biophysics, 16-20 Dec , Cairo University, Egypt (1969), p 201.
(14) WG. Osiris, F A Moktader, K.E. Shady, S. Hammad, M AH. Shokry and F.M. Ter a. Changes of some Physical Properties of Row Cotton Produced by Gamma and Fast Neutron Irradiated Seeds, Proc. of the 3*“<J Conf. on Optical Spectroscopy, Laser and their Applications, 15* 17 Oct., National Research Centre, Egypt (1990), p 177.
(15) FM. Tera, K.E. Shady, H Higazy and WG Osiris, Changes in the Optical Properties of Row Cotton Produced by fast Neutron and Gamma-Irradiation of the Seeds, Proc. of the yd Conf. on Optical Spectroscopy, Laser and their Applications, 15-17 Oct., National Research Centre, Egypt (1990), p. 171.
(16) D.L. Pavia, G.M. Lampman and G.S. Kriz, Introduction to Spectroscopy, W.B. Saunders Company, Philadelphia, London, Toronto (1979)
(17) A L. Smith, Applied Infrared Spectroscopy, Fundamental Techniques and Analytical Problem-Solving, John Wiley and Sons, N Y (1979).
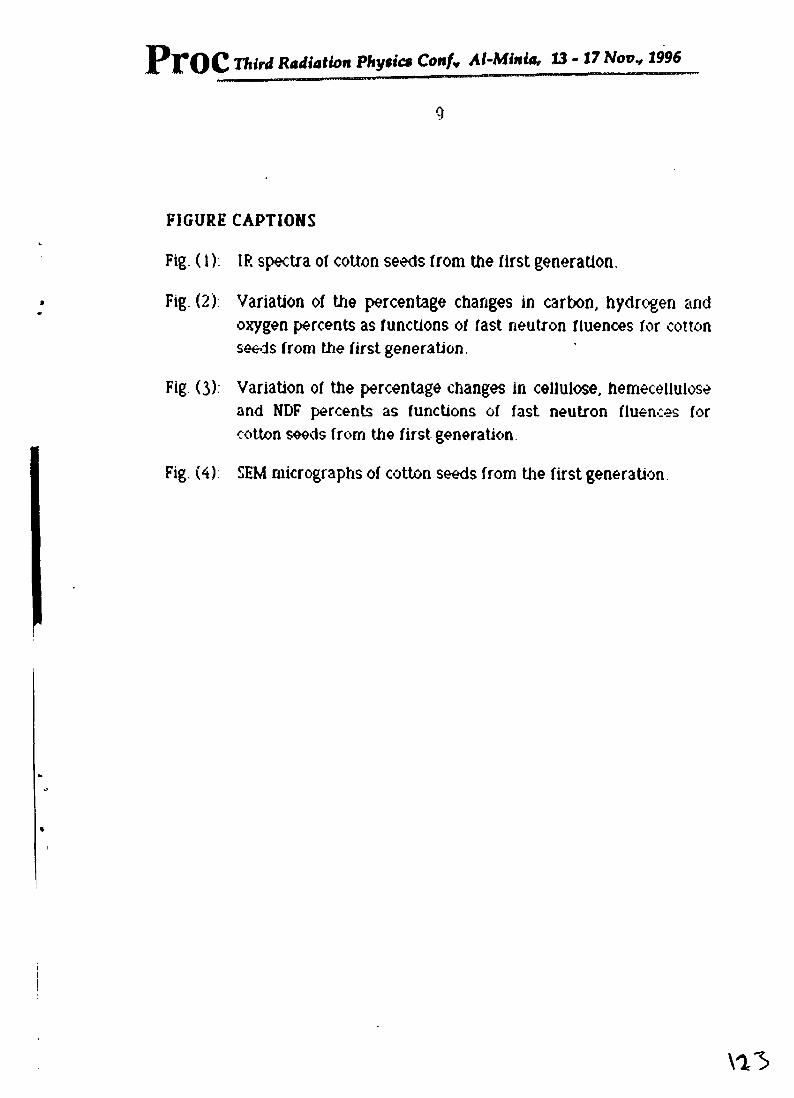
9
PrOC Third Radiation Phytic* Conf* Al-Minia, 13 - 17 Nov* 1996
FIGURE CAPTIONS
Fig. (l): IR spectra or cotton seeds from the first generation.
Fig. (2) Variation of the percentage changes in carbon, hydrogen and oxygen percents as functions of fast neutron fluences for cotton seeds from the first generation.
Fig (3). Variation of the percentage changes in cellulose, hemecellulose and NDF percents as functions of fast neutron fluences for cotton seeds from the first generation
Fig. (4) SEM micrographs of cotton seeds from the first generation
\i3

Third Radiation Physics Conf* Al-Minia, 13-17 Novv 1996
10
Table (1): The elemental amounts in cps as well as their percentage changes of cotton seeds from the first generation.
Element Control 2.06 X 10⁶
(n/cm2)Percentage
changel.lOx 108 (n/cm2)
Percentagechange
A1 35?6 6340 133 1 7.125 99 1
P 121.414 61.102 -497 57.096 -529
S 7972 446.214 462.2 475020 4956
K 696-461 771.263 -14.2 741.561 -17.5
Ca 161 156 265515 772 236716 461
Fe 46.452 36099 -17.9 30.432 -34-5
Cu 4.476 7.921 76.9 6757 956
Zn 17 662 20337 15 1 16674 57
The negative sign means that the values of irradiated seeds were less than that of the control ones

11
Table (2) Infrared absorption bands of the unirradiated (control) cotton seeds from the first generation.
PrOC TftM Radiation Phytic* Confr Al-Minia, 13 - 17 Nov* 1996
Wavenumber(cm*1)
Assignment
33603080
298029302560
1740167016451550153515151450
1405-1395
N-H stretch (amide A) and/or (OH ) hydroxyl group N-H stretch (amide B)C-H stretching groupC-H stretching groupC-H stretching groupCarbonyl group (C=H stretching vibration)C=0 stretching (amide I of random coil) groupC=0 stretching (amide I of B-type) groupN-H bending (amide II) groupN-H bending (amide II) groupN-H bending (amide II) groupCHz and CH-j bending groupCOO- group influenced by SO3-H3N' or SOg-NH
1320
1240114210601020
710645
Weak C-H bending groupN-H bending (amide III) groupCystine dioxide sulfonate groupR-SO2H vibration groupSulfoxide group (broad band)N-H out of plane groupAmide V (N-H bending) group
\13
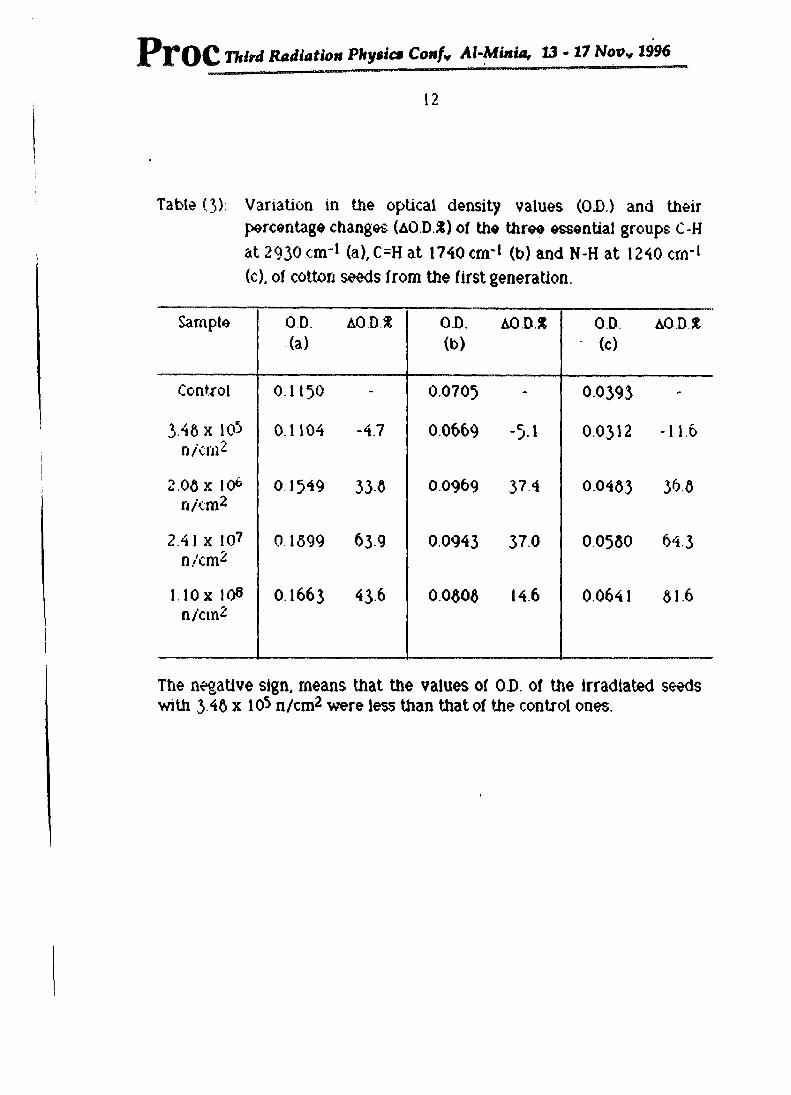
PrOC Third Radiation Physics Conf* Al-Minia, 13-17 Nov„ 1996
12
Table (3) Variation in the optical density values (OB.) and their percentage changes (AOD %) of the three essential groups C-H at 2930 cm-1 (a), C=H at 1740 cm*1 (b) and N-H at 1240 cm*1(c). of cotton seeds from the first generation.
Sample OD.(a)
A0.D.X OD.(b)
AOD.S OD(c)
AOD%
Control 0.11)0 - 0.0705 - 0.0393 -
3.46 x 10⁵ n/cm2
0.1104 -4.7 0.0669 -5-1 0.0312 -11.6
2.06 x 10* n/cm2
0 1)49 336 0.0969 374 0.0463 366
2 41 x 10? n/cm2
0 1699 639 00943 37.0 0.0560 64 3
1 10 x 108 n/cm2
0.1663 436 0.0606 14.6 0 0641 61.6
The negative sign, means that the values of OB of the irradiated seeds with 3 46 x 105 n/cm2 were less than that of the control ones.
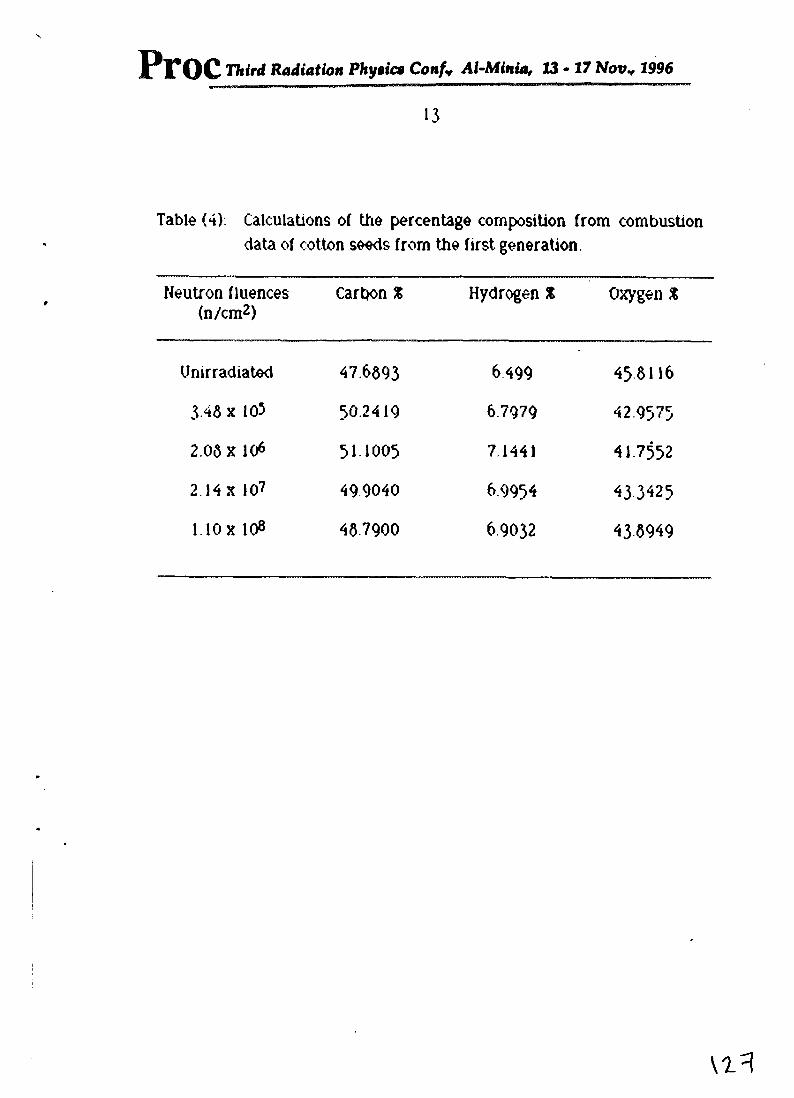
PtOC Third Radiation Phytic* Confy Al-Minia, 13 • 17 NovH 1996
13
Table (4). Calculations of tiie percentage composition from combustion data of cotton seeds from the first generation.
Neutron fluences (n/cm2)
Carbon % Hydrogen % Oxygen %
Unirradiated 47.6693 6499 45 8116
3 46 x 105 50.2419 6.7979 42.9575
2.06 X 10⁶ 511005 7.1441 41.7552
2.14x 10? 499040 6.9954 43 3425
1.10 X 10® 467900 6.9032 43-6949

PfOC Third Radiation Physics Conf* Al-Minia, 13-17 Nov* 1996
14
Table (5): Contents of cellulose, hemecellulose, NBF* and ADF** percents of cotton seeds from the first generation.
Neutron fluences (n/cm2)
Cellulose%
Hemecellulose%
NDF%
ADF%
Unirradiated 1.67 613 7.60 613
3 4dx 105 2.00 623 623 623
2.0$ X 106 2.63 6 17 660 6 17
2.14 X 10? 103 4.04 507 4.04
1 10 X 108 1.10 343 4 53 343
* NDF % = cellulose % + hemecellulose % + legnin %
** ADF % = cellulose % + legnin %
The values of legnin % in both unirradiated and irradiated samples are equal zeros, therefore, ADFS =cellulose %

4, l\
2.08
P^C Third Radiation Phytic* C
onfy Al-Minla, 13 - 17 Nov* 1996

V

PrO
C T
hird
Rad
iatio
n Ph
ytic
t Con
f* Al
-Min
ia, 13
-17 N
ov„ 1
996
Neutron fluence ,(n/cm )
£ -15
Cellulose 7.
50
25
0
-25
-50
-75
75
Perc
enta
ge c
hang
e
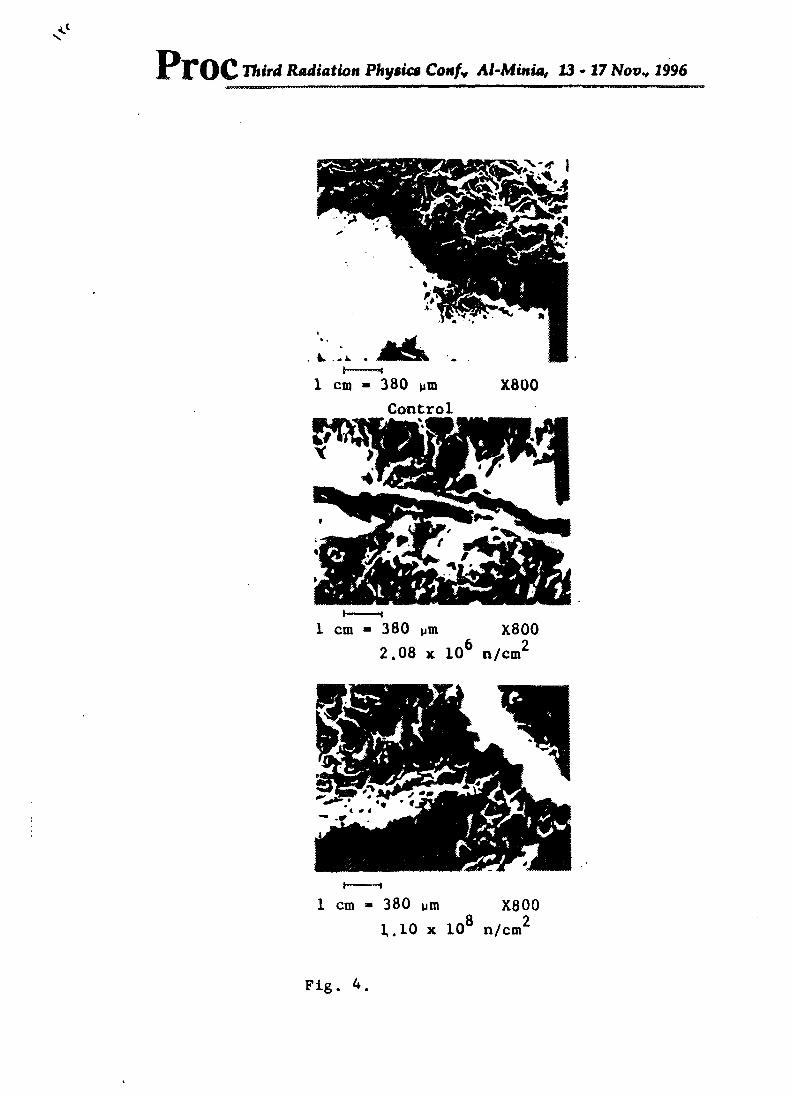
Proc Third Radiation Physics Confv Al-Minia, 13-17 Nov., 1996.............................................................................................. ......................................... .
Control
I--------- f1 cm - 380 um X800
2.08 x 10⁶ n/cm2
t"----11 cm = 380 um X800
1.10 x 10® n/cm2
Fig. 4.

Third Radiation Phytics Conf* Al-Minia, 13-17 Nov* 1996
KEYNOTE-LECTURES (1)
KL. 1- MATERIAL RESEARCH PROGRAMMEUSING NUCLEAR RADIATION AT THE INSTITUTE
OF ATOMIC ENERGY, POLAND
J. J. MUczarek
Institute of Atomic Energy, Swierk, Otwodt, Poland
ABSTRACT
The material research programme carried out at the institute of Atomic Energy, Poland, is based on extensive application of non-destructive methods. The thermal neutron scattering and Mdssbauer techniques are developed and used for determination of microscopic as well as coarse grained structure of materils.
The thermal neutron beams from the research reactors are main tools for materials investigations. The thermal neutron scattering laboratory provides the experimental possibilities in neutron diffractometry, inelastic scattering, neutron polarization analysis and small angle scattering.
The structure of new materials such as ionic conductors, alloys with high damping of mechanical vibrations, shape memory alloys, ferrites and magnetic alloys have been studied. The Inelastic neutron scattering allowed the studies of phonons and magnons in antiferromagnetic, invar and elinvar alloys.
The Mdssbauer spectroscopy was used in studies of biological materials, natural rocks, fuller!ties and Intel-metallic compounds. A variety of destructive methods for testing the construction materials in active state are available. The hot laboratory is equipped with standard instruments for testing the mechanical strength of radioactive materials and their internal structure. The programme of post-service inspection of the construction materials from the shut down reasearch reactor EWA (10 MW) is developed and planned to start
next year.
vs 3
•? t - /
Third Radiation Physics Co«/v Al-Minia, 13 - 17 Nov v 1996
K.L 2 LATTICE DEFORMATION STUDIES IN HIGH ENERGY IONS IMPLANTED SILICON BY MEANS OF
VARIOUS X-RAY METHODS
K. Wieteska*, W. Wierzchowski**, and W. Graeff***
•Institute of Physics, Warsaw University of Technology. ••Institute of Atomic Energy, Swtadt, Poland
*••(3 HASYLAB at DESY, Hamburg, Germany
ABSTRACT
The character of lattice deformation in silicon implanted with high energy a- particles and protons was studied with a number of X-ray methods. The experiments included double-crystal spectrometer method as well as single crystal section and projection topography realised both with conventional and synchrotron X-ray sources. The double-crystal rocking curve of samples investigated exhibited subsidiary maxima of variable periods corresponding to the diffraction fringes in the back-reflection double crystal topographs. A very good resolution of interference maxima was achieved using synchrotron multicrystal arrangement.
The rocking curves were systematically studied in different regions of the implanted area using the beam of a very small diameter. A number of results were obtained by means of synchrotron backreflection section topography using the beam front limited to 5 pm. The topographs revealed a characteristic sequence of stripes corresponding to the diffraction from the front and rear parts of the shot-through layer and the substrate. These topographs enabled the direct evaluation of implanted ion ranges. In several cases, the additional interference fringes were observed, especially in elastically bent smaples. All diffraction patterns observed were reasonably explainable assuming the lattice parameter depth distribution proportional to the vacancy-interstitial distribution coming from the Biersack-Ziegler theory. The theoretical rocking curves and density distribution in back-reflection double-crystal and section topographs were calculated using numerical integration of the Takagi-Taupin equations. In particular, the back-reflection section interference patterns in bent crystals were simulated. A good correspondence with the experiment was obtained when the vertical incoherence of the lattice in the substrate and in the shot-through layer was taken into account.
Third Radiation Phytic* Conf* Al-Minia, 13-17 Nov* 1996
K.L.3- ENERGY SITUATION AND NUCLEAR POWER
R. M. Megahld
Reactor and Neutron Physics Department Nedear Research Center A.ILA.
Cairo, Egypt
ABSTRACT
A brief general review is given concerning the requirements of power throughout history with an indication to the world capital reserves of energy. The energy released from the conversion of mass In chemical and nuclear processes is also discussed with comparative analysis between conventional fuel fired plant and nuclear power plant having the same energy output. The advantages and disadvantages arising from having a nuclear power programme are also discussed.
\<-\
Proc Third Radiation Physics Co#/v Al-Minia, 13-17 Novv 1996
X-Ray Diffraction Studies of Silicon Implanted with High Energy Ions
K. Wieteska*, W. Wierzchowski^, W. Graeff*
'institute of Atomic Energy, Otwock-Swicrk. Poland ^Institute of Electronic Materials Technology, Warsaw, Poland
^HASYLAB at DESY, Hamburg, Germanyi
AbstractThe character of lattice deformation in silicon implanted with high energy a-particles and protons was studied with a pumber of X-ray methods . The experiments included doublecrystal spectrometer method as well as single crystal section and projection topography realised both with conventional and synchrotron X-ray sources.
All observed diffraction patterns were reasonably explainable assuming the lattice parameter depth distribution proportional to the vacancy-interstitial distribution coming from the Biersack-Ziegler theory. The theoretical rocking curves and density distribution in back-reflection double-crystal and section topographs well corresponding to the experimental results were calculated using numerical integration of the Takagi-Taupin equations.
1. Introduction
In recent years ion implantation was introduced into technology of electronic devices. Many physical phenomena in the process of implantation are yet not well know and can be studied with X-ray diffraction methods, which were applied to the implanted layers in a number of papers (1-4).
In the present paper we confront results obtained with different X-ray methods in silicon implanted with light particles of high energies: 4.8 MeV a-particles and 1 and 1.6 MeV protons. Some of the discussed results were published in our former papers [5-7].
Good theoretical approximations of rocking curves and topographical contrast were obtained by numerical integration of Takagi-Taupin equations. The rocking curves were obtained from the form of equations assuming the solution dependent only on the vertical coordinate z:
(1)
The equations are integrated towards the surface starting from the top regions of the substrate with the values corresponding to the analytical solution in the semi-infinite crystal [8].
A modification of the program was applied for simulation of the fringe pattern observed in the double-crystal topographs. We assumed here that the lateral variation of lattice deformation is slow enough so locally we may still use equations (1). The simulations of back-reflection section images were performed using fine constant step close to 0.5 pm and the normal form of Takagi Taupin equations.

PrOC Third Radiation Phyiic* ConU At-Minia, 13 - 17 Novv 1996
A good correspondence between the theoretical and experimental curves was achieved approximating lattice parameter profile by a distribution of vacancies and interstitial computed using the TRIM-85 program published by Biersack and Ziegler [9].
The essential for obtaining a good approximation of fringes in back-reflection doublecrystal topograph and in the back-reflection section topography is taking into account the mutual displacement of the lattice of the shot-through layer with respect to the bulk crystal being the integral of the lattice parameter change. That was realised multiplying and Xf by a factor exp[±2n</(z)]where z is the co-ordinate perpendicular to the surface. The function
f{z) is proportional to the integral of lattice parameter change profile Ao(/):
(2)
o
2. Experimental
The experiments were performed on (I II) oriented silicon crystals implanted with 4.8 MeV a -particles and 1 and 1.6 MeV protons. The ion doses were 1 x 1016 cm*2 for a-particles and 1
x 1017 cm*2 for protons. In the most cases the significantly thick substrates in the range 1.5-6
mm were used and the radius of curvature was greater than 1000 m. The 1 and 1.6 MeV protons were implanted in two neighbouring regions of the same sample.
The samples were studied with different topographic methods and rocking curve measurements. Part of the experiments were realised using synchrotron radiation from the DORIS III storage ring operating with the energy of 4.455 GeV. The section experiments were performed both in transmission and reflection geometry with the wave front limited by 5 pm slit. The angle of incidence in back-reflection experiments was chosen to be equal to 8.5*
Each exposure revealed a number of reflections which were indexed using numerical program. The use of synchrotron radiation multicrystal arrangement enabled systematic recording of rocking curves from very small area* of implanted region.
3. Results
The rocking curves recorded using synchrotron multicrystal arrangement and small
diameter of the probe beam provided a very good resolution of the subsidiary maxima as may be seen in Fig. I. The higher dose causes larger separation between the main peaks due to the substrate and top region of the shot-through layer.
The theoretical curves reproducing the character of experimental ones were obtained by numerical integration of the Takagi-Taupin equations assuming the lattice depth distribution profile proportional to the vacancy-interstitial distribution profiles produced by Biersack-Ziegler program TRIM-85. It may be expected that both vacancies and interstitials should result the effective increase of lattice parameter. The reasonable angular positions of
subsidiary maxima were obtained assuming validity of cq. (2). The theoretical curve is shown
in Fig. 2.
2

Third Radiation Physics Conf* Al-Minia, 13-17 Nov* 1996
angle in degrees
Fig. 1. Experimental rocking curve for the I MeV proton implanted silicon taken with synchrotron triple-crystal arrangement with symmetrical 333 reflection of 1.35 A wavelength, recorded from 0.1 x
0.1 mm2 area.
angle in seconds
Fig. 2. The convoluted rocking curve taking into account 0.5" probe beam divergence obtained by numerical integration of Takagi-Taupin equation in 333 reflection of US A wavelength.
The double-crystal topographs exhibit interference fringes in the implanted area. The distance between fringes in the topographs is dependent on the angular position in the rocking curve and they became more dense close to the peak [6]. These fringes are also more distinct in the topographs taken with synchrotron multicrystal arrangement Two representative topographs of the sample implanted with protons are shown in Fig. 3. Here the sample is relatively flat and the formation of fringes is caused by inhomogeneous ion dose distribution.
In some cases when the distribution of the ion dose was regular it was possible to reproduce the character of the fringes using a kind of column approximation. It is illustrated in
Fig. 4 showing the comparison of photometric profile across the implanted area with a numerical simulation in 4,8 MeV a-particle implanted silicon. We assumed here the variation
of the ion dose described by a top fragment of the Gaussian curve.
3

Proc Third Radiation Physic* Confy Al-Minia, 13-17 Novv 1996
Fig. 3. Two representative topographs of the sample implanted with 1.6 (left part of the picture) and I VIeV protons (right part) taken with synchrotron triple-crystal arrangement. The topograph shown in a was taken at 26" lower angle than b. The numbers of fringes in the area implanted with I MeV energy are 31 in a and 33 in b respectively.
' ywv~wv\ ■
----------- ....—i---------------- 1 — i—■ i i----------------- —1_.
0 1 2 3 4 5 6Distance (mm)
Fig. 4. The comparison of photometric profile across the implanted area (a) with numerical simulation (b) in 4.8 MeV a-particle implanted silicon. The simulation was obtained assuming the
variation of the ion dose described by a top fragment of the Gaussian curve.
The synchrotron back-reflection section pattern representative for flat sample is shown m Fig 5. This topograph is characteristic for more sensitive reflection with higher indices. We may notice the strong line corresponding to the entrance of the beam into the sample and a complicated pattern corresponding to the vicinity of the buried layer. In this region a characteristic sequence of three black strips is seen. The first black strip (second from the top in the topograph) which is usually wide and intense is expected to be the direct contrast coming from the region with a significant lattice parameter gradient. The following clear gap is due to the mostly deformed region similarly as in the topographic image of dislocations. The following second black strip comes from the rear side of the buried layer where the lattice parameter is again decreasing. The last strip is due to the reflection from the bulk and the prior clear gap is probably due a possible kind of secondary extinction due to the reflection from the
top layerThe character of the Bragg-case section pattern was well reproduced using the
numerical integration of the Takagi-Taupin equations at it is shown in Fig. 6. In some patterns
\ 394

Vt'
Proc Third Radiation Physict Confy Al-Minia, 13 - 17 Nov v 1996
ue observed cha‘acten< c interference tails shown in fig. 7a. which appeared .n
inhomogeneous ion dose he interference tails were revealed in simulated images assuming a
' 'nation ot ion dose alo, : the beam as is representatively shown in fig. 7b. A reasonable agreement was obtained a ,o assuming validity ofeq. (2).
surface
-a,region with increasing lattice parameter
the most damaged layer
rV.■'.■Wl'- i region with decreasing lattice parameter
substrate
Fig. 5. White beam synchrotron back-reflection section topograph of flat silicon crystal implanted wirh I 6 MeV protons in 642 skew reflection of 0:61 A wavelength.
distance in micrometers
Fig. 6. Numerical simulation of intensity distribution for synchrotron section topograph m v*.
reflection of 0.4 A wavelength, assuming die lattice parameter depth distribution profile comine hum Biersack-Ziegler theory.
Fig. 7. a - The interference Unis in 1.11 back-reflection section topograph in I A wavelength ot I \k\
piotons implanted silicon crystal, b - the simulation of the interference fringes similar to those shownin a
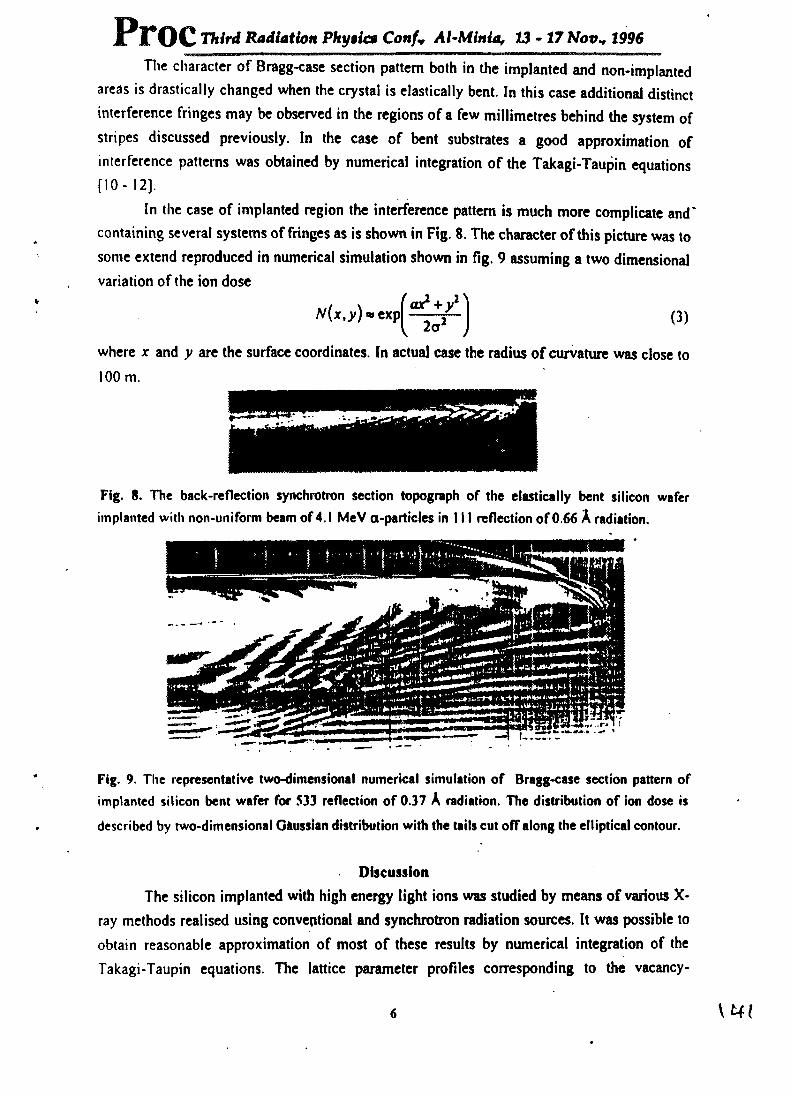
The character of Bragg-case section pattern both in the implanted and non-implanted areas is drastically changed when the crystal is elastically bent. In this case additional distinct interference fringes may be observed in the regions of a few millimetres behind the system of
stripes discussed previously. In the case of bent substrates a good approximation of
interference patterns was obtained by numerical integration of the Takagi-Taupin equations [10-12],
In the case of implanted region the interference pattern is much more complicate and' containing several systems of fringes as is shown in Fig. 8. The character of this picture was to some extend reproduced in numerical simulation shown in fig. 9 assuming a two dimensional variation of the ion dose
A/(x,y)*exp|~^-j (3)
where x and y are the surface coordinates. In actual case the radius of curvature was close to 100 nr
PrOC Third Radiation Phytic* Conf* Al-Minia, 13-17 Nov* 1996
Fig. 8. The back-reflection synchrotron section topograph of the elastically bent silicon wafer implanted with non-uniform beam of 4.1 MeV a-particles in 111 reflection of 0.66 A radiation.
Fig. 9. The representative two-dimensional numerical simulation of Bragg-case section pattern of implanted silicon bent wafer for 533 reflection of 0.37 A radiation. The distribution of ion dose is
described by two-dimensional Gfcusslan distribution with the tails cut off along the elliptical contour.
Discussion
The silicon implanted with high energy light ions was studied by means of various X- ray methods realised using conventional and synchrotron radiation sources. It was possible to obtain reasonable approximation of most of these results by numerical integration of the
Takagi-Taupin equations. The lattice parameter profiles corresponding to the vacancy-
V4<6
Third Radiation Phytic# Conf* Al-Minia, 13-17 Nov„ 1996
interstitial distribution obtained using Biersack-Ziegler TRIM-85 program was assumed. A proportional factor, including the ion dose, was used as a fitting parameter and the incoherence of lattice due to vertical displacement was taken into account.
It is expected that a good approximation of lattice parameter profiles by Ziegler- 13 iersack theory is probably restricted to a certain range of energy and dose of ions. The inadequacy of this approximation for higher energies was reported in [13].
In the case of fiat samples the back-reflection, synchrotron section topography produced a series of stripes corresponding to the reflection from the surface and the vicinity of the buried layer. The bending of the samples introduced additional wide spread interference pattern extended up to few millimetres behind the entrance of the beam.
The position of the direct contrast due to the buried layer can be used for direct determination of its location below the surface. As may be easily found the distance on the
section pattern for an arbitrary spot is related to the corresponding depth /, by the following
formula:. . cos(aJsin(©-<p) . ,
■ ' iin(26ta,) (4)
where: © denotes as previously the Bragg-anglc for centrally adjusted reflection. <p denotes
the inclination of the reflecting planes for centrally adjusted reflection and a denotes the angle between the projection of reflected beam of considered reflection on the vertical plane and the direction of reflected beam of centrally adjusted reflection. The values of a* can he calculated
from the position of spots on the film. The adequate accuracy of the evaluation requires exact knowledge of the entrance angle of the beam with respect to the surface and the misorientation of the planes with respect to the surface. A realistic value of 0.25* of accuracy,
provides usually 5% of accuracy in determination of ranges.The evaluated values of ion ranges were 21 pm for 4.8 MeV a-particles. 18 pm for I
MeV protons and 36 pm for 1.6 MeV protons. These values are in good agreement with those
based on Monte Carlo calculations from [14].
References[1] U. Bonse, M Hart and G.H. Schwuttke: phys. slat. sol. (a) 33.361 (1969).[2] A.G Serdakyan. V.S. Haroutyunyan, P.H. Bezirganyan. M. Subotowicz and G.K Trouni:
phys. slut. sol. (a) 123, 83 (1991).[3] R.N. Kyutt, P.V. Petrashen and M. Sobokin: phys. stai. sol. (a) 60.381 (1980).[4] M. Fatemi. P E. Thompson and J. Chaudhuri: J. Appl. Phys. 68,3694(1990)[5] K. Wieteska. W. Wierzchowski: phys. slut. sol. (a) 147. 55 (1995).
[6] K. Wieteska: phys. slat. sol. (a) 68. 179 (1981).[7] K. Wieteska, W. Wierzchowski: J. Appl. Crysl. 30 (1997), in press.[8] T. Bedyiiska: phys. slut. sol. (a) 18. 57 (1973).[9] J. F. Ziegler. J. P. B iersack and U. Littmark: The Slopping and Range of Ions in Solids
7

PfOC Third Radiation Physics Conf* Al-Mtnia, 13-17 Nov^l996
ed. J. F. Ziegler Pergamon Press 1985.
[10] I. J. Shulpina, P. V. Petrashen, F. N. Chukhowskii and K. T. Gabrielyan: Tezisi Dokl. IV Vsesoyuz. Soveth. Defecti Strukturi w Poluprovodnikach, Novosibirsk 23-25 Oktyabr 1984. part 2, p. 114 (In Russian).
[11] J B^k-Misiuk. J. Gronkowski. J. HSrtwig and W. Wierzchowski:phys. stat. sol. (a) 99, 345 (1987).
[12] F. N. Chukhovski, P. V. Petrashen: Acta Cryst. A44, 8 (1988).
[13] J. N. Gorecka and J. Auleytner: phys-xtat. sol. (a) 137, 309 (1993).[14] J. Tatarkiewicz: phys. slat. sol. (a) 63,423 (1980).
\H38
iadiation Physics Conf'v•fryfommi mi................................... .. n wm n i
Al-Minia, U - 17 Nov^ 1996
KUBHair SITUATION AND NUCLEAR POWER
R.M. MEGAHID
Reactor and Neutron Physics Department, Nuclear Research Centre, A E A ,Cairo, A.R of Egypt
ABSTRACT
A brief general review is given concerning the requirements of
power throughout the history with an indication to the world capital
reserv es of energy . The energy released from the conversion of mass in
chemical and nuclear processes was also discussed with a comparative
study between a conventional fuel fired plant and nuclear power plant
having the same energy output. The advantages and disadvantages arising
from having a nuclear power programme were also discussed.
1- INTRODUCTION
The requirements of power are very closely linked with the material
standard of living and the growth of world population. The power
consumptions in different countries vary in almost according to the
average income. The relevant fact is that, fuel consumption and standard
of living go hand in hand, so that in predicting our future fuel
requirements, some estimates of future standard of living are clearly called
for. In both developed and underdeveloped countries, the average standard
of living is still improving and the fuel consumption appears to increase at
the rate of about 3% per year.
In order to discuss the requirements of power and the rate at which
these requirements have grown throughout our history. The economists
have chosen the unit Q, which is equivalent to the energy produced by
Proc Third Radiation Physics Confv Al-Minia, 13-17 Nov., 1996
burning 46, 500 million tons of coal, prodcuing approximately 300 billion
kilo want hours of electric energy.
It is estimated that from the birth of Christ to the beginning of the
Industrial Revolution, about 1850, the world consumption of energy was
approximately 4 Q. By 1850 we were using fuel at the rate of some 1 Q
per century. A hundred years later, i.e. in 1950, the consumption had
increased to approximately 10 Q per century. According to these possibly
predictions, the world energy requirement between now and the end of this
century is estimated to be about 4 Q which is a many times greater than the
world's energy consumption during the last 10 years. Thus, it is relevant to
give a brief idea on our energy sources.
2- ENERGY SOURCES
Energy sources are devided into two categories, the capital reserves
which have accumulated in previous centuries (coal, oil and natural gas)
and the renewable sources, that is the energy which we receive every year
(solar energy, wind and water power). A brief discussion of the world
reserves of the main resources is given below.
2.1 Oil
The overall oil reserves are comparatively small probably less than
2 Q and the rate of discovery of new oil reserves on a global basis has
been falling steadily over the past fifty years. However, oil consumption
still continues to grow up despite the economies in its use by some
industrial nations10.
In the early 1980s it is anticipated that approximately 55% of the
total oil prodution is in the Middel East countries, 20% in the United
States,. and 25% in the rest of the world. The oil shortage in the late of this

Third Radiation Physics Confr Al-Minia, 13-17 Novv 1996f
century could be quite dramatic unless much more severe measure are
taken to restrict its use as a fuel to these applications in which it has a clear
advantage over other energy sources. It is clear that a move from oil as a
main energy source is both desirable and urgent.
2.2 Coal
The world reserves of minerable coal are estimated at about 8700
Gigatons (I Gigaton is equal to 1000 million tons) which is equal to about
190 0 The major coal reserves are in the U S S R., U S A. and China
which are remote from the Arab Countries, so that the cost of transporting
fuel from these countries would be excessive. Therefore reliance on coal
as a long-term energy source could clearly pose appreciable economic and
practical problems, even if political factors are ignored.
2.3 Renewable Energy Sources
These involve the large quantity of solar energy, about 50000 Q per
year falling on the earth’s surface, either directly or via its indirect
mainfestations such as wave and wind power. Therefore, it seems that the
renewable energy sources can be developed to meat a large fraction of the
demand of an advanced civilization, but at the time being it has proved
quite difficult to use even a small fraction of it for domestic and industrial
purposes.
3. NUCLEAR ENERGY
Before talking on nuclear energy, it should be stated that all
reactions whether chemical or nuclear oby Einstein’s mass-energy
relationship.
E = moC2
Third Radiation Physics Conf* Al-Minia, 13-17 Nov., 1996
where E is the energy released or absorbed in a reaction, m* the change in
mass, and C the velocity of light.
If we take as an example the simple chemical reaction of burning,
which is simply a combination of carbon with oxygen to form carbon
dioxide.
C + O] -» C02 + Energy,
By careful weighting of arbon dioxide formed would in principle, show it to be slightly lighter than the combined weights of oxygen and carbon. The amount of mass missing appears in the form of energy (thermal energy or heat) according to Einstein’s equation. In this reaction us in all chemical reaction, the fraction of mass converted into heat is very small about one part in a thousand million (1/10*). This is because in chemical reaction we arc merely rearranging the outer electrons of the atom and consequently only the relatively weak Coulomb forces are involved. However, in case of nuclear reaction the fraction of mass converted into energy is in general of the order of one part m a thousand. This may not appear to be very high figure, but it is nevertheless a million times higher than the figure of chemical reaction. This difference arises naturally from the fact that the forces involved in nuclear reactions are a million times stronger than those involved in chemical reactions. The former is a process of regrouping of neutrons and protons inside the nucleus.
The main sources of nuclear energy are the nuclear fission and nuclear fusion. In nuclear fusion two light elements is fusing together with the emission of energy. One of the most promising fusion reactions is the fusion of heavy isotopes of hydrogen, deuterium according to the equation.
\ 4*7

PrOC Third Radiation Physic* Conf* Al-Minia, 13 - 17 Nov* 1996
continuously. The furnace wall is lined with bioler tubes to produce the
steam and the whole thing is surrounded by insulation to keep the heat in.
Figure I shows a schematic diagram of a coal fired plant and a nuclear
power plant.
In the same way the nuclear power plant could be considered as a
huge electric kettle using rodes of uranium instead of the electric element
in the kettle. The uranium bums and gets hot, it boils water and the steam
drives the turbine. The reactor is surrounded by insulation to keep in the
heat as in coal furnace and in addition by concrete shielding to prevent the
more penetrating radiations. The nuclear fuel lasts so long and the weight
of fusion products is so small that refeuling and removal of fission
products is required once or perhaps twice a year. As it is seat the nucefar
power plant is basically a simpler plant than a coal fired station. So what is
the trap? Why are nuclear plants expensive? Why are they difficult to
construct?
The answer to these questions is that nuclear fuel and nearly
everything surrounding it becomes intensely radioactive when the plant is
running and this radioactivity persists for a very long time after the plant is
switched off. It is therefore necessary not only to surround the core of the
reactor with about 2-3 meter of concrete to contain the radiation, but also
to do all handling of the fuel and other radioactive components and all
maintenance of the reactor by remote control. This problem of
radioactivity is always upermost in the minds of everyone engaged in
nuclear power. Because a release of substantial quantity of radioactivity
would be hazardous, not only to operators but to the public, ft is necessary
to adopt extraordinarily high standard of safety. This applies not only to
operating techniques but also to the quality of the plant itself and in the
degree of inspection to which it is subjected. All this adds to the capital
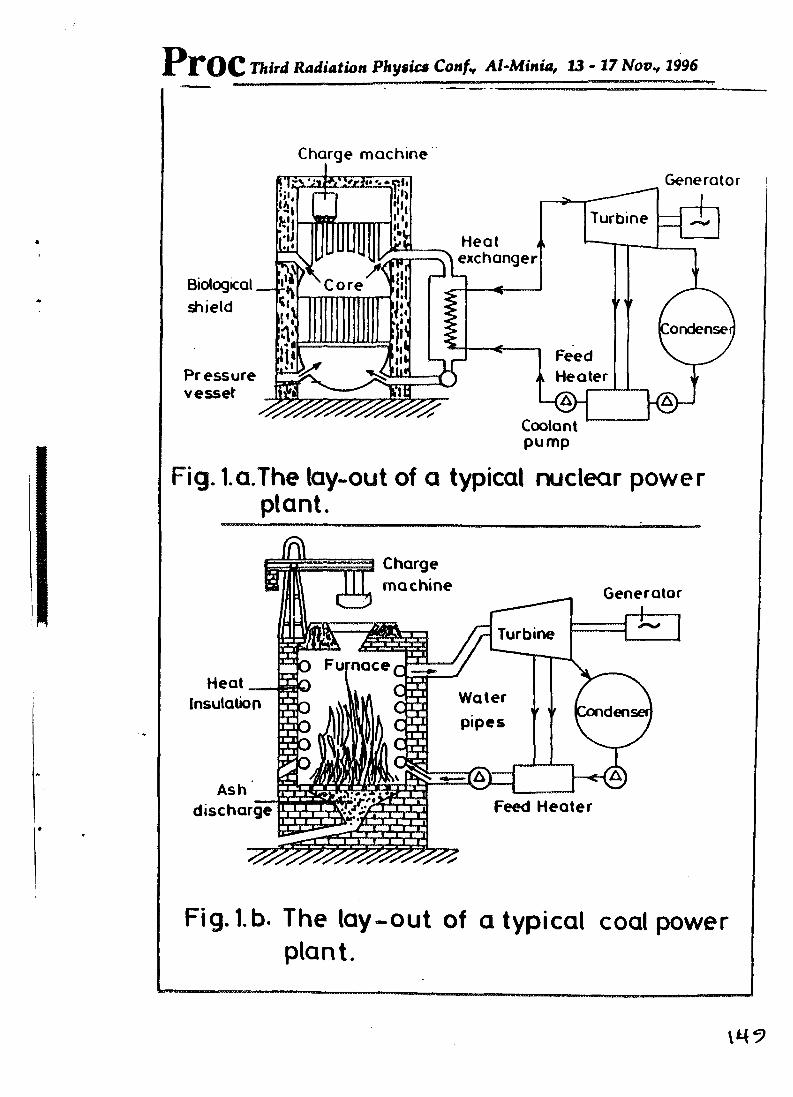
Proc Third Radiation Physic* Confy Al-Minia, 13-17 Nov., 1996
Charge machine
Fig. 1.a.The lay-out of a typical nuclear power plant.
Heat Insulation
Ash discharge Feed Heater
r.xrL, Q
Fig. 1. b- The lay-out of atypical coal power plant.
m?

PrOC Third Radiation Phytict Conf* Al-Minia, 13 - 17 Nov., 1996
costs Also the maintenance of a plant by remote methods is naturally
more difficult and slower than for a conventional plant.
The fuel for nuclear power stations is made of uranium-235
contained in tubes of stainless steel or zirconium. In the three years or so
that the fuel will remain in the reactor it will bum perhaps 2 or 3 per cent
of the total uranium present and will have produced as much heat as
50,000 times its weight of coal. Nuclear fuel is very expensive, but it is a
very low cost source of energy. Although a nuclear power station costs
perhaps about 40% more to build than a conventional fuel fired station of
the same output, the cost of the fuel for the nuclear station is perhaps a
quarter of the cost of equivalent amount of coal. Therefore, the cost of a
killowatt hour of electricity from a nuclear power plant is about two third
its cost from a conventional fuel fired station. Even, modem nuclear power
plant will generate electricity much cheaper than coal or oil fired plants.
What is more, once they are built they are substantially free from
inflation-because the fuel costs are so low. Does this mean then that we are
in need to have a vast nuclear progamme in future and that nuclear power
will be apple to supply all our electricity? I am sure tha answer is yes but
this will depend on the availability of qualified manpower and money.
It is also of prime importance to mention to one other essential
difference between nuclear power and the use of fossil fuels. This is the
possibility of increasing enormously the heat output obtained from a
killogramme 6f uranium by changes in the reactor design. At the present
time most of the nuclear power plants bum about 1% of the input of
natural uranium before it is so depleted in fissile material that the
remaining 99% has to be rejected as unusable waste. With re-cycling of
plutonium this can be increased to perhaps 2% burnt and 98% rejected as
PrOC Third Radiation Phytic* Con/Y Al-Minia, 13 - 17 Nov* 1996
waste. But fast reactor can in theory bums all the uranium and hence give
up to so-fold increase in utilization. In this case a ton of uranium becomes
equivalent to around 2 million tons of coal( \ What is more, they can use
the waste uranium rejected by todays commercial plants. Thus all the
major nations of the world having significant nuclear programmes have
realized this and have fast reactor development programmes.
Another problem of nuclear power is the attitude of some
environmentalists. Nuclear power is safer and cleaner and has less impact
upon the environment than any practical alternative way of producing
power. It is quite true that a major reactor accident could be very serious. It
is therefore necessary to ensure the highest standards of safety. Also it
would be intolerable for fission products and radioactivity to be dumbed
in the water sources and seas. Furthermore, the storage of fission
products is one of the main factors which has to be considered. It has to be
store in high integrity double clad stainless steel tanks located in concrete
vaults where the inner walls are clad in further stainless steel. Even the
chances of escape will be further reduced if the fission products are
converted into insoluble glass which can be kept for as long as we want in
a pond of water. These are the types of nasty problems of nuclear power,
but when we have solved these problems we will have a satisfactory way
of dealing with fission products.
4- CONCLUSIONS
1- According to the foregoing discussion, nuclear power can be used most
easily and economically to take up the growth in electricity production
and then to start to replace oil and coal fired power stations. This will
release on equivalent amount of oil for use as a fuel to those
PrOC Third Radiation Phytic* Conf* Al-Minia, 13 - 17 Nov* 1996
applications in which it has a clear advantages over other energy
sources.
2- It is very essential to construct several nuclear power stations with fast
breeder reactors at different places in the Arab countries. But this
requries a great of hard work to be done and for it we need a large
number of qualified scientests, nuclear engineers and technologists.
REFERENCES
1- Hunt S.E.,Fission fusion and the Energy Crisis”
Pergamon Press, Oxford, New York, Paris (1980).
2- Proceeding of the Intenational Coherence on Nuclear Power,Salzburg, (1977).
3- Barjon R.,“Reactor Technology and Teaching Confeence” University of Aston in Birmingham, (1972).
4- Hill JM“The Energy Situation and the Role of Nuclear Power “ Atom, No. 219, Jan. (1975).

Third Radiation Physics ConfH Al-Minia, 13-17 Nov,, 1996
SCIENTIFIC SESSION (3)
RADIATION EFFECTS |
THERMAL DECOMPOSITION OF IRRADIATED CASEIN MOLECULES
Maha A. AIL and Anwar A. Elsayed
Biophysics Dept, Faculty oi Science, Cairo University Gisa, Egypt
ABSTRACT
Non- isothermal studies were carried out using the derivatograph where thermogravimetry (TG), and differential thermogravimetry (DTG) measurements were used to obtain the activation energies of the first and second reactions for casein decomposition before and after exposure to gamma rays and fast neutrons. Cf - 252 was used as a source of fast neutrons associated with Gamma rays. TG and DTG patterns were also recorded for casein smaples before and after irradiation with 1 Gy y-rays of 0.662 MeV from Cs - 137. However, no change in activation energies were observed after exposure to •/-irradiation. On the other hand, the activation energies for the first and second reactions were found to be smaller at e ■ 1.15 x 10⁷ n/ cm2 than that at lower and higher neutron fluences.
TEMPERATURE DEPENDENCE OF FREE VOLUME IN MODIFIED POLYVINYL CHLORIDE STUDIED BY POSITRON LIFETIME
SPECTROSCOPY
I. Y. AL- QARADAWT, A.M.A. El-Sayed", and RE. Abdel- Hady*
• Physics Dept, Faculty of Science, Qatar University •* Physics Dept, Faculty of Science, At- Minis University
ABSTRACT
Despite the high sensitivity of positron annihilation to the size and number of free volumes, which can highly regulate the physical and mechanical properties of pure and doped polymers. It is therefore interesting to
J
PrOC Third Radiation Phytict Conf* AUMinia, 13 - 17 Nov* 1996
deal the positron lifetime annihilation, PAL data with the aspects particular to e+ and positronium (Ps) reactions in the doped polymer. To accomplish this aim, the variation of the ortho-positronium (o-Ps) lifetime and intensity were investigated for polyvinyl chloride, (PVC) as a function of concentration of Cd and temperature. Positron annihilation lifetime spectra have been measured for polyvinyl chloride (PVC) doped with Cd (0.2% to 2%) at temperature range from room temperature to 140X2. The glass transition temperature (Tg), free volume (Vf), and fractional free volume (f) were derived from the positron annihilation parameter. Results appear to be in accord with the free volume theory. Results reveal the positron annihilation techniques as powerful tools in revealing the mechanism of the conduction in polymeric materials.
STUDY OF RECOVERY IN PLASTICALLY DEFORMED A1-L1-BASED ALLOYBY POSITRON ANNIHILATION
M. A. Abdel- Rahman
Physics Dept, Faculty of Science, El-Mlnl* University, At-MInla - Egypt
ABSTRACT
Positron annihilation mean lifetime measurements were performed on two samples of the commercial alloy ((8090) Al- Li-Cu-Mg- (Zn)]. One sample was deformed (37.5%) at room temperature and subjected to isochronal annealing. The temperature varied from 300 K to 623 K. The one was homogenized at 823 K and subjected to Isothermal annealing at 873 K. The time of annealing varied from 0 to 12 hours In steps of 2 hours. Evidence of non spurious lifetime component, in both cases was observed.
The results of plastically deformed sample fx= 202122 ps) are interpreted as trapping of positrons in dislocations and Li-rich zones. On the other hand, results of the homogenized sample (T = 183 ± 2 ps) are interpreted as trapping of positrons in Li-rich zone only.
Third Radiation Physics Confy Al-Minia, 13-17 Nov., 1996
GAMMA-IRRADIATION EFFECT OF THE EPR SPECTRA OFSr Mo04 : Mo5*
Mahmoud A. Hefni, and R. M. Mahfoux
Phyeks and Cbcmiatty Departments Faculty of Science, Assist University, Assist Egypt
ABSTRACT
The electron paramagnetic resonance (EPR) spectrum of molybdenum in SrMoOs has been studied before and after y- irradiation. The observed resonance lines were identified as due to Mo5*. The effective g-value was calculated. Hyperfine lines from Mo" and Mo97 were also observed and their hyperfine interaction constants were calculated, ^-irradiation of SrMoQ4 is shown to produce the radical centers MoO^3* and MoO^. Mechanisms of radical formation are discussed. Mo5* reduction to diamagnetic sites by y-irradlation have been investigated.
THE EFFECT OF GAMMA-RAYS ON THE OPTICAL PROPERTIES OF ZINC PHOSPHATE GLASSES DOPED WITH EUROPIUM OXIDE.
A. S. El- Joundl, and A. A. Higazys Physics Department Faculty of Science, Qatar University, Doha, Qatar.
•• Physics Department Faculty, Of Sdenca, Menoutia University, Menoufla, Egypt
ABSTRACT
A detailed study of the optical absorption spectra as a function of y* irradiation doses and' composition for the prepared Eu^ 0} - ZnO- ?2 0$ glass system is presented. Optical absorption spectra were measured in the wavelength range from 200 to 1100 nm at different y- doses in the range from0.25 to 8 Mrad (2.5 - 80 Kilo Gray). The absorption coffldent (a), absorption index (K) and the values determined of the optical energy gap (Eopt), and the width of the band tail of the localized states are found to be dependent on y doses and Eu2 03 oxide content. The variation of the position of the fundamental absorption edge (Xo) with Eu^Oj showed two maxima at 1 and 4 wt% EugOg oxide content, However, a systematic increase in (Xo) withy - dose is observed. The optical properties response to the irradiation dose was found to be highly sensitive at lower doses of gamma ray.

Third Radiation Phytica Conf* Al-Minia, 13-17 Nov„ 1996
ESTIMATION OF DISLOCATION CONCENTRATION IN PLASTICALLY DEFORMED SILVER BY POSITRON ANNIHILATION
M. A. Abdel-Rahman, E. A. Badawi, and S. K. Abdel-Rahcem
Physics Dept, Faculty of Science, El-Mlnla University, El- Min la- Egypt
ABSTRACT
Positron annihilation mean lifetime t measurements were performed on 7 different specimens of silver plastically deformed at room temperature (up to 56%). The positron mean lifetime T exhibits a saturation for deformations larger than 14% thickness reduction. The fitted lifetime varies from (135.9±2 ps) for annealed silver to (207 ± 2 ps) for the dislocation saturated value. Trapping cross-section and trapping efficiency were calculated. Dislocation concentration at saturation was estimated.
DEPENDENCE OF TRAPPING (CROSS - SECTION EFFICIENCY) AND MEAN LIFETIME ON THE BURGER'S VECTOR IN METALS
Emad Badawai
Physics Dept, Faculty of Science, A1 Min la University - Egypt
ABSTRACT
The Positron lifetime technique was used as a convenient characteristic of the positron decay process to dectect positron trapping at defects and noting changes in Positron lifetime as concentration of defects is altered. Positron lifetime measurements were performed in some metals.
One of the aims of positron annihilation techniques, is to find a logic correlation for the positron annihilation parameters with the main properties of metals. The mean lifetime in pure metals and as a functibn of the percentage of deformation of Mg, Cu, Ag, and A1 were measured, and some published data for Ni, Ag and Cu are presented. Results show that positron lifetime varies with the magnitude of Burger's vectors. Strong correlations were found between the trapping efficiency, trapping cross-section and mean lifetime for (lattice or trapped) state as a function of magnitude of Burger's vector.

Proc Third Radiation Physics Conf* Al-Minia, 13-17 Nov., 1996
STRUCTURAL CHANGES OF COTTON SEEDS DUE TO FAST NEUTRONS-IRRADIATION
W.G. OsirisBiophysics Department, Faculty of Science, Cairo University,
Giza, Egypt.
ABSTRACT
The effect of irradiation with different fast neutron fluences in the range 1(£-108 n/cm2 were studied on one Egyptian cotton seeds (Dandara, Giza 30
Both pre- and post-irradiated seeds were implanted and the effects of fast neutrons on the first generation were investigated through the use of: X-ray fluorescence analysis, infrared spectral, combustion technique, analysis as well as scanning electron microscopy. The changes in cellulose and hemecellulose contents in the seeds relative to the unirradiated one were also detected
From the obtained results, it was found that significant structural changes are indicated which may be attributed to the variation in the Internal mechanisms that occurred by the radiation effect on the structure of the seeds. In conclusion, irradiation with fast neutrons may cause genetic changes in seeds.
157

Physics Conf* Al-Minia, 13-17 Nov* 1996
THERMAL DECOMPOSITION OF IRRADIATED CASEIN MOLECULES
Maha A. Ali and Anwar A. Elsayed
Biophysics Dept., Faculty of Science , Cairo UniversityGiza , Egypt
ABSTRACT
Non-isothermal studies were carried out using the derivatograph where thermogravimetry (TG) and differential thermogravimetry (DTG) measurements were used to obtain the activation energies of the first and second reactions for casein (glyco-phospho-protein) decomposition before and after exposure to 1 Gy v-rays and up to 40 mGy fast neutrons.
252Cf was used as a source of fast neutrons, associated with y-rays. n7Cs source was used as pure y-source. The activation energies for the first and second reactions for casein decomposition were found to be smaller at 0.4 mGy than that at lower and higher fast neutron doses. However, no change in activation energies was observed after y-irradiation.
It is concluded from the present study that destruction of casein molecules by low level fast neutron doses may lead to changes of shelf storage period of milk.
INTRODUCTION
While contaminant radionuclides can and do reach man through food stuff and many pathways, milk is found to be a major contributor to the uptake of the fallout nuclides. Such nuclides which contribute the major hazard to man are 90Sr , ,37Cs and 13'I (Jensen and Lindhe 1986, Klupsch 1986,

PlTOC Third Radiation Physics Confr Al-Minia, 13 - 17 Nov., 1996
Nishizawa et al, 1986, O'Flaheitry 1986, Solo 1986, Aarkrog 1987, s d Haschke et al, 1987). The radiation emitted by these nuclides has a radi: r j . weighting factor equals one while that of fast neutrons equals twenty.
The effect of low level fast neutron doses on the molecular struc: r j jf imlk may lead to the formation of new molecular configuration that: u / je toxic, carcinogenic or even non-digestuble. These expected radiation eff.: s ire very important when milk forms the full diet of infants.
Therefore, in the present work, die effect of fast neutrons irrad: rt c i on casein as a major milk protein component (about 85%) is lnve.ti jned. Chemically the casein system is defined as a glyco-phospho-protein.
EXPERIMENTAL
Light white soluble casein was purchased from Biochenu i i< LTD Poole, England.
For non-isotheimal experiments a derivatograph device (MOM derivatograph, Budapest, Hungary) with heating rate of 5 °C/min. and sample weight of 3 mgm was used. This device simultaneously m insures the temperatures of the sample, the thermally inert substance, the fur lace and die change in mass of the sample with temperature (TG curve) and rate of change in mass (DTG curve) of the same sample automatically at the same ime (Paulik et al, 1979). The activation energy (E) was determined using th; method of Sabry et al, (1986).
Fast neutron doses (associated with y-rays) between 4 pGy ;o 40 mGy were obtained using 252Cf source-, (~ 2 MeV effective energy) ma iufactored by Radiochemical centre, Amersham, England. On die odiei hai d, 137Cs source, at the National Centre for Radiation Research and Technology (NCRRT), was used to obtain 1 Gy of y-rays. Irradiation proce. ses were carried out at room temperature.

PrOC Radiation Phytics Confv Al-Minla, 13-17 Nov-, t996
RESULTS
Figure (1) shows TG and DTG plots for unirradiated casein sample and Figure (2) for casein samples irradiated with fast neutron dose 0.4 mGy. As shown in these figures two main reactions take place representing casein decomposition stages.
Figures [1(a) and 2(a)] show dw/dt versus In w - (X/RT) of the first reaction for casein. Figures [1(b) and 2(b)] show dw/dt versus In w - (X/RT) of the second reaction for casein.
The activation energy (E) was calculated as follows :
R ln(w, / W2)
1/Tj - 1/T2 (1)
where n order number, R Boltzman's constant, w weight and T absolute temperature.
In dw/dt = In A + n(ln w - X/RT) (2)
where dw/dt change in weight with time and A constant.
Equation (2) shows that a plot of ln(dw/dt) against (In w - X/RT) gives str aight line of slope n. By substitution for n in equation (1), the value of E is obtained.
Table (1) shows the values of (E) for both reactions for casein samples irradiated with low level fast neutron doses.
Figure (3) shows the variation of activation energies of the first and second reactions for casein decomposition with different neutron doses ranged from 4 uGy to 40 mGy.
Irradiation of casein sample with lGy y-ray of energy 0.662 MeV showed no detectable var iation of TG and DTG patterns.
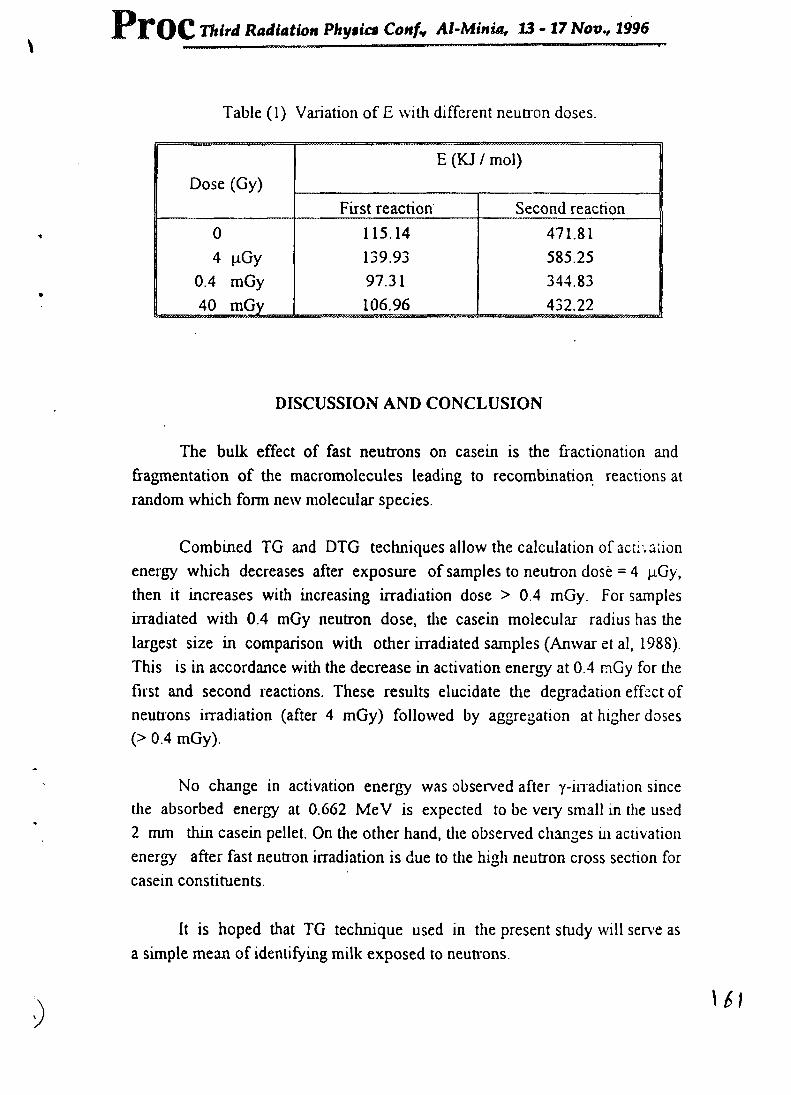
PrOC Third Radiation Physics Confy Al-Minia, 13-17 Nov., 1996
Table (1) Variation of E with different neutron doses.
Dose (Gy)E (KJ / mol)
First reaction Second reaction0 115.14 471.814 pGy 139.93 585.25
0.4 mGy 97.31 344.831 40 mGy 106.96 432.22 1
. . . . . . . . . . . . . . . . . . . . . . . . . . . . . . . . . . . . . . . . . . . . ....11piiujjeilil
DISCUSSION AND CONCLUSION
The bulk effect of fast neutrons on casein is the fractionation and fragmentation of the macromolecules leading to recombination reactions at random which form new molecular species.
Combined TG and DTG techniques allow the calculation of activation energy which decreases after exposure of samples to neutron dose = 4 pGy, then it increases with increasing irradiation dose > 0.4 mGy. For samples irradiated with 0.4 mGy neutron dose, the casein molecular radius has the largest size in comparison with other irradiated samples (Anwar et al, 1988). This is in accordance with the decrease in activation energy at 0.4 mGy for the first and second reactions. These results elucidate the degradation effect of neutrons irradiation (after 4 mGy) followed by aggregation at higher doses (> 0.4 mGy).
No change in activation energy was observed after y-irradiation since the absorbed energy at 0.662 MeV is expected to be very small in the used 2 mm thin casein pellet. On the other hand, the observed changes in activation energy after fast neutron irradiation is due to the high neutron cross section for casein constituents.
It is hoped that TG technique used in the present study will serve as a simple mean of identifying milk exposed to neutrons.
\6\

PrOC Third Radiation Phyaico Confr Al-Minia, 13-17 Nov, 1996
280 4 20Temperature (*C )
Figure (1) TG and DTG for unirradiated casein sample.
Figure (2) TG and DTG for casein sample irradiated with fast neutron dose = 0.4 mGy.

IP/ »P u 1
PrOC Third Radiation Physics Confy Al-Minia, 13-17 Nov., 1996
'Z/ 0.3
-S.57 •9.53 -9.51-5.55
in w —X/rt
Figure [1(a)] Evaluation of E of the fust reaction for casein (umrradiated) decomposition.
0.2 —
0-0 _______ I_______ I___ _____I_______ I----------- 1----------- 1----------- L.-12.69 -12.67 -12.65 -12.63 -12.61 -12.59 -12.57 -12.5
l n w - */ R T
\ 6~i
Figure [2(a)] Evaluation of E of die first reaction for casein decomposition after irradiation with fast neutron dose = 0.4 in Gy.

IP /*p
PlTOC Third Radiation Physic* Cow/y Al-Minia, 13-17 Nov* 1996
Figure (1(b)] Evaluation of E of the second reaction for casein (unirradiated) decomposition.
Figure (2(b)] Evaluation of E of the second reaction for casein decomposition after irradiation with fast neutron dose = 0.4 mGy.
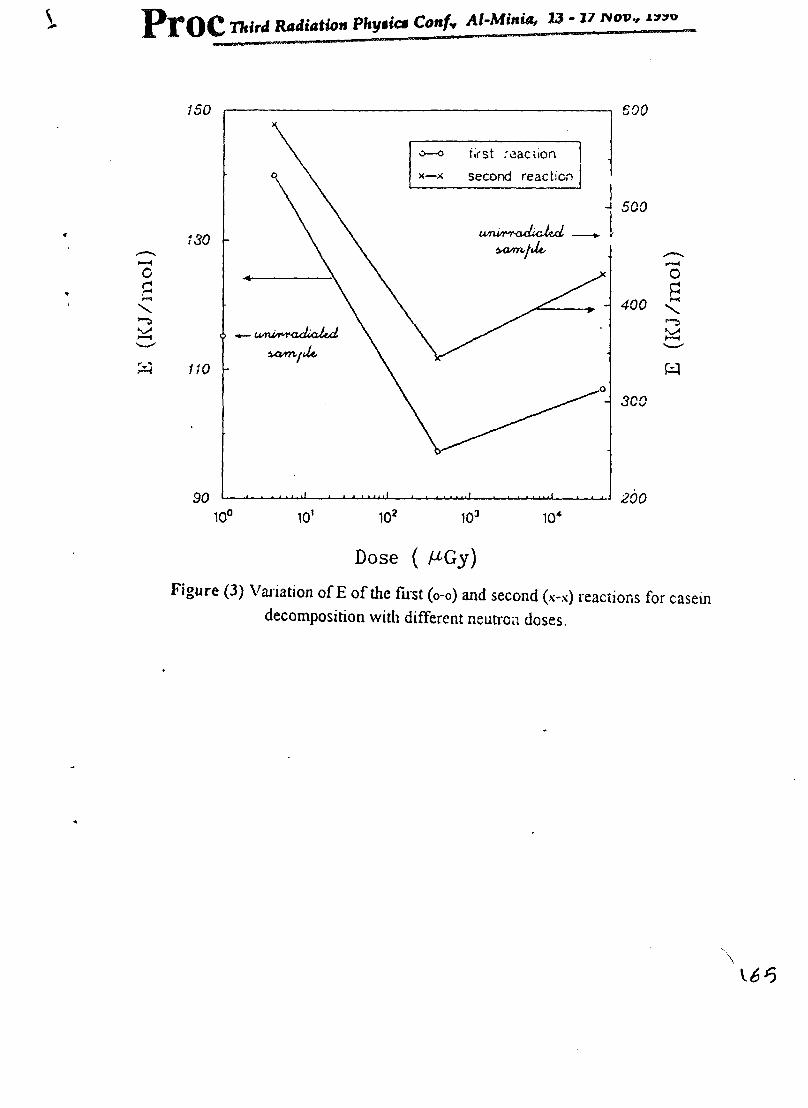
: (KJ/
mol
)
PrOC Third Radiation Phytic* Conf* Al-Minia, 13 - 17 nov.,
Dose ( MGy)Figure (3) Variation of E of the first (o-o) and second (x-x) reactions for casein
decomposition with different neutron doses.
E (KJ/
mol
)
PrOC Third Radiation Physic* Co«U Al-Minia, 13 - 17 Nov» 1996
FIGUnE CAPTIONS
Figure (1) TG and DTG for unirradiated casein sample.Figure (2) TG and DTG for casein sample irradiated with fast neutron dose = 0.4 mGy.Figure [1(a)] Evaluation of E of the first reaction for casein (unirradiated) decomposition.Figure [2(a)] Evaluation of E of the first reaction for casein decomposition after irradiation with fast neutron dose = 0.4 mGy.Figure [1(b)] Evaluation of E of die second reaction for casein (unirradiated) decomposition.Figure [2(b)] Evaluation of E of the second reaction for casein decomposition after irradiation with fast neutron dose = 0.4 mGy.Figure (3) Variation of E of the first (o-v) and second (x-x) reactions for casern decomposition with different neutron doses.
PrOC Third Radiation Physics Conf„ Al-Minia, 13-17 Nov., 1996
REF :nces
1 - Aarkrog, A.; Boeiskiftes, S. ; Bcner-Jcnsen, L. ; Daldgaard, H.; Hansen, H.and Nielsen, S. (1987) Environmental radioactivity in Denmark in 1984. Dairy Science Abstract, 4>(S) p.582 [5112].
2 - Anwar, M.; El-Refaie, F.; El Likanni, A. and Fade!, M. (1988) Effect oflow level fast neutron doses on the dielectric properties of casein. The First
Arab Conference on Biophysics, Nov. 1988. Cairo Univ. p. 313-323.
3 - Haschke, F. et al (1987) Radioactivity in Austrian milk after the Chernobylaccident (correspondence), New Englu. i. J. of Medicine, 315(7) 409-410.
4 - Jensen, M. and Lindhe, J. (1985) Monitoring the fallout, InternationalAtomic Energy Agency Bulletin, 28(3), 30-32.
5 - Klupsch, H. (1985) Radioactive contamination of milk and milk products,Milch Wirtschaft, 37(44) 1445-1448.
6 - Nishizawa, K. et al (1986) 13it mill: and ram after Chernobyl, Nature,324 (6095) 308.
7 - O'Flaherty, T. (1985) Chernobyl accident. What effect on our food? Farmand food research, 17(3), 87-88.
8 - Paulik, J.; Paulik, F.; Arnold, M. and Veress, G. (1979) Problems of thecharacterization of thermo-analytical processes by kinetic parameters,J. Thermal Analysis, 17, 507-528
9 - Sabry, A.; Mahdy, A. and Abadir, M. (1935) Thermal decomposition ofMnCO] (in air), Thermochimicn Acta, 93, 269-276.
10- Salo, A. (1986) Information exchange after Chernobyl, International Atomic Energy Agency EaFchn, 28(3) 18-22

O'
Proc Third Radiation Phyica Confv Al-Minia, 13 - 17 Nov., 1996
EG9700081
Estimation of dislocation concentration in plastically deformed silver by positron annihilation
M. A. Abdcl-Rahman, E. A. Badawi and S. K. Abdcl-Raheem EL- Minia University, Faculty of Science, Physics Dept, El-Minia- Egypt
Abstract:
Positron annihilation mean lifetime x measurements have been performed on 7 different speiemens of silver plastically deformed at room temperature (up to to 56% ).'The positron mean lifetime x
exhibits a saturation for deformations larger than 14% thickness reduction. The fitted lifetime varies from (135.9±2 ps) for annealed silver to (207±2 ps) for the dislocation saturated value. Trapping cross-section and trapping efficiency are calculated. Dislocation concentration at saturation has been estimated.

Proc Third Radiation Phytics Confr Al-Minia, 13-17 Nov., 1996
L Introduction
It is generally known that, by plastic deformation of metals a
high density of dislocations and also a certain amount of point
defects such as vacancies and vacancy complexes are introduced. If
the deformation is performed at a temperature below the stage for
migration of vacancies the defects are retained in the metal sample.
The effect of plastic deformation on positron annihilation in
metals was first reported by Dekhtyar et al.,<n, Berko et al.,(2) and
Hautojarvi (3). All sets of authors have suggested that positron may
be trapped in the core of dislocations, vacancies, vacancy clusters,
and voids which are produced during deformation. The work which
most unambiguously separates the effects of trapping at dislocation
from that of vacancies is that of Cotterill et al.,(4) who measured
positron lifetime in Aluminum samples containing dislocation
loops resulting from annealing at 80°C of quenched vacancies.
Their conclusions were limited because the density of dislocations
was insufficient for saturated positron trapping. In recent years
there have been, various reports of positron trapping in plastically
deformed metals, (5*l0)
In this paper, estimation of the dislocation density at different
degrees of deformation for plastically deformed silver is attempted.
I £5>
-2-

Third Radiation Physics Confv Al-Minia, 13-17 Nov., 1996
2. Experiment:
Before , deformation the silver samples (4 N Purity) were annealed in a vaccum of 10'4 Pa for 18 hours at a temperature of 850°C and then cleaned chemically, rinsed in distilled water and dried. The Ag samples were then plastically deformed at room temperature to different degrees of thickness reduction i.e. 5.5, 16, 20, 35, 45 and 56.5%. Edge and screw dislocations are produced in F.C.C. lattices. After deformation, a22Na positron source placed between two kapton foils was sandwiched between two identical Ag samples. The source- and samples were then wrapped in thin aluminum foil. The positron lifetime was measured in the conventia! way by determining the time interval between the detection of 1.274 Mev y-rays emitted almost simultaneously with the positrons and the detection of one of the two 0.511 Mev annihilation photons. The positron lifetime was recorded using a spectrometer with a fast concidence system incorporating a I in. X 1 in KL 236 plastic scintillator and 8550 RCA. photomultipliers. The lifetime resolution of the system with a60Co source was approximately 280 ps (Full Width at half maximum). Figure (1) shows a schematic diagram of the experimental system used for the lifetime measunnents.
3. Theory :
Positron trapping at dislocation may be detected by measuring some conveniet characteristics of the positron decay

Third Radiation Physics Confv Al-Minia, 13-17 Nov., 1996
process. In the presnt experiment, the mean lifetime x, and its change with the thickness reduction was measured. The measured lifetime X must have different values Xf and Xd when positrons annihilate from the free and trapped state respectively, and must vary linearly with the fraction annihilating from traps. Consequently, in this case, the change in the mean lifetime is a measure of the fraction of positron annihilating from the trapped state.
The trapping probability, Pt, will be equal to the fraction annihilating from traps and we can write :
\i - yIt was also possible to interpret the data in view of the
trapping model(ll l2). In this model the total fraction of positrons annihilating at dislocation is given by :
X<i-N<i(‘).dt . (2)N0 J
where N„ is the total number of incident positrons, A.d is the disintegration rate of the trapped positrons, and Nd(t) is given by :
N„(t) = P-P' -N.-p-'(3)A-f - "P A'
where (p.p') is the trapping rate (p being the trapping efficiency and p' the dislocation density) and Xf is the disintegration rate of the free positrons.
VI/
-4-
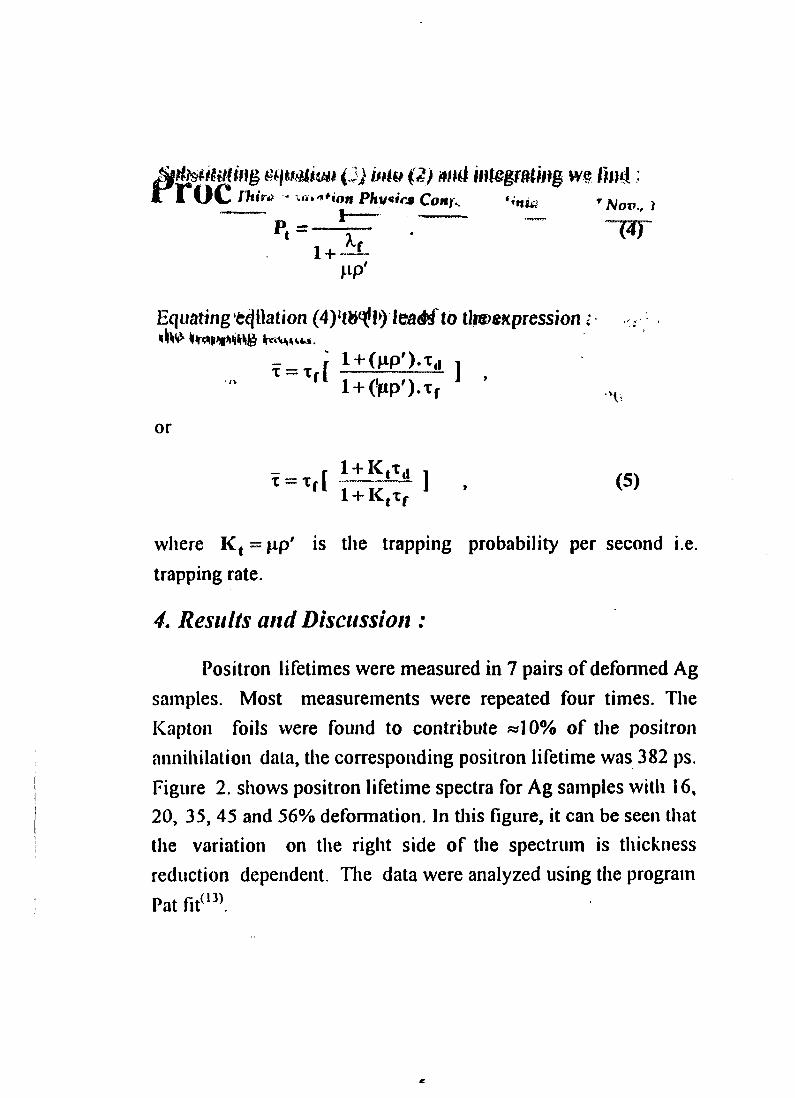
niing mimimi (J) buy (2) mib integrating m #M; OC rhira - 'oi+ion Physics Cortf\ T Nov., 1
' l + lLHP
Equating tejllation (4),tb^!>) lea<*f to thwexpressionttrsWiWWS ^vrvstkM.
1 + (PP').T,, ,l + Cpp').Tf J %it
or
1 + K|*,i ,l + ICtxf J (5)
where Kt = pp' is the trapping probability per second i.e. trapping rate.
4, Results and Discussion :
Positron lifetimes were measured in 7 pairs of deformed Ag samples. Most measurements were repeated four times. The Kapton foils were found to contribute «10% of the positron annihilation data, the corresponding positron lifetime was 382 ps. Figure 2. shows positron lifetime spectra for Ag samples with 16, 20, 35, 45 and 56% deformation. In this figure, it can be seen that the variation on the right side of the spectrum is thickness reduction dependent. The data were analyzed using the program Pat lit011.

Third Radiation Physics Confy Al-Minia, 13 - 17 Nov* 1996
Figure 3. shows that x increases as the thickness reduction increases, and that above «14% thickness reduction, the value of the mean lifetime is approximately constant.
The results were interpreted in the way of Baram and Rosen(l4), as follows:
A dislocation is considered to be a chain of spherical scattering centers of density p', given by :
where b is the Burger’s vector, for silver b = 2.9A0 . The trapping probability per second, Kt, is proportional to the dislocation concentration as:
where p is the trapping efficiency.
The trapping efficiency p is expressed in tenns of collision cross section a of the free moving positron with a trapping center.
p ™ a.u ,
where,
\73
-6-
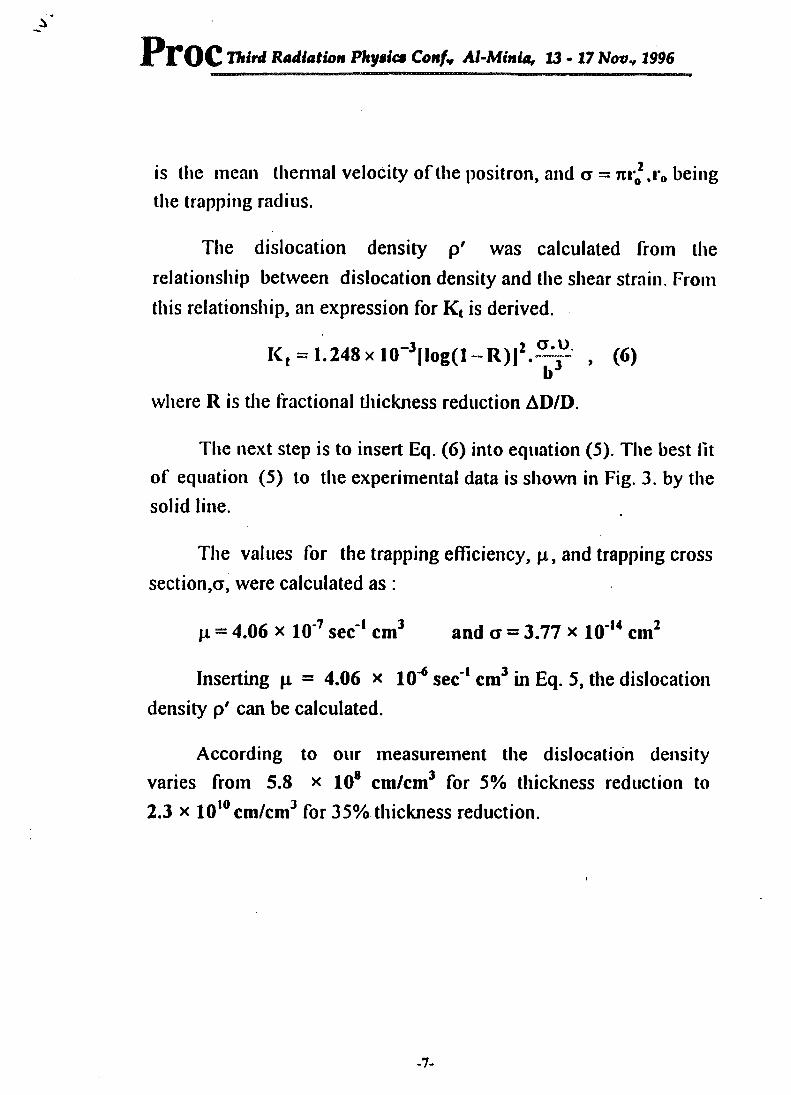
PrOC Third Radiation Phytic* Conf* Al-Minia, 13 - 17 Nov* 1996
is the mean thermal velocity of the positron, and a - itr#2,r0 being the trapping radius.
The dislocation density p' was calculated from the relationship between dislocation density and the shear strain. From this relationship, an expression for Kt is derived.
K, = 1.248x 10"3|log(l-R)|2.2^ , (6)ir
where R is the fractional thickness reduction AD/D.
The next step is to insert Eq. (6) into equation (5). The best lit of equation (5) to the experimental data is shown in Fig. 3. by the solid line.
The values for the trapping efficiency, p, and trapping cross section,ct, were calculated as :
p - 4.06 x 10*7 sec'1 cm3 and a - 3.77 x 10‘14 cm2
Inserting p = 4.06 x 10"6 sec'1 cm3 in Eq. 5, the dislocation density p' can be calculated.
According to our measurement the dislocation density varies from 5.8 x 10* cm/cm3 for 5% thickness reduction to 2.3 x 1010 cm/cm3 for 35% thickness reduction.
-7-

Proc Third Radiation Phytica Confv Al-Minia, 13-17 Nov* 1996
References1) I. Ya. Deklityar, D A. Levina, and V.S. Mikhalenkov: Sov. Phys-
DokJ. 9(1964) 492.
2) S. Berko and J.C. Erskine: Phys. Rev. Lett. 19 (1967) 307.
3) P. Hautojarvi, A. Tammimen, and P. Jauho: Phys. Rev. Lett. 24 (1970)459.
4) R.M.J. Cotterill, K. Petersen, G. Trumpy, and J. TraafT: J. Phys. F 2(1972)459.
5) P.T.A. Mckee, S. Saimoto, A T. Stewart, and M. J. Stott: Con. J. Phys. 152(1974) 759.
6) G. Dlubek, G. Brawer, O. Brummer, W. Andrejtscheff and P. Man frass: Phys. status. Solidi A 30 (1975) K 37.
7) C. Dauwe, M. Dorikens, and D. Segers: Appl. Phys. 5 (1974) 117.
8) C. Dauwe, L. Dorikens, and M. Dorikens: Phys. Status. Solidi A 18 (1973) 171.
9) A. Andreef, G. Brauer, and Chr. Doering: Mater. Sci. Forum 105-110 (1992) 885.
10) M A. Abdel-Rahman, and E. Badawi: Jpn. J. Appl Phys. 35 (1996).
11) D C. Connors and R.N. West: Phys. lett. 30 A (1969) 24.
12) D. Bergersen and M.J. Stott: Solid state commun : 7 (1969) 1208.
13) P. Kiregaard, M. Eldrup, O. Mogensen, and N. Pedersen: Comp. Phys. Commun. 23(1981) 307.
14) J. Barom and M. Rosen: Phys. Status Solidi A 16 (1973) 263.
W5
8-

PrOC Third Radiation Physic* Conf, Al-Minia, 13 - 17 Nov., 1996
TPHCCFDD CFDD
MEMORY
Fig. 1. Schematic diagram of the positron lifetime measurement system.

Coi
ncid
ence
cou
nts
Third Radiation Phy$ics Conf* Al-Minia, 13-17 Nov., 1996
10s
10*
■ xwjec ♦<♦ iJ». . j,..
M 0*K> • XId OlJ U* A
20 40 60 80 100 120 140 160 180 200 220 240
Channal number
Fig. 2. Positron liftime spectra for Ag samples at different degree of deformation.
V7Y

Third Radiation Phytics Confy Al-Minia, 13-17 Nov* 1996
(ADZ D) %
Fig.3. Experimental results and fitted curve for lifetime as a function thickness reduction for Ag deformed at room temperature.
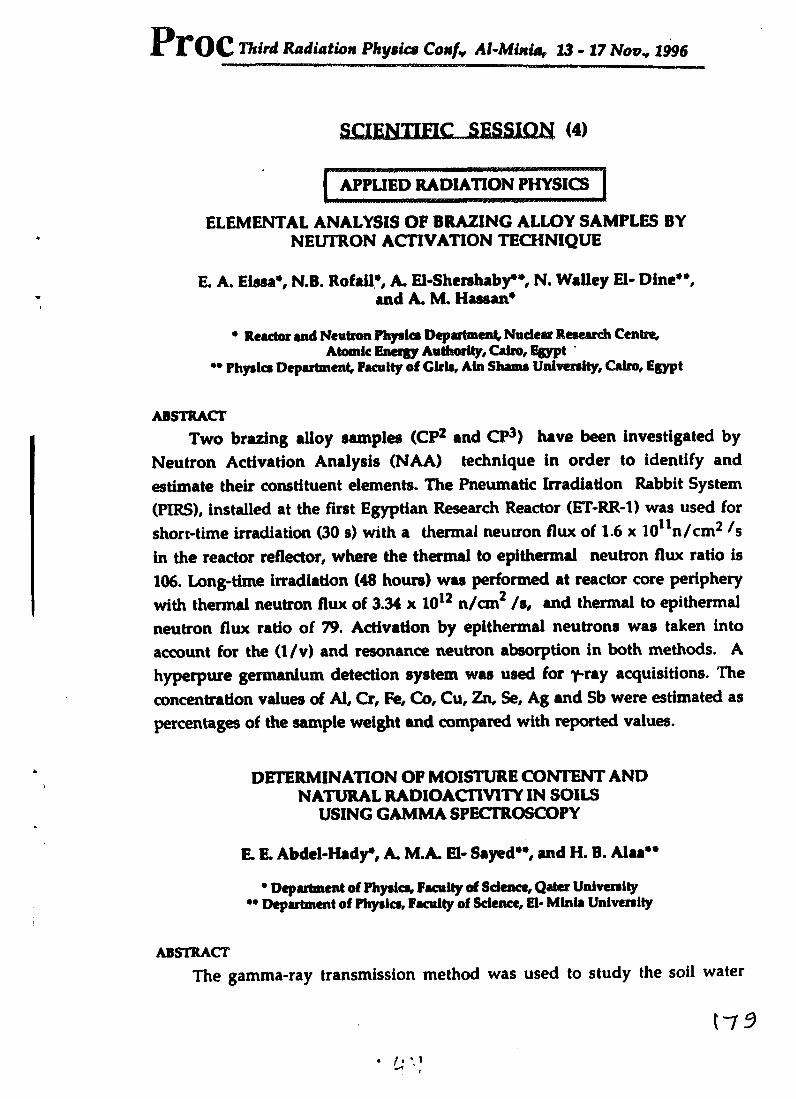
Third Radiation Physics Confr Al-Minia, 23-17 Nov* 1996
SCIENTIFIC SESSION (4)
APPLIED RADIATION PHYSICS
ELEMENTAL ANALYSIS OF BRAZING ALLOY SAMPLES BY NEUTRON ACTIVATION TECHNIQUE
E. A. Eissa\ N.B. Rofail*, A. El-Shershaby**, N. Walley El- Dine**,and A. M Haasan*
• Reactor and Neutron Physio Department, Nuclear Research Centre,Atomic Energy Authority, Cairo, Egypt
** Physics Department, Faculty of Girls, Ain Shams University, Cairo, Egypt
ABSTRACT
Two brazing alloy samples (CP2 and CP3) have been investigated by Neutron Activation Analysis (NAA) technique in order to identify and estimate their constituent elements. The Pneumatic Irradiation Rabbit System (FIRS), installed at the first Egyptian Research Reactor (ET-RR-1) was used for short-time irradiation (30 s) with a thermal neutron flux of 1.6 x 10nn/cm2 /s in the reactor reflector, where the thermal to epithermal neutron flux ratio is 106. Long-time irradiation (48 hours) was performed at reactor core periphery with thermal neutron flux of 3.34 x 10¹² n/cm2 /s, and thermal to epithermal neutron flux ratio of 79. Activation by epithermal neutrons was taken into account for the (1/v) and resonance neutron absorption in both methods. A hyperpure germanium detection system was used for y-ray acquisitions. The concentration values of Al, Cr, Fe, Co, Cu, Zn, Se, Ag and Sb were estimated as percentages of the sample weight and compared with reported values.
DETERMINATION OF MOISTURE CONTENT AND NATURAL RADIOACTIVITY IN SOILS
USING GAMMA SPECTROSCOPY
R E. Abdel-Hady*, A. M.A. El- Sayed**, and H. B. Alaa**
• Department of Physics, Faculty of Science, Qatcr University *• Department of Physics, Faculty of Science, El- Minis University
ABSTRACT
The gamma-ray transmission method was used to study the soil water
t-73
• /• \i

PrOC Third Radiation Physics Conf, Al-Minia, 13 - 17 Nov* 1996
properties in the laboratory as well as in the field. The present measurements were performed using y-ray spectroscopy system based on a 5 x 5 cm Nal (Tl) scintillation detector and two combined sources (137Cs & 241 Am). The two sources are placed in a suitable lead collimator to obtain a pin beam of 1 mm diameter. Suitable samples of day and sandy soils obtained from the local field were prepared to determine the water content and the soil bulk densities by the combined method for different moisture stages.
From the results obtained, it is dear that the soil density at both stages (saturated and after drainge) remains the same. This is because the soil particles do not rearrange during the wetting and drying process. The full results will be presented in the text.
Natural radioactivity of the investigated samples was also studied using f-ray spectrometer having HPGe detector. Qualitative and quantitative analysis of natural gamma radiations revealed the presence of 40K, 214Bl, 208 H and 228Ac in meaningful concentrations.
TRACE ELEMENT CONCENTRATION VALUES IN SOME DOMESTIC ALUMINIUM SAMPLES
A. S. Abdel-Haleem*, N. Abdel-Basset”, M. Abdel-Wahab, »*and A.M. Haasan***
• Hot Laboratory Center, Atomic Energy Authority,*• Nuclear Physics Laboratory, Faculty of Girls, Aim Shams University,
Cairo, Egypt*** Reactor and Neutron Physics Dept, NRG, Atomic Energy Authority,
Cairo, Egypt
ABSTRACT
Four Egyptian aluminum samples used for domestic purposes were analyzed for trace elements using neutron activation analysis technique. The concentration values of Na, Fe, Sc, Cr, Zn, da, As, Br, Sb, Ba, La, Gd, Ho, Hf, and Au are presented. The samples appear safe to use far from human diet. For more industrial purfication to bring down the level of the nonessential elements and those that could be toxic when present at high concentrations, some requirements are needed.
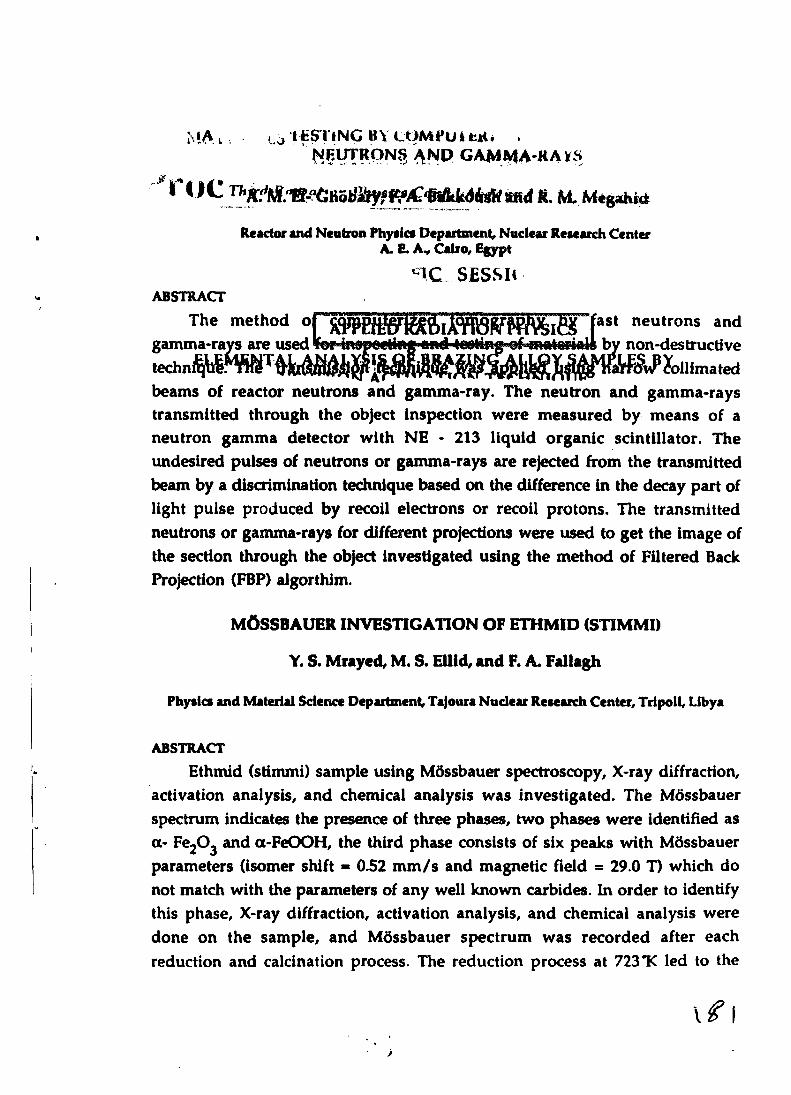
MA t ■ • . o I fcS I INC BY LUMFUI td* .' "MKyT«QN§ *NP GAMMA-KAiS
f <IC md 8. M. Mtgahirt
Reactor and Neutron Physics Department, Nuclear Research Center A.EA, Cairo, Egypt
C1C SESSItABSTRACT
The method ofgamma-ra techn
ast neutrons and by non-destructive
llimatedare used TOr-inspcetinfl'and ■testingof-g
beams of reactor neutrons and gamma-ray. The neutron and gamma-rays transmitted through the object inspection were measured by means of a neutron gamma detector with NE - 213 liquid organic scintillator. The undesired pulses of neutrons or gamma-rays are rejected from the transmitted beam by a discrimination technique based on the difference in the decay part of light pulse produced by recoil electrons or recoil protons. The transmitted neutrons or gamma-rays for different projections were used to get the image of the section through the object investigated using the method of Filtered Back Projection (FBP) algorthim.
MdSSBAUER INVESTIGATION OF ETHMID (STIMMI)
Y. S. Mrayed, M. S. Ellid, and F. A. Fallagh
Physics and Material Science Department, Tajoura Nuclear Research Center, Tripoli, Libya
ABSTRACT
Ethmid (stimmi) sample using Mdssbauer spectroscopy, X-ray diffraction, activation analysis, and chemical analysis was investigated. The Mdssbauer spectrum indicates the presence of three phases, two phases were identified as a- Fe203 and a-FeOOH, the third phase consists of six peaks with Mdssbauer parameters (isomer shift - 0.52 mm/s and magnetic field = 29.0 T) which do not match with the parameters of any well known carbides. In order to identify this phase, X-ray diffraction, activation analysis, and chemical analysis were done on the sample, and Mdssbauer spectrum was recorded after each reduction and calcination process. The reduction process at 723 "K led to the

Ill
PrOC Third Radiation Phytic* Confv Al-Minia, 13-17 Nop* 1996
formation of a single phase only, which was identified as a-Fe. The calcination process at 773"K led to the formation of a- Fe^O^. The results of these studies indicate that the third phase should be FeS (Trotiite) In agreement with other reported data.
BACKGROUND LEVELS OF SOME TRACE ELEMENTS IN EGYPTIAN SOILS DETERMINED BY NEUTRON ACTIVATION ANALYSIS
ML F. Abdel-Sabour*, A. S. Abdel- Haleem*EE. Zohny**, A. Sroor *** and R. Zaghloul*
•Hot L aba and Soil Pollution Unit, Nuclear Rea Center, Atomic Energy Authority, Egypt •• Phyaica Dept Faculty of Science, Cairo Unto. Beni-Sen# Branch.
• Nuclear Phyaica Dcp* Faculty of Glrta, Ain Shame Unlv* Cairo
ABSTRACT
As part of a research program on the influence of agricultural practices activities on soil content of heavy metals. The present work was carried to investigate the feasibility of instrumental neutron activation analysis for purpose. Elements studied were, Fe, Zn, Co, Sc, Sb, As, Cd, hg and Cr.
The soil samples analyzed were from different locations to represent different land uses and types. Results revealed that As, Cd and Hg show a pronounced accumulation in soils especially those exposed to industrial and organic wastes disposal.
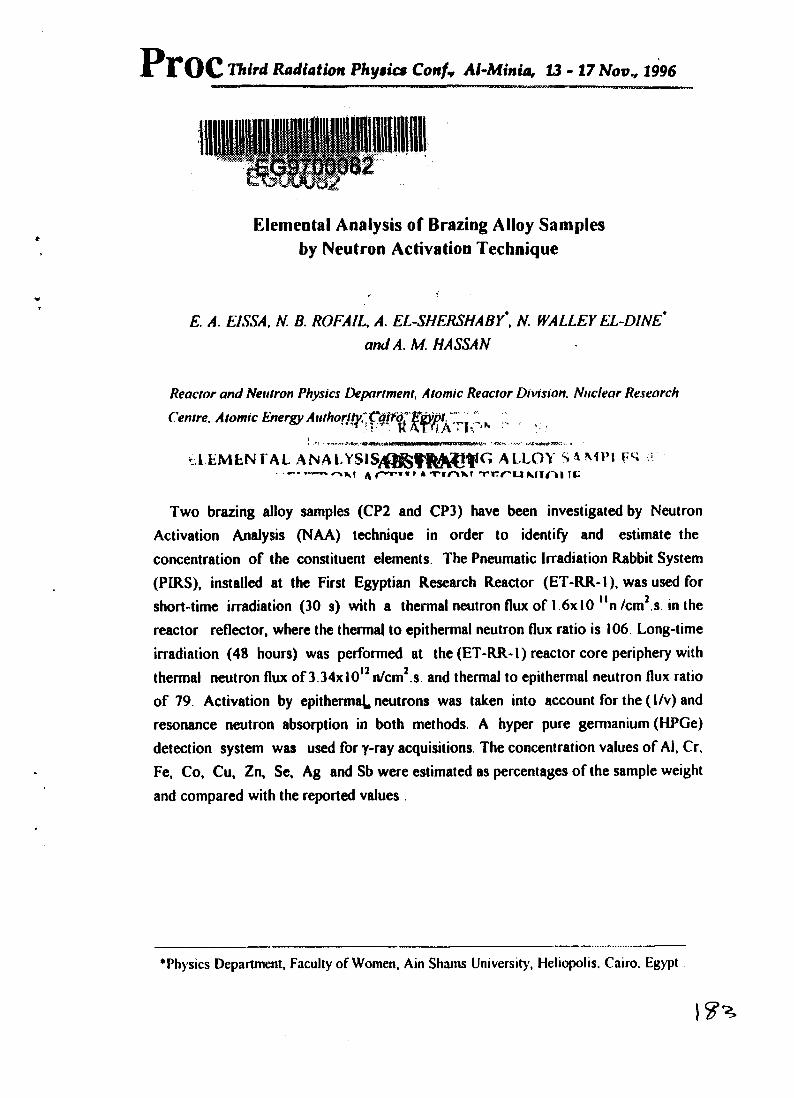
Third Radiation Physics Conf* Al-Minia, 13-17 Nov., 1996
Elemental Analysis of Brazing Alloy Samples by Neutron Activation Technique
< iE. A. EISSA, N. B. ROFAIL, A. EL-SHERSHABV', N. WALLEY EL-DINE'
and A. M. HASSAN
Reactor and Neutron Physics Department, Atomic Reactor Division. Nuclear Research Centre. Atomic EnergyAuthorl^rCdff^^r:^: ^
tLEMENFAL ANAFVSIS/0®fi^G¥G ALLOY SA MPl-----—^ pt-” r » xiam rrru Mini It'
Two brazing alloy samples (CP2 and CP3) have been investigated by Neutron Activation Analysis (NAA) technique in order to identify and estimate the concentration of the constituent elements. The Pneumatic Irradiation Rabbit System (PIRS), installed at the First Egyptian Research Reactor (ET-RR-1), was used for short-time irradiation (30 s) with a thermal neutron flux of 1.6x10 un /cm2.s. in the
reactor reflector, where the thermal to epithermal neutron flux ratio is 106 Long-time irradiation (48 hours) was performed at the (ET-RR-l) reactor core periphery with thermal neutron flux of 3.34xl012 n/cm2.s. and thermal to epithermal neutron flux ratio
of 79. Activation by epithermal neutrons was taken into account for the (l/v) and resonance neutron absorption in both methods. A hyper pure germanium (HPGe) detection system was used for y-ray acquisitions. The concentration values of Al, Cr,
Fe, Co, Cu, Zn, Se, Ag and Sb were estimated as percentages of the sample weight
and compared with the reported values
•Physics Department, Faculty of Women, Ain Shams University, Heliopolis, Cairo, Egypt

Proc Third Radiation Phy$ica Conf* At-Minia, 13-17 Nov., 1996
-2-
INTRODUCTION
Silver alloy solders or brazing materials were first used by jewelers and other similar trades. These had a silver content of approximately 80% and were white in color to match “sterling silver”. Silver brazing is the joining of metals by means of heat, using a filler metal consisting of silver, copper and small percentage of other metals. The flow temperature of this filler metal alloy must be above (427* C), to classify as silver brazing<l>.
Brazed joints are superior joints in a number of ways. They are strong, with tensile strengths greater than those of the brazing alloys themselves and approaching the strength of the metals joined. They are ductile-able to withstand the stresses of shock and thermal expansion and contraction. They are excellent conductors of electricity and heat, and they are leak tight, corrosion resistant, and smooth in appearance.
Brazing alloys are used extensively for joining copper, especially refrigeration and air conditioning copper tubing and copper electrical conductors. They may also be used on brass, with specialized application on silver, tungsten molybdenum*21 The unit cost of brazed joints is relatively low, for several reasons, as very little brazing alloy is needed to make a joint and brazing is performed at low temperatures compared to welding.
Analysis of some complex industrial samples such as alloys, to obtain some information on the elemental constituents has a considerable interest in the last few decades(3‘9). Such analysis can be achieved by (NAA) technique which is considered as a very sensitive and non destructive method. This gives a good indication on the quality of the samples under investigation by direct determination of the concentration values of the effective elements
EXPERIMENTAL
Two samples of brazing alloys (CP2) and (CP3) were provided in a wire form by the Egyptian General Engineering & Motor company which imports them from two
PrOC Third Radiation Phytic* Confy Al-Minia, 13-17 Nov., 1996
-3-
Brilish companies, Johnson Matthey PLC MTD Metal Joining and Thessco Limited, respectively110 Each sample was prepared in a homogeneous granular form.
A specimen weighing 15 mg of each were packed in a clean aluminum foil of known weight. A gold foil monitor and an empty aluminum foil of known weights were included with the two specimens in the same irradiation can for qualitative and quantitative analysis purposes. The can was irradiated with 3 34x1012 thermal neutrons / cm2, s. for 48 hours at the (ET-RR-1) reactor core periphery where the
thermal to epithermal neutron flux ratio is 79. All of the can contents were left
for 3 days to cool down post the end of irradiation and before y-ray spectrum measurements were started. Gamma-ray acquisition was performed for an hour for each of the can contents and was repeated weakly for 3 weeks.
The (PiRS) installed at the (ET-RR-1) reactor was used for irradiating 45 mg from each of the brazing alloy specimens enveloped in cellophane paper of a known weight. A pure gold foil monitor was included with each specimen inside a polyethylene vial. The irradiation was performed for 30 s in the reflector near the reactor core with a thermal rietiiVon flux of 1 63xIp'' net^^^^i^g ^q^rtpl to epithermal flux
ratio was 106. Gamma-ray acquisitions were performed for an hour after the elapse of 50 s in transporting the specimen post irradiation.
A coaxial (HPGe) detector of diameter 56.5 mm and 81 3 mm length with an active volume facing the window of 200 cm1 and a dead layer of thickness 600 microns was
used with the associating electronic units and a MYLEX PCA. A lead shield was surrounding the detector and a lead y-ray collimator was located above the (HPGe) detector to achieve a good detection geometry The dependence of the absolute full- energy peak (FEP) on the y-ray energies was determined by means of 22Na, 24Na, “CO
and a multigamma-ray standard sources113). A fortran computer program was
constructed for calculating the elemental concentration of the samples by TANDY 3000N PCA.
RESULTS AND DISCUSSION
The sensitivity tables reported by Eissa et al(I4 I5) for long- and short-time irradiation
were used in interpreting the y-ray spectra of the (CP2) and (CP3) brazing alloys

Third Radiation Physics Confv Al-Minia, 13 -17 Nov., 1996
-4-
Background y-ray lines resulting from contaminants with the lead shield and collimator surrounding the (HPGe) detector are mainly due to y-ray lines from “K, “Co. l37Cs, 226Ra and mTh
The trace elements in the aluminum envelopes of the specimens are Na, K, Sc, Fe, Co. Zn, Ga. As, Br, Mo, Sb, Hf, Au and Th which were considered as background y- ray lines to be subtracted in case of interference with those of the brazing alloy specimens. The (FEP) area of the gamma-ray lines emitted from the empty A1 envelope were normalized to the weight of the envelopes containing the brazing alloy samples as well as the decay time before subtraction.
Cellophane paper is insensitive to activation by short-time irradiation, so that the only y-ray background lines are due to contaminants in the lead shield and collimator.
The epithermal neutron contribution to the sample activation was taken into account for the (1 /v) and resonance neutron absorption in both methods by using the following expression:
A
(I)[FlYeYN0/MX]ou,4>u, [l-Ko^/o^K 1-e XT)e x,*( l-e ^)
whereC is the concentration of the element as a fraction of the sample weight,A is the net (FEP) area, which represents the number of characteristic
y-rays accrued during a time interval tm(=3600 s) per gram of the specimen,F is the fractional isotopic abundance of the target nuclide,IT is the absolute intensity of the characteristic y-ray line,Ey is the absolute (FEP) efficiency of the (HPGe) spectrpmeter for a characteristic
y-ray line,N° is Avogadro's number in atoms / gm atom,X is the decay constant of the product nuclide in s'.
Proc Third Radiation Physics Conf*mnanmn
Al-MiniOf 13 - 17 Nov* 1996
-5-
M is the atomic weight of the trace element in gm / gm atom,0* is the thermal neutron capture cross section in cm2 / atom,Oepi is the integral cross section, in cm2 / atom, due to (1/v) and resonance absorption
over the reactor (1/E) epithermal neutron spectrum,<t>th is the thermal neutron flux in n/ cm2, s,4>epi is the epithermal neutron flux in n/ cm2, s,T is the irradiation period in seconds,t, is the transportation time interval in seconds elapsed post irradiation until y-ray
measurement is started, and L is the measurement time in seconds.
Values of thermal neutron capture cross section and resonance integral cross section over the epithermal neutron spectrum were taken from ref*l6>. The denominator of Equation (1) can be defined as the total sensitivity(l4,l5) corrected for activation by epithermal neutrons. This is the number of accrued characteristic y-rays during tmdue to activation by a thermal reactor neutron spectrum per unit elemental concentration. Table (1) shows the concentrations estimated in percentage for the constituent elements of the two brazing alloy samples compared with the previously reported values(,on)
In the present work the presence of Cr, Fe, Co, Se and Sb in the two brazing alloy samples is reported for the first time. The concentrations of Zn and Cu in the present work are in fair agreement with the reported values The aluminum concentration of the present work is 1.46 times the reported value for (CP2) while it is nearly fourth the reported value for (CP3).The present work gives an upper concentration limit of 0.71% for silver in the (CP2) sample which is much lower than the reported value 1.8%. Also an upper concentration limit of 0.12% of silver for the (CP3) sample which was reported as a silver free sample.
Both elements Be and P form a single stable nuclide (9Be and 3IP) which are activated to the pure beta emitters l0Be (2 5x10* years) and 32P (14.28 days) This is the reason for their undetectability in the present work.

PrOC Third Radiation Physic* Conf* Al-Minia, 13-17 Nov* 1996
-6-
Bismuth forms a single stable nuclide 209Bi which can be activated in the long-time irradiation method to ll0Bi of half-life time 5.01 days, but it was undetectable, probably because of its low concentration and poor sensitivity.
Natural Lead has four isotopes 204Pb(1.4%), 206Pb (25.1%), M7Pb(21.7%) and 208Pb (52.3%). The very long lived product nuclide M3Pb (3.0xl07 years) as well as the stable product isotopes 207Pb and M8Pb, in addition to the pure beta-emitter **Pb keep lead undetectable even with 100% concentration.
Naturally occurring Cadmium has eight isotopes l06Cd (1.25%), l08Cd (0.89%), "°Cd (912 5%), mCd (12.8%), ,l2Cd (24.1%), l,3Cd (12.2%), ,,4Cd (28.7%) and ll6Cd (7.5%). ll3Cd has an extremely high thermal neutron capture cross section (19910 bams) leads to a stable product isotope ll4Cd. This is in addition to the stable product isotopes lllCd and mCd will be undetectable. Similarly the extremely long lived product isotope "3Cd (9xl015 years) and its isomer ll3wCd (14 years) will be undetectable. The product isotopes llleCd (48.6 minutes), nlCd (53.4 hours), ll7Cd (2.4 hours) and its isomer ,l7wCd (3.4 hours) were not detected in the short-time irradiation method probably because of their poor sensitivities and the low content of cadmium in the samples. Similarly the product isotopes l09Cd (453 days), ll$Cd (53.4 hours) and its isomer ,l5raCd (44.8 days) were not detected in the longtime irradiation method because of their poor sensitivities and the low concentration of cadmium in the samples.
Finally, one may say that (NAA) technique with the facilities mentioned in this work was able to make a good elemental analysis with high accuracy for such industrial samples.
PrOC Third Radiation Physic* Conf* At-Minia, 13-17 Nov* 1996
-7-REEERENCES
1- Kclvinator, 1439. chapter No.4 Basic Training Manual, Silver Brazing, USA (1983).2- Engelhard Ltd. 49-63 spencer street, Birmingham BI86DQ, England. Trademark of
Engelhard corporation EC3761P (Rev. 1/92) (1992).
3- Rouchaud, J.c., FedorofT, M. and Dubertret, A., J. Radioanal., Nucl., Chem. (Feb 1993)V 1M(2), p.p.481-487
4- Hamada, Tatsuji, J. Rad.Res (March 1991). V . 32. P p 99-102.5- Sardesal, N.N., Dighe, P M , Patil, R.R., J.Radioanal , Nucl, Letters. (I July 1988),
V 121(4), p p 227-233.6- Hoelttac, P, Rosenberg, R J, J. Radioanal., Nucl, Chem. Articles(sepl987). V. 114(2),
p p 403-408.7- Erasmus, C.S., Sellschop, J.P.F. and Watterson, J.I.W. Nucl. Geophys. (1987) V 1(1),
pp 1-238- Galdino, S M L Recife, PE (Brazil). Sep (1985), p p 1239- Lambrev, V.G., Rodin, N.N., Blinova, LA and Povdalskij, A A , Zhumal-Analiticheskoj-
Khimii- USSR . (Jan 1985) V #(l), p.p.74-82.10- Silbralloy, BS 1845 (1984) cp2, Johnson Matthey PLC MTD METAL JOINING Orchard
Road, Royston, Herts SG85HF, England.11- Phosphorus Brazing Alloy, BS 1845 (1984) cp3, Thessco Limited, Royds Mills,
Windsor Street, Sheffield, S47WB, England.12- General Engeneering & Motor company, the general industrial building, 48 El Galaa street
Tanta, Egypt, (personal communication).13- A certificate of standard sources “Oxford Instruments Analytical Systems’’
(Private Communications). July (1994).14- Eissa, E A, Aly, R.A., Rofail, N.B and Hassan, A.M. “Feasibility Study On Neutron
Activation Analysis By Long-Time Irradation Facility”, AREAEA/Rep -333 (1995), Egypt.
First International Scientific Conference (Science and Development) Faculty Of Science,
Al-Azhar University, Cairo, 20-23 march (1995). Egypt.15- Eissa, E A , Aly, R.A., Rofail, N.B. and Hassan, A.M. Second International conference
on Engineering Mathematics and Physics, Cairo University, Dec 27-29(1994) v I, p.p. 229-247 of the conference proceedings.
16- Muyghabghab, S.F. and Garber, D l. “Neutron Cross Sections". Volume I Resonance Parameters, BNL-325, June (1973)

Third Radiation Physics Confv Al-Minia, 13 •17 Nov* 1996
-8-
Tablc (1): Concentration (in •/• ) of elements in the two brazing alloy
samples compared with the previously reported values.
Element Isotope or Isomer
Present work concentration^) Reported values0*’10
CP2 CP3 CP2 max CP3 max
Beryllium 7Be undetectable undetectable 0.0005
Aluminium# “A1 0.0146*0.0015 0.0024*0.0006 0.0100 0.0100
Phosphorous ”P undetectable undetectable 6.9000 7 8000
Chromium 5,Cr 0.0010*0.0001 00036*0 0002
Iron *Fe 2.300*00490 2.1200*0.0490
Cobalt “Co 0 0035*0.00014 00030*0.0001
Zinc «Zn 0.0486*0.0017 0.0472*0.0015 0.0500 0.0500
Copper “Cu 92.0561*3.9634 95.4200*2.2100 90.6500 93.0000
Selenium 7,Se 00049*0.0002 0.0037*00002
Silver “®"Ag 5 0.7100*0.0078 <0.1200*0 0030 1 8-2.2
Cadmium n,Cd undetectable undetectable 0.0250 0.0250
Antimony mSb,lMSb 00060*00002 0.0087*0.0005
Lead “*Pb undetectable undetectable 0.0200 0.0200
Bismuth ,MBi undetectable undetectable 00010 00010
* Elements which were analyzable only by the short-time irradiation method.

Conf* Al-MiniOf 13 - 17 Nov* 1996
DETERMINATION OF MOISTURE CONTENT AND NATURAL RADIOACTIVITY
IN SOILS USING GAMMA SPECTROSCOPYE.E.Abdel-hady *, A..M.A..EL-Sayed and H.B.AIaa.
Department of Physics, Faculty of Science, El-Minia University
AbstractThe gamma-ray transmission method has been used to study the soil-
water properties in the laboratory as well as in the field. The present measurements were performed using y-ray spectroscopy system based on a 5x5 cm Nal(TI) scintillation detector and two combined sources (,3,Cs& 24,Am).From the obtained results, it is clear that the soil density at both stages (saturated and after drainge) remains the same. Natural radioactivity of the samples under investigation was also studied using y-ray spectrometer having HPGe detector. Qualitative and quantitative analysis of the obtained natural gamma radiations have revealed the presence of the radioisotopes: 238U and 232Th series and *K in meaningful concentrations.
INTRODUCTIONWith the increased interest in the behavior of water in swelling soils and
the resulting theoretical studies on the subject, a method is required for
measuring changes in both water content and soil density in order to
experimentally evaluate these theoretical analyses . Gamma-ray transmissionmethod has been very accurate and useful for the study of soil-water propertiesin the laboratory as well as in the field Experiments have been conductedusing a single monoenergetic source as well as two sources simultaneously.
«
Soane<2> proposed a y-ray dual-energy method for the simultaneous
measurements of water content and soil density using a broad beam.
The principle equation of y-ray transmission is
I ■ l0 exp (- p X) (1)
where I and lo are the initial and transmitted intensities of y-rays through a
medium of thickness X and attenuation coefficient p.
* Present address: Dept, of Physics, Faculty of science, Qatar University.
V2I

PrOC Third Radiation Pkytk* Couf* AUMinia, 13-17 Nov* 1996
The attenuation equation for a soil-water system using 662 keV photons is given as
(l/lo)c. = exp[-(n,clp + MwCse)X] (2)Similarly the attenuation equation for 60 keV photons is given as
( I / lo >Am = exp [ - ( p^ p + 8 ) X] (3)
where pt and pw are the mass attenuations of soil and water respectively, p, is the soil density (g/cm3) and 9 is the moisture content (g/cm3), and X is the
thickness of the sample (cm). From Eqs. (2) and (3) one can get
PwAm In ( Vlo)cs - PwC* In (l/io)AmP= -------------- --------- ------------- (4)
MwC* PsAm X - P«Ce PwAm Xand
MiAm In ( l/lo)ce - Pece In (l/lo)Ame- ------------—---------------------------------- (5)
PwAm PeCe X - p*Am PwCe XThus if (l/l0)cs and (l/l0)Am are measured by experiment, p, and 9 can be computed.
In the present work. the two source method has been applied to study the ^il-water characteristics. For this purpose, 241Am & 137Cs, (60 keV) and
(662 keV) y-rays were used. Also, the activity concentration of the natural radionuclides of the investigated samples is determined.EXPERIMENTAL
The y-ray spectrometer has been used to measure the moisture content in
soils. It consists of a Nal(TI) scintillation detector, cylindrical in form, 5 cm in
diameter and 5 cm in thickness. The crystal is optically coupled with an RCA
8850 photomultiplier tube (P.M.T.). A cylihdrical pm-magnetic shield surrounds the photomultiplier and the crystal. The-dynode pulses are fed to an ORTEC (7150) multichannel analyzer (MCA) set to 1024 channels through an ORTEC (
575A) amplifier. The detector is shielded with 5 cm thick lead castle lined with
thin sheet of aluminum. The spectrometer was calibrated using y-rays from the decay of ,09Cd, ,33Ba, MNa, ,37Cs and wMn sources.

In the present work, 24lAm and ,37Cs radioactive sources emitting 60 and 662 keV gamma-ray, respectively were combined in a single collimator. The 24,Am source was encapsulated in a stainless steel container with a thin window and placed in front of the ,37Cs source in the lead collimator. This arrangement minimizes the absorption of the low energy gamma-ray from 24,Am proir to their reaching the soil sample. Unlike 241 Am, self-absorption is on problem with ,37Cs because of its much higher gamma energy.
The higher gamma energy source ( ,37Cs) produces Compton scatter through interaction with the sample. Some of these Compton scatters will be counted as gamma-rays in the lower energy source (241Am). This error was eliminated by correcting the obtained spectra according to the suggested method of Cory et al(4).
After the correction has been done, the dry soil samples were packed in a plastic column (5x5x10 cm3). The transmission measurements were made at
different depths down the dry column for each soil. Water was applied to the surface up to the saturation point (ponding on the surface). Twenty four hours following the addition of water, the transmission measurements were repeated. The time of collection data for each soil was 15 minutes. Also, the background was subtracted from each spectrum and the moisture content and bulk density of the column at each depth were calculated from Eqs. (4&5)
For carrying out the measurements of natural radioactivity in soil samples, a HPGe detector was used in connection with MCA/PC. spectroscopy system to collect and analyze the data. Also, the spectrum was calibrated before and after each measurement and the efficiency curve has been obtained. RESULTS AND DISCUSSION
In the present work, the two source method has been tested from the study of soil-water characteristics. From the measured values of (l/lo)c and (l/l0)Am, the moisture contents and the bulk densities of the samples under investigation have been calculated using Eqs. (4&5) after applying the correction for the Compton contribution of the higher energy to the lower energy peak. The
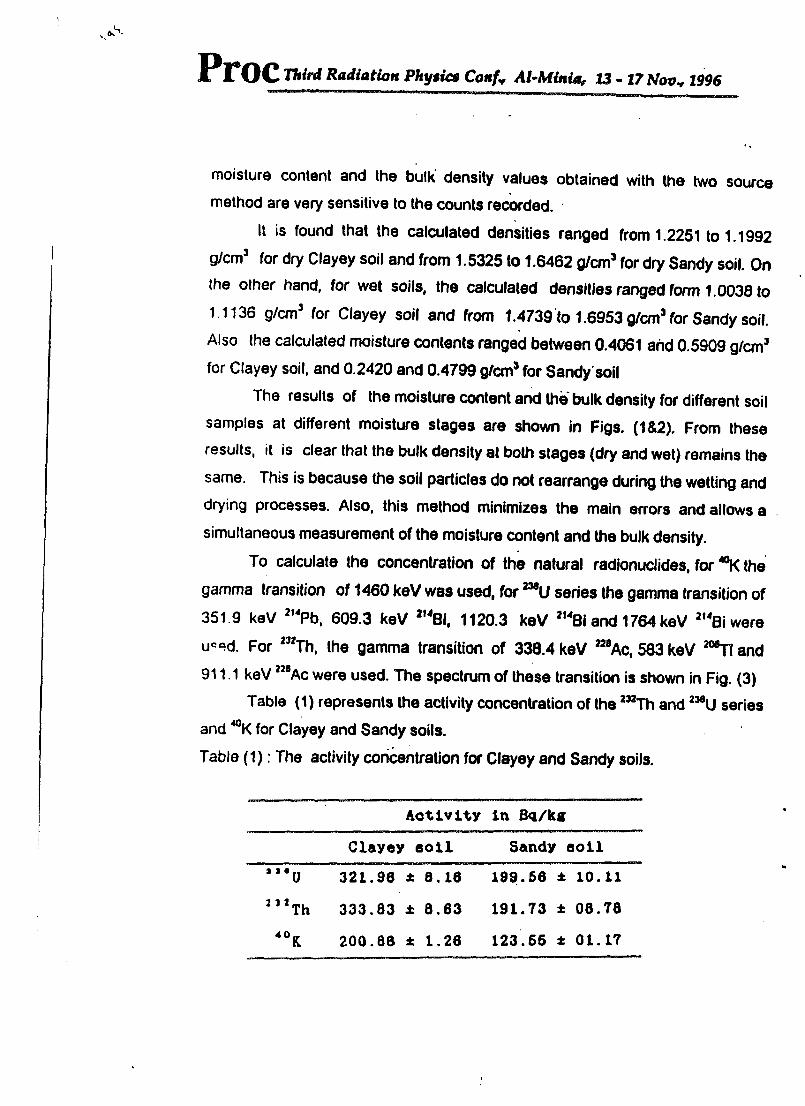
Third Radiation Physics Conf* Al-Minia, 13 - 17Nov* 1996
moisture content and the bulk density values obtained with the two source method are very sensitive to the counts recorded.
It is found that the calculated densities ranged from 1.2251 to 1.1992 g/cm3 for dry Clayey soil and from 1.5325 to 1.6462 g/cm3 for dry Sandy soil. On
the other hand, for wet soils, the calculated densities ranged form 1.0038 to 1 1136 g/cm3 for Clayey soil and from 1.4739 to 1.6953 g/cm3 for Sandy soil.
Also the calculated moisture contents ranged between 0.4061 and 0.5909 g/cm3 for Clayey soil, and 0.2420 and 0.4799 g/cm3 for Sandy soil
The results of the moisture content and the bulk density for different soil samples at different moisture stages are shown in Figs. (1&2). From these results, it is clear that the bulk density at both stages (dry and wet) remains the same. This is because the soil particles do not rearrange during the wetting and drying processes. Also, this method minimizes the main errors and allows a simultaneous measurement of the moisture content and the bulk density.
To calculate the concentration of the natural radionuclides, for *K the gamma transition of 1460 keV was used, for 238U series the gamma transition of 351.9 keV ZMPb, 609.3 keV 2,48i, 1120.3 keV 2,4Bi and 1764 keV 2MBi were u=ed. For 232Th, the gamma transition of 338.4 keV ”aAc, 583 keV ™TI and 911.1 keV 22BAc were used. The spectrum of these transition is shown in Fig. (3)
Table (1) represents the activity concentration of the 232Th and 2MU series and *K for Clayey and Sandy soils.
Table (1): The activity concentration for Clayey and Sandy soils.
Activity In Bq/kg
Clayey soil Sandy soil,,eU 321.96 * 8,16 199.66 ± 10.11
212Th 333.83 ± 8.63 191.73 ± 08.78
40K 200.86 ± 1.26 123.65 ± 01.17

Third Radiation Physics Conf* Al-Minia, 13-17 Nov., 1996
E 3-
E 3-
5 4-
Woter Content and Bulk Density (g/cmJ)
Fig.(1): Hater content and Bulk density determined by the dual gamma method for Clayey soil. a) before wetting, b) after wetting.

Proc Third Radiation Physic* Conf* Al-Minia, 13 - 17 Nov., 1996
1
2H
Eo
CL<DQ
ooO0
O
5-
6-
oooo
0-
1-
2
E 3-o
t4"eO5-
6-
7
*
*
»*
*
*
*
*«
*
*
*
ooooo
ooo
oooo
Water Content
*
e*
*e
*
#e
*
.0 0.3 0.6 . 0.9 1.2 1.5 1.8Water Content and Bulk Density (g/cm3)
06■t—T
0.9 T2
Bulk DensityT
1.5
Fig.(2): Water content and Bulk density determined by the dual gamma method for Sandy soil, a) before wetting, b) after wetting.

Fig.(3): A typical f-epectrum of the sandy soil.
Pl^OC Third Radiation Physics Conf* Al-Minia, 13-17 Nov1996
Counts/24 hourso o
u>
2
2 14
2 14
l 97

CONCLUSION
1) The gamma ray transmission method ( two source method) opens the
possibility to calculate both the moisture content and the bulk density of soil fractions simultaneously.
2) The method can be used to study the environmental conditions with saving time and efforts.
3) The activity concentration of the natural radionuclides could be explained by the differential adsorpation ability of soils (Clayey & Sandy).
REFERENCES:
1) C.G. Gurr, C.S.t.R.O, Adelaide. South Australia, 28,224 (1961).2) B.D. Soane. Nature 214, 1273(1967).3) M L. Whieter, Am. Chem. Soc. Symp. Series 35, Wash., D C., U S A. (1967).4) J.C. Corey , S.F. Peterson, and M.A Wakat, Proc. Soil Sci. U SA 35, 215
(1971).5) R.S. Saksena, S. Chandra, and B.P. Singh, J. Hydrol. 23, 341 (1974).6) T J. Marshall and J.W. Holmes, "Soil Physics", Cambridge University press,
(1979).7) P 8 Vose, "Introduction to Nuclear Techniques in Agronomy and Plant
Biology", International Atomic Energy Agency, Vienna at Centro de Energis Nuclear na agriculture Brazil Press, (1980).
8) A. Fishman, A. Notea and Y.Segal, Nucl. Instrum. Methods 184,571 (1981).9) E. S. B. Ferraz. IAEA-SM-267/41. Proc. of symposium, Aix-enProvence,
France, 449 (1983).10) G S Mudahar and H S. Sahota, J. Hydrol. 80,265 (1985).11) G.S.Mudahar and H.S. Sahota, Appl. Radiat. Isot. 37 No. 7, 563 (1986).

Third Radiation Physics Conf* Al-Minia, j
MATERIALS TESTING BY COMPUTERIZED TOMOGRAPHY WITH NEUTRONS AND GAMMA-RAYS
A M EL-GMOBARY. F A EI-BAKKOUSH*, and R M. MEGAHID
Reactor and Neutron Physics Department. Nuclear Research Centre,A E A , Cairo, A R of Egypt
ABSTRACT
The method of computerized tomography by fast neutrons and gamma-rays are used for inspecting and testing of materials by nondestructive technique. The transmission technique is applied using a
narrow collimated beam of reactor neutrons and gamma-rays. The
neutrons and gamma-rays transmitted through the objects under inspection
were measured by means of a neutron gamma detector with NE-213 liquid
organic scintillator. The undesired pulses of neutrons or gamma-rays are rejected from the transmitted beam by a discrimination technique based on
the difference in the decay part of light pulse produced by recoil electrons or recoil protons.
The transmitted neutrons and gamma-rays for different projections
were used to get the image of the section through the investigated object using the method of Filtered Back Projection (FBP)
. 1. INTRODUCTION
Computerized tomography (CT) by neutrons and gamma-rays is a very precise and efficient method to study the two and three dimensional
distribution of materials in objects under investigation by a non-destructivemanner0-0. This technique gives a cross-sectional image of the examined
object. The image is displayed as if it is possible to cut and view the tested
object over an arbitrarily oriented plane, but usually over a plane
perpendicular to its long axis. A full three dimensional picture can be
\* Nuclear Research Centre, Atomic Energy Authority - Libya.

L rOC Third Radiation Physic* Confv Al-Minia, 13-17 Nov., 1996- z -
obtained by stacking a sequence of such layers. Therefore, this technique is
now considered as the most precise way to have three dimensional
information about the internal structure and elemental distribution within
the object under investigation. By this technique it became possible to see
directly the cracks, inclusions and other inhomogeneties in the examined
objects.15’
The CT-techniqqe is now used for non destructive assay of reactor
materials and components. Also steel welds, concrete technology and other
industrial components are precisely examined by this technique. Further,
applying this technique by fast and thermal neutrons has also increased its
ability to reveal low density media, e g. water, oil and plastic within dense
materials, e g. steel, lead and uranium. Moreover, among the main
advantages of this technique by neutrons is the high penetrability of
neutrons and therefore thick objects can be examined.
2- EXPERIMENTAL DETAILS
The inhomogenity of concrete structure was tested by imaging two
cylinderical probes of ilmenitc-limonite concrete using the CT-scanner
shown in fig. 1. This CT-scanner is composed of a translating and rotating
tables with 5 phase step motors, detector table with detector collimator,
scintillation detector with NE-213 liquid organic scintillator, radiation
measuring instruments, main controller and image reconstruction
computers.
The cylinderical concrete samples under investigation have 15 cm
diameter and one of them was heated for 48 hours at 300°C. The concrete
samples are imaged by fast neutrons and gamma-rays emitted from one of
the horizontal channels of the ET-RR-1 reactor. A steel collimator of 400
mm length and with inner slit of 2x10 mm was placed inside the channel
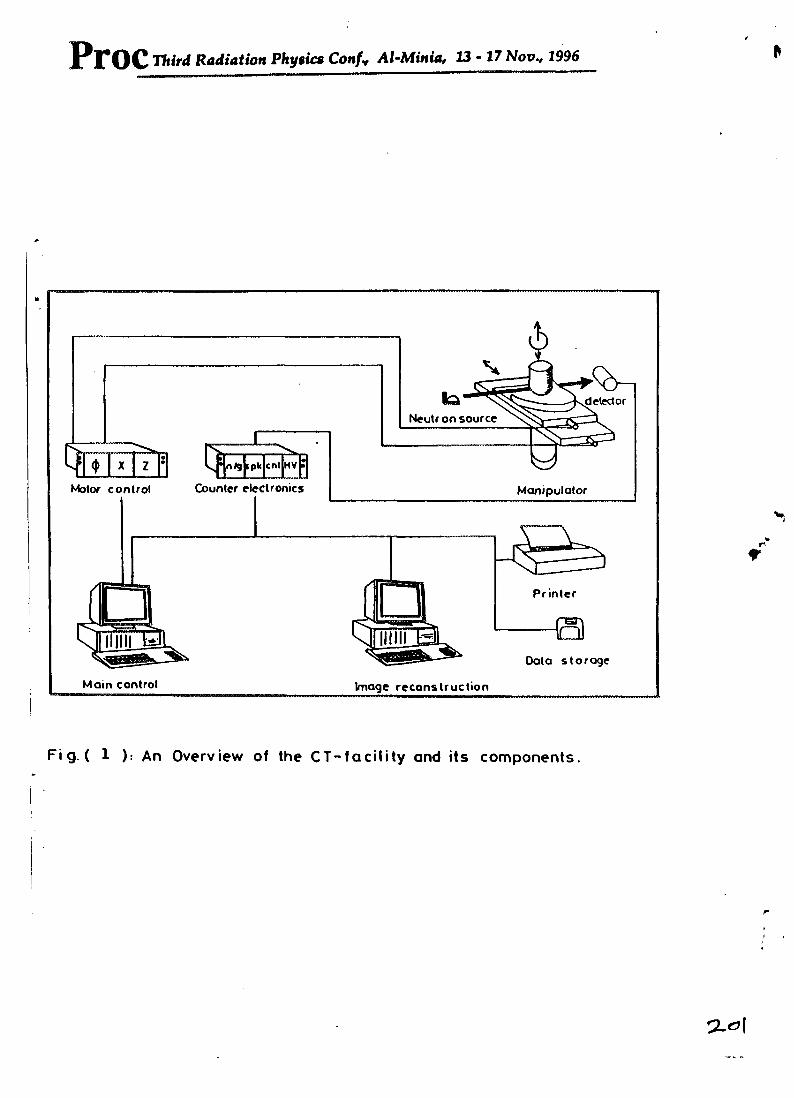
PrOC Third Radiation Phytic* Co«/y Al-Minia, 13-17 Nov., 1996
Data storage
Main control Image reconstruction
Fig. ( 1 ): An Overview of the CT-facility and its components.

Proc Third Radiation Physics Conf* Al-Minia, 13-17 Novv 1996- J -
and at the beam exit, also a steel collimator of 40 cm length and with inner
slit of 1x5 mm was placed before the detector. A special care was paid to
adjust both the beam and detector collimators axes with the beam
geometrical axis.
The fast neutron and gamma-ray fluxes which have passed through
the concrete sample are measured by NE-213 liquid organic scintillator
mounted on photomultiplier tube, type EMI 9815-B. The photomultiplier
output signal is fid directly to the signal input of the pulse shape
discriminator, type link 5020 for separation between neutrons and gamma-
ray pulses. Figure 2 shows a block diagram of the neutron-gamma
measuring system with the recommended dynode chain for the
photomultiplier tube.
The scanner spatial and density resolution were tested by imaging a
steel probe (50 mm diamter) with air holes of diameters vary from 1 to 5
mm. The probe was imaged by measuring the transmitted neutrons and
gamma-rays for 71 translational steps and 180 rotational scans. In case of
imaging the concrete samples, the transmitted neutron and gamma-fluxes
were measured for 171 translational steps each of 1 mm and for 90
rotational angles in steps of 2°. The measuring time for each translational
step was controlled by a fixed number of counts given by a neutron
monitor placed in one of the vertical channels in the biological shield of
the reactor.
3- RESULTS AND DISCUSSIONS
The CT-image of the tested object was reconstructed from the
projection data by the reconstruction program FBP (Filtered Back
Projection) which is based on the convolution technique/15 6). In this
program the projections are first filtered and then backprojected. Also the
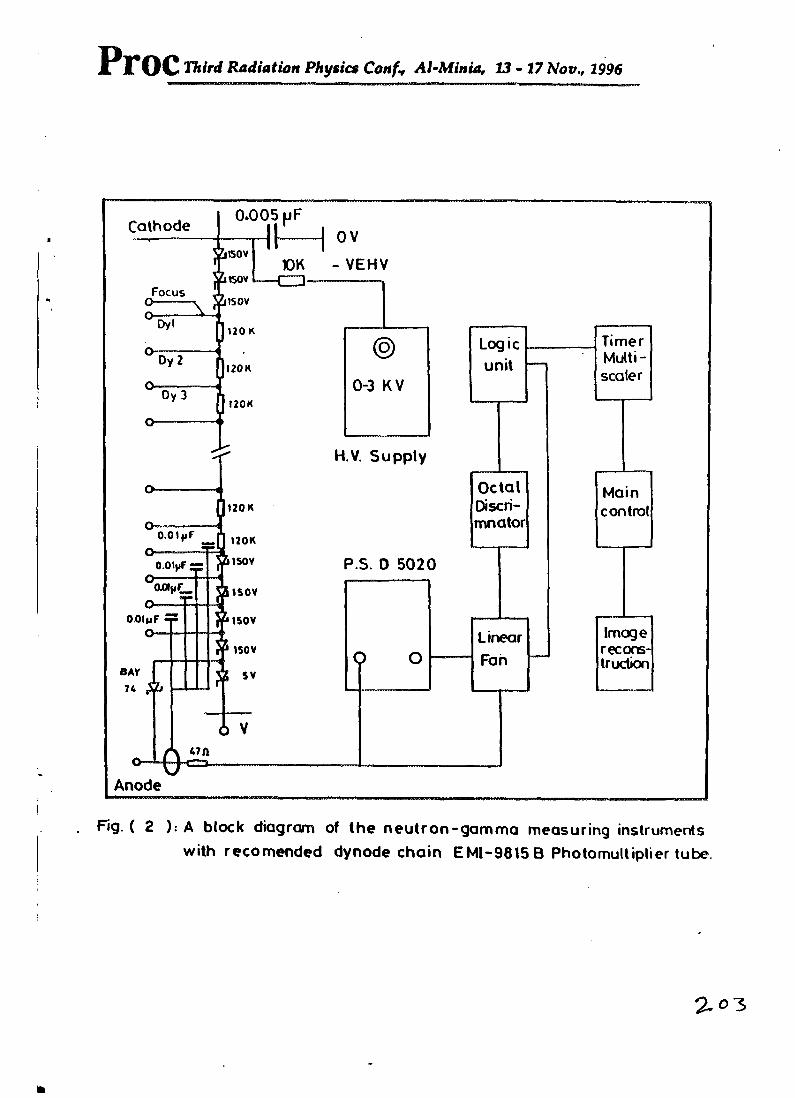
Third Radiation Physics Confy Al-Minia, 13-17 Nov., 1996
0.005 pFCathode
m -VEHVFocus
Timer Multi - scaler120K
0-3 KV
H.V. Supply
OctalDiscri-mnator
Maincontrol
O.OIfiF
P S. 0 5020
O.OlpFImagereconstruction
LinearFan
Anode
Fig. ( 2 ): A block diagram of the neutron-gamma measuring instruments with recomended dynode chain EMI-9815 8 Photomultiplier tube
2.03
Proc Third Radiation Physics Conf'v Al-Minia, 13-17 Nov., 1996- ‘-t -
transmitted dala arc normalized to I for the measurements going only
through ait . The reconstruction programme does this nonnalyzation lor the
first 5 values of each projection. The CT-images were reconstructed with
an image matrix size which is equal to the square of the number of the
transmission values in one projection. The CT-matrix was transformed to a
TIFF image file with the programme CTIFF and was visualized with the
programme Graphic Workshop GWS(7>.
The evaluated CT-images given by fast neutrons and gamma-rays
ate shown in figs. 3 and 4. Both images show clearly the air holes with
diameters down to 2 mm, but, the 1 mm diameter hole is not observed in
both images The CT-image given by fast neutrons shows nearly the same
linear attenuation coefficients for the steel probe while the image given by
gamma photons shows some differences in the attenuation coefficients.
The CT-images obtained by fast neutrons and gamma-rays for
unheated and heated samples of ilmenite-limonite concrete are given in
figs 5,6,7 and 8. All images show clearly the inhomogenity in concrete
structure and positions of ilmenite coarse aggregates and morter. Positions
of air cavities are more clearly observed in images obtained by fast
neutrons than those obtained by gamma-rays. All images for both unheated
and heated samples show clearly the differences in attenuation coefficients
and density variation of concrete construction. The combined evaluation of
these images shows that the variation of the attenuation coefficients can be
attributed to differences in density and inhomogenity in concrete structure.
The images also indicate that both unheated and heated samples show no
remarkable change in the density distribution of water content. This proves
that ilmenite-lemonite concrete can keep on its water content without any
appreciable loss when exposed to heating at temperatures up to 300°C.
Third Radiation Physics Confv Al-Minia, 13-17 Nov., 1996
4- CONCLUSIONS
The obtained CT-images for investigated concrete samples have proved the visibility of using the CT-technique by transmission method to
study the pattern of the attenuation coefficients for neutrons and gamma-
rays in shielding materials. It is a versatile technique which can be used to
study inhomogenity in concrete structure due to different components, air
cavities and local variation of water content.
The CT-images for unheated and heated ilmenite-limonite concrete
samples indicate that exposing ilmenite-limonite concrete to temperatures
up to 300°C do not cause any remarkable change in its water content. This
ensure the validity of using this concrete as heat resistant concrete for
constructing the inner part of the primary shield around the cores of
nuclear power plants.
S- REFERENCES
1- Gilboy W.B. and Foster J„ Industrial Application of Computerized
Tomography with X-and Gamma-Radiation, Research
Technique in Non destructive Testing, Vol.6, R.S. Sharpe Ed.,
Academic Press, New York (1982).
2- Maier P., Plister GM Stier G., Kegreiss W., and Hehn G., Progress
in Neutron Tomography for Nondestructive Testing. Proc. 2nd World Conf. on Neutron Radiography, Paris, France, June, lb-
20 (1986).
3- Plister G., Schatz A.K. and Siegel C., Non destructive Testing of
Materials and Components by Computerized Tomography with
Fast and Thermal Reactor Neutrons. Nucl. Sci. Eng. 110, pp
303-315 (1992).

Third Radiation Physics Conf, Al-Minia, 13-17 Nov., 1996
4- Levai F, Computed Tomographic Methods for Nuclear Fuel
Characterization and Safeguard, Periodical Poly. Tech. Elect.
Eng., Vol. 26, Nos 1-2, Budapest (1982).
5- Herman G.T., Image Reconstruction from Projections, the
Fundamental of Computerized Tomography, Academic Press,
New York (1980).
6- Siegel C., Neues Energieselektives Verfahren Zur Spektralkorrektur bei
der Computertomographie mit Schnellen Neutronen. IKE
report 6-182, (1993).
7- Tag Image File Format Specification Revision 5.0, Aldus
Corporation, 411 First Avenue South Suite ,200, Seattle,
WA98104 (USA) and Microsoft Corporation, 16011 NE 36th
Way, Box 97017, Redmond, WA 98073-9717 (USA).
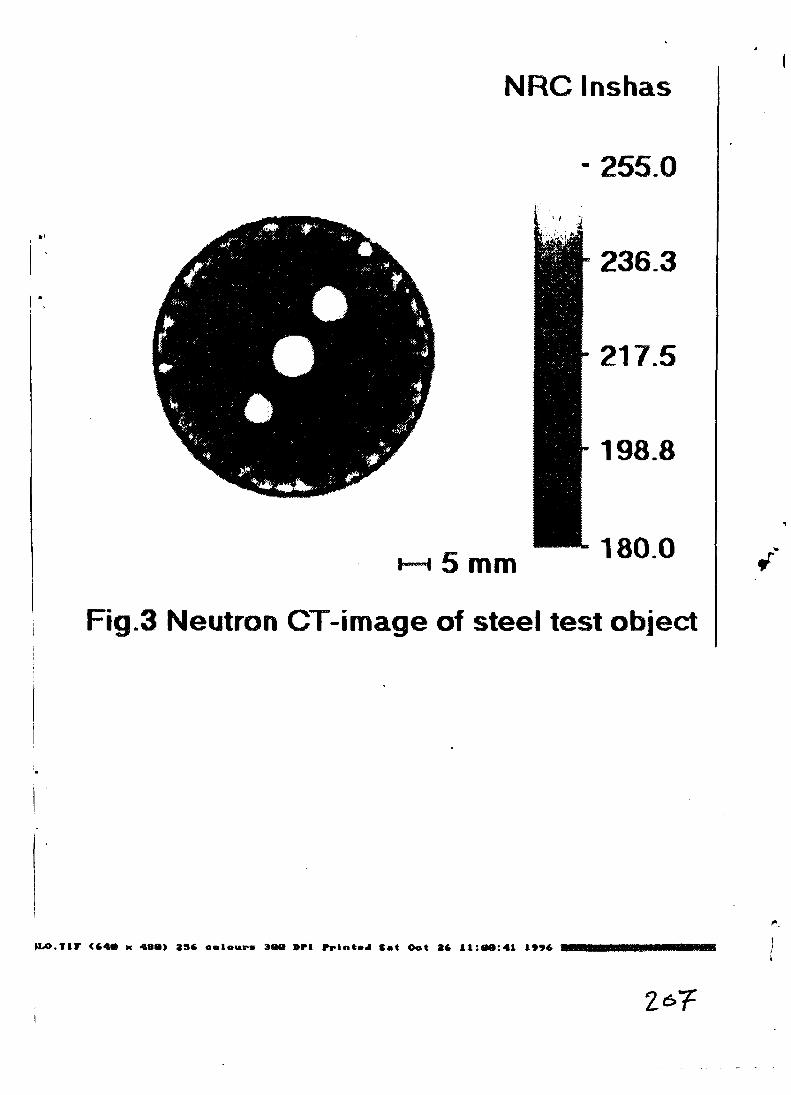
NRC Inshas
- 255.0
236.3
217.5
198.8
i—i 5 mm 180.0
Fig.3 Neutron CT-image of steel test object
IVO.Tir (iW x 488) 836 ooloutr-s 308 BPI PpinttJ Set Oot 26 11:88:41 1996
Z*T

i
PlTOC Third Radiation Physio Conf, Al-Minia, 13-17 Nov., 1996
NRC Inshas
- 230.0
Fig. 4 Gamma CT-image of steel test obje<
ie_CLO.TIF <64® K 48B> 236 308 DPI Printed Sat Oot 26 10:41:03 1906

Third Radiation Physics Conf* Al-Minia, 13-17 Nov., 1996
NRC Inshas
I
222.0
184.0
146.0
108.0
70.0
Fig.5 Neut. CT-image of unheated sample
2*3
flF9Q8_NEU.TIW <640 x 480> 236 colour* 300 DPI Printed tot Oot 26 11:36:07 1996
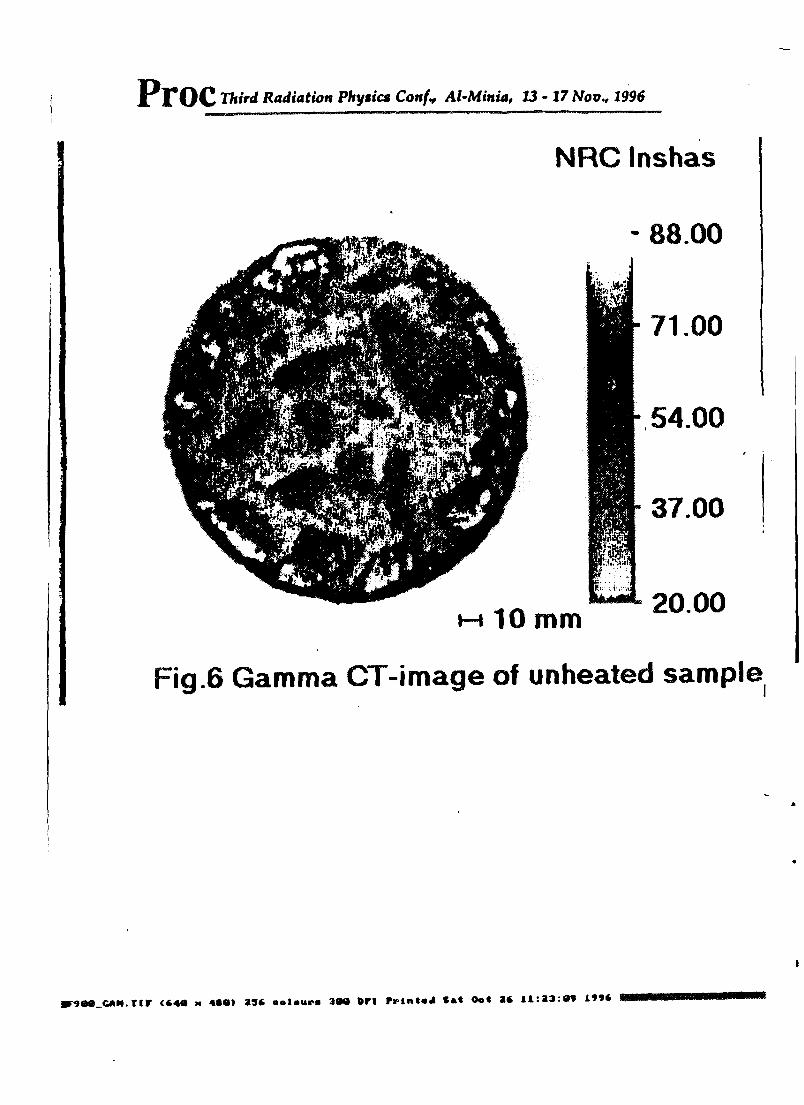
77iird Radiation Physics Conf* Al-Minia, IS - 17 Nov., 1396
NRC Inshas
- 88.00
71.00
54.00
37.00
20.00
Fig.6 Gamma CT-image of unheated sample
CAM TIP <64® m 4«e> 236 eelaura 3W Dfl Print#® Sat Oot 26 11:23:61 1416

PrOC Third Radiation Physics Conf^ Al-Mittia, 13 - 17 Nov., 1996
NRC Inshas
Fig 7 Neutron CT-image of heated sample
i
211
<*40 x 4SO> 236 colours 300 DPI Printed $ at Oot 26 12:04:14 1996

P]*Q(J Third Radiation Physics Confv Al-Minia, 13 - 27 Noov 1396
NRC Inshas
- 85.00
r 70.00
55.00
40.00
m 10 mm 25.00
Fig.8 Gamma CT-imgae of heated sample
ia CLO.TIF (64a * 488) 236 colours 388 DPI Printed Sot Oct 26 11:49:81 1996

Proc Third Radiation Physics Conf* Al-MiniFAQTnnnac
MOssbauer Investigation of Itmid (
Y.S. Murayed, M S. Ellid, F A. FallaghPhysics Department, Tajoura Nuclear Research Center
Tajoura- Libya
1. Abstract
A sample of itmid ( yjyi) available commercially was obtained and investigatedusing 57Fe MOssbauer spectroscopy, atomic absorption, X-ray fluoresence The MOssbauer spectra showed the presence hematite (a-Fe2C>3), goethite (a-FeOOH), anda third phase which has a six-line spectrum with the following parameters: Isomer Shift (5=0.52 mm/s), magnetic field (H=290 kOe) after conducting a series of reduction and calcination to the itmid sample and with the aid of atomic absorption and X-ray fluoresence results the third phase was identified as the iron sulfide compound FeS
1. Introduction
According to literature itmid ( xu/l) and kohl ( are two names for the same substance which consists mainly of powdered antimony sulfide (Sb2S])[l,2] Nevertheless, the itmid sample we obtained is a reddish brown powder, whereas kohl is a black powder. A run of 57Fe MOssbauer measurement on a sample of ordinary kohl produced no spectrum, itmid , on the other hand, produced very interesting spectra which makes it a substance that can be investigated by 57Fe MOssbauer spectroscopy The aim of this work is the identification of phases present in the relatively unknown sample of itmid and a test of the ability of the MOssbauer technique in phase analysis
2. Theory
The MOssbauer effect is defined as nuclear recoil-free emission and resonance absorption of gamma radiation [3], The MOssbauer spectra exhibits a hyperfine structure which is due to small changes that occur in the energy states of the nucleus as a result of interaction with the external envirbment (the electron shell and the other atoms of the crystal) For this reason, if the source and absorbent do not have identical chemical composition, the energy states of the atomic nuclei are also different and the possibility of resonance absorption doesn't exist If the source is moved at various rates, however, the resonance state can be created with the aid of the Doppler energy and, with knowledge of the rate of movement, conclusions can be drawn about the energy differences,i e, on the effect of the enviroment.
The parameters that provide such information are the isomer shift, quadrupole interaction, and magnetic hyperfine interaction
2/31
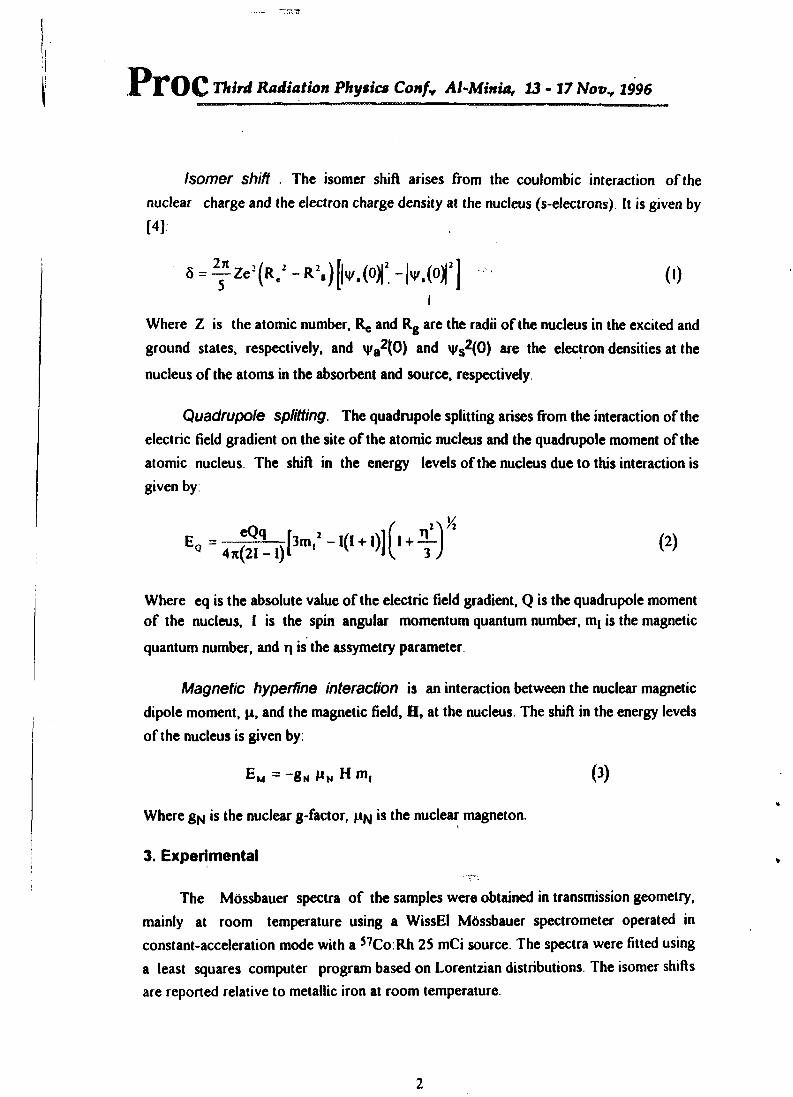
Proc Third Radiation Physics Confy Al-Minia, 13-17 Nop., 1996
Isomer shift . The isomer shift arises from the coulombic interaction of the nuclear charge and the electron charge density at the nucleus (s-electrons) It is given by[4]
8 = ~Ze2(Re1-R2,)[|y,(0)|2-|v,(0)| j (I)
IWhere Z is the atomic number, R@ and Rg are the radii of the nucleus in the excited and ground states, respectively, and \j/a2(0) and t|/s2(0) are the electron densities at the nucleus of the atoms in the absorbent and source, respectively
Quadrupole splitting. The quadrupole splitting arises from the interaction of the electric field gradient on the site of the atomic nucleus and the quadrupole moment of the atomic nucleus The shift in the energy levels of the nucleus due to this interaction is given by:
E-=4N3m‘-l<,+,>](,+T^ (2)
Where eq is the absolute value of the electric field gradient, Q is the quadrupole moment of the nucleus, I is the spin angular momentum quantum number, mI is the magneticquantum number, and q is the assymetry parameter.
Magnetic hyperfine interaction is an interaction between the nuclear magnetic dipole moment, p, and the magnetic field, H, at the nucleus The shift in the energy levels of the nucleus is given by:
Em ~ 6n Wn H m, (3)
Where g% is the nuclear g-factor, p^ is the nuclear magneton.
3. Experimental
The Mossbauer spectra of the samples were obtained in transmission geometry, mainly at room temperature using a WissEl Mossbauer spectrometer operated in constant-acceleration mode with a 57Co:Rh 25 mCi source. The spectra were fitted using a least squares computer program based on Lorentzian distributions. The isomer shifts are reported relative to metallic iron at room temperature.
2
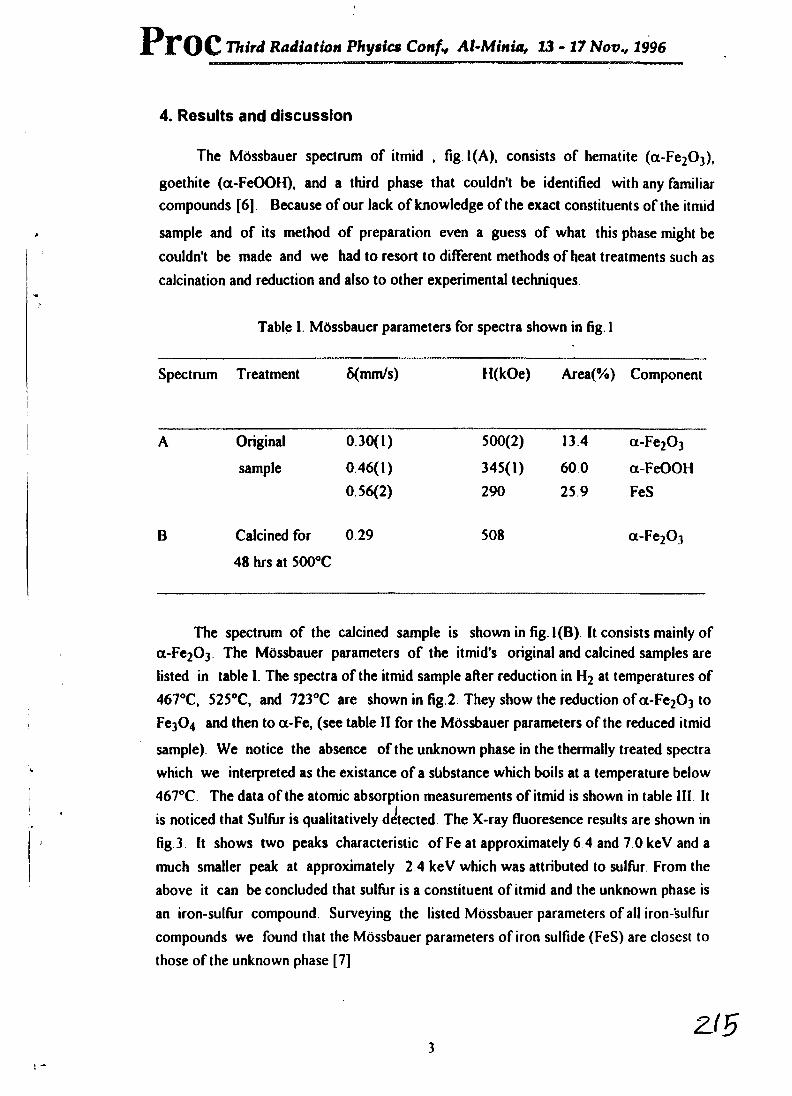
PrOC Third Radiation Physics Conf* Al-Minia, 13-17 Nov., 1996
4. Results and discussion
The Mtissbauer spectrum of itmid , fig 1(A), consists of hematite (a-Fe203),
goethite (a-FeOOH), and a third phase that couldn't be identified with any familiar
compounds [6] Because of our lack of knowledge of the exact constituents of the itmid
sample and of its method of preparation even a guess of what this phase might be
couldn't be made and we had to resort to different methods of heat treatments such as
calcination and reduction and also to other experimental techniques.
Table I. MOssbauer parameters for spectra shown in fig. 1
Spectrum Treatment 5(mm/s) H(kOe) Area(%) Component
A Original 0 30(1) 500(2) 134 a-Fe20]
sample 0 46(1) 345(1) 600 a-FeOOH
0 56(2) 290 259 FeS
B Calcined for 029 508 a-Fe203
48 hrs at 500°C
The spectrum of the calcined sample is shown in fig. 1(B) it consists mainly of a-Fe20] The MOssbauer parameters of the itmid's original and calcined samples are
listed in table I. The spectra of the itmid sample after reduction in H2 at temperatures of
467°C, 525°C, and 723°C are shown in fig 2 They show the reduction of a-Fe203 to
FegOj and then to a-Fe, (see table II for the MOssbauer parameters of the reduced itmid
sample) We notice the absence of the unknown phase in the thermally treated spectra
which we interpreted as the existance of a substance which boils at a temperature below
467°C. The data of the atomic absorption measurements of itmid is shown in table III ItIis noticed that Sulfur is qualitatively detected. The X-ray fluoresence results are shown in
fig 3. It shows two peaks characteristic of Fe at approximately 6 4 and 7.0 keV and a
much smaller peak at approximately 2 4 keV which was attributed to sulfur. From the
above it can be concluded that sulfur is a constituent of itmid and the unknown phase is
an iron-sulfur compound Surveying the listed MOssbauer parameters of all iron-'sulfur
compounds we found that the Mossbauer parameters of iron sulfide (FeS) are closest to
those of the unknown phase [7]
3
m

Proc Third Radiation Phytics Confi, Al-Minia, 13 - 17 Novv 1996
Table II Mossbauer parameters for spectra shown in fig 2
Spectrum Treatment 5(mm/s) H(kOe) Component
A Reduced in 0 35 491(1) ^ a-Fe2C>3
H2 for 1 hr 0 34 471(1) - Fe3°4at 467°C 035 , 438
B Reduced in 0 34(1) 485 a-Fe203
H2 for 1 hr 037(1) 461(2) Fe304
at 525°C 040(4) 403(8)003 321(1) a-Fe
C Reduced in 0 26(1) 480 Fc304H2 for 1 hr 0 58(2) 445
at 723°C -0 02 322 a-Fe
Table III. Results of atomic absorption analysis of itmid
Element concentration (%)
Fe 60±1Si 0 166Pb 0 125Ca 1 85Na 1 25Ba 0075*0.025Mn 007Sb =0.09Ni =001Zn =0 02S Qulitatively detectedh2o >10
*
4
Proc Third Radiation Physics Confv At-Minia, 13-17 Nov* 1996
5. conclusion
itmid was found to consist mainly of hematite (a-Fe2C>3), goethite (a-FeOOH), and iron sulfide (FeS). Mossbauer spectroscopy was proved to be a valuable analytical method in the investigation of various phases simultaneously present in unknown samples. The fact that itmid consists of the indicated compounds further distinguishes it from ordinary kohl which, according to literature, consists mainly of antimony sulfide.
6. References
[1] Encyclopedia Britannica, vol. 13, 1963[2] Encyclopedia Britannica, vol 21, 1963[3] Lustig H, Am. j Phys, 29, No. 1, 34(jan.l961)[4] Frauenfelder H. "The Mtissbauer effect". Benjamin Press, New York (1963)[5] Gibb T C. "Principles of Mdssbauer Spectroscopy", Chapman and Hall, London (1976)[6] Graham M.J. and Cohen M., Corrosion 32, 432 (1976)[7] Melchoir DC, Wildeman T R and Williamson D L , FUEL, 61, 516 Gun 1982)
I<
Zi*?
5
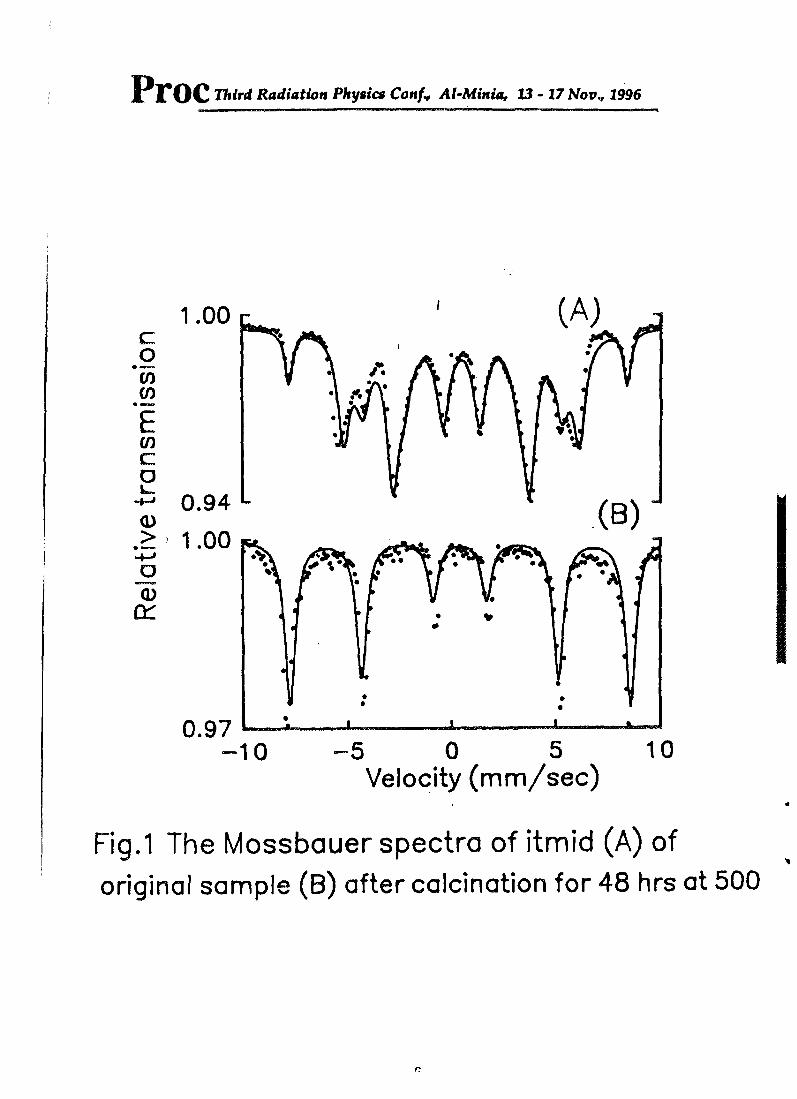
Proc Third Radiation Physics Conf* Al-Minia, 13-17 Nov., 1996
1 .00 r
Velocity (mm/sec)
Fig.1 The Mossbauer spectra of itmid (A) of original sample (B) after calcination for 48 hrs at 500
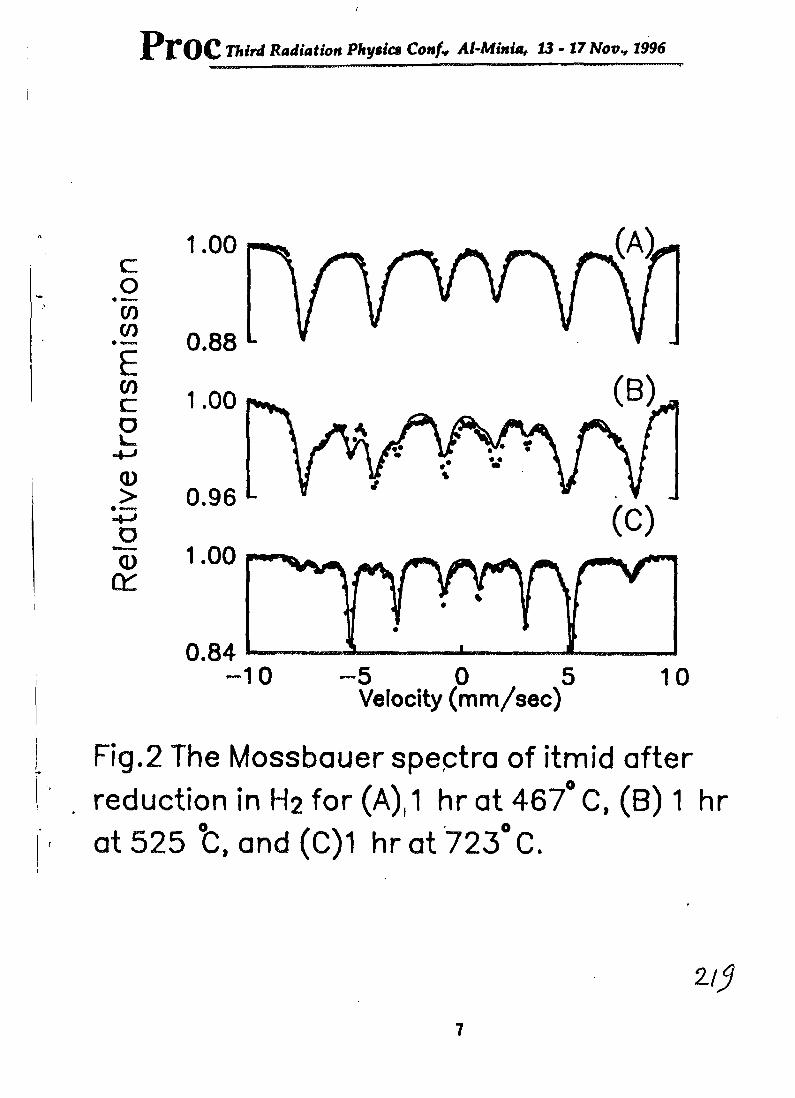
PrOC Third Radiation Physics Conf* Al-Minia, 13-17 Nov., 1996
COco
<u
1.00
CO
= 0.88L[YY^Yf
1.00
0.96 L
m 1.00cr ’ ryfyrpp"
0.84 I--------- i—------- '---------- 1----------10 -5 0 5 10—5
Velocity (mm/sec)
Fig.2 The Mossbauer speptra of itmid after reduction in H2 for (A), 1 hr at 467° C, (B) 1 hr at 525 °C, and (C)1 hr at 723° C.
2/5
7
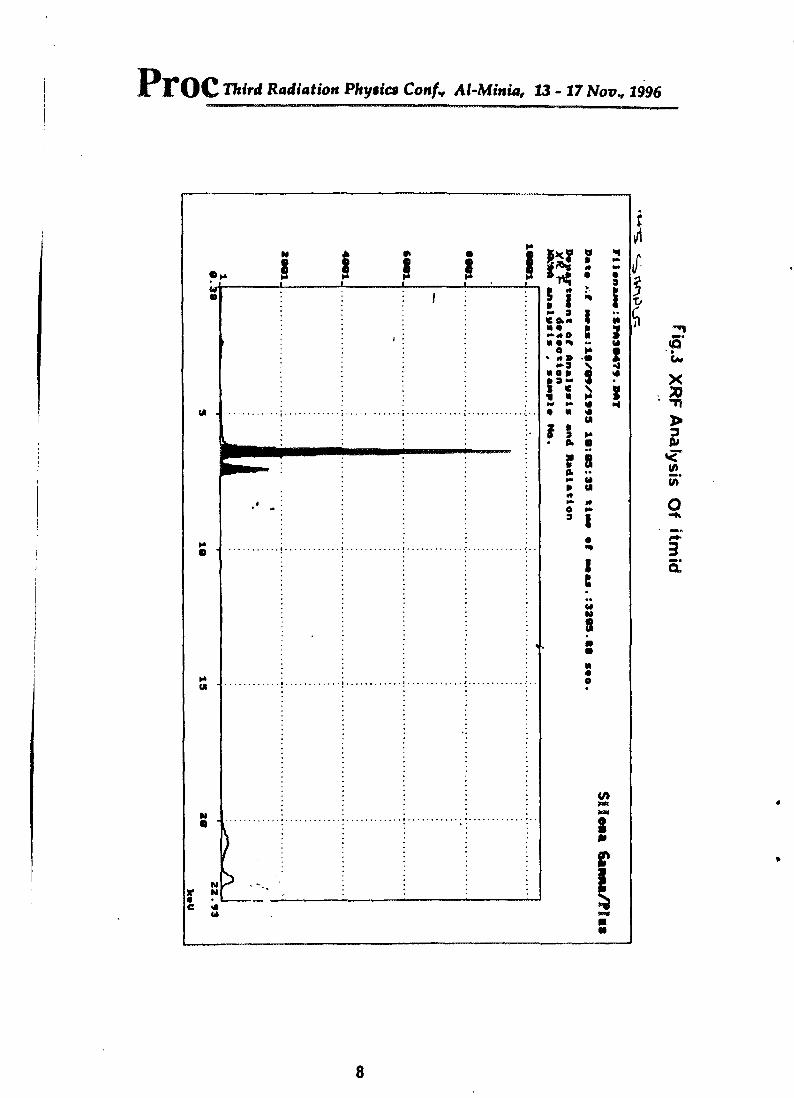
Third Radiation Physics Confy Al-Minia, 13-17 Novv 1996
O
til *
8
fig.3 XR
F Analysis O
f itmid

Proc Third Radiation Physics Conf* Al-Minia, 13 - 17 Nov., 1996
G00086BACKGROUND LEVELS OF SOME TRACE ELEMENTS
IN EGYPTIAN SOILSII) DIFFERENT SOIL TYPE, AS DETERMINED BY NEUTRON
ACTIVATION ANALYSIS
M.F. Abdel-SabourO), A S. Abdel-Haleemt*)E.E. Zohny(3), A. Sroorf*) and R. ZaghlouK®)
1) Soil Pollution Unit, Soil & Water Dept., Nuclear Res. Center.2) Hot Lab's, atomic Energy Authority, Egypt.3) Physics Dept, Faculty of Science, Cairo Univ., Cairo.4) Nuclear Physics Lab, Faculty of Girls, Ain Shams Univ, Cairo.5) Mubarak City for Scientific Research and Technology, Ministry of Scientific
Research, Cairo, Egypt.
ABSTRACT
As part of a research program on the influence of agricultural practices and activities on soil content of heavy metals. The present primary work was carried out in order to investigate the feasibility of instrumental neutron activation analysis for this purpose. Elements studied were, Fe, Zn, Co, Sc, Sb, As, Cd, Hg and Cr. The soil samples analyzed were from different locations to represent different land uses and types. Results revealed that As, Cd and Hg show a pronounced accumulation in soils especially those exposed to industrial and organic wastes disposal.
INTRODUCTION
A soil is like a palimpsest; it is overwritten record of all the different environmental factors and conditions which prevailed during its formation. With the development and widespread application of agricultural expertise, natural ecosystems have been increasingly changed into artificial ones, cultivated plants have replaced the wild flora in many parts of the world and productive soils are regularly tilled, limed and fertilized. The development of industry, intensive agricultural,

PlTOC Third Radiation Phytic* Conf* Al-Minia, 13-17 NovH 1996
i
transport and cities within the last 150 years has been so rapid and extensive that problems of soil alteration, especially changes in soil composition, have become increasingly acute, in particular, certain toxic elements are now entering and persisting in soil in relatively large quantities where formerly they were 'present in only traces. Soil is an important sink and metals in particular may entering and persisting in soil in relatively large quantities where formerly they were present in only traces. Soil is an important sink and metals in particular may accumulate rapidly but are depleted only slowly by leaching, plant uptake, erosion and deflation. PurvesO) concluded that contamination of soil with respect to Cu, Pb and Zn appears to be virtually permanent. The trace elements concentrated in neoanomalies are often metals, especially the "heavy" metals (density > 6 gZcm^). Some are essential for life processes but all are toxic to organisms at higher concentrations.
High quality measurements of total element concentrations are often more difficult to determine for soils than for most geochemical samples(2). This may be partially the result of wide range of soil compositions encountered and because the mineral and organic material coexistent in soils often resist simple, single-step procedures of sample dissolution. Also, the determination of a number of trace elements in soils is difficult for several reasons such as very low concentrations of the elements of interest in presence of large amounts of interfering elements. It was reported that nondestructive multi element techniques are best suited for such purposes. Among these tchniques, neutron activation, X-ray fluorescence, and emission spectroscopic methods are noteworthy. Instrumental neutron activation analysis (INAA) has been successfully applied to a number of complex sample matrices(3-6).
In this work, the long irradiation INAA technique was used for analysis of five Egyptian soils. Surface soil samples (0-30 cm) of various type and compositions was collected and analyzed to evaluate the efficiency of this technique to assess the environmental impact off industrial or agricultural activity on soil total heavy metals levels.

Proc Third Radiation Physic* Conf * Al-Minia, 13-17 Nov* 1996
-3-
EXPERIMENTAL
The sites for this primary study were selected to represent different historical usage and activities. For example, three alluvial soils samples from, Upper Egypt at Qena (agricultural land), soil samples from the textile industrial complexes area at El-Mahala city (industrial impact), soil samples from El-Zomor canal sides (residential wastes impact). Another two sandy soil samples from Abo-Zaabal area the first to represent uncontaminated soil, the second to represent soil enriched in heavy metals due to previous organic waste compost application. The selected soils differ widely in their texture (sandy, sandy loam, clay and clay loam soils), and compositions (due to different historical uses). The collected samples were dried, ground and sieved (800 mesh) in fine powder form. About 0.1 g of each sample were backed in aluminium foil and prepared for irradiation purpose, along with a capsule of standard reference materials from 1EAE (SL1). Then all samples were sealed well in aluminium cans. The irradiation time was 48 hour at the nuclear research centre reactor (ET-RR-1). The neutron flux was 4.4 x 10¹²n cnr^S'l. After 24 hours time cooling, samples were radio-assayed (for gamma-ray spectra) using high resolution Hyper Pure Ge. detector connected to Multi-channel analyzer through a suitable electronic system at the central Laboratory, Environmental Radioactive Pollution Department, Hot Laboratories Centre, Atomic Energy Authority. The samples and standards were radio-assayed 1 and 7 days after irradiation. In order to determine the elemental concentrations, (m) the following relation was used
PkAi X
e(Ek) ek a, N* <H <D (l-eJ^j) e-*V0-e'Xtm)
where;Pk = net number of counts under the peak,e(Ek) = absolute full energy peak detector efficiency at energy Ek,ek - Intensity of gamma-ray at energy Ek,
Proc ThWd Radiation Physics Conf* Al-Minia, 13 - 17 Nov., 1996
~4-
a | = abundance of gamma-ray,Aj = atomic weight,A. = decay constant,Ny\ = Avogadros number,o| = thermal neutron cross-section,<J> = thermal neutron flux, ,lj = irradiation time,*tr = transportation time,% = measuring time.Table (1) shows a summary of nuclear data used in this study as well as the count set. The counting time of each sample was 7200 Sec and the dead time did not exceed 2-4%.
RESULTS AND DISCUSSION
The main intention of the present study is to illustrate the use of NAA as a supplementary tecluiique in studies related to man-activities impact on soil and its influence on trace elements accumulation in soil. The mean concentration of each element in the samples are given in Table (2).
Iron-59 isotope has a thermal cross section of 1.15 bams due to 58pe(n, y)59pe reaction. Iron is presented in all soils and its values depend on the soild parent materials. The levels of total iron in tested soils ranged between 15500-76500 ppm and the alluvial soils contained higher amounts of Fe than the sandy soil. Iron is a major constituent of the lithosphere, comprising approximately 5.1%; the average content of soils is estimated at 3.8% (common range 7000-550,000 ppm)(?).
Zinc isotope (65Zn) as a product of ^Zn(n, y)^Zn reaction has gamma-ray line at 1115.5 Kev (50.8%) which was used in Zn determination in these samples. The concentration values obtaned were in the range of 24.7 to 254 ppm. Application of organic waste to sandy soil of Abo-Zaabal (E) increased the levels of Zn, Fe, Cd, Hg, As and Cr

Third Radiation Phytic* Conf, Al-MMa, 13 - TTNov* 1996Proc-5
if compared with its relevant soil sample (D) as shown in Table (2). ft was reported that Zn in soils ranges from 10 to 300 ppm with an average content of 50 ppm(?).
Cobalt isotope due to 59co(n,y)60Co reaction is considered as the main isotope of Co element. The two prominent gamma-ray lines at 1173.2 and 1332.5 KeV could be used for Co determination. The levels of Co in the tested soils ranged from 0.87 to 27.6 ppm. The normal range in soils world wide was reported to be 1-40 ppm.
Scandium as a trace element Could be determined using 45sc(n,y)46sc reaction. The gamma-ray lines at 889.2 and 1120.3 KeV of 100% intensities were used for estimating Sc. The lowest Sc content was found in soils A* D and E, however the highest Sc concentration values was found in soil B and C. This could be attributed to the soil parent materials. It was reported that soils derived from granitic rocks have higher amounts of Sc(?). The normal range world wide reported to be 5-50 ppm with grand value of 7 ppm(*).
Antimony (Sb), using the gamma-ray line at 563.9 (66%) KeV due to 121sb(n,Y)122sb reaction as well as the gamma-ray lines at 602.7 (98%) and 1690.9 (49%) KeV due to I23sb(n,y)*24sb reaction, the obtained concentration ranged from 0.21 to 0.72 ppm.
Arsenic has an isotope 75 As of abundance (100%). It is a product of 75As(n,Y)76As reaction of half-life time of 26.44 h. It produce two gamma-ray lines at 559.1 and 657.03 Kev with intensities of 44.6 and 6.4% respectively. The concentration of As ranged from 0.8 to 10.2 ppm. The highest As value was observed in soil C (the grand mean worldwide is 5 ppm) may indicate a potential pollution spot problem due to the uncontrolled solid waste dumping along El-Zomor canal (popular residential area). Arsenic is released and deposited into the environment by weathering of As-containing rocks, wet and dry deposition.

PrOC Third Radiation Phytic* Conf* Al-Minia, 13 - 17 Nov., 1996
application herbicides and pesticides (e g. lead arsenate), coal-fired power generation plants, burning vegetation, and volatilization^).
Cadmium isotopes * 1 $Cd at gamma-ray line 934 was used for Cd estimation in soil samples. Again, the highest Cd levels was obtained in soil C and B which is due to the results of industrial and residential actiivities in those areas. The background level of Cd in uncontamiinated soil normally very low. VinogradovU^) quoted an average level of 0.5 ppm for total content of Cd in soil with probably 25% of this amount available to plants. Our results revealed higher Cd content in most of tested soil. Phosphorus fertilizers, fungicides used on crops, car tires and motor oils, and fallout from atmospheric pollution and wind-blown dusts, incidental dispersion of refuse, litter, and deliberate addition of waste products to the soil, such as, soot, sewage sludge, municipal compost are important sources of Cd and are concentrated in urban and industrial areasU 0.
Mercury, 203ng at gamma-ray line 279.1 KeV was used to assess Hg content in the samples. The range was from 0.07 to 0.2 ppm which is in the normal Hg range (0.01 - 0.3 ppm). Mercury is very toxid metals particulary its organic forms and its transformations in the environment is a very factor which increase its adverse impact on humans.
Chromium has isotope 50cr due to 50cr(n,y)51Cr nuclear reaction. A prominent gamma-ray line at 320.1 KeV was used for estimation of the concentration values in this study. Soil E and C showed higher Cr content than other tested soils. The grand mean was reported to be 100 ppm (with wide range (1-1000 ppm)C7).
CONCLUSIONIn conclusion it is clear that NAA technique applied in this work
could be very useful in detecting trace elements constituents in soils for environmental assessment. Moreover, the historical uses of the soil could affect its content of heavy metals. Therefore, soil monitoring for heavy metlas is recommended to assess heavy metals accumulation in soil.
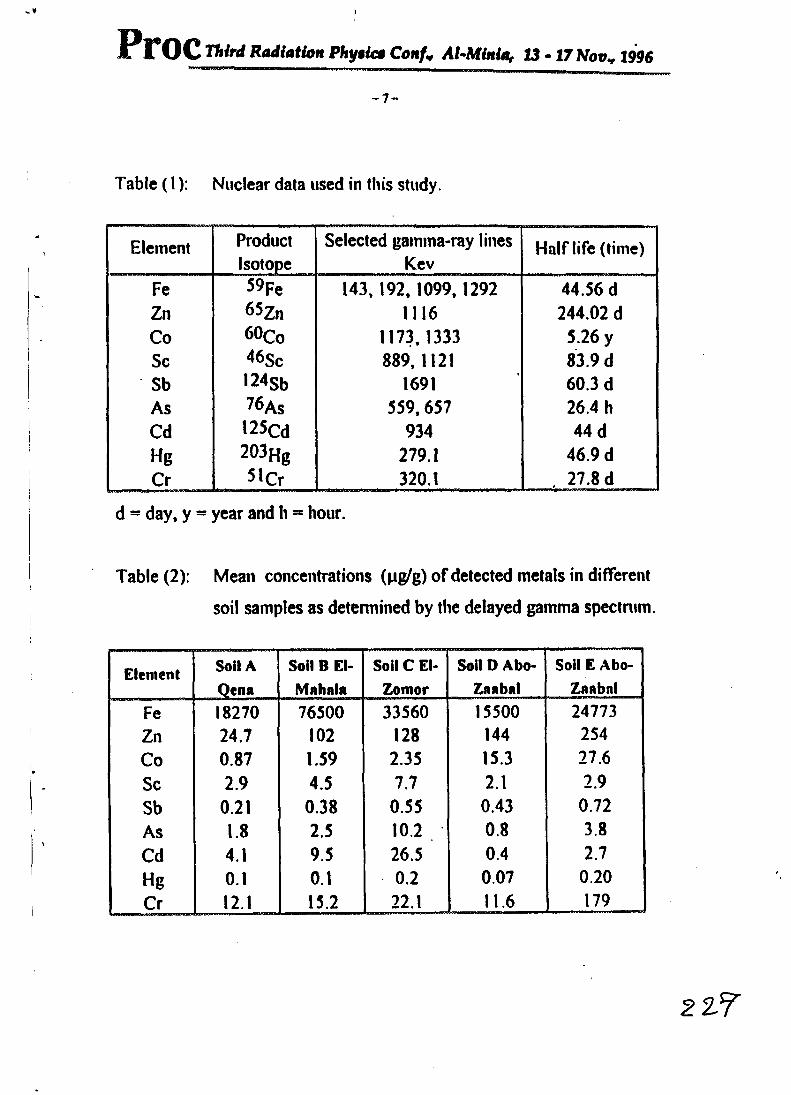
Third Radiation Phyic* Conf* Al-Minia, 13 -17 Nov„ 1996
-7-
Table (1): Nuclear data used in this study.
Element ProductIsotope
Selected gamma-ray lines Kev
Half life (time)
Fe 59Fe 143, 192, 1099, 1292 44.56 dZn 65zn 1116 244.02 dCo 6°Co 1173, 1333 5.26 ySc 46sc 889, 1121 83.9 dSb 124$b 1691 60.3 dAs 76 As 559,657 26.4 hCd l25Cd 934 44 dHg 203ng 279.1 46.9 dCr 5lCr 320.1 . 27.8 d
d = day, y = year and h = hour.
Table (2): Mean concentrations (pg/g) of detected metals in different soil samples as determined by the delayed gamma spectrum.
Element Soil AQena
Soil B El-
Mnhnla
Soil C El-
Zomor
Soil D Abo-
Zflnbnl
Soil E Abo-
Zoabnl
Fe 18270 76500 33560 15500 24773Zn 24.7 102 128 144 254Co 0.87 1.59 2.35 15.3 27.6Sc 2.9 4.5 7.7 2.1 2.9Sb 0.21 0.38 0.55 0.43 0.72As 1.8 2.5 10.2 0.8 3.8Cd 4.1 9.5 26.5 0.4 2.7
Hg 0.1 0.1 0.2 0.07 0.20Cr 12.1 15.2 22.1 11.6 179

Thfrd Radiation Physics Couf„ Al-Minia, 13 - 17 Nov., 1995
REFERENCES
1) Purves, D. Environ. Pollution. 3:17, (1972).2) Koons, R.D. and Helmka, P.A., Soil Sci. Soc. Am. J. 42:237
(1978).3) Flanagan, F.J. US Geol. Surv. Professional Pap. 840, p. 192,
(1972).4) Kratochvil, B., Duke, M.J. and Dennis, N O. Anal. Chein. Vol.
58: p. 102 (1986).5) Ellis, K.M. and Challopadhyay, A. Anal. Chem. Vol. 51, No. 7, p.
942(1979).6) Iskander, F.Y. J. Radionanal. Nucl. Chem, 89:511 (1985).7) Pendias, K. and Pendias, H. CRC Pub. Warsaw, p. 35 (1984).8) Lindsay, W.I. John Wiley & Sons, p. 7, (1979).9) Chilvers, D C. Peterson, P.J. T.C. Hutchinson and K.M. Meema,
Eds. John Wiley & Sons, New York, p. 279, (1987).10) Vinogradov, A.P. Transl. from Russian Consultant's Bureau, Inc.
New York 2nd ed. (1959).11) Purves, D. Elsevier Sci. Pub. Company, Amsterdam, Netherlands,
(1977).
1

Proc Third Radiation Physics Conf* Al-Minia, U -17 Nov* 1996
aaEimac-.session <s>
Keynatz.UctureRADON MEA8UR1 NTS
MEASUREMENTS OF RADON IN WATER AND GROSS GAMMA RADIOACTIVITY AT SITES OF TOURISTIC INTEREST IN EGYPT
B. Sanson!*, A. Allan**
• Editor, Bntenuttonel Euviransental Consult Newsletter, Germany •• Nuclear Research Center, ABA. Egypt
ABSTRACTDuring a visit in Egypt under touristic conditions some measurements of
radon-222 in different types of water have been performed at Cairo- Heliopolis, Aswan, Luxor, Eastern Desert, and Safaga with the new alpha scintillometer Alpha Sent 2001. Semlquantitative gross gamma/beta radioactivities as well as gamma dose rates on the surface of rock-layers, rock samples, soil and sand were measured with simple pocket instruments of low weight and costs. RADON-222 Inwaten
Public drinking water supply (PDWS) at Flchtelgebirge comes mainly from well type sources in granite regions. Contrary to that, the majority of all Egyptians are drinking River Nile water. Nile water at Isis island, Aswan within the First Cataract had neglectable radon concentrations between 0.1-1 Bq/L. The same is to be expected also in other parts of the Nile. Hotels have additional purification and, therefore, also neglectable radon concentrations below 1 Bq/L as at hotel Meridien /Cairo-Heliopolls, Isis Island Resort Hotel/Aswan, hotel isis/Luxor and Menaville Resort Hotel/Safaga. Well water for the village El Shallal/Aswan had 5-10 Bq/L, the well fountains of KIMA industry complex at Aswan (sandstone) 10-30 bq/L. Remarkably, drinking water from tap of a normal house in Cairo-Heliopolls (El-Hagaz street) had 15-22 Bq/L, contrary to Hotel Meridien with only 0,7 Bq/L Gross gamma/Beta radioactivity of rock layers, rock samples and sand Radioactivity seml-quantitatively has been characterized by "net" gross activities , obtained by subtracting the background of the next hotel room from measured groos activity of a sample. Pink Aswan granite from Shallal quarry/ Aswan had 37 ± 2 cpm, layers of black rocks at southern top of Isis Island/Aswan 61 and 65 cpm. Gamma dose rates of the In-door background of hotels with comparable rooms were 0,063- 0,073 pSv/h at Cairo-Heliopolis; 0,110 at Aswan and 0,144 pSv/h at Safaga.

PrOC TTiM Radiation Physic* ConU Al-Minia, 13 - 17 Nov* 1996
Qsmtxikutgd Payeis.
APPLICATION OF SOLID STATE NUCLEAR TRACK DETECTORS IN MEASUREMENT OF NATURAL ALPHA- RADIOACTIVITY
IN ENVIRONMENT
A. F. Maged, A<Z. El Behay, and R Botham
National Center for R*dl*tton Research end Technology, AhWc Energy Authority, Cairo, Egypt
ABSTRACT
The use of solid state nuclear trade detectors (SSNTDs) Is one of the most convenient techniques to assess the average radiation levels of alpha activities in the environment This technique has been used to assess radon gas and its daughters in buildings.
Exposed SSNTD films are chemically etched in an alkali solution and alpha tracks are evaluated by using the image analyzer system. The detailed procedure for this study and the etched films for conversion of alpha track density to radon concentration in Bq m‘3 are given and discussed in the text
A STUDY ON THORON DECAY PRODUCTS IN AIR
A. A. Ahmed, A. Abul- Hussein, and M. Mahmoud
Physics Dept Faculty of Science, E^MiaiaUalvvBl> Mini*, EgyptABSTRACT
After the formation of thoron gas (220Rn) decay products from the gas phase in the air form clusters which attach to aerosol particles forming radioactive aerosols. Transport of radioactive aerosols in the environment and finally their deposition in the respiratory system are controlled by their size and their distribution. The concentration and size distribution of attached 212Pb was studied. The activity was collected and analyzed by a low pressure
cascade impactor. The activity collected on each stage of the impactor was measured by a y-ray spectrometer. Results showed that the activity concentration of 212Pb « 83 Bq/1 at 30 m above the ground surface, and the activity size distribution of 2l2Pb was represented as uni-model log normal size
distribution.

THE EVALUATION OF RADON CONCENTRATION AND WORKING LEVELS USING SSNTD IN THE U-EXPLORATION GALLERIES IN THE
EASTERN DESERT, EGYPT
A.I. Abdel-Hafez’, A.A. Abdel-Monem**, H.M. Elssa, S.A., El-Fiki,”*YA. Abdel-Razek,**, and Anas M. El-Naggar, •*
‘National Institute Of Measurement and Standards, Technology, Egypt •‘Nuclear Materials Authority, Cairo, Egypt
••• Physics Dept, Faculty of Sciences, Ain Shams University.
ABSTRACTRadon gas concentrations and the working levels (radon daughters
concentrations) were measured using solid state nuclear track detectors (SSNTD) namely Cr-39, MK, LR 115 and CN85, in three U-exploration galleries at Qattar-1, El misslkat, and El-Erediya areas, Eastern Desert, Egypt. In each U-exploration gallery 10 monitoring stations were chosen for measurements. The locations covered the differing Intensities of the U-Mineralization as well as the ventilation conditions. Two sets of measurements were taken for uie time intervals (27 and 50 days). Calibration experiments on the SSNTD were performed using 238 Pu source (6.06/MeV), to find the optimum conditions for etching the detectors.
The ranges of alpha track densities (t/mm2 day) measured for Qattar-1
gallery are 23.7-46.6 (CR-39), 13.4-30.9 (MK), 11.1-22.9 (CN-85) and 8.8-15.4 (LR-115) for 27 day monitoring, whereas the ranges for the 50 days experiment are 8.8-25.8 (CR-39), 83-15.4 (MK) and 3.9-82 (LR-115).
In El Misslkat gallery, the alpha track densities ranges are 17.1-128.8 (CR-39), 11.4-73.1 (MK), 8.0-74.4 (CN.85) and 5.7 -37.8 (LR - 115) for the 27 day interval, whereas the ranges are (CR-39), 6.3-38.0 (MK) and 3.4-21.0 (LR-115) for the 50 days experiments.
Alpha tracks densities for El-Erediya gallery ranges are 14.1-39.9 (CR-39), 8.9-20.0 (MK), 7.9-23.1 (CN-85), and 2.7-17.6 (LR-115) for the 27 days experiment whereas the ranges are 8.5-22.7 (CR-39), 6.4-13.4 (MK), and 2.4-9.3 (LR-115) for the 50 days experiment.

Proc Third Radiation Physic* Conf'* Al-Minia, 13-17 Nov* 1996
Working level measurements are compared with 1 WL equivalent to 16.28 tracks/mm2 day. Evaluation of the measurements at each monitoring
station is discussed in terms of U-concentration and ventilation conditions. Also, the efficiency of the different SSNTD are discussed as well as the optimum time of monitoring at each U-exploration gallery.
CELLULAR DOSIMETRY fOR RADON PROGENY ALPHA PARTICLESIN BRONCHIAL TISSUE
A. A. Ahmad, M.A. Abdel-Rahman, A. Mohammad
Physics Dept, Faculty of Science, Q-Mlnia University
ABSTRACTInhaled radon progeny are deposited in different regions of the human
bronchial tree as functions of particle size and flow rate. This initial deposition pattern is subsequently modified by radioactive decay, mucociliary clearance, and transport through epithelial tissue into blood. The sensitive bronchial basal and secretory cells are therfbre irradiated by two different alpha particle sources: (i) radon progeny In the sol/ and or gel phase of the mucous layer, and (11) radon progeny within the bronchial epithelium.
An analytical method was developed to compute the local energy deposition from Po-218 and Po-214 alpha particle in l pm spheres located at different depths in bronchial epithelium. In order to reach the target, alpha particles travel either through tissue alone (near wall dose) or through air and tissue (far wall dose). While the depth-dose distributions for nuclides uniformly distributed within the epithelium are practically constant with depth, they decrease in an alomst linear fashion with increasing depth for nuclide on the airway surface. Histological studies have shown that the locations and relative frequencies of basal and secretory cell nuclei vary within a given bronchial airway generation and among different airway generations. Therefore, different assumptions about cell-specific depths and their frequency distrutions appreciably affect the related dose estimates.

-------------------- mmmmEG9700087
I
PrOC Third Radiation Phy$ic» Conf* Al-Minia "" *** Vr- l*hf
Application of Solid State Nuclear Track Detectors to Measurement of Natural alpha- Radioactivity in environment
A. F. Maged, A. Z. El Behay and E. Barham
National Center far Radiation Research and Technology, Atomic Energy Authority P.O. Rox 29Naxr City, Cairo, Egypt.
Abstract
The use of solid state nuclear track detectors (SSNTDs) is one of the most
convenient techniques to assess the average radiation levels of alpha activities in
the environment. This technique has been used to asses the radon and its
daughters in some buildings. Exposed SSNTD films are chemically etched in an
alkali solution and the alpha tracks are evaluated by using the image analyzer
system. This detailed procedure for this study and the etched films for conversion
of alpha track density to radon concentration in Bqm3 are given in this paper.
2.33

PrOC Third Radiation Phytic* Conf i, Al-Minia, 13 - 17 Novv 1996
Introduction
In recent years, there has been a considerable increase in the level estimated by
the United Nation Scientific Committee on the effect of Atomic Radiation
(UNSCEAR) of the effective dose equivalent absorbed on average-by members pf
the public because of exposure to natural sources of radiation. Until a few years
ago, the dose evaluated by UNSCEAR was 1 mSv y '; later, more accurate
estimates also taking the revaluation of the alpha particle quality factor into
consideration attributed a value of 2 mSv y * to the average per capita dose due
to natural radiation (1), and, more recently, 2.4 mSvy-'[2] These dose values
include contributions deriving from cosmic radiation, cosmogenic and primordial
radionuclides ; however, UNSCEAR attributes a preponderant contribution (ca.
2 mSv y->) to the primordial radionuclides rather than to the others. Primordial
radionuclides belong for the most part to natural radioactive decay chains, the
parent isotopes of which (232Th, USU and M,U) are present in the earth's crust in■
variable concentrations, with mean values of the order of those shown in table 1
13). According to UNSCEAR estimates, the overall contribution of the
radionuclides belonging to the natural radioactive decay chains to the external
dose is 0.26 mSv y * and to th$ internal dose 1.42 mSv y->.
One of the sources of radon in buildings (together with the ground water, and
natural gas for domestic use) consists of building materials from the point of view
of the dose which may derive from them, it is necessary to identify not only the
quantity of radionuclides which are to be found in them , but also the value of
the emanation ratio of 222Rn, e, defined as the quantity of mRn emanated in a
unit of time divided by the quantity which, in the same time, is formed in the
material. The C values of certain building materials are shown in table 2 [4],
which also shows the concentration of 226Ra (direct parent of 222Rn).
i
Proc Third Radiation Physics Conf* At-Miaia, 13-17 Nov„ 1996
Experimental procedure
Nuclear track detection using CR-39
CR-39 is the most sensitive of the nuclear track recording plastics. When a
charged particle traverses this material it is delineated by a trial of chemical
damage. The subsequent immersion of the plastic in a suitable etchant such as
NaOH results in bulk etching of the material at a characteristic rate, VB
(4.5pm/li) and preferential etching at a rate Vr (I3.2pm/h) along the track axes.
The etch pit so formed, when enlarged at a size that is easily visible under an
optical microscope, can be measured to find the etch rate ratio Vt/Vr (2.9) and
hence the ionization of the particle. CR-39 is unique among the solid state track
recorders in that it is very sensitive and possesses a high degree of Isotropy and
uniformity of response. It records protons with ease up to 10 MeV and tracks of
10 MeV protons have been revolved in some samples. In terms of particle nuclear
charge (Z) and relativistic velocity (B) it records particles in the range
(teZ/BslOO. The natural a-particles therefore lie towards the middle of the
response curve, the relationship between ionization and VyfVn which means that
all species of particles can be recorded at full energy and over a wide span of
acceptance angles. This feature makes CR-39 uniquely attractive for a-pnrtide
autoradiography.
ApplicationsSmall strips of the track detectors (CR-39 obtained from pershore mouldings,
Ltd., UK, of thickness 500 pm, casting time 32 hrs and containing 2.6% IPP +
0.2% Dof) of l.Oxl.O mm size are used for monitoring radon in different areas of
Cairo. The track detector within a closed container which permits nlRn to
diffuse into it. This “closed detector records only a-particle originating from the
radon entering the container and those from the decay products formed within
the container. The decay products in room air being excluded. This form of
detector provides results which are related to the true average radon gas
concentration during the period of exposure. The detectors placed at about 2m
high above the ground at various locations of Cairo. The period of exposure
range from 4 to 5 months. The exposed CR-39 detectors were collected and
chemically etched simultaneously at 70"C for 18 hr in 6 M NaOH solution. In

PrOC Third Radiation Phytic* Conf* Al-Minia, 13 - 17 Nov* 1996
value of r0 is about 1.5x10 * m and that of R is 4x10 * m (10). The alpha dose
deriving from the inhalation of the short-lived daughters of 222Rn present in the
air may be calculated on the basis of the level of concentration of 222Rn. The
value of this concentration may be calculated by means of a balance equation
written for the volume of the "standard" rpom considered: in fact, in stationary
conditions the number of222Rn atoms which are removed in a given unit of time
from such a volume must be equal to the number of atoms which at the same
time enter it. The level of the alpha dose attributable to the presence in air of the
short-lived daughters of 222Rn may be related to the exposure to radon (integral
of the concentration over time) and to the "equilibrium factor", which
characterises the removal of the mixture of 222Rn and its daughter from the
condition of secular equilibrium 112). Recent studies, however, have shown that
the dose due to radon in the conditions which are normally to be found in
dwellings may be more readily correlated to the concentration of 222Rn Itself
(13). The Commission of the European Communities recommends the use
of a conversion ratio by which 1 Bq m2 of 222Rn corresponds to an effective dose
equivalent of 0.05 mSv y * (14). In figure (!) values of the alpha dose calculated
by the model (15) are shown, as a function of the concentration of 2MU, assuming
emanation ratio levels between 0.01 and 0.1.
Conclusion
On the basis of the results obtained, it may be stated that the model (15) makes
it possible to calculate with a sufficient degree of reliability the contribution of
building materials to alpha dose, based on the concentrations of uranium,
thorium and potassium present in the materials themselves. In fact there is
substantial agreement between the levels of alpha dose calculated and those
measured experimentally; our results are shown in table 3. The calculated mean
alpha dose from our measurements is 0.57 mSv y » which is consistent with the
model (15), based on the uranium concentration 33 Bq kg1 table 1 between

PrOC Third Radiation Phytic* Conf* At-Minia, 13 - 17 Nov* 1996
emanation ratio 0.01 and 0.05. This value is less than 2.4 mSv y1 [2], the dose
evaluated by UNSCEAR.
References
(!) United Nation Scientific Committee on the Effect or Atomic Radiation 1982
Ionizing Radiation: Sources and Biological Effects Report to the General
Assembly! New York: United Nation )
(2| United Nation Scientific Committee on the effect of Atomic Radiation 1988
Sources. Effect and Risks of Ionizing Radiation Report to the General
Assembly! New York: United Nation )
|3J National Council on Radiation Protection and Measurement 1988
Measurement of Radon and Radon Daughters in Air NCRP Report 97
|4| Nero A V and Nazaroff W W 1984 Characterisiting the.source of radon
indoors Radiat. Prot. Dosim. 7 .23-39
J5] Maged AF, TAKAO TSURUTA and Durrani SA (1993), Experimental and
theoretical concentrations on the calibration factor K between a-activity
concentration in radon dosimetry. J. Radioanalytical nuclear chemistry,
Articles, Vol. 170, No. 2, 423-431.
(6| Maged AF and Durrani SA (1993), A new environmental chamber for
measuring the radon activity concentration and the eqtiilibruim factor F
between radon and its daughters for applications in radon dosimetry. The
Arab Journal of laboratory medicine, Vol. 19, No. 2.
[7| Colie R, Rubin R J and Hutchinson J M R 1981 Radon Transport through
and Exhalation from Building Materials: a Review and Assessment U S.
National Bureau of Standard Rebort NBS TN 1139 (Washington, DC: US
Departement of Commerce).
(8| Jost W 1960 Diffusion in Solids, Liquids, Gases, (New York: Academic)
pp314-23.

PrOC Third Radiation Phytic» Confv Al-Minia, 13-17 Nov* 1996
|9] Lambert G and Bristeau P 1973 Migration des atonies de radon implantes
dans les cirstaux par energie de recul J. dePhysiquc CS 137-9
|10| Morawska L 1989 Investigation of a specific surface area of a material on
the basis of nzRn emanation coefficient measurements Health Pliys. 57 23-7
|11) Bossus DAW 1984 Emanating power and specific surface area Radiat.
Prot. Dosim. 7 73-6.
112) 1CRP 1987 Lung cancer risk from indoor exposure to radon daughters
ICRP Publication 50 Annals of the 1CRP 17 (l)(Oxford Pergamon)
113) Bruzzil,Meier and pandoanif 1992 Evaluation of gamma and alpha doses
due to natural radioactivity of building materials. J. Radiol. Prot. 12. 277-84.
114) Commission des Communautes Europcennes 1990 Recommendation de la
Commission Relative a la Protection de la Population Center les Dangers
Resultant de P Exposition au Radon a l! Interieur des Bailments
(BrusselszCEC)
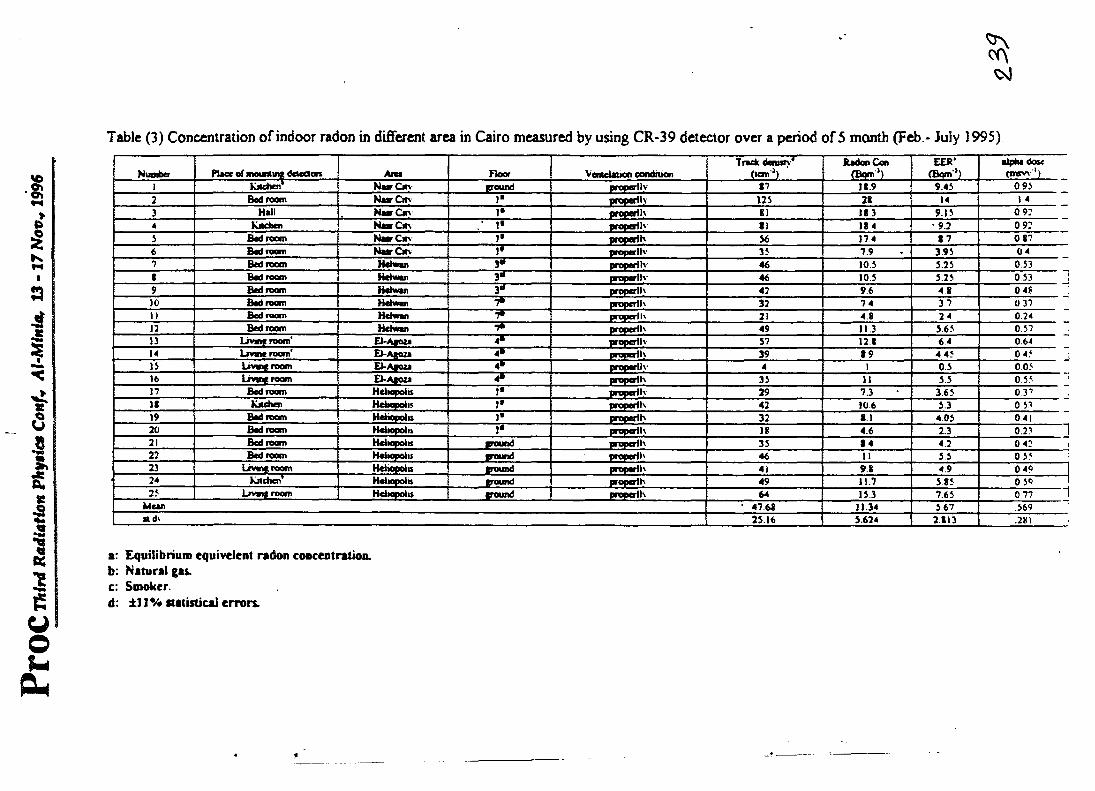
Proc
Thi
rd R
adia
tion
Pkya
ica
Con
f* At
-Min
ia, 13
-17
Nov
* 19
96$oj
Table (3) Concentration of indoor radon in different area in Cairo measured by using CR-39 detector over a period of 5 month (Feb - July 1995)
Number Piece of meununt deed on Area Floor Ventclation conditionTrack denary*
(tan'5) 'Redan Con
(Bqm»)EER'
(Bom'*)alpha dose (maw1)
1 kitchen1 Near Ov Found properllv «7 18.9 9.45 0.952 Bedroom Near Cm 1' propeHIv 125 28 14 1 4
3 Hall Near Cm- 1" properllv 81 183 9.15 09:4 kitchen Near Cm / 1' properllv SI 184 • 9.2 0 923 Bedroom Nam Cm l» properlh 56 174 87 0 876 Bedroom Near Cm 1' poperllv 35 7.9 3 93 047 Bedroom Hehean 3* properlh- 46 10 5 5.25 0.531 Bed room Hehean 3“ properllv 46 10 5 5.25 0 539 Bedroom Hehean 3“ properlh 42 9.6 4 8 0 4810 Bedroom Hehean 7* properlh 32 74 37 0 371) Bedroom Hehean 7* properlh 21 4 8 24 0.2412 Bedroom Hehean 7* poperllv 49 11.3 565 0.5713 Livmt room* EkApoze 4» properllv 57 128 64 06414 Li vine room' Ek Agaze 4* properllv 39 89 4 45 04515 Liveig room EkAeoza 4» properllv 4 1 0.5 005 !16 Live* room EkAgoza 4* poperth 35 11 5.5 0.55 1P Bedroom Heliopolis Is properllv 29 7.3 3.65 0 37IS kitchen Hehopoiis 1* properlh 42 106 5.3 0 5319 Bedroom Hehopdo Is properlh 32 SI 4 05 0 41 :20 Bedroom Heliopolis !• properlh 18 4.6 2.3 0.23 i21 Bed room Heliopolis pound properlh 35 84 4.2 0 4: t22 Bedroom Heliopolis pound properlh 46 II 3 5 0 5523 Living room Heliopolis pound properlh 41 9.8 49 0 49 I24 kitchen* Heliopolis pound poperth 49 11.7 585 0 56 I25 Lima room Heliopolis pound properllv 64 153 7.65 0 77 i
Mean ■ 47.68 11.34 5.67 .36925.16 5.624 2813 .28) -
a: Equilibrium equivalent radon concentration, b: Natural gas. c: Smoker.d: ±11 % statistical errors.

C *f J U0i|»uvi3v03 nMI K> UU.Uvfll • ll •lOueieiu Ouipiinq we,, ittoe tgdu pup uuiutO p*i»n3t«0 l unOy
I u»|»<iv#>oe» vamjom)tOt 001 **
Itr
«■> ( M01| optam It M) PUOMMI "'»• wnironm p«« unu pi skii; uptoei n, pmw mu wmwa ;t(-«>P«V l
HU (9 0 ti (1 wikJXq
100 01 0 (» f•to HI 1 ti 1
HU-,1 0 9t |-i>0 rt-t Mr/ooi»wt$pw#n
MO-10 0 - tt tl VZ>3110 0 - to II
or o-ioo - k m »UI5W3<e.wn>N
- (too - 1 piWS WA<d^- (100 - : 'I*'*- n - i. *t9»3W* 3|IMJS-Um|V- (»0 - ¥
1>euitt3Q
(too - H toro - UK ♦
0(000 - (* II <*ISK000 - 96 (C 9»» «U
ptie|t»4
0(0 0 MO <> out 1**1 P»Wno 1(0 (1 001 »IW3M3
(iilunfi
(100 91 0 01 tl 1*«l 0»01100 no in 61 iiiuuoi iqli».«ig(ri(too tl 0 w II AMMO) MOH
ossn
*91>0, .01) ItuiiSM)IV< votivueui* l,.«9bfll Mphtilt
SKHlturUI) •*<« fjiaqitmM ■vMum»3
£*>J Ouiotinq humio* Will OWIIUWI* pul nil uwiiuwul uy,„ 10 ly^, K> uoi|I>iuiwm» l« «mnn J i|ni
mop ludu pue iuiujiS »o uoumiiAg
U u V ► '1...V 1 too t 0 11..,
K i 1 1 M It..,
i, *lNi nuOO) lun> .01)uoitimuwo,} •JM-JKM »P'I»*H
ill IIOI3 I UIJII lg| Ul fu'll|3 AlDIP WUI3IWPIJ tljniluIo imoioii luiiwJ lul |P luo>iii|ui3u03 ueeyi , uqi|
9661 "a(fN a - H 'WWW-IV A/MOD **ott*!PW P'fHl JQJj

PrOC Third Radiation Phytico Conf* Al-Mii |]||IKHU
£<39700088
A STUDY ON THORON DECAY PRODUCTS IN THE AIRA. A. AHMED, A. EL- HUSSEEIN AND M MAHMOUD
Physic. Dept., Faculty of Science, Mini a Univ.
Egypt
Abstract:Low pressure Berner cascade impactor technique was used as sampling device to
determine the concentration and activity size distribution of 2,2Pb in the open
air The collected activity in each stage of the impactor was measured by a ?
spectrometer with 5X5 Nal(tl) detector. The activity size distribution of 212Pb was
described by one log-normal distribution. The mean AMAD was 345 nm with o, -
2.7.
IntroductionOne of the main sources of atmospheric pollution with radioactive nuclides is
252Th, which is existing in the earth crust and its products such as building
materials. The third decay product in the thorium series is *~°Th, which transforms
into its daughter ^Rn (T1/2 = 55.6 s).220 Rn ( called thoron ) is the only element
in the thorium series which is gas at the ordinary temperature It is distributed
through the earth crust by diffusion through the pores of rooks or soul and finally
evaporates into the atmospheric air.
The Thoron decay product, are 216Po (T1/2= 150 ms), ^l2 Pb ( T,,< = I0 6 h )
,212 Bi ( T,/2=1.01 h) , and2,2 Po (T1/a= 293 ms ). The nuclide 2,‘ Pb is not an
alpha emitter but it is important because it decays relatively slowly to *'2 Bi 36 %
of212 Bi atoms decay by beta emission to2,2 Po which is an alpha emitter
After the formation of thoron daughters from gas phase, a large fraction of
its daughters are attached to the surface of the aerosol particles in the
atmosphere forming the radioactive aerosols. The term aerosol is used to define a
system including particles solid or liquid in the size range from few manometei s up
to more than 100 pm in the atmospheric air111. A set of three logarithmic nonnal
•I
Third Radiation Phytic* Conf* Al-Minia, 13-17 Nov* 1996
size distribution has been recognized '2). The corresponding modes are nucleation
mode ( size < 100 nm), the accumulation mode ( 100 nm > size<2000 nm).
Because the thoron decay products are attached to aerosols, the behavior of
these radionuclides In the atmosphere is determined by the physical behavior of
aerosol particles. Determination of particle size and particle size distribution are
very important to study transfer and deposition of radioactive aerosols in the
environment.'3 4)
This study is devoted to determine concentration and mass size distribution
of 212Pb in the air.
Experimental.
In this study the low pressure cascade impactor technique has been used as
sampling device for measuring the concentration and particle size distribution of
the radionuclide 2,2 Pb in the air. The impactor consists of eight size-fractionating
stages and back-up filter holder, with diameter 5 cm. The Back-up filter is
mounted between the base of the impactor and a vacuum pump. Aluminum foils
were used as collection media and glass fiber as a back-up filter # . The impactor
operates at flow rate of 1.7 m3/h with aerodynamic "cut-off" size range from 0.06
up to 16pm. The total interstage losses of the radioactive aerosol particles are
less than 2% of the total activity^ .
In this work sampling was performed In the open air on the roof of the
physics Department ( 20 m above the ground ), Faculty of Science, El-Mlnia
University. This site is far from any direct pollution sources. The aerosol particle
concentration during the sampling periods was determined by condensation
nucleus counter ( TSI, Model 3020 ) and varied between 3X10³ and 5 X10⁴
particle / cm3 . Due to the low activity concentration of 212 Pb in the air and
relatively low flow rate of the impactor (1.7 m3 / h) while relatively high activity
concentration are necessary for measurements, the sampling time of every run
was 72 hours. After aerosol sampling, Aluminum foils were taken from the
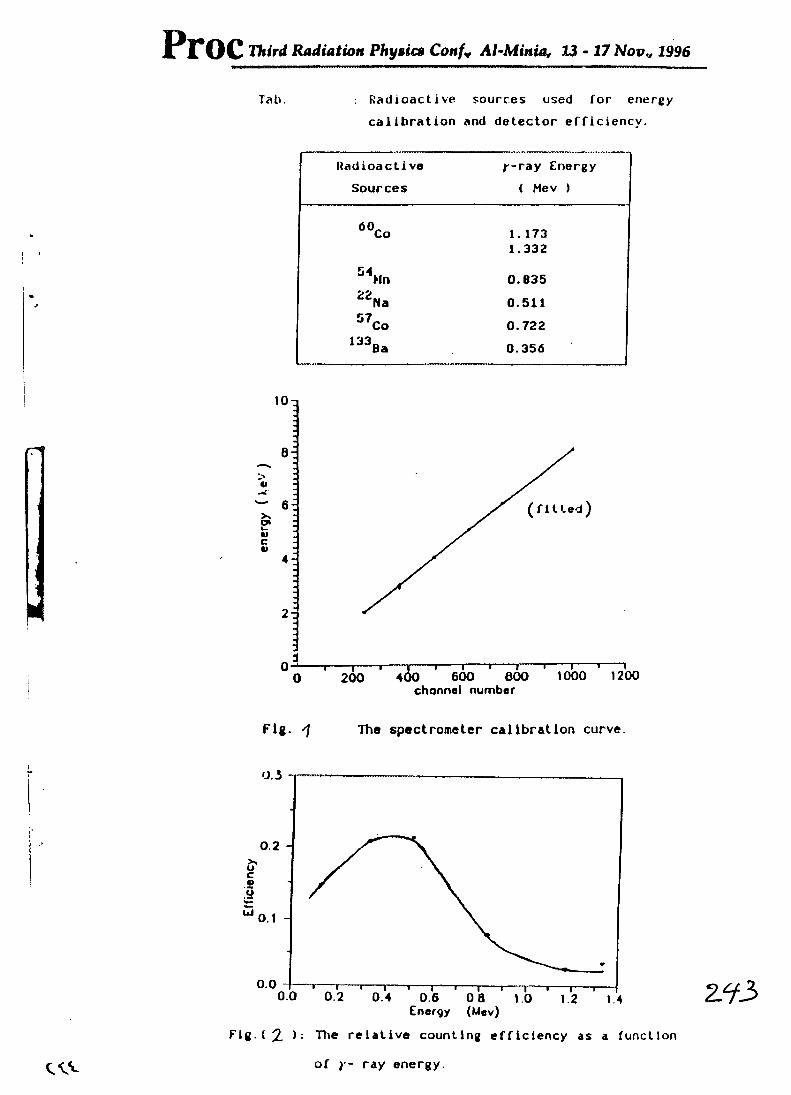
Third Radiation Physics Conf* Al-Minia, 13-17 Nov., 1996
Tab. Radioactive sources used for energycalibration and detector efficiency.
Radioactive y-ray EnergySources ( Mev )
60Co 1. 1731.332
54Mn 0.83522Na 0.51157Co 0.722
133ea 0.356
10q
Fig.
(fitted)
—i-- 1——i----1--- 1——i--- 1---- 1 i i i200 400 600 600 1000 1200channel number
The spectrometer calibration curve.
0.3 n
0.2 -
0.1 -
os o aEnergy (Mev)
Fig. ( 2. ): The relative counting efficiency as a function
Z73
of y- ray energy.
Third Radiation Phytic* Conf» Al-Minia, 13-17 Nov* 1996
impactor and weighted under controlled condition before and after air sampling
using a sensitive balance. Then difference between the two weights of each
Aluminum foil is considered to be the deposited aerosol mass. After determination
of aerosol mass, the Aluminum foils were taken and the deposited activities of
212Pb (E? = 238 kev) on each stage were determined by means of a 5 x5 Nal
(II) scintillation detector. In order to minimize the background, the detector was
shielded by a 6 cm lead castle, its inside surface was covered with a cu sheet.
The dynode pulse of the detector are fed to a Nucleus personal computer analyzer
(pc A) card set to 1024 channels through an ORTEC spectroscopic amplifier
(Model 572)
The 7-spectrometer was calibrated using standard 7- sources. The used
radioactive sources with their energies are listed In table (1). Fig (1) shows a
calibration curve of the 7-spectrometer. The efficiency of the 7-spectrometer has
been determined using the same standard 7-sources in table (1) The efficiency
curve is shown, in Fig (2).
The measuring time for each foil in the detector was 30 min. In order to
obtain the actual counting rate, the decay during measuring was corrected by the
known formula N=No e where N is the observed counting rate, A Is the decay
constant and t is the time difference between the end of sampling and the start of
measuring of each foil in the detector plus to the half of the measuring time. The
specific activity concentration of the radionuclide 212Pb was calculated by the
formula C = N A / IDO where N is the sum of actual counting rate per second for
all foils, A is the decay constant = 1.81 x 10 5 sec'1,1 is the transition probability
of radionuclide =43 %, D Is the detector efficiency (19 %) at the energy 238.6
Mev and Q is the impactor flow rate = 4.72 x 10⁴ m3/sec.
The unknown size distribution of each radionuclide was calculated by
comparing the measured activities with simulated data, using a modified least
/
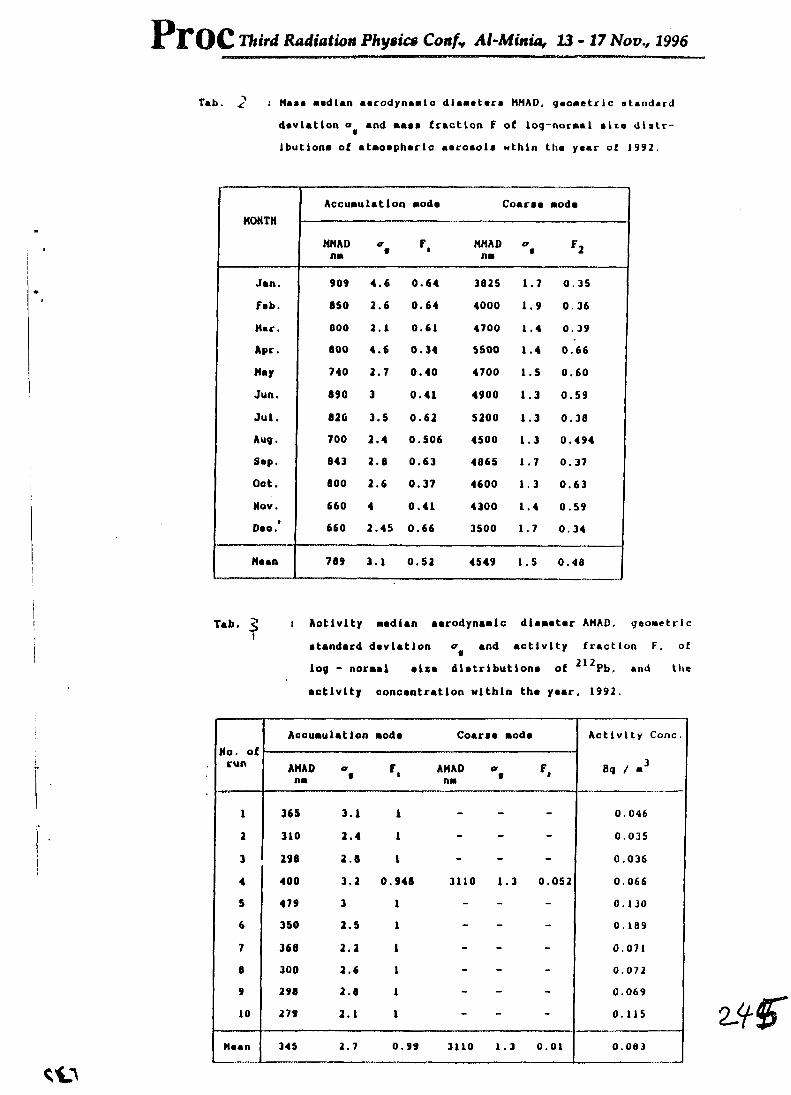
Third Radiation Phytic* Conf* Al-Minia, 13-17 Nov., 1996
Tab. 2 '■ Mama median aerodynamic diameter* HMAD, geoaietr 1 c standarddeviation and mama fraction F of log-normal alia diatr- Ibutlone of atmoapherlo aeroaola wthln the year of 1992.
MONTHAccumulation mode Coarae mode
MM ADAM
af F, MMAD
is*a• F2
Jan. 909 4.6 0.64 3825 1.7 0.35Fab. 850 2.6 0.64 4000 1.9 0.36Mar. GOO 2.1 0.61 4700 1 .4 0.39Apr. 800 4.6 0.34 5500 1.4 0.66May 740 2.7 0.40 4700 1.5 0.60Jun. 890 3 0.41 4900 1.3 0.59Jul. 820 3.5 0.62 5200 1.3 0.38Aug. 700 2.4 0.506 4500 1.3 0.494Sep. 843 2.8 0.63 4865 1.7 0.37Oct. 800 2.6 0.37 4600 1.3 0.63Nov. 660 4 0.41 4300 1.4 0.59Dec 660 2.45 0.66 3500 1.7 0.34
Mean 789 3.1 0.52 4549 1.5 0.48
Tab. i Activity median aerodynamic diameter AMAD, geometricetandard deviation and activity fraction F, oflog - normal else dletrlbutlona of 333Pb, and the
activity concentration within the year, 1992.
No of run
Accumulation mode Coarae mode Activity Cone.
AMADIS*
a• F, AMADIS*
a• F, Bq / m3
i 365 3.1 1 - - - 0.0462 310 2.4 1 - - - 0.0353 298 2.8 1 - - - 0.0364 400 3.2 0.948 3110 1.3 0.052 0.0665 479 3 1 - - - 0.1306 350 2.5 1 - - - 0.1897 368 2.2 1 - - - 0.0718 300 2.6 1 - - - 0.0729 298 2.8 1 - - - 0.06910 279 2.1 1 - - - 0.115
Mean 345 2.7 0.99 3110 1.3 0.01 0.083

Proc Third Radiation Phygica Conf* Ai-Minia, 13-17 NovH 1996
100001000
: Mass size distribution of atmospheric aerosols
in January and February, 1992.
10000
Activity size distribution ofin July. 1992

11v
PrOC Third Radiation Physics Co»/, Al-Minia, 13-17 Nov., 1996
square fitting program®. The simulated values were represented by the efficiency
curves and interstage losses of the impactor stages.
The size distribution was approximated by a log -normal distribution defined
by the activity median aerodynamic diameter (AMAO) and geometric standard
deviation. In addition to this numerical evaluation, the impactor data weie
evaluated by graphical method (cumulative method)
ResultsMeasurements were carried out through the years 1982 and 1983 A least
five runs were performed within each month, each run was 72 hours Fig (3)
shows the mass size distribution as a relation between the relative mass and the
aerodynamic particle diameter. Most of the collected aerosol mass was found in
the size range between 80 and 150000 nm, which corresponds to the
accumulation and coarse mode. Therefore, the mass size distribution was
represented by two-log normal distribution. The mass median aerodynamic
diameter (MMAD) of accumulation mode varies between 660 and 909 nm with a
mean value 739nm.with mean standard diveation of 3.1. MMAD of coarse mode
varies between 3500 and 5500 nm with mean value 4549 with standard deviation
1.5. About 52% of the collected aerosol mass is found in the accumulation mode,
while 48% is found in the coarse mode.
Fig (4) shows the average activity size distribution of the radionuclide 2'“Pb
It can be seen that the measured activities were found in the size range between
90 and 1000 nm which corresponds to the accumulation mode, Therefore, the
activity size distribution of the measured 2,2Pb is described by one log-normal
distribution. The average activity median aerodynamic diameter (AMAD) of iuPb
is found 345 nm with og =2.7 as shown in table (3).
The activity concentration of attached 2v2Pb is represented in table (3) It
varies between 0.035 and 0.189 Bq/m5 with mean value 0 083 Bq/m
4

Proc Third Radiation Phytica Confv Al-Minia, 13-17 Novy 1996
Discussion
Because (he measurements were performed under variable meteorological
conditions fluctuations in the size distributions were observed.
Nearly all the 212Pb activities (99 %) was associated with the aerosol
particles of the accumulated mode while negligible activity were observed in the
coarse mode in spite of about 49% of aerosol mass was found in this mode. This
discrepancy can be traced back to the removal processes of aerosol particles (in
the coarse mode) from the atmosphere which Is controlled by dry deposition^.
The deposition velocity of particles In the coarse mode extends to 20 cm/sec^.
The result will be short residence time (some hours) for the particles of the coarse
mode due to the high rate of their removal from the atmosphere. On the other
hand the deposition velocity of aerosol particles of accumulation mode particles is
smaller than 1 cm/sec, which is considered very small incomparison with that of the
coarse mode 'particles. Tbe result is very slowly removal of particles of
accumulation mode from the air where their residence times extend from 8 days in
the lower troposphere to 4 weeks in the upper troposphere .̂
The activity median aerodynamic diameter (AMAD = 345 nm) Is smaller than
the mass median aerodynamic diameter (MMAD = 790 nm). This result has been
expected because the deposited aerosol mass is related to the particle volume
while the attached activities are related to the particle surface.
It was found that at El-Minia the activity median aerodynamic diameter of
210Pb (T„2= 138 d) is 650 nm which is relatively longer than that of 212Pb p> This
difference Is due to the difference of the half life times of the two Isotopes
The mean value of the attached 212Pb Is found 0.083 Bq/m3 which is
considered to be normal range of the attached activity concentration reported by
the United Nations.

PrOC Third Radiation Physics Conf* Al-Minia, 13-17 Nov., 1996
Conclusions
1- The activity size distribution of iUPb was approximated as uni-modal loci
nonnal size distributions. The mean value of AMAD was 345 nm with o g=2 7
This size rang can penetrate with high probability to the human lung
2- The mean activity concentration of 2,2Pb is 0 083 Bq /m1 in the open air at
EFMinia which is considered to be in the normal range of the attached activity
concentrations
REFERENCE:
1- Wiltwkw, k, and Baror, P A Aerosol measurement Van Nosiiand
Reinhold, Newyork, 11 (1993).
2- Whitby, K.T. Atoms, Environ., 12,135, (1978).
3- Little, P. and Wiffen R.D., Atmos Environ., 11,437 (1977).
4- Sehmel, G.A. J. Aerosol Sci, 4, 125, (1973).
5- Mostafer, M., M.Sc. Thesis Faculty of Science, Minia University, Egypt. 13
(1994).
6- Reineking, A., EF Hussein, A., Becker, K.H. and Porstendoener, J , J Aeiosol
Sci, 15, 376(1984).
7- Ahmed, A.A. Ph. D. Thesis, Giessen Univ., F.R.G ( 1979).
8- Papastefanou, C. and Bondietti, E.,J. Aerosol Sci, 22,927 (1991).
9- EF Hussein, A. and Ahmed, A A , Radial Phys. Chem , 12,99,(1994)
i Phytics C6nf* At-Minia, 13 - 17 Nov* 1996EG9700089 , ------------- --------- "-------------- ---------------------
The Evaluation of Radon Concentration and Working Levels Using SSNTD in the U-exploration Galleries in the Eastern Desert, Egypt.Abdel-Haf ez , A. I. m , Abdel-Monem, A. A,2>, Bissa, H.M. m, El- Fiki, S .A.131, Abdel-Razek, Y.A.121, and Bl-Naggar, Anaa M.141.
(1) National Inatitute of Measurement and Standarda, Academy of Scientific Reaearch and Technology, Egypt.
(2) Nuclear Materiala Authority, Cairo, Egypt.(3) Physics Dept., Faculty of Sciences, Ain Shams Univ.(4) Nuclear Safety and Regulatory Center, Atomic Energy
Authority, Egypt.
ABSTRACT
Radon gas concentrations and the working levels (radon daughters concentrations) were measured using solid state nuclear track detectors (SSNTD) namely Cr-39, MX, LR 115 and CN85, in three U-exploration galleries at Qattar-1, El Miasikat and El Erediya areas, Eastern Desert, Egypt. In each D-exploration gallery 10 monitoring stations were chosen for measurements. The locations covered the differing intensities of the U- mineralization as well as the ventilation conditions. Two sets of measurements were taken for the time intervals (27 and 50 days) .
Calibration experiments on the SSNTD used were carried out using 3I,Pu-source (6. 06xl03 Bq) with 5 collimmators corresponding to « energies 1-5 MeV, to find the optimum conditions for etching each of the detectors.
The ranges of alpha track densities (t/mm2 day) measured for Qattar-1 gallery are 23.7-46.6 (CR-39), 13.4-30.9 (MK), 11.1 22.9 (CN-85) and 8.8-15.4 (LR-115) for 27 day monitoring, whereas the ranges for the 50 days experiment are 8.8-25.8 (CR-39), 8.3-15.4 (MK) and 3.9-8.2 (LR-115).
In El Missikat gallery, the alpha track densities ranges are17.1- 128.8 (CR-39), 11.4-73.1 (MK),8.0-74.4 (CN.85) and 5.7-37.8 (LR-1150 for the 27 days experiment, whereas the ranges are 9.8-67.7 (CR-39) , 6.3-38.0 (MK) and 3.4-21.0 (LR-115) for the 50 days experiments.
Alpha tracks densities for El-Erediya gallery ranges are14.1- 39.9 (CR-39), 8.9-20.9 (MK), 7.9-23.1 (CN-85), and 2.7-17.6 (LR-115) for the 27 days experiment, whereas the ranges are 8.5-22.7 (CR-39), 6.4-13.4 (MK), and 2.4-9.3 (LR-115) for the 50 days experiment.
Working level measurements are compared with 1 WL equivalent for each detector. Evaluation of the measurements at each monitoring station is discussed in terms of U-concentration and ventilation conditions. Also, the efficiency of the different SSNTD are discussed as well as the optimum time of monitoring at each U-exploration gallery.

\
PrOC Third Radiation Physics Conf* Al-Minia, 13-17 Nov., 1996
2
Introduction
Radon gas and radon daughters are known to constitute a
major health hazard in uranium exploration and mining works.
Routine periodic monitoring has become on established practice in
such sites in order to calculate the working levels (WL) (Abdel Monem et al, 1990) to which workers especially in underground galleries are exposed. Thus, radiation protection measures in these sites can be formulated and occupational radiation hazards
can be prevented.
Radon concentrations in mines atmospheres depend on uranium concentrations in the wall rocks, the degree and scale of fractures of the rocks and the conditions of ventilation, (OECD- 1985) . Also, the mine altitude and temperature are affecting factors, (Loysen, 1969).
Many types of Solid State Nuclear Track Detectors (SSNTD) were used to measure radon and radon daughters concentrations in human dwelling namely LR-115, Cr-39 and Makrofol PC, (Jonsson et al. 1996) .
In this study 3 sites of U-exploratory galleries are chosen to evaluate the radon and radon daughters concentrations in the
underground, and to determine whether or not their concentrations in tbs atmosphere of these galleries constitute an occupational hazard to mine workers. It is also intended to propose radiation
protection measures to control radon accumulation in the

PrOC Third Radiation Phy$ica Conf* Al-Minia, 13-17 Nov* 1996
3galleries. The chosen sites are at Jabal Qattar, Jabal A1 Missikat and Jabal Al Aradiya in the Eastern Desert of Egypt.
The Qattar-1 gallery which is located 65 Km due west of
Hurgada City, Red Sea is composed of a main adit (425 m) and
three cross cuts or drifts : Dt(53.32 m) at 140 m from the gallery entrance, Dlt (41.8 m) at 228 m from the gallery entrance arid DIIt (36.2m) at the end of the gallery as shown in Fig. (1) , (Salman et al. 1993).
Al Missikat gallery which is located 3 km south of the 85 Km post on Qena-Safaga Road is composed of a main adit and six drifts. The monitoring stations are in the main adit (958.85 m), D; (256.3m) and DXI(578.5m) drifts. Dx and D„ drifts are at 155 m from the gallery entrance. D„ drift is open to the atmosphere, causing natural ventilation in the area shown in Fig. (2). (Abu Deif, 1985) .
Al Aradyia gallery which is located 35 km south of the 85 Km post on Qena-Safaga Road is composed of a main adit and thirteen
drifts. The monitoring stations are located in the main adit (751.3) , DXI (87,7m) , DIIX(107.1 m) , Dm (24.1 m) and D„„ (340m)
drifts. DIt and DIIt drifts are at 51 m from the gallery entrance and DVII is at 145 m from the gallery entrance while Dvm drift is
at 37 2.5m from the gallery entrance. DVIII drift is open to the
atmosphere, causing natural ventilation in the area shown in Fig.
(3), (El Taher, 1985) . In general all the previous galleries
cross sections are 2x2m approximately.

PrOC Third Radiation Physics Conf* Al-Minia, 13-17 Nov., 1996
4
Four types of SSNTD were used in bare mode (Khan ec al.
1990, Farid, 1993)- to measure radon gas and radon daughters
concentrations. These are: 1) CR-39, 500 pm thick (Pershore
Moulding UK), 2) Makrofol E, 250 /iM thick (Bayer A.G., W.
Germany) , 3) LR-115 type II; 12 /ium thick (Kodak) and 4) CM - 8 5;
100 fua thick (Kodak) .
The obtained data will be used to calculate WL and the radiation effective equivalnet dose at each site, (Abdel Monem et al. 1990) . Also, the data will be related to the U-concentrations
available and the other controlling local factors at each site. An evaluation of the occupational hazard effects in these galleries will be discussed.
Experimental Techniquesa) Field Work
i) In the present study, 10 monitoring stations were chosen in each U-exploration gallery. At each station the four types of SSNTD were hanged at 150-200 cm above the floor of the gallery and 10 cm apart from the gallery side wall to prevent the detection of a-particles from radon daughters
plated out on the wall.
Two sets of measurements were taken for the time intervals
50 days (Jan 95-Mar, winter) and 27 days (May-June 96, in summer). After exposure, the detectors were collected from the field and chemically etched.

PrOC Third Radiation Phytic* Confv Al-Minia, 13 - 17 Novr 1996
5
ii) Gamma ray doses were measured at rock surfaces next to the
hanging detectors using a Geiger survey meter type Berthold
LB-1200. The direct readings (mr/h) were converted to jtSv/h.
b) Calibrationsi) To obtain the optimum etching conditions and times,
calibration experiments on the SSNTD used were carried out using ”'Pu-source with five collimmators corresponding to a-
energies 1-5 MeV. The optimum etching conditions and solutions reached are shown in Table (1).For radon and radon daughters measurements, SSNTD were calibrated relatively, (Teoulfanidis, 1983, El Fiki et al. 1993), in bare mode using a radon calibration chamber- constructed at NTS, (El Fiki et al. 1993) , with a radon source (av.conc. 176.28 PCi/1) and a professional radon
monitor BS-418. The relations between exposure time (d) apd track density (t/mm1) for the four SSNTD are shown in Fig.
(4), from which calibration factors for both radon
concentrations and WL at the steady state in the chamber were deduced.
ii) The LB-1200 survey meter was calibrated using standard
cobalt-60 gamma source.
c- Counting techniqueThe or-tracks on each detector were counted using an optical
microscope provided with a micrometer to measure the length of
each track. The counting*was carried out at a total magnification
(4 00X).
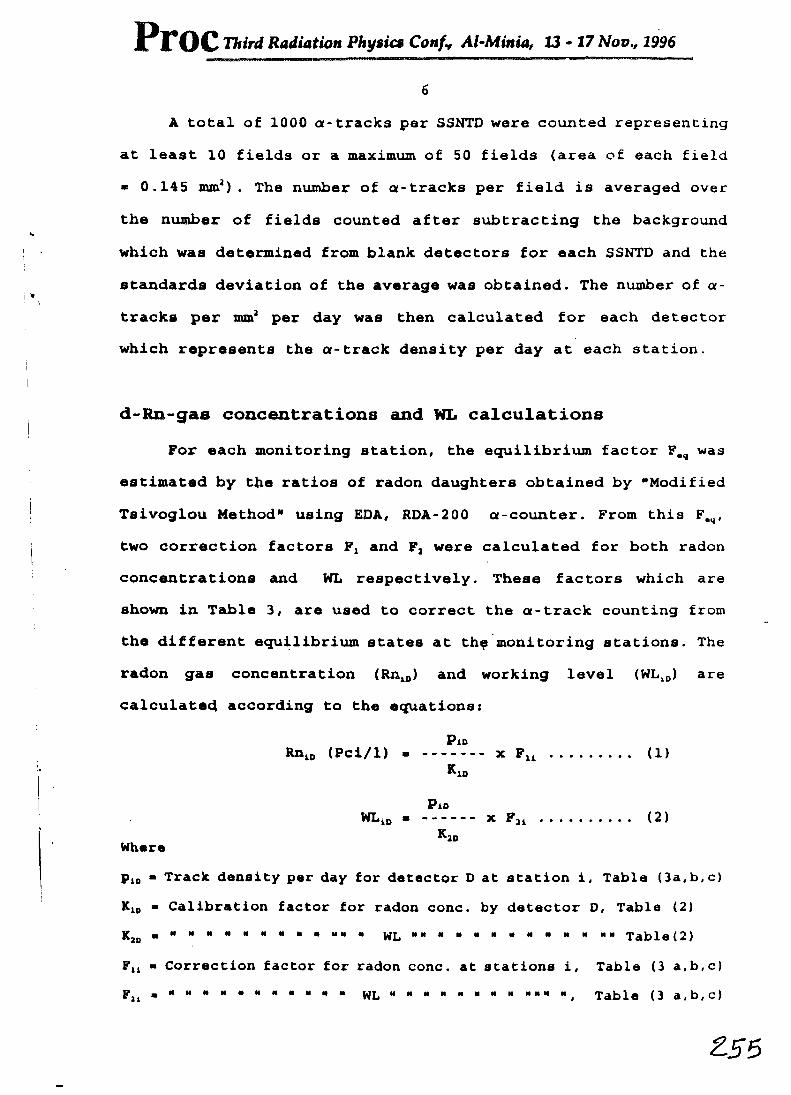
Third Radiation Physics Confy Al-Minia, 13-17 Nov., 1996
6
A total of 1000 a-tracks per SSNTD were counted representing
at least 10 fields or a maximum of 50 fields (area of each field ■ 0.145 mm2). The number of a-tracks per field is averaged over
the number of fields counted after subtracting the background
which was determined from blank detectors for each SSNTD and the
standards deviation of the average was obtained. The number of a-
tracks per mm2 per day was then calculated for each detector
which represents the a-track density per day at each station.
d-Rn-gas concentrations and WL calculationsFor each monitoring station, the equilibrium factor Feq was
estimated by the ratios of radon daughters obtained by "Modified
Tsivoglou Method" using EDA, RDA-200 a counter. From this F.q,
two correction factors Fx and F, were calculated for both radon concentrations and WL respectively. These factors which are shown in Table 3, are used to correct the a-track counting from the different equilibrium states at th? monitoring stations. The radon gas concentration (Rnl0) and working level (WLl0) are calculated according to the equations:
PioRnt0 (Pci/1)............ Fu .......... (1)
Pio
KWLio --------------x Fji ............................ (2)
Wherep10 ■ Track density per day for detector D at station i, Table (3a,b, c) K10 ■ Calibration factor for radon cone. by detector D, Table (2)*20 WL " "" Table(2)Flt ■ Correction factor for radon cone. at stations i, Table (3 a,b,c)?2. WL " " " , Table (3 a,b,c)MMMNMMMNM
PrOC Third Radiation Phytic* Conf* Al-Minia, 13 - 17 Nov* 1996
7
Results and DiscussionThe results of or-tracks counting for the SSNTD from the 30
stations at J. Qatar, J. A1 Missikat and J. A1 Aradiya are
converted to the a-track densities per day as shown in Tables (3
a, b, and c) along with the calculated statistical parameters.
It is clear that the standard deviation of the or-track counts (1000 track per detector) for the two sets of monitoring measurements are around ±5% for CR-39 type and around ± 7% for MK and CN-85 types. The standard deviation for LR-115 type may reach ±18%, Tables (3 a,b and c).
The obtained radon concentrations and WL for the 50 days monitoring experiment are shown in Tables (4 a,b, and c, while those obtained for the 27 days experiment are shown in Tables (5
a, b and c).
a. Qattar-1 GalleryIt is seen from Tables (4a) and (5a) that the higher radon
concentrations in this gallery are observed at the intersections
between the shear zone and the main adit and cross cuts No. I, II and III at stations No. 2,4,6 and 8. These high concentrations
are related to the higher radioactivity of the granite at the
shear zone (area of high fracturing) which varies from 80 to 150 choc/sec, while the normal radioactivity of granite in the main
adit and cross cuts varies from 50 to 70 choc/sec (Salman et al.
1993) . The high concentration at station No. 10 (8 m from the
gallery entrance) may be due to the high fracturing of this
PrOC Third Radiation Phytica Conf* Al-Minia, 13 - 17 Nov* 1996
8
r - on along the first 20 m from the gallery entrance (Salman et a I. . 1993) .
The variation of WL in this gallery shows the came feature a" the variation of radon concentrations because of the higher equilibrium factors. The minimum values of WL at station No. 10 ic clue to the natural ventilation at this station.
b. Al Missikat Gallery
From Tables (4b) and (5b) , the six monitoring stations No. 1 - 6 i:i D* Fig. (2) are of high radon concentrations. The uranium concentration in this drift reaches 430 ppm at 100 m from the entrance of the drift, (Abu Dief, 1985), at station No. 4. The highest ration concentration in Dt value ia at station No. 3 at Li-. ^ mineralized vein Fig. (2). The very high radon concentration In the gallery is at station No. 10 (main adit) although no high V concentration is observed there-. This may bo due to air t'i l-ulence at the intersection between the main adit and D, and D., drifts which may cause the radon gas to accumulate in this region which is not ventilated.
The low values of WL at stations No. 8,7 and 9 are duo to L! - d natural ventilation at these stations, Fig. (2).
::. fiL Aradiya Gallery
Four monitoring stations in this gallery No .11 are i c , two No. 5-6 are in D„ drifts, rig. (3). Du and S;iI dril tn ore
Third Radiation Physics Confr Al-Minia, 13 - 17 Nov., 1996
9
■ ! i /on at the shear zone No.2 Ganna radioactivity of the granite
' : lg this shear zone varies between 40-3000 choc/sec. , (El
i'. »r, 193a) . Higher radon concentrations in this gallery are
' ' >: erved at the monitoring stations in the closed drift U,,,. The
I ' n along the main adit and DVIIl drift is naturally ventilated,
h h- her radon concentrations at stations 8 (main adit) and 9 Dv;i,
indicate the poor ventilation at these stations. This is due to
l!. • long passage of air and the design of the gallery along this
'■: :-h .
The total effective equivalent doses (/aSV/h) calculated for
Qittar-1 gallery were (65.07+19.16) in winter time and
(75.25+33.66) in summer time. For Al Missikat gallery the total
d j es were (81.9 + 61.4)in Winter and (143±104) in summer. For Al
r-diya gallery the total doses were (43.07 + 23.95) in winter and
(50+52) in summer time. The major doses coming from radon
'’lighters concentrations which indicates the need for artificial
v ntilation.
The measurements showed that radon concentrations and WL in
"i ;amer time are almost twice that measured in winter in agreement
wich previous works at these sites (Abdel-Monem et al. 1990) .
Tliis might be due to heat outgassing effect (Hakel et al. 1996) .
In general, it is clear that the naturally ventilated areas
have low Rn gas concentrations but still above the permissible
.. In which case industrial ventilation should be used in these
- .lleries to prevent any occupational radiation li izard.
Third Radiation Phytic* Confr Al-Minia, 13-17 Nov., 1996
10
References
bl-Honem, A. A., Hussein, M.I., El Naggar, Anas M. , Attia,
Karnal E. and Omar, Sayed M.A. 1990: Monitoring of radon gas
and daughters in uranium exploration mines, Eastern Desert,
Egypt Proc. of the Regional Symposium on Environmental
studies, 507-522.
A' u Deif, A., 1985: Geology and uranium mineralization in A1
Missikat area. Eastern Desert M. Sc. Thesis, Faculty of
Science, A1 Azhar University, Cairo.
El Fiki, S.A., Kenway, M.A., Eissa, H.M., Sharaf, M.A., El Fiki,
S.A. Abd El Hady, M.L. 1993 : CR-39 and LR-115 as a
secondary standard dosimeter for radon dose calibration.
Nucl. Tracks Radiat. Meas. 22, 323-325.
El Fiki, S.A., Sharaf, M.A., Eissa, H.M, Abd El Hady, M.L.,
Kenawy, M.A. and El Fiki, M.A. 1993: The design of a radon
calibration chamber for testing radon measuring dosimeters,
Nucl. Track Radiat. Meas., 22, 319-322.
El Taher, M.A. 1985: Radioactivity and mineralization of
granitic rocks of El Erediya occurrence and comparison to El
Missikat-Rie El Garra occurrence. Eastern Desert, Egypt.
Ph.D. Thesis, Faculty of Science, Al Azhar University,
Cairo, 133p.
Fir id, S.M., 1993 : Measurement of concentrations of radon and
its daughters in Indoor Atmospheres using CR-39 nuclear
track detector, Nucl. Tracks Radiat. Meas., 22, 331-334.
E.k il, J. , Hunyadi, I, Csige, I, Geczy, G, Lenart, L. and
Varhegyi, A. 1996: Radon transport phenomena studi -d in
PrOC Third Radiation Physic* Confv Al-Minia, 13-17 Novv 1996
11
karst eaves:International Experiences on radon levels and
exposures in Ilic, R. and Durrani, S.A, (ed.) Radon
Measurements by Etched Track Dectectors, World Scientific
(in press) .
J s"son, G. , Alberracin, D. , Bacn-aister, G.U., Daixeras, G.U.,
Climcnt, H., Devantier, R., Enge, W. , Freyer, K, Font, U,
Ghose, R., Monnin, M.M.' Sciocchetti, G., Seidel, J.-L and
Treutler, H.C., 1996: Comparison of radon measurements done
by Solid State Nuclear Track Detectors and Electronic
Devices in the frame of an EU-Radon Project 18 th
International Conference on Nucl. Tracks in Solids, 1-5
Spet., Cairo, Egypt.
Khan, A.J., Varshney, A.K., Rajendra Prasad, Tyagi, R.K. and
Ramashendra, T.V., 1990: Calibration of a CR-39 plastic
track detector for the measurement of radon and its
daughters in dwellings Nucl. Track Radiat. Meas., 17, 4 97-
502 .
Lcysen, Peter, 1969: Errors in measurement of Working Level,
Health Physics, 16, 629-635.
OLCd-NEA, 1985: Meteorology and Monitoring of Radon, Thoron and
Their Daughter Products. Report by a group of experts, 1985.
Sa1 ran, A.B., Shalaby, M.H., Nosier, L.M., El Khouly, D.M., Roz,
M.A, Abu Zeid, M.I., Mostafa, M., Amin, N.F, Ayoub, R.R. and
Khamis, H.A. 1993 : Report on surface and subsurface
exploration works in Gebel Qattar uranium occurrence, North
Eastern Desert, Egypt NMA, NEDDD.
Tr > 1 fan id i s, Nicolas, 1983 F inurement and Detection of
Radiation, McGraw-Hill Book ;mpany.

Proc Third Radiation Phytic* Co#/., Ai-Minia, 13-17 AToov 1996
i
I' i M c (I): Optimum condition:! r the four yi'.M'i'h
CU-3V , M.ikrofol, CN-X5 .u.d l.lt- Ilf..
;; i tor K telling solution
Optivina conditions
Noras 1iLy(fl)
TemperatureoC
K! vliing . 1. i me (li)
ci: vi NaOII 6.25 70 11
MK by weight: 45 gII20* 10 g C2H50IIH5gK0ll
70 1.5
(-;:5 NaOII 2.5 GO :i
I! II5 Na Oil 2.5 GO .1
I,iliI' (2): Cal ilirullon factors: Kj for radon gas concentrations and K,
for HI. for tlie four SSNTD at tin* steady state.
Type K1(L/aa2.d.(pCi/1))
K2(l/:n i2.d. WL)
Cli-.TJ 0.191 IV.09
MK 0.122 12.21
CN-H5 0.105 10.51
I.R-115 0.06 6.01
Z&1

PlTOC Third Radiation Phytic* Confv Al-Minia, 33 - 17 Nop* 1996
i :ill
(3a): T u:k dc.isilies (l,/eiu*.<J) u<. 10 monitoring hint ii 1 2.s in (j.iU .sr_l Gallery
f> l ■ 11. i on .Nu
11Feu Cr-39 MK CN-H5 Ltt-115
bn
•b
12
! 0.916 25.7611.63(1) (20.7811.24)(2)
1C.6511.72 (15.3812.14)
1 1.7411.12 ti.7811.17 (tt.2110.77)
1.033 0.977
1.927 30.4212.21 (22.2011.24)
25.6412.20(14.0411.59)
22.9411.6 12.7511.51 (7.3110.Ill)
1.039 0.963
1 d. 9.911 21.7111.12 (12.8210.09)
15.7211.64 (tt.6H10.94)
12.8410,96 7.4911.29(4.2310.50)
1.038 0.971
1 0.H0H 3.1.0311.92(1.1.0310.92)
21.9011.60(12.5610.94)
ltt.60tl.29 10.9111.36(7.0410.73)
1.063 0.955
•» 0.8HH 30.0811.67 (1 1.1410.78)
19.9511,54(11.2910.92)
15.0111.12 9.9311.62 (5.C110.HI)
1.07 0.95
' 0.817 1C.Gill.8.1 (17.0210.94)
30.9211.91(ll.2tti0.tttt)
21.3511.48 15.3911.57 (5.5410.67)
1.096 0.928
1 0.8C1 20.2110.91 (8.31110.Gl)
13.3811.01(5.8610.73)
11.0810.88 6.6510.74(3.8810.19)
1.084 0.937
O.tlHIl 31.7711.32 (20.1710.85)
22.9111.12 (ll.34i0.B1)
17.4211.22 11.3311.2!)(5.5210.51)
1.07 0.95
0.711 12.0811.92(24.9810.9tt)
22.0711.95 (8.9310.90)
IJ.G8il.37 12.3811.12 (5.1910.69)
1.182 0.814
1 1 li.ZO 28.2411.31 (10.1810.67)
ltt.73il.6H(11.2910.80)
10.9511.2G 9.3211.68(5.1110.91)
1.526 0.305
1 V. Im: i obtained in the 27 days cx|K>surc in summer l ime.2 { ) ‘ lues in brackets arc obtained in tin: fiO days exposure in winter lime, u ■ i< <i.ui librium factor (see text).b : ' iorreution factors (sec text).
11/

PrOC Third Radiation Phytict Conf* Al-Minia, 13-17 Nov., 1996
Tal; ’ . Track deni;i I. i<;t> ( L/mia'.d) al 10 w i i luring uLaL ion;; in A l MissikaL Cal I cry.
lil.al. i"U rio
Kcq Cr-39 MK CN-85 LK-115 FI F2
1 0.918 53.69+3.3(19.48*1.2)
31.26+1.6(12.92+0.86)
24.75+1.72 17.71+1.86 (7.45*0.79)
1.032 0.979
2 0.017 55.95+3.76(29.09+1.18)
34.06+1.74(16.13+0.8)
25.63±1.77 20.98+2.2(15.88+1.1)
1.052 0.964
3 0.8G7(38.62+1.92)
37.84+1.94(17.91+0.82)
31.39+2.38 19.45+2.07(10.19+1.1)
1.082 0.938
1 0.(110 55.42+2.25(27.03+1.55)
35.3+1.8(17.24+0.73)
26.11+1.81 13.9+1.46(7.62+0.8)
1.12 0.907
5 0.707 13.71+2.92(21.21+1.21)
23.9511.58 (9.06+0.6)
25.26+1.71 14.42+1.51(7.35+0.77)
1.187 0.839
(> 0.751 28.40+1.74(16.09+0.99)
20.7±1.37 (10.87+0.72)
16.41+1.22 11.02+1.17(4.38+0.53)
1.156 0.368
7 0.435 28.44+1.64(15.87+0.97)
18.88+1.25 (10.19+0.67)
13.85+1.03 9.93+1.13(5.31+0.64)
1.307 0.595
II 0.199 17.14+0.69(9.77+0.56)
11.36+0.81(6.35+0.44)
7.96+0.59 5.65+0.67(3.46+0.55)
1.529 0.304
y 0.867 21.54+1.24(11.38+0.57)
15.19+1(7.02+0.46)
9.87+0.82 5.79+0.7(3.48+0.41)
1.083 0.939
I0 0.945 128.8±7.31 (67.66+3.89)
73.14+2.76(38.04+1.52)
74.44±4.91 37.8+2.12(20.95+I.9)
1.031 0.977
T■•.!(!<• ( !e): Truck densiLies (L/ms*.d) uL 10 nunitoning staLion:; in Al Aradiyn Callery.
: I. a I. i u»ir1"
Fcq Cr-39 MK CN-85 Lit-115 FI 12
l 0.917 39.89t2.01(22.7+1.12)
12.31+0.86(13.4+0.89)
23.06+1.61 17.6111.85(9.27+0.97)
1.052 0.961
2 0.944 31.43±1.27 (11.7+0.74)
17.83+1.18(9.94+0.64)
11.3911.2(1.02+0.18)
1.035 0.977
3 0.932 28.76+1.91(14.77+0.74)
20.88+1.38(9.47+0.63)
16.65+1.24 9.19+1.11(4.55+0.55)
1.042 0.971
1 0.661 20.66+1.05(12.11+0.5)
17.83+1.26(10.22+0.68)
11.96+0.89 7.010. Il l (4.02+0.19)
1.211 0.803
5 0.669 20.01+1.5 (10.95+0.56)
13.13+0.87 (7.7510.111)
9.03+0.67 5.98+0.73(3.28+0.4)
1.211 0.81
C 0.714 17.78+1.12(9.1110.57)
12.18+0.83 (6.4210.15)
10.1710.87 6.1+0.72(4.2610.51)
1.182 0.811
7 0.536 15.6 + 1.06 (8.47+0.12)
12.5910.76(7.0810.17)
8.5810.72 2.0310.38(2.1+0.43)
1.3 0.697
3 0.682 21. 15+1.08 (12. 12+0.42)
13.5810.9(7.8510.52)
12.3111.03 4.9+0.34 (4.1510.13)
i. 20; 0.821
9 0.371 20.32+1.21 (11.7310.67)
11.33+0.79 (6.1910.13)
10.2+0.85 3.2610.50 (2.27+0.1!)
1. 103 0.177
0.232 M.0710.81 ( 1 1. 11120.4 5)
8.9110.7 (7.33+0.51)
. ':910.68 2.71 j'V " (1.6910.r '
1 . "I "1
_ 1
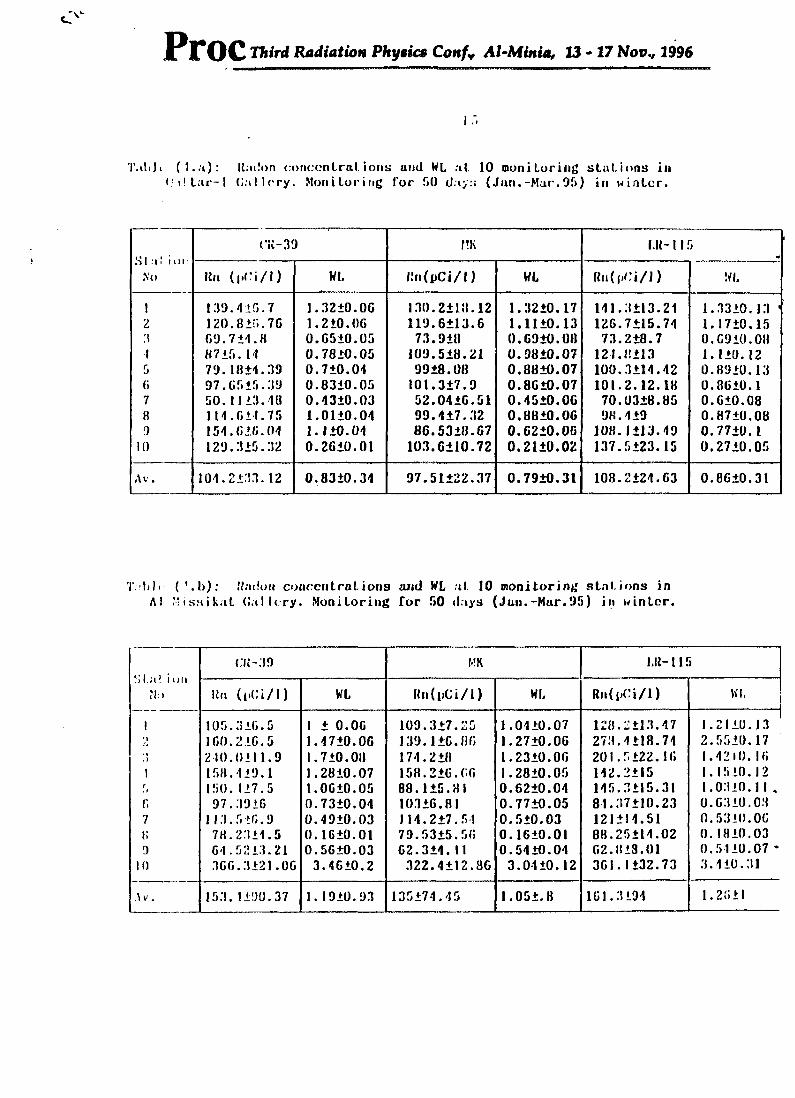
Third Radiation Phytic* Conf* Al-Minia, 13-17 Nov., 1996
T.itiJi (l.a): Ration conccnlral ions and WL at 10 monitoring stations in ( a! tar- I Cal !cry. Monitoring lor 50 day:; (Jun.-Mar. 95) in winter.
SI :ii im:No
('R-.39 MK Lit-115
Rn (|.Ci/l) WL Rn(t>Ci/l) WL Rn(|.Ci/j) !VL
i 139.415.7 1.3210.00 130.2118.12 1.3210.17 111.3113.21 1.3310.13 '2 120.815.7G 1.210.00 119.0113.0 1.1110.13 126.7115.71 1.1710.15:t 09.714.8 0.0510.05 73.910 0.0910.08 73.218.7 0.0910.08i 8715.14 0.7810.05 109.518.21 0.9810.07 121.8113 1.110.125 79.1811.39 0.710.01 9918.08 0.8810.07 100.3114.42 0.8910.130 97.0515.39 0.8310.05 101.317.9 0.8010.07 101.2.12.18 0.8010.17 50.1113.18 0.1310.03 52.0410.51 0.4510.00 70.0318.85 0.010.088 111.Oil.75 1.0110.01 99.117.32 0.8810.00 98.119 0.8710.089 154.010.04 1.110.01 86.5318.07 0.6210.00 108.1113.49 0.7710,1
10 129.315.32 0.2010.01 103.0110.72 0.2110.02 137.5123.15 0.2710.05
Av. 101.2133.12 0.8310.31 97.51122.37 0.7910.31 108.2124.63 0.8610.31
Tabh (1.1)): Radon concentrations and WL at 10 monitoring stat ions in AI "is.sikat Cal I cry. Monitoring for 50 days (Jan.-Mar.95) in winter.
CR-39 MK Lit-115SI n’ mu
Mu Rn (|iCi/l) WL I(n(i>Ci/l) WL Rn(i»Ci/l) WL
1 105.310.5 1 1 0.00 109.317.25 1.0110.07 128.2113.17 l.2 110.132 100.210.5 1.1710.06 139.110.80 1.2710.06 273.1118.71 2.5510.17
210.0111.9 1.710.08 171.218 1.2310.00 201.5122. 10 I.42K). 10t 158.119.1 1.2810.07 158.210.00 1.2810.05 112.2115 1.1510.12
150. 117.5 1.0010.05 88.115.81 0.6210.04 115.3115.31 1.0310.11 „r. 97.3910 0.7310.04 10310.81 0.7710.05 81.37110.23 0.0310.037 113.5+0.9 0.4910.03 114.217.51 0.510.03 121114.51 0.5310.00i; 78.2311.5 0.1610.01 79.5315.50 0.1610.01 88.25114.02 0.1810.039 61.5213.21 0.5610.03 62.311.II 0.5410.04 02.818.01 0.5110.07 •
10 300.3121.0G 3.4610.2 322.4112.80 3.0110.12 301.1132.73 3.110.31
\ v. 153. 1190.37 1.1910.93 135174.45 1.051.8 101.3191 1.2011
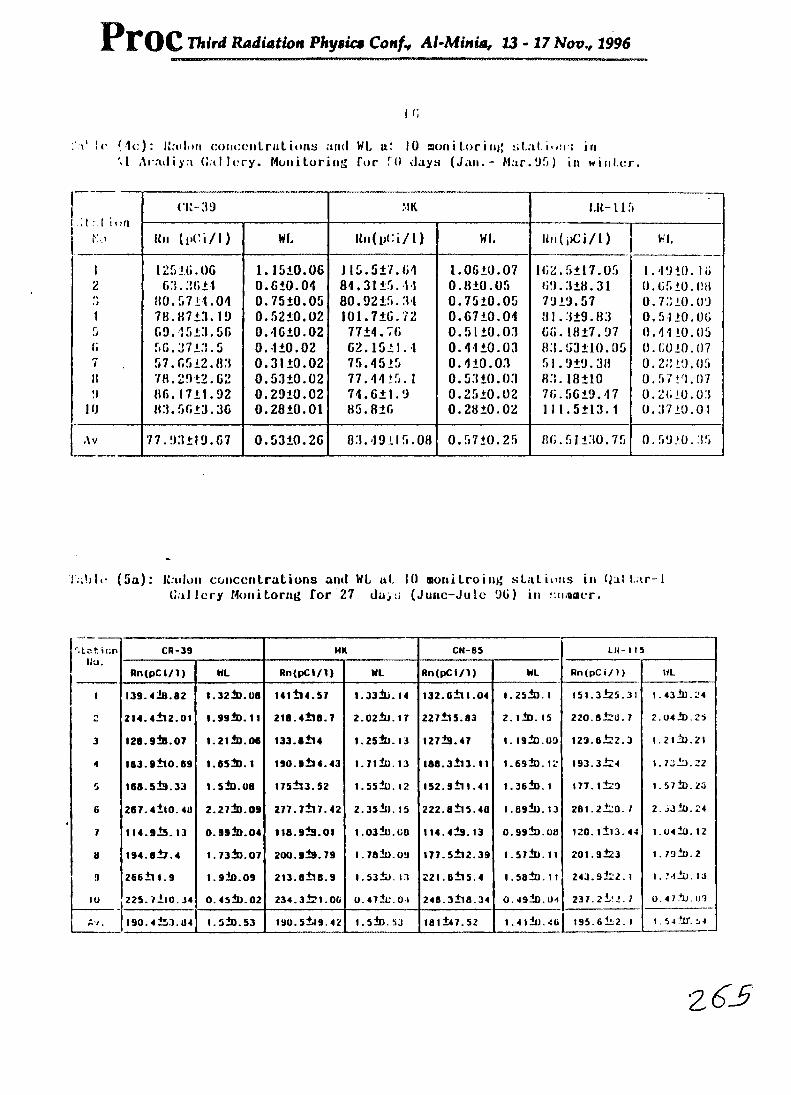
Proc Third Radiation Physic* Confy Al-Minia, 13-17 Nov., 1996
I 0:'c IZadon coiiccntruLions arid WL a! 10 aonilorinj; st.al.iwir; in
W Aradiya Cal I try. Monitoring for TO days (Jan.- Mar.05) in winter.
1,1,1 i 11 ri
iv,>
ei;-:vj MK Lit-115
Itn (vCi/l) WL Kn(ijCi/l) WL Itn (j>Ci/1) Wl.
1 12516.06 1.1510.06 J 15.517.01 1.0010.07 102.5117.05 1.4910.to2 o:i.:!c.ii 0.010.01 81.3115.11 0.810.05 09.118.31 0.0510.08;) 110.5711.01 0.7510.05 80.9215.11 0.7510.05 7919.57 0.7110.091 78.871.1. 19 0.5210.02 101.710.72 0.6710.01 81.119.83 0.5110.00
09.1511.50 0.1010.02 7714.70 0.5110.01 00.1817.97 0.4110.05i; 50.1711.5 0.110.02 02.1511.1 0.1110.03 81.03110.05 0.0010.077 57.0512.81 0.3110.02 75.4515 0.110.03 51.919.38 0.2119.05II 78.2912.02 0.5110.02 77.4115. 1 0.5110.01 81.18110 0.5719.070 80.1711.92 0.2910.02 71.611.9 0.2510.02 70.5619.17 0.2010.01
10 81.5011.10 0.2810.01 85.810 0.2810.02 111.5111.1 0.1710.01
Av 77.911I9.G7 0.5310.20 81.19115.08 0.5710.25 80.51110.75 0.5910.15
I all If (5a): Kadun concentrations and WL at 10 oonitroinr; stations in Cal tar-1 Cal lory Monitorng for 27 days (Junc-Jule 00) in s inner.
ILzticnIJu.
Cfl-39 MK CN-85 Lll- 1 15
Rn(pCi/l) ML Rn(pClZI) ML Rn(pCiZI) ML Rn(pCiZ1) WL
i 139.418.82 t.32l0.08 141 ±14.57 I.331U.14 132. 011 1.04 l.25±). 1 151.3+25.31 1.43+0.24
2 2l4.4ll2.0l i. 99 Id.ii 218.4+18.7 2.02lu.17 227+15.83 2.llD.15 220.8+2U. 7 2.04 ID.25
3 I28.91B.07 i. 2iId.06 133.8il4 1.25In.13 127+9.47 1.isId.oo 129.6122.3 1.21+0.21
4 I83.9ll0.69 i.eslo.i 190.9+14.43 l.7liu. 13 I80.3ll3.11 1.69+0.12 193.31:4 1.73+1.22
5 168.519.33 i.slo.oe 175+13.52 1.55lo.12 152.9lll.41 1.36+D. 1 177.1+23 1.57+D. 25
6 267.4llO.4U 2.27±).09 277.7+17.42 2.35ll). 15 222.8ll5.40 1.89+13. 13 201.2+20. I 2. j3lO. 24
7 114.915. 13 0.9910.04 118.913.01 1.03 ll).00 114.419.13 0.991D.08 120.1+13.44 1.0410. 12
a 194.S±7.4 1.7310.07 200.9l9.79 l.78ln.09 I77.5ll2.39 1.57+0.11 201.9123 1 . 731D.2
9 266+3 1.9 1.9+0.09 213.alia.9 1.53+n. i.i 221.6+15.4 i.salo.11 243.9122.1 1.7-1 in. iu
10 225.7ll0.34 0. 4SlD.02 234.3121.00 0. 47+0. 0 1 246.3+18.34 0.49+D.iM 237.21,’. 7 O. 4 7.+U. 09
Av. 190.4+53.04 I. 5+D.53 I90.5±19.42 1.5+D. 5J 18ll47.52 1,41+U.46 195.6152. 1 1.54+0". 54
26^

PrOC Third Radiation Physic* Conf» Al-Minia, 13-17 Nov* 1996
(:. b): it uimi concentrations and KI. ;.l. !0 monitoring stations in Al Missik.it Gallery. Monitoring for 27 days (June-Jule DG) in simmer.
rt.xt . .ho.
CR-39 MK CM-85 LR-115
Hn(pCi/1) WL Rn(|»Ci/1) ML RntpCi/1) WL nn(pCI/1) WL
I ’90.2+17.81 2.75+0. 17 264.6±13.5 2.51*0. 13 243.3+16.94 2.3lo.16 304.7*32 2.83 ll).3
_• JOB. 1*20.63 2. C3+0. 19 293*3.15 2.69*0.14 256.7+17.0 2.35iD.16 367.7*38.5 3.37*0.35
3 368. 1*38.87 2.0*0. 15 386.7lZ6.0G 2.75*0. 19 384.7*41 2.72*0.29
4 ’24.9±I3. ID 2. C3l0. 11 323.9+18.5 2.02*0. 13 276.3+19.34 2.25lo.16 259.3*27.3 2.1*0.22
6 71.6il8. ID 1.92*3.13 233+15.37 1.65*0.11 285.6+19.65 2.02*0.14 265.3*30 2.01*0.21
6 171.9+30.54 1.29 Jo. 00 196.2+13 1.47*0.1 160.7+13.45 1.36*0. 1 212.4*22.5 1.59*0.17
7 2 )3.5*1 1.71 0.89*0.05 2I1.5±14 0.92*0.06 160.3+13.43 0. 78 jD. 06 213 j25.83 0.92*0. 11
a l37.3l5.5U 0. 27*0.01 142.3±10.1 0.20*0.02 I15.9j0.62 0.23*0.02 144.1+17.15 0.29*0.03
9 122. 1+7.02 1.06*0.05 134.9*8.9 1.17*0.09 101.8*0.47 0.86*0.07 104.6*32.6 0.9*0.11
to 17.2+19 6 5.59*0.37 619.9*23.38 5.05*0. 22 733*48.30 6.92*0.46 651.4*41.64 6. 14*0.39
Av. 10. 8+173. 2 2.2S±1.80 278.8+141.3 2.18+1.54 276.4+161.6 2.18+1.86 292.7+154.3 2.29+1.80
T,,!> 1 Iv.nloi; concentrations and HI, at 10 monitoring stations in Al AradiyaGallery. Monitoring for 27 days (June-Jule 9ti) in .summer
il.lt Kill CO-39 MK CH-85 LR-115
pc* i /1) WL Kn<pCi/1) WL Rn( pCi/1) WL Rii(pCl/l) WL
I . I9.C+U.08 2.02*0.1 106.1+7.43 0.97*0.07 230.9*16.12 2.12 JO. 15 208.6+32.5 2.83*0.3
2 ■ /0.3+B.9 1.61*0.07 151.3+10 1.13*0.09 141.9tll.79 1.31*0.11
3 (56.9+30.4 l. 16*0.1 178.4*31.79 1.66*0.11 165.3+32.33 i.siio.ii 164.9*39.8 1.53+0. IS
4 'll.3*0.66 0.87*0.04 177.5+12.55 1.17+0.OH 138.3+10.34 0.91*0.07 HI.5+17.1 0.93*0.11
r, 1 JG.9i9.5l 0. 15*0.06 130.4*11.61 0.87iD.06 104.1+7.7C 0.7*0.05 120.7*34.8 0.01*0.1u 1 10.1*0.9 U.79i0.05 118*8.1 0.84iO.06 117.9*9.84 0.84+0.07 I20.2tl1.1 0.86*0.17 1 DU. 1*7.2 0.57*0.04 134.1*8.05 0.72+0.01 106.2±B.9 0.57 tD.05 14*8.21 o.zito.oi
M 1 13.3*0.81 0.91*0.05 134 + 8.85 0.91*0.06 111.1*31.77 0.96*0.08 98.4*C.3 0.67*0.05
9 1 19.3*9.13 (1.51*0.03 130.3*3.13 0.44+0.03 13C.3i3l.il 0.16*0.04 76.23+13.8 0.26*0.05
10 11:5.2*0.05 0.35*0.02 104.6*3.2 0.35 Jo. 0.1 107.3*3.2 0.36*0.03 65.09*12 0.22+0.01,\v. 1 :0.9+15.22 0.99*0.53 136.5*25.35 0.91 +1.4 1 38.9*37.86 0.96*0.51 1 20.6+76. 1 0.9 '. +J. 52

Third Radiation Phytic* Conf* Al-Minia, 13 - 17 Nov* 1996
■Trace of mineralized shear zone of level
Subsurface radio active anomaly
Surface
SubsurfaceU-lense
R2 ■ Drilling Room XC1> Cross Cut • 9 « Monitoring Station
Fig. 1; Map of the exploration mining Gallery G.Qattor - Ioccurrence showing the uraniferous lenses.(After Salman etol. 19931
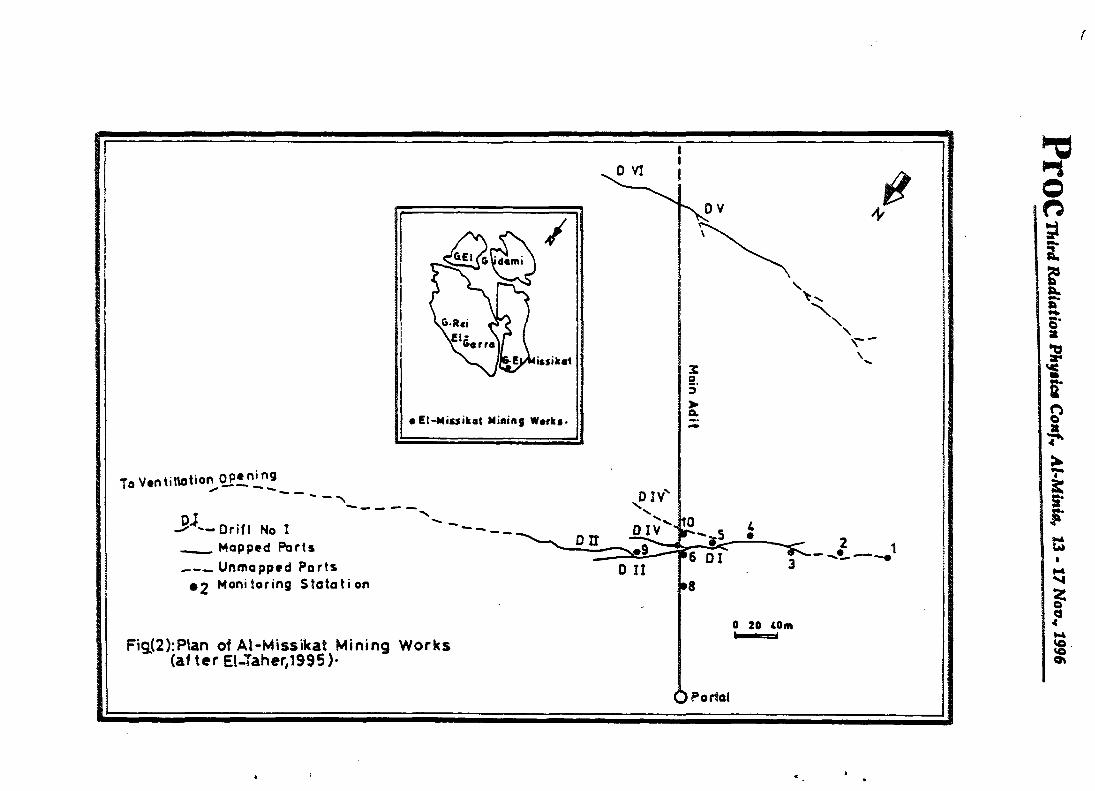
(
oEI-Misjikat Minin9 Works-
’ —Drifl No I___ Mopped Ports—_Unmapped Ports • 2 Monitoring Stateti on
DIV
Fig.(2):Plan of Al-Missikat Mining Works (af ter El-Taher,1995)-
Pl*OC Third Radiation Phytic* C
onfH Al-Minia, 13-
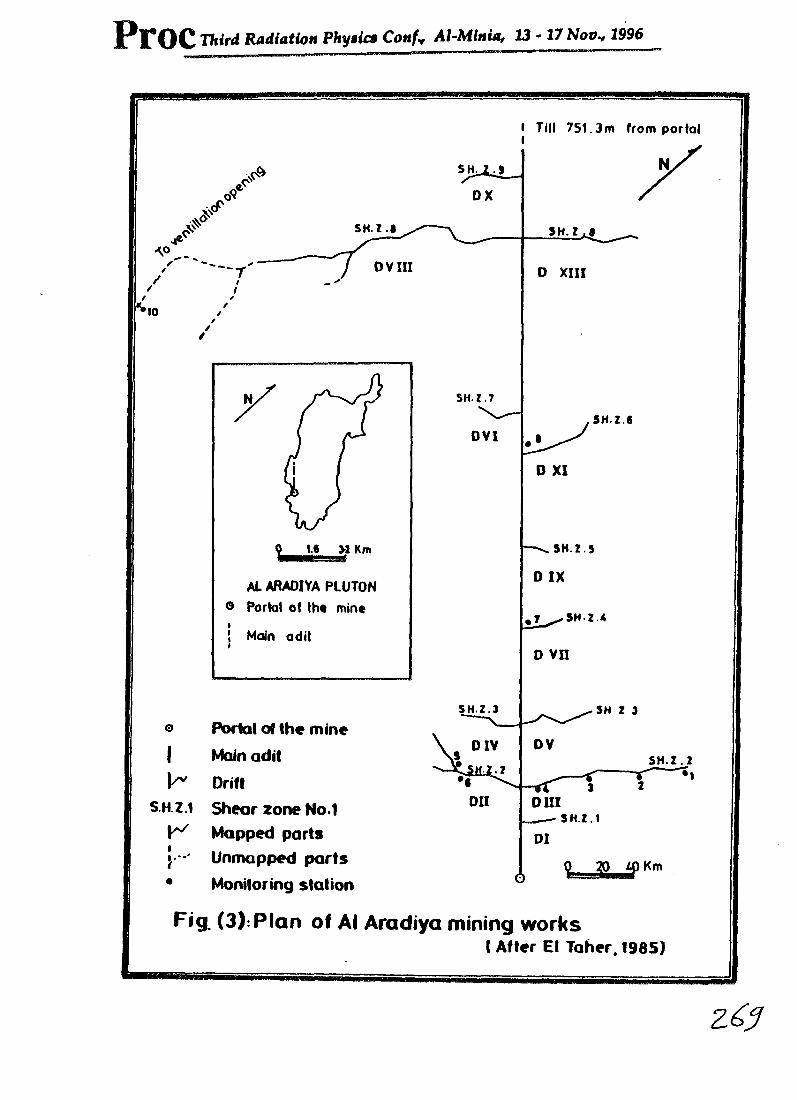
PtOC Third Radiation Phytic* Conf* Al-Mlnia, 13 - 17 Nov* 1996
I Till 751.3m from portal
OVIII D XIII
SHZ.7
SH-Z.6
SH.Z.5>2 Km
AL ARADIYA PLUTON o Portal of the mine
Main aditD VII
SN Z 3Portal of the mine
Main adit SH.Z.2
V* Drift
SH.Z.IK Mapped parts
Unmapped parts
• Monitoring station
Fig (3):Plan of Al Aradiya mining worksI After El Taher. 1985)

PrOC Third Radiation Phytic* Conf» Al-Minia, 13 -17 Nor„ 1996^
■ CR-39A MKO CN-85• LR-116
16 18 20 22 24 26Exposure Time Id 1
Fig(4):Relation between the track density(t/mm2)and the exposure time(d) for the four SSNTD in a radon chamber(av.conc.176.28 pCi/1 ) at the steady state.
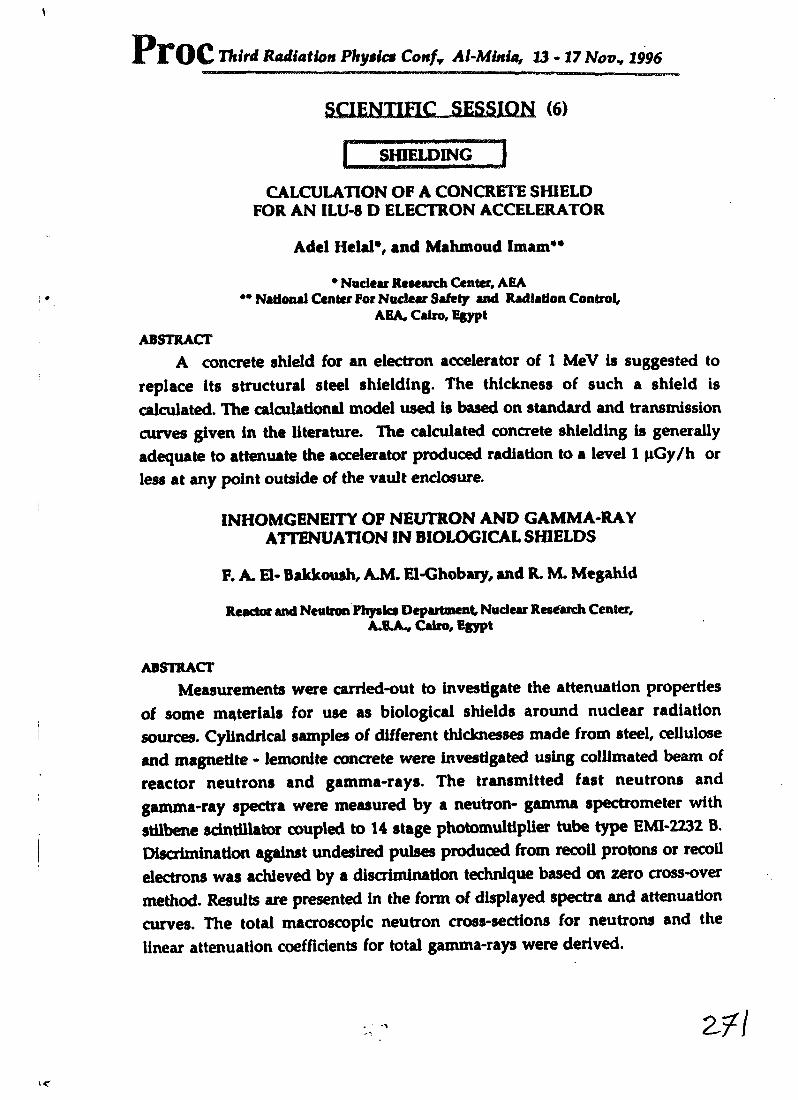
Third Radiation Phytic* Confv Al-Minia, 13-17 Nov* 1996
SCIENTIFIC SESSION (6)
| SHIELDING |
CALCULATION OF A CONCRETE SHIELD FOR AN ILU-8 D ELECTRON ACCELERATOR
Adel Helal*, and Mahmoud Imam**
• Nuclear Research Center, ABA •* National Center For Nuclear Safely and Radiation Control,
AHA, Cairo, Egypt
ABSTRACT
A concrete shield for an electron accelerator of 1 MeV is suggested to replace its structural steel shielding. The thickness of such a shield is calculated. The calculational model used is based on standard and transmission curves given in the literature. The calculated concrete shielding is generally adequate to attenuate the accelerator produced radiation to a level 1 pGy/h or less at any point outside of the vault enclosure.
INHOMGENEITY OF NEUTRON AND GAMMA-RAY ATTENUATION IN BIOLOGICAL SHIELDS
F. A. El- Bakkoush, AM. El-Ghobary, and R. M. Megahld
Reactor and Neutron Physics Department Nuclear Research Center,A.EA, Cairo, Egypt
ABSTRACT
Measurements were carried-out to investigate the attenuation properties of some materials for use as biological shields around nuclear radiation sources. Cylindrical samples of different thicknesses made from steel, cellulose and magnetite - lemon!te concrete were investigated using collimated beam of reactor neutrons and gamma-rays. The transmitted fast neutrons and gamma-ray spectra were measured by a neutron- gamma spectrometer with stilbene scintillator coupled to 14 stage photomultiplier tube type EMI-2232 B. Discrimination against undesired pulses produced from recoil protons or recoil electrons was achieved by a discrimination technique based on zero cross-over method. Results are presented in the form of displayed spectra and attenuation curves. The total macroscopic neutron cross-sections for neutrons and the linear attenuation coefficients for total gamma-rays were derived.

PrOC Third Radiation Phytics Conf* Al-Minia, 13 -17 Nov* 1996
SHIELDING ASSESSMENT OF THE ET-RR-1 REACTOR UNDER POWER UPGRADING.
Ensherah E. Ahmad* Reactor Department, Nuclear Research Center,
Atomic Energy Authority, Cairo, Egypt
ABSTRACT
The assessment of existing shielding of the ET-RR-1 reactor in case of power upgrading is presented and discussed. It was carried out using both the present EK-10 type fuel elements and some other types of fuel elements with different enrichments. The shielding requirements for the ET-RR-1 when power is upgraded are also discussed. The optimization curves between the upgraded reactor power and the shield thickness are presented. The calculation were made using the ANISN code with the DLC-75 data library.
A CONCEPTUAL GAMMA SHIELD DESIGN USING THE DRP MODEL COMPUTATION
Ensherah E. Ahmad*, and F A. Rahman**
* Reactor Department, Nuclear Research Center, Atomic Energy Authority, * National Center of Nuclear Safety and Radiation Control,
Atomic Energy Authority, Cairo Egypt
ABSTRACT
The purpose of this investigation is to assess basic areas of concern in the development of shielding calulations conceptual design for reactor shielding. A spherical shield model composed of two zones of low carbon steel and lead was constructed to surround a Co-60 gamma source. The numerical calculations were performed using both the ANISN code and DRP model computation together with the DLC 75-Bugle 80 data library. A resume of results for deep penetration in different shield materials with different packing densities is presented and discussed. The results show that the variation in fluxes attenuation distributions induced by the variation of packing density in lead were less that in iron.

PrOC Third Radiation Physics Conf* Al-Minia, 13-17 Nov., 1996
ESTIMATION OF RADIOACTIVITY IN STRUCTURAL MATERIALS OF ET-RR-1 REACTOR
Mahmoud Imam
National Center For Nuclear Safety And Radiaton Control Atomic Energy Authority, Cairo, Egypt
ABSTRACT
Precise knowledge of the thermal neutron flux in the different structural materials of a reactor is necessary to estimate the radioactive inventory in these materials that are needed in any decommissioning study of the reactor.
ET-RR-1 is a research reactor that went critical on 2/8/1961. In spite of this long age of the reactor, the effective operation time of this reactor is very short since the reactor was shutdown for long periods. Because of this long age one may think of reactor decommissioning. For this purpose, the radioactivity of the reactor structural materials was estimated.
Apart from the reactor core, the important structural materials in the ET-RR-1 are the reactor tank, shielding concrete, and the graphite thermal column. The thermal neutron flux was determined by the Monte carlo method in these materials and the isotope inventory and the radioactivity were caculated by the international code ORIGEN-JR
UTILIZATION OF IRRADIATION FACILITIES AT TNRCFOR SHIELDING RESEARCHES
AND RELATED TOPICS
T.S.Akkl
Physics Department, Nuclear Physics and Radiation Shielding Division Taj ura Nuclear Research Center,
Tripoli- Libya
ABSTRACT
This paper presents the running shielding research activities at Tajura Nuclear Research Center. The main area of researches are concentrated on the investigation of different types of concrete made from local materials such as
PrOC Third Radiation Physics Conf* Al-Minia, 13 - 17 Non* 1996
conventional concrete, Magnetite-Lemonite concrete, and heat resistant concrete. The measuring techniques used were neutron-gamma spectrometry, and activation foils.
The measurements were performed using collimated beam of reactor neutrons emitted from one of the horizontal channels, as well as from Californium - 252 neutron source. The transmitted neutron spectra through concrete barriers of different thicknesses were measured by a scintillation spectrometer with NE-213 liquid organic scintillator.
A non-destructive testing of some reactor materials were also carried out using neutron and gamma ray computerized tomgraphy technique (CT). Some experiments were also carried out related to measurements of neutron depth dose distributions inside tissue equivalent materials.
HOW GAMMA RAYS GO ROUND EFFICIENT SHIELDS
J. Ghassoun, A. Sabir, A. Khanouchi, M. Boulkheir, R. IchaouLand A. Jehouani
• Nuclear Physics and Techniques Laboratory. Faculty of Science Semlalla BJ*: S IS, Cadi Ayyad University, Marrakech- Morocco
ABSTRACT
The aim of this work is to evaluate the probability of photons to go round a pure absorbing medium. This is achieved by a sequence of diffusion interactions leading photons to turn round absorbing media. Indeed we consider a diffusing medium containing a pure absorbing region. For this purpose, the Klein-Nishina formulae was used to select propagation directions after collisions. An angular biasing technique was used to accelerate calculations convergence in deep penetration problems.
This study allowed the determination of the response of a finite detector placed behind a pure absorber when the source is placed on the other side of this absorber. The results are given for different photon energies and different absorbing medium thicknesses for slab geometry.
' y
j r • • r-
PlTOC Third Radiation Phy$ics Conf* Al-l |jj|| |jj|j||” EG9700090
CALCULATION OF A CONCRETE SHIELDING FOR AN ILU-0 D ELECTRON ACCELERATOR
Adol I Idol" find Mahmoud Imam"I Nuclear Research Cenler, Atomic Energy Authority, Cairo, Egypt
” ’ | National Center For Nuclear Safety And Radiation Control, Atomic Energy Authority, Cairo, Egypt
ABSTRACT
A concrete shielding for an electron accelerator of 1 MeV is suggested to
replace its structural steel shielding. The thickness of such a shield is calculated.
The calculnlional model used is based on standard and transmission curves given
in the literature.
The calculated concrete shielding is generally adequate to attenuate the
accelerator produced radiation to a level of 0.1 mrad/h or less at any point outside
of the vault enclosure.
r vr-v

Jr roc Third Radiation Physics Conf* Ai-Minia, 13 - 17 Nov* 1996
I. IntroductionIn this paper a concrete shielding is calculated for an ILU 8 D electron
accelerator. This kind of accelerator is built in the Bodker institute in Russia and is shielded by structural steel. Because of the advantage of concrete over steel as a shielding material a concrete shielding for this electron accelerator is suggested.
2. The Electron Accelerator ILU 8 D Main ParametersThe high frequency election accelerator ILU 8 D is designed and
manufactured in Russia. The beam of the accelerated electrons has the following parameters:
electron energy 0.7 - 1 MeV,maximum electron beam current 30 ntA, current pulse duration 0.7 msec,pulse repetition 2 - 50 Hz,duration of continuous run 16 h/day.
The accelerator is supplied with a multi sided extraction device with two extraction windows located 50 cm apart from each other, fig. (1).
By this accelerator the treated product either in form of a tube, film, or others, should be of materials having small index number Z. There is an aluminium water cooled collector target under the product to collect electrons that cross the product. It collects also electrons if there is no product.
Principally all materials will not have an induced activity after irradiation because the energy of the accelerated beam is much lower than the photonuclear reaction threshold.
3. Allowable Radiation LevelsIn designing a shielding for an electron accelerator we must take into
consideration the accelerated electrons, the X-ray generated due to stopping of electrons by the treated material, and the beam collected just under the irradiated product. The calculations should be made on the basis of providing sufficient shielding to reduce detectable radiation on the outside walls of the facility to a level of 0.1 mrnd/h. This value is based on the NCRP limit of 0.5 rad/year for general public in an uncontrolled area 111. Thus the following limits are set for the concrete shield design:
the dose rate on the outer surface of the shielding should be less than 0.1 mrnd/h,
- the dose rale outside the monitored zone should be less than 0.03 mrad/h.
4. Estimation of the Radiation Level for the Designed Concrete ShieldingWe considered a shield in which all walls made of normal concrete of
average density 2.3 gm/ccm, the first floor and ceiling from armoured concrete and the door from structural steel. The electron beam is decelerated by a target of steel. The estimation of radiation level is done at certain points on the outer surface of the concrete shield. These check points are marked in fig. (1). They are chosen because the radiation level at them has the highest value according to the geometric factor if the source is considered as a point source.
The radiation level estimation at the check points is done according to the method described in |2|. The radiation level at any arbitrary point around the

PrOC Third Radiation Phytic* Conf* Al-Minia, 13-17 Novv 1996
ILU 8 D conctcte shielded accelerator is dctei mined by (he beam parameters:- electron energy, E„ = 1 MeV,
average beam current, I = 30 mA,- the material of the target is steel,
the amount of egress angle, 0, with respect to the beam fall direction, the thickness of the shielding,
- the distance from chosen point to target.For the dose estimation at any point x, we used the equation:
D„ = (D„ . t . l)/d (1), where
D„ is the dose rate in rad/h at point x, D„ is the X-ray power at one meter from the target in rnd.m7 /h mA. t is the area occupancy factor (normally t = 1), d is the distance between X-ray source and reference point x in meters, and I is the electron beam current in mA.
D„ in equation (1) is determined from standard curves given in |2|. If 9 in degrees denotes the value of the angle between the direction of the beam and the line connecting the target to the reference point, then these standard curves (as those curves shown in fig. (2) from |2|) give for the two target materials of 2 = 13 and Z = 26 the relationship between D0 and 0 at different constant values of the electron energies in MeV. Thus for any reference point x of known value for d in meters, 9 in degrees, and D„ from standard curves the dose value D„ can be determined.
The reduction factor K is then determined by dividing the value of D, by the maximum permissible dose limit rate, H. Hence we get K from:
K - D„ / I I (2|, where
II = maximum desired intensity at outside of wall = 0.1 mrad/h as mentioned before.
Having fixed the value of the reduction factor K, the thickness of the concrete shielding is then determined from another transmission curves given in (2|. These transmission curves (as those curves shown in fig. (3) and fig. (4| from (2|) give the relationship between the thickness of the shielding material either concrete, steel or lead in cm and the value of the angle 9 in degrees for the two target materials of Z = 13 and Z = 26 at constant values of the electron energies, E„ , in MeV and constant K values.
5. Shielding Calculation DetailsBy the calculation method just described, we estimated the thickness of the
concrete shielding at two reference points, thickness of facility floor, and the thickness of the facility door made of structural steel. The results were as follows:
n) Reference point A on side wall (lower vault), fig. (1):9=115°, d « 2.5 mFrom standard curves in fig. (2) from |2| for Z = 26 and electron energy, E0= 1 MeV we getD„ - 800 rnd.m7 /h mA
2
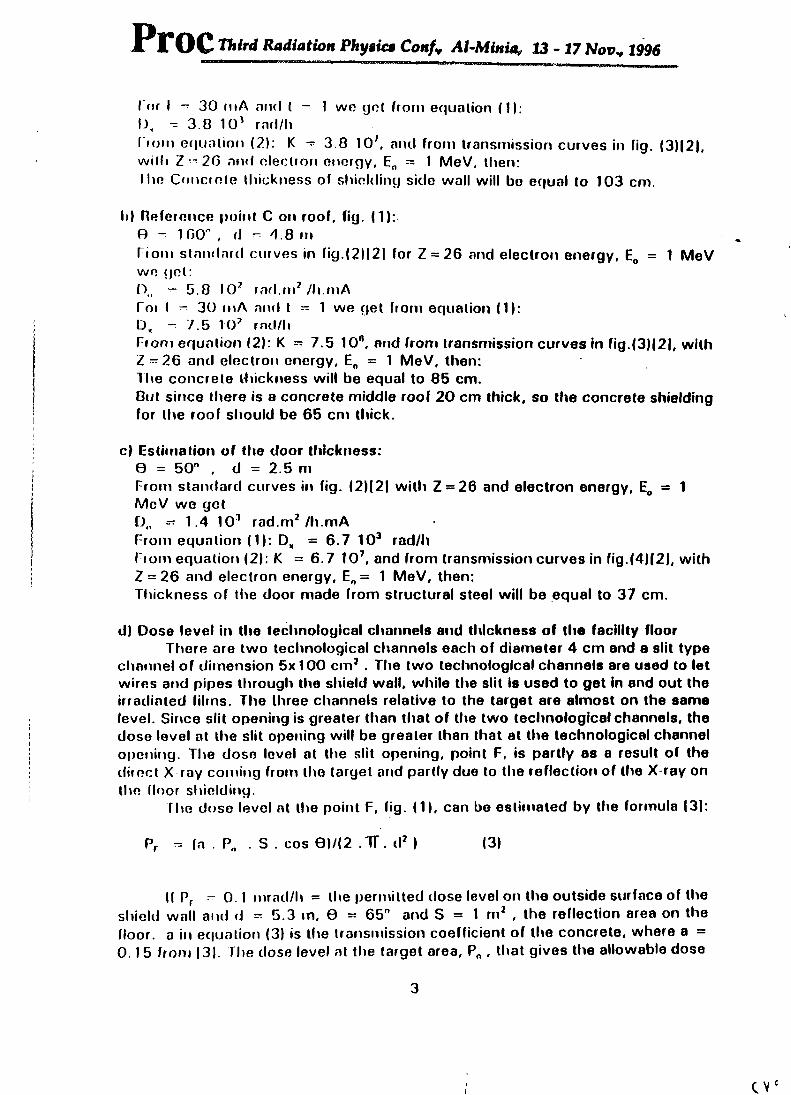
Third Radiation Phytict Conf* Al-Minia, 13-17 Nov* 1996
I or I - 30 miA and l - I wo yot from equation (1):A, ^ 3.8 10' rnrl/hI tom e(|unlion (2): K - 3.8 10', ami from transmission curves in fig. (3)(2|, will) Z - 26 and election energy, En - 1 MeV, then:I ho Concrete thickness of shielding side wall will be equal to 103 cm.
Id Reference point C on roof, fig. (1):A - 100" , d - 1.8 mPiom standard curves in fig.(2H2| for Z = 26 and electron energy, E0 = 1 MeV we yot:D„ - 5.8 I O' rad.m2 /h.mAfoi I - 30 inA and t - 1 we yet from equation (1):D„ - 7.5 102 rnd/liFrom equation 12): K - 7.5 10". and from transmission curves in fig.(3)|2|, with Z - 26 and electron energy, E„ = 1 MeV, then:The concrete thickness will be equal to 85 cm.But since there is a concrete middle roof 20 cm thick, so the concrete shielding for the roof should be 65 cm thick.
c) Estimation of die door thickness:0 = 50° . d = 2.5 mFrom standard curves in fig. (2)|2| with Z = 26 and electron energy, E„ = 1 MeV we gotD„ - 1.4 10' rad.m2/h.mAFrom equation (1): D, = 6.7 103 rad/llFiom equation (2): K = 6.7 107, and from transmission curves in fig.(4|(2|, with Z = 26 and electron energy, E„= 1 MeV, then:Thickness of the door made from structural steel will be equal to 37 cm.
d) Dose level in the technological channels and thickness of the facility floorThere are two technological channels each of diameter 4 cm and a slit type
channel of dimension 5x100 cm2 . The two technological channels are used to let wires and pipes through the shield wall, while the slit is used to get in and out the irradiated films. The three channels relative to the target are almost on the same level. Since slit opening is greater than that of the two technological channels, the dose level at the slit opening will be greater than that at the technological channel opening. The dose level at the slit opening, point F, is partly as a result of the direct X ray coming from the target and partly due to the reflection of the X ray on the floor shielding.
The dose level at the point F, fig. <1), can be estimated by the formula 131:
Pr = (n . P„ . S . cos 01/(2 TT. d2 ) (31
II Pr -o.l mrad/h = the permitted dose level on the outside surface of the shield wall and d = 5.3 in, 0 = 65" and S = I m2 , the reflection area on the floor, a in equation (3) is the transmission coefficient of the concrete, where a = 0.1 5 from |3|. The dose level at the target area, P„ , that gives the allowable dose
3
Third Radiation Physics Conf* Al-Minia, 13-17 Nov., 1996
level .'il |>oti11 F is given fmm cgunlinn (3) to hn:P„ - 0. 70 rad/h
Using cguatimi (1) tlm (lose level nl the point F is determined without taking into account the reduction in dose level due to the concrete shielding floor:
D, - (U„ t . l)/d;
For t — 1,1— 30 mA, d = 5.3 m, and Dn = 1000 rnd.m* /li.mA. Hence,D, - 1060 rnd/h.
Hie induction factor of the concrete floor is then:K - 3.9 I01
Using transmission curves given in |3| for the relationship between K and the shield thickness at different constant electron energies for different shielding materials. For a concrete floor shielding and for the above K value with 1 MeV electron energy we determined from these transmission curves given in fig. (5) and taken horn 131 the following value:
I hickness of the concrete floor = 40 cm.
6. ReferencesMl National Council on Radiation Protection (NCRP), Report No. 51, "Radiation
Protection Design Guidelines for 0.1-100 MeV Particle Accelerator Facilities".|2| Barkova, V.G., Chudaev, V.Ja, (1987), "Shielding Protection against
Bicmsstiahliing from Light Targets (0.5-3 MeV)”, Report No. 87-1 16, Institute of Nuclear Physics, Novosibirsk, Russia.
f31 Piolopopova, G.M., Chudaev, V.Ja, (1987), "Shielding Protection against Bremsslrahlung of the Electron Accelerator with Energy 0.5-3 MeV", Report No. 87-115, Institute of Nuclear Physics, Novosibirsk, Russia.
4

PrOC ThW Radiation Phytic* Conf*c
ILF. resonatorz .
Concrete shielding
Door
II. F. genera torI'd llie lilm
"" To the wire — technological
devices.< t-/ // Extraction
device
Under beamdevice drive
Under beam devices
II. F. Genera LorSI airs
Pa- u)
(
Scale 1: 50

L
Fig.(2) from ref. [2] standard curves

!
~n<pw—tio
%ro
tntno3oc"X<n>in
Concrete thicknesB(cm)
*ao/v zt - rr *vt»m-tv v p*im;

\
%,*: i
'ta e
t
z
3COS
*T.
Ci
FiQ
.(4)ir
om
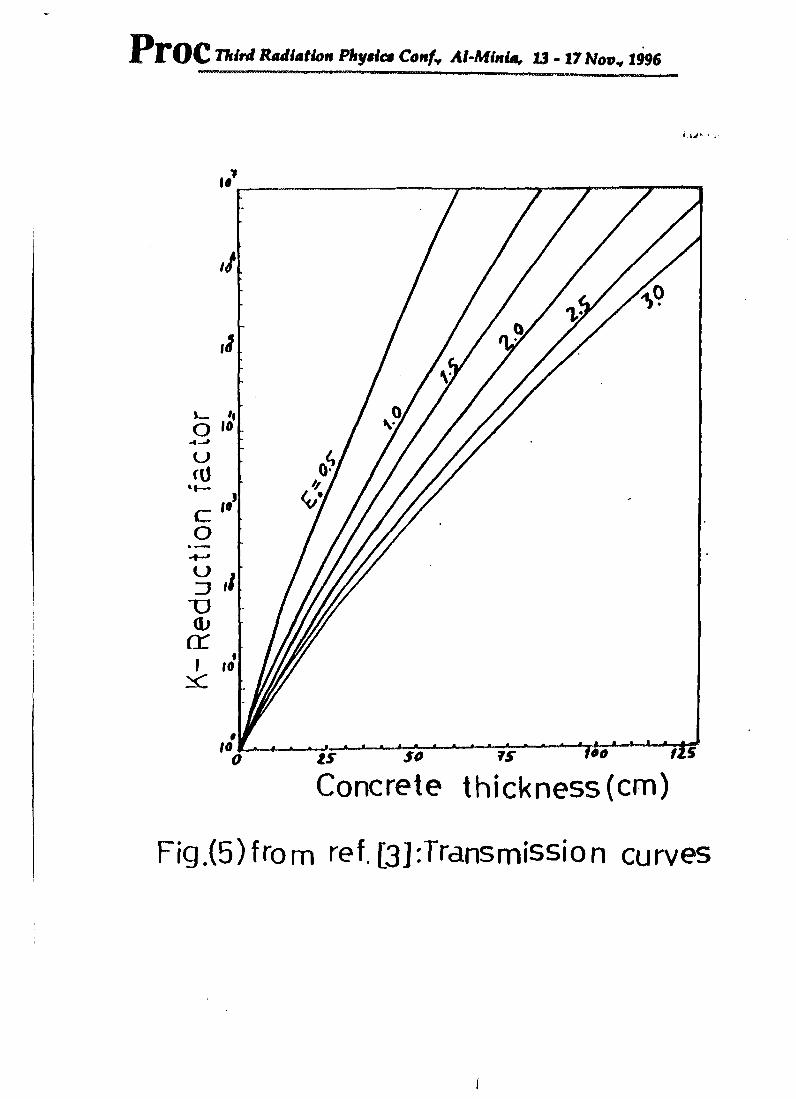
- Red
uctio
n fac
tor
Proc Third Radiation Physic* Confv Al-Mlnlm, U - 17 Nov* 1996
Concrete thickness (cm)
Fig.(5)from ref. (^Transmission curves
PrOC Third Radiation Phygica Conf* Al-Aiin ||||11MWWMHB1181I—— EQ9700091
INHOMOGENITY OF NEUTRON AND GAMMA-RAY ATTENUATION IN BIOLOGICAL SHIELDS
F A EI-BAKKOUSH*, A M EL-GHOBARY and R.M. MEGAHID
Reactor and Neutron Physcis Department, Nuclear Research Centre,A E A. Cairo. A R. of Egypt
ABSTRACT
Measurements have been carried-out to investigate the attenuation properties of some materials which are used as biological shields around nuclear radiation sources. Investigation was performed by measuring the transmitted fast neutron and gamma-spectra through cylinderical sampels of inagnetite-limonite, steel and cellulose shields. The neutron and gamma spectra were measured by a neutron gamma-spectrometer with stilbenc scintillator. Discrimiantion between neutron and gamma pulses was achieved by a discrimiantion method.
The obtained results are displayed in the form of neutron and gamma spectra and attenuation relations which are used to derive the total macroscopic cross-sections for neutrons and total linear attenuation coefficients for gamma-rays. The values of neutron and gamma relaxation lengths are also derived for the investigated materials.
1. INTRODUCTION
The design of a biological shield around a nuclear radiation source that is optimal efficient and economical depends on; the permitted level at the shield suface, available shield materials, heat limit released within the bulk shield, contribution of capture gamma-rays to the total heating, contribution of gamma-rays from neutron capture to the transmitted gamma-dose, activity level, lay out and shielding of the coalant circuits. In
* Nuclear Reaemrcb Centre, Atomic Energy Authority - Libya
Third Radiation Physic* Conf* Al-Minia, 13-17 Nov* 1996
-2-
addition, space and weight limitation for certain nuclear applications added more impetus to the open questions*U-3).
For shield design, neutrons and gamma rays are merely the two types of nuclear radiation which have to be considered, since any shield efficient to attenuate neutrons and gamma-rays is more effective for attenuating other radiations. Although the processes by which neutrons and gamma-rays interact with matters are reasonably well understood, but their relative importance depends on largely unknown physical parameters called cross-sections. Bulk attenuation properties of materials for these two principal radiations still need more accurate information for shield analysis and design*4561
2. EXPERIMENTAL DETAILS
Magnetite-limonite concrete with unit weight of 3.6 ton.m3 was designed from magnetite ore as coarse aggregates with grain size varies from 5 to 60 mm, while limonitc was used as fine aggregates. Portland cement and ordinary drinking water ware used for concrete mix. Special care was paid to ensure homogenity and identity of the concrete medium. A detailed description of the physical and chemical properties of the concrete different constituents are given elsewhere.*71 However, the composition of magnetite-limonite concrete under investigatibn is given in the following table
Material Content, k£.mMagnetite, coarse (40-60 mm) 853Aggregates (20-40 mm) 622
(10-20 mm) 592(5 -10 mm) 472
Limontic Fine Aggregates 462Cement 350Water 280

PrOC Third Radiation Phytic* Conf* Al-Mittia, IS • 17 Nov* 1996
.Concrete samples of 5, 10, 20 and 30 cm thicknesses were made. These samples allow to carry-out investigation of radiation attenuation for barriers having thicknesses vary in step of 5 cm and up to 65 cm.
Steel sampls of 15 cm diameter and of thicknesses 1.5, 2.0 and 5 cm were used. The attenuation properties of cellulose material were investigated using wood samples of 15 cm diameter and of 9 cm thickness.
The spectra of fast neutrons and total-gamma rays which have passed through the materials under investigation were measured by a neutron-gamma spectroemter with stilbene scintillator. The scintillator was coupled to a 12 stage photomultiplier tube type EMI-2232-B. The dynode chain appropriate to P S D. with a block diagram of the spectrometer is shown in fig. 1
Discrimination of undesired pulses of neutrons or gamma-rays was achieved by a technique based on pulse shape discrimination method. The spectrometer linearity, discrimination capabilities and energy scaling were tested and checked before measurements by measruing the spectrum of gamma-rays emitted from 22Na, l37Cs, as well as from Pu-a-Be neutron source.
The measured pulse amplitude distribution for neutrons and gamma- rays were converted to neutron and gamma-energy distribution by computer codes based on differentation methdos(7).
The material under investigation and the measuring detector were arranged infront of the horizontal channel number 2 of ET-RR-1 reactor. Special beam and detector collimators were designed for beam collimation before incident on the sample and detector. The beam collimator was provided with lead filter to supres the intensity of primary gamma-rays

Third Radiation Physics Confv Al-Minia, 13-17 1996
-1650 V
Peromp. Amptilei Delay
TB-HB ort. 485 Amplifierort.427A
ZeroCrossing detector or t.420 A
Anticoin cidence ort. 414 A
100 MHz Delaydicriminata
—> Generatorort. 436 orL416A
Linear gate
ort.427
it. .Multi-C ha
net
Analyser
Pig. 1. : a block diagram of the electronic equipments of the neutron -gamma spectrometer with a dynode chain of tiie photomultiplier tube.
Proc Third Radiation Phytict Confr Al-Minia, 13-17 Nov., 1996
4-
emitted directly from the reactor core. Figure 2 shows a schematic diagram
of the experimental lay-out
3. RESULTS AND DISCUSSIONS
The measured results of neutrons and gamma-rays are presented in
the form of displayed spectra i.c. , neutron or gamma flux per MeV
varsous neutron or gamma energy in MeV. These data were also used to
plot the attenuation relations i.e. flux per MeV varsous shield thickness in
cm. These attenuation relations were used to derive the value of neutron
total macroscopic cross-sections and gamma total attenuation coefficients.
The measured spectra of fast neutron and total gamma-rays
measured behind magnetite limonite concrete shields having different
thickness are given in fig. 3 and 4 respectively. Figure 4 shows that for
neutrons of energies > 7.0 MeV, the form of the spectrum and its slope do
not change as the sample thickness increases and remain approximately the
same. However, for neutrons of energies < 7 MeV the spectrum form and
shape depend on the sample thickness. In addition, the flux, value at the
positions of maxima and minima largely depends on the thickness of the
sample. The positions of maxima and minima reasonably agree with the
positions of minima and maxima observed in neutron total macroscopic
cross-sections of the concrete constituents.
The gamma spectra displayed in fig.4 shows that spectrum shape is
approximately the same for all photon energies and for all material
thicknesses. These spectra also show that the flux values decreases with the
increasing of the material thickness for all photon energies. The positions
of maxima observed at photon energies of 2.2 MeV and 7.0 MeV can be
attributed to the contribution of gamma-rays form thermal neutron
radiative capture.
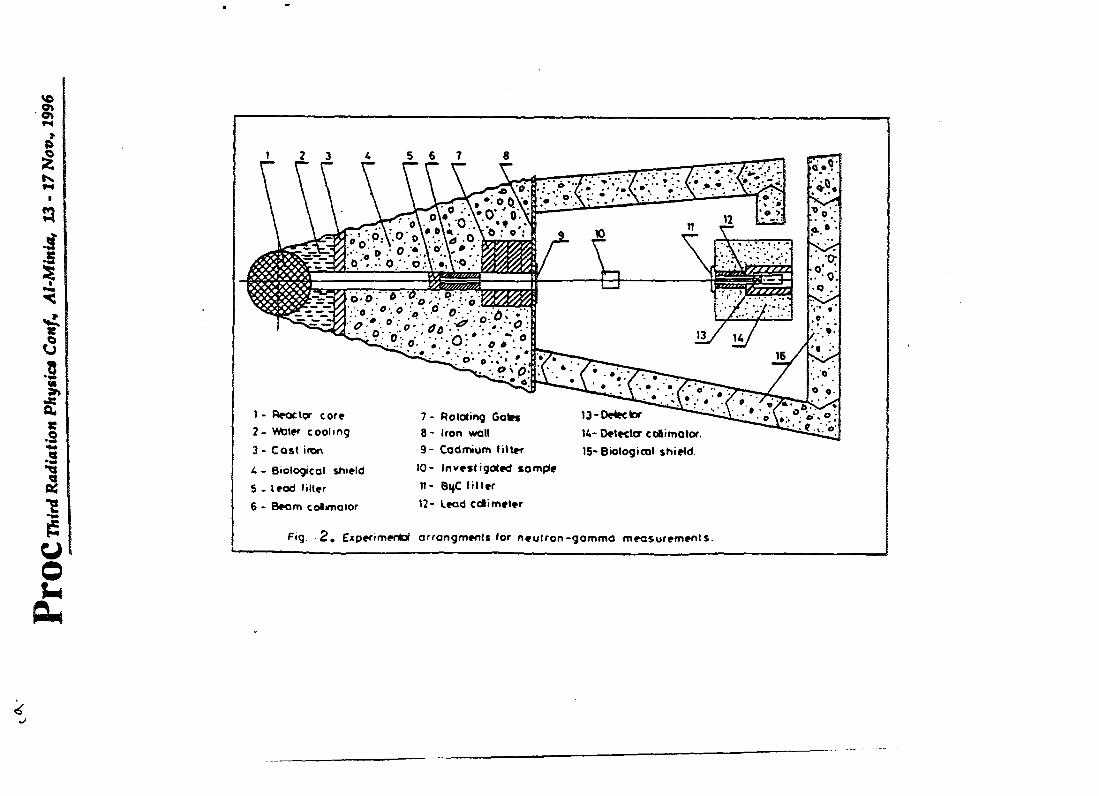
PrO
C T
hird
Rad
iatio
n Ph
ysic
s Con
f« Al-M
inia
, 13-1
7 N
ovv 1
996
1 - Reactor core 7 - Rotating Gates 13-Detector o'(,o'.°;2- Water cooling 8 - Iron watt 14-Detector coBimator.3 - Cast iron 9- Cadmium litter 15- Biological shield.4 - Biological shield 10- Investigated sample5 - lead filter n- BtfC filter6 - Beam co**notor 12- Lead ccii meter
F«g 2. Experimental arrongments for neutron -gamma measurements.

Neu
tron Fl
ux, Ne
utro
ns/C
mZ.
S.M
eV
Third Radiation Phytic* Confy Al-Minia, 13-17 Nov., 1996
1000000 -a
00000 1
10000 i
1000 t
0.1 i
' I ' I 1 I ' I ' | ' ■|"T Y i | l [ i T-| I I l | I2 3 * 5 6 7 6 9 10 11 12 13 1* 15
Neutron Energy, MeV
Figure 3 Spectra of fast neutrons measured behind mognetite-lemonite concrete shields of different thicknesses .
5.0 cm10.0 cm15.0 cm20.0 cm
40.0 cm10000
1001
1 23456769 io
Gamma Energy. MeV
2.^1

Third Radiation Physics Conf* Al-Minia, 13-17 Nov* 1996
-5-
The spectra of fast neutrons and gamma-rays measured behind steel
shields of different thicknesses are given in figs. 5 and 6 respectively.
Figure 6 shows that the spectrum form and shape depend on the sample
thickness especially for neutrons of energies within 2 to 7 MeV. The
spectra of total gamma-rays given in fig. 6 show that gamma-rays of
energies range from 2 to 4 MeV have the highest contribution, while
gamma-rays of energies beyond this range have the lowest contribution.
Similar spectra of fast neutrons and total gamma-rays measured
behind cellulsoe shields are given in fig. 7 and 8 respectively. The
displayed spectra of neutron indicate that, the depression in flux intensity
observed at neutron energies around 3.5 MeV largely increases with
increasing the material thickness. The energy positions of this depression
reasonably agree with the positions of maxima observed in neutron total
cross-sections of hydrogen, carbon and oxygen. The gamma spectra given
in fig.8 show that, the flux intensity slightly decreases with increasing the
cellulose thickness. This indicate that cellulose shield is poor attenuator for
gamma-rays.
The attenuation relations for fast neutrons and total gamma-rays
plotted in figs. 9 and 10 were used to derive the fast tieutron total*
macroscopic cross sections and total attenuation coefficients p. for
gamma-rays using the least square fit. The values of land p were used to
obtain the values of neutron and gamma relaxation lengths for the
materials under investigation and the given values of E, p and X are gien in
the following table
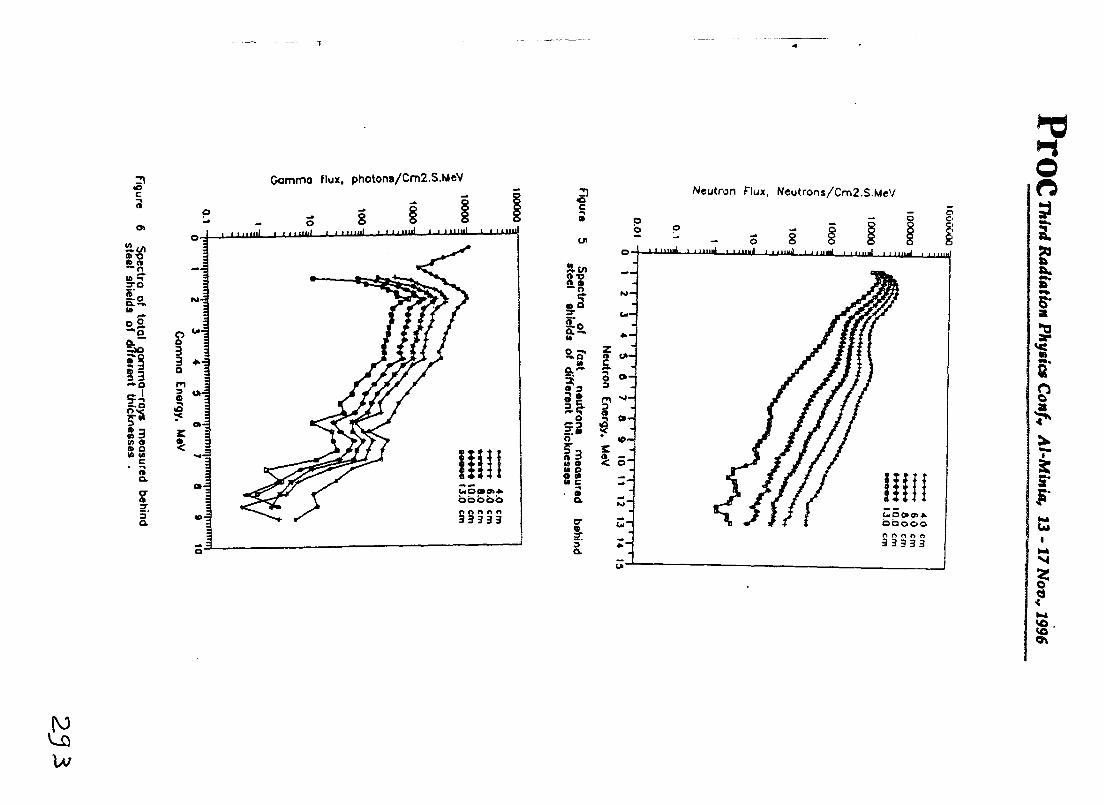
233
"I
Neutron Energy,
MeV
Figure 5
Spectra of
fast neutrons
measured
behind steel
shields of different thicknesses .
Neutron Flux, Neutrons/Cm2.S.MeVo
mil i 11 null iu«i i i mini
ooooon n o o a3 3 3 33
Third Radiation Phytic* Confv Al-Minia, 13-17
Nov., 1996

sassewpjin pajajjip 10 spiels eso||n|ao puiqaq pajnsoauj' sXdj-duliujdd |D>o> jo ojpadg Q ajoBij
A»M "Xbjeuj ouuujoq
00001UI3 0 ll
00000t
gB3CX
XJyoo5o3N)COz
saesauipjm *uaj»,;,p to cp|»ji|s (poo/*) esojinieo puigeq pejnsoeui suojpeu }so> fo ojpedg ejnbij
A»M *A6jau3 uojpaNei *i ri a n oi e e
i-1 J I I ill I , » J * ‘ ‘ ■
-001
-0001
00001 <*u/0 OYZUJ3 0 6
000001
9661 “a°N Ll - H */"°D K>f**Hd uofi»tpv)i

gam
mo fl
ux, ph
oton
e/cm
2.s.M
EV
Neu
tron F
lux.
Neut
rons
/Cm
2.S.
MeV
Third Radiation Physics Conf^ Al-Minia, 13-17 Nov., 1996
100000 3moq-lim
ooooo steel ft o o o ft cellulose
10000
1000
I I | I 1 TTI'I I I I |”l ITITI ITT| I I M I I II fp fTm I I 1
Thickness
Figure 9 Attenuation of integral fast neutron fluxes in the investigated shields .
ULBJip mog-lim steelftfteoe cellulose100000 -
10000
I TT I I I I I I I I I I I I I
Thickness . cm
^25
Figure 10 Attenuation of integral total gamma-ray fluxes in the investigated shields .
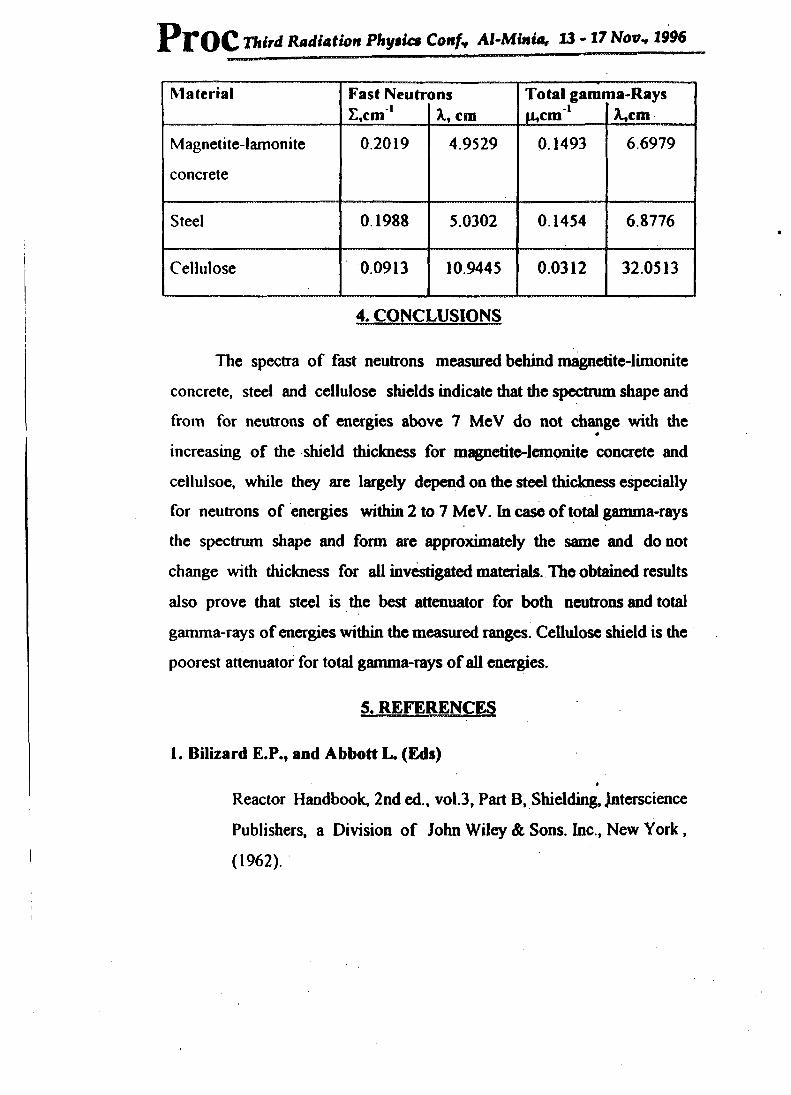
PtOC Third Radiation Phy$ic$ Confv Al-Minia, 13-17 Nov* 1996
Material Fast Neutrons Total gamma RaysE,cm' X, cm Ibcm X,cm
Magnetite-lamonite 0.2019 4.9529 0.1493 6.6979
concrete
Steel 0.1988 5.0302 0.1454 6.8776
Cellulose 0.0913 10.9445 0.0312 32.0513
4. CONCLUSIONS
The spectra of fast neutrons measured behind magnctite-limonite concrete, steel and cellulose shields indicate that the spectrum shape and from for neutrons of energies above 7 MeV do not change with the increasing of the shield thickness for magnetite-lemonite concrete and cellulsoe, while they are largely depend on the steel thickness especially for neutrons of energies within 2 to 7 MeV. In case of total gamma-rays the spectrum shape and form are approximately the same and do not change with thickness for all investigated materials. The obtained results also prove that steel is the best attenuator for both neutrons and total gamma-rays of energies within the measured ranges. Cellulose shield is the poorest attenuator for total gamma-rays of all energies.
S. REFERENCES
1. Bilizard E.P., and Abbott L. (Eds)
Reactor Handbook, 2nd ed., vol.3, Part B, Shielding, Jnterscience Publishers, a Division of John Wiley & Sons. Inc., New York, (1962).

PrOC Third Radiation Physics ConfY Al-Minia, 13 - 17 NovY 1996
2. Jaeger R.G. (Editor in Cheif),.
Engineering Compendium on Radiation Shielding, Springer
Verlag, New York, Vol.l, (1968); Vol. Ill, (1970).
3. Schaeffer N.M. (Editor),
Reactor Shielding for Nuclear Engineer, TID-25951, Prepared for Division of Reactor Shielding Development and technology, U S. Atomic Energy Commission, (1973).
4. Goldstein H.,
Fundamental Aspects of Rectors Shielding, Addision Wesly Publishing Company. Inc., Reading, Mass, (1959).
5. Abagyan A.A.,
Secondary Gamma Radiation Problems in Reactor Shielding, Atomnaya Energiya, USSR, Vol. 38, No.6, p.406 (1975).
6. Purwanto A., and Mardiyanto,
Calculation of Neutron Guide Shielding Thicknesses, Atom- Indonesia, Vol. 15, No.l, pp. 1-10 (1989).
7. Ei-Bakkoush FA.,
Inhomogenity of Radiation Attenuation in Biological Shicdls.A Thesis, submitted to the Faculty of Science, Cairo University for Ph D. Degree, Oct. (1996).

EG9700092 idiation Phytic« Confy Al-Minia, 13-17 Novy 1996
Shielding Assessment of the ET-RR-1 Reactor Under Power Upgrading.
byEnsherah E. Ahmed
Reactor Dept., NRC, AEA, Cairo, Egypt.
Abstract
The assessment of present shielding of the Egyptian first research reactor ET-RR-I in case of power upgrading from 2 MW to 10 MW is presented and discussed in this investigation. It was carried out for the present EK-10 type fuel elements elements with 10% enrichment. The shielding requirements for the ET-RR-1 (which is the Egyptian WWR-C reactor) when its power is upgraded to different power levels are also discussed. The optimization curves between the upgraded reactor power and the shield thickness for the seven neutron energy groups are presented and analyzed The calculations have been made using the ANISN code with the DLC-75 data library. The results showed that the present shield necessitates an additional layer of steel with thickness of 10, 20 and 25 cm. when its power is upgraded to 3, 6 and 10 MWt in order to cutoff all neutron energy groups to be adequately safe under normal operating conditions.
Key. Words
Reactor safety, shielding assessment, WWR-C reactors, power upgrading, shield design.
1. Introduction
As far as the shield design is concerned, only neutrons and gamma-rays are needed to be considered since these are - by far - the most penetrating radiations. Neutrons, because of their high relative biological effectiveness, constitute a significant source of undue radiations. Furthermore, the calculation of the neutron attenuation is expentionally difficult. Neutrons attenuation is affected by degrading the energy of neutrons primarily by inelastic scattering but also by elastic ones until they be absorbed. Therefore, the neutron shielding accuracy depends on the accuracy of nuclear data as well as the rigorousness of the analysis method. The present work presents an accurate assessment for the ET-RR-1 reactor shield when its present power level is upgraded from 2 MWt to different levels; 3, 4,5,6,8 and 10 MWt respectively. The neutron attenuation profiles for the different energy groups through the present shield are analyzed. Moreover, the shielding requirements for the ET-RR-1 reactor when its power is upgraded to different power levels are also discussed. The optimization curves between the upgraded reactor power and the shield thickness are discussed to obtain the optimum shield radius with optimum shield material that is required to cut off the different neutron energy groups such that safe accessibility and ALARA requirements*1* could be achieved.
I

PlTOC Third Radiation Phytic* Confv Al-Minia, 13 - 17 Nov., 1996
2. Theory JMHl-Mumcric»iSolutipp
The present investigation utilizes the transport theory which provides the basic theory for analyzing the nuclear reactors (2>.The Boltzmann transport equation for the energy - dependent steady - state condition can be written for the directional flux density 4>(r,Q ,E) in the form<3,4):
Q . V* (r, Q ,E) + £,(r,E) * (r, Q,E) = £ dE* £ dn‘(* (E) v£f(r,E’) +
E,(r, Cl + Cl\ E~E’)). * (r, 0\E’) + S(r, Q ,E) ........................... (I)
with the notations of the equation are those the well known ones. This equation is solved numerically using the discrete ordinates Sn method($). The energy-dependence is discretized in the usual multigroup approximation to get(6>:
iauO. V+,(r,n)+ E*(r)+g(r,0) = £
«'-•
E,i| _e(r,nvn,)). ♦g.(r,n‘) + S,(r,fi) ... g,g’=l,2.....,IGM......(2)
Then the angular- dependence is discretized in the discrete ordinates approximation to get(6):
KMO.. + - % (♦lvE„ (r)♦,'>)) +
£ dn‘(*,vEfg(r) +
KM LY. £ ((21+l)P,(|iVO ♦,') + s,m(r) ......MM.......... (3)('-I /-I
where fg.1 is the zeroth, first...... 1th moments of the group directional flux density
0«lcom * a set of non-negative angular weights assigned to the scattering angle cosine" p"(i.e. an area fraction on a unit sphere where £ <om= 1.0).
mMM = total number of discrete angular directions,L = highest scattering order represented in the scattering cross section, and P, (pm)»the L* Lagendre Polynomial evaluated at angular direction cosine (p m).
The spatial- dependence is discretized in the finite - difference approximation, adopted by the AN1SN code(6‘7) which is given - in its general form - by<7):
P(Aui Aj tg.i) + ((am-1« ) /ti> Xtg m+in- ♦Sm-in) + Etr V ^g = SV .... (4)
2

Third Radiation Physic* Conf v Al-Minia, 13-17 NovH 1996
where p is the cosine of Sn quadrature solid angles, A and V are the area and volume elements ( A= 2nrt , V = n (r2*., - r2) for cylindrical geometry, and i, m are the mesh
interval and direction indices. The neutron flux is defined across a mesh interval r( ,r,+, a is a coefficient associated with ray-to-ray transfer in curved mesh intervals, given by:
Ct m+1/2 - am-1/2 * 0^2 to) p (A(*i - A,) (5)
S is the source term (all terms in the R.H.S. of Eq. (3) are allowed to be lumped into a fixed source term S). The resulting transport equation - after its discretizations to Eqs. (3), (4) and (5) - is then solved iteratively by inner and outer iterations*2**. The outer iteration is for spatially energy group summed fission source along all total energy groups(g,g'=l- IGM) and all mesh intervals (1=1-- IM). The inner iteration is for individual group fluxes resulted from a given source.
3- ANISN Technical Description and Execution
To execute the ANISN code for the present investigated problem , some technical description are used . These are: order of angular quadrature = 16, left and right boundary conditions are reflection and no reflection respectively, no. of zones = 6 and 5, no. of fine mesh interval in the problem geometry = 30 and 40, type of calculation is the Eigen- value calculation, with first guess of Eigen- value »1, length of C.S. table - 10, position of 1,0, , EM (within group scattering), E, and Ef in the C.S. table = 3,4,1 and 2 respectively, max. number of inner and outer iterations = 20 and 100 respectively, relative convergence criterion for source, scatter and up-scatter ratios *= 1.0E-04, convergence relaxation factor for up-scatter and scatter ratio = 0.5, and point flux convergence criterion = 2.0 E-04. Moreover some modular function routines - of a package named FE-CM1<9) - were also constructed and coupled to ANISN code through the option I of its mixing table options.
4. The Physical Model Configuration
The ET-RR-1 reactor multilayer shield is composed of light water, iron and ordinary concrete as well as the first barrier of cladding material. Figure (1) shows a vertical cross-section of the ET-RR-1 multilayer shield representing the sections adopted to be employed in the model configuration. It is taken at the horizontal center- line level passing through the thermal column. Based on this section, the reactor cylindrical geometry is modeled in two different region-wise configurations (I&II). Configuration I: from core center-line to the right hand side passing through six regions; core .central and shield tanks with reflector, first layer of thermal shield, second layer of thermal shield, biological shield and a steel enclosure shield layer. Configuration II: from core center- line to the left hand side passing through five regions; core .central tank with reflector, thermal column, thermal column envelope and thermal column shield (iron or graphite depending on whether the thermal column is opened or closed).
3

PrOC Third Radiation Phy$ic§ Confr Al-Minia, 13-17 Norv 1996
Rsdtal Mesh Nutmot
Fig. (1) Geometrical Model of the Radial Shield Layers of the ET-RR-1.
5- Results and Diacuastoni
The radial attenuations of the neutron fluxes steradiancy for both configurations I, II representing the ET-RR-1 model when its power is upgraded up to 10 MWt (calculated using the ANISN / FE-CM1 code system) are shown in Fig (2). It must be mentioned that the whole range of neutron energies (up to 17.3 Mev) is grouped into 7 energy group structure(9\and each radial mesh interval = 10 cm. A regular decrease for the neutron distributions in the high energy groups (no. 1 to 6) is noticed from figures. The neutron flux behaviour for the low energy range (< 0.1 Mev included in group no. 7) increases at first upon entering light water layers of Config.I as a result of its highly slowing down power, and then decreases due to neutron capture. The low energy range distribution of neutron flux in Config.ll, however, showed a slight increase upon entering each of the graphite layers followed by a slight decrease. Such increase may be referred to the moderation of neutrons by carbon atoms while the decrease may be regarded to the neutron capture of carbon. It is also shown .from Figs. 2(a,b), that all energy groups have been cut-off at the outer periphery of ET-RR-1 reactor reflecting a good shielding capability at 2 MWt power level which is not valid for higher power levels (Figs.2(c,d)). This is clearly illustrated from Fig.3 .where the shielding outer radius exceeds the ET- RR-1 present shield periphery for Config. I (300 cm.) at power levels ranged from 3 to 10 MWt for energy group no. 1 ( E= 17.33299 Mev) and at 10 MWt power level for energy group no.4 (E *1.9205 Mev). This means the present ET-RR-1 shield necessitates an additional layer of steel (in Config. I side) with thickness of 10,20 and 25 cm. when its power is upgraded to 3,6 and 10 MWt in order to cut-off all neutron energy groups in be adequately safe under normal operating conditions.
4
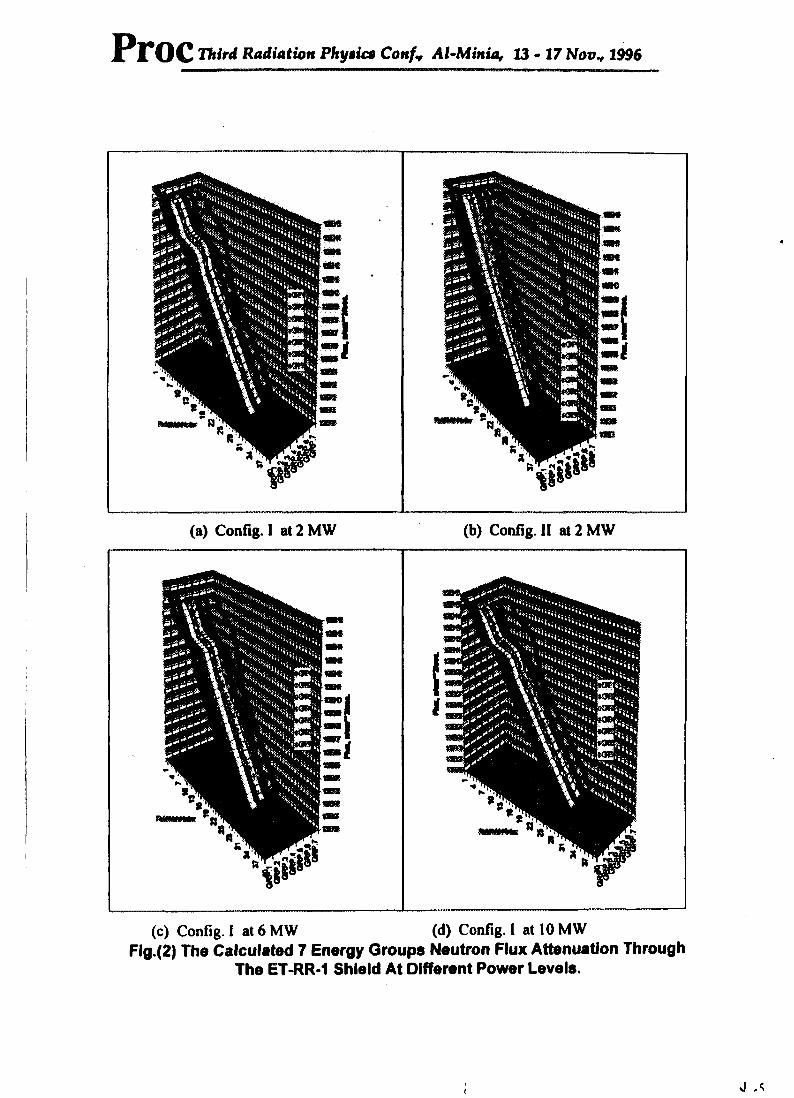
F*Z*OC Third Radiation Phytica Conf* Al-Mittia, 13 - 17 Nov* 1996
(a) Config. I at 2 MW (b) Config. II at 2 MW
(c) Config. I at 6 MW (d) Config. I at 10 MWFig.(2) The Calculated 7 Energy Groups Neutron Flux Attenuation Through
The ET-RR-1 Shield At Different Power Levels.
( J A
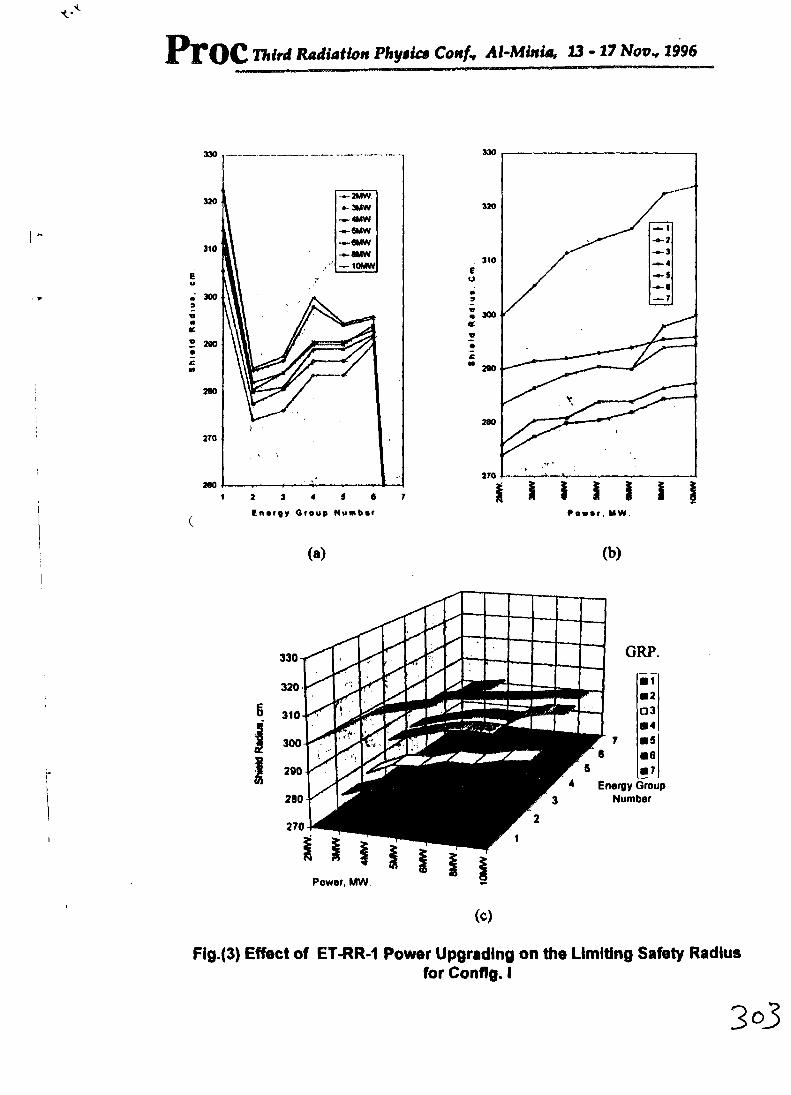
PfQC Third Radiation Phy$ica Confv Al-Minia, 13-17 Novv 1996
<•<
(c)
Fig.(3) Effect of ET-RR-1 Power Upgrading on the Limiting Safety Radiusfor Conflg. I
3°3

PrOC Third Radiation Phytic* Confi, AI-Minia, 13 - 17 Nop., 1996
(a)
330 -
no -
$ $ i $ I $ IPower. MW
(b)
(c)
Fig.(4) Effect of ET-RR-1 Power Upgrading on the Limiting Safety Radius for Config. I (with thermal column closed)

PrOC Third Radiation Physic* Confv Al-Minia, 13-17 Nopv 1996
The effect of power upgrading on the limiting safety radius of Config. II( when thermal column is closed ,i.e. is not used) is illustrated in Fig.4. As shown in figures, in the thermal column side, the present shield is highly capable to cut-off all neutron energy groups for all the investigated power levels.The limiting safety radius is ranged from 355 -359 cm. corresponding to power levels 2 to 10 MWt, Fig.4(a). In case when the thermal column is under use, the calculated flux density the energy group (no.7, E < 0.4 Mev) equals 1.85xl06 to 4.7x10⁶ steradiant n / cm2 sec. for the corresponding power levels of 3 to 10 MWt whereas all other higher groups are cut-off within the ET-RR-1 periphery (400 cm. in thermal column side).
6. Conclusions
From the results of ET-RR-1 shield validation under power upgrading conditions, it could be concluded that:1. The present ET-RR-1 shield design review has been evaluated under power upgrading for normal operation coditions.2. In Config I side, the shield necessitates an additional layer of steel with thickness of 10, 20 and 25 cm. when its power is upgraded to 3,6 and 10 MWt in order to cut-off all neutron energy groups in be adequately safe under normal operating conditions.3. In the thermal column side, when it is not used, the present shield is highly capable to cut-off all neutron energy groups for all the investigated power levels.
7. References
1. U S. NRC," 10 CFR SO. Appendix I ", USA (1990).2. Gandini ,A. .Ganesan.S. and Schmidt, J.J. (Eds.); " Proc. ICTP and IAEA Workshop
on Nuc. Reactor Physics, Design and Safety ". W.S. Publ. Co. Ltd., N. J. (1995).3. Bell.G I & Glsstone.S.; " Nuclear Reactor Theory ", Van Nostrand Co., N. Y. (1990).4. Duderstadt, J.J.&Martine,W.R.; "Transport Theory ",Jhon Wiley & Sons,N Y. (1979).5. Stevens,P.N.; "Weapons Radiation Shielding Handbook". Ch.3, Defense Nuc.Agency
USA (1972).6. ORNL ; "RSIC Computer Collection ANISN ", CCC-514, ORNL , USA (1987).7. ORNL ; "RSIC Computer Collection ANISN ", CCC-254, ORNL , USA (1987).8. Rahman, Kh. A.; " Determination of Multigroup Neutron Fluxes Dlstibutions in Some
Subcritical Assemblies ", M.Sc. Thesis , Al-Azhar Univ. .Cairo (1992).9. Ahmed, Ensherah E.M., et al; " A Spherical Shield Configuration Model For
Neutron Sources ", Proc. MSC’88 , p:521-525, Pitts., USA (1988).
2o
8
Proc Third Radiation Physics Conf v A/-A EG9700093A Conceptual Gamma Shield Design using
The DRP Model Computationby
Ensherah E. Ahmed* and F. A. Rahman**
* Reactors Dept., Nuclear Research Center (NRC), Atomic Energy Authority(AEA), Cairo, Egypt.
Operational Safety Dept., National Center of Nuclear Safety and Radiation Control (NCNSRC), AEA, Cairo, Egypt.
Abstract:
The purpose of this investigation is to assess the basic areas of concern in the development of reactor shielding conceptual design calculations. A spherical shield model composed of two concentric spherical zones of low carbon steel and lead have been constructed to surround a Co-60 gamma point source. Two alternative configurations have been considered in the model computations. The numerical calculations have been performed using both the ANISN code and the DRP model computations together with the DLC 75-Bugle 80 data library. A resume of results for deep penetration in different shield materials with different packing densities is presented and analyzed. The results showed that the gamma fluxes attenuation is increased with increasing the packing density of the shield material which reflects its importance of considering it as a safety parameter in shielding design.
KsyMoxste
Safety limits, conceptual design, y- shielding, ANISN- Code, DRP- Code.
I. Introduction
One of the most difficult problems in shielding design analysis for the effective reactor shielding is that of considering the transmission of shield materials containing voids or relatively poor attenuation characteristics. Such irregularities could be gaps, ducts, inhomogeneous materials,... etc. Exactly, as voids increase the effective relaxation length for hard radiation, they also increase the diffusion length for low radiation energy. In shielding design, the inhomogenity could be resulted frompreparation, moulding, casting, thermal treatment,.... etc. during the fabrication ofshielding materials or sometimes the shield material could be utilized in form of pebbles. Thus in shielding design analysis, the inhomogeneous materials - as for example a pebble shield - are considered to consist of randomly packed collection of pieces of shielding materials. So, it is required to consider the transmission of a shield to contain many closely spaced voids. In the limit, in which the average distance between voids vanishes relative to the relaxation length, the increase in transmission is given simply by the reduced density effect, according to a certain factor. When the
l
V

PrOC Third Radiation Phytic* Conf* Al-Minia, 13-17 "Nov., 1996
<-N
pebbles are not negligibly small, there will be significant statistical variations in the distance through the solid shield material traversed by the gamma-ray through the shield . The effect of such these poor attenuation regions in solid shield materials can usually be calculated by one of several approximate methods. One of the most useful methods for calculating the gamma-ray fluxes attenuation through the distributed voids in shields is that one for treating voids as perturbations via the one velocity transport equation01.
It Geometrical and PhysktUJYWels
The geometrical model consists of two concentric spheres with a fixed Co-60 point y-ray source located at its center. The inner sphere is 20 cm. outer radius of low carbon steel (contains small amount of impurities which do not affect the y-ray attenuation). The outer spherical shell is 20 cm. thickness of lead (Pb). Thus, this configuration has two zones. The model also comprises two alternative configurations; configuration I (with Fc has different values of packing densities while Pb is void free) and configuration II (with Fe is void free while Pb has different values of packing densities). The y-ray source energy spectra is divided into 21 energy group structure*2-31. The dense random packing DRP of hard spheres model, which is a good model to describe the structure of metals, was used by distributing atoms in a randomly irregular tetrahedron form*4).
3 .-Method Qf Anilyafai
The energy dependence Boltzmann transport equation*11 is solved numerically. The energy dependence is discretized in the usual multigroup approximation. The angular variable and the angular dependence are discretized in the discrete ordinates approximation (S6 ). However, the angular dependence of the scattering cross -section is represented by the standard orthogonal Legendre polynomial approximation (P3 ). The spatial operator and the spatial dependence are discretized in the finite difference approximation. The multigroup finite difference discrete equations are then solved iteratively*6,71. In the DRP model, the depicting atoms are packed together in a cluster which is dense because it contains no vacancies large enough to accommodate another atom and is random because it lacks long-range order . The detailed structure of random packing depends on many factors of modeling; softness and nature of the interatomic potential, nature of the boundary and the preparation conditions or the packing algorithms. The packing destiny r) is given by*41:
r\ =C37t/f/6Z,J
with Cy can be calculated from :
H(R)=(1/Hc) £ Z ~ I*'- *A) .........i- i y- i
where £ is the atomic diameter, L is the side of the lattice cube, R is the maximum radius of the cluster , Ri and Rj are the maximum distance between the center of the
23 <5?

PrOC Third Radiation Physics Co*/v Al-Minia, 13 - 17Nov„ 1996
globe and the center of atoms t and j, // is the total no. of distributing atoms in the cluster, H(R) is its statistical variation within the cluster and He is the no. of the central atoms<4).
The resulting T| is used to calculate the actual density of shielding materials by multiplying it by the corresponding theoretical density which in turns used to initiate a data library for the 21 groups of Po to P3 macroscopic cross sections for the ANISN code. This was done for all investigated values of T) (0.35 to 1.0).
li, Results and Ducttuumi
The 21 energy groups y radial fluxes distributions through the spherical shield configurations were calculated ( for P3 approximation and S6 angular quadrature). The active y-energy range up to 14 Mev was divided into 21 groups<3). The set of the physical constants were evaluated using both DLC-75 , Bugle-80 cross sections data library(Z> and the DRP code(4).
The calculated gamma - rays radial fluxes attenuations for energy groups number 11 to 21 ( 1.0 to 0.01 Mev) through both configurations I and II for different packing densities are shown in Fig. 1. Figure 1(a) presents such attenuation gradients when both Fe and Pb spherical shield shells are totally void free (i.e. T| =1.0 for each), while Fig. 1 (b,c) illustrate the attenuation behaviour in both configurations I & II when r) is reduced to 0.35. It is clearly observed that the attenuation intensities increase with increasing the shield radius. Also, a rapid attenuation behaviour for y - rays upon entering the shield (shallow penetration) is clearly noticed from the figures. This may be attributed to the geometrical spreading phenomena. As also clearly seen, all values of y- flux intensities in Fig. 1 (a) are less than the corresponding values of Fig. 1 (b,c). This means more attenuation characteristics is attained by increasing r| to 1.0. Besides, as seen from the figures, the attenuation behaviour through configuration II is sharper than that through configuration I since all energy groups are totally attenuated at shield radius £ 30 cm. in configuration II whereas they exceed 40 cm. shield radius in configuration I.
The effect of the variation of the packing density of Fe on the calculated y- fluxes of energy groups no. 11 ( 1.0-0.8 Mev ), no. 16 ( 0.2 -0.1 Mev ) and no. 20 ( 0.02 - 0.01 Mev) for configuration I are shown in Fig.2 (a, b, c). It is clearly seen from the figures that the fluxes distributions showed a similar attenuation behaviour for all values of packing densities. The figure also shows that attenuation intensities within both shield layers are increased with increasing the packing density for both middle and deep penetrations for the three energy groups (no. 11,16 and 20). This may be attributed to the effect of both mean free path and diffusion length.
The effect of Fe packing density variation (%e) on the calculated y - fluxes of energy groups no 11,16 and 20 respectively at different penetrating redii are shown in Fig. 3 (a,b,c). As seen from the Figs.2 and 3 ; at shallow penetration (r = 5 cm.) the fluxes distributions increase as T)Fe increase up to 1.0 for the low energy groups (no. 20,16)
3
I W
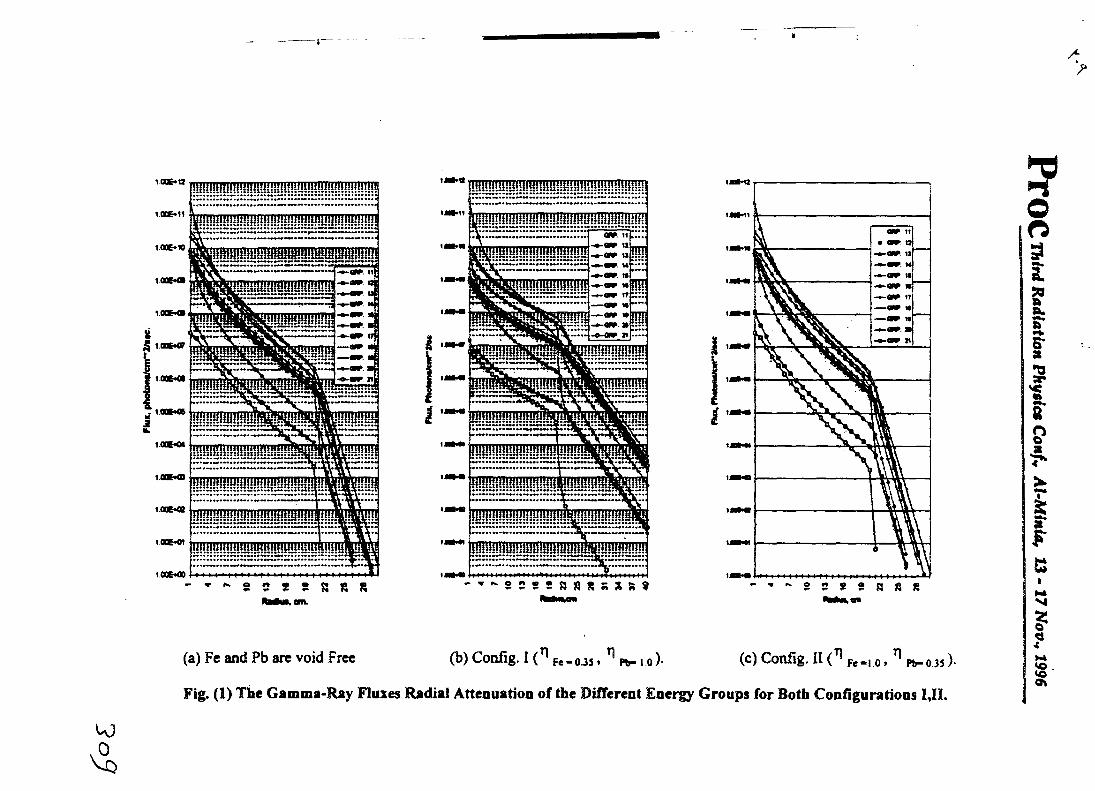
z>
W)
1006*12
V0CE.11
1006*10
b
1OCE**
10CEK*
11)06*00
100M
100M1006*10
imiiTfmnmmtunitftfimtimntifmimirti!
|EEE!EEEI™ni!n,4.« .# * * *-w ...... Ml # 4— ♦>«*»** jm .MM
piiiiiiyiiiiiii
p™
mmiM^inyEipaiEpiE! a
-*-OSP U
....— -w «----WF. H
UTOprams
nnnnran
!!!I!iS!!l!!!!5IIS]!lH«!Smig*M ...... ..*..M
fijnni
iiiiiiHiiiyiiiiiiiiiiliiSMil
!{!!!!!E!!!!H!!n!!!4EJ!!!l»!k!!!!pyy
•* S C 5 5 R
(a) Fe and Pb are void Free (b) Config. I Fe - 0 J5 » ^ Pb- I o) (c) Config. II Fe -10 » ^ Pb- 0 35 )■
Fig. (1) The Gamma-Ray Fluxes Radial Attenuation of the Different Energy Groups for Both Configurations 1,11.
PrOC
Third Radiation Physics Conf* Al-M
inia, 13 - 17 Nov* 1996
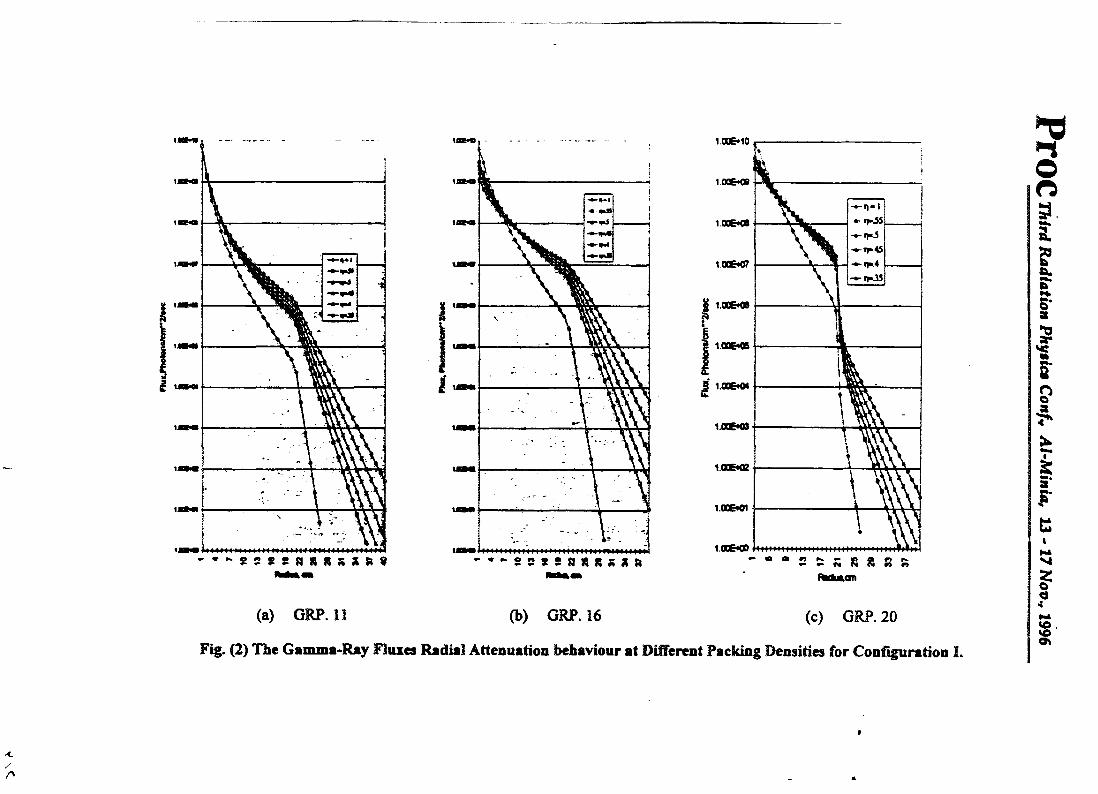
(a) GRP. 11 (b) GRP. 16 (c) GRP. 20
Fig. (2) The Gamma-Ray Fluxes Radial Attenuation behaviour at Different Packing Densities for Configuration I.
PrOC
Third Radiation Physics Conf* Al-M
inia, 13-17 Nov., 1996

Flu*
. Phe
lon»
/cm
'*2/
»ec.
Fl
u*. P
hete
ns/c
m,,2
fSsc
Fl
ux. Ph
sian«
/cm
*’2/
S«c
PrOC Third Radiation Phytict Conf* Al-Miniaf 13-17 Nov., 1996
1 00E *07
QRP.20
(a) Shallow Penetration (r* 5 cm)
OFF I 1ORP 20
2 i 2 2 2 I I S S 2 8 2 S ?
(b) Middle Penetration ( r ■ 10 cm)
, , .) !
2 2 2 2 3 I 1 5 S 2 2 2 2 51(c) Deep Penetration ( r = 20 cm)
Fig (3) The Effect of %c on Penetration at different radii for energy groups no. 11,16 and 20.
PrOC Third Radiation Phytic* Conf* Al-Minia, 13 - 17 Nov* 1996
whereas it decreases for the high energy group (no.ll). This behavioural change may be attributed to the mode of y- rays interaction with matter during its penetration within the shield since they interact through separate processes. However, the effectiveness of shield materials in attenuating y -rays is determined by the combined effect of a succession of processes upon the over all propagation of y-ray of those processes. For the proposed shield materials and for low energy y-rays, the photoelectric effect is predominant. Also, the probability of raylcight scattering is enhanced and prevails greatly. For high photon energies, the effect of compton scattering and pair production is the predominant. The figures also showed that at middle (r = 10 cm.) and deep penetrations (r = 20 cm.), the gamma flux distribution decrease as going through the shield shells with increasing T]Fe for the three energy groups. This confirms the importance of producing high quality grade iron as a shielding material since it greatly affects its packing density and implies the imortancc of considering T| as a controlling factor for gamma attenuation. In other words, this investigation recommends to introduce a void percentage stamp for shielding materials for the sake of precise prediction of the dimensional configuration needed for the requirements of safety limits calculations.
4. Conclusions
1- The calculated gamma fluxes distributions and its energy spectra for all attenuations through both iron and lead spherical shield layers have revealed that the use of multigroup cross-section data (DLC-75, Bugl-80)with the angular scattering represented by ( P3 ) Legendre expansion and the DRP model are adequate for predicting the variation in these distributions induced due to variation of packing density.
2- The variation in the gamma fluxes attenuation distributions induced by the variation of packing density in lead is less than that in iron.
3- The gamma fluxes attenuation is increased with increasing the shield material packing density which reflects its importance in considering it as an important safety parameter in shielding design.
4- For the geometrical model considered in this investigation, the effect of packing density variation in controlling the gamma rays attenuations is confirmed in both configurations for middle and deep penetrations.
5- The investigation recommends to introduce a void percentage stamp for shielding materials for the sake of precise prediction of the dimensional configuration needed for the requirements of the safety limits calculations.
Si
1. Bell, G.I. and Glasstone, S.; " Nuclear Reactor Theory", Van Nostrand Co., NY. (1990).
7
PrOC Third Radiation Phygics Conf* Al-Minia, 13-17 Novv 1996
2. ORNL; “RISC Data Library Collection DLC -75/ Bugle 80 ", ORNL and ANS- 6.1.2., USA (1985).
3. Rahman, F. A.,et al; " A Theoretical Model for Gamma Ray Attenuation and
Distribution in a Laminated Shield" , Int. Rad. Appl. Instrum., Part A, England (1989).
4. El - Desouki, S.F.;" Study of Some Physical Properties of Some Non- crystalline Compounds", Ph. D. Thesis, Fac. of Sc., Al-Azhar Univ.,Cairo (1988).
5. Bartine, D.E.; “ Proc. of 6 th. Int. Conf. on Radiation Shielding “, Tokyo (1983).
6. Larsen ,E.W.; ” Diffusion -Synthetic Acceleration Method for Discrete - Ordinate Problems", Transport Theory and Statistical Physics, 13 ,107-126 (1984).
7. Englcw.w. and Mynalt, F.R. ;" A Comparison of Two Methods of Iteration Convergence Acceleration in Discrete Ordinates Codes" , Trans. ANS ,11 ,193- 194,(1969).
8. Finney, J.L and Luborsky, F.E.(Ed); " Amorphous Metallic Alloys ", Butterworth Co. Pub. Ltd., p. 42 (1983).
EG9700094 i Radiation Physic* Conf* Al-Minia, 13-17 Nov., 1996tbliiVlAIIUN OF RADIOACTIVITY IN
STRUCTURAL MATERIALS OF ET-RR-1 REACTOR
Mahmoud ImamNational Center For Nuclear Safety And Radiation Control
Atomic Energy Authority, Cairo, Egypt
ABSTRACT
Precise knowledge of the thermal neutron flux in the different structural materials of a reactor is necessary to estimate the radioactive inventory in these materials, that in turn is needed in any decommissioning study of the reactor.
The ET-RR-1 research reactor went critical on 2/8/1961,. In spite of this long age of the reactor, the effective operation time of this reactor is very short since the reactor was shutdown for long periods. Because of this long age one may think in reactor decommissioning. For this purpose we estimated in this work the radioactivity in the reactor structural materials.
Apart from the ET-RR-1 reactor core, the important structural materials are the reactor tank, shielding concrete and the graphite thermal column. The thermal neutron flux was determined by the Monte Carlo method in these materials and the isotope inventory and the radioactivity were calculated by the international program ORIGEN-JR.
PrOC Third Radiation Phytic* Confv Al-Minia, 13-17 Nov., 1996
1. IntroductionThe ET-RR-1 reactor (11 is a 2 MW research reactor of tank type, that went
critical in 1961. It is a light water moderated and reflected reactor. On one side of the reactor core is placed the graphite thermal column. The core structural material is aluminium. The reactor biological shield is made of concrete. Figure (1) shows the ET-RR-1 reactor. Thus the reactor structural materials are the aluminium in core, graphite thermal column, stainless steel of the reactor tank, and the concrete of the reactor shield.
In spite of the long age of the reactor, the effective operation time of this reactor is very short since the reactor was shutdown for long periods. For this reason an estimate for the total operation time of the reactor by ten effective full power years would be very conservative.
2. Total Radioactivity in Neutron Activated Reactor ComponentsWe calculated by the program ORIGEN-JR (2] the radioactivity resulted from
the neutron activation of the different structural materials after an operation of the reactor for ten effective full power years and after decay times of 10, 30, 50, and 100 years following the final reactor shutdown. In the following are the results of these calculations.
2.1. Neutron Activated Aluminium in the ET-RR-1 Reactor CoreUsing the same neutron flux value of 4.3 10'3 n/cm2.sec as has been
calculated by Monte Carlo in a previous work [3| and by executing the program ORIGEN-JR we obtained:
Radioactivity in Ci/m3 at decay times (years after shutdown)
Shutdown 10 30 50 100
Light elements 5.29 103 1.97 102 9.38 103 6.05 103 4.52 10 3Heavy elements 9.29 104 1.83 102 8.04 10' 3.87 10' 1.21 10'Fission products 2.68 10* 1.68 103 9.85 102 6.09 102 1.87 102Total 3.66 10* 1.68 103 1.06 103 6.48 102 1.99 102
Thus the most radioactivity in this case is produced from the fission products and especially from the isotopes of these elements: Y, Nb, Tc, Ru, Rh, Sb, Te, I, Cs, and Ba. The radioactivity from heavy elements is the next in the rank after the fission products. The most contribution is from Uranium and Neptunium isotopes. The radioactivity from light elements is only great by shutdown.
Comparison with a reference research reactor (4) with nominal power of 60 MW and after reactor operation time of 4.47 effective full power years, the total radioactivity at shutdown was 1.12 10s Ci/m3 Our value of 3.66 10s Ci/m3 is little different because of the difference in the reactor power and the operation time.
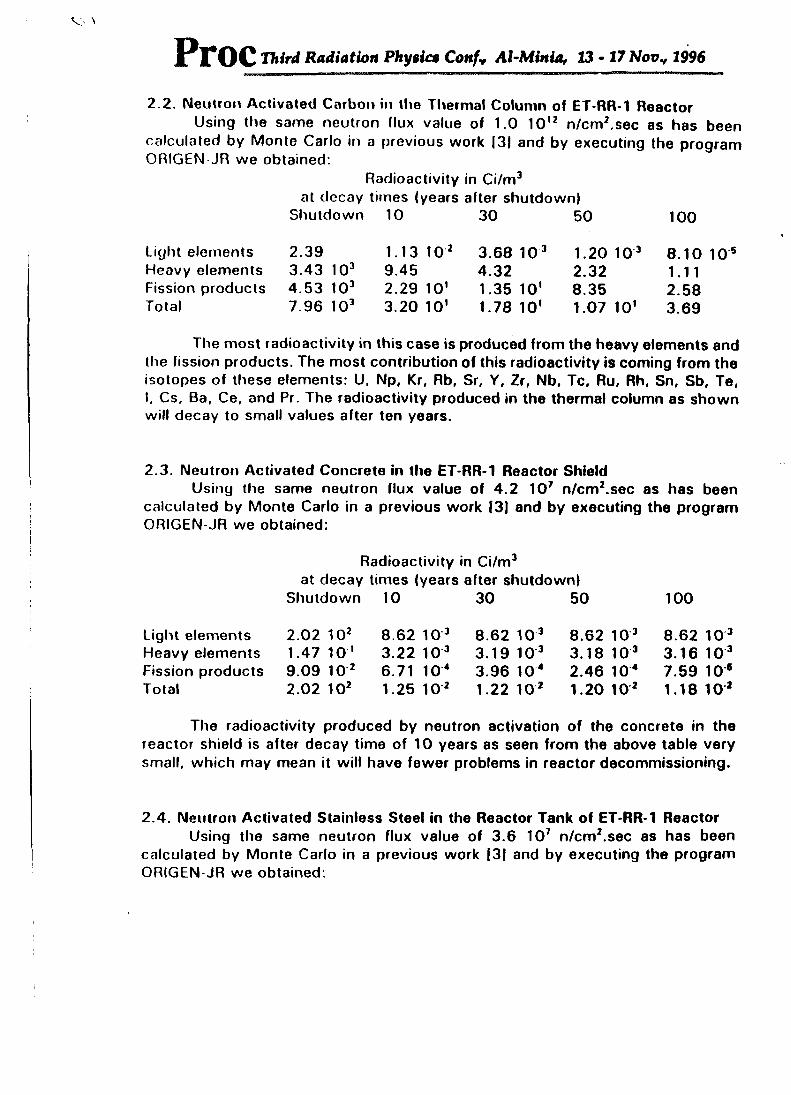
Pl^OC Third Radiation Physics Confy Al-Minia, 13-17 Nov* 1996
2.2. Neutron Activated Carbon in the Thermal Column of ET-RR-1 ReactorUsing the same neutron Mux value of 1.0 10'2 n/cm2.sec as has been
calculated by Monte Carlo in a previous work |3| and by executing the program ORIGEN-JR we obtained:
Radioactivity in Ci/m3 at decay times (years after shutdown)
Shutdown 10 30 50 100
Light elements Heavy elements Fission products Total
2.393.43 103 4.53 103 7.96 103
1.13 102 9.452.29 10' 3.20 10'
3.68 103 4.321.35 10' 1.78 10'
1.20 103 2.328.351.07 10'
8.10 10 1.11 2.58 3.69
The most radioactivity in this case is produced from the heavy elements and the fission products. The most contribution of this radioactivity is coming from the isotopes of these elements: U, Np, Kr, Rb, Sr, Y, Zr, Nb, Tc, Ru, Rh, Sn, Sb, Te, I, Cs, Ba, Ce, and Pr. The radioactivity produced in the thermal column as shown will decay to small values after ten years.
2.3. Neutron Activated Concrete in the ET-RR-1 Reactor ShieldUsing the same neutron flux value of 4.2 107 n/cmz.sec as has been
calculated by Monte Carlo in a previous work 13) and by executing the program ORIGEN-JR we obtained:
Radioactivity in Ci/m3 at decay times (years after shutdown)
Shutdown 10 30 50 100
Light elements Heavy elements Fission products Total
2.02 102 1.47 10' 9.09 10 2 2.02 102
8.62 10 3 3.22 10 3 6.71 10 + 1.25 102
8.62 10 3 3.19 10 3 3.96 10 + 1.22 10 2
8.62 103 3.18 10 3 2.46 10 + 1.20 102
8.62 10 3 3.16 10 3 7.59 10® 1.18 102
The radioactivity produced by neutron activation of the concrete in the reactor shield is after decay time of 10 years as seen from the above table very small, which may mean it will have fewer problems in reactor decommissioning.
2.4. Neutron Activated Stainless Steel in the Reactor Tank of ET-RR-1 Reactor Using the same neutron flux value of 3.6 107 n/cm2.sec as has been
calculated by Monte Carlo in a previous work |3| and by executing the program ORIGEN-JR we obtained:

PrOC Third Radiation Physics Conf* Al-Minia, 13-17 Nov* 1996
Radioactivity in Ci/m3 at decay times (years after shutdown)
Shutdown 10 30 50 100
Light elements 6.41 104 1.33 1.18 1.18 1.18Heavy elements 1.27 10 1 3.22 103 3.19 103 3.17 103 3.16Fission products 7.79 103 5.75 10 4 3.40 104 2.11 104 6.50Total 6.41 104 1.33 1.18 1.18 1.18
This table shows that the radioactivity produced is mainly from the isotope Co60. It has a great value at reactor shutdown and decay to a small value after ten years. The contribution to the radioactivity after ten years is mainly due to the Ni isotopes.
3. ConclusionAs expected the highest radioactivity produced from reactor structure
components would be from the core main structural material aluminium, which is used as fuel clad and fuel cassette wall. This aluminium will be treated by reactor final shutdown by the same treatment as the core fuel.
After ten years the radioactivity of the carbon in the thermal column, the concrete in the reactor shield, and the stainless steel of the reactor tank will be small enough, so that these materials could be used in other purposes.
4. References1. IAEA - Research Reactors Directory, p. 127, (I960).2. ORIGEN-JR, JAERI-M 8229, (1979).3. IMAM, M., "Monte Carlo Calculations for the Neutron Flux in ET-RR-1 Reactor
Shield", Arab Journal of Nuclear Sciences and Applications, (1996).4. Konzek, et al, "Technology, Safety, and Costs of Decommissioning Reference
Nuclear Research and Test Reactors", NUREG/CR-1 756, Vol. 1 & 2, (1982).
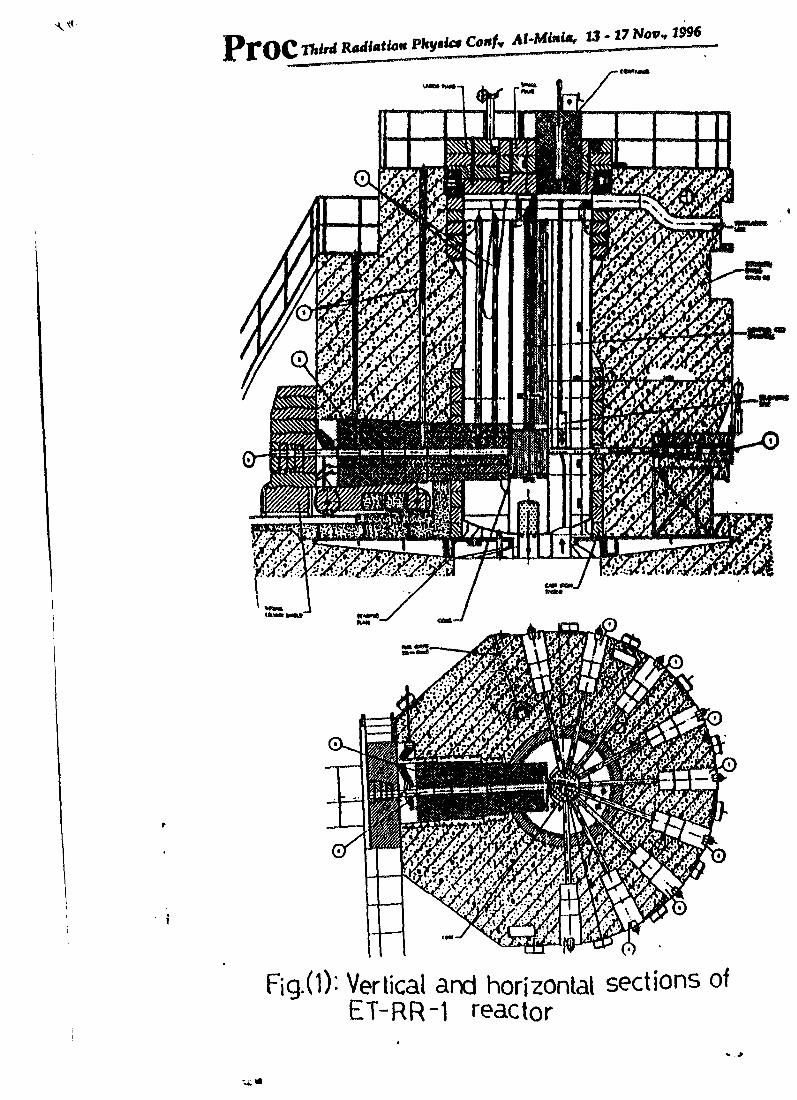
Proem-* Radiation Pfcy.ta Conf, Al-Mfato,
Fig.(1): Vertical and horizontal sections of ET-RR-1 reactor
^ >

PrOC Third Radiation Phytict ConfH ^^^'|il|||||||ti[i||[||l||
EG9700095
Utalization of Radiation Facilities at TNRC For Shielding Researches and Related Topics
T.S.AkklNeutron Physics and Radiation Shielding Division
Physics Department Tajura Nuclear Research Center
Tripoli- Libya.
Abstract
This paper presents the running shielding research activities at Tajura Nuclear Research Center . The main area of researches are concentrated on the investigation of different types of concrete made from local materials .such as conventional concrete , Magnetite- Lemonite concrete and heat resistant concrete. The measuring techniques used are neutron -gamma spectrometer, and activation technique.
The measurements were performed using collimated beam of reactor neutrons emitted from one of the horizontal channels of Tajura Research Reactor, as well as from Californium -252 neutron source . The transmitted neuton spectra through concrete barriers of different thicknesses were measured by a scintillation spectrometer with NE-213 liquid organic sdentillator.
A non destructive testing of some reactor materials are also carried out using neutron and gamma rays Computerized Tomomgraphy technique . Some experiments are also carried out related to measurements of neutron depth dose distributions inside tissue equivalent materials.
2

Third Radiation Phygict Conf* Al-Minia, 13-17 Nov., 1996
INTRODUCTION
Organic scientillators have wide applications for neutron measurements in mixed radiation field of neutron and Gamma-rays since the discovery that pulses produced from electron and proton recoils can be distinguished from the difference in pulse shapetherefore .neutron events can be distinguished from gamma-ray events by pulse shape
discriminator technique. In addition organic scientillators possess good detection efficiency and their response times allow relatively simple derivation of fast timing signals required for some experiments .
A neutron gamma spectrometer with NE-213 liquid organic scientillator is described bellow . The spectrometer distinguishes fast neutrons from gamma rays by means of the difference decay times of recoil proton and Compton Electron respectively.
This paper presents the irradiation facilities used at TNRC for shielding research and related topics .Neutron gamma spectrometer is used as a measuring tool for these experiments.
Irradiation FacilitiesThe available irradiation facilities used are .research reactor and Califorium-252
isotropic neutron source. The 10 MW research reactor type (NBB) has 10 horizontal channels and several vertical channels and the maximum fast neutron flux is 2.2x10*4 n/cm2/sec and thermal neutron flux is 2x10*4 n/cm2/scc. The californium- 252 neutron source of 50 microgram has been installed inside the irradiation cell of dimensions 100x100x100 cm with one horizontal channel and 4 vertical channels specially designed locally for shielding labratory with manual source loading and control ^^CF neutron flux is 2.3 x 10 7neutrons/cm2 /sec. In addition an isotropic gamma sources are also used schematic digram of irradiation cell is shown in fig. 1.
Experimental FacilitiesThe experimental facilities available at shielding laboratory are. neutron
gamma spectrometer .threshold detectors and computerized tomography scanner.The neutron gamma spectrometer with NE-213 liquid organic Scientillator was chosen to be used as a measuring tool of fast neutrons and gamma rays in mixed radiation fields because it can be discriminate between neutrons and gamma rays by means of pulse shape discriminator.
3

PrOC Third Radiation Phytic* Confr Al-Minia, 13 - 27 1996
The principle of its operation is to compare the time integrals of the input signals when presented simultaneously to gated integrals, one of this integrators has a short duration and will thus give a relatively large output on a shorter decay time signal e g. a gamma ray , where the other integrator having a much longer duration and will give relatively larger output on the longer decay time events eg. neutrons . a schematic diagram of the spectrometer is shown in fig. 2 . The CT. scanner is used for non destructive testing of reactor materials presented in fig. 3.
Field of ResearchesNeutron -gamma spectrometer has been installed and calibrated in radiation shielding
laboratory at TNRC since 1985 . We have applied this spectrometer for different areas such as radiation shielding , medical and industrial fields. A brief descriptions of some published papers related to this applications will be given below . 1-Radiation shielding applicationsIn radiation shielding experiments we have installed two units of the spectrometer one for the reactor experiments and the other for Californium 252 neutron source experiments.The main topic of the work is concerned with the investigation of concrete shield made from local materials such as magnetite, limonite, and limestone aggregates . One of the published paper (1) in this field deals with the spatial flux and energy distributions of reactor fast neutrons in two types of heat resistant concrete.
The measurement were performed to study the spatial fluxes and energy distributions of reactor fast neutrons in two types of heat resistant concrete made from magnetite - limonite and serpentine ores. The physical and mechanical properties and the effect of heating to elevated temperatures were checked . The transmitted fast neutron spectra through concrete barriers of different thicknesses were measured by neutron spectrometer with NE-213 liquid organic scientillator. Discrimination against gamma pulses was achieved by a method based on pulse shape discrimination technique . The measured pulse amplitude distributions of pulses due to recoil protons were converted to neutron energy distribution by a computer code based on double differentiation technique . Schematic diagram of the experimental lay-out and the obtained reactor fast neutron spectra leaking through serpentine and magnetic-lemonite concrete samples are shown in fig.4 and fig 5respectively.
3
4

PrOC Third Radiation Phy$lc» Confy Al-Minia, 13-17 Nov* 1996
1
■» -* »MZ!isrjL.i3r rr
I* ...... iVmiHW»Jl.........
i .? -! nr;,t?Lr wax 1 :hi:V
F-2x neutron source
} is 1 Schematic dicram of irradiation cell

PrOC Third Radiation Phytic* Conf* Al-Minia, 13-17 Nov., 1996
P. S.D3 earn CoUimctor
R{CCl.or r j, e ■ Concrete Semple
Detector Collimator
HV-P
F'9 % Schematic Diagram Of The Experimental Layout For
M ensue meats Of Neutron Soectra
Third Radiation Physics Conf* Al-Minia, 13-17 Novv 1996
Fin 3. Schematic Vi gram of computerized tomography scanner
iV r "1

^ C 0
PrOC Third Radiation Phytica Conf* Al-Minia, 13-17 Nov., 1996
Fig. ^ Schematic digram of the experimental lay-out for measurment of neutron spectra
S U 7 3 'i 10 II
f ^VUU'Xt l-'CKV. .'C'J
10
1, >ur
Uc
• • . .1 r- 111
~ I i * t i i ' I ^• 20 v::iO 2 j" :ua. m c.i«A SO
V'. ‘-‘"'A/- ;
j i i i i i l---1—1 ■. ; 3 •> 'ii ii;."CvUv.t '-j .vl V/. .'-W
Fig Reiiviui idst neutron spectra leaking through serpentine and magnetite-lemomter-cncretes
31£>
PrOC Third Radiation Phytic» Confy Al-Minia, 13-17 Nov., 1996
The other publeshed paper(2) concerned with the use of spectrometer with Californium -252 neutron source entitled" Experimental and Calculated leakage spectra from various shielding materials ", were the spectra of the fast neutrons passes through layers of concrete, two layers of iron-concrete and three layers of polyethylene iron and concrete media have been studied for roughly spherical assemblies containing a point source of CF-252 neutron source . The leakage neutron spectra were measured at the surface of the sphere along a radial from the source . measurements have been made with a scintillation spectrometer with NE-213 scientillator in which gamma rays are discriminated by a method based on the comparison of two weighted time integrals of the detector signal. The conversion of the integral pulse height distribution into neutron energy spectrum was achieved by method based on numerical differentiation . Schematic diagram of the experimental lay out is given in fig. 6
2- Medical ApplicationIn this program we measure neutron depth dose distributions emitted from CF-252
neutron source as well as gamma isotropic sources in tissue equivalent materials The published paper(3) described this applications entitled Measured and calculated neutron spectra emitted from Californium-252 neutron source in tissue equivalent materials".This paper outlines the measured and calculated data obtained for fast neutron spectra in tissue equivalent material implantable with Californium-252 neutron source. The tissue material was in the form of a polyethylene tank of 50x50x70 cm outer dimensions filled with water. a polyethylene tube was fixed at the center of the tank to accommodate the source during the measurement . The flux and spatial energy distributions at various water depths were measured by a neutron gamma spectrometer with NE-213 liquid organic scientillator.The neutron pulses were distinguished from gamma-pulses by a pulse shape discriminator technique. The neutron spectra were calculated at the same measured positions with a computational code based on multigroups removal and removal diffusion methods. The experimental layout and the obtained neutron spectra are shown in fig.7 and fig.8 .3- Industrial Applications
For industrial application Computer Tomography technique were used for Non- Destructive testing of materials by neutrons and gamma rays .
(5V r A

Proc Third Radiation Phytica Cottfy Al-Minia, 13 • 17 Nov., 1996
?
• :•
I j p.ir.min a'ax 2-2' 2 iv-urc'i! •.tmrr.f i- <- iy»nc ic;.i r- ;?c n- :i thiud ii i • . .v..:.!. : ;•>
h'iq f). Schvmatic liurum of the I'xpemnuiUnl layout -.f sphtrii al geometry

PrOC Third Radiation Physics Conf* Al-Minia, 13-17 Nov., 1996
uourcc Tube
/ . /. / .2// // / /
I’iC. > Schematic Diagram of the Experimental Lay-out

Neutron Flux,
n, c
m
Third Radiation Physics Confy Al-Minia, 13-17 Nov., 1996
r~t-i i i i i
0 -15 cm0 - 13 cm
1 1 1-1 JLJ. 1 1... 1 I
D -17 ctn
i-l.J.I. ! 112 3 4 5 6 7 & * 10 o 1 23 4 56 7 69 10
Neutron Energy, MeV
Fig 8. Variabon of fast neutron spectra with bssue depth

PrOC Third Radiation Physics ConfH Al-Minia, 13-17 Nop., 1996
The published paper(4) in this field entitled as " Application of Computer Tomography For Testing the internal Structure of Concrete Shield" . The paper was concerned with
the examination of concrete shields by computerized tomography using neutrons and gamma rays sources The measurements were performed on samples of ordinary concrete and magnetite lemonite concrete . The CF-252 neutron source was housed in an irradiation cell with beam collimator of 3mm width by 10 mm height. and the
transmitted neutrons were measured by neutron gamma spectrometer with NE-213 liquid organic scientillator placed in lead and bora ted-paraffin container fitted with
collimator of 2mm width by 10mm height to reduce the effect of beam scattering in the
sample under investigation . The source and detector were aligned optically to define the beam axes and the sample is traversed horizontally by the beam and rotated stepwise for 180 . The reconstructed CT images was displayed using a graphic program . The Experimental layout and the obtained cross-sectional image of concrete probe with iron rods and cavities are shown in fig.9 and 10
CONCLUSIONSFrom the above described papers we conclude that the neutron gamma
spectrometer with NE-213 liquid organic scientillator is the best measuring techniques in mixed radiation fields among that the obtained results of the works concludes the following conclusions :-I- The obtained results from shielding experiments concludes that the fast neutron
spectra measured behind concrete barrier of magnetite limonite and serpentine concrete shows that these two types of heat resistance concrete possess a good attenuation properties to fast neutrons and since these concrete can keep on their water content at temperatures above that expected behind the pressure vessel, and therefore they can be safely used for advantages of constructing the inner part of the primary concrete shield in adjacent to the pressure vessel.
2- For medical application experiments, neutrons with energies between 1.4 and 4MeV give the main contribution in the total number of fast neutrons delivered to all
positions around the neutron source .The obtained spectra can be used for advantages of estimating changes in depth dose delivered to any position in tissue phantom implantable with Californium -252 neutron source .
6^ 'it
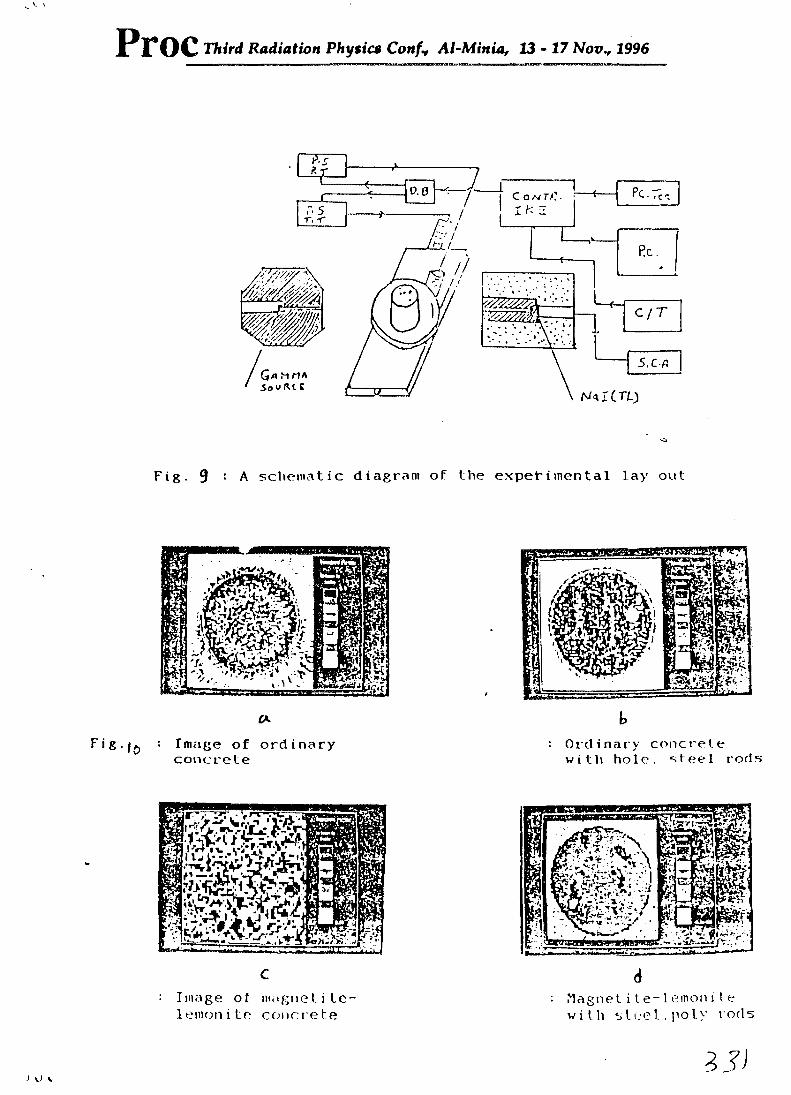
Proc Third Radiation Physics Confv Al-Minia, 13 - 17 Nov., 1996
4l- ■ '• --- 1 Cowrf. !-- <-- Pc.rea; I . / I t k -f. 5r. < r3'
/V<tI(TL)
Fig. 9 : A schematic diagram of the experimental lay out
Fig.jjj : Image of ordinary concrete
Ordinary concrete with hole. steel rods
Clinage of magnet i tc- lemonite concrete
dMagnetite-lemonit e with steel.poly rods
13)V V

PrOC Third Radiation Physics Confy Al-Minia, 13-17 Nov., 1996
3- For industrial application experiment we found that it is possible to use fast neutrons computer tomography for investigation the industrial materials of higher densities instead of using x-ray or gamma ray CT.Generally I conclude that the neutron- gamma spectrometer with NE-213 liquid organic scientillator posses a good measuring system for fast neutrons in mixed radiations.
REFERENCESI T.S.Akki, S.A.Benayad and R.M.Megahid, Spatial Fluxes and Energy Distributions of Reactor Fast Neutrons in Two Types of Heat Resistant Concretes. Annual meeting on nuclear technology .May 1990 .w.germany .2- S.Benayad . T.S.Akki and R.M.Megahid .Experimental and Calculated Leakage Spectra From Various Shielding Materials . Libyan physics confrence.June 1989, Tripoli Libya.3- F.A.Bakkoush .T.S.Akki and R.M.Megahid .Measured and Calculated Neutron Spectra Emitted from Californium Neutron Source in Tissue Equivalent Materials. First international conference of low cost experiments in biophysics . dec. 1989 Cairo.Egypt.
4- T.S.Akki and R.M.Megahid , Application of Computer Tomography for Testing the Internal Structure of Concrete Shield. Annual meeting of Canadian radiation protection association June 1990, Canada .
7