Proceedings of the 7th International Conference on Axiomatic ...
232
General rights Copyright and moral rights for the publications made accessible in the public portal are retained by the authors and/or other copyright owners and it is a condition of accessing publications that users recognise and abide by the legal requirements associated with these rights. Users may download and print one copy of any publication from the public portal for the purpose of private study or research. You may not further distribute the material or use it for any profit-making activity or commercial gain You may freely distribute the URL identifying the publication in the public portal If you believe that this document breaches copyright please contact us providing details, and we will remove access to the work immediately and investigate your claim. Downloaded from orbit.dtu.dk on: Aug 26, 2022 Proceedings of the 7th International Conference on Axiomatic Design Thompson, Mary Kathryn Publication date: 2013 Document Version Publisher's PDF, also known as Version of record Link back to DTU Orbit Citation (APA): Thompson, M. K. (Ed.) (2013). Proceedings of the 7th International Conference on Axiomatic Design. ICAD. http://books.google.dk/books?id=dig8E6Kag0gC&printsec=frontcover#v=onepage&q&f=false
-
Upload
khangminh22 -
Category
Documents
-
view
0 -
download
0
Transcript of Proceedings of the 7th International Conference on Axiomatic ...

General rights Copyright and moral rights for the publications made accessible in the public portal are retained by the authors and/or other copyright owners and it is a condition of accessing publications that users recognise and abide by the legal requirements associated with these rights.
Users may download and print one copy of any publication from the public portal for the purpose of private study or research.
You may not further distribute the material or use it for any profit-making activity or commercial gain
You may freely distribute the URL identifying the publication in the public portal If you believe that this document breaches copyright please contact us providing details, and we will remove access to the work immediately and investigate your claim.
Downloaded from orbit.dtu.dk on: Aug 26, 2022
Proceedings of the 7th International Conference on Axiomatic Design
Thompson, Mary Kathryn
Publication date:2013
Document VersionPublisher's PDF, also known as Version of record
Link back to DTU Orbit
Citation (APA):Thompson, M. K. (Ed.) (2013). Proceedings of the 7th International Conference on Axiomatic Design. ICAD.http://books.google.dk/books?id=dig8E6Kag0gC&printsec=frontcover#v=onepage&q&f=false

Proceedings of
The 7th International Conference onAxiomatic Design
EditorMary Kathryn Thompson
ICAD 2013

Proceedings of the 7th International Conference on Axiomatic Design
Mary Kathryn Thompson Editor

Editor Mary Kathryn Thompson ISBN 978-0-9894658-0-9 © ICAD 2013 All rights reserved. No part of this publication may be reproduced without the written permission of the copyright owner.

7th International Conference on Axiomatic Design
26-28 June 2013, Worcester, Massachusetts, USA
Organized by
Worcester Polytechnic Institute
Department of Mechanical Engineering School of Business
Sponsored by
Axiomatic Design Solutions, Inc.
MIT Park Center for Complex Systems
Technical University of Denmark
United Technologies Corporation

Honorary Conference Chair Nam P. Suh, MIT, USA
Conference Chairs
Torbjorn S. Bergstrom, WPI, USA
Walter T. Towner, WPI, USA
Christopher A. Brown, WPI, USA
Program Chair
Mary Kathryn Thompson, DTU, DK
Local Organizing Committee
Mary Kathryn Thompson, DTU, DK
Monica Pena, KAIST, KO
Larry Oh, MIT, USA
Matt Pallaver, Schlumberger, USA
Derrick Tate, Texas Tech, USA
Al Dickinson, UTC Power, USA
Torbjorn S. Bergstrom, WPI,USA
Christopher A. Brown, WPI, USA
Christopher Butcher, WPI, USA
Michelle Rheaume, WPI, USA
Walter T. Towner, WPI, USA
International Program Committee
Aurelian Vadean, EPM, CA
Yih-Chyun Sheu, Cherry Automotive, CN
Mary Kathryn Thompson, DTU, DK
Luc Mathieu, ENS Cachan, FR
Rima Ghemraoui, Natural Grass, FR
Mitchell M. Tseng, HKUST, HK
Moshe Shpitalni, Technion, IL
Dominik Matt, Univ. of Bolzano, IT
Gabriele Arcidiacono, Marconi Univ., IT
Paolo Citti, Marconi Univ., IT
Masayuki Nakao, Univ. of Tokyo, JP
Gyung-Jin Park, Hanyang Univ., KO
Dai Gil Lee, KAIST, KO
Taesik Lee, KAIST, KO
James Morrison, KAIST, KO
Monica Pena, KAIST, KO
Pedro Saraiva, FCT/UC, PT
A.M. Gonçalves-Coelho, FCT/UNL, PT
António Mourão, FCT/UNL, PT
Mats Nordlund, Skoltech, RU
Gunnar Sohlenius, KTH, SE
Sung Hee Do, ADSI, US
Hrishikesh Deo, Pentax Medical, US
Al Dickinson, UTC Power, US
Sang-Gook Kim, MIT, US
Hilario L. Oh, MIT, US
Nam P. Suh, MIT, US
Basem El-Haik, Six Sigma Profs., US
Derrick Tate, Texas Tech, US
Stephen C. Lu, USC, US
Christopher A. Brown, WPI, US
Torbjorn S. Bergstrom, WPI, US
Walter T. Towner, WPI, US

Dedicated to
Al Dickinson
1962-2013
A beautiful human being and outstanding contributor to Axiomatic Design
They shall have stars at elbow and foot; And death shall have no dominion.
(Dylan Thomas)

On the Occasion of the 2013 International Conference on Axiomatic Design Almost all areas of human endeavor involve systems. In general, systems must be designed before we can analyze them to understand, improve and optimize their performance. For example, the president of a nation should design national policies; universities should design their educational services; engineers should design technological systems to meet specific needs, and the chairman of a central bank should design the monetary policy instead of simply controlling the money circulation and the interest rates. Yet in many fields, experts try to improve existing systems and develop new systems without due consideration of the rationality of the systems in question. Often they take an existing system and tweak it, seeking to improve its performance. This approach results in undesirable manifestations: high cost, long development time, sub-optimal performance, and system failure. The ultimate output of engineering is the creation of an engineered system that satisfies specific human and societal needs. To be sure that the design can perform the required functions, we must identify the needs of customer or society, which is often the most difficult step in engineering. Only when we understand and can explicitly state the needs, can we conceive of a creative and successful design. Unfortunately, often we, the engineers, do a poor job in this task. Engineering schools have done a marvelous job in teaching analysis of existing designs. However, for historical reasons, they have done a poor job in teaching synthesis (i.e. design). They have treated design as an experience-based subject without a scientific foundation. Thanks to this state of design education, many industrial firms have created engineered systems by trial-and-error processes relying on their past experiences. This requires many iterations and can result in a long development time, high costs, and the risk of marginal performance. Having created many systems in many different fields - new products, processes, software, hardware, and organizations - I have found that the long development time and high cost is due to the trial-and-error processes used. Axiomatic Design follows the historical development of science and mathematics. Many theories (e.g., the Newton’s laws, thermodynamics, and geometry) started out with postulates or axioms. Many years later, they were found to have limitations, but their ability to create the foundation for thought processes has created the basis for modern science and technology. I hope that Axiomatic Design will make similar contributions to human society. Some of our most recent work on the design of complex systems – including On-Line Electric Vehicles (OLEV) and Mobile Harbor (MH) – was made possible through the use of Axiomatic Design. I would like to compliment the excellent leadership of Professors Chris Brown and Kate Thompson in bringing talented scholars and engineers from many parts of the world to organize the 2013 ICAD at WPI. I am deeply grateful to them for their effort and for their creative ideas that have laid the framework for this important conference.
Nam P. Suh Honorary Chair June 26, 2013

Table of Contents
ICAD-2013-01 An AD Based Design and Implementation Approach for Franchise-Networks with Distributed Manufacturing Units
Dominik T. Matt and Erwin Rauch
1
ICAD-2013-02 Design Improvement of Hybrid Composite Joints by Axiomatic Design
Marc Ouellet and Aurelian Vadean
10
ICAD-2013-03 Value-Based Axiomatic Decomposition (Part I): Theory and Development of the Proposed Method
Pedro Alexandre Marques, Pedro Manuel Saraiva, José Gomes Requeijo, and Francisco Frazão Guerreiro
18
ICAD-2013-04 Value-Based Axiomatic Decomposition (Part II): Case Study
Pedro Alexandre Marques, Pedro Manuel Saraiva, José Gomes Requeijo, and Francisco Frazão Guerreiro
26
ICAD-2013-05 An Axiomatic Approach to Managing the Information Content in QFD: Applications in Material Selection
Carlo Cavallini, Paolo Citti, Leonardo Costanzo, and Alessandro Giorgetti
32
ICAD-2013-06 Decision Criteria for the Design of HVAC Systems for Datacom Centres Based on Cost and Losses Due to the Failure of Components
Miguel Cavique, António Gonçalves-Coelho, and António Mourão
37
ICAD-2013-07 Design Parameter Selection for Rectangular Design Matrices
Efrén M. Benavides and Joan B. Rodríguez
43
ICAD-2013-08 A Constraint Optimized Perspective on Axiomatic Design
Hilario L. Oh
49
ICAD-2013-09 Axiomatic Design and Implementation of Service-Oriented University Classes: Emotion and Senses
Sang Yoon Bae, Chan-Eon Park, Jukrin Moon, and James R. Morrison
54
ICAD-2013-10 Knowledge Services in Campus: The Application of Axiomatic Design
Yuqiuge Hao, Jussi Kantola, Rubén Raúl Valverde Arenas, and Mingzhang Wu
63

ICAD-2013-11 Axiomatic Design Based Volatility Assessment of the Abu Dhabi Healthcare Labor Market: Part I – Theory
Amro M. Farid and Inas S. Khayal
71
ICAD-2013-12 Axiomatic Design Based Volatility Assessment of the Abu Dhabi Healthcare Labor Market: Part II - Case Study
Inas S. Khayal and Amro M. Farid
77
ICAD-2013-13 Using Creative Resources in Applying Axiomatic Design
Laurenţiu Slătineanu, Margareta Coteaţă, Lorelei Gherman, Irina Beşliu, Oana Dodun, and Nicolae Seghedin
84
ICAD-2013-14 The Vacuum Cleaner as a Case Study for Teaching Conceptual Design
Joan B. Rodríguez and Efrén M. Benavides
91
ICAD-2013-15 Lessons Learned from Teaching Axiomatic Design in Engineering Design Courses
Ang Liu and Stephen Lu
99
ICAD-2013-16 A Classification of Procedural Errors in the Definition of Functional Requirements in Axiomatic Design Theory
Mary Kathryn Thompson
107
ICAD-2013-17 Axiomatic Design Aspect of the Fukushima-1 Accident: Electrical Control Interferes with All Mechanical Functions
Masayuki Nakao, Kohei Kusaka, Kensuke Tsuchiya, and Kenji Iino
113
ICAD-2013-18 Failure Mode Analysis as an Implementation of Axiom2 in the Axiomatic Design Functional Decompositon Process
Matt Pallaver and Sung-hee Do
119
ICAD-2013-19 Toward Design for Safety Part 1: Functional Reverse Engineering Driven by Axiomatic Design
Leyla Sadeghi, Luc Mathieu, Nicolas Tricot, Lama Al-Bassit, and Rima Ghemraoui
124
ICAD-2013-20 Toward Design for Safety Part 2: Functional Re-Engineering Using Axiomatic Design and FMEA
Leyla Sadeghi, Luc Mathieu, Nicolas Tricot, Lama Al-Bassit, and Rima Ghemraoui
132
ICAD-2013-21 An Axiomatic Design Approach to Passenger Itinerary Enumeration in Reconfigurable Transportation Systems
Edgar Eugenio Samano Baca, Amro M. Farid, and I-Tsung Tsai
138

ICAD-2013-22 An Axiomatic Design Based Approach for the Conceptual Design of Temporary Modular Housing
Lindsey R. Gilbert III, Amro M. Farid, Mohammed Omar
146
ICAD-2013-23 Application of the Axiomatic Design Approach to the Design of Architectural Systems: A Literature Review
Marianna Marchesi, Sang-Gook Kim, and Dominik T. Matt
154
ICAD-2013-24 The Design of an Interoperable Self-Supported Reverse Logistics Management System
Pedro Espadinha-Cruz, António Gonçalves-Coelho, António Mourão, and António Grilo
162
ICAD-2013-25 Axiomatic Design as a Creative Innovation Tool Applied to Mold Design
Irene Ferreira, José A. Cabral, and Pedro M. Saraiva
169
ICAD-2013-26 Enhancement of the Systems Engineering Process in the Life Cycle with Axiomatic Design
David S. Cochran and Jason A. Barnes
178
ICAD-2013-27 A Method for Indexing Axiomatic Independence Applied to Reconfigurable Manufacturing Systems
Erik Puik, Edwin Smulders, Jan Gerritsen, Bert van Huijgevoort, and Darek Ceglarek
186
ICAD-2013-28 The Application of Sequence Enumeration to the Axiomatic Design Process
Brandon Woolley, Zhen Li, and Derrick Tate
195
ICAD-2013-29 Axiomatic Design of Production Systems for Operational Excellence
Gabriele Arcidiacono and Christopher A. Brown
200
ICAD-2013-30 A Comparative Study of Decompositions in Axiomatic Design Applied to Safety of the Anterior Cruciate Ligament in Alpine Skiing
John M. Madura and Christopher A. Brown
207
ICAD-2013-31 Total Productive Maintenance Implementation Procedures in Manufacturing Organizations Using Axiomatic Design Principles
Filmon Andemeskel
215

Proceedings of ICAD2013 The Seventh International Conference on Axiomatic Design
Worcester – June 27-28, 2013
ICAD-2013-01
- 1 -
ABSTRACT
In recent years franchising as an organizational form has been gaining more and more importance and growing even faster than the overall economy. While we can find many business or juridical approaches and much research about franchising, there is a lack of guidelines for the planning, design and implementation of distributed manufacturing units within franchise networks. This paper presents an Axiomatic Design based concept for the design of a franchise production system with geographically distributed, changeable, scalable as well as replicable manufacturing units. The aim of this research is to derive a complete set of design parameters as well as a systematic approach for the implementation of franchise production systems. To validate and prove the developed concept it has been applied and illustrated in a real case study with an Italian franchise company.
Keywords: Axiomatic Design, production systems, franchising, distributed production.
1 INTRODUCTION
Franchising has lately become more and more important. Under franchising we mean in its broadest sense to build a "best practice" business model and the subsequent transfer of licenses for the replication or duplication of the concept in different target markets [O Monye 1997; Castro et al., 2009]. By franchising, manufacturers can establish facilities in new markets with a minimum of delay and capital outlay [Hayfron et al., 1998].
Besides the traditional pure franchise sales or service license (e.g. Burger King or Subway) franchising is also possible in the form of a production franchise or license to assign the production of goods to a franchisee [Versavel, 2001]. Often, these companies produce not in a central location, but in a decentralized structure, because of the individual customer requests in the various destination countries or especially in the case of food products with a short shelf life. The individuality of products is sometimes given by ethnic, religious or cultural based differences in the markets [Matt and Rauch, 2012]. For the above described reasons franchising models in the form of geographically distributed production franchises or mixed forms (production franchise with simultaneous sales or service franchise) are increasingly used to expand into new markets. This paper puts
this special type of production company in focus, which will become increasingly important due to actual and future growth of franchise business models.
A production system should not only produce high quality products at the lowest possible price; it should also quickly adapt to market changes and react to consumer behaviour and trends. Geographically distributed production facilities composed of reconfigurable production systems allow these quick adjustments of production capacity and functionality with respect to local customer needs [Bruccoleri et al., 2005].
Given the promising development in the past and the anticipation of further growth in franchising brands and their significant share of total economic output [AZFranchises, 2012], it becomes important to develop specially adapted changeable and agile production systems also for this sector.
The main objectives of this research and the development of the illustrated approach in this paper can be summarized as follows:
Changeability through a modular and scalable expansion of the production systems capacity
Replicability of the production system in the roll-out phase and expansion of the franchise system
Identification of needs for production systems for franchise models using a systematic methodology
Derivation of an appropriate guideline with a set of design parameters for production system designers
Development of a holistic approach to design and implement a franchise system with decentralized production units, which includes not only technical but also organizational and strategic content
Ensuring the practical applicability and validation using a case study.
Axiomatic Design provides a systematic approach to derive in a first step, the functional requirements (FR) and in a second step a set of design parameters (DP) for a changeable and modular production system for franchising models. By applying the Axiomatic Design methodology [Suh, 1990] and the MSDD approach [Cochran et al., 2001] in this work, the requirements and specific design parameters could be achieved in a systematic and structured way.
The research in this paper is based on a real case study with a new North Italian franchise brand. The aim of the collaboration in this case study was to design and implement a modular and scalable production system for a network of
AN AD BASED DESIGN AND IMPLEMENTATION APPROACH FOR FRANCHISE-NETWORKS WITH DISTRIBUTED MANUFACTURING UNITS
Dominik T. Matt [email protected]
Faculty of Science and Technology Free University of Bozen-Bolzano
Piazza Università, 5 I-39100 Bolzano, Italy
Erwin Rauch [email protected]
Faculty of Science and Technology Free University of Bozen-Bolzano
Piazza Università, 5 I-39100 Bolzano, Italy

- 2 -
distributed franchise production facilities. The application of the AD-based approach in the case study was very useful and effective for the systematic investigation of the requirements as well as for the elaboration of a concept for scalable and modular production systems for franchising networks.
2 LITERATURE REVIEW
In the current research, great attention is paid to changeability in production systems. There exist countless articles and research papers to this argument [Hernández, 2002; Reinhart et al., 2003; Westkämper et al., 2000; Spath, 2006; Nyhuis et al., 2008; Yusuf et al., 1999; Dove, 2006; Matt, 2010; Wiendahl and Heger, 2003; Wiendahl et al., 2007; Park and Choi, 2008; Algeddawy and Elmaraghy, 2009]. Changeable systems are able to make anticipatory adjustments in addition to reactive interventions [Westkämper et al., 2000]. The design principles of reconfigurable module-based production systems are: convertibility, flexibility, scalability, modularity, integrability and diagnosability [Koren et al., 1999; Koren and Shpitalni, 2010]. Dove [2001; 2006] describes in his research concrete practical examples, how plant and machinery can be designed and constructed in a flexible and changeable manner.
2.1 CHANGEABLE, SCALABLE AND DISTRIBUTED
PRODUCTION IN FRANCHISE MODELS
The above mentioned approaches usually have a universal and general character and hardly respond to special operational or organizational forms like franchising. In recent decades the topic of franchising was addressed almost exclusively from the business and legal side [Ahlert, 2001; Sydow, 1994; Bonani, 2004; Dant and Kaufmann, 2003; Dieses, 2004; Elango and Fried, 1997; Kubitscheck, 2000; Kunkel, 1994; Martinek, 2003; Martius, 2008; Metzlaff, 2003; Skaupy, 1995; Skaupy, 2003]. Manufacturing aspects were highlighted only very superficially. While there are a number of practical guidelines on the introduction of franchising and the creation of franchise manuals (e.g. Ahlert [2001]; Kieser [2010]) it is missing entirely a guideline for the planning, design and implementation of geographically distributed production systems within franchise networks.
Only a few authors have done research on production franchising and/or geographically distributed production. The following literature review summarizes the most important works on this argument:
Hayfron et al. [1998] developed firstly rough approaches for the design and implementation of production franchising networks. The authors show, however, only partially the requirements of the technical and organizational design of appropriate production systems.
Unlike licensing systems, a franchise system consists of the transfer of an entire business model and production concept from the franchisor to the franchisee [Bititci and Carrie, 1998]. Carrie et al. [2000] present in their research a few basic requirements for the successful implementation of production franchise models:
The applied technologies and work processes must be established and tested (preferably by means of a pilot production facility)
The model must be easily replicable
The franchisor has the ability and expertise to transfer its know-how and knowledge to its franchisees.
The staff of the franchisee must be able to be trained in an efficient, fast and economical manner.
Hildebrand et al. [2005] developed a so called PLUG+PRODUCE concept, which could be applicable also for franchise models. The research aims were to develop a modular factory concept, which should enable particularly for small and medium enterprises, to expand production without much effort and to move the production facility also to a new location. The research focuses on the design of a standardized “type factory” with the aim of duplicating it without great effort. However, the approach is based on a specific example of the industrial partner in the research project and can therefore be used only as a very limited guide for the design of production systems for franchising models.
Zäh and Wagner [2003] developed in their research project named "Market-oriented production of customized products" a concept of mini-factory structures. The objective of the project was similar to the project PLUG+PRODUCE, to develop a modular concept of a mini-factory for the purposes of mass customization [Reichwald and Piller, 2002]. The design of the mini-factory is based on a modular kit which differentiates in necessary basic modules and optional modules. The requirements for the mini-factories are similar to those from the task of this work, but it is strongly focused on the topic of mass customization. The concept therefore has significant weaknesses to apply for franchising models as there are no recommendations regarding the integration and refinement in a franchise network.
2.2 SYSTEMATIC APPROACH FOR THE DESIGN OF
PRODUCTION SYSTEMS
Cochran developed an approach for the design of production systems, which is based on the principles of the Axiomatic Design approach [Cochran and Kim, 2000; Cochran et al., 2001]. The focus of the methodology is on the derivation of so-called functional requirements (FR), and associated design parameters (DP). Axiomatic Design is a top-down methodology and therefore very systematic and structured. Starting from a main goal, a hierarchically structured catalogue of requirements with proposed solutions is developed. By breaking down (decomposition) of the top goals and design proposals can be identified specific design parameters at operational level. Cochran's methodology "Manufacturing System Design Decomposition" (MSDD) is the graph of the derivative FR-DP tree and very clear and easy to understand. In the background are analysed the interactions between the individual requirements and design parameters in a mathematical way. This results, ultimately, in an ideal sequence to implement the design parameters at the lowest level.
Also ElMaraghy and AlGeddawy [2009] describe Axiomatic Design as a very suitable and frequently used method to derive the target system as well as the requirements and evaluate the interactions of the identified requirements in a systematic way.
Bergmann applies the MSDD-methodology and thus the Axiomatic Design approach for the derivation of

- 3 -
requirements for a sustainability-oriented holistic production system [Bergmann, 2010]. The work of Bergman proves once again, that the application of the Axiomatic Design methodology is suitable for a systematic and structured derivation of requirements and design parameters.
2.3 RESEARCH GAP AND NEED FOR ACTION
None of the shown approaches in literature, to achieve changeability and reconfigurability in manufacturing, provide information on the specific application in decentralized structures and franchising networks. All the discussed approaches show important and relevant findings for this work but they are only partially suitable and/or only generally formulated.
Thus, it is important to develop a comprehensive approach to the design of changeable and modular production systems for franchise models with geographically distributed production. Due to the property of the Axiomatic Design approach to consider the interactions between the various design elements, in the context of this work is used this method for deriving the requirements and design parameters.
3 SET OF PARAMETERS FOR THE DESIGN OF THE PRODUCTION SYSTEM
The AD-based approach for the determination and derivation of the design parameters can be basically divided into the following five usual steps in AD [Suh, 1990]:
1. Identification of customer attributes (CAs) 2. Transfer of customer needs into functional
requirements (FRs) at the highest level 3. Assignment (“mapping”) of solutions or design
parameters (DP) to the respective functional requirements (FRs). In the assignment, the two axioms of Axiomatic Design to be considered:
- The Independence Axiom in order to reduce the coupling of the system (avoid dependencies between the DPs and other FRs)
- The Information Axiom for the selection of solution alternatives (choose always the “simplest” solution with the least information content)
4. Decomposition (“Zig-Zagging”) into several hierarchical levels (top-down) to move from abstract requirements to concrete design parameters (FR-DP tree)
5. Development and revision of the design matrix.
3.1 CUSTOMER NEEDS AND FUNCTIONAL
REQUIREMENTS ON THE HIGHEST LEVEL
The customer needs in this case study were identified through interviews with management and executives of the franchising company. Based on these interviews, the functional requirement at the highest hierarchical level (level 0), which is the main objective of the production system, was determined:
FR0: Building a network of changeable, scalable and
economic franchise production facilities.
To meet this requirement, (FR0) was assigned on the physical design domain the following solution DP0:
DP0: Changeable and efficient production system for
franchising models. The proposed solution DP0 is formulated very abstractly
and as expected it could not be a sufficient design parameter for the production system. Therefore it is necessary to split the top functional requirement FR0 into more detailed functional requirements at the next level.
3.2 MAPPING AND DECOMPOSITION PROCESS
The mapping and decomposition process, starting from FR0, shows at the first hierarchical level five basic requirements, henceforth called the design fields (DF) of the production system:
FR1 Franchise-suitable and high qualitative products FR2 Franchise-suitable network structure of distributed
production facilities FR3 Changeable, scalable, decentralized and cost-effective
production of products FR4 Affordable supply and logistics FR5 Optimal and standardized processes.
The corresponding solutions to meet these functional requirements are:
DP1 Definition of products and services (assortment) DP2 Franchise model and network structure DP3 Changeable, scalable, replicable and profitable
production units DP4 Efficient supply structure DP5 Franchise process organization.
The design matrix on level 1 shows the influence of the
solutions (DPs) on the functional requirements (FRs):
{
}
[ ]
{
}
(1)
The design matrix shows a decoupled design. The functional requirements are not clearly distinguishable from each other, but can be uncoupled ordering them in a proper sequence. Therefore they show a useful or "good" system design. Figure 1 illustrates the graphical form of the FR-DP tree structure on hierarchy level 1.

- 4 -
Figure 1. FR-DP tree - hierarchy level 1.
In their MSDD approach Cochran et al. [2001] visualize the dependencies between FRs and DPs in the form of arrow connections and align the structure of the FR-DP tree based on the principle that the picture is read from top to bottom (top-down) and from left to right (recommended sequence for iterating the DPs). Because those FR-DP pairs with most interactions with other elements are always located to the left, in the presence of a decoupled matrix, the correct path is necessarily the reading see "from left-to-right".
Starting from the decomposition of the first hierarchy level the decomposition process continues to the next levels. For a better understanding of the approach the decomposition is shown exemplary on one of the identified design fields (DF3-Production unit):
The functional requirement FR3 can be subdivided into three further functional requirements (see Table 1).
Table 1. Decomposition FR3 - level 2.
FR31 Changeability of the production units
DP31 Changeable & replicable production units
FR32 Minimum production costs
DP32 Elimination of non-value added activities
FR33 Minimum overhead costs
DP33 Reduction of assets, fixed capital and overheads
The design matrix shows a decoupled matrix.
{
} [
] {
} (2)
DP31 is concerned with the adaptability and replicability of the production units, but needs a further decomposition to be broken down into more concrete proposals for solutions (see Table 2).
Table 2. Decomposition FR31 - level 3.
FR311 Changeability and flexibility of machines
DP311 Design guidelines of changeable machines
FR312 Gradual expansion of the production capacity
DP312 Modular expansion levels (capacity, resources, layout)
FR313 Minimizing the effort for the realization of a new production
DP313 Replicability of the production unit without effort
The design matrix for FR31-DP31 is thus a triangular
matrix and must be decoupled by the correct sequence.
{
} [
] {
} (3)
The design guidelines for changeable manufacturing systems and equipment (DP311) are based fundamentally on the changeability enablers: universality, mobility, scalability, modularity and compatibility [ElMaraghy and Wiendahl, 2009]. Table 3 shows the decomposition of FR311.
Table 3. Decomposition FR311 - level 4.
FR3111 Easily shifting and movement of machines
DP3111 Mobility by locally unrestricted machines (wheels, ...)
FR3112 Universal use of the machines
DP3112 Universal and flexible machines and work processes
FR3113 Simply linking the machines
DP3113 Compatibility with standard interfaces
The design matrix is again a triangular matrix (decoupled)
and must be decoupled by the correct sequence.
{
} [
] {
} (4)
The same procedure was applied in the decomposition process for all other design fields and levels.
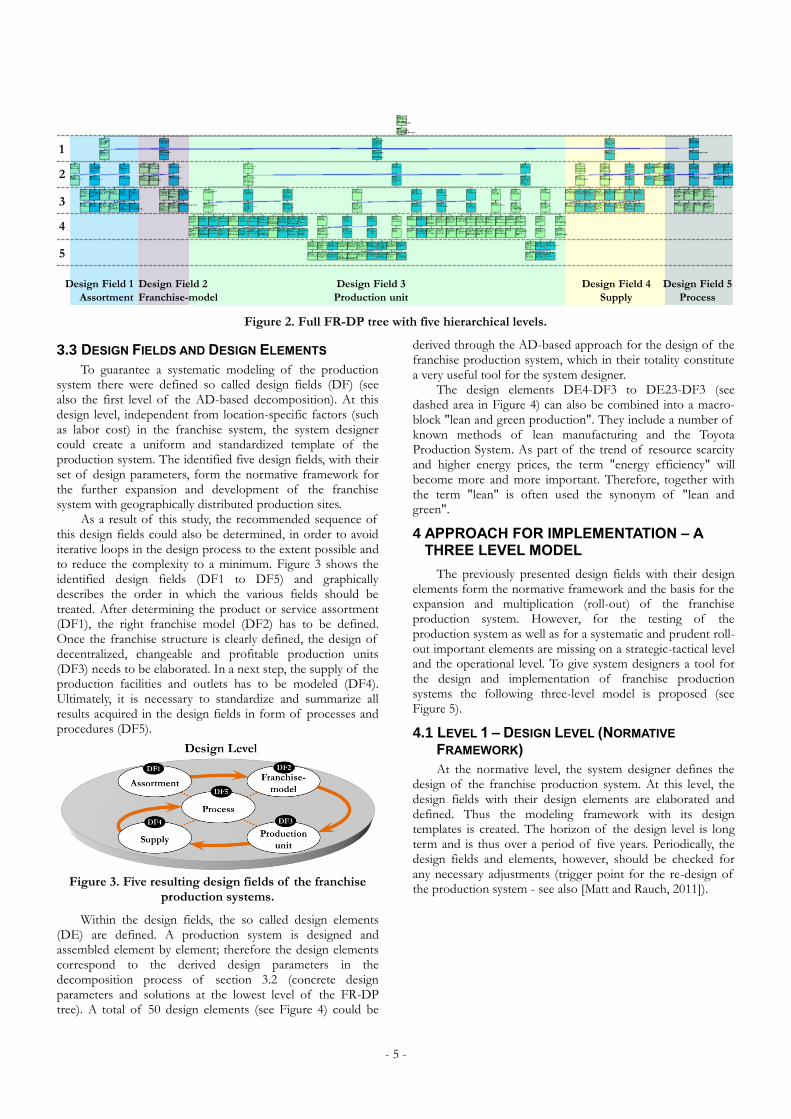
The result of the iterated decomposition process is the FR-DP tree with concrete design parameters at the lowest level (see Figure 2). In this work, the software Acclaro DFSS was used to create the design matrix and the FR-DP tree as well as to do a digitally assisted review and check of the independence axiom. The entire FR-DP tree consists of five hierarchy levels. FR-DP pairs marked with blue and the blue lines between DPs and FRs represents a path-dependent approach (decoupled). The FR-DP tree has to be read from left to right. Therefore this AD-based sequence in the FR-DP tree is also a recommendation for the sequencing of the various design parameters.
- 5 -
Figure 2. Full FR-DP tree with five hierarchical levels.
3.3 DESIGN FIELDS AND DESIGN ELEMENTS
To guarantee a systematic modeling of the production system there were defined so called design fields (DF) (see also the first level of the AD-based decomposition). At this design level, independent from location-specific factors (such as labor cost) in the franchise system, the system designer could create a uniform and standardized template of the production system. The identified five design fields, with their set of design parameters, form the normative framework for the further expansion and development of the franchise system with geographically distributed production sites.
As a result of this study, the recommended sequence of this design fields could also be determined, in order to avoid iterative loops in the design process to the extent possible and to reduce the complexity to a minimum. Figure 3 shows the identified design fields (DF1 to DF5) and graphically describes the order in which the various fields should be treated. After determining the product or service assortment (DF1), the right franchise model (DF2) has to be defined. Once the franchise structure is clearly defined, the design of decentralized, changeable and profitable production units (DF3) needs to be elaborated. In a next step, the supply of the production facilities and outlets has to be modeled (DF4). Ultimately, it is necessary to standardize and summarize all results acquired in the design fields in form of processes and procedures (DF5).
Figure 3. Five resulting design fields of the franchise production systems.
Within the design fields, the so called design elements (DE) are defined. A production system is designed and assembled element by element; therefore the design elements correspond to the derived design parameters in the decomposition process of section 3.2 (concrete design parameters and solutions at the lowest level of the FR-DP tree). A total of 50 design elements (see Figure 4) could be
derived through the AD-based approach for the design of the franchise production system, which in their totality constitute a very useful tool for the system designer.
The design elements DE4-DF3 to DE23-DF3 (see dashed area in Figure 4) can also be combined into a macro-block "lean and green production". They include a number of known methods of lean manufacturing and the Toyota Production System. As part of the trend of resource scarcity and higher energy prices, the term "energy efficiency" will become more and more important. Therefore, together with the term "lean" is often used the synonym of "lean and green".
4 APPROACH FOR IMPLEMENTATION – A THREE LEVEL MODEL
The previously presented design fields with their design elements form the normative framework and the basis for the expansion and multiplication (roll-out) of the franchise production system. However, for the testing of the production system as well as for a systematic and prudent roll-out important elements are missing on a strategic-tactical level and the operational level. To give system designers a tool for the design and implementation of franchise production systems the following three-level model is proposed (see Figure 5).
4.1 LEVEL 1 – DESIGN LEVEL (NORMATIVE
FRAMEWORK)
At the normative level, the system designer defines the design of the franchise production system. At this level, the design fields with their design elements are elaborated and defined. Thus the modeling framework with its design templates is created. The horizon of the design level is long term and is thus over a period of five years. Periodically, the design fields and elements, however, should be checked for any necessary adjustments (trigger point for the re-design of the production system - see also [Matt and Rauch, 2011]).
1
2
3
4
5
Design Field 1
Assortment
Design Field 2
Franchise-model
Design Field 3
Production unit
Design Field 4
Supply
Design Field 5
Process

- 6 -
Figure 4. 50 design elements (DE).
4.2 LEVEL 2 – PLANNING LEVEL (STRATEGIC-TACTICAL FRAMEWORK)
Once, the design parameters or elements for modeling the production system are developed on the design level, they have to be tested through the realization of a pilot production unit. The first step in the strategic and tactical planning level is planning and implementation of a pilot plant. The pilot production unit, which is operated by the franchisor itself, has to test and develop new products and production technologies. Once, the pilot production is consolidated by iterative feedback to the design and operational level and the profitability of the business model has been proven, finally the multiplication of the production units and thus the roll-out of the franchise model can be started. Before the start of the roll-out a multi-year scenario plan or business plan is being developed. This business plan includes not only the potential regions and countries, but also the number of planned outlets and production units as well as the time line for its implementation. The time horizon for this level includes the strategic planning in a time frame of three to five years and an annual, detailed tactical planning and budgeting.
4.3 LEVEL 3 – OPERATIONAL LEVEL (OPERATIONAL
FRAMEWORK)
The operational level comprises the implementation of the production units and the operational tasks of the franchisor with all his responsibilities. Of particular importance is that before the start of the roll-out, all processes and operational issues (e.g. ordering procedure in the outlets and production units, integrated data management, process for product development, etc.) are tested and examined in the pilot production. As shown in Figure 5, iterative feedback loops ensure that only a functional and viable production and franchise system is transferred to the franchisee. If not, there is a risk of failure of the franchisee and of the entire business model. The time horizon for the operational level is dominated through "daily business" and therefore shorter than one year.
4.4 FEEDBACK LOOP (RE-DESIGN AND RE-PLANNING)
As described in Figure 5, between the different levels there is an iterative feedback loop, similar to a control loop, to transfer the experiences from the pilot production unit to the other levels while "adjusting" and consolidating the production system. Between the different levels, we can distinguish two types of feedback loops or trigger-points:
Feedback loop on the design level ("re-design")
Feedback loop on the planning level ("re-planning"). The experience gained from the pilot production unit, as
well as its reconfigurations, is transferred through the iterative feedback loops to new production units (roll-out). By the above described regular and systematic feedback loops and the continuous adaptation of the design level the ability to change and adapt, the entire production system can be guaranteed.
Quality Standards
DE1-DF1
Business model
DE1-DF2
Master
FranchisingSingle-Unit-
Franchising
Multi-Unit-
Franchising
KernsortimentWahl-sortiment Lokales
Sortiment
DE2-DF1
Assortment
Modules
Know-how-
Protection
Premix
DE3-DF1
Standard Outlet
DE2-DF2
Network design
DE3-DF2
Changeability
Guidelines
A B CDE1-DF3
Modular expansion
levels
PRODPRODPRBasis-
Unit
Ausbaustufe 1
Ausbaustufe …
Ausbaustufe n
Inve
stit
ion
Output (Kapazität)
DE2-DF3
Replicability of
production units
DE3-DF3
Ergonomic material
supply
DE9-DF3 DE10-DF3
Material at lineOptimal transport
lot sizes
DE11-DF3
FMEA, Zero Error
and Poka Yoke
DE13-DF3 DE14-DF3
Material-oriented
layoutone-piece-flow
DE15-DF3
Line Balancing
DE5-DF3 DE6-DF3
Multiple machine
operation
Separation operat.
& supply activities
DE7-DF3
KISS („keep it
smart and simple“)
DE12-DF3
Appropriate
technology
DE16-DF3
Ergonomic
workstations
DE8-DF3
Quick Changeover
(SMED)
DE4-DF3
Awareness /
employee rules
DE21-DF3 DE22-DF3
JIT, Kanban and
optimal lot sizes
Low Work in
progress
DE23-DF3
Total Cost of
Ownership (TCO)
DE25-DF3 DE26-DF3
Lean and paperless
officeOutsourcing
DE27-DF3
Minimizing
process time
DE17-DF3
Total Productive
Maintenance
DE18-DF3
Leasing for
equipment/build.
DE24-DF3
extern Intern (Stillstand) extern
extern Intern extern
Sta
tio
n 1
Sta
tio
n 2
Sta
tio
n 3
Sta
tio
n 4
Taktzeit
An
lage
np
rod
ukti
vitä
t
Auto
n. I
nst
and
hal
tun
g
Gep
l. In
stan
dh
altu
ng
Tra
inin
g
Kai
zen
, KV
P
Ken
nza
hle
n
Energy-efficient
equipment
DE19-DF3
Energy
Energy-efficient
buildings
DE20-DF3
purchase operation disposal
EDV
Lean
Hierarchy
Visual
Management
EDV-
Administration
…
Maintenance
Franchise manual
DE1-DF5
ERP
software
ERP-System
DE2-DF5
Material
specifications
DE1-DF4 DE2-DF4
Centralized
purchasing
Local procurement
policy
DE3-DF4
Transport aids
DE5-DF4
Location
Assessment Team
DE3-DF5
Franchise-
Helpdesk
DE5-DF5
Regular trainings
DE6-DF5
CIP – Continuos
Improvement
DE7-DF5
Initial Training
DE4-DF5
Franchise-Audits
DE8-DF5
Do
Act
Plan
Check
Delivery times and
tour schedule
DE4-DF4
Warehouse and
security stock
DE6-DF4
Re-order points
DE7-DF4
Warehouse
equipment
DE8-DF4
Make-Or-Buy
DE9-DF4
In-House Outsourcing
DF1
Ass
ort
men
tF
ran
ch
ise-
mo
del
DF2
Pro
du
cti
on
un
it
DF3
DF4
Su
pp
ly
DF5
Pro
cess

- 7 -
Figure 5. Three-level model for the design, planning and operation of a franchise production system.
5 APPLICATION IN A CASE STUDY
The shown approach was developed and applied in a real case study and subjected to validation. The company in the case study is a new Italian franchise brand, which began its activities several years ago with the opening of its first own outlets. The business idea is based on the concept of coffee shops with an integrated shop. The specialty of the company in the case study is the combination of coffee shop and self-made products in the shop.
For the production of its own products, the company has established in advance an own pilot production unit, which first developed and produced in a traditional manner the products for the pilot market. With an increasing pilot market also the pilot production developed the industrial production methods. After the initial experience with the pilot production and outlets in the pilot market, the company pursued the vision of an international chain of franchise outlets and started at the end of 2010 a project for the development of a concept for global expansion and the related supply of the outlets. Due to the required freshness of the products and the limited shelf life and because of possible local needs of customers in the target countries, the company decided to produce with geographically distributed franchise production units. The case study showed very clearly, that the implementation of such a franchise system without a suitable methodology would take very long and can be disturbed by frequent iterative loops in the planning and design phase. The approach described in the paper was applied in the case study and was very helpful for the company. Through the approach, not only the design parameters for the production system could be defined, but also a simple and systematic approach for its implementation was developed.
6 CONCLUSION
By the "top-down" AD-based approach and the decomposition process a holistic overview of the requirements and design options was created. In addition, through the application of the methodology and the consideration of the Independence Axiom the correct sequence for the determined design parameters could be identified. By the presented three-level model system designers can find for the first time a complete and technically, economically as well as organizational aligned model for the design and implementation of changeable production systems in franchising. With this model, a scientific contribution is made to close the demonstrated research gap shown in section 2.3.
The application in the case study showed that the one-time expense and effort in the AD decomposition, to develop the design fields and to create the normative framework on the design level is not negligible, but then offers great benefits through a quick and high-quality design, planning and implementation of the production system in franchise models. In summary it can be said that the objective of this work was accomplished and the system designer with the presented approach receives a useful tool for the successful design and implementation of changeable and modular production systems for franchising models.
Further research will be done to investigate and define the trigger points for regular adaptation of the production system in a systematic way.
Design Level
Planning Level
Operational Level
Purchasing Logistics
PPS Controlling
Sales R&D
Marketing Production
SCMOutlet
Mgmt.…. ….
Iterative
Feedback
loop
Iterative
Feedback
loop
SupplyProduction
Unit
AssortmentFranchise-
model
Process
Production
Unit 1
Production
Unit 3Production
Unit n
Production
Unit 2Pilot-
Production
Unit
Roll-Out
Transfer
Transfer

- 8 -
7 REFERENCES
[1] Ahlert D., Handbuch Franchising and Cooperation. Das Management kooperativer Unternehmensnetzwerke (in German), Neuwied und Kriftel, Germany: Luchterhand, 2001. ISBN 3-47-204511-6
[2] AlGeddawy T., ElMaraghy H.A., “Changeability Effect on Manufacturing System Design”, in Changeable and Reconfigurable Manufacturing Systems, H. ElMaraghy (ed.), London: Springer Verlag, pp. 267-280, 2009.
[3] AZFranchises: Quick Franchise Facts, Franchising Industry Statistics, published online: URL: http://www.azfranchises.com/franchisefacts.htm, 07.10.2012.
[4] Bergmann L., Nachhaltigkeit in Ganzheitlichen Produktionssystemen (in German), Essen, Germany: Vulkan, 2010. ISBN 3-8027-8309-8
[5] Bititci U.S., Carrie A.S., “Strategic Management of the Manufacturing Value Chain”, Conference of the Manufacturing Value-Chain, Troon, Scotland UK, Aug. 26-28., 1998.
[6] Bonani G., Guida al Franchising – come diventare Affiliato (in Italian), Milan, Italy: FrancoAngeli, 2004. ISBN 88-464-5744-7
[7] Bruccoleri M., Lo Nigro G., Perrone G., Renna P., Noto La iega S., “ roduction planning in reconfigurable enterprises and reconfigurable production systems, CIRP Annals Manufacturing Technology, Vol. 54, No. 1, pp. 433–436, 2005.
[8] Carrie A.S., Hayfron L.E., Bititci U.S., “Is Franchising the future of Global Manufacture?”, 2000 IEEE Engineering Management Society, Albuquerque (NM), Aug. 13-15, pp. 260-265, 2000.
[9] Castro L.M., Mota J., Marnoto S.: “Towards a Networks Perspective of Franchising Chains”, Service Business, Vol. 3, pp. 15-30, 2009.
[10] Cochran S., Kim Y.-S., “Teaching Production system design with the Axiomatic Design methodology”, 1st International Conference on Axiomatic Design (ICAD), Cambridge (MA), Jun. 21-23, pp. 42-47, 2000.
[11] Cochran S., Arinez J. ., uda J.W., Linck J., “A decomposition approach for manufacturing system design”, International Journal of Manufacturing Systems Vol. 20, No. 6, pp. 371-389, 2001.
[12] Dant R.P., Kaufmann P.J., “Structural and strategic dynamics in franchising”, Journal of Retailing, Vol. 79, No. 2, pp. 63-75, 2003.
[13] Dieses P., Zukunft des Franchising in Deutschland (in German), Frankfurt, Germany: Peter Lang Verlag, 2004. ISBN 3-631-52124-3
[14] Dove R., “Design Principles for Highly Adaptable Business Systems, with Tangible Manufacturing Examples”, in Maynard's Industrial Handbook, K. Zandin, H. Maynard (ed.), New York: McGraw Hill, pp. 9.3-9.26, 2001.
[15] Dove R., “Engineering Agile systems: creative-guidance frameworks for requirements and design”, 4th annual
conference on systems engineering research (CSER), Los Angeles (CA), Apr. 7-8, 2006.
[16] Elango B., Fried V.H., “Franchising research: A literature review and synthesis”, Journal of Small Business Management, Vol. 35, No. 3, pp. 68-81, 1997.
[17] ElMaraghy H. and Wiendahl H.- . , “Changeability – An introduction” in Changeable and econfigurable Manufacturing Systems, H. ElMaraghy (ed.), London: Springer Verlag, pp. 3-24, 2009.
[18] Hayfron L.E., Carrie A.S., Bititci U.S., Pandya K.V., “Manufacturing franchising: transferring the service experience”, Responsiveness in Manufacturing, IEE Workshop (Digest No. 1998/213), IEE, 1998.
[19] Hernández Morales R.: Systematik der Wandlungsfähigkeit in der Fabrikplanung (in German), Düsseldorf: VDI-Verlag, 2002. ISBN 3-18-314916-8
[20] Hildebrand T., Mäding K., Günther U., PLUG+PRODUCE Gestaltungsstrategien für die wandlungsfähige Fabrik (in German), Chemnitz, Germany: IBF, 2005. ISBN 3-00-016076-0
[21] Kieser W., “Franchising - Wachstumschancen für KMU: Ein Leitfaden für Franchisegeber“ (in German), Wiesbaden, Germany: Gabler, 2010.
[22] Koren Y., Heisel U., Jovane F., Moriwaki T., Pritschow G., Ulsoy G., Van Brussel H., “Reconfigurable Manufacturing Systems”, Annals of the CIRP, Vol. 48, No. 2, pp. 527-540, 1999.
[23] Koren Y., Shpitalni M., “Design of reconfigurable manufacturing systems”, Journal of Manufacturing Systems, Vol. 29, No. 4, pp.130-141, 2010.
[24] Kubitschek C., Franchising. Effizienzvergleich mit alternativen Vertriebskonzepten (in German), Wiesbaden, Germany: Deutscher Universitätsverlag, 2000. ISBN 3-8244-7085-3
[25] Kunkel M., Franchising und asymmetrische Informationen. Eine institutionenökonomische Untersuchung (in German), Wiesbaden, Germany: Deutscher Universitätsverlag, 1994. ISBN 3-8244-6069-6
[26] Martinek M., „Erscheinungsformen von Vertriebsverträgen“, in Handbuch des Vertriebsrechts (in German), M. Martinek, F.-J. Semler, (ed.), Munich: C.H. Beck, pp. 97-111, 2003.
[27] Martius W., Fairplay Franchising: Spielregeln für partnerschaftlichen Erfolg (in German), Wiesbaden, Germany: Gabler, 2008. ISBN 3-8349-0898-8
[28] Matt D.T., “Functional periodicity as a concept for the (re-)design to agility of production systems”, Production Engineering – Research & Development, Vol. 4, No. 4, pp. 363-369, 2010.
[29] Matt D.T., Rauch E., “Continuous Improvement of Manufacturing Systems with the Concept of Functional Periodicity”, Key Engineering Materials, Vol. 473, pp. 783-790, 2011.
[30] Matt D.T., Rauch E., “ esign of a network of scalable modular manufacturing systems to support geographically distributed production of mass customized goods”, 8th CIRP Conference on Intelligent Computation in

- 9 -
Manufacturing Engineering (ICME 2012), Naples, Jul. 18-20, 2012.
[31] Metzlaff K., “Typischer Inhalt eines Franchisevertrages“, in Praxishandbuch Franchising (in German), K. Metzlaff (ed.), Munich, Germany: C.H. Beck, S. 43-214, 2003.
[32] Nyhuis P., Heins M., Pachow-Frauenhofer J., Reinhart G., Krebs P., Abele E., Wörn A., “Wandlungsfähige Produktionssysteme – Fit sein für die Produktion von morgen“ (in German), ZWF Zeitschrift für wirtschaftlichen Fabrikbetrieb, Vol. 103, No. 5, pp. 333-337, 2008.
[33] O Monye S.: “Transaction costs and the Internationalization of Business Franchising”, in Research Papers in International Business, Paper Number 1-97, London: South Bank University, 1997.
[34] Park H.-S., Choi H.-W., “Development of a modular structure-based changeable manufacturing system with high adaptability”, International Journal of Precision Engineering and Manufacturing, Vol. 9, No. 3, pp. 7-12, 2008.
[35] Reichwald R., Piller F., „Der Kunde als Wertschöpfungspartner: Formen und Prinzipien“, in Wertschöpfungsmanagement als Kernkompetenz (in German), H. Albach, B. Kaluza, W. Kersten, (ed.), Wiesbaden, Germany: Gabler, pp. 27-52, 2002.
[36] Reinhart G., Krüger A., Prasch M., “Stückzahl- und Variantenflexible Montage“, in Die wandlungsfähige Fabrik (in German), H.-P. Wiendahl (ed.), Hannover, Germany: IFA, pp. 183-215, 2003.
[37] Skaupy W., Franchising. Handbuch für die Betriebs- und Rechtspraxis (in German), Munich, Germany: Vahlen, 1995. ISBN 3-8006-1690-4
[38] Skaupy W., „Grundlagen“, in Praxishandbuch Franchising (in German), K. Metzlaff (ed.), Munich, Germany: C.H. Beck, pp. 1-19, 2003.
[39] Spath D., “Lean und intelligent produzieren – aber wie?“, in Modellfabrikforum 2006 – Ganzheitliche Gestaltung
wettbewerbsfähiger Produktionssysteme (in German), Stuttgart, Germany, IAO, pp. 1-51, 2006.
[40] Suh N.P., The Principles of Design, New York: Oxford University Press, 1990. ISBN 0-19-504345-6
[41] Sydow J., “Franchisingnetzwerke. Ökonomische Analyse einer Organisationsform der Dienstleistungsproduktion und -distribution“ (in German), Zeitschrift für Betriebswirtschaft, Vol. 64, No. 1, pp. 95-113, 1994.
[42] Versaevel B.: “Coordination costs and vertical integration in production franchise networks: a common agency model”, Research in Economics, Vol. 56, No. 2, pp. 157-186, 2001.
[43] Westkämper H.-P., Zahn E., Balve P., Tilebein M., “Ansätze zur Wandlungsfähigkeit von Produktionsunternehmen. Ein Bezugsrahmen für die Unternehmensentwicklung im turbulenten Umfeld“ (in German), wt Werkstattstechnik online, Vol. 90, No. 1/2, pp. 22-26, 2000.
[44] Wiendahl H.-P., Heger C.L., “Justifying changeability – a methodical approach to achieving cost effectiveness”, CIRP 2nd international conference on reconfigurable manufacturing, Ann Arbor (MI), Aug. 20-21, 2003.
[45] Wiendahl H.-P., ElMaraghy H.A., Nyhuis P., Zäh M.F., Wiendahl H.-H., Duffie N., Brieke M., “Changeable Manufacturing – Classification, Design and Operation”, CIRP Annals – Manufacturing Technology, Vol. 56, No. 2, pp. 783-809, 2007.
[46] Yusuf Y.Y., Sahardi M., Gunasekaran A., “Agile manufacturing: the drivers, concepts and attributes”, International Journal of Production Economics, Vol. 62, No. 1/2, pp. 33-43, 1999.
[47] Zäh M.F., Wagner W., “Planning Minifactory Structures for the Close-to-Market Manufacture of Individualized Products”, 2nd Interdisciplinary World Congress on Mass Customization and Personalization, Munich, Germany, Oct. 6-8, 2003.

Proceedings of ICAD2013 The Seventh International Conference on Axiomatic Design
Worcester – June 27-28, 2013
ICAD-2013-02
- 10 -
ABSTRACT
The performance of a hybrid (bolted/bonded) joint depends on many parameters and its design becomes complex when the design aims to create a synergy between these two joining methods which are commonly used for composite plates. In this paper, Axiomatic Design is applied to analyze the parameters that influence the load transfer between the different components of the joint as well as the maximum stress in the adhesive. A first decomposition of the joint into functional requirements and design parameters leads to a coupled design. A decoupled design is obtained through the reordering and reformulation of both functional requirements and design parameters. The design matrix is then used to propose a new design through physical integration of the design parameters. Comparison between this new design and baseline geometry shows a reduction in the maximal stress concentration inside the joint. This improvement should result in higher load transfer capability while maintaining similar dimensions.
Keywords: hybrid composite joint, bonded, bolted, Axiomatic Design, design decomposition.
1 INTRODUCTION
Nowadays, aircraft design tends towards a more extensive use of composite materials as a high strength to weight ratio directly impacts the desired performance. However, the joining of parts made of composite materials is a complex matter. Drilling holes for bolts or rivets in fibrous materials can lead to delamination or reduced strength. The addition of mechanical fasteners can also significantly increase the weight of a structure. This is partially why bonding of composite materials has become very popular. Bonded joints offer higher strength to mass ratios as well as higher static and fatigue strength than other joining methods [Chan, 2001]. However, in an attempt to further improve the performance of bonded joints as well as for aeronautical certification purposes, research on the combination of bonded joints with bolts or rivets, called hybrid joints, has become of major interest.
In this paper, an analysis of the couplings between the different design parameters of a hybrid joint is performed through an Axiomatic Design procedure. In section 1, a background on the performance of hybrid joints is presented according to a literature review. Then, in section 2, an Axiomatic Design decomposition is used to evaluate the
different functional requirements and design parameters involved in the design of a hybrid joint. This work also presents the steps required to remove unnecessary coupling inside the design matrix. Section 3 presents a new design obtained through physical integration based on the decoupled matrix from section 2. Finally, in section 4, the new design is analysed and compared to the initial geometry in order to validate the results.
2 LITERATURE REVIEW
2.1 STRENGTH AND LOAD TRANSFER IN HYBRID
JOINTS When designing a mixed technology of joining, one of
the goals is to benefit from the strengths of each joining method or simply to improve the performance of the first one by adding additional joining methods. The distribution of the loading within the joint is one of the main issues the research emphasises. Thus, one of the most important studies was performed by Hart-Smith [1985] who conducted an analytical study of the performance of a bonded/bolted composite to titanium stepped lap-joint. Using a high rigidity adhesive, the author predicted that the adhesive would transfer up to 98% of the external load. When using a low rigidity adhesive, Kelly [2006] showed that, in a single bolt single-lap hybrid joint, the bolt could transfer up to 32% of the external load. With similar results, Kweon et al. [2006] concluded that, for low strength adhesive, the addition of bolts greatly increases the strength of the joint while, for high strength adhesive, it is almost without results.
In the case of high rigidity adhesive, the bolts start transferring load only after the initial failure of the adhesive, thus helping to slow down the crack propagation [Hart-Smith, 1985]. This mechanism confers higher rigidity of hybrid joints at high external loads as well as improved fatigue life compared to bonded joints [Kelly, 2005; 2006]. Moreover, the addition of bolts in a bonded joint can also ensure structural integrity even after complete adhesive failure [Sawa et al., 1989].
Many authors [Bois et al., 2011; Oterkus et al., 2007; Paroissien et al., 2006; 2007] worked on promising analytical models to predict the stress distribution and the load transfer distribution in the joint. However, the use of linear material properties in the definition of these models reduces their usefulness without systematic comparison with test results or finite element analysis results.
DESIGN IMPROVEMENT OF HYBRID COMPOSITE JOINTS BY AXIOMATIC DESIGN
Marc Ouellet [email protected]
Department of Mechanical Engineering Polytechnique de Montréal
2500 Chemin de Polytechnique, Montréal Québec, Canada
Aurelian Vadean [email protected]
Department of Mechanical Engineering Polytechnique de Montréal
2500 Chemin de Polytechnique, Montréal Québec, Canada

- 11 -
Kumar et al. [2010] proposed an innovative new single lap hybrid joint configuration by adding bonded aluminum specimens in the overlap. These specimens served as additional load paths. The author obtained a 60% increase in the specific strength (load/mass) of these new joints compared to bonded joints.
2.2 FAILURE MECHANISMS OF HYBRID JOINTS Another major issue influencing the design choices of a
composite hybrid joint is its specific failure mechanisms. When in-plane loading occurs in a single-lap hybrid joint, one may isolate the different types of generated stress shown in Figure 1. For this type of joint, the load paths in both flat plates are not in the same plane. This offset of the load paths introduces a secondary bending of the adherents. This secondary bending generates peel stress in the adhesive layer, which is maximal near the edge of the overlap [Kelly, 2005]. The external load also generates shear stress which is the principal load transfer mechanism of the adhesive layer. Finally, bearing stress develops as the contact between the bolts and the adherents occurs.
Figure 1. Principal stress in a single-lap hybrid joint.
In most single-lap hybrid joints, failure follows as a result of crack initiation in the adhesive layer due to high peel stress at the edge of the overlap [Kelly, 2006]. Therefore, reducing the maximal peel stress is an important goal in hybrid joint design. Stewart [1997] has shown that the joint strength can be increased by changing the stacking sequence in composite laminates. By placing the 0 degree ply closer to the adhesive, the joint static strength can be improved due to the increased bending stiffness of the adherents. Tapered edges can also increase the joint strength by lowering the free-edge interlaminar stresses in the adherents [Lin and Jen, 1999].
Fu and Mallick [2001] also found how bolt pretension can help to increase the static strength as well as fatigue performance in structural reaction injection molded (SRIM) composites. In their experiments, the authors showed that the addition of bolt pretension served to apply a compressive force in the adhesive layer. This compressive force has proven effective in reducing or even stopping crack propagation in the adhesive. However, the bolt pretension proved effective in delaying crack initiation only if the pretention was applied with the use of thick washers covering the entire overlap region.
Chan [2001] evaluated the stress concentration in hybrid composite joints. The author concluded that stress concentration is reduced in hybrid joints compared to bolted
joints. Also, hybrid joints showed very low compressive bearing stress. It is suggested that joint failure by bearing stress is unlikely.
Lees and Makarov [2004] investigated the possibility to combine a mechanical system with a bonded system to obtain a more efficient joint than each separate system for use in piping. A right configuration of pin/bonded joint makes certain the joint failed outside of its overlap. They also noticed higher elongation at failure than for bonded or mechanically fastened joints alone.
3 DESIGN OF HYBRID JOINTS USING AXIOMATIC DESIGN
3.1 PROBLEM DEFINITION The following section will identify the functional
requirements and design parameters [Suh, 1990; 2001] involved in the design of a hybrid joint. Once an uncoupled design matrix is obtained, physical integration will be used to propose a new design. To validate the results, a comparison of the new design with a traditional geometry is performed. To achieve this, the coupling in a single lap hybrid joint will be analysed. This particular joint geometry has been chosen due to the high amount of available research. The initial problem can then be stated at the top level of functional requirement and design parameter as follows:
FR0 = Join two flat plates in composite materials DP0 = Single lap hybrid joint
3.2 FIRST LEVEL OF DECOMPOSITION The main goal of this research is to improve the
performances of the joint by effectively using the advantages of both joining methods in the same joint. By doing so, the maximal load that can be transferred should increase. To achieve this, the functional requirements will mostly concern load transfer and failure mechanisms. The first level of functional requirements is then defined as:
FR1 = Maximize the bolt load transfer capacity FR2 = Delay adhesive failure (crack initiation and propagation) FR3 = Minimize the secondary bending FR4 = Uniformly distribute the load inside the joint
Based on the literature review presented in section 2, the
corresponding design parameters are:
DP1 = Contact between the bolts shank and the flat plate holes DP2 = Clamping force (compression stress) DP3 = Bending stiffness of flat plates DP4 = In-plane rigidity of the joint
The design matrix obtained after the first level of
decomposition is shown in Figure 3. At this stage in the FR-DP decomposition of this problem, no coupling is apparent.

- 12 -
Figure 3. FR-DP matrix of first level decomposition.
3.3 SECOND LEVEL OF DECOMPOSITION The second level of decomposition is obtained through
the zigzagging process [Suh, 2001]. Each child must be defined based on its parent FR and its corresponding DP. For each FR, two children must be defined. Their definition is based on the knowledge that bolt load transfer in a hybrid joint is mostly the result of the contact between the shank and the flat plates, which generates bearing stress. McCarthy [2005] also showed that if there is a bolt-hole clearance in a bolted joint, the bolts start transferring load only once the relative displacement between the flat plates is high enough to bring the bolt shank into contact. Based on these observations, the second level of functional requirements for FR1 can be defined as: FR1.1 = Maximize the capacity of bolt load transfer through bearing stress FR1.2 = Minimize the delay in bolt load transfer For these functional requirements, the following design parameters are defined:
DP1.1 = Bolt diameter DP1.2 = Bolt hole clearance
For the second functional requirement (delay adhesive
failure), the clamping force needs to be applied on the flat plates and distributed on the largest possible area. The functional requirements for the second level can then be stated as:
FR2.1 = Distribute the compressive stress (near the edge of the overlap) FR2.2 = Ensure a compressive stress The corresponding design parameters are then: DP2.1 = Compression stress distributor (large base of bolt head or washer) DP2.2 = Bolt pretension
To minimize the secondary bending (FR3), two children
are identified. The first one requires increasing the bending stiffness. However, since the secondary bending is the result of an offset between the load paths of both flat plates, it is possible to reduce the secondary bending by reducing the bending moments generated by the external load. The second level of decomposition for FR3 then becomes:
FR3.1 = Increase bending stiffness FR3.2 = Minimise secondary bending moments
The following design parameters are then defined: DP3.1 = Flat plates' thicknesses DP3.2 = Positioning of neutral axis (i.e. composite stacking sequence)
Finally, to improve the load distribution inside the joint (FR4), a study can be performed following several physical sections. In the case of a joint with multiple bolts, the joint can be split in two general sections; the zones between the bolts and the zones between the bolts and the free edges. In general, shear stress tends to be higher near the free edges [Lees and Makarov, 2004]. To reduce the stress level in these zones, some of the load should be redirected between the bolts. The two following functional requirements are thus derived:
FR4.1 = Increase the adhesive load transfer between the bolts FR4.2 = Reduce the load transfer near the free edges The corresponding design parameters are: DP4.1 = Different adhesive between the bolts DP4.2 = Reduced flat plate rigidity near the free edges.
The final matrix of the hybrid joint is shown in Figure 4. The position of the coupling between the different parameters of the joint results in a coupled matrix. The amount of coupling in this matrix makes it impossible to obtain a decoupled matrix by reorganizing the FR-DP order without redefining the FRs or DPs.
Figure 4. FR-DP matrix of second level decomposition.
4 REMOVING DESIGN COUPLING
4.1 FIRST LEVEL OF DECOMPOSITION To reduce the coupling between the children of FR1 and
the other FRs, it is necessary to review some FRs and DPs. The approach we propose is to remove FR1.1 (maximize the capacity of bolt load transfer through bearing stress). Following the Hart-Smith [2003] guidelines when addressing bearing stress in bolted composite joints, the diameter of a bolt should be close to the thickness of the laminates for

- 13 -
thicknesses below 10mm. Also, since an FR cannot have only one child [Suh, 2001], FR1.2 (minimize the delay in bolt load transfer) can be reorganised as a child of FR4 (in-plane rigidity of the joint). FR1 is then removed and the first level of decomposition becomes: FR1 = Delay adhesive failure (crack initiation and propagation) FR2 = Minimize the secondary bending FR3 = Uniformly distribute the load inside the joint Based on the literature review presented in section 2, the corresponding design parameters can be defined as follows: DP1 = Clamping force (compression stress) DP2 = Bending stiffness of flat plates DP3 = In-plane rigidity of flat plates
The design matrix obtained after the first level of decomposition is shown in Figure 5. At this stage in the FR-DP decomposition of this problem, no coupling is apparent.
Figure 5. FR-DP matrix of first level decomposition (second iteration).
4.2 SECOND LEVEL OF DECOMPOSITION Because there wasn’t any coupling on the top side of the
initial design matrix between FR1 (maximize the bolt load transfer capacity) and FR2 (delay adhesive failure), no modifications were required to FR2’s children. Therefore, after renumbering to FR1, the result is: FR1.1 = Distribute the compression stress (near the edge of the overlap) FR1.2 = Ensure a compressive stress The corresponding design parameters are then: DP1.1 = Compression stress distributor (large bolt head base or washer) DP1.2 = Bolt pretension
The removal of FR1.1 (maximize the capacity of bolt load transfer through bearing stress) from the last iteration has also removed the coupling with DP3.1 (flat plates thickness) and DP3.2 (positioning of neutral axis). Therefore, no modifications are required for FR3 (minimize the secondary bending) and its children. After renumbering to FR2, the result is: FR2.1 = Increase bending stiffness FR2.2 = Minimise secondary bending moments
DP2.1 = Flat plates thickness DP2.2 = Positioning of neutral axis
The last functional requirement now has a third child,
which is FR1.2 (minimize the delay in bolt load transfer) from the last iteration. Because of the existing coupling between DP4.1 (different adhesive between the bolts) and DP4.2 (reduced flat plate rigidity near the free edges) from the last iteration, DP1.2 has been renamed to: minimal bolt hole clearance. By doing so, the effect of DP4.1 and DP4.2 will be very limited and the coupling can be removed. However, this will be achieved only if the corresponding process variable can ensure a tight tolerance during manufacturing and assembling.
Finally, because of the coupling between FR4.1 and FR4.2, it has been decided to rename FR4.2 to specify that the reduction in rigidity near the free edges is required. By renaming DP4.2 to a more specific solution (tapered edges), an uncoupled design can be achieved. The final solution is then: FR3.1 = Minimize the delay in bolt load transfer FR3.2 = Increase the adhesive load transfer between the bolts FR3.3 = Reduce flat plate rigidity near the free edges DP3.1 = Minimal bolt hole clearance DP3.2 = Stiffer adhesive between the bolts DP3.3 = Tapered edges
Figure 6 shows the final design matrix obtained after the FR-DP decomposition. The final result is a decoupled matrix. Based on this decomposition, physical integration will be used to propose an optimized joint configuration.
Figure 6. FR-DP matrix of second level decomposition (second iteration).
5 PHYSICAL INTEGRATION
One of the major design components defined in section 4 is the application of a clamping force on the joint. Fu and Mallick [2001] showed that the addition of a clamping force can effectively reduce the maximal peel stress in the adhesive layer near the edge of the overlap if the clamping force is distributed onto this area. For their analysis, the authors used thick flat washers. However, unless the washers have very high rigidity, their deformation under bolt pretention can prevent

- 14 -
an even distribution of this pretention under the entire washer surface. The actual result might be similar to what is shown in Figure 7. If such is the case, then the addition of washers might have a very limited result on performance while having a significant result on the overall mass of the joint.
Therefore, a new type of washers based on Belleville springs is proposed. The idea is to impose the washers to come into contact with the flat plates as far as possible from the bolt shank and as close as possible to the overlap edge. By doing so, the zone under compression can be much closer to the edge of the overlap without increasing the washers thickness and weight. A proposed design is provided in Figure 8.
Figure 7. Zone in compression under bolt pretension using a flat washer.
The other modification to the initial geometry introduced during physical integration is adding tapered edges to the flat plates as shown in Figure 8. This reduction in thickness near the edges has two effects. First, as required by DP3.3, the local in-plane rigidity of the plates is lowered by reducing the thickness of the flat plates. This should diminish the load transferred locally. The second effect is to bring the neutral axis closer to the joint central plane, thus reducing local secondary bending moments as required by DP2.2.
Finally, as stated in DP3.2, a second adhesive has been introduced between the two bolts. The objective of this change is to reduce the load transferred near the free edges of the joint by increasing the rigidity between the bolts. More loads should then be transferred in the stiffer load path created by the stiffer adhesive. This approach showed promising results in the work done by Fitton and Broughton [2005].
Figure 8. Joint Geometry after physical integration.
6 EVALUATION OF THE SOLUTION
The evaluation of the solution is done through the use of finite element analysis. Two different analyses were performed and compared to show the improvement obtained with the proposed solution. Both analyses were performed using 3D parametric finite element modelling in ANSYS APDL V13.0.
6.1 GEOMETRY The initial geometry analysed is shown in Figure 9. For
both analyses, the geometry uses two bolts with a pretension of 1500N per bolt. Figure 10 shows the dimensions of the proposed solution obtained through physical integration.
Figure 9. Dimensions of the baseline geometry analysed.
Figure 10. Dimensions of the new joint geometry
analysed.
6.2 MATERIALS For this analysis, the materials were chosen based on the
work done by Kelly [2005; 2006]. The results published by the author were used to compare the quality of the initial finite element model. The laminates are made of carbon fiber/epoxy unidirectional prepreg (T700/Epicote 828LV) with the properties shown in Table 1.
For the baseline analysis, the chosen adhesive is a polyurethane adhesive (Pilogrip 7400/7410). For the new joint geometry, the polyurethane adhesive was used between the bolts and the free edges. A stiffer epoxy adhesive (Epibond 1590 A/B) was used between the two bolts. Both adhesives were modeled using non-linear stress-strain curves as presented by Kelly [2005; 2006].

- 15 -
Table 1. Composite material properties [Sjögren et al. 2001].
Parameter Value E11 140 GPa E22 10 GPa E33 5.2 GPa
0.3 0.3 0.5
G12 5.2 GPa G13 5.2 GPa G23 3.9 GPa
Both geometries were modelled using the same quasi-
isotropic stacking sequence [0,+45,-45,90]S2, resulting in a total laminate thickness of 3.2mm (0.2mm per layer). For this analysis, it has been decided not to evaluate the effect of DP2.2 (positioning of neutral axis) through the use of the stacking sequence. The decision to remove this parameter from the final analysis was made because this change can have major impact on the overall behaviour of the plates outside the overlap combined with the fact that Stewart [1997] showed the impact of such a change on a hybrid joint.
6.3 RESULTS Figure 11 shows the difference in rigidity (joint
displacement resulting from the external force) between both geometries. As expected, the addition of a stiffer adhesive between the two bolts greatly increased the rigidity of the joint.
Figure 11. Comparison of the joints rigidity.
The load transfer ratio between the bolts and the adhesive joint is presented on Figure 12. This measure is the result of a summation of the reaction forces on the contact interface between the bolt shank and the flat plate holes. We may expect that a certain amount of the load also transits through friction between the washers and the flat plates but this load transfer should not be as important as in a high preloaded metallic joint.
As it can be seen, the load transferred by the bolt greatly decreases with the new geometry. This change can be attributed to the stiffer adhesive between the two bolts, thus
transferring more load. With such a low level of load transferred by the bolt, adhesive or adherent failure should occur before bearing failure. As one objective of this project is to improve the effectiveness of load transfer inside the joint, additional solutions should be evaluated to increase the bolt load transfer ratio.
Figure 12. Comparison of the bolt load transfer ratio.
Figure 13 shows the comparison of the maximal peel stress in the joint. The results show a clear reduction of the minimal peel stress in the compression zone near the bolts. This change can be attributed to the increased contact surface provided by the washers. It also has the advantage of providing the capability for higher bolt pretention forces before damaging the flat plates or inducing plastic deformation. The maximal peel stress is also greatly reduced, which was one of the main goals of the new geometry. By reducing the maximal peel stress in the adhesive by almost a factor of 2, the joint should withstand higher static and fatigue loads before failure.
Figure 13. Comparison of the adhesive peel stress
(measured in the middle plan of the joint).
Finally, Figure 14 shows the comparison of the shear stress in the adhesive layer. As it can be seen, the maximal shear stress is slightly higher within the new design. The deformation of the flat plates increased near the edges, which resulted in a higher shear stress level in these areas. However,

- 16 -
before rejecting this solution, additional analysis should be performed with different parameter values. The length of the chamfer or the area ratio of each adhesive should be further analysed as well as providing bonding line spew on the edge that demonstrated improved behaviour in bonded joints [Taib, 2006].
It is also possible that other parameters that were not considered in this analysis might have an influence on load transfer and shear stress. The effect of friction between the washers and the flat plates may be further investigated as a result of the bolt preload, but restrained by the compression limits of the composites as well as by the creep effects.
Figure 14. Comparison of the adhesive shear stress
(measured in the middle plan of the joint).
7 CONCLUSION
This work proposed a new geometry for single lap hybrid joints. This geometry is issued from an Axiomatic Design decomposition. With the functional requirements and design parameters defined, physical integration was used to propose a new joint geometry that successfully reduces the maximum peel stress inside of the adhesive layer. Because single lap joints tend to fail due to crack propagation initiated by high peel stress in the adhesive, this new geometry shows promising applications where high static strength and fatigue life are required.
However, the objective of reducing the maximum shear stress in the adhesive was not achieved with the selected values of each design parameters. Future work should be conducted to analyse the effect of the stiffness ratio between bonded areas. Also, additional knowledge should be gathered concerning the amount of external load transferred by friction under the washers and generally by the bolts as their contribution to the general performance of the joint should be optimized. Increasing the amount of load transferred by the bolts may help to reduce shear stress in the adhesive layer.
8 REFERENCES
[1] Bois C., Colt M., Wargnier H., Wahl J.-C., “Étude du tranfert de charge dans les assemblages composites hybrides boulonnés et collés”, JNC 17 - 17èmes Journées Nationales sur les Composites, 2011.
[2] Chan W.S., “Analysis of composite bonded/bolted joints used in repairing”, Journal of Composite Materials, Vol. 32, No. 12, pp. 1045-1061, 2001.
[3] Fu M., & Mallick P. K., “Fatigue of hybrid (adhesive/bolted) joints in SRIM”, International Journal of Adhesion and Adhesives, Vol. 21, pp. 145-159, 2001.
[4] Hart-Smith L.J., “Bonded-Bolted Composite Joints”, Journal of Aircraft, Vol. 22, No. 11, pp. 993-1000, 1985.
[5] Hart-Smith L.J., “Design and Analysis of Bolted and Riveted Joints in Fibrous Composite Structure”, in Recent advances in Structural Joints and Repairs for Composite, Tong L. & Soutis C. (ed.), Springer, pp. 211-257, 2003.
[6] Kelly G., “Load transfer in hybrid (bonded/bolted) composite single-lap joints”, Composite structures, Vol. 69, No. 1, pp. 35-43, 2005.
[7] Kelly G., “Quasi-static strength and fatigue life of hybrid (bonded/bolted) composite single-lap joints”, Composite structures, Vol. 72, No. 1, pp. 119-129, 2006.
[8] Kumar B., Sun C. T., Wang P. H., “Adding Additional Load Paths in a Bonded/Bolted Hybrid Joint”, Journal of Aircraft, Vol. 47, No. 5, pp. 1593-1598, 2010.
[9] Kweon J.H., Jung J.-W., Kim T.-H., Choi J.-H., Kim D.-H., “Failure of carbon composite-to-aluminum joints with combined mechanical fastening and adhesive bonding”, Composite structures, Vol. 75, No. 1-4, pp. 192-198, 2006.
[10] Lees J. M., & Makarov G., “Mechanical/bonded joints for advanced composite structures”, Proceedings of the Institution of Civil Engineers: Structures and Buildings Vol. 157, No. 1, pp. 91-97, 2004.
[11] Lin W.-H., & Jen M.-H. R., “The Strength of Bolted and Bonded Single-Lapped Composite Joints in Tension”, Journal of Composite Materials, Vol. 33, No. 8, pp. 640-666, 1999.
[12] McCarthy C.T., McCarthy M.A., “Three-dimensional finite element analysis of single-bolt, single-lap composite bolted joints: Part II––effects of bolt-hole clearance”, Composite Structures, Vol. 71, No. 2, pp. 159-175, 2005.
[13] Oterkus E., Barut A., Madenci E., Ambur D., “Analysis of bolted-bonded composite lap joints”, 48th AIAA/ASME/ASCE/AHS/ASC Structures, Structural Dynamics, and Materials Conference, Honolulu, April 2007.
[14] Paroissien E., Sartor M., Huet J., “Hybrid (Bolted/Bonded) Joints Applied to Aeronautic Parts: Analytical One-Dimensional Models of a Singlelap Joint”, 6th International Conference on Integrated Design and Manufacturing in Mechanical Engineering, Grenoble, 2006.
[15] Paroissien E., Sartor M., Huet J., Lachaud F., “Analytical Two-Dimensional Model of a Hybrid (Bolted/Bonded) Single-Lap Joint”, Journal of Aircraft, Vol. 44, No. 2, pp. 573-582, 2007.
[16] Sawa T., Kobayashi T., Fujii T., “Strength of combination joints of an adhesive with bolts (T-flange adherends subjected to an external bending moment)”. JSME International Journal, Series 1: Solid Mechanics, Strength of Materials Vol.32, No. 3, pp. 411-419, 1989.

- 17 -
[17] Sjögren A., Krasnikovs A.,Varna J., “Experimental determination of elastic properties of impact damage in carbon fiber/epoxy laminates”. Composite Part A: applied science and manufacturing, Vol.32, pp. 1237-1242, 2001.
[18] Stewart, M. L., “Experimental investigation of composite bonded and/or bolted repairs using single lap joint designs”. 38th AIAA/ASME/ASCE/AHS/ASC Structures, Structural Dynamics, and Materials Conference, pp. 2752-2760, Kissimmee, FL, 1997.
[19] Suh, N.P., The principles of design. New York: Oxford University Press, 1990. ISBN 978-0-19-504345-7.
[20] Suh, N.P., Axiomatic design : Advances and applications, New York: Oxford University Press, 2001. ISBN 978-0-19-513466-7.
[21] Taib, A, Boukhili, R., Achiou, S., Gordon, S., Boukehili, H., Bonded joints with composite adherends. Part I. Effect of specimen configuration, adhesive thickness, spew fillet and adherend stiffness on fracture, International Journal of Adhesion&Adhesives 26, pp. 226-236, 2006.

Proceedings of ICAD2013 The Seventh International Conference on Axiomatic Design
Worcester – June 27-28, 2013
ICAD-2013-03
- 18 -
ABSTRACT
Decomposition is very useful in simplifying design problems, by breaking down a set of goals, constraints, requirements, behaviours and structures, into less complex and more manageable ways. In Axiomatic Design Theory, this top-down approach takes place by zigzagging back and forth between at least two adjacent design domains. Nevertheless, the decomposition activities pose some challenges, such as assuring the consistency of the design decisions made between levels, generating proper functional requirements (FRs) and constraints (Cs) at the lower levels of abstraction, defining adequate design parameters (DPs) and integrating them into physical and/or logical parts, in order to achieve the required functions and the desired life cycle properties for the system.
In this paper we propose a new decomposition method that integrates Axiomatic Design with FAST (Function Analysis System Technique). The use of FAST diagrams and Value Engineering principles, during the zigzag path, are combined with the concepts and guidelines from Axiomatic Design Theory. This systematic articulation increases the ability to define a sufficient number of FRs at each layer of the design hierarchy as well as the coherence between sub-FRs.
In part II of this paper, a practical example describing the applicability of the proposed decomposition approach is provided.
Keywords: design decomposition, consistency, Axiomatic Design, Functional Analysis System Technique (FAST).
1 INTRODUCTION
Decomposition can be described as an iterative process where the high-level required functions of a technical system being designed are broken down into subfunctions, and, at the same time, the corresponding top-level design solutions are detailed, embodied and integrated into specific physical and/or logical elements.
A wide variety of strategies are available for accomplishing design decomposition [Koopman Jr, 1995]. In Axiomatic Design Theory (ADT), decomposition is achieved according to a zigzagging procedure between the system functional requirements (FRs) and the developed design solutions (design parameters, DPs) to achieve those requirements. As this top-down zigzagging proceeds, the details of the technical system emerge and a clear design hierarchy of FR-DP pairs is obtained, until such system can be implemented.
The decisions that are made at higher levels affect the statement of the design definition at the lower levels of the hierarchy [El-Haik, 2005]. During the decomposition process, lower-level design decisions, in terms of sub-FRs, sub-DPs, and their relationships (indicated by the corresponding design matrices), need to be consistent with the highest-level FR-DP pairs that represent the design intent. A consistent decomposition is defined as one in which, at every layer of the design hierarchy, the lower level design decisions match those that were made at the higher level [Tate, 1999].
Maintaining the consistency of the decisions between all levels of the design hierarchy is not just a crucial but also a difficult task faced by design teams. One difficulty concerns the lack of effective methods that can be used to develop good hierarchical decompositions [Brown, 2011].
This paper proposes a decomposition method based on Axiomatic Design Theory that incorporates the functional analysis principles from the Value Engineering discipline, in particular by taking advantage of the “How-Why” logic among functions provided by the FAST technique. Our intent in developing this value-based decomposition method is to contribute to guide designers in dealing with some of the most difficult issues that arise during the design decomposition activities, especially in the following:
To ensure that a minimum and sufficient set of FRs have been established at all levels of the design hierarchy.
To allocate all potential sub-FRs to the proper level of the design hierarchy.
VALUE-BASED AXIOMATIC DECOMPOSITION (PART I): THEORY AND DEVELOPMENT OF THE PROPOSED METHOD
Pedro Alexandre Marques [email protected]
UNIDEMI, Department of Strategy and Special Projects
ISQ – Welding and Quality Institute Av. Prof. Dr. Cavaco Silva, N.º 33, Edif. H
Taguspark-Oeiras, 2740-120 Porto Salvo, Portugal
José Gomes Requeijo
[email protected] UNIDEMI,
Department of Mechanical and Industrial Engineering Faculty of Science and Technology
Nova University of Lisbon Campus de Caparica, 2829-516 Caparica, Portugal
Pedro Manuel Saraiva [email protected]
Department of Chemical Engineering Faculty of Science and Technology
University of Coimbra Pólo II – Pinhal de Marrocos, 3030-290 Coimbra,
Portugal
Francisco Frazão Guerreiro
[email protected] Department of Strategy and Special Projects
ISQ – Welding and Quality Institute Av. Prof. Dr. Cavaco Silva, N.º 33, Edif. H
Taguspark-Oeiras, 2740-120 Porto Salvo, Portugal

- 19 -
To verify if the sub-FRs provide the functionality described by their parent FR-DP pair.
To determine what sub-FRs are actually required to perform the parent FR.
To identify which FR-DP pairs do not need to be further decomposed.
In addition, because the method establishes a functional classification for the FRs located at all levels of the hierarchy, design decisions that comply with axioms can also be made on a value analysis basis.
We start by reviewing the state of the art regarding design decomposition principles and methods, in particular within the context of Axiomatic Design Theory and of the Functional Analysis System Technique (FAST). Then, in
section 3, we present and discuss the proposed value-based decomposition method.
2 STATE OF THE ART
2.1 DESIGN DECOMPOSITION
The process of creating a design architecture often follows a process of decomposition, in which a top-level concept of the system’s required functions is broken down into sub-functions, and at the same time the most abstract version of its physical form is broken down into subsystems capable of performing the subfunctions [Crawley et al., 2004]. From this definition, and according to Ullman [2002], decomposition can be viewed from two perspectives:
As the deployment and refinement of the high-level functions performed by the technical system. This is called functional decomposition.
As the break-down of the means, or design solutions, for providing the functions. This is often called physical decomposition.
Every function that must be done by the system needs to be identified and defined in terms of allocated functional performance, and other limiting requirements [INCOSE, 2004]. This means that for each function that is partitioned into subfunctions, the requirements allocated to that function need to be decomposed with it.
In addition to the system’s functions, their corresponding requirements and the defined conceptual design solutions, it is important to ensure the decomposition of other design goals
[Koopman Jr, 1995], such as critical performance targets, aesthetics, limits in weight, and desired life cycle properties, among others. These goals are often known as design constraints.
Despite being widely employed in practice, there are several approaches used for performing design decomposition. Yu et al. [1998] and Mullens et al. [2005] review a wide set of decomposition techniques. Yu et al. [1998] propose a taxonomy structure to classify the different design decomposition approaches (Figure 1). This paper focuses on the hierarchical decomposition methods.
Many decomposition models, such as the ones proposed
by Pahl and Beitz [1996], Ullman [2002] and Ulrich and Eppinger [2004], first make a full functional decomposition and only when all subfunctions are completely described does the search for design concepts/solutions initiate.
According to Meijer et al. [2003] and Gonçalves-Coelho et al. [2005], the functional decomposition should be done attending to the design decisions made in the physical domain. The zigzag decomposition adopted by Axiomatic Design Theory [Suh, 1990] and the decomposition reasoning used in
the Critical Parameter Management (CPM) model [Creveling et al., 2003] are two approaches that take this into account, meaning that both functional and physical decompositions occur in parallel.
Decomposition
Hierarchical Non-hierarchical
Functional Physical Functional Physical
Decomposition
by theme
Decomposition
by block
Decompositionby specificapplication
Figure 1. Taxonomy of decomposition methods (adapted from: Yu et al. [1998]).
The CPM model, proposed by Creveling et al. [2003], is based on the Systems Engineering discipline and it is often employed during a product design or technology development project. In this model, the House of Quality from the Quality Function Deployment (QFD) is used to capture, relate and flow-down all critical requirements and functions. At each level of the hierarchy, and before proceeding to the next lower level, design concepts/solutions are developed in order to perform the intended functions and satisfy the corresponding requirements in a capable way.
2.2 DECOMPOSITION IN AXIOMATIC DESIGN
According to Suh [1990], the world of design consists of four domains: 1) Customer domain; 2) Functional domain; 3) Physical domain; 4) Process domain. Associated with each domain are the design elements it contains [Tate, 1999]. In addition to these elements, a set of constraints (Cs) imposing limits or bounds to the design task can also exist.
Apart from the customer domain wherein the decomposition process is usually not considered, the remaining domains may have several levels of abstraction that jointly describe the technical system architecture [Marques et al., 2009]. As depicted in Figure 2, the decomposition process in Axiomatic Design is achieved by zigzagging back and forth between at least two adjacent design domains, depending on the scope of the design process [Gonçalves-Coelho et al., 2005]. By use of this zigzagging method, hierarchies for FRs, DPs, and PVs are created in each design domain [Suh, 2005]. In some designs the process domain will be fully developed so
that the PVs relate to the DPs like the DPs relate to the FRs [Brown, 2006]. The lowest levels in each branch of the hierarchy are often called “leaf-levels”. Like FRs and DPs, constraints can be refined and clarified as decomposition progresses [Hintersteiner, 1999].
The zigzagging decomposition process is explained in detail in Suh [1990; 2001]. Some researchers proposed some advances to this traditional decomposition process. Authors like Guenov and Barker [2004], Tang et al. [2009] and Hong and Park [2009] developed enhanced decomposition methods by integrating Axiomatic Design with the Design Structure

- 20 -
Matrix (DSM), in order to capture the interactions amongst the DPs and to facilitate the design decisions in the physical domain. Mullens et al. [2005] present an axiomatic decomposition method that combines Alexander’s network partitioning formulation of the design problem with the Independence Axiom, and uses a cross-domain approach in a House of Quality context to estimate the interactions among the functional requirements. Kim and Cochran [2000] suggest the use of the Su-Field model from TRIZ to complement the decomposition process of Axiomatic Design.
In his PhD thesis, Tate [1999] developed a roadmap with the design activities that should performed during the decomposition process and their sequence. A set of useful guidelines and tools to assist designers in their decisions, in order to maintain the consistency of the decomposition, are also described in Tate’s research work. Hintersteiner and Friedman [1999] and Gumus [2005] provide standard templates for supporting and documenting, in a systematic and consistent manner, the design decisions made at every level of the design hierarchy. The coherent construction of a system’s architecture also relies on a proper classification of the functions, constraints, and design parameters. With this in mind, Tate [1999] proposes a classification for functions and constraints, while Gumus et al. [2008] define five types of design parameters, depending on their relative position in the design hierarchy.
2.3 DECOMPOSITION USING THE FAST APPROACH
The Function Analysis System Technique (FAST) was proposed in the 1960s by Charles W. Bytheway as an extension of the Value Engineering approach. An important contribution of FAST is its synergistic way of developing, decomposing, and understanding the functions of any product, process, service, or organization [Wixson, 1999]. It is a useful method for identifying and classifying the functional relationships during a design effort.
By making use of the intuitive “How-Why” logic, FAST is a prime tool for functional mapping and analysis, enabling
designers to relate functions located at different levels of detail. When questioning “how” a given function is performed, new function(s) is(are) brought into existence, while when asking “why” a certain function exists, it is possible to identify the function that caused that particular function to
come into existence [Bytheway, 2007]. The example of Figure 2 illustrates the reasoning behind the “How-Why” logic.
Provide asafe
workplace
Preventinjury
Protectagainst fall
HOW WHY
Figure 2. Example of the “How-Why” logic.
When repeated, this procedure allows the construction of a FAST diagram, whose classical model is depicted in Figure 3. Although there are different types and versions of FAST diagrams [Dallas, 2006], the “How-Why” logic is at the heart of them all. The main steps to construct a FAST diagram are the following:
1) Determine the scope of the conceptual process, which includes the definition of the technical system to be designed.
2) Identify the basic function(s) of the technical system. A basic function describes a fundamental task that must be performed by the system, thus representing the required reason for its existence.
3) Decompose the basic function(s) by applying the logical questions: How is the function accomplished? Why is the function performed?
All the functions on the right side of the basic function(s) describe the “concept” (i.e. design solutions) chosen to perform that basic function(s) [Yang, 2005]. The “objectives or specifications”, which correspond to quantitative critical performance requirements that need to be met to satisfy the highest-order function, can also be indicated in the diagram. The FAST diagram also includes the logic operators “AND” and “OR”: the first means that two or more functions need to be performed simultaneously, while the second signifies that two or more alternative dependent functions are available.
Support functions and activities are placed above and below the primary path, respectively. A “support function”, also known as independent function, does not comply with with the “How-Why” logic, but it supplements the basic function(s) placed on the same level of abstraction. An “activity” is the method selected to perform a function. The FAST method is explained in detail by Bytheway [2007].
Highest-order
function
Basic
function
Dependent
function
(Concept)
(Concept)
Dependent
function(AND) (OR)
Lowest-order
function
HOW WHY
WHEN
Objectives or
specifications
Support
function
Activity Activity
Decomposition higher-order Decomposition lower-order
Primary path
Secondary path
Scope of the problem under study
Figure 3. Classical FAST diagram (adapted from: Yang [2005]).

- 21 -
3 VALUE-BASED DECOMPOSITION METHOD
The proposed value-based axiomatic decomposition method is depicted in Figure 4. The activities where FAST
plays an important role are identified. The recursive nature of the decomposition process is clear in the method, since the same set and sequence of activities are performed, layer-by-layer, until the architecture of the designed system is completed.
The proposed method is intended to address the following difficulties that often arise at the beginning or during the traditional zigzagging decomposition process:
Systematize the development of a necessary and sufficient set of functional requirements at every level of the design hierarchy.
Distinguish the FR-DP pairs that require further decomposition from those that have reached the leaf-level.
Properly define sub-FRs, by ensuring they provide the functionality described by their corresponding FR-DP pair.
Ensure that all sub-FRs are correctly allocated to the different levels of the design hierarchy.
In addition, the purpose of the value-based decomposition method is to enable designers to make use of the principles from Value Engineering, while applying Axiomatic Design.
In the next sections the activities included in the value-based decomposition model will be discussed in detail.
3.1 DEFINITION OF THE DESIGN ELEMENTS AT THE
TOP-LEVEL OF THE HIERARCHY
The pre-decomposition activities are very important since they have a great impact on the design decision to be made during the decomposition process. Figure 5 exhibits the suggested procedure to establish the top-level Cs, the initial set of FRs and DPs, as well as their corresponding design matrix.
The first challenge is to define the initial set of functional requirements and the top-level constraints. Corollary 2 of Axiomatic Design states that the number of FRs and Cs should be minimized; nevertheless, they should be sufficient to fully represent the customer domain. In addition, it is important to clearly distinguish the FRs from the Cs [Brown, 2006].
The procedure considers that both top-level Cs and the initial set of FRs derive from the following elements of the customer domain: (1) customer needs (CNs); (2) design requirements (DRs). The CNs represent the “voice of the customer” and are translated into specific DRs using the House of Quality framework. The description of each design requirement is accompanied by its corresponding operational definition, which is clear, unambiguous, and observable standard of acceptance. The House of Quality is also used to identify the most important DRs, which is an important step towards the determination of the critical performance specifications type of constraints. Later on, during the
decomposition process, all the critical performance specifications are to be refined into sub-FRs, as recommended by Tate [1999].
The procedure to define the initial set of FRs relies on the generic template for listing FRs of Hintersteiner and Friedman [1999] and on the functional classification from Value Engineering. It is recommended that the initial set of FRs, in order to be minimum but sufficient in number, should be associated with the basic functions of the technical system. The basic functions can be regarded as the process functions referred by Hintersteiner and Friedman [1999]. As in a FAST diagram, the FRs that are associated with the basic functions should be located at the top-level of the design hierarchy.
To minimize the number of FRs, the definition of FRs associated with secondary functions that complement the
basic functions should be avoided, except when a command and control function and/or a support and integration function need(s) to be established. Hintersteiner [1999] and Tate [1999] discuss both the command and control and the support and integration functions.
Definition of the design elements at the top-level of the hierarchy
Determine the top-level constraints
Specific design
activity involving
FAST
Decompose?
EndYes
Zig
No
Customer Needs (CN)
Design Requirements (DR)
Begin
Define the set of designparameters ({DP})
Elaborate the top-levelDesign Matrix (DM)
Determine the initial set offunctional requirements ({FR})
Determine the top-levelconstraints (Cs)
Define the sub-FRsfor the decomposed
FR-DP pairZag
Carry-downand refine
Cs
Identify thesequence of thedecomposition
Check sub-FRsfor consistencyto parent level
Select the sub-DPs
Check compliancewith the
independence axiom
Check sub-DPs and DMfor consistency with
parents
Decomposition activities
Figure 4. Value-based axiomatic decomposition method.

- 22 -
Prioritization
Basic
functions
Top-level constraints (Cs)
FR1
FR2
. . . FRu
FRu+1
FRu+2
DP1
DP2
. . . DPu
DPu+1
DPu+2
Functional domain Physical domain
Constraints restrictsthe choice of the DPs
Initial
set of
DPs
Initial
set of
FRs
DR1
DR2
. . .
DRp
Criticalperformancespecifications
Interfaceconstraints
Globalconstraints
Projectconstraints
Featureconstraints
Basic functions Secondary
functions
XX
XXXXX
XXX
Design matrix (DM)
Operationaldefinitionfor DR
1
Operationaldefinitionfor DR
2
Operationaldefinitionfor DR
p
FR0
(Overall
function)
DP0
(technical
system)
The determination of the most importantDRs enable the identification of the criticalperformance specifications
DRs can be associated to FRs atdifferent levels of the hierarchy
Cu
sto
mer
Nee
ds
(CN
s)
Design
Requirements (DRs)
Figure 5. Procedure to define the initial set of FRs and DPs, and the top-level constraints (Cs).
The five categories of constraints indicated in Figure 5 were proposed by Tate [1999] and are herein adopted. The most important DRs usually give origin to the critical performance specifications type of constraints.
It is important to check if the specified initial set of FRs and top-level Cs actually are representative of the CNs. The template suggested by Gumus [2005], for relating CNs with FRs and Cs, may be useful for this purpose.
The initial set of DPs represents the design intent. These DPs are chosen with the aim of ensuring that their respective FRs can be independently achieved, by at the same time satisfying the bounds and restrictions imposed by the constraints on the possible design solutions. The top-level design matrix (DM) relates the initial sets of FRs and DPs, and its analysis enable to conclude if the intended design concept represents a decoupled, uncoupled or coupled design.
3.2 IDENTIFICATION OF THE DECOMPOSITION
SEQUENCE
This step involves the identification of the: (1) FR-DP
pair(s) requiring further decomposition; (2) most appropriate
sequence in which that decomposition should be conducted. If any of the initial FR-DP pairs needs to be further
detailed, the decomposition process begins. To identify which of the initial FR-DP pair(s) require further decomposition, the following guideline is formulated, based on the FAST model:
The designers have the option to consider an initial FR-DP pair as a leaf when the function associated with the FR is classified as a secondary function according to the Value Engineering principles, since secondary functions do not belong to the primary path.
As the decomposition process proceeds, designers still need to identify, at each level of the hierarchy, which FR-DP
pairs have reached the leaf-level and those that should be further decomposed. To help designers in this task, the previous guideline can be generalized:
At a certain level of the design hierarchy. designers have the option to consider a certain FR-DP pair as a leaf when the function associated with that FR is classified as a support function, since it does not comply with the “How-Why” logic with the
corresponding parent function (i.e. a support function does not make part of the primary path).
When, at a certain level of the design hierarchy, two or more FR-DP pairs have to be decomposed, one needs to determine the most suitable sequence to be followed. For the case of a decoupled design, the value-based decomposition method recommends that the following guidelines, provided by Tate [1999], should be employed:
To identify the next FR-DP pair to decompose, at each level, define sub-FRs in the order described by the design matrices.
To identify the next FR-DP pair to decompose, there is no penalty in terms of time/iteration for decomposing one branch of the design hierarchy more deeply than another, provided that the order follows that given in the design matrices.
3.3 DEFINITION OF SUB-FRS
For a certain FR-DP pair to be decomposed, a sufficient and necessary set of sub-FRs has to be specified. To achieve this goal, all potential sources of sub-FRs should be considered [Tate, 1999], in particular the following: parent DP; parent FR; parent-level Cs; parent DM; set of CNs. These potential sources are indicated by order of importance.
The FAST model and the Value Engineering principles for functional analysis can aid the development of sub-FRs

- 23 -
with origin on the parent DP and parent FR, by following the reasoning depicted in Figure 6. Consider that a certain FRi-DPi pair needs to be decomposed. If FRi is part of the initial set of FRs, then it is associated with a basic function; if it is not part of the initial set, then FRi is associated with a dependent function.
The application of Value Engineering principles to the analysis of the parent DP (DPi) helps designers to determine
its basic functions, enabling them to identify the sub-FRs that describe DPi. By its turn, the development of sub-FRs based on the knowledge of the parent FR (FRi) can be done using the “How-Why” logic of the FAST model, particularly by answering the following question: “how is FRi performed?”
The development of sub-FRs based on the knowledge of the parent Cs and DM, as well as on the set of CNs is discussed in detail by Tate [1999], who provides a set of useful guidelines on the subject.
All the sub-FRs that actually answer “how the parent FR is performed?”, including those that describe the parent DP, are classified as dependent functions. The sub-FRs that do not answer this question are classified as support functions. The functional classification of the sub-FRs is important for designers to detect potential FRs at the leaf-level, as described in section 3.2, but all the sub-FRs have the same importance as required in Axiomatic Design Theory.
During this step, for large or flexible system design [Suh, 1995], the employment of the logic operator “OR” adopted in the FAST technique can be useful to define different or alternative sets of FRs that the system may need to perform during its life time.
3.4 CARRYING-DOWN AND REFINING CS
This activity is entirely performed attending to the guidelines provided by Tate [1999] about carrying down and
refining Cs. Critical performance specifications and interface constraints are refined into sub-FRs, while global and project constraints are refined but remain as constraints at the lower levels of the hierarchy.
3.5 CHECKING SUB-FRS FOR CONSISTENCY
The good practices for generating sub-FRs, described in section 3.3, provide the conditions needed for consistency. The sub-FRs are consistent if they are descriptive (i.e. they describe consistency with respect to the parent DP), sufficient and necessary (i.e. they describe consistency with respect to the parent FR). Again, the “How-Why” logic of the FAST model can be used to check the consistency between the sub-FRs associated with a dependent function and the parent FR.
3.6 SELECTION OF SUB-DPS AND CHECKING
COMPLIANCE WITH THE INDEPENDENCE AXIOM
Once the set of sub-FRs are established, it is time to find the corresponding sub-DPs located in the physical domain. It is important to consider and assess alternative candidates for each of the sub-DPs, before selecting the final set of sub-DPs. Value Engineering principles, in terms of cost-benefit analysis, can be employed to evaluate alternative sets of sub-DPs.
The potential sets of sub-DPs, to be viable, should ensure the functional independency of their corresponding sub-FRs, while satisfying the imposing constraints. When possible, the Information Axiom should be applied to select the best set of sub-DPs complying with the Independence Axiom.
3.7 CHECKING SUB-DPS AND THE DM FOR
CONSISTENCY WITH PARENTS
In this step, the consistency of the design decisions in the selected sub-DPs and in the elements of the design matrix, that relates sub-FRs and sub-DPs, need to be confirmed. To check the consistency of the sub-DPs, it is necessary to verify if they:
Provide enough capability in satisfying the parent FR.
Satisfy the Cs applied to the parent DP.
Have been integrated into physical and/or logical element(s) in a way that does not violate the functional independence indicated in the parent level.
The consistency of the design matrix elements of all lower level design decisions can be checked by constructing the full design matrix [Suh, 2005]. In addition to the construction and analysis of the full design matrix, the guidelines provided
FRi
DPi
How?
Why?
FRi.1
FRi.2
FRi.3
FRi.4
Define sub-FRs by identifying
the basic function(s) of the
parent DP (DPi)
Define sub-FRs
using the "How-
Why" logic with the
parent FR (FRi)
Key:
FR associated to a
basic or dependent
function
FR associated to a
dependent
function
FR associated to a
support function
Figure 6. The role of the FAST model in the definition of sub-FRs.

- 24 -
by Tate [1999] enable designers to check consistency of the DM elements in every level of the hierarchy.
3.8 FINALISING THE DECOMPOSITION PROCESS
The activities of the value-based decomposition method, described in greater detail from section 3.2 to section 3.7, are
performed until the technical system is detailed enough to be fully implemented. At the end of the decomposition process the system architecture is thus completed.
Figure 7 illustrates a typical hierarchical structure of the design that is obtained after the value-based decomposition method is employed. It presents the case of a technical system that performs “u” basic functions and one secondary function. It means that at the highest-level of the design hierarchy there are an initial set of “u+1” FRs and an equal number of corresponding sub-DPs. As depicted, only the basic functions and their dependent functions were decomposed.
The “How-Why” logic and the functional classification provided by the FAST model contribute to systematise and enhance the consistency of the decomposition process.
4 CONCLUSIONS
A decomposition method integrating Axiomatic Design Theory with Value Engineering, in particular with the Function Analysis System Technique (FAST) approach, was proposed and described in the first part of this paper.
This value-based axiomatic decomposition method was developed with the aim of helping designers, with a logic framework and a set of new guidelines, to perform the decomposition activities in a way that the design decisions are coherently made in all the layers of the design hierarchy. More specifically, the main contributions of the proposed decomposition method, to the advance of this important subject, are the following:
Increase the coherence of the functional decomposition by adding the functional mapping and the “How-Why” intuitive logic, both provided by the FAST model, to the traditional decomposition process followed in Axiomatic Design.
Provide a systematic procedure to define a sufficient and necessary set of FRs in all levels of the design hierarchy, ensuring, at the same time, that the sub-FRs are allocate to the proper level of detail.
Enhance the ability to determine which FR-DP pairs, along the design hierarchy, should be considered as being at the leaf-level, and those pairs that can be further decomposed.
In the second part of this paper, a practical application of the proposed method, developed at a Portuguese company, will be presented.
In future studies, it is our objective to make use of this value-based decomposition method in the context of the Design for Six Sigma (DFSS) methodology.
HO
W
. . .FR
1FR
uFR
u+1
DP1
DPu
. . .
DPu+1
FR1.1
DP1.1
FR1.2
DP1.2
FRu.1
DPu.1
FRu.3
DPu.3
FR2.4
DPu.4
FR1.2.1
DP1.2.1
FRu.1.1
DPu.1.1
FRu.1.3
DPu.1.3
FRu.3.1
DPu.3.1
FRu.4.1
DPu.4.1
FR1.3
DP1.3
FRu.2
DPu.2
FRu.5
DPu.5
FRu.4.3
DPu.4.3
FRu.4.2
DPu.4.2
FRu.1.2
DPu.1.2
FR1.2.2
DP1.2.2
FR1.1.1
DP1.1.1
FR1.1.3
DP1.1.3
FR1.1.2
DP1.1.2
FR1.2.3
DP1.2.3
FRu.1.4
DPu.1.4
FRu.3.2
DPu.3.2
WH
Y
. . .
. . .
DP0
FR0
Highest-orderfunction (overall
function)Basic functions
Secondaryfunction
Dependentfunction
Supportfunction
Dependentfunction at the
leaf-level
Supportfunction at the
leaf-level
FRu.4.1.1
DPu.4.1.1
FRu.4.1.2
DPu.4.1.2
FRu.4.1.4
DPu.4.1.4
FRu.4.1.3
DPu.4.1.3
FRu.1.1.1
DPu.1.1.1
FRu.1.1.3
DPu.1.1.3
FRu.1.1.4
DPu.1.1.4
FRu.1.1.2
DPu.1.1.2
FR1.2.1.1
DP1.2.1.1
FR1.2.1.3
DP1.2.1.3
FR1.2.1.2
DP1.2.1.2
FRu.1.1.1.1
DPu.1.1.1.1
FRu.1.1.1.2
DPu.1.1.1.2
FRu.1.1.1.3
DPu.1.1.1.3
FRu.4.1.1.1
DPu.4.1.1.1
FRu.4.1.1.2
DPu.4.1.1.2
FRu.4.1.1.3
DPu.4.1.1.3
FRu.4.1.1.4
DPu.4.1.1.4
FRu.4.1.1.2.2
DPu.4.1.1.2.2
FRu.4.1.1.2.3
DPu.4.1.1.2.3
FRu.4.1.1.2.4
DPu.4.1.1.2.4
FRu.4.1.1.2.5
DPu.4.1.1.2.5
FRu.4.1.1.2.1
DPu.4.1.1.2.1
Figure 7. Typical design hierarchy structure that results from the use the value-based decomposition method.

- 25 -
5 REFERENCES
[1] Brown C.A., Elements of Axiomatic Design: a Simple and Practical Approach in Engineering Design, Draft: 29 March, New York: Cazenovia, 2006.
[2] Brown C.A.,” Decomposition and Prioritization in Engineering Design”, Proceedings of the Sixth International Conference on Axiomatic Design, ICAD2011, Daejeon, South Korea, March 30-31, 2011.
[3] Bytheway C.W., FAST Creativity & Innovation, Florida: J. Ross Publishing, 2007. ISBN 1-932159-66-0
[4] Crawley E., De Weck O., Eppinger S., Magee C., Moses J., Seering W., Schindall, J., Wallace D., Whitney D., “The Influence of Architecture in Engineering Systems”, Engineering Systems Monograph, The ESD Architecture Committee, Massachusetts Institute of Technology
(MIT), Cambridge, MA, USA, 2004.
[5] Creveling C.M., Slutsky, J.L., Antis, D., Design for Six Sigma in Technology and Product Development, New Jersey: Prentice-Hall, 2003. ISBN 0-13-009233-1
[6] Dallas, M.F., Value & Risk Management: A Guide to Best Practice, Montana: Blackwell Publishing, 2006. ISBN 1-4051-2069-X
[7] El-Haik B.S., Axiomatic Quality, New Jersey: John Wiley & Sons, 2005. ISBN 0-471-68273-X
[8] Gonçalves-Coelho A.M., Mourão A.J.F., Pereira Z.L., “Improving the use of QFD with Axiomatic Design”, Concurrent Engineering: Research and Applications, Vol. 13, No. 3, pp. 233-239, 2005.
[9] Guenov M.D., Barker, S.G., “Application of Axiomatic Design and Design Structure Matrix to the
Decomposition of Engineering Systems”, Systems Engineering, Vol. 8, No. 1, pp. 29-40, 2004.
[10] Gumus B., “Axiomatic Product Development Lifecycle”, Doctoral of Philosophy Thesis, Texas Tech University, Lubbock, TX, USA, 2005.
[11] Gumus B., Ertas A., Tate D., Cicek I., “The Transdisciplinary Product Development Lifecycle
Model”, Journal of Engineering Design, Vol. 19, No. 3, pp. 185-200, 2008.
[12] Hintersteiner J.D. “A Fractal Representation for
Systems”, Proceedings of the 1999 International CIRP Design Seminar, Enschede, Holland, March 24-26, 1999.
[13] Hintersteiner J.D., Friedman G. “System Architecture Template”, MIT White Paper, Axiomatic Design Group, 1999.
[14] Hong E, Park, G., “Decomposition Process of Engineering Systems Using Axiomatic Design and Design Structure Matrix”, Proceedings of the Fifth International Conference on Axiomatic Design, ICAD2009, Campus de Caparica, March 25-27, 2009.
[15] INCOSE, Systems Engineering Handbook – A “What To” Guide for All SE Practitioners, Seattle: International Council on Systems Engineering, 2004.
[16] Kim Y.S., Cochran D.S., “Reviewing TRIZ from the Perspective of Axiomatic Design”, Journal of Engineering Design, Vol. 11, No.1, pp. 79-94, 2000.
[17] Koopman Jr, P.J. “A Taxonomy of Decomposition Strategies Based On Structures, Behaviours, and Goals”, Proceedings of ASME 1995 Design Engineering Technical Conferences, Vol. 83, pp. 611-618, 1995.
[18] Lindholm D., Tate D., Harutunian V., “Consequences of Design Decisions in Axiomatic Design”, Transactions of the Society for Design and Process Science, 3(4), pp. 1-12, 1999.
[19] Marques P.A., Alink T, Saraiva P.M., Albers A., Requeijo J.G., Guerreiro FF, “Integration of the Contact and Channel Model with Axiomatic Design”, Proceedings of the Fifth International Conference on Axiomatic Design, ICAD2009, Campus de Caparica, March 25-27, 2009.
[20] Meijer B.R, Tomiyama T., Van der Holst B.H.A., Van der Warff K., “Knowledge Structuring for Function Design”, CIRP Annals – Manufacturing Technology, Vol. 52, No. 1, pp. 89-92, 2003.
[21] Miles L.D., Techniques of Value Analysis and Engineering, 3rd Edition, New York: Lawrence D. Miles Value Foundation, 1989. ISBN 978-0070419261
[22] Mullens M.A., Arif M., Armacost R.L., Gawlik TA, Hoekstra R.L., “Axiomatic Based Decomposition for Conceptual Product Design”, Production and Operations Management, Vol. 14, No. 3, pp. 286-300., 2005.
[23] Pahl G., Beitz W., Engineering Design: A Systematic Approach, 2nd Edition, London: Springer-Verlag, 1996. ISBN 0-387-50442-7
[24] Suh N.P., The Principles of Design, New York: Oxford University Press, 1990. ISBN 0-19-504345-6
[25] Suh N.P., Axiomatic Design: Advances and Applications, New York: Oxford University Press, 2001. ISBN 0-19-513466-4
[26] Suh N.P., “Design and Operation of Large Systems”
Journal of Manufacturing Systems, 14(3), pp. 203-213, 1995.
[27] Suh N.P., Complexity: Theory and Applications, New York: Oxford University Press, 2005. ISBN 0-19-517876-0
[28] Tang D., Zhu R., Dai S., Zhang G., “Enhancing Axiomatic Design with Design Structure Matrix”, Concurrent Engineering, Vol. 17, No. 2, pp. 129-137, 2009.
[29] Tate D., “A Roadmap for Decomposition: Activities, Theories, and Tools for System Design”, Doctoral Thesis, Department of Mechanical Engineering, Massachusetts Institute of Technology (MIT), Cambridge, MA, 1999.
[30] Ullman D.G., The Mechanical Design Process, 3rd Edition, New York: McGraw-Hill, 2002. ISBN 0-07-237338-5
[31] Ulrich K.T, Eppinger, S.D., Product Design and Development, 3rd Edition, New York: McGraw-Hill, 2004. ISBN 0-07-247142-5
[32] Wixson, J.R., “Function Analysis and Decomposition Using Function Analysis Systems Technique”, International Council on Systems Engineering Annual Conference, INCOSE’99, Brighton, England, June 6-10, 1999.
[33] Yang K., Design for Six Sigma for Service, New York: McGraw-Hill, 2005. ISBN 0-07-144555-2.
[34] Yu H., Shu L.H., Venter R., “An Enhanced
Axiomatic Design Process”, Proceedings of the 1998 ASME Design Engineering Technical Conferences, DETC’98, Atlanta, Georgia September 13-16, 1998.

Proceedings of ICAD2013 The Seventh International Conference on Axiomatic Design
Worcester – June 27-28, 2013
ICAD-2013-04
- 26 -
ABSTRACT
In the second part of this paper, the step-by-step application of the value-based axiomatic decomposition method, proposed in the previous part, is illustrated. The main results are also presented and discussed. The practical application took place at a Portuguese transportation delivery service company. The two main goals for this case study were to assist managers in their decisions during the redesign of the company’s delivery service, and to test the applicability of the value-based decomposition method. The context of the case study is firstly explained, followed by the step-by-step application of the proposed decomposition method, and by the discussion of the results obtained.
Keywords: design decomposition, consistency, Axiomatic Design, Functional Analysis System Technique (FAST).
1 INTRODUCTION
The top management of a Portuguese transportation delivery service company, under the scope of company’s continual improvement process, decided to start a project to redesign its service process. Axiomatic Design Theory, in particular the proposed value-based axiomatic decomposition method, was employed with the aim of contributing to the redesign effort by providing a logical framework for decision-making.
The application of the proposed decomposition method, described in detail in section 3 of part I of this paper, to this case was a good opportunity to test it in a practical environment in order to determine whether it could be useful in maintaining the coherence of the design decision along all the levels of the detail in the hierarchy.
In addition, the minimization of coupling situations was useful for the company’s operational efficiency goals, since the presence of coupling in the service design would greatly increase the chance of rework to occur during the required service planning activities, particularly for non-standard delivery services and time critical delivery services.
2 CASE STUDY
The practical application of the value-based axiomatic decomposition method herein presented was developed to redesign a transportation delivery service provided by a Portuguese company.
2.1 PRE-DECOMPOSITION ACTIVITIES
Knowing the scope of the design project enabled the design team to formulate FR0 and DP0:
FR0 = Transport packages or parcels from one point of
location to another, correctly and on-time. DP0 = Transportation delivery service.
Through retroactive sources of data (key performance
indicators, customer complaints, service reports, among others), individual customer interviews, focus groups and questionnaires, it was possible to gather the raw “voice of the customer” (VOC), which was then converted into more objective customer needs. After eliminating duplications and redundancies, the design team determined the definitive set of customer needs (CNs), which were organised using an affinity diagram [Mizuno, 1988]. The House of Quality framework was then used to translate these CNs into design requirements (DRs), to study the existing relationships between CNs and DRs, and to prioritise the most relevant DRs.
Three basic functions of the transportation delivery service (DP0) were identified and led the design team to define three initial functional requirements (FR1, FR2, and FR3). The basic function is the required reason for the existence of the service, and answers the question: “what must it do?” [Bytheway, 2007]. A fourth FR (FR4) that is associated with a secondary function was also defined. The initial set of FRs was then composed as follows:
VALUE-BASED AXIOMATIC DECOMPOSITION (PART II): CASE STUDY
Pedro Alexandre Marques [email protected]
UNIDEMI, Department of Strategy and Special Projects,
ISQ – Welding and Quality Institute, Av. Prof. Dr. Cavaco Silva, N.º 33, Edif. H
Taguspark-Oeiras, 2740-120 Porto Salvo, Portugal
José Gomes Requeijo
[email protected] UNIDEMI,
Department of Mechanical and Industrial Engineering, Faculty of Science and Technology,
Nova University of Lisbon Campus de Caparica, 2829-516 Caparica, Portugal
Pedro Manuel Saraiva [email protected]
Department of Chemical Engineering, Faculty of Science and Technology,
University of Coimbra Pólo II – Pinhal de Marrocos, 3030-290 Coimbra,
Portugal
Francisco Frazão Guerreiro
[email protected] Department of Strategy and Special Projects,
ISQ – Welding and Quality Institute, Av. Prof. Dr. Cavaco Silva, N.º 33, Edif. H
Taguspark-Oeiras, 2740-120 Porto Salvo, Portugal

- 27 -
FR1 = Deliver all shipped items in good conditions. FR2 = Pick and deliver each package/parcel at the correct
locations. FR3 = Deliver within the required time. FR4 = Provide good customer support service.
Please notice that these four FRs are all of the same
importance. The main objective in classifying their associated functions as basic or as secondary is to determine which FRs should be decomposed further. As described in section 3.2, sub-FRs should only be developed for the top-level FRs that are associated with a basic function.
The top-level Cs were then specified, classified and their impact on the initial FRs assessed (Table 1). The initial set of FRs and the top-level Cs were validated after analysing if they were actually representative of the CNs and DRs.
With the intent of independently satisfying each of the initial FRs, while meeting the applicable Cs, the design team came up with alternative design solutions. The chosen set of design parameters (DPs) was the following:
DP1 = Handling, packaging and storage solutions. DP2 = Description and location information about the
specific places for pickup and delivery. DP3 = Delivery speed. DP4 = Customer Service & Support system.
The design matrix relating the initial sets of FRs and DPs, representing the design intent, showed a decoupled design:
4
3
2
1
4
3
2
1
0
000
000
DP
DP
DP
DP
XXXX
XXX
X
X
FR
FR
FR
FR
(1)
2.2 DECOMPOSITION ACTIVITIES
The three FR-DP pairs associated with basic functions were decomposed, while the FR4-DP4 pair (associated with a secondary function) was not. The decomposition sequence followed the order indicated in the design matrix of equation 1.
2.2.1 DECOMPOSITION OF THE FR1-DP1 PAIR
To develop a necessary and sufficient number of sub-FRs, all potential sources for identifying sub-FRs were considered, namely the following: DP1, FR1, top-level Cs, DM of equation 1, and the set of CNs. The sources that lead to the definition of the following sub-FRs are described in Table 2:
FR1.1 = Handle transported items properly and with care. FR1.2 = Store shipped items properly during carriage. FR1.3 = Protect each shipped item from damage. FR1.4 = Prevent each shipped item from loss during service
operations. FR1.5 = Provide information to customer about the current
location of his/her shipped items.
Table 2. Sub-FRs resulted from the decomposition of the FR1-DP1 pair, their sources and associated functions.
Functional requirement Associated function Source(s)
FR1.1 Dependent DP1, FR1 FR1.2 Dependent DP1, FR1 FR1.3 Dependent DP1, FR1 FR1.4 Dependent FR1 FR1.5 Support C-6
All these sub-FRs have the same importance, despite the classification of their corresponding functions. The sub-FRs
that can answer “how” the FR1 is performed were classified as dependent functions, so they were further detailed through decomposition. On the opposite, the sub-FRs not answering this question were classified as support functions, so they were considered to be at the leaf-level.
Table 1. Description of the top-level Cs, their classification and impact on FRs.
Code Description FR1 FR2 FR3 FR4
C-1 On-time delivery for next-day services X
C-2 On-time-delivery for same-day services X
C-3 On-time pickup for next-day services X
C-4 On-time pickup for same-day services X
C-5 Ensure courtesy and politness when interacting with the customer X X
C-6 Enable customer interaction during the whole service X X
C-7 Adequate the vehicles used to the type of items to be transported X X
C-8 Optimise load fulfilment of the vehicles X
C-9 Comply with the organisation's quality, safety and environmental
procedures
X X X X
C-10 Comply with all applicable legal and standrad requirements X X X X
C-11 Provide trace-and-track solutions in all services X X X X
C-11 Integrate maximum of well-proven design solutions X X X X
C-12 Reuse maximum of existing design solution X X X X
N/A
Feature constraints
Constraints Impact of FRs
Critical performance specifications
Interface constraints
Global constraints
Project constraints

- 28 -
The Cs applicable to this level of the hierarchy, regarding the FR1-DP1 branch, resulted from the refinement of the top-level Cs, indicated in Table 1.
Before being mapped to the physical domain, the five sub-FRs (from FR1.1 to FR1.5) were checked for consistency to the parent level. The results are presented in Figure 1.
The decomposed set of sub-FRs was then mapped to the physical domain to define the corresponding set of sub-DPs:
DP1.1 = Handling procedures. DP1.2 = Storage and packing conditions. DP1.3 = System of packages. DP1.4 = Shipment labelling and documentation system. DP1.5 = Track and trace service. The design matrix for the second level of the hierarchy, for this branch, complied with the Independence Axiom:
51
41
31
21
11
51
41
31
21
11
000
0000
00
000
0000
.
.
.
.
.
.
.
.
.
.
DP
DP
DP
DP
DP
XX
X
XXX
XX
X
FR
FR
FR
FR
FR
(2)
The consistency of the design matrix elements, to the parent level, was then checked using a full design matrix for this point of the decomposition (Figure 2).
The second level FR-DP pairs that are associated with a dependent function were further decomposed, until their parent level FR1-DP1 pair could be fully implemented. The same reasoning of the value-based axiomatic decomposition method, previously described, was applied. The results of the decomposition for the branch corresponding to the FR1-DP1 can be regarded in Figure 3.
Figure 2. Full design matrix for the second level of the
decomposition of the FR1-DP1 pair.
2.2.2 DECOMPOSITION OF THE FR2-DP2 AND
FR3-DP3 PAIRS
Since there is no penalty for decomposing one branch of the design hierarchy more deeply than another, provided that the order follows that given in the design matrix of equation 1, the FR1-DP1 node was decomposed first. Attending to this guideline, the FR2-DP2 pair was then decomposed, followed by the decomposition of the FR3-DP3 pair.
Again, the iterative process of the value-based decomposition method, described in Figure 4 of part I of this paper, was used to consistently deploy, layer by layer of the hierarchy, the design decisions, in terms of sub-FRs, sub-DPs, elements of the DM, and refinement of Cs, of the high-level FR2-DP2 and FR3-DP3 pairs.
FR
1
Deliver all shipped
items in good
conditions
DP1
Handling,
packaging and
storage solutions
Zig
Zag
Analysis of consistency
- Sources: DP1 and FR
1
- Basic function of DP1
- Dependent function of
FR1.
Analysis of consistency
- Source: FR1
- Dependent function of
FR1
Analysis of consistency
- Source: C-6
Analysis of consistency
- Sources: DP1 and FR
1
- Basic function of DP1
- Dependent function of
FR1.
Analysis of consistency
- Sources: DP1 and FR
1
- Basic function of DP1
- Dependent function of
FR1.
How?
Why?FR
1.2
Store shipped items
properly during
carriage
FR1.4
Prevent each shipped
item from loss
FR1.5
Provide customer
information about the
current location of his/
her shipped items
FR1.1
Handle transported
items properly and with
care
FR1.3
Protect each shipped
item from damage
Figure 1. Checking of the consistency of the sub-FRs resulted from the decomposition of the FR1-DP1 pair.
DP1
DP
2
DP
3
DP
4
DP
1.1
DP
1.2
DP
1.3
DP
1.4
DP
1.5
FR1
FR1.1 X 0 0 0 0 0 0 0
FR1.2 X X 0 0 0 0 0 0
FR1.3 X X X 0 0 0 0 0
FR1.4 0 0 0 X 0 0 0 0
FR1.5 0 0 X X X 0 0 0
FR2 0 0 0 0 0 X 0 0
FR3 0 0 0 0 0 0 X 0
FR4 0 0 0 0 0 0 0 X

- 29 -
Figure 3. Overview of the decomposition results for the redesign of the transportation delivery service.
FR0: Transport packages or parcels from one point of location to another, correctly and on-time Overall function FR1: Deliver all shipped items in good conditions Basic function
FR1.1: Handle transported items properly and with care Dependent function FR1.1.1: Handle with care during moving operations Dependent function FR1.1.2: Handle with care during loading operations Dependent function FR1.1.3: Handle with care during unloading operations Dependent function FR1.1.4: Warn operators for special handling items Support function
FR1.2: Store shipped items properly during carriage Dependent function FR1.2.1: Protect shipped items from physical damage in the cargo area of the vehicle Dependent function FR1.2.2: Prevent shipped items from sliding and moving during carriage Dependent function FR1.2.3: Preserve the non-physical critical properties of the shipped items during carriage Dependent function FR1.2.4: Maximise the available space of the cargo Support function
FR1.3: Protect each shipped item from damage Dependent function FR1.3.1: Maintain the physical integrity of the packaged items Dependent function FR1.3.2: Preserve the non-physical critical properties of the packaged items Dependent function FR1.3.3: Ensure the packaging for each item is correctly done Support function
FR1.4: Protect each shipped item from loss during service operations Dependent function FR1.5: Provide information to customer about the current location of his/her shipped items Support function
FR2: Pick and deliver each package/parcel at the correct locations Basic function FR2.1: Pick and ship at the right location address Dependent function
FR2.1.1: Contact with the consignor whenever needed Support function FR2.1.2: Ensure all parcels are picked up at the address required by the consignor Dependent function FR2.1.3: Provide geographical location of the pickup address to the courier driver Support function
FR2.2: Deliver each shipped package/parcel at the required location address Dependent function FR2.2.1: Contact with the consignee whenever needed Support function FR2.2.2: Ensure all parcels are delivered at the consignee’s address Dependent function FR2.2.3: Provide geographical location of the delivery address to the courier driver Support function
FR2.3: Notify customer about the delivery status Support function FR3: Deliver within the required time Basic function
FR3.1: Pickup package/parcel at the agreed time Dependent function FR3.1.1: Schedule the pickup service for the defined pickup time Dependent function FR3.1.2: Update service status in the trace & tracking system Support function FR3.1.3: Inform consignor about the pickup status Support function
FR3.2: Deliver shipped package/parcel at the required time Dependent function FR3.2.1: Schedule the delivery service for the defined transit time Dependent function FR3.2.2: Update service status in the trace & tracking system Support function FR3.2.3: Inform consignor about the delivery status Support function
FR3.3: Comply with the optional delivery procedures requested by the customer Support function FR4: Provide good customer support service Secondary function
DP0: Transportation delivery service
DP1: Handling, packaging and storage solutions DP1.1: Handling procedures
DP1.1.1: Handling procedures during moving activities, for both normal and special handling items DP1.1.2: Handling procedures during loading activities, for both normal and special handling items DP1.1.3: Handling procedures during unloading activities, for both normal and special handling items DP1.1.4: Custom labels for special handling items
DP1.2: Storage and packing conditions DP1.2.1: Procedures for the immobilisation of the shipped items placed in the cargo area DP1.2.2: Procedures for the physical protection of the shipped items placed in the cargo area DP1.2.3: Cargo environmental controlled and customised conditions DP1.2.4: Load optimisation procedure
DP1.3: System of packages DP1.3.1: Protection features incorporated in the package, customised to the type of good to be transported DP1.3.2: Preservation features inherent to the package, customised to the type of good to be transported DP1.3.3: Packaging instructions
DP1.4: Shipment labelling and documentation system DP1.5: Track and trace service
DP2: Description and location information about the specific places for pickup and delivery DP2.1: Full address of the consignor
DP2.1.1: Name and contact of the consignor DP2.1.2: Address description in the pickup order
DP2.1.3: Map coordinate finder – location for pickup DP2.2: Full address of the consignee
DP2.2.1: Name and contact of the consignee DP2.2.2: Description of the address for delivery in the waybill and package(s) DP2.2.3: Map coordinate finder – location for delivery
DP2.3: Customer notification system DP3: Delivery speed
DP3.1: Service pickup time DP3.1.1: Most suitable network route to comply with the defined pickup time DP3.1.2: Track and trace update system – Pickup DP3.1.3: Online customer service – pickup status
DP3.2: Transit time for the service DP3.2.1: Most suitable network route to comply with the required transit time DP3.2.2: Track and trace update system – Delivery DP3.2.3: Online customer service – delivery status
DP3.3: Custom delivery instructions in the waybill DP4: Customer Service & Support system

- 30 -
Figure 4. Final full design matrix, containing all the FRs and DPs located at the leaf-level.
2.2.3 END OF THE DECOMPOSITION PROCESS
The complete sets sub-FRs and sub-DPs, placed along the different levels of the design hierarchy, are described in Figure 3. It can be seen that only the nodes which corresponding FR is or depends on a basic function of the transportation delivery service were actually decomposed. This is a consequence of the integration of the FAST model with Axiomatic Design Theory in the decomposition activities.
After all the leaf-levels in the different branches of the design hierarchy have been reached, and as stated by the value-based axiomatic decomposition method, the final full design matrix was constructed (Figure 4) to confirm the consistency of the lowest-level design decisions, in terms of the DM elements.
2.3 DISCUSSION AND RESULTS OF THE CASE STUDY
The case study herein presented contributed to illustrate the applicability of the proposed value-based axiomatic decomposition method. The main findings from this study are summarised next:
The value-based-decomposition method provided an iterative and systematic process to develop, in a consistently manner, the architecture of the transportation delivery service.
The articulated use of the FAST model with Axiomatic Design principles proved to be useful to:
o Identify the FRs that are associated with the basic functions of the transportation delivery service.
o Distinguish the FR-DP pairs of the design hierarchy that should be considered as leaf (FRs associated with secondary functions and sub-FRs associated with support functions) from
those that can be further decomposed (FRs associated with basic functions and sub-FRs associated with dependent functions).
o Define a sufficient and necessary set of FRs in all levels of the design hierarchy.
o Check the consistency of the sub-FRs with their corresponding parent level FR, by making use of the “How-Why” logic.
The decomposition guidelines provided by Tate [1999], which the value-based method incorporates, were applicable.
The final full design matrix (Figure 4), showing that design decisions led to a decoupled design, was important for the company since it indicated that the chance for rework during the service planning activities was minimal.
DP1 DP2 DP3
DP
4
DP1.1 DP1.2 DP1.3
DP
1.4
DP
1.5
DP2.1 DP2.2
DP
2.3
DP3.1 DP3.2
DP
3.3
DP
1.1
.1
DP
1.1
.2
DP
1.1
.3
DP
1.1
.4
DP
1.2
.1
DP
1.2
.2
DP
1.2
.3
DP
1.2
.4
DP
1.3
.1
DP
1.3
.2
DP
1.3
.3
DP
2.1
.1
DP
2.1
.2
DP
2.1
.3
DP
2.2
.1
DP
2.2
.3
DP
2.2
.4
DP
3.1
.1
DP
3.1
.2
DP
3.1
.3
DP
3.2
.1
DP
3.2
.2
DP
3.2
.3
FR
1
FR
1.1
FR1.1.1 X 0 0 0 0 0 0 0 0 0 0 0 0 0 0 0 0 0 0 0 0 0 0 0 0 0 0 0
FR1.1.2 X X 0 0 0 0 0 0 0 0 0 0 0 0 0 0 0 0 0 0 0 0 0 0 0 0 0 0
FR1.1.3 X X X 0 0 0 0 0 0 0 0 0 0 0 0 0 0 0 0 0 0 0 0 0 0 0 0 0
FR1.1.4 X X X X 0 0 0 0 0 0 0 0 0 0 0 0 0 0 0 0 0 0 0 0 0 0 0 0
FR
1.2
FR1.2.1 0 X X 0 X 0 0 0 0 0 0 0 0 0 0 0 0 0 0 0 0 0 0 0 0 0 0 0
FR1.2.2 0 X 0 0 X X 0 0 0 0 0 0 0 0 0 0 0 0 0 0 0 0 0 0 0 0 0 0
FR1.2.3 0 X 0 0 X 0 X 0 0 0 0 0 0 0 0 0 0 0 0 0 0 0 0 0 0 0 0 0
FR1.2.4 0 0 0 0 X X X X 0 0 0 0 0 0 0 0 0 0 0 0 0 0 0 0 0 0 0 0
FR
1.3
FR1.3.1 X X X 0 X X 0 X X 0 0 0 0 0 0 0 0 0 0 0 0 0 0 0 0 0 0 0
FR1.3.2 X X X 0 X X X X X X 0 0 0 0 0 0 0 0 0 0 0 0 0 0 0 0 0 0
FR1.3.3 0 0 0 0 0 0 0 0 X X X 0 0 0 0 0 0 0 0 0 0 0 0 0 0 0 0 0
FR1.4 0 0 0 0 0 0 0 0 0 0 0 X 0 0 0 0 0 0 0 0 0 0 0 0 0 0 0 0
FR1.5 0 0 0 0 0 0 0 0 0 0 0 X X 0 0 0 0 0 0 0 0 0 0 0 0 0 0 0
FR
2
FR
2.1
FR2.1.1 0 0 0 0 0 0 0 0 0 0 0 0 0 X 0 0 0 0 0 0 0 0 0 0 0 0 0 0
FR2.1.2 0 0 0 0 0 0 0 0 0 0 0 0 0 X X 0 0 0 0 0 0 0 0 0 0 0 0 0
FR2.1.3 0 0 0 0 0 0 0 0 0 0 0 0 0 0 X X 0 0 0 0 0 0 0 0 0 0 0 0
FR
2.2
FR2.2.1 0 0 0 0 0 0 0 0 0 0 0 0 0 0 0 0 X 0 0 0 0 0 0 0 0 0 0 0
FR2.2.2 0 0 0 0 0 0 0 0 0 0 0 0 0 X 0 0 X X 0 0 0 0 0 0 0 0 0 0
FR2.2.3 0 0 0 0 0 0 0 0 0 0 0 0 0 0 0 0 0 X X 0 0 0 0 0 0 0 0 0
FR2.3 0 0 0 0 0 0 0 0 0 0 0 0 0 0 0 0 0 0 0 X 0 0 0 0 0 0 0 0
FR
3
FR
3.1
FR3.1.1 0 0 0 0 0 0 0 0 0 0 0 0 0 0 X 0 0 X 0 0 X 0 0 0 0 0 0 0
FR3.1.2 0 0 0 0 0 0 0 0 0 0 0 0 X 0 0 0 0 0 0 0 0 X 0 0 0 0 0 0
FR3.1.3 0 0 0 0 0 0 0 0 0 0 0 0 0 X 0 0 0 0 0 X 0 X X 0 0 0 0 0
FR
3.2
FR3.2.1 0 0 0 0 0 0 0 0 0 0 0 0 0 0 0 0 0 0 0 0 X 0 0 X 0 0 0 0
FR3.2.2 0 0 0 0 0 0 0 0 0 0 0 0 X 0 0 0 0 0 0 0 0 X 0 0 X 0 0 0
FR3.2.3 0 0 0 0 0 0 0 0 0 0 0 0 0 X 0 0 0 0 0 X 0 0 0 0 X X 0 0
FR3.3 0 0 0 X 0 0 0 0 0 0 0 X 0 0 0 0 0 0 0 0 0 0 0 0 0 0 X 0
FR4 0 0 0 0 0 0 0 0 0 0 X 0 X 0 0 0 0 0 0 X 0 X X 0 X X X X

- 31 -
3 CONCLUSIONS
This paper illustrated a practical application of the decomposition method presented in part I that integrates the Axiomatic Design Theory with Value Engineering principles, in particular the Function Analysis System Technique (FAST). Each step of the proposed value-based axiomatic decomposition method was described and the results were presented and discussed.
The main findings that can be derived from this case study can be summarized as follows:
The suggested value-based axiomatic decomposition method proved to be applicable and useful in a real design project.
The use of the “How-Why” intuitive logic from FAST not only demonstrated to be useful in checking for design inconsistencies, but also revealed to be easily comprehended by the design project team.
During the decomposition activities, and in each level of the design hierarchy, the proposed method helped to define a necessary and sufficient number of FRs, understand the relationships among FRs located at different levels of detail, and distinguish leaf from non-leaf FR-DP pairs.
The result of the design process, which includes the decomposition activities, led to a decoupled design as showed by the final full design matrix (Figure 4). This provided a good decisional-order to be followed
by the operational managers during the service planning activities, especially for time critical and non-standard transportation delivery services.
In future studies, we aim to test the proposed value-based decomposition method in the context of other design projects, including projects which make use of the Design for Six Sigma (DFSS) methodology, in order to improve the method itself and check its applicability to others contexts.
4 REFERENCES
[1] Bytheway C.W., FAST Creativity & Innovation, Florida: J. Ross Publishing, 2007. ISBN 1-932159-66-0
[2] Hintersteiner J.D., Friedman G. “System Architecture Template”, MIT White Paper, Axiomatic Design Group, 1999.
[3] Mizuno S., Management for Quality Improvement: The Seven New QC Tools, New York, Productivity Press, 1988. ISBN 0-915299-29-1
[4] Suh N.P., The Principles of Design, New York: Oxford University Press, 1990. ISBN 0-19-504345-6
[5] Suh N.P., Axiomatic Design: Advances and Applications, New York: Oxford University Press, 2001. ISBN 0-19-513466-4
[6] Tate D., “A Roadmap for Decomposition: Activities, Theories, and Tools for System Design”, Doctoral Thesis, Department of Mechanical Engineering, Massachusetts Institute of Technology (MIT), Cambridge, MA, 1999.

Proceedings of ICAD2013 The Seventh International Conference on Axiomatic Design
Worcester – June 27-28, 2013
ICAD-2013-05
- 32 -
ABSTRACT
Material selection takes on a strategic importance to meet the highest level standard of a product/process design. The evolution of legislative, regulatory and functional needs makes this selection extremely complex as it is the result of several compromises involving the consumer. Choosing the wrong material produces product failures, reliability problems and high costs. On the other hand, the many compromises needed during product design are often responsible for a non-optimal final design and for a reduction in the design process efficiency (delays in schedule or a rise in the cost). In the material selection process, the designer has to deal with a lot of trade-offs. These are often caused by a failure to identify the functional specifications that are related to the materials (i.e. limited weight, ability to conduct heat, wear resistance, etc.). In many cases, however, the designer has correctly understood the functional specifications but there is a deficiency in the mapping of the connections between the functional specification and the physical characteristics (i.e. density, thermal conductivity, hardness, etc.). A systematic strategy to drive the designer to discover and map the correlation between the different physical characteristics is also missing. This paper shows how, using the Information Axiom of Axiomatic Design Theory, the designer can clearly define the functional specifications as functional requirements (FRs) and identify the mutual correlation between the different physical characteristics (the design parameters used in Axiomatic Design). In this way, material selection during the development of new product can be made more effective and innovative.
Keywords: MADM problems, materials selection, Information Axiom.
1 INTRODUCTION
Over the years, various attempts have been described which aim to provide a structured support in the selection of optimum materials for projects. The algorithms developed
tried to help assess material performance based on several critical aspects (selection attributes) minimizing the needs of high level competences.
It is important to observe that each of the selection attributes usually has a specific and different impact on the product quality and on the ideality of the solution so that an effective weighting method has to be adopted to consider all attributes during the material selection process. The correct definition of the different weights for selection attributes among many alternatives is still an open topic. Many of the proposed methods define a precise and complete structured methodology to overcome the problems of weighting evaluation (e.g. AHP method [Mayyas et al., 2011], Entropy Weighting Method, etc.) but at the same time they appear as extremely rigid frameworks with complex procedures that are usually not sustainable for application in the real industrial environment. In fact, the rigidity and the time consuming characteristics of these methods mean that the decision making process still used in many industrial environments is a structureless approach completely based on the expertise, and built on the trust, of the technicians and engineers who are members of the project team.
With the aim of developing a formal approach, without sacrificing the inventing contribution to the selection process, a study of the authors [Cavallini et al., 2013] proposed the use House of Quality (HoQ) as a preliminary aid in the material selection process. In this model, the correlation between the selection criteria is still not considered during the criteria weights calculation and this aspect can sometimes produce an incomplete understanding of the optimal weight that has to be assigned to each criteria. In other words, in articulate systems it is very important to estimate as soon as possible the complexity of the development phase of a new product. A large part of this complexity (as clearly shown in Axiomatic Design) is often due to the correlation between the design variables.
The aim of this study is to develop a simplified model to quantitatively take into account this coupling in the weighting
AN AXIOMATIC APPROACH TO MANAGING THE INFORMATION CONTENT IN QFD: APPLICATIONS IN MATERIAL SELECTION
Carlo Cavallini
[email protected] Department of Technologies and Innovation
Development University Guglielmo Marconi
Via Plinio, 44 - 00193 Roma –Italy
Paolo Citti
[email protected] Department of Technologies and Innovation
Development University Guglielmo Marconi
Via Plinio, 44 - 00193 Roma –Italy
Leonardo Costanzo [email protected]
Department of Technologies and Innovation Development
University Guglielmo Marconi Via Plinio, 44 - 00193 Roma –Italy
Alessandro Giorgetti [email protected]
Department of Technologies and Innovation Development
University Guglielmo Marconi Via Plinio, 44 - 00193 Roma –Italy

- 33 -
estimation for the selection criteria. The proposed method considers that the evaluation of the weight of each criterion has to be dependent on the following two points:
the ability to represent the functional needs of the product (i.e. to translate effectively the informal description of what the material has to sustain during the product lifecycle);
the number of degrees of freedom available for the optimization of each criteria, to avoid sacrificing the other criteria or more probably facing with trade-off problems.
The proposed methodology can be optimally and simply integrated with Multi Attributes Decision Making algorithms (MADM) to span the whole process of material selection.
To better explain the research topic, a brief case study is presented at the end of this paper.
2 PROPOSED METHODOLOGY
The proposed method wants to introduce an approach based on the second axiom of Axiomatic Design [Suh, 1990] that is the Information Axiom. This axiom says that the best design alternative among all is the one that minimizes the information content. It’s simple to understand that the larger the quantity of data necessary to complete the task, the greater the probability that something goes wrong. Therefore, less necessary information means a high probability of optimization of the task. Our aim is to deploy this concept in the study of the correlations between the characteristics of the materials and then use the results to better evaluate the different solution in the material selection problem.
Figure 1 shows the typical scheme of the first HoQ (based on the QFD cascade).
Figure 1. Scheme of the first HoQ.
The methodology to compile this graphical design tool is largely shown in literature [Hulrich, et al., 2008] and many possible integrations with Axiomatic Design have been developed during the years (e.g. [Rizzuti, et al., 2009]). For the aim of this paper we focus particularly only on two aspects of the HoQ:
The weighting method for the Critical to Satisfaction (CTS);
The signification of the roof of the first HoQ.
In the traditional HoQ algorithm the weight (wRj) for each
CTS is computed as (4).
wRj = ∑ (vi ∗ xij)ni=1 (4)
Where:
𝑣𝑖 is the weight of the i-th Voice of Customer (VOC);
𝑥𝑖𝑗 is the correlation coefficient between the j-th
CTS and the i-th VOC; This relative importance weight computed for the j-th CTS can be normalized as follows:
𝑊𝑅𝑖 = w
∑ w
(5)
The roof of the first HoQ shows the correlations between the CTSs. This part of the HoQ is the real theme of interest for the approach proposed in this paper. Usually the correlation between CTSs is considered in a qualitative manner. With this approach the design team can clearly show and understand intuitively the kind of correlation between the CTSs during the design phase. The data reported in the roof of the first HoQ are although very seldom used in a quantitative or semi-quantitative manner as a design driver to improve the project.
This paper proposes a new approach to integrate the data collected in the roof of the first HoQ in the weighting process of the CTS. In this context is very important to explore the different kinds of mutual correlation that can be found between two different CTSs.
Figure 2. Highlight of the roof of the first HoQ.
Three types of correlation can be enumerated through a simplified taxonomy (see Figure 2):
No correlation;
Positive correlation;
Negative correlation. The meaning of no correlation is clear. Positive correlation
means that two CTSs are correlated in a sense that the improvement of one involves the improvement also of the other. Finally negative correlation means that between the two CTSs there is a trade-off situation: i.e. the improvement of the one involves the worsening of the other. It is intuitive to understand that among the three alternative types of

- 34 -
correlation, the only critical for the design activity is the negative correlation.
The proposed axiomatic approach to manage the information content in QFD wants to take into account the negative correlation among the different CTSs in the weighting process. As mentioned in the introduction, the weight of each selection criteria (the CTS using the terminology of QFD), has to be dependent not only on the representation of the VOCs, but also on the correlation grade among the selection criteria. A quantitative and extremely simple method to manage the correlation among the selection criteria can be introduced with the aid of the Information Axiom.
In particular we define the following values for the correlation among the selection criteria:
0 for no correlation;
+1,+3,+9 for positive correlation;
-1,-3,-9 for negative correlation. These data should be used to fill in the roof of the HoQ and to fix in what manner each selection criteria interact with the other. If we assume as n the number of the selection criteria, the total number of correlations that each selection criterion can develop is n-1. The probability that the j-th selection criterion shows a non-negative correlation in the design activities can be calculated as:
𝑃𝑗 =(𝑛−1) − #𝑁𝑒𝑔𝑎𝑡𝑖𝑣𝑒 𝑐𝑜𝑟𝑟𝑒𝑙𝑎𝑡𝑖𝑜𝑛 𝑜𝑓 𝑡ℎ𝑒 𝑗−𝑡ℎ 𝑠𝑒𝑙𝑒𝑐𝑡𝑖𝑜𝑛 𝑐𝑟𝑖𝑡𝑒𝑟𝑖𝑎
(𝑛−1) (6)
The expression (6) defines an indicator able to “quantify” the correlation developed by the j-th selection criterion. The use of a probabilistic approach is useful because many of the correlations should have a stochastic behaviour. The partial content of information of the j-th selection criterion can then be defined as follows:
𝐼𝑝𝑗 = − log2 𝑃𝑗 (7)
The Expected Value of Negative Correlation (EVNC)j can be introduced to consider the magnitude of the negative correlations among the j-th selection criterion and the other. EVNCj is defined as follows:
𝐸𝑉𝑁𝐶𝑗 = ∑ (𝛼𝑘 ∗(𝑛−1)𝑘=1 𝛿𝑘) (8)
where:
𝛼𝑘 is the probability that the k-th correlation for the j-th selection criterion is negative;
𝛿𝑘 is the negative weight associated with the k-th correlation for the j-th selection criterion.
Finally, it can be defined the complete content of information for the j-th selection criterion as:
𝐼𝑗 = 𝐼𝑝𝑗 ∗ 𝑎𝑏𝑠 (𝐸𝑉𝑁𝐶)𝑗 (9)
The correlation weight for the j-th selection criterion is then defined as:
𝑊𝐶𝑗 = 1𝐼 ⁄
∑ 1𝐼 ⁄
(10)
where
0 ≤ 𝑊𝐶𝑗 ≤ 1 (11)
When the number of negative correlations made by the j-th
CTS is zero then 𝑊𝑐𝑗 = ∞. This condition can be easy
managed by the assumption shown in Table 1 (where k is the number of CTSs that have non-negative correlation).
Table 1. Summary of the proposed method.
Condition Results Assumption #𝑁𝐶𝑗 = 0 𝑊𝐶𝑗 = ∞ 𝐼𝑗 = max(𝐼𝑗) ∗ 𝑛 − 𝑘
#𝑁𝐶𝑗 = (𝑛 − 1) 𝑊𝐶𝑗 = 0
The 𝑊𝑐𝑗 should then be combined with the 𝑊𝑅𝑗 from (5),
to obtain a unique importance weight for the j-th selection criterion. With the aim to conjugate formal treatment and intuitive simplicity, the answer to the aforementioned question can be found in.
𝑊𝑗 =𝑊 ∗𝑊
∏ (𝑊 ∗𝑊 )
(12)
where
0 ≤ 𝑊𝑗 ≤ 1 (13)
On the basis of what has been described, the most important selection criterion is the one that satisfied better the combination of the two following tests:
Is more representative to the VOCs array.
Is more “independent” or uncoupled with the other selection criteria.
The proposed approach considers a negative correlation between the CTSs as a negative element for the research of the best solution for the system. The motivation of this assumption is based on a high number of real application experiences (in particular connected with material selection for mechanical applications) that have shown many problems in finding a good optimization for the material performance in presence of many trade-off situations.
3 CASE STUDY: THE MATERIAL SELECTION PROBLEM
In the proposed case study, the task is the selection of the optimal material for an engineering product. The product is the structural frame of a road bicycle, like the one reported in Figure 3.
Figure 3. Frame for a road bicycle used as Case Study.
The conceptual design starts with the collection of the Voices of the Customer expressed in the example as

- 35 -
functional requirements. The biker (customer) will use this road-bicycle had expressed the following desires for his/her bicycle:
A. Should be light; B. Should be strong; C. Should be resistant to repeated loads; D. Should have ductile rupture (the rupture has to be
not sudden). These desires should be integrated with the needs
identified by the design team, of which the most important are:
i. The frame has to be produced with a metal alloy, so that it can be easy joinable;
ii. The material should be correctly stiff to avoid transmitting excessive forces to the biker;
iii. The material should withstand to atmospheric agents;
iv. The material should have a limited cost (the target market is formed by amateur bikers).
In Figure 4 it is shown the first HoQ through which the Voices of the Customer and the design team needs are systematically traduced in technical terms.
According to the proposed method, the parameters computed from (5) to (9) are shown in table 2.
Figure 4. HoQ of structural frame for a road bicycle.
Table 2. Summary of the calculated parameters.

- 36 -
Figure 5. CTSs Importance Ranking with the proposed method.
Figure 6. Importance Ranking without correlations.
The importance rating Wj of CTS is shown in Figure 5 and it can be easily deduced that the set of CTSs can be divided into two groups:
High importance CTSs (on the left);
Low importance CTSs (on the right). The high level CTSs contain the maximum level of customer satisfaction and design optimization probability. Due to this consideration it is fundamental for the design team to focus its attention on these CTSs as the main drivers in the material selection for the system. For comparison in Figure 6 it is shown the importance rating of the CTSs deduced by the use of the HoQ without considering the correlation among the CTSs (WRj). From the comparison between Figure 5 and Figure 6 two aspects can be highlighted:
In Figure 6 no importance class can be identified through the CTSs array;
No design complexity evaluation is considered in Figure 6.
The proposed weighting method can be finally integrated in the advanced MADM algorithms to conclude the material selection problem [Cavallini, et al., 2013] and identify the best solution for the system.
4 CONCLUSIONS
In every engineering or management system there is the need to operate with the system complexity. This complexity can be declined in a lot of different project features: data, information, number of people involved, quantity of material resources consumed and so on. However it is important to note that the system complexity is due to “single objects” only to a limited degree instead a great contribute to this complexity is produced by the interaction of many “single objects”. Interaction is the key to manage and improve the performance in an organization not only at the top-notch level, but in every single design task. Axiomatic Design recognizes this strategic feature.
This paper has shown how the second axiom of Axiomatic Design can be used as an important step to manage the system complexity. The proposed approach represents a first attempt of the authors to use the concept of the Information Axiom in integral aided method for material selection based on Quality Function Deployment and MADM algorithms. In this context, the Information
Axiom is used to evaluate in a quantitative manner the degree of correlation trough the CTSs.
Thanks to this approach a total importance rating can be assigned to each CTS based both on:
The degree of Voice of Customers and Design
Teams Needs representativeness and
The number and magnitude of correlations
through the CTSs array.
This second aspect should result in a key factor to correctly evaluate the project optimization complexity that the design team must deal with during product development. The presented case study shows the conceptual soundness of the method while leaving interesting open ideas of research.
5 REFERENCES
[1] Cavallini C, Giorgetti A, Citti P, Nicolaie F, Integral aided method for material selection, 2013, Materials and Design 47, 27–34
[2] Hulrich KT, Eppinger SD, Product design and development, 2008, McGraw-Hill.
[3] Jahan A, Ismail MY, Sapuan SM, Mustapha F, Material screening and choosing methods – a review, 2010, Mater Des, 31:696–705.
[4] Jahan A, Mustapha F, Sapuan SM, Ismail MY, Bahraminasab M, A framework for weighting of criteria in ranking stage of material selection process, 2012 Int J Adv Manuf Technol, 58:411–20.
[5] Mayyas A, Shen Q, Mayyas A, Abdelhamid M, Shan D, Qattawi A, Using quality function deployment and analytical hierarchy process for material selection of body-in-white, 2011, Mater Des, 32:2771–82.
[6] Rizzuti S, De Napoli L, Giampà F, Lonfranco F, “Axiomatic design as a means to find contradiction in an integrated approach for product design”, Fifth International Conference on Axiomatic Design, ICAD2009, Campus de Caparica (Lisbon) – March 25-27, 2009.
[7] Suh NP, The Principles of Design, New York: Oxford University Press, 1990. ISBN 0-19-504345-6.
[8] Suh NP, Axiomatic Design: Advances and Applications, New York, Oxford University Press, 2001, ISBN 978-019513466.

Proceedings of ICAD2013 The Seventh International Conference on Axiomatic Design
Worcester – June 27-28, 2013
ICAD-2013-06
- 37 -
ABSTRACT
Most of the times, the high-level decision process uses scarce knowledge and data, but has a huge impact over the entire design of an artefact or an organization. This paper is a contribution to help making the best decision, using only the expected ranges of variation of the requirements for each alternative design solution.
As an application, this study focuses on the high-level decision between a chilled water and a direct expansion air conditioning system for a datacom centre. The decision depends on the cost and on the likelihood of failure, assuming that both systems have suitable basic cooling function performance. On the contrary to what is specified in most applications, cost applies herein for a functional requirement with specific ranges of variation. Moreover, one applies Axiomatic Design to the process of decision making, rather than to the definition of the artefact. The collected data helps to define the ranges of variation of the afore-mentioned functions, which are the only records needed for the decision process.
Notice that these ranges are also possible to obtain from a panel of experts in the field. As a result, this approach has a much wider purpose when there is just a global understanding of the phenomenon under discussion.
Keywords: Decision criterion, Information Axiom, fuzzy sets, FMEA, datacom-centre.
1 INTRODUCTION
When choosing between different technical infrastruc-tures the decider needs to know about the features of each solution as well as their costs. Usually, there are some basic functional requirements that all the proposed systems can fulfil, and some characteristics or features that define the quality of the solution. In this context, quality is "the totality of features and characteristics of a product or service that bears its ability to satisfy stated or implied needs”, according to the ISO 8402-1986 standard.
On the other hand, cost is a key factor that helps making a decision, which is dependent on the required quality for the investment and on the approach to the contractor market. Usually, entrepreneurs make a public procurement and decide to commission the supplier that proposes the lowest cost. Other entrepreneurs tend to define the limits for the cost in order to be in a safe position regarding the execution of the
assignment. It is also common that an investor invites just a set of suppliers, with whom he or she has confidence. Some other investors decide their investments directly with the con-tractors, because they get the necessary support or have the required self-reliance. What happens in the market exceeds all the afore-mentioned situations, but these examples show that the contractor market has segments, as it happens in any other kind of market. Therefore, the cost is not always a constraint and may have ranges that indirectly relate to expressed or unexpressed features, such as confidence, reliability of work, knowledge, technical support before commissioning and after sales, financial ability, accessibility and friendship, availability to the assignment, etc. In other words, in the context of Axio-matic Design (AD), an empirical function can be used to model the cost. This function is usually based on competition, which final parameter may be the overall cost [Gonçalves-Coelho et al., 2007]. Through the higher levels of decision, the segmentation of the embedded quality of the alternative solu-tions has a counterpart in different ranges of cost. On the other hand, in lower levels of decision making cost may become a constraint, after the target segment of the market for the system is defined.
For those reasons, the main issues at a high-level decision process are: “to define a technical system”; “to define the quality for the technical system”; and “to define the model for costs”. Figure 1 depicts those functional requirements (FR) and the corresponding design parameters (DP).
Figure 1. Investment decomposition.
DECISION CRITERIA FOR THE DESIGN OF HVAC SYSTEMS FOR DATACOM CENTRES BASED ON COST AND LOSSES DUE TO THE FAILURE OF
COMPONENTS
Miguel Cavique [email protected]
UNIDEMI & IPS Instituto Politécnico de Setúbal,
Campus do IPS, Estefanilha, Setúbal, Portugal, 2914-508
António Gonçalves-Coelho [email protected] UNIDEMI & DEMI-FCT,
Universidade Nova de Lisboa, Campus de Caparica, Caparica,
Portugal, 2829-516
António Mourão [email protected]
UNIDEMI & DEMI-FCT, Universidade Nova de Lisboa, Campus de Caparica, Caparica,
Portugal, 2829-516

- 38 -
Notice that the technical system may impact the defini-tion of the features and characteristics, and that the overall cost of the investment depends on the chosen FRs. Eq. (1) is the design equation, which expresses the relationships between DPs and FRs, where X denotes a strong relationship and x a weak relationship. Blank spaces are used for inexistent or almost inexistent relationships.
FR0
FR1.1
FR1.2
FR1.3
=
XXx XX X X
*
DP0
DP1.1
DP1.2
DP4
(1)
Eq. (1) might be read as follows: when choosing a system, there is room to choose the features, and cost can still vary after selecting the system and the features.
2 KEY CONCEPTS OF AXIOMATIC DESIGN
According to AD, the design of a product is a zigzagging decision process between the functional domain and the physical domain. AD stems on two axioms, the Independence Axiom and the Information Axiom. A possible statement for the Independence Axiom is that “in an acceptable design, mapping between FRs and DPs is such that each FR can be satisfied without affecting the other FRs” [Suh, 1990].
From the description of the highest-level functional requirements, one defines the corresponding design parame-ters, which will have a decisive influence on the designation of the child functional requirements.
During this process, the designer may decide to have more design parameters than functional requirements, making some of the former to be fulfilled by more than one of the latter. This decision may happen for different purposes, but in the context of this paper, the objective of using more design parameters than functional requirements is to achieve a safer system.
2.1 REDUNDANT DESIGNS When the design has more design parameters than
functional requirements, then the design matrix is rectangular and the design is redundant [Suh, 1990]. Eq. (2) shows an example of a redundant design, where both FR2 and FR3 de-pend on DP3 and DP4, causing the design to be coupled.
FR1
FR2
FR3
=X X
X X X XX X X X
*
DP1
DP2
DP3
DP4
(2)
If the design matrix is of the right-trapezoid or rhomboid types, then the design is decoupled [Gonçalves-Coelho et al., 2012].
FR1
FR2
X X X X
X X X X
*
DP1
DP2
DP3
DP4
DP5
(3)
The design matrix of Eq. (3) is rhomboid. In order to fulfil all its requirements, the designer may freeze DP2, DP3 and DP4, and achieve FR1 by adjusting DP1. After setting DP1, he or she can achieve FR2 by adjusting DP5.
2.2 TOTALLING THE INFORMATION CONTENT According to the Information Axiom, from the known
alternative design solutions, the one chosen might have the minimum information content. One calculates the information in the functional requirement domain by defining a system probability distribution function (p.d.f.) that expresses the behaviour of the system.
Eq. (4) allows computing the information content I for a one-FR design, where P is the probability for the system to perform within its design range.
(4)
Usually, the system p.d.f. is either unknown or hard to
figure out, but one knows a range of variation and has a lim-ited knowledge of the system performance. In such condition, one can assess the information content by computing the quotient of the common area by the system area defined through a membership function [Kulak et al., 2004] (Figure 2).
Figure 2. The common area and the system
membership.
I = -log2
Common area
System area
(5)
If the design has more than one FR and is uncoupled,
then all FR are achieved independently and the information content of the design is the sum of the information content of each FR:
I = -log2 P -log2 Pii
Ii
i (6)
The computation of the information content of
decoupled designs, such as the one of Eq. (1), involves the use of conditional probability as explained by Frey et al. [2000].
PP
I 22 log1
log

- 39 -
3 THE DECISION ON THE HVAC SYSTEM FOR A DATACOM CENTRE
In this section, one applies the above-mentioned summary of AD to help decide which system is the best for a datacom centre. The systems to be compared are a chilled water (CW) cooling system and a direct expansion (DX) one, each of them with redundant and non-redundant variants. The next subsection presents general knowledge about data centres and the following ones describe the FRs to perform, the corresponding DPs, the design matrix for all the four design variants that were considered and the information content.
3.1 THE STATE OF THE ART IN HVAC SYSTEMS FOR
DATA CENTRES Data centres are critical components in the telecommu-
nication and computer industries, as well as in all kinds of businesses. They must run 24/24 all 365 days of the year. Data centres of enterprises have power densities ranging from 500 W/m2 to 1,000 W/m2, occasionally going up to 2,000 W/m2. In the computer industry, the power density may range from 1 kW/m2 in tape storage data centres, to 60 kW/m2 in extreme power density applications [ASHRAE Handbook, 2011]. Some years ago, 2,000 W/m2 was usually considered or the power indicated by the equipment nameplates was used instead. Nowadays, the IT companies tend to give more accurate values for the density to consider, since most of the time the systems might run at 10% of their maximum power. As for datacom equipment, the power per server rack may be as low as 1 kW or as high as 20 kW, and an average power density of 1,500 W per square meter of area of the room housing the equipment is usually assumed [Beaty and Schmidt, 2004].
Internal conditions of temperature and humidity vary widely, depending on the class of the equipment. As a recom-mendation for all classes, ASHRAE assumes a temperature range of 18 ºC to 27 ºC and a maximum relative humidity (rh) of 60%. However, the relative humidity should be over 30% in order to avoid severe electrostatic discharges.
For low power density data centres (1.2 kW/m2 to 1.5 kW/m2), the HVAC architecture is usually based on distrib-uted cooled air. The cooled air comes under a raised floor or instead is ducted close to the ceiling. In these situations, the most usual solutions are the computer room air conditioning (CRAC), in which the cabinets are located inside the room, and the computer air-handling unit (CAHU) with its central air-handling unit (AHU). Both solutions have similar energy consumptions.
One can also use the so-called in row air handlers (IRAH), in which the cabinets are placed in the row of servers that provides cooling. These systems are usually water-cooled.
High-density installations use water to remove the heat directly from ultra-compact blade servers. In addition, the use of dielectric refrigerants is being developed in order to avoid damaging the electronic circuitry in the event of leak [Hughes and Tschudi, 2011].
As for the distribution of cooled air, the hot aisle/cold aisle is the most common arrangement, and the use fan
powered cabinets to extract cold air directly from the free space under the raised floor is also usual.
As one could see, datacom centres have high power consumption, making the energy management a special concern in the design of any HVAC system. A typical way to reduce the energy consumption is to manage the IT system by aggregating traffic and using the coalescence of the workloads in smaller groups of servers, in order to allow disconnecting the idling systems [Mahadevan et al., 2011]. On the HVAC side, free cooling by using direct air from outside is a potentially interesting technique to remove heat from data-centres [Siriwardana et al., 2013; Cho et al., 2012; Lu et al., 2011] located in frigid, temperate or subtropical regions. Anyway, according to the ASHRAE guidelines about data centres, the air of data centres must follow ISO 14644-1 Class 8 standard, which involves a high filtration requirements of the outside air. Therefore, there should be a special care when using the free-cooling technique due to the likely failures that particles may cause to the system, and failure mode and effect analysis (FMEA) is useful to identify the subsystems or components that are more likely to fail [Dai et al., 2012].
Because the HVAC system might ensure the continuous, faultless running of the IT system, it might have redundancy of the critical components, a condition that is typically achieved by installing two or more components with the same functionality.
3.2 DESCRIPTION OF THE APPLICATION In this application, the authors used data from twelve
datacom centres. Some of those centres are fitted with CRAC units others integrate a CAHU. In all the studied cases, the void of the raised floor ducts the air reaching the cold aisles through vents across the floor. All those datacom centres are situated in a tropical region. Their power density is lower than 1.5 kW/m2, and they were designed to keep the indoor tem-perature at 21 ºC. All sites have redundant HVAC systems by inclusion of an extra chiller (to be triggered in the event of failure of the other chiller) and at least two AHU.
This paper addresses the issue of whether to use chilled water units, either CRAC or CAHU, or to use direct expansion CRAC units. Two levels of safety for the system definition are considered: a less safe, non-redundant hypothesis, and a re-dundant alternative for increased safety. Both safety levels are achieved by employing of-the-shelf HVAC components. Ap-plying each of these levels of safety to CW and DX variants, one obtains the four HVAC specific solutions herein dis-cussed.
3.3 MAPPING AND THE DESIGN MATRIX Figure 3 and Figure 4 allow comparing the higher-level
decomposition stages of both non-redundant and redundant HVAC systems. The technical systems and their quality are denoted by the functional requirement “Provide air conditioning to a datacom centre”, FR0., at the top level of the architectures that are depicted in both figures. This FR should be achieved through the design parameter DP0. At the first level of the zigzag decomposition, both the non-redundant and the redundant systems have the same FRs.
The functional requirement FR1.1 of Figure 3 and Figure 4, “define a HVAC system”, combines both the FR1.1 and

- 40 -
FR1.2 of Figure 1 (i.e., the definition of the technical system and its quality). In reality, in the mappings of Figure 3 and Figure 4 it is assumed a quality for the whole systems that meets the quality requirements of a datacom centre.
Figure 4. The higher-level decomposition stages of a non-redundant HVAC system.
Figure 5. The higher-level decomposition stages of a redundant HVAC system.
As a result, the design equation of the redundant systems necessarily displays more DPs that FRs:
Eq. (7) denotes the design matrix of the non-redundant HVAC systems, from which one can ascertain that they are decoupled designs.
2.1
1.1
0
2.1
1.1
0
DP
DP
DP
*
XX
X
X
FR
FR
FR (7)
In the redundant design, the decomposition of FR1.1 encompasses the HVAC design solution and the subsystem backup(s), DP1.1 and DP1.2, as shown in Figure 5. Eq. (8) is the design equation of the redundant design solutions.
(8)
Since all the four design solutions expressed by Eq. (7) and Eq. (8) are decoupled, one has to use the Information Axiom in order to choose the best one. Classifying the design allows defining the way to compute the information. Notice that the information content of each solution may vary depending on the system architecture, so that it is plausible to find the minimum information content for different design solutions in different ranges of the same FRs.
The computation of the information content for each one of the alternative solutions employed the conditional probability of success for the system failure and for the cost.
The total information content is the sum of the information content of the system performance plus the joint information content of its cost [Frey et al., 2000]. As for the redundant system of Eq. (8), the block matrix that corre-sponds to DP1.2 and DP1.3 expresses the system performance. One may presume that the system provides suitable air-conditioning to the room as long as it is up and running. It is therefore possible to evaluate the information content of the system due to the likelihood of failure at low failure rates. Since it is difficult to determine a probability distribution function for the failure rates, a membership function is used instead.
In order to compute the information content associated to the costs, one assumes that the corresponding probability distribution is uniform.
3.4 THE FMEA PROCESS FMEA was used to investigate the likely failures of com-
ponents in each one of the alternative systems. The following specific rankings were employed: severity effect of the failure (SF), detection and fixing time (DFT), and failure rate (RF10) [Stamatis, 1995]. The potential effects of the failures employed a ranking for the failure severity that ranges from 1 (very small) to 10 (very high) and a ranking for the detection and fixing time going from 1 (immediate) to 5 (very long). Ad-ditionally, data from ten years of sales of HVAC systems and spares allowed estimating the rate of failure of the parts
This allows us to determine ranges for the variations of the failures, as well as the average failure values, by mixing statistical estimators and linguistic variables that express the opinions of the after sales personnel. As a bottom line, one could find a loss triangular membership function due to the failures.
Each one of those specific rankings apply to all the components that are likely to fail, so that the overall failure ranking of each component is the product of the specific ranks that are considered. Assuming an independent condition for the failure of each component, the system failure ranking is sum of the components’ rankings.
3.1
2.1
1.1
0
2.1
1.1
0
DP
DP
DP
DP
*
XXX
XX
X
FR
FR
FR
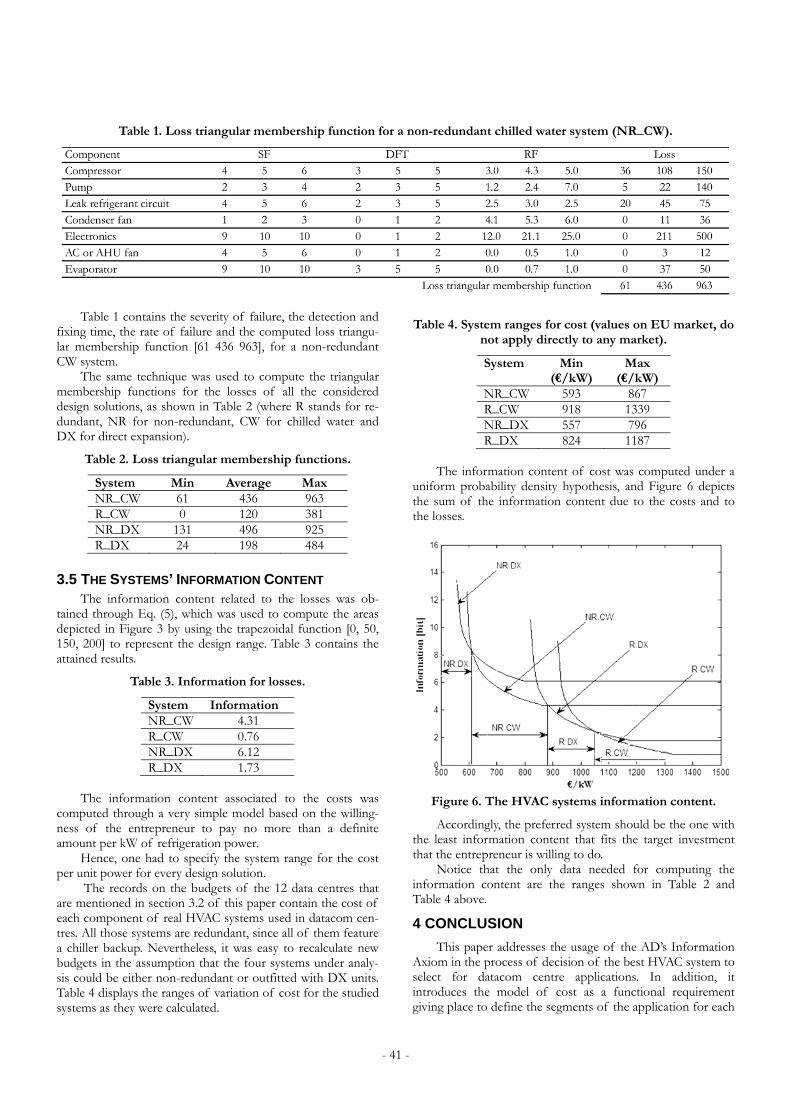
- 41 -
Table 1. Loss triangular membership function for a non-redundant chilled water system (NR_CW).
Table 1 contains the severity of failure, the detection and
fixing time, the rate of failure and the computed loss triangu-lar membership function [61 436 963], for a non-redundant CW system.
The same technique was used to compute the triangular membership functions for the losses of all the considered design solutions, as shown in Table 2 (where R stands for re-dundant, NR for non-redundant, CW for chilled water and DX for direct expansion).
Table 2. Loss triangular membership functions.
System Min Average MaxNR_CW 61 436 963 R_CW 0 120 381 NR_DX 131 496 925 R_DX 24 198 484
3.5 THE SYSTEMS’ INFORMATION CONTENT The information content related to the losses was ob-
tained through Eq. (5), which was used to compute the areas depicted in Figure 3 by using the trapezoidal function [0, 50, 150, 200] to represent the design range. Table 3 contains the attained results.
Table 3. Information for losses.
System Information NR_CW 4.31 R_CW 0.76 NR_DX 6.12 R_DX 1.73
The information content associated to the costs was
computed through a very simple model based on the willing-ness of the entrepreneur to pay no more than a definite amount per kW of refrigeration power.
Hence, one had to specify the system range for the cost per unit power for every design solution.
The records on the budgets of the 12 data centres that are mentioned in section 3.2 of this paper contain the cost of each component of real HVAC systems used in datacom cen-tres. All those systems are redundant, since all of them feature a chiller backup. Nevertheless, it was easy to recalculate new budgets in the assumption that the four systems under analy-sis could be either non-redundant or outfitted with DX units. Table 4 displays the ranges of variation of cost for the studied systems as they were calculated.
Table 4. System ranges for cost (values on EU market, do not apply directly to any market).
System Min (€/kW)
Max (€/kW)
NR_CW 593 867 R_CW 918 1339 NR_DX 557 796 R_DX 824 1187
The information content of cost was computed under a
uniform probability density hypothesis, and Figure 6 depicts the sum of the information content due to the costs and to the losses.
Figure 6. The HVAC systems information content.
Accordingly, the preferred system should be the one with the least information content that fits the target investment that the entrepreneur is willing to do.
Notice that the only data needed for computing the information content are the ranges shown in Table 2 and Table 4 above.
4 CONCLUSION
This paper addresses the usage of the AD’s Information Axiom in the process of decision of the best HVAC system to select for datacom centre applications. In addition, it introduces the model of cost as a functional requirement giving place to define the segments of the application for each

- 42 -
solution. The four systems under analysis are of the chilled water (CW) and direct expansion (DX) types, both with redundant (R) and non-redundant (NR) variants. The higher-level functional requirements that describe those systems are related to their behaviour, as well as to the losses due to the failure of components and to the cost. The design equations of all the considered systems exhibit a lower triangular or a rhomboid matrix, so that the designs are decoupled.
One employs the concept of conditional information, which allows computing the information content of the systems by using the Bayesian probability concept. This allows calculating the system information content as the sum of the information content of failure losses with the joint infor-mation content of cost.
As a result, the range of investment in €/kW for non-redundant direct expansion systems (NR_DX) is up to 610 €/kW; for non-redundant chilled water systems (NR_CW) the range is [610 880]; for redundant direct expansion systems (R_DX) the range is [880 1,050]; and for redundant chilled water systems (R_CW) the range is over 1,050 €/kW.
On the other hand, the R_CW is the system with the less information content, but it requires a minimum investment of 1,050 €/kW.
ACKNOWLEDGEMENTS
The authors gratefully acknowledge the support provided by Fundação para a Ciência e Tecnologia through the grant PEst-OE/EME/UI0667/2011 - UNIDEMI.
In addition, they acknowledge CEST, Comércio e Indústria, Lda for the helpful contribution of data about failures of components and costs of datacom centres. Their support made this paper worthwhile.
5 REFERENCES
[1] ASHRAE, ASHRAE Handbook, “Data processing and telecommunication facilities”, HVAC Applications, pp. 19.1-19.17, 2011.
[2] Beaty, Don; Schmidt, Roger. “Back to the future: Liquid Cooling Data Center Considerations”, ASHRAE Journal, Vol. 46, No. 12, pp. 42-46, 2004.
[3] Cho, Jinkyun; Lim, Taesub; Kim, Byungseon Sean. “Viabil-ity of datacenter cooling systems for energy efficiency in temperate or subtropical regions: Case study”, Energy and Buildings, Vol. 55, pp. 189-197, 2012.
[4] Dai, Jun; Das, Diganta; Pecht, Michael. “A multiple stage approach to mitigate the risks of telecommunication equipment under free air cooling conditions”, Energy Conversion and Management, Vol. 64, pp. 424-432, 2012.
[5] Frey, D.D.; Jahangir, E.; Engelhardt, F. “Computing the Information Content of Decoupled Designs”, Research in Engineering Design, Vol. 12, pp. 90-102, 2000.
[6] Gonçalves-Coelho, António M.; Mourão, António. “Axio-matic design as support for decision-making in a design for manufacturing context: A case study”, Int. J. Production Economics, Vol. 109, pp. 81-89, 2007.
[7] Gonçalves-Coelho, António M.; Neştian, Gabriela; Cavique, Miguel; Mourão, António. “Tackling with Redundant Design Solutions Through Axiomatic Design”, Int. J. of Precision Engineering and Manufacturing, Vol. 13, No. 10, pp. 1837-1843, 2012.
[8] Hughes, Phil; Tschudi, William. “Energy Efficient and Lower Capital Cost – an Alternative Data Center Cooling Strategy”, ASHRAE Transactions, ML-11-C005, 2011.
[9] Kulak, Osman; Satoglu, Sule Itır; Durmusoglu, M. Bulent. “Multi-attribute material handling equipment selection using information axiom”, paper ICAD-2004-30, Proc. 3rd Int. Conf. on Axiomatic Design, Seoul, June 21-24, 2004.
[10] Lu, Tao; Lu, Xiaoshu; Remes, Matias; Viljanen, Martti. “Investigation of air management and energy perfor-mance in a data center in Finland: Case study”, Energy and Buildings, Vol. 43, pp. 3360-3372, 2011.
[11] Mahadevan, Priya; Banerjee, Sujata; Sharma, Puneet; Shah, Amip; Ranganathan, Parthasarathy. “On Energy Efficiency for Enterprise and Data Center Networks”, IEEE Communications Magazine, Vol. 49, Issue 8, pp. 94-100, 2011.
[12] Siriwardana, Jayantha; Jayasekara, Saliya; Halgamuge, Saman K. “Potential of air-side economizers for data center cooling: A case study for key Australian cities”, Applied Energy, Vol.104, pp. 207-219, 2013.
[13] Stamatis, D.H., Failure Mode and Effect Analysis, FMEA from Theory to Execution, ASQC Quality Press, Milwaukee, Wisconsin, 1995. ISBN 0-87389-300-X.
[14] Suh, N.P. The Principles of Design, New York: Oxford Uni-versity Press, 1990.

Proceedings of ICAD2013 The Seventh International Conference on Axiomatic Design
Worcester – June 27-28, 2013
ICAD-2013-07
- 43 -
ABSTRACT
Design matrices that are derived from physical laws are, in general, rectangular matrices with a larger number of design parameters than functional requirements. This paper explores some algebraic properties of such matrices and uses them in order to find a diagonal square matrix, which is the ideal design required by the Independence and Information Axioms. Based on these properties, a measure of the distance to the ideal design is proposed. Uncoupled, decoupled and coupled design matrices are explored. Finally, a rule for selecting the best design parameters for achieving a square design matrix is proposed.
Keywords: design matrix, adjustment directions, ideal design, diagonalization theorem.
1 INTRODUCTION
Axiomatic Design [Suh, 1990; 2001] provides a solid structure for mathematically characterizing the design matrix associated with the best design. In addition to Axiomatic Design, the design matrices are subject to the laws of algebra and must be derived from physical laws. Hence, at a first glance, Axiomatic Design, Algebra and Physics are the tools that the engineer has for achieving the best design.
On one hand, physics is a rigid mathematical framework with a fixed set of physical laws. Normally, the number of equations derived from the laws of physics is much, much, lower than the number of variables that must be used for describing a determined solution for a design problem. Hence, the design equations that are used by the designers have a lot of parameters to be explored, and a question about what are the best parameters to be selected in first place appears. For reducing the impact of this resource-consuming task, engineers require a criterion for doing that selection as quick as possible. On the other hand, the algebra is a rigid mathematical framework that allows the designer to extract information about the structure of the design matrix. In this case, the difficult question to be solved is how to extract the required information. This paper proposes a criterion for this purpose. The criterion presented for selecting design parameters will be founded on Axiomatic Design Theory, and on Algebra, taking into account that the matrices derived from physical considerations are rectangular matrices.
Although Axiomatic Design establishes a general procedure for obtaining an ideal design, the mathematical
relationships that are embedded in the ideal design cannot always be implemented as a physical solution or device. In general, the result is a design that must satisfy r functional requirements and that have q with q r design parameters.
However, Axiomatic Design establishes that only r design parameters must be selected as true design parameters and the other q r must be discarded or frozen. Without additional
information, there are a large number of possibilities for this selection, but it is expected that only one set of r design parameters will be the best. Note that the number of possibilities is given by the combinatorial number
!/ ( )!/ !N q q r r which increases when q increases. For
this reason, if the best set of design parameters is not selected at the very moment of writing the design matrix the cost derived from a later iteration could be huge. As said, the aim of this paper is to propose a criterion for making this task easier.
The paper is structured as follows. First, the design equations are presented in the framework of a design environment. Second, a mathematical characterization of the best design is given by using the obtained design equations and Axiomatic Design. Third, the algebraic properties of a rectangular design matrix are presented. Fourth, based on these properties a criterion for selecting the best set of parameters is proposed. Then, the criterion is used for comparing uncoupled, decoupled and coupled designs. Finally, an example showing how the criterion discards a design parameter is presented.
2 TRANSFER FUNCTION AND DESIGN MATRIX
In engineering design problems, it is common to find a great variety of needs, specifications or requirements that can be described as variables whose value must belong to an allowed range. For example, we can think on the position of a given part, the concentration of an additive, the temperature of an infrared sensor, etc. In addition, for a great variety of specifications, this allowed range can be identified with an interval. Thus, a large number of engineering needs or specifications can be defined by using only two values: the minimum allowed value and the maximum allowed value. Suppose that for a given design problem there are r needs that can be specified by a set of allowed intervals that define the hyper-volume of acceptation D as:
DESIGN PARAMETER SELECTION FOR RECTANGULAR DESIGN MATRICES
Efrén M. Benavides [email protected]
Department of Propulsion and Fluid Mechanics Universidad Politécnica de Madrid
Pza. Cardenal Cisneros, 3 28040, Madrid, Spain
Joan B. Rodríguez [email protected]
Altran Calle Campezo 1,
28022 Madrid, Spain

- 44 -
1 1 2 2[ , ] [ , ] ... [ , ] r
r rD l l l l l l (1)
then we can establish the success condition for the design
process as 1 2( , ,..., )rl l l l D and the fail condition as
l D . In addition, the variables 1 2, ,..., rl l l associated with the
needs or specifications are considered to be a set of functional requirements such as are defined by Suh [1990]: the functional requirements are the smallest set of independent requirements that completely characterize the design objectives for a specific need.
Because a design solution must be implemented in the physical domain [Suh, 1990; 2001], the design equations must relate the functional requirements to a set of physical parameters. This set of physical parameters has to include all the physical constants (such as material properties), descriptive parameters (such as geometrical dimensions), and operational parameters (such as rotational speeds, temperatures, and voltages). The designer has no reason for not using all these variables in the process of seeking an adequate design point. From this point of view, all these variables can be considered as design parameters. It is interesting to note that, defined in this way, the number of design parameters is normally larger than the number of functional requirements to be satisfied. Let q (with q r ) be the number of design parameters. In
addition, as it has been argued for the functional requirements, suppose that the design parameters can be defined by the interval where they can be established. Suppose that for a given design solution there are q design parameters
that can be specified by a set of allowed intervals that define
the hyper-volume of variation C as:
1 1 2 2[ , ] [ , ] ... [ , ] q
q qC m m m m m m (2)
then we can establish the design range as
1 2( , ,..., )rm m m m C .
It is useful to define the center of the hyper-volumes D
and C as the following vectors:
1 1 2 2
, ,...,2 2 2
r r r
o
l l l l l ll (3)
1 1 2 2, ,...,2 2 2
q q q
o
m mm m m mm (4)
The engineer implements the laws of physics that relate the vector of functional requirements to the vector of design parameters in the following function:
: rf C (5)
This is the map that transfers the decisions adopted by the
designer in the space C (parameters of design) to the space
D (functional requirements). For this reason it can be considered a transfer function. Function f will be considered a differentiable function, and hence, by applying the Taylor theorem, we can write:
( ) ( )( ) ...o o ol l m J m m m (6)
The structure of Eqs. (1), (2) and (6) advises the following changes of variable [Benavides, 2012]:
2 ; 1,2,...,
2
j j
j
j
j j
l ll
y j rl l
(7)
2 ; 1,2,...,
2
j j
j
j
j j
m mm
x j qm m
(8)
As a result of these changes of variable, the hyper-volumes
D and C transform respectively to:
[ 1,1] [ 1,1] ... [ 1,1] r
rE (9)
[ 1,1] [ 1,1] ... [ 1,1] q
qE (10)
The substitution of Eqs. (7) and (8) into Eq. (6) leads to:
( ) (0) ...y x y Ax (11)
In this expression, the matrix A is a rectangular matrix of size r q :
11 1
1
q
r rq
A A
A
A A
(12)
( )j j j j i o
ij ij
ji i i i
m m m m f mA J
ml l l l (13)
This expression of an element of the design matrix was deduced by Benavides [2012] and gives a rational way for obtaining dimensionless design matrices.
3 IDEAL DESIGN
The conditions qx E and ry E assure that the
maximum deviation of the functional requirement i can be
written as:
max
1
(0) 1q
i i ij
j
y y A (14)
min
1
(0) 1q
i i ij
j
y y A (15)
The substraction and the addition of Eqs. (14) and (15) lead respectively to:
max min
1
12
qi i
ij
j
y yA (16)
max min(0)2
i i
i
y yy (17)
Inequality (16) shows that not all the design matrices produce an acceptable design. Indeed, the restriction that the hyper-volume of acceptance imposes over the elements of the design matrix is even more exigent. This new restriction comes from the inequalities (14) and (15) and can be condensed in the following inequality:
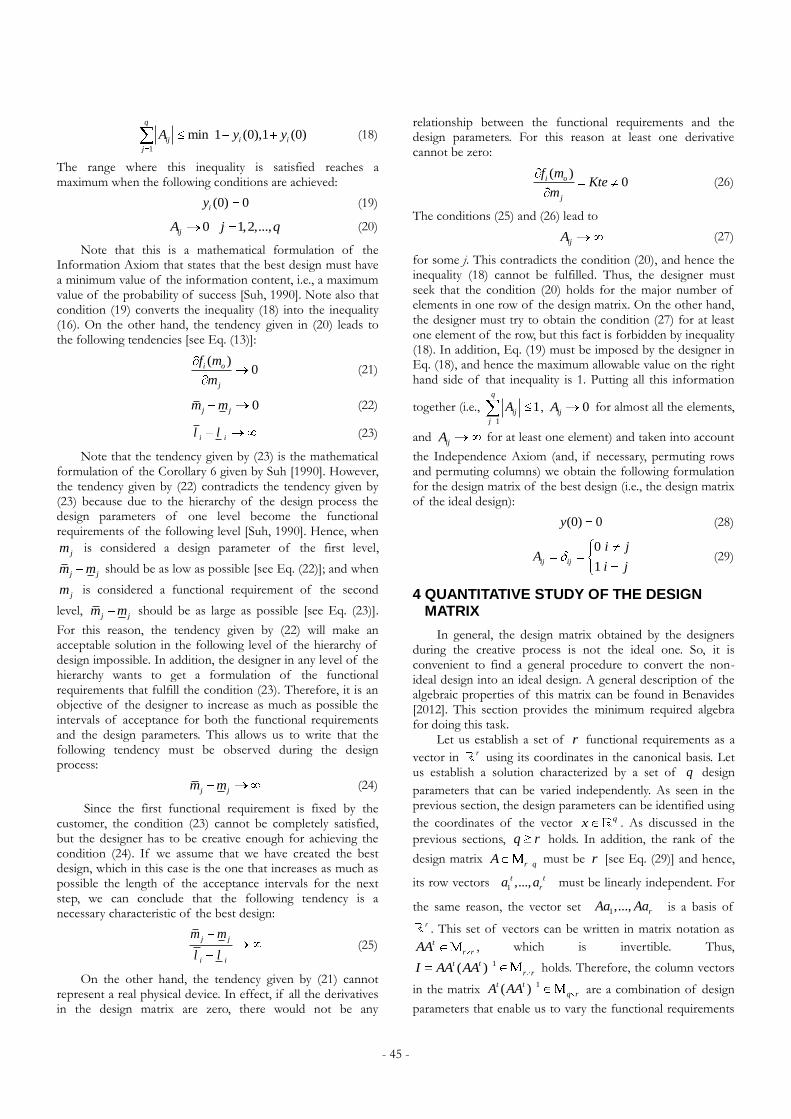
- 45 -
1
min 1 (0),1 (0)q
ij i i
j
A y y (18)
The range where this inequality is satisfied reaches a maximum when the following conditions are achieved:
(0) 0iy (19)
0 1,2,...,ijA j q (20)
Note that this is a mathematical formulation of the Information Axiom that states that the best design must have a minimum value of the information content, i.e., a maximum value of the probability of success [Suh, 1990]. Note also that condition (19) converts the inequality (18) into the inequality (16). On the other hand, the tendency given in (20) leads to the following tendencies [see Eq. (13)]:
( )
0i o
j
f m
m (21)
0j jm m (22)
i il l (23)
Note that the tendency given by (23) is the mathematical formulation of the Corollary 6 given by Suh [1990]. However, the tendency given by (22) contradicts the tendency given by (23) because due to the hierarchy of the design process the design parameters of one level become the functional requirements of the following level [Suh, 1990]. Hence, when
jm is considered a design parameter of the first level,
j jm m should be as low as possible [see Eq. (22)]; and when
jm is considered a functional requirement of the second
level, j jm m should be as large as possible [see Eq. (23)].
For this reason, the tendency given by (22) will make an acceptable solution in the following level of the hierarchy of design impossible. In addition, the designer in any level of the hierarchy wants to get a formulation of the functional requirements that fulfill the condition (23). Therefore, it is an objective of the designer to increase as much as possible the intervals of acceptance for both the functional requirements and the design parameters. This allows us to write that the following tendency must be observed during the design process:
j jm m (24)
Since the first functional requirement is fixed by the customer, the condition (23) cannot be completely satisfied, but the designer has to be creative enough for achieving the condition (24). If we assume that we have created the best design, which in this case is the one that increases as much as possible the length of the acceptance intervals for the next step, we can conclude that the following tendency is a necessary characteristic of the best design:
j j
i i
m m
l l (25)
On the other hand, the tendency given by (21) cannot represent a real physical device. In effect, if all the derivatives in the design matrix are zero, there would not be any
relationship between the functional requirements and the design parameters. For this reason at least one derivative cannot be zero:
( )
0i o
j
f mKte
m (26)
The conditions (25) and (26) lead to
ijA (27)
for some j. This contradicts the condition (20), and hence the inequality (18) cannot be fulfilled. Thus, the designer must seek that the condition (20) holds for the major number of elements in one row of the design matrix. On the other hand, the designer must try to obtain the condition (27) for at least one element of the row, but this fact is forbidden by inequality (18). In addition, Eq. (19) must be imposed by the designer in Eq. (18), and hence the maximum allowable value on the right hand side of that inequality is 1. Putting all this information
together (i.e., 1
1q
ij
j
A , 0ijA for almost all the elements,
and ijA for at least one element) and taken into account
the Independence Axiom (and, if necessary, permuting rows and permuting columns) we obtain the following formulation for the design matrix of the best design (i.e., the design matrix of the ideal design):
(0) 0y (28)
0
1ij ij
i jA
i j (29)
4 QUANTITATIVE STUDY OF THE DESIGN MATRIX
In general, the design matrix obtained by the designers during the creative process is not the ideal one. So, it is convenient to find a general procedure to convert the non-ideal design into an ideal design. A general description of the algebraic properties of this matrix can be found in Benavides [2012]. This section provides the minimum required algebra for doing this task.
Let us establish a set of r functional requirements as a
vector in r using its coordinates in the canonical basis. Let us establish a solution characterized by a set of q design
parameters that can be varied independently. As seen in the previous section, the design parameters can be identified using
the coordinates of the vector qx . As discussed in the
previous sections, q r holds. In addition, the rank of the
design matrix r qA must be r [see Eq. (29)] and hence,
its row vectors 1 ,...,t t
ra a must be linearly independent. For
the same reason, the vector set 1,..., rAa Aa is a basis of
r . This set of vectors can be written in matrix notation as t
r rAA , which is invertible. Thus,
1( )t t
r rI AA AA holds. Therefore, the column vectors
in the matrix 1( )t t
q rA AA are a combination of design
parameters that enable us to vary the functional requirements

- 46 -
independently. The kernel of the linear map A is the subspace generated with the column vectors of the matrix
( )q q rB , which has to verify 0AB . Let us define an
arbitrary matrix ( )q r r
, and construct the matrix
1( )t t
q rX A AA B (30)
This matrix contains in its columns all the combinations of the linear parameters that keep the functional requirements independent. For this reason they are called adjustment
directions [Benavides, 2012]. The arbitrary matrix can be
chosen for eliminating the influence of a design parameter (or a linear combination of design parameters). Because matrix
has q r column vectors, designer can remove the
influence of q r design parameters (or specified directions).
Let designer define a matrix ( )' q q rX whose column
vectors are the directions in the space of the design parameters that the designer wants to remove. The removing of these directions requires to solve the linear system
' 0tX X , which leads to
1 1( ' ) ' ( )t t t tX B X A AA (31)
Note that, as it is remarked in Benavides [2012], the
matrix ( ) ( )'t q r q rX B could not be invertible. The
substitution of leads to
1 1( ' ) ' ( )t t t tX I B X B X A AA (32)
This result lets us assume that there is a vector re that
represents a new set of design parameters. In effect, if this is assumed, then the transfer function can be written as:
1 1( ' ) ' ( ) ...
...
t t t ty A I B X B X A AA e
e (33)
Note that in this equation the designer has reduced the number of design parameters from q to r and has achieved
an ideal design. This result was used by Benavides [2012] to prove the diagonalization theorem that states that the ideal design always exists. For other interesting algebraic results, such as the spectral decomposition of the design matrix, please refer to Benavides [2012]. This expression shows also that, if the designer acts on the design parameters by following the strategy of varying several of them at the same
time, as indicated by the column vectors in matrix X , it is always possible to maintain the independence between the
requirements. By taking the column vectors of X as a basis, the linear map takes the form of the ideal design given by Eq. (29).
Eq. (33) shows that the existence of the ideal design comes from the following property of the design matrix:
AX I (34)
In addition, Eq. (34) shows that all the relevant information for obtaining an ideal design from a given (rectangular or not)
design matrix is collected in the matrix X defined by Eq. (32) which defines the adjustment directions.
5 MEASSURE OF THE GOODNESS OF THE DESIGN MATRIX
The vector X collects the relevant information from the design matrix required for transforming a general design into an ideal one. Eq. (34) states that the column vectors of the
matrix X collect the values of the design parameters that move the functional requirements to the point 1.0, which is the maximum value accepted by the customer. But because the ideal design matrix is the identity matrix, it states also that
each column vector of X moves one and only one functional requirement from the value 0.0 to the value 1.0.
From Eq. (30) we can obtain the following matrices:
1( )t t t t
r qX AA A B (35)
1( )t t t t
r rX X AA B B (36)
Eq. (36) shows that the condition for the ideal design is tX X I (note that when A I holds, 0B also holds).
However, in general, this condition cannot be reached and hence, it is convenient to define the matrix:
1( )t t tE AA B B I (37)
Note that E is a symmetrical matrix that should be identical to the zero matrix for the ideal design. If any
element in the matrix E is not zero, then the norm of the respective column vector will not be zero. This fact allows us to construct a real positive number that measures how much
the matrix E deviates from the zero matrix. This number is:
2 2trace( ) trace( )tE E E (38)
where 2E is given by the following expression
2 1
1 1
2
( )
( ) ( )
( )
t t
t t t t t t
t t
E AA AA I
AA B B B B AA
B B
(39)
Therefore, the ideal design ( A I ) meets the condition =0. The calculation of this deviation is quite hard because
the designer should explore all the possible values of the
matrix . Eq. (30) gives the adjustment directions for a given
. When is calculated with Eq. (31) the calculation of
is reduced to the adjustment directions that result from removing existing design parameters. In any case, the adjustment directions that produce the minimum value of
constitute the new set of design parameters that achieves the ideal design. However, as it is well discussed by Suh [1990], these new parameters are not always feasible in the real world because there could have some limitations, for example creativity, that avoid such implementation. When design parameters cannot be combined and the adjustment directions cannot be followed, a more practical criterion exits. This is the
one where the designer checks if the column vectors of X have a maximum component with an absolute value close to 1.0 and the other components remains between 0 and +1. In this case, the deviation function given by Eq. (38) could be substituted by:

- 47 -
2
1
max 1r
iji
j
D x (40)
This merit function was proposed, together with other additional measures of the degree of independence, by Benavides [2012] for detecting which one is the best set of parameters to be selected in a design matrix (an ideal design
meets the condition 0D ). The condition 0D indicates
if at least one design parameter has reached its maximum range of variation. For situations where the design parameters cannot be physically combined, D from Eq. (40) is more
suitable than from Eq. (38).
6 APLICATION TO UNCOUPLED, DECOUPLED, AND COUPLED DESIGNS
Suh [1990] clearly defines uncoupled, decoupled and coupled designs. Uncoupled and decoupled designs are those that have, respectively, a diagonal design matrix, and a triangular design matrix. Finally coupled designs are those that do not belong to the previous categories. In this section we will collect some simple examples of these categories in order to calculate the matrices and merit functions defined previously. These examples are illustrative and for this reason are kept as simple as possible: all the calculations [see Eqs.
(37) and (38)] will be done for full-rank ( B =0) square design matrices and for three functional requirements.
Table 1. Comparison between designs.
Uncoupled Decoupled Coupled
A
1 0 0
0 1 0
0 0 1
1 0 0
0 1 0
1 1 1
1 0 1
0 1 0
1 1 1
X
1 0 0
0 1 0
0 0 1
1 0 0
0 1 0
1 1 1
1 1 1
2 2 2
0 1 0
1 1 1
2 2 2
E
0 0 0
0 0 0
0 0 0
1 1 1
1 1 1
1 1 0
10 0
2
1 10
2 2
1 10
2 2
2 0 8 5
4
D 0 0 1
2
This example shows that a decoupled design can be worse, in terms of the deviation , than a coupled design. The reason
is that a decoupled design can have the adjustment directions near parallel. But both, the decoupled and the coupled designs, are worse than the uncoupled design, such as the ideal design requires.
7 APLICATION TO THE SELECTION OF DESIGN PARAMETERS
The first proposed example is a coupled design with the following rectangular matrix:
1 0 1 1
0 1 0 1
1 1 1 0
A
The main results for different values of the matrix 'X are collected in the Table 2.
Table 2. Selection of design parameters.
'X X E 2 D
0
0
0
0
1 1 1
2 2 2
1 1 1
6 2 6
1 10
3 3
1 1 1
6 2 6
7 1 1
12 4 12
1 1 1
4 4 4
1 1 7
12 4 12
145
144
3
2
1
0
0
0
Design matrix becomes singular
0
1
0
0
1 1 1
2 2 2
0 0 0
1 1 1
2 2 2
0 1 0
1 10
2 2
1 10
2 2
10 0
2
5
4
2
2
0
0
1
0
1 1 1
2 2 2
1 1 1
2 2 2
0 0 0
1 1 1
2 2 2
1 1 1
4 4 4
1 1 1
4 4 4
1 1 1
4 4 4
9
16
3
2
0
0
0
1
1 1 1
2 2 2
0 1 0
1 1 1
2 2 2
0 0 0
10 0
2
1 10
2 2
1 10
2 2
5
4
2
2
The results in Table 2 show that, in the studied case, the initial design matrix does not allow obtaining an ideal design by removing design parameters. When the DPs can be combined

- 48 -
to obtain new DPs, the table shows that the best selection for the design parameters is {DP1, DP2, DP4} ( =9/16), which
means that DP3 should be removed or frozen. The results also show that this option is better than not removing any design parameters. However, when the DPs cannot be combined, this is not the best option and the best selections will be {DP1, DP3, DP4} or {DP1, DP2, DP3} ( D =1/21/2). It is also interesting that DP1 cannot be removed: it is an essential part of the design because it is a key element for maintaining the rank of the design matrix.
The second proposed example is the design of a faucet that must control the flow rate and the temperature of a liquid flow: {FR1, FR2}={flow rate, temperature} and {DP1, DP2, DP3, DP4, DP5}={pressure1, pressure2, area1, area2, hot temperature}. The design matrix for this problem is [Benavides, 2012]:
1 1 1 10
4 4 2 2
1 1 1 11
4 4 2 2
A
This matrix is interesting because represents a real device with a coupled (select, for example, {DP1,DP2} as the design parameters) or decoupled (select, for example, {DP4, DP5}) design matrix that cannot be uncoupled by means of a
straightforward procedure. Results for tX , 2 and D are
presented in Table 3 for different values of the matrix 'tX . In this case, the best selection of the design parameters is
{DP3, DP4} for both criteria, minimum and D . This
means that: 1) because D is minimum, the option of controlling the areas is better than controlling the pressures or the temperature; and 2) because is minimum, the option of
combining the areas is better for achieving an ideal design than combining the pressures and the temperature. Uncoupled physical solutions, obtained by doing this combination of areas, can be found in Suh [2001] and Benavides [2012].
8 CONCLUSION
It is possible to derive an indicator, based on the deviation of the design matrix from the ideal one, from the algebraic properties of the design matrix. This indicator allows the designer to select the best set of design parameters when the design matrix is not a square matrix. The indicator also establishes that reconfiguring the PDs could be more difficult for a decoupled design than for a coupled design.
9 REFERENCES
[1] Benavides E.M., Advanced Engineering Design: An integrated Approach, Woodhead Publishing, 2012. ISBN 9780857090935.
[2] Suh N.P., The Principles of Design, New York: Oxford University Press, 1990. ISBN 0-19-504345-6.
[3] Suh N.P., Axiomatic Design, New York: Oxford University Press, 2001. ISBN 0-19-504345-6.
Table 3. Selection of design parameters.
'tX tX
2 D
1 0 0 0 0
0 1 0 0 0
0 0 1 0 0
0 0 0 2 1
0 0 0 0 1 18 1
1 0 0 0 0
0 1 0 0 0
0 0 0 1 0
0 0 2 0 1
0 0 0 0 1 18 1
1 0 0 0 0
0 1 0 0 0
0 0 0 0 1
0 0 1 1 0
0 0 1 1 0 2 0
1 0 0 0 0
0 0 1 0 0
0 0 0 1 0
0 4 0 0 1
0 0 0 0 1 258 3
1 0 0 0 0
0 0 1 0 0
0 0 0 0 1
Design matrix becomes singular
1 0 0 0 0
0 0 0 1 0
0 0 0 0 1
0 2 1 0 0
0 2 1 0 0 50 1.4
0 1 0 0 0
0 0 1 0 0
0 0 0 1 0
4 0 0 0 1
0 0 0 0 1 258 3
0 1 0 0 0
0 0 1 0 0
0 0 0 0 1
2 0 0 1 0
2 0 0 1 0 50 1.4
0 1 0 0 0
0 0 0 1 0
0 0 0 0 1
Design matrix becomes singular
0 0 1 0 0
0 0 0 1 0
0 0 0 0 1
2 2 0 0 0
2 2 0 0 0 98 1.4

Proceedings of ICAD2013 The Seventh International Conference on Axiomatic Design
Worcester – June 27-28, 2013
ICAD-2013-08
- 49 -
ABSTRACT
This paper aims to provide a mathematical perspective for the two axioms in Axiomatic Design. Specifically, the Independence Axiom 1 and the Minimum Information Axiom 2 are viewed from the perspective of equality constraint optimization.
Axiomatic Design declares Axiom 1 and Axiom 2 to be axiomatic; that they cannot be proven nor derived from other principles or laws of nature. In fact, this paper shows that the concept and implementation of the two axioms parallel those of equality constraint optimization. The two axioms could have been derived from it.
This paper also shows that the qualifying condition imposed by Axiom 1 that the design matrix be triangular or diagonal is only a sufficient condition for functional independence. It is subset of a larger set that satisfies the necessary condition. Thus, the design that has been allowed by Axiom 1 and found by Axiom 2 to have the minimum information content may not necessarily be the design with minimum information content among the larger set.
Keywords: equality constraint optimization, functional independence, constraint qualification, Axiomatic Design.
1 INTRODUCTION
Axiomatic Design (AD) is a design framework built on two rules for mapping functional requirements (FRs) to design parameters (DPs). The two rules are assumed to be axiomatic. Namely, they are self-evident truths for which there are no counter-examples or exceptions. They cannot be proven nor derived from other laws or principles of nature, Suh [1990]. AD has been around for four decades already. Yet it has not caught ‘fire’ in design community. A principal reason is the axiomatic assumption AD imposed. It is difficult for designers to accept truth without proof. Some criticisms are: “AD people invoke axioms to avoid proof of theory” and “AD is not a mathematically valid method”. The fact is logic and mathematical treatments have been provided to clarify and reinforce concepts in AD. For example, based on formal logic, Lu and Liu [2011] presented a theoretical underpinning to elucidate the delineation of “what” from “how”, providing justification and execution of mapping and decomposition unique to AD. As another example, Rinderle [1982] developed the mathematics for measuring coupling: reangularity which measure how close a design matrix is to becoming a
decoupled triangular matrix; and semangularity which measures how dominant the diagonal elements of a matrix is relative to its off-diagonal elements. It is a measure of how close the matrix is to becoming the uncoupled diagonal matrix. This paper is yet another effort to provide mathematical basis for AD.
The rest of this paper is organized as follows. In Section 2, we use an example involving single functional requirement to demonstrate the impact of constraint optimization on design. In Section 3 we develop the mathematical basis for constraint optimization involving multiple functional requirements. In Section 4 we view Axiom 1 and Axiom 2 in the context of the mathematical basis derived in Section 3. Concluding remarks then follow in Section 5.
2 CONSTRAINT OPTIMIZATION FOR SINGLE FUNCTIONAL REQUIREMEN - AN EXAMPLE
The power steering assembly in car consists of a vertical tubular “top hat” joined to a horizontal tubular housing (Figure 1). The steering valve rotates inside the top hat to direct fluid left/right for power steering. The top hat is made of cast iron (E=120,000MPa, µ=0.29) for wear resistance; the housing is made of aluminum (E=71,000MPa, µ=0.34) for weight reduction. Press fitting joints the two components of dissimilar material together. Figure 2 shows the cross-section of the assembly at the joint.
Figure 1. The power steering assembly.
A CONSTRAINT OPTIMIZATION PERSPECTIVE ON AXIOMATIC DESIGN
Hilario L. Oh [email protected]
Consultant Oakland Township, Michigan 48306
USA

- 50 -
Figure 2. Cross-section of assembly at the joint.
One functional requirement FR is that the radial pressure developed at the interface holds the two components together. From an engineering handbook, the radial pressure p is given in Equation 1.
To achieve a target value FR*, we solve Equation (1) for DP* that yields FR*. Hereafter bolded letters denote vectors. One approach is to minimize and reduce to zero the error:
Error FR DP1, DP2 , DP3 , DP4 FR* 2 The result is DP* = (26.00, 20.9738, 21.0161, 16.00) in millimeters which would give FR= 20 Pa, the target value. In our later discussion, we shall refer to this approach as nominal design.
In the presence of variability, FR will deviate from its target FR*. For example per Equation (1), a machining error of ±25m in and will result in a radial pressure that
ranges from -3.65Pa to 43.70Pa. (Axiomatic Design calls this range the system range.) At radial pressure < 0, solution by nominal design fails since a loose fit occurs at zero radial pressure.
The correct formulation is to pose the problem as an equality constraint optimization [Luenberger and Ye, 2008]. The designer should minimize the deviation due to variability, subject to the constraint that FR(DP) equals FR*, and thus expand FR(DP) in a Taylor series:
where NV denotes the noise variable, the source of variability; and the summation term is the deviation in FR. The NVs in this example are the radii and . So that:
Using squared deviation (SD) as the norm, we formulate the equality constraint optimization as follows:
Qualification (4) is necessary. Otherwise, all partial
derivatives of FR(DP) with respect to DPi equal zero, FR(DP) will not be a function of DP, and optimization cannot proceed. In our example, qualification (4) is satisfied because Equation (1) shows FR(DP) to be indeed a function of DP. Expression (5) is the objective function to minimize. Equation (6) is the constraint equation that DP needs to satisfy at all times. In our discussion later, we shall call this approach of Equality Constraint Optimization the ECO design.
For both the nominal and ECO design, we use Excel to compute the sensitivity to variability and the squared deviation per Expression (5). The results, see Table 1 and Table 2, show that both DP* (26.00, 20.9738, 21.0161, 16.00) from the nominal design and DP* (25.00, 21.9363, 22.0000, 17.00) from the ECO design give FR=20Pa. However, sensitivity to variability is less with ECO design. Consequently, the squared deviation using the ECO design is only 36% that of the nominal design.
From this example, we conclude that we should adopt the ECO design and the equality constraint optimization approach.
Table 1. Sensitivy and squared deviation of nominal design.
Table 2. Sensitivity and squared deviation of ECO design.
p=ri - ro
bEAL
c2 + b2
c2 -b2+ AL
+
bEFE
b2 + a2
b2 -a2-FE
1
where b=ri + ro
2
so that FR DP1, DP2 , DP3 , DP4 p g c, ro, ri , a ,where DP1, DP2 , DP3 , DP4 are respectively c, ro, ri , a.
ri ro
ri ro
Description
Housing OR, cHousing IR, roTop hat OR, riTop hat IR, a
NominalValue
26.0020.973821.0161
16.00
∆r
0.02500.0250
Sensitivity Squared
∂FR/ ∂r Deviation
-437.4396 119.5959434.3347 117.9041
Radial Pressure 20.00 Total = 237.5000
Description
Housing OR, cHousing IR, roTop hat OR, riTop hat IR, a
NominalValue
25.0021.936322.0000
17.00
∆r
0.02500.0250
Sensitivity Squared
∂FR/ ∂r Deviation
-267.4571 44.7083261.5885 42.7678
Radial Pressure 20.00 Total = 87.4762

- 51 -
3 CONSTRAINT OPTIMIZATION FOR MULTIPLE FUNCTIONAL REQUIREMENTS
For multiple functional requirements, FR(DP) is a vector valued function of the form
We first qualify that FR(DP)-FR* = 0 is non-degenerate.
Otherwise there can be no solution for DP and optimization cannot proceed. Given the system of equations:
For above system of equations to be non-degenerate, m
cannot be less than n. If m equals n, the determinant J of the Jacobian matrix of FR(DP) must not be zero: J ≠ 0. That is:
J
FR1
DP1
FR1
DP2
FR1
DPn
FR2
DP1
FR2
DP2
FR2
DPn
FRn
DP1
FRn
DP2
FRn
DPn
0. 7
If m is greater than n, then we choose n among the m DPs
such that the associated Jacobian J ≠ 0. Note that the Jacobian matrix is, in fact, the design matrix
[A] in Axiomatic Design:
Thus a re-statement of Equation (7) is that to qualify a system of equations FR(DP)-FR* = 0 for optimization, its Jacobian J, which is the determinant of [A] matrix, must not be zero:
J A
a11 a12 a1n
a21 a22 a2n
an1 an2 ann
0. 8
In testing for J ≠ 0, we are in fact testing the functional independence of FR (DP) [Chiang, 1984].
To derive the expression for squared deviation, we first expand FR (DP) into n set of Taylor series:
Each ith equation above is a Taylor series expansion of
similar to Equation (3). The above equation may be
written in matrix form:
where the [B] matrix is the Jacobian matrix of FR with respect to the noise variable NV with element
The squared deviation (SD) is then the inner product:
The formulation for equality constraint optimization of
multiple functional requirements is an extension of Equations (4), (5) and (6) as follows:
FR1 DP1,DP2 ,,DPm FR2 DP1,DP2 ,,DPm
FRn DP1,DP2 ,,DPm
FR1*
FR2*
FRn*
0
[A]
a11 a12 a1n
a21 a22 a2n
an1 an2 ann
FR1
DP1
FR1
DP2
FR1
DPn
FR2
DP1
FR2
DP2
FR2
DPn
FRn
DP1
FRn
DP2
FRn
DPn
bi k FRi
NV k
, i 1, 2,, n; k 1, 2,, l .

- 52 -
4 AXIOMATIC DESIGN IN THE CONTEXT OF EQUALITY CONSTRAINT OPTIMIZATION
Axiomatic Design (AD) is built on two axioms [Suh, 1990]. Axiom 1 is a rule that qualifies a design as acceptable only if its FRs maintains independence. Of those that qualify, Axiom 2 then selects the one that has minimum information content. The process behind the two axioms, qualifying designs for functional independence followed by searching among the qualified designs for one with minimum information content, is similar to the formulation of equality constraint optimization. We therefore view AD in that light.
4.1 INDEPENDENCE AXIOM 1 According to Equation (8), a constraint qualification for
FR(DP) is that its Jacobian J, i.e., the determinant of [A] matrix, not be zero. This is a necessary condition N.
In AD, Axiom 1 requires the design matrix [A] to be either diagonal or triangular. Since the determinant of these two types of matrices is not zero, the Axiom 1 requirement does fulfill the constraint qualification imposed by Equation (8). This also means that the FRs so qualified are functionally independent.
However, the condition that [A] be diagonal or triangular is only a sufficient condition S for |A| ≠ 0. It is a subset of the larger set N that satisfies the necessary condition (Figure 3) Therefore, there can be designs whose design matrix [A] is neither diagonal nor triangular and yet its determinant J ≠ zero. These designs continue to be functionally independent. They may possess information content lower than the minimum found among the subset S. Thus in using Axiom 1 to qualify design, AD may completely miss these designs.
Figure 3. Sufficient condition as a subset of necessary
condition.
4.2 INFORMATION AXIOM 2 Both ECO design and AD acknowledge the presence of
variability and the associated uncertainty in design. Both use deviation in FR from the target as the metric for variability. ECO design uses squared loss to quantify loss due to deviation: the farther the deviation from the target, the larger the loss (Figure 4). It delves deeper to identify the sources of the variability NV, and compute the matrix [B], the sensitivity of FR to these sources. With [B]T[B] as the objective function, it becomes possible to minimize sensitivity for reduced deviation.
Figure 4. Squared loss function.
AD measures variability in terms of the range of deviation and calls it the system range. It then uses absolute loss to quantify the loss due to deviation. Absolute loss defines a range in FR, known as design range, center on the target value FR* (Figure 5). A design whose deviation in FR falls within the design range incurs no loss. Otherwise, it will incur a loss of (1 – p), where p is given by:
The common range is the overlap of the design range and system range shown in Figure 5.
Figure 5. Design range, common range & system range.
AD further defines a quantity called the information content I as:
. Axiom 2 then uses information content I as the metric to
select the design with the least information content I from among the designs qualified by Axiom 1.
Since AD adopts an absolute loss function, designs like A and B in Figure 6 whose system range fall within the design range are deemed equally good. Both have zero information. Thus it is equally likely that Axiom 2 will pick A over B or B over A as the best design. This is counter-intuitive. Intuition tells us that design B is the better because it has a larger margin for error.
Unlike ECO design, AD does not attempt to identify sources of variability nor provide an objective function to minimize. Its treatment of uncertainty in design is less extensive than that of the ECO design.
p common range
system range
I log2
common range
system range

- 53 -
Figure 6. Design A versus Design B.
5 CONCLUDING REMARKS
AD declares Independence Axiom 1 and Minimum Information Axiom 2 to be axiomatic; that they cannot be proven nor derived from other principles or laws of nature. We have shown, in fact, that the concept and implementation of AD, i.e., qualifying design for functional independence followed by searching for the one design with minimum uncertainty, parallel those found in the decades-old equality constraint optimization. The concept and approach in AD could have been derived from it. Hence, there is no need to invoke axiomatic assumptions about them.
The qualifying condition imposed by Axiom 1 that design matrix [A] be triangular or diagonal is only a sufficient condition S for functional independence. It is subset of the larger set that satisfies the necessary condition N. Thus, the design that has been allowed by Axiom 1 and found by Axiom 2 to have the minimum information content may not necessarily be the design with minimum information content among the N set. If a design outside the S set is found to have
lower information content, then a counter example exists; and Axiom 1 and 2 do not hold.
In adopting an absolute loss function, Axiom 2 at times produces conclusions that are counter-intuitive. It is suggested that square loss function be used instead.
AD involvement in assessing uncertainty in design should be taken to a larger extend than it currently is. AD should begin to recognize and search for the sources of variability NV, sensitivity of FR to them, and try to reduce the sensitivity to achieve a reduced loss.
AD offers many other concepts and approaches: top down zigzag decomposition of FR-DP; separation of domains to provide a neutral environment for defining FRs; an environment conducive to bi-modal, linear and non-linear, thinking, etc. These are all unique to AD. Hence the name Axiomatic Design should be kept even though there is no need to invoke axiomatic assumption of the method.
6 REFERENCES
[1] Chiang A.C., Fundamental Methods of Mathematical Economics, New York: McGraw Hill, Inc. 1984. ISBN 0-07-010813-7, pp. 184-186.
[2] Lu S.C.Y. and Liu A., “A Logic-based Foundation of Axiomatic Design”, Proceedings of ICAD2011, The Sixth International Conference on Axiomatic Design ICAD-2011-01, Daejeon, Korea, 2011.
[3] Luenberger D. G. and Ye Y., Linear and Nonlinear Programming, Stanford, CA: Springer 2008. ISBN 978-0-387-74502-2.
[4] Rinderle J.R., “Measures of Functional Coupling in Design”, Doctoral Thesis, Department of Mechanical Engineering, Massachusetts Institute of Technology, Cambridge, MA, 1982.
[5] Suh N.P., The Principles of Design, New York: Oxford University Press, 1990. ISBN 0-19-504345-6.

Proceedings of ICAD2013 The Seventh International Conference on Axiomatic Design
Worcester – June 27-28, 2013
ICAD-2013-09
- 54 -
ABSTRACT
While university education is a part of the service economy, there have been no formal efforts to design university classes as a service. Here we embark upon the Axiomatic Design process to develop university classes with an eye toward including functional requirements found in other services. Drawing inspiration from world renowned university classes and deeply engaging services, we identify functional requirements related to emotions and the senses. Prototype functional requirements and design parameters that can be used to support the design of any service-oriented course are developed. We discuss the application of these prototypes to the design of a university course. The new course is being implemented and evaluated in the Spring 2013 semester at KAIST.
Keywords: Axiomatic Design, university education, service experience, service-oriented university courses.
1 INTRODUCTION
Billions of people have spent decades as the customers of educational services, up to and including university education. Such devotion to education is necessary as it is an essential factor in the success of individuals and nations. As such, there have been decades of research focus on education, and there have been marked improvements; c.f., [Bagchi, 2010]. Yet, despite this focus, and the fact that education is classified as part of the service economy, there have been no efforts to employ formal design methods to create university classes that exploit the fact that they are services. We employ Axiomatic Design [Suh, 1990; 2001] to develop prototype functional requirements (FRs) that focus on cognitive domains, learning styles, emotions and the senses. We hope they can be used to create exceptional service-oriented university classes. We exploit the new FRs to redesign a sophomore general elective class at KAIST entitled Introduction to Operations Research. The new design is being implemented and evaluated in the Spring 2013 semester.
2 RELEVANT LITERATURE & CONTRIBUTION
Much effort has been devoted to the study of education. We next briefly discuss traditional methods, service oriented methods and formal design methods in education. Our goal is to review the major directions and provide perspective that will enable us to clearly distinguish our contribution here.
2.1 TRADITIONAL EDUCATIONAL LITERATURE
There is a vast body of work on education and numerous journals devoted to it. Some of the significant thrusts include the development and application of knowledge taxonomies as exemplified by [Bloom et al., 1956]. In such work, hierarchies of knowledge, starting from rote memorization and culminating in complete mastery of a subject as demonstrated by synthesis, evaluation and creation skills, are developed and exploited in the educational process. Another key development is the study and use of learning styles as in [Davis, 2007]. Each student has their own method or combination of methods for learning that work best for them; these are called learning styles. They include visual, aural, logical, physical and social learning styles, among others. Multiple styles can and should be employed when guiding the learning process for a group of students.
2.2 SERVICE PERSPECTIVES IN EDUCATION
Education is part of the service economy, which broadly speaking, consists of those activities that are neither agriculture nor manufacturing. A host of tools have been developed to guide the creation and management of activities in the service sector. These include service classification models (e.g., the service process matrix of Schmenner [1986]), KANO needs (introduced in [Kano et al., 1984]) and evaluation instruments such as SERVQUAL (suggested in [Parasuraman et al., 1985] and [Parasuraman et al., 1988]). All of these are relevant in the context of education – it is a service – and there have been some efforts to employ such methods. Focusing on basic and performance needs, Cuthbert
AXIOMATIC DESIGN AND IMPLEMENTATION OF SERVICE-ORIENTED UNIVERSITY CLASSES: EMOTIONS AND SENSES
Sang Yoon Bae [email protected]
KAIST Department of Industrial and Systems Engineering 373-1 Guseong-dong, Yuseong-gu,
Daejeon, 305-701, Korea
Jukrin Moon
[email protected] KAIST Department of
Industrial and Systems Engineering 373-1 Guseong-dong, Yuseong-gu,
Daejeon, 305-701, Korea
Chan-Eon Park [email protected]
KAIST Department of Mathematical Science 373-1 Guseong-dong, Yuseong-gu,
Daejeon, 305-701, Korea
James R. Morrison
[email protected] KAIST Department of
Industrial and Systems Engineering 373-1 Guseong-dong, Yuseong-gu,
Daejeon, 305-701, Korea

- 55 -
[1996], Joseph et al., [1997], Aldridge et al., [1998], Sahney et al., [2004] and Tan et al., [2004] have used methods such as SERVQUAL in efforts to improve the overall university experience. They consider administrative issues such as course scheduling, support facilities and the like, but not individual classes. In [Kim et al., 2011], KANO excitement needs were studied in the context of a university course.
One element of service that has received considerable attention is the application of humor in the classroom. Skinner [2010] provides a brief discussion on the topic and asserts that there are numerous reasons to use humor in the classroom. Berk [2000] suggests that humor on exams can help student performance. These and other efforts of their kind represent what we consider an important perspective. This method is much more common in services such as movies, theatre and television; it has significant value for students. While many have considered humor for education, other facets of service have not been studied.
2.3 FORMAL DESIGN IN EDUCATION
In addition to a service-perspective, we are also concerned with the use of formal design methods in education. There are some papers in this realm. Quality Function Deployment (QFD) has been considered for course design; c.f., [Sahney et al., 2004] and [Bagchi, 2010]. The focus is on ensuring quality in courses with the standard design.
Of particular relevance for our approach are the three papers that, to our knowledge, have discussed the use of Axiomatic Design (AD) for education. The authors of [Tate et al., 2004] address the necessity of teaching Axiomatic Design (AD) and use AD to design such a course. In [Tate, 2005], the design of an internet-based platform for a mechanical design course is discussed. These two papers focused on specific courses. The general use of AD for course design is studied in [Thompson et al., 2009]. Many key issues related to the use of AD for course design are considered. Prototype functional requirements that could be used for any course are developed. As relates to course content, the focus of these AD papers is on incorporating traditional teaching strategies (learning styles and knowledge taxonomies) and organizational methods.
2.4 CONTRIBUTION AND ORGANIZATION
There is considerable evidence to suggest that taking a service orientation in education will improve service quality and educational outcomes. Humor is an element of many services such as comedies, movies, books and theatre. Good presentations are enriched by the use of humor. There is a body of work revealing the value of humor in the educational context; c.f., [Berk, 2000] and [Skinner 2010]. However, delivering humor is not the only service action that one can take. In restaurant service, repeating a customer’s order, kneeling next to the table, drawing cute faces on the bill, touching a customer, etc., have statistically significant implications for server tips. Is it possible that other such service oriented actions can improve educational service? In [Kim et al., 2011], experiments were conducted to investigate service actions such as giving candy to students who answer questions in class or calling students by their name. These results suggest, and it is intuitively clear that, designing a
course with a general service orientation may lead to significant improvements in perceived quality and outcomes.
Inspired by the success of humor in education, the monetary value of KANO excitement needs in restaurant service [Lynn, 1996] and experiments to demonstrate that service-oriented actions other than humor can improve education [Kim et al., 2011], we aim to design service-oriented university classes. Following the Axiomatic Design (AD) methodology, we collected hundreds of customer needs for university classes. From these, we extracted prototype functional requirements (FRs) that could be considered for use in the design of any university class. We focus on incorporating functions present in other services; namely, we strive to inspire emotions and stimulate the senses of students in the context of the course material. With these candidate FRs in hand, we proceed to redesign a general elective sophomore-level university course at KAIST in South Korea entitled “Introduction to Operations Research”. The resulting design is being used and evaluated in the Spring 2013 offering of the course.
The contributions of this work follow. For what is to our knowledge the first time, we
Propose the idea of a service perspective in university course education that includes the stimulation of emotions (not only humor) and senses;
Develop a list of prototype FRs and DPs in an effort to achieve this general service-oriented perspective;
Design a university course that includes, not only educational functions, but service-oriented ones such as experiencing emotions;
Discuss the implementation of such a course at KAIST. It is our hope that the resulting course will provide a truly
exceptional experience for the students with the potential to transform their perspective on the world. The inclusion of emotional content has the potential to draw deep connections between the course material and the students’ lives. There are a few existing examples of courses that have dramatic influence on students, including Alternatives to Violence [McCarthy, 2013] and a course discussed in [Pausch, 2008]). Such courses were crafted by skilled artisans. By extracting the essence of these experiences, which we believe center on the instilling of emotions related to the course material, the service-orientation may enable the creation of remarkably different educational experiences in a structured manner that can be replicated.
The paper is organized as follows. In Section 3, we review the results of our stakeholder needs evaluation. Prototype FRs and DPs are provided in Section 4. In Sections 5 and 6, we discuss the new course design and implementation, respectively. Concluding remarks are provided in Section 7.
3 STAKEHOLDERS AND BENCHMARKING
Seeking to create service oriented university classes that have the potential to transform students’ lives, we pursued the Axiomatic Design process. We began with a consideration of the stakeholder needs and related benchmarking. These needs were extracted from numerous sources, organized and distilled into about 250 Customer Needs (CNs) for use in the design process. The details of the stakeholder concerns evaluation are given next. The CNs are then reviewed. Selected details

- 56 -
about Bloom’s Taxonomy of knowledge, learning styles, emotions and senses are then discussed.
3.1 BACKGROUND RESEARCH
To identify a comprehensive list of stakeholder concerns that can then be condensed into our Customer Needs (CNs), we considered ten disparate sources. These were:
University student surveys;
Prior course evaluation survey scores and comments;
Interviews with the KAIST Dean of Education 3.0;
Interviews with professors who have received excellent teaching awards from KAIST;
On-line articles and videos about teaching;
Books on teaching authored by celebrated professors;
A popular non-fiction Korean television program where lecturing is the format;
Academic literature on service and education;
Our own perspectives on what is good about various services; and
Academic literature on emotions/senses. Brief details on some of these sources are provided next.
The university student survey was completed by 72 students in June 2012. We sought information on what they perceive as the most important factors for university classes, lectures and professors. We obtained student evaluation results and SERVQUAL surveys conducted in prior offerings of our target course. (These were obtained from the authors of [Kim et al., 2011].) These provided us with potential areas that students might consider as important. The academic literature on service included the seminal papers by [Parasuraman et al., 1985] and [Parasuraman et al., 1988].
This background research revealed that emotions and senses play key roles in good service. Korean Air is a multiple award winner for the best air carrier in the world. They are always kind and helpful and the environment is comfortable; customers feel welcome. Exceptional movies engage our minds and hearts. Popcorn and soda further stimulate our senses at the theatre. The exceptional university classes that we studied included surprise, amazement (e.g., [Pausch, 2008]) and sometimes negative emotions such as horror [McCarthy, 2013]. The stimulation of emotions and senses are essential in extraordinary services that we remember. So too may these be helpful in engaging students.
3.2 CUSTOMER NEEDS
We organized and condensed the stakeholder requirements obtained from these disparate sources into 259 customer needs (CNs). These were categorized into three main classes of needs: teaching staff, lecture/discussions and students. The teaching staff category contains 79 CNs associated with the staff ’s knowledge of the material, attitude toward the material and the students, and their preparedness for class meetings. The lecture category contains 160 CNs associated with the contents of class meetings, lectures and discussions. Lecture delivery methods, the exhibition of attitudes (such as kindness and respect toward the students), exhibition of emotions, stimulation of the senses and classroom environment were included. There were 20 CNs in the third category of student. These CNs related to the
student’s response to the class and included such needs as student ability, attitude and preparation. They focused not only on themselves, but on the attitudes of the other students. This third category reflects the fact that classroom learning occurs in a social environment. Participation by students can improve the experience.
From these CNs, several other broad categories were also observed. These included content, delivery, evaluation and overall course experience. Content refers to the knowledge gained by the students in the course. (We consider knowledge about the structure of the course itself in this category.) Delivery relates to how the knowledge is transmitted or communicated. Evaluation refers to the manner in which the student absorption of the knowledge is measured. The overall class experience relates to the manner in which the connections between the knowledge and the students’ lives are established. These categories will form the basis of our FRs.
3.3 COGNITIVE DOMAINS FOR LEARNING
The authors of [Bloom et al., 1956] identified six cognitive domains of learning objectives: knowledge, comprehension, application, analysis, synthesis, and evaluation. They are briefly described next:
The knowledge domain refers to the act of remembering data or information. The recall of basic concepts such as definitions and theorems are included.
The comprehension domain refers to the act of understanding a topic as opposed to just remembering the facts. It implies an understanding of how the topics relate to each other and intuition of their implications.
The application domain refers to the capability to apply knowledge from the first two domains. Solving example problems using the topics is included.
The analysis domain is a more advanced application domain. This domain can be satisfied studying situations and determining how the topics can be used in that context. Real life applications are at the highest level in this domain.
The synthesis domain involves creative problem solving in which seemingly disparate concept or ideas within the material are employed together.
The evaluation domain includes making judgements about the value of ideas or materials.
These six domains can be considered when developing course material. Different types of learning activities may be employed for each. Bloom’s taxonomy is typically depicted as a pyramid (Figure 1). This suggests a hierarchy of domains. Lower level domains form a base for the development of higher ones.
We will explicitly include these learning domains in our prototype functional requirements. The course designer should select which of the domains they wish to target for each particular learning module.

- 57 -
Figure 1. Bloom’s Taxonomy in the cognitive domain.
3.4 LEARNING STYLES
A service-oriented educational experience should be student-centric. The focus for the delivery of knowledge will be on how students learn rather than on how the instructor teaches. Since every student is different, and they can have dramatically different preferences in the manner in which they learn, the learning experience should consider methods to satisfy potentially diverse needs.
In [Davis, 2007], the literature on learning styles was organized into seven convenient categories. Students may prefer more than one of these styles.
Visual learners receive information best via images, pictures, and colours. Material organized and delivered with visual aids can be effective when targeting these students.
Aural learners prefer sound and music. Material presented via music, songs or rhythm is preferred.
Verbal learners best receive material via words. Written or spoken words help them to absorb material.
Physical learners prefer action. They use their body and senses, so that touch, action, and movement support their learning process.
Logical learners thrive with a logical and stepwise approach. They may have an advantage in understanding mathematics and sequential contents.
Social learners prefer to learn via communicating with each other. Group tasks are good ways to engage them.
Solitary learners tend to study alone. Individual homework or activities may be helpful to them. It can be difficult to address the specific needs of all
students in a university class simultaneously. Creating subgroups of students and providing them with customized learning material is typically infeasible. One option is to attempt to deliver each topic using several interleaved styles. An issue that may arise is that some material may not be suitable for all styles. For examples, the rigorous proof of vector calculus theories may not be easily delivered with aural styles (music, song, etc.).
To include these learning styles in our prototype FRs, we will include all of them. The course designer should then select those styles that they want to exploit.
3.5 EMOTIONS
A fundamental feature of other services, particularly in the entertainment category as well as the extraordinary classes
studied during our benchmarking, is the stimulation of emotions. Humor, empathy, excitement and many others are common. Humor is well known to improve learning experiences. In [Kim, 2011], various service activities were conducted and connected with a perception of the instructor’s compassion or caring (termed kindness in their study). We believe that establishing emotional connections between the students and the course material may significantly improve their retention and overall satisfaction with the experience.
In [Parrott, 2011], emotions are organized in a hierarchy (Table 1). While what is possible will depend on the course topics, emotions can be used in many ways in a university course. Joy is an important emotion that can be employed. Humor is a type of joy that has been shown effective in educational contexts. Pride is also in the class of joy. It can be instilled in students by impressing upon them the importance of the material or helping them to understand how challenging the material that they are mastering is. Students can be filled with surprise via demonstration. Chemistry classes often use exploding chemicals.
In [Pausch, 2008], it is described how a class professor destroys a fax machine with a sledge hammer. Unexpected and lively demonstrations in class can serve to instill surprise. Though it may be less clear initially, negative emotions such as anger, sadness, or fear can be exploited as well. Pity or horror have been used to demonstrate the suffering of animals in [McCarthy, 2013]. Pity for persons who suffer can be used to inspire students to care about a particular problem. Solving the problem via the course material may then show them the value of the material and encourage them to care about the power or possession of that knowledge.
A key here is not only to inspire emotions, but to inspire them in the context of the course material. It is through that link that will we hope to build deep connections between the student and the course material.
There are numerous methods that can be used to inspire emotions in others. These include providing knowledge that may inspire the emotion, demonstrating an emotion oneself (via voice timbre and body language), stating that a particular emotion should be felt and appealing to the senses.
3.6 SENSES
The stimulation of the senses can be helpful to improve the perception of service quality in university education. There are five human senses: sight, touch, smell, taste and hearing. To this we add the logical sense, which is the perception that an argument “makes sense”. Note that senses can be exploited in support of the various learning styles. In our surveys, many sensory needs were uncovered. Clearly visible teaching materials and the neat appearance of the teaching staff were mentioned. Touch, as in a comfortable temperature, and smell, as in clean fresh air, were mentioned in relation to the classroom. In [Kim, 2011], candy and treats were given to the students; this stimulates the taste sense. This is perhaps related to the sale of refreshments at movie theatres. Students were also concerned about the appropriate volume and clarity of an instructor’s voice. Logically clear course materials were also a concern.

- 58 -
Table 1. Parrott’s hierarch of human emotions.
First
level Second level Third level
Love
Affection Adoration, affection, love, fondness, liking, attraction, caring, tenderness, compassion, sentimentality
Lust Arousal, desire, lust, passion, infatuation
Longing Longing
Joy
Cheerfulness
Amusement, bliss, cheerfulness, gaiety, glee, jolliness, joviality, joy, delight, enjoyment, gladness, happiness, jubilation, elation, satisfaction, ecstasy, euphoria
Zest Enthusiasm, zeal, zest, excitement, thrill, exhilaration
Contentment Contentment, pleasure
Pride Pride, triumph
Optimum Eagerness, hope, optimism
Enthrallment Enthrallment, rapture
Relief Relief
Surprise Surprise Amazement, surprise, astonishment
Anger
Irritation Aggravation, irritation, agitation, annoyance, grouchiness, grumpiness
Exasperation Exasperation, frustration
Rage
Anger, rage, outrage, fury, wrath, hostility, ferocity, bitterness, hate, loathing, scorn, spite, vengefulness, dislike, resentment
Disgust Disgust, revulsion, contempt
Envy Envy, jealousy
Torment Torment
Sadness
Suffering Agony, suffering, hurt, anguish
Sadness
Depression, despair, hopelessness, gloom, glumness, sadness, unhappiness, grief, sorrow, woe, misery, melancholy
Disappointment Dismay, disappointment, displeasure
Shame Guilt, shame, regret, remorse
Neglect
Alienation, isolation, neglect, loneliness, rejection,
homesickness, defeat, dejection, insecurity, embarrassment, humiliation, insult
Sympathy Pity, sympathy
Fear
Horror Alarm, shock, fear, fright, horror, terror, panic, hysteria, mortification
Nervousness Anxiety, nervousness, tenseness, uneasiness, apprehension, worry, distress, dread
By taking a step back from these specific concerns and considering the larger context, the senses, one can consider methods to stimulate the senses that are not commonly used in this context and perhaps novel. The sense stimulating element need not be part of the course material. For example, one could spray air freshener or clean the desks prior to class with lemon scented cleaner. Sparkling clean chairs, desks and floor or soothing (learning friendly) colors might support the learning experience. Candy, doughnuts or pizza could bring joy to the student via the satisfaction of their taste sense. (Note here that the goal would not be to “bribe” the students to give a better course evaluation just prior to the survey, but to generally provide them with a pleasing sensory input through the learning experience. Although, it is possible the “bribe” approach is effective in increasing the course evaluation scores.)
Sensory stimulus directly related to the course material or the inspiration of emotions is also possible. Clear visual aids or physical objects may support learning objectives and the sense that the course is logically clear. (This relates to the learning styles.) When making efforts to inspire emotions, it is well known that even instrumental music can magnify feelings. Visual images of people displaying an emotion will often result in a related feeling in the viewer.
The senses can be used to improve student satisfaction.
4 PROTOTYPE FRs AND DPs
Based on the insights gleaned from the customer needs development in conjunction with a careful consideration of the existing literature on AD for education ([Tate et al., 2004; Tate, 2005; Thompson et al., 2009], we developed prototype functional requirements (FRs) and design parameters (DPs). The idea of prototype FRs is that, while they are not particularly detailed, they can be used for any course design at the level of the course, chapter or lecture. They are intentionally generic. The designer simply selects those FR/DP pairs they wish to employ at a particular time in the class. Specific FR topics must be selected and DPs created. This concept coincides with the perspective in [Thompson et al., 2009] regarding course design: “In a flexible system, only a subset of all FRs must to be satisfied at any given time. For each FR, there may be several candidate DPs to choose from.”
Our high level prototype FRs are as follows:
FR0: Establish student understanding of course knowledge (content) map;
FRi: Establish cognitive domains for course topic i in students;
FRA: Evaluate course quality; FRB: Establish connections between course topics and
students concerns; and FRC: Magnify intensity of emotion the student associates
with selected ideas.
Each of these is discussed briefly next. The detailed prototype FR and DP decomposition is provided in Appendix I. There, the prototype DPs are simply stated as “method to provide” the FR. Depending on the course topic and applications, the course designer will select DPs appropriate to their context. In

- 59 -
Section 5, examples of DPs for a particular course are provided.
FR0 seeks to develop an understanding of the overall structure of knowledge for the topics in the course. This function is essentially the same as FRi22 in [Thompson et al., 2009]. Each FRi seeks to teach the students the material for each topic i. Here, as children of each of these FRs, we will place the cognitive domains of [Bloom et al., 1956]. Beneath each of the cognitive domains, we will place children FRs for the various learning styles. We consider that this structure contains FRi3, FRi4 and FRi5 from [Thompson et al., 2009]. FRA will assess the quality of the course; this is FRi6 of [Thompson et al., 2009]. This FR could certainly be investigated in more detail, but our focus here is on the creation of emotions the stimulation of the senses. FRB and FRC largely venture into new territory. FRB seeks to connect the course material with things that the students care about. These may be everyday elements of their life, as in [Thompson et al., 2009]’s FRi23. They may be broader. This breadth enables one to select from a vast array of potential target life elements. Examples will be provided in our design. FRC seeks to establish deep meaning for a particular idea via the magnification of emotions associated with it. Under FRC, as children, the stimulation of emotions and senses will appear. One example in this broad class of functions is FRi21 of [Thompson et al., 2009]. There, emotions are connected with a particular course administration component (grades). Other topics can have deep emotions associated with them; these can then be exploited for many course objectives. We will demonstrate how this can be used in the context of a course in our course design discussion.
It is important to note that the prototype FRs and DPs should be considered as generic guidance and structural placeholders. Specific DPs and topics should be selected when creating a specific course. In addition, these FRs and DPs must be distributed across time (e.g., throughout each lecture or throughout the semester).
5 APPLICATION TO A UNIVERSITY COURSE
We elected to apply these prototype FRs and DPs to the redesign of the sophomore level general elective course entitled Introduction to Operation Research (IE 200) at KAIST. Many students who take the course have not yet chosen a major. They are at a ‘crossroads’ in their life. As such, a course intending to provide strong guidance to them may be appropriate. Moreover, as this is a basic elective course, many motivating examples should be included. We will discuss the design of this course and provide examples of the course material developed for the chapter on Optimization of Network Models.
5.1 SELECTED FRS AND SPECIFIED DPS
FRs must be selected for the course. While broad course level FRs such as FR0 and FRA must be selected, we do not discuss them here. We instead focus on the development of lecture material for an illustrative topic in our target course. We make particular efforts to include functions FRB and FRC. We primarily include these in the first or last lecture of a chapter, and focus on DPs including motivating examples and practical cases.
For our Optimization of Network Models chapter, we select FRs and DPs that include a surprising performance, strong emotional content and connecting examples. Naturally, course topics are covered. A typical high FRB and FRC content lecture is described next.
The primary FRBs and FRCs selected seek to surprise the students with a topic related performance in which the teaching team dresses as the Red Cross, enters to dynamic music and delivers “course survival kits” including candy and the assignment hand out for the day’s activities. Content connecting real world Red Cross food distribution to the course network models are discussed. Topics related to linear programming models for such networks are integrated throughout. The students solve a simple problem in class and try their hand at a more realistic one. Finally, an emotionally moving slide show including music, startling facts and pictures of huger stricken children is provided. The connection between an optimized food distribution network that provides more food and relief for these suffering children is established. The summary FRs and DPs used for this lecture design are provided in the lower half of Figure 2.
This kind of lecture will occur about one out of three lectures. The others are less dynamic, but still have FRB and FRC content. The lecture described is intended as the first class of the topic. It starts with a joyful surprise that also introduces the contents to be covered for that topic. It finally establishes a connection between the knowledge and the students’ emotional lives.
Figure 2. FRs and DPs for our example lecture.
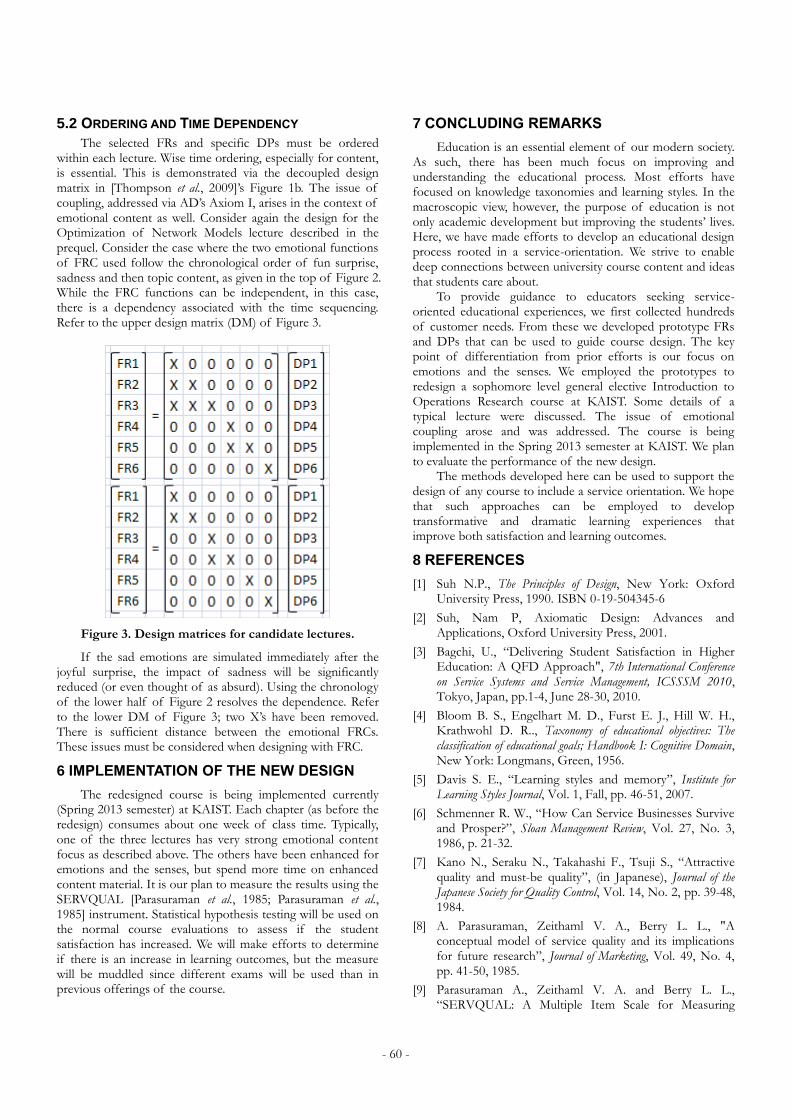
- 60 -
5.2 ORDERING AND TIME DEPENDENCY
The selected FRs and specific DPs must be ordered within each lecture. Wise time ordering, especially for content, is essential. This is demonstrated via the decoupled design matrix in [Thompson et al., 2009]’s Figure 1b. The issue of coupling, addressed via AD’s Axiom I, arises in the context of emotional content as well. Consider again the design for the Optimization of Network Models lecture described in the prequel. Consider the case where the two emotional functions of FRC used follow the chronological order of fun surprise, sadness and then topic content, as given in the top of Figure 2. While the FRC functions can be independent, in this case, there is a dependency associated with the time sequencing. Refer to the upper design matrix (DM) of Figure 3.
Figure 3. Design matrices for candidate lectures.
If the sad emotions are simulated immediately after the joyful surprise, the impact of sadness will be significantly reduced (or even thought of as absurd). Using the chronology of the lower half of Figure 2 resolves the dependence. Refer to the lower DM of Figure 3; two X’s have been removed. There is sufficient distance between the emotional FRCs. These issues must be considered when designing with FRC.
6 IMPLEMENTATION OF THE NEW DESIGN
The redesigned course is being implemented currently (Spring 2013 semester) at KAIST. Each chapter (as before the redesign) consumes about one week of class time. Typically, one of the three lectures has very strong emotional content focus as described above. The others have been enhanced for emotions and the senses, but spend more time on enhanced content material. It is our plan to measure the results using the SERVQUAL [Parasuraman et al., 1985; Parasuraman et al., 1985] instrument. Statistical hypothesis testing will be used on the normal course evaluations to assess if the student satisfaction has increased. We will make efforts to determine if there is an increase in learning outcomes, but the measure will be muddled since different exams will be used than in previous offerings of the course.
7 CONCLUDING REMARKS
Education is an essential element of our modern society. As such, there has been much focus on improving and understanding the educational process. Most efforts have focused on knowledge taxonomies and learning styles. In the macroscopic view, however, the purpose of education is not only academic development but improving the students’ lives. Here, we have made efforts to develop an educational design process rooted in a service-orientation. We strive to enable deep connections between university course content and ideas that students care about.
To provide guidance to educators seeking service-oriented educational experiences, we first collected hundreds of customer needs. From these we developed prototype FRs and DPs that can be used to guide course design. The key point of differentiation from prior efforts is our focus on emotions and the senses. We employed the prototypes to redesign a sophomore level general elective Introduction to Operations Research course at KAIST. Some details of a typical lecture were discussed. The issue of emotional coupling arose and was addressed. The course is being implemented in the Spring 2013 semester at KAIST. We plan to evaluate the performance of the new design.
The methods developed here can be used to support the design of any course to include a service orientation. We hope that such approaches can be employed to develop transformative and dramatic learning experiences that improve both satisfaction and learning outcomes.
8 REFERENCES
[1] Suh N.P., The Principles of Design, New York: Oxford University Press, 1990. ISBN 0-19-504345-6
[2] Suh, Nam P, Axiomatic Design: Advances and Applications, Oxford University Press, 2001.
[3] Bagchi, U., “Delivering Student Satisfaction in Higher Education: A QFD Approach", 7th International Conference on Service Systems and Service Management, ICSSSM 2010, Tokyo, Japan, pp.1-4, June 28-30, 2010.
[4] Bloom B. S., Engelhart M. D., Furst E. J., Hill W. H., Krathwohl D. R.., Taxonomy of educational objectives: The classification of educational goals; Handbook I: Cognitive Domain, New York: Longmans, Green, 1956.
[5] Davis S. E., “Learning styles and memory”, Institute for Learning Styles Journal, Vol. 1, Fall, pp. 46-51, 2007.
[6] Schmenner R. W., “How Can Service Businesses Survive and Prosper?”, Sloan Management Review, Vol. 27, No. 3, 1986, p. 21-32.
[7] Kano N., Seraku N., Takahashi F., Tsuji S., “Attractive quality and must-be quality”, (in Japanese), Journal of the Japanese Society for Quality Control, Vol. 14, No. 2, pp. 39-48, 1984.
[8] A. Parasuraman, Zeithaml V. A., Berry L. L., "A conceptual model of service quality and its implications for future research”, Journal of Marketing, Vol. 49, No. 4, pp. 41-50, 1985.
[9] Parasuraman A., Zeithaml V. A. and Berry L. L., “SERVQUAL: A Multiple Item Scale for Measuring

- 61 -
Consumer Perceptions of Service Quality”, Journal of Retailing, Vol. 64, No. 1, pp. 14-40, 1988.
[10] Cuthbert P. F., “Managing service quality in HE: IsSERVQUAL the answer? Part 1”, Managing Service Quality, Vol. 6, No. 2, pp. 11-16, 1996.
[11] Joseph M., Joseph B., “Service quality in education: A student perspective", Quality Assurance in Education, Vol. 5 No. 1, pp.15 – 21, 1997.
[12] Susan Aldridge, Jennifer Rowley, “Measuring customer satisfaction in higher education”, Quality Assurance in Education, Vol. 6, No. 4, pp.197-204, 1998.
[13] Sahney S., Banwet D. K., Karunes S., “A SERVQUAL and QFD approach to total quality education: A student perspective”, International Journal of Productivity and Performance Management, Vol. 53, No. 2, pp.143-166, 2004.
[14] Tan K. C., Kek S. W., “Service Quality in Higher Education Using an enhanced SERVQUAL approach”, Quality in Higher Education, Vol. 10, No. 1, pp. 17-24, 2004.
[15] Kim H., Morrison J. R., “Experiments on education as a service”, 8th International Conference on Service Systems and Service Management, ICSSSM'11, Tianjin, China, pp. 166-172, June 2011.
[16] Skinner M. E., “All Joking Aside: Five Reasons to Use Humor in the Classroom”, Education Digest: Essential Readings Condensed for Quick Review, Vol. 76, No. 2, pp. 19-21, 2010.
[17] Berk R. A., “Does Humor in Course Tests Reduce Anxiety and Improve Performance?”, College Teaching, Vol. 48, No. 4, pp. 151-158, 2000.
[18] Tate D., Lu, Y. “Strategies for Axiomatic Design Education”, 3rd International Conference on Axiomatic Design, ICAD2004, Seoul, Korea, June 21-24, 2004.
[19] Tate D., “Design and Creation of Web-based Educational Materials for Teaching Axiomatic Design”, 8th World Conference on Integrated Design and Process Technology, Society for Design and Process Science, Beijing, China, June 13-17, 2005.
[20] Thompson M.K., “Applying Axiomatic Design to the Educational Process”, 5th Fifth International Conference on Axiomatic Design, ICAD2009, Campus de Caparica – March 25-27, 2009.
[21] Lynn M., “Seven Ways to Increase Servers’ Tips”, Cornell Hotel and Restaurant Administration Quarterly, Vol. 37, No. 3, pg. 24, 1996.
[22] McCarthy, C., “HONR 359B Alternatives to Violence”, University of Maryland Honors Program, available from http://www.universityhonors.umd.edu/359B1001.php, accessed March 12, 2013.
[23] Pausch, R., The Last Lecture: The Legacy Education, Hyperion Press, 2008.
[24] Parrott, W. Emotions in Social Psychology, Psychology Press, 2001.

- 62 -
APPENDIX I – DECOMPOSITION OF PROTOTYPE FRs AND DPs
FR0: Establish students understanding of course knowledge (content) map (MKT FRi22)
DP0: Methods to establish students understanding of course knowledge (content) map (MKT DPi22)
FR0.1: Create student concept of course knowledge (content) map DP0.1: Methods to create student concept of course knowledge (content) map
FR0.2: Populate the map with the course ideas and connection DP0.2: Methods to populate the map with the course ideas and connection
FR1: Establish cognitive domain for course DPi: Methods to establish cognitive domain for course
FR1i: Establish cognitive domain for topic i DP1i: Methods to establish cognitive domain for topic i
FR1i.1: Establish knowledge domain for topic i DP1i.1: Methods to teach knowledge of topic I exploiting learning style
FR1i.1: Enable visual learning of knowledge domain for topic i DP1i.1.1: Visual aids on knowledge of topic i
FR1i.2: Enable aural learning of knowledge domain for topic i DP1i.1.2: Aural aids on knowledge of topic i
… … … …
FR1i.2: Establish comprehension domain for topic i DP1i.2: Methods to make students understand knowledge of topic i exploiting learning style
… … … …
… … … …
FRA: Evaluate course quality DPA: Methods to evaluate quality
FRA.1: Evaluate students learning DPA.1: Methods to evaluate students learning
FRA.2: Evaluate students satisfaction DPA.2: Methods to evaluate students satisfaction
FRB.j.k: Establish connection between course topic j and student concerns topic k
DPB.j.k: Methods to establish connection between course topic j and students concerns topic k
FRC: Magnify the intensity of student emotions associated with specific ideas DPC: Methods to magnify the intensity of student emotions associated with specific ideas
FRC.C0: Magnify the intensity of student emotions associated with ideas related to the overall course
DPC.C0: Methods to magnify the intensity of student emotions associated with ideas related to the overall course
FRC.C0.1: Magnify the intensity of the student emotion (fear) associated with the possibility of a poor evaluation in the course (MKT FRi21)
DPC.C0.1: Provide penalties for failure to learn (MKT DPi21)
FRC.C0.2: … … DPC.C0.2: … …
… … … …
FRC.Cm: Magnify the intensity of student emotions associated with course topic m
DPC.Cm: Methods to magnify the intensity of student emotions associated with course topic m
FRC.Cm.1: Magnify the intensity of student joy associated with course topic m DPC.Cm.1: Sense based methods to magnify the intensity of student joy associated with course topic m
FRC.Cm.1.1: Magnify the intensity of student joy associated with course topic m via sight
DPC.Cm.1.1: Vision based methods to magnify the intensity of student joy associated with course topic m
… … … …
FRC.Cm.1.6: Magnify the intensity of student joy associated with course topic m via logic/data
DPC.Cm.1.6: Logic/data based methods to magnify the intensity of student joy associated with course topic m
FRC.Cm.2: Magnify the intensity of student sadness associated with course topic m
DPC.Cm.2: Methods to magnify the intensity of student sadness associated with course topic m
… … … …
FRC.Ln: Magnify the intensity of student emotions associated with life topic n DPC.Ln: Methods to magnify the intensity of student emotions associated with life topic n
FRC.Ln.1: Magnify the intensity of student joy associated with life topic n DPC.Ln.1: Methods to magnify the intensity of student joy associated with life topic n
… … … …
FRC.Ln.2: Magnify the intensity of student sadness associated with life topic n DPC.Ln.2: Methods to magnify the intensity of student sadness associated with life topic n
… … … …
… … … …

Proceedings of ICAD2013 The Seventh International Conference on Axiomatic Design
Worcester – June 27-28, 2013
ICAD-2013-10
- 63 -
ABSTRACT
Knowledge is the intellectual capital of a university. In this knowledge intensive environment, it is very important to consider the knowledge capture and its application to solve practical problems. Knowledge services (KS) is a new concept which comes on the scene to put knowledge management (KM) into practice. KS refers to a boarder concept that covers information and knowledge management. In this paper, we will present the KS in a university setting. KS stimulates information sharing within one university and thus improves university performance. It helps the knowledge producers and receivers to cease working vertically, and collaborate with each other instead. Hereby, we propose a tool namely “Knowledge board” to achieve KS and support the knowledge sharing. The implementation of an efficient tool can assist the decision making process for the three main activities of a university: teaching, research, and cooperation and also the activities in general purpose. It can be used to plan future research activities, support teaching activities and reduce administration costs. This knowledge board is designed and realized based on Axiomatic Design (AD) principles. A case study is conducted to exemplify the process of using AD to design knowledge services within a university environment.
Keywords: knowledge services, campus information, Axiomatic Design, touch screen.
1 INTRODUCTION
Knowledge is a broad and abstract notion [Alavi and Leidner, 2001]. Knowledge is considered to be a core element in an evolving corporation, and it has become the most precious property of any business or academic institution [Chen and Burstein, 2006]. Knowledge management (KM) principles are also becoming more and more popular in modern organizations, especially in knowledge intensive areas, since knowledge-based activities have the greatest potential to provide a competitive advantage.
Universities are communities of scholars, teachers and students that are known for creating knowledge and spreading knowledge. Such organizations are highly suitable for the introduction of various KM strategies and practices [Mikulecká and Mikulecký, 2000; Loh et al., 2003; Oprea, 2011]. Because the number of knowledge producers and knowledge itself has been increasing, universities are frequently looking into the possibilities of applying KM [Loh et al., 2003]. There are many benefits of KM introduction into universities. For instance, it enables teachers to share their knowledge, improves the level of their teaching and research collaboration, as well as their working relationships [Mikulecká and Mikulecký, 2000]. In summary, it enhances internal and external services and the overall effectiveness of universities [Loh et al., 2003].
KM brings significant benefits to the university, nevertheless, that challenge of achieving goals through KM still remains. It is notable that the higher education is somewhat disconnected from society which it is supposed to serve. It is important to consider and apply some new approaches to support university knowledge sharing activities.
In recent years, the concept of knowledge services (KS) emerged and was soon acknowledged as the practical side of KM. KS provides a suite of services to transform knowledge, share knowledge and store knowledge.
This new research area, KS, brings us research question: What is the approach to design an effective tool to support knowledge services in the education sector?
With this research question, the goal of this paper is to develop a tool for KS to ensure that KS is managed as well as to support the knowledge sharing activities. This tool is named the “Knowledge Board”. It enables excellence in KS, which in turn improves university research process, enhances university staff decision-making, and accelerates the innovation in education sector.
The design is focused on providing an advanced tool for all university employees, in order to improve their communication, teaching, research, and other administrative
KNOWLEDGE SERVICES IN CAMPUS: THE APPLICATION OF AXIOMATIC DESIGN
Yuqiuge Hao
[email protected] Department of Production
University of Vaasa Wolffintie 34, 65200 Vaasa, Finland
Jussi Kantola [email protected]
Department of Production University of Vaasa
Wolffintie 34, 65200 Vaasa, Finland
Rubén Raúl Valverde Arenas [email protected]
Department of Computer Science University of Cordoba
Ctra. Madrid-Cádiz Km. 396 14071-Córdoba, Spain
Mingzhang Wu [email protected]
Department of Telecommunication University of Vaasa
Wolffintie 34, 65200 Vaasa, Finland

- 64 -
activities. There are two questions to be answered: what kind of knowledge should be included and what new technologies should be adopted to present the knowledge. The design procedure is guided by Axiomatic Design (AD) principles. AD principles can help address these two questions and lead to an optimal solution. This tool can be considered in creating and enhancing the knowledge services in our university.
The contributions of this paper are two-fold. First of all, only limited research has been done on the implementation of KS in university. This paper will provide a potential feasibility study to assess the KS implementation in university. Secondly, this paper will provide an idea of KS tools design based on AD principle.
2 KNOWLEDGE SERVICES IN CAMPUS
2.1 CONCEPT OF KNOWLEDGE SERVICES
Knowledge and Information are two different but connected concepts. Information has the potential to be used in a way that creates new knowledge. It also can be added to or used to transform existing knowledge [Simard, 2006]. Knowledge always resides in individuals. Efficiently using information and knowledge is critical to organizations’ success. More and more organizational managers recognize that business success can be realized when the company’s knowledge can be gathered and retrieved for certain business purposes [Clair and Stanley, 2009]. As a consequence, knowledge management (KM) is a strategy to organize an organization's information and knowledge holistically.
According to aforementioned definition [Kidwell et al., 2001], KM is the process of transforming information and intellectual assets into enduring value. People who make decisions or take actions need to be connected when they need knowledge. In the business environment, managing knowledge is a key to achieving breakthrough competitive advantage.
The goal of having KM is to enable organizations to improve the quality of management decision making by ensuring the reliability and availability of information and data. The primary purpose is to improve efficiency by reducing the need to rediscover knowledge. This requires accessible, quality and relevant data and information to be available to staff [Probst, 1998].
In the 21st century, the concept of Knowledge Services (KS) emerged. It was soon acknowledged as the practical side of KM [Clair and Stanley, 2009] and also a natural evolution of KM [Xia et al., 2007]. When there is a need to “put KM to work”, KS provides a practical approach to the management of information, knowledge, and strategic learning [Clair and Stanley, 2009]. The organizations can benefit from KS with the advantages of higher-level research, strengthened contextual decision-making, and accelerated innovation [Clair and Stanley, 2009].
KS can also be traced back to the concept of enterprise “Information Management” (IM). The focus of IM is on the management and utilization of information resources for an organization’s own purpose while the KM is about internal knowledge resource and expertise. Instead, the purpose of “information services” (IS) is basically on the management and utilization of information resource for serving some external customers. Based on this logic, the KS will be
considered as fusion of the fields of KM and IS, in additionally, it includes external knowledge into current states [Xia Wang and Dang, 2007]. Figure 1 shows four research fields rooted from IM and evolved to KS.
Figure 1. Evolution Path from IM toward KS [Xia et al., 2007]
Specifically, all of the knowledge focused elements come together in KS. This service should comprise of IM, KM and IS. The purpose of KS is to create an environment for all enterprise stakeholders to willingly share knowledge [Clair and Stanley, 2009].
2.2 KNOWLEDGE SERVICES IN UNIVERSITY
In most of previous research [Brown, 2007], KM is applied in business organizations, and knowledge is defined as value adding activities. Actually, the university is commonly a place where the knowledge base increases and abilities grow continually. Using KM in the higher education sector is as vital as in other business environments [Kidwell et al., 2001]. The researchers, professors, scientists, and other staff work on a daily basis, thence considerable knowledge is gained by individuals.
Due to the appearance of so many knowledge producers in university, more and more universities are looking into the possibility of apply KM [Loh et al., 2003]. Only when the KM is done effectively will it lead to improved decision making capabilities, as well as improved academic and administrative services, and reduced costs, etc.
When creating KM in universities, four key KM objectives must be addressed: 1) creating and maintaining knowledge repositories, 2) improving knowledge access, 3) enhancing the knowledge environment, and 4) valuing knowledge [Loh et al., 2003]. The common problems in most of the universities are the lack of an integrated collection of knowledge in one knowledge repository and also the lack of cross-discipline knowledge support. Knowledge hoarding still remains a challenge.
However, to fully reap the benefits from KM and to counter the challenges mentioned above, it is very necessary to go one step further, and put KM into practical use. Therefore, in this paper, we are focusing on providing a tool to support KS in the university to improve knowledge sharing, communication, and research performance. Two main issues will be addressed in this paper: 1) designing KS to facilitate the central control of knowledge and 2) presenting knowledge across a range of different disciplines to customers (various types of university employees). Transparency of knowledge is understood to be for the common good.
In this research paper, we define knowledge as the valuable information retrieved from different data resources,

- 65 -
which is important and essential in doing research, enhancing teaching activities, and adding value to staff ’s daily activities. Effective KS can add a tremendous value to the education sector. Nevertheless, KS cannot contribute to organizational success unless effective tools are available to support KS. Therefore, we used Axiomatic Design principle to guide us to design a tool to support KS.
2.3 PRINCIPLES OF AXIOMATIC DESIGN
Axiomatic Design Theory was proposed by Nam Pyo Suh. The goal of Axiomatic Design is to establish a scientific basis for design and to improve design activities by providing a theoretical foundation based on logical and rational thought processes and tools [Suh, 2001 p.5]. The Axiomatic Design framework divides the design process into 4 domains [Suh, 2001 p.11]: the customer domain, the functional domain, the physical domain and the process domain. In each domain, there is a characteristic vector. Respectively, they are customer attributes (CAs), functional requirements (FRs), design parameters (DPs) and process variables (PVs).
As shown in Figure 2, the domain on the left relative to the domain on the right represents "what we want to achieve", whereas the domain on the right represents the design solution of "how we choose to satisfy the needs (i.e., the what)" [Suh, 2001 p10]. Therefore, when mapping the right domain to the left domain, “zigzagging” decomposition is used. Designers are requested to create a design hierarchy. FRs and DPs, PVs must be decomposed into a hierarchy respectively until a complete detailed design or until the design is completed [Suh, 2001 p21].
Figure 2. All design procedures can be represented in four domains. {X} are characteristic vectors of each
domain [adapted from Suh, 2001].
During the mapping processes, the designer is guided by two fundamental axioms to produce a robust design: the Independence Axiom and the Information Axiom [Suh, 2001 p.16].
1. Independence Axiom: Maintain the independence of the functional requirements (FRs).
2. Information Axiom: Minimize the information content of the design.
The axioms offer a basis for evaluating and selecting designs. These two axioms jointly maximize the probability of
the design to fulfil its purpose, and thereby achieve the optimal design for a set of functional requirements [Brown, 2007]. In most design tasks, it is necessary to decompose the problem hierarchically. The FRs, DPs, and PVs mapping process can mathematically be described as vectors [Suh, 2001 p18] in the design matrix. A design equation should be written for each transition between domains and at each decomposition level. Detailed information and elaborations on the scientific background of Axiomatic Design are provided by Suh [2001].
3 CASE STUDY
Based on the prior considerations and research, we present the conceptual design of a KS tool for use in a university setting.
According to the principles of Axiomatic Design, background research was conducted. The customers (university employees who included professors, lecturers, researchers and administrative staff) were interviewed in order to determine their requirements which were further analysed. We discovered the staff ’s interests and needs from KS. Moreover, we participated in workshops to gather more ideas from university students. We summarized the functional requirements and design parameters from multiple face-to-face semi-structured interviews.
This resulted in a definite statement of the project goals as well as the means of achieving them.
3.1 PROBLEM ANALYSIS
The implemented approach was to look at the studied organization – the University of Vaasa (UVA) - from the perspective of business organization since there are many business activities occurring at the studied university. We stated that KS needs to be better suited to those activities. The interviewees were mainly complaining about issues such as the limited availability of information and the difficulties of locating the right information resource. There are three main reasons for that:
1. Lack of communication: Many employees (researchers, teachers and faculty staff) work in “silos”, and they are rarely aware of communication and collaboration opportunities.
2. Lack of support techniques: The employees do not have common standards and tools to communicate and share information with others. It is also possible that much valuable information is wasted before it is stored for long-term preservation.
3. Decentralized Information resources: It is difficult to allocate the information since the information is in various locations. It is time consuming to find the required information.
There are nodal points where knowledge is produced and from where it is distributed. Figure 3 demonstrates the dispersed knowledge in the whole campus. Currently, the information resides in four different buildings. Each building stores different types of knowledge:

- 66 -
Figure 3. Distribution of Knowledge in UVA
Tervahovi
Faculty of Business Studies
Faculty of Technology
Department of Mathematics and Statistics
Computer Centre and Helpdesk
Konttori
University Services
Research and Innovation Services
Communications and Publications
Fabriikki
Faculty of Philosophy
Faculty of Technology
University of Helsinki Faculty of Law, Vaasa Unit of Legal Studies
Technobothnia
Research and Teaching Laboratories of Technology
Tritonia
The Academic Library of Vaasa
EduLab The challenge is to manage this information centrally and
make it widely and easily available to any employee. The object is to connect different parties (they are
customers of KS) in the university, and to ensure they collaborate. Therefore, it is necessary to collect all the possible information from different databases and locations. We claimed that three aspects should be considered.
1. How to establish a common database that can be accessed by all parties?
2. What information is needed to create the knowledge? 3. How to display the knowledge in an effective way?
3.2 CUSTOMER ATTRIBUTES
Based on the preliminary research, we continued to elaborate on the customer attributes. The knowledge
requested by customers is classified into four knowledge categories: in general, teaching, cooperation and research. This implies that the university KS incorporates these four categories for the main activities performed by a university. Table 1 presents the categories.
Table 1. Four categories of Knowledge in UVA
IN GENERAL TEACHING
Campus map University press/news Annual Report Department Directory University Evaluation/Ranking Followed policies and practices Job Satisfaction
Ongoing Lectures information and statistics New courses Teacher assessment Teaching Method
COOPERATION RESEARCH
Relationships between departments within university Relationships with other universities Projects with other universities Projects with other industries/companies Workshops organized by university Conferences organized by university Visiting lecturers/Professors Opportunities to visit/teach in other universities
Research interests (vision & strategy impact) in different departments New research projects Research timeline New publications Research archive (Research outcomes) Forum Major Researchers Statistics about department research Research foundations Policy in research Job vacancies Relevant/ potential conferences Department Thesis collection
3.3 DESIGN CONCEPTS
Based on the customer requirements, we summarized 3 main functional requirements to design a KS tool.
The highest level FR0 is to support the knowledge services provided in university. This could be decomposed

- 67 -
into FR1: get the critical knowledge, and FR2: mange the knowledge effectively, FR3: visualize the information in a creative way.
FR1: Not all knowledge has the potential to add value and is worth capturing within the university. Therefore, it is important to get “Right Information” which is value-adding knowledge.
FR2: It is important to manage the knowledge we have already captured more effectively. Meanwhile, it is important to re-construct the knowledge so that it is useful and immediately applicable.
FR3: In order to interpret the knowledge in an easy understandable way, it is very necessary to find an innovative approach to illustrate the knowledge.
Figure 4. The design matrix for level one.
In Figure 4, the high level of functional requirements (FRs) and design parameters (DPs) of the knowledge services design are shown. The FRs must be formulated appropriately to provide an effective design environment [Dickinson and Brown, 2009]. The FRs describe the design intent while the DPs describe how to accomplish the intent.
The Xs indicate natural coupling for the indicated DP-FR interactions, and the Ss indicate a sequential coupling (which exists in that the design elements are independent from each other but could not be done without pervious steps.) [Brown, 2007].
Each level one FRs and DPs can be decomposed into the next level. The detailed list of the FRs and DPs is shown in Table 2.
Table 2. The FRs and DPs in second level
3.4 FR0: Support Knowledge Service in Campus
3.5 DP0: Tool of Knowledge Services
FR1:Get the Critical Knowledge
DP1: Capture Knowledge
FR1.1: Sustain Knowledge in the whole university across departments
DP1.1: Synchronize all Information from different databases
FR2: Manage the Knowledge effectively
DP2: Classify the Knowledge
FR2.1: organize knowledge in an appropriate way
DP2.1: Make relationship charts of all Knowledge
FR2.2: Capture the essence of the Knowledge
DP2.2: Organize Knowledge with certain keywords
FR2.3: Simplify the knowledge structure
DP2.3: Show the pattern of knowledge
FR3: Visualize the Knowledge DP3: Display the Knowledge on screen
FR3.1: Easy viewing of information
DP3.1: Use different colors to present different categories
FR3.2: Simplify the Knowledge Obtain Action
DP3.2: Display automatically
FR3.3: Easily interact with the Knowledge
DP3.3: Touch screen interaction
Figure 5 shows the design matrix, which is a substantial
improvement to the KS solution in the campus. The formulation of the FRs and DPs and their
interactions are considered results of the design process. The DPs are straightforward transformations of the FRs. From this design matrix, we can easily see it is a decoupled design, which means that at least one DP affects more than one FR. In this design, we want to classify all the knowledge by their keywords and simply display in the screen with well-grouped keywords. In this way, it can achieve one of the important requirements from customer’s perspective: “to acquire information without complex search for it”. Therefore, DP2.2 “how to classify the keywords” impacts FR2.2 but also FR3.2.
3.4 RESULT
In this part, we considered how we can put the customers’ requirements into practice and build a tool for KS that supports and enables the university knowledge sharing. This tool is called the “Knowledge Board”. It consists of the following characteristics as shown in Figure 6:
1. Integration of all the information from different database and locations
2. Categorization of the different types of information 3. Using different colors to present different categories 4. Using keywords to allocate the information (no search
needed) 5. Using touch screen to display all the information

- 68 -
Figure 5. The Design Matrix for Knowledge Service in Campus.
There are three organizational levels of a university, namely university, faculties, departments. Each university has one or more faculties and each faculty has one or more departments. Based on this logic, the knowledge is divided into these three levels as shown in this architecture. Each level also represents different data source locations. The four categories (in general, research, collaboration, teaching) are also classified by these three levels.
Figure 6. The Technical Architecture of Knowledge
Services Touch screen in Campus
There are many different possibilities to design the final solution. Nevertheless, by using Axiomatic Design principles, only the best fit solution can be selected. In the end, we decided to use an interactive screen to display our knowledge.
This interactive screen will be placed in the different departments and buildings.
The interactive screen technologies are changing constantly and we have found several models that we can use. For example, a Smart-TV would be a solution, but maybe it will be too expensive. Therefore, we use a projector as a simple solution. This projector will work along with a sensor to make sure that this screen is actually capable of interacting with people.
Figure 7. TUIO.org touchscreen solution [TUIO.Org]
TUIO.org provides a touch screen solution. It is an optimal solution for our project. The technical solution is presented in Figure 6. TUIO is an open framework that defines a common protocol and API for tangible multiple-touch surfaces. It provides a model that can be changed and

- 69 -
adapted to our needs. The protocol is inexpensive and, according to a programmer, the TUIO reference implementations are available for most common programming languages and media environments. Moreover, this solution is simple because it only requires three sensors.
Figures 8-11 sequentially demonstrate how the screen works. The initial screen is 3 balls (Department, Faculty and University). It is displayed in upper picture in Figure 8. The lower picture demonstrates user interactions with the screen by finger-pressing the category balls.
When users press one ball, it opens the sub categories. The sub categories are in the same colour system as their main category.
For instance, if one user wants to find information about funding opportunities about his/her proposed project, he/she can allocate the information by using the right “keywords”. (University-> Research-> Project->National research funding competitions) For instance, in Figure 9 and Figure 10, the “University” is in the colour green, and then all its sub-categories are in a green colour system. Moreover, the other not pressed main categories’ balls, such as department or faculty will fade out from the main screen for later use. If users want to change the information in the other categories, it is pending in the background. Also, the sizes of the higher level balls are reduced, and the degree of transparency is increased.
Figure 8. Screen Status 1
Moreover, the top-left corner will display the location and categories that have been opened. As a result, users can track and trace the information categories.
Figure 9. Screen Status 2
Figure 10. Screen Status 3
Ultimately, it is very easily to return to the initial status by pressing anywhere in the background area. For instance, in upper picture of Figure 11, user can press any background space to return to the initial status as shown in the lower picture of Figure 11. In case the user presses the background unexpectedly, the history view can get user’s view back immediately.
In summary, we proposed a generic idea of the tool to support university KS in this research paper. This “Knowledge Board” is still under development and needs further study and observation of customers’ interaction with this tool. Ultimately, this “Knowledge Board” will be developed and used by every department around the university campus. Certainly, KS is very complex concept and it cannot be implemented by only one tool. There are some other applications and tools of KS will be designed and be used in combination with this “Knowledge Board”. For instance, so far, only internal information from university is considered, but in future, external-organization knowledge (from partner universities, from industrial companies, etc.) will be integrated into this board as well. Moreover, this “Knowledge Board” will be able to support two-way interaction with users, which means that users will be able to input knowledge and automatically transform into the knowledge base. Then the knowledge can be classified, sorted and easily retrieved later. Of course, users’ search and behaviour analysis are also very important.

- 70 -
Figure 11. Screen Status 4
Based on the case of UVA, we argued that this tool of KS can indeed benefit and have the potential to advance the activities in the university. UVA will continue to promote and cultivate a knowledge services so as to enable and support the KS.
4 CONCLUSIONS
Universities have significant opportunities to apply knowledge management practices to support research and collaboration among staff. The core activities of universities are knowledge creation and knowledge dissemination. With the appearance of new concept “Knowledge services”, we are expecting more from knowledge management. It is interesting to consider improve the performance of the university knowledge management by putting it into practices. Therefore, we proposed a tool to support knowledge services in order to support the knowledge sharing activities in university. The designing process of this effective tool is guided by Axiomatic Design principles.
In this paper, we call this tool of knowledge service a “Knowledge Board”. It focuses on collecting the value-adding information as well as presents the information within the university. All the information is classified into different knowledge categories, and then can be used as knowledge. This design benefits from Axiomatic Design principles by transforming customer attributes into design parameters. We are able to optimize the design process and get an optimal idea. Ultimately, the proposed solution offers an opportunity
to enhance the teaching activities, research process, and also reduce administrative costs.
5 ACKNOWLEDGEMENTS
The authors would like to thank Ms. Anna Rymaszewska for supporting the writing process.
6 REFERENCES
[1] Alavi, M. and Leidner, D.E., Review: Knowledge Management and Knowledge Management Systems: Conceptual Foundations and Research Issues. Knowledge Management MIS Quarterly, Vol. 25, No. 1, pp. 107-136. 2001.
[2] Brown, C.A., Knowledge Management and Axiomatic Design. SAE World Congress, Detroit, 2007.
[3] Chen, F. and Burstein, F.V., A dynamic model of knowledge management for higher education development. 7th International Conference on Information Technology Based Higher Education and Training, 2006.
[4] Clair, G. and Stanley, D., The KM/Knowledge Services Continuum: Building the Knowledge Services Strategic Framework. SMR International Management Action Plans, 2009.
[5] Dickinson, A. and Brown, C.A., Design and Deployment of Axiomatic Design. Proceedings of ICAD 09. The Fifth International Conference on Axiomatic Design. Campus de Caparica-March 25-27, 2009. pp217-224, 2009.
[6] Kidwell, J. J., Vander Linde, K. M., and Johnson, S. L., Applying corporate knowledge management practices in higher education. Information Alchemy: The Art and Science of Knowledge Management. EDUCAUSE Leadership Series, 3, 1-24, 2001.
[7] Loh, B., Tang, A. C., Menkhoff, T., Chay, Y. W., & Evers, H. D., Applying knowledge management in university research. Governing and Managing Knowledge in Asia, 199, 2003.
[8] Mikulecká, J. and Mikulecký, P., University Knowledge Management – Issues and Prospects, research report, University of Hradec Králové, Czech Republic, 2000.
[9] Oprea, M., A University Knowledge Management Tool for Academic Research Activity Evaluation. Informatică Economică, 15(3), 58-71, 2011.
[10] Probst, G.B., Practical Knowledge Management: A model that works. Prism / Second Quarter, 1998.
[11] Suh, N.P., Axiomatic Design: Advances and Applications. Oxford University Press, ISBN 0-19-513466-4, 2001.
[12] Sallis, E. and Jones, G., Knowledge Management in Education, Kogan Page, London, 2002.
[13] Simard, C., Knowledge networks and the geographic locus of innovation. Open Innovation: Researching a New Paradigm, Oxford University Press, 2006.
[14] Xia, H., Wang, Z. and Dang, Y., Knowledge Services: A New Research Field between KM and SSME. Proceedings of the Eighth International Symposium on Knowledge and Systems Sciences, November 5-7, 2007.

Proceedings of ICAD2013 The Seventh International Conference on Axiomatic Design
Worcester – June 27-28, 2013
ICAD-2013-11
- 71 -
ABSTRACT
The progress of a developing nation is often measured by the advancement of its infrastructure. While “hard” infrastructure such as water, power and transportation are often easy to assess, “soft” structures such as healthcare systems are often more challenging. Furthermore, the quality and reliability of a nation’s healthcare system is often driven by the number and diversity of its healthcare professionals. Unfortunately many developing nations often suffer from very constrained segments in their highly skilled labor market and hence must “import” this human capital. Volatility in key healthcare professions can threaten reliable and sustainable healthcare delivery. In this two-part paper, the Axiomatic Design large flexible system modelling framework is used to assess healthcare delivery capability in Abu Dhabi, United Arab Emirates. Part I provides the methodological developments. Here, each profession type is modelled as a functional requirement and the physical hierarchy is modelled at three levels of decomposition: individuals, healthcare facilities, and regions. The associated knowledge base is filled with the associated number of professionals of a given type provided by the corresponding design parameters. The knowledge base is then evolved on a yearly basis as professionals enter, stay and ultimately leave. In Part II, the Abu Dhabi case study shows results indicative of significant volatility in the healthcare labor market. The work demonstrates that Axiomatic Design Theory as applied to large flexible systems can be applied to data-centric methods in human resources management in the context of skills shortages and high attrition rates.
Keywords: healthcare system, Axiomatic Design, large flexible system, human resource management, degrees of freedom, reconfiguration process, reconfigurability.
1 INTRODUCTION
The progress of a developing nation is often measured by the advancement of their infrastructure. While “hard” infrastructure such as water, power & transportation are often easy to assess, “soft” infrastructure [Niskanen, 1991] such as healthcare systems are often more challenging. Fundamentally, healthcare is a labor-intensive system whose quality and reliability is driven by the number and diversity of its healthcare professionals. Therefore, ensuring a nation’s development can be seen to equally depend on the retention
of knowledge-based healthcare professionals as it does on the maintenance of water, power, and transportation capital.
Moving from a macroeconomic scale to a microeconomic scale, recent research has shown the critical role of knowledge workers in the strategic development of organizations [Grant, 1996; Spender, 1996; Pettigrew et al., 2006]. This is due in large part to the workers’ possession of tacit knowledge [Nonaka and Nishiguchi, 2001; Nonaka and Takeuchi, 1995] which has received much attention in the context of the resource-based view [Barney, 1991; Wernerfelt 1995] competence-based competition [Nonaka and Takeuchi, 1995; Leonard-Barton, 1992], dynamic capabilities [Spender, 1996; Teece et al., 1997; Brown and Eisenhardt, 1998], and the knowledge-based view [Grant, 1996; Sveiby 2001].
The strategic importance of knowledge workers has subsequently led to supporting human resources management (HRM) practices. In one work, the impacts of HRM practices are studied from an operations management perspective [Pathirage et al., 2007]. In another, experienced and well-trained police and fire personnel made fewer mistakes and performed faster in the delivery of their critical services [Taylor III et al., 2006]. Such results are likely extensible to first-response healthcare professionals. HRM has also shown to be central to the development of a leadership-centric business vision [Roepke et al., 2000]. Recent work has also shown the importance of HRM to the knowledge management of an organization [Whelan and Carcary, 2011] and its criticality in the development of learning organizations [Lee-Kelley et al., 2007] especially as it develops key capabilities in corporate social responsibility and sustainability [Nicolopoulou, 2011].
Unfortunately, many nations suffer from very constrained segments in their highly skilled, knowledge-centric labor market [Jin and Li-ying, 2003]. Given the relative ease of attrition and relative difficulty to train, the HRM literature has given a great deal of attention to IT professionals [Roepke et al. 2000; Ang and Slaughter, 2004; Zheng and Hu 2008]. One author also highlights the critical service role of IT professionals in the healthcare sector [Boland, 1998]. Similarly, HRM research has addressed the challenges of maintaining a capable R&D staff [Han and Froese, 2010] including the needs posed by its female members [Servon and Visser, 2011; Cuny and Aspray, 2002]. The retention of Army officers is also a particularly interesting workforce segment given that their practical field experience represents decades of tacit knowledge [Dabkowski et al., 2011]. Similarly, HRM practices
AXIOMATIC DESIGN BASED VOLATILITY ASSESSMENT OF THE ABU DHABI HEALTHCARE LABOR MARKET: PART I - THEORY
Amro M. Farid [email protected]
Engineering Systems & Management Masdar Institute of Science and Technology
Box 54224, Abu Dhabi, UAE Massachusetts Institute of Technology
Cambridge, MA, USA
Inas S. Khayal [email protected]
Engineering Systems & Management Masdar Institute of Science and Technology
Box 54224, Abu Dhabi, UAE Massachusetts Institute of Technology
Cambridge, MA, USA

- 72 -
have recognized the important role of senior workers [Armstrong-Stassen and Schlosser, 2011; Wong and Kimura, 2009]. Finally, there is growing recognition that knowledge workers also includes skilled manual labor in manufacturing [Zheng et al., 2008; Foy and Iwaszek, 1996] and construction [Clarke and Herrmann, 2007; Gow et al. 2008].
These human resources challenges are particularly exacerbated in developing and emerging economies where either human capital has not had a chance to accumulate or where the growth rate of the economy outstrips efforts at human capital development [Beulen, 2009; Kapoor and Sherif, 2012]. Geography specific studies have addressed the large scale issues found in China and India [Zheng et al., 2008; Beulen, 2009; Kapoor and Sherif, 2012; Doh et al. 2011]. In similar studies, Horowitz shows the lingering impacts of centrally planned political economies on HRM in Eastern and Central Europe [Horwitz, 2011] while Zheng & Hu describe the effects of economic restructuring in Singapore & Taiwan [Zheng and Hu 2008]. Further attention has been given to Gulf Cooperation Council (GCC) countries where the absence of well-established indigenous human capital combined with fast economic and population growth has led to dramatic needs in human resources management [Doh et al., 2011; Horwitz, 2011].
Given these exacerbated conditions in the GCC, and the importance of retaining knowledge-centric healthcare professionals to a nation’s development, this paper specifically seeks to assess the volatility and the retention of healthcare HRM practices in the United Arab Emirates. Section 2 provides the methodological background to this study in terms of existing HRM research methods and the relevant aspects of Axiomatic Design. Section 3 then provides a methodological contribution by describing how an Axiomatic Design knowledge base can be used to model the healthcare labor pool as a large flexible system. Section 4 concludes the work and introduces Part II of this two-part paper.
2 BACKGROUND
In this Section, the methodological background for the study is provided. Existing human research management methods are first reviewed so as to be contrasted to how an Axiomatic Design based approach can be applied.
2.1 EXISTING HUMAN RESOURCE MANAGEMENT
RESEARCH METHODS In the context of this discussion, human resources
management research methods have centered around two broad classes of research questions 1.) what are the causal factors driving an individual’s decision to join and stay within an organization? [Afifi, 1991; Ang and Slaughter, 2004; Budhwar et al. 2009; Ghosh & Sahney 2010; Armstrong-Stassen & Schlosser 2011) 2.) what HRM strategies can be implemented to prolong the retention of this individual in an organization [Lockwood and Ansari 1999; Finegold et al., 2005; Kaliprasad, 2006; Chew and Chan, 2008; Beulen, 2009]? In the majority of this work, the research methods relied on semi-structured interviews and surveys to study the attrition intention of currently employed individuals. Such a research methodology presents two biases. First, it is not clear if the intention to resign is fleeting or if it is severe enough to be
actionable. Second, the individuals who have already resigned are not included in either the interviews or surveys. From the perspective of continuous improvement, these individuals present the greatest learning opportunities.
In contrast, some of the more recent research has taken the strategy of directly studying organizations’ human resources databases [Zheng and Hu, 2008; Holtbrugge et al., 2010; Dabkowski et al., 2011). Such a research methodology resolves the two previously mentioned concerns. Furthermore, it allows for rigorous diagnostic capabilities based upon data mining techniques [Dabkowski et al., 2011; Chien and Chen, 2008]. For example, recent work has proposed the usage of GIS technology to study the impact of location on human resources retention [Hanewicz, 2009]. Other work presents the development of work flexibility to manage the disturbances caused by worker attrition [Fry et al., 1995]. These types of practices lend themselves to the knowledge base-centric capabilities assessments used in the Axiomatic Design of large flexible systems.
2.2 AXIOMATIC DESIGN THEORY FOR LARGE
FLEXIBLE SYSTEMS The Axiomatic Design of large flexible systems provides
a natural extension to the data-centric trends in HRM research methods. Suh defines large flexible systems as systems with many functional requirements that not only evolve over time but also can be fulfilled by one or more design parameters. In this case, Suh uses the large flexible system design equation notation:
FR1$(DP1, DP2 , DP3)
FR2 $(DP2 , DP3)
FR3$(DP3)
(1)
to signify that FR1 can be realized by design parameters DP1, DP2, or DP3 [Suh, 2001]. Here, it is implicit that the set of functional requirements and design parameters is at a specified level of decomposition. Nevertheless, it may be necessary to describe the functional requirements and design parameters higher up in the functional and physical hierarchies respectively. Previous work has mathematically described aggregation as binary operation denoted by * [Farid, 2007]. Given an arbitrary element sjS, an arbitrary parent group skS, and a binary aggregation matrix A whose elements akj equal 1 if sjsk, then
S AS (2) is equivalent to:
(3)
For the purposes of recursively representing the Axiomatic Design functional and physical hierarchies,
FR AF * FR
DP AP * DP (4)
Previous work reinterprets Equation (1) in terms of a matrix equation using a boolean knowledge base matrix JS [Farid and McFarlane, 2008].
⊙ (5)

- 73 -
The A ⊙ B operation represents the Boolean equivalent of matrix multiplication
C(i,k) VjA(i, j ) B( j ,k) (6)
where Vj
is the array-OR operation similar to the familiar
sigma (summing) notation for real numbers [Farid and McFarlane, 2008].
The same work demonstrated that in production systems if the set of functional requirements is taken as the set of production processes and the set of design parameters taken as the value-adding and material handling resources, then the non-zero elements in the knowledge base J can be interpreted as the production system’s degrees of freedom [Farid and McFarlane, 2008). This work and others [Baca et al., 2013; Viswanath et al., 2013) seek to generalize this result for all large flexible systems that follow the Axiomatic Design definition. A generalized definition of a large flexible system’s degrees of freedom is:
DOF J(i, j )j
DP
i
FR
(7)
From this, it follows that the redundancy Ri of the ith functional requirement is:
Ri J(i, j )j
DP
(8)
and the flexibility of the jth design parameter is:
Fj J(i, j )i
FR
(9)
This work was extended to allow the possibility for a system architecture that changes in time through a reconfiguration process [Farid and Covanich, 2008]. Given a reconfiguration process R that occurs over a time interval T, the resulting discrete time difference equation describes the time evolution of the knowledge base
(10) Given that J represents independent degrees of freedom, it is valid to vectorize it with the vec() operator [Abadir and Magnus, 2005) as is typically implemented in MATLAB with the (:) operator. It follows that the knowledge base differential J caused by a reconfiguration process R is given by:
(11) These measures are applied to the development of a healthcare human resources knowledge base in the following section.
3 METHODOLOGY: MODELING HEALTHCARE SYSTEMS WITH AXIOMATIC DESIGN
In this section, the Axiomatic Design knowledge-based models are applied to data-centric human resources management of healthcare professionals.
The functional and physical hierarchies are established as follows. The set of functional requirements is defined as the set of healthcare professions: FR={Healthcare Professions}. The functional domain is only addressed at this level of hierarchy as it is important to be able to distinguish between
these individual healthcare function throughout the analysis. In contrast, the physical domain can be analysed at three levels of hierarchy. At the lowest level, the set of design parameters is the set of individuals’ names e.g. DP={IndividualNames}. Further analyses can be conducted if each individual belongs to a healthcare facility. DP={Healthcare Facilities}. Finally, these healthcare facilities can be viewed in terms of the geographic regions in which they are located. DP={Regions}. The resulting Axiomatic Design dual hierarchy is pictured in Figure 1.
The relationships between the healthcare professions in the functional hierarchy and the various aggregations of the physical system can be captured in the healthcare human resources knowledge base. At the lowest level, J is the binary map between the ith healthcare profession and the jth individual name. At a higher level of aggregation, JP is defined as an integer knowledge base whose elements equals the number of individuals with a given profession at a given healthcare facility, then it follows that
JP J APT (12)
Equation (12) may be used recursively for the regional analysis.
Figure 1. Axiomatic Design Dual Hierarchy for Healthcare
Human Resources System
The calculation of the number of healthcare human resources degrees of freedom follows straightforwardly from Equation (7). It represents the total number of healthcare professionals in the system at a given time. The redundancy Ri of the ith healthcare profession is given by Equation (8) or in the special case that all healthcare professionals work for a single healthcare facility or region then:
Ri JP(i,k)k
DP
(13)
Similarly, Equation (9) gives the functional flexibility Fj of the jth design parameter. It represents the number of professions for which an individual is licensed. Typically, this is only 1. The functional flexibility Fk of the kth healthcare facility exhibits the same form provided that JP is taken in binary rather than integer form.
Fj bi JP(i,k) i
FR
(14)
The healthcare system properties of profession redundancy and facility flexibility are particularly important system properties. The former is often related to a healthcare system’s quality of service especially when normalized by the

- 74 -
size of the patient population (e.g. # of doctors/patients). The latter is often related to a healthcare facility’s convenience, in that if a particular profession is present at a given facility then it eliminates the need of a patient to go elsewhere. Such a convenience measure addresses patient conditions that are time critical one-offs (e.g. emergency services) as well as more routine services (e.g. the neighbourhood pharmacist).
In this context, human resources management recruiting practices that counter natural rates of professional attrition can be modelled as reconfiguration processes acting upon the system knowledge base. Given a recruiting (reconfiguration) process RR and an independent attrition (reconfiguration) process RA that occur over a time interval T, the healthcare human resources knowledge base evolves by a differential:
(15) If the recruiting and attrition processes are taken to be time invariant processes that occur over successive time intervals, then Equation (15) can be rewritten as a familiar first order differential equation.
(16)
The efficacy of human resources management practices can then be measured in terms of the time constant matrix (RR-RA)/T. In a sense, Equation (16) describes the rate of change of the healthcare human resources system architecture and that its control are the region’s aggregate human resources practices. The rate of change is also particularly important in the context of rapid population growth as the normalization by population is closely linked with quality of service.
4 CONCLUSIONS & FUTURE WORK
This paper represents Part I in a two-part paper on the application of Axiomatic Design to the human resources management of the Abu Dhabi Healthcare system. It specifically addresses the necessary methodological contributions. After an extensive review of existing human resources, it was found that existing HRM research is trending towards data analysis intensive techniques. In this regard, the Axiomatic Design Knowledge base provided an effective tool for organizing the data. The concept of degrees of freedom previously applied to other large flexible systems was used to quantify the system architecture, and the concept of a reconfiguration process was used to develop a differential equation of the long-term evolution of the system architecture. Finally, the rate of change of the system architecture was proposed as a measure of the efficacy of human resources retention. In Part II of this two-part paper, these developments are applied to the Abu Dhabi healthcare system [Khayal and Farid, 2013]. Much effort is devoted to determining the effective time constants of the healthcare human resources knowledge base evolution over the span of 1967-2012.
5 REFERENCES
[1] Abadir, K.M. & Magnus, J.R., Matrix algebra, Cambridge ; New York: Cambridge University Press, 2005.
[2] Afifi, S.S., "Factors affecting professional employee retention", Journal of Management in Engineering, 7(2), pp.187–202, 1991.
[3] Ang, S. and Slaughter, S., "Turnover of information technology professionals: the effects of internal labor market strategies", Data Base for Advances in Information Systems, 35(3), pp.11–27, 2004
[4] Armstrong-Stassen, M. and Schlosser, F., "Perceived organizational membership and the retention of older workers", Journal of Organizational Behaviour, 32(2), pp.319–344, 1991.
[5] Baca, E.E.S., Farid, Amro M. & Tsai, I.-T., "An Axiomatic Design Approach to Passenger Itinerary Enumeration in Reconfigurable Transportation Systems" Proceedings of ICAD2013 The Seventh International Conference on Axiomatic Design. Worcester, MA, USA, p. 8, 1991.
[6] Barney, J., "Firm Resources and Sustained Competitive Advantage", Journal of Management, 17(1), p.99, 1991.
[7] Beulen, E., "The contribution of a global service provider’s Human Resources Information System (HRIS) to staff retention in emerging markets: comparing issues and implications in six developing countries", Information Technology & People, 22(3), pp.270–288, 2009.
[8] Boland, A.S., "Recruiting and retaining IT staff", Health Management Technology, 19(5), pp.74–77, 2009.
[9] Brown, S.L. and Eisenhardt, K.M., Competing on the edge : strategy as structured chaos, Boston, Mass.: Harvard Business School Press, 1998.
[10] Budhwar, P.S. et al., "Insights into the Indian call centre industry: can internal marketing help tackle high employee turnover?" Journal of Services Marketing, 23(5), pp.351–362, 1998.
[11] Chew, J. and Chan, C.C.A., "Human resource practices, organizational commitment and intention to stay." International Journal of Manpower, 29(6), pp.503–522. 1998.
[12] Chien, C.-F. and Chen, L.-F., "Data mining to improve personnel selection and enhance human capital: A case study in high-technology industry." Expert Systems with Applications, 34(1), pp.280–290, 1998.
[13] Clarke, L. and Herrmann, G., Skill shortages, recruitment and retention in the house building sector. Personnel Review, 36(4), pp.509–527, 2007.
[14] Cuny, J. and Aspray, W., "Recruitment and retention of women graduate students in computer science and engineering: results of a workshop organized by the Computing Research Association", SIGCSE Bulletin, 34(2), pp.168–174, 2002.
[15] Dabkowski, M.F. et al., "Shaping Senior Leader Officer Talent: Using a multi-dimensional model of talent to analyze the effect of Personnel Management Decisions and attrition on the Flow of Army Officer Talent Throughout the Officer Career Model. In Training Doctrine Command Anal. Center, United States Army, Fort Leavenworth, KS, United States BT - 2011 Winter Simulation Conference (WSC 2011), 11-14 Dec. 2011: IEEE, pp. 2466–2477, 2007.

- 75 -
[16] Doh, J.P. et al., "Pride and professionals: retaining talent in emerging economies", Journal of Business Strategy, 32(5), pp.35–42, 2007.
[17] Farid, A M, "Reconfigurability Measurement in Automated Manufacturing Systems -- Ph.D. Thesis." University of Cambridge Insititute for Manufacturing, 2007.
[18] Farid, A M and Covanich, W., "Measuring the Effort of a Reconfiguration Process", The Sixth IEEE International Conference on Industrial Informatics INDIN 2008: Harmonizing Computers, Machines and People. Daejeon, Korea. 2008.
[19] Farid, A M and McFarlane, D.C., "Production degrees of freedom as manufacturing system reconfiguration potential measures" Proceedings of the Institution of Mechanical Engineers, Part B (Journal of Engineering Manufacture), 222(B10), pp.1301–1314, 2008.
[20] Finegold, D., et al., "Access to training and its impact on temporary workers", Human Resource Management Journal, 15(2), pp.66–85, 2005.
[21] Foy, F.P. and Iwaszek, G., "Workforce development-building the public education pipeline to meet manufacturing technician hiring needs", Intel Corp., USA BT - IEEE/SEMI 1996 Advanced Semiconductor Manufacturing Conference and Workshop. Theme-Innovative Approaches to Growth in the Semiconductor Industry. ASMC 96 Proceedings, 12-14 Nov. 1996: IEEE, pp. 451–4, 1996.
[22] Fry, T.D., et. al., "Managing worker flexibility and attrition in dual resource constrained job shops", International Journal of Production Research, 33(8), pp.2163–2179, 1996.
[23] Ghosh, K. and Sahney, S., "Organizational sociotechnical diagnosis of managerial retention in an IT organization: SAP-LAP framework", International Journal of Organizational Analysis, 18(1), pp.151–166, 2010.
[24] Gow, K. et al., "Retention and intentions to quit among Australian male apprentices", Education + Training, 50(3), pp.216–230, 2008.
[25] Grant, R.M., "Toward a knowledge-Based Theory of the Firm", Strategic Management Journal, 17(SI), pp.109–122. 1996.
[26] Han, Z. and Froese, F.J., "Recruiting and retaining RD professionals in China", International Journal of Technology Management, 51(2-4), pp.387–408. 2010.
[27] Hanewicz, C., "Identifying student retention patterns using GIS technology BT", PICMET 2009 - 2009 Portland International Conference on Management of Engineering and Technology, Utah Valley University, Technology Management Department, Orem, UT, United States pp. 2231–1890843202, 2009.
[28] Holtbrugge, D., Friedmann, C.B. & Puck, J.F., "Recruitment and retention in foreign firms in India: A resource-based view" Human Resource Management, 49(3), pp.439–455, 2010.
[29] Horwitz, F.M., "Future HRM challenges for multinational firms in Eastern and Central Europe." Human Resource Management Journal, 21(4), pp.432–443, 2010.
[30] Jin, C. and Li-ying, W., 2003. "Flow and retention of intellectual employees in hi-tech companies", In Dept. of Manage., Zhejiang Univ., China BT - IEMC ’03
Proceedings. Managing Technologically Driven Organizations: The Human Side of Innovation and Change, 2-4 Nov. 2003: IEEE, pp. 176–80 BN – 0 7803 8150 5, 2010.
[31] Kaliprasad, M., "The human factor I: Attracting, retaining, and motivating capable people." Cost Engineering (Morgantown, West Virginia), 48(6), pp.20–26, 2006.
[32] Kapoor, B. and Sherif, J., "Global human resources (HR) information systems" Kybernetes, 41(1-2), pp.229–238, 2006.
[33] Khayal, I.S. and Farid, A. M., "Axiomatic Design Based Volatility Assessment of the Abu Dhabi Healthcare Labor Market: Part II", In Proceedings of the ICAD 2013: The Seventh International Conference on Axiomatic Design. Worcester, MA, USA, pp. 1–8, 2013.
[34] Lee-Kelley, L., Blackman, D.A. and Hurst, J.P., "An exploration of the relationship between learning organisations and the retention of knowledge workers." Learning Organization, 14(3), pp.204–221, 2007.
[35] Leonard-Barton, D., "Core Capabilities and Core Rigidities: A Paradox in Managing New Product Development", Strategic Management Journal (1986-1998), 13(SPECIAL ISSUE), p.111, 1992.
[36] Lockwood, D. and Ansari, A., "Recruiting and retaining scarce information technology talent: a focus group study", Industrial Management + Data Systems, 99(6), pp.251–256, 1999.
[37] Nicolopoulou, K., 2011. "Towards a theoretical framework for knowledge transfer in the field of CSR and sustainability", Equality, Diversity and Inclusion: An International Journal, 30(6), pp.524–538.
[38] Niskanen, W.A., "The Soft Infrastructure of a Market Economy", Cato Journal, 11(2), pp.233–238, 1991.
[39] Nonaka, I. o and Nishiguchi, T., Knowledge emergence : social, technical, and evolutionary dimensions of knowledge creation, Oxford ; New York: Oxford University Press, 2001.
[40] Nonaka, I. o & Takeuchi, H., The knowledge-creating company : how Japanese companies create the dynamics of innovation, New York: Oxford University Press, 1995.
[41] Pathirage, C.P., Amaratunga, D.G. and Haigh, R.P., "Tacit knowledge and organisational performance: construction industry perspective", Journal of Knowledge Management, 11(1), pp.115–126, 2007.
[42] Pettigrew, A.M., Thomas, H. and Whittington, R., Handbook of strategy and management, London ; Thousand Oaks, CA: Sage Publications, 2006.
[43] Roepke, R., Agarwal, R. and Ferratt, T.W., "Aligning the IT human resource with business vision: The leadership initiative at 3M", MIS Quarterly: Management Information Systems, 24(2), pp.327–353, 2000.
[44] Servon, L.J. and Visser, M.A., Progress hindered: The retention and advancement of women in science, engineering and technology careers. Human Resource Management Journal, 21(3), pp.272–284, 2011.

- 76 -
[45] Spender, J.C., "Making Knowledge the Basis of a Dynamic Theory of the Firm", Strategic Management Journal, 17(SI), pp.45–62, 2011.
[46] Suh, N.P., Axiomatic Design: Advances and Applications, Oxford University Press, 2011.
[47] Sveiby, K.-E., "A knowledge-based theory of the firm to guide in strategy formulation", Journal of Intellectual Capital, 2(4), pp.344–358, 2001.
[48] Taylor III, L.J., Murphy, B. and Price, W., "Goldratt’s thinking process applied to employee retention", Business Process Management Journal, 12(5), pp.646–670, 2006.
[49] Teece, D.J., Pisano, G. and Shuen, A., "Dynamic capabilities and strategic management" Strategic Management Journal, 18(7), pp.509–533, 1997.
[50] Viswanath, A., Baca, E.E.S. and Farid, A. M., "An Axiomatic Design Approach to Passenger Itinerary Enumeration in Reconfigurable Transportation Systems", submitted to: IEEE Transactions on Intelligent Transportaton Systems, pp.1–10, 2013.
[51] Wernerfelt, B., "The Resource-Based View of the Firm: Ten Years After", Strategic Management Journal (1986-1998), 16(3), p.171, 1995.
[52] Whelan, E. and Carcary, M., "Integrating talent and knowledge management: where are the benefits?", Journal of Knowledge Management, 15(4), pp.675–687, 2011.
[53] Wong, D. and Kimura, R., "Replenishing the aging work force in the power industry", BT - 2009 IEEE Power & Energy Society General Meeting (PES), 26-30 July 2009. In Piscataway, NY, USA: IEEE, p. 8 , 2009.
[54] Zheng, C. and Hu, M.-C., "Challenge to ICT manpower planning under the economic restructuring: empirical evidence from MNCs in Singapore and Taiwan", Technological Forecasting and Social Change, 75(6), pp.834–853, 2008.
[55] Zheng, C., Soosay, C. and Hyland, P., "Manufacturing to Asia: Who will win the emerging battle for talent between Dragons and Tigers?" Journal of Manufacturing Technology Management, 19(1), pp.52–72, 2008.

Proceedings of ICAD2013 The Seventh International Conference on Axiomatic Design
Worcester – June 27-28, 2013
ICAD-2013-12
- 77 -
ABSTRACT
The progress of a developing nation is often measured by the advancement of its infrastructure. While “hard” infrastructure such as water, power and transportation are often easy to assess, “soft” structures such as healthcare systems are often more challenging. Furthermore, the quality and reliability of a nation’s healthcare system is often driven by the number and diversity of its healthcare professionals. Unfortunately many developing nations often suffer from very constrained segments in their highly skilled labor market and hence must “import” this human capital. Volatility in key healthcare professions can threaten reliable and sustainable healthcare delivery. In this two-part paper, the large flexible system modelling framework from Axiomatic Design Theory is used to assess healthcare delivery capability in Abu Dhabi, United Arab Emirates. Part I provides the methodological developments. Here, each profession type is modelled as a functional requirement and the physical hierarchy is modelled at three levels of decomposition: individuals, healthcare facilities, and regions. The associated knowledge base is filled with the associated number of professionals of a given type provided by the corresponding design parameters. The knowledge base is then evolved on a yearly basis as professionals enter, stay and ultimately leave. In Part II, the Abu Dhabi case study shows results indicative of significant volatility in the healthcare labor market. The work demonstrates that Axiomatic Design Theory as applied to large flexible systems can be applied to data-centric methods in human resources management in the context of skills shortages and high attrition rates.
Keywords: healthcare system, Axiomatic Design, large flexible system, human resource management, degrees of freedom, reconfiguration process, reconfigurability.
1 INTRODUCTION
Healthcare human resources management (HRM) is key to the development of the Abu Dhabi Emirate. The Abu Dhabi Economic Vision 2030, a roadmap for the Emirate’s economic progress towards a secure society and a dynamic open economy, states human resources development as one of the four key priority areas [Abu Dhabi Council for
Economic Development, 2009]. Therefore, Abu Dhabi has acknowledged that ensuring a nation’s development can be seen to equally depend on the retention of knowledge-based healthcare professionals.
Existing human resources management methods are relatively weak in addressing developing and emerging economies where either human capital has not had a chance to accumulate or where the growth rate of the economy outstrips efforts for human capital development [Beulen, 2009; Kapoor and Sherif, 2012]. Further attention has been given to Gulf Cooperation Council (GCC) countries where the absence of well-established indigenous human capital combined with fast economic and population growth has led to dramatic needs in human resources management [Doh et al., 2011; Horwitz, 2011].
In this paper we apply Axiomatic design as a tool to assess HRM performance. The methodology for this paper is presented in Axiomatic Design Based Volatility Assessment of the Abu Dhabi Healthcare Labor Market: Part I [Farid and Khayal, 2013]. Section 2 presents and discusses the results for the evolution of the Abu Dhabi healthcare labor market over the last five decades. Section 3 concludes the work and presents potential extensions to the research.
2 CASE STUDY: EVOLUTION OF ABU DHABI HEALTHCARE HUMAN RESOURCES KNOWLEDGE BASE
In this section, the models presented in Part I are applied to an Abu Dhabi data set of healthcare professionals to draw some conclusions about the emirate’s human resources management practices. Section 2.1 describes the data in detail while Section 2.2 presents and discusses the results.
2.1 DATA
The Abu Dhabi Emirate is the largest of the seven emirates in the United Arab Emirates (UAE) and makes up 80% of the UAE land area. Abu Dhabi city is the capital of the UAE [Anonymous, 2013]. According to the Statistics Centre of Abu Dhabi (SCAD), in 2011 UAE Nationals made up approximately 20% of the population, while the remaining 80% were expatriates. This illustrates the UAE as a country in need of importing much of its healthcare labor market.
AXIOMATIC DESIGN BASED VOLATILITY ASSESSMENT OF THE ABU DHABI HEALTHCARE LABOR MARKET: PART II - CASE STUDY
Inas S. Khayal [email protected]
Engineering Systems & Management Masdar Institute of Science and Technology
Box 54224, Abu Dhabi, UAE Massachusetts Institute of Technology
Cambridge, MA, USA
Amro M. Farid [email protected]
Engineering Systems & Management Masdar Institute of Science and Technology
Box 54224, Abu Dhabi, UAE Massachusetts Institute of Technology
Cambridge, MA, USA

- 78 -
Figure 1. Evolution of healthcare professional recruiting in Abu Dhabi 1967 to 2012.
Figure 2. Evolution of healthcare professional attrition in Abu Dhabi 1967 to 2012.

- 79 -
The data used in this paper includes a publicly available list of all clinician licenses issued in the emirate of Abu Dhabi [Health Authority of Abu Dhabi, 2013]. The license list was cleaned and organized with the following attributes used in this case study: physician name, profession, facility licensed at, region (of the Abu Dhabi Emirate), start date and end date. The data used in this analysis spanned from 1967 to 2012, with 35 professions in 1769 facilities in 15 regions.
The numbers of clinicians per year were normalized across the 45 years by dividing the number of physicians by the population in Abu Dhabi. They are presented units of number of clinicians per million people. The population data was derived from SCAD’s published report: “Abu Dhabi Development Statistics-Population and Labour Force” [Statistics Center of Abu Dhabi, 2013].
2.2 RESULTS & DISCUSSION
The provided data was analyzed given the Axiomatic Design models and measures given the methodology presented in the theory paper [Farid and Khayal, 2013]. The results are presented in terms of healthcare system quality of service, quality of service and healthcare human resources retention.
2.2.1 QUALITY OF SERVICE
In this section, quality of service (QoS) is assessed in terms of profession redundancy. Figures 1, 2 and 3 present the evolution of healthcare professional recruiting, attrition and net in Abu Dhabi from 1967 to 2012 on a semi-log scale.
All three figures show a decreasing envelope trend where the exponential population growth is occurring at a faster rate than the process of recruitment or attrition. The data also shows a significant systematic change in healthcare recruiting between 2008 and 2010. The figures show varying trends between professions that have been established the longest, and those that have been available for the shortest period of time in Abu Dhabi. The oldest healthcare professions, such as medical practitioners, pharmacists and dentists, tend to show more stable evolutions. These older healthcare professions also show minimal to no attrition before the 1990s. The recruitment and attrition of professionals appears to be very volatile, while the net seems to be much more stable. This shows specific effort towards attempting to maintain and minimize volatility over the years, given patterns of high and variable attrition.
Table 1 presents the statistical measures of the quality of service. The statistic measures of the coefficient of variation, the regression line slopes bR, bA, and b, and the coefficient of determination (goodness of fit) R2 give complementary views of the evolution of healthcare professionals. The highest coefficients of variation of professions include nurses and family medicine. These are professions that have been established for approximately 30 years yet show large volatility. The values show that there is very large volatility in these very needed areas. Meanwhile, the regression line slopes demonstrate that the Abu Dhabi healthcare system is still very much in a ramping up phase indicative of a developing nation. Nearly all professions are growing at many multiples of the
population growth rate with the strongest trends in social workers, critical care and respiratory therapy. Finally, the correlation coefficients show the greatest volatility in healthcare professions with least redundancy suggesting the need for further recruiting to maintain quality of service.
Table 1: Statistical measure of QoS.
Profession N μ σ/μ bR bA b 1-R2
Podiatry 3 1 0.29 NaN NaN 0.29 0.01
Allergy and Immunology
32 1 0.32 NaN NaN -0.02 0.65
Community Medicine 4 4 0.50 NaN NaN 0.45 0.68
Audiology 15 2 0.75 -0.02 -0.77 0.09 0.75
Speech therapy 12 2 1.03 NaN NaN 0.11 0.67
Clinical Psychology 10 2 1.30 0.17 0.00 0.22 0.40
Social Worker 3 7 0.76 NaN NaN 1.03 0.15
Occupational Medicine
12 3 1.21 1.80 0.00 0.24 0.37
Oncology 6 7 0.76 NaN NaN 0.41 0.22
Critical Care 6 12 0.73 NaN NaN 0.72 0.34
Respiratory Therapy 4 17 0.64 NaN NaN 0.79 0.34
Scientist/Eng. 15 6 1.37 NaN NaN 0.19 0.29
Alternative Medicine 23 12 0.87 NaN NaN 0.16 0.19
Technologists 9 10 1.35 NaN NaN 0.55 0.12
Psychiatry 31 8 0.93 0.07 NaN 0.09 0.14
Dietician-Nutritionist 18 7 1.61 NaN NaN 0.18 0.38
Family Medicine 33 10 2.25 NaN 0.31 0.08 0.64
Pathology 33 26 0.78 NaN 0.02 0.10 0.09
Dermatology 33 29 0.80 NaN NaN 0.11 0.06
Physiotherapy 15 20 1.10 0.22 NaN 0.18 0.39
Midwife 9 54 1.26 0.78 1.99 0.57 0.09
Ophthalmology 37 38 0.86 0.07 0.01 0.10 0.04
Anesthesia 27 35 1.55 NaN NaN 0.18 0.05
Obstetrics & Gynecology
40 41 0.96 NaN NaN 0.09 0.05
Emergency Medicine 11 51 1.74 NaN NaN 0.56 0.16
Pediatrics 40 51 1.16 0.14 0.09 0.08 0.08
Radiology 32 44 1.31 -0.39 0.00 0.14 0.08
Medical Laboratory 22 60 1.69 NaN NaN 0.21 0.12
Internal Medicine 40 71 1.24 NaN NaN 0.08 0.11
Surgery 31 114 0.92 -0.51 0.00 0.12 0.05
Dentistry 35 190 0.68 0.04 -0.02 0.08 0.08
Clinical Support 28 176 1.58 -1.34 0.00 0.24 0.05
Pharmacy 38 261 1.15 0.09 NaN 0.15 0.02
Medical Practitioner 46 193 1.17 0.10 0.05 0.08 0.16
Nurse 28 716 2.04 0.28 0.00 0.29 0.08
where N=# of years of data; μ=mean # of clinicians/million
people; σ/μ= coefficient of variation; bR, bA and b=the slope of the log regression lines for recruitment, attrition, and net, respectively; 1-R2=measure of volatility.

- 80 -
Figure 3. Evolution of healthcare professionals in Abu Dhabi 1967 to 2012.
Figure 4. Evolution of the diversity of healthcare professions by facility.

- 81 -
Figure 5. Evolution of the diversity of healthcare professions by region.
Figure 6. Map of the Abu Dhabi Emirate with the 15 regions presented in this study.
2.2.2 CONVENIENCE OF SERVICE
In this section, convenience of service (CoS) is assessed in terms of functional flexibility for facilities as well as regions. Figure 4 shows the evolution of facility diversity over time for the 1769 facilities. Figure 5 shows the evolution of region diversity over time for the 15 regions in the Abu Dhabi
Emirate. Figure 6 illustrates the geolocation of the regions in the Abu Dhabi Emirate.
As can be expected, Figure 5 shows the greatest region diversity in well-established regions (e.g. Abu Dhabi, Al-Ain) with much more basic services than in more rural regions. The region diversity can be described as having a linear trend; however, there appears to be a drastic increase in region diversity for most regions starting in 2009.

- 82 -
Table 2 presents the statistical measures of the convenience of service.
Table 2. Statistical measures of CoS.
Region N μ σ/μ b 1-R2
Al Khatim 19 3 0.65 0.23 0.51
Liwa 14 3 0.83 0.51 0.38
Delma 4 13 0.19 1.60 0.37
Sila 7 7 0.84 2.36 0.17
Shahama 23 3 1.18 0.29 0.62
Ghayathi 20 5 1.11 0.70 0.41
Al Mirfa 18 5 0.96 0.69 0.32
Al Ruwais 15 8 0.60 0.66 0.64
Mussafah 30 2 0.88 0.16 0.39
Baniyas 37 5 0.74 0.36 0.08
Madinat Zayed 33 6 1.17 0.56 0.33
Al Mafraq 16 8 1.34 1.80 0.38
Al Ain 36 16 0.51 0.73 0.11
Abu Dhabi 46 16 0.64 0.77 0.02
where N=# of years of data; μ=mean region diversity; σ/μ= coefficient of variation; b=the slope of the regression lines for region diversity; 1-R2=measure of volatility
The statistical measures show the most consistent expansion in healthcare services in Abu Dhabi, Al Ain, and Baniyas as compared to the other regions that undertook the 2008 regional diversity expansion.
2.2.3 RETENTION OF HEALTHCARE KNOWLEDGE
In this section, retention of healthcare knowledge is assessed in terms of the average number of active license times. Figure 7 shows the turnover of healthcare human resources per decade. Figure 8 presents the average license times for each profession per region.
There appears to be very different patterns of turnover between the oldest decades of the 1970s and 1980s and the newest decades of 1990s and 2000s. The older decades retained healthcare professionals very well, while, the more recent decades have progressively shorter active license times.
Pharmacy has highest average license times across the regions of the Abu Dhabi Emirate, closely followed by dentistry. These are the two professions that appear in all regions. Interestingly, the less urban areas of Al Khatim, Baniyas, Liwa and Ghayathi despite having fewer professionals fulfilled, appear to retain their healthcare professions longer than the more urban regions.
3 CONCLUSIONS & FUTURE WORK
In conclusion, this paper has modelled healthcare professionals in the Emirate of Abu Dhabi as a large flexible system whose functions are the healthcare professions. The physical hierarchy was modelled at the level of individuals, then aggregated to healthcare facilities and then aggregated further to the regional level. Recruiting and attrition were modelled as reconfiguration processes that allowed for a discrete-time evolution of the system knowledge base. The results showed Abu Dhabi’s aggressive efforts to develop its healthcare human resources capital and maintain improving
quality of service despite high attrition rates and the quickly growing population. The results also showed a trend towards improving the flexibility of facilities; consistently in larger cities while abruptly in recent years in more rural areas. The data also showed a continually deteriorating ability to retain healthcare professionals in recent decades, especially in more urban areas. The precision of these results should serve decision-makers to develop HRM policies that stabilize healthcare quality of service, facility convenience and human resources retention where it is needed most.
The paper’s results demonstrate the significant potential of Axiomatic Design knowledge bases in the application of human resources management. The knowledge base, especially when viewed at multiple levels of physical hierarchy, allows for data-centric diagnosis methods that can support multi-facility organizations in their recruiting strategies and decisions.
4 REFERENCES
[1] Abu Dhabi Council for Economic Development, “Abu Dhabi Economic Vision 2030,” Abu Dhabi, 2009. Available: https://www.abudhabi.ae/egovPoolPortal_WAR/appmanager/ADeGP/Citizen?_nfpb=true&_pageLabel=p_citizen_homepage_hidenav&did=131654&lang=en. [Accessed: 12-Feb-2013].
[2] Anonymous, “Abu Dhabi,” 2013. [Online]. Available: http://en.wikipedia.org/wiki/Abu_dhabi. [Accessed: 10-Mar-2013].
[3] Beulen E., “The contribution of a global service provider’s Human Resources Information System (HRIS) to staff retention in emerging markets: comparing issues and implications in six developing countries,” Information Technology & People, vol. 22, no. 3, pp. 270–288, 2009.
[4] Doh J.P., Smith R.R., Stumpf S.A., and Tymon Jr. W.G., “Pride and professionals: retaining talent in emerging economies,” Journal of Business Strategy, vol. 32, no. 5, pp. 35–42, 2011.
[5] Farid A.M., Khayal I., “Axiomatic Design Based Volatility Assessment of the Abu Dhabi Healthcare Labor Market: Part I – Theory.” In Proceedings of the ICAD 2013: The Seventh International Conference on Axiomatic Design. Worcester, MA, USA, – June 26-28, 2013 ICAD2013.
[6] Horwitz F. M., “Future HRM challenges for multinational firms in Eastern and Central Europe,” Human Resource Management Journal, vol. 21, no. 4, pp. 432–443, Nov. 2011.
[7] Kapoor B., and Sherif J., “Global human resources (HR) information systems,” Kybernetes, vol. 41, no. 1–2, pp. 229–238, 2012.
[8] Health Authority of Abu Dhabi, “Clinician Licenses,” Shafafiya Website, 2013. [Online]. Available: http://www.shafafiya.org/dictionary/portal/. [Accessed: 12-Feb-2013].
[9] Statistics Center of Abu Dhabi, “Abu Dhabi Development Statistics-Population and Labour Force: Population and Demography,” Abu Dhabi, UAE, 2013.

- 83 -
Figure 7. Turnover of healthcare human resources per decade.
Figure 8. Average license times (in years) by region for each profession.

Proceedings of ICAD2013 The Seventh International Conference on Axiomatic Design
Worcester – June 27-28, 2013
ICAD-2013-13
- 84 -
ABSTRACT
In order to increase the participation of creative components of thinking in certain stages of applying Axiomatic Design, one considered the use of the ideas diagram method. This could be made when the design parameters are established or by establishing functional requirements and design parameters so that the principles valid in the case of the ideas diagram method may be applied. A case study concerning a technological solution of detaching cylindrical parts from a metallic workpiece by electrical discharge machining was used in order to illustrate the possibilities of increasing the creative character of certain stages of applying Axiomatic Design.
Keywords: Axiomatic Design, functional requirements, design parameters, ideas diagram method, electrical discharge machining.
1 INTRODUCTION
A largely accepted definition of Axiomatic Design shows that this is a design methodology that uses matrix methods in order to analyze the transformation of customer needs into functional requirements, design parameters, and process variables [Gonçalves-Coelho, 2009; Suh, 1990].
For the innovative designer, a problem could refer to those stages of Axiomatic Design where technical/engineering creativity could have a significant role and it could be efficiently used. Over time, researchers have tried to include substages able to ensure a creative character to the activities involved by applying Axiomatic Design.
Thus, Crowell and Gregson [2008] proposed the use of a so-called Creativity Matrix, in order to integrate a tool for creativity into design process. They highlighted the significance of analysis and synthesis, as essential components of the cognitive psychology within Axiomatic Design.
M.K. Thompson [2009] studied the problem of the intersection between design and analysis; she appreciated that
analysis is an element of design thinking and that design and analysis are interrelated.
Mann [1999; 2002] analyzed some of the compatibilities and contradictions between the theory of inventive problem solving (TRIZ) and Axiomatic Design. He concluded that the analytical methods of Axiomatic Design could complement the synthesizing capabilities of TRIZ in at least certain significant areas. An aspect of high importance was considered the recognizing and utilizing of the inter-dependences existing between both hierarchical layers and different hierarchical regimes specific to Axiomatic Design.
Brown [2005] showed that Axiomatic Design could develop engineering design from an iterative, abstract and intuitive process, relied essentially on creativity, into a science based on applying principles.
Thompson [2011] defined design as a “human activity which combines resources (knowledge, skills, experiences, creativity, tool, materials, etc.) to meet a need, accomplish a goal, or create an artifact”.
During the design activities developed along a certain period, the designer succeeds to find and apply personal creative modes, in order to creatively solve design problems. Kim et al. [2011] showed that in order to find a solid and original solution, an adequate distribution and interaction between the problem and solution spaces could be required; one could find here a similarity with the zigzagging activity specific to Axiomatic Design. Kim et al. considered also that the designer’s personal creativity modes are able to exert influence on the design activities in terms of design information and process.
In Axiomatic Design, if one analyses the content of the zigzagging activity, one may notice that sometimes, for each functional requirement, one tries to find a single design parameter and, usually, if this parameter is found, one considers that the problem specific to this stage is solved. This could generate an enhance of the creativity by eliminating bad ideas early [Suh, 2001], but sometimes some design parameters could offer maximum results only in the
USING CREATIVE RESOURCES IN APPLYING AXIOMATIC DESIGN
Laurenţiu Slătineanu [email protected]
Department of Machine Manufacturing Technology “Gheorghe Asachi” Technical University of Iaşi Blvd. D. Mangeron, 39A, 700050 Iaşi, Romania
Lorelei Gherman [email protected]
Department of Machine Manufacturing Technology “Gheorghe Asachi” Technical University of Iaşi Blvd. D. Mangeron, 39A, 700050 Iaşi, Romania
Margareta Coteaţă [email protected]
Department of Machine Manufacturing Technology “Gheorghe Asachi” Technical University of Iaşi Blvd. D. Mangeron, 39A, 700050 Iaşi, Romania
Irina Beşliu
[email protected] Mechanical & Technology Department
University “Ştefan cel Mare” of Suceava, Universitătii Street, 13, 720229 Suceava, Romania
Oana Dodun
[email protected] Department of Machine Manufacturing Technology
“Gheorghe Asachi” Technical University of Iaşi Blvd. D. Mangeron, 39A, 700050 Iaşi, Romania
Nicolae Seghedin [email protected]
Department of Machine –Tools “Gheorghe Asachi” Technical University of Iaşi
Blvd. D. Mangeron, 39A, 700050 Iaşi, Romania

- 85 -
presence of a certain type /size of other design parameters, or if only a design parameter is available, the above mentioned analysis could not be developed.
During the presentation of his work [Park, 2011] concerning the ways of teaching Axiomatic Design to students and practitioners, Park highlighted the necessity of increasing possibilities of Axiomatic Design to find and apply innovative solutions for the design problems.
Some techniques and methods were applied within didactic applicative activities aiming the development of the students’ creative capacity [Seghedin, 2010; Slătineanu et al., 2011]. One can appreciate that in our situation (training students in field of mechanical and industrial engineering), among the simpler methods, the one based on the use of the ideas diagram method led generally to positive results: some authors considerations about such an aspect are presented in this paper.
2 INCLUSION OF A CREATIVE METHOD IN APPLYING AXIOMATIC DESIGN
Most methods aimed at the stimulation of technical creativity firstly are based on finding many solutions able to solve the problem and only subsequently the problem of identifying the most convenient of these solutions is approached. This means that during the stage of the zigzagging specific to applying Axiomatic Design, it is important firstly to find many design parameters (Figure 1). This supposes the use of divergent thinking. Afterwards, when it is necessary to determine the most convenient solution, the role of the convergent thinking becomes significant.
The main actor in the design activity is the designer; in order to solve a design problem, he could be usually obliged to select one of the following design methods:
- A routine design method, applied when operative solving of a certain situation/problem is necessary and when he does not search new and creative solutions. In accordance with [Dym, 1994], in case of routine design, just from beginning the designer knows what he needs in order to elaborate a design;
- A creative design method, which must lead to new solutions. This design method needs a longer time and it could not be strictly normalized. Applying this method supposes stages of documentation, operative activities, incubation stage, illumination sequence or stage, validation stage etc.
During the last decades, various methods were identified and applied, in order to stimulate human creativity in finding innovative solutions. Essentially, such methods intend to avoid the routine and to place design out of common ways of thinking.
In time, especially due to the daily routine, the designer structures a proper design algorithm, a proper way of searching the solutions for the design problems, on the basis of his previous academic training, of knowledge/experience accumulated and of success obtained by applying various design methods. Generally, once accustomed with a certain design method, the designer gives up difficulty to his proper algorithm used in order to search and to find new/improved solutions, especially when an eventually new design method supposes many stages and long duration of familiarizing with respective stages.
If we take into consideration Axiomatic Design, we could formulate a question about the position of a creative method within the stages specific to the use of Axiomatic Design where the designer’s creative capacities could be efficiently applied.
In our opinion, such a more intense use of designer creative capacities could be materialized during the establishing of design parameters (Figure 1), when zigzagging between functional requirements and design parameters could facilitate the shaping of new or improved solutions for the approached problem. In such a case, elements based on the initial use of the ideas diagram method could be applied in one of the following ways:
a) A first way could be the shaping of an initial solution for the problem to be solved by direct elaboration of an ideas diagram, immediately after the functional requirements were established [Slătineanu et al., 2011]. Essentially, within application of this method of creativity stimulation, during the stage of the problem analysis, a general solution is thought, by considering the components of the solution and trying to find various versions for each of the components; subsequently, in the synthesis stage, the combinations of various components are considered, in order to establish which combination is the most convenient of them. One appreciates that this method (the method of the ideas diagram) applied in order to stimulate the technical creativity could be used inclusively in the first stages of the Axiomatic Design method.
Thus, an ideas diagram could be designed by taking into consideration a known solution and which could be
Figure 1. Using creative method for establishing the design parameters.

- 86 -
susceptible to fulfill the functional requirements or just a solution which does not exist, but which will be designed by considering the functional requirements. Indeed, analyzing and combining various versions of the proposed solution components (as specific stages valid when the ideas diagram method is applied), the effects of the divergent thinking could have a beneficial effect in identifying a new or improved solution. Applying criteria of diminishing the number of the versions that could be subsequently evaluated in detail and finally using an adequate selection method, the most convenient solution could be found. This solution could be considered in order to continue the zigzagging activity and to define the final solution.
b) A second way could be applying some changes in the elaboration of the ideas diagram, so it can be used in Axiomatic Design. Aspects specific to Axiomatic Design could be thus introduced and used. The functional requirements could be considered as subassemblies or components or possibilities of obtaining distinct versions of the problem solution. Afterwards, versions of design parameters afferent to each functional requirement could be identified, and, by combining and evaluating the resulted combinations, the most convenient solution could be finally established. This second way of solving the design problem practically combines aspects specific to Axiomatic Design and to applying a creative method by initially considering the ideas diagram.
3 CASE STUDY
In order to obtain a more adequate image about the possibilities of using some principles specific to the ideas diagram to increase the weight of the creative solving of the problem by applying the method of Axiomatic Design, a practical situation is considered. In our research activity, there was formulated the problem of detaching cylindrical parts from a workpiece made of difficult-to-cut material (a high temperature resistant metallic alloy); subsequently, these cylindrical parts had to be affected by certain special treatments and their properties had to be determined by adequate testing methods.
Due to the fact that the workpiece material was characterized by a very low machinability by classical cutting process and also due to necessity to find a machining process able to avoid significant loss of workpiece material, gradually
the idea of using the electrical discharge machining was shaped (Figure 2).
One could mention that the electrical discharge machining is a machining method based on the material removal from workpiece as a consequence of developing electrical discharges between closest asperities existing on active surfaces of tool electrode TE and workpiece WP, if a rectilinear low speed work motion vTE is achieved usually by tool electrode TE to workpiece WP (both the tool electrode TE and workpiece WP are connected in an electric circuit of pulse generator PG). By using a tubular tool electrode TE, cylindrical samples was seaming to be obtained in acceptable conditions from workpiece WP (Figure 2a). Indeed, placing the tool electrode TE on the work head of the electrical discharge machine tool and the workpiece WP in a device placed on the machine tool table, one thought that using the vertical work motion vTE of the tool electrode TE, a cylindrical part P could be separated from the workpiece WP. But a first experiment highlighted an unexpected aspect; due to the difficult evacuation of the metallic particles detached from tool electrode and workpiece as a consequence of developing the electrical discharge machining process, during their evacuation from the frontal work gap, these electroconductive metallic particles were facilitating the generation of supplementary electrical discharges (spurious electrical discharges) and, finally, the test piece was characterized by a conical surface, instead of cylindrical one (Figure 2b). It was clear that an improved solution of electrical discharge machining was necessary, in order to diminish the shape errors of the machined parts.
In such a stage, if the first way of applying principles valid in the case of the ideas diagram method within Axiomatic Design method is considered, the customer needs (CNs) could be formulated in the following way:
CN1: detaching a cylindrical part (sample) from a workpiece
made of difficult-to-cut material, by a machining process similar to the so-called trepanning process;
CN2: due to the fact that the workpiece material is expensive, it is necessary that machining method generates minimum material loss.
The functional requirement of zero level could be:
a b
Figure 2. Detaching a part form workpiece by electrical discharge machining with a tubular tool electrode: a – initial thought machining schema; b – obtaining a conical part, due to spurious electrical discharges.

- 87 -
FR0: Detaching a cylindrical part from a workpiece made of difficult-to-cut material, with minimum material loss by machining process.
Taking into consideration the professional experience of
the process designer and the unacceptable results of the first experiment, an ideas diagram could be elaborated (Figure 3), immediately after defining the functional requirement of the zero level and considering the functional requirements of first order as subassemblies/components of the desired solution. Subsequently, distinct design parameters could be taken into consideration as distinct possibilities of materializing each functional requirement. These distinct versions of the design parameters are the results of a zigzagging activity.
As one can see, firstly various possibilities of analyzing the machining process were considered and versions for each possibility were identified. Subsequently, the combinations of the above mentioned versions were analyzed and evaluated, so that finally the solution presented in Figure 4, a was thought.
Once this solution was established (by using a creative method included in the Axiomatic Design method), the zigzagging activity could be continued in order to optimize also the initial solution.
Considering the versions of subassemblies corresponding to the searched technological solutions in accordance with Figure 3, one may calculate the total number of possible combinations by multiplying the numbers of versions valid for each subassembly; because the subassembly A has 3 versions, B – 3 versions, C – 3 versions, D – 4 versions and E – 3 versions, the total number of combinations Nt is given by:
32434333 tN (1)
In the second approach of solving the problem, one tried to establish if the stages of elaborating the functional requirements and the design parameters could be adapted or changed by using some principles valid in the case of ideas diagram method.
Figure 3. Direct application of principles valid in the case of ideas diagram in searching a technological solution for detaching cylindrical part from workpiece, by electrical discharge machining.

- 88 -
Thus, the schema from Figure 5 was elaborated. As one can see, the functional requirements were inscribed in the initial horizontal line of this new graphical representation, instead of the so-called subassemblies or possibilities of analyzing an initial hypothetic solution from the case of ideas diagram. At their turn, each version of a design parameter was symbolized by a Latin small letter (a, b, c etc.) placed immediately after the symbol corresponding to a certain design parameter (DP1, DP2 etc.).
To each functional requirement FR, various design parameters (DPs) were attached, along a vertical line; each design parameter received a code including capital letters corresponding to design parameter and a number which is the serial number allocated to a certain functional requirement.
Among the possible combinations of the design parameters, at least some of them could be convenient for problem solving. In order to have a diminished number of problem solutions necessary to be examined in detail, various methods (for example, methods of value analysis) could be applied; an example of applying such a method was presented in [Slătineanu et al., 2009].
Analyzing the combinations of various versions of the subassemblies included in ideas diagram from Figure 3, one found as advantageous, from the point of view of machining accuracy, the following three combinations:
- A2B1C2D1E1; this means to place the tool electrode on the work table of machine tool (A2) and the workpiece on machine tool work head (B1), the work motion being materialized by workpiece (C2), without supplementary work motions (D1) and using a classical tubular tool electrode (E1). One can see that in this case (Figure 4a), the metallic particles detached from the workpiece and the tool electrode (as a consequence of developing electrical discharge machining process) will be more efficiently removed from the space between electrodes under the action of the gravitation. As a consequence, the number of the spurious electrical discharges diminishes and a higher machining accuracy could be obtained (the conicity of the machined surface could be significantly reduced);
- A2B1C2D2E1; this solution involves to place the tool electrode on the work table of machine tool (A2) and the workpiece on machine tool work head (B1), the work motion
being materialized by workpiece (C2), but using a supplementary rotation motion of the tubular tool electrode (D2) and a classical tubular tool electrode (E1). In such a case, in addition to the graphical representation from Figure 4a, a supplementary rotation motion of the tool electrode was included (Figure 4b) and, thus, a higher shape accuracy of the machined surface could be achieved;
- A2B1C2D2E2; this solution differs from the previous solutions by the modified shape of active zone of tubular tool electrode TE (Figure 4c). Thus, if two approximately rectangular windows are included immediately under the active zone of tubular tool electrode, a supplementary decrease of the spurious electrical discharges could occur and a higher machining accuracy could be expected.
One can see that the same three solutions for machining process could be established by adequate selection of the design parameters in accordance with the graphical representation from Figure 5; this means that for the first functional requirement (FR1), the design parameter DP1.b could be preferred, while for the other functional requirements, the selected design parameters could be FR2 – DP2.a, FR3 – DP3.b, FR4 - DP2.a and DP.b, respectively, FR5 – DP5.a and respectively DP5.b.
The second solution was applied and the decrease of the machined surface conicity was confirmed [Slătineanu et al., 2013]; indeed, if for the machining schema from Figure 2a, the conicity was of about 0.04, in the case of the machining schema from figure 4, a, the conicity was of about 0.0042.
A more attentive analysis of the solutions suggested by applying the principles valid in the case of ideas diagram method could highlight also other interesting solutions for solving the proposed problem.
4 CONCLUSIONS
In order to obtain new/improved and original solutions, the designer could use creative methods. Over time, various methods aimed at the stimulation of designer creativity were identified and applied. In the case of Axiomatic Design, such a method could be the so-called method of ideas diagram. This method could be applied when the design parameters are established by considering the functional requirements. A second way could be applying some principles valid in the case
a b c Figure 4. Improved solutions of detaching cylindrical part by electrical discharge machining: a - machining schema
without tool electrode rotation motion; b – machining schema by use of a supplementary tool rotation motion; c – tool electrode modified in order to increase the machining accuracy.

- 89 -
of the ideas diagram method just in the case of establishing the design parameters; for each functional requirement, many versions of each design parameter could be initially identified and subsequently the most convenient design parameters could be established, inclusively by applying an adequate selection method. An application of the two ways of using the principles of ideas diagram elaboration in Axiomatic Design was presented, for a given case when a technological solution for detaching a cylindrical part from a metallic workpiece by electrical discharge machining had to be established. Three possible solutions were identified; essentially, they are based on placing the tubular tool electrode on the electrical discharge machine table, and on the use of a
tubular tool electrode having a modified shape of the active zone. proposed problem.
5 AKNOWLEDGEMENTS
The authors are thankful to Professor Mary Kathryn Thompson for useful suggestions and editorial comments.
6 REFERENCES
[1] Brown C., “Teaching Axiomatic Design to engineers – theory, applications, and software”, Journal of Manufacturing Systems, Vol. 24, No., 3, pp. 186-195, 2005.
Figure 5. Application of the principle valid in the case of the ideas diagram method in establishing functional requirements and design parameters.

- 90 -
[2] Crowell B., Gregson P., “The creativity matrix: an extension to Axiomatic Design”, Proceedings of CDEN Conference, Dalhousie University, Halifax, July 27-29, 2008.
[3] Dym C.L. Engineering Design: A Synthesis of Views, New York: Cambridge University Press, 1994. ISBN 0-0521-44224-9
[4] Gonçalves-Coelho A., Tutorials of the Fifth International Conference on Axiomatic Design (ICAD 2009), Campus de Caparica, Portugal, March 25-27, 2009.
[5] Kim Y.S., Jin S.T., Lee S.W., “Relations between design activities and personal creativity modes”, Journal of Engineering Design, Vol. 22, No. 4, pp. 235-257, 2011.
[6] Mann D., “Axiomatic Design and TRIZ: compatibilities and contradictions”, Proceedings of ICAD2002, First International Conference on Axiomatic Design, Cambridge, MA, June 21-23, 2002.
[7] Mann D., “Axiomatic Design and TRIZ: compatibilities and contradictions. Part II”, available at http://www.triz-journal.com/archives/1999/07/f/index.htm, accessed: 3.03.2013.
[8] Park G.-J., “Teaching Axiomatic Design to students and practitioners”, Proceedings of ICAD2011. The Sixth International Conference on Axiomatic Design, Daejeon, March 30-31, 2011.
[9] Seghedin N.E. “Development methodology of idea diagrams”, Buletinul Institutului Politehnic din Iaşi (Romania), Vol. LVI (LX), No. 2a, 2010.
[10] Slătineanu L., Coteață M., Beșliu I., Gherman L., Dodun O., “Machining of external cylindrical surfaces on a ram electrical discharge machine”, Key Engineering Materials, Vols. 554-557, pp. 1800-1805, 2013.
[11] Slătineanu L., Coteaţă M., Dodun O., Toca A., “The Ideas Diagram in Creative Design”, Proceedings of the Fifth International Conference on Axiomatic Design (ICAD 2009), Campus de Caparica, Portugal, March 25-27, 2009.
[12] Slătineanu L., Gonçalves-Coelho A., Coteaţă M., Uliuliuc D., Grigoraş (Beşliu) I., Mazuru S., “Teaching students the basics of designing experimental research equipment”, ICAD 2011, Proceedings of the 6th International Conference on Axiomatic Design, KAIST, Daejeon, March 30-31, 2011.
[13] Suh N.P., Axiomatic Design: Advances and Applications, New York: Oxford University Press, 2001. ISBN 0195134664
[14] Suh N.P., The Principles of Design, New York: Oxford University Press, 1990. ISBN 0-19-504345-6
[15] Thompson M.K., “Establishing design as a discipline in civil and environmental engineering”, Proceedings of the 1st International Workshop on Design in Civil and Environmental Engineering”, Daejeon, April 1-2, 2011.
[16] Thompson M. K., "Simulation Thinking: Where Design and Analysis Meet", Proceedings of the 2009 Winter Simulation Conference, Austin, TX, Dec. 13- 16, 2009.

Proceedings of ICAD2013 The Seventh International Conference on Axiomatic Design
Worcester – June 27-28, 2013
ICAD-2013-14
- 91 -
ABSTRACT
This paper is intended as an academic example for teaching Axiomatic Design in a trimestral course to engineering students or practitioners connecting with the theory for the first time. The proposed example is an application of Axiomatic Design to the selection of the best filtering system for vacuum-cleaning. Two different physical solutions are considered for collecting and retaining the solid particles: first solution is based on a filter media with a given porous size, and second one is based on a separation due to the larger density of the particles. Physical laws for both cases are given and design matrices are derived from them. Finally, the axioms are used to guide the decision making process and conclusions are given.
Keywords: Axiomatic Design, qualitative analysis, quantitative analysis, education, design matrix.
1 INTRODUCTION / STATE OF THE ART
When teaching Axiomatic Design to an audience that faces the theory for the first time, one of the principal objectives of the educator is to make his students “feel” the axioms and comprehend their implications.
A main aspect that makes Axiomatic Design such a significant theory is its capacity to make explicit the relations existing between the functional and the physical domains, pointing the ones that govern the optimal designs [Suh, 1990].
It is particularly interesting to focus on how the Independence Axiom, based on a qualitative statement: “maintain the independence of the functional requirements” [Suh, 1990], triggers a quantitative formulation based on the design matrices. According to the authors’ experience, both qualitative and quantitative definitions of the Independence Axiom are often well understood by the audience, who at the beginning finds the main difficulties in the formal definition of the design problem, and later on, in the understanding of the implications that Axiom 1 has in their design routines.
On the other hand, the Information Axiom is based on a quantitative formulation: “minimize information content” [Suh, 1990]. Consequently, its entire understanding requires exploring its qualitative implications in the design process. Important efforts have been made in this sense as presented by Suh [2001] or Benavides [2012]. Full comprehension of the implications derived from a qualitative application of Axiom 2 constitutes a real challenge for the educator and for all the
engineers willing to acquire the ability of using Axiomatic Design in their own design processes.
As exposed by Park [2011], “design education is more like a philosophy”. As a consequence, in the framework of engineering, philosophical concepts guiding creative process have to be balanced with the accuracy of engineering laws. Nakao and Nakagawa [2011] present how the correct definition of the design problem helps the achievement of innovative products with a huge impact in the market.
In this sense, it is important to note that the analysis of a particular solution exclusively from a qualitative point of view may result in the loss of a good problem formulation. On the other hand, if only a quantitative approach is proposed, practitioners and students may get lost in the problem definition, resulting in the increased difficulty for selecting an adequate set of functional requirements (FR). Bathurst [2004] presents some of the common problems found by engineers when facing Axiomatic Design for the first time.
In order to communicate the qualitative and quantitative implications of the design axioms, it is significant to select adequate intuitive examples that could help students and practitioners to entirely understand and interiorize the theory.
The main purpose of this paper is to suggest the structure of a lecture which, based on the resolution of a pedagogical example, would help students to comprehend Axiomatic Design principles as postulated by Suh [1990; 2001]. Although this work focuses mainly on the learning of the Independence Axiom and its implications, it gives some interesting conclusions derived from the Information Axiom.
To achieve this objective, this paper focuses on the qualitative and quantitative analysis of the vacuum cleaner filtering system as a case study. First of all, a summary of the lecture’s structure is presented. Next, the design problem of the vacuum cleaner is solved; first qualitatively, and later on, quantitatively. In both, the lecture’s structure is conceived in order to illustrate the Axiomatic Design principles [Suh 1990; 2001] within the concrete example.
2 PROPOSED LECTURE’S STRUCTURE
The lecture’s structure is based on the methodological steps described by Suh [1990; 2001]. As a first step in the education of Axiomatic Design principles, it is suitable to analyze an existing solution from a qualitative perspective. Thanks to it, the students have the opportunity to come into contact with basic design problem definition, and particularly,
THE VACUUM CLEANER AS A CASE STUDY FOR TEACHING CONCEPTUAL DESIGN
Joan B. Rodríguez [email protected]
Altran Calle Campezo 1,
28022 Madrid, Spain
Efrén M. Benavides [email protected]
Department of Propulsion and Fluid Mechanics Universidad Politécnica de Madrid
Pza. Cardenal Cisneros, 3 28040, Madrid, Spain

- 92 -
with two main implications of the Independence Axiom: direct dependence (caused by the formulation of needs which represent equivalent concepts) and indirect dependence (caused by the synthesis of a physical solution that couples the set of FRs).
Once students have contacted qualitatively with the implications of the design axioms, the quantitative formulation of the design problem can be suitably exposed.
The proposed structure for the lecture is presented in the next subsections.
2.1 QUALITATIVE ANALYSIS For analyzing an existing solution from a qualitative
perspective, we propose the following steps [Based on Suh, 1990]:
1. Qualitative formulation of the design problem a. Challenge definition b. Selection of the minimum number of
independent FRs in a neutral solution environment
c. Establishment of constraints 2. Description of the physical solution through its
main DPs 3. Writing of the design matrix 4. Analysis with the use of the Independence axiom 5. Introduction to the Information Axiom in terms
of probability of success 6. Propose uncoupled solutions and outline new
challenges
2.2 QUANTITATIVE ANALYSIS For analyzing an existing solution from a quantitative
perspective, we propose the following steps [Based on Suh, 1990]:
1. Quantitative formulation of the design problem a. Challenge definition b. Selection of the minimum number of
independent FRs in a neutral solution environment
c. Establishment of constraints d. Definition of FRs
2. Description of the existing solution through its main DPs a. Writing of the design equations (physical
laws) b. Identification of DPs c. Establishment of new constraints derived
from the DPs 3. Writing of the design matrix 4. Analysis with the use of the Independence
Axiom 5. Introduction to the Information Axiom in
terms of probability of success 6. Selection of new DPs to achieve the optimal
design and outline new challenges. The selection of the new DPs may imply the selection of a new physical solution.
3 THE VACUUM CLEANER AS A CASE STUDY
According to Suh [1990], the design problem definition is performed when the challenge is expressed and the lists of FRs and constraints are established. Because the FRs have to be stated in a neutral solution environment, the problem formulation has to be valid when analyzing two different solutions to the same design problem.
For that reason, since the methodological steps 1a, 1b and 1c are common for both the quantitative and the qualitative approaches; we will collect them in the following block.
3.1 FORMULATION OF THE DESIGN PROBLEM
3.1.1 CHALLENGE DEFINITION Analyze two different technologies (porous filter and
centrifugal separation) for filtering dust particles when vacuum cleaning. Identify their main dependences and select the best solution according to Axiomatic Design.
3.1.2 SELECTION OF THE MINIMUM NUMBER OF
INDEPENDENT FRS IN A SOLUTION NEUTRAL
ENVIRONMENT The minimum list of independent FRs for the first level
of hierarchy can be settled as follows (because the main objective of this paper is focused on the FRs, the set of constraints will not be established):
FR1: Clean-up dust particles FR2: Retain dust particles FR3: Operate for a long time
At this point, students must realize that the needs stated in FR1, FR2 and FR3 are functional requirements because they represent, in a solution neutral environment, independent concepts. The concept of direct independence is explained as a necessary condition for establishing a correct set of FRs.
3.2 QUALITATIVE ANALYSIS
3.2.1 DESCRIPTION OF THE POROUS FILTER
SOLUTION THROUGH ITS MAIN DPS: The main DPs that satisfy in the porous filter solution the
aforementioned list of FRs can be settled as follows:
DP1: Vacuum DP2: Filter pores size DP3: Filter area
3.2.2 WRITING OF THE DESIGN MATRIX: ANALYSIS
WITH THE USE OF INDEPENDENCE AXIOM With the use of the Independence Axiom [Suh, 1990],
the design matrix relating the established sets of FRs and DPs can be written:
Clean-up dust particles X X X Vacuum
Retain dust particles X X X Filter pore size
Operate a long time X X X Filter area
(1)

- 93 -
3.2.3 ANALYSIS WITH THE USE OF THE
INDEPENDENCE AXIOM The design matrix (DM) makes explicit how the filtering
system couples the functional requirements (clean-up dust particles and retain dust particles). Indeed, the more particles that are retained, the more filter pores clog, and consequently, the power for vacuuming and cleaning-up particles decreases. For a particular time of use, the conceived solution generates a dependency between functional requirements that, prior to the obtaining of the physical solution, were independent.
3.2.4 INTRODUCTION TO THE INFORMATION AXIOM IN
TERMS OF PROBABILITY OF SUCCESS As stated by Suh [Suh, 2001] in a coupled design, the
variability of the DPs can generate a decrease in the probability of success of satisfying the FRs (and therefore of satisfying client needs). In this example this aspect is visible when the filter has to be removed and changed because the vacuum power is not enough to clean-up dust particles.
3.2.5 PROPOSING UNCOUPLED SOLUTIONS AND
OUTLINE NEW CHALLENGES The coupling identified leads to the formulation of a new
challenge: “how to retain dust particles without losing vacuum power and maximizing the time of use”.
There are different solutions in the market that solve this dependency. One of them is the one patented by Dyson: the centrifugal vacuum cleaner based on cyclone technology. In this solution, the FR “retain dust particles” is satisfied by a separation of the dust particles with the use of the centrifugal force. This solution responds to the following new design matrix.
Clean-up dust particles X 0 0 Vacuum
Retain dust particles X X 0 Cyclone
Operate a long time X X X Container capacity
(2)
In this case, the DM shows a decoupled design. Indeed, the filtering system for retaining dust particles does not affect the vacuum power, and consequently, the functionality of cleaning-up dust particles.
It’s remarkable to note the huge effect that this new concept had in the market, showing up the deep impact that the reduction of the number of dependencies has into the achievement of more competitive products.
At this point it is useful to induce the students to think about the independency obtained with respect to the porous bag required for the conventional filter vacuum cleaner. Additionally, they can be proposed to think in terms of probability of success, determining which of the solutions has a higher probability of satisfying FRs.
3.3 QUANTITATIVE ANALYSIS
3.3.1 DEFINITION OF FRS In order to achieve the quantitative analysis, the set of
FRs has to be defined in terms of the appropriate physical variables:
FR1: Clean-up dust particles: u1 FR1 represents the functionality of cleaning-up particles,
which might be represented by the variable u1 which represents the speed of particles that are cleaned.
FR2: Retain dust particles: dmin
FR2 may be stated as follows: separate all the particles
that have a size bigger than dmin.
FR3: Maximize operational time: tmax FR3 might be stated as the time in which FRs are
satisfied.
3.3.2 DESCRIPTION OF THE POROUS FILTER
SOLUTION THROUGH ITS MAIN DPS Writing of the design equations (physical laws):
In order to obtain the physical laws that apply to the problem, let us consider the following system as a simplification of the vacuum cleaner we want to analyze:
Figure 1. Solution based on porous filter.
where, 0 = room, 1 = tube, 2 = dust container before filter, 3= filter, 4= dust container after filter, and 5 = fan. The physical laws applying to them for an ideal gas are collected in Table 1.
Table 1. Main physical laws for filtering solution.
Zon
es
Spee
d
Pre
ssu
re
En
thal
py
Mas
s fl
ow
Stat
e eq
uat
ion
0 0 0u
0p 0h m
00 01
ph
1 1u 1p
21
1 0 2
uh h
1 1 1m Au
11 11
ph
2 2 0u
2 1p p 2 0h h m
22 21
ph
3 3u 3p
23
3 0 2
uh h
3 3 3m A u
33 31
ph

- 94 -
4 4 0u
4 3p p
4 0h h m 4
4 41
ph
5 5 0u
5 0p p
5 0
Wh h
m
m 5
5 51
ph
Assuming an isentropic evolution between 0-1, 2-3, and
4-5, i.e., 1 0 1 0/ /p p , 3 2 3 2/ /p p
,
5 4 5 4/ /p p ; and assuming that the variations of
density are small, we can retain the first terms of Taylor expansion in order to solve the system of equations in terms of the FR selected. The following transfer equations are deduced (see appendix for details):
Design equation for FR1- u1
0 1
1 23
1
3
2 /
1
W Au
A
A
(3)
Design equation for FR2 – dd
d poresd d (4)
Design equation for FR3 – tmax
Considering the limit as the moment when the whole filter is clogged:
max 2 21 1
2 20 3
1
3 132
max
2 2
11
4pores
N N Nt
m WA WAn n nA
AAd
N
(5)
Definition of DPs
The DPs that derive from design equations are
1, , andporesA N d W .
3.3.3 WRITING OF THE DESIGN MATRIX FOR
POROUS FILTER SOLUTION According to the design equation (3), none of the terms
of the first row of the DM are zero, consequently:
1 1 1 1
1
0; 0; ; 0; 0pores
u u u u
A d NW
(6)
According to the design equation (4), the terms of the second row of the DM are:
1
0
0
d d d
d
pores
d d d
A NW
d
d
(7)
Finally, analyzing the design equation (5) for FR3,
1
0; 0; 0; 0pores
t t t t
A d NW
(8)
This results in the following design matrix:
1 1 1 1
1
1
1
1
0 0 0
pores
dustpartd
pores pores
pores
u u u u
A d NW Wu
d Ad
d dt
Nt t t t
A d NW
(9)
3.3.4 ANALYSIS WITH THE USE OF THE
INDEPENDENCE AXIOM As it can be observed through the design matrix, the
solution based on a filter for retaining dust particles couples the FRs. Indeed, due to the fact that the number of the filter pores diminishes with time, and that the mass flow has to be conserved throughout sections 1, 2, 3, the effective area of
the filter 2
3 4poresd
A N
diminishes.
As a consequence, the vacuum power (represented by u1) decreases during the operational time. This coupling is particularly critical because as it can be observed, even if the other control parameters vary in order to compensate this coupling, the diameter of the filter pores cannot be as big as desired, because it would imply the not achievement of FR2:
minporesd d .
3.3.5 INTRODUCTION TO THE INFORMATION AXIOM IN
TERMS OF PROBABILITY OF SUCCESS As commented in the qualitative analysis, the coupling
generates a progressive loss of vacuum power. This decrease induces a smaller probability of success for satisfying FR1: clean-up dust particles.
3.3.6 SELECTION OF NEW DPS TO UNCOUPLE
SOLUTIONS AND OUTLINE NEW CHALLENGES: CYCLONE BASED VACUUM CLEANER
Axiomatic Design identifies how far designs are from the optimal solution. Therefore, it answers why solutions become separated from the best design, making explicit their critical points [Suh, 1990].
In this particular case, Axiomatic Design shows how the physical solution based on a filter generates a coupled design. The tendency indicated by DPs is that in order to eliminate the functional coupling, the porous filter has to be removed, requiring a new DP that would uncouple the solution. The

- 95 -
next subsection analyses how a different physical solution decouples the system.
3.3.7 DESCRIPTION OF THE CYCLONE BASED
SOLUTION THROUGH ITS MAIN DPS In order to obtain the main DPs that describe the cyclone
based solution, let us consider the following system:
Figure 2. Solution based on centrifugal force.
Writing of the design equations (physical laws)
Physical laws are equivalent to the ones exposed previously, considering that in this case, zone 2 and 3 are equivalent.
Table 2. Main physical laws for centrifugal solution.
Zon
es
Spee
d
Pre
ssu
re
En
thal
py
Mas
s fl
ow
Stat
e eq
uat
ion
0 0 0u
0p 0h m
00 01
ph
1 1u 1p
21
1 0 2
uh h
1 1 1
m
A u
1
1 11
ph
2-3 2 3 0u
2 3p
2 3h 0
-
4 4 0u
4 1p p
4 0h h m 4
4 41
ph
5 5 0u
5 0p p
5 0
Wh h
m
m 5
5 51
ph
Applying the laws previously exposed and solving the system in terms of the FR selected, and considering that in cyclone case A3 >> A1 we obtain:
Design equation for FR1- u1
31
0 1 0 1
2m Wu
A A
(10)
Design equation for FR2 – dd
The differential equation that describes the radial displacement of a dust particle inside the cyclone is:
3 3 2221
0
4 4 1
3 2 3 2 2 4d d d
d d d
d d dux x c
R
(11)
For large size particles or for low radial speeds the following inequality holds:
22
0
3 21
1
2 4 14
3 2
dd
dd
dx c
d u
R
(12)
Under this condition Eq. (11) yields to:
21
d d
um x m
R (13)
This equation can be integrated to obtain:
21u
x tR
(14)
2
211
2
ux t
R (15)
The time spent by the particle inside the cyclone is:
1
2 cRNt
u
(16)
Taking into account Eqs. (12, 13, 14, 15 and 16), we can write the condition for neglecting the aerodynamic forces:
2 2 03d c dd
d N c R
(17)
A particle will escape from the cyclone towards the container if 1x d , where 1d represents the diameter of the
tube (note that 21 1 / 4A d ). Thus a particle will reach the
container if the following inequality is satisfied:
11
2c
dN
R (18)
It is convenient to remark that this condition is easily satisfied, and hence, the FR is satisfied by all the particles that have a large size as stated by Eq. (17). For particles with a much lower diameter than that, the aerodynamic force will become dominant and the radial velocity will become constant as stated by:
214
3d
dd o
ux d
c R
(19)

- 96 -
214
3d
dd o
ux d t
c R
(20)
2
0 12 2
3
16d
dd c
c dd
RN
(21)
Design equation for FR3 – tmax
Considering the limit as the moment where the whole dust container is full:
233
23max 3 23
1
0
42
33
2 2
d
d
V
d
Vt
m d n WAn
(22)
Definition of DPs
The DPs that derive from design equations Eq. (10, 21 and 22) are
1 2, , ,cd A N R and W
3.3.8 WRITING OF THE DESIGN MATRIX FOR
CYCLONE BASED SOLUTION According to the design equations, the resultant design
matrix can be written as follows:
1 1 1 1 1
1 2
0; 0; 0c
u u u u u
d R N AW
(23)
1 2
0; 0; 0d d d d d
c
d d d d d
d A R NW
(24)
1 2
0; 0; 0; 0c
t t t t t
d A R NW
(25)
This results in the following design matrix:
1 1
11 1
1
21 2
0 0 0
0 0
0 0
d d dd
cc
u uW
dWu d
d d dd R
d R Nt N
t t tA
d AW
(26)
3.3.9 ANALYSIS WITH THE USE OF INDEPENDENCE
AXIOM As it can be observed, the solution obtained eliminates
the main functional dependence that was present in the porous filter solution. As it is derived from the design matrix, in the cyclone based solution vacuuming dust particles does not dependent on the system used to filter them.
As a consequence, in the aforementioned solution the vacuum power does not decrease during the operational time. In this case, the limit is imposed by the volume of the dust container, and not by the system used to separate particles. In
this sense, the quantitative analysis confirms the dependencies identified in the qualitative study.
As it can be noted, in the quantitative analysis presented (for both filter and cyclone based solutions) the number of DPs available is bigger than the number of FRs. Particularly, each FR depends on more than one and only one DP, conducting to redundant designs in terms of the number of DPs, and generating coupled or decoupled designs in terms of independency.
This situation is to be expected when the physical laws that allow designers to achieve the quantitative study of designs are settled. In general, the number of DPs that derive from the laws of physics is much bigger than the minimal set of independent FRs. For that reason, Axiomatic Design constitutes a valuable tool to minimize the impact that a bigger number of DPs generates in the definition of new designs. By minimizing the dependencies between FRs and DPs and by selecting the appropriate DP that maximizes the probability of success, Axiomatic Design theory keeps the inherent complexity of the physical problem minimal [Lu and Suh, 2009].
3.3.10 PROPOSING UNCOUPLED SOLUTIONS AND
OUTLINE NEW CHALLENGES Although the main functional coupling is solved with the
described solution, at this point it is convenient to induce students to think about how this solution could be improved. More specifically, students can be asked to think about how the obtaining of a non-redundant design could be achieved. For example, they can be asked for analyzing if the DPs could be combined in dimensionless variables and mainly, which of them should be fixed as constant values. Additionally, students should be invited to evaluate each derivative of the design matrix, and particularly, the relative weight of each term, concluding which terms should be frozen and what tendencies the DPs should follow in order to maximize independency and the probability of success.
4 CONCLUSION
This paper proposes the structure of a lecture whose purpose is to introduce students and practitioners the basics of Axiomatic Design through the case study of an existing product which presents different configurations. The aim is to examine whether the design is optimal or not.
The case study is solved both qualitatively and quantitatively, and it shows how the compliance or not with the design axioms introduces a rationale that certainly identifies the critical points where the synthetized solutions move away from the optimal. This identification constitutes a valuable guide for designers and decision makers, even when just a qualitative study can be conducted, in order to direct their creativity into the optimal solution, what confers a precious tool to validate designs before investing resources to develop them. In addition, it shows how the accomplishment of the Axiom 1 can lead to the accomplishment of the Axiom 2.
5 ACKNOWLEDGEMENTS
The authors would like to thank Altran for its support in the research and development of Axiomatic Design. This

- 97 -
paper has been conceived in the framework of the project “Application of Axiomatic Design in the resolution of technical, strategic or innovation problems”, financed by the Spanish Ministry of Science and Innovation (MICINN) through its program Torres Quevedo 2010, and co-financed by the European Social Fund.
6 REFERENCES
[1] Bathurst S., “On learning and executing axiomatic design in the engineering industry”, Proceedings 3rd International Conference on Axiomatic Design, ICAD 2004, Seoul, June 21-24, 2004.
[2] Benavides E.M., Advanced Engineering Design: An integrated Approach, Cambridge Woodhead publishing, 2012. ISBN 0-85709-093-3
[3] Lu S., Suh N.P., “Complexity in design of technical systems”, CIRP Annals – Manufacturing technology, 2009.
[4] Nakao M., Nakagawa S., “A superb industrial design has special FRs or DPs that go beyond the customer’s imagination”, Proceedings 6th International Conference on Axiomatic Design, ICAD 2011, Daejon, March 30-31, 2011.
[5] Park G.J, “Teaching axiomatic design to students and practitioners”, Proceedings 6th International Conference on Axiomatic Design, ICAD 2011, Daejon, March 30-31, 2011.
[6] Suh N.P., Axiomatic Design: Advances and Applications, New York: Oxford University Press,2001.ISBN 0-19-513466-7
[7] Suh N.P., The Principles of Design, New York: Oxford University Press, 1990. ISBN 0-19-504345-6

- 98 -
APPENDIX
LIST OF VARIABLES
iu Air speed in zone i
ip Air pressure in zone i
ih Air enthalpy in zone i
m Mass of the air
m Flow mass of the air Heat capacity ratio of the air
0 Air density
d Dust particles density
dd Dust particles diameter
n Number of dust particles per volume unit
poresd Filter pores diameter
N Number of filter pores
3A Porous filter area
1d Tube 1 diameter
1A Tube 1 area
23V Dust container capacity
W Fan power
R Radius of curvature of cyclone
cN Number of cyclone turns
x Radial acceleration inside cyclone
x Radial speed inside cyclone
x Radial position inside cyclone
dc Drag coefficient
PROCEDURE TO OBTAIN THE DESIGN
EQUATIONS 1. Density resolution in all the zones
1 22
01
0 1 0 0 1
11
2
m
h A
110
0
1
Incompressible regime.
2
210 10
0 0 1
10( )
2( 1)
m
h A
02 1 12 0 10
2 0 0 0
(1 )( 1) ( 1) ( 1)
pp p
h h h
2210 10
0
1 0( )
1 2 21
3 0 0
0 2 3 0 0 3
11
2
m
h N A
330
0
1
Filter not clogged; incompressible regime.
2
2130 10 10
3
0( )A
NA
3 3 34 2 14
4 0 0 2 0 2
0 3 014 0 10 30
0 0 2 2
( 1) ( 1) ( 1) ( 1)
(1 ) (1 )( 1)
pp p p
h h h h
p
h
2
24 110 10
0 3
1 1 0( )A
NA
0
5 0
1W
mh
2. Obtaining of iu and m as a function of DPs
1/0 0 40 0 0 0 4
5 4 54 5
2 1/1/0
31 110
3 2 0
20 0
13 01 11010
3 0 2 0
1 1 1
1 1 1
1
1 1 1
1 1
( 1) 11 1 1
W W Wm
h h h p
p
W
h pA p
NA p p
W W
h h AA
NA
2
3
2 2
1
0 1 3
2
1
NA
Wm
Am
A NA
2
0 1
23
1
3
2
1
W Am
A
NA
0 11 2
30 1 1
3
2 /
1
W Amu
A A
NA

Proceedings of ICAD2013 The Seventh International Conference on Axiomatic Design
Worcester – June 27-28, 2013
ICAD-2013-15
- 99 -
ABSTRACT
Axiomatic Design is an important design theory that is often taught in many engineering design courses. This paper presents a case study to summarize our various lessons learned of teaching Axiomatic Design in practice. Based on the study of 30 team design projects that were collected from a graduate level engineering design course, we observed some common challenges/difficulties that student designers often encounter when learning and practicing Axiomatic Design Theory. These lessons are organized according to their relevance to several key concepts in Axiomatic Design: domains, hierarchy, the zigzagging process, the design axioms, and constraints. For each practical challenge/difficulty, we prescribe some relevant theoretical foundations and related design methods to facilitate the understanding and practice of the Axiomatic Design.
Keywords: Axiomatic Design, design education.
1 INTRODUCTION
Engineering design courses play the role of equipping student designers with the required knowledge and expertise to solve practical design problems. In the past, the vast majority of design courses primarily focused on the technical design phase by teaching students how to analyse, optimize, and improve a given problem (i.e. an existing product), while those truly important concepts and methods that are critical for the early design stages (e.g., the functional and conceptual design phase) are often either simply ignored or superficially covered. As a consequence, most existing design courses are famous for producing “engineers” who only know how to solve the problem right instead of “designers” who also understand how to frame the right problem. As the importance of design creativity and early stage design decision making draws increasing attentions in both academia and industry, today’s design education is experiencing a profound paradigm shift from teaching students specific design techniques and knowledge to teaching them general “design thinking”.
Axiomatic Design (AD) has many unique features that make it a perfect candidate to expedite such a paradigm shift. Above all, AD is a domain-independent theory that can be applied in different design fields. Such a universal applicability of AD theory is important to cultivate student’s general “design thinking”. Furthermore, AD has been extensively
studied in the past. There exist many practical applications of AD theory in both academia and industry, which can be incorporated into the teaching as illustrative examples to guide the design practice. Last but not least, relatively speaking, it does not require much sophisticated technical or mathematical knowledge to grasp the essences of AD theory. Therefore, the theory can be taught to different levels of student designers including freshmen in college [Thompson, 2009].
The teaching of AD is not foreign to the design community [Tomiyama et al., 2009]. In general, there exist two common strategies to teach AD theory within different engineering design courses. Some instructors introduce AD only as one of the many design theories and methodologies together with the teaching of other approaches (e.g., systemic design approach [Pahl et al., 2007]). Some others treat AD theory as the main subject of the course and focus on guiding student designers how to employ AD to solve real-world problems via practice oriented assignments such as case studies and design projects. The disadvantage of the former strategy is that there is often not enough time and assignments for the student designers to develop a deep understanding of AD theory. In contrast, the disadvantage of the latter strategy is that designers are often unable to see the whole picture of how AD theory is related to other design approaches. Regardless of the strategies adopted, another common weakness of the current AD teaching is that the theory remains mostly taught as an analysis tool for alternative comparison, evaluation, and selection, while its unique values in supporting design synthesis are far from fully released. This is evident by the fact that majority of current AD teaching primarily highlights the importance of the two design axioms without elaborating on the theoretical rationales and practical meanings of other key concepts of AD theory such as “domains”, “hierarchy”, “zigzagging”, etc.
In the past few years, we have been exploring a new strategy to teach AD theory in a more effective and systemic manner. Specifically, we still treat AD theory as the main subject of the course, but in the meantime we also incorporate some related design methods to complement the teaching of AD. These complementary methods serve to deepen the understanding of certain blurry aspects of AD theory. The complementary methods are not randomly selected, but rather they are chosen to address a common difficulty designers often encounter when learning and practicing AD theory. This paper provides a detailed case study to summarize our various lessons learned in adopting
LESSONS LEARNED FROM TEACHING AXIOMATIC DESIGN IN ENGINEERING DESIGN COURSES
Ang Liu [email protected]
Department of Aerospace and Mechanical Engineering Viterbi School of Engineering
University of Southern California Los Angeles, CA, USA.
Stephen Lu [email protected]
Department of Aerospace and Mechanical Engineering Viterbi School of Engineering
University of Southern California Los Angeles, CA, USA.

- 100 -
this new strategy to teach AD theory in a graduate level engineering design course.
The rest of the paper is organized as follows. Section 2 introduces the background of the case study in terms of its participants, design problem, and data collection. Section 3 elaborates the various lessons we have learned from this case study that are relevant to multiple key concepts in AD theory: domains, hierarchy, the zigzagging process, the axioms, and constraints. Section 4 ends this paper with conclusions and the limitations of this study.
2 CASE STUDY
The subjects to study are 30 team design projects that are all collected from a graduate level engineering design course, “Advanced Mechanical Design”, which is offered by the Aerospace and Mechanical Engineering Department at the University of Southern California. These course projects are all accomplished by different design teams across 5 semesters during the years 2009-2012. The course participants are all graduate students registered in the University of Southern California, majoring in engineering related fields such as mechanical engineering, aerospace engineering, industrial engineering, etc. At the beginning of every semester, the class is equally divided into 6 design teams, each with 4-6 students. Almost half of the course participants are distance students who have full-time and engineering-related jobs. Therefore, in some sense, this study can be regarded to have included the feedback of both “expert designers” (distance students) and “novice designers” (on-campus students).
This design course consists of three sequential teaching/learning modules: the identification of design targets, the generation and selection of design concepts, and the modification of the chosen concept. It normally takes 3 lectures plus one design review presentation to finish every module. During the review presentations, every project team is allowed 15 minutes to present its design results up to the stage. At the end of the course, every team is also required to compose and submit a provisional patent application report to summarize the innovativeness of its final design results. Within each module, different design approaches are explained to provide designers with the right “tool” to address diverse challenges in different design phases. The theoretical rationale and practical requirements of including every approach and how these chosen approaches contribute to the teaching of AD will be elaborated in section 3.
The design approaches covered in the first module include: Quality Function Deployment [Akao, 2004], the Kano Customer Satisfaction Model [Berger et al., 1993], and the Smart Question Approach [Nadler and William, 2004]. The focus of this module is to teach student designers how to leverage various customer needs in the market segment to frame the unique decision opportunities and determine the real design targets (i.e., functional requirements). The second module consists of two approaches: the Synthesis Reasoning Framework (i.e., SRF) [Lu and Liu, 2011] and Axiomatic Design Theory. Based on our previous work, the SRF can
provide some theoretical explanations for certain blurry aspects (e.g., why it is important to distinguish between the different design domains) of AD theory. The focus of this module is to teach student designers how to create multiple new concepts via a systemic synthesis reasoning process guided by the SRF, and then select the best concept via the design axioms prescribed by AD theory. Finally the third module teaches student designers how to improve/modify an existing product (for example, their chosen concept) using Complexity Theory [Suh, 2005] and TRIZ [Altshuller, 1999]. Note that the technical design phase (which further transforms the modified concept into the production process) is not addressed in this course.
The specific problem to address is “to design a computer input artifact that avoids and/or reduces the user’s repeated stress injuries (RSI) on the dominant hand”. The same assignment has been used in the past four years. It is appropriate for a graduate level engineering design course because it addresses a recently emerging customer need (i.e., to reduce RSI) on a widely seen and commonly used product (i.e., computer input device). On one hand, the product itself is already familiar to the designers. On the other hand, however, depending on the unique choice of target customers, this problem is still open to many creative solutions.
The data are collected from the design documents (i.e., presentation slides and the final provisional patent application report) each team submitted and the video records of their three design review presentations. All verbal materials are properly transcribed. Specifically, there are four types of data that are relevant to the study of AD: the design architecture (i.e., domain and hierarchy), the zigzagging process, the usage of the Independence Axiom (i.e., the design matrix) and the Information Axiom (i.e., the probability density function graph), and the sketches or CAD drawings of the final solution. Here we provide a real project accomplished in this course as the illustrative example (Figures 1-3). At the end of the course, we also conducted an informal survey in order to collect student’s feedback towards the various design approaches covered in this course. Specifically, we require every team to reflect on their entire design process and summarize the 5 most important design concepts/principles/axioms/knowledge that they have learned in this course, and the 5 greatest challenges that they have faced when applying these design methods in practice.
3 LESSONS LEARNED
This session summarizes various lessons we have learned from teaching this course. These findings are organized into five subsections with each focusing on an important concept in AD theory including: domains, hierarchy, zigzagging, the axioms, and constraints. In each subsection, first we briefly review the theoretical meaning of the concept, next we present some common mistakes of interpreting the concept based on our observation in practice, and finally we prescribe our method to deepen student’s understanding of the concept.

- 101 -
Figure 1. An illustrative example of the “zigzagging” process.
Figure 2. An illustrative example of the “design matrix”.
Figure 3. An illustrative example of the final solution sketching.

- 102 -
3.1 DESIGN DOMAINS
Domains are a new concept introduced by AD theory to distinguish between different types of activity/decisions in the design process. According to Suh, there exist four types of fundamental design domains: (1) the customer domain, (2) the functional domain, (3) the physical domain, and (4) the process domain. The specific design decisions that are addressed in each domain are customer needs (CN), functional requirements (FR), design parameters (DP), and process variables (PV) respectively. For each pair of adjacent domains, the left domain represents the “what” (or “ends”) that designers intend to achieve, whereas the right domain represents the “how” (or “means”) that the designers propose to achieve the “what”. In the design process, decisions in the “what” domain are constantly transformed into decisions in the “how” domain via a horizontal mapping operation.
In the informal survey, one third of the design teams reported that they encountered frequent difficulties in distinguishing between CNs and FRs in practice. The confusion of CNs and FRs can be indirectly reflected by the fact that many designers often use the term “customer requirement” to represent either “customer need” or “functional requirement” by mistake. As a result of such confusion, instead of using the mapping operation to transform CN (as “what”) to FR (as “how”), designers often generate CNs and FRs separately and then link them afterwards. For example, we have observed some extreme cases where the designers first proposed multiple need/requirements all at once, then categorized them into the customer or functional domain (as CN or FR) accordingly, finally to identify and establish any appropriate CN-FR mapping relationships. Compared to the distinction of CNs and FRs, it is much easier for the designers to clearly differentiate between FRs and DPs. In the study, there are only a few design teams that regard the FR-DP distinction as one of their major challenges in this course.
According to Suh, customer needs describe “the benefits customers seek” from a product, whereas “functional requirements” prescribe how to provide customers with the desired benefits. By definition, it is clear that the former should be collected from the customers based on their experience and preference, whereas the latter should be determined by the designers based on their design knowledge and expertise. If these two types of decisions are confused, designers can easily lose their autonomy in the design process. Although the customer involvement [Kauliu, 1998] in new product development is drawing increasing attentions in recent years, most of its successful applications are limited to the industrial product development in which it is much easier to identify the lead users [Urban and Hippel, 1988]. But for the vast majority of design tasks (particular consumer product design), it is still critical to explicitly differentiate between CNs and FRs particularly at the early design stages.
Based on our observation, the primary reason of such difficulty is that course participants in the classroom environment often play dual roles of both customers and designers. On one hand, due to the difficulty (with regards to both time and resources) of conducting independent survey of customer needs from the market segment, course
participants often imagine themselves as the target customers and brainstorm for CNs based on their own product using experience. This is evident by the fact that 8 out of 30 design teams identified the CAD engineers (which is exactly the professions of many distance students enrolled in this course) as the initial target customers. In addition, our assignment addresses a very specific design problem (i.e., reduce RSI) on a commonly seen and used product (i.e., computer input device). This relatively small design scope also limits the designer’s ability to identify many concrete CNs. In practical applications when customer needs are often collected and analysed by other stakeholders (e.g., marketing people) than the designers themselves, it is reasonable to expect that the difficulty of distinguishing CN with FR might be significantly reduced.
Our strategy is to introduce multiple customer need identification methods to complement AD theory. The current methods that we teach include the Quality Function Deployment (QFD) and the Kano Customer Satisfaction model. In the informal survey, almost half of the design teams attributed the Kano Customer Satisfaction model as particularly useful in helping them to predict the future customer “wants” based on the existing customer “needs”. In the future, we also intend to tailor the “smart question approach” in the context of AD theory to guide the designers to systemically carry out the functional design phase (i.e., the mapping from CN to FR) based on three fundamental questions “how to describe your CN as initially unique”, “what purposeful information is needed to generate the initial FR”, and “how to organize the chosen CN and FR using a system viewpoint”.
3.2 DESIGN HIERARCHY
Hierarchy, which represents the “design architecture”, is another important concept in AD theory. Within every domain, a separate hierarchy must be created to properly organize design entities of the same kind according to their different levels of abstraction. In AD theory, a decomposition operation has been prescribed to guide designers to build design hierarchies in a systemic manner (as opposed to an ad hoc manner). Designers carry out the decomposition process layer by layer until the design becomes fully implementable or until the available design resources (such as schedule or budget) are exhausted. Because participants of this study are all graduate students in engineering majors, both “hierarchy” and “decomposition” are relatively familiar concepts to them. As a result, very few design teams regarded the concept of “hierarchy” as a difficulty of learning AD theory.
In practice, a common mistake regarding “hierarchy” is that designers often incorrectly place decisions of different kinds (i.e., CN, FR, DP, and PV) into the same hierarchy. As a consequence, rather than building four “small” hierarchies that organize different kinds of design decisions separately, designers often end up with a “large” hierarchy that completely mix-up all kinds decisions. This is to say that, diverse design decisions are decomposed into multiple segments of the same hierarchy (Figure 4). Among the 30 design samples, we have observed 5 such mistakes. Based on our observation, there are two main causes. On one hand, as we mentioned in section 3.1, it is by nature difficult for novice designers to clearly distinguish between different kinds of

- 103 -
design decisions (e.g., CN and FR) at the early design stages when everything remains relatively intangible. On the other hand, it is also because most designers lack a deep understanding of the unique two-dimensional structure of AD theory.
Figure 4. A common mistake in building a hierarchy in Axiomatic Design.
The distinction between “domains” and “hierarchy” is an important feature that distinguishes AD theory from other design theories and methodologies, because this leads to the new perspective of treating design as a two-dimensional thinking instead of the traditional one-dimensional thinking. Specifically, the mapping between adjacent domains (from “what” to “how”) forces the designer to reason along the horizontal direction seeking for a particular “how” to realize a general “what”. In contrast, the decomposition between adjacent layers within the same hierarchy guides the designer to reason along the vertical direction looking for multiple particular “sub-whats” to detail the general “what”. This two-dimensional “domain-hierarchy” structure is in sharp contrast with other approaches, such as the Analytical Hierarchical Process (AHP) [Saaty, 1990], which focuses on decomposing a complex decision problem into multiple relatively simpler sub-problems, so that each of the sub-problems can be analysed separately. In AHP, any relevant aspects of the highest problem can be organized into the same hierarchy via decompositions. When comparing the AHP theory with AD theory, it is clear that the former follows a typical one-dimensional thinking via only the vertical decomposition, whereas the latter follows a two-dimensional thinking via both the horizontal mapping and vertical decomposition. Although such a two-dimensional (i.e., domain and hierarchy) structure is complicated to build, it is very important for early stage design. On one hand, it guides the designers to perceive the subtle distinctions between similar decisions and hence place them into different domains. On the other hand, by doing so, it becomes much easier to trace back different previous decisions and make design modifications accordingly. The latter is particularly meaningful for the design of complex systems in which decisions in different domains are often made by separate stakeholders (e.g., marketing people, product designer, manufacturing engineers, etc.).
In our previous work, we proposed to use the “analytic-synthetic distinction” to guide the designer to strictly follow the two-dimensional thinking prescribed by AD theory [Lu and Liu, 2011]. The “analytic-synthetic distinction” is a fundamental distinction in philosophy to differentiate two types of propositions namely the “analytic proposition” and the “synthetic proposition” [Kant, 1781]. By dictionary definition, proposition means the activity of proposing something new to be considered and accepted. Any proposition must contain two components: a subject and a predicate. The former is the input of a proposition, whereas the latter is the output of the proposition. In some sense, design can be regarded as a “proposition making” process in which designers propose some new systems (i.e., predicate) to accomplish certain intended goals (i.e., subject). Analytic proposition is a type of proposition whose predicate is contained within its precedent subject, whereas synthetic proposition is a kind of proposition whose predicate is not contained within its precedent subject. We argue that the horizontal mapping across adjacent domains should be made via making synthetic propositions, while the vertical decomposition across adjacent layers within the same domain should be made via making analytic propositions [Lu and Liu, 2011].
3.3 ZIGZAGGING PROCESS
Figure 5. Decomposed-of vs. constrained-by
relationships in the “zigzagging” process.
Based on the two-dimensional (i.e., domain and hierarchy) structure, AD theory prescribes a unique “zigzagging” process to develop hierarchies by alternating between adjacent domains. Specifically, when decomposing a general FR into multiple sub-FRs (e.g., FR1, FR2, and FR3), the generation of a sub-FR must consider its superior FR-DP pair (see Figure 5). In other words, to arrive at a sub-DP (say DP1) from a general FR, designers must go through a three step zigzagging process: (1) a “zig” from FR to DP, (2) a “zag” from parent FR-DP pair to FR1, (3) another “zig” from FR1 to DP1.
We observed that designers often make mistakes with regards to the (2) “zag” step. Specifically, when a superior FR is decomposed into multiple sub-FRs, the resulting sub-FRs often directly become “part-of ” their superior DP, which are certain behaviors of the chosen device. This is to say that, the “constrained-by” relationship between the superior DP and sub-FRs (the blue dash arrow in Figure 5) is mistakenly replaced by the “decomposed-of ” relationship (the red solid

- 104 -
arrow in Figure 5). Below are some examples of such incorrect understanding of the (2) “zag” step.
a) FR: convert user’s natural motion to game navigation
DP: motion sensing system Sub-FR: sense rotational motion
b) FR: to avoid losing and easy to switch when users type DP: a device that can be worn Sub-FR: to wear on the head
c) FR: to keep user alert DP: a device that doesn’t cause fatigue Sub-FRs: to avoid users becoming fatigued for 4 hours In all three examples, the sub-FR can be regarded as
“part-of ” the superior DP instead of the superior FR. The superior DP is the physical solution (i.e., how) that realizes the superior FR (i.e., what). “Part-of ” the superior DP should be its more detailed components (i.e., sub-DPs) with certain behaviors. If the diagonal “constrained-by” relationship is confused with the vertical “decomposed-of ” relationship, it is likely that the sub-FRs become indifferent with derived behaviors of the superior DP. As indicated by previous research, the confusion of function and behavior will greatly hinder the designer’s creativity particular at early design stages. Last but not least, if the generation of a sub-FR only considers the impacts of the superior DP (while ignoring the impact of the superior FR), the two-dimensional “zigzagging” process and structure of AD theory will also be reduced to the one-dimensional structure of the Function-Means Tree [Bracewell, 2002] (see Figure 6).
Figure 6. One dimensional Function-Means Tree.
To deepen the understanding of the zigzagging process, our approach is to introduce an extra “bounding” operation (in addition to the existing “mapping” and “decomposition” operations in AD theory) to represent the reasoning forces coming from the superior DP to the sub-FRs. By doing so, the generation of sub-FRs must consider both the superior FR via a decomposition operation and the superior DP via a bounding operation. The former creates a “part-of ” relationship between FR and sub-FRs, whereas the latter establishes a “constrained-by” relationship between superior DP and sub-FRs. In addition, we also detail the “zigzagging” process into a 3-phase and 9-step synthesis reasoning process, (Figure 7) [Lu and Liu, 2011].
Figure 7. A “zigzagging” synthesis reasoning process
[Lu and Liu, 2011].
3.4 DESIGN AXIOMS
The two design axioms (i.e., the Independence Axiom and the Information Axiom) are the most essential (as well as famous) concepts in AD theory. At every decision point of the zigzagging process, the Independence Axiom is used to maintain the functional independence of the design and to characterize multiple design alternatives (or options) into three categories: uncoupled, decoupled, and coupled; and then the Information Axiom is employed to compare those alternatives (that comply with the Independence Axiom) in order to select the best alternative that has the minimum information content (or the maximum probability of success).
Half of the design teams attributed the “functional thinking” behind the Independence Axiom as the most important lessons they learned in this course. Based on our assessment of their design results, the vast majority of teams are able to correctly employ the Independence Axiom to structure their functional and physical hierarchies towards the uncoupled or at least decoupled designs. Among the three categories of designs (uncoupled design, coupled design, and decoupled design), most in-class questions from student designers go to the decoupled design such as “how to eliminate the unwanted sequence?” As expected, the majority of teams consider the design matrix as particularly useful in clarifying the FR-DP interactions. Furthermore, designers often confuse the “functional coupling” (i.e., FR-FR coupling or FR-DP couple) with the “physical coupling” (i.e., DP-DP coupling). According to the designers, it is most difficult to identify the FR-FR coupling in practice, because it requires much deeper abstract thinking.
With respect to the Information Axiom, due to the lack of sufficient knowledge of probability theory, it is common to see that designers often make mistakes in drawing the probability density function (i.e., PDF) curves (Figure 8). When multiple “system PDF” curves appear in the same chart, these curves (although with different shapes) must occupy the same amount of areas which represent the “probability”. This is to say that, the shape of curves can be either tall but narrow (to represent the small standard deviation) or short but wide (to indicate the large standard deviation), but never both tall and wide (or both short and narrow). This finding suggests that, even for the graduate level engineering design course, it is still necessary to provide some basic statistics knowledge as backgrounds of the Information Axiom. Furthermore, as a

- 105 -
supplement of the Information Axiom, we also teach a set of domain-independent measures that are developed based on relevant studies of abductive reasoning to describe the quality of a concept. These measures include clarity (M1), feasibility (M2), testability (M3), simplicity (M4), and analogy (M5).
Figure 8. A common mistake of drawing probability
density function curves.
After the introduction of AD theory, we also teach students how to use Suh’s “complexity theory” [Suh, 2005] as a way to identify different kinds of complexities within existing systems. The intention is to deepen the understanding of the two axioms in a backward manner to highlight the importance of “functional independence” and “physical certainty” in reducing the future complexity. There are 4 design teams that regard “this new way of articulating complexity” as one of their most important lessons.
3.5 DESIGN CONSTRAINTS
In AD theory, constraints are defined as the “bounds of acceptable solutions”. At early design stages, constraints are often confused with functional requirements. In this study, for example, one third design teams mistakenly attributed certain constraints as functional requirements. FRs are the real targets (objectives) of design, whereas design constraints are only the limitations of acceptable solutions which are proposed to satisfy the intended FRs. Unlike FRs which must maintain independent of each other, design constraints do not have to comply with the independence requirement [Suh, 1990]. Furthermore, FRs normally have a design range associated with them, while constraints only have a boundary value [Suh, 1990]. With regards to the mutual relationship between FRs and constraints, according to Suh, it becomes more efficient to select FRs when design is appropriately constrained [Suh, 1990]. In any case, FRs must be clearly distinguished from constraints. Otherwise, the design can easily diverge from the right course of objective-driven to constraint-driven.
In practice, a common mistake is that designers often regard weight/size as a FR (e.g., “be portable”, “be light”, “be small”, “easy to carry”, etc.) in the functional domain. Note that the weight/size of an integrated technical system is determined by multiple individual DPs. Suppose it is treated as a FR (instead of a constraint), this FR will unavoidably be affected by different DPs at the same time. According to AD theory, this violates the Independence Axiom and thus leads
to a coupled design. Another common mistake is that designers often wrongly regard “low cost” as one of its FR to satisfy instead of a constraint to comply with. Similar to the case of weight/size, if cost is seen as a FR, it will also results in coupled designs. This is because that the overall cost of a technical system is also simultaneously determined by multiple DPs (instead of a single DP).
To facilitate the distinction between constraints and functional requirements, we have developed a new constraint management method for AD theory. From the theoretical perspective, we conceptually modeled constraints as the initial/boundary conditions of synthesis reasoning. For the practical perspective, we prescribe a more detailed classification of constraints. Specifically, in addition to Suh’s existing classification of constraints as "input constraints" which apply to the overall design task and "system constraints" that apply to specific design decisions [Suh, 1990], we further categorize constraints into “internal constraints” and “external constraints”. The internal constraint is a part of the technical system; hence, it limits the further evolvement of the system only from inside. The internal constraint is evident when design decisions demand more than the existing system can deliver. In contrast, external constraints are not part of the technical system; as a result, they bound the further expansion (rather than evolution) of the system from the outside. The external constraint appears when the system attempts to function more than it is currently capable of.
In our new classification [Lu and Liu, 2012], constraints are classified into four more specific categories: internal input constraint, external input constraint, internal system constraint, and external system constraints. Internal input constraints define the constraints which must be part of the technical system but are not chosen by designers themselves. External input constraints represent the constraints that are not contained in the technical system but are part of the design task description or problem statement. Internal system constraints refer to the constraints which are chosen by the designers to be part of the technical system. External system constraints describe the constraints that result from the designer’s previous decisions but are not part of the final technical system.
4 CONCLUSION
Axiomatic design is an important design approach that is covered in many existing design courses. How to effectively teach the Axiomatic Design to student designers in the classroom has long been a struggling question for many instructors. In our perspective, the key to success lies in providing related theoretical foundations and relevant design methods to complement the teaching of Axiomatic Design. Based on the study of 30 team design projects that were collected from a graduate level engineering design course, we summarized some common challenges/difficulties that student designers often encounter when learning and practicing the Axiomatic Design in the classroom.

- 106 -
Table 1. Summary of lessons learned.
AD Concept Theoretical Importance Common Mistake in Practice Teaching
Domains Distinguish between different kinds of design decisions
Confusion of CNs with FRs QFD, Kano customer satisfaction model, and “smart question” approach
Hierarchy Structure the same kind of design decisions
Mix “what” and “how” in one hierarchy
Analytic-synthetic distinction
Zigzagging Build hierarchies by alternating between adjacent domains
Confusion with the “function-means” tree structure
A Synthesis Reasoning Process
Independence Axiom
Maintain functional independence Confusion of functional coupling with physical coupling
Complexity Theory
Information Axiom Reduce physical uncertainty Probability density function curves
Statistics knowledge
Constraints Bounds on acceptable solutions Confusion of constraints with FRs
A new constraint management method
These lessons are organized according to their relevance
to different key concepts of the Axiomatic Design: domains (section 3.1), hierarchy (section 3.2), the zigzagging process (section 3.3.), the axioms (section 3.4), and constraints (section 3.5). For each challenge/difficulty, we prescribe certain theoretical foundations and design methods (as a supplement of the Axiomatic Design) to facilitate the understanding and practice of the concepts (Table 1). Future work includes a rigorous and relevant assessment of designer’s understanding towards the Axiomatic Design due to the introduction of these complementary methods.
There are several limitations that should be considered when interpreting the results of this case study. Above all, the informal survey was conducted in the team level instead of the individual level. Therefore, the results may not reflect individual designers’ interpretations of Axiomatic Design. Furthermore, this course, which is offered on the Distance Education Network platform at the University of Southern California, consists of both distance students and on-campus students. The former can be regarded as close to the “expert designers”, whereas the latter should be treated as the “novice designers”. Although it is ignored in this study, it is reasonable to hypothesize that these two kinds of student designers may have very different understandings of Axiomatic Design. Last but not least, although the basic structure of the course remains the same, there were new content, methods, and examples added to each module of the course every time it was offered. On one hand, this is how we constantly adjust the “course design” based on emerging “student needs”. But on the other hand, this also means that it might not be completely rigorous to combine all student feedback towards the course in the same study, because strictly speaking they are not learning exactly the same content.
5 REFERENCES
[1] Akao, Yoji. Quality function deployment: integrating customer requirements into product design. Productivity Press, 2004.
[2] Altshuller, Genrich. The innovation algorithm: TRIZ, systematic innovation and technical creativity. Technical Innovation Ctr, 1999.
[3] Berger, Charles, et al. "Kano’s methods for understanding customer-defined quality." Center for Quality Management Journal 2.4 (1993): 3-36.
[4] Bracewell, R. H. "Synthesis based on function-means trees: schemebuilder." (2002): 199-212.
[5] Kant, I., Critique of Pure Reason, Wood Cambridge University Press, 1781. ISBN: 0-521-65729-6.
[6] Kaulio, Matti A. "Customer, consumer and user involvement in product development: A framework and a review of selected methods." Total Quality Management 9.1 (1998): 141-149.
[7] Lu, S. C.-Y., and A. Liu. "A Synthesis Decision Framework for Early-Stage Innovative Design." Interdisciplinary Design: Proceedings of the 21st CIRP Design Conference. Mary Kathryn Thompson, 2011.
[8] Lu, S. C.-Y., and A. Liu. "Managing Design Constraints in Synthesis Reasoning." CIRP Design 2012. Springer London, 2013. 73-82.
[9] Nadler, G., and William, C. “Smart questions: Learn to ask the right questions for powerful results”. Jossey-Bass, 2004.
[10] Pahl, G and Beitz, W. “Engineering design - a systematic approach”, 2nd ed. Springer, London, 2006
[11] Saaty, T. L., “How to make a decision: The analytic hierarchy process”, European Journal of Operations Research, 48, 9–26, 1990.
[12] Suh N.P., The Principles of Design, New York: Oxford University Press, 1990. ISBN 0-19-504345-6
[13] Suh, Nam P. Complexity: theory and applications. Oxford University Press, USA, 2005.
[14] Thompson, Mary Kathryn. "Teaching axiomatic design in the freshman year: a case study at KAIST." Proceedings of the 5th International Conference on Axiomatic Design. 2009.
[15] Tomiyama, T., et al. "Design methodologies: Industrial and educational applications." CIRP Annals-Manufacturing Technology 58.2 (2009): 543-565.
[16] Urban, Glen L., and Eric Von Hippel. "Lead user analyses for the development of new industrial products." Management science 34.5 (1988): 569-582.

Proceedings of ICAD2013 The Seventh International Conference on Axiomatic Design
Worcester – June 27-28, 2013
ICAD-2013-16
- 107 -
ABSTRACT
The definition of functional requirements is one of the most critical and difficult steps in the Axiomatic Design process. This paper presents five classes of procedural errors made by both novice and expert designers during the definition of functional requirements in Axiomatic Design Theory. Each category is described in detail, the linguistic markers for the errors are identified, examples from the literature are provided, and strategies for avoiding these errors are suggested. The implications of these errors for design practitioners, educators, and researchers are considered. The paper ends with a discussion about the nature of requirements and future requirements research topics in Axiomatic Design Theory.
Keywords: Axiomatic Design, requirements process, functional requirements, constraints.
1 INTRODUCTION
The definition of functional requirements is one of the most critical steps in the Axiomatic Design (AD) process [Suh, 1990]. Functional requirements (FRs) represent both the “objective” [Suh, 1990] and the “intent” [Suh, 2001] of the designer. As such, they explicitly define the problem to be solved and guide its solution. The functional requirements also lay the foundation for all of the major steps in the Axiomatic Design process: decomposition, mapping between the design domains, the creation of design matrices, and the application of the design axioms. Thus, “a good design is not likely to result” without “an acceptable (or correct) set of FRs” [Suh, 1990]. Unfortunately, the correct definition of FRs is also one of the most difficult tasks in AD.
The requirements process defines the design problem through the elicitation, collection, evaluation, translation, and organization of information about the desired artifact and its stakeholders. Axiomatic Design Theory provides some structure and guidelines to facilitate this process. For example, the design domains define and separate customer, functional, physical, and process information. This helps to organize the requirements information and to differentiate it from the information (and information content) associated with various design solutions. The design hierarchies and decomposition process organize information based on its level of detail. And, both the design hierarchies and the design domains separate “what” and “how” information within and across the
domains. However, Axiomatic Design offers only two categories for requirements information (functional requirements and constraints), leaving the designer with no guidance for how to process the remaining information. In addition, AD generally places the system boundary around the artifact and thus offers no methods for the classification of information related to the designer and the other stakeholders who will produce (or implement) and interact with the artifact.
The difficulties associated with learning to use Axiomatic Design Theory and with managing the information that falls outside its boundaries cause designers to make five types of procedural errors during the definition of FRs:
1. Mixing FRs with design parameters (DPs) 2. Mixing FRs with other types of requirements 3. Mixing the FRs of the various stakeholders and of
the artifact 4. Mixing the FRs of the artifact and of related systems 5. Defining negative FRs
In this context, procedural errors are defined as errors that stem from an incorrect interpretation or application of Axiomatic Design Theory. Thus, this paper seeks to differentiate between ‘true’ FRs and information that has been labelled as such. The more subtle problems that can decrease the quality or utility of an FR such as fixation and bias, the presence of hidden or latent needs or assumptions, insufficient decomposition, and the premature loss of solution neutrality are not addressed in this work.
In the follow sections of the paper, each of the procedural errors is described in detail. The linguistic markers for the errors and their sub-types are identified. Examples from the literature are provided when available and strategies for avoiding these errors are suggested. Next, the implications of these errors for design practitioners, educators, and researchers are considered. The paper concludes with a discussion about the nature of requirements and future requirements research topics in Axiomatic Design Theory.
2 MIXING FRS WITH DPS
The differentiation between ‘what’ and ‘how’ information is “one of the most essential and unique features” of AD” [Lu and Liu, 2011a]. This distinction lays the foundation for solution-neutral thinking, which increases the “innovation possibilities” for new artifacts [Lu and Liu, 2011b]. However, learning to distinguish between ‘what’ and ‘how’ information and to apply the different types of information appropriately
A CLASSIFICATION OF PROCEDURAL ERRORS IN THE DEFINITION OF FUNCTIONAL REQUIREMENTS IN AXIOMATIC DESIGN THEORY
Mary Kathryn Thompson [email protected]
Department of Mechanical Engineering Technical University of Denmark
2800, Lyngby, Denmark

- 108 -
in Axiomatic Design Theory can be a challenge. The two perspectives are “easily confused … in real work applications” in part because an “upstream ‘how’ must also be viewed as a downstream ‘what’” [Lu and Liu, 2011b]. This leads to “difficulties in carrying out the zigzagging procedures systematically” and results in “bad mixes of ‘what’ and ‘how’” in design decompositions [Lu and Liu, 2011b].
In the early stages of the design process, these bad mixes of ‘what’ and ‘how’ information manifest as the presence of DPs or physical information in the high-level FRs. These errors can usually be identified by the presence or emphasis on a noun (a physical means of performing a function) instead of on the verb (the function that should be performed). The verbs ‘to use’ (i.e. ‘The artifact should use [material, component, energy source, etc.]’) and ‘to have’ (i.e. ‘The artifact should have [component or feature]’) are also commonly associated with these types of errors.
The conflation of FRs and DPs is the most problematic of the five classes of procedural errors and only one of two that is unambiguously incorrect. The presence of physical information in the FRs prevents the creation of a solution neutral design environment, violates the first axiom, trivializes the mapping process between the functional and physical domain, and otherwise undermines the foundations of Axiomatic Design Theory.
Fortunately, these are also the least persistent errors. The comingling of FRs and DPs is frequently observed in the early decompositions of designers who are still learning to use AD and who have not learned about functional thinking and solution neutrality from other sources. These errors result from a lack of understanding of the theory and are not an indication of AD’s limitations. As a result, these errors tend to disappear as designers gain more knowledge about and experience with AD. They are almost never seen in the literature.
3 MIXING FRS WITH OTHER TYPES OF REQUIREMENTS INFORMATION
Requirements in AD are usually defined by mapping the customer needs (CNs) to FRs and constraints (Cs). However, additional types of requirements, including non-functional requirements (nFRs), selection criteria (SCs) and optimization criteria (OCs) are often needed [Thompson, 2013]. Classical Axiomatic Design Theory does not acknowledge these additional categories or provide any guidance on how to include them in the design process. This leaves designers with three choices: “classify all requirements information as [FRs] even if much of it is not functional in nature,” discard all non-functional requirement information, or create a parallel classification for this information (Figure 1) [Thompson, 2013]. Most novice and intermediate designers recognize the importance of this additional information but are not sufficiently comfortable with AD to modify its methodological framework to suit their needs. As a result, they usually choose the first option and integrate this information into the FRs.
Figure 1. Expanded requirements categories for AD. Adapted from [Thompson, 2013].
3.1 MIXING FRS WITH NFRS
Non-functional requirements (nFRs) describe how the design should be (durable, easy to use, etc.) and specify the qualities or attributes that the artifact should have (inexpensive, light weight, etc.). As a group, they describe the “character” of the artifact and are needed to ensure that the artifact is accepted, liked, and used by its stakeholders [Roberson and Robertson, 2006].
Non-functional requirements influence the definition of the Cs, SCs, and OCs and the mapping of the FRs to DPs. They can also introduce the need for new functionality and new FRs in order to achieve the desired qualities. However, nFRs are more like CNs than true FRs. They rarely translate directly to a single physical feature and thus are not subject to the one-to-one mapping required by the Independence Axiom. As a result, mixing FRs and nFRs, disrupts “the mapping of the FRs to DPs later in the design process” and interferes with the application of the design axioms [Thompson, 2013].
While both FRs and nFRs rely on the presence of a verb in their definitions, nFRs can almost always be identified by the use of the verb ‘to be’ (i.e. ‘The artifact should be [adjective]’). nFRs can also address the user’s perception of the artifact – how it feels, looks, smells, tastes, etc. In these cases, the verb ‘to be’ is implicit rather than explicit.
The confliction of FRs and nFRs is commonly seen in novice decompositions. In these cases, the nFRs often greatly outnumber the ‘true’ FRs. However, these errors are rarely seen in expert decompositions. There are four factors that may contribute to this. First, nFRs are more important in industrial and product design than in engineering design. Since product design is more common in educational settings while experts tend to use AD more for engineering design, students have a greater need to define nFRs and more opportunities to conflate nFRs with FRs. Second, AD experts instinctively recognize the interference of nFRs with the FR to DP mapping process. Thus, they are more likely to create a parallel classification system for this information, while students are more likely to classify nFRs as FRs. Third, when making purchasing decisions, consumers tend to focus on the qualities of products and take the functionality for granted. Since
FR1
FR11 FR12
DP1
DP11 DP12
Constraints
Selection Criteria
Functional Domain Physical Domain
Non-FRs
Optimization Criteria

- 109 -
students have been consumers for much longer than they have been designers, they also focus more on the qualities of an artifact than its functionality. Finally, functional and solution neutral thinking can be uncomfortable and unintuitive for new designers. The high ratio of nFRs to FRs (which sometimes reaches 100%) indicates that some students may replace FRs with nFRs to avoid engaging in functional thinking.
3.2 MIXING FRS WITH INPUT CONSTRAINTS
Input constraints (or “constraints in design specifications” [Suh, 1990 p. 39]) set a hard limit on the values of a quality or metric (cost, weight, size, operating temperature range, etc.). All design options that fall within those bounds are acceptable while those that fall outside cannot be chosen or included in the final artifact. Input constraints can usually be identified by the use of absolute limits or comparative words (at least, less than, greater than, equal to, etc.).
Errors that involve the conflation of FRs with input constraints are common in the Axiomatic Design literature and are regularly made by AD experts. For example, Suh’s [2001 p. 43] ‘functional requirements’ for buying a house include a minimum and maximum commute time (FR1), a minimum quality for the local school system (FR2), minimum air quality (FR3) and a maximum housing price for a given square footage (FR4). These requirements are not related to the main function of a house (providing shelter). Instead, they define the qualities or attributes of acceptable houses and their locations. All houses that do not have these qualities cannot be purchased.
Similarly, Suh [1990 p. 30] defines FR2 of a microcellular polymer as “maintain toughness of the plastic part to equal or exceed that of the original part made of impact-grade polystyrene”. This should also be a constraint. All new materials that do not have the required toughness cannot be selected for use.
Suh [1990 p. 39] acknowledges that it is “sometimes difficult to determine when a certain requirement should be classified as an FR or as a constraint”. This confusion likely stems from the fact that classical Axiomatic Design Theory does not acknowledge the existence of non-functional requirements.
3.2.1 FRS VS. CONSTRAINTS IN CLASSICAL AD
In classical AD, constraints are defined as “the bounds on an acceptable solution” [Suh, 1990 p. 39]. FRs are distinguished from constraints by the fact that “a constraint does not have to be independent of other constraints and FRs” while the independence of FRs is mandated by the 1st Axiom. Constraints also “do not normally have tolerances associated with them, whereas FRs typically” do [Suh, 1990 p. 39].
3.2.2 DESIGN RANGE VS. CONSTRAINTS
The 2nd Axiom requires that all (lowest level) FRs have bounds on their acceptable values in the form of the design range. Otherwise, the information content of a given design cannot be calculated. If constraints specify the bounds on acceptable solutions and FRs are the only other category of requirements information, then constraints must specify the
acceptable bounds of the FRs. This implies that each design range is composed of a pair of constraints.
However, if we accept that both function and non-functional requirements exist, then we may define the design range as the bounds on an FR and define input constraints as the bounds on a quality or an nFR. This definition is consistent with Suh’s statement above since nFRs are not bound by the Independence Axiom.
3.2.3 TOLERANCES VS. CONSTRAINTS
In order to address Suh’s second criterion, we must define tolerances. Tolerances specify the acceptable deviation from a specified value, typically in the form: value +/- tolerance. In order for a requirement to have a tolerance, it must have a target value as well as an upper and lower bound. Many nFRs (such as required operating temperature range) have both upper and lower bounds, but most will not have a target value. In contrast, every true FR must have both a target value and at least one upper or lower bound in order to apply the 2nd Axiom.
Based on this discussion, the ‘FRs’ listed above are still constraints since none of the requirements (commute time, school quality, air quality, price, and toughness) have a target value. They state only a single bound and a preference for values furthest from that boundary.
3.3 MIXING FRS WITH SCS, AND OCS
Selection criteria and optimization criteria help to determine which design(s) should be chosen and where to focus efforts to improve them. Unlike constraints, selection criteria imply a ranking. They direct the designer to choose the ‘best’ (lightest, cheapest, most robust, etc.) design according to the SCs. Optimization criteria specify which design parameter(s) to optimize (often in rank order). SCs and OCs can usually be identified by the use of superlatives (most, least, [adverb]-ist, etc.) or transitive verbs (minimize, maximize, etc.).
Errors that involve the conflation of FRs with SCs and OCs are also common in the Axiomatic Design literature. For example, Suh [2001 p. 20] defines FR2 of a refrigerator door as “minimize energy loss”. “Minimize energy loss” implies a ranking between design options and should instead be defined as an SC or OC. To retain this sentiment as an FR, it would need to be rephrased as: “prevent energy loss” or “insulate the refrigerator”.
Similarly, Shin et al [2011] propose eco-FRs of the form: consume the “minimal amount of material,” consume the “minimal amount of energy,” etc. These, too, represent SCs or ways to choose between design options, rather than a function that the artifact must perform. The final artifact may, in fact, consume both energy and resources. But it will do so as a by-product of performing its intended functions.
4 MIXING THE FRS OF THE ARTIFACT AND RELATED STAKEHOLDERS
Not all errors during the definition of FRs involve the conflation of different types of design information. Designers are also observed confusing the actions of the artifact with those of various actors. This manifests as a mixing of the FRs of the artifact and various stakeholders. It is most commonly

- 110 -
observed with the two most important stakeholders: the designer and the user.
4.1 MIXING THE FRS OF THE ARTIFACT AND THE
DESIGNER
Both novices and experts can be observed mixing the FRs (and other requirements information) of the artifact and of the designer. At the novice level, this is most commonly seen in the definition of constraints. Design students frequently list the constraints that limit their abilities to complete the design task (their limited domain-specific knowledge, the project budget, the project deadline, etc.) rather than the constraints on the final artifact (size, weight, cost, etc.).
At the expert level, the conflation of the artifact and the designer is most commonly seen in the highest level FRs. For example, Suh [2001 p. 353] defines FR1 of a microcellular plastic as “reduce the amount of plastic used”. However, the plastic can only perform functions such as resisting forces, absorbing energy, resisting crack formation, and resisting crack propagation. The designer is responsible for choosing (and thus reducing) the amount of plastic used by the final artifact.
Similarly, Brown [2011] proposes that all manufacturing systems share two highest-level FRs:
FR1 = Maximize the value added to the product FR2 = Minimize the cost in the production process
However, the highest-level FR of all manufacturing systems is probably better defined as: manufacture [artifact]. From a requirements perspective, minimizing and maximizing are ranking terms and could be translated into SCs or OCs. But, as written, these functions can only be performed by the designer.
4.2 MIXING THE FRS OF THE ARTIFACT AND THE
USER
A less common and less obvious error is the conflation of the artifact and the user. For example, Suh [1990 p. 51] defines the two FRs of a manual bottle/can opener as:
FR1 = Open beverage bottles FR2 = Open beverage cans
Manual bottle/can openers are classic examples of physical integration in AD and demonstrate how physical integration can be utilized without interfering with the application of the Independence Axiom. However, these simple devices are tools. They can be used (by a person) to open bottles and cans, but the only true functions that they perform involve resisting and transmitting forces and torques. This is similarly true for hammers and other simple tools.
Opening bottles and cans can be true FRs. For example, electric can openers actually open cans. Likewise, driving nails can be a true FR when designing a nail gun. But these types of FRs can only be defined for active machines and not passive hand tools.
Both novice and expert designers make these types of errors when applying AD. Ensuring that all FR definitions
have a subject (‘the designer’, ‘the user’, or ‘the artifact’) could help to avoid the conflation of what the design should do and what the designer should do. But since this error is tied to the fundamental nature of functional requirements (which is still not fully understood), it is unlikely to eliminate them altogether.
5 MIXING THE FRS OF THE ARTIFACT AND RELATED SYSTEMS
Finally, experts are occasionally observed mixing the FRs of the artifact and of related systems. For example, in an earlier discussion of microcellular plastics, Suh [1990 p. 30] defines FR1 as “reduce the material cost by 20%”. This could be interpreted as a mix of FRs and Cs (i.e. the material costs for the new artifact must be 20% lower or the concept cannot be considered). It could also be interpreted as a mix of the FRs of the artifact and the designer (i.e. the designer must reduce the material costs by 20%). But a better or more literal interpretation is that this is one of the functions that the company that produces the artifact must perform.
FR1Business = Increase profits
FR11Business = Reduce material costs
Similar examples can be seen from Suh [2001 p. 318] and Brown [2011] who argue that the highest-level FR of a manufacturing system should be to “maximize the return on investment (ROI)”. The use of the term ‘maximize’ implies the presence of an SC or OC. The statement could also be interpreted as a directive for the designer. But if taken literally, this is an SC and/or an OC for the business that owns and operates the manufacturing system. The highest level FRs and DPs for such a business might look like this: FR1Business = Earn money DP1Business = The Business
FR11Business = Produce artifacts DP11Business = Manufacturing division FR12Business = Sell artifacts DP12Business = Sales division
The statements from Suh and Brown could then be interpreted as directives to optimize FR1.
In a rare counter-example, Shin et al. [2011] acknowledge the difference between the FRs of the company and the product. For example, they suggest that a software company might define “protect the environment” as an FR. They then observe that the corresponding DP (“tree planning program”) does not have to be related to the software that the company develops and sells.
6 NEGATIVE FRS: A SPECIAL CASE
The final class of procedural errors involves the definition of ‘negative FRs’. Negative FRs define what the design should not do. For example, ‘the artifact should not harm the user’. This is the second class of errors that is unambiguously incorrect.
Most of the time, negative FRs are simply customer needs which have not yet been translated into the language of the designer. Like all CNs, these statements may contain FRs

- 111 -
(‘cut high volt power when electrical panel is open’), nFRs (‘be safe’), input constraints (‘surface temperature should not exceed 90F’), and selection and optimization criteria (‘minimize risk to user while performing maintenance’).
However, ‘negative FRs’ can also be true system constraints. System constraints are “constraints imposed by the system in which the design solution must function” [Suh, 1990 p. 39]. Unlike input constraints, which are “usually expressed as bounds on size, weight, materials, and cost,” system constraints “are interfacial bounds such as geometric shape, capacity of machines, and even the laws of nature” [Suh, 1990 p. 39]. ‘The artifact may not use fossil fuels’ is an example of a system constraint.
Negative FRs regularly appear in the functional decompositions of novice designers. However, because ‘negative FRs’ are not true FRs (by definition), these errors are rarely, if ever, observed in the literature.
7 DISCUSSION
This paper has distinguished between errors made by novices and experts in Axiomatic Design Theory. This was done, in part, because this work has different implications for design practice, education, and research.
7.1 IMPLICATIONS FOR DESIGN PRACTICE
The implications of this work for professional designers and AD experts are limited. These individuals have typically reached the unconsciously competent stage of design. As a result, they naturally avoid errors that can impact their decompositions and the application of the design axioms. For AD experts, FRs act as mental placeholders for information. As long as the information is processed in the same way, the words used to convey that information are of little importance. These distinctions could matter if the experts are working in a larger design team where their decompositions will be used to communicate progress and to serve as documentation for future use. However, both AD experts and design experts in general should be able to recognize the intent behind the FR definition. Thus, these lapses in rigor are unlikely to cause problems in the design process or in the final artifact.
7.2 IMPLICATIONS FOR DESIGN EDUCATION
In contrast, the implications for Axiomatic Design education are significant. It is important for AD novices to have clear guidelines to direct the definition of their FRs. It is also important for design faculty members to have guidelines to identify errors in FR definition so they can provide feedback to their students. Finally, it is essential for students to have models for how to reformulate and improve their FRs.
Errors made by experts, especially in seminal texts, provide students with bad examples of how to perform design decompositions and could encourage them to make similar errors in the future. A clarification of requirements categories and how to define FRs could pave the way for more rigorous and consistent AD texts and teaching materials. This, in turns, should also increase the ease and efficiency of AD education.
7.3 IMPLICATIONS FOR DESIGN RESEARCH
Finally, these issues are important for design researchers. Expert errors might not be errors. Instead, they might represent different strategies employed by expert designers to work around the limitations of existing design theories. Alternatively, the miscategorization of these FRs as ‘errors’ could indicate faulty assumptions on the part of the design researcher (in this case, the author) and the limitations of his or her understanding of requirements and design information. In either case, identifying and studying expert ‘errors’ can stimulate discussion and help the design community as a whole to improve both our understanding of design and to improve and expand existing design theories.
8 FUTURE WORK
This work raises a number of questions about the nature of requirements and the relationship between AD and more traditional product and engineering design. First, it raises questions about the concept selection process in AD. Axiomatic Design Theory can be viewed as a way to model the relationships between various types of design information rather than a step-by-step design process to follow. As a result, the generation of competing design concepts is mostly neglected in the classic AD texts and concept selection is primarily governed by the two axioms. Further discussion is needed to determine if SCs are a valid and necessary category of information in AD or if their role is built into other aspects of the theory.
Similarly, the requirements categories presented in this paper (FRs, nFRs, Cs, SCs, and OCs) are derived from both AD and from other design texts. As a result, the relationships between these categories have not been fully established in the context of Axiomatic Design Theory. For example, in section 3.2 of this paper, Suh treats real estate constraints as functional requirements and then applies the second axiom these ‘FRs’. This raises the question of whether FRs and constraints are really different types of information and whether or not the 2nd Axiom could or should be applied to other types of requirements.
In addition, in this work we define nFRs as a distinct category of requirements information. But it remains to be seen whether nFRs are more than CNs that have been carried over to the functional domain without being properly mapped to the ‘true’ requirements categories (FRs, Cs, etc.). If nFRs are found to be a valid requirements category, do they currently serve as a catch-all for other yet-undefined requirements information like Norman’s [1988] signifiers and affordances? This, in turn, indicates that we should explore whether or not signifiers and affordances represent sub-categories of human-centered FRs.
Finally, in this work input and system constraints are differentiated based on their focus and level of granularity. (Input constraints are portrayed as focusing on nFRs and being more specific and quantitative while system constraints are portrayed as focusing more on high level DPs.) However, the major distinction between the two is usually based on the source of the constraint (does it come from within the design process or from an external source?). This raises questions about the definitions of these types of constraints, if additional categories of constraints are necessary, and if

- 112 -
constraints should be decomposed in hierarchies with different levels of detail like other types of requirements information.
This work does not attempt to answer these questions. Nor does it claim to identify an exhaustive list of requirements research questions to explore. It only suggests that a more rigorous investigation of ‘errors’ in FR definition may lead both to these questions and to their answers.
9 SUMMARY AND CONCLUSIONS
This paper presented five classes of common procedural errors that are made by designers at all levels during the definition of functional requirements. It was observed that certain types of errors are more likely to be made by AD novices while others are more common from AD experts. Novice errors seem to result from a lack of understanding of the theory. As a result, these errors tend to disappear as designers gain more knowledge and experience with AD. They are not an indication of AD’s limitations. However, expert ‘errors’ may be indicative of questions about the nature of design information and/or the limitations of existing design theories. It is suggested that a more rigorous investigation of expert ‘errors’ in FR definition may lead to the identification of new design research questions and their answers. This, in turn, may improve design education.
10 REFERENCES
[1] Brown, C.A., “Axiomatic Design for Understanding Manufacturing Engineering as a Science,” Proceedings of the 21st CIRP Design Conference, Daejeon: KAIST, 2011.
[2] Lu, S.C.-Y. and Liu, A., “A Logic-Based Foundation of Axiomatic Design,” Proceedings of the 6th International Conference on Axiomatic Design, Daejeon: KAIST, 2011.
[3] Lu, S.C-Y. and Liu, A, “A Synthesis Framework for Early-Stage Innovative Design,” Proceedings of the 21st CIRP Design Conference: Daejeon: KAIST, 2011.
[4] Norman, D. A., The Design of Everyday Things, New York: Basic Books, 1988.
[5] Roberson, S. Robertson, J, Mastering the Requirements Process, Upper Saddle River, NJ: Addison-Wesley, 2006. ISBN 0-321-41949-9.
[6] Shin, M., Azhar, M., Morrison, J.R., Lee, T., and Suh, H.W., “On the Use of Axiomatic Design for Eco-Design,” Proceedings of the 6th International Conference on Axiomatic Design, Daejeon: KAIST, 2011.
[7] Suh N.P., The Principles of Design, New York: Oxford University Press, 1990. ISBN 0-19-504345-6
[8] Suh N.P., Axiomatic Design: Advances and Applications, New York: Oxford University Press, 2001. ISBN 978-0-19-513466-7
[9] Thompson, M. K., “Improving the Requirements Process in Axiomatic Design,” CIRP Annals-Manufacturing Technology, 2013.

Proceedings of ICAD2013 The Seventh International Conference on Axiomatic Design
Worcester – June 27-28, 2013
ICAD-2013-17
- 113 -
ABSTRACT
The independence axiom recommends independence among all functional requirements. Modern machines, however, are all driven by electrical power and follow commands from computers with algorithms dependent on instrumentation signals; electrical functions interfere with all mechanical functional requirements. Moreover, a typical machine loses its entire function when its single electrical system fails. The Fukushima-1 accident followed this exact scenario; the tsunami destroyed all power supplies and switchboards, then all pumps and valves turned inoperable from the control room. Delayed counteractions led to a loss of cooling functions and eventually to core damage. This interference is a fundamental design problem with modern machines.
Keywords: Axiomatic Design, failure, Fukushima.
1 INTRODUCTION – MECHATRONIC ACCIDENTS
As of 2013, a glance at machines produced in modern countries reveals that they all have electrically driven control systems to operate their mechanisms in an ideal manner. The most common design employs “mechatronics” that operate mechanisms with electrical power controlled by digital signals. In other words, most machines have computers that estimate the state based on signals from sensors to optimally drive mechanical actuators. Mechatronics is now not only applied for robotics and automated factories, but also for appliances like TVs, cellular phones, washing machines, and air-conditioners as well as larger machines like automobiles, trains, and machining tools. The only traditional machine left in our daily life that does not rely on any electrical control is probably just the bicycle.
The big concern with a mechatronic machine is that it only has one complex electrical control system, just like humans have only one brain; when the control system fails, the entire machine no longer meets its functional requirement,
like brain-death in our case. In fact, a single electrical point of failure, e.g., CPU, battery, capacitor, relay, connector or sensor, would cause confusion in the mechanism control leading to an accident due to failure in the mechanical functional requirement assigned to the mechanism [Hatamura et al., 2003; Nakao et al., 2010]. For example, the 2010 recall by Toyota was in response to a runaway accident caused when a stepped-on gas pedal did not spring back to its off position. The computer was suspected to have continued to output a throttle-full-open signal but even NASA’s investigation did not reproduce the failure situation. Even the designer cannot easily find whether a program of over 10 million lines contain a bug or not.
Upon failure of a mechatronic machine, humans not equipped with the eye to capture the flow of electrons cannot patch up a quick fix. Even an engineer with a Ph.D. cannot repair a malfunctioning washing machine, unless the problem is with a dented washing tub or a bent rotary shaft that the doctor can repair by hammering it in the right shape. If, however, the problem resides in the program or the electrical circuit, the engineering doctor cannot even bypass an interlock nor identify which electrical part has failed its function.
To overcome this difficulty, a mechatronic machine requires another mechatronic machine for its repair work. At an automobile garage, for example, even a skilled mechanic cannot identify a troubled sensor without an automatic diagnosis system. A railway control system depends on the automatic railway checking system to monitor the status of hundreds of railway signals and switches every few seconds to pinpoint a tiny glitch in their circuits. Another example is accidental driving recorders mounted on automobiles or trains to record images, velocities and other data for a period of 1 minute before and after abrupt braking. Such an environment is vulnerable to a power outage; not only the mechanical machine itself, but also its mechatronic diagnosis machine could stop completely.
The radioactivity release accident at Fukushima-1 Nuclear Power Plant (Fuku-1 NPP) that broke out in March of 2011
AXIOMATIC DESIGN ASPECT OF THE FUKUSHIMA-1 ACCIDENT: ELECTRICAL CONTROL INTERFERES WITH ALL MECHANICAL
FUNCTIONS
Masayuki Nakao [email protected]
Department of Engineering Synthesis School of Engineering
The University of Tokyo Hongo 7-3-1, Bunkyo-ku, Tokyo, 113-8656, Japan
Kensuke Tsuchiya
[email protected] Department of Mechanical and Biofunctional Systems
Institute of Industrial Science The University of Tokyo,
Komaba 4-6-1, Meguro-ku, Tokyo, 153-8505, Japan
Kohei Kusaka [email protected]
Department of Engineering Synthesis School of Engineering
The University of Tokyo Hongo 7-3-1, Bunkyo-ku, Tokyo, 113-8656, Japan
Kenji Iino
[email protected] SYDROSE LP
475N. 1st St., San Jose, CA, 95112, USA

- 114 -
was another such mechatronic failure. The accident took place with outdated boiling water reactors (BWR) designed by General Electric (GE) in the 1970s. Their base mechatronics electrically processed analog signals to drive mechanisms like pumps or valves. Upon losing all DC power sources, the operators lost the sensor readings and ways of remotely operating the valves. Even when nuclear reaction is suppressed, the fuel keeps generating decay heat and the fuel rod damage is said to start within 3 hours following loss of water supply to a reactor pressurized vessel (RPV) of BWR. For Fuku-1 NPP, when the operators lost control of the reactor, the cooling that had to recover within hours relied on “manual” operations, but insufficient slow hands inside the dark buildings could not stop the core damage.
This paper aims to find ways to protect mechatronic machines from fatal damage. For this purpose we analyze the Fuku-1 NPP accident in Chapter 2. Chapter 3 then shows that mechatronics are coupled designs from the Axiomatic Design perspective, and Chapter 4 suggests design methods to avoid catastrophes.
2 CAUSAL ANALYSIS OF FUKU-1 NPP ACCIDENT
A number of accident reports have been made available in Japanese and in English [IAEA, 2011; INPO, 2011] about the Fuku-1 NPP accident. The plant, still under high radioactivity, has not gone through thorough visual inspection. All these reports based their analyses on plant data during the accident, made public by Tokyo Electric Power Company (TEPCO) owned Fuku-1 NPP, and testimonies by TEPCO workers and the government, and thus reached similar technical conclusions about the accident causes.
The direct cause of the accident was the tsunami waves and not the earthquake. When the magnitude 9.0 earthquake hit at 14:46 (Japan Time) on March 11th, 2011, external power was lost due to failures of power line towers and switches, however, the operators had confidence in reaching the state of cold shutdown by just following the manual using emergency diesel generators and high pressure cooling functions as mentioned later. Damages on the RPV itself and its piping were not large enough to release detectible radioactivity to the environment.
52 minutes after the earthquake, a huge tsunami reaching as high as 13.1m, never marked in history since 869, hit the plant at 10m elevation. Almost all emergency diesel generators, AC switchboards, and DC batteries for control at Fuku-1 NPP were submerged under water. The result was station blackout. The electrical power vehicles rushed to the site, however, were useless due to the loss of switchboards. It took 10 days to recover AC power. In place for 125V DC power, TEPCO collected 12V car batteries from their employees to hook up to sensors and valves, however, they needed hundreds of them; a number far beyond what were available on the site by March 13th.
The engineers, at the time, were following the planned emergency procedures in Figure 1 to reach cold shutdown even without AC power. First, they start the high pressure cooling system to inject water into the RPV using the high pressure steam in the RPV. These systems were the Isolation Condenser (IC) which condenses steam into water to return
to the RPV with gravity for Unit-1, and for Unit-2 and -3, the Reactor Core Isolation Cooling (RCIC) or the High Pressure Coolant Injection (HPCI) that turn turbines with steam to run pumps to inject cooling water. Secondly, they depressurized the RPV and made up the piping route for low pressure cooling until the high pressure cooling could stop due to lowered steam pressure, and then kick in the low pressure cooling systems. Finally, they changed to the circulated cooling system to remove the heat to the sea with a heat exchanger, reaching cold shutdown.
RCIC for Unit-2 and -3 were for emergency use and the circuits were designed to “fail as is” and upon losing DC power after the tsunami, the valves remained open to keep the RCIC running. The IC system for Unit 1, on the other hand, was designed so its valves would “fail close” and the loss of DC power after the tsunami closed the valves; a situation that is the same as when the piping broke. Water in Unit-1 RPV then evaporated to lower the water level and as the simulation predicted, fuel rod damage started around 19:00 on the 11th. GE had designed the IC as a system for RPV depressurization to operate under normal conditions and had adopted “fail close” to avoid human errors. TEPCO, on the other hand, normally used Safety Relief Valves (SRV) for RPV depressurization and the IC, for 40 years, only worked during testing and none of the plant workers recognized this coupled interlock.
The General Manager of Fuku-1 NPP issued instructions, in the early stage of an hour and a half from the tsunami, to “prepare a low pressure cooling system using the fire engines while this high pressure system was running.” Japanese nuclear power plants had prepared, several years ago, water plugs for fire engines from outside the buildings to counter fires inside them. The workers had opened some of the valves in preparing piping routes for water injection into the RPV at night on the 11th. Instructions from the General Manager would have required the following additional valve operations: as shown in Figure 1 (b), open the SRV of the RPV to release steam into the Containment Vessel (CV), and then open the CV vent valves to exhaust the steam into the atmosphere. This procedure would lower the RPV pressure from 7 MPa to about 0.5 MPa to allow 1 MPa water injection from the fire engines into the RPV. Nuclear power plant engineers are all familiar with this procedure and all the eight power plants at Fukushima-2, Onagawa, and Tokai completed it to successfully reach cold shutdown.
The SRVs, however, are inside the CV and the vent vales are directly above the donut shaped suppression chamber (S/C). These valves are too large to operate by hands; they require DC power and compressed air to open and keep opening against the spring. Compressed air is generated by a compressor run by AC power. Both the SRVs and the vent valves are coupled with the electrical power. Each successful plant, even after the tsunami, had at least one AC power available to supply the needed electricity. Whereas, Fuku-1 NPP was out of them and the delay in the procedure caused core damage on the 14th to Unit-2 and 13th to Unit-3. If they had prepared a large number of 12V batteries for automobiles and an engine operated compressor beforehand, and the operators had rushed to the locations within an hour to open
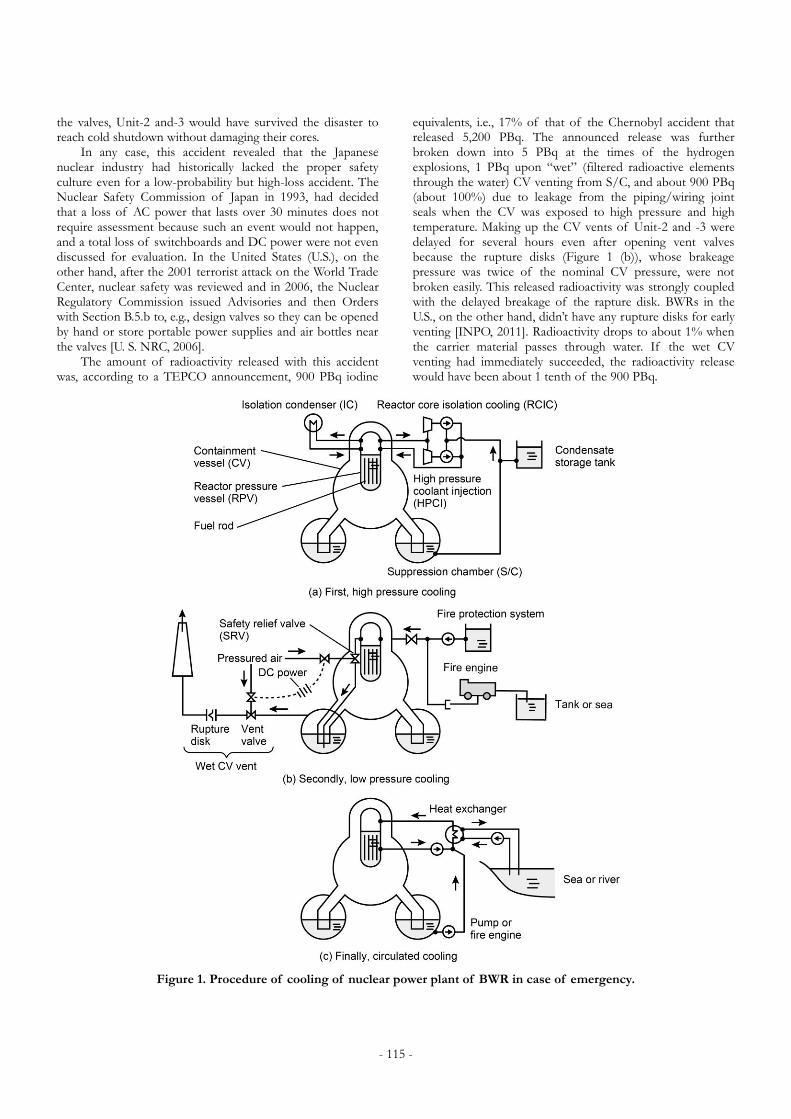
- 115 -
the valves, Unit-2 and-3 would have survived the disaster to reach cold shutdown without damaging their cores.
In any case, this accident revealed that the Japanese nuclear industry had historically lacked the proper safety culture even for a low-probability but high-loss accident. The Nuclear Safety Commission of Japan in 1993, had decided that a loss of AC power that lasts over 30 minutes does not require assessment because such an event would not happen, and a total loss of switchboards and DC power were not even discussed for evaluation. In the United States (U.S.), on the other hand, after the 2001 terrorist attack on the World Trade Center, nuclear safety was reviewed and in 2006, the Nuclear Regulatory Commission issued Advisories and then Orders with Section B.5.b to, e.g., design valves so they can be opened by hand or store portable power supplies and air bottles near the valves [U. S. NRC, 2006].
The amount of radioactivity released with this accident was, according to a TEPCO announcement, 900 PBq iodine
equivalents, i.e., 17% of that of the Chernobyl accident that released 5,200 PBq. The announced release was further broken down into 5 PBq at the times of the hydrogen explosions, 1 PBq upon “wet” (filtered radioactive elements through the water) CV venting from S/C, and about 900 PBq (about 100%) due to leakage from the piping/wiring joint seals when the CV was exposed to high pressure and high temperature. Making up the CV vents of Unit-2 and -3 were delayed for several hours even after opening vent valves because the rupture disks (Figure 1 (b)), whose brakeage pressure was twice of the nominal CV pressure, were not broken easily. This released radioactivity was strongly coupled with the delayed breakage of the rapture disk. BWRs in the U.S., on the other hand, didn’t have any rupture disks for early venting [INPO, 2011]. Radioactivity drops to about 1% when the carrier material passes through water. If the wet CV venting had immediately succeeded, the radioactivity release would have been about 1 tenth of the 900 PBq.
Figure 1. Procedure of cooling of nuclear power plant of BWR in case of emergency.

- 116 -
3 AXIOMATIC DESIGN ANALYSIS OF MECHATRONICS COUPLED DESIGN
This section illustrates the problem of electronics interfering with mechanisms using Suh’s Axiomatic Design [Suh, 2001]. The Independence Axiom states that an ideal design has design parameters (DP) so that each functional requirement (FR) maps to a single DP in a one-to-one manner. The design matrix for this uncoupled design is diagonal as Figure 2 (a) shows. In reality, the designer often selects readily available but redundant parts that affect other FRs or constraints (C) to complicate an uncoupled design or even make it impossible. An example is a bicycle that uses the DP of readily available chain and sprocket to meet the FR of transferring torque from the pedals to one of the wheels. This redundant DP, however, affects another FR of shifting the transmission and imposes the additional C of keeping adequate tension in the chain.
Many machines, nonetheless, are designed to the next-best decoupled design as Figure 1 (b) shows. For such decoupled designs, the designer from the one-to-one relation of FR1 and DP1, finds DP1 to satisfy FR1. He then substitutes the DP1 to the one-to-two relation of FR2 to DP1 and DP2 to determine DP2, and similarly substitutes the set of DP1 and DP2 into the FR3 to DP1, DP2, and DP3 relation to determine DP3. Arranging the process of determining DPs in such a manner allows all DPs to be easily solved. The design matrix is then is an upper or lower triangular matrix.
In contrast, if the machine design is coupled like Figure 1(c) shows, the design matrix is non-triangular with components in both upper and lower parts, forcing the designer to simultaneously solve a set of design equations. Repairing such a machine or modifying one of its DP would interfere with multiple FRs and result in making changes to multiple DPs at the end. The machine is difficult to work with in terms of service and sooner or later disappears from the market. The information axiom states the information content of the coupled design is larger than that of the decoupled/uncoupled design, meaning the coupled is worse than the decoupled/uncoupled.
Now let’s turn our attention to a mechatronic machine. The design is certainly coupled. Figure 1 (d) shows the FRe of electronically controlling the machine (not in an open way but with feedback) that is affected by the sensing status of all mechanisms DPm (all the effects are shown as Xs in the lower left-hand corner of the design matrix, Interference Group 1). The electrical control system DPe affects all mechanical functional requirements FRm via controlling the actuator movements (the effects appear as Xs in the upper right-hand corner of the design matrix, Interference Group 2). The resulting design equation clearly shows a fully coupled design with nonzero components in the upper and lower areas of the design matrix. The long and unwelcome lines of Xs in Interference Group 1 and 2 cannot be decoupled easily and make the information content larger.
Design Structure Matrix (DSM) methods also mention a strong interaction among most components [Eppinger et al., 2012]. It indicates the similar long and unwelcome lines of interactions in the matrix of component by component
though the matrix is not the one of function by component in Axiomatic Design. DSM introduces four types of interactions: special proximity, material flow, information flow and energy transfer. Fuku-1 NPP included the problem of interactions of information flow and energy transfer for controls.
In developing such a mechatronic machine, tweaking the DPe in the program for electronic controlling allows minor adjustments in the mechanical FRm during the final stage of development. Such adjustments can make smaller variation in the performance of FRm; each mechanism is tuned to the best state. This is the biggest advantage of mechatronics. On the other hand, such a structure reveals the disadvantage of coupled design upon exchanging a single degraded mechanical part will require readjusting the entire system. This complex readjustment needs another automatic diagnosis mechatronic machine. The modern designers employ the useful electricity for most of machines; however they ignore the implicit risk 3.
Figure 2. Interference of FRs of the mechatronic
machines in Axiomatic Design.

- 117 -
Figure 1 (e) shows yet another disadvantage of a coupled design uncovered at a time of emergency. For Interference Group 1 described above, when DC power is lost, the sensors are stuck at low output and the electronic control system upon receiving such signals will enter an abnormal state to either cause runaway actuators or force shutdown with interlocks designed to the safe side. The later was the case with IC of Unit-1 in Fuku-1 NPP accident. Mechatronics with feedback control all have such interlocks, for example, motor-driven mechanisms are designed to stop the motor when an encoder signal line brakes or short-circuits. Even the safety interlock may induce the worse situation after stopping the machine or cutting the electricity. In 1972, the electrical train with a burning dining car stopped in the long Hokuriku tunnel according to the operation manual in Japan; but the train could not evacuate from the tunnel after the fire melted the power line; 30 passengers died from smoke inhalation.
Similarly with regards to Interference Group 2, when the electrical control system DPe fails due to some external disturbance, all mechanical FRm turn uncontrollable or stop in response to the emergency situation like most of FRm of Fuku-1 NPP except the “fail as is” systems. In the mechatronic machines, when the DC power for semiconductors is lost, the control circuit fails and mechanical actuators either runaway or stop with interlocks to land them in their safer side. A system designed to produce DC power by rectifying AC will face the most dangerous moment when its mechanisms run away upon a power outage just before the interlocks kick in. In 2006, a boat with a crane accidentally cut a TEPCO power cable while it was traveling in a river and the city of Tokyo suddenly lost power. Some network servers that could not counter the accident without enough time for capacitors or batteries for gentle shutdown froze immediately. A large number of corporations had to devise Business Continuity Plans to cope with their loss of business records.
4 PLANS TO SAVE MECHATRONICS MACHINES FROM FATAL ACCIDENTS
Multiplicity and variety of emergency safety systems are said to save machines from fatal accidents. Nuclear Safety Commission of Japan has imposed multiplicity or variety and Fuku-1 NPP had enforced multiplicity. For example, it had eight external power lines and fourteen emergency diesel generators; however, their functions were all washed away by the earthquake and tsunami.
What we need is to add variety. As shown examples in Figure 3(a) to (d), we should install a mechanical safety system DPms that does not require normally used electricity: (a) handle for manually opening a valve by hand. Even the SRV inside the CV can be opened with a handle equipped with a long shaft to turn it from outside the CV; (b) dispatch an emergent electrical power supply vehicle stationed at high elevations to feed power to a backup switchboard built also at high elevations; (c) release water from a reservoir at a high elevation to drop cooling water with gravity for cooling from outside the CV; (d) build floating nuclear power plants in the ocean to submerge the CV under the sea in the accident; and so on. In fact, Fuku-1 NPP had planned some variety like low-pressure water injection from a fire engine. If that were even
lost, the RPV would have ruptured to release about 10 times the radioactivity.
Figure 3 (e) explains this concept with Axiomatic Design. The design matrix is still a fully coupled one; however, the information content could be decreased because the mechanical FRs can be controlled by the mechanical safety system DPms even after station blackout, meaning that the information content is not infinite any more. For example, to prepare manually operated valve openers FRms monitored with human eyes to replace electrically operated FRe when they fail. The return of Apollo 13 in 1970 is a good example of FRms. When its oxygen tank exploded and the power generation system failed, the astronauts controlled the angle of atmosphere re-entry by watching the earth from a small window. During the great east Japan earthquake, a control system at home, originally designed to generate AC power to sell to TEPCO by converting solar generated DC power, failed due to the power outage; however, some systems had terminals to directly output DC power and they helped residents by offering DC power for charging cellular phones and for boiling water. Radios and flashlights charged by manually turning handles helped the people in a refuge. Recent electrical motors allow acceleration, braking and stop
Figure 3. Mechanical safety system to avoid
catastrophes.
position control using electricity from regeneration brakes. They are used for the super-expresses, elevators in high rises, and linear motors for machining tools. Nevertheless, all these machines are also equipped with large friction brakes in case of emergencies and terminals have large cushion dampers called buffer stops to avoid collision in the unlikely case of running away without brakes.

- 118 -
Design in the coming years will be more demanding that the designer has to plan how to safely stop machines in case its control system fails. Many young researchers in the field only know the design of mechatronics. Mechatronics is certainly a convenient methodology that applies to almost any machine, however, that alone does not enrich the design and carries with it the danger of blocking the designer’s ideas for such mechanical safety measures we explained above.
5 CONCLUSION
We studied the Fukushima-1 accident to find that electrical control interferes with mechanical functional requirements and if it loses electricity in case of emergency, mechanisms turn uncontrollable. From the viewpoint of Axiomatic Design, we showed that machines controlled with electrical feedback are coupled designs and that compensating such electrical interference under blackout requires design solutions with an emergency mechanical control to prevent runaway mechanisms. The measures can reduce the information content of the coupled design.
These mechatronic types of coupled designs are fundamental problems with modern machines. We are concerned that if young researchers study only mechatronic design methodologies, they will fail to implement purely mechanical safety measures for cases of emergency.
6 REFERENCES
[1] Eppinger S., Browing T., Design Structure Matrix Methods and Applications, The MIT Press, 2012.
[2] Hatamura Y., Iino K., Tsuchiya K., Hamaguchi T., “Structure of Failure Knowledge Database and Case Expression”, Annals of the CIRP, 52(1), pp. 97–100, 2003.
[3] IAEA (International Atomic Energy Agency), “IAEA International Fact Finding Expert Mission of the Fukushima Dai-ichi NPP Accident Following the Great East Japan Earthquake and Tsunami”, 2011. http://www.pub.iaea.org/mtcd/meetings/pdfplus/2011/cn200/documentation/cn200_final-fukushima-mission-report.pdf
[4] INPO (Institute of Nuclear Power Operations) “Lessons Learned from the Nuclear Accident at the Fukushima Daiichi Nuclear Power Station”, 2011.
http://www.nei.org/corporatesite/media/filefolder/
INPO_11-005_Fukushima_Addendum_1.pdf
[5] Nakao M., Miyamura T., Tsuchiya K., Iino K., “Two Design Problems Identified in Consumer Product Recalls: Degradation over Extended Use and Scarce FR- Coupling”, Annals of the CIRP, 59(1), pp. 163-166, 2010.
[6] Suh N.P., Axiomatic Design: Advanced and Application, Oxford University Press, 2001.
[7] U. S. NRC (United State Nuclear Regulatory Commission), “B.5.b Phases 2 &3 Submittal Guideline”, Engineering and Research, Inc. NEI 06-12, Revision 2, 2006.

Proceedings of ICAD2013 The Seventh International Conference on Axiomatic Design
Worcester – June 27-28, 2013
ICAD-2013-18
- 119 -
ABSTRACT
Of the two central axioms of Axiomatic Design Theory, Axiom 2, the Information Axiom, is the more powerful concept in directly addressing the performance issue that most plagues design efforts: product failures. Prior work has described a complementary relationship between Axiomatic Design and Failure Modes and Effects Analysis (FMEA). This paper proposes that failure mode analysis is more than just a complementary tool to Axiomatic Design. Failure mode analysis processes are an embodiment of the second axiom and a practical method of applying the second axiom during the decomposition process.
Keywords: Axiom 2, Failure Modes and Effects Analysis (FMEA), P-Diagrams, information content, Axiomatic Design.
1 INTRODUCTION
Effective design and development processes in industry are an exercise in risk management. Management balances three key risks of performance, delivery and costs. Tools and techniques that can provide insight into risks and risk management strategies are valuable.
Axiomatic Design is a process tool that operates in the design domain. It offers an alternative viewpoint to analyzing and developing solutions to design problems. In particular, the second axiom, the Information Axiom, of the Axiomatic Design process teaches that assessing and considering risk is an important factor of the design synthesis process.
However, for reasons discussed in this paper, Axiom 2 is very seldom applied in the decomposition process. This is a real weakness of current Axiomatic Design practice.
This paper discusses the issues around applying Axiom 2 to the decomposition process. Then this paper proposes that the functional requirement decomposition process of Axiomatic Design produces a useful framework for risk assessment and mitigation, a key process of design management, that the second axiom is a fundamental approach to robustness, that the application of Axiom 2 concepts can be achieved by the application of failure mode analysis and mitigation to the decomposition framework, and, finally, that this approach results in a broader and more useful interpretation of Axiom 2 that is valuable for general development risk mitigation.
2 BACKGROUND
Axiomatic Design Theory proposes an analysis framework of top down hierarchical functional decomposition to develop potential solutions to a problem. An Axiomatic Design functional decomposition is a hierarchy of pairs of functions, called FRs, and solutions, called DPs. As an example, in a cell phone application, the FR is a requirement to notify the user of an incoming cell phone. The DP, in traditional cell phones, is a ring tone. A completed design is represented, often graphically, as an inverted tree with each branch having two or more FR-DP pairs. The balance of this text assumes a basic familiarity with Axiomatic Design processes, and references are suggested here for the reader seeking more information. [Suh, 1990; 2001]
Axiomatic Design proposes a rule, referred to as Axiom 2, or the Information Axiom, to evaluate the alternative goodness, of a set of proposed DPs, at a given decomposition level, at achieving the targeted FRs. A well-defined FR should have a target measure and a tolerance. This range of acceptable FR performance values is called the design range. Ideally, selected DPs will always deliver a solution within the acceptable FR design range. The range of (FR) solution values that the DP will (in actual practice) deliver is referred to as the system range.
Often selected DPs will not deliver system range results that are completely within the FR design range. For example, in a high ambient noise environment, buried in a pocket or purse, the cell phone DP of a ring tone may fail to notify the user of an incoming phone call.
Axiom 2 asks the designer to quantify the probability that selected DPs will deliver on the required Design Range. In the original definition of Axiom 2, a probability, p, was defined as the percentage DP system range falling completely within the FR design range. [Suh, 1990; 2001] In order to add up these probabilities across a set of n FRs and their DPs, the
information content of Axiom 2 was defined as∑ ln(1
𝑝)
𝑛
𝑝=1.
As DP selections deliver increasing percentages system ranges within the FR design ranges, the information content approaches 0. As the system range within the FR design range falls to zero, the information content metric will approach infinity.
FAILURE MODE ANALYSIS AS AN IMPLEMENTATION OF AXIOM 2 IN THE AXIOMATIC DESIGN FUNCTIONAL DECOMPOSITION PROCESS
Matt Pallaver [email protected]
Schlumberger Houston, TX USA
Sung-hee Do [email protected]
Axiomatic Design Solutions Inc. Brighton, MA, USA

- 120 -
Classic Axiomatic Design proposes that when there are alternative solutions sets of DPs at a given decomposition level, the set that minimizes the information content is preferred as it is more likely, probabilistically, to deliver solutions within the desired FR design ranges.
Note that this application of the information content assumes an equal design value weighting of all the FRs. Also, this application focuses only on the fraction of the DP system range that falls outside of the FR design range, and is not a measure of the actual total error in achieving the targeted FR. And lastly, this assumes that the Axiom 1 does not provide a decision criterion.
To avoid confusion with other meanings of risk, this text defines the term Performance Risk as a measure of the likelihood that the proposed DP solutions will fail to deliver the required FR performance (as represented by the design range). The second axiom, the Information Axiom, per its definition is a metric of Performance Risk.
Traditional Performance Risk assessment techniques rarely identify and analyze the relationship between FRs and their DPs. In part this is because most contemporary risk methods do not identify these parameters. But more significantly, in the author’s experience, there is an implied assumption that the selected DP will, under a reasonable set of conditions, deliver the required FR performance. If such conditions did not readily exist, then the design would never get past the initial prototype stage.
Rather, designers interested in analyzing Performance Risk focus on events or conditions that might cause the DP to fail to satisfy the FR. These are often discontinuous and outside of the nominal FR-DP relationship. Examples include wear-out, product misuse, manufacturing mistakes, supply chain errors, and other factors affecting the nominal FR-DP relationship.
The Parameter Diagram or P-Diagram is a representation of the variables of process capability and a common tool in robust design analysis. [Guangbin, 2007] Translating this tool into the Axiomatic Design domain gives us the representation of Figure 1. Examining this figure we see a black box representation of a function where changing the input signal factor(s) varies the output response, subject to the influence of control factors and noise factors.
In the Axiomatic Design paradigm, DPs are signal factors, FRs are the response, and control factors are the designer specifiable child functions of the next lower decomposition level. In a process known as Parameter Design, designers typically select the control factors to either maximize the control of the FR by the DP, increasing the probability of FR success, or minimize the cost of implementing the functional relationship.
This P-diagram visualizes the requirement that a designer needs to address noise factors in order to assess the functional performance risk that the DP will achieve the required FR. Noise factors, often discontinuous, are typically environmental variables that have the potential to interrupt the ‘Happy Path’ relationship, between FRs and the DPs, that is desired and specified by the designer. These interruption events are called failure modes.
Figure 1. P-Diagram.
During the concept synthesis phase, while it is difficult to define the percentage of the DP design range within the FR range without significant additional information, the designer can reasonably identify and quantify the failure modes that might interrupt a nominal FR-DP relationship.
For example, at this writing, the Boeing Company is battling problems with its lithium battery system on the 787 airplane. [Pasztor et al, 2013]. Although the original nominal FR-DP design relationship was certainly extensively studied, tested and validated prior to deployment, a seemingly random and unanticipated failure mode is causing serious program disruptions. This underscores the importance of failure mode analysis and helps to establish its value to the design process and product functional performance.
The design industry has a process and a framework tool, Failure Modes and Effects Analysis (FMEA), used to capture and codify failure modes. For a given performance function, the FMEA process asks the designer to consider the noise factors and control factors, and list the potential failure modes. Three scoring assessments are made for each failure mode, normally on a ten point scale. These scores are for the probability of the failure mode, the severity of the failure mode, and the likelihood the failure mode would escape early detection and prevention and manifest itself in actual product use. These scores are multiplied together giving a product, called the Risk Priority Number (RPN), which can range from 1 to 1000 for a ten point scoring scale, with 1000 being the highest risk. For a more detailed description of an FMEA process see references. [Stamatis, 2003]
3 LITERATURE REVIEW
The application of Axiom 2 to decomposition is largely absent from case studies and literature. The author proposes that during the concept synthesis phase when the DPs are selected, at a given decomposition level, it is generally difficult to sufficiently quantify the traditional Axiom 2 information content definition for these reasons:
1. Such analysis requires details which are effectively the major work of the development effort and not available until near the end of the project.
2. The Performance Risk is highly dependent upon the external noise factors which are not (traditionally) included as part of the Axiomatic Design decomposition and analysis framework.
3. The Performance Risk is highly dependent upon the selection of potentially risk altering lower level child functions, which are not yet available to the designer when making DP tradeoff decisions.

- 121 -
On this third issue, it can be suggested that deriving a complete set of lower level child FR-DPs is included as part of the Axiom 2 information content analysis. However, executing this approach asks the designer to decompose all alternative DPs to their leaf levels. Given the number of DPs considered in typical design processes, this is hardly a realistic approach.
Prior authors have linked the Axiomatic Design process to FMEA analysis. Mohsen and Cekecek [2000] identified integrating AD with other quality tools such as FMEA, P-diagram, FRS and testing and verifications to achieve better quality products with minimum development time and minimum cost. Arcidiacono et al [2004] discussed applying FMEA analysis to FR-DP trees and developed a metric, the Esteemed Risk Priority Number, to adjust RPN rankings for coupling affects. Heo et al [2007] described the direct and intimate relationship between Axiomatic Design and failure mode analysis as represented by Fault Tree Analysis. Trewn and Yang [1998] developed a model to characterize the relationship between functional reliability and component reliability considering failure dependence.
From both observation of Axiomatic Design practitioners, and a review of prior literature, it appears that the Axiomatic Design second axiom is represented as somehow separate from a traditional failure mode performance risk analysis tools. Yet, failure modes are clearly a variable of contemporary and historic design product Performance Risk. And potential failures are most commonly analyzed by considering the potential deviations from expected nominal design performance, whose drivers are called noise factors. And mitigating failure modes is a necessary step to improving Performance Risk. Therefore, if the reader accepts the concept that the information content is a measure of Performance Risk, then, by transitive logic, addressing noise factor and failure modes is a necessary and integral part of Axiom 2.
So the relationship between Axiomatic Design and the FMEA noted by the authors above is not just a convenient and complementary relationship between independent design processes. The FMEA is a direct technique to assessing and scoring Performance Risk, the same risk addressed by the Axiom 2 information content metric. Even more practical, FMEA analysis suggests actions to further minimize the Performance Risk. Whereas the Axiom 2 classical definition is a theoretical consideration of Performance Risk, the FMEA process is a practical and applicable tool to measure and mitigate Performance Risk during the concept synthesis phase.
4 METHODS
Given the limitations discussed above, how can a designer apply Axiom 2 concepts during the concept decomposition to evaluate and select DPs to minimize Performance Risk?
Failure mode analysis is a systematic approach to assessing and improving Performance Risk and, as such, is an implementation of the Axiom 2 value proposition. Therefore, this paper proposes that a systematic approach to implementing Axiom 2 during the concept synthesis phase, in order to measure and improve the Performance Risk, should
be to quantify and address the potential failures modes created by identified noise factors of the FR-DP relationship.
To implement such a process, at every level of decomposition, proposed DPs should be assessed for failure modes. Rather than try to calculate an information content metric on how well the DP delivers on the FR, ask the inverse question “What failure modes might cause the DP to fail to deliver on the FR?”
Applying an FMEA framework, each identified DP failure mode is analyzed, scored and the RPN calculated. The DP will then have a list of failure mode scores associated with it. If the DP is changed, the failure modes have to be re-evaluated. If alternative DPs are being considered, failure modes are independently assessed for each DP.
The DP decision process can be viewed as a tradeoff analysis between alternative DPs including, as part of the analysis, a consideration of the failure mode risks and RPN scores.
The RPN risk score (and thus logically the Axiom 2 information content metric) is not a static measure. As risks are identified, risk mitigation strategies can be developed and actively applied, reducing the Performance Risk associated with a DP. In the Axiomatic Design framework, failure mode mitigations are implemented as child functions of the FR-DP pair being de-risked.
For example, consider our cell phone FR to alert users to incoming calls. The classic DP is a cell phone ring tone. FR1: Alert user of incoming cell phone call DP1: Ring tone FR1 Target Measure: 100% notification rate
To assess the Performance Risk (Axiom 2) using failure mode analysis, consider Table 1 with a list of potential failure modes that would prevent the DP from achieving the desired FR. These failure modes are scored for probability, severity, and detectability per the FMEA process on a 1 to 10 scale (10 highest) giving an RPN risk score.
Table 1. Failure mode analysis of ringtone DP.
Failure mode
Pro
bab
ility
Sev
erit
y
Det
ecta
bili
ty
RP
N
Dead battery 8 5 10 400
Noisy environment 4 5 2 40
Cell phone sound damped in purse 4 5 10 200
Cell phone sound damped in pocket 4 5 10 200
Dirt blocked speaker path 2 5 3 30
Earphones in cell phone, but not in ears.
6 5 1 30
It is possible to score a weighted overall DP risk score, perhaps by summing the products of the probability and severity, when comparing alternative DPs. But this is too simplistic, and a review of the failure mode risks should be just one aspect of analyzing competing DPs. Note that only failures to notify were considered here which resulted in the constant severity score. It is not unusual to have multiple

- 122 -
failure modes having varying severities. Also, these are qualitative assessments, appropriate for a concept phase analysis.
The dynamic nature of assessing Performance Risk can be demonstrated by evaluating each failure mode and determining potential mitigations. Table 2 summarizes proposed mitigations and post mitigation RPN risk scoring.
Table 2. Ringtone DP performance risk mitigation.
Failure mode Mitigation strategy P
rob
abili
ty
Sev
erit
y
Det
ecta
bili
ty
RP
N
Dead battery None (no Performance Risk change)
8 5 10 400
Noisy environment
Detect ambient noise and compensate ring volume
2 5 2 20
Cell phone sound damped in purse
After period of normal ring volume, increase volume
2 5 10 100
Cell phone sound damped in pocket
After period of normal ring volume, add vibration
2 5 10 100
Dirt blocked speaker path
Periodic power on sound test to analyze sound quality, detect problems/blockages, notify user.
1 5 3 15
Earphones in cell phone, but not in ears.
Detect earphones, after period of earphone ring, switch to speaker ring
1 5 1 5
Effective mitigations are incorporated as additional child functions of the DP, as noted below. FR1: Notify user of important incoming cell phone call DP1: Ring tone FR1 Measure: 100% notification rate
FR1.1: Mitigate Noisy environment failure mode. DP1.1: Detect ambient noise and compensate volume
FR1.2: Mitigate cell phone sound damped in purse failure mode. DP1.2: After period of normal ring volume, increase volume
FR1.3: Mitigate cell phone sound damped in pocket failure mode. DP1.3: After period of normal ring volume, add vibration
FR1.4: Mitigate dirt blocked speaker path failure mode. DP1.4: Periodic power-on sound test to analyze sound quality, detect problems/blockages, notify user.
FR1.5: Mitigate earphones in cell phone, but not in ears failure mode. DP1.5: Detect earphones, after period of normal ring volume, switch to speaker ring
Comparing Tables 1 and 2 demonstrate that failure mode mitigation has changed the RPN measures of the Performance Risk of the selected DP, and thus the design proposal. This demonstrates the dynamic nature of Performance Risk and points out the power of applying Axiom 2 considerations during the Axiomatic Design requirements decomposition process to improve Performance Risk by modifying the decomposition architecture.
In addition to being an active feedback mechanism to improving the FR-DP decomposition, the analysis can be easily extended into identifying the necessary manufacturing and field process steps, where applicable, to detect and catch the development of these failure modes before they impact the customer.
5 RESULTS AND OBSERVATIONS
The initial reaction a new practitioner might have is that failure modes would be more easily determined for lower level functions. It is the experience of the authors that upper level functions are also very easily analyzed for failure modes.
The authors considered the utility of developing a mathematical model to summarize RPN scores throughout the design hierarchy or across a decomposition level. Assuming that FRs are generally independent, assessing DP failure modes individually is valuable. Examining if aggregate scores bring additional value may be explored more in the future.
No attempt was made, nor did it seem useful, to categorize failure modes as design or process analysis, typical divisions of traditional FMEA processes. This means that detectability scores can vary in interpretation as a design or process measure. Also, the overall organization of this failure mode analysis is by the Axiomatic Design function (FR), whereas traditional FMEAs are usually organized by later phase artifacts such as part numbers. Also, failure modes can be introduced in all phases of the design process, so as the design progresses, it is very appropriate to repeat the FMEA in its more traditional forms. It is important to note that probability, severity, and detectability are all potential variables in risk mitigation as lower level design decisions (child functions) can affect all three measures. Also, implementing Performance Risk analysis at the DP selection point is preventative in timing, as opposed to design it in, then later analyze and fix problems created early in the design process.
Whereas traditional Axiomatic Design proposed applying Axiom 2 to comparing alternative DPs, the author’s work has demonstrated that implementing failure mode analysis during decomposition is also an active risk mitigation process that can be applied after the DP selection to further improve Performance Risk. It can be inferred from this experience that applying Axiom 2 concepts to just comparing alternative DPs is a limited application and ignores the significant potential benefit of an expanded view of the concept.
And finally, if we examine the cell phone example above, we see the child FRs identified to mitigate the Performance Risk (as represented by failure modes) of a cell phone ringtone DP are all reasonable and easily implemented. Yet these mitigations are not found on contemporary cell phones. This demonstrates how experienced design teams of the cell phone industry are consistently failing to deliver on functional

- 123 -
design performance, a value proposition of Axiomatic Design.
6 CONCLUSIONS
The Axiomatic Design practitioner should consider using failure mode analysis as a practical technique to assess, compare and mitigate Performance Risk of selected DPs.
In the experience of the authors, when this technique is introduced to practitioners of Axiomatic Design, the resulting decompositions are substantively and dramatically improved resulting in reduced development risk. Prior to this technique, Axiomatic Design would be considered an interesting but narrow point tool that could be used to analyze and better visualize potential root causes of a functional design problem. With this technique, Axiomatic Design becomes a useful tool for Performance Risk management worthy of inclusion into a design and development toolkit and applied as a standard process over the entire design.
7 REFERENCES
[1] Arcidiacono, G., Citti, P., Fontana, V., & Martelli, T., Reliability Improvement of Car Sliding Door using Axiomatic Approach, Seoul: Proceedings of the Third International Conference on Axiomatic Design, 2004.
[2] Guangbin, Yang “P - Diagram” in Life Cycle Reliability Engineering, John Wiley & Sons, pp. 133-135, 2007.
[3] Heo, G. H., Lee, T., & Do, S.H., Interactive System Design Using the Complementarity of Axiomatic Design and Fault Tree Analysis. Nuclear Engineering and Technology, 39(1) February, 2007.
[4] Mohsen, & Cekecek, Thoughts on the use of Axiomatic Designs within the Product Development Cycle. Cambridge, MA: Proceedings of ICAD2000 First International Conference on Axiomatic Design, 2000.
[5] Pasztor, A., Koh, Y., & Takahashis, Y. (n.d.). “Needed: Battery Expertise for Probe,” Wall Street Journal, Feb 27, 2013.
[6] Stamatis, D. H., Failure Mode and Effect Analysis: FMEA from Theory to Execution, Milwaukee, Wisconsin, ASQ Quality Press, 2003.
[7] Suh N.P., The Principles of Design, New York: Oxford University Press, 1990. ISBN 0-19-504345-6
[8] Suh N.P., Axiomatic Design: Advances and Applications, New York: Oxford University Press, 2001. ISBN 978-0-19-513466-7
[9] Trewn, J., & Yang, K., The Relationship between system Functions, Reliability and Dependent Failures. San Diego: 1998 IEEE International Conference on Systems, Man and Cybernetics, September, 1998.

Proceedings of ICAD2013 The Seventh International Conference on Axiomatic Design
Worcester – June 27-28, 2013
ICAD-2013-19
- 124 -
ABSTRACT
The design process of product development is the earliest opportunity to integrate safety into products. The term ‘design for safety’ captures this effort to integrate safety knowledge in the design process. Whereas, reverse engineering (RE) has been a common method to obtain design feedback and knowledge of the existing system, this paper presents a method for functional reverse engineering (FRE). Axiomatic Design (AD) is an attractive support for the concept of FRE because of its criteria for evaluating designs, its standard format for recording design decisions, and its ability to present design requirements and associated design parameters. The power take-off (PTO) system is used as a case study to illustrate and examine the proposed method.
Keywords: design for safety, IRAD method, functional reverse engineering, Axiomatic Design.
1 INTRODUCTION
The main accountability for making a product safe lies in the design process. The term ‘design for safety’ captures this effort to integrate the knowledge on safety in the design process. Hazards should be eliminated and risk reduced during early design phases of the product. Furthermore, safeguards and safety sheets should be used to mitigate any residual risk. General principles for safe design of machinery are stated in safety standards type A [ISO 12100, 2010; ISO/TR 14121-2, 2008]. These two standards show that an unacceptable risk may be reduced by the designer based on a four-step safety improvement strategy in this order of priority: 1. Elimination of hazards by design; 2. Risk reduction by design. This can be obtained by reducing energy, using more reliable components and etc; 3. Safeguarding by using barriers, as well as implementing protective measures through engineering controls and specific safety functions; 4. Adopt administrative measures to inform and warn users about residual risks.
Furthermore, many standards (type B and type C) have been issued to detail the design requirements, typical applications, and mode of utilization of various types of safeguards. In parallel, much research has been conducted to integrate safety objectives, constraints and requirements in the design processes [Hasan et al., 2003; Fadier and De la Garza, 2006; Houssin et al., 2011]. Although there is much research on safety considerations in the design process, we are not aware of any full general accounts. In this context, Ghemraoui et al. [2009a; 2009b; 2011] attempted to define safety objectives early in the product design process by proposing the innovative risk assessment design (IRAD) method. This method offers the mechanism for generating non-technical design objectives when preparing the requirements and constraints list based on AD.
Figure 1. Experience feedback analysis
For successful safety integration in design, design experiences to answer what-how and then know-how play a crucial role. On the other hand, to make an effective design, designers would like to reuse existing design knowledge along meaning, reasons, arguments, choices, consequences, etc. Indeed, it is important to extract design information to use in the design process. However, IRAD does not yet guide the designers how to achieve these aims.
TOWARD DESIGN FOR SAFETY PART 1: FUNCTIONAL REVERSE ENGINEERING DRIVEN BY AXIOMATIC DESIGN
Leyla Sadeghi [email protected]
National Research Institute of Science and Technology for Environment and Agriculture- Irstea rue Pierre
Gilles de Gennes, 92761, Antony cedex, France
Luc Mathieu [email protected],fr
Automated Production Research Laboratory- LURPA- ENS de Cachan- Paris 11, 61 avenue du president
Wilson, 94235, Cachan cedex, France
Nicolas Tricot [email protected]
National Research Institute of Science and Technology for Environment and Agriculture- Irstea rue Pierre
Gilles de Gennes, 92761, Antony cedex, France
Lama Al-Bassit lama.al [email protected]
National Research Institute of Science and Technology for Environment and Agriculture- Irstea rue Pierre
Gilles de Gennes, 92761, Antony cedex, France
Rima Ghemraoui [email protected]
Natural Grass 106 rue des poissonniers, 75018 Paris, France
Technical solution
Technical requirements
Experience feedbacks
Risk definition
Safety requirements

- 125 -
Chikofsky and Cross [1990] present a taxonomy of engineering terminology: “Forward engineering is the traditional process of moving from high-level abstractions and logical, implementation-independent designs to the physical implementation of a system”. “Reverse engineering is the process of analyzing a subject system to identify the system’s components and their interrelationships and create representations of the system in another form or at a higher level of abstraction”. “Re-engineering is the examination and alteration of a subject system to reconstitute it in a new form and the subsequent implementation of the new form.” In this context, in the research work toward design for safety, reverse engineering and re-engineering are investigated.
RE has been a common method to obtain the design feedback and knowledge of the existing system [Urbanic, 2008; Tang et al., 2010]. In the aim of safety integration in design, it needs to obtain the original intrinsic knowledge which is located in the function model of the existing system. However, up to date, the majority of research on RE is focused on the geometric and structured design rather than the functional aspects of the design. Therefore, there is a need to expand upon reverse engineering as a FRE. Little research has been conducted in form to function mapping [Otto and Wood, 1998; Gietka et al., 2002; Tang et al., 2010] which is important for FRE. However, the process of FRE is commonly informal. FRE does not consider either the reason why the concepts were introduced into the system, nor the functions and solution principles. Furthermore, FRE does not consider specific mechanisms to facilitate the identification of functions and solution principles, both important to the design process. Therefore, it is necessary to propose a formal method for FRE. The function analysis system technique (FAST) develops the system function tree. This technique highlights the order function(s) [Adams and Lenzr, 1997] but not clearly their interrelation with the solution. Whereas, AD [Suh, 1990; 2001] is a design methodology that guides the designer to find suitable design parameters (DPs) to meet the needs of the functional requirements (FRs). Therefore, the idea is to use this method in order to assess the original intrinsic knowledge of the design and to highlight areas of its improvement to enhance safety. Therefore, the objective of this paper is to propose a method for functional reverse engineering driven by AD. This method will be used to determine how the system works, and what the DPs and FRs are, but also the safety hazards and which DP and FR can be responsible for causing an accident. It is necessary to note that FRE does not involve changing the system objective or creating a new solution based on the reverse engineered system. Hence, the next step of design for safety will be to propose a functional re-engineering method based on the result of this paper to propose the safe design solutions.
The remainder of this paper is organized as follows. Section 2 explains briefly the AD principles and structure. This section also describes the motivation of our research work in terms of using AD as a base for proposing one method for FRE. Section 3 explains the proposed method for FRE. In Section 4, the PTO system is used as a case study to illustrate and examine the various steps of the proposed method. Finally, Section 5 includes the results, a brief discussion and conclusion.
2 AXIOMATIC DESIGN AND FUNCTIONAL REVERSE ENGIEERING
AD is an attractive support for the concept of FRE due to its criteria for evaluating designs, the standard format for recording design decisions, and the ability to present design requirements and associated design parameters. This method consists of four fundamental concepts. In the context of our objective to propose one method for FRE, we use all these concepts. In the following, we list [Suh, 1990] these four concepts and their link with our objective:
2.1 DESIGN AS A MAPPING PROCESS In FRE, for each component of the system, the DP and
FR have to be defined. We have to well describe the mapping between functional domain and physical domain.
2.2 DESIGN TOP-DOWN HIERARCHICAL STRUCTURE In the framework of FRE objective, the design top-down
hierarchical decomposition proposed by AD is used for hierarchies of the DPs defined for system components and then hierarchies of the FRs defined for DPs.
2.3 DESIGN AXIOMS The results of FRE have to respect two axioms of AD.
Based on these axioms, our aim is to design a reliable safe system.
2.4 DESIGN MATRIX In our research work, we need to use design matrix after
DPs and FRs identification of system to analyze their relationships for technical and safety solutions.
3 PROPOSED METHOD
The objective of this section is to propose a FRE method as a convenient way to express and represent the design history by describing how and why it proposed. As it is explained in previous sections, AD is basic. In this paper, the product's structure and architecture is called the ‘system’. This paper addresses the following questions: What is the intended context of use of the system? What are the system elements and their interactions and associated accidents and hazards? What is the function of the system component? (It must focus on the accidental component). In order to answer these questions, we suggest a FRE method of four steps and two sub-steps:
3.1 SYSTEM TECHNICAL EVALUATION
3.1.1 IDENTIFY SYSTEM EVOLUTION The first step is to study the previous systems in order to
identify system evolution. In fact, the term ‘evolution’ represents the value of the new system under study which is the result of meticulous work in the last years that has evolved into the new. The resources needed to investigate system evolution are: standards, patents, instruction for use, safety data sheets, accident reports and other applicable resources related to the system.

- 126 -
3.1.2 IDENTIFY SYSTEM COMPONENTS AND THEIR
INTERACTION
The system components not only contain the physical components in the system, but also performance requirements (behavior), which are important in determining the relationship with DPs. The purpose of this paper is to present a ‘component to function’ mapping framework to determine the function structure of the existing system. At first, the abstraction schema of the system has to delineate to find the units. In the second step, the product breakdown structure (PBS) [Ho Kon Tiat, 2006] is used to represent the system components by the structural decomposition (Figure 3). To illustrate the interaction between this system component decomposition [Ho Kon Tiat, 2006], we propose to use the functional block diagram (FBD). This diagram (Figure 4) highlights the fluxes existing between the elements of the product (contact, energy, matter, regard), and the external environments. This step involves the identification of the component defined based on the technical objective and the component based on the safety objective. The safety components will be grayed in the PBS and FBD.
Figure 2. The product breakdown structure.
Figure 3. The functional block diagram.
3.2 SYSTEM ACCIDENT EVALUATION
3.2.1 INVESTIGATE ON ACCIDENT REPORTS The goal of this section is to determine the hazardous
conditions of the system. Understanding the cause of accidents in the work place is an essential step toward design to safety. Accident scenario definitions help to describe the
reason accidents occur. One of the documents for describing the accident scenario is called the ‘accident report’. The important question is how do we define, understand and describe accidents? Accident reports provide details on factors that can cause an injury, but it is difficult to predict the location, the time and the reason the accident occurred.
For accident evaluation, the cause tree analysis (CTA) suggested to use. As a result, for accidents, the following information is listed: phase of machine usage, task identification, state of the machine, unintended behavior of the operator, harm, hazard zone, hazardous situation, hazardous event and hazard.
3.2.2 IDENTIFY SYSTEM COMPONENT THAT
GENERATES THE HAZARD After the system hazards are identified, the specific
system component related to these hazards needs to be determined. In step 2, the system and its components have been defined, and in step 3, the accident causes are listed. Therefore, by comparing these two steps, it is possible to connect each accident cause in its system component.
3.3 SAFETY DESIGN IDENTIFICATION
3.3.1 DEFINE DPS AND FRS HIERARCHY AND
DESIGN MATRIX As explained in Section 2, from the AD point of view,
product design begins in the customer domain, where various kinds of design constraints are considered to arrive at a final design solution after an iterative mapping process. This step is based on a design with a top-down hierarchical structure concept proposed by AD, but it starts from the system component, and after searching the design solutions, it defines the design goals. It means we do AD in the reverse way.
Table 1. Guide to formulate the DPs, FRS based on AD
DPs: Solutions FRs: GoalsAnswer what does it look like? what is its function?Start with nouns with verbsPresent design solutions design goalsDescribe -principal solution:
working means - mechanical motion components: rotating, reciprocating and transverse elements - mechanical action component: cutting, fitting, jointing, locking, accelerating, decelerating, elements
- working principle: efficiency - layout design: space requirements, weight, arrangement, fits, etc. - form design: material utilization, durability, deformation, strength, wear, shock resistance, stability, resonance, etc. - safety design: protection, etc.
The schema of defining DPs and FRs as shown includes two steps (Figure 4). Table 1 is proposed as a guide to formulate the DPs and FRs. For each system component, two sequential questions have to be answered: what does it look like? and what is its function?. The PBS and FBD have to integrate in this step to make DPs and FRs decomposition in a hierarchical way. After formulating the DPs and FRs hierarchy, the aim is use AD matrix to evaluate the design.
System
Unit2 Unit1 External environment1
Component1 Component2
Component2.1
Systematic level
0
1
2
3
n
. .
Component2.2
Component2.2…n
External environment1
External environment2
Unit2 Component1
Component2
Component2.2 Component2.1
Unit1

- 127 -
3.3.2 DEFINE THE LINK BETWEEN FR-DP- HAZARD This section aims to establish a link between the hazard
identified in Section 3.2 and the DP and FR. In Section 3.2, following accident evaluation, the system component that generates the hazard is defined. As stated in the previous section, the DP and FR for each component are determined. Therefore, the two section results combined together will define the FR and DP related to the mechanical hazard.
Figure 4. DPs and FRs hierarchy definition.
3.4 SAFETY RISK MEASUREMENT
3.4.1 RATE THE PROBABILITY FOR EACH HAZARD According to NF EN ISO 12100, the risk associated with
a particular hazardous situation (H) depends on the severity of harm and the probability of occurrence of that harm. Based on this definition, the Probability of hazard (Ph) is defined as:
Ph=
(3)
And the severity of harm is identified as impact factor for
hazard (IFh), in Figure 5:
Figure 5. IFh identification.
3.4.2 DEFINE THE JUDGMENT CRITERIA TO BE USED
IN RISK LEVEL IDENTIFICATION Based on the risk definition presented in Section 3.4.1, we
defined the decision factor for hazard (DFH), as the following equation, to measure the level of safety risk. A safer design solution is a solution with low DFH.
DFH=∑ P IF ⋯ P IF (4)
0 ≤ IFh≤ 100; 0 ≤ Ph ≤ 1
3.5 SYNTHESIS In the framework of ongoing research in ‘design for
safety’, a FRE method driven by AD is proposed. Table 2 lists the objective, input and output of each step of proposed FRE method.
Table 2. FRE method steps.
Step Summary
1: S
yste
m t
echn
ical
id
enti
fica
tion
Objective1: identify system evolution Input: information on standards, patents, instruction for use, safety sheets, other applicable resources Output: the value of the new system form technical and safety points of view Objective2: identify system components and their interaction based on schema abstraction of system, PBS and FBD Input: information about a typical system Output: list of system components and their interaction
2: S
yste
m a
ccid
ent
iden
tifi
cati
on
Objective1: evaluate system accident through CTAInput: information in accident reports Output: accident causes Objective2: identify system components that generate hazard Input: list of accident causes Output: hazard related each system component
3: S
afet
y d
esig
n
iden
tifi
cati
on
Objective1: define DPs and FRs hierarchy and design matrix Input: system components and their interaction Output: DPs and FRs hierarchy and their mapping evaluation with AD matrix Objective2: define the link between DP-FR-hazardInput: component and the hazards generated with that , component and related DPs, FRs, Output: component-DP-FR-hazard
4: S
afet
y ri
sk
mea
sure
men
t
Objective1: rate the probability for each hazardInput: information in accident reports Output: for each mechanical hazard, its Ph and IFh
Objective2: define the judgment criteria to be use in risk level identification Input: for each mechanical hazard, its Ph and IFh Output: component-DP-FR- hazard- DFH
4 CASE STUDY: PTO SYSTEM
Currently, the farming sector constitutes a serious problem in the domain of human safety. In this sector, the main source of safety risks is related to PTO systems. In agricultural tractors, the power of the engine is transmitted to a PTO drive shaft through a clutch and a mechanical reduction gear. It is further transmitted through a PTO clutch and a PTO shaft to a work machine provided at the rear of a tractor body. Figure 6 shows a PTO system.
FBD
What it does? What it looks like?
FR0
FR1 FR2
FR2.1 FR2.2
FR2.2.1 FR2.2.2
FR2.2.2.n
Safety solution Safety goal DP2.2.1 FR2.2.1
DP0
DP1 DP2
DP2.1 DP2.2
DP2.2.1 DP2.2.2
DP2.2.2.n
PBS
; ;
0 10 20 30 40 50 60 70 80 90 100
Minor Moderate Catastrophic Serious So serious

- 128 -
Figure 6. A PTO system.
4.1 IDENTIFY PTO SYSTEM EVOLUTION The existing PTO is the result of almost one century of
technical evolution and more than 80 years of safety evolution. Nevertheless, along with the extensive work done to improve the safety of PTO, this system is one of the oldest and most persistent hazards associated with agricultural machinery, and it is extremely dangerous even with safeguards [Klancher, 2008]. At first, we look at the PTO standards and patents evolution to find the gaps during its development.
Agricultural PTOs are standardized [ISO 5673-1, 2005; ISO 5673-2, 2005; NF EN ISO 5674, 2009; NF EN 12965+A2, 2009] in dimensions and rotation speed and the guards, shields and coupling have been introduced to eliminate or minimize the risk of entanglement. Current United States and Australian standards allow for the safety cover to rotate with the shaft. However, the safety cover must stop rotating when it comes into contact with an object. This requirement is normally achieved by the use of a safety guard bearing between the safety guard and the PTO shaft. European standards specify that safety guards must not rotate with the PTO shaft. PTO shafts typically incorporate the restraining member in the outer surface. Most current safety guard bearings have a flange or projection that rests in the groove in the PTO.
The patent evolution analysis covers a period of 88 years, from 1924 to 2012. We gathered and analyzed more than 50 patents as the solutions correspond to improving the PTO from a technical aspect or a safety aspect. This analysis confirms the first concept (using the rotating element to transform tractor energy to implement) has not changed and thus, more patents have been investigated to improve the PTO system from the safety point of view. To improve the safety of the PTO system, the researchers proposed to use guards to cover the rotating elements or they propose protective devices to shut the PTO systems down.
4.2 IDENTIFY PTO SYSTEM COMPONENTS AND
THEIR INTERACTION A typical PTO system is selected to identify its
components and their interaction. Figure 7 represents the abstraction schema of this system. This figure uses 0 for the PTO shaft, 1 and 2 for universal joints by the side of tractor, T1 for the telescopic member, 3 and 4 universal joints by the side of the implement, and 5 for the PIC shaft. This schema helps to determine the system units to analyze.
Based on abstraction schema of PTO system, the PBS is used to represent the PTO system components by structural decomposition (Figure 8). Figure 9 represents the PTO system component interaction based on a FBD.
Figure 7. Abstraction schema of the PTO system.
Figure 8. Decomposition of PTO system components.
Figure 9. PTO system component interaction.
Restraining member
PTO shield
PTO drive shaft guard
PTO shaft PIC shaft
Telescopic member
PIC yoke
PIC guard
PTO yoke
y0
z5
y1
R
R R
x0 x1 x4 x5x2 x3
y5y4y2y3
z2z3z0 z4
T1
z3z0 z1
T1
R
PTO system
PTO drive shaft
PTO yoke
PTO PIC PIC yoke
PTO drive shaft guard
Universal joint
Telescopic member
Universal joint
Guard cone
Guard cone
Guard tube
Restraining member
Tractor Implement
Unit2
Implement
PTO yoke
PTO drive shaft guard
Unit3
Unit1
Tractor
Guard cone
Guard cone
Guard tube
Restraining member
Universal joint
Telescopic member
Universal joint
PTO yoke

- 129 -
4.3 EVALUATE PTO SYSTEM ACCIDENTS The aim of this step is to evaluate the accidents that
occur as a result of the power take-off system through cause tree analysis (CTA). In France, from 2000 to 2011, there were 1915 accidents related to PTO systems. Table 3 shows the results of two selected accident report evaluations related to this system. Figure 10 shows that a person is at an increased risk of having an accident if they are in the vicinity of a PTO system with a missing, broken, damaged or poor fitting safeguard. The figure also correlates the number of accidents with the body part that is injured.
Table 3. The results of two PTO accident analyses.
Results Accident1 Accident2Phase of its usage Use Use Task identification removal of
product from the system
preventive maintenance
State of machine operates normally but without guard
operates normally but with broken guard
Unintended behavior of the operator
lack of carelessness
lack of concentration
Harm death death Hazardous situation
possibility to get closer to system
possibility to get closer to system
Hazardous event get closer to system
get closer to system
Hazardous zone space around of system
space around of system
Hazard entanglement with rotating element without guard
entanglement with rotating element with broken guard
Figure 10. PTO system accident evaluation.
4.4 IDENTIFY PTO SYSTEM COMPONENTS THAT
GENERATE HAZARDS The accident evaluation confirms that PTO drive shaft
safe guards still don’t ensure human safety. In fact, in the case
of missing, broken, damaged or badly fitting safeguards of the PTO system, this system will be very dangerous. As a consequence, to improve the safety of the PTO system, we will investigate the safeguards and define their DPs and FRs.
4.5 DEFINE DPS AND FRS HIERARCHY AND DESIGN
MATRIX OF A PTO SYSTEM Using the Figure 7, Figure 8 and Figure 9, and based on
the design top-down hierarchical structure concept proposed by AD, we identified the hierarchy for the DPs and the FRs of the PTO system (Figure 11). Each DP presents what does component look like; for example, telescopic members like the shaft (DP1.2) or safe guarding (DP2.2) presents PTO shaft guard. The FRs describe the functions of the DPs; for example, allow a translation along the PTO shaft (FR1.4) describes T1. Figure 11 shows in PTO system, there is no design solution to carry out the alignment between universal joint and PTO. That is because DP13 does not satisfy any of the FRs.
After formulating the FRs and DPs hierarchy, the AD matrix is used to evaluate the PTO system design (Figure 12). This matrix illustrates the coupling related to FRs for the PTO system itself and also for its safeguarding. These couplings have to be evaluated from mechanical and safety points of view. The evaluation shows that, from a mechanical point of view, the PTO system and its safeguarding are coupled designs. One DP has to satisfy several FRs. Moreover, the accidents are not introduced by the coupling. Indeed, from the safety point of view the safeguard designing is not a robust design and Axiom 2 of AD is not verified. The aim of this research is not to eliminate the coupling.
4.6 DEFINE THE LINK BETWEEN DP-FR-HAZARD Based on results of previous steps, the aim of this step is
to define the link between DP-FR-Hazard related to PTO system. Table 4 shows the link for two the PTO accidents presented in Table 3.
Table 4. Hazard- DP-FR.
Hazard DP FREntanglement with rotating element without guard
Enclosing guard
Make the system rotating safe
Entanglement with rotating element with broken guard
Enclosing guard
Make the system rotating safe
4.7 RATE THE PROBABILITY OF HAZARD In this step based on the available accident reports, the Ph
and the IFh for the PTO system are defined as following. In this case, ‘h’ is defined as ‘entanglement by PTO drive shaft with a missing, broken, damaged or a badly fitting safeguard’. Ph= 0.7 80 ≤ IFh ≤ 100
4.8 DEFINE JUDGMENT CRITERIA FOR PTO SYSTEM
RISK LEVEL IDENTIFICATION After defining the Ph and IFh related to the PTO system
accident, the decision factor for hazard as a judgment criterion for risk measurement is determined: 56 ≤ DFH ≤ 70

- 130 -
Figure 11. DPs and FRs hierarchies of a PTO system.
Figure 12. PTO system design matrix.
4.9 SYNTHESIS To conclude, the results of applying the proposed FRE
on the PTO system, is presented in the Table 5.
Table 5. Results FRE of PTO system accident analysis.
PTO system accident Hazard Entanglement by PTO drive shaft with missed,
broken, damaged or badly fitting safeguard DP Enclosing guardFR Make the system rotating safe DFh 56 ≤ DFH ≤ 70
Based on these results in the case of missing, broken, damaged or badly fitting safeguards, there is always a high probality of an accident occuring. The first idea; to safely operate implement with the tractor energy is to make a robust design with a guard through applying axiom 2 of AD. The other idea is to improve new solutions for safeguard design. And the third idea is to search for new concepts of transmitting energy with respect to safety objectives.
5 CONCLUSION
The term ‘design for safety’ captures the effort to integrate the knowledge of safety in the design process. Therefore, in order to provide a more effective design to safety, in the present paper, a FRE driven by AD has been developed. The proposed method can distinguish the components, design parameters and function requirements of an existing system and define the hazard related to each component, the design parameter and the functional requirement. The PTO system is used to illustrate the proposed method. The following work will focus on functional re-engineering to propose safe requirements, safe design parameters and finally safe solution. A technology for software support of proposed method is in the process of being developed.
DP0: system with rotating element
DP1: positioning system
DP1.1: universal jointing by side of implement
DP1.2: universal jointing by side of tractor
DP1.3: -
DP1.4: telescopic shaft
DP1.5: fixed jointing by side of tractor
DP1.6: fixed jointing by side of implement
DP2: power transmission system
DP2.1: rotating axis system
DP2.2: safe guarding
DP2.2.1: conical guard by side of tractor
DP2.2.2: tubing telescopic guard
DP2.2.3: conical guard by side of implement
DP2.2.4: restraining member
FR0: operate implement through tractor energy
FR1: allow different positions between two shafts
FR1.1: allow a rotation around 2axes perpendicular to PTO shaft axe
FR1.2: allow a rotation around PTO shaft
FR1.5: connect the system to PTO shaft of tractor
FR1.6: connect the system to PTO shaft of implement
FR2: transmit power form tractor to implement
FR2.1: transmit power with rotation
FR2.2: make the system rotating safe
FR2.2.2: cover telescopic member
FR2.2.3: cover universal joint by side of implement
FR2.2.4: prevent rotation
FR2.2: cover universal joint by side of tractor
FR1.3: allow a translation along 2axes perpendicular to PTO shaft
FR1.4: allow a translation along PTO shaft

- 131 -
6 ACKNOWLEGMENTS
The authors wish to thank the French Agricultural Social Insurance (CCMSA) and the French Ministry of Agriculture, Agri-Foods and Forests (Labor and Social Protection Sub-Division) for making available the accident reports and accidents statistics.
7 REFERENCES
[1] Adams M., Lenzer W., “Facts of FAST”, Save international conference proceeding, 1997.
[2] Chikofsky E., Cross J. H., “Reverse Engineering and Design Recovery: A Taxonomy”, IEEE Software, vol. 7, no. 1, pp. 13-17, 1990.
[3] Dunbing T., Renmiao Zhu, Xuling Chen, Tiegang Zang, Ronghua Xu, “Functional Reverse Engineering for Re-creation Design”, Proceedings of the 6th CIRP-Sponsored International Conference on Digital Enterprise Technology , 2010.
[4] Fadier E., De la Garza C., “Safety Design: Towards a new philosophy”. In: Safety Science, 44(1), 55-73, 2006.
[5] Ghemraoui R., Mathieu, L., Tricot, N., “Design Method for Systematic Safety Integration”, CIRP Annals -Manufacturing Technology. 58,161-164, 2009a.
[6] Ghemraoui R., Mathieu, L., Tricot, N., “Systematic human-safety analysis approach based on Axiomatic Design principles”, International Conference on Axiomatic Design, 5th ICAD, Lisbon, Portugal, March 25-27, 2009b.
[7] Ghemraoui R., Mathieu, L., Brown, C., “Defining safety objectives during product design”, International Conference on Axiomatic Design, 6th ICAD, Daejeon, March 30-31, 2011.
[8] Gietka P., Verma,M,Wood, W,H., “Function Modeling, Reverse Engineering, and Design Reuse”, Design Enginerring Technical conferences, Monteral, Canada, Sptembre 29- Cotobre 2, 2002.
[9] Hasan R., Bernard B., Ciccotelli J.Martin, P., “Integrating safety into the design process: elements and concepts relative to the working situation”. Safety Science. 41,155-179, 2003.
[10] Ho Kon Tiat V., “Aide à la décision pour la conception préliminaire de procédés d'évaporation flash”, Doctoral
thesis, Laboratoire interétablissements CNRS, ENSAM, ENSCPB, Université Bordeaux 1, France, 2006.
[11] Houssin R., Coulibaly A. “An approach to solve contradiction problems for the safety integration in innovative design process”, Computers in Industry 62 398-406, 2011.
[12] ISO 5673-1., “Agricultural tractors and machinery- power take-off drive shafts and power input connection- part1: General manufacturing and safety requirements”, 2005.
[13] ISO 5673-2., “Agricultural tractors and machinery -Power take-off drive shafts and power input connection - Part 2: Specification for use of PTO drive shafts, and position and clearance of PTO drive line and PIC for various attachments”, 2005.
[14] ISO/TR 14121-2, “Safety of machinery- Risk assessment- Part 2: Practical guidance and examples of methods”, 2008.
[15] Klancher L., “The Farmall Dynasty: A History of International Harvester Tractors: Titan, Mogul, Farmall, Letter, Cub, Hundred, And More”, 2008. http://books.google.fr
[16] NF EN ISO 12100. , “Safety of machinery - General principles for design - Risk assessment and risk reduction”, 2010.
[17] NF NE 12965+A2, “Tractors and machinery for agriculture and forestry: Power take-off (PTO) drive shafts and their guards”, 2009.
[18] Otto K.N., Wood K.L., “Product Evolution: A Reverse Engineering and Redesign Methodology”, Research in Engineering Design 10:226–243, 1998.
[19] Suh N.P., The Principles of Design, New York: Oxford University Press, 1990. ISBN 0-19-504345-6
[20] Suh N., Axiomatic Design: Advances and Applications, New York: Oxford University Press, 2001. ISBN 0-19-513466-4
[21] Urbanic R. J., ElMaraghy H. A., ElMaraghy. W. H., “A reverse engineering methodology for rotary components from point cloud data”, Int J Adv Manuf Technol, 37:1146–1167, 2008.
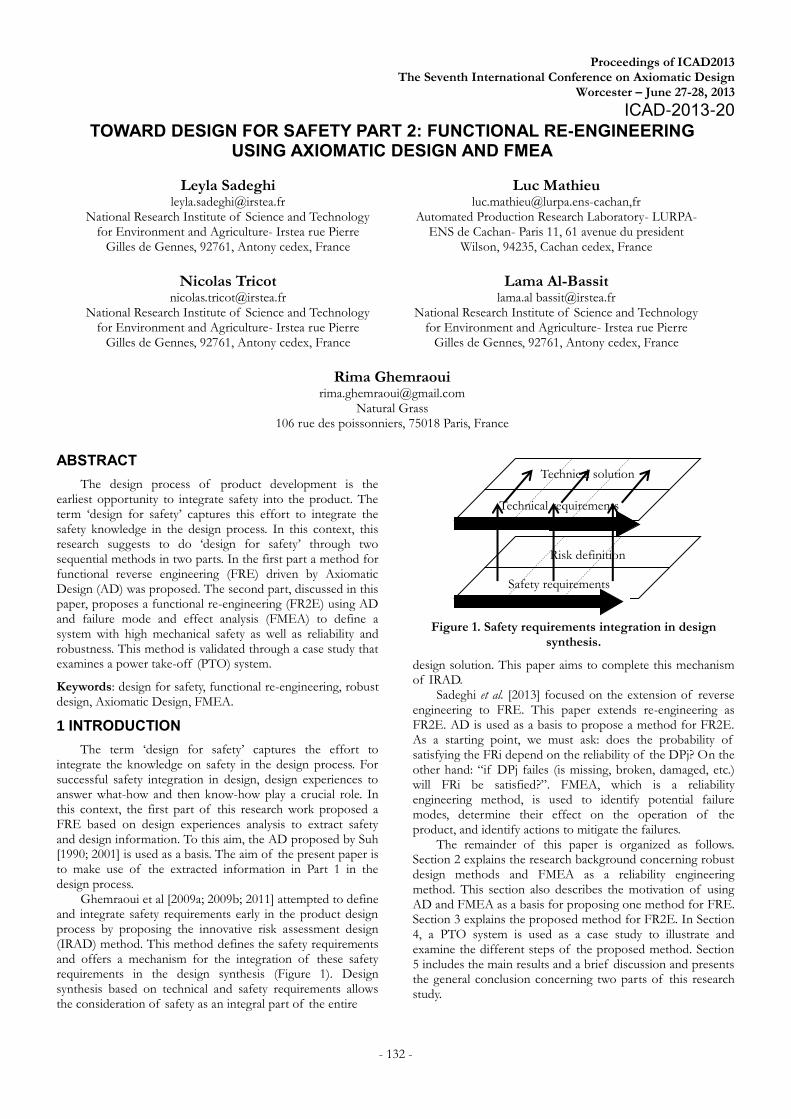
Proceedings of ICAD2013 The Seventh International Conference on Axiomatic Design
Worcester – June 27-28, 2013
ICAD-2013-20
- 132 -
ABSTRACT
The design process of product development is the earliest opportunity to integrate safety into the product. The term ‘design for safety’ captures this effort to integrate the safety knowledge in the design process. In this context, this research suggests to do ‘design for safety’ through two sequential methods in two parts. In the first part a method for functional reverse engineering (FRE) driven by Axiomatic Design (AD) was proposed. The second part, discussed in this paper, proposes a functional re-engineering (FR2E) using AD and failure mode and effect analysis (FMEA) to define a system with high mechanical safety as well as reliability and robustness. This method is validated through a case study that examines a power take-off (PTO) system.
Keywords: design for safety, functional re-engineering, robust design, Axiomatic Design, FMEA.
1 INTRODUCTION
The term ‘design for safety’ captures the effort to integrate the knowledge on safety in the design process. For successful safety integration in design, design experiences to answer what-how and then know-how play a crucial role. In this context, the first part of this research work proposed a FRE based on design experiences analysis to extract safety and design information. To this aim, the AD proposed by Suh [1990; 2001] is used as a basis. The aim of the present paper is to make use of the extracted information in Part 1 in the design process.
Ghemraoui et al [2009a; 2009b; 2011] attempted to define and integrate safety requirements early in the product design process by proposing the innovative risk assessment design (IRAD) method. This method defines the safety requirements and offers a mechanism for the integration of these safety requirements in the design synthesis (Figure 1). Design synthesis based on technical and safety requirements allows the consideration of safety as an integral part of the entire
Figure 1. Safety requirements integration in design
synthesis.
design solution. This paper aims to complete this mechanism of IRAD.
Sadeghi et al. [2013] focused on the extension of reverse engineering to FRE. This paper extends re-engineering as FR2E. AD is used as a basis to propose a method for FR2E. As a starting point, we must ask: does the probability of satisfying the FRi depend on the reliability of the DPj? On the other hand: “if DPj failes (is missing, broken, damaged, etc.) will FRi be satisfied?”. FMEA, which is a reliability engineering method, is used to identify potential failure modes, determine their effect on the operation of the product, and identify actions to mitigate the failures.
The remainder of this paper is organized as follows. Section 2 explains the research background concerning robust design methods and FMEA as a reliability engineering method. This section also describes the motivation of using AD and FMEA as a basis for proposing one method for FRE. Section 3 explains the proposed method for FR2E. In Section 4, a PTO system is used as a case study to illustrate and examine the different steps of the proposed method. Section 5 includes the main results and a brief discussion and presents the general conclusion concerning two parts of this research study.
TOWARD DESIGN FOR SAFETY PART 2: FUNCTIONAL RE-ENGINEERING USING AXIOMATIC DESIGN AND FMEA
Leyla Sadeghi [email protected]
National Research Institute of Science and Technology for Environment and Agriculture- Irstea rue Pierre
Gilles de Gennes, 92761, Antony cedex, France
Luc Mathieu [email protected],fr
Automated Production Research Laboratory- LURPA- ENS de Cachan- Paris 11, 61 avenue du president
Wilson, 94235, Cachan cedex, France
Nicolas Tricot
[email protected] National Research Institute of Science and Technology
for Environment and Agriculture- Irstea rue Pierre Gilles de Gennes, 92761, Antony cedex, France
Lama Al-Bassit lama.al [email protected]
National Research Institute of Science and Technology for Environment and Agriculture- Irstea rue Pierre
Gilles de Gennes, 92761, Antony cedex, France
Rima Ghemraoui
[email protected] Natural Grass
106 rue des poissonniers, 75018 Paris, France
Technical solution
Technical requirements
Risk definition
Safety requirements

- 133 -
2 RESEARCH BACKGROUND
2.1 RELIABILITY, ROBUSTNESS, PERFORMANCE, ACCIDENTS, SAFETY
This section attempts to answer the question: why is reliability and robustness analysis needed in research toward design for safety? Safety is defined as the absence of unwanted events while risk is defined as the probability that something unwanted may happen. Unwanted occurrences can lead to accidents [Ghemraoui, 2009]. Accidents can occur due to human errors, machine (system) faults, environmental anomalies or a combination of them.
System faults are due to a system or component that does not perform as expected under erroneous, stressful, or unexpected inputs or conditions (in perturbations). This refers to two concepts: ‘reliability’ and ‘robustness’. In engineering, ‘reliability’ is associated with the confidence that a system will perform its intended function during a specified period of time under the stated conditions, as well as under unexpected circumstances [Barber and A Salido, 2011]. Reliability is defined as the ability of a machine or its components to perform a required function under specified conditions and for a given period of time without failing [NF EN ISO 12100]. In a general way, ‘robustness’ can be defined as the ability of a system to withstand stress, pressure, perturbations, unpredictable changes or variations in its operating environment without loss of functionality [Barber and A Salido, 2011]. In engineering, robustness can be defined as reducing the variation in FRs of a system and having them on target as defined by the customer [Taguchi and Wu, 1980].
In some cases, safety problems are related to system reliability and its robustness. That means the safety aspect is considered during the design process of system and there are no accident and safety problems for new systems but it does not consider more time. Therefore, in the design for safety method, the system must be both robust and reliable in order to fulfill safety goals and this must be considered early in the design process
2.2 ROBUST DESIGN METHODS
Park et al. [2006] classified robust design in three methods: 1. the Taguchi method, 2. robust optimization, and 3. robust design with AD. In this section, the first and third methods are briefly reviewed.
2.2.1 TAGUCHI METHOD
Two types of variables or factors are defined by Taguchi in robust design: easy-to-control variables (control factors) and hard-to-control variables (noise factors). Noise factors may come from several sources; noise external, noise internal, and noise unit-to-unit. The objective of robust design is to determine the setting of the control factor to achieve the best product or process performance that is insensitive to the variability of noise factors. To achieve this, Taguchi recommends performing experiments in which control and noise factors setting are determined using orthogonal arrays [Taguchi, 1987]. Table 1 presents the three major phases of the design process emphasized by Taguchi: concept design, parameter design, and tolerance design. For each phase, some
design activities are listed that have a major impact on robustness.
Table 1. Phases in the design process and design activities related to robustness.
Phase Design activities related to robustness
Concept design
Generate concepts to create the desired function Generate concepts to make a function more robust Evaluate concepts Select from a set of concepts that one is to pursue
Parameter design
Plan a search through the design space Conduct experiments Analyze data
Tolerance design
Estimate the economic losses due to variations Allocate variations among components Optimize trade-offs between cost and quality
The advantage of the Taguchi method is that it provides
a simple and systematic framework for identifying critical characteristics in systems to achieve best quality characteristics while minimizing the variation and cost.
2.2.2 ROBUST DESIGN WITH AD
The Information Axiom of AD Theory deals with information content, the probability of satisfying the FRs, and complexity. Information content is defined in terms of probability of success and is the additional information required to satisfy the FR. The process to apply these two axioms has been illustrated by Gebala and Suh [1992] and Suh [2001]. These axioms provide a framework to indicate the adequacy of the design. They are used for considering, evaluating, and comparing different alternatives to satisfy the needs or requirements of a system.
The natures of the Independence and the Information Axioms improve the robustness of artifacts created using AD. By designing a system with minimal interaction between components (satisfying Axiom 1); if noise is introduced into one component of the system, it will not propagate into other components, and therefore robustness will be improved. The second axiom instructs the designer to select the design with the least information content. The information content of a design is determined by the probability of satisfying the design objectives (what the design is trying to achieve). Therefore robustness will be enhanced by satisfying the second axiom of AD.
Computing the information content in a design is facilitated by the notation of the design range and the system range. The design range is specified for each FR by the designer, whereas the system range is the resulting actual performance of the design embodiment [Suh, 2001]. To achieve a robust design, Suh proposed to eliminate the bias and reduce of the variance of the system (Figure 2). The term bias is defined as the difference between the mean of an FR in the system range distribution and the target value T defined by the customer, as depicted in Figure 2. In this figure the

- 134 -
overlap between design range and system range is called the common range.
Figure 2. Suh’s definition of probability of success [2001].
To eliminate or reduce of bias, in a one-FR design, Suh [2001] suggested changing the DP with a more appropriate one. When there is more than one FR to be satisfied, to eliminate bias, the design must satisfy the Independence Axiom first. To reduce the variance, Suh proposed different ways to determine if the design satisfied the Independence Axiom: a. Through reduction of stiffness; b. Through design of a system that is immune to variation; c. Through minimizing the random variation of DPs and
PVs (process variables); d. By compensation; and e. By increasing the design range.
Information content is defined in terms of the probability of satisfying a given FRi. In some cases, the probability of satisfying the FRi depends on the reliability of the DPj. On the other hand, if DPj fails, then FRj will not be satisfied. This is why this research requires reliability analysis.
2.3 RELIABILITY ENGINEERING
Reliability engineering methods like failure mode and effect analysis or fault tree analysis (FTA) can be helpful for the analysis of present the failure(s) in the system [Heo et al., 2007]. FTA is frequently used to improve system reliability and safety by identifying the cause(s) of the failure. FMEA is used to identify potential failure modes, determine their effect on the operation of the product, and identify actions to mitigate the failures. The main difference between these two methods is: FTA is used when effect is known and cause is unknown, while FMEA is used for the conditions where cause is known and effect is unknown.
Arcidiacono et al. [2004] proposed an approach to reliability improvement of a sliding car door using an AD and FMEA. This paper selected FMEA to define the opportunities to enhance the reliability and robustness of a component. Therefore, a brief description of this method is presented here. FMEA is a method for analyzing potential reliability. This method is used to identify potential failure modes, determine their effect on the operation of the system, and identify actions to mitigate the failures. A crucial step is anticipating what might go wrong with a system. Therefore, it is designed to help the engineer improve the quality and reliability of a design.
2.4 FUNCTIONAL RE-ENGINEERING
Sadeghi et al. [2013] extended reverse engineering as FRE. The present paper extends re-engineering as FR2E. According to research background presented in this section, the next section aims to propose a method for FR2E using AD, principles of the Taguchi method and FMEA.
3 PROPOSED METHOD
The purpose of FR2E in this research is to define a system with high mechanical safety, which is reliable and robust with few possible human errors. The proposed method for FR2E integrates AD representation (the design matrix), the two axioms of AD, principles of Taguchi method, and FMEA to propose safe solution(s).
3.1 SYSTEM RELIABILITY ANALYSIS
3.1.1 IDENTIFY UNRELIABLE COMPONENT(S) AND
RELATED DP(S) AND FR(S)
The FRE method [Sadeghi et al., 2013] can determine the components, physical structure and functional structure of an existing system and define the hazard related to each component, DP and FR. The question that must be answered is: does the probability of satisfying FRi depend on the reliability of DPj? On the other hand: “if DPj fails (is missing, broken, damaged, etc.) will FRi be satisfied?” If the response of the above question is ‘no’, we deduce that design is un-robust and unreliable. Therefore, the component that is identified by DPj and FRi has to be redesigned. In the context of FR2E, this question can be answered based on experience feedback analysis (the results of FRE), and this is the advantage of FR2E. The objective is to identify unreliable component(s), and its (their) related DP(s) and FR(s) and try to improve the robustness of the DP(s) and FR(s) to increase the reliability of related component.
3.1.2 Define THE SYSTEM RANGE
This section aims to identify the actual performance of the design embodiment (system range) for the functional failure identified in the previous section. Normally the system range depends on time, meaning that, during the specified period of time, under the stated conditions, as well as unexpected circumstances, the component is reliable.
3.2 SYSTEM NOISE FACTORS IDENTIFICATION
This section aims to identify noise factors. Noise factors may come from several sources. Taguchi defines three types of noise, which include; external, noise internal, and noise unit-to-unit [Taguchi, 1986]. Knowing the categorization of a noise can help the designer to predict which noise may play a factor in the system under consideration. This is an area in which experience feedback on the system will be important.
The information from experience feedback may also be used to predict which noise factors are likely to contribute to the behavior of the system and enhance its performance. The strategy proposed to achieve this purpose is based on use of the FMEA method. The first step is to identify major sources of noise (failure mode and its causes and effects), and then specifically target them to identify the opportunities for

- 135 -
improving performance and in consequence robustness and reliability.
An accident can occur due to human error, machine (system) faults, environmental anomalies or a combination. Human error and environmental anomalies can be reduced by supplying guidelines for use (e.g. warning devices, operating procedures and employee training programs) to enhance safety of the system. However, people do not always respect operator guidelines; hence this research investigates a way to enhance the safety of the system through identifying machine faults
3.2.1 IDENTIFY FAILURE MODE, CAUSES AND
EFFECTS
The FMEA method is used to identify potential failure modes, determine their effect on the operation of the system, and identify actions to mitigate the failures. A crucial step of this method is anticipating what might go wrong with a system. To effectively identify a failure mode and its causes and effects, the experiences feedback analysis (accident reports and other resources analysis) must be used. This is the advantage of FRE over forward engineering (FE). In FE, the designer defines a potential failure mode and its potential causes and effects, but in FR2E based on experiences feedback analysis the designer can define the real failure mode and its causes and effects.
3.2.2 IDENTIFY OPPORTUNITIES FOR IMPROVING
PERFORMANCE
The second step in identifying system noise factors using FMEA is to identify opportunity(s) for improving the performance of a component that is not robust, hence enhancing its reliability and robustness. To achieve this purpose, the suggestions proposed by Suh [2001] to eliminate or reduce bias and variance should be applied.
3.3 ROBUST SAFE DESIGN
3.3.1 CREATION OF ROBUSTNESS FR(S)
For each defined noise factor in the previous step, this section aims to create FR(s) to minimize the system response or susceptibility to the noise factor. The general form of the FR, in concurrence with standard AD practice, should express the requirement as a verb. The robustness FRs for a PTO system guard will be given in Section 4.
3.3.2 MAPPING TO ROBUSTNESS DP(S)
After creating robustness FR(s), the next step will be mapping it (their) to DP(s) by applying AD. One possibility may be to select some parameters of the existing component and use them as the DPs to control system response to a noise factor. If this is not possible, a new element may be added as the DP to the component to provide a parameter to control response to the noise factor. The new robust DP(s) may reduce sensitivity or shield the system from the noise.
3.4 SYNTHESIS
In the framework of ongoing research in ‘design for safety’, a FR2E method using AD and FMEA is proposed. Table 2 lists the objective, input and output of each step of the proposed FR2E method.
Table 2. FR2E method steps.
Step Summary
1: S
yst
em
reli
abil
ity a
nd
an
aly
sis
Objective 1: identify unreliable component(s) and related DP(s) and FR(s) Input: AD matrix Output: unreliable component(s), and its (their) related DP(s) and FR(s) Objective 2: define system range Input: unreliable component(s) and its (their) related DP(s) and FR(s) Output: system range
2:
Syst
em
no
ise f
acto
r
defi
nit
ion
Objective 1: identify failure mode, its cause and effects Input: unreliable component(s) and its (their) related DP(s) and FR(s) and system range Output: failure mode, its causes and effect(s) failure
based on experiences feedbacks analysis
Objective 2: identify opportunities for improving performance Input: unreliable component(s) and its (their) related DP(s) and FR(s), system range, failure mode, its cause and effects Output: opportunities for improving performance
3:
Ro
bu
st
safe
desi
gn
Objective 1: creation robustness FR(s) Input: system noise factors Output: new robust FR(s) Objective 2: mapping to robustness DP(s) Input: new robust FR Output: new robust DP(s)
4 CASE STUDY: PTO SYSTEM
This section examines a PTO system to illustrate and investigate the proposed FR2E method. Based on the definition of robustness, the aim is to design a PTO system safeguard to withstand stress, pressure, perturbations, unpredictable changes or variations in the operating environment without loss of function. Furthermore, the PTO system safeguard must be robust: it must not be affected by humidity, vibrations, accelerations, temperature, or other noise factors.
4.1 IDENTIFY UNRELIABLE COMPONENT(S) AND
RELATED DP(S) AND FR(S) OF PTO SYSTEM
Entanglement with a PTO system is most common when the system is working with missing, broken, damaged or badly fitting safeguards and the person gets too close in proximity [Sadeghi et al, 2013]. The results of this section are shown in Table 3. In this table, column 1 illustrates the number of unreliable and un-robust components, and columns 2, 3, 4 present the unreliable components and their related DPs and FRs for PTO system safeguarding.
4.2 DEFINE PTO GUARD SYSTEM RANGE
The PTO system guard is damaged or broken after a period of its utilization. The experience feedback analysis

- 136 -
illustrates the actual performance of its design embodiment is about 1000 hours (Column 5 of Table 3).
Table 3. Results of PTO system reliability and robustness analysis.
4.3 IDENTIFY PTO SYSTEM GUARD FAILURE MODE, CAUSES AND EFFECTS
The first question is ‘why do PTO system guards tend to break or damage over time?’ A review of relevant literature shows that although several aspects of PTO system guarding have been studied, they have not determined the specific causes for damage found on the PTO system guards.
These PTO system guards (guard cones by the side of the tractor, guard tubes and guard cones by the side of the implement) are designed to protect the operator and equipment. These guards not only reduce the risk of an injury; they also keep dust and other foreign objects from damaging the moving elements of the system. A restraining member shall be provided to prevent the guard rotating with the shaft. The member(s) of the restraining system (e.g. a chain or a wire rope) should be securely attached to the guard and provided with a fitting that will enable it to be attached to a stationary part of the system. This restraining system shall not be used as support of the shaft [NF EN 12965+A2].
In Table 4, columns 2, 3 and 4 show the PTO systems guard failure modes, and the causes and effects present after reviewing different accident reports and other applicable resources. The results show that steel guards were missing more often than plastics ones; however plastics guards were more often damaged. The problem with the steel PTO guard is that when it is dented it cannot freely rotate on the shaft. The problem with the plastic guards is that they are not resistant to degradation of the universal joint. The main problem with safeguards is that they crash, rub and push against each other and other parts such as draw bars and three points hitch linkage arms. In addition, safeguards rust, become obsolete and brittle and perish due to exposure to the elements or environmental conditions (sunlight and heat, cold, etc.).
4.4 IDENTIFY OPPORTUNITIES FOR IMPROVING
PERFORMANCE OF PTO GUARDS
The opportunities for improving the performance of PTO guards are presented in column 5 of Table 4. The designer can propose information to enhance the PTO system
safety following its design. For example: a system can remain in a garage to reduce exposure to damage, or farmers can be encouraged to maintain accepted levels of safety by replacing damaged guards. However, the operators do not always respect the user guidelines. Therefore, the main objective of this research is to improve the PTO system design to enhance safety. In the PTO system, improving the guard cone and restraining member design can enhance their performance and safety.
Table 4. PTO system noise factor definition.
N Failure mode (what)
Cause(s) of failure (why)
Effect(s) of failure
Opportunities for improving performance
1 - cut - scuffed - missing - bent - loose
- greasing mode - rubbing on the implement PIC guard - contacting the master shield or PIC guard
no/ loss cover of the universal joint
- proposition information for use - improvement of guard cone design
2 - broken fixed eyes
guard -vibration - friction - arrachement
guard rotate
- proposition information for use - improvement of restraining member design
4.5 CREATION OF ROBUSTNESS FR(S) FOR PTO
GUARDS
Based on the results in the previous section, to improve robustness of the first component, ‘guard cone by the side of the tractor’, we can use the new safe robust FR221 to ‘cover universal joint by side of tractor able to resist contact damage’. The new FR224 to improve robustness of the ‘restraining member’ can be created to ‘prevent rotation in a condition of high vibration’. The next section deals with definition of a robust DP for satisfaction of each new robust FR.
4.6 MAPPING TO ROBUSTNESS DP(S) FOR PTO
GUARDS
Damage caused by contact of different components is related to the type of material(s) used in PTO system safeguards. Therefore, we propose a new robust DP221, which is to create a “conical guard by the side of the tractor manufactured using resistant material(s)”.
To enhance the robustness of the restraining member (to prevent it from breaking) the chain has to be strengthened, but without increasing complexity. Therefore, we suggest the new robust DP224 by ‘fitting stronger restraining member’.
4.7 SYNTHESIS
To conclude, the results of applying the proposed FR2E method on the PTO system are summarized in Table 5. The
N Component FRi DPj System range
1 guard cone by side of tractor
FR221: cover universal joint by side of tractor
DP221: conical guard by side of tractor
about maximum 1000 hours utilization
2 restraining member
FR224: prevent rotation
DP224: restraining member
about maximum 1000 hours utilization

- 137 -
first column illustrates existing un-robust FRs and DPs while the second column presents the robust FRs and DPs to increase the reliability of safeguarding the PTO system.
Table 5. Results of FR2E on the PTO system.
un-robust FRs and DPs robustness FRs and DPs
FR221: cover universal joint by side of tractor
DP221: conical guard by side of tractor
FR221: cover universal joint by side of tractor in the contact condition
DP221: conical guard by side of tractor manufactured by resistant material(s) (to compression, tension, friction, environmental factors)
FR224: prevent rotation
DP224: restraining member
FR224: prevent rotation in condition of high vibration
DP224: fitting stronger (to compression, tension, friction, environmental factors) restraining member
5 GENERAL CONCLUSION
This paper has attempted to illustrate how AD can be integrated with reliability engineering methods to enhance safety in the design process. The proposed method, FR2E, includes three steps. In the first step, based on the AD matrix and feedback evaluation, the reliability and robustness of the system design are analyzed. Next, the FMEA method is used to identify noise factors. In the third step, robust new FR(s) and DP(s) are proposed. This method is demonstrated with a PTO system.
This paper is the result of ongoing research in ‘design for safety’ and suggests a design for safety method through two sequential methods in two parts. The first part proposed a FRE approach driven by AD to obtain the design feedback and knowledge of the existing system. The aim of FRE is to obtain the original intrinsic design and safety knowledge which is located in the functional model of existing systems. To identify system components and their interaction the following methods are used: the schema abstraction of system, the product breakdown structure and functional block diagrams. The second part proposed a FR2E using AD and FMEA to define a system with high mechanical safety that is reliable and robust with few possible person errors.
The PTO system is used as a case study to illustrate and examine the proposed method in each part. To aid in design decision making, the knowledge from each part has started to be formalized through knowledge engineering approaches. Furthermore, technology for software support of the proposed method is being developed.
6 REFERENCES
[1] Arcidiacono G., Citti P., Fontana V., Martelli T., “ Reliability Improvement of Car Sliding Door Using Axiomatic Approach”, International Conference on Axiomatic Design, 3th ICAD, Seoul – June 21-24, 2004.
[2] Barber F., A Salido M., “Robustness, Stability, Recoverability and Reliability in Dynamic Constraint Satisfaction Problems”, Technical Report DSIC-IA-PS: 1, Departamento de Sistemas Informaticos y Computacion. Universidad Politecnica de Valencia, 2011.
[3] Chikofsky E., Cross J. H., “Reverse Engineering and Design Recovery: A Taxonomy”, IEEE Software, vol. 7, no. 1, pp. 13-17, 1990.
[4] Gebala DA., Suh N.P., “An application of Axiomatic Design”, Research in Engineering Design 3: 149-162, 1992.
[5] Ghemraoui R., Mathieu, L., Tricot, N., “Design Method for Systematic Safety Integration”, CIRP Annals - Manufacturing Technology. 58, 161-164, 2009a.
[6] Ghemraoui R., Mathieu, L., Tricot, N., “Systematic Human-safety analysis approach based on Axiomatic Design principles”, International Conference on Axiomatic Design, 5th ICAD, Lisbon, Portugal, March 25- 27, 2009b.
[7] Ghemraoui R., Mathieu, L., Brown, C., “Defining safety objectives during product design”, International Conference on Axiomatic Design, 6th ICAD, Daejeon, March 30-31, 2011.
[8] Heo G., Lee T., Do S.H., “Interactive System Design Using the Complementarily of Axiomatic Design and Fault Tree Analysis,” Nuclear Engineering and Technology, Vol. 39, No. 1, Feb, 2007.
[9] NF NE 12965+A2, “Tractors and machinery for agriculture and forestry: Power take-off (PTO) drive shafts and their guards”, 2009.
[10] NF EN ISO 12100. , “Safety of machinery – General principles for design - Risk assessment and risk reduction”, 2010.
[11] Park G., Lee T., Lee K., Hwang K., “Robust design: An overview”, AIAA Journal, Vol. 44, 181–191, 2006.
[12] Sadeghi L., Mathieu, L., Tricot, N., Al Bassit L., Ghemraoui R., “Towards Design for Safety Part1: Functional Reverse Engineering Driven by Axiomatic Design”. International Conference on Axiomatic Design, 7th ICAD, Worcester, June 27-28, 2013.
[13] Suh N.P., The Principles of Design, New York: Oxford University Press, 1990. ISBN 0-19-504345-6
[14] Suh N., Axiomatic Design: Advances and Applications, New York: Oxford University Press, 2001. ISBN 0-19-513466-4
[15] Taguchi G., Wu Y., “ Introduction to Off-Line Quality Control” , Central Japan Quality Control Association, Nagoya, Japan, 1980.
[16] Taguchi, G., “System of Experimental Design: engineering Methods to Optimize quality and Minimize Cost”, While Plains, New York: UNIPUB/ Karsye International Publication, 1987.

Proceedings of ICAD2013 The Seventh International Conference on Axiomatic Design
Worcester – June 27-28, 2013
ICAD-2013-21
- 138 -
ABSTRACT
Transportation systems represent a critical infrastructure upon which nations' economies and national security depend. As infrastructure systems, they must be planned and operated to accommodate the uncertain and continually evolving needs of their passengers and freight. These changes represent not just changes in state - or system behavior - but also changes in system architecture. New routes and destinations are continually added and new modes of transport are introduced to realize them. Such changes occur in the planning time scale when the transportation is intentionally expanded, but also in the operational time scale when, for example, buses and trains breakdown. As such, transportation systems meet the Axiomatic Design classification of large flexible systems where many functional requirements not only evolve over time, but also can be fulfilled by one or more design parameters. This paper builds upon a recent work in which Axiomatic Design was used to develop a theory of degrees of freedom in manufacturing systems for their reconfigurable design and operation. The theory is specialized here to reconfigurable transportation systems. The methodological developments are then demonstrated on a small subsection of the Mexico City transportation system to demonstrate its wide ranging utility in reconfigurability decision-making at the planning and operations time scales.
Keywords: Axiomatic Design, transportation paths, transportation itineraries, Mexico City transportation system, re-configurability, resilience, reconfigurable transportation systems, resilient transportation systems.
1 INTRODUCTION
Transportation systems represent a critical infrastructure upon which nations' economies and national security depend. In the 1990s, transportation systems the world over became increasingly strained by the continually evolving needs of a growing population that has trended towards concentrating in cities for the past 100 years [de Weck et al., 2011]. One particularly pertinent problem is the need to quickly find ways to reallocate and adjust the capacity and capabilities of transportation resources to the variants that need them most. Another key challenge is the transportation system’s resilience in the face of unplanned disturbances, events, or disasters. Re-configurability and resilience drivers can be found to varying degrees in many of the modes of transport: air, ship, rail, and
road. Recently, decentralized reconfiguration strategies for reconfigurable transportation systems have emerged [Vallee et al., 2011]. In order to achieve and support these solutions, it becomes necessary to model the evolution of the system architecture. The realization of these incremental changes requires decisions to be made in the operations and planning of transportation systems. This requirement causes a multi-dimensional engineering management problem which stakeholders have to find ways to address. To fulfill these needs, reconfigurable transportation systems are proposed as a possible solution. They are defined as:
Definition 1. Reconfigurable Transportation System: A system designed at the outset for rapid change in structure, in order to quickly adjust capacity and functionality in response to sudden changes in stakeholder requirements. Reconfigurable transportation systems are those in which new capabilities are added only when needed, and the system is not over-designed with capabilities that may be left unused.
This paper uses an Axiomatic Design approach called transportation degrees of freedom to enumerate the number of passenger itineraries in reconfigurable transportation systems; transportation systems with variable system architecture. The enumeration of passenger itineraries, and more generically paths through a network, has long been associated with network reliability and resilience [de Silva et al., 2011; Rai and Kumar, 1986; Khan and Singh, 1980]. Here, the Axiomatic Design based approach serves two additional purposes. First, the enumerated passenger itineraries are set in terms of the evolving system architecture variables in both function and form. Second, it bridges the traditionally graph theoretic approaches to the engineering design community.
The remainder of the paper proceeds as follows. Section II provides the background to the methodological developments with brief introductions to graph theory [van Steen, 2010; Lewis, 2009; Newman 2010], Axiomatic Design for large flexible systems [Suh, 2001], and production degrees of freedom [Farid, 2007; 2008; Farid and McFarlane, 2006a]. Section III then reframes previous work on production degrees of freedom [Farid, 2007, 2008; Farid and McFarlane, 2006a] into a transportation system context. Next, Section IV enumerates passenger itineraries as a measure called passenger degrees of freedom upon this foundation. Section V illustrates the methodological developments on a small subsection of the Mexico City transportation system. Section VI describes the re-configurability applications of these measures in the planning and operations time scales. Section
AN AXIOMATIC DESIGN APPROACH TO PASSENGER ITINERARY ENUMERATION IN RECONFIGURABLE
TRANSPORTATION SYSTEMS
Edgar Eugenio Samano Baca [email protected]
Engineering Systems and Management Masdar Institute of Science and
Technology Abu Dhabi, United Arab Emirates
Amro M. Farid [email protected]
Engineering Systems and Management Masdar Institute of Science and
Technology Abu Dhabi, United Arab Emirates
I-Tsung Tsai [email protected]
Engineering Systems and Management Masdar Institute of Science and
Technology Abu Dhabi, United Arab Emirates

- 139 -
VII concludes the work and proposes avenues for future work.
2 BACKGROUND
This section summarizes the methodological developments found in the existing literature in order to provide a foundation for the enumeration of passenger itineraries in the next section. The discussion proceeds in three steps. Section 2.1 gives a brief introduction to graph theory while Section 2.2. introduces the application of Axiomatic Design for large flexible systems to transportation systems. Section 2.3 then discusses a taxonomy of transportation system degrees of freedom as presented in earlier work.
2.1 GRAPH THEORY IN TRANSPORTATION
NETWORKS Graph theory is a long established field of mathematics
with applications in many fields of science and engineering where artifacts are transported between physical locations [van Steen, 2010; Lewis, 2009; Newman 2010]. A number of definitions from this field are introduced later in the discussion.
Definition 2. [van Steen, 2010] A graph: G= {V, E}, consists of a collection of nodes V and a collection of edges E. Each edge eE is said to join two nodes, which are called its end points. If e joins v1, v2 V, we write e=‹v1, v2›. Nodes v1 and v2 in this case are said to be adjacent. Edge e is said to be incident with nodes v1 and v2, respectively.
Definition 3. [van Steen, 2010] A directed graph (digraph): D, consists of a collection of nodes V, and a collection of arcs A, for which D = {V, A}. Each arc a=‹v1, v2› is said to join node v1V to another (not necessarily distinct) node v2. Vertex v1 is called the tail of a, whereas v2 is its head.
Definition 4. Adjacency matrix: A, is binary and of size (V) x (V) and its elements are given by:
A(i, j ) 1 if vi ,vj exists
0 otherwise
(1)
where the operator () gives the size of a set. Interestingly, AN(i,j) represents the number of traveler itineraries of n-steps between origin i and destination j [Newman 2010].
Definition 5. [van Steen, 2010] Incidence matrix: M of size (V) x (A) is given by:
M (i , j )
1 if vertex vi is the head of arc a
j
1 if vertex vi is the tail of arc a
j
0 otherwise
(2)
While graph theory for decades has presented a useful abstraction of transportation networks for operations research, it has limitations from an engineering design and systems engineering perspective. “Interestingly, the fraction of bona fide engineers pursuing this approach has remained relatively small; it is mostly mathematicians, physicists and biologists who pursue this particular view of complex systems. This may be because of the emphasis on analyzing systems ‘as
they are’ rather than on building systems that do not yet exist. It may also be that engineers have to focus on technical details and many of them remain suspicious of highly abstracted mathematical representations of systems such as system graph representations, where all nodes are essentially treated as equal” [de Weck, 2011]. The above definitions focus on the abstract form of the transportation network and less so the transportation functions itself. Furthermore, how the function is realized is not explicitly stated. Unless generalized, such graph theoretic approaches are likely to have limitations in systems of heterogeneous function and form. Furthermore, because the system function and its realizing form has been abstracted away, such approaches may not straightforwardly lend themselves to active control solutions that implement reconfigurable transportation system architectures.
2.2 AXIOMATIC DESIGN FOR LARGE FLEXIBLE
SYSTEMS In contrast, Axiomatic Design of large flexible systems
provides a natural engineering design description of transportation systems. Axiomatic Design has been previously applied to transportation applications in the design of intersections [Pena et al., 2010; Thompson et al., 2009a; Thompson et al., 2009b; Yi and Thompson, 2011], airport terminals [Pastor, 2011], and shipping companies & ports [Celik et al., 2009; Kulak, 2005; Celik, 2009]. While relevant to these applications, this work expands the scope to include the entire transportation system network.
To this end, the Axiomatic Design of large flexible systems proves a useful design tool. Suh [2001] defines large flexible systems as systems with many functional requirements that not only evolve over time, but also can be fulfilled by one or more design parameters. In transportation systems, the set of functional requirements is taken as the set of transportation processes, FR = {Transportation Processes}. The definition of a transportation process is adapted from Farid [2008] where it was used in a production system application.
Definition 6. Transportation Process: A transportation-resource-independent process pu∈P that transports individuals between stations.
The set of design parameters is taken as the set of transportation resources DP = {Transportation Resources}. This definition is similarly adapted for application to transportation systems [Farid, 2008].
Definition 7. Transportation Resource: A vehicle h∈H capable of realizing one or more non-null transportation processes such as a bus or train.
Once the high-level functional requirements and design parameters have been established, they may be simultaneously decomposed to establish full functional and physical hierarchies as part of a rigorous engineering design process. While this goal is not the objective of this paper, establishing the development in terms of the evolving high-level system architecture variables in both function and form grounds the methodology within the engineering design literature.

- 140 -
2.3 TRANSPORTATION DEGREES OF FREEDOM: AN
ANALOGY The concept of degrees of freedom as applied to large
flexible systems originated with research in automated reconfigurable manufacturing systems in which an analogy between mechanical and production degrees of freedom was drawn [Farid, 2007, 2008; Farid and McFarlane, 2006a]. So as to make this paper's developments more intuitive, the analogy --this time for transportation systems --is redrawn.
Production system degrees of freedom arose from an analogy between mechanical and production systems that holds equally well for transportation systems [Farid and McFarlane, 2006a]. At the most basic level, a mechanical system is defined by its kinematics which is described by links and coordinates [Shabana, 1998]. Links make up the physical composition of a mechanical system. Similarly, transportation systems are composed of transportation resources. Coordinates are used to express the time-evolution of a continuous state which results in motion. However, an event-driven evolution of discrete states is more appropriate for reconfigurable transportation system architecture. Cassandras and LaFortune [1999] have previously drawn this analogy between coordinates for time-driven systems and events for event-driven systems. Finally, when analyzing multi-body mechanical systems, the number of coordinates is calculated based upon the number of combinations of dimensions and links less any applicable constraints [Shabana, 1998]. For example, a fully free three-link system has 18 degrees of freedom: 6 dimensions for each of the three links. The analogy suggests that transportation system degrees of freedom would come from the feasible combinations of transportation processes and their associated resources less applicable constraints. Finally, mechanical degrees of freedom are classified as either scleronomic, i.e. time-independent, or rheonomic, i.e. time-dependent [Shabana, 1998]. This suggests that event-driven systems' degrees of freedom would be scleronomic or rheonomic in relation to their sequence dependence.
3 TRANSPORTATION DEGREES OF FREEDOM
This section reframes previous work on production degrees of freedom [Farid, 2007, 2008; Farid and McFarlane, 2006a] into a transportation system context. First, a measure of scleronomic transportation degrees of freedom is developed as a measure of the sequence-independent capabilities of the transportation systems. Next, a measure of rheonomic transportation degrees of freedom is developed to address sequence-dependent capabilities. Along the way, a number of modeling simplifications are made to reflect transportation's relative simplicity in comparison to manufacturing. Additionally, matrix-based developments are introduced to replace scalar-based ones found in previous work.
3.1 SCLERONOMIC TRANSPORTATION DEGREES OF
FREEDOM The scleronomic transportation degrees of freedom arise
from the Axiomatic Design knowledge base for large flexible
systems [Farid, 2008]. Its development is recounted here for clarity.
Suh uses the large flexible system design equation notation:
1 1 2 3
2 2 3
3 3
$( , , )
$( , )
$( )
FR DP DP DP
FR DP DP
FR DP
(3)
to signify that FR1 can be realized by design parameters DP1, DP2, or DP3 [Suh, 2001]. Previous work reinterprets the design equation in Equation 3 in terms of a matrix equation using a Boolean knowledge base matrix J which contains the systems degrees of freedom [Farid, 2008].
⊙ (4) where matrix Boolean multiplication ⊙ is equivalent to , , ⋀ , where ∨… ∨ is the array-OR operation [Warshall, 1962;
Farid, 2008]. The transportation system knowledge base found in
Equation 4 describes the transportation system's capabilities and is defined formally as follows. A transportation system is composed of a set of transportation processes P = {p1, … p(P)} that transport passengers from an arbitrary station by1 to by2. If B is taken as the set of stations, then by definition there are 2(B) such processes. Of these, (B) are “null" processes where no motion occurs. The rest of the paper adopts the indices convention that a transportation process pu transports passengers from station by1 to by2 such that
1 2( )( 1)u B y y (5)
These transportation processes are realized by a set of resources R = {r1,…,rσ(R)} which realize them. An event εuv∈E (in the discrete event system sense) [Cassandras and Lafortune, 1999] can be defined for each feasible combination of production process pu being realized by resource rv.
Definition 8. Transportation System Knowledge base: A binary matrix: JS, of size σ(P) σ(R) is defined where element JS(u,v)∈{0,1} is equal to one when event euv exists..
Interestingly, the Axiomatic Design knowledge base itself forms a bipartite graph [van Steen, 2010] between the set of processes (e.g. functional requirements) and resources (e.g. design parameters).
Proceeding with the development, a number of discrete holonomic constraints can apply in the operational time frame so as to eliminate events from the event set. These constraints are said to be scleronomic as they are independent of event sequence. Such constraints can arise from any phenomenon that reduces the capabilities of a transportation system e.g. vehicle breakdowns, line closures, or road detours. The description of the discrete holonomic constraints can be captured succinctly in a single binary matrix.
Definition 9. Transportation System Scleronomic Constraints Matrix: A matrix KS of size σ(P) σ(R) whose elements KS(u,v)∈{0,1} are equal to one when a constraint eliminates event euv from the event set.
So as to not exaggerate the transportation system capabilities with null processes of remaining at the same

- 141 -
station, these events are eliminated by convention in the context of this paper.
KS(u,v)
1 if mod ((u1), (B))
(u1) / (B)
0 otherwise
(6)
Or equivalently,
KS not[I ( B)V 1 ( R)T ] (7)
where Im is the identity matrix of size m m, 1m is the ones vector of length m, the AV operation is shorthand for vectorization vec() commonly implemented in MATLAB with
the (:) operator, and is the Kronecker tensor product. From these definitions of JS and KS, follows the
definition of scleronomic transportation degrees of freedom. Definition 10. Scleronomic Transportation Degrees of
Freedom [Farid, 2007, 2008]: The set of independent transportation events ES that completely defines the available transportation processes in a transportation system. Their number is given by:
(8)
where the operation is “boolean subtraction"
Alternatively, is equivalent to ∙ . Note that the boolean “AND” is equivalent to the hadamard product, and
. In matrix form, Equation 8 can be rewritten in terms of the Frobenius inner product [Abadir and Magnus, 2005]:
, ( )TS S S F S SDOF J K tr J K (9)
The form Equation 9 interestingly matches the form of the expression used for mechanical degrees of freedom. Furthermore, it allows the usage of the Axiomatic Design knowledge base for further detailed engineering design. Finally, the constraints matrix captures the potential for operational constraints like vehicle breakdowns, line closures, or road detours. As such, it allows a flexible expression of transportation system capabilities in the design and operational phases.
3.2 RHEONOMIC TRANSPORTATION DEGREES OF
FREEDOM The previous subsection recalled the development of
transportation degrees of freedom as independent. However, a transportation system has constraints that introduce dependencies in the sequence of events. Rheonomic transportation degrees of freedom provide a sequence-dependent measure of the capabilities in a transportation system [Farid, 2008].
Definition 11. Rheonomic Transportation Degrees of Freedom [Farid, 2007, 2008]: The set of independent transportation strings Z that completely describes the transportation system language.
In other words, the transportation system language L can be described equally well in terms of the Kleene closure [Cassandras and Lafortune, 1999] of the scleronomic and rheonomic transportation degrees of freedom.
* *L E Z (10) For mathematical tractability, the length of strings z is limited to two. Strings of longer length are discussed in Section 4.
Given string z=eu1v1eu2v2 ∈ Z, =σ(P)(u1-1)+u2 and =σ(R)(v1-1)+v2, ∀ u1,u2∈{1,σ(P)} and ∀v1,v2∈{1,σ(R)}. Intuitively speaking, certain transportation events can follow one another, while others are not possible. These feasible strings can be captured succinctly in a single binary matrix of size σ2(P) σ2(R) whose elements J(,)∈{0,1} are equal to one when string z exists and can be calculated as:
S SJ J J (11)
Allowing the presence of scleronomic constraints, Equation 11 becomes
(12)
As before, a binary constraints matrix of size σ2(P) σ2(R) is used to describe the potential elimination of strings z=eu1v1eu2v2 from the transportation system string set. While KS can equal zero, has perpetual non-zero continuity constraints. In other words, in order for one degree of freedom to follow another, the destination of the former must be equivalent to the origin of the latter. Formally, the convention described in Equation 5 implies that u equals the sequence of digits ((y1-1),y2) in base σ(B). This yields two useful results: y1= (u-1)/σ(B)+1 where '/' represents integer division and y2=mod((u-1),σ(B))+1 where mod(x,y) represents the modulus of x with respect to y. Calculation of is executed from a binary square constraint matrix of size σ(P) σ(P) which is defined as
1
1 2 2
0 if mod (( 1), ( ))
( , ) ( 1) / ( )
1 otherwise
u B
C u u u B
(13)
which may be more simply calculated in terms of the following matrix equation
C 1 ( B) I ( B) 1 ( B)T (14)
From this, the rheonomic transportation constraint matrix can be calculated
2 ( )[1 ]V R TK C (15)
It follows that the number of rheonomic transportation degrees of freedom is:
(16)
Equation 16 can be rewritten in a number of equivalent forms [Farid, 2013].
DOF [
v2
( R)
v
1
( R)
u
2
( P)
u
1
( P)
[JS K
S](u
1,v
1)
[JS K
S](u
2,v
2) C
(u
1,u
2)]
(17)

- 142 -
Equation [17] views rheonomic degrees of freedom as a sequence of binary conditions. An alternative approach is to rearrange the vector spaces such that.
JR [JS KS]V[JS KS]VT
KR C [1 (R)1 (R)T ]
(18)
Here, scleronomic transportation degrees of freedom are treated as a basis vector – as would typically be done with mechanical degrees of freedom. JR strongly resembles an adjacency matrix where are the degrees of freedom are treated as nodes and are mutually connected. KR consequently applies the perpetual rheonomic constraints. The rheonomic transportation degrees of freedom measure becomes
(19)
where w=(R)(u-1)+ v. This section has reused the Axiomatic Design large
flexible system knowledge base to introduce the concept of scleronomic and rheonomic transportation degrees of freedom. These measures are used in the next section to enumerate the number of passenger itineraries.
4 ENUMERATED ITINERARIES – PASSENGER DEGREES OF FREEDOM
As inspired by research in product degrees of freedom [Farid, 2008], the passenger degrees of freedom measure takes advantage of the efforts in the previous section to measure the number of ways that a passenger in the transportation system may be transported from a desired origin to a final destination (i.e. the number of possible itineraries). The derivation rests on three definitions:
Definition 12. Passenger Event: A scleronomic transportation degree of freedom that permits a passenger's transport along one leg of an itinerary from a desired origin y1 to a desired destination yn.
Definition 13. Passenger Itinerary: An n-string of passenger events that permit the passenger's transport from a desired origin y1 to a desired destination yn.
Definition 14. Passenger Degrees of Freedom ( ): The number of passenger itinerary strings in the language between a desired origin y1 to a desired destination yn.
From these definitions, a straightforward derivation of the passenger degrees of freedom is to sum the itineraries consisting of 1 leg, 2 legs, up to the number of n legs deemed impractical by the passenger.
n
p pii
DOF DOF (20)
The number of direct routes follows from Equation 9 considering that only the process u=(B)(y1-1)+y2 is desired.
1 , (( ) ( ))T T T T Tp u S u S F u S u SDOF e J e K tr e J e K (21)
where en represents nth the elementary basis vector of appropriate size.
The number of two-leg routes uses the rheonomic transportation degrees of freedom found in Equation [19] but
requires that the scleronomic constraints matrices be updated from their original formulation in Equation [7] to incorporate the desired origin y1 to a desired destination yn..
K
Sy1 not [e
y1 ( B) 1 ( R) ][1 ( R) ]T
KSy2
not [1 ( R) ey2 ( B) ][1 ( R) ]T
(22)
and that JR be updated accordingly.
JRy1y2 [JS KSy1
]V[JS KSy2]VT
(23)
here en represents nth the elementary basis vector of appropriate size.
The number of n-leg passenger routes is derived from the scalar form in Equation [17] where strings of the form z=eu1v1eu2v2 were considered. Extending this string to n events z=eu1v1…eunvn yields the number of n-event rheonomic transportation degrees of freedom
1 1
( ) ( ) 1
1,..., ,...,
[J K ](u , v ) ( , )
[J K ](u , v )n n
P R n
s s x x x xu u v v x
s s n n
C u u
(24)
This rather cumbersome scalar form based upon single events can be simplified by recalling that the product in Equation [19] is a square adjacency matrix AR between scleronomic transportation degrees of freedom.
AR JR KR (25) Following the initial introduction to graph theory, where the nth power of an adjacency can be used to calculate the n-step paths through a network,
DOFn ARn1
w2
( Es)
w1
( Es)
(w1,w2 ) (26)
Here, the (n-1) power originates from the differences between the traditional formulation of the transportation network graph and that the Axiomatic Design based approach. To fix the passenger itineraries specifically from the desired origin y1 to a desired destination yn., Equation [26] becomes
DOFn ARy1AR
n3ARy2
w2
( Es)
w1
( Es)
(w1,w
2) (27)
where
ARy1
[JS KSy1]V[JS KS]VT KR
ARy2 [JS KS]V[JS KSy2
]VT KR
(28)
In this section, passengers were modeled in terms of sequences, which allowed for the enumeration of their itineraries in a measure called passenger degree of freedom. All measures continued to exhibit the same three common elements found in mechanical degrees of freedom: discrete events captured in Axiomatic Design knowledge bases, constraint matrices, and a Boolean difference of these two matrices.
The transportation degrees of freedom broadly measure "reconfiguration potential". The scleronomic transportation degree of freedom measures provide a quantitative description of which transportation capabilities exist in the

- 143 -
system and potentially how they can be changed. Mathematically, it can be described as a reconfiguration
process R :
' '( , ) ( , )S S S SJ K J KR (29)
The rheonomic transportation degree of freedom measures provide a quantitative description of how transportation capabilities can be combined into sequences. In either case, these measures describe the impact of the desired set of reconfigurations on the system capabilities. Mathematically, it can be described by the transformation:
R(JR, K
R) (J
R' , K
R' ) (30)
While the Axiomatic Design approach to the calculation is admittedly more complex than the traditional graph theoretic method, the Axiomatic Design approach explicitly represents the transportation system knowledge base and constraint matrices. Therefore, these matrices can be readily decomposed and incorporated into design processes specifically aimed to achieve system resilience and reconfigurability. Furthermore, active control solutions can be developed to evolve these matrices in the operational time scale.
5 ILLUSTRATIVE EXAMPLE: MEXICO CITY PUBLIC TRANSPORTATION SYSTEM
To demonstrate the application of the passenger DOF measures, the Mexico City Public Transportation System is taken as an illustrative example. This system is one of the largest of its kind in the world and includes various modes of transportation, such as light rail, the bus network, the Metro and Metrobus. It serves a population of approximately 25 million and has over 300 stations [Hewlett Foundation, 2012].
For the purpose of this example, the system boundary is narrowed down to a few square blocks around the City Center (Centro), which is considered the exact geographic center and hub of activity of most typical Mexican cities. This is done for two reasons: first, to simplify the analysis and ensure a better understanding of the developed degree of freedom measures; and second, because the DOF approach for reconfigurable transportation system development is extensible to systems of any size.
The system has a total of 9 public transportation system stations that fall within the defined system boundary (B). These include stops along Metro and Metrobus lines, excluding other modes of public transportation available in the city such as buses (no longer running in the city center) and light rail (mostly used to serve outlying areas to the north and south of the city that are not covered by other transportation modes). There are 2 considered modes of transport (H), the Metro and Metrobus, and 49 transportation processes.
The knowledge base for the system being analyzed is an 81 2 binary matrix JS on a 1-hour time scale, where the rows represent possible transportation processes between stations and the columns represent the transportation resources (or modes: Metro and Metrobus). By definition, the transportation process is valid (1) if there exists at least one resource that can do the process within the allotted timeframe.
Its corresponding constraints matrix, KS, is calculated from Equations 6 and 7.
A DOFS of 56 represents the number of transportation processes that are possible within the 1-hour time scale with the two resources provided. is the number of sequences of two processes that are possible in the same system. Aside from these values, it is interesting to note that the sum of the non-zero elements in each column serves as a measure of the flexibility of the given transportation mode; the sum of the elements in each row provide a measure of redundancy.
6 DISCUSSION: RECONFIGURABILITY APPLICATIONS IN TRANSPORTATION SYSTEMS
Axiomatic Design has proven a powerful tool to measure transportation degrees of freedom as a measure of reconfiguration potential. This section discusses three classes of applications for these developments: reconfigurable operations, reconfigurable planning, and reconfigurability valuation.
6.1 RECONFIGURABLE OPERATIONS The concept of transportation degrees of freedom can
be applied to achieve reconfigurable transportation system operations when the knowledge base and constraint matrices are taken over a short but regular time interval i.e. one hour. In such a case, a reconfiguration process can be said to occur from one hour to the next. For example, not all bus and metro lines are in service at all times in the day. Their periods of non-operation can be captured within the constraints matrix.
These observations suggest that there exist many types of constraints that limit the reconfiguration potential of the transportation system. One can easily conceive code that pushes trains without choice down a dedicated line. The resulting transportation system language would be
when it could have been written to support the language ∗ . In essence, railway operators that engage in active real-time switching sequences can be viewed as making real-time reconfigurations, or eliminating scleronomic and rheonomic constraints all together. Fixed public transportation system schedules are another example of inflexible operations. Buses and trains leave at a fixed time from a fixed location irrespective of existing traffic conditions or vehicle breakdowns elsewhere in the system. Real-time transportation scheduling algorithms represent a key enabling technology for reconfigurable operations in the face of disturbances and shocks to the system.
6.2 PLANNING The concept of transportation degrees of freedom can
also be applied to long-term planning decisions. In the medium term, the schedules generated by transportation system operators represent a planning activity of which transportation system resources are going to be used to realize which transportation system processes. In the long term, the expansion of a transportation system network represents an expansion of the system knowledge base to include new transportation processes (i.e. rows in the knowledge base) and

- 144 -
new transportation resources/modes (i.e. columns in the knowledge base).
Returning to the Mexico City system as an example, the reader is taken back to the late 1990's, before the Metrobus was developed for Mexico City. Back then, typical city buses covered the streets of the downtown area, contributing to what was already the most heavily-congested traffic area in the city. Even worse, the service was lackluster due to the long trip times between locations that were oftentimes reached faster on foot rather than by taking a bus. The Metro, known then for being crowded to the point of being uncomfortable and a safety hazard, was avoided by many passengers. A decision was taken to expand the transportation system. Table 1 shows the degrees of freedom for the system before 2005 (8 stations) and the same values for the current system (9 stations, already shown in Section 5). The system flexibility and reconfigurability are shown to increase dramatically with the introduction of the Metrobus. Additionally, this new transportation mode runs mostly on surface streets on dedicated median lanes -which translates to virtually no traffic congestion.
Table 1. Mexico City Public Transportation System Degrees of Freedom.
Variable Before 2005 After 2005DOFS 40 56 DOFρ 228 422
6.3 THE VALUE OF RECONFIGURABILITY The concept of transportation degrees of freedom as a
measure of reconfiguration potential draws questions about the value of this reconfigurability. To this end, it is important to recognize that each transportation degree of freedom can be associated with tangible measures that figure in ROI and cost/benefit decisions. In operations, each degree of freedom is associated with a passenger capacity and hence a revenue. Alternatively, it can be associated with a time of execution, energy consumption, greenhouse gas emissions, operating costs, and externalities. Furthermore, one can measure the ease of a reconfiguration process and value it in terms of time or monetary cost [Farid, 2007]. In such a strategy, it becomes possible to value reconfigurability as an operations-stage life cycle property. In planning decisions, each degree of freedom can be associated with not just an expected capacity and revenue, but also the required investment to make the degree of freedom possible. Similarly, such an approach can be used to model future energy consumption and greenhouse gas emissions from a perspective of technical planning rather than macroeconomic development.
7 CONCLUSIONS AND FUTURE WORK
This paper has developed a set of system measures called passenger degrees of freedom. The work rests firmly on the foundation of previous work in the field of reconfigurability measurement. Specifically, an analogy between mechanical and transportation degrees of freedom was drawn. The application-neutral Axiomatic Design model of a knowledge base of functional requirements and design parameters was contextualized to transportation processes and resources
[Farid, 2007, 2008; Farid and McFarlane, 2006a] in an intuitive fashion.
The developed passenger degree of freedom measures came in two varieties. The scleronomic degrees of freedom assess available transportation processes irrespective of sequence. Second, the rheonomic degrees of freedom describe the independent paths available from one point to another. These measures were discussed both practically and theoretically. For the former, the measures provided an intuitive description of how the reconfiguration potential of the Mexico City public transportation network changed in the face of additional resources. It also represented potential reconfigurations in which stations and resources and the processes that they realize are added, modified or removed. These measures showed that in large flexible systems -such as transportation networks -many insights into the system structure can be gained if the allocation of pairs of processes was considered in relation to pairs of resources. In such a way, the measures gave a thorough understanding of the potential for reconfiguration.
From a theoretical perspective, the Axiomatic Design models have multiple advantages. Each of the measures developed form an absolute scale; thus facilitating measurement and quantitative comparison [Ejiogu, 1991; Kriz, 1988; Roberts, 1979; Stevens, 1946; Zuse, 1991] involving all forms of statistics including means and percentages. The measures provide a high level of objectivity and consistency that may allow them to be a potentially expressive tool in the evaluation of transportation systems. Lastly, the measures provide a significant amount of design feedback. Their functional form shows clearly that reconfiguration potential can be improved with additional resources and processes, and with careful attention to the emergence of system constraints.
From a modeling point of view, the Axiomatic Design models avoid any needless complicating detail. In a formal sense, every element in the knowledge bases is required for the associated degree of freedom measures. In an empirical sense, each element corresponds to a physical relationship fundamental to the desired reconfiguration.
In future work, the authors seek to extend the development of passenger degrees of freedom as part of a systematic approach to reconfigurability measures described elsewhere [Farid, 2007, 2008]. The measurement of "reconfiguration potential" only addresses half of the reconfigurability measurement question [Farid, 2008]. Further measures of "reconfiguration ease" are forthcoming [Farid, 2007, 2008; Farid and McFarlane, 2006b, 2007]. The integration of these two branches of reconfigurability research into more complex measures of key characteristics such as integrability and convertibility also provide a challenging avenue of future work [Farid, 2007]. Finally, all of these measures would benefit from their application into industrial case studies.
8 REFERENCES
[1] Abadir K.M., Magnus J.R., “Matrix Algebra”, Cambridge, New York: Cambridge University Press, pp. 434, 2005.
[2] Cassandras C., Lafortune S., Introduction to Discrete Event Systems, New York: Springer, 1999.

- 145 -
[3] Celik, M., Cebi, S.. Kahraman, C., Deha, I, “Application of Axiomatic Design and TOPSIS Methodologies under Fuzzy Environment for Proposing Competitive Strategies on Turkish Container Ports in Maritime Transportation Network”, Expert Systems with Applications, vol. 36, no. 3, pp. 4541-4557, 2009a.
[4] Celik, M., Kahraman, C., Cebi, S., Deha, I., “Fuzzy Axiomatic Design-Based Performance Evaluation Model for Docking Facilities in Shibuilding Industry: The Case of Turkish Shipyards”, Expert Systems with Applications, vol. 36, no. 1, pp. 599-615, 2009b.
[5] de Silva G., Ryavy O., Matouek P., and Veda M., “On formal reachability analysis in networks with dynamic behavior,” Telecommunication Systems, pp. 1–11, 2011.
[6] de Weck O.L., et al., Engineering Systems: Meeting Human Needs in a Complex Technological World, Cambridge: The MIT Press, 2011.
[7] Ejiogu L.O., Software Engineering with Formal Metrics, Boston: QED Technical Publishing Group, McGraw-Hill Book Company, 1991.
[8] Farid A.M., “A Review of Holonomic Manufacturing Systems Literature”, Technical Report, Institute of Manufacturing, University of Cambridge, Cambridge, 2004.
[9] Farid A.M., “Reconfigurability Measurement in Automated Manufacturing Systems”, Doctoral Thesis, Institute of Manufacturing, University of Cambridge, Cambridge, United Kingdom, 2007.
[10] Farid A.M., “Product Degrees of Freedom as Manufacturing System Reconfiguration Potential Measures”, International Transactions on Systems Science and Applications, Vol. 4, No. 3, pp. 227-242, 2008.
[11] Farid A.M., “Derivation of N-Leg Transportation Rheonomic Degrees of Freedom”, Technical Report #01-2013, Laboratory for Intelligent Integrated Networks of Engineering Systems, Masdar Institute, Abu Dhabi, 2013.
[12] Farid A.M., McFarlane D., “A Development of Degrees of Freedom for Manufacturing Systems”, IMS’2006: 5th International Symposium on Intelligent Manufacturing Systems: Agents and Virtual Worlds, Sakara, 2006(a).
[13] Farid A.M., McFarlane D., “A Tool for Assessing Reconfigurability of Distributed Manufacturing Systems”, INCOM 2006: 12th IFAC Symposium on Information Control Problems in Manufacturing, Saint-Etienne, 2006(b).
[14] Farid A.M., McFarlane D., “A Design Structure Matrix-Based Method for Reconfigurability Measurement of Distributed Manufacturing Systems”, International Journal of Intelligent Control and Systems, Vol. Special Issue, 2007.
[15] Khan A. A. and Singh H., “Petri net approach to enumerate all simple paths in a graph,” Electronics Letters, vol. 16, no. 8, pp. 291–292, 1980.
[16] Kriz J., Facts and Artifacts in Social Science: An Epistemological and Methodological Analysis of Empirical Social Science Research, Boston: McGraw-Hill Research, 1988.
[17] Kulak, O., Kahraman, C., “Fuzzy Multi-Attribute Selection among Transportation Companies Using Axiomatic Design and Analytical Hierarchy Process”,
Information Sciences, vol. 170, no. 2-4, pp. 191-210, Feb. 2005.
[18] Lewis T. G., Network science : theory and practice. Hoboken, N.J.: John Wiley & Sons, 2009, p. xi, 512 p.
[19] Newman M. E. J., Networks : an introduction. Oxford ; New York: Oxford University Press, 2010, p. xi, 772 p.
[20] Pastor, J.B.R., Benavides, E.M., “Axiomatic Design of an Airport Passenger Terminal”, in Proceedings of ICAD2011: The Sixth International Conference on Axiomatic Design, 2011, pp. 95-102.
[21] Pena, M., Ibragimova, E.S., Thompson, M.K., “Evolution over the Lifespan of Complex Systems”, in Global Product Development: Proceedings of the 20th CIRP Design Conference, 2010.
[22] Rai S. and Kumar A., “On Path Enumeration.,” International Journal of Electronics, vol. 60, no. 3, pp. 421–425, 1986.
[23] Roberts F.S., Encyclopedia of Mathematics and its Applications, Addison Wesley Publishing Company, 1979.
[24] Shabana A., Dynamics of Multibody Systems, Cambridge, U.K.: Cambridge University Press, 1998.
[25] Stevens S.S., On the Theory of Scales and Measurement, Science, 1946.
[26] Suh N.P., Axiomatic Design: Advances and Applications, New York: Oxford University Press, 2001.
[27] The William and Flora Hewlett Foundation, “Cleaner, Greener Public Transit a Success in Mexico, and Elsewhere”, Report: The William and Flora Hewlett Foundation, 2010.
[28] Thompson, M.K., Kwon, Q.H., Park, M.J., “The Application of Axiomatic Design Theory and Conflict Techniques for the Design of Intersections: Part 1”, in Proceeedings of ICAD2009: The Fifth International Conference on Axiomatic Design, 2009, pp. 121-127.
[29] Thompson, M.K., Park, M.J., Kwon, Q.H., Ibragimova, E., Lee, H., Muyng, S., “The Application of Axiomatic Design Theory and Conflict Techniques for the Design of Intersections: Part 2”, in Proceedings of ICAD2009: The Fifth International Conference on Axiomatic Design, 2009, pp. 129-136.
[30] Vallee M., Merdan M., Lepuschitz W., and Koppensteiner G., “Decentralized Reconfiguration of a Flexible Transportation System,” Industrial Informatics, IEEE Transactions on, vol. 7, no. 3, pp. 505–516, 2011.
[31] van Steen M., Graph Theory and Complex Networks: An Introduction, no. January. Maarten van Steen, 2010, pp. 1–300.
[32] Warshall, S., “A Theorem on Boolean Matrices”, J. ACM, vol. 9, no. 1, pp. 11-12, Jan. 1962.
[33] Yi, Y., Thompson, M.K., “Quantifying the Impact of Coupling in Axiomatic Design: Calculating the Coupling Impact Index for Traffic Intersections”, in Proceedings of ICAD2011: The Sixth International Conference on Axiomatic Design, 2001, pp. 103-110.
[34] Zuse H., Software Complexity: Measures and Methods. Programming Complex Systems, Berlin: W. de Gruyter, 1991.

Proceedings of ICAD2013 The Seventh International Conference on Axiomatic Design
Worcester – June 27-28, 2013
ICAD-2013-22
- 146 -
ABSTRACT
Temporary housing has emerged as a practical solution to a plethora of contemporary circumstances, including, though not limited to, emergency housing, worker housing, and large-scale events housing. Interim housing is also a possible solution to future housing on lunar and Martian expeditions. Unfortunately, achieving the short-term nature of temporary housing is less than straightforward. One design pitfall leads to scanty housing that does not meet occupants’ functional requirements, while another leads to overdesigned, permanent homes that may evolve into unsightly unstructured settlements. Thus, current design practices may not fully meet the diverse range of stakeholder requirements adequately. This paper addresses the central issue of temporary housing as a non-functional requirement on the housing system’s lifecycle properties of modularity, reconfigurability, extensibility, and reusability. The large flexible system proposed in Axiomatic Design and the modularity found in product platforms impact the proposed conceptual design from the beginning of the design process. Design interdependence is systematically addressed to avoid needless coupling and maximize cohesion within the modules. The large flexible system knowledge base framework and the Independence Axiom serve to achieve the central goal of temporary housing. The first illuminates the high-level functional requirements (FRs) of a temporary house as well as the common module unit that serves as a product platform with standard interfaces. Next, to ensure the functional requirements for each unit are met, a design matrix (DM) is made for each module highlighting the respective FRs and design parameters (DPs).
Keywords: temporary housing, knowledge-based design, Axiomatic Design, modularity, large flexible systems.
1 INTRODUCTION
The use of temporary housing (TH) stretches back into the depths of human history. For thousands of years, the only “housing” used by humankind was temporary, and although today most people live in permanent housing, there remains a strong demand for TH in a number of unique settings. Despite the long history of the use of temporary shelters, literature shows that TH consistently is unable to realize appropriately the stakeholder’s needs and requirements [Johnson, 2007a; 2007b]. This is in part due to the approach that designers of TH take in the design process. No formal
methodology of the design of temporary housing is readily available in the literature. This lack of structure forces designers to rely on their intuition or previous experience, making the design more of an art form than a science.
For these reasons, producing a temporary housing unit that optimally meets the stakeholder’s requirements has proven to be difficult, particularly because the stakeholder’s requirements and constraints change rapidly with time and fluctuate drastically from location to location. While it may be difficult to find a “one-size-fits-all” house design, a one-size fits all approach to the design process may be possible. In recent years, approaches such as Axiomatic Design have been developed to make design less of an art and more of a science [Suh, 2001]. Axiomatic Design is a useful tool that systematically allows designers to map user requirements onto function, and the function onto form.
The use of Axiomatic Design’s knowledge base can ensure that the high-level requirements of a large flexible system, such as temporary housing, are accomplished. The modularity afforded by proper large flexible system design is further benefitted by the use of product platform philosophy [Simpson, 2004]. A design matrix ensures the functional requirements (FRs) and design parameters (DPs) are achieved by satisfying the Independence Axiom.
The goal of this paper is to prove that the design of modular, reusable temporary housing will be improved through the application of a product platform and Axiomatic Design from the beginning of the design process. The rest of the paper proceeds as follows. Section 2 introduces Axiomatic Design, and provides a background into existing literature on Product platform design and Axiomatic Design. Section 3 contains the knowledge base and the design matrix for the proposed modular house, and discusses how the use of Axiomatic Design can ensure functional requirements are met during the design process.
2 BACKROUND
This section provides the background necessary for the development of a conceptual design of temporary housing based upon Axiomatic Design principles in Section 3. First, Section 2.1 describes the existing literature on temporary housing design, and Sections 3.2 and 2.3 discuss how the product platforms and Axiomatic Design are well equipped to meet these needs.
AN AXIOMATIC DESIGN BASED APPROACH FOR THE CONCEPTUAL DESIGN OF TEMPORARY MODULAR HOUSING
Lindsey R. Gilbert III [email protected]
Engineering Systems & Management Masdar Institute Abu Dhabi, UAE
Amro M. Farid [email protected]
Engineering Systems & Management Masdar Institute Abu Dhabi, UAE
Massachusetts Institute of Technology Cambridge, MA USA
Mohammed Omar [email protected]
Engineering Systems & Management Masdar Institute Abu Dhabi, UAE

- 147 -
2.1 EXISTING LITERATURE ON THE DESIGN OF
TEMPORARY HOUSING
Temporary housing is a shelter that is meant to be used for a short period, and in the context of this paper refers to a man-made, short-term, modular, and reusable structure [Johnson, 2007b]. Whereas in the past, temporary shelters were predominantly the domain of migratory groups, today the applications are far more diverse and facilitate all of the following and more:
Refugee and Internally Displaced Person (IDP) housing [Mooney, 2009]
Natural Disaster Relief housing [Johnson, 2007a]
Recreation
Military housing [Ferguson, 2010]
Entertainment venues overflow housing [Bundhun, 2010]
Housing on Martian or lunar expeditions [Carlson and Criswell, 2004]
Different functional requirements are needed to meet the diverse uses and varying locations of temporary housing.
Emergency temporary housing is used whenever a person or group of people is forcibly evicted from their home, such as a natural disaster or military conflict. To satisfy this need, temporary shelters are often provided by governments and non-government organizations (NGO’s) while permanent houses are built [Johnson, 2007b]. People may pass through four sheltering and housing stages after an emergency:
Emergency shelter: One night to a couple of days during the emergency while normal routines are suspended. Often takes the form of mass shelter or tarp.
Temporary shelter: A few weeks following the disaster, normal routines continue to be suspended. May take the form of a tent or public mass shelter.
Temporary housing: A few weeks to several years while waiting for a permanent solution. People should be able to return to normal daily activities. Temporary housing can take the form of a rented apartment, a prefabricated home or a small shack, depending on the context
Permanent housing: Return to the reconstructed former home, or resettlement in a new home [Johnson, 2007b; Nigg et al., 2006]
Because it can take years to rebuild an adequate supply of permanent housing, temporary housing becomes very important. Temporary housing units provide secure accommodations that allow people to return to normal life.
Though the focus of this paper is on the design of the physical structure of the TH, it is important to remember that the house is only part of the larger “housing program.” According to one paper, a “program for temporary housing must not only include a roof, but also offer aspects that make it possible to return to normal life, such as housing in a location that has reasonably convenient access to services and jobs or an affordable transport system, schools, shopping… etc.” [Johnson, 2007b]. They also need to be situated in a location that will not be affected by post-natural disaster problems [El-Anwar et al., 2010; Nigg et al., 2006]. While
these considerations may not always directly influence the design of a TH, it is important that the larger context be kept in mind both while specifying the user requirements and throughout the remainder of the design process.
Pre-planned temporary housing is used when there is existing knowledge of the need for a short-term housing. One example is when a temporary military camp is needed to serve as a base of operation. Another is for mobile recreational needs including campers, RV’s and tents. A third situation for pre-planned TH is to deal with a large-scale influx of people coming into an area for a particular event. The needs for temporary housing solutions arise in this case because the current housing solutions are insufficient for the size of the group. An excellent example of this would be the influx of people to a World Expo, the Olympics or even the World Cup. Qatar, the host of the World Cup in 2022, is currently experimenting with different ideas on how to fulfill the housing demand of football fans that will be entering the country for a span of a few months while the World Cup is being held. Building hotels is a very tricky solution, as they are a massive expense, and will only be needed for a few months during the World Cup. Qatar does not have a particularly large tourism industry, and there is low expectation for significant growth after the World Cup. “Analysts said to avoid ‘white elephant’ properties, Qatar would have to find as many short-term solutions, such as temporary pre-fabricated accommodation” [Bundhun, 2010]. However, for this to be a practical solution, these units will need to make economic sense to build in the first place, and must be reusable in the future.
The current practices used in the design of temporary housing often do not meet the all of the user requirements. Johnson [2007b] concisely states a number of problems facing temporary housing: “Temporary housing programs suffer from excessively high cost, late delivery, poor location, improper unit designs and other inherent issues”. Other problems in unit design included: leaky units, units built with faulty electrical systems, units with poor foundations, and units unable to meet the standards for a cold climate [Davidson et al., 2007; Johnson, 2007b]. In addition, TH can be extremely small and overcrowded, with units sizes ranging from 15-35m2, and occupant rates often as high as 10 people in a single unit [Johnson, 2007a].
The temporary housing units are often culturally or climatically inappropriate, have large delays in their design and construction, and ultimately cause health and social problems within the temporary housing camps [Johnson, 2007b].
A number of conflicting constraints may inhibit temporary housing. For example, TH may be used for a significantly longer period than was originally planned during the design process [Arslan and Cosgun, 2008; Johnson, 2007a; Nigg et al., 2006]. However, because policy makers and landowners around the location where the temporary housing has been built do not want the area to turn into a “slum,” it cannot be built to be too permanent. This suggests it should be “targeted to last long enough for people to resume daily activities, but not comfortable enough to become permanent” [Johnson et al., 2006]. This issue is further compounded by the fact that in many developing countries, home based businesses serve as one of the primary sources of income. As such, it is

- 148 -
important that the house be able to continue to serve this FR [Lizarralde, 2011; Rubio et al., 2004]. There is also often no plan as to how to remove, reuse or recycle the units when their original planned use is over [Arslan, 2007; Arslan and Cosgun, 2008].
Unlike traditional housing where the home is sold directly to the customer and the customer can influence the design and market, temporary housing is generally driven by a third party, often a government or NGO. This means that the link between the functional requirements and the stakeholders is not as clear with temporary housing as it would be in the case of traditional housing.
2.2 PRODUCT PLATFORM LITERATURE
The discussion on temporary housing above shows that a core set of functional requirements are required for as long as the housing is in service, while a number of occupants’ functional requirements evolve over the usage phase of the building’s life cycle. Furthermore, the need for the housing to be temporary also motivates a flexible approach to the building’s set of functional requirements [Simpson et al., 2005]. Product platform design is one design concept well-suited to achieving a variable set of functional requirements.
Product platforms, or product families, is another recently developed approach to product architecture that shares a number of similarities to AD, but also provides approaches that, if used concurrently with AD theory, can help to significantly improve the design of modular systems. Product platform design is built on the concept of using a common platform upon which a number of different products are built. This approach allows manufacturing cost to be reduced by capturing economies of scale in the production process, and helps decrease the design cost as only a few aspects of each module need to be designed uniquely. This creates the competitive advantage that has been dubbed “mass customization” since it affords businesses the ability to meet a number of unique customers’ needs at a low cost [Simpson, 2004; Simpson et al., 2005].
One of the handicaps of the product platform approach to design is that it often results in “over-design” of the modules that have lower demands. Scale-based product families are a potential solution to overcome this constraint as well as an effective way to improve the flexibility of product platform design. “Scale-based product families are developed by scaling one or more variables to “stretch” or “shrink” the platform and create products whose performance varies accordingly to satisfy a variety of market niches” [Simpson, 2004]
Take, for example, the design of the Honda automobile platform. The Honda platform is capable of being “stretched” in length and width to satisfy the length and width requirements of any car frame design [Simpson, 2004].
2.3 AXIOMATIC DESIGN LITERATURE
In addition to product platforms, Axiomatic Design has also accounted for systems whose set of functional requirements evolve over the use phase of the system’s life cycle. Suh describes a system that needs to be able to “reconfigure itself to satisfy a different subset of FR’s throughout its life” as a “large flexible system” [Suh, 2001].
The structure of a knowledge base for a large flexible system is modeled like Equation 1 below.
),...,,$(
),...,,$(
),...,,$(
2222
1111
r
m
b
m
a
mm
rba
rba
DPDPDPFR
DPDPDPFR
DPDPDPFR
(1)
Equation (1) states that the FR can be satisfied by any of the following DP’s. The addition of a DP to this equation is similar to expanding the database, and as the database grows, the more dynamic the design can be. The database will grow and change as new technologies are developed. This is important since “available knowledge and technology determine the best design we can develop at a given point in time” [Suh, 2001]. Once the database is built, it can be applied to a system that has subsets that vary as a function of time. Equation (2) below is an example of such a subset.
64322
53211
5410
,,@
,,@
,,0@
FRFRFRFRTt
FRFRFRFRTt
FRFRFRFRt
(2)
In this example, the FR’s at time 0 are FR1, FR4, and FR5. This means that to satisfy each of these FRs a corresponding DP from the database like the one in Equation 2 will need to be found. However, to maintain the Independence Axiom, DP1 must affect only FR1 and have no effect on FR4, and FR5. However, at time T1 the FR’s change and a new set of DP’s will need to be determined [Suh, 1995]. Using this process to model the design process of a large system is very useful when the system must be reconfigurable on demand, such as when there is a change in customer requirements. As will be demonstrated in the model later in this paper, the reconfigurability of a large flexible system is an advantage when designing temporary housing.
The Axiomatic Design large flexible system provides an excellent framework for the high-level architectural design of a system. In complement, a traditional AD design matrix can be used for the more detailed levels of the design hierarchy.
A Design Matrix (DM) is created by mapping the functional requirements (FRs) to the Design Parameters (DPs) of the system. First, the highest level FR is determined, and used to find the high level DPs. Next, lower levels of FRs are created by “mapping” the DP back to the FR. This process is continued until the system is sufficiently decomposed to be used by the designer. A set of axioms, theorems, and corollaries govern the entire process.
3 MODELING AND DISCUSSION
The previous section proposed product platforms and Axiomatic Design as useful design concepts for temporary housing. The modular house proposed is built in individual “units” where each unit fulfills specific high-level functional requirements. For example, the kitchen module fulfills the high-level requirement of supporting the preparation of food, and personal hygiene. The knowledge base model presents all of the high-level requirements of temporary housing, and the
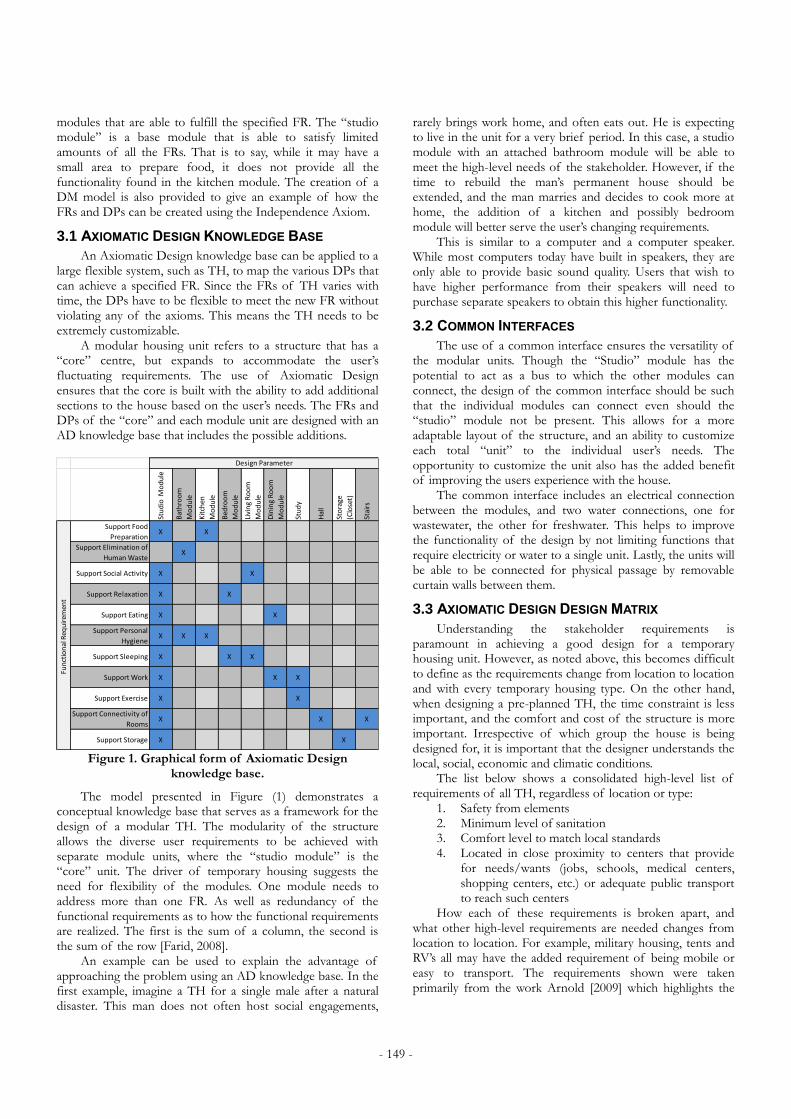
- 149 -
modules that are able to fulfill the specified FR. The “studio module” is a base module that is able to satisfy limited amounts of all the FRs. That is to say, while it may have a small area to prepare food, it does not provide all the functionality found in the kitchen module. The creation of a DM model is also provided to give an example of how the FRs and DPs can be created using the Independence Axiom.
3.1 AXIOMATIC DESIGN KNOWLEDGE BASE
An Axiomatic Design knowledge base can be applied to a large flexible system, such as TH, to map the various DPs that can achieve a specified FR. Since the FRs of TH varies with time, the DPs have to be flexible to meet the new FR without violating any of the axioms. This means the TH needs to be extremely customizable.
A modular housing unit refers to a structure that has a “core” centre, but expands to accommodate the user’s fluctuating requirements. The use of Axiomatic Design ensures that the core is built with the ability to add additional sections to the house based on the user’s needs. The FRs and DPs of the “core” and each module unit are designed with an AD knowledge base that includes the possible additions.
Figure 1. Graphical form of Axiomatic Design
knowledge base.
The model presented in Figure (1) demonstrates a conceptual knowledge base that serves as a framework for the design of a modular TH. The modularity of the structure allows the diverse user requirements to be achieved with separate module units, where the “studio module” is the “core” unit. The driver of temporary housing suggests the need for flexibility of the modules. One module needs to address more than one FR. As well as redundancy of the functional requirements as to how the functional requirements are realized. The first is the sum of a column, the second is the sum of the row [Farid, 2008].
An example can be used to explain the advantage of approaching the problem using an AD knowledge base. In the first example, imagine a TH for a single male after a natural disaster. This man does not often host social engagements,
rarely brings work home, and often eats out. He is expecting to live in the unit for a very brief period. In this case, a studio module with an attached bathroom module will be able to meet the high-level needs of the stakeholder. However, if the time to rebuild the man’s permanent house should be extended, and the man marries and decides to cook more at home, the addition of a kitchen and possibly bedroom module will better serve the user’s changing requirements.
This is similar to a computer and a computer speaker. While most computers today have built in speakers, they are only able to provide basic sound quality. Users that wish to have higher performance from their speakers will need to purchase separate speakers to obtain this higher functionality.
3.2 COMMON INTERFACES
The use of a common interface ensures the versatility of the modular units. Though the “Studio” module has the potential to act as a bus to which the other modules can connect, the design of the common interface should be such that the individual modules can connect even should the “studio” module not be present. This allows for a more adaptable layout of the structure, and an ability to customize each total “unit” to the individual user’s needs. The opportunity to customize the unit also has the added benefit of improving the users experience with the house.
The common interface includes an electrical connection between the modules, and two water connections, one for wastewater, the other for freshwater. This helps to improve the functionality of the design by not limiting functions that require electricity or water to a single unit. Lastly, the units will be able to be connected for physical passage by removable curtain walls between them.
3.3 AXIOMATIC DESIGN DESIGN MATRIX
Understanding the stakeholder requirements is paramount in achieving a good design for a temporary housing unit. However, as noted above, this becomes difficult to define as the requirements change from location to location and with every temporary housing type. On the other hand, when designing a pre-planned TH, the time constraint is less important, and the comfort and cost of the structure is more important. Irrespective of which group the house is being designed for, it is important that the designer understands the local, social, economic and climatic conditions.
The list below shows a consolidated high-level list of requirements of all TH, regardless of location or type:
1. Safety from elements 2. Minimum level of sanitation 3. Comfort level to match local standards 4. Located in close proximity to centers that provide
for needs/wants (jobs, schools, medical centers, shopping centers, etc.) or adequate public transport to reach such centers
How each of these requirements is broken apart, and what other high-level requirements are needed changes from location to location. For example, military housing, tents and RV’s all may have the added requirement of being mobile or easy to transport. The requirements shown were taken primarily from the work Arnold [2009] which highlights the
Stu
dio
Mo
du
le
Bat
hro
om
Mo
du
le
Kit
chen
Mo
du
le
Bed
roo
m
Mo
du
le
Livi
ng
Ro
om
Mo
du
le
Din
ing
Ro
om
Mo
du
le
Stu
dy
Hal
l
Sto
rage
(Clo
set)
Stai
rs
Support Food
PreparationX X
Support Elimination of
Human WasteX
Support Social Activity X X
Support Relaxation X X
Support Eating X X
Support Personal
HygieneX X X
Support Sleeping X X X
Support Work X X X
Support Exercise X X
Support Connectivity of
RoomsX X X
Support Storage X X
Design Parameter
Fun
ctio
nal
Req
uir
emen
t

- 150 -
requirements for the design for permanent structures, adjustments were made based on TH literature.
What is meant by “safety from elements” will vary drastically from location to location and will depend a great deal on the reasoning for the TH. There are often codes and regulations that ensure these safety needs are met. However, often for temporary structures this code is incomplete or non-existent and, in nearly all cases, the regulations for TH are less strict then that of permanent housing. However, no matter the regulations, TH is required to fulfill some, or all of the following:
1. Resistance to water 2. Insulation for cold weather 3. Insulation for hot weather 4. Structurally sound for transportation and seismic
loads 5. Resistant to earthquakes 6. Ability to keep out intruders 7. Sturdy foundation 8. Resistance to high winds 9. Fire resistant An acceptable level of sanitation also depends heavily on
the location and type of TH used. To achieve this minimum level of sanitation any combination of the following may be needed:
1. Sufficient ventilation 2. Natural Lighting 3. Access to running water 4. Area that supports personal hygiene 5. Elimination of human waste As with safety from elements and sanitation, there is a
great deal of variation in what is considered an appropriate level of comfort. Comfort also takes into account a number of cultural specific requirements, and may have overlaps from any of the above two sections. A list of what features may be needed to be included in a TH are:
1. Access to running water 2. Access to hot and cold water 3. Electricity 4. Ability to maintain an ideal temperature 5. Lighting (Natural and artificial) 6. Area that supports personal hygiene and elimination
of human waste 7. Area that supports privacy 8. Area that supports sleep and relaxation 9. Area that supports social activities 10. Area that supports food preparation 11. Area that supports work 12. Area that supports storage 13. Regional specific requirements 14. Access to materials to expand house (and ability of
house to be expanded) The last section, access to centers that provide basic
needs and wants, may not be important in the design of the individual housing unit, but it is important for the designer to know. The following list shows a number of services that may be important for residents in temporary housing:
1. Access to jobs 2. Access to schools 3. Access to shopping center
4. Access to public transit 5. Access to religious center A DM of the studio module was created by using the
Design Matrix theory of mapping the FR’s to the DP’s, and is shown in a Figure 2. Table 1 below shows a list of the first two levels of decomposition. The decisions used to make the selected FRs and DPs is also discussed below. In an attempt to preserve the Independence Axiom, when possible, interactions were designed to be either uncoupled or decoupled.
The Design matrix started with recognition that the improved design of temporary housing implies customizable, flexible, and changing needs. Knowing this, a central “core” module that allowed the addition of “extra” modules was determined to be the best possible solution, with modularity, reconfigurability, extensibility, and reusability being the most important life cycle properties to focus the design. As shown in Table 1, the FR0 was selected to be “Provide ‘Platform Unit that Meets Basic Housing Needs,” and this was achieved by a studio “core” module DP.
Based on the constraints and requirements of a temporary structure above, the second level functional requirements were selected: Protect internal climate (FR1), Connect with environment (FR2), Remain structurally sound (FR3), Support user activities (FR4). An exterior barrier, connections, structure, and system configuration DP were selected to meet each FR respectively. These DP’s become significantly more clear in the next decomposition. FR1, Protect internal climate, was met by DP1, an exterior barrier, and was further decomposed to the following: Keep out moisture, insulate from hot/cold fluctuations in external environment, heat interior area, cool interior area, keep interior area dry, protect from insects, and protect from intruders. DP’s were selected to preserve the Independence Axiom. If the DPs properly meet the FR, then problems like leaking roofs and improperly insulated units will not be a problem. It will be important to specify the acceptable parameters for all FRs and DPs and optimize using the Information Axiom.
As shown in Table 1, FR2, connect with the environment, is met by DP2, connections, and is further decomposed to the following: connect with other modules, allow controllable interaction with external environment, and connect to infrastructure. The DPs selected were standard interface, controllable inlet/outlet, and connection module. These selections were made to allow a further decomposition of each FR without compromising the Independence Axiom, while also enabling an easier design of a standard platform. Table 1 also shows that FR2.3 will only be required in the studio and bathroom modules. Also, as can be seen in Figure 2, these were all further decomposed, but were excluded from the table for brevity. Proper design of the standard interface is important to allowing the unit to meet the life cycle properties of modularity, reconfigurability, extensibility. The design must include ways to allow the passage of key elements such as electricity, water, and people, while also being simple to connect. Design of the other two connections is important as they provide access to key requirements for any structure, temporary or otherwise.

- 151 -
FR3, remain structurally sound, is met by DP3, structure, and is further decomposed to the following: remain stable, and maintain shape. The DP’s selected to meet these FRs were the foundation and frame. While these are both common elements in all structures, they have unique characteristics when implemented with a temporary, re-usable structure. They must be able to maintain their shape despite numerous dynamic loads, including normal loads such as seismic and wind loads, but also will need to withstand forces placed on the frame during transport. Likewise, the foundation should be designed to be removable at the end of the structures use so as to minimize site damage, and the resultant loss of value to the property. These requirements are both important to ensuring the safety and reusability of the structure.
Last, FR4, support user activities, is met by DP4, system configuration. It is decomposed into the following: provide artificial lighting, support storage, support food preparation, support eating, support social activity, support relaxation, support sleeping, support work/study, support exercise, and support elimination of human waste. As can be seen in Table 1, not all of these FRs and DPs will occur in every unit. This is important because it is in satisfying these diverse FRs that the modularity of the house becomes important. Also, as the discussion about the knowledge base explained, this variation allows the entire house to be customizable to each user’s needs.
As previously mentioned, TH is often constrained by the total permissible square area. This becomes even more of a problem when the units are re-usable and need to be easy to transport. While the modularity of the structure helps to eliminate the space constraints, it remains a problem for the design of the “studio” module. The studio module is constrained by space but still must be able to meet a number of functional requirements each of which require a minimum amount of space. The spatial constraints affect the functional requirements specified in FR4 in particular. All of these FR’s require a certain amount of space, which, when all are added together, is greater than the area of the unit. This produces unintentional coupling. As AD Theorem 20 states, this coupling is an unavoidable side effect of tightening the spatial constraint [Suh, 2001]. While this coupling is not ideal and should be avoided where possible, it is an unfortunate consequence of attempting to maximize functionality in a limited space. This coupling can be seen in Figure 2. It is important that designers keep this in mind throughout the design process.
It is also important to recall that because the housing is temporary it has to be easy to disassemble. Functional requirements will ramp down to zero when the structure has finished fulfilling the high-level functional requirements.
Table 1. Level one and level two FRs and DPs.
FR # Functional Requirement
DP # Design Parameter
FR0* Provide "Platform" Unit that Meets Basic Housing Needs
DP0* "Studio Module" S
FR0* Provide "Bathroom" Unit that Provides for Hygiene Needs
DP0* "Bathroom Module"
Br
FR0* Provide "Kitchen" Unit that Supports Food Preparation
DP0* "Kitchen Module" K
FR0* Provide "Bedroom" Unit that Supports Privacy and Sleeping
DP0* "Bedroom Module"
B
FR1 Protect Internal Climate DP1 External Barrier S, Br, K, B
FR1.1 Keep out Moisture DP1.1 Waterproof Shell S, Br, K, B
FR1.2 Insulate from Hot/cold Fluctuations in External Environment
DP1.2 Insulation S, Br, K, B
FR1.3 Heat Interior Area DP1.3 Electric Heating Unit
S, Br, K, B
FR1.4 Cool Interior Area DP1.4 Fans S, Br, K, B
FR1.5 Keep Internal Area Dry DP1.5 Drainage S, Br, K, B
FR1.6 Protect from Insects DP1.6 Screen S, Br, K, B
FR1.7 Protect from Intruders DP1.7 Locks S, Br, K, B
FR2 Connect With Environment
DP2 Connections S, Br, K, B
FR2.1 Connect with Other Modules
DP2.1 Standard Interface S, Br, K, B
FR2.2 Allow Controllable Interaction with External Environment
DP2.2 Controllable Inlet/outlet
S, Br, K, B
FR2.3 Connect to Infrastructure
DP2.3 Connection Module
S, Br
FR3 Remain Structurally Sound
DP3 Structure S, Br, K, B
FR3.1 Remain Stable DP3.1 Foundation S, Br, K, B
FR3.2 Maintain Shape DP3.2 Frame S, Br, K, B
FR4 Support User Activities DP4 System Configuration
S, Br, K, B
FR4.1 Provide Artificial Lighting
DP4.1 Lights S, Br, K, B
FR4.2 Support Exercise DP4.2 Floor Space S, B
FR4.3 Support Storage DP4.3 Shelves S, K, B
FR4.4 Support Food Preparation
DP4.4 Kitchenette S, K
FR4.5 Support Eating DP4.5 Table S, K
FR4.6 Support Work DP4.6 Desk S, B
FR4.7 Support Social Activity DP4.7 Gathering Area S, K
FR4.8 Support Relaxation DP4.8 Sofa S, B
FR4.9 Support Sleeping DP4.9 Pullout Bed S, B
FR4.10
Support Elimination of Human Waste
FR4.10 Wash Room Br
* indicates FRs and DPs that cannot occur concurrently S=studio, Br= Bathroom, K= kitchen, B=Bedroom

- 152 -
Figure 2. Design Matrix of the “studio” module for a temporary house.
3.4 PRODUCT PLATFORM
The DM presented in Figure 2 has a large number of functional requirements and is not decomposed to the lowest level FRs and DPs.
As Table 1 shows, the modules share a number of similarities, particularly in FR1, FR2, and FR3. The largest difference between the studio module and the additional modules occurs in FR4: support user activities.
The concept of a product platform based module design is a useful way to encourage a large variety of modules and highly customizable housing while minimizing manufacturing and design cost. The studio module needs to be larger to be able to meet its diverse set of functional requirements with minimal coupling. Likewise, the bathroom and hallway module need not be as large as the either the studio or other modules. This diversity in module size can still be achieved through the use product family design. The design of the architectural units can be approached as a scale-based product family. This approach enables the units to continue to capture the benefits of product platform design of having low design and manufacturing cost while achieving high customization.
In the proposed model, the functional requirements that are shared across all four modules, shown in Table 1, are met by the product platform. The remaining functional requirements, such as those in FR4, use customized DPs for each individual module.
4 CONCLUSION AND FUTURE WORK
This paper shows how Axiomatic Design is applied to the early design stages of a TH in order to ensure stakeholder’s needs are met without inhibiting the creative process. Treating the TH as a large flexible system and applying the knowledge base concept to the high-level requirements and design parameters allows the designer to assign specific functionalities to individual units. This modularity has an added benefit of minimizing accidental coupling in the design process. When applying the AD to the design process, the addition of the product platform theory aided in better defining independent product functional features.
Future work will investigate the robustness of the design through the use of the AD Information Axiom. The model will also be tested by the actual design and creation of a
DP
0
DP
1
DP
1.1
DP
1.2
DP
1.3
DP
1.4
DP
1.5
DP
1.6
DP
1.7
DP
2
DP
2.1
DP
2.1
.1
DP
2.1
.2
DP
2.1
.3
DP
2.1
.4
DP
2.2
DP
2.2
.1
DP
2.2
.2
DP
2.2
.3
DP
2.3
DP
2.3
.1
DP
2.3
.2
DP
2.3
.3
DP
3
DP
3.1
DP
3.1
.1
DP
3.1
.2
DP
3.2
DP
3.2
.1
DP
3.2
.2
DP
3.2
.3
DP
4
DP
4.1
DP
4.2
DP
4.3
DP
4.4
DP
4.4
.1
DP
4.4
.2
DP
4.4
.3
DP
4.4
.4
DP
4.5
DP
4.6
DP
4.7
DP
4.8
DP
4.9
"Stu
dio
Mo
du
le"
Exte
rnal
Bar
rier
Wat
erp
roo
f Sh
ell
Insu
lati
on
Elec
tric
Hea
tin
g U
nit
Fan
s
Dra
inag
e
Scre
en
Lock
s
Co
nn
ecti
on
s
Stan
dar
d In
terf
ace
Larg
e P
ort
al
Inte
r-m
od
ula
r El
ectr
ical
Co
nn
ecti
on
Fres
h W
ater
Pip
ing
Co
nn
ecti
on
Was
te W
ater
Pip
ing
Co
nn
ecti
on
Co
ntr
olla
ble
Inle
t/o
utl
et
Do
or
Win
do
w
Ven
tila
tio
n S
yste
m
Co
nn
ecti
on
Mo
du
lus
Co
nn
ecti
on
to
Po
wer
So
urc
e
Co
nn
ecti
on
to
Wat
er S
ou
rce
Co
nn
ecti
on
to
Was
te W
ater
Dis
po
sal
Stru
ctu
re
Fou
nd
atio
n
Co
mp
acte
d S
oil
Tem
po
rary
Fo
un
dat
ion
Pile
s
Fram
e
Late
ral B
raci
ng
Sem
i-R
igid
Fra
me
Co
lum
ns
Syst
em C
on
figu
rati
on
Ligh
ts
Flo
or
Spac
e
Shel
ves
Kit
chen
ette
SIn
k
Co
un
tert
op
Sto
ve
Cab
inet
Tab
le
Des
k
Gat
her
ing
Are
a
Sofa
Pu
llou
t B
ed
FR0 Provide "Platform" Unit that Meets Basic Housing Needs O
FR1 Protect Internal Climate X
FR1.1 Keep out Moisture X
FR1.2 Insulate from Hot/cold Fluctuations in External Environment X X
FR1.3 Heat Interior Area X
FR1.4 Cool Interior Area X
FR1.5 Keep Internal Area Dry X X
FR1.6 Protect from Insects X X
FR1.7 Protect from Intruders X X
FR2 Connect With Environment X X X X
FR2.1 Connect with Other Modules X
FR2.1.1 Provide Ingress for Users Between Modules X
FR2.1.2 Provide Electrical Connection Between Modules X
FR2.1.3 Provide Freshwater Connection Between Modules X
FR2.1.4 Provide Wastewater Connection Between Modules X
FR2.2 Allow Controllable Interaction with External Environment X X X
FR2.2.1 Allow Ingress Into and and Out of Structure for People X
FR2.2.2 Allow Entrance of Natural Light X X
FR2.2.3 Maintain Adequate Air Quality X X X X X X
FR2.3 Connect to Infrastructure X X X
FR2.3.1 Provide Electricity X
FR2.3.2 Provide Running Water X
FR2.3.3 Dispose of Waste Water X X X
FR3 Remain Structurally Sound X
FR3.1 Remain Stable X
FR3.1.1 Protect from Erosion X
FR3.1.2 Protect from Differential Settlement X
FR3.2 Maintain Shape X
FR3.2.1 Protect from Lateral Loads X
FR3.2.2 Protect from Dynamic Loads (Wind/ Seismic) X X X X
FR3.2.3 Protect from Vertical Loads X X
FR4 Support User Activities X X X X X X X X
FR4.1 Provide Artificial Lighting X
FR4.2 Support Exercise X X X X
FR4.3 Support Storage X X X X X
FR4.4 Support Food Preparation X X X X X X X X X
FR4.4.1 Provide Easy Access To Running Water X X
FR4.4.2 Provide Prep Area X X X X
FR4.4.3 Provide Heat Source X X X X
FR4.4.4 Store Food X
FR4.5 Support Eating X X X X X
FR4.6 Support Work/study X X X X X X
FR4.7 Support Social Activity X X X X X X X X
FR4.8 Support Relaxation X X X X X
FR4.9 Support Sleeping X X X X X

- 153 -
working TH model. The process variables, such as manufacturability, will also be investigated.
5 REFERENCES
[1] Arslan, H., "Re-design, re-use and recycle of temporary houses", Building and Environment, 42, 1, 400-406, 2007.
[2] Arslan, H. and Cosgun, N., "Reuse and recycle potentials of the temporary houses after occupancy: Example of Duzce, Turkey", Building and Environment, 43, 5, 702-709, 2008.
[3] Bundhun, R., "Qatar hotels may feel post-world cup blues", Dec. 8, 2010, <http://www.thenational.ae/business/travel-tourism/qatar-hotels-may-feel-post-world-cup-blues>.
[4] Carlson, J. S. and Criswell, M. E., "Concepts for the Design and Construction of a Modular Inflatable Habitat", Engineering, Construction, and Operations in Challenging Environments, 9-16, 2004.
[5] Davidson, C. H., Johnson, C., Lizarralde, G., Dikmen, N. and Sliwinski, A., "Truths and myths about community participation in post-disaster housing projects", Habitat International, 31, 1, 100-115, 2007.
[6] El-Anwar, O., El-Rayes, K. and Elnashai, A., "Maximizing Temporary Housing Safety after Natural Disasters", Journal of Infrastructure Systems, 16, 2, 138-148, 2010.
[7] Farid, A. M., McFarlane, D. C., "Production degrees of freedom as manufactoring system reconfiguration potential measures", Proceedings of the Institution of Mechanical Engineers, Part (Journal of Engineering Manufactoring), 222, B10, 1301-1314, 2008.
[8] Ferguson, K., "Target Logistics - Temporary Workforce Housing for Military Personnel", Feb. 21, 2010, <http://www.army-technology.com/contractors/logistics/target-logistics2/>.
[9] Johnson, C., "Impacts of prefabricated temporary housing after disasters: 1999 earthquakes in Turkey", Habitat International, 31, 1, 36-52, 2007a.
[10] Johnson, C., "Strategic planning for post-disaster temporary housing", Disasters, 31, 4, 435-458, 2007b.
[11] Johnson, C., Lizarralde, G. and Davidson, C. H., "A systems view of temporary housing projects in post-disaster reconstruction", Construction Management and Economics, 24, 4, 367-378, 2006.
[12] Lizarralde, G., "Stakeholder participation and incremental housing in subsidized housing projects in Colombia and South Africa", Habitat International, 35, 2, 175-187, 2011.
[13] Mooney, E., "When 'temporary' lasts too long", Forced Migration Review, 33, 64-66, 2009.
[14] Nigg, J. M., Barnshaw, J. and Torres, M. R., "Hurricane Katrina and the Flooding of New Orleans: Emergent Issues in Sheltering and Temporary Housing", The ANNALS of the American Academy of Political and Social Science, 604, 1, 113-128, 2006.
[15] Rubio, R., Anzellini, S. and Echeverry, D., "Low Income Housing Development and the Sustainability of Large Urban Settlements", Construction Research Congress, 1-8, 2004.
[16] Simpson, T. W., "Product platform design and customization: Status and promise", Artificial Intelligence for Engineering Design, Analysis and Manufacturing: AIEDAM, 18, 1, 3-20, 2004.
[17] Simpson, T. W., Siddique, Z. and Jiao, J., Product Platform and Product Family Design: Methods and Application, Springer, New York: 2005.
[18] Suh, N. P., "Design and operation of large systems", Journal of Manufacturing Systems, 14, 3, 203-213, 1995.
[19] Suh, N. P., Axiomatic Design Advances and Applications, New York, New York: Oxford University Press, 2001.

Proceedings of ICAD2013 The Seventh International Conference on Axiomatic Design
Worcester – June 27-28, 2013
ICAD-2013-23
- 154 -
ABSTRACT
Architectural design has become increasingly complex due to the global environmental, energy issues, and socio-economic changes. Key parameters well considered in the early phase of the design process would provide good performance, competitive costs, and close-to-envisioned appearance of the built environment. Therefore, in order to reduce or minimize the complexity of the entire design process, a systematic approach is required, especially in the early phase of architectural design projects. While many systematic design approaches have been developed in engineering design, little effort has been made in architecture. Axiomatic Design (AD) is distinguished from other systematic design methods by having design axioms that guide good design decisions, especially in the early design phase. The AD approach has basic design principles which can be applied to problem analysis and decision-making. In this paper, a review and classification of AD applications in the architectural design processes is conducted. This study provides an initial framework which will be further developed to create a systemic framework to support architectural design in an efficient and effective way.
Keywords: architecture, Axiomatic Design, design principles.
1 INTRODUCTION
The complexity of architectural design is rising due to socio-economic changes, and environmental and energy issues. At the present time, the traditional decision models in construction project management are based on balancing cost, time, quality and sustainability. The goal of sustainability has become an important part of a holistic and simultaneous approach to overall building quality [BBSR, 2011]. Moreover the customer demands have become much more diverse and segmented, and each market segment requires specific design solutions. Architectural design has to satisfy specific customer’s needs in order to improve customer satisfaction [Sabbadin, 2011]. Therefore the design of architectural systems has to be optimized with respect to a large number of different (sometimes conflicting) requirements and constraints, and the solution has to be selected from different available alternatives. The increasing complexity of architectural design entails the need for a more rational and systematic approach to the design process, especially in the conceptual design phase when decisions with fundamental
and extensive effects on appearance, performance and costs are made [American Institute of Architects, 2007]. In this phase, most designers emphasize intuition and experience [Danke, 1979], which may not be adequate when the desired design solution is not easily found, the cost of failure is extremely high, the design task is extremely complicated, or when multiple stakeholders for the design are involved in the project. Conventional design methods are not suitable in many design projects due to complexity, high probability of errors and the requirement for team work [Cross, 2000]. Moreover the design process in architecture is not supported by a clear, integrated framework of available design supports [Chang, 2011].
Optimizing a design decision based on a varied and complex set of constraints requires an integrated and systematic approach, starting with the early phase of the design process which may include performing complex analyses, making decisions among conflicting parameters, and defining necessary compromises. In addition to conventional design methods, specific procedures are available. These methods, developed in engineering design, propose systematic approaches to the design activities, formalizing specific procedures and externalizing design thinking [Cross, 2000]. Although architectural design shares its framework with other design domains, like engineering design, rarely engineering design methods are applied in the architectural design process. AD is distinguished from other engineering design methods by the use of axioms that form a systematic and scientific basis for design decisions [Suh, 1990]. AD, developed by Nam P. Suh at MIT in engineering field, establishes that there are design principles that govern all good design decisions. It has been shown that this design theory can be applied to many different domains of problems including product design, systems design, large and small scale systems design, manufacturing process design and health care system design [Suh, 2001; Peck et al., 2010]. It provides designers with a decision framework to evaluate the synthesized idea before and during the analytical phase, or to select good ideas from several plausible designs even in the very early design phase. AD allows the selection of the best alternative within a set of constraints, and also assures the most appropriate solution [Suh, 1990].
The AD approach has great potential in some non-engineering applications, such as architectural design. This study provides a literature review of these applications, and introduces a classification scheme based on application area,
APPLICATION OF THE AXIOMATIC DESIGN APPROACH TO THE DESIGN OF ARCHITECTURAL SYSTEMS: A LITERATURE REVIEW
Marianna Marchesi [email protected] Faculty of Science and Technology Free University of Bozen-Bolzano
Piazza Universitá, 5 39100, Bolzano, Italy
Sang-Gook Kim [email protected]
Department of Mechanical Engineering Massachusetts Institute of Technology
77 Massachusetts Avenue 02139, Cambridge, MA, USA
Dominik T. Matt [email protected]
[email protected] Faculty of Science and Technology Free University of Bozen-Bolzano
Piazza Universitá, 5, 39100 Bolzano, Italy Fraunhofer Italia Research
Via del Macello, 57, 39100 Bolzano, Italy

- 155 -
applied design phases and design activities, and applied methods and axioms. In the reviewed papers, AD has been mainly applied in the conceptual phase of the design process for addressing the design problems effectively towards specific goals. In most cases, the design problem is very specific, and usually concerns functional aspects. It is rare that an architectural design problem is studied as a multi-criteria decision making problem even though the fact that architectural design fulfils both practical and expressive requirements.
This study intends to analyse the applications of AD to the design of architectural systems, in order to improve the effectiveness of the decision-making process and to maintain the designed quality during the subsequent detail design processes. This analysis should contribute to the future development of a systems framework for the understanding and achievement of architectural design concepts in an efficient and effective way.
2 LITERATURE REVIEW
Architectural design is a process of creating synthesized solutions in the form of the built environment that fulfil both practical and expressive requirements according to existing constraints and available resources. Architectural design serves both utilitarian and aesthetic aims. They cannot be separated, but the relative weight given to each can vary widely. Therefore the characteristics of quality in a work of architecture consists of the suitability for the use by human beings and its adaptability to specific activities, the stability and permanence of the construction, and the aesthetic aspect through its form [Ackerman, 2013]. The required quality of architecture is constrained by finite resources (finance, time, resource, and whole-life value) [Dickson, 2004]. The traditional construction decision model, based on the balance among quality, time and cost, is nowadays widened involving the sustainability. Therefore the complexity of architectural design is increasing in an exponential way: architectural planning has to harmonize various demands in a utilitarian and aesthetic way within given socio-economic constraints.
Architectural design is an iterative and incremental process performed before the construction. In this process, an architectural product is identified (conceptual phase), defined (preliminary phase and develop phase) and specified (detailed phase) [UNI, 2007]. The architectural design process consists of multiple sub-processes through which various solutions are developed at different times, while the creation-evaluation-selection cycles for generating design solutions are constantly repeated during the entire process [Roozenburg and Cross, 1991]. In the architectural design process, design problem and solution co-evolve together along the process [Roozenburg and Cross, 1991], while the opportunity to influence the design decreases rapidly over time. In the early stage of the design process, architects elaborate potential solutions in order to obtain more information about problems from client. They use previous experiences and knowledge to define a simplified problem on the basis of which they later elaborate conjectures of possible solutions. Therefore, architects usually need to reformulate the design problem many times, while they keep track of all relevant issues of the specific design task [Danke, 1979]. In the early phase, there is a great
potential to take decisions that are crucial on customer satisfaction, on performances and appearances of the design solution, and on reduction of project costs [American Institute of Architects, 2007]. In order to improve the effectiveness of the decision-making process in this phase, the team members have to agree on a common design strategy, that is a design process and design methods to follow, and on common goals [Macmillan et al., 2001].
Traditional tools of design, such as design-by-drawing, cannot always adequately solve the current complex design tasks frequently imposed on designers [Cross, 2000]. An analysis of available architectural design tools shows that the design process in Architecture is not supported by a clear, integrated framework of design supports [Chang, 2011]. Moreover usually architectural design tools specialize in supporting late design development activities and relatively few have been developed to support the conceptual design phase [Wang, 2002]. Cavieres et al. [2011] retain that the lack of available conceptual design supports is due to the approach of architects to design in the conceptual design phase [Cavieres et al., 2011]. Regarding sustainable building, a specific group of tools is available to evaluate different aspects of sustainability [Haapio and Viitaniemi, 2008] or to assess the overall building quality [BBSR, 2011]. Nevertheless these sustainable building assessment methods are designed to evaluate building projects at the later design stage, in order to provide an indication of the performances of buildings. They rely on detailed design information [Ding, 2008].
An analysis of existing design process models from both within and beyond construction was conducted by Macmillan et al., [2001], in order to develop a generic framework of design activities for supporting building design in the conceptual phase [Macmillan et al., 2001]. This study highlights some common features among existing design process models. Most describe a sequence of phases which, typically, imply iteration within phases, but not between one phase and another. Most set out only what should be undertaken, not why or how it should be performed. All the models start with an analysis of requirements, before the generation of possible solutions, showing progression. Most of the models imply convergence to one solution quite early in the design process, and only a few explicitly encourage the generation of alternative concepts for evaluation. None of the models makes explicit reference to ways for generating alternative solutions, or to formal measurement, evaluation or assessment methods [Macmillan et al., 2001]. Moreover some differences emerge between architectural and engineering design approaches. Usually the architectural approach adopts solution-oriented models to design problems, generating solution concepts early in the design process through conjectures, followed by spiral and cyclic stages of descriptive procedures. Engineering approaches instead adopt problem-oriented models, focused on analysis of the problem, followed by prescriptive multi-phase procedures [Roozenburg and Cross, 1991]. These different approaches and the consequent lack of a shared understanding of the design process among the work team results in inefficient results [Macmillan et al., 2001]. Suggestions for the development of common approaches are proposed by Blessing [1996] and Macmillan et al. [2001]. Blessing suggests merging solution-oriented and

- 156 -
problem-oriented models. Macmillan et al. propose merging models focused on design solutions and models oriented to process management [Gericke and Blessing, 2012]. An integrated framework of phases and design activities for the conceptual building design phase is developed by Macmillan et al. [2001], based on a literature review, interviews and case study analyses, in order to guide the interdisciplinary work team to share common goals. This framework is composed of twelve activities in five phases, as shown in Table 1.
Table 1. Conceptual Building Design Framework [Macmillan et al., 2001].
Stages Phases Activities Develop business need into design strategy
Interpretation of needs
Specify business needsAssess stakeholder requirements Identify essential problems
Developing of design parameters
Develop functional requirements Set key requirementsDetermine project characteristics
Develop design strategy into conceptual proposal
Divergent search
Search for solution principles
Transformation of concepts
Transform and combine concepts Select suitable combinations Firm up into concept proposals
Convergence to proposal
Evaluate and choose the proposal Improve details and cost of proposal
Usually in the early phase, many designers emphasize intuition and experience, but it is not often sufficient, especially when the design variables are numerous, and the context of application changes. Conventional design methods are not suitable in many design projects due to complexity, high probability of errors, and a lack of tools for team work. Architectural design needs systematic approaches to perform complex design analysis and knowledge integration, especially in the early stage of the design process, when decisions are made with fundamental and extensive effects on appearance, performance and costs. In addition to conventional design methods, specific procedures are available. These approaches, developed in engineering design, propose rational procedures of the design process, formalizing specific design methods and externalizing design thinking [Cross, 2000]. Designers may use and combine them to improve the effectiveness of the design process.
Although AD is one of these approaches, it is distinguished from the others because it guides the synthesis and decision-making process in developing design solutions through basic principles. It can be applied to all situations of solving design problems, from synthesis to analysis of the synthesized idea, then to select only good ideas from plausible solutions [Suh, 1990]. AD defines that the design process is
the creation of synthesized solutions in the form of products, processes or systems, that satisfy perceived needs through interplay between functional requirements (FRs) and physical solutions expressed in terms of design parameters (DPs) at every hierarchical level of the process. This process continues moving down along the hierarchy until the designer produces an acceptable result. The design process is performed through design activities, and consists of four phases: problem definition, creative process, analytical process and ultimate check [Suh, 1990].
A comparison between the conceptual building design framework and the AD framework is conducted to relate them (Table 2).
Table 2. Design activities frameworks comparison.
Conceptual Building Design Framework [Macmillan et al., 2001]
AD Framework [Suh, 1990]
Specify business needs Identify needsAssess stakeholder requirements Identify essential problemsDevelop functional requirements
Define a minimum set of functional requirements and determine constraints Set key requirements
Determine project characteristics Search for solution principles Synthesize a physical
solution characterized in term of design parameters
Transform and combine concepts
Analyse the solution.Eventually come up with a new idea or change the functional requirements
Select suitable combinations Firm up into concept proposals Evaluate and choose the proposal
Check the ultimate solution
Improve details and cost of proposal
In AD, problem specification and solution are developed, starting by an analysis of needs, before the generation of possible solutions, in a gradual progression. During the design process, the formulation of the problem and ideas for a solution are developed together with constant shuttling to-and-from problem and solution (zig-zagging between what and how) in a top-down manner. The process starts with the specification of the first level of FRs in the functional domain and physical solutions (design parameters at the same level) have to be conceived that can satisfy FRs. The designer switches between functional and physical domains each time, moving down in the hierarchy and decomposing the upper-level of the FRs into lower-level. At each level of the functional domain only the most important FRs must be identified, eliminating secondary factors [Suh, 1990]. Architectural design in practice shows some similarities: it is an incremental process that has multiple sub-processes, while the creation-evaluation-selection cycle for generating design solutions is repeated during the process. On account of the previous considerations, AD may provide a suitable systematic

- 157 -
framework for architectural design in the conceptual phase for addressing the design solution towards the demanded quality: it sets out what should be undertaken, and how it should be performed; it encourages the generation of alternative concepts, and indicates how to carry out the evaluation of alternative solutions.
An analysis of articles on AD applications to architectural design is conducted, and a classification is elaborated (Table 3 and Table 4). The reviewed articles are classified according to five main criteria: application area, design phase performed, methods proposed or applied and design activities performed, and finally the type of axiom adopted.
The application area column in Table 3 shows the major sectors of architectural applications and consists of five sub-sections: urban planning, building design, existing building improvement, construction project management and furniture design. The design phase column is created to highlight in which phase of the architectural design process the AD approach has been applied. The methods section intends to show how AD is utilized in each study to reach its objective. In this section, application of AD means that AD alone is applied in the study. Application of integrated methods states that the AD approach is utilized together with another method or methods in the study. Theoretical development explains whether the study proposes a theoretical improvement based on AD approach. The section AD framework and methods explains in detail the methods adopted or proposed in each design activity during the design process. The axioms section deals with the use of which kind of axiom in the paper: the first axiom (the Independent Axiom) and the second axiom (the Information Axiom).
Eliasson and Psilander [2000] intend to guarantee the achievement of customer satisfaction and profit required by home building industry through the application of specific methods. The ability of entrepreneurs in the home building industry is furnishing housing development for a chosen group of customers that places maximum value on the product offered. Competence Bloc Theory is used to relate customer preferences to the design process. A careful identification and definition of the customer is required. AD is introduced to focus on achieving the aesthetic quality and the maximum diversity of product quality with the minimum variability of inputs, in order to reach production process efficiency and customer satisfaction [Eliasson and Psilander, 2000].
Sohlenius [2000] presents a synthesis framework of a research proposal in terms of its aims, methods and phases regarding building industry and real-estate development. The goal is to maximize profitability in the construction industry in terms of income, cost and capital, by seeking a higher customer-value in both the short and long term and an effective building process. Since the building industry has many similarities with the manufacturing industry, the application of various manufacturing system design methods, such as AD, to the building process is discussed. Their research intends to understand the effectiveness of the design method regarding decision-making activities in the early stages of the design process. Qualitative Methods are proposed in combination with AD in a decision-making framework to facilitate the understanding of the customer requirements, especially according to aesthetic and social values [Sohlenius, 2000].
Table 3. Classification of literature review: application area and design phase.
Application area Design phase Urban
planning Building design
Existing building improvement
Project manage ment
Furniture design
Conceptual
Preliminary
Developed
Detailed
Eliasson et al. [2000]
housing development
√ - - -
Sohlenius [2000]
housing development
√ - - -
Helander et al. [2000]
seated workplace
√ - - -
Psilander [2002]
single-family house
√ - - -
Sohlenius et al. [2002]
housing development
√ - - -
Kowaltowskiet al. [2003]
housing area development
√ - - -
Kankey and Ogot [2005]
acoustics ofauditorium
- √ - -
Cavique et al. [2009]
energy efficiency of buildings
√ - - -
Pastor et al. [2011]
airport terminal
√ - - -

- 158 -
Table 4. Classification of literature review: methods, design activities and axioms.
Methods AD framework and methods Axioms Applic
ation of AD
Application of integrated methods
Theoretical development
Problem definition
Creative process
Analytical process
Ultimate check
1 2
Recognition of needs
Determination of FRs and Cs
Creation of solution in term of DPs
Analysis of solution
Check ultimate solution
Eliasson et al. [2000]
√ Competence Bloc Theory
AD AD - - √ -
Sohlenius [2000]
√ Qualitative Methods
AD AD - - √ -
Helander et al. [2000]
√ Literature review AD AD AD - √ √
Psilander [2002]
√ Market analysis, Literature review
AD AD AD - √ -
Sohlenius et al. [2002]
√ Market analysis, Kano Model
AD, QFD, Robust Design, LOLA-rule
AD, TIPS - - √ -
Kowaltowski et al. [2003]
√ Literature review, POE study
AD AD - - √ -
Kankey and Ogot [2005]
√ Literature review, EMS Model
AD, TRIZ AD AD - √ -
Cavique et al. [2009]
√ Literature review AD AD AD - √ -
Pastor, et al. [2011]
√
Customer needs survey
AD AD AD - √ -
Helander et al. [2000] apply AD to improve the
anthropometric design of a seated workplace. Using the Independence Axiom, an unconventional design solution is proposed. It results in a better solution than the conventional design solution recommended in the literature. The Information Axiom is introduced to select the best furniture available on the market. The selection is carried out based on the anthropometric data defined in the previous design phase. A significant improvement of the design methodology in ergonomics is possible with the specific features of AD. This approach proposes a clear framework: the analysis of the FRs through the design matrix, the evaluation of alternative designs by applying the Information Axiom, finally the identification of critical design parameters through the decomposition of the domains in hierarchical structures [Helander et al., 2000].
Psilander [2002] applies AD to the design of dwellings in order to assure the correspondence between tastes of specific groups of customers and the realized project outcome. Their application concerns the conceptual design of a single-family house, using only qualitative information. The aim is to form an operative basis for making decisions about how the house can be realized, while maximizing profits and limiting costs. In order to maximize profits, the tastes of the target customer groups have to be guaranteed. The FRs of a dwelling are expressed in terms of function, quality and aesthetics. Appropriate DPs are indicated [Psilander, 2002]. Further, the highest level FRs and DPs are decomposed; for example the functionality is developed in terms of FRs and DPs to satisfy
certain spatial relationships. With regard to the reduction of cost, standardization has been a known method. But some variety has to be guaranteed in order to go along with the customer’s taste, and to provide identity. The possibility to combine architectural variations and standardized solutions depends on which types of standardized building materials and elements are used. Compared with an intuitive design process, the design process developed by AD allows rejecting bad project ideas even at the conceptual design stage. Moreover it allows identifying possible deviations during the process, determining where they appear and why they are made, and evaluating the consequences of deviations [Psilander, 2002].
Sohlenius and Johansson [2002] propose a framework based on AD combined with the Theory of Flexibility and LOLA-rule (LOw and LAte commitment) and other methods (Robust Design, Theory of Inventive Problem Solving and Quality Function Deployment) to improve the decision-making process in the conceptual design phase of the housing development process, and to achieve high customer value and high productivity. Meeting target customer’s demand in the housing development means providing the satisfaction of the customer’s requirements in an efficient way. Modularity can support the achievement of variation in order to satisfy different customer requirements efficiently [Sohlenius and Johansson, 2002]. An analysis of the context of a real estate development project (housing demand, housing supply site conditions, laws and regulations) is required to understand the market system, and to define needs and constraints. Proper

- 159 -
specifications of a market analysis are necessary to allow an accurate quantification and identification of constraints and FRs. The Kano Model is proposed to structure the customer needs and to focus on the right quality. According to AD, FRs should be expressed with tolerances, but many architectural proprieties that are essential to achieve the overall quality of housing are non-measurable. In these cases, the profile for the real-estate development should be expressed clearly through an early market analysis. Constraints and FRs may change over time which cannot be foreseen. The Theory of Flexibility and the LOLA-rule are proposed for defining flexibility and limits of the design changes [Sohlenius and Johansson, 2002].
Kowaltowski et al. [2003] adopt AD to elaborate a systematic evaluation method regarding environmental impact and quality of life for the design of typical low-income housing, in order to improve the quality of future public housing design projects. This method should enable designers to consider a large number of factors that may interfere with the quality of user’s life and the environmental sustainability. A literature review is elaborated to establish architectural and urban indicators that influence environmental and life quality for low income family housing projects [Kowaltowski et al., 2003]. POE (Post Occupation Evaluation) method is proposed to verify if the selected indicators meet the perceived quality of life and the environmental quality by local population. The inclusion of people’s perception of quality into the design process allows a direct link between design criteria and user desires. Therefore these indicators are included in the AD framework to rationalize, and to support the decision-making activity in the architectural design process. AD is able to include qualitative information in the design process, increasing the quality of the design solutions. Other analysis methods, such as simulation, checklist and multi-criteria optimization, are considered for the evaluation and the optimization of the design solutions, according to specific design parameters, especially regarding the aspects of comfort and energy efficiency [Kowaltowski et al., 2003].
Kankey and Ogot [2005] investigate the use of AD combined with TRIZ to solve a problem of poor acoustics in a historical auditorium. The aim is the development of an affordable permanent solution that determines an enjoyable listening experience for most of the audience, and retains the historical aspect of the building. The Energy-Material-Signal (EMS) Model allows the designer to define the correct problem, decomposing and identifying scarce aspects (energy, material or signal flows) of the phenomena. FRs and DPs are defined and their couplings are shown. The result is a decoupled design. To obtain an uncoupled design according to the Independence Axiom, TRIZ is employed. Using AD to establish appropriate contradictions and TRIZ to come up with design solutions to overcome them, the solution results an uncoupled design [Kankey and Ogot, 2005].
Cavique et al. [2009] apply the AD approach to develop a framework to support the design of energy efficient heat, ventilation and air-conditioning (HVAC) systems. The energy consumption of HVAC systems depends on the characteristics of the building where the systems are installed. On account of this concept, the aim of the paper is to analyse both the reduction of energy consumption in a building and the decrease of energy consumption of the HVAC systems.
Standards, directives and regulations are used to identify FRs and DPs. The mapping process of AD decomposes FRs and DPs in a general framework. The evaluation of the reduction of the energy consumption in the buildings considers the improvement of the performances of the building envelope, the reduction of internal loads and energy systems consumption and the local production of energy [Cavique et al., 2009].
Pastor et al. [2011] test a new approach to the functional design problem of a passenger terminal in a small tourist airport applying the AD. The design of an airport passenger terminal requires the evaluation of an enormous number of variables. In the conceptual design phase, basic dimensions and infrastructures are defined based on specific formulas indicated by each national regulatory authority and international organizations, in order to guarantee a certain level of service and safety. Subsequently, distribution and configuration are determined according to architectural and functional criteria [Pastor et al., 2011]. In this paper, the aim is to define a basic layout of the passenger terminal, using a minimal set of FRs. An analysis of the motion path following each passenger is conducted. Moreover an elaborated survey was conducted in order to establish a list of FRs of each functional area. A minimum set of FRs is selected following the Independent Axiom. This set represents the basic functions that each area should provide to guarantee customer satisfaction. The conceptual design of each functional area is defined individually, and the derived concept for the whole system is composed, linking optimally the sub-systems to each other. This study shows that a suitable selection of FRs and constraints allows the designer to define both dimensions and layout together and to determine a solution based on specific needs of different stakeholders [Pastor et al., 2011].
3 DISCUSSION
This paper focuses on the early phase of the architectural design process, when decisions have the most effect on performance, appearance and the cost of the whole building project. This phase is not well understood and has been treated as an art. For design in practice, there has been little or no guidance on what should be done and how it should be achieved [Macmillan et al., 1999]. A considerable amount of knowledge and experience from different disciplines and stakeholders are required to elaborate the problem description as well as the architect’s intuitive imagination. These factors make it very difficult to develop an initial complete description of the architectural project, normally found in the scientific approach. Confusion often appears among the design team regarding the direction of progression, due to the lack of common goals. Moreover team members expect that all requirements can be satisfied equally without considering that some requirements often conflict [Macmillan et al., 2001]. In this phase, architects usually use previous experiences and knowledge to define a simplified problem, in order to stimulate the conjecture of possible solutions, and they iteratively need to reformulate the design problem until problem and solution are defined explicitly. Therefore in architectural design, design problem and solution co-evolve together during the design process, while the opportunity to influence the design parameters decreases rapidly over time.

- 160 -
Although experience is important, it is often not sufficient, especially when the design variables are numerous, and the context of application changes. Experience should be supported by a systematic framework.
Many design studies show that designers supported by a systematic framework are better able to focus on the demands of a problem than those without a framework [Archer, 1984]. A framework of design activities developed by Macmillan et al. [2001] for the conceptual building design phase is available, in order to support interdisciplinary teamwork through the promotion of collaborative design development. This framework may form the basis on which systematic design methods are embedded, in order to evaluate their effectiveness in the decision-making activity.
The AD approach, a systematic design method, proposes to support the development of good design solutions through basic principles of functional independence and complexity minimization. This approach demands a clear formulation of the design problem: it states that, in order to generate good design satisfying specific needs and required quality, designers must define the design goals in terms of “what they want to achieve” and provide a clear description of “how to achieve it” [Suh, 2001].
An assessment of the literature review regarding applications of AD to the design of architectural systems is provided, and a classification scheme is introduced based on the application area, performed design phase and design activities, applied methods and axioms. The number of papers on this topic is not high. This analysis takes in account papers elaborated on applications of AD in architectural design between the years of 2000 and 2011. Unfortunately there are certain limitations: studies published in academic journals outside of databases and non-English papers have not been included. Both practical and theoretical papers are evaluated and classified.
As regards practical articles, AD has been used to support the definition of solutions for specific design problems. The application of AD covers various fields and built-in structures such as: housing development, customization of dwellings in the building industry, functional design of a small passenger terminal airport, acoustic improvement of a historic building, increase of the energy efficiency performances of the building envelope and improvement of anthropometric design of a seated workplace. In these cases, the design problem is very specific, and mainly concerns functional aspects. Although architectural design fulfils both utilitarian and aesthetic requirements, it is rare that the aesthetic aspect of architectural design problem is considered as a multi-criteria decision making problem. In one case, functional, constructional and aesthetic aspects of the design problem are evaluated together [Psilander, 2002]. The field of furniture design can also benefit by the AD approach, which has been widely used in the production design area.
Theoretical articles pertain to studies which allow theoretical developments in specific fields through the use of the AD approach. In particular, AD is proposed to support the project management activity for ensuring the correspondence between needs of customers and realized projects. In the reviewed papers, AD is mainly applied in the
conceptual design phase to address the design process effectively towards specified goals. In most studies, the AD approach is applied alone without the contribution of other methods. In one case, AD is integrated with other methods, such as TRIZ, to solve contradictions. Moreover different specific methods are proposed for the definition of the design problem.
In most articles, the first axiom is generally applied. It is widely used since it permits the designer to reduce random research processes, and to minimize the repeated trial-and-error-activities [Kulak et al., 2010]. The second axiom is rarely used in these applications. In general, the Information Axiom is applied on multi-criteria decision making problems and for the selection of the most appropriate alternative within specific criteria [Kulak et al., 2010]. In the analysed applications, the design problem is usually very specific. Moreover rarely different alternative solutions are proposed and evaluated.
4 CONCLUSIONS
Design research on the architectural design process underlines that this process has a hierarchical structure in which the formulation of the problem and the development of the solution evolve together in a cyclic sequence during the process. The design problem escapes an initial complete definition since it requires a considerable amount of knowledge from different disciplines and stakeholders. Therefore usually designers use their knowledge and past experience to formulate a simplified problem and to stimulate a solution-conjecture based on it.
In AD, the problem specification and the solution are developed in a gradual progression starting by an analysis of needs, before the generation of possible solutions and with top-down and to-and-from navigation between problem (FRs) and solution (DPs). A clear formulation of the design problem is required: the design goals must be defined and a clear description of related design parameters must be provided.
This study identifies that in the majority of the published applications of AD to architecture, AD is used for solving specific design problems. We believe, however, that AD can support the designer’s experience by providing a logical and rational thought process when the design variables are numerous and the context of application changes. Therefore AD needs to be further studied in the early phase of architectural design applications that intend to consider the various FRs, DPs and constraints of architectural design projects.
This article intends to form the basis for the future development of a systems framework that improves the effectiveness and the efficiency of the conceptual design process in architectural design. An existing framework of design activities that supports and aids the interdisciplinary team towards common goals can be adopted and integrated to the AD framework.

- 161 -
5 REFERENCES
[1] Ackerman, J. S., "Architecture", Encyclopædia Britannica Online Academic Edition, Encyclopædia Britannica Inc., 2013.
[2] American Institute of Architects, Integrated Project Delivery: A Guide, AIA, p. 21, 2007.
[3] Archer, B. L., “Systematic method for designers” in Developments in Design Methodology, Cross, N. (ed.), John Wiley & Sons, Chichester, 2013.
[4] Cavieres, A., Gentry, R., Al-Haddad, T., “Knowledge-based Parametric Tools for Concrete Masonry Wall: Conceptual Design and Preliminary Structural Analysis” Automation in Construction, Vol. 20, pp. 716-728, 2011.
[5] Cavique, M., Goncalves-Coelho, A., “An Energy Efficiency Framework for Design of HVAC Systems”, The Fifth International Conference on Axiomatic Design, Campus de Caparica, March 25-27, 2009.
[6] Chang, S., “Methodological Polymorphism for Supporting the Architectural Design Process”, First International Workshop on Design in Civil and Environmental Engineering, Daejeon, Apr. 1-2, 2011.
[7] Commissione Tecnica UNI, UNI 10722-2: Building – Qualification and Control of Building Project and Design for New Constructions, Ente Nazionale Italiano di Unificazione, 2007.
[8] Cross, N., Engineering Design Methods: Strategies for Product Design. Wiley & Sons, Chichester, 2000.
[9] Danke, J., “The Primary Generator and the Design Process”, Design Studies, Vol. 1 No. 1, pp. 36-44, 1979.
[10] Ding, G. K.C., “Sustainable Construction – The Role of Environmental Assessment Tools”, Journal of Environmental Management, Vol. 86, pp. 451-464, 2008.
[11] Eliasson, G., Psilander, K., “Entrepreneurship in Customer Satisfaction. The Case of Swedish, Danish and Californian Home Building”, The Eighth International Joseph A. Schumpeter Society Conference, Manchester, June 28 – July 2, 2000.
[12] Federal Institute for Research on Building, Urban Affairs and Spatial Development (BBSR), Sustainable Building. Strategies-Methods-Practice, BBSR-Berichte Kompakt, No. 8, 2011.
[13] Gericke, K., Blessing, L., “An Analysis of Design Process Models Across Disciplines”, International Design Conference – Design 2012, Dubrovnik, May 21-24, 2012.
[14] Haapio, A., Viitaniemi, P., “A Critical Review of Building Environmental Assessment Tools”, Environmental Impact Assessment Review, Vol. 28, pp. 469-482, 2008.
[15] Helander, M. G., Lin, L., “Anthropometric Design of Workstations”, The First International Conference on Axiomatic Design, Cambridge, June 21-23, 2000.
[16] Kankey, A., Ogot, M., “Improving the Acoustics in a Historic Building Using Axiomatic Design and TRIZ”, The TRIZ Journal, June, 2005.
[17] Kowaltowski, D., Pina, S., Ruschel, R., Silva, V., Labaki, L., Moreira, D., “Creating an Axiomatic Evaluation Method for Low Income Housing in the State of São Paulo, Brazil”, The International Conference “Methodologies in Housing Research”, Royal Institute of Technology, Stockholm, Sept. 22-24, 2003.
[18] Kulak, O., Cebi, S., Kahraman, C., “Applications of Axiomatic Design Principles: A Literature Review”, Expert Systems with Applications, Vol. 37, pp. 6705-6717, 2010.
[19] Macmillan, S., Steele, J., Austin, S., Kirby, P., Spence, R., “Mapping the early stage of the design process – a comparison between engineering and construction”, Proceedings of the 12th International Conference on Engineering Design 1999, Munich, Germany, 1999.
[20] Macmillan, S., Steele, J., Austin, S., Kirby, P., Spence, R., “Development and Verification of a Generic Framework for Conceptual Design”, Design Studies Vol. 22, pp. 169-191, 2001.
[21] Pastor, J. B. R., Benavides E. M., “Axiomatic Design of an Airport Passenger Terminal”, The Sixth International Conference on Axiomatic Design, Daejeon, March 30-31, 2011.
[22] Peck, J., Nightingale, D., Kim, S-G., “Axiomatic approach for efficient healthcare system design and optimization,” CIRP Annals -Manufacturing Technology, Vol. 59, Issue 1, pp. 469-472, 2010.
[23] Psilander, K., “Axiomatic Design in the Customizing Home Building Industry Engineering”, Construction and Architectural Management, Vol. 4, pp. 318-324, 2002.
[24] Roozenburg, N. F. M., Cross N. G., “Models of the Design Process: Integrating Across the Disciplines”, Design Studies Vol.12 No. 4, pp. 215-220, 1991.
[25] Sabbadin, E., “La casa nel mercato globale dei beni immateriali”, in Casa Tecnologia Ambiente, Ghini, A. (ed.), Bologna, Italy, Maggioli Editore, pp. 71-81, 2011.
[26] Sohlenius, U., Johansson C., “A Framework for Decision Making in Construction – Based on Axiomatic Design”, The Second International Conference on Axiomatic Design, Cambridge, June 10-11, 2002.
[27] Sohlenius, U., “Can Axiomatic Design Improve the Building Process?”, The First International Conference on Axiomatic Design, Cambridge, June 21-23, 2000.
[28] Steele, J., Macmillan, S., “Towards an interdisciplinary design process”, in Interdisciplinary Design in Practice, Spence, R., Macmillan S., Kirby P. (ed.), Thomas Telford, London, 2001.
[29] Suh N.P., The Principles of Design, New York: Oxford University Press, 1990.
[30] Suh N.P., Axiomatic Design: Advances and Applications. Oxford University Press, 2001.
[31] Wang, L., Shen, W., Xie, H., Neelamkavil, J., Pardasani, A., “Collaborative Conceptual Design – State of the Art and Future Trends”, Computer-Aided Design, Vol. 34, No. 13, pp. 981-996, 2002.

Proceedings of ICAD2013 The Seventh International Conference on Axiomatic Design
Worcester – June 27-28, 2013
ICAD-2013-24
- 162 -
ABSTRACT
Green Supply Chain Management (SCM) strategies emerged as a response to business competition with commitment to the environment. Reverse Logistics is part of this strategy that allows materials and products to be returned for re-use, re-manufacture or re-furbishing, requiring effective and efficient cooperation between supply chain (SC) firms. However, the lack of interoperability affects the alignment of operations with partners. This work presents a methodology to design the cooperation between partners using the systematic approach that is provided by Axiomatic Design Theory and a case study to demonstrate the application of this method to design a self-supported reverse logistics management system.
Keywords: reverse logistics, green supply chain management, business interoperability, Axiomatic Design.
1 INTRODUCTION
Due to the current market situation, the fierce competition between companies requires innovative strategies committed with the environment. Green Supply Chain Management (GreenSCM) strategies emerged as a response to environmental changes, guaranteeing environmental excellence in business activities [Srivastava, 2007]. In this context, Reverse Logistics (RL) arose as a solution to assign value to non-valued products or materials [Lau and Wang, 2009]. Therefore, this practice has the challenge of coordinating, effectively and efficiently, operations and material flows with regular business activities. For this reason, the latest achievements in business interoperability research combined with Axiomatic Design Theory allow us to describe how to establish reverse logistics cooperation, from top strategy issues to data transactions supported by information technology. This work presents a method to design an interoperable dyadic relationship with the purpose of applying reverse logistics between a first tier supplier and a focal firm that can manage alone the reverse logistics activities.
The work is structured in the following sections: section two contains a review of key topics (reverse logistics and business interoperability); section three describes the method and the background research that inspired the presented design; section four describes in detail the design of a dyadic reverse logistics relationship between a focal firm (manufac-turer) and a first tier supplier; and, section five presents the final conclusions and comments related to the described design and outlines the main contributions and goals to achieve in future research.
2 LITERATURE REVIEW (KEY TOPICS)
2.1 REVERSE LOGISTICS
Reverse logistics (RL) refers to the physical flow of discarded materials that have lost their original value [Shi et al., 2012]. It involves all the operational aspects related to collection, inspection, pre-processing and distribution associated with green manufacturing (reduce; recycle; production planning and scheduling; inventory management; remanufacturing, material recovery) and waste management (source reduction; pollution prevention; disposal) [Srivastava, 2007]. From a strategic point of view, RL has a high relevance to business. Srivastava [2007] stresses that investments in GreenSCM strategies like RL can be resource saving, waste eliminating and productivity improving. But, on other hand, the high cost of reverse logistics also compels firms to look at the issue seriously from a long-term strategic perspective [Lau and Wang, 2009].
The complexity of flows in RL leads to a diversity of return routes from end customer to raw materials suppliers (see Figure 1), making it hard to coordinate with forward logistics activities. Unlike the forward chain, there are many more sources of raw materials and they enter the reverse chain at a small cost or at no cost at all, and with high uncertainty of supply (collection) [Kot and Grabara, 2009]. In their work, Lau and Wang [2009] present three configurations for the RL networks: self-supported reverse logistics model;
THE DESIGN OF AN INTEROPERABLE SELF-SUPPORTED REVERSE LOGISTICS MANAGEMENT SYSTEM
Pedro Espadinha-Cruz [email protected]
UNIDEMI, Dept. de Engenharia Mecânica e Industrial Faculdade de Ciências e Tecnologia
Universidade Nova de Lisboa Campus de Caparica, 2829-516 Caparica, Portugal
António Gonçalves-Coelho [email protected]
UNIDEMI, Dept. de Engenharia Mecânica e Industrial Faculdade de Ciências e Tecnologia
Universidade Nova de Lisboa Campus de Caparica, 2829-516 Caparica, Portugal
António Mourão
[email protected] UNIDEMI, Dept. de Engenharia Mecânica e Industrial
Faculdade de Ciências e Tecnologia Universidade Nova de Lisboa
Campus de Caparica, 2829-516 Caparica, Portugal
António Grilo [email protected]
UNIDEMI, Dept. de Engenharia Mecânica e Industrial Faculdade de Ciências e Tecnologia
Universidade Nova de Lisboa Campus de Caparica, 2829-516 Caparica, Portugal

- 163 -
Figure 1. Forward and reverse logistics flows (adapted from Srivastava [2007]).
third-party reverse logistics (3PRL) model and collaborative reverse logistics model.
A self-supported RL management system helps firms collect valuable information about its products for continuous improvement ([Smith, 2005], cited by Lau and Wang [2009]). However, self-supported RL management systems involve significant capital investment [Lau and Wang, 2009]. On the other hand, a collaborative approach to manage and perform RL is less expensive, involves lower investment, and enables economies of scale through centralization [Lau and Wang, 2009].
A third conformation for RL network is suggested by the same authors. This approach allows a firm to focus on its core activities as well as to achieve more flexible reverse logistics operations and to transfer risk to third party [Lau and Wang, 2009].
2.2 BUSINESS INTEROPERABILITY
Business interoperability was introduced by Legner and Wende [2006], who defined it as “the organizational and operational ability of an enterprise to cooperate with its business partners and to efficiently establish, conduct and develop IT-supported business with the objective to create value”. Far from the technical perspective initially defined by IEEE [1990], this concept has evolved from syntactic and semantic perspectives to a more pragmatic position, concerning not only the interactions with the information systems, but also the organizational point of view. Initiatives like ATHENA [2007; Berre et al., 2007], the European Interoperability Framework (EIF) [IDABC, 2010], ECOLEAD [Consortium and others, 2006], Levels of Information Systems Interoperability (LISI) [DoD, 1998], Levels of Conceptual Interoperability Framework (LCIF) [Tolk and Muguira, 2003] and IDEAS have defined a possible path to achieve “optimal interoperability” [ATHENA, 2007] in electronic systems and businesses. Such frameworks provided data to achieve interoperability in three layers: business, knowledge, and information and communications technology (ICT) systems.
These three layers become a common concern in the context of the above-said frameworks, specifically in the definition of the business interoperability parameters (BIP), as proposed by Zutshi et al. [2012] and Zutshi [2010]: 1) business strategy (BS), 2) organizational structures (OS), 3) employees and work culture (EWC), 4) collaborative business processes (CBP), 5) management of external relationships (MER), 6) intellectual property rights management (IPRm), 7) business semantics (BSe) and 8) information systems (IS). These eight parameters represent the driving forces of collaboration between organizations, and allow analysing business-to-business (B2B) relationships that are suitable to SC’s relation-ships between actors [Espadinha-Cruz et al., 2012; Espadinha-Cruz, 2012]. The role of these parameters in the current work is to provide the main guidelines to decompose business activities into each BIP perspective.
3 METHOD AND AIM
The design herein depicted intends to provide solutions to problems identified by Espadinha-Cruz et al. [2012] and Espadinha-Cruz [2012] in a case that pertains to a Portuguese automaker. Those authors developed a business interoper-ability assessment methodology to analyse the implementation of reverse logistics with a first tier supplier. Their study unveiled some difficulties at the strategic, operational and information issues, since they found that it was lacking interoperability at some BIPs. Specifically, BS, EWC, CBP, MER, BSe and IS required a substantial revamping in order to take their interoperability to a condition that could be considered appropriate for the implementation of RL. The analysed automaker understands the importance of RL to the business goals, however some conditions are lacking. For instance, it is missing a business process to rule the RL activities. As consequence, issues like IS, MER, and EWC, have no guidelines to be established, and the occurrence of a rework, remanufacture or disposal is planned in each case.
Axiomatic Design (AD) Theory [Suh, 1990] provides an appropriate method to develop a systematic approach to fulfil the objectives of RL and the business interoperability
... 2nd Tier Supplier 1st Tier Supplier Focal FirmRaw Material Wholesalers
End Costumers
Retailers
Forward Logistics
Reverse Logistics

- 164 -
requirements. This method permits us to describe in detail the dyadic relationship, committing design parameters (DP) to functional requirements (FR) along the diverse levels of the design decomposition: the business interoperability parameters. These parameters rule the interaction between two or more companies and should be included in the design of relationships, to reflect the design solution to each interoperability aspect. Although AD is often regarded just as one more engineering design tool, the literature shows that it can be used to design business platforms of diverse kinds. For instance, dos Santos et al. [2011] describe an Axiomatic Design approach to the design of a new business oriented to venture capital fundraising. This research led to interesting results, proving that AD is a useful approach to setup businesses focused on financial issues.
4 DESIGN OF SELF-SUPPORTED REVERSE LOGISTICS BETWEEN FOCAL FIRM AND 1ST TIER SUPPLIER
4.1 CUSTOMER NEEDS (CN) CHARACTERIZATION
The focus of this project is the dyad between a focal firm and a 1st tier supplier of an automotive supply chain. The customer is the focal firm that wants to establish a cooperation procedure and an IT system to allow the implementation of RL with a supplier for a specific product that represents most of the production value. However, as mentioned in section 2.1, there are three possible configurations for the RL networks. So, for this relationship three possible case studies are considered: CS1 - self-
supported reverse logistics model; CS2 - collaborative reverse logistics model and CS3 - third-party reverse logistics (3PRL) model. For the present design, it is assumed the situation of CS1, in which the focal firm can manage alone the RL operations constraint, and support its costs, only needing to assign the re-manufacturing activities to the supplier. On the other hand, the supplier can guarantee the re-manufacturing of slightly damaged products.
4.2 PROCESS DESCRIPTION
The RL process is made of 5 main activities: collection, inspection, pre-processing, location and distribution and re-manufacturing. In the presented scenario, the focal firm has the ability to manage RL. Thus, is responsible for the first 4 activities, performing the collection of items, inspecting them in order to evaluate and deciding how and whom will recover the items. Additionally, in the pre-processing, the focal firm makes the preparation of the item to be recovered or disposed. In other words, it repairs and disassembles the components and processes waste before disposal. The supplier is only responsible for re-manufacturing and receiving the disassembled component.
The main concerns of the business correspond to the frontier of the responsibility. The effectiveness material and information flows and the coordination of activities rule the performance of RL. Figure 2 illustrates the generic processes (material flows) of the supplier and focal firm, referring to the interface activities between these actors.
Figure 2. RL generic activities inherent to a self-supported RL management configuration.
Raw/Intermediate materials
Non-conforming components
Reception
Manufacturing/Re-manufacturing
Components reception
Quality? Manufacturing
Collection
Inspection/Sorting
Delivery
Non-conforming/damaged
components disposal
Pre-processing
Return
Supplier
Delivery
In-production deffects
yes
no
no
yes
RecoverableOn Supplier
Non-recoverable
SC Beginning
Focal FirmInterface
Re-work
RecoverableOn Focal Firm

- 165 -
The project of this relationship acts precisely at the interface between the two companies, addressing materials, data and currency flows, as well as human collaboration.
4.3 DEFINITION OF HIGHEST LEVEL DESIGN
OBJECTIVES
In the perspective of AD, the functional requirement of order zero (FR0) is to ensure interoperability in the implementation of reverse logistics, which is achieved if the level 1 functional requirements are fulfilled. For this design, the following was selected as the highest level FR: FR0: Ensure interoperability in the implementation and
management of reverse logistics. In order to fulfil FR0, the design parameter DP0 will be: DP0: RL partnership.
The RL partnership (DP0) success will be achieved if the measures of success, such as recovery, return, defect and scrap rates, cycle times, inventory turns, repair, remanufacturing and refurbish costs, etc. are satisfied.
4.4 DEFINITION OF TOP LEVEL FRS AND DPS
The strategic focus of RL is translated by clarity in the cooperation goals for both companies. It stresses the main objectives, agreements and contracts that settle the arrangement on formal conditions. For this business perspective, the needed requirements fit in the following: FR1: Establish the cooperation goals to implement RL with
the selected supplier.
The management of business processes is related to the development of the business activities, in order to ease material flow between partners. Thus, the main requirements in this subject are translated in: FR2: Establish business processes to ease reverse material
flows.
Business relationships must be of concern from contract initiation until termination. The efficient management of interests and partnership behaviour will allow the growth of a trustworthy relationship that will bring the most advantages to RL performance. Hence, the functional requirement for this set of requirements is: FR3: Manage business relationships between partners, from
RL cooperation initiation until termination.
Employees and their inherent work culture must also be managed. The activities developed in RL are performed mostly by human resources, and their failures are not easy to assess and model. So, to effectively run RL there must be the appropriate conditions to avoid human failures, conditioned by cultural differences, idiosyncratic factors (personality, motivation and responsibility) and suitable training for the RL
roles. Hence, the main requirement that translates the presented need is: FR4: Manage human resources to perform RL activities.
At last, the fifth requisite concerns the information
systems. Information systems provide the main data exchange infrastructure that will allow easing the access to the relevant data across organisations, regardless of if the activities are transactional or operational. As a consequence, the main FR for this matter is: FR5: Establish the information systems that provide the data
required to run the RL process. To fulfil the above FRs, the following DPs are proposed: DP1: The list of objectives (to implement RL), conflicts (of
interests) and liabilities DP2: Description of a business process design, planning and
coordination that fits the operational requirements of RL
DP3: Description of the Interactive design of cooperation relationships, since initiation to termination
DP4: Description of the work environment and training program that is suitable to the employee’s characteristics
DP5: Description of an IT solution suitable to support RL activities
Table 1 illustrates the design matrix of this level of the project.
Table 1. Design matrix for level 1.
DP1 DP2 DP3 DP4 DP5
FR1 X 0 0 0 0
FR2 X X 0 0 0
FR3 X 0 X 0 0
FR4 X 0 0 X 0
FR5 0 X 0 0 X
The present design is decoupled, requiring that the FRs are fulfilled in the specified order.
4.5 DEFINITION OF LEVEL 2 FRS AND DPS
The first FR fully describes the necessary detail to satisfy the strategic objectives of RL. Hence, this FR its not decomposed.
Other requirements must be fulfilled in order to achieve FR2: clarify the business processes, the responsibility sharing definitions, the business process coordination, the business
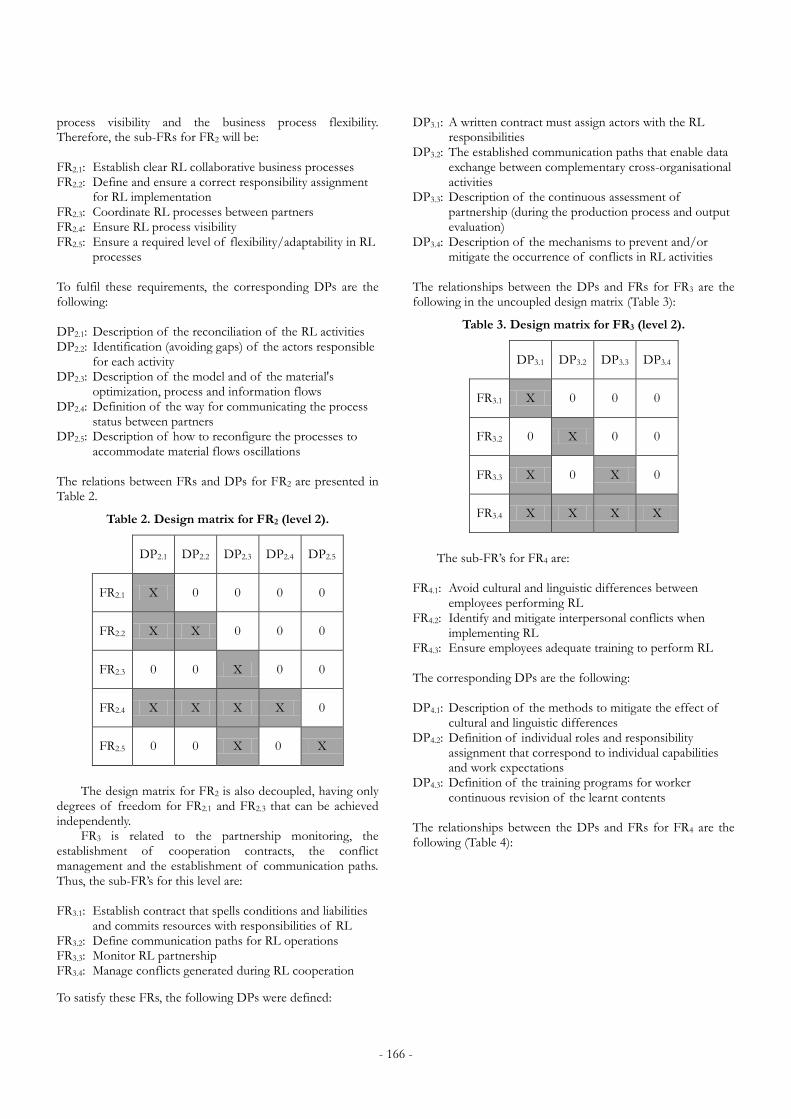
- 166 -
process visibility and the business process flexibility. Therefore, the sub-FRs for FR2 will be: FR2.1: Establish clear RL collaborative business processes FR2.2: Define and ensure a correct responsibility assignment
for RL implementation FR2.3: Coordinate RL processes between partners FR2.4: Ensure RL process visibility FR2.5: Ensure a required level of flexibility/adaptability in RL
processes To fulfil these requirements, the corresponding DPs are the following: DP2.1: Description of the reconciliation of the RL activities DP2.2: Identification (avoiding gaps) of the actors responsible
for each activity DP2.3: Description of the model and of the material's
optimization, process and information flows DP2.4: Definition of the way for communicating the process
status between partners DP2.5: Description of how to reconfigure the processes to
accommodate material flows oscillations The relations between FRs and DPs for FR2 are presented in Table 2.
Table 2. Design matrix for FR2 (level 2).
DP2.1 DP2.2 DP2.3 DP2.4 DP2.5
FR2.1 X 0 0 0 0
FR2.2 X X 0 0 0
FR2.3 0 0 X 0 0
FR2.4 X X X X 0
FR2.5 0 0 X 0 X
The design matrix for FR2 is also decoupled, having only
degrees of freedom for FR2.1 and FR2.3 that can be achieved independently.
FR3 is related to the partnership monitoring, the establishment of cooperation contracts, the conflict management and the establishment of communication paths. Thus, the sub-FR’s for this level are: FR3.1: Establish contract that spells conditions and liabilities
and commits resources with responsibilities of RL FR3.2: Define communication paths for RL operations FR3.3: Monitor RL partnership FR3.4: Manage conflicts generated during RL cooperation
To satisfy these FRs, the following DPs were defined:
DP3.1: A written contract must assign actors with the RL responsibilities
DP3.2: The established communication paths that enable data exchange between complementary cross-organisational activities
DP3.3: Description of the continuous assessment of partnership (during the production process and output evaluation)
DP3.4: Description of the mechanisms to prevent and/or mitigate the occurrence of conflicts in RL activities
The relationships between the DPs and FRs for FR3 are the following in the uncoupled design matrix (Table 3):
Table 3. Design matrix for FR3 (level 2).
DP3.1 DP3.2 DP3.3 DP3.4
FR3.1 X 0 0 0
FR3.2 0 X 0 0
FR3.3 X 0 X 0
FR3.4 X X X X
The sub-FR’s for FR4 are:
FR4.1: Avoid cultural and linguistic differences between
employees performing RL FR4.2: Identify and mitigate interpersonal conflicts when
implementing RL FR4.3: Ensure employees adequate training to perform RL The corresponding DPs are the following: DP4.1: Description of the methods to mitigate the effect of
cultural and linguistic differences DP4.2: Definition of individual roles and responsibility
assignment that correspond to individual capabilities and work expectations
DP4.3: Definition of the training programs for worker continuous revision of the learnt contents
The relationships between the DPs and FRs for FR4 are the following (Table 4):

- 167 -
Table 4. Design matrix for FR4 (level 2).
DP4.1 DP4.2 DP4.3
FR4.1 X 0 0
FR4.2 X X 0
FR4.3 0 0 X
To fulfil FR4, the training of employees (FR4.3) can be
defined at any time, but to fulfil an efficient mitigation of interpersonal conflicts (FR4.2), first one needs to address the cultural and linguistic issues (FR4.1) of the employees.
Other conditions must be met in order to satisfy FR5. For instance, the design of the IT interface must fit the needs of RL and simultaneously minimize the effect of human failure. Other concerns include security issues, data synchronization, interactions between databases and the IT application required to manage RL. Hence, the sub-FR’s for this category are: FR5.1: Design the IT application for RL information needs FR5.2: Design the IT interface for RL operations FR5.3: Design information systems that are able to exchange
RL data FR5.4: Establish the databases and/or the database interfaces
that allow the data flows related to RL To achieve these requirements, the following DPs are proposed: DP5.1: Description of the adopted IT to RL functional areas DP5.2: Description of the IT interfaces that replace manual
interfaces in order to reduce human dependency DP5.3: Description of the data synchronization required to
achieve RL DP5.4: Selected common data resources The relationships between this set of FRs and DPs are presented in Table 5.
Table 5. Design matrix for FR5 (level 2).
DP5.1 DP5.2 DP5.3 DP5.4
FR5.1 X 0 0 0
FR5.2 X X 0 0
FR5.3 X 0 X 0
FR5.4 0 0 X X
This design matrix is uncoupled, and requires that the FRs are achieved in the specified order.
Figures 3 and 4 summarize the descriptions above. Figure 3 depicts the system architecture, while Figure 4 contains the corresponding complete design matrix.
FR0
FR1
FR2
FR3
FR4
FR5
FR2.3
FR2.4
FR2.2
FR2.5
FR2.1
FR3.3
FR3.4
FR3.2
FR3.1
FR4.3
FR4.2
FR4.1
FR5.3
FR5.4
FR5.2
FR5.1
DP0
DP1
DP2
DP3
DP4
DP5
DP2.3
DP2.4
DP2.2
DP2.5
DP2.1
DP3.3
DP3.4
DP3.2
DP3.1
DP4.3
DP4.2
DP4.1
DP5.3
DP5.4
DP5.2
DP5.1
Figure 3. The RL system architecture.
Figure 4. Complete design matrix of self-supported reverse logistics between focal firm and 1st tier supplier.
5 CONCLUSIONS AND FUTURE WORK
This article proposes a design solution to establish a reverse logistics (RL) relationship between a focal firm and a 1st tier supplier, in which the focal firm manages and coordinates the activities of RL.

- 168 -
The application of the Axiomatic Design allowed us to systematize the reverse logistics definitions, considering the business interoperability parameters, making it possible to decide in which sequence the activities must be fulfilled. For instance, in the management of external relationships during cooperation (FR3), first one needs to formalize a contract (FR3.1). Next, one should define the communications paths (FR3.2) that allow the partnership monitoring (FR3.3). This will allow us to manage the conflicts generated during RL cooperation (FR3.4). However, there is no precedence over FR3.2, a fact that allows us to perform this task before FR3.1.
Although it was possible to demonstrate the potential of Axiomatic Design to describe how to achieve an interoperable reverse logistics relationship between a supplier and a focal firm that manages the RL operations, some difficulties arise from this method (for example, the decomposition of the reverse logistics design aspects into interoperability requirements). There are several approaches to implement reverse logistics, in both the literature and the practice. All those approaches require an in depth knowledge about the models that rule the green supply management (for instance transaction cost economics and resource-based view).
Future work will focus on detailing the present model and developing other scenarios that could fit the presented situation, namely, the collaborative RL model (CS2) and the third-party RL model (CS3). These achievements will make it possible to apply the Information Axiom, allowing us to determine which design fits best to the needs of the focal firm.
Research will also be conducted in the field of computer simulation and business process modelling, and will address the testing and validation of the design. Also, the effect of interoperability variables in the RL metrics will be studied using the response surface methodology and design of experiments.
6 ACKNOWLEDGEMENTS
The authors would like to thank Fundação para a Ciência e Tecnologia for providing a research grant to Pedro Espadinha da Cruz through the project PTDC/EME-GIN/115617/2009.
7 REFERENCES
[1] ATHENA., “D.B3.1 Business Interoperability Framework, version 2.0”, 2007.
[2] Berre A., Elvesæter B., Figay N., Guglielmina C., Johnsen G., Karlsen D., Knothe T., et al., “The ATHENA Interoperability Framework”, 3th International Conference on Interoperability for Enterprise Software and Applications, IESA 2007, Funchal, Apr. 20-23, 2007.
[3] Consortium E., and others., “Characterization of VBE Value Systems and Metrics”. ECOLEAD Deliverable D, Vol. 21, 2006.
[4] DoD., “Levels of Information Systems Interoperability (LISI)”, pp. 1 – 139, 1998.
[5] dos Santos J. C. P., Gonçalves-Coelho A., Mourão A. J. F., “Designing the design of new businesses for raising Venture Capital”, 6th International Conference on Axiomatic Design, ICAD 2011, Daejeon, Mar. 27-28, 2011.
[6] Espadinha-Cruz P., “Lean , Agile , Resilient and Green Supply Chain Management Interoperability Assessment Methodology. Supply Chain Management”, Master Thesis, Departamento de Engenharia Mecânica e Industrial. Faculdade de Ciências da Universidade Nova de Lisboa, Almada, Portugal, 2012.
[7] Espadinha-Cruz P., Grilo A., Cruz-Machado V., “Fuzzy evaluation model to assess interoperability in LARG Supply Chains”, 9th International Conference on Fuzzy Systems and Knowledge Discovery, FSKD 2012, Chongqing, May 29-31, 2012.
[8] IDABC., “European Interoperability Framework - Version 2.0”, European Commission, 2010.
[9] IEEE., “IEEE Standard Glossary of Software Engineering Terminology”, The Institute of Electrical and Electronics Ehgineers, 1990.
[10] Kot S., Grabara J., “Theoretical frames for designing reverse logistics processes”, Review of General Management, Vol. 9, No. 1, pp. 55–61, 2009.
[11] Lau K. H., Wang Y., “Reverse logistics in the electronic industry of China: a case study”, Supply Chain Management: An International Journal, Vol.14, No.6, pp. 447–465, 2009.
[12] Legner C., Wende K., “Towards an Excellence Framework for Business Interoperability”, 19th Bled eConference eValues, Bled, Jun. 5-7, 2006.
[13] Shi X., Li L. X., Yang L., Li Z., Choi J. Y., “Information flow in reverse logistics: an industrial information integration study”, Information Technology and Management, Vol. 13, No.4, pp. 217–232, 2012.
[14] Smith A. D., “Reverse logistics programs: gauging their
effects on CRM and online behaviour”, VINE, Vol. 35, No. 3, pp.166 – 181, 2005.
[15] Srivastava S. K., “Green supply-chain management: A state-of-the-art literature review”, International Journal of Management Reviews, Vol. 9, No. 1, pp. 53–80, 2007.
[16] Suh N.P., The Principles of Design, New York: Oxford University Press, 1990. ISBN 0-19-504345-6
[17] Tolk A., Muguira J. A., “The levels of conceptual interoperability model”, IEEE 2003 Fall simulation Interoperability Workshop, Orlando, 2003.
[18] Zutshi A., “Framework for a Business Interoperability Quotient”, Master Thesis, Departamento de Engenharia Mecânica e Industrial. Faculdade de Ciências da Universidade Nova de Lisboa, Almada, Portugal, 2010.
[19] Zutshi A., Grilo A., Jardim-Goncalves R., “The Business Interoperability Quotient Measurement Model”, Computers in Industry, Vol. 63, No.5, pp. 389–404, 2012.

Proceedings of ICAD2013 The Seventh International Conference on Axiomatic Design
Worcester – June 27-28, 2013
ICAD-2013-25
- 169 -
ABSTRACT
Traditional design practices result, typically, in a poor design space exploitation, usually as a consequence of the short lead time and due to technical resources constraints. Moreover, given mostly time to market constraints, the main concern of product designers is to achieve an acceptable solution, instead of looking for the best one. This is the case of the design of mold tools for plastic injection. The injection mold is a high precision tool, responsible for the production of mostly plastic parts used everywhere. Its design is considered critically important to product quality and efficient processing, as well as determinant for the economics of the entire injection molding process. In this context, a fully integrated framework is proposed in order to support mold tools design. This framework encompasses Axiomatic Design (AD) as main methodology to support the Design stage. Thus, following AD guidelines, a few of conceptual solutions are generated by mapping the functional requirements previously identified onto the corresponding design parameters. Afterwards, the best conceptual solution is detailed and optimized with the aim of maximizing customer satisfaction. The developed framework was validated through an existing mold, where the results attained highlight the great potential of the proposed framework to achieve mold design improvements. In particularly, the value of mold solutions generated led to a global improvement on mold performance of 5%.
Keywords: Axiomatic Design, Design for Six Sigma, injection molding, mold design, product development.
1 INTRODUCTION
Currently, product development is assumed as the new frontier for achieving competitive advantage in today’s rapidly changing business environments [Chan et al., 2003; Low, 2003]. In fact, both managers and scholars increasingly understand the central role that product development plays in creating competitive advantage [Ferreira et al., 2010]. This is especially true because decisions made during early design stages, designated as conceptual design stage, have the greatest impact over the total cost and quality of the system. Typically, these crucial decisions are mainly supported based on intuition, empiricism and the so-called handbook method. The consequence is a lot of failure-trial-fix loops and development costs dominated by failure recovery actions.
Additionally, several iterations are typically necessary because of inherently conflicting trade-offs for which it is very difficult to find a balance. For these reasons, it is imperative to adopt new methods and tools allowing for a better exploitation of new and different alternatives for the design solutions considering its novelty and degree of response to customer’s needs.
Regarding mold’s tooling industry, this sector has been increasingly facing the pressure to reduce the time and cost of mold development, offer better accuracy and surface finish, provide flexibility to accommodate future design changes and meet the requirements of shorter production runs [Candal and Morales, 2005]. These mold tools must be custom designed and built, where, usually, no formal structural analysis is performed. Typically, the designer relies on his skill and intuition, and follows a set of general guidelines [Centimfe, 2003]. As a result, the conceived mold solution may be acceptable and not necessarily the best option [Tang et al., 2006]. In fact, traditionally, the design practice involving mold design tends to quickly converge to a solution (corresponding to a point in the solution space), which is then modified until it meets customer’s impositions. Therefore, subsequent iterations to refine the solution will generally occur after mold manufacturing and trial, where most of the design gaps will come up [Ferreira, 2002; Low and Lee, 2003]. Conscious of conceptual stage critical role regarding mold cost and performance, as well as time to market, this paper aims to provide a further contribution to the development of a global methodology to support mold design activities. For that purpose, Axiomatic Design (AD) will be adopted as main methodology to support the design stage of metallic mold tools for plastic parts injection [Ferreira et al., 2009; Ferreira, 2012].
2 AXIOMATIC DESIGN METHODOLOGY
According to AD theory, the world of design is made up of four domains (Figure 1): the customer domain, the functional domain, the physical domain and the process domain [Suh, 1990]. The starting point of process design is the identification of Customers Attributes (CAs) in the customer domain. Then, these CAs must be translated to specific requirements designated as FRs, which are formalized in the functional domain. After that, considering that the objective of design is generated as a physical solution, characterized in terms of Design Parameters (DPs) (that
AXIOMATIC DESIGN AS A CREATIVE INNOVATION TOOL APPLIED TO MOLD DESIGN
Irene Ferreira [email protected]
School of Technology and Management,
Polytechnic Institute of Leiria, Campus 2, Portugal
José A. Cabral [email protected]
University of Porto INESC TEC
Faculty of Engineering Universidade do Porto, Rua Dr.
Roberto Frias, s/n, 4200-465 Porto, Portugal
Pedro M. Saraiva [email protected]
Department of Chemical Engineering, University of Coimbra,
Pólo II - Pinhal de Marrocos, 3030-290 Coimbra, Portugal

- 170 -
meets FRs) the design must progress by interlinking these two domains (functional and physical) through zigzag approach. Finally, the last step involves interlinking the DPs with the Process Variables (PVs), which assures product production [Suh, 1990; Ferreira et al., 2009].
Figure 1. World of AD design: domains (adapted from [Suh, 1990; Yang and El-Haik, 2003])
A previous research work was done in order to identify mold’s CAs and to translate them into FRs (first task of AD design process). Based on the gathered data [Ferreira et al., 2008; Ferreira et al., 2009], it was possible to identify these CAs, which are typically required by injection mold’s customers when they ordered the mold (Figure 2).
Figure 2. Typical CAs regarding injection mold design.
The next step in AD approach encompasses the translation of the previously identified CAs into FRs, which are the minimum set of functional requirements states in the functional domain (Table 1).
Table 1. Mapping CAs and FRs.
Customer attributes Functional Requirements Geometrical accuracy Deflection Dimensional accuracy Shrinkage Aesthetic aspects Aesthetic defects (e.g. Sink
marks) Properties Specific property (e.g. in cavity
residual stress) Productive capability Cycle time Moldability Pressure drop Adaptability Mold’s volume Efficiency Volume of material waste (i.e.
scrap) Maintainability Mean Down Time (MDT)Reliability of solutions
Mean Time Between Failure (MTBF)
Accessibility Information content
After that, a few number of alternative molds solutions must be generated. This will be achieved by mapping these FRs into the respective DPs. Nevertheless, several architectural concepts can be developed to fulfill these FRs. In
theory, the number of plausible solutions characterized by each DPs is unlimited depending only of the designer and the lead-time available for designing. Thus, AD support is considered essential to facilitate the physical structure generation [Yang and El-Haik, 2003] and to identify the potential system interactions (coupling) [Mohsen and Cekecek, 2000] helping the designer to think in different ways to answer the key functions, aiding to increase the degree of mold’s innovation supported in a more rational approach.
3 DEVELOPED FRAMEWORK
According to Ulrich and Eppinger [2003], the concept Design stage must be divided into two consecutive parts: Concept Generation and Concept Screening. At the Concept Generation stage the objective is to generate as many as possible product concepts involving different design solutions. All solutions will be then evaluated and screened at the Concept Screening stage. The product concepts must be conceptually defined (i.e. high level system definition), which means that a roughly product design must be achieved through some technical decisions. As it was described, the proposed approach consists of using AD methodology to support the conceptual design stage, which is more focused on human creativity and intuition, aiming to guide the initial decisions in a more rational approach. For that purpose, the initial mold’s design decisions will be defined by linking the previous identified FRs with DPs through zigzagging as established by AD. This FRs-DPs mapping will be developed for the upper levels in order to generate a few number of conceptual solutions for the mold. Afterwards, these solutions must be evaluated, in order to select the solution which has the most well ranked customer satisfaction level.
Currently, the search and generation of alternative methodologies for design of molds arises as an answer for the plastic industry to cope and compete with new market threats. The potential improvements on mold design only can be reached if the design process begins by broadly considering sets of possible mold solutions and, then, gradually narrowing the set of possibilities to converge to a final solution. This procedure, which helps to find more easily the best solution [Ulrich and Eppinger, 2003], can be achieved by a better exploration of the design space and by the resolution of system’s trade-offs, early in the design. Moreover, since the design of an injection mold is a highly interactive process (i.e. involves substantial knowledge of multiple areas, such as mold design features, mold making processes, molding equipment and part design, all of which highly coupled to each other), a multidisciplinary view of injection mold must also be adopted [Ferreira et al., 2010].
Based on that, an injection mold must be seen as a complex multidisciplinary system with some functional subsystems, such as the structural, impression, feeding, heat-transfer and ejection systems. The Feeding System (including the venting system) has the main function to channel the molten plastic material coming from the injection nozzle of the molding machine and distribute it into each cavity, through the runners and respective gate points. The venting subsystem must allow for gas release, because when the melt enters into the cavity the displaced air must have a means to escape.

- 171 -
The Heat-transfer System supplies the mold with a system of cooling channels, through which a coolant is pumped. Usually, its main function is to remove heat from the mold, so that - once filled - the part is sufficiently rigid to be demolded.
The Ejection System has the main function to knock out the injection molded parts, in order to release them from the mold. Typically, after the mold is opened, the hydraulic cylinder of the injection machine will actuate the ejection system to move forward, pushing the molded parts out. It is critical that the ejection system does not cause damage (marks) to completed parts.
The Structural System must allow the mold (tool) to be coupled into the injection machine and assure the overall assembly of its components. It is also necessary to guarantee the alignment and guiding of the mold.
Finally, the Impression system must give the required shape to the part. To do so, it is composed by the cavity, which is generally responsible for the external impression of the part, and by the core, which produces the internal impression. Additionally, in order to proceed with FRs-DPs mapping regarding mold design, it is important to define its main function. Considering that the main challenge of mold design is to design and produce a mold that is straightforward to manufacture, while providing uniform filling and cooling of plastic parts, as well as has to be strong enough to withstand millions of cyclic internal loads from injection pressures and external clamp pressures, in order to assure the target part’s reproducibility [Ferreira et al., 2010]. Based on that, Figure 3 presents the top design levels structure defined for the FRs and Figure 4 for the DPs.
Figure 3. FRs defined for top design levels.
Figure 4. DPs defined for top design levels.
Based on the previous figures, it is possible to observe that, regarding the first two levels, the map between FRs and
DPs has no special issues. However, this is not true for the third level, where some theoretical considerations were taken into account in its definition. A brief description of these considerations are:
i) DP1.1. - Deflection or warpage of an injected plastic part is a dimensional distortion that causes structural unfitness and aesthetic problems. This warpage is one of the critical quality issues for injection molded parts, because when the molded part does not satisfy a dimensional tolerance it is useless as a final product [Shen and Li, 2003]. According to some authors [Liu, 1996; Zheng et al., 1999; Ozcelik and Erzurumlu, 2006; Gao and Wang, 2008], the warpage can be largely the result of thermally induced effects that arise during the mold cooling stage of the injection process. For that reason, the mold cooling system must be carefully set. Based on that, at the conceptual design stage of mold design this system was detailed in the following design variables (Table 2).
Table 2. Design variables regarding the heat-exchange design (DP 1.1.).
Design variable
Definition
n_turns Number of turns of the cooling line in cavities
ii) DP1.2. - Controlling the part shrinkage is of
paramount importance in mold design, particularly in applications requiring tight tolerances. The impression system design (i.e. cavity and core design) should take shrinkage into account, in order to conform to the part dimension. Therefore, these parameters were considered to be DP 1.2 (Table 3).
Table 3. Design variables regarding impression system design and packing conditions (DP 1.2.)
Design variable Definitionposition_parts Position of each part relatively to
the Partition Plane(PP) partition_plane Position of the PP
iii) DP1.3. - In general, the aesthetic quality of a molded
part requires the absence of defects such as sink marks, bubbles, weld lines, flashing, etc., where one of the major problems is the presence of sink marks [Shen et al., 2007; Shen et al., 2007]. Several authors impute the quality of injected parts to the gate’s location [Pandelidis and Zou, 1990; Lee and Kim, 1996], because it influences the way in which the plastic flows into the mold cavity. Therefore, sink marks were assumed to be mainly related with the gate’s location. Accordingly, the design variables included in the model as determinant for the aesthetics defects formation are the number of gates and its position, as shown in Table 2.
Table 4. Design variables regarding the gate’s location design (DP 1.3.).
Design variable
Definition
nGates Number of gates per partposition_gates Position of each gate relatively to the
PP

- 172 -
iv) DP1.4. - The quality characteristics of the plastic injection molded products can be roughly divided into three kinds of properties: (1) the dimensional properties, (2) the surface properties and (3) the mechanical properties. Regarding mechanical properties, which involve, typically, the tensile strength and the impact strength of the plastic part, they are related with operational conditions of the injection process. Therefore, these operational conditions that encompass injection speed and temperature settings were assumed as DP 1.4 (Table 5).
Table 5. Design variables regarding operational conditions (DP 1.4.).
Design variable Definition Tmelt Temperature of the meltTmould Temperature of the moldtinj Time of injection
Nevertheless, since mold’s customers usually impose the
plastic material and the injection machine parameters, these variables will be assumed as fixed following material’s supplier recommendations.
v) DP2.1. - Cycle time can be defined as the sum of each injection stage time (e.g. Plasticizing, Injection, After-Filling or Packing, Cooling and Release [Rosato et al., 2001]). Since only the release time (i.e. the time for mold opening, part ejection and closing mold) is not yet included, and because it is mainly function of the ejection system [Autodesk, 2010], the design of ejection system is assumed as DP2.1 (Table 6).
Table 6. Design variables regarding the ejection system design (DP 2.1.).
Design variable Definition nEjectors Number of ejectors per part position_ejectors Position of ejectors in relation to the
PP vi) DP2.2. – Higher moldability occurs when the pressure
drop per unit length is constant along the flow path. This pressure drop must be minimized since it reduces the injection pressure needed to inject the melt. Moreover, it is important to note that by using lower injection pressure, power is saved and the wear and tear on machines is minimized, consequently enlarging the mould’s life. Based on that, Moldability can be described by the flow path length defined by the feeding layout (Table 7).
Table 7. Design variables regarding the flow path (DP 2.2.).
Design variable Definition type_layout Type of feeding layout
Note that, there are three possible feeding configurations
or layouts for cold runners, namely, Symmetrical (or in series configuration), Circular and Hybrid (i.e. that combines both circular and symmetrical layouts). A symmetrical layout can mostly compactly deliver the melt to many in-line cavities through a single primary runner, with many subsequent secondary runners leading to individual cavities. Since the secondary runners branch off at different locations down the
length of the primary runner, the flow rate will be different for each cavity (lower for the cavities located further away from the sprue). This disadvantage can be overcome by assuming different diameters for each cavity, which can be difficult to do in practice. An alternative solution can be the branching of the feed system in multiple locations (multiple branching). Regarding circular layouts, they naturally assure a balanced flow rate and melt pressure, with a moderate amount of runner volume. However, this balance is somewhat limited to the base of the sprue. Nevertheless, this can also be overcome by multiple branching. Note that multiple branching has limits, since a branched layout consumes significantly more material while it also imposes a higher pressure drop between the sprue and the cavities.
vii) Regarding the FR2.3. (Mold’s size), and because the structural system design is the one that contributes the most for the size of the mold, it was defined as DP2.3. Considering a 2-plate mold (Figure 5), the design of structural system is assumed as DP 2.3. (Table 8).
Figure 5: Typical structure for a 2-plates mold type.
Table 8. Design variables regarding the structural system design (DP 2.3.).
Design variable Definition mold_material Mold’s material cavity_material Material for cavity’s inserts
viii) About FR2.4., Volume of scrap, and considering
only cold runner molds, it is possible to verify that this FR depends upon the volume of the feeding system. Thus, the correspondent DP is the feeding system design. The outcome of the deploying of this system into the design variables that must be considered at the design stage is the type of runners cross-section (Table 9).
Table 9. Design variables regarding the feeding system (DP 2.2.).
Design variable Definition type_runner Type of runners cross-section
1 Injection clamping plate or top clamping plate2 Cavity retainer plate or plate A 3 Core plate or plate B 4 Core retainer plate 5, 6 Spacer Block7 Ejector pin plate8 Ejector pin retainer plate 9 Ejection clamping plate or bottom clamping plate

- 173 -
Regarding the type of possible geometries for the runners’ cross-section, there are the Full-Round (FuR), Trapezoidal (T), Rectangular (R) and Half-Round (HR). A detailed description of the advantages and disadvantages of each type can be found in [28-32]. Based on their characteristics, the FuR circular runners were adopted, which is extremely common in mold designs, because they render uniform shear rates and shear stresses around the perimeter of the cross-section.
ix) For the remaining FRs, namely FR3.1. (Minimize MDT) and FR3.2. (Maximize MTBF), they are mapped with DP3.1. (Standardization/Modularity) and with DP3.2. (Type of constructive solutions), respectively. In relation to the FR4. (Maximize information content of mold), it is mapped to DP4 (Minimize mold’s complexity), since the objective is to design the simplest mold solution. Nevertheless, at this stage these requirements are not included in the model, for the reason that they are not previously explored in the literature as design parameters of injection molds.
4 CASE STUDY: KEY HOLDERS MOULD
In order to test the proposed approach, an existing injection mold was used as baseline in order to compare mold solution obtained through traditional procedures and mold solutions achieved by the proposed approach. Figure 6 presents the existing mold, which is used to produce four key holders in each cycle.
Figure 6. A view of the existing mold for key holders.
The selected plastic part’s material is Moplen HP 500N, produced by Basell Polyolefins. The existing mold is a 2-plate mold, with nine plates, where a DME standard structure made of 1.1730 steel was adopted. Regarding the injection molding machine, a EuroInj was employed, with a maximum locking force of 7.84E5N and a screw diameter of 32mm.
Figure 7. Geometric data regarding the injected key
holder.
As mentioned before, the main objective of Design stage is to conceive rough design layouts, where each concept is generated through the combination of each design variable alternatives characterized by each DPs. These design variables, previously obtained through FRs-DPs mapping, are summarized in Table 10. Then, by assigning different values to each conceptual variable, a number of different conceptual solutions for the mold can be accomplished.
Table 10. Design variables considered in the design stage.
Mold system Design variable
Value
Heat-exchange n_turns Integer (2, 4)
Impression position_parts Geometrical (I, II)Feeding position_gates Geometrical (A, B)
Ejection position_ejectors Integer (2,4)
nEjectors (Circular, Symmetrical)
Based on the design variables presented in Table 10, a
few number of conceptual solutions must be generated combining the alternative options proposed by the mold designer that were established according to industrial practical guidelines [Centimfe, 2003]. Figure 8 exemplifies the two possible alternatives for the number of turns of each cooling line. Two different positions of the parts, relatively to the PP, are exemplified in Figure 9. Figure 10 shows different positions for each gate, relatively to the PP, for the same parts positioning. Figure 11 exemplifies the two alternatives for the type of feeding layout, also considering the same parts positioning. Finally, Figure 12 shows the two possible alternatives for the number of ejector pins, per part. These figures are shown to highlight the geometrical complexity of these conceptual solutions. Afterwards, these solutions will be evaluated and compared, in order to select the conceptual solution that has the highest rank customer satisfaction level.
In this study, some variables were considered fixed, mostly due to the characteristics of the existing mold, in order to enable a better comparison between the results attained by the proposed approach and the reference. The variables that were assumed as fixed are presented in Table 11, which shows also the fixed value considered.
Table 11. Fixed variables at the Design stage.
Symbol Fixed valuepartition_plane Geometrical (Baseline)type_ejectors Full-Round (FuR)mould_material 1.1730 cavity_material 1.1730

- 174 -
Figure 8. The two possible alternatives for n_turns: two
turns (left) or four turns (right).
Figure 9. The two possible alternatives for position_parts: Position I (left) or Position II (right).
Figure 10. The two possible alternatives for
position_gates: Position A (left) or Position B (right).
Figure 11. The two possible alternatives for type_layout:
Symmetrical (left) or Circular (right).
Figure 12. The two possible alternatives for nEjectors: two pins per part (left) or four pins per part (right).

- 175 -
Due to the number and type of design variables
considered at this stage, a total of 32 conceptual solutions were evaluated. For that purpose, it was requested to this mold customer to compare each previous identified CAs (see Figure 2), two at a time, using a 1-9 scale with three levels. Hence, through Analytical Hierarchical Process (technique that is widely used for addressing multi-criteria decision-making problems [Chuang, 2001]), each attribute was ranked according to its relative importance to the customer, aiming to build a weighted objective function. The results achieved can be observed in Table 12.
Table 12. Relative priority of each CA regarding key holders mold.
CAs FRs Relative weights
Geometrical accuracy
Deflection 12.2%
Dimensional accuracy
Shrinkage 12.2%
Aesthetic aspects Sink marks (Sink) 22.9%Properties Residual stress (Stress) 2.0%Productive capability
Cycle time (tCycle)
2.8%
Moldability Pressure 16.3%Adaptability Mold’s volume
(Vmould) 1.8%
Efficiency Waste of material 5.3%Maintainability MDT 5.8%Reliability of solutions
MTFB 5.0%
Accessibility Information 13.7% Based on that, it is possible to observe that the most
important attributes are the aesthetic aspects and moldability. This ranking is a little bit different from industrial practice, where the most important attributes are usually also aesthetics aspects, but where, typically, cycle time, geometrical and dimensional accuracy have at least a similar importance. However, since the selected mold is not a commercial application, the attained values are coherent. Based upon these values, it was possible to express the Quality of Mold (QM) as:
(1)
Figure 13 presents the most well ranked conceptual solution (i.e. that have the highest QM value), which has two turns of cooling channels, position II of the parts on the PP, symmetrical feeding layout and gates positioned on point B. Regarding the number of ejectors, based on the results achieved, it was observed that it has no effect over QMD value.
Figure 13. Most well ranked conceptual solution.
Afterwards, this conceptual design solution will be detailed and optimized through a platform, developed with the aim of maximizing customer satisfaction. To that end, Eq. (1) will be used as single objective function defined as a weighted function of the previously determined FRs. For that purpose, it was built a platform where thermal, rheological and structural analyses are undertaken by high-fidelity codes, namely Autodesk Moldflow Insight 2010 code [Autodesk, 2010] and ABAQUS version 6.10-1 [Simulia, 2011]. An overseeing code, ModeFRONTIER version 4.4.1 [Esteco, 2011] was responsible for managing the connections between the codes, launching the simulations, accessing the outputs and changing the input data according to the pre-defined mathematical exploitation and optimization schemes [Ferreira, 2012]. A comparison between the most well ranked conceptual solution optimized (Figure 14) and the baseline is presented in Table 13.
Figure 14. The optimized most well ranked conceptual solution.
It is possible to verify that major improvements were achieved in all the objectives, expect Pressure drop and Cycle time. As shown in Table 14 the selected solution presents a reduction on Sink index of 26%, on Waste of 25.1%, on mold’s Volume of 9.1%, on Deflection of 11.4%, on Cost of 7.6%, and a drop on Shrinkage of about 0.8%. On the contrary, the achieved solution has a very important increase in Pressure drop (31%) and in Cycle time (6.3%). In average, the well ranked solution allows for an improvement on performance of about 5%. This enhancement can result in an increase of quality of mold design in almost 4%.

- 176 -
Table 13. Selected conceptual solution and baseline solution.
Baseline Selected solutionnEjectors 4 4 n_turns 2 2 position_gates A B position-parts I II type_layout S S
Table 14. Comparison between the performance of the baseline and the well-ranked solution.
Baseline Well-ranked Impact
Shrinkage (%) 12.24 12.14 -0.8%Sink 1.54 1.14 -26.0%Vmould (m3) 1.98E-02 1.80E-02 -9.1%Deflection (mm)
8.13E-04 7.20E-04 -11.4%
Pressure (MPa) 11.14 14.59 31.0%Stress (MPa) 2.018E+04 2.02E+04 0.0%tCycle (s) 39.44 41.933 6.3%Waste (mm3) 5.18E+03 3.88E+03 -25.1%Cost (€) 1133.1 1225.9 -7.6%Global improvement (in average) 4.7%Quality of Mold 3.7%
Thus, it is possible to verify that the selected solution
presents a global improvement of almost 5% on its performance, and leads to an increase of nearly 4% over quality of mold design
5 CONCLUSION
The main objective of this paper was to describe a new approach, which adopts the Axiomatic Design (AD) methodology to support the design stage of molds tools for plastic injection. In this sense, the framework proposes to carry out the conceptual design through AD approach aiming to map FRs with the corresponding DPs. It is possible to conclude that AD is helpful to facilitate the physical structure generation, as well as to identify potential system interactions (i.e. couplings). Through an existing mold comparison, it has been demonstrated that AD can help to generate more adequate solutions regarding its key functions. It also helps to think in different ways to answer the key functions, aiding to increase the degree of mold’s innovation. It is important to note that at the top level of product design, theoretically all design solutions are possible. In fact, early in the design process, there is a complete freedom for decision making, since there are no limits caused by previous decisions. On the other hand, knowledge about the implications on product performance of these design decisions is scarce. Thus, it becomes even more important to conceive and evaluate different conceptual solutions, in order to understand and identify the critical aspects of the design and its implications on product’s performance.
For that reason, this design proposal surpasses the traditional design practices that lead, typically, in a poor design space exploitation (mostly due to time constraints, where the
main concern is to achieve an acceptable mold solution instead of looking for the best one). In fact, using an existing mold it was demonstrated that with the proposed approach, it was possible to achieve a global improvement on performance of almost 5% resulting in an increase in quality of mold design of about 4%. Therefore, it is our belief that the proposed approach will help designers to achieve a more efficient design of mold tools, as a way to face the current market challenges.
6 REFERENCES
[1] Autodesk (2010). Moldflow Insight http://www.moldflow.com/stp/.http://usa.autodesk.com/moldflow/. [Accessed 20th, May, 2011].
[2] Candal, M. V. and R. A. Morales, "Design of plastic pieces and their molds using CAD/CAE Tools", Computer Applications in Engineering Education, 13(4), 233-239, 2005.
[3] Centimfe, "Manual do projectista para moldes de injecção de plásticos", 2003.
[4] Chan, W. M., L. Yan, W. Xiang and B. T. Cheok, "A 3D CAD knowledge-based assisted injection mould design system", International Journal Of Advanced Manufacturing Technology, 22, 387-395, 2003.
[5] Chuang, P. T., "Combining the Analytical Hierarchy Process and Quality Function Deployment for a location Decision from a Requirement Perspective", International Journal Of Advanced Manufacturing Technology, 18, 842-849, 2001.
[6] Esteco, 2011. ModeFrontier - Explore new frontiers of innovation [online]. Available from http://www.esteco.com/home.html. [Accessed 11th, May, 2011].
[7] Ferreira, I., "Caracterização da indústria de moldes da região da Marinha Grande, na óptica da Qualidade", Escola de Gestão do Porto, 2002.
[8] Ferreira, I., "An integrated quantitative framework for supporting product design: application to metallic moulds injection design case", PhD, Industrial Engineering and Management, 2012.
[9] Ferreira, I., J. A. Cabral and P. M. Saraiva, “Customer´s satisfaction evaluation of Portuguese mould makers based on the ECSI approach”, RPD 2008 - Rapid Product Development, Oliveira de Azeméis – Portugal, 2008.
[10] Ferreira, I., J. A. Cabral and P. M. Saraiva, “A new AD/MDO approach to support product design”, The Fifth International Conference on Axiomatic Design, Campus de Caparica, Portugal, 2009.
[11] Ferreira, I., O. d. Weck, P. M. Saraiva and J. A. Cabral, "Multidisciplinary Optimization of Injection Molding Systems", Structural and multidisciplinary optimization, 41(4), 621-635, 2010.
[12] Gao, Y. and X. Wang, "An effective warpage optimization method in injection molding based on the Kriging model", International Journal of Advances Manufacturing Technology, 37, 953-960, 2008.
[13] Lee, B. H. and B. H. Kim, "Automated Selection of Gate Location Based on Desired Quality of Injection-Molded

- 177 -
Part", Polymer-Plastics Technology and Engineering, 35, 253-269, 1996.
[14] Liu, S.-J., "Modeling and simulation of thermally induced stress and warpage in injection molded thermoplastics", Polymer Engineering and Science, 36(6), 807-818, 1996.
[15] Low, M. L. H., "Application of standardization for initial design of plastic injection moulds", International Journal of Production Research, 41(10), 2301-2324, 2003.
[16] Low, M. L. H. and K. S. Lee, "A Parametric-Controlled Cavity Layout Design System for a Plastic Injection Mould", International Journal of Advances Manufacturing Technology, 21, 807-819, 2003.
[17] Mohsen, H. A. and E. Cekecek, “Thoughts on the use of axiomatic designs within the product development process”, ICAD - 1st International Conference on Axiomatic Design, Cambridge, 2000.
[18] Ozcelik, B. and T. Erzurumlu, "Comparison of the warpage optimization in the plastic injection molding using ANOVA, neural network model and genetic algorithm", Journal of Materials Processing Technology, 171, 437-445, 2006.
[19] Pandelidis, I. and Q. Zou, "Optimization of injection molding design. Part I: Gate location optimization", Polymer Engineering and Science, 30(15), 873-882, 1990.
[20] Rosato, D. V., D. V. Rosato and M. G. Rosato, Injection Molding Handbook, Kluwer Academic Publishers, 2001.
[21] Shen, C.-Y. and H.-M. Li, "Numerical simulation for effects of injection mold cooling on warpage and residual stresses", Polymer-Plastics Technology and Engineering, 42(5), 971-982, 2003.
[22] Shen, C., L. Wang, W. Cao and L. Qian, "Investigation of the Effect of Molding Variables on Sink Marks of Plastic Injection Molded Parts Using Taguchi DOE Technique", Polymer-Plastics Technology and Engineering, 46, 219-225, 2007.
[23] Shen, C., L. Wang, W. Cao and J. Wu, "Optimization for Injection Molding Process Conditions of the Refrigeratory Top Cover Using Combination Method of Artificial Neural Network and Genetic Algorithms", Polymer-Plastics Technology and Engineering, 46, 105-112, 2007.
[24] Simulia, 2011. Abaqus CAE [online]. Available from http://www.simulia.com/products/abaqus_cae.html. [Accessed 25th, May, 2011].
[25] Suh N.P., The Principles of Design, New York: Oxford University Press, 1990. ISBN 0-19-504345-6
[26] Tang, S. H., Y. M. Kong, S. M. Sapuan, R. Samin and S. Sulaiman, "Design and thermal analysis of plastic injection mould", Journal of Materials Processing Technology, 171, 259-267, 2006.
[27] Yang, K. and B. El-Haik, Design for Six Sigma: A Roadmap for Product Development, McGraw-Hill, 2003.
[28] Zheng, R., P. Kennedy, N. Phan-Thien and X.-J. Fan, "Thermoviscoelastic simulation of thermally and pressure-induced stresses in injection moulding for the prediction of shrinkage and warpage for fibre-reinforced thermoplastics", Journal of Non-Newtonian Fluid Mechanics, 84, 159-190, 1999.
[29] Ulrich, K. T. and S. D. Eppinger, Product Design and Development, McGraw-Hill, 2003.

Proceedings of ICAD2013 The Seventh International Conference on Axiomatic Design
Worcester – June 27-28, 2013
ICAD-2013-26
- 178 -
ABSTRACT
This paper is about the use of Axiomatic Design to enhance the Systems Engineering Process during the product life cycle. The Systems Engineering Process must be enhanced to include the design of the enterprise that develops products since the enterprise design affects the efficacy of the process.
Keywords: Systems Engineering, product development, Collective System Design, Enterprise Design, performance measurement.
1 INTRODUCTION
This paper examines the traditional product life cycle based Systems Engineering (SE) Process as described by Blanchard and summarized by Cochran [Blanchard, 2008; Cochran, 2013].
The paper has four research objectives: 1. Describe limitations of the traditional SE Process and
its implementation. 2. Provide examples that illustrate why the design of the
enterprise affects the traditional product life cycle within the SE Process.
3. Demonstrate the inherent lack of definition in the SE Process that results in design parameters being interpreted as functional requirements.
4. Propose a method called Collective System Design which uses Axiomatic Design to enhance the traditional product life cycle SE Process.
2 PROBLEM STATEMENT
This section defines the problem statement relative to the traditional SE Process and its implementation. There are eight key deficiencies identified for the purposes of this study:
1. The design of the enterprise affects the efficacy of the SE Process. An enterprise system is the arrangement of components, materials, information, and people to produce a product or service that achieves the Functional Requirements (FRs) that state intended purpose (of the system) to meet customer needs; the work in that system is arranged according to flow to provide value to the customer called the value stream [Rother and Shook, 1998]. The Value Stream defines the system boundary. An Enterprise Design is the design of the enterprise system through the selection of FRs and the Design Parameters (DPs) to choose the FRs of the enterprise.
In contrast, the definition of a system in systems engineering does not specifically address the design of the enterprise, which we may call “Enterprise Engineering; [Cochran, 2009] instead, a system in systems engineering refers to the process for developing the capabilities of a product.
Figure 1. The Systems Engineering (SE) Process creates
a coupled design.
For example, a coupled organization design can lead to a coupled product design. Sections 3.1 and 3.2 provide examples of this occurring in practice.
2. Requirements that are defined are often a mixture of functional requirements and design parameters [Cochran, 2009]. This means that the SE Process starts with requirements that may be actual solutions that are masked as requirements; the consequence may be to limits innovation and creativity. The opportunity is to add an up-front innovation process before defining FRs. In many cases, DoD contracts specify technical solutions as requirements that close the solution space before a contract is ever let.
3. Technical Performance Measures (TPMs) relate to requirements. Since requirements are a mixture of FRs and DPs (per item 2), TPMs are a mixture of performance characteristics placed on the FRs and attributes on the DPs. Also, TPMs apply at multiple blocks in the SE Process (see Figure 2).
Technical Performance Measures show how well a system is satisfying its requirements or meeting its goals. For the Joint Capabilities Integration and Development System (JCIDS), Key Performance Parameters (KPPs), “are attributes or characteristics of a system that are considered critical or essential to the development of an effective military capability” [Hagan, 2009]. This definition does not make a distinction between an FR or PS. The military contracting officer can consider a TPM to apply to a pre-conceived PS under the military procurement procedure.
FR1: Create a Sustainable Enterprise
FR2: Develop New Products
DP1: Enterprise System Design
DP2: Traditional SE Process
ENHANCEMENT OF THE SYSTEMS ENGINEERING PROCESS IN THE LIFE CYCLE WITH AXIOMATIC DESIGN
David S. Cochran [email protected]
IPFW Center of Excellence in Systems Engineering Indiana University Purdue University Fort Wayne
2101 East Coliseum Boulevard Fort Wayne, IN 46805-1499
Jason A. Barnes [email protected]
IPFW Center of Excellence in Systems Engineering Indiana University Purdue University Fort Wayne
2101 East Coliseum Boulevard Fort Wayne, IN 46805-1499

- 179 -
Figure 2. Technical Performance Measures (TPMs)
apply to multiple blocks in the SE Process.
4. Requirements flow down and derived requirements eliminate an understanding of context of prior design decisions. When the design decisions of higher-level requirements are obscured, revisions to the design requirements only occur at the lowest level. Hence, engineers working to a set of requirements may not know the context of their work. Software tools like DOORS attempt to resolve this issue [IBM, 2008] but there frequently is no method to improve the design when there is no opportunity to change higher-level design decisions. An example of this occurring is provided in Section 3.2.
5. There is increased susceptibility to no-name agency requirements and “requirements soup.” During the development of a system, requirements may be added late during system development and the requirements may not be traceable to the original source – thus, the identifier as a no-name requirement. Requirements soup occurs when every idea becomes a requirement, whether it is a solution or a functional requirement, doesn’t have an identified level in functional decomposition or a priority in the implementation. For example, one result of the SE Process is the addition of “-ility” requirements at different times during the SE process, the impact on design level, sequence and implementation is unclear. An example of this occurring is provided in Section 3.2.
6. Testing is done at the end of the design process, ignoring the organization FR of not advancing a defect to the next operation (called Jidoka in Japanese). Often designs decisions are first tested when the first product is produced, leading to an expensive loop considered to be an integral component of the design process. An example of this occurring is provided in Section 3.2.
7. Operating scenarios on which requirements are based may not be well understood; therefore subsequent requirements definitions may be inadequate. For example, in an interview, a design engineer stated that he was working the design to a set of requirements that he had received in a requirements document. When asked if he understood the operating scenario for the product design that he was working on, he replied, “No, I don’t.” Furthermore, the product design itself had two other major product interfaces, both of which were also unknown to the designer. From this evaluation it is shown that the requirements documents and interface definitions in the SE Process assumed an understanding of the operating scenario and use of the product in the field. The SE documentation process does not ensure that “use-cases” are conveyed to the design engineers in their requirements documentation. To correct this deficiency, a front-end to enhanced systems engineering process using Axiomatic Design was developed using HP’s use-case approach [Cochran and Wong, 2004].
8. Milestone checklists treat the SE Process as a recipe, not a design activity. Optimal or improved designs are often missed because the opportunity for innovation has been removed from the design process entirely. An example of the impact of this perception is provided in Section 3.2.
3 EXAMPLE CASES
This section presents two new case studies that illustrate the aforementioned deficiencies.
3.1 CASE STUDY OF ORGANIZATION A
The structure of the organization itself can determine whether a design is coupled or not (Deficiency 1). For example, the management program for a project is shown in Figure 3 as consisting of two FRs: Ensure successful development and Ensure successful integration. The organization at the highest level was split into a Development Branch and an Integration Branch.
Program management split the Development Branch by the type of contract issued; one contract was let for the vehicle program, while the other contract was let for affordable engine development. The impact of separating the development contracts showed up during program integration.
The Weight Management Office was responsible for ensuring that weight and thrust performance parameters were achieved. This office did not have direct contract responsibility for the vehicle and engine contractors. The two FRs of the Weight Management Office were to Ensure proper weight at launch and to Ensure proper center of gravity (CG) at launch (see Figure 4).
Customer Attributes
FRs
DPs
FRs
FRs
FRs
FRs
TPMs
DPs
DPs
TPMs
DPs FRs
TPMs
FRs
FRs

- 180 -
Figure 3. The Management Program of Organization A.
Figure 4. Expansion of the Integration Branch of Organization A.
FR1: Achieve total project affordability
DP1: Management Program for project
FR1.1: Ensure successful
development
DP1.1: Engine and vehicle contracts …
separated
FR1.2: Ensure successful integration
DP1.2: Performance Integration program
FR1.1.1: Ensure vehicle affordability
FR1.1.2: Ensure engine affordability
DP1.1.1: Vehicle program
optimization
DP1.1.2: Engine program
optimization
FR1.2.1: Ensure weight-related
parameters
DP1.2.1: Weight Management Office
FR1.2.2: Ensure thrust-related
parameters
DP1.2.2: Thrust Management
Program Office
Dev
elo
pm
ent
Bra
nch
Integratio
nB
ranch
Coupled Coupled
Thrust
Weight
FR1.2: Ensure successful integration
DP1.2: Performance Integration program
FR1.2.1: Ensure weight-related
parameters
FR1.2.2: Ensurethrust-related
parameters
DP1.2.1: Weight Management Office
DP1.2.2: Thrust Management
Program Office
FR1.2.1.1: Ensure proper weight at
launch
FR1.2.1.2: Ensureproper CG at launch
DP1.2.1.1: Weight Management
program
DP1.2.1.2: CG Management
program
FR1.2.1.1.1: Determine actual
mass
FR1.2.1.2.1: Determine actual CG
DP1.2.1.1.1: Mass measurement
DP1.2.1.2.1: CG measurement
FR1.2.1.2.2: Balance resultant CG
DP1.2.1.2.2: Addition of pig iron
CG Target: = c
Coupled
Coupled
Integratio
nB
ranch

- 181 -
Figure 4 illustrates that the Weight Management Office did not realize that a problem with the organization design existed until there was an addition of pig iron to create the necessary CG for the vehicle. If Axiomatic Design had been used for the enterprise design, it would have been possible to realize that the selection of DP1.2.1.1 and DP1.2.1.2 resulted in a coupled organization design – one that would require a different approach to ensuring the achievement of weight and CG parameters at launch.
One possible solution is to redefine the decomposition of DP1: Management Program for project to just two performance FRs, with cost as a constraint: to make the new FR1.1: Achieve the CG target at launch, and FR1.2 Achieve the thrust target.
However, upon reflection, the real issue lies within the definition of the highest level FR, FR1: Achieve total project affordability.
Achieving total project affordability is not the same as achieving mission success, which means that a vehicle is designed, built, and operated successfully. The new high-level FR could be stated as: FR1(new): Achieve successful mission operating parameters with DP1(new): Program to Identify successful mission and vehicle operating parameters.
Once a vehicle is developed that successfully meets the required mission and operational parameters, a second vehicle development program could be launched to refine the design of the successful vehicle designed under FR1(new) to reduce cost. The second program level FR could then be stated as, FR2: Reduce cost of the successful vehicle design with DP2: Program to reduce life-cycle cost. Life-cycle cost is brought into the picture because a development vehicle design would not necessarily consider maintainability cost factors.
It is important to consider that the best DP to achieve the original FR1: Achieve total project affordability is DP1: No Vehicle. By not developing a vehicle there is no cost; the FR is achieved for the least cost.
3.2 CASE STUDY OF ORGANIZATION B
Organization B is a systems contractor that developed the organizational structure shown in Figure 5 to implement the SE Process. This study examines the effectiveness of the implementation and the organizational transformation that occurred over a period of five years due to the process outcomes.
In this implementation, the SE Process was divided into phases: System Definition, System Design, Functional Design, System Integration, and Production. During the first phase, System Definition, a business development team interfaced directly with the customer to determine scope and project risk to develop a set of top-level requirements which would be integrated into a contract. These contract requirements were handed off to Systems Engineers at the start of the System Design phase to be broken into a conceptual implementation, allocating the requirements derived from the top-level, contract requirements into subsystems or subassemblies. Meanwhile, the business development teams of Organization B would typically end their involvement with a project once the contract was approved, moving on to the next development opportunity.
Figure 5. The implementation of Organization B’s
SE Process.
By design, Organization B removed the people with the best knowledge of customer need from the process as soon as the first phase was completed. This increased the difficulty of meeting the top-level FRs which are determined solely by customer need. In this regard, the implementation of the SE Process in Organization B reduced its effectiveness (Deficiency 1). Additionally, this immediately broke the flow of context in the system design. Systems Engineers in the System Design phase had no knowledge of customer need. Then when Systems Engineers supplied their derived requirements to designers in Functional Design, knowledge of the derivation process was similarly not communicated. Any changes to requirements in this phase were only done at this lowest level (Deficiency 4).
In the initial process design (SE Process A), Systems Engineers completed a Modeling & Simulation task as part of the System Design phase. There were four purposes of this task:
1. Assist with functional trade studies and design feasibility during System Design.
2. Provide reference artifacts for verification during Functional Design.
3. Troubleshoot test failures during System Integration and Production.
4. Provide baseline analyses for future applications and use-cases of the product family.
A typical product required a single Systems Engineer to spend 6-12 months developing the model. Because many products only allocated one or two Systems Engineers to the System Design phase, this development time showed up directly on the project budget and schedule. Deemed an unnecessary impact to the cost and delivery of its products by organization management, the SE Process was revised to
Customer Needs
System Definition
System Design
Functional Design
System Integration
Production
Model Simulation
SE P
roce
ss
SE Process A

- 182 -
move Modeling & Simulation efforts in parallel with the Functional Design phase as in Figure 6.
Figure 6. The first revision of Organization B’s
SE Process.
In this adapted process (SE Process B), the initial schedule seemed to show an improvement in delivery time by 6-12 months since Functional Design was starting earlier. However, because requirements developed during System Design might still be changed due to Modeling & Simulation outcomes, schedules for Functional Design often slipped by 6-12 months as Design Engineers incorporated or waited on varying requirements. In effect, the cost of one engineer became the cost of many engineers over that time with no difference in delivery time from the initial process. The constantly changing requirements during multiple phases of the SE Process also impacted the quality of the design (Deficiency 5).
Because of the obvious schedule slippages, Modeling & Simulation was viewed as a suboptimal verification tool for Functional Design and it was removed from the SE Process entirely as in Figure 7. As a result, all of the testing of the product design had been moved to the System Integration phase (SE Process C). It became typical for product designs to have errors that required passing results back to the System Design and Functional Design phases for iterated development.
By removing testing of the design during the System Design and Functional Design phases, the organization FR of not advancing a defect between phases was ignored (Deficiency 6). From an internal Six-Sigma Black Belt project, it was determined that 10% of the errors detected in System Integration or Production required a model to solve adequately. Without a model developed for the product earlier
in the SE Process, Modeling & Simulation was done on a smaller scale when problems occurred, tailoring the model to the application in error. These models typically took 1-3 months to develop and halted workflow for all of the workers involved in the phase where the error was detected, either System Integration or Production. The Black Belt project estimated that having a pre-existing model would save about 6-12 months and $1 million in man-hours per project.
Figure 7. The second revision of Organization B’s
SE Process.
In addition to the added costs of not testing the design during each phase, the pressure of holding up System Integration or Production led to seemingly lower-quality models. These models also could only be applied to the very specific purpose of troubleshooting a single issue and could not be used for expanding the product family. This method of operation was allowed to continue because of the perception that the milestones present in the SE Process worked to vet the product design (Deficiency 8).
4 PROPOSED ENHANCEMENTS
This section describes how each limitation above can be resolved with a proposed method entitled Collective System Design, which is a combination of the SE Process, Enterprise Design, and Axiomatic Design. The section assumes a working knowledge of Axiomatic Design.
A key difficulty addressed by Collective System Design is lack of a shared purpose among the people involved in the development of a product or service and its delivery by a value stream. Management, engineering, production, finance, and other groups may have completely different viewpoints on how to meet customer needs. Thus, it is important to develop a shared mental model of the Enterprise Design that
Customer Needs
System Definition
System Design
Functional Design
System Integration
Production
Model Simulation
Customer Needs
System Definition
System Design
Functional Design
System Integration
Production
Model Simulation
Model Simulation
SE P
roce
ss
Organizational Time
SE Process A SE Process B
Customer Needs
System Definition
System Design
Functional Design
System Integration
Production
Model Simulation
Customer Needs
System Definition
System Design
Functional Design
System Integration
Production
Model Simulation
SE P
roce
ss
Organizational Time
Model Simulation
SE Process B SE Process C
Model Simulation

- 183 -
starts with the functional requirements of the enterprise. This can be accomplished using the Language for Collective System Design, a dialect of system relationships developed from Axiomatic Design (see Figure 8) [Cochran, 2010].
For Collective System Design, the term DP has been replaced by the term Physical Solution (PS) to convey the distinction between the functions of an organization and implementation in the form of physical solutions. To promote a mindset of learning, a PS is considered to be the best work method, known at the time, to achieve an FR. The result is that enterprise designers treat each PS as a hypothesis (H0) to achieve each FR. The concept of work and physical implementation being a hypothesis was first proposed as part of the four rules of the Toyota Production System, in which it was stated that, “any improvement must be made in accordance with the scientific method, under the guidance of a teacher at the lowest possible level in the organization” [Spear and Bowen, 1999]. The design of an enterprise requires this same mindset that any proposed implementation requires the designers to realize that a physical solution is a proposed design choice that they think will achieve the FR. However, the proposed PS must be tied to achieving an enterprise FR that is both understood and agreed upon collectively by the people who are part of the design and do the work within the enterprise [Won et al., 2001].
The Performance Measures of Collective System Design (MFR and MPS) implement metrics on the Enterprise Design to track how effectively the organization is achieving its functional requirements and its effectiveness of implementing its own physical design. While the SE Process uses TPMs that can be metrics on both requirements and design attributes, the separation of MFR and MPS reinforces the difference between FRs and PSs.
Collective System Design not only provides a language for obtaining agreement about enterprise requirements, but it also establishes an order of precedence in Enterprise Design. First the FRs must be defined by the group, then the PSs as proposed solutions for those FRs. Once that architecture is in place, measures on the design can be implemented.
For example of how to use this language, consider a Customer Need of traffic safety at a city intersection. The FR could be agreed upon as Safely regulate traffic. A suitable PS would then be a Traffic light, although that is not the only viable solution. Once that system is in place, the designers could agree on performance measures such as the number of accidents (a measure on the FR) or traffic light up-time (a measure on the PS.)
Figure 9 illustrates a learning loop to sustain an Enterprise Design. The enterprise system design is decomposed using the Axiomatic Design decomposition process, i.e. the language for Collective System Design. The result is the Enterprise Design (ED) Map, a hierarchy of FRs and PSs that determine the requirements of the enterprise and how the enterprise plans to achieve them.
Each Physical Solution (PS) is implemented to specify the content, sequence and timing of the work, also known as Standard Work. The Plan-Do-Check-Act (PDCA) learning loop is the method for implementing the Enterprise Design Map. A check of the physical work implementation leads to three options: (1) improving the Standard Work without modifying the PS; (2) creating a new PS and the new Standard Work; (3) deciding that the FR must be changed, which requires modifying the ED Map. In this way, the people in an organization practice the mindset that work is improvable and that the ED mapping can quantify enterprise purpose and actions necessary to achieve enterprise purpose.
Figure 8. Language for Collective System Design.
Collective System Design may be characterized as a sequence of design relationships…
Functional Requirement (FR) - Performance Measure on FR is MFR
Physical Solution (PS) - Performance Measure on PS is MPS
Not every FR or PS requires a measure.
MFR/KPPFR
PSStandard
Work
A PS is a hypothesisto achieve an FR
Customer
Needs
1st Step
of Design
MPS/KPP
3rd Step
of Design
(as needed)
2nd Step
of Design
4th Step
of Design
(as needed)
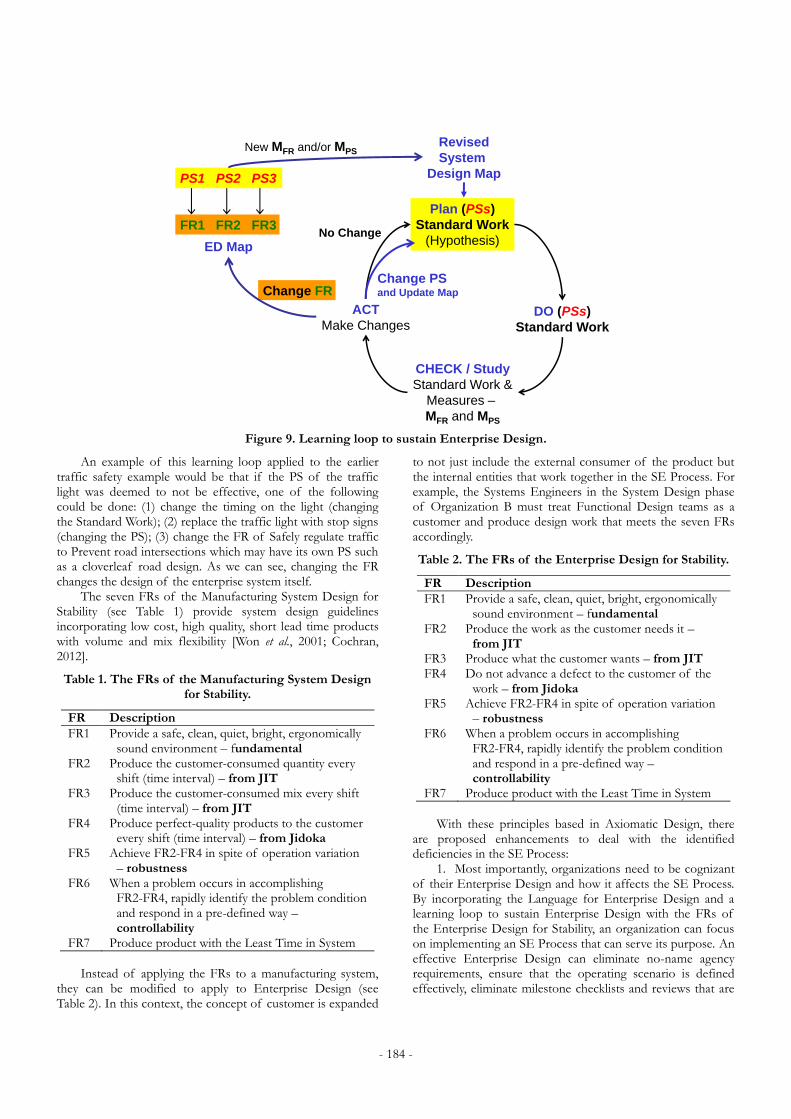
- 184 -
Figure 9. Learning loop to sustain Enterprise Design.
An example of this learning loop applied to the earlier traffic safety example would be that if the PS of the traffic light was deemed to not be effective, one of the following could be done: (1) change the timing on the light (changing the Standard Work); (2) replace the traffic light with stop signs (changing the PS); (3) change the FR of Safely regulate traffic to Prevent road intersections which may have its own PS such as a cloverleaf road design. As we can see, changing the FR changes the design of the enterprise system itself.
The seven FRs of the Manufacturing System Design for Stability (see Table 1) provide system design guidelines incorporating low cost, high quality, short lead time products with volume and mix flexibility [Won et al., 2001; Cochran, 2012].
Table 1. The FRs of the Manufacturing System Design for Stability.
FR Description
FR1 Provide a safe, clean, quiet, bright, ergonomically sound environment – fundamental
FR2 Produce the customer-consumed quantity every shift (time interval) – from JIT
FR3 Produce the customer-consumed mix every shift (time interval) – from JIT
FR4 Produce perfect-quality products to the customer every shift (time interval) – from Jidoka
FR5 Achieve FR2-FR4 in spite of operation variation – robustness
FR6 When a problem occurs in accomplishing FR2-FR4, rapidly identify the problem condition and respond in a pre-defined way – controllability
FR7 Produce product with the Least Time in System
Instead of applying the FRs to a manufacturing system,
they can be modified to apply to Enterprise Design (see Table 2). In this context, the concept of customer is expanded
to not just include the external consumer of the product but the internal entities that work together in the SE Process. For example, the Systems Engineers in the System Design phase of Organization B must treat Functional Design teams as a customer and produce design work that meets the seven FRs accordingly.
Table 2. The FRs of the Enterprise Design for Stability.
FR Description
FR1 Provide a safe, clean, quiet, bright, ergonomically sound environment – fundamental
FR2 Produce the work as the customer needs it – from JIT
FR3 Produce what the customer wants – from JIT FR4 Do not advance a defect to the customer of the
work – from Jidoka FR5 Achieve FR2-FR4 in spite of operation variation
– robustness FR6 When a problem occurs in accomplishing
FR2-FR4, rapidly identify the problem condition and respond in a pre-defined way – controllability
FR7 Produce product with the Least Time in System
With these principles based in Axiomatic Design, there
are proposed enhancements to deal with the identified deficiencies in the SE Process:
1. Most importantly, organizations need to be cognizant of their Enterprise Design and how it affects the SE Process. By incorporating the Language for Enterprise Design and a learning loop to sustain Enterprise Design with the FRs of the Enterprise Design for Stability, an organization can focus on implementing an SE Process that can serve its purpose. An effective Enterprise Design can eliminate no-name agency requirements, ensure that the operating scenario is defined effectively, eliminate milestone checklists and reviews that are
Plan (PSs)
Standard Work
(Hypothesis)
DO (PSs)
Standard Work
CHECK / Study
Standard Work &
Measures –
MFR and MPS
ACT
Make Changes
Change FRChange PSand Update Map
No Change
ED Map
Revised
System
Design Map
FR1 FR2 FR3
PS1 PS2 PS3
New MFR and/or MPS
- 185 -
done robotically and typically don’t accomplish anything, and ensure the ability to improve the design process.
2. Use of Axiomatic Design distinguishes and separates the DP from the FR, ensuring that high-level requirements are functional requirements and are not pre-conceived solutions. Furthermore, by employing Collective System Design, the design team must gain agreement on the FRs before determining the DPs/PSs to achieve them. This practice also promotes innovation at the front end of product development by fleshing out the requirements for the entire system design while keeping them separate from design choices.
3. Use of Axiomatic Design identifies the FRs, allowing TPMs to be directly tied to FRs as measures, called FR_M. FRs to address each “-ility” can be placed visibly on a design board with Post-It notes for consideration at each level of the design decomposition.
4. The decomposition process in Axiomatic Design ensures that the DP is identified prior to moving to the next lower level of decomposition. To promote design clarity and improvability, a decomposition hierarchy should be tied in with a learning loop to enable and encourage a design improvement cycle.
5. By defining the system boundary of a development program, the agencies that affect the design are identified at the beginning of a design activity. Each agency must be brought in to the same room at the early stages of design and must identify the functional requirements and constraints they place on the design. Similarly, the enterprise must develop the hierarchy of FRs as the first step of the SE Process. This is the DP necessary for meeting FR3 of the Enterprise Design.
6. To achieve FR4 of the Enterprise Design, testing must be integrated into each stage of the SE Process. This testing should include checks at each layer of requirements decomposition, ensuring that the selected DPs are viable, uncoupled solutions.
7. By involving the designer in a physical model built to show how work will be done between the end-user and the product, operation scenarios can be demonstrated. The designer should also be allowed to discuss customer need and use scenarios with the customer.
8. Milestone reviews should monitor the TPMs of the design in reference to the FRs instead of being a predefined checklist. This would ensure that the system design is tracking the customer needs and would vary from product to product, reducing the likelihood that designs are created robotically.
5 CONCLUSION
The SE Process is necessary but not sufficient. Engineering is not checking the box on milestone checklists that were established by people who are external to a development enterprise. A milestone checklist does not convey the Enterprise Design FR, only “artifacts,” proposed solutions of a design. When an agency or person mandates solutions without clarifying the FRs, the thinking leaves the room. People and organizations become robotic, checking a box for the sake of checking it (or to get paid). Leaders must get the FRs on the table within an organization before jumping to the implementation (the how-to’s).
As engineers practice SE, we have the opportunity to get the FRs on the table and collaboratively agree on the best
solutions understood by the designers at the time. The axiomatic decomposition framework enables requirements traceability and conveys an easy to understand visible model of the thinking process and design decisions that a designer makes when doing design.
The use of axiomatic design enables us to know the why (the functional requirements) before choosing the how (the design parameters or physical solution) of the design.
6 ACKNOWLEDGEMENTS
Thank you to Ma Oo, IPFW graduate student in the Spring 2013 semester of SE 53000 – Systems Engineering Management, for developing Figure 2 illustrating the FR/DP relationships to the SE Process.
7 REFERENCES
[1] Blanchard B., System Engineering Management, Hoboken, New Jersey: John Wiley & Sons, Inc., pp. 51-120, 2008.
[2] Cochran D.S., Wong D., "Integration of Collective System Design (CSD) and Hewlett Packard's Value Chain Requirements Management (VCRM)", Hewlett-Packard, 2004.
[3] Cochran D.S., “Enterprise Engineering, Creating Sustainable Systems with Collective System Design – Part I”, The Journal of RMS (Reliability, Maintainability, Supportability) in Systems Engineering, Winter Journal, 2009.
[4] Cochran D.S., “Enterprise Engineering, Creating Sustainable Systems with Collective System Design – Part II”, The Journal of RMS (Reliability, Maintainability, Supportability) in Systems Engineering, Spring Journal, 2010.
[5] Cochran D.S., "The Challenges of Advanced Manufacturing System Design and Sustainability", Blacksburg, Virgina, Nov. 13, 2012.
[6] Cochran D.S., Lecture Notes, SE 53000 – Systems Engineering Management, Indiana University-Purdue University Fort Wayne, Spring, 2013.
[7] Hagan G., Glossary of Defense Acquisition Acronymns and Terms, Fort Belvoir, Virginia: Defense Acquisition University Press, 2009.
[8] IBM Rational Software, Telelogic DOORS: Getting Started with Telelogic DOORS, IBM Corporation, 2008.
[9] Rother M., Shook J., Learning to See: Value Stream Mapping to Add Value and Eliminate Muda, Cambridge, Massachusetts: Lean Enterprise Institute, 1998.
[10] Spear S., Bowen H.K., "Decoding the DNA of the Toyota Production System", Harvard Business Review, Sept.-Oct., pp. 97-106, 1999.
[11] Won J., Cochran D.S., Johnson H.T., Bouzekouk S., Masha B., "Rationalizing the Design of the Toyota Production System: A Comparison of Two Approaches", International CIRP Design Seminar Proceedings, Stockholm, Sweden, June, 2001.

Proceedings of ICAD2013 The Seventh International Conference on Axiomatic Design
Worcester – June 27-28, 2013
ICAD-2013-27
- 186 -
ABSTRACT
Modern manufacturing has to deal with global competition, in which customers have high purchasing power. Production efficiency and rapid response to customer demand are dominant conditions for enterprises to stay successful. Reconfigurable Manufacturing Systems (RMSs) are designed to have a modular architecture in both mechanical design and control system. The architecture enables change of the machine structure quickly, by adding and removing parts of the system, and by changing the corresponding software programming. It can handle short times to market. This paper presents an ‘Index-Method’ to monitor the reconfiguration of RMS. The method is able to categorise the reconfiguration and related development in seven stages. It focusses specifically on the Independence Axiom. The main goal is to find all relevant parameters to cause interactions, and to decouple them. The solution, aiming to be scientifically vigorous and practically applicable, was applied to a true case; the development of a manufacturing system for an inkjet print head for industrial applications. The realisation of the system required the development of new process technology. The index-method may be considered successful. It has the ability to structure the configuration process of RMSs. The method harmonises well with the industry known V-model.
Keywords: reconfigurable manufacturing systems, Axiomatic Design, Independence Axiom, structured analysis design technique, qualitative modelling and analysis of processes, V-Model, RMS, SADT, QMAP.
1 INTRODUCTION
Modern manufacturing enterprises have to compete in a global economy. Global competition increases the purchasing power of customers. It enlarges the dynamics with which manufacturing enterprises have to deal. The arena is highly competitive; high production efficiency and rapid response to changing customer demand are dominant conditions for
enterprises to stay successful [Koren, 2006]. This has led to adjustments in production processes, production approach and applied equipment. Manufacturing has become ‘agile’. Production locations and manufacturing equipment have become modular and subject to evolve frequently and on short notice. This is the venue of ‘Reconfigurable Manufacturing Systems’ (RMSs) [Gunasekaran, 2001; Puik, 2010].
RMSs are a logical addition to ‘Dedicated Manufacturing Systems’ (DMSs) and ‘Flexible Manufacturing Systems’ (FMSs). DMSs are most traditional; they are applied for a long period of manufacturing without significant changes, even up to 30 years. FMSs are computer numerically controlled systems. In FMSs, the application of computerised control systems enables fast adaptions to a range of variations in production. The structure of the machine, however, was determined by the mechanical system design and is not able to change. RMSs fill the gap by adding a modular architecture in both mechanical design and control system. The architecture enables change of the machine structure quickly by adding and removing parts of the system, and by changing the corresponding software programming [Moergestel, 2011]. The core characteristics of the RMSs are: modularity, integrability, customisation, scalability, convertibility, and diagnosability. RMSs therefore are responsive manufacturing solutions whose production capacity is adjustable to fluctuations in market demand and whose functionality is adaptable to new products [Koren, 1999]. The re-configuration of RMSs takes from hours up to some months, depending on if the change can be implemented by the application of existing process-modules or if new modules have to be developed. Especially in this last situation, there is a desire to closely follow the development of the new process-modules, since their development largely determines the critical path of the total manufacturing solution. The increased attention focuses on the mechanical- and software design of the modules, initial testing of these modules and the improvements required to bring the level of the new modules up to the desired standard.
A METHOD FOR INDEXING AXIOMATIC INDEPENDENCE APPLIED TO RECONFIGURABLE MANUFACTURING SYSTEMS
Erik Puik [email protected]
Research Centre for Technology and Innovation HU University of Applied Science
Oudenoord 700, 3500AD Utrecht, the Netherlands
Jan Gerritsen Research Centre for Technology and Innovation
HU University of Applied Science Oudenoord 700, 3500AD Utrecht, the Netherlands
Edwin Smulders [email protected]
MA3Solutions BV Research Centre for Micro Assembly Solutions
Science Park 5080, 5692 EA, Son, the Netherlands
Bert van Huijgevoort Research Centre for Technology and Innovation
HU University of Applied Science Oudenoord 700, 3500AD Utrecht, the Netherlands
Darek Ceglarek [email protected]
International Digital Laboratory Warwick Manufacturing Group, University of Warwick
Coventry, CV4 7AL, UK

- 187 -
This paper presents an ‘Index-Method’ to monitor the development of new process-modules and their interaction with other (existing) modules. The method is able to categorise the development of reconfigurable modules in seven stages, from ‘functional definition’ to ‘product accepted’. The index-method focusses specifically on the Independence Axiom. The main goal is to find all relevant parameters to cause interactions and to decouple them. The solution is aiming to be scientifically vigorous as well as practically applicable.
2 METHODS FOR MONITORING DEVELOPMENT PROGRESS OF RMS
A range of systems engineering tools, which have been defined in literature, could be applied to monitor the reconfiguration of RMSs. The following paragraphs inventory the most successful tools today. Most of these tools are actually applied in industry for monitoring the progress in development of RMSs, eventually in a concurrent way.
2.1 TOOLS FOR THE CONCEPTUAL DESIGN PHASE The Structured Analysis Design Technique (SADT) was
originally developed for software development but appeared to have a much broader application area [Ross, 1977]. For manufacturing purposes, SADT has been refined to focus on errors that tend to inherit through subsequent process steps. This method is called Qualitative Modelling and Analysis of Processes (QMAP) [Brands, 2000; Bullema, 1998]. Structured analysis methods, either SADT or QMAP, can be applied when no hardware is available yet. This makes these methods particularly suitable for the early stage of development. The combination of SADT and Axiomatic Design (AD) has been applied before on manufacturing systems [Triki, 2011], however, this study optimises equipment occupation ratio. There is no focus on FMSs or RMSs.
Quality Function Deployment is a value-engineering tool usually applied for mapping customers’ wishes in relation to a product design. It uses a layered approach to deploy function to lower product levels e.g. subsystems and parts [Akao, 2004]. All methods, SADT/QMAP and QFD have proven to be useful in the early phase of product/process development and have, successfully been combined with Axiomatic Design methods [Triki, 2011; Kim, 1991; Buseif, 2006].
2.2 RISK ANALYSIS METHODOLOGIES Parallel to the structured design techniques, which pull
development risks forward in time when developing RMSs, industry frequently applies ‘risk analysis’ tools. During early development, risk plotting in Maturity Grids (MG) seems favourite. During the engineering phase, the Failure Mode Effect Analysis (FMEA) may be considered the most popular method [Hassan, 2010; Werdich, 2011; Puik, 2013]. Many variations of these basic tools apply.
2.3 STATISTICAL PERFORMANCE MONITORING Industry usually determines the performance of
manufacturing systems by measurement of the ‘Production Yield’ (Yp). Yp is calculated by dividing ‘the number of products produced with all functional requirements successfully met’, by ‘the total number of products produced’.
Depending on the applied philosophy about manufacturing, usually an enterprise standard, the production yield is applied for process improvement using a statistical set of tools and strategies e.g.: ‘Six Sigma’ analysis as developed by Motorola, ‘Design of Experiments’ DoE’ by Taguchi or an arbitrary process capability index. Since all methods are based on statistical input, determination of full maturity should take place on a sample set of products taken from pilot- or actual production. Statistical production information is a reliable and generally well-accepted measure but it also has its downside. In the early development phase, little statistical information is available because the new production modules have not been realised yet. Their only existence may be in CAD systems or even in the developers’ heads. At this stage, Statistical information is of no use for an index-strategy for RMS modular building bricks. Therefore, statistical production information is considered to be of great use as a verification tool for the absolute state of quality, but only during the engineering stage of the development.
2.4 GENERAL SYSTEM ENGINEERING TOOLS Maturity, or the state of reaching full development in
design and manufacturing of products, is in literature mainly investigated using the Capability Maturity Model (CMM) [Bate, 1995; Dooley, 2001; Fraser, 2002; Team, 2002; Ren, 2004; Shah, 2009]. CMM uses five stages to define maturity and its progress, but is mainly used from an organisational perspective rather than a technological perspective. This makes CMM rather unsuitable to follow the development progress of RMSs during its development. A technologically driven approach uses a quantitative way of calculating product maturity by indicators [Tekcan, 2010]. However, this method strongly depends on statistical process data, and its indicators are unsuitable for the early design stage where systems only partially have been realised yet.
2.5 V-MODEL AND WATERFALL-MODEL The ‘V-model’ is a modified and optimised version of the
‘Waterfall-model’. Both methods, originated for software development, are graphical representations of the systems development lifecycle [Royce, 1970; Friedrich, 2009].
Figure 1: The V-Model may be currently be seen as an industry standard, but many versions apply and
implementations differ.
The main steps to be taken in conjunction with the corresponding deliverables are summarised in a validation framework. This is done in a sequential process (Figure 1). The V-model focuses on testing more than the waterfall model. Both models are indicating the ‘actions to be taken’ more that defining the ‘state of the product’. Interpretation of
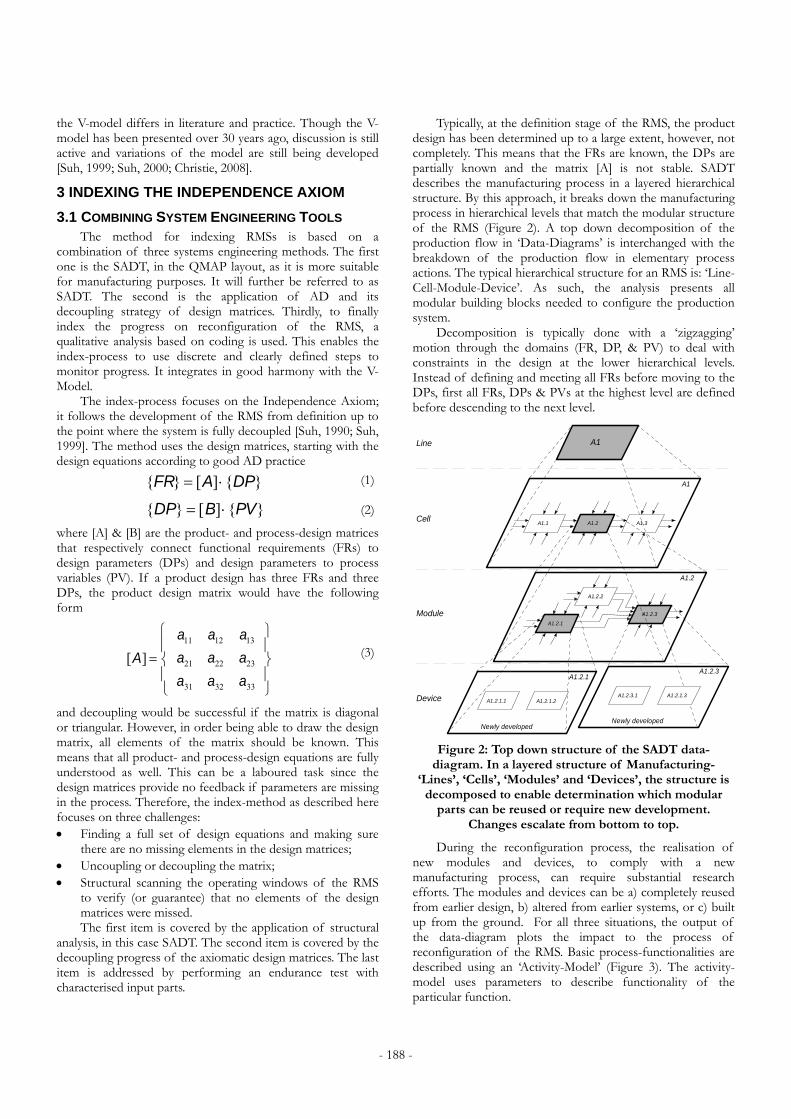
- 188 -
{FR} [A]{DP}
{DP} [B]{PV}
[A]
a11 a12 a13
a21 a22 a23
a31 a32 a33
the V-model differs in literature and practice. Though the V-model has been presented over 30 years ago, discussion is still active and variations of the model are still being developed [Suh, 1999; Suh, 2000; Christie, 2008].
3 INDEXING THE INDEPENDENCE AXIOM
3.1 COMBINING SYSTEM ENGINEERING TOOLS The method for indexing RMSs is based on a
combination of three systems engineering methods. The first one is the SADT, in the QMAP layout, as it is more suitable for manufacturing purposes. It will further be referred to as SADT. The second is the application of AD and its decoupling strategy of design matrices. Thirdly, to finally index the progress on reconfiguration of the RMS, a qualitative analysis based on coding is used. This enables the index-process to use discrete and clearly defined steps to monitor progress. It integrates in good harmony with the V-Model.
The index-process focuses on the Independence Axiom; it follows the development of the RMS from definition up to the point where the system is fully decoupled [Suh, 1990; Suh, 1999]. The method uses the design matrices, starting with the design equations according to good AD practice
(1) (2)
where [A] & [B] are the product- and process-design matrices that respectively connect functional requirements (FRs) to design parameters (DPs) and design parameters to process variables (PV). If a product design has three FRs and three DPs, the product design matrix would have the following form
(3)
and decoupling would be successful if the matrix is diagonal or triangular. However, in order being able to draw the design matrix, all elements of the matrix should be known. This means that all product- and process-design equations are fully understood as well. This can be a laboured task since the design matrices provide no feedback if parameters are missing in the process. Therefore, the index-method as described here focuses on three challenges: Finding a full set of design equations and making sure
there are no missing elements in the design matrices; Uncoupling or decoupling the matrix; Structural scanning the operating windows of the RMS
to verify (or guarantee) that no elements of the design matrices were missed. The first item is covered by the application of structural
analysis, in this case SADT. The second item is covered by the decoupling progress of the axiomatic design matrices. The last item is addressed by performing an endurance test with characterised input parts.
Typically, at the definition stage of the RMS, the product design has been determined up to a large extent, however, not completely. This means that the FRs are known, the DPs are partially known and the matrix [A] is not stable. SADT describes the manufacturing process in a layered hierarchical structure. By this approach, it breaks down the manufacturing process in hierarchical levels that match the modular structure of the RMS (Figure 2). A top down decomposition of the production flow in ‘Data-Diagrams’ is interchanged with the breakdown of the production flow in elementary process actions. The typical hierarchical structure for an RMS is: ‘Line-Cell-Module-Device’. As such, the analysis presents all modular building blocks needed to configure the production system.
Decomposition is typically done with a ‘zigzagging’ motion through the domains (FR, DP, & PV) to deal with constraints in the design at the lower hierarchical levels. Instead of defining and meeting all FRs before moving to the DPs, first all FRs, DPs & PVs at the highest level are defined before descending to the next level.
Figure 2: Top down structure of the SADT data-diagram. In a layered structure of Manufacturing-
‘Lines’, ‘Cells’, ‘Modules’ and ‘Devices’, the structure is decomposed to enable determination which modular
parts can be reused or require new development. Changes escalate from bottom to top.
During the reconfiguration process, the realisation of new modules and devices, to comply with a new manufacturing process, can require substantial research efforts. The modules and devices can be a) completely reused from earlier design, b) altered from earlier systems, or c) built up from the ground. For all three situations, the output of the data-diagram plots the impact to the process of reconfiguration of the RMS. Basic process-functionalities are described using an ‘Activity-Model’ (Figure 3). The activity-model uses parameters to describe functionality of the particular function.
A1
A1.2
A1.2.3A1.2.1
A1.1 A1.2 A1.3
A1.2.1
A1.2.2
A1.2.3
A1.2.1.1 A1.2.1.2A1.2.3.1 A1.2.1.3
A1Line
Cell
Module
Device
Newly developedNewly developed

- 189 -
Figure 3: SADT/QMAP activity-model.
Input parameters, can be ‘functional’ or binding characteristics of a good product at start, or ‘dysfunctional’ representing potential hazards or errors of the product before the particular process has even started. Conditional input parameters, like ‘norms and controls’ reflect boundary conditions or demands of the process. Parameters related to the transformation mechanism, comprising of ‘constants and variables’, are representing the process or equipment characteristics. All input parameters serve as determinants for the output parameters, again functional or dysfunctional.
The SADT analysis presents a total overview of the reconfiguration process of RMSs since its hierarchy and process steps are visualised in detail: a) It confronts the engineers with the logistic, but also the functional layout of the system. b) The SADT procedure decomposes system functions when moving from data-level to activity-model. During this stage, not only the modules are defined, but also their interfaces, both physical as functional. c) The general system architecture is finalised with the completion of data- diagram and activity-model of the SADT analysis, having defined all building blocks.
SADT, being a singe domain analysis, needs to be performed for each domain separately. However, SADT and derived tools are most effective for sequential processes. In the product domain, to find FRs and DPs, QFD might be the more obvious choice. Both tools can be combined in good harmony.
Execution of the SADT and/or QFD analysis is done by a diverse group of engineers. The participants have different backgrounds, from product- and manufacturing engineering and even service operations. The level of experience of the
participants varies from junior+, as it appears hard to contribute from the entry level of engineering, to senior.
3.2 TOWARDS AN INDEX-METHOD FOR RMSS The outcome of the SADT analysis will serve as the basis
for the first two index-levels to enable tracking the reconfiguration process of the RMS. The index-process is qualitatively coded from -3 to +3 to provide a match with the in industry widely accepted V-model, starting with
Level -3; Product or process hierarchy is not completely known yet. This corresponds with not having completed the SADT analysis at data-level;
Level -2; Product or process hierarchy has been determined, but parameters have not. This level corresponds with a completed SADT at data-level but no completion of the activity-level.
Axiomatic Design matrices provide the input for the successive levels ‘-1’ and ‘0’. The elements of the design matrix are subtracted from the parameters of the analysis at SADT activity-level. Figure 4 shows the gathering of elements in the process-design matrix [B]. In parallel, matrix [A] will be updated as well to get a complete set of design matrices. It will serve as obligatory condition for the next index-level. The statuses of the elements are indicated as respectively ‘?’, ‘X’ and ‘0’, being ‘Unknown’, ‘Relevant’ and ‘Not Relevant’. Optionally, the small ‘x’ may be used without consequence for ‘Somewhat Relevant’.
Level -1; Both levels of the SADT analysis have been completed, elements of the design matrices have been gathered to form a complete set of design matrices ( [A] & [B] are known at all hierarchical levels).
Whereas the elements of the process-design matrices have been gathered, the next step is to satisfy the Independence Axiom. An independent design requires the design matrices to be diagonalised or triangulated. This process, requiring structural understanding of the design and production methods, leads to an uncoupled (diagonal) or decoupled (triangular) process design.
Figure 4: Application of the design matrices for quantification of the independence measure. Data is extracted from the SADT activity-model.

- 190 -
Due to the fact that the SADT data-level has introduced a layered hierarchical structure, not al process-design matrices will be optimised simultaneously. The optimisation process starts at the highest level (Cell & Line, Figure 2) and works its way down to the bottom-level (Module & Device). Once this process is completed, all parameters are known. Process design matrices are defined and uncoupled or decoupled, represented by diagonal or triangular design matrices. If this is the case, the design axiom may be considered satisfied. All information to realise construction, hardware- and software-controls is gathered. The physical realisation process of the system may be finalised. Based on the completion process of the Axiomatic Design matrix, the next Index-level is defined as
Level 0; Completed SADT and parameters in matrix, all levels uncoupled or decoupled. Systems & sub-systems have been realised.
3.3 ASCERTAIN MATRIX ELEMENTS BY TESTING At this point, the index-process has not yet been
completed. The reason for this is that certainty of all elements of the design matrices being found cannot be guaranteed. Forgotten elements of the matrix could show up during late engineering work or even in the field when the product has been released. This effect could occur due to the fact that properties, which always stayed within a narrow margin, start altering due to unforeseen changes in construction, materials or structure. Though this effect cannot be excluded completely, the risk of similar occurrences can be minimised by applying testing over the full specified operating conditions. Therefore, the index-method is elongated with a practice tests in a realistic environment, with realistic parts and tools up to the level of factory- and site-acceptance-testing (FAT & SAT).
Level 1; Sub-system testing has been completed successfully;
Level 2; Full system test, successful FAT & SAT (Relation FR→DP→PV at all hierarchical levels).
3.4 ACCEPTANCE TESTING The last step is optional for RMSs, but completes the
index-method up the level of customer satisfaction. Once the production is running well, PVs, FRs & DPs are satisfied but it does not automatically mean that the end-customer is satisfied too. A satisfied customer does not only find the FRs within specs but also the ‘customer attributes’ (CA, the specific expectance towards the product by the customer). This step may be considered as the ultimate level of verification. It is optional for the development of RMSs, since production engineers usually get the functional specifications as a starting point. However, it completes the index-method to enable verification for product designers and marketeers as well.
Level 3; Customer satisfaction: customer perception matrix was successfully verified (Relation CA→FR).
3.5 OVERVIEW OF THE INDEPENDENCE INDEX- METHOD FOR RMS The development of RMSs, and specifically new
production modules to be used for RMSs, has been categorised in a number of seven stages as shown in Figure 5. The development progress is monitored from left to right.
Each completed level is a milestone in the configuration process. This does not mean that completion of a level is a binding condition to start working on successive stages. However, the true level of development, e.g. as reported to the management, does never exceed the last completed stage.
Figure 5: Development of an RMS in seven steps from the embryonic stage to a complete and independent design. Levels are analogue to the progress of the axiomatic independence of the product- and production-design.

- 191 -
4 CASE STUDY; ASSEMBLY OF INKJET PRINT HEADS
4.1 DEFINITION OF THE PRODUCT The applied case concerns the manufacturing of an inkjet
print head for industrial applications. The total manufacturing process consists of over twenty fabrication steps, most of them performed within a modular manufacturing framework. The manufacturing step, which was selected for the analysis of the index-method, required the development of new process technology. This process concerned the bonding of a thin plastic foil onto an injection moulded base assembly of the print head, consisting of several parts. The print head is shown in Figure 6.
The equipment integrator had the availability of a state of the art equipment framework, consisting of a cell concept with a library of functional process modules, applied and tested in the past. Bonding thin foils under these circumstances, however, was considered a new process that required a new gripping device and a new process module.
Figure 6: The print head has been pre-assembled from a number of parts. The foil is to be bonded to the lateral
side of the channelled structure.
The required assembly process, at the start of the configuration, was tested up to some extent. The process had been performed, using manually operated assembly tools, which required a high level of craftsmanship. So far, the quality of the adhesive bonds had been of moderate quality.
The status at start of the process development: a) all FRs of the print head had been defined in detail; b) DPs had been determined, but up to less extent and may not be complete; c) PVs had not been defined at all.
4.2 APPLICATION OF THE INDEX-METHOD TO INKJET
ASSEMBLY The development of a new process-module and the
integration process into the reconfigurable manufacturing framework is described and visualised from stage to stage in Figure 7. Since manually operated tools only had provided moderate product quality, an overhaul of the assembly process was inventoried at the earliest design stage. A number of shortcomings were found in the manually operated tools during initial analysis. To correct for the imperfections, the mechanism for alignment, mating and clamping the part needed considerable change, which in its turn introduced extra risks in the development. A test setup for the modified process was realised to address the risks, again manually operated but with a totally new assembly core. This setup was tested to assure full decoupling. Next, the assembly core was copied into the newly designed process module and verified
for operation at the successive hierarchical levels. Step to step details are found in Figure 7.
5 DISCUSSION
The index-process to monitor configuration of an RMS for an inkjet assembly problem was considered successful. The question arises what would have been the result if indexing had not been applied. Processes for industrialisation of miniaturised hybrid systems are diverse and involve large investments. This makes an objective reference measurement expensive and heterogeneous.
5.1 SATISFYING THE INDEPENDENCE AXIOM What can be concluded is that well-configured RMSs
fully satisfy the Independence Axiom and that the process of configuration benefits from a well-structured approach towards this state. The index-method as described in this paper maximises the chances of successfully meeting the Independence Axiom for the following reasons:
At first, it maximises the chances of missing matrix elements being found, satisfying the Independence Axiom and the process of decoupling have been described extensively in literature. However, guarantee of having found all matrix elements is still a significant problem in industrial practice. Note that missing matrix elements are destructive to the decoupling process. Pulling the decoupling process forward towards the project start, by applying SADT, helps finding many parameters that can be transferred to the design matrices, but is no total guarantee that all matrix elements are actually found. Elongating the decoupling process backwards, by scanning operating windows and endurance testing, increases chances of missing matrix elements being found substantially. The combination of SADT and testing is in every way the most optimal situation.
Figure 8: Development of RMSs in six steps from the embryonic stage to a complete and independent design.
Progress again monitored from left to right.

- 192 -
Figure 7: Configuration Process of a Manufacturing Solution for Bonding Thin Foils in Inkjet Systems.

- 193 -
Maximising the chances of finding all matrix elements is a typical strength for the V-model, because it structurally connects the design process with testing of the final design solution. Figure 8 shows the match between the index-method and the V-model. Where the V-model describes the actions that need to be taken, the index-method describes the condition that should be met before a certain level may be considered complete.
Secondly, the axiomatic design technique introduces a zigzagging motion that compensates for a significant weakness of as well the V-model as SADT. These methodologies tend to struggle with changing specifications. This is also the case if changes need to be made in the product specifications, during the development of processes; this is a recurrent problem for RMSs when the product design needs to be changed in order to reduce complexity of manufacturing equipment. Zigzagging starts at the highest hierarchical level and goes down through the lower levels till realisation starts. In the second half of the V-model, zigzagging is performed again, but in opposite direction, going back up to the highest system level again (Figure 9).
Thirdly, the index-method is fairly simple to implement and connects to the existing level of industrial knowledge. It increases awareness in finding matrix elements and the
decoupling process. Together with the V-model it not only monitors the progress of development, but it also defines the next actions to take. The designers have a paved path to follow.
The combination of these three effects will lead to a well-structured and thorough analysis of product and production means to satisfy the Independence Axiom. This in its turn will lead to a better system architecture of as well product and production means at a more competitive cost.
Level 0 indicates the moment where investments in equipment start to increase rapidly. In practice, flexibility decreases at the same pace as investments go up. Negative indices clearly indicate that decomposition has not been completed yet, positive indices indicate that hard- and software have been realised but that testing is still in progress. As such, estimation can be made of the (financial) impact of considered changes and how to reduce them to managerial and technological consequences.
In general management, the V-model is usually well understood. Axiomatic design and the axiomatic index-levels, as defined here, are practical tools for design- and system-engineers. The model has the ability to connect the managerial framework of thinking to the world of engineers, leading to better understanding of both parties in the organisation.
Figure 9A: Zigzagging motion within the hierarchical descent of the V-model to recursively connect domains.
Figure 9B: During testing the zigzagging direction is reversed and hierarchically moving up again.
6 CONCLUSION
The index-method to monitor the progress in satisfaction of the Independence Axiom has the ability to structure the configuration process of RMSs. The method combines well with the industry known V-Model and closes the gap to the operational management. The method was successfully applied to monitor and optimise an industrial case. In this paper, the investigations were focussing on RMSs, but the method may be applicable in a broader range of situations where monitoring development progress is needed.
7 FUTURE WORK
The index-method, as described here, was developed for-and applied to RMSs. The method is expected to have broader potential. Investigations should be carried out to determine the value for other domains. Possibly the model needs optimisations for these applications.
The index-method focuses solely on the Independence Axiom. A method for indexing the information axiom could increase the understanding of product and process maturity in a broader sense.
Requirements Def
Outline Design
Detailed Design
Realisation
Acceptance Test
System Test
Integration Test
Realisation
A
B
Requirem. Definition
OutlineDesign
DetailedDesign
Realisation
Integration Testing
SystemTesting
Acceptance Testing
Requirem. Definition
OutlineDesign
DetailedDesign
Realisation
Integration Testing
SystemTesting
Acceptance Testing
PV
A1
A1.2
A1.1 A1.2 A1.3
A1.2.1
A1.2.2
A1.2.3
A1
DP
A1
A1.2
A1.1 A1.2 A1.3
A1.2.1
A1.2.2
A1.2.3
A1
FR
A1
A1.2
A1.1 A1.2 A1.3
A1.2.1
A1.2.2
A1.2.3
A1
PV
A1
A1.2
A1.1 A1.2 A1.3
A1.2.1
A1.2.2
A1.2.3
A1
DP
A1
A1.2
A1.1 A1.2 A1.3
A1.2.1
A1.2.2
A1.2.3
A1
FR
A1
A1.2
A1.1 A1.2 A1.3
A1.2.1
A1.2.2
A1.2.3
A1

- 194 -
8 ACKNOWLEDGEMENTS
This research was funded by the company MA3-Solutions, TNO Science & Industry and the HU University of Applied Sciences in the Netherlands.
9 REFERENCES
[1] Akao Y., Quality Function Deployment: Integrating Customer Requirements Into Product, 2004. ISBN: 978- 1563273131
[2] Bate R., Kuhn D., Wells C., Armitage J., and Clark G., A Systems Engineering Capability Maturity Model, Version 1.1, Nov. 1995.
[3] Brands D., Beter op weg naar BEST; Allocatie van Besturingsstructuur van Zelfsturende productie-eenheden, Technical University Eindhoven, case Philips Lighting Weert, Feb 2000.
[4] Bullema J. E., Stollman G., Nederland B., and Bekkers P., Default Design for Processability aanpak, Philips Centre of Fabrication Technology, 1998.
[5] Buseif L., Using IDEF0/SADT Model for Design Flexible Manufacturing Systems (FMS's) Prototype, knu.edu.tw, Jan. 2006.
[6] Christie J., The Seductive and Dangerous V-Model, Testing Experience, Dec. 2008.
[7] Dooley K., Subra A., and Anderson J., Maturity and its impact on new product development project performance, Research in Engineering Design, vol. 13, no. 1, pp. 23–29, Aug. 2001.
[8] Fraser P. and Gregory M., A maturity grid approach to the assessment of product development collaborations, May 2002.
[9] Friedrich J., Hammerschall U., Kuhrmann M., and Sihling M., Das V-Modell® XT, Springer, 2009.
[10] Gunasekaran A., Agile manufacturing, Elsevier Science, 2001. ISBN 978-0080435671
[11] Hassan A., Siadat A., Dantan J.Y., and Martin P., Conceptual process planning – an improvement approach using QFD, FMEA, and ABC methods, Robotics and Computer-Integrated Manufacturing, vol. 26, no. 4, pp. 392–401, Aug. 2010.
[12] Kim S. J., Suh N.P., and Kim S.G., Design of software system based on axiomatic design, CIRP Annals - Manufacturing Technology, 1991.
[13] Koren Y., Heisel U., Jovane F., Moriwaki T., Pritschow G., Ulsoy G., and Van Brussel H., Reconfigurable Manufacturing Systems, CIRP Annals - Manufacturing Technology, vol. 48, no. 2, pp. 527–540, Jan. 1999.
[14] Koren Y., General RMS Characteristics; Comparison with Dedicated and Flexible Systems, no. 3. Berlin, Heidelberg: Springer Berlin Heidelberg, 2006, pp. 27–45.
[15] Moergestel L. van, Puik E., and Telgen D., Decentralized autonomous-agent-based infrastructure for agile multipa-rallel manufacturing, International Symposium on Autonomous Decentralized Systems (ISADS), 2011.
[16] Puik E.C.N., van Moergestel L., Agile Multi-Parallel Micro Manufacturing using a Grid of Equiplets, IPAS2010, Berlin, Heidelberg, 2010, vol. 315, no. 32, pp. 271–282.
[17] Puik E.C.N., van Moergestel L., Telgen, D., Ceglarek D., Structured Analysis of Reconfigurable Manufacturing Systems, International Conference on Flexible Automation & Intelligent Manufacturing FAIM2013, Porto, 2013.
[18] Ren Y.T. and Yeo K.T., 2004 IEEE International Engineering Management Conference (IEEE Cat. No.04CH37574), presented at the 2004 IEEE International Engineering Management Conference, 2004, vol. 2.
[19] Ross D.T., Structured Analysis (SA): A Language for Communicating Ideas, Software Engineering, IEEE Transactions on, no. 1, pp. 16–34, 1977.
[20] Royce W.W., Managing the development of large software systems, IEEE WESCON, 1970.
[21] Shah L., Siadat A., Maturity assessment in risk management in manufacturing engineering, presented at the Systems Conference, 2009 3rd Annual IEEE, 2009, pp. 296–301. ISBN 978-0195178760
[22] Suh N.P., The principles of design, Oxford University Press, USA, 1990. ISBN 978-0195043457
[23] Suh N.P., A Theory of Complexity, Periodicity and the Design Axioms, Research in Engineering Design, vol. 11, no. 2, pp. 116–132, Aug. 1999.
[24] Suh N.P., Axiomatic design of software systems, CIRP Annals - Manufacturing Technology, 2000.
[25] Team C., Capability Maturity Model® Integration (CMMI SM), Version 1.1, Software Engineering Institute, 2002.
[26] Tekcan T. and Kirisken B., Maturity scoring method for consumer electronics products, Environment and Electrical Engineering (EEEIC), 2010 9th International Conference on, 2010, pp. 400–403.
[27] Triki A.H., Hachicha W., and Masmoudi F., A conceptual design framework of production line systems based on axiomatic design: case of assemble line, 4ième Congrès International Conception et Modélisation des Systèmes Mécaniques CMSM, 2011.
[28] Werdich M., FMEA – Einführung und Moderation, no. 8. Wiesbaden: Vieweg + Teubner, 2011, pp. 123–174.

Proceedings of ICAD2013 The Seventh International Conference on Axiomatic Design
Worcester – June 27-28, 2013
ICAD-2013-28
- 195 -
ABSTRACT
Today, software engineering is a well-defined structured discipline. Many new software engineers enter the workforce with a fundamental understanding of a software development life cycle. Unfortunately, new software engineers lack the necessary design techniques to move from requirements through the design phase. The idea of applying Axiomatic Design to software development was first proposed over two decades ago, yet is scarcely used today. Axiomatic Design provides a systematic approach to software design that programs of any size can use. This paper reviews several powerful attributes of Axiomatic Design for software engineering and evaluates the application of the embedded software engineering technique: sequence enumeration. In the case study, we show how to use both concepts seamlessly to yield a proper design for embedded systems.
Keywords: software engineering, Axiomatic Design, sequence enumeration.
1 INTRODUCTION
Traditionally, software programming was thought of as more art than science. Software engineering has evolved over the last forty years from simply programming or coding into the well-defined discipline that it is today. Through this evolution, software engineering has had countless software process models and various methodologies applied to it. These numerous process models were created to address the complexities associated with the software development life cycle. Each process model has advantages and disadvantages [Munassar and Govardhan, 2010]; however, all share one major disadvantage: They neglect the design phase. They also tend to over complicate the fundamental engineering process.
Axiomatic Design (AD) provides a basic established set of activities necessary for engineering design. Though it has been in use since the mid-nineties in other disciplines it hasn’t garnered the similar attention from software engineering. Axiomatic Design facilitates the generation of only some the necessary software engineering artifacts for interphase transitions. Sequence enumeration can help fill in the artifact gap while providing a simple method for doing so.
Sequence enumeration is typically an embedded software engineering technique that provides the engineer with a formalized method for analyzing a system. It further aids the creation of a requirements specification that is in turn used to
implement system state machine. Sequence enumeration is at the heart of creating a sequence-based software specification [Prowell, 1996]. Oshana [2006], used sequence enumeration as a method for developing use-case-based requirements specifications. This provides the embedded software engineer a valuable tool for creating correct end-to-end traceability in his or her designs.
2 BACKGROUND
2.1 RELATED WORK Based on the work of Kim et al. [1991a; 1991b], Do and
Suh extended the application of Axiomatic Design to software development to include object-oriented programming. Suh and Do illustrated the benefits of combining AD and object-oriented programming [Do and Suh, 2000; Do and Suh, 1999; Suh and Do, 2000]. These benefits include the ability to identify modules affected by a requirement change and a way to ensure low coupling through functional independence. AD also suggests the use of a design matrix to order the development tasks. For better understanding, consider Equation 1 [Suh, 2005].
(1)
The above relationship can be expanded to show the effect of the Independence Axiom on a design. For example, Figure 2 contains a functionally dependent (or coupled) design where more than one design parameter satisfies more than one functional requirement.
Figure 1. Coupled design (left) and decoupled design (right).
Additionally, the second part of Figure 1 represents a functionally decoupled (independent) design where the DPs and FRs have been rearranged into a lower-triangular matrix. This will provide the design enough functional independence by reducing the complexity (ergo coupling). The decoupled matrix also illustrates an order of task execution starting from the left side and moving to the right. This arrangement identifies the DPs with the most functional interdependence and these should be implemented first.
{FR} [A]*{DP}
FR1
FR2
FR3
X X 00 X XX X X
DP1
DP2
DP3
FR1
FR2
FR3
X 0 0X X 0X X X
DP1
DP2
DP3
THE APPLICATION OF SEQUENCE ENUMERATION TO THE AXIOMATIC DESIGN PROCESS
Brandon Woolley [email protected]
Department of Mechanical Engineering
Texas Tech University 7th and Boston
Lubbock, TX 79409, USA
Zhen Li [email protected]
Department of Mechanical Engineering
Texas Tech University 7th and Boston
Lubbock, TX 79409, USA
Derrick Tate [email protected]
Department of Mechanical Engineering
Texas Tech University 7th and Boston
Lubbock, TX 79409, USA

- 196 -
Pimentel and Stadzisz [2006] integrated AD with the unified software development process and utilized use cases to support functional decomposition. Moreover, they linked the need of a use-case-driven design to AD and functional requirement decomposition.
Schreyer and Tseng [2000], analyzed the application of Axiomatic Design to the design of PLC software. In their paper, Schreyer and Tseng illustrated the usefulness of state charts to support the decomposition and zigzagging of FRs and DPs. The key take-away was the application of state diagrams and sequence evaluation methods to the Axiomatic Design process.
Do [2004], pointed out that most software processes have difficulty dealing with changing requirements. As a result, most Unified Modeling Language (UML) tools intended to manage requirements are often used for tracking and reporting functions. This renders the tools irrelevant. Do goes on to demonstrate how the Axiomatic Design approach could benefit software product management.
2.2 SEQUENCE ENUMERATION Sequence enumeration is an embedded software
engineering technique used to expose buried requirements and for producing thorough specifications. The process ensures correct, complete, and traceable requirement specifications as well as a source for decisions. Oshana [2000], explained how this approach considered unforeseen permutations of stimuli to bring out ambiguities and omissions in the requirements. Prowell et al., [1999], provided an orderly step-by-step process for defining system behavior and Oshana [2012], extended this into a systematic specification development method:
1. Establish the system boundary 2. Define the interfaces 3. Itemize the stimuli and the responses 4. Perform sequence enumeration 5. Identify the canonical sequence 6. Generate the state machine specification 7. Convert the state machine to code
Sequence enumeration is broadly applicable to many different types of systems. For example, it can be used to quickly model the behavior of a soda machine or to model the interfaces of a weapons system. The best way to express the usefulness of the sequence enumeration process is by example (see the next section).
3 CASE STUDY - SIMPLE WATCH EXAMPLE
Axiomatic Design has been used to augment the software engineering process to aid the design phase. Sequence enumeration can add more detail and fidelity in generating requirements as well as modelling initial system behavior. To illustrate the effectiveness of combining axiomatic design and sequence enumeration, a simple digital watch example is explored.
3.1 APPLYING AXIOMATIC DESIGN The watch should display the time. A tick event should
occur every second. And the time should be updated and output to display. In this paper, we concentrated on the watch’s internal mechanism – tick and update. Therefore, two top FRs were:
FR1: Tick FR2: Update watch
For a watch, buttons are often reused to perform multiple functions that are more practical for small devices such as a watch in our case. DP2 reflects this intuition. Equation 2 is the matrix for the top-level design.
DP1: Tick Event DP2: Button sequential operations
12
00
12
(2)
Further decomposing FR2, we discovered several sub-
FRs. And these FRs should be met with two buttons (Button A & Button B). The question is: how can we determine a sequence of buttons to satisfy five FRs? We rely on sequence enumeration to explore appropriate DPs.
FR2.1: Mode Change FR2.2: Mode Change (hour) FR2.3: Minute Set FR2.4: Hour Set FR2.5: Mode Update (normal)
3.2 APPLYING SEQUENCE ENUMERATION In general, the fundamental progression for sequence
enumeration is: Start with the smallest length stimulus sequences and
define the appropriate response Record derived requirements as necessary Extend sequences that are not illegal or have
equivalencies Continue until all sequences are either illegal or
equivalent to previous sequences Identify the canonical sequences
Table 1. Simple watch requirements.
Req. # Requirement1 The watch displays the time and a tick event
occurs every second; the time is updated and output to display
2 The watch has two external buttons A & B.Whenever ‘A’ is pressed in normal mode, the watch enters set mode, with minute update mode first
3 Each depression of ‘B’ causes the minutes field to update by 1(mod 60)
4 Pressing the ‘A’ button again will cause the watch to enter the hour update mode
5 Each successive depression of the ‘B’ button will increment the hour field by 1(mod 12)
6 Pressing ‘A’ again causes the watch to return to normal mode (displaying current time)
First, the requirements and DPs (buttons) are gathered in Table 1 using natural language in the voice of the customer.

- 197 -
With these requirements a system boundary definition with interfaces can be crafted. First, defining the system boundary allows for the identification of external interfaces. Generically speaking, the interfaces are the system’s inputs and outputs. Once the interfaces are defined, the external stimuli and their corresponding responses can be drawn.
Figure 2. Simple watch system boundary.
Next, an itemized set of stimuli and responses (Table 2 and 3) can be created recording their requirements trace. Note the abstractions used are meant to obscure well-understood and previously recorded details. These abstractions are necessary for the management of the enumeration process.
Table 2. Itemized stimuli.
Stimuli Description Trace
Tick Event Occurs every second 1A-Button Used to select time field to
increment 2, 4, 6
B-Button Used to increment the minute and hour fields
3, 5
Table 3. Itemized response.
Response Description Trace
Time Update Updates the time accordingly 1Mode
Change Cycles between minute, hour, and
normal mode 2, 4, 6
Minute Set Sets the minute field 3
Hour Set Sets the hour field 5
There are two supplementary responses not identified in
the system boundary nor the preceding itemizations: NULL Response – occurs when there is no external
response for the given stimuli Illegal Response – is an impossible sequence A stimulus can be illegal by definition or by design. An
illegal by definition is one where it is impossible for the system to encounter it or for the system to generate it. An illegal by design is one that the system is designed explicitly to prevent. Moreover, a sequence can be 'equivalent' to another sequence if they share the responses to the same future stimuli. It is 'reduced' if it has been declared equivalent to a previous sequence. Finally, it is 'canonical' if it is legal and unreduced when the enumeration process is complete. The sequence enumeration process produces:
Table 4. Sequence enumeration.
Seq. # Stimuli Response Equivalence Req. 0 Empty NULL D11 T Time Update 1
A Mode Change 2B NULL Empty D2
2 TT Time Update T 1TA Mode Change A 2TB NULL B D2AT NULL A D3AA Mode Change
(hour) 4
AB Minute Set 33 AAT NULL AA D3
AAA NULL Empty D3AAB Hour Set 5ABT NULL AB D3ABA Mode Change
(hour) AA 4
ABB Minute Set AB 34 AABT NULL AAB D3
AABA Mode Update (normal)
Empty 6
AABB Hour Set AAB 5
To reiterate, one of the most important aspects of sequence enumeration is that it can uncover unforeseen sequence permutations. These unforeseen permutations often become derived requirements. By definition, a derived requirement is one that is not defined by the customer but is generally uncovered by the design process. During the enumeration process it is normal to create, record, and include derived requirements like D1, D2, and D3. These newly added requirements become a part of the enumeration process and are evaluated accordingly. Notice that this simple system has equivalences at sequences of length 4 and the enumeration process is concluded. Each sequence has been mapped to a response providing a complete and consistent scenario of use. Enumeration exposes all possible, impossible, intended, and unintended uses of the system. A sequence of use characterizes a use case scenario.
The next step is canonical sequence analysis. This step is used to extract the sequences without equivalences, thereby constructing the canonical sequences depicted in Table 5:
Table 5. Canonical sequence.
Seq. # Stimuli Response Equivalence Req. 0 Empty NULL D11 T Time Update 1
A Mode Change 22 AA Mode Change
(hour) 4
AB Minute Set 33 AAB Hour Set 54 AABA Mode Update
(normal) 6

- 198 -
The canonical sequence table represents the legal and unique sequences for system usage. The analysis also reveals state data to be used to capture and preserve components of stimulus history to produce the correct system response. From the canonical sequence a state data table (Table 6) can be extracted. Also, we can use information from Table 5 to derive our DPs to meet sub-FRs derived from FR2. DP2.1: A DP2.2: A → A DP2.3: A → B DP2.4: A → A → B DP2.5: A → A → B → A
The design matrix for FR2 can be re-written in the form of Equation 3. The matrix indicates that the design we obtained is a decoupled design. However, it’s not likely to obtain an uncoupled form since the number of buttons is fewer than the number of FRs.
2.12.22.32.42.5
0 0 0 00 0 0
0 0 00 0
2.12.22.32.42.5
(3)
Table 6. State data creation.
Sequence State Variable
Before Stimulus
AfterStimulus
Empty N/A T; a tick event has
occurred
MODE TIME
NORMAL CUR_TIME
NORMALCUR_TIME+1
s A; the user has
pressed the A-button
MODE TIME
NORMAL CUR_TIME
SET_MINCUR_TIME
AA; user pressed the
A-button twice
MODE TIME
SET_MIN CUR_TIME
SET_HOURCUR_TIME
AB; user pressed the
A then B-button
MODE TIME
SET_MIN CUR_TIME
SET_MINCUR_TIME+1
m
AAB; user pressed the
A-button twice followed by the B-button
MODE TIME
SET_HOUR CUR_TIME
SET_HOURCUR_TIME+1
h
The newly created variables represent state data for the
system. These state variables can then be recast into a state-based specification using natural language. Generation of the following state transition diagram in Figure 5 is the last artifact necessary before implementation.
Figure 3. Simple watch state transition diagram.
It should also be noted that the sequence enumeration process calls for the conversion of the state transition diagram to source code. A step that can use the information in Table 6 can be automated.
As indicated by Oshana [2006], sequence enumeration provides complete, consistent, traceable, verifiably correct specifications. For example, each element of the state-based specification can be compared to the sequence-based specification to confirm that correctness is preserved.
4 DISCUSSION
Axiomatic Design and sequence enumeration are employed to deal with complexity within their respective disciplines. Sequence enumeration and Axiomatic Design have a set of complementary design activities. AD is used at a higher level while sequence enumeration is generally employed at a lower level. The deployment of sequence enumeration helps explore proper DPs at low-level design without sacrificing exhaustiveness of all logical sequences. The design matrix derived from sequence enumeration can be used for determining if the Independence Axiom is satisfied or not. The integration of two theories makes it possible to yield a design with the low complexity (avoid coupled design) and high completeness (ensured by sequence enumeration).
There have been other approaches to enhance Axiomatic Design for software. Do’s early work [Do and Suh, 1999] highlighted the application of AD to OOP to ensure a higher degree of functional independence while Schreyer and Tseng [2000], applied state charts to support decomposition, and Pimentel and Stadzisz [2006], employed use case based OO software design.
The sequence enumeration process has many practical advantages for software engineering. The process provides various artifacts for specifications and provides a systematic method for development. Combining both AD and sequence enumeration has the potential to enhance the software design phase by adding greater detail and fidelity. Furthermore, sequence enumeration aids the generation of a system model that early AD phases will benefit from. The advantages of sequence enumeration emphasized by Oshana, in [2000] are:

- 199 -
The ability to model system functionality early Provide the customer operational system
understanding A conduit to analyse and improve functional
requirements The lower level applicability of sequence enumeration
can augment the AD process to provide some measure of checks and balances. Further investigation will be needed in order to develop a more formalized model or framework of integration.
5 REFERENCES
[1] Do, S.-H., "Software product lifecycle management using axiomatic approach". The 3rd International Conference on Axiomatic Design, 2004.
[2] Do, S.-H. and Suh, N. P., "Systematic OO programming with axiomatic design." Computer, Vol. 32, No. 10, pp.121-124, 1999.
[3] Do, S.-H. and Suh, N. P., "Object-oriented software design with axiomatic design". Proceedings of the 1st International Conference on Axiomatic Design, Cambridge, MA, 2000.
[4] Kim, S.-J., Suh, N. and Kim, S.-G., "Design of software system based on axiomatic design." CIRP Annals-Manufacturing Technology, Vol. 40, No. 1, pp.165-170, 1991.
[5] Kim, S.-J., Suh, N. P. and Kim, S.-G., "Design of software systems based on axiomatic design." Robotics and Computer-Integrated Manufacturing, Vol. 8, No. 4, pp.243-255, 1991.
[6] Munassar, N. M. A. and Govardhan, A., "A Comparison Between Five Models Of Software Engineering." IJCSI
International Journal of Computer Science Issues, Vol. 7, No. 5, pp.94-101, 2010.
[7] Oshana, R., "Sequence Enumeration." from http://www.embedded.com/design/debug-and-optimization/4403169/Sequence-Enumeration, 2000.
[8] Oshana, R., DSP software development techniques for embedded and real-time systems, Newnes, 2006.
[9] Oshana, R., DSP for Embedded and Real-time Systems, Newnes, 2012.
[10] Pimentel, A. R. and Stadzisz, P. C., "A use case based object-oriented software design approach using the axiomatic design theory". The 4th International Conference on Axiomatic Design, 2006.
[11] Prowell, S. J., "Sequence-based software specification", University of Tennessee, Knoxville, 1996.
[12] Prowell, S. J., Trammell, C. J., Linger, R. C. and Poore, J. H., Cleanroom software engineering: technology and process, Addison-Wesley Professional, 1999.
[13] Schreyer, M. and Tseng, M., "Hierarchical State Decomposition for Design of PLC Software by applying Axiomatic Design". Proceedings of the 1st International Conference on Axiomatic Design, Cambridge, MA, 2000.
[14] Suh, N. P., Complexity: Theory and Applications, Oxford University Press on Demand, 2005.
[15] Suh, N. P. and Do, S.-H., "Axiomatic design of software systems." CIRP Annals-Manufacturing Technology, Vol. 49, No. 1, pp.95-100, 2000.

Proceedings of ICAD2013 The Seventh International Conference on Axiomatic Design
Worcester – June 27-28, 2013
ICAD-2013-29
- 200 -
ABSTRACT
Companies should design unique production systems according to each company’s overall strategy. The production system is the set of methods that transform resources into finished goods and services. To be competitive and profitable, these resources should be appropriately managed. While what is appropriate depends on the company, every organization should be dynamic and adapt to changing market conditions. It is not sufficient to improvise, so it is necessary to structure companies considering all the variables and scenarios. This should guarantee that all the different contexts and situations have been accommodated in the best way. This paper focuses on Axiomatic Design of production systems.
Adding global operations optimization to a global manufacturing strategy can provide cost-reduction opportunities and process efficiency. In particular, the paper focuses on building and sustaining the organization and capabilities of the supply chain. At the same time, the paper compares different operational excellence models to balance efforts and advantages. Design for operational excellence means creating a strategic operating model.
Keywords: Axiomatic Design, production system design, decomposition, design for operational excellence
1 INTRODUCTION
Advancement can be difficult in a market, similar to that which is being experienced currently, that many find to be competitive and complex. Companies that wish to advance can restructure. To be successful, the restructuring can be designed using new solutions that are more scientific and, at the same time, more flexible. Today the “Blue Oceans” are even smaller, the variability in raw material and shipping costs are more unpredictable, and the markets are crazier and more subject to the difficulties of economic crises [Chan Kim and Mauborgne 2005]. Therefore, companies should design a production system, according to the particular company’s strategy. It is might not be sufficient to improvise. It might be better to take into consideration all the relevant variables and scenarios and to radically restructure companies. One important objective of restructuring is to assure that all the different contexts and situations will be accommodated in the best way for an individual company.
In this paper Axiomatic Design (AD) is used as the tool to design production systems that reach this objective. Axiomatic Design provides a framework in which the design process can be managed [Brown, 2011]. In particular, it provides criteria for distinguishing bad designs from good ones [Suh, 1990]. The systematic bi-dimensional decomposition used in Axiomatic Design facilitates the inclusion of all the relevant variables and scenarios, as well as contexts and situations. The first dimension of the decomposition into functional, physical, and process domains provides a clear categorization of functional requirements (FRs), design parameters (DPs), and process variables (PVs). These represent the domain where the concepts “WHAT we want to achieve” and “HOW we want to achieve it” lie (see Figure 1).
Figure 1. Meaning of the different variables related to the
domains.
The second dimension of the decomposition is hierarchical within the domains. This analysis can be done according to equivalence relations, based on partitioning [Brualdi, 1999]. The objective is to achieve a collectively exhaustive and mutually exclusive collection of the functions [Rasiel, 1999; Brown 2011] to address the relevant business situations. Axiomatic Design supplies companies with a disciplined design process [Nordlund et al., 1996]. In particular, the AD process drives the decomposition between domains and “qualitatively” defines the project structure. It provides the basis for the selection of the key physical variables (DPs) that characterize the design that satisfies the FRs. The selection of the DPs is tested against the axioms.
Axiomatic Design also provides the basis for generating the systems architecture for complex machines and systems: Axiomatic Design Systems Architecture (ADSA). The process of matching variables in one domain (e.g., FRs) with other
AXIOMATIC DESIGN OF PRODUCTION SYSTEMS FOR OPERATIONAL EXCELLENCE
Gabriele Arcidiacono [email protected]
Dipartim. per le Tecnologie e i Processi di Innovazione Università degli Studi Guglielmo Marconi
Via Plinio, 44 - 00193 Roma ITALY
Christopher A. Brown [email protected]
Department of Mechanical Engineering Worcester Polytechnic Institute Worcester, Massachusetts 01609
USA
FRs
PVs
DPs
WHAT we want to achieve
HOW to achieve it
HOW to produce it

- 201 -
variables in another domain (e.g., DPs) is called mapping: to go from WHAT to HOW [Cochran et al., 2000].Compared to TRIZ [Altshuller, 1988], which is adept at suggesting physical solutions to design problems, Axiomatic Design has the advantage of illuminating and avoiding potential problems in the conceptual stages of design [Kim and Cochran, 2000].
2 PRODUCTION SYSTEM DESIGN: THEORY
A system produces an output by acting on and transforming its inputs. The output is influenced by noise factors, which are generated from interactions. AD provides for control of interactions and noise factors.
The production system is the set of methods used in industry and the related processes that transform resources into finished goods and services. The resources are generally labor, capital, and land, but generally are called also the “six M’s”: men, machines, methods, materials, money, and mother-nature.
Why should you project your own production system according to company strategy? To be competitive and to generate profits, these resources should be appropriately managed [Kalpakjian, 1995]. What is appropriate depends on the situation. Every organization should be dynamic and adapt to changing market conditions. In addition the capital investment should be linked to focus on areas in alignment with the strategy.
The most common method used to develop company strategy is a Balanced Scorecard or BSC [Kaplan and Norton, 2001], which uses an excellent performance measurement dashboard to give managers and executives a more “balanced” view of organizational performance. It is based on four perspectives:
1. Economic-Financial perspective 2. Customer-Market perspective 3. Processes perspective 4. Learning & Innovation perspective The courses of action selected by the company should be
structured so that they can be overseen from these four perspectives. This oversight would verify their efficiency in the chosen market segment. It would also establish the role by which companies are ordinarily classified. This classification is based on:
1. Product 2. Product plus (the best product compared to the
competition, e.g., extra comfort in an airline) 3. Price 4. Customization The first step is to choose the placement in the market,
i.e., the first of the four categories mentioned above, and to project the subsequent business model. At the same time, it is also necessary to design an appropriate production system to optimize the processes. The objective of this design is to improve process efficiency and to introduce new products/services or new technologies. The Production System basically consists of four general types:
1. The project (one-shot) system-for a one-off product, such as a made-to-order ship, or a prototype.
2. The batch system–variable lot sizes, depending on the kind of process/product.
3. The continuous system (assembly line) - common in mass production.
4. Any mix of the above systems. The production system is characterized by physical flows
of materials and by flow of information in the process, depending on the previous typology of the system.
3 PRODUCTION SYSTEM DESIGN AND AXIOMATIC DESIGN: DESIGN FOR OPERATIONAL EXCELLENCE
This paper focuses on production system design, using AD in order to decompose what we want to achieve (functional requirements) and how to achieve it (design parameters). Adding a global operations optimization to a global manufacturing strategy can provide cost-reduction opportunities and make processes more efficient. In particular, focusing on building and sustaining organization and capabilities of the supply chain, it is useful to compare different operational excellence models in order to balance efforts and advantages. Design for operational excellence means creating a strategic operating model.
The top managers (called also Chief or C-Levels) have to be focused on assessing and developing a customized global production system. CEOs of some major companies that have developed customized, global production systems have been studied in order to define the business macro aims (FRs), within the functional domain. Typical BSC perspectives are used to suggest a theme for the decomposition (see Figure 3 and Figure 4):
FR1= Establish shareholders’ value
(Economic-Financial perspective) FR2= Provide competitiveness in the Market
(Customer-Market perspective) FR3= Improve process efficiency (Processes perspective) FR4= Provide innovations
(Learning & Innovation perspective) To satisfy these FRs, the following DPs have been
suggested by the CEOs:
DP1= Sector selection and the placement of the company (Economic-Financial perspective)
DP2= Business Model Design (Customer-Market perspective)
DP3= Production System Design (Processes perspective) DP4= New products/services or new technologies
Innovation System (Learning & Innovation perspective)
The highest level Design Matrix (DMX) is shown in
Figure 2. The interactions have been determined by the CEOs.

- 202 -
Figure 2. Design matrix DMX.
The DMX demonstrates that the project is decoupled, considering A12, A13, A23 (whose correlation value has been indicated with a dot, “.”) and negligible with respect to the others values “x” as well as “X”. In other words, it is possible to consider a dot as being equal to“0”. Axiom 1 can also be satisfied by a decoupled design, taking into account the order in which the DPs must be adjusted (the proper sequence). It is worth noting that, for a full triangular matrix, there is only one order in which the DPs can be adjusted to satisfy the FRs without iterating. In practice, when designing from scratch, it is best to find an uncoupled design. If this is impossible, a decoupled design is acceptable. Under some circumstances, however, it might be necessary to deal with designs that are coupled. Even in these cases, it is important to realize that Axiom 1 can still provide guidance. Beyond the three main categories of coupling, further sub-types of coupling with variable levels of severity exist (e.g., full coupling is worse than sparse coupling, and stiff coupling is worse than robust coupling) [Arcidiacono et al., 2001]. In this way, the proper sequence has been identified as required by the first axiom of Axiomatic Design [Suh, 1998]. First, select the sector, then the business model, followed by the production system, and, lastly, the innovation system.
Through the decomposition process, it is possible to study the details in the functional and physical domains (FRs in Figure 3 and DPs in Figure 4) through zig-zagging (Figure 6). Using mapping and zig-zagging, the design can be summarized in two structures that are hierarchically arranged in levels of increasing detail and correlated by the design matrices.
The expected output of this exercise is a production system that leads the company to maximum competitiveness, considering the constraints of available resources and available capital. Competitiveness in the market requires a calculation of the capacity of the system. Too much capacity could burden a company with high costs. Too little capacity, and opportunities could be lost, especially if a market is developing rapidly.
Mechanisms such as hiring-&-firing workers, scheduling overtime and cutting back on work hours, changing the rate of production, adding and shutting down machines, etc., are singular important leverages to be included in a global company strategy. Some of the effectiveness of “adjustment” of the capacity of a company would be an important design tool.
The capacity of the system for managing the flows in order to achieve the expected FRs depends, for example, on the quality of the goods and services, durability, functionality, and on-time delivery by the company and by the suppliers. The flexibility of the production volume, which is required to
meet changes in market demand, depends on the technology to be used and on the process design. These include the choice of equipment, layout, space, and procedures. In this scenario, the process efficiency has to be improved with the appropriate production system design. The focus should be on the strengths for value-added activities, simultaneously designing a business model that can capture the voice of the customer and increase customer satisfaction.
Figure 3. Functional domain.
The first issue is that most production systems are not designed today. The second issue is that few production systems are customized. Ultimately, the goal of this paper is to design a customized production system to improve process efficiency in order to optimize overall processes. Simultaneously, it must consider both macro-economic and market prospective as well as the company prospective, which can also vary quickly.
Generally, any manufacturing system has four types of operations: processing, inspection, transportation/motion, and inventory. Few operations are value-added activities. For instance, inspection, transportation/motion, and inventory are

- 203 -
non-value adding, even if sometimes necessary. Optimizing operations means reducing and eliminating the wastes inherent to integrating the entire system, rather than treating them one at a time. This is the difference between the application of some basic tool (basic Lean) and taking a global approach. When extended to an entire company, Lean [Womack and Jones, 2003] is integrated to the entire supply chain. It is also called the Toyota Production System [Ohno, 1988].
Cochran [1994] uses AD to illustrate the differences between two different production systems (mass and lean production). More specifically, AD is an important element for defining how the production system goals are accomplished from a system design perspective. In this paper, using recent methodological developments, the aim is to extend Cochran’s comparison by considering different models of operational excellence, enterprise cost reduction, and cost avoidance. In this way it is possible to create continuous improvement and obtain hard/soft cost savings.
Figure 4a. Physical domain.
Figure 4b. Physical domain.
The design matrix (DM3X) in Figure 5 shows the results of this comparison. DM3X is decoupled and satisfies Axiom 1. It could be argued that the FRs ‘cut cost’ and ‘avoid cost’ are inherently coupled. If so, then this decomposition would violate the decomposition directive to be mutually exclusive. However, in this case ‘cut cost’ refers to reducing existing costs, and ‘avoid costs’ refers to avoiding new costs; so the two are independent and satisfy Axiom 1.
Figure 5. Design matrix DM3X.

- 204 -
Figure 6. Hierarchical tree: decomposition and zig-
zagging.
Decomposing F31 and DP31, ‘continuous improvement’ and ‘operational excellence’ results in the following elements (see Figure 3 and Figure 4):
FR311= Lead and sustain processes efficiency FR312= Reduce or eliminate the Non Value Added (NVA)
activities FR313= Restore basic conditions and standardize best
practice FR314= Reduce NVA by reviewing the Value Chain (more
global than just NVA as in 312) and DP311= Lean Six Sigma (LSS) DP312= Basic Lean DP313= World Class Manufacturing (WCM) [Kinni, 1996] DP314= Toyota Production System (TPS) whose design matrix (DM31X ) is:
Figure 7. Design matrix DM31X.
In this case, the design matrix is coupled, indicating that Axiom 1 is not fulfilled. Therefore, different solutions need to be sought, or a proper sequence for adjustment of the DPs is
required for decoupling. Following this last choice, “reordering” [Suh, 1998] between FR/DP312 and FR/DP314
has been applied. The design matrix DM31X after “Reordering” is:
Figure 8. Design matrix DM31X after reordering.
The design matrix in Figure 8 is decoupled and therefore satisfies the Independence Axiom. The proper sequence of adjustment that satisfies the FRs without iteration is indicated.
The question is: how does a company become the best in manufacturing? Currently, the quick answer is to become a Lean company (with advanced Lean tools and with a global deployment of TPS), or, better, a Lean Six Sigma company, as indicated by previous results. Lean Six Sigma, which is better than Toyota Production System and World Class Manufacturing, represents a new model of operational excellence. It operates inside the production system; in other words, it is the driver of the production system.
Based on DM31X, in fact, it is evident that LSS suits, and to some degree satisfies, all the FRs. As a consequence, LSS becomes the most powerful tool. At the same time, LSS is also more complex. And, if LSS is not well structured and “customized”, it is more convenient for companies to follow a gradual “proper sequence”. In any case LSS must be well defined in order to reach excellence.
For those who wish to create a path of continuous improvement starting from scratch, introduction to the Lean approach basically requires a “waste walk”, identifying the eight types of waste, in order to eliminate them. In this way, NVA activities are eliminated. Subsequently, following what our study of DM31X has demonstrated, the application of World Class Manufacturing permits restoration of basic conditions and standardizes the best practices. At a later stage, the introduction of Toyota Production System concepts to the whole company permits the increase of value and reduces the flow of different operative and transformation phases. This introduction of TPS allows for faster response to the client’s requests and, at the same time, increases competitiveness.
Finally, creating the right culture for change can bolster the company to hold out against conditions of high criticality, where results are achievable only with a radical change of mindset. Such conditions could be similar to the current global recession. Lean Six Sigma shows the most complete and structured method for industrial process engineering and optimization, for both manufacturing and service.
Lean Six Sigma aims to relentlessly identify and eliminate waste in order to maximize the speed and flexibility of business processes and thereby to deliver what is needed when it is needed and with the quantity required by the customer. The waste is the use of resources (time, material, labor, etc.) for doing something that customers are not willing to pay for.

- 205 -
Waste does not add value to the product or service provided [Arcidiacono et al., 2012].
Each of the five phases in which Lean Six Sigma is structured (DMAIC) sets few milestones that indicate the “walk to do”, i.e. the roadmap to be followed. The way that these milestones are defined, the ability of the people involved to understand the contextand supply the proper effort required to achieve the goal are issues that could influence the final results. Correct use (the right one for the right information) of the tools, the rigor of the method, the step-by-step approach, and strict time management on projects, are surely the basis for success [Arcidiacono, 2006]. Among different management techniques, Lean Six Sigma is the one that gives a scientific approach. It does this through the use of proper tools, both statistical and other, and a strict method that develops in five steps, DMAIC. LSS starts from the recognition of criticalities and ends with their resolution. It does this in a way that respects the above needs. In particular, Lean Six Sigma is the most effective and efficient business strategy for optimizing existing processes. It can enforce a business vision that can consolidate a company’s market leadership.
At the beginning, it is necessary to understand the system design fully, as well as to grasp the “as is” picture of the plant, the industry, and the manufacturing sector. To reach this goal requires knowledge and leadership. The knowledge is in terms of operations, system design, methodology and strategy.
If the C-Level Managers don’t acquire the right information, or the right data, and if they don’t know the processes in depth, which would be sufficient for a customized production system design, then they cannot drive the company successfully.
4 CONCLUDING REMARKS
Processes that use a system design that is able to deploy the company strategy through singular operations and relative interactions [Arcidiacono et al., 2012] are required for management.
The differences between diverse operational excellence models approaches from a design point of view can be understood using AD.
Three key elements of AD, adaptable to various manufacturing environments and extendible across industries, are:
1. Decomposition in design domains 2. Zig-zagging to create the design hierarchy 3. Independence Axiom The decomposition includes functional and physical
domains and provides the methodology for designing a customized operational excellence model (industry, manufacturing sector, or plant specific). The decomposition facilitates the selection of new DPs (system designs) to meet new FRs. The zig-zagging process establishes a hierarchy of DPs at a higher level, determining the decomposition of FRs at lower levels through the FRs-DPs leaves. The Independence Axiom drives the designer to select one and only one DP to satisfy an FR. Designing and improving operations is different from designing and improving the production system by means of the journey to operational excellence. This is the goal of Lean Six Sigma, understanding
the purpose of each operation (inputs, outputs and relative iterations). Continuous improvement, which has been used for years, forces a company to specify concretely the quality of services and products in a daily action plan [Phadke, 1989]. Productivity increase, the growth of customer fidelity, and investment effectiveness are tools that improve competitiveness. Lean Six Sigma strengthens company leadership by setting a pace for steady development. The developmentis based on a given service and product level measurement and systematic analysis, on internal processes, continuous improvement, performance indicators, constant monitoring, market demand, and on internal competencies to meet the voice of the customer.
5 REFERENCES
[1] Altshuller G.S., Creativity as an Exact Science: The Theory of Inventive Problem Solving, New York: Gordon and Breach, 1988.
[2] Arcidiacono G., Campatelli G., Lipson H., “A Measure for Design Coupling”, IMechE, Proceedings of the International Conference on Engineering Design ICED 01, Glasgow, 2001.
[3] Arcidiacono G., “Keys to success for Six Sigma”, Proceedings of ICAD06, The Fourth International Conference on Axiomatic Design, Firenze, 2006.
[4] Arcidiacono G., Calabrese C., Yang K., Leading processes to lead companies: Lean Six Sigma Handbook, Springer, 2012. ISBN 978-88-470-2492-2
[5] Brown C.A., “Decomposition and Prioritization in Engineering Design”, The Sixth International Conference on Axiomatic Design, ICAD2011 Daejeon, Mar. 30-31, 2011.
[6] Brualdi R.A., Introductory Combinatorics, Third Edition, New Jersey: Prentice Hall, Upper Saddle River, 1999.
[7] Chan Kim W., Mauborgne R., Blue Ocean Strategy, Boston: Harvard Business School Press, 2005. ISBN 1-59139-619-0
[8] Cochran D.S., “The Design and Control of Manufacturing Systems”, Doctoral Thesis, Auburn University, 1994.
[9] Cochran D.S., Eversheim W., Kubin G. and Sesterhenn M.L., “The application of axiomatic design and lean management principles in the scope of production system segmentation”, International Journal of Production Research, 38:6, 1377-1396, 2000.
[10] Kalpakjian S., Manufacturing Engineering and Technology, Addison Wesley Publishing Company, 1995.
[11] Kaplan R.S. and Norton D.P., The Strategy-Focused Organization: How Balanced Scorecard Companies Thrive in the New Business Environment, Boston: Harvard Business School Press, 2001.
[12] Kim Y.S., Cochran D.S., “Reviewing TRIZ from the perspective of Axiomatic Design”, Journal of Engineering Design, Vol. 11, No. 1, pp. 79-94, 2000.
[13] Kinni T.B., Guide to World Class Manufacturing Plants, Wiley, 1996. ISBN 978-0-471-16002-1
[14] Nordlund M., Tate D., Suh N.P., “Growth of Axiomatic Design through Industrial Practice”, 3rd CIRP Workshop

- 206 -
on Design and the Implementation of Intelligent Manufacturing Systems, Tokyo, pp. 77-84, June 19-21, 1996.
[15] Ohno T., Toyota Production System: Beyond Large-Scale Production, Cambridge, MA: Productivity Press, 1988. ISBN 0915299143
[16] Phadke S., Quality Engineering using Robust Design, Prentice-Hall International Editions, 1989.
[17] Rasiel E.M., The McKinsey Way, McGraw-Hill, New York, 1999.
[18] Suh N.P., The Principles of Design, Oxford University Press, 1990. ISBN 0-19-504345-6
[19] Suh N.P., Axiomatic Design: Advances and Applications, Oxford University Press, 1998.
[20] Womack J.P. and Jones D.T., Lean Thinking, HarperBusiness, 2003. ISBN 0-7432-4927-5

Proceedings of ICAD2013 The Seventh International Conference on Axiomatic Design
Worcester – June 27-28, 2013
ICAD-2013-30
- 207 -
ABSTRACT
The objective of this work is to advance the understanding of thematic decomposition of designs for safety in the context of Axiomatic Design. Four different design solutions addressing the same safety-related customer need are compared. Special attention is given to the themes applied in the hierarchical decomposition, as well as the order in which the themes are applied. Good hierarchical decompositions are essential for the development of a well-functioning solution. The themes applied in the decomposition influence the decomposition process, and can impact the solution. Differences in the decompositions and solutions are shown. Finally, the importance of incorporating safety into the decompositions is discussed.
Keywords: thematic decomposition, ski bindings.
1 INTRODUCTION
This paper compares four different design solutions that satisfy the same safety-related customer need. The objective is to advance the understanding of thematic decomposition of designs for safety in the context of Axiomatic Design.
An important issue is the selection of an appropriate theme for the decomposition. This is important because the theme provides a basis for a assuring a collectively exhaustive and mutually exclusive decomposition [Brown, 2011]. A complete decomposition is necessary for the application of the axioms.
It has been noted that TRIZ [Altshuller, 2002] has applications in this kind of design problem. It was not used or presented to the students here. It was decided to leave it outside the scope of the current investigation.
1.1 IRAD It has been noted in the literature that in systems where
safety and functional requirements are present, performance requirements are often applied before safety requirements. This can lead to additions later on in the design process, which could complicate the design. Applying safety requirements in the conceptual stage of the design is the best way to avoid unwanted coupling and complications later in the design [Ghemraoui-Lagord et al., 2011].
Innovative Risk Assessment Design (IRAD) is a method of designing safety parallel with the design of the device [Ghemraoui-Lagord et al., 2011]. The designer works on task clarification, followed by development of design parameters in
each of the design phases. At each stage risk is thought to be constantly evolving and dependent on the design technologies. Risks are analyzed through the design parameters, and the human interaction with them. Risks are identified, transformed into safety requirements, and then listed in the specification document. These safety requirements are then inserted at the next level of the hierarchical decomposition.
Risks can be divided into three types, corresponding to the three stages of the design. During the conceptual design stage general working principals are developed (Table 2). The risks in this stage are placed in the Human-Principal Interaction (HPI). HPI risks are defined based on the environment or the working principals of the design. They are independent of any specific solution and come from past experience. These risks become input safety objectives and act as constraints in the design [Ghemraoui-Lagord et al., 2011].
This work considers a ski binding and the protection of the anterior cruciate ligament (ACL) in the knee from injurious loads that can be transmitted from the snow through the ski to the binding, to the boot, and then to the skier’s leg. The function of the binding is to transmit control loads from the skier to the ski, and sensory information from the ski to the skier, and to avoid transmitting injurious loads from the ski to the skier. In this regard, it is similar to many kinds of human machine interfaces.
In the current work we note that for systems, such as ski bindings, where a primary goal is safety, input safety objectives are functional requirements in the first level of decomposition. Constraints, in this work, would be distinguished from FRs as design objectives that do not take DPs. In IRAD input safety objectives are functional requirements at the conceptual stage. At the embodiment and detail stages safety objectives consist of input constraints [Ghemraoui-Lagord et al., 2011].
During the embodiment stage of the design in IRAD, the way in which the device will function is defined. Systems to carry out the working principals developed in the conceptual stage are developed (Table 2). During this stage risks are placed in the Human-System Interaction (HSI) and are related to the human activity or the existing design parameters. These risks become system safety objectives when placed in the design decomposition as functional requirements. System safety objectives are design specific. At the level of the detail stage components of the device begin to be specified (Table 2). At this stage risks fall into the Human-Machine Interaction
A COMPARATIVE STUDY OF DECOMPOSITIONS IN AXIOMATIC DESIGN APPLIED TO SAFETY OF THE ANTERIOR CRUCIATE LIGAMENT IN ALPINE
SKIING
John M. Madura [email protected]
Department of Mechanical Engineering Worcester Polytechnic Institute
100 Institute Rd Worcester, MA 01609
Christopher A. Brown [email protected]
Department of Mechanical Engineering Worcester Polytechnic Institute
100 Institute Rd. Worcester, MA 01609

- 208 -
(HMI) and are often associated with technical design choices [Ghemraoui-Lagord et al., 2011].
1.2 THEMATIC DECOMPOSITION Decomposition is one of the ways in which Axiomatic
Design facilitates designers in approaching a problem. Different themes can be applied to the decomposition, which, in-practice, arrive at different solutions, or different representations of similar solutions. The creation of a hierarchical decomposition allows designers to apply different themes at different stages of the decomposition.
Examples of general, broad themes are: temporal, spatial, energetic, and hazard based. A design can only be as good as its functional requirements [Suh, 1990]. The decomposition is the process of developing progressively lower level FRs. If a collectively exhaustive decomposition is not created at any level, the quality of the final design will be impacted. For example, a hazard based theme would only be exhaustive if all of the possible hazards could be identified [Brown, 2011]. Unidentified hazards would lead to unmitigated risks.
The prioritization of the theme can also have an effect on the number of FRs needed in the decomposition [Brown, 2011]. If for example, two themes are applied in a decomposition, the order in which they are applied may have an effect on the number of FRs. The designers should investigate different themes and prioritization of themes to ensure a collectively exhaustive decomposition with the minimum number of FRs.
1.3 SKI INJURIES AND SKI BINDINGS Injuries to ACLs are the most common type of serious
injury in alpine skiing, accounting for over 20% of all skiing injuries [Shealy et al., 2003]. There are two prominent mechanisms for tearing the ACL: the Boot Induced Anterior Drawer (BIAD) [Bally et al., 1989], and a combined valgus and rotation of the knee known as the “phantom foot” [St-Onge et al., 2004]. This paper will focus mainly on the BIAD injury. The BIAD injury is caused by a shearing load transmitted to the knee from the stiff rear of a ski boot. This is often the result of landing after a flight in a rearward unbalanced position. Historically ski bindings do not protect the skier from ACL injury [Johnson, 1995].
Ski bindings present a special opportunity to study the interplay of performance and safety in a human-mechanical interface. A ski binding must transmit control loads to the ski while preventing injurious loads from being transferred to the skier. There are many risks which could be classified as input safety objectives, however we will focus on BIAD ACL tears for this paper. Historically, it was standard for ski bindings to release the boot from the ski when certain loads were exceeded [ASTM F939-06, 2009]. While it might seem obvious to mitigate injury by simply placing limits on the magnitude of force transmitted to the skier, it is known from experience that this strategy leads to inadvertent release, i.e., release and subsequent loss of control when injury is not imminent [Ghemraoui-Lagord et al., 2011; Brown and Ettlinger, 1985]. This compromises the objective of transmitting control loads. A better decomposition, adhering to the axioms, can provide a better solution to protecting an equipment user from injury.
This paper studies the decompositions of four engineering capstone design projects addressing the customer need to reduce the risk of injury to the ACL. Only the conceptual and embodiment stages of the design will be studied. Special attention is given to the theme selected in the student’s decompositions. Themes will be identified, and the order of the themes which were applied will be analyzed. The number of FRs in the decomposition will be compared along with the extent of the solutions.
2 PROJECTS
The senior capstone design projects considered here were completed between late August and mid-April. The groups were all advised by co-author Brown, who played only a passive role in the student’s designs. Brown presented the problem and provided discussion on the mechanisms of injury of the ACL in skiing. Brown also provided instruction on AD. The projects were all presented to the students in April. Serious work on the decompositions began at the end of August, with the beginning of academic credit. The projects finished in April of the following year. Details of the groups can be seen in Table 1. All but the first group had access to the solutions of the previous groups.
Table 1. Details of the Groups
Group Number of Students Year of Completion1 1 20062 1 20093 3 20114 4 2013
All of the designs were constrained to use current ski
bindings, boots and skis. The groups created a separate device to be placed between the ski and the binding system. This device is called a riser plate, or binding plate, in skiing.
The groups know that ACL injuries are a consistent problem in skiing. The ACL injury becomes one of groups’ input safety objectives and is an HPI [Ghemraoui-Lagord et al., 2011]. The FR0s and first level functional requirements are developed from this objective. Subsequent FRs addresses the embodiment stage of the design. The design stages are defined in Table 2.
Table 2. Stages of Design [Ghemraoui-Lagord et al., 2011]
Design Stage Description of Design StageConceptual General working principals are
developed Embodiment Systems to carry out the working
principals developed in the conceptual stage are developed
Detail Components of the device are specified
2.1 FR0 The initial functional requirements can be seen in Table
3. All of the groups addressed the customer need of a safer skiing system for protecting the ACL. Groups 1, 3, and 4 used

- 209 -
a hazard based theme when selecting their FR0, while group 2 selected a theme based on safety in general.
Table 3. Group FR0s.
Group FR0 1 Prevent ACL injury 2 Add safety to the Binding – Ski
interface 3 Protect ACL from Injuries during
skiing 4 Prevent ACL Injury while skiing
By not specifying a specific hazard group 2 opened that solution to more injuries and solutions. This makes it more difficult for the designer to form a collectively exhaustive decomposition, but a better and more complete design may be the result.
An assumption applied to the FR0 of project 1 is that it is in the context of skiing. All designs must have both skiing performance FRs and safety FRs for their decompositions to be collectively exhaustive.
2.2 SUBSEQUENT FRS The creation of functional requirements between the
initial FR0 and the detail design stage serves two purposes. The first is to assist in communicating the design to others. The second is to ensure that the design remains collectively exhaustive and mutually exclusive through the development of the design.
The initial FR0s are decomposed along themes. The themes guide the decompositions. Groups 1, 2, and 3 chose a spatial, load theme to segment the decomposition into control
loads and injurious loads as a first step. These groups then applied different themes to each the control loads and the injurious loads in the decomposition. A work theme was applied to the injurious loads. Work was decomposed along its components, force and displacement. Through this theme the groups were able to develop a design that would absorb energy in the device that would normally be transferred to the skier, possibly causing injury. Instead of work being done on the skier’s ACL, the work would be done on the plate device.
The control loads were decomposed using a location theme. Control loads transmitted though the plate device were distinguished from injurious loads transmitted to the plate device by either the ski or binding. Control loads transmitted through the plate device were then decomposed using a Cartesian theme. A flow chart showing the decomposition process can be seen in Figure 1.
Group 4 chose a spatial, Cartesian theme to decompose all of the forces in skiing as a first step. The group then applied a control load v. injurious load theme as a next step. Because the group only focused on the BIAD injury, only one direction, the y direction, was decomposed into control loads and injurious loads. The injurious loads were decomposed using a work theme, resulting in a displacement FR and a force FR. The control loads were decomposed with a moment theme, creating a FR to provide an interface for the force, and a lever arm for the force to act on. A flow chart showing the decomposition process of Group 4 can be seen in Figure 2.
The themes applied by group 4 differ in order from groups 1, 2, and 3. Four themes were still needed to reach the detail design phase. Furthermore, all of the groups used the same themes.
Figure 1. Decomposition flow chart for groups 1, 2, and 3. The themes are to the right of the arrows.

- 210 -
Figure 2. Decomposition flow chart for group 4. The themes are to the right of the arrows.
2.3 NUMBER OF FRS The number of functional requirements used to reach the
detailed design phase depended on how the themes were applied. Some groups combined themes together into one. Group 1 applied a control load v. injurious load theme simultaneously with a theme based on the location of the load in the system. A portion of the group’s decomposition can be seen in Table 4.
Table 4. Group 1 partial decomposition
FR Number Functional Requirement FR 0 Prevent ACL injuries
FR 1 Allow attachment to ski and traditional binding
FR 2 Transmit normal skiing forces between ski and binding
FR 2.1 Transmit forces in x direction FR 2.2 Transmit forces in y direction FR 2.3 Transmit forces in z direction FR 2.4 Transmit moments about x axis
FR 2.5 Transmit moments about y axis
FR 2.6 Transmit moments about z axis FR 3 Filter out harmful forces FR 3.1 Allow rotation about heel when forces are
excessive
FR 3.2 Absorb Forces
FR 3.3 Allow adjustment for skiers of different weights
The number of functional requirements also depended upon when the detail stage of their decomposition began. Group 3 did not continue their decomposition far enough to
apply a Cartesian theme to the control loads. The group did apply a Cartesian theme to the injurious loads, which was combined in the first step of the hierarchical decomposition with a control v. injurious load theme. A portion of group 3’s decomposition can be seen in Table 5. The group created a solution which addressed both BIAD injuries and “phantom foot” injuries.
Table 5. Group 3 Partial decomposition.
FR Number Functional Requirement FR 0 Protect the knee from ACL injuries during
skiing
FR 1 Provide an interface between binding and ski
FR 1.1 Transfer loads from binding to top plate
FR 1.2 Transfer loads from top plate to base FR 1.3 Transfer loads from base to ski
FR 2 Provide horizontal absorption of loads during high load conditions
FR 2.1 Allow horizontal rotation about z-axis FR 2.2 Control horizontal rotation of heel toward
inside of ski
FR 3 Provide vertical absorption of loads during high load conditions
FR 3.1 Allow vertical rotation about toe FR 3.2 Control vertical rotation of heel
downwards
The numbers of FRs used to reach a solution for the BIAD injury, while transmitting control loads, are listed in Table 6. The numbers of FRs do not include FR0, and FRs pertaining to other injuries are not included.

- 211 -
Table 6. Number of FRs created.
Group Number Number of FRs Createdfrom FR0
1 13
2 12
3 7
4 13
2.4 FINAL DESIGNS All of the groups created working prototypes. These
plate devices all could reduce the number of BIAD ACL injuries in skiing. These plate devices would still transmit control loads to the ski with something close to the fidelity without the plate device. The influence that these plate devices might have on performance would be limited to the added weight and height stand-off between the boot and the ski caused by the plate devices.
The plate devices are all similar conceptually. All of the plate devices absorbed the energy seen by the skier, as opposed to releasing the skier from the ski. This was accomplished by allowing the foot to rotate in the posterior direction when an injurious load is eminent. This solution is a result of applying a work based theme to their decompositions.
Differences appear at the system level in the embodiment stage of the design [Ghemraoui-Lagord et al., 2011]. Three of the groups allow the heel to rotate about a point forward from the heel. Group 1 achieved the rotation with an upward rotation of the toe about a point close to the heel. The other groups absorbed the energy with a downward rotation of the heel about a point close to the toe (the location of the pivot points can be seen in Figures 3, 4, 5 and 6). This introduces coupling between the geometry and flex of the ski and the amount of energy that can be adsorbed. The design of group 1 could be said to be superior by Axioms 1 and 2. This is because the design is not coupled to the geometry of the ski beneath the plate device. It is also because the solution works in a wider range of situations, when the ski is flexed, thereby the probability of success is greater and the information content is lower. A solid model of group 1’s solution can be seen in Figure 3.
All the designs with a fixed pivot will be insensitive to loads applied at the pivot point. The loads that cause BIAD injuries are applied to the rear of the ski. Therefore, when the pivot is placed further back, the probability of success is limited and the information content of the solution increases. Group two avoids a fixed pivot. The plate is able to move vertically along its length (Figure 4).
Groups 2 and 3 also incorporated components that address other injury mechanisms in their designs. Group 2 increased the work to release the heel of the boot from the binding, thereby reducing the likelihood of inadvertent releases. The design also absorbs vertical forces which can contribute to tibial plateau fractures. The designers of group number 3 incorporated a system to reduce the number of “phantom foot” ACL injuries. Images of group 2 and 3’s solutions can be seen in Figures 4 and 5 respectively.
Figure 3. Group 1 final design [Miley, 2006]. The pivot point can be seen close to the heel of the plate device. The plate is seen in an open position as if the plate device has
absorbed an injurious load.
Figure 4. Group 2 final design [Havener, 2009]. The floating pivot is nominally equidistant from the toe and heel
of the plate device. The plate is allowed to rotate in either the posterior or anterior direction.
Figure 5. Group 3 final design [Austin et al., 2011]. The pivot point is at the toe of the plate device. The plate rotates
downward at the heel about this point.
Figure 6. Group 4 final design [Bisacky et al., 2013]. The
pivot point is near the toe of the plate device. The plate rotates downward at the heel about this point.
ToeHeel
Pivot
Moveable Pivot
Toe
Heel
Pivot
Heel
Toe
Pivot

- 212 -
3 DISCUSSION
3.1 THEMES IN SKI BINDINGS All of the groups in this study chose spatial themes.
Temporal themes were avoided by the groups. The theme most associated with the function of the device is a work theme. The three other themes used by the groups to create their solutions are the direction of the load, the location of the load in the system, and the nature of the load, i.e., whether the load is a control load or an injurious load.
The application of a work theme resulted in ski-plate-binding systems which absorbed the injurious energy. The absorption of energy was based on the direction and magnitude of the injurious force. To arrive at the solutions the groups all applied the same themes in their decompositions. The application of these themes allowed the groups to assure a collectively exhaustive and mutually exclusive decomposition.
Although temporal themes were not applied by the groups, they have been used in ski bindings. An electronic binding was developed which released the skier from the ski based on the force impulse [D’Antonio, 1984]. If an injurious force was seen by the binding, the ski boot is released from the ski only if the force had been active for a predetermined amount of time. This solution was designed to reduce the number of inadvertent releases. The ski would not be released from the skier inadvertently by a high force, if only seen for a short amount of time. It is thought that these force surges are in excess of the nominal retaining force of a mechanical work based system. These impulse loads would not be produced in a traditional mechanical system because of its compliance, which adsorb impulses or shocks. In a stiffer system with an electronic release mechanism it was found that the ski need not be released if the duration of the force is short [D’Antonio, 1984]. The solution decouples the force seen from the time duration of the force, allowing a lower release force to be specified.
The design of D’Antonio’s ski binding [1984] did not address any ACL injuries, because at the time of the invention ACL injuries were not prevalent. The design addresses the problems of inadvertent release as well as leg fractures caused by excessive rotational and bending forces to the lower leg. But this does not invalidate the use of a temporal theme in the development of a system to reduce ACL injuries. The use of a temporal them could result in a good decomposition, which could produce a design solution with a good probability of success.
3.2 ORDER OF THEMES Three of the four groups applied a theme based on the
type of load in the first level of their decomposition, segmenting the decomposition immediately into control loads and injurious loads. Two of these groups applied two themes at once, either load type and direction, or load type and location in device.
Group 4 was the only group to apply a directional theme first before decomposing the loads into injurious loads and control loads. Because the group only focused on BIAD injuries, only one direction needed to be decomposed into control and injurious loads.
Table 7. Group 4 Partial Decomposition
FR Number Functional Requirement FR 0 Prevent ACL injury while skiing
FR 1 Transmit loads about y axis FR 1.1 Transmit control loads about the y axis
FR 1.2 Filter BIAD ACL injury loads about y axisFR 2 Transmit loads about x axis FR 3 Transmit loads about z axis
The order of the themes applied in these groups did not have a large impact on the number of functional requirements created. Group 3 had fewer FRs than the other projects because they did not continue their decomposition to apply a directional theme to the control loads. It is interesting to note that in these projects, four themes were applied to reach a complete decomposition. Group 3 applied a Cartesian theme to the injurious loads, but not to the control loads. The number of themes applied was independent of the order of the themes.
It has been shown that the order of the themes applied in the decomposition can have an effect on the number of functional requirements [Brown, 2011]. When creating a functional decomposition, it is important to investigate different orders of themes to create a decomposition with the minimum number of functional requirements.
The order in which themes are applied can also have an impact on the exhaustiveness of a functional decomposition. A theme can only be useful if it can help the designer see all possible children of the parent. If all the children are not obvious, a different theme can be applied first to decompose the problem further.
3.3 CHOOSING A THEME All groups created different solutions to the same
customer need. Each final design was different from the others; however the working principles of the designs were all the same. All the designs utilized absorption of energy to eliminate injurious loads seen by the skier. This is the result of all the groups applying the same themes in their decomposition, even if in different orders.
Other themes could be applied to the decomposition of the initial customer need to create solutions acting on different working principles. It has been illustrated how the application of a temporal theme could be used to address the customer need. Designers should experiment with different themes, combinations of themes, and orders of themes during the decomposition process. Axiom 2 might be applied to choose the best solution.
3.4 IRAD AND THE PROJECTS It is interesting to consider the IRAD system when
looking at these projects. The IRAD system was developed to incorporate safety into the design of devices and systems in the early stages of design. This prevents complications of designs from the addition of safety constraints being applied late in a design. The groups here did not know about the IRAD system.

- 213 -
In these projects, the designers knew from experience that knee injuries were a problem in skiing, resulting in an input safety objective of preventing knee injuries. In all projects, some safety functional requirement was present in the first tier of the functional decomposition. As the groups moved through the design process risks were analyzed at each stage to form system safety objectives. These system safety objectives were dependent on the design. A common system safety objective was adjustability of the design for different weight skiers, or skiers with different size boots.
A driving factor in these designs was the safety element of the device. The designers transformed their input safety objectives into functional requirements in their decomposition. Input safety objectives can be transformed into constraints, or into functional requirements. Classifying input safety objectives as functional requirements leads to design parameters to achieve the function. Classification of input safety objectives as constraints leads to the creation of design parameters which do not compromise safety. Creation of constraints at the upper levels of decomposition influences the specification of sub-FRs, often making it more difficult to generate an acceptable set of DPs. This, in turn, can make achieving an uncoupled or decoupled design difficult [Hintersteiner, 1999].
In design problems where safety is not an important customer need, and no safety concerns are immediately obvious, safety is not often considered a functional requirement in the decomposition. But lack of safety considerations can lead to design complications. Constraints, created at the beginning will ensure the conceptual elements of the design do not place users in danger. The IRAD system can be used to incorporate safety throughout the system. Failure to incorporate safety early in the design can result in late additions to the design which may complicate the design [Ghemraoui-Lagord et al., 2011].
Even though these designers were unaware of the IRAD system, safety was still incorporated as functional requirements in the design decomposition. As new risks were developed based on the function of the specific solution, new safety requirements were developed and added to the decomposition. The results were devices which integrated both safety and performance. The design process of the groups was similar to the IRAD method of design. IRAD introduces a more systematic and documented strategy for incorporating safety into design. IRAD can be beneficial in large organizations or in design teams where design tasks are distributed amongst the designers, where communication of the design can become difficult. The results clearly support the IRAD model. Validation of the IRAD model would require a more directed experiment, and was not the intent of this work.
Future work on comparing design solutions could be through design contests and through the integration of similar design projects into basic curricula. These could provide controlled studies of decompositions of similar design problems using different themes. Such approaches could be the basis for a design of experiments to examine the influences of different factors more thoroughly.
3.5 IRAD AND SKI BINDINGS When the safety ski binding was first created, ACL
injuries were not common. The bindings were created without ACL injuries as an input constraint, and design parameters were developed without ACL injuries in mind. As boots got stiffer in backward lean and ACL injuries became more prevalent, designers introduced features to try to eliminate the injury. These features were added to the already existing ski binding, after the conceptual and embodiment stages of the design had been established. The result is a vertical release of the toe, which is coupled with the horizontal release of the toe. To adjust the retention force of the vertical release, the retention force of the horizontal release must be adjusted [Fischer et al., 1994]. This addition of a safety feature late in the design stage has added unnecessary complexity to the design.
4 CONCLUSIONS
In the context of this work some observations can be made to facilitate the development of thematic decompositions in designs, especially those addressing safety.
1. The selection of themes facilitates the development of
FRs and impacts the solutions. 2. The order of the application of themes appears to
influence the number of functional requirements, the collectively exhaustive element of the functional requirement, as well as the final design.
3. Both performance and safety can be integrated into the design process consistent with collectively exhaustive and mutually exclusive criteria.
5 REFERENCES
[1] Altshuller, G, TrizTools Volume 1 40 Principles TRIZ Keys to Technical Innovations, Technical Innovation Center, Worcester 2002.
[2] ASTM F939-06, 2009, “Standard Practice for Selection of Release Torque Values for Alpine Ski Bindings,” Annual Book of ASTM Standards, Vol. 15, ASTM International, West Conshohocken, PA, pp. 133-138, 2009.
[3] Austin, R.D., B.T. Ferland, W.D. Seibold “Design and Prototype of an Under-Binding Plate to Reduce ACL” Major Qualifying Project, Department of Mechanical Engineering, Worcester Polytechnic Institute, Worcester, MA, USA, 2011.
[4] Bally, A., Boreiko, M., Bonjour, F., and Brown, C.A., "Modeling Forces on the Anterior Cruciate Knee Ligament During Backward Falls While Skiing," Skiing Trauma and Safety: Seventh International Symposium, ASTMSTP 1022, Philadelphia, 1989.
[5] Bisacky, L.H., B. Calvetti, R. Izzo, E. Veracka “Advanced Design of a Binding Plate to Reduce Anterior Cruciate Ligament Injury during Alpine Skiing” Major Qualifying Project, Department of Mechanical Engineering, Worcester Polytechnic Institute, Worcester, MA, USA, 2013.

- 214 -
[6] Brown, C.A. “Decomposition and Prioritization in Engineering Design”, The Sixth International Conference on Axiomatic Design, ICAD2009, Daejeon, Mar. 30-31, 2011.
[7] D’Antonio, Nicholas Fred. “Electronic safety ski binding which automatically adjusts itself to the correct release value.” Patent EP 0039003 B1. 7 November 1984.
[8] Fischer, J.F., P.F. Leyvraz, A. Bally “A Dynamic Analysis of Knee Ligament Injuries in Alpine Skiing” Acta Orthodaedica Belgica Volume 60, Issue 2, pp194-203, 1994
[9] Ghemraoui-Lagord, R., L. Mathieu, C.A. Brown, “Defining Safety Objectives During Product Design”, The Sixth International Conference on Axiomatic Design, ICAD2009, Daejeon, Mar. 30-31, 2011.
[10] Havener, D.M. “Design of a Spring Loaded Tilting Binding Plate” Major Qualifying Project, Department of Mechanical Engineering, Worcester Polytechnic Institute, Worcester, MA, USA, 2009.
[11] Hintersteiner, J.D. “A Fractal Representation for Systems”, The 1999 International CIRP Design Seminar, CIRP 1999, Enschede, Mar. 24-26, 1999.
[12] Johnson, S. “Anterior Cruciate Ligament Injury in Elite Alpine Competitors” Medicine and Science in Sports and Exercise. Volume 27, Issue 3. pp323-327, 1995
[13] Miley, B. “Design and Manufacture of a Binding to Reduce ACL Injuries in Alpine Skiing” Major Qualifying Project, Department of Mechanical Engineering, Worcester Polytechnic Institute, Worcester, MA, USA, 2006.
[14] Shealy, J. E., Ettlinger, C. F., and Johnson, R. J., "What Do We Know About Ski Injury Research that Relates Binding Function to Knee and Lower Leg Injuries?" Skiing Trauma and Safety: Fourteenth Volume, ASTM STP 1440, West Conshohocken, PA, 2003.
[15] St-Onge, N. Chevalier, Y. Hagemeister, N. Van De Putte, M. De Guise, J. “Effect of Ski Binding Parameters on Knee Biomechanics: A Three-Dimensional Computational Study” Medicine and Science in Sports Exercise. Volume 36, Issue 7, pp 1218-1225, 2004.
[16] Suh N.P., The Principles of Design, New York: Oxford University Press, 1990. ISBN 0-19-504345-6

Proceedings of ICAD2013 The Seventh International Conference on Axiomatic Design
Worcester – June 27-28, 2013
ICAD-2013-31
- 215 -
ABSTRACT
Total Productive Maintenance (TPM) is one of the World Class Manufacturing tools that seeks to manage assets by involving everyone in the manufacturing organization. The financial and productivity benefits of implementing TPM are significant. Many approaches have been proposed regarding TPM implementation procedures, of which logically sequenced implementation procedure is an identified success factor; yet the majority of TPM implementation attempts fail to achieve their intended goals. Moreover, Axiomatic Design principles have been proven to provide fast and reliable implementation procedures for engineering and non-engineering applications. This paper aims to assess a reliable TPM implementation procedure by systematically arranging the TPM affiliated parameters using Axiomatic Design principles. The paper presents an open TPM implementation matrix for organizations to further develop in accordance to their needs.
Keywords: Total Productive Maintenance (TPM), Axiomatic Design, implementation procedures.
1 INTRODUCTION
TPM is one of the World Class Manufacturing tools that seeks to manage assets by involving everyone in manufacturing organization. Nakajima [1989] defined TPM as an organization wide programme that tries to create a conducive environment to maximize effectiveness of a production system by eliminating accidents, defects, and breakdowns. “TPM involves everyone in an organization, from top-level management to production mechanics, and production support groups to outside suppliers” [Ahuja and Khamba, 2008a].
The financial and productivity benefits of TPM for a manufacturing organization are significant. TPM has a strong impact on manufacturing performance in terms of low cost, high level of quality and strong delivery performance [McKone et al., 2001]. A case study by Ahuja and Khamba [2007] in manufacturing organizations that have successfully implemented TPM reported a 14-45% improvement in overall equipment effectiveness (OEE), a 45-58% reduction in inventory, a 22-41% improvement in plant output, 50-75% reduction in customer rejections, a 90-98% reduction in accident, a 18-45% reduction in maintenance cost, a 65-80% reduction in defects and rework, a 65-78% reduction in
breakdowns, an 8-27% reduction in energy costs, and a 32-65% increase in employee suggestions.
Considering the stated benefits, researchers and TPM practitioners have been proposing different TPM implementation approaches. A twelve-step implementation methodology has been developed by Nakajima [1988]; additions and improvements to this methodology have been suggested by Hartmann [1992], Pirsig [1996], Carannante et al. [1996], Bamber et al. [1999], Leflar [2001], and Ahuja and Khamba [2009]. One of the prevalent TPM implementation approaches is that of Japanese Institute of Plant maintenance (JIPM)—the eight pillar approach which includes autonomous maintenance, focused maintenance, planned maintenance, quality maintenance, education and training, office TPM, development management, and safety health and environment [Ireland and Dale, 2001; Rodrigues and Hatakeyama, 2006]. A similar approach purposed by Ahuja and Khamba [2009] suggests an Indigenous TPM methodology with top management commitment, cultural transformation, employee involvement and integration, KAIZEN, education and training, CMMS, 5S, and visual workplace as foundations to the JIPM’s remaining pillars plus tool management and maintenance benchmarking pillars. The methodology also suggests deploying key performance indicators and lean manufacturing practices and sustaining TPM initiatives as requirements to standardize the TPM program.
The common goal of the above TPM implementation methodologies is to avoid all losses that impede a manufacturing organization’s performance. Shirose [1996] proposed the inclusion of 16 losses which are categorized as seven major losses impeding equipment efficiency (breakdown, setup/ adjustment, speed, idling/minor stoppages, defects/rework, startup, and tool changeover losses], loss that impede machine loading time [planned shutdown loss], five major losses that impede human performance (logistic/ distribution, line organization, measurement/adjustment, management and motion losses) and three major losses that impede effective use of production resources (yield, consumables, and energy losses).
With so many TPM implementation options and clearly identified losses, however, less than 10% of the companies that attempted to implement TPM succeeded to achieve their goals [Mora, 2011]. Further, a common TPM implementation methodology for all organizations cannot be developed due to factors such as variable skills and age of the workforce, complexities and age of equipment, organizational cultures,
TOTAL PRODUCTIVE MAINTENANCE IMPLEMENTATION PROCEDURES IN MANUFACTURING ORGANIZATIONS USING AXIOMATIC DESIGN
PRINCIPLES
Filmon Andemeskel [email protected]
Department of Production Engineering School of Industrial Engineering and Management
Royal Institute of Technology (KTH) Brinellvägen 68, S-100 44 Stockholm, Sweden

- 216 -
and status of maintenance capability [Wireman, 2004]. Moreover, working out the right sequence of initiatives for deploying TPM practices successfully in a structured and most effective manner has been a challenge and an identified success factor for organizations world-wide, a key element of TPM programs [Ahuja and Khamba, 2008a].
With these needs in mind, this paper uses Axiomatic Design principles for developing a structured and logically sequenced TPM implementation process. Axiomatic Design principles have been expanded and applied to numerous engineering and non-engineering applications and proved to provide structured implementation procedures [Kulak et al., 2010] and specifically the principles have been used in design of manufacturing systems systemically and logically [Cochran et al., 2002]. In the following sections, the steps followed in the decomposition of the TPM implementation process are explained and the matrix generated out of the decomposition is discussed.
2 DECOMPOSITION OF TPM IMPLEMENTATION PROCEDURE
Top management expectations out of a successful TPM implementation can fairly be assumed to be the same in all organizations. According to Yamaguchi [2011], from a management point of view, a successful implementation of a TPM project should yield increased productivity, reduced costs and customer complaints, and eliminated accidents. Nakajima [1988] recommends allocation of time to prepare and kick-off the TPM program; and Ahuja and Khamba [2008a] cover many papers that suggest the need to practice the necessary activities to sustain the program. Hence,
FR0 - Implement TPM successfully DP0 - Methods for successful TPM implementation
Further decomposing DP0- Methods for successful TPM implementation yields:
Table 1. FR/DP1 decomposition.
FR DP 1 Initiate a TPM program Preparation stage and TPM
kick-off 2 Reduce accidents to zero Methods to reduce accidents
to zero 3 Reduce costs Methods to reduce costs4 Reduce customer
complaints Increasing customer satisfaction
5 Increase productivity Methods to increaseproductivity
6 Sustain the TPM program
Methods to sustain TPM activities
FR1FR2FR3FR4FR5FR6
X 0 0 0 0 0X X 0 0 0 0X X X 0 0 0X 0 0 X 0 0X X X X X 0X 0 0 0 0 X
DP1DP2DP3DP4DP5DP6
(1)
The above relationship between the FRs and DPs will be used as a TPM implementation framework which aids the TPM implementation process in discrete parts manufacturing organizations. The 6 FR/DP pairs (modules) are necessary and sufficient modules for a successful TPM implementation process. These modules are named as preparation and kick off, accidents, costs, customer satisfaction, productivity and sustainability modules. Any parameter affiliated with the TPM implementation process is considered to fit in any of the 6 modules, based on its primary effect on the process. The decomposition of the modules is summarized in Figure 1. The matrix is filled by posing a question while jumping from row to row, “Does this particular DP directly contribute to the performance of the FR in question?” The relationships between FRs and DPs and some of the proposed solutions (DPs) are based on author’s industrial experience, knowledge on TPM implementation process and wide literature references. Some of the decisions that produce the lower level FRs associated with TPM implementation process, shown in Figure 1, are briefly explained below.
2.1 INITIATING A TPM PROGRAM (FR/DP1) Planning to implement a TPM program has a positive
effect on all FRs of the program. Preparing and kicking-off a TPM program can follow the first six steps suggested by Nakajima [1988]. It is worth noting that the planning activities are done in such a way to increase the effect of the DP on the remaining 5 FRs.
2.2 REDUCING ACCIDENTS TO ZERO (FR/DP2) OSHA [2011] lists the common causes of accidents in
organizations; to eliminate the causes FR21-26 are identified. Further decomposition of one of the causes of accidents, DP22-methods to reduce equipment breakdown, yields FR221-involve everyone and FR222-planned maintenance.
2.3 REDUCING COSTS (FR/DP3) Costs associated with TPM can be reduced by reducing
inefficient use of production resources, labor cost, delays in recognizing and communicating problems, and facilities cost [Gomez et al. 2000], which lead to FR/DP31, FR/DP33, FR/DP321, FR/DP322, and FR/DP34 respectively. Further decomposition of FR/DP31 and FR/DP 33 lead to the three major losses that impede efficient use of production resources (energy, yield and consumables losses), two of the seven major losses that impede overall equipment efficiency (speed and defect/rework losses), and the five major losses that impede worker efficiency (logistic, inspection, motion, management and line organization losses). To maintain the functional independence of the FRs, equipment break down loss which can also be grouped under this module, is considered under FR2 only. The particular selection of the FRs is done in such a way to separate the requirements that directly affect predictability of the operations from those that do not.

- 217 -
Figure 1. Full design matrix table.
2.4 REDUCING CUSTOMER COMPLAINTS (FR/DP4) Customer complaints can be reduced by increasing
product quality, increasing dependability, increasing the speed of delivery and increasing flexibility [Nigel et al., 2007]. In addition, the price of a product influences customer satisfaction, which is mainly dependent on costs; this requirement is considered in FR3-reduce costs.
2.5 INCREASING PRODUCTIVITY (FR/DP5) Productivity is expressed by the ratio of output to input;
in this framework, however, operator input, or labour hours, is considered in FR3-reduce costs. To increase operations output, the remaining major losses that impede overall equipment efficiency that also delay or reduce the speed of predictable-operations (planned shutdown, change over, start-up, setup and minor stoppage losses) are considered. In addition, productivity can be increased by reducing systematic operational delays [Cochran et al., 2002].

- 218 -
Figure 2. Flow diagram for TPM implementation.
2.6 SUSTAINING THE PROGRAM (FR/DP6) Using the factors that influence TPM failure presented by
Rodrigues and Hatakeyama [2006] and Chan et al. [2005], arguments to standardize improvements by Shukla and Cochran [2011], and the need to minimize investment over the production system lifecycle suggested by Cochran et al. [2002], a list of requirements is prepared.
3 RESULTS AND DISCUSSION
After decomposing the TPM implementation goals, a decoupled design matrix was derived. The derived design matrix, Figure 1, was put in the form of a flow diagram shown in Figure 2. The pillars and foundations of TPM that commonly appear in literature were highlighted for comparison with this framework. Weak design couplings and weak relationships between FRs and DPs that were identified after decomposition of the top level requirements were indicated by the letter “Y”; these relationships were neglected in the generation of the flow diagram because of their limited effect on TPM implementation process. All FR/DP pairs were assigned module numbers “Mx(xx)”; the module numbers were used to refer a module in relation to other modules and aid checking whether the left most DPs of a module have been attempted before initiating the right most DP.
At the highest level of this framework, the accident reduction parameters satisfy cost reduction and productivity increment requirements; moreover, customer satisfaction increment parameters satisfy productivity requirements while their requirements are independent of accident and cost parameters. Hence accident, cost reduction and customer satisfaction activities should be attempted before making any activity related to productivity increment. Further, the rest of the parameters cannot satisfy the requirements to sustain the TPM program, which suggests the need to start all the activities necessary to sustain the program early on.
Any attempt to alter the sequence of implementation would likely be ineffective to achieve the intended goals, or would require iterations and extra investment. Attempts to
reduce costs before attempting to reduce accidents, for instance, will likely increase costs by adding expenses to cover incidences of accidents, besides human safety is a priority. Similarly, attempt to increase productivity or reduce costs not along activities that satisfy the customer would likely increase inventory of unsold products. Furthermore, if activities to sustain the program are attempted at the middle or the end of the duration, successful implementation of TPM cannot be guaranteed [Ahuja and Khamba, 2008a]. Aside from the accidents module, the results are in line with that of manufacturing system design decomposition approach developed by Cochran et al. [2002], whose implementation or improvement of manufacturing systems follows the sequence of quality improvement, problem solving, predictable output and delay reduction.
In this framework, the accident reduction module is attempted right after planning and kicking-off the program. Since an education and training program fulfills the highest number of requirements, it is a priority in the TPM implementation process. The result is similar to that of Steinbacher and Steinbacher [1993] and Ahuja and Khamba [2009] who argue that education and training is an element of all other pillars (functional requirements in this framework). Using the design matrix, the curriculum for an education and training program or any other DP can be designed in such a way to satisfy the indicated FRs in the costs and productivity modules. Thus, investment in education and training or in any other DP should continue until the monetary benefits gained from all the functional requirements that they depend on matches [Cochran et al., 2011]. Furthermore, the 5S and activities to make operations mistake proof can be carried out in parallel with autonomous and preventive maintenance activities, which greatly increases the speed of implementation.
In the costs module, the activities follow the sequence shown in Figure 2. The benefits of this particular sequence are two fold: (1) reduce costs associated with the machines and worker inefficiency, and (2) in line with the argument from Cochran et al. [2002], provide predictable output through

- 219 -
DP311-315 and reduce operational delays through DP331-335. To sustain the operations’ output predictability, operators have to quickly recognize problems and communicate to the right people preferably in real time, which is provided by DP321 and DP322.
The level of success of the TPM implementation program is highly dependent on the costs module; the DPs, efficient layout and balanced work flow, have a significant contribution to the success of the program. It is a cautious belief of the author that TPM implementation programs fail to achieve their intended goals mainly due to the low level of achievement of the two DPs on satisfying their respective requirements. A case on the importance of the two DPs is shown by Estrada et al. [2000] where a long assembly line which had a slow defect detection capability, high work in progress, low process predictability, no flexibility and low operator interest to solve problems other than on their part of a line, when the system was converted to cell layout all the problems were significantly improved. When a TPM program is attempted for systems which have not achieved a cell level layout will likely inherit the weaknesses of the lower level manufacturing system layouts, leading to limited success or failure of the program. Furthermore, the conventional approach of prioritizing and addressing operational losses has being using the effect of the losses on costs or overall equipment effectiveness (OEE). This approach is more operations focused thinking than systems thinking which limits the effectiveness of the maintenance efforts.
In the customer satisfaction module, office TPM is a major activity next to research and development activities. Customers do not benefit much by the activities to reduce accidents, costs and increase productivity in production floor, but by some activities in the offices. Hence due effort should be invested in R&D, office TPM, through put and rescheduling capability. Further, this module is weakly coupled with the costs module. Some of the efforts to increase equipment predictability contribute to a reduction of customer complaints by increasing the dependability of the organization while research and development efforts contribute to the elimination of defects/rework in production floor. Similarly, office TPM, fast through put and rescheduling capability efforts contribute to management losses. However, from the point of view of TPM implementation these relationships can safely be ignored.
In the productivity module, the selected FRs intend to eliminate the causes that impede overall equipment efficiency, which an operator has limited capability to influence the process or the machine. To gain maximum benefit out of the proposed sequence in this framework, the production system should sustain a predictable output before attempting this module. After devising a method to synchronize plant shut downs and equipment start up times with operator break times, and a method to engage operators in value adding activities during star ups, the rest of activities can be implemented simultaneously.
In the sustainability module, the sequence of implementation should follow the one shown in Figure 2 to reduce the investment necessary to achieve the requirements. For example, employee moral can be improved by committed top management, participation in the cross functional teams,
regularly published results as part of a benchmarked maintenance activities, and proper application of lean manufacturing philosophy; hence, relatively small reward and recognition efforts would likely suffice to improve moral. Since this module contributes to the health of the overall program, an early maturity of this module is advisable. The control junction, in Figure 2, leading to this module has a responsibility to allocate resources to achieve the intended maturity levels. Moreover, in line with maintenance benchmarking, the practicing organization should develop qualitative or quantitative metrics specifically designed to check the level of achievement by each DP in meeting the requirements set in this framework. The metrics can be used to check whether to continue or stop making efforts and predict the likelihood of success of the succeeding activity. As part of this framework, a general metric fit for the stated TPM implementation requirements is set for further research.
Once the top level TPM implementation sequence is determined, on a need basis, organizations can further decompose the stated high level modules to low level modules. This further decomposition to lower hierarchies should be checked against the constraints in an organization; barriers which Ahuja and Khamba [2008b] classified as organizational, cultural, behavioral, technological, operational, financial and departmental can be used as constrains. Even though most of the proposed DPs are conventional for achieving their corresponding FRs, the matrix is open for improvement on the arrival new management principles or organization specific DPs, as far as decoupled nature of the matrix is maintained. The improvement efforts should give priority to the modules indicated by “Y”. Such practice avoids what Wireman [2004] calls a “cook-book” approach.
Further, this procedure is developed with an organization-independent scenario in mind, unlike most of the existing methods, which are based on empirical results that were found to work on specific organizations. The non-AD approaches do not argue on the efficiency and effectiveness of the approach used outside the bounds of empirical comparisons. Using the decoupled nature of the approach developed in this paper, however, the efficiency and effectiveness of TPM implementation procedure can be argued.
4 CONCLUSION
The paper has used AD principles to systematically sequence TPM affiliated parameters to ease the implementation process in discrete parts manufacturing organizations. The developed AD matrix presents three benefits. First, it identifies TPM activities that can be attempted along other activities, thereby increasing the speed of implementation. Second, it identifies the right sequence of implementation that would likely reduce the effort to actually attempt to satisfy a particular goal. Last, it becomes easier to identify the functional requirements that could be affected by a TPM activity, hence easier to design and plan activities to satisfy particular requirements. The paper also leaves the TPM implementation matrix open for further decomposition and improvement by practicing organizations in accordance to their needs.

- 220 -
5 REFERENCES [1] Ahuja, I.P.S., “Total productive maintenance practices in
manufacturing organizations: literature review” International Journal of Technology, Policy and Management, 11(2), 117–138, 2011.
[2] Ahuja, I.P.S. and Khamba, J.S. “Evolving the indigenous TPM methodology for the Indian manufacturing industry”, International Journal of Technology,Policy and Management, 9 (1), 29–73, 2009.
[3] Ahuja, I.P.S. and Khamba, J.S. “Total productive maintenance – literature review and directions”, International Journal of Quality and Reliability Management, 25(7), 709–756, 2008a”.
[4] Ahuja, I.P.S. and Khamba, J.S., “Strategies and success factors for overcoming challenges in TPM implementation in Indian manufacturing industry”, Journal of Quality in Maintenance Engineering, 14 (2), 2008b.
[5] Ahuja, I.P.S. and Khamba, J.S. “An evaluation of TPM implementation initiatives in an Indian manufacturing enterprise”, Journal of Quality in Maintenance Engineering, 13 (4), 338-352, 2007.
[6] Bamber, C.J. et al. “Factors affecting successful implementation of total productive maintenance: a UK manufacturing case study perspective”, Journal of Quality in Maintenance Engineering, 5(3), 162-181, 1999.
[7] Chan, F.T.S. et al., “Implementation of total productive maintenance: A case study. International Journal of Production Economics, 95(1), 71–94, 2005.
[8] Carannante, T. “TPM implementation – UK foundry industry”. The Foundry man Supplement, 88(11), 1-34, 1995.
[9] Cochran, D. et al., A decomposition approach for manufacturing system design. Journal of Manufacturing Systems, 21(6), Citeseer, 2002.
[10] Cochran, D et al., “Investment and Resource Allocation Methodology to Support Manufacturing System Design Implementation. Retrieved from http://www.sysdesign.org/pdf/paper20.pdf, 2011.
[11] Estrada et al., “Converting from moving assembly lines to cells”. The Third World Congress on Intelligent Manufacturing Processes and System, Cambridge, MA, 2000.
[12] Gomez et al, “Equipment evaluation tool based on the manufacturing system design Decomposition”, The Third World Congress on Intelligent Manufacturing Processes and System, Cambridge, MA, 2000.
[13] Hartmann, E., “Successfully Installing TPM in a Non-Japanese Plant”, TPM Press Inc., Pittsburgh, PA, 1992.
[14] Ireland, F. and Dale, B.G. “A study of total productive maintenance implementation”, Journal of Quality in Maintenance Engineering, 7 (3), 183-191, 2001.
[15] Kulak, O. et al. “Applications of axiomatic design principles: a literature review”, Expert Systems with Applications, 37, 6705–6717, 2010.
[16] Leflar, J.A. “Practical TPM: Successful Equipment Management at Agilent Technologies” Productivity Press, Portland, OR, 2001.
[17] Lenz, R.K. and Cochran, D.S., “The application of axiomatic design to the design of the product development organization. Proceedings of First International Conference on Axiomatic Design, Cambridge, MA, 2000.
[18] McKone, K.E. et al., “The impact of total productive maintenance practices on manufacturing performance”, Journal of Operations Management, 19, 39–58, 2001.
[19] Mora, E. “The Right Ingredients: Keys to Succeed Implementing TPM and Lean Strategies”. Retrieved from at: www.tpmonline.com. 2011.
[20] Nakajima, S. “Introduction to Total Productive Maintenance (TPM).” Productivity Press, Portland, OR. 1988.
[21] Nakajima, S., “TPM Development Program: Implementing Total Productive Maintenance” Productivity Press, Portland, OR, 1989.
[22] Osha.gov, “Fatal Facts”, Retrieved from http://www.osha.gov/OshDoc/toc_FatalFacts.html, 2011.
[23] Pirsig, R.M., “Total productive maintenance: Managing Factory Maintenance”, Industrial Press Inc., New York, NY. 1989.
[24] Rodrigues, M. and Hatakeyama, K, “Analysis of the fall of TPM in companies”, Journal of Materials Processing Technology, 179 (1-3), 276-279, 2006.
[25] Shirose, K., “Total Productive Maintenance: New Implementation Program in Fabrication and Assembly Industries”, Japan Institute of Plant Maintenance, Tokyo, 1996.
[26] Steinbacher, H.R. and Steinbacher, N.L., “TPM for America”. Productivity Press, Portland, OR, 1993.
[27] Suh, N. P. “Axiomatic Design”, Oxford University Press, New York, 1990.
[28] Shukla and Cochran, “Impact of System Design, Organizational Processes and Leadership on Manufacturing System Design and Implementation”, Retrieved from http://www.sysdesign.org/pdf/paper17.pdf, 2011.
[29] Wireman, T., “Total Productive Maintenance”, Industrial Press Inc., New York, NY, 2004.
[30] Yamaguchi, S. “TPM (Maintenance and Management) Management Index and Activity Index. Retrieved from http://www.tpmclubindia.org, 2011.

Editor
Prof. Mary Kathryn Thompson
© ICAD 2013.
All rights reserved. No part of this publication may be reproduced without the written permission of the copyright owner.
9 780989 465809
90000>ISBN 978-0-9894658-0-9
$0.00