Proceedings of the 13th International Conference on - DSpace
477
Proceedings of the 13th International Conference on Technology in Mathematics Teaching ICTMT 13 ´ Ecole Normale Sup´ erieure de Lyon / Universit´ e Claude Bernard Lyon 1 3 to 6 July, 2017 Gilles Aldon, Jana Trgalov´ a
-
Upload
khangminh22 -
Category
Documents
-
view
1 -
download
0
Transcript of Proceedings of the 13th International Conference on - DSpace
Proceedings of the 13th International Conference onTechnology in Mathematics Teaching
ICTMT 13
Ecole Normale Superieure de Lyon / UniversiteClaude Bernard Lyon 1
3 to 6 July, 2017
Gilles Aldon, Jana Trgalova

2

Table of contents
1 Introduction 9
2 CURRICULUM 13
THE IMPACT OF TECHNOLOGY USE ON THE CURRICULUM OF THECOURSE ”PLAN TRANSFORMATIONS IN GEOMETRY”: A SELF-STUDY, Gure-vich Irina [et al.] 13
COMPUTER SCIENCE IN MATHEMATICS’ NEW CURRICULA AT PRI-MARY SCHOOL: NEW TOOLS, NEW TEACHING PRACTICES?, HaspekianMariam 23
INTERACTIVE DIAGRAMS USED FOR COLLABORATIVE LEARNING, Naf-taliev Elena 32
COMPETENCIES AND DIGITAL TECHNOLOGIES – REFLECTIONS ONA COMPLEX RELATIONSHIP, Weigand Hans-Georg 40
BLENDING COMPUTATIONAL AND MATHEMATICAL THINKING INPRIMARY EDUCATION: THE SCRATCHMATHS PROJECT IN ENG-LAND, Clark-Wilson Alison [et al.] 48
3 ASSESSMENT 51
A, B or C? THE ROLE OF POLES IN PROMOTING FORMATIVE AS-SESSMENT IN A CONNECTED CLASSROOM ENVIRONMENT, CusiAnnalisa [et al.] 51
ICTMT 13 1 Lyon 3 - 6 July 2017

25 YEARS OF E-AsSESSMENT AND BEYOND: HOW DID I DO!, McCabe Michael 61
MAKING GOOD PRACTICE COMMON PRACTICE BY USING COM-PUTER AIDED FORMATIVE ASSESSMENT, Olsher Shai [et al.] 69
CAN I SKETCH A GRAPH BASED ON A GIVEN SITUATION?–DEVELOPINGA DIGITAL TOOL FOR FORMATIVE SELF-ASSESSMENT, RuchniewiczHana 75
4 STUDENTS 87
STUDENTS’ EXPANDING OF THE PYTHEGOREAN THEOREM IN ATECHNOLOGICAL CONTEXT, Anabousy Ahlam [et al.] 87
LOOKING AT COMPOSITIONS OF REFLECTIONS IN A DGE FROMTHINKING MODES AND SEMIOTIC PERSPECTIVES, Donevska-TodorovaAna [et al.] 96
GAMIFYING MATH TRAILS WITH THE MATHCITYMAP APP: IM-PACT OF POINTS AND LEADERBOARD ON INTRINSIC MOTIVATION, Gur-janow Iwan [et al.] 105
”POWER OF SPEED” OR ”DISCOVERY OF SLOWNESS”: TECHNOLOGY-ASSISTE GUIDED DISCOVERY TO INVESTIGATE THE ROLE OF PA-RAMETERS IN QUADRATIC FUNCTIONS, Gobel Lisa [et al.] 113
DYNAMIC GEOMETRY SOFTWARE IN MATHEMATICAL MODELLING:ABOUT THE ROLE OF PROGRAMME-RELATED SELF-EFFICACY ANDATTITUDES TOWARDS LEARNING WITH THE SOFTWARE, HertleifCorinna 124
FEEDBACK IN A COMPUTER-BASED LEARNING ENVIRONMENT ABOUTQUADRATIC FUNCTIONS: RESEARCH DESIGN AND PILOT STUDY, JedtkeElena 134
EXPLOITING POTENTIALS OF DYNAMIC REPRESENTATIONS OFFUNCTIONS WITH PARALLEL AXES, Lisarelli Giulia 144
2

REASONING STRATEGIES FOR CONJECTURE ELABORATION IN DGE, OstaIman [et al.] 151
ALGEBRA STRUCTURE SENSE IN A WEB ENVIRONMENT: DESIGNAND TESTING OF THE EXPRESSION MACHINE, Rojano Teresa44 159
CENTRAL AND PARALLEL PROJECTIONS OF REGULAR SURFACES:GEOMETRIC CONSTRUCTIONS USING 3D MODELING SOFTWARE, SurynkovaPetra 169
SPATIAL–SEMIOTIC ANALYSIS OF AN EIGTH GRADE STUDENT’SUSE OF 3D MODELLING SOFTWARE, Uygan Candas [et al.] 177
MATHEMATICS IN PRE-SERVICE TEACHER EDUCATION AND THEQUALITY OF LEARNING: an experience with paper planes, smartphonesand geogebra, Luıs Santos Fernando [et al.] 187
THERE IS MORE THAN ONE FLIPPED CLASSROOM, Andra Chiara [etal.] 190
5 TEACHER 199
MOOC FOR MATHEMATICS TEACHER TRAINING: DESIGN PRINCI-PLES AND ASSESSMENT, Aldon Gilles [et al.] 199
THE EFFECT OF COLLABORATIVE COMPUTERIZED LEARNING US-ING GEOGEBRA ON THE DEVELOPMENT OF CONCEPT IMAGES OFTHE ANGLE AMONG SEVENTH GRADERS, Baya’a Nimer 208
TEACHING WITH GEOGEBRA: RESOURCE SYSTEMS OF MATHE-MATICS TEACHERS, Bozkurt Gulay [et al.] 216
PLANNING TO TEACH LOWER SECONDARY MATHEMATICS WITHDYNAMIC MATHEMATICAL TECHNOLOGY: QUALITY FEATURES OFLESSON PLANS, Clark-Wilson Alison [et al.] 224
PRE-SERVICE TEACHERS' PREPARATION AS A CATALYST FORTHE ACCEPTANCE OF DIGITAL TOOLS FOR TEACHING MATHE-MATICS AND SCIENCE, Daher Wajeeh [et al.] 232
3
EFFECT OF GEOGEBRA COLLABORATIVE AND ITERATIVE PRO-FESSIONAL DEVELOPMENT ON IN-SERVICE SECONDARY MATHE-MATICS TEACHERS’ TPACK, Kasti Houssam 241
GEOGEBRA AND NUMERICAL REPRESENTATIONS: A PROPOSALINVOLVING FUNDAMENTAL THEOREM OF ARITHMETIC, OliveiraGerson 248
ANALYSING THE TEACHER’S KNOWLEDGE FOR TEACHING MATH-EMATICS WITH TECHNOLOGY, Rocha Helena 256
A CASE STUDY OF A SECONDARY SCHOOL MATHEMATICS TEACHER’SCLASSROOM PRACTICE WITH WEB-BASED DYNAMIC MATHEMAT-ICAL SOFTWARE, Simsek Ali 266
A CLASSIFICATION OF RESOURCES USED BY MATHEMATICS TEACH-ERS IN AN ENGLISH HIGH SCHOOL, Umameh Michael [et al.] 276
DOCUMENTATION EXPERTISE AND ITS DEVELOPMENT WITH DOC-UMENTATIONAL EXPERIENCE IN COLLECTIVES: A FRENCH CASEOF COLLECTIVE LESSON PEPRATION ON ALGORITHMIC, De MoralesRocha Katiane [et al.] 285
IN SEARCH FOR STANDARDS: TEACHING MATHEMATICS IN TECH-NOLOGICAL ENVIRONMENT, Tabach Michal [et al.] 293
MATHMAGIC: the ENCOUNTER BETWEEN COMPUTATIONAL ANDMATHEMATICAL THINKING, Lealdino Pedro [et al.] 301
MOVING, COMPARING, TRANSFORMING GRAPHS: A BODILY AP-PROACH TO FUNCTIONS, Ferrara Francesca [et al.] 304
DYNAMIC TECHNOLOGY FOR SIMULATING A SCIENTIFIC INQUIRYFOR LEARNING - TEACHING PRE-CALCULUS CONCEPTS, SwidanOsama [et al.] 308
6 INNOVATION 313
THE TRANSPOSITION OF COUNTING SITUATIONS IN A VIRTUAL
4

ENVIRONMENT, De Simone Marina [et al.] 313
HANDWAVER: A GESTURE-BASED VIRTUAL MATHEMATICAL MAK-ING ENVIRONMENT, Dimmel Justin [et al.] 323
MONITORING A TECHNOLOGICAL BASED APPROACH IN MATHE-MATICS IN PORTUGAL - THE CASE OF KHAN ACADEMY, DomingosAntonio 331
THE DESIGN AND USE OF OPEN ONLINE MODULES FOR BLENDEDLEARNING IN STEM TEACHER EDUCATION, Drijvers Paul [et al.] 339
TEACHING LOCUS AT UNDERGRADUATE LEVEL: A CREATIVITYAPPROACH, El-Demerdash Mohamed [et al.] 347
MATHEMATICS FOR GRAPHICS COMPUTING: students learn Algebraand program Python to create a project where they make Algebra create ascenario’s photo., Gaspar Martins Sandra [et al.] 357
7 SOFTWARE AND APPLICATIONS 367
AN INTERACTIVE BOOK ON AXIAL SYMMETRY AND THE SYNER-GIC USE WITH PAPER AND PIN, Faggiano Eleonora [et al.] 367
STUDENTS’ COVARIATIONAL REASONING: A CASE STUDY USINGFUNCTION STUDIUM SOFTWARE, Gitirana Veronica 378
CATO-ANDROID: THE GUIDED USER INTERFACE FOR CAS ON AN-DROID SMARTPHONES, Janetzko Hans-Dieter 386
WIMS WWW INTERACTIVE MULTIPURPOSE SERVER AN INTERAC-TIVE EXERCISE SOFTWARETHAT HAS 20 YEARS AND STILL IS ATTHE TOP, Kobylanski Magdalena 392
GEOGEBRA AUTOMATED REASONING TOOLS: A TUTORIAL WITHTOOLS: A TUTORIAL WITH EXAMPLES, Kovacs Zoltan [et al.] 400
FUNCTION HERO: AN EDUCATIONAL GAME TO AFFORD CREATIVE
5

MATHEMATICAL THINKING, Lealdino Pedro 405
(UN)INTENDED REPRESENTATION IN DYNAMIC GEOMETRY SOFT-WARE: PEDAGOGICAL CONSIDERATIONS, Okumus Samet 412
INCORPORATING LyX AS STANDARD TOOL FOR WRITING MATH-EMATICS - EFECTS ON TEACHING AND LEARNING, Weiss Ittay 419
PRACTICING WIMS : HANDS-ON TRAINING, Buskulic Damir 427
8 POSTERS 431
AUGMENTED LOG: USING AR TECHNOLOGY TO CONSTRUCT LEARN-ING ABOUT LOGARITHMS AND EXPONENTIALS, Bini Giulia 431
STRUCTURING HINTS AND HEURISTICS IN INTELLIGENT TUTOR-ING SYSTEMS, Bos Rogier 436
TECHNOLOGY AS A RESOURCE TO PROMOTE INTERDISCIPLINAR-ITY IN PRIMARY SCHOOLS, Domingos Antonio 440
DESIGNING TASKS THAT FOSTER MATHEMALLY BASED EXPLANA-TIONS IN A DYNAMIC SOFTWARE ENVIRONMENT, Fahlgren Maria [etal.] 443
BOUNDARY OBJECTS IN INTERDISCIPLINARY RESEARCH ON MUL-TIMODAL ALGEBRA LEARNING, Janßen Thomas [et al.] 447
LEARNING WITH INTERACTIVE VIRTUAL MATHS IN THE CLASS-ROOM, Palha Sonia [et al.] 449
DIGITAL MATHEMATICS TEXTBOOKS: ANALYZING STRUCTURE ANDSTUDENTS USES, Pohl Maximilian [et al.] 453
BRINGING APPROPRIATE MENTAL IMAGES TO THE FOREGROUNDUSING DYNAMIC GEOMETRY AS A SEMIOTIC MEDIATOR: WHENIS A RECTANGLE A RECTANGLE?, Rizzo Ottavio 457
6

THE USE OF COMPUTER BASED ASSESSMENT PISA 2012 ITEMS INMATHEMATICS CLASS: STUDENTS’ ACTIVITIES AND TEACHERS’PRACTICES, Salles Franck [et al.] 460
THE GRAPHING CALCULATOR IN THE DEVELOPMENT OF THE MATH-EMATICS CURRICULUM IN THE 7TH GRADE OF BASIC EDUCA-TION, Subtil Manuela [et al.] 463
WeDRAW: USING MULTISENSORY SERIOUS GAMES TO EXPLORECONCEPTS IN PRIMARY MATHEMATICS, Duffy Sam 467
Author Index 472
9 SPONSORS 475
7

8

Chapter 1
Introduction
The 13th International Conference on Technology in Mathematics Teaching – ICTMT 13 wasorganized by the Ecole Normale Superieure de Lyon and the University Lyon 1. It was held inLyon, France, 3 to 6 July, 2017.
This biennial conference is the thirteenth of a series which began in Birmingham, UK, in1993, under the influential enterprise of Professor Bert Waits from Ohio State University. Thelast conference was held in Faro, Portugal, in 2015 and the next conference will be held in Essen(Germany) in July 2019.
The ICTMT conference series is unique in that it aims to bring together lecturers, teach-ers, educators, curriculum designers, mathematics education researchers, learning technologistsand educational software designers, who share an interest in improving the quality of teachingand learning, and eventually research, by effective use of technology. It provides a forum forresearchers and practitioners in this field to discuss and share best practices, theoretical know-how, innovation and perspectives on educational technologies and their impact on the teachingand learning of mathematics, as well as on research approaches.
The ICTMT conferences aim to bring together lecturers, teachers, educators, curriculumdesigners, mathematics education researchers, learning technologists and educational softwaredesigners, who share an interest in improving the quality of teaching and learning by effectiveuse of technology. It provides a forum for researchers and practitioners in this field to discussand share better practices, theoretical know-how, innovation and perspectives on educativetechnologies and their impact on the teaching and learning of mathematics.
The general theme of this conference is related to the progress of mathematics educationresearch on the design and integration of technology in educational settings, for learners of allages rom primary schools to universities.
The ICTMT 13 gave to all participants the opportunity to share research and to reportprogress regarding technology in the mathematics classroom. The following themes were pre-sented and discussed during the four days of the conference and these proceedings are the resultof both the proposals and the discussion made during the presentation slots.
ICTMT 13 9 Lyon 3 - 6 July 2017

Curriculum
Technology and its use impact the ways that the mathematics curriculum is designed and im-plemented both in schools and at the university level. What are the new impacts of technologyon the content, progression and approach to the mathematics curriculum?
Assessment
Technology offers through its functionalities and affordances new possibilities for assessment inmathematics and particularly for formative assessment. How can teachers support the students’learning that make use of these functionalities and affordances? How can technology supportstudents to gain a better awareness of their own learning?
Students
Does technology still motivate students to learn mathematics? How can technology support stu-dents’ to learn mathematics? How can technology foster the development of creative mathemat-ical thinking in students? How can students use their day-to-day technological skills/experiencesto support their mathematics learning in and out of schools?
Teachers
Technology can provide a means for mathematics teachers’ professional development throughonline professional development initiatives, such as blended courses and more recently “mas-sive Open Online Courses (MOOCs). How can technology best support mathematics teachers’professional development? What are the design principles for technology-mediated professionaldevelopment courses? How can the impact of such courses on mathematics teachers’ professionallearning be assessed? Does the use of technology within professional courses for practicing math-ematics teachers impact positively on teachers’ uses of technology in mathematics lessons?
Innovation
New developments in technology for learning and teaching mathematics come both from thedesign of new applications and from research and innovation. In what ways can these devel-opments enhance mathematics teaching and learning? How can technology become a bridgebetween mathematics and other subjects? Does creativity in the design of technology impactthe creativity of students in maths classes?
10

Software and applications
What is new in the design of educational software and applications? How can the recent techno-logical developments, such as robotics, touch technology, virtual reality, be exploited to refreashor enhance mathematics teaching and learning?
11

12

Chapter 2
CURRICULUM
ICTMT 13 13 Lyon 3 - 6 July 2017

THE IMPACT OF TECHNOLOGY USE ON THE CURRICULUMOF THE COURSE “PLANE TRANSFORMATIONS IN
GEOMETRY”: A SELF-STUDYIrina Gurevich and Mercedes Barchilon Ben-Av
Achva Academic College (ISRAEL)
In the current research, we analysed our own teaching experience of integrating technology inthe classroom. We traced the impact of integrating technology on the curriculum of the course“Plane transformations in geometry”. This research is a self-study. The course is taught in themathematics department of Achva Academic College. The students are mathematics studentteachers. While adapting our classroom to a high-tech environment we modified the coursecurriculum. These changes have been traced across almost a decade and are analysed withrespect to basic principles of constructivist teaching. The results indicate significant changes inthe curriculum, coherent with the constructivist approach to teaching.
Background
Unkefer, Shinde, & McMaster (2009) propose that the implementation of technology in theeducational process induces teachers to look for the appropriate learning environment andpedagogical procedure. According to this conception, the principle of integrating a dynamicenvironment into the educational process entails continual modification of the classroom and theteaching methodology. Furthermore, educational researchers widely agree that one of the criticalfactors that can lead to the effective integration of technology into teaching is teachers’ beliefthat technology can improve learning (e.g., Chen, Looi, & Chen, 2009; Ertmer, 2005; Drijvers etal., 2010; Mittal & Chawla, 2013; So & Kim, 2009). Unfortunately, many mathematics teachersstill worry that technology might harm the development of formal thinking in mathematicsstudents, although they accept that the visualization of mathematical objects can facilitatestudents’ understanding of the learning material (Blum & Kirsch, 1991; Pinto & Tall, 2002). As aresult of integrating technology, even the teachers’ way of “doing mathematics” may change -from the belief that mathematics has only correct or incorrect statements to the belief thatmathematics may mean the process of solving a particular mathematical problem, while refiningthe understanding and clarifying the correct mathematical ideas which fits well withconstructivist approaches to constructing knowledge (Sachs, 2014).
Motivation of the study
In the current research, we intend to analyze the impact of the usage of dynamic software(GeoGebra) on the curriculum of the course “Plane transformations in geometry”.
As to the plane isometries, which are the main part of the transformations studied within thecourse, the students’ previous acquaintance with these transformations is usually restricted to avisual level of perception, while rigorous study of geometrical definitions and properties relatedto these transformations is also more or less new to them. Even on the visual level, they
ICTMT 13 14 Lyon 3 - 6 July 2017

encounter difficulties e.g., in discerning a pure reflection from reflection composed withtranslation, reflection from central symmetry etc. Such issues, for example, a composition ofisometries, is important in the course since it is difficult. Hence, in order to provide a goodunderstanding of transformations, one has to teach them anew.
In view of specific features of recently developed computerized tools, it seems almost obvious toconsider applying new methods in geometry teaching based on these tools in teachingtransformations. In the modern literature on new approaches in geometry teaching and learning,specific computerized tools such as dynamic geometry environments are being regarded as oneof the teaching alternatives (see, for example, Healy & Hoyles, 2001). The rationale behindapplying dynamic computerized tools in the course "Plane Transformations in Geometry" isrelated to some essential features of these tools, such as: convenient and adequate visualizationof geometrical argumentation; direct implementation of basic and composed plane isometries;flexibility of dynamic structure, which preserves and accentuates essential transformation-invariant relations between elements of geometric objects. Moreover, our own experience ofteaching for more than a decade indicates that integrating digital technology contributes to abetter understanding of the subject by the students (Barabash, Gurevich & Yanovski, 2009,Gurevich & Gorev, 2012).
In the current research, as instructors’ teachers we were interested in testing whether the changesmade contribute to the transformation of the process of students’ passive acquisition ofknowledge into an active, constructive process of knowledge building.
Course curriculum
The course is taught in the mathematics department of Achva Academic College in Israel. Thestudents are mathematics student teachers. The main topics are basic plane isometries:translations, reflections, rotations, glide reflections, and their compositions. Students learn todefine isometry in terms of functions. They also study such transformations as central similarityand inversions that are not isometries. They become acquainted with the invariants of differenttransformations, for example, invariance of images under composition of two reflections with thesame angle between their axes, and invariance of an angle under inversion. In addition, studentsstudy the properties of each transformation and develop mathematical arguments aboutgeometric relationships. Students become acquainted with matrix representations of differenttransformations and their compositions by means of matrices, and finally, they becomeacquainted with the solutions of construction problems using transformations.
Methodology
Participants
We are two teacher educators in the mathematics department of a college of education. Datawere drawn from the course “Plane transformations in geometry” across almost a decade (2007-2016). Our students were mathematics student teachers.
ICTMT 13 15 Lyon 3 - 6 July 2017

A self-study
We have chosen the genre of self-study since as teacher educators we sought to analyse our ownteaching with the purpose of adjusting our teaching to current trends. We felt a tension betweenthe intention of teaching the students to present elaborated formal answers and the belief that themost appropriate way of teaching is based on students’ construction of knowledge in acomputerized environment. In our research, we concentrated on the following themes:presentation of material, classroom activity and homework assignments. In order to discover howthe chosen themes developed throughout the research period we examined the data obtained byourselves over two academic years, 2007 and 2016. These academic years were chosen since in2007 the course was taught in traditional classrooms where the digital tools were usedepisodically, mainly for illustration, while in 2016 the dynamic digital tool GeoGebra was fullyintegrated into teaching/learning process.
Data collection and analysis
We evaluated the mode of our teaching together with the level of activity of our students’ processof acquiring knowledge regarding basic characteristics of the traditional and constructivistclassroom defined by Brooks and Brooks (1993) as follows:
Table 1. Basic characteristics of the traditional and constructivist classroom (Cited from Brooks and
Brooks, 1993, p.17)
Traditional Classrooms Constructivist Classroom… …
Strict adherence to fixed curriculum ishighly valued.
Pursuit of student questioning is highlyvalued
Curricular activities rely heavily ontextbooks and workbooks.
Curricular activities rely heavily on primarysources of data and manipulative materials.
Students are viewed as “blank slates”onto which information is etched by theteacher.
Students are viewed as thinkers withemerging theories about the world.
Teachers generally behave in a didacticmanner, disseminating information tostudents.
Teachers generally behave in an interactivemanner, mediating the environment forstudents.
Teacher seeks the correct answer tovalidate student learning.
Teachers seek the student’s point of view inorder to understand student’s presentconceptions for use in subsequent lessons.
Assessment of student learning is viewedas separate from teaching and occursalmost entirely through testing.
Assessment of student learning is interwovenwith teaching and occurs through teacherobservations of students at work and throughstudent exhibitions ….
ICTMT 13 16 Lyon 3 - 6 July 2017

The data were collected from the following sources: lessons plans, assignments given to thestudents, examinations, and comments on course evaluations (taken from the researchers’ log andnotes on office conversations).
The data from each academic year were analyzed with respect to the above characteristics, thatis, based on the data we tried to determine to which kind of classroom (traditional vsconstructivist) they fit.
Results
Below we present the examples of presentation of material, classroom activity and homeworkassignments taken from two academic years (2007 and 2016) that illustrate the changes thatoccurred in reference to the characteristics described in Table 1 that specify the traditional vs. theconstructivist classroom. It is important to emphasize that in all the activities described below thestudents worked in small groups to construct their knowledge by themselves. Plenary discussionfollowed each activity.
Episode 1 - Presentation of material.
We proved the theorem that if two points A and B are collinear with the centre of inversion O,and Q is any other point, then the angle AQB is preserved under inversion (see Figure 1).
Figure 1. Point O is the center of inversion. Tree points A, B and Q are given where A and B arecollinear with the center of inversion. If A1=Inv(A), B1=Inv(B), Q1=Inv(Q) thenAQB=A1Q1B1.
a) In 2007 the analytical proof of the theorem was presented to the students.b) In 2016 after the theorem was proven, the students suggested that the theorem holds only when both points (A and B) are either inside or outside the circle of inversion. The students were then asked to explore the given situation using GeoGebra and to test their conjectures. They found that the theorem holds no matter where the points A and B are (while they are on the same ray). Then we analysed the analytical proof to make sure that it does not depend on whether the points are inside or outside the circle of inversion.
Commentary:
In the described situation, digital technology enables the students to explore the theorem bythemselves and to make sure that it holds.
Episode 2 - Classroom activity
ICTMT 13 17 Lyon 3 - 6 July 2017

The students were given the following assignment:
Suppose T(-3,0) is a translation by the vector (3,0). Define H=Sx◦ T(-3,0). What is the transformationrepresented by H? What is the transformation represented by H◦H?
a) Academic year 2007 – the students had previously learned that the transformation resulting from a composition of translation and reflection when the translation vector is parallel to the reflection line is glide reflection. Moreover, the composition of two glide reflections results in translation by a double vector of the given one. After multiplying the matrices, they confirm this
result:
H=(1 0 00 −1 00 0 1 )⋅(
1 0 30 1 00 0 1 )=(
1 0 30 −1 00 0 1 )
H ∘H=(1 0 30 −1 00 0 1 )⋅(
1 0 30 −1 00 0 1 )=(
1 0 60 1 00 0 1 )
b) Academic year 2016 – Besides the described above activity the students were asked whatwould happen if the given vector were not parallel to the reflection line. The students suggestedthat the result of H◦H, where the H is defined as H=Sx◦ T(a,b) should be a translation by 2(a,b).Given the students’ misconception, we decided to experiment with GeoGebra, where thestudents’ conjecture was refuted. Namely, it was observed that the discussed transformationresults in translation by a double projection of the given vector on the x-axis (see Figure 3).
Figure 3. The image of P under H◦H, where H is defined as H=Sx◦ T(a,b) is P’: P’= (H◦H)(P). The
vector of translation is defined as u=( a ,b) . The given transformation results in translation by the
vector v=(2u )x=(2a ,0 ) .
After having obtained the above results in GeoGebra, the students derived it analytically usingcorresponding matrices, as follows:
ICTMT 13 18 Lyon 3 - 6 July 2017

H=(1 0 00 −1 00 0 1 )⋅(
1 0 a0 1 b0 0 1 )=(
1 0 a0 −1 −b0 0 1 )
H ∘H=(1 0 a0 −1 −b0 0 1 )⋅(
1 0 a0 −1 −b0 0 1 )=(
1 0 2a0 1 00 0 1 )
Commentary:
The above example shows that GeoGebra enabled the students to explore new situations, testtheir conjectures, come to a completely unexpected result, and thereby refine their understandingof mathematics.
Episode 3 - Homework assignments
Below we present an example of a homework assignment:
Find the matrix S that represents the transformation obtained by first rotating around the origin(0, 0) by 45˚ and then translating by (-2, 6). What is the transformation that corresponds to S(Find its parameters).
a) In 2007 the students were supposed to find the matrix S by multiplying the correspondingmatrix, then they were supposed to identify the resulting transformation as a rotation by 45˚ butwith a new origin, and after that to find the image of the given point.
b) In 2016 the students were requested to perform the following steps:
1. Draw the image of the point (4, 3) with respect to S, by using GeoGebra;2. Find the centre of the rotation found in step 1, using geometrical constructions (see Figure 6);3. Find the matrix S and then find the centre of the corresponding rotation analytically;
4. Make sure that in both cases (in GeoGebra and analytically) the result is the same.
ICTMT 13 19 Lyon 3 - 6 July 2017

Figure 4. The same point P1''
is obtained as the image of P in two different ways:1) under composition of rotation around the origin (0, 0) by 45˚ and then translating by (-2, 6); 2) by rotating P around O’ by 45˚. A new origin (O’) was found as an intersection of a perpendicularbisector of a line sector PP1’’ and a line forming an angle of 67.5˚ with this line sector.
Commentary:
In 2016 the students experiment with the given task: first they perform the given transformationsand find the solution by means of GeoGebra, and then solve the same problem analytically. Thus,they can compare the answers received and make sure the solution is correct. Students foundevidence that it is possible to get the same results using either geometric or algebraic methods.
Discussion
Dealing with the tension between teaching mathematics courses in a computerized environmentand the mandatory requirement for the students to present formal proofs and answers led us tomake important changes in the curriculum of the course “Plane transformations in geometry”.
The analysis of all the data obtained from two academic years within a period of ten academicyears revealed the changes both in our mode of teaching and in the level of involvement of ourstudents in the learning process.
We found that in 2007, as instructors we behaved in a rather didactic manner, disseminatinginformation to our students, while curricular activities relied mainly on textbooks andworkbooks. The dynamic geometrical software was used only for visualization.
ICTMT 13 20 Lyon 3 - 6 July 2017

Referring to the data obtained in 2016, the following changes were found:
• Each new topic was explained and presented both analytically and using the computer, sothat the students got the opportunity to explore the topic themselves.
• The students raised conjectures consistent with the given problem, before we presented aformal solution, and thereby created their own knowledge based on their findings.
• The learning activity became interactive, and the students’ questions led to additionalelaborations of the studied topics.
• The students performed the homework assignments not only analytically but also usingGeoGebra.
We have analysed both the mode of our teaching and the level of our students’ involvement inthe learning process regarding basic characteristics of the traditional vs. the constructivistclassroom. It was found that in 2007 they fit the most of characteristics of the traditionalclassroom, while in 2016 our classroom fits well enough the characteristics of the constructivistclassroom. Thus, the obtained results permit us to conclude that during the period described ourclassroom changed from traditional to constructivist. Moreover, those changes are mainly due tothe integration of dynamic mathematical tools into our teaching.
The described changes concur with relevant studies demonstrating the ability of the instructor totake advantage of the dynamic environment when the pedagogy of the course was entirelytechnology-oriented (Monaghan, 2001; Hollebrands, 2007), and claiming that that theconstructivist approach intelligently utilizes a wide variety of computer capabilities to create acomputerized learning environment that facilitates constructivist teaching methods (Eshet &Hammer 2006).
Based on our own teaching experience, we believe that teaching mathematics in a computerizedenvironment contributes to understanding the formal subjects taught in mathematical courses.The students understand that although ultimately there must be a formal answer to amathematical problem, there are various ways to reach the solution. Thus, a computerizedenvironment can improve both learning in class and working at home while preparingassignments.
We as instructors constantly update the curriculum of the course according to our ongoingexperience of integrating new technological tools, and we intend to continue using varioustechnological tools that are appropriate to both our teaching goals and the students’ levels ofability.
References
Barabash, M., Gurevich, I., & Yanovski, L. (2009). Usage of computerized environment inthe course "Plane Transformations and Constructions in Geometry". The InternationalJournal for Technology in Mathematics Education, 16(2), 49-62.
Blum, W., & Kirsch, A. (1991). Pre-formal proving: Examples and reflections. EducationalStudies in Mathematics, 22(2), 183–203.
ICTMT 13 21 Lyon 3 - 6 July 2017

Brooks, J.G., & Brooks, M.G. (1993). The case for constructivist classrooms. Alexandria, Va.:Association for Supervision and Curriculum Development.
Chen, F. H., Looi, C. K., & Chen, W. (2009). Integrating technology in the classroom: A visualconceptualization of teachers’ knowledge, goals and beliefs. Journal of Computer AssistedLearning, 25, 470–488.
Drijvers, P., Kieran, C., Mariotti, M. A., Ainley, J., Andresen, M., Chan, Y. C., & Meagher ,M. (2010). Integrating technology into mathematics education: Theoretical perspectives. In C. Hoyles & J-B. Lagrange (Eds.), Mathematics education and technology—Rethinking the terrain; The 17th ICMI Study (pp. 89–132). Vol. 13, New ICMI Study Series. New York: Springer.
Ertmer, P. A. (2005). Teacher pedagogical beliefs: The final frontier in our quest for technologyintegration. Educational Technology Research and Development, 53(4), 25–39.
Eshet, Y. & Hammer, R. (2006). Principles of design and analysis of computer-basedlearning environments. The Open University of Israel. 31-38. (Hebrew).
Gurevich I., & Gorev D. (2012). Examining the impact of an integrative method of usingtechnology on students’ achievement and efficiency of computer usage and onpedagogical procedure in geometry. The International Journal for Technology inMathematics Education, 19(3), 95-104.
Healy, L., & Hoyles, C. (2001). Software tools for geometrical problem solving:Potentials and pitfalls. International Journal of Computers for Mathematical Learning,6, 235-256.
Hollebrands, K. F. (2007). The role of a dynamic software program for geometry in the strategieshigh school mathematics students employ. Journal for Research in Mathematics Education, 38(2),164-192.
Mittal, A. K., & Chawla, N. (2013). Pedagogy of mathematics: Role of technology in teaching-learning mathematics. Journal of Indian Research, 1(1), 105-110.
Monaghan, J. (2001). Teachers’ classroom interactions in ICT-based mathematics lessons.In M. V. D. Heuvel, (Ed.), Proceedings of the 25th International Conference for thePsychology of Mathematics Education, Vol. 3, (pp. 239-257).
Pinto, M., & Tall, D. (2002). Building formal mathematics on visual imagery: A case study and atheory. For the Learning of Mathematics, 22(1), 2–10.
Sachs, J. M. (2014). Managing the challenges of technology to support learning: Somelessons from experience. In: M. Gosper & D. Ifenthaler (Eds.): Curriculum models for21st century: Using learning technologies in higher education, 407-422. Springer.
So, H. J., & Kim, B. (2009). Learning about problem based learning: Student teachers integratingtechnology, pedagogy, and content knowledge. Australasian Journal of EducationalTechnology, 25(1), 101–116.
Unkefer, L., Shinde, S., & McMaster, K. (2009). Integrating advanced technology in teachereducation courses. TechTrends, 53(5), 80–85.
ICTMT 13 22 Lyon 3 - 6 July 2017

COMPUTER SCIENCE IN MATHEMATICS’ NEW CURRICULA AT PRI-
MARY SCHOOL: NEW TOOLS, NEW TEACHING PRACTICES?
Mariam Haspekian
University of Paris Descartes, Sorbonne Paris Cité, France, [email protected]
Abstract: Based on the observation of a teacher incorporating a programming language for the first
time in his teaching, and on previous research centred on the development of teaching practices in
mathematics, we highlight here the importance of didactic “landmarks”, functioning as references in
the dynamics involved along the development of teaching practices with ICT.
Keywords: teaching practices, Scratch, computer science, didactical landmark, instrumental distance
1. INTRODUCTION
In France, since September 2016, new mathematics curricula ask primary schools teachers and sec-
ondary mathematics teachers to integrate computer science, algorithmic, programming, using robots
or new software such as Scratch. This latter is referred to all along the different school levels, point-
ing computer science knowledge but also more or less traditional mathematics notions such as the
“location in space” (6/7 years-old, MEN 2015, p.86), the “production of simple algorithms” (8 y.o,
ibid.), or the “notions of variables and functions” (from the age of 12, ibid. p.378). Yet, the difficuly
for ICT to penetrate mathematics classrooms is not new, explained in many research by the "teacher
barrier". Will it be different this time? How will practices using these new tools for new curricula
develop over time?
We present here a case-study from the on-going ANR research project “DALIE” (Didactics and
learning of computer science in primary school), where 24 ordinary teachers (with no training), vol-
unteered to use robots and/ or Scratch software. We focus on the first sessions of René, a primary
school teacher, who uses for the first time Scratch. As most primary school teachers and mathemat-
ics teachers, René is a beginner in both the functioning of this tool, in the knowledge that it embeds,
and a fortiori in its didactic uses. How does Scratch become a teaching tool for René and for which
aims? What knowledge and practices does he develop? What can be learned from this study for the
teacher training to be set up but also the resources to support teachers?
The section 2 details the theoretical tools we use to analyse René’s practices, based on our previous
researches, and the section 3 our main results of observations. We end by a discussion in section 4.
2. THEORETICAL FRAMES FOR THE STUDY
Inscribed in the field of didactics of mathematics, our analyses are framed by two theoretical frames
that we briefly present next: the Double Approach and the Instrumental Approach in didactics.
Components of practices and instrumental approach in didactics
The Double Approach frame (didactic and ergonomic) of Robert & Rogalski (2002) models teach-
ing activity with five components (institutional, social, cognitive, mediative and personal). The in-
stitutional and social ones constraint the choices the teacher makes when organizing the students’
work: at cognitive level (as choices of contents, of tasks…) and mediative one (space and time or-
ganization). Decisions are taken according to the teachers’ own person (history, representation of
teaching, of education, of mathematics, of learning, etc.). To explain here why teachers act such as
ICTMT 13 23 Lyon 3 - 6 July 2017

they do, we take this personal component as crucial, supposing that daily cognitive/ mediave choic-
es, are imprinted of several didactic knowledge, which pre-exists in this personal component. In
other words, we think that the personal component contains knowledge on the cognitive and media-
tive ones themselves. This diversified knowledge acts as didactic landmarks guiding the subsequent
activity, which refers to it in order to perform the cognitive and mediative choices.
To specify this general approach to the case of instrumented situations, we turn towards the Instru-
mental Approach in didactics (Artigue 2002, Guin, Ruthven and Trouche, 2004, Lagrange 1999),
which borrows two of the keys ideas from the theory of instrumentation developed in cognitive er-
gonomic by Vérillon and Rabardel (1995 of): the process of instrumental genesis with its artefact/
instrument distinction, and the fact that this is not a one-way process. Rather there is a dialectic be-
tween the subject acting on her personal instrument (instrumentalization: the different functionality
of the artefact are progressively discovered, eventually transformed in a personal way) and the in-
strument acting on the subject’s mind (instrumentation: the progressive constitution of the cognitive
schemes of instrumented actions). So, human activity transforms an artefact into an instrument
across a long individual process of instrumental genesis, which combines these two interdependent
mechanisms. Both points out that instrumentation is not neutral: instruments have impacts on con-
ceptualizations. For example, using a graphic calculator to represent a function can play on student’s
conceptualizations of the notion of limit. This idea of not neutral "mediation", which exists (and al-
ways existed) between mathematics and instruments of mathematical activity, was used in several
studies, first on symbolic calculators, then on other software as dynamic geometry or spreadsheets.
In what follows, we introduce in more detail the notion that will be used from this frame: the dis-
tinction personal/ professional instrumental genesis.
Double instrumental genesis
Applying the notion of instrumental genesis to the teacher entails to divide it into a professional ge-
nesis and a personal genesis. To briefly present here this idea of double instrumental genesis, we go
back to the research context, which gave birth to it: the study of the spreadsheet integration in ma-
thematics classroom; more recent details can be found in (Haspekian, 2014).
For a person (the students, the teacher), an instrumental genesis (IGpe) can lead the artefact spread-
sheet to become a personal instrument of mathematical work. In addition, for the teacher, the same
artefact spreadsheet has to progressively become a didactic instrument serving mathematics learn-
ing, along a process of a professional instrumental genesis (IGpro). These are, for teachers and stu-
dents, two different spreadsheet instruments, from the same artefact. In this “splitting in two” in-
strument, the important point is that they both exist on the teacher’s side. The teacher has to
organize the students’ work, and accompany their instrumental geneses with the spreadsheet, a tool
of students’ mathematical work. This accompaniment evolves through the teacher’s various experi-
ments, along a professional genesis where the spreadsheet becomes an instrument for her profes-
sional activity: teaching mathematics. Unlike the students, the teacher thus faces two instruments,
one personal (possibly ancient as in the case of pocket calculators for which a IGpe process has gen-
erally taken place, former to any teaching context), and a professional one, based on the transform-
ing of the new artefact or already personal instrument (as the pocket calculator) into an instrument
to teach mathematics. The example of the pocket calculator as didactic instruments is rather telling
if considering the many (and now classic) situations of "broken machines" (in display, in use…)
provided in educational resources and developed in this aim of mathematics teaching (“broken key”,
“defective machine” [1]). This calculator, as a didactic instrument, is quite different from the per-
sonal "pocket calculator" instrument, which is ordinarily neither defective, nor with broken keys…
ICTMT 13 24 Lyon 3 - 6 July 2017

IGpro and IGpe interfere one on each other. Haspekian (2014) shows these interferences in the case
of a teacher integrating the spreadsheet while discovering it herself. But even when the IGpe is well
advanced, we claim that the process of IGpro is far from being evident. More, it also has to take into
account the student’s instrumental geneses. Schemes has to be built aiming at organizing the ’ work,
accompanying their own instrumental geneses with the tool. This piloting role is necessary for
Trouche (2004), who speaks about the teacher’s instrumental orchestration (configurations and
mode of exploitation of the tool in class) [2]. The figure 1 shows the relations between this teacher’s
double instrumental geneses interfering also with those of the students.
Fig 1 • Instrumental Geneses of the teacher (personal and professional) and the ’ Scratch puts René in this complex case. His personal schemes of action with Scratch are evolving
simultaneously, non-independently, with its professional schemes that aim students’ learning. An
additional difficulty comes in his case: knowledge to teach (computer science) is also new…
3. USING SCRATCH WITH FOURTH GRADE (9 YEARS OLD)
Methodology
Collected data consist of videos of the Scratch sessions and pre/ post interviews of the teachers. In
these data, we try to understand the activity of the teacher with Scratch, the way instrumental genes-
es develop, particularly the links between IGpe (teacher and students) and IGpro (teacher). The ses-
sions we focus here are situated at René’s very beginning of IGpro: it is his 2nd session with
Scratch, the first one consisting of a "free" discovering of Scratch by the students. What did René
plan next? What knowledge does he aim at (mathematics? computer science? instrumental only?),
through which functionality, in which order and under which modalities? In other words what are
René’s cognitive, mediative and instrumental choices? Another point makes this second session in-
teresting: the class is divided into two groups with whom René repeats the same 1,5h session on two
consecutive slots. We thus directly access to an instant of development of the teacher’s IGpro,
who’s reinvesting with the 2nd group the marks taken with the first. It is interesting to see, in real
time conditions, what types of marks he can he reinvest on the spot and why.
Main observed results
A detailed presentation of this session and its repetition is provided in Haspekian & Gélis (to come).
We present here a synthesis of the two main results: on the one hand an IGpe too little advanced to
efficiently support René’s IGpro, on the other hand, despite the difficult situation, an evolution nev-
ertheless of the IGpro, visible in the session repetition.
An IGpe too little advanced: consequences on the IGpro
In the session planed by Rene, the students were to answer two instructions [3] that, considering
their own IG advancement with Scratch and their mathematical knowledge at this school level, were
rising three foreseeable obstacles: first, the students did not yet meet the coordinates in Scratch, an
Teacher: IGpe
personnelle
Teacher: IGpro
professionnelle
The students:
IG
personnelles
influe on
organize,
accompany (influe on)
ICTMT 13 25 Lyon 3 - 6 July 2017

instrumental knowledge (a) necessary here to both locate, control moves of objects, and give them
an initial position. This relates to mathematical knowledge of this school level clearly mentioned in
the curricula (location in a plan or space). Then, they did neither meet the necessity (b) to define a
starting position with certain movement commands used (with absolute and nonrelative positions,
like “Going to…”). This instrumental knowledge is not obvious, insofar as an incompleteness of the
program is only visible if run twice (the object does not move anymore). Third, the students do not
either know the existence (c) of “scripts of scenario” associated to each object, which is again non-
intuitive (only one page of scripts is displayed at once) but necessary to control two or more objects.
Did René’s task aim at making this knowledge emerge? The videos and interviews show that Rene
did not prepare his session in this approach, having little identified himself these 3 points. Class-
room interactions show René having the same interrogations as the students and discovering (a), (b)
and (c), more or less realizing their importance on the spot. But René’s personal knowledge of
Scratch features, even if beginning, far from putting him in discomfort, is on the contrary utilized to
show students the importance of seeking solutions, carrying out tests, not discouraging...
This too little advanced GIpe of Rene has two consequences on his GIpro: in the management of the
students’ GI, and in the definition of the learning objectives with Scratch. Indeed, having not him-
self anticipated knowledge (a), (b), (c), René could not effectively support the students’ difficulties,
nor help their IG advance with Scratch. At several moments, in the two sessions, Rene is looking for
the origin of the problem. Sometimes he succeeds on the spot (it is the case for the knowledge (b)
but in an incomplete way: for the objects moved by translation but not by rotation), but more often
he blames Scratch features, saying they do not function well, or dismiss the problem without more
explanation, the dysfunction remaining thus not understood by the students. Lastly, Rene does not
manage Scratch like a didactic tool of learning mathematical concepts nor informatics concepts,
which are not identified at this stage (for example, his vocabulary is unstable: “coordinates” is
sometimes said “codes of the character” or “codes of movement”). Yet, René has two other objec-
tives instead. In the interviews, he states aiming at the learning of the French language (reading and
understanding of the commands, project of writing a novel, importance of the chronology of a story,
of sequencing the actions…) and of transdisciplinary objectives (to seek, to try and adjust, to devel-
op interactions between pairs).
Finding of landmarks and development of the IGpro
Observing Rene at the first stages of his GIpro with Scratch, we see the teacher taking reference
points with the first semi-group, and immediately reinvesting part of them with the second.
If the knowledge (c), a bit identified in mid-session 1, is never mentioned again, René clearly
evolves on (a): the interactions show that he discovers at the beginning of the group 1 session the
display of coordinates on the screen. At the end of this session, he points them directly (yet without
seeking the coordinate system that generates them): "If you don’t see it anymore, it means that the x
and y coordinates you put are outside of the page. (...) look, there you have the coordinates of the
pointer. If you move, the coordinates change". Then, with group 2 session, he anticipates and this
time mentions (a) during the beginning collective exchange: "I will save time compared to the pre-
vious group: see if we put the pointer here…” The interview confirms that he discovered knowledge
(a) during the session: "the coordinates of the pointer were displayed on the screen!"; "Look here,
there, here: x zero! y zero! I had not seen it but in fact when you move you have the exact position!"
In the same way, but at a later stage (in session 2), René becomes aware of knowledge (b). Once this
landmark taken, he immediately identifies the students’ difficulties related to uninitialized positions
ICTMT 13 26 Lyon 3 - 6 July 2017

and in a dialogue with a student, he clearly express regrets of not having specified it collectively: "I
see very interesting things but there is a point that you, uh, a point that, besides, we did not specify
in common...'. If the initial position problems in programs with displacements are thus well identi-
fied, the similar need to initialize a starting "orientation" in programs with rotations remains uniden-
tified, leaving the students who encounter it blocked.
The table 1 summarizes René's evolution on (a), (b), (c) knowledge, along the consecutive sessions:
Knowledge Group 1 session Group 2 session
a : - Coordinates - Existence of a coordinate
system
Coord : NO at the beginning, then awareness all along the session
System : NO
Coord. : YES and beyond (asking a start and final point different)
System : NO
b Initialize (if necessary) the starting position/ orientation
NO NO at the beginning, then awareness all
along the session for the displacements. No for the orientations.
c Scripts per object NO at the beginning, then YES YES and NO
Table 1 • Evolution of René’s GIpe/pro along the 2 groups
Levers to manage the sessions while finding landmarks in parallel
René is 14 years experienced. His teaching practices are rather stabilized and coherent (Robert &
Rogalski, 2002). The irruption of this new tool in the classroom destabilizes these equilibriums until
evolving towards a new stability, which maintain the teacher’s coherence in his professional activi-
ty. What is in the core of this process of evolution? The above analysis shows at least one thing: the
teacher is taking landmarks on the utilization of Scratch. Here, this constructive activity (Samurçay
and Rabardel, 2004) is occurring in the very time of the sessions, then how does Rene manage his
sessions for the time duration needed to find landmarks? He reports himself needing time: “I think it
is necessary to redo a week more exercises of uh..., to discover a little because uh...” But in spite of
these difficult conditions (non-specialist, untrained, new tool and with unidentified underlying
knowledge, be it algorithmic, mathematics or computer science), René remains at ease in the ob-
served sessions, at no time in difficulties, neither at the macro level of its progression with Scratch,
nor at the meso level of each session. What levers does he use?
Our hypothesis is that René has sufficient other landmarks (brought by his experience outside of
tools as Scratch) to engage on innovative sessions without being toughly shaken, sessions that will
provide him new landmarks. However, his use of Scratch does not lead him to use the tool with a
mathematical or computer learning goal; he relates to transversal learning or French language learn-
ing. We make the hypothesis that these levers are not fortuitous choices, on the contrary they could
be explained, again, in terms of landmarks acquired by the teacher, minimizing the distance that the
software introduces to his everyday practices: René knows very well the teaching of French, and
choosing transdisciplinary aims (group work, students’ socialization, construction of a class project)
also provides well-known landmarks, easily transferable because without underlying concepts.
4. DISCUSSION ET PERSPECTIVES FOR RESEARCH AND TEACHER TRAINING
Distance and landmarks
In earlier work, we have encountered two other cases, as René, of teachers minimizing the distance
embarked by "newness" in old practices: the introduction of the spreadsheet into algebra teaching,
which led to the idea of instrumental distance (Haspekian, 2014), and that of algorithmic into high
school, where we observed similar phenomena to those of instrumental distance: tensions and resis-
tances, practices of juxtaposition (homework, not integrated activities) or setting up of situations
minimizing the "distance" that we then extended to a "distance to usual mathematical practices"
ICTMT 13 27 Lyon 3 - 6 July 2017

(Haspekian & Nijimbéré, 2016). The didactic landmarks appear as another hyphen to all these cases,
like another face of the distance. If there is distance (to former practices), disturbing the teacher, not
simply innovation, added without making waves on the current practices, it is because some didactic
landmarks have been already built and the newness moves the teacher away from them, causing a
loss feeling. New marks are to be created, either brought by training, resources, or by imagining
them oneself or still accepting trying the experiment after all, in a blind manner. A first trial creates
new reference marks which can lead to quite a different teaching activity at the second attempt. At a
longer scale, several such experiments can supply the teacher with sufficiently robust landmarks
enabling him to act in brand-new situations since they’re not too distant on what was lived up, or
since the teacher manages to bring it closer to what he knows. We saw these on-going processes
happening in the case of Rene, but also with the spreadsheets. In other words, an enough expe-
rienced teacher will not only have more reference marks but may also be able to transpose, adapt old
reference marks to create new ones more quickly and more easily than a beginner. In the same way,
when we note phenomena of reduction of the distance, this translates the teacher’s attempt to ap-
proach a situation in which she finds back didactic references. The distance is problematic when
these landmarks are too much disrupted and/or without new ones being considered. For example,
the factor making the spreadsheet instrumental distance too large had been analyzed as epistemolog-
ical. The spreadsheet drops too much references on this dimension; letting the teacher with not
enough didactic landmarks particularly in mathematical praxeologies. Thus, speaking of “distance”
supposes the existence of an upstream referential to which new practices are compared. Whatever
the term to name it, this referential serves the teacher to navigate in her daily practices by carrying a
number of preexistent didactic landmarks (which can thus be disturbed, modified, searched, built,
rebuilt…). The definition includes this idea of guidance of the teacher’s later activity: a didactic
landmark is a professional knowing, guiding the teacher in her action. The term “didactic” is taken
in a very common sense, to specify that the elements of knowledge in which we are interested are
those linked to the teaching-learning (including class management for instance).
The factors identified here and in our former research as contributing to create distance allow a ca-
tegorization of the didactic landmarks, theoretically structured by the components of the Double
Approach where we specifically isolate in the personal one: teachers epistemology and representa-
tions:
Even if legitimacy institutional (and social) is given and accepted, the teacher can still feel difficulties on the levels of: - The disciplinary knowledge embarked by the tool: a too long distance to the usual objects of teaching (for example in
the case of the spreadsheet in algebra: distance to the discipline and importance of “epistemological” legitimacy). This level where the epistemology of the teacher plays relates to the personal component of the Double Approach (repre-sentations on a discipline, on its teaching, its learning)
- Mediative knowledge of teaching: too large distance compared to the usual didactic landmarks (example of Scratch here). This level relates to the mediative component of the DA.
- Knowledge on the learning of the concepts by the students, on the possible situations, their potentialities, the classic difficulties/ errors, the possible remediation…: the new object must present a cognitive legitimacy but this is not enough. Even if the teacher recognizes it, she can feel its implementation too distant from its current knowledge. This level relates to the cognitive component.
- Knowledge on the curricula: the distance can be too large compared to the usual institutional landmarks. This level relates to the institutional and social component of the DA
Table 2 • Factors contributing to distance in general (instrumental in particular) hampering integra-
tion of newness (tool, domain or entire discipline)
From this, it comes out the following organization, which opposes legitimacies supporting newness
integration to the tensions “landmark-distance” which slows it down:
Legitimacy of the “newness” Tension landmarks-distance
I: institutional - legitimacy given by curricula, inspection, assess- Require an appropriation on the part of the
ICTMT 13 28 Lyon 3 - 6 July 2017

S: social ments, schoolbook; and by societal developments, fully immersed in technology
teacher: new landmarks are to be con-structed here, even if curricula give some
Didactic:
- C: cognitive
- M: mediative
Research studies, professional training and literature, legitimize the contributions and benefits to cognitive levels (eg dynamic geometry for the notion of geometric figure, spreadsheets for entry into algebra ...) and mediative (saving time in the drawing of geometric constructions, in obtaining a large number of data, in the simulation of random experiments, in automated calcula-tions, curve plots, illustration, etc.)
A priori, for an ordinary teacher: loss of cognitive marks here loss of mediative marks here Instrumental professional geneses are to develop in terms of orches-tration, particularly to manage students’ IG
P: Personal:
- E: Epistemology of the teacher)
- R: Representa-tions
Legitimate/ foster or hinder (variable according to teachers): Depend on the person, her very know-ledge of the disciplines at stake
- Epistemology of the teacher on the impacted disciplines (epistemology of the discipline and of its teaching and learning)
- Representation, in general, on teaching and learning (not specifically disciplinary)
Is function of the distance introduced by the “new-ness” regarding the disciplines usually taught
Table 3 • Legitimacies, landmarks and distance to ancient: the distance to current school practices is
problematic if too few landmarks remain (I, C, M) (negative factors). This loss is counterbalanced on
one part by the perceived/ conferred legitimacies at the levels (S, I, C, M) (positive factors), on the
other part by the personal component, particularly the teachers’ representation and epistemology in
the concerned domain (P: R/ E) (factor positive or negative according to the person).
In conclusion, the quantity and the quality of the integration of a new object (in a broad sense) de-
pend on two conditions on each one of the 5 components I, S, C, M, P: a condition on legitimacy
and a condition on the didactic landmarks:
1. Legitimacy perceived/conferred by the teacher to this object at the institutional (I, S), didactic (C, M) and
personal (E and R) levels
2. This legitimacy alone is not enough, the “newness” should not create (on the level of each components I,
C or M) a too big distant situation to the usual practices where the teacher has landmarks (I, C or M), i.e
that the integration of new can be done on landmarks close to the already acquired ones. A too large dis-
tance (for these components) hinders integration.
Finally, integration/or not, and its qualitative characteristics, depend on balance for each teacher be-
tween these various landmark-distance tensions (I, C, M) on one hand and the perceived/ conferred
or not legitimacies (I, S, C, M and P) on the other.
Perspectives for rese arch and teacher accompaniment (training and resources)
The study of the case of Rene put in perspective with other research brings elements of comprehen-
sion of the practices in cases where the context “moves away” the teachers from their usual practic-
es, either by the introduction of a new artifact, or by the introduction of a new field within mathe-
matics, or by the introduction of a new discipline like informatics at elementary school. That led us
to introduce the idea of "didactic landmarks" to speak about these common situations, idea that
turns out to be the "counterpart" of that of distance. Defining and studying these are both objects of
our current researches (with a theoretical link certainly necessary with the notion of schemes (con-
cepts and theorems in acts, here professional; thus related to the Activity theory), but also with that
of beliefs or Anglo-Saxon research on professional knowledge of the teachers: PCK model of Shul-
man (1986) and its later developments whose models are not based on the framework of the Double
Approach). But if the didactic landmarks prove to be crucial, several interrogations upraise: how to
facilitate their acquisition? Are some easier than others? Can some be more easily acquired in au-
tonomy than others? In particular can we reasonably bet on the only experiment to develop didactic
landmarks concerning the teaching of computer science concepts? The teachers in DALIE project
(with Scratch or with robots) do not appear in a difficulty thanks to strategies of “substitution”, why
would they turn towards a new knowledge that they did not even identified and what could help
ICTMT 13 29 Lyon 3 - 6 July 2017
them acquire the necessary associated landmarks? These reflections indicate ways for the resources
and more generally for needs in teacher training, to work out new didactic landmarks, supporting
former and new situations, taking into account various dimensions of these landmarks:
knowledge disciplinary of the fields, possible praxeologies,
didactic knowledge in link with these fields (cognitive, mediative, instrumental, including class manage-
ment in general at mediative level, but also at instrumental one with the orchestrations),
These dimensions should not be separated if one wants changes in practices according the Double
Approach frame (Robert & Rogalski, 2002). We assume that if certain didactic landmarks can be
more or less quickly acquired through the development of the teacher’s GIpro/pe, undoubtedly there
is a need to accompany, through training and resources, some conceptual didactic landmarks.
REFERENCES
Artigue M. (2002). Learning Mathematics in a CAS Environment: The Genesis of a Reflection
about Instrumentation and the Dialectics between Technical and Conceptual work. International
Journal of Computers for Mathematical Learning 7 (3): 245-274.
Guin, D., Ruthven, K. & Trouche, L. (eds.) (2004) The Didactical Challenge of Symbolic Calcula-
tors: Turning a Computational Device into a athematical Instrument. Springer, New York.
Haspekian, M. et Nijimbéré, C. (2016) Favoriser l’enseignement de l’algorithmique : une question
de distance aux mathématiques ? Education et Didactique, vol 10(3), 121-135
Haspekian, M. (2014). Teachers' instrumental geneses when integrating spreadsheet software. In
Clark-Wilson, Robutti, Sinclair (eds.) The Mathematics Teacher in the Digital Era, Springer,
pp.241-275
Lagrange J.B. (2000). L’intégration d’instruments informatiques dans l’enseignement : Une ap-
proche par les techniques. Educational Studies in Mathematics 43 (1): 1-30.
Ministère de l’éducation national. (2015). Programme d'enseignement du cycle des apprentissages
fondamentaux (cycle 2), du cycle de consolidation (cycle 3) et du cycle des approfondissements
(cycle 4). Bulletin Officiel du 26 novembre 2015.
Robert, A. & Rogalski, J. (2002). Le système complexe et cohérent des pratiques des enseignants de
mathématiques: Une double approche. Canadian Journal of Science, Mathematics and Technology
Education, 2 (4), 505-528
Trouche, L. (2004). Managing the complexity of human/machine interactions in computerized
learning environments: Guiding students’ command process through instrumental orchestrations,
International Journal of Computers for Mathematical Learning 9, 281-307
Samurçay, R., Rabardel, P. (2004). Modèles pour l’analyse de l’activité et des compétences : propo-
sitions. In R.Samurçay, P.Pastré (dir.), Recherches en didactique professionnelle, Toulouse : Octa-
rès, pp. 163-180.
Vérillon P. & Rabardel P. (1995), Cognition and artifacts: a contribution to the study of though on
relation to instrumented activity. European Journal of Education. 10 (1). 77-101.
1 see for instance MEN 2002, or Caron, F. (2007). Au cœur de « la calculatrice défectueuse » : un virus qu’on souhaite-
rait contagieux ! Petit x 73, 71-82, or also online resources, as for example:
http://emmanuel.ostenne.free.fr/arras/rallye/rallye8.html or: http://calculatice.ac-lille.fr/calculatice/spip.php?article60
ICTMT 13 30 Lyon 3 - 6 July 2017

2 regarding Robert & Rogalski frame(2002), they are part of the teacher’s personal component
3 with only one initial command, move two characters at the same time, then in a successive way
ICTMT 13 31 Lyon 3 - 6 July 2017

INTERACTIVE DIAGRAMS USED FOR COLLABORATIVE LEARNING Elena Naftaliev
Achva Academic College, Israel; [email protected]
The present research focuses on the development of knowledge about motion processes involving
collaboration between students and interactive multiple representations diagrams. We designed
three settings of interactive diagrams that share an example represented as an animation of multi-
process motion but differ in their organizational functions. The 13- and 14-year-old students
explored sets of characteristics of the mathematical models in the diagrams to analyze the related
phenomena presented as real model and developed meaning of the abstract representations
regarding the phenomena. The development of shared knowledge occurred when the students
engaged in a reflective activity concerning the other members’ reasoning and instruments involved
in the collaborative process.
Keywords: Interactive Diagrams; Collaborative Learning; Mathematical Models; Animation
INTRODUCTION
Our research interests are concerned with the development of knowledge about mathematical
models of motion processes involving collaboration between students and interactive diagrams.
Interactive diagrams (IDs) are relatively small units of interactive text (in e-textbooks or other
materials) and are important elements in e-textbooks. The ID`s components include: the given
example, its representations (verbal, visual and other) and interactive tools. The difference between
an ID and other interactive tools is that an ID is built around a pre-constructed example to carry a
specific task. Whereas a static text presents information and a point of view implicitly engaging the
viewer in meaningful interpretations, an ID explicitly requires the viewer to take action and change
the diagram within given limitations.
Mathematical modeling is defined as the process of constructing a mathematical representation of
reality that focuses on selected features of the reality being modeled (Cai, et al. 2014). To help
learners construct mathematical representations of reality, the teaching-learning processes need to
include the development of tools that will serve them in the practice. There are two approaches to
teaching-learning mathematical modeling: (1) to learn by constructing models and (2) to learn by
using models (Schwartz, 2007). But the two perspectives should not be in contrast with each other.
Students who do not have experience with mathematical models will probably not benefit greatly
from constructing their own models, if indeed they can learn to do so at all (ibid.). At first, learners
tend to explore models by modifying their parameters. Next, they are often asked to modify the
models themselves, thus providing them with the original and many similar models with which to
work. Finally, students may be asked to devise models of phenomena independently. Pedagogic
artistry, or the art of executing the teaching-learning process well, lies in helping students move
through this sequence in ways that are appropriate to their current understanding of mathematical
modeling.
Using technology to develop interactive curriculum materials, such as interactive textbooks,
provides a captivating, engaging tool which encourages learners to explore mathematical models
and to devise their own models as suggested by the learning sequence. The material presented in
this way attempts to create new avenues for learners to develop knowledge about mathematical
modeling. It is especially important that, while students learn about dynamic processes, such as
ICTMT 13 32 Lyon 3 - 6 July 2017

similarly dynamic way by animations and interactive models in order to reinforce their knowledge
development (Ainsworth, 2006;Yerushalmy and Naftaliev, 2011; Schwartz, 2007). The animations
and models are simplifications that attempt to capture the essential features of the reality they
describe. Technological developments are introduced into the range of resources available to
students and teachers. In order to guide students to focus their attention on the essential details of
the dynamic processes and to analyze the process, interactive curriculum materials should be
designed to provide opportunities for exploration of mathematical models.
VISUAL SEMIOTIC ANALYSIS OF ID FUNCTIONS
There are profound differences between the traditional page in math textbooks that appears on paper
and the new page that derives its principles of design and organization from the screen and the
affordances of technology. Current technology allows for a variety of interactive tools, examples
and representations. For example, IDs focused on motion may include the following components: a
wide range of representations of motions; a wide repertoire of linking tools, and choices of
activation of various representations. The question is, ”How do a curriculum designer, a learner, and
a teacher decide how and which IDs components of the text to use for different purposes in
teaching-learning processes?” To explain some aspects of the design of an ID, we adopted a
framework developed by semiotic research of text and visuals and provided a collection of
categories that would allow an orderly discussion of the subject. (Naftliev and Yerushalmy, 2017;
Yerushalmy, 2005). There are three ID’s functions in the framework: the orientational function, the
presentational function and the organizational function.
The presentational function focuses on what and how is being illustrated by the diagram. The reader
may act within the context of the given example and change it or create other similar examples.
Three types of examples are widely used: Random examples, Specific examples and Generic
examples. The orientational function relates to the type of relationships that the text design attempts
to set between the viewer and the text. IDs can function both as sketches and as diagrams in the
sense that they can reveal their details.
The organizational function looks at the system of relations defining wholes and parts and
specifically at how the elements of text combine. IDs can be designed to function in three different
ways: Illustrating, Elaborating, Guiding. Illustrating IDs are simply operated unsophisticated
representations. They are intended to orient the student’s thinking to the structure and objectives of
the activity by usually offering a single representation and relatively simple actions. For example, an
Illustrating ID may have a limited degree of intervention by activation of controls in the animation
(Table 1). At any time, users can freeze the positions on the track, continue the run, or initialize the
race. Elaborating IDs provide the means that students may need to engage in activities that lead to
the formulation of a solution and to operate at a meta-cognitive level. The important components in
the design of the Elaborating IDs are rich tools and linked representations that enable various
directions in the search for a solution. For example, the same animation that serves as an illustrating
ID can be part of an elaborating ID when set within other tools and representations. The ID provides
four adjacent, linked representations: a table of values that represents distance and time; a two
dimensional graph of distance over time; a one dimensional graph which traces the objects'
positions at each time unit; and an animation (Table 1). The variety of linked representations and
rich tools in this elaborating ID enables various options in viewing the ID: as a sketch and/or as a
neat diagram, as discrete information and/or as a continuous flow of information. We use the term
Guiding IDs in relation to guided inquiry. This kind of diagram provides the means for students to
explore new ideas. In addition to providing resources that promote inquiry, they also set the
ICTMT 13 33 Lyon 3 - 6 July 2017

boundaries and provide a framework for the process of working with the task. The Guiding IDs are
designed to call for action in a specific way that supports the construction of the principal ideas of
the activity and may serve to balance constraints and open-ended explorations and support
autonomous inquiry. For example, the guiding ID was designed around a known conflict about a
time-position graph describing a "motionless" situation over continuously running time (Table 1).
The ID consists of two representations of the motion of four cars: an animation and a hot-linked
position-time graph. The task is to establish a one-to-one correspondence between the graphs and
the cars. The graph and the animation are only partially linked: motion occurs simultaneously on the
animation and on the graph but there is no color-match, so the identification process requires
extracting data from the animation and the graph in order to link them. The following constraints
contribute to making the task an interesting challenge: the small number of animated
representations, the partial link between the representations, the absence of representations and
controls that could turn the given sketchy nature of the representations into an accurate diagram, and
the exceptional example in a list of examples that are aimed at focusing on a motionless situation
over time.
Table 1. Comparative view on the IDs’ design
RESEARCH DESIGN
The series of activities included a preliminary activity and three comparable activities that contained
different ID's. The IDs shared an example represented as an animation of multi-process motion but
they were different in their organizational functions. The activity, which asked the students to
describe a motion situation, was first illustrated by a video clip and subsequently as an Illustrating,
Elaborating or Guiding IDs, all based on the animation. The three IDs varied by the design choices
concerning what was included in the given example and how it was represented and controlled.
Guiding ID Elaborating ID Illustrating ID
, ,
, ,
, ,
Animation
"run“, "stop", “timer”
choose components
1D graph
(sketch) (neat and sketch) 2D graph
Table of Values
(partial) Links between
representations
Generic (motionless
component)
Generic Generic Examples
ICTMT 13 34 Lyon 3 - 6 July 2017

Regarding what to include in the example, the animation was designed around simultaneous multi-
process motions, to include motion situations known to be challenging, such as non-constant rate-
of-change and "no motion" situations, as well as surprising situations such as an ”unexpected win“.
Considerations of how to design these choices were driven by the semiotic functions framework.
We made comparative decisions about the variety and type of representations, the control features,
and the linking features.
The interviews were sorted by students into groups of three. Each interviewee met the interviewer
twice. The first meeting included an interview with each student individually. The second meeting
was a group interview. Each participant followed a three-step procedure that enabled us to examine
and track the role of IDs in the students’ knowledge development process concerning mathematical
models of motion. At the first stage, the students were given a preliminary task presented as a video
clip and designed to evaluate their knowledge and solution techniques. At the second stage, the
students were given a task similar to the one they received before, except that it was presented as an
ID. The purpose of the interview was to learn how the students constructed their knowledge using
the diagram. At the third stage, the three students who had been asked to address similar tasks that
included different IDs shared their work and participated in a group discussion. The students were
asked to describe the technique they used in their solution, to present their use of the ID, to reflect
upon their changes and to be involved in a conversation regarding other students' techniques. The
students could use all the diagrams they worked with in the previous stages. The interview time was
flexible and varied according to the participants' responses. All the interviews were video recorded.
For the first step of the research, we analyzed the students' emerging, personal, engagement
processes as they interacted with one of the three mathematical modeling IDs which were designed
to support different functions of inquiry teaching-learning. The findings of our previous research
show that similar tasks with different IDs should be considered as different learning settings
(Naftaliev and Yerushalmy, 2013, 2017; Yerushalmy and Naftaliev, 2011). In the presented
research, we focus on the second step by asking the students who had already been asked to address
similar activities that included different IDs to share their work and to participate in a group
discussion. The process allowed us to analyze the social construction of knowledge in a new
pedagogical setting.
THE SOCIAL CONSTRUCTION OF KNOWLEDGE IN A NEW PEDAGOGICAL
SETTING
We are going to analyze one of the groups’ engagement processes to present the social construction
of knowledge in a new pedagogical setting (Table 2). The group has one student for each of the
three types of IDs: Illustrating, Elaborating, and Guiding. We’ll begin by looking at their individual
work in the two first stages. With video clips, the learners put the emphasis on getting the story
right, which required attending to details such as the runners' body motion. The video clip kept
learners too close to the situation and prevented them from thinking in the abstract. Elad, the student
who worked with the illustrating ID, started by activating the animation. Throughout the process, he
stopped the animation several times. During each pause, Elad examined the runners’ respective
positions and described the changes in speed between each stop. Elad described each runners’
changes in speed with reference to their relative positions at specific moments. He mistakenly
interpreted continuous change of speed by comparing relative positions. For example, he argued that
passing another runner must have meant speeding up; whereas, in reality, the runner maintained a
constant speed. To cope with the challenge, Elad resorted to a failed attempt at drawing graphs by
himself to complete the diagram. Helena, the student who worked with the elaborating diagram,
ICTMT 13 35 Lyon 3 - 6 July 2017

started by activating the representation and tools in the ID. She learned about the wide variety of
options and representations available in the ID, but we didn’t have evidence that showed developing
knowledge concerning mathematical models of motion processes. Or, the student who worked with
the Guiding ID, began his work by identifying a visual and kinematic conflict: while all seven dots
moved on the graphs, one of the dots in the animation stopped and remained still. To resolve this
conflict, he focused on discrete events much like Elad, using discrete events to match the motions
described in the animation and graph extracting discrete motion characteristics such as: average
speed, time and distance. He successfully matched the dots yet failed to resolve the conflict.
Table 2. Knowledge developments in the second and third stage
Progressing to the group discussion, Or decided to open the conversation with the question which
remained unsolved in his individual work (Fig. 1). He demonstrated the problem while activating
the Guiding ID with which he worked. The two other participants, Elad and Helena, were intrigued
by the question and it turned into the goal of their collaborative work. They began by familiarizing
themselves with the options of the ID and examples presented in it to resolve the conflict. When
they didn’t have success resolving the conflict using the Guiding ID and realized their diagrams
Knowledge development
concerning Characteristics of
Motion and the elements of IDs
In stage 2 In stage 3
Elad with
Illustrating ID
Helena with
Elaborating ID
Or with
Guiding ID
Elad, Helena
and Or
Familiarize him/herself with the
elements of the IDs
Discrete Characteristics
(Animation): average speed,
time for distance, distance
Discrete Characteristics (Graph):
average speed, time for distance,
distance
Continues Characteristics
describing the motion process
(Animation and Graphs): such
as speed, time, and distance as
variables in motion processes
Fig. 1 “…has anyone solved it?”
ICTMT 13 36 Lyon 3 - 6 July 2017

were different, Helena suggested using representations and tools from her Elaborating ID to
accomplish the goal they defined for themselves. Each time she suggested adding only one of the
options from the Elaborating ID. They used it firstly to develop meaning regarding the motion
presented in the Elaborating ID. Then, they used the ideas which they developed to resolve the
conflict using the Guiding ID. The following dialogue presents the process which took place in the
last step of their work in which they successfully resolved the conflict.
Following suggestion of Helena, the students activated the animation with traces, resulting in the
generation of a 1D graph of the motion (Fig. 2). While running the animation and generating of a
1D graph, they read the race from the traced motion using the size of the spaces between the traces
as a gauge for speed:
Helena: Press on traces. You see! Where they are stopping?
Or: Ahh… Yes, it describes every time point.
Elad: It describes the steps, the distance of the steps.
Helena: Here, you see the black starts [green] to advance more
Elad: Pink starts with greater steps. If the traces describe the steps then here he starts to slow
down as the time goes on and here it stays at the same speed
Helena: And the black [green] is really fast
Elad: But in the end he speeds a bit. The black [green] almost doesn't, he starts with slowness, as
the time goes on, his steps only enlarge
Helena: The red doesn't change… and the red.. At the same speed
Elad: And the red, like I told you in the beginning, remember? That the red is always at the
same distance, at the same speed, the same steps. And the blue at the beginning
until the middle at the same speed, same steps and towards the end he starts to
slow down.
Following the interpretation of the 1D graph as describing speed, the students check whether this
option is available in the Guiding ID. Once they verify it is not, they returned to work with
Elaborating ID. They began by interpreting the 2D graph based on the 1D graph in static mode with
which they became familiar. At the end they were able to describe the speed by using only the 2D
graph.
Fig. 2 2D and 1D (traces) graphs recorded while running the
animation
ICTMT 13 37 Lyon 3 - 6 July 2017

Helena: Wait, in his [Or] diagram there is it [the traces]? Check
Or: Check
Helena: It's interesting what happened with the pink in his [Or] diagram
Or: No. I think that this [the elaborating ID] is the best.
Helena: The red is running at the same speed. The black in the beginning runs really slow, and
then he ups his speed more and more [they closed the 1D graph and continued
work only with the 2D graph]. The blue runs really quick and then he starts to
slow down. The pink runs fast, in the middle he slows down and then in the end
again he runs fast.
Once they have succeeded in interpreting the 2D graph in the Elaborating ID, they were able to
resolve the conflict they had about motionless process presented by the Guiding ID:
Or: Yes. So, as the line is steeper, then his speed is... ehh... it is steep and… that's it, I see that in
the end it turns into a straight line, plain, something like this. That means that he
slowed the speed and even stopped in place.
Elad: If this shows distance, then it means that the distance here does not change.
The episode describes exploration concerning the speed description in four stages: analysis of a
dynamic mode of 1D graph which was linked to running animation, analysis of a static
representation of 1D graph, analysis of shapes of 2D graphs and analysis of motionless process
represented by 2D graph. They examined the graphs, each being composed of curving segments,
representing an increase or decrease in speed, and straight segments, describing constant speed.
DISCUSSION
Students do need to have enough experience with abstract models to understand the point of
mathematical modeling, its “language” (Schwartz, 2007). Once such representations exist in
cognitive “baggage” of learners,” it also becomes a tool for mathematical modeling (Wilensky,
1999). In our research we focused on knowledge development concerning mathematical models
involving collaboration between students and various IDs.
The students explored sets of characteristics of the mathematical models in the IDs to analyze the
related phenomena presented as real model and developed meaning of the abstract representations
regarding the phenomena. They looked for ways to bypass the designed constrains of the Guiding
ID: they develop meaning regarding the motion represented in the real and mathematical models by
using the Elaborating ID, pointing to the speed, time, and distance as continues variables. Then they
used the ideas which they had developed to analyze the characteristics of motion presented in the
Guiding ID. At the end of the discussion, the mathematical models in static mode prompted them to
mentally recreate and describe the motion processes.
The development of shared knowledge occurred when the students engaged in a reflective activity
concerning the other members’ reasoning and instruments involved in the collaborative process. As
a result of the group collaboration, the students generated an interactive text. The participants did
the following: posed a new question, decided what component from what ID to bring to discussion,
decided on the sequence between the components, defined the role of each component, and, created
a representation of the data. All of this was done to accomplish the goal they posed to themselves,
thus building meaning concerning mathematical models of motion. Ainsworth (2006), who
ICTMT 13 38 Lyon 3 - 6 July 2017
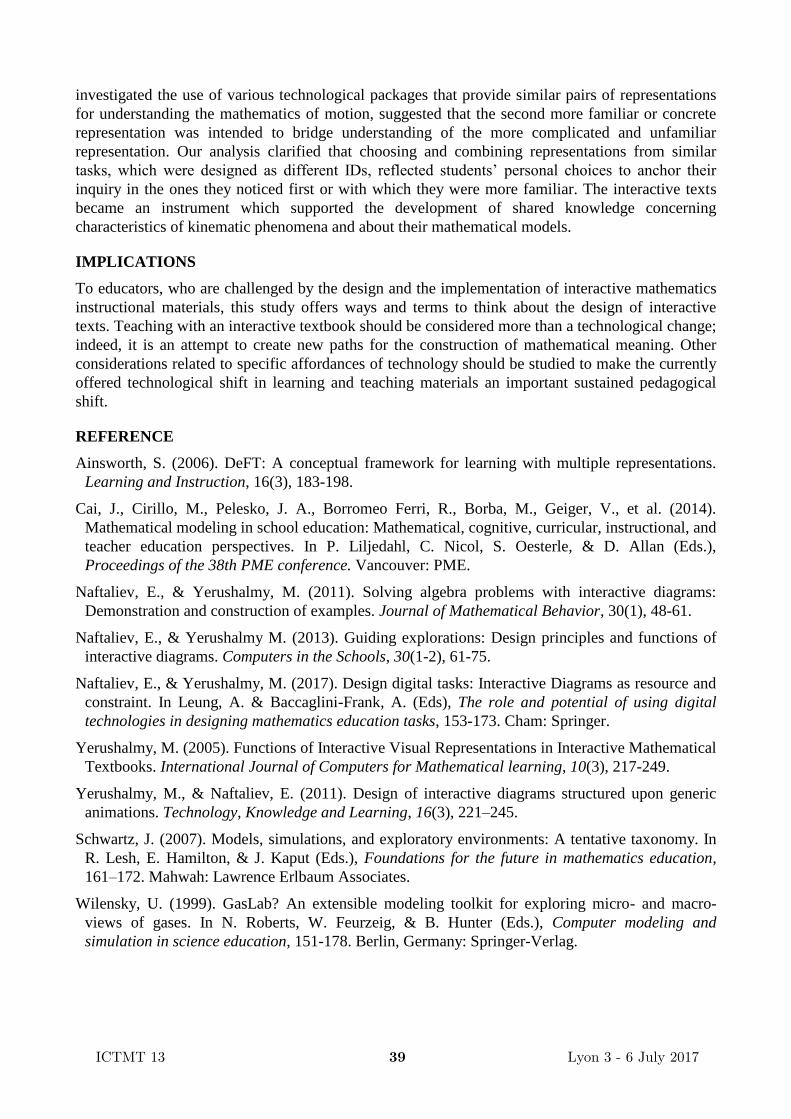
investigated the use of various technological packages that provide similar pairs of representations
for understanding the mathematics of motion, suggested that the second more familiar or concrete
representation was intended to bridge understanding of the more complicated and unfamiliar
representation. Our analysis clarified that choosing and combining representations from similar
tasks, which were designed as different IDs, reflected students’ personal choices to anchor their
inquiry in the ones they noticed first or with which they were more familiar. The interactive texts
became an instrument which supported the development of shared knowledge concerning
characteristics of kinematic phenomena and about their mathematical models.
IMPLICATIONS
To educators, who are challenged by the design and the implementation of interactive mathematics
instructional materials, this study offers ways and terms to think about the design of interactive
texts. Teaching with an interactive textbook should be considered more than a technological change;
indeed, it is an attempt to create new paths for the construction of mathematical meaning. Other
considerations related to specific affordances of technology should be studied to make the currently
offered technological shift in learning and teaching materials an important sustained pedagogical
shift.
REFERENCE
Ainsworth, S. (2006). DeFT: A conceptual framework for learning with multiple representations.
Learning and Instruction, 16(3), 183-198.
Cai, J., Cirillo, M., Pelesko, J. A., Borromeo Ferri, R., Borba, M., Geiger, V., et al. (2014).
Mathematical modeling in school education: Mathematical, cognitive, curricular, instructional, and
teacher education perspectives. In P. Liljedahl, C. Nicol, S. Oesterle, & D. Allan (Eds.),
Proceedings of the 38th PME conference. Vancouver: PME.
Naftaliev, E., & Yerushalmy, M. (2011). Solving algebra problems with interactive diagrams:
Demonstration and construction of examples. Journal of Mathematical Behavior, 30(1), 48-61.
Naftaliev, E., & Yerushalmy M. (2013). Guiding explorations: Design principles and functions of
interactive diagrams. Computers in the Schools, 30(1-2), 61-75.
Naftaliev, E., & Yerushalmy, M. (2017). Design digital tasks: Interactive Diagrams as resource and
constraint. In Leung, A. & Baccaglini-Frank, A. (Eds), The role and potential of using digital
technologies in designing mathematics education tasks, 153-173. Cham: Springer.
Yerushalmy, M. (2005). Functions of Interactive Visual Representations in Interactive Mathematical
Textbooks. International Journal of Computers for Mathematical learning, 10(3), 217-249.
Yerushalmy, M., & Naftaliev, E. (2011). Design of interactive diagrams structured upon generic
animations. Technology, Knowledge and Learning, 16(3), 221–245.
Schwartz, J. (2007). Models, simulations, and exploratory environments: A tentative taxonomy. In
R. Lesh, E. Hamilton, & J. Kaput (Eds.), Foundations for the future in mathematics education,
161–172. Mahwah: Lawrence Erlbaum Associates.
Wilensky, U. (1999). GasLab? An extensible modeling toolkit for exploring micro- and macro-
views of gases. In N. Roberts, W. Feurzeig, & B. Hunter (Eds.), Computer modeling and
simulation in science education, 151-178. Berlin, Germany: Springer-Verlag.
ICTMT 13 39 Lyon 3 - 6 July 2017

COMPETENCIES AND DIGITAL TECHNOLOGIES – REFLECTIONS ON A
COMPLEX RELATIONSHIP
Hans-Georg Weigand
University of Wuerzburg (Germany): [email protected]
Advantages and disadvantages of the use of digital technologies (DT) and especially of computeralgebra systems (CAS) in mathematics lessons are worldwide discussed controversially. Manyempirical studies show the benefit of the use of DT in classrooms. However, despite of inspiringresults, classroom suggestions, lesson plans and research reports, the use of DT – and especiallyCAS – has not succeeded, as many had expected during the last decades. The thesis of this article isthat we – the researchers and teachers who are interested in the use of DT since many years ordecades – have not been able to convince teachers, lecturers at university and parents of the benefitof DT in the classrooms in a sufficient way. In the following, the working with DT will be related tounderstanding and classroom activities. The basis of the argumentation is a competence model,which classifies – for a special content – the relation between levels of understanding (of theconcept), representations of DT and different kinds of classroom activities.
Keywords: digital technologies, tool-competencies, representations, classroom activities, calculus.
CONCERNING THE USE OF DIGITAL TECHNOLOGIES (DT) IN MATHEMATICSCLASSROOMS
There are many theoretical considerations, empirical investigations and suggestions for theclassroom concerning the use of DT in mathematical learning and teaching (e. g. Guin et.al., Zbiek2007, Drijvers & Weigand 2010, Weigand 2013). In recent times, some empirical studies startedintegrating DT and especially computer algebra systems (CAS) into regular classroom teaching andcovering longer periods of investigation. E. g. the e-CoLab1 (Aldon et al. 2008), RITEMATHS2,CALIMERO3 (Ingelmann and Bruder 2007), M3-Project4 (Weigand 2008, Weigand and Bichler2010b, Weigand & Bichler 2010c). The main results of these projects and investigations canroughly be summarized as follows: DT (and especially CAS)
• allow a greater variety of strategies in the frame of problem solving processes;• are a catalyst for individual, partner and group work;• do not lead to a deficit in paper-and-pencil abilities and mental abilities (if these abilities are
regularly supported in the teaching lessons)• allow more realistic modelling problems in the classroom (but also raise the cognitive level
of the understanding of these problems);
1 e-CoLab = Expérimentation Collaborative de Laboratoires mathématiques. See: http://educmath.inrp.fr/Educmath/dossier-parutions/experimentation-collaborative-de-laboratoires-mathematiques. Accessed 23 February 2017
2 RITEMATHS = The project is about the use of real problems (R) and information technology (IT) to enhance
(E) students' commitment to, and achievement in, mathematics (MATHS).http://extranet.edfac.unimelb.edu.au/DSME/RITEMATHS. Accessed 23 February 2017
3 CALIMERO = Computer Algebra in Mathematics Lessons: Discovering, Calculating, Organizing (translated title).
4 M3 = Model Project New Media in Mathematics Education
ICTMT 13 40 Lyon 3 - 6 July 2017

• do not automatically lead to changed or modified test and examination problems (compared to paper-and-pencil tests);
• demand and foster advanced argumentation strategies (e.g. if equations are solved by pressing only one button).
Overall, Drijvers et.al. (2016) concluded from a meta-study-survey of quantitative studies, that thereare “significant and positive effects, but with small average effect sizes” (p. 6), if for the benefits ofintegrating DT in mathematics education is asked. Moreover, there is also a broad consensus, thatgainful changes in classroom teaching and learning need didactic and methodic considerations and athorough thinking about the goals of teaching and learning.
VISIONS AND DISILLUSIONS
The first ICMI study in 1986 “The Influence of Computers and Informatics on Mathematics and itsTeaching” (Churchhouse) was affected by a great enthusiasm concerning the perspectives ofmathematics education in view of the availability of new technologies. However, in the ICMI Study17 “Mathematics Education and Technology – Rethinking the terrain” (Hoyles & Lagrange 2010)and the OECD Study (2015), “Students, computers and learning. Making the connection”,disappointment is quite often expressed about the fact that – despite the countless ideas, classroomsuggestions, lesson plans and research reports – the use of DT has not succeeded, as many hadexpected at the beginning of the 1990s.
Worldwide, the current situation concerning the use of DT is very versatile. There are countries(like Norway or Denmark) that are intensively using laptops, tablets (with the programs Geogebraor Maple) or symbolic calculators (like the TI-Nspire or the Casio Classpad). These countries evenallow using these tools in examinations. There are other countries (like the UK or France) that allow“only” symbolic calculators in examinations, there are countries – especially in Asia – which arevery sceptical about the use in examinations, and there are countries (like Germany) where there area different situations about the use of DT – depending on the state.
Reflecting the developments of the use of DT in the last decade, the results concerning thepossibilities of supporting students’ learning processes have been started to rethink and thenespecially raised the question: What is the benefit of using DT in the classroom? (Weigand 2017).More specifically important questions are:
1. In relation to which mathematical contexts does the use of DT make sense and which (mathematical) competencies are supported and developed?
2. Which mathematical and tool competencies are necessary, or at least helpful, when working with DT for specific mathematics content?
3. How can the DT-use be described in a more detailed form?
In the following it will be tried to give answers to these questions, by constructing a model thatshows the relation between working with DT, different levels of understanding and specificactivities in the classroom. The result is a three-dimensional competence model for DT-use.
COMPETENCE MODELS
Theoretical Foundations
The concepts of competence and competence (level) models have aroused interest in mathematicseducation in the past years. Starting with the NCTM Standards (1989) and especially the PISAstudies, competence and competencies are expressions, often used in the context of standards and
ICTMT 13 41 Lyon 3 - 6 July 2017

substituted the “old expression” goals which envisaged knowledge and abilities in mathematicseducation. “Mathematical competence means the ability to understand, judge, do, and usemathematics in a variety of intra- and extra-mathematical contexts and situations in whichmathematics plays or could play a role …” (Niss 2004, p. 120). In the PISA studies, competenciesare on the one hand related to the content, e.g. numbers, space and shape, change, etc., and on theother hand – in a more general way – related to processes like problem-solving, modelling and theuse of mathematical language. In order to evaluate or operationalize the competencies through theconstruction of items and tests, it is helpful to organize these competencies in levels, categories orclasses. In the PISA studies, each of the possible pairs (content, process) can be divided into threedifferent levels or competence classes (OECD 1999, p. 43): Class 1: reproduction, definitions, andcomputations; Class 2: connections and integration of problem solving; Class 3: mathematicalthinking, generalisation and insight. This leads to a three-dimensional competence-model with thedimensions content, basic or process competencies and cognitive activation.5
Competence model for symbolic calculators while working with functions
In Weigand and Bichler (2010a) a competence model for the use of symbolic calculators with CASin mathematics lessons in the frame of working with functions was developed. It can also beextended to the use of DT overall. Different levels of understanding the function concept have beenseen in relation with the representations and – as a third dimension – with cognitive activation.These levels of understanding are not strictly hierarchical, because they are intertwined during thedeveloping process, e. g. conceptual aspects have to be seen in relation to intuitive and relationalaspects.
The ability or the competence toadequately use the tool requirestechnical knowledge about the handlingof the tool. Moreover, it requires theknowledge of when to use whichfeatures and representations and forwhich problems it might be helpful.Three levels are distinguished, whichmight also be categorized by using DTas a (simple) function plotter, as a toolfor creating dynamic animations and asa multi-representational tool.
Competence model for DT-use in the classroom
The model in Fig. 1 is gainful if tasks and problems have to be classified, e. g. for tests andexaminations. It does not adequately fit if activities in the classroom should be integrated andevaluated. In the following model the second dimension “Representation” was changed due to thewell-established theory of representation, which emphasizes the reasoning with multiple anddynamic representations (Bauer 2013 or Ainsworth 1999). Moreover, understanding and workingwith representations are seen in relation to classroom activities. A third dimension with thefollowing activities will be introduced:
5 In PISA, these dimensions are called “Overarching ideas” (content), “Competencies” (process) and “Competence
Clusters” (cognitive activation).
Fig. 1. Competence model for DT while working with functions
ICTMT 13 42 Lyon 3 - 6 July 2017

Calculate: DT as a tool for (numeric and symbolic) calculations, and especially CAS are tools, which allow calculation on a symbolic level in notations close to the mathematical language. Example: Seeing parameter dependent functions as functions of several variables allows an efficient working in problem solving processes.
Consult: DT – especially CAS – as a consultant in the sense of using a formulary. Example:(a+b)
3=a3
+…. Control: DT as a controller of hand-written solutions, suggestions and ideas on a graphical,
numeric or symbolic level. Explain: DT are catalysts for the communication between the user (student, learner) and
someone who has to interpret or understand the DT-solutions (e.g. a teacher). DT are sourcesfor explanations and argumentations.
Discover: DT as a tool for evaluating and testing suggestions and strategies in a problem solving process.
This classification may be seen as a hierarchy while moving from a procedural knowledge(Calculate) to a conceptual knowledge (communicate, discover). Of course, also the activity“levels” are intertwined and do not represent a strict hierarchy. This new third dimension is more onthe teaching side while the dimension “Cognitive activity” (Fig. 1) is more on the learning side.
Fig. 2. An extended competence model integrating (classroom) activities
This competence model has three categories and gives us 4 x 4 x 5 = 80 cells. If each cell is againsubdivided into three levels of cognitive activation, this makes a total of 240 cells and this is onlyfor a special concept. This already shows that it is very difficult or even impossible to create specialexamples for each of these cells. This competence model is more for pointing out the directions andgoals concerning understanding, the kinds of used representations, and the kinds of activities DTmight be used for adequately develop a special concept.
What is meant by tool competence? A tool as “something you use to do something” (Monaghanet.al. 2016, p. 5) is the quite general definition. Mathematical tools allow us to create, to operatewith and to change mathematical objects. DT and CAS are digital tools. The word tool is usedinstead of instrument because the facilities of DT in relation to mathematics aspects in theclassroom are in the foreground, and the development of the user-tool-relationship in the frame ofan instrumental orchestration, which is the heart of the instrumental genesis (see Artigue 2002,
ICTMT 13 43 Lyon 3 - 6 July 2017

Drijvers et.al. 2010), is left to the user or learner. Tool-competence is the ability to refer thecompetence-model (Fig. 2) to a special concept. Tool-competence describes the development of theunderstanding of a concept in relation to the tool-representation in the frame of classroom-activities.
While empirical competence models – like the PISA model – help to answer the question whetherstudents or learners do benefit from special learning or teaching interventions, the model (Fig. 2) ismore process-oriented and should give reasons why and how this might be the case.
The problem of this model is the specification of the 80 cells with prototypical examples. It is notpossible to construct a one-to-one-relationship between a cell and a special example. Problems,situations or examples can mainly or even always be seen under different aspects and never relateonly to one level of understanding or to one level of activity. The challenge with regard to anempirical justification of this model is the construction of prototypes of examples which emphasizethe triad of one cell of this model.
EXAMPLES
In the following the concentration is on CAS, the fields these tools are mostly used and DT promisethe biggest changes compared to traditional courses: algebra and calculus. In this article therestriction on a few spotlights of examples is necessary.
Functions
Working with functions on a structural level means to see functions as objects, to use symbols like fand g on the symbolic level, to e.g. add (f + g) and multiply (f g) them, and to represent them indifferent representations. It is expected that learners e. g.
can work with functions on different levels of understanding;
can work with functions as objects on a symbolic and a graphical level; they especially interpret changes of variables of a function as geometrical transformations;
understand the definition of functions of several variables and they can– adequately to the situation–interpret them as functions of one variable with parameters;
can use functions of several variables to solve mathematical and modelling problems.
Sequences
Working with recursively-defined sequences with ak+1=f (ak) , k∈N , a first elementa1∈R and a function f :R→R , CAS allow to calculate the sequence of iteration
a1 , a2=f (a1 ) , a3=f (a2) ,… ,
and to represent it numerically and graphically as k-ak-diagrams or “cobweb-diagrams”. This can bedone on a conceptual level of understanding and multiple dynamic representations can be used.
Difference sequences (Δ ak )N with Δak≔ ak+ 1−ak and a given sequence (ak )N are wellsuitable for a discrete introduction of the difference quotient (see Weigand 2015).
Overall, the meaning of CAS concerning the content sequences can be summarized like thefollowing: CAS
are tools with notations (or a language) quite close to mathematical notations (or themathematical language);
allow symbolic calculations and show related numeric and graphic representations;
ICTMT 13 44 Lyon 3 - 6 July 2017

allow object-related working with sequences and discrete functions; have to be seen or evaluated in relation to other–especially graphical–representations.
Equations
A CAS is a formulary that offers in particular solution formulas for linear and quadratic equationsand for systems of linear equations. In relation with a graphic representation, questions concerningthe number of zeros of a quadratic function can (at first) be answered through experimentalexploration. A CAS can be used to calculate the zeros of a function by only pressing one button, butmoreover, it serves as visualization. Furthermore, the relation of function and equation isfundamental for the mutual representation in the CAS and the graphic window.
If the CAS is used tool for solving systems of equations with parameters, learners work on astructural level of understanding with multiple dynamic representations.
Example 1: Systems with quadratic equations can be calculated (on a symbolic and graphic level)
Fig. 3. Solving a system of quadratic equations with one parameter
The CAS provides calculations and solutions on the symbolic level and these have then to beinterpreted, especially in relation to the graphical level.
Example 2: The symbolic solutions of more complex equations like x3 – x + 1 = 0, 1 + sin(x) = 2x
or x7 – 4x5 + 4x3 = 0 depend on the equation. But an efficient use of a CAS is only possible if it isbased on mathematical knowledge concerning the solution of equations, the characteristics of theunderlying functions of the equations and the possibilities of the solution varieties. For calculationsthe CAS is used mainly within the static isolated symbolic representation, adding graphicrepresentations for interpreting or explaining symbolic results. The advantage of using CAS is thenotation of solutions on a symbolic level, especially while working with equations with parameters.The communication with the tool is possible in a language close to the traditional mathematicallanguage. The CAS is a consultant in the sense of a formulary for symbolic solutions especially forpolynomial equations of order 2 or 3.
CONCLUSIONS
The developed competence model is a theoretical or normative model. It applies the understandingof a concept to the working in the classroom and the use of a tool (with different representations). Itis a model for the evaluation of the process and development of understanding of a special conceptin a tool-supported classroom.
ICTMT 13 45 Lyon 3 - 6 July 2017
Concerning the empirical justification of the theoretical model and with the aim of constructing anempirical competence model, some questions have to be answered.
1. Task development: Tasks and appropriate learning environments concerning a specialconcept for the levels of understanding and kinds of activities have to be developed, whichpromise a benefit while working with DT compared to traditional paper and pencil working.Will the learners be able to work adequately (in the theoretically expected way) withdifferent kinds of representations and do they develop a normative expected understandingon different levels?
2. Micro-connectivity of the tool-use: Working with a CAS on the symbolic level has to be seenin relation with other representations, especially with numerical and graphicalrepresentations (the aspect of multiple representations). These additional representationsallow interpretations of symbolic results and expressions. Which representations areadequate on which levels of understanding and which kinds of activities?
3. Dynamic aspects. The dynamics of representations have to been seen in relation to thedynamic aspects of variables, and in consequence to the dynamics of the concepts offunction, equation, derivative, … How is the transition from static to dynamicrepresentations and how is it related to levels of understanding and kinds of activities?
4. Diagnostic instrument: The competence model might also be used for diagnostic reasons toevaluate the “tool-competencies” of special learners (or one special learner). Diagnostics arethe first step while improving students’ understanding; the second step is to establishconsequences to improve these. How can a learner be supported the best way to attain tool-competencies?
5. From a qualitative to a quantitative model: The PISA studies use a model with a numericalcompetence scale, which is based on the relative frequency with which students are able tosolve a problem. The problem that has been solved successfully is taken as a measure of thedifficulty of the exercise. The scale is standardized on a mean value of 500 with a standarddeviation of 100 (OECD 2003). This might also be an aim in the context of this competencemodel. How can the competence model (Fig. 2) be extended or transformed to a quantitativemodel?
References:
Ainsworth, S. (1999). The functions of multiple representations. Computers & Education, 33, 131–152Aldon, G., Artigue, M., Bardini, C., Trouche, L. (Ed.) (2008). Une étude sur la conception et les usages didactiques
d’une nouvelle plate-forme mathématique, potentialité, complexité. http://educmath.inrp.fr/Educmath/dossier-parutions/experimentation-collaborative-de-laboratoires-mathematiques. Accessed 29 May 2010.
Artigue, M. (2002). Learning mathematics in a CAS environment: The genesis of a reflection about instrumentation andthe dialectics between technical and conceptual work. International Journal of Computers for Mathematical Learning, 7, 245–274.
Bauer A. (2013). Reasoning with multiple and dynamic representations. In: Faggione, E., Montone, A.: Proceedings of
the ICTMT 11, Bari. 327-329 http://www.dm.uniba.it/ictmt11/download/ICTMT11_Proceedings.pdf
Drijvers, P. et.al. (2010). Integrating technology into mathematics education: Theoretical perspectives. In: Hoyles, C., Lagrange, B. (eds.) Mathematics education and technology-rethinking the terrain. The 17th ICMI study. Dordrecht: Springer: 89–132
Drijvers, P., Ball, L., Barzel, B., Heid, M. K., Cao, Y., Machietto, M. (2016). Uses of Technology in Lower Secondary Mathematics Education. ICME-13 Topical Surveys. Springer Open Access
Drijvers, P., Weigand, H.-G. (Hrsg.) (2010). Handheld technology in the mathematics classroom – theory and practice, ZDM - The International Journal on Mathematics Education, 7
ICTMT 13 46 Lyon 3 - 6 July 2017

Guin, D., Ruthven, K. and Trouche L. (Eds.) (2005). The didactical challenge of symbolic calculators. New York: Springer.
Hoyles, C. & J.-B. Lagrange (Eds.) (2010). Mathematics Education and Technology – Rethinking the Terrain. The 17th ICMI Study, Springer: New York a. o.,
Ingelmann, M., Bruder, R (2007). Appropriate CAS-use in class 7 and 8. In J.-H. Woo et al. (Ed.). Proceedings of the 31st Conference of the International Group for the Psychology of Mathematics Education. PME. Seoul: The Korea Society of Educational Studies in Mathematics
Kultusministerkonferenz (KMK) (2004). Bildungsstandards im Fach Mathematik für den mittleren Schulabschluss. München: Wolters Kluwer.
Kultusministerkonferenz (KMK) (2012). Bildungsstandards im Fach Mathematik für die Allgemeine Hochschulreife. München: Wolters Kluwer.
Niss, M. (2004). Mathematical competencies and the learning of mathematics: The Danish KOM project. In A. Gagtsis, S. Papastavridis: 3rd Mediterranean Conference on mathematical education, 3–5 January 2003, Athens, Greece(pp. 115–124). Athens: The Hellenic mathematical society, 2003.
OECD: Organisation for Economic Co-operation and Development (Ed.) (1999). Measuring student knowledge and skills. A new framework for assessment. Paris: OECD Publication Service.6 http://www.pisa.oecd.org
OECD (Ed.) (2003). The PISA 2003 Assessment Frmework: Mathematics, reading, science and problem solvingknowledge and skills. Paris: OECD Publication Service.7 http://www.pisa.oecd.org
OECD (2015). Students, computers and learning: making the connection. Paris: OECD Publishing.http://www.oecd.org/edu/students-computers-and-learning-9789264239555-en.htm
Trouche, L. (2005). Instrumental Genesis, individual and social aspects. In: D. Guin, K. Ruthven, K., L. Trouche (Eds.).The didactical challenge of symbolic calculators (pp. 197-230). New York: Springer.
Weigand, H.-G. (2008). Teaching with a symbolic calculator in 10th grade - Evaluation of a one year project. International Journal for Technology in Mathematics Education, 15(1), 19–32
Weigand, H.-G. (2013). Looking back and flashing ahead - Didactical implications for the use of digital technologies in the next decade. Faggione, E., Montone, A.: Proceedings of the ICTMT 11, Bari. 298-303 http://www.dm.uniba.it/ictmt11/download/ICTMT11_Proceedings.pdf
Weigand, H.-G. (2010). Book Review of Hoyles, C. & J.-B. Lagrange (Eds.) (2010). Mathematics Education and Technology – Rethinking the Terrain. The 17th ICMI Study, Springer: New York a. o., ZDM - The International Journal on Mathematics Education 42(7), 801-808
Weigand, H.-G. (2015). From an intuitive-oriented to a content-oriented understanding of the basics of calculus. Amado, N. & Carreira, S. (Eds.). (2015). Proceedings of the 12th International Conference on Technology in Mathematics Teaching. University of Algarve, Faro, Portugal. 95-102. Siehe hier: http://sapientia.ualg.pt/handle/10400.1/6081
Weigand, H.-G. (2017). What is or what might be the benefit of using computer algebra systems in the learning and teaching of calculus. In: Faggiano, E., Ferrera, F., Montone, A. (Ed.). Digital Technologies. Springer. In press.
Weigand, H.-G., Bichler, E. (2010a). Towards a Competence Model for the Use of Symbolic Calculators in
Mathematics Lessons – The Case of Functions, ZDM - The International Journal on Mathematics Education
42(7), 697-713
Weigand, H.-G., Bichler, E. (2010b). Symbolic calculators in mathematics lessons – The case of calculus. In International Journal for Technology in Mathematics Education, 17(1), 3–15.
Weigand, H.-G., Bichler, E. (2010c). The long-term Project “Integration of Symbolic Calculator in Mathematics Lessons" – The case of Calculus. In: Durand-Guerrier, V., Soury-Lavergne, S., Arzarello, F. (Eds.). Proceedings of the Sixth Congress of the European Society for Research in Mathematics Education. 2009, Lyon (France). 1191–1200 http://ife.ens-lyon.fr/publications/edition-electronique/cerme6/wg7-15-weigand-bichler.pdf
Zbiek, R. M., Heid, M. K., Blume G. W., Dick, Th. P. (2007). Research on technology in mathematics education. In F. K. Lester (Ed.). Second Handbook of Research (pp. 1169–1206). Charlottte, NC: Information Age Publishing
6 http://www.pisa.oecd.org/document/58/0,2340,en_32252351_32236159_33688954_1_1_1_1,00.html7 http://www.pisa.oecd.org/document/29/0,3343,en_32252351_32236173_33694301_1_1_1_1,00.html
ICTMT 13 47 Lyon 3 - 6 July 2017

Workshops / Posters
48

BLENDING COMPUTATIONAL AND MATHEMATICAL THINKING IN
PRIMARY EDUCATION: THE SCRATCHMATHS PROJECT IN
ENGLAND
Alison Clark-Wilson, Richard Noss and Celia Hoyles
UCL Institute of Education, University College London, [email protected]
A 3-year design-based research project in England, ScratchMaths, has developed a set of curriculum materials for the
last two years of primary school.These materials use the Scratch programming language to blend computational and
mathematical thinking. In this workshop you will have the opportunity to explore some of the curriculum activities as a
means to discuss the potential impacts of the underlying pedagogy and curriculum content on pupils’ classroom
experiences in other countries’ contexts.
Keywords: mathematical thinking; computational thinking; Scratch programming language;
INTRODUCTION
Internationally, many countries are seeing a resurgence on the teaching of computer programming or ‘coding’ within
formal and informal educational settings. In England, a revised national curriculum introduced coding within primary
school education, which created a sudden need for both curriculum resources and teacher professional development
opportunities. Pupils in Year 6 also sit a national examination in mathematics, which is ‘high-stakes’ in that it both
contributes to all primary schools’ nationally published accountability data and provides a baseline for pupils’
mathematical outcomes as they enter secondary school. A 3-year project funded by the Education Endowment Fund has
led to the development of a set of curriculum units that use the Scratch programming language (MIT Media Lab, 2013)
and are aimed at the final two years of primary school education, Years 5 and 6 (9-10 years and 10-11 years
respectively). These materials, which bridge ideas from the computing and mathematics curricula, have the underlying
aim to improve pupils’ mathematical outcomes. The project team has outlined the theoretical foundations for the
ScratchMaths project and reported on aspects of its design and early implementations (Benton, Hoyles, Kalas, & Noss,
2016, 2017). Fundamental to our approach is the foregrounding of the Sc4atchMaths pedagogy, ‘the 5 Es’, Explore,
Envisage, Explain, Exchange and BridgE: all will be explained in the workshop!
The workshop will be ‘hands-on’, which means that you will be expected to explore some activities from the
ScratchMaths curriculum resources by interacting with the Scratch programming environment and the accompanying
pupil andteacher materials. As we anticipate that many of the workshop’s international participants will have examples
of other similar projects, we will aim to address questions such as:
What are the points of intersection between the primary school computing and mathematics curricula? How
does this vary between countries?
How can these points of intersection be developed?
Can the language of programming, and the ideas and the approaches represented within it, offer a more open,
more accessible and more learnable mathematics without sacrificing what makes mathematics work?
REFERENCES
Benton, L., Hoyles, C., Kalas, I., & Noss, R. (2016). Building mathematical knowledge with programming: insights from the ScratchMaths project. Paper presented at the Constructionism Conference 2016, Bangkok, Thailand.
Benton, L., Hoyles, C., Kalas, I., & Noss, R. (2017). Bridging Primary Programming and Mathematics: Some Findings of Design Research in England. Digital Experiences in Mathematics Education, 1-24. doi:10.1007/s40751-017-0028-x
MIT Media Lab. (2013). Scratch (Version 2). Massachusetts: Massachusetts Institute of Technology.
ICTMT 13 49 Lyon 3 - 6 July 2017

50

Chapter 3
ASSESSMENT
ICTMT 13 51 Lyon 3 - 6 July 2017

A, B, OR C? EXPLOITING POLLS AS A FORMATIVE ASSESSMENT TOOL
FOR MATHEMATICS IN A CONNECTED CLASSROOM
ENVIRONMENT
Annalisa Cusi*, Francesca Morselli**, Cristina Sabena*
* University of Torino, Italy **University of Genova, Italy
This contribution addresses the theme of technology for formative assessment in the mathematicsclassroom. Taking a design-based research approach within the European project FaSMEd, wefocus on the ways connected classroom technology may support formative assessment strategies inwhole class activities. We will refer to a theoretical framework developed within the FaSMEdproject, which relates the development of different formative assessment strategies by differentagents (teacher, peers, and the student) to different technology functionalities. In particular, we willfocus on the functionalities that allow to submit polls to students, gather the answers from them andshow the results (both individual answers and cluster ones) in real time. With reference to thetheoretical framework and existing literature, we discuss, how the polls can be used, duringclassroom activities, to foster the activation of formative assessment strategies.
Keywords: Connected classroom technologies, formative assessment, polls, classroom discussion
INTRODUCTION AND BACKGROUND
Research has highlighted the support given to formative assessment (FA) by the so called Connectedclassroom technologies (CCT), i.e. networked systems of computers or handheld devicesspecifically designed to be used in a classroom for interactive teaching and learning (Irving 2006).CCT include: classroom response systems (Roschelle & Pea 2002), networked graphing calculators(Clark-Wilson 2010), and participatory simulations (Ares 2008). Specific features of CCT that makethem effective tools for FA are related to the support they may provide in:
1. monitoring students’ progress, collecting the content of students’ interaction over longertimespans and over multiple sets of classroom participants (Roschelle & Pea 2002) and givingpowerful clues to what they are doing, thinking, and understanding (Roschelle et al. 2004);
2. providing students with immediate private feedback, supporting them with appropriateremediation and keeping them oriented on the path to deep conceptual understanding (Irving2006);
3. fostering positive student’s thinking habits, such as arguing for their point of view, creatingimmersive learning environments that highlight problem-solving processes (Irving 2006);
4. enabling the students taking a more active role in the class discussions and encouraging them toreflect and monitor their own progress (Roschelle & Pea 2002, Ares 2008).
In our research we focused on the way CCT may be exploited for formative assessment duringwhole class activities. In particular, in this contribution we focus on a specific feature of the CCTwe investigated: the possibility of activating polls. Polls are a typical characteristic of what researchcalls Classroom Response System (CRS), which consists of a set of input devices for students,communicating with the software running on the instructor’s computer, and enabling the instructorto pose questions to students and take a follow-up poll (Beatty & Gerace 2009). Beatty and Gerace(ibid.) observe that one crucial feature of CRS is that they simultaneously provide anonymity and
ICTMT 13 52 Lyon 3 - 6 July 2017

accountability, support collecting answers from all students in a class, rather than just the few whospeak up or are called upon and enable recording the data of students’ individual and collectiveresponses for subsequent analysis. They also highlight the flexibility in the use of CRS technology,listing specific instructional purposes connected to its use. Among them: (a) the use of polls forstatus check, that is to ask students their self-reported degree of confidence in their understanding ofa topic; (b) exit poll, that is to poll students to find out which concepts they want to spend moretime on; (c) assess prior knowledge, that is to elicit what students know or believe about a topic; (d)provoke thinking, that is to ask a question to get students engaged within a new topic; (e) elicit amisconception; (f) exercise a cognitive skill, that is to engage students in a specific cognitiveactivity; (g) stimulate discussion with questions having multiple reasonable answers; (h) review,that is to pose questions aimed at remainding students a body of material already covered.
Notwithstanding the potential of these tools, many researchers have stressed that the effectiveness ofthese technologies depends on the skill of the instructor and on his/her ability to incorporateprocedures such as tracking students’ progress, keeping students motivated and enhancing reflectionwith technologies (Irving 2006). Different studies have highlighted that CCT have increased thecomplexity of the teacher’s role with respect to ‘orchestrating’ the lesson (Clark-Wilson 2010,Roschelle & Pea 2002). Therefore, in order to bring about progress in student participation andachievement, technology must be used in conjunction with particular kinds of teaching strategies.
Beatty and Gerace (2009) developed technology-enhanced formative assessment (TEFA), apedagogical approach for teaching science and mathematics with the aid of a CRS. To help teachersimplement FA, the TEFA approach introduces an iterative cycle of question posing, answering, anddiscussing, which forms a scaffold for structuring whole-class interaction. The essential phases ofthe cycle are: 1) pose a challenging question to the students; 2) have students wrestle with thequestion and decide upon a response; 3) use a CRS to collect responses and display a chart of theaggregated responses; 4) elicit from students different reasons and justifications for the chosenresponses; 5) develop a student-dominated discussion of the assumptions, perceptions, ideas, andarguments involved; 6) provide a summary, micro-lecture, meta-level comments.
In our research we focus on the use of polls to enhance effective classroom discussions with FApurposes. In this contribution we will analyse, in particular, how the processing of students’ answersby technology can be exploited to activate different FA strategies. This study is part of a widerdesign-based research, characterized by cycles of design, enactment, analysis and redesign, wherethe goal of designing learning environments is intertwined with that of developing new theories(DBRC 2003). The research is carried out in authentic settings (classroom environments), focusingon “interactions that refine our understanding of the learning issues involved” (ibid. p. 5).
FORMATIVE ASSESSMENT WITH TECHNOLOGY: A THEORETICAL FRAMEWORK
FA is conceived as a method of teaching where “evidence about student achievement is elicited,interpreted, and used by teachers, learners, or their peers, to make decisions about the next steps ininstruction that are likely to be better, or better founded, than the decisions they would have taken inthe absence of the evidence that was elicited” (Black & Wiliam 2009, p. 7).
Taking this perspective, in the FaSMEd project we developed a three-dimensional framework forthe design and implementation of technologically-enhanced formative assessment activities (Aldonet al. 2017, Cusi, Morselli and Sabena 2017). The starting point is the work by Wiliam andThompson (2007), who identified five key strategies for FA: (A) Clarifying and sharing learningintentions and criteria for success; (B) Engineering effective classroom discussions and otherlearning tasks that elicit evidence of student understanding; (C) Providing feedback that moves
ICTMT 13 53 Lyon 3 - 6 July 2017

learners forward; (D) Activating students as instructional resources for one another; (E) Activatingstudents as the owners of their own learning. These FA strategies may be activated by three agents:the teacher, the peers and the student himself. The FaSMEd framework extends this model of FA,taking into account the two dimensions already included (FA strategies and the agents activatingsuch strategies), and adding a further dimension: the functionalities of technology. Technology,indeed, may support the three agents in developing the FA strategies in different ways, which wecategorized in three functionalities:
(1) Sending and displaying, that is the ways in which technology support the communication amongthe agents of FA processes (e.g. sending and receiving messages and files, displaying and sharingscreens or documents to the whole class...).
(2) Processing and analysing, that is the ways in which technology supports the processing and theanalysis of the data collected during the lessons (e.g. through the sharing of the statistics of students’answers to polls or questionnaires, the feedbacks given directly by the technology to the studentswhen they are performing a test…).
(3) Providing an interactive environment, that is when technology enables to create environments inwhich students can interact to work individually or in group on a task or to exploremathematical/scientific contents (e.g. through the creation of interactive boards to be shared byteacher and students or the use of specific software that provide an environment where it is possibleto dynamically explore specific mathematical problems…).
The following chart1 (fig.1) schematizes the FaSMEd three-dimensional model.
Fig. 1: Chart of the FaSMEd three-dimensional model
1 We thank D. Wright (Newcastle University) for the digital version of the chart and Hana Ruchniewicz (University Of Duisburg-Essen) forits adaptation.
ICTMT 13 54 Lyon 3 - 6 July 2017

DESIGNING FA ACTIVITIES WITHIN A CCT ENVIRONMENT
In our design study we adopted a Vygotskyan perspective on the crucial role of the interaction withpeers and with an expert in students’ learning (Vygotsky 1978). Moreover, we believe that FA has tofocus also on metacognitive factors (Schoenfeld 1992). Accordingly, we designed activities aimed atsupporting students in (a) making their thinking visible (Collins, Brown & Newmann 1989),through the sharing of their thinking processes with the teacher and the classmates, by means ofargumentative processes, (b) developing their ongoing reflections on the learning processes.Effective mathematical discussions (Bartolini Bussi 1998) are considered a key activity, where theteacher plays a key role in planning and promoting fruitful occasions for FA and learning.
Concerning technology, we explored the use of a CCT (provided by a software called IDM-TClass),which connects the students’ tablets with the teachers’ laptop, allows the students to share theirproductions and the teacher to easily collect the students’ opinions and reflections, during or at theend of an activity, by means of the creation of instant polls.
The use of IDM-TClass was integrated within a set of activities on relations and functions, and theirrepresentations (symbolic representations, tables, graphs), adapted from different sources. For eachactivity, we designed a sequence of worksheets, to be sent to the students’ tablets or to be displayedon the IWB (or through the data projector). The worksheets were designed according to four maincategories: (1) Worksheets introducing a problem and asking one or more questions (problemworksheets); (2) Helping worksheets; (3) Worksheets prompting a poll between proposed options(poll worksheets); (4) Worksheets prompting a focused discussion.
As said before, in this contribution we focus on the creation and use of instant polls, combined withthe possibility, offered by the CCT, of showing the results of the polls to all the students. The IDM-TClass software collects all the students’ choices and processes them, displaying an analyticalrecord (collection of each answer) as well as a synthetic overview (bar chart). In reference to theanalytical framework, we may say that instant polls are used through the support of the “Processingand Analysing” functionality of the technology. The possibility of showing the results in real timebrings to the fore also the “Sending and Displaying” functionality of technology.
In principle, the software enables also to set the time given to students before completing the poll,and offers the opportunity to provide an immediate automatic correction to the student. However,our choice was not to provide the immediate automatic correction to student, so that they could beengaged in a subsequent classroom discussion. In tune with Beatty and Gerace’s framework (2009),we, in fact, conceived the use of polls as a way of scaffolding whole-class interaction with the aimof fostering the sharing of results and the comparison between students (FA strategy B). This is alsocoherent with our belief on the key role of the teacher and the importance of peer interaction.
During our design experiments, we both implemented planned polls that were a priori created to beinserted within each teaching sequence (through poll worksheets, which can be used in alternative toproblem worksheets, where the students are expected to write down a written solution andjustification) and instant polls, created and implemented on the spot. In the perspective of design-based research, polls created on the spot that revealed fruitful in terms of FA strategies may beinserted in the repertoire of planned polls for the subsequent cycles of experimentation.
Concerning polls, our investigation is guided by the following research question: What kind of FAstrategies can be activated thanks to the use of technology enhanced (planned or instant) polls?
Due to limits of space, in this paper we focus on planned polls.
ICTMT 13 55 Lyon 3 - 6 July 2017

DATA ANALYSIS
All the lessons were video-recorded, fields notes were taken, and students’ productions (doc files)were collected, building a large amount of data (about 450 hours of class sessions, carried out incollaboration with 20 teachers). Furthermore, teachers were interviewed every two-three lessonsand, after each lesson, they were asked to write a report on the effectiveness of the lesson in terms ofthe activated FA processes and of the support provided by technology. In line with design-basedresearch, the study is carried out through a close collaboration between researchers and teachers,who share the aim of improving practice, taking into account both contextual constraints andresearch aims.
In the following, we present an excerpt from a class discussion developed starting from the resultsof a planned poll. The example relates to an activity on time-distance graphs adapted from the tasksequence “Interpreting time-distance graphs”, from the Mathematics Assessment Program(http://map.mathshell.org/materials/lessons.php). From the original source based on paper-and-pencil materials for grade 8, we adapted the activities and created a set of 19 digital worksheets tobe used with students from grade 5 to 7. Here we refer to a discussion carried out in grade 7.
The sequence starts with a short text about the walk of a student, Tommaso, from home to the busstop. This text is accompanied by a time-distance graph, as illustrated in Figure 2:
Fig.2: The time-distance graph of Tommaso’s walk
Students’ interpretation of this graph is guided through questions, posed to them within problem,helping, and poll worksheets. Since the students meet time-distance graphs for the first time throughthis activity, we designed an introductory activity based on the use of a motion sensor, in whichstudents could explore in a laboratorial way the construction of the graph after a motion experiencealong a straight line.
Here we focus on an episode concerning the interpretation of the final part of the graph. At first,students were asked via a problem worksheet to establish what happens during the last 20 seconds,motivating their answers. During the classroom discussion, a poll worksheet was used to focus onthe completeness of answers (FA strategy A). Specifically, the poll required students to identifywhich is the most complete among three given answers:
“Some students of another class wrote these answers. Which of them is the most complete?A) During the last 20s, Tommaso is not walking because we have already said that he has reached thebus stop
ICTMT 13 56 Lyon 3 - 6 July 2017

B) I think that, during the last 20s, Tommaso is not walking because, from the graph, it is possible tounderstand that, in the period between 100s and 120s, he is always at the same distance from home,that is 160mC) I understood that, during the last 20s, Tommaso is not walking because the line of the graph ishorizontal.”
Students discussed in pairs to answer to the poll. Afterwards, the teacher displayed the distributionof their answers on the IWB: 10% of students chose option A, 50% chose option B and 40% choseoption C. Starting from the display of the results, the discussion took place. The teacher exploitedthe poll worksheet as a way to engineer effective classroom discussions that elicit evidence ofstudent understanding (FA strategy B). The following table (table 1) presents selected excerpts fromthe discussion, analysed according to the FaSMEd framework in the right column.
Excerpts from the class discussion Analysis according to the FaSMEd three-dimensional framework
After a brief analysis of A, justifications Band C are compared.
353) Teacher: let’s look at B and C. Let’shear some explanations of those who choseC, why did they chose C, and somemotivation of those who chose B.
354) Brown: we chose B because Bspecifies also that he (Tommaso) stayed stillfrom 100 to 120 seconds, while C doesn’tsay this, saying that they were only 20seconds they could have been 150, 170, 180and so on…
355) Silvia: B is the most complete.
356) Teacher: B is the most complete.
357) Mario: for me the B is not rightbecause, we understood that, when we usedthe motion sensor, let’s say, you understandthat a person stops when the line ishorizontal, and there (justification B) itdoesn’t say this, then it is not the mostcomplete.
The teacher encourages the students to discussthe reasons behind the choices of the poll. Heraim is to promote a discussion on thecompleteness of the two options. This is aninstance of FA Strategy A, since the focus is onthe requirements that a complete answer mustsatisfy.
Suggesting that answer B gives moreinformation on the last trait, Brown activatesherself as responsible of her learning (FAstrategy E) and at the same time as instructionalresource for her mates (FA strategy D). Silvia,echoing Brown, affirms that B is the mostcomplete, thus giving a implicit feedback toBrown (FA strategy C). In line 357 the studentMario challenges the former evaluation,activating himself as owner of his own learning(FA strategy E) : in his opinion, answer B is notcomplete because it does not refer to theexperience with sensor detectors. Thisintervention provides a good occasion to discussagain the role and value of the empiricalexperience with sensors
…
390) Lollo: but if we had not done thatactivity before…
391) Teacher: the activity with the motionsensor.
392) Lollo: we could not have known that ifyou are still the line is horizontal
Lollo suggests that one cannot refer to theexperience with sensors, since the answer shouldbe intelligible also by a reader who did not dosuch an experience. Lollo turs himself asinstructional resource for his mates (FA strategyD). In particular, he gives feedback to Mario (FAstrategy C). The teacher reformulates Lollo’sintervention so as to involve the other students,turning Lollo as a resource for his mates (FA
ICTMT 13 57 Lyon 3 - 6 July 2017

… strategy D). In this way she also activates FAStrategy C.
399) Rob: And anyway from the graph youcan understand why the distance is alwaysthe same but the seconds, let’s say, go on…
400) Teacher: ok… then, even if we had nothad the experience with the motion sensor,that made you understand in an experimentalway that if I stay still the line is horizontal,your classmate [Rob] says: “from the graph Ican understand it anyway”. Why? Rob,could you please repeat it?
401) Rob: because from the graph you canunderstand that when you don’t move, thatis to say when there is the horizontal line…
402) Teacher: what does it mean?
403) Rob: the meters remain the same butthe seconds go on, let’s say.
Rob intervenes, stating that in the horizontal traitthe distance from home is always the same. Thisis a shift from an explanation based on theexperience with sensors to a theoreticalexplanation, based on the meaning of the graph.Rob provides to other students a feedback tomove forward (FA strategy C), turning himself asan instructional resource for his classmates (FAstrategy D).
The teacher reformulates Rob’s intervention,giving to all the students a feedback that movesthem forward (FA strategy C). Reformulation isalso a means to activate Rob as a resource forhis classmates (FA strategy D).
…
413) Teacher: B explains why the line ishorizontal, while C just says “the line ishorizontal”; B instead explains why the lineis horizontal, because the meters remain thesame, even if time goes on, isn’t it?
As a final intervention, the teacher rephrases theresult of the discussion, pointing out what makesanswer B more complete. In this way sheactivates FA strategy A.
Table 1: Excerpts from the class discussion and corresponding analysis
The analysis showed a wide range of FA strategies activated by different agents: not only by theteacher, but also by the students themselves. More specifically, since options B and C were bothchosen by many students (50% and 40%), the teacher decided to ask students to express themotivation subtended to their choice. In this way, on one side, it was possible to focus on themistakes subtended to the choice of incorrect answers, making students activate themselves asowners of their own learning (strategy E) because they could recognize their own mistakes andreflect on the reasons subtended to them. On the other side, students who chose the correct answerprovided their justification, becoming more aware of the reasons why they chose a specific option(again activation of strategy E). The students were therefore activated as instructional resources fortheir mates (strategy D) because they gave feedback to each other (strategy C) on the reasons why achosen option is better than the other.
CONCLUSIONS
In this contribution we studied the use of polls for promoting formative assessment in theclassroom. The analysis, carried out by means of the FaSMEd analytical framework, showed theemergence of a variety of FA strategies and involved agents, suggesting that planned polls,exploiting the “Processing and Analysing” and “Sending and Displaying” functionalities of thetechnology, may turn into a fruitful formative assessment activity.
ICTMT 13 58 Lyon 3 - 6 July 2017

The outlined pattern may be related to Beatty and Gerace’s (2009) TEFA cycle of question posing,answering and discussing. Also in our case, the use of polls may be conceived within a cycle ofactivities that encompass: solving a problem (and justifying the answer), taking a position inrelation to a question in form of poll, commenting the poll results, justifying choices. Our analysisbrings even more to the fore the variety of FA strategies that are promoted by the use of the polls,thus giving more insight into each phase of the TEFA cycle.
Although in this paper we confined ourselves to an example of discussion carried out starting from aplanned poll, we are currently analysing a variety of examples concerning poll use. After threecycles of design, implementation and analysis, we propose a first tentative classification of the pollsused during our design experiments, according to their different focus and (consequent) aims: (1)polls that ask to choose the correct answer to a problem, with the aim of promoting a discussion onsolving strategies; (2) polls that ask to compare different answers to a problem, with the aim ofpromoting a meta-discussion on the features of the answers (such as in the example discussed in thispaper); (3) polls focused on the difficulties students meet when facing specific kind of tasks or thebest strategies to be used to face specific tasks, with the aim of promoting metacognitive reflections;(4) poll focused on students’ feelings when facing a specific kind of task or when a particularmethodology were adopted during the lessons, with the aim of bringing to the fore also the affectivedimension. Referring to the instructional purposes of polls described by Beatty and Gerace’sframework (2009), type-1 may be related to “provoke thinking” and “exercise a cognitive skill”,whereas type-2 may be linked to “elicit a misconception” and “stimulate discussion with questionshaving multiple reasonable answers”. Types 3 and 4 are of different nature: even if they could besomehow related to “status check”, they bring to the fore metacognitive and affective issues that arenot so evident in Beatty and Gerace’s list. We remark that, in our design, polls are always intendedas a starting point for a class discussion and not for individual “revising” or “check status”.
Further research will be done on the analysis of the effects of the use of the four types of polls interms of patterns of FA strategies activated during the class discussion that takes place after eachpoll. Moreover, we are going to study how the structure of the class discussion is influenced by theresults of the processing of data.
Acknowledgment
Research funded by the European Community’s Seventh Framework Programme fp7/2007-2013 under grantagreement No [612337].
REFERENCES
Aldon, G., Cusi, A., Morselli, F., Panero, M., & Sabena, C. (2017). Formative assessment andtechnology: reflections developed through the collaboration between teachers and researchers InG. Aldon, F. Hitt, L. Bazzini & U. Gellert, Mathematics and technology: a CIEAEM source book.Series ‘Advances in Mathematics Education’. Springer International Publishing.
Ares, N. (2008). Cultural practices in networked classroom learning environments. Computer-Supported Collaborative Learning, 3, 301–326.
Bartolini Bussi, M. G. (1998). Verbal interaction in mathematics classroom: A Vygotskian analysis.In H. Steinbring, M. G. Bartolini Bussi, & A. Sierpinska (Eds.), Language and communicationin mathematics classroom (pp. 65–84). Reston, VA: NCTM.
ICTMT 13 59 Lyon 3 - 6 July 2017

Beatty, I.D, and Gerace, W.J. (2009). Technology-Enhanced Formative Assessment: A Research-Based Pedagogy for Teaching Science with Classroom Response Technology. Journal ofScience Education and Technology, 18, 146–162.
Black, P., and Wiliam, D. (2009). Developing the theory of formative assessment. EducationalAssessment, Evaluation and Accountability, 21(1), 5-31.
Clark-Wilson, A. (2010). Emergent pedagogies and the changing role of the teacher in the TI-NspireNavigator-networked mathematics classroom. ZDM Mathematics Education, 42, 747–761.
Collins, A., Brown, J.S., & Newman, S.E. (1989). Cognitive Apprenticeship: Teaching the Crafts ofReading, Writing and Mathematics! In L.B. Resnick (Ed.), Knowing, Learning, and Instruction:Essays in Honor of Robert Glaser (pp. 453-494). Hillsdale, NJ: Lawrence Erlbaum Associates.
Cusi, A., Morselli, F. & Sabena, C. (2017). Promoting formative assessment in a connectedclassroom environment: design and implementation of digital resources. Vol. 49(5), 755–767.ZDM Mathematics Education.
DBRC - The Design Based Research Collective (2003). Design-Based Research: An EmergingParadigm for Educational Inquiry. Educational Researcher, 32(1), 5-8.
Irving, K.I. (2006). The Impact of Educational Technology on Student Achievement: Assessment ofand for Learning. Science Educator, 15(1), pp. 13-20.
Roschelle, J., & Pea, R. (2002). A walk on the WILD side. How wireless handhelds may changecomputer-supported collaborative learning. International Journal of Cognition and Technology,1(1), 145-168.
Roschelle, J., Penuel, W.R., & Abrahamson, L. (2004). The networked classroom. EducationalLeadership, 61(5), 50-54.
Schoenfeld, A. H. (1992). Learning to think mathematically: Problem solving, metacognition, andsense-making in mathematics. In D. Grouws (Ed.), Handbook for research on mathematicsteaching and learning (pp. 334–370). New York: Macmillan.
Vygotsky, L. S. (1978). Mind in society: The development of higher mental processes. Cambridge,MA: Harvard University Press.
Wiliam, D., & Thompson, M. (2007). Integrating assessment with instruction: What will it take tomake it work? In C. A. Dwyer (Ed.), The future of assessment: Shaping teaching and learning(pp. 53–82). Mahwah, NJ: Erlbaum.
ICTMT 13 60 Lyon 3 - 6 July 2017

25 YEARS OF E-ASSESSMENT AND BEYOND: HOW DID I DO!
Michael McCabe
University of Portsmouth; [email protected]
E-assessment is a powerful tool for supporting the learning of mathematics. Early trials beganback in 1991 on a local network. Over the past 25 years technical advances have widened andimproved its delivery. For the past 10 years MapleTA has been adopted and a huge range ofquestion banks have been developed. Some recent topics include dimensional analysis, fractals,linear programming, Fourier series, oscillatory motion, series solution of ODEs, Laplacetransforms and basic solution methods for PDEs. A key element in providing students withfeedback on their progress is the “How Did I Do?” option, which allows them to check theiranswers as they progress through extended problems. The same question is equally relevant whenevaluating the effectiveness of e-assessment for many thousands of students over several decades.
Keywords: E-assessment, feedback, modelling, mechanics, calculus
A QUARTER CENTURY OF E-ASSESSMENT ADVANCES
It is over 25 years since e-assessment was first used for mathematics students at the University of Portsmouth on a local network (Figure 1).
Figure 1. Mathematics e-Assessment Delivery using QuestionMark Software 1991-2007
Although computer algebra systems were not widely available then, it was still possible to author and deliver a variety of standard question types. In 1996 a CAS powered assessment system was developed (McCabe and Watson, 1997) using the Maple kernel within Toolbook authoring software (Figure 2). For the first time ever it was possible to check algebraic question responses with a CAS and develop mathematical questions with a user-friendly interface.
Around the same time the delivery of online assessment was beginning and the main tool used at Portsmouth was QuestionMark Perception (McCabe, 1998), which had no underlying CAS. In 2005 the Department of Mathematics switched to using MapleTA and it has been the primary tool used for e-assessment since then (Figure 3). Initially a local server was used, but in recent years a managed server has proved more convenient and reliable, especially when dealing with product upgrades. Increasing student numbers at Portsmouth (McCabe 2009) made the effort worthwhuile.
ICTMT 13 61 Lyon 3 - 6 July 2017

The adoption of a commercial product, rather than an open source e-assessment system, such asSTACK (Sangwin, 2004), Numbas (Foster, Perfect and Youd, 2012), DEWIS (Gwynllyw andHenderson, 2009) and Math e.g.(Greenhow and Kamavi, 2012), has provided stability and theavailability of support when it was required.
Figure 2. World First Use of CAS for e-Assessment (McCabe and Watson, 1997)
Figure 3. Early Mathematics e-Assessment Delivery using MapleTA 2005 - 2007
AN EVOLVING STRATEGY FOR E-ASSESSMENT DELIVERY
The literature on e-assessment has grown considerably over the past 25 years. Timmis et al (2016)provides an up-to-date set of general references for what it calls Technology Enhanced AssessmentTEA. Sangwin (2013) is the first textbook specifically on the subject of mathematics e-assessmentand many other sources of guidance on e-assessment have been written over the years, e.g.Whitelock (2006), QCA (2007). At Portsmouth it has largely been years of practice and a gradualevolution that has shaped the present strategy for delivering e-assessment.
E-assessment delivery initially focussed on summative tests. Mathematical Models is a typical 1st
year mathematics undergraduate course unit, for which MapleTA has been routinely used over thepast 10 years. As question banks have increased in size, weekly practice tests with feedback havebecome the norm. A monthly coursework assessment on each topic, allows students a controlled 24-hour period to complete their work. Although different assessment patterns have been tried out,our experience is that a 40:60 weighting of continuous assessment to a final exam motivatesstudents to work steadily through a course unit and achieve high marks as they progress. The final e-assessment exam lasts 2-hours and is always formally invigilated. Intermediate Calculus, a 2 nd
year course unit, adopts a similar progressive style of weekly practice e-assessments, monthly 24-hour courseworks, but with a more traditional 2-hour written final exam. The weekly practiceassessments often promote flipped learning, with many students using them as the starting point intheir study.
ICTMT 13 62 Lyon 3 - 6 July 2017

EFFICIENT DEVELOPMENT OF NEW QUESTION BANKS
The efficient production of high quality algorithmic questions with feedback has been the key to thesuccessful delivery of e-assessment. The many features of MapleTA have enabled rapid authoringwithout getting bogged down in technicalities. Three special cases are highlighted here: reverseengineering, randomised components (datasets, functions, equations, graphs, networks, matrices ...)and multipart questions.
Figure 4. Efficient Question Setting Via Reverse Engineering of Dimensional Analysis
Special Case 1: Dimensional analysis is an extremely useful mathematical technique for solving problems with minimal work, but without a full understanding of the underlying physical processes.It is introduced as part of the Mathematical Models course unit. The left hand screenshot in Figure 4 shows a typical “real-world” question, which leads a student through the solution of a specific problem. The drawback is that finding sufficient realistic dimensional analysis problems to solve and the creation of a question bank is time-consuming. To avoid this, a randomised set of fictitious problems have been developed which allow the technique to be practiced effectively on meaningful questions. To illustrate its implementation, suppose we wish to find an unknown relationship X = X(A,B,C) = kAnBmCp . If the dimensions of X, A, B and C are given as Mx1Lx2Tx3, Ma1La2Ta3 , Mb1Lb2Tb3, Mc1Lc2Tc3 respectively, then we deduce that
a1 n + b1 m + c1 p = x1
a2 n + b2 m + c2 p = x2
a3 n + b3 m + c3 p = x3
We could solve for n, m and p using Maple, but cannot easily be assured of user-friendly solutions. Instead the trick is to reverse engineer the question. Rather than setting up a randomised question and solving it, we start with a randomised solution for n, m and p, but then create randomised questions by choosing suitable question parameters. In practice, this simply means randomising ai, bi and ci (i=1..3) and calculating x1, x2 and x3 from the three equations shown above. An important
ICTMT 13 63 Lyon 3 - 6 July 2017

condition, easily implemented in a MapleTA question algorithm, is to ensure that
|a1 b1 c1
a2 b2 c2
a3 b3 c3| = 0
is satisfied. A resulting question is shown on the right hand side of Figure 4. The difficulty of the question is readily adjusted by varying the range of randomised parameters and adding more physical quantities, such as temperature. Reverse engineering is an important technique in setting e-assessment questions in mathematics and allows them to be generated far more simply and reliably than the direct approach of solving a randomly generated problem.
Special Case 2: Algorithms with randomised components lie at the heart of most questions. The generation of simple numerical datasets for fractal box counting is a classic example (Figure 5). A simple logarithmic relationship log N(s) = log C + D log s implies that a graph of log N(s) vs. log s will be a straight line with slope D, the fractal dimension. Data can be generated with or without randomised “noise”.
Figure 5. Randomised Datasets for Fractal Box Counting
Large banks of ODE and PDE questions have been developed with randomly generated equations, covering a wide range of types and solution methods.
Figure 6. Randomised Equations for ODE and PDE Solution
ICTMT 13 64 Lyon 3 - 6 July 2017

For these questions, the technique of cloning, i.e. the copying and modification of existing questions, plays an important role in speeding up question production. Often only minor changes are needed to generate a completely different question.
Randomised graphs can be generated in MapleTA very efficiently. The matching question in Figure7 is an example taken from a linear programming question bank and includes a different, graph for each of the 4 solution possibilities. Any graph that can be generated in Maple can be randomised in MapleTA with minimal effort.
Figure 7. Randomised Graphs for Linear Programming
Other examples of efficient graph plotting, using Maple commands and packages, are shown in Figure 8 below. All the graphs are generated dynamically for each instance of the question with a single command.
Figure 8. Randomised Graphs for Networks and Parametric Coordinate Problems
ICTMT 13 65 Lyon 3 - 6 July 2017

Special Case 3: Multi-part questions are used frequently to guide students though common solutionsmethods. Figure 8 (right) shows the combination of randomised graphs with a multipart question insolving a problem involving parametric coordinates. A further example, shown in Figure 9, is aquestion which works through statistical hypothesis testing.
Figure 9. Multi-Part Question for Statistical Hypothesis Testing
Without efficient means of authoring e-assessment questions, their development becomes a slow and unproductive process. The process can become even slower when the time taken to add feedback is taken into account. Experience has shown that reverse engineering, randomised algorithmically generated components and multi-part questions are often the key elements in creating effective, reusable questions.
EFFICIENT AND EFFECTIVE DELIVERY OF FEEDBACK
Basic principles of feedback practice in e-assessment have been well identified over the years, e.g.Nicol and Milligan (2006), but are often extraordinarily difficult to implement. The preparation ofdetailed, dynamically generated feedback can be extraordinarily time-consuming and may oftentake longer to produce than the question itself. It is often found to be more efficient to providetraditional written solutions to sample questions. Indeed it can be argued that automated solutionsand feedback can eliminate the need to cross-reference different sources of information, such astextbooks, lecture notes and worked examples, making the arena of learning too restricted.
Although students are encouraged to read their lecture notes and worked examples, when theytackle e-assessment questions, some automatically generated feedback is always worthwhile. InMapleTA students can simply ask “How Did I Do?” while they are attempting a multi-part question.For example, when solving an ODE using Laplace transforms (Figure 10), partial solutions can bechecked before moving on to later stages of the solution. Thus, mistakes in early parts of thequestion can be corrected before moving on to the complete solution.
ICTMT 13 66 Lyon 3 - 6 July 2017

Often a compromise must be reached between time spent on preparing fully automated feedbackand more questions for a bank. The pragmatic approach has been to use the “How Did I Do?”option to provide a basic level of feedback without requiring much extra work. When it is routinelyavailable in all questions during weekly practice tests, students usually take full advantage of thehelp that it gives them.
Figure 10. How Did I Do on my Laplace Transform Problem?
THE PRESENT AND FUTURE OF E-ASSESSMENT
Mathematics e-assessment has advanced considerably over a period of more than 25 years, since itwas first used at the University of Portsmouth. Software developments have enabled onlinedelivery, CAS checking of responses, randomisation in many different forms, algorithmic questiongeneration, multi-part questions, new question types, targeted feedback and adaptive questions.Changes in the software tools over the first 15 years often made it necessary to abandon existingquestion banks and write new ones. Maintenance and improvement of question banks is stillimportant, but far less time-consuming than it used to be. For the past 10 years there has beenrelative stability and the size of question banks has grown (Figure 10) as new topics have beenadded. With the recent addition of Fourier series, the total number of MapleTA questions nowapproaches 1000. These are available for MapleTA users of the future, who can also answer thequestion “How Did I Do?”.
Figure 10. A Megabank of MapleTA Questions
ICTMT 13 67 Lyon 3 - 6 July 2017
REFERENCES
Greenhow, M. and Kamavi, K. (2012). Maths e.g. - a web assessment application for STEM and beyond, Proceedings of the HEA STEM Learning and Teaching Conference.
Gwynllyw, R. and Henderson, K. (2009). DEWIS: a computer aided assessment system for mathematics and statistics, CETL-MSOR 2008 Conference Proceedings, pp. 38-44.
McCabe, E.M. and Watson, J. (1997) From MathEdge to Mathwise: The Cutting 'Edge ofInteractive Learning and Assessment in Mathematics”, Proceedings of the 3rd InternationalConference on Technology in Maths Teaching, Koblenz
McCabe, E.M. (2009) The Exponential Growth of Mathematics and Technology at the University ofPortsmouth Teaching Mathematics and Its Applications: An International Journal of the IMA,v28 n4 p222-227 Dec 2009 http://teamat.oxfordjournals.org/content/28/4/222
McCabe,E.M. (1998) CAA Workers Do IT with Perception, Proceedings of the 2nd AnnualComputer Assisted Assessment Conference, 105 – 110, Loughborough University, ISBN 0-95332101 0
Nicol, D. and Milligan, C. (2006) Rethinking technology-supported assessment practices in relationto the 7 principles of good feedback practice D. Nicol & Milligan in “Innovative Assessment inHE” Routledge Falmer http://ewds.strath.ac.uk/REAP/public/Papers/Nicol_Milligan_150905.pdf
QCA, e-Assessment: Guide to Effective Practice (2007) Available online at https://www.e-assessment.com/wp-content/uploads/2014/08/e-assessment_-_guide_to_effective_practice_full_version.pdf
Sangwin, C. (2004). Assessing mathematics automatically using computer algebra and the internet, Teaching Mathematics and its Applications 23(1): 1-14.
Sangwin, C. (2013). Computer Aided Assessment of Mathematics, Oxford University Press.
Timmis, S., Broadfoot, P., Sutherland, R. and Oldfield, A. (2016), Rethinking assessment in a digitalage: opportunities, challenges and risks. Br Educ Res J, 42: 454–476. doi:10.1002/berj.3215
Whitelock, D. M. & Brasher, A. (2006) Developing a Roadmap for e-Assessment: Which Way Now?in: D. Myles (Ed) Proceedings of the 10th CAA International Computer Assisted AssessmentConference (Loughborough, UK, Professional Development, Loughborough University), 487–501.
ICTMT 13 68 Lyon 3 - 6 July 2017

MAKING GOOD PRACTICE COMMON PRACTICE BY USING
COMPUTER AIDED FORMATIVE ASSESSMENT
Shai Olsher, Michal Yerushalmy
University of Haifa, Israel,
[email protected], [email protected]
Rich technological environments present many opportunities for guided inquiry in the mathematics
classroom. In this paper we focus on the role of the teacher supporting the forming and proving of
conjectures by the students, during a whole class discussion. We examine the practices of an expert
teacher that conducts a classroom discussion based on students' conjectures formed while working
in pairs with a dynamic geometry environment (DGE). Specifically, we analyse the way the teacher
categorizes the different conjectures, and then addresses them during the whole class discussion.
We suggest that this categorization could be offloaded onto a technological platform that would do
it automatically, thus making this type of information accessible not only to teachers that could
perform this categorization on the spot.
Keywords: Instrumental orchestration, classroom discussions, conjectures,
Dynamic Geometry Environment (DGE)
INTRODUCTION
Defining, analysing, and trying to distribute good practice of teachers in the mathematics classroom
is an ongoing challenge for the research community (Chazan & Ball, 1999). Guided inquiry tasks
are open ended tasks that usually have more than one solution, and often require taking into account
various dimensions that were not addressed in previous learning, thus requiring the students to go
through a problem-solving process. Promoting and evaluating this process presents challenges for
teachers. In the case of computer based guided inquiry, where students are expected to form and
reason about conjectures, the primary role of the teacher is to promote and organize discussions
(Yerushalmy & Elikan, 2010).
Orchestrating the work of students in a technological environment, referred to by Trouche (2004) as
instrumental orchestration, while gathering information about students that could be used for
formative assessment, presents challenges for the teachers (Drijvers, Doorman, Boon, Reed, &
Gravemeijer, 2010). In terms of evaluation, formative assessment requires the teacher to draw on
information from teaching as feedback to modify accordingly the teaching of the students the
information was gathered about (Black & William, 1998). The abundance of data that is created and
could be analysed when students engage in rich inquiry tasks on a technological platform presents a
challenge for teachers. Some researchers suggest the use of technological platforms for the
gathering and display of student answers (Arzarello & Robutti, 2010; Clark-wilson, 2010). Another
practice observed by Panero & Aldon (2015) was the combination of automatically collected digital
data with tradition pencil and paper work that was used by the teacher in formative assessment in
real-time. Another strategy suggested by Olsher, Yerushalmy, and Chazan (2016) would be to
offload some of the processing of the data onto a digital platform, automatically categorizing
student answers by mathematical characteristics, thus enabling the teacher to have accessible
processed data to inform his decision making.
ICTMT 13 69 Lyon 3 - 6 July 2017

Yet, although data is accessible, and practices are studied, guided inquiry is not a prominent practice
in mathematics classroom. One way to address is to explore ways to study and promote good
practice of teachers in technologically rich environments that present students with guided inquiry.
CONTEXT OF THE STUDY
This study recalls a recorded guided inquiry session with 24 students from grades 9th-10th, working
in pairs. The students are using a first generation DGE (Geometric Supposer), which served as a
technological platform used to elicit conjectures for about half a year prior to the recorded lesson.
The lesson's was planned to summarize major theorems of similarity in triangles. The students are
walked through the construction on the board, while the teacher describes the actions, and the
students get a printed version of the task as well.
The leading research aim is answering the question whether it is possible to identify good practices
about conducting conjecture based discussions in the classroom, and whether the categorization of
conjectures in a way that facilitates these practices by providing these categorizations automatically.
METHODOLOGY
In order to address the research question we study a classroom in which the teacher needs to gather,
process, and utilize information that is generated by his students while conducting an individual
inquiry activity using a DGE. Truoche (2004) uses the term "instrumental orchestration" to describe
didactic configurations and the way that they are being exploited in the classroom, and also suggests
them as a construct that could "give birth to new instrument systems" (ibid, p.304). In the observed
lesson this framework is suitable to describe the way the teacher works with the students answers,
and suggest "new instrument systems" whether available within the given environment or supported
by different technological platforms.
For the analysis presented in this paper, we have analyzed a recording of a one-hour lesson in a
classroom, which serves as our main data source. In addition we draw upon the design principles of
the STEP platform for use in classrooms that are equipped with personal digital devices.
In the next part, we describe the task presented to the students. Following that part we analyse the
way the teacher orchestrates the discussion surrounding the conjectures raised by the students.
Specifically, we analyze the categorization of the conjectures in terms of placement on the
blackboard (if at all), and type of treatment they are given by the teacher (i. e. acknowledging the
difficulty to prove a certain conjecture, or specifying the underlying constraints). As this
orchestration requires a lot of real-time decision making by the teacher, we then examine how the
use of automatic analysis tools (e. g. the STEP platform) could offload some of this orchestration,
creating new instrument systems thus possibly making this process more accessible for other
teachers.
The task
Construct an acute triangle. Draw the altitudes from each one of the triangle points, and mark the
feet of the altitudes D, E, F. Label the intersection point G. reflect point G over each side of the
triangle. What’s the relationship between triangle DEF which is formed by connecting the feet of
each altitude, and the triangle formed by connecting the image points of G, the original triangle, and
angles, segments? Investigate anything that you can find. Write out formal conjectures as we have
been doing in class.
ICTMT 13 70 Lyon 3 - 6 July 2017

In figure 1 appears a sketch that resembles the one that was drawn on the blackboard in the recorded
lesson.
Figure 1. A sketch of the geometric construction discussed in the classroom
DATA ANALYSIS
During the recorder session, we have identified 11 conjectures that were addressed in the classroom
(Table 1). Once the seven conjectures were listed, the teacher initiated a discussion aiming to review
the conjectures and the argumentation and underlying supposing at the base of each conjecture.
Listed on the left side of the
blackboard
Listed on the right side of
the blackboard
Conjectures that were raised
by students but did not appear
on the black board
A1. B1. If is isosceles and
acute then:
is geometric mean of
C1.
A2.
B2. Bisector is the same as
altitude.
bisects and
bisects
C2. Corresponding sides are
parallel
A3.
B3
( is isosceles )
C3. bisector of
H also bisects E.
A4. , C4. IF ABC is isosceles:
Creates two other isosceles
triangles.
Table 1. Conjectures raised by students according to their appearance on the black board
ICTMT 13 71 Lyon 3 - 6 July 2017

When addressing these conjectures, we have identified four strategies used by the teacher. The first
strategy can be demonstrated with conjecture A1 (table 1), was to state the conjecture on the left
side of the blackboard, and then ask how many of the students agree with the conjecture:
Teacher: You think that triangle IHJ is similar to triangle DEF [writes on the
blackboard]. Raise your hand if you believe that's true? [All of the students raise
their hand] oh. So everyone does. Great.
The second strategy can be demonstrated using conjectures C1 and A3, was not to write the initial
conjecture, but to either refine it by himself (C3 turned into B2) or by involving the students, as can
be shown from the following excerpt:
Student 1: Their sides are two to one.
Teacher: The ratio of their sides is two to one.
Students: Perimeter.
Teacher: Perimeter is two to one [writes on the blackboard].
The perimeter of triangle IHJ, to the perimeter of triangle DEF is two. Which
means the ratio of their sides is also two to one.
The third strategy can be demonstrated using conjecture B1, as to write the conjecture with the
additional constraints relevant to it on the right hand side of the board (on the right side of the
sketch). In this case the teacher also assigns ownership of this conjecture and the additional
constraints to the students that raised it:
Student 2: If triangle ABC is isosceles, then hmm, the measure of the angle ACB equals
either of the two base angles in the two smaller triangles. Because those two
smaller triangles are also isosceles.
Teacher: You and Jenifer worked a lot with isosceles triangles, didn't you? [Drawing on the
blackboard a sketch represented in Figure 2] OK what do you claim?
Student 2: That angle ACB equals, is congruent to angle FED and angle FDE
Teacher: [writes ( is isosceles) on the blackboard].
Figure 2. A sketch of the constrained case students addressed in the classroom
ICTMT 13 72 Lyon 3 - 6 July 2017

The fourth strategy used was in cases that were stated on the right side of the blackboard, but were
general. There was one occurrence of a case such as this, conjecture C3 that was raised and then
processed to conjecture B2 that was finally written on the board. This conjecture was not one that
the lesson plan for this activity prepared the teacher for.
Table 1 suggests rough categories for the conjectures as they were addressed by the teacher. The
Conjectures that appeared on the left side of the blackboard (A1-A4) were conjectures that the
teacher expected, and went over their justifications in class. The conjectures that did not reach the
blackboard (C1-C3) required some additional rephrasing or generalization in order for them to be
well defined and represented, and their evolved form eventually appeared on the board. The
conjectures that appeared on the right side of the blackboard were either case specific conjectures
(B1, B3), or conjectures that were more advanced compared with the learned content.
The teacher then moves on with a reflection, sharing his thoughts and his planning with the
students. In this the teacher, a well-established authority figure in the classroom, demonstrated that
he was not completely prepared for everything that appeared - on the contrary. He was happy to be
surprised by the students' ideas he did not expect. He asks which conjecture the students thought
surprised him, and they stated the bisector one (B2), to which the teacher agreed. He then states that
he will not address all of the conjectures, but he will do the ones on the left side, stating that these
are the ones that everyone found; he then goes over the proofs for all of them. Then he turns to the
right hand side of the board, and categorises the conjectures further: conjectures B1 and B3 are
referring to the sketch in Figure 2, and are given as homework, but conjecture B2 is referred to as a
general conjecture, true for any triangle. The teacher states it might be difficult for them to prove,
and gives them additional time and offers hints if they will have difficulties. So the reflection about
the "surprising" aspect in students' conjectures serves beyond the issue of authority; this could be the
teachers' way to categorize conjectures as being more or less trivial (expected) to be proved.
DISCUSSION
Expert teachers have the skills and knowledge to filter and categorize student answers during the
classroom session even in complex situations of inquiry based learning. Yet, this ability is not
common practice, especially when gathering information from technologically based platforms
(Drijvers, Doorman, Boon, Reed, & Gravemeijer, 2010). As also appears in the case presented
above, the teacher refers to cases that were not expected by him as cases that he might not address in
the classroom. Olsher, Yerushalmy, & Chazan (2016) suggest the use of automatic filtering of
student responses to make this type of information more accessible for teacher use as means for
formative assessment. One example that is suggested by Olsher et al. (2016) is the STEP platform,
which enables teachers to predefine mathematical properties of student answers, for the platform to
automatically analyze and categorize for increasing the accessibility of the teacher to the student
answers.
For the case presented, the categorization of the teacher could be mapped into an automatic filtering
scheme. As the topic of this lesson is similarity, many conjectures that address certain
characteristics of similarity are expected to be raised: ratio between sides, areas, relationship
between corresponding segments (e.g. parallel segments). Even student mistakes that are prominent
in the teaching of the similarity could be expected (e.g. mistaking between the ratio of segments and
the ratio between areas).
These relations could be predefined and automatically recognized by the platform (e.g. STEP),
making relevant data such as: is this relation addressed by the students? If so, by how many of the
ICTMT 13 73 Lyon 3 - 6 July 2017

students? Furthermore, as DGE's are currently even more flexible than the Geometric Supposer in
terms of the student's ability to drag pre-constructed figures, categorizing by the mathematical
properties stated could be even more important as the students' example spaces potentially grow
even wider. One example for filtering student answers is by determining whether they added
constraints to the given situation, and by that potentially limited the generality of their answer, such
as was demonstrated in conjectures B1 and B3 that were related to isosceles triangles. By defining
the expected relations, we are also setting the stage for the unexpected relations to appear. They
could easily be addressed by the teacher, and also automatically determine their correctness. By
acknowledging that the platform will not identify the entire space of relations that students raised
we leave room for student creativity, which is a substantial part of inquiry based activities, but also
might keep educators from using automatic assessment platforms. In later sessions teachers could
choose to incorporate these relations into the detected relations scheme if they see it fit.
We conclude in suggesting that the automatization of the categorizing and surveying of the student
answers, beyond their correctness, could serve as a tool for teachers in their instrumental
orchestration of a technologically based guided inquiry learning environment.
REFERENCES
Arzarello, F., & Robutti, O., (2010). Multimodality in multi-representational
environments. ZDM, 42(7), 715-731.
Black, P., & Wiliam, D., (1998), Assessment and Classroom Learning, Assessment in Education,
Vol. 5, 7-74.
Chazan, D., & Ball, D.(1999). Beyond being told not to tell. For the Learning of Mathematics, 19,
2-10.
Clark-Wilson, A. (2010). Emergent pedagogies and the changing role of the teacher in the TI-Nspire
Navigator-networked mathematics classroom. ZDM,42(7), 747-761.
Drijvers, P., Doorman, M., Boon, P., Reed, H., & Gravemeijer, K. (2010). The teacher and the tool:
instrumental orchestrations in the technology-rich mathematics classroom, Educational Studies in
Mathematics, 75(2), 213-234.
Olsher, S., Yerushalmy, M., & Chazan, D. (2016). How might the use of technology in formative
assessment support changes in mathematics teaching? For the Learning of Mathematics, 36(3),
11-18.
Panero, M., & Aldon, G. (2015). How can technology support effectively formative assessment
practices? A preliminary study. In N. Amado & S. Carreira (Eds.) proceedings of the 12th
International Conference on Technology in Mathematics Teaching (ICTMT 12).293-302 .
Trouche, L. (2004). Managing the complexity of human/machine interactions in computerized
learning environments: Guiding students’ command process through instrumental orchestrations.
International Journal of Computers for mathematical learning, 9(3), 281-307.
Yerushalmy, M. & Elikan, S. (2010). Exploring reform ideas of teaching Algebra: Analysis of
videotaped episodes and of conversations about them In R. Leikin & R. Zazkis (Eds.), Learning
through Teaching: Developing mathematics teachers' knowledge and expertise in practice. (pp.
191-207). Springer Netherlands.
ICTMT 13 74 Lyon 3 - 6 July 2017

CAN I SKETCH A GRAPH BASED ON A GIVEN SITUATION? –
DEVELOPING A DIGITAL TOOL FOR FORMATIVE SELF-ASSESSMENT
Hana Ruchniewicz
University of Duisburg-Essen; [email protected]
This article describes the development of a digital tool for formative self-assessment in a design-based research study. The aim is to create a tool that allows students to self assess their work,rather than having technology evaluate their answers. Thus, learners are provided with a list oftypical misconceptions to check their solutions to an open assessment task. This assessment tasktests the students’ ability to draw a graph based on a given situation. Two case studies in form oftask-based interviews with sixteen-year-old students are described. The analysis leads toreconstruction of the learners’ formative assessment processes by using a theoretical frameworkdeveloped in the EU-project FaSMEd. The results show which formative assessment strategiesstudents actively use when working with the digital tool and which functionalities of the technologycan be identified.
Keywords: formative self-assessment, role of technology, functions, design-based research
AIM OF THE TOOL
A challenge for the design of a digital tool for student formative self-assessment is that the actualassessment should not be done by the technology. Some digital self-assessment environmentsgenerate a set of questions, check the student’s answers based on two categories: right or wrong;and then provide the student with feedback in form of the number of correct responses. However,while a student works individually in such environments, he/she does not adopt the role of theassessor. Therefore, the term “self”-assessment refers only to the organisation of the assessment forsuch tools. In order to move the learning process forward, it is essential for the student to gaininformation on his/her own understanding of the learning content (Wiliam & Thompson, 2008).Moreover, the active involvement of learners is identified as a common characteristic of effectiveformative assessment approaches. Investigating their (mis-)conceptions helps students to gainsensitivity for their strengths and weaknesses. In addition, students can discover how to observe anddirect their learning processes using metacognitive strategies along with reflection and adoptresponsibility for their own learning in the process (Black & Wiliam, 2009; Heritage, 2007). Hence,a key design feature of our tool is a checklist of typical misconceptions related to the mathematicalcontent, which is the change from a situational to a graphical representation of a function, that helpsstudents to become self-assessors. The tool was developed during the design-based research EU-project FaSMEd (Raising Achievement through Formative Assessment in Science and MathematicsEducation), which introduced and investigated technology enhanced formative assessment practices(www.fasmed.eu).
THEORETICAL BACKGROUND
Conceptualising formativeassessment
Formative assessment (FA) is “theprocess used by teachers and studentsto recognize and respond to studentlearning in order to enhance thatlearning, during the learning.” (Bell &Cowie, 2001, p. 540). It results in the
Figure 1: Key strategies of FA (Wiliam & Thompson, 2008)
ICTMT 13 75 Lyon 3 - 6 July 2017

active adaptation of classroom practices to fit students’ needs by continuously gathering,interpreting and using evidence about ongoing learning processes (Black & Wiliam, 2009). Therequired data can be elicited and exploited during the different phases of these processes. Wiliamand Thompson (2008) refer to Ramaprasad (1983) and focus on three central steps in teaching andlearning, namely establishing: where the learners are, where the learners are going and how theymight get there. The authors state that FA can be conceptualised in five key strategies (Figure 1).These strategies enable teachers, peers and students to close the gap between the students’ currentunderstanding and the intended learning goals.
While Wiliam and Thompson (2008) take into account central steps of the learning process and theagents (teacher, peers and learners) who act in the classroom, their framework regards mainly theteacher to be responsible for the process of FA. It is the teacher who creates learning environmentsto investigate the students’ understanding (strategy 2), who gives feedback (strategy 3) and whoactivates students as resources for one another (strategy 4) and as owners of their own learning(strategy 5). In order to regard all three agents as being able to take responsibility for each of thesteps and key strategies, the framework was refined in the FaSMEd project. The FaSMEdframework (Figure 2) allows the characterisation and analysis of technology enhanced FA processesin three dimensions: agent/s, FA strategies and functionalities of technology (www.fasmed.eu;Aldon, Cusi, Morselli, Panero, & Sabena, 2017).
The “agent/s” dimension specifies who is assessing: the student, peer/s, or the teacher. It isimportant to involve all of the agents in FA as the “assessment activity can help learning if itprovides information that teachers and their students can use as feedback in assessing themselvesand one another […]” (Black, Harrison, Lee, Marshall & Wiliam, 2004, p.10). Moreover, an activeinvolvement of students by peer and self-assessment is stated as key aspect of FA. It includesopportunities for learners to recognize, reflect upon and react to their own/ their peers’ work. Thishelps them to use metacognitive strategies, interact with multiple approaches to reach a solution andadapt responsibility for their own learning (Black & Wiliam, 2009; Sadler, 1989).
The “FA strategies” dimension of the FaSMEd framework refers to the five key strategies (Wiliam& Thompson, 2008), but understands them in a broader sense by acknowledging that all agents canbe responsible for FA. For example, a student can elicit evidence on his/her own understanding(strategy 2) by working and reflecting on assessment tasks, peers can provide effective feedback(strategy 3), or a student can control his/her own learning process using metacognitive activities(strategy 5).
To specify thedifferentfunctionalities thattechnology canresume in FAprocesses, FaSMEdintroduced a thirddimension to theframework:“functionalities oftechnology”. Wedistinguish threecategories:
(1) Sending &Displaying, which
Figure 2: The FaSMEd framework
ICTMT 13 76 Lyon 3 - 6 July 2017

includes all technologies that support communication by enabling an easy exchange of files anddata. For example, the teacher sending questions to individual students’ devices or displaying onestudent’s screen to discuss his/her work with the whole class.
(2) Processing & Analysing considers technology converting collected data. This includes softwarethat generates feedback and results to an operation or applications which create statistical diagramsof a whole class’ solution, for example after a poll.
(3) Providing an Interactive Environment refers to technology that enables students to work in adigital environment and lets them explore mathematical or scientific contents interactively. Thiscategory includes, for example, shared worksheets, Geogebra files, graph plotting tools, spreadsheets or dynamic representations (www.fasmed.eu).
The mathematical content: Functions
During the development of a self-assessment tool, its mathematical content needs carefulconsideration. Bennett (2011) states that “to realise maximum benefit from formative assessment,new development should focus on conceptualising well-specified approaches […] rooted withinspecific content domains” (p.5). Therefore, a content analysis needs to evaluate, for example, whichcompetencies or skills students need to master, what a successful performance entails and whichconceptual difficulties might occur. This ‘a priori’ analysis revealed three aspects relating tofunctions relevant for the tool’s development: different mental models that students need to acquirefor a comprehensive understanding, translating between mathematical representations and knownmisconceptions.
The German tradition of subject-matter didactics specifies the idea of mental models in the conceptof ‘Grundvorstellungen’ (GVs). It is used to “characterize mathematical concepts or procedures andtheir possible interpretations in real-life” (vom Hofe & Blum, 2016, p.230). Thereby, GVs identifydifferent approaches to a content that makes it accessible for students. They describe, which mentalmodels learners have to construct in order to use a mathematical object for describing real-lifesituations. In this sense, GVs act as mediators between mathematics, reality and the learners’ ownconceptions (vom Hofe & Blum, 2016). When using the graph of a function to describe a givensituation, students have to acquire three GVs for the concept of functions: mapping, covariation andobject. In a static view, a function maps one value of an independent quantity to exactly one valueof a dependent quantity. The graph of a function can, thus, be seen as a collection of points thatoriginate from uniquely mapping values of one quantity to another. In a more dynamic view, afunction describes how two quantities change with each other. Considering a functional relationwith this focus allows a graph to embody the simultaneous variation of two quantities. Finally, afunction can be seen as a whole new mathematical object. Then, the graph is viewed from a globalperspective (Vollrath, 1989).
Besides constructing these three GVs, a comprehensive understanding of the concept requiresstudents to be able to change between different forms of representations of a function (Duval,1999). Functional relations appear in a range of semiotic representations. Learners encounter them,for instance as situational descriptions, numerical tables or Cartesian graphs. Each of theseemphasizes different characteristics of the represented function. Thus, transforming one form intoanother makes other properties of the same mathematical object explicit (Duval, 1999). What ismore, Duval (1999) stresses that mathematical objects are only accessible through their semioticrepresentations. Therefore, each mathematical activity can be described as a transformation ofrepresentations. Duval (1999) differs between treatments, meaning the manipulation within thesame semiotic system, and conversions, meaning the change of one representational register toanother while preserving the meaning of the initial representation. The author identifies conversionsbetween different registers to be the “threshold of mathematical comprehension for learners […]”
ICTMT 13 77 Lyon 3 - 6 July 2017

(Duval, 2006, p.128) and concludes that “only students who can perform register change do notconfuse a mathematical object with its representation and they can transfer their mathematicalknowledge to other contexts different from the one of learning” (Duval, 1999, p.10). Hence, askingstudents to draw a graph based on a given situation means assessing a key aspect of theirunderstanding of the concept of functions.
As students’ mistakes can mirror their conceptual difficulties, typical misconceptions in the field offunctions are considered for the development of our digital self-assessment tool. For instance,Clement (1985) states that many students falsely treat the graph of a function as a literal picture ofthe underlying situation. They use an iconic interpretation of the whole graph or one of its specificfeatures instead of viewing it as an abstract representation of the described functional relation(Clement, 1985). To overcome this mistake, students need opportunities to consider graphssymbolically. Thus, instructions might ask learners to interpret a graph point by point or to describethe change of the dependent quantity for certain intervals. Another example of a typical cognitiveissue when graphing functions is the ‘swap of axes’ labels. This mistake can arise when studentsname the axes intuitively without regarding mathematical conventions (Busch, 2015).Hadjidemetriou and Williams (2002) even speak of the “pupils’ tendency to reverse the x and the yco-ordinates” (p.4). In order to correctly label the axes for a given situation, learners need tounderstand the functional relation between two quantities from its description and apply theconvention to record the independent quantity on the x-axis and the dependent one on the y-axis ofa Cartesian coordinate system (Busch, 2015). These are examples of some of the findings on typicalmisconceptions that were used in the design of our tool that both anticipate certain studentdifficulties and provide hints to foster the desired competencies.
DESIGN OF THE DIGITAL SELF-ASSESSMENT TOOL
The structure of the tool draws on a set of self-assessment materials originating from the KOSIMA(German acronym for: contexts for meaningful mathematics lessons) project (Barzel, Prediger,Leuders & Hußmann, 2011). Therefore, the tool comprises five parts: Test, Check, Info, Practiceand Expand. These are connected in a hyperlink structure and labelled with different symbols(Figure 3) to support easy learner orientation regarding the tool’s use.
Figure 1: Hyperlink structure of the digital self-assessment tool
The aim is to create a tool that allows students to be self-assessors, that is why the design intends tocreate a balance between providing enough information as well as autonomy for the learners. Theinitial step of the self-assessment process is for the student to identify the learning goal. It isspecified and made transparent in our tool by the question: “Can I sketch a graph based on a givensituation?”, which appears on the top of the first screen (Figure 4). The learner is provided with theTest task (labelled with a magnifying glass icon). This Test presents the story of a boy’s bike rideand asks the student to build a graph that shows how the boy’s speed changes as a function of thetime. Besides labelling the axes by selecting an option from drop-down menus, the learner can buildhis/her graph out of moveable and adjustable graph segments. These are dragged into the graphingwindow and placed in any order the student chooses. Furthermore, the slope of the single segmentscan be altered by the user. After submitting a graph, a sample solution and Check are presented tohelp evaluate the individual answer (Figure 4). The Check is labelled with the symbol of a positiveand negative check mark. It presents the student with six statements regarding important aspects ofthe functional relation at hand alongside common mistakes that could arise when solving the Test
ICTMT 13 78 Lyon 3 - 6 July 2017

task. For example, one of the Check-points addresses the graph’s slope: “I realized when the graphis increasing, decreasing or remaining constant.”, or another represents the Graph-as-a-picturemistake: “I realized that the graph does not look like the street and the hill.” The learner decides foreach statement, if it is true for his/her solution, in which case it is marked off. For this diagnosticstep, the student’s screen not only presents the Check-list, but his/her answer as well as a samplesolution to make a comparison easy. Thus, the Check helps the learner to self-assess his/her solutionby presenting criteria for successfully solving the Test and by encouraging reflection of one’sanswer in comparison to the sample solution and Check-points. Additionally, the Check serves as adirectory through the tool’s hyperlink structure (Figure 3). This way, the student is encouraged totake further steps to move his/her learning forward.
Figure 4: Test and Check of the digital self-assessment tool
If an error is identified by the learner, he/she can choose to work on the Info and Practice taskcorresponding with the Check-point’s statement. The Info is labelled by the symbol of a lightningbulb. It entails a general explanation that is intended to repeat basic classroom contents to overcomethe certain mistake. Moreover, the explanation is made accessible by using the time-speed contextof the Test as an example. In addition, an illustration is included to ensure a visual help and toencourage the learner to change between the two semiotic representations: verbal description aswell as Cartesian graph. Then, the Practice task lets the student test his/her understanding of therepeated content. It is marked by the picture of an exercise book. Afterwards, the user can go backto the Check and work on the next statement. If the sketched graph is stated as correct, two furtherPractice tasks and one Expand task with a more complex context are provided. The Expand islabelled with a gearwheels icon and, in this case, asks the student to draw two different graphs forthe same situation.
Above all, the tool aims to challenge the student to reflect on his/her own solutions and reasoning.This is why, besides offering a Check-list, it presents sample solutions for all tasks. It is the learnerwho decides weather the own answer is correct by comparing it to the sample solution.
METHODOLOGY
The conception and evaluation of the digital self-assessment tool are connected within a design-based research study. This is a “formative approach to research, in which a product or process isenvisaged, designed, developed, and refined through cycles of enactment, observation, analysis, andredesign, with systematic feedback from end users” (Swan, 2014, p.148). Here, two different formsof case studies are applied: class trials and student interviews. The purpose of the class trials is toevaluate the effectiveness of the tool’s implementation by exploring whether: self-assessment ispossible using the tool, the structure is clear, and any technical issues are identified. Hence, classtrials are conducted during a lesson where students work on the digital self-assessment toolindividually or in pairs. Data is collected in the form of the researcher’s notes on the lesson and a
ICTMT 13 79 Lyon 3 - 6 July 2017

classroom discussion about the students’ experiences with the tool. In addition, task-basedinterviews with individual students aim for a more detailed understanding of the learners’ FAprocesses. This is why, students are asked to “think out loud” during their work with the tool andinterviewers are instructed to only intervene the students’ self-assessment to remind them toverbalise their thoughts or to help with technical issues. At the end, reflecting questions about thestudents’ experience with the tool are asked. The interviews are videoed and transcribed to serve asthe main data pool for qualitative analyses. These lead to the reconstruction of FA processes usingthe FaSMEd framework (Figure 2). Besides generating a well-grounded tool, the aim of the study isto examine the following research questions:
When students work with the digital self-assessment tool:1) which formative assessment strategies do they use?2) which functionalities does the technology have within the student’s FA processes?
In each cycle of development, the investigation of these questions using the FaSMEd framework(Figure 2) informs the re-design of the tool. On this account, several development cycles took placein the study since 2014. A first pen-and-paper version of the tool was evaluated through interviewswith eleven grade eight students from two different secondary schools in Germany.
Following the tool’s redevelopment, two digital prototypes were created using differenttechnologies: JACK and TI-Nspire Navigator. JACK is a server-based system for online assessmentdeveloped by the Ruhr Institute for Software Technology at the University of Duisburg-Essen.While the software has several useful options, such as being able to generate automatic feedbackbased on student answers, to create statistical overviews of submitted solutions and to insert taskswith variable contents, the JACK prototype proved to be unfit for implementation of our tool due tothree main reasons: First, its hyperlink structure could only be implemented in a restricted way. Itwas not possible to display the entire Check-list at once, but only single Check-points. Furthermore,the software has a limited number of task types that are mainly in form of multiple choice or openanswer formats. Finally, JACK requires an internet connection, but most schools in Germany do nothave access to wireless internet in their classrooms, which would limit its potential use. The seconddigital prototype was programmed in Lua script using the software TI-Nspire Navigator, whichenabled the tool’s hyperlink structure to be realized, offline access and a choice of using the tool ona computer or iPad. Moreover, the options for implementing open tasks were greater and dynamicvisualisations could be inserted. Hence, the tool’s design was implemented only for TI-NspireNavigator. The subsequent classroom trial of the digital tool run on iPads involving 18 grade tenstudents led to further redevelopments.
The finished digital version was trialled in twograde ten classrooms at two further secondaryschools and associated student interviews (one perclass) were recorded. Finally, another set ofstudent interviews with two second semesteruniversity students were held. The wide range ofdata in different age groups and schools resulted ina thorough evaluation of the tool’s potential andconstraints. As it is intended to assess and repeatbasic mathematical competencies, its use is not limited to one specific group of learners. Firstexperiences with the tool show that students in all of the tested class levels (grades 8, 10 anduniversity) had similar issues concerning mathematical understanding as well as technical problems.This article focuses on the two single student interviews recorded in grade ten.
For the following situation, sketch a graph to show
how the speed changes as function of the time.
Niklas gets on his bike and starts a ride from his home.
He rides along the street with constant speed before it
carves up a hill. On top of the hill, he pauses for a few
minutes to enjoy the view. After that he drives back
down and stops at the bottom of the hill.
ICTMT 13 80 Lyon 3 - 6 July 2017

RESULTS
Two students’ work with the digital tool are presented and their FA processes analysed using theFaSMEd framework (Figure 2). Both learners (S1 & S2) are female and sixteen years old, but visitdifferent secondary schools. Their interviews were chosen for the analysis because they both trialledthe digital version of the tool and selected the same Check-point regarding switching the x- and y-axis labels to take further steps in their learning. Both students start with the Test task (see text box).
S1 built her graph (Figure 5) by dragging moveable graphsegments into the graphing window and selecting labels forboth axes from drop-down menus. As she solved theassessment task, she evidences her understanding of sketchinggraphs of given situations (strategy 2) while the tool providesan interactive learning environment (functionality 3). Afterreading the sample solution out loud, S1 moved to the Checkand was silent for a while. The interviewer asked what she wasthinking about. The student mentioned being unsure aboutwhich Check-list items to mark off because she “saw in thesample solution that there was another graph and this was missing in [her] own solution.” With the“other graph” she means a second hill-shaped part of the graph, which she indicated by gesturing itsshape on the screen with her finger. It can be concluded that the Check stimulates S1 to assess heranswer by comparing her own graph to the sample solution. By reflecting on her answer, S1 uses ametacognitive activity and, thus, adopts some responsibility for her own learning process (strategy5). The tool displays the information she needs for the diagnostic step in form of the samplesolution and Check-list (functionality 1). Furthermore, the student decided to evaluate the laststatement in the Check. It reads “I realized that the time is the independent variable recorded on thex-axis and that the speed is the dependent variable recorded on the y-axis.” S1 stated that this wasnot true for her graph, which means that she understands a criterion to successfully solve the Test(strategy 1). What is more, she reflects on her solution by comparing it to the Check-point statement(strategy 5) and formulates a self-feedback (strategy 3): “The speed and time were wrong becausethere [she points to x-axis] needs to be the time and there [she points to y-axis] the speed. I did notrealize this.” Here, the technology is once more functioning as a display of information in the formof the Check-point (functionality1).
At that point S1 decided a next step in her learning (strategy 5) when she read the associated Info.After the interviewer reminded her of the possibility to do another exercise related to her mistake,S1 worked on the linked Practice. This helps her to elicit evidence about her understanding of theindependent and dependent quantity of a functional relation (strategy 2). The tool provides the taskand sample solution (functionality 1). The task presented the learner with ten different situationsdescribing the functional relation between two quantities. For each one, the learner was asked toassign labels to the axes of a coordinate system (given that he/she imagined drawing a graph basedon the situation in the next step). The labels were chosen from a number of given quantities:temperature, distance, speed, time, pressure, concentration, money, and weight. S1 solved six out often items correctly. While she seemed to have no difficulties with situations in which time appearedas the independent quantity, she struggled to label the y-axis when time was being dependent onanother quantity. For example, in the situation “In a prepaid contract for cell phones, the time leftto make calls depends on the balance (prepaid).” S1 chose “time” as the label for the x-axis and“money” as the label for the y-axis. However, she explained “if you have a prepaid phone, you canonly make calls as long as you have money.” Therefore, she grasped the relation in the real-lifecontext but ccouldn’t use this knowledge when asked to represent it in form of a graph. Moreover,the student repeated this mistake of ‘swapping the axes’ even in situations that didn’t include time
Figure 5: S1's Test solution
ICTMT 13 81 Lyon 3 - 6 July 2017

as a quantity. For instance, S1 selected “distance” as the label for the x-axis and “speed” for the y-axis in the situation “Tim’s running speed determines the distance he can travel within half anhour.” Nonetheless, she explained correctly that “the speed specifies how far he can run.” Apossible explanation for her repeating mistake could be her approach to the task. S1 selected a labelfor the y-axis first before going on to the x-axis. This could mean that she does not fully understandthe conventions of drawing a Cartesian coordinate system. However, her mistake could alsooriginate from a deeper misunderstanding as Hadjidemetriou and Williams (2002) speak of the“pupils’ tendency to reverse the x and the y co-ordinates” and their inability to adjust theirknowledge in unfamiliar situations” (p.4). This would show a need for further interventions.However, S1 was able to identify two out of her four mistakes by comparing her answers to thesample solution (strategy 5) before she returned to the Check and marked off the respective Check-point statement.
In summary, S1’s work with the digital self-assessment tool can be depicted as shown in Figure6. She solves a diagnostic task, identifies a mistakeby understanding criteria for success, reflecting onher answer and comparing it to a sample solution anddisplayed statement. She gives herselffeedback and decides to take furthersteps in her learning by revisinginformation on her error and practicing.Though she is not fully able toovercome her mistake, the tool supportsS1 to think about her work on ametacognitive level and adoptresponsibility for her learning. Thus, S1uses four FA strategies, while the tool’sfunctionality can be labelled asdisplaying information or, in case of theTest task, providing an interactiveenvironment. Her formative assessmentprocess can be characterised using the FaSMEd framework as shown in Figure 7.
S2 also sketched a graph (Figure 8) to solve the Test and elicitevidence of her understanding (strategy 2) using the tool’sinteractive graphing window (functionality 3). In the Check, shedidn’tmarkoff the
Figure 10: Characterisation of S2’s FA process
Figure 7: Characterisation of S1’s FA process
Figure 6: Reconstruction of S1’s FA process
Figure 8: S2’s Test solution
Figure 9: Reconstruction of S2’s FA process
ICTMT 13 82 Lyon 3 - 6 July 2017

statement concerning time being the independent and speed being the dependent quantity. Thus, S2identifies a supposedly error based on the displayed Check statement (functionality 1). Even thoughshe labelled the axes correctly, S2 decided to read the Info concerning her alleged mistake and is,thus, adopting responsibility for her learning (strategy 5). When reading the Info, she realized: “Oh,that is correct as well because I did it in the same way." She not only states a self-feedback (strategy3), but also compares the displayed information (functionality 1) to her own Test answer andreflects on her assessment (strategy 5). Then S2 went back to the Check and marked off thestatement correcting the error in her previous assessment autonomously. In conclusion she identifiesa correct aspect about her work, which means she now understands a criterion for success (strategy1).
In summary, S2’s work with the digital self-assessment tool can be illustrated as in Figure 9. Sheworks on a diagnostic task, identifies an assumed mistake and decides to gather more informationon it. Then S2 identifies an error in her previous self-assessment by comparing her solution of theTest to the displayed Info. Finally, she corrects her assessment. The analysis shows that within thisprocess, she uses four different formative assessment strategies, while the tool functions mainly as adisplay of information and for the Test provides an interactive environment (Figure 10).
CONCLUSIONS AND FURTHER STEPS
The analysis of the two cases shows that the tool does have the potential to support students’formative self-assessment concerning their ability to draw a graph based on a given situation. It isthe user, who holds the responsibility to identify mistakes and decide on next steps in the learningprocess. In addition, the tool stimulates students to actively use four different key strategies offormative assessment: the clarification and understanding of criteria for success, eliciting evidenceon student understanding, formulating feedback and being activated as the owners of one’s ownlearning.
However, the case studies highlight someconstraints of the digital self-assessment tool,which (in the cyclic process of the study) lead toa redesign that is currently being programmed.In the interviews, it became clear that studentsare uncertain about assessing themselves as theymentioned that they expect validation fromeither the teacher or the technology. This is why,the redesign focuses on improving students’comprehension of the learning goal, namely thechange of representation from situation to graph,and simplifying the learners’ self-evaluation.Hence, the static picture of the Test’s samplesolution will be replaced with a simulation ofthe described bike ride connected to the samplegraph as well as the student’s own solution(Figure 11). Furthermore, all Practices willallow simultaneous views of the student’s answer next to a sample solution for easier comparison.The students’ interview statements and S1’s case, in which she was unable to fully overcome hermistake, revealed that it will not be possible for all students working with the tool to (re)learn thechange of representation from situation to graph on their own. Further interventions not included inthe tool might be necessary. Therefore, the newest version will save the individual student’s work
Figure 11: Simulation of bike ride as samplesolution of the Test task in the tool’s current
redesign
ICTMT 13 83 Lyon 3 - 6 July 2017

and include a teacher functionality to review students’ solutions and enable more effective planningof post-assessment classroom interventions by addressing students’ needs more directly.
Furthermore, the two cases show that the tool’s functionality can mainly be described as displayinginformation. To increase the interaction between students and tool, the redesign will includedynamic visualisation for most of the Info units. These will enable students to click on highlightedsegments of a displayed graph to open and read an explanation. In addition, simulations asdescribed for the Test’s sample solution, that allow to make connections between the real-lifesituation and the graph of a function, will be used in some of the Practice tasks as well.
Finally, the interviews show that more detailed analyses are necessary to gain a deeperunderstanding of the students’ formative self-assessment processes. While working with the digitaltool did not help learners to overcome all of their mistakes, it encouraged them to reflect on theirown solutions on a metacognitive level. This seems to be the key for students’ success in doing self-assessment. Therefore, a category system for a qualitative content analysis of the interviews iscurrently being developed. It focuses on three main categories regarding the students’:metacognitive activities, tool activities and content-related activities. The aim is to observe whichmetacognitive activities are prompted through which design aspects of the digital self-assessmenttool and how this can help the students’ conceptual understanding of the content of functions.
REFERENCES
Aldon, G., Cusi, A., Morselli, F., Panero, M., & Sabena, C. (2017). Formative assessment andtechnology: reflections developed through the collaboration between teachers and researchers. InG. Aldon, F. Hitt, L. Bazzini, U. Gellert (Eds.), Mathematics and Technology: A C.I.E.A.E.M.Sourcebook (pp. 551-578). Springer International Publishing.
Barzel, B., Prediger, S. Leuders, T., & Hußmann, S. (2011). Kontexte und Kernprozesse: Aspekteeines theoriegeleiteten und praxiserprobten Schulbuchkonzepts [Contexts and core processes –Aspects of a school book concept guided by theory and practice]. Beiträge zumMathematikunterricht, 71-74.
Bell, B., & Cowie, B. (2001). The characteristics of formative assessment in science education.Science Education, 85(5), 536-533.
Bennett, R. E. (2011). Formative assessment: A critical review. Assessment in Education:Principles, Policy & Practice, 18(1), 5-25.
Black, P., Harrison, C., Lee, C., Marshall, B., & Wiliam, D. (2004). Working inside the black box:Assessment for learning in the classroom. Phi Delta Kappan, 86(1), 8-21.
Black, P., & Wiliam, D. (2009). Developing the theory of formative assessment. EducationalAssessment, Evaluation and Accountability, 21(1), 5-31.
Busch, J. (2015). Graphen „laufen“ eigene Wege. Was bei Funktionen schiefgehen kann [Graphs“run” own ways. What can fail with functions]. Mathematik lehren, 191, 30–32.
Clement, J. (1985). Misconceptions in graphing. In L. Streefland (Ed.), Proc. 9th Conf. of the Int.Group for the Psychology of Mathematics Education (Vol.1, pp. 369-375). Utrecht: PME.
Duval, R. (1999). Representation, Vision and Visualization: Cognitive Functions in MathematicalThinking. Basic Issues for Learning. Retrieved fromhttp://files.eric.ed.gov/fulltext/ED466379.pdf.
Duval, R. (2006). A cognitive analysis of problems of comprehension in a learning of mathematics.Educational studies in mathematics, 61(1), 103-131.
ICTMT 13 84 Lyon 3 - 6 July 2017

Hadjidemetriou, C., & Williams, J. (2002). Children's graphical conceptions. Research inMathematics Education, 4(1), 69-87.
Heritage, M. (2007). Formative assessment: What do teachers need to know and do? Phi DeltaKappan, 89(2), 140-145.
Ramaprasad, A. (1983). On the definition of feedback. Systems Research and Behavioral Science,28(1), 4-13.
Sadler, D. R. (1989). Formative assessment and the design of instructional systems. Instructionalscience, 18(2), 119-144.
Swan, M. (2014). Design research in mathematics education. In Encyclopedia of mathematicseducation (pp. 148-152). Springer Netherlands.
Vollrath, H.-J. (1989). Funktionales Denken [Functional thinking]. Journal for Didactics ofMathematics, 10(1), 3-37.
vom Hofe, R., & Blum, W. (2016). “Grundvorstellungen” as a Category of Subject-MatterDidactics. Journal for Didactics of Mathematics, 37(1), 225-254.
Wiliam, D., & Thompson, M. (2008). Integrating assessment with learning: what will it take tomake it work? In C. A. Dwyer (Ed.), The Future of Assessment: Shaping Teaching and Learning(pp. 53-82). Mahwah, NJ: Erlbaum.
ICTMT 13 85 Lyon 3 - 6 July 2017

86

Chapter 4
STUDENTS
ICTMT 13 87 Lyon 3 - 6 July 2017

STUDENTS' EXPANDING OF THE PYTHEGOREAN THEOREM IN A
TECHNOLOGICAL CONTEXT
Anabousy Ahlam1,2
, Tabach Michal1
1Tel-Aviv University
2Alqasemi Academic College of Education; [email protected]
Dynamic Mathematical Software (DMS) in general and GeoGebra in particular have attracted the
attention of mathematics educators because of their potential to influence student learning. The
present research aims to add to the growing research efforts to study the influence of GeoGebra on
processes used by dyadic learners to construct knowledge. Specifically, we study the context of
three pairs of seventh graders who worked on an inquiry task to construct the relations between
areas of squares built on the sides of an obtuse/acute triangle in a specially designed GeoGebra
environment. The analysis used the Abstraction in Context (AiC) framework. The findings indicate
that the three pairs constructed all the expected knowledge elements, and that one pair constructed
unexpected construct. Generally, findings indicate the positive influence of the GeoGebra
technological tool on the construction processes.
Keywords: GeoGebra, Construction of knowledge, Pythagorean theorem
INTRODUCTION
Two areas are at the core of the current study: (1) the construction of abstract mathematical
knowledge; and (2) the use of dynamic technology in mathematics education. These two domains
are examined below.
Construction of abstract mathematical knowledge
Understanding how learners construct abstract mathematical knowledge is a central aim of research
in mathematics education. Abstraction in Context (AiC) is a theoretical framework for describing
processes of abstraction in different contexts (Dreyfus, Hershkowitz, & Schwarz, 2001). Dreyfus et
al. (2001) defined abstraction as a process in which previous mathematical constructs are vertically
reorganized into a new structure. The role of context is central to the process of constructing
abstract mathematical knowledge. Several contextual factors may influence mathematical
abstraction, including the students' prior knowledge, the nature of the task, and interactions with
other learners and with technology. Understanding the role of context may lead to a better
understanding of abstraction processes. Hence, the present study began with a careful design of the
contextual factor – technology applet.
The AiC framework postulates that the genesis of abstraction passes through a three-stage process:
the need for a new construct; the emergence of the new construct; and the consolidation of that
construct. The emergence of a new construct is described and analyzed by the RBC model:
recognizing (R), building-with (B) and constructing (C). Recognizing refers to the learner's
realization that a previous knowledge construct is relevant for the situation at hand. Building-with
involves combining recognized constructs in order to achieve a localized goal, such as the
actualization of a strategy, a justification or a solution to a problem. Constructing consists of
assembling and integrating previous constructs by vertical mathematization to produce a new
construct.
Some studies have used the AiC framework for investigate the processes of constructing knowledge
in technological contexts (Anabousy & Tabach, 2015; Kidron & Dreyfus, 2010; Ofri & Tabach,
ICTMT 13 88 Lyon 3 - 6 July 2017

2013). These studies demonstrated the positive influence of technological tools. Specifically,
Kidron and Dreyfus (2010) studied how instrumentation led to constructing actions and how the
roles of the learner and a computer algebra system (CAS) become intertwined during the process of
constructing a justification. They showed that certain patterns of epistemic actions were facilitated
by the CAS context. Ofri and Tabach (2013) studied knowledge construction among eighth-grade
dyads in a GeoGebra environment to explore a problem situation related to functions. They found
that the students constructed the targeted knowledge while interacting with a dynamic and multi-
representation environment.
The present study aims at tracing processes of constructing abstract mathematical knowledge among
three pairs of seventh-grade students engaged in an inquiry task to construct the relations between
areas of squares built on the sides of an obtuse/acute triangle in a GeoGebra environment. Also, the
present study describes how the technological tool influenced the participants’ actions.
Use of dynamic technology in mathematics education: the case of GeoGebra
Numerous studies have shown that dynamic technologies can be used to encourage exploration,
conjecture, construction and explanation of geometrical relationships (Jones, 2005). Studies have
also shown that the visual characteristics of these technologies may develop the ability to make
correct assumptions (Hohenwarter et al., 2008). One such dynamic mathematical software system is
GeoGebra, which is specifically designed for learning and teaching mathematics.
The educational potential of GeoGebra has been demonstrated by various studies that examined its
effect on learning mathematics (see, for example, Dikovic, 2009). This tool has the potential to
encourage student-centred and discovery learning by using interactive explorations to experiment
with mathematical ideas (Tran et al., 2014).
As mentioned, the integration of GeoGebra software into teaching and learning mathematics has
various benefits (Dikovic 2009; Erkek & Işıksal-Bostan, 2015). On the other hand, this integration
also has its disadvantages (Jones, 2005; Erkek & Işıksal-Bostan, 2015). Research on the
effectiveness of integrating GeoGebra in teaching and learning mathematics is still limited (Dikovic
2009; Saha et al. 2010). In the present study, GeoGebra was used to build carefully designed applet
used in an inquiry task to examine the process of mathematical knowledge construction in this
context.
The study was guided by the following research questions:
1. How do seventh-grade students construct the expansion of the Pythagorean Theorem: the
case of changing the right-angle triangle to obtuse/acute triangle?
2. How do the purposefully designed GeoGebra-applet influence the construction process?
METHOD
Three pairs of seventh-grade students from the same class participated in the study. According to
their teacher, all had high mathematical achievements.
An appropriate GeoGebra applet and an inquiry task concerning the relations between areas of
squares built on the sides of an obtuse/acute triangle were designed for the study.
The task presented a mathematical situation (Figure 1). The students were asked to propose a
hypothesis regarding the mathematical situation and then to experiment with GeoGebra to verify or
refute their hypothesis. Finally, they were asked to explain/justify the constructed mathematical
ICTMT 13 89 Lyon 3 - 6 July 2017

concept/relation. The students worked on the task for about 45-55 minutes, and their work was
recorded and transcribed verbatim.
Figure 1: The mathematical situation presented in the task
GeoGebra was selected as the technological environment due to its dynamic nature and ease of use.
One GeoGebra applet was built for the study by the first researcher. Figure 2 provides a screenshot
of the interface of this applet.
Figure 2: screenshot of the interface of this applet
The expected knowledge elements and sub-elements to be constructed were assumed based upon a-
priori analysis. We also considered the Pythagorean Theorem to be a previous knowledge element
because of its critical role in the construction processes we assumed would occur. The Pythagorean
Theorem was constructed by the three pairs in a task designed by the researchers in a previous study
(Anabousy & Tabach, 2015).
Figure 3 shows the a-priori analysis of the connections between the knowledge elements
subsequently described. An operational definition was developed for each element to guide the
analysis of the students' knowledge constructing activity.
E1: The relations between areas of squares built on the edges of an obtuse triangle.
E2: The relations between areas of squares built on the edges of an acute triangle.
E3: The justification of E1.
E4: The justification of E2.
ICTMT 13 90 Lyon 3 - 6 July 2017

Figure 3: The connections between assumed knowledge elements
Here we consider that expected knowledge elements to be constructed as (Ei), while when the
student construct that element we refer to this process as construction (Ci) of the element.
FINDINGS
We describe the process of constructing knowledge graphically and verbally. We also present an
episode that shows the constructing of knowledge in the technological context.
To describe the knowledge construction process graphically, we chose the following representations
which include all possible cases. When a knowledge element is in the process of being constructed,
a solid rectangle appears under it ( ). When there are no acts of construction, the rectangle is empty
( ). When the construction is successfully completed, a bold black line ( ) appears at the bottom of
the rectangle. When the construction ends partially, a bold red line appears ( ) at the bottom of the
rectangle. When an unexpected element is constructed, the rectangle is dashed (). When a
knowledge element is constructed incorrectly, the rectangle is red ( ). Finally, when a knowledge
element has not been constructed at all, a solid rectangle framed in red appears ( ).
We divided the activity into ten segments that are parallel to the activity questions. These segments
are arranged chronologically: (1) Recording the areas of squares built on the sides of an obtuse-
angled triangle; (2) Identification of the relations between the areas of the squares built on the sides
of an obtuse-angled triangle and its generalization; (3) Explanation of the relations between the
areas of the squares built on the sides of an obtuse-angled triangle; (4) Problem formulation for
exploring the case of the acute-angled triangle; (5) Exploration of one case (of the acute-angled
triangle) and generalization; (6) Adjustment of generalization; (7) Checking the students’
confidence in their conclusion; (7*) Discovery of another connection (unexpected knowledge
element constructed by the first pair); (8) Last formulation of the conclusion; (9) Explanation of the
connection between areas of squares built on the sides of an acute-angled triangle. Figure 4 below
describes the process of knowledge construction by the three pairs in the activity graphically. In the
following figure 4, the vertical axis represents the ten segments, while the horizontal axis represents
the knowledge constructs.
ICTMT 13 91 Lyon 3 - 6 July 2017
Figure 4: Knowledge construction in the activity: first, second and third pairs, respectively.
Figure 4 shows the order of construction. As we assumed, the constructs C1, C2, C3, and C4
(usually) were successfully built one after the other by the three pairs. The figure also demonstrates
that the first pair produced an unexpected construction: as one of the angles of the triangle
approaches 90º, the sum of the areas of the two squares built on both sides of the angle approaches
the area of the square built on the opposite side (this process is described in episode 1). Based on
Figures 4a-4c, we can also claim that by and large, all the pairs underwent similar construction
processes. The process of constructing C4 was similar for the first and the second pairs, and
different for the third pair, with the difference manifested in the time it took to build the construct.
Below is episode 1, which shows construction of the unexpected construct by the first pair. Here, R
indicates recognizing action, B indicates building-with action and C indicates constructing action.
Episode 1: Construction of the unexpected knowledge element (S1 and S2 are the students)
1. S1 This is a right angle triangle [presented in fig.5].
2. B_Pythagorean
theorem S2
No, we cannot depend on the picture. 22+9=27… it's 'more than' relation
[she means: the sum of the areas of the two squares built on the edges
comprising the acute angle is more than the area of the square built on the
edge opposite to the acute angle]. 9+13= 22…ohhh what?!!
3. S1 Something unusual has happened!
4. Inter. What?
5. S1 S2, You were wrong, this is not 13, it is 14 if we approximate it to an
integer [means to approximate 13.8 to integer number]
6. B S2
Yes, 14+9=23, it's a 'more than' relation.
7. Inter. You do not have to approximate the numbers. Look at this triangle; it is
close to being what?
ICTMT 13 92 Lyon 3 - 6 July 2017

8. R_right-angle
triangle S2 A right-angle triangle.
9. Inter. And what happens to the areas?
10. B
C S2
Ahhh… the sum of the areas of the two squares built on both sides of the
angle, the angle that is approaching 90°, approaches the area of the square
built on the opposite side.
11. S1 That's it, we're finished.
Figure 5: Screen shot from the work of the second pair in episode 1
In this episode, the students investigated an extreme case (see Fig. 5). This investigation enabled the
students to move from constructing E2 to constructing the unexpected construct in line 10. The
students watched the change in the areas of the squares built on the sides of an acute triangle, and
formulated two knowledge constructs: (a) as one of the angles of the triangle approaches 90, the
sum of the areas of the two squares built on both sides of the angle approaches the area of the square
built on the opposite side [line 10]; and (b) E2 [in discussion after episode 1, not shown].
As mentioned, the knowledge construction processes of these students occurred in a technological
context. The technological tool (GeoGebra applet) supported the processes of constructing
knowledge, as it enabled students to (1) explore "representative" cases such as triangles with
different “types” of side lengths: large/small numbers, fractions and integers and specific extreme
cases (e.g., when constructing E1 and E3); (2) transition from one construct to two parallel
constructs and constructing an unexpected construct. This transition took place during the
construction of E2 by the first pair (see episode 1, lines 1-3); (3) justify/explaining the constructed
relations (when constructing E2 and E4). Below we present in details the process of constructing the
explanation of E1 and E3 by the first pair.
Constructing C2 and C4 (explanation of C1 and C3) by the first pair (S1 and S2 are the students): S1
performed the construction immediately at the beginning of the question, with the help of
knowledge elements C1 and C3. She said, "...in an acute-angled triangle, the right angle decreased
[refers to the method they use to obtain an acute-angled triangle]; therefore, the side was reduced,
and therefore the area of the square was reduced. And they [squares] were bigger than it, as opposed
to the obtuse." S1 tried to explain this to S2, but S2 was not convinced. Eventually, S1 suggested to
ICTMT 13 93 Lyon 3 - 6 July 2017

S2 to use her hands and began to explain to her what was happening in an acute-angled triangle and
in an obtuse-angled triangle, while examining the case of a right-angled triangle. Figure 6 shows an
example of S1's explanation of this connection.
Figure 6: Gestures used by the first pair while explaining the expanded Pythagorean Theorem
DISCUSSION
The present study traced processes of constructing mathematical knowledge by three pairs of
seventh-grade students engaging in an inquiry task to construct the relations between areas of
squares built on the sides of an obtuse/acute triangle in GeoGebra environment. The findings
indicate that the three pairs constructed all the knowledge elements. Successful construction of
knowledge in a technological context has also been reported by Ofri and Tabach (2013).
GeoGebra applets supported the knowledge construction sequence: examination of various cases,
generalization, proving or explaining. For example, when constructing C1 (The relations between
areas of squares built on the edges of an obtuse triangle), pairs of students discovered the relation by
considering many different cases, which was made possible by manipulating the applet. The various
cases were not random, as the students selected specific representative cases, such as polygons with
sides measured in integers, fractions, large and small numbers. This examination allowed students
to make a generalization regarding the relation. Dikovic (2009) also reported on support provided
by the technological tool GeoGebra in exploration and generalization activities.
The technological tool also allowed two parallel construct actions to take place simultaneously and
it enabled unexpected constructs to be built. For example, when the first pair was constructing C3
(the relation between the areas of squares built on the sides of an acute-angled triangle), the students
observed the change in the areas of the squares built on the sides of an acute-angled, they also
examined extreme cases which were provided by the applet and then built unexpectedly two
knowledge constructs (for similar findings see Kidron & Dreyfus, 2010)
The construction process was further supported by the technological tool by reducing the need to
spend time on calculations, allowing the pairs to focus on searching relations and explanations, for
ICTMT 13 94 Lyon 3 - 6 July 2017

example when constructing C1 and C3. The tool provided the areas of the shapes. Many studies have
reported similar contributions of the technological tool, for example Becta (2003).
The technological tool also supported the explanations given by the pairs, for example the
explanation of C2. All the pairs argued that when transitioning from a situation in which the triangle
is right-angled to one in which the triangle is obtuse-angled, the side opposite the angle will be
longer, so that the area of the square built on it will be larger, which will change the relation from
equivalence to one of "bigger than." In this case, the structure of the applet and the work using it
supported and facilitated the emergence of the explanation provided by the students (Lachmy &
Koichu, 2014). Several studies (Ng & Sinclair, 2013) showed students' reliance on gestures and
dragging to be multimodal resources for communicating about dynamic aspects of mathematics.
REFERENCES
Anabousy, A., & Tabach, M. (2015). Constructing and Consolidating Mathematical Knowledge in GEOGEBRA environment by a pair of students. In K., Beswick, T., Muir, & J., Wells, (Eds.), Proceedings of the 39th Conference of the International Group for the Psychology of Mathematics Education (Vol. 2, pp. 41-48). Hobart, Australia: PME.
Becta. (2003). What the Research Says about Using ICT in Maths. UK: Becta ICT Research. NJ: Lawrence Erlbaum Associates.
Dikovic, L. (2009). Applications GeoGebra into teaching some topics of mathematics at the college level. Computer Science and Information Systems, 6(2), 191–203.
Dreyfus, T., Hershkowitz, R. & Schwarz, B. (2001). Abstraction in Context II: The case of peer interaction. Cognitive Science Quarterly, 1(3), 307-368.
Erkek, Ö., & Işıksal-Bostan, M. (2015). Is the use of GeoGebra advantageous in the process of argumentation? In K. Konrad, & V. Nada (Eds.), Proceedings of the ninth Congress of the European Society for Research in Mathematics Education, CERME 9, (pp. 121-127). Prague, Czech Republic.
Hohenwarter, M., Hohenwarter, J., Kreis, Y., & Lavicza, Z. (2008). Teaching and learning calculus with free dynamic mathematics software GeoGebra. 11th International Congress on Mathematical Education. Monterrey, Nuevo Leon, Mexico.
Jones, K. (2005). Research on the use of dynamic geometry software: implications for the classroom. In: J. Edwards & D. Wright (Ed), Integrating ICT into the Mathematics Classroom (pp. 27-29). Derby: Association of Teachers of Mathematics.
Kidron, I., & Dreyfus, T. (2010). Interacting Parallel Constructions of knowledge in a CAS Context. International Journal of Computers for Mathematical Learning, 15, 129-149.
Lachmy, R., & Koichu, B. (2014). The interplay of empirical and deductive reasoning in proving “if” and “only if” statements in a dynamic geometry environment. The Journal of Mathematical Behavior, 36, 150-165.
Ng, O.-L., & Sinclair, N. (2013). Gestures and temporality: Children's use of gestures on spatial transformation tasks. Proceedings of PME 37, 3, 361-368.
Ofri, O., & Tabach, M. (2013). Knowledge constructing in a computerized environment: Eight grade dyads explore a problem situation. In A. M. Lindmeier, & A. Heinze, (Eds.), Proceedings of the 37th Conference of the International Group for the Psychology of Mathematics Education (Vol. 3, pp. 401-408). Kiel, Germany: PME.
Saha, R., Ayub, A., & Tarmizi, R. (2010). The effects of GeoGebra on Mathematics achievement: Enlightening coordinate geometry learning. Procedia Social and Behavioral Science, 8, 686-693.
Tran, T., Nguyen, N. G., Bui, M.D., & Phan, A. H. (2014). Discovery learning with the help of the Geogebra Dynamic Geometry Software. International Journal of Learning, Teaching and Educational Research, 7(1), 44- 57.
ICTMT 13 95 Lyon 3 - 6 July 2017

LOOKING AT COMPOSITIONS OF REFLECTIONS IN A DGE FROM
THINKING MODES AND SEMIOTIC PERSPECTIVES
Ana Donevska-Todorova1, Melih Turgut2
1Humboldt-Universität zu Berlin, Germany; [email protected] Osmangazi University, Turkey; [email protected]
The aim of this paper is to investigate whether and how three modes of thinking and semioticperspectives are compatible for researching the teaching and learning of elementary geometry in adynamic geometry environment (DGE). It first provides an epistemological analysis ofcompositions of reflections in a line from geometric, analytic and abstract aspects. Then, itrepresents a design of a task considering semiotic potential of particular tools in the DGE that wasfield-tested with a pair of prospective primary school teachers. Further, it discusses how has thedouble analyses allowed a detailed understanding of the semiotic potential of the designed artefactfor the development of all three modes of thinking of the chosen geometric concept for prospectiveprimary school teachers. It finalizes with suggestions for future investigations of development ofknowledge of other concepts in geometry through the modes and their support by digital tools.
Keywords: Composition of reflections, DGE, Three modes of thinking, Semiotic perspective,Integrating technology.
INTRODUCTION
One of the themes of the ICTMT 13 refers to mathematics teachers’ education and professionaldevelopment involving the use of technologies. The selection of the most appropriate content forsuch programmes is not always a trivial task. It not only has to consider local school curricularequirements but also the enhancement of the learning of mathematics itself by bridging differenteducational levels systematically. Such systematization necessitates deep insights intoepistemological and historical evolutions of mathematical concepts, besides the didactical aspects.
This study tries to bring a possible systematization specifically for the concept of congruencetransformations into focus of the analysis. We have considered that the theoretical framework fordifferent modes of thinking of mathematical concepts (Sierpinska, 2000) may be suitable tofacilitate our aim. In addition, a creation of digital materials considering the semiotic perspectiveaccording to Bartolini Bussi and Mariotti (2008) that may support such structured approach bringsinnovation and opens new questions not only about the efficiency of the suggested teachingmaterials but also about the effectiveness of linking these chosen theories in analyzing it. Therefore,we consider the following research question. Are the thinking modes and semiotic perspectivescompatible for researching the teaching and learning phenomena of concepts in geometry, e.g.composition of reflections in a line, when they take place in a DGE? Along this direction we presentresults coming from a case study conducted with two prospective teachers.
THEORETICAL FRAMEWORK
In this work, as already announced above, we refer to two theoretical constructs: first, three modesof thinking of concepts in linear algebra (Sierpinska, 2000) which are to be adjusted for thepurposes of geometry, and second, theory of semiotic mediation (Bartolini Bussi & Mariotti, 2008).We argue that these two theoretical frameworks may be used for constructing appropriatetheoretical foundation for explanations of the teaching and learning elementary geometry; so firstwe explain each of them.
ICTMT 13 96 Lyon 3 - 6 July 2017

Epistemological Considerations
As Winter (1976, p. 16) expressed “symmetry and congruence mappings are considered afundamental idea in the teaching of geometry even in primary school from several aspects: shape,algebraic, esthetical, economic-technical and arithmetical”. Besides, learning complexity ofsymmetry and rotation notions have also been investigated by researchers (Turgut, Yenilmez, &Anapa, 2014; Xistouri & Pitta-Pantazi, 2006) in different school levels. In order to investigate suchphenomena, we hypothesize that three thinking modes that are highly relevant for the research intothe teaching and learning of linear algebra could also be useful for studying the development ofstudents’ conceptual understanding in geometry, we have chosen to focus on congruencetransformations on a plane, in particular, reflections in a line. An appropriate accommodation of thetheoretical constructs about the different modes of description and thinking of concepts in linearalgebra into geometry is not straightforward.
Congruence Transformations through the Lenses of Thinking Modes
In this paper we focus on isometries, or congruence transformations of the n-dimensional EuclideanSpace, particularly, for n=1,2,3. The types of isometries, e.g. for n=2, E(2) are the identitytransformation, translation, rotation about a point, reflection in a line and glide reflection. Everyisometry of the Euclidean plane is a bijective distance-preserving map. Two geometric figures arecongruent if there exists an isometry, which maps one into the other one, that is: either a rigidmotion (translation or rotation), or a composition of a rigid motion and a reflection. Let us proposethinking modes in relation to those expressed above.
Synthetic-Geometric Mode (SGM)
In grades 1 to 4 primary schools, Euclidean plane isometries are generally studied typically with theapparatus of geometry. Starting from observing and discussing in- and out of school contexts,through paper folding and drawing, constructing with straight edge and pair of compasses, pupilsgain knowledge about some of the distant-preserving transformations. In this period, usually, due tothe level of mathematics, no explicit reference to E(1) or E(3) is made. Mathematical objects suchas points, lines, planes or triangles refer to the SGM. In other words, SGM is also considered as akind of ‘thinking in-action’ (Sierpinska, 2005), i.e., thinking about the objects in coordinate-freegeometry, but not about how they are constructed on. Consequently, if a student speaks aboutgeometric objects, for example, points, lines, triangles or basic properties of them, then, those aretraces of SGT mode.
Analytic-Arithmetic Mode (AAM)
While geometrical approaches for the introduction to the congruence mappings in school are widelyaccepted, the analytic-arithmetic mode of thought, though being an inseparable part of the concept,often remains unnoticed. The analytic counterpart that relates to the use of arithmetic language andsymbolism is rarely conducted even in lower secondary school mathematics. While drawing,sketching and visualizing refer to the SGM and are typical school activities, thinking of congruencemappings as functions (from the plane in itself) in an analytic-arithmetic mode, persists out of thescope in school. Within the context of elementary geometry, representing objects as a system orusing formulas to describe the action can be considered as a kind of AAT mode.
Analytic-Structural mode (ASM)
The set of isometries of the Euclidean plane E(2) with the operation composition of functions formsa group (closure, associative, identity and invertibility properties). A glance on the historicalevolution shows that the Euclidean groups E(n) of n—dimensional Euclidean space are among theoldest and most studied, at least implicitly for n=2,3, long before the concept of group wasintroduced. This historical geometrical conduction, prior the algebraic and the abstract, seems to be
ICTMT 13 97 Lyon 3 - 6 July 2017

reflected in mathematics school curricula and textbooks designs even today. In primary schools, theabstractness is largely decreased. Yet, in our opinion, this knowledge is also relevant for teachereducation and teacher professional development programs. Ignorance of any of the modes mayprevent pupils from further earlier cognitive development. For an illustration, incomplete pupil’sacquisition of reflection in a line in grade 3 may occur as a result of a teacher’s insufficient personalresources about reflection regarding components of teacher's knowledge as reported by Donevska-Todorova (2016). “Interestingly, students mostly do not use symmetry to explain a particularconjecture” (De Villiers, 2004, p. 713) about a geometric figure (e.g., isosceles trapezoid) bydragging even in cases when it has been constructed by means of line reflection. Both prospectiveand practicing mathematics teachers usually require substantial assistance with the formal defining(e.g. of an isosceles trapezoid) but they do indeed develop abilities of descriptive and constructivedefining (De Villiers, 2004, p. 722).
With respect to traces of AST mode can be considered as emergence of thinking about mathematicalobjects and conjecturing about the action, and/or making generalizations about the mathematicalproperties. For example, within the scope of this paper, thinking about congruence and group offunctions such as identity function, i.e., inverse, associative and other properties of the function canbe considered as traces of AST mode.
Theory of Semiotic Mediation (TSM)
The TSM proposed by (Bartolini Bussi & Mariotti, 2008), not only aims to construct mathematicalmeanings in a social communicative environment (where the teacher has a role of a mediator), butalso to analyse teaching-learning process with a semiotic lens. In the TSM, in mediation process,the teacher focuses on specific artefacts and intentionally but carefully uses them to guide students’personal meanings to desired, culturally accepted mathematical meanings. At the same time, theteacher analyses possible evolution of signs that foster students’ learning. Consequently, TSM baseson two key notions: (i) semiotic potential of an artefact and (ii) design of didactic cycles. The firstrefers to epistemological and didactical analysis of the artefact’s evocative power to stimulateemergence of meaningful mathematics (Mariotti, 2013), while the second refers to (carefully)design the teaching-learning environment, specifically in the light of the epistemological learningroute elaborated in the first phase.
A complex semiosis could be observed when the students interact with the artefact. In order toclassify the signs that emerge, Bartolini Bussi and Mariotti (2008) have identified three type ofsigns: artefact signs (AS), mathematical signs (MS) and pivot signs (PS). AS immediately emergewhen the student uses the artefact, and they are generally in relation to practical observations,specifically about the artefact. MS refer to mathematical meanings that are accepted by thecommunity by generalizing and/or expressing a conjecture, a definition or a proposition. PSunderline interpretative link between personal meanings and MS sometimes including hybridexpressions.
METHODOLOGY
The participants of this case study are two (sophomore level) prospective teachers (A, B, bothnineteen years old females) from a department of primary education. Regarding the mathematicalcontent, the students had experience mainly in algebra, e.g. relations, functions, and (2D and 3D)geometry, e.g. geometric transformations and their representations and notations as functions(independent-dependent variables, etc.). However, they did not have any experience withcompositions of reflections. Regarding didactical considerations, the participants had experiencewith a dynamic geometry system (DGS), e.g., GeoGebra. They were familiar with fundamentaltools, their roles and distinctive property of any DGS: initial drawings (independent objects) can bedragged but constructed (dependent) objects cannot.
ICTMT 13 98 Lyon 3 - 6 July 2017

Task-based interviews were video-recorded, where screen-recorder software worked synchronously.The interview lasted half an hour and the collected data coming from two videos and students’productions were analysed through a double lens, first referring to the thinking modes, and second,from a semiotic lens.
Semiotic Potential of Specific Functions and Tools of a DGS and the Task
The mathematical context embedded in aforementioned three thinking modes in elementary geometry provided us to
consider compositions of reflections on the Euclidean plane R2 in a specific DGS GeoGebra. We have consideredscalene triangles and compositions of two reflections in a line. First, a triangle ABC was reflected (σ1) according to
line l (the black line in Figure 1), by this way obtaining the triangle A'B'C'. Next, the triangle A'B'C' was reflected (σ2)
according to a line g (the purple line in Figure 1) resulting with a triangle A''B''C''. Consequently, with respect to the
position of the lines, one can refer to three separate cases: (1) when the axes of reflections coincide (Figure 1a), (2)
when the axes are parallel (Figure 1b) and (3) when the axes intersect in a point (Figure 1c, 1d).
(a) (b)
(c) (d)
Figure 1: (a), (b), (c), (d) Three cases for compositions of reflections
With the terminology of the ASM, one could implicitly refer to properties of a group, in particular:closure (cases on Figure 1b: translation for a vector and Figure 1d: rotation where the intersectionpoint of the reflection lines is the center of the rotation, both being isometries) and neutral element,i.e. identity transformation (case in the Figure 1a). We hypothesize that the following tools andfunctions of the DGS (in this case GeoGebra) have semiotic potential for creating meaning for suchcases, i.e., mathematical notions expressed above:
– Dragging function enables the students to move and manipulate free (independent)geometric figures, by this way creates an environment for exploring different situations.
ICTMT 13 99 Lyon 3 - 6 July 2017

However, dragging function of any DGS does not work for constructed (dependent) objects,which also provides the notion of co-variance of the objects.
– Grid function of any DGS constructs parallel lines on the geometric plane, which cancontribute students’ observation of distances between initial and reflected objects.
Following this, the task delivered to the students was: Step I: Click on σ1, drag the points or the linel. Explain your observations mathematically. Step II: Click on σ2 and follow the first step. Step III:Explain the relationships between triangles and generalize your findings.
ANALYSIS WITH A DOUBLE LENS
The discussion started by asking the students to follow steps of the task, what is a composition oftwo reflections in a line. In the first step, they focused on the reflection in the line l and realized thatpoints A, B and C can be dragged. The following excerpt in Table 1 (Unit I) was drawn from thisdiscussion (I: Interviewer), where we also provide first step of a double analysis.
Unit I Thinking Modes Analysis Semiotic Analysis
[14] B: … A, B and C can be dragged. Then this triangle [points ABC triangle] can be dragged.[15] I: Did you check the other points?[16] A: But it is depended…[17] B: Yes, because this [points A'B'C' triangle] is depended on initial one…[18] A: Exactly. I mean there is a transformation here something like that [writes f()=f’]…
[19] B: Yes. Something like that. When x varies, then y varies you know. Nevertheless, here we have triangles as variables … we can write [writes f(x)=y,x independent]. Because y is dependent on x, here this triangle [means A'B'C' triangle] is depended on the initial triangle [explains pointing on the window]. Therefore, we cannot drag this.
…[22] A: a reflection transformation…[23] B: Actually, points are transforming. Then triangle is transforming, and then we have a new triangle…
– In [14-17], students speak in-action, i.e., about movements of geometric objects can be dragged on the screen. Actually, they speak about what they observed when they drag the moveable objects. Those are traces of being in SGM, although they mention the notion of dependent- independent variables.– In [18-19], the students move forward from SGM to AAM by beginning to use symbolic language of the action. They express the 1 reflection throughfunction f and express independent and dependent triangles on the screen by explaining which can be dragged. – In [22-23], the students characterized transformation and related situation with their pre-knowledge. B’s explanation reflects her thinking about transformation as a mathematical object, which can be referred as being in ASM.
- The students’ immediate observations are due to the use of the artefact. For instance, not only verbal expressions such that “can be dragged”, “this triangle”, “is depended on”, “dependedon”, “cannot drag”, but also their gestures for pointing triangles can be considered as AS.- There appears a specific PShere: the notion of function, which contributes students toemerge their personal meanings with their observations coming from the artefact. In other words, the PS function mediates the emergence of a mathematicalcharacterization: “… points are transforming. Then the triangle transforming…” thatcan be considered as a mathematical expression andalso a manifestation of MS.
Table 1: Double analysis of the Unit I
ICTMT 13 100 Lyon 3 - 6 July 2017

(a) (b)
Figure 2: (a) A’s mathematical expressions, (b) B’s mathematical expressions
Then, the students were asked to follow the second step of the task and express what they observedby clicking 1 and 2 reflections. They immediately observed the second reflection with respectto the line g. The students used an interesting terminology to represent composition of reflections.The following excerpt (Unit II in Table 2) shows the discussion and the second step of the doubleanalysis.
Unit II Thinking Modes Analysis Semiotic Analysis
[35] A: Could you drag line l? … The second transformation is also depended on the movement of line l. [B drags the lines] Actually, this is… [36] B: This [means the final triangle A''B''C''] is our new dependent variable.
[37] A: [Pointing the A''B''C'' triangle] Dependent variable is changed…
…[40] I: How can we express this situation mathematically?[41] A: For example, let me show the second transformation with f2 [she writes the second row of Figure 2a] … But, finallywe have [she writes the third row of Figure 2a]; because of the two composite reflections.[42] B: Yes. [She writes synchronously to A, see the first row of Figure 2b].
– In [35-37], the students, again, speak about the movements and draggable points and lines. They characterize “new” dependent – independent variables. However, they are aware that the dependent variable “is changed”. – After the teacher’s intervention [40], the students immediately relate the compositions of reflections with composite functions. They use mathematical expressions ofthe composite of reflections [41-42]. These all over imply that the students are in the AAM.
- Students discuss about artefact’s feedbacks about dragging (e.g., “drag line l”, “movement of line l”), which were AS. However, their observations trigger to emergence of a new PS: independent–dependent variables in the compositions ofreflections (e.g., “new dependent variable”).- Finally, they use mathematicalrepresentations to express their mathematical meanings (use of a triangle as a dependent or independent variable in Figure 2) about compositions of reflections. This can be considered as an example of how AS transform into MS.
Table 2: A double analysis of the Unit II
Further, the discussion continued about the three different positions of the lines, which affect thepositions of the initial and final triangles. Therefore, the students were asked to unclick the firstreflection and discuss the mathematical situation on the screen (see Excerpt III in Table 3).
ICTMT 13 101 Lyon 3 - 6 July 2017

(a) (b)
Figure 3: (a) B’s cursor mimics, (b) B’s translation gesture with pencil
Unit III Thinking Modes Analysis Semiotic Analysis
[45] I: Ok, right. Please unclick σ1, … what do you observe when you drag ABC triangle?[46] B: … This [mimics with cursor, see Figure 3a] is not a reflection… The distance …For example, we have ABC triangle, but it seems like translated into [she gestures with pencil, seeFigure 3b] A''B''C'' triangle…
…
[48] I: Ok. Please click on σ1 … Check the position of such lines![49] B: They are now parallel…[50] A: They can intersect, either can be paralleland they can overlap.[51] B: Let’s move this [she drags the line l onto line g].[52] A: The initial and final triangles overlapped![53] B: Like functions…[54] I: How can we express this situation mathematically?[55] B: One-to-one and onto …? [She writes thelast line of Figure 2b]… Is this identity function? …[56] A: … [She writes the last line of Figure 2a].
…[67] B: Let’s intersect the lines… [she drags continuously and tries to understand the situation][68] A. Here … [gestures with pencil, see Figure4a]. Like a… [B drags the points and lines] The final triangle is rotated around initial triangle. Yes this is now a rotation… [They together write their conclusions, see Figure 4b]…
– In [46], the student use her spatial perception and therefore express their observations in the case of the axes are parallel, even shefinds the translation of the triangles, but not mathematically. Because she does not mention any translation vector. Also, in [49-52], the students speak about their observations on the screen, not about mathematical necessities. All those are traces of being in SGM. – However, in [53], B relates the situation with functions. She also realizes that such kind of reflection might be similar to identity function and have one-to-one and ontoproperties. A also uses a similar notion. Since, suffice it to say that, in this point, they are in AAM, since they does not generalize the situation [55-56], and does not mention how this could be possible.–They finally explore the case when the reflection axes intersect. They analyze the three cases and make a generalization [67-78], whichseem a kind of having ASM.
- In [46], mimicking withcursor, “the distance”, “ABC triangle”, “translated into” and alsoB’s gesture with pencil and A''B''C'' triangle are AS. - In [49-52], there appearseveral AS. For example,“parallel”, “intersect”, “overlap”, “move this”, and “the initial and final triangles overlapped” arealso AS.- In [53] pivot signs “function” and “identity function” and also specific expressions in Figure 2 appear, which show interpretative link with classification of composition of reflections with respect to axes. - They finally categorize the cases, and characterize composition of reflections with respect to positions of axes. They express their conjectures with validation through dragging, e.g., “yes this is now a rotation”, whichcan be accepted as traces MS.
Table 3: A double analysis of the Unit III
ICTMT 13 102 Lyon 3 - 6 July 2017

(a) (b)
Figure 4: (a) A’s rotation gesture, (b) Students’ conclusions (translated into English)
FINDINGS AND DISCUSSION
Based on the double analysis in Table 1, we have found out that the PS of the artifact have mediatedan appearance of MS related to congruence of triangles in a SGM of thinking. Then, in contrast toour expectations that the most frequent mode would be the SGM, it was the AAM, which dominatedindeed. A reason for it may be the students’ pre-knowledge about transformations. Yet, the analysisin Table 2 shows that it may also be a result of the semiotic potential of the created DGE tostimulate an emergence of MS due to interactions within the artifact. Further, our double analysishas shown that the occurrence of the ASM, manifested through an axiomatic property of a group,e.g. the identity transformation on the plane (Figure 2a, on the bottom), could be influenced by thepotentials of the design (Table 3). An observation of the students’ written materials, leads to aconclusion that though the symbolic language is not fully developed, the AAM was influenced bythe SGM of thinking (triangles occur as variables on Figure 2) showing that the design hascontributed to changes from one into another mode of thinking. This analysis has leaded us topropose a diagram of possible links between the three modes of thinking and the potentials of theDGS for the emergence of the three signs (Figure 5).
Figure 5: Relationships between the modes of thinking and emergence of signs
CONCLUSIONS
In this paper, we have considered the research question, ‘Are the thinking modes and semioticperspectives compatible for researching the teaching and learning of composition of reflections in aline taking place in a DGE?’ Firstly, we have shown that the “borrowed” terminology related to thethree modes of thinking of concepts in linear algebra (Sierpinska, 2000) may be meaningful forstudying the teaching and learning processes of certain concepts in elementary geometry, in this
ICTMT 13 103 Lyon 3 - 6 July 2017

case, congruence of reflections in a line. Additional exemplary geometric concepts are required inorder to investigate whether (or to which extent) a “nested diagram” of three modes of thinking inlinear algebra (Donevska-Todorova, 2017) is also suitable or adjustable for studying concepts ingeometry on a local level.
Secondly, the analysis from a semiotic perspective has shown how students’ personal meaningstransformed into mathematical meanings, and how gestures contributed to emergence of students’thinking. One interesting point in the semiotic analysis was how gestures contributed students’thinking and emergence of mathematical meanings. Another point was about affirmative result ofthe semiotic potential of the specific functions and tools of a DGS, which confirmed that thosecould be considered as a tool of semiotic mediation that is consisted within the recent literature(Turgut, 2015, 2017).
Finally, our double analysis has provided affirmative insights into existing relationships between thethree modes of thinking and the potentials of the tools of the designed DGE (Figure 5). As seenfrom Figure 5, SGM, sometimes were in relation to both AS and PS, while AAM mode also impliedboth AS and MS. But interestingly, ASM separated from AS and PS and was directly in relation toMS. Complexity of analysis tools of the thinking modes and semiotic perspectives also appeared ina recent study with respect to learning the notion of parameter in linear algebra (Turgut & Drijvers,2016). We express our awareness of the affordance and limitations of this diagram for interpretingexplicit relationships between the modes and the semiotic potentials by pointing out that suchconfirmations require further research.
REFERENCESBartolini Bussi, M. G., & Mariotti, M. A. (2008). Semiotic mediation in the mathematics classroom:
Artifacts and signs after a Vygotskian perspective. In L. English, M. Bartolini Bussi, G. Jones,R. Lesh, & D. Tirosh (Eds.), Handbook of International Research in Mathematics Education (2.ed., pp. 746–783). Mahwah, NJ: Erlbaum.
De Villiers, M. (2004). Using dynamic geometry to expand mathematics teachers’ understanding ofproof. International Journal of Mathematical Education in Science and Technology, 35(5), 703–724.
Donevska-Todorova, A. (2016). What (Should) Teachers Assess in Elementary Geometry? Paperpresented at the Third ERME Topic Conference, Berlin, 2016.
Donevska-Todorova, A. (2017, to appear). Fostering Students’ Competences in Linear Algebra withDigital Resources. In Stewart, S., Andrews-Larson, C., Berman, A. & Zandieh, M. (Eds.).Challenges in Teaching Linear Algebra. Springer.
Mariotti, M. A. (2013). Introducing students to geometric theorems: how the teacher can exploit thesemiotic potential of a DGS. ZDM-Mathematics Education, 45(3), 441–452.
Sierpinska, A. (2000). On some aspects of students’ thinking in linear algebra. In J.-L. Dorier (Ed.),On the teaching of linear algebra (pp. 209–246). The Netherlands: Kluwer AcademicPublishers.
Sierpinska, A. (2005). On practical and theoretical thinking and other false dichotomies inmathematics education. In M. G. Hoffmann, J. Lenhard, & F. Seeger (Eds.), Activity and Sign(pp. 117–135). US: Springer.
Winter, H. (1976). Was soll Geometrie in der Grundschule? Zentralblatt der Didaktik derMathematik, 8(1/2), 14–18.
ICTMT 13 104 Lyon 3 - 6 July 2017

GAMIFYING MATH TRAILS WITH THE MATHCITYMAP APP: IMPACT
OF POINTS AND LEADERBOARD ON INTRINSIC MOTIVATION
Iwan Gurjanow, Matthias Ludwig
Goethe University Frankfurt, Goethe University Frankfurt; [email protected],[email protected]
Gamification in education describes the application of game elements in the design of learningprocesses. The MathCityMap project, which consists of a web portal and a gamified application forsmartphones, combines the idea of math trails with the possibilities of mobile devices. To evaluatethe impact of points and leaderboard on intrinsic motivation a pilot study has been conducted. Theresults suggest that there is no significant difference between these two game elements. However,gender seems to play an important role on the impact of gamification on intrinsic motivation.
Keywords: math trails, app, gamification, motivation, gender
INTRODUCTION
The British Department of Education and Skills recommends doing more lessons outside theclassroom. Learning outside can “nurture creativity, develop skills, improve attitude to learning,stimulate and improve motivation” just to name a few (DfES, 2006). One suitable way to implementlearning outdoors in the math classroom is the math trail concept. The math trail idea was born inAustralia in the early 80s (Blane & Clark, 1984). A math trail consists of a set of mathematicaloutdoor tasks or problems in walking distance. Tasks like “What is the height of the building?” or“How much water is in the pond?” are bound to real objects in the environment and therefore oftenauthentic and motivating. To answer this kind of questions it is necessary for the student to measure(enactive action), to translate the problem into a mathematical model (abstraction) and to calculatethe answer (cognitive action). The connection of these three cognitive levels is valuable, becauseone is more likely to remember the learned later (Rösler, 2011). The trail guide (Shoaf, Pollak &Schneider, 2004) is a booklet, which contains a map that shows mathematically interesting placesand the description of the tasks.
Although mobile devices and computers are widely used in every aspect of our daily lives(especially among pupils), they play just a little role in education (Chen & Kinshuk, 2005). Goingon a math trail could greatly benefit from using mobile devices, because they allow learning tooccur in an authentic context and extend to real environments. At the Goethe-University of Frank-furt / Main we started the MathCityMap Project (MCM), which combines traditional math trailswith the opportunities of new technologies. In 2013 first ideas have been made concrete (Ludwig,Jesberg, Weiss, 2013), but it took until 2016 to finally launch a web portal and a mobile application.These are mainly for teachers and their students to use in class, but everyone is free to use it.
In the summer term 2016, we had the opportunity to observe some school classes going on a mathtrail with the MCM app. Besides many positive observations, we also made two negativeobservations: (1) answers were often guessed, (2) there is a motivational obstacle to begin workingon the tasks (for example expressed in walking slowly to the first task).
ICTMT 13 105 Lyon 3 - 6 July 2017

THEORETICAL BACKGROUND
Motivation
The most basic distinction in Self-Determination Theory (SDT) is between intrinsic motivation,which refers to doing something because it is inherently interesting or enjoyable, and extrinsicmotivation, which refers to doing something because it leads to a separable outcome (Ryan & Deci,2000). Most activities in school are not inherently interesting and therefore must initially beexternally prompted. A person that faces an activity due to external regulations might experience theactivity’s intrinsically interesting properties, resulting in an orientation shift (Ryan & Deci, 2000).The Intrinsic Motivation Inventories (IMI, 1994) define interest and enjoyment as a central measureof intrinsic motivation. For Ryan & Deci (2000) the source of intrinsically motivated behaviour liesin satisfying psychological needs namely competence, autonomy and relatedness. A higher intrinsicmotivation manifests in personal, cognitive, emotional and behavioural engagement (Fredricks,Blumenfeld & Paris, 2004), which are desirable attitudes towards learning.
Gamification
Gamification describes the application of game elements in a non-game context to manipulate thebehaviour of users towards a certain goal (Fuchs et al. 2014). The term gamification started to occurmore frequently from 2010 mainly in marketing, where gamification is used to increase thecustomers brand loyalty. Huotari & Hamari (2012) divide gamification into three parts: (1)implementation of game elements in non-game activities, (2) resulting psychological changes and(3) visible changes in the user’s behaviour. One main goal of gamification is to modify a seriousactivity, which is bound to a particular purpose (in our case that could be working on a math trailtask), so that it appears more game-like and therefore is more inherently interesting to the userresulting in a higher intrinsic motivation and engagement (Hamari et al. 2014).Game elements are often different types of feedback on the user’s action like points, levels,leaderboards, badges and quests (Zichermann & Cunningham, 2011). Although the gamificationconcept seems suitable to improve psychological aspects in non-game activities, many projects mayfail or will not meet the expectations due to poor understanding of how to design gamification(Morschheuser et al. 2017). This is also the case for gamification in education. Dicheva & Dichev(2015) analysed the outcomes of gamification projects in education in the period July 2014 – June2015 and conclude:
[…] papers that report positive results are only 24%, while those reporting negative results – 7%and the inconclusive – 49%. Thus from 41 papers only 10 can be considered as evidence ofpositive effects for gamification in education […] (Dicheva & Dichev, 2015, p. 7).
Prior to implementing game elements, Morschheuser et al. (2017) recommend to analyse theprojects target group, the conditions and the inherent activities. The result of the analysis is thedefinition of goals that gamification should achieve. The next step is to design and implement gameelements based on the defined goals. Finally, evaluation and monitoring is useful to make furtherimprovements.
Gamification in math education
“Gamification in education refers to the introduction of game elements and gameful experiences inthe design of learning processes” (Dicheva & Dichev, 2015). The number of papers aboutgamification in education grows: 34 papers in the period January 2010 – June 2014 and 41 papers inthe period July 2014 – June 2015.
ICTMT 13 106 Lyon 3 - 6 July 2017

One example of gamification in math education is Attali & Arieli-Attali (2014) “Gamification inassessment: Do points affect test performance?”. The assessment is based on a mathematical onlinetest with 100 questions from grade six to eight (e.g. fraction addition). Participants were randomlyassigned to three groups: (1) control group (no gamification), (2) experimental group 1 and (3)experimental group 2. The experimental group 1 could earn up to 10 points per question dependingon the time needed to answer the question, whereas the experimental group 2 could earn up to 10 +5 points (10 for a correct answer and up to 5 additional points depending on the speed). Resultsshow that “the point manipulation had no effect on the main performance outcome, responseaccuracy” (Attali & Arieli-Attali, 2014). Whereas the response time decreased significantly, but theeffect sizes were small. In addition, no differences between female and male participants werefound.
GPS-based applications in math education
Two examples of applications in math education, that already successfully use mobile GPS-data, areWijers, Jonker & Drijvers (2010), who developed a game which allows students to walk along theshape of geometric objects outside the school, and Sollervall and de la Iglesia, who have developeda GPS-based mobile application for embodiment of geometry (Sollervall & de la Iglesia, 2015).
The MathCityMap project
The intention of the MathCityMap (MCM) project is to automate many steps in the creation of themath trail booklet/guide and to provide a collection of tasks and trails that can be freely used or justviewed to get inspiration for own tasks. Furthermore, it gives users (e.g. groups of pupils) thepossibility to go on a math trail more independent by using mobile devices’ GPS functions to findthe tasks location, by giving feedback on the users answer and by providing hints in the case thatone got stuck at a particular task. The core of the MCM project can be divided into two parts, theMCM web portal and the MCM app.
MCM web portal - www.mathcitymap.eu
The web portal is a math trail management system. After a short registration, the user can viewpublic trails and tasks or create his own tasks and trails by typing in the necessary data (e.g.position, the task itself, the answer, an image of the object etc.) into a form. For every math trail, themath trail booklet can be downloaded as PDF or accessed via the MCM App (see Figure 1). Itcontains all tasks information, a map overview and a title page.
MCM app for mobile devices
The MCM app allows the user to access math trails created with the web portal. The trail data, suchas images and map tiles, can be downloaded to the mobile device. After this procedure, it is possibleto use a trail without internet connection (see Figure 2). This design decision minimizes technicalissues when using the app without mobile internet or in an area with low connectivity. Furthermore,the app offers an open street map overview for orientation purposes, feedback on the enteredanswers and a stepped hint system. The hint system has the purpose to enable pupils to solve thetasks independently and additionally has a positive impact on learning performance, learningexperience and communication (Franke-Braun, Schmidt-Weigand, Stäudel, & Wodzinski, 2008).
ICTMT 13 107 Lyon 3 - 6 July 2017

Figure 1: Screenshots of the MCM App
To describe the pedagogical functionality of MCM, we use the model by Drijvers, Boon and VanReeuwijk (2010). It divides digital technologies into three groups of didactical functionalities: (a) domathematics, (b) practice skills, (c) develop concepts. MCM offers mathematical tasks at real lifeobjects where the user mainly can practice his skills.
GAMIFYING THE MATHCITYMAP APP
Following Morschheuser et al. (2017), we have analysed the MCM project prior to implementinggamification.
Analysis of the MCM supported math trail activity
Secondary school students, who are familiar with using smartphones and apps, are the target groupof our project. A math trail in school is usually used irregularly (e.g. day’s hike, project days). In ourapproach, students collaborate in groups of three (one is using the MCM app, one is responsible formeasuring and the last one is responsible for taking notes) and walk the math trail independentlyduring math classes.
The math trail activity is divided into sub activities that are titled “working on a task”. Each subactivity consists of the following sequence: (1) finding the task’s location; (2) reading the taskdescription; (3) collecting data; (4) transform task into mathematic model; (5) calculating theanswer; (6) entering answer into the app and getting feedback; (7) optionally, taking hints and retry.During step (1), (2), (6) and (7) students use the MCM app.
Gamification goals
The gamification goals are based on the negative observations that were mentioned in theintroduction of this article.
(1). Prevent students from guessing answers
(2). Increase intrinsic motivation for working on math trail tasks (decrease time that passes whenwalking from one task to the next).
Implementation
To prevent guessing we have decided to implement (1) points that the user is rewarded whenanswering a task correctly. When the user guesses too often, the maximum amount of possible
ICTMT 13 108 Lyon 3 - 6 July 2017

points decreases. The second gamification is the (2) local leaderboard, which is based on the pointsgamification. The difference between a global and local leaderboard is that the first displays allusers so that it is possible to see one’s absolute ranking. The latter displays only the user’s rank incomparison to the user in front and the user behind him. Additionally, we have added a computerplayer who is always the last.
0: No gamification 1: Points 2: Local leaderboard
Table 1: Types of gamification in MathCityMap.
Research Question
Is there a difference in student’s intrinsic motivation while walking a math trail using the MCM appwith points or with leaderboard gamification?
METHODOLOGY
In December 2016, we conducted a pilot study with two ninth grade school classes (n = 47)comparing the intrinsic motivation between points (g1) and leaderboard (g2) gamification.
Study design
In the first 15 minutes, the participants learned how to walk a math trail with MCM. Thefunctionalities of the app and the rules were explained. Subsequently, they had 90 minutes to workon the tasks independently in groups of three. The tasks were mainly about cylinders. Finally, theywere asked to fill in a translated version of the Intrinsic Motivation Inventory (IMI, 1994)questionnaire. In this case, both groups were experimental groups. The first group walked the mathtrail with points gamification (g1), whereas the second group used the leaderboard gamification(g2).
Questionnaire
The used IMI questionnaire consisted of twenty-two 7-point Likert scale items that can be assignedto four sub scales. The sub scales represent positive or negative indicators for intrinsic motivation
ICTMT 13 109 Lyon 3 - 6 July 2017

(see table 2). The students had to indicate how true the statements were for them (not at all true –very true).
Sub scale Example item
Interest / Enjoyment (positive) This activity was fun to do.
Perceived Competence (positive) I am satisfied with my performance at this task.
Perceived Choice (positive) I believe I had some choice about doing thisactivity.
Pressure/Tension (negative) I felt pressured while doing these.
Table 2: Sub scales and example items (IMI, 1994).
RESULTS
An independent-samples t-test was conducted to compare intrinsic motivation for walking a mathtrail using the MCM app with points gamification (g1) and leaderboard gamification (g2). Therewas no significant difference in the scores of any sub scale:
Interest / Enjoyment: g1 (M=3.6, SD=1.4) and g2 (M=3.8, SD=1.1); t (45) = -.542, p = .59. Perceived Competence: g1 (M=3.7, SD=1.5) and g2 (M=3.5, SD=1.5); t (45) = .352, p = .72. Perceived Choice: g1 (M=3.8, SD=1.6) and g2 (M=4.2, SD=1.2); t (45) = -.815, p = .42. Pressure / Tension: g1 (M=2.8, SD=1.3) and g2 (M=3.2, SD=1.4); t (45) = -.789, p = .43.
At the first glance, these results suggest that the two types of gamification do not differ in how theyimpact intrinsic motivation. However, when taking the sex of the participants into account theresults of the sub scale Interest / Enjoyment do change.
Gamification Sex M SD N
Interest /Enjoyment Points male 3,4290 1,34171 10
female 3,7031 1,49078 13
Leaderboard male 4,1869 ,96772 13
female 3,2991 ,99534 11
Table 3: Statistics of gamification and sex as independent variables
A two-way analysis of variance was conducted on the influence of two independent variables(gamification, sex) on the Interest / Enjoyment sub scale. The interaction effect was not significant,F(1,43) = 2.63, p = .112.
Finally, two independent-samples t-tests were conducted to compare the Interest / Enjoyment subscale with the combination of gamification type and sex. The first test compared female participantswith points gamification (M=3.7, SD=1.5) and male participants with points gamification (M=3.4,SD=1.3). No significant difference in score of the sub scale could be found, t(21) = -.456, p = .653.The second test compared female participants with leaderboard gamification (M=3.3, SD=1.0) andmale participants with leaderboard gamification (M=4.2, SD=.97). There was a significantdifference in the interest sub scale score, t(22) = 2.2, p = .04. These results suggest that the impactof points gamification (g1) on intrinsic motivation does not differ for ninth grade female and male
ICTMT 13 110 Lyon 3 - 6 July 2017

students. Whereas the leaderboard gamification (g2) impacts the intrinsic motivation differentdepending on the sex of the participant.
DISCUSSION
In the conducted pilot study, no significant difference in intrinsic motivation between points andleaderboard gamification was found. However, the results indicate that points gamificationinfluences the interest / enjoyment sub scale of male and female students equally (cf. Attali &Arieli-Attali, 2014) since no significant difference in their scores could be found. Whereasleaderboard gamification leads to a significant higher interest / enjoyment sub scale score for malestudents (M=4.2) compared to female students (M=3.3).
Mathematic classroom rates (at least in Germany) as a male domain (Budde, 2009). The resultssuggest that different gamification types might influence this issue in a positive or in a negative way.Prior to implementing gamification in math classroom, it should be considered carefully that itmight favour one group and discriminate the other.
Prospects
The main study with 25 ninth-grade classes will be conducted in May / June 2017. The classes willparticipate in a pre-test and be divided into three groups: (g0) control group; (g1) pointsgamification; (g2) leaderboard gamification. Additionally, to the impact on intrinsic motivation, theevaluation of the gamification goals will be examined.
REFERENCES
Attali, Y. & Arieli-Attali, M. (2015). Gamification in assessment: Do points affect test performance?In Computers & Education (83), p. 57-63.
Blane, D.C. & Clark, D. (1984). A Mathematics Trail Around the City of Melbourne, MonashMathematics Education Centre, Monash University.
Budde, J. (2009). Mathematikunterricht und Geschlecht - Empirische Ergebnisse und pädagogischeAnsätze. Bonn, Berlin: Bundesministerium für Bildung und Forschung (BMBF).
Chen, J. & Kinshuk (2005). Mobile technology in educational services. J. Educ. Multimed.Hypermed., 14, 91–109.
Department for Education and Skills (DfES). (2006). Learning Outside the ClassroomMANIFESTO, DfES Publications, Nottingham, United Kingdom.
Dicheva, D. & Dichev, C (2015). Gamification in Education: Where Are We in 2015? Inproceedings of the World Conference on E-Learning (E-LEARN 2015), Kona, Hawaii, October19-22, 2015.
Drijvers, P., Boon, P., & Van Reeuwijk (2010). Algebra and technology. In P. Drijvers (Ed.),Secondary algebra education. Revisiting topics and themes and exploring the unknown (pp.179-202). Rotterdam, The Netherlands: Sense.
Franke-Braun, G., Schmidt-Weigand, F., Stäudel, L., & Wodzinski, R. (2008). Aufgaben mitgestuften Lern-hilfen - ein besonderes Aufgabenformat zur kognitiven Aktivierung derSchülerinnen und Schüler und zur Intensivierung der sachbezogenen Kommunikation. In R.
ICTMT 13 111 Lyon 3 - 6 July 2017

Messer, & W. Blum, Lernumgebungen auf dem Prüfstand. Zwischenergebnisse aus denForschungsprojekten. (pp. 27-42). Kassel: Kassel Univ. Press
Fredricks, J., Blumenfeld, P., & Paris, A. (2004). School Engagement: Potential of the Concept,State of the Evidence.
Fuchs, M., Fizek, S., Ruffino, P. & Schrape, N. (2014). RETHINKING GAMIFICATION, mesonpress, p.10 f
Hamari, J., Koivisto, J. & Sarsa, H. (2014). Does gamification work? – A literature re-view ofempirical studies on gamification. In proceedings of the 47th Annual Hawaii InternationalConference on System Sciences, Hawaii, USA, January 6-9, 2014.
Huotari, K., & Hamari, J. (2012). Defining Gamification - A Service Marketing Perspective. InProceedings of the 16th International Academic Mindtrek Conference (pp.17–22). Tampere,Finland, October 3–5, 2012. ACM, New York, NY, USA.
Intrinsic Motivation Inventory. (1994). Intrinsic Motivation Inventory (IMI). The IntrinsicMotivation Inventory, Scale description. URL: http://selfdeterminationtheory.org/intrinsic-motivation-inventory/ (23.11.2016)
Ludwig, M., Jesberg, J., David Weiß (2013). MathCityMap – eine faszinierende Belebung der Ideemathematischer Wanderpfade. In: Praxis der Mathematik (53), p. 14-19
Morschheuser, B., Werder, K., Hamari, J., & Abe, J. (2017). How to gamify? A method fordesigning gamification. In Proceedings of the 50th Annual Hawaii International Conference onSystem Sciences (HICSS), Hawaii, USA, January 4-7, 2017.
Rösler, F. (2011). Psychophysologie der Kognition, Spektrum Akademischer Verlag, Heidelberg,p.109 ff
Ryan, R. & Deci, E. (2000). Intrinsic and Extrinsic Motivations: Classic Definitions and NewDirections. Contemporary Educational Psychology, 25, 54-67
Shoaf, M., Pollak, H. & Schneider, J. (2004). Math Trails. Lexington: COMAP
Sollervall, H. & de La Iglesia, D.G. (2015) Designing a didactical situation with mobile andwebtechnologies. Konrad Krainer; Nada Vondrova. CERME9 - Ninth Congress of the EuropeanSociety for Research in Mathematics Education, Feb 2015, Prague, Czech Republic. pp.2410-2417, Proceedings of the Ninth Congress of the European Society for Research in MathematicsEducation.
Wijers, M., Jonker, V., & Drijvers, P. (2010). Exploring mathematics outside the classroom. ZDMMathematics Education, pp. 789-799.
Zichermann, G., & Cunningham, C. (2011). Gamification by Design: Implementing GameMechanics in Web and Mobile Apps, first ed. Sebastopol, CA: O’Reilly Media.
ICTMT 13 112 Lyon 3 - 6 July 2017

“POWER OF SPEED” OR “DISCOVERY OF SLOWNESS”: TECHNOLOGY-
ASSISTED GUIDED DISCOVERY TO INVESTIGATE THE ROLE OF
PARAMETERS IN QUADRATIC FUNCTIONS
Lisa Göbel 1, Bärbel Barzel1, Lynda Ball2
1University of Duisburg-Essen, Germany; 2University of Melbourne, Australia;
This paper reports an intervention-study where students investigated the role of parameters inquadratic functions through technology-assisted guided discovery. The intervention had threeexperimental groups of students, each of which used a different type of visualisation (sliders, “dragmode”, or a function plotter) and one control group. The study provides insight into whethertechnology-assisted discovery learning supports the conceptualization and understanding of therole of parameters in quadratic functions. Qualitative analysis of students’ work investigated thepotential and constraints of each of the four different approaches for visualisation. Initial findingsshowed that technology does support the students in their learning, with the dynamic visualisationgroups (drag mode and sliders) showing greater understanding than the function plotter group.
Keywords: quadratic functions, dynamic visualisations, parameter, discovery learning, technology
BACKGROUND
During the study, the students take part in a self-paced guided discovery learning about the conceptof parameters in the field of quadratic functions. Mosston and Ashworth (2008) describe guideddiscovery as a “convergent process that leads the learner to discover a predetermined target” (p.214) whereas Gerver and Sgroi (2003) stress the importance that guided discovery lessons “have astory line that inherently engages the participant” (p. 6). The lessons also need an “Aha!Component” (Gerver & Sgroi, 2003), so at some point in the lessons the students realize that theydiscovered mathematical ideas through their exploration. Even though minimal guidance is widelypromoted, Kirschner, Sweller & Clark (2006) state that there is no research supporting the use ofinstruction using minimal guidance. However, Alfieri, Brooks, Aldrich, and Tenenbaum (2011) in ameta study of 164 studies of discovery learning found that enhanced discovery learning, forexample through use of guided tasks, was indeed beneficial for learning.
In order for students to develop conceptual understanding of parameters it is important to have anunderstanding of both variables and functions, as well as being able to change between differentrepresentations.
Variables can be used differently in different contexts. For example, a variable can be used as aplaceholder or as an unknown, depending on the context of a problem. Küchemann (1981)described six ways children use letters in mathematical tasks: letter evaluated, not used, used as anobject, used as a specific unknown, used as a generalised number and used as a variable. Usiskin(1988) however, describes the variable as a “symbol for an element of a replacement set” (p. 9) butalso states that there are different views possible. He distinguishes variables as pattern generalizers,unknowns, parameters and arbitrary marks on paper (Usiskin, 1988). Küchemann and Usiskin usedifferent terms for the same concept, for example Küchemanns’ letter evaluated and Usiskin’sunknown both describe the same use of a variable. In contrast, Malle (1993) only describes threeroles of variables namely, variables as unknowns, generalized number and changing variable. Someauthors, for example Usiskin (1988), view parameters as a specific role of variables, whereas others,for example Drijvers (2003), describe parameters as meta-variables with several meaningsthemselves. Drijvers distinguishes between parameter as a placeholder, as a generalizer, as a
ICTMT 13 113 Lyon 3 - 6 July 2017

changing quantity and as an unknown. The view of a parameter as a placeholder can result inconsideration of specific values, one by one, for the parameter; in a graphic model, each time theparameter is changed it is visualized as one graph being replaced by another. However, graphs canalso be viewed dynamically, and therefore the parameter as a changing quantity can be observed viadynamic software (e.g. graphics calculators, or computer software) while the parameter iscontinuously changed to take a number of values. Lastly, a parameter as a generalizer can bevisualized by a family of functions (Drijvers, 2003). Drijvers (2003) suggests a hierarchy for theunderstanding of parameters, with parameter as a placeholder associated with a lower level ofunderstanding than both parameter as a changing quantity and an unknown, while understanding ofa parameter as a generalizer shows a higher level of understanding. Students need to be able todistinguish between parameters and variables, but this presents difficulties as the distinction iscontext related and parameters cannot be explained without second order structures (Bloedy-Vinner,2001). Bardini, Radford, and Sabena (2005) describe this as “the paradoxical epistemic nature” (p.130) of parameters, which makes it difficult for students to understand. Therefore, parameters needto be addressed in a variety of ways (Bardini et al., 2005).
In addition to understanding the concepts of variables, it is necessary for students to understand theGrundvorstellungen associated with functions. Grundvorstellungen and the development ofGrundvorstellungen are terms used in the German literature to describe the connection between themathematical concepts, real contexts and the students’ mental models (Blum, 2004).Grundvorstellungen includes normative, descriptive and constructive aspects, where the normativeaspects of Grundvorstellungen can be used to determine, what a full understanding of a particularmathematical concept should include. These normative aspects are derived through a subject matteranalysis (vom Hofe & Blum, 2016). Descriptive aspects of Grundvorstellungen are used to describethe student’s mental representation and these can include misconceptions or partial understandings(vom Hofe & Blum, 2016). Grundvorstellungen can be constructed through teaching, hence theconstructive aspects of Grundvorstellungen. Blum (2004) identified the Grundvorstellungen of afunction as mapping, covariation and object. Mapping is aligned with a static view, where onequantity is matched with another. Covariation, however is more aligned with a dynamic view, wherea change in one quantity is observed when the other quantity changes and this dynamic view can besupported through the use of technology. Object as a whole is a global view of the function as oneobject (vom Hofe & Blum, 2016), which is different to the other two ideas of mapping andcovariation, as the global features of the function are considered. vom Hofe, Kleine, Wartha, Blum,and Pekrun (2005) describe the linking of different Grundvorstellungen as an essential requirementfor developing mathematical understanding. For the study presented here, it is therefore crucial thatthe three Grundvorstellungen of functions are developed, when students are learning about thedifferences between an original graph and the resultant graph as one of the parameters of a functionequation changes.
As mathematical objects cannot be accessed without the use of representations, understanding theconcept of a function is closely intertwined with being able to change from one representation toanother (Duval, 2006). Duval (2006) describes being able to change between representations as a“critical threshold for progress in learning” (p. 107). He distinguishes two kinds of transformationsof representations: treatments and conversions. Treatments occur within one register, for examplesolving an equation, whereas conversions transform one register into another, for example graphinga function from its equation (Duval, 2006). Using multiple representations have been found to beimportant in the teaching and learning of all mathematical concepts, with Kaput (1992) describingthe change between different representations as a part of “true mathematical activity” (p. 524).Penglase and Arnold (1996) in their review of research on graphics calculators pointed out that thischange between different representations can be supported through use of graphics calculators.Kaput (1992) described that the automatic linking possible through use of technology (so that a
ICTMT 13 114 Lyon 3 - 6 July 2017

change in one representation immediately occurs in the other) can help students to visualize theconnections between representations in a different way than a static change of representation. Someauthors describe this linking of different representations as essential for developing a fullunderstanding of concepts (e.g. Thomas, 2008; Duncan, 2010). This linking of representations canbe supported through the use of digital technologies (Ferrara, Pratt & Robutti, 2005).
Using general-purpose technology like dynamic geometry software, spreadsheets or functionplotters to explore mathematical connections is included in the core curricula in North RhineWestfalia in Germany (MSW, 2007). It is not specified when or how it should be used, but startingfrom 2017 all students in North Rhine Westfalia need to use graphics calculator in their final uppersecondary school exams (“Abitur”). Many studies have shown that dynamic technology can bebeneficial for learning, however Zbiek, Heid, Blume, and Dick (2007) pose the question, whetherthe use of sliders obscures, rather than enhances, the understanding of a connection between thevalue of the parameter and the changing graph. Drijvers (2003) outlines that when students workwith sliders, the students are often not successful in explaining the effects of the sliders as they onlyexamine the effects superficially. However, Drijvers (2004) found that concerning the parameter asa changing quantity, students achieved a higher understanding through the use of sliders regardinghis proposed hierarchy of parameter roles.
RESEARCH QUESTIONS
The main research question of this project is:
How can technology-assisted guided discovery support the conceptualization of parameters in thefield of quadratic functions?
This paper reports on three sub-questions:
Is it possible for a sample of 379 grade 9 students to support the learning of the concept ofparameters in the field of quadratic functions through technology-assisted guided discovery?
What insight into students’ exploration and testing of hypotheses can be generated? What limitations of the study are visible?
METHODS, METHODOLOGY AND DESIGN OF THE STUDY
Participants
This study is a control group design intervention study with three experimental groups and onecontrol group. 14 classes of grade 9 with a total of 379 students participated in the study. The 14classes were from 8 different upper secondary schools from 5 different cities in two states inGermany (13 classes in North-Rhine Westphalia and 1 class in Thuringia). Ten teachers taught asingle class and two teachers taught two classes each. In each school, where there was more thanone class participating in the study, each class was assigned to a different group. A pen-and-papertechnology-free pretest was conducted in all classes before the intervention to collect baseline dataon pre-requisite algebra knowledge and skills for the intervention. This showed that the controlgroup and experimental groups had similar skills in the field of linear functions and equations.Further information from the pretest is not reported in this paper.
Intervention: structure of the groups
All students took part in an intervention which involved the use of a given technology (using eithera scientific calculator or TI-Nspire CX CAS) to investigate the role of parameters in the vertexform, f ( x )=a⋅ (x−b )2+c , of a quadratic function. Table 1 provides an overview of the groups inthe study, the type of visualisations and screenshots of pre-prepared files.
ICTMT 13 115 Lyon 3 - 6 July 2017
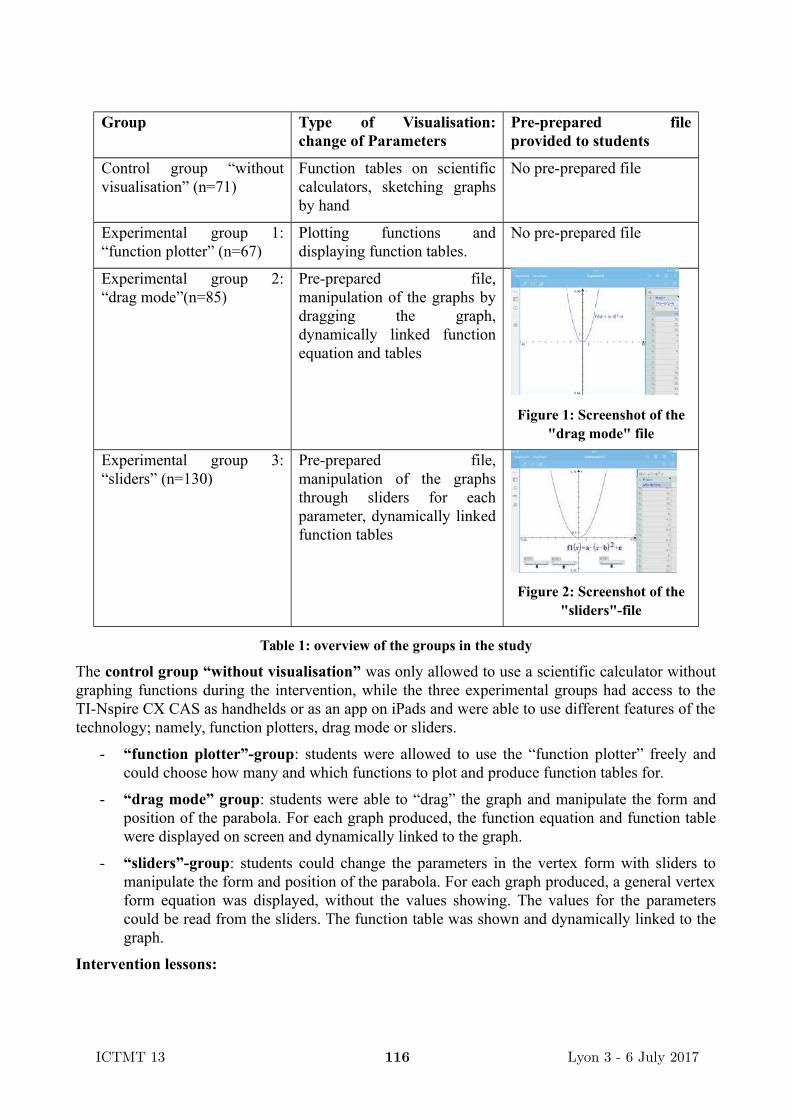
Group Type of Visualisation:change of Parameters
Pre-prepared fileprovided to students
Control group “withoutvisualisation” (n=71)
Function tables on scientificcalculators, sketching graphsby hand
No pre-prepared file
Experimental group 1:“function plotter” (n=67)
Plotting functions anddisplaying function tables.
No pre-prepared file
Experimental group 2:“drag mode”(n=85)
Pre-prepared file,manipulation of the graphs bydragging the graph,dynamically linked functionequation and tables
Figure 1: Screenshot of the"drag mode" file
Experimental group 3:“sliders” (n=130)
Pre-prepared file,manipulation of the graphsthrough sliders for eachparameter, dynamically linkedfunction tables
Figure 2: Screenshot of the"sliders"-file
Table 1: overview of the groups in the study
The control group “without visualisation” was only allowed to use a scientific calculator withoutgraphing functions during the intervention, while the three experimental groups had access to theTI-Nspire CX CAS as handhelds or as an app on iPads and were able to use different features of thetechnology; namely, function plotters, drag mode or sliders.
- “function plotter”-group: students were allowed to use the “function plotter” freely andcould choose how many and which functions to plot and produce function tables for.
- “drag mode” group: students were able to “drag” the graph and manipulate the form andposition of the parabola. For each graph produced, the function equation and function tablewere displayed on screen and dynamically linked to the graph.
- “sliders”-group: students could change the parameters in the vertex form with sliders tomanipulate the form and position of the parabola. For each graph produced, a general vertexform equation was displayed, without the values showing. The values for the parameterscould be read from the sliders. The function table was shown and dynamically linked to thegraph.
Intervention lessons:
ICTMT 13 116 Lyon 3 - 6 July 2017

The intervention consisted of three lessons of 45 minutes designed by the first and second namedresearchers. The first lesson involved an introduction to the use of technology features needed forlessons 2 & 3. This lesson was run by the teacher, or the first-named researcher where requested.This lesson is not reported here.
Lessons 2 & 3: Self-paced technology assisted guided discovery
Lessons 2 and 3 were conducted as a double lesson and were designed as a self-paced learningenvironment with guided discovery and the design process was empirically grounded. All studentsworked on the same worksheet which did not contain any instructions about technology use, but thestudents in the experimental groups were given a help-sheet for the use of TI-Nspire CX CASSystem, where syntax for the most needed features was provided. Additionally, a pre-prepared file(refer to Table 1) was provided to each of the students in the “drag mode” and “sliders” groups. Themain worksheet was structured in four parts, where students were asked to:
Part 1: Describe one example of a transformed parabola and explain the differences compared to astandard parabola.
Part 2: Explore the influence of the different parameters a ,b , c in the vertex formf ( x )=a⋅ (x−b )2+c one by one.
Part 3: Find explanations for the change in the graphs.
Part 4: Write a summary sheet in a form of a cheat sheet of everything learned during the lessons.
For parts 2 and 3 of the worksheet students were provided with a number of guiding questions onthe worksheet. For example, in Part 2, the students were asked to first look at f (x)=x2
+c andchange the value c.
Data
In 13 of the classes, one pair of students was videographed during theintervention and asked to think aloud and discuss their work with eachother; these students (n=26) were told that it was not necessary to producea summary sheet, however 22 students out of the 26 produced summarysheets. The videos were transcribed and qualitatively analysed. The firstnamed researcher was present in these classes and wrote lessonobservation notes. Summary sheets (for an example refer to Erreur : sourcede la référence non trouvée) were also collected from all other students(n=331), who produced the sheets in pairs or groups of three. In total, 178summary sheets from 353 students were collected for analysis. The lessonobservation notes, videos, video transcripts and the summary sheetsprovided data for this study.
A coding manual for the summary sheets was developed based on thequalitative content analysis of the summary sheets from two classes. Fourmain categories (language use, representation, structure, content) were setby the first and second named researchers and 84 sub-categories developed from the data. Allsummary sheets were coded by three master’s thesis candidates after intensive instruction by thefirst named researcher. The codes for each summary sheet were assigned to each student in thegroup who produced the sheet. After the initial coding a first analysis was conducted and the resultsled to a refinement of the coding manual. During this refinement, some sub-categories werecombined and some were coded in a slightly different way. After the revision of the coding manualthe first named researcher then recoded all summary sheets. The results concerning the summary-sheets presented in this paper are based on the second round of coding.
Figure 3: summary sheet example
ICTMT 13 117 Lyon 3 - 6 July 2017
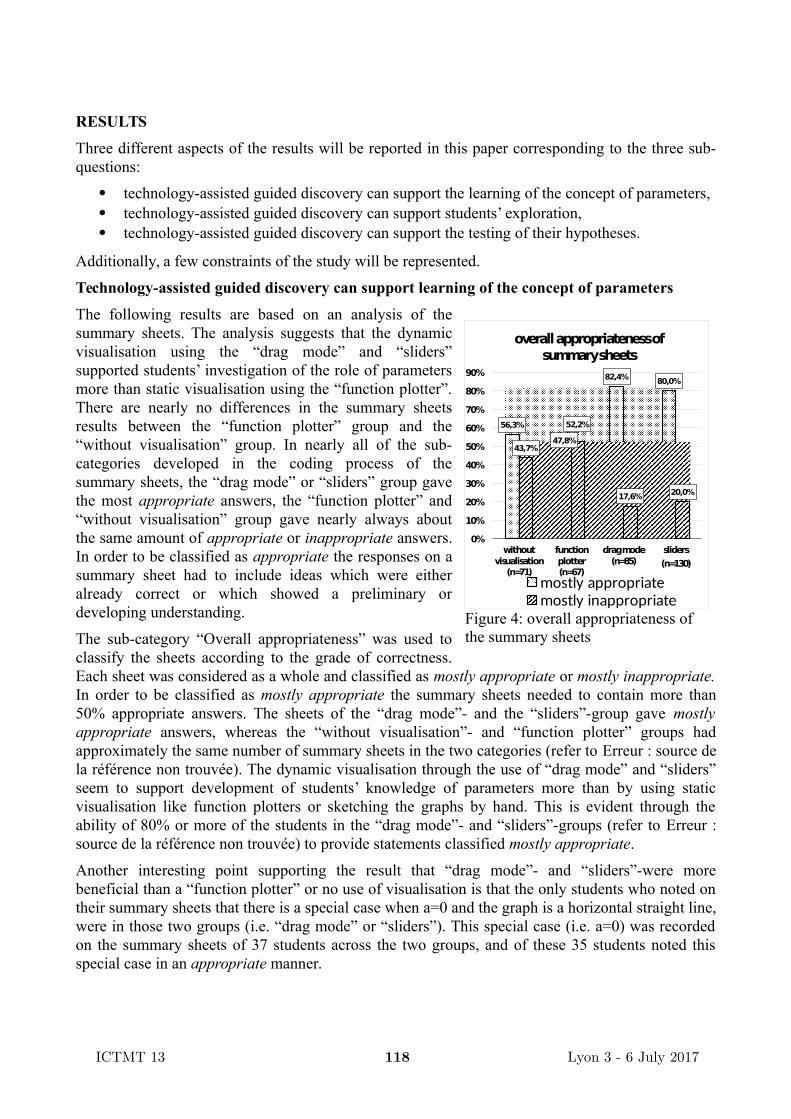
RESULTS
Three different aspects of the results will be reported in this paper corresponding to the three sub-questions:
technology-assisted guided discovery can support the learning of the concept of parameters, technology-assisted guided discovery can support students’ exploration, technology-assisted guided discovery can support the testing of their hypotheses.
Additionally, a few constraints of the study will be represented.
Technology-assisted guided discovery can support learning of the concept of parameters
The following results are based on an analysis of thesummary sheets. The analysis suggests that the dynamicvisualisation using the “drag mode” and “sliders”supported students’ investigation of the role of parametersmore than static visualisation using the “function plotter”.There are nearly no differences in the summary sheetsresults between the “function plotter” group and the“without visualisation” group. In nearly all of the sub-categories developed in the coding process of thesummary sheets, the “drag mode” or “sliders” group gavethe most appropriate answers, the “function plotter” and“without visualisation” group gave nearly always aboutthe same amount of appropriate or inappropriate answers.In order to be classified as appropriate the responses on asummary sheet had to include ideas which were eitheralready correct or which showed a preliminary ordeveloping understanding.
The sub-category “Overall appropriateness” was used toclassify the sheets according to the grade of correctness.Each sheet was considered as a whole and classified as mostly appropriate or mostly inappropriate.In order to be classified as mostly appropriate the summary sheets needed to contain more than50% appropriate answers. The sheets of the “drag mode”- and the “sliders”-group gave mostlyappropriate answers, whereas the “without visualisation”- and “function plotter” groups hadapproximately the same number of summary sheets in the two categories (refer to Erreur : source dela référence non trouvée). The dynamic visualisation through the use of “drag mode” and “sliders”seem to support development of students’ knowledge of parameters more than by using staticvisualisation like function plotters or sketching the graphs by hand. This is evident through theability of 80% or more of the students in the “drag mode”- and “sliders”-groups (refer to Erreur :source de la référence non trouvée) to provide statements classified mostly appropriate.
Another interesting point supporting the result that “drag mode”- and “sliders”-were morebeneficial than a “function plotter” or no use of visualisation is that the only students who noted ontheir summary sheets that there is a special case when a=0 and the graph is a horizontal straight line,were in those two groups (i.e. “drag mode” or “sliders”). This special case (i.e. a=0) was recordedon the summary sheets of 37 students across the two groups, and of these 35 students noted thisspecial case in an appropriate manner.
56,3%
47,8%
82,4% 80,0%
43,7%
52,2%
17,6% 20,0%
0%
10%
20%
30%
40%
50%
60%
70%
80%
90%
withoutvisualisation
(n=71)
functionplotter(n=67)
dragmode(n=85)
sliders
(n=130)
overallappropriatenessofsummarysheets
mostly appropriatemostly inappropriate
Figure 4: overall appropriateness of the summary sheets
ICTMT 13 118 Lyon 3 - 6 July 2017

From the video and lesson observation notes, there was evidence that some students appeared tostumble across this special case by accident when using the technology to give negative values forthe parameters; in moving from positive to negative values for the parameter ‘a’ students had topass a=0, prompting them to further explore this case.
Technology-assisted guided discovery can support student exploration
The videos and lesson observations showed that in all three experimental groups and in the controlgroup, students used a variety of different approaches to the task. Even though the task was pre-structured, a number of pairs in the “drag mode”- and “sliders”-groups explored their own relevantexamples, rather than those provided, which still enabled them to explore the influence of theparameters using the iPads or handhelds.
For example, one pair of students (in the “sliders” group) initially followed the pre-structured taskfor describing the example of a transformed parabola, but three minutes after beginning their workthey started exploring on their own, investigating examples which weren’t suggested on theworksheet. This exploration was prompted when students were changing the values of the sliders toreplicate the values in the example and they noted that changing parameters caused transformations.After doing this for a while (about 1 minute), the following statements were made (translated by thefirst-named author, text in italics describe the movements of the students).
TNA24: so a describes (points with pen to slider for a) this open and close, how wide it isopen and how far it is closed (IAR20 moves finger to slider b, then onto theequation)
TNA24: b describes…ahm right or left (moves pen to right and left, while IAR20 movesslider for b)
IAR20: mh exactly…exactly
TNA24: c describes up or down, so move up. Yes but how can you, four is a (writessomething), isn’t it?...but wait…
The transcript above is one example of how the students used the technology to explore anddiscover the influence of the different parameters in a very short time by manipulating the sliders toreproduce the given example. Concurrently, the students observed the change in the graph andhypothesized a generalisation for the effect of the parameter.
Technology-assisted guided discovery can support students to test their hypotheses
The same students used the technology to test their hypotheses. The students were working on Part2 of the worksheet and as suggested they were investigating f ( x )=x2
+c for different values forc. To do this they had put all sliders to zero first and then changed the one for c to 4.9. Afterzooming out so the graph was displayed the following statements were made (translated by the first-named author, italics describe movements of students).
TNA24: Oh didn’t think that, ha but wait ahm, four point 9 (points with pen on slider of c)ah minus yes
IAR20: yes so when you, through c
TNA24: through c
IAR20: it is determined if it is a parabola, is the function
TNA24: a parabola, yes ok
ICTMT 13 119 Lyon 3 - 6 July 2017

IAR20 then changed the slider for c to 3.3 (refer to Erreur : source de la référence non trouvée) withstops in between around zero, while TNA24 states that it just moves, IAR20 replies:
IAR20: no wait, wait, no, c doesn’t determine that, that must be something else, becauseotherwise it would have changed
TNA24: correct
IAR20: Then it has to be one of the other, so a or b
TNA24: so c only determines (TNA24 points tothe graph)
IAR20: the y-intercept
They discuss for a minute about the vertex points of thegraph and then change the slider for c back to zero and goon to the next part:
IAR20: now comes a (moves slider for a)
TNA24: a…that determines it, so a determines ifit is a graph or not
IAR20: if it is a parabola or not
They changed the slider for ‘a’ to zero and back again and then decided that ‘a’ determines if thegraph is a parabola or not. These transcript passages show that the students used the technology totest and falsify their statement that c determines whether the graph is a parabola.
Limitations of the study
The videos, the summary sheets and the lesson observations show that a lot of the students wereable to find out the effect on the graph, when one of the parameters is changed, but throughout allexperimental groups and the control group reasons (correct or incorrect) for the transformationswere not provided by most students. Some students tried arguing using knowledge of multiplicationof fractions to explain the changes in the function tables when ‘a’ was changed, but they werelargely unsuccessful in providing appropriate reasoning.
In order to support the students in finding explanations for the effect of changing ‘c’, there were twostatements given in part 3 on the pre-structured worksheet concerning the shape of the graph, one ofwhich was false. In addition, part 3 provided support for consideration of parameter ‘b’ byproviding two correct statements asking students to reconstruct them. Unfortunately, this aspect ofthe pre-structured worksheet caused confusion for some students. When students realised that oneof the statements for c was wrong they tried to find out which one of the two statements forparameter b was also wrong, rather than attempt to reconstruct the two correct statements asrequested.
There were some technical difficulties which impacted students’ ability to focus on the underlyingmathematical ideas. A number of the students in the “drag mode” group had difficulties with theaccuracies of the given file. Due to the programming, the numbers in the function equation weredisplayed with two decimal places and the table with up to three decimal places. It was nearlyimpossible to get whole numbers as values for the parameters while dragging the graph. Hints fromthe teachers that the students should only try to achieve approximate values did not help much. Thestudents lost considerable time trying to achieve exact values, which distracted them from the task.
Figure 5: screenshot of the file the students are working on
ICTMT 13 120 Lyon 3 - 6 July 2017

The difficulties achieving exact values made comparing values in different function tables verydifficult.
A similar problem occurred in the “sliders”-group, where sliders could only be manipulated in 0.1steps and the function tables value were displayed with two decimal places, resulting in students’confusion again caused by accuracy of the displays. In addition, sliders were too small for somestudents to work with accurately and it took considerable time for some students to move sliders toobtain desired values. Despite this, it was observed that during the intervention lessons studentstended to get more proficient with the sliders while working on the tasks, so the size issue could justbe related to familiarity with the use of sliders.
DISCUSSION
The technology-assisted learning of the concepts of parameters in quadratic functions is possible inmultiple ways, with all three different approaches having some potentials and constraints. Overallthe “drag mode” seemed the most suitable to support the learning of the concept of parameter. Useof sliders was also found to support students’ learning. The two experimental groups using “dragmode” and “sliders” were, on the whole, able to produce much more appropriate summary sheetsthan the control group, so it could be argued that the dynamic visualisation approaches have greaterbenefits for students’ abilities to provide explanations for the effects of parameters on graphs thanthe static visualisation in the “function plotter” and control group. So in the frame of this studyZbiek et al.’s (2007) conjecture that the slider obscures rather than enhances students’ understandingwas not observed. On the contrary, the dynamic visualisation in the two groups “drag mode” and“sliders” proved to be beneficial for the investigation of the role of parameters. Even though thisstudy involved a short intervention and did not explore the persistence of the learning gains, theresults seemed promising. Overall, the study suggests that technology-assisted guided discovery isbeneficial for the conceptualization of parameters.
ACKNOWLEDGEMENT
The presenting author would like acknowledge the German Academic Exchange Service (DAAD)for their funding of a research visit at the University of Melbourne through a “Kurzstipendium fürDoktorandinnen und Doktoranden” during which part of this paper was written.
REFERENCES
Alfieri, L., Brooks, P. J., Aldrich, N. J., & Tenenbaum, H. R. (2011). Does discovery-basedinstruction enhance learning? Journal of Educational Psychology, 103(1), 1-18.doi:10.1037/a0021017
Bardini, C., Radford, L., & Sabena, C. (2005). Struggling with variables, parameters, andindeterminate objects or how to go insane in mathematics. In H. L. Chick & J. L. Vincent (Eds.),Proceedings of the 29th Conference of the International Group for the Psychology of MathematicsEducation, Vol. 2, pp. 129-136. Melbourne: PME.
Bloedy-Vinner, H. (2001). Beyond unknowns and variables - parameters and dummy variables inhigh school algebra. In R. Sutherland, T. Rojano, A. Bell & R. Lins (Eds.), Perspectives on schoolalgebra (pp. 177-189). Dordrecht, Netherlands: Kluwer Academic Publishers.
Blum, W. (2004). On the role of „Grundvorstellungen” for Reality-Related-Proofs – Examples andReflections. In M. A. Mariotti (Ed.), CERME-3 – Proceedings of the Third Conference of theEuropean Society for Research in Mathematics Education. Universitá di Pisa.
ICTMT 13 121 Lyon 3 - 6 July 2017

Drijvers, P. (2003). Learning algebra in a computer algebra environment: design research on theunderstanding of the concept of parameter. Utrecht: CD- Press, Center for Science andMathematics Education.
Drijvers, P. (2004). Learning Algebra in a Computer Algebra Environment. International Journalfor Technology in Mahtematics Education, 11(3), 77-89.
Duncan, A. G. (2010). Teachers’ views on dynamically linked multiple representations, pedagogicalpractices and students’ understanding of mathematics using TI-Nspire in Scottish secondaryschools. ZDM, 42(7), 763-774. doi:10.1007/s11858-010-0273-6
Duval, R. (2006). A Cognitive Analysis of Problems of Comprehension in a Learning ofMathematics. Educational Studies in Mathematics, 61(1-2), 103-131. doi:10.1007/s10649-006-0400-z
Ferrara, F., Pratt, D. & Robutti, O. (2006). The role and uses of technologies for the teaching ofalgebra and calculus. In A. Gutiérrez & P. Boero (Eds.), Handbook of Research on the Psychologyof Mathematics Education. Past, Present and Future (pp. 237-273). Rotterdam: Sense.
Gerver, R. K. & Sgroi, R. J. (2003). Creating and Using Guided-Discovery Lessons. TheMathematics Teacher, 96(1), 6-13.
Kaput, J. (1992). Technology and mathematics education. In D. Grouws (Ed.), A Handbook ofResearch on Mathematics Teaching and Learning (pp. 515–556). New York: MacMillan
Kirschner, P. A., Sweller, J., & Clark, R. E. (2006). Why Minimal Guidance During InstructionDoes Not Work: An Analysis of the Failure of Constructivist, Discovery, Problem-Based,Experiential, and Inquiry-Based Teaching. Educational Psychologist, 41(2), 75-86.doi:10.1207/s15326985 ep4102_1
Küchemann, D.E. (1981). Algebra. In: K.M. Hart, (Ed.), Children’s understanding of mathematics:11 - 16 (pp. 102 – 119). London: J. Murray.
Malle, G. (1993). Didaktische Probleme der elementaren Algebra. Braunschweig, Wiesbaden:Vieweg.
Ministerium für Schule und Weiterbildung des Landes Nordrhein-Westfalen [MSW] (2007) (Ed.).Kernlehrplan für das Gymnasium – Sekundarstufe I (G8) in Nordrhein-Westfalen Mathematik.Frechen: Ritterbach.
Mosston, M. & Ashworth, S. (2008). Teaching physical education: First online edition. Retrievedfrom http://spectrumofteachingstyles.org/NEW2/wp-content/themes/sots/img/Teaching_Physical_Edu_1st_Online.pdf
Penglase, M. & Arnold, S. (1996). The graphics calculator in mathematics education: a criticalreview of recent research. Mathematics Education Research Journal, 8(1), 58–90.doi:10.1007/bf03355481
Thomas, M.O.J. (2008). Conceptual representations and versatile mathematical thinking. In M. Niss(Ed.), ICMI-10 proceedings and regular lectures. Copenhagen, Denmark.
Usiskin, Z. (1988). Conceptions of school algebra and uses of variables. In A.F. Coxford (Ed.), Theideas of algebra, K-12 (1988 Yearbook of the NCTM) (pp. 8-19). Reston, VA: NCTM.
Vom Hofe, R. & Blum, W. (2016). “Grundvorstellungen” as a Category of Subject-MatterDidactics. Journal für Mathematikdidaktik 37(S1), 225-254.
Hofe, R. vom, Kleine, M., Wartha, S., Blum, W., & Pekrun, R. (2005). On the role of„Grundvorstellungen“ for the development of mathematical literacy – First results of the
ICTMT 13 122 Lyon 3 - 6 July 2017

longitudinal Study PALMA. Mediterranean Journal for the research in Mathematics Education,4(2), 67-84.
Zbiek, R. M., Heid, M. K., Blume, G. W., & Dick, T. P. (2007). Research on Technology inMathematics Education – A Perspective of Constructs. In F. Lester (Ed.), Second Handbook ofresearch on mathematics teaching and learning. (pp. 1169-1207). Charlotte, NC: Information Age.
ICTMT 13 123 Lyon 3 - 6 July 2017

DYNAMIC GEOMETRY SOFTWARE IN MATHEMATICAL MODELLING:
ABOUT THE ROLE OF PROGRAMME-RELATED SELF-EFFICACY
AND ATTITUDES TOWARDS LEARNING WITH THE SOFTWARE
Corinna Hertleif
Westfälische Wilhelms-Universität Münster; [email protected]
Mathematical modelling is a complex process consisting of several steps, which can also be carriedout with the use of digital tools. This paper takes a closer look on how students perceive the DGSGeoGebra when learning mathematical modelling, how their confidence in their tool competencieschanges when using the software to do modelling, and if the learning outcome concerningmodelling competencies is influenced by programme-related self-efficacy or attitudes towardslearning with the digital tool. Results from both qualitative and quantitative evaluations of a studywith approx. 300 grade 9 students are reported.
Keywords: DGS, Modelling, Self-efficacy, Attitudes
THEORETICAL BACKGROUND
Modelling with Dynamic Geometry Software
Mathematical modelling is a complex process in which a problem in a real-world situation must beunderstood and simplified and then translated into the world of mathematics to be solved bymathematical means. The found mathematical results then must be related back to the real-worldproblem and finally be reflected and checked for plausibility. If this check indicates that the foundresults do not yet represent a satisfying solution, the steps of the modelling process can or should berepeated until a satisfying solution is found (Blum 2015). That is why this process often is displayedas a cycle (see Figure 1), even though the real process of solving a modelling problem does notnecessarily have to strictly follow this cycle (Borromeo-Ferri 2006). Modelling consists thus ofdifferent steps, most prominently among them are simplifying, mathematising, interpreting andvalidating. Being competent in modelling therefore means, in a comprehensive sense, being able toconstruct and to use or apply mathematical models by carrying out appropriate steps as well as toanalyse or to compare given models (Blum et al. 2007). The abilities to carry out a certain step ofthe modelling process respectively are also called sub-competencies of modelling (Blum 2015).
It is also possible to make use of digital tools while modelling. Depending on the kind of modellingproblems, spreadsheets, computer-algebra-systems or dynamic geometry software (DGS) may notonly support or take on the mathematical work but also visualise models, simulate real-worldprocesses or be used to control mathematical results (Siller & Greefrath 2010). When modellingwith a DGS, the software can for example be used to draw or construct geometric models or tomeasure specific quantities needed to solve a problem. The dynamics of the software are especiallyuseful for a flexible adaptation of already constructed models either with the aim of simulatingpossible solutions or of improving the used model. Thus, not only the step of mathematising maybenefit from the use of a digital tool. Steps like validating or reflecting, which require the adaptationor adjustment of mathematical models, may profit from the use of a digital tool as well (Greefrath,Siller & Weitendorf 2011).
ICTMT 13 124 Lyon 3 - 6 July 2017

When using a DGS, the different actions that can be carried out, can be classified into a scheme ofoperations (Mackrell 2011, Sedig & Sumner 2006). The most obvious actions done with a DGS areprobably those in which a new object is constructed using both already existing objects and theavailable DGS-tools. These construction-operations are supplemented by object-operations in whichno new object is created, but existing objects are changed. For example with the help of a drag-mode, it is possible to rearrange objects, to simulate dynamic processes or to vary differentparameters. Both construction- and object-operations can enhance the modelling process: in the stepof mathematising or validating for example, geometric models can be build using construction-operations and be reflected using object-operations. Additionally, view-operations, in which aconstructed object is displayed in an alternative way, e.g. from a different angle, can supportreflections regarding the model fit.
But even though a DGS might be supportive for different modelling steps, mathematical modellingremains a cognitively demanding activity, which requires not only mathematical knowledge but alsoconcept ideas, appropriate beliefs, attitudes and extra-mathematical knowledge (Blum 2015).Modelling with digital tools additionally requires skills in certain software tools (Siller &Greefrath 2010). When students are learning modelling with a digital tool, it is possible that twolearning processes take place at the same time. On the one hand students have to learn how to dealwith complex tasks like modelling problems and on the other hand they have to cope with software
Fig. 1. Possible use of digital tools for
modelling (Greefrath et al. 2011)
ICTMT 13 125 Lyon 3 - 6 July 2017
to which they might not yet be fully accustomed. Little is known on how students perceive the usedinstrument when learning modelling with a digital tool, what difficulties they encounter and whatstrategies they pursue to take full advantage of the instrument’s power.
Programme-Related Self-Efficacy and Attitudes Towards DGS
It is known from the Social Cognitive Theory that self-efficacy (SEF), which is the belief that onehas the ability to perform a particular action, has a strong influence on behaviour (Bandura 2012).When confronted with difficulties, those individuals with a low confidence in their abilities areeasily discouraged whereas more confident students will intensify their efforts (Igbaria &Iivari 1995). This concept was extended to the context of computer software. Studies in the ninetiesalready showed the important role of computer-SEF in performances using information technologies(e.g. Compeau & Higgins 1995, Gist, Schwoerer & Rosen 1989). Individuals with a high computerSEF use the computer more, derive more of their use of computers and are able to exploitmanagement support better (Igbaria & Iivari 1995). While computer SEF means general confidencein one’s own abilities to work with a computer, independent from specific programmes or software,specific computer self-efficacy or programme-related self-efficacy describes one’s own beliefs aboutbeing able to operate a specific software like for example a certain DGS (Agarwal, Sambamurthy &Stair 2000). It is yet unknown if persons with a higher programme-related SEF also benefit more oflearning mathematical modelling with the use of a DGS than persons with a lower SEF concerningthe development of modelling competencies. This could be the case because the former perhaps takemore advantage of the tools a DGS offers while searching for mathematical models or adaptingthem. Additionally, user attitudes towards the computer or specific software can moderate theoutcome of training programmes (Torkzadeh, Plfughoeft, & Hall 1999) or the individual’s SEF(Torkzadeh & Dyke 2002). It is yet unknown, if the attitudes towards software also moderate theoutcome on programmes where not the computer usage itself is trained, but the computer just servesas a medium to learn, e.g. mathematical content. Therefore, we take a closer look on the followingquestions in this paper:
RESEARCH QUESTIONS
1.) How do students perceive the DGS GeoGebra when learning mathematical modelling andespecially, what difficulties do students encounter?
2.) Does the students’ programme-related SEF or their attitudes towards the software change whenlearning mathematical modelling with a DGS?
3.) Is there a relationship between students’ programme related SEF or their attitudes towards theused software and their growth of modelling competency when learning modelling with a DGS?
METHODOLOGICAL BACKGROUND
Design of the Study
To answer these research questions, we conducted an intervention study with a pre- and post-test aswell as a four-lesson intervention in which students worked on geometric modelling tasks with thehelp of the DGS GeoGebra. A total of 328 grade 9 students in 15 different classes took part in thisstudy, which was carried out in their regular mathematics lessons. During four consecutive mathlessons, which were held in computer labs at their schools, the students worked in pairs on ageometric modelling task that was implemented in GeoGebra. Even though the participatingteachers had to make sure that their students had already worked with the software GeoGebra beforethe beginning of the project, the teaching unit began with a short revision of useful symbols and
ICTMT 13 126 Lyon 3 - 6 July 2017

constructions in GeoGebra to ensure basic knowledge about possible commands in the software.After this programme related revision, students worked independently on different modellingproblems with the software. At the end of the respective lessons different solutions were projectedand discussed. Before and after the teaching unit all students filled out a modelling test whichmeasured their modelling competencies and a questionnaire concerning their confidence in theirabilities to operate GeoGebra and their attitudes towards this software.
During the teaching unit, the students worked on four different modelling tasks. While the first ofthe used tasks was structured by different instructions and served as an introduction into the varioussteps of the modelling process, the remaining three tasks were rather open problems with severalcorrect answers. For example, one of the tasks dealt with finding market areas of supermarkets inBerlin to determine where a new branch could be opened. With the help of GeoGebra, it is possibleto try out different models. For example students may neglected the network of roads and find areasby constructing midperpendiculars between different branches of the supermarket. Alternatively, theexisting roads can be taken into account and assumptions on the number of residents in differentstreets can be made. In this case it is sensible to choose polygons as market areas which can beadapted to their assumed number of residents.
All lessons started with a short presentation of the problem by the teacher to the class. Following,students worked in pairs on one computer. They had both a working sheet which presented the taskin a written format and a DGS-file that contained the necessary graphics, e.g. a map of Berlin in thetask described above. Students were asked to use the DGS GeoGebra and to write down theirsolution processes as comprehensible as possible. After a working time of approximately 25minutes, several students presented their results or suggestions with the help of a projector. Thewhole class discussed and compared different solutions with a special focus on the different steps inthe modelling process.
During the intervention, the teachers gave as little help as possible but gave students freedom towork independently and to make their own decisions. If the teachers intervened, they mostly gavestrategic help or helped with issues with the software, e.g. helping to save the files in the rightplaces. To prepare teachers for the intervention they were instructed with detailed materialsincluding lesson plans in several meetings. During these meetings they were also prepared to typicalquestions and sensitized for students’ modelling processes.
Questionnaires and Test Instrument
To assess students’ programme-related SEF, which is their confidence in their own tool competency,an adaption of the CUSE-D questionnaire (Spannnagel & Bescherer 2009) was used. Since thisquestionnaire, originally developed by Cassidy and Eachus (2002), aims to measure generalcomputer-related SEF, but not the confidence in one’s own ability to operate a specific software, theused items were adapted to be more specifically related to GeoGebra. Students had to express theiragreement to ten statements like “I think working with GeoGebra is easy” or “I think of myself as askilled user of GeoGebra” on a rating scale with six categories. The lowest score of 10 pointsimplied no confidence in the own tool competencies, the highest score possible of 60 points implieda very high confidence. The internal consistency of this scale was Cronbach’s α=0.82 for the pre-testand α=0.92 for the post-test. The attitudes towards learning with GeoGebra were measuredanalogously. Exemplary items are “GeoGebra is a good help for learning” or “Using GeoGebramakes learning more interesting”. Even though only five items were used, the reliability for thisscale was as good as for the first with Cronbach’s α = 0.87 for the pre-test and α = 0.90 for the post-
ICTMT 13 127 Lyon 3 - 6 July 2017

test. The minimal score of 5 indicates strong disapproval of the software whereas the highest scoreof 30 indicates strong approval and a very positive attitude towards the software.
The modelling competencies were measured by a newly constructed test instrument that consistedof multiple choice or short-answer questions and focused on different steps of the modellingprocess. To avoid that students had to answer to the same modelling items twice but nevertheless tobe able to use the same items in the pre- and in the post-test, a multi-matrix design was used, whichhad to be evaluated within the frame of Item Response Theory. With the help of this theory,Weighted Likelihood Estimators for the modelling sub-competencies at the different points ofmeasurement could be estimated. As explained above, the steps of the modelling process differregarding the use of a DGS. Therefore, we analysed two different aspects of modelling competencyseparately: On the one hand the sub-competency Mathematising/Validating (MV) in which the DGSwas used to build, try out and compare different mathematical models and on the other hand a sub-competency Simplifying/Interpreting (SI) where the DGS did not play an equally active role. Theestimators for these two dimensions could be determined with a reliability of α = 0.70 for SI both inthe pre-and post-test, and α = 0.71 for MV in the pre-test and α = 0.73 in the post-test. 40 % of thetests were rated by two independent coders. The interrater-reliability lay within a range of .81 ≤ κ ≤ .95 (Cohen’s Kappa). Both the modelling test and the questionnaire were answered within45 minutes in the math lessons directly before and after the teaching unit. For these lessons, nocomputers were needed since both the test and the questionnaire were purely in a paper-pencilformat.
Interviews
During the teaching unit, the desktops of student pairs from six different classes (n = 12) werefilmed and their conversations were recorded. These recordings and films were analysed to identifyscenes where the students encountered difficulties during the modelling process. After theintervention, six pairs of students were confronted with their respective scenes and questioned in asemi-structured interview. The focus of this interview was on difficulties the students perceivedwhile working on modelling tasks with GeoGebra, on their strategies to overcome these difficultiesas well as on their attitudes towards GeoGebra and digital tools in general.
Methods of Evaluation
To evaluate the interviews, they were transcribed and coded in accordance with the summarizingqualitative content analysis. To do so, all transcribed interviews were line-serially analysed toinductively build different categories (Deeken 2016). In a final analysis, all interviews were coded.
Since the intervention took place in the regular classes, the quantitative data is structured in clusters.Students who are in the same class are likely to be more similar to their classmates than to studentsfrom different classes. Ignoring this structure when statistically evaluating the intervention wouldlead to distorted standard errors and thus to incorrect tests of significance. That is why we decidedto correct these errors by using the programme Mplus and the type = complex-Option. With Mplus,we calculated Wald’s t-tests to analyse possible change in programme-related SEF and attitudestowards the programme from pre- to post-test. To analyse a possible relationship between thegrowth of modelling competency and SEF and attitudes towards the software respectively, wecalculated multiple regressions using the post-test values as dependent variable and pre-test values,gender, SEF and attitudes toward GeoGebra in the post-test as covariates.
ICTMT 13 128 Lyon 3 - 6 July 2017
FINDINGS
Results of the Interviews
The analysis of students’ remarks in the interviews concerning their perception of GeoGebrarevealed several different categories: required working time, insecurity, calculating device,operation, precision and usefulness. Students saw a connection between the use of the DGS and thetime they spent working on the task. While some students found working with the DGS to be “quickand easy”, others said looking for complex models was “time-consuming and complicated”. Thelatter was especially the case when students still felt insecure with the software. In those cases,students were for example “slightly annoyed by those appearing numbers you had to hide byclicking on the buttons on the right”. Often, these difficulties were due to missing knowledge aboutthe geometric rules of constructions that lay behind the software’s commands. All students agreedthat working with the software became easier once they felt more familiar with it. They alsoperceived the software supportive of calculations. Some students remarked that they “had no cluehow to calculate” the surface of a non-regular polygon without the software. They found the DGS tobe practical, some saw an even bigger potential for the software in more complex tasks than thoseused in the study. Other students stressed the software’s precision. One student compared her workin GeoGebra with constructions on paper: “A pencil goes blunt and you have to sharpen it whileworking. And if you want to erase it, it does not go away completely. That’s much easier withGeoGebra”. The aspects of changing models, adapting models or restarting a modelling process arealso remarked by several students. “You can delete things quickly without having to restartcompletely” a student says. He goes on: “We went through the different options in the programme tofind something to model the figures in the best way possible”. Like him, several students mentionedthe opportunity to be inspired by the commands implemented in the software while searching forsuitable mathematical models. They “just tried out different things without having to ask someone”and “were able to find solutions on [their] own”. Thus, the mathematics lessons became “a welcomechange to regular math classes” and GeoGebra “a sound assistance”.
Change in programme-related Self-Efficacy and Attitudes
A total of 289 students answered to all items measuring the programme-related SEF in both the pre-and the post-test. The confidence in tool competencies increases from a mean of 38.63 (SD = 8.12)in the pre-test to a mean of 44.41 (SD = 9.71) in the post-test. The Wald’s t-test reveals that thisdifference of 5.46 is significant (t(1) = 74.64, p < .001). The effect size Cohen’s d = 0.61 indicates amedium effect. The attitudes towards the programme remain relatively stable with a mean in thepre-test of 20.26 (SD = 5.74) and 20.42 (SD = 6.42) in the post-test. The Wald-test shows that thisdifference is not significant (t(1) = 0.182, p = .670), Cohen’s d = 0.03 also indicates no effect. Itthus can be stated that the four-lesson intervention where students worked on modelling tasks with aDGS lead to a significant improvement in their programme-related SEF while their attitudestowards the software remained the same.
Table 1. Descriptive Statistics for Pre- and Post-Test
pre-test post-test
N M SD N M SD
SEF 277 38.86 8.06 308 44.45 9.49Att 282 20.62 5.65 311 20.66 6.28MV 320 0.00 0.72 320 0.11 0.80SI 320 -0.04 0.75 320 0.01 0.84
ICTMT 13 129 Lyon 3 - 6 July 2017

N =Number of participants; M = Mean; SD = Standard Deviation; MV=Mathematising/Validating; SI=Simplifying/Interpreting; SEF=programme-related self-efficacy (measured in post-test); Att = attitude towards the software (higher value=more positive attitude, measured in post-test);
Relationship between Modelling and programme-related Self-Efficacy or Attitudes
As it can be seen in Table 2, there is a significant correlation between the programme-related SEFand the competency Mathematising/Validating (MV), both measured after the intervention, but notbetween the programme-related SEF and the competency Simplifying/Interpreting (SI). The moreconfident a person in their abilities to operate the software is, the better their result in MV in thepost-test is. But this is also valid for their results in the pre-test, as the correlation between MV inthe pre-test and SEF is significant as well. Persons who feel more confident in their tool competencyafter the unit also achieved a higher score in the pre-test. Concerning SI the correlation with SEF issignificant for the pre-test only. Apparently, students who have a higher competence in SI at thebeginning of the teaching unit also have a higher programme-related SEF. This seems to changeduring the teaching unit so that at the end no relationship between SEF and SI-competencies can beseen.
The attitudes towards the software and the programme-related SEF are strongly correlated. Themore confident a person in their own competencies in using the software is, the more positively theysee the software. It can also be seen that neither MV nor SI are correlated with gender but SEF andattitudes are. Boys tend to be more confident in their own abilities to operate the software and seethe software more positive.
Table 2. Correlations of the used variables in the regression models
MV _post MV_pre SEF Att SI_post SI_pre SEF Att
MV_pre 0.41*** SI pre 0.46***SEF 0.20*** 0.15** SEF 0.10 0.15**Att 0.07 0.03 0.62*** Att 0.04 0.06 0.62***gender 0.12 0.05 0.26*** 0.16** gender 0.09 0.06 0.26*** 0.16****p<0.01; ***p<0.001 (MV=Mathematising/Validating; SI=Simplifying/Interpreting; SEF=programme-related self-efficacy (measured in post-test); Att = attitude towards the software (higher value=more positive attitude, measured in post-test); gender: 1= boys, 0 = girls)
To analyse the influence of programme-related SEF and the attitudes towards the software on themodelling competencies independently from differences of competencies that already existed beforethe teaching unit began, two multiple regression-models were calculated. With help of the firstmodel we analysed if programme-related SEF or attitudes towards the software were significantpredictors of the achievement in the post-test in the dimension MV when controlled for bothachievement in the pre-test and gender. The second model examined analogously their influence onthe independent variable SI.
As can be seen in Table 3, only the score in the pre-test and the programme-related SEF aresignificant predictors of the achievement in the post-test concerning MV. Persons who feel moreconfident in using GeoGebra also improved their competencies in MV more, regardless of theirgender. The attitude towards the software was no significant predictor of the post-test achievementin MV. The development of this modelling competency seems to be independent from the students’perception of the programme. Even when they did not recognize the software as a useful instrumentfor learning, they were able to build up the modelling competency MV by modelling with it. Thestandardized regression weight indicates a small effect size (β=.15). And on the other hand, a
ICTMT 13 130 Lyon 3 - 6 July 2017

positive view on the software did not automatically lead to a stronger improvement in the modellingcompetency. This is also valid for the competency SI.
For the achievement in SI in the post-test, only the score in the pre-test is a significant predictor.Persons who are more confident in their tool competencies thus do not achieve higher scores in theSI part of the modelling post-test, when adjusted for the pre-test scores. Equally the attitude towardsthe software had no influence on their achievement either. With these regression models 19.4 % and22 % respectively of the total variance can be explained.
Table 3. Multiple Regressions on MV_post and SI_post
model coefficient b SE β p R²
1 (criterium:MV_post)
Intercept -0.37 0.23 -.46 .12
19.4 %MV_pre 0.43 0.08 .39 < .001
SEF 0.01 0.00 .15 <.001
Att -0.01 0.01 -.05 .54
gender (1=boys) 0.12 0.10 .15 .23
2(criterium:SI_post)
Intercept -0.10 0.17 -.12 .57
22.0 %SI_pre 0.50 0.05 .46 <.001
SEF 0.00 0.01 .03 .64
Att -0.00 0.01 -.02 .72
gender (1=boys) 0.11 0.08 .13 .18
MV = Mathematising/Validating; SI = Simplifying/Interpreting; SEF = programme-related self-efficacy(measured in post-test); Att = attitude towards the software (higher value = more positive attitude, measuredin post-test); gender: 1= boys, 0 = girls
Summary, Discussion and Outlook
To sum up the findings it can be stated that students did recognize possible benefits of working witha DGS as they stressed the software’s precision und usefulness. But they also experienceddifficulties, mainly due to missing either mathematical or software-related knowledge. Studentsstated that after having worked with the software during the four intervention lessons they felt moresecure and more confident in their tool abilities. This impression can be confirmed by thequantitative data. We have seen that even the short period of four lessons in which students workedwith a DGS led to a significant improvement in their programme-related SEF that was sustainedeven three month after the teaching unit. The attitudes towards learning with the software thoughremain stable throughout all points of intervention. Apparently students did not see the softwaremore positively even though they felt more secure with it.
Comparing the two dimensions of modelling competency, only the development of the competencyMV is influenced by the programme-related SEF when modelling is learned with the help of a DGS.This is in accord with the theoretical considerations that there are different phases of the modellingprocess where the software can play different roles. While trying out different models, adaptingthem or searching for alternative useful mathematics the DGS plays an important role. It serves notonly as tool to visualise models, but it also gives inspirations on what kind of mathematics could beworth trying out to find a solution to the given problem. A possible explanation for the relationshipbetween programme-related SEF and the development of MV is that persons who feel confident in
ICTMT 13 131 Lyon 3 - 6 July 2017

the software can concentrate more on the step of mathematising or validating. Perhaps those personscan profit more of the benefits that the software offers which then leads to a greater improvement inthe modelling competence. This assumption is supported by the results of the qualitative studywhere students recognised possible benefits of the software but also saw the need of basicknowledge in operating the DGS. Nevertheless, students’ difficulties were not solely to be attributedto the software. The combination of the qualitative with the quantitative data showed that especiallythose students who improved their competencies in mathematising and validating often also nameddifficulties that resulted from the task itself and not from problems in operating the software. But ofcourse the students who were interviewed is just a small sub-sample and certainly notrepresentative. The intervention study, even though conducted with a large number of students waslimited to students of higher-achieving schools in grade nine. This was mainly due to practicalreasons as this group of students was most likely to have already worked with a DGS. A focus oncomplete novices or experts in the software when modelling with a DGS might be useful to reflectthe results found in this study.
But nevertheless, this study gives a first insight into the complex interplay between modelling andfactors like programme-related SEF and attitudes when modelling with a DGS. Yet there is still aneed for research on how modelling with digital tools can be successfully learned, which premisesshould be fulfilled so that digital tools can be used in a profitable way when learning modelling andfinally on the effects of digital tools on the development of modelling competencies.
An important point also lays in the design of tasks when digital tools are available. In our research,the used tasks could still be solved without the use of a digital tool. This reflects the usual practicein classrooms of just expanding students’ tools in solving tasks and is the best basis to understandwhat changes in a working process are caused by the software. Equally interesting is the questionhow modelling processes change, when the problem cannot be tackled without a digital tool.Perhaps in those tasks the role of computer competencies has to be taken in account even more.
In our up-coming studies, a special focus will be given to the role of difficulties when modellingwith a DGS. As the interviews in this study have shown, students remark problems that could betraced back either to a lack of software-knowledge or to barriers in the modelling processindependently from the tool. As the confidence in tool-competencies seemed to have a biggerimpact on the development of the competencies mathematising and validating than on othercompetencies, the hypothesis arises that in those phases of the modelling process more software-related difficulties might occur. Detailed observations of students modelling processes with specialfocus on their difficulties will give more insight into the different role of the software duringdifferent phases of modelling. The observation of students’ modelling processes in this study alreadyrevealed interesting scenes where difficulties in using the software (e.g. how to construct a circle)led to a deeper mathematical understanding of the problem (e.g. is it generally possible to constructa circle in the given situation). We hope by this means to reach a better understanding of how adigital tool and the process of learning how to use a tool can be used in a promising way to fostermodelling competencies.
REFERENCES
Agarwal, R., Sambamurthy, V., & Stair, R. M. (2000). Research Report: The Evolving RelationshipBetween General and Specific Computer Self-Efficacy—An Empirical Assessment. InformationSystems Research, 11(4).418-430.
Bandura, A. (2012). Self-efficacy: The exercise of control. New York, NY: Freeman.
ICTMT 13 132 Lyon 3 - 6 July 2017

Blum W. (2011) Can Modelling Be Taught and Learnt? Some Answers from Empirical Research. In:Kaiser G., Blum W., Borromeo Ferri R., Stillman G. (eds), Trends in Teaching and Learning ofMathematical Modelling. International Perspectives on the Teaching and Learning ofMathematical Modelling, Vol 1. (p.15-30). Dordrecht: Springer.
Blum, W. (2015). Quality Teaching of Mathematical Modelling: What Do We Know, What Can WeDo? In: Cho, S.J. (Ed.), The Proceedings of the 12th International Congress on MathematicalEducation - Intellectual and Attitudinal Challenges (p. 73-96). New York: Springer.
Borromeo Ferri, R. (2006). Theoretical and empirical differentiations of phases in the modellingprocess. In: Zentralblatt für Didaktik der Mathematik, 38 (2), 86-95.
Cassidy, S & Eachus, P. (2002). Developing the computer user self-efficacy (CUSE) scale:Investigating the relationship between computer self-efficacy, gender and experience withcomputers. Journal of Educational Computing Research, 26(2), 169-189.
Compeau, D. R., Higgins, C. A. (1995). Computer self-efficacy: Development of a measure andinitial test. MIS Quart. 19. 189–211.
Deeken, J. (2016). Modellierungsprozesse mit GeoGebra aus Sicht von Schülerinnen und Schülernin Klasse 9 – eine qualitative Interviewstudie. Unpublished Masterthesis. Westfälische Wilhelms-Universität: Münster.
Gist, M., Schwoerer, C. & Rosen, B. (1989). Effects of alternative training methods on self-efficacyand performance in computer software training. Journal of Applied Psychology, 74(6). 884–891.
Greefrath G, Siller H, Weitendorf J. (2011). Modelling considering the Influence of Technology. InKaiser G, Blum W, Borromeo Ferri R, Stillman G (Eds.), Trends in Teaching and Learning ofMathematical Modelling (p. 315-329). Dordrecht: Springer.
Igbaria, M., & Iivari, J. (1995). The Effects of Self-Efficacy on Computer Usage. Omega, 23 (6),587-605.
Siller, H.-St. & Greefrath, G. (2010): Mathematical modelling in class regarding to technology. InDurand-Guerrier, V.; Soury-Lavergne, S. & Arzarello, F. (eds.), Proceedings of the SixthCongress of the European Society for Research in Mathematics Education (p. 2136-2145). Lyon:IRNP.
Spannagel, C. & Bescherer, C. (2009). Computerbezogene Selbstwirksamkeitserwartung inLehrveranstaltungen mit Computernutzung. Notes on Educational Informatics - Section A:Concepts and Techniques, 5(1), 23-43.
Torkzadeh, G., & Van Dyke, T. (2002). Effects of training on Internet self-efficacy and computeruser attitudes. In: Computers in Human Behavior, 18(5), 479–494.
Torkzadeh, G., Plfughoeft, K., & Hall, L. (1999). Computer self-efficacy, training effectiveness anduser attitudes: an empirical study. Behaviour & Information Technology, 18, 4 299–309.
Sedig, K. & Sumner, M. (2006). Characterizing Interaction with Visual MathematicalRepresentations. International Journal of Computers for Mathematical Learning, 11, 1–55.
Mackrell, K. (2011). Design decisions in interactive geometry software. ZDM MathematicsEducation, 43, 373–387.
ICTMT 13 133 Lyon 3 - 6 July 2017

FEEDBACK IN A COMPUTER-BASED LEARNING ENVIRONMENT
ABOUT QUADRATIC FUNCTIONS:
RESEARCH DESIGN AND PILOT STUDY
Elena Jedtke
University of Münster; [email protected]
Even though feedback is an essential part of computer-based learning environments (CBLEs), it isstill not clear what effect different types of feedback have on students math achievement and ontheir abilities to assess their own achievement. To approach this problem we are currently planninga quasi-experimental study with grade eight or nine students using a CBLE called “DiscoverQuadratic Functions”. This paper gives insight both into existing research concerning the design ofCBLE as well as concerning different types of feedback and into the theoretical principals thatguided the CBLE design. Additionally, results of a qualitative pilot study as well as the design of theup-coming main study are presented.
Keywords: Computer-Based Learning Environment, Quadratic Functions, Feedback (Response),Mathematics Achievement
THEORETICAL BACKGROUND
The theoretical basis for our research consists of three main topics. Firstly theoretical and empiricalfindings about CBLEs are reported with a focus on the definition of CBLEs and basic designprinciples. Secondly, the current state of research regarding feedback is discussed with a focus onthe relationship between feedback and achievement and finally the chosen mathematical subject ofquadratic functions is explained from a didactical point of view highlighting both mentalmathematical representations (Grundvorstellungen) and learning difficulties as well as possibilitiesto avoid or overcome them.
Computer-Based Learning Environments
In search for a definition of CBLEs, it gets obvious that this phrase commonly is used as genericterm for computer- and web-based proposals (cf. Baker, D’Mello, Rodrigo, & Graesser 2010;Balacheff & Kaput 1996; Isaacs & Senge 1992). Roth (2015) gives a more precise definition ofCBLEs based on mediawiki software. According to him, CBLEs provide structured pathways with awell-matched sequence of tasks, which invites learners to work self-regulated and self-reliantly(Roth 2015). Aside from interactive materials like (GeoGebra-)applets, which are a central contentof CBLEs, the integration of retrievable help and the presentation of results are promising ways tosupport students’ working processes in a CBLE (Roth 2015). Wiesner & Wiesner-Steiner (2015)explored central functions of those CBLEs in a qualitative study where they interviewed, amongothers, experts about central functions regarding the technical and didactical level. Their findingsimply that experts gave great account to the (technical) integration of dynamic tools and availabilityof direct feedback. Concerning the didactic level especially included metacognitive activities andreflexion tasks were pointed out. Suchlike CBLEs are for example available on the German OER-website ZUM-Wiki (https://wiki.zum.de/wiki/Hauptseite), which is called on to yield a well-keptsurrounding (Vollrath & Roth 2012). The learning environments are subjected to the creative
ICTMT 13 134 Lyon 3 - 6 July 2017

commons licence CC-by-sa 3.0, so that everybody is invited to copy and even change them oncondition that the authors name(s) are mentioned and the licence stays the same. Considerably, allZUM-Wiki CBLE versions are saved online and can be re-activated.
Feedback
There are different models and understandings of feedback. Boud and Molloy (2013) for exampledistinguish a unilateral from a multilateral view on feedback. In the first, feedback is understood asa “one way transmission” (Boud & Molloy 2013, p. 701) whereby the teacher acts as “driver offeedback” (ibid., p. 698). In contrast, the multilateral view attributes a key role to the learners. Thisview is shared by several other authors (e.g. Nicol & Macfarlane-Dick 2006, Sadler 1989). Forexample, Sadler (1989) names feedback only “dangling data” (p. 121), if one does not investigateand monitor if and how feedback effect on students behaviour. In addition, Nicol and Macfarlane-Dick (2006) see a connection between self-regulated work and feedback. Thus feedback “can helpstudents take control of their own learning, i.e. become self-regulated learners” (Nicol &Macfarlane-Dick, p. 199). According to this, they worked out seven principles of good feedbackpractice, such as “[it] facilitates the development of self-assessment (reflection) in learning”(Nicol & Macfarlane-Dick, p. 205). Beside the feedback practice, the possible types of feedback areof interest for our research. The complexity of feedback is called a specific aspect of effectivefeedback, whereby studies about this particular field have yielded inconsistent results (Mory 2004,cf. Nelson & Schunn 2008, Shute 2008). The impact of feedback for the process of learning isinvestigated frequently (cf. Black & Wiliam 1998; Shute 2008; Hattie 2009). Hattie (2009) forexample identified feedback as one of the top influences on achievement in school. The intensity ofthis influence differs depending on the kind of provided feedback. While knowledge of the correctresponse feedback (KCR) has shown similar effects to no feedback, variants of feedback that have amultiple-try function (MTF) have shown a positive gain on learning (Attali 2015; cf. Shute 2008;Niegemann 2008). MTF offers the possibility to re-think results and thus to remove mistakes.Provided additional help may structure and foster this processes (Attali 2015). Furthermore,Attali (2015) names the effects of providing “explanations for the correct answers” (p. 266), whichmeans a combination of KCR and explanations, as “an interesting area for future research” (p. 266).Dempsey, Driscoll and Swidell (1993) have defined this kind of feedback earlier and allocated it aselaborated feedback (EF). Kulhavy and Stock (1989) categorised basically three elaboration types:“(a) task specific, (b) instruction based and (c) extra-instructional” (p. 286). Shute (2008) offerssome more types of EF such as giving hints that guide the learners. She says that in general EF“provides information about particular responses or behaviours beyond their accuracy” (Shute 2008,p. 157). In addition to the portrayed variants of feedback, reference should also be made to otherinfluencing factors such as prior knowledge and the point of time when feedback is given (Shute2008, cf. Mory 2004). The research outcomes concerning the proper time for feedback aredivergent, although different meta-analysis tend to foster immediate feedback (cf. Bangert-Drownset al. 1991; Shute 2008; Niegemann 2008).
Quadratic Functions
Quadratic functions play a central role in German secondary math education (NRW Ministry forSchools and Further Education 2007) and there is wide range of didactical considerations of thistopic. One important current revolves around the idea of mental mathematical representations, inGerman Grundvorstellungen. Doorman, Drijvers, Gravemeijer, Boon, and Reed (2012) mentionthree of them concerning the function concept: “functions as an input-output assignment”,“functions as a dynamic process of co-variation” and “functions as a mathematicalobject” (p. 1246). Besides, many others have specified these concepts as well (e.g. Vollrath 1989;
ICTMT 13 135 Lyon 3 - 6 July 2017

Malle 2000; Greefrath, Oldenburg, Siller, Ulm, Weigand 2016). The input-output concept refers tothe attribution of a domain element to a single element of the target set, co-variation records howchanges of one quantity involve modifications of another one and object perceptions means seeingfunctions as a single object, which describes a relationship as a whole. Functions as mathematicalobjects are primarily discussed in German upper school (Greefrath et al. 2016). Hence, lowersecondary education especially addresses the other two concepts. Zaslavsky (1997) indicates five“cognitive obstacles” (p. 20) concerning quadratic functions (Zaslavsky 1997, p. 30–33):
“Obstacle 1. The interpretation of graphical information (pictorial entailments) […]Obstacle 2. The relation between a quadratic function and a quadratic equation […] Obstacle 3. The analogy between a quadratic function and a linear function” […]Obstacle 4. The seeming change in form of a quadratic function whose parameter is zero […] Obstacle 5. The over-emphasis on only one coordinate of special points”.
Furthermore, Nitsch (2015) reports about learning difficulties in the field of representationalchanges upon functional relationships. One of the difficulties she reveals within her study refers tothe understanding of parameter impacts on the graphical representation of quadratic functions(Nitsch 2015). Systematic variation of parameters may be a connecting factor to fosterunderstanding (cf. Vollrath & Roth 2012). It can for instance be offered by the possibility to use aslider in dynamic geometry applets.
RESEARCH QUESTIONS
Based on the portrayed research findings regarding variants of feedback and in view of the possiblelearning difficulties in dealing with quadratic functions, it is interesting to investigate the impact onself-rating as well as achievement.
1. Is students’ self-rating better if they work with a CBLE including feedback towards the correctsolution in combination with explanations, than it is when students receive feedback withoutexplanations (research based on quadratic functions)?
2. Does a computer-based learning environment, including feedback towards the correct solution incombination with explanations, have greater benefit on students’ math achievement in comparisonto students’ achievement when they receive feedback without explanations (research based onquadratic functions)?
In preparation for the main study, in which the research questions above will be examined, a pilotstudy pays attention to the evaluation and enhancement of the designed CBLE about quadraticfunctions.
0.1 How do students perceive their self-reliant work with the CBLE? What do they think about thegiven steering measurements?
0.2 Which metacognitive contents of the CBLE are estimated supportive by students for the processof learning?
DESIGN
In the following sections, two different types of design are described. On the one hand the researchdesign and on the other hand, the underlying thoughts regarding the designed CBLE about quadraticfunctions are illustrated. The research design, especially the main study design, depicts our plansand might be adapted due to supplementary requirements. Currently we are conducting somepreliminary studies with various focuses. Concerning the CBLE design, some general reflections,
ICTMT 13 136 Lyon 3 - 6 July 2017

exemplary variants of integrated feedback and two inserted exercise formats are described in thefollowing paragraph. In our research the definition by Roth (2015), concerning CBLEs based onmediawiki software is used.
Research Design
The research questions already implicate that the main study will focus on different types offeedback, which can be integrated in CBLEs, and especially on their influence on students’ mathachievement. As a further interest, we want to examine if there is a link between received feedbackand self-assessment in the sense of self-rating the own achievement. A quasi-experimental studywith a control group design (1x1) is planned. Both the control and the experimental group receivethe same CBLE and self-assessment scales. Since the scales have to be in accordance with theCBLE contents, no pre-existing questionnaire can be used and the scales are going to be developedtoo. The experimental group receives immediate feedback about the correct answer of a taskincluded in the CBLE. This feedback combines KCR with explanations and a kind of MTF. It has tobe discussed if the included feedback can be ranked as EF. The control group gets another variant offeedback in CBLEs, comparable to KCR, which mainly means that there are no explanations aboutthe procedure of solution and no prompts to try a task again. Our aim is to examine if the type offeedback in the experimental group is as effective as the theory leads us to think. As mentionedabove, KCR has shown similar effects to giving no feedback, whereby the combination withexplanations and a multiple-try function may show positive effects on learning (p. 2). But since therisk remains that students use the feedback in a nonreflective way and just copy the promptedresults, it is also possible that the experimental group’s gain in math achievement stays behind thecontrol group’s. To measure the math achievement before and after students’ work in the CBLE, weare developing two tests that are connected via anchor items. While in the pre-test the focus lays onfunctional thinking and linear functions with only a few items on quadratic functions integrated tomeasure previous knowledge, the post-test contains items measuring functional thinking as well asknowledge about quadratic functions. Those items are designed to be comparable to the pre-testitems concerning linear functions. A duration of six school lessons for the intervention is intendedbetween pre- and post-test. Learners are supposed to work on their own respectively in groups oftwo students with the CBLE. Teachers’ role is to be attendant as advisor especially for technicalquestions, but stay out of students’ work in total. Before the conduction of our main study, we areconducting several preliminary studies. On the one hand, we conduct qualitative pre-studies to testand enhance the designed CBLE (pre-study I). One of these studies with focus on students’ workingexperience in the CBLE is described below. Others will be expert interviews as well as monitoringstudents’ while working with the entire CBLE. On the other hand, a quantitative pilot run is plannedto check the quality of the used achievement test as well as to get a first impression of what kind oflearning progress can be expected in the main study (pre-study II).
ICTMT 13 137 Lyon 3 - 6 July 2017

Computer-Based Learning Environment Discover Quadratic Functions
Figure 1. Index of the created CBLE Discover Quadratic Functions. (Translated)
At the moment, the CBLE consists of eight chapters shown in figure 1. After a short introduction(Welcome), which combines technical instructions with a declaration of required- and goal-competencies, the learners are encouraged to work with the CBLE. If they are not sure aboutwhether they already possess the needed competencies, they have the opportunity to work on tasksthat repeat basic knowledge (Repetition). Otherwise, they may enter the next chapters QuadraticFunctions in Daily Life and Getting to Know Quadratic Functions. The formers thematic priority ismotivation, whereby the latter introduces simple quadratic functions (f(x) = x2). The next step is towork with parameters (Parameters Introduce Themselves) and thus to discover the Vertex Form.Afterwards the Standard Form is thematised as well as the proceeding to Transform Vertex intoStandard Form. The CBLE ends with further Exercises about all included subjects. Within onechapter, the learners can decideabout the order of the exercisesand the time they spend on each.Regarding the interactive tasks, arepetition is possible too (cf.figure 2). Furthermore, withinsome application tasks the learnerscan adapt the level of difficulty (cf.figure 3). Nevertheless, since thisCBLE introduces a new subjectarea for learners, the flexibility islimited in contrast to CBLEs thatare built for e.g. repetition. Besidesto working at the computer,students are needed to write into anotebook while working with theCBLE. Some tasks explicitly askfor paper-pencil work ensuring thatlearners do not forget how to drawa graph by hand for example. Inaddition, students may gathermnemonic sentences or completeself-assessment scales in there.
There are different exerciseformats integrated in the CBLE.Besides being interactive or not,the exercises can be distinguishedinto inner-mathematical orapplication tasks. The inner-mathematical tasks serve as an
Figure 2. Exemplary inner-mathematical task about matching terms and graphs. (Translated)
Figure 3. Exemplary application task about quadratic functions. During the exercise, students need to work in pairs.
(Translated)
ICTMT 13 138 Lyon 3 - 6 July 2017

introduction to get to know the subtopics of quadratic functions and to consolidate new skills. Theapplication exercises are included to deepen students’ knowledge. In figure 2, an inner-mathematicaltask of the CBLE is shown. It exposes an interactive applet in which the learners should matchquadratic terms and parabolas. After they have finished, they can check their results by clicking thebutton downright. Correct answers are marked green, wrong ones red. If no matched pairs remain,their solution is omitted. This exercise is also exemplary for allowing and encouraging multipletries. Application tasks need more skills than draw on taught issues. Figure 3 for example requiresknowledge about how to modify quadratic functions and creativity as well. The shown exercise isabout finding a suitable term for a freely chosen ball sports. In the following tasks the learnersexchange terms with a partner who tries to detect the underlying sports. Last step is to explain onesdecisions and to reflect it together in pairs.
Since the CBLE is built toinvestigate the impact offeedback during the main study,figure 4 shows different variantsof feedback which are applied.The rationale behind choosingexactly these feedback variantsare mainly due to thepossibilities delivered by ZUM-Wiki. On the one hand,interactive applets are bound. Asmentioned above, this kind oftasks has a control button whose activation shows if the entered solution is right or should bereconsidered (figure 4a). On the other hand, hints and solutions are integrated. They are hidden untilthe learners activate them by mouse click (figure 4b). For further information about the concretekinds of feedback behind it and the rationale for using these variants, see paragraph “ResearchDesign” (p. 4).
PILOT STUDY
In preparation for the main study, the designed CBLE is tested. The portrayed pre-study isqualitative with the aim to evaluate and enhance the designed learning environment (pre-study I). Ithas been performed in cooperation with Sur (2017) in the course of his master thesis at theUniversity of Münster. Six ninth grade students of a high school (Gymnasium) in North Rhine-Westphalia have participated within this study. They worked for approximately 45 minutes with theCBLE chapter Vertex Form [1] and were afterwards questioned in guided interviews with a durationof about 15 minutes each. The interviews were transcribed and coded with MAXQDA. The codingwas based on summarizing content analysis according to Mayring (2010), whereby the usedprocedure can be declined to have a focus on inductive coding with some deductive approaches.
The guided interviews contained questions related to research questions no. 0.1 and 0.2 (p. 3). Thequestions were verbalised in an open way that animated the students to speak freely. For example,they were asked: “You have now worked on your own with the CBLE for 45 minutes. Which parts
Figure 4. Exemplary variants of feedback that are included in the designed CBLE: a) Bound interactive applet with a control
button. b) Hidden help and solution. (Translated)
ICTMT 13 139 Lyon 3 - 6 July 2017

of the CBLE supported your work? a) How did you use it? b) In which way did it support yourworking process?” (Sur 2017, p. XV, translated).
FINDINGS AND DISCUSSION
Students’ comments were summarized to the intended categories steering measurements andparticipant activity (combined to the generic term self-reliance) and metacognition. These twocategories concern research questions no. 0.1 and 0.2 and findings relying on them are hereindepicted in brief. Since the results of the pilot study are organised in categories, their depiction willfollow the same structure. First some remarkable citations are shown (translated; names modified).Afterwards positive aspects the students’ named as well as some of their supplementary remarks aresummarized. With reference to the rationale for research questions 0.1 and 0.2, each paragraph hasintegrated some exemplary résumé on how the CBLE will be revised due to the presented results.As final remark it should be emphasized that the shown findings just express the individualmeaning of a small group of students (n=6). There is no aspiration to generalize them, but they serveas a starting point for a complete evaluation of the developed CBLE. Besides they are going to besupplemented by expert interviews.
Self-Reliance
Isabell: I liked to work self-reliantly and yes it is something different from only beingpresent in classroom and absorb thinks like a sponge.
Felix: This partner work. That was good; it was not working all by myself, but to havethe possibility to compare how others work.
According to their own statements, students liked to work actively with the contents of the CBLE.They also welcomed the variability of some tasks, for example, when it was their turn to choosethree of five pictures to work with (according CBLE chapter [1], exercise 1). Occasionally, studentswished to be more assisted by the teacher, especially at the beginning. Tasks, which included theneed to work in pairs accommodated the students and have been highlighted (cf. Felix’ citation). Inaddition, the immediate feedback was mentioned as being helpful. One of the students remarkedthat she felt pressed for time.
With reference to the last point, we are going to provide a weekly schedule in future. It is to behoped that this overview will facilitate time-management. Assistance by teacher is difficult tomanage during the quantitative study, because of non-evaluable influences. A more detailed briefingin combination with extended CBLE-usage, as well as the according weekly schedule may perhapspromote the students’ self-reliant working processes. Since the students are going to work self-reliantly for a long time during the main study, it may be thought of organizing them in pairs for thewhole time.
Metacognition
Mia: I liked the possibility to self-control my results.
Marcus: I see slight risks because of the integrated feedback. Perhaps one looksimmediately for the solution.
Metacognitive components of the CBLE are the integrated transparent goals, self-assessment scales,hints and suggested solutions. Students mainly underlined the transparent goals. They named themhelpful for understanding why to work on the following tasks. The self-assessment scales have beenpresented as open questions, which is why some of the students have had some phrasing difficulties
ICTMT 13 140 Lyon 3 - 6 July 2017

as they stated. Nonetheless, this activity was highlighted assistant for the process of learning and forteachers’ acknowledgement as well. Students in this study made not much use of hints. A probablereason is that the learners already knew quadratic functions and used the CBLE chapter forrepetition. However, they remarked that the hints might be an enrichment for students who aregetting to know quadratic functions. Finally, students had different opinions on the suggestedsolutions. Most students liked the possibility to self-control their results (cf. Mia’s citation), but sawassociated risks as well (cf. Marcus’ citation). According to the students’ statements, detectingmistakes was facilitated because of the retrievable feedback.
Regarding these findings, we are going to transfer the self-assessment scales into a closer format,e.g. a checklist. On the one hand, we thereby hope to foster the students’ self-rating activity. On theother hand, it will also be easier to analyse the filled scales by statistical means. The mentioned risk,namely using the feedback unreflectively, is exactly what we want to investigate in our main study.
SUMMARY AND PROSPECT
Within this paper, we reported on preparations we made for an upcoming study about the impact ofdifferent kinds of feedback integrated in a CBLE about quadratic functions on students’ mathachievement and self-assessment. Framed by the theoretical background, we drew up our researchquestions and informed about the planned main study as well as about several pre-studies.Furthermore, design choices concerning the content of the CBLE and the included feedback variantshave been presented. Thus far, we conducted a pilot study with the aim to evaluate and enhance theCBLE (pre-study I). Based on the findings of the reported pilot study and to gain more informationabout how our adaptions and assumptions work in total, further qualitative pre-studies willaccompany the quantitative pilot-run (pre-study II) which will take place in November 2017.
NOTES
1. See ZUM-Wiki link: https://wiki.zum.de/wiki/Quadratische_Funktionen_erkunden/Die_Scheitelpunktform (in the
version of 2016-11-29), only available in German language.
REFERENCES
Attali, Y. (2015). Effects of multiple-try feedback and question type during mathematics problemsolving on performance in similar problems. Computers & Education, 86, 260–267.
Baker, R.S.J.d., D’Mello, S.K., Rodrigo, M.M.T., Graesser, A.C. (2010). Better to Be FrustratedThan Bored: The Incidence, Persistence, and Impact of Learners’ Cognitive-Affective StatesDuring Interactions with Three Different Computer-Based Learning Environments.International Journal of Human-Computer Studies, 68(4), 223–241.
Balacheff, N., Kaput, J.J. (1996). Computer-Based Learning Environments in Mathematics. In A.J.Bishop, K. Clements, C. Keitel, J. Kilpatrick, C. Laborde (Eds.), International Handbook ofMathematics Education: Part 1 (pp. 469–501), doi:10.1007/978-94-009-1465-0_14.
Bangert-Drowns, R.L., Kulik, C.-L.C., Kulik, J.A., Morgan, M.T. (1991). The Instructional Effect ofFeedback in Test-Like Events. Review of Educational Research, 61(2), 213–238,doi:10.3102/00346543061002213.
Black, P., Wiliam, D. (1998). Assessment and Classroom Learning. Assessment in Education:Principles, Policy & Practice, 5(1), 7–74, doi:10.1080/0969595980050102.
Boud, D., Molloy, E. (2013). Rethinking models of feedback for learning: the challenge of design.Assessment & Evaluation in Higher Education, 38(6), 698–712.
ICTMT 13 141 Lyon 3 - 6 July 2017

Dempsey, J. V., Driscoll, M. P., Swindell, L. K. (1993). Text-based feedback. In J. V. Dempsey andG. C. Sales (Eds.), Interactive instruction and feedback (pp. 21–54). Englewood Cliffs, NJ:Educational Technology.
Publications.Doorman, M., Drijvers, P., Gravemeijer, K., Boon, P., Reed, H. (2012). Tool Use andthe Development of the Function Concept: From Repeated Calculations to FunctionalThinking. International Journal of Science and Mathematics Education, 10(6), 1243–1267.
Greefrath, G., Oldenburg, R., Siller, H.-S., Ulm, V., Weigand, H.-G. (2016). Didaktik der Analysis.Aspekte und Grundvorstellungen zentraler Begriffe. Berlin and Heidelberg: Springer Spektrum.
Hattie, J.A.C. (2009). Visible learning: A synthesis of 800+ meta-analyses on achievement.Abington: Routledge.
Isaacs, W., Senge, P. (1992). Overcoming Limits to Learning in Computer-Based LearningEnvironments. European Journal of Operational Research, 59(1), 183–196, doi:10.1016/0377-2217(92)90014-Z.
Kulhavy, R. W., Stock, W. A. (1989). Feedback in Written Instruction: The Place of ResponseCertitude. Educational Psychology Review, 1(4), 279–308.
Kulhavy, R. W., Wagner, W. (1993). Feedback in programmed instruction: Historical context andimplications for practice. In J. V. Dempsey & G. C. Sales (Eds.), Interactive instruction andfeedback (pp. 3–20). Englewood Cliffs, NJ: Educational Technology Publications.
Malle, G. (2000). Zwei Aspekte von Funktionen: Zuordnung und Kovariation. mathematik lehren,118, 57–62.
Mayring, P. (2010). Qualitative Inhaltsanalyse. Grundlagen und Techniken (11., revised edition).Weinheim and Basel: Beltz.
Mory, E. H. (2004). Feedback research revisited. In D.H. Jonassen (Eds.), Handbook of Research onEducational Communications and Technology: Second Edition (pp. 745-783). Taylor&Francis.
Nicol, D. J., Macfarlane-Dick, D. (2006). Formative assessment and self-regulated learning: amodel and seven principles of good feedback practice. Studies in Higher Education, 31(2),199–218.
Niegemann, H. M.; Domagk, S.; Hessel, S.; Hein, A.; Hupfer, M., & Zobel, A. (2008). Kompendiummultimediales Lernen. Heidelberg: Springer.
Nitsch, R. (2015). Diagnose von Lernschwierigkeiten im Bereich funktionaler Zusammenhänge.Eine Studie zu typischen Fehlermustern bei Darstellungswechseln. Wiesbaden: SpringerSpektrum.
NRW Ministry for Schools and Further Education (2007). Kernlehrplan für das Gymnasium –Sekundarstufe I (G8) in Nordrhein-Westfalen. Mathematik. Retrieved fromhttp://www.schulentwicklung.nrw.de/lehrplaene/upload/lehrplaene_download/gymnasium_g8/gym8_mathematik.pdf.
Roth, J. (2015). Lernpfade: Definition, Gestaltungskriterien und Unterrichtseinsatz. In J. Roth, E.Süss-Stepancik & H. Wiesner (Eds.), Medienvielfalt im Mathematikunterricht. Lernpfade alsWeg zum Ziel (pp. 3–25). Wiesbaden: Springer Spektrum.
Sadler, D. R. (1989). Formative assessment and the design of instructional systems. InstructionalScience, 18, 119–144.
Shute, V. J. (2008). Focus on Formative Feedback. Review of Educational Research, 78(1), 153–189, doi:10.3102/0034654307313795.
Sur, C. (2017). Selbstgesteuertes Lernen mit Lernpfaden im Mathematikunterricht aus Sicht derLernenden – Eine qualitative Untersuchung auf Basis von Interviews. Unpublished masterthesis, University of Münster.
ICTMT 13 142 Lyon 3 - 6 July 2017

Taras, M. (2003). To Feedback or Not to Feedback in Student Self-Assessment. Assessment &Evaluation in Higher Education, 28(5), 549–565, doi:10.1080/0260293032000120415.
Vollrath, H.-J., Roth, J. (2012). Grundlagen des Mathematikunterrichts in der Sekundarstufe (2.edition). Heidelberg: Springer Spektrum.
Vollrath, H.-J. (1989). Funktionales Denken. Journal für Mathematikdidaktik, 10(1), 3–37. Wiesner, H., Wiesner-Steiner, A. (2015). Einschätzungen zu Lernpfaden – Eine empirische
Exploration. In J. Roth, E. Süss-Stepancik & H. Wiesner (Eds.), Medienvielfalt imMathematikunterricht. Lernpfade als Weg zum Ziel (pp. 27–45). Wiesbaden: SpringerSpektrum.
Zaslavsky, O. (1997). Conceptual Obstacles in the Learning of Quadratic Funtions. Focus onLearning Problems in Mathematics Winter Edition, 19(1), 20–44.
ICTMT 13 143 Lyon 3 - 6 July 2017

EXPLOITING POTENTIALS OF DYNAMIC REPRESENTATIONS OF
FUNCTIONS WITH PARALLEL AXES
Giulia Lisarelli
University of Florence, Department of Mathematics; [email protected]
The concept of function has a central role both at school and in everyday situations. Several studiesrevealed that it is hard for students to think of functions and graphs in terms of covariation and thiscould contribute to their struggles in Calculus. The emergence of available technologies has fostered new teaching and learning approaches to overcome students’ difficulties and some of them concerns the use of dynamic algebra and geometry software programs to experience the dependence relation and to explore functions as covariation. In this paper we describe a particular representation of functions with parallel axes and the analysis of a protocol in which four students work together on a problem that involves the exploration of a function represented in a dynamic interactive file. The analysis has been carried out to explore the potential of the proposed dynamic representation of functions that incorporates the semantic domain of space, time and movement.
Keywords: dynamic algebra and geometry software, dragging, function.
INTRODUCTION
The concept of function is very important both in secondary school and university mathematics butit also has a central role in everyday situations. For a long time, this notion has been at the core ofseveral studies in mathematics education, and a rich literature has revealed students’ difficulties inunderstanding the concept in all its aspects (Vinner & Dreyfus, 1989; Tall, 1991; Dubinsky & Harel,1992). Difficulties in interpreting the dependence relation as a dynamic relation between covaryingquantities are widely reported (Goldenberg et al., 1992; Carlson et al., 2002) and also difficulties inmanipulating graphs and recognizing functions’ properties from graphs (Carlson & Oehrtman,2005).
Indeed, the tendency to think of functions and graphs as static objects, rather than as dynamicprocesses, may contribute to students’ struggles in the learning of Calculus (Ng, 2016). At the sametime the emergence of a variety of new available software has fostered new teaching and learningapproaches. Therefore, we can find several studies about the use of technology to manipulatemultiple representations of functions (Healy & Sinclair, 2007; Sinclair et al., 2009).
Falcade et al. (2007) suggest that the use of a dynamic algebra and geometry software, such asGeoGebra, allows students to experience functions as covariation, that is a crucial aspect of the ideaof function (Confrey & Smith, 1995; Tall, 1996). According to these assumptions we are interestedin studying students' cognitive processes involved in working with functions represented in adynamic environment.
In this paper we describe a particular dynamic representation of functions and some results from apilot study conducted last year. This study is part of a larger research project whose focus isinvestigating how certain aspects of the mathematical concept of function could be supported bysuch dynamic representation. Moreover, we are interested in exploring the semiotic potential of therepresentation of functions with parallel axes (Bartolini Bussi & Mariotti, 2008), to gain insight intohow to exploit it didactically.
ICTMT 13 144 Lyon 3 - 6 July 2017

DYNAGRAPHS
Dynagraphs, as they have been referred to by Goldenberg et al. (1992), are particular representationsof functions obtained by using a dynamic software, which consist in representing both the x- and y-axes horizontally, in one dimension, unlike the Cartesian graphs which represent functions in twodimensions. The underlying assumption is that this kind of representation can support a dynamicconception of functions because it draws attention to variables’ variations and movements and to therelation between these variations.
We now propose a description of our development of this idea, implemented within the algebra andgeometry software GeoGebra. In particular, we designed a sequence of activities aimed at makingthe representation of functions in the Cartesian plane rich in meanings. We start with a kind ofdynagraph and evolve its design, through a sequence of activities, in order to reach the Cartesiangraph.
As we can see in Figure 1 the first dynagraph has one horizontal line, with 0 and 1 marked, and twolittle ticks that can move on it in this way: one of them represents the independent variable and canalways be dragged, the other one represents the dependent variable, it cannot be directly dragged,but it moves depending on the movements of the independent tick. We note that the variables arerepresented by ticks and not by points, because a point is usually seen as a pair of coordinates, whilea tick better expresses the idea of “value”. Moreover, there are two points marked on the line thatdetermine the unit segment, to highlight that it is the real number line.
Figure 1. Dynagraph
The design of our representations also allows to separate out the two variables, that is, to create acopy of the line in order to have one notch on each line. So what can be seen on the screen changesbecause there is a fixed horizontal line, representing the x-axis, and its double, representing the y-axis, that can be dragged up and down maintaining the parallelism, and the alignment of the origin.
Thanks to the dragging and the design of the dynamic files there is the opportunity to rotate the y-axis, joining the zeros and making it orthogonal to the x-axis; obtaining a representation thatincludes the Cartesian axes on which two ticks can move. As described above, the tick on the x-axiscan be directly dragged while the other one moves depending on it. The following step for theconstruction of the Cartesian graph of a function consists of the construction of the point (x, f(x))and, finally, by activating the trace tool on this point and dragging the independent variable we
ICTMT 13 145 Lyon 3 - 6 July 2017
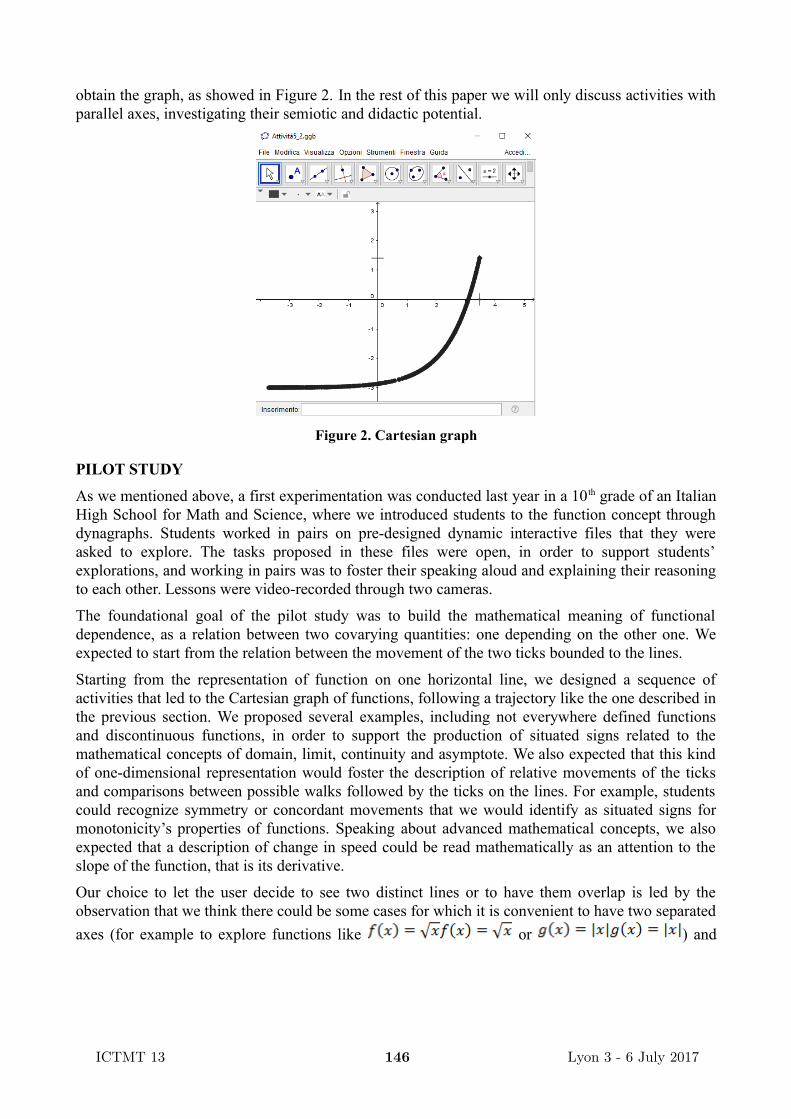
obtain the graph, as showed in Figure 2. In the rest of this paper we will only discuss activities withparallel axes, investigating their semiotic and didactic potential.
Figure 2. Cartesian graph
PILOT STUDY
As we mentioned above, a first experimentation was conducted last year in a 10th grade of an ItalianHigh School for Math and Science, where we introduced students to the function concept throughdynagraphs. Students worked in pairs on pre-designed dynamic interactive files that they wereasked to explore. The tasks proposed in these files were open, in order to support students’explorations, and working in pairs was to foster their speaking aloud and explaining their reasoningto each other. Lessons were video-recorded through two cameras.
The foundational goal of the pilot study was to build the mathematical meaning of functionaldependence, as a relation between two covarying quantities: one depending on the other one. Weexpected to start from the relation between the movement of the two ticks bounded to the lines.
Starting from the representation of function on one horizontal line, we designed a sequence ofactivities that led to the Cartesian graph of functions, following a trajectory like the one described inthe previous section. We proposed several examples, including not everywhere defined functionsand discontinuous functions, in order to support the production of situated signs related to themathematical concepts of domain, limit, continuity and asymptote. We also expected that this kindof one-dimensional representation would foster the description of relative movements of the ticksand comparisons between possible walks followed by the ticks on the lines. For example, studentscould recognize symmetry or concordant movements that we would identify as situated signs formonotonicity’s properties of functions. Speaking about advanced mathematical concepts, we alsoexpected that a description of change in speed could be read mathematically as an attention to theslope of the function, that is its derivative.
Our choice to let the user decide to see two distinct lines or to have them overlap is led by theobservation that we think there could be some cases for which it is convenient to have two separated
axes (for example to explore functions like or ) and
ICTMT 13 146 Lyon 3 - 6 July 2017

some other cases in which it is easier to work with one line with two variables moving along it (for
example to determine ).
Analysis of an activity
The Theory of semiotic mediation (Bartolini Bussi & Mariotti, 2008) describes the semioticpotential of an artifact as follows:
On the one hand, personal meanings are related to the use of the artifact, in particular in relationto the aim of accomplishing the task; on the other hand, mathematical meanings may be relatedto the artifact and its use. This double semiotic relationship is named the semiotic potential of anartifact.
According to this definition we analyze the semiotic potential of the representation of functionswith parallel axes focusing on the embedded knowledge and the utilizations schemes that studentsemploy when exploring the dynamic files.
In the first lesson of the pilot study, after the exploration of a linear function, students are asked to
explore the dynagraph of the function and to write down their observations.We chose to give them this not everywhere defined function in order to introduce them to themathematical concept of domain, while exploring the dependence relation between the twovariables. We expected that the particular behaviour of the dependent variable in a neighborhood of
the vertical asymptote could have supported the employment of a language referring tothe movement and to the relation between the movements of the two ticks. Moreover we expected
that students would have noticed the existence of the horizontal asymptote in terms ofchanging in speed of the tick representing the dependent variable.
In the next sections we analyze some excerpts from this lesson with the goal of recognizinginstances in which the semiotic potential of dynagraphs seems to be exploited.
Excerpt 1
The following transcript is a dialogue between four students who are interacting with a GeoGebra
file that represents the dynagraph of the function . We chose this excerpt from the first lessonbecause in it students frequently use words that refer to variables’ movements and to the relationbetween these movements. Moreover, as we expected, the function’s behaviour in a neighborhood
of the vertical asymptote causes students’ astonishment and some interestingobservations.
1 Gian: Oh no, it is going crazy!
2 Fra: Look there, it dashes backwards
3 Gian: It makes certain leaps!
4 Fra: Ah, but are they three points here?
5 Dar: What? Here there is back to the future!
6 Fra: Eh eh, there are three points guys
7 Rob: No
8 Fra: Or not?
9 Gian: This one doesn’t move, and the meeting point is the same, it doesn’t change.
ICTMT 13 147 Lyon 3 - 6 July 2017

10 Fra: No no they are two, indeed I tried to make some changes but they are equal,actually they are the same
As we can read from the dialogue, the discontinuity of the function is something very interesting forthese students, because when they drag the independent variable they see the dependent onedisappear from one side of the screen and then re-appear from the other side of the screen. They tryto interpret this phenomenon by using a “continuous” interpretation. Fra supposes that there couldbe three points, possibly because he does not accept that one point can run off on one side and comeback from the other side. But another interesting fact is that he modifies the tick representing thedependent variable in order to convince himself that the points are two and not three: dragging theindependent tick he always sees the same output. Therefore the feedback is directly given by thesoftware, and by useful manipulations made on the file.
Let us now look at a sentence that we consider as a first sign, situated in the context of the dynamicfile, of the mathematical concept of domain of the function. It is important to observe that therepresentation of the function with parallel axes requires the following interpretation of the domain:this needs to be read on the y-axis because the independent variable can always be dragged,bounded to its line. So we could say that a point on the x-axis belongs to the domain of the functionif it has a corresponding output on the y-axis.
As we can read from Rob’s words there are different aspects of the semiotic potential of therepresentation of the function that come to light. Indeed, he refers to time (after a moment), to space(upper, below) and to movement (a range of movement).
24 Rob: After a moment, the upper point moves only in a certain range of movementof the point below.
The next excerpt concerns a description of the asymptotic behavior of the function when x tends toinfinity.
Excerpt 2
71 Fra: But do you see how it dashes away? Look!
72 Dar: Try to move a bit further backwards, look, it still moves very little.
73 Fra: It continues to move
74 Dar: Do you see? it moves a little bit
75 Fra: Yes, it is moving a little bit
76 Dar: Look, it moves here
77 Rob: Nothing is moving, where do you see that it moves?
78 Fra: It moves you’re right, yes
79 Rob: No, here it does not move
80 Fra: Yes Rob it moves, look!
81 Rob: Zoom in zoom in, so we can see it. And then it makes certain leaps…
82 Fra: It leaps it leaps!
83 Rob: Look, it has leapt to one side
84 Fra: And then it stops
85 Rob: That’s it, from here on it is fixed, look
Recalling the verb (to dash away) used previously as well, Fra underlines the unexpected
acceleration of the dependent variable (71). Then the other students observe that makes
ICTMT 13 148 Lyon 3 - 6 July 2017

some leaps (81) when dragging the x in a neighborhood of the point where the function is notdefined. The semiotic potential of this dynagraph comes into play in the mathematical concept of
derivative: by dragging the x-tick in a neighborhood of the -tick leaps, whichcorresponds to a function having a very high slope.
Then students discuss about the function’s behavior for x tending to negative infinity. Dar suggests
that still moves when x is dragged backwards (72), that is x tending towards negativeinfinity; and Fra agrees (82). But Rob prefers to zoom in because it seems to him the x-tick to befixed and he would convince himself of the contrary. Again the semiotic potential of the dynagraphcomes into play, supporting with respect to the mathematical concept of limit; aspects of suchpotential can be observed in students’ words and actions. In particular, zooming in students canobserve the function’s behavior for ever smaller variations of the independent variable.
In the last sentence (85) Rob refers to x values bigger than zero and far from it, and we are sure of itbecause we see from the video that he is dragging the x-tick to the right on its line.
Before the discussion we would just notice that the analysis of the two excerpts reveals someinteresting considerations consistent with the a priori analysis of the designed activity.
DISCUSSION
The studies on the interaction between humans, technology and mathematics have to take intoaccount a variety of aspects: the relation between the teacher and the technology in the mediation ofmathematical knowledge, or how this knowledge is influenced by constraints and actions allowed inthe technological environment, and several other components that are involved. In this paper wehave presented a study to better understand the explorations of functional dependence in a dynamicalgebra and geometry environment. In particular, we have analysed aspects of the semiotic potentialof the representation of functions with parallel axes, presenting some excerpts from a pilot studyconducted last year.
We noticed that students’ descriptions of dynagraphs are rich in references to movement, time andspace. We think that it could be fostered by the dynamic environment, by the task that requires forthe exploration, and by the possibility of dragging. However such richness could also be affected bythe fact that the students never met the concept of function (in high school) before, so they have notyet developed a formal mathematical vocabulary about functions, so the use of these terms becomesnecessary for them.
From the analyses we can infer that introducing students to functions through dynagraphs seems topromote a covariational view of functions, seen as relations between the movements of quantitiesthat are varying in an interval of real numbers. In the same way also some mathematical propertiesof functions are conceived dynamically, for example Rob identifies the domain of the function as acertain range of movement of the independent variable. Consistent with our expectation about thiskind of one-dimensional representation, that it would have fostered the description of relativemovements of the ticks and comparisons between possible walks followed by the ticks on the lines,we also notice students frequent use of verbs strictly related to movement and speed (2, 3, 9,Excerpt 2).
Finally, we highlight students’ creativity, revealed by their use of the tools offered by the software,
for example Fra changes the -tick’s visualization and Rob zooms in to convince himself
that moves on.
ICTMT 13 149 Lyon 3 - 6 July 2017

In a future study it could be interesting to investigate whether students’ conceptions of functionsevolve, and if so how. In particular we are interested in analyzing students’ use of references tomovement and time when they are taught the mathematical definitions: do they disappear or do theylast? How do students deal with these dynamic terms together with the static definition of function?
Along the lines of the design of these activities, it could be interesting to design some new activitiesconcerning other properties of functions in order to gain a deeper insight into possible exploits ofthe semiotic potential of functions’ representation with parallel axes.
REFERENCES
Bartolini Bussi M. G., & Mariotti M. A., (2008). Semiotic mediation in the mathematics classroom:Artifacts and signs after a Vygotskian perspective. In L. English et al. (Eds.), Handbook ofInternational Research in Mathematics Education, second edition, (pp. 746-783). New York andLondon: Routledge.
Carlson M., Jacobs S., Coe E., Larsen S., & Hsu E., (2002). Applying covariational reasoning whilemodeling dynamic events: A framework and a study. Journal for Research in MathematicsEducation, 33(5), 352–378.
Carlson M., & Oehrtman M., (2005). Key aspects of knowing and learning the concept of function.Research Sampler 9. MAA Notes.
Confrey J., & Smith E., (1995). Splitting, covariation and their role in the development ofexponential function. Journal for Research in Mathematics Education, 26, 66–86.
Dubinsky E., & Harel G., (1992). The nature of the process conception of function. In G. Harel andE. Dubinsky (Eds.), The concept of function: aspects of epistemology and pedagogy, (pp. 85–106). MAA Notes.
Falcade R., Laborde C., & Mariotti M.A., (2007). Approaching functions: Cabri tools asinstruments of semiotic mediation. Educational Studies in Mathematics, 66, 317–333.
Goldenberg E. P., Lewis P., & O’Keefe J., (1992). Dynamic representation and the development ofan understanding of functions. In G. Harel and E. Dubinsky (Eds.), The Concept of Function:Aspects of Epistemology and Pedagogy, 25. MAA Notes.
Healy L., & Sinclair N., (2007). If this is your mathematics, what are your stories? InternationalJournal of Computers for Mathematics Learning.
Ng O., (2016). Comparing calculus communication across static and dynamic environments using amultimodal approach. Digital Experiences in Mathematics Education.
Sinclair N., Healy, L., & Reis Sales C., (2009). Time for telling stories: Narrative thinking withDynamic Geometry. ZDM, 41, 441–452.
Tall D., (1991) The psychology of advanced mathematical thinking, In: D. Tall (Eds.) AdvancedMathematical thinking, 3–21. Dordrecht: Kluwer.
Tall D., (1996). Function and Calculus, In: A.J. Bishop et al. (Eds.) International Handbook ofMathematics Education, (pp. 289–325). The Netherlands: Kluwer Academic Publishers.
Vinner S., & Dreyfus T., (1989). Images and Definitions for the Concept of Function. Journal forResearch in Mathematics Education, 20(4), 356–366. National Council of Teachers ofMathematics.
ICTMT 13 150 Lyon 3 - 6 July 2017

REASONING STRATEGIES FOR CONJECTURE ELABORATION IN DGE
Iman Osta, Madona Chartouny, Nawal Abou Raad
Lebanese American University; [email protected]
Lebanese University; [email protected]
Lebanese University; [email protected]
The present study analyzes students’ reasoning strategies for elaboration of conjectures when
working in a Dynamic Geometry Environment (DGE). We observed 18 pairs of ten-graders in a
private school in Lebanon, while working on open geometrical proof problems using Dynamic
Geometry Software (DGS), namely GeoGebra. The analysis revealed three reasoning strategies
employed by students. In the first two, the students worked on satisfying the presumed premise of the
conjecture in the figure and identifying / validating the conclusion, either by observing the figure at
hand (strategy 1) or by dragging the figure to validate the conclusion across different instances
(strategy 2). Conversely, in the third strategy, the students worked on satisfying the conclusion of
the conjecture in the figure and observing it to identify the premise that corresponds. Each strategy
entails the use of different construction tools and types of constructions which affect the correctness
of the resulting conjecture.
Keywords: secondary – conjecture – dynamic geometry – reasoning
SETTING THE CONTEXT
The proving process involves two sub-processes: conjecture elaboration and proof development.
These two processes become particularly more explicit in Dynamic Geometry Environments
(DGEs) since the nature of the first process in DGE is radically different from pencil-and-paper en-
vironments, which consequently affects the way the second process evolves. Dynamic draggable
constructions strongly affect the proving process by mediating the type of conjectures developed
(Sinclair & Robutti, 2012).
Extensive research (Hölzl, 2001; Laborde & Sträßer, 2010; Laborde & Laborde, 2011; Laborde,
2005) has been conducted on the potentialities of the dragging tool, which resulted in understanding
this tool as a pedagogical tool conducive to mathematical reasoning (Jones, 1998), particularly in
the process of conjecture formation in geometry. The epistemic potential of the dragging tool lies in
its relationship with the discernment of invariants (Leung, Baccaglini-Frank, & Mariotti, 2013). Ac-
cording to Mariotti (2014), dragging acts as a mediator between geometrical invariants and logical
statements. In fact, dragging to elaborate a conjecture is a complex process as it requires the inter-
pretation of perceptual data by analyzing the image in order to identify a geometrically significant
relationship between its elements and properties. For example, when dragging to search for conse-
quences, students need to interpret the geometrical dependence between direct invariants (i.e. invar-
iant properties observed between independent elements) and indirect invariants (i.e. invariant prop-
erties observed between dependent elements) as the logical dependence between the premise and
the conclusion of a conditional statement.
Given that in the literature the primary focus in the process of conjecture elaboration has been on
the role of dragging, this study aims at a more comprehensive analysis of the process of conjecture
elaboration within DGE by shifting the focus from the dragging tool to include the different reason-
ing strategies, construction tools and types of constructions employed by students. The study con-
sisted of a series of observations of 18 pairs of ten-graders (15-17 years old) who worked on open
geometrical proof problems within a DGE, namely Geogebra. Data were collected using video-
recording and collection of materials, including any paper trace (sketches, scribblings, proof formu-
ICTMT 13 151 Lyon 3 - 6 July 2017

lations) generated by students, together with their GeoGebra files. This paper presents students’
work on two problems previously used by Olivero (2002) and Arzarello et. al. (2002) respectively:
Problem 1 (P1) (Olivero, 2002)
1) Let ABCD be a quadrilateral. Consider the bisectors of its internal angles and the intersection
points H, K, L, and M of pairs of consecutive bisectors.
2) Drag ABCD, considering different configurations, and explore how HKLM changes in relation
to ABCD.
3) Write down conjectures and prove them.
Problem 2 (P2) (Arzarello et. al., 2002)
Given a triangle ABC, consider P the midpoint of [AB] and the two triangles APC and PCB.
1) Explore the properties of the triangle ABC which are necessary so that both APC and PCB are
isosceles (in this case, the triangle ABC is called “separable”).
2) Write down conjectures and prove them.
STRATEGIES FOR CONJECTURE ELABORATION
Through observing and analyzing the students’ work, it was possible to identify three reasoning
strategies that were used for conjecture generation and that describe the way students moved from
exploring the changes of the dynamic geometrical figure to identifying relational properties of the
figure. A sentence is considered to be a conjecture when stated in the form “If… then….” the first
part (if…) is referred to as premise and the second part (then…) as conclusion. Upon analyzing stu-
dents’ work, the following strategies for conjecturing were identified.
Strategy 1 – Forward Static Observation (FSO)
This strategy consisted in building a figure and satisfying the presumed premise, then observing a
static instance of the figure to conclude the conjecture. Students construct the figure while incorpo-
rating the properties provided in the presumed premise, then observe, without any manipulation, a
single static instance of the figure obtained, to identify invariants and to formulate a conjecture. The
constructed figure may be robust or visually adjusted.
The inferences made while using the FSO strategy are of two types:
Type 1 inference – visual verification: When the conclusion was a priori known by the students,
i.e. provided by the statement of the problem (as in problem 2 where students knew they had to
find a separable triangle ABC), students incorporated the presumed premise and observed
whether the single instance of the geometric figure obtained met the conclusion. In such a case,
a conjecture was developed; if not, then the premise was rejected based on the counterexample.
Type 2 inference – visual speculation: When the conclusion was not provided within the prob-
lem (as in problem 1 where students did not know which shape of HKLM they will obtain),
then, after incorporating the presumed premise, students identified the conclusion based on a
single instance of the geometric figure and formulated a conjecture.
The following examples illustrate different cases of use of the FSO strategy for conjecturing. The
code between parentheses refers to the problem being solved (P1 or P2).
Example 1 (P1). Many students who were working on problem 1 started by investigating the case -
premise: “If ABCD is a square”. They constructed a robust square using the Regular Polygon tool
(Figure 1). Not knowing what the conclusion should be (type 2 inference), they observed the figure
and developed the conjecture: “If ABCD is a square then H, K, L and M coincide”.
ICTMT 13 152 Lyon 3 - 6 July 2017

Even though the conjecture was based on the mere observation of a single figure, the fact that it was
a robust construction provided greater validity and reliability for the conjecture.
Figure 1. Constructing a robust square and observing a static drawing to conclude
Example 2 (P1). Another pair of students constructed a parallelogram using the Parallel Line tool,
then the angle bisectors of the angles and dragged A, B and D to form a square by visual adjustment
(Figure 2). Similarly to example 1, they did not know what the conclusion should be (type 2 infer-
ence), so they observed the figure and developed the following conjecture: “If ABCD is a square
then HKLM is also a square”.
However, in contrast to example 1, their conjecture was based on a single instance of a soft figure
obtained by visual adjustment, in which case the drawing was inaccurate, yielded a rectangle in-
stead of a square, and led to an incorrect conjecture.
Figure 2. Constructing a square and observing a static drawing to conclude
Example 3 (P1). One of the observed pairs of students dragged the vertices of the scalene polygon
ABCD to make it a trapezoid, based only on visual adjustment (Figure 3). As they did not know
what conclusion to expect (type 2 inference), they observed the figure and formulated the conjec-
ture: “If ABCD is a trapezoid then H, K, L and M coincide”.
The students observed in a single figure that H, K, L and M coincided and generalized the result to
the entire class of trapezoids ABCD without validating the conjecture in additional instances of the
figure. Thus they were not able to observe the different types of quadrilaterals HKLM obtained for
different types of trapezoid ABCD.
ICTMT 13 153 Lyon 3 - 6 July 2017

Figure 3. Constructing a trapezoid and observing a static drawing to conclude
Example 4 (P2). A pair of students investigated the premise, “ABC equilateral triangle”, by drawing
a scalene triangle ABC, constructing the perpendicular bisector of [AC], dragging B onto it to make
the triangle isosceles, displaying the measure of 𝐴𝐵��, and dragging B along the perpendicular
bisector until having 𝐴𝐵�� = 60º (Figure 4). Since the students were given the conclusion they are
supposed to reach, i.e. ABC separable (type 1 inference) they rejected the premise since in that
figure ABC was not separable.
Figure 4. Constructing an equilateral triangle and observing a static drawing to conclude
Strategy 2 – Forward Dynamic Observation (FDO)
This second strategy consisted in constructing a robust figure satisfying the presumed premise, then
dragging to search for the invariant properties and conclude the conjecture. If the invariants were
observed across dragging, the conclusion is identified and a conjecture is developed (examples 5
and 6); if not then the premise is rejected based on a multitude of counterexamples (examples 7 and
8). To use this strategy, the construction is required to be robust in order to hold under dragging.
Example 5 (P2). A pair of students wanted to explore if the triangle ABC is separable when it is
right at C. They built a robust figure that satisfied their premise (i.e. ABC right) using perpendicular
lines (CA) and (CB) (Figure 5). They dragged the independent points to identify invariant proper-
ties across dragging (i.e. two equal sides for each of the triangles CPA and CPB) which was their
conclusion.
Figure 5. Constructing a robust right triangle and dragging to identify invariants
ICTMT 13 154 Lyon 3 - 6 July 2017

Example 6 (P1). One pair of students chose to investigate the premise “If ABCD is a parallelogram”
to determine its conclusion. They constructed a robust parallelogram using parallel lines (Figure 6).
They dragged A, B and D and identified the invariant properties of HKLM and deduced that it is a
rectangle. They formulated the conjecture: “If ABCD is a parallelogram then HKLM is a rectan-
gle”.
Figure 6. Constructing a robust parallelogram and dragging to identify invariants
Example 7 (P1). One of the observed pairs of students, attempted to investigate the premise: “If
ABCD is a trapezoid”. They constructed a robust trapezoid using the Parallel Line tool. They
dragged the vertices of ABCD (Figure 7) but were not able to identify any invariant property for
HKLM through dragging. Thus the case of the trapezoid was rejected.
Figure 7. Constructing a robust trapezoid and dragging to identify invariants
Example 8 (P2). A pair of students wanted to explore if the triangle ABC is separable when it is
isosceles. So they built a robust figure that satisfied their premise (i.e. ABC isosceles) by placing a
point F on the perpendicular bisector of a segment [DE] and formed a robust isosceles triangle (Fig-
ure 8). They dragged the independent point D to identify invariants of the conclusion i.e. two equal
sides for each of the triangles DGF and GFE. Given that the conclusion could not be met, the prem-
ise was rejected.
Figure 8. Constructing a robust isosceles triangle and dragging to identify invariants
Strategy 3 – Backward Static Observation (BSO)
This third strategy consisted of incorporating the conclusion of the desired conjecture in the figure
and observing that single static instance of the figure to discover the corresponding premise. Stu-
dents’ assumption is that, if they are able to incorporate the properties of the conclusion into the
ICTMT 13 155 Lyon 3 - 6 July 2017

construction, the drawing should reveal the premise for which they are looking. If it is not possible
to incorporate the properties of the conclusion in the construction, the premise should be rejected.
In problem 2, although the conclusion is given by the problem, it can be further developed into sub-
conclusions; CPA and CPB can be considered simultaneously isosceles at different vertices. Stu-
dents have actually attempted testing different sub-conclusions.
Example 9 (P2). A pair of students satisfied the conclusion of the conjecture in their figure by mak-
ing ABC separable (APC and PCB isosceles at P and C respectively). To do so, they sketched a sca-
lene triangle ABC, constructed the perpendicular bisectors of [AC] and [BP], and then dragged the
vertices of ABC to bring P and C simultaneously onto the respective perpendicular bisectors (Figure
9). They were able to observe in the figure that the conclusion (i.e. APC and PCB isosceles at P and
C respectively) is satisfied when ABC is a right triangle, thus completing their conjecture. We note
that, in this case, PCB is equilateral, but students were not aware of this fact.
Figure 9. Satisfying the conclusion “ABC separable” and identifying the premise “ABC right triangle”
Example 10 (P1). After developing the conjectures “If ABCD is a square then H, K, L, and M coin-
cide” and “If ABCD is a rhombus then H, K, L, and M coincide”, one pair of students attempted to
investigate under which condition (in general) do the points H, K, L and M coincide. They dragged
the vertices of ABCD to form a new quadrilateral ABCD where H, K, L and M coincided; that is
they satisfied the conclusion “H, K, L and M coincide” in the figure. They formed a kite shape
(Figure 10). However, they were not able to identify its nature and thus were not able to develop a
general conjecture on the nature of ABCD for which H, K, L and M coincide.
Figure 10. Satisfying the conclusion “H, K, L and M coincide”
Example 11 (P2). One pair of students thought about investigating whether there is a specific prem-
ise, i.e. nature of ABC, which satisfies the conclusion “ABC separable at C”, that is CA = CP and
CP = CB. They constructed AC = 5; CB = 5 and connected A and B. Then they constructed CP = 5
and tried to drag P onto [AB] but were not able to do so (Figure 11). Thus they concluded that it is
an impossible case.
ICTMT 13 156 Lyon 3 - 6 July 2017

Figure 11. Satisfying the conclusion “ABC separable at C” to identify the premise
CONCLUSION
The analysis of students’ work provided in the study allowed us to identify three strategies (Figure
12) for the elaboration of conjectures based on the way students move from exploring the different
instances of the figure to identifying relational properties of the figure and thus developing conjec-
tures. In the first two strategies the students work on satisfying the premise in the figure and identi-
fying the conclusion by observing the static figure at hand (strategy 1 - FSO) or by dragging a ro-
bust figure to validate the conclusion across different instances (strategy 2 - FDO). Conversely, stu-
dents can also work on satisfying the conclusion in a soft figure and observing it, without any ma-
nipulations, to deduce the premise that corresponds (strategy 3 - BSO).
Figure 12. Reasoning strategies for conjecture elaboration
The weakness of FSO is caused by the elaboration of the conjecture based on a single instance of
each case; students are only observing the figure they constructed and formulating the conjecture
based on that single instance of the figure which, in many cases, happened to have additional prop-
erties leading to a misguided conclusion.
In FDO, the use of robust constructions and dragging tool lead to the creation of a powerful instru-
ment for conjecture generation since the use of robust constructions results in valid drawings, which
eliminates ambiguous results. Also, when dragging robust constructions, the premise can be verified
in a multitude of figures. Thus the elaboration of a conjecture or the rejection of the premise is
based on a multitude of instances of the same case.
Reasoning strategies for conjecture
elaboration
Strategy 1
Forward Static Observation (FSO)
Type 1 inference
visual verification
(conclusion known)
Type 2 inference
visual speculation
(conclusion not known)
Strategy 2
Forward Dynamic Observation (FDO)
Strategy 3
Backward Static Observation (BSO)
ICTMT 13 157 Lyon 3 - 6 July 2017

In contrast to the first and second strategy, in BSO the students work their way backwards from
conclusion to premise, which is not always an easy task. Most students preferred strategies 1 and 2,
that is testing different premises to find the one that satisfied the conclusion instead of incorporating
the conclusion into the construction and letting the figure reveal the premise i.e. strategy 3. Howev-
er, based on a single instance of the figure, students may consider a certain observed property to be
the premise, when in fact it is not. The premise has to be induced from invariants across dragging.
The identification of these three strategies induces thinking about a fourth possible strategy that was
not observed in the participating students’ work but that we can see as a possible one. When work-
ing from premise to conclusion, students used both soft (FSO) and robust (strategy 2) constructions.
However, when working from conclusion to premise, only soft constructions were used (strategy 3).
Therefore, we develop this potential fourth strategy in order to hypothetically describe the work
from conclusion to premise using a robust construction. The strategy would be named “Backward
Dynamic Observation (BDO)” and would consist in satisfying the conclusion by construction and
dragging to deduce the premise that led to the desired conclusion. The use of robust constructions is
required to ensure the validity of the figure and allow the elaboration of the conjecture based on a
multitude of instances of the same case through the use of dragging. More research with a larger
sample of students is needed to validate the fourth potential strategy.
REFERENCES
Arzarello, F., Olivero, F., Paola, D., & Robutti, O. (2002). A cognitive analysis of dragging practices in
Cabri environments. ZDM, 34, 66-72.
Hölzl, R. (2001). Using dynamic geometry software to add contrast to geometric situations–a case study.
International Journal of Computers for Mathematical Learning, 6, 63-86.
Jones, K. (1998). Deductive and intuitive approaches to solving geometrical problems. In C. Mammana, &
V. Villani, Perspectives on the Teaching of Geometry for the 21st century (pp. 78-83). Dordrecht: Kluwer
Academid Publishers.
Laborde, C. (2005). Robust and soft constructions: two sides of the use of dynamic geometry environments.
In H.-C. L.-C. Sung-Chi Chu, Proceedings of the Tenth Asian Technology Conference in Mathematics
(pp. 22-35). South Korea: Advanced Technology Council in Mathematics, Incorporated.
Laborde, C., & Laborde, J. M. (2011). Interactivity in dynamic mathematics environments: What Does
that Mean? Retrieved from ATCM:
http://atcm.mathandtech.org/ep2011/invited_papers/3272011_19113.pdf
Laborde, C., & Sträßer, R. (2010). Place and use of new technology in the teaching of mathematics: ICMI
activities in the past 25 years. ZDM, 42, 121-133.
Leung, A., Baccaglini-Frank, A., & Mariotti, M. (2013). Discernment of invariants in dynamic geometry
environments. Educational Studies in Mathematics, 84, 439-460.
Mariotti, M. A. (2014). Transforming images in a DGS: The semiotic potential of the dragging tool for intro-
ducing the notion of conditional statement. In S. Rezat, M. Hattermann, & A. Peter-Koop, Transfor-
mation - A Fundamental Idea of Mathematics Education (S. 155-172). NY: Springer.
Olivero, F. (2002) The proving process within a dynamic geometry environment. Doctoral dissertation. UK:
University of Bristol.
Sinclair, N., & Robutti, O. (2012). Technology and the Role of Proof: The Case of Dynamic Geometry. In
M. K.-K. Clements, Third international handbook of mathematics education (S. 571-596). New York:
Springer.
ICTMT 13 158 Lyon 3 - 6 July 2017

ALGEBRA STRUCTURE SENSE IN A WEB ENVIRONMENT: DESIGN AND
TESTING OF THE EXPRESSION MACHINE
Valentina Muñoz-Porras and Teresa Rojano
Center of Research and Advanced Studies (Cinvestav) Mexico
[email protected] ; [email protected]
The article reports on outcomes from a study that aims to investigate the role of affordances, level-up and feedback in the web environment Expression Machine in developing the algebra structuresense of tertiary education students. Algebraic substitution is the main procedure involved in theway the software works. Its design and testing methodology are based on the Human - ComputerInteraction aspect of Activity Theory. From this approach, the study redefines the notion of algebrastructure sense formulated in previous works. Results from the experimental sessions show thatsome features of the environment favor the development of sutudents structure sense, specificallywhen they deal with substitution and factorization tasks. At the same time, it was possible to identifyaspects to be improved, for instance, adding categories of tasks with increasing structuralcomplexity and less visually salient, which may require a greater cognitive demand from students.
Keywords: Algebra structure sense, web environment, human-computer interaction, activity theory.
INTRODUCTION
Once they have overcome the difficulties of learning the rules of syntax, as well as those forunderstanding the semantics of symbols and the conventions of algebraic notation, students intertiary education face the challenge of recognizing the basic structures of algebraic expressions incomplex transformational algebra tasks. Hoch & Dreyfus call this recognition ability ‘algebrastructure sense’ and they define it as a set of abilities that involve: 1) recognizing a familiar structurein its simplest form; 2) dealing with a compound term as an entity and, by performing theappropriate substitutions, recognizing a familiar structure within a more complex form; and 3)choosing appropriate manipulations for a better use of structure (Hoch & Dreyfus, 2007, pg. 436).
As of the above definition, these authors designed activities to be used during teaching interviewswith 11th grade students. A pre-post test scheme and an analysis of the interview protocols revealedthat the students made progress regarding the development of structure sense in specific cases, suchas applying the rule a2 – b2 = (a + b) (a - b) in compound expressions such as (x + 8)2 – (x - 7)2 or x2
– (x + 1)4. However, the results also showed that students found factoring variants like (x + 3)4 – (x– 3)4 extremely challenging, despite their having the support of the researcher. This shows that theresearch area is emerging, especially when investigating how to teach structure sense. Formulationof the project ‘Developing structure sense with digital applications’ was largely inspired by the workof Hock and Dreyfus. This project intends to deepen the research of the learning and teaching of thestructural aspects of symbolic algebra within technology environments. The study reported here wasundertaken in the framework of this project and its main goal is to investigate the role ofaffordances, level-up and feedback [1] in the virtual environment Expression Machine in developingthe algebra structure sense of tertiary education students. This article briefly describes the designfeatures of the Expression Machine and reports its testing results, specifically with tasks that involvealgebraic substitution and factorization [2].
ICTMT 13 159 Lyon 3 - 6 July 2017

BACKGROUND
Structure Sense
Prior to the work of Hock & Dreyfus, the topic of structure sense in algebra was studied by A.Arcavi, who tried to characterize symbol sense by extrapolating part of the information fromnumber sense. The latter is conceived as ‘a non-algorithmic sense of numbers’, based primarily onan understanding of its nature and the nature of its operations, as well as the need to examine thegood sense of its results and related effects. The author establishes parallels with this conception byreferring to symbol sense as the complementary relationship between algebraic manipulation and‘seeing through’ algebraic expressions (i.e seeing the unseen, Arcavi, 1994).
On the one hand, in 2004 D. Kirschner found that students spontaneously respond to the visualpatterns of algebraic expressions (visual salience) independently of the declarative rules, whichsuggests that typical errors like a + x / b + x = a/b reflect the predominance of visual aspects overthe declarative knowledge of algebraic rules. According to this author, the receptive disposition ofstudents to the visual structure of rules, independently of their intellectual commitment to thedeclarative content, is at odds with the habitual cognitive presumption that human intellectualabilities rely on the acquisition or development of algorithms and well structured rules (Kirshner,2004, pg. 4). From this, Kirshner concludes that absent an understanding of the structuralfundamentals, what students register is something about the visual shape of correct and incorrectapplications, and that eventually, with persistence, the visual pattern recognition processes becomesufficiently refined that they may restrict incorrect applications (2004, pg.42).
On the other hand, Sfard and Linchevski (1994) have documented the persistence of students toremain within the procedural aspects of algebra. That is, students tend to interpret algebraicexpressions as calculation processes, and after repeatedly applying a procedure (or algorithm), theysee them as objects, something upon which to reflect. They call this phenomenon reification. Fromthis perspective, according to these authors, algebraic expressions have a dual process/object nature.
In very different ways, the studies of Hock & Dreyfus, Arcavi, Sfard & Linchevski, and Kirshnerstate that independently of what is meant by the nature of structure sense, implementing it in symbolmanipulation tasks is enormously complex. Furthermore, the conclusions reached by these authorssuggest that teaching structure sense is extremely challenging. The research shown in this paperintends to face this challenge by using the potential of technological resources for the learning ofmathematics.
Algebra Learning with Technology
There is currently a broad repertoire of technological tools that can be used to teach algebra atvarious school levels, most notably; Computer Algebra Systems (CAS), Spreadsheets, Aplusix andthe widely used Geogebra, which combines several mathematical representations (graphical,algebraic and geometric). In most cases, learning activities are focused on topics of functions,equations and graphs, as well as the use of CAS to verify the results of solving equations orperforming algebraic expression transformations by hand (for instance, simplifying or developingexpressions). The literature reporting results of research undertaken using these tools for teachingand learning algebra is significant and provides evidence of their great didactic potential. However,the literature on the use of software designed for teaching specific topics is less abundant. Some
ICTMT 13 160 Lyon 3 - 6 July 2017

examples of these types of environments are: eXpresser, especially designed to foster generalizationprocesses in algebra (https://migenproject.wordpress.com/using-migen/); Virtual Balance, used toteach the solving of linear equations (Rojano & Martínez, 2009); and the program DragonBox(www.dragonbox.com) which has the features of serious games [3], developed around entertainmentin solving algebraic tasks and integrating these activities in the game.
STRUCTURE SENSE AND THE EXPRESSION MACHINE
To undertake the study reported here, the web environment Expression Machine (EM) wasdesigned. EM is an ad-hoc tool for developing structure sense among tertiary education students,inspired by serious games and touch applications, with virtually no instrumentation time (trainingtime at the use of the artifact level). The guiding resarch questions are:
1. Is it possible to guide students, through affordances and feedback, towards actions that allowthem to perform tasks fostering development of an algebra structure sense?
2. Specifically, what features of affordances and feedback in a virtual environment foster studentsdeveloping a structure sense for algebraic substitution and factoring expressions?
Theoretical Elements
Regarding the notion of structure sense underlying the design of EM, the principle of algebraicsubstitution is the main consideration, which allows for equivalent symbols to be usedinterchangeably, so one may be used instead of the other in an algebraic expression; a variable maybe replaced by an expression and vice versa (Freudenthal, 1983, pg.483). In terms of the way that astructure sense may be acquired or developed, we resort to the idea, on the one hand, that meaningsarise during usage and activity in practices that are shared socially within a community (the secondWittgenstein, 1988); and on the other hand, the idea that meanings are associated with training,following rules and seeing how (Huemer 2006).
EM software design and testing methodology are based on the Human - Computer Interaction (HCI)aspect of Activity Theory, with special emphasis on the notion of affordances or preconditions foraction.
In the Activity Theory (AT), activity in general -not just human activity- but rather the activity ofany subject, is understood as an intentional interaction of the subject with the world –a process inwhich mutual transformations take place between the “subject-object” poles. In this theory, thesubject-object relationship is a starting point and it is interpreted as a non-direct relationship, that isto say, that it is mediated by language and artifacts, and as a non-symmetrical relationship becausein it the subject holds the initiative and command.
In the field of HCI and of designing digital artifacts, the foregoing is translated into having therelationship between two components of a large scale system be asymmetrical, given that theinteraction is begun and undertaken by the subject so as to cover its needs (Kaptelinin & Nardi,2006, pg. 30). As such, an activity consists of a person or several persons doing something towardattainment of some end. In the field of learning, according to Knutti (1996), an activity is a way ofdoing that is oriented towards an objective, and learning is strongly linked to the doing and thesocial system in which the doing takes place. From this perspective, technologies are not a means bywhich knowledge is transmitted to a user, rather a tool that provides structure and mediates learning
ICTMT 13 161 Lyon 3 - 6 July 2017

through activity (DeVane & Squire, 2012, pg. 242).
The AT envisages learning technologies not as ‘teaching machines’, but rather as ‘a support systemfor learning by doing’. Learning is not only accomplished through observation, but also by ‘doing’,and learning technologies serve to support and structure those tasks (Knutti, 1996, pg. 26).
Taking this approach, the study redefines algebra structure sense in terms of actions, as follows: Astudent demonstrates having algebra structure sense if, in order to solve an algebraic manipulationtask efficiently, the student performs a combination of the following actions: a) Recognition ofstructures (for instance, recognizes notable products); b) See-how, that is, switching betweenvarious forms of an expression, to take advantage of the structures (learn to see sub-expressions asan object or entity); c) Substitution (whether internal or explicit); and d) Timely application ofknown algebraic identities.
Characteristics of Expression Machine
EM is a web application that was developed for users to learn, through experimentation andpractice, the rules that the machine uses to generate tasks and, in time, acquire an algebra structuresense, in terms of actions a) to d). It incorporates school algebra rules such as algebraic substitutionand equivalence of expressions. The interactive sequence was designed as of a scheme where theelements of the machine are the input (two expressions IE1 and IE2), process (a generatingexpression GE) and output (a resulting expression OE after substituting IE1 and IE2 in GE) (seeFigure 1a).
a) b)
Figure 1. a) Expression Machine b) Main screen
In all cases, the expression machine generates an output expression upon substituting the inputexpressions in the generating expression. For instance, if the input expressions are 9x and 6y, and ifthe generating expression is 6(a+b), then the machine will output 6(9x+6y) as it substitutes a with9x and b with 6y. The activities proposed with this machine are of three types, which can beaccessed through the main screen (see Figure 1b). These activities are:
1. Conjecture input expressions. Given an output and a generating expression, students mustdescribe two input expressions that would produce such output expression.
2. Predict the output expression. Given the input expressions and a generating expression,students must describe the output expression the machine would produce. Students are asked towrite down the expression they believe the machine will produce. They may then process theexpressions and get the machine to produce an output expression. With this activity, in additionto practicing algebraic substitution, students may strengthen their knowledge on equivalentexpressions, as the machine may give an equivalent expression that is syntactically different
ICTMT 13 162 Lyon 3 - 6 July 2017

from their prediction. Feedback from the machine will clarify that the expression they input iscorrect and equivalent to that given by the machine.
3. Conjecture generating expressions. Given input and output expressions, students mustconjecture a generating expression that will make the machine produce the given outputexpression. They may key in the generating expression into the machine to prove that it reallyworks.
In most of the cases, interaction with EM requires intensive algebraic manipulations to beperformed by hand (Muñoz & Rojano, 2014).
EXPERIMENTAL WORK WITH EM
The EM was tested with a group of 35 tertiary level students in a Mexico City public school. A pre-post test scheme (based on the questionnaires of Hoch and Dreyfus) was applied to assessparticipants’ mastery of symbolic manipulation and their structure sense level. Participants had aperiod of interaction with the EM between tests. 16/35 of the students correctly solved 15 or moreof the 32 items in the pre-test, and seven of the students took part in the experimental in-personsessions (with the participation of the researcher to briefly explain operation of the EM). In that 1.5-hour session, the students worked intensively on the three types of EM activities (‘find the output’,‘find the input’, and ‘find the generating expression’, see Figure 1b) and they worked throughdifferent levels of complexity in terms of the algebraic expressions involved. ‘The doing’ of thestudents included paper and pencil algebraic manipulations to solve the three types of EM activities.Their actions were recorded during this experimental period, and the method described in Bødker(1995) was used to analyze recordings that detected focus shifts and breakdowns [4].
After the in-person experimental session, they were given the URL of the EM web application forthem to use it freely at home over the course of one week. The post-test was applied at the end ofthat week of home use. In summary, two types of data were collected, as follows: 1) data collectedwith application of the pre and post-tests, where the written algebraic productions of students wereanalyzed; and 2) the material entailed in the video-tape of the interactive experimental (in person)session with the EM, together with the respective paper and pencil productions of the students,which show the algebra manipulations that they undertook in order to solve the EM exercises (seeFigure 2).
Figure 2. Types of collected data
ICTMT 13 163 Lyon 3 - 6 July 2017

Pre – Post Test Results
As a group, students improved significantly between the pre and the post test in both items ofalgebraic manipulation, and in items related to structure sense (according to the re-definition ofstructure sense formulated in this study in terms of actions a)-d)). One performance of particularmerit was noted (Bedani), as it showed algebraic skills that surpassed those of the rest of the group.In order to illustrate this progress, two extracts taken from the productions of Edwin in the pre andpost tests are presented.
In problem 9 (Figure 3) Edwin shows a good level of algebraic manipulation in the pre-test but failsto recognize 5-x as an entity. However, he correctly factorizes 7-y in the post-test in order to obtain aproduct of two binomials, and quickly solves the problem. In the latter case, actions a) and b)become evident. Similarly, in problem 12 of the pre-test, Edwin applies several rules and even triesto assign values to the variables but fails to solve the problem. In contrast, during the post-test, heidentifies the product xy as a single entity and makes an explicit substitution in order to find thesolution using the general formula (see Figure 4). Here Edwin performs actions such as thosedescribed in b) and c).
It is noteworthy that the substitution technique was not explicitly taught to the students in any of theactivities of their experimental session with the EM: Nevertheless, this technique is included in EM(that is, substitution is the process used by the machine).
Figure 3. Problem 9, (Edwin pre-test/Edwin post-test)
ICTMT 13 164 Lyon 3 - 6 July 2017

Figure 4 Problem 12 Edwin. (Edwin pre-test/Edwin post-test)
Results from the Interactive Experimental Session with the EM
The experimental session with the EM lasted for approximately 90 minutes and 4 groups of datacorresponding to 3 activities were gathered: 2 answer sheets on the functioning of the machine priorto using it (activity 1), and 10 minutes using the machine (activity 2); video recording of on-screeninteractions (activities 2 and 3); and audio clip of the group solving exercises with the EM.
Activity 1: Consisted of projecting the EM on a screen and asking: What do you think the machine isdoing? and, how does it work? Three students mention substitution in their answers, although insome cases implicitly. David, Jenifer and Bedani use the verbs elaborate, substitute and assignrespectively. Only Bedani answered the question about how the machine works and she did socorrectly. Activity 2: The EM is designed to not require a manual in order to learn how to use it.Instrumentation is achieved through affordances, feedback and progressively encountering levels.Therefore, the second activity consisted of a 10-minute-long free exploration. Here it was observedthat, in less than 10 minutes, not only did the students learn to use the machine, but they alsoobtained a fairly accurate idea of its functioning. On average, it took 1 minute and 44 seconds tocorrectly solve the first exercise. Activity 3: 40 minutes of free exploration of the EM. The analysiswas centered around the breakdowns of student interactions with the machine. Three types ofbreakdowns were identified: one was associated with the process/object duality and the other twowere associated with feedback.
Exercise 3/22 of the Find Input (FI) scene is analyzed below. Although this exercise is simple, it’schallenge lies in the generating expression being a sum and the output expression being a product,that is, they don’t have the same structure. This implies that a solution requires for the product xy(output expression) to be considered as a single entity. While six of the seven students attempted asolution, only three of them managed to identify the product xy as a single entity on the first try, twodid so after several attempts, and one was trapped in an operational or procedural conception.
Fabiola’s case illustrates a quick transition to identifying the expression as an object. She failed tosolve exercise 3/22 on the first try, probably because she didn’t see xy as a single entity (Figure 5a)and then she abandons the problem. At 17:53 however, she returns; writing down something atminute 19 (Figure 5b). Upon isolating the variables, she clearly parses xy as a process and not as an
ICTMT 13 165 Lyon 3 - 6 July 2017
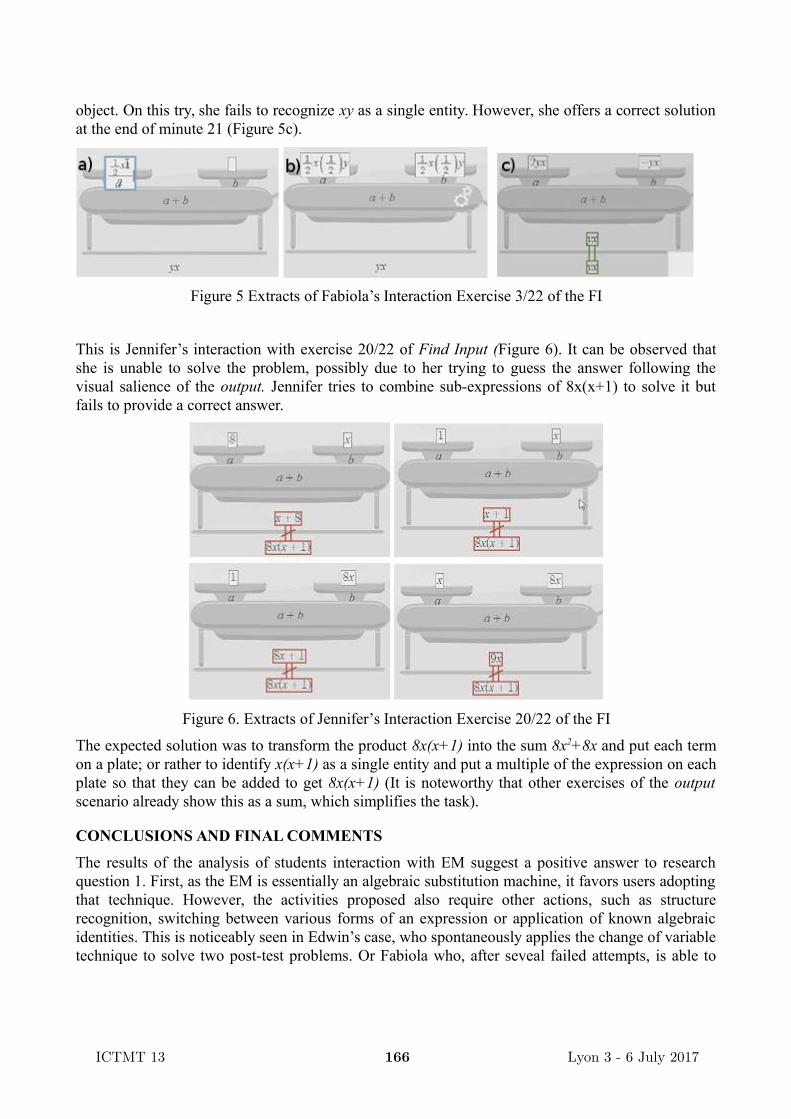
object. On this try, she fails to recognize xy as a single entity. However, she offers a correct solutionat the end of minute 21 (Figure 5c).
Figure 5 Extracts of Fabiola’s Interaction Exercise 3/22 of the FI
This is Jennifer’s interaction with exercise 20/22 of Find Input (Figure 6). It can be observed thatshe is unable to solve the problem, possibly due to her trying to guess the answer following thevisual salience of the output. Jennifer tries to combine sub-expressions of 8x(x+1) to solve it butfails to provide a correct answer.
Figure 6. Extracts of Jennifer’s Interaction Exercise 20/22 of the FI
The expected solution was to transform the product 8x(x+1) into the sum 8x2+8x and put each termon a plate; or rather to identify x(x+1) as a single entity and put a multiple of the expression on eachplate so that they can be added to get 8x(x+1) (It is noteworthy that other exercises of the outputscenario already show this as a sum, which simplifies the task).
CONCLUSIONS AND FINAL COMMENTS
The results of the analysis of students interaction with EM suggest a positive answer to researchquestion 1. First, as the EM is essentially an algebraic substitution machine, it favors users adoptingthat technique. However, the activities proposed also require other actions, such as structurerecognition, switching between various forms of an expression or application of known algebraicidentities. This is noticeably seen in Edwin’s case, who spontaneously applies the change of variabletechnique to solve two post-test problems. Or Fabiola who, after seveal failed attempts, is able to
ICTMT 13 166 Lyon 3 - 6 July 2017

see product xy as an entity and correctly solves the problem. In this sense, and given that thestudents showed improvement in their structure sense as a group, we can say that the EM facilitatesand fosters development of algebra structure sense, where the latter is conceived in terms of actionsa)-d).
Regarding research question 2, the HCI aspect of Activity Theory suggests that minimalist design,affordances, feedback and level-up (task design by levels of complexity) had a positive usabilityeffect on students. This is evidenced and confirmed by the nearly null instrumentation periodrequired. In addition, students continued to explore and solve the exercises without interventionfrom the teacher or researcher.
Level-up is one of the distinctive features of EM, and the results of this research suggest that tasksinvolving a greater level of difficulty and complexity should be included in the future, in order totrigger stress and breakdowns (Bodker) and in turn expand students’ learning experience.
The experimental work showed that visual salience often causes students to solve the tasks quickly,without carrying out a structural analysis of the algebraic expression (an analysis based ondeclarative rules, according to Kirshner). This motivates the inclusion (in a future EM version) ofless visually salient levels that require greater cognitive demand from students.
Notes
1. The term affordances is used in the sense of Norman (2002), that is to say as suggestions or invitations (of the
artifact) for usage possibilities. The broad and general meaning of feedback is adopted as ‘information provided by
an agent (e.g., teacher, peer, book, parent, self, experience) regarding aspects of one’s performance or
understanding’ (Hattie & Timperley, 2007, pg. 81). In the particular case of technology learning environments, the
agent is the computer program, which provides feedback to the learner’s performance based on its ability to
interact with the latter.
2. The design and development of EM was funded by Conacyt – Mexico (V. Munoz-Porras doctoral dissertation,
2015). We want to thank students and authorities of CCH Vallejo school for the facilities to carry out the
experimental work of the study.
3. A serious game is a game designed with a purpose other than pure entertainment. Its design explicitly emphasizes
the added pedagogical value of fun and competition (Wikipedia, consulted on February 22, 2017,
https://en.wikipedia.org/wiki/Serious_game).
4. Bødker (1996, pg. 6) uses the term breakdown when the learning activity is interrupted because something did not
happen as it was expected to (for example, if a button is pressed, but nothing happens). That same author uses the
term focus shift when interruption of the activity is more deliberate and does not necessarily happen due to a
system failure, for instance when the teacher wants to explain something in particular about the operation of an
artifact. A breakdown is the perception of a discrepancy between our expectations and what actually happens in the
world. A breakdown causes a focus shift from the object of the activity mediated by the artifact to the artifact itself.
REFERENCES
Arcavi, A. (1994). Symbol sense: Informal sense-making in formal mathematics. For the Learningof Mathematics 14 (3), pg. 42-47.
Bødker, S. (1995). Context and Consciousness. En B. A. Nardi (ed.), (pgs. 147-174). MassachusettsInstitute of Technology. (ISBN: 0-262-14058-6.)
ICTMT 13 167 Lyon 3 - 6 July 2017

DeVane, B., & Squire, K. D. (2012). 10 Activity Theory in the Learning Technologies. Theoreticalfoundations of learning environments.
Freudenthal, H. (1983). Didactical Phenomenology of Mathematical Structures. Dordrecht: Kluwer- Reidel.
Hoch, M. & Dreyfus, T. (2007). Recognising an algebraic structure. in D. P. Pantazi & G. Philippou(ed.), Proceedings of the Fifth Congress of the European Society for Research inMathematics Education (pgs. 436-445).
Hattie, J. & Timperly, H. (2007). The power of feedback. Rev. Educ. Res., 77, 81-112.Huemer, W. (2006). The Transition from Causes to Norms: Wittgenstein on Training. In M. Kober
(ed.), (pgs. 205-225). Rodopi.Kaptelinin, V. & Nardi, B. A. (2006). Acting with technology: activity theory and interaction
design. The MIT Press.Kirshner, D. (2004). Visual salience of algebraic transformations. Journal for Research in
Mathematics Education, 35 (4), 224–257.Kuutti, K. (1996). Activity theory as a potential framework for human-computer interaction
research. Context and consciousness: Activity theory and human-computer interaction, 17--44.
Muñoz, V. (2015). Herramienta ad hoc para el sentido de la estructura en álgebra. Doctoral disser-tation, Centro de Investigación y de Estudios Avanzados (Cinvestav) IPN, Mexico.
Muñoz, V. & Rojano, T. (2014). Algebraic Expression Machine. A web ad hoc learning environmentfor developing structure sense. In G. Futchek & C. Kynigos (eds.) Proceedings of the 3rdInternational Constructionism Conference 2014 (pp 540-541). Ósterreichishe ComputerGesellschaft (OCG) (ISBN: 9783854033011).
Norman, D. (2002). The Design of Everyday Things. Basic Books.Rojano, T. & Martinez, M. (2009). From concrete modeling to algebraic syntax: learning to solve
linear equations with a virtual balance. En S. L. Swars, D. W. Stinson, y S. Lemons-Smith(Eds.), Proceedings of the 31st annual meeting of the North American Chapter of theInternational Group for the Psychology of Mathematics Education. Georgia State University:Atlanta, GA.
Sfard, A. & Linchevski, L. (1994). The gains and the pitfalls of reification - The case of algebra.Educational Studies in Mathematics 26 (2), 191-228.
Wittgenstein, L. (1988). Investigaciones Filosóficas. Mexico: Instituto de InvestigacionesFilosóficas UNAM.
ICTMT 13 168 Lyon 3 - 6 July 2017

CENTRAL AND PARALLEL PROJECTIONS OF REGULAR SURFACES:
GEOMETRIC CONSTRUCTIONS USING 3D MODELING SOFTWARE
Petra Surynková
Charles University in Prague, Faculty of Mathematics and Physics, Sokolovská 83, 186 75Praha 8, Czech Republic; [email protected]
The contribution addresses the constructions of central and parallel projections of regular surfaceswhich can be regarded as a subarea of descriptive geometry. My aim is to increase the interest ofstudents in classical and descriptive geometry primarily through 3D computer modeling. I havebeen seeking to establish a stronger connection between descriptive geometry and its practicalapplications and to extend descriptive geometry with knowledge of computer graphics andcomputer geometry. In order to provide insight into more complex geometric problems and toincrease the interest in geometry, I have integrated 3D computer modeling in my lectures andseminars. Geometry is a necessary component of many engineering processes such as thedevelopment of innovative graphics software or the design of complex industrial and architecturalstructures. My aim is to show that the principles and knowledge of classical and descriptivegeometry are the stepping stones for solving tasks in practice.
Keywords: central and parallel projections; regular surfaces; descriptive geometry; 3D computermodeling; computer geometry
MOTIVATION
I have been teaching classical geometry, descriptive geometry and computational geometry at theFaculty of Mathematics and Physics (Charles University) in the Czech Republic for several years. Ialso supervise bachelor and master theses on various geometric topics. The motivation for studyinggeometry can be found in many branches (building practice, engineering and construction practice,architectural and industrial design, production industries …) and geometry represents one of thehighly demanding fields of mathematical science which require logical thinking and which alsostrongly stimulates spatial imagination. The study of geometry represents an ongoing challenge interms of research and practice.
In this contribution I will focus on modern teaching methods of descriptive geometry and I will putthese methods in contrast to traditional hand sketching and drawing activities. Computer-aidededucation of geometry will be demonstrated on examples of central and parallel projections ofregular surfaces.
Descriptive geometry (Paré et al., 1996; Pottmann et al., 2007; Robertson, 1966) represents asubarea of classical geometry and deals with the representation of three-dimensional objects in twodimensions. The typical task in descriptive geometry is to represent three-dimensional objects on atwo-dimensional planar surface or to reconstruct three-dimensional objects from the two-dimensional image i.e. result of the projection. Descriptive geometry deals with thoserepresentations which are one-to-one correspondent. From a historical point of view, thedevelopment of descriptive geometry reached its greatest height in the last century. Nevertheless,even despite today’s innovative approaches and continuous development of modern computertechnology and equipment, descriptive geometry has not lost its importance. The role of descriptivegeometry in practice is irreplaceable in such branches in which correct visualization is crucial. To beable to project some three-dimensional object and get the two-dimensional result the construction
ICTMT 13 169 Lyon 3 - 6 July 2017

methods require good knowledge of the fundamental geometry, the properties of geometricalobjects in the plane and in the space, and their relations. This means that the study of descriptivegeometry represents the significant stepping stones for solving geometric tasks in real practice.
In my research, I investigate innovative methods of explaining complex concepts in teaching ofgeometry (specifically descriptive, classical, computational geometry) at Czech colleges and theirimpacts on students’ successes. The innovation in explanation and didactic methods include 3Dcomputer modeling and interactive software visualization. My aim is to stimulate the interest ofstudents in geometry, to increase their motivation, to improve their understanding of geometry, toimprove the methods of teaching geometry currently in use, to help students achieve better results inexaminations and to promote the practical use of geometry. I seek to make traditional topics fromclassical and descriptive geometry more attractive to students by updating the current methods ofteaching geometry. The new teaching methods are aimed at strengthening the connection betweenclassical geometry and the practical applications thereof on the one hand and extending classicaland descriptive geometry into computer graphics and computational geometry on the other. Theconnection between classical geometry and 3D computer modeling is intuitively understood bystudents.
In this contribution I will describe possible activities, examples of outputs from 3D modelingsoftware and the combination of descriptive and computational geometry. I will explain whatcomputer-aided education of geometry means in my lessons. I have been using described activitiesin university classroom practice for several years. The main research question within this article isto discuss either use 3D computer modeling software for creation of 3D models and animations orhand sketching and drawing activities within specific task in education of descriptive geometry orhow to combine them. The possibilities of 3D computer modeling in education of geometry will beshown and discussed.
I also find very important to clarify what is my aim for the future. I plan to deal with the followingexplorations and gather the results regarding computer-aided education in university classroom:
the evaluation of success rate of university students attending geometric courses in the lastfew years (before and after when the innovative methods were implemented),
questionnaire survey which was conducted among university students attending the coursesand lectures on geometric topics where computer aided education was realized,
my survey revealed that the modern type of computer-aided education was adopted verypositively among students and according to higher students’ interest in geometric topicswithin the research projects and qualification theses they seem to be more motivated,
using computers in education of geometry is an efficient aid because geometrical andmathematical software (GeoGebra, Rhinoceros, Mathematica, Maple,…) allow us to dealwith more complex task even in classroom practice,
proper functions and tools in geometrical software develop creativity and imagination ofstudents; on the other hand, the ability to use geometrical or mathematical software is notequal to the knowledge of geometry.
The evaluation of these surveys is a very complex and long-lasting task but first results show thatour efforts to improve geometry education are successful. Some results of my didactic survey havebeen already published, (Surynková, 2013, 2015).
ICTMT 13 170 Lyon 3 - 6 July 2017

In this article we will show the examples of using modeling and graphics software in teachinggeometry. Computer-aided education of descriptive geometry is demonstrated on typical tasks fromdescriptive geometry - the constructions of the two-dimensional results of central and parallelprojections.
The rest of the paper is organized as follows. In Section 3D modeling software versus traditionalteaching methods of descriptive geometry we introduce novel methods of using modern software ina classroom practice and remind the importance of traditional approaches including hand sketchingand drawing. In Section Parallel and central projections of regular surfaces we show examples ofgeometric tasks regarding these topics including students’ work. Discussion, summary, and futurework are given lastly.
3D MODELING SOFTWARE VERSUS TRADITIONAL TEACHING METHODS OFDESCRIPTIVE GEOMETRY
Geometry in general ranks among the demanding subjects in secondary schools and colleges. Onepossibility how to stimulate the interest of students in geometry is to show them that the challengesof this Information Age can be addressed by means of geometry. The practical applications ofgeometry include computer-aided architectural and industrial design. Geometry is essential to themanufacturing, engineering and construction industries; the digitization of real objects using 3Dscanning; digital surface reconstruction from point clouds; the replication of the shapes of real-world objects using 3D printing; computer graphics and many more, (Eilam, 2005; Foley et al.,1995; Hoschek and Lasser, 1993; Lipson et al., 2013; Sarkar, 2015). All these applications can becharacterized by combinations of geometric principles. The extension of descriptive geometry, andgeometry in general, into 3D computer modeling is a very promising approach how to increasestudent’s motivation and to improve the methods of teaching geometry currently in use.
There exist a wide range of professional graphics software and environments which provide therequired user input tools, and speed up production and are commonly used in the process ofdesigning, design documentation and construction for modeling and drawing (Farin et al., 2002).We can use similar software in teaching of descriptive geometry.
I have integrated 3D computer modeling in my descriptive geometry lessons and seminars and Iwork mainly with the Rhinoceros (NURBS Modeling for Windows) software which is a commercialNURBS-based 3D modeling tool, (McNeel, 1999), commonly used in the process of designing,design documentation and construction. It is not necessary to work only with Rhinoceros or withexpensive CAD applications. As there exist the number of inexpensive or free software applicationsfor geometry and mathematics, students and teachers can use them. One of the most widespread freegeometrical tools is mathematics and geometry dynamic software GeoGebra. The great advantageof GeoGebra is the possibility to change dynamically the parameters of the designed geometricalobjects.
I have been teaching descriptive geometry and related subjects for more than ten years and mypersonal experiences show that teaching and studying geometry must be accompanied by traditionalmethods i.e. hand sketching and drawing on the blackboard and on the sheets of paper. Drawing andsketching helps us to develop our precision skills and patience and we rely on these tools whendeveloping of our initial ideas and finding solutions to geometrical problems. In my lectures andseminars I combine the both approaches to the teaching of descriptive geometry - the traditionalgeometry teaching methods and procedures (sketching and drawing activities) and moderncomputer-aided education using digital modeling tools.
ICTMT 13 171 Lyon 3 - 6 July 2017
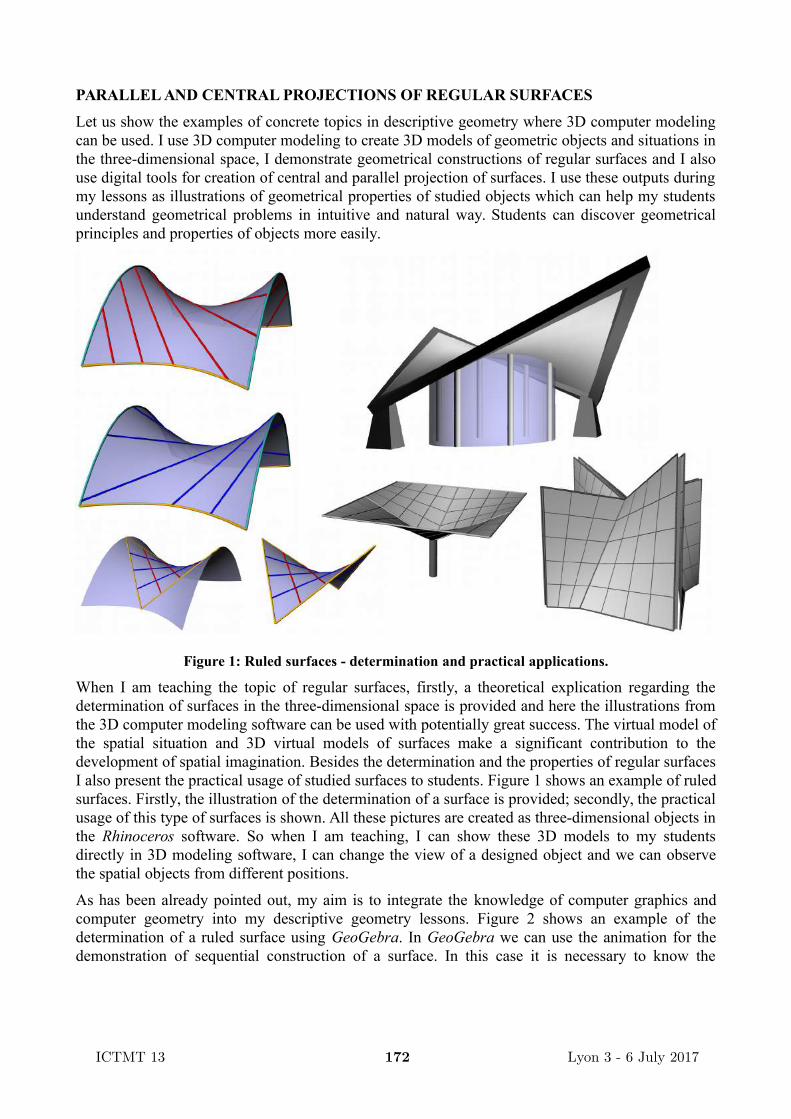
PARALLEL AND CENTRAL PROJECTIONS OF REGULAR SURFACES
Let us show the examples of concrete topics in descriptive geometry where 3D computer modelingcan be used. I use 3D computer modeling to create 3D models of geometric objects and situations inthe three-dimensional space, I demonstrate geometrical constructions of regular surfaces and I alsouse digital tools for creation of central and parallel projection of surfaces. I use these outputs duringmy lessons as illustrations of geometrical properties of studied objects which can help my studentsunderstand geometrical problems in intuitive and natural way. Students can discover geometricalprinciples and properties of objects more easily.
Figure 1: Ruled surfaces - determination and practical applications.
When I am teaching the topic of regular surfaces, firstly, a theoretical explication regarding thedetermination of surfaces in the three-dimensional space is provided and here the illustrations fromthe 3D computer modeling software can be used with potentially great success. The virtual model ofthe spatial situation and 3D virtual models of surfaces make a significant contribution to thedevelopment of spatial imagination. Besides the determination and the properties of regular surfacesI also present the practical usage of studied surfaces to students. Figure 1 shows an example of ruledsurfaces. Firstly, the illustration of the determination of a surface is provided; secondly, the practicalusage of this type of surfaces is shown. All these pictures are created as three-dimensional objects inthe Rhinoceros software. So when I am teaching, I can show these 3D models to my studentsdirectly in 3D modeling software, I can change the view of a designed object and we can observethe spatial objects from different positions.
As has been already pointed out, my aim is to integrate the knowledge of computer graphics andcomputer geometry into my descriptive geometry lessons. Figure 2 shows an example of thedetermination of a ruled surface using GeoGebra. In GeoGebra we can use the animation for thedemonstration of sequential construction of a surface. In this case it is necessary to know the
ICTMT 13 172 Lyon 3 - 6 July 2017

mathematical description of a studied surface. So creating all these illustrations does not mean only“drawing nice pictures”; we have to know how to describe a surface in software environment. Wecan for example use a parameterization or synthetic construction of studied surfaces.
Figure 2: Example of the determination of a ruled surface using GeoGebra.
The typical task in descriptive geometry is to construct central or parallel projection (a two-dimensional image) of a surface or of its parts. An example of projections of a ruled surface is givenin Figure 3. Firstly, the situation in the three-dimensional space is provided (i.e. 3D model),secondly two types of projections are shown - central and parallel projection of the same ruledsurface (i.e. planar images). If we want to project complicated 3D object in parallel or centralprojections from general view point (i.e. we do not consider now simple top or front view of anobject), we have to find a proper position in the three-dimensional space from which we can clearlyobserve this object. I use 3D modeling software for the determination this position and also for theautomatic construction of the two-dimensional result of the projection. This is very useful toolbecause it is very difficult to estimate the proper view point of a surface manually. We can also usethe determination of projection for testing purposes, i.e. the task for students is to construct the two-dimensional image of a surface in given projection from given inputs. Students can solve the tasksusing 3D modeling software or they can draw the solutions by hand. It means that in this stage theywork just in the plane. When using software, it is necessary to construct the silhouette of thesurface; if drawn by hand, the aim is to depict some of the important curves on the surface. In bothcases, the result is a planar image. An example of a geometric task is given in Figure 4, parallelprojection and the determination of a ruled surface are given and the task is to construct an image ofa surface (the result of the projection) and an intersection curve of a surface and a given cuttingplane. 3D model of the constructed surface is also presented.
1
2
0,17
1,
�
�
u
v
25 3 3811 16 11
( , ) 10 10
( , )
( , ) 5 5
x u v v
y u v u
z u v u v u u
ICTMT 13 173 Lyon 3 - 6 July 2017

Figure 3: Example of projections of a ruled surface. The situation in the three-dimensional space,central and parallel projection of the same ruled surface.
Figure 4: The determination of a parallel projection and a ruled surface. The result of the projection,an intersection curve of a surface and a given cutting plane, and 3D model of the spatial situation.
pa
k
n
kx
z
a
m
p
p
1a
y
x
n
k
y
z
a
m
p
p
1a
the central projection
the parallel projection3D model
x y
z
m
n
a
1a
x y
z
m
n
a
1a
ICTMT 13 174 Lyon 3 - 6 July 2017
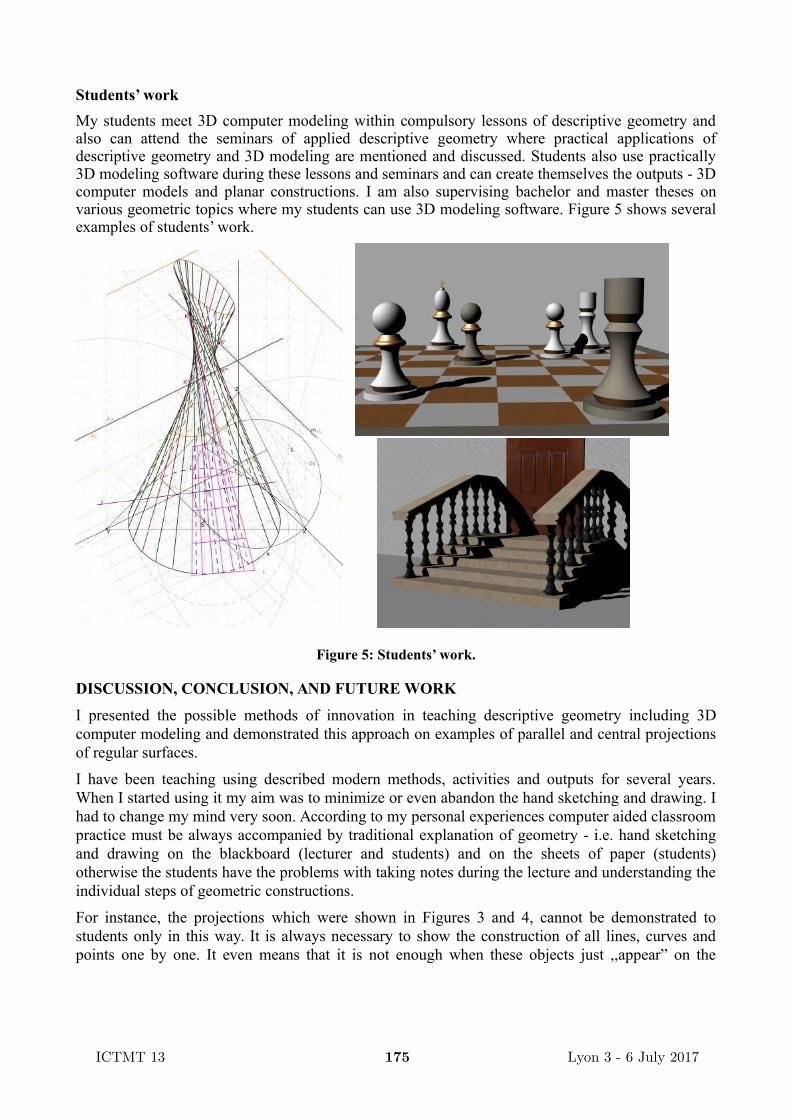
Students’ work
My students meet 3D computer modeling within compulsory lessons of descriptive geometry andalso can attend the seminars of applied descriptive geometry where practical applications ofdescriptive geometry and 3D modeling are mentioned and discussed. Students also use practically3D modeling software during these lessons and seminars and can create themselves the outputs - 3Dcomputer models and planar constructions. I am also supervising bachelor and master theses onvarious geometric topics where my students can use 3D modeling software. Figure 5 shows severalexamples of students’ work.
Figure 5: Students’ work.
DISCUSSION, CONCLUSION, AND FUTURE WORK
I presented the possible methods of innovation in teaching descriptive geometry including 3Dcomputer modeling and demonstrated this approach on examples of parallel and central projectionsof regular surfaces.
I have been teaching using described modern methods, activities and outputs for several years.When I started using it my aim was to minimize or even abandon the hand sketching and drawing. Ihad to change my mind very soon. According to my personal experiences computer aided classroompractice must be always accompanied by traditional explanation of geometry - i.e. hand sketchingand drawing on the blackboard (lecturer and students) and on the sheets of paper (students)otherwise the students have the problems with taking notes during the lecture and understanding theindividual steps of geometric constructions.
For instance, the projections which were shown in Figures 3 and 4, cannot be demonstrated tostudents only in this way. It is always necessary to show the construction of all lines, curves andpoints one by one. It even means that it is not enough when these objects just ,,appear” on the
ICTMT 13 175 Lyon 3 - 6 July 2017

screen one by one, students have to see the process of their drawings. In these situations is usuallybetter to draw the constructions by hand on the blackboard because students can easily follow theinstructor. The computer outputs can be shown at the same time.
3D computer modeling is an efficient aid for creating the animations as has been shown in Figure 2.These animations can be still accompanied with physical models on which we can demonstrate asequential construction of geometric objects. According to my experiences there will be alwaysstudents in a classroom who prefer more physical models which can touch by hand.
Regarding the future work I plan to focus on preparing a new textbook on descriptive geometry andto continue on the creation of study materials, 3D computer models, and another outputs fordescriptive geometry. Besides these plans I would like to deal with the didactic survey andexplorations which were introduced in this article, moreover to discuss following questions:
advantages and disadvantages of computer-aided education of geometry (in general ofmathematics),
computer-aided education support and develop students' skills for future occupation intechnical fields and branches,
students' hand sketching and drawing (the both - in the classroom and during homepreparation) is still necessary in currently digital era.
REFERENCES
Eilam, E. (2005). Reversing: Secrets of Reverse Engineering. Wiley.
Farin, G., Hoschek, J., Kim, M.-S. (2002). Handbook of Computer Aided Geometric Design. TheNetherlands: Elsevier Science.
Foley, J. D., Dam, A., Feiner, S. K., Hughes, J. F. (1995). Computer Graphics: principles andpractice. Addison-Wesley Publishing Company
Hoschek, J., Lasser, D. (1993). Fundamentals of Computer Aided Geometric Design. Secondedition, USA: A K Peters.
Lipson, H., Kurman, M. Fabricated (2013). The New World of 3D Printing. First edition, USA:John Wiley & Sons.
McNeel, R. (1999). Rhino NURBS 3D Modelling. New Riders.
Paré, E.G., Loving, R. O., Hill, I. L., Paré, R. C. (1996). Descriptive Geometry. Peachpit Press.
Pottmann, H., Asperl, A., Hofer, M. & Kilian A. (2007). Architectural Geometry. Exton, USA:Bentley Institute Press.
Robertson, R. G. (1966). Descriptive Geometry. Pitman Press.
Sarkar, J. (2015). Computer Aided Design: A conceptual Approach. First edition, USA: CRC Press.
Surynková, P. (2015). Reflections of Developments in Educational Techniques in the Design of aNew Textbook on Descriptive Geometry. Proceedings of the 12th International Conference onTechnology in Mathematics Teaching (ICTMT12), pp. 320-327, University of Algarve.
Surynková, P. (2013). Recent Advances in the Application of 3D Geometric Modeling Softwarewith Focus on Linear Perspective. Proceedings of the eleventh International Conference onTechnology in Mathematics Teaching (ICTMT11), pp. 336-337, University of Bari Aldo Moro.
ICTMT 13 176 Lyon 3 - 6 July 2017

SPATIAL–SEMIOTIC ANALYSIS OF AN EIGHTH GRADE STUDENT’S
USE OF 3D MODELLING SOFTWARE
Candas Uygan, Melih Turgut
Eskisehir Osmangazi University, Turkey; [email protected], [email protected]
The aim of this paper is to analyse the emergence of spatial–semiotic resources attached to aneighth-grade student’s use of 3D modelling software while solving certain spatial tasks. The datacomes from a task-based interview and it is analysed within a spatial-semiotic lens, includingdifferent kinds of resources not only based on the discourse, but also based on extra-linguisticexpressions such as that sketches and gestures. The results of the study show that generally thestudent’s reasoning steps explored a viewpoint for adding or removing cubes by use of the ‘orbit’and ‘select’ tools, using ready-made mental pictures derived from completed steps, linking 2D and3D representations through spatial visualisation and spatial orientation, emergence of spatialvocabulary including his strategies and generalizations.
Keywords: Spatial thinking, Spatial–Semiotic lens, 3D modelling software, Multimodal paradigm.
INTRODUCTION
The acts of thinking, constructing and expressing meaning through digital technologies are generallybeyond words, but they can also be interlaced with our gestures, mimics and sometimes withspecific sketches. Consequently, involvement of our sensory-motor functions’ productions in ourcommunication can be considered to be a multimodal process (Arzarello & Robutti, 2008).Following a multimodal paradigm, to interpret specific signs that emerge in communicating and/orexpressing meaning, semiotic perspectives have received robust attention from mathematicseducators (Arzarello, 2008; Godino, Batanero, & Font, 2007; Ng & Sinclair, 2013; Presmeg,Radford, Roth, & Kadunz, 2016).
Spatial thinking is a core concept in the teaching and learning of mathematics, which can be definedas an amalgam of different sub-skills in relation to geometric reasoning. Because of its importance,a number of epistemological analyses were conducted to elaborate and explain how individualsthink spatially when they commence a mathematical task, and specific spatial images (Presmeg,1986) and specific processes for 3D geometry and visualization (Bishop, 1983; Gutiérrez, 1996;Yakimanskaya, 1991) have been defined by researchers.
In this work, we acknowledge a combination of two paradigms, namely the synergy between thesemiotic perspective-multimodal paradigm and spatial thinking, and consider the following researchquestion: what kind of spatial–semiotic resources emerges when an eight-grade student solvesspatial tasks with a 3D modelling software?
CONCEPTUAL FRAMEWORK
In order to analyse classroom activities with a spatial–semiotic lens (S-SL), Turgut (2017) proposesa conceptual framework based on the hypothesis that thinking spatially in a 3D modelling softwareenvironment is also multimodal. S-SL combines three theoretical constructs (i) mental images(Presmeg, 1986), (ii) interpret figural information (IFI) and visual processing (VP) (Bishop, 1983),and (iii) Action, Production and Communication space and the notion of semiotic bundle (Arzarello,2008). These are used to look at the emergence of signs linked to spatial thinking. Following themultimodal paradigm, S-SL frames classroom productions that include specific signs, such aswords, gestures, sketches and acts and so on, which are attachments to students’, as well as the
ICTMT 13 177 Lyon 3 - 6 July 2017
teacher’s, spatial thinking processes. To do so, S-SL distinguishes spatial thinking as two majorprocesses; IFI and VP. IFI includes the emergence of spatial vocabulary and the interpretation ofvisual images, while VP includes the emergence of Concrete Images (CI), Kinaesthetic Images (KI)and Dynamic Images (DI). CI can be considered as pictures in the visual memory, whereas KI refersto physical movements, and DI covers conceiving and manipulating dynamic mental images(Presmeg, 1986; Turgut, 2017). Figure 1 summarizes the S-SL and its components.
Spatial Thinking
IFI VP
— Concrete Images — Kinaesthetic Images
— Dynamic Images
— Spatial Vocabulary — Reading and
Interpreting of Visual Images
Use of Tools and Functions of the Modelling Software Emergence of
Gestures, Words, Sketches, Clicks, …
Fig. 1: S-SL with its components (modified from Turgut, 2017, p. 183)
Within the context of the present paper, we identify two strategies under IFI; a spatial–analyticstrategy, meaning focusing on parts of the object, and a spatial–holistic strategy, which refersto comprehending and reasoning on the object as a whole. S-SL offers analysis on theemergence of signs through the notion of semiotic bundle (Arzarello, 2008), which constitutestwo different, but complementary analysis tools; a synchronic analysis and a diachronicanalysis. Synchronic analysis refers to ‘the relationships among different semiotic resourcessimultaneously activated by the subjects at a certain moment’, while a diachronic analysismeans the ‘evolution of signs activated by the subject in successive moments’ (Arzarello,Paola, Robutti, & Sabena, 2009, p. 100).
METHODOLOGY
A task-based interview was conducted with an eighth grader, Atakan (pseudonym), who has amoderate level performance in mathematics. He has a desktop computer in his home and, as aresult, he is competent in the use of basic computer tools. In order to research Atakan’s spatialreasoning process, we considered 3D modelling software SketchUp® (SU) as an artefact, which isoriginally designed for engineering and model building. It should be noted that Atakan hasexperience in the use of SU since, as a part of a larger study he carried out 3D geometry tasks withthe same software when he was in 7th grade.
In the context of acquisitions described in the Turkish middle school mathematics curriculum, weprepared two interrelated but different tasks. During the interview, we first proposed three (top,front and right) views of a building (Figure 2a, 2b, 2c) made up of unit cubes and asked Atakan toconstruct the building. This initial task included two main steps; (i) constructing the building usingconcrete unit cubes provided and (ii) using virtual cubes within SU that provides a zero-gravityenvironment with the aim of making alternative 3D buildings. In the second task, we asked Atakanto complete 3D buildings within only the SU environment according to top and front views given onthe paper (Figure 2d, 2e).
ICTMT 13 178 Lyon 3 - 6 July 2017

(a) (b) (c) (d) (e)
Fig. 2. (a) Top, (b) front, (c) right views in 1st task; (d) top, (e) front views in 2nd task
The video-recorded interview lasted about an hour. In order to capture signs, we used two camerasin different positions as well as screen recorder software. A thematic analysis (Braun & Clarke,2006) was employed covering all the collected data to elaborate Atakan’s reasoning steps.
SPATIAL-SEMIOTIC ANALYSIS OF THE DATA
For the sake of presenting an evolution of the student’s reasoning, we first briefly present a macroanalysis of the initial step of Task 1. As the first step, Atakan built the first floor of the building in away to provide the top view (building blocks parallel to the ground) to form the structure withconcrete cubes in accordance with the views given in the worksheet. In the second step, he built thecube block in a vertical position relative to the ground) to form the front view without changing thetop view. In the third step, he compared the right view of the structure (with the right view given inthe worksheet) changing the viewpoint by bending. Finally, in the fourth step, without changing thetop and front views, he put a cube in an appropriate place to complete the right view. By the end ofthe process, Atakan had built a structure using twelve cubes.
Synchronic and Diachronic Analyses of the Second Step of Task 1
Several spatial–semiotic resources appeared synchronously, when Atakan solved the second step ofthe Task 1 through SU. Table 1 briefly provides a summary of the most frequent spatial-semiotic resources categorized under the IFI and VP processes (SV: Spatial Vocabulary).
IFI VPSpatial–Analytic Spatial–Holistic CI KI DI
–Exploring an appropriate viewpoint to add or remove a cube–Adding block cubes which are parallel or verticalto the base to obtain a top view–Focusing single views of the object
–Evaluating the object from different viewpoints–Reasoning which cubes that can be removed without changing the views–SV: expressing why front views isolated his strategies–SV: expressing strategies in relation to top and right views
–Using a mentalpicture derived from the paper and concrete object–Basing an obtained mental image in the completed (reasoning) step(s)
–Using the Orbit tool to complete different steps–Adding, moving orremoving the cubes using the Select tool–Using the cursor for pointing out cubes or the object while explaining thesituation
–Linking 2D and 3D representations mentally–Mental rotation with respect to given directions–Spatial orientation with respect to different viewpoints
Table 1. An overview of spatial–semiotic resources attached to the reasoning steps of Task 1
In order to present the emergence of specific resources expressed in Table 1, in the followingstatements, we summarize Atakan’s reasoning steps for Task 1. At first, he repeated the steps in theinitial part of Task 1 to create a representation of the structure (formed with twelve concrete unitcubes) in SU. In this process, by making use of the tool ‘orbit’, he made reasoning (using the toolslowly) about the procedures to be applied (KI, DI). He searched for a viewpoint appropriate to cubeaddition (using the tool fast) (KI) (Figure 3a), and he evaluated the top, front and right views of thestructure he had formed (using the tool fast) (KI, CI) (Figure 3b). In the second part of Task 1, it was
ICTMT 13 179 Lyon 3 - 6 July 2017
seen that without changing the top, front and right views, Atakan deleted a cube from the first floorin the process of transition from a 12-cube structure to an 11-cube structure (DI, KI), deleted a cubefrom the second floor in the process of transition to a 10-cube structure (DI, KI), deleted a cubefrom the first floor in the process of transition to a 9-cube structure (DI, KI), deleted a cube from thesecond floor in the process of transition to an 8-cube structure (DI, KI) and evaluated the views ofthe new structure at the end of each step (CI, KI).
(a) (b)
Fig. 3: (a) Atakan’s exploration for a viewpoint (b) Evaluating the object from different viewpoints
In the third part of Task 1, it was seen that without making any changes in the top and right views,Atakan changed the top view by deleting a wrong cube from the second floor in the process oftransition from an 8-cube structure to a 7-cube structure (KI) (Figure 4a), recognized the wrongstrategy in the second step (CI) (Figure 4b) and placed the cube (he had deleted) unintentionally inthe first floor rather than in the second floor (Figure 4c) while trying to cancel this deletion (KI).
(a) (b) (c)
Fig. 4: (a) Deleting wrong cube, (b) Evaluating the top view, (c) Replacing the deleted cube
In the third step, Atakan examined the structure he had formed previously with concrete cubes whenhe failed to develop a strategy for transition from the 8-cube structure to the 7-cube structure, and hereturned back to the 11-cube structure by adding cubes (KI) (Figure 5a). In the following steps, theparticipant used the cube-deletion strategy, respectively, to form 8-cube structure (Figure 5b), andfinally to form the 7-cube structure (Figure 5c) that provided the top and right views and reached thecorrect result (DI, KI, CI). In the 2nd and 3rd parts of Task 1, Atakan, with the help of ‘orbit’; (i) didreasoning in relation to solution strategies (using the tool slowly) (KI, DI), (ii) evaluated the viewsof the new structures formed (using the tool fast) (KI, CI) and (iii) searched for a viewpointappropriate to cube-deletion and cube-addition (using the tool quickly) (KI). When the researchersasked Atakan why he had returned back to the 11-cube structure from the 8-cube structure, hereplied, “Well, it didn’t work. I had formed according to the front view… the previous shape” (SV).
ICTMT 13 180 Lyon 3 - 6 July 2017

(a) (b) (c)
Fig. 5: (a) 11-cube building, (b) 8-cube building, (c) 7-cube building
In order to summarize a combination of synchronic and diachronic analyses of Task 1, i.e., toarticulate specific signs with respect to evolution of reasoning, we borrow the notion of semioticchain in (Bartolini Bussi & Mariotti, 2008) and express Figure 6 to overview an evolution ofAtakan’s reasoning process.
Fig. 6: A semiotic chain shows an evolution of Atakan’s reasoning for Task 1
Synchronic and Diachronic Analyses of Task 2
Because the aims of the second step of the second task and the third task are close, the emergence ofspatial-semiotic resources was similar to Table 1. However, in the second task, Atakan’s strategiesdiffered, where in this case two views of the building were provided on paper. Therefore, heexploited his experience coming from the first task and, in this way, he developed new insight forexploring the situation and all of this changed the IFI and VP columns in Table 1. Another fact isthat, in the present case, the SV is more apparent compared to Task 2. Table 2 summarizes theemergence of specific signs.
Atakan first focused on building the first floor of the structure to form the top view in the first stepand formed the cube-block in a position parallel to the ground. In this process, Atakan changed theviewpoint on the screen with the help of ‘orbit’ (fast use) to add the cubes where needed (KI). Inaddition, the participant considered the direction codes on the screen and rotated the image for thetop view in his mind as appropriate to the direction codes while building the first floor of thestructure (DI) (Figure 7a).
ICTMT 13 181 Lyon 3 - 6 July 2017

(a) (b)
Fig. 7: (a) Initial structure, (b) Moving the cube from the first to second floor
In the second step, Atakan focused on the second and third floors of the structure as appropriate tothe front view given in the worksheet and realized that the first floor he had formed in the first stepprovided the top view but not the front view (CI). In addition, he carried one of the cubes from thefirst floor to the second floor (DI, KI) (Figure 7b).
IFI VPSpatial-Analytic Spatial-Holistic CI KI DI
–Exploring an appropriate viewpoint to add or remove a cube–Adding block cubes which are parallel or vertical to thebase to obtain a top view–Focusing single views of the object–SV: emphasis on a partial solution strategy–Work (temporarily) on the cubes that satisfy a front view while not satisfying a top view–SV: evaluating the differentviews part by part–SV: explaining why he could not develop a strategy for removing cubes with respect to the floors of the cubes–Focusing only on removal of the cubes, and as a result of this, failing to visualise ofthe object with 7 cubes
–Evaluating the object from different viewpoints–Reasoning on the cubes thatcan be removed but which donot change the views–SV: explaining and pointingout the cubes that can be moved but also satisfying theviews–Determining symmetric cubes satisfying two differentviews when they are deleted–SV: reasoning on the relationship between the front and rear views– Building the object from the beginning for developingnew strategies–SV: a new strategy for moving cubes on the third floor–SV: generalizing strategy ofremoving cubes to satisfy topview
–Using a mental picture derived fromthe paper–Basing single views (top, front and so on) of the object– Basing obtained mental images in the completed (reasoning) step(s)
–Using the ‘Orbit’ tool to complete different steps–Adding, moving or removing the (symmetric) cubes and/or blocks using the ‘Select’ tool–Using the cursor for pointing out cubes or the object while explaining the situation–Using the zoom in-zoomout tool–Deleting the whole object
–Linking 2D and 3D representations mentally–Mental rotationwith respect to given directions–Spatial orientation with respect to different viewpoints–Visualising new views of theobject when some cubes are moved–Visualising different views synchronously in the case of removing and/ormoving the cubes
Table 2. A summary of spatial–semiotic resources attached to reasoning steps of Task 2
Following this process, Atakan built a cube block in a vertical position to the ground (KI) andformed a structure that provided the front view. In addition, it was seen that Atakan searched for aviewpoint appropriate to cube addition with the help of ‘orbit’ (fast use) (KI) and evaluated views ofthe structure (CI). In the second part of Task 2, Atakan focused on building the structures thatprovided top and front views using fewer cubes. In this process, Atakan focused on symmetricalcube pairs on the right and left sides that did not change the top and front views when deleted (DI)and he deleted two symmetrical cubes from the first floor (KI) (Figure 8a). Following this, while the
ICTMT 13 182 Lyon 3 - 6 July 2017

participant evaluated the top and front views of the new structure with the help of ‘orbit’ (fast use)(CI, KI), the researchers asked him whether there was an alternative solution, which included ninecubes. Within the scope of this question, it was seen that Atakan initially replaced again the twosymmetrical cubes he had deleted (KI) and then simultaneously examined the 11-cube structure andthe views given in the worksheet to produce new strategies (DI). In such a way, it was also seen thatAtakan examined the structure from different viewpoints with the help of ‘orbit’ (slow use) (KI),searched for the cubes that would not change the views when deleted, and failed to produce solutionstrategies.
Therefore, the researchers asked Atakan whether he would be able to form an alternative 11-cubestructure with the same top and front views. Within the scope of this question, to begin with, Atakansimultaneously examined the 11-cube structure and the views given in the worksheet (DI) and thensaid the block which formed the second and third floors could be moved one unit backward or oneunit forward (DI, SV). In the following step, he moved this cube block one unit forward (KI)(Figure 8b). Following this, Atakan, with the help of ‘orbit’ (fast use), evaluated the top and frontviews of the structure (CI, KI) and saw that the top view had changed. As a result, he moved onecube on the second floor to provide the top view (KI) (Figure 8c). Following this step, Atakanevaluated the views with the help of ‘orbit’ (CI, KI), realized that the top view was again wrong anddeleted one cube in the second floor, which changed the top view (KI). Following this strategy, inwhich the participant did not change the top and front views, he evaluated the views with the help of“orbit” again (fast use) (KI, CI) and said that the alternative 11-cube structure was complete (SV).
(a) (b) (c)
Fig. 8: (a) Deleting symmetrical cubes, (b) Moving cube block forward, (c) Moving the cube backward
In the next part, the researchers asked Atakan whether he could work on the structure and form analternative 9-cube structure. Within the scope of this question, the participant, with the help of‘orbit’ (slow use), searched for symmetrical cubes, which would not change the top and front viewswhen deleted (KI, CI, DI) and said that he failed to find a strategy to form such a structure (SV). Inthe following process, Atakan continued his search with ‘orbit’ (slow use) (KI) and realized thatthere would be no change in the top and front views when two symmetrical cubes in the first floorwere deleted. The participant deleted the symmetrical cubes he had determined (KI), and he thenevaluated the top and front views of the new structure with the help of ‘orbit’ (fast use) (CI, KI).
In the final part, the researchers asked Atakan whether he could form a 7-cube structure withoutchanging the top and front views. Within the scope of this question the participant, with the help of‘orbit’ (slow use), searched for cubes that would not change the top and front views when deleted(KI, CI, DI). As a result, Atakan reasoned in relation to the 9-cube structure and the views in theworksheet (DI), but failed to develop a strategy to form the 7-cube structure at the end of theprocess. Eventually, he deleted all the cubes on the screen to re-form the 11-cube structure (KI, SV).Atakan, who started building the structure again, this time formed the cube block in a vertical
ICTMT 13 183 Lyon 3 - 6 July 2017

position to the ground to complete the front view (CI, KI). This block was built in such a way as toform the rear of the structure differently from his previous structures.
In the next part, the participant examined the structure from the top with the help of ‘orbit’ (fast use)(KI) and saw that one of the cubes he had added to the second floor changed the top view (CI).Therefore, he moved this cube one unit forward (DI, KI). Following this, Atakan worked on thecube block in a position parallel to the ground and built the first floor (KI) in such a way as tocomplete the top view without changing the front view (CI, DI). As a result, he completed the 11-cube structure. The participant deleted two symmetrical cubes from the first floor during transitionto the 9-cube structure (KI) (Figure 9a). Next, he used the ‘zoom’ tool to examine the structure inmore detail (KI). Lastly, with the help of ‘orbit’ (slow use), he searched for cubes he could delete tomake transition to the 7-cube structure (KI). In this process, Atakan did reasoning in relation to the9-cube structure and regarding views given in the worksheet (CI, DI). He said that he did not maketransition to the structure with the cube-deletion strategy as demanded in the question (DI, SV). Inthis respect, when the researchers asked Atakan whether he had developed his thinking strategybased on a cube-deletion strategy, he responded positively to this question and said he would thinkabout the structure a bit more and move two symmetrical cubes in the third floor one unit forward.He then added that these cubes would hang in the air at the end of the process without changing theviews (DI, SV). Following this, the participant moved the symmetrical cubes in the third floor oneunit forward (KI) (Figure 9b). Next, he added the cubes to places where he wanted and examinedthe structure with the tool of ‘zoom’ (KI). After this, he deleted the symmetrical cubes in the firstfloor, which were under the symmetrical cubes he had moved forward (DI, KI) (Figure 9c). In thelast step, Atakan evaluated the top and front views with the help of ‘orbit’ (fast use) (CI, KI).
(a) (b) (c)
Fig. 9: a, b, c Process of transition from 9-cubes building to 7-cubes building
At the end of the solution process, the researchers asked Atakan to explain his reasoning processes,and he said that the cubes placed under one cube in the upper floors were not visible from the topview and that deleting the cubes below would not change the top view (SV). In this respect, Atakanreported, “from the top view, we see the upper cubes, and the ones below are not visible. If we takethe ones below, those at the top look the same”. In addition, Atakan stated that he evaluated howsimultaneously the deletion process, which did not change the top view, did not change the frontview (SV). In this respect, Atakan said, “When we did not move to the front and if I take these(showing the symmetrical cubes he had deleted from the first floor in the last step), then these(coming to the top view rapidly with the help of ‘orbit’) would have looked as if they had beenremoved (pointing to the procedure that changed the top view). In addition, if I had taken these(showing the symmetrical cubes in the second floor at the back) … they would have remained at theback (showing the symmetrical cubes in the third floor he had moved one unit forward) … Thenthey would have looked … (taking the front view rapidly with the help of ‘orbit’ and showing thespaces that would appear in the front view at the end of the process).”
ICTMT 13 184 Lyon 3 - 6 July 2017
Figure 10 refers to a combination of synchronic and diachronic analyses of Atakan’s reasoningprocesses associated with Task 2.
Fig. 10: A semiotic chain shows an evolution of Atakan’s reasoning for Task 2
CONCLUSIONS
In this paper, we consider the following research question: ‘What kind of spatial-semiotic resourcesemerge when an eighth-grade student solves spatial tasks using 3D modelling software?’ Spatial-semiotic analyses of the data obtained provided us with a detailed understanding of student’s spatialreasoning processes in SU. In the first task, the student easily built the structure with concrete unitcubes whose different views provided on the paper. In the second task, the student’s reasoning stepsappeared with an emphasis on a spatial-analytic strategy based on exploring a viewpoint for addingor removing cubes, using ready-made mental pictures, linking 2D and 3D representations throughspatial visualisation and spatial orientation, and an emergence of spatial vocabulary, including hisstrategies. However, in the third task, certain specific reasoning steps appeared as spatial-holisticstrategies more than in the previous task, such that focusing on an environment with zero-gravity,symmetric cubes, and constructing and explaining strategies, interlaced into completed steps in thesecond task. Within the context of our study, gestures were limited to in the use of specific tools(‘orbit’, ‘select’, mimicking with cursor, ctrl+v, delete and ‘zoom’). There did not appear to be anygestures independent of the artefact (mouse and keyboard), such as hand movements, tracing with afinger and so on.
In terms of the obtained results, we finally summarize the synergies among the KI, CI, DI and VPand IFI processes through Figure 11, which are a theoretical contribution and an attachment toFigure 1.
Fig. 11: Synergies between spatial thinking processes
Figure 11 implies that spatial–analytic and spatial–holistic strategies that we consider in this papercommonly intertwined with IFI process and emergence of KI, CI and DI. IFI process alwaysemerged when the student solved spatial tasks and this appears to be that IFI is the core element in
ICTMT 13 185 Lyon 3 - 6 July 2017
spatial thinking and creation of DI. The emergence of signs confirmed that the student’s initialstrategy was spatial–analytic, and specific images were KI and CI. The next step was emergence ofDI in terms of spatial–holistic strategy and IFI process. However, these results come from only aneighth grader’s result, it will be meaningful to explore a group of students’ results to discussarticulation of Figure 1 and Figure 11 in a further research.
REFERENCESArzarello, F. (2008). Mathematical landscapes and their inhabitants: perceptions, languages,
theories. In E. Emborg & M. Niss (Eds.), Proceedings of the 10th International Congress ofMathematical Education (pp. 158–181). Copenhagen: ICMI.
Arzarello, F., Paola, D., Robutti, O., & Sabena, C. (2009). Gestures as semiotic resources in themathematics classroom. Educational Studies in Mathematics, 70(2), 97–109.
Arzarello, F., & Robutti, O. (2008). Framing the embodied mind approach within a multimodalparadigm. In L. English, M. Bartolini Bussi, G. Jones, R. Lesh, & D. Tirosh (Eds.), Handbook ofInternational Research in Mathematics Education (2 ed., pp. 720–749). Mahwah, NJ: Erlbaum.
Bartolini Bussi, M. G., & Mariotti, M. A. (2008). Semiotic mediation in the mathematics classroom:Artifacts and signs after a Vygotskian perspective. In L. English, M. Bartolini Bussi, G. Jones,R. Lesh, & D. Tirosh (Eds.), Handbook of International Research in Mathematics Education (2.ed., pp. 746–783). Mahwah, NJ: Erlbaum.
Bishop, A. (1983). Spatial abilities and mathematics thinking. In M. Zweng, T. Green, J. Kilpatrick,H. Pollak, & M. Suydam (Eds.), Proceedings of the Fourth International Congress onMathematical Education (pp. 176–178). Boston: Birkhäuser.
Braun, V., & Clarke, V. (2006). Using thematic analysis in psychology. Qualitative Research inPsychology, 3, 77–101.
Godino, J. D., Batanero, C., & Font, V. (2007). The onto-semiotic approach to research inmathematics education. ZDM-Mathematics Education, 39(1), 127–135.
Gutiérrez, A. (1996). Visualization in 3-dimensional geometry: In search of a framework. In L. Puig& A. Gutiérrez (Eds.), Proceedings of the 20th Conference of the International Group for thePsychology of Mathematics Education (pp. 3–19). Valencia: Universidad de Valencia.
Ng, O.-L., & Sinclair, N. (2013). Gestures and temporality: Children's use of gestures on spatialtransformation tasks. In A. M. Lindmeier & A. Heinze (Eds.), Proceedings of the 37thConference of the International Group for the Psychology of Mathematics Education (Vol. 3, pp.361–368). Kiel, Germany: PME.
Presmeg, N. C. (1986). Visualization in high school mathematics. For the Learning of Mathematics,6(3), 42–46.
Presmeg, N. C., Radford, L., Roth, W.-M., & Kadunz, G. (2016). Semiotics in MathematicsEducation. Switzerland: Springer International Publishing.
Turgut, M. (2017). A Spatial–Semiotic Framework in the Context of Information andCommunication Technologies (ICTs). In M. S. Khine (Ed.), Visual–spatial Ability in STEMEducation: Transforming Research into Practice (pp. 173–194). Switzerland: SpringerInternational Publishing.
Yakimanskaya, I. S. (1991). The development of spatial thinking in schoolchildren (Vol. 3). Reston,USA: NCTM.
ICTMT 13 186 Lyon 3 - 6 July 2017

Workshops
187

MATHEMATICS IN PRE-SERVICE TEACHER EDUCATION AND THE
QUALITY OF LEARNING: AN EXPERIENCE WITH PAPER PLANES,
SMARTPHONES AND GEOGEBRA
Fernando Luís Santos (1)(3)
and António Domingos (2)(3)
(1) Piaget Institute, School of Education, Almada, Portugal; [email protected]
(2) Universidade Nova de Lisboa, Faculdade de Ciências e Tecnologia, Portugal; [email protected]
(3) Research Centre for Education and Development (UIED), Portugal
This poster presents an instance of mathematics modelling by students on a geometry activity in a
pre-service teacher training course analysed through a model designed to access the mathematical
thought and the quality of student leaning outcomes. This analytical model, supported by the SOLO
taxonomy, uses Activity Theory as a contextual framework that integrates the different relations,
namely advanced mathematical thinking concepts like procept and proceptual divide. Results
allowed us to see three different pathways taken by the students to solve the same problem.
Keywords: Advanced mathematical thinking, geometry, proceptual divide, quality of learning,
SOLO taxonomy.
INTRODUCTION
Portfolio assessment brings an open evaluation method into the mathematical classroom and allows
the mathematical abilities of the students to grow. In this study, students use paper planes,
smartphones and dynamic geometry software (geogebra) to find the equation that describes the
flight path of the paper planes and were given two classes to solve them and to explain in detail
their solution process. This solution process involves brainstorming sessions centred on the best
solution, and the detailed explanation necessarily involved in self-regulated learning processes. This
teaching method aims to extend the mathematical knowledge of future teachers, involving them in
activities more open and less structured than the traditional ones.
The data presented here were chosen because it highlights three different path and took different
approaches to the same problem. Data was studied using the analytical model that highlights these
differences and integrates SOLO taxonomy (Biggs & Collis, 1982) with the advanced mathematical
thinking theories and concepts of Tall (2002) alongside the conceptualization of the proceptual
divide (Gray & Tall, 1994), and activity theory (Engeström, 2001) as a contextual structure. The
SOLO taxonomy allows us to identify five progressive levels of understanding from the
prestructural (lowest level), through the unistructural, the multistructural, the relational to the
extended abstract (highest level).
The task statement asks to find the equation that describes the flight path of a paper plane, using
smartphones and geogebra, writing a step-by-step report of the activity. In the first class students
started by folding the paper planes (exploring somehow the art of origami), all the instructions were
given using geometry concepts like area, midpoint, segment bisector and so on. With the planes
built, the group moved outside the classroom and, using the cameras of their smartphones,
photographed the various moments of the flight of the planes since its launch, the flight itself and
the landing. Photographs sequences were drawn according to contemplate various angles, forces
and aircraft launch positions and capture the movement of the same in flight and subsequent
landings.
After the images were collected, they were recorded on the computers and using geogebra, the
flight sequence of the various planes was simulated using a Cartesian axis and the plane's nozzle as
ICTMT 13 188 Lyon 3 - 6 July 2017
a point of reference for marking points. With the complete sequence of the flight scanned in points
in the software the described curve of the airplane was worked in order to find one, or more
equations of the function described by the airplane. This trajectory (usually a parabola - represented
by a second degree equation) can be shown and students can control the parameters of the same,
appropriating algebraic concepts. In this case, factors like the idea of air resistance and elevation
were not contemplated, which would allow other types of explorations (which were not the
objective of this task).
FINAL REMARKS
This form of mathematical modelling becomes attractive and allows students to visualize
mathematics to take shape as a real activity, evading the notion of common sense that mathematical
concepts do not represent reality. Geogebra was introduced in the task, and students learned their
handling by trial-and-error. To finalize the exploration task, hypothetical situations were created
with the software that served as an exercise to study the characteristics of a quadratic function and
the parameters of its variables. Experience had good adhesion by the students and were in some
expectant form on the final results, some of the comments involved the strangeness of a math class
have to go out of the classroom (which, in most cases it was an absolute novelty).
The results of the analysis identify three levels of response: a first level, where the construction of
the function fails to recognize the graphical movement of the various parameters of the quadratic
function, identify the vertex, place the parabola in the correct place, but show difficulties in
adjusting the aperture of the parabola (roots of the quadratic equation) to the curve of the airplane
were classified as of the prestructural level; a second level where, when debating with the same
problems of the previous level, they use the calculation (with paper-and-pencil or with graphing
calculator - even having the software of dynamic geometry available) to adjust the parameters of the
function and were classified as multistructural level, possibly relational and; a third level where
using the functions of the selectors adjusted the parabola to the plane curve, arriving with some ease
to the quadratic equation classified as relational level, possibly extended abstract.
Given the constraints, such as the lack of knowledge of the software and the lack of habituation to
tasks of this kind, allowed the students to have a different view of what can be an attractive math
class for the students, which is evidenced with some of the conclusions of the students themselves:
Student A: We can also verify that math can be fun and does not have to be just worked
indoors and with the use of new technologies we can catch attention and perform
a certain type of exercises easier (student report).
REFERENCES
Biggs, J., & Collis, K. (1982). Evaluating the quality of learning. London: Academic Press.
Engeström, Y. (2001). Expansive learning at work: toward an activity theoretical
reconceptualization. Journal of education and work, 1(14), 133-156.
Gray, E., & Tall, D. (1994). Duality, ambiguity and flexibility: a proceptual view of simple
arithmetics. The journal for research in mathematics education, 2(26), 115-141.
Tall, D. (Ed.). (2002). Advanced mathematical thinking. New York: Kluwer Academic Press.
ICTMT 13 189 Lyon 3 - 6 July 2017

THERE IS MORE THAN ONE FLIPPED CLASSROOM
Chiara Andrà1, Domenico Brunetto1 and Igor’ Kontorovich2
1Polytechnic of Milan, Italy; 2The University of Auckland, New Zealand
The Flipped Classroom pedagogy has been developed for being responsive, student-centered andpromoting self-directed learning. Three years ago, we started an international research projectaimed at understanding how the FC can be implemented by secondary school math teachersthrough the use of a MOOC (Massive Open Online Course) developed at the Polytechnic of Milan.In particular, we focus on the teachers’ use of MOOC videos. A variety of scenarios emerged fromour direct classroom observations and work-in-team with the teachers. In this paper we propose asketch of such a variety of FC implementations.
Keywords: MOOC; teaching with technology; student-centered learning; teachers’ beliefs.
INTRODUCTION AND THEORETICAL FRAMEWORKFlipped Classroom (FC) is mostly associated with university setting and it is commonly known as amethod that arranges the lecturing part of the teaching as homework through videos. This isconsidered the out-of-class part of the FC and as such can be seen as a case of technology used forteaching and learning. When students come to class, FC features the students’ learning in a student-centered manner, using various problem-solving activities in small groups (Bergmann & Sams,2012). This is considered as the in-class part of FC. Both parts are vital for the FC learning model towork.
The out-of-class video learning “primes” the students for the in-class active phase. This happenswith some difficulties, as Fredriksen, Hadjerrouit, Monaghan and Rensaa (in press) have singledout: (a) the students expect to be “taught” by the teacher; (b) the students express preferencetowards solving the exercises in solitude; (c) preparation through video lessons requires discipline;(d) the need to express mathematical problems verbally requires fluency in discourse; (e) groupwork requires social skills to be developed. We would say that MOOC videos are a kind oftechnology that promotes self-directed learning: the quality of student group collaboration andunderstanding, and overall the quality of the lesson, depends on how the students grasp themathematics in the videos and on how they work out-of-class (Fredriksen et al., in press). The mainidea of FC is that, by saving time in introducing material, a teacher obtains an opportunity tochallenge the students at both a collaborative and conceptual level through well-designedmathematical activities (Wan, 2015).
To sum up, we draw on evidence in literature that FC is a student-centered pedagogy that promptsstudents to go beyond rote-learning and may even promote conceptual understanding. At the sametime, we acknowledge that FC is all but easy to implement in the classroom since it necessitates asignificant change in the classroom’s rules and practices. Moreover, we recall that recent researchreports on an existence of a considerable gap between the learning potential of technology andactual teaching practices, a gap that is both qualitative and quantitative (for an elaborated review seeBretscher, 2014). The quantitative gap is understood in terms of the limited impact that newtechnologies have on classroom practices compared to the huge amount of money and time spent ontechnology and teachers’ training to use it. The qualitative gap refers to the majority of teachers whouse technology in a transmissive or teacher-centered way compared to the ones who exploit it forlearner-directed activities. Despite curriculum changes, professional development and substantialfinancial investment, mathematics classroom practices are often still surprisingly similar to thosepracticed decades ago (McCloskey, 2014). Windschitl and Sahl (2002) have identified two factorsthat appear to be crucial to the ways in which teachers adopt or resist changes: (i) their beliefs about
1ICTMT 13 190 Lyon 3 - 6 July 2017

learners, about what counts as good teaching in their institutional culture, and about the role oftechnology in learning; (ii) the resources available at school. Thus, it becomes crucial to investigateteachers’ goals, resources and orientations towards FC in general and towards MOOC videos inparticular is.
In order to analyse teachers’ attitudes towards technology (MOOC videos, in our case) and student-centered lessons, their goals, their knowledge and the resources they have at disposal, we refer toSchoenfeld’s (2011) theoretical lens, which focuses on teachers’ beliefs, goals and resources duringin-the-moment classroom decision making. The basic assumption of Schoenfeld’s framework is thatbeliefs and orientations are an essential factor shaping teachers’ decision-making, and thus shapingtheir behavior and professional development. In Schoenfeld’s view, teachers’ behaviors also dependon their goals and goals recruit resources (including: knowledge, materials, personal andinterpersonal skills and connections):
Every sequence of actions can be seen as consistent with a series of goal prioritizations thatare grounded in the teacher’s beliefs and orientations, and the selection, once a goal hasbeen given highest priority, of resources intended to help achieve that goal (Schoenfeld,2011, p. 460).
A goal, whether explicit or tacit and unarticulated, is something that a teacher wants to accomplish.Resources include all kinds of ‘goods’ that are available for a teacher. For example, the tools in theclassroom; students’ knowledge; teachers’ knowledge, interpersonal skills and relations withstudents.
RESEARCH QUESTIONS AND METHODOLOGYThe research questions we aim at addressing are: (1) how do secondary school math teachers plan toand actually integrate MOOC videos in their classrooms? (2) How do teachers promote self-directed and student-centered learning when using MOOC videos? In a pilot study with twoteachers (Andrà, Brunetto & Kontorovich, under review), we compare and contrast their goals,resources and orientations. At the present stage of the research, we have at disposal more datacoming from a larger set of teachers who participated in the research project. The data for this paperis concerned with the final weeks of the first semester, when the teachers need to arrange suitableactivities to recap mathematics studied during the school year and to help students to end thesemester with good marks. Thus, we proposed teachers to integrate MOOC videos, accompanyingexercises and their solutions into their classrooms. Introducing new technology for recalling notnew mathematical content was aimed at preventing students from facing a double difficulty: thedifficulty of adjusting to a new way of teaching and learning and the difficulty of engaging withunfamiliar mathematics.
As a part of our project, twelve secondary teachers chose 1-3 MOOC videos to work with from aMOOC course made of 84 videos, covering different topics (arithmetic, sets, logics, algebra,analytic geometry, exponential and logarithms, trigonometry, probability and statistics). For eachtopic, 3-6 videos recap mathematical theory (definitions, properties and theorems), and procedures(algorithms and computations). Among the teachers who participated in the study, Nadia (N),Francesca (F) and Elisabetta (E) teach in three grade-12 classes, where it was necessary to recallexponential and logarithms in the first two ones, and the use of Excel spreadsheet for descriptivestatistical analysis in the third one. Following Schoenfeld, we explored goals, resources andorientations through teachers’ lesson images and conducted lessons, paying specific attention tounplanned decisions that were made. N teaches in a school where math lessons are delivered 6hours/week, while F and E 3 hours/week.
2ICTMT 13 191 Lyon 3 - 6 July 2017
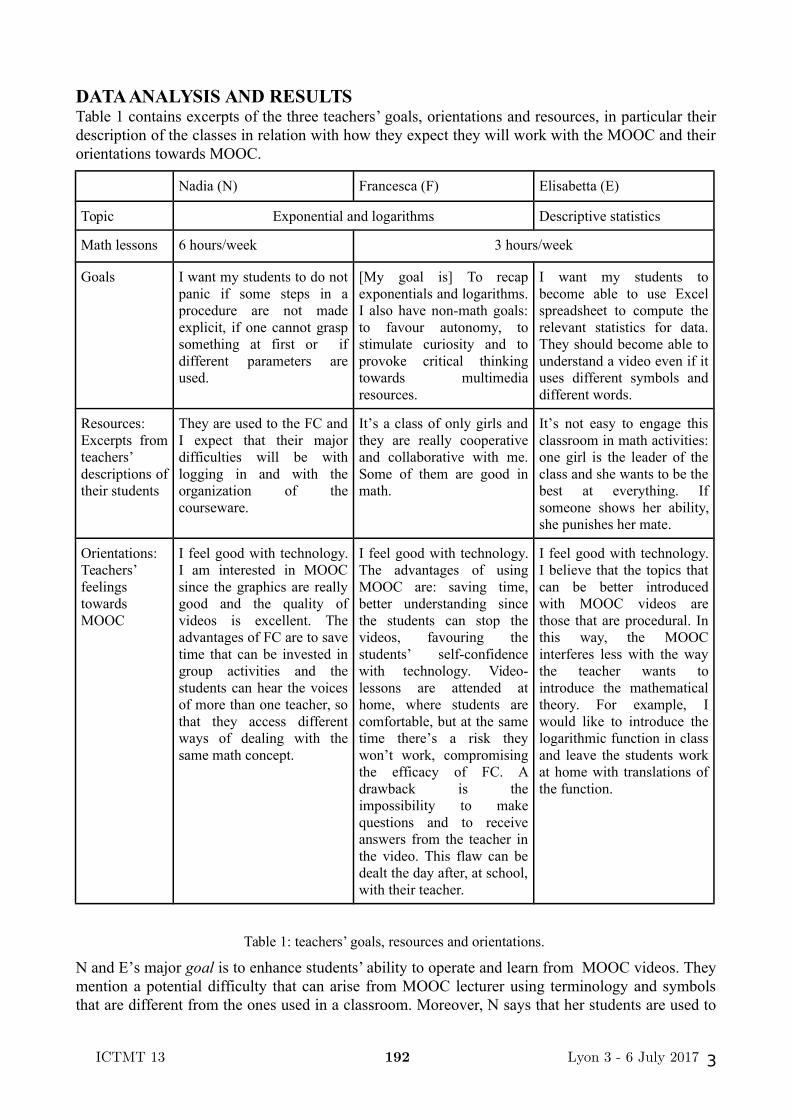
DATA ANALYSIS AND RESULTSTable 1 contains excerpts of the three teachers’ goals, orientations and resources, in particular theirdescription of the classes in relation with how they expect they will work with the MOOC and theirorientations towards MOOC.
Nadia (N) Francesca (F) Elisabetta (E)
Topic Exponential and logarithms Descriptive statistics
Math lessons 6 hours/week 3 hours/week
Goals I want my students to do notpanic if some steps in aprocedure are not madeexplicit, if one cannot graspsomething at first or ifdifferent parameters areused.
[My goal is] To recapexponentials and logarithms.I also have non-math goals:to favour autonomy, tostimulate curiosity and toprovoke critical thinkingtowards multimediaresources.
I want my students tobecome able to use Excelspreadsheet to compute therelevant statistics for data.They should become able tounderstand a video even if ituses different symbols anddifferent words.
Resources:Excerpts fromteachers’descriptions oftheir students
They are used to the FC andI expect that their majordifficulties will be withlogging in and with theorganization of thecourseware.
It’s a class of only girls andthey are really cooperativeand collaborative with me.Some of them are good inmath.
It’s not easy to engage thisclassroom in math activities:one girl is the leader of theclass and she wants to be thebest at everything. Ifsomeone shows her ability,she punishes her mate.
Orientations:Teachers’feelingstowardsMOOC
I feel good with technology.I am interested in MOOCsince the graphics are reallygood and the quality ofvideos is excellent. Theadvantages of FC are to savetime that can be invested ingroup activities and thestudents can hear the voicesof more than one teacher, sothat they access differentways of dealing with thesame math concept.
I feel good with technology.The advantages of usingMOOC are: saving time,better understanding sincethe students can stop thevideos, favouring thestudents’ self-confidencewith technology. Video-lessons are attended athome, where students arecomfortable, but at the sametime there’s a risk theywon’t work, compromisingthe efficacy of FC. Adrawback is theimpossibility to makequestions and to receiveanswers from the teacher inthe video. This flaw can bedealt the day after, at school,with their teacher.
I feel good with technology.I believe that the topics thatcan be better introducedwith MOOC videos arethose that are procedural. Inthis way, the MOOCinterferes less with the waythe teacher wants tointroduce the mathematicaltheory. For example, Iwould like to introduce thelogarithmic function in classand leave the students workat home with translations ofthe function.
Table 1: teachers’ goals, resources and orientations.
N and E’s major goal is to enhance students’ ability to operate and learn from MOOC videos. Theymention a potential difficulty that can arise from MOOC lecturer using terminology and symbolsthat are different from the ones used in a classroom. Moreover, N says that her students are used to
3ICTMT 13 192 Lyon 3 - 6 July 2017

watch math videos at home, while for E’s students it is going to be the first time. At the same time,N and E share a similar goal, namely that their students become fluent with mathematics discussedin the videos. F’s goals can be classified into long-term goals within Schoenfled’s view, since shealso wants to develop critical thinking. F’s reflections on her students make an impression that shesees her students as more collaborative. E, on the other hand, describes her classroom as “difficult”,given that a girl plays the role of a leader. With respect to considering MOOC as a resource, theteachers are aware of the possibility for using it to save time in the class. They are also aware thatvideos are not interactive: there exist a chance that the students will not engage with videos athome. Notably, E’s orientations propose that she wants to be the one who (re)introduces themathematical concepts, consequently, she prefers to use the MOOC videos for recalling procedures.
Lesson images
Both N and F assigned the same video to be watched at home. In this 3-minutes long video, the
graph and some properties of an exponential function f(x)=ax are explained. The particular cases ofex and 1/ex are also discussed (Figure 1 shows a snapshot from the video). The logarithmic functionis recalled as well.
Figure 1: a snapshot from the video assigned by N and F.
Nadia. “[...]I will assign the videos on exponential and logarithmic functions to be watched at homeand I will assign some questions to be answered as well. I will assign the theoretical video whichrecalls definitions and properties, and two practical videos which show the solution of exercises.The questions I will assign to my students will enable them to reflect on how a video can bewatched, which questions can one pose to oneself, how exercises can be solved. I want to see mystudents’ answers in advance, hence I will collect their work through emails. In class, I will startfrom the part in the video where the graphs of exp(x) and of exp(-x) are shown simultaneously. Iwill ask my students to draw the graph of f(x) and f(-x) for the following functions: a parabola ofthe form ax2+bx+c, sin(x) and cos(x). This will prompt the students to notice symmetries in somecases and I will introduce the definition of an even function focusing on the features on theexamples drawn by the students. The students will work in groups”. In N’s lesson image, her goalabout her students’ ability to watch the video and be able to understand emerges in her intention toinvite them to reflect on how to access the video content: in fact, she says that “the questions I willassign to my students will enable them to reflect on how a video can be watched, which questionscan one pose to oneself, how exercises can be solved”. Nadia also mentions the good quality ofgraphs and in fact she wants to exploit one of the graphs in the video to introduce the definition ofeven function: this speaks to N’s resources.
4ICTMT 13 193 Lyon 3 - 6 July 2017

Francesca. “In a previous lesson, I will show my students how to access the MOOC and I willassign them the exercises in the MOOC, both ones that have a solution provided in videos and thosewhich required to be solved in solitude. In class, I will discuss with students’ solutions, which I willcollect via email in advance, and we will do more exercises”. In F’s lesson image, we notice thatshe plans to spend a lesson commenting the videos (“I will discuss with students’ solutions”),watched at home and to do more exercises. This is in line with her orientation about the MOOC,namely that the students don’t have the possibility to ask questions to the teacher in the video, butthis can be done in class the day after.
The video assigned by E regards an exercise about the grades taken during an exam by 32 studentsand it shows how to compute the mean, the median, the standard deviation of the given data.
Elisabetta. “I want my students to become confident with Excel spreadsheet. In a previous lesson, Iwill introduce the main statistical measures: the mean, the median, the variance, the standarddeviation, the absolute deviation. Then, I will introduce the software and main commands forworking with data and computing these descriptive statistics. Then, I will assign to watch relatedMOOC videos as a homework and I will ask my students to do an exercise that is similar to the onepresented in the videos. There is some difference between my lesson and the videos: we usedifferent terms and the video does not address the absolute deviation. I want to see if in theirsolutions students will follow what we did in class, or what was done in the video”. Similarly toother teachers, E wants to use the MOOC videos as a resource for recapping some concepts andreinforcing students’ knowledge. Differently from the other teachers, however, E explicitly says thisin her lesson image. E’s choice of a procedural video is in line with her orientation about the use ofMOOC, namely that it is more suited for exercises while the teacher should be left free to introducethe concepts in class. Finally, we comment on the differences between the MOOC videos and E’slesson and on her way to detect whether the students will follow the former or the latter: we see thiscomment from E in line with her goal that the students should become able to understand the videoeven if it differs from what they have seen in class.
Implemented lessons
Nadia. Even though N did not plan to show the videos in the classroom, she noted that manystudents did not sent her their homework in advance. She also suspected that the majority of thestudents did not watch the video. Hence, she started the lesson with the video (saying: “it will lastjust for a few minutes, to show the video won’t compromise the lesson”), and then the studentsworked in groups. They sketched the graphs of exp(x) and exp(-x), of sin(x) and sin(-x), of cos(x)and cos(-x), while Nadia navigated the class and engaged in conversations with the groups. Sheinvited them to find out general features of the drawn functions and she introduced the definition ofan even function.
Francesca. Like N, F also notes that some of her students did not send her their homework and inclass she asked them why. She also asked how the students coped with the assignments. Thestudents replied that the videos were clear but they experienced difficulties with assigned exercisesand requested teacher’s assistance. Hence, the teacher engages the classroom in a rich discussionabout “how to do”. The students actively engaged in the discussion, which aligns with F’s opinionabout her students’ cooperative mood. We also notice that her way of conducting the lessonstimulates the students’ critical thinking, since many times during the lesson they were not satisfiedwith the procedure recapped by F and wanted also to recap “why to do so”.
Elisabetta. All her students submitted their homework before the lesson and E says this withsatisfaction at the beginning of the lesson. After reviewing the submissions, however, she noticedthat some students have followed her lesson while others have followed the video. She, thus,engages in a frontal lesson in which she poses questions to the students in order to better know how
5ICTMT 13 194 Lyon 3 - 6 July 2017

much they grasped the out-of-class activity. The first half of the lesson can be summarised as theteacher posing questions and the students avoiding to answer, while the teacher solved exercisesfrom the homework showing all the steps and elaborating on the concepts involved. At some point,one student asked for clarifications on the formula to compute standard deviation. The studentsspent the rest of the lesson in posing questions to the teacher, making-sense of her explanations andreplying to the questions the teacher in turn made them.
Links between the lesson image and the implemented lesson (...and more data)
We have commented that N and E are concerned that a terminology used in the video might hindertheir students’ engagement with the content. In N’s lesson image, she was planning to deal with theconcern through inviting students to reflect on the experiences. N also mentions the good technicalquality of graphs and in fact she wants to exploit one of the graphs in the video to introduce thedefinition of an even function (see Figure 1). In N’s implemented lesson, she starts watching thevideo, since she noticed that few students have sent her their homework. Her orientation is that “thiswon’t compromise the lesson” and we see something deep in this comment from N: we see anacknowledgement that it would be a ‘deviation from the plan’ and as such it is a decision made todeal with students’ lack of homework, but at the same time we also see that N’s orientation is that toshow the video in class is in line with her goals. N’s orientation is completely different from E’sone, who chose not to show the video and to make questions about it in class, so that the studentswho have done their homework will both have the opportunity to shine and to help their peers evenif those did not watch the video had not seen it. E explicitly says that she does not want her studentsto think that even if they do not make their home-work there would be an in-class opportunity tocope with this lack of work. We have noticed that N and E share similar goals (i.e., to allow theirstudents to be able to grasp the mathematics in the videos), but the decisions that they make to copewith their students’ lack of home-work are rather opposite.
N’s decision-making led to a student-centered lesson, while E delivered a frontal lesson. Thestudents’ lack of homework is, thus, addressed in two different ways which can be explained withteachers’ orientations towards teaching and learning: N assigns a paper for each students andarranges the class so that each one can work individually but at the same time s/he can ask forher/his mates’ help or N’s help. This overcomes one of the possible tensions highlighted byFredriksen et al., namely that students prefer to work in solitude. E arranges a frontal lesson, whichis not as teacher-centered as it appears at a first glance: her lesson, in fact, is responsive of thestudents’ feedback provided in the homework sent to E in advance. She highlights the terminologythat is not clear for the students, she commented on some students’ mistakes and she designed thelesson accordingly. We can say that this particular use of MOOC videos prompts even the teacherswho prefer teacher-centered lessons to arrange responsive frontal lessons, since they are allowed toknow in advance their students’ difficulties. This can be seen as an interesting feature of FC.
F, being not concerned about her students’ ability to access the video content, engages the studentsin a classroom discussion that is rich and at the same time challenging for the students. One of herstudents, in fact, at a certain point says that she finds it difficult to follow what her peers say andpropose, and asks the teacher to make a summary to clarify the ideas that have emerged. Thisrequest speaks both to the genuity of the classroom discussion and to this student’s will tounderstand. Given that the class has a weak mathematical curriculum, this can not to be taken forgranted. F is reaching her goal, namely to stimulate curiosity and critical thinking. Like E, also Fdoes not show the video in class. Like E, also F engages in a frontal lesson to correct the exercisesthe students have found difficult to solve in solitude. Differently from E, however, F’s lesson resultsin a classroom discussion rather than a frontal delivery of mathematical content.
6ICTMT 13 195 Lyon 3 - 6 July 2017

We would like to summarise the three teachers’ lessons as follows: her way of using MOOC videosallows N to design a groupwork activity aimed discovering the features of even function. Her(different) way of using MOOC videos allows E to implement a frontal lesson that is responsive tostudents’ difficulties as they emerged from their homework. Her (different) way of using MOOCvideos allows F to carry out a classroom discussion, which is not planned: the students’ need tocorrect the homework emerges as the lesson starts. For E, it was possible to plan a responsive lesson(while for F it was not), because E’s students sent their homework in advance, while F coped withher students’ lack of homework: F arranges an unplanned responsive lesson.
DISCUSSIONAs a response to our research questions, we can propose that secondary school teachers can useMOOC videos in their classrooms in different ways (question 1): they assign videos as homeworkand design group activities for introducing new concepts, or they design a classroom activity thatallow to pinpoint the differences in terminology and symbols between the teacher’s lesson and thevideo, or they plan to do more exercises on the basis of the out-of-class activity. Self-directed andstudent-centered learning (question 2) can be seen as an intrinsic feature of FC: frontal lessons areresponsive, classroom discussion in informed by out-of-class activity and group work is primed byconceptual work done at home.
To our understanding, FC is a combination of a learning setting and activities. The students wereasked to watch videos at home, but if a teacher solves or even answers questions in the class, is theclassroom flipped? This remains an open question, but the three teachers in our study used MOOCvideos to create new forms of classroom. Definitely it was not a classical version of FC, but thiswas to some extent expected, because teachers and students learn to flip. We would say that Eimplements FC: she assigns out-of-class work and she arranges an in-class activity that draws onthe students’ homework. By not showing the video in class, she provokes the students’ self-directedlearning, since they are not able to follow if they had not watched the video. Also F implements FC:she does not show the videos in class and she implements a lesson that is responsive to her students’needs, namely instead of making challenging exercises as per her lesson image, she spends themajority of time showing the procedure to solve the exercises assigned as homework and replyingto the students’ questions. E’s students learn that they need to do the out-of-class activity in order tobe able to follow the in-class lesson. F’s students learn that if they are not able to understand theout-of-class activity, her teacher is there to help them in class. N shows the video in class and shecomments the video, connecting the students’ work with the content of the video. As such, wewould say that N’s lesson is a case of co-teaching instead of FC. She co-teaches with the teacher inthe video and she implements a student-centered lesson.
REFERENCES
Andrà, C., Brunetto, D., and Kontorovich, I. (under review). How to combine technology insecondary math classroom? A case of MOOC videos.
Bergmann, J., & Sams, A. (2012). Flip your classroom, reach every student in every class everyday. Washington, DC: International Society for Technology in Education.
Bretscher, N. (2014). Exploring the quantitative and qualitative gaps between expectation andimplementation: a survey of English mathematics teachers’ uses of ICT. In: A. Clark-Wilson, N.Sinclair & O. Robutti (Eds.), The mathematics teacher in the digital era. Springer.
Fredriksen, H., Hadjerrouit, S., Monaghan, J., Rensaa, R.J. (in press). Exploring tensions in amathematical course for engineers utilizing a flipped classroom approach. In: Proceedings ofCERME10, Dublin, February 1-5, 2017.
7ICTMT 13 196 Lyon 3 - 6 July 2017

McCloskey, A. (2014). The promise of ritual: a lens for understanding persistent practices inmathematics classrooms. Educational Studies in Mathematics, 86(1), 19–38.
Schoenfeld, A. H. (2011). Toward professional development for teachers grounded in a theory ofdecision making. ZDM, 43(4), 457-469.
Wan, N. (2015). Technology Integration and the Flipped Classroom. In: N. Wan (Ed.), New DigitalTechnology in Education (pp. 149-170). Switzerland: Springer International Publishing.
8ICTMT 13 197 Lyon 3 - 6 July 2017

198

Chapter 5
TEACHER
ICTMT 13 199 Lyon 3 - 6 July 2017

MOOC FOR MATHEMATICS TEACHER TRAINING: DESIGN
PRINCIPLES AND ASSESSMENT
1Gilles Aldon, 2Ferdinando Arzarello, 1,2Monica Panero, 2Ornella Robutti, 2Eugenia Taranto, 3JanaTrgalová
1S2HEP-EducTice, Institut Français de l’Education, ENS de Lyon, France, 2University of Turin,Italy, 3Claude Bernard University Lyon 1, S2HEP (EA4148); [email protected],[email protected], [email protected], [email protected],
[email protected], [email protected]
This paper reports on an ongoing international research about MOOCs for in-service mathematicsteacher training. We describe and analyse two different experiences of this kind: the Italian MOOCGeometria and the French MOOC eFAN Maths. Both MOOCs aimed at supporting the teachers’professional development through a suitable mediation of technology and at triggering as much aspossible the teachers’ engagement so that they could develop from a non-community towards one ormore communities of practice. As authors of this paper, we are members of the trainers’ team of therespective MOOCs and we also participated in the design. Starting from our methodologicalchoices, we want to propose some reflections about design principles of MOOCs for mathematicsteacher training in order to foster participation and collaboration among trainees and to efficientlyassess this kind of engagement.
Keywords: MOOC, design principles, project-based assessment, completion rate
INTRODUCTION
The Massive Online Open Courses (MOOCs) are becoming widespread as a training tool inuniversities (Pomerol et al., 2015) and management institutions (Porter, 2015) and also for in-service teacher training, but not so much for mathematics teacher training.
Our paper describes and analyses a double experience gained in France and in Italy with MOOCs ofthis kind, delivered to mathematics teachers, mainly from secondary schools, with the aim ofincreasing their professional competencies and improving their classroom practices.
In fact, there are at least three main problems in MOOCs: (i) How to trigger an active participation?(ii) How to assess in a trustable way the efficiency of the MOOC? and (iii) What type of technologyis better to use in order to get as positive results as possible in the previous two points? This lastissue assumes a specific connotation in the case of mathematics teachers. Our paper shows thatthere are different ways to catch the interest of trainees and we explore, compare and discuss themconsidering two different design approaches.
For the assessment issue, a first crude evaluation estimate consists in considering the drop-out rate.The literature suggests a mean of 95% rate (Bayne & Ross, 2013). In our cases the figures arecompletely different: in France it was about 88% (second experience), and in Italy 64% (firstexperience). In other joint papers (Taranto et al., submitted chapter; Panero et al., 2017; Taranto etal., 2017) we have described how a subtler analysis can help to develop a more sophisticatedassessment of the level and nature of participation in a MOOC for in-service mathematics teachertraining.
ICTMT 13 200 Lyon 3 - 6 July 2017

For the technology, we sketch how some 2.0 open source devices and software or professionalsocial network, suitably organized and exploited, can trigger and support an active participation ofthe trainees in the MOOCs activities.
Based on the analysis of the two experiences our paper faces the following two research questions:
(i) What design principles are useful to mediate teachers’ professional development courseswith technology?
(ii) How to assess the impact of such courses on mathematics teachers’ engagement?
AIMS AND DESIGN PRINCIPLES OF MOOC
In this section we explain the specific aims of each MOOC. They have been achieved taking intoconsideration precise methodologies and design principles: (i) promote educational innovation; (ii)stimulate reflection on the use of technology in the classroom and with the students; (iii) createcommunities of practices (Wenger, 1998) and support the sharing.
Italian MOOC: The MOOC Geometria
MOOC Geometria is a MOOC on Geometry, for training in-service mathematics teachers ofsecondary school (both lower and higher). 424 participants enrolled in it, all teachers in secondaryschool, from all over Italy. It was delivered on a Moodle platform called DIFIMA1 during 8 weeks:from October 2015 to January 2016. MOOC Geometria was designed by experienced teachers ofsecondary school in collaboration with some researchers in Mathematics Education from theDepartment of Mathematics of Turin University; the same team took care of delivering the course.These experienced teachers were trained in Mathematics Education and in innovation basing on thedidactical material of the [email protected] project (https://goo.gl/Q30Dn0), a plurennial National Programthat pushed innovation in mathematics teaching basing on concrete activities proposed to teachersand discussed with them in suitable training e-courses. The following needs had been identified:awareness of the role of training in teaching activities; willingness of developing best practices ofinnovation using software; reconsidering in terms of learning the sharing practices of social mediamost used by the students. Hence, it was decided to offer the opportunity of an authenticdevelopment experience designed for a larger group of teachers that could have become acommunity of practices (Wenger, 1998): that is the idea of the Italian MOOC Geometria.
In particular, five specific modules on geometric contents were created. The activities had a weeklybasis and the duration of each section varied from 1 to 2 weeks (depending on the treated topics).All the activities are based on mathematics laboratory and MERLO2 assessment tools. As pointedout above, they are inspired by [email protected] project and are transposed in a digital format following theE-tivity framework (Salmon, 2013). The E-tivity are designed before opening the MOOC toparticipants. They provide learners with an effective scaffolding to support them in achieving thelearning outcomes: in fact, they promote a learner-centred task and problem-based approach toonline learning (moving away from content-centric design) and find easily purposeful ways of usingfreely available, topical and/or game-based resources within the learning design.
To motivate participants to contribute and consolidate ideas in a focused way, and, at the same time,to collaborate and communicate, specific technological tools were selected. There are only open
1 DIFIMA: Didactics of Physics and Mathematics (http://difima.i-learn.unito.it/), hosted by the Department of
Mathematics of Turin University
2 MERLO: Meaning Equivalence Reusable Learning Object (Arzarello et al., 2015)
ICTMT 13 201 Lyon 3 - 6 July 2017

source tools in the MOOC (e.g. Geogebra, Dynamic Geometry System), thus respecting the Open inthe MOOC acronym and, above all, enabling teachers to easily fit in with them in their teachingpractices. In the design we took into account also the TPACK model (Mishra & Koehler, 2006) withthe intention of enlarging the mathematical technological knowledge of the trained teachers. Inparticular, with respect to the 7Cs (Conole, 2014), a great attention was given to “Communicate”and to “Collaborate”, focusing on the choice of the best tool to be used both for a catchy and easyonline access presentation of a selected content and for supporting the communication andcollaboration among the participants in the course. In fact, specific communication message boardsfrom web 1.0 to web 2.0 were selected (Forum, Padlet - https://it.padlet.com/, Tricider -https://www.tricider.com/). Trainers reduce their interventions in this space as much as possible forfostering the development of an interactive only-trainees community. However, trainers were“behind the scenes”: they sent weekly emails to inform all participants about the progress of theirexperience training; they also intervened when technical problems came up (sometimes even withan email to a single person). Real moments of contact with the trainees were the three webinars.They are online meetings in which an expert shares with the participants some issues about theresearch in mathematics education and focuses on some questions that could be raised during theprevious weeks in the MOOC. During the webinars the participants had the opportunity of takingpart in a chat in synchronous way. All of the three webinars had a high participation (from 90participants in the first one to 50 in the last one) and consensus by the trainees, who posed manyquestions and doubts.
French MOOC: MOOC eFAN Maths
MOOC eFAN Maths (Enseigner et Former avec le Numérique en Mathématiques – Teach and trainwith digital technology in mathematics) is a MOOC about teaching mathematics with technology,for training in-service mathematics teachers and teacher educators, particularly from secondaryschool. The second season of the MOOC eFAN Maths was delivered on the French MOOCsnational platform, called FUN (France Université Numérique) from the 8th of March to mid-April2016. The MOOC eFAN Maths was organised in five weeks, each proposing three video-lessons onkey concepts of technology in mathematics education, one multiple-choice test per lesson, anactivity related to the theme of the week and a few articles for in-depth study. The examplesdiscussed in the video-lessons were selected and adapted from different European research projects(e.g., FaSMEd3, MC Squared4) with a focus on the use of technology supporting formativeassessment and enhancing creative mathematical thinking.
The trainers were also members of the designers’ team of the MOOC, composed of experiencedsecondary school teachers and researchers in Mathematics Education working at the Ifé (FrenchInstitute of Education) of the Ecole Normale Supérieure de Lyon. The designers were motivated bya double institutional aim: to support teachers and teacher educators in understanding andimplementing the new French curriculum (applicable since September 2016 in all French primaryand secondary schools) and to promote collaboration within the French-speaking mathematicseducation community.
The designers’ methodological choices can be explained according to some of the “pillars of anaccompanied auto-training” introduced by Carré (2003). Inspired by these pillars, the designers triedto manage and equilibrate the interplay of the individual project with which each trainee enrols in a
3 Formative Assessment in Science and Mathematics Education (fp7/2007-2013 grant agreement n.612337).
4 Mathematical Creativity Squared (ICT-2013.8.1 "A Computational Environment to Stimulate and Enhance Creative
Designs for Mathematical Creativity", Project 610467).
ICTMT 13 202 Lyon 3 - 6 July 2017

training, the pedagogical contract between trainers and trainees, the trainees’ pre-training to usesome particular tools (such as the possibility to access tutorials), the role of the trainer as afacilitator, and the presence of an open environment. The designers provided an open environmentto encourage trainees’ participation in the training. Only free open-source tools were presented, sothat teachers could easily find and appropriate them. Moreover, to foster collaboration betweentrainees, they were invited to join a professional social network for teachers, called Viaéduc(www.viaeduc.fr), where trainees could gather together around a shared project constituting publicgroups (so that any trainee could read the work of any other group and follow any discussion). Sometrainers worked as community managers: they helped trainees to solve technical problems, such ascreating an account on Viaéduc; they made tutorials for using FUN and Viaéduc platforms; theycreated and regularly updated a list with all the trainees’ ongoing projects to help teachers to find aproject to join; they recalled the tasks to be done week by week. Furthermore, every week beganwith a quick video titled “From one week to the other” in order to bridge two consecutive weeks ofthe MOOC. Finally, to cultivate and induce the generation of trainees’ groups as communities ofpractice, one trainer per group followed the development of the group project from the inside,intervening to encourage and trigger the collaborative work (Panero et al., 2017). This representsalso a special condition of the pedagogical contract between trainees and trainers.
The total number of participants enrolled in the MOOC on the FUN platform was 2572, mostlyFrench-speaking mathematics teachers and teacher educators interested in the use of technology.However, only 737 trainees decided to join Viaéduc and work on collaborative projects.
PROJECT-BASED ASSESSMENT
In this section we illustrate the activities expected by the participants in each MOOC. In bothMOOCs we chose a project-based methodology for assessing the trainees’ participation, butarticulating it in different ways, and both turned out to be efficient.
Italian MOOC: Project Work with Learning Designer
Every week the trainees had an individual work and interfaced themselves with methodologies atdifferent levels, in order to collect their weekly badges: watching a video where an expertintroduced a conceptual knot of the week; watching a “cartoon video” with some guidelines to carryout the units; reading the geometry activities based on mathematics laboratory (and possiblyexperimenting them in their classroom). Moreover, they had to use the suitable communicationmessage boards (Forum, Padlet, Tricider) to express opinions about the content of the course, makea comparison between colleagues, and benefit from experiences or ways of thinking of others. Therewere a collaborative climate and, surprisingly, some of them started to voluntarily share materialcreated by themselves and that they were using in their lessons. This is certainly an aspect that doesnot occur in a traditional training course.
The MOOC design included as a final module two production activities: the design of a teachingactivity (or Project Work, hereafter PW) and the review (or Peer Review, hereafter PR) of a projectdesigned by a colleague. The time available to perform these last activities was two weeks. For allthose who took part in all MOOC stages (that is, accomplishing all tasks for collecting all weeklybadges and accomplishing the PW and PR), a participation certificate was issued by the MathDepartment of the University of Turin.
It was not necessary that the PW was experienced in class to carry out a PR: it was an activity to bedone remotely, demonstrating teaching competencies and experience. In fact, PW and PR have beendesigned to give the participants the opportunity to get involved in the MOOC activities in terms of
ICTMT 13 203 Lyon 3 - 6 July 2017

methodology, creativity, and with the aim of sharing and discussing them in the community. Eachtrainee could choose individually a geometrical theme taking a cue from those of the MOOC oreven choosing a new one. A lot of freedom was given in the design of the PW both because asteachers the trainees had surely already had experience with these activities (and we as trainers didnot want to influence them) and to give space to their creativity. Moreover, the PW had to be donethrough a web-based tool, the Learning Designer (hereafter LD) designed by D. Laurillard (2012).LD is a software that guides and encourages the planning of the lesson: it is characterized by astandard format that allows the integration of technologies (the teacher can include links to materialthat s/he has produced or that is on the net); it allows you to have an overview of theteaching/learning dynamics centered on the student and allows sharing of what you have producedonline. In order to familiarize the trainees with LD we created both a video tutorial (suggested vialink) and a paper-based tutorial: they were made available two weeks before the opening of the lastmodule. For this tutorial supports we detected 411 readings: these figures show its utility.
It was considered important to ask the trainees to make a PR of a colleague’s PW in order to have ananalysis from an educational point of view, generated by the eyes of a teacher who had no other aimthan the analysis of the asset itself. The instructions for the PR were given in a more specific waycompared with the PW. We specified the review criteria to follow, because we wanted to focusattention on the main aspects of each educational intervention and, for the purposes of the MOOCitself, on a conscious use of instruments and of digital software.
The deadline had been announced as "sharp" because we wanted to allow everyone to be able tocontinue with the peer review. However in the forum dedicated to technical problems, some traineesexpressed the need of having more time available to accomplish their PW. As trainers-designers, weare taking this feedback into account for the next season of the MOOC.
In the last module of the MOOC, the participants were asked to complete a final questionnaire: wecould so receive a feedback on their experience of distance learning, as well as their impressionsabout the latest activities (for more information see: Taranto et al., 2016).
French MOOC: collaborative project on Viaéduc
Week by week, the proposed activities aimed to support trainees in the design of a mathematicaltask integrating the use of a digital tool. The phases of the project design consisted of: a) adescription of the mathematical task; b) a toolkit made of digital or non-digital artefacts andresources with the related usage schemes within the designed task; c) an analysis of the students’expected mathematical activity and interactions with the artefacts; d) an analysis of the teacher’srole in orchestrating the situation in the classroom.
The activities of the weeks devoted to students’ and teacher’s role relied on two grids designed,uploaded and commented by the trainers. They helped to analyse the designed mathematical taskand the role of technology from the point of view both of the students and of the teacher. Theyconsisted in guiding questions grounded on the instrumental approach (Artigue, 2002, Rabardel,1995) and on the instrumental orchestration (Trouche, 2004), which were both introduced in thelessons delivered in the corresponding weeks. To encourage collaboration, trainees were invited towork on the proposed activities in a collaborative way, by forming groups around common interestsfor a mathematical theme on Viaéduc a platform that essentially allows members to post comments,to create groups, to create and publish documents and to comment/recommend/share them. Groupmembers can work collaboratively either asynchronously, being authors of the same onlinedocument, or synchronously, writing on the same online collaborative board (padlet).
ICTMT 13 204 Lyon 3 - 6 July 2017

The project, collaboratively written, went through two phases of evaluation: a peer evaluation withthe possibility of improving the work basing on the received feedback, and a trainers’ evaluation(the evaluator was the trainer who followed the group from the inside). An evaluation grid wasconstructed by the trainers to encompass all the phases of the project design, developed in theMOOC week after week. This grid was structured around the following four criteria: 1) Accuracy ofthe definition and description of the project; 2) Relevance of the mobilised digital tools andresources with respect to the educational goals of the designed mathematical task; 3) Relevance ofthe analysis of the students’ expected mathematical activity; 4) Relevance of the analysis of theteacher’s role.
For each criterion, some guiding questions were proposed with a double objective: to foster theproduction of justified feedback and to deepen the reflection carried out in the previous weeks of theMOOC. The grid finally asked for a brief global feedback on the project and some suggestions toimprove the work. Each trainee was invited to use the grid individually to evaluate the project ofanother group, by answering each guiding question with an evaluation: very good, satisfactory,fragile or insufficient, accompanied by a justification. The community managers gradually collectedfeedback and comments in a table and shared it in a specific space on Viaéduc, called “Projectevaluation”, so that all the trainees could access them.
After the MOOC, a questionnaire was sent to all the enrolled participants to get feedback on such anexperience of distance training, with a particular focus on the collaborative project and collaborativetools of Viaéduc. As trainer-designers, we are taking this feedback into account for the third seasonof the MOOC.
DISCUSSION AND CONCLUSIONS
In this paper we have introduced and compared two different MOOCs for training in-servicesecondary schools mathematics teachers, one in France and one in Italy. The courses were designedaccording to a different structure in the two countries, because of the different institutional schoolbackgrounds and traditions, but they had two common goals: (i) to foster the professionaldevelopment of teachers through a suitable mediation of technology; (ii) to trigger as much aspossible the engagement of participants in order that they could develop from a non-communitytowards one or more communities of practice (and possibly of enquire). These two goals are relatedto the two research questions listed above and put forward some challenging methodological issuesfor the research teams: the design principles and the assessment of teachers’ engagement.
For the design both teams had to hypothesize a “common” zone of proximal development(Vygotsky, 1978) of participating teachers with respect to their pedagogical and mathematicalknowledge mediated by technology – what Mishra and Koehler (2006) call TPACK – so that theproposed activities could be interesting for the majority of trainees and introduced them to situationsthey were able to approach and elaborate. The MOOCs were also a training opportunity for sharingthe results and the reflections about research projects with the community of teachers. But the majorrelated problem was to transpose such an information into the MOOC environment, namely we hadto transpose the usual methodology of training courses into images, words, videos, and nothing else:we had so to choose friendly open source tools that could be easily available and that could be easilyused in the trainees’ activities in their own classrooms. We had to support the developingcommunity not imposing the team’s presence but being vigilant and ready to intervene promptly incase some help is required. Implementing some webinars in the MOOC, where the “expert” couldcommunicate through a video-chat with the trainees, as well as proposing a trainer per group as apersonal tutor, had the purpose (and effect) of making trainees feel accompanied and become
ICTMT 13 205 Lyon 3 - 6 July 2017

faithful followers. As said above, the positive effects of such a complex design were tangible: infact, while the literature says that the percentage of people who complete a MOOC is about 5%(Bayne & Ross, 2013), in the French MOOC it was 12%; in the Italian MOOC Geometria it was36%; and in the successive Italian MOOC Numeri it was 43%.
To concretely check the possible development of communities of practice, some more creativityfrom the designers’ teams was required: it is not an easy task to extract data from the MOOCenvironment, where the researchers must base only on the stored traces and messages that theparticipants leave on the MOOC devices, on the tasks they upload and on their answers to thequestionnaires. Of course this second issue is strictly linked to the previous one: having data easy toaccess strongly depend on the type of activities required to the participants and to their willingnessto do them. Hence a first filter consists in checking if the trainee has accomplished all the requiredtasks. For this, a good strategy could be using a gamification context within the training: e.g., inItalian case, each week a badge was automatically released to those who did everything: thesequence of the got badges certificated the level of participation to the course. A second importantevaluation tool is the elaboration of a final project, where the trainee could show how she was ableto apply what had been presented in the course. This second evaluation was based in both MOOCson a peer review, complemented in France with a trainers’ evaluation of the project necessary fordelivering the university certificate. We took care of this aspect, and we recommend to do it asMOOC designers, because obtaining such a certificate of completion by universities can be animportant stimulus for teachers to engage in distance training. The (relatively) good percentage ofpeople who ended the MOOCs shows that this goal was positively achieved in both cases.
Of course not everything was rosy in our experience. In both MOOCs we realized that a project-based methodology can create a gap between the timeline of the MOOC (videos, quizzes, activities)and the timeline of the project, which can destabilize the trainee in some cases. For these reasons, inthe following seasons of the MOOCs, the time factor has been taken into greater account, leadingalso to modify some aspects of the design.
ACKNOWLEDGEMENTS
We thank the entire MOOC Geometria team and, in particular, Virginia Alberti and Sara Labasin fortheir help and their crucial contribution to the design and managing of the project. We thank LucTrouche, Pierre Bénech and the entire MOOC eFAN Maths team. Without them neither the MOOCnor this paper would exist.
REFERENCES
Artigue, M. (2002). Learning mathematics in a CAS environment: The genesis of a reflection aboutinstrumentation and the dialectics between technical and conceptual work. International Journalof Computers for Mathematical Learning, 7, 245–274.
Arzarello, F., Robutti, O., & Carante, P. (2015). MERLO: a new tool and a new challenge inmathematics teaching and learning. In Beswick, K., Muir, T., & Wells, J. (Eds.). Proceedings of the39th Conference of the International Group for the Psychology of Mathematics Education, Vol. 2,pp. 57-64. Hobart, Australia: PME.
Carré, P. (2003). L’autoformation accompagnée en APP ou les sept piliers revisités. Les ateliers depédagogie personnalisée ou l’autoformation en actes, P. Carré et M. Tétart (dir.), Paris,L’Harmattan.
ICTMT 13 206 Lyon 3 - 6 July 2017

Conole, G. (2014). The 7Cs of learning design a new approach to rethinking design practice. InProceedings of the 9th International Conference on Networked Learning (pp. 502-509).
Laurillard, D. (2012). Teaching as a design science. London: Routledge.
Mishra, P., & Koehler, M. J., (2006). Technological pedagogical content knowledge: A frameworkfor teacher knowledge. Teachers college record, 108(6), 1017-1054.
Panero, M., Aldon, G., Trgalová, J. & Trouche, L. (2017). Analysing MOOCs in terms of theirpotential for teacher collaboration: the French experience. Presented to TWG15 of the 10thConference of European Research on Mathematics Education (CERME). Dublin, Ireland.
Pomerol, J. C., Epelboin, Y., & Thoury, C. (2015). MOOCs: Design, use and business models. JohnWiley & Sons.
Porter, S. (2015). To MOOC or not to MOOC: How can online learning help to build the future ofhigher education?. Chandos Publishing.
Rabardel, P. (1995). Les hommes et les technologies ; approche cognitive des instrumentscontemporains. Armand Colin.
Salmon, G. (2013). E-tivities: The key to active online learning. Abingdon, UK: Kogan Page
Taranto, E., Alberti, V., Labasin, S., Arzarello, F., Gaido, S. (2016). Project Work e Peer Review:attività conclusive di un MOOC di matematica per la formazione docente. Atti diEMEMITALIA2016
Taranto, E., Arzarello, F., Robutti, O., Alberti, V., & Labasin, S. (submitted). A MOOC on Geometryfor teachers designed by teachers. In V. Hoyos, J. Silverman, R. Barcelos-Amaral, R. Vogel (Eds.),Distance Learning, E-Learning and Blended Learning of Mathematics: Advances in the Researchof Distance Mathematics Education Mediated by Technology (pp. XX-XX). Springer
Taranto, E., Arzarello, F., Robutti, O., Alberti, V., Labasin, S., & Gaido, S. (2017). AnalysingMOOCs in terms of their potential for teacher collaboration: the Italian experience. Presented toTWG15 of the 10th Conference of European Research on Mathematics Education (CERME).Dublin, Ireland.
Trouche, L. (2004). Managing complexity of human/machine interactions in computerized learningenvironments: Guiding students’ command process through instrumental orchestrations.International Journal of Computers for Mathematical Learning, 9, 281–307.
Vygotsky, L. (1978). Mind in society. Cambridge, MA: Harvard University Press.
Wenger, E. (1998). Communities of practice: Learning, meaning, and identity. Cambridge universitypress.
ICTMT 13 207 Lyon 3 - 6 July 2017

THE EFFECT OF COLLABORATIVE COMPUTERIZED LEARNING
USING GEOGEBRA ON THE DEVELOPMENT OF CONCEPT IMAGES OF
THE ANGLE AMONG SEVENTH GRADERS
Nimer Baya'a1, Wajeeh Daher1,2 and Samah Mahagna1
1Al-Qasemi Academic College of Education, Baqa-El-Gharbia, Israel; [email protected] National University, Nablus, Palestine
This research intends to investigate the effect of collaborative computerized learning usingGeoGebra on the development of the concept images of angle among seventh graders who wereengaged with computerized collaborative activities that encouraged the development of five types ofthe angle concept images: verbal, authentic-life, graphical, numeric and dynamic. The researchsample consisted of eight seventh grade students who worked collaboratively in groups of two. Twotests (a pre-test and a post-test) were administered to examine the development of students’ conceptimages of the angle. In addition, interviews were held with the participants to study thisdevelopment. The Constant Comparison Method was used to analyze the data. The results showedpositive effects of the visual and dynamic use of GeoGebra, as well as of the collaborative learningon the development of participants' concept images of the angle, especially the dynamic one.
Keywords: Angle, Concept Image, Dynamic Image, Collaborative Learning, ComputerizedLearning
INTRODUCTION
If students do not adequately understand concepts related to angles, their cognitive understanding ofsubsequent topics in geometry in particular and daily life activities connected with geometricconcepts in general will be affected negatively (Alkan & Altun, 1998). Moreover, the concept ofangle will never be fully grasped until students can identify and distinguish it easily, andconsequently; use it better in their life. This can only be achieved through displaying the angledynamically by the use of technological tools such as GeoGebra, Applets, etc., which promote andfacilitate learning geometry. Once technology is used properly, the learning environment becomessuitable for visual and dynamic investigations, through which students will grasp geometricalconcepts better (NCTM, 1989). In the present research, we try to find how GeoGebra helps seventhgrade students develop the concept of angle.
In addition to the use of technological tools that promote students’ investigations of mathematicalconcepts, collaborative learning encourages students to participate, argue with each other, and raisequestions for discussions, resulting in internalizing mathematical concepts. Furthermore, duringcollaborative investigation, wrong concepts are raised for discussion in order to be corrected. This isbetter than getting the right answers directly in order to conceive the mathematical conceptdefinitions.
Concept image
A concept image refers to the total cognitive structures that are associated with the concept andincludes all the concept images of the individual, as well as the associated properties and processeswhich have been built up over the years through experiences of all kinds; they are likely to changedepending on the different stimuli the individual receives (Tall & Vinner, 1981). It is possible for theconcept image to be totally different from the formal concept which is scientifically acceptable. This
ICTMT 13 208 Lyon 3 - 6 July 2017

difference may lead to the emergence of knowledge-based conflict (Lambertus, 2007). Vinner andDreyfus (1989) stated that students divide concepts into definition and concept images, withoutrelating properly the formal definition to their concept images.
The concept image develops based on the type of ideas being learnt by students at different stages.More specifically, they change according to students’ experiences, examples they had, and theirawareness of mathematical concepts (Tall, 1992; Vinner & Dreyfus, 1989). Concept images can beincarnated into verbal forms; however, these verbal forms are not the first thing that stimulatesstudents’ memories (Vinner, 1991).
The concept image of angle
Based on what had previously been mentioned, when students are exposed to technology, they areintroduced to new experiences and various examples, due to the fact that concepts are dynamicallypresented with different forms and different representations. Consequently, technological tools suchas GeoGebra are conceptual tools that support students in developing multiple concept imagesassociated with mathematical concepts (Battista, 2002; Choi-Koh, 1999; Dixon, 1997). Amongthese concept images is the dynamic representation of the mathematical concepts.
Mathematical curricula usually lack dynamic representation of the angle concept, which is normallyseen as a fixed entity by students. For instance, students do not realize what happens to the angleafter rotating or extending one of its rays. Moreover, most curricula concentrate on four conceptimages of the angle: verbal, authentic-life, graphical and numeric. Therefore, the teaching unit thatwe built to develop the various concept images of the angle took in consideration also the dynamicconcept image of the angle, hoping to improve the perception of this concept.
There is no doubt that the concept of angle is multifaceted, therefore, researchers had given differentdefinitions for the concept of angle (e.g. Lo, Gaddis & Henderson, 1996). These definitions includethe rotation of a ray around its endpoint, the geometrical shape formed when two rays meet at theirendpoints, the area enclosed between two rays that meet in one endpoint, etc. For this reason,students may have a set of different images for the concept of angle.
Some researchers (e.g., Clements & Battista, 1992; Mitchelmore & White, 2000), pointed out thatstudents do not realize angle as a rotation of a ray, therefore, their perception of the concept ispartial and superficial rather than complete and deep. Mitchelmore and White (2000) conducted astudy to identify the way students from grades (2 - 8) define the angle concept. They found that thestudents looked at an angle as a point and two arms. Many students in the eighth grade still do notrelate rotation to the concept of angle. Therefore, these students have wrong perception of the angleconcept, as they believe that the length of the angle arms affects its value.
Several studies showed that technology helps represent the angle dynamically, which enablesstudents to notice the rotation of the ray and how this affects the value of the angle (Battista, 2002;Choi-Koh, 1999; Dixon, 1997; Kakihana & Shimizu, 1994).
The authors of the current study reviewed the mathematics curriculum of the seventh grade in Israel,and they found that this curriculum presents four different types of representations of the angleconcept: verbal, authentic-life, graphical and numeric. In more detail, according to this curriculum,the seventh grade students should possess different meanings related to angles including: definingand representing angles verbally, representing angles in daily life experiences, drawing angles andmeasuring angles. This study focused on the development of the angle ideas and representationsamong seventh grade students after carrying out a number of computerized collaborative activities.
ICTMT 13 209 Lyon 3 - 6 July 2017

Research question
What is the effect of computerized collaborative learning based on GeoGebra on the development ofconcept images of the angle concept among seventh graders?
RESEARCH METHODOLOGY
The research procedure, context and participants
The participants consisted of eight female seventh graders (12-13 years old) who were grouped intofour pairs. The students were of various levels including weak, good, and excellent students. A pre-test and a post-test were built to measure the development of the different types of representations ofangle concept including: the verbal, the authentic-life, the graphical, the numeric and the dynamic.After teaching the unit, the students were interviewed individually in order to identify theirdevelopment of the angle concept images.
The research tests
A pre-test and a post-test were administered to identify the concept images of angle among seventhgraders. The researchers used the curriculum of the elementary school in Israel to build the pre-testand the post-test based on the angle ideas in the curriculum. According to this curriculum, the sixthgrade students should possess different meanings related to angles including: Defining andrepresenting angles verbally, representing angles in daily life experiences, drawing angles andmeasuring and calculating angles. The unit developed includes also the dynamic image of angles.The students took the pre-test before carrying out the collaborative computerized activities includedin the teaching unit. Later, they took another test (a post-test), where the results of the two tests werecompared to arrive at the development of students’ concept images in the five representations.
Data analysis method
The Constant Comparison Method was used to obtain various themes related to the manifestation ofthe five representations of the angle. Then, the participating students' concept images of the anglemanifested in the post-test were compared with those in the pre-test.
The teaching unit
We chose GeoGebra for its visual and dynamic features that can assist the students in investigatingand discovering independently and collaboratively various mathematical representations of theangle concept and its components. The students were also given the opportunity to construct variousangle representations through performing teacher-guided activities. More specifically, we developeda unit that utilizes computerized collaborative learning using GeoGebra and based on GuidedDiscovery. The unit included seven activities that aim to develop different representations of theangle concept. The activities were based on investigation to help the students discover the differentrepresentations of the angle. It also included construction activities to help them constructmathematical objects related to the angle concept in order to understand the angle manifestations.The students were also asked to observe the effect of the dynamic changes on the anglerepresentations. The collaborative aspect was also stressed through the instructions in the activitiesbefore and during performing the activities. For example, some of the teacher’s instructions were:
A) When solving a problem, think aloud and describe to your mate the solution steps asking her forhelp.
B) When your mate performs a move in GeoGebra, ask her to explain this move and discuss it withher.
C) Discuss together and write a proper definition of the angle.
ICTMT 13 210 Lyon 3 - 6 July 2017

D) Explain this phenomenon to your mate and discuss it with her. E) Discuss, with your mate, the other angles you see in the pyramid, and explain why these are
considered angles.F) Construct an angle using an icon in GeoGebra and give your mate a chance to construct other
angles herself.G) Raise a conjecture and ask your mate to verify its correctness.H) Formulate a definition of the angle based on the way you constructed it in GeoGebra; then ask
your mate to check how exact the definition is, by constructing an angle in GeoGebra using thisdefinition, or constructing an example of a shape which is not an angle but satisfies theconditions of the definition.
RESEARCH RESULTS
The main objective of this research was to identify the effect of computerized collaborative learningusing GeoGebra on the development of the images of the angle concept among seventh graders. Inthis section we shall summarize the development of the images of the angle concept due tocollaboratively being engaged with the angle concept with the help of GeoGebra.
Verbal image
The research results showed significant development of verbal perception of the ray concept and,consequently, the angle concept. Before the experiment, the students could not define the raycorrectly saying that it is the distance between two fixed points. While after the experiment, all thestudents defined both the ray and the angle correctly based on their graphical manipulation of theseconcepts in GeoGebra. It was clear that the students' development of the graphical perception of theray and the angle led to the correct verbal perception of these concepts. For instance, the studentsdraw the ray in GeoGebra starting with an endpoint, so they defined it as a straight line which has anendpoint from one side only.
Authentic-life image
During the experiment, the students developed various meanings of the authentic-life representationof the angle. For instance before the experiment, the students expressed the angle in daily life onlyverbally as the corner of a door, a window, or cover of an open book. They also talked only aboutright angles in daily life, and did not mention any dynamic ones. However, the students, after theexperiment, had developed deeper understanding of the angle concept to the extent that they startedto talk about different types of angles in daily life both verbally and graphically. For instance, theybegan to talk about and draw angles formed by an open window, the angle made by the back and thebase of a chair, the angle formed between the pen and the sheet of paper, the angle of an open fridgedoor, the angle of an open laptop, the angle formed by the hands of a clock, or the subtended angleformed by the observer's eye when looking at an object (for example: a building).
Furthermore, the students developed wide perception of the angle concept as a dynamic one that canbe moved and controlled based on their daily needs. For instance, the angles formed when they opena laptop, when they move a pen on a sheet of paper, when they move their heads, also angles formedby the movement of the hands of a clock, or subtended angles formed by the observer's eye whenlooking at an object. They could notice the change in the angle's value according to the movementof its sides or its vertex as in the subtended angle case. The study also showed that prior to theexperiment, the students mentioned only two important aspects of angles in daily life: beauty andorganization. Yet after the experiment, the students listed four further important aspects inperforming daily tasks: household chores, practicing sports and writing and reading. All in all, the
ICTMT 13 211 Lyon 3 - 6 July 2017

development the student had with respect to the angle concept resulted in developing students'perception of its vital roles in their daily lives.
Graphical image
There was a noticeable development in students' abilities to perceive graphically the angle concept.For example, the participants mentioned only three types of angles before the experiment (acute,obtuse and right). Furthermore, the students were not able to draw all three types of angles in onegeometrical shape. However, after using GeoGebra, and through collaborative leaning, the studentsstated five different types of angles (acute, obtuse, right, straight and reflex) and managed to drawall of them using one geometrical shape.
Numeric image
Before the experiment, the students stated that shrinking or extending the side of an angle affects itsvalue considerably; yet after the experiment, the students denied this claim and stated that thechange in the length of the angle sides does not affect its value, because angles are formed byrotating a ray, and the lengthening or shortening of that ray does not affect the size of the angleformed by its rotation.
Dynamic image
The students of the seventh grade were not capable of dealing with the problems related to thedynamic perception of angles on the pre-test. For example, they could not imagine the effect ofmoving one of the angle's components such as the vertex or a side on the angle's value. After theexperiment, the students managed to overcome problems of this type on the post-test to the extentthat they provided valid verbal and graphical justifications for most of them based mainly on theidea that an angle is a rotation of a ray.
After carrying out the activities, the students stressed, during the interviews, that before usingGeoGebra it was very difficult for them to imagine what happens to the angle when they stretch orshrink one of its sides, or move its side or its vertex. On the other hand, when they started to use it,they were able to imagine every possible change that might happen when moving any part of theangle. Therefore, they began to realize the importance of angles in their daily lives and howdynamic they are. For example, they started noticing the change in the value of the subtended angleof a particular object to the observer's eye when approaching or moving away from it, or the changein the value and the shape of the angle when a laptop screen is moved in order to use it in acomfortable position and to see the objects on the screen properly.
DISCUSSION
The study results showed that using computerized collaborative environment helped studentsdevelop their images of the angle concept, mainly the dynamic and daily-life images. Before theexperiment, these students managed to express the angle concept mainly verbally, considered onlyright angles and did not view angles as dynamic objects. This indicates that the participants hadpartial perception of the angle, which was reflected also in the examples they gave in the pre-test.After working visually, dynamically and collaboratively with angles, we notice that the students’perception of angles got more profound through expressing various kinds of angles from their dailylife verbally, graphically and dynamically. This advancement achieves one of the objectives of theNCTM (2000), which emphasizes the importance of linking mathematics with students’ daily-life aswell as their personal matters. Moreover, the development of students’ perception of the angle asdynamic object could be due to the use of the dynamic features of GeoGebra, such as dragging thatthe students utilized when carrying out the activities (Anabousi, Daher, & Baya’a, 2012).
ICTMT 13 212 Lyon 3 - 6 July 2017

Furthermore, students’ interactions with dynamic diagrams, in our case angles in GeoGebra, enabledthem to see how dragging changes the angle graphically as well as its measures, which allowed theparticipating students to find characteristics of the angle that might remain hidden in static diagramsof the angle (Gonzalez & Herbst, 2009). Moreover, these interactions with dynamic anglesconstituted strategic use of a content-specific mathematics technology that supported the students inexploring and identifying the geometric concept with which they worked (NCTM, 2015); i.e. theangle.
With respect to students' graphical images of angles, it is possible to attribute students' developmentin recognizing various types of angles and drawing them in the same shape to a number of factorsincluding: the construction process using GeoGebra and the dragging process which helped studentsnotice how angles change. Besides, the activities instructions (e.g. moving one side of the angle andidentifying the type of the resulted angle) helped the students develop various concept images of theangle. In addition, collaboration and discussion helped in increasing students' awareness of variousaspects of the angle concept. All these interpretations are consistent with the claim that the conceptimages of a particular concept are the result of students' experiences, including examples, of thismathematical concept (Tall, 1992; Vinner & Dreyfus, 1989). Furthermore, the teacher’s actions andinteractions with the students, including the activity instructions, presented her as an orchestratorand coach of the strategic use of GeoGebra for the learning of the angle concept (NCTM, 2015).
In terms of the numeric image of angles, the students stated, before the experiment, that theextension or shrinking of the ray of the angle affects the angle’s size. After the students’ engagementwith angles collaboratively utilizing GeoGebra, they noticed that neither the extension nor theshrinking affects the size of the angle, because an angle appears as a consequence of rotating a rayand has nothing to do with the decrease or increase of the two sides of the angle. This developmentof students’ numeric concept of the angle was supported by the software potentiality ofmeasurement that enabled the students to verify their claims and substantiate them (Gonzalez,2009). Furthermore, These findings emphasize the claim of Biber, Tuna and Korkmaz (2013) whoconcluded that when students have meaningful, real experiences of measuring and comparing anglesvia different methods, they become more likely to perceive the standard definition of the angle, andunderstand that the angle value is affected by the amount of the rotation of its ray rather than thelength of its sides. For this matter, our study concentrated on the use of technology and theimplementation of collaborative learning strategies for treating students’ misconceptions of angles.
As far as the dynamic image of the angle is concerned, the students' had developed deeperunderstanding of this image due to the use of GeoGebra in solving the problems in the activities asthe students emphasized during the interviews. They stressed that GeoGebra helped them imagineand perceive the angle concept deeper, especially when they realized it as an object resulting fromrotating a ray. This development of their dynamic concept of angles depended on working withGeoGebra which helps display ideas and concepts visually and dynamically through variousrepresentations that are mostly related to geometry and algebra (Anabousi, Daher, & Baya’a, 2012).Generally speaking, using technology encourages looking at angles as an act of rotating a ray aroundits endpoint, and thus helps overcome misconceptions related to the angle concept, as well aswidens the meanings associated with the mathematical concept (Battista, 2002; Chazan, 1988;Choi-Koh, 1999; Dixon, 1997; Kakihana & Shimizu, 1994).
In addition to the arguments above, the research results show the advantages of students’collaboration in groups or pairs. The participating students in the present research were urged tocollaborate with and criticize each other through discussions and comments. This collaborationsupported the students in carrying out the activities successfully (Gellert, 2014). The studentsmanaged to define the concepts correctly and gradually based on arguments and constructions
ICTMT 13 213 Lyon 3 - 6 July 2017

(Herbst, Gonzalez & Macke, 2005). These results show that it is necessary to allow students toconstruct, explore and investigate mathematical concepts by themselves, as well as to encouragethem to develop their knowledge of mathematics through collaboration with each other.
CONCLUSION AND RECOMMENDATIONS
The multiple visual and dynamic features of GeoGebra proved to be very helpful in collaborativesettings in deepening students' understanding of the angle concept as an object which can be movedand controlled. This led to widening their images of the angle, especially as they realized thatdifferent types of angles could be created when a ray is rotated. This what the students lacked priorto the experiment, for they were not able to express the angle created dynamically from rotation.The deficiency of not being able to see the angle as a rotation of a ray was stressed in previousstudies, concluding that it led to partial understanding of angles and misconceptions included in theimages of students of the angle concept. Here technology enabled seeing the angle as a rotation,which helped the students develop new image of the angle, that of rotation.
Specifically, collaboration among group members led to lively mathematical discussions about thedifferent images related to the angle concept. These discussions helped reach a concise and accuratedefinition of what an angle is, and consequently, led to understanding deeply the various images ofthe angle concept. The results of the present research agree with the consideration that small-groupdiscussions that involve students and their teacher and that focus on mathematical meanings throughproblem solving offer great potential for debate and argument (Gellert, 2014).
We recommend that teachers should share different examples of angles in the various angle images,especially the dynamic one. This could happen when encouraging students to construct andmanipulate visually and dynamically angles in GeoGebra. Teachers’ participation with students indiscussing ideas about angles, after and during students’ constructions of angles with GeoGebra,helps the students arrive at an acceptable accurate definition of the angle close as possible to thestandard one.
REFERENCES
Alkan, H., & Altun, M. (1998). Mathematics teaching. Eskiúehir: Open Education FacultyPublications.
Anabousi, A., Daher, W., & Baya'a, N. (2012). GeoGebra in the mathematics classroom. Jamea'a,16, 3-54.
Battista, M. T. (2002). Learning geometry in a dynamic computer environment. Teaching ChildrenMathematics, 8, 333-339.
Biber, C., Tuna, A. & Korkmaz, S. (2013). The Mistakes and the misconceptions of the eighth gradestudents on the subject of angles. European Journal of Science and Mathematics Education 1(2),50-59.
Chazan, D. (1988). Similarity: Exploring the understanding of a geometric concept. (TechnicalReport No. 88-15). Educational Technology Center, Cambridge, MA.
Choi-Koh, S. S. (1999). A Student’s learning of geometry using computer. Journal of EducationalResearch, 92, 301-311.
Clements, D. H. & Battista, M. T. (1992). Geometry and spatial reasoning. In D. Grouws (Ed.),Handbook of Research on Mathematics Teaching and Learning (pp. 420-466). Reston, VA:National Council of Teachers of Mathematics.
ICTMT 13 214 Lyon 3 - 6 July 2017
Dixon, J. K. (1997). Computer use and visualization in students’ construction of reflection androtation concepts. School Science and Mathematics, 97, 352-358.
Gonzalez, G. & Herbst, P. G. (2009). Students’ conceptions of congruency through the use ofdynamic geometry software. International Journal of Computers for Mathematics Learning, 14,153–182.
Gellert A. (2014). Students discussing mathematics in small-group interactions: opportunities fordiscursive negotiation processes focused on contentious mathematical issues. ZDM, 46(6), 855-869.
Herbst, P., Gonzalez, G. & Macke, M. (2005). How can geometry students understand what it meansto define in mathematics? The Mathematics Educator, 15(2), 17-24.
Kakihana, K. & Shimizu, K. (1994). The roles of measurement in proof problems analysis ofstudents’ activities in geometric computer environment. In D. Kirshner (Ed.), Proceeding of the18th conference of the international group for the psychology of mathematics education (Vol. 3,pp. 81-88).
Lambertus, A. J. (2007). Students understanding of function concept: concept image and conceptdefinitions (Unpublished Master Theses). North Carolina State University.
Lo, J-J., Gaddis, K. & Henderson, D. (1996). Building upon student experience in a collegegeometry course. For the learning of mathematics, 16(1), 34–40.
Mitchelmore, M. & White, P. (2000). Development of angle concepts by progressive abstraction andgeneralization. Educational Studies in Mathematics, 41, 209–238.
National Council of Teachers of Mathematics (NCTM) (1989). Curriculum and evaluationstandards for school mathematics. Reston, Va.: NCTM.
NCTM (2000). Principles and Standards for School Mathematics. Reston, Va.: NCTM.
NCTM (2015). Strategic use of technology in teaching and learning mathematics: A position of theNational Council of Teachers of Mathematics. Reston, Va.: Author.
Tall, D. (1992). The transition to advanced mathematical thinking: functions, limits, infinity. In D.Grouws (Ed.), Handbook of Research on Mathematics Teaching and Learning (pp. 495-514).New York: Macmillan Publishing Company.
Tall, D. & Vinner, S. (1981). Concept image and concept definition in mathematics with particularreference to limits and continuity. Educational Studies in Mathematics. 12, 151-169.
Vinner, S. (1991). The role of definitions in the teaching and learning of Mathematics. In D. Tall(Ed.), Advanced Mathematical Thinking (pp. 65-81).
Vinner, S. & Dreyfus, T. (1989).Images and definitions for the concept of function. Journal forResearch in Mathematics Education, 20(4), 356-366.
ICTMT 13 215 Lyon 3 - 6 July 2017

TEACHING WITH GEOGEBRA: RESOURCE SYSTEMS OF
MATHEMATICS TEACHERS
Gulay Bozkurt, Kenneth Ruthven
Eskisehir Osmangazi University; [email protected]
University of Cambridge; [email protected]
This paper reports from a study of use of the dynamic mathematics software, GeoGebra. This studyused Ruthven’s (2009) Structuring Features of Classroom Practice model to analyse the classroompractices of three teachers in English secondary schools. Here the particular focus is on howteachers manage their resource system with the use of GeoGebra. The main conclusion was that thestage teachers were at in terms of learning to teach with this software indicated differences inregard to establishing a functioning resource system especially in teaching the operation of thesoftware, preparing the dynamic files and the choice of tasks. It became evident that the mostexperienced teacher was more fluent in managing his system of resources.
Keywords: classroom practice, mathematics teaching, resource system, dynamic mathematicssoftware
INTRODUCTION
Although the influence of new digital technologies has been increasing over recent decades, theirincorporation into mathematics education has been slow. It has become apparent that teachers havea central role in the integration of technology in mathematics classrooms, and that this issue needsmore attention by research. Understanding the process that teachers go through to appropriatetechnology effectively into their instruction is of crucial importance to help facilitate successfulintegration. In this report the concept of ‘resource system’ will be used to describe a central aspectof the instructional environment of classrooms bearing on the use of technology. Ruthven (2009)has drawn attention to this concept as one of five key structuring features of classroom practice(alongside working environment, resource system, curriculum script and time economy), whichshape the use of technology in lessons and the kinds of professional knowledge required. Resourcesystem relates to collection of didactical tools and materials in use, and coordination of use towardssubject activity and curricular goals (Ruthven, 2014).
With the influx of new technologies in schools, on the one hand classrooms are filled withresources, which can be considered as providing more opportunities for learning. On the other hand,the usability and adaptability of new technologies can present challenges for some teachers andstudents since “resources are not self explanatory objects with mathematics shining clearly throughthem” (Adler, 2000, p. 207). Researchers have shown that the challenge of adaptability of dynamicgeometry software (DGS) lead the majority of teachers to use them in the more conventional typesas “a reduced and static use of the possibilities of the software”, and “the absence of autonomousexperimentation by students” (Laborde, 2001, p. 299). Additionally, Ruthven et al. (2008) arguesthat there is an ‘interpretative flexibility’ in the incorporation of dynamic geometry software intoeducational practices. The researchers highlight the difference between how mathematics educatorsinterpret DGS to be used in classrooms (e.g. more open student exploration) and how more typicalteachers use it in their teaching.
ICTMT 13 216 Lyon 3 - 6 July 2017

Where dynamic geometry has entered mainstream classrooms, it appears to be used to supportmore established forms of pedagogical practice, notably student activity directed towardsempirical confirmation of standard curricular results, often through guided discovery, asalready prevalent in the teaching of geometry in many educational systems. (Ruthven et al.,2008, p. 314)
In terms of the design of tasks, Laborde’s (2001) study indicated that it was challenging for teachersto go beyond textbook tasks when using DGS. Development of task design scaled from almosttraditional geometry tasks, to tasks that could only be approached in a dynamic geometryenvironment. The former indicated tasks typically applied in a paper-and-pencil environment oftensupported by a textbook and by applying available tools such as compasses and ruler. Using DGSon such tasks only facilitated drawing the shapes more accurately and quickly. In this regard,Laborde emphasised the fact that integration of DGS into mathematics teaching is a lengthyprocess. On the other hand, Monaghan’s (2004) study indicated that most of the teachers managedto leave aside their textbooks in their technology-based lessons. However, the tasks in theworksheets “emphasised students’ management of the computer software per se” as mentionedbefore. Similarly, findings from Erfjord’s (2011) study investigating teachers’ initial use of DGS inNorway indicated that two teachers used DGS with prepared instructional material focusing on thetechnical aspects of using DGS and had little explicit focus on the mathematics by mostly demoingfor students what they needed to do in technical terms. This offered students a good background tofurther develop their ability to use compasses. Dragging mode was utilised for checking theaccurate use of DGS rather than for provoking mathematical interpretation with the aim ofimproving students’ abilities of using compasses. Furthermore, Assude (2005) also reported that interms of use of compasses and Cabri there was not “any major changes with regard to the broadtypes of tasks: construction, description and property identification.” (p. 192). Similarly, Ruthven,Hennessy, and Deaney (2005) argue that the typical use of DGS proposed by teachers in England isto let students work with geometrical properties utilising the dynamic dragging-function; furtherthat many teachers in their teaching tried to control and constrain student work in order to avoidstudents spending too much time on the exploratory affordances in the DGS.
In this respect, this paper examines how three mathematics teachers establish their resource systemwith the use of GeoGebra –a dynamic mathematics software- in ordinary classrooms. The specificresearch question is: “What aspects of teachers professional knowledge emerge in relation toworking with their resource system?”
RESEARCH CONTEXT
This paper reports on the ‘resource system’ aspect of the classroom practice of three Englishsecondary-school mathematics teachers, associated with their use of GeoGebra for mathematicsteaching. GeoGebra is an open-source educational software package, which provides dynamicmathematical representations (Hohenwarter & Preiner, 2007). We chose to study GeoGebra lessonsin particular because of the interest that this software has attracted amongst teachers in England.After teachers agreed to participate in the research, the first author visited their schools to discusstheir timetable and to find out when they were planning to make some significant use of thissoftware. Observations and interviews then took place at a time agreed in advance with each teacherat his or her convenience. In this paper we focus on a type of mathematical topic which all threeteachers chose to teach with GeoGebra, concerned with geometrical transformations.
The three teachers participating in this research have rather different profiles:
ICTMT 13 217 Lyon 3 - 6 July 2017

− an experienced teacher (pseudonym Chris) and Advanced Skills Teacher (a recognised grade ofclassroom teacher within the English school system, also taking special responsibility for leadingprofessional development), who utilises new technologies in a progressive way in mathematicsinstruction. He taught the topic over a series of four lessons to a high attaining Year 9 class.
− an experienced teacher (pseudonym Susan) in terms of mathematics teaching but a novicetechnology user who is in her early stages in using GeoGebra. It was the first time she hadintegrated GeoGebra into her teaching of this topic to the extent of actively involving students indynamic exploration. She taught the topic over two lessons to a lower set Year 7 class.
− a less experienced teacher (pseudonym Tom) in terms of mathematics teaching (4 years teachingexperience) but familiar with the use of GeoGebra in mathematics teaching. He started usingGeoGebra regularly in his teaching from the beginning of his career. He taught this topic over aperiod of three lessons to a Year 10 class (set 2 out of 4).
Classroom Observations: A semi-structured, non-participant observation approach was adopted forwhich the SFCP framework as an interpretative lens provided guidelines.
Teacher Interviews: Semi-structured post-lesson interviews were conducted in order to clarify theobserved lessons and the professional thinking behind them according to the key themes of theSFCP framework.
RESULTS AND DISCUSSION
The resource system for all the teachers consisted of prepared dynamic files involving use ofGeoGebra.
Susan employed GeoGebra with a pre-developed (paper) worksheet including four tasks,accompanied by prepared dynamic versions of each task for students to experiment with inGeoGebra. She borrowed these tasks from a Geogebra website. The purpose of these lessons wasfor students to learn a specific type of transformation, reflection. Susan’s use of GeoGebra for thistopic aimed at easing students’ learning by permiting them to observe and think about the processesinvolved. In addition, Susan reported that GeoGebra speeded the learning process up by allowingthe students to engage with more examples that were unusual to see in the traditional paper-and-pencil environment. She used the school’s Virtual Learning Environment (VLE) for students todownload/upload the tasks. Use of the VLE also aimed at sharing students’ work with the wholeclass. All the reflection files required, first, students’ predictions of where they thought the shapeswould end up after reflection, second, students checking their predictions in GeoGebra to see if theywere correct. In addition, for some tasks, students were told to move some of the points at thecorner of the shapes and observe the changes.
Tom used teacher-created files involving use of GeoGebra for these lessons. Tom considered thedynamic and instant nature of GeoGebra as essential characteristics. With the aid of GeoGebra,students could be more curious and see what happens in a diagram, which Tom believed wasdistinctive to Dynamic Mathematics Software use in comparison with traditional methods. One ofthe prepared files was the Reflection file. Students were asked to draw the reflections of a numberof shapes by using the polygon tool, and then check their answers by using the reflection tool to seeif they were right or wrong.
Chris also used teacher-created dynamic files involving use of GeoGebra. As an example, in thesecond lesson the teacher set up a file, where there was an object and its image locked so that the
ICTMT 13 218 Lyon 3 - 6 July 2017

students were not able to move anything. The assignment was to locate the line of symmetry.Working with these prepared dynamic files, Chris encouraged his students to explore different pathsto reach the same mathematical solution and placed less emphasis on finding the exact answer. Inthis case, he considered the use of GeoGebra for this topic as a tool to help students’ thinking.
Four subthemes emerged, reflecting different aspects of teachers’ professional knowledge in relationto working with this resource system.
Operation of the software
Susan’s class was novice in GeoGebra use; therefore she allocated some lesson time to showingstudents the general set up of GeoGebra and the VLE, prior to the Transformations lessons, forstudents to get familiar with the technology. At the beginning of the first lesson, Susan did atechnical demo on the IWB in order to show students how to go onto the VLE and find theGeoGebra files for students to download and work on and then upload back the finished activity tothe VLE. In addition, she explained the tasks on the paper worksheet and the dynamic version ofthose tasks found through the VLE. Then, Susan provided students with a task (that was relatedonly to technical aspects of the software) for them to accustomed to the software (see Table 1).
Table 1. The face activity and instructions for the activity
Reduce the size of his eyes
Make him look sad
Give him two earrings (chose a shape:polygon or circle).
Make one on the left and then reflect itin the line using the reflect tool
Give him eyebrows (use line segmentand reflect it in the line)
Tom demonstrated and explained a number of GeoGebra techniques to students when and asnecessary during different segments of his lessons. For instance, at the beginning of the first lesson,Tom demonstrated some new skills that are as following: how to copy and paste, which wasdifferent in the new GeoGebra version, how to use a vector from a point in GeoGebra, how to set aslider. His class had used GeoGebra before and had the basic knowledge of the software, such ashow to find and open GeoGebra and get access to the tool bar.
Chris began the lesson by demonstrating how to operate the software: how to open the software,where to find the prepared files for transformations, where the related icons were located, as well ashow to use the dragging tool. Then, he provided students with a dynamic file to explore the softwareby themselves the students were using GeoGebra for the first time for this particular topic (seeFigure 1). With this dynamic file, he required students not only to learn the software but also “tolook for interesting things” in the diagram and “explore the mathematics”.
ICTMT 13 219 Lyon 3 - 6 July 2017

Figure 1. Reflection file that students worked on during Lesson 1
Prepared files involving use of GeoGebra
All teachers provided students with pre-designed dynamic files so that students could work ontransformation concepts.
Level of professional knowledge underpinning pre-designed dynamic files was varried:
- Susan borrowed a pre-developed (paper) worksheet and accompanied by dynamic files forstudents to experiment with in GeoGebra. According to Susan, the use of such worksheet “helps theteacher” by acting as a “crutch” especially for those new to learning to teach with GeoGebra.
- Tom designed his own tasks involving GeoGebra use. On the basis of his experience, Tom foundstarting from a blank page “too much” for students as “there is quite a lot going on at thebackground of the program”. He prepared dynamic files for students “to get them just seesomething in action, understand what the idea of translation or rotation is and to be able to thenvisualise their imagination.”
- Chris had well-established teaching repertoires with the use of GeoGebra and plannedinvestigative lessons. He graded students’ use of technology by providing prepared files for the firstfive lessons and then for the last two lessons asking them to start from blank pages to create theirown files with the guide of instructions. This implied that Chris saw value in eventually having thestudents create their own files. As believed by Chris, working with prepared files to start with gavethe students more time to focus on the mathematics and their thinking, and thus increased theirlearning time.
These case studies illustrated a relationship between the technology experience level of teachers andthe use of ready-made resources. Susan as a novice technology-using teacher found it moreappropriate to start with files and worksheets already prepared by someone else: this gave her moreconfidence and also alleviated the time pressures she felt. On the other hand, Tom, who has mademore use of GeoGebra in teaching than Susan, created the dynamic files himself taking into accountof his previous experience. Chris, who is the most experienced of the three in teaching withGeoGebra, also managed students use of GeoGebra gradually by allowing them to gain confidence
ICTMT 13 220 Lyon 3 - 6 July 2017

in working from scratch with GeoGebra. This development of activities appeared very similar to theprogression reported by Laborde (2001). Following four teachers for three years to understand howteachers novice to technology integrated it into their teaching, Laborde found that they graduallygranted control of technology and the learning environment to students.
Choice of tasks
Tom and Chris designed the tasks for students themselves whereas Susan borrowed a pre-madeworksheet from a GeoGebra website. In this sense, Susan was at the stage where she needed pre-madeworksheets/tasks to incorporate GeoGebra into her lessons so that she could follow those worksheets toset a lesson agenda. The tasks designed by Chris were more open ended in the sense that theyallowed the students to discover different ways of solving a problem. Furthermore, Chrisencouraged the students to take various directions and focused on students’ thinking rather than theresult itself, which in turn enabled him to create whole class discussion of different ideas andapproaches. However, the tasks prepared by Tom were more structured in that there was not roomfor students to consider from multiple perspectives. In addition, he mostly relied on questions froma textbook which he considered the best he had ever used because it was very close to the currentexamination specifications. This implied that he wanted his students to practice with questions thatcould also directly prepare them for examinations.
In this sense, Tom and Susan both tended to use closed-ended tasks with the focus on studentsgetting the questions correct. However. Chris used open ended tasks that allowed students todiscover different ways of solving a problem. He had much richer repertoire of interactional movesrelated to open ended GeoGebra based tasks.
Again, Laborde (2001) emphasised that teachers experienced the design of tasks to be employedwith computer software as a challenging process (exemplified in her study by the DynamicGeometry Software, Cabri). Both Laborde (2001) and Monaghan (2004) found that most teachersused and designed worksheets characterised as having elements of control or guidance, which wereusually in accordance with teachers' use of tasks from textbooks in non-technology lessons. Thus,Susan’s and Tom’s choices to use files/questions intended to closely guide and support theirteaching of the lessons and the individual student work in GeoGebra are not surprising. However,Chris, as an experienced teacher and technology user, moved beyond that and came up with his ownresources, which were not inspired by paper-and-pencil activities. This suggested that he had cometo the point that he no longer found tasks that replicated those from textbooks to be learningproductive.
Promoting independent learning through the use of software
The tasks to be utilised with GeoGebra for Transformations lessons attempted to stimulate students’use of a trial and refinement process. All the teachers pointed to the ways in which use of thesoftware could facilitate the process of self-testing and self-correcting. Hence, the main new aspectthat these case studies provided evidence for was that activity formats depended more on processesthrough which the students made a prediction and the technology provided feedback on it ratherthan (as the teachers pointed out) the teacher or other students validating – or invalidating – it. Thatshifted the role of the teacher towards becoming an organizer/observer of this process. In addition,technology appeared to be conducive, even essential, to this activity format providing for thenecessary levels of interactivity and immediate feedback.
In this connection, Predict-and-test was part of the logic of all the teachers’ lesson agendas forhandling this topic. In Tom’s and Susan’s cases, choice of the tasks making use of GeoGebra aimedto enable pupils to check the results of Transformations already done ‘by hand’. In this regard, they
ICTMT 13 221 Lyon 3 - 6 July 2017

had limited professional knowledge regarding interactional moves around tasks. However, as hasalready been discussed, Chris provided students with more open-ended tasks that allowed studentsto have different ideas and encouraged them to test their ideas with the dynamic software. The aimwas to promote students’ skills “in terms of their development as a mathematician”. He was alreadyused to discursive open ended approach.
In summary, the three teachers clearly demonstrated how establishing a functioning resource systemwas an important issue for them and they illustrated different stages in achieving that (see Table 2).Susan was at the stage where consideration of the resource system was the focus as she and thestudents needed to learn how to use the particular software. On the other hand, Tom was moreconfident in operating the software and constructed his own files for students to work on. In Chris’scase, he was at the stage where a coherent set of resources was already developed as a functioningresource system and knew how to prepare his students in order for them to be able to use those. Inthis sense, it is possible to see the transition to actually creating geometric constructions and otherdynamic figures from scratch as teachers gain more confidence in operating the software. In termsof design of technology-based tasks, these case studies illustrated that the experience level alsosuggests that there is a change from regular forms of extension activity to things that need high-level thinking. Considering the most experienced teacher in the study, it is clear that for teaching thetopic Chris placed far more emphasis on the development of high-level mathematicalreasoning/thinking in comparison with Susan and Tom. Furthermore, between Tom and Susan, theevidence highlights that Tom, drawing on his experience, put more thought into designing his taskby focusing on students’ thinking.
Table 2. Characterisation of Novice/Expert teachers that relates to resource system
Susan (limited) Tom (developing) Chris (sophisticated)
Resource System
Just embarked on establishing a functioning resource system with GeoGebra for her classes.
Prioritized mainly developing instrumental knowledge to make it part of the resource system, first for herself personally and then also for her students. Started with filesand worksheets already prepared by someone else:this gave her more confidence and also alleviated the time pressures she felt.
Had confidence in operating the software since he previously made use of GeoGebrain teaching.
Created dynamic files himself taking into account of his previous experience sothat students could focus on mathematicalcontent rather than dealing with complexity of software.
Had already established a set of resources as a functioning resource system.
Managed students use of GeoGebra graduallyby allowing them to gain confidence in working from scratch with GeoGebra.
Designed more open-ended tasks that allowed students to discover different ways of solving a problem.
ICTMT 13 222 Lyon 3 - 6 July 2017

REFERENCES
Adler, J. (2000). Conceptualising resources as a theme for teacher education. Journal ofMathematics Teacher Education, 3(3), 205–224.
Assude, T. (2005). Time management in the work economy of a class. A case study: Integration ofCabri in primary school mathematics teaching. Educational Studies in Mathematics, 59(2), 183-203.
Drijvers, P. (2012). Teachers transforming resources into orchestrations. In G. Gueudet, B. Pepin, &L. Trouche (Eds.), From Text to ’Lived’ Resources (pp. 265–281). New York: Springer.
Drijvers, P., Doorman, M., Boon, P., Reed, H., & Gravemeijer, K. (2010). The teacher and the tool:instrumental orchestrations in the technology-rich mathematics classroom. Educational Studies inMathematics, 75(2), 213–234.
Erfjord, I. (2011). Teachers’ Initial Orchestration of Students’ Dynamic Geometry Software Use:Consequences for Students’ Opportunities to Learn Mathematics. Technology, Knowledge andLearning, 16(1), 35–54.
Laborde, C. (2001). Integration of technology in the design of geometry tasks with Cabri-geometry.International Journal of Computers for Mathematical Learning, 6(3), 283–317.
Monaghan, J. (2004). Teachers’ activities in technology-based mathematics lessons. InternationalJournal of Computers for Mathematical Learning, 9(3), 327–357.
Ruthven, K. (2009). Towards a naturalistic conceptualisation of technology integration in classroompractice: The example of school mathematics. Education & Didactique, 3(1), 131–159.
Ruthven, K. (2014). Frameworks for analysing the expertise that underpins successful integration ofdigital technologies into everyday teaching practice. In A. Clark-Wilson, O. Robutti, & N. Sinclair(Eds.), The Mathematics Teacher in the Digital Era (pp. 373–393). Berlin: Springer.
Ruthven, K., Hennessy, S., & Deaney, R. (2005). Incorporating dynamic geometry systems intosecondary mathematics education: Didactical perspectives and practices of teachers. In D. Wright(Ed.) Moving on with Dynamic Geometry (pp. 138-158). Derby: Association of Teachers ofMathematics.
Ruthven, K., Hennessy, S., & Deaney, R. (2008). Constructions of dynamic geometry: A study of theinterpretative flexibility of educational software in classroom practice. Computers & Education, 51(1),297–317.
Ruthven, K., Deaney, R., & Hennessy, S. (2009). Using graphing software to teach about algebraicforms: A study of technology-supported practice in secondary-school mathematics. EducationalStudies in Mathematics, 71(3), 279-297.
ICTMT 13 223 Lyon 3 - 6 July 2017
PLANNING TO TEACH LOWER SECONDARY MATHEMATICSWITH DYNAMIC MATHEMATICAL TECHNOLOGY:
QUALITY FEATURES OF LESSON PLANS
Alison Clark-Wilson and Celia Hoyles
UCL Institute of Education, University College London; [email protected]
Set within the context of the longitudinal Cornerstone Maths project in England. we adapt Thomasand Hong’s theoretical framework (mathematical) ‘pedagogic technology knowledge’ (MPTK,Thomas & Hong, 2013) to explore teachers’ espoused knowledge to teach with dynamicmathematical technology in lower secondary mathematics. We conclude a set of eight ‘qualityfeatures’ of such plans, and highlight how each of these features can provide a dynamic insight intoteachers’ MPTK development over time.
Keywords: Dynamic mathematical technology; linear functions; algebraic variable, geometricsimilarity; mathematical pedagogic technology knowledge (MPTK)
INTRODUCTION
The Cornerstone Maths project, which began in England in 2011 has researched the design,implementation and impacts (on both students and teachers) of a set of three digitally enhancedcurriculum units for lower secondary mathematics: algebraic variable; linear functions; andgeometric similarity. These are three topics that are considered hard to teach and for which a bodyof evidence exists to suggest that dynamic mathematical technologies can enhance students’understandings. This earlier work is widely reported (Clark-Wilson & Hoyles, 2017; Clark-Wilson,Hoyles, & Noss, 2015; Clark-Wilson, Hoyles, Noss, Vahey, & Roschelle, 2015; Hoyles, Noss,Vahey, & Roschelle, 2013). In this paper, we focus on a strand of work that is motivated by theresearch question: What mathematical pedagogic technology knowledge is desirable for teachers tointegrate dynamic visual technologies in their teaching of these concepts? This required anarticulation of such knowledge and a methodological design that would have legitimacy within thecontext of a 15-month long professional development project.
THEORETICAL FRAMEWORK
Conceptualising teacher knowledge
A major shortcoming of widely adopted frameworks that conceptualise teacher knowledge such asBall et al’s ‘Mathematical Knowledge for Teaching’ (MKT, Ball, Hill, & Bass, 2005) and Rowlandet al’s ‘knowledge quartet’ (Rowland, Huckstep, & Thwaites, 2005) is that they have not evolvedfrom researching teaching scenarios in which dynamic mathematical technologies were present. Wedefine ‘dynamic mathematical technologies’ as those that offer different mathematicalrepresentations (geometric shapes, graphs, tables, algebraic expressions) that teachers and pupilscan manipulate and by doing so, engage with the underlying mathematical concepts andrelationships. Consequently, such frameworks pay no attention to the particular aspects of ateachers’ knowledge for planning and teaching lessons with such technologies.
Hence, we looked to a broader framework that includes MKT, but also conceives knowledge as adynamic construct that considers both cognitive and affective aspects of knowledge and that hademanated from research into teachers’ developing use of DMT in classrooms. We adopted a
ICTMT 13 224 Lyon 3 - 6 July 2017

framework developed by Thomas and colleagues, ‘(Mathematical)1 Pedagogical TechnologyKnowledge’, (Thomas & Hong, 2013; Thomas & Palmer, 2014), henceforth we call MPTK, asshown in Erreur : source de la référence non trouvée.
Figure 1 Components of (Mathematical) Pedagogical Technology Knowledge (Thomas & Hong,2013)
This is a theoretical construct with the following components:
Pedagogical knowledge: First suggested by Shulman (1987), this is a teacher’s knowledgeof the ‘broad principles and strategies of classroom management and organization thatappear to transcend subject matter’ (p. 8).
Mathematical content knowledge: A teacher’s own knowledge of mathematics. Mathematical Knowledge for Teaching (MKT): This combination of a teacher’s
pedagogical knowledge alongside their mathematical content knowledge was first defined asMKT by Ball, Hill and Bass (2005).
Personal orientations: The teachers’ affective variables, that is their goals, attitudes, dispositions, beliefs, values, tastes and preferences, as described by Schoenfeld (2011, p.29),also incorporating their perceptions of the nature of mathematical knowledge and how itshould be learned (with and without technology).
Technology instrumental genesis: Rooted in activity theory, this is the process throughwhich the teacher makes actions and decisions through which the technological tool isadapted to accomplish a particular mathematical task (Drijvers & Trouche, 2008; Guin &Trouche, 2002). Furthermore, for teachers, this genesis incorporates the development of theteachers’ understanding of pupils’ processes of instrumental genesis, whereby pupils becomefamiliar with the affordances of the technology and can begin to use it in mathematicallyproductive ways (Haspekian, 2005).
Landmark activities
An important construct that underpinned both our theoretical framing and informed our researchmethodology is that of ‘landmark activities’. We define landmark activities as those which provoke
1 Thomas & Hong do not include Mathematical in their description of PTK, as, we conjecture their‘overarching world’ is Mathematics. For clarity, we add Mathematical to the PTK, so henceforwardcall it MPTK.
ICTMT 13 225 Lyon 3 - 6 July 2017

a rethinking of the mathematics or an extension of previously held ideas – the ‘aha’ moments thatshow surprise - and provide evidence of pupils’ developing appreciation of the underlying concept.Although each curriculum unit includes several potential landmark activities, the research teamselected one activity from each unit, which became the focus for teachers’ planning, teaching andsubsequent reflection within our adapted ‘lesson study’ approach. In this way, the landmarkactivities act as boundary objects for the study (A more detailed account of landmark activities canbe found in Clark-Wilson, Hoyles, & Noss, 2015).
METHODOLOGY
The project involved 209 teachers from 48 London secondary schools in the period Jan 2014 - July2016. Teachers were either self-selecting or nominated by their school and they or their schoolschose for them to be involved in up to three cycles of professional development that enabled themto plan, teach and evaluate a landmark activity from each of the three Cornerstone Mathscurriculum units. Some schools opted to send the same teacher(s) to two or three of these cycles.Briefly, the teachers participated in a one-day face to face session that: introduced them to thecurriculum topic; supported them to become instrumented with the CM software; provided anopportunity for a lesson planning activity; and inducted them to the project’s online community. Theteachers were also invited to give their ethical consent for their data to be used within the study(n=111, 53%).
During the lesson planning exercise, which the teachers carried out in pairs, a common lessonplanning proforma was adopted that captured the following information:
Contextual information about the class: (age, ability level): Teacher’s preparation notes: Pupils' prior experience/skills with the software: Key intended learning outcomes for the pupils: Description of the planned phases of the lesson that included the teachers intended actions
and the anticipated pupils’ responses to these.
Furthermore, a critical aspect of the methodology was that all teachers shared their lesson planswithin the project online community, what was visible to all participants. The teachers were activelyencouraged to review each other’s plans and to adopt or adapt the text, as they thought useful. Theteachers were encouraged to produce the best plan possible, although it was understood that, as theytaught the CM curriculum tasks that preceded the identified landmark activity, they would mostprobably want to review and revise their plan in the light of this classroom experience.
The lesson plans were evaluated according to the following set of ‘desirable’ features:
Feature 1: Describes teachers’ actions and questions (not involving the DMT).
Feature 2: Describes pupils' actions on DMT.
Feature 3: Supports pupils in their instrumental genesis of the DMT, as appropriate to the activities.
Feature 4: Refers to the mathematical concept at stake (i.e. variables, functions, geometric objects).
Feature 5: Describes acting on and connecting mathematical representations.
Feature 6: Uses mathematical vocabulary.
ICTMT 13 226 Lyon 3 - 6 July 2017

Feature 7: Uses technological/contextual vocabulary.
Feature 8: Includes planned teacher use of the DMT.
These eight features had been developed a priori by the researchers as a means to arrive at a ‘qualityscore’ of between zero and eight for each plan, depending on whether the plan included particularfeature. Hence it was possible to arrive at quantitative indications of quality in addition to the moreobvious qualitative analysis that could be deduced from the plans.
FINDINGS
82% of the teachers surveyed (n=111) reported that they had never or only occasionally used amathematical technology in their key stage 3 teaching, with only 33% reporting that they feltconfident or very confident to do so. From this data, we conclude that, for many of the teachers, thelesson plans were their first ever plan for this type of lesson.
The analysis of the teachers’ lesson plans provided an insight their MPKT as they prepared to teachthe lessons. We begin by presenting our findings with respect to the first of the three CM curriculumtopics (algebraic variable) to highlight the nature of the resulting data and then describe the cross-topic analysis that led to a more general set of outcomes.
Algebraic variable
Twenty-eight lesson plans that had been produced in pairs and trios by 74 teachers were analysedand the frequencies of each feature is shown in Table 2.
Feature of lesson plan Frequency % (n=28plans)
1. Explicit descriptions of teachers’ actions/questions 16 57%2. Explicit descriptions of pupils' actions on DMT during the
lesson9 32%
3. Appreciation of pupils’ instrumental knowledge (i.e. prior skills with software, progression of skills in lesson)
12 43%
4. Explicit reference to variables (i.e. creating, naming, acting on)
11 39%
5. Explicit reference to acting on reps (i.e. dragging/moving sliders)
17 61%
6. Explicit use of mathematical vocabulary 18 64%7. Explicit use of technological/contextual vocabulary 18 64%8. Includes planned plenary phases that involved teacher use of
software5 18%
Table 2 Algebraic variable: Summary of lesson plan analysis (28 Lesson plans)
An exemplification of high quality planning for the algebraic variable research lesson in relation toeach of the desirable features (taken from the complete set of lesson plans) is provided in Table 3.
Feature of lesson plan Exemplification from teachers’ plans
1. Explicit descriptions of teachers’ actions/questions
“Encourage pupils to play the pattern again and ask does it correspond to your pattern if you change the number of blocks?”
ICTMT 13 227 Lyon 3 - 6 July 2017

2. Explicit descriptions of pupils' actions on DMT during the lesson
“Encourage students to use slider - ask them how you can make both sliders move at the same time. What will they need to do the variables?”
3. Appreciation of pupils’ instrumental knowledge (i.e. prior skills with software, progression of skills in lesson)
“Remind students how to use the software – recap Investigation 1. i.e. Blocking and patterning. (Lock student screens)”
4. Explicit reference to variables (i.e.creating, naming, acting on)
“Ensure all pupils start to introduce a variable for their blocks (‘unlock’ the no of blocks column)”.
5. Explicit reference to acting on reps(i.e. dragging/moving sliders)
"[Ask] What is the purpose of the slider? What impact is it having when you slide along the bar?"
6. Explicit use of mathematical vocabulary
“[Ask] How can we check if our orange and green blocks increase in the same way?”
7. Explicit use of technological/contextual vocabulary
“Ask students to create a table snapshot, starting from 1 block. What do students notice about the total number of lights?”
8. Includes planned plenary phases that involved teacher use of software
“demonstrate how the Blocks and Pattern should have been made. What does the slider do?”
Table 3 Algebraic variable: Exemplification of the features of high quality lesson plans
The plans were of a highly variable quality and it was notable that only five plans included six ormore of the desirable features, which suggests that the teachers had very little prior experience of alesson planning approach that emphasised their own actions and words, rather than solely a plan ofwhat their pupils would be expected to do. Within the plans, approximately two thirds of the plansincluded references to actions on the dynamic slider and approximately one fifth of the lessonsplans included a planned plenary phase that involved the teacher’s use of the software.
Development of lesson plans over time
The above process was replicated for the two subsequent curriculum topics (linear functions andgeometric similarity) and distributions of the quality scores produced as shown in Figures 2, 3 and4.
Figure 2 Algebraic variable: Distribution of quality scores for lesson plans (n=27, = 3.9
SD = 1.8)
Figure 2 Linear functions: Distribution of quality scores for lesson plans (n=42, = 4.2xx
ICTMT 13 228 Lyon 3 - 6 July 2017

SD = 2.1)
Figure 3 Geometric similarity: Distribution of quality scores for lesson plans (n=21, = 5.5,xx
SD = 1.8).
These mean average and median quality scores show very clearly the development in the quality of the teachers’ lesson plans over time as they participated in the repeated PD cycles as both scores increased. This is substantiated by the qualitative analysis of the lesson plan text, examples of which will be shared in the conference presentation. A summary table of the frequencies of quality features across the three topic areas is also informative (Table 4).
Tea
cher
s’ a
ctio
ns a
nd
ques
tion
s
Pup
ils'
act
ions
on
DM
T
Sup
port
s fo
r pu
pils
' in
stru
men
tal g
enes
is
Foc
us o
n m
athe
mat
ical
co
ncep
t
Act
ions
on
repr
esen
tati
ons
to e
xplo
re m
athe
mat
ical
Use
s m
aths
voc
abul
ary
Use
s te
chni
cal a
nd/o
r co
ntex
tual
voc
abul
ary
DM
T
Algebraic variable (n=28) 57% 43% 32% 39% 61% 64% 64% 18%Linear functions (n=42) 69% 38% 45% 57% 26% 62% 31% 24%Geometric similarity(n=21) 95% 33% 86% 71% 62% 86% 71% 43%
Table 4 Comparison of lesson plan quality features by topic
The nature of the individual landmark activities did provoke a need for teachers to plan in ways thatmight privilege particular features, i.e. the geometric similarity landmark activity requiredincreasingly more detailed definitions, which would by necessity privilege the use of mathematicallanguage. However, given that the three PD cycles took place over the period of a year, thefollowing conclusions can be made:
Teachers became much more aware of the need to plan what they were going to do and sayduring the lessons and particularly during the whole class plenaries around the importantmathematical ideas.
Teachers became more mindful of the need to provide support for pupils to make sense ofthe DMT such that they could use it in mathematically productive ways beyond only theinitial lessons (i.e. support the pupils’ instrumental genesis more explicitly).
Teachers paid increasing attention to the mathematical concept at stake.
ICTMT 13 229 Lyon 3 - 6 July 2017

Teachers were more explicit in their plans to convene whole class plenaries to focus on themathematics at stake (with more teachers considering how they would use the DMT tosupport this work).
DISCUSSION
The teachers’ lesson plans provide an insight into their espoused MPTK. Furthermore, the featuresof the lesson plans can be mapped to the components of the teachers’ knowledge as shown in Figure2.
Figure 2 Features of CM landmark activity lesson plans and their relationship to a teacher’s MPTK.
This provides an indication of the key elements of planning lessons with technology that concernthe development of pupils’ instrumental geneses – a significant element of teachers’ knowledge thatshould be developed within teacher education and professional development programmes.
ACKNOWLEDGEMENTS
The research reported in this paper was funded by the Nuffield Foundation (Award reference 9190).The views expressed are those of the authors and not necessarily those of the Foundation.
REFERENCES
Ball, D. L., Hill, H. C., & Bass, H. (2005). Knowing Mathematics for Teaching: Who KnowsMathematics Well Enough To Teach Third Grade, and How Can We Decide? AmericanEducator(Fall 2005), 14-46.
Clark-Wilson, A., & Hoyles, C. (2017). Developing teachers’ mathematical knowledge for teachingthrough engagement with key mathematical concepts using dynamic digital technology[Nuffield Foundation funded project 2014-2017]. Retrieved from London:
Clark-Wilson, A., Hoyles, C., & Noss, R. (2015). Scaling mathematics teachers’ professionaldevelopment in relation to technology: Probing the fidelity of implementation through
ICTMT 13 230 Lyon 3 - 6 July 2017

landmark activities. In K. Krainer & N. Vondrovà (Eds.), Proceedings of the NinthConference of the European Society for Research in Mathematics Education (pp. 2333-2339). Prague, Czech Republic: Charles University in Prague, Faculty of Education andERME.
Clark-Wilson, A., Hoyles, C., Noss, R., Vahey, P., & Roschelle, J. (2015). Scaling a technology-based innovation: Windows on the evolution of mathematics teachers' practices. ZDMMathematics Education, 47(1), 79-92. doi:10.1007/s11858-014-0635-6
Drijvers, P., & Trouche, L. (2008). From artifacts to instruments: A theoretical framework behindthe orchestra metaphor. In G. Blume & K. Heid (Eds.), Research on technology in thelearning and teaching of mathematics: Syntheses, cases and perspectives. Vol 2 Cases andperspectives (pp. 363-392). Charlotte: National Council of Teachers ofMathematics/Information Age Publishing.
Guin, D., & Trouche, L. (2002). Mastering by the teacher of the instrumental genesis in CASenvironments: necessity of instrumental orchestrations. ZDM Mathematics Education, 34(5),pp. 204 - 211.
Haspekian, M. (2005). An “Instrumental Approach” to study the integration of a computer tool intomathematics teaching: The case of spreadsheets. International Journal of Computers forMathematical Learning, 10(2), 109-141.
Hoyles, C., Noss, R., Vahey, P., & Roschelle, J. (2013). Cornerstone Mathematics: Designing digitaltechnology for teacher adaptation and scaling. ZDM Mathematics Education, 45(7), 1057-1070. doi:10.1007/s11858-013-0540-4
Rowland, T., Huckstep, P., & Thwaites, A. (2005). Elementary teachers' mathematics subjectknowledge: The knowledge quartet and the case of Naomi. Journal of Mathematics TeacherEducation, 8, pp. 255-281.
Schoenfeld, A. (2011). How we think. A theory of goal-oriented decision making and itseducational applications. New York: Routledge.
Shulman, L. (1987). Knowledge and teaching: Foundations of the new reform. HarvardEducational Review, 56(1), 1-22.
Thomas, M. O. J., & Hong, Y. Y. (2013). Teacher integration of technology into mathematicslearning. International Journal for Technology in Mathematics Education, 20(2), 69-84.
Thomas, M. O. J., & Palmer, J. (2014). Teaching with digital technology: Obstacles andopportunities. In A. Clark-Wilson, O. Robutti, & N. Sinclair (Eds.), The MathematicsTeacher in the Digital Era: An International Perspective on Technology FocusedProfessional Development (pp. 71-89). Dordrecht: Springer.
ICTMT 13 231 Lyon 3 - 6 July 2017

PRE-SERVICE TEACHERS' PREPARATION AS A CATALYST FOR THE
ACCEPTANCE OF DIGITAL TOOLS FOR TEACHING MATHEMATICS
AND SCIENCE
Wajeeh Daher1,2 Nimer Baya'a2 Ahlam Anabousy2 Rawan Anabousy2
1 An-Najah National University, Nablus, Palestine; [email protected]
2 Al-Qasemi Academic College of Education, Baqa-El-Gharbia, Israel
The present research examines whether the pre-service teachers’ preparation in using digital toolsin their teaching develops their acceptance of these tools as teaching tools. Here, acceptance ismeasured in terms of the constructs of the technology acceptance model (TAM) introduced byDavis. It also examines the mediation of self-efficacy, anxiety of using digital tools for teachingmathematics and science and enjoyment of this use between the constructs of acceptance of digitaltools for teaching. We used questionnaires that are part of TAM. Forty eight mathematics andscience pre-service teachers participated in the study. We analyzed the collected data using SPSS21. The research results indicate that the pre-service teachers’ preparation resulted in significantdifferences in their scores of affective and usage constructs associated with their acceptance ofdigital tools for mathematics and science teaching, except in the scores of anxiety.
Keywords: Pre-service teachers, preparation model, digital tools, mathematics, science
INTRODUCTION
A main factor in the use of technological tools in the mathematics classroom is the teacher (Thomas& Palmer, 2014), which necessitates educating pre-service teachers in using these tools in theirteaching in the training schools. This education would encourage them to use these tools in theirfuture teaching of the subject matter. In the present paper, we describe a model for preparing pre-service teachers in the use of digital tools in teaching and the effect of this preparation on someaffective and behavioral aspects of the usage of these tools in the classroom. Two of the factors thataffect teachers’ use of technological tools in their teaching are their orientations towards this use andthe value of this use (Thomas & Palmer, 2014). In the present research, we are interested in theprevious two constructs, among other constructs, as constructs that could affect teachers’ use ofdigital tools in the classroom. We utilize the Technology Acceptance Model (TAM) of Davis (1989)as a framework for such analysis. We are aware that other frameworks could be used to analyze thestudied issue (e.g., Getenet, Beswick & Callingham, 2015), but we chose the TAM frameworkbecause it suits the analysis of the acceptance of digital tools for teaching the subject matter, whichis one aspect of pedagogical technological knowledge (PTK) (Hong & Thomas, 2006). This servesstudying teachers' professional development in integration technology in the classroom, usingdifferent theoretical frameworks, which serves understanding teachers' learning from differentperspectives.
Technology Acceptance Model (TAM)
One of the most widely used models for technology adoption and usage is the 'TechnologyAcceptance Model' (TAM) developed by Davis (1989). Similar to other technology acceptancemodels, TAM assumes that users choose to employ a specific technology based on individual cost-
ICTMT 13 232 Lyon 3 - 6 July 2017

benefit considerations (Compeau, Higgins, & Huff, 1999). Specifically, TAM assumes thatperceived ease-of-use (PEOU) and perceived usefulness (PU) determine the user’s acceptance of atechnology. Davis , Bagozzi, & Warshaw (1989) describes PEOU as the degree to which the userexpects the technology to be free of effort, while PU is the individual’s subjective perception of thetechnology as increasing performance within an organizational context. As shown in Figure 1, TAMsuggests that the user’s actual usage of a particular system develops over four stages, where externalvariables as individual abilities and situational constraints influence technology usage through theirimpact on the PEOU and PU. Both factors affect a user’s attitude towards the technology, which inturn influences the user's intention to use the technology. Furthermore, there is a direct impact ofperceived usefulness on the user’s intention to use the technology, which could mean that even if theindividual has a negative attitude towards a technology, this could be overcome by a positive beliefabout the technology’s usefulness, which finally leads to a positive usage intention (Röcker, 2009).
Figure 1: Original Technology Acceptance Model as in Davis et al. (1989)
Alenezi, Karim and Veloo (2010) added 'enjoyment', 'computer anxiety', 'computer self-efficacy'(CSE) and 'internet experience' to PEOU and PU to explain users' attitudes towards using E-learning. They found that computer anxiety, CSE and Enjoyment significantly influenced students'intention to use E-learning, while the Internet experience insignificantly influenced them. Alenezi etal. (2010), in contrast to Shih and Huang (2009), found that attitude was confirmed to mediate therelationship between PU, PEOU and the users' behavioral intention. Results from Yi and Hwang(2003) highlighted the important roles of self-efficacy, enjoyment, and learning goals orientation (ascomponents of intrinsic motivation) in determining the actual use of web-based informationsystems. In the present research, we examined whether self-efficacy, enjoyment and anxiety mediatebetween the constructs of accepting digital tools for teaching mathematics and science.In addition to the said above, though different theoretical frameworks are suggested today to studyteachers' acceptance of digital tools in mathematics and science classes, TAM is still worldwideused to study mathematics and science teachers' acceptance of digital tools as tools in theirclassrooms (e.g., Pittalis & Christou, 2011; Frikkie & Ogunniyi, 2016). Theoretical frameworks likeTAM are especially needed when studying the acceptance of technology for teaching by teachers ofdifferent disciplines (e.g., Padmavathi, 2016), as the case in the present research.
Research rationale and goals
Different studies examined students' acceptance of technological tools, but little research examinedpre-service teachers' acceptance of digital tools for mathematics and science teaching, as a result oftheir preparation, especially when affective constructs are considered as mediators for thisacceptance. The present study attempts to do so, considering self-efficacy, enjoyment and anxietywhen using digital tools in teaching mathematics or science, as personal constructs that couldmediate between the different constructs of pre-service teachers’ acceptance of using digital tools intheir teaching. Doing so, one of the present study goals is to examine whether pre-service teachers’
PerceivedUsefulnessExternal
VariablesPerceived Ease-of-Use
Attitude Intention to Use
Actual Usage
ICTMT 13 233 Lyon 3 - 6 July 2017

preparation in using digital tools in their teaching in the training schools, develops their acceptanceof these tools as teaching tools. Here, acceptance is measured in terms of the TAM components, i.e.PEOU, PU, CSE, attitude and future use. As mentioned above, another goal is to examine themediation of self-efficacy, anxiety of using digital tools for teaching mathematics and science andenjoyment of this use between the constructs of the pre-service teachers’ acceptance of digital toolsfor their teaching.
Research questions
1. Does the preparation of pre-service teachers in the use of digital tools increase theiracceptance of these tools for teaching mathematics and science?
2. Does the preparation result in significant differences in the scores of the different constructsof pre-service teachers' acceptance of digital tools (for teaching mathematics and science)according to the pre-service teachers' specialization, computer-ability and computer-use?
3. Do CSE, anxiety of using digital tools for teaching mathematics and science and enjoyment of this use mediate between PEOU and PU on one side and attitude towards this use on the other side?
4. Do CSE, anxiety of using digital tools for teaching mathematics and science and enjoyment of this use mediate between attitude towards this use on one side and intention to use on the other side?
METHODOLOGY
Research context and participants
The current research accompanies the preparation of third year pre-service teachers to use digitaltools effectively in teaching mathematics and science. The preparation of the pre-service teachers inthe college lasts four years, where the third year is the year in which the pre-service teachers areprepared to use digital tools in their teaching in the training schools. In their first year, the pre-service teachers participate in a course that focuses on technological skills as skills to use editorsand spreadsheets. In their second year, the pre-service teachers participate in a course that focuseson integrating technology in teaching the discipline, as mathematics or science. In the third year, thepre-service teachers are expected to practice the integration of digital tools in their teaching in thetraining schools.
We administered questionnaires to measure the advancement of the pre-service teachers’ acceptanceof digital tools in teaching mathematics and science. Forty eight pre-service teachers majoring inmathematics and science teaching (twenty four in each discipline) completed the questionnaires atthe beginning and end of the preparation.
Research instruments
The questionnaire is based on Davis' Technology Acceptance Model (Davis, 1989), with 7-pointLikert items, was composed to conduct the research. Since TAM variations in different previousstudies were all reliable, factor analysis was not carried out in this study. Instead, face validity andreliability (Cronbach's Alpha) calculations were carried out. The six following scales were used:digital tools usefulness (9 items), digital tools self-efficacy (5 items), digital tools ease-of-use (3items), attitude towards digital tools (3 items), intention-to-use and use of digital tools (3 items).
ICTMT 13 234 Lyon 3 - 6 July 2017

The added constructs (self-efficacy, enjoyment and anxiety were taken from Alenezi, Karim andVeloo (2010).
Statistical exams
The questionnaire had two parts. The first part collected personal information as specialization,computer-ability, and computer-use, while the second part was composed of the six scales. Thequestionnaire was translated for the first time to Arabic language before administering them to thepre-service teachers. The questionnaire underwent validity and reliability exam.
Face validity: The Arabic translation of the questionnaire was given to a group of pre-serviceteachers who were required to examine if the scales' statements were understandable to the reader.Some items of the scales were restated to clarify their ambiguity.
Content validity: The questionnaire was given to a group of experts (five college pre-serviceteachers) who were required to examine whether the questionnaires' items cover the full domain ofthe different educational constructs and whether they cover constructs other than the appropriateones. The experts gave no remarks that necessitated the modification of the TAM questionnaire.
The scales' reliability: The scores of the pre-service teachers in the TAM questionnaires were usedto compute Cronbach alpha of the various TAM constructs. The computations resulted in values thatranged between .82 and .91, which are considered acceptable reliability scores.
Data processing: Research question 1 was answered using paired-samples t-test. Research question2 was answered using ANOVA. Research questions 3 and 4 were answered using the four steps ofBaron and Kenny (1986).
RESULTS
The preparation model:
The pre-service teachers’ preparation was based on two theoretical frameworks: the community ofinquiry framework (Jaworski, 2005) and practice-based or practice-oriented professionaldevelopment framework (Ball & Bass, 2003; Ponte, 2012). The utilization of the two previousframeworks targeted developing mathematics and science pre-service teachers’ practice in workingwith digital tools for teaching. More specifically, it targeted developing pre-service teachers’practices with digital tools, starting from selection of a digital tool for a specific topic, continuing topreparing lesson plans that utilize the tool, teaching a specific topic with the selected digital tool,reflecting on this teaching and improving the lesson plan as a result of the reflection.
The preparation model depended on the interaction between the pre-service teachers in an electronicforum designed for discussing the selection of digital tools for specific topics, utilizing them inlesson plans and implementing them in the mathematics and science classrooms. The four authorsof the paper functioned as educators of the pre-service teachers in the forums, discussing with themissues that the pre-service teachers or the educators raised. The discussion also happened at officehours between the pre-service teachers and their educators.
In more detail, the pre-service teachers’ preparation concentrated on two aspects. First, knowing thetool technically (technological knowledge) and pedagogically (pedagogical knowledge) and being
ICTMT 13 235 Lyon 3 - 6 July 2017

able to suggest it for teaching a mathematical or scientific content (one aspect of PTK). Second,being able to start from a specific content, and select and integrate appropriate digital tools for itsteaching (another aspect of PTK). In more detail, each pre-service teacher had to learn at least twodigital tools technically by himself/herself and prepare user guides (PDF file or digital book) forother teachers that include description of the most significant operations in these digital tools.Furthermore, the pre-service teacher had to record video clips of screen shots while performingoperations in these digital tools in order to explain for the users how to perform these operations.
Moreover, each pre-service teacher was required to prepare pedagogical materials of how to use thedigital tools in teaching mathematics or science, and then present the materials in the trainingworkshop and afterwards in the electronic forum. Following that, all the materials were uploaded tointernet sites that were constructed by the pre-service teachers. An internet site was constructed bythe pre-service teachers’ educators that included all the materials prepared by the pre-serviceteachers, where these materials constituted a data bank for digital tools. In addition, each pre-serviceteacher was requested to prepare at least two lessons for teaching mathematics or science usingthree digital tools from the data bank. These lessons had to involve also collaborative learning andinvestigations that encourage the use of higher order thinking skills. In addition, each pre-serviceteacher chose a subject in a digital textbook for teaching mathematics or science, and added layerson it that connect to pedagogical activities based on using digital tools from the data bank site. Allthese issues were discussed by all the pre-service teachers in the electronic forum, as well as in theoffice hours of the pre-service teachers’ educators.
All this happened in the first semester. In the second semester, the pre-service teachers were askedto experiment with the prepared materials and lessons in their training schools, reflect on theirexperimenting and then improve the lesson plans they built before. All the previous steps werepractice-based and intended to develop the actual practice of the pre-service teachers of using digitaltools in the science and mathematics classroom. Figure 2 describes the teachers’ preparation modelthat we followed to encourage the pre-service teachers to adopt digital tools for teachingmathematics and science.
Figure 2: Teachers’ preparation model for adopting digital tools for teaching
Inquiry and negotiation
of practice
Interactions in the electronic forum
Interactions in the office hours
Practice
Selecting digital tools
Appropriating a tool for specific topic
Teaching with a digital tool
Reflection
Reflecting about:
Selecting a tool,
appropriating a tool
and teaching with a
tool
Adjustment
Adjustment of how to
select a tool, how to
appropriate a tool and
how to utilize a tool
for teaching
ICTMT 13 236 Lyon 3 - 6 July 2017

The effect of the preparation model on the participating pre-service teachers’ acceptance ofdigital tools for mathematics and science teaching
The present research examined the influence of using a specific model (described in the methodssection) to prepare pre-service teachers for using digital tools through one academic year. Doing so,we computed means and standard deviations of the scores of the different constructs of acceptancedigital tools for mathematics and science teaching. We also ran paired t-test to examine whether thedifferences between the scores before and after the intervention are significant. Table 1 shows theresults of the previous computations.
Table 1: Means, standard deviations, T value of the scores of the different constructs ofacceptance of digital tools for mathematics teaching (N=48)
Category Pre-Mean (SD) Post- Mean (SD) T value
Ease of use 5.23 (1.29) 6.05 (1.13) 5.31***
Usefulness 5.69 (1.11) 6.15 (1.11) 2.80**
Attitude 5.72 (1.19) 6.18 (1.13) 2.82**
Intention to use 5.83 (1.11) 6.18 (1.20) 2.39*
Use 5.14 (1.48) 6.18 (1.18) 4.21***
Self-efficacy 5.80 (1.13) 6.16 (1.15) 2.23*
Anxiety 3.00 (1.83) 3.33 (2.28) 0.79
Enjoyment 5.71 (1.31) 6.15 (1.20) 2.58*
*p<.05, **p<.01, ***p<0.001
Table 1 shows that using a specific model (described in the methods section) to prepare pre-serviceteachers for using digital tools through one academic year resulted in significant differences in thescores of the different components of the technology acceptance model used in the present research,except in the scores of anxiety.
We measured the effect size related to the differences that resulted from the intervention, usingCohen's (1988), where 0.8 is considered a large effect size, 0.5 is considered a medium effect sizeand 0.2 a weak one. Doing so, we found that the effect size of the intervention for "ease of use" (d =0.78) was found to be a large effect, while the effect size of the intervention for "usefulness"(0.405), "use" (0.406) and "intention to use" (0.607) were found to be medium effects. In addition,the effect size of the intervention for "attitude" (0.33), "self-efficacy" (0.33) and "enjoyment" (0.37)were found to be weak effects.
Another goal of the present research was to examine whether the independent variables(specialization, computer-ability, and computer-use) influenced the results of preparing the pre-service teachers utilizing a model which is bases on the community of inquiry framework, togetherwith a practice-based framework. Doing so, we ran mixed way ANOVA which showed nosignificant interaction at the level of 0.05 or lower.
ICTMT 13 237 Lyon 3 - 6 July 2017

A third goal of the present study was to examine the mediation of enjoyment, anxiety and self-efficacy between the predictors ease-of-use and usefulness, and the outcomes attitude and use. Atthe beginning, Pearson correlations were computed, which showed non-significant correlations withanxiety. So, anxiety was not considered as mediator construct. Moreover, self-efficacy andenjoyment were examined as mediators between ease-of-use and usefulness and between attitudes(First mediation). Afterwards, self-efficacy and enjoyment were examined as mediators betweenattitude and the intention to use digital tools in teaching (second mediation).
In Step 1 of examining the first mediation, the regression of attitude as outcome on the predictors,ease of use and usefulness scores, ignoring the mediator, was significant, b =.94, t(47) = 1.71, p=.000 for ease of use and b=0.96, t(47)=24.28, p=0.000 for usefulness. Step 2 showed that theregression of the mediators’ scores, self-efficacy and enjoyment, on the predictors, was alsosignificant, b = 0.91, t(47) = 15.22, p =.000 for self-efficacy on ease-of-use; b = .97, t(47) = 26.35, p=.000 for self-efficacy on usefulness; b = .92, t(47) = 16.13, p =.000 for enjoyment on ease-of-use;b = .97, t(47) = 28.39, p =.000 for enjoyment on usefulness. Step 3 of the mediation process showedthat the regression of attitude scores on the mediators was also significant, b=.96, t(47)=24.19,p=.000 on self-efficacy and b=.95, t(47)=20.39, p=.000 on enjoyment. Step 4 of the mediationprocess showed that the regression of the attitude on the ease-of-use controlling for enjoyment as amediator was also significant, b =.46, t(47) = 4.57, p =.000. This shows partial mediation ofenjoyment as the effect of ease-of-use has dropped from .94 to .46. Partial mediation was obtainedtoo for self-efficacy as mediator between attitude and ease-of-use, b =.39, t(47) = 4.81, p =.000,where the effect of ease-of-use has dropped from .94 to .39. The same computations in step 4 werecarried out for the mediators between attitude, as outcome, and usefulness, as predictor. Thesecomputations showed partial mediation regarding self-efficacy and no mediation regardingenjoyment.
As to the second mediation, computing for mediation effects for intention to use as outcome andattitude towards use as predictor, the first three steps showed significant results for self-efficacy andenjoyment as mediators. Step 4 showed partial mediation of self-efficacy, where the effect ofattitude on the intention to use has dropped from .95 to .31. It also showed partial mediation ofenjoyment, where the effect of attitude on the intention to use has dropped from .95 to .36. Theprevious results are illustrated in Figure 3.
Figure 3: Regression analysis of the TAM constructs for pre-service teachers acceptance ofdigital tools for teaching
ICTMT 13 238 Lyon 3 - 6 July 2017

DISCUSSION AND CONCLUSIONS:
The present research examined the influence of using a specific model in the preparation of pre-service teachers for using digital tools through community of inquiry practices and practice-basedprofessional development. The research results indicate that the preparation resulted in significantdifferences in the scores of the different constructs, except anxiety, of the acceptance of digital toolsfor teaching mathematics and science. These results show the effectiveness of the community ofinquiry practices (Jaworski, 2005) regarding the acceptance of technology for teaching, where thesepractices included synchronous as well as asynchronous means of communication. It is ourconclusion that both means are essential in pre-service teachers’ education. The results also showthe effectiveness of practice-based professional development (Ball & Bass, 2003) which includedthe two effective means (Spector et al., 2008): pre-service teachers’ access to the digital tools, andthe opportunities they had during the preparation year to utilize these tools in their teaching.Regarding the insignificant differences in the scores of anxiety, these scores were already low beforethe preparation as a result of the pre-service teachers' preparation in their first two years of study, soit is natural that they stayed low after the preparation.Running mixed way ANOVA showed that the independent variables (specialization, computer-ability, computer-use) did not interact significantly with the intervention. This insignificantinteraction indicates that the intervention influenced positively all the pre-service teachers, and notonly part of them. We expected that the intervention would benefit the science pre-service teachersmore because the mathematics pre-service teachers who are specialized in computers too. It seemsthat this did not happen because the intervention was involved with technological pedagogicalcontent knowledge which was developed in the two groups of pre-serves teachers as a result ofpreparing them to integrate digital tools in teaching during one year. This has not much to do withthe technological knowledge that the mathematics pre-service teachers are engaged with during theircomputer specialization.
The anxiety scores, being low, resulted in insignificant correlations with the other variables, whatexcluded anxiety from being a mediator between the variables of technology acceptance. Self-efficacy proved to be a partial mediator between ease-of-use and attitude, as well as betweenusefulness and attitude. Moreover, self-efficacy proved to be a partial mediator between attitude andintention-to-use. At the same time, enjoyment proved to be a partial mediator between ease-of-useand attitude, but not between usefulness and attitude. At the same time, enjoyment proved to be apartial mediator between attitude and intention-to-use. These results show the importance of payingattention to affective and psychological constructs as mediators or moderators between otherconstructs of pre-service and in-service teachers’ acceptance of technological tools for teaching.Thomas and Palmer (2014) studied the teachers’ confidence-to-use of technologies and their beliefsin the value of technology as constructs that affect their use of technological tools in teachingmathematics. Here self-efficacy is related to the confidence-to-use construct. Nevertheless, moreattention to the various affective and psychological constructs are needed in order to study the issueof technology use in teaching mathematics and science, as well as teachers’ education regarding thisuse.
REFERENCES
Alenezi, A. R., Karim, A. MA., & Veloo, A. (2010). An empirical investigation into the role of enjoyment, computer anxiety, computer self-efficacy and internet experience in influencing the
ICTMT 13 239 Lyon 3 - 6 July 2017
students' intention to use e-learning: a case study from Saudi Arabian governmental universities. The Turkish Online Journal of Educational Technology, 9(4), 22-34.
Baron, R. M., & Kenny, D. A. (1986). The moderator-mediator variable distinction in social psychological research: Conceptual, strategic, and statistical considerations. Journal of Personality and Social Psychology, 51 (6), 1173-1182.
Compeau, D., Higgins, C., & Huff, S. (1999). Social cognitive theory and individual reactions to computing technology: A longitudinal study. MIS Quarterly, 23(2), 145-158.
Davis, F.D. (1989). Perceived usefulness, perceived ease of use and user acceptance of information technology. MIS Quarterly, 13(3), 319–339
Davis, F. D., Bagozzi, R. P., & Warshaw, P. R. (1989). User acceptance of computer technology: a comparison of two theoretical models. Management Science, 35(8), 982-1003.
Frikkie, G., & Ogunniyi, M. (2016). Teachers’ perceptions on the use of ICT in a CAL environment to enhance the conception of science concepts. Universal Journal of Educational Research, 4(1), 151-156
Getenet, S. T., Beswick, K., & Callingham, R. (2015). Conceptualising technology integrated mathematics teaching: The STAMP knowledge framework. In K. Beswick, T. Muir, & J. Wells (Eds.), Proceedings of PME 39, Vol (2), pp. 321–328. Hobart, Australia: PME.
Hong, Y. Y., & Thomas, M. O. J. (2006). Factors influencing teacher integration of graphic calculators in teaching. Proceedings of the 11th Asian technology conference in mathematics (pp. 234–243). Hong Kong.
Jaworski, B. (2005). Learning communities in mathematics: Creating an inquiry community between teachers and didacticians. In R. Barwell and A. Noyes (Eds.), Research in Mathematics Education: Papers of the British Society for Research into Learning Mathematics, Vol. 7 (pp. 101-119). London: BSRLM.
Padmavathi, M. (2016). A study of student-teachers' readiness to use computers in teaching: an empirical study. I-manager’s Journal on School Educational Technology, 11(3), 29-39.
Pittalis, M., & Christou, C. (2011). Extending the technology acceptance model to assess secondary school teachers' intention to use Cabri in geometry teaching, in: M. Pytlak, R. Rolland, & E. Swoboda (eds.), Proceedings of CERME 7 (2318–2327), Rzeszów, Poland: University of Rzeszów.
Ponte, J.P. (2012). A practice-oriented professional development programme to support the introduction of a new mathematics curriculum in Portugal. Journal of Mathematics Teacher Education, 15, 317–327
Röcker, C. (2009). Perceived Usefulness and Perceived Ease-of-Use of Ambient Intelligence Applications in Office Environments. In: M. Kuroso (Ed.), Proceedings of the 13th InternationalConference on Human-Computer Interaction (pp. 1052 - 1061). Heidelberg, Germany: Springer Verlag.
Shih, Y. Y., & Huang, S. S. (2009). The actual usage of ERP systems: An extended technology acceptance perspective. Journal of Research and Practice in Information Technology, 41(3), 263–276.
Spector, J. M., E. Jakubowski, et al. (2008). Investigating pre-service mathematics teachers' initial use of the next-Generation TI-Nspire graphing calculators: A case study. Tallahassee, FL: Florida Center for Research on STEM education (FCR-STEM), Learning Systems Institute, Florida State University.
Thomas, M. O. J., & Palmer, J. (2014). Teaching with digital technology: Obstacles andopportunities. In A. Clark-Wilson, O. Robutti & N. Sinclair (Eds.), The Mathematics Teacher inthe Digital Era: An International Perspective on Technology Focused Professional Development(pp. 71-89). Dordrecht: Springer.
Yi M. Y., Hwang Y. (2003). Predicting the use of web-based information systems: self-efficacy, enjoyment, learning goal orientation, and the technology acceptance model. International Journal of Human-Computer Studies, 59(4), 431-449.
ICTMT 13 240 Lyon 3 - 6 July 2017

EFFECT OF GEOGEBRA COLLABORATIVE AND ITEARTIVEPROFESSIONAL DEVELOPMENT ON IN-SERVICE SECONDARY
MATHEMATICS TEACHERS’ TPACK Houssam Kasti
Lebanese University, Lebanon; [email protected]
This study aims at understanding the effect of collaborative and iterative GeoGebra intervention onin-service mathematics teachers GeoGebra adoption in their teaching and the factors that mediatethat adoption. This article is one out of four parts of the study. The type of the study is a multiplecase studying in depth the effect of a GeoGebra (a free mathematics software) intervention on theTechnological Pedagogical Content Knowledge (TPACK) of in-service mathematics teachers insecondary schools who follow the Lebanese curriculum. The methodology used is Design-BasedResearch that focuses on working closely with practitioners in collaborative and iterative mannerin the real context to add principles to theory and practice. Results showed an increase in the levelof TPACK domains of teachers especially in their student-centered teaching approach.
Keywords: In-service secondary teachers PD, GeoGebra, TPACK.
INTRODUCTION
To effectively integrate technology in their classrooms mathematics teachers need to have goodmathematical content knowledge, technological knowledge, pedagogical knowledge, and moreimportantly a mix of all of them as TPACK. In addition, they need to know what barriers they mightface when they integrate technology in their classes and how to overcome them.
Literature review
The previous research on using technology in teaching of mathematics is so rich. For examplebetween 2012 and 2017 there were more than 15000 articles about GeoGebra, more than 5000 onmathematics teachers’ TPACK. But there is around hundred combining both (Google scholaradvanced search, August 2017). Very few of these hundred studies address in-service secondarymathematics teachers and their practices. After reading and analyzing all relevant literature thefollowing was found. First, research on technology integration lately is focusing on the design,implementation, and impact of tasks that are intended for prospective and practicing teachers fortheir professional learning concerning technology use in classrooms. (European society forResearch in Mathematics Education ERME book, in print). However, “research on the applicationof these theories [theories on technology integration and teachers’ knowledge] within the design oftasks intended for teachers’ professional learning initiatives is still in its infancy.” (ibid)Second, in a recent meta-analysis concerning all the articles written about the issue of using technology in upper secondary mathematics education reported four striking issues (Hegedus,et.al., 2017). One of them was the gap between teachers’ needs and the teacher education contents which is an under-represented issue in the field of mathematics education research. Third, there is evidence of GeoGebra being used extensively around the globe; it has been translated into fifty fourlanguages and has been used by approximately more than millions of teachers worldwide for more than 15 years now (Hohenwarter, GeoGebra Global Gathering 2017). However, systematic enquiries into the effectiveness of GeoGebra in teaching practices are limited. (Lu, 2008). One of the studies concerning GeoGebra and TPACK worked with 44 prospective secondary mathematics teachers enrolled in two methods courses. One of the results was that creating dynamic activities is essential to the development of teachers’ TPACK. One of their recommendations was that we can deepen prospective teachers’ knowledge of teaching and learning mathematics with technology by creating a rich and collaborative learning environment and challenging them with new problems, new pedagogies, and new solutions associated with the use of technology. Fourth, it terms of TPACK it was found that the Technology, Pedagogy and Content Knowledge (TPACK) framework
ICTMT 13 241 Lyon 3 - 6 July 2017

(Mishra & Koehler, 2006) is a dominant frame used to address teachers’ professional knowledge and skills (ERME book). Recently, despite the large number of researches done on TPACK, one research recommended “further research through participant observation studies…to ascertain the nature, magnitude, and direction of the interaction among teachers’ TPACK elements and the realityof school contexts” (Handal , Campbell, Cavanagh, Kelly, & Petocz, 2013, p. 36). The changes in teachers’ knowledge can lead to the changes in their classroom practices and that these changes can be reliably measured by the TPACK survey (Shin, Koehler, Mishra, Schmidt, Baran, & Thompson, 2009). Finally, though there has been a flowering of research on TPACK and its measurement, the review indicates that there is still much to be done particularly in the area of measuring how TPACK works in different disciplinary contexts. The quality of research has also been patchy, and there is a clear need for better-designed studies and instruments. (Koehler, Mishra, Kereluik, Shin, & Graham, 2014)Summing up, this research aims to study how a collaborative and iterative work with in-servicemathematics teachers affects their GeoGebra integration level in their teaching. Accordingly, thisstudy aims to answer the following research questions:
1. How does a GeoGebra intervention done cooperatively and iteratively affect in-service secondary mathematics teachers' TPACK regarding integrating GeoGebra in their teaching?
2. How do participants’ Valsiner’s three zones mediate the impact of the intervention on teachers’ TPACK regarding GeoGebra integration in their teaching?
Theoretical framework
In this study we have selected three theories namely: The zone theory, the diffusion of innovationtheory, and TPACK (Technological Pedagogical Content Knowledge).The Zone Theory states that the factors affecting technology usage by teachers are categorized intothree zones namely zone of proximal development (ZPD, includes skill, experience, and generalpedagogical beliefs), zone of free movement (ZFM, includes access to hardware..., support,curriculum and assessment requirements, students...) and zone of promoted action (ZPA, includespre-service education, practicum and professional development) (Goos et al., 2010). TPACK claimthat whenever new technology is to be effectively employed, teachers need to develop dynamicequilibrium among three elements, namely, technology, pedagogy, and content (Mishra and Kohler ,2006). The diffusion of innovation model describes the stages a person goes through when makingthe decision to adopt or reject a new technology (or innovation). It includes the following stages: (a)knowledge, (b) persuasion, (c) decision, (d) implementation, and (e) confirmation. Niess et.al.(2009) combined TPACK and the diffusion of innovation theories to obtain a new model called the“TPACK development model”. In this study we have used that model with Valsiners’ zones.
Methodology
Design Based Research (DBR) methodology in three iterations was used in this study over twostages (Figure 1). The first stage is the pre-intervention stage. This stage was dedicated tounderstanding the situation of integrating GeoGebra in the Lebanese curriculum, piloting theGeoGebra activities and testing the instruments. Six workshops were conducted over two years anda pilot study with two teachers. At the end of this stage four teachers (other than the ones in the pilotstudy) were selected as cases for the study. After selecting the participants 3 hour-workshop wasconducted by the researcher with the four participants to make sure all participants acquired thebasic features of the software (GeoGebra). In addition, as a group we collaborated in discussing thetopics in the secondary mathematics Lebanese curriculum that could be better taught with the use ofGeoGebra. We found that GeoGebra can be used in 37 different lessons of the secondary Lebanesecurriculum. The second stage was the intervention stage which was made up of two iterations. Inthis stage collaboration was one-to-one between the researcher and each of the participants. In thefirst iteration, the participating teachers decided which lesson they wanted to teach with GeoGebra
ICTMT 13 242 Lyon 3 - 6 July 2017

in accordance with their school mathematics scope and sequence. They were provided with a ready-made GeoGebra activities (made by the researcher) to be implemented in their classes. In thesecond iteration, teachers adapted already made GeoGebra activities and/or made their ownGeoGebra activities. Three visits were conducted with each participant at his/her own school andaccording to his/her free time. The first visit was to prepare for the first lesson. The second visit wasto evaluate the first lesson and prepare for the second lesson. Analysis of data collected from theinstruments was done before starting the second iteration as required by Design Based research. Thelast visit was to evaluate the second lesson and give a general overview of the whole experience.
Figure 1. The stages of the study
Instruments
For the pre-intervention phase, three questionnaires were administered by the participating teachers:(1) Demographics questionnaire, (2) The Technological Pedagogical Content KnowledgeDevelopment Level Questionnaire TPACKDLQ (Form 1), (3) Barriers (grouped in zones) in UsingTechnology Questionnaire BUTQ (Form 1). The purpose of these questionnaires was to measureteachers’ current TPACK integration level of the GeoGebra software in their teaching and thebarriers that affect their technology integration. The questionnaires were adapted from TPACKdevelopment model (Niess, et.al, 2009). After conducting the first lesson, semi-structured interviewin parallel form of the previous pre-intervention instruments TPACKDLI (Form 2) and BUTSI(Form 2) but combined were used to measure the impact of the intervention on teachers’ TPACKand to find out to what extent the zones could mediate that effect. In addition, another instrumentwas used to assess the GeoGebra activity itself .The instrument is Lesson Assessment Criteria semi-structured Interview (LACI) which is based on instrument by Harris, Grandgenett & Hofer (2010).
Niess et.al (2009) combined the four categories of TPACK: (a) curriculum and assessment, (b)learning, (c) teaching, and (d) access, with the five levels of the diffusion of innovation theory: (a)recognizing (knowledge), (b) accepting (persuasion), (c) adapting (decision), (d) exploring(implementation), and (e) advancing (confirmation). The results of this combination are elevendomains that constitute the TPACK development model. Each domain is made up of a five-scalethat measures teachers’ level of integrating a particular technology in teaching and learningmathematics. In this study we adapted this instrument to ask specifically about GeoGebra.
For the impact of the intervention we were interested in the change of the TPACK integration levelof GeoGebra at the end of each implementation, whereas for the dynamicity we were interested inthe pattern in which this change happened in between the implementation stages: ‘beforeimplementation’, ‘after implementation 1’, and ‘after implementation 2’. The dynamicity could be:(1) static: there was no change in the level in between the implementation stages or (2) dynamic:there was a change in the level in between the implementation stages. In this sense after the twolessons a general pattern could be static (across the 2 iterations), dynamic, (across the 2 iterations)static (no change) then dynamic (change) or dynamic (change) then static (no change).
ICTMT 13 243 Lyon 3 - 6 July 2017

Participants
In the last (sixth) workshop conducted by the researcher for the study attendees were given the pre-intervention questionnaires mentioned above and another questionnaire that measures the extent ofusing the GeoGebra in their practices. Based on the answers, for the practice instrument, the valueswere 0 (never use GeoGebra), 1(sometimes use GeoGebra), and 2(most of the time use GeoGebra).The average of all the questions was calculated. An average within the range [0, 0.7[ is consideredlow integration level, an average between [0.7, 1.3] is moderate integration level, and between ]1.3, 2] a high integration level. Similarly the average for each zone was calculated in the zonequestionnaire that consists of 27 questions. Based on these results, four cases were selected(Pseudonyms: Tima, Sara, Amani, and Hazem) in a way that they differ among themselves inpractice level and/ or in at least one barrier level. Table 1 represents the characteristics of eachparticipant.
Name Age Highestdegree
Teaching experience
Practice level ZFM ZPA ZPD
Amani 50-55 BS 25 years Low Moderate Moderate LowTima 23-26 Masters +TD 2 years Moderate Low Moderate Not*Sara 33-40 BS 7 years Moderate Moderate Low Not
Hazem 41-50 Masters 31 years High Moderate Not Not
Table 1. Participants domographics, practice and zones level*Not: the zone is not considered as a barrier to GeoGbera integration
GeoGebra modules
The criteria used for lesson selection are based on the criteria identified by Angeli & Valanides(2009) called ICT-TPCK. The GeoGebra activities were prepared by the researcher and tested onboth students and teachers. The activities were designed based on the following criteria: Eachactivity: 1) should be student centered, 2) can be conducted by students in a computer lab orelsewhere (classroom or at home), 3) allows student to discover the concept or theorem under study,4) includes immediate application of the concept under study, 5) does not require prior knowledgeof the software.
Each teacher selected an activity according to his/her scope and sequence, so each teacher applied adifferent GeoGebra activity. Table 2 shows which activities applied by each teacher. An example ofone activity is provided at the end of the article.
Activity 1 Activity 2
Amani Sign of quadratic polynomials Derivative
Tima vectors 3D
Hazem Equation of a straight line Thales Theorem
Sara Translation of functions Vectors
Table 2. The intervention activities conducted by each of the participating teachers
RESULTS
The median of all eleven domains for each participant before, after first implementation, and aftersecond implementation were calculated and the results are shown as box plots in Figure 2. It was found that before the intervention the median result for all cases is the adapting level, after
ICTMT 13 244 Lyon 3 - 6 July 2017

the first implementation the median −¿ for most cases −¿ improved to the exploring level butmany subcategory levels stayed in the adapting, whereas after the second implementation themedian −¿ for most cases −¿ stayed at the exploring level but with less subcategory levels onadapting and more on the advancing level.
Figure 2. The effect of the intervention on participants’ TPACK level
Iterations: Before: before the intervention; 1: after first implementation; 2: after second implementationLevels: 1 recognizing, 2 accepting, 3 adapting, 4 exploring, and 5 advancing
Based on the details of the results and to answer the research questions we can say the interventiondone iteratively and cooperatively improved all TPACK domains for all the participants: (1)teachers learned and experienced how to effectively integrate GeoGebra in their curriculum, (2)they started using some kind of GeoGebra assessment questions, (3) they started using morestudent-centered activities that require more critical thinking skills, and (4) they sensed they needmore professional development in GeoGebra and in technology integration in general. Most of the mediating zone factors were overcome except some related to the zone of freemovement (ZFM) that came in the way of reaching higher levels. Those ZFM factors were: (1)curriculum requirements because not all lessons are appropriate to be taught with technology, (2)lack of hardware (or not enough), and (3) students’ motivation.For the dynamicity of change it was found that eight of the eleven domains of TPACK developmentmodel were dynamic then static, two domains were dynamic specifically the professional
ICTMT 13 245 Lyon 3 - 6 July 2017

development and overcoming barriers, and lastly one static (to a certain extent) domain which ismathematical teaching.
For most cases before the intervention, most participants’ subcategories were in adaptinglevel and after two iterations they reached either the exploring or the advancing level (highestTPACK level). The change was mostly dynamic with change happening immediately after the firstimplementation. There were some assisting factors to higher TPACK levels mainly collaboration(ZPA), increase in knowledge and skills (ZPD), and some ZFM factors like availability ofhardware, curriculum requirements and students’ motivation. The limiting factors were mainlyZFM factors such as: not enough available or accessible hardware, lack of time to prepare andconduct GeoGebra activities, students’ motivation, and curriculum requirements… and one ZPDfactor lack or not enough skill.
DISCUSSION
It was clear from the dynamicity of change the direct effect of the intervention on teachers’ TPACKin all its eleven domains. Not only it raised the adoption level of GeoGebra in their teaching butalso kept that adoption high. In addition, as a direct impact on collaboration and applying GeoGebraactivities in their teaching teacher felt the need of learning more about this software and how toeffectively integrate it in their teaching. In fact, many after the intervention attended otherworkshops conducted by the researcher and kept on using GeoGebra in their teaching. Sometimesteachers’ perception of the barriers is not related to reality and that we have seen when they changedtheir list of barriers before the intervention and after. One important factor acted sometimes asencourager and sometimes as barrier to higher integration level was students’ motivation.
RECOMMENDATIONS
In terms of the research questions, can we say that the effect of the design as collaborative and iterative manner is more powerful than one-day-workshops? Does the effect of such intervention affect teachers’ knowledge more than teachers’ practices? The study is an ongoing one and much to be discussed in its four parts to get a clearer and better picture of the integration of technology problem.
REFERENCES
Angeli, C. & Valanides, N. (2009). Epistemological and methodological issues for the conceptualization, development, and assessment of ICT–TPCK: Advances in technological pedagogical content knowledge (TPCK). Computers & Education 52, 154 −¿ 168. Retrieved from http://teaching.cycu.edu.tw/pdf/2009_TPCK.pdf
Goos, M., Soury-Lavergne, S., Assude, T., Brown, J., Ming Kong, C., Glover, D., … Sinclair, M. (2010). Teachers and Teaching: Theoretical perspectives and issues concerning classroom implementation. In C., Hoyles, & J. -b. Lagrange (Eds.), Mathematics education and technology-rethinking the terrain (pp. 311 −¿ 328). New York: Springer.
Handal, B., Campbell, C., Cavanagh, M., Petocz, P. & Kelly, N. (2013). Technological pedagogical content knowledge of secondary mathematics teachers. Contemporary Issues in Technology and Teacher Education, 13(1), 22-40.
Hegedus, S., Laborde, C., Brady, C., Dalton, S., Siller, H. S., Tabach, M., ... & Moreno-Armella, L. (2017). Uses of Technology in Upper Secondary Mathematics Education. In Uses ofTechnology in Upper Secondary Mathematics Education (pp. 1-36). Springer InternationalPublishing.
ICTMT 13 246 Lyon 3 - 6 July 2017

Koehler, M. J., Mishra, P., Kereluik, K., Shin, T. S., & Graham, C. R. (2014). The technological pedagogical content knowledge framework. In Handbook of research on educational communications and technology (pp. 101-111). Springer New York.
Lu, Y. W. A. (2008). Linking Geometry and Algebra: A multiple-case study of Upper-Secondary mathematics teacher's conceptions and practices of GeoGebra in England andTaiwan. Unpublished Master's thesis, Cambridge: University of Cambridge, UK.
Mishra, P., & Koehler, M. (2006). Technological pedagogical content knowledge: A framework for teacher knowledge. Teachers College Record, 108(6), 1017-1054.
Niess, M. L., Ronau, R. N., Shafer, K. G., Driskell, S. O., Harper S. R., Johnston, C., Browning, C.,Özgün-Koca, S. A., & Kersaint, G. (2009). Mathematics teacher TPACK standards and development model. Contemporary Issues in Technology and Teacher Education, 9(1), 4-24
Shin, T., Koehler, M., Mishra, P., Schmidt, D., Baran, E., & Thompson, A. (2009, March). Changingtechnological pedagogical content knowledge (TPACK) through course experiences. In Societyfor Information Technology & Teacher Education International Conference (pp. 4152-4159). Association for the Advancement of Computing in Education (AACE).
Example of a part of an activity
Objective: Understand the definition of derivative.
Given the function f defined by: 2( ) 3 4f x x x . Let (P) be its representative curve in an
orthonormal system.
A) In the input bar type 2( ) 3 4f x x x . Let A(-2,-6) and B (x, f(x)) be two points of (P).
B) Join A and B by a straight line and specify its slope.C) Change the position of B and note what is happening to the slope of (AB).D) Can x be -2 in the slope of (AB)? _________. E) Can it be near -2? _____________. F) As point B approaches point A, the slope of (AB) approaches_____.
G) Prove that the slope of (AB) expressed in terms of x is: Slope of (AB) =
2 3 2
2
x x
x
.
H) Calculate
2
2
3 2lim
2x
x x
x�
= What can you deduce?_______________.
I) Can we call the line (AB), with respect to (P), in this case a tangent? _______________.
Conclusion: The slope of the tangent to (P) at point A of (P) with abscissa
x =-2 is equal to 2
( ) ( 2)lim
( 2)x
f x f
x�
. It is also called the derivative of f at x = -2.
ICTMT 13 247 Lyon 3 - 6 July 2017
GEOGEBRA AND NUMERICAL REPRESENTATIONS: A PROPOSAL
INVOLVING FUNDAMENTAL THEOREM OF ARITHMETIC
Gerson Pastre de Oliveira
Pontifícia Universidade Católica de São Paulo and Universidade Paulista (Brasil);[email protected]
This paper reports a qualitative research whose subjects were Elementary School Teachers whotook part in a workshop about primality of positive integers and the Fundamental Theorem ofArithmetic (FTA). These topics was dealt with from different technological perspectives andanalysed under a theoretical proposal connected to the concepts of transparency and opacity ofnumerical representations and to the "humans-with-media" approach. The interactions occurred ina Post Graduate Program in Mathematics Education and they consisted of two activities created toask subjects which numbers in a random list would be prime. The analysis showed that participantshad difficulties with FTA, which led them to adopt strategies with a high cognitive cost and makemistakes. Likewise, data showed that hindrances were overcome based on the educational proposalplanned from a configuration of humans-with-GeoGebra.
Keywords: fundamental theorem of arithmetic; numerical representations; digital technologies ineducation; human-with-media; GeoGebra.
INTRODUCTION
The task of recognizing whether a positive integer is prime may seem simple and not veryinteresting in terms of teaching or researching in the field of Mathematics Education. Consideringthat a natural number is prime if it can be divided uniquely by itself and by one, we might think thatthere are no associated complexities. Ultimately, it just seems to be a question of finding a divisorbetween 2 and the square root of the number tested for primality or of applying the so-called‘divisibility rules’. Such a search, however, can have quite a high operational cost. For example, ifthe number is 30847, we must consider that its first divisor is 109 and that there is only anotherdivisor apart from the number itself and 1, which is 283.
In order to deal with such problem, this work describes a research whose participants were a groupof basic education teachers from public schools, involved in the projects “Mathematics Teachingand Learning Processes in Technological Environments”, constituted through a partnership betweenthe Pontifical Catholic Universities (PUC) of Sao Paulo (Brazil) and of Lima (Peru), and“Technologies and Mathematical Education: researches on fluency in devices, tools, artefacts andinterfaces”, also linked to the PUC Sao Paulo [1]. In the proposed activities, teachers had to identifywhether several numbers were prime, in situations where divisibility rules, for example, were aninefficient strategy and where FTA knowledge would be relevant. Through the chosen researchinstruments – a question about the subject ‘primality of natural numbers’ and an application builtwith GeoGebra – we sought to highlight the strategies used by the subjects to solve the problems,their ideas about the representation of natural numbers and the influence of the type of technologyon the mobilization of the mathematical knowledge at issue. In this respect, arguments related to thenumber representation arise, as well as discourses related to the use of technology in MathematicsEducation, which leads to the following theoretical treatment.
ICTMT 13 248 Lyon 3 - 6 July 2017

NUMERICAL REPRESENTATIONS
One of the core concepts addressed in this research refers to transparency and opacity of numericalrepresentations. In this respect, the study of Zazkis and Liljedahl (2004) mentions the role ofrepresentations in the field of natural numbers. In their paper, the authors discussed data obtainedfrom a research conducted with basic education teachers in training, which focused on subjectsunderstanding of prime numbers, so as to detect the factors that interfere with such understanding.The argument used in the analysis of collected data is that the lack of transparency of primenumbers representation is a hindrance to understand them. This idea was inspired from the paper ofLesh, Behr and Post (1987). When referring to different representations of rational numbers, theauthors show that they “incorporate” mathematical structures, meaning that they represent themmaterially. Thus, representational systems can be regarded as opaque or transparent: a transparentrepresentation has no more or less meaning than the ideas or structures it represents, while anopaque representation emphasizes some aspects of the ideas or structures it represents while hidingothers. When having different representational possibilities, a didactic strategy should, for example,capitalise on the strengths of a specific representational system and minimize its weaknesses.
Expanding Lesh, Behr and Post’s proposal (1987), Zazkis and Gadowsky (2001) introduce thenotion of relative transparency and opaqueness, focusing on numerical representations. The authorssuggest, on their paper, “that all representations of numbers are opaque in the sense that they alwayshide some of the features of a number, although they might reveal other, with respect to which theywould be ‘transparent’” (p.45). As an example, the authors provide a list with the following items:(a) 2162, (b) 363, (c) 3 x 15552, (d) 5 x 7 x 31 x 43 + 1, (e) 12 x 3000 + 12 x 888. The authorsmention that such expressions do not seem to represent the same number, 46656, pointing that eachrepresentation shifts our attention to different properties of number.
Based on the above-mentioned concepts, the authors claim that all numeric representations areopaque, but they have transparent features. In relation to the work we describe here, activitiesinvolving the features of numerical representations were presented to the subjects by using differentmeans and technological interfaces. For this reason, a discussion about the use of technologies inMathematics Education becomes necessary in this paper.
ABOUT THE USE OF TECHNOLOGIES IN MATHEMATICS EDUCATION
Technologies have been part of educational processes from time immemorial, if we consider, likeLévy (1993) that transmutation of temporalities in Human History brought about differentinstruments; some of them prevailed over the others depending on the evolutionary character of thesociety in a given time. Thus, orality, writing and information technology are enrolled astechnologies of intelligence. The ascendancy of information technology did not suppress previoustechnological proposals, but constituted, in relation to them, a feature of redefining functions and, inthe last resort, of convergence. Thus, it is unavoidable to associate the use of some technology inprocesses of teaching or learning: a construction of knowledge and its forms of access, therefore,were always linked to more or less material tools of technological nature.
From this perspective, we can conjecture that the process of knowledge construction involvespeople and technologies associated in some way. However, technologies are not part of thisassociation as substitutes for human capacities, not even as a supplement to them, but asreorganizers of human thought (Tikhomirov, 1981). In this sense, computer applications, forexample, allow for unusual forms of mediation, delegating to the computer the role of tool forhuman mental activity, with functions similar to those performed by language in vygotskinianlogics. Similar reasonings apply to contemporary devices such as tablets or cell phones.
ICTMT 13 249 Lyon 3 - 6 July 2017

Such considerations support the claim that, in Mathematics, learning is a process involvingtechnologies that are somehow integrated with people what allows intentions, strategies, plans andconjectures come into play. According to Borba and Villarreal (2005), such integration must be ofsuch an order that it excludes any attempt to see these items, people and technologies, as separategroups. Therefore, for these authors, mathematical knowledge is formed from a collective ofhumans-with-media, considering that media reorganize people’s thinking and that the presence ofdifferent technologies conditions the production of different forms of knowledge. Thus, in theresearch described here, the two activities explained below attempted to investigate how teachers incontinuing education comprise numerical representations related to prime numbers and FTA, basedon the use of different technologies at different times: during the first activity, teachers-with-pencil-and-paper; in the second activity, teachers-with-computers-and-GeoGebra.
METHODOLOGICAL APPROACH
The participants of this qualitative research are eight basic school teachers in São Paulo and Parástates, all of them voluntary in workshops carried out in the framework of the projects mentioned atthe start of this text. The research we describe here was conducted in one of the computing labs ofthe abovementioned institution, in a single session which lasted around four hours. Among theteachers so described, five work in primary and secondary education while three of them work onlyin primary education. Moreover, all of them have completed their bachelor’s degree in Mathematics,three of them are attending an Academic Master in Mathematics Education and two have completedtheir Specialization in Mathematics Education.
Participants in this study were invited to working with two kinds of activities involving knowledgeon primality in the framework of the Theory of Numbers. The first activity consisted of an issue tobe solved individually (here, the response had to be presented in writing): “Consider F = 151 x 157.Is F a prime number? Circle YES/NO, and explain your decision” (Zazkis & Liljedahl, 2004,p.169). To answer to the abovementioned question, students would have to write down the option‘No’, since the representation in question, with transparent features, shows that F is composite, andit even relates the component prime factors. Teachers should resort to the Fundamental Theorem ofArithmetic (FTA) to conclude that the said decomposition would be unique, except by the order.
If they considered another strategy, subjects could perform the multiplication contained in thequestion, obtaining 23707, an opaque representation in relation to the detection of the compositecharacter of the number. From this other representation, teachers could test with several possibledivisors, although this was not necessary to solve the problem. It might even happen that someteacher attempted to divide 23707 by the prime numbers from 3 onwards, giving up after someattempts, since natural numbers below 151 are not divisors of 23707 – in this case, this teachercould even erroneously state that the number would be prime.
The next activity was carried out immediately after the first one. Individually, the eight teachers hadin front of them a GeoGebra screen containing only one button with the word “Números”(“Numbers”) on it. They were all informed that the application would draw nine numbers when theypressed the said button. Then, researcher instructed teachers with regard to the result they would seeat clicking the button: nine numbers would be shown on the Algebra View of the software. They hadto state, by writing on a blank paper that had been handed out and in a lapse of 20 minutes, whethereach drawn number was prime or not. In the meantime, they should not click on the button withlabel “Coisa” (“Do something”) [2] on it (Figure 1) shown after the draw.
ICTMT 13 250 Lyon 3 - 6 July 2017

Figure 1. Screen with drawn numbers (developed by the author)
Regarding the numbers, it is worth noting that the construction of the javascript code that carriedout the draw took into consideration the random selection of numbers in the range of 1001 to 99999(Figure 1). The purpose was to restrict the direct application of rules and division algorithms.Despite this, these resources could be successfully used in some cases (such as 47301, which isdivisible by 3) and fail in others (such as 39203, which is not prime, but whose prime factors are197 and 199). In theory, the representations provided by the software were opaque with respect tothe primality of the numbers, at least up to this point of the experiment.
Once the time allowed was over, regardless of the amount of resolutions among the nine proposals,subjects were invited to click on button “Coisa”. After this action, the Algebra View of GeoGebrashowed the decomposition of each of the nine numbers into prime factors, in the form of lists(Figure 2) – in the case of primes just the number itself was presented.
Figure 2. Numbers and their compositions in prime factors (developed by the author)
Immediately after this action and still individually, participants were invited to revisit their previousanswers in the light of the new data obtained with the factorization carried out in GeoGebra. At thatoccasion, subjects were expected to relate the lists obtained with the numbers drawn previously anduse the FTA so as to decide on the primality or not of each one. Ten minutes were allowed for thispart of the activity, after which there would be a debate involving the subjects and the researcher.The button “Apagar Listas” (“Erase all”) (Figure 2) could be used to go back to the initial screen,which would allow repeating the experience as many times as considered necessary by participants.
ICTMT 13 251 Lyon 3 - 6 July 2017

ANALYSIS
At the very beginning of first activity, Teach2 after trying some division operations with pencil andpaper stated that 23707 would ‘probably’ be prime. Other four participants also stated, wrongly, thatthe number in question would be prime, using similar strategies:
Teach3 did countless division operations and ended up stating that “23707 is prime,because it can be divided by itself and by one”. In this way, Teach3 showed he is notaware that this criterion does not distinguish between prime and composite numbers;
Teach4, after several attempts using division operations, concluded that 23707 would be aprime number because it “ends in 7 and 7 is prime”;
For Teach5, as the divisibility tests by 2, 3, 5, 7, 11 and 13 ‘failed’ (divisions had aremainder other than zero), the number in question would be prime – in this case theteacher indicates he believes that “decomposition into prime factors meansdecomposition into small prime factors” (Zazkis & Campbell, 1996, p. 215);
In the case of Teach8, number 23707 “is prime, because it is an odd number and it cannotbe divided by its square root or any other prime number”. Like Teach5, Teach8 limited theuniverse of prime numbers to the interval between 2 and 13 and it evidenced severalconfusions involving the concepts of perfect square numbers and odd numbers.
The representation of F provided in the question formulation had transparent features in relation toprimality, because it presented the number by means of its unique decomposition in prime factors.However, the abovementioned teachers did not use this idea as expressed in the FTA, which pointsout the fact that a numeric representation with features that make it transparent can be kept opaquewhen mathematical knowledge about it is not mobilized by the individual. Similar results wereobserved in the work of Zazkis and Liljedahl (2004), which leads us to consider the need to usedidactic strategies capable of reinforcing the transparent characteristics of this representationalsystem, as advocated by Zazkis and Gadowvsky (2001). This was done in the second activity.
Furthermore, some participants correctly stated that F would not be prime. According to Teach1, “Fis divisible by 151 and 157, which makes it non-prime”. Participants Teach6 and Teach7 said, in asimilar way, that F had other divisors besides itself and 1, which would make it non-prime.Nevertheless, none of the three participants that answered correctly did show any sign of using theFTA in their conjectures: when questioned about the possibility of F having other divisors apartfrom the ones mentioned, all of them said it was possible but that they would have to test numbersup to a certain limit (according to Teach1 up to the number square root; according to Teach6 andTeach7, up to half the number). Another aspect worth highlighting is that none of the teachersshowed awareness of the fact that factors 151 and 157 represented prime numbers.
From a different perspective, the technological component of the collective humans-with-pen-and-paper, even if intensively used, does not seem to support cognitive movements related to a changeof strategies in this activity – in the case of participants who exhausted attempts with divisibilityalgorithms – or to the use of formal notions in Mathematics, such as the FTA – in the case ofparticipants who stated that 23707 might have other divisors.
Regarding the second activity, carried out in GeoGebra, participants accessed the application thatwas available on the computers in the institution’s lab and drew the nine numbers, as shown onfigure 1, without further questions. From this moment, teachers had 20 minutes to decide whichnumbers would be primes. All participants alleged, initially, that time was too tight and that
ICTMT 13 252 Lyon 3 - 6 July 2017

numbers would be too big (odd numbers between 1001 and 99999) to be able to provide an answer.The researcher said that they should state as many results as possible in this lapse of time, whichcould not be extended.
Until that moment, the technological aspect in the collective teachers-with-GeoGebra did not havegreat influence on the issue of transparency of the numeric representation regarding primality,because the program interface in question only provided odd random numbers within the said limits.Thus, as drawn numbers were potentially different, the amount of correct or wrong results showedsignificant differences among the subjects. Those whose drawn numbers allowed direct applicationof divisibility rules or tests with ‘small’ prime divisors (3 to 13) obtained more hits than thosewhose drawn numbers were 11741 (59 x 199) or 31753 (113 x 281), for example. Generally, suchnumbers were wrongly stated to be prime. Even when prime numbers were identified, as 17231, adoubt used to remain, as in the case of Teach5, who wrote, next to the said number, “I think it isprime. I tested up to 13”. As we have already seen, this strategy, in the case of numbers whose primefactors are all higher than 13, is not efficient.
Among the teachers’ talks during the 20 minutes allowed for the activity, several references weremade to the numbers ‘difficult form’, a clear attempt to refer to their representation, which is clearlyopaque in terms of the feature ‘primality’. Teach6 even got to question the goal of GeoGebra in thatcontext, as the application did not seem, according to him, “to make things easier for those who tried tosolve the problem”.
Faced with perplexity caused by the proposal, the researcher, after the time allowed, proceeded tocoordinating a debate with the participants, whose main motivation was raising the conjectures andstrategies that subjects had proposed in order to verify the primality of their nine numbers. None ofthe participants said to have tried or even thought about obtaining the factorization of the numbersto be tested for primality in order to using knowledge on FTA. Once the debate was ended, theresearcher said that subjects could click on button ‘Coisa’, which would show, for each rafflednumber, the respective list of component prime factors (figure 2). After this, in 10 minutes, teachershad to review their answers. Immediately after clicking on the button, teachers had to construe thedata showed on the screen.
When they realized the correspondence between the lists provided and drawn numbers (list1referred to number a1, list2 referred to number a2, and so on), most teachers started searching forrelations among the said components:
Teach6: Professor, I would like to review my answers.
Researcher: Yes, why so?
Teach6: Because I realized something that I had not seen before… the lists… they are thefactors of each number...
Teach1: By multiplying the numbers in the lists we obtain the drawn numbers…
Teach4: It´s true, but there are cases where only one number appears… these numbers areprimes, as we can only multiply by one!
Teach3: [does not seeming convinced] Professor, I´ll draw the numbers again… [afterrepeating the draw and factorization] It’s true! Prime numbers do not have factors,only composite numbers do.
Teach4: A prime number’s factors are itself and one...
ICTMT 13 253 Lyon 3 - 6 July 2017

Teach7: I was thinking... In my case, one of the numbers is 88739... Factorization is shownas 7, 7 and 1811. I could as well write 49 and 1811, right?
Teach8: [after some discussion with pairs] I think that 49 can appear, but 49 is not prime,and lists show prime factors of numbers. The idea is that only prime numbersappear. We can see that all the factors, in all the numbers, are prime.
Teach4: You are right. Any number can be written as a product of prime factors! This is it!Wow! First question was obvious! There is only one decomposition into primenumbers for each number.
Teach8: It is the Fundamental Theorem of Arithmetic!
After these observations, subjects could tell which numbers were prime and which were not, byrepeating raffling and the whole procedure several times. As noted by Borba and Villarreal (2005),visualization and experimentation were important factors in the new strategy adopted by subjectsfrom configuration humans-with-GeoGebra. According to these authors, such items allow, amongother actions, for example, to invest in generating conjectures about the problems at issue (andtesting them through countless examples), bring to light some results which were not known beforethe experiments and testing different ways of collecting results. The access to visual components, inthe consolidation of the results of actions carried out by people-with-GeoGebra, became a way totransform the understanding they had about the problems at issue.
Another aspect that must be taken into account in the configuration teachers-with-GeoGebra is thedynamism of digital technologies that has been seen here as a possibility to manipulate theparameters, attributes or values which served the constitution and/or definition of a mathematicalconstruct in a computerized context. Faced the possibilities open by this resource, a fundamentalinvestigative movement to mathematics finds consistent subsidies in the development, testing andvalidation (or refutation) of conjectures. This could be largely seen in the experiment we describehere, when teachers invested, through experimenting and visualizing, in the procedure repetition,using the regularities observed in factorizations – and dynamically obtained - as a means to supportthe reorganization of ideas on the primality of the presented numbers. All these factors collaboratedto mobilise knowledge on FTA for the solving of the problem.
FINAL CONSIDERATIONS
The discussion following the last activity was quite fruitful: participants stated that, in activity 1they had not realized that the ‘way’ in which the number was written (its representation) allowed thequestion to be answered directly by mobilizing knowledge related to the FTA.
Regarding activity 2, participants said that numbers were not expressed in a ‘convenient way’(transparent representation), i.e., according to them, they were ‘big numbers’ that were notdecomposed in prime factors. Teachers mentioned the fact that they had spent the 20 minutes to tryand say which of the numbers were prime, but if they had the appropriate representation in factorsand had remembered the FTA, they would have done this much faster. This last feature wasperceived when they clicked on the second button, causing the decomposition of the numbers inprime factors to appear. The participants concluded that, when there were other factors besides thenumber itself, the number in question would not be prime. Moreover, teachers highlighted theimportance of FTA knowledge and of the use of GeoGebra in the procedures, saying that this wouldbe a good way to approach the topic in classroom.
ICTMT 13 254 Lyon 3 - 6 July 2017
Moreover, in this context, the Geogebra´s application would work as a ‘calculator to decompose inprime factors’, turning a numeric representation, opaque in relation to primality, into a transparentrepresentation, provided that the knowledge about the FTA has been mobilized. In this case, theconfiguration teachers-with-GeoGebra contributed in a more efficient way to direct the problem-solving effort towards a strategy that brings more chances of success. Dialogues show, althoughonly to some extent, the renegotiation of meanings, the conjectural reformulations and thereorganization of thinking which allowed the right answer to come out. Another feature that must behighlighted is that representations of prime numbers can give opportunity to transparent featuresemerge, as soon as the appreciation of underlying meanings and concepts is taken into account.When this does not occur, the tendency is to call for large, expensive solutions in cognitive terms.To investigate the nature of these processes and develop proposals in order to avoid such difficultiesto remain among basic school teachers seems to be an important challenge, open to new researches.
NOTES
1. Research projects supported by FAPESP and CNPq, respectively (Brazilian scientific development agencies).
2. The button title could then be ‘Factorize’, but the idea was to promote a research where subjects were the authors of
the hypothesis formulated to solve the problem: the use of this title might imply that teachers needed, compulsorily, to
do the factorization of the numbers, which would compromise their autonomy.
REFERENCES
Borba, M. C, & Villarreal, M. (2005). Humans-with-media and the reorganization of mathematicalthinking: Information and communication technologies, modelling, visualization andexperimentation. New York: Springer.
Lesh, R., Behr, M., & Post, T. (1987). Rational Number Relations and Proportions. In C. Janiver(Ed.). Problems of Representations in the Teaching and Learning of Mathematics (pp. 41-58).Hillsdale: Lawrence Erlbaum.
Lévy, P. (1993). As tecnologias da inteligência: O futuro do pensamento na era da informática. Riode Janeiro: Editora 34.
Tikhomirov, O. K. (1981). The psychological consequences of computerization. In Wertsch, J. V.(Ed.). The concept of activity in soviet psychology (pp. 256–278). New York: M. E. Sharpe.
Zazkis, R., & Campbell, S. R. (2006). Number Theory in mathematics education research. InZazkis, R.; Campbell, S. (Eds.). Number Theory in mathematics education: perspectives andprospects (pp. 1-18). New Jersey: Lawrence Erlbaum Press.
Zazkis, R., & Campbell. S. R. (1996). Prime decomposition: Understanding uniqueness. Journal ofMathematical Behavior, 15, 207-218.
Zazkis, R., & Gadowsky, K. (2001). Attending to transparent features of opaque representations ofnatural numbers. In Cuoco, A. (Ed.). NCTM 2001 Yearbook: The roles of representation in schoolmathematics (pp. 41-52). Reston: NCTM.
Zazkis, R., & Liljedahl, P. (2004). Understanding primes: The role of representation. Journal forResearch in Mathematics Education, 35, 164-186.
Zazkis, R. (2002). Language of number theory: metaphor and rigor. In Campbell, S. R., Zazkis, R.(Eds.). Learning and teaching number theory: Research in cognition and instruction (pp. 83-96).Westport: Ablex Publishing.
ICTMT 13 255 Lyon 3 - 6 July 2017

ANALYZING THE TEACHER’S KNOWLEDGE FOR TEACHING
MATHEMATICS WITH TECHNOLOGY
Helena Rocha
Faculdade de Ciências e Tecnologia, Universidade NOVA de Lisboa; [email protected]
The teacher’s knowledge has long been viewed as a strong influence on the students’ learning.Several authors have sought to develop procedures to assess this knowledge, but this has proved tobe a complex task. In this paper I present an outline of a conceptualization to analyze the teacher'sknowledge, based on the model of the Knowledge for Teaching Mathematics with Technology(KTMT) and a set of tasks. These tasks are chosen by the teacher taking into account the potentialof the tasks to take advantage of the technology’s potential. The analysis of the teacher’s KTMT isbased on the characteristics of the tasks chosen by the teacher; the balance established between therepresentations provided by the technology that the tasks advocate; the way how the tasks payattention to the new issue of seeking for a suitable viewing window; and also the way how the taskstake into account the expectable difficulties of the students in the process of looking for the window.
Keywords: Professional knowledge; KTMT; technology.
INTRODUCTION
The teacher’s knowledge is considered as an important requirement for high-quality teaching(Fauskanger, 2015). And many are the authors who have been dedicated to developingcharacterizations of this knowledge, identifying important aspects of the knowledge required toteach and developing models that articulate specific knowledge in a global and comprehensivestructure. And closely related to this intention to characterize the teacher’s knowledge, is the desireto assess the knowledge effectively held by the teacher. And this is an issue that has proved to becomplex. Several authors (such as Fauskanger (2015) and Schmidt et al. (2009)) point outweaknesses and even question the reliability of the results achieved through the application of someof the instruments developed. There are also several authors who criticize the options taken toassess the teacher's knowledge (such as Rocha (2010) and Schmidt et al. (2009)). According tothem, these options are too demanding, in terms of the time required to implement and in terms ofthe resources required to achieve them.
This article intends to present a theoretical conceptualization to analyze the knowledge of theteacher in a context of technology use. It is a work still in progress, based on the model ofKnowledge for Teaching Mathematics with Technology (KTMT) and that is based on the analysis ofthe tasks proposed by the teacher to the students. At this stage of the work it is only considered theteaching of Functions with the graphing calculator.
The structure of the paper includes a section devoted to a summary presentation of KTMT, followedby a brief critical analysis of the main options taken by two authors who developed tools orstrategies to assess the teacher’s knowledge. It is then presented the conceptualization that is theobject of this article and justified the options assumed. Finally, to clarify the ideas presented, anhypothetical example of application of this conceptualization is discussed. The data presented in thislast part are real and have been collected in the course of another study. This means that the taskswere actually implemented by one teacher. However, this is not a real example of application of thisconceptualization, once the tasks were selected by the researcher and not by the teacher.
ICTMT 13 256 Lyon 3 - 6 July 2017

KNOWLEDGE FOR TEACHING MATHEMATICS WITH TECHNOLOGY – KTMT
A look at the knowledge models developed so far, such as Mathematical Knowledge for Teaching(MKT) by Hill et al. (2007) or the TPACK from Mishra and Koehler (2006), suggests theknowledge of Mathematics, Teaching-Learning, Technology, and Curriculum as important domains.These are the basic domains of KTMT, being the Curriculum viewed in a transversal way,influential over all the others domains.
Besides those, KTMT particularly values two sets of inter-domain knowledge developed at theconfluence of more than one domain: Mathematics and Technology Knowledge (MTK) andTeaching-Learning and Technology Knowledge (TLTK). This is new knowledge that goes beyondthe intersection between knowledge of the base domains. The MTK focuses on the knowledge ofhow technology influences Mathematics, enhancing or constraining certain aspects. The TLTKfocuses on how technology interferes with the teaching-learning process, enhancing or constrainingcertain approaches.
One of the main intentions behind the design of KTMT, which distinguishes it from other existingmodels, is to integrate into a single model the research on professional knowledge and on theintegration of technology into professional practice. That is why MTK necessarily includes:
- Knowledge of technology’s mathematics fidelity, i.e., knowledge of the level of agreement
between the results of the Mathematics and the results of the mathematics as presented by thetechnology;
- Knowledge of the new emphasis that technology puts on the mathematical content (e.g., more
intuitive approaches encouraging or requiring a different domain of the influence of the values represented in the coordinate axes on the shape of the displayed graph);
- Knowledge of new sequences of content;- Representational fluency, involving knowledge of different representations, of how to relate them
and how to alternate between different representations and between different forms of the samerepresentation.
And TLTK necessarily includes:
- Knowledge of new issues that technology requires students to deal, including the difficulties theyface when using technology and that arise from such use;
- Knowledge of mathematical concordance of the proposed tasks, i.e., the alignment between themathematics the teacher intended the students to work on and the mathematics the studentsactually worked;
- Knowledge of the potential of technology for the teaching and learning of mathematics, includingknowledge of different types of work and teacher roles that technology becomes possible,knowledge of ways of articulating them and knowledge of the contribution they can bring tomathematics learning.
Finally, KTMT includes Integrated Knowledge (IK). A knowledge held by the teacher thatsimultaneously articulates knowledge in the base domains and in the two sets of inter-domainknowledge. This is a knowledge developed from the interaction between all the domains and that ischaracterized by its comprehensive and global nature and at the same time by its particularity, in thesense that it is this knowledge that allows the teacher to maximize the specific potentialities of thetechnology to provide a better mathematical learning to the students. It is this knowledge that is thetrue essence of KTMT.
ICTMT 13 257 Lyon 3 - 6 July 2017

Figure 1 presents a schematic representation of the KTMT model, trying to highlight its pyramidalstructure. The colors intend to illustrate the process of development of new knowledge at a higherlevel. The intention is to represent, for example, the MKT as a new knowledge developing from theknowledge on Mathematics and on Technology. MKT is a new knowledge and not just theintersection of the base knowledge on Mathematics and Technology, in the same sense that orange isa new color developing from red and yellow.
Figure 1. Schematic representation of KTMT model.
ANALYSIS OF THE PROFESSIONAL KNOWLEDGE OF THE TEACHER
The analysis of the professional knowledge held by the teacher has been a concern for severalauthors, but it has proved to be a complex task.
Angeli and Valanides (2009) assess the TPACK held by the teacher focusing on the task developedby him and a set of five criteria: (1) identification of topics to be taught with technology where theadditional value brought by it is patent; (2) identification of representations to transform the contentto be taught so that it becomes understandable to the students and in cases where it would bedifficult to do so on the basis of traditional methods; (3) identification of teaching strategies thatwould be difficult or impossible to implement based on traditional means; (4) selection ofappropriate technology; (5) identification of appropriate strategies for the introduction of technologyin the classroom. The assessment process they use involves expert assessment, peer assessment, andself-assessment, which turns its implementation complex in terms of the structure it requires.
Niess et al. (2009) propose a model of professional development based on a characterization of theuse and concerns of the teacher in relation to technology. The authors present four themes(curriculum and assessment, learning, teaching and access), five stages (recognizing, accepting,adapting, exploring and advancing) and a set of descriptors and examples. They do not, however,clarify the reasons behind the choice of these themes to conceptualize the development ofknowledge based on a model that is organized in very different domains (knowledge of content,pedagogy, technology and intersections between them). Moreover, as they themselves recognize, themodel does not allow a global analysis of professional knowledge, being possible to find teachers atdifferent levels depending on the theme considered.
ANALYZING KTMT BASED ON THE TASKS PROPOSED BY THE TEACHER
The implications of technology’s use on mathematics teaching and learning are well recognized(Graham et al., 2003). And Dunham (2000) points to the differences on the tasks proposed and onthe students’ work resulting from those proposals as the main impact that the graphing calculator
IK
MTK TLTK
TKMK TLK
ICTMT 13 258 Lyon 3 - 6 July 2017

can have on teaching. Therefore, it seems pertinent to consider the tasks proposed by the teacher asthe basis for the analysis of his KTMT.
According to Goos and Geiger (2000), teaching approaches that emphasize problem solving andexploration, find in this technology a natural and mathematically powerful partner. Increasing thework around open questions and the exploration of concepts by the students is one of the possibleconsequences of technology integration (Cavanagh, 2006; Graham et al., 2003). The graphingcalculator also allows the students to work on data collected by others as well as on data collectedby the students themselves (White, 2009). In this sense, the tasks have the potential to elucidateabout how the teacher takes advantage of the potential of technology for the teaching and learningof Mathematics.
Ponte (2005) classifies the tasks based on the level of demand that the task places on the studentsand on the level of structure, taking into account the context of the task (strictly mathematical orfrom reality). The author then distinguishes the tasks in exercises, problems, explorations orinvestigations, where the explorations correspond to investigations with a lower degree of difficultyand the modeling tasks are regarded as problems or investigations, depending on the level ofstructure.
Laborde (2001) considers the tasks in a context of technology use and classifies them into: (1) tasksthat are facilitated by the technology, but are not modified by it; (2) tasks where technologyfacilitates exploration and analysis; (3) tasks that can be done with paper and pencil, but wheretechnology comes to allow new approaches; (4) tasks that cannot be performed without thetechnology. And the author organizes these types into two groups, depending on how the tasks arefacilitated by the technology, but could continue to be implemented without using it; or aremodified by it, as in the tasks in which real phenomena are modeled or deductions are made from aset of observations.
Therefore it seems pertinent to start from an analysis of the tasks proposed to access the knowledgeon the potential of technology for the teaching and learning of Mathematics held by the teacher and,consequently, his TLTK.
One of the features of the graphing calculator is to allow access to multiple representations (Kaput,1992), which makes it possible to establish or reinforce connections in a way that would not bepossible without the support of technology (Cavanagh & Mitchelmore, 2003), articulating numericalor tabular, symbolic or algebraic and graphical representations (Goos & Benninson, 2008) andfostering the development of a better understanding of Functions (Burril, 2008). As Kaput (1989)points out, the connection between different representations creates a global vision, which is morethan the joining of the knowledge relative to each of the representations. And the author emphasizeshow the technology allows a full exploration of the numerical and graphic approaches in a way thatuntil then was not possible, thus favoring an integrated approach of the different representations andconsequently the development of a deeper understanding. Thus the use of multiple representationshas the potential to turn learning in a meaningful and effective experience.
Despite the importance of working with different representations and the teachers' concern aboutarticulating and balancing their use, Molenje and Doerr (2006) found that the use of algebraic andgraphic representations are dominant with respect to numerical representation. Moreover, whenteachers actually use all the three representations, there tends to be a pattern in the way they do it.This pattern in the alternation between representations tends to be copied by the students, and thismakes it difficult for students to develop the desired fluency between the different representations.
ICTMT 13 259 Lyon 3 - 6 July 2017

In this sense, an analysis of how the tasks proposed require the use of different representations and,when they do, an analysis of the characteristics that can be identified in their use, is an indicator ofthe representational fluency of the teacher and, consequently, of his MTK.
The integration of the graphing calculator in the teaching and learning of Mathematics forces thestudents to take mathematical decisions that until then they never had to face (Cavanagh &Mitchelmore, 2003). As the authors point out, the graphing calculator requires the students to makean adequate choice of the scale and of the values of the viewing window, to know how to deal withsituations in which no graph is observed, or in which only a partial view appears. This ismathematical content that the students were not used to deal with and, in this sense, the way howthe teacher includes it in the tasks proposed to the students may be another indicator of his MTK.
According to Cavanagh and Mitchelmore (2003), the main difficulty faced by the students when thetechnology becomes available in the classroom concerns to the process of finding a suitable viewingwindow. And the authors attribute the origin of this difficulty to the previous mathematicalexperience of the students, where all the graphs were drawn with paper and pencil using areferential where the values represented were almost always the same. This highlights the attentionthat the teacher needs to give to these issues, reflecting on the new emphases that the use oftechnology tends to place on mathematical contents. It is therefore crucial that the teacher managesappropriately the form and, above all, the moment when the students face these difficulties.Actually, according to Cavanagh (2006), it is fundamental that the teacher promotes a gradualcontact with potentially problematic situations, ensuring that the students do not face them too soon.And an analysis of the tasks proposed will undoubtedly allow us to understand how the teacherconsiders this question. It will thus be another way of accessing elements of his TLTK.
We have thus identified a set of aspects that allow us to access elements of teacher’s KTMT and,consequently, to assess the teacher’s professional knowledge from an analysis of the tasks proposedby the teacher (see figure 2 for a synthesis).
Figure 2. Synthesis of aspects to analyze in the tasks to access KTMT.
ICTMT 13 260 Lyon 3 - 6 July 2017

EXAMPLE
Let us suppose that a teacher selects four tasks to illustrate the work done by his students of a 10 th
grade class when they study functions using the graphing calculator.
The first of the tasks selected was implemented in the third lesson (L3) and asked the students tostudy some families of quadratic functions: ax2, ax2+c, a(x-h)2, a(x-h)2+k (a0). Students shouldobserve graphs of their choice of functions in each of the families under study and conjecture aboutthe effect on the graph of changing the parameters. Then they are asked to report their conclusions.
In the fourth lesson (L4), the task consists on a situation with real context, where the number ofbacteria, in thousands, of a certain colony, is given by N(h)=-h2 + 4h + 9, where h represents theelapsed time. Questions relating to the number of bacteria at certain times and to the period of timewhen the number of bacteria is higher or lower than certain values are then placed. The students areexpected to analyze the function and calculate function values, find the object of a certain image andcalculate the zeros of the function.
In the task proposed on the tenth lesson (L10), the students were given a graph on paper (see figure3) and informed that the function represented is a 3rd degree polynomial function with a root for x=
. Then they are asked to draw the referential so that the function is odd. After finding that theexpression of the function is f(x)= 1/6 x (x2-3) (using analytical methods), the students were askedto find the relative maximum and minimum of the function.
Figure 3. Graphical representation of the function on the task of 10th lesson.
In the task proposed on the twelfth lesson (L12), the students were asked to graphically solve theinequality x3 – 100x 10x2 + 100x.
The analysis of the tasks supposedly chosen by this teacher shows a reduced diversity in whatconcerns to the type of tasks. Adopting the classification developed by Ponte (2005), the taskproposed at the 3rd lesson (L3) can be classified as an exploration. The other three tasks areexercises where the students rely on already known strategies. In all the cases the students usedsome procedure to get the intended answer from the calculator (find a zero or a maximum, calculatea value of the function or the object of a certain image, find the intersection points of twofunctions).
In what concerns the relevance of the technology to solve the tasks, in most of these tasks thetechnology does not assume a central role. Dunham (2000) points to the potential of technology toallow the exploitation of different kinds of tasks, as the main impact of technology integration. Butin this set of tasks, sometimes the use of technology is not even required to solve the task. That isthe case of tasks on the 4th and 12th lessons (L4 and L12). However, solving the tasks with and
ICTMT 13 261 Lyon 3 - 6 July 2017

without the technology is slightly different. According to the classification of Laborde (2001) fortasks in a context of technology integration, those are tasks that can be done with paper and pencil,but where the technology comes to allow new approaches. The task proposed on the 3rd lesson (L3)is a task that cannot be done without the technology. Actually, it is the technology that allows thestudents to explore the different graphs, trying to find the impact of changing the parameters on thegraph of the function. The task solved on 10th lesson (L10) requires the use of technology tocalculate the maximum and minimum values of the function because the students have not learnedthe analytical way of doing it.
Therefore it seems that the teacher’s choice of tasks does not take into account the different types oftasks available, neither the potential of the technology to change the characteristics of the studentswork and to promote students’ mathematical understanding.
Concerning the way in which the tasks require the students to deal with the viewing window, it ispossible to identify mainly two situations. The task proposed on the 3rd lesson (L3) leaves to thestudents the decision about the functions to represent graphically. However, if they do not choosebig values for the parameters, it will be possible to represent the functions using the standardwindow of the calculator. On the 4th lesson (L4), the task includes a function whose graphic is notcompletely visible on the standard window (see figure 4a), nevertheless it is possible to understandthe behavior of the function from that view of the graph and to solve the task without changing theviewing window. On the task from lesson 10 (L10), the graph of the function in the standardwindow is somehow compressed around the x-axis (see figure 4b), but once again it is possible tointuit the behavior of the function and to solve the task without any change on the window. So thisthree tasks can be solved using the standard window and do not require knowledge about a suitablechoice of the viewing window. The task proposed on the 12 th lesson (L12) is different. In this casethe standard window shows two lines that do not allow an understanding of the two functionsrepresented (see figure 4c). Although the image immediately suggests that this is not a goodrepresentation of the graph, finding a suitable window is not trivial.
(a) (b) (c)
Figure 4. Graphic representation of the functions from 3rd, 4th and 10th lessons on the standard window.
The approach to the viewing window, suggested by these tasks, indicates that the teacher is awarethat finding a suitable viewing window is a complex task for the students. As a consequence theteacher seems to avoid complex situations too early (as recommended by Cavanagh (2006)).Nevertheless, there is no evidence about the teacher’s knowledge on the different types of situationsrelated to finding a suitable viewing window. In fact, the tasks do not include situations of hiddenbehavior, incomplete view or partial view, suggesting that the teacher could have moved fromsituations where the standard window allows the students to solve the task (such as the tasks in L3,L4 and L10), to situations of simultaneous incomplete and partial view (the task in L12). There isalso no evidence about the teacher’s knowledge in what concerns the different mathematicalknowledge needed to deal with each of the different types of situations.
ICTMT 13 262 Lyon 3 - 6 July 2017

In what concerns the work around the representations, it is again possible to identify two situationsrelated to how the different representations are articulated. On the task proposed on the 3rd lesson(L3), the students start from an algebraic representation and move to a graphic representation,starting a cycle of alternation between these two representations, trying to make sense of the impactof the parameter on the graph. On the other three tasks proposed the students start from an algebraicrepresentation, move to a graph representation and then to a numerical representation (on thegraph). This option suggests a preference for a pattern in the alternation between representations. Itis also evident an absence of the use of tabular representation.
Figure 5 presents a schematic synthesis of the knowledge of this teacher.
Figure 5. Synthesis of the teacher's KTMT analysis.
This teacher evidences having knowledge about important aspects, however it is possible to identifydomains where his KTMT could be developed. That is, domains that should be considered whenplanning a professional development program for this teacher. That is the case of developing adeeper knowledge on the type of tasks taking advantage of the potentialities of the technology forthe learning of mathematics; of the different types of situations requiring a change on the viewingwindow and of the mathematical knowledge needed on each one; and of the different ways ofarticulate and balance the representations available on the calculator.
CONCLUSION
In this article we present a proposal for the analysis of the professional knowledge of the teacherbased on the KTMT’s model and a set of tasks chosen by the teacher as representative of what wasdone with the students using technology. A reflection based on the fictitious example presentedsuggests that this proposal has the potential to access aspects of professional knowledge,nevertheless some criticism of the options assumed is inevitable. And the main one is related to theway how this proposal for analyzing the teacher’s knowledge ignores all the aspects related to theimplementation of the tasks.
In fact, although important, the tasks proposed alone do not characterize the teacher's practice. AsBoaler (2003) emphasizes, one must take into account the complexity of practice and keep in mind
ICTMT 13 263 Lyon 3 - 6 July 2017

that the same task can support different practices. In other words, we cannot forget that even themost meritorious task does not necessarily constitute the inevitable source of a productive learningenvironment, since what might at first be a rich question, that appeals to the students’ explorationcan, depending on the teacher’s implementation, lose its potential and become a trivial exercise.
And if it is undeniable that the absence of elements regarding the implementation of the tasks by theteacher is a reality, it is not so clear that it is effectively a significant limitation. In the worst case(where the implementation of the task in the classroom reduces its potential), we will always have amajorization of the teacher’s professional knowledge. And this because if there are references to areduction of the cognitive demand of the task during its implementation, the opposite does not seemto be usual. And this majorization of the teacher’s knowledge will continue to be useful and relevantinformation.
This proposal intends to assume a simple structure, still allowing access to relevant information. Itaims to avoid complex analyzes carried out by multiple actors, as in the case of Angeli andValanides (2009); or multiple interpretations of the teacher's knowledge according to the domainconsidered, as in the case of Niess et al. (2009).
Moreover, this is not the only proposal which does not include aspects relating to the teacher’spractice. The work of Hill et al. (2007), which is based on a closed-ended questionnaire to whichteachers respond, is well known. The number of authors who developed their research based on theideas of Hill et al. (2007) suggests that it is possible to develop useful strategies to analyze theteacher’s knowledge that do not include elements from the classroom practice.
This is, however, a proposal that is still in an early stage of its development. It is now important torefine it and to analyze in more depth the contributions it can bring, in particular by considering itsintegration within existing ones.
REFERENCES
Angeli, C., & Valanides, N. (2009). Epistemological and methodological issues for theconceptualization, development, and assessment of ICT-TPCK: advances in technologicalpedagogical content knowledge (TPCK). Computers & Education, 52, 154-168.
Boaler, J. (2003). Studying and capturing the compexity of practice – the case of the “dance ofagency”. In N. Pateman, B. Dougherty & J. Zilliox (Eds.), Proceedings of the 27th PMEInternational Conference (vol.1, pp. 3-16). Hawai: PME.
Burril, G. (2008). The role of handheld technology in teaching and learning secondary schoolmathematics. In Proceedings of ICME 11. Monterrey, México: ICME.
Cavanagh, M. (2006). Enhancing teachers’ knowledge of students’ thinking: the case of graphicscalculator graphs. In P. Jeffery (Ed.), Creative dissent, constructive solutions. Parramatta, NSW:AARE.
Cavanagh, M., & Mitchelmore, M. (2003). Graphics calculators in the learning of mathematics:teacher understandings and classroom practices. Mathematics Teacher Education andDevelopment, 5, 3-18.
Dunham, P. (2000). Hand-held calculators in mathematics education: a research perspective. In E.Laughbaum (Ed.), Hand-held technology in mathematics and science education: a collection ofpapers (pp. 39-47). Columbus, OH: The Ohio State University.
ICTMT 13 264 Lyon 3 - 6 July 2017

Fauskanger, J. (2015). Challenges in measuring teacher’s knowledge. Educational Studies inMathematics, 90, 57-73.
Goos, M., & Bennison, A. (2008). Surveying the technology landscape: teachers’ use of technologyin secondary mathematics classrooms. Mathematics Education Research Journal, 20(3), 102-130.
Goos, M., & Geiger, V. (2000). Towards new models of teaching and learning in technologyenriched mathematics classrooms. In W-C. Yang, S-C. Chu & J-C. Chuan (Eds.), Proceedings ofthe Fifth Asian Technology Conference in Mathematics. Chiang Mai, Thailand: ATCM Inc.
Graham, T., Headlam, C., Honey, S., Sharp, J., & Smith, A. (2003). The use of graphics calculatorsby students in an examination: what do they really do?. International Journal of MathematicalEducation in Science and Technology, 34(3), 319-334.
Hill, H., Sleep, L., Lewis, J., & Ball, D. (2007). Assessing teachers’ mathematical knowledge: whatknowledge matters and what evidence counts?. In F. Lester, Jr. (Ed.), Second Handbook ofResearch on Mathematics Teaching and Learning (pp. 111-156). Charlotte, NC: NCTM, IAP.
Kaput, J. (1989). Linking representations in the symbol systems of algebra. In S. Wagner & C.Kieran (Eds.), Research issues in the learning and teaching of algebra (pp. 167-194). Reston, Va:NCTM.
Kaput, J. (1992). Technology and mathematics education. In D. Grouws (Ed.), Handbook ofresearch on mathematics teaching and learning (pp. 515-556). New York: Macmillan.
Laborde, C. (2001). Integration of technology in design of geometry tasks with Cabri-geometry.International Journal of Computers for Mathematical Learning, 6, 283-317.
Mishra, P., & Koehler, M. (2006). Technological pedagogical content knowledge: a framework forteacher knowledge. Teachers College Record, 108(6), 1017-1054.
Molenje, L., & Doerr, H. (2006). High school mathematics teachers’ use of multiple representationswhen teaching functions in graphing calculator environments. In S. Alatorre, J. Cortina, M. Sáiz &A. Méndez (Eds.), Proceedings of the 28th annual meeting of NA-PME. Mérida, México:Universidad Pedagógica Nacional.
Niess, M. et al. (2009). Mathematics teacher TPACK standards and development model.Contemporary Issues in Technology and Teacher Education, 9(1), 4-24.
Ponte, J. (2005). Gestão curricular em Matemática. In GTI (Eds.), O professor e o desenvolvimentocurricular (pp. 11-34). Lisboa: APM.
Rocha, H. (2010). Ensinar Matemática com a tecnologia: uma nova conceptualização doconhecimento e das etapas subjacentes ao seu desenvolvimento. In Actas I Enconto InternacionalTIC e Educação (pp. 121-126). Lisboa: IE-UL.
Schmidt, D. et al. (2009). TPACK: The development and validation of an assessment instrument forpreservice teacher. Journal of Research on Technology in Education, 42(2), 123-149.
White, A. (2009). Graphics calculator in the secondary mathematics classroom, pedagogical tool orjust a gadget?. In Proceedings of the Conference Redesigning pedagogy: research, policy, practice.Singapore: National Institute of Education.
ICTMT 13 265 Lyon 3 - 6 July 2017

A CASE STUDY OF A SECONDARY MATHEMATICS TEACHER'S
CLASSROOM PRACTICE WITH WEB-BASED DYNAMIC
MATHEMATICAL SOFTWARE
Ali Simsek
UCL Institute of Education, London, UK
The broad purpose of this research is to gain a holistic understanding of teachers' integration ofdigital technology into classroom practices. This research examined a case of a secondarymathematics teacher’s classroom teaching in England in which a web-based dynamic mathematicaltool, the Cornerstone Maths software, was used in the teaching of geometric similarity. One of thecontemporary theoretical frameworks, the Structuring Features of Classroom Practice (Ruthven,2014), guided my research with its five different components related to the integration of newtechnologies into classroom practice. Classroom observation and semi-structured post-lessonteacher interview was employed for data collection. The analysis shows how the teacher used thedynamic mathematical software to teach geometric similarity in terms of five underlined features ofclassroom practice within the framework.
Keywords: secondary mathematics teachers, classroom teaching practice, dynamic mathematicaltechnology, the SFCP framework
INTRODUCTION
Over the last two decades, the mathematics education community has paid increasing attention tothe integration of digital technology into classrooms, aiming to exploit the full potential oftechnological developments into mathematics pedagogy. To date, there has been a considerableamount of research focusing on digital technology integration in the mathematics classroom. Whilesome studies have concentrated on the impact of particular technologies on students’ understandingof mathematical ideas (Saha, Ayub, & Tarmizi, 2010), others have focused on the interactionsbetween teachers and students, and technological tools (Mason, 2014). Due to the fact thattechnology integration is a complex process that encompasses various relations that are not easilydescribable and analysable, researchers have started to focus on teachers and their integration ofdigital technologies into classroom practice (Clark-Wilson et al., 2014). More recently, thereappears a need for further research investigating holistically the process of incorporating digitalmathematical tools into classroom practice so as to both develop a more comprehensiveunderstanding of the process of integration and improve the emergent theoretical frameworks(Artigue, 2010).
In this sense, through a contemporary theoretical framework (the Structuring Features of ClassroomPractice) (Ruthven, 2014), my research [1] seeks to develop a better comprehensive understandingof dynamic geometry software (DGS) integration into classroom teaching, in respect of how a newweb-based dynamic tool, the Cornerstone Maths (CM) software, interacts with various features ofclassroom practice in the hands of a secondary mathematics teacher teaching geometric similarity.Therefore, this present study aims to address the following research question:
How does a secondary mathematics teacher’s integration of dynamic mathematicaltechnology into classroom teaching to promote students’ understanding of geometric
ICTMT 13 266 Lyon 3 - 6 July 2017

similarity interact with the five factors of classroom practice identified in the SFCPframework?
THEORETICAL FRAMEWORK
The SFCP framework was chosen as the most appropriate theoretical model for this study as it haspotential to help comprehensively analyse the teacher’s classroom practice using digital technologythrough its productive lens that focuses directly on five structuring components of classroompractice, namely: working environment, resource system, activity structure, curriculum script, andtime economy.
Since this framework promises “a system of constructs closer to the lived world of teacherexperience and classroom practice” (Ruthven, 2012, p.100) that other frameworks mostly neglect, itis particularly helpful in elucidating the gap between the potential of digital technology use outlinedby research and the reality of teachers’ use of digital technology in classroom practice and also inunderstanding how and why mathematics teachers use digital technology in classroom teaching tosupport students’ understanding of mathematics (Bozkurt & Ruthven, 2016). However, I shouldnote a limitation with regard to the SFCP framework, which is that the ideas which lead to thedevelopment of the components of the framework partly emanated from research studies which arenon-specific to mathematics education. Despite this fact, I employed this framework to guide myresearch.
Working Environment
The incorporation of digital technology into teaching practice makes a number of demands onteachers in working environments, which involve changes of location and physical layout,modification of classroom organisation and routines. Teachers are required to make sure that thegeneral technical infrastructure available in the working environment functions properly, thatstudents, tools and materials are wisely arranged and that students are seated appropriately forindividual and group work.
Resource System
The incorporation of digital technology into teaching practice might lead to difficulties for teachersin terms of building a coherent resource system of compatible didactical elements. Teaching withdigital technology thus entails establishing suitable techniques and norms and handling doubleinstrumentation, where technologies already in use can efficiently perform alongside new digitaltechnologies. The employment of new digital technologies also calls for an environment in whichstudents are allowed to familiarise themselves with core techniques and to explore a wider range oftechnical possibilities.
Activity Structure
The incorporation of digital technology into teaching practice presents some changes in the formatof activities and creates new classroom routines. Teachers are therefore obliged to develop newstructures to encourage interaction between students, teacher, and new technological tools and toidentify appropriate (re)specifications of roles, in order to exploit new technological resources.
Curriculum Script
The incorporation of digital technology into teaching practice requires teachers to develop acurriculum script through a loosely ordered model of aims, resources and activities for teaching aparticular topic, the treatment of potential emergent issues, and alternative paths of action.
Time Economy
ICTMT 13 267 Lyon 3 - 6 July 2017

The incorporation of new digital technology into teaching practice has implications in terms of theuse of time in the classroom since there is a time cost related to the innovation itself (Ruthven,2014). That is why, in order to reduce the “time cost” in classroom practice, teachers are required torecalibrate their timing for digital technology-enriched classroom practice.
RESEARCH CONTEXT
The qualitative case study approach was employed in this research to gain a comprehensiveunderstanding of how the teacher uses a particular dynamic technology in classroom teaching. Thismethod enabled me to understand the case by highlighting why things happen as they do, and allowme to interpret findings through “an in-depth investigation of the interdependencies of parts and ofpatterns that emerge” (Sturman, 1994, p.61).
The Cornerstone Maths project
The present study concerns with one of the Cornerstone Maths (CM) project teachers’ use of theCM software in the actual classroom teaching. The project was devised at the University CollegeLondon Institute of Education in England. This multi-year project aims to raise mathematicsteachers’ awareness of the potential benefits of digital technologies to ensure that thesetechnological tools are routinely employed by them in the classroom for effective teaching andlearning of mathematics. It covers three web-based dynamic units pertaining to “hard-to teach andlearn” topics within Key Stage 3 of England’s new National Curriculum (geometric similarity, linearfunctions, and algebraic patterns and expressions). The project provides secondary mathematicsteachers with professional development alongside resources such as web-based dynamicmathematical software, student workbook and teacher guidebook (see Clark-Wilson & Hoyles, 2014for more detailed information about the CM project).
The term CM software is used in this paper to refer to a new DGS tool. This software was designedas web-based DGS (Clark-Wilson, Hoyles, & Noss, 2015), drawing on the design affordances ofDGS. Apart from common functionality with DGS (e.g. dragging, measuring), the CM software alsooffers other functionalities such as the ratio checker by which students can compare the ratios of thelengths of the corresponding sides of two geometric figures to determine if the figures aremathematically similar.
Participant
A secondary mathematics teacher from the active community of teachers formed by the CM projectappeared to represent a suitable case for this study because those have started to integrate the CMsoftware and its materials into their classroom practice after involving in the professionaldevelopment course provided. A secondary mathematics teacher who has experience in teachingusing digital technology was identified for my case study research through the project coordinator,Alison Clark-Wilson. Having agreed to participate in my research, the teacher scheduled theteaching of geometric similarity with the CM dynamic tool within his mathematics classroomsetting during the school term (2015-2016). I will call the teacher as Joseph (pseudonym name) hereforth.
Joseph was a reasonably experienced teacher in terms of teaching mathematics with digitaltechnologies. He had 4-5 years of mathematics teaching experience in a secondary school inLondon. He was also responsible for developing schemes of work and lesson plans in line with thecurriculum objectives of the school. He was following a Masters’ degree in mathematics educationespecially to improve his competencies in exploiting the mathematical fidelity of available digitaltechnologies. This indicates that Joseph is rather enthusiastic about benefiting from digitaltechnologies to enhance students’ understanding of mathematics.
ICTMT 13 268 Lyon 3 - 6 July 2017

Data Collection
Classroom observations took place in times scheduled in advance with Joseph in his classroom (twoseparate lessons in different days). An observation protocol was designed based on five elements ofthe SFCP theoretical framework and employed in the research. My primary focus of observationwas on Joseph’s integration of the CM software into his classroom teaching rather than on hisstudents. He was informed of the focus of the observation. The audio recorder was placedsomewhere in the classroom to be used as support in my writing up of some aspects of theobservations.
Following the observations, semi-structured post-lesson interview was conducted with Joseph. Aninterview protocol with more and less structured questions was developed according to each of thecomponents of the SFCP framework to ensure the questions covered all of the components. Theinterview lasted about 40 minutes and was digitally audio-recorded. A laptop computer was alsoused during the interview to enable Joseph to articulate his thoughts on the CM software activitiesin the dynamic environment.
RESULTS
The findings are presented according to five structuring features of classroom practice, namely:working environment, resource system, activity structure, curriculum script, and time economy,respectively.
Working Environment
In the two sessions, which I observed, Joseph was covering for his colleague who was on maternityleave at the time. The lessons took place in a classroom regularly used by his colleague. In the class,there was an interactive smart board along with an ordinary whiteboard and teacher’s maincomputer. There were rows of tables and chairs at which students sat. The students used laptops andiPads at their tables, with each device being shared by two students.
In the interview, the teacher, Joseph, stated that the U-shaped classroom layout is the best layout forhim in terms of the provision of computers. He was, however, not able to teach in the computerroom where computers are placed in a U-shape, since the computer room had been booked by hiscolleague. Joseph claimed that the U-shape classroom arrangement allows teachers to better monitorstudents’ screens and facilitate group work with the students in the middle of the classroom.
I would like to have computers all-round the sides. It means that I can see more easily whatis on their screens from where I am standing. I think that is the most flexible arrangementbecause groups, they can sit in the middle. We can do group work and then we go away anduse the computers and then come back to the middle.
This result echoes Bozkurt and Ruthven’s (2015) findings in relation to the advantages of a U-shaped computer room.
In the first lesson, the students were provided with laptops; however, in the second lesson, Josephpreferred to use iPads instead of laptops due to the layout of the classroom. In the interview, hereported that since he was not able to monitor the screens of the students’ laptops during the whole-class lesson instruction in the first lesson, he had to either circulate around the classroom or ask thestudents to lower the screens of their laptops. He emphasised that, in the first lesson, he could notask the students to push the screens of their laptops down, as they would need to log in again, so hedecided to use iPads in the second lesson.
With the iPads, what I like is that you can just put the face down because what is difficultwith the students is getting them not to look at the screen and to focus on you when they
ICTMT 13 269 Lyon 3 - 6 July 2017

have these devices. So putting it face down as a way of moving that...which you cannot doso much with laptops because if you lower the laptop screens, you have to log in again. Ittakes a lot of time so iPads are better from that perspective.
This finding indicated that teachers need to develop fall-back strategies to deal with possiblecontingencies in technology-integrated classrooms. Joseph turned to the use of iPads rather thanlaptops for the second lesson, as iPads can be used in a way that made them less distracting for thestudents especially during plenary discussion. Given that there is a strong connection betweenconfidence in using technology in the classroom and the teachers’ experience which supports the useof the pedagogical use of the digital technology (Thomas & Palmer, 2014), it can be claimed thatJoseph’s experience provided him with the flexibility of choosing the most suitable device at thetime.
Resource System
Joseph appreciated both the CM dynamic mathematical software with the structured twelvedynamic investigations with regard to geometric similarity and its two ready-to-use booklets: onewas for the students and included tasks and instructions on how to engage with software-based tasksfocusing on geometric similarity, and the other was for teachers and contained a wide range ofinformation involving some implementation suggestions related to the tasks and possible studentanswers. Since he found CM resources sufficient, he did not adapt any other resources for hislessons.
According to Thomas and Palmer (2014), there is still considerable need for classroom resourcesdelivering good ideas for teachers to incorporate into classroom practice. Joseph’s case suggests thatproviding more reliable access to technological resources might be important in terms of promotingtheir use by teachers in the classroom.
The focus of Joseph’s lessons was on determining whether an image is the enlargement of anoriginal shape through numbers and using a scale factor. He took advantage of the dynamic softwareand the booklets throughout the lessons. For example, in light of the instructions in the booklets, thestudents were asked to watch an animation, which aimed to enable them to explore what copies arealways mathematically similar to the original object by pausing the animation to rotate and translatethe shapes to investigate. They were also encouraged to use dynamic measurements andcomparisons and the ratio checker. The students used the CM software to discover some ideas, suchas “the relationship between mathematically similar shapes”, “the scale factor” and “the relationshipbetween corresponding sides”, formulating some conjectures and then checked and verified them inthe dynamic environment. During his reflections, Joseph mentioned those outcomes as benefits ofusing CM resources as follows:
It is the kind of discovering for themselves if the scale factor of two is being doubled or thescale factor of three is being tripled and that actual half [inaudible]. You know, they haveconstructed the understanding, which I think research shows that this is much more powerfulthan we are just telling them. Conjecturing both what the impact of scale factor was and thenbeing able to check it and verify it for themselves was, for me, the key aspects of the lessons,which was purely driving by their interaction with the mathematical world.
The extent to which teachers make students use digital technologies depends on how teachers viewthem in terms of advancing students’ understanding (Ruthven, Hennessy, & Deaney, 2008). Joseph’sexperience of teaching with digital technologies and his awareness of the potential of them toenhance students’ understanding led him to conduct the lessons in this manner.
ICTMT 13 270 Lyon 3 - 6 July 2017

Joseph also showed an awareness of the difficulties that the students might encounter wheninteracting with the CM software investigation activities. At the beginning of the two lessons, hedemonstrated some technical features of the software and how the tasks on the booklet should beused along with the dynamic software; i.e. how the lengths of the objectives could be measured andcoloured or how the measurements of corresponding sides could be dragged. In the interview, hestated that since he had experienced a problem using the measurement and colouring buttons, heunderscored a few technical features for students before starting to teach the main content.
Overall, it can be said that the case indicates that the teacher has not yet integrated CM resourcesinto his resource system. The CM materials are still stand-alone resources for the teacher, which isnot surprising because he has only used them in his teaching practices a few times.
Activity Structure
Joseph broke down his lessons roughly into three sections. In the first section, before introducingthe tasks, the students were asked to explain what they had learnt in the previous lessons. His aimwas to remind the students of the prerequisite knowledge needed for that day’s lessons. In thesecond section, he adapted a sequence of the activities, which allowed the students to discoverparticular objectives pertaining to the topic in the CM software environment in pairs, through“predict-test-explain” sequences (Ruthven, 2014, p.387). Throughout most of this section, thestudents used the web-based dynamic tool by engaging with the investigation activities in thebooklet. However, to create a whole class discussion, Joseph sometimes asked the students to stopusing the software.
In his reflection on the lesson, Joseph stated that when he gives lessons in the computer room, heoften selects a couple of students’ work to share with the whole class on their screens. He feels thatthis method is quite powerful to draw the students’ attention to mathematical facts.
In my other [computer] room, what is possible to do is to pick one student’s screen and put itup on front of everybody’s screen which is really cool because students are more interested inanother student’s work. They really care more. So, that is quite a powerful thing to do.
He also emphasised the fact that allowing students to work in pairs in the CM dynamic environmenthelped them learn from one another.
Having them in pairs like this, I think, helps them [overlap] by making them explain andthen one pair can be slower and they can learn from the neighbour. I guess the softwareprovides hints for them when they have a disagreement, they can use the software tocheck...always check and see the results.
In the third section, the key ideas raised by the lessons were highlighted by Joseph by asking severalprobing questions to the students. In the students’ responses, he paid attention to the appropriatenessof the mathematical language they used, to support the development of their mathematical language.
Curriculum Script
Joseph did not prepare a specific lesson plan demonstrating his curriculum script (CS) for theselessons. The classroom observations and post-lesson interview helped me sketch out Joseph’s CS onthe topic of geometric similarity.
He told that he developed his lesson plan in line with the guidance provided by the CM teacherbooklet. The booklet, for example, provided him with the key ideas that students should develop anunderstanding of in the lessons such as “the heights and the widths of mathematically similarrectangles are related to a common multiplier” and “scale factor is the multiplier by which thelengths in the original shape result in the enlargement”. Additionally, the booklet indicated where
ICTMT 13 271 Lyon 3 - 6 July 2017

students might get confused about geometrical facts, for instance, “some pupils may confuse heightand width, which does not necessarily affect the relationship between the shapes, but this approachmight be confusing in discussion with the whole class. If this happens, you can briefly mention therole of conventions in mathematics”.
In his reflection on CS, he drew attention to why such a booklet is useful for helping teachersdevelop a lesson plan.
Adapting and using these things [the CM software and the booklets] is quite difficult. And, Imean, teaching in London schools is a lot of pressure to get the results [and to] get through thecurriculum. So what is good about the Cornerstone [Maths booklets] is that they help me a lotlike think how to use these table things [a part of an activity in the booklet] effectively and Iguess the bridging activities are in the big club, you know the focus of attention is on the rightthings. The hard thinking has already been done for teachers.
This quotation implies that incorporating new dynamic digital technologies into their curriculumscript (CS) might be a challenge for teachers for two reasons. The first reason is that teachers arerequired to teach all the topics mentioned in the national curriculum over the school term, whichmeans that they do not have enough time to devote to designing their CS around digital technologytools. Second, the schemes of learning (SOL) developed by schools do not generally take the use oftechnologies into consideration, which leads them to have difficulty in integrating digital tools andrelated resources into lessons. Thus, curriculums should be designed with the use of digitaltechnologies and resources in mind, thus providing teachers with “explicitly designat[ed] topics,problems or investigations to be delivered using specific educational software” (Sinclair et al., 2010,p.67).
Overall, according to Joseph, the students were able to gain an understanding of hard-to-grasp ideasof geometric similarity through the dynamic environment, which the CM software offers, and withthe guidance of the teacher booklet. This finding is in agreement with those obtained by Ruthven(2009) regarding the accuracy, speed and manipulative facilities of dynamic software in support ofstudents’ explorations of various cases.
Time Economy
One issue arising from Joseph’s lessons was that organising the students’ access to the web-basedCM activities took up a considerable amount of the available teaching time. Joseph asked thestudents to open the CM web-based activities by typing the CM website address(http://cornerstonemaths.co.uk/) on the board when the software needed to be used at the beginningof the lessons. The students then spent some time accessing the dynamic activities. In the interview,Joseph referred to this issue, observing that as well as getting the technological devices set up,having to choose between student A or B and teacher A or B [2] before accessing the CM activitieswas time-consuming and confusing for the students.
I think, one thing [which] is annoying with the CM software is that you have to choosestudent A, and teacher A. That seems to be confusing to them [the students], because that doesnot seem to be anything.
His well-established lesson routines also meant that his lessons started, proceeded, and ended in atimely and purposeful manner. He devoted a reasonable amount of time to familiarising the studentswith the core technical software features that they may need. This enabled him to optimise thedidactic return on time investment during the students’ interaction with the software.
Furthermore, according to Joseph, the feedback provided by the CM software facilitated thestudents’ learning and reduced the time he had to spend for revising the students’ work.
ICTMT 13 272 Lyon 3 - 6 July 2017

CONCLUDING REMARKS
Through the Structuring Features of Classroom Practice (SFCP) framework, this study investigateda case of classroom practice of a secondary school teacher having experience in using digitaltechnology in the teaching of mathematics.
The key finding related to the working environment was that the teacher valued the U-shapeclassroom arrangement, as it allowed him to monitor students’ screens better; thus facilitatingclassroom management, and offering the space to conduct group work without using technology. Interms of resource system, the study revealed that teachers may need ready-to-use resources “withgood ideas” to assist them to effectively plan and conduct their lessons since they do not have timeto prepare such resources themselves for use in technology-embedded lessons. The teacher in thisstudy used a structured activity format and spent time on the students’ own discovery of facts inrelation to geometric similarity through the use of dynamic activities and on maintaining a balancebetween individual and group work. Additionally, the teacher mentioned various benefits of usingthe CM software: the software enabled the students to discover geometric facts through positing andtesting conjectures and provided feedback. Thus, it increased the speed of learning by focusing thestudents’ attention on the geometric relationships involved and enabling teachers to devote moretime to making students more active.
In terms of the conceptual framework used in this study, it assisted me in analysing the data bymaking particular aspects apparent and workable. However, I sometimes struggled to decide underwhich component a piece of data should be examined. Even though this struggle could be caused bythe intertwined nature of teachers’ classroom practice, I believe that the components of thisframework need to be clarified further to avoid the danger of providing researchers with “a coarse-grained tool” (Ruthven, 2014, p.380).
In terms of suggestions for further research, it would be beneficial to carry out longitudinalsystematic studies, which explore the use of digital technologies by mathematics teachers, who havevarying levels of experience in using technology to teach, because teachers’ confidence andcompetence can influence how teachers use digital technologies in classroom practice (Bretscher,2014). It would also be helpful for researchers to employ the combination of several frameworkswhich have different theoretical lenses in parallel, to carry out a much deeper and fruitfulinvestigation of teachers’ classroom practice using digital technologies.
Notes
1. This paper was developed based on a part of the author’s Master’s thesis at the University College London (UCL)
Institute of Education.
2. At the beginning, in order to access the CM software activities, students need to select the group of their teacher and
then their names.
REFERENCES
Artigue, M. (2010). The future of teaching and learning mathematics with digital technologies. In C.Hoyles, & J.-B. Lagrange (Eds.), Mathematics Education and Technology-Rethinking the Terrain: The 17th ICMI Study (pp. 463-475). New York: Springer.
Bozkurt, G., & Ruthven, K. (2015). Expert and novice teachers' classroom practices in a technologi-cal environment. In K. Krainer, & N. Vondrová (Ed.), CERME9 Proceedings of the Ninth Congress of the European Society for Research in Mathematics Education (pp. 2319-2325). Prague, Czech Republic: Charles University in Prague, Faculty of Education and ERME.
ICTMT 13 273 Lyon 3 - 6 July 2017

Bozkurt, G., & Ruthven, K. (2016). Classroom-based professional expertise: A mathematicsteacher’s practice with technology. Educational Studies in Mathematics, 94(3), 309–328.
Bretscher, N. (2014). Exploring the quantitative and qualitative gap between expectation and imple-mentation: A survey of English mathematics teachers' uses of ICT. In A. Clark-Wilson, O. Robutti, & N. Sinclair (Eds.), The Mathematics Teacher in the Digital Era: An InternationalPerspective on Technology Focused Professional Development (pp. 43-70). Dordrecht: Springer.
Clark-Wilson, A., & Hoyles, C. (2014). Blended learning and e-learning support within the Corners-tone Maths Project. In K. Maaß, B. Barzel, G. W. Törner, E. Schäfer, & K. Reitz-Konce-bovski (Ed.), Proceedings of the Conference hosted jointly by the project mascil (mathema-tics and science for life) and the German Centre for Mathematics Education (DZLM) (pp. 158-166). Essen: WTM.
Clark-Wilson, A., Aldon, G., Cusi, A., Goss, M., Haspekian, M., Robutti, O., & Thomas, M. (2014).The challenges of teaching mathematics with digital technologies – the evolving role of the teacher. In P. Liljedahl, C. Nicol, S. Oesterle, & D. Allan (Eds.) Proceedings of the Joint Meeting of PME 38 and PME-NA 36 (Vol. 1 pp. 87-116). Vancouver, Canada: PME.
Clark-Wilson, A., Hoyles, C., & Noss, R. (2015). Scaling mathematics teachers' professional deve-lopment in relation to technology -probing the fidelity of implementation through landmark activities. In K. Krainer, & N. Vondrová (Ed.), CERME9 Proceedings of the Ninth Congress of the European Society for Research in Mathematics Education (pp. 2333-2339). Prague, Czech Republic: Charles University in Prague, Faculty of Education and ERME.
Mason, J. (2014). Interactions between teacher, student, software and mathematics: Getting a pur-chase on learning with technology. In A. Clark-Wilson, O. Robutti, & N. Sinclair (Eds.), TheMathematics Teacher in the Digital Era: An International Perspective on Technology Focu-sed Professional Development (pp. 11-40). Dordrecht: Springer.
Ruthven, K. (2009). An investigate lesson with dynamic geometry: A case study of key structuring features of technology integration in classroom practice. Proceedings of the Sixth European Conference on Research on Mathematics Education, (pp. 369-378).
Ruthven, K. (2012). Constituting digital tools and materials as classroom resources: The example ofdynamic geometry. In G. Gueudet, B. Pepin, & L. Trouche (Eds.), From Text to “Lived” Re-sources: Mathematics Curriculum Materials and Teacher Development (pp. 83–103). New York: Springer.
Ruthven, K. (2014). Frameworks for analysing the expertise that underpins successful integration ofdigital technologies into everyday teaching practice. In A. Clark-Wilson, O. Robutti, & N. Sinclair (Eds.), The Mathematics Teacher in the Digital Era: An International Perspective on Technology Focused Professional Development (pp. 373-393). Dordrecht: Springer.
Ruthven, K., Hennessy, S., & Deaney, R. (2008). Constructions of dynamic geometry: A study of theinterpretative flexibility of educational software in classroom practice. Computers & Educa-tion, 51(1), 297-317.
Saha, R. A., Ayub, A. F., & Tarmizi, R. A. (2010). The effects of GeoGebra on mathematics achieve-ment: Enlightening coordinate geometry learning. Procedia Social and Behavioural Sciences, 8, 686-692.
ICTMT 13 274 Lyon 3 - 6 July 2017

Sinclair, N., Arzarello, F., Gaisman, M. T., Lozano, M. D., Dagiene, V., Behrooz, E., & Jackiw, N. (2010). Implementing digital technologies at a national scale. In C. Hoyles, & J. B. Lagrange(Eds.), Mathematics Education and Technology-Rethinking the Terrain: The 17th ICMI (pp. 61-78). New York: Springer.
Sturman, A. (1994). Case study methods. In J. P. Keeves (Eds.), Educational Research, Methodology, and Measurement: An International Handbook ( 2nd ed.) (pp. 61-66). Oxford:Permagon.
Thomas, M. O., & Palmer, J. M. (2014). Teaching with digital technology: Obstacles and opportuni-ties. In A. Clark-Wilson, O. Robutti, & N. Sinclair (Eds.), The Mathematics Teacher in the Digital Era: An International Perspective on Technology Focused Professional Develop-ment (pp. 71-90). Dordrecht: Springer.
ICTMT 13 275 Lyon 3 - 6 July 2017

A CLASSIFICATION OF RESOURCES USED BY MATHEMATICS
TEACHERS IN AN ENGLISH HIGH SCHOOL
Michael Umameh; John Monaghan
[email protected]; [email protected]
University of Leeds, UK; Universities of Agder, Norway and Leeds, UK
This paper provides a classification of resources used by mathematics teachers in an English highschool. It is based on data analysis from ongoing PhD research exploring mathematics teachers’appropriation of digital resources and the impact on classroom practices in selected schools. Thispaper reports a way of making sense of the myriad curricular and digital resources that areincreasingly available to the teachers in planning and enacting their teaching and assessing theirstudents’ understandings in the context of their every day practices. The classification has potentialto aid understandings of teachers’ appropriation of resources for teaching mathematics.
Keywords: Coding data, Mathematics, Resources, Teachers
INTRODUCTION
This paper examines the resources used by four teachers in a Mathematics department in a stateschool in England. It presents and discusses a way to classify resources used by teachers andexplores similarities and differences in teachers’ use of resources using this classification. The paperis structured as follows. We begin with a review of literature on mathematics teachers and resourcesand the theoretical framework which guides the PhD research. We then present the context of ourresearch, the school and the four teachers. The methodology of the research (the means of collectingand analysing data) is then outlined which is taken a step further in the next section which present a‘logical classification’ of codings obtained in data analysis. We then present the results, theresources used by the four teachers in preparing to teach and in teaching; we present these using the‘logical classification’. The paper ends with a discussion of the classification and of the resourcesthe four teachers used.
LITERATURE REVIEW AND THEORETICAL FRAMEWORK
The literature on the importance and relevance of the use of curricular and digital resources inmathematics teaching and learning has matured over the new millennium. Our understanding ofresources aligns with Adler’s (2000, p. 7) reconceptualization of resources “It is possible to thinkabout resource as the verb re-source, to source again or differently”. Within educational settings,‘curricular resources’ (Stylianides, 2016) or ‘curriculum material’ (Remillard, 2005), include all thematerials (digital or physical) that teachers appropriate in and for their teaching, with the textbooksbeen the most dominant resource internationally. In the context of mathematics teaching andlearning Pepin, Gueudet, & Trouche define “mathematics teaching resources as all the resourceswhich are developed and used by teachers (and pupils) in their interaction with mathematics in/forteaching and learning, inside and outside the classroom” (2013, p.929). A more recent publication,Monaghan, Trouche and Borwein (2016) documents the major milestones in the studies on teachers’integration of digital technology and the ongoing research efforts focusing on the appropriation ofcurricular and digital resources in the context of practice. We appropriate the above views in ourresearch and consider mathematics teaching resources as including:
Text resources, such as curriculum materials: mathematic textbooks, teacher curricular
ICTMT 13 276 Lyon 3 - 6 July 2017

guides, teachers’ worksheets, spreadsheet, posters and syllabi.
ICT resources, such hardware and software: laptops, iPads, applets, e-textbooks, games,Geogebra, blogs and learning platforms.
Other material resources, such as students’ handheld white boards, manipulatives andcalculators.
The above suggests that the construct resource is understood in the context of mathematics teachingand learning as everything that supports and facilitates teachers’ practices but the practice takesplace in a context and in a community that need to be considered to account for actual use (andvariation in use) of resources by teachers. In the preparation for teaching, teachers select, use,combine and modify, bookmark and save a variety of resources over time into a structured set ofteacher’s resources, this is referred to as teacher’s resource system. Bozkurt and Ruthven (2015)show how digital resources structure teachers’ planning and classroom practices. They identify fivekey features in the structuring process: working environment, resource system, activity format,curriculum script and time economy. Our research takes into consideration this milieu in whichteacher’s practice with mathematics teaching resources takes place. The milieu in preparing to teachoften includes people and we consider people (face-to-face and online) as resources when theysupport teachers’ practices.
In the analysis of the data in this study we combine an activity theoretic approach (Engeström,1987) with the more recent ‘documentational approach’ (Gueudet and Trouche, 2009) from theFrench didactics as theoretical tools for developing an understanding of the teachers' appropriationof resources in the context of planning and enacting their lessons and assessment. These providecoherent multiple interpretative perspectives to be simultaneously considered in the processes ofdata collection and analysis.
CONTEXT
Data for analyses presented in this paper were gathered in the context of the aforementioned PhDresearch exploring mathematics teachers’ appropriation of digital resources in selected High schoolsin the UK. The unit of analysis is the teachers’ nested activity contexts. The mathematicsdepartments in the selected schools are the broad setting since teachers usually undertake theirpractices within that collective context. This environment consists of overlapping layers ofinteractions: the whole school environment, the Mathematics Department, classrooms, curricularand digital resources available for mathematics teachers for planning, for teaching and forassessment. The four teachers considered in this paper volunteered to participate in the project andeach has more than 5 years of teaching experience. The overall structure of these teachers’ lessonswas a three-part-lesson: Starter phase- to engage students and bridge learning from previous lessonsinto the current; main part of the lesson- for the development and consolidation of new learningand; the plenary- for extension and assessment (Jones & Edwards, 2005; Beere, 2012). The school,for students aged 11-18 years, hosts one of the maths hubs (a collaborative national networks ofschools’ initiative) where the use of digital resources are encouraged and supported. The schoolshosted many visitors over the data collection year including mathematics teachers from China(hence the reference to ‘Chinese teacher’ in Table 1 below). The students were in mixed abilityclasses. The classification we provide in this paper is based on these four teachers from this schoolthough we believe it could be used more widely.
ICTMT 13 277 Lyon 3 - 6 July 2017

METHODOLOGY
A qualitative case study approach (Creswell, 2013) was adopted. Purposive sampling was used inselecting seven teachers from three schools based on the use of curricular and digital resources,access, proximity and the opportunity to observe teachers’ practice with mathematics teachingresources in natural settings. Data collection was undertaken during the 2015-2016 school yearthrough periodic whole day school visits. Data were collected from a range of sources: audio-recorded semi-structured interviews; classroom observations using an adapted systematic classroomanalysis notation for mathematics lessons (SCAN) (Beeby, Burkhardt & Fraser, 1979); recordingsof teachers accessing digital resources, enabled by screen capture software (SnagIt,https://www.techsmith.com/snagit.html); researchers’ field notes; and the collation of documents towhich the teachers made reference. In this paper, the interviews are used as primary data sources,complemented by the screen capture data.
The four teachers from the school described above are the case units of analysis: Katie, James,Emily and Joe (pseudonyms). They were selected from teachers willing to be involved in the studybased on their commitment to the of ethos the Mathematics department in the school. They taughtin a context where a wide range of curricular and digital resources are easily available for use.Transcripts of the interviews and screen capture data were coded and thematically mapped,constantly grouped and regrouped into categories (we use the term ‘category’ for a set of codes).
Our classification of resources (for these four teachers)
The coding process described above produced a lot of codes/categories. There were four stages inthe development from initial coding/categories to the classification in Table 1 below, these were: (i)initial coding by the first author; (ii) discussion and refinement of the initial coding by both authors;(iii) an informal inter-coder reliability session between the first author and a teacher from a non-study school which also produced a slight refinement of the coding; (iv) a second meeting of thetwo authors in which a ‘logical classification’, which we now discuss, was superimposed on thepost stage iii categories.
Open coding is an interesting, and often useful, activity but it is very subjective (even when morethan one coder is involved). In discussing this in stage iv we saw that the codes could be dividedlogically; ‘human’ – ‘non-human’ provides a partition of all resources a teacher may use. Takingthis logical division further we can: partition human resources into those where there is ‘physicalcontact’ and those where there is ‘not physical contact’; similarly, non-human resources can bepartitioned into those which are ‘electronic’ and those which are ‘non-electronic’. Our final divisionis to partition: electronic resources into ‘hardware’ and ‘not hardware’ (notice that ‘hardware’ and‘software’ is not a logical partition); and non-electronic resources into those created by theindividual teacher under consideration (‘individual’, e.g. Katie) and those which were not createdby the individual teacher under consideration (‘not individual’). Note that a worksheet created byKatie and used by Katie and James would be coded ‘individual’ for Katie but ‘not individual’ forJames.
Note that further divisions are possible. For example, ‘human, physical contact’ could be partitionedinto ‘formal’ (e.g. within a scheduled meeting that has an agenda) or ‘informal’ but we found theclassification provided in Table 1 was sufficient to accommodate all of the codings developed instage iii; it was also manageable, relatively easy for the two authors to code in an identical manner.
RESULTS
Table 1 provides a summary of resources used by the four teachers.
ICTMT 13 278 Lyon 3 - 6 July 2017

ICTMT 13 279 Lyon 3 - 6 July 2017

Human Non-Human
Physicalcontact
Not Phys-ical Contact
Electronic Non-Electronic
KATIE
Personnel
CPD
TeachMeet
Chineseteacher
Podcast
Social-networking
Hardware Not Hardware Individual Not Individual
iPads
IWB
HWB
Resource banks
Mangahigh
Task-spec websites
applets
Gcsepod.com
Resourceaholic
TES.com
Music
Paper-basedresources
WorkbooksWorksheets
Posters
Resource banks
Paper-basedresources
textbook
JAMES
Personnel
TeachMeet
CPD
Podcast
Blogs
iPads
Laptops
IWB
Resource banks
Mangahigh
applets
Resourceaholic
TES.com
GeoGebra
Mathspad.co.uk
Desmos
Coberttmaths.com
Paper -basedresources
WorkbooksWorksheets
Posters
Resource banks
Paper-basedresources
EMILY
Personnel
TA
TeachMeet
CPD
Twitter Calculators
iPads
Laptops
IWB
HWB
Wordwall
Ttrockstars
Mathsbox.com
Code buster
King of Maths
QR code
Stopwatch
Paper -basedresources
WorkbooksWorksheets
Number line
Resource banks
Paper-basedresources
JOE
Personnel
TeachMeet
CPD
Calculators
iPads
Laptops
IWB
HWB
TES.com
Socrative
Mathswatch.co.uk
Plickers
QR codes
10ticks
Virtual manipulatives
Paper -basedresources
WorkbooksWorksheets
Resource banks
Paper-basedresources
ICTMT 13 280 Lyon 3 - 6 July 2017

Table 1 Resources used by the four teachers (Katie, James, Emily and Joe)
Table 1 is structured with the columns representing the partitions we described in the previoussection and the rows representing the four teachers. Many of the terms (e.g. twitter, iPad), we feel,need no explanation. Abbreviations used are: CPD – continued professional development; IWB –interactive whiteboard; HWB – handheld manual whiteboard; and TA – teaching assistant.‘TeachMeet’ are informal but organised opportunities for teaching to meet to share ‘good practice’.We now explain software used by teachers under five terms in common use in English schools.Endnotes provide links to websites for specific resources.
Resource Banks
There are three types of resources banks. (i) The individual mathematics teachers’ resources on aniPad and flash drive (ii) The Shared resource bank of the mathematics department. )iii) Onlineresource banks, some of which are commercial and some are free. Online resources banks include:Gcsepod.comi, Resourceaholicii, TES.comiii, Mathspad.co.uk, Mathswatch.co.uk, 10ticksiv andMathsbox.com. Here teaching resources of various sort can be accessed and used by teachers,parents and students.
Applets
These are small applications that performs specific task. They run within the scope of adedicated widget engine and are designed to be placed on a web page as a plug-in auxiliaryapplication. Applets used by these four teachers include Plickers, Socrative (mathematics specific)and King of Maths.
Dynamic Mathematics Software
These are open-source software that afford teachers and students dynamically linked multiplemathematical representations tools to help create models of real situations and links algebra andgeometry representational systems simultaneously. In this category Geogebra and Desmosv wereused by one of the teachers.
General Purpose software
This is often a suite of software in the form of an integrated package like MS Works incorporatingspreadsheet and presentation software like power point. Wordwall belong to this class.
Data-capture Software
This are simple but powerful tools that allow the teacher capture, collate and analyse data in real-time for a whole class formative assessment. Plickers and Socrative were used for this purpose.
DISCUSSION
We first comment on our classification and then consider similarities and differences over the fourteachers.
As mentioned above, open coding is often useful but it subjective. The partitioning in ourclassification is not subjective, it employs the law of the excluded middle: in classical mathematicallogic, for any well-defined statement A, ‘A or not A’ is true. Our classification of resources was notdesigned or used to replace the open codes generated in stage iii but as a means to present theresources contained in the open codes. We think this is a case of having your cake and eating it.With research on teachers’ use of resources on the rise we offer this logical classification to fellowresearchers as a means to present the results of our research in similar formats. We offer this as a‘malleable template’. The partitions we used in Table 1 suited, in our opinion, the data we collected
ICTMT 13 281 Lyon 3 - 6 July 2017

and analysed; a different set of partitions may be more suitable for a different research study. Wenow move on to similarities and differences that can be observed in Table 1.
In exploring the similarities and differences the classroom setting is worth considering first. Theschool of study has a new ultra-modern building, all the classrooms are spacious and equipped withan IWB, an adjacent chalk board, a laptop, a projector and every student is given a handheld writingboard (HWB). The mathematics teachers have a growing shared bank of mathematics teachingresources where peer-reviewed resources are stored and are accessible to every member of theMathematics department as a ‘collective resources system’; this a ‘go-to area’ in lesson planning.There are class sets of iPads with an accessible iPad storage and charging trolley within thedepartment for student use. This is the structuring context for understanding the similarity anddifferences amongst the teachers.
Similarities exist across the four teachers in their access to the CPD, teach-meet (a periodic wholeschool teachers’ meeting to share experiences and expertise). All four teachers use social media andTwitter (see https://twitter.com/hashtag/mathschat?lang=en) in particular. The entries for this inTable 1 are for the specific purpose of planning lessons. The use of a mathematics teacher dedicatedsocial networking media as a tool for communication, queries and sharing of resources is a regularfeature among these teachers. There are many similarities with regard to non-human resources.Under hardware, all used iPads and IWBs. Under not hardware Resource banks, Mangahigh,TES.com and Resourceaholic are all used by two or more of the four teachers. With regard to non-human & non-electronic resources, the cells in the individual and non-individual columns of Table1 are almost identical; this, we posit, is related to what we say above of the Mathematics departmentas a collective resources system.
With regard to differences between the four teachers and the resources they use we first note thatthe similarities far outweigh the differences. But we comment on differences with regard to ‘doingmathematics’ and to ‘uniqueness’. With regard to ‘doing mathematics’, four resources that stand outto us as different to the rest are: calculators, Desmos, Geogebra and, to a lesser extent, virtualmanipulatives. These are resources which students or teachers can use flexibly to exploremathematical relationshipsvi as opposed to being shown how to do mathematics by someone else.With regard to the four teachers and the two electronic columns contain these four resources we cansee that: Katie uses neither; James uses non-hardware (software actually); Emily uses hardware; andJoe uses both. Are these individual differences? This leads us to ‘uniqueness’.
Each of teachers has something unique in their use of other resources. For instance: only Katie hasused a Chinese teacher as a source of ideas and uses GCSEpod.com; only James is recorded to haveused blogs, GeoGebra, and Desmos in his lessons; only Emily makes use of Ttrockstars, code busterand King of Maths; only Joe uses Plickers, 10ticks, Socrative and virtual manipulatives. We alsonote with interest that the differences only exist with regard to digital electronic resources and wewonder whether this is the case in other European countries (as our perception is that ‘TheMathematics Department’ in English/UK high schools is a more homogeneous community ofpractice than it is in many European countries). Whatever the answer to our speculations, theuniqueness of each teacher seems to be related to the teacher’s confidence in the use of digitalresources and the use of those resources that help attend to the needs of the students in theirengagement with mathematics.
ICTMT 13 282 Lyon 3 - 6 July 2017

NOTES
REFERENCES
Adler, J. (2000). Conceptualising resources as a theme for teacher education. Journal ofMathematics Teacher Education, 3, 205–224.
Beeby, T., Burkhardt, H., & Fraser, R. (1979). Systematic Classroom-analysis-notation formathematics lessons: SCAN. Shell Centre for Mathematical Education, University of Nottingham
Beere, J. (2012). The Perfect Ofsted Lesson-revised and updated. Crown House Publishing.
Bozkurt, G., & Ruthven, K. (2015, February). Expert and novice teachers' classroom practices in atechnological environment. In CERME 9-Ninth Congress of the European Society for Research inMathematics Education (pp. 2319-2325).
Creswell, J. W. (2013). Qualitative inquiry and research design: Choosing among five approaches(3rd Ed.). Thousand Oaks, CA: Sage
Engeström, Y. (1987). Learning by Expanding: An Activity-theoretical Approach to DevelopmentalResearch. Orienta-Konsultit, Helsinki.
Gueudet, G., & Trouche, L. (2009) towards new documentation systems for teachers? EducationalStudies in Mathematics, 71(3), 199-218.
Jones, K., & Edwards, R. (2005). Planning for mathematics learning. Learning to TeachMathematics in the Secondary School: A Companion to School Experience, 93.
Monaghan, J., Trouche, L., & Borwein, J. M. (2016). Tools and Mathematics. Springer InternationalPublishing.
Pepin, B., Gueudet, G., & Trouche, L. (2013). Re-sourcing teachers’ work and interactions: acollective perspective on resources, their use and transformation. ZDM, 45(7), 929-943.
Remillard, J. (2005). Examining key concepts in research on teachers’ use of mathematics curricula.Review of Educational Research, 75(2), 211–246.
Stylianides, G. (2016). Curricular resources and classroom use: The case of mathematics. OxfordUniversity Press.
ICTMT 13 283 Lyon 3 - 6 July 2017

i https://www.gcsepod.com/ii http://www.resourceaholic.com/iii https://www.tes.com/teaching-resourcesiv http://www.10ticks.co.uk/v https://www.desmos.com/vi Some apps allow this too.
ICTMT 13 284 Lyon 3 - 6 July 2017

DOCUMENTATION EXPERTISE AND ITS DEVELOPMENT WITH DOCUMENTATION EXPERIENCE IN
COLLECTIVES: A FRENCH CASE OF COLLECTIVE LESSON PEPRATION ON ALGORITHMIC
Katiane de Moraes Rocha, Chongyang Wang, Luc Trouche
French Institute of Education, École Normale Supérieure, Lyon, France
[email protected]; [email protected] ; [email protected]
With a background of great changes of curriculum reform in France, there comes the new challenge for both (1) the
new teaching contents such as the new content of algorithmic and (2) their working way in collectives, such as inter-
discipline teaching practice and three-year-cycles. In this study, we are interest to see how the mathematics teachers
react to the new challenges from a resource view. The two notions of documentation experience and documentation
expertise are used in a case study of Anna and Cindy in our research.
Keywords: resource, mathematics teachers, documentation work, documentation experience, documentation expertise
INTRODUCTION
From September 2016, the middle schools in France started to carry out the new curriculum program with a series of
great changes: the curriculum is organized on three-year-cycles without details of what has to be done in each level of
the cycle, besides, the last two grades in primary school (Grade 4 and Grade 5) and the first grade in lower secondary
school (Grade 6) are put in cycle 3, which demands more cooperation and communication between teachers within the
same school and the primary schools. The components of computer sciences, algorithmic and programing, firstly
appeared in cycle 4, with the contents separated into mathematics and technology. To contribute to the idea of
interdisciplinary teaching practice, each school has to choose at least three interdisciplinary teaching activities, thus for
example, algorithmic and programing becomes a choice for mathematics teachers and technology teachers. Great
changes also come with great challenges: the French middle school mathematics teachers never teach or be trained how
to teach this topic before, lots of teaching resources needs to be developed; and cooperation between teachers from
different disciplines needs to be tempered because although it is stated that “teaching is collaborating” in French
Dictionary of Pedagogy (Buisson, 1911), most of teachers in France prefer working individually than collectively.
With an aim to explore how mathematics teachers react to new challenges, we situated our study in a time of French
curriculum change, with a French middle school math teacher, Anna, and her collective work with her colleague, Cindy
in a lesson preparation on algorithmic and programing as a case study. Without any teaching and training experience, to
teach algorithmic and programing successfully, teachers have to integrate their available and potential resources. We
assumed that there remains some expertise in teachers’ resources integration, which is closely linked to the resources
accumulated from their experience in both learning and working. As cooperation among teachers is considered
important for teacher professional development (Hargreaves, 1995), we pay a specific attention on the collective aspect.
We are interested to see: How does teachers’ experience in collectives benefit their resource work when preparing a new
lesson? How does teachers’ collective work contribute to their expertise in resource work?
In the following sections, we will start from our theoretical frameworks, introducing the concepts of documentation
experience and documentation expertise, and then with a more precisely stated research questions, we proposed our
research methodology and tools. In the fourth part, we will analysis the French case from documentation experience and
documentation expertise. As a conclusion part, a summarization of the relationship between documentation experience
and documentation expertise will be presented.
THEORETICAL FRAMEWORKS
Our study based on the Documentational Approach to Didactics (DAD) (Gueudet & Trouche, 2008). In this section, we
will present our theoretical choices for analyzing collective dimension in teachers’ work with resources, with two new
concepts, documentational experience and documentation expertise, for analyzing teachers work with resources.
ICTMT 13 285 Lyon 3 - 6 July 2017

With an interest on analyzing and understanding teacher professional development, we chose a view of resource:
according to DAD, the first theory framework of our study. Professional development is defined as the results of an
interrelated process of incorporating new resources to the teacher’s work, the development of her knowledge for
teaching and her relationships with other participants of this process. The interactions between teachers and resources,
including restricting, selecting, modifying, adapting, saving and sharing off, are defined as documentation work in DAD,
and resource could be anything with the potential to re-source teachers’ activity (Adler, 2000), and the structured set of
resources a teacher is working on/with is named her resource system. Along with teachers’ integrating continuously new
resources, there is a process of generating the schemes of developing a resource, incorporating the resource produced
and its usage, thus defined as a document in DAD. Scheme is defined by Vergnaud (1998) as an invariant organization
of activity for a given class of situations, comprising goals, rules of action, knowledge and possible inferences. The
framework of DAD provides a resource-view on teachers’ work, both individually and collectively, with the elements to
be analyzed: resource, goal(s), rules of action, and knowledge.
While taking DAD as a framework to see the resource perspective on teachers’ work, there also comes the question of
the nature of teacher work: their work is neither isolated nor individual, but part of society, their documentation work is
connected to others, and culturally and socially situated (Gueudet et al., 2013). Thus to explore the factors of collective,
we adapt two different frameworks to explore how do documentation experience in collectives nourish documentation
expertise:
- The thought collective (Fleck, 1934), for analyzing teachers collective work over time, the broad definition of
thought collective proposed exists when “two or more people are exchanging thoughts” (p. 44) and generates a
thought style “characterized by standard features in the problems of interest to a thought collective, by the
judgment which the thought collective considers evident, and by the methods which it applies as a means of
cognition” (p. 99);
- Activity theory (Engeström, 1987), for understanding and analyzing teachers’ collective activity with a structure
of situating three components (subject, instruments, object) into the background collective (the role of the
subject in the activity, the rule of the collective, and the labor division in the activity), which links the teachers’
activity with the social and cultural elements of the collective where the activity occurs. It also echo DAD from
its principles as (1) collective, artifact-mediated and object oriented; (2) multi-voicedness which calls on
listening to the other members besides the subject in the activity; (3) historicity, in both the history of the
collective and the history of teachers’ activities in this collective; (4) the central role of contradictions as
sources of change and development.
The open definition of collective of Fleck (1936) allow us to analyze collective work of different nature: formal or
informal, regulated or not, stable or transit, required or voluntary, collaborative or cooperative, etc. We use the term
cooperation and collaboration as Roschelle and Teasley (1995, p. 70): cooperation “is accomplished by the division of
labor among participants” and collaboration “as the mutual engagement of participants in a coordinated effort to solve
the problem together”.
In teacher’s day-to-day activity documentation work happens: when she decides to join a new collective, or meets new
resources, or has to face a curriculum change, or has to take into account students with special needs. And in these
activities teachers accumulate their experience working with resources. And we kept the definition of experience of
Pastré (2005), which could be understood as the accumulation of the past as the accumulation and appropriation of the
past by the subject. As we focus on the resource-aspect of working experience, we call this experience related to
teachers’ documentation work as documentational experience. For analyzing teacher’s documentation experience
accumulated in collective work we first, collective thought style and for that we proposed three points inspired in Fleck
(1936) definition: collective’s interest standard features (CSF) (targeted audience, objectives, missions, types of
resources designed, etc.), collective’s judgment (CJ) about mathematics and teaching mathematics (pedagogical
assumptions, point of view about mathematics digital resources, institutional purposes for teaching mathematics, etc.)
ICTMT 13 286 Lyon 3 - 6 July 2017
and collective’s methods (CM) for creating resources (functioning mode, member status, type of interaction, etc.). Still
following the reflective investigation perspective, we use self-collective’s description (charts, status...). After, we identify
in Anna discus what she did in these collectives in relation to new curricular changes.
In a similar way, we proposed another new notion of documentation expertise (DE) as teacher’s expertise in their
documentation work. In Berliner’s study (1988), expertise “is specific to a domain, and to particular contexts in
domains, which is developed over hundreds and thousands of hours”. Key elements of expertise are linked with teaching
problems solving efficiently and creatively with a wide range of knowledge and experience (Sternberg & Horvath,
1995), or more precisely, teachers with “adaptive expertise” were proposed as “specialists in retrieving, organizing,
utilizing, and reconsidering their professional knowledge and beliefs” (Avalos, 2011). Drawing from the definitions of
expertise and documentation work, DE is defined preliminarily as the abilities and related knowledge to deal with the
whole process of interacting (retrieving, selecting, organizing, modifying, adapting, creating and sharing off) with
resources. It is considered as a developing resource-aspect state of teacher professional development.
In this way, we re-formulate our research questions as: for preparing a new lesson on algorithmic,
1. How does teachers’ documentation experience accumulated in collectives benefit their resource work?
2. How does their collective work contribute their documentation expertise?
We hold a hypothesis that in front of new challenges, teachers will integrate the resources from their corresponding
documentation experience into their current work, documentation expertise could be seen and developed through
collective work by teachers’ mutual interactions on documentation experience, such as conflicts, complementation,
questions and answers.
METHODOLOGY
Based on DAD, our study mainly adapted the reflective investigation, which involves the teachers as part of the study
throughout the whole data collection, with the four principles of “long-term follow-up”, “in- and out-of-class follow-
up”, “reflective follow-up” and “broad collection of the material resources” (Gueudet et al., 2013, p. 27). We will
present our methodological design in three parts. First, we present our tools based in the principles of reflective
investigation. After, we will present the collective putting in evidence the choice the concept of documentation-working
mate.
Reflective investigation tools
Different from the traditional investigation, reflective investigation involves the teachers as part of the study throughout
the whole data collection, which means the teachers are not only the data provider, but also the data creator. In this way
we have two types of tools for following the teachers:
(1) To know how the teachers organize and represent their available resources, the tool of “schematic representation of
the resource system (SRRS)” (ibid, P. 28) was kept, where a teacher is asked to draw a schematic representation of
the structure of the resources she uses. To be noticed that this SRRS is not a final one, but improved,
complemented, and reorganized continuously with the development of teachers’ cognition on their resource system.
(2) Online “Reflective Investigation Box (RI Box)” was built and shared between us and the targeted teachers, in which
the teachers could share their resources used during the activities (such as lesson plans, screenshots of blackboard
writing etc.), and respond the questions (either about resources in RI Box, or any other questions) from the
researcher regularly. Considering the using habits of the targeted teachers, we use Dropbox to support the RI box.
Documentation-working mate
To understand how teachers develop DE during their daily work, it is needed to situate the targeted teacher into a
collective. Following the principle of “multi-voicedness” of AT, a new notion of documentation-working mate is
ICTMT 13 287 Lyon 3 - 6 July 2017

proposed here as someone who works closely with the targeted teacher, with mutual influences on their documentation
work and DE development. Mate in Oxford Dictionary infers “a fellow member of joint occupant of a specific thing,
like table-mate”, with an “origin related to meat (the underlying concept being that of eating together)” ( see in
https://en.oxforddictionaries.com/definition/mate) . The reason to choose “mate” but not “peer” as in “peer education”
(Turner & Shepherd, 1999) is that “mate” breaks the boundary of age and education/professional background. For a
given teacher, her documentation working could be a colleague with similar working experience in her school, or
someone from a totally different working context as an university or research institute etc. In each case of this study, a
documentation-working mate will be selected according to the targeted teacher: they form a smallest but closet
collective, and the documentation-working mate will be followed in the same way as the targeted teacher.
With a broad meaning of “resource”, a variety of information from the teachers is considered in our study: emails, CVs,
published papers and articles, blogs etc. Observations and interviews are intertwined: while observing school activities
(such as classroom teaching or teachers meetings), field notes were taken by the researcher.
A two step case study analysis
Designed as a case study, two mathematics teachers were selected from a same middle school in France, Anna as the
main teacher, and Cindy as her documentation-working mate. Anna is selected because of her rich working experience in
collectives, and she proposed Cindy as her documentation-working mate because: they are both experienced teachers
(started to work together since 1990) and they both participate in several collectives; they have cooperated with each
other in the same school over ten years (since 2006); they both work as part-time in education research collectives and
they are willing to attend our research.
A two-step case study analysis includes a preliminary analysis from individual level, and a deep analysis from collective
level:
-The preliminary study mainly focuses on the main teacher, Anna’s resource work experience in collectives, as well the
resources and resource habits gained in these collectives. We will identify the thought style of the collectives that Anna
participated and how they support her preparation for new curricular changes;
-As for the deep analysis, we adapted video analysis on a collective lesson preparation between Anna and Cindy, from
two dimensions: the documentation expertise shown in the collective work, and how it is developed by their interactions.
Details will be presented in the following section.
CASE STUDY AND ANALYSIS
Graduated in 1989, Anna passed her CAPES (Certificate of Secondary Education Professional Qualification) exam in
1990, after one year’s pre-service teacher education, she got her first position in a middle school of urban Paris, a
“famous” school for the tricky problem students, till 1995. From 1995 to 2005, she worked in a middle school in Lyon.
Then since 2005, she starts to work in the current middle school with three classes. And, we will present our analysis in
two parties: first, we will analyze Anna documentational experience working in different collectives, and second we will
analyze Anna documentation-working mate with Cindy.
Anna documentational experience nourishing itself of a plurality of collective
In this section, we will address the research question: how does teachers’ documentation experience accumulated in
collectives benefit their resource work?
We present our analyses about Anna collective works for preparing for new curricular changes in two parts: first, we will
present her work in three regulated collectives, in which we could infer some elements about their thought style in their
site; second, we will present her work in one informal collective, in which we follow Anna works inside it, them we infer
they thought style.
ICTMT 13 288 Lyon 3 - 6 July 2017

We start for older regulated collective that she is member the SÉSAMES, in which teachers and researchers discussing
Algebra. Anna met SÉSAMES coordinator, Sylvie Coppé, in her school and she invites Anna to join the collective. Anna
hesitated, because Algebra was not her favorite notion to teach. However, she enjoyed this collective in 2006. For
observing SÉSAMES site (http://pegame.ens-lyon.fr/) we could infer their though style as:
Teachers and researchers thinking about resources for teaching Algebra and promoting teacher’s training
(CSF); mathematics for solving problems and teaching mathematics basing in activity of research by students;
collaboratively and voluntary work between teachers and researchers, principles for creating resources (CM).
SÉSAMES is an important collective for Anna documentational experience, during more then 10 years of work she
created a hug resource system to teach Algebra. And for the new curricular program, the members started to review all
resources and think about some programs of calculus to be used in algorithmic. For example, one important resource
that they will use for teaching is the Mise en train (MET). Resources MET are created for exploring one notion in a
progressivity way, during many sections, that was applied in the fifteen first minutes of class lesson. This resource was
used in others collectives: IREM, APMEP, ANNA-CINDY collective, among others.
In the national French institute of research, IREM, teachers and researchers research together how to improve teaching
mathematics. And Anna uses their resources since she started to teach. And in SÉSAMES she met some members of this
collective then she decided to join them too in 2010. For observing IREM site (http://math.univ-lyon1.fr/irem/) we could
infer their thought style as:
Articulated work between research and practice looking for diffusing research results and promoting teacher’s
training (CSF); mathematics in live and teaching mathematics malleable (CJ); collaboratively work for
designing resources, not have specific principles for creating resources, but created resources with didactical
advices (CM).
IREM have discussed teaching by competences since 2006 when the new common core was implemented in France.
This common core is the base of new curricular change, then Anna discussed there how teaching by competences. Also
she designs new activities to teach in the interdisciplinary way. And in this collective, Anna had access to many
resources about teaching algorithmic exchanging with members.
In the teacher’s professional association, APMEP, in which teachers working together for thinking about teaching
mathematics. Anna also uses their resources (booklets with activities, articles in their site, etc.) since that she started to
teach. And in 2012 she goes from simple consumer of resources to the member of the association. For observing
APMEP site (http://www.apmep.fr/) we could infer they though style as:
Gathering teachers teaching mathematics from pre-primary schools to University and promoting teacher’s
training (CSF); being a force of proposal for improving mathematics teaching and providing math teachers with
rich resources (from a didactical and epistemological point of view) (CJ); working voluntarily and
collaboratively without hierarchy, not having specific principles for creating resources, but created resources
with didactical advices (CM).
Anna re-interprets and takes position about curricular changes in this collective. They have meeting in which they
review all notions proposed in curricular program, in particular, they discuss about algorithmic and programming. In this
collective, she shared in their site some resources that she found online for supporting teaching in the new reform.
The last collective that we will explore here is ANNA-CINDY collective, in which they always prepared their lesson
together. We recorded their lesson preparation for teaching algorithmic and programming, and we use that for infer some
elements about their tough style:
Anna-Cindy collective though style: prepare their lesson together in a moment the exchange their experience
about teaching (CSF); about algorithmic and programming they look for activities to teach algorithmic as
thinking about mathematics, they did not want to teach as used one software (CJ); gathered all possible
ICTMT 13 289 Lyon 3 - 6 July 2017

resources that may be interesting to use (many textbooks, sites, etc.); discuss them and take all decisions
together collaboratively exchanging their experience (CM).
In this collective Anna prepare her activities for teaching this new content that will applied in class and shared her
experience about lesson implementation. In the next section, we present more elements about resources designed in this
lesson preparation.
Finally, in this section, we evidenced that Anna use collective work as one network for preparing her teaching in the new
curricular program. Specially, about her documentation experience for teaching algorithmic and programming, she:
interprets curriculum proposes in APMEP, discuss some activities for teaching Algebra in SÉSAMES, exchange
activities in IREM and design her planning activities with Cindy.
A deep analysis on a collective lesson preparation of Anna and Cindy
In May 2016, a video of collective lesson preparation between Anna and Cindy on algorithmic was filmed, when it was
the time to prepare their teaching plans for the following academic year, and decide the textbooks to be used. This
collective lesson preparation lasted for one hour, which was proposed by Anna, with the reason that they were used to
prepare lessons together. An email with three questions was sent before their collective work: What are the difficulties
for teaching this topic? What resources do you have and lack of? Why do you prefer to work together?
The first transcription was shared with Anna through Google document, in which we marked our confusions and
questions in the video, particularly the name of the resources that are unclear for us. Then with the second transcription,
we discuss with Anna face-to-face, mainly on the source of the resource appeared in their collective lesson preparation.
This section will analyze it from two dimensions: the documentation expertise (schemes) shown, and how it is developed
in the collective work:
(1) Some schemes of resource work could be found in this collective activity:
The schemes of retrieving resources, which are also based on the schemes of resources management or storage. It could
be an ability to make the use of the available resources. In the eyes of Cindy, Anna herself is already a kind of resource:
“When I need some resources, Anna is always the first choice”. Her documentation expertise could be traced back to her
online working habit, in both the organization and preparation: with various high qualified website resources, she has
Google drive to shared documents and agendas with her colleagues in SESAMES team, Dropbox with her colleagues in
her school. Meanwhile she stored her personal resources in Dropbox and Evernote, in which the documents are
classified by the name of different collectives and projects. She has also some online platform like Pixies and Viaéduc to
collect and store her favorite resources so that when she needs some resources she could find them easily.
The schemes of selecting resources, which rely on the understanding on activity goals, related concepts, and their
teaching practices. For Anna, she is clear that the first lesson preparation of algorithmic should be an introduction with
some activities. She has her own understanding of algorithmic, which is different from the explanations in the official
program, and this is the basic for her critical thinking on the official resources and the suggestions from the inspectors.
The critical thinking in resources selecting also relies on the confidence and proficient knowledge about their teaching
practice, for example, when Anna and Cindy were reading the goals of algorithmic in a textbook, they doubted that the
goals written (“encourage the students to understand the variables…”) impossible, because “it is a notion in
information”, so “it is better to change the name”.
The schemes of modifying and adapting resources need the teacher’s understanding of the situation requirements, and
technology skills. Such trends appear more obvious on Anna, she has no personal office space, so she has to take her
laptop all the day. According to an interview, as a mathematics teacher in middle school, Anna does not need to learn
very complex software, and her first big challenge was the whiteboard when her school equipped it in each classroom,
and she had to learn how to use it, which cost her almost one year. She explained happily that her students learned much
quicker and often assisted her. This is also an open mind or a kind of curious towards new things, and new changes.
ICTMT 13 290 Lyon 3 - 6 July 2017

The schemes of resources sharing, which is not a spirit of contributing others, but an efficient way of mutual benefiting.
Taking Anna and Cindy as an example, Cindy used to say directly that when she had some problems in searching
information and resources, she will turn to Anna and she always got her answer. And also from the observation of their
school meetings or co-training in service teachers, Cindy seems to be strong to propose her ideas, comments, and
suggestions in a clear and reasonable way. The sharing off of resources is not only an action of throwing the resources
into the common area, but a carefully maintained, regular refreshed and re-organized, just like the common folder named
“le cours” shared among Anna, Cindy and other mathematic colleagues.
Besides, for both Anna and Cindy, there is a kind of flexibility in integrating resources into different roles. This could be
evidenced by their presentation on the difficulties and available resources at the beginning. They both traced back from
teaching experience to training experience, and then to their learning experience in university and students’ activities
they ever organized. This kind of scheme is not only integrating resources from different sources (or collectives) to their
current task, but also their current work could be the future resources for other tasks. For example, when teaching the
“line, segment and half-line” chapter, she arranged several drawing exercises, which come from IREM website, as
classroom exercises for students. Then she collected and took pictures of their work, and uploaded to the school
webpage for inter-discipline students’ masterpieces; she also adapts these as examples to her teacher-training work,
shared and discussed with other teachers.
(2) Seeing from the dialogues between Anna and Cindy, their interactions were classified in three types: disagree and
conflicts, agreements and complements, questions and answers. The interactions are considered as a mutual way in
developing documentation expertise:
The conflicts could be seen when they hold different ideas, but between Anna and Cindy, there are not obvious or strong
conflicts seeing from their dialogues. Taking their first ideas about the Scratch as an example: At the beginning, Cindy
seems to agree with teaching Scratch according to the suggestions in the program, when she heard the word “but…”
from Anna, she tried to remind her that the inspectors also suggested to use Scratch. When Anna explained that
algorithmic should be a kind of thinking rather than using a software usage, Cindy seems to change her ideas, she
reacted with “Hum” and “Yes”. Later she commented that almost the whole activities suggested in the program are
centered with Scratch, then Anna re-stated her idea that she do not want to teach Scratch. However, in the end, they
decided to arrange a computer lesson for the students to let them explore Scratch. This could be seen as a process in
exchanging their ideas, and influences on each other.
There are more agreements and complementation in this collective work, and they appeared more tacit agreement when
Anna and Cindy were discussing the textbooks, they read textbooks on their own, they had their division for these 13
textbooks, and they shared the valuable parts, and exchanged he doubtful points.
In this collective work, the questions and answers happened when one teacher did not know something, and the other
explained it. Anna plays more roles on solving the questions proposed by Cindy. For example, when reading the
Sésamath textbook, Cindy asked Anna “How do you understand ‘some languages are not used in a declared way’?”,
Anna proposed an example of Python, the equal (“=”) is not the equal that we know normally, “it is specific, but it has a
different meaning”. Also, when Cindy proposed the “idea of dance” in the document of creative computing, she also
explained the source and author of the document, it is the first time heard by Anna, but she learned this after it is
explained.
DISCUSSION
After a two-step analysis on Anna’s documentation experience in collectives and her documentation expertise shown and
developed in collective work with Cindy, we find some answers to our research questions: documentation experience in
collectives for the teachers not only bring resources to them, but also some thought styles that guide resource design; she
takes resources from one collective to another, for example, the resource MET; while in new collective documentation
work, ANNA-CINDY collective develop their documentation expertise through trying to adapt those resources and
ICTMT 13 291 Lyon 3 - 6 July 2017

thought styles into their new work. When exploring an individual teacher’s professional develop, it is needed to situate
her/his work in not only her personal documentation work, but also her documentation experience in collectives,
because interactions within collectives could be a crucial way of learning, and developing her documentation expertise.
REFERENCES
Adler, J. (2000). Conceptualizing resources as a theme for teacher education. Journal of Mathematics Teacher
Education, 3, 205–224.
Avalos, B. (2011). Teacher professional development in teaching and teacher education over ten years. Teaching and
Teacher Education, 27(1), 10-20.
Buisson, F. (Ed.) (1911). Nouveau Dictionnaire de Pédagogie et d’instruction primaire. Paris: Hachette. Retreived in
September 2015 at: http://www.inrp.fr/edition-electronique/lodel/dictionnaire-ferdinand-buisson/
Berliner, D.C. (1988). Describing the behaviors and documenting the accomplishments of expert teachers. Bulletin of
Science Technology and Society, 24(3), 200-212.
Engeström, Y. (1987). Learning by expanding. An activity-theoretical approach to developmental research. Helsinki:
Orienta-Konsultit.
Fleck, L. (1981). Genesis and Development of a Scientific Fact. Chicago: University of Chicago Press (original edition,
1934).
Gueudet, G., & Trouche, L. (2008). Du travail documentaire des enseignants: genèses, collectifs, communautés. Le cas
des mathématiques. Education et didactique, 2(3), 7-33.
Gueudet, G., Pepin, B., & Trouche, L. (2013). Collective work with resources: an essential dimension for teacher
documentation. ZDM - The International Journal on Mathematics Education, 45(7), 1003-1016.
Hargreaves, A. (1995). Beyond Collaboration: Critical Teacher Development in the Postmodern Age. In J. Smyth (Ed.),
Critical Discourse on Teacher Development (pp. 149-173). London: Cassell,
Roschelle, J., & Teasley S. D. (1995). The construction of shared knowledge in collaborative problem solving, In
O’Malley C. (dir.), CSCL (pp. 69-97). Springer-Verlag.
Pastré, P. (2005). Genèse et identité. In P. Rabardel, & P. Pastré (Eds), Modèles du sujet pour la conception: dialectique
activités développement (pp. 231-260). Toulouse: Octarès.
Sternberg, R. J. & Horvath, J. A. (1995). A prototype view of expert teaching. Educational Researcher, 24(6), 9-17.
Turner, G. & Shepherd, J. (1999). A method in search of a theory: peer education and health promotion[J]. Health
Education Research, 14 (2), 235-247.
Vergnaud, G. (1998). Toward a cognitive theory of practice. In A. Sierpinska, & J. Kilpatrick (Eds.), Mathematics
education as a research domain: A search for identity (pp. 227–241). Dordrecht: Kluwer.
ICTMT 13 292 Lyon 3 - 6 July 2017
IN SEARCH FOR STANDARDS: TEACHING MATHEMATICS IN
TECHNOLOGICAL ENVIRONMENT
Jana Trgalová1, Michal Tabach
1Claude Bernard University, Lyon, France; [email protected]
2Tel-Aviv University, Israel; [email protected]
In the literature review on teacher education aimed at integrating technology to mathematics
lessons we presented in the topic study group 43 at the 13th
ICME conference, we brought to the
fore a lack of standards for teaching mathematics with technology, which is, in our view, an issue
for the actors of teacher education. In this paper, we tackle this issue by presenting existing ICT
standards at the international and national levels and analyse them through the lenses of TPACK
model and double instrumental genesis. We argue that the existing standards are too general, as
they are neither school level, nor subject matter specific. We call the mathematics education
community to take this issue in consideration.
Keywords: Mathematics teachers' knowledge for ICT; Standards for teaching with ICT; TPACK
model, Double instrumental genesis
INTRODUCTION
Teacher education was one of the four central themes discussed at ICME 13 congress in the Topic
Study Group 43, Uses of technology in upper secondary mathematics education (age 14 to 19). In
our contribution to this theme (Tabach & Trgalová, 2016), we noticed, in a number of research
papers, a disappointment with the outcomes of teacher education programs. The gap between
teachers’ needs and the teacher education contents is deemed as the main reason. This brings to the
fore a necessity for teacher educators to understand better what teachers need to know in order to
use efficiently ICT, which raises the issue of ICT competency standards. We thus searched for an
institutional framework regarding teachers’ knowledge for teaching mathematics with technology.
Surprisingly, we could hardly find such standards for mathematics teachers or even for teachers in
general. Therefore, we recommended that "Elaboration of ICT standards for mathematics teacher
education might become one of the goals of the mathematics education international community"
(Hegedus at el., 2016, p. 30).
In this paper, we aim to expand on the issue of standards that we consider crucial for teacher
education: standards aiming at teachers, and specifically mathematics teachers working with ICT.
We relate to both international and national levels.
THEORETICAL PERSPECTIVE
Several researchers suggested theoretical frameworks for examining and analyzing teacher
knowledge in general. In theorizing about the unique knowledge needed for teaching with digital
technology, Mishra and Koehler (2006) introduced the concept of Technological Pedagogical
Content Knowledge (TPCK or TPACK): the knowledge and skills teachers need to meaningfully
integrate technology into instruction in specific content areas.
ICTMT 13 293 Lyon 3 - 6 July 2017

The notion of TPCK emerged from Shulman's (1986)
construct of pedagogical content knowledge (PCK).
Shulman rejected the view of Content knowledge (CK)
and Pedagogical knowledge (PK) as two distinct bodies of
knowledge, and suggested a partial overlap between them.
This overlap implies a unique type of knowledge, specific
for teachers, PCK. Along similar line of thoughts, Mishra
and Koehler (2006) suggested an additional body of
knowledge, Technological, which partially overlaps CK
and PK. The resulted image of teachers' knowledge is
captured in Fig. 1, and includes seven bodies of
knowledge.
The TPACK framework was used by many
researchers and several different interpretations
are currently accepted (Voogt et al., 2012):
T(PCK) as extended PCK; TPCK as a unique and distinct body of knowledge; and TP(A)CK as the
interplay between three domains of knowledge and their intersections. In the current paper we adopt
the latter view.
The theoretical construct of double instrumental genesis (Haspekian, 2011) brings forth the
implication of both personal and professional instrumental geneses in teachers using ICT. While the
first is related to the development, from a given artefact, of a teacher’s personal instrument for
mathematical activity, the second results in a professional instrument for her didactical activity.
These two processes mobilize knowledge of the artefact (TK), ability to solve mathematical
problems using it (TCK), to orchestrate ICT-supported learning situations (TPK) and to teach
mathematics with ICT (TPACK).
METHODS
In this paper, we review institutional documents in an attempt to answer the following questions:
What knowledge standards are set for teachers working in technological environments? What are
the specificities for mathematics teachers that are unique to this sub-group of teachers?
Two types of data sources were available for us. At the international level, we searched the web for
organizations that published documents on the subject. We found the UNESCO ICT Competency
Framework for Teachers (2011) and the International Society for Technology in Education (ISTE1)
Standards-T (2008), both sources relate to teachers in general. At the national level, we consider the
NCTM (2001) from the US, specific for teaching mathematics, yet focused mainly on standards for
learning, as well as available documents from France and Israel to have a wider national
perspective.
While reading each of the data sources, we tried to relate them to one of the four knowledge areas
that pertain to technology, as reflected by the TPACK framework.
1 International Society for Technology in Education, http://iste.org
Figure 1: TPACK (with permission from
TPACK.org)
ICTMT 13 294 Lyon 3 - 6 July 2017

FINDINGS
ICT standards around the world
UNESCO ICT Competency Framework for Teachers (ICT-CFT) (2011) sets out “the competencies
required to teach effectively with ICT” (p. 3). The framework stresses that
“it is not enough for teachers to have ICT competencies and be able to teach them to their students.
Teachers need to be able to help the students become collaborative, problem solving, creative learners
through using ICT so they will be effective citizens and members of the workforce” (ibid.).
The Framework is therefore organized in three different approaches to teaching corresponding to
three stages of ICT integration. The first is Technology Literacy “enabling students to use ICT in
order to learn more efficiently”, the second is Knowledge Deepening “enabling students to acquire
in-depth knowledge of their school subjects and apply it to complex, real-world problems” and the
third is Knowledge Creation “enabling students, citizens and the workforce they become, to create
the new knowledge required for more harmonious, fulfilling and prosperous societies” (p. 3). It is
interesting to note that these stages are formulated in terms of students’ abilities to exploit the ICT
potential as a result of the ways teachers use ICT. All aspects of teachers’ work, namely
understanding ICT in education, curriculum and assessment, pedagogy, ICT, organization and
administration, and teacher professional learning, are addressed at the three stages (Fig. 2).
Figure 2. The UNESCO ICT Competency Framework for Teachers (UNESCO, 2011, p. 13)
The authors of the UNESCO framework claim that
“[t]he successful integration of ICT into the classroom will depend on the ability of teachers to structure
the learning environment in new ways, to merge new technology with a new pedagogy, to develop
socially active classrooms, encouraging co-operative interaction, collaborative learning and group work.
This requires a different set of classroom management skills. The teaching skills of the future will
include the ability to develop innovative ways of using technology to enhance the learning environment,
and to encourage technology literacy, knowledge deepening and knowledge creation” (ibid., p. 8).
ICTMT 13 295 Lyon 3 - 6 July 2017

The Framework specifies competencies teachers need in all aspects of their work. At the level of
Technology Literacy,
“teacher competences […] include basic digital literacy skills and digital citizenship, along with the
ability to select and use appropriate off–the-shelf educational tutorials, games, drill-and-practice
software, and web content in computer laboratories or with limited classroom facilities to complement
standard curriculum objectives, assessment approaches, unit plans, and didactic teaching methods.
Teachers must also be able to use ICT to manage classroom data and support their own professional
learning.” (ibid., p. 10).
Referring to the TPACK model, we may consider “basic digital literacy” as part of TK and the
ability to select appropriate resources to “complement […] standard didactic teaching methods” as
part of TPACK. TPK and TCK are mentioned together with the TPACK at the further level,
Knowledge Deepening:
“teacher competences […] include the ability to manage information, structure problem tasks, and
integrate open-ended software tools and subject-specific applications [TCK] with student-centred
teaching methods and collaborative projects in support of students’ in-depth understanding of key
concepts [TPACK] and their application to complex, real-world problems. To support collaborative
projects, teachers should use networked and web-based resources to help students collaborate, access
information [TPK], and communicate with external experts to analyze and solve their selected problems.
Teachers should also be able to use ICT to create and monitor individual and group student project plans,
as well as to access information and experts and collaborate with other teachers to support their own
professional learning’ (ibid., p. 11).
Finally, at the level of Knowledge Creation, teachers
“will be able to design ICT-based learning resources and environments; use ICT to support the
development of knowledge creation and the critical thinking skills of students [TPACK]; support
students’ continuous, reflective learning [TPK]; and create knowledge communities for students and
colleagues” (ibid., p. 14).
The UNESCO document provides examples of syllabi for teacher education that demonstrate ways
how to operationalize the ICT competency framework. In the Table 1, a few examples of tasks
suggested in the syllabi at the three levels, technology literacy (TL), knowledge deepening (KD) and
knowledge creation (KC), of teachers’ competencies are given, organized according to the TPACK
model and the double instrumental genesis concept.
These examples of teachers’ competencies show that the UNESCO ICT framework takes into
account both teacher’s personal and professional ICT knowledge and skills, although the first are
only present at the TL and KD levels, the teachers at the KC level being certainly considered as
having a sufficient personal mastery of technology. All technology-related categories of the TPACK
model are present, although the TPACK itself is not specific to whatever subject matter.
ICTMT 13 296 Lyon 3 - 6 July 2017

Table 1. Examples of teachers’ competencies mentioned in the UNESCO ICT framework.
The ISTE Standards-T (2008) define five skills teachers “need to teach, work and learn in the
digital age”:
(1) “Teachers use their knowledge of subject matter, teaching and learning, and technology to facilitate
experiences that advance student learning, creativity, and innovation“, (2) “Teachers design, develop,
and evaluate authentic learning experiences and assessments incorporating contemporary tools and
resources“, (3) “Teachers exhibit knowledge, skills, and work processes representative of an innovative
professional“, (4) Teachers [...] exhibit legal and ethical behavior in their professional practices”, and (5)
“Teachers continuously improve their professional practice […], exhibit leadership in their school and
professional community by promoting and demonstrating the effective use of digital tools and
resources“.
These skills are rather general and relate to various aspects of teacher profession. These skills do not
relate to TK per-se. It seems that in these standards, teachers’ TK is taken as a starting point. Also,
as the standards are not subject specific, they do not relate to TCK. In fact, this set of skills is about
TPK. Note that the standards encompass various aspects of teacher's profession – designing,
teaching, evaluating, leading their peers in school and in their professional community, as well as
legal behavior. A hint that some adaptation to the content taught is needed can be found in the
beginning – "Teachers use their knowledge of subject matter…". Yet, it is not directly conveying
that adaptation of these skills to different content areas within K-12, namely focusing on TPACK,
may yield different results for different subject matters.
To summarize, at the international level the standards mostly aim at teachers in general, with no
specific adaptation to any school subject. As a result, the documents refer to teachers’ TPK, rather
Personal instrumental genesis Professional instrumental genesis T
each
ers
sho
uld
be
ab
le t
o…
TL - Describe the purpose and basic function of
graphics software and use a graphics software package
to create a simple graphic display (TK)
TL - Identify the appropriate and inappropriate social
arrangements for using various technologies (TPK)
TL - Use common communication and collaboration
technologies, such as text messaging, video
conferencing, and web-based collaboration and social
environments (TK)
TL - Match specific curriculum standards to
particular software packages and computer
applications and describe how these standards are
supported by these applications (TCK)
TL - Use ICT resources to support their own acquisition
of subject matter and pedagogical knowledge (TCK,
TPK)
TL - Incorporate appropriate ICT activities into
lesson plans so as to support students’ acquisition of
school subject matter knowledge (TPACK)
KD - Identify or design complex, real-world problems
and structure them in a way that incorporates key
subject matter concepts and serves as the basis for
student projects (TCK)
KD - Structure unit plans and classroom activities so
that open-ended tools and subject-specific
applications will support students in their reasoning
with, talking about, and use of key subject matter
concepts and processes while they collaborate to
solve complex problems (TPACK)
KD - Operate various open-ended software packages
appropriate to their subject matter area, such as
visualization, data analysis, role-play simulations, and
online references (TCK)
KC - Help students reflect on their own learning
(TPK)
ICTMT 13 297 Lyon 3 - 6 July 2017

than TCK or TPACK, which are only referred to by evoking “didactic teaching methods” or
“support of students’ in-depth understanding of key concepts”.
ICT standards at the national level
The National Council of Teachers of Mathematics (NCTM) organization published document
statement and positions aimed to the US, yet these documents are influential beyond the national
level. In many countries, they serve as model for the national documentation. The NCTM relates
specifically to mathematics teachers, as can be viewed from an explicit relation to mathematics, as
well as to digital tools specific to mathematics.
NCTM (2011) claims that
“Programs in teacher education and professional development must continually update practitioners’
knowledge of technology and its application to support learning. This work with practitioners should
include the development of mathematics lessons that take advantage of technology-rich environments and
the integration of digital tools in daily instruction, instilling an appreciation for the power of technology
and its potential impact on students’ understanding and use of mathematics.”
The NCTM position toward technology in mathematics education emphasizes three conditions for
an efficient integration of technology, which should guide the development of teacher education
programs: teachers’ awareness of the technology added value in terms of students’ understanding of
mathematics, which is about TPACK; teachers’ continuous upgrading of their knowledge of
technology and its use in teaching, which relates both to teachers TK and TPK; and designing
teaching resources taking advantage of affordances of digital tools, which is about TPACK.
In a position statement from 2015 the NCTM further stated that
"Effective teachers optimize the potential of technology to develop students' understanding, stimulate
their interest, and increase their proficiency in mathematics. When teachers use technology strategically,
they can provide greater access to mathematics for all students."
The document further relates to particular technologies to be used, from mathematical and non-
mathematical domains:
"Content-specific mathematics technologies include computer algebra systems; dynamic geometry
environments; interactive applets; handheld computation, data collection, and analysis devices; and
computer-based applications. Content-neutral technologies include communication and collaboration
tools, adaptive technologies, and Web-based digital media."
Teachers are viewed as orchestrators and coaches of strategic use, and their leading consideration
should stem from the mathematics they are teaching. Technology is used at the service of
mathematics. Although not specifically stated, it seems that for the NCTM, TCK, TPK and TK all
play central role in the knowledge teachers need to have in order to teach with ICT. This impression
is enhanced by the fact that in most of the publication, ICT appears at the background rather than up
front.
The situation in Israel is quite different in terms of teachers' standards for teaching in ICT
environment in general, and for mathematics teachers in particular. At the national level of
preservice teacher education, the only reference is made to the 21th century skills in general. In
other words, they refer to TK which is expected from all citizens and are not particular to teachers.
At the mathematics education level, again there are no particular standards as to what do
ICTMT 13 298 Lyon 3 - 6 July 2017

mathematics teachers need to know. This is not typical, as the Israeli ministry of education is very
centralistic in its approach.
France was, until 2014, one of the European countries in which a certificate of digital skills, called
“certificate of computer science and Internet”, was required to become a primary or a secondary
teacher. Since 2014, this certification is integrated in the preservice teacher education. This
certification was created in 2010 to vouch for professional skills in the pedagogical use of digital
technologies, common and necessary to all teachers and trainers for the exercise of their profession.
National standards of competencies related to the certification comprise two main parts: (A) general
skills related to the exercise of the profession, and (B) skills needed for ICT integration into the
teaching practice. The general skills (part A) are organized in three domains: “A1 - mastery of
professional digital environment” (e.g., select and use the most appropriate tools to communicate
with the actors and users of the education system), “A2 - development of skills for lifelong
learning” (e.g., use online resources or distance learning devices for self-training), and “A3 -
professional responsibility in the education system” (e.g., take into account the laws and
requirements for professional use of ICT). The skills for ICT integration are classified in four
domains: “B1 - Networking with the use of collaborative tools” (e.g., search, produce, index, and
share documents, information, resources in a digital environment), “B2 - design and preparation of
teaching content and learning situations” (e.g., design learning and assessment situations using
software that is general or specific to the subject matter, field and school level), “B3 – pedagogical
enactment” (e.g., manage diverse learning situations by taking advantage of the potential of ICT
(group, individual, small groups work), and “B4 - implementation of assessment techniques” (e.g.,
use assessment and pedagogical monitoring tools). While the skills from the part A refer mostly to
TK, those from the part B refer to TCK, TPK and TPACK. Numerous intersections can be found
between the French national and UNESCO international standards, mainly in considering various
aspects of teachers’ profession, not only reducing it to their classroom activity, leading to taking
into account both personal and professional mastery of ICT. Like the other standards presented
above, the French ones are common to all teachers, whatever their school level and the subject
matter taught.
CONCLUSION
In the current paper, we asked two connected questions: What knowledge standards are set for
teachers working in technological environments? What are the specificities for mathematics
teachers that are unique to this sub-group of teachers? To answer the two questions, we searched for
institutional documents, both at the world-wide level and at the national level. In the findings
section we detailed our analysis of the few documents we found, through the lenses of the TPACK
framework for teachers' knowledge and the double instrumental genesis concept. We found a
document composed by the UNESCO with elaborated ICT standards for teachers in general –
regardless of the subject matter or grade level. The second document was composed by the
International Society for Technology in Education organization, again at the general level. We were
surprised to find only these two documents. We would like to point out that the two documents did
not address any specific grade level – as if the standards for teaching in an ICT environment at any
grade level were the same. Also, the documents did not address any specific subject matter, or did
not suggest that particular adaptations are needed for teaching various school subjects.
At the national level we searched for documentation from three countries –US, France and Israel.
There are profound differences between the three countries in terms of national level standards for
teaching with ICT as well as some striking similarities: like at the international level, both in Israel
ICTMT 13 299 Lyon 3 - 6 July 2017

and France the reference is made only to teaching in general, with no relation to specific age level or
subject domain. Yet, while in Israel there is some reference to 21th ICT skills needed for any
citizen, centering on TK, in France we saw awareness to both the personal TK as well as
professional knowledge needed for teaching, in line with the double instrumental approach. The
findings from the US are different in the sense that the standards specifically aim at teaching
mathematics. Indeed, the analysis shows that these standards relate to all types of TPACK
knowledge. However, they lack specifications.
We are currently at a time of change in terms of teachers' technological knowledge – the newcomers
to this profession are expected to be more skillful at the personal level than the veterans. Yet, we
think that teachers' mastery of ICT, both in terms of TK and TCK should not be taken for granted.
Rather, this personal level in the double instrumental genesis should be addressed by standards.
Moreover, we call for much more elaborated sets of standards for teaching in ICT for different age
groups and school subjects, to allow for the professional level of instrumental genesis to be
promoted.
REFERENCES
Haspekian, M. (2011). The co-construction of a mathematical and a didactical instrument. In M.
Pytlak, E. Swoboda, & T. Rowland (Eds.), Proceedings of the seventh Congress of the European
Society for Research in Mathematics Education. CERME 7, Rzeszow.
Hegedus, S., Laborde, C., Brady, C., Dalton, S., Siller, H. S., Tabach, M., Trgalova, J., & Moreno-
Armella, L. (2016). Uses of Technology in Upper Secondary Mathematics Education. Springer.
ISTE (2008). ISTE Standards for Teachers. Online
http://www.iste.org/standards/standards/standards-for-teachers [Retrieved February 20, 2017].
NCTM (2011). Technology in Teaching and Learning Mathematics. A Position of the National
Council of Teachers of Mathematics. Online http://www.nctm.org/Standards-and-
Positions/Position-Statements/Technology-in-Teaching-and-Learning-Mathematics/ [Retrieved
September 17, 2015]
Mishra, P., & Koehler, M. J. (2006). Technological pedagogical content knowledge: A framework
for integrating technology in teacher knowledge. Teacher College Records, 108(6), 1017-1054.
Shulman, L. (1986). Those who understand: knowledge growth in teaching. Educational
Researcher, 15(2), 4-14.
Tabach, M., & Trgalová, J. (2016). Teacher education: what, how and why? Invited paper presented
in the TSG43 at the ICME13 congress, July 2016, Hamburg.
UNESCO (2011). UNESCO ICT competency Framework for Teachers. Online
http://unesdoc.unesco.org/images/0021/002134/213475E.pdf [Retrieved February 20, 2017].
Voogt, J., Fisser, P., Pareja Roblin, N., Tondeur, J. & van Braak, J. (2012). Technological
pedagogical content knowledge – a review of the literature. Journal of Computer Assisted
Learning, 29(2), 109-206.
ICTMT 13 300 Lyon 3 - 6 July 2017

Workshops
301

MATHMAGIC: THE ENCOUNTER BETWEEN COMPUTATIONAL AND
MATHEMATICAL THINKING
Pedro Lealdino Filho; Christian Mercat;
Université Claude Bernard – Lyon 1; [email protected];
Computer Science is becoming more present in the curricula of the schools. Some countries already
have changed their programs to offer subjects like algorithms, logic and programming languages
since the beginning of early cycles of fundamental education. However, the contents are strongly
related with mathematics, and for this reason, mathematics teachers need to update themselves to
be able to teach the fundamentals of computer science. For this reason, we offer on this workshop
an introduction to the development of computational thinking from a mathematical trick with cards.
At the end of the workshop, the participants will be able to write their own code, solving a
mathematical problem.
Keywords: computer science; mathematics; algorithms; computational thinking; mathematical
thinking;
THE PROBLEM
The problem to be solved during the Workshop will be to model a magic trick from the Figure
below:
Figure 1: Cards
The magical trick is to guess a number between 1 and 31 indicating in which card the number is
present. For instance, if one choses the cards: 1, 2, 3 and 5 in the previous order, it’s possible to say
that the chosen number was 29. Of course, I won’t reveal the trick here. This is one of the exercises
of the Workshop. Also, the participants will learn:
Writing an algorithm in pseudocode: Describing the thoughts and steps to solve a problem in
natural language, explaining the reasoning to achieve the solution;
Creating an algorithm in visual language (Scratch): Understand the scope of a computer
program, create variables, methods and operations and printing the result. At the end of this
stage the participant will have the game in a digital version.
Creating a program in programming language (Python): Going a little bit deeper the
participant will be able to create the algorithm to generate the cards used in the magical trick
writing down a Python program.
Then, is expected that participants achieve the following levels:
ICTMT 13 302 Lyon 3 - 6 July 2017

Pseudocode – Level 1 Flowcharts – Level 2
Visual Programming – Model – Level 3 Coding – Abstraction and Generalization –
Level 4
The participants shall bring their own computers and the time expected is about 4 hours.
REFERENCES
images:
http://www.bbc.co.uk/education/guides/z3bq7ty/revision/2
https://scratch.mit.edu/projects/111975655/
ICTMT 13 303 Lyon 3 - 6 July 2017

MOVING, COMPARING, TRANSFORMING GRAPHS: A BODILY APPROACH TO FUNCTIONS
Francesca Ferrara and Giulia Ferrari
Università di Torino, Italy;
[email protected], [email protected]
The workshop aims at presenting and discussing activities in which graphing motion technology named WiiGraph is
used. The activities offer possible lines of (inter)action within the classroom to introduce discourses about the concept
of function, graph sense, transformations, all through modelling motion. These lines might be followed at different
school levels subjected to suitable task design (for example, we are going to carry out similar activities with grade 4,
grade 7 and grade 10 students). The software allows for working with graphs of many different types. It leverages two
remote controllers of the Nintendo Wii to detect and graphically display the location of two users as they move along
lifesize number lines. Embodied interactions with the software are the ground for gaining insights into temporo-spatial
mathematical relationships and covariational reasoning. We will discuss these aspects in relation to task design.
Keywords: Functional relationships; Graphs; Movement; Time; Task design
A BODILY APPROACH TO FUNCTIONS
Graphing motion activities have been largely investigated in mathematics education research since the 90s, through the
use of motion sensor and other technology (e.g. Nemirovsky et al. 1998; Yerushalmy & Shternberg, 2005; Radford,
2009). Researchers have been studying the ways in which the interaction with this kind of tools may stimulate
mathematical thinking while taking advantage of perceptuomotor activity. Even though different researchers have had
different conceptions of function, these studies generally share the vision of covariation as a foundation for function in
mathematics (see Thompson & Carlson, 2017). Our focus here is on highlighting features of graphing motion activities
with a specific technology: a new software application, named WiiGraph [1]. This technology allows for the creation of
different types of graphs while two users are moving each a controller of the Nintendo Wii (Wii Remote or Wiimote).
Initially, we used it with the idea of introducing secondary school students to variational and covariational reasoning.
Drawing on Nemirovsky and colleagues (2013), WiiGraph is a mathematical instrument, that is, “a material and
semiotic device together with a set of embodied practices that enable the user to produce, transform, or elaborate on
expressive forms (e.g., graphs, equations, diagrams, or mathematical talk) that are acknowledged within the culture of
mathematics.” (p. 376). Implicating movements of the controllers by two people in an interaction space, activities with
WiiGraph also implicate bodily proprioceptive and kinaesthetic experiences both with the devices in use and with the
graphical lines and symbolic operations provided by the technology. Nemirovsky et al. (2013) unfold the powerful idea
of mathematical instrument to speak about fluent use and mathematical expertise as inseparable from perceptual and
motor aspects implied in the activity with the tool. While these researchers are interested in studying fluency with the
instrument in the informal context of a scientific exhibition, we focus on the more formal context of the mathematics
classroom. In the design of tasks and intervention that we propose in the workshop, the vision of Nemirovsky and
colleagues helped us, as researchers and educators, to draw attention to the kind of engagement and practices that
activity with the technology might favour within the classroom (e.g., strategic thinking, competitive and collaborative
dynamics, use of material resources, etc.; see e.g. Ferrara & Ferrari, 2015a; Ferrara & Ferrari, 2016). We centre on these
aspects as a way of discussing challenging lines of flight on covariation, function and families of functions and the issue
of designing activities for students from the early years to secondary school. Attending closely to the perceptual and
motoric aspects of the experiences, we are interested in offering insights into the ways in which creating and thinking of
graphs and functions might change through these experiences and into the new meanings that might emerge from the
activities.
ICTMT 13 304 Lyon 3 - 6 July 2017

WIIGRAPH
To the aim stated above, we focus here on two main options of WiiGraph: Line and Versus. Line furnishes in real time
two position-time graphs that capture the distance of the Wiimotes over time from a sensor (origin of the reference
system). Time and spatial ranges can be set and modified for the Cartesian axes. This in turn implies specific time
interval for the motion to be performed (e.g. 30 seconds) and space constraints for the two users’ movements (e.g. at
most 10 feet far from the sensor) within the interaction space. Labelled a and b the two distances, the software displays
the lines a(t) and b(t) differently coloured on the screen (Figure 1 left). Additionally, selecting the Make your own
Maze! modality allows for the creation of a target maze to be traversed through the movements. The maze can be built
choosing a number of inflection points, a certain value for its thickness and tension, thus a particular graphical
arrangement for the maze, which appears on the screen as a tick light blue line. At the end of the session, each user gets
a score based on the traversal rate of the created graph with respect to the maze.
Figure 1. Line graphs; Line graphs and a+b operation; a rectangle in Versus
Within the Operation modality, a third coloured graph is shown on the screen: in particular, the addition a+b implies a
third graph of position over time that depicts in real time a(t)+b(t) (Figure 1 middle); in a word, the graph shows instant
by instant the sum of the two distances. It is also possible to choose among the other simple mathematical operations
(subtraction/multiplication/division), with an analogous result (a third graph with the chosen characteristics).
The second option we draw attention to is Versus, which allows for the creation of a single graph on a Cartesian plane
with isometric axes, depending on both users’ movement. Versus plots at each time t an ordered pair of the positions of
the two controllers, showing the line b(a) and leaving time implicit, therefore giving a motion trajectory. Practically,
(Figure 1 right) vertical displacement in the graph corresponds to one user’s movement, horizontal displacement to the
other user’s movement.
ACTIVITIES OF GRAPHING MOTION(S): MOVING, COMPARING, TRANSFORMING
In this section, we discuss insights coming from activities with WiiGraph that we carried out through some teaching
experiments in Italian classrooms during the last three years. While we recognize that the use of WiiGraph engenders
mathematical discourse similar to work with other motion detectors—which have been explored in the literature, we are
interested in the ways in which we can exploit the potential of WiiGraph through the design of tasks. We believe that
this technology might permit novel reasoning about variation and covariation in the context of graphing motion,
therefore new ways of exploring mathematical relationships. In fact, the software requires that two people move in the
same interaction space, in the same time interval. In the meanwhile, there are at least two graphs on the screen, which
“move” together while originating in real time on the same Cartesian plane. When two students move with the devices,
relationships between movements are captured through the relationships between the graphs that are created. Therefore,
we can think of activities as (mainly) unfolding along two dimensions. One dimension is concerned with types of bodily
engagement of the users with the technology, the other dimension regards how the concepts of graph and function can
be grounded on aspects of covariation, coordination and plane transformation. In particular, the ideas shown in the
following arise from five different teaching experiment that involved classes of grade 4, 9, 7 and 10 students.
ICTMT 13 305 Lyon 3 - 6 July 2017

Line and Versus
In a first exploration phase, using Line option, students might be simply asked to move and make conjectures about the
meaning of the lines created on the screen. They might be challenged to move in order to get a couple of graphs with
specific shape (like two straight lines or two curved lines). But, profiting of the potential of having two graphs on a
single Cartesian plane, they might also be asked to think of ways of moving to obtain two graphs with related shapes
(like two parallel slanted straight lines, two meeting straight lines or two translated gibbous lines). Thinking of two
parallel straight lines in terms of vertical translation of one to obtain the other, for example, opens room for discussing
relationships among the two graphs from a qualitative point of view. This also offers occasions for exploring bodily
ways of moving that express given constraints (like parallelism and straightness): for instance, pairs of students have
actually been asked to find ways of coordinating together to get the parallel straight lines. While this is rather trivial in
the case of horizontal straight lines, it is not in the case of slanted straight lines, in which the two students have to try to
keep the same pace. In our experiences, we observed some students drawing attention to each other, in order to maintain
their relative positions while moving; some others instead held their hands to keep stretched arms (and fixed distance
between them; Figure 2). Different coordination strategies embodied the need of preserving distance among the users to
achieve the desired configuration on screen. Students involved in such explorations can give kinaesthetic definitions to
vertical translation of graphs, whose mathematical counterpart is the idea of a constant vector that describes a rigid
motion.
Figure 2. Bodily movements to capture graphical translation
Using the Make Your Own Maze! modality, a maze is added to the graphical space offering a visible shape as the goal of
graphing motion for the students. In this case, learners might be challenged to move in pairs to traverse the maze as
precise as possible, eventually engaging them in competitive interactions. Being in the challenge means to focus on both
quantitative and qualitative aspects of the graphical notation, which are relevant to pursue the highest score. In addition,
students might be asked to think of difficult graphs for their mates to match, and to describe features in terms of
changes in direction, speed and position. In previous case studies (e.g. Ferrara & Ferrari, 2015b), we have seen how the
challenging situations offered by the Make Your Own Maze! actually involve degrees of covert/overt coordination
among the students. The ways that bodies partake in the creation of the graphs do have a role in the perception and
thinking of speeds and shapes.
Selecting the Operation modality, for example working with the sum, the students have to shift attention to the
relationships among the three graphs on the screen. Beyond this, it is challenging for the students to think of different
bodily ways of producing a given sum—imagined or made present through the Make your own Maze! modality—like
an horizontal straight line. Of course, an horizontal straight line can easily be obtained summing up two suitable
horizontal straight lines, however one can discover and discuss further possibilities by summing up pairs of suitable
slanted straight lines, etc. Another intriguing experience is that of moving keeping fixed distance (like in the case of two
parallel slanted straight lines) and discovering that the sum does not preserve slope. Again, learners enter the realm of
collaborative interactions, looking for suitable coordination between their movements.
ICTMT 13 306 Lyon 3 - 6 July 2017

New possibilities in terms of collaboration and coordinated movement are given by the Versus option that displays a
single graph. In fact, one of the most interesting challenges for a Versus graph involves the creation of plane shapes, like
rectangles, rhombuses and circles, or closed lines (see again Figure 1 right). Different ways of bodily coordination are
assembled in different graphical lines with specific qualities: for example, moving at the same pace in the same
direction produces a piece of line segment slanted by 45 degrees. All of this makes room for focusing on the crucial role
of time as independent variable, as well as connecting the spatial relationships in Versus, which essentially are motion
trajectories, with the space-time relationships in Line, which are functional relationships. The kinaesthetic ways of
interacting with this option implicate an extended perception of movement, which goes beyond the perception of each
student's movement to incorporate the composition of the coordinated movements of the students (de Freitas et al.,
2017).
Notes
1. WiiGraph has been developed by R. Nemirovsky (Manchester Metropolitan University) and some colleagues (C.
Bryant, M. Meloney, B. Rhodehamel) from the Center of Research in Mathematics and Science Education of San Diego
State University.
REFERENCES
de Freitas, E., Ferrara, F. & Ferrari, G. (2017). The coordinated movement of a learning assemblage: Secondary school
students exploring Wii graphing technology. In E. Faggiano, F. Ferrara & A. Montone (Eds.), Innovation and
Technology Enhancing Mathematics Education. Springer Verlag. (forthcoming)
Ferrara, F. & Ferrari, G. (2015a). Becoming mathematical subjects by playing mathematical instruments: Gibbous lines
with WiiGraph. In S. Carreira & N. Amado (Eds.), Proceedings of the 12th International Conference on Technology in
Mathematics Teaching (pp. 378-386). Faro, Portugal: Faculty of Sciences and Technology of the University of
Algarve.
Ferrara, F. & Ferrari, G. (2015b). Being collaborative, being rivals: Playing WiiGraph in the mathematics classroom. In
B. Di Paola & C. Sabena (Eds.), Proceedings of the 67th Conference of the Commission Internationale pour l’Etude et
l’Amélioration de l'Enseignement des Mathématiques, Quaderni di Ricerca in Didattica (Scienze Matematiche),
25(2), 461-472. Palermo, Italy: G.R.I.M., Dipartimento di Matematica e Applicazioni. ISSN: 1592-4424.
Available at: http://math.unipa.it/~grim/CIEAEM%2067_Proceedings_QRDM_Issue%2025,%20Suppl.2_WG3B.pdf
Ferrara, F. & Ferrari, G. (2016). Traversing Mathematical Places. In Csíkos, C., Rausch, A., & Szitányi, J. (Eds.),
Proceedings of the 40th Conference of the International Group for the Psychology of Mathematics Education , Vol. 2,
251-258. Szeged, Hungary: PME.
Nemirovsky, R., Tierney, C. & Wright, T. (1998). Body motion and graphing. Cognition and Instruction, 16(2), 119-
172.
Nemirovsky, R., Kelton, M.L. & Rhodehamel, B. (2013). Playing mathematical instruments: Emerging perceptuomotor
integration with an interactive mathematics exhibit. Journal for Research in Mathematics Education, 44(2), 372–415.
doi: 10.5951/jresematheduc.44.2.0372
Radford, L. (2009) Signifying relative motion: Time, space and the semiotics of Cartesian graphs. In W.M. Roth (Ed.),
Mathematical Representations at the Interface of the Body and Culture (pp. 45-69). Charlotte, NC: Information Age
Publishers.
Yerushalmy, M. & Shternberg, B. (2005). Chapter 3: Epistemological and cognitive aspects of time: A tool perspective.
Journal for Research in Mathematics Education, Monograph, 13. Retrieved from
http://www.jstor.org/stable/30037731
ICTMT 13 307 Lyon 3 - 6 July 2017

Dynamic Technology for Simulating a Scientific Inquiry for Learning - Teaching
Pre-Calculus concept
Osama Swidan*, Ferdinando Arzarello**, Silvia Beltramino***
*Ben-Gurion University, Israel, **Turin University, Turin, Italy, ***M. Curie School, Pinerolo,Italy
[email protected], [email protected], [email protected]
In the proposed workshop, we are interested to share with mathematics educators a possible use for dynamic
technology to simulate a scientific inquiry for teaching-learning pre-calculus topics. Inspired by the logic of inquiry
approach and the variation theory, we designed a set of activities and methodology that aim to bridge the gap between
the formal world of mathematics and the real-life situations. Participants of the workshop will experience the activities
and will engage in the methodology for conducting classroom practices. Results from our ongoing research would be
shared with the participants and insights could be discussed that would emerge from the experience.
Rational
Calculus is considered to be one of the most important topics in mathematics, and it is included in several curricula
worldwide. Calculus - the study of how things change - is inherent in many other topics and in many real-life situations.
It is difficult to imagine that there could be any other dynamic phenomena which is unable to be modelled by means of
calculus. Nurturing of calculus thinking can result in the productive integration of citizens into modern society.
Exposing students to the logical structure of calculus concepts may help develop the logical thinking of the students.
This type of thinking is essential in dealing with the challenges that citizens face in the 21 st century. Furthermore,
encouraging students to model mathematically real-life situations may help them integrate within society as citizens
who are able to make intellectual decisions. Our research is aimed at understanding the ways of teaching-learning of
pre-calculus concepts in a technologically rich environment that simulate a scientific inquiry of real-life situations.
Often, as seen in Italy as well as in Israel, calculus is taught in the upper secondary schools in a formal way as a set of
rules and strategies for investigating functions and computing areas bound between functions. This kind of teaching-
learning essentially concentrates on the formal world of mathematics which poses a barrier for the sense of
mathematical statements (Arzarello, 2016a, b). Several scholars have criticized this kind of teaching and claimed that it
is not a guarantee for boosting the understanding of calculus concepts, and even found it to be a barrier for
understanding calculus when it is learned at a university level (e.g. Thompson et al; Swidan & Yerushalmy, 2016;
Broussard, 2011). Also the Italian official curriculum
(www.indire.it/lucabas/lkmw_file/licei2010/indicazioni_nuovo_impagi
nato/_decreto_indicazioni_nazionali.pdf) points out the necessity of
presenting examples where mathematical models of different
phenomena are emphasized.
To overcome the barrier that existed between the formal world and the
real-life situation, Arzarello (2016a) has suggested a ‘virtuous cycle’
model. The model consists of four formal and informal intertwined
aspects: (1) Aspects of the real situation represented in the formal
system. (2) Treatment within a formal system / Conversions between systems. (3) Interpretation of the results of the
formal system in the real situation. And (4) Interpretation/theorization of the real situation through the theoretical lens.
Since the formal and informal aspects are deeply intertwined in the
ICTMT 13 Lyon 1
Figure 1. Virtuous Cycle (Adapted from
Arzarello (2016a))
ICTMT 13 308 Lyon 3 - 6 July 2017

mathematical reasoning, Arzarello (ibid.) argued that a major teaching goal should be to operationalize this virtuous
cycle in classroom practices.
However, the main question remains as to how to apply the virtuous cycle in classroom practices, that ensures a deepunderstanding of the mathematical concepts. This question should guide the discussion of the workshop. Inspired by thelogic of inquiry approach (Hintikka, 1998), which generally viewed scientific inquiry and knowledge construction as aquestion-answer process, and the variation theory (Marton and Tsui, 2004) which defines learning as a change in theway something is seen, experienced or understood. We have designed a set of activities and suggest a methodology(Method of Variation Inquiry) which may facilitate the conceptual learning of pre-calculus concepts and to engagestudents in a scientific inquiry.
Task 2Your task is to explore how the change of the massaffects the extension of the spring.A. Can you make a conjecture about how the
change of the mass should affect the extensionof the spring?
B. Open the Hooke's Law 1applet (Fig. 3). Changethe mass to verify or refute the conjectures youraised in (A). Did your conjectures change? Ifyes, why? If not, justify and prove yourconjectures.
C. How do the differences between the y values ofthe points on the graph change when varying thethe mass. Why? Is your conjecture always true?Can you prove it?
D. Can you find an equation that represents thesketch of the spring? Why or why not? Justifyyour answer.
Task 3 Your task is to explore how the change of the springelasticity affects its extension.A. Hypothesize how the elastic of the spring affects
its extension. Why?B. Open the Hooke's Law 2applet (Fig. 4), vary the
elasticity of the spring, and change the mass.Refute or verify the hypotheses you raised in (A).Justify and prove your hypotheses.
C. Why does the function graphs change as theelasticity of the spring varies? Discuss with yourclassmates which aspects changed and whichones remained invariant.
D. Follow your interaction with the applet. Writenew hypotheses based on your experience withthe applet. Which hypotheses can and can’t youjustify? Why?
Task 4Challenge your classmates by asking them questions.You win the game if you ask a question about theHooke's Law, which your classmate cannot answer.Use either applet to ask your questions.
Task 1Your task is to watch the Hooke's Law clip (Fig. 2)and to answer the following questions:What attracted your attention when you watched theclip? Write as many observations as you can?After watching to the Hooke's Law clip, write asmany hypothesis as possible about the content of theclip, which you may wish to discuss later.
Hooke's Law Activity
Figure 1. Hook’s Law activity that was given to the students
ICTMT 13 Lyon 2
ICTMT 13 309 Lyon 3 - 6 July 2017

Figure 2. Video clip that the students watch as the
starting point for the inquiry
Figure 3. Interface of the Hooke's Law 1 applet
Figure 4. Interface of the Hooke's Law 2 applet
ICTMT 13 Lyon 3
ICTMT 13 310 Lyon 3 - 6 July 2017

The Method of Variation Inquiry (MVI) is based on the idea of creating inquiry modes for students by changing andchallenging the observations they make during the learning process. The MVI model consists of six levels:
Level 0. Choosing a starting point.
Level 1. Listing the observations.
Level 2. Collective discussion (asking questions, reacting to observations). The conclusion should be If (Oi)
then (Dj). The explanation why the sentence is or is not correct is shared.
Level 3. What if the statement is not correct? (~Oi)
Level 4. Collective discussion: the conclusion should be If (~Oi) then (Dj)*. The explanation why the
sentence is or is not correct is shared.
Level 5. Meta-reflection:
– If (Oi) then (Dj)? (Rk)
– If (~ Oi) then (Dj)* (Rk)*
Questions and Goals
The workshop will address the question of how the designed activities and the suggested methodology could be applied
in classrooms across different cultures. In addition, epistemological and cognitive opportunities as well as obstacles that
are raised during the application of the proposed activities and methodology in classrooms could be discussed. We will
use examples from our ongoing research to provoke discussions of these questions. These examples are derived from
our analysis of a beta experiment conducted in a scientific oriented school in Italy, in which 10 th grade students are
working in small groups as well as a teacher who conducts a collective discussion using the suggested methodology. In
our beta experiment, we have noticed learning opportunities that encouraged a deep understanding of pre-calculus ideas.
We hope participants in the workshop will notice additional opportunities (obstacles) which would allow them to
engage in discussions of the implications of such results for improving the teaching-learning pre-calculus concepts in
classrooms.
Planned Activities
a. Introducing the ‘Method of Variation Inquiry’: theory and practice. 15 min
b. Experiencing the methodology in small groups through solving the designed activities. 20 min
c. Discussing the opportunities and obstacles of the methodology and the activities. 15 min
d. Introducing the finer logic of inquiry model: theory and practice 20 min
e. Analyzing transcripts using the finer model of logic of inquiry 20 min
f. Collective discussing of how the methodology and the activities could be applied in classrooms 20 min
REFERENCES
Arzarello, F. (2016a). How to promote mathematical thinking in the classroom. Lecture delivered at the 3rd
Italian Summer School in Math Education, UMI-CIIM, Bardonecchia, 2016. Downloadable from:
http://www.umi-ciim.it/attivita-della-ciim/scuole-estive/3a-scuola-estiva-2016/materiali/
Arzarello, F. (2016b). Tra sensate esperienze e necessarie dimostrazioni: quale senso matematico alle pratiche in classe?In: a cura di D'Amore, B. e Sbaragli, S., La matematica e la sua didattica. Convegno del trentennaleAtti del Convegno "Incontri con la Matematica" n.30 - Castel S. Pietro Terme, Relazione Generale.
ICTMT 13 Lyon 4
ICTMT 13 311 Lyon 3 - 6 July 2017

Bressoud, D. M. (2011). Historical reflections on teaching the fundamental theorem of integral calculus. American
Mathematical Monthly, 118(2), 99-115. doi: 10.4169/amer.math.monthly.118.02.099
Hintikka, J. (1998). The principles of mathematics revisited. Cambridge University Press.
Marton, F., & Tsui, A. B. M. (2004). Classroom discourse and the space of learning. In P. P. M. Chik, P. Y. Ko, & M. L.
Lo (Eds). Mahwah, NJ: Lawrence Erlbaum Associates, Inc.
Swidan, O., & Yerushalmy, M. (2016). Conceptual structure of the accumulation function in an interactive and multiple-
linked representational environment. International Journal of Research in Undergraduate Mathematics
Education, 2(1), 30-58.
Thompson, P. W., Byerley, C., & Hatfield, N. (2013). A Conceptual approach to calculus made possible by
technology. Computers in the Schools, 30(1–2), 124–147.
ICTMT 13 Lyon 5
ICTMT 13 312 Lyon 3 - 6 July 2017

Chapter 6
INNOVATION
ICTMT 13 313 Lyon 3 - 6 July 2017
THE TRANSPOSITION OF COUNTING SITUATIONS IN A VIRTUALENVIRONMENT
Marina De Simone, Hamid Chaachoua
Université de Grenoble Alpes; [email protected], [email protected]
The mathematics education research is increasingly focused on different didactical hypotheses forconstructing teaching and learning situations involving the decimal principle of the numerationsystem. One of these situations is, for example, counting a big collection of objects through thetangible manipulation. In this paper we introduce the simulating device, “Simbûchettes”, foranalysing its potential concerning this situation with respect to the tangible material. In particular,we will show that “Simbûchettes” preserves all of the techniques we identified in the tangible worldand it allows to mobilise other techniques strongly grounding on the decimal principle of thenumeration system that we rarely observed with the tangible material.
Keywords: TAD, simulating device design, tangible manipulation, decimal number system
INTRODUCTION
Learning how decimal number system works has an important role in understanding several areas ofmathematics: the calculus, the conversion of units of measurement, the decimal numbers, etc. Thedecimal number system is the product of the articulation between two different principles: thedecimal and the positional one (Serfati, 2005). The “positional principle” allows associating a rankwithin a string of digits to each numbers unit (ones, tens, hundreds, thousands…). In other words,the position of a digit in the number determines its value. The “decimal principle” explains therelations between different numbers units in a number: each unit is equal to ten units of the nextlower rank (for example, 1 ten=10 ones, 1 hundred=10 tens= 100 ones; 1 thousand=10 hundreds=100 tens=1000 ones …).
THEORETICAL PERSPECTIVES
According to Tempier (2010), the decimal principle is considered as a source of learningdifficulties. However, this aspect is necessary for understanding the numeration system. Thisprinciple can be taken into account, for example, through activities involving grouping by tens andexchanges. These rules state that 10 elements of a numbers unit can be grouped and exchanged withone element of the numbers unit of the next bigger rank. Moreover, one element of a numbers unitcan be ungrouped and exchanged with 10 elements of the numbers unit of the next lower rank.
Difficulties related to teaching the numeration system at primary school
Research carried out by Bednarz and Janvier (1984) has shown students’ difficulties related tounderstanding the decimal principle of the numeration system:
- “difficulty in seeing groups of tens and their role in the canonical form of written-numbers,despite the important place that this canonical form takes in teaching”;
1. “difficulty in seeing the relevance of these groups of tens”;2. “difficulty in working with these groups of tens, in terms of constructing and deconstructing
them”;3. “difficulty in working with two different groups of tens at the same time”;4. “difficulty in the interpretation of the calculus procedures in relation to the mathematical
operations (additions, subtractions, multiplications, divisions), in terms of groups of tensthat leads to classic errors on the operations” (Bednarz and Janvier, 1984).
ICTMT 13 314 Lyon 3 - 6 July 2017

The analysis of pupils’ errors carried out by Parouty (2005) reinforces the fourth of these difficultieson the relation between the numeration system and the calculus. The activities observation proposedin the mathematics classroom explains why students have these type of difficulties. Actually, theseactivities mostly concern the positional principle of the numeration system. This is why pupils’learning is principally based on this aspect. Bednarz and Janvier (1984) make the same observationregarding the activities choice. For example, “the number representation appears according to thealignment related to the canonical form of the written-number”. 26 years later, Tempier (2010) findsthe same difficulties in students. For these reasons, a lot of researches focuses on how to take intoaccount the decimal principle of the numeration system in the current teaching. In particular,different research studies have pointed out several working hypotheses on which constructingdidactical situations highlighting the decimal principle (Tempier, 2010; Chaachoua 2016).
Didactical hypotheses
In this paper, we will consider three of these didactical hypotheses developed in Chaachoua (2016).
The relations among numbers units
According to Chambris (2008), it is very important to consider the different relations among thenumbers units for mobilising the decimal principle, favouring the conversion tasks, for exampleconverting 23 hundreds into tens. That is why our first working hypothesis is:
(HT1) “The relations among numbers units”: to work on the numeration system, we have toconsider tasks that mobilise the relations among numbers units.
Big numbers
Big numbers allow us to explicitly work on numeration system and, particularly, on the decimalprinciple. Actually, the introduction of a new numbers unit produces different relations amongnumbers units. This way, the repetition of grouping of tens and the exchanges allow us to betterunderstand the decimal principle of the numeration system. Hence, our second working hypothesisis the following:
(HT2) “Big numbers”: The introduction of big numbers increases and reinforces the understandingof numeration system and, particularly, its decimal principle.
The objects’ manipulation
For teaching numbers and the numeration system, the objects’ manipulation constitutes a veryimportant phase in sense-making.
According to Raoul-Bellanger and Bellanger (2010), the manipulation in mathematics allows pupilsto construct a mental image and to improve their abstraction capacity (iconic or symbolic system).This becomes really true for pupils with learning difficulties where the manipulation could be usedin the remediation phase. Hence, our third working hypothesis is:
(HT3) “The objects’ manipulation”: the objects’ manipulation is important for practising rulesconcerning grouping of tens and exchanges for giving sense to the decimal principle of thenumeration system.
Drawing on these different didactical hypotheses, we will focus on the type of task “Counting a bigcollection of objects”, through which we can take into in account the decimal principle after havingchosen a relevant collection configuration.
ICTMT 13 315 Lyon 3 - 6 July 2017
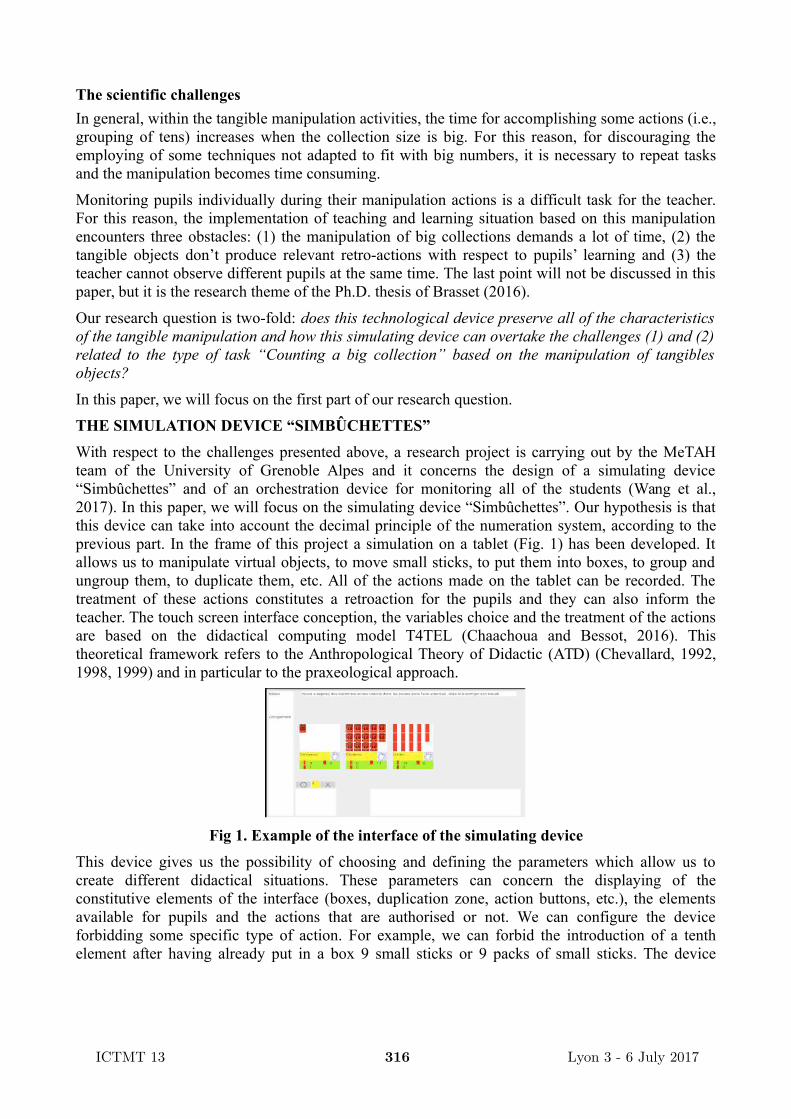
The scientific challenges
In general, within the tangible manipulation activities, the time for accomplishing some actions (i.e.,grouping of tens) increases when the collection size is big. For this reason, for discouraging theemploying of some techniques not adapted to fit with big numbers, it is necessary to repeat tasksand the manipulation becomes time consuming.
Monitoring pupils individually during their manipulation actions is a difficult task for the teacher.For this reason, the implementation of teaching and learning situation based on this manipulationencounters three obstacles: (1) the manipulation of big collections demands a lot of time, (2) thetangible objects don’t produce relevant retro-actions with respect to pupils’ learning and (3) theteacher cannot observe different pupils at the same time. The last point will not be discussed in thispaper, but it is the research theme of the Ph.D. thesis of Brasset (2016).
Our research question is two-fold: does this technological device preserve all of the characteristicsof the tangible manipulation and how this simulating device can overtake the challenges (1) and (2)related to the type of task “Counting a big collection” based on the manipulation of tangiblesobjects?
In this paper, we will focus on the first part of our research question.
THE SIMULATION DEVICE “SIMBÛCHETTES”
With respect to the challenges presented above, a research project is carrying out by the MeTAHteam of the University of Grenoble Alpes and it concerns the design of a simulating device“Simbûchettes” and of an orchestration device for monitoring all of the students (Wang et al.,2017). In this paper, we will focus on the simulating device “Simbûchettes”. Our hypothesis is thatthis device can take into account the decimal principle of the numeration system, according to theprevious part. In the frame of this project a simulation on a tablet (Fig. 1) has been developed. Itallows us to manipulate virtual objects, to move small sticks, to put them into boxes, to group andungroup them, to duplicate them, etc. All of the actions made on the tablet can be recorded. Thetreatment of these actions constitutes a retroaction for the pupils and they can also inform theteacher. The touch screen interface conception, the variables choice and the treatment of the actionsare based on the didactical computing model T4TEL (Chaachoua and Bessot, 2016). Thistheoretical framework refers to the Anthropological Theory of Didactic (ATD) (Chevallard, 1992,1998, 1999) and in particular to the praxeological approach.
Fig 1. Example of the interface of the simulating device
This device gives us the possibility of choosing and defining the parameters which allow us tocreate different didactical situations. These parameters can concern the displaying of theconstitutive elements of the interface (boxes, duplication zone, action buttons, etc.), the elementsavailable for pupils and the actions that are authorised or not. We can configure the deviceforbidding some specific type of action. For example, we can forbid the introduction of a tenthelement after having already put in a box 9 small sticks or 9 packs of small sticks. The device
ICTMT 13 316 Lyon 3 - 6 July 2017

“Simbûchettes” gives the possibility to easily make and unmake groups of ten. It also gives theopportunity of producing exchanges among different numbers units focusing on their relations.Moreover, we can manage collections with a big number of elements. Actually, in terms of the timeand equipment management, it allows us to make repetitions: this is an important condition to avoidcostly techniques. This makes the teacher able to know all of the actions of pupils during themanipulation without coaching them one by one.
METHODOLOGY
This research involves 30 pupils in two third grade classes of a primary school of Grenoble. 7 ofthem have worked with the tangible material and the others 23 with the device “SimBûchettes” onthe same activities concerning the type of task “Counting a collection”, in according to thedidactical hypotheses explained in the theoretical part of the paper. This type of task has beenstudied in Chaachoua (2016) in which the author has developed an epistemological model ofreference according to the theoretical framework T4TEL. We have relied on this study forconceiving our activities. In particular, we have focused on three different problems and manydifferent activities that we resume in the table below. The question was always the same: “Howmany sticks?”
Problem Example of an activity of the experimentation
1. Counting a collection “in bulk” 80 sticks “in bulk”
2. Counting a homogeneouscollection
9 tens of sticks, 12 tens of sticks, 67 tens of sticks
3. Counting a completely orderedcollection
2 hundreds of sticks, 23 tens of sticks, 15 sticks
Table 1. General description of the different tasks proposed to the pupils with examples
Pupils’ actions were video recorded during the activities with the camera facing their hands and thematerial on the table in the case of the tangible experiment or the tablet in the other one. All voiceand hands movement during the activity were recorded. The videos were transcribed for dataanalysis.
In the following, we will describe pupils’ techniques we have observed for solving the differenttasks listed above. Concerning the structure of the analysis, in the first part, we will show that in thevirtual environment, we have observed the same techniques appeared in the tangible one, even if theimplementation of a same technique is deeply different in the two cases. In the second part, we willgo further showing how “Simbûchettes” produces other techniques that strongly mobilise thedecimal principle.
DATA ANALYSIS
In the first part of the data analysis, for each problem, we are going to present the differenttechniques we have identified during the teaching experiments with “Simbûchettes”.
Problem 1:
Technique 1.1: Grouping by tens, counting by tens (or by 20 or by 30). Technique 1.2: Grouping by tens, counting by numbers units, converting numbers units to
ones. Technique 1.3: Counting by n, where n is 1, 2, 3…
ICTMT 13 317 Lyon 3 - 6 July 2017

Problem 2:
Technique 2.1: Grouping by tens, counting by numbers units, converting numbers units toones.
Technique 2.2: Grouping and counting by X, where X is a power of ten (1, 10, 100…). Technique 2.3: Counting by n, where n is 1, 2, 3…
Problem 3:
Technique 3.1: Counting separately each rank by number units, converting the number unitsto ones and adding them.
Technique 3.2: Counting separately each rank by number units, converting the number unitsto ones and thinking to the configuration of the written-number.
As shown above, the simulating device doesn’t avoid the techniques related to the tangiblemanipulation presented in Chaachoua (2016). This point answers to the first part of our researchquestion: from an ecological point of view, the simulating device preserves all of the characteristicsof the tangible manipulation. Moreover, we can highlight that the simulating device enhances thevariety of techniques: for example, we have observed that the technique of “grouping and countingby hundreds” is present in the virtual manipulation, while it doesn’t appear in the tangible one.Moreover, in general, all of the pupils employed the technics of “grouping by tens” in the virtualenvironment, while in the tangible one they used very often other technics without makinggroupings. These observations lead us to hypothesize that with “SimBûchettes” it is more naturalfor pupils to make grouping of tens or of hundreds with respect to the tangible material.
In the second part of the data analysis, we will show the mathematical activity of two pupils (S1 andS2 in the following) who employ different technics for the same activities in the two environments.Three months have passed between the tangible teaching experiment and the virtual one. During theexperimentations, before starting the activities, the researchers (R in the following) gives somepreliminary information about the material pupils had at disposal. For the tangible material, theresearchers said that each package of sticks contains exactly 10 sticks and each package has thesame cardinality and that there were some elastics on the table that pupils can use if they wish. Forthe virtual environment, the researchers explains the different elements constituting the interface of“SimBûchettes”.
S1 Activity: 12 tens of sticks Activity: 67 tens of sticks
Tangible “SimBûchettes” Tangible “SimBûchettes”
First of all, S1 counts thenumber of sticks in apackage (see Fig.1)
Fig. 1: S1 counts the sticks inone package
After, S1 mentally countsthe number of packages,taking in his hands the
S1 immediatelyconstructs one groupingof tens for making thehundreds (see Fig.3)
Fig. 3: On the table zonethere are the package of
hundreds and two packages
S1 makes groupings oftwo tens without usingthe elastic and he putsthem on one of thecorners of the table (seeFig.4).
Fig. 4: S1 makes thegroupings of two tens
without using the elastic
S1 makes immediatelygroupings of hundreds(see Fig. 6 and Fig. 7)
Fig. 6 S1 is moving thepackages of tens in the
construction zone of theinterface
ICTMT 13 318 Lyon 3 - 6 July 2017

packages one by one (seeFig.2).
Fig. 2 S1 counts the packages
of tens Then, he decides to takean elastic for encirclingthe packages of twotens he made (see Fig.5).
Fig. 5: S1 takes an elastic forencircling the grouping of
two tens he made
Fig. 7 At the end, S1 has onthe table 6 groupings of
hundreds and 7 groupings oftens
T
ran
scri
pt S1: 120
R: How did you do?
S1: 10 by 10
R: How did you do?
S1: I have found thatthere were 12 packagesof tens, I have put 10
S1: 680
R: How did you do?
S1: I started to count 20by 20, but then I
S1: 670
R: Can you countaloud?
S1: 100, 200, 300, 400,
An
alys
is S1 counts the sticks 10by 10 (without makinggrouping of hundreds),after having verified thatin one package therewere 10 sticks.
In this case, S1 countsthe number of packagesand he makes agrouping of hundreds.Then, he makes 100plus 20.
S1 started to make thegrouping of two tensfor counting 20 by 20,probably because hewanted to save time.
But, then, he continuedto count 10 by 10,probably because it wassimpler for him tocount 10 by 10 withrespect to 20 by 20. Atthe end, he made anerror in the calculus.
S1 makes groupings ofhundreds and he counts100 by 100.
S2 Activity: 80 sticks “in bulk” Activity: 67 tens of sticks
Tangible “SimBûchettes” Tangible “SimBûchettes”
S2 counts withoutmoving the sticks (seethe sequence of figuresbelow), even if manytimes the researcher saidto her that she couldmove them.
S2 makes groupings oftens in the constructionzone of the interface(see Fig. 8) and, then,she counts the packagesshe made (see Fig. 9).
S2 counts withoutmoving the sticks (seethe sequence of figuresbelow), even if manytimes the researchersaid to her that shecould move them.
S2 makes groupings ofhundreds in theconstruction zone of theinterface (see Fig. 10)until she makes 6packages of hundreds.After she tries to makeanother grouping ofhundreds but shebecomes aware of thefact that there are 7grouping of tens instead
ICTMT 13 319 Lyon 3 - 6 July 2017

Fig. 8 S2 moves the sticks inthe grouping zone for
making packages of 10
Fig. 9 She counts thenumber of packages she has
of 10. She decides toleave the 7 packages of10 in the constructionzone (see Fig. 11) andthe she counts.
Fig. 10 She moves the last 7packages of 10 she had for
trying to make anotherpackage of 100, but she
becomes aware of the factthat the number of packagesis not sufficient for making
100
Fig. 11 She left the 7packages in the groupingzone and she begins to
count.
T
ran
scri
pt R: Can you count this
way?
S2: uhm
R: How many ?
S2: I’m done
R: How many sticks arethere?
S2: 80
S2: 500
R: 500?
S2: yes
S2: I’m done
R: How many sticks arethere?
S2: 670 A
nal
ysis S2 counts the sticks one
by one without movingthem, just pointing themwhile she counted and
In this case, S2 is moreself-confident of herresult with respect tothe other case: in fact,she called the
S2 probably counts 10by 10 without movingthe packages.
S2, after makinggrouping of hundreds,makes an addition,founding the correctanswer.
DISCUSSION AND CONCLUSION
As we discussed in the data analysis, the technological device allows to produce the sametechniques identifying with the tangible material and it enhances others techniques (i.e., makinggrouping of hundred) deeply linked to the decimal principle of the numeration system that we haverarely observed in experimentations with the tangible material. From an ergonomic point of view,probably, it is not easy for pupils to make, for example, grouping of hundred with tangible sticks.Moreover, as we shown above, even a same pupil who immediately makes grouping of hundredswith “Simbûchettes”, three months earlier, for the same activity, he preferred to count 10 by 10without making packages of 100. This element gives us some first information about the potential
ICTMT 13 320 Lyon 3 - 6 July 2017

of “Simbûchettes” with respect to the tangible material. In the future research, we will try toinvestigate more deeply this potential answering to the second part of the research question “howthis simulating device can overtake the challenges (1) and (2) related to the type of task “Countinga big collection” based on the manipulation of tangibles objects? We will study if “Simbûchettes”could reduce the time of manipulation with respect to what happens in the tangible environment.Anyway, we can already state that, with “Simbûchettes”, the teacher reduces her time regarding thepreparation of the different configurations of collections. Moreover, even if the time will not bedifferent, we could investigate the different implications that the two environments have onstudents’ learning and how the role of the retro-actions offered by the simulation device couldenhance them.
REFERENCES
Bednarz, N., Janvier, B. (1984). La numération : les difficultés suscitées par son apprentissage,Grand N, (33), 5-31
Bosch, M. et Chevallard, Y. (1999). La sensibilité de l’activité mathématique aux ostensifs.Objetnd’étude et problématique. Recherches en didactique des mathématiques, 19(1), 77-124.
Brasset, N. (2016). Simulation du matériel de numération « Bûchettes ». Actes du 43ième ColloqueCopirelem, 14-16 Juin 2016, Le-Puy-En-Velay, France.
Chaachoua Y. (2016), Praxéologie de référence de l’aspect décimal de la numération par lamanipulation selon le modèle T4TEL, Mémoire de Master de Didactique des Sciences, Universitéde Grenoble Alpes.
Chaachoua, H., Bessot A. (à paraître) Introduction de la notion de variable dans le modèlepraxéologique. Actes du 5e congrès pour la Théorie Anthropologique du Didactique. Castro-Urdiales, Espagne, 2016.
Chambris, C. (2008). Relations entre les grandeurs et les nombres dans les mathématiques del'école primaire. Évolution de l'enseignement au cours du 20e siècle. Connaissances des élèvesactuels. Thèse de l’Université Paris Diderot, Laboratoire de didactique André Revuz.
Chevallard, Y. (1992). Concepts fondamentaux de la didactique: perspectives apportées par uneapproche anthropologique. Recherches en Didactique des Mathématiques, 12(1), 73–112.
Chevallard, Y. (1998). Analyse des pratiques enseignantes et didactique des mathématiques :l’approche anthropologique. In R. Noirefalise (Ed.), Actes de l’École d’été de la Rochelle, 91-120.
Chevallard Y. (1999) L’analyse des pratiques enseignantes en théorie anthropologique dudidactique. Recherches en Didactique des Mathématiques, 19(2), 221–266.
Chevallard, Y. (2001). Organiser l’étude 1. Structures et Fonctions. In J-L. Dorier & al. (eds) Actesde la 11ième Ecole d’été de didactique des mathématiques, Recherches en Didactique desMathématiques, pp. 3-22.
Parouty, V. (2005). Compter sur les erreurs pour compter sans erreurs: état des lieux surl'enseignement de la numération décimale de position au cycle 3; Actes du XXXIème colloque sur laformation des maîtres.
Raoul-Bellanger A., Bellanger F. (2010) Construire les notions mathématiques, 50 activités demanipulation, Retz
Tempier, F. (2010). Une étude des programmes et manuels sur la numération décimale au CE2.Grand N, (86), 59-90.
ICTMT 13 321 Lyon 3 - 6 July 2017

Serfati, M. (2005). La révolution symbolique : la constitution de l'écriture symboliquemathématique,Paris : Pétra.
Wang P., Tchounikine P., Quignard M. (à paraître), Chao: a framework for the development oforchestration technologies for Technology-Enhanced Learning activities using tablets in classroom.In International Journal of Technology Enhanced Learning.
ICTMT 13 322 Lyon 3 - 6 July 2017

HANDWAVER: A GESTURE-BASED VIRTUAL MATHEMATICALMAKING ENVIRONMENT
Justin Dimmel Camden BockMaine IMRE Lab, University of Maine
[email protected] [email protected]
We report on the design and development of HandWaver, a gesture-based mathematical making environment for use with immersive, room-scale virtual reality. A beta version of HandWaver was developed at the IMRE Lab at the University of Maine and released in the spring of 2017. Our goalin developing HandWaver was to harness the modes of representation and interaction available in virtual environments and use them to create experiences where learners use their hands to make and modify mathematical objects. In what follows, we describe the sandbox construction environment, an experience within HandWaver where learners construct geometric figures using a series of gesture-based operators, such as stretching figures to bring them up into higher dimensions, or revolving figures around axes that learners can position by dragging and locking. We describe plans for research and future development.
Keywords: Geometry, Virtual Reality, Technology
OVERVIEW OF HANDWAVER HandWaver is a gesture-based virtual mathematical making environment, currently optimized for in-room (as opposed to seated) immersive virtual reality platforms (such as the HTC Vive) that support gesture recognition. From points in space, users can construct uni-, two-, and three-dimensional mathematical objects through iterations of gesture-based operators. Figure 1 shows iterations of the stretch operator: a point is stretched into a line segment; the line segment is stretched into a plane figure; the plane figure is stretched into a prism. The hands that are shown in the images are virtual renderings of a user’s actual hands, tracked via a Leap Motion sensor that is mounted to the virtual reality headset (see Figure 2).
Figure 1. Different cases of the stretch operator: a point is stretched into a line segment, thesegment is stretched into a plane figure, and the plane figure is stretched into a prism.
Figure 2. A user (red sweatshirt) in the virtual space. The large monitor displays a 2D view ofthe user’s first-person view of the virtual world. The device that tracks the user’s hand
movements is mounted to the front of the headset he is wearing.
ICTMT 13 323 Lyon 3 - 6 July 2017

A second gesture-based operator is revolve. Users can position an axis in space, select objects to rotate around the axis, and then spin a wheel to revolve the selected objects around the axis. Revolving objects in this way creates surfaces of revolution. Figures 3 and 4 show different cases ofthe revolve operator. In Figure 3, a point is revolved to create a circle; the circle is then revolved around itself to create a sphere; and the circle is revolved around an axis to create a torus.
Figure 3. Different cases of the revolve operator. The ship’s wheel is a spindle that users turnto revolve figures. The line through the ship’s wheel is the axis of rotation.
In Figure 4, a segment is revolved parallel to an axis of rotation to create a cylinder; a segment is revolved perpendicular to an axis of rotation to create an annulus; the annulus is revolved around itself to create a sphere with a hole in its center.
Figure 4. Different cases of revolving a segment. When the segment is parallel to the axis ofrotation, the result is a cylinder. When the segment is perpendicular, the result is an annulus.The last image shows an annulus revolved around itself to create a sphere with a hole in its
center (note: the hole is visible in the image by slicing the sphere). We organized the sandbox environment around the stretch and revolve operators to help learners train their dimensional deconstruction skills (Duval, 2014). Dimensional deconstruction is the process of resolving geometric figures into lower-dimensional components, rather than seeing them as whole, fixed shapes. In the HandWaver sandbox, learners can fluidly move from lower-dimensional shapes (e.g., circles) to their higher dimensional analogs (e.g., spheres) and vice versa. The environment brings plane and solid geometry together—subjects that have been separated fromeach other in the usual presentation of geometry in K-12 schools. The solid analogs of plane figures, in particular sphere-and-plane constructions, are “seldom developed” or “slighted...owing to their theoretic nature” (Franklin, 1919, p. 147). Three-dimensional dynamic geometry software (e.g., GeoGebra or Cabri 3D) has made it possible to engage in such constructions, however the limitations of two-dimensional screens has constrained their practicability. But for users immersed in a three-dimensional space—where the user has natural control over the angle at which an object is viewed, is able to move and manipulate the object in space, and can readily select the components of a figure to be incorporated into a new construction—three-dimensional constructive geometry becomes more feasible. Thus, a final feature of the sandbox environment is three-dimensional analogs of classic construction tools. The arctus tool (Figure 5) allows users to make a sphere centered at a point, through any other point. The size of the arc shown in the figure is variable, and the midpoint of the arctus tool can be locked to any point in the display. Arctus is a spatial compass that creates spheres.The user sets the arc to have the desired radius and then generates a sphere by spinning the arc through space.
ICTMT 13 324 Lyon 3 - 6 July 2017

Figure 5. The arctus tool being used to inscribe a sphere. Users position the tool on a centerpoint and on a point on the surface of the sphere . To generate the sphere, one turns the circle
through space by spinning the blue wheel. The flatface tool (Figure 6) allows users to define a plane through any three points. A user sets one of the lines of the flatface to coincide with two of the three points. Once in place, the user sets the second line so that it is collinear with the third point. To generate the plane, one acts with the stretchgesture on one of the lines of the flatface. We implemented plane-and-sphere constructions via gesture- (and motion-) based virtual tools to mimic the physical actions of spinning a compass or drawing a line with a straightedge. Our goal in doing so was to highlight the manual history of making geometric figures.
Figure 6. Series of images showing the flatface tool being used to spawn a plane.With arctus and flatface, learners can complete solid geometry construction tasks that are inherentlyvirtual, such as constructing a tetrahedron from three spheres (see Figure 7).
Figure 7. Constructing a tetrahedron from three-spheres in the HandWaver sandbox. These tools provide an occasion for learners to explore how plane geometry construction protocols can be extended to higher dimensions. Other experiences within the HandWaver environment include a volume lab, an operator lab, and LatticeLand, which is a spatial analog of the geoboard (Kennedy & McDowell, 1998). Users can define the edges or faces of polyhedra by selecting a circuit of lattice points with a virtual pin (see Figure 8).
Figure 8. Connecting the dots in LatticeLand to define a the edges of a cube (second frame), aparallelepiped (third frame), a pyramid (fourth frame), and a trapezoid (fifth frame); the
sixth frame shows the trapezoid cut into components (the orange triangle, the blue trapezoid).
MOTIVATION AND DESIGN CONSIDERATIONSOur primary goal in developing HandWaver was to provide a space where learners at all levels could use their hands to act directly on mathematical objects, without the need to mediate intuitions through equations, symbol systems, keyboards, or mouse clicks (Sinclair, 2014). We designed the environment around natural movements of user’s hands to foreground the connection between diagrams and gestures (de Freitas & Sinclair, 2012; Chen & Herbst, 2013). As one example of how the environment realizes this connection, the stretch operator multiplies (Davis, 2015) single points into many to form a segment, or multiples single segments into many to form a plane figure, or multiplies a single plane figure into many to form a solid. The notion that n-dimensional figures consist of adjoined (n-1)-dimensional figures is foregrounded by the generative use of the stretchinggesture.
ICTMT 13 325 Lyon 3 - 6 July 2017

Gestural interfaces (Zuckerman & Gal-Oz, 2013), where objects can be manipulated in natural, intuitive ways by movements of one’s hands, allow a degree of direct access to virtual objects that have been shown to facilitate learning (Abrahamson & Sánchez–García, 2016) while minimizing cognitive barriers (Sinclair & Bruce, 2015; Barrett, Stull, Hsu, Hegarty, 2015). Virtual environmentswith gestural interfaces have affordances for translating multimodal cues—e.g., head or hand movements—into mathematical operations, such as projecting a plane figure into three dimensions by pulling it up into space. The name of the environment, HandWaver, is an attempt to reposition “hand waving”—a term used to criticize mathematics that is insufficiently rigorous—as a means fordoing mathematical work. A further motivation for developing a construction environment with a gesture-based interface was to make it accessible to younger learners. Soon, children will routinely and increasingly incorporate virtual reality environments into their leisure activities. They will be playing games that require spatial reasoning and problem solving skills—imagine, for example, an immersive first-person version of Monument Valley (Ustwo, 2014)—but what will they be doing in schools? Currently, children’s encounters with geometry in elementary schools are limited to shape recognition and naming tasks (Bruce & Hawes, 2015). Yet a growing body of research indicates thatchildren have the interest and capacity to train their spatial reasoning skills (Hallowell, Okomato, Romo, La Joy, 2015; Whiteley, Sinclair, & Davis, 2015; Taylor & Hutton, 2013) and study meaningful mathematics (Newton & Alexander, 2013; Sinclair & Bruce, 2015) from the moment they enter the schoolroom door. New modes of interacting with virtual mathematical objects (Hwang & Hu, 2013; Kaufman 2011) have the potential to expand children’s access to deep geometric ideas. For all of its educational promise, however, virtual reality is on a track to follow the slow, complex process of technology acceptance and adoption that is standard in schools and that falls short of true integration (Ertmer, 1999; Inan & Lowther, 2010). Given how difficult it has been, historically, to incorporate promising technologies into classrooms at scale, there is every reason to believe that the educational potential of virtual reality will remain unfulfilled. Our final reason for developing HandWaver is thus perhaps the most important: We developed the environment so that we would be able to critically investigate the disparity between what is and what could be in using virtual reality to enhance mathematics education. There is a “scarcity of boldresearch on interactive mathematics learning” that “impedes the formulation of empirically based progressive policies concerning the integration of technological environments into educational institutions” (Abrahamson & Sánchez–García, 2016, p. 204). In addition to investigating how students explore mathematical structures within an immersive virtual mathematics laboratory (Bock& Dimmel, in press), we are convening study groups to investigate (1) how practicing teachers would manage the challenges and opportunities of incorporating virtual reality technology into theirinstruction, and (2) how pre-service teachers could be adequately prepared for teaching with such technology.
DEVELOPMENT PROCESSThe environment is built in room-scale virtual reality, with a 4 meters by 8 meters activity space. This provides affordances of consistent head tracking and perspectives from varied physical heightsand locations, which are not available with seated virtual reality (e.g., GearVR) and 360-video hardware (e.g., Google Cardboard). Recent advances in hardware have made significant improvements in performance and cost. The HTC Vive and Oculus Touch head mounted devices (HMDs) both provide room-scale virtual reality with consumer-grade hardware and cost similar to other classroom technology (e.g., Interactive White Boards). We chose the HTC Vive for it’s larger activity space, early room-scale availability and local multiplayer in a shared activity space. Recentadvances in consumer GPUs have expanded access to the processing power required to drive these HMDs to consumer workstations. The combination of improvements in processing and in the
ICTMT 13 326 Lyon 3 - 6 July 2017

HMDs has minimized previous issues with motion sickness. Room-scale optimizes problems with posture and fatigue in the environment, and also allows for more advanced image processing to improve immersion. Finally, the LeapMotion Orion SDK allows for reliable hand tracking integrated across the HTC and Oculus platforms.
RESEARCH PLANSWe are engaged in parallel lines of research using HandWaver. One line of research concerns documenting student encounters with mathematical objects in the virtual space. The immersive nature of the environment, combined with the gestural interface, provides a level of control over perspective, orientation, and position relative to mathematical objects that is difficult to replicate with other display technologies. Even the relatively straightforward means for rotating the graphics view in the 3D version of GeoGebra is complicated when compared to moving one’s head, walking around a figure, or examining it from several different angles in quick succession. How do students use the angle of their gaze, the position of their bodies relative to virtual mathematical figures, or the ability to quickly change the scale of figures—from something that one could hold in one’s hands, to something that one could fit inside—to explore mathematical structures? This line of research frames activity within HandWaver (e.g., the volume laboratory) using the conceptions-knowing-concept (cK¢) model of conceptions (Balacheff & Gaudin, 2010; Balacheff, 2013): the virtual environment creates a milieu where students encounter problems that they exploreusing a suite of virtual operators, such as the ability to compare solid figures by superposition (see Figure 9).
Figure 9. Comparing volumes of virtual solids by superpositioning. In one study (Bock & Dimmel, in press), we used semi-structured interviews where participants—three master’s students pursuing certification as science teachers—were asked to think-aloud as they explored the volume of a pyramid. One of the operators available to participants was the abilityto dynamically change the pyramid by pinching and dragging its apex in space. Participants could lock the apex in the z-direction (shearing) or xy-directions (elongating) to control how the apex moved. Other operators included the ability to enclose the pyramid in a unit cube and add additionalpyramids to it (see Figure 10).
ICTMT 13 327 Lyon 3 - 6 July 2017

Figure 10. Enclosing the pyramids in a unit cube, adding additional pyramids, and adjustingthe pyramids by moving the apex.
Participants could then explore how the volumes of the added pyramids were affected by movements of the apex. One strategy used by participants in this study was to reason about the volume of a pyramid by analyzing how the surface area of its faces was affected when the apex was moved in different ways. We are planning an interview study that would investigate how participants use the gesture-based operators available in the sandbox to construct different geometric figures. A parallel line of research pertains to issues of instructional implementation: How do practicing andpreservice teachers imagine incorporating virtual reality technology into their teaching? What support do they need? What barriers do they anticipate? For this research, we are developing multiplayer and partial immersion modes so that HandWaver could be used by a teacher with a whole classroom. The multiplayer mode will allow more than one user to be in the same virtual world at one time. The partial immersion mode will allow other users to view what is happening in the virtual world through a tablet. The partially immersed users will also be able to have some limited interactions with the virtual world, such as using gestures to control their angle of view, their position within the environment, or to construct figures. We are anticipating a time in the not-too-distant future when it will become feasible for a classroom to have multiple VR consoles that will allow students to work on problems in groups. In such configurations of virtual reality enhanced mathematical explorations—what we call virtual mathematics laboratory experiences—some students would be fully immersed in a virtual world and others would access the environment via a gesture-tracking tablet. We have a dedicated laboratory classroom space at the University of Maine where we will convene groups of teachers to study the instructional potential of teaching in avirtual reality-enabled classroom. Groups of participating teachers will explore and critique the HandWaver environment. They will work with each other to devise plans for how such an environment could be used in their teaching and anticipate obstacles they would expect to encounter. The first study group will be convened during the 2017-2018 academic year.
ICTMT 13 328 Lyon 3 - 6 July 2017

FUTURE DEVELOPMENT
The development of HandWaver is ongoing. We are planning a second release that will have new experiences, new modes of interacting within the environment, and new tools for use within existing experiences. A new experience that we are developing is a spherical trigonometry and nautical science lab, where users would be able to investigate properties of triangles that are inscribed on the surfaces of spheres. We are also developing a suite of measurement tools for use in the sandbox and volume labs, such as a paint roller that has different shaped heads (e.g., triangular, rectilinear, circular) that can be varied in size. Users would be able to “roll on” various area units to cover plane figures. The purpose of such a tool would be to provide a visual representation that units for measuring area are two-dimensional.
The advent of consumer grade virtual reality consoles (e.g., Oculus, HTC Vive) is likely to usher a frenzy of development of commercial, virtual reality educational content. If such development follows the path of educational apps, a preponderance of the mathematics education content that is developed for virtual reality consoles will amount to little more than immersive, visually engaging flashcards (Davis, 2015). By designing and developing the HandWaver environment, we are attempting to ensure that research-based ideas about the nature of productive mathematical activity are represented in this next generation of virtual learning environments.
REFERENCESAbrahamson, D., & Sánchez–García, R. (2016). Learning is Moving in New Ways: The Ecological
Dynamics of Mathematics Education. Journal of the Learning Sciences, (online first edition).Barrett, T. J., Stull, A. T., Hsu, T. M., & Hegarty, M. (2015). Constrained interactivity for relating
multiple representations in science: When virtual is better than real. Computers & Education, 81, 69-81.
Bruce, C. D., & Hawes, Z. (2015). The role of 2D and 3D mental rotation in mathematics for youngchildren: what is it? Why does it matter? And what can we do about it?. ZDM, 47(3), 331-343.
de Freitas, E., & Sinclair, N. (2012). Diagram, gesture, agency: Theorizing embodiment in the mathematics classroom. Educational Studies in Mathematics, 80(1-2), 133-152.
Chen, C. L., & Herbst, P. (2013). The interplay among gestures, discourse, and diagrams in students’ geometrical reasoning. Educational Studies in Mathematics, 83(2), 285-307.
Davis, B. (2015). Gumm(i)ing up the works? Lessons learned through designing a research-based “app-tutor”. Proceedings of the 12th International Conference on Technology if Mathematics Teaching, Faro, Portugal.
Dimmel, J. K., & Herbst, P. G. (2015). The Semiotic Structure of Geometry Diagrams: How Textbook Diagrams Convey Meaning. Journal for Research in Mathematics Education, 46(2), 147-195.
Duval, R. (2014). Commentary: Linking epistemology and semio-cognitive modeling in visualization. ZDM, 46(1), 159-170.
Ertmer, P. A. (1999). Addressing first-and second-order barriers to change: Strategies for technologyintegration. Educational Technology Research and Development, 47(4), 47-61.
Franklin, P. (1919). Some Geometrical Relations of the Plane, Sphere, and Tetrahedron. The American Mathematical Monthly, 26(4), 146-151.
Hallowell, D. A., Okamoto, Y., Romo, L. F., & La Joy, J. R. (2015). First-graders’ spatial-mathematical reasoning about plane and solid shapes and their representations. ZDM, 47(3), 363-375.
Hwang, W. Y., & Hu, S. S. (2013). Analysis of peer learning behaviors using multiple representations in virtual reality and their impacts on geometry problem solving. Computers & Education, 62, 308-319.
ICTMT 13 329 Lyon 3 - 6 July 2017
Inan, F. A., & Lowther, D. L. (2010). Factors affecting technology integration in K-12 classrooms: A path model. Educational Technology Research and Development, 58(2), 137-154.
Kennedy, J., & McDowell, E. (1998). Geoboard Quadrilaterals. The Mathematics Teacher, 91(4), 288-290.
Kaufmann, H. (2011). Virtual Environments for Mathematics and Geometry Education. Themes in Science and Technology Education, 2(1-2), 131-152.
Moss, J., Bruce, C. D., & Bobis, J. (2015). 5 Young Children’s Access to Powerful Mathematics Ideas. Handbook of International Research in Mathematics Education, 153.
Murphy, C. (2012). The role of subject knowledge in primary prospective teachers’ approaches to teaching the topic of area. Journal of Mathematics Teacher Education, 15(3), 187-206.
Newton, K. J., & Alexander, P. A. (2013). Early Mathematics Learning in Perspective: Eras and Forces of Change. In Reconceptualizing Early Mathematics Learning (pp. 5-28). Springer Netherlands.
Sinclair, N. (2014). “Generations of research on new technologies in mathematics education.” Teaching mathematics and its applications, 3, 166-178.
Sinclair, N., & Bruce, C. D. (2015). New opportunities in geometry education at the primary school.ZDM, 47(3), 319-329.
Taylor, H. A., & Hutton, A. (2013). Think3d!: training spatial thinking fundamental to STEM education. Cognition and Instruction, 31(4), 434-455.
Ustwo (2014). Monument Valley [computer game]. Available at: https://www.monumentvalleygame.com/mv1
Whiteley, W., Sinclair, N., & Davis, B. (2015). What is spatial reasoning? In Davis, B. (ed.) Spatial reasoning in the early years: Principle, assertions, and speculations. New York, NY: Routledge.Zuckerman, O., & Gal-Oz, A. (2013). To TUI or not to TUI: Evaluating performance and preference in tangible vs. graphical user interfaces. International Journal of Human-Computer Studies, 71(7), 803-820.
ICTMT 13 330 Lyon 3 - 6 July 2017
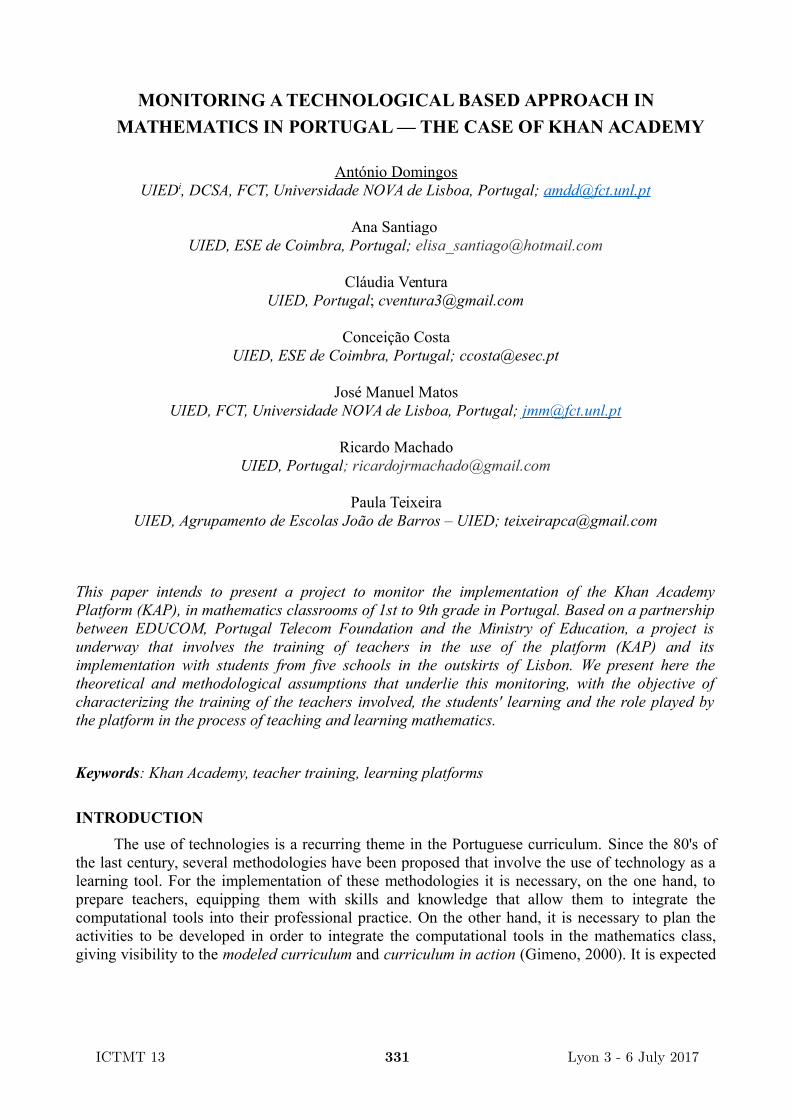
MONITORING A TECHNOLOGICAL BASED APPROACH IN
MATHEMATICS IN PORTUGAL — THE CASE OF KHAN ACADEMY
António DomingosUIEDi, DCSA, FCT, Universidade NOVA de Lisboa, Portugal; [email protected]
Ana Santiago UIED, ESE de Coimbra, Portugal; [email protected]
Cláudia Ventura
UIED, Portugal; [email protected]
Conceição CostaUIED, ESE de Coimbra, Portugal; [email protected]
José Manuel MatosUIED, FCT, Universidade NOVA de Lisboa, Portugal; [email protected]
Ricardo MachadoUIED, Portugal; [email protected]
Paula TeixeiraUIED, Agrupamento de Escolas João de Barros – UIED; [email protected]
This paper intends to present a project to monitor the implementation of the Khan AcademyPlatform (KAP), in mathematics classrooms of 1st to 9th grade in Portugal. Based on a partnershipbetween EDUCOM, Portugal Telecom Foundation and the Ministry of Education, a project isunderway that involves the training of teachers in the use of the platform (KAP) and itsimplementation with students from five schools in the outskirts of Lisbon. We present here thetheoretical and methodological assumptions that underlie this monitoring, with the objective ofcharacterizing the training of the teachers involved, the students' learning and the role played bythe platform in the process of teaching and learning mathematics.
Keywords: Khan Academy, teacher training, learning platforms
INTRODUCTION
The use of technologies is a recurring theme in the Portuguese curriculum. Since the 80's ofthe last century, several methodologies have been proposed that involve the use of technology as alearning tool. For the implementation of these methodologies it is necessary, on the one hand, toprepare teachers, equipping them with skills and knowledge that allow them to integrate thecomputational tools into their professional practice. On the other hand, it is necessary to plan theactivities to be developed in order to integrate the computational tools in the mathematics class,giving visibility to the modeled curriculum and curriculum in action (Gimeno, 2000). It is expected
ICTMT 13 331 Lyon 3 - 6 July 2017

that actions focused between these curriculum levels and the use of technology lead to more solidand lasting learning by the students.
Based on these assumptions, a pilot training project for teachers using the Khan AcademyPlatform is underway in a partnership between three institutions: EDUCOM, Portugal TelecomFoundation and the Ministry of Education. This project involves the realization of two TrainingWorkshops, with a total of 30 teachers of Basic Education (1st, 2nd and 3rd Cycles). Theseworkshops have a total of 50 hours of training, distributed throughout a school year, where teachersmobilize half of this time for in-person training to work with the platform (KAP). The remaininghours are designed to work in class with their students. This project also provides for a second yearfor the implementation and improvement of practices initiated with the training process.
The Platform (KAP), translated into Portuguese, presents a vast set of functionalities where itis possible to visualize videos about specific topics, perform exercises and tasks proposed by theteacher, while it is possible to monitor all the actions carried out by students enrolled in thisenvironment. The fact that this environment have a game character has shown a strong support bythe students involved in it.
In this paper we discuss the underlying theoretical assumptions, as well as the researchmethodology that allows us to monitor the actions of the different actors (trainers, trainees andstudents) in the different interactions with the platform (KAP) and its integration in the curriculumand the teaching and learning process.
THEORETICAL FRAMEWORK
The theoretical constructs called for the foundation of the work that is intended to be carriedout in the monitorization of this project, are essentially based on three dimensions: a) activitytheory, b) professional knowledge of teachers and c) students’ learning. With activity theory(Engeström, 2001), we intend to broadly frame the actions of the various stakeholders in the project.In this way we can characterize the actions of the various actors in the integration of thetechnological tool in use. We thus seek support for the processes of instrumentation andinstrumentalization (Rabardel 1995) which will help us to interpret how teachers and students relateto technology in general and the platform in particular, reinforcing the semiotic power of theartefact (Bartolini Bussi & Mariotti, 2008).
In order to clarify the way in which teachers take ownership of the artifact, we use the notionsof professional knowledge of teachers, where knowledge of content, pedagogical knowledge andtechnological knowledge are framed (Ball, Thames, & Phelps, 2008). In order to characterizestudents' learning, we will also use the activity theory, establishing and comparing the differentsystems of student activity when involved in working with the technological tool.
Activity Theory
Activity Theory initiated by Vygotsky and developed by Leont'ev, assuming its system ofcollective activity (object oriented and mediated by artifacts) as the unit of analysis, has beendeveloped over three generations. Was initially based on the idea of mediation introduced byVygotsky in his triangular model that becoming the triad subject - object - mediator artifact, leavingbehind the separation between the person and the social environment (Engeström, 2001). In thesecond generation, centered Leont'ev the unit of analysis is no longer individual and now includeslinks to other areas involved in a collective activity system, focusing now on the interrelationshipsbetween individual objects and communities. The third generation of activity theory could besummarized by Engeström (2001) seeing the object of activity as a moving target for an expansivetransformation in activity systems supported by the contradictions as a source of development.
ICTMT 13 332 Lyon 3 - 6 July 2017

These contradictions are not conflicts since it evolves a dialectic and multi-directional relationsupported by Marx and Hegel in the contradictions of the dialectic relation (Figure 1).
Figure 1 – Interaction between two systems of activity (Adapted from Engeström, 2001, p. 136)
Human activity is mediated by cultural artifacts, which are culturally, historically and socially produced and reproduced, by means of complex and multidimensional relationships (Engeström, 1999). Artifacts have possibilities for action that the user may or may not use. We are concerned with the ways in which teachers appropriate these artifacts, or, following Drijvers and Trouche’s (2008), terminology how they become instruments. Instrumental genesis (Rabardel 1995), therefore,is the progressive construction of schemas of use for an artifact by an actor for a given purpose, which was adapted to the study of teaching and learning mathematics by Artigue (2002), Ruthven (2002), particularly in technology-mediated learning. The instrumental genesis will be deepened here in order to understand in depth how the different actors relate to technology and the platform. Although this relation is present in the Activity Theory, it is intended to give a special emphasis to this relation because it represents a very important aspect of the relation between the subject and theartifact.
With the use of technological artifacts it seems to be crucial consider the notion of semioticmediation (Bartolini Bussi & Mariotti, 2008) to enhance mathematics teaching and learning. In thiscontext, it is important take into account the semiotic potential of the artifact that involves twosemiotic links, one between the artefact and the personal signs that emerging from its use and thesecond between the artifact and the mathematical signs evoked by its use and recognizable asmathematics by an expert.
Professional knowledge of the teacher
The current education systems are organized around a set of dimensions which give it astructure and a coherent organization, which believes it can boost its development and impact on thepreparation of future generations. The role of the teacher is considered as one of these dimensions,occupying a central position throughout the process. Given this premise the professionaldevelopment of teachers becomes a fundamental element so that the process of teaching andlearning has the desired impact on students and the educational community in general.
Several studies have been addressing this issue, focusing sometimes on the curriculardimension as a way to promote success, namely success in mathematics. Ball (2003) considers thatthis intervention is only effective if it is focused on the way teachers teach "In curriculum teaches
ICTMT 13 333 Lyon 3 - 6 July 2017

itself, and standards do not operate independently of professionals' interpretations of them" (p.1).The mathematical knowledge for teaching has thus been a concern of many researchers seeking toidentify and discuss the various domains that this knowledge involves.
Ball, Thames and Phelps (2008) use the notion of knowledge of pedagogical content of Shulman(1986), which refers to the existence of knowledge of unique content to teach, trying to identify thecompetences of teaching, starting from an empirical approach, to understand the knowledge of thecontent necessary to teach (figure1).
Figure 1: Mathematical knowledge domains to teach (Ball, Thames, & Phelps, 2008)
Given that we live in an age marked by technology and the role of computational tools,Koehler and Mishra (2009) extend TPACK (technological pedagogical content knowledge), whichthey consider to be teachers' pedagogical knowledge to integrate technology. Koehler, Mishra andCain (2013) add that the interaction of these forms of knowledge, both theoretical and practical,yields the types of flexible knowledge needed to successfully introduce / integrate technology intoteaching. The TPACK results from the intersection of content knowledge, with pedagogicalknowledge and technological knowledge (Figure 2)
ICTMT 13 334 Lyon 3 - 6 July 2017

Figure 2: Domains of technological knowledge (Koehler, Mishra, & Cain, 2013)
The identification of these dimensions becomes an asset to create learning opportunities forteachers, since one can not expect that they know or do what they had no opportunity to learn. Inthis sense, the careful development of courses, workshops and well-designed and managedmaterials is fundamental (Ball, 2003). It is in this sense that the work with the trainees has beendeveloped, involving them in the use of the platform, both as learners and as teachers of theirstudents in the computational environment.
The theoretical framework presented here establishes and maintains the main constructs tomobilize in monitoring the implementation of the Platform (KAP) in basic education schoolsinvolved in the project. This is still a macro perspective who will be detailed as the study progresson the ground. The students' learning will be subject to a deeper analysis taking into account thespecificities of the Platform and classroom orchestration conducted by the teacher.
METHODOLOGY
The development of this monitoring study can be considered as a mixed study from themethodological point of view. The qualitative dimension is mostly present in monitoring actions. Itinvolves a descriptive and interpretive analysis of teacher training processes, their appropriation ofthe technological tool (KAP), the integration of this tool in their pedagogical practice and thestudents' learning when using the platform. Due to the intrinsic characteristics of the platform, it ispossible to monitor student performance in solving the tasks and challenges proposed. It is thuspossible to quantify the evolution of the students, from the time it takes to solve each task, thenumber of hits and errors committed, the working time devoted to each task or subject, amongothers. The triangulation of these two approaches will allow a better understanding of both theformative process of the teachers and the learnings carried out by the students. It is also intended tocarry out some case studies, both with teachers and with students, in order to deepen the differenttypes of knowledge developed.
To develop this monitoring work we used essentially on three analysis tools. One of thesetools intends to synthesize an inventory to analyze a task. This inventory involves the followingcategories: content, process and task type (Pepin, 2012). In the corresponding category of contentare taken into account the content domain and connections with math. In the category of processes,in addition to the processes of representation, analysis, interpretation and communication, are takeninto account the connections with mathematics. In the category referring to the type of task,procedural fluency, familiarity, context, conceptual understanding, cognitive requirement,mathematical representation and the tools used are taken into account.
The second tool is related to the type of feedback and relationship with the activity, whichinvolves the following phases: Literature review, Development of task analysis scheduling, Taskanalysis, Assessment, task analysis and national curriculum and Learning steps (Pepin, 2012). Thesephases involve the following types of feedback: reflexive and diagnostic.
The third tool involves an inventory for the analysis of an artifact produced with atechnological resource for the actions in class. In this inventory are highlighted different types oftask and their relation with the work to be developed by the student (Teixeira, 2015).
The techniques of data collection are varied and serve different purposes. Teacher training isaccompanied by a non-participant observation, where teachers are followed in all training sessions.Field notes taken during the training sessions, the semi-structured interviews with trainers and later
ICTMT 13 335 Lyon 3 - 6 July 2017

with teachers, seek to realize some of the dimensions of their professional development. Theobservation of teachers' classes when using PKA and the participation of students in these sameclasses help to understand the process of instrumental genesis in teachers and students. Conductinginterviews with students, who will be involved in specific case studies will assess on their learningat the same time that these qualitative data are being crossed with quantitative data provided byKAP.
Participants in the study are teachers from five schools in the west of Lisbon, a total of 30teachers and 700 students of classes belonging to these same teachers (1st through 9th grade).Teachers are involved in a 50-hour Training Session (25 classroom and 25 at distance, in class workwith their students). The training process involves introducing teachers to the platform (PKA) andits use with students.
After this process of instrumentation teachers are invited to develop learning paths based onKAP that will later implement with the students. All students were enrolled on the platform (KAP)and are followed in the course of two processes: the implementation of learning pathwayspreviously designed by teachers and performing specific tasks on the platform that are suggested byteachers as a training supplement taking into account the performance that students demonstrate onthe platform.
IN SUMMARY
The project is currently in an early stage with the teachers finishing a phase of appropriationin the use of the platform. The development of lesson planning using KAP is ongoing, depending onthe curriculum topics that each teacher intends to implement. Along with this approach, studentshave already been introduced to the platform (KAP) where they are developing some conceptsreview tasks, with teacher supervision.
Throughout this process it is possible to identify a general satisfaction of the teachers becausethey belong to the privileged group that integrates this pilot project. It is possible to see that a largepart of the teachers involved are taking the first steps in introducing the technology in their classes,showing a dynamics and involvement that was not observable at the beginning of the trainingprocess. The students involved are also very motivated. It is possible to verify that most of themhave already used the platform to make their first experiences, and some are already reaching levelsof excellence in the field of some elementary concepts. The fact that the platform (PKA) has astrategy game has been singled out by teachers and students as an asset to the strong interaction thatcomes to check.
The lack of equipment in schools, to ensure fair access to the platform, has been the mainproblem detected. Many of the student accesses are made from home, out of school hours. Accessesfrom school are still unsatisfactory, with some students expressing dissatisfaction with theorchestration of classes, where only part of the class can access the platform, while other studentsare invited to develop paper and pencil tasks.
REFERENCES
Artigue, M. (2002). Learning Mathematics in a CAS environment: the genesis of a reflection aboutinstrumentation and the dialectic between technical and conceptual work. InternationalJournal of Computers for Mathematical Learning, 7(3), 245–274.
Ball, D. L. (2003). Mathematics in the 21st century: What mathematical knowledge is needed forteaching mathematics. Paper presented at the Secretary’s Summit on Mathematics, U.S.
ICTMT 13 336 Lyon 3 - 6 July 2017
Department of Education, Washington, DC.Ball, D. L., Thames, M. H., & Phelps, G. (2008). Content knowledge for teaching what makes it
special? Journal of Teacher Education, 59(5), 389-407. Bartolini Bussi, M. G., e Mariotti, M. A. (2008). Semiotic mediation in the mathematics classroom:
Artifacts and signs after a Vygotskian perspective. In L. D. English (Ed.), Handbook ofinternational research in mathematics education (pp. 750–787). Mahwah, NJ: LEA.
Drijvers, P., e Trouche, L. (2008). From artefacts to instruments: A theoretical framework behind theorchestra metaphor. In G. W. Blume e M. K. Heid (Eds.), Research on technology and theteaching and learning of mathematics: Vol. 2. Cases and perspectives (pp. 363–392).Charlotte, NC: Information Age.
Engeström, Y. (1999). Activity theory and individual and social transformation. In Y.Engeström, R.Miettinen, & R.-L. Punamäki (Eds.), Perspectives on activity theory (pp. 19-38). Cambridge:Cambridge University Press.
Engeström, Y. (2001). Expansive learning at work: toward an activity theoreticalreconceptualization. Journal of Education and Work, 14 (1), 133-156.
Gimeno, J. (2000). O currículo: uma reflexão sobre a prática (3.ª ed.). Porto Alegre: Artmed.Koehler, M. J., & Mishra, P. (2009). What is technological pedagogical content knowledge?
Contemporary Issues in Technology and Teacher Education, 9(1). Retrieved fromhttp://www.citejournal.org/volume-9/issue-1-09/general/what-is-technological-pedagogicalcontent-knowledge.
Koehler, M. J., Mishra, P., & Cain, W. (2013). What is technological pedagogical contentknowledge (TPAK)? Journal of Education, 193(3), 13-19. Recuperado dehttp://www.bu.edu/journalofeducation/current-issues/journal-of-education-2000-2010/volume-193/
Rabardel, P. (1995). Les hommes et les technologies. Paris: Armand Colin.Ruthven, K. (2002). Instrumenting mathematical activity: Reflections on key studies of the
educational use of computer algebra systems. International Journal of Computers forMathematical Learning, 7(3), 275–291.
Shulman, L.S. (1986). Paradigms and research programs for the study of teaching. In M.C. Wittrock(Ed.), Handbook of research on teaching (3rd ed.). New York: Macmillan.
Pepin, B. (2012). Task Analysis as “Catalytic Tool” for Feedback and Teacher Learning: Working with Teachers on Mathematics Curriculum Materials. In G. Gueudet, B. Pepin, & L. Trouche (Eds.), From text to 'lived’ resources: mathematics curriculum materials and teacher development (pp. 123-142). Berlin: Springer.
Teixeira, P. (2015). Construindo novas ferramentas didáticas em matemática: professores, aula e recursos tecnológicos. Doctoral Thesis. Lisbon: Universidade Nova de Lisboa, Faculdade de Ciências e Tecnologia.
ICTMT 13 337 Lyon 3 - 6 July 2017

i This work is supported by Portuguese national funds through FCT - Foundation for Science andTechnology in the context of the project UID/CED/02861/2016
Revisão do paper
Notation Grid
Focus and rationale : 6 - Research question to be precised The paper presents a project of in-training sessions aiming at using the Khan academy platform in the classes.
Theoretical and methodological (TMF) : 6 - TMF might be further improved What I miss is the articulation of the different frameworks that are presented. For example, is it necessary to have references to the instrumental genesis and what does it brings that is not studied through the activity theory?
Statement and discussion of results : 3 - Missing or unfounded results The weaknes of this paper in my sense lies in the absence of significative results both regarding the in-training and the effective interest of the use of the platform in the maths classes.
Clarity and relevance to ICTMT 13 : 6 - Relevant but needs further improvments
› Comment author
What I miss is the articulation of the different frameworks that are presented. For example, is it necessary to have references to the instrumental genesis and what does it brings that is not studied through the activity theory?
But, the weaknes of this paper in my sense lies in the absence of significative results both regarding the in-training and the effective interest of the use of the platform in the maths classes.
ICTMT 13 338 Lyon 3 - 6 July 2017

THE DESIGN AND USE OF OPEN ONLINE MODULES FOR
BLENDED LEARNING IN STEM TEACHER EDUCATION
Theo van den Bogaart1, Paul Drijvers
2,1, Jos Tolboom
3
1HU University of Applied Sciences Utrecht,
2Utrecht University,
3Netherlands Institute for Curriculum Development, [email protected]
Blended learning, a teaching format in which face-to-face and online learning is integrated,
nowadays is an important development in education. Little is known, however, about its affordances
for teacher education, and for domain specific didactical courses in particular. To investigate this
topic, we carried out a design research project in which teacher educators engaged in a co-design
process of developing and field-testing open online learning units for mathematics and science
didactics. The preliminary results concern descriptions of the work processes by the design teams,
of design heuristics, and of typical ways of collaborating. These findings are illustrated for the case
of two of the designed online units on statistics didactics and mathematical thinking, respectively.
Keywords: blended learning, design teams, mathematics education, STEM, teacher education
INTRODUCTION
In august, 2015, a new curriculum for mathematics in upper secondary education (grades 9-12) was
introduced in the Netherlands. Among others, this curriculum has a stronger focus on mathematical
thinking and on new approaches to statistics education, based on data sets made available through
the use of ict. The crucial factor in curriculum innovation, however, is to make these innovations
impact on classroom practice (Anderson, 1997; Fullan, 2007).
Obviously, there is a responsibility for in-service teachers, as well as for teacher education
institutes. The former have to ensure that they are capable of teaching the new curricula adequately;
the latter have to make sure that their students, being prospective mathematics teachers, are not
only familiar with the new curricula, but also with ways of how to teach them. Exploiting the
potential of information and communication technology still deserves special attention (Hegedus et
al., 2017).
When addressing this „how to‟, blended learning comes into play. Roughly speaking, blended
learning means blending face-to-face education with online learning activities. Nowadays, more
than twenty-five years after the introduction of the worldwide web as part of the internet (Berners-
Lee, 1989), a staggering amount of digital resources for the teaching and learning of mathematics is
available online. This leads educational designers and teachers to selecting, re-designing and
arranging resources in order to orchestrate their students‟ learning (Drijvers et al., 2010). For the
case of teacher education, however, and for courses on domain-specific didactics in particular, the
affordances of blended learning remain largely unexplored.
In this paper we describe how online learning units for pre-service teacher education for secondary
mathematics in a blended learning context are designed, implemented and evaluated by design
teams. We describe the design of two specific units, one for mathematical thinking, the other for
exploratory data analysis utilizing ICT. The results of using these learning units in pre-service
teacher training will be available later this spring.
ICTMT 13 339 Lyon 3 - 6 July 2017

THEORETICAL FRAMEWORK
In higher education, blended learning has been on the rise since the early 2000‟s. With respect to
terminology, quite a few buzz words came along. In fact, one might wonder if educational goals
have fundamentally changed since researchers from the University of Illinois in 1960 utilized a
mainframe computer with work stations for their students for computer assisted learning, which
they called Programmed Logic for Automatic Teaching Operations (PLATO, see Woolley, 1994).
Terminology evolved from computer-assisted (or -based or -supported) learning to intelligent
tutoring systems (Anderson, 1995), E-learning (Clark & Mayer, 2008), with blended learning as a
popular teaching approach nowadays (Bonk & Graham, 2006). In retrospective, all terminology
boils down to roughly the same issue, i.e., how to arrange the educational resources -including
information and communication technology- into an educational design that optimizes learning?
What we appreciate in the term „blended learning‟ is that it explicitly points at the fact that there is
more than one medium to be addressed when designing instruction.
From the perspective of learning theory, scientific insights have evolved as well: from the
behaviourist view on human learning (Skinner, 1954), suitable for computer assisted mastery
learning (Skinner, 1958), to the nowadays accepted social constructivist view, as initiated by
Vygotsky (1962), which can be supported by a more open learning environment. Blended learning is
a technological paradigm that suits this view on learning and teaching.
A major didactical issue with respect to blended learning is how to arrange the interplay between
online and face-to-face mathematical activities, and how to co-design such arrangements. In this
paper, we address this issue for the case of domain-specific didactics courses within pre-service
mathematics teacher training. In this way, we address the following research question:
How to collaboratively design, evaluate and disseminate digital blended learning units for
mathematics teacher education?
METHOD
The context of this study is a small, one-year project granted by the Dutch ministry of education and
supervised by SURFnet, the collaborative ICT organisation for Dutch education and research [1].
The aim of the project is to co-design, evaluate and disseminate four blended modules for pre- and
in-service teacher training, and for domain specific STEM didactics in particular. In this paper we
focus on the design of two of these units, one on the topic of mathematical thinking, and one on
statistics didactics.
For each of the modules, a design team was set up. Each design teams consisted of three teacher
educators: one from the HU University of Applied Sciences, one from Utrecht University, and one
from another teacher training institute in the Netherlands. The latter would facilitate dissemination
and bring in a wider view. Most of the designers were experienced teacher educators, but had
limited experience with (the design of) blended learning resources.
As each of the designers had limited time for the project (like 40 hours over the whole period of one
year), the coordinating team -this paper‟s authors- decided to organize short, intensive collaborative
“boot camp” design sessions. During the fall of 2016, three of such one-day boot camps were
organized, during which the design teams engaged in their co-design, but informal exchange
between teams was also possible. Camera teams were available, as well as tools such as light boards
for the production of video clips.
ICTMT 13 340 Lyon 3 - 6 July 2017

A collaborative online design environment was set up, so that the designers could continue their co-
design activities between the boot camp sessions. The ICT environment was provided by Kennisnet,
a Dutch semi-governmental organisation for ICT in education [2]. In this way, a blended design
approach was made possible.
The different teams met during boot camp days to discuss overarching topics, such as module layout
and structure, the guidelines for use that a teacher educator might use. During the design process,
design heuristics and decisions were monitored. After the design period, the use of the blended
modules will be field-tested in didactics courses by teacher educators all over the country, including
co-designers and educators not involved in the design. To evaluate the experiences, the field tests
will be monitored through pre- and post-interviews with the educators.
RESULTS
Unfortunately, as the monitoring process of the field tests is currently ongoing during spring 2017,
its results will only be available in July. Therefore, we now focus on the design process, which we
will describe subsequently for the two units, one on statistics didactics and the other on
mathematical thinking.
Case 1: A learning unit on statistics didactics
As a first case of designing an open online learning unit for a blended course on mathematics
didactics, we now briefly describe the design process of a unit on statistics didactics for pre-service
teacher education. Based on general ideas on exploratory data analysis (Tukey, 1977) and the
analysis of large data sets through the use of ICT, the statistics curricula have been reformed
recently. Therefore, statistics didactics is an issue in teacher education and this explains the choice
for this topic.
The design team consisted of two pre-service teacher educators and one professor in mathematics
education. As the team members had not collaborated before so closely, the first day of the three-
day design process was spent on getting to know each other and exploring the unit‟s theme. A joint
dropbox folder had been created to exchange ideas and existing materials. It was noticed that many
mathematics teachers, due to their education, only have limited knowledge about statistics and the
new approach to it, so that some content knowledge should be intertwined with a pedagogical and
didactical approach. As a consequence, the team decided to focus on core aspects of statistics,
namely (1) Describe data, and (2) Beyond data.
During the second design boot camp, the outline was elaborated. In the Describe data part, particular
attention is given to data visualization, levels of measurement, and statistical literacy. The Beyond
data part focuses on correlation and causality, the interpretation of p-values, and of confidence
intervals. These topics were selected because on the one hand, we expected them to be beneficial to
teachers‟ content knowledge, and on the other hand we identified them as didactical challenges
while teaching.
During the third and final design day, special attention was paid to design tasks for the teacher-
students. Also, the team worked on the comments provided by an external review committee.
In the design process, a mix was made of existing resources such as video clips, text books, research
papers, and newly designed resources such as tasks for teacher-students and guidelines for the
teacher educator, and dedicated video clips. On the one hand, it made sense to make use as much as
possible from existing resources. On the other hand, the need was felt to have dedicated resources
that fit well to the specific Dutch situation and curriculum. Figure 1 shows a still of a new clip made
ICTMT 13 341 Lyon 3 - 6 July 2017

with light board technology. Figure 2 shows an extract of a dialog between Dutch mathematics
teachers‟ Facebook group on a particular problem, which is used in the online learning unit to
enhance discussion between students during the face-to-face part of the blended course.
The results of the design are available online [3]. As part of the ongoing design process, input from
other teacher educators is expected to further improve and extend the unit in a collaborative way.
Figure 1. Still from a video made with light board technology
Figure 2. Copy of a dialog on the Dutch mathematics teachers’ Facebook Group
Case 2: A learning unit on mathematical thinking
The second case we describe concerns an open online unit about didactics for fostering
mathematical thinking. Attention to this topic is evident in the international research community
(e.g., see Devlin, 2012; Schoenfeld, 1992) and was invigorated in the Netherlands by recent
curriculum developments in Dutch secondary education (Drijvers, De Haan, & Doorman,
submitted).
The team that designed the unit about mathematical thinking consisted of three teacher educators,
all of whom had some prior experience with this topic. One of them also developed and taught a
course on mathematical thinking as in-service training for teachers.
ICTMT 13 342 Lyon 3 - 6 July 2017

The outlines of the online unit were quickly decided on. One reason for this was that the members
of the design team already had collaborated in different projects (although not about mathematical
thinking) and also had shared ideas about the topic under concern. The unit was planned to consist
of several self-contained student activities divided into three categories: (i) designing classroom
tasks that stimulate mathematical thinking, (ii) supporting such classroom tasks in the classroom,
(iii) assessing proficiency in mathematical thinking. Having established an outline, the ideas for the
individual student activities emerged organically during the three boot camp days. Here follows an
impression of this process.
During the first day the team focused on a key article (Swan, 2005) as inspiration for the design of
the first student activity. This resulted in a small set of materials, including a video clip, and a guide
for teacher educators how the material could be used. Figure 3 gives an impression. The day was
further spent in selecting appropriate study materials from a large set that the design team had
collected in advance.
During the second boot camp day, the idea emerged of using materials produced by some of the
experienced teachers that had participated in the in-service training of one of the design team‟s
members. Those materials consisted of a classroom exercise aimed at stimulating mathematical
thinking and a description about how it worked out in practice. The team planned a filmed interview
with one of those teachers and worked out ideas for four film projects. These film projects shared
the same set-up: each focused on an exercise explicitly designed to stimulate mathematical thinking;
and each consisted of a sequence of three clips A, B and C. Clip A showed two team members
discussing the exercise before it was used in practice (see Figure 3). They tried to predict what kind
of thought processes the question would evoke in pupils. Clip B was filmed inside a school
building. A pupil was asked to work on the set question, and was then interviewed about the
strategies he or she had used. Clip C showed the team members again, but now they reflected on
their experiences with the pupils. The film projects were placed on the website together with
suggestions for use in teacher education. The suggestions involved a choice for the teacher educator.
He could either just use the clips B together with digital copies of the exercises, or use the whole
series of clips modelling how to discuss potential thought provoking questions. In the former case,
his students can predict and reflect on the quality of the exercises in a whole-class discussion. In the
latter case, students can be given the task to try it out themselves with other (e.g., self-designed)
exercises in their own classrooms.
Between the second and third boot camp day an external reviewing committee provided feedback on
the site. Besides useful comments on usability, the remark was made that the important aspect of
„the culture of answer getting in mathematical classrooms‟ had been ignored. During the third boot
camp, the team tried to deal with this by adding materials about experiences of working teachers.
They also made a film interview with an expert on the subject.
The results of the design process are available online [4]. Input from other teacher educators is
expected to further improve and extend the unit in a collaborative way.
ICTMT 13 343 Lyon 3 - 6 July 2017

Figure 3. An impression of the web site (in Dutch)
CONCLUSION
The research question is how to collaboratively design, evaluate and disseminate digital blended
learning units for mathematics teacher education. At present, we can only draw conclusions with
respect to the design phase. Results on the evaluation are expected in July, followed by results about
dissemination in October. Concerning the design aspect, the preliminary conclusions fall into three
categories: (1) the composition of design teams, (2) design heuristics, and (3) ways of collaborating.
The design teams were each composed of three experienced teacher educators from different
institutes. In consequence, the team members could share experiences and materials. This resulted
in a shared collection of existing materials that were already, but unknown or inaccessible outside
individual institutes. The project was also instructive for the team members – both with regard to
their personal subject knowledge (e.g., statistics didactics) as to blended learning skills (e.g., camera
experience). A drawback of using mixed teams is that people need time to getting to know each
other and to form a joint vision on the subject at hand. Although this is important for a fruitful
collaboration, care must be taken that teams dwell too long in this phase. This leads to the first
conclusion.
1. Small design teams of experienced teacher educators from different institutes leads to
boundary crossing between institutes, resulting in (i) rich material and (ii) professional
development of the educators themselves, although a pitfall is that (iii) too much time may
be spent on discussion rather than on the actual design.
The most important design heuristics from the start were that we aimed at learning units which were
open online and blended. „Open online‟ implied that the materials would eventually be published on
the web under a creative commons license [5]. Without any difficulty this turned out to be a tenable
mind set, although extra care was given in using materials from others that could have copyrights on
them. In practice, „blended‟ meant that materials should at least encompass texts, film clips and
descriptions for student activities. These student activities involved both classroom tasks supervised
by a teacher educator and online tasks.
Other design heuristics emerged in the course of the process: we used mid-session intervals during
the boot camps to discuss ideas and explicate some shared heuristics. The most important one that
ICTMT 13 344 Lyon 3 - 6 July 2017

emerged in this process concerned the target audience. In fact, two target groups were recognized:
the student teachers and the teacher trainers. This was apparent in the materials: film clips,
worksheets, etc. aimed at the former, guidelines and suggestions for use at the latter. But design
teams had the teacher trainer in mind also in another way. A comparison was made with the way an
educator uses a handbook, selecting exercises from it, skipping or supplementing content, etc. It was
felt that this level of autonomy should also be provided in the learning units that were designed.
2. Digital blended learning units should be designed with both student teacher and teacher
educators in mind. Toward teacher educators, a balance need be found between guidance on
the one hand and autonomy on the other.
As explained above, we stimulated collaboration by organizing boot camps. These boot camps were
intensive days of working in the design teams, apart from a plenary meeting at the start of the
project and the aforementioned mid-session discussions during lunch. We facilitated the teams by
setting a time and place and organizing technical support for the film clips. Teams sat together and
worked in ways they could decide for themselves. This was successful: participants on the one hand
experienced a large measure of autonomy – which, we belief, had a positive effect on their
motivation while on the other hand were encouraged to reserve three full days outside their usual
working habitats. This last aspect could be the most difficult one to generalize, since we
experienced that it is difficult to schedule days where everyone is available – especially in an extra-
institutional context.
3. Scheduling design sessions were teams can collaborate for several hours with full focus on
producing materials makes it feasible to construct digital blended learning units in a short
time span. Readily available technical assistance during these sessions lowers the barrier for
producing film clips.
These preliminary conclusions concern the design process. This spring, teacher educators
throughout the Netherlands will field-test (parts of) the designed learning units. To monitor this,
they fill in an online questionnaire beforehand, to assess their intentions and ideas. After the field
test, they will receive a second questionnaire to assess their appreciation of the units as well as the
ways in which they used them in practice. This will be followed by a limited number of interviews
with some of these educators. Through the analysis of these data, we hope to be able to answer
questions on the evaluation and dissemination of the learning units, and to extrapolate them to more
general recommendations on the process of co-designing blended learning for teacher education.
NOTES
1. See https://www.surf.nl/en/innovationprojects/customised-education.html
2. See https://www.wikiwijsleermiddelenplein.nl/
3. For the current state of the unit (in Dutch) see http://maken.wikiwijs.nl/86112/Didactiek_van_statistiek
4. For the current state of the unit (in Dutch) see http://maken.wikiwijs.nl/85927/Wiskundige_denkactiviteiten
5. See https://creativecommons.org/licenses
ICTMT 13 345 Lyon 3 - 6 July 2017

REFERENCES
Anderson, J. R., Corbett, A. T., Koedinger, K. R., & Pelletier, R. (1995). Cognitive tutors: lessons
learned. The Journal of the Learning Sciences, 4(2), 167-207.
Anderson, S. E. (1997). Understanding Teacher Change: Revisiting the Concerns Based Adoption
Model. Curriculum Inquiry, 27(3), 331-367
Berners-Lee, T. (1989). Information management: a proposal. Geneva: CERN.
Bonk, C. J., & Graham, C. R. (2006). The Handbook of Blended Learning: Global Perspectives, Local
designs. Hoboken, NY: John Wiley & Sons.
Clark, R. C., & Mayer, R. E. (2008). e-Learning and the Science of Instruction: Proven Guidelines for
Consumers and Designers of Multimedia Learning. San Francisco, CA, USA: Pfeiffer.
Devlin, K. (2012). Introduction to Mathematical Thinking. Palo Alto, CA: Keith Devlin.
Drijvers, P., Doorman, M., Boon, P., Reed, H., & Gravemeijer, K. (2010). The teacher and the tool:
Instrumental orchestrations in the technology-rich mathematics classroom. Educational Studies in
Mathematics, 75(2), 213-234.
Drijvers, P., De Haan, D., & Doorman, M. (submitted). Scaling up mathematical thinking; a case study
on the implementation of curriculum reform in the Netherlands.
Fullan, M. (2007). The new meaning of educational change (Fourth Edition). New York: Teachers
College Press.
Hegedus, S., Laborde, C., Brady, C., Dalton, S., Siller, H.-S., Tabach, M., et al. (2017). Uses of
Technology in Upper Secondary Mathematics Education. In Uses of Technology in Upper
Secondary Mathematics Education (pp. 1-36). Cham: Springer International Publishing.
Schoenfeld, A. H. (1992). Learning to think mathematically: Problem solving, metacognition, and
sense making in mathematics. In D. Grouws (Ed.), Handbook for Research on Mathematics
Teaching and Learning: A Project of the National Council of Teachers of Mathematics (pp. 334-
370). New York: MacMillan.
Skinner, B. F. (1954). The science of learning and the art of teaching. Harvard Educational Review,
24, 86-97.
Skinner, B. F. (1958). Teaching machines. Science, 128, 969-977.
Swan, M. (2005). Improving learning in mathematics: challenges and strategies. London: Department
for Education and Skills Standards Unit.
Tukey, J. W. (1977). Exploratory Data Analysis. Reading, MA: Addison-Wesley.
Vygotsky, L. S. (1962). Thought and Language. Cambridge, MA: The MIT Press.
Woolley, D. R. (1994). The emergence of online community. Computer-Mediated Communication
Magazine, 1(3), 5-5.
ICTMT 13 346 Lyon 3 - 6 July 2017

TEACHING LOCUS AT UNDERGRADUATE LEVEL: A CREATIVITY
APPROACH
Mohamed El-Demerdash 1, Jana Trgalova2, Oliver Labs3 and Christian Mercat4
1Menoufia University, Egypt, [email protected], 2Claude Bernard University Lyon 1,France, [email protected], 3MO-Labs, Germany, [email protected], and 4Claude
Bernard University Lyon 1, France, [email protected]
In this paper, we present our experience, while working in the MC Squared project, with the designand evaluation of educational digital resources aiming at promoting creative mathematical thinkingamong undergraduate students. The resources, called “c-books” (c for creative), are producedwithin an innovative socio-technological environment by a community gathering together computerscientists and researchers in mathematics and mathematics education. The paper highlights theimportance of teaching loci curves at undergraduate level as an introduction to implicit equations.It presents the design choices providing the c-book with affordances to promote creativity inmathematics in terms of personalized non-linear path, constructivist approach, and meta-cognitionbased activities, among others. The paper also presents experts’ a priori evaluation of the c-bookmathematical creativity potential.
Keywords: Creative mathematical thinking, socio-technology environment, locus, implicitequations, experimental geometry.
INTRODUCTION
Historically, mathematical curves essentially occurred as loci, e.g. a parabola as the locus of allpoints having the same distance from a given fixed line and a given fixed point outside the line. Theconcept of a curve within a coordinate system was only quite recently developed by Descartes,Fermat, and others in the 17th century – about 2000 years after the Greek had performed quitedetailed studies of various curves, and also had created interesting and important new curves forspecific purposes, purely via their description as loci (Boyer, 2004, pp. 74-102).
The curves in Descartes’ “La Geometrie” (Descartes, 1637, see also Boyer, 2004, pp. 74-102) thenarise naturally as implicit curves as a result of solving systems of implicit equations where eachequation represents a condition on the geometric objects involved. In the following centuries, curvesand in particular the special cases of graphs of functions in one variable were being studied deeply.But at the beginning of the 20th century when Felix Klein was working a lot on the question of howto teach mathematics, implicit equations still played a very important role for him. E.g., in the firstsection on algebra in his Mathematics from a Higher Standpoint (Klein, 1924, part I, pp. 93-109)when he discusses simple examples such as graphs of quadratic functions, he immediately usesimplicit equations as well, namely some discriminants describing the reality of the roots of thefunctions. It was only later that some others misinterpreted his ideas to focus on the importance offunctions in a too narrow way, namely only to functions from R to R.
Besides the historical importance of loci and their often implicit equations there are many reasonsfor using them at school level. The following is an important one: The description of a curve as alocus gives a more intrinsic description and also a more operational description than an equation.So, even for curves appearing as graphs of functions, looking at them as geometric loci oftendeepens their understanding. Moreover, using loci and implicit equations early in teaching is a good
ICTMT 13 347 Lyon 3 - 6 July 2017

preparation for studying implicit equations later in linear algebra, e.g. planes and the classificationof quadrics. It is also a good companion to the implicit equation of a circle which is otherwise aquite isolated example of such an equation in many cases (sometimes, ellipses are also mentioned,at least in their standard form x²/a²+y²/b²=1, but the fact that implicitly described curves are a mostnatural thing to consider is often not mentioned).
The importance of implicit loci arises even more at the undergraduate level: for example, a curvemight be associated not only with an explicit equation, a function graph, a parametrized curve, or animplicit algebraic equation but as well with solutions of differential equations. It is important tounderstand function graphs, implicit equations and parametrized curves as loci in order to be able tofully grasp differential geometry tools such as tangent line or plane, curvature, osculating circles orellipsoids. In real life mathematics or engineering, most objects are loci of some sort. Control theoryfor example deals with trying to keep a mobile position not far from a target trajectory, with the helpof integral and differential calculus. The investigation of soft loci with a dynamic geometry system(Healy, 2000; Laborde, 2005) is very helpful in building this picture in the mind of students.
The flexible production of loci is of paramount interest in industry and design to define curves andsurfaces used in computer aided design, such as Bézier curves and their variants (see Piegl, 2013).The main feature of those is the fact that they can be described in many different ways: asparametrized curves, as implicit curves, and also as loci. All those descriptions have theiradvantages for the application at hand such as: Through the parameterization, many properties ofthe curves can be studied easily; with the implicit equation, it is straightforward to decide if a givenpoint is on the curve, or on one side or the other side; and the description as a locus provides anumerically robust and quick way to compute points on the curve, draw it or 3D-print it.
Promoting creative mathematical thinking (CMT) is a central aim of the European Union by beingconnected to personal and social empowerment for future citizens (EC, 2006). It is also consideredas a highly valued asset in industry and as a prerequisite for meeting economic challenges.Exploratory digital media provide users with potential for developing CMT in unprecedented ways(Hoyles & Noss, 2003; Healy & Kynigos, 2010). Yet, new designs are needed to support learners'engagement with CMT in collectives using dynamic digital media.
The MC Squared project, briefly presented in the next section, looks for new methodologies thatwould assist designers of digital educational media to explore, identify and bring forth resourcesstimulating more creative ways of mathematical thinking. The paper focuses on the design of onesuch resource, the “Experimental Geometry” c-book, highlighting the design choices and theresource affordances to foster CMT in its users. Concluding remarks bringing forward factorsstimulating creativity in the collaborative design of digital educational resources are proposed in thefinal section. The research work presented in this paper is related to (Trgalova, El-Demerdash, Labs,&Nicaud, 2016), submitted to ICME13, with more emphasis on the locus theoretical backgroundand its importance to introduce implicit equations at the undergraduate level. Design choices tofoster CMT are as well detailed here.
THE MC SQUARED PROJECT
MC Squared project (http://mc2-project.eu/) aims at designing a software system, the “c-bookenvironment”, to support stakeholders from creative industries producing educational content toengage in collective forms of creative design of appropriate digital media. The c-book environmentprovides an authorable tool including diverse dynamic widgets, an authorable data analytics engineand a tool supporting collaborative design of resources called “c-books”. The project studies theprocesses of collaborative design of c-books intended to enhance CMT.
ICTMT 13 348 Lyon 3 - 6 July 2017

CREATIVE MATHEMATICAL THINKING
Based on a literature review studying creativity (El-Demerdash, 2010; El-Demerdash &Kortenkamp, 2009; Haylock 1997; Weth 1998, among others), CMT has been defined in the projectas an intellectual activity generating new mathematical ideas in a non-routine mathematicalsituation. Drawing on Guilford’s (1950) model, the generation of new ideas shows fluency (theability to generate quantities of ideas), flexibility (the ability to create different categories of ideas),originality (the ability to generate new and unique ideas that others are not likely to generate), andelaboration (the ability to redefine a problem to create others by changing one or more aspects).
THE "EXPERIMENTAL GEOMETRY" C-BOOK
The notion of geometric loci of points is the topic of the “Experimental Geometry” c-bookpresented in this section. According to Jare and Pech (2013), this notion is difficult to grasp andtechnology can be an appropriate media to facilitate its learning. The authors suggest one way is touse dynamic geometry software to “find the searched locus and state a conjecture” and a computeralgebra system to “identify the locus equation”.
Fig. 1: A screenshot of a c-book page showing three widgets: Cinderella, EpsilonWriter andEpsilonChat.
The challenge in designing this c-book was to exploit c-book technology affordances to propose acomprehensive study of geometric and algebraic characterization of some loci within the c-book.We decided to create activities aiming at studying loci of important points in a triangle. These loci(for example locus of the orthocenter) are generated by the movement of one vertex of a trianglealong a line parallel to the opposite side (see Fig. 1). These are classical problems from the field ofgeometry of movement that were proposed for teaching purposes even before the advent of dynamicgeometry (Botsch, 1956). Elschenbroich (2001) revisits the problem of locus of the orthocenter in atriangle with a new media, dynamic geometry software. El-Demerdash (2010) uses this example topromote CMT among mathematically gifted students at high schools.
The c-book invites students to experiment geometric loci generated by intersection points of speciallines of a triangle while one of its vertices moves along a line parallel to the opposite side (see Fig.2b). The activity can give rise to a number of various configurations, which makes it a rich situationfor exploring, conjecturing, experimenting, and proving.
ICTMT 13 349 Lyon 3 - 6 July 2017
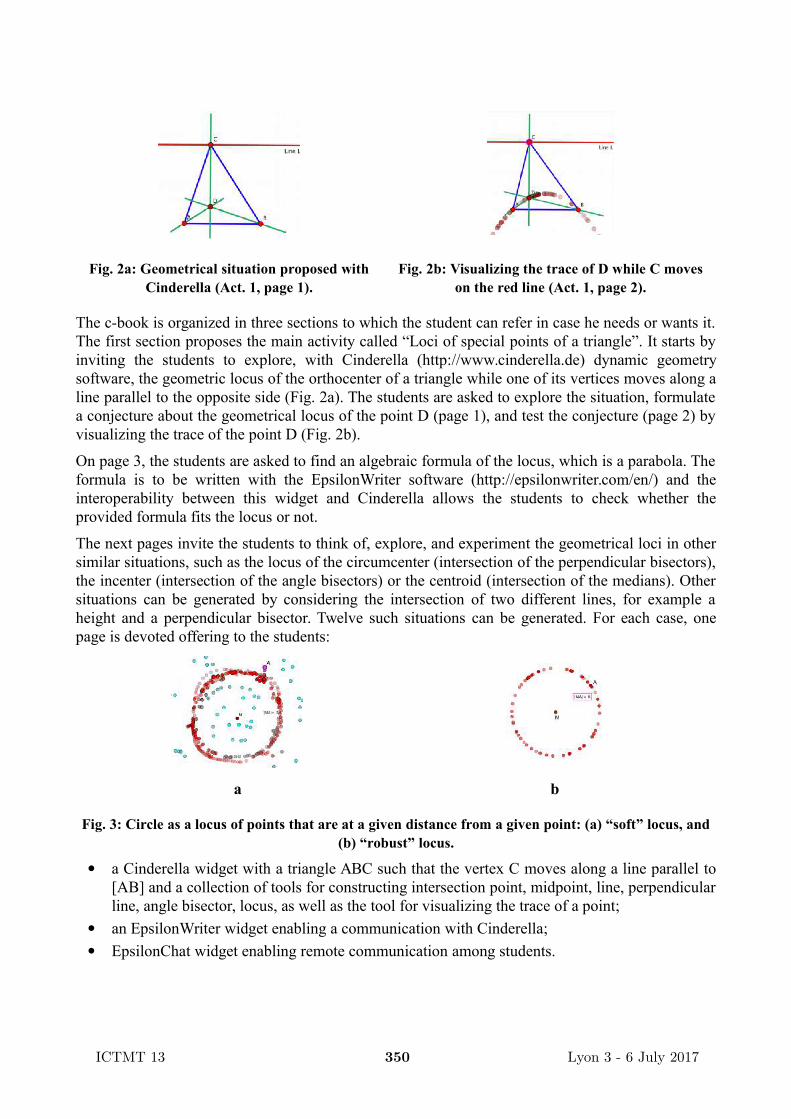
Fig. 2a: Geometrical situation proposed withCinderella (Act. 1, page 1).
Fig. 2b: Visualizing the trace of D while C moveson the red line (Act. 1, page 2).
The c-book is organized in three sections to which the student can refer in case he needs or wants it.The first section proposes the main activity called “Loci of special points of a triangle”. It starts byinviting the students to explore, with Cinderella (http://www.cinderella.de) dynamic geometrysoftware, the geometric locus of the orthocenter of a triangle while one of its vertices moves along aline parallel to the opposite side (Fig. 2a). The students are asked to explore the situation, formulatea conjecture about the geometrical locus of the point D (page 1), and test the conjecture (page 2) byvisualizing the trace of the point D (Fig. 2b).
On page 3, the students are asked to find an algebraic formula of the locus, which is a parabola. Theformula is to be written with the EpsilonWriter software (http://epsilonwriter.com/en/) and theinteroperability between this widget and Cinderella allows the students to check whether theprovided formula fits the locus or not.
The next pages invite the students to think of, explore, and experiment the geometrical loci in othersimilar situations, such as the locus of the circumcenter (intersection of the perpendicular bisectors),the incenter (intersection of the angle bisectors) or the centroid (intersection of the medians). Othersituations can be generated by considering the intersection of two different lines, for example aheight and a perpendicular bisector. Twelve such situations can be generated. For each case, onepage is devoted offering to the students:
a b
Fig. 3: Circle as a locus of points that are at a given distance from a given point: (a) “soft” locus, and(b) “robust” locus.
a Cinderella widget with a triangle ABC such that the vertex C moves along a line parallel to[AB] and a collection of tools for constructing intersection point, midpoint, line, perpendicularline, angle bisector, locus, as well as the tool for visualizing the trace of a point;
an EpsilonWriter widget enabling a communication with Cinderella;
EpsilonChat widget enabling remote communication among students.
ICTMT 13 350 Lyon 3 - 6 July 2017

The second section called “The concept of geometric locus” introduces the concept of locus ofpoints. It starts by a baby example, leading the students to “discover” the fact that a circle can becharacterized as a locus of points that are at the same distance from a given point (page 1). Thestudents first experiment a “soft” locus (Healy, 2000; Laborde, 2005) of a point A placed at thedistance 6 cm from a given point M (Fig. 3a), and then they verify their conjectures by observing a“robust” construction of the circle centered at A with a radius 6 cm (Fig. 3b).
The next page is constructed in a similar way in order to allow the students to explore perpendicularbisector as a geometric locus of points that are at a same distance from two given points. Finally, thepage 3 proposes a synthesis of these two activities and provides a definition of the concept ofgeometrical locus of points.
The third activity, “Algebraic representation of loci”, proposes a guided discovery of algebraiccharacterization of the main curves that can be generated as loci of points as those in section 2.
Design choices and rationale
Personalized non-linear path: The c-book is designed to allow students to go through it accordingto their knowledge and interest. They are invited to enter by the main activity (section 1). However,the concept of geometric locus is a prerequisite. In case this knowledge is not acquired yet, or thestudents need revising it, they can reach the section 2 by an internal hyperlink from various placesof the main activity. Similarly, section 3, which allows the students to develop knowledge about thealgebraic characterization of some common curves that is useful in the main activity, is reachablefrom the main activity. Thus the students can “read” the c-book autonomously, in a non-linearpersonalized way, deepening their knowledge about geometric or algebraic aspects of loci of pointsaccording to their needs.
Promoting creative mathematical thinking: The c-book is designed in a way to support thedevelopment of creative mathematical thinking through promoting its four components (fluency,flexibility, originality, and elaboration) among undergraduate students. First, the main activity isdesigned in a way to call for students’ elaboration: they are invited to modify the initial situation byconsidering various combinations of special lines in a triangle, whose intersection point generates alocus to explore. Fluency and flexibility are fostered by providing the students a rich environment inwhich they can explore geometric configurations and related algebraic formulas while benefittingfrom a feedback allowing them to control their actions and verify their conjectures (see feedbackand learning analytics section). Specific feedback is implemented toward directing students toproduce different and varied situations and help them to break down their mind fixation byconsidering yet different configurations, such as two different kinds of special lines in a trianglepassing through the movable vertex (e.g. a height intersecting with an angle bisector), and then theintersection of two different lines that do not pass through the movable vertex. The c-book providesthe students not only with digital tools enabling them to explore geometric and algebraic aspects ofthe studied loci separately, but also with a so-called “cross-widget communication” affordancesbetween Cinderella, a dynamic geometry environment, and EpsilonWriter, a dynamic algebraenvironment, which makes it possible to experimentally discover the algebraic formula that matchesthe generated locus in a unique way; this feature may contribute to the development of originalapproaches by the students.
Constructivist approach – Learning by doing – Guided discovery: The c-book activities in bothsection 2 and section 3 are developed based on the constructivist learning theory practices throughguided discovery approach in order to enable students to create new experiences and link them to
ICTMT 13 351 Lyon 3 - 6 July 2017
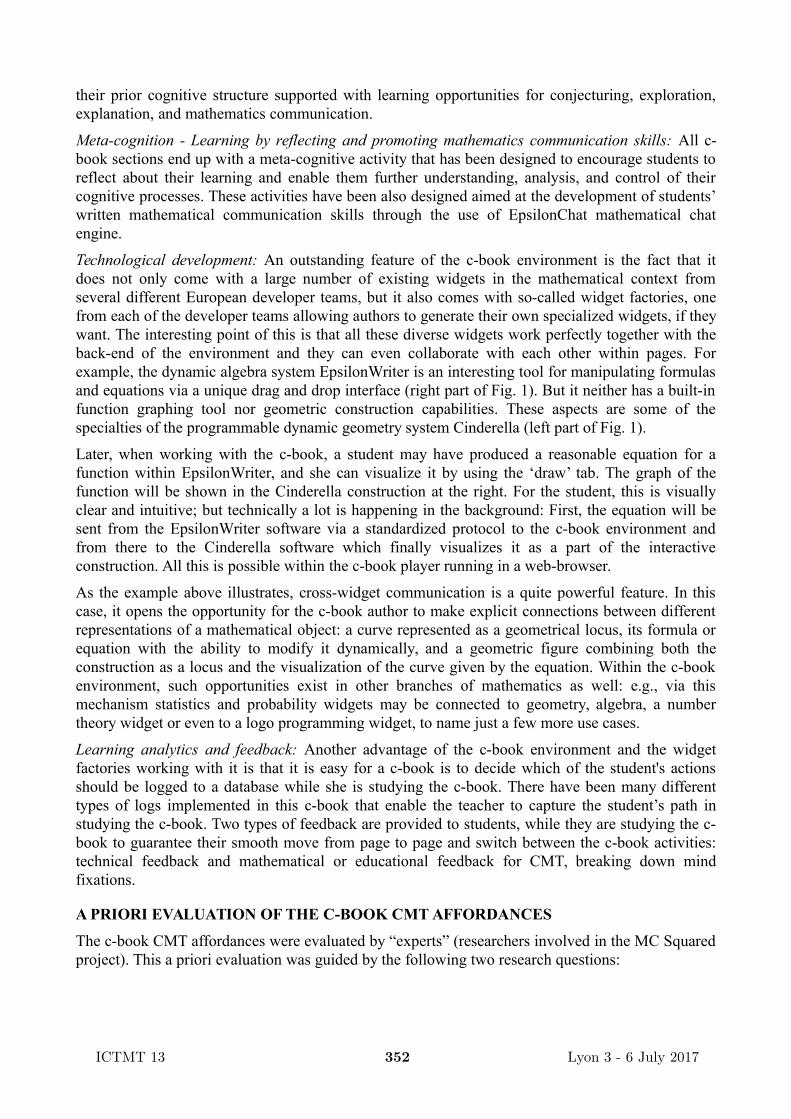
their prior cognitive structure supported with learning opportunities for conjecturing, exploration,explanation, and mathematics communication.
Meta-cognition - Learning by reflecting and promoting mathematics communication skills: All c-book sections end up with a meta-cognitive activity that has been designed to encourage students toreflect about their learning and enable them further understanding, analysis, and control of theircognitive processes. These activities have been also designed aimed at the development of students’written mathematical communication skills through the use of EpsilonChat mathematical chatengine.
Technological development: An outstanding feature of the c-book environment is the fact that itdoes not only come with a large number of existing widgets in the mathematical context fromseveral different European developer teams, but it also comes with so-called widget factories, onefrom each of the developer teams allowing authors to generate their own specialized widgets, if theywant. The interesting point of this is that all these diverse widgets work perfectly together with theback-end of the environment and they can even collaborate with each other within pages. Forexample, the dynamic algebra system EpsilonWriter is an interesting tool for manipulating formulasand equations via a unique drag and drop interface (right part of Fig. 1). But it neither has a built-infunction graphing tool nor geometric construction capabilities. These aspects are some of thespecialties of the programmable dynamic geometry system Cinderella (left part of Fig. 1).
Later, when working with the c-book, a student may have produced a reasonable equation for afunction within EpsilonWriter, and she can visualize it by using the ‘draw’ tab. The graph of thefunction will be shown in the Cinderella construction at the right. For the student, this is visuallyclear and intuitive; but technically a lot is happening in the background: First, the equation will besent from the EpsilonWriter software via a standardized protocol to the c-book environment andfrom there to the Cinderella software which finally visualizes it as a part of the interactiveconstruction. All this is possible within the c-book player running in a web-browser.
As the example above illustrates, cross-widget communication is a quite powerful feature. In thiscase, it opens the opportunity for the c-book author to make explicit connections between differentrepresentations of a mathematical object: a curve represented as a geometrical locus, its formula orequation with the ability to modify it dynamically, and a geometric figure combining both theconstruction as a locus and the visualization of the curve given by the equation. Within the c-bookenvironment, such opportunities exist in other branches of mathematics as well: e.g., via thismechanism statistics and probability widgets may be connected to geometry, algebra, a numbertheory widget or even to a logo programming widget, to name just a few more use cases.
Learning analytics and feedback: Another advantage of the c-book environment and the widgetfactories working with it is that it is easy for a c-book is to decide which of the student's actionsshould be logged to a database while she is studying the c-book. There have been many differenttypes of logs implemented in this c-book that enable the teacher to capture the student’s path instudying the c-book. Two types of feedback are provided to students, while they are studying the c-book to guarantee their smooth move from page to page and switch between the c-book activities:technical feedback and mathematical or educational feedback for CMT, breaking down mindfixations.
A PRIORI EVALUATION OF THE C-BOOK CMT AFFORDANCES
The c-book CMT affordances were evaluated by “experts” (researchers involved in the MC Squaredproject). This a priori evaluation was guided by the following two research questions:
ICTMT 13 352 Lyon 3 - 6 July 2017

R.Q1 - Which of the four cognitive components of CMT: fluency, flexibility, originality andelaboration, and social and affective aspects have been better integrated and promoted through thedesign of the c-book units? That is, what affordances are perceived by the evaluators as enhancers ofthese components?
R.Q2 - Is there any correlation among the cognitive components of CMT, as perceived by theevaluators?
In order to answer the above research questions we used an evaluation tool called “CMTAffordances Grid” (Appendix A). This tool was developed and refined within the MC Squaredproject. The grid contains three sections. The 13 first items evaluate the c-book affordances towardsthe development of mathematical creativity in users/students. These items address the c-bookaffordances such as nature of the activities or variety of representations of mathematical concepts atstake and ask the evaluators to what extent these affordances are likely to enhance the user’scognitive processes (fluency, flexibility, originality, elaboration). The second and third sections dealwith social and affective aspects of the c-book that are likely to enhance mathematical creativity inits users.
As for the first aspect, the responders were asked to evaluate the items in relation to each one of thefour cognitive components of mathematical creativity in a scale from 1 (weak affordance) up to 4(strong affordance). There was an extra option called N/A in case the affordance was not applicablefor the specific item.
The evaluation of the mathematical creativity affordances of this c-book was done by three expertsin the field of mathematics education, a senior researcher, a post-doctoral researcher, and a Ph. D.student who were not involved in its design. It was organized in three steps. First, the evaluators hadto use the c-book and be acquainted with the affordances. Second, a teleconference was organizedby the main designer of the c-book to address evaluators’ needs for understanding and clarification.Third, the evaluators evaluated the c-book affordances based on the grid using an online formprepared for this purpose.
Fig. 4: Evaluation of CMT Cognitive from the experts’ point of view on CMT affordances Grid.
The chart, shown in Fig. 4, represents the evaluation of the cognitive components of CMT from theexperts’ point of view. The height of the bars represents the mean value of each component (fluency,flexibility, originality and elaboration), while the thickness represents the mean between the fouraspects for each question. From the evaluators’ point of view, there are no affordances on the items4 and 13, which means that the c-book does not establish connections between different knowledgeareas and mathematics (item 4) and it does not include half-baked constructs that call forintervention (item 13). On the other hand, the evaluators consider that the c-book encouragesexploratory activity and user experimentations (item 7) and encourages also generalizingmathematical phenomena, going from concrete cases to general ones or generalizing real worldphenomena through the use of mathematics (item 10).
ICTMT 13 353 Lyon 3 - 6 July 2017
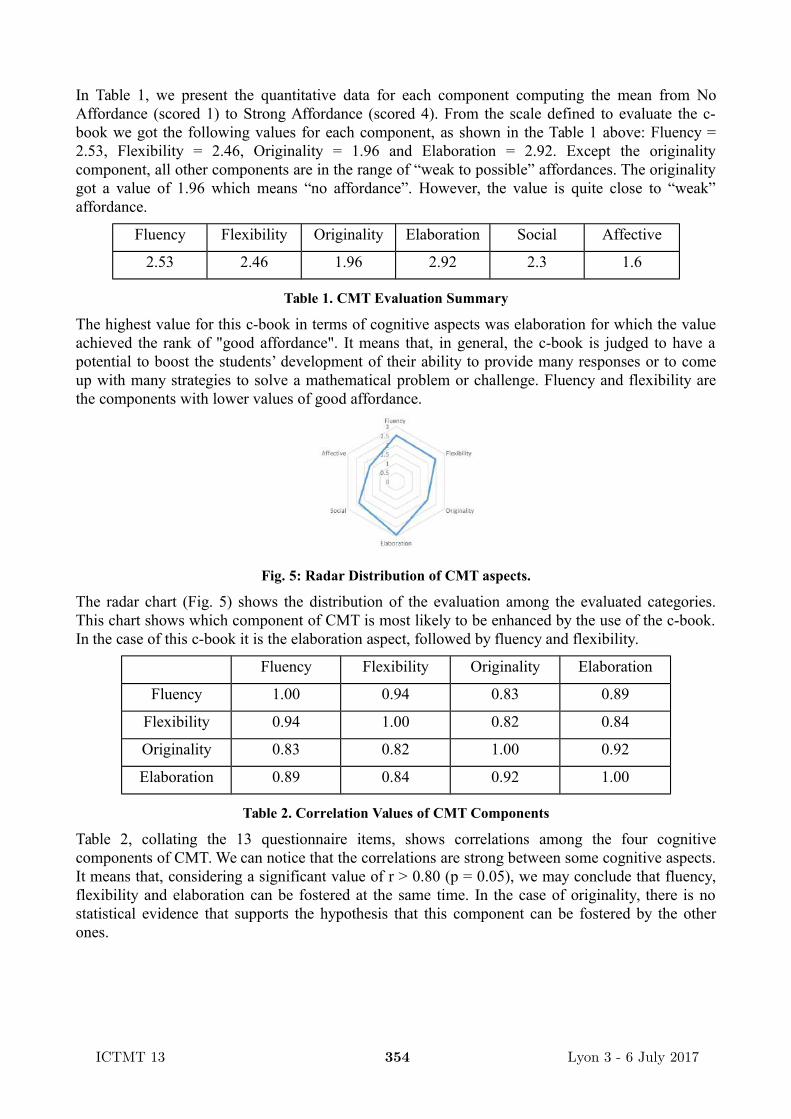
In Table 1, we present the quantitative data for each component computing the mean from NoAffordance (scored 1) to Strong Affordance (scored 4). From the scale defined to evaluate the c-book we got the following values for each component, as shown in the Table 1 above: Fluency =2.53, Flexibility = 2.46, Originality = 1.96 and Elaboration = 2.92. Except the originalitycomponent, all other components are in the range of “weak to possible” affordances. The originalitygot a value of 1.96 which means “no affordance”. However, the value is quite close to “weak”affordance.
Fluency Flexibility Originality Elaboration Social Affective
2.53 2.46 1.96 2.92 2.3 1.6
Table 1. CMT Evaluation Summary
The highest value for this c-book in terms of cognitive aspects was elaboration for which the valueachieved the rank of "good affordance". It means that, in general, the c-book is judged to have apotential to boost the students’ development of their ability to provide many responses or to comeup with many strategies to solve a mathematical problem or challenge. Fluency and flexibility arethe components with lower values of good affordance.
Fig. 5: Radar Distribution of CMT aspects.
The radar chart (Fig. 5) shows the distribution of the evaluation among the evaluated categories.This chart shows which component of CMT is most likely to be enhanced by the use of the c-book.In the case of this c-book it is the elaboration aspect, followed by fluency and flexibility.
Fluency Flexibility Originality Elaboration
Fluency 1.00 0.94 0.83 0.89
Flexibility 0.94 1.00 0.82 0.84
Originality 0.83 0.82 1.00 0.92
Elaboration 0.89 0.84 0.92 1.00
Table 2. Correlation Values of CMT Components
Table 2, collating the 13 questionnaire items, shows correlations among the four cognitivecomponents of CMT. We can notice that the correlations are strong between some cognitive aspects.It means that, considering a significant value of r > 0.80 (p = 0.05), we may conclude that fluency,flexibility and elaboration can be fostered at the same time. In the case of originality, there is nostatistical evidence that supports the hypothesis that this component can be fostered by the otherones.
ICTMT 13 354 Lyon 3 - 6 July 2017

We can conclude that even though the c-book main activity is designed to call for students’elaboration (they are invited to modify the initial situation by considering various combinations ofspecial lines in a triangle, whose intersection point generates a locus to explore), fluency andflexibility are fostered by providing the students a rich environment in which they can exploregeometric situations and try out algebraic formulas whereas benefitting from a feedback systemallowing them to control their actions and verify their conjectures. Specific feedback isimplemented toward directing students to produce different and varied situations and help them tobreak down their mind fixation by considering yet different configurations.
The c-book provides the students not only with digital tools enabling them to explore geometric andalgebraic aspects of the studied loci separately, but also with a so-called “cross-widgetcommunication” of Cinderella and EpsilonWriter, which makes it possible to experimentallydiscover the algebraic formula that matches the generated locus in a unique way; this feature maycontribute to the development of original approaches by the students.
CONCLUSION
The c-book presented in this paper is the result of a collaborative work of a group of designerscoming from various professional backgrounds, as the group comprises researchers in mathematics,mathematics education and computer science, as well as educational software developers. Withoutthe synergy among those group members, a number of design choices would have remained in ahypothetical state, namely the technological advances in terms of cross-widget communication andlearning analytics features. The design of the c-book has thus become a driving force in the c-booktechnology development, and in return, the unique c-book technology features enabled the creationof a resource with affordances promoting creative mathematical thinking.
This experience brings to the fore factors stimulating creativity in the collaborative design of digitaleducational resources. Among these are the following two:
A variety of designers’ profiles, as pointed out by Fischer (2005), as it encourages the searchfor novel information and perspectives;
A close collaboration with software developers which is critical for the design andimplementation of unique features of the c-book technology resulting in a creative resource.Thus the development of the technology and the educational resources designed with thistechnology feeds each other.
REFERENCES
Botsch, O. (1956). Bewegungsgeometrie. Reinhardt-Zeisberg, Band 4b. Moritz Diesterweg.
Boyer, C. B. (2012). History of analytic geometry. Courier Corporation Publications.
Descartes, R. (1637). La Géométrie. Appendix to Discours de la méthode.
EC (2006). Recommendation 2006/962/EC of the European Parliament and of the Council of 18December 2006 on key competences for lifelong learning. Official Journal of the European Union,L 394, 10–18.
El-Demerdash, M. (2010). The Effectiveness of an Enrichment Program Using Dynamic GeometrySoftware in Developing Mathematically Gifted Students' Geometric Creativity in High Schools.Doctoral dissertation, University of Education Schwaebisch Gmünd, Germany.
El-Demerdash, M. & Kortenkamp, U. (2009). The effectiveness of an enrichment program usingdynamic geometry software in developing mathematically gifted students' geometric creativity.
ICTMT 13 355 Lyon 3 - 6 July 2017

Paper Presented at the 9th International Conference on Technology in Mathematics Teaching –ICTMT 9, Metz, France, July 6-9, 2009.
Elschenbroich, H. J. (2001). Dem Hoehenschnittpunk auf der Spur. In Herget, W. et al; (Eds.),Medien verbreiten Mathematik (Proceedings) (pp. 86-91), Berlin: Verlag Franzbecker, Hildesheim.
Guilford, J. P. (1950). Creativity. American Psychologist, 5, 444–454.
Fischer, G. (2005). Distances and diversity: sources for social creativity. In Proceedings of the 5thconference on Creativity & cognition (pp. 128-136), ACM New York, NY, USA.
Guilford, J. P. (1950). Creativity. American Psychologist, 5, 444–454.
Haylock, D. (1997). Recognizing mathematical creativity in schoolchildren. Zentralblatt fürDidaktik der Mathematik, 27(2), 68-74.
Healy, L. (2000) Identifying and explaining geometrical relationship: interactions with robust andsoft Cabri constructions In: Proceedings of the 24th Conference of the International Group for thePsychology of Mathematics Education, T. Nakahara and M. Koyama (Eds.) (Vol.1, pp. 103-117)Hiroshima: Hiroshima University
Healy, L., & Kynigos, C. (2010). Charting the microworld territory over time: design andconstruction in learning, teaching and developing mathematics. Zentralblatt für Didaktik derMathematik, 42(1), 63-76.
Hoyles, C., & Noss, R. (2003). What can digital technologies take from and bring to research inmathematics education? In A. J. Bishop et al. (Eds.), Second International Handbook ofMathematics Education. Dordrecht: Kluwer Academic Publishers
Trgalova, J., El-Demerdash, M., Labs, O., & Nicaud, J. (2016). Collaborative design of educationaldigital resources for promoting creative mathematical thinking. Paper Presented at the 13th
International Congress on Mathematical Education – ICME 13, Hamburg, Germany, July 24-31,2016
Jares, J., & Pech, P. (2013). Exploring loci of points by DGS and CAS in teaching geometry.Electronic Journal of Mathematics and Technology, 7(2), 143-154.
Klein, F. (1924). Elementarmathematik vom h?heren Standpunkte aus, Band I. Dritte Auflage.Springer.
Laborde, C. (2005). Robust and soft constructions: two sides of the use of dynamic geometryenvironments. In Proceedings of the 10th Asian Technology Conference in Mathematics, KoreaNational University of Education, pp. 22-35.
Peigl, L. A., & Wayne, T. (2013). The NURBS book: monographs in visual communication.Springer, New York.
APPENDICES
Appendix A: CMT Affordances Grid
ICTMT 13 356 Lyon 3 - 6 July 2017

MATHEMATICS FOR GRAPHICS COMPUTING: students learn Algebra and program Python to create a project
where they make Algebra create a scenario’s photo.
Sandra Gaspar Martins1,2, José Manuel Matos2, João Beleza de Sousa1, Lucía Suárez1
1Instituto Superior de Engenharia de Lisboa- IPL, Portugal; 2Faculdade de Ciências e Tecnologia da UNL – UIED, Portugal
[email protected], [email protected], [email protected], [email protected]
This paper presents and evaluates an innovative multidisciplinary approach to teach algebra. Students learn, at the
same course, algebra and object-oriented programming in Python (a programming language). Both contents are widely
used to create a final project. The final project is a python program that, using the usual algebra sylabus simulates a
camera; Given, as input, a 3D scene created using triangles (three 3Dpoints), some light sources (3Dpoints) and a
point of view (3Dpoint) from where the “photo” is taken it gives, as output, an image file with the photo of that scene.
Many students revealed that to create an immediate application of algebra enhances their engagement. Other input
(other scene, other lights or other point of view) produces as output a new photo. Many of the participants: teachers,
students and researchers, evaluate positively this multi contents course besides the hard work it demands from all.
Keywords: Algebra; Python; Informatics Undergraduate Students; Applications; Engagement
INTRODUCTION
The integration of mathematics and computers is spread all over research. For example, in the Principles and Standards
of School Mathematics the National Council of Teachers of Mathematics (NCTM, 2000) one of six principles for high
quality mathematics education is the “Technology principle”. The act of programming a mathematical concept makes
school practice not essentially repetitive and foster reflective teaching experiences (Teixeira, Matos, & Domingos,
2015). Michele Artigue (2016) argues that dramatic changes come with the technological evolution in the ways that
teachers and students access information and resources, learn, communicate, interact, work and produce with others.
Using programation to teach mathematics is certainly one of those dramatic changes.
In a review of research on project-based learning, J. W. Thomas (2000) found many studies involving project based
learning and concluded that although it has some limitations, its evaluation was positive among students and teachers.
Mills and Treagust (2003) states that “the use of project-based learning as a key component of engineering programs
should be promulgated as widely as possible, because it is certainly clear that any improvement to the existing lecture-
centric programs that dominate engineering would be welcomed by students, industry and accreditors alike.”
To contrast programming languages, Fangohr (2004) made a comparison of C, MATLAB and Python as teaching
languages for engineering students. His study comprised two phases: to make an algorithm to solve a problem and to
translate it to a programming language. He found Python as the best choice in terms of clarity and functionality. Python
was also used to teach mathematics (Schliep & Hochstättler, 2002) since teaching algorithms is one of the natural
applications of multimedia in mathematics. The mathematics objects that they considered were of a highly dynamic
nature and require an adequate dynamic visualization using Python. Students also prefered Python as the first
programming language to learn when compared to Java and other commercial languages (Radenski & Atanas, 2006).
CONTEXT
In the semester of 2011/12, at Instituto Superior de Engenharia de Lisboa, Instituto Politécnico de Lisboa, was
developed a new course, Multimedia and Computer Science Engineering Graduation, and a course of Algebra for
graphic computation conceived by a mathematician (Carlos Leandro) and then itteratively improved by another
mathematician (Lucía Suárez) both working together with a computer scientist (João Beleza de Sousa). The syllabus
ICTMT 13 357 Lyon 3 - 6 July 2017

was conceived from the beginning and all Algebra concepts taught were programmed in Python and used to create the
project. This is a second semester curricular unit, students already know the programming basics, and are beginning
object oriented programming. The course has weekly classes of 1h30m of Python and 3h of Algebra, all taught by the
same professor (some are mathematicians, others are computer scientists). The classification is obtained 60% from
exam, 20% from online homework and 20% from individual final project with required discussion (students must grade
higher than 50% in every one of the 3 parts).
The course goal, as illustrated in the final project, is to develop a program in Python that when the user inserts (input) a
3D scenario made of triangles (three 3D points) with an associated RGB colour (triple/3D point), including the position
(3D point) and colour of some lights (RGB colour-triple) and the position of the camera (3D point), the output is a
photo of that scenario. If the input are different triangles, lights or position of the camera it immediately produces a
different photo as a “.ppm” file.
Figure 1. Example of the output of a student's project (not totally correct but very illustrative). The student made a
scenario with a background big blue trinangle and five pyramids: four yellow pyramids and one red. Two light focuses
give rise to two shadows for each pyramid and the different face colours dependent of the light incidence.
To create that program, students work with 3D points, vectors and matrices. The whole syllabus was designed to benearly all applied in this project. The syllabus is:
1. Matrices operations; Inverse matrix; Determinants; Linear equation systems; Proper values and vectors.2. 2D and 3D: Vectors and points; Referential and coordinates; Lines and plans; Internal and external product;
Angles; Barycentric coordinates.3. Geometric transformations (rotations, translations, scaling, …); Homogeneous coordinates and matricial
representation; Perspective and parallel projections. 4. Surfaces: Intersection of lines and planes; normal vectors, reflection and refraction.
DETAILED PROJECT
In “Algebra” classes, which are theorethical/practical, students are taught traditional Algebra.
In “Python” classes, typically every week, students program a class/object into a file, by themselves with the naturalsupport of teachers, using a guide provided before by teachers. Those students are Computer Science students and alltake their own labtop to class, all have one – this is not an issue. The first week there is an example, out of context, toteach students the basics of object oriented programming, for example, students create a class named Circle with thedata “radius”, its “constructor” and some operations as: area, perimeter; double_perimeter (whose output is the doubleof the perimeter) and n_perimeter (analogous). In the following weeks, student program every class (part of theprogram) that are needed for the final project.
ICTMT 13 358 Lyon 3 - 6 July 2017
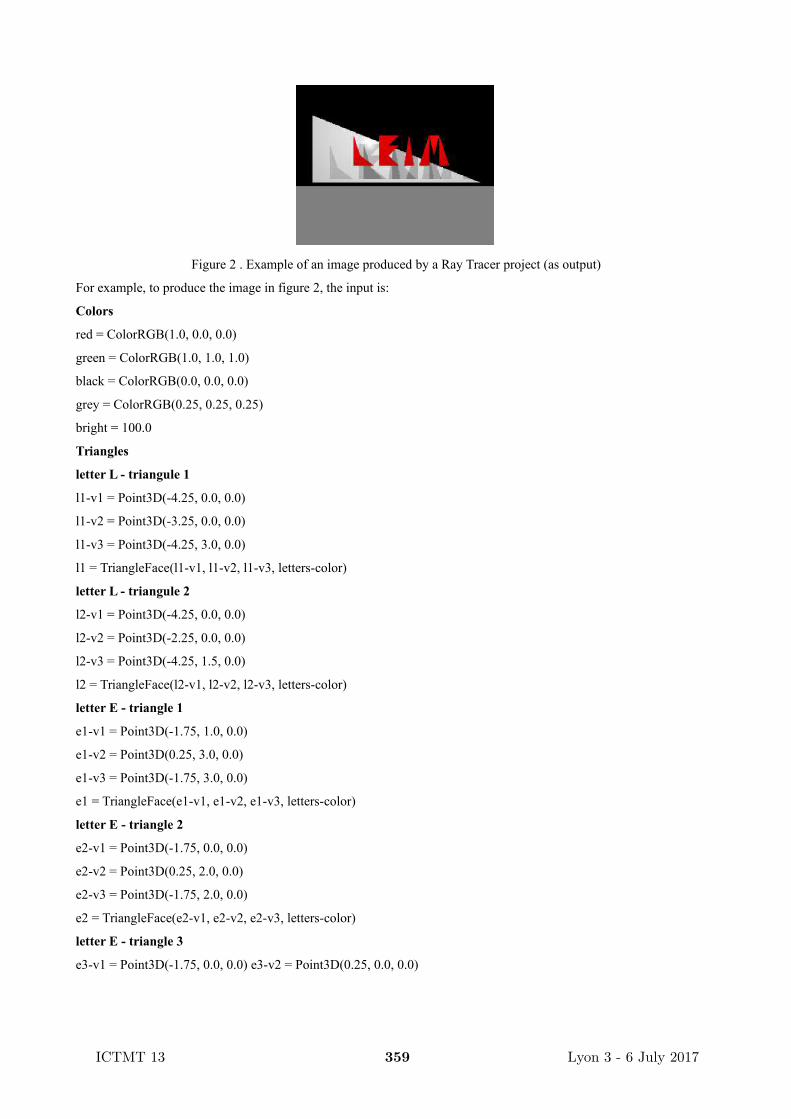
Figure 2 . Example of an image produced by a Ray Tracer project (as output)
For example, to produce the image in figure 2, the input is:
Colors
red = ColorRGB(1.0, 0.0, 0.0)
green = ColorRGB(1.0, 1.0, 1.0)
black = ColorRGB(0.0, 0.0, 0.0)
grey = ColorRGB(0.25, 0.25, 0.25)
bright = 100.0
Triangles
letter L - triangule 1
l1-v1 = Point3D(-4.25, 0.0, 0.0)
l1-v2 = Point3D(-3.25, 0.0, 0.0)
l1-v3 = Point3D(-4.25, 3.0, 0.0)
l1 = TriangleFace(l1-v1, l1-v2, l1-v3, letters-color)
letter L - triangule 2
l2-v1 = Point3D(-4.25, 0.0, 0.0)
l2-v2 = Point3D(-2.25, 0.0, 0.0)
l2-v3 = Point3D(-4.25, 1.5, 0.0)
l2 = TriangleFace(l2-v1, l2-v2, l2-v3, letters-color)
letter E - triangle 1
e1-v1 = Point3D(-1.75, 1.0, 0.0)
e1-v2 = Point3D(0.25, 3.0, 0.0)
e1-v3 = Point3D(-1.75, 3.0, 0.0)
e1 = TriangleFace(e1-v1, e1-v2, e1-v3, letters-color)
letter E - triangle 2
e2-v1 = Point3D(-1.75, 0.0, 0.0)
e2-v2 = Point3D(0.25, 2.0, 0.0)
e2-v3 = Point3D(-1.75, 2.0, 0.0)
e2 = TriangleFace(e2-v1, e2-v2, e2-v3, letters-color)
letter E - triangle 3
e3-v1 = Point3D(-1.75, 0.0, 0.0) e3-v2 = Point3D(0.25, 0.0, 0.0)
ICTMT 13 359 Lyon 3 - 6 July 2017

…
letter M - triangle 1
m3-v1 = Point3D(4.25, 0.0, 0.0)
m3-v2 = Point3D(5.25, 0.0, 0.0)
m3-v3 = Point3D(4.25, 3.0, 0.0)
m3 = TriangleFace(m3-v1, m3-v2, m3-v3, letters-color)
Background
background-v1 = Point3D(-10.0, -2.0, -2.0)
background-v2 = Point3D(10.0, -2.0, -2.0)
background-v3 = Point3D(-10.0, 6.0, -2.0)
background = TriangleFace(background-v1, background-v2, background-v3, background-color)
Floor
floor-v1 = Point3D(-12.0, -2.0, 0.0)
floor-v2 = Point3D(12.0, -2.0, 0.0)
floor-v3 = Point3D(0.0, -2.0, 1.0*10**4)
floor = TriangleFace(floor-v1, floor-v2, floor-v3, floor-color)
faces-list = [l1, l2, e1, e2, e3, i1, m1, m2, m3, background, floor]
Lights list
light1-position = Point3D(-5.0, 4.0, 5.0)
light2-position = Point3D( 5.0, 4.0, 5.0)
light1 = PontualLight(light1-position,white, white ,white)
light2 = PontualLight(light2-position, white, white, white )
lights-list = [light1, light2]
The camera
camera-position = Point3D(0.0, 0.0, 10.0)
camera-looking-to = Point3D(0.0, 0.0, 0.0)
camera-vertical = Vetor3D(0.0, 1.0, 0.0)
camera-distance-eye-to-projection-plane= 5.0
camera-large-projection-rectangle = 10.0
camera-high-projection-rectangle = 8.0
camera-resolution-horizontal = 300
camera-vertical-resolution = 240
Main body
camera =. . .
background-color = black
ray-tracer = RayTracer(faces-list, lights-list, camera, background-color)
Roughly, we have a World Coordinates System where the scene (set of coloured triangles) is implemented; the Camera
ICTMT 13 360 Lyon 3 - 6 July 2017

Coordinates System and a plane (projection plane) where the scene is projected and where the image is produced.
Figure 3. The two coordinate systems in use and the projection plan.
The “Ray Tracing” model will be explained now in detail. In order to produce an image from a 3D scene, a virtualcamera is placed on the scene. The virtual camera projection surface is a rectangle placed at some distance from thecamera position, along the view direction. This projection rectangle is divided into pixels. Since the image resolution isfinite only a finite number of rays that came from each light must be followed.
Given that the virtual camera properties, such as the distance from the camera position to the projection rectangle, arespecified in the Camera Coordinates System, and the scene, composed by triangles, is defined in the World CoordinatesSystem, a simple ray tracing algorithm would be:
1) for each pixel in the projection rectangle create a ray (a line) that start at the camera position (the eye position-a 3Dpoint) and passes through the pixel position (a 3D point).
2) convert the scene coordinates (3D points) from the World Coordinates System to the Camera Coordinates System(Referential change). This is because the ray constructed in the previous step (defined in the Camera CoordinatesSystem) will be intercepted with the scene triangles defined in the World Coordinates System. This conversion isdone using a matrix.
3) intercept each ray (line) with each triangle in the scene. Each triangle is defined by a plane equation. Theinterception of ray/triangle (equations system) is solved by the Crammer method (matrix determinants).
a) if the ray does not intersect any triangle, use the scene background color as the pixel color.
b) if the ray intercepts a set of triangles, choose the nearest one, as the visible one (this assumes that the trianglesare opaque). Determining the nearest triangle is done by computing vectors (defined between the eye positionand the interception) length.
i) create new rays (lines) starting at the interception point and ending at each light source. If some othertriangle in the scene intercepts this new ray, that means that the point is in shadow. In either case, inshadow or not, use a color model such as the Phong model, to get the color of the interception point.
ii) add the contribution of all light sources to get the pixel color (sum of 3Dpoints).
Figure 4. A scheme illustrating the Ray Tracer procedure.
ICTMT 13 361 Lyon 3 - 6 July 2017
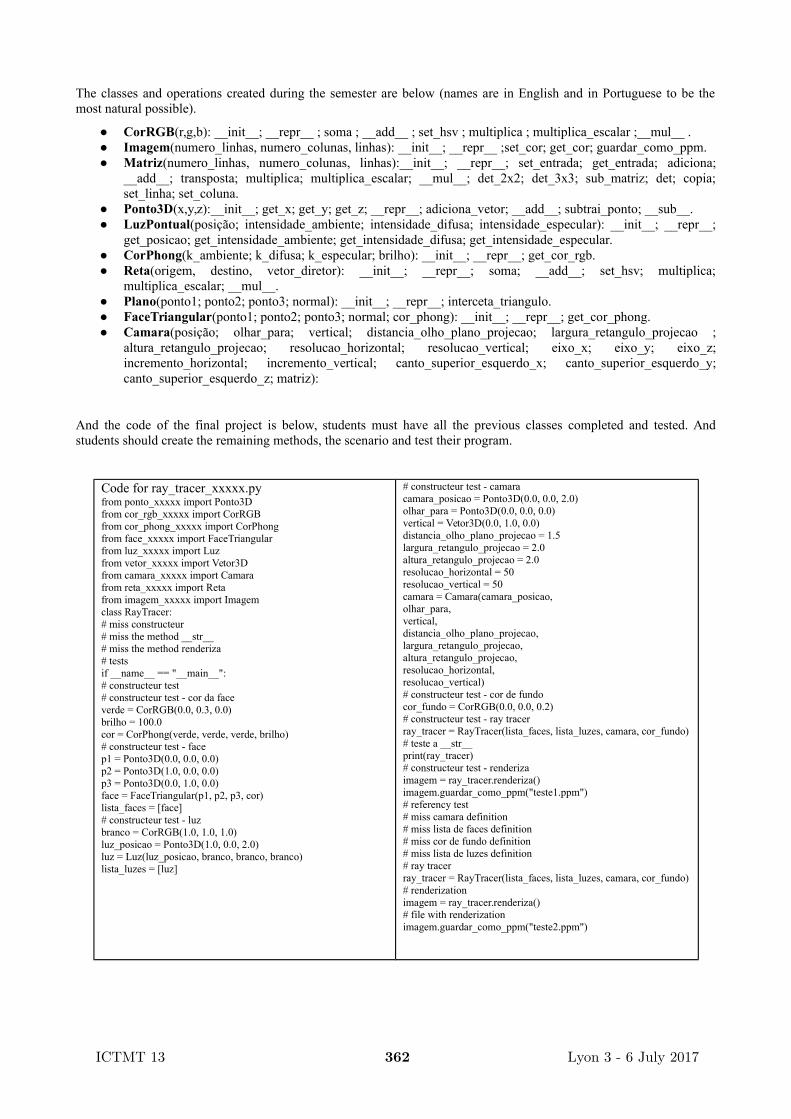
The classes and operations created during the semester are below (names are in English and in Portuguese to be themost natural possible).
● CorRGB(r,g,b): __init__; __repr__ ; soma ; __add__ ; set_hsv ; multiplica ; multiplica_escalar ;__mul__ .● Imagem(numero_linhas, numero_colunas, linhas): __init__; __repr__ ;set_cor; get_cor; guardar_como_ppm.● Matriz(numero_linhas, numero_colunas, linhas):__init__; __repr__; set_entrada; get_entrada; adiciona;
__add__; transposta; multiplica; multiplica_escalar; __mul__; det_2x2; det_3x3; sub_matriz; det; copia;set_linha; set_coluna.
● Ponto3D(x,y,z):__init__; get_x; get_y; get_z; __repr__; adiciona_vetor; __add__; subtrai_ponto; __sub__.● LuzPontual(posição; intensidade_ambiente; intensidade_difusa; intensidade_especular): __init__; __repr__;
get_posicao; get_intensidade_ambiente; get_intensidade_difusa; get_intensidade_especular.● CorPhong(k_ambiente; k_difusa; k_especular; brilho): __init__; __repr__; get_cor_rgb.● Reta(origem, destino, vetor_diretor): __init__; __repr__; soma; __add__; set_hsv; multiplica;
multiplica_escalar; __mul__.● Plano(ponto1; ponto2; ponto3; normal): __init__; __repr__; interceta_triangulo.● FaceTriangular(ponto1; ponto2; ponto3; normal; cor_phong): __init__; __repr__; get_cor_phong.● Camara(posição; olhar_para; vertical; distancia_olho_plano_projecao; largura_retangulo_projecao ;
altura_retangulo_projecao; resolucao_horizontal; resolucao_vertical; eixo_x; eixo_y; eixo_z;incremento_horizontal; incremento_vertical; canto_superior_esquerdo_x; canto_superior_esquerdo_y;canto_superior_esquerdo_z; matriz):
And the code of the final project is below, students must have all the previous classes completed and tested. Andstudents should create the remaining methods, the scenario and test their program.
Code for ray_tracer_xxxxx.pyfrom ponto_xxxxx import Ponto3Dfrom cor_rgb_xxxxx import CorRGBfrom cor_phong_xxxxx import CorPhongfrom face_xxxxx import FaceTriangularfrom luz_xxxxx import Luzfrom vetor_xxxxx import Vetor3Dfrom camara_xxxxx import Camarafrom reta_xxxxx import Retafrom imagem_xxxxx import Imagemclass RayTracer:# miss constructeur# miss the method __str__# miss the method renderiza# testsif __name__ == "__main__":# constructeur test# constructeur test - cor da faceverde = CorRGB(0.0, 0.3, 0.0)brilho = 100.0cor = CorPhong(verde, verde, verde, brilho)# constructeur test - facep1 = Ponto3D(0.0, 0.0, 0.0)p2 = Ponto3D(1.0, 0.0, 0.0)p3 = Ponto3D(0.0, 1.0, 0.0)face = FaceTriangular(p1, p2, p3, cor)lista_faces = [face]# constructeur test - luzbranco = CorRGB(1.0, 1.0, 1.0)luz_posicao = Ponto3D(1.0, 0.0, 2.0)luz = Luz(luz_posicao, branco, branco, branco)lista_luzes = [luz]
# constructeur test - camaracamara_posicao = Ponto3D(0.0, 0.0, 2.0)olhar_para = Ponto3D(0.0, 0.0, 0.0)vertical = Vetor3D(0.0, 1.0, 0.0)distancia_olho_plano_projecao = 1.5largura_retangulo_projecao = 2.0altura_retangulo_projecao = 2.0resolucao_horizontal = 50resolucao_vertical = 50camara = Camara(camara_posicao,olhar_para,vertical,distancia_olho_plano_projecao,largura_retangulo_projecao,altura_retangulo_projecao,resolucao_horizontal,resolucao_vertical)# constructeur test - cor de fundocor_fundo = CorRGB(0.0, 0.0, 0.2)# constructeur test - ray tracerray_tracer = RayTracer(lista_faces, lista_luzes, camara, cor_fundo)# teste a __str__print(ray_tracer)# constructeur test - renderizaimagem = ray_tracer.renderiza()imagem.guardar_como_ppm("teste1.ppm")# referency test# miss camara definition# miss lista de faces definition# miss cor de fundo definition# miss lista de luzes definition# ray tracerray_tracer = RayTracer(lista_faces, lista_luzes, camara, cor_fundo)# renderizationimagem = ray_tracer.renderiza()# file with renderizationimagem.guardar_como_ppm("teste2.ppm")
ICTMT 13 362 Lyon 3 - 6 July 2017

Table 1. Code to drive students to create the final class: Ray Tracer
ICTMT 13 363 Lyon 3 - 6 July 2017

METHODOLOGY
This research is a design research (Reeves, Herrington, & Oliver, 2005). The research question is: Is it possible to create
an innovative multidisciplinary course joining algebra and a programming language that is positively evaluated by
students and teachers? This is by itself a significant educational problem, but also it is made using a real project wich
makes it pedagogicaly even more relevant.
This approach has been taught for seven years, reaching around 700 students. In the last two of those years an
anonymous survey was presented to the students to get their feedback from the course. The approval rates of the last
three years were monitorized. Iterative teachers’ and researcher’s reflection lead to changes and corrections to the
project until to arrive to this stable status. For example, in the beginning teachers give the correct programing code to
students before all Python classes, but now students program the code (following a guide) by themselves mostly in class
with teacher’s support. In the beginning the program was slower, it was improved to became faster, however, is still
slow; in the following semester, we will study the implementation of a slightly different program wich is not a Ray
Tracer but a Rendering Pipeline which produces images with lower quality but much faster.
DATA ANALYSIS
In 2016, the survey was compound of three questions:
● General evaluation of the course (0 to 20).● Positive aspects of the course, to maintain.● Negative aspects of the course, to change.
It was presented to the 45 students who completed the project immediately after getting their final mark and was
answered anonimously. The mean grade given to the course was 15,5. And 35 over 45 gave 15 or more as the grade to
the course. Many different aspects were approached as positive and negative. The most relevant to this research was:
● 14 students refer the interest of the course and final project, for example: “extremely positive the connectionbetween mathematics and Python”; “final project strongly interesting”; “positive: connect mathematics andPython”, “interesting subject”; “abstract subject that makes connection to reality”.
● 9 students refer as negative that need more classes/support in Python while 14 refer that there is a high/enoughtsupport from teachers.
● 9 students had nothing to refer as negative while only two had nothing to refer as positive.
In 2017, the anonymous survey was presented online to all subscribed students and it was answered by 43 over the 113
subscribed. Beyond the questions of the previous semester some were added. One of them allows us to know that 72%
of respondents were approved students, which as in the previous survey introduces some biase on results.
The mean grade given to the course was 16,1. And 17 over 31 gave 15 or more as the grade to the course. Many
different aspects were approached as positive and negative. The most relevant to this research was: As positive: “The
fact that mathematics complements programming and vice versa”; “Programming certain functions helped me to better
understand Algebra”; “The creation of RayTracer, I found interesting and a good application to mathematics”, “The
project”; “I like the work of Python and Mathematics”; “the interconnection between the given subject and the final
work is excellent and helps to consolidate all the knowledge and to test it.”; “There should be MCG2”; “increases
motivation”;… As negtive: little time to finish the project (5 students reffered it).
All the four teachers of the course unanimously evaluate that approach as highly positive and that showing an
immediate utilization of Algebra, using programming languages to create an image makes mathematics more interesting
and engaging to those students. Moreover, Graphics computing, it’s not just an example, is a central issue on a
Multimedia Degree. Aldo, it creates a course with double difficulty since students must learn mathematics and
programming. In 2015, the approval rate over assessed students was of 24/84=29% and over subscribed was
36/109=33%. In 2016, the approval rate over assessed students was of 36/72=50% and over subscribed was
ICTMT 13 364 Lyon 3 - 6 July 2017

36/110=33%. In 2017, the approval rate over assessed students was of 49/93=53% and over subscribed was
49/113=43%.
The approved students in fact learned all the parts since they grade more than 50%: in mathematic’s final exam; in
online individual (randomly generated) online homework (around 6 a semester) and also since they created and
defended on a 30 minutes individual interview their project of object oriented programing in Python.
CONCLUSIONS AND FUTURE WORK
As conclusion, it is, in fact, possible to create a real multidisciplinary approach to teach algebra and a programming
language together. Teachers and many students mostly found as positive that innovative approach that allows to
experience the connection between mathematics and Python. However, some problems occurred, like mixing two
difficult contents that makes the approval rate of students to be lower than desirable.
The Ray tracer program is a bit slow when renderizing the image, so we are studying the hypotesis of migrating to a
Pipeline project that allows the image to be created faster but with lower quality.
REFERENCES
Artigue, M. (2016, March). Mathematics Education Research at University Level: Achievements and Challenges.
In First conference of International Network for Didactic Research in University Mathematics.
Fangohr, H. (2004). A comparison of C, MATLAB, and Python as teaching languages in engineering. In International
Conference on Computational Science (pp. 1210-1217). Springer Berlin Heidelberg.
Mills, J. E., & Treagust, D. F. (2003). Engineering education—Is problem-based or project-based learning the answer.
Australasian journal of engineering education, 3(2), 2-16.
NCTM. (2000). Principles and standards for school mathematics, Reston, VA.
Radenski, Atanas. "Python First: A lab-based digital introduction to computer science." ACM SIGCSE Bulletin 38.3
(2006): 197-201.
Reeves, T. C., Herrington, J., & Oliver, R. (2005). Design research: A socially responsible approach to instructional
technology research in higher education. Journal of Computing in Higher Education, 16(2), 96.
Schliep, A., & Hochstättler, W. (2002). Developing gato and catbox with python: Teaching graph algorithms through
visualization and experimentation. In Multimedia Tools for Communicating Mathematics (pp. 291-309). Springer
Berlin Heidelberg.
Teixeira, P., Matos, J. M., & Domingos, A. (2015). MATHEMATICS TEACHERS’INSTRUMENTAL GENESIS OF
TECHNOLOGICAL MATERIALS. In 12th International Conference on Technology in Mathematics Teaching (p.
328).
Thomas, J. W. (2000). A review of research on project-based learning.
ICTMT 13 365 Lyon 3 - 6 July 2017

366

Chapter 7
SOFTWARE AND APPLICATIONS
ICTMT 13 367 Lyon 3 - 6 July 2017

An interactive book on axial symmetry and the synergic use with paper and pin
Eleonora Faggiano1, Antonella Montone1, Michele Giuliano Fiorentino1, Maria Alessandra Mariotti2
1Università di Bari Aldo Moro, Italy,
[email protected]; [email protected]; [email protected]à di Siena, Italy, [email protected]
This work presents results from a teaching experiment concerning the construction-conceptualization of axial symmetry at Primary School through an interactive book, developed in aDynamic Geometry Environment (DGE), which embeds a set of tasks to be accomplished withselected DGE tools. The tasks are part of a teaching sequence, framed by the Theory of SemioticMediation (TSM), whose main characteristic is the synergic use of a “duo of artefact”. The duo ismade up of a digital artefact - the interactive book - and a manipulative artefact, constituted bypaper and pin. Herein, we describe the design of the interactive book and we show how a cognitivesynergy arises from its use combined with the use of the manipulative artefact within the sequence,thus leading to the conceptualization of mathematical meanings.
Keywords: Synergy between artefacts, Duo of artefacts, Digital Artefacts, Dynamic GeometryEnvironments, Theory of Semiotic Mediation
INTRODUCTION
Nowadays scholars generally agree that the use of tools, being manipulative or digital artefacts, canhave potential to enhance mathematical understanding (Monaghan et al., 2016). In particular, manyresearchers have investigated on the use of Dynamic Geometry Environments (DGEs) in themathematical teaching and learning processes. Leung (2008), for instance, underlies that a DGE hasthe ability to visually make explicit the implicit dynamism of “think about” mathematical concepts.The dragging function in DGE, indeed, allows to perceive patterns of variation and to discoverinvariant properties, thus playing a key role in the construction of mathematical meanings.However, different epistemological approaches to mathematical learning have different implicationson designing tool-based teaching and learning activities (Leung and Bolite-Frant, 2015). Forexample, tools can be seen as mediators for mathematical discourse (Sfard, 2008) or aspsychological tools in the context of social and cultural interaction, developed through the zone ofproximal development and internalization processes (Vygotsky, 1978).
This work is part of a research project developed in a Vygotskian perspective and, more precisely,under the overarch of the Theory of Semiotic Mediation (TSM) (Bartolini Bussi and Mariotti,2008), in which artefacts can be seen as tools of semiotic mediation. In order to design a teachingsequence, aimed at fostering the construction/conceptualization of axial symmetry at PrimarySchool, we have considered a “duo of artefacts” (Maschietto and Soury-Lavregne, 2013), composedby a manipulative artefact and a digital one. The choice of the artefacts has been done with the aimto develop a synergy between their use, whereby the potential of the activities with the artefactswould be enhanced.
In this paper we describe, in particular, the design of the digital artefact, an Interactive Book (IB)developed in a DGE. The IB is presented focusing on the semiotic potential of its use, according tothe TSM, within the designed sequence, in which it is combined with the use of the manipulativeartefact.
Moreover, we present and discuss outcomes from the experimentation of the sequence, aiming toanswer to the following research question: can the synergic use of our duo of artefacts develop acognitive synergy fostering the conceptualization of axial symmetry?
ICTMT 13 368 Lyon 3 - 6 July 2017

THEORETICAL FRAMEWORK
The Theory of Semiotic Mediation, developed by Bartolini Bussi and Mariotti (2008), deals withthe complex system of semiotic relations among: the artefact, the task, the mathematical knowledgethat is the object of the activity, and the teaching/learning processes that take place in the class.
According to it, in semiotic activities various signs are produced: the “artefact signs”, that oftenhave a highly subjective nature and are linked to the learner's specific experience with the artefactand the task to be carried out; the “mathematical signs”, in other words the knowledge ofmathematics to which the “artefact signs” must evolve; and finally the “pivot signs”, that illustratethe evolution between artefact signs and mathematical signs, through the linked meanings.
The role of the teacher is to foster, through Mathematical Discussions (Bartolini Bussi, 1998), theshared construction of mathematical signs, guiding the evolution of personal meanings towardmathematical meanings. In the design of our teaching sequence, we followed the general scheme ofsuccessive “didactic cycles”, which organize the coordination between activities with the artefactand semiotic activities, finalized to make the expected evolution of signs occur.
Moreover, in the design process of the teaching activities we focused upon the “semiotic potential”of the artefact, that is the basis underlying, on the one hand, the design of the teaching activitiesand, on the other, the analyses of both the actions and production of signs and the evolution ofmeanings.
To complete the description of the theoretical framework of this research we need to refer to thenotion of “duo of artefacts”. Maschietto and Soury-Lavregne (2013) have designed a digital artefactcorresponding to a given physical artefact in order to investigate if such a “duo of artefacts”, canenlarge and improve the learning experience of the students. In our study, as in their duo, the twoartefacts must have some common characteristics, enabling transfer and reinvestment from one tothe other. For this reason, whilst our digital artefact is not a digital counterpart of the manipulativeartefact, we do use this notion in our work as well.
RESEARCH METHODOLOGY
Following the teaching experiment methodology (Steffe and Thompson, 2000), a teaching sequencehas been designed in conformity with the chosen theoretical framework and the formulatedhypothesis. It constructs the environment where the data, on which to analyse the results of theexperiment, are collected. The sequence is framed on the TSM taking into account a theoreticalreflection on the meaning of axial symmetry, with its definition and its properties, and an a priorianalysis of the semiotic potential of the artefacts. It has been implemented with fourth gradestudents in a pilot study, involving two groups of four pupils, and in a further study, involving awhole class of twenty pupils. The teaching experiments were videotaped and conversations weretranscribed, that also took into account the specific actions taken with the artefacts. The videotapesand transcriptions were then used to analyse the teaching experiments.
Analysis of the pilot study results, not only showed that the sequence contributed to the emergenceand evolution of signs – in line with what expected by the a priori analysis - but also demonstratedthe development of a cognitive synergy, linked to the alternate use of the two artefacts thatpromoted the construction of meanings (Faggiano et. al, 2016). The need to examine any changes inorder to develop the same path in a “real” class led to the design and implementation of the teachingexperiment with the class. The results presented here are based on this last study.
THE INTERACTIVE BOOK AND THE SYNERGIC USE WITH PAPER AND PIN
The artefacts of our duo address the same mathematical content and have been chosen for theirsemiotic potential, in terms of meanings that can be evoked when carrying out suitable tasksinvolving their use.
ICTMT 13 369 Lyon 3 - 6 July 2017

The components of the manipulative artefact are a sheet of paper, with a straight line drawn on itmarking where to fold it, and a pin to be used to pierce the paper at a point in order to construct itssymmetrical point. This artefact allows an axial symmetry to be created in a direct fashion, becausethe sheet naturally models the plane and the fold allows the production of two symmetrical pointsusing the pin.
The components of the digital artefact, that appears as an Interactive Book (IB), originate from thecomponents of a specific Dynamic Geometry Authoring Environment (New Cabri - Cabrilog), inwhich learning activities, involving objects and tools of a DGE, can be created. The IB Book isdescribed with more details in the following section.
The design of the Interactive Book and an overview of the teaching sequence
The Interactive Book has been designed, in order to exploit the potential offered by the draggingfunction. Below we present, how the design of the tasks embedded in the IB has been developed forthe digital artefact and the manipulative one. The main hypothesis inspiring the design concerns thepotential synergy between the use of one artefact with respect to the other.
The IB contains a title page (Fig. 1.a) and a page created with the aim to introduce the buttons/toolsinvolved in the activities of the IB (Fig. 1.b). The chosen tools are: those that allow the constructionof some geometric objects (Point, Straight Line, Segment, Middle Point, Perpendicular Line,Intersection Point); the “Compass”; the “Symmetry”, which gives back a symmetric figure,provided that a figure and a line/axis have been chosen; and the “Trace” tool which, allowing theobservation of the relations among the trajectories, makes more evident the effects of the dragging.The next pages of the IB have been integrated in the sequence as it will be explained below.
1.a 1.b
Figure 1. The first two pages of the Interactive Book
In the teaching sequence, in accordance with the study hypothesis, it was decided to alternateactivities involving the use of one or the other artefact, formulating tasks that could exploit thecomplementarity of their semiotic potentials. The sequence, made up of six didactic cycles, beginwith the use of the manipulative artefact. It continues with the use of the digital artefact in thesecond cycle and alternating the use of the artefacts in the third and the fourth cycle, while the orderof the artefacts in the last two cycles is inverted.
In the first cycle, pupils are asked to construct the symmetric figure of a given figure with respect toa given line, by folding the paper along the line and piercing with the pin on the necessary points.The acts to fold the paper along the line and to pierce on a point with a pin, in order to obtain acouple of overlapping points, is a first possible way to concretely realise a symmetric configuration.
ICTMT 13 370 Lyon 3 - 6 July 2017

Such a manipulative experience, can foster the emergence of the idea that an axial symmetry is aone-to-one correspondence between points in the plane, defined by a line, locus of fixed points. Inaddition, joining the points, obtained with the pin, is the process that yields as product thesymmetrical figure, provided that the correspondence between the segments is preserved. Thisevokes the idea that axial symmetry transforms segments into congruent segments. In the followingtask of the cycle, pupils are asked to compare what changes and what remains unchanged whendrawing two symmetrical figures of the same figure, with respect to two distinct axes. This task hasbeen conceived to evoke the dependence of the symmetrical figure on the axial symmetry.
The first activity page of the IB (Fig. 2.a) presents the tasks of the second cycle. They have beendesigned with the aim to make two key meanings emerge: the dependence of a symmetric pointfrom the point of origin and the role of the line to define an axial symmetry. The pupils are asked toconstruct the symmetric point of a given point A with respect to a given line, using the “Symmetry”button/tool, and call it C. Then pupils are invited to activate the “Trace” tool on point A and point C,move A and see what moves and what doesn’t, and explain why. In the next two steps, in the sameway, the pupils are invited to move the line and the symmetric point and to observe what happensduring the dragging.
We emphasize that, in the DGE used, unlike for example in Cabrì Géometrè, it is possible to dragthe symmetric point obtained, and this in fact allows the whole paper to be “shifted”.
In this activity, dragging the point of origin and observing the resulting movement of thesymmetrical point evokes the idea of the dependence of the symmetrical point on the point oforigin; dragging the axis and observing the resulting movement, only of the symmetrical point,evokes the idea of dependence of the symmetrical point on the axial symmetry; dragging thesymmetrical point and observing the resulting rigid movement of the entire configuration evokesthe idea of the dual dependence of the symmetrical point both on the point of origin and on the axis.The difference in the movements between the symmetrical point and the point of origin can becompared to the distinction between dependent and independent variable.
The tasks of the third cycle aim at: observing that the line joining two symmetrical points isperpendicular to the axis and that the two points are equidistant from the axis; recognizing that thesetwo properties are reversible and that they characterize axial symmetry. With this purpose, pupilsare asked to construct the symmetric point without the use of the pin.
The tasks of the fourth cycle are embedded in the next page of the IB. Similarly to the third cycle,pupils are asked to construct the symmetric point without the use of the “Symmetry” button/tool. Inorder to make this construction, the two properties that characterise axial symmetry, alreadyemerged in the previous cycle, need to be properly used. Pupils, indeed, have to: draw theperpendicular line to the axis, passing through the point of origin; draw the circumference withcentre in the intersection point between the axis and the perpendicular line; and finally find thesymmetric point as the intersection point between the circumference and the perpendicular line.
ICTMT 13 371 Lyon 3 - 6 July 2017

2.a 2.b
Figure 2. Examples of activity pages of the Interactive Book
In the fifth and sixth cycles the tasks are the same: there is a pair of points A and C that must beinterpreted as symmetrical points with respect to a symmetry where the axis is hidden. Pupils areasked to identify and draw the axis (Fig 2.b). Finally, they are asked to check, using the“Symmetry” button/tool or with the pin, whether the symmetrical point of A with respect to thedraw line is really C.
A priori analysis of the potential synergy
The hypothesis formulated is that a reciprocal boosting process will occur, in the form of a synergicprocess of mediation through the different types of artefacts.
For example, at the second cycle we can expect that the meanings that have already emerged thanksto the use of the manipulative artefact may be extended and completed by the specific meanings thatshould emerge using the digital artefact.
In other words, the images on the screen can be better interpreted in the light of the previous acts offolding and piercing. In this sense, after having constructed the symmetrical point using the digitalartefact, the relation between the two points can be interpreted through the actions of folding, so thetwo points can be seen as two holes generated by the pin. While the meaning of the relation can beenhanced by the distinction between the original point and the corresponding point, which in the IBcorresponds respectively to the direct movement and the indirect movement.
In this way, such a combined interpretation, may contribute to the development of the mathematicalmeaning of a functional relation between a point (independent) and its symmetrical point(dependent).
Conversely, at the third cycle, we can expect that, the interpretation of the actions and theconfigurations with the manipulative artefact might be related to the experiences within the digitalenvironment.
For example, we can expect that two different points, of which to construct the symmetric points,can be interpreted as different positions adopted by a point that has been dragged, therebycontributing to the generalization of the two properties (perpendicularity and equidistance) and tothe evolution of the status of these properties from being seen as contingent to being seen ascharacterizing.
Further similar considerations can be done concerning the expected synergy between the artefacts inthe next cycles. More details can be found in (Montone et a., 2017).
ICTMT 13 372 Lyon 3 - 6 July 2017
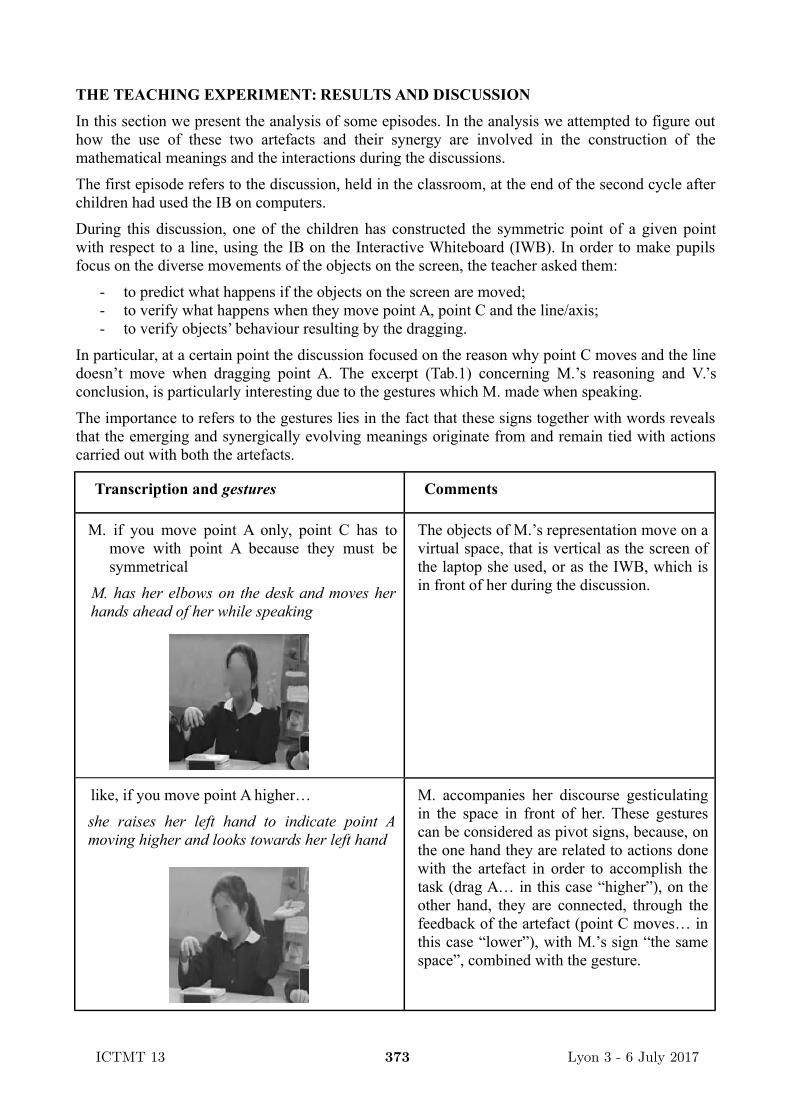
THE TEACHING EXPERIMENT: RESULTS AND DISCUSSION
In this section we present the analysis of some episodes. In the analysis we attempted to figure outhow the use of these two artefacts and their synergy are involved in the construction of themathematical meanings and the interactions during the discussions.
The first episode refers to the discussion, held in the classroom, at the end of the second cycle afterchildren had used the IB on computers.
During this discussion, one of the children has constructed the symmetric point of a given pointwith respect to a line, using the IB on the Interactive Whiteboard (IWB). In order to make pupilsfocus on the diverse movements of the objects on the screen, the teacher asked them:
- to predict what happens if the objects on the screen are moved; - to verify what happens when they move point A, point C and the line/axis; - to verify objects’ behaviour resulting by the dragging.
In particular, at a certain point the discussion focused on the reason why point C moves and the linedoesn’t move when dragging point A. The excerpt (Tab.1) concerning M.’s reasoning and V.’sconclusion, is particularly interesting due to the gestures which M. made when speaking.
The importance to refers to the gestures lies in the fact that these signs together with words revealsthat the emerging and synergically evolving meanings originate from and remain tied with actionscarried out with both the artefacts.
Transcription and gestures Comments
M. if you move point A only, point C has tomove with point A because they must besymmetrical
M. has her elbows on the desk and moves herhands ahead of her while speaking
The objects of M.’s representation move on avirtual space, that is vertical as the screen ofthe laptop she used, or as the IWB, which isin front of her during the discussion.
like, if you move point A higher…
she raises her left hand to indicate point Amoving higher and looks towards her left hand
M. accompanies her discourse gesticulatingin the space in front of her. These gesturescan be considered as pivot signs, because, onthe one hand they are related to actions donewith the artefact in order to accomplish thetask (drag A… in this case “higher”), on theother hand, they are connected, through thefeedback of the artefact (point C moves… inthis case “lower”), with M.’s sign “the samespace”, combined with the gesture.
ICTMT 13 373 Lyon 3 - 6 July 2017

point C moves lower… so it is the same…
she puts her hands in front of her face, tosimulate, with the thumb and index of eachhand, two identical segments, she moves herright hand lower to show that, in this case,point C moves lower and looks towards herright hand
…because there must be… the samespace… between the two points
with a fast coordinated movement of her hands,she simulates two segments having the samelength, using the thumb and index and bendingthe other fingers
The equidistance of the points A and C fromthe axis, thus, is evoked simultaneously by theverbal sign with the gesture. This sign is againa pivot sign.
V. because there must be the same distancebetween the line… there must be alwaysthe same distance between the two pointsand the line
The pivot sign “the same space” is evolvinginto the mathematical sign “same distance”.
M. …between the line and the point A and,between the line and the point C
M. recalls what V. said, as to further explainthat the distance to be considered is exactlythat between each of the points and the axis.
Teacher: Why?
V. and M. (together) because otherwise theyaren’t symmetrical!
The equidistance between each of the pointsand the axis is recognised as a necessary
ICTMT 13 374 Lyon 3 - 6 July 2017

condition for the points to be symmetrical.
Table 1. From “the same space” to “the same distance”
As expected, this episode shows the unfolding of the semiotic potential of the dynamicenvironment, but also illustrates how the elements used by pupils to support their claims are notlimited to refer to the dragging process visualized in the digital artefact. The manipulative artefactappears to be essential to construct the symmetric point and to give rise to a startingconceptualization. However, it gives a static vision because, for instance, after finding a symmetricpoint of a given point, making a hole on a sheet of paper by piercing it with a pin, the two pointscannot move at all. In the previous transcription, instead, M. refers to the dynamic processvisualized with the digital artefact: “if you move it”, “it moves” and matches words with handgestures that simulate what she saw on the computer.
The discussion followed-up and the role of synergy emerges: in order to indicate what a symmetricpoint is, pupils refer to the activity carried out with the sheet of paper and the pin and their initialconceptualization depends on the direct experience of piercing made at the beginning.
Moreover, a further interesting episode which underlines the need to mentally go back to the digitalartefact as for G. and the reference in synergy of both artefacts as for V.. The teacher restarts andasks again how they know that the distance is always the same, and G. says:
G.: We figured it out because when [the pupil acting on the IWB] moved point A,point C moved too, but when they were very far away from the red line it wasalways the distance from the red line… from point C to the red line there was thesame distance as… from point A to the red line.
G. matches his speech gesticulating in the space ahead of him. In fact, he looks towards the IWBscreen, points his finger towards a hypothetical point A in front of him, with his right hand, while hesymmetrically raises his left hand at the same height. He leans back with his body and spreads hisarms outwards simulating the two points moving and keeping the same distance from the axis.Here, it shows how the interaction with the digital artefact allowed G. to perceive the invariantelement, the distance, thanks to the variation on the screen of the position of point A andconsequently of point C, which depends on A. He visually perceives and anticipates thegeneralization of the invariance of the distance of these two points from the line. In other words, itis as if the pupil visually analysed the variation of an aspect of the whole configuration, keepinganother aspect constant, hence anticipating the surfacing of invariant schemes.
Then V., in order to analyse the relationships, explicitly re-calls the manipulative artefact,synergically joins the two activities, and says:
V.: If we have available a sheet of paper that can be folded….
She receives from the teacher a sheet of paper and a pin and makes a symmetric point folding andpiercing the paper with the pin, reopens the paper, looks at it, and, simultaneously looking at theIWB adds:
V.: It is more visible there and it is easier… because there you can move the point andso I easily realise that if I move the point… the already created figure… it iseasier to realize that there is the same distance because just by moving, you canunderstand, especially when we distance a lot from the line, that also point Cmoves… and so there is always the same distance. But I was able to understand iton the paper, also.
ICTMT 13 375 Lyon 3 - 6 July 2017

V.’s words confirm the hypothesis that the digital artefact is acting in synergy with the manipulativeone. However, it is also clear that the modality with which these two artefacts operate is different.The manipulative artefact allows the direct action of the pupil. The pupil’s body learns while actingand, in order to describe what a symmetric point is, pupils simulate the folding and piercing of asheet of paper. When they refer to the digital artefact, instead, pupils simulate with their own bodythe objects of the actions that they perform with the artefacts: they move the harms as if they werelines and the hands as if they were points, drawing the tracing seen on the screen in the space ahead.
The dragging function, combined with the trace, after allowed pupils to mentally move the objects,and the previous visualization of what happened made explicit the implicit dynamism of thinkingmathematical objects.
The next steps show the difference in the way pupils understand that the distance between A and Cfrom the line is always the same: with the manipulative artefact, folding the sheet of paper andobserving the superimposition of the two holes; with the digital artefact, animating/moving point Aand observing how consequently point C moves. The underlined difference is at the base of thesynergic use of the two artefacts since they operate on cognitive processes and different operativeand non-superimposable modalities.
CONCLUSIONS
In this paper we have presented the design of a digital artefact, an interactive book developed in aDGE, and of a teaching sequence involving it together with a manipulative artefact. The use of thisduo in the teaching sequence was framed by the TSM. The related teaching experiment, conductedwith fourth grade students, has been analysed from a semiotic mediation point of view.
The analysis of the results showed, not only the unfolding of the semiotic potential of the artefacts,but also the development of a cognitive synergy, linked to the alternate use of the duo that fosteredthe construction/conceptualization of axial symmetry and its properties.
REFERENCES
Bartolini Bussi, M. G. (1998). Verbal interaction in mathematics classroom: A Vygotskiananalysis. In H. Steinbring, M. G. Bartolini Bussi, & A. Sierpinska (Eds.), Language andcommunication in mathematics classroom (pp. 65–84). Reston, VA: NCTM.
Bartolini Bussi M. G. & Mariotti M. A. (2008), Semiotic mediation in the mathematicsclassroom: Artifacts and signs after a Vygotskian perspective, in L. English (ed.), Handbook ofInternational Research in Mathematics Education, (second edition), Routledge.
Faggiano, E., Montone, A. and Mariotti, M. A., (2016) Creating a synergy betweenmanipulatives and virtual artefacts to conceputalize axial symmetry at primary school, In Csíkos,C., Rausch, A., & Szitányi, J. (Eds.). Proceedings of the 40th Conference of the InternationalGroup for the Psychology of Mathematics Education, Vol. 2, pp. 235–242. Szeged, Hungary: PME
Leung, A. (2008). Dragging in a dynamic geometry environment through the lens of variation.International Journal of Computers for Mathematical Learning, 13, 135–157.
Leung, A. & Bolite-Frant, J. (2015). Designing Mathematics Tasks: The Role of Tools. In A.Watson and M. Ohtani (Eds.). Task Design in Mathematics Education: The 22nd ICMI Study (NewICMI Study Series) (pp. 191-225). New York: Springer
Maschietto M., Soury-Lavergne S. (2013) Designing a Duo of Material and Digital Artifacts: thePascaline and Cabri Elem e-books in Primary School Mathematics. ZDM – The InternationalJournal on Mathematics Education 45(7), 959-971
Monaghan, J., Trouche, L., & Borwein, J. (2016). Tools and mathematics. Dordrecht: SpringerInternational Publishing.
ICTMT 13 376 Lyon 3 - 6 July 2017

Montone, A., Faggiano E., Mariotti, M. A. (2017). The design of a teaching sequence on axialsymmetry, involving a duo of artefacts and exploiting the synergy resulting from alternate use ofthese artefacts, Proceedings of the 10th CERME Conference, to appear
Sfard, A. (2008). Thinking as communicating. Cambridge: Cambridge University Press.
Steffe L. P. & Thompson, P. W. (2000). Teaching experiment methodology: underlying principlesand essential elements. In R. Lesh & A. E. Kelly (eds.), Research design in mathematics andscience education. Hillsdale, NJ: Erlbaum, 267-307
Vygotskij, L. S. (1978), Mind in Society. The Development of Higher Psychological Processes,Harvard University Press.
ICTMT 13 377 Lyon 3 - 6 July 2017

STUDENTS’ COVARIATIONAL REASONING: A CASE STUDY USING
FUNCTION STUDIUM SOFTWARE
César Thiago da Silva, Ricardo Tibúrcio, Franck Bellemain, Verônica Gitirana
Universidade Federal de Pernambuco 1,2,3,4, Prefeitura da Cidade do Recife 3;[email protected], [email protected], [email protected],
This paper presents a case study on students’ development of covariational reasoning, while usingFunction Studium software to perform activities about rate of change of linear and quadraticfunctions. This software was designed by LEMATEC-EDUMATEC/UFPE, a research group, and itsdevelopment was guided by a model of software process based on Informatic-Didactic Engineering.The results of the case study pointed out some contribution of activities designed within thesoftware to support students' covariational reasoning, such as: dynamic and simultaneousconnections of the different representations of "rate of change" allowed the students to inferpatterns of variation of these types of functions; and to coordinate average of rate of change toinstantaneous rate of change.
Keywords: function, covariational reasoning, educational software
INTRODUCTION
This paper presents a case study on students’ covariational reasoning using an adhoc software forthe study of functions developed by LEMATEC-UFPE [1] (a Brazilian research group), as part oftwo master's dissertations (Tibúrcio, 2016; Silva, 2017).
The development of Function Studium software (Bellemain, Gitirana, Silva, & Tibúrcio, 2016) wasguided by a model of software process that aims to combine aspects of teaching and learningmathematical concepts to computational aspects, contributing to a framework in both areas. Theprocess model (Tibúrcio, 2016) is based on the idea of Didactic-Informatic Engineering (Bellemain,Ramos, & dos Santos, 2015), an object of study in LEMATEC - the research group.
Regarding Function Studium characteristics, the concept of rate of change and the variationalperspective of functions underpin its tools. The ideas of covariational reasoning discussed inCarlson, Jacobs, Coe, Larsen, and Hsu (2002) contributed both to design the software tools and tobuild a framework for assessing their contribution on the development of students’ covariationalreasoning after undertaken some activities within Function Studium.
ICTMT 13 378 Lyon 3 - 6 July 2017

Figure 1. First screen of Function Studium Software
In this paper, we discuss some results of the case study, which was undertaken with a pair ofpreservice mathematics teachers of a Brazilian university. It is structured by: a brief discussion ofthe concept of covariational reasoning (Carlson, Jacobs, Coe, Larsen, & Hsu, 2002), thedevelopment of Function Studium, the methodology used in the case study and the analyse of someresults obtained.
COVARIATIONAL REASONING
Covariation approach of function privileges the relationship between variables and how variation ofone variable affects the variation of the other. Covariational reasoning is defined as "the cognitiveactivities involved in coordinating two varying quantities while attending to the ways in which theychange in relation to each other" (Carlson, Jacobs, Coe, Larsen, & Hsu, 2002, p.354). Theresearchers designed a framework to analyse students’ covariational reasoning while exploringdynamic situations of functions: five mental actions. According them, as students develop suchreasoning, they advance in levels of covariational reasoning, as shown in Table 1
Mentalaction
Description of the mental action
MA1 Coordinating the value of one variable with changes in the otherMA2 Coordinating the direction of change of one variable with changes in the other variableMA3 Coordinating the amount of change of one variable with changes in the other variableMA4 Coordinating the average rate of change of a function with uniform increments of
change in the input variableMA5 Coordinating the instantaneous rate of change of the function with continuous
changes in the independent variable for the entire domain of the function
Table 1. Mental Actions of Covariational Framework (Adapted from Carlson, Jacobs, Coe, Larsen, &Hsu, 2002, p.357)
The concept of rate of change assumes such an important role in the study of real functions underthe variational approach. It is explored from elementary school to advanced courses for some areas,
ICTMT 13 379 Lyon 3 - 6 July 2017

in which derivative is a central concept. Rate of change gains even more importance within thecovariational perspective. Instead of emphasizing the correspondence among values, it focuses onhow the variation of one variable affects the variation of the other, and so, it is expressed by the rateof change.
FUNCTIONS STUDIUM SOFTWARE DEVELOPMENT
To develop Function Studium software, a methodology that integrates principles from Didactic ofMathematics to Software Engineering process was built. This methodology is a proposal ofimplementing the educational software engineering principles (ESE) (Tchounikine, 2011) in theconception-development of a microworld for math teaching. More specifically, we worked in theintegration of the firsts stages of Didactic Engineering (Artigue, 1996). The methodology takes intoconsideration methods of requirement, from software engineering, integrated with DidacticEngineering, which can be defined as an Engineering (Bellemain, Ramos, & dos Santos, 2015), inwhich we contemplate specifically theoretical potentialities (from teaching and learning theknowledge) and technologies (of computation).
The engineering phase (Bellemain, Ramos, & dos Santos, 2015) comprises essentially of four steps:delimitation of the field, theoretical, experimental, validation.
The step of delimitating the field aims to select the field of knowledge the software will exploit. Init, some questions were focused:
[…] which mathematics knowledge will be exploit within the software, what are the correlated knowledge that will also be needed to exploit, and son on and what kinds of professional can help in this development.
(Tibúrcio, 2016, p.57, our translation).
The theoretical step comprised of a review of literature which aims to reach the state of theknowledge (didact, epistemological, cognitive and technological) regarding the selected field. It isthe starting point of the process of requirements gathering. In the theoretical step, it is alsoimportant to address some questions which regards the didactic transposition (Balacheff, 1994):how computer potentialities will be used to digitally represents the knowledge domain; the wayobjects, relationships and operations are “internally” coded; and how they “dynamically” behave atthe interface. In this step, it also starts software prototyping, in which: situations of use weredesigned, problems that could be raised while using the software were predicted; user’s answerswere hypothesized; and the software prototype is developed to start some tests.
The experimental step comprises specific moments to test and to analyse the software prototype:interface, commands, bottoms, and so on, within the validation regarding of teaching and learningobjectives traced within the situations of use.
The last step, validation, comprises an analyses a-posteriori of the results reached during theexperimentation and the confrontation of this analysis with the theoretical one. This confrontation ismade within the student's results for each activity, it gives us elements to improve the software aswell as the situation of use. The step of validation can be done within different experiments, such asin a case study with pairs of students, and with the whole class. In this paper, we are still in the testwith a pair of students.
ICTMT 13 380 Lyon 3 - 6 July 2017

Technologies used
Function Studium is a web-based software developed using HTML (HTML5), CSS andJAVASCRIPT. These languages, interpreted by any browser, can be edited with a simple texttreatment and have already also innumerous object libraries what allows to shorten the period ofdevelopment and to dedicate, almost exclusively, to implement the software codes regarding thedidactic-informatic transposition of the concept of function and of rate of change, as well as thedidactic proposal for these concepts.
The choice to use web platform also facilitates: to share it with the team involved in the Project,what helped to reconfigure the process of educational software engineering, mainly between thesoftware engineering who conceive and technically develop it and the requirement engineering whoworked in the conception/development regarding teaching and learning aspects. The use of an agilemethod and/or a methodology to facilitate a robust and quick interaction among the team wasfacilitated by this choice.
Function Studium Software
Function Studium presents a main window (Figure 2) rounded by icons which represent tools orconfigurations for the graphic representation, and others secondary Windows, in which othersrepresentations of function, such as tabular, algebraic, where implemented to interact with thegraph.
Figure 2. Main Screen of Function Studium
Function Studium starts with one prototype of each type of function (constant, affine, quadratic andcubic), obtained by menu (2). It is based on the idea of an algebra of functions, which starts withsome basic functions and operations defined (area 1). Other polynomial functions can be obtained asthe result of an operation with these functions, as well as, the rational functions. In area 3, thewindow “Função editada” (Edited function) shows the algebraic representation of the function,while it is being inserted. In this window, it is possible to define the value of the coefficients of thefunction, using sliders. In area 4 (Functions), it shows the algebraic model of already definedfunctions. About area 5 (Parameters), it is exhibiting the coefficient of the already defined functions,what allows dynamic changes by sliders. Area 6 (Point/rates) shows the variable values, theirvariations and the rate of change of the functions in the select input values. It is possible to definesuch values both, directly through the window and through the graph. In area 7, there is tools todefine a point in the graph. Regarding area 8, there is the tool "Rate of change", which, whenactivated, allows to calculate the rate of change of a selected function, both, between two points ofthe graph and between a sequence of successive intervals of x with the same length. Areas 9 and 10refer to the tools "secant line" and "tangent line", in which it is possible to define tangent or secantlines to the graph of the function at the selected points, to articulate these lines with the rate ofchange of the function, contextualizing this concept with its geometrical meaning.
A detailed presentation and analyse which do not fit in this paper is necessary to clearly understandhow the software works and to justify its conception, the chosen behaviour and articulations of thevarious representation registries of functions used in it. We suggest Silva (2016) and Tibúrcio(2016) to dive deeper in Function Studium elaboration. Concerning the functionalities to supportand investigate the covariational reasoning of the students developed in the artefact, the conceptionfollowed the specifications elaborated during the requirements engineering process which basicallyspecifies:
ICTMT 13 381 Lyon 3 - 6 July 2017

a) A covariational perspective: tools and characteristics that support students in thecoordination of variable variation;
b) Dynamism, interactivity and different notations connected simultaneously: suchcharacteristics are based on Kaput (1992), which synthetises possibilities of computationalenvironments to instantiate variables and represent functions;
c) Tools and characteristics based on the results of the preliminary analysis on the concept ofrate of change: these analyses pointed out elements of epistemology, teaching and learningof the concept, therefore, they should also support the software tools construction.
METHODOLOGY OF THE CASE STUDY
A Case Study was specially designed as a first validation of Function Studium. The study wasundertaken with a pair of mathematics preservice teachers, who used the software to perform twoactivities about rate of change of linear and quadratic functions. The data were analysed to searchcontributions and/or limitations to the students' covariational reasoning derived from the use of thesoftware.
The activities took place in a session of two and a half hours, in a classroom with the pair ofstudents and the researcher, who had an observer role, except in moments in which it was necessaryto interact with the students to solve doubts about the technical aspects of using the software. Thestudents explored Function Studium, in a computer with internet access, and had to discuss to solvede problems proposed in a worksheet.
The activities focused on the last two levels of covariational reasoning (Carlson, Jacobs, Coe,Larsen, & Hsu, 2002), that is, on the coordination of the average rate of change and theinstantaneous rate of change, although aspects of initial levels were naturally included in thequestions. Some questions will be explicit in the analysis.
The data collected comprises a screen capture video with students’ interactions in the software, avideo with students’ interactions between themselves, the notes on worksheets and a researcherdiary. The data were analysed by the researcher, searching the students' answers and the dialoguesassociated with their actions on the computer screen, to identify extracts which explicit how thesoftware interfered to the students' covariational reasoning.
ANALYSE OF THE RESULTS
As regard the last two levels of covariational reasoning (Carlson, Jacobs, Coe, Larsen, & Hsu,2002), that is, on the coordination of average of rate of change and the instantaneous rate of change,the following results could be stated.
First, the dynamic variation of the independent variable in the graph, simultaneously connected tothe dependent variable variation, allowed the students to coordinate the variation of the rate ofchange continuously (MA4). This allowed inferences about the rate of change behaviour in eachtype of functions addressed. An example is the students’ discussion about question 1.4 (Figure 3)when exploring a linear function.
Use the tool "rate of change" and in some interval of x, make the Δx decreasing in the graph ordirectly in the "points / rates" window (for example, 1; 0.5; 0.1; 0.05; 0.01; 0.001; 0.0001), observethe behavior of the rate of change. In this software, when Δx is small enough, for example Δx =0.0001, it is possible to simulate the limit of the function at point x0 when x tends to x0 .
ICTMT 13 382 Lyon 3 - 6 July 2017

1.4) When simulating the process described above, take different linear functions and vary thevariable x, observing the value of Δy / Δx. How does this value change as a function of x? What doesthis suggest about the rate of change in linear function?
Figure 3. Question 1.4
After the students varied x in the graph and observed, for a fixed Δx, and observed the behaviour ofΔy, they inferred the behaviour of the related function.
Student 1: [...] "Delta x" is not changing correctly? Only x ... (He varies x in the graph andobserves the invariance of the value of the rate of change for all the pointsreached). Do you understand? (He questioned whether his colleague had the sameconclusion.). The value of "delta y" over "delta x" ... It doesn’t vary. When youmake delta x always smaller and then you change the value of x, it (Refers toΔy/Δx) will not vary.
Student 2: Ok…
Student 1: What does this suggest about variation in linear function? ... Humm ... Ah, that itsvariation is constant... What do you think?
Student 2: Thus, the rate of change of it is constant. It is always equal to the coefficient.
Second, the "rate of change" tool, which calculates the rate of change at successive intervals of thefunction domain and displays them both in graph and in points windows, was an important resourcefor students to coordinate the variation of average rate of change (MA3 and MA4) and to observepatterns of variation in quadratic functions. This can be seen in their discussion regarding question2.3 while exploiting a quadratic function.
2.3) Still in the simulation of the previous item, vary the variable x in the graph and note the variationof the variation rate Δ (Δy/Δx) in the "Points/Rates" window. How does Δ (Δy/Δx) behave with thevariation of x? Test other quadratic functions, describe what you perceive and what this suggests inrelation to the variation in quadratic functions.
Figure 4. Question 2.3
Student 1 varies x in the graph and observes the "points window", in which the successivedifferences between the rates of change in the intervals of the graph are shown. Thus, he argued.
Student 1: In relation of the rate of change, when you change x, the rate of change willvary ... But, there, the difference between "delta y - two" over "delta x - two" and"delta y - one " over "delta x – one" is constant. The difference between the ratesof change will be constant. That's interesting.
Third, their explorations of the "points window" helped them to coordinate the variation of averagerate of change (MA4), since it exhibited in the same area the variation of Δx, Δy and Δy/Δx,simultaneously with the variation of x in the graph. Their discussion regarding question 2.1 showsthat. Student 1 chooses the function x2–2x+2 and uses the tool “rate of change” to change x in thegraph while observes the variation of Δy in the points window.
Student 1: Look, I'm changing x here, and look at y ... x is the same, it's "one", and theny increases. Consequently, the rate of change, is that right? Because if x isalways equal to "one" and y is increasing, then the rate of change will increase aswell. Write there!
ICTMT 13 383 Lyon 3 - 6 July 2017

Student 2: How? What did you mean?
Student 1: y is increasing as you increase the values of x (...)
Fourth, as regard to the coordination of the instantaneous rate of change (MA5), as can be seen,students were able to vary the value of Δx in the "points window", making it closer to 0, whileobserving the variation of Δy approaching a specific value. In doing so, they could coordinate thetransition from the average rate of change to the instantaneous rate of change, through smaller andsmaller refinements of Δx, obtained in the "point window" and in the graph.
Fifth, the simultaneous connection of actions in different representations enabled within FunctionStudium supported them to coordinate the variation of the instantaneous rate of change, whilevarying x in the graph. This connection allowed them to explore aspects such as the signal and thevariation of the rate of change as a function of x, as well as aspects of graph such as concavity andinflection points, from a variational perspective, relating these aspects to the behaviour of the rate ofchange.
CONCLUSIONS
This paper presented some of the results of a case study on covariational reasoning of a pair ofstudents, who exploited Function Studium software within activities about rate of change of linearand quadratic functions. The results reveled that some characteristics and tools of the softwaresupported the students' covariational reasoning till the last level (MA5), with emphasis on thesimultaneous connection of different notations, which contributed to coordinate aspects such as thesign of the rate of change and patterns of variation of each type of function, as well as, it contributedto a variational interpretation of inflection points and concavity in the graph. Moreover, thedynamism within simultaneous variation of Δx, Δy and Δy/Δx allowed them to coordinate both theaverage and instantaneous rates of change, by means of smaller and smaller refinements in Δx.
NOTES
1. LEMATEC – Laboratory of Studies in Mathematics and Technology – of EDUMATEC - the Program of High Studies
in Mathematics and Technologic Education – at UFPE - University Federal of Pernambuco - Brazil.
REFERENCES
Artigue, M. (1996). Engenharia Didática. In J. Brun (Eds.), Didática das Matemáticas (193-217).Lisboa: Instituto Piaget.
Balacheff N. (1994) La transposition informatique. Note surun nouveau problème pour ladidactique. In M. Artigue, M., R. Gras, C. Laborde, P. Tavignot, & N. Balacheff (eds) Vingt ans dedidactique des mathématiques en France. (pp.364-370). Grenoble: La pensée sauvage éditions.
Bellemain, F.G.R., Gitirana, V., Silva, C., & Tibúrcio, R. (2016). Function Studium Software © ,[web-based software]. Recife: LEMATEC – EDUMATEC/UFPE. Retrieved fromhttp://lematecstudium.net.br/function/
Bellemain, F.G.R., Ramos, C.S., & dos Santos, R.T. (2015). Engenharia de Software Educativos, ocaso do Bingo dos Racionais. In Anais do VI SIPEM - Seminário Internacional de Pesquisa emEducação Matemática (pp. 1-12). Pirenópolis, Brasília: Sociedade Brasileira de EducaçãoMatemática.
ICTMT 13 384 Lyon 3 - 6 July 2017

Carlson, M.P., Jacobs, S., Coe, E., Larsen, S., & Hsu, E. (2002). Applying covariational reasoningwhile modeling dynamic events: A framework and a study. Journal for Research in MathematicsEducation, 33, 352-378.
Kaput, J. (1992). Technology and Mathematics Education. In D.A. Grows (Ed.) Handbook ofResearch on Mathematics Teaching and Learning (515-556). NY: Macmillan.
Silva, C.T.J. (2016) A Engenharia Didático-Informática na prototipação de um software paraabordar o conceito de taxa de variação. (Master dissertation. Universidade Federal dePernambuco, Brazil). Retrived from http://repositorio.ufpe.br/handle/123456789/19687.
Tchounikine, P. (2011). Computer Science and Educational Software Design. Berlin Heidelberg:Springer-Verlag. doi:10.1007/978-3-642-20003-8_1.
Tibúrcio, R.S. (2016) Processo de desenvolvimento de software educativo: Um estudo daprototipação de um software para o ensino de função. (Master dissertation, Universidade Federalde Pernambuco, Brazil) Retrieved from http://repositorio.ufpe.br/handle/123456789/17425.
ICTMT 13 385 Lyon 3 - 6 July 2017

CATO-ANDROID: THE GUIDED USER INTERFACE FOR CAS ON
ANDROID SMARTPHONES
Hans-Dieter Janetzko
FH Lübeck; [email protected]
CATO is the self-explanatory user interface for several CAS on Windows, Linux/Unix and Mac/Ox.
The principles of CATO are for example: packages realized as selection menus for the commands
and extra windows for the input of multi-parameter commands.
The author has developed an application, CATO-Android, with the principles of CATO for
smartphones with the operating system android. It is a user interface for guided input for CAS, at
the moment only for Symja.
In the article below, the author describes this app and how he realized the principles of guided
input.
Keywords: GUI, CAS, android, smartphone, small display
THE REASONS FOR A GOOD USER INTERFACE
The demand for better designs of user interfaces for computer algebra systems is almost as old as
the systems themselves. Kajler has described and developed his ideas for a perfect user interface in
various works (Kajler, 1992) and (Kajler, 1993). He has postulated that well-designed computer
algebra interfaces should afford intuitive access. As such, users should be able to enter commands
with more than one parameter in a two-dimensional fashion. This prevents syntactic and structural
errors. In addition, all templates and masks should follow the convention of operating from left to
right.
Many of his reflections and wishes are not realized by the computer algebra systems running on
Windows, Linus or MacOSx. So the author has developed the GUI CATO, (Janetzko, 2015) for
intuitive usage of CAS. CATO aims at users who want to use the CAS only sporadically, e.g., one,
two or three times a week.
The author believes the usage of a CAS on a smartphone (Fujimoto, 2014) will be sporadically, too.
Therefore, a guided input is very important.
THE PRINCIPLES OF CATO
CATO, the Computer Algebra Taschenrechner (calculator) Oberfläche (surface), is a realization of
some principles for a guided input: The commands of CATO are structured into packages in the
usual mathematical kind: “analysis I, analysis II, linear algebra, numeric, …”. Alternatively, the
names of the packages clearly identify the content: “solving equations, trigonometric functions,
integral transformations, …”. Because there are only twenty-seven packages in CATO, some
packages will have sub-packages. The user can select a package with a drop-down menu and then
the correct command (or the sub-package) in a second one, commands of a sub-packages in a third
one. The menus are collocated from left to right. All multi-parameter commands have their own
input window with one input row for each parameter and a short description for it. Consequently,
the windows of the multi-parameter commands are uniform, independent of the CAS. Furthermore,
ICTMT 13 386 Lyon 3 - 6 July 2017

the absence of abbreviations is very crucial for an effective sporadic usage of CAS and
consequently, CATO does not abbreviate commands.
Other possibilities of CATO reflect state-of-the-art settings of other CAS: the kind of output,
numerical or accurate, is a global option, also the user defined precision of numeric output. The
design guidelines of CATO are thoroughly maintained as for example options can be selected and
set like commands. Furthermore, there exists the package “chronicle”, which collects all used
commands (if they are selected by a menu). Additionally, another global option is the choice of the
selected CAS. CATO provides a log for the re-usage of recent inputs.
ICTMT 13 387 Lyon 3 - 6 July 2017
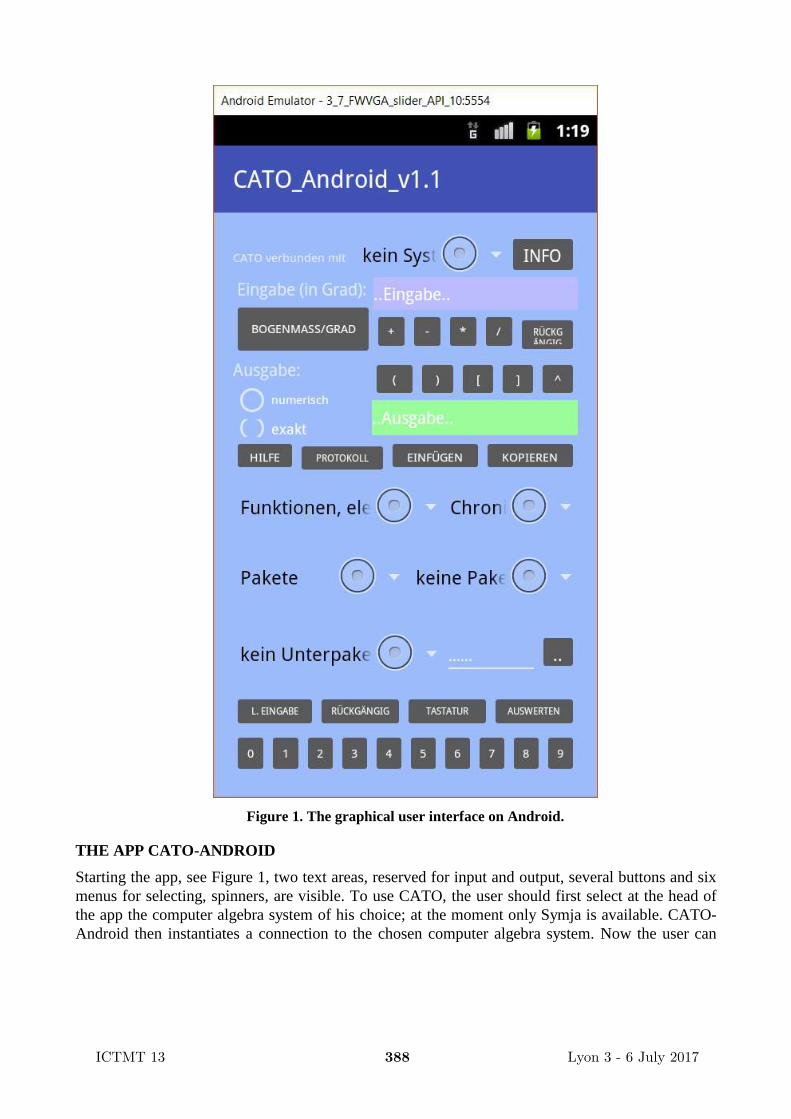
Figure 1. The graphical user interface on Android.
THE APP CATO-ANDROID
Starting the app, see Figure 1, two text areas, reserved for input and output, several buttons and six
menus for selecting, spinners, are visible. To use CATO, the user should first select at the head of
the app the computer algebra system of his choice; at the moment only Symja is available. CATO-
Android then instantiates a connection to the chosen computer algebra system. Now the user can
ICTMT 13 388 Lyon 3 - 6 July 2017

select commands. For example, for calculating “sin(3.4)”, he has to select in the menu “Pakete”
(packages) “Analysis I” (analysis I), see Figure 2.
Fig. 2: Selecting Analysis I in the spinner
packages.
Fig. 3: Selecting a command in the spinner
right next.
In the menu right next, the commands of this package are now available. The user can select the
command he wants, see Figure 3. In the input text area he reads “Sinus(“ and he can use the buttons
of the app for the remaining part of the input.
For the input of more complicated terms he gets with the button “tastatur” (keyboard) a window
with several buttons for many signs.
THE EXTRA WINDOWS FOR MULTI-PARAMETER COMMANDS
The user can also select a command with more than one input, for example “differentiate”. He
selects at first “analysis I” in the menu “packages” and the command itself in the menu right next.
The extra window will appear, see figure 4. The user can see at first the name of the command, then
a short description of it, and two input rows for the parameters with a short description “fonction”
(function) and “variable”. Like in the Desktop version of CATO, the user does not need to know the
right order of the parameters, the correct brackets or separators. But it is an android window for
dialog, so the user can not apply the functionality of the CATO-Android surface itself: Therefore
several buttons of the surface are part of this window useable for the input, also the button “tastatur”
(“clavier”) for a keyboard. For the same reason the selecting menus spinner can not be part of this
window. The author has solved this problem with the application of scrollviews, vertical tables of
buttons. The user can use them like the spinners for selecting packages and commands.
Also the log of the version 1.1 is an android window for dialog, where the user can select an old
input by typing its number in a field for input.
ICTMT 13 389 Lyon 3 - 6 July 2017

Figure 4: The extra window of the command “differentiate”.
OUTLOCK
English and French versions of CATO-Android like the English or French versions of CATO are
published. Also the connection of CATO-Android with Symja will be a first step, other computer
algebra systems will follow.
ICTMT 13 390 Lyon 3 - 6 July 2017
REFERENCES
Fujimoto, M. (2014). How to develop a mobile computer algebra system. Retrieved from
http://www.inftyproject.org/issac2014/ISSAC2014_Tutorial_fujimoto.pdf
Janetzko, H.-D. (2015). CATO – a guided user interface for different CAS. In N´elia Amado (Ed.)
Proceedings of the 12th international conference on technology in mathematics teaching, ICTMT
12, (pp 429–437). Faro: University of Algarve, Retrieved from
http://sapientia.ualg.pt/handle/10400.1/6081
Kajler, N. (1992). CAS/PI: a portable and extensible interface for computer algebra systems.
International Conference on Symbolic and Algebraic Computation (pp. 376-386). ACM New
York, NY, USA.
Kajler, N. (1993). Building a computer algebra environment by composition of collaborative tools.
Lecture notes in computer science, 1993 (pp. 85-85).
ICTMT 13 391 Lyon 3 - 6 July 2017

WIMS: AN INTERACTIVE EXERCISE SOFTWARE
20 YEARS OLD AND STILL AT THE TOP
Magdalena Kobylanski
Université Paris-Est Marne-la-Vallée (UPEM) LAMA-UMR8050
Université Paris-Est IDEA
WIMS (Web Interactive Multipurpose Server) is a collaborative, open source e-learning platformhosting online interactive exercises in many different fields such as mathematics, chemistry,physics, biology, French and English among others. It is widely used in France mainly inmathematics from secondary school and up to the first university years. Using it in a proper waycan bring advantage both to students and teachers.
Keywords: e-learning platform, grading, motivation, pedagogical alignment, community ofpractice.
INTRODUCTION
WIMS (Web Interactive Multipurpose Server) is a collaborative, open source e-learning platform,under the GNU (general public license), hosting online interactive exercises in many different fieldssuch as mathematics, chemistry, physics, biology, French and English among others. It is usedmostly in France [1] and mostly in mathematics in high school or during the first years of highereducation [2]. It provides real learning advantages for students and for teachers. In this paper wewill first present a quick history of its first development and describe the communities of developersand users. In a second part we present the way the software is built and how it interacts with othersoftwares. Then we present the advantages using such an exercise software can provide to studentsin terms of learning, skills development in a specific subject area but also in cognitive skillsdevelopment. We will then discuss some observation we have obtained during our implementationof WIMS in UPEM. In the last part we give some hints to start with WIMS and conclude.
A BRIEF HISTORY OF WIMS AND THE COMMUNITY AROUND IT
WIMS has been first created by Xiao Gang (1951-2014) [3]. The initial version is released in 1997.Professor XIAO Gang was a brilliant mind, born in China, professor of mathematics at theUniversity of Nice (France), one of the best world specialists of algebraic surfaces. Ten years afterthe first release, the association WIMS EDU is founded, and Xiao Gang leaves the software in thehands a small community of developers. The development is then taken over, mainly by BernadettePerrin-Rioux in a mastery way. The association WIMS EDU [4], whose main goal is to support thediffusion of WIMS, organizes, among other things, once every two year, a colloquium attended bymore than a hundred persons.
WIMS was created at about the same time as Google (registered on September 15, 1997) and longbefore Wikipedia (created in January 2001) or Moodle (first release in 2002). Comparing WIMS tothese giants may seem to lower it’s impact. But the mere fact that it continues to exists after 20years, is still growing, has a wide community of users both teachers and students, an importantcommunity of exercise developers, and a very active and effective community maintaining anddeveloping the software itself, is significant and remarkable.
ICTMT 13 392 Lyon 3 - 6 July 2017

It appears, from different statics and surveys, that classes in WIMS are almost only created byteachers, mostly french, proficient and very involved in teaching. We have no evidence showingstudents using WIMS by themselves, without belonging to a WIMS class created by a teacher.Whence, in terms of teaching theory, WIMS appears to be class depended with the teacher as a key-stone.
WHAT IS WIMS
In this part we will first explain the real specificity of WIMS: the WIMS exercise, and then explainthe whole environment it provides to student, to teacher, and to exercise developer.
WIMS’s interactive random exercise
The main specificity of WIMS is it interactive exercises. Most LMS develop interactive exercisessuch us MCQs, matching, drag-and-drop exercises. WIMS can do much more. It provides aframework and a specific language that allows to use very powerful softwares as MuPAD, PARI/GP,Octave, Gnuplot, POV-ray, Coq proof assistant, GeoGebra among others. Thus formal calculus,drawing figures can be made quiet simply. And truly new and original exercises can be proposed tostudents.
The most original feature of the WIMS exercise is its random feature. To make it simple, let us con-sider a very simple example and look what is necessary in order to check whether a student can addsmall numbers. A naive way to achieve it is to program a question 2+2= Answer Field. The stu-dent’s answer is stored in the variable StudentAnswer. The TrueAnswer, here “4”, is compared tothe StudentAnswer. If these two variables are equal the student receives the notice of success. If thevariables are different, TrueAnswer can be displayed and more feed-back can be programed.
In a WIMS exercise one doesn’t program the question 2+2 but a+b where a and b will be variablesrandomly chosen by WIMS between values determined by the programmer, for instance integersbetween 1 and 10. When the student calls a cession of a WIMS exercise the software presents arandom draw of a, b. Thus in several lines of programming one can obtain an exercise that will havea great and maybe almost infinite versions. For examples of WIMS exercises we advise the readerto explore a WIMS server [5].
WIMS allows a to have a direct access to mistake. Once the answer’s given in one clic WIMSdisplays if the answer’s right or not. In most cases the right answer can be given. However, whenthere is more than one solution for instance, it can be more tricky to program. Consider thefollowing WIMS exercise: Let A be a subset of the real numbers defined as follows: A= …. – Is Abounded (yes or no) if yes give an upper-bound of A. Here, the programer decides to choserandomly the set A between union or intersections of intervals, set of the values taken by types ofsequences, values taken by a quiet simple function. The programmer may calculate for each type ofexamples the supremum s of the set A, and test if s is less and equal than the answer m. When thestudent is wrong, his answer m is strictly smaller than the supremum s, programming the feed-backof the exercise in order to get an element a in A which realizes a>m can be a much greaterbrainteaser. Of course the feed-back can just propose a content where a similar example is solved.
WIMS as an LMS
WIMS belongs to the class of LMS (Learning Management System). Anyone, with web access andan e-mail address, can create a virtual class and become a teacher on any WIMS server around theworld in less than 2 minutes. Then the new teacher has two tasks: first build the resources of herclass, and then enroll the students. Building the resources consists mostly in choosing or creating
ICTMT 13 393 Lyon 3 - 6 July 2017
and organizing the exercises in sheets of exercises. There are short ways for doing it. For instance ifa so called Classe ouverte corresponds to the teachers aim, she can in several clicks copy it and haveit privatize for her own students.
Of course, it can be customized, exercises can be changed, added, taken away. One can also (it takestwo minutes) restore a class built previously and backed-up. A research engine can also propose fullexercise sheets corresponding to the key-word and to the level, and thus import parts of the classstructure in a fast way. The research engine can also help you to select exercises one by one. Animportant task, which has many pedagogical implications, is the choice of evaluation and rating.Several parameters have to be set. The severity (if one mistake is heavily paid or not), the ratingscale, i.e. the way the grade obtained in several repetitions of an exercise will be taken into account(will the final grade be an average of all trials, of the last n trials, of the best n trials, the worst of thebest n trials…). Let us underline that the choices made by the teacher can influence motivation ofthe students, sustainability of the training. One has to be aware that sometimes good grades does notmean good work, if for instance a gambling strategy allows to obtain the maximal grade in a shortamount of time. An interesting modality of parametrizing exercises is to make strings. A string is apool of exercises made of several steps, each step can be one item of the exercise or an item of adifferent exercise. For instance the second step of the string adds a new kind of difficulty to theexercise proposed in the first step. The grade is given at the end of the string. Counting on gamblingto fulfill a string of exercise is no longer a time saving option. And taking the time for deepunderstanding becomes a time gaining strategy. The teacher can also define the weight of anexercise in its exercise sheet, the weight of exercise sheets in the global average. The task ofchoosing the exercises and the parametrization of a class is the occasion of a didactical reflection.Sometimes it is time consuming. After all, composing a classical exercise sheet can also be long. Ofcourse, if there is no resources corresponding to your curriculum in WIMS, you always have thechoice of developing them. And this involves even more time.
The second task is to enroll the students. Several modalities are possible. One of them consistssimply to provide them with the address of the server and the name and the code of the class (theteacher chooses this code while creating the class). They can then enroll by creating their privateuser name and password. The teacher may also registers the class students, creating user names andpasswords. It is also possible to use directly a CAS identification.
WIMS’ Analytics
The student, when she enters her class sees the sheets (you can have a very precise overview byentering in a classe ouverte) organized by chapters. At the bottom of the sheets one sees a tool-barcomposed of little squares, each corresponding to an exercise (or a string of exercises) that will begreen once she has succeeded. Thus in the glimpse of an eye, she can see where she stands, whatshe has achieved, what has to be done. By clicking on one sheet she has access to the list ofexercises composing the sheet. A last click and she is confronted to the exercise and thats where thework begins. Of course at any moment she can consult mes notes that is my grades.
The teacher, can also see in his class the results of each students first by global average, by averageon each sheet, or detailed in one sheet exercise by exercise. Other statistics of the class can befound. One of the very meaningful is the indice de difficulté d’un exercice. It indicates the averagenumber of times necessary to get the exercise done. Clearly if this indicator is between 1 and 2, theexercise isn’t difficult. Experience shows that when this indicator is above 3, the teacher shouldconsider explaining the solution to the exercise to the class.
ICTMT 13 394 Lyon 3 - 6 July 2017

Let us mention that the teacher can also set groups by defining “variables techniques”, say group A,B, C. A group can be given specific exercises and the day set to open or close a sheet can bespecified depending on groups. Of course, analytics can also be sorted by these variables.
An LMS which favours sharing
We want to underline two strong specificities of WIMS which make this server so unique. First, thevery rich typology of exercises, enabled by the use of powerful software. It allows, once one hasmastered the programming language, to create in several lines a very large set of versions of anexercise. Second, it is one of the rare existing LMS which allows and encourages sharing exercises.Indeed everyone who creates his exercise is then invited to publish them. After some review on thecode and of the content, the exercise enters in the common base and is published under a freelicense. Then anyone will be able not only to use it but also can register the code of the exercise inhis own class and change or modify it. This specificity is very rare, and users of WIMS are veryattached to it. Of course the procedure of edition could still be more fluid and the searching engineimproved. It is an important demand of the community of users and work is being currently done.
The economical model
WIMS is under GNU license. It is thus a free and open-source software. The resources published inWIMS are also published under a free license. WIMS during his 20 years long life, has not receivedirectly any founding from public authorities. The software developers are volunteers. So are, in amajor part, the exercises developers. Though one can nevertheless consider that there is some publicfunding when a university attributes a server to WIMS and maintains it, or if some institution paysout the creation of exercises.
There are some wishes to evolve on this model, to be able to benefit from a IT provider to developsome aspects of the software. It appears though [14] that, for developers and users as well, a crucialvalue of WIMS relies on its sharing potentiality. The free and open source model relying onbenevolent contributors (as wikipedia) is certainly the best model to support this value.
WHAT ADVANTAGES WIMS PROVIDES TO STUDENTS – OUR THEORY
Learning an unknown area of knowledge can be hard time. To grasp it, one relies on previousknowledge and skills, and on indications from the teacher, not always well understood. The fasterone has to handle and manipulate the new material, the better. Yet first time can be hard. F. Garniershows an experiment where more than a hundred persons were asked to open, for the first time oftheir life, a pressure cooker, with the help of a drawn instruction. The video shows a young womanfighting for opening it and achieving it in 104 seconds [6] . And then she does it again in 2 seconds,as anyone. WIMS allows to take the necessary time to achieve a task. Then, in the way to expertise,rehearsal is needed. Again WIMS meets this demand.
Let us underline that the human brain is much more analogical than deductive by nature. And themathematical activity is clearly an activity which requires both ways of thinking, deductive ofcourse, but also analogical during the creative steps. For an analogy to be made, one has first toexperiment a number of different cases.
The necessity of multiplying examples of different type of representation in order to allow studentsto form a good representation of a problem is very well explained in Cordier & Cordier. It appearsclearly that students only exposed to the use of Thales theorem when the parallels are from the sameside of the intersection of the two scant lines, have a lesser possibility to understand the wholegenerality of Thales theorem than those exposed to a greater generality of cases. WIMS clearly
ICTMT 13 395 Lyon 3 - 6 July 2017

meets this purpose. It’s random features pushes the creator of an exercise to imagine a variety ofexamples and to encode them.
Let us also recall the celebrated lack of differentiation between the concepts of length and quantityfor small children. Piaget’s experience consists in showing two sets of 5 balls on a line, but thesecond set of balls are closer to each over than in the first set. Children are asked which of the setshas more balls. Up to six years, children answer that there are more balls on the line where the ballstake more place. It appears that small children have some difficulty in distinguishing betweenlength and number. Mixing up two concepts does not require to be under six, and a gooddiscrimination comes not only with age but also with the occasion of seeing multiple situations andunderstanding their common features and differences. Again, as WIMS allows to offer the studentsan occasion to work and a wild diversity of cases, it can be used to train their discrimination skills.
If the deductive way of proving is certainly the most used in school especially in teachingmathematics, let us underline that the analogical thinking seems strikingly effective and deeplywired in human brains. To learn what is a cat or a dog no needs to explain. Present several items isenough. And then the animals will be recognized with no cognitive expensive. Achieve this type ofquick recognition can be an important skill in learning. Again WIMS allows to enforce such type oflearning thanks to the diversity of exercises it can generate.
Another celebrated experiment by Kahneman is the Linda experiment:
Linda is 31 years old, single, outspoken, and very bright. She majored in philosophy. Asa student, she was deeply concerned with issues of discrimination and social justice, andalso participated in anti-nuclear demonstrations. – Which is more probable? (A) Linda isa bank teller. (B) Linda is a bank teller and is active in the feminist movement.
It appears that 89% of the persons asked answer (B), which is in fact false because (B) is clearly asubset of (A) and therefore has a smaller probability. This example illustrates the existence of twomodes of thinking, fast and slow. The fast way of thinking, or system 1 – which works by analogyand is closer to feelings – jumps to the conclusion that Linda has to be at least active in the feministmovement and cannot be only a bank teller and thus chooses (B). When the emotional context isvery vivid, the mathematical way of thinking, which is slower, has almost no chance to take over.And indeed, even when the persons interviewed are specialists, the number of wrong answers issurprisingly high. Olivier Houdé argues that the only way to get out of this dilemma is to work onwhat he calls system 3. In order to be able to let system 2 to work, one has first to inhibit the fastsystem 1. This can only be done by using an emotional key. This key is the shame of having beenmistaken a first time. Thus doing mistakes is a fundamental step in constructing knowledge. Theuncomfortable moment when a mistake happens generates thus the possibility of updating thethinking process which has caused this mistake. Moreover making this mistakes appears to be anecessary step. And one has to suffer its bitterness to be able avoiding it later. Better to experience itwhile training on WIMS.
If training is very central to learn, the influence of grading should not to be neglected in order tomotivate students and push them to repeat. Experience shows that repetition is not always the clueto successful learning. Indeed if you choose for rating scale “the best of trials” or “the mean of thethree best trials” the result is an increasing function of the answers’ number. Letting chance decide,a wining strategy requiring no endeavor, might be chosen by some students. With no profit inlearning. On the other side, choosing a rating scale involving quality (Q is calculated as a mean ofthe grade of all trials with a decreasing influence of the first ones), fosters another deviant behavior.
ICTMT 13 396 Lyon 3 - 6 July 2017

Some students are ready to pass hours on an exercise to improve the quality indicator repeating overand over an exercise they have understood. With no profit in learning again. At UPEM we are foundof strings with very high severity index and we take the best of the trials. To obtain full grade on astring of four or five items with a high severity requires some mastership.
Research shows that memory, in particular working memory, is one of the best predicator of successin studies. And research shows that it can be trained by proper exercise. The main impact of mentalarithmetics, to which generations of children where submitted together with the learning of deadlanguages, was perhaps the development of working memory. Thankfully, it can be trained at allages and has similar characteristics as physical training: it is particularly efficient if it fits to thelevel of the training person. WIMS allows, to some extent, to individualize training and to enforceworking memory. WIMS exercises, proposed with proper grading, can also enforce attention:students are particularly cautious at the last item of a string of four questions, and analyze thequestion with mindful attention. The diversity of types of questions which allow to ask questions ofdifferent types enforce processing. Sequencing as well can be strengthen. A possible scenario is topropose an exercise whose solution needs sequencing. A first the student is asked directly for thefinal result. If she does not succeed, the exercise is proposed in a sequenced form, step by step.Once it has been done with success the question is asked again directly.
EXPERIMENTING WIMS AT UPE: AN IDEA PROJECT
The community of Universities Paris Est (UPE) has won a call for project called (IDEA) in thecontext of « initiative d’Excellence en Formations Innovantes » (IDEFI) and of the ProgrammeInvestissements d'Avenir (PIA) financed by the Research National Agency (ANR). The projectallowed working groups to get support in order to set and experiment pedagogical disposals. Itappeared to be an opportunity to develop and test the use of WIMS during the first year ofmathematics at university. This project started in November 2014. There are four mathematicalcourses, each one corresponding to 6 UCTS and to 2 hours of lecture and 3 hours of tutorials. Theprinciple aim of the project was to build pathways of exercises corresponding to each of the learningmodule.
There exists huge numbers of exercises in the common base of WIMS corresponding to the firstyear after bachelor degree and we could rely on this resources. In addition hundreds of exerciseshave been developed, especially basic ones. For each chapter of the courses two sheets of exerciseshave been created, a basic and a standard one. Each sheet is composed of 8 to 15 strings ofexercises. Within the basic sheet, exercises give the occasion to manipulate directly elementarynotions of chapter. The standard sheet aims to propose exercises which correspond to the recourse’slevel. With one big difference: WIMS does not train writing a proof. Yet with a part of the trainingmade on WIMS, more time can be spent in the classroom to practice this competency.
We choose an evaluation in WIMS with exercises’s strings, high severity, and the best of the stringsuccess for grade. The sheets are opened for two weeks. After closure, students can continue topractice, but the grade is frozen. We use WIMS as a formative assessment. Its grade counts for apart of the continuous assessment. The final grade is given by the maximum between the exam fromone hand and the average between the continuous assessment and the exam from the second hand.The work on WIMS has to be done outside of the classroom. If asked, teachers answer questionsand use video projector to address some examples. A tutorship system is organized. Firstcompulsory during the two pre-entry weeks, a daily permanence is then opened at noon along thewhole academic year. The mentorship is provided by the top students of the previous years.
ICTMT 13 397 Lyon 3 - 6 July 2017

It appears from WIMS statistics that students work on WIMS for 2 to 3 hours on average. Theamount of time does not depend of the student’s level. Good student finish all with the maximumgrade whereas average students may have trouble to succeed the full standard sheet.
Anonymous inquiry has been proposed. In the first semester of year 2016-2017 we obtained 82answers on a promotion of 250 students. The inquiry dealt not only on WIMS but on all the aspectsof the course. Concerning WIMS, it turns out that it has convinced users. More specifically 84,2%answered that WIMS’ goals have been reached. A large majority thinks that the evaluation was clearand just. There was some complains about the time during which the sheets were opened. Indeed atthe end the semester this information hasn’t been provided clearly enough due to some overflow ofthe teaching staff. But a large majority (70,7%) declared to be satisfied by WIMS. Concerninglearning methods, we are faced with students lacking of method. This is made clear by the way theyengage in learning: only 7% answer that they open the course notes or the lecture notes shortly afterthe course, about 54% open it while preparing to an evaluation, and 49% read there notes whileworking on WIMS. This enables us to think that WIMS may be a tool that fosters working on thecourse itself. 78% used a scrap paper while doing WIMS exercises. Hence WIMS invites students tomobilize appropriate tools to build their thinking paths and answers. This remark has to be setagainst the fact that only 36,6% declare paying sustained attention to the reading of the statement ofthe exercises. Half of the students did not appreciate the feedback given by WIMS. Moreinvestigation has to be made to understand why.
According to 83,3% of students, WIMS helped developing competencies in mathematics. Somegive testimony from which it seems to appear that it is through WIMS that they understood theprincipal course concepts and have begun to construct their mathematical thinking. According to43% of students, WIMS has also helped to develop meta-competencies. This inquiry seems toestablish first that WIMS was a truly effective tool in order to structure time during which studentshad the occasion to mobilize the resources of the course. Second WIMS invites the students to berigorous in calculous or in reasoning, this fact has been often underlined. Third the exercise pathscould still be optimized as students stipulate that sometimes the exercises are repetitive and the timerequired to achieve the exercise sheet is sometimes too long.
SOME HINTS TO START
Let us emphasize that organizing complete pathways of exercises is time consuming. It usually takes3 years of work unless one can find resources that correspond to the wishes. If nothing corresponds,you’ve got to start programing.
Of course the main task is to align the pedagogical objectives and work on the coherence betweenlectures, classical exercises, class practice, WIMS exercises and exam. With striking efficiency, asshown in Berland 2017.
Here some pragmatic points. First, students have to be paid for their work: the grade obtained inWIMS has to be taken in account. Second, it is important to propose easy exercises which allow towork on basic notion of the course. Third, the sheets have to be apparently not to long and havingone easier sheet to begin a chapter is a plus.
To preserve engagement of students, and to foster the efficiency of training on WIMS, teachershould follow students’ work, speak of WIMS in class, and address some examples, especially whenan exercise has a difficulty index greater than 3.
To preserve teacher’s engagement, having contacts with WIMS EDU in order to enter a communityof practice is a true help. Yet, WIMS gains to be part of the school or university project, to appear in
ICTMT 13 398 Lyon 3 - 6 July 2017

the institutional brochure. Moreover, teacher promoting its use, by developing exercises forinstance, should receive some kind of compensation.
To conclude, we underline again that WIMS is 20 years old. In 1997 it was really a visionary tool.And even if some parts would gain to be updated, it still is at the top. One of the greatest strength isits community and its free and open model. This allows to use and share exercises and possiblywhole classes of exercises. We underline that there is something in the values shared that fosters agreat engagement from the volunteers developing exercises and the software itself. Is the heroicaltime where the entire development is sustained by volunteers finishing? Will the model be updatedin order to be able to sustain the payment of providers, needed to develop the software? Its future isnot yet written. But whatever happens, these fundamental values, that foster engagement, should becarefully preserved. As for the pedagogical advantages of WIMS, to support student’s learning,recall Von Neuman’s quote: Young man, in mathematics you don't understand things. You just getused to them. WIMS, when well used, appears to be a tool that can make the getting used to mucheasier.
[1] Interactive map showing where WIMS is used. http://downloadcenter.wimsedu.info/download/map/map2.html
[2] Enquête auprès des utilisateurs WIMS http://moin.irem.univ-mrs.fr/groupe-wims/Enquete [consulted 2017/09/14]
[3] Le professeur Xiao Gang, créateur du logiciel WIMS s’est éteint le vendredi 27 juin 2014 http://unice.fr/fil/service-
communication/actualites/le-professeur-xiao-gang-createur-du-logiciel-wims-s2019est-eteint-le-27-juin-2014
[4] WIMS EDU site http://wimsedu.info
[5] To see some examples of WIMS, connect to a WIMS-server, for instance http://wims.auto.u-psud.fr/wims/?lang=fr.
You can change the language but the french version is the richest one. Then explore some classes ouvertes as a visiteur
anonyme.
REFERENCES
Berland, C. (2017) E-learning platform WIMS for bachelor first year courses on electric circuit.Presented at EAEEIE Annual conference 2017, Grenoble, Fr.
Cordier, F. & Cordier, J. (1991). L’application du théorème de Thalès. Un exemple du rôle desreprésentations typiques comme biais cognitifs. Recherche en didactique des Mathématiques, 11(1),45-64.
Ganier, F (2016). C'était pourtant écrit !!! Pourquoi est-il si difficile de comprendre desinstructions? Presented at WIMS EDU colloque 2016, Annecy, Fr. http://webcast.in2p3.fr/videos-pourquoi_est_il_si_difficile_de_comprendre_des_instructions
Giner, E. & Kobylanski, M. (2017). Retour sur l’expérimentation WIMS. ResearchReport. UPEM.
Houdé, O. (2014). Le raisonnement. Que Sais-je ? PUF.
Jacquemin, L. (2017). Enquête sociologique auprès d’utilisateurs enseignantsde WIMS sur leurs usages et pratiques effectives. Research Report. UPEM.
Khaneman, D. (2011). "Linda: Less is More". Thinking, Fast and Slow. New York: Farrar, Strausand Giroux. pp. 156-165.
Kobylanski, M. (2015). Plates-formes d'apprentissage et WIMS. Gazette desMathematiciens, (145), 47-51.
ICTMT 13 399 Lyon 3 - 6 July 2017
GEOGEBRA AUTOMATED REASONING TOOLS:
A TUTORIAL WITH EXAMPLES
Zoltán Kovács 1, Tomás Recio 2, Philippe R. Richard3 and M. Pilar Vélez 4
1Private Pädagogische Hochschule der Diözese Linz; [email protected]. 2Universidad deCantabria; [email protected]. 3Université de Montréal; [email protected].
4Universidad Antonio de Nebrija; [email protected]
GeoGebra Automated Reasoning Tools (GGB-ART) are a collection of GeoGebra tools andcommands ready to automatically derive, discover and/or prove geometric statements in a dynamicgeometric construction. The aim of this workshop is to present, through examples, the use of GGB-ART and to argue about its potential impact in the classroom.
Keywords: Automated theorem proving and discovery, GeoGebra, Dynamic geometry software,Elementary geometry in education.
AUTOMATED REASONING IN ELEMENTARY GEOMETRY …
By “automated derivation of geometry statements” we refer totools that, rigorously, output some/all geometric relations verifiedby a collection of selected elements within a geometricconstruction. For instance1: given a free point A and three pointsB, C, D on a line, consider E, F, G, the midpoints of segments AB,AC and AD. Then, the automatic derivation tool should outputsome property relating E, F and G.
By “automated discovery ofgeometry statements” we refer to algorithmsthat systematically find complementary, necessary, hypotheses forthe truth of a conjectured geometric statement. For example2,given a triangle ABC and a point X, let M, N, P, be the symmetricimages of X with respect to the sides of the triangle. Then M, N, Pare aligned. Obviously, this conjecture is false but…the automaticdiscovery algorithm should be able to output the necessary (andsufficient) location for X in order to have the alignment of M, N,
P.
Finally, by “automated proving of geometry statements” we refer toalgorithms that accept as input a geometric statement, such as3: “Iftwo lines are drawn from one vertex of a square to the midpoints ofthe two non-adjacent sides, then they divide the diagonal into threeequal segments”. Then, the algorithm performs an exact computation(i.e. not using floating point numbers) and outputs a mathematicallyrigorous (e.g. not based upon a probabilistic proof) yes/no answer tothe truth of the given statement.
The community of mathematicians and computer scientists has been working on these issues alongthe past 50 years, with a variety of approaches, outcomes and popularization results. See, forinstance, the pioneer work of Gelertner (1959) in the A.I. context, or the algebraic geometry
ICTMT 13 400 Lyon 3 - 6 July 2017

framework for automated reasoning in geometry, disseminated by the book of Chou (1988), that isbehind our current implementation). Moreover, it is clear that the didactic perspective on proof(with or without technology) has been a research topic for over 40 years in the world ofmathematics education (Richard, Oller & Meavilla, 2016).
… ITS GEOGEBRA IMPLEMENTATION
Hence, we consider quite relevant to present in this workshop a tutorial describing in detail the veryrecent implementation (2016) of tools and commands for the automatic deriving, discovery andproving of geometric theorems over the free dynamic geometry software GeoGebra, with a greatimpact in mathematics education. See: Abánades et al. (2016), Hohenwarter et al. (2016).
To begin with GGB-ART we have to draw in GeoGebra a geometric construction. Then we willexhibit the many possibilities that GeoGebra offers to enhance investigating and conjecturing aboutgeometric properties of our construction. Say: investigating visually; using the Relation tool tocompare objects and to obtain relations; or using the Locus tool to learn about the trace of a pointsubject to some constraints. These methods are usually well known by the GeoGebra communityand well documented at the GeoGebra Materials web (https://www.geogebra.org/materials/). Butthese methods are mostly numerical, i.e. not mathematically rigorous, they only work on thespecific construction with concrete coordinates, so they do not allow to deal with generalstatements.
GGB-ART brings to GeoGebra new capabilities for automatic reasoning in Euclidean planegeometry in an exact way, by using symbolic computations behind the concrete construction: theRelation tool and command can be now used to re-compute the results symbolically; theLocusEquation command refines the result of the Locus command by displaying the algebraicequation of the graphical output, allowing to investigate and conjecture statements; the Prove andProveDetails commands decide in an exact way if a statement is true (i.e. checking themathematical correctness of some previously found relation).
… ITS EDUCATIONAL IMPACT
Our final goal is to share these tools with the community of math teachers and math educationresearchers, aiming to improve, after suitably addressing the necessary changes and approaches inthe educational context, geometry education (Botana, Recio & Vélez, 2017). This is an involveddidactical issue, dealing with human reasoning with technology and with the validation modesavailable in the classroom (i.e. deductive, inductive and instrumental), so that the student canaccomplish his/her mathematical work (Richard, Oller & Meavilla, 2016). It is not a new issue: infact, it was already 30 years ago when educators started reflecting about the potential role ineducation of software programs dealing with automatic theorem proving (automatic discovery andderivation were inexistent at that time). See, for instance, the visionary ICMI Study “SchoolMathematics in the 1990's” (Howson and Wilson, 1986) or the inspiring paper by P. Davis (1995),with a section that refers to the “transfiguration” power of computer-based proofs of geometrystatements. But these reflections were formulated rather as considerations about the future than asproposals for the present time of their authors…
Currently, although there already are some studies concerning the development of intelligenttutorial systems designed to assist students to construct proofs in geometry, such as GRAMY(Matsuda and Vanlehn, 2004), GeoGebraTutor or QED-Tutrix (Tessier-Baillargeon, Richard, Leducand Gagnon, 2014) –as detailed in the most comprehensive review of existing tutorial systems,available in the comparative study of Tessier-Baillargeon, Leduc, Richard and Gagnon (2017)– it is
ICTMT 13 401 Lyon 3 - 6 July 2017
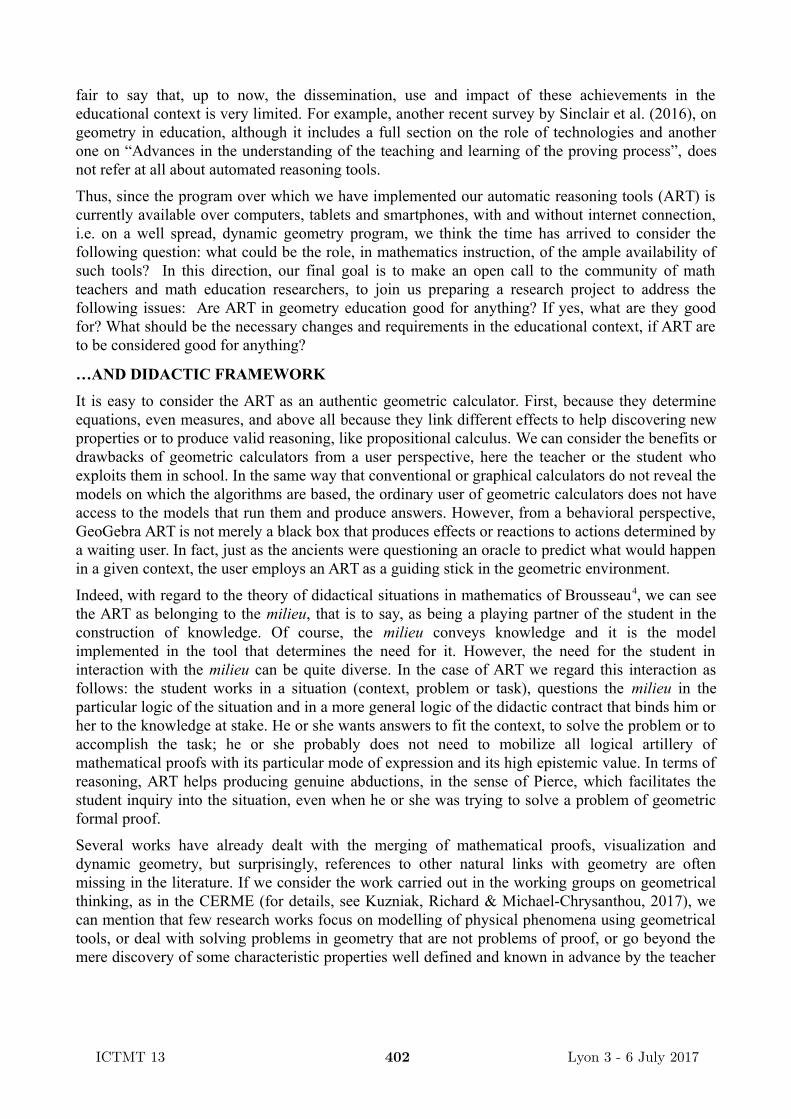
fair to say that, up to now, the dissemination, use and impact of these achievements in theeducational context is very limited. For example, another recent survey by Sinclair et al. (2016), ongeometry in education, although it includes a full section on the role of technologies and anotherone on “Advances in the understanding of the teaching and learning of the proving process”, doesnot refer at all about automated reasoning tools.
Thus, since the program over which we have implemented our automatic reasoning tools (ART) iscurrently available over computers, tablets and smartphones, with and without internet connection,i.e. on a well spread, dynamic geometry program, we think the time has arrived to consider thefollowing question: what could be the role, in mathematics instruction, of the ample availability ofsuch tools? In this direction, our final goal is to make an open call to the community of mathteachers and math education researchers, to join us preparing a research project to address thefollowing issues: Are ART in geometry education good for anything? If yes, what are they goodfor? What should be the necessary changes and requirements in the educational context, if ART areto be considered good for anything?
…AND DIDACTIC FRAMEWORK
It is easy to consider the ART as an authentic geometric calculator. First, because they determineequations, even measures, and above all because they link different effects to help discovering newproperties or to produce valid reasoning, like propositional calculus. We can consider the benefits ordrawbacks of geometric calculators from a user perspective, here the teacher or the student whoexploits them in school. In the same way that conventional or graphical calculators do not reveal themodels on which the algorithms are based, the ordinary user of geometric calculators does not haveaccess to the models that run them and produce answers. However, from a behavioral perspective,GeoGebra ART is not merely a black box that produces effects or reactions to actions determined bya waiting user. In fact, just as the ancients were questioning an oracle to predict what would happenin a given context, the user employs an ART as a guiding stick in the geometric environment.
Indeed, with regard to the theory of didactical situations in mathematics of Brousseau4, we can seethe ART as belonging to the milieu, that is to say, as being a playing partner of the student in theconstruction of knowledge. Of course, the milieu conveys knowledge and it is the modelimplemented in the tool that determines the need for it. However, the need for the student ininteraction with the milieu can be quite diverse. In the case of ART we regard this interaction asfollows: the student works in a situation (context, problem or task), questions the milieu in theparticular logic of the situation and in a more general logic of the didactic contract that binds him orher to the knowledge at stake. He or she wants answers to fit the context, to solve the problem or toaccomplish the task; he or she probably does not need to mobilize all logical artillery ofmathematical proofs with its particular mode of expression and its high epistemic value. In terms ofreasoning, ART helps producing genuine abductions, in the sense of Pierce, which facilitates thestudent inquiry into the situation, even when he or she was trying to solve a problem of geometricformal proof.
Several works have already dealt with the merging of mathematical proofs, visualization anddynamic geometry, but surprisingly, references to other natural links with geometry are oftenmissing in the literature. If we consider the work carried out in the working groups on geometricalthinking, as in the CERME (for details, see Kuzniak, Richard & Michael-Chrysanthou, 2017), wecan mention that few research works focus on modelling of physical phenomena using geometricaltools, or deal with solving problems in geometry that are not problems of proof, or go beyond themere discovery of some characteristic properties well defined and known in advance by the teacher
ICTMT 13 402 Lyon 3 - 6 July 2017

and by the student. However, the very constitution of the geometric model by the student iscertainly an incarnation of what modelling of form, shape and space is. Unfortunately, modellingactivity is generally not widely practiced in compulsory education, and problem solving ingeometry classes is often limited to those based on well-defined tasks. Moreover, few studiesconcern the solving of open problems or those that require a problematization which is not alreadylinked to a geometric model known in advance. In this context, we believe that the functionalities ofART are particularly useful in supporting the development of mathematical competencies throughthe development of a geometrical culture, building on mathematical discovery and modellingapproaches.
References
Abánades, M.A., Botana, F., Kovács, Z., Recio T. & Sólyom-Gecse, C. (2016). Development ofautomatic reasoning tools in GeoGebra. Software Demonstration Award at the ISSAC 2016Conference. Retrieved from http://www.issac-conference.org/2016/awards.php)
Botana, F., Recio, T. & Vélez, M.P. (2017). The role of automated reasoning of geometry statementsin mathematics instruction. Poster CERME-10, TWG 15. Retrieved from(https://keynote.conference-services.net/resources/444/5118/pdf/CERME10_0181.pdf)
Chou, S.C. (1988). Mechanical Geometry Theorem Proving. D. Reidel Pub. Co. Dordrecht,Holland.
Davis, P. (1995). The rise, fall, and possible transfiguration of triangle geometry: a mini-history.The American Mathematical Monthly, 102(3), pp. 204-214.
Gelernter, H. (1959): Realization of a geometry theorem proving machine. Proc. Int. Conf. onInformation Processing. Paris, UNESCO house. pp. 273-282.
Hohenwarter, M., Kovács, Z. & Recio, T. (2016). Deciding geometric properties symbolically inGeoGebra. ICME 13, TSG 18: Reasoning and Proof in Mathematics Education.
Howson, G. and Wilson, B. (1986). ICMI Study series: School mathematics in the 1990’s. Kuwait:Cambridge University Press.
Kuzniak, A., Richard, P.R. & Michael-Chrysanthou, P. (2017). From geometrical thinking togeometrical working competencies. In T. Dreyfus, M. Artigue, D. Potari, S. Prediger & K.Ruthven (Eds.), The ERME-Book: Development of European Research in MathematicsEducation - Twenty Years of Communication, Cooperation and Collaboration (in press).
Matsuda, M., Vanlehn, K. (2004). GRAMY: A Geometry Theorem Prover Capable of Construction.Journal of Automated Reasoning, 32, pp. 3-33.
Richard, P.R., Oller, A.M. & Meavilla, V. (2016). The Concept of Proof in the Light ofMathematical Work. ZDM-The International Journal on Mathematics Education, 48(6), 843–859. DOI: 10.1007/s11858-016-0805-9
Sinclair, N., Bartolini Bussi, M.G., de Villiers, M. & Owens, K. (2016). Recent research ongeometry education: an ICME-13 survey team report. ZDM Mathematics Education, 48(5), pp.691-719.
Tessier-Baillargeon, M., Leduc, N., Richard, P.R. & Gagnon, M. (2017). Étude comparative desystèmes tutoriels pour l’exercice de la démonstration en géométrie. Annales de didactique et desciences cognitives, pp. 22, 91-117.
Tessier-Baillargeon, M., Richard PR., Leduc N. & Gagnon M. (2014). Conception et analyse degeogebratutor, un système tutoriel intelligent: Genèse d’un espace de travail géométrique idoine.Revista Iberoamericana de Investigación en Matemática Educativa, 17(4-II), pp. 303-326.
ICTMT 13 403 Lyon 3 - 6 July 2017

1 Reference question N°046 https://www.emis.de/data/projects/reference-levels/EMS_RQ_BUNDLE_ENGLISH.pdf2 Recio, T. and Vélez, M.P. (1999). Automatic Discovery of Theorems in Elementary Geometry. Journal of AutomatedReasoning 23, 63-82. DOI: 10.1023/A:10061353221083 Howson, G. and Wilson, B. (1986). ICMI Study: School mathematics in the 1990’s. Cambridge University Press.4 See, for some of his key works, translated to English, http://www.springer.com/gp/book/9780792345268
ICTMT 13 404 Lyon 3 - 6 July 2017

FUNCTION HERO: AN EDUCATIONAL GAME TO AFFORD CREATIVE
MATHEMATICAL THINKING
Pedro Lealdino Filho
Université Claude Bernard – Lyon I; [email protected];
The enhancement of educational processes at all levels of education can be achieved by
implementing Game Based Learning (GBL), engaging students to the educational objectives
affording the “Flow” mind state in which individuals optimize their actions scaffolded by intrinsic
motivation. In mathematics, most of the games are based on arithmetical or logical thinking due the
software’s limitation in assessing user’s inputs. Aiming to develop a game about functions affording
Creative Mathematical Thinking (CMT), we used a Dynamic Cinderella Software (DCS) called
Cinderella, the Game Development Environment, Unity and the Kinect Sensor from Microsoft. In
this paper, we presentdesign elements of the game Function Hero that affords CMT.
Keywords: game based learning; technology in education; mathematics; functions;
INTRODUCTION
The emergence of motion-controlled technologies within the increasing usage of embodied
cognition and augmented reality environments open new doors for students to use their different
senses into their learning process. Nowadays, students can experiment mathematics more than just
listening and watching what happened on the blackboard overcoming the traditional approaches in
teaching mathematics, moreover, having fun during the learning activity.
Creating fun in learning environment is not only to make up the content or the activity. Having fun
means that the individual entered in a engagement state known as “Flow”, optimizing its motivation
and relaxation. Relaxation enables a learner to take things more easily, and motivation enables them
to put forth effort without resentment (Prensky, 2007). This mental state also contributes to
creativity. When in flow, the creator ignores the external environment, apart from the action which
is performed, the distractions don’t effect the individual and one’s mind is fully open and attuned to
the act of creating.
In the flow state, the challenges presented and the ability to solve them are almost perfectly
matched, and the individual often accomplish things that they thought they couldn’t, along a great
deal of pleasure. To keep a person in the flow state the designer must consider that making things
too easy, the players become bored and stop. Making thing to hard, the players stop because they
become frustrated. The same rule can be applied at the educational tasks. The representation of the
concept of flow is shown on the figure below.
ICTMT 13 405 Lyon 3 - 6 July 2017

Figure 1: Flow, boredom, and anxiety as they relate to task difficulty and user skill level.
Csikszentmihalyi, 1990.
Mathematicians profess that performing mathematics is a creative activity (Hadamard, 1954).
Technology supported inquiry based learning is a possible way to put students in situations where
their creativity is needed and can be expressed (Blumenfeld et al., 1991). In this article, we first
introduce the concept of Creative Mathematical Thinking. We then present the educational resource
under consideration in the reported experiment, the game “Function Hero”.
CREATIVE MATHEMATICAL THINKING
Based on the literature review on creativity (Guilford, 1950; Kaufman & Sternberg, 2010),
mathematical creativity (Sriraman, 2004; Leikin & Lev, 2007; El-Demerdash, M. & Kortenkamp,
U, 2009) and mathematical thinking (Tall, 2002; Blinder, 2013), the CMT (Creative Mathematical
Thinking) can be understood as the combination of divergent and convergent thinking in
mathematics. Starting from this principle we created the concept of “Creativity’s Diamond”
(Lealdino F, et al, 2015) (Figure 2).
Figure 2: Creative Process
ICTMT 13 406 Lyon 3 - 6 July 2017

This idea is based mainly on Guilford’s and Walla’s models of creativity. Guilford emphasized the
distinction between convergent and divergent thinking. In 1976 he introduced the model of
Divergent Thinking as the main ingredient of creativity. Guilford appointed the following
characteristics for creativity:
Fluency: The students’ ability to provide many responses or to come up with many strategies
to solve a mathematical problem or challenge.
Flexibility: The students’ ability to provide different/varied responses or to come up with
different/varied strategies to solve a mathematical problem or challenge.
Originality: The students’ ability to come up with unique (original) responses (solutions,
strategies, representations, etc.) to a mathematical problem or challenge.
Elaboration: The students’ ability to describe, substitute, combine, adapt, modify, magnify,
extend the usability, eliminate or rearrange mathematical situations.
Wallasoutlines four stages of the creative process - preparation, incubation, illumination, and
verification - dancing in a delicate osmosis of conscious and unconscious work. These phases go as
follows:
Preparation: The problem is investigated in all directions as the thinker readies the mental
soil for the sowing of the seeds. It’s the accumulation of intellectual resources out of which
to construct new ideas. It is fully conscious and entails part research, part planning, part
entering the right frame of mind and attention.
Incubation: Next comes a period of unconscious processing, during which no direct effort is
exerted upon the problem at hand - this is where the combinatory play that marked
Einstein’s thought takes place. Wallas notes that the stage has two divergent elements - the
“negative fact” that during Incubation we don’t consciously deliberate on a particular
problem, and the “positive fact” of a series of unconscious, involuntary mental events taking
place. “Voluntary abstention from conscious thought on any problem may, itself, take two
forms: the period of abstention may be spent either in conscious mental work on other
problems, or in a relaxation from all conscious mental work.
Illumination: Following Incubation is the Illumination stage, which Wallas based on French
polymath Henri Poincaré’s concept of “sudden illumination” - that flash of insight that the
conscious self can’t will and the subliminal self can only welcome once all elements
gathered during the preparation stage have floated freely around during incubation and are
now ready to click into an illumination new formation.
Verification: The last stage, unlike the second and the third, shares with the first a conscious
and deliberate effort in the way of testing the validity of the idea and reducing the idea itself
to an exact form.
THE GAME FUNCTION HERO
To develop the artifact used in this study, the Kinect sensor was used. Kinect is a motion detection
device, equipped with RGB camera, infrared depth detection sensor, microphone and a dedicated
processor. Originally designed to be a gaming accessory for the Microsoft Xbox 360 gained
popularity within developers and a windows compatible version was released.
ICTMT 13 407 Lyon 3 - 6 July 2017

To integrate the affordances from kinect sensor we use two main softwares: Unity and Cinderella.
Unity is a game development environment where is possible to create 2D and 3D experiences and
afterwards exploit to many platforms, whether android, iOS, Windows, Linux or macOS. Providing
a wide range of possibilities in creating digital content to be used in education.
The other software, Cinderella, is a dynamic geometry software developed to provide an
environment to develop high-end educational applications to teach geometry. It has its own
programming language, called CindyScript, which afford the possibility to create with considerable
freedom, interactive digital content, either for geometry or physical simulations. This software was
used in the study to translate the data received from Kinect in function graphs.
Therefore, using the technology available and taking into account the kinesthetic learning approach,
where students use their bodies to perform and react in accordance with what is being demanded by
the game. We expect to enrich the repository of digital tools to teach mathematics and at same time,
to enhance student’s motivation towards learning mathematical functions using game based learning
approach, promoting efficient learning and fun for those who play the game “Function Hero”
The game was played by various students and exposed in some science or mathematics fairs.
Following the same gameplay of games like Guitar Hero, Just Dance, Rock Band and more, the
player must perform the graph of the functions, given in their algebraic expression, with its body.
The choreographies are created by the rival players and sent via a web page. Then, the game shows
the expressions on the screen as goals to be performed by the user. See on the figure below the game
in action.
Figure 3: Student playing the Function Hero
DESIGN ELEMENTS THAT AFFORDCMT
For CMT affordances we started from Gibson’s (1979) theory of affordances. Gibson considers
affordances as properties in the environment that present possibilities for action or as cues in
ICTMT 13 408 Lyon 3 - 6 July 2017

environment such as substances, surfaces, objects, that hold possibilities for action. In a
technological environment, and according to Akrich and Latour (1992), affordance is a legislator
within a sociotechnical system, e.g., what a device allows or forbids from the actors, what it
prescribes and what permits. Therefore, CMT affordances of a technology are about its properties,
features, its structure or organization, its inherent conditions or qualities, which:
Mathematical content: Consist of open and/or non-standard problems that connect (i)
multiple representations of the same concept, (ii) different mathematical fields, and (iii)
different knowledge areas and mathematics.
Mathematical processes: Offer interaction with the technology that allow engaging with and
making sense of mathematics by exploration of, experimentation within, and formulation of
mathematics problems.
Creative Mathematical Thinking skills: Foster the users’ cognitive processes of Fluency,
Flexibility, Originality and Elaboration by stimulating/encouraging students to make and
check conjectures, find multiple solutions and/or strategies for the same problem, think and
reflect on their mathematical work, generalize mathematical phenomena.
Social Aspect: Value the mathematical communicative skills.
Affective aspect: Promote engagement by generating a feeling of (aesthetic) pleasure
because of the narrative, some game features of the flow of the mathematical activities.
RESULTS
After the game was introduced in the classes, the students had one week to change their
choreographies on the web site. The set of functions created by them where played in a sort of
tournament. The engagement of students was more than expected, they created the choreographies
and played along the tournament supporting their colleagues and vibrating with the scores.
Team
Choreography
0 abs(sin(x)), cos(x)+2, x^(-2), log(x), exp(2*log(x)) , exp(-x) , 3*x , -x^(10)
1 abs(x),log(-x+4),log(x+6),cos(x),tan(-x),0,sin(x-2),exp(x^2),cos(x^1/2),cos(-x),(x-3)(x+5)
2 5*x^3,sin(86)+arctan(1515),abs(sin(x)),arccos(x^69)),1/(1+6*x^2),arccos(x^1664)
3 ln((-3+2*x)^(-1)),heavyside(x),-x ,x^3,cos(x),log(exp(sqrt(x))),tan(x),sin(exp(x)),log(x^2)
4 (x+2)^1, abs(x)+2,(-(x)+1)^1,-abs(x)+1^3,sin(-x),x^3+1^4,-(x^3)+1^2, 2+(17^12)x*0, x^-2*log(x)
5 2*x,log(x+2),x^(-2),exp(x), ch(x+1/2)
6 log((-3+2*x)^(-1)),-x^3,-x ,x^3,cos(x),log(exp(sqrt(x))),tan(x),sqrt(-x)
7 (x+2)^1, abs(x)+2,(-(x)+1)^1,-abs(x)+1^3,sin(-x),x^3+1^4,-(x^3)+1^2, 2+(17^12)x*0
Table 1: Teams’ choreographies for the Function Hero Tournament
ICTMT 13 409 Lyon 3 - 6 July 2017

CONCLUSION
The game Function Hero was created with the intention to provide another technology to the
mathematics education scenario allowing to promote motivation and engagement using an
educational game. It differs from the other game in the aspect of its design, which doesn’t ask user
closed answers.
Following the CMT affordances elements (Table 1), we developed a game which doesn’t present
standard problems since the goal is to create sets of functions representing choreographies to be
“danced” by others. The multiple representation of the same subject, functions, is seen when
students must think about the algebraic expression, translate it into machine expression and imagine
the graphical result in accordance body movement that fits well the function thought by them.
The social aspect with other players was encouraged promoting the Function Hero Tournament,
which teams faced each other dancing the choreographies created by themselves and by other teams.
The affective aspect is present in the game itself, providing scores which students can verify their
movements and evaluation of the algebraic expression in real time.
Analysing the choreographies, it’s possible to trace some elements of divergent thinking listed as
Fluency, Flexibility, Originality and Elaboration. For instance, we notice that the Team 2 shows
more fluency in trigonometric functions while the Team 4 in quadratic and cubic functions. The
Team 6 elaborated their choreography using some redundant expression to make harder to the other
teams to recognize but easy to themselves (log(exp(sqrt(x))).
Thus, the game allows the evaluation of any gesture of the student giving points in accordance to it.
Some further studies will be conducted to verify if there is a learning gain on the recognition and
understanding of functions using the game.
REFERENCES
Akrich, M., & Latour, B. (1992). A summary of a convenient vocabulary for the semiotics of human
and nonhuman assemblies. In W. Bijker & J. Law (Eds.), Shaping technology / building society:
Studies in sociotechnical change (pp. 259–264). Cambridge: MIT Press
Blinder, S. M. (2013). Guide to Essential Math. Elsevier: New York.
El-Demerdash, M. (2010). The effectiveness of an enrichment program using dynamic geometry
software in developing mathematically gifted students' geometric creativity in high schools Doctoral
dissertation, University of Education Schwäbisch Gmünd, Germany.
Gibson, J. J. (1979). An ecological approach to visual perception. (Boston, MA, Houghton Mifflin)
Guilford, J.P. (1950). Creativity. American Psychologist, 5, 444-454.
Hadamard, J. (1954). The psychology of invention in the mathematical field. New York: Dover
Publications.
Kaufman, J. C., & Sternberg, R.J. (Eds.) (2010). The Cambridge Handbook of Creativity.
Cambridge: Cambridge University Press.
Lealdino, P. F., Mercat, C., Emin, V., Trgalova, J., Essonnier, N.(2015). Assigned to creativity:
didactical contract negotiation and technology. In K. Krainer & N. Vondrová (Eds), Proceedings of
the Ninth Conference of the European Society for Research in Mathematics Education (CERME9,
ICTMT 13 410 Lyon 3 - 6 July 2017
4-8 February 2015) (pp. 992-1006). Prague, Czech Republic: Charles University in Prague, Faculty
of Education and ERME.
Leikin, R., & Lev, M. (2007). Multiple solution task as a magnifying glass for observation of
mathematical creativity. In J. H. Woo et al. (Eds.), Proceeding of the 31st International Conference
of the Psychology of Mathematics Education, 3 (pp. 161 – 168), Seoul, Korea.
Prensky, 2007. Digital Game-Based Learning: pratical ideas for the application of digital game-
based learning. McGraw-Hill Pub.
Sriraman, B. (2004). The characteristics of mathematical creativity. The Mathematics Educator,
14(1), 19-34.
Tall, D. (2002). Advanced Mathematical Thinking. Dordrecht: Kluwer.
Wallas, G. (1926). The art of thought. New York, NY: Harcourt Brace Jovanovich. The Stages of
Creativity. In Rothenberg, A. & Hausman, C. (Eds) The creativity question. (1976) . (pp. 69-73).
ICTMT 13 411 Lyon 3 - 6 July 2017

(Un)intended representations in dynamic geometry software: pedagogical considerations
Samet Okumus
Recep Tayyip Erdogan University; [email protected]
In recent years, dynamic geometry software (DGS) has become common in classrooms for teachingand learning of mathematics. In this paper, I address some representational issues with whichstudents and teachers may encounter while using DGS. Unintended representations may stem fromthe design principles for DGS, tasks that involve constructions with a limitation and representationsof mathematical objects in DGS. Pedagogical considerations about using those representations asan opportunity for mathematical investigation are discussed.
Keywords: dynamic geometry software, (un)intended representations, pedagogical considerations
INTRODUCTION
Mathematics educators call for using technology in mathematics classrooms such as dynamicinteractive mathematics technologies (Association of Mathematics Teacher Educators (AMTE),2006; National Council of Teachers of Mathematics (NCTM), 2000). An issue for teachers mayinclude finding the right tool to use in the mathematics classroom to enhance students’mathematical learning (Smith, Shin, & Kim 2016). Smith et al. (2016) emphasize that a quicksearch on the Internet for a mathematical topic yields in a number of commercial and free-of-chargetools.
Dick (2008) provides some criteria for selection of technologies teachers may take intoconsideration. For example, a technological tool should stay true in mathematics – that is known asmathematical fidelity (Dick, 2008; Dick & Hollebrands, 2011). Also, a digital tool should nottrigger a mismatch between students thinking and intended mathematics learning – that is known ascognitive fidelity (Dick, 2008; Dick & Hollebrands, 2011). For example, the angle between twoperpendicular lines is perceived as an acute or obtuse angle in an unequal scale of coordinate system(see Dick & Burrill, 2016; Dick & Hollebrands, 2011). Moreover, a technological tool should bepedagogically faithful, in that “the student should perceive the tool as (a) facilitating the creation ofmathematical objects, (b) allowing mathematical actions on those objects, and (c) providing clearevidence of the consequences of those actions” (Dick, 2008, p.334). Smith et al. (2016) found thatpedagogical and mathematical fidelity for selecting a digital tool to use in classrooms was importantfor in-service and prospective mathematics teachers value.
Leung and Bolite-Frant (2015) emphasize that a technological tool with a limitation or uncertaintyhas a discrepancy potential. The researchers state that unintended mathematical representationsopen a pedagogical space for teachers. For example, teachers may capitalize an unintendedmathematical concept with a focus on technological representations. A pedagogical space may takeplace by means of “feedback due to the nature of the tool or design of the task that possibly deviatesfrom the intended mathematical concept or (ii) uncertainty created due to the nature of the tool ordesign of the task that requires the tool users to make decisions” (p.212). In this paper,representational issues stemming from constructions with a limitation, the design of DGS andrepresentations of mathematical objects in DGS are discussed.
ICTMT 13 Lyon 1
ICTMT 13 412 Lyon 3 - 6 July 2017

CONSTRUCTION WITH A LIMITATION
DGS allows for manipulating primitive elements (e.g., points, line segments) and exploring theinvariant attributes of geometric objects. Properties of geometric objects remain invariant when apoint or object is dragged in a properly constructed shape (Laborde, Kynigos, Hollebrands, &Strässer, 2006). Students or teachers may use a DGS drawing – that is “a process that involves theuse of "freehand" tools to create a geometrical object”, and focus on its perceptual characteristics(Hollebrands & Smith, 2009, p.221). Also, teachers may provide a construction with a limitation forstudents.
Drawings or constructions with a limitation trigger unintended mathematical representations (seeMariotti, 2013; Ruthven, Hennessy, & Deaney, 2008). Such technological representations stem fromhow the tools in DGS are utilized. For example, in Figure 1a, the Parallel line tool is utilized tocreate a trapezoid with one pair of parallel sides. Students may notice a trapezoid can also have twopairs of parallel sides dragging point C towards point D (Figure 1b) and conclude that “a trapezoidis sometimes a parallelogram.” When points C and D coincide as shown in Figure 1c, the trapezoidbecomes a triangle. Moreover, if point C crosses point D, a crossed quadrilateral is created (deVilliers, 1994). This construction does not preserve the invariant properties of the trapezoid and hasa limitation. However, this construction may allow for a mathematical discussion about thecounterexamples of the trapezoid. Researchers point out that constructions with a limitation ordrawings give an opportunity for students to reason about geometric objects with the supervision of
mathematics teachers. For example, Ruthven et al. (2008) stress that teachers capitalize drawings or unintended
mathematical constructions. On the other hand, they observe a teacher who concealed anomaly constructed geometric
objects.
(a) (b) (c) (d)
Figure 1. (a) A trapezoid, (b) The trapezoid becomes a parallelogram, (c) The trapezoid becomes atriangle, (d) The trapezoid becomes a crossed quadrilateral
Unintended representations may result in interruptions in the flow of a lesson and teachers maymake ad hoc decisions about how to respond in these moments (Cayton, Hollebrands, Okumuş, &Boehm, 2017). For example, teachers may emphasize counterexamples of geometric objects usingan unintended representation with a focus on mathematics and technological representation. On theother hand, they may eliminate unintended representations. Teachers’ pedagogical dispositionsdetermine if they conceal, capitalize or eliminate an unintended mathematical representation (Dick& Burrill, 2016; Mariotti, 2013; Ruthven et al., 2008). For the elimination of unintendedrepresentations, the teacher should use his or her technological and mathematical knowledge toconstruct objects that stay true in mathematics (Dick & Burrill, 2016). For example, the restrictionof point D on a ray that is parallel to as shown in Figure 2a eliminates the counterexamples ofthe trapezoid. Then, point C does not meet at or cross point D (Figure 2b). Teachers’ mathematical and
technological knowledge should be in action to construct a geometric sketch that preserves the critical attributes of a
geometric shape (Dick & Burrill, 2016).
ICTMT 13 Lyon 2
ICTMT 13 413 Lyon 3 - 6 July 2017

(a) (b)
Figure 2. (a) Point D bounded on a ray, (b) Points D and C do not coincide
DESIGN OF DGS
Developers of DGS make design decisions and users (e.g., teachers) most often have no freedom tochange the interface for the tool. The interface for a tool may violate mathematical fidelity andprovide incorrect feedback (Dick, 2008; Dick & Burrill, 2016; Dick & Hollebrands, 2011). InGeoGebra (a free dynamic geometry program), the Angle Bisector tool creates two angle bisectorlines when two lines/line segments are selected (Steketee, 2010). Then, angle bisectors of a trianglemeet at four points as shown in Figure 3a. This representation may be confusing for students andteachers because three angle bisectors of a triangle should meet at a point – that is called incenter.However, the design decision on the Angle Bisector tool results in demonstrating the excenters of atriangle [the center of a circle that is tangent to a side of a triangle and the extension lines of theother two sides]. Teachers may prefer to use DGS that provides more transparent feedback forstudents. For example, the Geometer’s Sketchpad (a commercial dynamic geometry program)creates a ray as an angle bisector and the angle bisectors of a triangle meet at a point (see Steketee,
2010).
(a) (b)
Figure 3. (a) Angle bisectors of a triangle in GeoGebra, (b) The excenters (Points D, E, F) of atriangle
Teachers should be able to make sense of an unintended technological representation to determine ifthe tool provides a correct mathematical representation. This skill requires establishing a link
ICTMT 13 Lyon 3
ICTMT 13 414 Lyon 3 - 6 July 2017

between mathematical and content knowledge to reason about unintended representations (Dick &Burrill, 2016). Teachers may utilize different techniques to use the tools in DGS to eliminateunintended representations. For example, the Angle bisector tool in GeoGebra does not demonstratethe excenters if the three vertex points of a triangle are selected. Knowledge of an alternativeutilization of a tool in DGS or about different dynamic geometry programs may assist teachers inmaking a decision about identifying the right DGS.
Smith et al. (2016) found that in-service and student teachers were not concerned about cognitivefidelity. However, tools that violate cognitive fidelity result in giving misleading information (Dick& Burrill, 2016; Dick & Hollebrands, 2011). For example, in GeoGebra, one may change the scaleof coordinate system. As shown in Figure 4a, a circle in an unequal scale of coordinate system lookslike an ellipse (see Steketee, 2010). On the other hand, some programs (e.g., Graphic Calculus)create graphs on an unequal scale of system as default when a graph is plotted (Figure 4b).Familiarity with the tool may eliminate unintended representations. For example, the Square tool in
Graphic Calculus equalizes the axes (Figure 4c) (van Blokland, van de Giessen, & Tall, 2006).
(a) (b) (c)
Figure 4. (a) A circle on an unequal scale of coordinate system in GeoGebra, (b) a circle in anunequal scale of coordinate system in Graphic Calculus, (c) the circle in an equalized coordinate
system
REPRESENTATIONS OF MATHEMATICAL OBJECTS IN DGS
According to Laborde (1993), “drawing refers to the material entity while figure refers to atheoretical object” (p.49). Material drawings (e.g., diagrammatic representation of a circle in DGSor on a sheet of paper) have flaws, for example, “marks have a width, straight lines are not reallystraight” (p.50). She refers to the abstraction of material drawings as idealized drawings. A materialdrawing may result in a confusion for students/teachers and they may have difficulty identifying itscorresponding figure (theoretical object). Similarly, a dual relationship between mathematical andtechnological representations should be established because DGS may not provide an accuraterepresentation for a figure. For example, a quadrilateral signifies a plane in Cabri 3D as shown inFigure 5. Then, students may think of a plane as a quadrilateral or a bounded object because it doesnot extend in all directions forever. The Sector tool that extends the plane as shown in Figure 6 maybe utilized to demonstrate the unboundedness of plane. Knowledge of tools in DGS assists teachersin providing a more accurate representation of plane. Teachers may consider using differentdynamic geometry programs to develop their understanding of figures. For example, some dynamicgeometry programs (e.g., GeoGebra) do not allow students/teachers to extend the plane in alldirections. Google SketchUp provides a more accurate representation of plane as default (seePanorkou & Pratt, 2016). Then, dynamic geometry programs have different discrepancy potentials.
ICTMT 13 Lyon 4
ICTMT 13 415 Lyon 3 - 6 July 2017
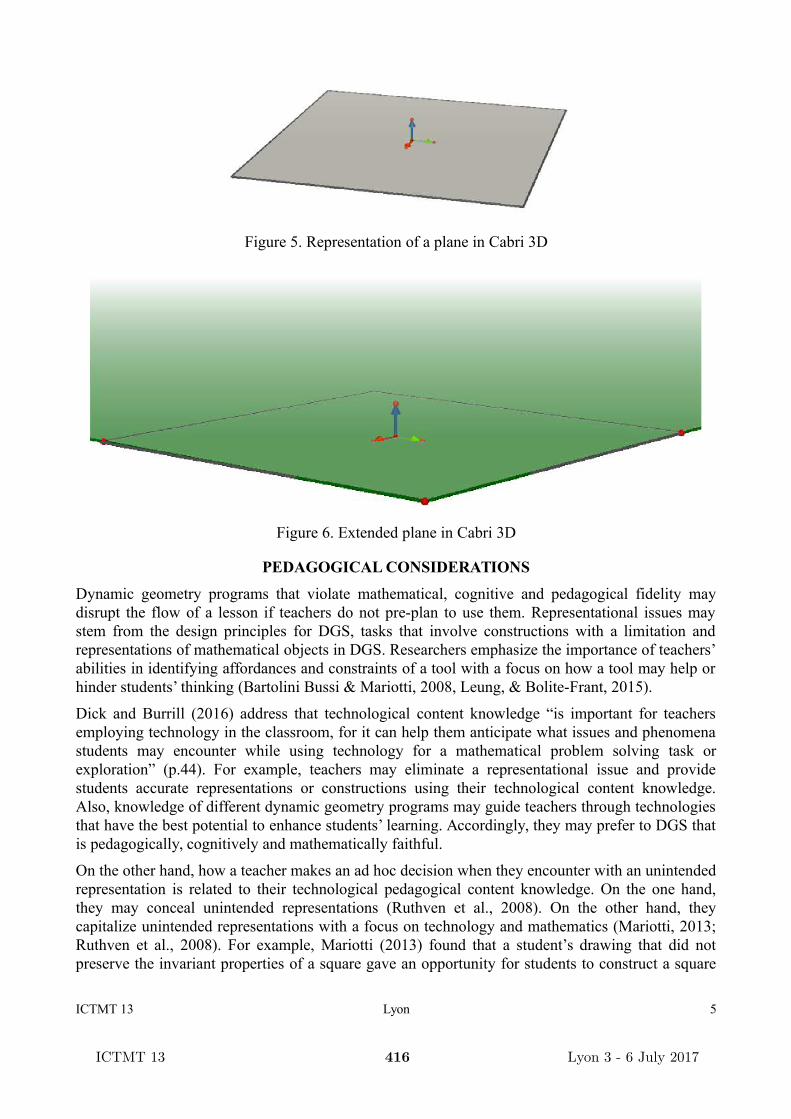
Figure 5. Representation of a plane in Cabri 3D
Figure 6. Extended plane in Cabri 3D
PEDAGOGICAL CONSIDERATIONS
Dynamic geometry programs that violate mathematical, cognitive and pedagogical fidelity maydisrupt the flow of a lesson if teachers do not pre-plan to use them. Representational issues maystem from the design principles for DGS, tasks that involve constructions with a limitation andrepresentations of mathematical objects in DGS. Researchers emphasize the importance of teachers’abilities in identifying affordances and constraints of a tool with a focus on how a tool may help orhinder students’ thinking (Bartolini Bussi & Mariotti, 2008, Leung, & Bolite-Frant, 2015).
Dick and Burrill (2016) address that technological content knowledge “is important for teachersemploying technology in the classroom, for it can help them anticipate what issues and phenomenastudents may encounter while using technology for a mathematical problem solving task orexploration” (p.44). For example, teachers may eliminate a representational issue and providestudents accurate representations or constructions using their technological content knowledge.Also, knowledge of different dynamic geometry programs may guide teachers through technologiesthat have the best potential to enhance students’ learning. Accordingly, they may prefer to DGS thatis pedagogically, cognitively and mathematically faithful.
On the other hand, how a teacher makes an ad hoc decision when they encounter with an unintendedrepresentation is related to their technological pedagogical content knowledge. On the one hand,they may conceal unintended representations (Ruthven et al., 2008). On the other hand, theycapitalize unintended representations with a focus on technology and mathematics (Mariotti, 2013;Ruthven et al., 2008). For example, Mariotti (2013) found that a student’s drawing that did notpreserve the invariant properties of a square gave an opportunity for students to construct a square
ICTMT 13 Lyon 5
ICTMT 13 416 Lyon 3 - 6 July 2017

using the function tools of DGS (e.g., the Perpendicular Line tool). In other words, the teacher usedthe student’s drawing as an opportunity for mathematical investigation and generated a whole-classdiscussion. Also, inaccurate representations may allow students and teachers to revisit thedefinitions of a geometrical object and discuss about its counterexamples. Leung and Bolite-Frant(2015) emphasize “task design can intentionally make use of a tool’s discrepancy potential to createuncertainties and cognitive conflicts which are conducive to student learning” (p.221).
REFERENCES
Association of Mathematics Teacher Educators (AMTE). (2006). Preparing teachers to usetechnology to enhance the learning of mathematics: A position of the Association of MathematicsTeacher Educators. Retrieved from http://www.amte.net
Bartolini Bussi, M. G., & Mariotti, M. A. (2008). Semiotic mediation in the mathematics classroom:Artifacts and signs after a Vygotskian perspective. In L. D. English & D. Kirshner (Eds.),Handbook of International Research in Mathematics Education, second edition (pp. 746-783).New York and London, Routledge.
Cayton, C., Hollebrands, K., Okumuş, S., & Boehm, E. (2017). Pivotal teaching moments intechnology-intensive secondary geometry classrooms. Journal of Mathematics Teacher Education,20(1), 75-100.
de Villiers, M. (1994). The role and function of a hierarchical classification of quadrilaterals. Forthe Learning of Mathematics, 14(1), 11-18.
Dick, T. P. (2008). Keeping the faith, fidelity in technological tools for mathematics education. In G.W. Blume & M. K. Heid (Eds.), Research on technology and the teaching and learning ofmathematics: Vol. 2. Cases and perspectives (pp. 333–339). Charlotte, NC: Information Age.
Dick, T. P., & Burrill, G. F. (2016). Design and Implementation Principles for Dynamic InteractiveMathematics Technologies. In M. Niess, S. Driskell, & K. Hollebrands (Eds.), Handbook ofresearch on transforming mathematics teacher education in the digital age (pp. 23-51). Hershey,PA: IGI Global.
Dick, T P. & Hollebrands, K. F. (2011). Focus in High School Mathematics: Technology to SupportReasoning and Sense Making (pp. xi-xvii). Reston, VA: National Council of Teachers ofMathematics.
Hollebrands, K., & Smith, R. (2009). The impact of dynamic geometry software on secondarystudents’ learning of geometry: Implications from research. In T. Craine, & R. Rubenstein (Eds.),Understanding geometry for a changing world. (pp. 221-232) Reston, VA: NCTM.
Laborde, C. (1993). The computer as part of the learning environment: The case of geometry. In C.Keitel & K. Ruthven (Eds.), Learning from Computers: Mathematics Education and Technology(pp. 48-67), Springer-Verlag, Berlin.
Laborde, C., Kynigos, C., Hollebrands, K., & Strässer, R. (2006). Teaching and learning geometrywith technology. In A. Gutiérrez & P. Boero (Eds.), Handbook of research on the psychology ofmathematics education: Past, present and future (pp. 275–304). Rotterdam: Sense.
Leung, A., & Bolite-Frant, J. (2015). Designing mathematics tasks: the role of tools. In A. Watson &M. Ohtani (Eds.), Task design in mathematics education: The 22nd ICMI study (pp. 191– 225).,New ICMI study series Cham: Springer.
ICTMT 13 Lyon 6
ICTMT 13 417 Lyon 3 - 6 July 2017

Mariotti, M. A. (2013). Introducing students to geometric theorems: How the teacher can exploit thesemiotic potential of a DGS. ZDM, 45(3), 441-452.
National Council of Teachers of Mathematics (NCTM). (2000). Principles and standards for schoolmathematics. Reston, VA: Author.
Panorkou, N., & Pratt, D. (2016). Using Google SketchUp to Develop Students’ ExperiencesofDimension in Geometry. Digital Experiences in Mathematics Education, 2(3), 199-227.
Ruthven, K., Hennessy, S., & Deaney, R. (2008). Constructions of dynamic geometry: A study ofthe interpretative flexibility of educational software in classroom practice. Computers andEducation, 51(1), 297-317.
Smith, R. C., Shin, D., & Kim, S. (2016). Prospective and current secondary mathematics teachers’criteria for evaluating mathematical cognitive technologies. International Journal ofMathematical Education in Science and Technology, 1-23.
Steketee, S. (2010). Comparison of Sketchpad and GeoGebra. Retrieved fromhttp://math.kendallhunt.com/documents/GSP5/Detailed_Comparison_of_Sketchpad_and_GeoGebra.pdf
van Blokland, P., van de Giessen, C., & Tall, D. (2006). Graphic Calculus Software. VUsoft.
ICTMT 13 Lyon 7
ICTMT 13 418 Lyon 3 - 6 July 2017

INCORPORATING LyX AS STANDARD TOOL FOR WRITING MATHEMATICS - EFFECTS ON
TEACHING AND LEARNING
Ittay Weiss
Department of Mathematics, University of Portsmouth, UK;
We report on the experience of half a decade of teaching mathematics in the South Pacific region, incorporating LyX as
a standard tool for the students in the preparation of their submitted assignments. LyX is a What-You-See-Is-What-You-
Mean graphical frontend to LaTeX, the most widely used mathematics markup tool for publishing mathematics
documents. We briefly survey the current state of affairs of software used in common practices relevant to the teaching
of mathematics, and then concentrate on the advantages offered by LyX. We describe the practicalities of adopting LyX
as part and parcel of the course tools and aims,and we then discuss the immediate and longer term effects thereof, and
contemplate on the pedagogical efficacy and relevance of LyX as a communication tool.
Keywords: LyX, LaTeX, mathematics writing, mathematics communication.
INTRODUCTION
Communication in writing is at the heart of learning and teaching – a statement so patently obvious that one may find
curious the need to state it at all. But indeed, there is a curiosity to be resolved. Students in all taught subjects expect all
written communication from the lecturer to be readable, clearly typed, and professionally presented. Similarly, teachers
expect students to hand in written assignments which are well-prepared, with attention and care given not just to the
content but also to the presentation thereof. In fact, the ability to present ideas and results in a fashion conforming to the
subject standards is generally considered part of the competency buildup of a study program. In mathematics students
still expect no less than professionally typed material from the lecturer, while the students themselves are allowed to
submit handwritten solutions which are far removed from being professionally typed and are often barely readable.
This asymmetry, unique to mathematics teaching, is unfortunate from several perspectives. The written material
presented to the students serves as a beacon of mastery. A standard of presentation to appreciate, enjoy, and to strive to
achieve. A failure to guide and nurture such a vital communication competency should be viewed as suboptimal design.
Further, particularly in mathematics, typing up one’s thoughts into a readable, coherent, and beautifully presented
document, even if consisting of just a few lines of text, significantly heightens one’s understanding of the material due
to mathematics’ unique feature of being communicated as a mixture of a natural language, typically English, and a
formal language, typically set theory formalized to a certain degree of comfort. Students often find making the
distinction between the formal and the natural components very difficult, especially when writing their own solutions on
a piece of paper. The pen-and-paper’s permitting nature, giving the student complete freedom, serves to further blur the
line between the formal and the natural aspects in their answers. Lastly, we mention an important psychological effect
related to this issue. It is quite disheartening if after solving a difficult problem, all that the student has to show for it is a
few sheets of scribbled paper which, even if marked as a full 10/10, cannot be considered anything even remotely close
to a document. It simply does not look impressive. If, instead, part and parcel of obtaining full marks is to present the
solution as a professionally typed document, the end result becomes truly something to strive for; a readable piece of
work, elegant in content and in form. Further work, opinions, and discussion on the importance of communication
competencies along these lines can be found in Pugalee, D. K. (2001), Quinn, R. J., & Wilson, M. M. (1997), Baxter, J.
A., Woodwar, J., & Olson, D. (2005), and Bicer, A., Capraro, R. M., & Capraro, M. M. (2013).
Various software solutions exist for typesetting mathematics formulas within a document. Perhaps the two most worthy
of mentioning are MS Word’s equation editor and LaTeX. The former is mentioned due to the widespread use of MS
ICTMT 13 419 Lyon 3 - 6 July 2017

Word, while the latter is without a shadow of a doubt the publishing standard for professional mathematicians. Most
mathematicians probably never even once invoked MS Word’s equation editor, and are thus reluctant to prescribe usage
of it as part of their teaching. On the other hand, LaTeX is not a word processor, and using it requires quite a bit of
preparation with some non-trivial hurdles to surmount. For that reason, lecturers are reluctant to introduce LaTeX early
on, resorting to allowing handwritten submissions.
The aim of this paper is to report on the experience of using LyX as an alternative solution while the author taught
mathematics courses at the main campus of the University of the South Pacific in Fiji from 2011 to 2016. The plan of
the paper is to first give the reader a quick taste of LaTeX, not shying away from its unpleasant features, in order to
appreciate what it does and why it is not the case that students can be expected to simply start using it without
significant guidance. There follows a glance survey of LyX, emphasizing its key aspects for the purposes of this report.
Then the author’s experience is recounted, including a brief description of the common practice in sufficient detail to
allow mimicry for those interested. The observed effects are reviewed, followed by a discussion and concluding
remarks.
THE LaTeX FEAR FACTOR
LaTeX, unlike Word, is a document processor rather than a word processor. It is used to produce professional looking
documents by means of a markup language typed in an editor which then compiles to produce the end result. All
formatting decisions are made by LaTeX during compilation, leaving the writer to concentrate on the content. There are
numerous LaTeX editors and compilers, each with its own set of extras and special features. The examples below were
all created using Valletta Venture’s TeXpad. Figure 1 is a snapshot of typical work in progress, cycling through editing
and compiling phases. Already the brief description above is sufficient to send tremors of anxiety down the spines of
many brave souls. There are many books dedicated to imparting the mysteries of LaTeX, e.g., Gratzer, G. (2016) or
Mittelbach, F., Goossens, M., Braams, J., Carlisle, D., & Rowley, C. (2004), but often such texts serve to further deter
curious newcomers, making one seek the comfort of the familiarity of a word processor rather than all this business
with weird looking commands, editors, and compilers.
On the left-hand-side of Figure 1 is the LaTeX code one must type in in order to produce what is displayed on the right-
hand-side. A particularly deterring feature of LaTeX is its unforgiving nature to the slightest of mistakes, coupled with
its tendency to deliver most cryptic errors when one, unfortunately inevitably, types incorrectly. For instance, if in the
Figure 1: TeXpad session showing LaTeX code on the left and the compiled result on the right.
ICTMT 13 420 Lyon 3 - 6 July 2017

LaTeX code presented in Figure 1, the line reading “\begin{abstract}” were to be replaced by “\begin{abstrat}”, an
innocent enough typo, the LaTeX compiler is known to respond quite harshly and unintelligibly, producing output as
shown in Figure 2 and errors as shown in Figure 3.
The fact that virtually all professional mathematicians use LaTeX to communicate their research, given the non-
ICTMT 13 421 Lyon 3 - 6 July 2017

triviality of getting used to using it, should indicate
that there is sufficient gain to using LaTeX rather than
a word processor. Here is not the place to further
expand on that point, but it is certainly the place to
remark that it should now be obvious that teaching
LaTeX, especially early on, is challenging.
A further difficulty that one meets just a few steps
down the road to using LaTeX is the inevitable
consequence of writing code, namely the need to
debug. A significant difference between an
experienced LaTeX user and a novice is that that
former mastered working techniques that minimize the
risk of bugs, while the latter spends much time
searching one’s code for elusive bugs.
Other than the typographical advantages offered by
LaTeX, a pedagogically important feature is the need
(lest dreaded errors will be reported) to clearly
separate text from mathematics content, as can be seen
in Figure 1. The unforgiving nature of LaTeX is here a
blessing since only 100% correct code will be
accepted, forcing the writer to first very clearly figure
out on her own precisely what she means to say.
Suffice it to say that LaTeX has much to offer, but it is not easy to get going. A more user-friendly solution is desirable.
THE LyX SOLUTION
LyX is an open source project providing a freely
distributed graphical frontend for LaTeX. It must be
emphasized that under the hood of a document
produced using LyX is LaTeX code, but that code is
automatically produced and compiled by LyX. The
LyX interface resembles that of a word processor, in
fact so much so that a casual observer is likely to
mistake it for just that. Figure 4 illustrates that feature
in a snapshot of a LyX session, with the LyX interface on the left-hand-side and the output on the right-hand-side. The
resemblance to a word processor immediately dispels any anxiety as one automatically feels at home when working
with LyX. It is a familiar environment, there are no odd looking commands, no visible compiling, and no unwieldy
errors to cope with. This is all true, but just on the surface. What LyX does very well is hide the code and the
compilation, providing convenient graphical features to give one the illusion that the whole thing has nothing to do with
LaTeX. But the illusion is easily broken by LyX’s ability to export any LyX document as a LaTeX document, a feature
the uninterested user, and certainly newcomers, can safely disregard. Unbeknown to the user, LyX constantly compiles
whatever the user is typing, a feature that pretty much guarantees there will never be a need to debug a LyX document.
It is worthwhile noticing that some LaTeX editors resort to a similar technique in order to reduce the risk of bugs.
Still just on the surface, LyX differs from a word processor in its use of environments (a pull-down menu at the top left
corner) used to specify different sections or portions of text, and in its highly sophisticated math mode. The latter is
LyX’s support for typing mathematical symbols, equations, formulas, and so on. It is here that LyX shines when
Figure 2: Output due to a simple typo.
Figure 3: Errors reported due to a simple typo.
ICTMT 13 422 Lyon 3 - 6 July 2017
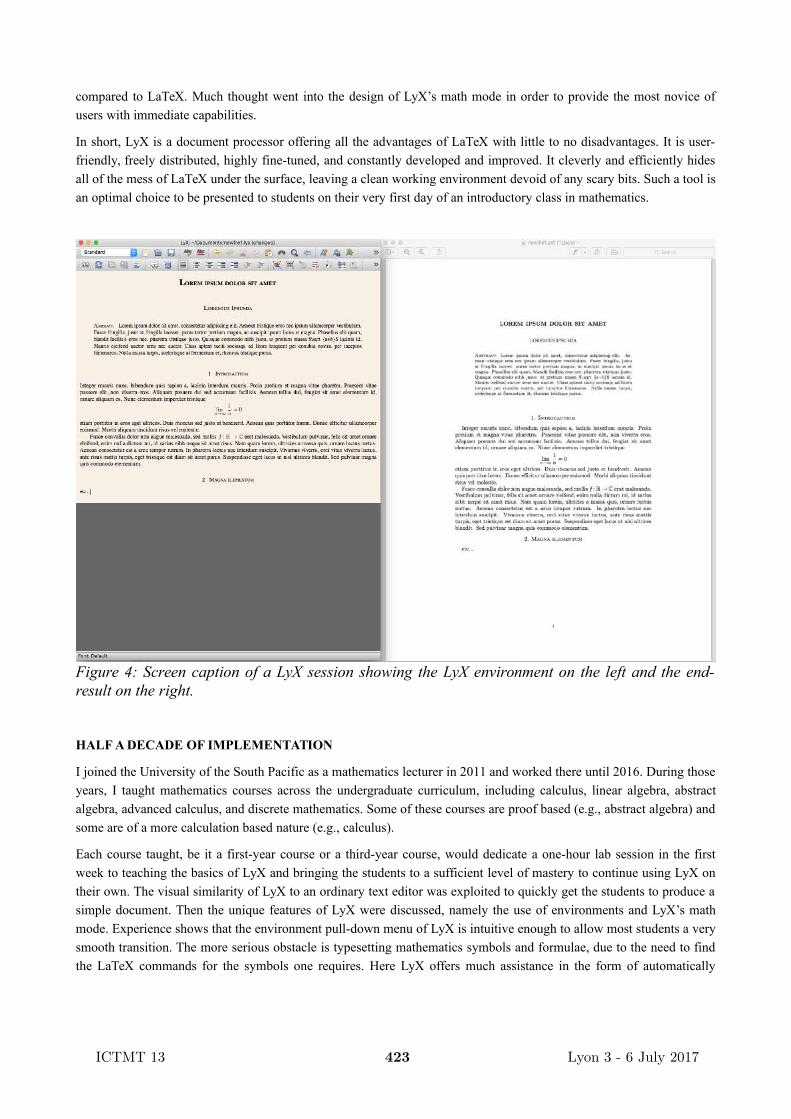
compared to LaTeX. Much thought went into the design of LyX’s math mode in order to provide the most novice of
users with immediate capabilities.
In short, LyX is a document processor offering all the advantages of LaTeX with little to no disadvantages. It is user-
friendly, freely distributed, highly fine-tuned, and constantly developed and improved. It cleverly and efficiently hides
all of the mess of LaTeX under the surface, leaving a clean working environment devoid of any scary bits. Such a tool is
an optimal choice to be presented to students on their very first day of an introductory class in mathematics.
Figure 4: Screen caption of a LyX session showing the LyX environment on the left and the end-result on the right.
HALF A DECADE OF IMPLEMENTATION
I joined the University of the South Pacific as a mathematics lecturer in 2011 and worked there until 2016. During those
years, I taught mathematics courses across the undergraduate curriculum, including calculus, linear algebra, abstract
algebra, advanced calculus, and discrete mathematics. Some of these courses are proof based (e.g., abstract algebra) and
some are of a more calculation based nature (e.g., calculus).
Each course taught, be it a first-year course or a third-year course, would dedicate a one-hour lab session in the first
week to teaching the basics of LyX and bringing the students to a sufficient level of mastery to continue using LyX on
their own. The visual similarity of LyX to an ordinary text editor was exploited to quickly get the students to produce a
simple document. Then the unique features of LyX were discussed, namely the use of environments and LyX’s math
mode. Experience shows that the environment pull-down menu of LyX is intuitive enough to allow most students a very
smooth transition. The more serious obstacle is typesetting mathematics symbols and formulae, due to the need to find
the LaTeX commands for the symbols one requires. Here LyX offers much assistance in the form of automatically
ICTMT 13 423 Lyon 3 - 6 July 2017

suggesting symbols and capabilities in a pane that opens up as soon as one engages math mode. Further, the online tool
Detexify (made available by Kirelabs at http://detexify.kirelabs.org/classify.html) is a website allowing one to draw any
desired symbol and obtain the LaTeX command for it. All in all, after this opening one-hour session over 90% of the
students were able to produce a simple looking document, like the one shown above, without any difficulties.
Struggling students were typically helped out of their confusion on an individual basis, allowing competency in using
LyX to a degree that permits students to immediately start using it to be achieved very early on.
In the first year of the experiment I provided the students with a lengthy hand-in assignment to work on. The
assignment consisted of several problems with a preparation time of about six weeks. The instructions were to work on
the problems progressively and to use a weekly one-hour lab session to type-up their work as a LyX document. I was
then still reluctant to require only a PDF submission, and so declared the lab sessions as highly recommended but not
mandatory. When the submission deadline arrived 80% of submissions were printouts of professional looking
documents, clearly prepared with LyX. Encouraged by the outcome, in year two I declared that only PDF submissions
prepared using LyX will be accepted. The deadline was met largely without any issues, save for a few students who ran
into technical problems preventing them from obtaining a PDF. All of these issues were resolved on an individual basis,
resulting in a 100% PDF submission of type-set documents.
From year three of the experiment onwards I adopted LyX as a standard tool for students to use in the preparation of all
of their mathematics related work. I kept holding a first week induction phase, quickly introducing students to LyX,
though this quickly became relevant only for the first-year students. I declared that only submissions of professional
looking typeset documents will be accepted for relevant coursework. Consistently, deadlines were met according to the
set guidelines with typically 2-3% of students reporting difficulties, all of which were solved on an individual basis. The
main source of problems for those students facing difficulties was an inability to export their work as a PDF file,
primarily due to installation issues.
To conclude, from the very beginning of the experiment students showed no signs of distress or discomfort with the
new technology. Using LyX so naturally builds upon existing word editing competencies shared by virtually all students
that a single one-hour lab session is all that was required to bring the students to a level of competency granting them
independence in the typesetting of their work. Students were able to immediately start typesetting their hand-in work,
requiring very little further support. Technical issues related to installation on students’ private computers sometimes led
to inability to produce a PDF, a problem usually discovered shortly before a submission deadline. Such problems were
typically solved individually by allowing the student to submit the LyX file directly, or suggesting the student re-installs
LyX.
EFFECTS ON LEARNING AND TEACHING
Consistently throughout the experiment, feedback from students was very positive, with statements such as “we learned
how to produce professional mathematics documents” and “I now know how to produce beautiful worksheets for my
own students” appearing often in student evaluations. Retention of LyX capabilities was also very high, and in fact it
was often reported to me by other lecturers that they see a significant increase in typeset submissions in their courses
too, even though they do not make any efforts to encourage that, indicating that students see the added value of using
LyX and choose to do so even when not instructed to. As a by-product, other colleagues’ feedback is also very positive
since it is much more pleasant to grade a typeset document rather than hard to decipher scribbles on a piece of paper.
Other than these appreciative responses from students and pleasant side-effects for the teachers, positive effects of a
pedagogical nature were also observed. The need to enter math mode in LyX in order to type-set a symbol or an
equation forces the student to make a clear distinction in her mind between the language and the mathematical content.
It becomes much clearer how the surrounding language supports the mathematical content and that the two are truly
very different in nature. The use of LaTeX commands, with their alien look, all starting with a backslash, serves to
accentuate that difference even more, generally leading to better understanding and better performance, and since LyX
immediately converts the commands to the symbols they stand for, the student is not distracted away from the content
ICTMT 13 424 Lyon 3 - 6 July 2017

she is producing. Particularly in the proof-intensive courses (e.g., abstract algebra) a marked improvement was observed
in the students’ ability to produce correct proofs, primarily since simply following LyX’s mode of operation forces one
to pay a great deal of attention precisely to those aspects of one’s solution which are crucial to a reasonable flow of
ideas and presentation in a proof.
In all of the courses taking part of this experiment students were quite satisfied to be working with LyX, clearly
appreciative of the relative ease with which they produced professional documents. Many of my students who were
themselves high-school teachers were appreciative of that new capability and reported on considerable time reduction in
their own preparation of worksheets for their students.
To conclude, with very minimal adaptation and preparation I was able to successfully and efficiently incorporate LyX as
a convenient and powerful tool to empower students in their written mathematics communication, resulting in increased
competency when dealing with the material, appreciation of the ability to produce elegant documents, and happier
colleagues who now know they too, just like in any other taught subject, have an alternative to allowing handwritten
submissions out of inertia.
DISCUSSION
The importance of being able to express oneself clearly, elegantly, and with relative ease as a contributing factor to
effective learning is probably widely accepted. However, in mathematics teaching, due to significant initial technical
hurdles one must overcome before one can use the most prevalent software solution used by experts, the development
of mastery of exposition is deferred to later stages of the study program, and often deferred completely out of existence.
The negative aspects of this situation include pedagogical issues, such as increased difficulty in distinguishing between
the formal and natural use of language in one’s solutions, as well as psychological issues, namely a lack of a neatly
looking ‘finished product’ to be proud of and refer to once an assignment is completed, leading to lack of interest in
one’s solutions past the immediate need to fulfill a course requirement.
A further complication is the disconnect between software solutions used by expert mathematicians and software used
by educators. The latter typically use MS Word, perhaps with the aid of its equation editor, while the former exclusively
use LaTeX. This disparity leads to a poor exchange of practices and a general avoidance of introduction of any software
solution as a standard tool for students. The solution discussed in this report is using LyX, an open-access software
providing a graphical frontend to LaTeX. Among professional mathematicians LyX is very seldom used, primarily due
to inertia and the fact that the vast majority of journals require LaTeX submissions (though it is crucial to remember that
LyX can export any document to a perfectly acceptable LaTeX file). Thus, LyX emerges as an obvious candidate to
bridge the chasm between handwritten solutions and LaTeX typeset solutions by providing a sufficiently familiar
working environment allowing students to quickly produce a satisfactory first document and become self-sufficient with
minimal time investment in the beginning of a course.
Half a decade of teaching mathematics at the University of the South Pacific demonstrates the efficacy of incorporating
LyX as a powerful and much appreciated learning aid, contributing to student success and engagement. Particularly in
developing countries, the fact that LyX is distributed completely free of charge is of great importance, and since pricy
licenses are an issue for any university, the no extra cost involved with adopting LyX is significant everywhere.
Moreover, there is already a well-established dedicated online community of LyX users who are generally very eager to
offer assistance to newcomers, all in all manifesting LyX as a very robust and friendly solution to a long-standing
problem in the teaching of mathematics. The author intends to follow a similar path introducing LyX in all first-year
mathematics courses at the University of Portsmouth, England, in September 2017.
REFERENCES
Gratzer, G. (2016). More Math Into LaTeX, Springer, xxx-609.
Mittelbach, F., Goossens, M., Braams, J., Carlisle, D., & Rowley, C. (2004). The LaTeX Companion (Second Edition),
Addison Wesley, xxx-1120.
ICTMT 13 425 Lyon 3 - 6 July 2017

Pugalee, D. K. (2001). Using communication to develop students’ mathematical literacy. Mathematics Teaching in the
Middle School, 6(5), 296.
Quinn, R. J., & Wilson, M. M. (1997). Writing in the mathematics classroom: Teacher beliefs and practices. The
Clearing House, 71(1), 14-20.
Baxter, J. A., Woodwar, J., & Olson, D. (2005). Writing in mathematics: an alternative form of communication for
academically low-achieving students. Learning Disabilities Research & Practice, 20(2), 119-135.
Bicer, A., Capraro, R. M., & Capraro, M. M. (2013). Integrating writing into mathematics classroom to increase
students’ problem solving skills. International Online Journal of Educational Sciences, 5(2), 361-369.
ICTMT 13 426 Lyon 3 - 6 July 2017

Workshops
427

PRACTICING WIMS: HANDS-ON TRAINING
Damir Buskulic
LAPP / Université Savoie Mont Blanc; [email protected]
WIMS (Web Interactive Multipurpose Server) is a collaborative, open source e-learning platform hosting online
interactive exercises in many different fields such as mathematics, chemistry, physics, biology, French and English
among others. The pedagogical specificities of WIMS were shown, such as a bank of exercises readily available, the
deeply embedded random feature, a wide variety of exercise types, including formal answers and personalized student
monitoring tools. We also presented how to make custom exercises with an interactive editor.
INTRODUCTION
WIMS, Web Interactive Multipurpose Server, described extensively elsewhere in these proceedings
(Kobylanski,~2017), is a collaborative, open source e-learning platform hosting online interactive exercises in many
different fields such as mathematics, chemistry, physics, biology, French and English among others. A bank of exercises
is readily available on each server.
Figure 1: Examples of WIMS interfaces.
WIMS has some unique pedagogical specificities, such as
An extensive bank of interactive exercises in various fields (around 4000 exercises, mostly in French, but also
in English)
WIMS is open source. Custom exercises produced by the users can be shared with all the WIMS servers in the
world
A deeply embedded random feature, providing the possibility to do an exercise in different ways and to test a
large number of students simultaneously
The possibility to configure a wide variety of exercise types such as multiple choice questions, drag and drop
exercises, selecting a graph, drawing interactive curves, exercises requesting a numerical value or a formal
answer, and many others.
Support for many languages
Support for external packages / software (JSMol, JSXGraph Povray, maxima, Pari/GP, Octave…)
ICTMT 13 428 Lyon 3 - 6 July 2017

Support for LaTeX, HTML, Javascript, MathML
Personalized monitoring tools for filtering student results: success rate, quality of work, results by skill, …
The WIMS platform complements various other platforms and Learning Management Systems such as Moodle or
Chamilo.
GOALS OF THE WORKSHOP
The goals of the workshop were to learn how to create a virtual class on the WIMS platform by selecting exercises
readily available from the exercise bank, learn how to create custom exercises and show how some of the specific
pedagogical aspects of WIMS can be integrated in the exercises.
TOPICS AND ACTIVITIES DURING THE WORKSHOP
After a general presentation of the interface, we presented the following features:
Creation of a class with worksheets and documents
A class is the basic frame in which a teacher puts exercise sheets, students do their exercises, read documents and answer
questions. A teacher is able to view the student activity, marks, difficulties and can process the overall results of all the
students.
Figure 2: The class preparation interface
Finding an exercise or activity
WIMS integrates a search engine that allows to find exercises and activities by name or field. There is also available a
taxonomic classification (Fig. 3).
ICTMT 13 429 Lyon 3 - 6 July 2017

Figure 3: An interface to a taxonomy of mathematical subjects
Integrating existing exercises in the class.
Creating an exercise or a pedagogical sequence is time consuming. The WIMS embedded mechanism for sharing the
teacher’s creations, exercises and activities allows for a reduction of the exercise development time. The simplest way to
create an exercise sheet is to gather the exercises among the existing ones in the available database. This is the way used
by newcomers to quickly understand all the potentialities of the WIMS platform.
Creation of an exercise using an interactive editor in WIMS.
The creation of an exercise may be done in three different ways. The first is a set of simple exercise models which can
be modified according to several variables. The second way is by means of programming in the Open Exercise Format
(OEF) language. This allows for the building of almost any kind of exercise. When a user wants complete control over
the appearance and functionalities of an exercise, he can use the Modtool mode which gives him complete control over
the html code.
However, except for the prepared models, there is still a need for programing knowledge, which all teachers are not able
or willing to learn. The WIMS developers are in the last stages of the development of an interactive editor which should
greatly simplify the programming of OEF exercises. The user will be able to use a web word editor as well as a
simplified graphical programing interface. This is shown in figure 4.
Figure 4: The interface of the exercise editor
RESOURCES
Server at the Université Savoie Mont Blanc: https://wims.univ-savoie.fr/
Server at the Université Paris Sud: https://wims.auto.u-psud.fr/wims/
CNRS Server: https://wims.math.cnrs.fr/wims/
Tutorial for the creation of classes: https://wims.di.u-psud.fr/wims/wims.cgi?module=help/teacher/docbeginner.fr
Site of the WIMSEDU NGO: http://wimsedu.info
REFERENCES
Kobylansky, M. (2017). WIMS Www Interactive Multipurpose Server an interactive exercise software that has 20 years
and still is at the top, Communication at the ICTMT13 conference, Lyon, France.
ICTMT 13 430 Lyon 3 - 6 July 2017

Chapter 8
POSTERS
ICTMT 13 431 Lyon 3 - 6 July 2017

AUGMENTED LOG: USING AR TECHNOLOGY TO CONSTRUCT
LEARNING ABOUT LOGARITHMS AND EXPONENTIALS
Giulia Bini
LSS Leonardo da Vinci, Milano, Italy; [email protected]
This poster describes how an augmented reality learning experience effectively motivated andsupported students in organising mathematical content related to a usually painful subject in highschool mathematics. The outcomes of this experience, monitored through classroom observation,were aligned with the theoretical framework of AR and proved that the use of technology reinforcedstudents’ understanding and fostered long-term memory about the topic.
Keywords: Augmented Reality, high school math, constructivist learning
INTRODUCTION AND THEORETICAL FRAMEWORK
Augmented Reality is rather a new entry within educational technologies and has huge potentialpower as a learning tool that has yet to be explored.
This project had a double goal: from a research point of view the aim was evaluating whether “as acognitive tool or pedagogical approach, AR aligns with situated and constructivist learning theory asit positions the learner within a real-world physical and social context, while guiding, scaffoldingand facilitating participatory and metacognitive learning processes such as authentic inquiry, activeobservation, peer coaching, reciprocal teaching and legitimate peripheral participation with multiplemodes of representation”, as suggested by Dunleavy & Dede (2013).
From a pedagogical point of view the purpose was to investigate the educational dimension of avision-based AR technology (that is to say the triggering of a superimposed computer generatedlayer pointing a GPS-enabled device to a precise spot), enhanced by the fact that studentsthemselves have been authors of the digital content, with the goal of evaluating how technologycould foster the development of significant mathematical literacy and assess how students could usetheir day to day technological skills to support their mathematical learning.
METHOD AND ACTIVITY
The activity, which involved a class group of 28 16 y.o. students attending the 3rd year of highschool (Liceo Scientifico), was divided into three phases: introduction and synthesis took place atschool, while the actual production of the digital media (trigger image and video overlay) wasassigned as homework.
The results were gathered by the teacher through the assessment of students’ homework and theobservation of the resulting classroom discussion.
The three phases were organised as follows:
1. At school: after completing the module on logarithm and exponential functions, the teacherselected and assigned to each student a specific segment of the subject, ranging from practicaltopics as the properties of logarithm and the techniques for solving exponential equations tohistorical themes such as the number e and the legend of the chessboard.
ICTMT 13 Lyon 1
ICTMT 13 432 Lyon 3 - 6 July 2017

The teacher then had students download the Aurasma AR free app for iOS- and Android-basedmobile devices, log in with the class account – augmentedlog – which had been created for thatpurpose and point it to the image in figure 1, which triggered an instruction video for the task.
Figure 1
2. At home: each student produced a 2/3 minutes video on the given topic with a related triggerimage and, using the class account, uploaded and connected them through the Aurasma Studiodesktop site https://studio.aurasma.com/landing (figure 2).
Figure 2
Once the production of the videos has been completed (students had two weeks to finish thetask), the teacher collected all the trigger images in a poster (figure 3) and had it printed.
ICTMT 13 Lyon 2
ICTMT 13 433 Lyon 3 - 6 July 2017

Figure 3
3. At school: the poster was brought to school and hung in the classroom so that students couldview and share their productions pointing their devices to the trigger images (figure 4) anddiscuss the results.
Figure 4
To sum up, the AR experience was designed as an interactive storytelling learning activity whicheach student contributed to by creating a specific piece of the story.
ICTMT 13 Lyon 3
ICTMT 13 434 Lyon 3 - 6 July 2017

The role of the teacher was to identify and assign the single pieces of the story to each student,organise the virtual Aurasma Studio learning environment through which students could connecttheir digital content and eventually collect and assess the final products as well as build asynthesised whole in order to give back the complete view of the topic.
RESULTS AND CONCLUSION
The skills and attention showed by the students in creating their products and commenting those ofthe classmates proved that working with AR has been a powerful strategy: this technologycaptivates students more than other digital means, increasing their yearning to participate and fixingthe activity and its mathematical content in their memories for good.
The described jigsaw design approach added value to this experience, making learning “a co-constructed, participatory process” (Dunleavy & Dede) and encouraging students to share theirproducts.
The “interplay between competition and collaboration” (Dunleavy & Dede) turned this AR activityinto a deep and successful learning experience, combining traditional and non-traditional settingsand interactions, in which the appreciation of students’ technological skills acted as a strongmotivational drive and empowered the students’ willingness to focus and discuss mathematicalconcepts.
References
Bower, M. Howe, C. McCredie, N. Robinson A. Grover, D. (2014) Augmented Reality in education– cases, places and potentials, Educational Media International, 51:1, 1-15.
Dunleavy, M., and Dede, C. (2013). Augmented reality teaching and learning. In J.M. Spector, M.DMerrill, J. Elen, & M.J. Bishop (Eds.), The Handbook of Research on EducationalCommunications and Technology (4th ed.), pp. 735-745. New York: Springer.
Petrucco, C., Agostini. D., Augmented Reality Learning: Pedagogical aspects and Technologies fora future Methodological Framework. University of Padua Department of Philosophy, Sociology,Education and Applied Psychology.
ICTMT 13 Lyon 4
ICTMT 13 435 Lyon 3 - 6 July 2017

SUPPORTING PROBLEM SOLVING THROUGH HEURISTIC TREES IN
AN INTELLIGENT TUTORING SYSTEM
Rogier BosFreudenthal Institute, Utrecht University, [email protected]
In this article we address how to teach the use of heuristics in problem solving. We present anapproach using a new support model within an online tutoring system. The outcomes of a pilotstudy conducted in the Netherlands are discussed. On the basis of these outcomes we makesuggestions to improve the model and its implementation.
Keywords: problem solving, heuristics, heuristic tree, digital learning environment
THEORETICAL BACKGROUND
To solve a mathematical problem, one needs to combine mathematical skills and activities that havealready been mastered. So one needs to make strategic decisions on a cognitive level that transcendsthe procedural. A way to guide a student in such strategic decisions is by providing heuristics. Aheuristic (Pólya, 1945) is a general strategy to address a problem, e.g., investigate special cases.Heuristics are a form of support on the high end of the cognitive spectrum. On the other end areconcrete hints that reveal steps towards a solution.
In this research we study how the delivery of heuristics and hints to learners should be structured.Schoenfeld claims (1985, p. 73): “many heuristic labels subsume half a dozen strategies or more.Each of these more precisely defined strategies needs to be fully explicated before it can be usedreliably by students”.
So how should the support using heuristics be structured? The phases suggested by Pólya (1945)and elaborated by Schoenfeld (1985) provide structure. Additionaly, several studies suggest a rolefor fading in various ways, in particular using Intelligent Tutoring Systems. Renkl et al. (2004)begin instruction with worked examples of multi-step problems. In each subsequent problem theyremove more solution steps from the example and end up with problems to be solved unguided.This strategy proves to be effective in their experiments. Bokhove and Drijvers (2012) report thateven though gradually fading the available feedback on a task causes the performance on that taskto gradually decrease as well, the overall effect of the course seems to increase. Roll, Baker, Alevenand Koedinger (2014) discuss an intelligent tutoring system that influences help-seeking patterns.They find that “overusing help is associated with lower learning gains” and “on steps for whichstudents lack basic knowledge, failed attempts are more productive than seeking help”.
SUPPORT FOR PROBLEM SOLVING THROUGH HEURISTIC TREES
For this study we designed a series of problem solving tasks in an online tutoring system (theDigital Mathematics Environment, recently renamed Numworx1). All the problems neededPythagoras’ Theorem in some way.
1 http://www.numworx.nl/en/
ICTMT 13 436 Lyon 3 - 6 July 2017
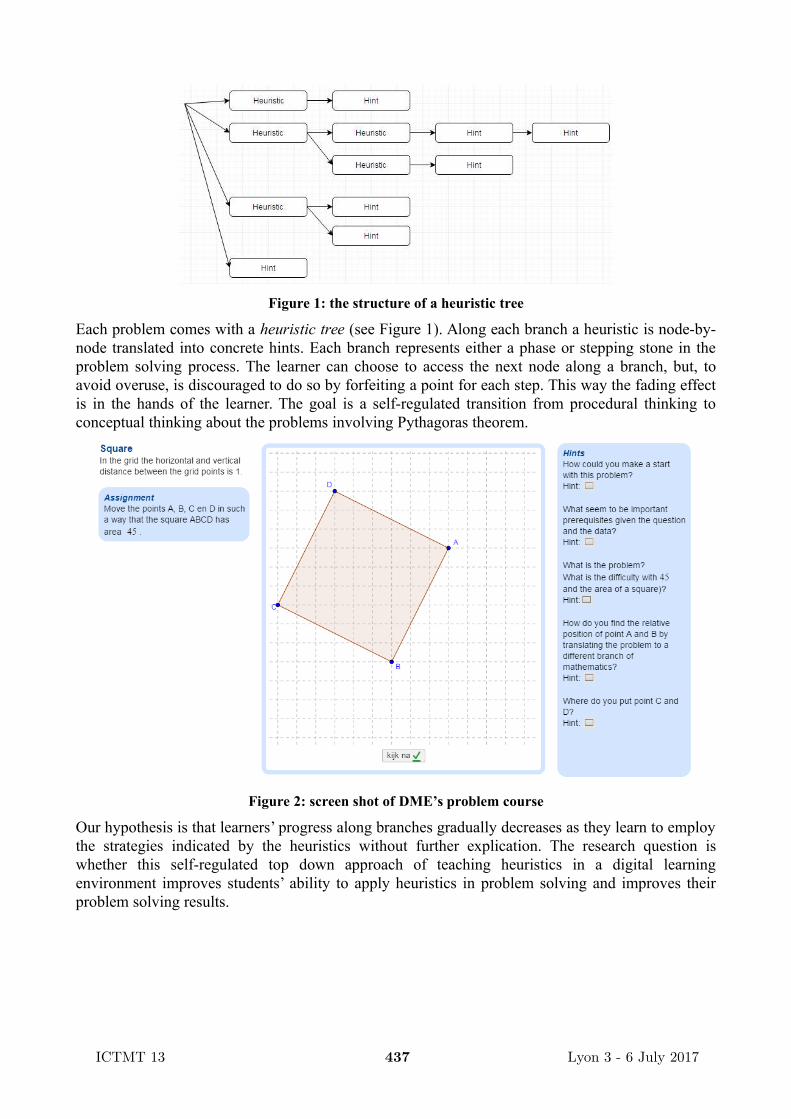
Figure 1: the structure of a heuristic tree
Each problem comes with a heuristic tree (see Figure 1). Along each branch a heuristic is node-by-node translated into concrete hints. Each branch represents either a phase or stepping stone in theproblem solving process. The learner can choose to access the next node along a branch, but, toavoid overuse, is discouraged to do so by forfeiting a point for each step. This way the fading effectis in the hands of the learner. The goal is a self-regulated transition from procedural thinking toconceptual thinking about the problems involving Pythagoras theorem.
Figure 2: screen shot of DME’s problem course
Our hypothesis is that learners’ progress along branches gradually decreases as they learn to employthe strategies indicated by the heuristics without further explication. The research question iswhether this self-regulated top down approach of teaching heuristics in a digital learningenvironment improves students’ ability to apply heuristics in problem solving and improves theirproblem solving results.
ICTMT 13 437 Lyon 3 - 6 July 2017

DESIGN PRINCIPLES FOR HEURISTIC TREES
We would like to design a heuristic tree structure that both supports learners in problem solving andteaches them to use heuristics. Navigating the heuristic tree should be intuitive and logical for thelearners. To this purpose we used the following design principles:
1. The structure of the tree should represent the logical order of reasoning within a solutionmodel.
2. The various branches should also be ordered following the various stages of problemsolving. In general: orientation, planning and acting, reflection.
3. The structure of the tree should also match with the intuitive approach of the problem takenby learners.
4. The order along a branch should be from heuristics to more concrete hints, therebyexplaining the use of the heuristic.
5. The help offered in different branches should be independent stepping stones, in the sensethat for the help offered in one branch no information in any of the other branches should beneeded.
6. Each click should not give more help than asked for.
7. The formulation before the click should not yet give away the heuristic or hint, but give anindication of what can be obtained.
It is a challenge to simultaneously satisfy principles 1,2 and 3, because they not always agree.Principles 5, 6 and 7 are meant to ensure that learners do not receive more help than desired.Designing a heuristic tree that satisfies all these principles is a challenge.
THE ROLE OF HEURISTIC TREES
The ideal heuristic tree should offer help that is as well suited to the learner as the help offered by areal life teacher. The student must self-diagnose what help is needed, whereas in traditionalclassroom situations it is the teacher who makes that diagnosis
The concept of the heuristic tree was conceived for the implementation of heuristic problem solvingtraining in digital learning environments. A defining characteristic of problems is that studentsworking on them get stuck. Providing help during a problem solving session with a big group ofstudents can therefore be very demanding for a teacher. The digital environment can provide reliefand the possibility to monitor the students’ progress in the use of heuristics. In our implementationthe teacher can track which heuristics and hints have been used by individual learners.
This suggests that designing a heuristic tree for a problem is useful preparation for a teacher whowants to use the problem even in a classroom without a digital learning environment. In two recentworkshops teachers were given the task of designing a heuristic tree for a given problem. It sparkedengaged didactical discussions on how to support the students in their problem solving. Theheuristic tree provides a structure for the teachers’ thoughts and discussions and highlights both thephasing of problem solving and the tension between hints and heuristics.
PILOT STUDY OUTCOMES AND OUTLOOK
Pilot studies took place in one grade 8 and one grade 11 class at a secondary school in theNetherlands. The students had about 45 minutes to work on the problems. They first received a
ICTMT 13 438 Lyon 3 - 6 July 2017

short instruction in how to navigate the Digital Mathematics Environment and the problem solvingtutor.
The general conclusion is that, in focusing on the structure of heuristic trees, this first version didnot pay enough attention to important factors of problem solving as discussed in, for example,Schoenfeld (1985): control (self-regulation) and belief (motivation). These aspects will have to beimplemented in version 2.0. Before conclusions can be drawn regarding the hypothesis, these issuesand the problems with navigation the heuristic tree and help abuse will have to be addressed.
Self-regulation. Learners either used no hints or used them all at once. They either wanted to solvethe problem without help or search the whole tree for the golden hint. This fits in with two mainforms of help abuse as described by Aleven et al. (2006): clicking through the hints, and helpavoidance. They suggest that the learner should actively be taught how to use (digital) assistance. Tothis purpose they designed a “help-seeking tutor”, but they also presented the learner with a videoexplaining what they consider the ideal way to seek help.
Motivation. Many learners struggled with the difficulty of the problems. This caused loss inmotivation for some. In version 2.0 the problems will have a wider range of levels, beginning witheasier ones and building up from there. Different avenues within problems or a choice of problemsshould be offered.
Another issue: navigation. Learners find it hard to navigate through the heuristic tree. They do notrealize that it is structured on the phases of the solving process or that the heuristics precede thehints. Learning to use it properly should be part of the lesson, as well as learning about heuristics.45 minutes was not long enough: one would probably need a short series of lessons. The phasesshould perhaps be based less on Pòlya’s phases or the steps of the solution and more on the intuitiveapproaches of students; on the questions that come to them naturally while working on the problem.
The next step in this research project will be to improve the online course on the points mentionedabove. This will be followed by a larger scaled field test over a longer period of time, hopefullygiving us data to draw conclusions on our main hypothesis concerning the use of heuristic trees.
REFERENCES
Aleven, V., McLaren, B., Roll, I. & Koedinger, K. R. (2006). Toward Meta-cognitive Tutoring: A Model of Help-Seeking with a Cognitive Tutor. International Journal of Artificial Intelligence in Education, 16, 101-130.Bokhove, C. & Drijvers, P. (2012). Effects of feedback in an online algebra intervention. Technology, Knowledge and Learning, 17(1-2), 43-59.Pólya, G. (1945). How to solve it. Princeton, NJ: Princeton University Press.Renkl, A., Atkinson, R. K. & Große, C. S. (2004). How fading worked solution steps works – a cognitive load perspective. Instructional Science, 32(1), 59-82. Roll, I., Baker, R. S. J. D., Aleven, V., Koedinger, K. R. (2014). On the benefits of seeking (and avoiding) help in online problem solving environment. Journal of the Learning Sciences, 23(4), 537-560.Schoenfeld, A. H. (1985). Mathematical Problem Solving. Orlando, FLA: Academic.
ICTMT 13 439 Lyon 3 - 6 July 2017

TECHNOLOGY AS A RESOURCE TO PROMOTE
INTERDISCIPLINARITY IN PRIMARY SCHOOLS
Maria Cristina Costa1 and António Domingos2 1Instituto Politécnico de Tomar, UIEDi, Portugal; [email protected]
2 UIED, DCSA, FCT, Universidade NOVA de Lisboa, Portugal; [email protected]
This poster aims to show how technology may be used as a resource to promote interdisciplinarity,namely using mobile technologies to engage children to learn mathematics, applied to the soundsubject, according to1st grades of primary school syllabus. A preliminary study shows that theproposed tasks resultant from technology resources are efficient to catch the attention of thestudents and can engage them to learn mathematics and science.
Keywords: Technology, interdisciplinarity, hands-on, mobile technologies, primary school.
INTRODUCTION, LITERATURE REVIEW AND THE PRELIMINARY STUDY
The great lack of professionals in the STEM areas must be countered with an early intervention atthe level of the early years of schooling, (DeJarnette, 2012; Rocard et al, 2007). The incorporationof hands-on experimental activities into the classroom, leads to significant improvements inperformance and produce positive attitudes towards science (Mody, 2015; Johnston, 2005).
Kim e Bolger (2016) sustain the creation of a curriculum that integrates Mathematics, Science andTechnology, being crucial to involve teachers into interdisciplinarity lessons adequate to thisapproach. Kermani e Aldemir (2015) defend the integration of Mathematics, Science andTechnology in the first years of school, through teachers’ professional development, as well as thecreation of well-designed materials to implement hands-on experimental activities.
Technologies in primary education can promote children’s attention, socialization, development oflanguage and learning (Gimbert, & Cristol, 2004). Technology leads to a positive impact onstudent’s motivation and meaningful learning, provides hands-on learning oportunities and canintegrate school subjects like mathematics (Costley, 2014).
This study is part of a bigger pedagogical intervention project, in first grades of elementary schools,aiming to introduce cross-cutting methodologies, focused on learning and teaching mathematics,science and technology, within a cluster of schools in Portugal. This poster aims to show howtechnology may be used as a resource to promote interdisciplinarity, namely using mobiletechnologies to engage primary school children to learn mathematics, applied to the sound subject,according to primary school syllabus. In order to achieve this purpose, a team of university teachers,in the areas of electrical engineer and mathematics, designed sound artefacts to exploremathematical tasks with technology.
A preliminary study occurred with 3rd and 4th grade students of local primary schools who workedthe sound with technology. With a design research methodology, we intend to present how childrenengaged on the proposed tasks. At the classroom, students were introduced to sound contents andperformed hands-on activities exploring the day to day sound and how to measure it, withtechnology. After this presentation, children organized in groups with a tablet or mobile phone pergroup, were invited to play a game, called “SonicPaper”. First, they installed on theirtablets/smartphones, the Sound Meter application that allows sound intensity measurements and the
ICTMT 13 440 Lyon 3 - 6 July 2017

QR code reading application. To perform the game, questions to be answered and clues, togetherwith the campus map, allows participants to find the key points, previously defined, where they hadto register the sound intensity. Key points had signs alluding to the sound and QR codes givinganswers to some questions and clues to the next location.
After finishing the game, children return to the classroom, to find out if their answers are correctand to present the registered sound measurements. Organization and processing of data of themeasurement results was performed, in order to promote interdisciplinarity with mathematics.
FINAL CONSIDERATIONS AND FUTURE WORK
Data analysis, from participant observation and semi-structured interviews, lead to the conclusionthat the proposed technology resources are efficient to catch the attention of the participants and canengage students to learn mathematics and science, according to the school syllabus. In particular, itpermits to work school subjects like “space orientation” and “organization and processing of data”.
In the course of the hands-on activities and the SonicPaper game, children were very participatory,showing a great interest in the tasks performed. Because this strategy promotes students’ motivationand attention, we propose to use these resources in the context of teachers’ professionaldevelopment (Costa & Domingos, 2017), to adapt them to be implemented at primary school.
REFERENCES
Costa, M. C.; & Domingos, A. (2017). Innovating teachers’ practices: potentiate the teaching ofmathematics through experimental activities. Dublin City University: CERME 10.
Costley, K. C. (2014). The Positive Effects of Technology on Teaching and Student Learning.Online Submission.
DeJarnette, N. K. (2012). America's children: Providing early exposure to STEM (science,technology, engineering, and math) initiatives. Education, 133 (1), 77-85
Gimbert, B., & Cristol, D. (2004). Teaching curriculum with technology: enhancing children'stechnological competence during early childhood. Early Childhood Education Journal, 31(3),207-216.
Johnston, J. (2005). Early explorations in science: Exploring primary science and technology. 2nd
Edition. England: Open University Press
Kermani, H., & Aldemir, J. (2015). Preparing children for success: Integrating science, math, andtechnology in early childhood classroom. Early Child Development and Care, 185(9), 1504-1527.doi:10.1080/03004430.2015.1007371
Mody, C. C. M. (2015). Scientific practice and science education. Science Education, 99(6), 1026-1032. doi:10.1002/sce.21190
Rocard, M., Csermely, P., Jorde, D., Lenzen, D., Walberg-Henriksson, H., & Hemmo, V. (2007).Science education now: A renewed pedagogy for the future of Europe. Bruxelas: ComissãoEuropeia.
ICTMT 13 441 Lyon 3 - 6 July 2017

i This work is supported by national funds through FCT - Foundation for Science and Technology in the context of the
project UID/CED/02861/2016
ICTMT 13 442 Lyon 3 - 6 July 2017

DESIGNING TASKS THAT FOSTER MATHEMATICALLY BASED
EXPLANATIONS IN A DYNAMIC SOFTWARE ENVIRONMENT
Maria Fahlgren and Mats Brunström
Department of Mathematics and Computer Science, Karlstad University, Sweden
This poster introduces the main ideas behind a study conducted during the spring 2017. The aimwas to investigate how different formulations of tasks, where students are expected to providemathematically based explanations, might influence their responses. Preliminary results from thefirst stage in the analysis process indicate that there are some interesting differences due to smalldifferences in task formulation.
Keywords: dynamic mathematics software, task design, mathematically based explanation
BACKGROUND
The increased availability of different kinds of technology in mathematics classrooms offers newpossibilities, but it requires change in teaching and learning practice. For example there is a need fordifferent kinds of task to utilize the affordances provided by new technology (Hegedus et al., 2017).Recently, the issue of designing tasks suitable in the digital mathematics classroom had an entirebook devoted to it: Digital Technologies in Designing Mathematics Education Tasks edited byLeung and Baccaglini-Frank (2017). The literature suggests various task design principles topromote mathematical reasoning in a Dynamic Mathematics Software (DMS) environment, theparticular technology used in this study.
This study builds on our previous work on developing new types of task environment to fosterstudents’ mathematical reasoning (Brunström & Fahlgren, 2015; Fahlgren & Brunström, 2014). Oneresult from a design-based research project, conducted in a DMS environment by the authors of thispaper in collaboration with four upper-secondary school teachers, showed that students’explanations tended to be superficial and more descriptive than explanatory. These results are in linewith results from other studies showing that there is a risk that students do not reflect on themathematics involved when using DMS to explore and conjecture (e.g. Drijvers, 2003; Healy &Hoyles, 1999; Joubert, 2013).
It is important for task designer to be aware that small differences in the formulation of tasks mighthave significant impact on students’ responses (Sierpinska, 2004). We found that the wording iscrucial in the formulation of questions where students are asked for explanations (Brunström &Fahlgren, 2015). So far, however, there are few studies that have investigated how small changes inwording might influence students’ explanatory responses in a DMS environment.
This study compares two different ways of formulating explanation tasks in a DMS environment.The explanation tasks are embedded in a task sequence with the aim of developing students’awareness of some of the connections between the standard form of quadratic function f(x) = ax2 +bx + c and the corresponding graphical representation and quadratic equation. In total, the tasksequence includes three explanation tasks formulated in the following two versions: (A) “Explain
ICTMT 13 443 Lyon 3 - 6 July 2017

why…” and (B) “Give a mathematical explanation why…”. The aim with the study is to investigateif this small difference in task formulation has any impact on student responses.
THE STUDY
The study involves seven 10th grade upper-secondary classes in which half of each class received theA-version and the other half received the B-version of the task sequence. The students worked inpairs with one computer per pair. The purpose of this is that the computer screen should provide ashared object for discussions between students (Brunström & Fahlgren, 2015; Paiva, Amado, &Carreira, 2015). The empirical data consists of the written responses from 229 students; 121 versionA, and 108 version B.
PRELIMINARY RESULTS
So far, a preliminary analysis of the first explanation task, with focus on parameter c, has beenmade. In this task, the students are asked: (1) to investigate and find out how the value of c affectsthe graph; then (2) how the value of c can be found in the coordinate system; and finally (3) to (A)Explain why/(B) Give a mathematical explanation why the value of c can be found in this way.When answering the second subtask, almost all students described that the value of c can be foundwhere the graph intersects the y-axis. Our focus in the analysis was on student responses on the thirdsubtask. The tables below indicate differences in student responses, both in terms of types ofexplanation (Table 1) and forms of representation (Table 2).
TYPE OF
EXPLANATION
VERSIONA
VERSIONB
Correct and complete, i.e. explains that c = f(0). 4 % 13 %
Refers to the b-value in the straight lineequation y = mx + b 44 % 57 %
Describes that c can be found where the graphintersects the y-axis (i.e. repeats the answer to the previous subtask)
21 % 13 %
Provides more than one explanation. 16 % 29 %
Table 1. Some differences in student responses concerning types of explanation
The preliminary results indicate that the B-version that includes the words “mathematicalexplanation” prompts student responses based on mathematical properties and relations to a higherdegree than the A-version does. Even if not many students gave a correct and complete explanationthis was more frequent among students responding to the B-version. We also found it interestingthat these students more often referred to their previous knowledge concerning the straight lineequation, and also gave more than one explanation to a greater extent.
FORM OF VERSION VERSION
ICTMT 13 444 Lyon 3 - 6 July 2017

REPRESENTATION A B
Verbal only 75 % 42 %
Algebraic Symbols only 1 % 16 %
Verbal and Algebraic Symbols 4 % 17 %
Verbal with Elements of Algebraic Symbols 11 % 18 %
No answer 9 % 7 %
Table 2. Some differences in student responses concerning types of representation
The preliminary results also indicate that the task formulation including “mathematical” promptsmore students to use algebraic symbols in their explanations, and fewer to use solely verbalexplanations. In student responses classified as “Verbal with Elements of Algebraic Symbols”formulas or other algebraic symbols are just mentioned without being used. Hence, the categories“Algebraic Symbols only” and “Verbal and Algebraic Symbols” are the only categories wherestudents really use algebraic symbols (even if not always in an appropriate way). When mergingthese two categories the tendency becomes clear, 33 % of the students answering the B-version usedalgebraic symbols while the corresponding value for those responding to the A-version was 5 %.
The next step in the analysis process, is to develop a more general framework to use in the analysisof all three explanation tasks.
REFERENCES
Brunström, M., & Fahlgren, M. (2015). Designing prediction tasks in a mathematics softwareenvironment. International Journal for Technology in Mathematics Education, 22(1), 3-18.
Drijvers, P. (2003). Learning algebra in a computer algebra environment: Design research on theunderstanding of the concept of parameter. Dissertation, Utrecht: Freudenthal Institute,Utrecht University.
Fahlgren, M., & Brunström, M. (2014). A Model for Task Design with Focus on Exploration,Explanation, and Generalization in a Dynamic Geometry Environment. Technology,Knowledge and Learning, 19(3), 287-315.
Healy, L., & Hoyles, C. (1999). Visual and symbolic reasoning in mathematics: making connectionswith computers? Mathematical Thinking and Learning, 1(1), 59-84.
Hegedus, S., Laborde, C., Brady, C., Dalton, S., Siller, H.-S., Tabach, M., . . . Moreno-Armella, L.(2017). Uses of Technology in Upper Secondary Mathematics Education ICME-13 TopicalSurveys (pp. 1-36). New York, NY: Springer.
Joubert, M. (2013). Using computers in classroom mathematical tasks: revisiting theory to developrecommendations for the design of tasks. In C. Margolinas (Ed.), Task design inMathematics Education. Proceedings of ICMI Study 22 (pp. 69-77). Oxford, UnitedKingdom: University of Oxford.
Leung, A., Baccaglini-Frank, A., & (Eds.). (2017). Digital Technologies in Designing MathematicsEducation Tasks Potential and Pitfalls (Vol. 8). New York, NY: Springer.
Paiva, J., Amado, N., & Carreira, S. (2015). The role of peer and computer feedback in studentslearning. In N. Amado & S. Carreira (Eds.), Proceedings of the 12th InternationalConference on Technology in Mathematics Teaching (pp. 491-499). Faro, Portugal:University of Algarve.
ICTMT 13 445 Lyon 3 - 6 July 2017

Sierpinska, A. (2004). Research in mathematics education through a keyhole: Taskproblematization. For the learning of mathematics, 24(2), 7-15.
ICTMT 13 446 Lyon 3 - 6 July 2017

BOUNDARY OBJECTS IN INTERDISCIPLINARY RESEARCH ON
MULTIMODAL ALGEBRA LEARNING
Thomas Janßen & Tanja Döring
University of Bremen; [email protected], [email protected]
We present a set of boundary objects we indentified in an ongoing interdisciplinary research and
development project, where mathematics didacticians collaborate with human-computer interaction
experts to develop digitally enhanced versions of manipulatives for algebra learning.
Keywords: interdisciplinary research, multimodality, tangible interaction, technology design
Developing truly novel technologies for learning requires interdisciplinary teams that consist of
experts from different domains, e.g., didactitians and computer scientists. This is also the case in the
research project MAL: Mathematics educators and human-computer interaction (HCI) researchers
jointly develop interactive and digitally enhanced versions of manipulatives for algebra learning.
BOUNDARY OBJECTS AT THE ELECTRONIC FRONTIER
While both mathematics education and HCI can be seen as interdisciplinary in themselves,
conferences, journals, professorships, etc. have been established for each, thus exemplifying
disciplinarity “(a) [as] a phenomenon of the social world marked by increasing specialization and
differentiation of (material and discursive) practices and (b) [as] a form of discourse making the
specialization thematic” (Williams et al., 2016, p. 4). For interdisciplinary research, common
objects are a condition: “they coordinate the activities involved even though the practices
surrounding these objects differ. These objects are known as boundary objects” (p. 11). Here, we
share experiences about boundary objects we encountered in our particular collaboration.
Design cycles. The widespread implementation of design research gives didacticians common
ground with engineering and design disciplines, where the term originated. However, what is
investigated in such research can vary. Computer scientists and HCI researchers, in order to build
systems, have to focus on details (colour schemes, sizes, single modes of feedback) and sometimes
consider these isolated from each other. In contrast, the design of mathematics tasks is more
dominated by basic assumptions that both guide the design and are subject to testing in each cycle.
Users. HCI research focuses heavily on usability and user experience. Doing so, the user is defined
the person who deals with the technology, either a (group of) student(s) or the teacher or possibly
another person with a defined role. From a didactical perspective, however, the users of new
learning environments are (a) not limited to teachers and learners as individuals and may encompass
larger institutions (up to the society as a whole) and (b) are often seen as interconnected.
Embodiment and Modalities. In both disciplines theories on embodied cognition have been taken
up. In this context, the involved modalities are central. The term, however, can be used differently.
In HCI, modalities are usually either defined by the sensory channels (e.g. Obrist et al., 2016) or by
the input and output modes (Oviatt, 2012) used for interaction with a system. In mathematics
education, modalities are used as an analytic term whose definition is often dependent on the
mathematical context: A picture of a situation may be seen as a different modality than a graph in a
coordinate system, although both would be “graphical output” in HCI terminology. Gesture is one
particular modality that has received much attention in both fields. Again, both disciplines refer to
ICTMT 13 447 Lyon 3 - 6 July 2017
the same background theory (e.g., McNeill, 1992). But in practice, the HCI discourse is dominated
by the gestures possible to track with current technology, while mathematics educators are more
open towards all the gestures that may occur in the classroom (de Freitas and Sinclair, 2017).
Feedback. In HCI, feedback refers to communication from the system to the user as a direct result
of a user’s action (Shneiderman, 1987). While there is awareness that feedback is not an end in
itself, this definition may lead to oversimplified interactions. Research from mathematics education
can be helpful here, e.g. by identifying different levels of feedback (Hattie & Timperley, 2007) or by
working out adequate feedback in specific learning situations referring to concepts like scaffolding
(e.g., Sharma & Hannafin, 2007).
OUTLOOK
Although often a pragmatic approach will suffice to fulfil the goals of a particular collaboration, the
identification and deeper reflection of boundary objects can help to understand each other and the
roles of both sides. If interdisciplinary working groups manage to understand their partners’ fields,
the transfer of discourses and practices from one field to the other is facilitated. Mathematics
educators could help HCI researchers broaden their view on users and feedback, for example. HCI
researchers could challenge their mathematics education partners to identify gaps in existing
technology, and then proceed together to improve it. Furthermore, what each side learns when
working with the other may also help shaping the self-understanding of the two juvenile disciplines,
and possibly prevent their boundaries from becoming incrusted.
ACKNOWLEDGEMENTS
The MAL (Multimodal Algebra Learning) project is funded by the German Federal Ministry of Education and Research
in the grant programme “Erfahrbares Lernen” (experiencable learning).
REFERENCES
de Freitas, E. & Sinclair, N. (2017). Mathematical gestures: multitouch technology and the
indexical trace. Paper presented at CERME10. Retrieved from https://keynote.conference-
services.net/resources/444/5118/pdf/CERME10_0525.pdf
Hattie, J. & Timperley, H. (2007). The power of feedback. Review of Educational Research, 77(1),
81–112.
McNeill, D. (1992). Hand and mind: What gestures reveal about thought. Chicago, IL: University
of Chicago Press.
Obrist, M., Velasco, C., Vi, C., Ranasinghe, N., Israr, A., Cheok, A., … (2016). Sensing the future
of HCI: Touch, taste, and smell user interfaces. interactions, 23(5), 40–49.
Oviatt, S. Multimodal interfaces. (2012) In J. A. Jacko (Ed.), The human-computer interaction
handbook: Fundamentals, evolving technologies and emerging applications (3rd ed.) (pp. 405–
429). Boca Raton, FL: CRC Press.
Sharma, P. & Hannafin, M. J. (2007). Scaffolding in technology-enhanced learning environments.
Interactive Learning Environments, 15(1), 27–46.
Shneiderman, B. (1997). Designing the user interface: Strategies for effective human-computer
interaction (3rd ed.). Boston, MA: Addison-Wesley Longman.
Williams, J., Roth, W.-M., Swanson, D., Doig, B., Groves, S., Omuvwie, M., … (2016).
Interdisciplinary mathematics education. A state of the art. Cham: Springer.
ICTMT 13 448 Lyon 3 - 6 July 2017

LEARNING WITH INTERACTIVE VIRTUAL MATH IN THE CLASSROOM
Sonia Palha 1 and Stephan Koopman1 1University of Applied Sciences of Amsterdam, The Netherlands
[email protected] and [email protected]
Interactive Virtual Math (IVM) is a visualization tool to support secondary school students’ learning of dynamic functions situations graphs. The logbook-function allows teachers to get continuous and real-time assessment on classroom progress and of individual students’ learning process. In a teaching experiment involving four mathematics teachers and their students, we investigated how the tool was used by the students and by the teachers.
Keywords: visualization, Virtual Reality, interactive tool, secondary education, learning analytics
AIM AND RESEARCH BACKGROUND
Students’ difficulties with tasks involving dynamical situations are well documented in the literature. And there is also a body of knowledge that shows that conventional curricula have not been effective in promoting covariational reasoning in students (Carlson, Larsen, & Lesh, 2003). New technologies can allow for studying dynamic events and therefore be valuable for students to analyse and interpret dynamic function situations. The aims of the Interactive Virtual Math-project are to design and develop a digital tool for learning covariation graphs at high school (14-17 years old students) and to explore the use of new technologies for learning in classroom. The project started in 2016 as a proof of concept in which a prototype tool was developed and tried out with 14-15 years old students (Palha and Koopman, 2016). In the present stage we explore how the tool is used in classroom by teachers.
INTERACTIVE VIRTUAL MATH
Research provides some directions to develop instruction that supports the learning of covariational reasoning. Thompson (2011) states that it is critical that students first engage in mental activity to visualize a situation and construct relevant quantitative relationships prior to determining formulas or graphs. Also, learners should be helped to focus on quantities and generalizations about relationships, connections between situations, and dynamic phenomena. Digital tools can be valuable for students to analyse and interpret dynamic functional situations. These experiences, when connected to proper curriculum materials and teacher support, can become rich opportunities for students to learn covariational reasoning (Carlson et al, 2003). Tools that include Educational Data Mining (or learning analytics) also have the possibility to generate new understandings of howstudents learn and how to adapt our environments to those new understandings (Berland, Baker, & Blikstein, 2014). Following these ideas, the IVM-tool was designed and developed to (i) help learners to focus on the relevant quantitative relationships and engage them in the mental activity ofvisualizing these relationships; (ii) help teachers to get more data about students processes while solving covariation problems. The tool and an instructional video about how it works can be respectively found at https://virtualmath.hva.nl (select EN for English) and https://youtu.be/lc7mNUcZ8CQ.
Students’ visualizing relationships
ICTMT 13 449 Lyon 3 - 6 July 2017

When entering the tool the students are given a task that encourage them to imagine two variables changing simultaneously. The tool requests the students to construct the graphical representation and the verbal explanation for this relation on themselves within the application. That is, it requires students to represent their concept image graphically and verbally (Vinner, 1983). Through hints and feedback the student is challenged to improve his own construction. The tool also includes the use of Virtual Reality (VR), which is still very limited. The use of VR (sound, movement, interaction) is expected to improve the experience of the graphic situation.
Teacher’s use of data about students’ processes
Another feature of the tool is the logbook-function, which is only available for teachers. Students’ attempts to solve the tasks and whether they view the help-features are recorded and summarized in the logbook. This function allows teachers to get continuous and real-time assessment on the classroom progress and on individual student’s learning process, which can be used by the teacher to provide individual feedback and to orchestrate classroom discussions. It also provides more data about students’ processes while solving covariation problems.
METHOD
Two versions of the prototype have been developed so far. The first version of the prototype was tested with four students. The four students improved their original graphical representation throughrelating representations and using quantitative reasoning. In the present study we investigate the second prototype version of the tool use in classroom. We conducted a small scale experiment at secondary and tertiary education involving four classes and their students and teachers that used IVM during one lesson (45-50 minutes). Because we wanted to explore how students use the tool inthe regular classroom practice the teachers were encouraged to setup the lesson from themselves. This paper reports part of the whole study (Palha, 2017). It concerns students’ experiences with the tool and the corpus data consists of students' responses to questionnaires.
The participants were seventy nine students and four teachers from four classrooms in different schools in The Netherlands: nine students from the first year of the bachelor mathematics teacher, twenty-eight students from 11th grade with, pre-university stream with mathematics B; twenty one students from 10th grade with pre-university stream with mathematics B and twenty one students from 10th grade with, vocational stream with mathematics A. The four classes vary in their mathematical knowledge and ability. It is expected that the 10th grade vocational is the class with less pre-knowledge. No student had, as far as we know, worked before with the tool before the experiment.
The four teachers were invited to take part of the study; they knew about the tool but they were not used to work with it. The teachers are two men and two women with ages varying between 28 and 40 years and with teaching experience varying between 5 to 15 years. The teachers were selected bytheir teaching experience (we wanted to have a different range of experience since this is a factor that influences classroom performance). And, because they had previously showed interest in usingthe tool with their students. Not all teachers dare to experiment new approaches especially technological tools that are still in development. We should therefore be careful with the generalization of the results of the experiences of these teachers as they are not representative for the Dutch teachers. More details about the study can be found in Palha (2017).
ICTMT 13 450 Lyon 3 - 6 July 2017

MAIN FINDINGS
About half of students in all classes reported that the tool have helped them to create, to improve or correct a graph. The way students felt supported by the tool varied per class. Students at 10th and 11th grade with mathematics B reported to have already an idea about the shape of the graph and the tool helped them to work it out and consolidate this idea. Students-teachers at the bachelor have a good idea about the graph and the tool helped them to correct some mistake. The half of the students at the 10th grade following vocational stream also felt support of the tool but they did not have previously any idea about how the graph would be or they had vague idea. The tool helped them in the construction of the graph and to improve their vague initial image.
Specifically, all classes reported that seeing the result of the form of the jar at the end and the self-construction graph were the most helping to them (with exception of one class, in which a slightly higher percentage pointed the help 3D animation as more helpful than the self-construction). Also the comparison feature was considered by the four classes helpful. The help-features were not often mentioned
All students in the four classes ( with one exception in one class) reported that they could work independently with the tool. In three of the four classes a great percentage of the students (81%-89%) reported that they haven't needed help at all and a small percentage reported that they felt the need of some help (11%-19%). In the fourth class (10th grade vocational) about the halve (48%) didn't need help and the other halve (48%) needed some help
The findings suggest that the students can work independently with the tool in the classroom and without much help. The tool can create opportunities for students to produce and try to improve a mathematical representation of a dynamic event. However, we do not provide much information about the process of coming to generate the graph representations and verbal explanations and its transformation. This study invites further research on this matter. Our research also calls for an extension of the tool and improvement of some features, students provided insightful suggestions that can help us in this direction.
REFERENCES
Berland, M., Baker, R. S., & Blikstein, P. (2014). Educational data mining and learning analytics: Applications to constructionist research. Technology, Knowledge and Learning, 19(1-2), 205-220.
Carlson, M., Larsen, S., & Lesh, R. (2003). Integrating a models and modeling perspective with existing research and practice. Beyond constructivism: Models and modeling perspectives on mathematics problem solving, learning, and teaching, 465-478..
Palha, S., & Koopman, S. (2016). Interactive Virtual Math: a tool to support self-construction graphs by dynamical relations. Proceedings of CERME10 will be available at HAL archives website: https://hal.archives-ouvertes.fr/ (see more info about CERME10 at www.cerme10.org).
Palha, S. (2017). Students learning with Interactive Virtual Math: an exploratory study in the classroom. Ensino Tecnologia em Revista, 1(1), 80-102. https://periodicos.utfpr.edu.br/etr/issue/view/333
Thompson, P. W. (2011). Quantitative reasoning and mathematical modeling. In L. L. Hatfield, S. Chamberlain & S. Belbase (Eds.), New perspectives and directions for collaborative research in mathematics education. WISDOMe Mongraphs (Vol. 1, pp. 33-57). Laramie, WY: University of Wyoming"
ICTMT 13 451 Lyon 3 - 6 July 2017

Vinner, S. (1983). Concept definition, concept image and the notion of function. International Journal of Mathematical Education in Science and Technology, 14(3), 293-305.
ACKNOWLEDGMENTS
This research was supported by the Center for Applied Research in Education of the University of Applied sciences of Amsterdam and the development of the tool was supported by the University ofAmsterdam. I thank the rest of the team of the project IVM: my colleague Stephan Koopman who set up the experiment together with me and the rest of the team of technological developers by the university of Amsterdam: Ernst-Jan Verhoeven, Tom Kuipers, Maarten Veerman, Jaap Tuyp, Renee Cornelissen, Fleur van Keimpema, Pierre Bocande.
ICTMT 13 452 Lyon 3 - 6 July 2017

DIGITAL MATHEMATICS TEXTBOOKS: ANALYZING STRUCTURE AND STUDENT USES
Maximilian Pohl, Florian Schacht
University of Duisburg-Essen; [email protected]
The use of digital tools in the Mathematics classroom is an important focus of research in the field of mathematics teaching. In the context of digital textbooks, however, there is still a high need for research and development. Although there are first versions of digital textbooks in the German language, it is unclear what structure and elements digital Mathematics textbooks generally offer or how learners work with them. This contribution addresses this research topic.
Keywords: digital mathematics textbooks, student uses, structure of digital textbooks
THEORETICAL BACKGROUND
When working with (traditional) textbooks, students use the textbook to engage in the field of the book’s subject, e.g. mathematics. By doing that, the use of the textbook is affected by its content and structure. Both aspects define the artefact textbook and, therefore, influence student uses of the textbook as Chazan and Yerushalmy (2014) pointed out:
[T]extbooks give teachers guidance on both what and how students should learn. On the one hand, especially initially, textbooks organized the content of what students were to learn and indicated what students needed to know at what age, grade level, or institutional track within schooling. On the other hand, by presenting instructional tasks, textbooks attempt to organize the knowledge that they present in ways that will help make this content learnable. (Chazan & Yerushalmy, 2014, S. 67)
When talking about student uses of textbooks and to see how students work with textbooks in order to engage in the field of mathematics, Rabardel’s theory of instrumental genesis (Béguin & Rabardel, 2000) is helpful. According to Rabardel, the user turns the artefact textbook into an instrument for learning mathematics during the two intertwined processes (a) instrumentalization and (b) instrumentation. In the course of instrumentalization, the user individually attributes functions to (parts of) the artefact that can be fulfilled, while the instrumentation process is concerned with how students select relevant content within the textbook. Rezat (2011) applied this framework to students’ paper textbook uses focusing on elements students select for certain learning activities and thus describing student uses of elements within the textbook. He pointed out that students mostly engage in the activities of practicing and solving tasks and problems and that they usually work with exercises and boxes containing basic knowledge (cf. Rezat, 2011, p. 171).
In the context of digital mathematics textbooks, the question arises whether the same learning activities and elements can be identified or whether these categories need to be extended.
RESEARCH QUESTIONS AND METHODOLOGY
Transferring and adapting research findings to the context of digital mathematics textbooks involves knowledge on a) the structure and elements of a range of existing digital textbooks concepts and b) what roles/functions students ascribe to certain elements of the digital textbook during a variety of
ICTMT 13 453 Lyon 3 - 6 July 2017

learning activities. These two research perspectives can be framed into the following research questions a) What kind of structural characteristics and elements can be identified in digital mathematics textbooks? and b) What kind of structural elements do students instrumentalize when working with digital mathematics textbooks?
Analysing digital mathematics textbooks within the frame of Mayring’s Qualitative Content Analysis (2008) offers a valid category-developing method in order to identify relevant structural elements. This serves as a basis for the second focus – analysing student uses of the textbook within the frame of Instrumental Genesis (Rabardel, 2002).
Approaching the first research question involves analysing several digital mathematics textbooks (normative analysis). Concerning the second research question (empirical analysis), student uses of the analysed structural elements were videotaped, transcribed and studied based on two levels – concept-related and structural-element-related.
RESULTS AND DISCUSSION
The main outcome in terms of the normative analysis is that several structural elements could be identified that had not been identified for traditional textbooks (cf. Rezat 2009). This means that a broader variety of types of exercises in terms of their static or dynamic mode were characterised as well as different kinds of feedback modes on how well (or not) exercises were completed. More precisely, we could identify dynamic exercises with a drag-and-drop mode where students can select and move small elements within the exercise, notification exercises where the user can write down notes, calculation methods or ideas and download the notes in the end, calculation exercises where the solution (of that exercise) can be entered in a predefined field and checked for its correctness, or interactive exercises which allow students to access mathematical ideas in a dynamic and visualised way. Furthermore, the digital nature of textbooks allows a variety of different feedback modes, i.e. solution, solution process, and check solution. While the first feedback mode gives the learner the correct answer to the task and the second one reveals the solution process and the necessary calculations, only the structural element check solution allows a dynamic feedback on the student solution displaying whether the entered solution is right or wrong. The following table lists all structural elements that could be identified for digital textbooks:
Structural Element Information Additional information Tip for specific task/exercise Animation Visualisation of mathematic content, not modifiable
through user Box with basic knowledge Formula, definition Box with hints General information on current topic Check solution Dynamic feedback on the student solution displaying
whether the entered solution is right or wrong Drag-and-drop exercise Dynamically select and move small elements within the
exercise Dynamic calculation exercise Solution (of that exercise) can be entered in a predefined
field and checked for its correctness Exercise Static exercise Interactive exercises Access mathematical ideas in a dynamic and visualised way Notification exercise Notes, calculation methods or ideas can be entered and
ICTMT 13 454 Lyon 3 - 6 July 2017

downloaded Picture Static Solution Correct answer to the task Solution process Solution process and the necessary calculations Table Static Text Continuous text
Table 1: Overview of structural elements identified for digital mathematics textbooks
Based on the normative analysis or rather the identified structural elements, student uses of the analysed structural elements were videotaped, transcribed and studied. In order to see how new structural elements in digital textbooks effect student uses, the empirical analysis concentrated on how different kinds of feedback options influence student uses of these structural elements. The main outcome of this focus was that individual uses of structural elements on both the concept-related level as well as on the structural-element-related level could be identified. For example, students referred to their mathematical concept images (in German: “Grundvorstellungen”) when comparing their results (concept-related) before using the structural elements solution, solution process, or check solution as the following example shows:
Student 1 Your book … is definitely smaller than your room.
Student 3 (…) I compared the book with ehh with a small coin.
We can see that although the students compared the book referring to different objects they applied the same underlying concept image, i.e. the concept of ‘comparing’ (in German: “Vergleichsaspekt”) (Weigand et al. 2014, S. 160). Furthermore, student 3 demonstrates the concept image of ‘filling out’ (in German: “Ausfüllaspekt”) (Weigand et al. 2014, S. 161) as the following transcript extract shows:
Student 3 (…) Let’s say the book is as big as this [takes a sheet of paper in A4]. Maybe a little bit smaller. Eh … let’s say (…) it is up to here [draws a line on the sheet] (…) If I put coins down, then everything will be full of coins. For me, the coin is small. The pinhead is very small. (…) And if you take that to the book, for me, it results in medium-sized.
Student 3 does not only compare the coin to the pinhead and the book, but also fills out the book with a lot of coins whereby the argument refers to the concept image of ‘filling out’.
After the learners have used the technological check and correct or wrong assignments are displayed, the statements from the users show reactions on a structural-element-related level. For example, students rejected the textbook solution when they did not understand the textbook solution. Another reaction can be seen in the following example as the student is comparing the textbook solution to her own solution:
Student 3 [M]y reasoning was better [than your reasoning].
Here, the student extrapolates from the textbook’s feedback to her reasoning and to that of her classmates. Therefore, her argumentation refers to the displayed solutions – hence, to the textbook. A third reaction which could be observed was that of student 2 as he – on the basis of the textbook’s feedback – is trying to make sense of the computer solution:
ICTMT 13 455 Lyon 3 - 6 July 2017
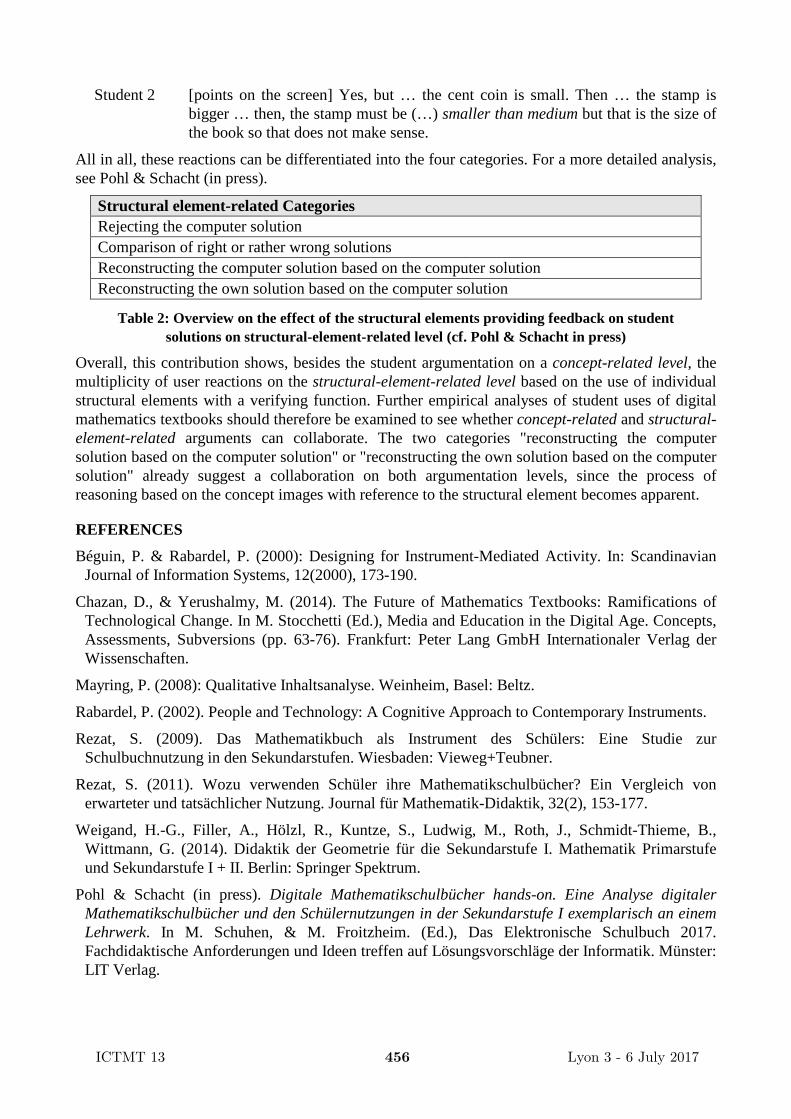
Student 2 [points on the screen] Yes, but … the cent coin is small. Then … the stamp is bigger … then, the stamp must be (…) smaller than medium but that is the size of the book so that does not make sense.
All in all, these reactions can be differentiated into the four categories. For a more detailed analysis, see Pohl & Schacht (in press).
Structural element-related Categories Rejecting the computer solution Comparison of right or rather wrong solutions Reconstructing the computer solution based on the computer solution Reconstructing the own solution based on the computer solution
Table 2: Overview on the effect of the structural elements providing feedback on student solutions on structural-element-related level (cf. Pohl & Schacht in press)
Overall, this contribution shows, besides the student argumentation on a concept-related level, the multiplicity of user reactions on the structural-element-related level based on the use of individual structural elements with a verifying function. Further empirical analyses of student uses of digital mathematics textbooks should therefore be examined to see whether concept-related and structural-element-related arguments can collaborate. The two categories "reconstructing the computer solution based on the computer solution" or "reconstructing the own solution based on the computer solution" already suggest a collaboration on both argumentation levels, since the process of reasoning based on the concept images with reference to the structural element becomes apparent.
REFERENCES
Béguin, P. & Rabardel, P. (2000): Designing for Instrument-Mediated Activity. In: Scandinavian Journal of Information Systems, 12(2000), 173-190.
Chazan, D., & Yerushalmy, M. (2014). The Future of Mathematics Textbooks: Ramifications of Technological Change. In M. Stocchetti (Ed.), Media and Education in the Digital Age. Concepts, Assessments, Subversions (pp. 63-76). Frankfurt: Peter Lang GmbH Internationaler Verlag der Wissenschaften.
Mayring, P. (2008): Qualitative Inhaltsanalyse. Weinheim, Basel: Beltz.
Rabardel, P. (2002). People and Technology: A Cognitive Approach to Contemporary Instruments.
Rezat, S. (2009). Das Mathematikbuch als Instrument des Schülers: Eine Studie zur Schulbuchnutzung in den Sekundarstufen. Wiesbaden: Vieweg+Teubner.
Rezat, S. (2011). Wozu verwenden Schüler ihre Mathematikschulbücher? Ein Vergleich von erwarteter und tatsächlicher Nutzung. Journal für Mathematik-Didaktik, 32(2), 153-177.
Weigand, H.-G., Filler, A., Hölzl, R., Kuntze, S., Ludwig, M., Roth, J., Schmidt-Thieme, B., Wittmann, G. (2014). Didaktik der Geometrie für die Sekundarstufe I. Mathematik Primarstufe und Sekundarstufe I + II. Berlin: Springer Spektrum.
Pohl & Schacht (in press). Digitale Mathematikschulbücher hands-on. Eine Analyse digitaler Mathematikschulbücher und den Schülernutzungen in der Sekundarstufe I exemplarisch an einem Lehrwerk. In M. Schuhen, & M. Froitzheim. (Ed.), Das Elektronische Schulbuch 2017. Fachdidaktische Anforderungen und Ideen treffen auf Lösungsvorschläge der Informatik. Münster: LIT Verlag.
ICTMT 13 456 Lyon 3 - 6 July 2017

BRINGING APPROPRIATE MENTAL IMAGES TO THE FOREGROUND USING
DYNAMIC GEOMETRY AS A SEMIOTIC MEDIATOR: WHEN IS A
RECTANGLE A RECTANGLE?
Ottavio G. RizzoDipartimento di Matematica; Università degli Studi di Milano
Abstract: We claim that a Dynamic Geometry Environment could be an effective semiotic mediator to bring a correct mental image to the foreground, despite the prevalence of a primeval and incorrect image.
Keywords: Dynamic Geometry Environments; mental images; mental models; semiotic mediators.
A GEOMETRIC PROBLEM: WHAT IS A RECTANGLE?
Elisa Gallo (1994, 1989) studied experimental settings to recognize formed or not formed, appropriate or not appropriate models (Ackermann-Valladao et al. 1983). In particular, pupils aged 14–15 were asked to perform the following activity: “Draw a rectangle ABCD, with the side AB lying on the line r and the points A, C as given” —where the line r, a point A of r and a point C outside of the line are drawn on the text of the activity with—this is paramount! — the line r not parallel to the sides of the sheet. (Fig. 1)
Fig. 1. Elisa Gallo’s activity
401 answers were collected and classified in 37 different models (some are shown in Fig. 2), only one of them being correct: the correct answer appears 100 times, 60 more answers are rectangles, 206 answers are about parallelograms and 35 answers are other figures (right trapetia, triangles, etc.). Notice that pupils were asked not to erase any attempt.An informal observation while displaying the present work at ICTMT showed about a third of the observees drawing a parallelogram (the third item in Fig. 2) with their finger before giving the correct answer.
THE CONCEPTUAL FRAMEWORK
Following D'Amore (1999) we define a mental model of a phenomenon as a collection of mental images that arose from the different manifestations of that phenomenon. Thus, many of the results (Fig. 2) of E. Gallo's experiment could be read as the emergence of a primeval mental image, branded in primary school: a rectangle is the part of the plane limited by a couple of horizontal lines and by a couple of vertical lines. A formed but not appropriate image, in Ackermann-Valladao's framework.
ICTMT 13 457 Lyon 3 - 6 July 2017

Fig. 2. Some of the results
Rabardel and Samurçay (2001) define an instrument as a mixed entity “made up of both artifact-type components and schematic components that we call utilization schemes.” A double semiotic link appears between such an instrument, a task and a piece of knowledge (Bartolini Bussi & Mariotti, 2008).
EXPERIMENTAL HYPOTHESIS
Mariotti & Bartolini Bussi (1998) and Mariotti (2002) show that dragging in a Dynamic Geometry Environment (DGE) carries the pupil—through an “expected although not simple and spontaneous”process—to internalize the construction of a geometric figure (a square, in their case). We expect that, in a similar way, the use of a DGE perpendicular line instrument (as defined by Rabardel) through its capability to manage and facilitate (Bu, Spector e Haciomeroglu 2011) would effectively mediate in bringing to the foreground the mental image of a rectangle as an equiangular quadrilateral.
PLANNING THE EXPERIMENT
The experimentation will be carried out during the 2017/2018 school year, in eighth and ninth gradeclasses of teachers in the Milan area with whom we are collaborating.
DUO OF ARTIFACTS
We intend to extend the proposed experimentation to allow the use of a duo of material and digital instruments (Maschietto & Soury-Lavergne, 2013), too; developing—similarly to Faggiano, Montone, Rossi (2017)—a teaching plan based on the interplay of material (viz. a geometry set) anddigital (viz. perpendicular line tool) instruments.
REFERENCES
Ackermann-Valladao E, et al. (1983). Formation et actualisation des modèles du sujet en situation de résolution de problème. Archives de Psychologie 51: 61-70.
Bartolini Bussi, MG & Mariotti, MA (2008). Semiotic mediation in the mathematics classroom. In L English, et al. (Eds.), Handbook of International Research in Mathematics Education (2nd ed., pp. 746–805). Mahwah: Lawrence Erlbaum.
ICTMT 13 458 Lyon 3 - 6 July 2017

Bu, L, Spector JM & Haciomeroglu ES (2011). Toward model-centered mathematics. In: Model-Centered Learning. Rotterdam: SensePublishers. 13-40.
D'Amore B (1999). Elementi di didattica della matematica. Bologna: Pitagora.Faggiano E, Montone A & Rossi PG (2017). Tecnologie per la didattica ed educazione matematica
con le tecnologie. Atti del XXXIV seminario nazionale di didattica della matematica. Rimini. Mariotti, MA & Bartolini Bussi, MG (1998). From drawing to construction. In: Proceedings of the
22nd PME Conference, Stellenbosh, vol 3, pp. 247–254.Maschietto M., & Soury-Lavergne S. (2013). Designing a Duo of Material and Digital Artifacts: the
Pascaline and Cabri Elem e-books in Primary School Mathematics. ZDM Mathematics Education 45(7), 959-971.
Gallo E (1989). “Sul ruolo dei modelli nella risoluzione di problemi di geometria: controllo ascendente e discendente.” Ricerche di didattica della matematica 7. Torino: Nucleo di ricerca didattica CNR.
Gallo E (1994). Elaboration of models for problem resolution in interaction with 14/15-year-old pupils. In: Proceedings of the Second Italian-German Bilateral Symposium on Didactics of Mathematics: Haus Ohrbeck (Georgsmarienhütte) 21-26 April 1992. Inst. für Didaktik der Mathematik der Univ. Bielefeld.
Rabardel P & Samurçay R (2001). From artifact to instrument-mediated learning. In: Symposium on New challenges to research on Learning. University of Helsinki.
ICTMT 13 459 Lyon 3 - 6 July 2017

THE USE OF COMPUTER BASED ASSESSMENT PISA 2012 ITEMS IN
MATHEMATICS CLASS: STUDENTS’ ACTIVITIES AND TEACHERS’
PRACTICES
Maha ABBOUD, Franck SALLES, Nathalie SAYAC
LDAR; University Paris Diderot, [email protected]
Until few years ago, the PISA assessment was paper based. Recently, the computer based test
administration modality has been chosen for PISA' next cycles. How student mathematical
performance measurement could be affected by this modality? WouldFrench
teacherspractices,particularly assessment practices,change by consideringthe PISA’s new
framework, and if so, how? This poster presents the first exploratory steps of a thesis research
project through analysing the mathematical task and students’activity at stake in a PISA 2012 CBA
released items.
Assessment; TeachersPractices; Technology; Mathematics; PISA
PISA 2012 CBA ITEM « CD PRODUCTION » ANALYSIS RATIONALE
In 2012, OECD‟S PISA proposed an optional assessment in Mathematics in a computer based
environment (OECD, 2013). New itemswere specifically developed at this occasion. The “CD
Production” is an example of such an item. Using Activity Theory and its development in the
French sphere of didactics (Robert & Rogalski, 2005; Abboud-Blanchard & Vandebrouck, 2012)
as theoretical background, we analysedthe mathematical task in this item by taking also into
account the levels of mathematical knowledge operation (Roditi&Salles, 2015). Additionally, we
identified how the item potentially explores students‟ Instrumental Genesis (Folcher, Rabardel,
2004) and how this affects the item‟s task performing. We will show how confronting thea priori
analysis to actual students‟ responses, transcripts and mathematical work on the item,recorded
during cognitive laboratory run with two 9 graders, guide us in our investigation of such items‟
affordances.
Figure 1. CD Production Question 01, French National version,MENESR, DEPP, OECD, PISA 2012
ICTMT 13 460 Lyon 3 - 6 July 2017

APRIORI MATHEMATICAL TASK ANALYSIS
This « real life » situation compares two different techniques used to copy CDs, more specifically
their cost by the number of copies. Information is given in “hotlinked” numerical and graphical
representations. Students can put in numbers of copies in a price calculator that outputs prices for
both techniques. The task consists in working out the difference in prices for 500 copies. Response
format is multiple choices. The operation at stake is a subtraction. However one has first to adapt
the information given to find the values to operate. At this end, students can either use the graphical
representation and work out an approximate difference or work in the numerical representation and
use the price calculator to find exact costs for 500 copies before subtracting. The choice depends on
the level of accuracy needed by the subject. The distractor 110 is close enough to the correct
response (140) to allow approximate graphical values lead to a wrong answer, whereas the correct
use of the price simulator leads to the correct answer only.
ABOUT THE TECHNOLOGY RICH SITUATION
The technological tools available to students in this item, a ready to use calculator as well as the
embedded price simulator, release the “burden of computation”. Hence, students can focus on the
strategy and the structure of the given information. More specifically, dealing with both a graphical
and a numerical representation of the relation between number of copies and price, is allowed and
eased by the fact that representations are “hotlinked” (Stacey, Wiliam, 2013), as the graph displays
the points from the coordinates entered in the price calculator. Besides, the price simulator can be
instrumented(Folcher, Rabardel, 2004) by students to the finding of exact values.
AN EXAMPLE OF STUDENTS’ ACTIVITIES WITH COGNITIVE LABORATORY
RECORDINGS METHODOLOGY
Two grade 9 students have been audio and video recorded when performing this task in a
collaborative way. The objective of such a cognitive laboratoryconsists in gathering as much
information as possible regarding students‟ activity. Students are encouraged to collaborate and
speak aloud during the process and a short interview is administered when finished.Results of
observation give information on the time spent to solve, student‟s pointer moves on the screen,
numbers entered and chosen responses, as well as an audio recording of their collaboration and of
the interview with the researcher. Results show that the simulator has been instrumented, but this
instrumentation was not straightforward for one of the two students. The graphical representation
has quickly been abandoned to the profit of the numerical one. One of the students was familiar
with a price simulator and she was at the initiative of using it which reveals the availability of using
schemes (Folcher, Rabardel, 2004) at the service of the mathematical activity.
REFERENCES
Abboud-Blanchard, M. & Vandebrouck, F. (2012). Analysing teachers‟ practices in technology
environments from an Activity Theoretical approach. The International Journal for Technology in
Mathematics Education, vol 19.4, 159-164.
OECD (2013), PISA 2012 Assessment and Analytical Framework: Mathematics, Reading, Science,
Problem Solving and Financial Literacy, pp. 43-44. OECD Publishing.
Robert, A. & Rogalski, J. (2005). A cross-analysis of the mathematics teacher‟s activity. An
example in a French 10th
grade class. Educational Studies in Mathematics,59, 269-298.
ICTMT 13 461 Lyon 3 - 6 July 2017

Roditi, E. & Salles, F. (2015) Nouvelles analyses de l‟enquête PISA 2012 en mathématiques. Un
autre regard sur les résultats In Education & Formations n° 86-87, pp.235-257, MENESR, DEPP
Folcher V., Rabardel P. (2004) Hommes-Artefacts- Activités : perspective instrumentale In P.
Falzon (Eds) L „ergonomie, (pp. 251-268) PUF.
Stacey, K.&WiliamD. (2013), “Technology and Assessment in Mathematics”, in Clements M. A.
(Ken), A. Bishop, C. Keitel, J. Kilpatrick and F. Leung (eds.), Third International Handbook of
Mathematics Education, (pp. 721 – 752) Springer.
ICTMT 13 462 Lyon 3 - 6 July 2017

THE GRAPHING CALCULATOR IN THE DEVELOPMENT OF THE
MATHEMATICS CURRICULUM IN THE 7TH GRADE OF BASIC
EDUCATION
Manuela Subtil 1 and António Domingos2
1 Escola Básica 2º, 3º ciclos Fragata do Tejo, Moita, UIED1, Portugal; [email protected]
1 UIED, 2DCSA, FCT da Universidade Nova de Lisboa, Portugal; [email protected]
This poster refers to the first data of a project that involves an educational teaching experiment thatseeks to integrate technology in the curriculum of the 7th grade of basic education. This study issupported by the Activity Theory and seeks understand the instrumental genesis and semioticpotential played by technology in student’s activity system, developing the process of semioticmediation.
Keywords: Graphing calculator, curriculum development, Activity Theory, Semiotic Mediation,Instrumental Approach.
INTRODUCTION
Adopting several teaching strategies, in an essentially exploratory learning environment, based onseveral tasks that involve the use of the graphing calculator, it is intended to create an unusualcurricular dynamics at this level of education. Some of the tasks are specific to the different topicsof the curriculum (eg Algebra, Statistics or Geometry) and others are intended to relate variousdomains of mathematics, using mathematical modeling.
It seeks to understand how the student builds mathematical knowledge in solving specific tasks withthe support of the graphing calculator as a member of a learning community. The Activity Theory(Engeström, 2001) is used to understand how the teacher, faced as a representative of a culturalcommunity of reference, taking into account the semiotic potential of the graphing calculator,orchestrated didactic interventions with this mediating artifact, developing the process of semioticmediation which is increased through the instrumented activity of the student.
The purpose of this study is to investigate, in the development of the curriculum, how the use oftechnology, namely the graphing calculator, promotes the processes of instrumental genesis andsemiotic mediation, in the student's system of activity in interaction with other systems of activity,through the orchestration of the teacher. In this sense, the central questions inherent to the study arepresented: What are the schemes of instrumented action created by students when they use agraphing calculator? How does the graphing calculator act as semiotic mediation tool?
THEORICAL FRAMEWORK
Benefits of the implementation of technology in the teaching of mathematics
There are several benefits that emphasize the incorporation of technology into didacticenvironments, namely increased motivation, involvement, cooperation, hands-on learningopportunities, confidence, and students' technological skills (Costley, 2014). For Schwartz (1999)there are five aspects of mathematical activity: (a) conjectures and exploration; (b) acquisition,
1 This work is supported by national funds through FCT - Foundation for Science and Technology in the context of theproject UID/CED/02861/2016
ICTMT 13 463 Lyon 3 - 6 July 2017

evaluation and analysis of data; (c) modeling; (d) conceptual foundation of manipulative skills; (e)deepening and broadening understanding; that if they are explored through a weighted software, itwill contribute to the development of abilities in the students and teachers, as well as influence theachievement of the educational objectives of the society, present in the mathematics curriculum.
The inclusion of the graphing calculator by students at different levels of school performance,shows that all have positive benefits, when a teaching approach is done with this artifact and withmore significant emphasis in students with special educational needs (Li, 2010).
Activity Theory
Being the unit of analysis, the activity system within the classroom, the third generation of ActivityTheory (Engeström, 2001) allows us to understand what happens when different systems of activityinteract.
Figure1 - Two activity systems in interaction (Adapted from Engeström, 2001, p. 136)
Instrumental Genesis
The construction of an instrument is not spontaneous and occurs according to a process calledinstrumental genesis. An instrument is seen as a mixed entity, as it results from the appropriation ofan artifact, material or symbolic, by the subject, through associated schemes (Rabardel, 1995). Theschemes of use are directed to the management of the artifact and the schemes of instrumentedaction are entities directed to the accomplishment of the task (Drijvers & Trouche, 2008).
Semiotic Mediation
The Semiotic Mediation is a theoretical approach that at a didactic level approaches the teachingand learning of mathematics through the integration of technology, with the objective to analyze thedifferent types of signs included in activities oriented by artifacts. In a classroom environment, inactivities performed with artifacts, several signs emerge that can be used intentionally by the teacherto explore semiotic processes, aiming to guide the evolution of meanings within the classcommunity. From the individual point of view, there are personal meanings that are related to theuse of the artifact arise, namely as regards to the objective of accomplishing the task, on the otherhand, from the social point of view, the mathematical meanings that may be related to the artefactand its use. In this sense, there is a double semiotic relationship articulated by the artifact, called bythe semiotic potential of the artefact that is characterized by the easiness it has in associatingculturally determined mathematical meanings, with individual meanings that each subject developsin the use of the same or in the accomplishment of tasks with their support. The artifact plays a dualrole, both as a means of performing a task, and as a semiotic mediation tool to fulfill a didactic goal(Bussi & Mariotti, 2008).
ICTMT 13 464 Lyon 3 - 6 July 2017

METHODOLOGY
The techniques used to collect data for the research problem were based on the planning of the studyunits, writing of reports by pupils resulting from the completion of the tasks and reports from theparticipant observation of the teacher, insofar as investigator and mediator. It also consolidatedrigorous, attentive and structured observation of classes, using the logbook and photographs ofgraphic representations of the graphing calculator (Creswell, 2012).
DATA ANALYSIS
Taking into account task 1 and task 2, the first one was given at the beginning of the experiment andthe second given one month later:
Task 1 - Use the graphing calculator to represent the following functions: y = 2x; y = 3x; y = 5x; y= - 2x; y = - 3x; y = - 5x. What do you conclude?
Task 2 - What is the relationship between the amplitude of inscribed angle and the amplitude ofangle to the center of a circle? What is the mathematical model that fits the situation?
In task 1 it was noticed that the students were still appropriating the graphing calculator artifact,using schemes of use, in situations such as: Student1: How do I enter another function? Student2: Press control tab!As time went by the students were more comfortable in manipulating the graphing calculator anddeveloped instrumented schemes of action, solving the tasks. On the other hand, the students, intask 1 when analyzing the graphs of the functions, taking into account their personal meanings,arrived at the properties of the linear function.
In task 2 the students have easily understood that the amplitude of an angle to the center is doublethe amplitude of an inscribed angle and they also have easily transited among variousrepresentations (geometric, tabular, graphical, algebraic). The worst performing student was able tofirst arrive at the modeling function of the relationship.
Figure2 - Records of the various representations of the graphing calculator in the resolution of thetask2
CONCLUSIONS
The students developed schemes of instrumented action (mental schemes) through schemes of use.Being difficult to directly observe the mental schemes, the observations was limited to thetechniques that the students accomplished with the artifact and also as they said in their oral reports.The transformation of the artifact (graphing calculator) into an instrument is still being done.
Given the semiotic potential of the artifact the teacher acted as a mediator and used the artifact as asemiotic mediation tool in solving the tasks in social environment where several activity systemsinteract. The students produced personal signs, related to the meanings that emerge from the
ICTMT 13 465 Lyon 3 - 6 July 2017
accomplishment of the task and the use of the artifact, developing the collective production ofcommon signs related to the use of the artifact and the mathematical contents to be learned. In thissense, in both tasks the students managed to articulate the personal meanings with the mathematicalmeanings, operating a process of semiotic mediation.
This project will continue in the school year 2017/2018.
REFERENCES
Bussi, M.G.B., & Mariotti, M. A. (2008). Semiotic mediation in the mathematics classroom:artifacts and signs after a Vygotskian perspective. In L. English, M. Bartolini Bussi, G. Jones, R.Lesh, & D. Tirosh (Eds.), Handbook of International Research in Mathematics Education,second revised edition (pp. 746-783). Mahwah, NJ: Lawrence Erlbaum.
Costley, K. C. (2014). The positive effects of technology on teaching and student learning. Reports-Evaluative. (Document ERIC nº ED554557). Retrievied fromhttp://www.eric.ed.gov/contentdelivery/ servelet/ERICServelet?accno=ED554557
Creswell, J. W. (2012). Educacional Research, Planning, Conducting, and Evaluating Quantitativeand Qualitative Research. (4 th ed.). Boston: Pearson.
Drijvers, P., & Trouche, L. (2008). From artefacts to instruments: A theoretical framework behindthe orchestra metaphor. In G. W. Blume & M. K. Heid (Eds.), Research on technology and theteaching and learning of mathematics: Vol. 2. Cases and perspectives (pp. 363–392). Charlotte,NC: Information Age.
Engeström, Y. (2001). Expansive Learning at Work: Toward an activity theoreticalreconceptualization. Journal of Education and Work, 14(1), 133-156.
Li, Q., & Ma, X. (2010). A meta-analysis of the effects of computer technology on school students'mathematics learning. Educational Psychology Review, 22, 215-243.
Rabardel, P. (1995). Les hommes et les technologies: une approche cognitive des instrumentscontemporains. Paris: Armand Colin.
Schwartz, J. L. (1999). Can technology help us make the mathematics curriculum intellectuallystimulating and socially responsible?. International Journal of Computers for MathematicalLearning, 4(2-3), 99-119.
ICTMT 13 466 Lyon 3 - 6 July 2017

WeDRAW: USING MULTISENSORY SERIOUS GAMES TO EXPLORE
CONCEPTS IN PRIMARY MATHEMATICS
Sam Duffy 3, Sara Price3, Gualtiero Volpe2, Paul Marshall3, Nadia Berthouze3, Giulia Cappagli1, Luigi Cuturi1, Nicolo
Balzarotti1, David Trainor4, Monica Gori1
Fondazione Istituto Italiano di Tecnologia1, Universita degli Studi di Genova2, University College London3, LearnTPM4
[email protected], [email protected], [email protected], [email protected],
[email protected], [email protected], [email protected], [email protected], [email protected],
ABSTRACT
In this paper we introduce weDRAW, a project to support primary school children in the exploration of mathematicalconcepts, through the design, development and evaluation of multisensory serious games, using a combination ofsensory interactive technologies. Working closely with schools, using participatory design techniques, the games will be
embedded into the school curricula, and configurable by teachers. Besides application to typically developing children,
a major goal is to explore the benefits of this multisensory approach with visually impaired and dyslexic children.
Keywords: Mathematics, Multisensory, Serious Games, Geometry, Arithmetic.
INTRODUCTION
weDRAW (http://www.wedraw.eu) is a two-year project which aims to mediate the teaching of primary school
mathematical concepts, such as geometry and arithmetic, through the design, development and evaluation of
multisensory serious games, using a combination of sensory interactive technologies, taking into account developmental
psychology and classroom interaction. The project proposes an embodied and enactive approach to learning. Enactive
knowledge is not simply multisensory mediated knowledge, but knowledge stored in the form of motor responses and
acquired by the act of doing. The games will integrate visual, sound and haptic feedback, in response to whole body
movement. In this paper we will introduce the project and discuss work carried out to date.
MULTISENSORY LEARNING
The past two decades have seen increased exploration of technology to supporting teaching and learning (Laurillard,2012, p. 2; Roschelle, Pea, Hoadley, Gordin, & Means, 2001), with a recent emphasis on multimodal and multisensoryinteraction. While concepts of embodiment are not new, the growth of ubiquitous computing and the possibility toenhance physical environments and interaction have brought discussions around embodiment to the forefront,emphasising the role of experience, the sensory body, emotion and social interaction for cognition and learning(Barsalou, 2008; Shaun Gallagher, 2005; Smith & Gasser, 2005; Wilson, 2002). There is evidence that mathematical
cognition is embodied (Lakoff & Núñez, 2000), since it is grounded in the physical environment, and based in
perception and action (Alibali & Nathan, 2012). That mathematical understanding arises from physical experiences
suggests that learning environments need to introduce concepts through physical means, such as action or gestures. The
importance of engaging with other modalities besides the visual for learning is not new. According to Kalogirou, Elia
and Gagatsis (2013, in Jones & Tzekaki 2016), in the context of geometry, visual perception provides “direct access to
the shape and never gives a complete apprehension of it” (p.129-130). Hall & Nemirovsky (2012) highlight the value in
experiencing the difference between looking down on a geometric figure on paper or being inside it, or the tactile
experience of that same figure. Several recent studies show the benefits of embodied learning approaches in primary
mathematics (e.g. Goldin-Meadow, Wagner Cook, & Mitchell, 2009; Manches & O’Malley, 2016).
The use of different modalities can reduce cognitive load and improve learning (Moreno & Mayer, 1999), as well asoffer new opportunities. Multimodal feedback has been shown to support skills development in children with dyslexia,
ICTMT 13 467 Lyon 3 - 6 July 2017

for example, a musical training programme including cross-modal activities such as rhythm production, which has beenshown to improve the reading problems experienced by dyslexic children (Habib et al., 2016). Another opportunity is tosupport learning for visually impaired children through the provision of additional stimuli. People who have never hadany visual experience (congenitally blind), or who have lost their vision in early infancy (early blind) are seriouslyimpaired when performing spatial tasks compared to blind participants who have lost their vision after becoming anadult (late blind) or sighted participants. As a result, complex computations that rely on such types of representationsare more difficult (Thinus-Blanc & Gaunet, 1997), which impacts the ability to understand concepts of geometry.However, research from psychophysics and developmental psychology suggests that children have a preferential
sensory channel for learning, and that vision is not always the dominant channel, especially for children under 8-10years of age (Cappagli & Gori, 2016; Gori, Del Viva, Sandini, & Burr, 2008). For example, auditory feedback has beenshown to improve spatial cognition in visually impaired children (Finocchietti, Cappagli, & Gori, 2017; Gori, Sandini,Martinoli, & Burr, 2014). The use of body movement has been shown to deepen and strengthen learning, retention, and
engagement (Klemmer, Hartmann, & Takayama, 2006). Body movement is naturally associated with space and could beused to reinforce the understanding of spatial concepts which is weakened in visually impaired individuals.
TECHNOLOGY AND SERIOUS GAMES
Games and play are an important part of the social and cognitive development of young children (Nicolopoulou, 1993).
‘Serious games’ are (digital) games with a purpose beyond pure entertainment. There are related, and sometimes
overlapping domains, such as e-learning, edutainment, and game-based learning, but the goals of serious games go
much further (Susi, Johannesson, & Backlund, 2007) and they can motivate learners in new ways (Prensky, 2005).
Consideration of serious games is often limited to video games, played on a desktop computer, however this reduces the
affordances available for multisensory learning. Digital technology has the potential to create new educational materials
which exploit different sensory modalities, offering opportunities for new ways of thinking and processing information,
and opening new avenues for creativity. The goals of most serious games are to facilitate learning higher order thinking
skills through characteristics of gameplay. However, a serious game will not succeed just because it is a game with
educational content. To be effective, instructional designers and video game designers need to understand how game
characteristics such as competition and goals, rules, challenges, choices, and fantasy can influence motivation and
facilitate learning (Charsky, 2010). Serious games have previously been applied to the learning of STEM subjects, but
largely focused on teenage children, and as a result lack a developmental perspective (Berta, Bellotti, van der Spek, &Winkler, 2015; Ritterfeld, Cody, & Vorderer, 2009, Chapter 10,11). Renewed neuroscientific understanding about howsensory modalities interact, and are integrated during development, need to be taken into account during game design.Educational research has also found that working in pairs or small groups can have beneficial effects on learning and
development, particularly in early years and primary education (Benford et al., 2000), hence weDRAW games will aim
to foster collaboration and interaction between children, as well as with the teacher, in the classroom.
RESEARCH PROGRESS
Working closely with primary school teachers, weDRAW makes use of observations of everyday classroom activity and
practice, interviews and ongoing workshops to inform design requirements. In order to identify the most appropriate
mathematical concepts to support through digital multi-sensory activities, the project team has collected data from
teachers in UK and Italy, through teacher workshops and questionnaires (completed by over 100 teachers). The key
areas of the primary mathematics curriculum that children find challenging, and where multimodal and multisensory
engagement hold particular promise were found to include isometric transformations, symmetry, adding and multiplying
fractions, measurement and estimation, and making the link between fractions, percentages and decimals. Interestingly,
the concepts described as most challenging were not consistent across the levels or ages of children. This is partly
because some concepts are not introduced to children until a certain age, and partly because the complexity of a concept
increases as the children progress from year to year of the national curriculum (Department for Education, 2013). This
has implications for the design of the games, to ensure that stretch and challenge is appropriate for all children in the
target age range (6-10 years old), whilst providing an accessible entry point that develops knowledge through
ICTMT 13 468 Lyon 3 - 6 July 2017
exploration (Price, Duffy, & Gori, 2017). For visually impaired students specifically, young children were described as
finding it difficult to conceptualise arithmetic magnitude, in particular in the use of number lines where negative
numbers were included. A geometric challenge was understanding the beginning and end of a shape; visually impaired
students requiring reference points on a spatial and temporal continuum.
During teacher workshops, participants were supported to imagine what a future solution might look like (Rosson &
Carroll, 2002), using participatory design techniques. These were then developed into design scenarios. Four workshops
were undertaken with teachers in UK and Italy: three involved teachers from mainstream schools, and one involved
teachers from a school for visually impaired children. Some common classroom activities described by the teachers in
brainstorming sessions, such as constructing physical shapes using paper to demonstrate nets, or folding paper to
explore symmetry, were thought to lend themselves more naturally to multimodal approaches than others, such as
number lines. Colour was commonly recognised as a useful visual resource, but audio or tactile resources were
perceived as less commonly used in the classroom. However, some activities described by the teachers, such as
manipulating paper into 3D shapes, folding to find lines of symmetry, or using a trundle wheel suggest that there may
be an unrecognised tactile or audio aspect that can be exploited by the weDRAW project.
CONCLUSION
Working with the concepts identified, we will encourage the creative capacities of children, as well as support the role
of the teacher in the learning process. The suite of games created will be flexible and modular, allowing teachers to
customise content to best suit their students’ preferred mode of learning (i.e. audio, tactile, motor and visual), whilst
unified by an overarching game story and narrative. A hardware and software platform will be developed to support this
approach, and three serious games designed to evaluate it. The adoption of an embodied and enactive learning paradigm
will allow motoric behaviour to be mapped onto the preferential sensory modality for typically developed children, or
onto an alternative modality for impaired children. As a result, the same learning paradigm can be applied to all children
interacting together in the classroom, reducing differences and social barriers.
ACKNOWLEDGEMENTS
This project has received funding from the European Union's Horizon 2020 Research and Innovation Programme under
Grant Agreement No. 732391. The content of this publication is the sole responsibility of the authors. The European
Commission or its services cannot be held responsible for any use that may be made of the information it contains.
REFERENCES
Alibali, M. W., & Nathan, M. J. (2012). Embodiment in Mathematics Teaching and Learning: Evidence From Learners’and Teachers’ Gestures. Journal of the Learning Sciences, 21(2), 247–286.
Barsalou, L. W. (2008). Grounded Cognition. Annual Review of Psychology, 59, 617–645.
Benford, S., Bederson, B. B., Åkesson, K.-P., Bayon, V., Druin, A., Hansson, P., … Taxén, G. (2000). Designingstorytelling technologies to encourage collaboration detween young children. In Proceedings of the SIGCHIconference on Human factors in computing systems - CHI ’00 (pp. 556–563). New York, New York, USA: ACM
Berta, R., Bellotti, F., van der Spek, E., & Winkler, T. (2015). A tangible serious game approach to science, technology,engineering, and mathematics (STEM) education. In Handbook of Digital Games and EntertainmentTechnologies (pp. 571–592).
Cappagli, G., & Gori, M. (2016). Auditory spatial localization: Developmental delay in children with visualimpairments. Research in Developmental Disabilities, 53–54, 391–398.
Charsky, D. (2010). From Edutainment to Serious Games: A Change in the Use of Game Characteristics. Games andCulture, 5(2), 177–198. Department for Education. (2013). Mathematics programmes of study: key stages 1 and 2National curriculum in England.
Finocchietti, S., Cappagli, G., & Gori, M. (2017). Auditory spatial recalibration in congenital blind individuals.Frontiers in Neuroscience, 11(76), 1–7.
ICTMT 13 469 Lyon 3 - 6 July 2017

Goldin-Meadow, S., Wagner Cook, S., & Mitchell, Z. A. (2009). Gesturing Gives Children New Ideas About Math.Psychological Science, 20(3), 267–272.
Gori, M., Del Viva, M., Sandini, G., & Burr, D. C. (2008). Young Children Do Not Integrate Visual and Haptic FormInformation. Current Biology, 18(9), 694–698.
Gori, M., Sandini, G., Martinoli, C., & Burr, D. C. (2014). Impairment of auditory spatial localization in congenitallyblind human subjects. Brain, 137(1), 288–293.
Habib, M., Lardy, C., Desiles, T., Commeiras, C., Chobert, J., & Besson, M. (2016). Music and Dyslexia: A NewMusical Training Method to Improve Reading and Related Disorders. Frontiers in Psychology, 7(26).
Hall, R., & Nemirovsky, R. (2012). Modalities of Body Engagement in Mathematical Activity and Learning. Journal ofthe Learning Sciences, 21(2), 207–215.
Jones, K., & Tzekaki, M. (2016). Research on the Teaching and Learning of Geometry. In Ángel Gutiérrez, G. C. Leder,& P. Boero (Eds.), The Second Handbook of Research on the Psychology of Mathematics Education (pp. 109–149). Rotterdam: SensePublishers.
Klemmer, S. R., Hartmann, B., & Takayama, L. (2006). How Bodies Matter: Five Themes for Interaction Design. InProceedings of the 6th ACM conference on Designing Interactive systems - DIS ’06 (pp. 140–149). Pennsylvania:ACM Press.
Lakoff, G., & Núñez, R. E. (2000). Preface. In Where mathematics comes from: How the embodied mind bringsmathematics into being (pp. XI–XVII). New York: Basic Books.
Laurillard, D. (2012). Teaching as a Design Science: Building Pedagogical patterns for learning and technology.London: Routledge. Routledge.
Manches, A., & O’Malley, C. (2016). Cognition and Instruction The Effects of Physical Manipulatives on Children’sNumerical Strategies. Cognition and Instruction, 34(1), 27–50.
Moreno, R., & Mayer, R. E. (1999). Cognitive principles of multimedia learning: The role of modality and contiguity.Journal of Educational Psychology, 91(2), 358–368.
Nicolopoulou, A. (1993). Play, cognitive development, and the social world: Piaget, vygotsky, and beyond. HumanDevelopment, 36(1), 1–23.
Prensky, M. (2005). Computer games and learning: Digital Game-Based Learning. Handbook of Computer GameStudies, 18, 97–122.
Price, S., Duffy, S., & Gori, M. (2017). Developing a Pedagogical Framework for Designing a Multisensory SeriousGaming Environment. In 1st ACM SIGCHI International Workshop on Multimodal Interaction (p. In press).Glasgow: Association for Computing Machinery.
Ritterfeld, U., Cody, M., & Vorderer, P. (2009). Serious games: Mechanisms and effects. (Ute Ritterfeld, Michael Cody,& Peter Vorderer, Eds.). Routledge.
Roschelle, J., Pea, R., Hoadley, C., Gordin, D., & Means, B. (2001). Changing how and what children learn in schoolwith collaborative cognitive technologies. The Future of Children, 10(2), 76–101.
Rosson, M. B., & Carroll, J. M. (2002). Scenario-Based Design. In The human-computer interaction handbook:fundamentals, evolving technologies and emerging applications (pp. 1032–1050).
Shaun Gallagher. (2005). How the Body Shapes the Mind. Oxford: Clarendon Press.
Smith, L., & Gasser, M. (2005). The Development of Embodied Cognition: Six Lessons from Babies. Artificial Life,11(1–2), 13–29.
Susi, T., Johannesson, M., & Backlund, P. (2007). Serious Games – An Overview. Technical Report HS-IKI-TR-07-001.
Thinus-Blanc, C., & Gaunet, F. (1997). Representation of space in blind persons: vision as a spatial sense?Psychological Bulletin, 121(1), 20–42.
Wilson, M. (2002). Six views of embodied cognition. Psychonomic Bulletin & Review, 9(4), 625–36.
ICTMT 13 470 Lyon 3 - 6 July 2017

ICTMT 13 471 Lyon 3 - 6 July 2017

Author Index
Abboud Maha, 460–462Abou Raad Nawal, 151–158Aldon Gilles, 200–207Anabousy Ahlam, 88–95, 232–240Anabousy Rawan, 232–240Andra Chiara, 190–197Arzarello Ferdinando, 200–207, 308–312
Ball Lynda, 113–123Barchilon Ben-Av Mercedes, 14–22Barzel Barbel, 113–123Baya’a Nimer, 208–215, 232–240Beltramino Silvia, 308–312Bini Giulia, 432–435Bock Camden, 323–330Bos Rogier, 436–439Bozkurt Gulay, 216–223Brunetto Domenico, 190–197Brunstrom Mats, 443–446Buskulic Damir, 428–430
Chaachoua Hamid, 314–322Chartouny Madona, 151–158Clark-Wilson Alison, 49, 224–231Cusi Annalisa, 52–60
Doring Tanja, 447, 448Daher Wajeeh, 232–240De Morales Rocha Katiane, 285–292De Simone Marina, 314–322Dimmel Justin, 323–330Domingos Antonio, 188, 189, 331–338, 440–
442, 463–466Donevska-Todorova Ana, 96–104Drijvers Paul, 339–346Duffy Sam, 467–471
El-Demerdash Mohamed, 347–356
Faggiano Eleonora, 368–377Fahlgren Maria, 443–446Ferrara Francesca, 304–307Ferrari Giulia, 304–307Fiorentino Michele Giuliano, 368–377
Gobel Lisa, 113–123
Gaspar Martins Sandra, 357–365Gitirana Veronica, 378–385Gurevich Irina, 14–22Gurjanow Iwan, 105–112
Haspekian Mariam, 23–31Hertleif Corinna, 124–133Hoyles Celia, 49, 224–231
Janßen Thomas, 447, 448Janetzko Hans-Dieter, 386–391Jedtke Elena, 134–143
Kasti Houssam, 241–247Kobylanski Magdalena, 392–399Kontorovich Igor’, 190–197Koopman Stephan, 449–452Kovacs Zoltan, 400–404
Labs Oliver, 347–356Lealdino Pedro, 302, 303, 405–411Lisarelli Giulia, 144–150Luıs Santos Fernando, 188, 189Ludwig Matthias, 105–112
Mariotti Maria Alessandra, 368–377Matos Jose, 357–365Mc Cabe Michael, 61–68Mercat Christian, 302, 303, 347–356Monaghan John, 276–284Montone Antonella, 368–377Morselli Francesca, 52–60
Naftaliev Elena, 32–39Noss Richard, 49
Okumus Samet, 412–418Oliveira Gerson, 248–255Olsher Shai, 69–74Osta Iman, 151–158
Palha Sonia, 449–452Panero Monica, 200–207Pohl Maximilian, 453–456
Recio Tomas, 400–404
ICTMT 13 472 Lyon 3 - 6 July 2017

Richard Philippe, 400–404Rizzo Ottavio, 457–459Robutti Ornella, 200–207Rocha Helena, 256–265Rojano Teresa44, 159–168Ruchniewicz Hana, 75–85Ruthven Kenneth, 216–223
Sabena Cristina, 52–60Salles Franck, 460–462Sayac Nathalie, 460–462Schacht Florian, 453–456Simsek Ali, 266–275Sousa Joao, 357–365Suarez Lucıa, 357–365Subtil Manuela, 463–466Surynkova Petra, 169–176Swidan Osama, 308–312
Tabach Michal, 88–95, 293–300Taranto Eugenia, 200–207Tolboom Jos, 339–346Trgalova Jana, 200–207, 293–300, 347–356Trouche Luc, 285–292Turgut Melih, 96–104, 177–186
Umameh Michael, 276–284Uygan Candas, 177–186
Velez M., 400–404Van Den Bogaard Theo, 339–346
Wang Chongyang, 285–292Weigand Hans-Georg, 40–47Weiss Ittay, 419–426
Yerushalmy Michal, 69–74
473

474

Chapter 9
SPONSORS
This conference has been organized with the help of our institutions and our sponsors.
ICTMT 13 475 Lyon 3 - 6 July 2017