Xilinx UltraFast Design Methodology Guide for the Vivado ...
PG
NCa
b
c
a
AA
KUTRA
1
mript[Gptlbmfms
bielt
htSi
0h
Journal of Electron Spectroscopy and Related Phenomena 189S (2013) 40– 45
Contents lists available at ScienceDirect
Journal of Electron Spectroscopy andRelated Phenomena
jou rn al h omepa g e: www.elsev ier .com/ lo cate /e lspec
robing ultrafast dynamics in electronic structure of epitaxiald(0 0 0 1) on W(1 1 0)
athan Beaulieua, Gregory Malinowskib, Azzedine Bendounana, Mathieu G. Sillya,hristian Chauveta, Damjan Krizmancicc, Fausto Sirotti a
Synchrotron SOLEIL, L’Orme des Merisiers, Saint-Aubin BP 48, 91192 Gif-sur-Yvette Cedex, FranceLaboratoire de Physique des Solides, Université Paris Sud, Orsay, FranceInstituto Officina dei Materiali (IOM)-CNR Laboratorio TASC, in Area Science Park S.S.14, Km 163.5, I-34149 Trieste, Italy
r t i c l e i n f o
rticle history:
a b s t r a c t
The electronic and magnetic properties of Gd have been studied using time- and angle-resolved
vailable online 28 June 2013eywords:ltrafast demagnetization processesime-resolved photoemission spectroscopyare earth
photoelectron spectroscopy employing laser pump and synchrotron radiation probe pulses. The statictemperature evolution of the valence band and more precisely, the 5d6s exchange splitting is reported.Ultrafast demagnetization is measured using dichroic resonant Auger spectroscopy. Remarkably, a com-plete demagnetization is observed followed up by a non-monotonic recovery that could be associated tomagnetization oscillations.
© 2013 Elsevier B.V. All rights reserved.
ngle resolved photoemission spectroscopy. Introduction
Pulsed laser induced magnetization dynamics has attracteduch attention during the last two decades, both for its elementary
elevance in the field of magnetism and its potential for applicationsn magnetic data storage. In 1991, using time- and spin-resolvedhotoemission, Vaterlaus et al. reported that the loss of magnetiza-ion in Gd related to the 4f spin-lattice relaxation takes ∼100 ± 80 ps1]. Recent experiments confirmed the slow demagnetization ofd [2,3]. In 1996, the results of Beaurepaire et al. came as a sur-rise. Indeed, they showed that a single 60 fs laser pulse could leado a partial quenching of the magnetization of a Ni thin film iness than a picosecond [4]. This result was quickly corroboratedy other studies and nowadays it is well accepted that the loss ofagnetization in transition metals takes place in several hundred
emtoseconds. Despite an intense research activity in this field, theicroscopic processes responsible for the loss of magnetization are
till debated.From a theoretical point of view, different approaches have
een considered to describe laser induced magnetization quench-ng based on conservation of angular momentum [5–9], ultrafastlectron transport [10,11] or coherent effects occurring during theight-matter interaction [12]. However, the relative contribution ofhese different processes remains unknown.
The absorption of a laser pulse by a metallic system generates
ot electrons–holes pairs. After a few hundreds of femtoseconds, ahermalized electron gas is established due to Coulomb interaction.ubsequently, the energy is transferred from the electronic bathnto the lattice by electron–phonon interaction within a couple of368-2048/$ – see front matter © 2013 Elsevier B.V. All rights reserved.ttp://dx.doi.org/10.1016/j.elspec.2013.06.005
picosecond. However, the microscopic processes involved in thisloss of magnetization remain uncertain.
In the Gd rare earth element, the magnetic moment per atom� = 7.55�B arises mainly from the localized 4f electrons (�4f = 7�B).The intra-atomic 4f–5d interaction induces a spin polarization ofthe valence electrons of �5d6s = 0.55�B. Those delocalized electronsare then responsible for the ferromagnetic order in Gd through indi-rect exchange interaction (RKKY coupling) resulting in an exchangesplitting of the valence band of 99 meV [13]. These microscopicmagnetic properties, together with the slow spin-lattice relax-ation time of the 4f electrons, make Gd a good candidate to studylaser induced magnetization dynamics, since it allows fast spinexcitation in the valence band electrons independently of the local-moment of the 4f electrons.
Photoelectron spectroscopy using synchrotron radiation withcore-level photoemission and valence-level angular resolvedphotoelectron spectroscopy (ARPES) is the most effective tool tostudy electronic properties in solids. In the case of Gd, a sig-nature of the sample magnetization can be found in the bandstructure of the 5d valence electrons, which are completely spinpolarized when observed around the �-point of the Brillouin zone.Soft X-ray absorption spectroscopy and core-level photoemissionobtained with the light polarization control are also powerful toolsto measure element specific, site specific magnetization. A paral-lel experiment measuring magnetic and electronic properties on
the same system should thus bring a better understanding of thedemagnetization process and of the energy transfer from the elec-tronic excitation to the spin system and of the recovery of the initialproperties after the short laser excitation.
N. Beaulieu et al. / Journal of Electron Spectroscopy and Related Phenomena 189S (2013) 40– 45 41
Fg
dbtf
ttnptdp
2
ecwslir1leftfFtd
Itatnf
Fig. 2. Gd-4d photoemission spectra measured by reversing the sample magneti-zation direction in the photoemission plane (black and red curve). The magneticcircular dichroism as a function of the laser power is reported in the inset at left ofthe figure. The experiments were performed at 700 eV. The decreasing of the mag-netization of the sample is a consequence of its heating due to the thermal powerdeposited by the laser. The temperature values were extracted fitting a Fermi func-
ig. 1. Schematic representation of the sample environment and the experimentaleometry in the UHV photoemission chamber.
Recently, Carley et al. reported a clear difference between theynamics of minority and majority spin components of the valanceand in Gd using time- and angle-resolved photoemission spec-roscopy [14]. They associate this behavior to the half-filled 4f shellavoring a spin-flip energy transfer from the majority valence band.
We present here a magnetic and electronic structure charac-erization of epitaxial Gd layers on W(1 1 0) along with a study ofhe demagnetization process induced by fs laser pulses. The mag-etic properties are extracted from magnetic circular dichroism inhotoemission of 4d and 4f electrons and are then directly relatedo the 5d band structure measured in ARPES. The magnetizationynamics is also measured with a time resolution of 50 ps usingartial yield soft X-ray absorption at the Gd M5 edge.
. Experimental
The experiments were performed on the UHV-photoemissionxperimental station of the TEMPO beamline at the SOLEIL syn-hrotron radiation facility [15]. The experimental geometry whichas used to perform magnetic dichroism experiments in photoemi-
sion, as well as angular resolved photoelectron spectroscopy underaser excitation, is summarized in Fig. 1. The measurement chambers equipped with a 2D Scienta SES 2002 analyzer with an angularesolution better than 0.2 degrees and covering an angular range of5 degrees in the horizontal plane. The detection system of the ana-
yzed was modified in order to perform pump/probe time resolvedxperiments [16]. The soft X-ray beam of the TEMPO beamline isocused to a spot size of about 100 �m FWHM and impinges onhe sample surface with an angle of 43◦. The photon energy rangesrom 50 to 1500 eV, with an energy resolution E/�E better than 104.our light polarizations are available (linear horizontal, linear ver-ical, circular left, circular right) which allows us to perform circularichroism, as well as ARPES measurements.
A horseshoe electromagnet is installed in the back of the sample.t is used to impose a sample magnetization before the photoelec-ron spectroscopy experiments which are performed in remanence
t zero magnetic field. The angle between the magnetization andhe soft X-ray propagation axis reduces the measured magnetic sig-al by about 30%. The laser pulses from a Coherent REGA 9050 areocused to a spot size of 150 microns FWHM and superposed on
tion to the valence band photoemission spectra measured for the same laser power.(For interpretation of the references to color in this figure legend, the reader isreferred to the web version of the article.)
the soft X-ray. The incoming angle of the laser beam is 70◦ withrespect to the analyzed axis. The sample temperature can be con-trolled in the temperature range 50–450 K. The sample was cooledwith liquid nitrogen to a temperature of 90 K. Temperatures wereextracted directly from high resolution Fermi level measurementsin ARPES as explained in the following.
The W(1 1 0) surfaces were prepared using the conventionalmethod [17,18] consisting in Ar sputtering, annealing in O2 par-tial pressure (10−7 mbar), flashing at high temperature (2000 ◦C)by electron bombardment. 10 nm thick Gadolinium layers weregrown “in situ” in a base pressure better than 5 × 10⁻¹⁰ mbar on theW(1 1 0) surface and annealed (350 ◦C) to obtain clean and orderedGd(0 0 0 1) surface, as checked by XPS and LEED techniques.
3. Magnetic and electronic properties
The magnetic properties were characterized using circulardichroism in photoelectron spectroscopy. This is an excellent tech-nique to evaluate the properties of a thin epitaxial layer becauseof its surface sensitivity [19]. In Fig. 2 we present the Gd-4d pho-toemission spectra measured at 90 K (black and red curve). Theywere measured with circular polarized monochromatic radiationset at 700 eV in the geometry presented in Fig. 1. The multipletstructure of the Gd-4d core level can easily be seen on the figureand a large difference between the curves measured with oppositemagnetization directions is observed. The difference curve is theMagnetic Circular Dichroism signal (MCD) and is proportional tothe magnetic moment of Gd [19].
The MCD curves measured as a function of the laser power arereported in the left panel of Fig. 2. The laser power was increasedup to 500 mW in order to reduce to zero the dichroic signal andthe sample magnetization. The temperature behavior of the sam-ple magnetization was extracted from fitting a Fermi function tothe valence band photoemission spectra measured for the samelaser power. In these experimental conditions the laser power issufficient to increase the temperature over the Curie temperature
of Gd [20].In the same experimental geometry we can change the photonenergy and the light polarization to obtain the angular and energydistribution of the Gd 5d and 6s valence electrons.
42 N. Beaulieu et al. / Journal of Electron Spectroscopy and Related Phenomena 189S (2013) 40– 45
Fm
aboebraseaatmoifs[bawtstsb
ts
etfmhpFdFts
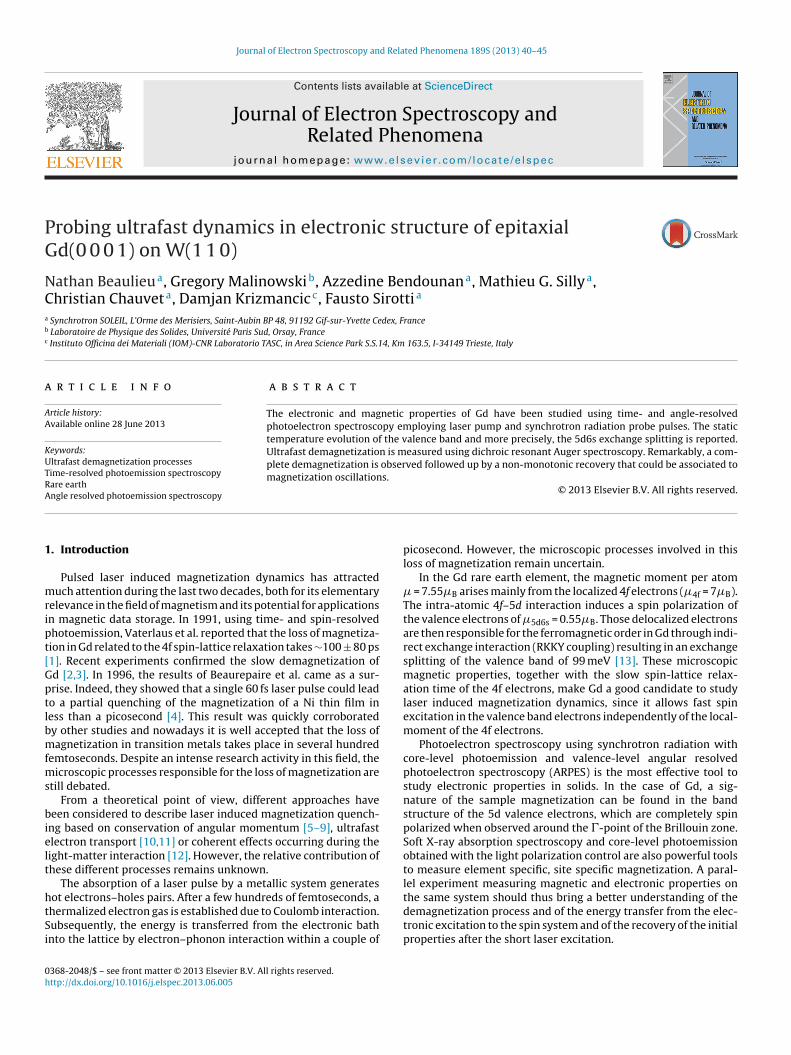
Fig. 4. Photoemission spectrum of the Gd(0 0 0 1) surface at 90 K obtained by inte-grating the map of Fig. 3 on an angle of one degree centered along the � direction(dots). The blue line is the product of the Fermi function and the sum of three
of the spin polarized bands. The temperature behavior of the 5dband splitting is presented in Fig. 7a in solid symbols. The continu-ous red line, indicated to guide the eye, is a Curie–Weiss law witha ̌ parameter of 0.28 and a critical temperature of 293 K. When
ig. 3. ARPES measurement of the valence band (5d, 6s electrons) of the Gd (0 0 0 1),easured along the �–М direction· Photon energy: 100 eV.
In Fig. 3 we present ARPES measurements obtained at 90 Klong the �–M direction. The entire mapping has been obtainedy changing the polar angle of the sample. Around the �-point onebserves two dispersive bands with different maximum bindingnergies (band A: E0 = 1.4 eV, and a weaker band B: E0 = 2.3 eV);oth bands are known to have strong 5d character [21]. Spin-esolved photoemission experiments have shown that those bandsre spin-polarized (A, minority-spin-polarized and B, majority-pin-polarized) [22] and their energy separation represents thexchange splitting. We observe also another band near gamma,nd very close to the Fermi level. This band is characterized by
weak dispersion and represents the surface state. Accordingo spin-resolved scanning tunneling spectroscopy (STS) measure-
ents, the surface state is also spin-polarized, but we see herenly the minority states since the majority states band is locatedn the unoccupied region [23]. From local-density calculations per-ormed by Kurz et al., the surface state presents also a Rashba typepin splitting that is too small to be measured by ARPES or by STS24]. We show in Fig. 4 the normal emission spectrum obtainedy integration of about 2◦ around �-point. We observe three peaksssociated respectively with the spin polarized bands (A and B) andith the surface state band. Their line-widths depend strongly on
he binding energy, in agreement with Fermi liquid theory. Thepectroscopic signal can be reproduced by three Lorentzian con-ributions for A, B and surface state bands and by a Fermi functiontep. From our investigation, the exchange splitting is estimated toe about 1 eV, which appears in good agreement with Ref. [13].
The measured band structure is in good agreement with theheoretical calculations for bulk Gd done within the quasiparticleelf-consistent GW approximation [25].
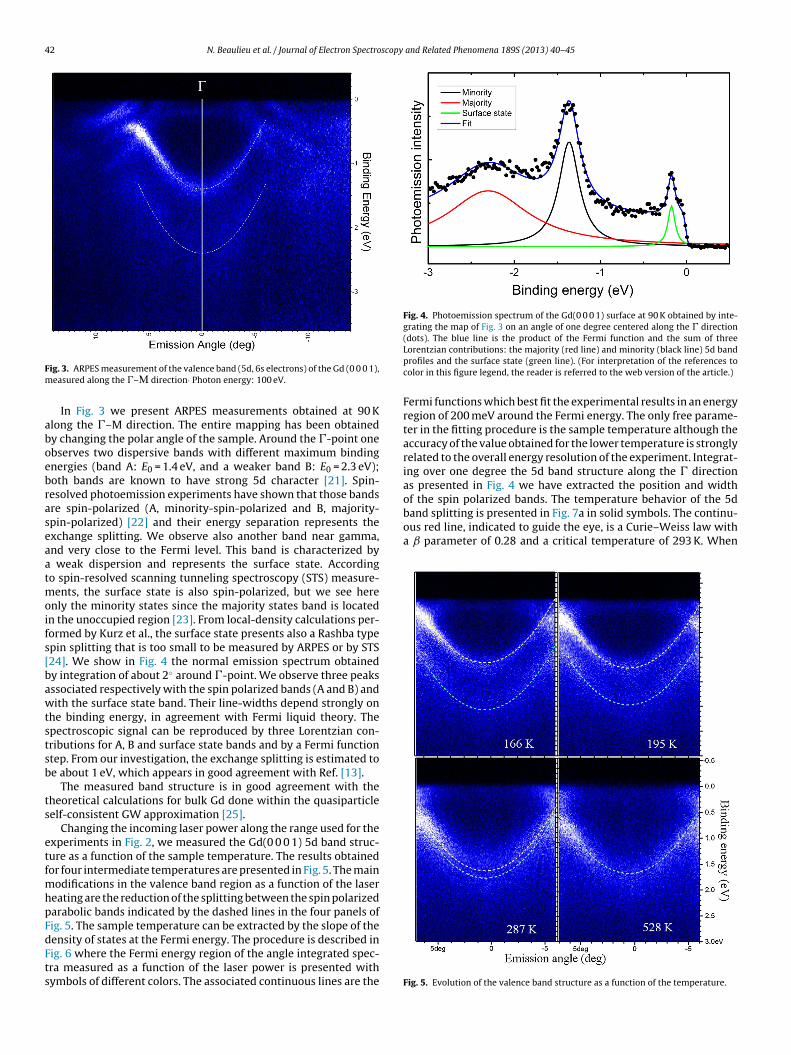
Changing the incoming laser power along the range used for thexperiments in Fig. 2, we measured the Gd(0 0 0 1) 5d band struc-ure as a function of the sample temperature. The results obtainedor four intermediate temperatures are presented in Fig. 5. The main
odifications in the valence band region as a function of the lasereating are the reduction of the splitting between the spin polarizedarabolic bands indicated by the dashed lines in the four panels ofig. 5. The sample temperature can be extracted by the slope of the
ensity of states at the Fermi energy. The procedure is described inig. 6 where the Fermi energy region of the angle integrated spec-ra measured as a function of the laser power is presented withymbols of different colors. The associated continuous lines are theLorentzian contributions: the majority (red line) and minority (black line) 5d bandprofiles and the surface state (green line). (For interpretation of the references tocolor in this figure legend, the reader is referred to the web version of the article.)
Fermi functions which best fit the experimental results in an energyregion of 200 meV around the Fermi energy. The only free parame-ter in the fitting procedure is the sample temperature although theaccuracy of the value obtained for the lower temperature is stronglyrelated to the overall energy resolution of the experiment. Integrat-ing over one degree the 5d band structure along the � directionas presented in Fig. 4 we have extracted the position and width
Fig. 5. Evolution of the valence band structure as a function of the temperature.
N. Beaulieu et al. / Journal of Electron Spectroscopy
Fw
twmib[bp
Fiot
Fam
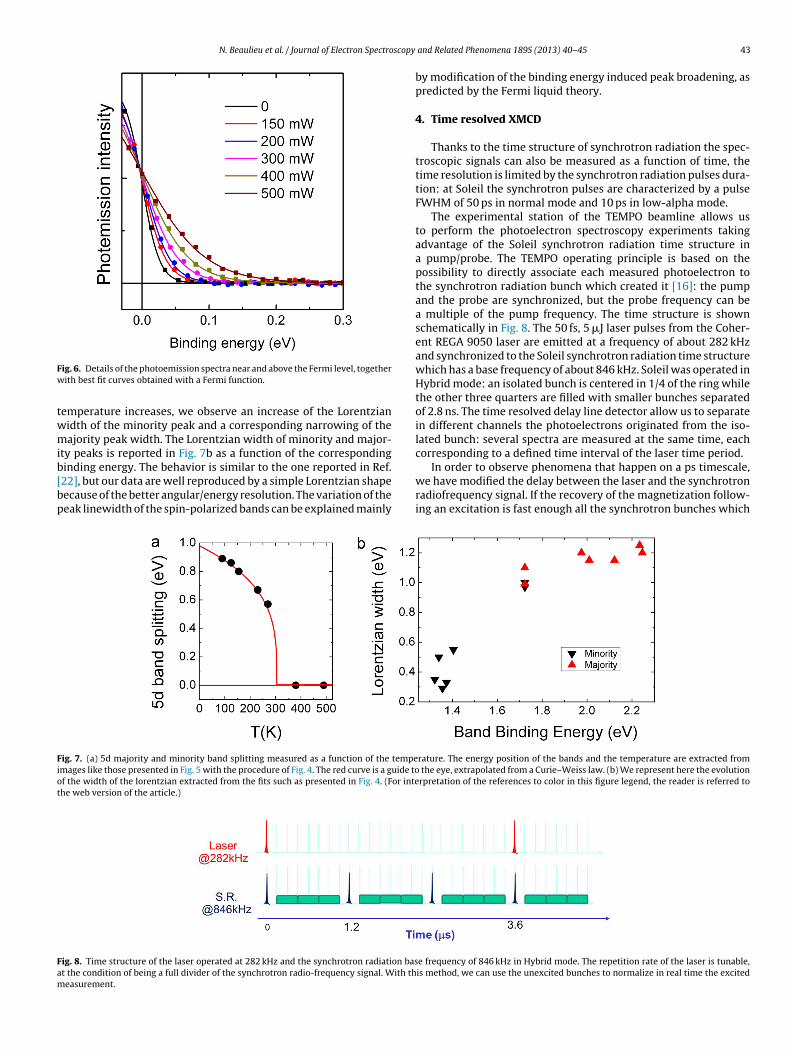
ig. 6. Details of the photoemission spectra near and above the Fermi level, togetherith best fit curves obtained with a Fermi function.
emperature increases, we observe an increase of the Lorentzianidth of the minority peak and a corresponding narrowing of theajority peak width. The Lorentzian width of minority and major-
ty peaks is reported in Fig. 7b as a function of the corresponding
inding energy. The behavior is similar to the one reported in Ref.22], but our data are well reproduced by a simple Lorentzian shapeecause of the better angular/energy resolution. The variation of theeak linewidth of the spin-polarized bands can be explained mainlyig. 7. (a) 5d majority and minority band splitting measured as a function of the tempemages like those presented in Fig. 5 with the procedure of Fig. 4. The red curve is a guide tof the width of the lorentzian extracted from the fits such as presented in Fig. 4. (For intehe web version of the article.)
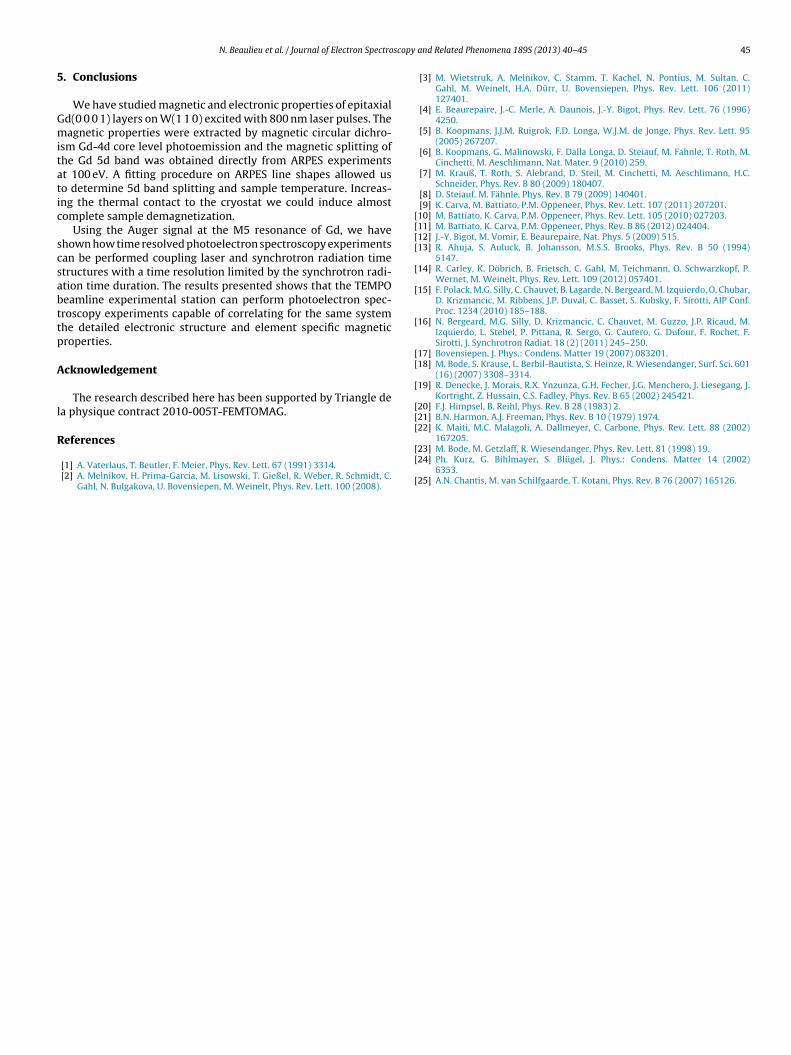
ig. 8. Time structure of the laser operated at 282 kHz and the synchrotron radiation bast the condition of being a full divider of the synchrotron radio-frequency signal. With theasurement.
and Related Phenomena 189S (2013) 40– 45 43
by modification of the binding energy induced peak broadening, aspredicted by the Fermi liquid theory.
4. Time resolved XMCD
Thanks to the time structure of synchrotron radiation the spec-troscopic signals can also be measured as a function of time, thetime resolution is limited by the synchrotron radiation pulses dura-tion: at Soleil the synchrotron pulses are characterized by a pulseFWHM of 50 ps in normal mode and 10 ps in low-alpha mode.
The experimental station of the TEMPO beamline allows usto perform the photoelectron spectroscopy experiments takingadvantage of the Soleil synchrotron radiation time structure ina pump/probe. The TEMPO operating principle is based on thepossibility to directly associate each measured photoelectron tothe synchrotron radiation bunch which created it [16]: the pumpand the probe are synchronized, but the probe frequency can bea multiple of the pump frequency. The time structure is shownschematically in Fig. 8. The 50 fs, 5 �J laser pulses from the Coher-ent REGA 9050 laser are emitted at a frequency of about 282 kHzand synchronized to the Soleil synchrotron radiation time structurewhich has a base frequency of about 846 kHz. Soleil was operated inHybrid mode: an isolated bunch is centered in 1/4 of the ring whilethe other three quarters are filled with smaller bunches separatedof 2.8 ns. The time resolved delay line detector allow us to separatein different channels the photoelectrons originated from the iso-lated bunch: several spectra are measured at the same time, eachcorresponding to a defined time interval of the laser time period.
In order to observe phenomena that happen on a ps timescale,we have modified the delay between the laser and the synchrotronradiofrequency signal. If the recovery of the magnetization follow-ing an excitation is fast enough all the synchrotron bunches which
rature. The energy position of the bands and the temperature are extracted from the eye, extrapolated from a Curie–Weiss law. (b) We represent here the evolutionrpretation of the references to color in this figure legend, the reader is referred to
e frequency of 846 kHz in Hybrid mode. The repetition rate of the laser is tunable,is method, we can use the unexcited bunches to normalize in real time the excited

44 N. Beaulieu et al. / Journal of Electron Spectroscopy
Fig. 9. XAS and XMCD spectra of the Gd(0 0 0 1) sample at the Gd M4,5 edges. Whenthe photon energy is set on the maximum of the XMCD signal a large dichroic signalis observed on the resonant 4f Auger photoelectrons at 8 eV of binding energy. TheAuger spectra measured in photoemission for the two magnetization directions arereported in the inset. The difference curve is reported in the bottom (blue curve). (Forinterpretation of the references to color in this figure legend, the reader is referredto the web version of the article.)
aIm
blcd
Fmbr
re not superposed with the laser will detect an unperturbed signal.n any case the decay time is immediately detected in the experi-
ent.In Fig. 9 are shown XMCD data obtained in X-ray absorption
y measuring the total electron yield, together with near-Fermievel photoemission spectra in the inset. The black and the redurves are obtained by reversing the sample magnetization, theifference XMCD signal is reported in the bottom (blue curve). For
ig. 10. (Left) Normalized magnetic signals obtained by reversing the sample magnetizalization presented as a function of the pump/probe delay is obtained by dividing the r
unch. (Right) Time-resolved magnetization obtained by integrating the magnetic circularadiation probe. (For interpretation of the references to color in this figure legend, the rea
and Related Phenomena 189S (2013) 40– 45
photoemission, we set the photon energy on the maximum of theXMCD curve indicated by the arrow in Fig. 9, for which a strongphotoemission intensity is observed at about 1177 eV, correspond-ing to the resonant Auger electrons involved in the 3d core holerelaxation. The two photoemission spectra corresponding to thesame magnetization directions observed in XAS are presented inthe inset of Fig. 9. The difference curve is reported in the bottom ofthe inset.
Ultrafast magnetization dynamics of the Gd layer was then stud-ied by analyzing the temporal evolution of the dichroic resonantAuger photoemission intensity as a function of the delay betweenthe laser pump and the X-ray probe. Due to the time structuredepicted in Fig. 7, each synchrotron pulse corresponding to a laserexcitation is followed by two unperturbed pulses which were usedas a reference to obtain the amplitude of the magnetization loss. Inorder to decrease the static loss of magnetization due to the strongcontinuous heating by the laser, we had to lower the laser repetitionrate to 141 kHz. As a result, residual magnetization at the equilib-rium corresponds to 50% of the maximum magnetization measuredat 90 K without laser.
The magnetization dynamics reported in Fig. 10b was obtainedby measuring the evolution of the integral of the dichroic signalobtained by resonant auger photoemission as a function of thedelay between the laser and the X-ray pulses. Just after the laserexcitation, the magnetization reduces to zero within less than a100 ps. Interestingly, this complete quenching of the magnetizationis followed by a non-monotonic recovery showing what could beinterpreted as oscillations. The change of the magnetization direc-tion observed for delay times of 100 ps and 200 ps together with
a modification of the shape of the dichroic signal are clearly seenin Fig. 10a. The nature of these oscillations is still under investiga-tion and further experiments with a better time resolution will becarried out to understand these results.ation in the partial electron yield XMCD experiment explained in Fig. 9. The nor-esidual dichroic signal by the full dichroic signal measured on unperturbed single
dichroism at the Gd-M5 edge presented. The blue curve represents the synchrotronder is referred to the web version of the article.)
scopy
5
Gmitatic
scsabttp
A
l
R
[[[[
[
[
[
[[
[
[[[
N. Beaulieu et al. / Journal of Electron Spectro
. Conclusions
We have studied magnetic and electronic properties of epitaxiald(0 0 0 1) layers on W(1 1 0) excited with 800 nm laser pulses. Theagnetic properties were extracted by magnetic circular dichro-
sm Gd-4d core level photoemission and the magnetic splitting ofhe Gd 5d band was obtained directly from ARPES experimentst 100 eV. A fitting procedure on ARPES line shapes allowed uso determine 5d band splitting and sample temperature. Increas-ng the thermal contact to the cryostat we could induce almostomplete sample demagnetization.
Using the Auger signal at the M5 resonance of Gd, we havehown how time resolved photoelectron spectroscopy experimentsan be performed coupling laser and synchrotron radiation timetructures with a time resolution limited by the synchrotron radi-tion time duration. The results presented shows that the TEMPOeamline experimental station can perform photoelectron spec-roscopy experiments capable of correlating for the same systemhe detailed electronic structure and element specific magneticroperties.
cknowledgement
The research described here has been supported by Triangle dea physique contract 2010-005T-FEMTOMAG.
eferences
[1] A. Vaterlaus, T. Beutler, F. Meier, Phys. Rev. Lett. 67 (1991) 3314.[2] A. Melnikov, H. Prima-Garcia, M. Lisowski, T. Gießel, R. Weber, R. Schmidt, C.
Gahl, N. Bulgakova, U. Bovensiepen, M. Weinelt, Phys. Rev. Lett. 100 (2008).
[[
[
and Related Phenomena 189S (2013) 40– 45 45
[3] M. Wietstruk, A. Melnikov, C. Stamm, T. Kachel, N. Pontius, M. Sultan, C.Gahl, M. Weinelt, H.A. Dürr, U. Bovensiepen, Phys. Rev. Lett. 106 (2011)127401.
[4] E. Beaurepaire, J.-C. Merle, A. Daunois, J.-Y. Bigot, Phys. Rev. Lett. 76 (1996)4250.
[5] B. Koopmans, J.J.M. Ruigrok, F.D. Longa, W.J.M. de Jonge, Phys. Rev. Lett. 95(2005) 267207.
[6] B. Koopmans, G. Malinowski, F. Dalla Longa, D. Steiauf, M. Fahnle, T. Roth, M.Cinchetti, M. Aeschlimann, Nat. Mater. 9 (2010) 259.
[7] M. Krauß, T. Roth, S. Alebrand, D. Steil, M. Cinchetti, M. Aeschlimann, H.C.Schneider, Phys. Rev. B 80 (2009) 180407.
[8] D. Steiauf, M. Fähnle, Phys. Rev. B 79 (2009) 140401.[9] K. Carva, M. Battiato, P.M. Oppeneer, Phys. Rev. Lett. 107 (2011) 207201.10] M. Battiato, K. Carva, P.M. Oppeneer, Phys. Rev. Lett. 105 (2010) 027203.11] M. Battiato, K. Carva, P.M. Oppeneer, Phys. Rev. B 86 (2012) 024404.12] J.-Y. Bigot, M. Vomir, E. Beaurepaire, Nat. Phys. 5 (2009) 515.13] R. Ahuja, S. Auluck, B. Johansson, M.S.S. Brooks, Phys. Rev. B 50 (1994)
5147.14] R. Carley, K. Döbrich, B. Frietsch, C. Gahl, M. Teichmann, O. Schwarzkopf, P.
Wernet, M. Weinelt, Phys. Rev. Lett. 109 (2012) 057401.15] F. Polack, M.G. Silly, C. Chauvet, B. Lagarde, N. Bergeard, M. Izquierdo, O. Chubar,
D. Krizmancic, M. Ribbens, J.P. Duval, C. Basset, S. Kubsky, F. Sirotti, AIP Conf.Proc. 1234 (2010) 185–188.
16] N. Bergeard, M.G. Silly, D. Krizmancic, C. Chauvet, M. Guzzo, J.P. Ricaud, M.Izquierdo, L. Stebel, P. Pittana, R. Sergo, G. Cautero, G. Dufour, F. Rochet, F.Sirotti, J. Synchrotron Radiat. 18 (2) (2011) 245–250.
17] Bovensiepen, J. Phys.: Condens. Matter 19 (2007) 083201.18] M. Bode, S. Krause, L. Berbil-Bautista, S. Heinze, R. Wiesendanger, Surf. Sci. 601
(16) (2007) 3308–3314.19] R. Denecke, J. Morais, R.X. Ynzunza, G.H. Fecher, J.G. Menchero, J. Liesegang, J.
Kortright, Z. Hussain, C.S. Fadley, Phys. Rev. B 65 (2002) 245421.20] F.J. Himpsel, B. Reihl, Phys. Rev. B 28 (1983) 2.21] B.N. Harmon, A.J. Freeman, Phys. Rev. B 10 (1979) 1974.22] K. Maiti, M.C. Malagoli, A. Dallmeyer, C. Carbone, Phys. Rev. Lett. 88 (2002)
167205.23] M. Bode, M. Getzlaff, R. Wiesendanger, Phys. Rev. Lett. 81 (1998) 19.24] Ph. Kurz, G. Bihlmayer, S. Blügel, J. Phys.: Condens. Matter 14 (2002)
6353.25] A.N. Chantis, M. van Schilfgaarde, T. Kotani, Phys. Rev. B 76 (2007) 165126.
Copyright © 2022 FDOKUMEN