Pro-active dairy herd udder health management decisions ...
171
ProͲactivedairyherdudder healthmanagementdecisions basedonmicroͲbiologyand cytologyofmilksamples IngeͲMariéPetzer
-
Upload
khangminh22 -
Category
Documents
-
view
3 -
download
0
Transcript of Pro-active dairy herd udder health management decisions ...

Pro active dairy herd udderhealth management decisionsbased on micro biology andcytology of milk samples
Inge Marié Petzer

i
Pro active dairy herd udder health management decisionsbased on micro biology and cytology of milk samples
by
Inge Marié Petzer
Submitted in partial fulfilment of the requirements for the PhD degree
In the Faculty of Natural & Agricultural Sciences
University of Pretoria
Pretoria
2018

ii
Supervisors : Prof Edward. F. Donkin
: Prof Edward C. Webb
Co supervisor : Mrs Joanne Karzis
__________________________________________________________________________

iii
Table of Contents
..............................................................................................................................
Table of Contents............................................................................................... iii
DECLARATION ..................................................................................................... ix
ACKNOWLEDGEMENTS ....................................................................................... x
LIST OF TABLES....................................................................................................xi
LIST OF FIGURES................................................................................................ xiv
LIST OF ABBREVIATIONS .................................................................................... xv
MAIN AIMS AND OUTCOMES ON THE THESIS ................................................ xviii
THESIS ABSTRACT................................................................................................ 1
Pro active dairy herd udder health management decisions based on micro biology andcytology of milk samples........................................................................................................ 1
Papers in perspective and into context ......................................................................... 3
Relevance and importance of this study ....................................................................... 4
CHAPTER 1 .......................................................................................................... 6
Pro active dairy herd udder health management decisions based on micro biology andcytology of milk samples........................................................................................................ 6
INTRODUCTION TO MASTITIS ............................................................................................ 6
1.1 Somatic cells in milk............................................................................................. 8
1.2 Introduction to micro organisms causing udder infections ..............................10
1.2.1 Contagious udder pathogens (Host adapted)................................................10
Staphylococcus aureus ................................................................................................. 11
Streptococcus agalactiae ............................................................................................. 12
Managing and identifying intramammary infections with contagious udderpathogens .................................................................................................................... 12
1.2.2 Environmental mastitis pathogens ................................................................13
Escherichia coli ............................................................................................................. 14
Streptococcus uberis .................................................................................................... 15
1.2.3 Minor udder pathogens .................................................................................15
REFERENCES ..................................................................................................................... 16

iv
CHAPTER 2 ........................................................................................................ 23
A pathogen specific approach towards udder health management in dairy herds usingmicro cytology from routine herd investigations................................................................23
SIGNIFICANCE OF THE WORK........................................................................................... 23
ABSTRACT......................................................................................................................... 23
INTRODUCTION................................................................................................................ 24
MATERIALS AND METHODS............................................................................................. 26
Milk samples and data ................................................................................................. 26
Some of the various reports that will be discussed.....................................................27
Criteria used for diagnosis ........................................................................................... 27
RESULTS AND DISCUSSIONS............................................................................................. 28
2.1 Serial Udder Health Reports (Composite milk samples)....................................28
2.1.1 Part 1 – Serial Herd Microbiological report ...................................................28
Prevalence of species specific herd intramammary infections...................................28
New intramammary infections .................................................................................... 29
Repeat (persistent) cases and cases cured..................................................................29
Application of results in a Streptococcus agalactiae positive herd.............................30
Case study: Application of results in a Staphylococcus aureus positive herd .............31
Application of results in herds with mainly gram negative IMI...................................33
2.1.2 Part 2 – Serial Herd Somatic Cell Count Report .............................................33
2.2 Current Herd Udder Health Report (Quarter milk samples) .............................35
2.3 GROUP REPORTS................................................................................................ 37
Pathogen Specific Group Report..................................................................................37
Application in herds during a Str. agalactiaemastitis outbreak .................................37
Stage of lactation and parity........................................................................................ 39
Udder health up to 30 days post partum (multiparous and primiparous cows) ........39
Udder Health in early, mid and late lactation (90 days, 180 days and later inlactation) ...................................................................................................................... 40
General udder health of the herd................................................................................41
Lactation stages – intramammary infections ..............................................................42
Lactation stages – somatic cell counts.........................................................................42
Economic Report.......................................................................................................... 42

v
Table 2.5a: Estimated milk production losses in a herd associated with elevated quarter milksomatic cell counts of all lactating cows in the herd...............................................................43
CONCLUSION.................................................................................................................... 44
ACKNOWLEDGEMENTS.................................................................................................... 45
REFERENCES ..................................................................................................................... 45
ADDENDUM 2.1 (Case study – Herd Udder Health Report) ............................................50
CHAPTER 3 ........................................................................................................ 57
Somatic cell count thresholds in composite and quarter milk samples as indicator ofbovine intramammary infection status ...............................................................................57
SIGNIFICANCE OF THE WORK........................................................................................... 57
ABSTRACT......................................................................................................................... 57
INTRODUCTION................................................................................................................ 58
MATERIALS AND METHODS............................................................................................. 60
Study design and study population .............................................................................60
Data selection and sampling........................................................................................ 60
Laboratory methods .................................................................................................... 61
Data analysis ................................................................................................................ 62
RESULTS........................................................................................................................ ....63
3.1 Composite milk samples .................................................................................... 63
Table 3.2. Analysing intramammary infection (IMI) in composite milk samples at differentsomatic cell count (SCC) thresholds......................................................................................... 65
3.2 Quarter milk samples......................................................................................... 65
DISCUSSION...................................................................................................................... 68
Quarter milk samples................................................................................................... 70
Composite milk samples .............................................................................................. 72
Comparing quarter and composite cow milk sample results ......................................73
CONCLUSIONS.................................................................................................................. 73
ACKNOWLEDGEMENTS.................................................................................................... 74
REFERENCES ..................................................................................................................... 74
CHAPTER 4 ........................................................................................................ 79

vi
Pathogen specific bovine intramammary infections: The validity of a somatic cell countthreshold as an indicator of intramammary infection in quarter and composite milksamples ............................................................................................................................... .79
SIGNIFICANCE OF THE WORK........................................................................................... 79
ABSTRACT......................................................................................................................... 79
INTRODUCTION................................................................................................................ 80
METHODS......................................................................................................................... 82
RESULTS........................................................................................................................ ....84
4.1 Quarter milk samples......................................................................................... 84
4.2 Composite milk samples .................................................................................... 87
DISCUSSION...................................................................................................................... 91
Quarter milk samples................................................................................................... 91
Composite milk samples .............................................................................................. 93
CONCLUSION.................................................................................................................... 95
ACKNOWLEDGEMENTS.................................................................................................... 96
REFERENCES ..................................................................................................................... 96
ADDENDUM 4.1 ............................................................................................................. 100
Table 4.9. Comparing the percentage of 8 different bacterial species that would notbe isolated in quarter milk at a SCC threshold of 200 000 cells/mL and 150 000cells/mL in composite milk samples ..........................................................................102
ADDENDUM 4.2 (Poster – International Congress 2016) ..............................................103
CHAPTER 5 ...................................................................................................... 104
Epidemiological and partial budget analysis for treatment of subclinical Staphylococcusaureus intramammary infections considering microbiological and cytological scenarios104
SIGNIFICANCE OF THE WORK.........................................................................................104
ABSTRACT....................................................................................................................... 105
INTRODUCTION.............................................................................................................. 106
MATERIAL AND METHODS............................................................................................. 109
5.1 Stage 1 Basis for both the economic- and epidemiological models ...............109
5.1.1 Staphylococcus aureus dynamic...................................................................109
Transmission parameter for new S. aureus IMI ...........................................109
5.1.3 Herd prevalence of SCC................................................................................110
5.1.4 Herd prevalence of S. aureus IMI.................................................................110

vii
5.1.5 Different treatment scenarios used in models ............................................111
Figure 5.1. Flow diagram used in the modulation of the models..........................................111
5.2 Stage 2: Model development...........................................................................111
5.2.1 Epidemiological models ...............................................................................111
Epidemiological model to predict persistent S. aureus IMI.......................................112
Epidemiological model indicating probable clinical flare ups ...................................113
Epidemiological model indicating new intramammary infections and numbers oftreatment of subclinical cases ...................................................................................114
5.2.2 Economic Models .........................................................................................115
Statistical analysis ...................................................................................................... 118
RESULTS........................................................................................................................ ..118
5.3 Economic models ............................................................................................. 118
5.5 Sensitivity analysis ........................................................................................... 123
DISCUSSION.................................................................................................................... 124
Economic model......................................................................................................... 125
Epidemiological model............................................................................................... 126
Persistent S. aureus cases .......................................................................................... 126
New IMI and flare ups of clinical mastitis .................................................................127
Combining cost/benefit and epidemiological outcomes...........................................128
CONCLUSION.................................................................................................................. 129
ACKNOWLEDGEMENTS.................................................................................................. 129
REFERENCES ................................................................................................................... 130
ADDENDUM 5.1 (Persistant S. aureus cases).............................................................134
ADDENDUM 5.2 (Clinical cases of S. aureus) .............................................................135
ADDENDUM 5.3 (Numbers treated) ..........................................................................137
ADDENDUM 5.4 ......................................................................................................... 138
ADDENDUM 5.5 (Keynote speech IDF congress).......................................................140
ADDENDUM 5.6 (Paper presented at ISVEE Conference) .........................................142
ADDENDUM 5.7 (Poster presented at WBC Conference) .........................................143
ADDENDUM 5.8 ......................................................................................................... 144
CHAPTER 6 ...................................................................................................... 145

viii
THESIS SUMMARY.......................................................................................................... 145
Somatic cell count thresholds as indicators of bovine intra mammary infection statusin quarter and composite milk samples. ...................................................................146
Pathogen specific bovine intramammary infections: The validity of somatic cell countthreshold as an indicator in quarter and composite milk samples. ..........................147
Cost benefit analysis when treating subclinical Staphylococcus aureus intramammaryinfections considering micro cytological scenarios: a stochastic approach..............148
Positive advantages of the study ...............................................................................149
Limitations and weakness in the research.................................................................150
Future research.......................................................................................................... 151

ix
DECLARATION
I, Inge Marié Petzer declare that the thesis, which I hereby submit for the PhD degree at theUniversity of Pretoria, is my own work and has not previously been submitted by me for adegree at this or any other tertiary institute.
Signature: …………………………
Date: ……………………………….

x
ACKNOWLEDGEMENTS
I would like to express my sincere appreciation to:
Prof Edward Donkin for his guidance, wisdom, unselfish assistance and encouragement duringthis project. He was always available to guide and encourage me even after moving to Natal;
Prof Edward Webb for agreeing be become supervisor despite a heavy work load;
Mrs Joanne Karzis for her help and for putting her studies on hold for a year in order to giveme the opportunity to take sabbatical leave and focus on mine and for her always unselfishand kind help;
Prof Eric Etter for his help and adding value to this study by introducing a model concept andhis perseverance despite a high workload;
Prof Geoff Fosgate for his guidance in the analysis of some data at short notice;
MrsMarie Smith for sharing her vast statistical experience withme and for always respondingso promptly;
NRF for trusting me and providing me with money that granted me the time to complete myThesis;
A special word of thanks for all the Onderstepoort Milk Laboratory Staff who devoted theirtime in doing the laboratory tests over the years and for helping me to gather contact detailsand other information from farmers; especially Corrie Watermeyer, Renette Badenhorst andFredah Konaite;
To the milk producers for South Africa that have made use of the Milk Laboratory and myconsultations, and provided me with the opportunity to learn and to apply laboratory resultson the farming;
A special thanks to my husband Andrew for his loving, unselfish support and understandingALWAYS through this journey and for eating so many micro wave meals without anycomplaints, just the odd – I think we should go and eat out tonight.Without your help it wouldnot have been possible;
But most of all to our heavenly Father for granting me this opportunity and for His grace thatproviding me with knowledge, wisdom, day to day strength and perseverance to finish thistask to enable me to serve others better in future.

xi
LIST OF TABLES
Table 2.1. Serial Herd Udder Health Report. Case study Part 1: Bacteriology history reportfor four consecutive herd examinations of the same herd using composite cow milk samples.............. ………………………………………………………………………………………………………………………………30
Table 2.2. Serial Herd Udder Health Report. Part 2: Somatic cell count (SCC) history reportfor four consecutive herd examination of the same herd based on results of composite cowmilk samples………………………………………………………………………………………………………………………32
Table 2.3. Current Herd Udder Health Report based on somatic cell count and culture resultsof quarter milk samples from lactating and dry cows…………………………………………………………36
Table 2.4. Herd Udder Health status correlated with different stages of lactation usingquarter milk samples…………………………………………………………………………………………………………41
Table 2.5a: Estimated milk production losses in a herd associated with elevated quarter milksomatic cell counts of all lactating cows in the herd………………………………………………………….43
Table 2.5b: Estimated milk production losses in a herd associated with quarters infectedwith Streptococcus agalactiae……………………………………………………………………………………………44
Table 3.1. The presence and absence of intramammary infection (IMI) within each somaticcell count (SCC) range in composite milk samples (n=345 461)………………………………………….64
Table 3.2. Analysing intramammary infection (IMI) in composite milk samples at differentsomatic cell count (SCC) thresholds…………………………………………………………………………………..65
Table 3.3. Quarter milk samples indicating the presence and absence of intramammaryinfection (IMI) for each somatic cell count (SCC) range (n=89 638)…………………………………..66
Table 3.4. Sensitivity and predictability of quarter intramammary infections (IMI) for varioussomatic cell count (SCC) thresholds………………………………………………………………………………….67
Table 3.5. Receiver operating characteristic curves (ROC) and area under the curve (AUC) forthe efficacy of SCC test to identify IMI in quarter and composite milk samples………………..68
Table 4.1. Bacteriologically negative and positive quarter milk samples indicating pathogenspecific bacteria and groups isolated from samples with and without somatic cell counts(SCC) above 200 000 cells/mLmilk…………………………………………………………………………………..Error! Bookmark not defined.
Table 4.2. Cumulative percentages of eight mastitis pathogens and culture negativesamples isolated from quarter samples distributed on various cell count thresholds (n =89 635)……………………………………………………………………………………………………………………………Error! Bookmark not defined.

xii
Table 4.3. Sensitivity and specificity with 95% confidence intervals (CI) for pathogen specificdetection using an SCC threshold of 200 000 cells/mL milk in quarter milk samples andpositive likelihood ratios at SCC thresholds of 200 000cells/mL……………………………………....Error! Bookmark not defined.
Table 4.4. Composite milk samples either negative or positive for bacteria indicatingindividual pathogen specific bacteria and groups isolated from samples with and withoutsomatic cell counts (SCC) above 200 000 cells/mLmilk………………………………………………….…Error! Bookmark not defined.
Table 4.5. Cumulative percentages of 10 bacteria species and culture negative samplesisolated from composite cow milk samples distributed on various cell count thresholds (n =345 461)…………………………………………………………………………………………………………………………..89
Table 4.6. Sensitivity and Specificity with 95% lower (LCI) and upper (UCI) for variousbacterial species and groups indicated in composite samples at SCC threshold levels of 150000 and 200 000 cells/mL………………………………………………………………………………………………..90
Table 4.7. The positive likelihood ratios at somatic cell count (SCC) thresholds of 150 000and 200 000 cells/mL for detecting various bacterial species and groups in compositesamples…………………………………………………………………………………………………………………………….91
Table 5.1. Economic parameters used in developing the cost/benefit indices…………………116
Table 5.2. Results of the economic model comparing cost outcome (cost index) of the threetreatment scenarios in herds with a low initial S. aureus intramammary infection (IMI)prevalence, (6.83% if SCC > 200 000 1.54% if SCC 200 000 cells/ml), with high or lowtransmission ratio................................................................................................................120
Table 5.3. Results of the economic model comparing cost outcome (cost index) of the threetreatment scenarios in herds with a high initial S. aureus intramammary infection (IMI)prevalence, (25% if SCC > 200 000 and 5% if SCC 200 000 cells/ml), with high or lowtransmission ratio…………………………………………………………………………………………………………..120
Table 5.4. Results of the three different treatment scenarios summarised to indicate thepersistent S. aureus IMI per cycles and those still present after a period of 255 days in eachcase comparing scenarios of low and high initial S. aureus prevalence and transmission risks.(Calculation was rounded off to the nearest integer).........................................................121
Table 5.5. A comparison of expected outcomes of treatment scenarios of clinical flare ups,new intramammary infections and number of subclinical treatments during the 255 dayperiod in scenario with both low and high initial S. aureus prevalence and transmissionratio…………………………………………………………………………………………………………………………….…122

xiii
Table 5.6. Combining economic and epidemiological outcomes of treatment scenarios withdifferent S.aureus prevalence and transmission risk to determine option providing the bestfinancial option for the optimal epidemiological outcome of S. aureus based on the farmersset goal………………………………………………………………………………………………………………………….Error!Bookmark not defined.
Table 5.7. Comparing the number of persistent S. aureus cases in herd with initial low andhigh S. aureus herd intramammary infections and risk of infections, for the varioustreatment scenario over 3 and 8 days, in quarter and composite milk samples at SCCthresholds of 200 000 cells/ml and composite samples at 150 000 cells/ml…………………..139
Table 5.8. Comparing the number of new, clinical and total number of subclinical S. aureuscases that required treatment in herds with initial low and high S. aureus herdintramammary infections and risk of infections, for the various treatment scenario over 3and 8 days, in quarter and composite milk samples at SCC thresholds of 200 000 cells/ml andcomposite samples at 150 000cells/ml………………………………………………………………………….Error! Bookmark not defined.

xiv
LIST OF FIGURES
Figure 2.1. The criteria used in the calculation of the probability of cure for a cow withStaphylococcus aureus intramammary infection of the individual cow……………………………..32
Figure 2.2. A flow chart indicating events during the management of a Streptococcusagalactiae IMI outbreak in a dairy herd…………………………………………………………………………….38
Figure 5.1. Flow diagram used in the modulation of the models……………………………………..111
Figure 5.2. Flow chart of treatment scenarios of subclinical IMI S. aureus that were used inboth the economic and epidemiological models……………………………………………………………...112
Figure 5.3a. Correlation coefficients (Spearman Rank) of low transmission ratio scenario.
………………………………………………………………………………………………………………………………………..124
Figure 5.3b. Correlation coefficients (Spearman Rank) of high transmission ratioscenario…………………………………………………………………………………………………………………………..124
Figure 5.4. Schematic representation of the principle used in a first cycle on which theepidemiological models were based upon………………………………………………………….……………144

xv
LIST OF ABBREVIATIONS
E. canis Enterococcus canis
E. coli Escherichia coli
E. faecalis Enterococcus faecalis

xvi
S. aureus Staphylococcus aureus
S. chromogenes Staphylococcus chromogenes
S. pseudintermedius Staphylococcus pseudintermedius

xvii
Str. agalactiae Streptococcus agalactiae
Str. dysgalactiae Streptococcus dysgalactiae
S. hyicus Staphylococcus hyicus
Str. pyogenes Streptococcus pyogenes
Str. uberis Streptococcus uberis
T. pyogenes Trueperella pyogenes

xviii
MAIN AIMS AND OUTCOMES ON THE THESIS
Chapter 1
Aim: To develop a good understanding of udder health and to use this to the advantage ofthe dairy producers.
Outcome: Knowledge and practical experience gained in the field of udder health lead tothe development of a computer program that is used to analyse laboratory results. Reportswere developed to provide information on herd and individual udder health status, to helpidentifying the origin of problems and to monitor progress.
Chapter 2
Aim: To develop a semi intelligent computer program that would assist in analysing herdudder health data generated by a milk laboratory. The reports generated should support apro active herd udder health approach that focus on prevention rather than cure.
Outcome: The MSD program was developed and tested over a period of 15 years under fieldconditions. Reports provide information in a format that can be used to identify problemsand their origin and is used to monitor progress. The current dataset holds information ofmore than 1000 South African dairy herds. Dairy producers find the information andpractical assistance beneficial.
Chapters 3 and 4
Aim: To learn more regarding the relation between IMI (aerobic udder pathogens) andsomatic cell count (SCC) levels (chapter 3) as well as that of specific pathogens and SCClevels (Chapter 4) in both quarter milk and composite milk samples from South African dairyherds.
Outcome: The threshold for SCC of 200 000 cell/ml used to detect only IMI in quarter and150 000 cells/ml milk in composite samples were find to be optimal as selection criteria forculturing milk sample. The level of SCC differed considerably according to the various udderpathogens investigated in both quarter and composite milk samples. It was further noticedthat 20.5% and 30.8% S. aureus IMI might remain undetected in a herd, when SCCthresholds of 200 000 and 150 000 cell/mL (in quarter and composite milk respectively)were used to select samples for culturing. The knowledge gained can assist with moreefficient goal orientated decision making at farm level.
Chapter 5
Aim: To develop models that could be used by dairy consultants, veterinarians or producersto help with decision making. These models should utilize current farm information and beable to accurately predict future events. The second aim was to predict cost effectiveness of

xix
management changes in combination with an indication of epidemiological outcome in theStaphylococcus aureus population in herds.
Outcome: Models providing both financial and epidemiological outcomes of Staphylococcusaureus intramammary herd infections were developed and can be used under fieldconditions. They utilize current farm information such as initial prevalence of this bacteriumin the herd combine with the level of management (transmission ratio) and compare theoutcome of various treatment scenario. Various time frames can be used. When bothfinancial and epidemiological outcomes of scenario are calculated informed decisions can bemade.

1
THESIS ABSTRACT
South Africa is a country that has gone through a period of many changes, also in theagricultural arena. The number of dairy herds shrank from 7077 in 1997 to 1600 in 2016(Lactodata 2017, Personal communication with Milk SA, January 2017). Many herdsamalgamated and cows were bought in from different herds. The movement of cattlebetween herds increased risks of new infections to spread from herd to herd as soundbiosecurity practices were and are still lacking in the South African dairy industry. Diseasessuch as Bovine Viral Diarrhoea (BVD) and Bovine Leukosis spread through the country andthough Staphylococcus aureus (S. aureus) and Streptococcus agalactiae (Str. agalactiae)intramammary infections (IMI) were introduced into many herds. The magnitude andconsequences of BVD or EBL on the somatic cell count (SCC) have not been taken intoconsideration in this study. We are currently unsure as to what extent of EPL and dairyproducers are reluctant to test for this disease. Producers soon realized that an increase inherd size required much better planning and management. With an increasing herd size therisk of stress may increase and this in itself may have a negative effect on the immune statusof cows. In addition to new infections risk due to cattle movement, it is known that thebacterial population that is isolated from milk of dairy cows do not remain static but changeswith time as many factors may contribute to the shift in bacterial population. The role thatanaerobic bacteria play in udder health was not investigated in this study.
The Milk Laboratory (Faculty of Veterinary Science at Onderstepoort, Department ofProduction Animal Studies) took the initiative to assist farmers with mastitis outbreaks andthe implementation of better management practices by starting to analyse milk samples ofall lactating cows in herds for both microbiology and cytology. This provided knowledge onpathogen specific herd challenges. A computer programme (Milk Sample Diagnostic – theMSD program) was developed to assist in data manipulation. The laboratory not onlyprovided the producers with mere microbiological and SCC results but all data was analysedby an experienced veterinarian at the laboratory. The data analysed was firstly aimed at theherd level, helping to identify root problems in management and infection status. The studydoes not address individual stressor but only evaluated overall responses of a large data setover time and seasons. Once the principle microorganisms or SCC cause were identified inherds the immediate emphasis was to change inappropriate management practices or targetcauses of high herd SCC including the milking machine settings, use or maintenance. Actionscould be directed to first addressing the cause, and once this was achieved the emphasisshifted to monitor progress in the herd udder health. Monitoring of herds focused ondetection of probable problems early in order to eliminate them in order to prevent major

2
losses in herds and damage to udder parenchyma of cows. Herd trends such as levels of newpathogen specific IMI, persistent infections on cow or quarter level, cure of mastitis cases(bacterial cure and not only clinical cure or a decreased SCC beyond a chosen level) and theshifts in SCC ranges were monitored and analysed.
Teams worked together involving the producer, his local veterinarian, the laboratory andother specialists. An important aim was to become more pro active in identifying potentialproblems at the start in order to prevent mastitis as far as possible. The data obtained frominvestigating the milk samples was used as basis, but a more holistic approached towardsudder health was used.
Many success stories could be told. Herds positive for S. aureus tested were tested monthlyto 3 monthly. Where good management was maintained few new S. aureus IMI occurred,positive cases were separated and chronic cases were culled. All milk samples in those herdsbecome S. aureus free (bacterial negative) by following testing regimes that were followed byeffective management. Herds continued to participate in routine testing and remained S.aureus negative (bacteriology of milk samples). Data to confirm results available in the MSDprogram. No teat canal swabs were used in this study.
Testing of milk samples and mainly the identification of microorganisms is becomingexpensive, mainly in large herds with more than 1 000 lactating cows. Although it is still donein South Africa it is a huge task to sample and analyse samples of all individual cows. Due tothe increase in herd size in South African dairies, composite cow milk samples are nowpreferred to quarter milk samples. Little current data is available on the SCC threshold thatindicate IMI in composite samples. The information available on SCC thresholds in quartermilk samples are more readily available but practical levels used in the field differ fromcountry to country, indicating that these aspects require further research. The aim of thestudy was to contribute additional knowledge to the interaction between IMI and SCC levelsas well as specific pathogens and SCC levels in both quarter milk and composite milk samplesfrom dairy cows. The determination of SCC is a more cost effective and a less cumbersometest to perform. Once appropriate SCC threshold levels could be determined per pathogen,the result of using the selected threshold was used in a model to test both the cost / benefitand the epidemiological outcome after a period of 255 days for various scenarios. Thescenarios not only simulated the percentage of infected animals treated but also the level ofrisk of transmission of S. aureus in these scenarios.
Despite decades of intensive research and management strategies, bovine mastitis stillremains an immense challenge. While the occurrence of clinical mastitis has been reportedto have decreased there has been almost no reduction in the prevalence of subclinical mastitis(Py rälä, 2002). One can only speculate on what the reason for the phenomenon can be. Isthe immune system of the modern cow challenged beyond its natural abilities due to theincreased demands on the genetically changed animal for highmilk yield? Are we now dealing

3
with more pathogenic bacteria than in the past that can also enter with ease through adamaged teat canal caused by our quest to remove milk as fast as possible because time is soprecious and enter into an udder of a cow with an inferior immune system? The focus ofmilking machines was not always on preserving the first line of the natural defencemechanism of the udder, notably the teat canal. New teat liners are emerging with differentshapes (triangular, or square), sizes, harness, made of silicon, impulse lines, quarter milkersand liner compression (over pressure) is taken into account.
Papers in perspective and into context
In the introduction (Chapter 1) the basic information regarding mastitis and background oncytology and different microbiological infections in the udder are discussed.
In Chapter 2 some results and reports of the milk Sample diagnostic (MSD) program arediscussed and the proactive usage of the data in this program under field conditions. Theadvantage of being able to identify most infected animals in consecutive samplings, even inS. aureus herds where the bacteria is an intermitted shedder. We were able to determinebacterial cure post treatment and did not only base cure on clinical symptoms vanishing orSCC lowering but could indicate that bacteria were no longer present.
In Chapters 3 and 4 we used a part of the large dataset generated in the laboratory over yearsto investigate the effect that limited culturing, using SCC with cut off point may have on theefficacy of identification of IMI. The use of SCC as monitoring tool is generally accepted butthe level indicating IMI or bacterial positive cultures is not. This SCC threshold remainedcontroversial through many years. The first objective was to compare IMI with SCC levels inthe two sample types: quarter and composite cow milk samples. Although composite cowmilk samples combine milk of the 4 quarters of a cow, these milk samples became veryvaluable in identifying cows with IMI. They are more practical for monitoring udder health inlarge herds and are less expensive to analyse. Recommendation on the level of SCC level formilk with a greater risk of being infected are available from the NMC Guideline, (2001) forquarter milk samples. The same is not true regarding composite cow milk samples. We usedcomposite milk samples for many years and analyses indicated the value of these samples inpractise despite their limitation. An objective was to determine in this large dataset underSouth African conditions a SCC threshold for composite cow milk samples that could mimicthe 200 000 cells/ml milk recommended for quarter milk samples that could be used in thefield. In Chapter 4 we took another step and compared bacterial groups (Major Gram positiveand negative and minor pathogens) and individual bacterial species with SCC thresholds. Thestudy investigated SCC levels of 15 different bacterial species. The investigation comparedfindings of quarter and compositemilk samples. The aim of this studywas to be able to changethe SCC threshold level in individual herds depending on what the principle mastitogenicbacteria are in managing udder health and when sampling had to be selected formicrobiological determination.
4
In Chapter 5 the knowledge obtained on the SCC threshold values for S. aureus was used. Inthis study models were developed to predict the cost benefit of various scenarios. Twotreatment regimens were compare (treatment duration varied) when subclinical S. aureuswere all identified S. aureus IMI were treated, compared to no treatment and treatment ofonly those cases with a SCC exceeding 200 000 cells/ml in quarter and 150 000 cells/ml incomposite cowmilk samples. The stochastic models compared these treatments in herds withlow and high initial S. aureus herd prevalence and in good and poor management situations.In addition to the partial cost benefit models epidemiological models were developed. Theywere used to predict the probable number of persistent, new and cured cases of S. aureusIMI for the same scenarios as in the partial cost benefit study over a period of 255 days. Thenumber of cases that would need treatment were calculated and compared for the scenario.Different combinations of the cost benefit and epidemiological models were compared to findthe most effective (financially, number of treatments and S. aureus IMI status of the herd atthe end of a chosen time period) combination for practical use by a producer for hiscircumstances. This was done to assist managers on farms to regularly upgrade relevantmanagement protocols using current information tomakemore effective decisions for betterfuture outcomes.
In the last chapter (6) findings were summarised, limitations and weakness in the researchwere discussed and the need for future research were identified.
Relevance and importance of this study
Research is a crucial element for development and finding solutions to problems. In SouthAfrica we were able to assist more than 900 commercial dairy farmers over the past 15 yearswith udder health challenges. The experience that was gained by evaluating the herd udderhealth results was partly captured in the MSD laboratory program that is a semi intelligentprogram assisting with problem identification and measurements. Program reports weredeveloped and tested in practice under field condition. Microbiology and cytology wereperformed on milk samples of all lactation cows in herds over the years. These results wereused to investigate less costly but still effective methods of udder health determination. Theaim was to help assure that the udder health status of the individual cow could still bemonitored on a subclinical level even though lactating cow numbers in herds in South Africaincreased substantially. Once the udder health status is known decisions need to be madethat always have cost implications. A further aim was therefore to assist decision makers byproviding them with a tool to help predict financial and epidemiological implications. Variousscenarios were compared in herds with either high or low prevalence of Staphylococcusaureus intramammary infection, different hygiene management levels and differenttreatment scenarios. With the models that were developed in this study the decision makersare assisted to take both financial and epidemiological outcomes into consideration whenplanning ahead.
5
An interesting and perhaps unexpected finding was that by prudent treatment of subclinicalStaphylococcus aureus intramammary infections less treatments were needed than whenonly clinical cases were treated. Although this was not one of the objectives of the study, thisinformation can be helpful in coping with the current prudent antimicrobial use to maintainsensitivity to antimicrobial remedies.

6
CHAPTER 1
INTRODUCTION TOMASTITIS
Mastitis is defined as an inflammation of the udder. This inflammation is quantified inlactating cows using somatic cell count (SCC) of milk. Milk normally contains somatic cells butthe concentration is generally considered to be less than 100,000 cells/ml milk when theudder quarters are uninfected or uninflamed. Once the udder becomes inflamed, the somaticcell concentration in the milk increases.
Abnormal milk is defined by the National Mastitis Council of the USA (NMC) Guidelines (2001,2015) as milk with a SCC of 200 000 cells/ml whether clinical changes to the milk are presentor not. According to the NMCGuidelines (2001, 2015) quarters with a SCC of 200 000 cells/mlare likely to be infected or are recovering from infections. Increased SCC is further associatedwith a reduced suitability of the milk for human consumption. Clinical mastitis is defined ashaving the appearance of milk changes and flakes or clots are present, and in this situationmilk is generally accepted almost always to have a SCC in excess of 200 000 cells/ml. Udderinfections are often as result of inferior or inadequate hygiene in housing or during milkharvesting. The higher the SCC the greater the likelihood of the presence of pathogens in themilk. Researchers are unsure, based on current knowledge, whether milk with a SCC ofbetween 100 000 cells/ml and 199 000 cells/ml is normal or not (NMC Guidelines 2001, 2015)
Mastitis is the most costly disease of dairy cattle in first world countries and is also regardedas an animal welfare and food safety problem (Sharma et al. 2011). Sub clinical mastitis whichis not effectively diagnosed in the parlour is responsible for most losses. This disease ischaracterised by physical, chemical and bacteriological changes in the milk and pathologicalchanges in the udder. Mastitis is responsible for a reduced efficiency of production, reducedsuitability of products for processing and it can affect human wellbeing directly throughzoonosis. This amounts to a great reduction in the total value a society gains from livestock(Giesecke et al., 1994, NMC Guidelines 2001, 2005, Huijps et al., 2010, Sharma et al. 2011).Mastitis affects the dairy producer directly through lower milk yields, milk that is discarded,and a lower milk price. Modern dairy cows are bred to reach their highest production duringthe 4th and 6th lactation. Mastitis is however often the reason for a shortened productive lifeand a lower lifetime milk yield both due to lower milk yields and increased culling rate (Huijpset al., 2010). The cost of replacement of mature dairy cows decreases proportionally to thenumber of years that the cow has been productive in a herd (Giesecke et al. 1994, Sharma et

7
al. 2011). The International Dairy Federation (IDF) recommendation for dairy cows is tocomplete at least six lactations. According to figures provided by the South African Studbook(personal communication, Jan 2018) the average age of 14 266 active lactating Holstein cowson total mix rations systems is 5.7 (±2.3) years and that of 14 252 active Holsteins on pasturesystems, 7.5 (±3.0) years. Studies in South Africa have shown that within a herd 7% of cowscan be responsible for 40% of clinical mastitis cases and 6% of cows for 50% of all discardedmilk (Giesecke et al. 1994). The frequency of subclinical mastitis varies, but has beenestimated to be responsible for 93 97 % of the total incidence of mastitis (Giesecke et al.1994).
Veterinary practitioners, dairy workers and producers are changing their herd udder healthmanagement system from a reactive approach which involved only the treatment of clinicalcases to a pro active approach which focuses on preventing both clinical and subclinicalmastitis. The latter concept is based on identifying critical points that with regular monitoringwould show early signs of deterioration of management and identify changes in the level ofsub clinical mastitis within a herd.
Current literature causes confusion regarding criteria considered as a cure of mastitis. Someauthors refer to cure as clinical cure only, some to a reduction in SCC to below 200 000cell/ml,and others refer to a true cure involving clinical cure, reduction of SCC and the absence ofbacteria (bacterial cure) (Harmon 2001, NMC Guideline 2001, 2015).
The primary defence mechanism of the udder is the teat canal. It forms a physical barrierpreventing bacteria from entering. When damaged or dilated after milking, the chance ofascending infection is high (Kehrli & Harp 2001). Epithelial desquamation andmilk flow duringmilking helps to prevent bacterial colonisation in the teat canal. The keratin layer containsantibacterial proteins and fatty acids to combat bacteria. Lymphocytes and plasma cellsaccumulate beneath and between the epithelial cells of the teat canal and particularly atFürstenberg’s rosette to combat bacteria that have gained entrance (Sordill et al. 1988).
When pathogens pass through the teat canal, the secondary (innate and adaptive) immuneresponses of the udder are activated. The innate immunity, a combination of chemicalsecretions (lactoperoxidases, lactoferrin, complement) and a cellular immune response isactivated immediately after pathogen invasion (Kehrli & Harp 2001, Tizard 2013). This isfollowed by a response of the adaptive immune system (Tizard 2013). The adaptive immunesystem recruits antigen specific T and B lymphocytes responsible for an antibody mediatedresponse and activates a cell mediated immune response directed against intracellularpathogens (Tizard 2013, Morin 2015). The cellular response is measured in practice utilizingthe SCC (Morin 2015).

8
1.1 Somatic cells in milk
Somatic cells in this study, were counted by fluoro opto electronic means using a Fossomatic
5000 and Fossomatic FC (Rhine Ruhr).
Although numerous factors can influence the SCC at individual cow and quarter level, such asparity, stage of lactation, incorrectmilkingmachine settings, stress and other factors includinggenetics, the most important cause remains the infection status of the udder (Schepers et al.1997).
Milk somatic cells are primarily leukocytes (macrophages, lymphocytes and polymorphonuclear neutrophils (PMN)) and the SCC in cow milk may include 0 to 7% epithelial cellsoriginating from the udder (Harmon 2001, Morin 2015). Blood monocytes becomemacrophages when they enter the tissue and are the predominant cell type in normal milkand constitute to 30 to 74% of the total white blood cells in the milk (Burvenich et al. 2003).
During bacterial infection, macrophages serve to facilitate the immune response andnumerous inflammatory mediators may be directly involved (Gallin et al. 1992, Zeconni &Smith 2000, Sharma et al. 2011). Mediators include components such as prostaglandins,leukotriene, histamine, serotonin, interleukins, interferon and other cytokines (Shuster et al.1997, Kehrli & Harp 2001). Inflammation causes increased vascular permeability,vasodilatation, oedema, increased blood flow to the affected area, neutrophil migration,decreased mammary secretion and it is responsible for pain and fever (Harmon 2001).Neutrophils that undergo programmed cell death through apoptosis are phagocytised bymacrophages present at the site to help to reduce damage to the epithelium cells (Biggs,2009).
Lymphocytes are the only immune cells that recognize a variety of antigenic structuresthrough membrane receptors, which define their memory characters (Oviedo Boyso et al.2007). One of the initial major defence responses is the influx of leucocytes into themammarytissue (Nickerson & Pankey 1984). The PMN pass through the larger blood vessels in theudder, adhere to the endothelium of small blood vessels and pass between cell linings intothe tissue (Kehrli & Harp, 2001). Chemical chemotactic agents released from leukocytesattract PMN into the milk in large numbers (Akers & Nickerson, 2011). Up to 90% of the cellspresent in themilk during early inflammationmay be PMN (Nickerson & Pankey, 1984). Speedof migration is believed to be a key factor in response to infections and severity of the disease(Burvenich et al. 2000) and this depends on the effectiveness of the immune system of theanimal. The PMN engulf and digest the bacteria; however the fat globules and casein that canalso be engulfed, decrease their efficacy in milk. Casein and the milk fat globule are producedlong after the immune system has matured. They thus remain foreign to the immune system.During lactation the PMNs therefore may phagocytize and ingest of these unrecognisedcasein micelles and milk fat globules in the normal milk, and this is believed to diminish the

9
function of the PMN (Paape et al. 2003). Mammary epithelial cells digest phagocytisedbacteria and can produce inflammatory mediators (Sharma et al. 2011). Akers and Nickerson,(2011) reported that damage to the milk secretory cells caused by an influx of PMNmay likelybe the most damaging during mammary development in heifers and may therefore causedamage during the peripartum period when the udder is developing in preparation of the firstlactation.
Increased SCC is not only an accepted indicator of intramammary infection (IMI), but very lowSCC has also been associatedwith a reduced immune response and an increased susceptibilityto clinical mastitis increasing the complexity of the measurement. This suggests that somaticcells may provide protection from IMI as well as act asmarkers of infection (Green et al. 2006).
In practice one might need to consider a trade off between low cell counts with higherproduction versus low cell counts and a reduced ability to combat future IMI (Fox, 2013)because somatic cells are an important part of the immune system. A question that is askedfrom time to time is whether SCC can become too low for a sufficient number of leucocytesto fight future IMI. Primiparous cows have lower SCC than multiparous cows (Laevens et al.1997). The most important cause of increased SCC remains IMI in all lactating cows andespecially first lactating cows (Laevens et al. 1997). Heritability of resistance to mastitis hasbeen found to be low and estimated to range from .04 to .14 depending on the test used(Mrode et al. 2012). Shook & Schutz (1994) evaluated genetic control of the udder, as well asphysiology, anatomy and immunology and found that the incidence of mastitis was mainlycaused by the cow’s environment and management.
Schuster et al. (1996) found that the most important immune factor to resist IMI was theability to recruit leukocytes to the udder and not the pre challenge numbers of SCC in milk.The expression of L selectin, a cell membrane protein that is shed during diapedesis, wasfound to be highly associated with the ability of a pathogen to replicate in the udder (Schusteret al. 1996). Another factor associated with resistance to pathogens is the level ofphagocytosis. It appears that the primary immune factors associated with combating IMI isnot only the number of cells present in the milk prior to pathogen entry, but mostly the speedat which these cells can be mobilized to the udder (Fox, 2013).
The current generally agreed SCC threshold does not distinguish between principal udderpathogens although pathogens are known to differ in their pathogenicity (Barkema et al.2006, Petzer et al. 2009, Petzer et al. 2012). Little is currently known regarding SCC thresholdsindicating IMI of species specific udder infections. Current information about these specificpathogens is required because of changes that may occur in bacterial infection in dairy herdsover time (Petzer et al. 2009, Zadoks and Fitzpatrick 2009, Petzer et al. 2012).
Any dairy producer with a herd infected with contagious bacteria (S. aureus and Str.agalactiae) and who wants to eliminate these infections from the herd can benefit from aherd survey where microbiology and cytology is performed. Such a herd survey will identify

10
the prevalence of specific pathogens and their distribution patterns within that herd. Thesuccess of such a programmewill be dependent upon accurate identification of infected cowsand a fast processing time in the laboratory in order to be able to segregate and treat positivecows, but even more so to prevent new IMI. As microbiology on a herd basis can be costly,alternative methods should be sought for indicating IMI in general. Debate continues aboutwhich SCC thresholds are adequate for indicating IMI in general, or IMI with major or minorudder pathogens, the presence of mastitis or even the cure of mastitis. The thresholdrecommended for SCC in quarter milk samples has been documented by the National MastitisCouncil (2001) but no such threshold for composite cow milk samples appear to have beenproposed. Although a composite milk sample has the disadvantage that it combines samplesfrom the four quarters and therefore has a dilution effect, taking these samples is much lesstime consuming, it costs less to analyse them and they are practical to use in large herds. Thishas been proven to be true under South African conditions. Confusion regarding the apparentcure of mastitis may sometimes exist when researchers have not explained the criteria usedto measure this and only refer to “mastitis cure”. This assumption may be made either whenclinical signs of mastitis disappear, or when a reduction is measured in the SCC from above200 000 to below 200 000 cells/ml, or when there is actual elimination of bacteria (Hoogeveenand Lam, 2011; Swinkels et al. 2012). This research was intended to also investigate thevalidity of the assumption that the cure of IMI was associated with a decrease in SCC to below200 000 cells/ml.
1.2 Introduction to micro organisms causing udder infections
1.2.1 Contagious udder pathogens (Host adapted)
Contagious udder pathogens spread from cow to cow mainly but not exclusively duringmilking. Contagious udder pathogens are mostly intra cellular invaders of udder parenchymaor they may possess a mechanism that enables them to adhere to the epithelial udder cellsin order to protect themselves against the local immune system and antimicrobial agents. Themain contagious bacteria causing IMI in South Africa have been identified as Staphylococcusaureus (S. aureus), Streptococcus agalactiae (Str. agalactiae) and Streptococcus dysgalactiae(Str. dysgalactiae) of which S. aureus is the most difficult to eradicate (Petzer et al. 2009).Mycoplasma spp. have not yet been isolated from milk samples in South African herdsalthough this organism is present in cases of respiratory disease. Other bacteria such asEnterococcus canis (E. canis) (Tikofsky and Zadoks, 2005) and Streptococcus uberis (Str. uberis)(Zadoks, 2007b) are not classified as contagious, but are thought to have the potential also tospread in a contagiousmanner.Mastitis caused by contagious bacteria often becomes chronicand SCC levels remain elevated. These organisms are transmitted within the herd from cowto cow mainly at milking, and adhere to hands of milkers, teat liners or udder cloths. It ispossible, but not easy, to eradicate contagious mastitis pathogens from a herd by aggressive

11
antimicrobial therapy, culling, maintaining good biosecurity and pro active management(Hovinen and Pyorala, 2011, Petzer, et al 2016).
Staphylococcus aureus
Staphylococcus aureus remains a major challenge in South African dairy herds and has beenisolated from 10.99% of intramammary infections (IMI) (n=201 062) for the period from 2006to 2012 (Petzer & Karzis, 2012). Staphylococcus aureus IMI has been said to cause a decreaseof up to 45% in milk production per infected quarter or 15% in the infected cow (NMC, 2001,2015). Cows with S. aureus IMI with often do not recover their yield potential due to itschronic and destructive nature. Irregular shedding patterns of many S. aureus strainscomplicate the diagnosis (Sears et al. 1990), and the control and management of these udderinfections (Piccinini et al. 1999). The ability and the severity of S. aureus to cause IMI dependson bacterial characteristics as well as on the susceptibility of the udder of the cow to thisorganism (Piccinini et al. 1999). The S. aureus bacteria possess the ability to produce biofilmresulting in a structured community of bacterial cells enclosed in a self produced matrix thatadhere to a living surface (Costerton et al. 1999). Biofilm provides a protected environmentallowing bacteria to resist antimicrobial therapy and host immunity response. This resistanceis related to factors such as the increased difficulty of the antimicrobials to penetrate throughthe extracellular matrix, a lower rate of cell division (detrimental for lactam action) and agreater resistance to phagocytosis (Bronzo et al. 2012; Costerton et al. 1999). Theexopolysaccharide poly N acetyl 1, 6 glucosamine (PNAG) enzyme responsible for theproduction of biofilm was found to be present in 94.36% to 100% (Vasudevan et al. 2003) ofS. aureus strains and in 75% of CNS isolated from mastitis cases. The protective effect of thebiofilm in CNS is currently still being research. Middleton et al. (2002) made use of SCC andN acetyl beta D glucosaminidase (NAGase) activity as indicators of udder parenchyma injury.They found no significant differences between S. aureus strains and suggested that the degreeof parenchyma injury during IMI with S. aureus was not due to the strain type.
Conventional intramammary and systemic antibiotic therapy used in the treatment of IMI isoften unsuccessful in preventing and eliminating chronic S. aureus (Barkema et al. 2006;Zadoks, 2007a). Some S. aureus strains can produce lactamase which inactivates penicillin.In recent years S. aureus isolated from animals (pigs, horses, calves and pets) and cow milkhas shown resistance to methicillin and has become an important public health concern.Antibiogram results are no guarantee for bacterial cure but only provide knowledge that anantimicrobial possesses the ability to inhibit bacterial growth in a laboratory situation. Strainspecific resistance cannot be routinely diagnosed and is therefore not yet of practical value.Treatment duration is for now the most important factor promoting better cure (Sol et al.2000, Deluyker et al. 2005).
Genetic resistance to mastitis in cows has been studied. Although favourable resistant alleleshave been found against S. aureus (Aarestrup et al. 1995), there were also negative

12
correlations with milk yield and a lack of cross resistance against other pathogens. Cure ratesof S. aureus IMI have been shown to decreasewith increasing cow age, the number of infectedquarters per udder, infections in hind quarters, increased SCC, increased duration of infection,and the number of bacterial colonies isolated before treatment (Sol et al. 1994, Barkema etal. 2006). Palpation of udder parenchyma after milking is a valuable tool to determine theseverity of chronic udder damage. Before considering treatment of sub clinical S aureusmastitis, the probability of success of such treatment should be estimated (Sol et al. 1994).Extended treatment may or may not be justified economically, but indirect effects such asprevention of shedding and new infections should also be taken into consideration (Swinkelset al. 2005).
Streptococcus agalactiae
Streptococcus agalactiae is an obligate udder pathogen and is found in early infections in thelactiferous ducts of the udder parenchyma. During a Str. agalactiae outbreak in a herd thebulk milk SCC (BMSCC) can increase within days to become more than 1,000 000 cells/ml.Streptococcus agalactiae IMI is usually introduced into a herd with purchased cows, and thelikelihood is high that the infection will spread, especially when parlour hygiene is lacking orstress levels of cows are high. Treatment success (bacterial cure) of over 80% can be regularlyachieved in early outbreaks, but once udders are chronically infected and the parenchymadamage is evident, this success rate drops significantly. Eradication of Str. agalactiae IMI inSouth African herds is based on repeated sampling and identification of all Str. agalactiaeinfected cows. This is followed by immediate segregation and treatment of all identified cases.Sampling and follow up actions continue till the herd is negative in more than one successiveexamination. Eradication is only achieved when there is strict adherence to milking hygieneand parlour management (disinfection of milkers’ hands and liners) to prevent new IMI anddry cows are included in the investigation (Loeffler et al. 1995).
Managing and identifying intramammary infections with contagious udderpathogens
The focus of udder health management should be pro active and preventative. The NMC,2001 published a 10 point plan for dealing with mastitis pathogens (Reneau, 2001). This planincludes correct milking procedures, machine hygiene and use, the use of post milking teatdisinfectants, dry cow treatment of all cows, and treatment of clinical mastitis cases, cullingof chronically infected animals, ensuring biosecurity is in place, and effective record keepingand planning. Although routine dry cow treatment with antimicrobials has been criticized dueto concern over the potential development of antimicrobial resistance, Robert et al. (2006)and Karzis et al. (2016) showed that this is not always the case and under effectivemanagement this situation sensitivity to antimicrobials increased.

13
Fast identification methods are needed for successful implementation of a mastitis controlprogramme for S. aureus and Str. agalactiae IMI, in order that the opportunity for spread ofthe pathogen in the herd is reduced (Zadoks et al. 2002). Polymerase chain reaction (PCR)analysis of bulk milk can be used to indicate the presence of pathogens such as Str. agalactiaeand S. aureus in a herd. The bulk milk test should be followed by monitoring of pathogenspecific identifications of individual animals (Fox et al. 2005). An effective system of diagnosiswill play a key role in the successful elimination of these IMI from the herd. S. aureus and Str.agalactiae positive cows should all be segregated and milked last immediately afteridentification. Decisions regarding treatment should be based on an individual cow riskassesment (Sol et al. 1994). Alternative actions include quarter inactivation, early drying off,or culling of cows with a bad prognosis for cure. Any new dairy animals purchased, and cowsand heifers that calve down need to be tested for the presence or these bacteria beforeentering the parlour. Calves in herds where S. aureus and Str. agalactiae have been positivelyidentified should only be fed fresh milk that has been pasteurized. Introducing new cows andeven heifers into a herd increases the risk of new IMI (Fox 2009; Petzer et al. 2012).
1.2.2 Environmental mastitis pathogens
Coliforms is a large group of non spore forming Gram negative bacteria capable of fermentinglactose with production of acid and gas at 32 C. They include bacteria of faecal and non faecalorigin and some are pathogenic and some not. A high coliform count in bulk milk indicatescontamination during production, storage processing or handing of the milk.
Environmental mastitis bacteria can either be Gram negative species such as E. coli, Klebsiellaspp., Enterobacter spp. and Serratia spp. or Gram positive species such as Streptococcusuberis (Str. uberis) and Enterococcus faecalis (E. faecalis). The prevalence of both Str. uberisand E. coli, although still low, has increased over the past 10 years in South African dairy herds(Petzer et al. 2009). Escherichia colimastitis increasedmostly in free stall barns in theWesternCape province of South Africa during winter rainfall. Althoughmost E. coli strains are harmlesscommensals that live in the intestinal track. Five E. coli strains are known to cause diarrhoea;enteropathogenic (EPEC), enterotoxigenic (ETEC), enteroinvasive (EIEC), enterohaemorragic(EHEC) and enteroadherent (EAEC). An enterohaemorragic E. coli 0157:H7 has beenassociated with outbreaks of haemorragic colitis in humans associated with consumption ofraw milk and dairy products.
Streptococcus uberis appears to be increasing in pasture based herds according to Blignaut(2016). Gröhn et al. (2004) found that milk loss due to mastitis caused by streptococci,Klebsiella spp. and Trueperella pyogenes (T. pyogenes) can persist for up to 70 days afterdiagnosis.

14
Escherichia coli
Escherichia coli mastitis affects mainly high producing cows around the time of parturitionand during the first trimester of lactation in herds with low bulk milk somatic cell count(BMSCC). Wet and unhygienic bedding poses a high risk environment for E. coli IMI challenge(Bradley and Green, 1998). The environmental challenge includes an increase in the herd size,confinement of cows (freestall barns), and high milk yields (with subsequent increase in drymatter intake and manure production). These are dairy management realities that allpromote the risk of environmental mastitis. Although only 10% to 30% of clinical coliformcases have been reported to be acute (Hogan et al. 1989) such an acute infection is presentedas causing severe local udder damage accompanied by an acute febrile disease that can endin the death of the cow.
Escherichia coli are present in the environment of the cow and invade the udder via the teatcanal. It is generally accepted that the E. coli strain itself does not play a major role in theseverity of mastitis but rather the lipopolysaccharide (LPS) endotoxin produced (Burvenich etal. 2003) and the failure of the immune system of the cow. Escherichia colimultiplies rapidlyonce in the udder and can reach peak numbers within 5 to 16 hours (Berning et al. 1993). TheLPS endotoxin induces defence mechanisms in the udder and an influx of neutrophils. Muchof the inflammatory changes are due to the release of the LPS endotoxin followingphagocytosis and killing of E. coli by neutrophils. To reduce the severity of acute coliformmastitis either bacterial growth must be slowed down or the effect of the LPS endotoxinneeds to be neutralized (Burvenich et al. 2003). Treatment only commences when clinicalsymptoms are seen, and in the case of coliform mastitis this may be at the peak of bacterialgrowth. When antimicrobial remedies with bacteriocidal action are used and bacteria arekilled in large numbers, high levels of endotoxin may be released that may cause the death ofthe cow. Antimicrobial remedies with bacteriostatic action should therefore rather be usedwhen E. colimastitis is suspected.
The release of neutrophils is beneficial to the udder following E. coli infection but theresponse needs to be rapid and it is essential they arrive at the lumen of the udder in orderto prevent the coliform bacteria from reaching high numbers (Burvenich et al. 2003).According to Burvenich et al. (2003) it seems that at parturition and during early lactation,high producing cows are especially sensitive. In the second and third trimester of thelactation, clinical signs of coliform mastitis tend to be moderate and subside very rapidly, andthe cows may cure themselves (Berning et al. 1993).
In summary, environmental conditions that increase the risk of coliform mastitis are overcrowding as seen in zero grazing systems, poorly designed housing, wet unhygienic bedding,housing systems that lead to teat injuries, poor udder preparation before milking, milking ofwet udders and milking machine malfunctions. High stock densities on pastures may result

15
in increasing manure contamination with a greater risk of environmental pathogens affectingthe udder (Burvenich et al. 2003).
Streptococcus uberis
Streptococcus uberis (Str. uberis) is currently still categorised as an environmental udderpathogen but with the knowledge derived from strain typing it is becoming clear that somestains can be contagious in nature and can survive inside the udder of the cows (Bradley,2002, Charman et al. 2012, McDougall, 1998). Streptococcus uberis is one of the importantcultured mastitogenic pathogens. It has been isolated from cows’ bedding, pastures, water,and from their feet, teat and udder skin. Streptococcus uberis is also thought to colonize theintestine of 10 35% of cows where it contaminates the environment and pastures via faecalexcretion. The proportion of faecal samples containing Str. uberis was found to be highestduring the winter grazing season in New Zealand where low levels of solar radiation, lowtemperatures, highmoisture and high stocking density enhanced their survival on the pasture(Lopez Benavides et al. 2005).
Although transmission of Str. uberis IMI from cow to cow is not of primary importance, herdsurveys can be a valuable management tool to identify cows with persistent IMI and tomonitor the success of control programme. As IMI with environmental streptococci andcoliforms are more likely to occur during the dry period than during lactation, it can bebeneficial to sample cows shortly after calving in order to identify cows at risk of having theseIMI (Smith et al. 1985).
Tamilselvam et al. (2006) showed that Str. uberis has the potential to survive withinmammaryepithelial cells for up to 120 hours. Other studies (Zadoks et al. 2003, Zadoks, 2007b,Abureema et al. 2014) suggest that Str. uberis has the epidemiological characteristics similarto that of contagious pathogens regularly found in dairies. Zadoks et al. (2003) showed that apredominant random amplified polymorphic DNA fingerprinting (RAPD) strain of Str. uberiswas isolated from milk samples from multiple quarters of a cow and from within a group ofcows. This indicated the possibility that multiple cows became infected from a commonenvironmental source or alternatively it could have been the result of between cowtransmission of the pathogen.
1.2.3 Minor udder pathogens
Coagulase negative staphylococci (CNS) have been identified increasingly as mastitispathogens in many countries with intensive dairy production, including South Africa (Petzeret al. 2009; Taponen et al. 2010,). According to Zadoks (2007a) CNS strains vary in their abilityto cause mastitis and have been classified as opportunistic, environmental or contagious.Based on strain typing studies of Staphylococcus chromogenes, Staphylococcus hyicus andStaphylococcus epidermidis, contagious transmission of CNS appears to be relatively rare

16
(Gillespie et al. 2009). Increasing numbers of CNS have been identified which are thought tobe capable of causing both subclinical and clinical mastitis (Myllys, 1995). This may be due toan increased pathogenicity of this group or to a reduced ability of the udders’ immune systemin the cows or a combination of both of these factors (Myllys, 1995).
REFERENCES
Aarestrup, F. M., Dangler, C.A. & Sordillo, L.M., 1995. Prevalence of coagulase genepolymorphism in Staphylococcus aureus isolates causing bovine mastitis. Canadian Journal ofVeterinary Research 59, 124–128.
Abureema, S., Smooker, P., Malmo, J. & Deighton, M., 2014. Molecular epidemiology ofrecurrent clinical mastitis due to Streptococcus uberis: evidence of both an environmentalsource and recurring infection with the same strain. Journal of Dairy Science 97, 285 290.
Akers, R.M. & Nickerson, S.C., 2011. Mastitis and its Impact on Structure and Function in theRuminant Mammary Gland. Journal of Mammary Gland Biological Neoplasia, (doi10.1007/s10911 011 9231 3).
Barkema, H.W., Schukken, Y.H. & Zadoks, R.N., 2006. Invited review: The role of cow,pathogen, and treatment regimen in the therapeutic success of bovine Staphylococcus aureusmastitis. Journal of Dairy Science 89, 1877–1895.
Berning, L.M., Paape M. & Peters R.R., 1993. Functional variation in endogenous andexogenous immunoglobulin binding to bovine neutrophils relative to parturition. AmericanJournal of Veterinary Research 54, 1145 1153.
Biggs, A.M., 2009. Optimising the use of SCC information. Proceedings of the British MastitisConference 2009, Stoneleigh Park, pp. 15–26.
Blignaut, D.J.C., 2016. Prevalence of mastitogenic pathogens in pasture and total mixed rationbased dairies during 2008 and 2013. Masters dissertation in Veterinary Medicine.
Radley, A. J., 2002. Bovine mastitis: An evolving disease. The Veterinary Journal 164, 116 128.
Bradley, A. J. & Green, M., 1998. A prospective investigation of intramammary infections dueto Enterobacteriacae during the dry period: a presentation of preliminary findings. CattlePractice 6, 95 101.
Bronzo, V., Locatelli, C., Scaccabarozzi, L., Casula, A., Rota, N., Pollera, C. & Moroni, P., 2012.
Bacterial biofilm, Results of Mastitis Vaccination, Hipra Symposium,World Buiatrics Congress,2012, Lisbon.
Burvenich, C., Van Merris, V., Mehrzad, J., Diez Fraile, A. & Duchateau, L., 2003. Severity of E.colimastitis is mainly determined by cow factors. Veterinary Research 34, 521 564.

17
Charman, N., Dyson, R., Hodge, A., Robertson, N. & Chaplin, S., 2012. A survey of mastitispathogens in the south eastern Australian dairy industry. Proceedings of CountdownSymposium.
Costerton, J.W., Stewart, P. S. & Greenberg, E.P., 1999. Bacterial biofilms: a common cause ofpersistent infections. Journal Dairy Science 284, 1318 1322.
Deluyker, H.A., Van Oye, S.N. & Boucher J.F., 2005. Factors affecting cure and somatic cellcount after pirlimycin treatment of subclinical mastitis in lactating cows. Journal of DairyScience 88, 604 614.
Fox L.K., 2013. Can herd somatic cell count be too low? MSU Extension.msue.anr.msu.edu/news/can_herd_somatic_cell_count_be_too_low.
Fox L. K., 2009. Prevalence, incidence and risk factors of heifer mastitis. VeterinaryMicrobiology 134, 82–88.
Fox, L. K., Zadoks, R.N. & Gaskins, C.T., 2005. Biofilm production by Staphylococcus aureusassociated with intramammary infection. Veterinary Microbiology 107, 295–299.
Gallin, E.K., Green, S.W. & Patchen, M.L., 1992. Comparative effects of particulate and solubleglucan on macrophages of C3H/HeN and C3H/HeJ mice. International Journal ofImmunopharmacology 14, 173 183.
Giesecke, W.H., du Preez, J.H. & Petzer, I.M., 1994. Practical Mastitis Control in Dairy Herds.Butterworths, Durban. 9780409109238: Books Amazon.ca.
Gillespie, B.E., Headrick, S.I., Boonyayatra, S. & Oliver, S.P., 2009. Prevalence and persistenceof coagulase negative Staphylococcus species in three dairy research herds. VeterinaryMicrobiology 134, 65–72.
Green, M.J., Bradley, A.J., Newton, H. & Browne, W.J., 2006. Seasonal variation of bulk milksomatic cell counts in UK dairy herds: Investigations of the summer rise. Preventive VeterinaryMedicine 74, 293 308.
Gröhn, Y.T., Wilson, D.J., González, R.N., Hertl, J.A., Schulte, H., Bennett, G. & Schukken Y.H.,2004. Effect of pathogen specific clinical mastitis on milk yield in dairy cows. Journal of DairyScience 87, 3358 74.
Harmon, R. J., 2001. Somatic cell counts: A primer. National Mastitis Council MeetingProceedings 2001, pp. 1 9.
Hogan, J.S., Smith, K.L. & Hoblet, K.H., 1989. Field survey of clinical mastitis in low somatic cellcount herds. Journal of Dairy Science 72, 1547 1556.

18
Hoogeveen, H. & Lam, T. J. G. M., 2011. Technology & Engineering associated with mastitis,treatment costs can also be significant and on many in place systems and methods formonitoring the efficacy of mastitis treatment.https://books.google.com/books?isbn=9086861857. p302.
Hovinen, M. & Pyorala, S., 2011. Invited review: Udder health of dairy cows in automaticmilking. Journal of Dairy Science 94, 547 562.
Huijps, K., Hoogeveen, H., Lam, T.J.G.M. & Oude Lansink, A.G.J.M., 2010. Costs and efficacy ofmanagement measures to improve udder health on Dutch dairy farms. Journal of DairyScience 93, 115–124.
Karzis, J., Petzer, I.M., Etter, E.M.C., Naidoo, V. & Donkin, E.F., 2016. Change in antimicrobialresistance of Staphylococcus aureus in dairy herds in Southern Africa between 2001 and 2010due to management practices. Proceedings, IDF Mastitis Conference, 7 9 September 2016,Nantes, France.
Kehrli, M.E., Jr & Harp, J.A., 2001. Immunity in themammary gland. Veterinary clinics of NorthAmerica: Food animal practice. 17, 495 516.
Lactodata., 2012, 15(1), viewed 30 October 2015, from http://www.milksa.co.za.
Laevens, H., Deluyker, H., Schukken, Y.H., De Meulemeester, L., Van der Meersch, R., DeMuêlenaere, E. & De Kruif, A., 1997. Influence of Parity and Stage of Lactation on the SomaticCell Count in Bacteriologically Negative Dairy Cows. Journal of Dairy Science 80, 3219–3226.
Loeffler, S. H., Lam, T. J. G. M., Barkema, H. W., Scholten, D., Hessels, A.L. & van Gestel, A.M.,1995. The dairying veterinary approach to a high bulk milk cell count caused by Streptococcusagalactiae. Tijdschrifdt Diergeneeskunde 120, 458–463.
Lopez Benavides, M. G., Williamson, J. H., Cursons, R. T., Lacy Hulbert, S. J. & Woolford, M.W., 2005. Streptococcus uberis population dynamics in the New Zealand pastoral dairy farm.Proceedings 4th IDF International Mastitis Conference, Maastricht, Netherlands, 12 15 June2005.
McDougall, S., 1998. Efficacy of two antibiotic treatments in curing clinical and subclinicalmastitis in lactating dairy cows. New Zealand Veterinary Journal 46, 226 32.
Middleton, J.R., Fox, L.K., Gay, J.M., Tyler, J.W. & Besser, T.E., 2002. Influence ofStaphylococcus aureus strain type onmammary quarter milk somatic cell count and N acetylbeta D glucosaminidase activity in cattle from eight dairies. Journal of Dairy Science 85, 11331140.
Morin, D.E., 2015. Mammary gland health in B.P. Smith, P.L. Ruegg & R.J. Erskine (eds.), Largeanimal internal medicine, 5th ed, pp. 1015 1043, Mosby Elsevier, St. Louis Missouri.

19
Mrode, R., Pritchard, T., Coffey, M. & Wall, E., 2012. Joint estimation of genetic parametersfor test day somatic cell count and mastitis in the United Kingdom. Journal of Dairy Science95, 4618 28. (doi: 10.3168/jds.2011 4971).
Myllys, V., 1995. Staphylococci in heifer mastitis before and after parturition. Journal of DairyResearch 62, 51 62.
National Mastitis Council, 2001. Guidelines on Normal and Abnormal Raw Milk Based on SCCand Signs of Clinical Mastitis. Harmon, B. 40th Annual mastitis meeting 11 14 February 2001.Viewed 15 January 2015. http://www.nmconline.org/docs/abnmilk.pdf.
National Mastitis Council, 2015. Somatic cell counts at a first Test: More than a number.Kirkpatrick, M.A., Olson, J.D. 54th Annual mastitis meeting 1 4 February 2015. Viewed 18January 2017. http://www.nmconline.org/docs/abnmilk.pdf.
Nickerson, S.C. & Pankey, J.W., 1984. Neutrophil migration through test end tissues of bovinemammary quarters experimentally challenged with Staphylococcus aureus. Journal of DairyScience 67, 826 834.
Oviedo Boyso, J., Valdez Alarcón, J.J., Cajero Juarez, M., Ochoa Zarzosa, A., López Meza, J.E.,Bravo Patiño, A. & Baizaba Aguirre, V.M., 2007. Innate immune response of bovinemammarygland to pathogenic bacteria responsible for mastitis. Journal of Infection 54, 399 409.
Paape, M.J., Bannerman, D.D., Zhao, X. & Lee, J.W., 2003. The bovine neutrophil: Structureand function in blood and milk. Veterinary Research 34, 597 627.
Piccinini, R., Bronza, V., Moroni, P., Luzzago, C. & Zecconi, A., 1999. Study on the relationshipbetween milk immune factors and Staphylococcus aureus intramammary infections in dairycows. Journal of Veterinary Research 66, 501 510.
Petzer, I.M., Karzis, J, Donkin, E.F. & Webb, E.C., 2016. A pathogen specific approachtowards udder health management in dairy herds – using culture and somatic cell countsfrom routine herd investigations. Onderstepoort Journal of Veterinary Research 81, (2016),12 pages. (doi: 10.4102/ojvr.v83i1.1146).
Petzer, I.M. & Karzis, J., 2012. The prevention of intra mammary infections in pregnant heifersthat were co housed as calves, and reared on whole milk, in eight South African Dairy herds.Proceedings of the Livestock Health and Production Annual Congress, Stellenbosch 7 9 April2012, 1 10.
Petzer, I.M., Karzis, J., Watermeyer, J.C, van der Schans, T.J. & van Reenen, R., 2009. Trendsin udder health and emerging mastitogenic pathogens in South African dairy herds. Journal ofthe South African Veterinary Association 80, 17 22.

20
Reneau, J.K., 2001. Somatic cell counts: Measures of farm management and milk quality.National Mastitis Council Annual Meeting Proceedings 2001, 29 37.
Robert, A., Seegers, H. & Bareille, N., 2006. Incidence of intramammary infections during thedry period without or with antibiotic treatment in dairy cows – a quantitative analysis ofpublished data. Veterinary Research 37, 25–48.
Schepers, A.J., Lam, T.J.G.M., Schukken, Y.H., Wilmink, J.B.M. & Hanekamp, W.J.A., 1997.Estimation of various components for somatic cell counts to determine the threshold foruninfected quarters. Journal of Dairy Science 80, 1833 1840.
Sharma, N., Singh, H.K. & Bhadwal, M.S., 2011. Relationship of Somatic Cell Count andMastitis: An Overview. Asian Aust. Journal of Animal Science 24, 429 438.
Shuster, D.E., Kehrli, JR., M.E., Rainard, P. & Paape, M., 1997. Complement Fragment C5a andInflammatory Cytokines in Neutrophil Recruitment during Intramammary Infection withEscherichia coli. Infection and Immunity Aug, 3286–3292.
Schuster, D. E., Lee, E.K. & Kehrli, M.E., 1996. Bacterial growth, inflammatory cytokineproduction, and neutrophil recruitment during coliformmastitis in cows within ten days aftercalving, compared with cows at mid lactation. American Journal of Dairy Research 57, 15691575.
Shook, G.E. & Schutz, M.M., 1994. Selection on Somatic Cell Score to Improve Resistance toMastitis in the United States. Journal of Dairy Science 77, 648 658.
Smith, K.L., Todhunter, D.A. & Schoenberger, P.S., 1985. Environmental Pathogens andIntramammary Infection during the Dry Period. Journal of Dairy Science 68, 402–417.
Sears, P. M., Smith, B. S., English, B. P., Herer, P.S. & Gonzalez, R.N., 1990. Shedding patternof Staphylococcus aureus from bovine intramammary infections. Journal of Dairy Science 73,2785 1789.
Sordill, L.M., Oliver, S.P., Guidry, A.J. & Dermody, J.T., 1988. Humoral Immune Response ofBovine Mammary Glands Colonized with Corynebacterium bovis: Enumeration of Plasma CellPopulations in Tissue and Immunoglobulin Concentrations in Milk. Journal of Zoonosis andPublic Health 35, 617–627. (doi: 10.1111/j.1439 0450.1988.tb00536).
Sol, J., Sampimon, O.C., Barkema, H.W. & Schukken, Y.H., 2000. Factors associated with cureafter therapy of clinical mastitis cases caused by Staphylococcus aureus. Journal of DairyScience 83, 278 284.
Sol, J., Sampimon, O. C. Snoep, J.J. & Schukken, Y.H., 1994. Factors associated withbacteriological cure after dry cow treatment of subclinical Staphylococcus aureus mastitiswith antibiotics. Journal of Dairy Science 77, 75–79.

21
Swinkels, J.M., Hoogeveen, H. & Zadoks, R.N., 2005. A partial model to estimate economicbenefits of lactational treatment of subclinical Staphylococcus aureus mastitis. Journal ofDairy Science 88, 4273 4287.
Swinkels, J., Schukken, Y.H. & Cox, P., 2012. Efficacy of short versus long duration of treatmentof clinical Staphylococcus aureusmastitis. Proceedings of the XXYII World Buiatrics Congress,Lisbon Portugal, 3 8 June 2012, 150.
Tamilselvam, B., Almeida, R.A., Dunlap, J.R. & Oliver, S.P., 2006. Streptococcus uberisinternalizes and persists in bovine mammary epithelial cells. Microbial pathogenesis 40, 279285.
Taponen, S., Koort, J., Björkroth, J., Salomieni, H. & Pyörala, S., 2010. Bovine intramammaryinfections caused by coagulase negative staphylococci may persist throughout lactationaccording to amplified fragment length polymorphism based analysis. Journal of DairyScience 90, 3301 3307.
Tikofsky, L. L. & Zadoks, R.N., 2005. An alternative treatment trial for Staphylococcus aureusmastitis in organically managed dairy cattle. In Proc. Proceedings 4th Int. Dairy Fed. MastitisSeminar, Maastricht, Netherlands. International Dairy Federation, Brussels, Belgium. 358–363.
Tizard, I., 2013. Introduction to bovine immunology: Innate immunity (anti microbialmolecules & anti microbial cells), adaptive immunity (antibody and cell mediated immunity)and genetic influences on immunity in cattle. Proceedings of Livestock Health and ProductionGroup Congress: Practical ruminant immunology for the veterinarian, Sibaya Lodge, KwaZuluNatal, South Africa, 27 May 2013. 6.
Vasudevan, P., Nair, M. K.M., Annamalai, T. & Venkitanarayanan, K.S., 2003. Phenotypic andgenotypic characterization of bovine mastitis isolates of Staphylococcus aureus for biofilmformation. Veterinary Microbiology 92, 179 185.
Zadoks, R. N., 2007a. Changing trends in mastitis pathogens. International Dairy FederationDairy Summit proceedings, Dublin. 3 October 2007.
Zadoks, R.N., 2007b. Sources and epidemiology of Streptococcus uberis, with special emphasison mastitis in dairy cattle. CAB Reviews: Perspectives in agriculture, veterinary science,nutrition and natural resources 2, 15.
Zadoks, R.N., Allore, H.G., Hagenaars, T.J., Barkema, H.W. & Schukken, Y.H., 2002. Amathematical model of Staphylococcus aureus control in dairy herds. Epidemiology andInfection 129, 397 416.
Zadoks, R.N. & Fitzpatrick, J.L., 2009. Changing trends in mastitis. Irish Veterinary Journal62(Supplement), 59–70.
22
Zadoks, R.N., Gillespie, B.E., Barkema, H.W., Sampimon, O.C., Oliver, S.P. & Schukken, Y.H.,2003. Clinical, epidemiological and molecular characteristics of Streptococcus uberisinfections in dairy herds. Epidemiology and Infection 130, 335 349.
Zecconi, A. &Smith, K.L., 2000. IDF Position Paper on Ruminant Mammary Gland Immunity.Symposium on Immunology of Ruminant Mammary Gland. Stresa, Italy, 1 120.

23
CHAPTER 2
Published 30 August 2016: Inge Marié Petzer, Joanne Karzis, Eduard F. Donkin, Edward C.Webb. 2016. Onderstepoort Journal of Veterinary Research. ISSN: (Online) 2219 0635, (Print)0030 2465. Copy write of article permitted for Thesis under: Creative Commons Attribution4.0 International (CC BY 4.0) licence.
SIGNIFICANCE OF THEWORK
A dedicated udder health diagnostic program was developed and used over a 15 year periodin South Africa. This programme is used to analyse milk samples of herds based onmicrobiological and cytological results of individual cows. This is a fresh approach as very fewcountries worldwide can perform micro cytology on a complete herd. This programme witha current dataset of 1.5 million samples makes a detailed analysis possible and helps toidentify and provide insight into possible sources of udder health problems. The aim of thismanuscript is to share the information and experience that was acquired over the years withveterinarians, udder health consultants and animal scientists. This knowledge enables adetailed pro active udder health approach based on knowledge of pathogens isolated fromindividual cows or quarters in the complete lactation herd. Results are presented as variousgroup reports indicating trends within herds, cases studies and also providing analysis of theindividual cow or quarters.
ABSTRACT
A dedicated udder health diagnostic programme was developed and used over a 15 yearperiod in South Africa to analyse milk samples based on microbiological and cytologicalpatterns within various groups and for individual cows and udder quarters in dairy herds.These pathogen specific analyses are utilized for pro active improvement and managementof udder health in South African commercial dairy herds. The programme acts as amonitoringtool and identifies management areas at risk and individual cows with udder disease andutilizes both quarter and composite milk samples. Intramammary infection (IMI) is a dynamicsituation and depending on the time a milk sample is taken, false negative results may beobtained. A new IMI and an infection that is curing (after treatment or spontaneous cure) mayboth have low somatic cell counts (SCC), masking the true bacterial status. Somatic cell countin individual infected udder quarters may differ greatly depending on the causative bacterialspecies, its pathogenicity, the host immune status and environmental factors involved. Apathogen specific udder health approach was followed with repeated herd tests to takeaccount of these udder health dynamics. The results of the herd IMI investigation is applied

24
in practice to assist veterinarians, udder health consultants and managers to make informedand specific detailed decisions at both herd basis and on an individual cow basis regardingudder health.
Key words: pathogen specific, herd udder heath, management programme, dairy cows,udder quarter and composite samples
INTRODUCTION
Mastitis is an endemic disease and is considered the most frequent and costly disease in thedairy industry responsible for the highest financial losses, which effects both the animal andthe quality of the product (Halasa et al. 2007; Hoogeveen et al. 2010).
Mastitis is complex and multi factorial in nature and generally results from an interactionbetween a variety of microbial infections, host factors, environment and managementfactors, and with a generally poor treatment success. It is defined by the National MastitisCouncil (NMC) as an inflammation of the mammary gland mainly due to bacterial infection(NMC Guidelines 2001, 2015). Dealing with clinical mastitis cases remains important butdamage to the udder parenchyma may have lowered a cow’s lifetime production potentialand she may have already shed pathogens (DeGraves & Fetrow, 1993; White, 2010). Optimalmanagement practices are considered to be the most effective way to control the disease.Research conducted during the 1960s set the stage for our current understanding of mastitisand established standards for contagious mastitis control (Davidson, 1961; Dodd et al. 1969;Neave et al. 1969; Neave et al. 1966). From this work a five point mastitis control programmewas developed and was later upgraded to the NMC 10 point mastitis control plan (Smith andHogan, 2001). Utilization of this program has led to a reduction in the prevalence andelimination of contagious mastitis from many South African farms. However, Staphylococcusaureus (S. aureus) and Streptococcus agalactiae (Str. agalactiae) remain a challenge onindividual farms on South Africa and abroad (Petzer et al. 2009).
In a paper published by Middleton (2013) he questioned what we have learned regarding S.aureus mastitis in the last 50 years. His response summarised the global udder healthdilemma. We have gained much knowledge but the basic fact that milking time hygiene is themain critical control point has not changed. Decisions regarding the control of mastitis in agiven herd will depend on the contagiousness, persistence and inflammatory nature of themain infecting species and strains. The use of historical data to evaluate true new IMI rates,the extent of chronic carriers within the herd, the bacterial cure rates in combination withsomatic cell count (SCC) levels are all valuable measures to identify mastitis and stress relatedcauses of high SCC.
Knowledge of the bacterial species present in the udders of cows in a herd and the ability toidentify cows with and without intramammary infections (IMI) can be used as a tool for in

25
depth management decisions. The rate of new IMI can be more effectively controlled by theseparation of cows with IMI in the case of contagious pathogens, and despite the best effortsbacteria will be transmitted from cow to cow. Cows infected with known contagious IMI canbemilked last, thereby limiting the risk of spreading this infection to the healthy cows. Parloursupervision of the cows infected with contagious pathogens should then be intensified. It hasbeen well established that the probability of IMI cure depends on cow, pathogen andtreatment factors (Barkema et al. 2006). Although treatment success is influenced by choiceand use of an appropriate product and also the lactation stage of the cow, the main factorinfluencing treatment success has been found to be treatment duration (Barkema et al. 2006).In addition the bacterial species or strains involved, their pathogenicity and possibleantimicrobial resistance needs to be considered, as well as the immune response of the cow.Cure rates for S. aureusmastitis have found to range from 3 74%. Cure is lower in older cows,and in those with high SCC, increased chronic IMI and increasing numbers of mammaryquarters infected (Barkema et al. 2006). Spontaneous cure of new S. aureus IMI may be ashigh as 21%, while in chronic cases this figure can be as low as 3% (Swinkels et al. 2012). Onlya few udder pathogens such as Str. agalactiae are known for a high treatment success duringlactation (Keefe, 1997). Staphylococcus aureus and Str. agalactiae IMI are still present in dairyherds in South Africa (Petzer et al. 2013) and warrant a more efficient testing system thatcould identification truly infected quarters and enable producers to eliminate both of thesepathogens from their herds.
The SCC measure has been used worldwide for several decades as a primary indicator ofudder health in dairy herds (Hillerton, 1999; Reneau 2001; Heeschen, 2010). More than 95%of the cells in milk are leucocytes consisting of variable proportions of macrophages thatrecruit the neutrophils and lymphocytes in the event of invading pathogens by releasingchemo attractants. The lymphocytes actmostly asmemory cells for the immune systemwhileneutrophils phagocytise and destroy the pathogens. Less than 5% of SCC consists of epithelialcells originating from the mammary gland. The level of SCC in milk depends on various factorsof which IMI is the most important. Factors include parity, stage of lactation, milkingfrequency, stress (environmental, nutritional, systemic disease, and day to day changes inmanagement) and non specific disturbance (NSD) where an increase in SCC is not cause bypathogens.
Traditionally bulk milk tank somatic cell count (BMSCC) is used as a primary index whenanalysing herd udder health and is used as one of the quality criteria for payment by thesecondary milk industry (Ruegg and Pantoja 2013). High BMSCC could indicate udder healthproblems, whereas a too low level (below 100 000 cells/ml) could act as a warning to becomepro active in preventing mastitis. However, the BMSCC provides only an estimation of theprevalence of infection and irritation of the udders of the cows. This is not a true reflection ofthe herd udder health status as milk from problem cows should have been excluded (cowswith clinical mastitis, fresh in milk cows, cows under treatment, and sometimes those withhigh SCC). The BMSCC can also be influenced by herd dynamics such as the average parity of

26
cows, and the distribution of lactation stage seen in seasonality calving herds compared toherds with an all year round calving pattern. The impact of any individual cow on BMSCC willfurther depend on its SCC and themilk yield of the cow and the dilution factor within the tank.It has been estimated that there is likely to be a 10% increase in IMI prevalence in a herd forevery 100 000 cells per ml increase in BMSCC (Bradley, 2007). In the year 2014 an estimated145 million dairy farms operated globally and the largest average dairy herds were found inSaudi Arabia (8125 cows) followed by New Zealand (393 cows) and South Africa (238 cows)(Lactodata, 2015). The larger the herd themore critical the interpretation of the BMSCC needsto be and the less valuable it becomes as a pro active udder health monitoring tool due tothe dilution effect of the milk masking high SCC of an individual cow.
To evaluate changes in udder health status the somatic cell counts of individual cows are oftenanalysed together with herd clinical mastitis statistics (Bradley and Green, 2001). A SCCthreshold is used as a guideline to estimate new IMI, chronic IMI, cure rates and those cowsor udder quarters that remain without IMI. There has never been absolute consensusregarding the correct threshold level to indicate IMI, but 200 000 cells/ml for udder quartermilk samples has been adopted to indicate IMI by most in the field (Heeschen, 2010). Thereliability of records of clinical mastitis cases depends on accurate detection of mastitis on aday to day basis on farms and these records are often questionable.
The aim of this article is to outline a fresh approach to herd udder health monitoring thatfacilitates an in depth analysis of clinical and subclinical mastitis using software that has beendeveloped and tested over the past 15 years at the Faculty of Veterinary Science, Universityof Pretoria. Currently more than 930 commercial dairy herds from South Africa andneighbouring countries are benefiting from its application. The Milk Sample Diagnostic (MSD)program that was developed provides an overview of the current and historical herd udderhealth situation and allows for analysis related to parity, days in milk, and other herdgroupings, and facilitates decision making on an individual cow level based on current andhistoric species specific and udder pathology information. It is used as a practical tool toidentify challenges at herd, cow and udder quarter level, and guides decision making at anoperational level. Only by addressing the particular cause can the problem be eliminated. Thisudder health approach differs from the conventional approaches that use primarily SCC anddata of clinical mastitis cases as an aid to decision making.
MATERIALS ANDMETHODS
Milk samples and data
Udder quarter and composite milk samples (one milk sample taken from all four quarters) aretaken in most cases from all lactating cows in a herd to establish the presence and prevalenceof udder pathogens. Professional milk samplers assist milk producers in South Africa to take

27
samples in an aseptic manner, ensuring that the sample quality is good, and that the coldchain is maintained until the samples reach the milk laboratory. Most milk samples reach thelaboratory within 24 hours. On arrival at the Milk Laboratory (Milk Laboratory, Departmentof Production Animal Studies, Faculty of Veterinary Science, University of Pretoria, SouthAfrica) the batch temperature of the milk samples is recorded. Milk is then plated out onBovine Tryptose agar, and cultures are read after 18 24 and 48hours (Petzer et al. 2012b).Samples are not preserved but stored in a walk in fridge at 4C for at most 48 hours till cellcounting. Somatic cell counts were performed using a Fossomatic 5000 (Petzer et al. 2012b).Identification of mastitis pathogens is generally completed within 48 to 72 hours after thesamples have been received at the laboratory.
In addition to the micro cytology and clinical appearance of milk, general cow information isadded to the MSD program. This includes information regarding calving dates, parity, milkyield, stage of pregnancy, status of the udder parenchyma (assessed by palpation) and teatcanal scores.
Results of quarter milk and composite milk samples are analysed separately and the resultsare summarised in individual cow reports and in various group reports.
Some of the various reports that will be discussed
The Serial Herd Udder Health Report used for evaluation of composite cow milk samplesprovides an overview of the current and historical udder health status of the herd based onmicrobiological and cytology results. The report also provides a perspective on the level ofnew, persistent and cured cases for each bacterial species isolated from the herds, andindicates the SCC distribution within the herd.
A Current Herd Udder Health Report for analysis of quarter milk samples summarises themicro cytology results of the current test of the herd as percentage of quarters with mastitis,or with NSD, IMI with low SCC, and the percentage of normal quarters.
Group Reports focus on species identification, early post partum reports (for the first 30 daysin lactation), a lactation stage report (5 90 days, 91 180 and 180+day groups) alsodifferentiating between parities.
The Economic Report provides financial information on probable loss in revenue as a resultof milk not being produced due to an udder that is not completely healthy, indicated by theSCC level.
Criteria used for diagnosis
Microbiology and cytology results are available for each quarter milk sample. In this programquarters that tested bacteria negative with a SCC of below 300 000 cells/ml milk were

28
regarded as being normal (N); quarters that tested bacteria positive with a SCC of equal orabove 300 000 cells/ml milk were regarded as having mastitis (M); quarters that testedbacteria positive with a SCC of below 300 000 cells/ml were identified as having a “teat canalinfection” (TCI) or sub clinical mastitis; and quarters that tested bacteria negative with a SCCof equal or above 300 000 cells/ml were identified as having a non specific disturbance (NSD).The desired herd values aimed for are: less than 5% of quarters with mastitis; less than 5%quarters with TCI; less than 3% quarters with NSD and more than 50% normal quarters.
RESULTS AND DISCUSSIONS
2.1 Serial Udder Health Reports (Composite milk samples)
The Serial Herd Udder Health report is presented in two parts. The first part provides asummary overview of 1 to 4 consecutive herd micro cytology examinations based on resultsof composite milk samples, while the second part deals with the SCC. The current herd udderhealth status is analysed and compared to results of previous examinations. Positive progressor negative developments in the herd in terms of IMI and SCC trends is measured andevaluated. The various bacterial species isolated from individual cows are indicated asnumbers and percentages of cows sampled (see Table 2.1) while the SCC are summarisedaccording to six threshold levels (Table 2.2).
2.1.1 Part 1 – Serial Herd Microbiological report
Each bacterial species isolated from individual composite milk samples in the herd is indicatedas a number and as a percentage of the total samples examined. Of each bacterial speciesisolated the number of new, repeat or persistent cases, and cases cured are indicated. In thefirst examination of a herd all cases are indicated as new infections. In consecutive herdexaminations, new infections are indicated when a specific bacterial species has not beenisolated from the same cow at the previous examination; persistent cases are those withidentical bacterial isolations as shown previously; while “cases cured” (those that are culturenegative) in the current examination for the specific bacterial species that was isolated at theprevious examination (Table 2.1).
Prevalence of species specific herd intramammary infections
Depending on the principal bacteria present and its prevalence in the herd, managementstrategies should be planned in collaboration with the herd manager. A policy of zerotolerance is followed in most cases where Str. agalactiae and S. aureus are isolated, aiming atthe eradication of these bacteria from all udders in these herds. This approach has proved to

29
be practical and successful in South African herds over the past fifteen years. The prevalenceof S. aureus IMI in more than 930 South African commercial dairy herds decreased from14.08% in 2008 to 7.77% in April 2012 (Petzer and Karzis, 2012a) and to 5.14% in December2014 (Petzer, unpublished data). Bacteriological results as shown in Table 2.1 provide theveterinarian, udder health consultant and dairy manager and owner with detailed results toassist informed decision making regarding udder health management at the herd level.
New intramammary infections
Depending on the species of bacteria and the level of new intramammary infections (IMI) inthe herd deductions can bemade regarding parlour hygiene and beddingmanagement (Table2.1). Management may prove to be inadequate and protocols may need to be revised andupgraded.
The level of new IMI can be a valuablemeasurement of effective parlour hygiene and ofmilkereducation, dedication and health, especially in the case of contagious mastitis bacteria suchas S. aureus and Str. agalactiae. It can also indicate ineffective separation of S. aureus and Str.agalactiae positive cows or an incorrect milking order. The level of new infections mayincrease if there is a lack of biosecurity when new cows or heifers are introduced into a dairyherd without determining the status of their IMI prior to allowing them on the farm, in theparlour and mixing them with the local herd. Bacteria such as S. aureus and Streptococcuspyogenes (Str. pyogenes) are known to be able to cause reverse zoonosis (Messenger et al.2014). When reverse zoonosis is suspected in a herd milkers and people in close contact withthe cows should be tested for the presence of these bacteria by requesting throat swabs.
When most new IMI are predominantly environmental bacteria such as the coliforms (E. coli,Klebsiella spp. and Serratia spp.) or streptococci other than Str. agalactiae, then udder, feetand flank hygiene scores (Cook and Reinemann, 2007) can be performed to quantify thechallenge and identify areas of risk. Sources may include inadequate management of beddingwhich can cause increased levels of loose faeces on bedding surfaces (Reneau et al. 2003), orwater pollution (mineral or microbial), or over crowding.
Repeat (persistent) cases and cases cured
When the same bacterial species is isolated from the same udder (composite milk samples)or the same quarter (quarter milk samples) on two consecutive examinations within areasonable time period it is regarded as a repeat or persistent IMI. The percentage of casesthat repeat and those cured (bacterial cure) indicate the level of chronicity and theproblematic bacterial species or strains present in the herd. It may be an indication ofineffective mastitis treatment. Udders of cows that repeat are palpated to identify possibleparenchyma pathology because unsuccessful treatmentmay be as a result of fibrosis, nodulesor atrophy of the udder parenchyma, and not necessarily due to bacteria that are resistant to

30
antimicrobials. “Fibrosis” (hardening udder quarter) is used as an indication of a more recentchronic case compared to “atrophy” (shrinking udder quarter).
Table 2.1. Serial Herd Udder Health Report. Case study Part 1: Bacteriology history reportfor four consecutive herd examinations of the same herd using composite cow milk samples.
Bacteria isolated Dates Oct 28, 2014 Nov 17, 2014 Jun 4, 2015 Jul 2, 2015
Numbers examined 1 290 (*) 1 304 (*) 1366 (*) 1 297 (*)
Staphylococcus aureus Total 78(6.05) 214 (16.41) 72 (5.27) 58 (4.47) New 78(6.05) 159 (12.19) 22 (1.61) 12 (0.93)
Repeat 0 (0.00) 44 (3.37) 32 (2.34) 27 (2.08) Cured 0 (0.00) 11 (0.84) 18 (1.32) 19 (1.47)
Streptococcus agalactiae
Total 24 (1.86) 0 (0.00) 73 (5.34) 45 (3.47) New 24 (1.86) 0 (0.00) 72 (5.27) 40 (3.08) Repeat 0 (0.00) 0 (0.00) 1 (0.07) 5 (0.39) Cured 0 (0.00) 1 (0.80) 8 (0.59) 33 (2.54)
Streptococcus dysgalactiae
Total 4 (0.31) 0 (0.00) 2 (0.15) 2 (0.15) New 4 (0.31) 0 (0.00) 2 (0.15) 1 (0.80) Repeat 0 (0.00) 0 (0.00) 0 (0.00) 1 (0.80) Cured 0 (0.00) 3 (0.23) 1 (0.70) 1 (0.80)
(*) Percentage of samples examined
Application of results in a Streptococcus agalactiae positive herd
The herd indicated in Table 2.1 had 3.47% of cows infected with Str. agalactiae at theexamination dated 2 July 2015. Although this percentage decreased from the previousexamination on 4 June 2015 (from 5.34% to 3.47%) too many (40 of 45) of these infectionswere new Str. agalactiae IMI possibly indicating a relaxed parlour hygiene. Five cases of Str.agalactiae IMI persisted and 33 had been cured since the June examination. The producerwas asked to provide information on the whereabouts of 35 cows that were infected with Str.agalactiae in June 2015 and which were not tested in July. These cows might have been driedoff, removed from the herd or were merely not sampled. The targets should be < 5% for ofStr. agalactiae should be new IMI and < 5% persistent cases. A revised management planshould include better prevention and follow up of cases that did not cure.
In this case where Str. agalactiae IMI has been isolated from a herd a partial “blitz therapy”can be implemented because in this case positive cows have been identified. They shouldimmediately, after conformation of their infections status, be separated from the rest of thecows for the treatment period and until they have been resampled and found to be cured(bacteria free). Retesting of both the lactating herd and treated cows is essential for the

31
successful elimination of Str. agalactiae from the herd in a relative short period of time. Apercentage of Str. agalactiae infected cows may have been missed during the laboratoryexamination due to the small volume of milk plated out; or because of sub minimalconcentrations of bacteria present in milk samples; or due to the presence of coagulasenegative staphylococci (CNS) in udders with high SCC initially masking the presence Str.agalactiae (personal experience). A short laboratory turnover time in the case of Str.agalactiae IMI is crucial to the success of eliminating these bacteria from the herd (Keefe,1997).
Case study: Application of results in a Staphylococcus aureus positive herd
In herds where a low prevalence of S. aureus is identified, the few positive animals should beculled as soon as possible, and management should focus on sound parlour and milkingprocedure hygiene. The lactating herd should be retested and quarter udder secretionsamples of dry cows in late gestation should be included. When a herd is identified with amedium to high prevalence of S. aureus a longer term strategy is adopted rather than that ofculling all positive animals, although culling will form part of the action taken. An importantaction will be to upgrade the protocol and application of parlour management and themilkingroutine, the hygiene and monitoring strategies. Other factors such as the within herdprevalence, the contagiousness of the bacteria, the milk price, and the current percentage ofcows culled because of mastitis, and the number of replacement heifers available must alsobe considered (Bradley, 2007).
The herd indicated in Table 2.1 was diagnosed with 78 (6.05%) S. aureus cows in October 2014and was regarded as herd with a moderate level of infection prevalence. The producer wouldbe advised to separate the S. aureus positive cows, if possible for life, and to keep them in aS. aureus group. The results from November 2014 (Table 2.1) showed an increased in thenumber of S. aureus cases to 214 (16.41%). Of these, 159 cows (12.19%) cows had new S.aureus infections indicating that the preventative measures were inadequate; 44 cows(3.37%) showed persisted infection from the previous test, indicating a in these cases a highpossibility of chronic cases, and only 11 cows (0.84%) were apparently “cured”.
Though the choice and duration of treatment should be discussed with the farmer theprobability of cure could be calculated for each S. aureus positive cow using the systemdeveloped by Sol et al. (1997). This formula incorporates parity (1st lactation and higher),stage of lactation (early, mid or late), level of SCC (above or below a linear score of 6.9 orapproximately 800 000 cells/ml), the number of quarters per udder positive for S. aureus (lessor more than 3) and quarter position (front or hind) of individual cows, as well as thetreatment duration. It can be used to calculate the probability of S. aureus cure (Swinkels etal. 2012) (Figure 2.1). Information for individual cows on parity, lactation stage, pregnancystatus, milk yield, mastitis and SCC history is available in the MSD program to aid in thedecision making. Udders of S. aureus cows should be palpated to identify gross parenchyma

32
damage such as fibrosis, nodules and atrophy, which usually would make treatmentineffective. An informed decision could then be made regarding actions to be taken in caseof each individual S. aureus cow, and a detailed action list for individual cows can beformulated for the manager. This might include intramammary therapy with or without anextended duration, early drying off with therapy, inactivation of a quarter, or culling of thecow.
Adapted from Sol et al. 1997
Figure 2.1. The criteria used in the calculation of the probability of cure for a cow withStaphylococcus aureus intramammary infection of the individual cow.
In this particular herd (Table 2.1) at the next examination date on 4 June 2015 the number ofnew cases had decreased to 22 cows (1.61%) of samples, while persistent infections remainedrelative low at 32 (2.34%), as does the numbers with bacterial cure (1.32%). Staphylococcusaureus “cure cases” however needs to be retested because of the nature of S. aureus to shedintermittently. This is the reason why these cows should remain separate from the rest of theherd for life.
South African dairymanagers and veterinarians are aware of the existence of reverse zoonosiswhere infections carried by people may pose a threat to udder health of cows. A noteworthynumber of the work force (Statistics South Africa, 2013) has immune systems compromisedbecause of HIV with a consequence of an increased risk for disease. Milkers with upperrespiratory infections caused by S. aureusmay pose a risk to the udder health of dairy cows ifhygienic principles are not adhered to in the parlour (Petzer et al. 2009). Precautions such asthe wearing of facial masks, and placing milkers that have tested positive for S. aureusinfections into strategic milking positions where they do not need to touch udders (like teatdipping) have been helpful (personal experience).

33
Application of results in herds with mainly gram negative IMI.
When IMI with bacteria of environmental origin is predominantly in a herd the managementfocus should shift to camps, pasture, bedding and the parlour as sources and areas of risk.The specific bacterial species may provide information on the probable source. Pseudomonasspp. for instance is often found in a water source, and Listeria spp. is mostly present in silage(Hogan and Smith 2003). In South African pasture based dairy herds the prevalence ofStreptococcus uberis (Str. uberis) is increasing (Petzer et al. 2009).
2.1.2 Part 2 – Serial Herd Somatic Cell Count Report
In the second part of the Serial Herd Udder Health Report six SCC thresholds are calculatedfrom the herd test (percentages and cumulative percentages). The SCC increments are 125000 cells/ml up to 500 000 cells/ml and become larger for higher SCC levels. The herd targetis to have more than 80% of lactating cows with SCC of less than 250 000 cells/ml, while lessthan 5% should have a SCC in excess of 750 000 cell/ml. Herds with a high percentage (>90%)of cows with low SCC may be at higher risk of contracting E. coli mastitis. In such a situationmanagement practices such as teatdip prior to milking and feeding immediately after milkingto prevent cows from lying down would be advised to allow enough time for the teat canal toclose. This is especially true of high yielding herds where the immune system of cows is morelikely to be weakened during the first trimester of their lactation (Hogan and Smith, 2003).
Table 2.2. Serial Herd Udder Health Report. Part 2: Somatic cell count (SCC) history reportfor four consecutive herd examination of the same herd based on results of composite cowmilk samples.
SCC x 103
cells/mlDates x Values (% of lactating cows)
Oct 28, 2014 Nov 17, 2014 Jun 4, 2015 July 2, 2015 1 290 cows 1 304 cows 1 366 cows 1 297 cows
% Cum* % % Cum % % Cum % % Cum % 1-125 35.71 35.71 25.14 25.14 36.85 36.85 59.46 59.46
126-250 13.75 49.46 15.45 40.62 17.61 54.46 9.27 68.73 251-375 9.53 58.99 11.48 52.09 10.56 65.02 5.66 74.39 376-500 6.39 65.38 7.29 59.38 5.87 70.89 3.99 78.38 501-750 8.32 73.7 9.49 68.87 7.51 78.4 4.89 83.27
750+ 26.3 100 31.15 100 21.6 100 16.73 100
*Cum= Cumulative

34
Somatic cell count dynamics of four consecutive herd investigations from 26 October 2014 to2 July 2015 are compared in Table 2.2. The percentage of cows with SCC below 250 000cells/ml although still low at 68.13% in July 2015 has improved from 40.62% in November2014. Similarly, the percentage of cows with SCC above 750 000 cells/ml decreased from31.15% to 16.73% for the same period.
In herds with a high proportion of cows with high SCC, a distinction is made between thosewith and without IMI. In cases where most samples that showed high SCC also had IMI, thesources of these infections should be identified and eliminated or managed. When samplesfrom which no bacteria were isolated form a significant portion of samples with high SCC,possible stressors and causes of udder irritation need to be investigated. Composite milksamples from cows identified with high SCC can be tested on farm with the California MilkCell test to gain insight into the inter quarter SCC relation. Heat stress, mud stress, nutritionalstress and social or handling stress are examples of stressors that can be responsible forincreased SCC (Du Preez, 2000). Differences in SCC between quarters of the same udder areused. Physiological changes and stressors to the cow will be more prone to cause an elevatedSCC in 3 or 4 quarters, while udder irritation is more often seen in only 1 or 2 quarters of anudder. The latter can be caused by incorrect milking techniques, incorrect milking machinesettings, or lack of adequate machine maintenance. Cows that have recently been treatedwith intra mammary antimicrobials could also test culture negative with a high SCC.
The probability of incorrect milking machine settings and incorrect use causing irritation canbe investigated by using teat canal scoring (Neijenhuis et al. 2001) on first lactating cows, 1to 3 months in lactation. The teat canal is the first line of udder defence and a very importantbarrier preventing IMI when damaged. Pulsator function should be tested by performing thestatic test on all milking units followed by dynamic testing to check vacuum stability and levelat the teat end during milking. Milking machines with high milk lines as well as swing overparlour systems are still used in South African dairies. Teat canal damage is more likely occurin high milk lines systems than in systems with low milk lines and due to over milking and theincreased risk of the higher system vacuum. Swing over systems with automatic clusterremovers (ACR) are now installed in South African dairies. Flow meters that measure the milkflow per unit and initiate cluster take off are installed in these systems far above the level ofthe udder, and the milk lines transporting milk from the cluster to the flow meters are oftenmore than 1.5 to 2 metres long. There is therefore too long a delay in the time from when thetake off flow rate is reached until the cluster is actually removed, increasing the risk ofovermilking.
Milking routine should be monitored on site; and a System Lactocorder (WMB AG, Balgach)can provide measurements of the milk let down time, rate of milk flow and the timing ofcluster removal. Automated inline monitoring systems such as Afimilk program (Afimilk Ltd,Kibbutz Afikim, Israel) are available to identify cows that are in incorrect groups, and toidentify current and past trends in the milking routine. These can include the time from touch

35
to attachment of clusters, milking speed, cluster fall off, re attachment and earlydetachments. Reasons for insufficient stimulation or delay in take off can be identified andrectified, whether by training or notifying themilkers or by correcting amilkingmachine fault.
Nutritional stress can contribute to high SCC and practical methods such as bunker score andspace (Bolsen and Pollard, 2004), rumen filling (Burfeind et al, 2010), faecal score andpercentage cows ruminating may be used as a starting point for the investigation in totalmixed ration herds, body condition scoring (Wildman et al. 1982) and locomotion scoring(Manson and Leaver, 1988) followed by an in depth analysis of the feed when indicated. Cowson pastures and in paddocks may suffer from stress because of mud during the rainy season.In South Africa the high Temperature Humidity Index (THI) may often have a negative effecton the SCC levels, milk yield and reproduction efficiency during the hot summer months(Giesecke et al. 1988, Du Preez et al. 1990).
2.2 Current Herd Udder Health Report (Quarter milk samples)
A summary of species specific IMI and somatic cell counts for herds are shown in Table 2.3.The Report is divided in two sections with the first part indicating results from lactating cowsand the second part from non lactating cows. The Milk sample Diagnostic (MSD) programcurrently uses a somatic cell count level of 300 000 cells/ml as the lower threshold to diagnosemastitis in quarter milk samples when a pathogen is present, and classifies these findingsclassified and NSD in the absence of IMI. Quarters with a SCC level of below 300 000 cells/mland without IMI are identified as “normal”, while those with a low SCC where and IMI ispresent are diagnosed as “teat canal infections”. Dry cow secretions are only examined forthe presence of bacteria and no SCC is done.

36
Table 2.3. Current Herd Udder Health Report based on somatic cell count and culture resultsof quarter milk samples from lactating and dry cows.
Cows Diagnosis Micro-organisms
Right front quarters
(%)
Right hind quarters
(%)
Left front quarters
(%)
Left hind quarters
(%)
Total(%)
Lactating Mastitis* S. aureus 0 1.1 1.1 1.1 3.3
Mastitis CNS 0 2.1 0 0 2.1
Mastitis Str. uberis 0 0 0 1.1 1.1
Normal none 14.7 10.1 9.8 10.9 45.5
NSD** none 5.9 8.4 6.4 8.6 29.3
TCI*** S. aureus 3.3 1.8 2.2 0 7.3
TCI CNS 1.1 1.5 4.4 3.3 10.3
TCI Str. agalactiae 0 0 1.1 0 1.1
Dry Dry Normal none 8 12 8 17 45
Dry IMI S. aureus 5 3 3 1 12
Dry IMI CNS 10 8 11 5 34
Dry IMI Str. uberis 2 2 3 2 9
*Mastitis criteria: (SCC 300 000 cells/ml and culture positive), **NSD: Non specific disturbance or udderirritation (SCC 300 000 cells/ml and culture negative), ***TCI: teat canal infections (SCC < 300 000cells/ml andculture positive), Normal criteria: (SCC < 300 000 cells/ml and culture negative), CNS: coagulase negativestaphylococci, IMI: Intramammary infection.
Two major concerns can be identified regarding the udder health status in the lactating cowsin the herd indicated in Table 2.3, namely the large percentage of quarters with high SCC, andthe presence of S. aureus IMI in the herd. Staphylococcus aureus was isolated from 10.6% ofquarters, coagulase negative staphylococci (CNS) from 12.4%, and Str. uberis and Str.agalactiae each from 1.1%. Of the 35.9% quarters with SCC of 300 000 cells/ml and above(mastitis and NSD cases) only 6.6% had IMI, indicating that something besides IMI was primereason causing high SCC in the herd, even though 25.3% of all quarters had IMI. More hindthan front quarters were diagnosed with NSD and might indicate incorrect removal ofclusters.
Of the dry cows sampled 4 weeks post intra mammary treatment, 12% were infected with S.aureus, 34%with CNS and 9%with Str. uberis. This could indicate a poor cure rate for S. aureusand a possible high new IMI occurring during the dry period for both CNS and Str. uberiswhencompare to the results of the lactating cows (Table 2.3).

37
An action list could be complied for the producer which may include:
Staphylococcus aureus cows to be followed up by evaluating their mastitis history, performingudder palpation, and evaluating criteria of each cow for her probability of cure (Fig 2.1). Themilking machine should be checked, milk routine evaluated and other possible stressorsinvestigated.
2.3 GROUP REPORTS
Calving dates, pregnancy status, level of milk yield and status of the udder parenchyma canbe entered into the MSD program as information additional to the laboratory results forindividual cows.
Pathogen Specific Group Report
Reports of cows currently infected with specific udder pathogens are generated to use as onfarm action lists. As explained above cows should be selected and separated, to deal withcontagious IMI such as S. aureus or Str. agalactiae IMI in a herd. Cows that have had Str.agalactiae IMI and were cured (bacterial cure) may be returned to their previous groups, butS. aureus cases should remain in a separate group for life. Reports of consecutiveexaminations provide information on the dynamics of IMI in the individual cow and identifycows with persistent or chronic IMI.
Application in herds during a Str. agalactiaemastitis outbreak
During a Str. agalactiae IMI outbreak in a dairy herd composite milk samples are taken fromall lactating cows and quarter secretion samples from the dry cows not currently underantibiotic treatment. When the heifers presently in late gestation had been reared on freshmilk as calves are they are also sampled due to a risk of them having Str. agalactiae IMI (Petzerand Karzis, 2012).
The initial list of cows that tested positive for Str. agalactiae is emailed to the producer within24 hours after receiving the samples at the laboratory. Managers should then immediatelyseparate cows that tested positive for Str. agalactiae, treat all quarters with of those cowswith intramammary antimicrobials, and milk these cows last under strict hygiene conditions.Udders of Str. agalactiae cows should be palpated to identify gross pathology, in which casethe cure rate may be low. Any dry cow or heifers positive for Str. agalactiae IMI are alsotreated.
Ten to fourteen days after the last intra mammary treatment the Str. agalactiae positive cowgroup is resampled (quarter milk samples) for micro cytological analysis, and compositesamples are collected from the rest of the lactating herd. The percentages of Str. agalactiae

38
cases that are cured, those that persisted and the number of new IMI are analysed, and amanagement plan is formulated based on this information. Cows with Str. agalactiae IMI areonly regarded as being cured when no Str. agalactiae can be isolated from any of theirquarters, when the SCC in all quarters is below 200 000 cells/ml and when there is only a smallvariation in the SCC between quarters.
Monitoring of the herd should be continued on a regular basis, and intervals may be monthlyor longer until all lactating cows have tested negative for Str. agalactiae at least two or moreconsecutive tests. This may take 3 to 6 months depending on the initial Str. agalactiaeprevalence as well as the motivation and dedication of the producer and milkers (Figure 2).
*SAG: Streptococcus agalactiae
Figure 2.2. A flow chart indicating events during the management of a Streptococcusagalactiae IMI outbreak in a dairy herd.
For most major udder pathogens different protocols are required. In the case of a Str. uberisIMI different strains were identified (Zadoks, 2007). Some strains were found to bemore likely
*SAG Positive Herd
Lactating cows
SAG negativecows
Strict parlour hygiene & Retest (Composite samples)
SAG positivecows
Separate,Treat all quarters &Retest after 14 days(Quarter milk samples)
SAG negative(All 4 quarters negative & low SCC plus small inter quarter variation)
SAG positive:Palpate
Parenchyma damage:Inactivate or cull a.s.a.p.
No damage parenchyma: 2nd treatment
Dry cows &Heifers
SAG positive cows
Treat all quarters &Retest after 14 days(Quarter milk samples)
SAG negativecows

39
to cause chronic IMI while others cured spontaneously after a period of only days. Straintyping of Str. uberis from individual cow samples on a herd basis has not been shown to becost effective. When Str. uberis is isolated repeatedly from the same cows the herd manageris advised to increase the duration of intramammary treatment only in the event of clinicalmastitis in those cows, and to use intramammary dry cow therapy at drying off in thosespecific cows.
Stage of lactation and parity
The immune system of the lactating cow is known to be weakened during the peripartumperiod due to hormonal changes and many stressors. These can include calving and onset oflactation stress, social stress, and stress due to the adaption to a new diet, and the onset of anegative energy balance in the cow that can last up to day 100 of lactation (Collard et al.2000). Due to vulnerability of the cow during this period, this stage of the production cycle iscritical for monitoring udder health.
Udder health up to 30 days post partum (multiparous and primiparous cows)
The number of new IMI and cases with elevated SCC that occur from days 5 30 post partumprovides insight into the udder health during the dry period and calving hygiene. It is also anindication of bacterial cure rate during the dry period. There is however also a risk of new IMIpost partum when milking commences. Knowledge about the prominent bacterial speciescausing IMI in a herd enables advisors andmanagers to identify and deal with the sources andcauses of infection timeously and effectively. The report that summarises the species specificIMI information including total, cured, persistent and new IMI for cows between 5 to 30 dayscan be used to evaluate udder health during the dry period. The current species specific IMIand SCC results of individual multiparous cows should be compared to their udder health intheir previous late lactation. Results for primiparous cows are indicated in a separate reportas total numbers (and percentages) of species specific IMI that have been isolated. Managersshould aim to have less than 10% of cows with IMI and SCC in excess of 200 000 cells/mlduring this period, and an incidence of less than 5% of clinical mastitis.
Heifers are more prone than cows to develop severe udder oedema prior to calving andrecently calved primiparous cows are said to have a greater prevalence of mastitis thanolder cows, despite having less mastitis later in lactation (Barkema et al. 1998). Heifers thatare close to calving and primiparous cows should receive a diet with an adequate energybalance and without excessive sodium and potassium therefore a negative dietary cationanion difference (DCAD) balance (Goff et al. 2004). Stress around calving should be limitedby stimulating heifers to exercise, and by avoiding overcrowding in order to reduce negativesocial interactions (Hutjens & Aalseth 2005). The IMI profile of first lactation cows shortlypost partum is an indication of udder health challenges that have occurred mostly during

40
late pregnancy (environmental bacteria) but can in some cases be traced back to the waythey were reared as calves when fed infected milk and kept in groups (Petzer and Karzis,2012).
When bacteria isolated frommilk samples shortly post partum are predominantly contagious,this may indicate treatment failure, the presence of chronic udder damage or new infectionscontracted during early lactation. When few cases are cured treatment protocol needs to berevisited to indicate whether the correct anti microbial product was used for the correctduration of time.
Udders of treated cows should be palpated to determine if there is chronic udder parenchymadamage (fibrosis, nodules or atrophy). A high rate of new IMI caused by contagious bacteriacould be an indication of poor milking hygiene of newly calved cows. Trends of total, cured,new and persistent IMI in a herd can be followed over time to improve managementdecisions.
In the event where most IMI are caused by environmental bacteria shortly post partum,caused can be chronic infections or treatment failure but new environmental IMI are morelikely to have occurred during the dry period or at calving. Most new IMI caused byenvironmental bacteria are known to occur just after drying off and shortly before and aftercalving (Oliver and Sordillo, 1988). In these situations daily pre calving teat dipping duringthe high risk periods in the dry period should be added to the management routine. No teatseal is currently registered on the South African market to assist in the prevention of new IMIduring the dry period of cows.
Udder Health in early, mid and late lactation (90 days, 180 days and later inlactation)
Bacteriological and SCC results of milk samples during early, mid and late lactation arecompared to evaluate progress or failure of udder healthmanagement during lactation (Table2.4). Important events occur during the first 90 days of lactation, which includes peak milkproduction and re breeding.
Early lactation is also a high risk period for metabolic diseases and multifactorial stresstogether with other diseases such as metritis and mastitis. The status of IMI in cows at calvingwill determine udder health in that whole lactation. If recently calved cows have a highincidence of IMI, little progress will be made in lowering the BMSCC, as each animal curedduring lactation would be replaced by another infected cow that has recently calved. Themanagement aim should be to have less than 15% cows with SCC in excess of 200 000 cells/mlup to 90 days in lactation (Green and Bradley, 2012).
Mid lactation is generally a lower risk period and a less eventful time for dairy cows than earlylactation. During late lactation the optimum body condition of around 3.5 for cows should be

41
achieved, foetus growth accelerates and cows are prepared for drying off. The timing ofdrying off usually depends on the expected calving date and level of milk yield to allow for asufficient dry period. Concentrates may need to be reduced when milk yields are still highclose to the date of drying off to prevent excess udder oedema. While there may be a smallrise in a cow’s SCC in late lactation, sharp increases that are seen at this stage may be as aresult of udder infection or irritation.
Table 2.4. Herd Udder Health status correlated with different stages of lactation usingquarter milk samples.
DiagnosisBacteriaisolated
% In Earlylactation(5 90days)
% In Midlactation
(91 180days)
% In Latelactation
(180+ days)
Portion of herd 34.78 27.53 37.67
Normal none 66.68 78.97 70.22Aseptic mastitis (NSD) none 14.58 6.57 12.50Mastitis Str. dysgalactiae 1.04 1.31 0.00Mastitis CNS 7.30 2.62 2.87Mastitis Str. uberis 3.13 1.31 0.96Mastitis S. aureus 2.07 0.00 0.96Total % mastitis (M) 13.54 5.23 4.78Teat canal infection CNS 4.17 9.23 12.50Teat canal infection Str. uberis 1.04 0.00 0.00Total % Teat canal infection (TCI) 5.20 9.23 12.50
Total % with intramammary infections (M + TCI) 18.75 14.46 17.28Total % with high somatic cell count (M + NSD) 28.12 11.81 17.28CNS: coagulase negative staphylococci, Str. dysgalactiae: Streptococcus dysgalactiae; Str. uberis: Streptococcusuberis; S. aureus: Staphylococcus aureus, Mastitis criteria: (SCC 300 000 cells/ml and culture positive), NSDcriteria: (SCC 300 000 cells/ml and culture negative), TCI criteria: (SCC < 300 000cells/ml and culture positive),Normal criteria: (SCC < 300 000 cells/ml and culture negative).
General udder health of the herd
In a herd used as an example 71.38% of quarters were diagnosed as being normal, 11.6% withNSD, 7.95% with mastitis and 9.06% with TCI. Although the percentage of normal quarters inthis herd is satisfactory, the 19.55% of quarters with a SCC above 300 000 cells/ml milk isunacceptable high and so are the 17.01% cases of IMI. The quarters with high SCC in the herdoriginated from 7.95% mastitis and 11.6% NSD cases. When no bacteria is isolated from alarge percentage of milk samples with high SCC, the milking machine and stress factors (hightemperature humidity index, overcrowding, mud, nutritional shortcomings and inadequatemanagement) may be indicative as causes.

42
The bacteria responsible for IMI in this herd are CNS (13.04%), Str. uberis (2.14%), S. aureus(1.08%) and Streptococcus dysgalactiae (0.72%). It was noted that 72.24% of intramammaryinfections in early lactation were due to mastitic quarters while only 27.65% of IMI identifiedin quarters in late lactation were mastitic.
Lactation stages – intramammary infections
As the percentage of cows in this herd in early (34.78%), mid (27.53%) and late lactation(37.67%) differ the percentage IMI and high SCC quarters were calculated per lactation stage(Table 2.4). There were IMI (mastitis plus TCI cases) in 18.75% of quarters taken from cows inearly, 14.46% in mid and 17.28% in late lactation respectively (Table 2.4). The percentage IMIdetected in early lactation cows was high. This would warrant further investigation into thedry period and calving management, persistent of chronic cases, stress during early lactationand supressed immunity of cows early in lactation. When the IMI increases with days in milk,a distinction should bemade between failure to cure of existing IMI that (increased persistentcases) and an increase of new IMI. Persistent casesmay be due to udder parenchyma damage,treatment failure or virulent or resistant pathogen strains, and a supressed host immunesystem. Depending on the bacterial species involved, new infections may originate from theenvironment (bedding, pastures, water contamination and inadequate milking machinehygiene), the parlour hygiene during the milking routine; or when biosecurity is lacking.
Lactation stages – somatic cell counts
In the example in (Table 2.4) cows in early lactation had the highest percentage (28.10%)quarters with increased SCC compared to mid (11.80%) and late lactation (17.30%) cowsalthough cows less than 5 days inmilk are excluded. Quarters identifiedwithmastitis (13.54%)and NSD (14.58%) contributed almost equally to the high percentage SCC found in earlylactation (Table 2.4). In this herd both suspected causes responsible for IMI and NSD in earlylactation cows needed therefore to be investigated.
Economic Report
Estimations are made on the whole herd and do not take into account variations betweencows. The MSD program is used to estimate milk production losses based on quarter milksample with elevated somatic cell counts (Giesecke et al. 1994; Hortet and Seegers, 1998;Sharma et al. 2011). The herd used as an example in Table 2.5a had a daily milk production of2400 litres. IN the calculation used losses with SCC less than 125 000 cells/ml are disregardedand a loss of 100% would indicate an inactive quarter (Table 2a). The daily milk loss in thisherd due to elevated SCC was estimated to be 162.3 litres. This loss represents an estimatedloss of 4 936 litres per month and 59 235 litres annually. This represented a 14.81% loss inpotential milk production for this herd.

43
When making a management decision regarding a Str. agalactiae IMI in a herd it is helpful tohave an indication of the current production loss due to Str. agalactiae. In Table 2.5b thedaily milk production loss in the Str. agalactiae infected quarters was estimated to be 48.2litres amounting to a just over 1% production loss. Although this case may not warrant blitztherapy to eradicate Str. agalactiae, the focus should be on improving the milking routine.This calculation is only based prevalence at the time of sampling and does not incorporaterisks of new infection, shedding, cure rate and number of persistent cases.
.
Producer Code: 840 Daily Milk Production: 2650 litres
Producer: Farmer A Milk price per litre : ZAR 4.45
Dairy: Dairy A Selection criteria: All samples tested
SCC levels x 1000cells/ml
% Losses based onthe SCC level of
individual quarters
Number ofquarters perSCC level
Loss in litres Lost Revenue
< 125 0 183 0.00 R 0.00
125 350 3.7 33 12.26 R 54.54
351 500 11.3 14 15.88 R 70.67
501 750 16.3 8 13.09 R 58.25
> 750 25 34 85.32 R 379.68
Inactive quarters 100 0 0.00 R 0.00
Estimated daily milk loss: 126.55 liters values at ZAR 563.14Estimated monthly milk loss: 3 796.43 liters values at ZAR 16 894.10Estimated annual milk loss: 46 190 liters values at ZAR 205 544.84
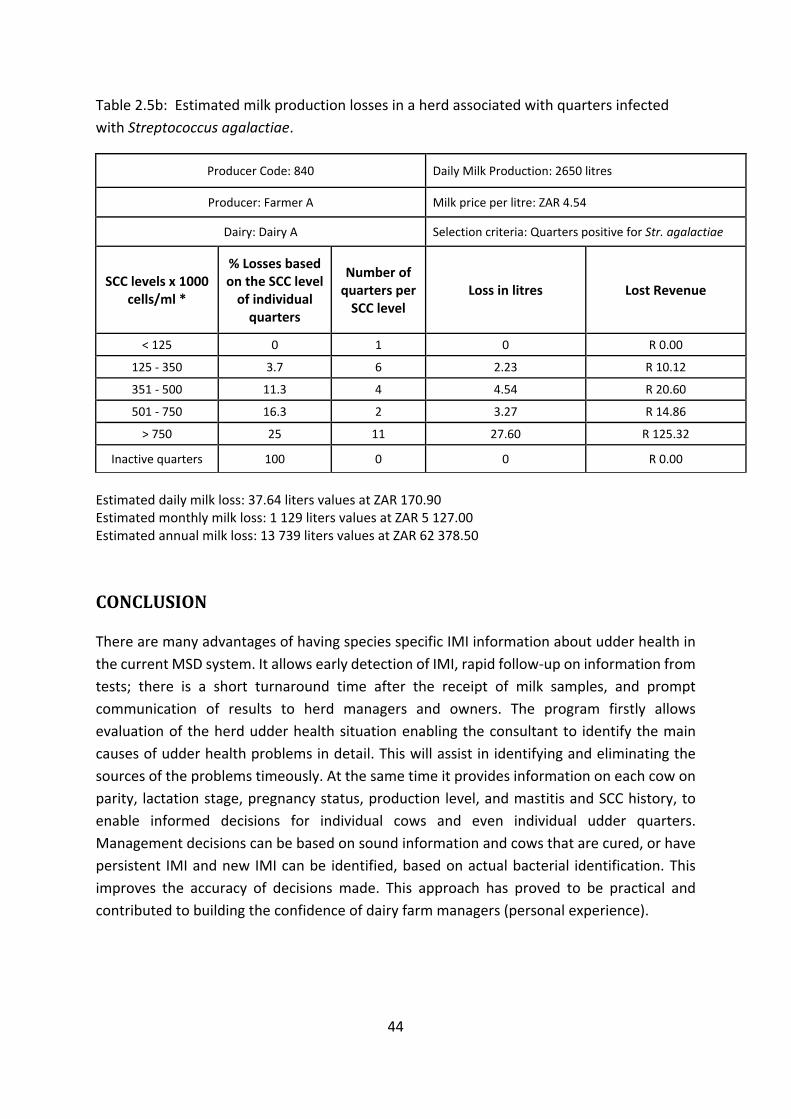
44
Table 2.5b: Estimated milk production losses in a herd associated with quarters infectedwith Streptococcus agalactiae.
Producer Code: 840 Daily Milk Production: 2650 litres
Producer: Farmer A Milk price per litre: ZAR 4.54
Dairy: Dairy A Selection criteria: Quarters positive for Str. agalactiae
SCC levels x 1000cells/ml *
% Losses basedon the SCC levelof individualquarters
Number ofquarters perSCC level
Loss in litres Lost Revenue
< 125 0 1 0 R 0.00
125 350 3.7 6 2.23 R 10.12
351 500 11.3 4 4.54 R 20.60
501 750 16.3 2 3.27 R 14.86
> 750 25 11 27.60 R 125.32
Inactive quarters 100 0 0 R 0.00
Estimated daily milk loss: 37.64 liters values at ZAR 170.90Estimated monthly milk loss: 1 129 liters values at ZAR 5 127.00Estimated annual milk loss: 13 739 liters values at ZAR 62 378.50
CONCLUSION
There are many advantages of having species specific IMI information about udder health inthe current MSD system. It allows early detection of IMI, rapid follow up on information fromtests; there is a short turnaround time after the receipt of milk samples, and promptcommunication of results to herd managers and owners. The program firstly allowsevaluation of the herd udder health situation enabling the consultant to identify the maincauses of udder health problems in detail. This will assist in identifying and eliminating thesources of the problems timeously. At the same time it provides information on each cow onparity, lactation stage, pregnancy status, production level, and mastitis and SCC history, toenable informed decisions for individual cows and even individual udder quarters.Management decisions can be based on sound information and cows that are cured, or havepersistent IMI and new IMI can be identified, based on actual bacterial identification. Thisimproves the accuracy of decisions made. This approach has proved to be practical andcontributed to building the confidence of dairy farm managers (personal experience).

45
ACKNOWLEDGEMENTS
We gratefully acknowledge ABACI Systems for developing the MSD computer program thatenabled us to perform semi intelligent herd health analysis, Dr WH Giesecke for the originalconcept of the program, the milk producers of South Africa for their continue support. Thankyou to the following staff of the Milk Laboratory staff of the Department Production AnimalStudies, Faculty of Veterinary Science, Onderstepoort for their quality work: Mrs JCWatermeyer, F Konaite, N Labuschagne and R Ludike, Miss R Badenhorst, Mr LL Mohapi andMalekane.
REFERENCES
Barkema, H.W., Schukken, Y.H. & Zadoks, R.N., 2006. Invited Review: The role of cow,pathogen and treatment regimen in the therapeutic success of bovine Staphylococcus aureusmastitis. Journal of Dairy Science 89, 1877 1895.
Barkema, H. W., Schukken, Y.H., Lam, T.J., Beiboer, M.L., Wilmink, H., Benedcitus, G. & Brand,A., 1998. Incidence of clinical mastitis in dairy herds grouped in three categories by bulk milksomatic cell counts. Journal of Dairy Science 81, 411 419.
Bolsen, K.K. & Pollard, G.V., 2004. Feed Bunk Management to Maximize Feed Intake.Advances in Dairy Technology 16, 227 238.
Bradley, A., 2007. Mastitis pattern analysis – a fresh look at the analysis of bovine mastitis:Part 1 – somatic cell count data. United Kingdom Veterinary Journal 12, Nov 2007.
Bradley, A.J. & Green, M.J., 2001. Aetiology of clinical mastitis in six Somerset dairy herds.Veterinary Record 148, 683 686.
Burfeind, O., von Keyserlingk, M.A.G., Weary, D.M. & Heuwieser, W., 2010. Technical note:Evaluation of a scoring system for rumen fill in dairy cows. Journal of Dairy Science 93, 3635–3640.
Collard, B.L., Boettcher, P.J., Dekkers, J.C.M., Petitclerc, D. & Schaeffer, L.R., 2000.Relationships between energy balance and health traits of dairy cattle in early lactation.Journal of Dairy Science 83, 2683–2690.
Cook, N.B. & Reinemann, D.J., 2007. A Tool Box for Assessing Cow, Udder and Teat Hygiene,paper presented at the annual meeting of the NMC, University of Wisconsin, Madison. 2007.
Davidson, I., 1961.The epidemiology of staphylococcal mastitis. Veterinary Record 73, 10151018.
DeGraves, F.J. & Fetrow, J., 1993. Economics of mastitis and mastitis control. VeterinaryClinical Journal of North America: Food Animal Practice 9, 421 434.

46
Dodd, F.H., Westgarth, D.R., Neave, F.K. & Kingwill, R.G., 1969. Mastitis – the strategy ofcontrol. Journal of Dairy Science 52, 689 695.
Du Preez, J.H., 2000. Parameters for the determination and evaluation of heat stress in dairycattle in South Africa. Onderstepoort Journal of Veterinary Research 67, 263 271.
Du Preez, J.H., Giesecke, W.H. & Hattingh, P.J., 1990. Heat stress in dairy cattle and otherlivestock under southern African conditions. I. Temperature humidity index mean valuesduring the four main seasons. Onderstepoort Journal of Veterinary Research 57, 77 87.
Giesecke, W.H., Van Staden, J.J., Barnard, M.L. & Petzer, I.M., 1988. Major effects of stress onudder health of lactating dairy cows exposed to warm climatic conditions. TechnicalCommunication, No 210, Pretoria South Africa, Department of Agricultural andWater Supply.
Giesecke, W.H., Du Preez, J.H. & Petzer, I.M., 1994. Practical mastitis control in Dairy Herds.1994. Butterworths, Durban. ISBN 978 0 40910 923 8.
Goff, J. P., Ruiz, R., Horst, R.L., 2004. Relative acidifying activity of anionic salts commonlyused to prevent milk fever. Journal of Dairy Science 87, 1245 1255.
Green, M. & Bradley, A.J., 2012. Dairy herd health. ISBN 978 1 84593 997 7. pp. 5 11.
Halasa, T., Huijps, K., sterås, O. & Hoogeveen, H., 2007. Economic effects of bovine mastitisand mastitis management: A review. Veterinary Quarterly 29, 18 31.
Heeschen, W.H., 2010. IDF and mastitis – A general review. Mastitis Research into Practice:5th IDF Mastitis Conference, proceedings, Christchurch, New Zealand, March 21 24, 2010. pp.22 32.
Hillerton, J.E., 1999. Re defining mastitis based on somatic cell count. Bulletin of theInternational Dairy Federation 345, pp. 4 6.
Hoogeveen, H., Huijps, K., Halasa, T. & Lam, T.J.G.M., 2010. Mastitis costs money: What’snew? Mastitis Research into Practice: 5th IDF Mastitis Conference, proceedings, Christchurch,New Zealand, March 21 24, 2010. pp. 62 71.
Hogan, J. & Smith, K.L., 2003. Coliform Mastitis. Veterinary Research 34, 507 519.
Hortet, P. & Seegers, H., 1998. Calculate milk production losses associated with elevatedsomatic cell counts in dairy cows: review and critical discussion. Veterinary Research 29, 497510.
Hutjens, M.F. & Aalseth, E.P., 2005. Caring for Transition cows, viewed 15 September 2015,from https://books.google.com/books/isbn=0932147461, pp. 35 38.

47
Keefe, G.P., 1997. Streptococcus agalactiae mastitis: a review. Canadian Veterinary Journal38, 429–437.
Lactodata, 2015. 18(1), viewed 30 October 2015, from http://www.milksa.co.za.
Manson, F.J. & Leaver, J.D., 1988. The influence of concentrate amount on locomotion andclinical lameness in dairy cattle. Journal of Animal Science 7: 185 190.https://doi.org/10.1017/S0003356100003251.
Messenger, A.M., Barnes, A.N. & Gray, G.C., 2014. Reverse Zoonotic Disease Transmission(Zooanthroponosis): A Systematic Review of Seldom Documented Human Biological Threatsto Animals, viewed 12 February 2015, fromhttp://journals.plos.org/plosone/article?id=10.1371/journal.pone.0089055.
Middleton, J.R., 2013. Staphylococcus aureus mastitis: Have we learned anything in the last50 years? NMC Regional Meeting, proceedings, 2013.
Neave, F.K., Dodd, F.H. & Kingwill, R.G., 1966. A method of controlling udder disease.Veterinary Record 78, 521 523.
Neave, F.K., Dodd, F.H., Kingwill, R.G. &Westgarth, D.R., 1969. Controlling mastitis in the dairyherd by hygiene and management. Journal of Dairy Science 52, 696 707.
Neijenhuis, F., Mein, G.A., Britt, J.S., Reinemann, D.J., Hillerton, H E., Farnsworth, F., Baines,J.R., Hemling, T., Ohnstad, I., Cook, N., Morgan, W.F. & Timm, L., 2001. Evaluation of bovineteat condition in commercial dairy herds: 4. Relationship between teat end callosity orhyperkeratosis and mastitis. 2nd International Symposium on Mastitis and Milk QualityProceedings, Vancouver, BC, Canada, September 13 15, 2001. pp. 362 366.
National Mastitis Council, 2001. Guidelines on Normal and Abnormal Raw Milk Based on SCCand Signs of Clinical Mastitis. Harmon, B. 40th Annual mastitis meeting 11 14 February 2001.Viewed 15 January 2015. http://www.nmconline.org/docs/abnmilk.pdf.
National Mastitis Council, 2015. Somatic cell counts at a first Test: More than a number.Kirkpatrick, M.A., Olson, J.D. 54th Annual mastitis meeting 1 4 February 2015. Viewed 18January 2017. http://www.nmconline.org/docs/abnmilk.pdf.
Oliver, S.P., Sordillo, L.M., 1988. Udder health in the periparturient period. Journal of DairyScience 71: 2584 2606.
Petzer, I.M., Karzis, J., Donkin, E.F., Webb, E.C., Etter, E.M.C. 2017. Somatic cell countthresholds in composite milk samples as indicator of bovine intra mammary infection status.Onderstepoort Journal of Veterinary Research 84, 1 12. doi.org/10.4102/ovjr.v84.1.1269.

48
Petzer, I.M., Karzis, J., Meyer, I.A. & van der Schans, T.J., 2013. A cost benefit modelcomparing the California Milk Cell Test and Milk Electrical Resistance Test. OnderstepoortJournal of Veterinary Research 80, 6.
Petzer, I.M. & Karzis, J., 2012. The prevention of intra mammary infections in pregnant heifersthat were co housed as calves, and reared on whole milk, in eight South African Dairy herds.Livestock Health and Production Annual Congress, proceedings, Stellenbosch, South Africa,April 7 9, 2012. pp. 1 10.
Petzer, I.M., Karzis, J., Watermeyer, J.C., Badenhorst, R. & van der Schans, T., 2012. Trends ofMastitogenic Bacteria from 2008 to 2012 in South African Dairy Herds. IDF World DairySummit, poster exhibition, Cape Town, South Africa, November 4 8, 2012.
Petzer, I.M., Karzis, J., Watermeyer, J.C., van der Schans, T.J. & van Reenen, R., 2009. Trendsin udder health and emerging mastitogenic pathogens in South African dairy herds. Journal ofSouth African Veterinary Association 80, 17 22.
Reneau, J.K., Seykora, A.J., Heins, B.J., Bey, R.F. & Farnsworth, R.J., 2003. Relationship of cowhygiene scores and SCC. National Mastitis Council Annual Meeting, proceedings. 2003. pp.362 363.
Reneau, J.K., 2001. Somatic cell counts: Measures of farmmanagement andmilk quality. NMCMeeting, proceedings, 2001. p. 29.
Ruegg, P. & Pantoja, J.F.C., 2013. Understanding and using somatic cell counts to improvemilkquality. Irish Journal of Agriculture and Food Research 52, 101–117.
Sharma, N., Singhand, N.K. & Bhadwa, M.S., 2011. Relationship of Somatic Cell Count andMastitis: An Overview. Asian Australian Journal of Animal Science 24, 429 438.
Smith, K.L. & J.S. Hogan, J.S., 2001. The World of Mastitis. 2nd International Symposium onMastitis and Milk Quality, proceedings, Vancouver, BC, Canada, September 13 15, 2001. pp.1 12.
Sol, J., Sampimon, O.C., Snoep, J.J. & Schukken Y.H., 1997. Factors associated withbacteriological cure during lactation after therapy for subclinical mastitis caused byStaphylococcus aureus. Journal of Dairy Science 80, 2803–2808.
Statistics South Africa., 2013. P0302,Mid year population estimates, 14May 2013, viewed 30June 2015, from www.statssa.gov.za/publications/statsdownload.asp/PPN=p0302&SCH.
Swinkels, J.M., Schukken, Y.H. & Cox, P., 2012. Efficacy of short versus long duration oftreatment of clinical Staphylococcus aureus mastitis. XXYII World Buiatrics Congress,proceedings, Lisbon, Portugal, June 3 8, 2012. p. 150.

49
White, A., 2010. Mastitis, A practice approach. Journal of Veterinary Surgeon in GeneralPractice, Livestock 15, 36 40.
Wildman, E.E., Jones, G.M., Wagner, P.E., Boman, R.L., Troutt Jr, H.F., Lesch, T.N., 1982. ADairy Cow Body Condition Scoring System and Its Relationship to Selected ProductionCharacteristics. Journal of Dairy Science 65, 495 501.
Zadoks, R.N., 2007. Sources and epidemiology of Streptococcus uberis, with specialemphasis on mastitis in dairy cattle', CAB Reviews: Perspectives in Agriculture, VeterinaryScience, Nutrition and Natural Resources 2, p. 15.

50
ADDENDUM 2.1
The goal is to eventually rid your herd completely from Staphylococcus aureus (S. aureus). Thesource of the S. aureus infection in a herd is the udders of the S. aureus cows, people withupper respiratory S. aureus infections, open wounds and cows that are bought into the herdwithout testing them first.
This addendum act only as an example of the type of report that is generated for dairyproducer when a herd visit and consultation is done. Consultations follow when laboratorydata identified an udder health herd problem.More detail reports are then generated to helpin pin pointing the probable causes of this problem. During the farm consultation that followsmilking routine andmilker performance are evaluated. The milkingmachine is tested (dry andwet testing) and udders are palpated, either the whole herd or only selected groups such ascows that tested positive for S. aureus IMI. The latter is done to identify nodules, fibroses andatrophy in quarters. When the parenchyma is damaged treatment success is low.
The MSD program was developed to assist in data mining after every herd examination. Milkfrom 5 to 20 herds are tested weekly for 11 months of the year. Laboratory herd data isinterpreted for dairy producers and reports included the overall udder health herd status andthe current most probable udder health challenges in the herd visible from the data areidentified. Individual problem groups are identified for instance S. aureus positive cows aswell as advice regarding individual cows. When the root of the udder health problem cannotbe identified in a problem herds, an udder health herd visit is scheduled.
An example of a letter to a dairy producer
You have culled a number of chronically infected S. aureus cows lowering the risk of sheddingof this bacteria significantly. We should focus now on farming the rest out. Keep the S. aureuscows separate but your main focus should be on preventing new infections in the herd. Thelatter will require excellent parlour hygiene at every milking! Do not underestimate the valueof basic parlour management and hygiene.
Also take note that the teat canal is the first and core part of the immune system of the udderin the dairy cow. Once the teat canal has been damaged the immune system of the udder iscompromised and the cow can no longer protect herself against new IMI. Teat canal damageoccur as a result of incorrect milking machine settings, maintenance or use.
The immediate way forward I want to suggest:
You will need to resample your herd from time to time (maybe 6 monthly) to make surethat the negative cows remain negative and if we do find a S. aureus cow to move her tothe S. aureus group a.s.a.p.Parlour hygiene is the number one key to success – hands of milkers, teat liners andcommunal papers/cloths from udder to udder.

51
Ensure that people are not a sourceBiosecurity when buying new animals into the herdHeifers that calve down (small risk) and dry cows that were not tested beforeTake care of the teat canals of the cows and their immune system and they can take careof themselvesKeep the functioning of the milking machine sound.
Findings with the herd visit cows
It was such a pleasure to work with your tame cows. The animals are handled with care on aconstant basis. It does promote good hygiene when the bottom part of the tail hair is cut atcalving and again later during lactation.
Udder conformation of cows was generally very good with some excellent hind quarterdevelopment.
The teat canal scores were overall good (mostly1 and 2) but what did worry me was that alarge number of cows had hard teats and hardened rings at the teat base just after the clusterscame off.
Milking Routine
The waiting area in front of the parlour is well designed (size, surface and slope).Some hosepipes in the parlour are just too long and touch the floor – this maycontaminate the hands of the milkers when handled. The part that the milkers touchshould be off the floor and kept clean.The management of your liner plugs was good.
Pre milking
Time from touch (of teats) to attachment (of clusters) varied but seemed to be a bit toolong. However, this is not a major problem. The reason for doing this measurement is tobe sure that sufficient time is allowed for the milk let down (your teat dip containingoxytocin is also assisting), and to be done with milking within 8min. max after attachmentin most of the cows. The Afimilk report indicated that there were only a few cows (thismight have been those fresh in milk / colostrum cows) that milked for too long. Theaverage milking time per cow should be more or less 5 minutes when they are producing10 litres.The pre teatdip application needs improvement as many of the teats were not wellcovered. You are using the pre teatdip for 2 reasons – the first is to lower the bacterialload on the teat skin prior to milking (including the STA) and the second is to disinfect thehands of the milkers. The latter remains one of the 3 crucial actions during the milkingroutine to prevent the spread of STA from cow to cow.

52
Milking
It would be beneficial to test milkers, yourself (all those in close contact) with the cows atleast on an annual basis (throat swabs at your local clinic) just to ensure that newinfections do not occur via human contact.Clusters are attached from time to time with some vacuum lost, but it is not easy to attacha cluster to Jerseys with deep udders without losing vacuum. Again this is not a majorproblem. Where there were liner slips milkers reacted fast to rectify the situation. Afimilkcould be used to monitor trends in liner slips, re attachments and kick offs.
Post milking
As mentioned earlier in this report many cows showed increased hardness (swelling) ofteats and teat base rings. This may be an indication that clusters are attached for too long.As discussed – it is a long time aftermilk flow has decreased at teat end that the flowmeterregisters it because it is lifted about 1.8m above the udder and the long milk pipes are2.5m long. These settings need to be changed. Could Piet from Afimilk please provide uswith your various machine settings.Post teat dip application should also improve – to cover at least 2 thirds of the bottompart of the teats.Backflush of units should be done every time after each cow has been milked, as this isthe other crucial action in the prevention of spread of S. aureus in the parlour.One can milk the average residual milk the ideal is 150 to 200ml per udder. Emptyingand filling time of the parlour was good.The graph on Afimilk indicating the % low flow time of a milking is valuable. Not only doesit indicate the preparation efficacy for milking but it also indicates the risk of teat canaldamage due to the milking machine. It mainly indicate for how long is the test beingmilked at a high vacuum (when little milk in flowing) – the ideal is 15%.
The Milking Machine (30 point swing over Waikato system with ACR)
The overall setting of the pulsator ratio is within the norms (but will cause milking to berelatively slow). Your machine helps to prevent teat canal damage in your herd.
The work to rest ratio is 59:41 with long A and D phases. The pulsation is average at 55.The high milk line needs a high system vacuum and again can promote damage:
A phase: 10 – 20% (Vacuum is created in the pulsation chamber)
B phase: > 35% (Liner totally open)
C phase: 10 – 20% (Air is let into the pulsation chamber and the liners close)
D phase: > 15% (Liner totally closed or collapsed)

53
Summary of the Pulsograph results
System vacuum was approximately 46.7 kPa at all units.The variation within (2x2) milking units is too much. In most of the cases the 2x2 valueswithin units differ more than 1% point. The most serious problems are where the limpingis above 1% point as indicated. The latter creates a situation where one side of the udderis milked out before the other side and is then over milked.The following pulsators are not functioning optimally:4 (units 7 & 8); 7 (units 13 & 14); 9 (units 17 & 18); 10 (units 19 & 20); 11 (units 21 & 22)and 15 (units 29 & 30) plus units 1, 10, 11 and 28.
Teat end vacuum at maximum milk flow (2nd minute)
Two of the secondminute teat end vacuums were over 40kPa. Besides some cases of highteat end vacuum there where indentations of the teat base and hardness of teat aftermilking.The teat end vacuum of the average producers should be at 36 38 kPa while those of thehigh producers should be at 33 to 34 kPa. The teat end vacuum while milking lowproducing cows should preferably not be above 40 kPa. This monitoring should be anongoing process. The sooner you know about a problem, the less damage is done to yourcows.The timing of the take off units should be investigated and most likely changed.
Results of the second minute teat end vacuums
Milk production Average vacuum (kPa)
Variation in vacuum (ideal < 5 kPa)
Low 40.5 3.8 High 32.6 4.0 Average 36.8 4.8 Low 42.2 3.6 Average 34.8 3.6 Average 34.9 2.4
The normal usage time of a teat liner is usually 2500 milkings. Please ensure that youalways adhere to this liner life. In your parlour with 30 units and 2milkings per day for 330cows the liners should be replaced every 114 days.Be sure that the vacuum control valves and the filters in the filter lines are clean at alltimes.Automatic cluster removals (ACR) settings
The Afimilk program dictates when the ACR will be taken off. It is based on more than onesetting in the program but the 2 most important ones are those that indicate at what volume(formula that relates time and volume) the ACR should be taken off and the second one is the

54
setting that is set for the delay time (when that volume is reached – how long must themachine wait before taking the unit off). Could you kindly obtain these values from theprogram? They are taking off too late. The flow meter in your system is far from the udder ofthe cow and high above it with the result that there is a delay time before the machinemeasures the end of a milking. We therefore have to set them to take off earlier that thesetting where flow meters are close and below the level of the udders. I believe that theincorrect setting is the major reason for the swollen teats after milking.
Another setting that should be checked is the min. time on. If this is too long cows may beover milked when units are reattached.
Clinical examination of udders
Lesions in front of the udder increased from 9 to 27 cases. They are: 2084; 9711; 3052;1045; 9990; 1255; 1124; 9785; 1043; 9778; 9950; 1086; 97154; 30411; 1009; 3032; 1165;1063; 1160; 2103; 96120; 3026; 3087; 1108; 9978; 1215 & 9922 (Those printed in boldwere also positive with the previous visit). Any wounds can harvest bacteria, especially S.aureus.There were again 5 cows with clinical mastitis on the day of our visit (cows: 1028(RA),9714 (LA); 1010(RA); 9960(RA) and 2030(LA).There were 5 cows with old or new abscesses on their udders: 1068 (puss dripped fromteat); 97119; 3002(RA); 1102 and 9960.Cow 1310 had blood in her quarter. It is contra indicated to treat these cows withintramammary drugs. This increases the tissue irritation in the affected udder. She shouldhowever, always be treated systemically and the quarter should be milked very gently byhand. Hose the udder down for several minutes a day with cool water.Two rudimentary teats that produce milk were found: 1289 and 3042.Warts were found on teats of 12 cows.79 cows (29%) had asymmetric udders while the overall teat canal scores (TCS) were asfollows:22 cows had oedema of their udders and 10 had ventral oedema.Cow 2147 had a sore foot. The hoof care in the herd was very good.Results of udder parenchyma on individual cows are presented in the printouts. Do notreact to any scores of 1. These fibroses often resolve and cannot be found with a secondexamination. Any parenchyma scores of 3 are very serious and, except in cases of clinicalmastitis, is an indication of severe, permanent damage to the udder.

55
Laboratory results Overall 15% (Aug = 23%) of all quarters had mastitis, 6.8% (Aug =11%) showed signs of udderirritation, 24.8% (Aug = 20%) had teat canal infection and 51.6% (Aug =45%) were normal.This means that 22% (Aug =34%) of all quarters had a somatic cell count (SCC) of above 400000 cells/ml and 30% (Aug =43%) of quarters were infected. There was an overallimprovement in the udder health status of the herd, but it is not yet ideal. Bacterial profile of lactating cows in the herd
12.5% (Aug =14.3%) of quarters were infected with Staphylococcus aureus (STA) of which1.3% (Aug = 2.7%) were suspected human strains (STH).0.5% (Aug =1.2%) were infectedwith Streptococcus agalactiae (SAG); 1.8% (Aug =3%) SFA;0.5% (Aug =1%) SPY; 0.4% (Aug =3.4%) SUB and 13.5% (Aug =18%) STE.8 cows had one inactive quarter each while cow 1284 had two (LF and LH). 50% of allinactive quarters were LF quarters.67 cows had mastitis in one quarter, 25 in two, 7 in three and 7 in all four quarters.56 cows had udder irritation in one or two quarters and 4 in three or four quarters.The estimatedmilk loss at present due to high quarter SCC is 1276 litters or R2362 per day(R70 860 per month).Individual Cows: Please see the attached data. I marked the STA cows that is suspect tohave chronic STA infections.
Results of Bulk Milk hygiene tests
Bacterial plate count (cfu/ml)
Coliforms (cfu/ml)
E. coli type 1 (cfu/ml)
SCC x 103
(cells/ml)Brucella milk
ring test Bulk milk >300 000 >110 Positive 389 Negative
Requirements <50 000 <20 Negative <500 Negative
Results of Water tests
Bacterial plate count (cfu/ml)
Coliforms (cfu/ml)
E. coli type 1 (cfu/ml)
Water 84 0 Negative
Recommendations <100 cfu/100ml None / 100 ml Negative

56
Comments on somatic cell counts (SCC) from your E Report (dated 5 Sept 2016):
The SCC of the cows in early lactation is too high. The first and second lactation cows have fartoo high SCCwhichmeans that cows are infected or udders are irritated early during lactation.The graph showing only SCC below 250 000 cells/ml could improve to 75% and more. The SCChistory table shows an overall improvement with the low SCC increasing but the high SCC isstill too high.
Dr Inge Marié Petzer
57
CHAPTER 3
Published March 2017: Inge Marié Petzer, Joanne Karzis, Edward F. Donkin, Edward C. Webb,Eric M.C. Etter. 2017. Onderstepoort Journal of Veterinary Research 84(1). ISSN: (Online)a1269.https://doi.org/10.4102/ovjr.v84.1.1269. Copy write of article permitted for Thesisunder: Creative Commons Attribution 4.0 International (CC BY 4.0) licence.
SIGNIFICANCE OF THEWORK
Somatic cell count (SCC) as indicator of udder health status in quarter milk samples has beenwell researched and reported on for many centuries. Although researchers agree that itremains an useful indicator of the udder health status in cows they do not agree on the SCCthreshold indicating intramammary infections (IMI). There is currently no internationalguidelines for a SCC threshold indicating IMI in composite milk samples. The number oflactating cows per herd in South Africa increased causing effective monitoring of the udderhealth status of the individual cow to becomemore challenging. In South Africa routine udderhealth examinations of quarter milk samples have been replaced by composite milk samplesbeing more practical and less costly to analyse. Due to the dilution effect of combining thefour udder quarters in one sample results of these samples are currently difficult to interpretas single test under field conditions. Some South African milk laboratories culture milksamples only with SCC above a chosen SCC threshold. It is of importance to know whatpercentage of IMI in general and infections with contagious udder pathogens would bemissed at those SCC thresholds. This information can be of key importance to the veterinarypractitioner and the manager alike for wise pro active udder health management decisions,both on herd and individual cow level.
In this first of two manuscripts utilizing 345 461 composite and 89 638 quarter samples fromdairy herds in 7 of 9 South African provinces the main objective was to establish a SCCthreshold for composite milk samples that could be used for initial screening for IMI.
ABSTRACT
The objective of the study was to establish an operational SCC threshold to predict thepresence of intramammary infection (IMI) in composite milk samples and compare findingswith those in quarter milk samples. South African dairy producers now prefers composite milk

58
samples for herd udder health analysis due to increasing cow numbers, convenience ofsampling and lower cost.
A retrospective study was done on 345 461 composite and 89 638 quarter milk samples fromSouth African herds. Variance estimates for the proportion of quarter samples testing positivewere adjusted to account for the lack of their independence within individual cows. The IMIat SCC thresholds of 150 000 and 200 000 cells/ml differed only by 3.26% in composite milksamples. Youden’s Index indicated the optimum SCC thresholds for composite and quartermilk samples as 150 000 and 200 000 cells/ml respectively. At 150 000 cells/ml, Sensitivity(95% CI) in composite milk samples was 65.3% (64.0%, 66.6%) and Specificity was 66.8%(65.7%, 67.9%); and in quarter milk samples Sensitivity was at 200 000 cells/ml 70.8% (69.5%,72.0%) and Specificity was 63.6% (62.4%, 64.8%). The likelihood of infection for udders andquarters respectively was 1.034 and 1.327 at a SCC threshold of 150 000 cells/ml and 0.864and 1.177 at 200 000 cells/ml. The area under the curve of the receiver operatingcharacteristics graph was 0.7084 and 0.7277 for composite and quarter samples respectivelyindicating that the SCC test could be considered as good indicator of IMI in both sample types.
Key words: Composite milk samples, somatic cell count threshold, intramammary infections,dairy cows
INTRODUCTION
Bovine mastitis remains a major challenge and the disease responsible for most economiclosses in dairy cows in developed countries despite improvements in management ofsubclinical mastitis over the past decade (Geary et al. 2012). More than 80% of financial lossesdue to mastitis have been estimated to occur as a result of the subclinical from of the diseaseindicating that this should be the key focus in pro active udder health management (Gieseckeet al. 1994).
There is a correlation between the bulk milk somatic cell count (BMSCC) and the estimatedpercentage of cows with IMI in a herd (National Mastitis Council Guidelines, 2001). Bulk milksomatic cell count is useful for indicating milk quality, safety and suitability for manufacturingof dairy products (Sheldrake, Hoare andMcGregor, 1983; Miller and Paape 1985; Reneau andPackard 1991) but it does not provide information about udder health of the individual cow.No consensus exists worldwide regarding the legal limits of BMSCC in milk for humanconsumption. In the European Union, Australia, New Zealand, Canada and Switzerland thelegal BMSCC limit is 400 000 cells/ml, in South Africa 500 000 cells/ml, in the USA 750 000cells/ml and in Brazil 1 million cells/ml (Ruegg and Pantoja 2013).
Somatic cell counts from quarter samples have been generally accepted and used as theoperational measure of inflammation of the bovine lactating gland since 1960 (Heeschen1996; Barkema et al. 1999; Harmon 2001; Schukken et al. 2003; Biggs 2009; Heeschen 2010),

59
as an indicator of the severity of IMI (Harmon 1994) and as indicator of economic losses(DeGraves and Fetrow 1993). The SCC threshold level used to describe normal milk, IMI andsubclinical mastitis however has often been, and still is a controversial subject (Heeschen2010). In the 1967 International Dairy Federation (IDF) bulletin an udder quarter wasconsidered to be normal when no pathogens were isolated and the SCC was less than 500 000cells/ml milk. However, more recently, quarter milk with a SCC of equal or less than 100 000cells/ml from which no microorganisms has been isolated and without a history of recentinfection are considered to be normal (Harmon 2001; NMC Guidelines 2001) while those witha SCC of exceeding 200 000 cells/ml have been regarded as an indication of an inflammatoryresponse and that the quarter is likely to be infected (Dohoo and Leslie 1991; Laevens et al.1997; Schepers et al. 1997; NMC Guidelines 2001). In 2001 the National Mastitis Councildefined subclinical mastitis as an infected quarter with a SCC equal to or above 200 000cells/ml in the absence of clinical changes to milk (National Mastitis Council Guidelines 2001)based on findings by DeGraves and Fetrow, (1993); Harmon (1994) and Hillerton (1999). Thisdecision was endorsed at an IDFWorld Dairy Summit in New Zealand (2001), but it was agreedthat a tolerance range of up to 400 000 cells/ml was necessary for practical reasons. Furthercontroversy still exists in literature regarding mastitis cure, as the term “cure” may be usedwhen describing only clinical cure of mastitis, clinical cure with reduced SCC, or when clinicalsymptoms disappear, SCC has reduced and mastitis pathogens are absent (Hiitiö et al. 2012;Roy et al. 2012; Swinkels, Schukken and Cox 2012). The current quarter milk SCC threshold of200 000 cells/ml does not distinguish between principal udder pathogens although pathogensare known to differ in their pathogenic effects (Barkema et al. 1999, Petzer et al. 2009,Pantoja, Hulland and Ruegg 2009, Petzer et al. 2012). Current information on SCC thresholdlevels for pathogen specific IMI is needed because SCC are known to differ between udderpathogens and over time (Zadoks and Fitzpatrick 2009, Petzer et al. 2009, Petzer et al. 2012).
The average number of lactating cows per herd in South Africa increased from 100 in 1997 to238 in Jan 2015 and in provinces ranges from 76 in the Northern Cape to 769 in the EasternCape (Lactodata 2013, Lactodata 2015). Quarter milk samples for routine udder health herdexamination have been replaced by composite milk samples due to practical and financialreasons. In composite samples milk from the four udder quarters is combined, with aconsequent dilution effect that has required different interpretation of the results fromquarter milk samples. Although an international SCC threshold has been established for theindication of IMI in quarter milk this has not been agreed for composite milk samples.Identification of pathogens by phenotypically classification, biochemical analysis andgenotyping is costly and may well become impractical in both small and large South Africanherds in future. Knowledge of udder pathogens in herds remains of immense importance fora correct focus of pro active strategies and monitoring of udder health in dairy herds(Schukken et al. 2003; Ruegg 2011). Early detection of IMI will assist management lessen theseverity and duration of mastitis, reduce parenchyma damage, improve bacterial cure and

60
lessen the risk and duration of bacterial shedding and development of new IMI (Giesecke, etal, 1994, Schukken 2012).
A screening test is required to enhance the likelihood of identifying individual cows at risk ofhaving IMI within herds (Reneau and Packard 1991). Such a test can be considered successfulwhen it is simple, inexpensive and reproducible, widely available and with sufficientdiscriminatory power. Somatic cell count was chosen in this study for the evaluation ofcomposite milk samples, to be used as a screening test that could identify individual cowswith possible IMI. In this paper the incidence of IMI in composite milk samples at various SCCthresholds with indications of probable accuracy (Sensitivity and Specificity) and an“optimum” SCC threshold were evaluated. Results of composite and quarter samples wereevaluated and compared to results obtained at similar SCC thresholds.
MATERIALS ANDMETHODS
Study design and study population
A retrospective observational study was done on milk samples of lactating cows from SouthAfrican (SA) commercial dairy herds over a period of more than 4 years (January 2008 untilApril 2012). Samples originated from approximately 830 commercial SA dairy herds thatsubmitted samples as part of their routine udder healthmonitoring programme and also fromherds with increased BMSCC who had sought help. The lactating cow numbers in herds testedvaried from approximately 30 to 1 700 cows, while their intervals for herd examinationsranged from monthly and three monthly, to annually and bi annually, or in some cases onlya once off test.
Data selection and sampling
In the majority of cases all lactating cows within herds were sampled and not only selectedindividuals or groups. A total of 386 031 composite cow and 95 228 quarter milk samples wereinitially under consideration for use, of which 10.51% and 5.87% respectively were defined asbeing unsuitable and were excluded from the dataset. Samples were regarded as unsuitablewhen any visible abnormalities such as dirt, floccules, blood or watery milk were detected.Sample results were excluded from this study when cultures indicated contaminated, mixedbacterial growth or when there were doubtful SCC results or missing identificationinformation. The final dataset comprised of 345 461 composite and 89 638 quarter milksamples. Results were exported to and captured in the Milk Sample Diagnostic (MSD)computer program and were identified by producer, cow number, quarter position, date ofprocessing and sample type. In most cases information regarding parity, milk yield and daysin milk were not provided. The MSD program was developed over several years by Abaci SAfor the Milk Laboratory at the University of Pretoria (Faculty of Veterinary Science), to assist

61
in the analysis of milk samples received of dairy herds. (Petzer et al. 2016). Milk samples weretaken by professional samplers or milkers trained according to a standard operatingprocedure (Giesecke et al. 1994). Prior to sampling, first milk was stripped from all quartersand teat ends were carefully cleaned and disinfected with methylated alcohol. Approximately10 ml of foremilk was collected aseptically into sterile marked sample tubes and keptrefrigerated until shipment. In the case of composite milk samples the same procedure wasfollowed, only approximately equal volumes of milk from each of the four quarters werecollected in one sample tube. Samples were transported on ice to reach the Milk Laboratoryat the University of Pretoria (Faculty of Veterinary Science) within 48 hours after sampling.Temperatures and conditions such as sample tubes cleanliness and appearance were notedon arrival at the laboratory and samples which were spoiled or of doubtful quality were notprocessed. Samples were plated out at the laboratory on the day of their arrival.
Laboratory methods
Microbiology and somatic cell counts were done by the Milk Laboratory at the University ofPretoria (Faculty of Veterinary Science), on all milk samples under consideration for this study.Milk was plated on bovine blood tryptose agar plates (Oxoid, supplied by QuantumBiotechnologies (Pty) Ltd, Ferndale, South Africa). Inoculated agar plates were incubatedaerobically at 37 +1 oC and examined after 18 to 24 hours and 48 hours. Colonies were initiallyidentified based on colony morphology, haemolysis and potassium hydroxide test (KOH)results (IDF Document 132). The catalase reaction was used to differentiate betweenstaphylococci and streptococci. Staphylase, a coagulase test (Oxoid, supplied by QuantumBiotechnologies (Pty) Ltd, Ferndale, South Africa) was used to distinguish between coagulasepositive (Staphylococcus aureus) and coagulase negative staphylococci (CNS). The Staph APItest (Biomerieux South Africa (Pty) Ltd, Randburg, South Africa) was used for identification ofstaphylococci. Streptococci species were differentiated into the various Lancefield groupsusing a Strepkit (Oxoid, supplied by Quantum Biotechnologies (Pty) Ltd, Ferndale, SouthAfrica). Gram negative organisms were diagnosed using DNase and MacConkey agar (Oxoidsupplied by Quantum Biotechnologies (Pty) Ltd, Ferndale, South Africa) and API 20E(Biomerieux South Africa (Pty) Ltd, Randburg, South Africa).
Intramammary infection was defined as a pure culture when only one species grew on aninoculum. Growth of two distinct species was regarded as mixed growth and a sample wasconsidered to be contaminated when more than two species were present. Samples withgrowth of two and more colonies from the same bacterial species were recorded (NationalMastitis Council Guidelines 2001) except in the case of Staphylococcus aureuswhere one andmore colonies were recorded.
Somatic cells were counted by fluoro opto electronic means using a Fossomatic 5000 (RhineRuhr, P.O. Box 76167, Wendywood, 2144, South Africa).

62
Data analysis
In this study all pure bacterial cultures isolated from milk samples were considered asintramammary infections (IMI). A further study, using the same dataset investigated andanalysed results from 16 different udder pathogens. Somatic cell count was compared withthe presence and absence of organisms at eleven threshold levels. Results were analysed atSCC thresholds with increments of 50 000 cell/ml up to 500 000 cells/ml, thereafter theincrements escalated to 750 000 cells/ml and greater.
Two by two tables were generated. True positive (TP) and false positive (FP) cases weredefined as those milk samples that had SCC above the level investigated and where TP caseswere culture positive and FP not. True negative (TN) and false negative (FN) sample weredescribed as having SCC levels below the level of investigation but with either IMI (FN) orwithout IMI (TN). The results were analysed using a GenStat program (Payne et al. 2012). TheLikelihood Ratios (LR) was determined using the category oriented likelihood method(Moosapour et al. 2011).
In the case of composite milk samples Sensitivity, Specificity and 95% confidence intervals (CI)of binomial proportions around these estimates were determined using the Mid P exact testfrom the OpenEpi freeware program. Quarter samples cannot be considered to beindependent but rather clustered within cows (potentially multiple sample sets per cow)(Ampe et al. 2012). Sample dependency of SCC values within each cow was modelled to takeinto account individual cow factors that may affect quarter samples. An estimator of clustervariance was determined as described by Scheaffer et al., (1996). The 95% confidenceintervals were adjusted for clustering by using the design effect (cluster variance / samplerandom sample variance) (Scheaffer et al., 1996):
where
= the estimated proportion of unweighted quarters with intramammary infection (IMI)
n = the number of cows
i = the number of quarters with IMI per cow
mi = the number of quarters tested per cow
The estimated variance of the portion ( ) of quarters with IMI was calculated using thefollowing formula (Schaeffer et al. 1996):

63
The area under the curve (AUC) of the receiver operating characteristics (ROC) curves wasused to estimate the discriminative power of the SCCmeasurement over the range of possiblethresholds ranges and was calculated with the trapezoid method (Perkins and Schisterman2006). The best threshold point for balancing the Sensitivity and Specificity Ratios of the SCC,the one closest to the (0 , 1) point was taken as the threshold point that best differentiatedbetween those udders (composite milk) or quarters with IMI and those without. Youden’sindex which indicates themaximum distance between the ROC curve and the diagonal chanceline was calculated by subtracting 1 from the sum of the maximum Sensitivity and Specificity.
RESULTS
3.1 Composite milk samples
The SCC threshold levels of primary interest initially focused on in this study were 100 000,200 000 and 400 000 cells/ml for they were the levels in quarter milk samples that have beenrecommended by the International Mastitis Council (IMC). Because SCC threshold levels usedon the various farms may well differ from those recommended by the IMC, other SCC rangeswere also investigated in an attempt to minimize diagnostic error under differentcircumstances.
The percentage of IMI in this dataset of 345 461 composite milk samples was 43.37% (Table3.1). The percentage of samples with IMI at SCC threshold levels of 100 000, 200 000 and 400000 cell/ml were 10.89%, 18.31% and 26.26%. Of the 149 817 culture positive samples 57.78%had SCC in excess of 200 000 cells/ml milk comparedwith 26.67% of culture negative samples.The ratio in composite samples of culture negative to culture positive samples were 2.960,2.268 and 1.821 to 1 at SCC thresholds of 100 000, 200 000 and 400 000 cells/ml, respectively(Table 3.1).

64
Table 3.1. The presence and absence of intramammary infection (IMI) within each somaticcell count (SCC) range in composite milk samples (n=345 461).
SCC range cellsper ml milk
Samplenumberswith IMI
Samplenumberswithout IMI
Totalsamplenumbers
IMI prevalence perSCC range (95% LCIand UCI)
Cum % withIMI per SCCrange
1 000 50 000 19462 77244 96706 0.201 (0.199, 0.204) 5.63
51 000 100 000 18157 34114 52271 0.347 (0.343, 0.352) 10.89
101 000 150 000 14381 19419 33800 0.426 (0.420, 0.431) 15.05
151 000 200 000 11257 12701 23958 0.470 (0.464, 0.476) 18.31
201 000 250 000 9081 8055 17136 0.530 (0.522, 0.537) 20.94
251 000 300 000 7504 6242 13746 0.546 (0.538, 0.554) 23.11
301 000 350 000 6081 4445 10526 0.578 (0.568, 0.587) 24.87
351 000 400 000 5146 3573 8719 0.590 (0.580, 0.601) 26.36
401 000 450 000 4280 2986 7266 0.589 (0.578, 0.600) 27.6
451 000 500 000 3801 2520 6321 0.601 (0.589, 0.613) 28.7
501 000 750 000 12431 7597 20028 0.621 (0.614, 0.627) 32.3
750.000 + 38236 16748 54984 0.695 (0.692, 0.699) 43.37
Totals 149817 195644 345461
Cum % = Cumulative percentage; LCI = lower confidence interval; UCI = Upper confidence interval
Sensitivity of SCC thresholds as an indicator of IMI in composite samples were 87.0%with 95%upper and lower confidence intervals of (85.5%, 88.5%) at the lowest SCC range investigated(50 000 cells/ml) but dropped noticeably as SCC increased to 74.9% (73.5%, 76.3%) at 100000, 57.8% (56.6%, 59.0%) at 200 000 and 39.2% (38.2%, 40.2%) at 400 000 cells/ml SCCthreshold ranges. At the 200 000 threshold the Specificity was 73.3% (72.2%, 74.5%) (Table3.2). Likelihood Ratios (LR) for culture negative samples ranged from 3.039 at 50 000 cells/mlto 0.468 at 750 000 cells/ml while the LR became larger than 1 at the 150 000 cells/ml SCCrange. The Youden’s Index, that balances Sensitivity and Specificity to obtain a mathematicaloptimum SCC threshold, was indicated at 150 000 cells/ml in composite samples with aSensitivity of 65.3% (64.0%, 66.6%) and Specificity of 66.8% (65.7%, 67.9%) (Table 3.2).

65
.
SCC cells perml milk
Sensitivity (95% LCIand UCI)*
Specificity (95% LCIand UCI)*
Youden’sIndex
LikelihoodRatio
50 000 0.870 (0.855, 0.885) 0.395 (0.386, 0.404) 0.265 3.039
100 000 0.749 (0.735, 0.763) 0.569 (0.559, 0.580) 0.318 1.439
150 000 0.653 (0.640, 0.666) 0.668 (0.657, 0.679) 0.321 1.034
200 000 0.578 (0.566, 0.590) 0.733 (0.722, 0.745) 0.311 0.864
250 000 0.517 (0.506, 0.529) 0.775 (0.762, 0.789) 0.292 0.679
300 000 0.467 (0.456, 0.478) 0.806 (0.794, 0.891) 0.274 0.637
350 000 0.427 (0.416, 0.437) 0.829 (0.817, 0.842) 0.256 0.56
400 000 0.392 (0.382, 0.402) 0.847 (0.837, 0.860) 0.24 0.532
450 000 0.364 (0.335, 0.373) 0.863 (0.850, 0.876) 0.226 0.534
500 000 0.338 (0.329, 0.348) 0.876 (0.863, 0.889) 0.214 0.508
750 000 0.255 (0.247, 0.263) 0.914 (0.901, 0.928) 0.17 0.468
*LCI= lower confidence interval, UCI= upper confidence interval.
3.2 Quarter milk samples
Of the 89 638 quarter milk samples analysed, 43 746 (48.8%) had a SCC of above 200 000cells/ml. The percentage of quarter milk samples in this dataset from which microorganismswere isolated was 33.99% representing 30 467milk samples (Table 3.3). The prevalence of IMIat various SCC ranges was determined with standard errors at 95% confidence intervals. AtSCC ranges of 100 000, 200 000 and 400 000 cells/ml the prevalence (upper and lower 95%CI) of IMI were 20.4% (19.7%, 21.2%), 29.1% (28.3%, 30.9%) and 41.1% (38.9%, 43.3%).

66
Table 3.3. Quarter milk samples indicating the presence and absence of intramammaryinfection (IMI) for each somatic cell count (SCC) range (n=89 638).
SCC ranges cellsper ml milk
Samplesnumberswith IMI
Samplesnumberswithout IMI
Totalsamplenumbers
IMI prevalence perSCC range (95% LCIand UCI)
Cum %with IMIper SCCrange
1 000 50 000 3019 19891 22910 0.132 (0.127, 0.136) 13.18
51 000 100 000 2332 9078 11410 0.204 (0.197, 0.212) 15.59
101 000 150 000 1811 4923 6734 0.269 (0.258, 0.280) 17.45
151 000 200 000 1432 3406 4838 0.291 (0.283, 0.309) 18.73
201 000 250 000 1188 2429 3617 0.328 (0.313, 0,344) 19.76
251 000 300 000 1068 1845 2913 0.367 (0.349, 0.384) 20.7
301 000 350 000 899 1395 2294 0.392 (0.372, 0.412) 21.47
351 000 400 000 790 1133 1923 0.411 (0.389, 0.433) 22.14
401 000 450 000 711 966 1677 0.424 (0.400, 0.448) 22.72
451 000 500 000 617 809 1426 0.433 (0.407, 0.459) 23.21
501 000 750 000 2294 2862 5156 0.445 (0.431, 0.459) 24.9
750.000 + 14303 10437 24740 0.578 (0.572, 0.584) 33.99
Totals 30464 59174 89638
Cum % = Cumulative percentage; LCI = lower confidence interval, UCI = upper confidence interval
The percentage of quarter milk samples with IMI was 18.73% at 200 000 and 22.14% at400 000 cells/ml. (Table 3.3). The ratio of quarter samples without IMI to those with IMIremained positive up to a SCC level of 750 000 cells/ml. Only at SCC above 750 000 cells/mlthere was a clear negative ratio of uninfected to infected samples.
While discriminative measures are mostly used to make policy decisions, predictive measuresare most useful in predicting the probability of a disease in an individual. The Likelihood Ratiofor identifying culture negative samples at the various SCC thresholds ranged from 3.145more likely at 50 000 cells/ml to 0.446 at 750 000 cells/ml. The Youden’s index at 100 000cells/ml was 0.311 and increased to the highest values of 0.344 and 0.345 at SCC thresholdsof 200 000 and 250 000 cells/ml quarter milk (Table 3.4). The Youden’s Index range from 0 fora poor result to 1 for the perfect test indicating the best balance between the Sensitivity andSpecificities of tests.

67
Table 3.4. Sensitivity and predictability of quarter intramammary infections (IMI) for varioussomatic cell count (SCC) thresholds.
SCC cellsper ml milk
Sensitivity (95% LCIand UCI)*
Specificity (95% LCIand UCI)*
LikelihoodRatio
Youden'sIndex
50 000 0.889 (0.870, 0.907) 0.336 (0.328, 0.344) 3.145 0.225
100 000 0.819 (0.808, 0.830) 0.492 (0.490, 0.503) 1.868 0.311
150 000 0.757 (0.745, 0.769) 0.577 (0.566, 0.589) 1.327 0.334
200 000 0.708 (0.695, 0.720) 0.636 (0.624, 0.648) 1.177 0.344
250 000 0.667 (0.655, 0.679) 0.678 (0.666, 0.690) 1.046 0.345
300 000 0.631 (0.618, 0.643) 0.709 (0.697, 0.722) 0.899 0.34
350 000 0.600 (0.588, 0.612) 0.734 (0.721, 0.746) 0.817 0.334
400 000 0.573 (0.561, 0.581) 0.753 (0.741, 0.765) 0.757 0.326
450 000 0.549 (0.537, 0.560) 0.770 (0.758, 0.781) 0.732 0.319
500 000 0.528 (0.516, 0.539) 0.783 (0.771, 0.795) 0.702 0.311
750 000 0.449 (0.437, 0.461) 0.882 (0.821, 0.895) 0.446 0.331
*The effect of clustering was taken into account, LCI= lower confidence interval, UCI= upper confidenceinterval.
The result of the AUC of the ROC, that express the discriminative power of the SSC test toidentify IMI in both composite and quarter milk samples, was 0.7084 in composite and 0.7277in quarter milk samples (Table 3.5). The closer the AUC is to 1 the higher the diagnosticaccuracy of the test.

68
Table 3.5. Receiver operating characteristic curves (ROC) and area under the curve (AUC) forthe efficacy of SCC test to identify IMI in quarter and composite milk samples.
SCCthreshold(cells/mlmilk)
Q Sen Q Sp Q 1 Sp Q.Area
QuarterAUC*
SCCthreshold(cells/mlmilk)
C Sen C Sp C 1 Sp C. AreaCompositeAUC*
1 0 1 0.7277 1 0 1 0.7084
1 0.336 0.664 1 0.395 0.60550 000 0.889 0.336 0.664 0.3174 50 000 0.87 0.395 0.605 0.369250 000 0.889 0.492 0.508 50 000 0.87 0.569 0.431100 000 0.819 0.492 0.508 0.1332 100 000 0.749 0.569 0.431 0.1412100 000 0.819 0.577 0.423 100 000 0.749 0.668 0.332150 000 0.757 0.577 0.423 0.067 150 000 0.653 0.668 0.332 0.0696150 000 0.757 0.636 0.364 150 000 0.653 0.733 0.267200 000 0.708 0.636 0.364 0.0432 200 000 0.578 0.733 0.267 0.0399200 000 0.708 0.678 0.322 200 000 0.578 0.775 0.225250 000 0.667 0.678 0.322 0.0289 250 000 0.517 0.775 0.225 0.0225250 000 0.667 0.709 0.291 250 000 0.517 0.806 0.194300 000 0.631 0.709 0.291 0.0201 300 000 0.467 0.806 0.194 0.0157300 000 0.631 0.734 0.266 300 000 0.467 0.829 0.171350 000 0.6 0.734 0.266 0.0154 350 000 0.426 0.829 0.171 0.0102350 000 0.6 0.753 0.247 350 000 0.426 0.847 0.153400 000 0.573 0.753 0.247 0.0111 400 000 0.392 0.847 0.153 0.0075400 000 0.573 0.77 0.23 400 000 0.392 0.863 0.137450 000 0.549 0.77 0.23 0.0095 450 000 0.364 0.863 0.137 0.0058450 000 0.549 0.783 0.217 450 000 0.364 0.876 0.124500 000 0.528 0.783 0.217 0.007 500 000 0.338 0.876 0.124 0.0045500 000 0.528 0.882 0.118 500 000 0.338 0.914 0.086750 000 0.449 0.882 0.118 0.0484 750 000 0.255 0.914 0.086 0.0115750 000 0.449 1 0 750 000 0.255 1 0maximum 0 1 0 0.0265 maximum 0 1 0 0.0109
___________________________________________________________________________________Q. Sen = Quarter milk Sensitivity, Q. Sp=Quarter milk Specificity, Q. area= Quarter milk area, Q. AUC = Quarter milkarea under the curve, C. Sen = Composite milk Sensitivity, C. Sp= Composite milk Specificity, C. area= Composite milk area,C. AUC =Composite milk area under the curve, * Area calculated using the trapezoid method even though trapezoid methodeven though the graph is presented descriptively as steps (rectangles).
DISCUSSION
The average number of cows in South African dairy herds has increased especially in theEastern Cape and Kwazulu Natal Provinces (Lactodata 2015) with some herds exceeding 1 700cows. In order to be able to make effective decisions at herd and individual cow level, alllactating cows in a dairy herd were tested both for microbiology and somatic cell count in theMilk Laboratory at the University of Pretoria (Faculty of Veterinary Science). This is however
69
not the system used in other South African laboratories. Due to the practical difficulty ofsampling all cows in the large herds and analytical costs, only cows previously identified withhigh SCC counts or those found the have high SCC in the present test would be cultured. Insome laboratories the chosen SCC threshold for culturing may be as high as 500 000 cells/mlmilk (personal communication with laboratory managers). Information of all four quarters, allwith possible different infection status, pathogen strains and inflammatory responses isamalgamated into a composite milk sample. These results can be expected to be lessinformative and the values less sensitive than those from quarter milk samples. The currentstudy has indicated that at a 500 000 cells/ml SCC threshold 66.18% and 45.52% of IMI maybe missed in composite and quarter milk samples (Tables 3.1 and 3.3).
Few test results in a laboratory are either simply positive or negative and there is usually agradual change between results from those considered to be normal to what may beabnormal. Dohoo and Leslie (1991) indicated that a SCC threshold of 200 000 cells/ml of milkwas not an absolute value but the SCC threshold was associated with probability of IMI. Milksamples with SCC below that threshold could not be considered to all be culture negative, butthey were only more likely to be associated with no IMI. It was in this spirit that this largedataset was analysed in order to quantify the likelihood of predicting the culture negativesamples as a whole at various SCC thresholds. This dataset provided an overview of the onfarm operational conditions experienced by South African commercial dairy herds at the time.It did not attempt to distinguish between farming systems,management variations and levels,dairy breeds, cow age, parity, days in milk, quarter position, yield or stress factors originatingfrom environmental, milking machine use, maintenance or machine settings, possiblenutrition short comings, social stress or systemic diseases that may challenge the immunityof dairy cows. This study was intended to serve as an initial study to identify the relationbetween IMI in general and SCC levels while the second part of this study will report on SCCfinding regarding major and minor pathogen groups as well as for 16 specific udderpathogens.
Failure to isolate bacteria from quarter samples with high SCC does not necessarily alwaysindicate that the udder or quarter has no IMI. Bacteria may be missed due to very lowconcentrations present in the milk (Ruegg and Pantoja, 2013). Other studies have found thatin 10 – 25% of cases of quarters with high SCC where they failed to isolate bacteria, thepossibility existed that bacterial numbers were too low to detect with the laboratorytechnique (volume of milk used) or bacteria were excreted intermittently by the udder, as isknown to occur with Staphylococcus aureus IMI (Dohoo and Leslie 1991; Schepers et al. 1997;Pantoja et al. 2009). Schepers et al. (1997) found that 50.2% of the variation in SCC could beexplained by the presence of IMI. Some other factors also known to increase SCC are days inmilk, month of sampling, udder quarter position, parity, interaction between stage oflactation and parity (Schepers et al. 1997). Somatic cell count is also known to increase in theabsence of IMI during stressful events such as extreme environmental temperatures.Transportation stress has been shown to change the peripheral blood neutrophil function by

70
enhancing their migration capacity across the blood udder barrier with a consequent increasein SCC (Yagi et al. 2004). Wegner et al. (1976) reported an increase in both blood and milkleucocytes concentrations following heat stress. Green et al. (2006) in two consecutivesummers found increased proportions of cows with SCC above 200 000 cells/ml withoutevidence of higher IMI, and considered that heat stress was presumably responsible for 70.8%of the overall SCC increase. In such situations it may not be beneficial to treat cows withintramammary antimicrobials.
Quarter milk samples
The most accurate relationship between IMI and SCC exists where quarter milk samples aretaken, and reduced milk yields have been observed and when SCC has exceeded 100 000cell/ml (Schukken et al. 2003). Somatic cell counts of milk from healthy quarters have beenfound to be consistently low, and at a threshold of below 200 000 cells/ml has been proposedto be the most practical level for defining udder health (Dohoo and Leslie 1991; Schepers etal. 1997; Pantoja et al. 2009).
In this study the percentage of quarter milk samples with IMI at 100 000 (15.59%) and at 200000 cells/ml (18.73%) differed only slightly indicating a reduced risk of missing IMI when usinga threshold of 200 000 cells/ml, compared to a threshold of 100 000 cells/ml. Furthermoreover 63.03% of all quarter samples tested were culture negative at the 200 000 cells/ml SCCthreshold, indicating the usefulness of SCC as a screening test in quarter milk samples.Compared with similar studies by Eberhart et al. (1979) and Malinowski et al. (2006) thepercentage of uninfected quarters in this study at threshold levels of 100 000 and 200 000cells/ml were noticeably higher than their findings of 50.0% and 59.6% respectively.
Although the Sensitivity ratio predicting accuracy in identifying IMI at 50 000 cells/ml wasrelatively high at 88.9% with 95% upper and lower confidence intervals of (87.0%, 90.7%) itreduced rapidly to 81.9% (80.8%, 83.0%), 70.8% (69.5%, 72.0%) and 57.3% (56.1%, 58.1%) atSCC levels of 100 000, 200 000 and 400 000 cells/ml respectively. These Sensitivity Ratios,although slightly lower, compared favourably with those found by Schepers et al. (1997) of83.2%, 74.5% and 60.8% at similar SCC thresholds. The Specificity that predicted accuracy ofculture negative results increased from a low of 49.2% (49.0%, 50.3%) at 100 000 cells/ml to75.3% (74.1%, 76.5%) at 400 000 cells/ml (Table 3.4). Specificity values reported by thecurrent study for SCC ranges of 100 000, 200 000 and 400 000 cells/ml were howevermarkedly lower than the 80.5%, 89.6% and 95.0% reported by Schepers et al. (1997). Hillerton(2000) proposed Sensitivity of 80% and Specificity of 99% as appropriate target values forscreening tests, but these were clearly impractical in this study, even for quartermilk samples.The 95% upper and lower Confidence Interval (CI) for Sensitivity and Specificity that wasadapted for clustering varied little for all SCC threshold levels, indicating that cow factors hadlittle or no influence on the SCC levels of the quarters in this study, but it should be taken intoconsideration that this could possibly have been masked by the large dataset.

71
Clinicians are often more interested in the predictive values of a test indicating a disease thanin the Sensitivity or Specificity Ratios of the test. Ruegg and Pantoja (2013) found positivepredictive values relatively poor for indicating recovery from IMI when using the 200 000 SCCthresholds. The Likelihood Ratio (Table 3.4) obtained in this study confirmed that finding ofRuegg & Pantoja (2013). The Likelihood Ratio 1.177 at a SCC level of 200 000 cells/mlincreased to below 1 only at a SCC threshold of 300 000 cell/ml. A Likelihood Ratio of less than1 indicates that the SCC level is more commonly associated with lack of IMI than with IMI.Although the highest Youden’s index (0.345) was found to be at a SCC threshold of 250 000cells/ml in quarter milk, the threshold of 200 000 cells/ml with an almost similar value (0.344)was selected. This was done due its higher Sensitivity (70.8% versus 66.7%) at a SCC of 200000 cells/ml with the aim of identifying cases with IMI rather than those without (Table 3.4).Even the highest values obtained with the Youden’s index were closer to 0 than 1 indicatingonly fair accuracy. The efficacy of the SCC test for indicating IMI in quarter milk was found tobe good but not excellent when the AUC in the ROC curve was determined at 0.7277 (Table3.5).
Different populations, for example younger cows or herds with a low or high BMSCC mayjustify the use of different SCC thresholds for screening purposes. When the prevalence ofIMI in a herd is high, the SCC threshold used may shift towards higher Specificity levels, inorder to identify the true negative cows, while Sensitivity might be of greater value inidentifying true positive cases in herds where IMI prevalence is low. Thus prior to analysingthe data for practical operations, clarity should be obtained as to the requirement for thatspecific dairy herd. The operational threshold selected should depend on what thepractitioner wants to achieve with this information and what is therefore the most importantaspect to optimize. One of the first questions to answer is whether it is more important toidentify samples with IMI or samples without IMI. Because Sensitivity and Specificity Ratiosare inversely related in most cases, one of the two will be favoured when setting a thresholdin a test. When the aim is to eradicate IMI with Streptococcus agalactiae from a herd throughseparation and treatment of cows with infected udders, for instance, it could be beneficial totest all cows in the herd, even if the prevalence is low, or to set a low threshold because ofthe low Sensitivity at higher SCC levels. When culling is the purpose for testing, as may be thecase with Staphylococcus aureus, the SCC threshold may be increased to high levels such as800 000 cells/ml (Sol et al. 1991; Swinkels et al. 2012). In the latter case the SCC test shouldrather be used as a screening and not a diagnostic test to select cows for further bacterialanalysis. When a decision needs to be made whether subclinical IMI with Staphylococcusaureus should be treated and the SCC level, the number and position of quarters infected,parity, days in milk and treatment regime is known, the probable outcome of treatmentsuccess can be calculated (Sol et al. 1997). Knowledge of cows or quarters infected withcoagulase negative staphylococci (CNS) may be of little to no benefit and the cost of furthertesting may not be justified. Cows with CNS are neither treated nor separated when infected.

72
It may therefore be beneficial to use variable SCC thresholds when evaluating dairy herdsdepending on the main udder pathogens isolated from that herd.
Composite milk samples
Few studies have been done on compositemilk samples comparedwith the number of studiesdone investigating SCC and IMI in quarter milk samples. A composite sample is a combinationof milk from the four udder quarters, and it is to be expected that the Sensitivity andSpecificity of this sample type should differ at similar SCC levels from that in quarter milksamples.
In this study composite milk samples of 52.91% and 59.84% had SCC equal to or less than 150000 and 200 000 cells/ml respectively, and 15.05% % and 18.31% were culture positive at thesame SCC levels (Tables 3.1). This is a disturbingly high percentage if only viewed from a pointof possible misdiagnosis of IMI when choosing either of these SCC thresholds. However itneeds to be considered that a substantial portion of these IMI may be minor pathogens andcoagulase negative staphylococci (CNS). The proportion of major pathogens and contagiousspecies isolated from low SCC were not examined in this paper, but will be reported in asubsequent paper.
Sensitivities of the SCC test for the composite milk samples were 65.3%with 95% CI of (64.0%,66.6%) at 150 000 and 57.8% (56.6%, 59.0%) at 200 000 cells/ml and decreased to a low of25.5% (24.7%, 26.3%) at the highest SCC range. These results indicated that SCC for compositemilk samples at 200 000 cell/ml was less able to detect IMI than at SCC for quarter milksamples at 200 000 cells/ml where the Sensitivity was 70.8%. Although still less precise,results of the test at SCC of 150 000 cells/ml were more comparable with results obtained inquarter milk samples (Tables 3.2 & 3.4). Specificity and the ability to detect culture negativesamples accurately using SCC was higher in composite samples than quarter milk samples. Itincreased from 66.8% (65.7%, 67.9%) at the SCC threshold of 150 000 cells/ml to 73.3%(72.2%, 74.5%) at 200 000 cells/ml compared to 63.6% (62.4%, 64.8%) for quarter milk sampleat a SCC threshold of 200 000 cells/ml (Tables 3.2 & 3.4). Dohoo and Leslie (1991) reported incomposite samples overall higher Sensitivity (83.4%) and slightly lower Specificity (58.9%) formajor pathogens at 200 000 cells/ml. The SCC threshold point in composite samples whereSensitivity and Specificity were evenly balanced using the Youden’s index, was indicated at150 000 cells/ml (Table 3.2). This was found to be the optimum mathematical SCC thresholdto identify IMI when examining composite samples without including any further informationsuch as cow and environmental information.
Likelihood Ratios were lower in composite samples than those at similar SCC thresholds inquarter milk samples. At 150 000 and 200 000 cell/ml the Likelihood Ratios to detect culturenegative composite samples were 1.034 and 0.864 compared to 1.177 in quarter samples at200 000 cells/ml (Tables 3.2 and 3.4).

73
Comparing quarter and composite cowmilk sample results
The percentage samples from which organisms were isolated at a threshold of 200 000cells/ml were surprisingly similar in composite (18.31%) and quarter (18.73%) milk samples(Tables 3.1 and 3.3). It was however possible that the dilution effect of the composite milksample causedmore IMI to be at a subminimum level of detection for conventional laboratorymicrobiological detection systems (Dohoo and Leslie 1991; Pantoja et al. 1997; Hulland andRuegg 2009).
For every one infected composite or quarter milk sample at a SCC threshold of 50 000 cells/ml3.969 composite and 6.589 quarters were uninfected respectively. At a SCC threshold of 200000 cells/ml the ratio of infected to uninfected were 1 to 2.268 in composite milk samplescompared to 1 to 4.340 in quarter milk samples (Tables 3.1 and 3.3) making it more likely tocorrectly identify quarters with IMI using SCC.
Although Specificity of the SCC test was higher in composite milk samples at a threshold of200 000 cells/ml than for quarter milk samples, this difference between the sample typesremained fairly constant at all SCC levels tested. Sensitivities of SCC for composite and quartersamples however started at a similar level at the 50 000 cells/ml SCC threshold (87.0% and88.9%) but differed increasingly as the SCC level increased. Sensitivity decreasedmore rapidlyin composite samples to 25.5% and quarter samples to 44.9% at the high SCC level (Tables 3.2and 3.4).
An “optimum” threshold was sought for the SCC test that could indicate IMI in milk samplesat a level effective for screening of samples to be cultured under South African conditions. Incomposite milk samples the best threshold level proved to be 150 000 cells/ml while SCCthreshold levels from 200 000 cells/ml were indicated for quarter milk (Tables 3.2 and 3.4).This result is in agreement with the 200 000 cell/ml threshold recommended by the NationalMastitis Council when using the SCC test to indicate the presence of IMI in quarter milksamples (National Mastitis Council 2001). The area under the curve (AUC) was found to be0.7084 in composite and 0.7277 in quarter samples indicating that SCC was a good but not anexcellent test for indicating IMI in both sample types (Table 3.5).
CONCLUSIONS
The large dataset used in this study was a reflection of actual samples received by thelaboratory for analysis and interpretation. Samples were received from herds that differed inmanagement levels, exposure to environmental conditions, microbial IMI and cow factors(age, parity, days in milk and milk yield).
The SCC test was found to be good but not excellent as an indicator of IMI in both quarter andcomposite sample types. The current threshold for SCC of 200 000 cell/ml used to detect onlyIMI in quarter milk samples was reconfirmed to be optimal. Based on the findings of this study

74
a SCC threshold of 150 000 cells/ml milk can be recommended for use in composite milksamples and could be used in practice as a selection criteria to select samples for culturing inlarge herds. This study indicated that the likelihood of identifying culture negative samples ata SCC threshold of 200 000 cells/ml in quarter milk samples was 1.177 compared with 1.034in composite milk samples at a SCC threshold of 150 000 cells/ml. Although less true culturenegative milk samples can be expected to be identified for composite milk compared toquarter milk samples due to a lower sensitivity of the SCC test in composite samples, it wasindicated that SCC could be used at the lower threshold level, to indicate IMI in compositemilk samples.
It should be noted however that these optimal statistically determined SCC threshold levelsneed to be adapted depending on specific operational circumstances. Even at these “optimal”SCC levels, using the SCC as the only test to predict the presence of IMI is helpful as screeningtest to select samples for microbiological determinations, but is not ideal as a stand alone testto indicate IMI.
ACKNOWLEDGEMENTS
We gratefully acknowledge the milk producers of South Africa for their continuous use andsupport of the Milk Laboratory and for allowing us to use the data to gain knowledge. Manythanks to the staff of the Milk Laboratory of the Department of Production Animal Studies,Faculty of Veterinary Science, Onderstepoort for their continued quality work: Mrs JCWatermeyer, F Konaite and N Labuschagne, R Ludike, Miss R Badenhorst, P Malokotsa, KMadiba andMr LLMohapi and KMalekane for performing all technical work and data logging,for Mrs M. Smith for data management and Prof GF Fosgate for his assistance with the modelto determine estimators of cluster variance.
REFERENCES
Ampe, B., Goethals, K., Laevens, H. & Duchateau, 2012. Investigating clustering in intervalcensored udder quarter infection times in dairy cows using a gamma frailty model. PreventiveVeterinary Medicine 106, 251 277.
Barkema, H.W, van der Ploeg, J.D., Schukken, Y.H., Lam, T.J.G.M., Benedictus, G. & Brand, A.,1999. Management style and its association with bulk milk somatic cell count and rate ofclinical mastitis. Journal of Dairy Science 82, 1655 1663.
Biggs, A.M., 2009. Optimising the use of SCC information. Proceedings of the British MastitisConference 2009, Stoneleigh Park, pp. 15–26.
DeGraves, F.J. & Fetrow, J., 1993. Economics of mastitis and mastitis control. VeterinaryClinics of North American: Food Animal Practice 9, 421 443.

75
Dohoo, I.R. & Leslie, K.E., 1991. Evaluation of changes in somatic cell counts as indicators ofnew intra mammary infections. Preventive Veterinary Medicine 10, 225–237.
Eberhart, R. J. Gilmore, H.C., Hutchinson, L.J. & Spencer, S.B., 1979. Somatic cell counts in DHIsamples. Proceedings of the Annual meeting National Mastitis Council. p. 32.
Geary, U., Lopez Villalobos, N., Begley, N., McCoy, F., O’Brien, B., O’Grady, L. & Shalloo, L.,2012. Estimating the effect of mastitis on the profitability of Irish dairy farms. Journal of DairyScience 95, 3662–3673.
Giesecke, W.H., du Preez, J.H. & Petzer, I.M., 1994. Practical Mastitis Control in Dairy Herds,Butterworths, Durban. 9780409109238: Books Amazon.ca.
Green, M.J., Bradley, A.J., Newton, H. & Browne, W.J., 2006. Seasonal variation of bulk milksomatic cell counts in UK dairy herds: Investigations of the summer rise. Preventive VeterinaryMedicine 74, 293 308.
Harmon, R. J., 2001. Somatic cell counts: A primer. National Mastitis Council MeetingProceeding 2001, pp. 1 9
Harmon, R.J., 1994. Physiology of Mastitis and Factors Affecting Somatic Cell Counts. Journalof Dairy Science 77, 2103 2112.
Heeschen, W.H., 1996. Mastitis: The disease under aspects of milk quality and hygiene.Mastitis Newsletter of the International Dairy Federation 144, p. 16.
Heeschen,W.H., 2010. IDF andmastitis – A general review. Proceedings of the 5th IDFMastitisConference 21 24 March 2010, Christchurch, New Zealand. Mastitis Research into Practice,pp. 22 32.
Hiitiö, H., Simojoki, H., Autio, T., Rsinio, V. & Pyörälä, S., 2012. Mastitis in Finland – changesduring the resent decade. Proceedings of the XXYII World Buiatrics Congress 2012, LisbonPortugal, 3 8 June, p. 136.
Hillerton, J.E., 1999. Redefining mastitis based on somatic cell count. Bulletin of theInternational Dairy Federation 345, 4 6.
Hillerton, J.E., 2000. Detecting mastitis cow side. Proceeding of the International MastitisCouncil 39th Annual Meeting, Atlanta, GA, NMC, Madison, WI. p. 48 53.
International Dairy Federation World Dairy Summit, 2001. (New Zealand), October 2001,Results of annual survey presented by the chair of the standing Committee “Dairy Policies andEconomics”. International Dairy Federation Bulletin, No 368/2001.
International Dairy Federation, 1967. Definition of mastitis. International Dairy Federation,Brussels, Belgium, Annual Bulletin Part III, p. 1.

76
Lactodata 16(2): Nov 2013. www.milksa.co.za/category/all reports/industry information.
Lactodata 18(1): May 2015. http://www.milksa.co.za/sites/default/files/BIPLAC022.
Laevens, H., DeLuyker, H., Schukken, Y.H., De Meulemeester, L., Van der Meersch, R., DeMuelenaere, E. & De Kruif, A., 1997. Influence of Parity and Stage of Lactation on the SomaticCell Count in Bacteriologically Negative Dairy Cows. Journal of Dairy Science 80, 3219 3226.
Malinowski, E., Lassa, H., K ossowska, A., Markiewicz, H., Kaczmarowski M. & Smulski, S.,2006. Relationship between mastitis agents and somatic cell count in foremilk samples.Bulletin of the Veterinary Institute in Pulawy 50, 349 352.
Miller, R.H. & Paape, M.J., 1985. Relationship between milk somatic cell count and milk yield.Proceedings Annual Mastitis Council p. 60.
Moosapour, H.,Raza, M., Rambod, M. & Akbar Soltani, A., 2011. Conceptualization ofcategory oriented Likelihood ratio: a useful tool for clinical diagnostic reasoning. BioMedCentral, Medical Education. p. 11. http://www.biomedcentral.com/1472 6920/11/94
National Mastitis Council, 2001. Guidelines on Normal and Abnormal Raw Milk Based on SCCand Signs of Clinical Mastitis.
Pantoja, J.C., Hulland, C & Ruegg, P.L., 2009. Dynamics of somatic cell counts andintramammary infections across the dry period. Preventive Veterinary Medicine 90, 43 54.
Payne, R., Murray, D., Harding, S., Baird, D. & Soutar, D., 2012. Introduction to GenStat forWindowsTM (15th Edition). VSN International, Hemel Hempstead.
Perkins, N.J. & Schisterman, E.F., 2006. The inconsistency of “optimal” cut points obtainedusing two criteria based on the receiver operating characteristic curve. American Journal ofEpidemiology 163, 670 675.
Petzer, I.M., Karzis, J., Watermeyer, J.C, van der Schans, T. & van Reenen, R., 2009. Trends inudder health and emerging mastitogenic pathogens in South African dairy herds. Journal ofthe South African Veterinary Association 80, 17 22.
Petzer, I.M., Karzis, J., Watermeyer, J.C., Badenhorst, R. & van der Schans, T., 2012. Trends ofMastitogenic Bacteria from 2008 to 2012 in South African Dairy Herds. IDF, World DairySummit Poster Exhibition, Cape Town, South Africa.
Petzer, I.M., Karzis, J., Donkin, E. F., Webb, E, C., Etter, M.C., 2016. Somatic cell countthresholds in composite and quarter milk samples as indicator of bovine intramammaryinfection status. Onderstepoort Journal of Veterinary Research 84, 1 12.(doi: 10.4102/ojvr.v83i1.1146).

77
Reneau, J.K. & Packard, V.S., 1991. Monitoring mastitis, milk quality and economic losses indairy fields. Dairy Food Environment Sanitation 11, p. 4.
Roy, J., Fauteux, V., Bouchard, E. & Scholl, T.D., 2012. Establishing benchmarks to evaluateand compare dairy herd udder health status using monthly somatic cell counts: descriptivedata. Proceedings of the XXYII World Buiatrics Congress 2012, Lisbon Portugal, 3 8 June 2012p. 132.
Ruegg, P.L., 2011. Managing Mastitis and Producing Quality Milk.(doi: 10.1002/9780470960554.ch18).
Ruegg, P. & Pantoja, J.F.C., 2013. Understanding and using somatic cell counts to improvemilkquality. Irish Journal of Agriculture and Food Research 52, 101–117.
Schepers, A.J., Lam, T.J.G.M., Schukken, Y.H., Wilmink, J.B.M. & Hanekamp, W.J.A., 1997.Estimation of various components for somatic cell counts to determine the threshold foruninfected quarters. Journal of Dairy Science 80, 183 1840.
Scheaffer, R.L., Mendenhall, W. & Ott, R.L., 1996. Elementary survey sampling (Ed 5th),Belmont: Wadsworth Publishing Company, Pp. 307 310.
Schukken, Y.H., Wilson, D.J., Welcome, E., Garrison Tikofsky, L. & Gonzalez, R.N., 2003.Monitoring udder health and milk quality using somatic cell counts. Veterinary Research 34,579 598.
Schukken, Y.H., Chuff, M., Moroni, P., Gurjar, A., Santisteban, C., Welcome, F. & Zadoks, R.,2012. The “Other” Gram Negative Bacteria in Mastitis Klebsiella, Serratia, and More,Veterinary Clinical Food Animal 28, 239 256.
Sheldrake, R.F., Hoare, R.J.T. & McGregor, G.D., 1983. Lactation stage, parity, and infectionaffecting somatic cells, electrical conductivity, and serum albumin in milk. Journal of DairyScience 66, 542–547.
Sol, J., Sampimon, O.C., Snoep, J.J. & Schukken Y.H., 1997. Factors associated withbacteriological cure during lactation after therapy for subclinical mastitis caused byStaphylococcus aureus. Journal of Dairy Science 80, 2803–2808.
Swinkels, J., Schukken, Y.H. & Cox, P., 2012. Efficacy of short versus long duration of treatmentof clinical Staphylococcus aureusmastitis. Proceedings of the XXYII World Buiatrics Congress,Lisbon Portugal, 3 8 June 2012, p. 150.
Wegner, T.N., Schuh, J.D., Nelson, F.E. & Stott, G.H., 1976. Effect of stress on blood leucocyteand milk somatic cell counts in dairy cows. Journal of Dairy Science 59, 949 956.

78
Yagi, Y., Shiono, H., Chikayama, Y., Ohnuma, A., Nakamura, I. & Yayou, K., 2004. Transportstress increases somatic cell counts inmilk, and enhances themigration capacity of peripheralblood neutrophils of dairy cows. Journal of Veterinary Medicine 66, 381 387.
Zadoks, R.N. & Fitzpatrick, J.L. 2009. Changing trends in mastitis. Irish Veterinary Journal62(Suppl.), pp. 59–70.

79
CHAPTER 4
Published 13 April 2017: Inge Marié Petzer, Joanne Karzis, Edward F. Donkin, Edward C.Webb& Eric M.C. Etter. 2017. Journal of South African Veterinary Association.http://www.jsava.co.za/index.php/jsava/article/view/1465. Copy write of article permittedfor Thesis under: Creative Commons Attribution 4.0 International (CC BY 4.0) licence
SIGNIFICANCE OF THEWORK
The pro active approach necessary in the management of udder health in dairy herds requirethe knowledge of the most prominent udder pathogen. It is no longer enough tomerely knowwhether this is primary a contagious (host adopted) or environmental organism forprevention strategies that differ substantially within these groups. This study was aimed atassisting with the effective (both cost effective and the accuracy) diagnosis of intramammaryinfections is lactation cows. Although the IDF recommend that cows with somatic cell counts(SCC) higher than 200 000 cells/ml is more likely to come from quarter of cows withintramammary infections (IMI), no mention is made of the probable difference between themajor and udder pathogens.
In case of outbreaks of for instance Streptococcus agalactiae consultants need to know whatpercentage of cow could be miss diagnosed when only samples with SCC of above 200 000cells/ml is cultured. With this knowledge a decision can be made whether or not all cowsshould be sampled or not. This together with the estimated 15% production lost in a lactation,a more informed decision can be made.
In this manuscripts utilizing 345 461 composite and 89 638 quarter samples from dairy herdsin 7 of 9 South African provinces the main objective was to establish a SCC threshold forcomposite milk samples that could be used for initial screening for IMI.
ABSTRACT
The objective of this study was to determine whether somatic cell count (SCC) was aneffective test, with a sensitivity exceeding 85%, to determine species specific bacterialinfections. In addition the relation between the SCC and various udder pathogens groups
80
were investigated. Somatic cell count thresholds of >200 000 cells/mL were used in quarterand > 150 000 cells/mL in composite milk samples.
A retrospective study was conducted on a dataset for 89,635 quarter and 345,467 compositecow milk samples. Eleven SCC threshold values were used to evaluate the diagnostic efficacyfor the following bacteria: Gram positive major pathogens: Staphylococcus aureus,Streptococcus agalactiae, Streptococcus dysgalactiae, Streptococcus uberis; Gram negativemajor pathogens: Escherichia coli, Klebsiella pneumonia, Serratia spp.; minor pathogens:coagulase negative staphylococci, Micrococcus spp., Staphylococcus pseudintermedius,Streptococcus pyogenes, Enterococcus faecalis, Enterococcus canis, Trueperella pyogenes andother Enterobacteriaceae. Sensitivity and specificity were calculated taking the effect ofclustering into account with quarter milk samples.
Most samples yielding major Gram positive pathogens (88.9% in quarter and 79.9% incomposite samples) andminor pathogens (61.4% in quarter and 51.7% in composite samples)had SCC >200 000 cells/mL. Sensitivity of the SCC test to detect major pathogens at a SCCthreshold of >200 000 cells/mL in quarter samples and at >150 000 cells/mL in composite milksamples were 88.2% and 84.2% respectively but specificity was low (57.7% and 52.8%).
Keywords: Intramammary infections, mastitis diagnosis, pathogen specific, somatic cellcount
INTRODUCTION
Mastitis remains the most costly disease in dairy cattle (Geary et al. 2012). Subclinical mastitisis considered the most important form of mastitis, as it has been estimated to be responsiblefor more than 80% of economic mastitis losses (Giesecke et al. 1994, Shim et al. 2004) due tolong term reduction in milk quality and production (Halasa et al. 2009, Holland et al. 2015).Somatic cell counts (SCC) have generally been accepted and used as a measure ofinflammation (Barkema et al. 1999, Biggs 2009, Heeschen 2010), as a measure of the severityof intramammary infection (IMI) (Harmon 1994) and as an indicator of economic losses(DeGraves and Fetrow 1993). The SCC threshold value used to describe normal milk, IMI andsubclinical mastitis has, however, often been and still is controversial (Heeschen 2010). Dohooet al. (2011) included the following criteria for diagnosing IMI: the number of coloniesisolated, whether the organism was recovered in pure culture, and whether or not IMI waspresent with an increased SCC. Their conclusions were based on a study in which cultureresults of single milk samples were compared with a set of triplicate quarter milk samples(used as ‘gold standard’). The authors concluded that results of a single sample may be usedfor the diagnosis of IMI in quartermilk when aminimumof one or two colonies were recordedwithout taking the SCC into consideration. The term ‘IMI’ used in this study refers to thepresence of a bacterial species isolated from a milk sample as a pure culture, regardless ofthe level of SCC. A pure culture was defined when only one species grew on an inoculum.

81
Early detection of subclinical mastitis remains important for treatment success (Ruegg 2004),particularly in cases of contagious pathogens (Staphylococcus aureus and Streptococcusagalactiae) where the infected udder is the primary source of infection for other cows (Neaveet al. 1969, Fox and Gay 1993, Keefe 1997). However, performing microbiology on milksamples of all cows in a herd can be expensive, and therefore, other effective diagnostic andscreening tests are essential to identify affected cows for further investigation. The principalreason for increased SCCs in milk of dairy cows remains IMI (Giesecke et al. 1994). In 2001,the National Mastitis Council (USA) stated that when a quarter SCC is equal to or exceeds200 000 cells/mL, the likelihood is high that it is infected or recovering from an infection(National Mastitis Council 2001). A study conducted on a large data set that did notdifferentiate between udder pathogens and where results were obtained using Youden’sindex and ROC graphs indicated that 200 000 cells/mL or more in quarter milk samples and150 000 cells/mL or more in composite milk samples were the optimum SCC to indicate IMIand culturing of positive samples (Petzer et al. 2016).
Although more than 100 different microorganisms can cause mastitis, only a few species ofstaphylococci, streptococci and Gram negative organisms are currently considered to be ofeconomic importance (Zadoks and Fitzpatrick 2009). There have been changes in the relativeproportion of mastitis pathogens over the past 60 years in First World countries due tochanges in herd and parlour management, udder health monitoring, treatments anddifferences in genetics (Zadoks and Fitzpatrick 2009). Research in countries practising goodudder health has recorded a lower incidence of mastitis caused by contagious bacteria butincreases in Gram negative bacteria. In South Africa, most cases of subclinical mastitis havebeen caused by coagulase negative staphylococci (CNS), S. aureus, Str. agalactiae and Str.uberis (Petzer et al. 2009). Coagulase negative staphylococci, regarded as minor pathogens,are now causing an increasing number of clinical mastitis cases and increasingly high SCC(Zadoks and Watt 2009; Petzer et al. 2009).
The primary objective of this study was to determine whether or not the SCC test could beused with a reasonable level of accuracy (sensitivity >85%) to identify species specific IMI.The study investigated how SCC levels differ between the various udder pathogens andpathogen groups in both quarter milk samples and composite milk samples. In addition, thepercentage of infection with a species with SCC below 200 000 cells/mL in quarter milksamples and below 150 000 cells/mL in composite milk samples was quantified.
Decisions in the field need to rely on current farm information to predict future eventsaccurately so that measures can be taken to prevent disease in advance. Early identificationand dealing with cows positive for contagious udder pathogens can lower the risk oftransmission for new infections significantly (Petzer et al. 2016). An effective, inexpensive testis therefore required to aid in early detection of the presence of bacteria.

82
METHODS
A retrospective study was conducted of milk cultures of lactating cows obtained from SouthAfrican commercial dairy herds over a period of 4 years. Samples originated fromapproximately 830 South African dairy herds that submitted samples as part of their routineudder health monitoring programme and also from herds with increased bulk milk somaticcell count (BMSCC) who had sought help. The South African national average daily milk yieldwas 20.2 kg (Lactodata 2013) and lactating cow numbers varied from approximately 30 to1700 cows in herds tested in this data set. Intervals for herd examinations ranged frommonthly to annually and bi annually, or in some cases only as a once off test. The studypopulation included different dairy breeds and cows differed in parity, milk yield and days inmilk.
Quarter and composite milk samples were investigated. Milk samples were taken byprofessional samplers or milkers trained according to a standard operating procedure(Giesecke et al. 1994). Prior to sampling, first milk was stripped from all quarters and teatends were carefully cleaned and disinfected with methylated alcohol. Approximately 10 ml offoremilk was collected aseptically into sterile marked sample tubes and kept refrigerated untilshipment. In the case of composite milk samples, the same procedure was followed, onlyapproximately equal volumes of milk from each of the four quarters were collected in onesample tube. Samples were transported on ice to reach the Milk Laboratory at the Universityof Pretoria (Faculty of Veterinary Science) within 48 h after sampling. Temperatures andconditions such as sample tube cleanliness and appearance were noted on arrival at thelaboratory, and samples that were spoiled or of doubtful quality were not processed. Sampleswere plated out at the laboratory on the day of their arrival.
A total of 95 228 quarter milk samples and 386 031 composite milk samples obtained fromroutine herd investigations were initially under consideration for use, of which 5.9% and10.5%, respectively, were defined as being unsuitable and were excluded from the data set.Samples were regarded as unsuitable for this study when any visible abnormalities such asdirt, flakes or blood were detected, when cultures indicated contamination or mixed bacterialgrowth ( 2 bacterial species), or when data were incomplete. In cases where two majorpathogens were isolated from the same sample, an identifying code was used in order to beable to use this information for herd management decisions, but this information was notincluded in the data set. The final data set comprised 89 638 quarter milk samples and345 461 composite milk samples.
Milk from samples was plated out on bovine blood tryptose agar plates [Oxoid, supplied byQuantum Biotechnologies (Pty) Ltd, Ferndale, South Africa]. Inoculated agar plates wereincubated aerobically at 37 1 C and examined after 18 to 24 h and 48 h. All samples in thecurrent data set were diagnosed by using one or more colonies in cases where S. aureus wassuspected and two or more in all other cases. Only pure cultures were used. Colonies were

83
initially identified based on colony morphology, haemolysis and potassium hydroxide (KOH)test results (International Dairy Federation 1981; Sears et al. 1993). The catalase reaction wasused to differentiate between Gram positive staphylococci and streptococci. Staphylase, acoagulase test [Oxoid, supplied by Quantum Biotechnologies (Pty) Ltd, Ferndale, SouthAfrica], was used to distinguish between coagulase positive and coagulase negativestaphylococci. Maltose agar plates (Merck NT Laboratory Supplies, Halfway House, SouthAfrica) and Staph API [Biomerieux South Africa (Pty) Ltd, Randburg, South Africa] were usedfor further identification of staphylococci. Catalase negative streptococci were differentiatedinto the various Lancefield groups using a Strepkit [Oxoid, supplied by QuantumBiotechnologies (Pty) Ltd, Ferndale, South Africa]. Gram negative organisms were diagnosedusing DNase and MacConkey agar [Oxoid supplied by Quantum Biotechnologies (Pty) Ltd,Ferndale, South Africa] and API 20E [Biomerieux South Africa (Pty) Ltd, Randburg, SouthAfrica]. Staphylococcus aureus isolates were further identified by phage typing (Blair &Williams 1961). Typing was performed by using an international set of 23 phages. The strainswere typed as one of four groups or as non allocated. All S. aureus isolates that wereidentified as being from phage group 3 were indicated by the abbreviation STH whereas allthose that were not from this group were identified as STA. Phage typing was performed todifferentiate between the S. aureus isolates for another study investigating the possible roleof reverse zoonosis in udder health. Isolates that have been identified as STA and STH arefurther being genotyped but does not form part of this study. The reason for differentiatingbetween them in this study is to compare their SCC threshold levels as this may have aninfluence on the management decisions on farm.
Somatic cells were counted by fluoro opto electronics using a Fossomatic 5000 (Rhine Ruhr).SSC was evaluated by comparing the presence or absence of 8 and 10 specific pathogensisolated at 11 threshold levels in quarter and composite sample types, respectively. SCCthresholds were used with increments of 50 000 cells/mL up to 500 000 cells/mL; thereafter,the two thresholds were 750 000 cells/mL and above.
IMI was diagnosed in single quarter milk samples at any level of SSC and only using purecultures when at least one or more S. aureus colonies and two or more colonies of any otherbacteria were isolated (Dohoo et al. 2011). In the case of composite cow milk samples, thesame principle was used but referred to as culture positive samples. Two by two tables weregenerated using the GenStat programme (Payne et al. 2012) and the positive likelihood ratiowas used.
In the case of composite milk samples sensitivity, specificity [95% confidence intervals (CI)] ofbinomial proportions around these estimates was determined using theMid P exact test fromthe OpenEpi freeware programme. Sample dependency of SCC values within each cow wasmodelled to take into account individual cow factors that may affect quarter samples. Anestimator of cluster variance was determined and the 95% CI were adjusted for clustering by

84
using the design effect (cluster variance or sample random sample variance; Scheaffer et al.1996).
RESULTS
4.1 Quarter milk samples
Bacteria were isolated from 33.9% of quarter milk samples examined. Of these culturepositive samples, 12.43% were major Gram positive, 0.3% major Gram negative and 21.2%minor pathogens. The most frequently isolated bacteria were CNS (19.2%), S. aureus (STA andSTH) (6.8%), Str. agalactiae (2.1%), Str. uberis (2.5%) and Str. dysgalactiae (1.1%). Thepercentage of quarter milk samples with an SCC in excess of 200 000 cells/mL was 48.8% andbacteria were isolated from 49.9% of these samples (Table 4.1).

85
Table 4.1. Bacteriologically negative and positive quarter milk samples indicating pathogenspecific bacteria and groups isolated from samples with and without somatic cell counts(SCC) above 200 000 cells/mL milk.
Bacteria isolated Total numbers of samples from which bacteriawere isolated
Bacterialspeciesas a % of the total samples
Bacterialspeciesas a % of bacteriaisolated
Number of quarters with a SCC >200 000 cells/mL per bacterialspecies
*As a % of all quarters with a SCC >200 000 cells/mL per bacterialspecies
As a % of bacteriological diagnoses with SCC >200 000 cells/mL
Staphylococcus aureus (STA) 3657 4.08 12.03 3125 7.15 85.45 Staphylococcus aureus (STH) 2430 2.71 7.99 2286 5.23 94.07 Streptococcus agalactiae 1875 2.09 6.17 1707 3.91 91.04 Streptococcus uberis 2212 2.47 7.28 1856 4.25 83.91 Streptococcus dysgalactiae 964 1.08 3.17 924 2.11 95.85 Major Gram-positive pathogens 11138 12.43 36.64 9898 22.65 88.87
Escherichia coli 141 0.16 0.46 128 0.29 90.78 Klebsiella pneumonia 45 0.05 0.15 42 0.10 93.33 Serratia spp. 102 0.11 0.34 99 0.23 97.06 Major Gram-negative pathogens 288 0.32 0.95 269 0.62 93.40 All major pathogens 11426 12.75 37.59 10167 23.27 88.98
Staphylococcus pseudintermedius 445 0.50 1.46 237 0.54 53.26 Coagulase negative staphylococci 17249 19.24 56.74 10352 23.69 60.02 Streptococcus pyogenes 56 0.06 0.18 53 0.12 94.64 Enterococcus faecalis 651 0.73 2.14 557 1.27 85.56 Enterococcus canis 33 0.04 0.11 26 0.06 78.79 Trueperella pyogenes 19 0.02 0.06 16 0.04 84.21 Micrococcus spp. 141 0.16 0.46 104 0.24 73.76 Other Gram-negative bacteria 379 0.42 1.25 309 0.71 81.53 All minor pathogens 18973 21.17 62.41 11654 26.67 61.42 Culture negative samples 59236 66.09 21876 50.06 36.93 All culture positive samples 30399 33.91 21821 49.94 71.78 All samples tested 89635 43697 48.75
aThe number of quarter milk samples, per pathogen group or species, that had an SCC of below 200 000 cells/mLexpressed as a percentage of the total quarters (43 697) identified with SCC below 200 000 cells/mL. Totals arewritten in bold.
The cumulative percentages of the eight most prominent bacterial species isolated in quartermilk samples are indicated at 11 different SCC threshold levels. Less than 10% of the followingbacterial species were isolated at an SCC of below 200 000 cells/mL: Str. dysgalactiae (4.2%),

86
S. aureus (STH) (5.9%) and Str. agalactiae (9.0%). In contrast, 40.0% of CNS and 46.2% S.pseudintermedius were isolated at an SCC of below 200 000 cells/mL (Table 4.2).
Table 4.2. Cumulative percentages of eight mastitis pathogens and culture negativesamples isolated from quarter samples distributed on various cell count thresholds (n =89 635).
SCC x 103
cells/mL % CNS % STA % STH % STI % SAG % SUB % SDY % SFA % No
growth 50 14.77 7.07 3.00 22.38 2.65 5.17 1.41 3.97 34.55 100 26.17 11.71 4.79 34.03 5.80 9.98 2.82 7.93 40.32 150 34.94 12.69 5.52 42.19 7.13 14.15 3.59 11.41 56.88 200 39.98 14.55 5.93 46.74 8.96 16.09 4.15 14.44 63.07 250 47.34 21.07 10.38 53.85 12.48 21.10 6.67 20.34 69.01 300 52.06 23.11 13.12 59.21 15.51 24.30 8.72 24.31 72.22 350 55.93 24.66 14.45 63.17 18.66 27.77 10.64 28.10 74.64 400 59.24 26.49 15.45 66.43 21.88 30.87 12.69 31.55 76.61 450 62.13 28.53 17.38 69.23 25.16 33.20 13.97 34.48 78.29 500 64.62 30.14 18.84 73.19 26.80 35.83 16.03 36.55 79.69 750 73.31 36.19 25.83 79.25 37.45 46.38 24.62 45.34 84.67 Sample size
17 249 3 657 2 430 445 1 875 2 212 964 651 59 236
CNS, coagulase negative staphylococci; STA and STH, Staphylococcus aureus; STI, Staphylococcuspseudintermedius; SAG, Streptococcus agalactiae; SUB, Streptococcus uberis; SDY, Streptococcus dysgalactiae;SFA, Enterococcus faecalis; no growth, culture negative samples.
The cumulative percentages of the eight most prominent bacterial species isolated in fromquarter milk samples are indicated at 11 different SCC threshold levels. Less than 10% of thefollowing bacterial species were isolated at a SCC of below 200 000 cells/mL: Streptococcusdysgalactiae (4.2%), S. aureus (STH) (5.9%) and Str. agalactiae (9.0%). In contrast 40.0% ofCNS and 46.2% S. pseudintermedius were isolated at SCC below 200 000 cells/mL (Table 4.2).
Sensitivity (95% CI) at an SCC threshold of 200 000 cells/mL for all bacteria that were isolated(Table 4.3) and for major and minor pathogen groups identified was 70.8%, 88.2% and 60.7%,and specificity was 66.6%, 57.7% and 55.6%, respectively. The sensitivity for detecting Str.dysgalactiae (95.6%), S. aureus (STH) (93.3%), Str. agalactiae (90.5%) and the major Gramnegative pathogen group (93.1%) using SCC was high. The highest sensitivity obtained withthe SCC test indicating a minor pathogen species was 85.4% for detecting Enterococcusfaecalis. Positive likelihood ratios at 200 000 cells/mL to indicate major and minor pathogenswere 2.085 and 1.369, respectively (Table 4.3).

87
Table 4.3. Sensitivity and specificity with 95% confidence intervals (CI) for pathogen specificdetection using an SCC threshold of 200 000 cells/mL milk in quarter milk samples andpositive likelihood ratios at SCC thresholds of 200 000 cells/mL.
Number of samples
Bacteria isolated Sensitivity Specificity Positive Likelihood
Ratio (95% LCI and UCI)*
(95% LCI and UCI)*
89635 Bacteria pooled 0.708 (0.695, 0.720) 0.666 (0.636, 0.690) 2.120 3657 S. aureus (STA) 0.846 (0.828, 0.863) 0.537 (0.519, 0.554) 1.827 2430 S. aureus (STH) 0.933 (0.911, 0.955) 0.533 (0.511, 0.555) 1.998 1875 Streptococcus agalactiae 0.905 (0.873, 0.937) 0.530 (0.499, 0.562) 1.926 2212 Streptococcus uberis 0.833 (0.814, 0.851) 0.530 (0.509, 0.552) 1.772 964 Streptococcus dysgalactiae 0.956 (0.928, 0.985) 0.527 (0.494, 0.559) 2.021 288 Major Gram-negative
pathogens** 0.931 (0.901, 0.961) 0.523 (0.464, 0.582) 1.952
11426 Major pathogens 0.882 (0.866, 0.898) 0.577 (0.561, 0.594) 2.085 445 S. pseudintermedius 0.528 (0.482, 0.575) 0.522 (0.475, 0.569) 1.105 17249 CNS 0.594 (0.585, 0.603) 0.549 (0.541, 0.558) 1.317 651 Enterococcus faecalis 0.854 (0.826, 0.881) 0.524 (0.485, 0.563) 1.873 249 Other minor pathogens*** 0.795 (0.744, 0.846) 0.522 (0.459, 0.586) 1.663 379 Other Gram-negative
bact.**** 0.773 (0.726, 0.820) 0.523 (0.466, 0.579) 1.621
18973 Minor pathogens 0.607 (0.598, 0.616) 0.556 (0.547, 0.567) 1.367 59236 Culture negative samples 0.364 (0.352, 0.376) 0.293 (0.281, 0.305) 0.515
*Confidence intervals have been adapted for clustering; LCI/UCI lower and upper confidence intervals; **majorGram negative pathogens: E. coli, Serratia spp. and Klebsiella pneumonia;***cother minor pathogens:Micrococcus spp., Enterococcus canis, Streptococcus pyogenes and Trueperella pyogenes; ****other Gramnegative bacteria: all Gram negative bacteria isolated excluding E. coli, Serratia spp. and Klebsiella pneumonia.CNS, coagulase negative staphylococci; Totals are written in bold.
4.2 Composite milk samples
Major Gram positive, Gram negative and minor pathogens were, respectively, isolated from8.9%, 0.3% and 34.2% of composite samples examined. Themost frequently isolated bacterialspecies in this sample type were CNS, S. aureus (STA and STH) and Str. uberis. Of the samplesexamined, 40.1% of bacteria positive samples and 62.3% of all examined had an SCC in excessof 200 000 cells/mL. Approximately, 80% of the major Gram positive and Gram negativegroups and 51.7% of minor pathogen group had SCC exceeding 200 000 cells/mL. More than80% of all major pathogens investigated in this study had SCC exceeding 200 000 cells/mLexcept S. aureus (STA) and Str. uberis. In 81% of samples positive for Trueperella pyogenes, aminor pathogen, the SCC exceeded 200 000 cells/mL (Table 4.4).
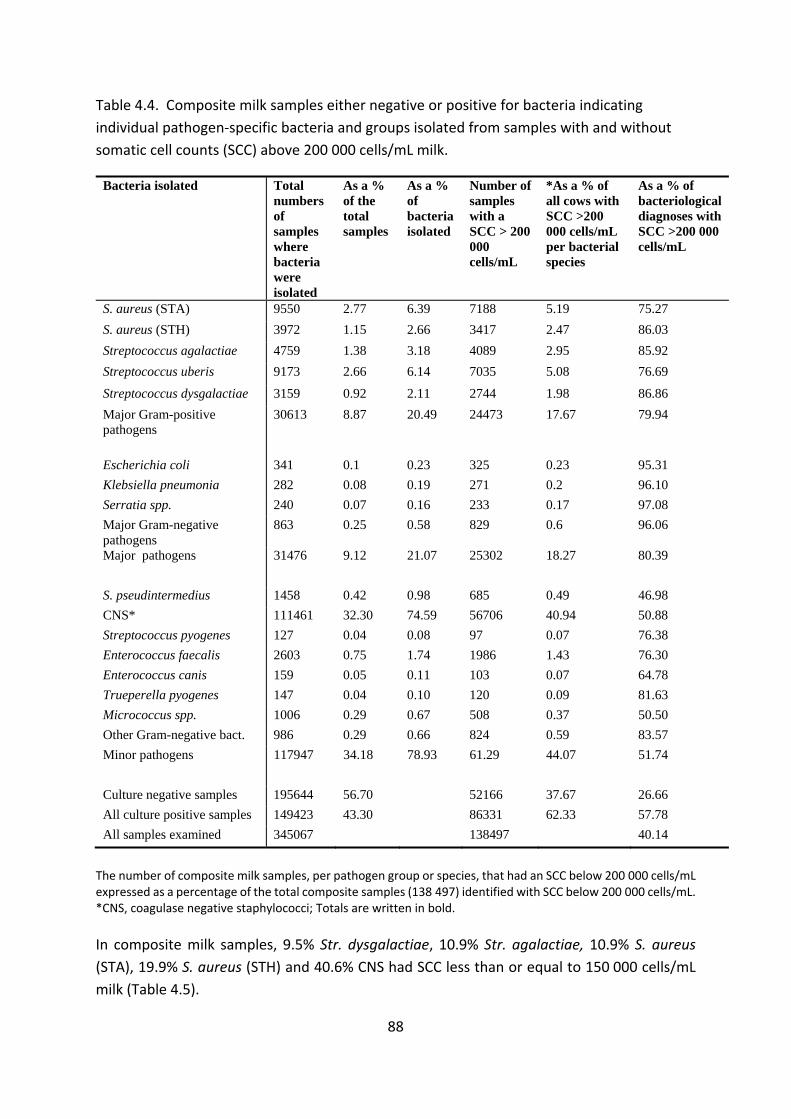
88
Table 4.4. Composite milk samples either negative or positive for bacteria indicatingindividual pathogen specific bacteria and groups isolated from samples with and withoutsomatic cell counts (SCC) above 200 000 cells/mL milk.
Bacteria isolated Total numbers of sampleswherebacteria wereisolated
As a % of the total samples
As a % of bacteria isolated
Number of sampleswith a SCC > 200 000 cells/mL
*As a % of all cows with SCC >200 000 cells/mL per bacterial species
As a % of bacteriological diagnoses with SCC >200 000 cells/mL
S. aureus (STA) 9550 2.77 6.39 7188 5.19 75.27 S. aureus (STH) 3972 1.15 2.66 3417 2.47 86.03 Streptococcus agalactiae 4759 1.38 3.18 4089 2.95 85.92 Streptococcus uberis 9173 2.66 6.14 7035 5.08 76.69
Streptococcus dysgalactiae 3159 0.92 2.11 2744 1.98 86.86 Major Gram-positive pathogens
30613 8.87 20.49 24473 17.67 79.94
Escherichia coli 341 0.1 0.23 325 0.23 95.31 Klebsiella pneumonia 282 0.08 0.19 271 0.2 96.10 Serratia spp. 240 0.07 0.16 233 0.17 97.08 Major Gram-negative pathogens
863 0.25 0.58 829 0.6 96.06
Major pathogens 31476 9.12 21.07 25302 18.27 80.39
S. pseudintermedius 1458 0.42 0.98 685 0.49 46.98 CNS* 111461 32.30 74.59 56706 40.94 50.88 Streptococcus pyogenes 127 0.04 0.08 97 0.07 76.38 Enterococcus faecalis 2603 0.75 1.74 1986 1.43 76.30 Enterococcus canis 159 0.05 0.11 103 0.07 64.78 Trueperella pyogenes 147 0.04 0.10 120 0.09 81.63 Micrococcus spp. 1006 0.29 0.67 508 0.37 50.50 Other Gram-negative bact. 986 0.29 0.66 824 0.59 83.57 Minor pathogens 117947 34.18 78.93 61.29 44.07 51.74
Culture negative samples 195644 56.70 52166 37.67 26.66 All culture positive samples 149423 43.30 86331 62.33 57.78 All samples examined 345067 138497 40.14
The number of composite milk samples, per pathogen group or species, that had an SCC below 200 000 cells/mLexpressed as a percentage of the total composite samples (138 497) identified with SCC below 200 000 cells/mL.*CNS, coagulase negative staphylococci; Totals are written in bold.
In composite milk samples, 9.5% Str. dysgalactiae, 10.9% Str. agalactiae, 10.9% S. aureus(STA), 19.9% S. aureus (STH) and 40.6% CNS had SCC less than or equal to 150 000 cells/mLmilk (Table 4.5).

89
Table 4.5. Cumulative percentages of 10 bacteria species and culture negative samplesisolated from composite cow milk samples distributed on various cell count thresholds (n =345 461).
SCCx103
cells/mL
%CNS
%STA
%STH
%STI
%SAG
%SUB
%SDY
%SFA
%SCA
%SPY
% No growth
50 15.32 7.32 3.50 17.42 3.11 6.67 2.41 6.84 11.95 6.30 39.48 100 29.56 14.31 7.43 32.30 6.64 12.41 5.89 12.87 16.98 12.60 56.92 150 40.61 19.92 10.90 44.31 10.86 18.27 9.47 18.44 26.42 18.90 66.84 200 49.12 24.73 13.97 53.02 14.08 23.31 13.14 23.70 35.22 23.62 73.34 250 55.87 28.83 16.72 58.85 17.15 28.28 16.37 28.28 37.11 26.77 77.45 300 61.36 32.28 18.78 64.40 20.17 32.48 19.12 33.19 39.62 33.07 80.64 350 65.68 35.25 21.12 68.31 23.53 36.32 22.06 37.88 43.40 40.16 82.92 400 69.28 37.81 23.04 71.81 26.08 39.94 25.20 41.80 48.43 42.52 84.74 450 72.21 40.08 25.08 74.42 28.18 43.27 27.92 45.10 49.69 44.88 86.27 500 74.77 42.23 26.89 76.20 30.32 46.03 31.31 48.44 52.20 48.03 87.56 750 82.65 50.48 33.46 82.30 39.02 57.25 42.92 60.35 61.64 62.20 91.44
Sample size
111461 9550 3972 1458 4759 9173 3159 2603 159 127 195644
CNS, coagulase negative staphylococci; STA and STH, Staphylococcus aureus; STI, Staphylococcuspseudintermedius; SAG, Streptococcus agalactiae; SUB, Streptococcus uberis; SDY, Streptococcus dysgalactiae;SFA, Enterococcus faecalis; SCA, Enterococcus canis; SPY, Streptococcus pyogenes; no growth, culture negativesamples.
At a 200 000 cells/mL SCC threshold, the sensitivity for detecting major Gram positive, Gramnegative and minor pathogens was 79.9%, 95.5% and 51.7% with specificity of 50.3%, 52.8%and 53.5%, respectively. At a 150 000 cells/mL SCC threshold, the sensitivity improved to84.2%, 96.1% and 60.1% for the same microbial groups (Table 4.6).

90
Table 4.6. Sensitivity and Specificity with 95% lower (LCI) and upper (UCI) for variousbacterial species and groups indicated in composite samples at SCC threshold levels of 150000 and 200 000 cells/mL.
Bacteria isolated Sensitivity at 150 000 cells/mL threshold(95% LCI & UCI)
Specificity at 150 000 cells/mL threshold(95% LCI & UCI)
Sensitivity at 200 000 cells/mL threshold(95% LCI & UCI)
Specificity at 200 000 cells/mL threshold(95% LCI & UCI)
S. aureus (STA) 0.801 (0.783, 0.819) 0.521 (0.514, 0.529) 0.735 (0.730, 0.770) 0.523 (0.515, 0.531)
S. aureus (STH) 0.891 (0.862, 0.921) 0.525 (0.517, 0.533) 0.860 (0.832, 0.890) 0.525 (0.518, 0.533)
Streptococcus agalactiae 0.891 (0.865, 0.919) 0.524 (0.516, 0.532) 0.859 (0.833, 0.886) 0.525 (0.517, 0.532)
Streptococcus uberis 0.817 (0.799, 0.836) 0.521 (0.514, 0.529) 0.767 (0.749, 0.785) 0.523 (0.515, 0.530)
Streptococcus dysgalactiae
0.905 (0.873, 0.939) 0.526 (0.518, 0.533) 0.869 (0.837, 0.902) 0.526 (0.518, 0.538)
Major Gram-positive Pathogens
0.842 (0.811, 0.875) 0.499 (0.492, 0.507) 0.799 (0.769, 0.831) 0.503 (0.495, 0.511)
Major Gram-negative pathogens*
0.961 (0.897, 1.028) 0.528 (0.520, 0.536) 0.955 (0.891, 1.022) 0.528 (0.520. 0.536)
S. pseudintermedius 0.557 (0.520, 0.596) 0.529 (0.521, 0.537) 0.470 (0.436, 0.506) 0.529 (0.522, 0.537) CNS 0.594 (0.580, 0.608) 0.498 (0.489, 0.507) 0.509 (0.496, 0.522) 0.539 (0.530, 0.548)
Enterococcus faecalis 0.816 (0.781, 0.851) 0.527 (0.519, 0.535) 0.763 (0.730, 0.797) 0.527 (0.520, 0.535)
Other Gram-negative bacteria**
0.827(0.771, 0.885) 0.528 (0.521, 0.536) 0.836 (0.780, 0.894) 0.528 (0.521, 0.536)
Streptococcus pyogenes 0.811 (0.665, 0.980) 0.529 (0.522, 0.537) 0.764 (0.623, 0,928) 0.529 (0.521, 0.537)
Enterococcus canis 0.736 (0.611, 0.879) 0.529 (0.521, 0.537) 0.648 (0.532, 0.782) 0.529 (0.521, 0.537)
Trueperella pyogenes 0.871 (0.729, 1,032) 0.529 (0.521, 0.537) 0.816 (0.680, 0.973) 0.529 (0.521, 0.537)
Micrococcus spp. 0.588 (0.542, 0.636) 0.529 (0.521, 0.537) 0.505 (0.463, 0.550) 0.529 (0.512, 0.537)
Other minor pathogens combined***
0.653 (0.612, 0.695) 0.529 (0.521, 0.536) 0.575 (0.537, 0.616) 0.529 (0.521, 0.537)
Minor pathogens 0.601 (0.587, 0.615) 0.491 (0.483, 0.501) 0.517 (0.505, 0.530) 0.535 (0.526, 0.545) Bacteria pooled 0.653 (0.640, 0.666) 0.668 (0.657, 0.679) 0.578 (0.566,0.590) 0.733 (0.722, 0.745)
*Major Gram negative pathogens: Escherichia coli, Klebsiella pneumonia and Serratia spp.; **other Gramnegative bacteria: all Gram negative isolated excluding E. coli, Klebsiella pneumonia and Serratia spp.;***Other minor pathogens combined: Streptococcus pyogenes, Enterococcus canis, Trueperella pyogenesandMicrococcus spp. CNS, coagulase negative staphylococci. Totals are written in bold.
In almost all cases in composite samples, the probability of identifying pathogen groups orspecific pathogen species was only slightly higher than the likelihood of identifying culturenegative samples at both 150 000 cells/mL and 200 000 cells/mL SCC thresholds. S.pseudintermedius was less likely to be identified than culture negative samples when usingan SCC threshold of 200 000 cells/mL (Table 4.7).

91
Table 4.7. The positive likelihood ratios at somatic cell count (SCC) thresholds of 150 000and 200 000 cells/mL for detecting various bacterial species and groups in compositesamples.
Bacteria isolated Positive Likelihood Ratio at 150 000 cells/mL
Positive Likelihood Ratio at 200 000 cells/mL
Staphylococcus aureus (STA) 1.672 1.541 Staphylococcus aureus (STH) 1.876 1.811 Streptococcus agalactiae 1.872 1.808 Streptococcus uberis 1.706 1.608 Streptococcus dysgalactiae 1.909 1.833 Major Gram-positive pathogens 1.681 1.608 Major Gram-negative pathogens* 2.036 2.023 Staphylococcus pseudintermedius 1.183 0.998 Coagulase negative staphylococci 1.183 1.104 Enterococcus faecalis 1.725 1.613 Other Gram-negative bacteria** 1.752 1.771 Minor pathogens 1.181 1.112 Bacteria pooled 1.967 2.165 *Major Gram negative pathogens: Escherichia coli, Klebsiella pneumonia and Serratia spp.; **other Gramnegative bacteria: all Gram negative isolated excluding E. coli, Klebsiella pneumonia and Serratia spp. Totalsare written in bold.
DISCUSSION
This study provided an overview of the incidence of IMIs and culture-positive samples under operational conditions experienced by South African commercial dairy herds at the time of the investigation. This study was intended as an initial investigation on data already available from routine samples.
Quarter milk samples
Observations of quarter milk are not independent and within cows dependency wasconsidered in the study design. The within herd correlations were not taken into account inthis initial study to enable evaluation of results as they are obtained under field conditions ona daily basis by diagnostic laboratories. The ratio of culture negative to culture positivequarter milk samples with SCC less than or equal to 200 000 cells/mL was approximately fourto one, whereas almost equal numbers of culture negative and culture positive samples werepresent at SCC exceeding 200 000 cells/mL (Table 4.1). Although the ratio of positive culturesincreased with increasing SCC conforming to general accepted standards (National MastitisCouncil 2001, Biggs 2009, Roy et al. 2012), it was surprising to learn that such a large portionof samples with SCC exceeding 200 000 cells/mL were culture negative (Table 4.1). This

92
finding indicates that the SCC test is only a survey tool to aid in the identification of IMI underfield conditions (Table 4.1). Although numerous factors can influence the SCC at individualcow and udder quarter level, such as parity, lactation stage, incorrect milking machinesettings, stress and other factors including genetics, the most important cause remains theinfection status of the mammary gland (Schepers et al. 1997).
A further objective of this study was to determine whether the SCC levels differed in milksamples identified with different pathogen species and between pathogen groups. Althoughonly very small percentages of major Gram negative bacteria (E. coli, K. pneumonia andSerratia spp.) were isolated from South African dairy herds, most were associated with highSCC (Table 4.1). In contrast to the finding of Harmon (1994) that quarters with SCC below200 000 cells/mL were not likely to be infected with major mastitis pathogens, we isolated11.0% of major pathogens from low SCC samples (Table 4.1). This value could even be slightlyhigher as samples that yielded a mixed growth of bacteria were not included in this study.Few researchers in other countries sample as a rule all lactating cows in herds formicrobiological evaluation, but rather rely on identification of clinical mastitis and cases withhigh SCC to identify problem animals. Cows infected with major pathogens that have low SCCmay therefore pass unnoticed. In herds with poor parlour hygiene and management, the riskof transmission from unidentified cows causing new IMI can be high (Sears et al. 1990, Zadokset al. 2002).
Malinowski et al. (2006) found very high SCC (some exceeding 10 million cells/mL) for theGram negative pathogen group, Str. agalactiae and T. pyogenes, whereas Schepers et al.(1997) identified S. aureus as being responsible for the highest SCC. In this study from theeight pathogens that were quantified according to SCC levels, Str. dysgalactiae had overallthe highest SCC followed by S. aureus (STH and STA) and Str. agalactiae (Table 4.2). Althoughonly small numbers of T. pyogenes were isolated in this data set, more than 84% of thesebacteria had SCC exceeding 200 000 cells/mL (Table 4.1). Another bacterium, Str. pyogenes,which is not often isolated from cow’s milk but is frequently isolated from human throatswabs and is known to cause reverse zoonosis (Aboul Dahab et al. 1993), was found to beresponsible for high SCC (Table 4.1).
A study conducted by Nickerson and Boddie (1994) showed that the mean SCC for samplesidentified with the CNS strains S. chromogenes and S. hyicus was 168 000 and 193 000cells/mL compared with 39 000 cells/mL from uninfected quarters. In this study, CNS werethe most frequently isolated bacteria and were equal in numbers to all the major pathogenscombined. More than 61% of samples with minor pathogens had SCC greater than or equalto 200 000 cells/mL (Table 4.1). This finding indicates the extent to which minor pathogensmay contribute towards high bulk milk cell counts. Malinowski et al. (2006) indicated thatmost milk samples with CNS, S. aureus and streptococcal IMI had SCC ranging from 200 000to 2 million cells/mL. Of the more than 17 000 milk samples from which CNS was isolated inthis study, 60% had SCC above 200 000 cells/mL, and of those, 26.7% had SCC exceeding

93
750 000 cell/mL (Tables 4.1 and 4.2). Currently, CNS is still generally regarded as a minorudder pathogen, but scientists may need to reconsider this status in future when moreinformation regarding pathogenicity of different CNS stains become available.
The sensitivity for detecting pooled udder pathogens at a 200 000 cells/mL SCC threshold waslow (70.08%), but it was moderately high (88.2%) for detecting major udder pathogens (Table4.3). Sears et al. (1990) found a 74.5% sensitivity at 200 000 cells/mL for a single bacterialculture to detect S. aureus. This sensitivity improved to 94% and 98% when two or threeconsecutive samples of the same quarter were evaluated. Under field conditions, cows areusually selected for culling based on the evaluation of single samples but follow up samplesshould preferably be examined to improve diagnostic accuracy. The sensitivity of SCC fordifferent minor pathogens varies from as low as 52.8% for S. pseudintermedius to 85.4% inthe case of Enterococcus faecalis (Table 4.3).
The specificity at a 200 000 cells/mL SCC threshold to indicate the absence of major (57.7%)andminor (55.6%) pathogen groups was low. These valueswere not in agreementwith resultsobtained by Dinsmore et al. (1990) of 95% to 100% for Str. agalactiae. Although sampledependency of quarter SCC values within each cow was modelled, cow factors did not affectthe outcome of results.
Positive Likelihood Ratios were used to indicate the probability of a sample being foundaccurately positive for specific bacteria when the SCC threshold would be increased whensamples were accurately positive for specific bacteria. It was disappointing that at the 200 000cells/ml SCC threshold, only the major pathogen group and Str. dysgalactiae had a smallincrease in probability of detection and this applied to none of the minor pathogens. Evenwhen all bacteria were pooled, the probability remained small at just above 2% (Table 4.3).
Composite milk samples
The use of quarter milk samples for routine udder health monitoring has become expensivefor large dairy herds, and initial udder health surveys are now conducted using composite cowmilk samples in South African dairy herds (Petzer et al. 2016). It is important, therefore, toknow how reliable SCC of composite milk samples are as indicators of IMI and culture positiveresults and to learn more regarding the interpretation of these results. Although a compositemilk sample is a combination of four quarters, a number of studies have found their SCC tobe a useful indicator in mastitis control practices (Erskine et al. 1987, Bartlett et al. 1992,Barkema et al. 1998, 1999, Reyher and Dohoo 2011).
In both quarter and composite samples with SCC less than or equal to 200 000 cells/mL, theratio for culture negative to culture positive samples was 7:3. In samples with SCC exceeding200 000 cells/mL, composite samples had a ratio of one culture negative sample per twoculture positive samples compared with a 1:1 ratio found in quarter milk samples (Tables 4.1

94
and 4.4). In contrast to results for quarter milk samples, a minority of both infected (44.4%)and uninfected (26.7%) composite samples had SCC exceeding 200 000 cells/mL. Thisindicated that this threshold might not be ideal to use in surveying composite milk samplesfor culture positive samples (Table 3.4). In order to use SCC in composite milk samples as asurvey tool providing an indication of specific pathogens at a similar level than 200 000cells/ml in quarter milk, a SCC threshold lower than 200 000 cells/mL is needed.
Most samples with S. aureus (STA and STH), Str. agalactiae, Str. uberis and Str. dysgalactiaehad SCC exceeding 200 000 cells/mL in both sample types but the levels at which they wereisolated were noticeably lower in composite samples (Tables 4.1 and 4.4). Staphylococcusaureus has been shown in the past to cause a high incidence ofmastitis and to be an importantcause of continuing udder infections (Barkema, et al. 2006). The highest SCC was evident inthis study in culture positive samples containing S. aureus (STH), Str. dysgalactiae and Str.agalactiae (Table 4.5). Mastitis and IMI caused by CNS have increased in recent years, andSCC in CNS positive samples have risen significantly (Reksen et al. 2008, Reyher et al. 2012).Staphylococcus pseudintermedius appears to be an emerging udder pathogen in South Africandairies but was present in samples with low SCC ( 200 000 cells/m) both in quarter (46.7%)and composite samples (53.0%) (Tables 4.2 and 4.5).
Petzer et al. (2016) have found that an SCC threshold of 150 000 cells/mL was moreappropriate to use in composite milk samples when surveying a herd for the purpose ofidentifying samples with positive bacterial growth. This study showed that the percentages ofdifferent pathogen species that were isolated from composite milk samples at a 150 000cells/mL SCC threshold compared better than the percentages isolated at a 200 000 cells/mLthreshold to that isolated from quarter milk samples at an SCC threshold of 200 000 cells/mL.When lowering the threshold to 150 000 cells/mL, an additional 8% of CNS, S.pseudintermedius and Enterococcus canis could be identified and more than 4% extrainfections of Str. uberis, S. aureus (STA and STH) and Str. agalactiae (Table 4.5). The bacteriaisolated from composite milk samples with the highest SCC were S. aureus (STH), Str.agalactiae, Str. dysgalactiae and Str. agalactiae (Table 4.5). When only samples with an SCCexceeding 150 000 cells/mL are cultured, 31% of S. aureus (STA and STH), 18% of Str. uberis,11% Str. agalactiae and 10% of Str. dysgalactiae would remain unidentified (Table 4.5). All ofthese bacteria are known to be contagious, and culture negative cowsmilked after themmaybe at risk of being infected (Petzer et al. 2016). Decision makers in the field may set their goalto eradicate Str. agalactiae from a herd and, therefore, culture samples from all cows.Missingeven one cow may start new infections or outbreaks in herds (Petzer et al. 2016). In the caseof Str. uberis, eradication is not an option as this is an environmental udder pathogen andonly those with high SCC that are repeatedly isolated from the same cow would be importantto identify to achieve the goal set here.
Although Reksen et al. (2008) found sensitivity in composite samples to be low, this studyfound moderately high to high sensitivities (84.2% and 96.1%) for identifying major Gram

95
positive and Gram negative pathogens at the 150 000 cells/mL threshold but low sensitivity(65.3%) for detecting the minor pathogen group (Table 4.6). Lam et al. (1996) and Reyher andDohoo (2010) reported at the 200 000 cells/mL threshold sensitivities of 63.0% to 77.1% todetect S. aureus. To detect S. aureus (STA) and (STH), we recorded sensitivity levels of 73.5%and 86.0%, respectively, at 200 000 cells/mL SCC, and these improved to 80.1% and 89.1% at150 000 cells/mL SCC, respectively (Table 4.6). The sensitivity at 150 000 cells/mL fordetecting Str. dysgalactiae and Str. uberis was 90.5% and 81.7% compared with 73.4% and62.1% reported by Reyher and Dohoo (2010) at a 200 000 cells/mL SCC threshold. Thesefindings supported the use of a 150 000 cells/mL SCC threshold in composite milk samples forsurveying the udders infected with major pathogens.
There was little improvement in the level of specificity of the SCC test when using the lowerthreshold (Table 4.6). According to Reyher and Dohoo (2010), factors such as parity and daysin milk did not influence sensitivity and specificity of composite sampling, only for CNS.
The positive likelihood ratio for detecting specific pathogens species and groups differed verylittle when the SCC was lowered from 200 000 to 150 000 cells/ml milk (Table 4.7).
CONCLUSION
Electronic somatic cell counting has traditionally been used since the 1960s as a diagnostictool in udder health assessment (Heeschen 2010). Although most major and minor udderpathogen groups were isolated at SCC exceeding 200 000 cells/mL, over a third in quartersamples and almost a third in composite samples were culture negative at SCC exceeding200 000 cells/ml. From these results, it is clear that SCC is not an accurate tool when used onits own to identify bacteria positive cultures in quarter or composite samples. When optingto use SCC as a test indicating specific udder pathogens or groups, the low specificity of thetest that was recorded will have a negative effect on the accuracy of results. However,decreasing the SCC threshold in composite samples to 150 000 cells/mL improved thesensitivity of the test to moderately high and high levels of 84% and 96% for the major Grampositive and Gram negative udder pathogen groups, whereas specificity remained low at 50%and 52%, respectively.
The level of SCC differed considerably according to the various udder pathogens identified,and species that caused the highest SCC in both sample types were Str. dysgalactiae, Str.agalactiae and Str. uberis. When SCC thresholds of 200 000 (in quarter milk samples) and150 000 cells/mL (in composite milk samples) were used to detect S. aureus positive cultures,if it was found that 20.5% of quarters and 30.8% of cows positive for S. aureus might remainundetected due to their low SCC. These values could increase to 49% quarters and 69% ofcows whenmilk samples with SCC exceeding 500 000 cells/ml were to be cultured. This articleindicates the estimated risk of under diagnosing of pooled bacterial infections, variouspathogens and pathogen groups at specific SCC levels in both quarter and composite milk

96
samples. The knowledge gained in this study can assist with more efficient goal orientateddecision making on farm level.
The effects of days in lactation, parity, milk yield, management level and prevalence ofpathogen specific IMI or culture positive samples on SCC thresholds were not measured inthis research and need to be further investigated.
ACKNOWLEDGEMENTS
Wewant to thank the dairy producers for allowing us to use data obtained on their farms andthe staff on the Milk Laboratory, Faculty of Veterinary Science, Onderstepoort, University ofPretoria: Mrs JC Watermeyer, F Konaite, N Labuschagne, Miss R Badenhorst, Mr LL Mohapiand K Malekane for performing the technical work, data logging and verification, for Mrs M.Smith for the data management and for Prof G.F. Fosgate for his assistance with modulationto determine estimators of cluster variance.
REFERENCES
Aboul Dahab, O.M., Darhous, M.S. & Abdel Rahman, R., 1993. The incidence of Streptococcuspyogenes in throat and plaque cultures in cases with acute throat infections. EgyptianDentistry Journal 39, 527–532.
Barkema, H.W., Schukken, Y.H., Lam, T.J.G.M., Beiboer,M.L., Benedictus, G. & Brand, A., 1998.Management practices associated with low, medium, and high somatic cell counts in bulkmilk. Journal of Dairy Science 81, 1917–1928. http://dx.doi.org/10.3168/jds.S00220302(98)75764 9.
Barkema, H.W., Schukken, Y.H. & Zadoks, R.N., 2006. The role of cow, pathogen, andtreatment regimen in the therapeutic success of bovine Staphylococcus aureus mastitis.Journal of Dairy Science 89, 1877–1895. (doi.org/10.3168/jds.S0022 0302(06)72256 1).
Barkema, H.W., Van der Ploeg, J.D., Schukken, Y.H., Lam, T.J.G.M., Benedictus, G. & Brand, A.,1999. Management style and its association with bulk milk somatic cell count and rate ofclinical mastitis. Journal of Dairy Science 82, 1655–1663.(doi.org/10.3168/jds.S0022 0302(99)75394 4).
Bartlett, P.C., Miller, G.Y., Lance, S.E. & Heider, L.H., 1992. Environmental and managerialdeterminant of somatic cell counts and clinical incidence in Ohio dairy herds. PreventiveVeterinary Medicine 14, 195–207. (doi.org/10.1016/0167 5877(92)90016 9).
Biggs, A.M., 2009. Optimising the use of SCC information. Proceedings of the British MastitisConference, Stoneleigh Park, 14 October 2009, pp. 15–26.

97
Blair, J.E. &Williams, R.E.O., 1961. Phage typing of staphylococci. Bulletin of theWorld HealthOrganization 24, 771–784.
DeGraves, F.J. & Fetrow, J., 1993. Economics of mastitis and mastitis control. VeterinaryClinics of North America: Food Animal Practice 9, 421–443. (doi.org/10.1016/s07490720(15)30611 3).
Dinsmore, R.P., English, P.B., Gonzalez, R.N., Sears, P.M. & Schulte, H.F., 1990. Evaluation ofmethods for the diagnosis of Streptococcus agalactiae intramammary infections in dairycattle. Journal of Dairy Science 74, 1521–1526. (doi.org/10.3168/jds.S0022 0302(91)783124).
Dohoo, I.R., Smith, J., Andersen, S., Kelton, D.F. & Godden, S., 2011. Diagnosingintramammary infections: Evaluation of definitions based on a single milk sample. Journal ofDairy Science 94, 250–261. (doi.org/10.3168/jds.2010 3559).
Erskine, R.J., Eberhart, R.J., Hutchinson, L.J. & Spencer, S.B., 1987. Herd management andprevalence of mastitis in dairy herds with high and low somatic cell counts. Journal of the American Veterinary Medical Association 190, 141-1416.
Fox, L.K. & Gay, J.M., 1993. Contagious mastitis. Veterinary Clinics of North America: FoodAnimal Practice 9, 475–487. (doi.org/10.1016/S0749 0720(15)30615 0).
Geary, U., Lopez Villalobos, N., Begley, N., McCoy, F., O’Brien, B. & O’Grady, L., 2012.Estimating the effect of mastitis on the profitability of Irish dairy farms. Journal of DairyScience 95, 3662–3673. (doi.org/10.3168/jds.2011 4863).
Giesecke, W.H., du Preez, J.H. & Petzer, I.M., 1994. Practical mastitis control in dairy herds,Butterworths, Durban.
Halasa, T., Nielen, M., De Roos, A.P., Van Hoorne, R., de Jong, G. & Lam, T.J., 2009.Production loss due to new subclinical mastitis in Dutch dairy cows estimated with a test daymodel. Journal of Dairy Science 92, 599–606. (doi.org/10.3168/jds.2008 1564).
Harmon, R.J., 1994. Physiology of mastitis and factors affecting somatic cell counts. Journal ofDiary Science 77, 2103–2112. (doi.org/10.3168/jds.S0022 0302(94)77153 8).
Heeschen, W.H., 2010. IDF and mastitis – A general review, Mastitis Research into Practice:5th IDF Mastitis Conference, Proceedings, Christchurch, New Zealand, March 21–24, 2010,pp. 22–32.
Holland, J.K., Hadrich, L.C., Wolf, C.A. & Lombard, J, 2015. Economics of Measuring Costs Dueto Mastitis Related Milk Loss, Paper presented at the AAEA& WAEA Joint Annual Meeting,26 28 July 2015, San Francisco, California.

98
International Dairy Federation, Brussels, Belgium, 1981. Laboratory Methods for the use inMastitis Work, International Dairy Federation Bulletin, 132/1981.
Keefe, G.P., 1997. Streptococcus agalactiae mastitis: A review. Canadian Veterinary Journal38, 429–437.
Lactodata, 2013. Lactodata 6(2), November 2013, viewed June 2016 fromhttp://www.milksa.co.za/category/all reports/industry information.
Lam, T.J., van Wuijckhuise, L.A., Franken, P., Morselt, M.L., Hartman, E.G. & Schukken, Y.H.,1996. Use of composite milk samples for diagnosis of Staphylococcus aureus mastitis in dairycattle, viewed May 2016 from http://europepmc.org/abstract/med/8641956.
Malinowski, E., Lassa, H., K ossowska, A., Markiewicz, H., Kaczmarowski, M. & Smulski, S.,2006. Relationship between mastitis agents and somatic cell count in foremilk samples.Bulletin of Veterinary Institute in Pulawy 50, 349–352.
National Mastitis Council, 2001. Guidelines on normal and abnormal raw milk based on SCCand signs of clinical mastitis, National Mastitis Council, New Ulm, Minnesota.
Neave, F.K., Dodd, F.H., Kingwill, R.G. &Westgarth, D.R., 1969. Control of mastitis in the dairyherd by hygiene and management. Journal of Dairy Science 52, 696–707.(doi.org/10.3168/jds.S0022 0302(69)86632 4).
Nickerson, S.C. & Boddie, R.L., 1994. Effect of naturally occurring coagulase negativestaphylococcal infections on experimental challenge with major mastitis pathogens. Journalof Dairy Science 77, 2526–2536. (doi.org/10.3168/jds.S0022 0302(94)77194 0).
Payne, R., Murray, D., Harding, S. Baird, D. & Soutar, D., 2012. Introduction to GenStat for WindowsTM, 15th ed., VSN International, Hemel Hempstead.
Petzer, I.M., Karzis, J., Donkin, E.F., Webb, E.C. & Etter, M.C., 2016. Somatic cell countthresholds in composite milk samples as indicator of bovine intra mammary infection status.Onderstepoort Journal of Veterinary Research 81, 1–12.(doi.org/10.4102/ojvr.v83i1.1146).
Petzer, I.M., Karzis, J., Watermeyer, J.C, van der Schans, T. & van Reenen, R., 2009. Trends inudder health and emerging mastitogenic pathogens in South African dairy herds. Journal of the South African Veterinary Association 80, 17–22. (doi.org/10.4102/jsava.v80i1.163).
Reksen, O., Sølverød, L. & Østerås, O., 2008. Relationships between milk culture results andcomposite milk somatic cell counts in Norwegian dairy cattle. Journal of Dairy Science 91,3102–3113. (doi.org/10.3168/jds.2008 1006).

99
Reyher, K.K. & Dohoo, I.F., 2010. Evaluation of utilisation of composite milk samples to detectthe status of bovine quarter infection with specific mastitis pathogens. Proceedings of the 5thIDF Mastitis Conference, Mastitis Research into Practice, Christchurch, New Zealand, March21–24, 2010, pp. 533–538.
Reyher, K.K. & Dohoo, I.R., 2011. Diagnosing intramammary infections: Evaluation ofcomposite milk samples to detect intramammary infections. Journal of Dairy Science 94,3387–3396. (doi.org/10.3168/jds.2010 3907).
Roy, J., Fauteux, V., Bouchard, E. & Scholl, T.D., 2012. Establishing benchmarks to evaluateand compare dairy herd udder health status using monthly somatic cell counts: Descriptivedata. Proceedings of the 27th World Buiatrics Congress, Lisbon, Portugal, June 3–8, 2012, p.132.
Ruegg, P., 2009. Taking mastitis control to the next level. Paper presented at the NMCRegional Meeting, May 2009, Harrisburg PA.
Scheaffer, R.L., Mendenhall, W. & Ott, R.L., 1996. Elementary Survey Sampling. 5th ed.,Wadsworth Publishing Company, Belmont, NC.
Schepers, A.J., Lam, T.J.G.M., Schukken, Y.H., Wilmink, J.B.M. & Hanekamp, W.J.A., 1997.Estimation of various components for somatic cell counts to determine the threshold foruninfected quarters. Journal of Dairy Science 80, 1833–1840.(doi.org/10.3168/jds.S0022 0302(97)76118 6).
Sears, P.M., Smith, B.S., English, B.P., Herer, P.S. & Gonzalez, R.N., 1990. Shedding pattern ofStaphylococcus aureus from bovine intramammary infections. Journal of Dairy Science 73,2785–1789. (doi.org/10.3168/jds.S0022 0302(90)78964 3).
Sears, P.M., Gonzalez, R.N., Wilson, D.J., Han, H.R., 1993. Procedures for mastitis diagnosisand control. Veterinary Clinics of North America: Food Animal Practice 9, 445 468.
Shim, E.H., Shanks, R.D. & Morin, D.E., 2004. Milk loss and treatment costs associated withtwo treatment protocols for clinical mastitis in dairy cows. Journal of Dairy Science 87, 2702–2708. (doi.org/10.3168/jds.S0022 0302(04)73397 4).
Zadoks, R.N., Allore, H.G., Hagenaars, T.J., Barkema, H.W. & Schukken, Y.H., 2002. Amathematical model of Staphylococcus aureus control in dairy herds. Epidemiology andInfection 129, 397–416. (doi.org/10.1017/S0950268802007483).
Zadoks, R.N. & Fitzpatrick, J.L., 2009. Changing trends in mastitis. Irish Veterinary Journal62(Suppl.), 59–70. (doi.org/10.1186/2046 0481 62 S4 S59).
Zadoks, R.N. & Watt, J.L., 2009. Species identification of coagulase negative staphylococci:Genotyping is superior to phenotyping. Veterinary Microbiology 134, 20–28.

100
ADDENDUM 4.1
Youden’s index was calculated for every bacterial species and bacterial group examined forevery SCC threshold level in both quarter and composite samples. The highest Youden’s indexfor each and the SCC threshold level at which it was found are indicated in Table 8. In caseswhere two Youden’s indexs were found to be almost similar both were indicated and the onewith the highest sensitivity (the lower SCC level) would be preferred, for the aimwould ratherbe to identify IMI than culture negative samples. The SCC threshold levels at the higestYouden’s index varied in major Gram positive pathogens from 300 000 cells/ml (Str.agalactiae and Str. uberis) to 500 000 cells/ml (S. aureus (STA & STH)) in quarter and from 250000 (Str. uberis) to 350 000 cells/ml (S. aureus (STA & STH) and Str. dysgalactiae) in compositemilk samples. The SCC thresholds at the point where sensitivity and specificity were in balancewere 450 000 for the major Gram negative pathogens in quarter and 300 000 cells/ml incomposite milk. In minor pathogens the highest Youden’s index varied from a SCC thresholdlevel of 100 000 cells/ml (CNS, S. pseudintermedius and minor pathogens) to 400 000 cells/ml(Enterococcus canis) in quarter samples and from 50 000 (Micrococcus spp.) to 300 000cells/ml (minor Gram negative bacteria) in composite samples (Table 4.8).
In Table 9 the difference in the percentage of eight bacterial species is evident at the 200 000and 150 000 cells/mL SCC threshold levels for quarter and composite milk samples. Bacterialspecies that was responsible for high SCC were less likely to be missed at these chosen SCClevels than those prone to low SCC. Staphylococcus aureus (STH) and Str. dysgalactiea werethe 2 bacterial species that different the most in the percentage isolated from quarter andcomposite milk samples while the percentage CNS isolated from both sample types wasalmost the same (Table 4.9). It may therefore be nessesary to take quarter milk samples whenS. aureus (STH) is suspected in a herd and culture those with a SCC >200 000 cells/ml or tosample the whole herd (composite milk samples).

101
Table 4.8. Evaluation of bacterial species and groups according to Youden’s index todetermine the SCC threshold level at the equilibrium point between sensitivity andspecificity in Quarter and Composite milk samples.
Bacteria isolated QUARTER MILK SAMPLES COMPOSITE MILK SAMPLES Highest
Youden’s Index
SCC x103 cells/ml threshold
level at highest Youden’s index
Highest Youden’s
index
SCC x103 cells/ml threshold
level at highest Youden’s Index
Staphylococcus aureus (STA) 0.461 500 0.368 / 0.370 350 / 400 Staphylococcus aureus (STH) 0.580 500 0.515 350 Streptococcus agalactiae 0.463 300 0.483 300 Streptococcus uberis 0.382 300 0.363 / 0.364 250 / 300 Streptococcus dysgalactiae 0.543 400 0.407 350 Major Gram positive pathogens 0.464 450 0.417 400
Escherichia coli 0.547 500 0.634 300 Klebsiella pneumonia 0.635 500 0.509 300 Serratia spp. 0.573 450 0.583 250 Major Gram negative pathogens 0.563 450 0.632 300 Coagulase negative staphylococci 0.164 100 0.583 250 Staphylococcus pseudintermedius 0.055 100 0.109 100 Enterococcus faecalis 0.374 250 0.365 250 Other Gram negative bacteria* 0.329 200 0.460 300 Micrococcus spp. 0.260 150 0.096 50 Streptococcus pyogenes 0.499 250 0.253 150 Enterococcus canis 0.329 400 0.138 200 Trueperella pyogenes 0.353/0.354 150 / 200 0.392 150 Other minor (combined)** 0.329 200 0.187 100 Minor pathogens 0.144 100 0.303 250
*Other Gram nagative bacteria = all Gram negative isolated excluding E. coli, Klebsiella pneumonia & Serratiaspp. , **Otherminor pathogens (combined) = Streptococcus pyogenes, Enterococcus canis, Trueperella pyogenesandMicrococcus spp.

102
.
% Bacteria missed in quarter milk at SCC threshold of 200 000 cells/ml
% Bacteria missed in composite milk at SCC
threshold of150 000 cells/ml
Staphylococcus aureus (STA) 14.55 19.92 Staphylococcus aureus (STH) 5.93 10.90 Streptococcus agalactiae 8.96 10.86 Streptococcus uberis 16.09 18.27 Streptococcus dysgalactiae 4.15 9.47 Coagulase negative staphylococci 39.98 40.61 Staphylococcus pseudintermedius 46.74 44.31 Enterococcus faecalis 14.44 18.44

103
ADDENDUM 4.2
Poster presented at the International Dairy Federation Mastitis Conference 7-9 September 2016, Nantes, France. 2016. Pathogen specific bovine intramammary infections: The validity of a somatic cell countthreshold as an indicator in quarter and composite milk samples. (Inge Marié Petzer, JoanneKarzis, Edward F. Donkin, Edward C. Webb&Eric M.C. Etter).

104
CHAPTER 5
Staphylococcus aureus.
Published 1 December 2017: Inge Marié Petzer, Eric M.C. Etter, Edward F. Donkin, Edward C.Webb & Joanne Karzis. 2017. Journal of Preventive Veterinary Medicine 48, 66 77.https://doi.org/10.1016/j.prevetmed.2017.10.005. Copy write of article permitted for Thesisunder: Creative Commons Attribution 4.0 International (CC BY 4.0) licence
SIGNIFICANCE OF THEWORK
Antimicrobial resistance is currently an actual global topic. This study is a fresh approachtowards this challenge. The aims for developing the models were: firstly to provide aconsultant, veterinarian or dairy producer with a tool to base decisions on current farminformation to accurately predict future events so that measurements could be taken toprevent disease in advance; secondly wewanted to predict cost effectiveness ofmanagementchanges in combination with an indication of epidemiological outcome in the Staphylococcusaureus population in herds. Current availability of advances on farm technology and datacapabilities based on scientific approach predictions is making this approach become a reality.
Predictions were based on the combination of financial cost benefit but included alsopredictions of probable epidemiological outcomes such as number of clinical mastitis cases,new intramammary infections, persistant cases likely to occur and number of subclinicalStaphylococcus aureus cases that would require treatment for the period chosen. The studyfurther compare these outcomes for different initial herd prevalence of Staphylococcusintramammary infections, different management levels and varying duration ofintramammary treatments. When results of economic and epidemiological models werecompared, the best financial option differed in some scenarios. Such models may assistproducers, consultants and veterinarians in optimising decisions balancing cost/benefit withend point IMI dynamics. Where initial effective treatment was applied, a lower number oftreatments were needed for the 255 days.
We believe that the models can make a positive contribution to enhance current herd udderhealth decisions by providing more accurate predictions of outcome of inventions such as thetreatment of subclinical Staphylococcus aureus.

105
ABSTRACTStaphylococcus aureus
S. aureusS.
aureus
S. aureus
S. aureus
Staphylococcus aureus
S.aureus
S. aureusS. aureus
S. aureus
Key words Staphylococcus aureus

106
INTRODUCTION
.
S. aureus
S. aureusS. aureus
Staphylococcus aureus S. aureus Streptococcus agalactiae Str. agalactiae

107
S. aureus
S.aureus
Staphylococcus aureus
S. aureus

108
S. aureusS. aureus
S. aureus.
S. aureus
S. aureus,
et al.
S. aureusS. aureus
S.aureus.
S.aureus Str.agalactiae
.
S. aureusS. aureus

109
S.aureus
S. aureusS. aureus
MATERIAL AND METHODS
5.1 Stage 1 Basis for both the economic- and epidemiological models
5.1.1 Staphylococcus aureus dynamic
S. aureus.
S. aureus
S. aureus
S. aureus
5.1.2 Transmission parameter for new S. aureus IMI
S. aureus S. aureus.

110
S.aureus
.S. aureus
S. aureus
S. aureus
S. aureus
5.1.3 Herd prevalence of SCC
.
5.1.4 Herd prevalence of S. aureus IMI
S. aureus
S. aureus

111
5.1.5 Different treatment scenarios used in models
S. aureusS. aureus S. aureus
.
S. aureus
S. aureus
5.2 Stage 2: Model development
5.2.1 Epidemiological models (Determining S. aureus infection status during the studyperiod and at the end point of measurement)
S. aureusS. aureus
S. aureusS. aureus

112
S. aureus
Figure 5.2. Flow chart of treatment scenarios of subclinical IMI S. aureus that were used inboth the economic
Epidemiological model to predict persistent S. aureus IMI
S. aureus
S. aureusS.
aureusS. aureus

113
S. aureus
S. aureus
S. aureus
S. aureus
S. aureus
S. aureus
S. aureus
Epidemiological model indicating probable clinical flare ups
S. aureus

114
S. aureus
S. aureus
S. aureus
S. aureus
S. aureus
S. aureus
Epidemiological model indicating new intramammary infections and numbers oftreatment of subclinical cases
S. aureus

115
5.2.2 Economic Models
S. aureus
S. aureus
S. aureus
Table 5.1. Economic parameters used in developing the cost/benefit indices.
Economical parameter Cost / losses (ZAR) References
General information

116
et al.
High Prevalence scenario:S. aureus
High Prevalence scenario:S. aureus
Low Prevalence scenario:S. aureus
Low Prevalence scenario:S. aureus
Costs (ZAR)

117
Losses
et al.
et al.
Clinical mastitis
et al
et al

118
Adapted from Baret al. 2007
Statistical analysis – Economic model environment and software
.
RESULTS
5.3 Economic models
S. aureus
S. aureus
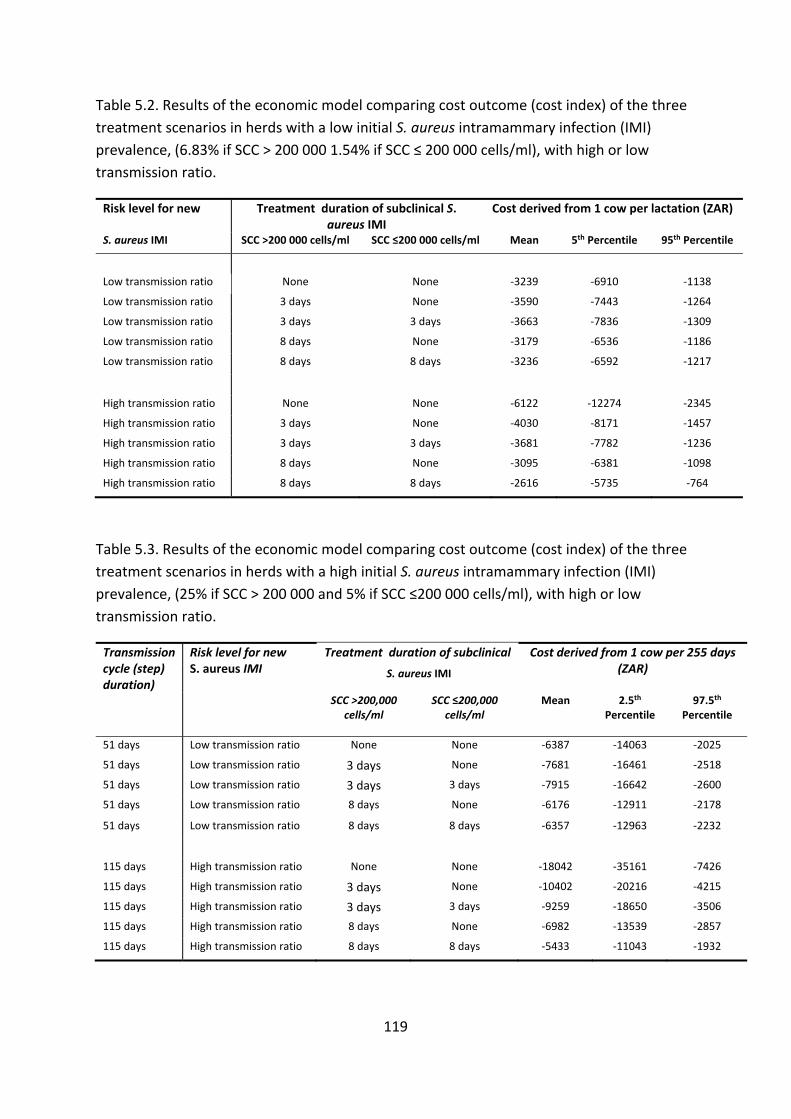
119
Table 5.2. Results of the economic model comparing cost outcome (cost index) of the threetreatment scenarios in herds with a low initial S. aureus intramammary infection (IMI)prevalence, (6.83% if SCC > 200 000 1.54% if SCC 200 000 cells/ml), with high or lowtransmission ratio.
Risk level for new Treatment duration of subclinical S.aureus IMI
Cost derived from 1 cow per lactation (ZAR)
S. aureus IMI SCC >200 000 cells/ml SCC 200 000 cells/ml Mean 5th Percentile 95th Percentile
Low transmission ratio None None 3239 6910 1138
Low transmission ratio 3 days None 3590 7443 1264
Low transmission ratio 3 days 3 days 3663 7836 1309
Low transmission ratio 8 days None 3179 6536 1186
Low transmission ratio 8 days 8 days 3236 6592 1217
High transmission ratio None None 6122 12274 2345
High transmission ratio 3 days None 4030 8171 1457
High transmission ratio 3 days 3 days 3681 7782 1236
High transmission ratio 8 days None 3095 6381 1098
High transmission ratio 8 days 8 days 2616 5735 764
Table 5.3. Results of the economic model comparing cost outcome (cost index) of the threetreatment scenarios in herds with a high initial S. aureus intramammary infection (IMI)prevalence, (25% if SCC > 200 000 and 5% if SCC 200 000 cells/ml), with high or lowtransmission ratio.
Transmissioncycle (step)duration)
Risk level for newS. aureus IMI
Treatment duration of subclinical Cost derived from 1 cow per 255 days(ZAR)S. aureus IMI
SCC >200,000cells/ml
SCC 200,000cells/ml
Mean 2.5thPercentile
97.5thPercentile
51 days Low transmission ratio None None 6387 14063 2025
51 days Low transmission ratio 3 days None 7681 16461 2518
51 days Low transmission ratio 3 days 3 days 7915 16642 2600
51 days Low transmission ratio 8 days None 6176 12911 2178
51 days Low transmission ratio 8 days 8 days 6357 12963 2232
115 days High transmission ratio None None 18042 35161 7426
115 days High transmission ratio 3 days None 10402 20216 4215
115 days High transmission ratio 3 days 3 days 9259 18650 3506
115 days High transmission ratio 8 days None 6982 13539 2857
115 days High transmission ratio 8 days 8 days 5433 11043 1932

120
S.aureusS.
aureus
Table 5.4. Results of the three different treatment scenarios summarised to indicate thepersistent S. aureus IMI per cycles and those still present after a period of 255 days in eachcase comparing scenarios of low and high initial S. aureus prevalence and transmission risks.(Calculation was rounded off to the nearest integer).
Prevalence and Risk Scenario
Duration (Days)
No treatment of subclinical S. aureus IMI
Treat all subclinical S. aureus IMI
Treat subclinical S. aureus with SCC >200 000
Treatment periods 0 Days 3 Days 8 Days 3 Days 8 Days
Low
Pre
vale
nce
Low
Ris
k
51 0 0 0 0 0 102 0 0 0 0 0 153 0 0 0 0 0 204 0 0 0 0 0 255 0 0 0 0 0
Total cases 0 0 0 0 0
High
Risk
115 3 2 1 2 1 230 4 1 1 2 1 255 4 1 0 2 1
Totalcases 11 4 3 5 3
Hig
h Pr
eval
ence
LowRisk
51 1 1 0 1 1 102 0 0 0 0 0 153 0 0 0 0 0 204 0 0 0 0 0 255 0 0 0 0 0
Total cases 1 1 0 1 1
High
Risk
115 17 11 7 12 9 230 25 8 3 11 6 255 27 8 3 11 5
Totalcases 69 27 13 34 20
S. aureus

121
Table 5.5. A comparison of expected outcomes of treatment scenarios of clinical flare ups,new intramammary infections and number of subclinical treatments during the 255 dayperiod in scenario with both low and high initial S. aureus prevalence and transmission ratio.
Assumed scenario No treatment of subclinicalS. aureus IMI
Treatment of all subclinical
S. aureus IMI
Treatment of subclinical S. aureus IMI with
SCC >200 000
Duration of treatment 0 Days 3 Days 8 Days 3 Days 8 Days
Low
Pre
vale
nce
Low
Ris
k Clinical flare-ups 1 1 0 1 0 Total new IMI 1 0 0 1 1
Subclinical S. aureus treated 0 4 4 3 3
Hig
h R
isk
Clinical flare-ups 14 2 1 3 2 Total new IMI 47 11 4 14 5
Subclinical S. aureus treated 0 12 7 9 6
Assumed scenario No treatment of subclinical S. aureus IMI
Treatment of all subclinical
S. aureus IMI
Treatment of subclinical S. aureus IMI with
SCC >200 000
Duration of treatment 0 Days 3 Days 8 Days 3 Days 8 Days
Hig
h Pr
eval
ence
Low
Ris
k Clinical flare-ups 3 2 1 2 2 Total new IMI 4 1 1 1 1
Subclinical S. aureus treated 0 16 15 13 12
Hig
h R
isk
Clinical flare-ups 53 7 3 11 6 Total new IMI 180 42 16 53 20
Subclinical S. aureus treated 0 45 27 36 21

122
Table 5.6. Combining economic and epidemiological outcomes of treatment scenarios withdifferent S.aureus prevalence and transmission risk to determine option providing the bestfinancial option for the optimal epidemiological outcome of S. aureus based on the farmersset goal.
Prevalence and Risk scenario
Cost index S. aureus dynamics: during or at the end of 255 days
Lowest and 2nd lowest financial outcomes
Persistent (at the end)
Number new
(during)
Clinicalflare-ups (during)
Number S/C Rx
(during)
Total treatments (S/C & clinical)
(at the end)
Low
Pre
vale
nce
Low Risk
1st Treated 8days (>200 000cells/ml) -3179 0 1 0 3 3
2nd Treated 8days (all subclinical) -3236 0 0 0 4 4
HighRisk
1st Treated 8days (all subclinical) -2616 0 4 1 7 8
2nd Treated 8days (>200 000cells/ml) -3095 0 5 2 6 8
Hig
h Pr
eval
ence
Low Risk
1st Treated 8days (>200 000cells/ml) -6176 0 1 2 12 14
2nd Treated 8days (all subclinical) -6357 0 1 1 15 16
HighRisk
1st Treated 8days (all subclinical) -5433 0 16 3 27 30
2nd Treated 8days (>200 000) -6982 2 20 6 21 27

123
5.5 Sensitivity analysis

124
Figure 5.3a. Correlation coefficients (Spearman Rank) of low transmission ratio scenario.
Correlation
DISCUSSION
S. aureusS. aureus
0.98
0.83
0.65
0.09
1.00 0.80 0.60 0.40 0.20 0.00 0.20 0.40 0.60 0.80 1.00
Prod Loss SCC>200000 L/d
ProductionL/d
Prod Loss SCC<200000
Milk price ZAR/l
Coefficient value
Correlation Coefficients (Spearman Rank) Lowtransmission

125
Economic model
S. aureus,
S.aureus S. aureus

126
Epidemiological model
S. aureus
S. aureus
Persistent S. aureus cases
S. aureus
S. aureus S. aureus
S.aureus

127
Staphylococcus aureus
New IMI and flare ups of clinical mastitis
S. aureus
S. aureus
S. aureus
S. aureusS. aureus
S. aureus

128
S. aureus
S. aureus
S.aureus,
Combining cost/benefit and epidemiological outcomes
S. aureus

129
S. aureus
CONCLUSION
S. aureus
S. aureusS.
aureus
S. aureus
ACKNOWLEDGEMENTS
We would like to thank the staff of the Milk Laboratory Department of Production AnimalStudies, Faculty of Veterinary Science, Onderstepoort, University of Pretoria: Mrs JC
130
Watermeyer, F Konaite, Miss R Badenhorst and Mr K Malekane for performing the technicalwork, data logging and verification.
REFERENCES
Allore, H.G., Erb, H.N., Schruben, L.W. & Oltenacu, P.A., 1998. A simulation of strategies tolower bulk milk somatic cell count below 500 000 cells per millilitre. Journal of Dairy Science81, 694 702.
Bar, D., Grohn, Y.T., Bennett, G., Gonzalez, R.N., Hertl, J.A., Schulte, H.F., Tauer, L.W.,Welcome, F.L. & Schukken, Y.H., 2007. Effects of Repeated Episodes of Generic ClinicalMastitis on Mortality and Culling in Dairy Cows. Journal of Dairy Science 91, 2196–2204(doi:10.3168/jds.2007 0460).
Barkema, H.W., Schukken, Y.H. & Zadoks, R.N., 2006. Invited Review: The role of cow,pathogen and treatment regimen in the therapeutic success of bovine Staphylococcus aureusmastitis. Journal of Dairy Science 89, 1877 1895.
Barlow, J.W., Zadoks, R.N. & Schukken, Y.H., 2013. Effect of lactation therapy onStaphylococcus aureus transmission dynamics in two commercial dairy herds. BMCVeterinary Research 9, 28–40.
Davies, J. & Davies, D., 2010. Origins and evolution of antibiotic resistance. Microbiology andMolecular Biology Reviews 74, 417 433.
Deluyker, H.A., Van Oye, S.N. & Boucher, J.F., 2005. Factors affecting cure and somatic cellcount after pirlimycin treatment of subclinical mastitis in lactating cows. Journal of DairyScience 88, 604 614.
Fox, L.K. & Gay, J.M., 1993. Contagious mastitis. Veterinary Clinical North American FoodAnimal Practice 9, 475 487.
Giesecke, W.H., du Preez, J.H. & Petzer, I.M., 1994. Practical Mastitis Control in Dairy Herds,Butterworths, Durban. 9780409109238: Books Amazon.ca.
Guimarães, J.L.B., Brito, M.A.V.P., Lange, C.C., Silva, M.R., Ribeiro, J.B., Mendonça, L.C,,Mendonça, J.F.M. & Souza, G.N., 2017. Estimate of the economic impact of mastitis: A casestudy in a Holstein dairy herd under tropical conditions. Preventive Veterinary Medicine142, 46 50. (doi:10.1016/j.prevetmed.2017.04.011).
Halasa, T., Huijps, K., sterås, O. & Hogeveen, H., 2007. Economic effects of bovine mastitisand mastitis management: A review. Veterinary Quarterly 29, 18 31.

131
Halloran, M.E., Struchiner, C.J., & Longini, I.M. Jr., 1997. Study designs for evaluatingdifferent efficacy and effectiveness aspects of vaccines. American Journal of Epidemiology146, 789–803.
Hollard, J.K., Hadrich, J.C., Wolf, C.A. & Lombard, J., 2015. Economics of measuring cost dueto mastitis related milk loss. Paper presented at the 2015 AAEA &WAEA joint annualMeeting, San Francisco, California, July 26 28, 2015.
Hortet, P. & Seegers, H., 1998. Calculate milk production losses associated with elevatedsomatic cell counts in dairy cows: review and critical discussion. Veterinary Research 29,497 510.
Huijps, K., Hogeveen, H., Lam, T.J.G.M. & Huirne, R.B.M., 2007. Preferences of cost factorsfor mastitis management among Dutch dairy farmers using adaptive conjoint analysis.Preventive Veterinary Medicine 92, 351–359.
Kitchen, B.J., Middleton, G., Durward, I.G., Andrews, R.J., 1980. Diagnostic Tests to EstimateMammary Gland Epithelial Cell Damage. Journal of Dairy Science 63, 978 983.
Lactodata, 2013. Lactodata 6(2), November 2013. www.milksa.co.za/category/allreports/industry information.
Lam, T.J.G.M., DeJong, M.C., Schukken, Y.H. & Brand A., 1996. Mathematical modeling toestimate efficacy of post milking teat disinfectant in split udder trials of dairy cows. Journalof Dairy Science 79, 62 70.
Lam, T.J.G.M., van Vliet, J.H., Schukken, Y.H., Grommers, F.J., van Velden Russcher, A.,Barkema, H.W. & Brand A., 1997. The effect of discontinuation of post milking teatdisinfection in low somatic cell count herds. Dynamics of intramammary infections.Veterinary Quarterly 19, 47 53.
Lavon, Y., Leitner, G., Klipper, E., Moallem, U., Meidan, R. & Wolfenson, D., 2011. Subclinical,chronic intramammary infection lowers steroid concentrations and gene expression in bovinepre ovulatory follicles. Domestic Animal Endocrinology. 40, 98–109.
Middleton, J.R., Fox, L.K., Gay, J.M., Tyler, J.W., Besser, T.E., 2002. Influence of Staphylococcusaureus strain type on mammary quarter milk somatic cell count and N acetyl beta Dglucosaminidase activity in cattle from eight dairies. Journal of Dairy Science 85, 1133 1140.
Neave, F.K., Dodd, F.H., Kingwill, R.G., Westgarth, D.R. 1969. Control of mastitis in the dairyherd by hygiene and management. Journal of Dairy Science 52, 696 707.
Nelson, W.H., 1991. Techniques for enumerating bacteria in raw milk. In: Physical methodsfor Microorganism Detection. CRC Press, Boca Raton, Ann Arbor Boston London. pp 40 48.

132
National Mastitis Council, 2001. Guidelines on Normal and Abnormal Raw Milk Based on SCCand Signs of Clinical Mastitis. Harmon, B. 40th Annual mastitis meeting 11 14 February 2001.Viewed 15 January 2015. http://www.nmconline.org/docs/abnmilk.pdf.
National Mastitis Council, 2015. Somatic cell counts at a first Test: More than a number.Kirkpatrick, M.A., Olson, J.D. 54th Annual mastitis meeting 1 4 February 2015. Viewed 18January 2017. http://www.nmconline.org/docs/abnmilk.pdf.
Ott, S., 1999. Costs of herd level production losses associated with subclinical mastitis in USDairy Cows. PP 152 156 in Proceedings of the 38th annual meeting of National MastitisCouncil, Arlington, VA. National Mastitis Council Madison WI. pp 152 156.
Petrovski, K.R., Trajcev, M. & Buneski, G., 2006. A review of the factors affecting the costs ofbovine mastitis. Tydskrift van Suid Afrikanse Veterinêre Vereeniging 77, 52–60.
Petzer, I.M., Karzis, J., Donkin, E.F. & Webb, E.C., 2016. A pathogen specific approachtowards udder health management in dairy herds: Using micro cytology from routine herdinvestigations. Onderstepoort Journal of Veterinary Research 83, 1 12. a1146(doi.org/10.4102/ojvr.v83i1.1146).
Petzer, I.M., Karzis, J., Donkin, E.F., Webb, E.C. & Etter, E.M.C., 2017a. Somatic cell countthresholds as indicators of bovine intra mammary infection status in quarter and compositemilk samples. Onderstepoort Journal of Veterinary Research ISSN, 2219 0635, 003 2465.
Petzer, I.M., Karzis, J., Donkin, E.F., Webb, E.C. & Etter, E.M.C., 2017b. Pathogen specificbovine intramammary infections: The validity of a somatic cell count threshold as anindicator in quarter and composite milk samples. Journal of the South African VeterinaryAssociation https://www.jsava.co.za/index.php/jsava/article/view/1465.
Piccinini, R., Bronza, V., Moroni, P., Luzzago, C. & Zecconi, A., 1999. Study on the relationshipbetween milk immune factors and Staphylococcus aureus intramammary infections in dairycows, Journal of Dairy Research 66, 501 510.
Py rälä, S., 2002. New strategies to prevent mastitis. Reproduction in Domestic Animals 37,211–216.
Raubertas, R.F. & Shook, G.E., 1982. Relationship between lactation measures of somatic cellconcentration and milk yield. Journal of Dairy Science 65, 419 425.
Ruegg, P., 2000. Premiums, Production and Pails of Discarded Milk. How Much Money DoesMastitis Cost You? http://milkquality.wisc.edu/wp content/uploads/2011/09/ how muchmoney does mastitis cost.pdf

133
Sears, P. M., Smith, B. S., English, B. P., Herer, P.S. & Gonzalez, R.N., 1990. Shedding patternof Staphylococcus aureus from bovine intramammary infections. Journal of Dairy Science 73,2785 2789.
Schepers, J.A. & Dijkhuizen, A.A., 1991. The economics of mastitis and mastitis control indairy cows: a critical analysis of estimates published since 1970. Preventive VeterinaryMedicine 10, 213 224.
Schukken, Y.H., Bronzo, V., Locatelli, C., Pollera, C., Rota, N., Casula, A., Testa, F.,Scaccabarozzi, L., March, R., Zalduendo, D., Guix, R. & Moroni, P., 2014. Efficacy ofvaccination on Staphylococcus aureus and coagulase negative staphylococci intramammaryinfection dynamics in 2 dairy herds. Journal of Dairy Science 97, 5250 5264.
Sol, J., Sampimon, O.C., Barkema, H.W. & Schukken Y.H., 2000. Factors associated with cureafter therapy of clinical mastitis caused by Staphylococcus aureus. Journal of Dairy Science83, 278 284.
Sol, J., Sampimon, O.C., Snoep, J.J. & Schukken Y.H., 1997. Factors associated withbacteriological cure during lactation after therapy for subclinical mastitis caused byStaphylococcus aureus. Journal of dairy Science 80, 2803–2808.
Swinkels, J.M., Hogeveen, H. & Zadoks, R.N., 2005. A partial budget model to estimateeconomic benefits of lactational treatment of subclinical Staphylococcus aureus mastitis.Journal of Dairy Science 88, 4273 4287.
Sutra, L. & Poutrel, B., 1994. Virulence factors involved in the pathogenesis of bovineintramammary infections due to Staphylococcus aureus. Journal of Medical Microbiology 40,79 89.
Vaarst, M., Paarup Laursen, B., Houe, H., Fossing, C. & Andersen, H.J., 2002. Farmers’ Choiceof Medical Treatment of Mastitis in Danish Dairy Herds Based on Qualitative ResearchInterviews. Journal of Dairy Science 85, 1 10.
Valeeva, N.I., Lam, T.J.G.M. & Hogeveen, H., 2007. Motivation of dairy farmers to improvemastitis management. Journal of Dairy Science 90, 4466 4477.
Vose, D., 2000. Risk Analysis: A Quantitative Guide 2nd Edition. John Willey & Sons, Ltd: NewYork. ISBN 10: 047199765X / ISBN 13: 9780471997658, Published by Wiley.
Zadoks, R.N., Allore H.G., Hagenaars, T.J., Barkema, H.W. & Schukken Y.H., 2002. Amathematical model of Staphylococcus aureus control in dairy herds. Epidemiology andInfection 129, 397 416.

134
ADDENDUM 5.1 (Persistant S. aureus cases)
Calculation of persistant S. aureus cases: U1 = U0 (1 T) paR + U0TbpaR
U2 = U1 (1 T) aR + U1TbpaR
Un+1 = Un (1 T) aR + UnTbpaR
Un+1/Un = (1 T) aR + TbpaR
Un+1/Un = aR – aRT + TbpaR
Un+1/Un = aR (1 T + Tbp)
So we can write
Un = U1 [aR (1 T+Tbp)]n 1
Un = U0 (1 T) paR [aR (1 T+Tbp)]n 1 + U0 Tb paR [aR (1 T+Tbp)]n 1
Un = U0 paR [aR (1 T+Tbp)]n 1 (1 T+Tb) formula(a)
Where
Un = number of persistent cases of S. aureus IMI at end of the period
U0 = initial number of S. aureus IMI prevalence at the start of the simulation
T = percentage of the S. aureus IMI in the herd that was treated (all)
p = percentage S. aureus IMI that persistent form old cases (78%)
R = percentage persistent S. aureus IMI form new IMI (62%)
a = percentage of new IMI with S. aureus (RR)
b = percentage S. aureus IMI that was not cure (65% or 40%)
n = number of cycles

135
ADDENDUM 5.2 (Clinical cases of S. aureus)
Calculation of clinical cases (Cl) of S. aureus IMI.
Cl1 = Clinical Flare up + New clinical cases
= Uo (1 T) C0 + U0 Tb C0 + U0 (1 T) pa Cn + U0 TbpaCn
Cl2 = U1 Tb C0 + U1 (1 T) aCn = U1 (TbC0+aCn aCnT)
Cl3 = U2 (Tb C0 + aCn aCnT)
Cln+1 = Un (Tb C0 + aCn – aCnT)
Then we replace Un using formula (a)
Cln+1 = U0 paR (1 T + Tb) [aR (1 T+Tbp)]n 1 (TbC0 + aCn – aCnT) formula (b)
Wewant to calculate the total number of clinical cases and therefor need to add all the clinicalcases that developed during the different cycles:
In order to simplify the equation we preferred a change in the variables using A, ß, and Y asnew variables as follows:
with A = Cl1
ß = U0 paR (1 T+Tb) (TbC0+aCn aCnT)
Y = aR (1 T+Tbp)

136
So Cln+1 = ßYn 1
Sn = A+ ß Y+ ß Y2 + …….. + ß Yn 2
YSn = AY+ ß Y2 + ……… + ß Yn 1
Sn– YSn = A+ ß Y–AY– ß Yn 1
Sn =
Sn = A+ formula (c)
Where
Cn = clinical onset
Co = % clinical flare up
Cli = number of clinical cases developed during the ith cycle
U0 = initial number of S. aureus IMI prevalence at the start of the simulation
T = percentage of the S. aureus IMI in the herd that was treated (all)
p = percentage S. aureus IMI that persistent form old cases (78%)
R = percentage persistent S. aureus IMI form new IMI (62%)
a = percentage of new IMI with S. aureus (RR)
b = percentage S. aureus IMI that was not cure (65% or 40%)
n = number cycles

137
ADDENDUM 5.3 (Numbers treated)
Calculation of the total number of treatments (X) of subclinical S. aureus IMI.
X1 = U0T
X2 = U1T
X2 = U0 Tbp aRT + U0 (1 T) p aRT
X3 = U2 T
Xn = Un 1 T
= U0 T + U1 T + ………. +Un 1 T
= (U0 + ………….. + Un 1) T
We first need to calculate
U0 + ………….. + Un 1
Un 1 =U0 paR (1 T + Tb) (aR (1 T +Tbp))n 2 formula (a)
U1 = U0 paR (1 T + Tb) (aR (1 T +Tbp))0
U2 = U0 paR (1 T + Tb) (aR (1 T +Tbp))
U3 = U0 paR (1 T + Tb) (aR (1 T +Tbp))2
and we had
Y = aR (1 T+Tb)
Un 1 = U1 Yn 2

138
ADDENDUM 5.4
Results at SCC threshold of 150 000 cells/ml in composite milk samples. Table 5.7. Comparing the number of persistent S. aureus cases in herd with initial low andhigh S. aureus herd intramammary infections and risk of infections, for the varioustreatment scenario over 3 and 8 days, in quarter and composite milk samples at SCCthresholds of 200 000 cells/ml and composite samples at 150 000 cells/ml.
RX Scenario Persistent at end of 255d No
treatment Treat all
subclinical STA
Quarter samples: Treat
subclinical STA with
SCC>200 000
Composite samples:
Treatsubclinical STA with SCC >150
000
Composite samples:
Treatsubclinical STA with SCC >200
000
Treatment duration
Risk level Herd STA prevalence
3 days
3 days
Low High 0.0541 0.0000 0.0000 0.0000 0.0000 Low 0.0142 0.0000 0.0000 0.0000 0.0000
High High 26.8534 0.2129 6.897 6.1892 14.2918 Low 7.0356 0.6321 1.8070 2.7812 3.7444
8 days
8 days
Low High 0.0541 0.0000 0.0000 0.0000 0.0000 Low 0.0142 0.0000 0.0000 0.0000 0.0000
High High 26.8534 0.1310 1.3313 1.2116 5.0523 Low 7.0356 0.03433 0.3488 0.7813 1.3237

139
Table 5.8. Comparing the number of new, clinical and total number of subclinical S. aureuscases that required treatment in herds with initial low and high S. aureus herdintramammary infections and risk of infections, for the various treatment scenario over 3and 8 days, in quarter and composite milk samples at SCC thresholds of 200 000 cells/ml andcomposite samples at 150 000 cells/ml.
A) Low Risk / No RxRx all
Rx quarters Rx composite Rx composite
High prevalence SCC > 200 000cell/ml
SCC > 150 000cell/ml
SCC > 200 000cell/ml
115d 3 Days 8 Days 3 Days 8 Days 3 Days 8 Day 3 Days 8 DaysPersist End 0.012 0 0 0 0 0 0 0 0Tot New 4.374 1.137 0.687 1.272 0.914 1.340 1.029 1.382 1.100Tot Clinical 4.106 2.133 1.289 2.386 1.715 2.513 1.929 2.593 2.064Tot Rx 15.705 15.426 12.484 12.262 10.865 10.672 9.849 9.674
B) High Risk /No Rx Rx all
Rx quarters Rx composite Rx composite
High prevalence SCC > 200 000cell/ml
SCC > 150 000cell/ml
SCC > 200 000cell/ml
115d 3 Days 8 Days 3 Days 8 Days 3 Days 8 Day 3 Days 8 DaysPersist End 54.596 3.271 0.289 8.383 6.012 10.953 8.889 12.565 10.695Tot New 308.288 53.132 19.715 79.046 52.482 92.071 68.953 100.246 79.290Tot Clinical 81.202 14.549 5.399 21.645 14.371 25.212 18.882 27.451 21.712Tot Rx 44.671 26.934 35.509 21.410 30.903 18.633 28.013 16.891
C) Low Risk /No Rx Rx all
Rx quarters Rx composite Rx composite
Low Prevalence SCC > 200 000cell/ml
SCC > 150 000cell/ml
SCC > 200 000cell/ml
115d 3 Days 8 Days 3 Days 8 Days 3 Days 8 Day 3 Days 8 DaysPersist End 0.003 0.000 0.000 0.000 0.000 0.000 0.000 0.000 0.000Tot New 1.146 0.298 0.180 0.605 0.511 0.351 0.270 0.362 0.288Tot Clinical 1.076 0.559 0.338 1.135 0.959 0.659 0.506 0.679 0.541Tot Rx 4.115 4.042 3.271 3.213 2.847 2.796 2.580 2.535
D) High Risk /No Rx Rx all
Rx quarters Rx composite Rx composite
Low Prevalence SCC > 200 000cell/ml
SCC > 150 000cell/ml
SCC > 200 000cell/ml
115d 3 Days 8 Days 3 Days 8 Days 3 Days 8 Day 3 Days 8 DaysPersist End 14.304 0.857 0.076 2.053 1.563 2.870 2.329 3.436 2.815Tot New 80.772 13.921 5.165 18.374 12.884 24.123 18.066 28.600 21.641Tot Clinical 21.275 3.812 1.414 5.031 3.528 6.606 4.947 7.832 5.926Tot Rx 11.704 7.057 7.339 4.425 8.0966 4.882 9.303 5.610

140
ADDENDUM 5.5 (Keynote speech IDF congress)
Keynote speech – IDF Mastitis Conference 7-9 September 2016, Nantes, France.
Combining epidemiological and cost benefit analysis to assist in udder health managementdecisions.
ABSTRACT
Despite decades of intensive research and managemental strategies, bovine mastitis remainsan immense challenge. While the occurrence of clinical mastitis has decreased, that ofsubclinical mastitis has not. Economic pressure drives modern dairy farmers to exertcontinuous efforts to optimize profitability so benefits associatedwith controlling and limitingsubclinical mastitis will motivate them to invest in pro active udder health management.
Objective: An innovative method was investigated to aid in the decision making inStaphylococcus aureus (S. aureus) positive dairy herds. Stochastic cost/benefit models wereused to explore 3 or 8day treatments of subclinical S. aureus intramammary infections (IMI)in all S. aureus infected cowswith a somatic cell count (SCC) above 200 000 cells/ml comparedto no treatment. Additional models were developed to predict and compare the S. aureussubclinical cases that cured, persisted, flared up clinically and new infections that occurredover 255 days.
Methods: Economic models applied direct costs such as drugs, labour, discarded milk, cowfatalities and laboratory fees and indirect costs of decreasedmilk yield and penalties. Low andhigh transmission rates related to management practises were incorporated into the models.Using retrospective analysis of microbiological and cytological results from 2008 – 2012 inSouth Africa, an algorithm used S. aureus prevalence for a SCC 200 000cells/ml from [1.495;1.595]90% and for SCC >200 000cells/ml from [6.72; 6.95]90% . A second model using the sameSCC groups explored a 5 to 25% S. aureus herd prevalence. Epidemiological models have beendeveloped to calculate persistant, new infections and clinical S. aureus cases, incorporatingprobability of cure of 3 or 8day treatments, spontaneous cure, persistant and new infectionsfor different levels of management.
Results: In the economic model, investigating a low prevalence, the best cost index of 644ZAR [ 875; 382]90%, resulted when no subclinical S. aureus IMI were treated. In the modelsimulating a high S. aureus prevalence and good management a less costly scenario was totreat for 8d, only positive animals with the higher SCC resulting in a cost index of 730 ZAR [938; 474]90%. In this higher S. aureus prevalence situation, all treatment scenarios proved tobe more cost effective than when no treatment was used.
Treatment of subclinical S. aureus IMI in herds with good management did not provebeneficial in the epidemiological model. A major benefit was seen in high risk herds wherenew IMI was reduced by 71% in one scenario and 91% in another in the 3 and 8d treatments

141
scenarios. There was also a reduction of 2 to 49% in treatment numbers compared to the notreatment group (only clinical cases were treated). When results of economic andepidemiological models were combined the best financial option did not always have themost favourable epidemiological outcome.
Conclusions: Stochastic cost/benefit models combined with epidemiological models mayhave many practical applications that can assist both producers and veterinarians inoptimising decisions balancing cost/benefit with end point IMI dynamics. The key beneficialfactor however remains the level of management.

142
ADDENDUM 5.6 (Paper presented at ISVEE Conference)
Paper presented at the ISVEE Conference, Yucatau, Mexico November 3-7, 2015. Financial cost/benefit when treating subclinical Staphylococcus aureus intramammaryinfections considering micro cytological scenarios: a stochastic approach.
ABSTRACT
Purpose: An innovative method was investigated to aid in the elimination of Staphylococcusaureus (S. aureus) intramammary infections (IMI) from dairy herds in South Africa. Stochasticmodels were used to explore cost/benefit of 3 or 8 d treatment of subclinical S. aureus IMI inall infected cows and in only those with a somatic cell count (SCC) above 200 000 cells/mlcompared to no treatment.
Methods: The model included direct cost such as additional laboratory fees for performingmicrobiology and indirect effects of treatment on cure and new infection rate. Herds with lowand high transmission rates were incorporated into the simulation. A first model used S.aureus prevalence provided by retrospective analysis of micro cytological results (2008 2012)i.e. 3.93% [3.88; 3.99]90%. A second model explored existing severe situations with a higherprevalence of S. aureus in a herd varying from 5 to 25% according to the SCC. To compare thedifferent strategies we used a cost index resulting for one strategy of the sum of the productsof the probability of each possible event by its cost, balanced with the reduction of the IMI.These probabilities and costs were calculated for one animal in a herd over a lactation periodof 260 days.
Results: In the case of 3.93% prevalence, the best scenario, with a cost index of 644 ZAR [875; 382]90%, is to treat 8d only animals with higher SCC. In case of no teat dip the 3dtreatment scenario is even cheaper than no treatment at all. In the high prevalence modelthe best scenario, with a cost index of 730 ZAR [ 938; 474]90%, is to treat 8d only animalswith higher SCC if teat dip is used and with a cost index of 765 ZAR [ 975; 515]90% if teat dipis not used. In this model all treatment scenarios proved cheaper than no treatment.
Conclusions: Such models have many practical applications that can help with decisionmaking both producers and veterinarians.
Relevance: The level of S. aureus IMI that was likely to be missed when using a SCC thresholdwas based on the retrospective study which indicated that 20.57% and 33.23% of S. aureusIMI went undetected at 200 000cells/ml in quarter and composite cow milk samplesrespectively.

143
ADDENDUM 5.7 (Poster presented at WBC Conference)
A poster presented at the World Buiatrics Conference, Dublin, Ireland (5-8 July 2016).
A model approach to estimate Staphylococcus aureus intramammary infection dynamics fordifferent scenarios when vaccinating for mastitis.

144
ADDENDUM 5.8
Figure the

145
CHAPTER 6
THESIS SUMMARY
.
A dedicated udder health diagnostic program has been developed and used over a 15 yearperiod in South Africa. This program is used to analyse milk samples of dairy herds based onmicrobiological and cytological results of individual cows. This is a fresh approach as very fewcountries worldwide can perform micro cytology on a complete lactating herd on a relativelyregular basis. This program with a current dataset of 1.5 million samples makes a detailedanalysis possible and helps to identify and provide insight into possible key sources of udderhealth problems on farms. The aim of this manuscript is to share the information andexperience that was acquired over the years with veterinarians and udder health consultants.This knowledge enables a detailed pro active udder health approach based on knowledge ofpathogens isolated from individual cows or quarters in the complete lactation herd. Resultsare presented as various group reports indicating trends within herds, cases studies and alsoproviding analysis of the individual cow or quarters.
There are many advantages of having species specific IMI information about udder health inthe current Milk Sample Diagnostic (MSD) system. It allows early detection of IMI, rapidfollow up on information from tests; there is a short turnaround time after the receipting ofmilk samples, and prompt communication of results to herd managers and owners. Theprogram firstly allows evaluation of the herd udder health situation enabling the consultantto identify the main causes of udder health problems in detail. This will assist in identifyingand eliminating the sources of the problems timeously. At the same time it providesinformation on each cow on parity, lactation stage, pregnancy status, production level, andmastitis and SCC history, to enable informed decisions for individual cows and even individualudder quarters. Management decisions can be based on sound information and cows that arecured, or have persistent IMI and new IMI can be identified, based on actual bacterialidentification. This improves the accuracy of decisions made.

146
Somatic cell count thresholds as indicators of bovine intra mammary infectionstatus in quarter and composite milk samples.
Somatic cell count (SCC) as indicator of udder health status in quarter milk samples has beenwell researched and reported on for many decades, because it is a cost effective techniquethat is easy to use. Although researchers agree that it remains an useful indicator of the udderhealth status in cows they do not agree on the SCC threshold indicating intramammaryinfections (IMI). There are currently no international guidelines for a SCC threshold indicatingIMI in composite milk samples. The number of lactating cows per herd in South Africa hasincreased causing effective monitoring of the udder health status of the individual cow tobecome more challenging. In South Africa routine udder health examinations of quarter milksamples have been replaced by composite milk samples which are more practical and lesscostly to analyse. Due to the dilution effect of combining samples from the four udderquarters into one sample results of these samples, the analyses of these samples are currentlydifficult to interpret as a single test under field conditions. Some South African milklaboratories culture milk samples only with SCC above a chosen SCC thresholds. It is ofimportance to know what percentage of IMI in general and infections with contagious udderpathogens would be missed at those SCC thresholds. This information can be of keyimportance to the veterinary practitioner and the manager alike for wise pro active udderhealth management decisions, both at herd and individual cow level.
In this first of two manuscripts utilizing 345 461 composite and 89 638 quarter samples fromdairy herds in 7 of 9 South African the main objective was to establish a SCC threshold forcomposite milk samples that could be used for initial screening for IMI.
This large dataset used in this study was a reflection of samples received daily by laboratoriesthat needed analysis and interpretation. Samples are received for herds that differ inmanagement levels, exposure to environmental conditions, microbial IMI and cow factors(age, parity, days in milk and milk yield). The SCC test was found to be sufficient but notexcellent as an indicator of IMI in both sample types. This study reconfirmed a threshold forSCC of 200 000 cell/ml use to detect IMI in quarter milk samples to be optimal. Based on thefindings of this study a SCC threshold of 150 000 cells/ml milk can be recommended for usein composite milk samples.
It should be noted that these optimal statistically determined SCC threshold levels need to beadapted and interpreted carefully depending on operational circumstances. Even at these“optimal” SCC levels, using the SCC as the only test to predict the presence of IMI is not ideal.Somatic cell count thresholds based on pathogen specific infections in quarters and uddersand management levels will still need to be determined to assist in decision making and proactive management in operational conditions.

147
Pathogen specific bovine intramammary infections: The validity of somatic cellcount threshold as an indicator in quarter and composite milk samples.
The pro active approach necessary in themanagement of udder health in dairy herds requiresknowledge of the most prominent udder pathogen. It is no longer enough to merely knowwhether this is primarily a contagious (host adopted) or environmental organism, becauseprevention strategies can differ substantially between these groups. This study was aimed atassisting with the effective (both cost effective and accurate) diagnosis of intramammaryinfections in lactating cows. Although the IDF recommend that cows with somatic cell counts(SCC) higher than 200 000 cells/ml are more likely to come from quarter of cows withintramammary infections (IMI), than from uninfected quarters, no mention is made of theprobable difference between the major and udder pathogens.
In case of outbreaks for instance of Streptococcus agalactiae, consultants need to know whatpercentage of cows that could be mis diagnosed when only samples with SCC of above200 000 cells/ml is cultured. With this knowledge a decision can be made whether or not allcows should be sampled. This together with the estimated 15% production lost in a lactation,will allow a more informed decision to be made.
In this research utilizing 345 461 composite and 89 638 quarter samples from dairy herds in 7of 9 South African provinces themain objectivewas to establish a SCC threshold for compositemilk samples that could be used for initial screening for IMI.
Although most major udder pathogens and just over half of minor udder pathogen groupswere isolated at a SCC of 200 000 cells/mL in both quarter and composite milk samples, thepercentages of pathogen species specifically identified within these groups differedconsiderably. At the selected SCC thresholds of 200 000 cells/mL for quarter and 150 000cells/mL in composite samples, the bacterial species isolated at the highest percentages wereStr. dysgalactiae, Str. agalactiae and Str. uberis. Less pathogens were isolated and a lowersensitivity of the SCC test was seen for composite milk samples at a SCC threshold of 150 000cells/mL than for quarter samples. Results for composite samples at 150 000 cells/mlcompared favourably with those for quarter milk samples at 200 000 cells/mL.
This research indicated in the case of sixteen contribute udder pathogens, that SCC alonemay either to under or over diagnose pathogen specific IMI in both quarter and compositemilk samples. At a SCC threshold of 200 000 cells/ mL 20.48% and 38.70% of S. aureus IMIcould be expected not to be identified unless cultured from quarter and composite milksamples respectively.
The effects of days in lactation, parity, milk yield, management level and prevalence ofpathogen specific IMI on SCC thresholds were not measured in this research and need to befurther investigated.

148
Cost benefit analysis when treating subclinical Staphylococcus aureusintramammary infections considering micro cytological scenarios: a stochasticapproach.
Antimicrobial resistance in bacteria is currently perceived to be a critical and urgent topic.This study is a fresh approach towards this challenge. The aims for developing the modelswere: firstly to provide a consultant, veterinarian or farmer with a tool to base decisions oncurrent farm information in order to predict future events accurately, so that measures couldbe taken to prevent disease before it occurs; secondly wewanted to predict cost effectivenessof management changes in combination with an indication of the likely epidemiologicaloutcome of the Staphylococcus aureus population in herds. The availability of advances infarm technology and data processing capabilities resulting in scientific predictions is makingthis approach a reality.
Predictions were based on the combination of financial cost benefit but included alsopredictions of probable epidemiological outcomes such as the number of clinical mastitiscases, new intramammary infections, persistant cases likely to occur and number ofsubclinical Staphylococcus aureus cases that would require treatment for the period chosen.The study further compared these outcomes for different initial herd prevalence ofStaphylococcus intramammary infections, different management levels and varying durationof intramammary treatments. When results of economic and epidemiological models werecompared, the best financial option differed in some scenarios. Such models may assistproducers, consultants and veterinarians in optimising decisions balancing cost/benefit withend point IMI dynamics. One of the main findings was to treat more effectively initially inorder to treat less.
We believe that the models can make a positive contribution to enhance current herd udderhealth decisions by providing more accurate predictions of outcome of inventions such as thetreatment of subclinical Staphylococcus aureus.
Models can be an innovative approach for simulating epidemiological and economicalsituations and outcomes combine to aid in better decision making. In this study models wereused to compare additional costs of culturing all milk samples to culturing only those with SCC>200 000 cells/ml, as well as comparing different treatment durations and managementinventions, and the results on the economic and epidemiological outcome. Costs varybetween countries and laboratories and this will affect the economic predictions. Even withtreatment of only 79% of S. aureus cases in high risk herds distinct advantages were evidentwhen subclinical cases were treated.
Combining financial and epidemiological outcomes in the models indicated that in the lowprevalence of S. aureus in a herd combinedwith a low transmission risk (LPLT), low prevalencehigh transmission risk (LPHT) and high prevalence low transmission risk (HPLT) scenarios
the best economic solution also proved to be the best for the epidemiological outcome S.

149
aureus. With the high prevalence high transmission risk (HPHT) a the second mosteconomical scenario proved to be the better option for the epidemiological outcome with 11less new IMI, 4 less clinical and 5 less persistent cases over the period investigated.
Global concern and new legislation in some countries regarding microbial resistance toantibiotics is currently evident. Opting to treat subclinical S. aureus may therefore seem atfirst a contradictory decision to prevent growing antimicrobial resistance. However, whensubclinical S. aureus IMI were treated fewer cows in total were treated for the 255 day periodin all treatment groups compared to those where no subclinical cases were treated. This wasdue to the larger number of clinical cases that developed and required treatment later on.Treating more infected cows initially did result in treating less overall. Not only were fewercows treated but by treating subclinical cases the probability of bacterial cure was likely to bebetter than in clinical mastitis cases and less parenchyma damage could be expected. In thetreated groups the number of new IMI was distinctly lower. Persistent cases in the case of 8day treatments were not only eliminated earlier from herds, but S. aureus IMI weresubstantially lower in all high risk herds compared to the scenario where subclinical S. aureusIMI were not treated. In herds with a low risk for new IMI regardless of the initial S. aureusprevalence, it was not advantageous to treat subclinical cases.
The best case scenario remains to create a low risk environment within a S. aureus positiveherd where the focus will be on excellent management rather than only on treatment. Forherds that have not yet achieved acceptable levels of management and mastitis prevention,treatment of subclinical S. aureus IMI seems an option to consider with the intention ofacquiring a S. aureus free herd with the least treatments.
Positive advantages of the study
Dataset
The study was based on a very large data set that was obtained from actual udder healthinvestigations in the commercial dairy industry. A further advantage of the data set is that inmost cases all lactating cows in a herd were sampled in order to obtain a complete picture ofsuch a herd. All milk samples were cultured and not only selective samples related to the levelof somatic cell counts. This is a privilege few researchers have in the field due to the financialburden of extensive milk sample testing.
The data were collected in the different farming systems (Total mixed ration (TMR) to pasturebased) as they are experienced in practice under South African conditions and at variouslevels of management and seasons. Data included outbreak situations and routinemonitoringto provide an actual situation the laboratories may be faced with on a daily basis.

150
Milk Sample Diagnostic (MSD) program
This diagnostic program was developed over several years in practice. It was and is stilladapted according to the need for different reports used by consultants and farmers. Thecollection and use of the information from the MSD program was proven to be effective asnumerous outbreaks were dealt with in an effective manner as farmers can testify. Dairyherds were cleared of Streptococcus agalactiae from infection rates as high as 35% within 3to 6 month periods from herds as large as 1200 lactating cows and these herds remainedclean from this bacteria for more than 10 years now..
Staphylococcus aureus IMI were completely eliminated frommany herds in South Africa eventhough reverse zoonosis poses a substantial additional challenge in our country. Data thatbecame available indicate additional challenges such as shifts in the mastitis bacteria isolatedfrom pasture based herds where an increase in Streptococcus uberis was noted, and in wellmanaged TMR herds Gram negative bacteria increased. Not only were shifts in the bacterialspecies noted but strain typing is now used for identifying the prominent and dangerousstrains under the various farming conditions and for individual dairy farms.
Experience based on case studies
Milk samples were collected from more than 900 commercial herds in South Africa wherefarmers paid for the samples and the University of Pretoria subsidised the analyses of samplesto build up a data base that could be available for research and student training.
It is the opinion of the author that information obtained in this study can be applied in practiceto assist future decisions. We have now a better understanding how regarding the usesomatic cell counts (SCC) thresholds in composite milk samples as a survey tool. The thresholdof SCC levels abovewhichmilk samples could be cultured can now be selected per herd, basedon the dominant mastitis pathogen in that herd. The goal of the dairy producer (eradicationof contagious bacteria from the herd or not) could also be taken into account.
The models provide us now with a different perspective to assist in decisions making. Theyprovided insight into the likely scenario of the epidemiological outcome and over differenttime periods. These models can also be used to calculate a reasonable time periods afterimplementations of actions such as mastitis vaccinations to obtain the true benefits.Producers will be able to decide whether the treatment or vaccination will be economicallyviable in their herds and for what period this treatment needs to be used as a tool, withoutneglecting good management practices, to obtain optimal results.
Limitations and weakness in the research
The large data set is also a limitation obscuring some findings. Information on days in milk(DIM), milk yield and parity was not available for further detailed investigations at the time ofthis study.

151
Inter herd variation was not considered and although inter quarter (variation betweenquarters of the same cow) was calculated, the effect of the large data setmay have influencedresults.
Although the best information obtained was used and great number of aspects were takeninto account in the analyses of the models, some assumptions were also made. For example:when taking milk loss into account it was assumed by the model that all animals calved at day1 (to be able to follow a lactation curve). More aspects could have been taken intoconsideration in models but we had to select those that we believed at the time that werethe most important, those that had practical implications for an increase complexity of themodels might not result in any increased practical benefit.
Future research
Effective the SCC threshold can be sought for different functional groups according to parity,DIM, yield, inter quarter, clustering effect in composite milk samples and quarter milksamples.
Models developed in this study for S. aureus could be extended to incorporate more criteriaand new similar models could be developed for other mastitis pathogens such asStreptococcus agalactiae.
More research is needed to determine more effective transmission factors to bring theoutcomes of the models closer to reality. The effect of excellent dairy herd managementshould be qualified.
As knowledge become available we know that comparisons on a species level is not sufficientfor bacteria such as coagulase negative staphylococci (CNS) and Streptococcus uberis. Weneed to know which strains are contagious, opportunistic and environmental and to whatlevel the strains increase somatic cell count in cows.