Primary production and plankton carbon biomass in a river-influenced upwelling area off Concepción,...
13
Primary production and plankton carbon biomass in a river-influenced upwelling area off Concepción, Chile Jose Luis Iriarte a,d,e,⇑ , Cristian A. Vargas b,d , Fabián J. Tapia c , Rafael Bermúdez b,1 , Roberto E. Urrutia b a Instituto de Acuicultura, Universidad Austral Chile, Sede Puerto Montt, PO Box 1327, Puerto Montt, Chile b Aquatic System Unit, Environmental Sciences Center EULA Chile, Universidad de Concepción, Concepción, Chile c Centre for Oceanographic Research in the Eastern South Pacific (COPAS), Universidad de Concepción, Concepción, Chile d Centro de Investigación de Ecosistemas de la Patagonia (CIEP), Bilbao 466, Coyhaique, Chile e Centro COPAS-Sur Austral, Universidad de Concepción, Concepción, Chile article info Article history: Available online xxxx abstract The combined influence of freshwater inputs and wind-driven upwelling may generate contrasting environmental conditions over small spatial scales in the coastal ocean. Over two consecutive years (mid-2006 through to mid-2008), we compared the springtime and wintertime composition, biomass, and primary production of the main phytoplankton groups at two coastal stations (RV and UW) near the Itata River mouth in the upwelling area off central Chile. Hydrographic and nutrient profiles showed distinct seasonal features: a relatively weak surface thermocline and weak river influence at both stations in spring, and in winter a stronger surface halocline at station RV, located closer to the river mouth. At both stations, primary production (24–8000 mg C m 2 d 1 ) and chlorophyll-a concentrations (5–20 mg Chl-a m 3 ) were highest in the spring, with a dominance of microphytoplankton (Chaetoceros spp., Thalassiosira spp.). Total primary production and chlorophyll-a in the winter corresponded mostly to smaller size fractions (pico- and nanoplankton), which dominated the phytoplankton community (>50%) in terms of carbon biomass at station RV. At this river-influenced station, small autotrophic and heterotrophic groups (<20 lm), including picophytoeukaryotes, photo- and heterotrophic nanoflagel- lates, and ciliates, were two to four times more abundant than at station UW. We conclude that most of the integrated carbon biomass and production rates during winter months are accounted for by small cells in the microbial food web. This component of the phytoplankton community may be enhanced in response to the additional surface input of nutrients by river discharges into the nearshore environment. Ó 2011 Elsevier Ltd. All rights reserved. 1. Introduction Fluctuations in coastal phytoplankton communities associated with changes in freshwater inputs and water column stratifica- tion/mixing may greatly influence biogeochemical fluxes and the annual trophic status of coastal ecosystems. In association with freshwater inputs to the surface ocean, increased rates of primary production (PP) and autotrophic biomass, along with the develop- ment of algal blooms, have been documented in major productive coastal areas such as the Gulf of Trieste (Malej et al., 1995), the Mississippi River (Liu et al., 2004), the NW Peninsula Iberica (Varela et al., 2005), the Washington/Oregon coast (Frame and Lessard, 2009), and Antofagasta, Chile (Iriarte and González, 2004). The seasonal upwelling of cold, nutrient-rich water along the central and northern coast of Chile–Peru (Thomas et al., 2001) produces a highly productive phytoplankton assemblage, which supports a large commercial fishery. The continental shelf off Con- cepción, central Chile (36°S) corresponds to one of the widest sec- tions of the continental shelf along the Chilean coast, and it is influenced by freshwater discharges from the Itata and Biobío riv- ers, with mean outflows of 286 and 1699 m 3 s 1 , respectively (Sobarzo et al., 2007a). These fresh water river inputs supply sub- stantial amounts of silicic acid, nitrate, and orthophosphate to the adjacent coastal ocean (Sánchez et al., 2008). The area is also char- acterized by the occurrence of wind-driven upwelling in the austral spring–summer months (Cáceres and Arcos, 1991). In asso- ciation with these events, PP rates in the area increase dramatically and reach some of the highest values in the world ocean (4–20 g C m 2 d 1 ; Montero et al., 2007). Phytoplankton blooms that are typically dominated by long-chain-forming diatoms have been observed near Coliumo Bay (Vargas et al., 2007). Along the river-influenced continental shelf of central Chile, the coastal upwelling area off Concepción is one of the most productive in 0079-6611/$ - see front matter Ó 2011 Elsevier Ltd. All rights reserved. doi:10.1016/j.pocean.2011.07.009 ⇑ Corresponding author at: Instituto de Acuicultura, Universidad Austral Chile, Sede Puerto Montt, PO Box 1327, Puerto Montt, Chile. Tel.: +56 65 27 7124; fax: +56 65 23 3385. E-mail address: [email protected] (J.L. Iriarte). 1 Present address: M.S. Program in Biological Oceanography, Leibniz-institut für Meereswissenschafter an der Universität Kiel, Kiel, Germany. Progress in Oceanography xxx (2011) xxx–xxx Contents lists available at ScienceDirect Progress in Oceanography journal homepage: www.elsevier.com/locate/pocean Please cite this article in press as: Iriarte, J.L., et al. Primary production and plankton carbon biomass in a river-influenced upwelling area off Concepción, Chile. Prog. Oceanogr. (2011), doi:10.1016/j.pocean.2011.07.009
Transcript of Primary production and plankton carbon biomass in a river-influenced upwelling area off Concepción,...

Progress in Oceanography xxx (2011) xxx–xxx
Contents lists available at ScienceDirect
Progress in Oceanography
journal homepage: www.elsevier .com/ locate /pocean
Primary production and plankton carbon biomass in a river-influencedupwelling area off Concepción, Chile
Jose Luis Iriarte a,d,e,⇑, Cristian A. Vargas b,d, Fabián J. Tapia c, Rafael Bermúdez b,1, Roberto E. Urrutia b
a Instituto de Acuicultura, Universidad Austral Chile, Sede Puerto Montt, PO Box 1327, Puerto Montt, Chileb Aquatic System Unit, Environmental Sciences Center EULA Chile, Universidad de Concepción, Concepción, Chilec Centre for Oceanographic Research in the Eastern South Pacific (COPAS), Universidad de Concepción, Concepción, Chiled Centro de Investigación de Ecosistemas de la Patagonia (CIEP), Bilbao 466, Coyhaique, Chilee Centro COPAS-Sur Austral, Universidad de Concepción, Concepción, Chile
a r t i c l e i n f o
Article history:Available online xxxx
0079-6611/$ - see front matter � 2011 Elsevier Ltd. Adoi:10.1016/j.pocean.2011.07.009
⇑ Corresponding author at: Instituto de AcuiculturSede Puerto Montt, PO Box 1327, Puerto Montt, Chile.65 23 3385.
E-mail address: [email protected] (J.L. Iriarte).1 Present address: M.S. Program in Biological Ocea
Meereswissenschafter an der Universität Kiel, Kiel, Ger
Please cite this article in press as: Iriarte, J.L., etChile. Prog. Oceanogr. (2011), doi:10.1016/j.poc
a b s t r a c t
The combined influence of freshwater inputs and wind-driven upwelling may generate contrastingenvironmental conditions over small spatial scales in the coastal ocean. Over two consecutive years(mid-2006 through to mid-2008), we compared the springtime and wintertime composition, biomass,and primary production of the main phytoplankton groups at two coastal stations (RV and UW) nearthe Itata River mouth in the upwelling area off central Chile. Hydrographic and nutrient profiles showeddistinct seasonal features: a relatively weak surface thermocline and weak river influence at both stationsin spring, and in winter a stronger surface halocline at station RV, located closer to the river mouth. Atboth stations, primary production (24–8000 mg C m�2 d�1) and chlorophyll-a concentrations (5–20mg Chl-a m�3) were highest in the spring, with a dominance of microphytoplankton (Chaetoceros spp.,Thalassiosira spp.). Total primary production and chlorophyll-a in the winter corresponded mostly tosmaller size fractions (pico- and nanoplankton), which dominated the phytoplankton community(>50%) in terms of carbon biomass at station RV. At this river-influenced station, small autotrophic andheterotrophic groups (<20 lm), including picophytoeukaryotes, photo- and heterotrophic nanoflagel-lates, and ciliates, were two to four times more abundant than at station UW. We conclude that mostof the integrated carbon biomass and production rates during winter months are accounted for by smallcells in the microbial food web. This component of the phytoplankton community may be enhanced inresponse to the additional surface input of nutrients by river discharges into the nearshore environment.
� 2011 Elsevier Ltd. All rights reserved.
1. Introduction
Fluctuations in coastal phytoplankton communities associatedwith changes in freshwater inputs and water column stratifica-tion/mixing may greatly influence biogeochemical fluxes and theannual trophic status of coastal ecosystems. In association withfreshwater inputs to the surface ocean, increased rates of primaryproduction (PP) and autotrophic biomass, along with the develop-ment of algal blooms, have been documented in major productivecoastal areas such as the Gulf of Trieste (Malej et al., 1995), theMississippi River (Liu et al., 2004), the NW Peninsula Iberica(Varela et al., 2005), the Washington/Oregon coast (Frame andLessard, 2009), and Antofagasta, Chile (Iriarte and González, 2004).
ll rights reserved.
a, Universidad Austral Chile,Tel.: +56 65 27 7124; fax: +56
nography, Leibniz-institut fürmany.
al. Primary production and plaean.2011.07.009
The seasonal upwelling of cold, nutrient-rich water along thecentral and northern coast of Chile–Peru (Thomas et al., 2001)produces a highly productive phytoplankton assemblage, whichsupports a large commercial fishery. The continental shelf off Con-cepción, central Chile (36�S) corresponds to one of the widest sec-tions of the continental shelf along the Chilean coast, and it isinfluenced by freshwater discharges from the Itata and Biobío riv-ers, with mean outflows of 286 and 1699 m�3 s�1, respectively(Sobarzo et al., 2007a). These fresh water river inputs supply sub-stantial amounts of silicic acid, nitrate, and orthophosphate to theadjacent coastal ocean (Sánchez et al., 2008). The area is also char-acterized by the occurrence of wind-driven upwelling in theaustral spring–summer months (Cáceres and Arcos, 1991). In asso-ciation with these events, PP rates in the area increase dramaticallyand reach some of the highest values in the world ocean(�4–20 g C m�2 d�1; Montero et al., 2007). Phytoplankton bloomsthat are typically dominated by long-chain-forming diatoms havebeen observed near Coliumo Bay (Vargas et al., 2007). Along theriver-influenced continental shelf of central Chile, the coastalupwelling area off Concepción is one of the most productive in
nkton carbon biomass in a river-influenced upwelling area off Concepción,

2 J.L. Iriarte et al. / Progress in Oceanography xxx (2011) xxx–xxx
the Humboldt Current System (Daneri et al., 2000; Montero et al.,2007). This area exhibits a clear seasonal regime in PP, withspring–summer and autumn–winter rates of 5–9 g C m�2 d�1 and<2 g C m�2 d�1, respectively (Daneri et al., 2000; Farías et al.,2004; Montecino et al., 2004; Montero et al., 2007). Spring monthsare characterized by a high biomass of autotrophic phytoplanktonthat corresponds mostly to the microphytoplankton fraction (Gon-zález et al., 1989; Ahumada et al., 1991; Vargas et al., 2006, 2007;González et al., 2007) and, more specifically, to chain-forming dia-toms such as Skeletonema sp., Chaetoceros spp., Thalassiosira spp.,and Detonula sp. In contrast, in winter, autotrophic biomass islow (<2 mg Chl-a m�3) and dominated by small-sized components(<20 lm), such as phytonanoflagellates and cyanobacteria(González et al., 1989; Anabalón et al., 2007; Böttjer and Morales,2007). Studies conducted in this highly productive area suggestthat nanoplanktonic groups may account for a substantial fractionof the autotrophic biomass in winter months. Studying phyto-plankton productivity in a size-structured fashion is, thus, essentialfor assessing the contribution and fate of photosynthetically-fixedcarbon by small algal cells to the food web dynamics in this region.
Coastal systems such as upwelling and estuarine areas displaydrastic changes in hydrographic regimes in a range of temporalscales that goes from daily (e.g., tides, summer sea breeze) to in-tra-seasonal (e.g., upwelling events, storms, river discharge pulses)to seasonal (e.g., coastal wind patterns, radiation). All of these vari-ations in physical forcing and coastal hydrography may elicitchanges in the distribution and composition of phytoplankton.Off Concepción, the wind-forced upwelling of deep, nutrient-richwaters into the euphotic zone is the main physical factor drivingspring pulses of high PP and autotrophic biomass. Furthermore,the annual cycle of inorganic nutrients in Concepción Bay hasshown low nitrate and orthophosphate concentrations during win-ter, whereas higher nutrients values are observed during spring,when frequent coastal upwelling events take place (Ahumadaet al., 1991). Nevertheless, near river outflows, the input of bot-tom-water nutrients driven by upwelling may interact with thenutrient load associated with freshwater inputs, thereby establish-ing spatial gradients in the concentrations and ratios of inorganicnutrients that may, in turn, determine shifts in the compositionof the phytoplankton community.
We suggested that changes in biomass composition and theproduction rates of the phytoplankton community could be a con-sequence of spatial variability observed during non-upwelling(winter) and upwelling (spring) periods, as a result of the balanceof upwelling-driven fertilization of the coastal ocean versus theinput of river-borne nutrients into surface layers. The aim of thisstudy was to assess the winter–spring changes in biomass compo-sition and productivity of phytoplankton at two coastal stations inthe upwelling area off Concepción, one of which was strongly influ-enced by freshwater inputs from the Itata River. We used a combi-nation of approaches that included estimates of size-fractionatedautotrophic biomass and PP, as well as the carbon biomass of themain pico-, nano-, and microplanktonic groups. We showed thatchanges in the biomass composition and PP of coastal phytoplank-ton do occur at these stations and that the changes are mostly de-tected at the station that is closer to, and more strongly affected by,freshwater inputs near the Itata River mouth.
2. Materials and methods
2.1. Physical and hydrography
We used daily fields of Level 3 gridded QuikSCAT data providedby NASA’s Jet Propulsion Laboratory (ftp://podaac.jpl.nasa.gov/pub/ocean_wind/quikscat/L3/) to characterize patterns of wind
Please cite this article in press as: Iriarte, J.L., et al. Primary production and plaChile. Prog. Oceanogr. (2011), doi:10.1016/j.pocean.2011.07.009
stress variability over the study area. A daily series of meridionalwind stress was extracted from images collected between July2002 and September 2009 for a pixel centered at 36�37.50S,73�37.50W (ca. 60 km SW of station UW). For the same period, aweekly time series of surface PAR radiation over the study areawas gathered from 8-day composite SeaWIFS images with a spatialresolution of 9 km, whereas weekly Sea Surface Temperatures(SST) and chlorophyll-a concentrations in the vicinity of stationsRV and UW (5 km offshore) were obtained from 8-day compositeMODIS-Aqua images with a 4 km spatial resolution. Additionally,we used a time series of in situ SST measurements conducted daily(9 AM) at the Dichato Marine Biology Station (University of Con-cepción), ca. 6 km SE of station UW, to assess the timescales overwhich surface conditions in the area respond to wind forcing.Hourly data on river discharges of freshwater were obtained fromthe Direccion General de Aguas (www.dga.cl), and corresponded tostations located near the mouth of the rivers Itata and BioBio (seeFig. 1).
During each cruise, surface distributions of water temperatureand chlorophyll-a (Chl-a) concentrations were monitored fromsatellite imagery collected by MODIS-Aqua and made availableby the ANTARES network (http://www.antares.ws). At each station,temperature, salinity, oxygen, and fluorescence profiles wererecorded from the surface to near-bottom depths using a SeaBirdSBE-19 plus CTD equipped with a YSI-calibrated Beckman oxygensensor and a Wetstar fluorometer.
2.2. Chemistry
Additional samples for phytoplankton analyses and dissolvedinorganic nutrient determinations were collected from the surface,fluorescence maximum, and at a depth of 1% surface PAR (photo-synthetically active radiation). Samples for nutrient analyses,including nitrate (NO�3 ), nitrite (NO�2 ), orthophosphate (PO�3
4 ), andsilicic acid (Si(OH)4), were filtered onboard through GF/F glass-fiberfilters and frozen at �20 �C until analysis in the laboratory. Nitrateand orthophosphate concentrations were determined via spectro-photometry following Parsons et al. (1984) and Murphy and Riley(1962). Nitrite concentrations were measured using an automatednutrient analyzer (ALPKEM, Flow Solution IV) and following theUS Environmental Protection Agency protocol (Method 353.2). Aspart of an environmental monitoring program, additional samplesfor similar dissolved inorganic nutrient analyses were collectedmonthly at the Itata River mouth (St. IR, Fig. 1). Nutrients in thesesamples were determined following Standard Methods 20th Edi-tion (WEF, 1998) at the Environmental Chemistry Laboratory ofthe EULA Center (Universidad de Concepción). Daily records of riveroutflow were obtained from the National Water Directorate (http://www.dga.cl), whereas PAR time series were obtained from anHOBO weather station (Onset Computer Corp., USA) installed bythe COPAS Center (Universidad de Concepción) at 36�31.6870Sand 72�57.9550W.
2.3. Plankton
Water samples (1 L) for analyses of nanoplankton and micro-plankton abundance and biomass were collected from discretedepths (1, 5, 10, 25, 35 m) with a rosette system equipped with12 Niskin bottles. Nanoplankton samples were preserved in glutar-aldehyde (6.0% W/V in 0.2-lm prefiltered seawater). Microplank-ton samples were preserved in alkaline Lugol’s solution 1%(Levinsen and Nielsen, 2002). Nanoflagellates were measured andbiovolumes were estimated from a minimum of 80 cells per group.Biomass was estimated using a size-dependent carbon:volumeratio as suggested by Verity et al. (1992). Large cells were countedunder the same inverted microscope. Subsamples of 50 mL were
nkton carbon biomass in a river-influenced upwelling area off Concepción,

(a) (b)
(c)
Fig. 1. (a) Study area with locations of the sampling stations in the Itata River plume area (Stn RV), the upwelling site off Coliumo Bay (Stn UW), and the Itata River mouthstation (Stn IR). Side panels show representative images of surface chlorophyll concentration (mg m–3) in (b) austral spring (December 26th, 2006) and (c) austral winter(June 19th, 2007).
J.L. Iriarte et al. / Progress in Oceanography xxx (2011) xxx–xxx 3
allowed to settle for 24 h in sedimentation chambers (Utermöhl,1958) prior to the identification, enumeration, and measurementof diatoms, dinoflagellates, and ciliates. Plasma volumes were cal-culated (Edler, 1979) and averaged for a minimum of 50 cells perspecies. Biovolumes of ciliates were calculated assuming conicalshapes with length:diameter ratios of 1.25 for ciliates <50 lm and2.0 for ciliates >50 lm (Tiselius, 1989). We assumed carbon:plasmavolume ratios of 0.11 pg C lm�3 for diatoms (Edler, 1979), 0.3 and0.19 pg C lm�3 for heavily thecate and athecate dinoflagellatesforms (E.J. Lessard unpubl. data fide Gifford and Caron, 2000), and0.148 pg C lm�3 for ciliates (Ohman and Snyder, 1991).
The abundance of bacteria, cyanobacteria, and picophytoeuk-aryotes was estimated by flow cytometry. Subsamples of 150 mLwere processed on a FACSCalibur flow cytometer equipped withan ion-argon laser of 488 nm of 15 mW (Becton Dickinson). Identi-fication of coccoid cyanobacteria (Synechococcus) and photosyn-thetic eukaryotes was based on differences in side light scatterand fluorescence in orange (cyanobacteria) and red (eukaryotes)wavelengths. Abundance of heterotrophic bacteria was estimatedfrom samples previously stained with Sybr green I (MolecularProbes) (Marie et al., 1997). Small nanoflagellates were quantifiedwith the proflavine technique (Haas, 1982). For the enumeration ofnanoflagellates, subsamples were filtered with a 0.8-lm polycar-bonate membrane filter, stained with Proflavine (0.033% w/v indistilled water) following Haas (1982), and fixed with glutaralde-hyde (as above) for subsequent analysis. Nanoflagellates werecounted with an inverted microscope OLYMPUS IX-51 equippedwith UV model UMWU2 (width band pass 330–385 nm) and FITCmodel U-MWB2 (width band pass 450–480 nm) filter sets.
2.4. Primary productivity
Water samples for PP estimates were collected at four depths(0 m, the subsurface maximum fluorescence, 15 m, and 20 m) usinga 5.0-L PVC Go-Flo bottle (General Oceanics, USA). Samples were
Please cite this article in press as: Iriarte, J.L., et al. Primary production and plaChile. Prog. Oceanogr. (2011), doi:10.1016/j.pocean.2011.07.009
incubated in 125-mL polycarbonate bottles (two clear + one darkbottle) and placed in a natural-light incubator for ca. 4 h (roughlybetween 10:00 AM and 14:00 PM). Ambient temperature was reg-ulated by running surface seawater over the incubation bottles.Sodium bicarbonate (30–40 l Ci–NaH14CO3) was added to eachbottle. Primary production was measured using the method de-scribed by Gächter et al. (1984). Samples were manipulated undersubdued light conditions during pre- and post-incubation periods.Filters (0.7 lm) were placed in 20-mL plastic scintillation vialsand kept at �15 �C until reading (15 days later). To remove excessinorganic carbon, filters were treated with HCl fumes for 24 h. Acocktail (8 mL, Ecolite) was added to the vials and radioactivitywas determined in a Beckmann scintillation counter. Differentialsize fractionation of phytoplankton was carried out in three consec-utive steps for PP and autotrophic biomass determinations. Toobtain the nanoplankton fraction (5.0–20 lm), seawater was pre-filtered using a 20-lm Nitex mesh and the filtrate was collectedon a 2.0-lm Nuclepore. Further filtration with the 2.0-lm Nucle-pore and collection of the residue on a 0.7-lm MFS filter (fiber-glassfilter, Micro Filtration System) were conducted to extract the pico-plankton fraction (0.7–2.0 lm). The microphytoplankton fraction(>20 lm) was obtained by subtracting the value estimated for pico-plankton and nanoplankton from the total PP or total Chl-a values.Water samples for Chl-a measurements were taken at the samedepths as the samples collected for PP analysis. Seawater samples(200 mL) were filtered (GF/F), extracted in 90% v/v acetone, andanalyzed using a digital PS-700 Turner fluorometer (Parsons et al.,1984). Depth-integrated PP and Chl-a values in the euphotic layerwere estimated by the trapezoidal integration method.
2.5. Statistical analyses
Environmental variability was characterized through a principalcomponent analysis (PCA) of the set of physical–chemicalmeasurements (e.g., temperature, salinity, oxygen, nutrient
nkton carbon biomass in a river-influenced upwelling area off Concepción,

4 J.L. Iriarte et al. / Progress in Oceanography xxx (2011) xxx–xxx
concentrations) taken at both stations during each cruise, togetherwith indices derived from such measurements (e.g., seawater den-sity, Si:N and N:P ratios). The data matrix used in our multivariateanalysis consisted of 10 variables and 65 cases (5 depths � 6 cruisesat St. RV plus 5 depths � 7 cruises at St. UW). Although river-induced variability in physical–chemical conditions faced by thephytoplankton community is a central component of this study,the daily outflow data available for the Itata River were not in-cluded in the PCA dataset given their lack of spatial resolution(horizontal and vertical). The riverine influence was better cap-tured by CTD data, as shown by the temperature-salinity diagramsfor each station and season (Fig. 2b). We used the first two princi-pal components to represent environmental variability in the studyregion. Subsequently, Spearman correlations between these ‘new’environmental variables and our biological measurements werecalculated for each depth sampled during our cruises. Potential dif-ferences in community structure between stations RV and UWwere tested for using a randomized paired t-test that compareddepth-integrated biomass estimates for each taxonomic groupwithin each season (see Manly, 1997). The same approach wasused to perform among-site comparisons of depth-integrated PPfor <2 lm, 2–20 lm, and >20 lm size fractions, and to comparebiomass and primary production across spring cruises (see Table1) at station UW. For each comparison, N = 5000 iterations of a ran-domization procedure were used to determine the empirical prob-ability distribution of the test statistic t ¼ �xD
sDffiffinp , where
�xD ¼ 1n
PNi¼1RVi� UWi is the mean of paired differences between
Temperature (ºC)10 12 14
Dep
th (m
)
40
30
20
10
0
Stn RVStn UW
Salinity (psu)32.5 33.5 34.5
Dep
th (m
)
40
30
20
10
0
Ommix 112 Dec
Ommix 216 Dec
Ommix 311 Jun
Ommix 413 Jun
Ommix 511 Dec
SPRING 2006 WINTER 2007 SPRIN
(a)
32.5 33.5 34.5 32.5 33.5 34.5 32.5 33.5 34.5 32.5 33.5 34.5 3
10 12 14 10 12 14 10 12 14 10 12 14 10
Fig. 2. (a) Temperature and salinity profiles for Stn RV and Stn UW during each sampliDensity contours correspond to sigma-t.
Table 1Integrated primary productivity (mg C m�2 d�1) in the upper 20 m durinNumerically dominant size fractions are marked in bold.
St. RV (River Plume)
Size fraction (lm) <2 2–20 >
OMMIX I 80 132 3OMMIX II 337 186 4OMMIX III 90 45 2OMMIX IV 17 2 5OMMIX V – – –OMMIX VI 189 199 5OMMIX VII 38 29 6
Please cite this article in press as: Iriarte, J.L., et al. Primary production and plaChile. Prog. Oceanogr. (2011), doi:10.1016/j.pocean.2011.07.009
stations and SD is the standard deviation of the n differencescomputed within each season and taxonomic group. Significanceof the test statistic, given the null hypothesis that depth-integratedbiomass (or PP) at station RV is equal to, or lower than, station UW,was determined as N0/(N + 1), where N0 is the number of iterationswith trnd > t. A Bonferroni correction for multiple comparisons wasused to assess the significance of each comparison (Manly, 1997).
Finally, to test for correlations between phytoplankton bio-mass/productivity and wind forcing, cumulative alongshore windstress was computed over periods that ranged between 2 and30 days prior to each cruise. Depth-integrated biomass for eachtaxonomic group and PP estimates for each size fraction wereused in the correlation analyses.
3. Results
3.1. Physical forcing, surface conditions and hydrography
Wind stress in the study region exhibits a distinct seasonal cy-cle, with prevailing equatorward winds from early spring throughto early autumn (September–April), and events of poleward windsduring late autumn–late winter (Fig. 3a and e). During this period,Photosynthetically Available Radiation reaches minimum values(June–July, Fig. 3b and f) and precedes the minimum SST values re-corded typically in July–August at both sampling stations (Fig. 3cand g). Spring–summer temperatures were almost identical
Ommix 613 Dec
Ommix 79 Aug
G 2007 WINTER 2008
(b)
2.5 33.5 34.5 32.5 33.5 34.5
12 14 10 12 14
ng campaign. (b) Temperature – salinity diagram for the spring and winter cruises.
g all field campaigns at the Itata River plume and off Coliumo Bay.
St. UW (off Coliumo Bay)
20 <2 2–20 >20
534 158 112 5381690 72 56 30567 12 5 19
14 5 8104 137 4532
258 212 318 756616 8 1
nkton carbon biomass in a river-influenced upwelling area off Concepción,

Jan Apr Jul Oct Jan Apr Jul Oct Jan Apr Jul Oct Jan
SST
(°C
)
8
10
12
14
16
18UWRV
Jan Apr Jul Oct Jan Apr Jul Oct Jan Apr Jul Oct Jan
Mer
idio
nal w
ind
stre
ss(N
m-2
)-0.8
-0.4
0.0
0.4
0.8
(A)
(B) Jan Apr Jul Oct Jan Apr Jul Oct Jan Apr Jul Oct Jan
PAR
(Ein
stei
n m
-2 d
-1)
0
20
40
60
Jan Apr Jul Oct Jan Apr Jul Oct Jan Apr Jul Oct Jan
Surfa
ce c
hlor
ophy
ll(m
g m
-3)
0
20
40
60 UWRV
(C)
(D)
J F M A M J J A S O N D-0.3
-0.2
-0.1
0.0
0.1
0.2
0.3
J F M A M J J A S O N D0
20
40
60
J F M A M J J A S O N D10
11
12
13
14
15
16
MonthJ F M A M J J A S O N D
0
10
20
30
40
(E)
(F)
(G)
(H)
2006 2007 2008
Fig. 3. Time series (A–D) and 2002–2009 climatologies (E–H) for satellite-derived data on atmospheric forcing and surface conditions at the study area. Data on daily windstress (A and E) and 8-day average PAR radiation (B and F) near the study area were obtained from Level-3 QuikSCAT and SeaWIFS images, respectively. Data on 8-day averageSea Surface Temperature (C and G) and surface chlorophyll-a concentration (D and H) at the study sites were obtained from Level-3 MODIS-Aqua images. Error bars onclimatologies correspond to standard deviations. Vertical dashed lines indicate dates on which cruises took place.
J.L. Iriarte et al. / Progress in Oceanography xxx (2011) xxx–xxx 5
between stations, although surface waters at station RV appearedto be slightly cooler than at station UW in autumn and wintermonths (Fig. 3c and g). Satellite-derived chlorophyll concentra-tions exhibited large temporal fluctuations at both stations(Fig. 3d), a mean annual cycle with minimum values in May–August and maxima in October–March, with slightly higher con-centrations at station UW during late spring and summer months(Fig. 3h). Daily fluctuations in meridional wind stress during2006–2008 (Fig. 3a) were significantly auto-correlated (a = 0.05)over scales of 3–4 d, whereas in situ SST anomalies near stationUW (not shown) showed scales of de-correlation of 12–13 d, andsignificant (a = 0.05) negative cross-correlations with changes inwind stress (i.e., drops in SST when winds blew equatorward andvice versa) over lags of 0–2 d.
Satellite-derived SST and Chl-a images indicated dramatic dif-ferences in the spatial distribution of temperature and pigments be-tween spring and winter cruises (Fig. 1b and c). During the springcruises, patches of cold water (ca. 8 �C) and high concentrations ofChl-a (7 mg Chl-a m�3) spanned a wide area over the continentalshelf off Concepción (Fig. 1b), whereas winter cruises tended to findhigher SST (�11 �C) with more homogeneous distributions, to-gether with low chlorophyll concentrations (�0.3 mg Chl-a m�3)except for, a few inner-shelf areas (Fig. 1c). Dramatic differences be-tween cruises were also found when comparing CTD profiles oftemperature and salinity (Fig. 2a). Winter cruises were character-ized by a strong river (i.e., low salinity) signal at the surface and
Please cite this article in press as: Iriarte, J.L., et al. Primary production and plaChile. Prog. Oceanogr. (2011), doi:10.1016/j.pocean.2011.07.009
the absence of thermal stratification. In spring, strong thermalstratification occasionally co-occurred with a freshwater signalfrom the Itata River (Fig. 2a). Temperature-salinity diagrams plot-ted with CTD data for the depths from which phytoplankton andnutrient samples were taken showed a distinct river signal thatwas apparent at both stations during wintertime cruises, thoughmore strongly at station RV (Fig. 2b). A strong riverine influencewas also detected at station RV during the first two spring cruises(Fig. 2b, grey circles).
Although freshwater discharges from the Itata River can reachvalues >1000 m3 s�1 in winter (Figs. 4 and 5a; DGA, 2000–2007),our winter cruises took place on days when average dischargesfluctuated between 100 and 300 m�3 s�1. At the scale of the entireautumn–winter season (1 May–31 August), however, a substantialdrop in mean river discharge was observed from 2006 (mean ±SD = 690.4 ± 620.7 m3 s�1) to 2007 (297.3 ± 221.0 m3 s�1). Duringthe spring cruises, river discharge ranged from 50 to 150 m�3 s�1
(Fig. 5c).
3.2. Nutrients
Surface concentrations of inorganic nutrients measured at theItata River mouth showed increased nitrate + nitrite in wintermonths (May–August), with annual values ranging between 4 and14 lM, whereas orthophosphate values remained constant between0.5 and 1.5 lM (Fig. 5b). The seasonal pattern of silicate showed the
nkton carbon biomass in a river-influenced upwelling area off Concepción,

2006 2007 2008 2009
Riv
er d
isch
arge
(103 m
3 s-1
)
0
1
2
3
4
5
6
ItataBioBio
Fig. 4. Daily series of freshwater discharge from the two main rivers in the study region (see Fig. 1a). Dashed vertical bars indicate the dates on which spring (red) and wintercruises (black) were carried out. (For interpretation of the references to colour in this figure legend, the reader is referred to the web version of this article.)
Date
nov dic en
e feb mar ab
rmay jun
jul ag
o se
p oct
nov dic en
e feb mar ab
r may
jun
jul
ag
o se
p
NO
2 + N
O3 a
nd P
O4
Con
cent
ratio
n (µ
M)
0
2
4
6
8
10
12
14
Si(OH
) 4 Concentration
( µM)
0
50
100
150
200
250
300NO3 + NO2
PO4
Si(OH)4
2007 2008
Riv
er F
low
(m3 s
-1)
0200400600800
1000120014001600(a)
(b)
(c)
Dec 2006
Riv
er d
isch
arge
(m3 s
-1)
0
100
200
300
400
500
600
700River discharge
Jun 2007 Dec 2007 Aug 200810 12 14 16 18 8 10 12 14 16 10 12 14 16 6 8 10 12
PAR ( µE)
0
500
1000
1500
2000
2500PAR
Fig. 5. (a) Daily river discharge (m3 s�1) from the Itata River during the whole study period, (b) Concentration of nitrate + nitrite (NO3 + NO2, lM), orthophosphate (PO4, lM),and silicic acid (SiOH4, lM) in a sampling station located at the Itata River mouth, and (c) mean daily river flow (m3 s�1) and photosynthetic active radiation (PAR, lE) duringthe specific sampling days. (Shaded bars represent sampling period.)
6 J.L. Iriarte et al. / Progress in Oceanography xxx (2011) xxx–xxx
highest concentrations in fall and winter, with high annual valuesfluctuating between 100 and 235 lM (Fig. 5b), as have been de-tected by Karrasch et al. (2006). During the spring cruises, the riverdischarges ranged between 50 and 150 m�3 s�1 (Fig. 5c). The recordof solar radiation for the region from 2006 to 2008 showed seasonalfluctuations with lower values in winter (June–August:<500 lmol
Please cite this article in press as: Iriarte, J.L., et al. Primary production and plaChile. Prog. Oceanogr. (2011), doi:10.1016/j.pocean.2011.07.009
s�1 m�2) and higher values in summer (December–February:1500–2000 lmol s�1 m�2) (Fig. 5c).
Except in spring 2006, high orthophosphate and nitrate concen-trations were found throughout the water column, with valuesranging from 0.5 to 2.0 and between 10 and 20 lM, respectively,within the first 30 m depth in winter 2007, 2008 and spring 2007
nkton carbon biomass in a river-influenced upwelling area off Concepción,

J.L. Iriarte et al. / Progress in Oceanography xxx (2011) xxx–xxx 7
at both stations (Fig. 6a). Silicic acid profiles showed the highestsurface concentrations at station RV (10–30 lM) with a subsurfaceminimum (5–10 lM) at 10 m in winter 2007, 2008 and spring2007. Silicic acid profiles at station UW, on the other hand, showedseasonal variations: concentrations in winter were higher at thesurface (10–20 lM) and homogeneous down to 35 m (Fig. 6b)and, in spring, were lower at the surface (<6 lM) with a tendencyto increase with depth (5–25 lM at 25 and 35 m).
3.3. Size-fractioned chlorophyll and plankton community structure
Primary production and autotrophic biomass showed seasonalvariability that is typical of the upwelling area off Concepción.Chlorophyll-a measurements at stations RV and UW showed highlevels of autotrophic biomass (5–20 mg Chl-a m�3) in spring,whereas winter months were characterized by low values (0.2–5mg Chl-a m�3). On average, the contribution of three phytoplank-ton size classes to total Chl-a revealed the dominance of micro-phytoplankton (>70%) during the spring (Fig. 7), and a greaterimportance of nano- and picoplankton (>60%) in the winter.
Wintertime estimates of depth-integrated biomass at station RVshowed a dominance of heterotrophic nanoflagellates (5–20 lm)and bacteria (Fig. 8a and c) and a rather constant or ‘background’signal of picophytoeukaryotes and small heterotrophic photoauto-troph nanoflagellates. In contrast, at station UW, heterotrophicnanoflagellates (HNF) were less important in both seasons anddiatoms dominated the spring biomass (Fig. 8b, d, and f). The high-est abundance of chain-forming diatoms such as Chaetoceros spp.and Thalassiosira spp. was found at both stations in spring(>10,000 cells L�1), whereas the lowest values were found in
NO3 - PO4 C
Dep
th
-40
-30
-20
-10
00 10 20 30 0 10 20 30
Si(OH)4 C
Dep
th
-40
-30
-20
-10
0
Si:N
0 10 20 30
0 2 4 6 8 10 12
0 10 20 30
0 2 4 6 8 10 1
NO3 PO4
(a)
(b)
Spring 2006 Winter 2007
Spring 2006 Winter 2007
Fig. 6. Vertical profiles of (a) dissolved nitrate (NO3) and orthophosphate (PO4), and (b) sspring 2007, and winter 2008. Black and grey symbols correspond to St. RV and UW, re
Please cite this article in press as: Iriarte, J.L., et al. Primary production and plaChile. Prog. Oceanogr. (2011), doi:10.1016/j.pocean.2011.07.009
winter (ca. 100 cells L�1) (Table 2). Finally, dinoflagellates and cil-iates were found to be relatively important in terms of abundanceat both stations in winter (Table 2).
3.4. Primary productivity
Depth-integrated estimates of PP varied from 24 to 8000 mgC m�2 d�1 (Table 1) and were two orders of magnitude higher inthe spring. A three-way Analysis of Variance performed on the datashown in Table 1 indicated that phytoplankton size (F2,31 = 11.97,p = 0.0001) and season (F1,31 = 14.45, p = 0.0006), but not station(F1,31 = 0.07, p = 0.795), have a significant effect on depth-integrated primary production. At both stations, photosyntheticrates and Chl-a biomass were highest at depths below thepycnocline (10–15 m; Figs. 7 and 9). In terms of carbon uptake,microphytoplankton (>20 lm) dominated and accounted for asubstantial proportion (50–90%) during cruises with higher totalPP level (spring 2006, 2007; Table 1); whereas nanoplankton andpicoplankton fractions dominated (>50%) during the low-PP wintermonths (Fig. 9). A comparison of depth-integrated biomass and PPrates among stations indicated that the wintertime biomass of bac-teria, cyanobacteria, and PNF were significantly greater at stationRV (Fig. 8 and Table 3). Depth-integrated PP corresponding to the<2 lm size fraction was also significantly greater at station RV inwinter months (Tables 1 and 3). When biomass and PP estimatesfor station UW were compared across spring seasons (i.e., 2006and 2007), biomass estimates for cyanobacteria were significantlygreater (p < 0.0001) during the spring of 2006, whereas PNF andciliate biomass, as well as pico-phytoplankton production, weresignificantly greater (p < 0.0001) during the spring of 2007.
oncentration0 10 20 30 0 10 20 30
oncentration
ratio2
0 10 20 30
0 2 4 6 8 10 12
0 10 20 30
0 2 4 6 8 10 12
Si(OH)2 Si:N
Spring 2007 Winter 2008
Spring 2007 Winter 2008
ilicic acid (Si(OH)2) in lM units and Si:N ratio averaged for spring 2006, winter andspectively.
nkton carbon biomass in a river-influenced upwelling area off Concepción,

Size-fractioned chlorophyll a (mgChl m-3) D
epth
(m) -40
-30
-20
-10
0
Ommix 112 Dec
Ommix 216 Dec
Ommix 311 Jun
Ommix 413 Jun
Ommix 511 Dec
Ommix 613 Dec
Ommix 79 Aug
SPRING 2006 WINTER 2007 SPRING 2007 WINTER 2008
-40
-30
-20
-10
0
0 5 10 15 20 25
0 5 10 15 20 25
0.0 0.5 1.0
0.0 0.5 1.0
0 5 10 15 20 25
0 5 10 15 20 25
0.0 0.2 0.4 0.6 0.8 1.0
0 5 10 15 20 25
0 5 10 15 20 25
0.0 0.5 1.0
0.0 0.5 1.0
0 5 10 15 20 25
0 5 10 15 20 25
0.0 0.2 0.4 0.6 0.8 1.0
µ µTotal < 2 m 2- 20 m > 20 µm
Fig. 7. Vertical profiles of size-fractioned chlorophyll (mg Chl m�3) during each sampling campaign at both Stn RV (upper panel) and UW (lower panel). Size fractionscorrespond to picoplankton (<2 lm), nanophytoplankton (2–20 lm), and microphytoplankton (>20 lm).
Biom
ass
(mgC
m-2
)
0500
10001500200025003000
Bacteria Cyanobacteria Picophytoeuk
0
200
400
600
800
1000PNF MNF HNF
Campaign/Date
OMMIX I
OMMIXII
OMMIX III
OMMIX IV
OMMIXV
OMMIXVI
OMMIX VII0
4000
8000
12000
16000Dinoflagellates Ciliates Diatoms
OMMIX I
OMMIX II
OMMIX III
OMMIX IV
OMMIXV
OMMIXVI
OMMIXVII
(a) (b)
(c) (d)
(e) (f)
Spring2006
Winter2007
Spring2007
Winter2008
Spring2006
Winter2007
Spring2007
Winter2008
Fig. 8. Upper 20 m depth-integrated biomass (mg C m�2) of major taxonomic groups in the picoplankton (a and b), nanoplankton (c and d), and microplankton size fraction (eand f) averaged for spring 2006, winter and spring 2007, and winter 2008 at the Stn RV (a, c, and e) and UW (b, d, and f).
8 J.L. Iriarte et al. / Progress in Oceanography xxx (2011) xxx–xxx
3.5. Physical forcing, hydrography and plankton community properties
The PCA performed on our environmental dataset yielded twoprincipal components that jointly explained 56% of the total
Please cite this article in press as: Iriarte, J.L., et al. Primary production and plaChile. Prog. Oceanogr. (2011), doi:10.1016/j.pocean.2011.07.009
variance (Table 4). The first principal component (PC1) explained41.4% of the total environmental variability and accounted mostlyfor variability induced by cold, nutrient-rich, bottom waters thatare brought closer to the surface during the upwelling season.
nkton carbon biomass in a river-influenced upwelling area off Concepción,

Table 2Mean abundance of numerically dominant (>200 cells L�1) microphytoplankton and microzooplankton groups during all field campaigns at the maximum fluorescence depth.
St. RV St. UW
Ommix I–II Ommix III–IV Ommix V–VI Ommix VII Ommix I–II Ommix III–IV Ommix V–VI Ommix VIIDec. 2006 Jun. 2007 Dec. 2007 Aug. 2008 Dec. 2006 Jun. 2007 Dec. 2007 Aug. 2008
Mean fluorescence max. 10 8 10 8 10 5 10 5
Diatom chainsAsterionellpsis glcialis 0 0 0 0 0 0 1828 0Chaetoceros compressum 0 0 0 0 0 0 2860 0Chaetoceros radicans 0 0 85,661 0 0 0 32,487 0Chaetoceros socialis 0 0 0 0 0 0 16,015 0Chaetoceros sp. 1 0 250 1503 0 593 0 1369 912Chaetoceros sp. 2 0 0 886,663 0 0 0 598,657 152Eucampia cornuta 0 0 0 0 0 0 0 0Lauderia borealis 8589 0 0 0 0 0 0 0Odontella sp. 3304 0 10,520 0 581 0 7528 0Odontella longicruris 0 0 4508 0 0 0 1144 0Skeletonema costatum 0 0 0 1660.6 7548 678 0 456Thalassiosira sp. 1 102,545 62 10,520 0 124,062 0 64,418 0Thalassiosira sp. 2 11,475 0 0 0 20,419 0 0 0Thalassiosira sp. 3 141,437 0 0 0 106,788 762 0 0Thalassiosira sp. 4 58,944 0 171,321 255.5 83,805 0 410,295 0Thalassiosira sp. 5 13,875 0 0 0 24,919 0 0 0Thalassiosira sp. 6 27,750 0 0 0 8710 0 0 0Thalassiosira sp. 7 7929 0 3006 0 2129 0 7425 0
Pennate diatomsCilindroteca closterium 0 499 0 0 0 675 0 0Frustulia vulgaris 0 0 9604 128 0 0 5475 152Navicula gregaria 0 0 0 0 581 0 0 0Navicula vitata 0 74 482 0 0 379 0 0Navicula dicephala 0 324 0 0 0 126 0 0Navicula sp. 0 0 0 0 0 0 3792 304Nitzchia sigma 0 0 1928 0 0 0 6843 0Pseudonitzchia sp. 19,822 0 1446 128 4306 0 572 760Unidentified pennate cell 24,447 1004 4338 255 4306 845 5822 706
Centric diatomsCorethron criophylum 0 1454 0 0 0 95 0 0Cocsinodiscus sp. 1 3079 0 0 0 5032 0 0 0Cocsinodiscus sp. 2 0 0 0 0 2226 0 0 0
DinoflagellatesProtoperidinium leonis 661 0 0 0 0 126 0 0Protoperidinium spp. 25–50 lm 0 851 0 766 0 128 0 304Dinophysis acuminata 0 0 25 639 0 28 0 0Gymnodinium spp. 8–20 lm 0 3821 4338 1150 0 4559 745 456Gyrodinium spp. 10–28 lm 13 357 482 255 67,934 635 572 0Katodinium spp. 18–20 lm 0 0 0 861 0 22 0 304Not identified athecate 42 0 0 0 13 43 0 0
CiliatesHelicostomella spp. 5 0 23 23 12 0 0 0Udella spp. 0 0 12 287 0 0 0 0Strombidium capitatum 0 567 40 1435 0 888 0 1179Strombidium compressum 0 8 0 0 0 11 0 2063Strombidium spp. 29 1474 24 1722 16 12 30,658 1474
J.L. Iriarte et al. / Progress in Oceanography xxx (2011) xxx–xxx 9
PC1 was characterized by large, positive coefficients assigned tonitrate and orthophosphate concentrations and water density,and a similarly large but negative coefficient assigned to tempera-ture (Table 4). The second principal component accounted for 15%of total variability, and corresponded to a balance between riverand marine influences, with a large, positive coefficient assignedto the silicic acid concentration, and large negative coefficientsassigned to salinity and density (Table 4).
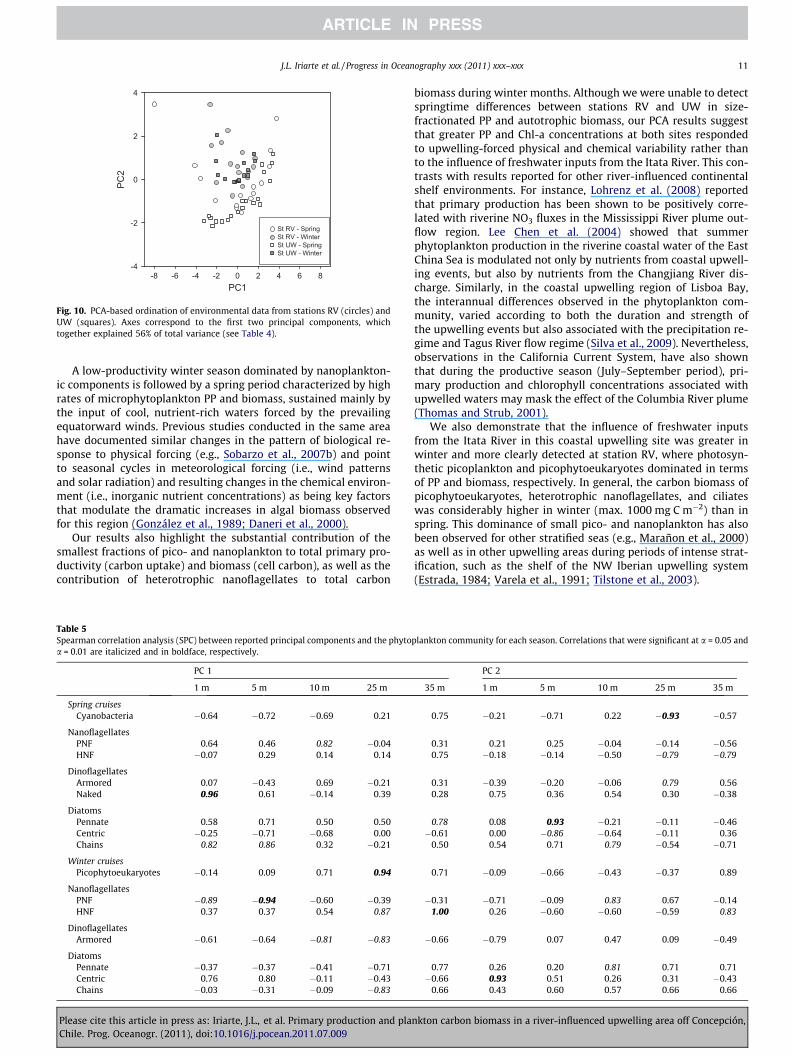
PCA scores corresponding to PC1 and PC2 produced an ordina-tion of environmental data that separated winter from springtimeobservations along the PC2 axis (Fig. 10, filled versus emptysymbols) corresponding to the winter–spring shift in the balancebetween river and marine influences. Since there was no apparentseparation between stations within seasons (Fig. 10, squares versuscircles), correlation analyses for phytoplankton abundance versuswater column conditions were conducted separately for springand winter cruises. Significant positive correlations were found
Please cite this article in press as: Iriarte, J.L., et al. Primary production and plaChile. Prog. Oceanogr. (2011), doi:10.1016/j.pocean.2011.07.009
between PC1 and the springtime abundance of diatom chainsand naked dinoflagellates near the surface (1 and 5 m, Table 5).In winter, there was a strong negative correlation between PNFabundance near the surface and PC1 (Table 5), whereas centric dia-toms at 1 m were positively correlated with PC2. All significantcorrelations between PC2 (i.e., balance between river and upwell-ing influences) and the abundance of phytoplankton taxa werepositive in winter months (Table 5).
Correlations between depth-integrated biomass and cumulativealongshore wind stress were contrasting among taxonomic groupsand similar across stations. Diatom biomass was positively corre-lated with cumulative wind stress at both stations (i.e., biomass in-creased when alongshore winds were upwelling-favorable) andreached maximum correlation when wind stress was integratedover periods of 10–20 days prior to each cruise. A similarly delayedand strong response to wind, but with the opposite sign, was foundfor the biomass of cyanobacteria, ciliates, and picophytoeukaryotes
nkton carbon biomass in a river-influenced upwelling area off Concepción,

Size-fractioned primary production (mgC m-3 h-1) D
epth
(m)
-40
-30
-20
-10
0
Ommix 112 Dec
Ommix 216 Dec
Ommix 311 Jun
Ommix 413 Jun
Ommix 511 Dec
Ommix 613 Dec
Ommix 79 Aug
SPRING 2006 WINTER 2007 SPRING 2007 WINTER 2008
-40
-30
-20
-10
0
0 40 80 120 160
0 40 80 120 160
5
0 1 2 3 4 5
0 40 80 120 160
0 40 80 120 160
0 1 2 3 4 0 1 2 3 4 5
0 40 80 120 160
0 40 80 120 160
5
0 1 2 3 4 5
0 40 80 120 160
0 40 80 120 160
0 1 2 3 4 0 1 2 3 4 5
< 2 µ µ µTotal m 2 -20 m > 20 m
Fig. 9. Vertical profiles of size-fractioned primary production (mg C m�3 h�1) during each cruise at St. RV (upper panel) and UW (lower panel). Size fractions correspond topicoplankton (<2 lm), nanophytoplankton (2–20 lm), and microphytoplankton (>20 lm).
Table 3Results of randomized paired t-tests that compared depth-integrated biomass andsize-fractioned primary production among stations within each season. Significantdifferences at a = 0.05 are shown in boldface. Bonferroni-corrected significance levelsfor multiple biomass and primary production comparisons were ab = 0.0056 andap = 0.0167, respectively.
Spring Winter
t p t p
Biomass (mg C m�2)Bacteria �1.13 0.757 3.53 0.000Cyanobacteria �1.27 0.738 2.01 0.000Picophytoeukaryotes �1.65 0.755 1.43 0.120PNF 0.97 0.246 13.96 0.000MNF 1.11 0.121 0.02 0.373HNF 0.71 0.243 1.39 0.115Dinoflagellates 0.43 0.379 1.50 0.119Ciliates �1.00 0.516 0.71 0.382Diatoms �0.93 0.749 �1.17 0.881
Primary production (mg C m�2 d�1)<2 lm 0.51 0.382 1.53 0.0002–20 lm 0.14 0.249 1.55 0.130>20 lm �0.68 0.748 1.02 0.127
Table 4Principal component analysis (PCA) performed on environmental data collected atboth sampling locations. Columns show the weights assigned to originally measuredvariables. Weights > 0.3 are shown in boldface.
Physical–chemical variable PC1 PC2
Temperature (�C) �0.392 0.090Salinity (psu) 0.275 �0.494Density 0.352 �0.436Oxygen (mL L�1) �0.241 �0.202NO3 (lM) 0.419 0.212NO2 (lM) 0.119 0.256PO4 (lM) 0.337 0.051Si(OH)4 (lM) 0.256 0.519Si:N �0.253 0.286N:P 0.199 0.201
% Total variance 41.4 15.0
10 J.L. Iriarte et al. / Progress in Oceanography xxx (2011) xxx–xxx
(i.e., biomass of these groups increased after downwelling events,which are typically associated with winter storms in this region).Although this negative correlation was found at both stations, re-sults were significant only at station UW, where the biomass ofPNF and mixotrophic nanoflagellates were negatively and signifi-cantly correlated with wind integrated over 25–30-day periods.
4. Discussion
The coupling between riverine inputs of nutrients and biologi-cal responses of the coastal ecosystem in the outflow region of con-tinental shelves has been a major issue in coastal ecology,
Please cite this article in press as: Iriarte, J.L., et al. Primary production and plaChile. Prog. Oceanogr. (2011), doi:10.1016/j.pocean.2011.07.009
biogeochemistry, and oceanography, especially given the futurescenarios of climatic-driven hydrological regime changes (Lohrenzet al., 2008). Over two consecutive winter–spring transitions in thecoastal upwelling area off Concepción, we have found substantialchanges in phytoplankton primary productivity (carbon uptake),autotrophic biomass (Chl-a), and the abundance and relative cellbiomass (cell carbon) of planktonic groups. Primary productionestimates ranged between 0.025 and 5.6 g C m�2 day�1, and werecomparable to those previously recorded in the same region(0.1–9 g C m�2 d�1; Daneri et al., 2000; Montero et al., 2007;Vargas et al., 2007), as well as in other upwelling systems suchas Perú (1–5 g C m�2 d�1: Barber and Smith, 1981), Benguela(0.5–4.0 g C m�2 d�1; Brown and Field, 1986), Antofagasta, Chile(1.1–8.1 g C m�2 d�1; Iriarte and González, 2004), NW PeninsulaIberica, Spain (0.1–2.5 g C m�2 d�1; Varela et al., 2005). All theseregions showed similar patterns of strong seasonal variability, withhighest PP estimates during spring compared to winter.
nkton carbon biomass in a river-influenced upwelling area off Concepción,
PC1-8 -6 -4 -2 0 2 4 6 8
PC2
-4
-2
0
2
4
St RV - SpringSt RV - WinterSt UW - SpringSt UW - Winter
Fig. 10. PCA-based ordination of environmental data from stations RV (circles) andUW (squares). Axes correspond to the first two principal components, whichtogether explained 56% of total variance (see Table 4).
J.L. Iriarte et al. / Progress in Oceanography xxx (2011) xxx–xxx 11
A low-productivity winter season dominated by nanoplankton-ic components is followed by a spring period characterized by highrates of microphytoplankton PP and biomass, sustained mainly bythe input of cool, nutrient-rich waters forced by the prevailingequatorward winds. Previous studies conducted in the same areahave documented similar changes in the pattern of biological re-sponse to physical forcing (e.g., Sobarzo et al., 2007b) and pointto seasonal cycles in meteorological forcing (i.e., wind patternsand solar radiation) and resulting changes in the chemical environ-ment (i.e., inorganic nutrient concentrations) as being key factorsthat modulate the dramatic increases in algal biomass observedfor this region (González et al., 1989; Daneri et al., 2000).
Our results also highlight the substantial contribution of thesmallest fractions of pico- and nanoplankton to total primary pro-ductivity (carbon uptake) and biomass (cell carbon), as well as thecontribution of heterotrophic nanoflagellates to total carbon
Table 5Spearman correlation analysis (SPC) between reported principal components and the phytoa = 0.01 are italicized and in boldface, respectively.
PC 1
1 m 5 m 10 m 25 m
Spring cruisesCyanobacteria �0.64 �0.72 �0.69 0.21
NanoflagellatesPNF 0.64 0.46 0.82 �0.04HNF �0.07 0.29 0.14 0.14
DinoflagellatesArmored 0.07 �0.43 0.69 �0.21Naked 0.96 0.61 �0.14 0.39
DiatomsPennate 0.58 0.71 0.50 0.50Centric �0.25 �0.71 �0.68 0.00Chains 0.82 0.86 0.32 �0.21
Winter cruisesPicophytoeukaryotes �0.14 0.09 0.71 0.94
NanoflagellatesPNF �0.89 �0.94 �0.60 �0.39HNF 0.37 0.37 0.54 0.87
DinoflagellatesArmored �0.61 �0.64 �0.81 �0.83
DiatomsPennate �0.37 �0.37 �0.41 �0.71Centric 0.76 0.80 �0.11 �0.43Chains �0.03 �0.31 �0.09 �0.83
Please cite this article in press as: Iriarte, J.L., et al. Primary production and plaChile. Prog. Oceanogr. (2011), doi:10.1016/j.pocean.2011.07.009
biomass during winter months. Although we were unable to detectspringtime differences between stations RV and UW in size-fractionated PP and autotrophic biomass, our PCA results suggestthat greater PP and Chl-a concentrations at both sites respondedto upwelling-forced physical and chemical variability rather thanto the influence of freshwater inputs from the Itata River. This con-trasts with results reported for other river-influenced continentalshelf environments. For instance, Lohrenz et al. (2008) reportedthat primary production has been shown to be positively corre-lated with riverine NO3 fluxes in the Mississippi River plume out-flow region. Lee Chen et al. (2004) showed that summerphytoplankton production in the riverine coastal water of the EastChina Sea is modulated not only by nutrients from coastal upwell-ing events, but also by nutrients from the Changjiang River dis-charge. Similarly, in the coastal upwelling region of Lisboa Bay,the interannual differences observed in the phytoplankton com-munity, varied according to both the duration and strength ofthe upwelling events but also associated with the precipitation re-gime and Tagus River flow regime (Silva et al., 2009). Nevertheless,observations in the California Current System, have also shownthat during the productive season (July–September period), pri-mary production and chlorophyll concentrations associated withupwelled waters may mask the effect of the Columbia River plume(Thomas and Strub, 2001).
We also demonstrate that the influence of freshwater inputsfrom the Itata River in this coastal upwelling site was greater inwinter and more clearly detected at station RV, where photosyn-thetic picoplankton and picophytoeukaryotes dominated in termsof PP and biomass, respectively. In general, the carbon biomass ofpicophytoeukaryotes, heterotrophic nanoflagellates, and ciliateswas considerably higher in winter (max. 1000 mg C m�2) than inspring. This dominance of small pico- and nanoplankton has alsobeen observed for other stratified seas (e.g., Marañon et al., 2000)as well as in other upwelling areas during periods of intense strat-ification, such as the shelf of the NW Iberian upwelling system(Estrada, 1984; Varela et al., 1991; Tilstone et al., 2003).
plankton community for each season. Correlations that were significant at a = 0.05 and
PC 2
35 m 1 m 5 m 10 m 25 m 35 m
0.75 �0.21 �0.71 0.22 �0.93 �0.57
0.31 0.21 0.25 �0.04 �0.14 �0.560.75 �0.18 �0.14 �0.50 �0.79 �0.79
0.31 �0.39 �0.20 �0.06 0.79 0.560.28 0.75 0.36 0.54 0.30 �0.38
0.78 0.08 0.93 �0.21 �0.11 �0.46�0.61 0.00 �0.86 �0.64 �0.11 0.36
0.50 0.54 0.71 0.79 �0.54 �0.71
0.71 �0.09 �0.66 �0.43 �0.37 0.89
�0.31 �0.71 �0.09 0.83 0.67 �0.141.00 0.26 �0.60 �0.60 �0.59 0.83
�0.66 �0.79 0.07 0.47 0.09 �0.49
0.77 0.26 0.20 0.81 0.71 0.71�0.66 0.93 0.51 0.26 0.31 �0.43
0.66 0.43 0.60 0.57 0.66 0.66
nkton carbon biomass in a river-influenced upwelling area off Concepción,

12 J.L. Iriarte et al. / Progress in Oceanography xxx (2011) xxx–xxx
The influence of freshwater inputs was also apparent in Si(OH)4
profiles, which showed maxima near the surface and minima in thesubsurface (5–10 m depth). Based on our observations, we suggestthat, although cold and nutrient-rich upwelling waters fueled PPand microphytoplankton biomass in spring months, the predomi-nantly river-induced conditions of winter months led to sustainedhigh heterotrophic biomass, and pico- and nanoplankton PP. Thisalternate state of the phytoplankton community in winter mayplay an important role in the carbon budget and trophic state ofthe coastal upwelling area off Concepción. Whereas small-sizedphytoplankton (<20 lm) have been suggested as potentiallyimportant contributors to the total PP in coastal upwelling areas(Hall and Vincent, 1990; Iriarte and González, 2004), high abun-dances of picophytoplankton and picoeukaryotes have been ob-served at the front between river and oceanic waters offMississippi (Liu et al., 2004), whereas enhanced bacterial produc-tion associated with increased river flows has been reported forthe Bay of Biscay (Iriarte et al., 2003).
There seemed to be an association between wintertime bacte-rial biomass at station RV and changes in river outflow in 2007.Furthermore, the biomass of bacteria, nanoplanktonic hetero-trophs, ciliates, and heterotrophic dinoflagellates appeared to bemore tightly coupled during the less productive winter monthsthan in the more productive spring season. The observed changesin the microbial community structure in wintertime, associatedwith a greater influence of freshwater inputs, could be summarizedin the following hypothesis: an increase in river outflow in winterprovides more nutrients and dissolved organic matter (DOM) tothe nearshore water column off Concepción and promotes an in-crease in bacterial and picophytoplankton productivity that, inturn, promotes an increase in grazing by heterotrophic nanoflagel-lates and ciliates.
It is not clear to what extent this relationship is a direct re-sponse to changes in the quality and quantity of nutrient andDOM inputs, regardless of seasonal changes in water column sta-bility. Humic substances supplied by freshwater runoff from theheavily forested Itata watershed may play a role in the wintertimeincrease of microbial abundance; as such substances have beenshown to have a positive effect on the growth of several protozoanspecies (e.g., Carlsson et al., 1995; Hallegraeff et al., 1995; Weiseet al., 2002). Furthermore, protozoans have been shown to playan important role as grazers of phytoplankton in river plume areas(Fahnenstiel et al., 1995; Dagg et al., 2004). Indeed, during thesesame sampling campaigns, Vargas and Martínez (2009) showed arelatively high grazing impact of ciliates on bacterivorous nano-plankton and autotrophic nanoflagellates, which accounted foraround 99% of the PP per day, in winter within the river plume.
Our results clearly show the extent to which the compositionand biomass of the phytoplankton community may vary spatiallyand temporally in the upwelling area off Concepción. They alsoillustrate the potential for seasonal and inter-annual changes inthe river plume-upwelling balance to generate small-scale spatialdifferences in phytoplankton biomass and community compositionduring certain months. The existence (absence) of significant dif-ferences in phytoplankton biomass and composition in winter(spring) months could be partly explained by seasonal changes inthe interaction of river outflow and prevailing coastal winds.Wintertime coastal winds often blow polewards (Sobarzo et al.,2007a) and, at the same time, river plumes tend to move cum soledue to the Coriolis effect (e.g., Piñones et al., 2005). The end resultof this resonance between prevailing winds and the alongshoredisplacement of river discharges is a north–south gradient in riverinfluence on the physical–chemical conditions for phytoplanktongrowth at both stations. In the springtime, river discharge is min-imal and strong coastal winds blow consistently towards theEquator (Sobarzo et al., 2007a). Persistent coastal upwelling in this
Please cite this article in press as: Iriarte, J.L., et al. Primary production and plaChile. Prog. Oceanogr. (2011), doi:10.1016/j.pocean.2011.07.009
region is expected to generate a more homogeneous set of physi-cal–chemical conditions for phytoplankton growth.
Differences among taxa in the delay with which biomassresponded to variability in alongshore wind forcing were consis-tent with expectations based on food web dynamics. For instance,whereas the diatom biomass appeared to respond to upwelling-favorable winds within �5 days, the biomass of bacteria anddinoflagellates were positively correlated with wind forcing overperiods P15 days. Wind-integration periods for which correlationswith PP reached maximum (and significant) values could providean indication of characteristic response times for shelf phytoplank-ton in the region. Among-station differences in biomass composi-tion, as well as the response of small-cell PP to wind forcing,highlight the potential for divergence in phytoplankton dynamicsover small spatial scales in this region. We propose that such dif-ferences are linked to a shift in the relative importance of upwell-ing versus river influence as a driver of physical–chemicalvariability in the nearshore water column.
In summary, our results support the hypothesis that thespatial–temporal variability of the river plume influence and itsimportance relative to wind-induced coastal upwelling in centralChile may drive changes in the biomass and size composition ofcoastal phytoplankton. These changes may sustain and/or enhancea wintertime ‘‘microbial food web’’ in this highly productiveupwelling region. These results highlight the ecological and bio-geochemical implications of current and future changes in the vol-ume and/or composition of river inputs to the coastal ocean.
Acknowledgements
We thank the captain and crew of the research vessel L/C KayKay and the OMMIX team who participated in our cruises, espe-cially Paulina Contreras, Cynthia Valenzuela, and David Opazo.We are also indebted to Rubén Escribano (COPAS Center) for pro-viding the PAR data, as well as all the logistical facilities at theMarine Research Station of Dichato and onboard the RV Kay-Kay,Universidad de Concepción (e.g., CTDO, Tucker trawl nets, Niskinbottles). Financial support for this study was fully provided byFONDECYT Grant No. 1060709 to CAV and JLI, and FONDECYTGrant No. 1095069 to CAV.
References
Ahumada, R., Matrai, P., Silva, N., 1991. Phytoplankton biomass distribution andrelationship to nutrient enrichment during an upwelling event off Concepciónbay, Chile. Boletín de la Sociedad Biológica de Concepción, Chile 62, 7–19.
Anabalón, V., Morales, C.E., Escribano, H.R., Varas, M.A., 2007. The contribution ofnano- and micro-planktonic assemblages in the surface layer (0–30 m) underdifferent hydrographic conditions in the upwelling area off Concepción, CentralChile. Progress in Oceanography 75, 396–414.
Barber, R.T., Smith, R.L., 1981. Coastal upwelling ecosystems. In: Longhurst, A.R.(Ed.), Analysis of Marine Ecosystems. Academic Press, New York, pp. 31–68.
Brown, P.C., Field, J.C., 1986. Factors limiting phytoplankton production in anearshore upwelling area. Journal of Plankton Research 8, 55–68.
Böttjer, D., Morales, C.E., 2007. Nanoplanktonic assemblages in the upwelling areaoff Concepción (36 S), central Chile: abundance, biomass, and grazing potentialduring the annual cycle. Progress in Oceanography 75, 415–434.
Cáceres, M., Arcos, D.F., 1991. Variabilidad en la estructura espacio-temporal de unarea de surgencia frente a la costa de Concepción, Chile. Investigación Pesquera37, 55–66.
Carlsson, P., Graneli, E., Tester, P., Boni, L., 1995. Influences of riverine humicsubstances on bacteria, protozoa, phyto-plankton, and copepods in a coastalplankton community. Marine Ecology Progress Series 127, 213–221.
Dagg, M., Benner, R., Lohrenz, S., Lawrence, D., 2004. Transformation of dissolvedand particulate materials on continental shelves by large rivers: plumeprocesses. Continental Shelf Research 24, 833–858.
Daneri, G., Dellarossa, V., Quiñones, R., Jacob, B., Montero, P., Ulloa, O., 2000. Primaryproduction and community respiration in the Humboldt Current System offChile and associated oceanic areas. Marine Ecology Progress Series 197, 41–49.
Edler, L., 1979. Recommendations for marine biological studies in the Baltic Sea. TheBaltic Marine Biologists Publication 5, 1–38.
Estrada, M., 1984. Phytoplankton distribution and composition off the coast ofGalicia (northwest of Spain). Journal of Plankton Research 6, 417–434.
nkton carbon biomass in a river-influenced upwelling area off Concepción,

J.L. Iriarte et al. / Progress in Oceanography xxx (2011) xxx–xxx 13
Fahnenstiel, G.L., McCormick, M.J., Lang, G.A., Redalje, D.G., Lohrenz, S.E., Markowitz,M., Wagoner, B., Carrick, H.J., 1995. Taxon-specific growth and loss rates fordominant phytoplankton populations from the northern Gulf of Mexico. MarineEcology Progress Series 117, 229–239.
Farías, L., Graco, M., Ulloa, O., 2004. Temporal variability of nitrogen cycling incontinental-shelf sediments of the upwelling ecosystem off central Chile. Deep-Sea Research II 51, 2491–2505.
Frame, E.R., Lessard, E.J., 2009. Does the Columbia River influence phytoplanktoncommunity structure along the Washington and Oregon coasts? Journal ofGeophysical Research 114, 1029–1042.
Gächter, R., Mares, A., Tilzer, M.M., 1984. Determination of phytoplanktonproduction by the radiocarbon method: a comparison between theacidification and bubbling method (ABM) and the filtration technique. Journalof Plankton Research 6, 359–364.
Gifford, D.J., Caron, D.A., 2000. Sampling, preservation, enumeration and biomass ofmarine protozooplankton. In: Harris, R.P., Wiebe, P.H., Lenz, J., Skjoldal, H.R.,Huntley, M. (Eds.), ICES Zooplankton Methodology Manual. Academic Press, pp.193–221.
González, H.E., Pantoja, S., Iriarte, J., Bernal, P., 1989. Winter-spring variability ofsize-fractionated autotrophic biomass in Concepción Bay, Chile. Journal ofPlankton Research 11, 1157–1167.
González, H.E., Menschel, E., Aparicio, C., Barría, C., 2007. Spatial and temporalvariability of microplankton and detritus, and their export to the shelfsediments in the upwelling area off Concepción, Chile (36 S), during 2002–2005. Progress in Oceanography 75, 435–451.
Haas, L.W., 1982. Improved epifluorescence microscopy for observing planktonicmicroorganisms. Annual Institute of Oceanography 58, 261–266.
Hall, J.A., Vincent, W.F., 1990. Vertical and horizontal structure in the picoplanktoncommunities of a coastal upwelling system. Marine Biology 106, 465–471.
Hallegraeff, G.M., McCausland, M.A., Brown, R.K., 1995. Early warning of toxicdinoflagellate blooms of Gymnodinium catenatum in southern Tasmanianwaters. Journal of Plankton Research 17, 1163–1176.
Iriarte, J., González, H., 2004. Phytoplankton size structure during and after the1997/98 El Niño in a coastal upwelling area of the northern Humboldt CurrentSystem. Marine Ecology Progress Series 269, 83–90.
Iriarte, A., Madariaga, I., Revilla, M., Sarobe, A., 2003. Short-term variability inmicrobial food web dynamics in a shallow tidal estuary. Marine EcologyProgress Series 31, 145–161.
Karrasch, B., Parra, O., Cid, H., Mehrens, M., Pacheco, P., Urrutia, R., Valdovinos, C.,Zaror, C., 2006. Effects of pulp and paper mill effluents on th microplankton andmicrobial self-purification capabilities of the Biobio River, Chile. Science of theTotal Environment 359, 194–208.
Lee Chen, Y.-L., Chen, H.-Y., Gong, G.-C., Lin, Y.-H., Jan, S., Takahashi, M., 2004.Phytoplankton production during a summer coastal upwelling in the East ChinaSea. Continental Shelf Research 24, 1321–1338.
Levinsen, H., Nielsen, T.G., 2002. The trophic role of marine pelagic ciliates andheterotrophic dinoflagellates in arctic and temperate coastal ecosystems: across latitude comparison. Limnology and Oceanography 47, 427–436.
Liu, H., Dagg, M., Campbell, L., Urban-Rich, J., 2004. Picophytoplankton andbacterioplankton in the Mississippi River Plume and its adjacent waters.Estuaries 27, 147–156.
Lohrenz, S.E., Redalje, D.G., Cai, W.-J., Acker, J., Dagg, M., 2008. A retrospectiveanalysis of nutrients and phytoplankton productivity in the Mississippi Riverplume. Continental Shelf Research 28 (12), 1466–1475.
Manly, B.F., 1997. Randomization, Bootstrap and Monte Carlo Methods in Biology,second ed. Chapman & Hall/CRC, New York.
Marie, D., Partensky, F., Jacquet, S., Vaulot, D., 1997. Enumeration and cell cycleanalysis of natural populations of marine picoplankton by flow cytometry usingthe nucleic acid stain SYBR Green I. Applied Environmental Microbiology 63,186–193.
Malej, A., Mozetic, P., Malacic, V., Terzic, S., Ahel, M., 1995. Phytoplankton responsesto freshwater inputs in a small semi-enclosed gulf (Gulf of Trieste, Adriatic Sea).Marine Ecology Progress Series 120, 111–121.
Marañon, E., Holligan, P.M., Varela, M., Mouriño, B., Bale, A.J., 2000. Basin-scalevariability of phytoplankton biomass, production and growth in the AtlanticOcean. Deep-Sea Research Part I 47, 825–857.
Montecino, V., Astoreca, R., Alarcón, G., Retamal, L., Pizarro, G., 2004. Bio-opticalcharacteristics and primary productivity during upwelling and non-upwellingconditions in a highly productive coastal ecosystem off central Chile (36 S).Deep-Sea Research II 51, 2413–2426.
Please cite this article in press as: Iriarte, J.L., et al. Primary production and plaChile. Prog. Oceanogr. (2011), doi:10.1016/j.pocean.2011.07.009
Montero, P., Daneri, G., Cuevas, L.A., González, H.E., Jacob, B., Lizárraga, L., Menschel,E., 2007. Productivity cycles in the coastal upwelling area off Concepción: theimportance of diatoms and bacterioplankton in the organic carbon flux.Progress in Oceanography 75, 518–530.
Murphy, J., Riley, I.P., 1962. A modified single solution method for thedetermination of phosphate in natural waters. Analytica Chimica Acta 27, 31–36.
Ohman, M.D., Snyder, R.A., 1991. Growth kinetics of the omnivorous oligotrichciliate Strombidium sp. Limnology and Oceanography 36, 922–935.
Parsons, T.R., Maita, Y., Lalli, C.M., 1984. A manual of chemical and biologicalmethods for seawater analysis. Pergamon Press, Oxford.
Piñones, A., Valle-Levinson, A., Narváez, D.A., Vargas, C.A., Navarrete, S.A., Yuras, G.,Castilla, J.C., 2005. Wind-induced diurnal variability in river plume motion.Estuarine Coastal and Shelf Science 65, 513–525.
Sánchez, G.E., Pantoja, S., Lange, C.B., González, H.E., Daneri, G., 2008. Seasonalchanges in particulate biogenic and lithogenic silica in the upwelling system offConcepción (36 S), Chile, and their relationship to fluctuations in marineproductivity and continental input. Continental Shelf Research 28, 2594–2600.
Silva, A., Palma, S., Oliveira, P.B., Moita, M.T., 2009. Composition and interannualvariability of phytoplankton in a coastal upwelling region (Lisbon Bay,Portugal). Journal of Sea Research 62, 238–249.
Sobarzo, M., Bravo, L., Donoso, D., Garcés-Vargas, J., Schneider, W., 2007a. Coastalupwelling and seasonal cycles that influence the water column over thecontinental shelf off central Chile. Progress in Oceanography 75, 363–382.
Sobarzo, M., Shearman, R.K., Lentz, S., 2007b. Near-inertial motions over thecontinental shelf off Concepción, central Chile. Progress in Oceanography 75,348–362.
Thomas, A., Strub, P.T., 2001. Cross-shelf phytoplankton pigment variability in theCalifornia Current. Continental Shelf Research 21, 1157–1190.
Thomas, A.C., Carr, M.E., Strub, P.T., 2001. Chlorophyll variability in easternboundary currents. Geophysical Research Letters 28, 3421–3424.
Tilstone, G.H., Figueiras, F.G., Lorenzo, L.M., Arbones, B., 2003. Phytoplanktoncomposition, photosynthesis and primary production during differenthydrographic conditions at the NW Iberian upwelling system. Marine EcologyProgress Series 252, 89–104.
Tiselius, P., 1989. Contribution of aloricate ciliates to the diet of Acartia clausi andCentropages hamatus in coastal waters. Marine Ecology Progress Series 56, 49–56.
Utermöhl, H., 1958. Zur vervollkommnung der quantitativen phytoplanktonmethodik. Mitteilungen Internationale Vereinigung Theorie AngewandteLimnologie 9, 1–38.
Varela, M., Del Rio, G., Alvarez-Ossorio, M.T., Costas, E., 1991. Factors controllingphytoplankton size class distribution in the upwelling area of the Galiciancontinental shelf (NW Spain). Scientia Marina 55, 505–518.
Vargas, C., Escribano, R., Poulet, S., 2006. Phytoplankton food quality determinestime windows for successful zooplankton reproductive pulses. Ecology 87,2992–2999.
Varela, M., Prego, R., Yolanda, P., Morono, A., 2005. Influence of upwelling and riverrunoff interaction on phytoplankton assemblages in a Middle Galician Ria andComparison with northern and southern rias (NW Iberian Peninsula). EstuarineCoastal and Shelf Science 64, 721–737.
Vargas, C., Martínez, R., Cuevas, L., Pavez, M., Cartes, C., González, H., Escribano, R.,Daneri, G., 2007. The relative importance of microbial and classical food webs ina highly productive coastal upwelling area. Limnology and Oceanography 54,1495–1510.
Vargas, C.A., Martínez, R.A., 2009. Grazing impact of natural populations of ciliatesand dinoflagellates in a river-influenced continental shelf. Aquatic MicrobialEcology 56, 93–108.
Verity, P.G., Robertson, C.Y., Tronzo, C.R., Andrews, M.G., Nelson, J.R., Sieracki, M.E.,1992. Relationships between cell volume and the carbon and nitrogen contentof marine photosynthetic nanoplankton. Limnology and Oceanography 37,1434–1446.
WEF, 1998. Standard Methods for the Examination of Water and Wastewater 20thEdition, Water Environmental Federation (WEF), 510 pp.
Weise, A.M., Levasseur, M., Saucier, F.J., Senneville, S., Bonneau, E., Roy, S., Sauvé, G.,Michaud, S., Fauchot, J., 2002. The link between precipitation, river runoff, andblooms of the toxic dinoflagellate Alexandrium tamarense in the St. Lawrence.Canadian Journal of Fisheries and Aquatic Science 59, 464–473.
nkton carbon biomass in a river-influenced upwelling area off Concepción,