Coastal upwelling process on a continental shelf limited by submarine canyons, Concepción, central...
20
Coastal upwelling process on a continental shelf limited by submarine canyons, Concepcio ´n, central Chile Marcus Sobarzo Department of Oceanography, University of Concepcio ´n, Concepcio ´n, Chile Leif Djurfeldt Department of Oceanography, Earth Sciences Center, Go ¨teborg University, Go ¨teborg, Sweden Received 26 February 2004; revised 29 July 2004; accepted 6 October 2004; published 9 December 2004. [1] The subinertial flow on the continental shelf off Concepcio ´n (central Chile) and its relation with the local wind-forcing and the topography are studied. Emphasis is placed on the three-dimensional aspects and the effect of the topography on the classical two- dimensional approach to the coastal upwelling. Time series coming from 18 current meters installed on six moorings during March–April 1994 were analyzed. Hydrographic data were collected during two hydrographic cruises (6–7 March and 30–31 March). Complementary information includes wind data and sea level. Empirical orthogonal functions using all series showed two principal subinertial flow patterns. The first mode corresponds to an alongshore flow responding to the intensification of southwesterly wind on a 3- to 10-day scale. The second mode is dominated by the cross-shore fluctuations at the shelf break. The importance of the local wind-forcing appears clearly when comparing the theoretical and observed Ekman transport in the north and central shelf (R = 0.8). Near the bottom a mean southward flow was found with a clear southward intensification induced by the bathymetry and probably by a meridional pressure gradient. This bottom flow modifies the typical coastal upwelling pattern through an offshore Ekman transport in the surface and bottom layers. This implies that the compensation flow for the coastal divergence comes from intermediate waters that arrive onto the shelf through ageostrophic process related with the submarine canyons located toward the north and south of the shelf. INDEX TERMS: 4219 Oceanography: General: Continental shelf processes; 4279 Oceanography: General: Upwelling and convergences; 4572 Oceanography: Physical: Upper ocean processes; KEYWORDS: coastal upwelling, local wind-forcing, submarine canyons Citation: Sobarzo, M., and L. Djurfeldt (2004), Coastal upwelling process on a continental shelf limited by submarine canyons, Concepcio ´n, central Chile, J. Geophys. Res., 109, C12012, doi:10.1029/2004JC002350. 1. Introduction [2] The Chile-Peru Current, one of the four major Eastern Boundary Currents (EBC) of the world ocean, flows to the north along the western South American coast. The trans- port of cold sub-Antarctic water to the north causes a negative zonal temperature anomaly. During the austral summer the wind regime is dominated by the large sub- tropic high of the South Pacific causing an equatorward wind component along the coast. The wind-forced offshore Ekman transport causes upwelling at the coast, increasing the negative anomaly. The cross-shore air pressure gradient is further enhanced by the differential heating between ocean and land that leads the sea-breeze process, which increases the upwelling-favorable wind. A poleward under- current carrying subequatorial water is a persistent feature having its core at about 150 m depth [Strub et al., 1998]. [3] This physical setting is associated with areas of very high biological productivity (Chile-Peru Upwelling Systems, CPUS) that accounts for nearly 15% of the 80 million tons of fishing estimated worldwide [Hill et al., 1998]. One of the major areas of coastal upwelling in this system is located between Punta Nugurne (35°57 0 S; 72°47 0 W) and Punta Lavapie (37°15 0 S; 73°36W). The economic importance of this zone has been recognized [Wooster and Reid, 1963; Brandhorst, 1971; Peterson et al., 1988; Ahumada, 1989; Ca ´ceres and Arcos, 1991; Strub et al., 1998], having a great impact on the pelagic fisheries. Different from the rest of the CPUS, this region presents two important features, namely, the upwelling-favorable wind is more intense, with a clear seasonal influence during the spring and summer time [Figueroa and Moffat, 2000], and the upwelling process is developed in an area of a complex bathymetry characterized by a wide continental shelf limited by two submarine canyons (Figure 1). 1.1. Submarine Topography and Coastal Upwelling [4] A great part of the theoretical and observational work carried out during the last 2 decades has been related with subinertial flows on continental shelves with relatively large JOURNAL OF GEOPHYSICAL RESEARCH, VOL. 109, C12012, doi:10.1029/2004JC002350, 2004 Copyright 2004 by the American Geophysical Union. 0148-0227/04/2004JC002350$09.00 C12012 1 of 20
Transcript of Coastal upwelling process on a continental shelf limited by submarine canyons, Concepción, central...

Coastal upwelling process on a continental shelf limited by submarine
canyons, Concepcion, central Chile
Marcus SobarzoDepartment of Oceanography, University of Concepcion, Concepcion, Chile
Leif DjurfeldtDepartment of Oceanography, Earth Sciences Center, Goteborg University, Goteborg, Sweden
Received 26 February 2004; revised 29 July 2004; accepted 6 October 2004; published 9 December 2004.
[1] The subinertial flow on the continental shelf off Concepcion (central Chile) and itsrelation with the local wind-forcing and the topography are studied. Emphasis is placed onthe three-dimensional aspects and the effect of the topography on the classical two-dimensional approach to the coastal upwelling. Time series coming from 18 current metersinstalled on six moorings during March–April 1994 were analyzed. Hydrographic datawere collected during two hydrographic cruises (6–7 March and 30–31 March).Complementary information includes wind data and sea level. Empirical orthogonalfunctions using all series showed two principal subinertial flow patterns. The firstmode corresponds to an alongshore flow responding to the intensification of southwesterlywind on a 3- to 10-day scale. The second mode is dominated by the cross-shorefluctuations at the shelf break. The importance of the local wind-forcing appearsclearly when comparing the theoretical and observed Ekman transport in the north andcentral shelf (R = 0.8). Near the bottom a mean southward flow was found with a clearsouthward intensification induced by the bathymetry and probably by a meridionalpressure gradient. This bottom flow modifies the typical coastal upwelling pattern throughan offshore Ekman transport in the surface and bottom layers. This implies that thecompensation flow for the coastal divergence comes from intermediate waters that arriveonto the shelf through ageostrophic process related with the submarine canyons locatedtoward the north and south of the shelf. INDEX TERMS: 4219 Oceanography: General:
Continental shelf processes; 4279 Oceanography: General: Upwelling and convergences; 4572 Oceanography:
Physical: Upper ocean processes; KEYWORDS: coastal upwelling, local wind-forcing, submarine canyons
Citation: Sobarzo, M., and L. Djurfeldt (2004), Coastal upwelling process on a continental shelf limited by submarine canyons,
Concepcion, central Chile, J. Geophys. Res., 109, C12012, doi:10.1029/2004JC002350.
1. Introduction
[2] The Chile-Peru Current, one of the four major EasternBoundary Currents (EBC) of the world ocean, flows to thenorth along the western South American coast. The trans-port of cold sub-Antarctic water to the north causes anegative zonal temperature anomaly. During the australsummer the wind regime is dominated by the large sub-tropic high of the South Pacific causing an equatorwardwind component along the coast. The wind-forced offshoreEkman transport causes upwelling at the coast, increasingthe negative anomaly. The cross-shore air pressure gradientis further enhanced by the differential heating betweenocean and land that leads the sea-breeze process, whichincreases the upwelling-favorable wind. A poleward under-current carrying subequatorial water is a persistent featurehaving its core at about 150 m depth [Strub et al., 1998].[3] This physical setting is associated with areas of
very high biological productivity (Chile-Peru Upwelling
Systems, CPUS) that accounts for nearly 15% of the80 million tons of fishing estimated worldwide [Hill etal., 1998]. One of the major areas of coastal upwelling inthis system is located between Punta Nugurne (35�570S;72�470W) and Punta Lavapie (37�150S; 73�36W). Theeconomic importance of this zone has been recognized[Wooster and Reid, 1963; Brandhorst, 1971; Peterson etal., 1988; Ahumada, 1989; Caceres and Arcos, 1991; Strubet al., 1998], having a great impact on the pelagic fisheries.Different from the rest of the CPUS, this region presentstwo important features, namely, the upwelling-favorablewind is more intense, with a clear seasonal influence duringthe spring and summer time [Figueroa and Moffat, 2000],and the upwelling process is developed in an area of acomplex bathymetry characterized by a wide continentalshelf limited by two submarine canyons (Figure 1).
1.1. Submarine Topography and Coastal Upwelling
[4] A great part of the theoretical and observational workcarried out during the last 2 decades has been related withsubinertial flows on continental shelves with relatively large
JOURNAL OF GEOPHYSICAL RESEARCH, VOL. 109, C12012, doi:10.1029/2004JC002350, 2004
Copyright 2004 by the American Geophysical Union.0148-0227/04/2004JC002350$09.00
C12012 1 of 20

along-shelf scales compared with its width. However, theeffects of complex coastal features such as capes, wideshelves, and submarine canyons, which have along-shelfscales that are comparable to or even smaller than cross-shelf scales, are less understood [Trowbridge et al., 1998].Even more, there has been the tendency to avoid submarinecanyons in modeling studies of continental shelves [Klinck,1996]. However, these topographical features, in particularsubmarine canyons, can modify the local circulation signif-icantly, differing from the classical theory [Klinck, 1989;Huthnance, 1995; Allen, 1996; Hickey, 1997; Sobarzo et al.,2001; Mesias et al., 2001, 2003]. Thus, although theclassical two-dimensional theory of coastal upwelling iswell understood [Hill et al., 1998], the influence of ashallow continental shelf and an irregular submarine topog-raphy on the coastal upwelling process is not so clear.
[5] The aim of this study is to characterize the physicaldevelopment of the coastal upwelling process off Concep-cion (Chile) and its relation to local wind-forcing and thetopographic control of the subinertial flow. We have orga-nized the results in the following way: (1) descriptiveanalysis of the wind, sea level and subinertial currents;(2) empirical orthogonal decomposition for the vertical andhorizontal cases; (3) temporal and spatial variations in thesubinertial thermal field; (4) discussion of some componentsof the coastal upwelling on this shelf; and (5) summary ofthe importance of wind and topographical features on thispeculiar coastal upwelling system.
1.2. Study Area
[6] The continental shelf in front of Concepcion islocated between the Bio-bio River Submarine Canyon
Figure 1. Study area showing the locations of the moorings, tide gauge, and the hydrographic andmeteorological stations. Thioploca Cruise, March 1994. The C-line shows, in this study, the alongshoredirection (18�N).
C12012 SOBARZO AND DJURFELDT: COASTAL UPWELLING AND SUBMARINE CANYONS
2 of 20
C12012
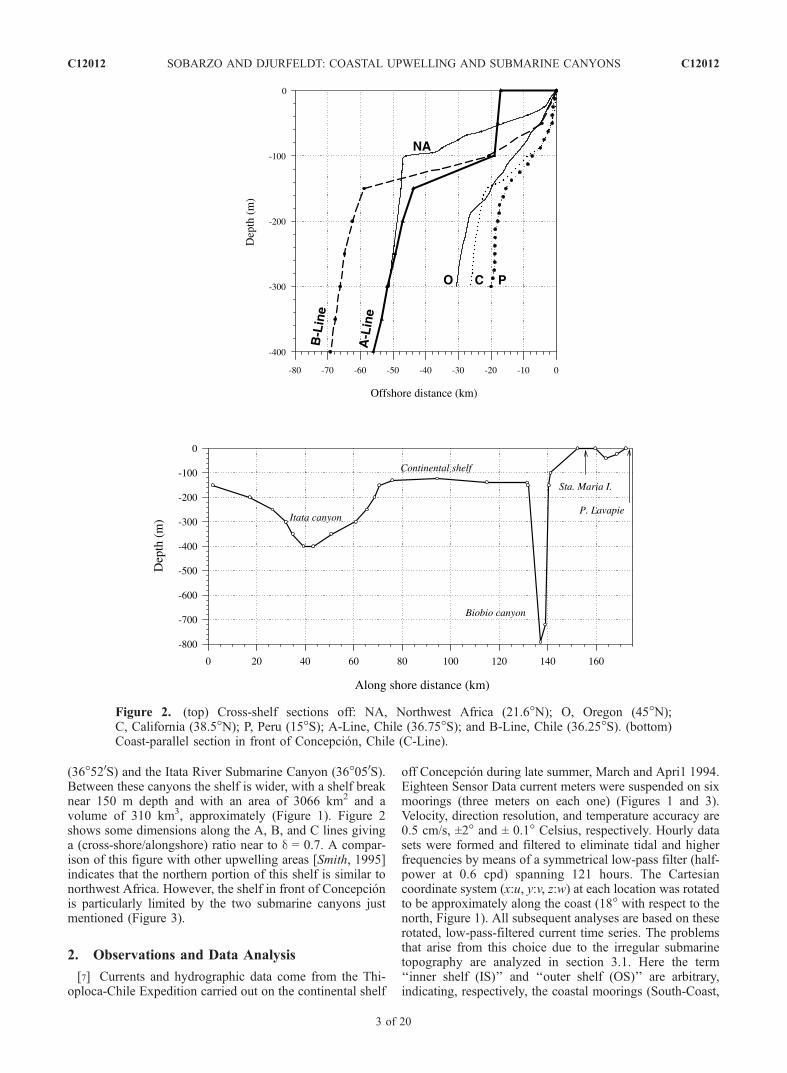
(36�520S) and the Itata River Submarine Canyon (36�050S).Between these canyons the shelf is wider, with a shelf breaknear 150 m depth and with an area of 3066 km2 and avolume of 310 km3, approximately (Figure 1). Figure 2shows some dimensions along the A, B, and C lines givinga (cross-shore/alongshore) ratio near to d = 0.7. A compar-ison of this figure with other upwelling areas [Smith, 1995]indicates that the northern portion of this shelf is similar tonorthwest Africa. However, the shelf in front of Concepcionis particularly limited by the two submarine canyons justmentioned (Figure 3).
2. Observations and Data Analysis
[7] Currents and hydrographic data come from the Thi-oploca-Chile Expedition carried out on the continental shelf
off Concepcion during late summer, March and Apri1 1994.Eighteen Sensor Data current meters were suspended on sixmoorings (three meters on each one) (Figures 1 and 3).Velocity, direction resolution, and temperature accuracy are0.5 cm/s, ±2� and ± 0.1� Celsius, respectively. Hourly datasets were formed and filtered to eliminate tidal and higherfrequencies by means of a symmetrical low-pass filter (half-power at 0.6 cpd) spanning 121 hours. The Cartesiancoordinate system (x:u, y:v, z:w) at each location was rotatedto be approximately along the coast (18� with respect to thenorth, Figure 1). All subsequent analyses are based on theserotated, low-pass-filtered current time series. The problemsthat arise from this choice due to the irregular submarinetopography are analyzed in section 3.1. Here the term‘‘inner shelf (IS)’’ and ‘‘outer shelf (OS)’’ are arbitrary,indicating, respectively, the coastal moorings (South-Coast,
Figure 2. (top) Cross-shelf sections off: NA, Northwest Africa (21.6�N); O, Oregon (45�N);C, California (38.5�N); P, Peru (15�S); A-Line, Chile (36.75�S); and B-Line, Chile (36.25�S). (bottom)Coast-parallel section in front of Concepcion, Chile (C-Line).
C12012 SOBARZO AND DJURFELDT: COASTAL UPWELLING AND SUBMARINE CANYONS
3 of 20
C12012

Center-Coast, and North-Coast) and the ocean moorings(South-Ocean, Center-Ocean, and North-Ocean).[8] The hydrographic data come from two cruises carried
out during 7–8 March (Hydrographic Cruise 1, HC-1) and30–31 March (Hydrographic Cruise 2, HC-2) on board RVAbate Molina (Figure 1). At each station, temperature andsalinity profiles were obtained using a Seabird Seacat SBE19-02 CTD with a sample frequency of 30 samples/second.Wind velocity and sea level were measured in PuntaHualpen and Talcahuano Port (Figure 1). Sea level wasadjusted for the ‘‘inverted barometer effect.’’ Wind stresswas computed according to Smith [1980]. Hourly wind andadjusted sea level (ASL) data were filtered in the same wayas the current data to remove diurnal and shorter periods.Wind components were calculated using the same orienta-tion as was used for the current data.[9] For each current meter the principal axis, along which
the variance in the subinertial fluctuations is maximized,was calculated [Kundu and Allen, 1976]. For each mooringthe vertical structure of the fluctuations was described bymeans of empirical orthogonal modes [Kundu et al., 1975].Means for each current meter were removed before theeigenvectors were computed and the components werenormalized by the standard deviation of each mode [Huyeret al., 1978]. The length of the time series analyzed was18.6 days and did not include the meters at 50 m depth onthe Center-Coast and Center-Ocean moorings and at 10 mdepth on the South-Ocean mooring because these timeseries are shorter.[10] The complete structure of the subinertial flow was
analyzed with the same methodology but using the onshoreand alongshore components from each meter as if they werescalar time series; that is, we computed the ‘‘overall’’empirical orthogonal modes for 36 time series. Two caseswere studied depending on the time series lengths assumingthat oscillations are in phase at all locations. Case 1(12.4 days) focuses on the spatial variability and includes17 of the 18 installed meters (the meter at 50 m depth
of the Center-Coast mooring is not analyzed). Case 2(18.6 days) focuses on the temporal variability considering15 of the 18 meters (like the vertical EOF analysis).
3. Results
3.1. Wind, Sea Level, and Subinertial CurrentsFluctuations
[11] Over the inner shelf (IS), the alongshore subinertialflow appears dominated by a 3- to 10-day oscillation,particularly in the south, where the mean flow is south-ward increasing with depth, especially during maximumflow (Figure 4f). At the North-Coast and North-Oceanmoorings, the oscillation amplitude in midwater andbottom is smaller than 5 cm/s. Over the outer shelf(OS), the Center-Ocean mooring shows an intense north-ward surface flow (>20 cm/s) and a southward bottomflow. Only the South-Ocean mooring (Figure 4e), inparticular at 50 m depth, shows different oscillations ofsmaller period (2 to 5 days).[12] The alongshore wind is correlated with 3- to 10-day
current oscillation along the IS (Figure 4g, thick line) and isout of phase with respect to the ASL (Figure 4g, dottedline). Southwesterly wind drives northward currents in thecenter and north of the shelf and not so much at the South-Coast mooring. During northerly wind conditions thealongshore surface flow weakens (Center-Coast, North-Coast and North-Ocean) and the southward bottom flowis intensified, especially at the South-Coast mooring. Thesouthward flow also is related with a high-ASL at the coast(Figure 4g, dotted line) that could be consistent with abarotropic flow in geostrophic balance in front of PuntaHualpen (Figure 4f).[13] In the IS, the amplitudes of the cross-shore surface
current (10 m) increase northward (Figure 5). These cur-rents (<8 cm/s) contrast with the stronger cross-shorecurrents at the OS, especially at the Center-Ocean andSouth-Ocean moorings (Figures 5c and 5e).
Figure 3. Three-dimensional view of the continental shelf off Concepcion (Chile) and the associatedsubmarine canyons. Vertical bars indicate the locations of current meter moorings.
C12012 SOBARZO AND DJURFELDT: COASTAL UPWELLING AND SUBMARINE CANYONS
4 of 20
C12012
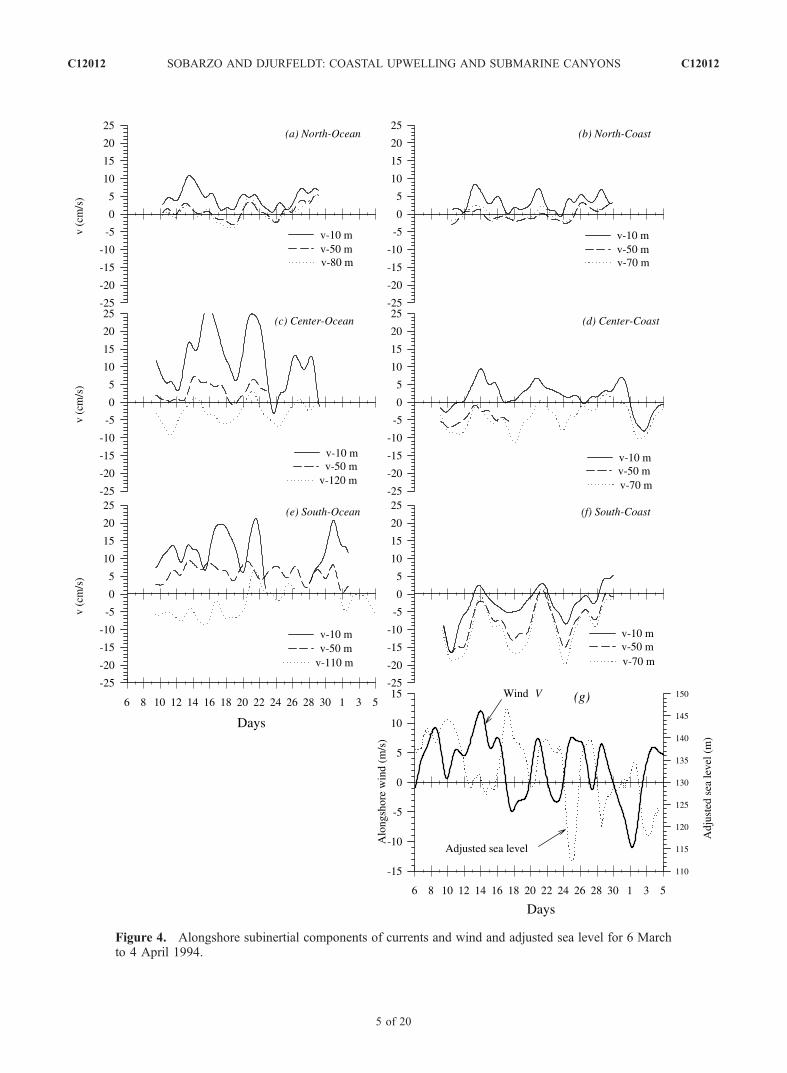
Figure 4. Alongshore subinertial components of currents and wind and adjusted sea level for 6 Marchto 4 April 1994.
C12012 SOBARZO AND DJURFELDT: COASTAL UPWELLING AND SUBMARINE CANYONS
5 of 20
C12012

Figure 5. Cross-shore subinertial components of currents and wind and adjusted sea level for 6 Marchto 4 April 1994.
C12012 SOBARZO AND DJURFELDT: COASTAL UPWELLING AND SUBMARINE CANYONS
6 of 20
C12012

[14] Owing to the topographic steering over the IS, thealongshore fluctuations (vSD) are larger than the cross-shorefluctuations at all meters, with exception of the North-Coastmooring at 10 m depth (Table 1). Eddy kinetic energydefined by Ke = 1=2(u
02 + v02), with u0 = u � �u and v0 = v � .,decreases with depth at the South-Ocean, Center-Oceanand North-Coast moorings. The South-Coast mooring isthe exception, increasing Ke with depth. Strong differencesbetween the Center-Ocean mooring (Ke: 63.6 cm2/s2)and the North-Ocean and North-Coast moorings (Ke: <7.7 cm2/s2) were found.[15] At 10 m depth, the mean flow is northward, except at
the South-Coast mooring (Figure 6a). Over the IS, thesurface major principal axes (MPA) is larger than the mean
flow at the Center-Coast and South-Coast moorings. At theOS the northward surface mean flow is more intense thanthe fluctuations, which are almost cross to the shelf break inthe center and south. At 50 m depth, the fluctuations aresmaller than the mean flow in the center and south of the ISand they tend to be aligned with the coast, with a southwardmean flow (Figure 6b). Over the OS, the mean flow isnorthward with the MPA almost perpendicular to the shelfbreak and to the mean flow. Over the IS the bottom levelshows a mean flow and MPA aligned with the coast andwith a mean flow intensified southward with greater valuesof variance explained (Figure 6c). The center and south ofthe OS at 10 and 50 m depth show smaller values ofvariance explained indicating more dispersed currents. This
Table 1. Descriptive Statistics of Subinertial Currents and Temperatures on the Continental Shelf off Concepcion, March 1994a
Mooring Depth, mNumber ofData Points
u Crossshore, cm/s
v Alongshore, cm/s T , �C TSD, �C uSD, cm/s vSD, cm/s Ke, cm2/s2 MPA
MeanFlow
South-Coast 10 493 0.9 �3.0 11.9 0.43 1.20 4.66 11.5 26 18150 494 1.1 �7.8 11.4 0.08 0.93 4.83 12.1 11 19070 497 1.6 �9.7 11.5 0.07 1.09 6.08 19.0 10 189
South-Ocean 10 542 4.8 13.0 13.7 1.14 4.80 4.30 20.5 66 3850 561 �1.0 5.9 11.1 0.25 4.60 2.13 12.8 108 9110 335 3.0 �3.2 11.3 0.15 3.26 3.84 12.6 163 155
Center-Coast 10 671 �1.2 1.6 13.3 0.49 2.20 3.70 9.2 172 34150 198 0.3 �4.3 11.3 0.02 0.90 1.80 2.1 42 19470 670 �0.2 �4.2 11.6 0.09 1.00 3.40 6.4 26 201
Center-Ocean 10 475 �9.7 12.0 13.9 0.69 8.20 7.70 63.6 128 33950 322 �3.6 3.1 11.4 0.16 3.50 2.40 9.0 42 328120 475 �1.5 �3.0 11.1 0.08 1.91 2.95 6.2 22 225
North-Coast 10 465 �1.7 3.4 14.2 0.51 2.82 2.18 6.4 143 35150 467 �0.4 �0.3 11.5 0.03 1.16 1.61 2.0 24 25070 465 �0.2 0.1 11.7 0.02 0.60 1.63 1.5 15 323
North-Ocean 10 452 �1.8 4.5 14.1 0.49 2.99 2.54 7.7 152 35750 453 0.8 0.8 11.3 0.12 1.44 2.04 3.1 173 6380 452 1.4 0.4 11.6 0.02 1.92 2.33 4.5 159 93
aThe major principal axes (MPA) and the mean flow direction are oriented with respect to geographical north. Meters located at 50 m depth in the Center-Coast and Center-Ocean moorings had mechanical faults during this sampling period and so the time series are shorter.
Figure 6. Major principal axes (squares) and mean flows (arrows) at 10 m, 50 m, and bottom depths.The variance percent of the major axes are included. March and April 1994.
C12012 SOBARZO AND DJURFELDT: COASTAL UPWELLING AND SUBMARINE CANYONS
7 of 20
C12012
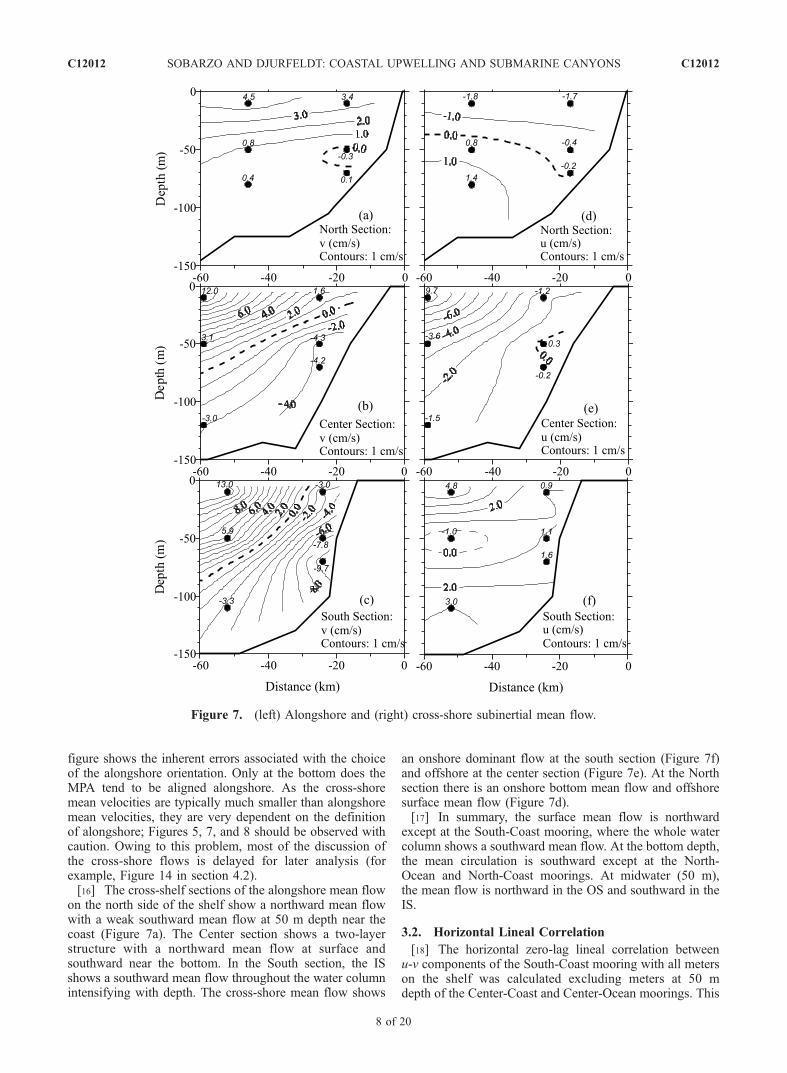
figure shows the inherent errors associated with the choiceof the alongshore orientation. Only at the bottom does theMPA tend to be aligned alongshore. As the cross-shoremean velocities are typically much smaller than alongshoremean velocities, they are very dependent on the definitionof alongshore; Figures 5, 7, and 8 should be observed withcaution. Owing to this problem, most of the discussion ofthe cross-shore flows is delayed for later analysis (forexample, Figure 14 in section 4.2).[16] The cross-shelf sections of the alongshore mean flow
on the north side of the shelf show a northward mean flowwith a weak southward mean flow at 50 m depth near thecoast (Figure 7a). The Center section shows a two-layerstructure with a northward mean flow at surface andsouthward near the bottom. In the South section, the ISshows a southward mean flow throughout the water columnintensifying with depth. The cross-shore mean flow shows
an onshore dominant flow at the south section (Figure 7f)and offshore at the center section (Figure 7e). At the Northsection there is an onshore bottom mean flow and offshoresurface mean flow (Figure 7d).[17] In summary, the surface mean flow is northward
except at the South-Coast mooring, where the whole watercolumn shows a southward mean flow. At the bottom depth,the mean circulation is southward except at the North-Ocean and North-Coast moorings. At midwater (50 m),the mean flow is northward in the OS and southward in theIS.
3.2. Horizontal Lineal Correlation
[18] The horizontal zero-lag lineal correlation betweenu-v components of the South-Coast mooring with all meterson the shelf was calculated excluding meters at 50 mdepth of the Center-Coast and Center-Ocean moorings. This
Figure 7. (left) Alongshore and (right) cross-shore subinertial mean flow.
C12012 SOBARZO AND DJURFELDT: COASTAL UPWELLING AND SUBMARINE CANYONS
8 of 20
C12012
correlation is not totally horizontal at the bottom because, atthis level, the meters of the IS and OS are at differentdepths. A similar analysis was made using the North-Oceanmooring.[19] The alongshore v-component of the South-Coast
mooring is well correlated with the IS moorings at 70 mdepth, while at 50 m depth, there is not a significantcorrelation. Near the bottom, there is a remarkably strongcorrelation (0.92) between the South-Coast and the Center-Ocean moorings and a lack of correlation between the
South-Coast and South-Ocean moorings. The u-componentof the South-Coast mooring is not correlated with the othermoorings.[20] Differently, the u-component of the North-Ocean
mooring shows a strong horizontal correlation with theNorth-Coast (0.87) and Center-Coast (0.76) moorings at10 m depth. This indicates a high coherence in the cross-shore surface flow between the north (ocean and coast) andcenter of the IS. At 50 and 70 m depths this correlation isnot observed. The v-component at 10 m depth of the North-
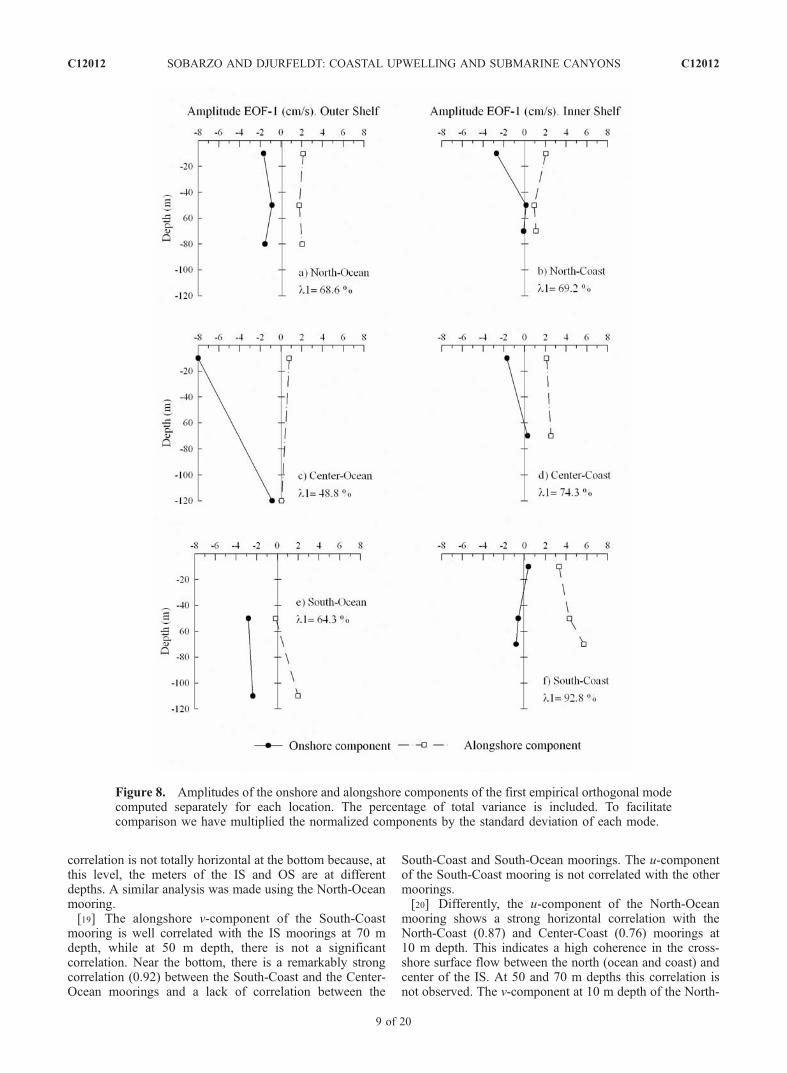
Figure 8. Amplitudes of the onshore and alongshore components of the first empirical orthogonal modecomputed separately for each location. The percentage of total variance is included. To facilitatecomparison we have multiplied the normalized components by the standard deviation of each mode.
C12012 SOBARZO AND DJURFELDT: COASTAL UPWELLING AND SUBMARINE CANYONS
9 of 20
C12012

Ocean mooring is well correlated with the three moorings ofthe IS but not with the center and south part of the OS. Nearthe bottom this component is correlated with all mooringsexcept the South-Ocean.[21] Other correlations in both components indicate that
the South-Ocean mooring, at 50 m and 110 m depths, doesnot have a significant horizontal correlation with the cur-rents at the other moorings. The v-component at 120 mdepth at the Center-Ocean mooring shows an interestingcorrelation with the bottom level at the South-Coast: 0.92;Center-Coast: 0.83; North-Coast: 0.76; and North-Oceanmooring: 0.61. Thus the horizontal structure of the along-shore bottom flow (except at the South-Ocean mooring) ishighly correlated and modulated by an oscillation of periodO(3–10 days). The cross-shore bottom flow is notcorrelated, indicating different space scales for the u-vcomponents.[22] Correlation between u-v components for each current
meter are significantly different from zero at 95% only incases South-Coast (50 and 70 m depth), North-Coast (10 m),and North-Ocean (50 and 80 m). In the other cases,especially at the South-Ocean and Center-Ocean moorings,correlation between alongshore and cross-shore componentare not significantly different from zero.
3.3. Empirical Orthogonal Decomposition: VerticalStructure of Currents
[23] On the IS the percentage of variance explained by theFirst Vertical Mode increases southward (Figures 8b, 8d,and 8f) from 69.2% to 92.8%. The alongshore fluctuationsshow a similar structure which is intensified southward andwith depth, especially at the South-Coast mooring. Thiswould correspond to a quasi-barotropic structure [Huyer etal., 1978], where the v-component has the same signthrough the water column, but with a dependence on depth.The u-component on the IS tends to be baroclinic, and it is,in general, smaller and less coherent between the north andsouth. At the surface this component changes from positivevalues at the South-Coast mooring to negative values at theNorth-Coast mooring. On the OS, this mode has smallerpercentage of variance explained than the IS (Figures 8a, 8c,and 8e). The alongshore fluctuations are not intensifiedsouthward, being barotropic in the north and baroclinicsouthward. The cross-shore fluctuations are bigger than inthe IS and maximum at the Center-Ocean mooring.
[24] On the IS, the Second Vertical Mode (not shown)explains less than 17% of the variance. The percentage ofvariance explained increases northward. At the Center-Ocean mooring the percentage of variance of this mode is46.4% with an intense alongshore component.[25] On the IS, the amplitudes of the First Mode show a
good correlation with the alongshore wind (Table 2). In theOS this correlation is strong only with the North-Oceanmooring. Correlation between the alongshore wind andASL with the Second Vertical Mode were not significant.The First Vertical Mode has a high cross-correlation in theIS with a southward propagation speed of 94 km/day.
3.4. Empirical Orthogonal Decomposition: OffshoreStructure
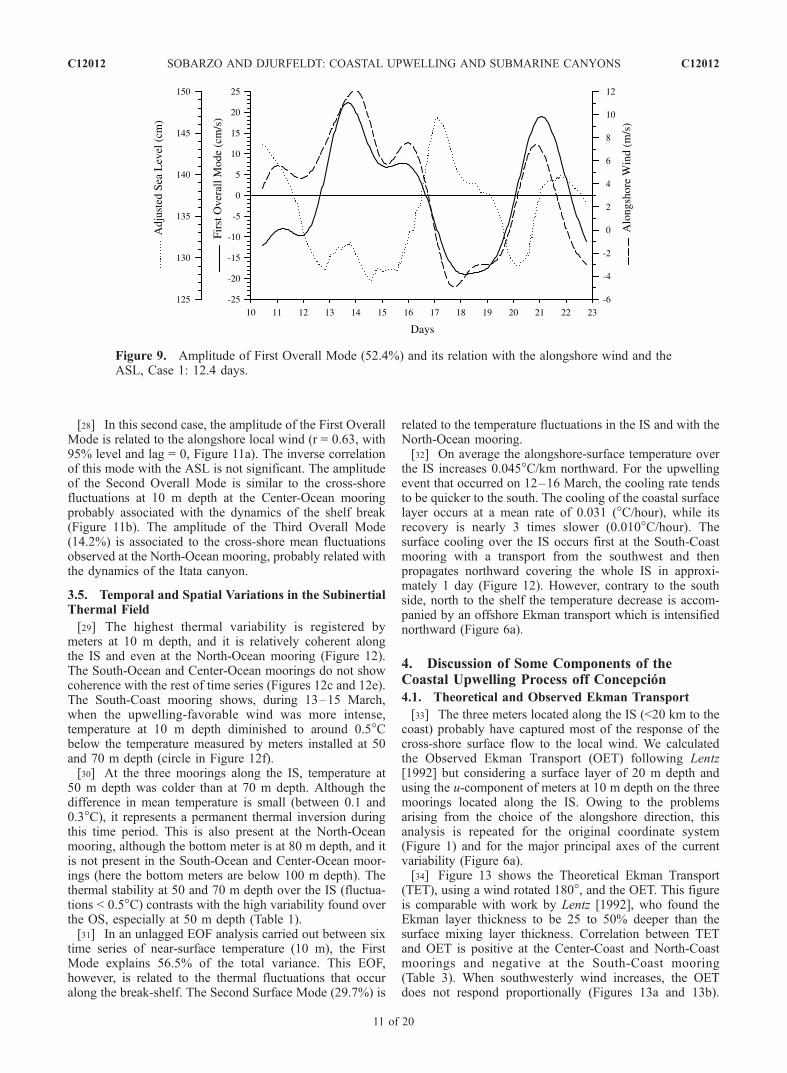
3.4.1. Case 1: Time Series of 12.4 Days, Without Lags[26] In this case, the First Overall Mode (52.4%) appears
related with the alongshore flow on the shelf (IS and northand central side of the OS) and with the cross-shore surfaceflow (10 m) at the central and north side of the shelf. Thismode is highly correlated with the alongshore local wind(maximum correlation = 0.97; lag = 0, Figure 9) and alsomaintains a high inverse correlation with the ASL (maxi-mum correlation = �0.82; lag = 19 hours, with the sea levelvariation preceding the wind).3.4.2. Case 2: Time Series of 18.6 Days, Without Lags[27] With a longer time series the First Overall Mode
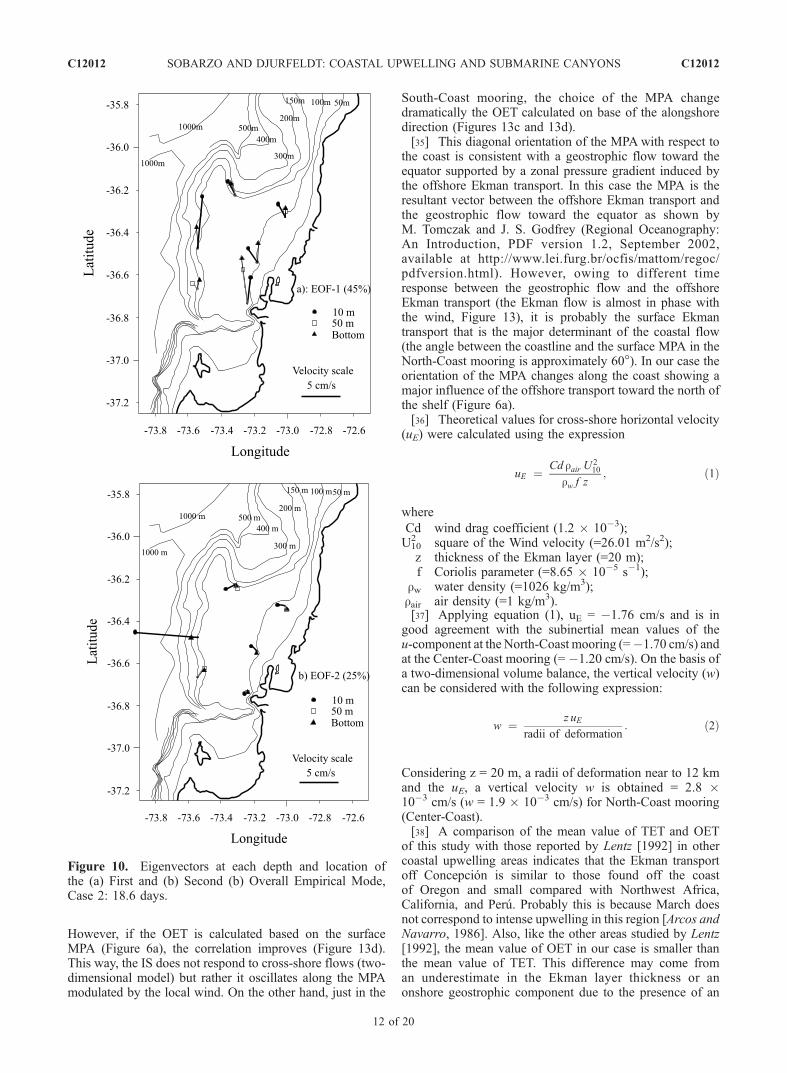
explains 45% of total variance, and its eigenvectors, mul-tiplied by the square root of the eigenvalue, are plotted asvectors at each depth and location (Figure 10a). This modetends to be barotropic and represents the portion of thefluctuations which are coherent and in phase across theentire shelf. In the south of the IS, near-surface fluctuations(circles) are guided alongshore, while in the north they areguided approximately cross-shore, consistent with theresponse of the Ekman surface layer to the local wind-forcing. The bottom meters over the IS present fluctuationapproximately aligned alongshore (triangles) and that in-crease their intensity southward. The fluctuations in theNorth-Ocean mooring show the influence of the Itatacanyon. Figure 10b shows the Second Overall Mode(25.0% of the total variance). Contrary to the alongshoretendency in mode 1, this mode tends to be cross-shore witha very high influence of currents fluctuations at 10 m depthat the Center-Ocean mooring.
Table 2. Correlation Between First Vertical Mode and Alongshore Wind and ASLa
Mooring Maximum Correlation Lag, Hours Unlagged Correlation
Correlation EOF-1 Versus Alongshore WindInner shelf (IS) South-Coast 0.61b 11 0.49c
Outer shelf (OS) South-Ocean 0.19c 2 0.18c
Inner shelf (IS) Center-Coast 0.71 0 0.71Outer shelf (OS) Center-Ocean 0.33c 6 0.31c
Inner shelf (IS) North-Coast 0.93 0 0.93Outer shelf (OS) North-Ocean 0.83 0 0.83
Correlation EOF-1 Versus Adjusted Sea Level (ASL)Inner shelf (IS) South-Coast �0.41c 27 �0.05c
Inner shelf (IS) Center-Coast �0.52c 12 �0.42c
Inner shelf (IS) North-Coast �0.65b 12 �0.53c
aCorrelation coefficients without footnotes are significantly different from zero at the 99% level.bCorrelation coefficients significant at the 95% level.cCorrelation coefficients not significant at the 95% level.
C12012 SOBARZO AND DJURFELDT: COASTAL UPWELLING AND SUBMARINE CANYONS
10 of 20
C12012
[28] In this second case, the amplitude of the First OverallMode is related to the alongshore local wind (r = 0.63, with95% level and lag = 0, Figure 11a). The inverse correlationof this mode with the ASL is not significant. The amplitudeof the Second Overall Mode is similar to the cross-shorefluctuations at 10 m depth at the Center-Ocean mooringprobably associated with the dynamics of the shelf break(Figure 11b). The amplitude of the Third Overall Mode(14.2%) is associated to the cross-shore mean fluctuationsobserved at the North-Ocean mooring, probably related withthe dynamics of the Itata canyon.
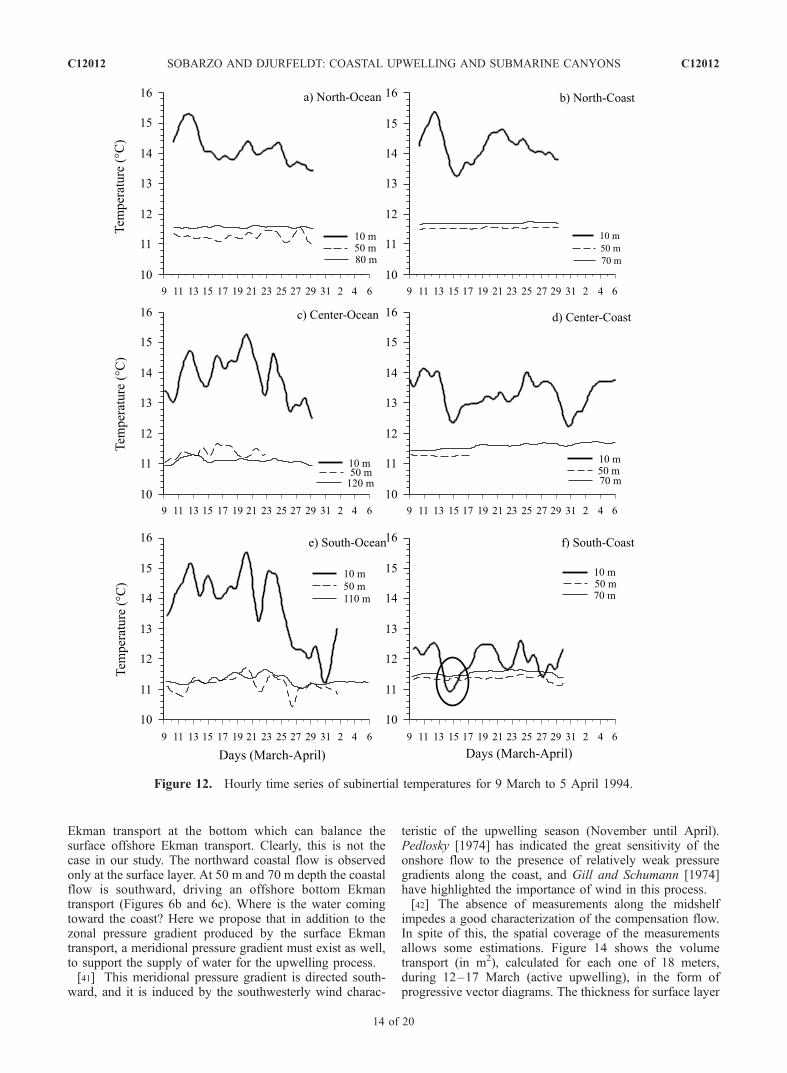
3.5. Temporal and Spatial Variations in the SubinertialThermal Field
[29] The highest thermal variability is registered bymeters at 10 m depth, and it is relatively coherent alongthe IS and even at the North-Ocean mooring (Figure 12).The South-Ocean and Center-Ocean moorings do not showcoherence with the rest of time series (Figures 12c and 12e).The South-Coast mooring shows, during 13–15 March,when the upwelling-favorable wind was more intense,temperature at 10 m depth diminished to around 0.5�Cbelow the temperature measured by meters installed at 50and 70 m depth (circle in Figure 12f).[30] At the three moorings along the IS, temperature at
50 m depth was colder than at 70 m depth. Although thedifference in mean temperature is small (between 0.1 and0.3�C), it represents a permanent thermal inversion duringthis time period. This is also present at the North-Oceanmooring, although the bottom meter is at 80 m depth, and itis not present in the South-Ocean and Center-Ocean moor-ings (here the bottom meters are below 100 m depth). Thethermal stability at 50 and 70 m depth over the IS (fluctua-tions < 0.5�C) contrasts with the high variability found overthe OS, especially at 50 m depth (Table 1).[31] In an unlagged EOF analysis carried out between six
time series of near-surface temperature (10 m), the FirstMode explains 56.5% of the total variance. This EOF,however, is related to the thermal fluctuations that occuralong the break-shelf. The Second Surface Mode (29.7%) is
related to the temperature fluctuations in the IS and with theNorth-Ocean mooring.[32] On average the alongshore-surface temperature over
the IS increases 0.045�C/km northward. For the upwellingevent that occurred on 12–16 March, the cooling rate tendsto be quicker to the south. The cooling of the coastal surfacelayer occurs at a mean rate of 0.031 (�C/hour), while itsrecovery is nearly 3 times slower (0.010�C/hour). Thesurface cooling over the IS occurs first at the South-Coastmooring with a transport from the southwest and thenpropagates northward covering the whole IS in approxi-mately 1 day (Figure 12). However, contrary to the southside, north to the shelf the temperature decrease is accom-panied by an offshore Ekman transport which is intensifiednorthward (Figure 6a).
4. Discussion of Some Components of theCoastal Upwelling Process off Concepcion
4.1. Theoretical and Observed Ekman Transport
[33] The three meters located along the IS (<20 km to thecoast) probably have captured most of the response of thecross-shore surface flow to the local wind. We calculatedthe Observed Ekman Transport (OET) following Lentz[1992] but considering a surface layer of 20 m depth andusing the u-component of meters at 10 m depth on the threemoorings located along the IS. Owing to the problemsarising from the choice of the alongshore direction, thisanalysis is repeated for the original coordinate system(Figure 1) and for the major principal axes of the currentvariability (Figure 6a).[34] Figure 13 shows the Theoretical Ekman Transport
(TET), using a wind rotated 180�, and the OET. This figureis comparable with work by Lentz [1992], who found theEkman layer thickness to be 25 to 50% deeper than thesurface mixing layer thickness. Correlation between TETand OET is positive at the Center-Coast and North-Coastmoorings and negative at the South-Coast mooring(Table 3). When southwesterly wind increases, the OETdoes not respond proportionally (Figures 13a and 13b).
Figure 9. Amplitude of First Overall Mode (52.4%) and its relation with the alongshore wind and theASL, Case 1: 12.4 days.
C12012 SOBARZO AND DJURFELDT: COASTAL UPWELLING AND SUBMARINE CANYONS
11 of 20
C12012
However, if the OET is calculated based on the surfaceMPA (Figure 6a), the correlation improves (Figure 13d).This way, the IS does not respond to cross-shore flows (two-dimensional model) but rather it oscillates along the MPAmodulated by the local wind. On the other hand, just in the
South-Coast mooring, the choice of the MPA changedramatically the OET calculated on base of the alongshoredirection (Figures 13c and 13d).[35] This diagonal orientation of the MPA with respect to
the coast is consistent with a geostrophic flow toward theequator supported by a zonal pressure gradient induced bythe offshore Ekman transport. In this case the MPA is theresultant vector between the offshore Ekman transport andthe geostrophic flow toward the equator as shown byM. Tomczak and J. S. Godfrey (Regional Oceanography:An Introduction, PDF version 1.2, September 2002,available at http://www.lei.furg.br/ocfis/mattom/regoc/pdfversion.html). However, owing to different timeresponse between the geostrophic flow and the offshoreEkman transport (the Ekman flow is almost in phase withthe wind, Figure 13), it is probably the surface Ekmantransport that is the major determinant of the coastal flow(the angle between the coastline and the surface MPA in theNorth-Coast mooring is approximately 60�). In our case theorientation of the MPA changes along the coast showing amajor influence of the offshore transport toward the north ofthe shelf (Figure 6a).[36] Theoretical values for cross-shore horizontal velocity
(uE) were calculated using the expression
uE ¼ Cd rair U210
rw f z; ð1Þ
where
Cd wind drag coefficient (1.2 � 10�3);U102 square of the Wind velocity (=26.01 m2/s2);z thickness of the Ekman layer (=20 m);f Coriolis parameter (=8.65 � 10�5 s�1);
rw water density (=1026 kg/m3);rair air density (=1 kg/m3).[37] Applying equation (1), uE = �1.76 cm/s and is in
good agreement with the subinertial mean values of theu-component at the North-Coast mooring (=�1.70 cm/s) andat the Center-Coast mooring (= �1.20 cm/s). On the basis ofa two-dimensional volume balance, the vertical velocity (w)can be considered with the following expression:
w ¼ z uE
radii of deformation: ð2Þ
Considering z = 20 m, a radii of deformation near to 12 kmand the uE, a vertical velocity w is obtained = 2.8 �10�3 cm/s (w = 1.9 � 10�3 cm/s) for North-Coast mooring(Center-Coast).[38] A comparison of the mean value of TET and OET
of this study with those reported by Lentz [1992] in othercoastal upwelling areas indicates that the Ekman transportoff Concepcion is similar to those found off the coastof Oregon and small compared with Northwest Africa,California, and Peru. Probably this is because March doesnot correspond to intense upwelling in this region [Arcos andNavarro, 1986]. Also, like the other areas studied by Lentz[1992], the mean value of OET in our case is smaller thanthe mean value of TET. This difference may come froman underestimate in the Ekman layer thickness or anonshore geostrophic component due to the presence of an
Figure 10. Eigenvectors at each depth and location ofthe (a) First and (b) Second (b) Overall Empirical Mode,Case 2: 18.6 days.
C12012 SOBARZO AND DJURFELDT: COASTAL UPWELLING AND SUBMARINE CANYONS
12 of 20
C12012

alongshore pressure gradient. In relation to the Ekman layer,the thickness of 20 m used seems to be a good valueconsidering that the surface mixing layer varied between 0and 20 m depth (with just two profiles of more thickness)and taking into account others’ measurements [Ahumada,1989]. This thickness may even overestimate the OET.[39] On the other hand, OET in front of Concepcion
shows, like the rest of the upwelling areas, except California1981 (Mooring C3) and Northwest Africa, a variability thatis larger than the mean value (Table 3). This variability,which decreases with the decrease of the mean value, is
because the coastal upwelling responds quickly to the windstress fluctuations in this area (period 3 to 10 days). Avariability larger than the mean value is also observed in thewind stress data.
4.2. Compensation Flow and the Coastal Cooling
[40] The mass balance required at the coastal divergencezone implies a compensatory onshore flow. In the simplestcase the northward along-shore wind drives a geostrophicflow toward the north which can extend to the bottom layer.The bottom stress on this flow can induce an onshore
Figure 11. (a) Amplitude of First Overall Mode (45%), and its relation with the alongshore wind andthe ASL for Case 2: 18.6 days. (b) Amplitude of Second Overall Mode (25%), and its relation with thecross-shore flow registered in the Center-Ocean mooring, Case 2: 18.6 days. (c) Amplitude of ThirdOverall Mode (14.2%), and its relation with the cross-shore mean flow registered in the North-Oceanmooring, Case 2: 18.6 days.
C12012 SOBARZO AND DJURFELDT: COASTAL UPWELLING AND SUBMARINE CANYONS
13 of 20
C12012
Ekman transport at the bottom which can balance thesurface offshore Ekman transport. Clearly, this is not thecase in our study. The northward coastal flow is observedonly at the surface layer. At 50 m and 70 m depth the coastalflow is southward, driving an offshore bottom Ekmantransport (Figures 6b and 6c). Where is the water comingtoward the coast? Here we propose that in addition to thezonal pressure gradient produced by the surface Ekmantransport, a meridional pressure gradient must exist as well,to support the supply of water for the upwelling process.[41] This meridional pressure gradient is directed south-
ward, and it is induced by the southwesterly wind charac-
teristic of the upwelling season (November until April).Pedlosky [1974] has indicated the great sensitivity of theonshore flow to the presence of relatively weak pressuregradients along the coast, and Gill and Schumann [1974]have highlighted the importance of wind in this process.[42] The absence of measurements along the midshelf
impedes a good characterization of the compensation flow.In spite of this, the spatial coverage of the measurementsallows some estimations. Figure 14 shows the volumetransport (in m2), calculated for each one of 18 meters,during 12–17 March (active upwelling), in the form ofprogressive vector diagrams. The thickness for surface layer
Figure 12. Hourly time series of subinertial temperatures for 9 March to 5 April 1994.
C12012 SOBARZO AND DJURFELDT: COASTAL UPWELLING AND SUBMARINE CANYONS
14 of 20
C12012
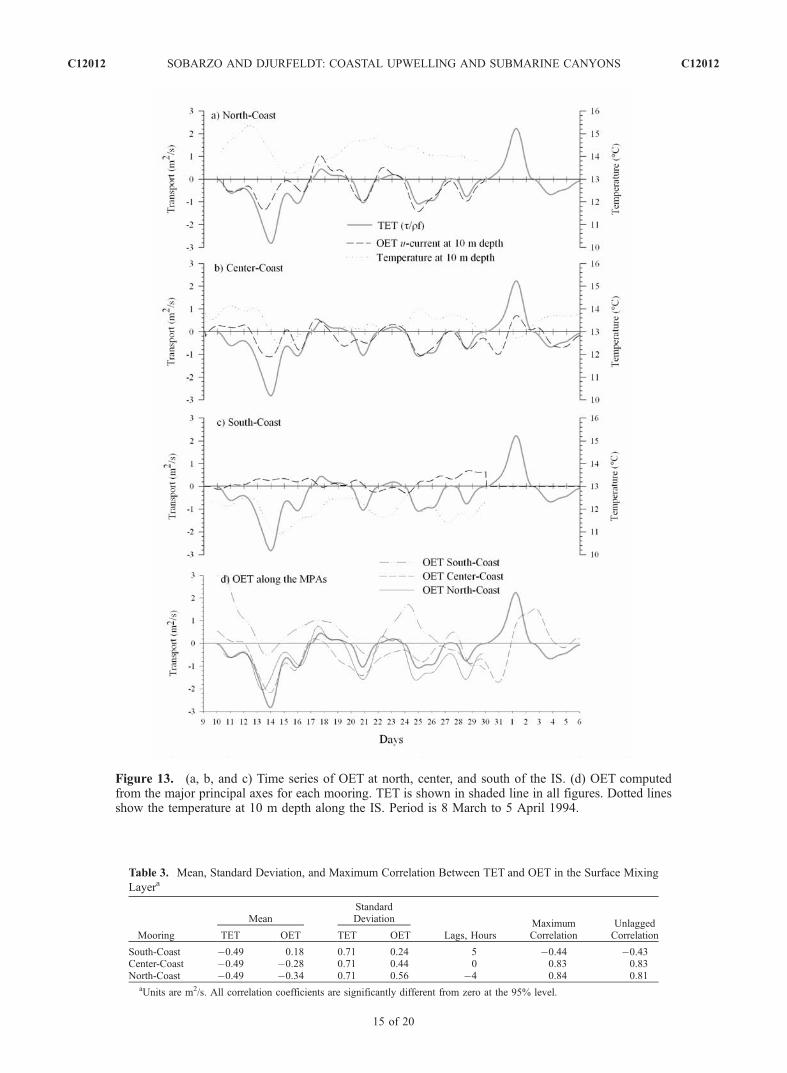
Figure 13. (a, b, and c) Time series of OET at north, center, and south of the IS. (d) OET computedfrom the major principal axes for each mooring. TET is shown in shaded line in all figures. Dotted linesshow the temperature at 10 m depth along the IS. Period is 8 March to 5 April 1994.
Table 3. Mean, Standard Deviation, and Maximum Correlation Between TET and OET in the Surface Mixing
Layera
Mooring
MeanStandardDeviation
Lags, HoursMaximumCorrelation
UnlaggedCorrelationTET OET TET OET
South-Coast �0.49 0.18 0.71 0.24 5 �0.44 �0.43Center-Coast �0.49 �0.28 0.71 0.44 0 0.83 0.83North-Coast �0.49 �0.34 0.71 0.56 �4 0.84 0.81
aUnits are m2/s. All correlation coefficients are significantly different from zero at the 95% level.
C12012 SOBARZO AND DJURFELDT: COASTAL UPWELLING AND SUBMARINE CANYONS
15 of 20
C12012
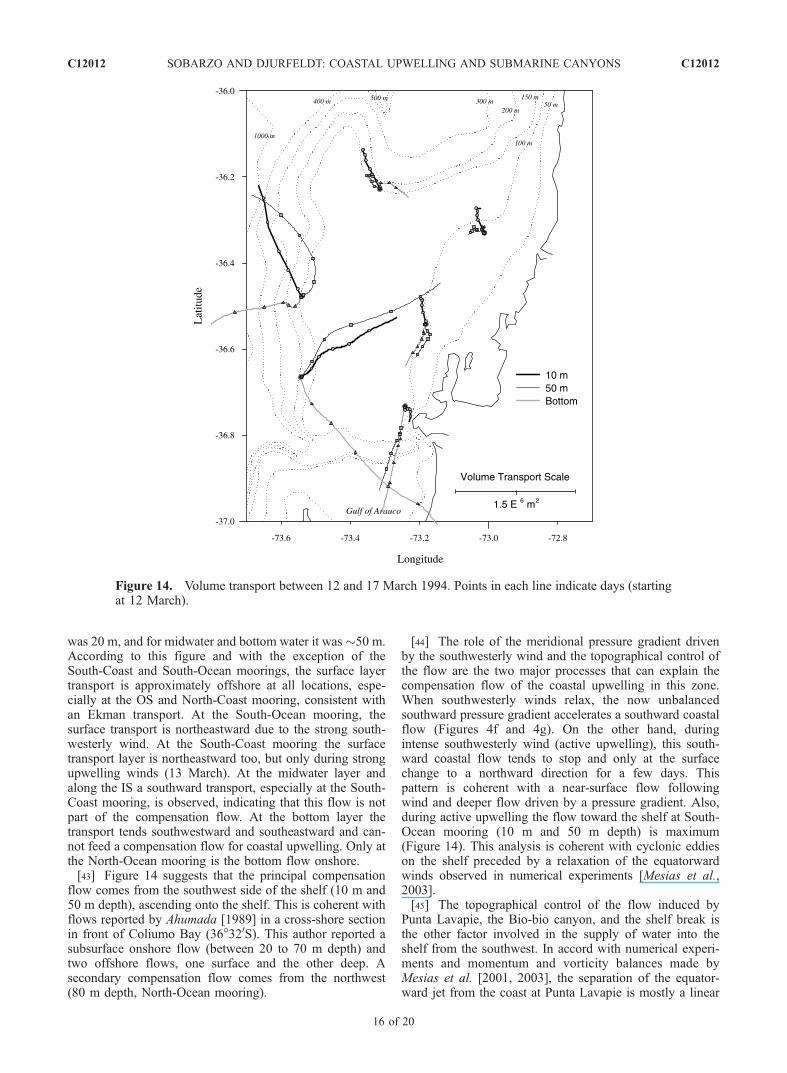
was 20 m, and for midwater and bottom water it was�50 m.According to this figure and with the exception of theSouth-Coast and South-Ocean moorings, the surface layertransport is approximately offshore at all locations, espe-cially at the OS and North-Coast mooring, consistent withan Ekman transport. At the South-Ocean mooring, thesurface transport is northeastward due to the strong south-westerly wind. At the South-Coast mooring the surfacetransport layer is northeastward too, but only during strongupwelling winds (13 March). At the midwater layer andalong the IS a southward transport, especially at the South-Coast mooring, is observed, indicating that this flow is notpart of the compensation flow. At the bottom layer thetransport tends southwestward and southeastward and can-not feed a compensation flow for coastal upwelling. Only atthe North-Ocean mooring is the bottom flow onshore.[43] Figure 14 suggests that the principal compensation
flow comes from the southwest side of the shelf (10 m and50 m depth), ascending onto the shelf. This is coherent withflows reported by Ahumada [1989] in a cross-shore sectionin front of Coliumo Bay (36�320S). This author reported asubsurface onshore flow (between 20 to 70 m depth) andtwo offshore flows, one surface and the other deep. Asecondary compensation flow comes from the northwest(80 m depth, North-Ocean mooring).
[44] The role of the meridional pressure gradient drivenby the southwesterly wind and the topographical control ofthe flow are the two major processes that can explain thecompensation flow of the coastal upwelling in this zone.When southwesterly winds relax, the now unbalancedsouthward pressure gradient accelerates a southward coastalflow (Figures 4f and 4g). On the other hand, duringintense southwesterly wind (active upwelling), this south-ward coastal flow tends to stop and only at the surfacechange to a northward direction for a few days. Thispattern is coherent with a near-surface flow followingwind and deeper flow driven by a pressure gradient. Also,during active upwelling the flow toward the shelf at South-Ocean mooring (10 m and 50 m depth) is maximum(Figure 14). This analysis is coherent with cyclonic eddieson the shelf preceded by a relaxation of the equatorwardwinds observed in numerical experiments [Mesias et al.,2003].[45] The topographical control of the flow induced by
Punta Lavapie, the Bio-bio canyon, and the shelf break isthe other factor involved in the supply of water into theshelf from the southwest. In accord with numerical experi-ments and momentum and vorticity balances made byMesias et al. [2001, 2003], the separation of the equator-ward jet from the coast at Punta Lavapie is mostly a linear
Figure 14. Volume transport between 12 and 17 March 1994. Points in each line indicate days (startingat 12 March).
C12012 SOBARZO AND DJURFELDT: COASTAL UPWELLING AND SUBMARINE CANYONS
16 of 20
C12012

process, but the nonlinear terms, in turn, play a critical rolein the formation of cyclonic eddies north of Punta Lavapie,and have contributions that are strongly correlated tochanges in the bottom topography. According to theseauthors, while the general tendency of the currents is toflow along planetary vorticity contours, inertial effects forcethe current to cross isobaths at places where their change ofcurvature is too abrupt for the flow to adapt. According toour study this occurs at the southwest of the shelf inducedprincipally by the Bio-bio canyon. In this area the com-pensation flow is influenced by the water that is advectedup in front of Punta Lavapie and then moves northward
following the 200-m isobath. Probably, the discontinuity ofthis isobath, due to the Bio-bio canyon, causes ageostrophicprocesses that induce the flow onto the shelf as demon-strated by Allen [1996].[46] Maps of temperature at 2 m, 30 m, 50 m, and 100 m
are coherent with a compensation flow coming from thesouthwest (Figure 15). It is clear that during the hydro-graphic cruises HC-1 and HC-2, there is cold waters comingfrom the southwest at 30 m and 50 m depths. Maps ofsalinity and dissolved oxygen (not shown) indicate a similarhorizontal pattern. Although the isotherm of 11�C appearsmore related to the Bio-bio canyon, some influence of cold
Figure 15. Maps of temperatures at 2 m, 30 m, 50 m, and 100 m depth during (a, b, c, and d) HC-1 and(e, f, g, and h) HC-2. Shaded line indicates the isobaths of 150 m depth.
C12012 SOBARZO AND DJURFELDT: COASTAL UPWELLING AND SUBMARINE CANYONS
17 of 20
C12012
water is observed also related to Itata canyon. Probably,this canyon also is involved in the supply of cold watersinto the shelf (compare with Figure 14). The compensationflow coming from the southwest of the shelf wouldexplain why the temperature at 10 m depth decreases belowthat at 50 m depth during the most intense upwelling event(13–15 March, Figure 12f) and also would explain the
surface thermal gradient observed in the IS (Figures 12b,12d, and 12f).
4.3. Poleward Subsurface Flow
[47] This study shows a southward mean flow near thebottom in the central and south side of the shelf comparablewith a poleward subsurface flow. This flow is more intensenear the coast, and its major principal axis is oriented alongthe bathymetry. However, the low mean values of thev-component found at the center-south side of the shelf(�9.7 to �3.0 cm/s) and the absence of this flow in thenorth of the shelf suggests a more careful interpretation.Probably, the poleward subsurface flow follows the isobathsof 200 m along the OS, and, on the other hand, thesouthward bottom flow observed at the South-Coast moor-ing is a local response to the wind-forcing and the merid-ional pressure gradient. We propose that the intensificationof the southward bottom mean flow on the shelf is due tothe following: (1) The trapezoidal geometry of the shelfimplies that the cross-sectional area of the southward flowdiminishes southward, increasing its velocity; and (2) thepresence of the Bio-bio canyon in the south intensifies thebottom flow by topographic steering.
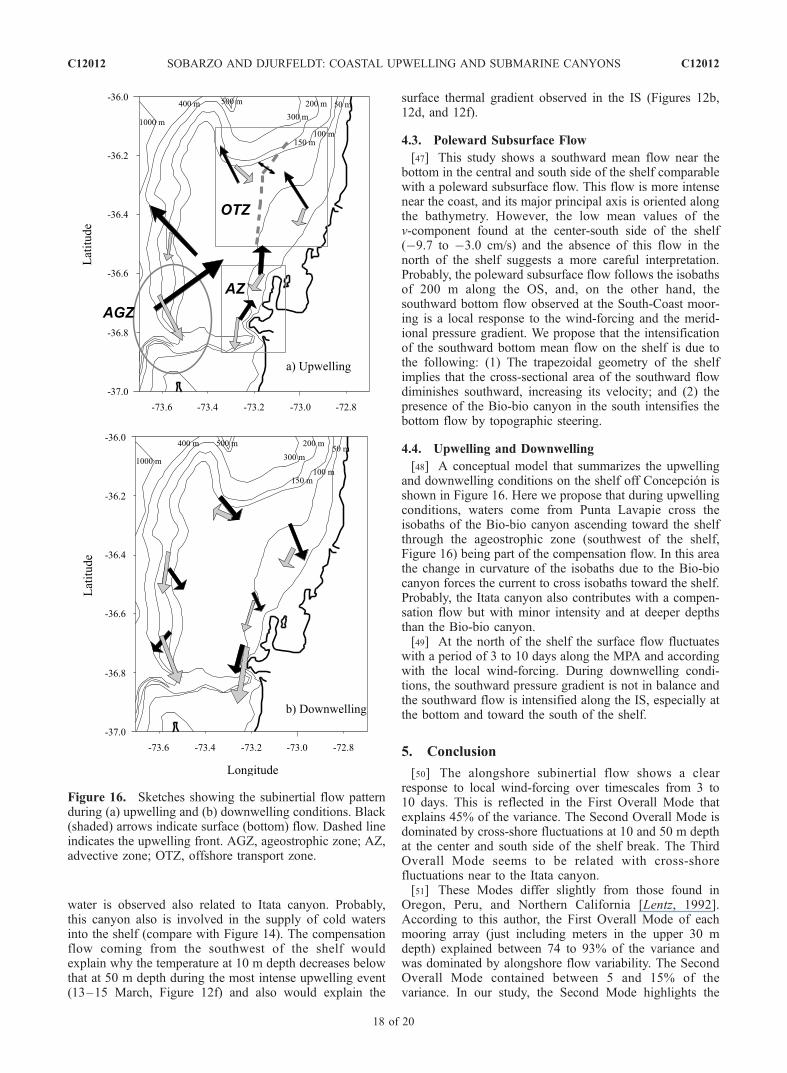
4.4. Upwelling and Downwelling
[48] A conceptual model that summarizes the upwellingand downwelling conditions on the shelf off Concepcion isshown in Figure 16. Here we propose that during upwellingconditions, waters come from Punta Lavapie cross theisobaths of the Bio-bio canyon ascending toward the shelfthrough the ageostrophic zone (southwest of the shelf,Figure 16) being part of the compensation flow. In this areathe change in curvature of the isobaths due to the Bio-biocanyon forces the current to cross isobaths toward the shelf.Probably, the Itata canyon also contributes with a compen-sation flow but with minor intensity and at deeper depthsthan the Bio-bio canyon.[49] At the north of the shelf the surface flow fluctuates
with a period of 3 to 10 days along the MPA and accordingwith the local wind-forcing. During downwelling condi-tions, the southward pressure gradient is not in balance andthe southward flow is intensified along the IS, especially atthe bottom and toward the south of the shelf.
5. Conclusion
[50] The alongshore subinertial flow shows a clearresponse to local wind-forcing over timescales from 3 to10 days. This is reflected in the First Overall Mode thatexplains 45% of the variance. The Second Overall Mode isdominated by cross-shore fluctuations at 10 and 50 m depthat the center and south side of the shelf break. The ThirdOverall Mode seems to be related with cross-shorefluctuations near to the Itata canyon.[51] These Modes differ slightly from those found in
Oregon, Peru, and Northern California [Lentz, 1992].According to this author, the First Overall Mode of eachmooring array (just including meters in the upper 30 mdepth) explained between 74 to 93% of the variance andwas dominated by alongshore flow variability. The SecondOverall Mode contained between 5 and 15% of thevariance. In our study, the Second Mode highlights the
Figure 16. Sketches showing the subinertial flow patternduring (a) upwelling and (b) downwelling conditions. Black(shaded) arrows indicate surface (bottom) flow. Dashed lineindicates the upwelling front. AGZ, ageostrophic zone; AZ,advective zone; OTZ, offshore transport zone.
C12012 SOBARZO AND DJURFELDT: COASTAL UPWELLING AND SUBMARINE CANYONS
18 of 20
C12012
importance of the physical processes related with the shelfbreak.[52] Associated with a fluctuating southwesterly wind
with period 3 to 10 days, an offshore transport is generatedin the center-north side of the IS. The mean value of TETand OET is similar to that found off the Oregon coast and issmall compared with other places, probably due to thesampling date. These two quantities are coherent in thecentral and north side of the IS (r = 0.8) and have lowcorrelation at the south side. Probably, this last is due to thefact that South-Coast mooring is very near the coast andshows a very strong southward quasi-barotropic flow.Eventually, when the pycnocline reaches the surface, itleaves a band of cold water onshore separated from warmerwaters offshore by the upwelling front. This front is ingeostrophic balance, which implies an equatorward baro-clinic jet and could be similar to that outlined by Barangeand Pillar [1992] and Brink [1998]; that is to say, when theupwelling is intermittent and not very intense, there is highprobability of finding these fronts near the coast. However,when the upwelling is intense and permanent, the upwellingfront would move offshore, interacting with the frontassociated with the shelf-break of the Itata canyon.[53] On the north side of the IS, the wind variability
produces fluctuations of the pycnocline that could propagatesouthward as coastal trapped waves [Huthnance, 1981; Hillet al., 1998]. In their southward motions these fluctuationstend to brake the coastal jet, and, therefore, they tend toweaken the upwelling, and then a new southerly wind isnecessary to drive upwelling events [Fennel, 1999]. Whenthe southwesterly winds relax, the cyclonic tendency on theshelf intensifies the southward coastal flow, exporting watertoward the Bio-bio canyon. Considering average oscilla-tions of 5 days for the intensification-relaxation cycle of theupwelling and a barotropic mean velocity southward of0.1 m/s with an estimate width of 15 km (mean transports =0.16 Sv), the shelf would be exchanging, on the south sideof the IS, nearly 20% of its volume in each one of thesecycles.[54] The southward bottom flow observed on this shelf
modifies the classical two-dimensional model of coastalupwelling due to the induced offshore Ekman transport atthe surface and bottom layers [Hill et al., 1998]. Thisimplies that the coastal surface waters should be replaced,necessarily, through the midwater depths. The shelf mayreceive this supply through advection coming from south-west and where the nonlinear processes related with theBio-bio canyon are important. The temperature of thiscompensation flow varies between 10.4� and 11.8�C, andit could be the water that affects of South-Coast mooring at10 m depth and that explains the alongshore thermalgradient along the coast. In this conceptual frame it isprobable that this compensation flow could be related tosome onshore flow along the thermocline. Other contribu-tion to a compensation flow may come through the Itatacanyon.[55] How much could these conclusions be influenced by
the spatial resolution of the measurements of this study(horizontal and vertical coverage)? Although the stronginfluence of cold water coming from the southwest ontothis shelf and the influence of the canyons is clear (espe-cially the Bio-bio canyon), more vertical and horizontal
resolution is necessary for a good characterization of thecompensation flow. The study of the midwater compensa-tion flow coming from the southwest and the coastalsouthward bottom flow over the shelf need a better resolu-tion that, probably, could affect our results. The influence ofthe shelf break seems to be very important on the physicalprocesses such as internal waves generation, fronts, andsecondary upwelling, but the spatial resolution of themeasurements is not enough for a better description. Also,more vertical resolution would permit a better understand-ing of the surface and bottom mixed layer and the role ofboth on the coastal upwelling. Finally, more horizontalresolution near the coast is necessary to identify the spatialand temporal variability of the coastal upwelling fronts.[56] Taking into account these limitations, this study
shows, at least, three different physical environments thatoffer different conditions for the chemistry and biology ofthe waters on the shelf (Figure 16): (1) The advective zone(AZ) is dominated by a southward coastal jet related,probably, to a meridional pressure gradient driving by thelocal wind. (2) The ageostrophic zone (AGZ) is dominatedby nonlinear processes where the flow crosses the isobathstoward the shelf and where the vertical velocities areincreased, driving a secondary upwelling area at the shelfbreak. (3) The offshore transport zone (OTZ) is dominatedby the coastal upwelling front modulated by a resultantvector between offshore Ekman transport and the equator-ward coastal geostrophic flow.
[57] Acknowledgments. This work was carried out while one of theauthors (M. S.) was visiting scientist at the University of Goteborg,Sweden, and at the Woods Hole Oceanographic Institution, USA. Supportfrom both institutions is acknowledged. The research stay in Sweden wassponsored by the Chilean Government (MIDEPLAN, DFL 22/81), and thework at WHOI was sponsored by Fundacion Andes (Chile) through aWHOI/UDEC Visiting Scientist Fellowship. Oceanographic data comefrom a multidisciplinary experiment jointly carried out by the Max-PlanckInstitute for Marine Microbiology, Bremen (Germany), the University ofConcepcion, CONICYT (Chile), Project 1940998, and the Chilean NavyHydrographic and Oceanographic Service. We are grateful to Victor ArielGallardo, Chief of this expedition, and to Silvio Pantoja for his sponsorshipin this research and Jaime Henrıquez for his considerable technical support.Also, this research was partially supported by CONICYT (Chile) grant1040986. Finally, we wish to thank Steve Lentz, from WHOI, and twoanonymous referees for their very helpful comments that improved theoriginal manuscript.
ReferencesAhumada, R. (1989), Produccion y destino de la biomasa fitoplanctonica enun sistema de bahıas en Chile Central: Una hipotesis, Biol. Pesquera, 18,53–66.
Allen, S. E. (1996), Topographically generated, subinertial flows within afinite length canyon, J. Phys. Oceanogr., 26, 1608–1632.
Arcos, D., and N. Navarro (1986), Analisis de un ındice de surgencia parala zona de Talcahuano, Chile (lat. 37�S), Invest. Pesqueras, 33, 91–98.
Barange, M., and S. Pillar (1992), Cross-shelf circulation, zonation andmaintenance mechanisms of Nyctiphanes capensis and Euphausiahanseni (Euphausiacea) in the northern Benguela upwelling system,Cont. Shelf Res., 12(9), 1027–1042.
Brandhorst, W. (1971), Condiciones oceanograficas estivales frente a lacosta de Chile, Rev. Biol. Mar. Valparaıso, 14(3), 45–84.
Brink, K. H. (1998), Wind-driven currents over the continental shelf, in TheSea, vol. 10, pp. 3–20, John Wiley, Hoboken, N.J.
Caceres, M., and D. Arcos (1991), Variabilidad en la estructura espacio-temporal de un area de surgencia frente a la costa de Concepcion, Chile,Invest. Pesqueras, 36, 27–38.
Fennel, W. (1999), Theory of the Benguela upwelling system, J. Phys.Oceanogr., 29, 177–190.
Figueroa, D., and C. Moffat (2000), On the influence of topography in theinduction of coastal upwelling along the Chilean coast, Geophys. Res.Lett., 27(23), 3905–3908.
C12012 SOBARZO AND DJURFELDT: COASTAL UPWELLING AND SUBMARINE CANYONS
19 of 20
C12012

Gill, A. E., and E. H. Schumann (1974), The generation of long shelf wavesby the wind, J. Phys. Oceanogr., 4, 83–90.
Hickey, B. (1997), The response of a steep-sided, narrow canyon to timevariable wind forcing, J. Phys. Oceanogr., 27, 697–726.
Hill, E., B. Hickey, F. Shillington, T. Strub, K. Brink, E. Barton, andA. Thomas (1998), Eastern ocean boundaries coastal segment (E), inThe Sea, vol. 11, edited by A. Robinson and K. Brink, pp. 30–67, JohnWiley, Hoboken, N. J.
Huthnance, J. M. (1981), Waves and currents near the continental shelfedge, Prog. Oceanogr., 10, 193–226.
Huthnance, J. M. (1995), Circulation, exchange and water masses at theocean margin: The role of the physical processes at the shelf edge, Prog.Oceanogr., 35, 353–431.
Huyer, A., R. L. Smith, and E. J. Sobey (1978), Seasonal differences inlow-frequency current fluctuations over the Oregon continental shelf,J. Geophys. Res., 83, 5077–5089.
Klinck, J. (1989), Geostrophic adjustment over submarine canyons, J. Geo-phys. Res., 94, 6133–6144.
Klinck, J. (1996), Circulation near submarine canyons: A modeling study,J. Geophys. Res., 101, 1211–1223.
Kundu, P. K., and J. S. Allen (1976), Some three-dimensional character-istics of low-frequency current fluctuations near Oregon coast, J. Phys.Oceanogr., 6, 181–199.
Kundu, P. K., J. S. Allen, and R. L. Smith (1975), Modal decomposition ofthe velocity field near the Oregon coast, J. Phys. Oceanogr., 5, 683–704.
Lentz, S. (1992), The surface boundary layer in coastal upwelling regions,J. Phys. Oceanogr., 22, 1517–1539.
Mesias, J., R. Matano, and T. Strub (2001), A numerical study of theupwelling circulation off central Chile, J. Geophys. Res., 106, 19,611–19,623.
Mesias, J., R. Matano, and T. Strub (2003), Dynamical analysis of theupwelling circulation off central Chile, J. Geophys. Res., 108(C3),3085, doi:10.1029/2001JC001135.
Pedlosky, J. (1974), On coastal jets and upwelling in bounded basins,J. Phys. Oceanogr., 4, 3–18.
Peterson, W., D. Arcos, G. McManus, H. Dam, D. Bellantoni, T. Johnson,and P. Tiselius (1988), The nearshore zone during coastal upwelling:Daily variability and coupling between primary and secondary produc-tion off central Chile, Prog. Oceanogr., 20, 1–40.
Smith, R. L. (1995), The physical processes of coastal ocean upwellingsystems, in Upwelling in the Ocean: Modern Processes and AncientRecords, edited by C. P. Summerhayes et al., pp. 39–64, John Wiley,Hoboken, N. J.
Smith, S. D. (1980), Wind stress and heat flux over the ocean in gale forcewinds, J. Phys. Oceanogr., 10, 709–726.
Sobarzo, M., D. Figueroa, and L. Djurfeldt (2001), Upwelling of subsurfacewater into the rim of the Biobio submarine canyon as a response tosurface wind, Cont. Shelf Res., 21, 279–299.
Strub, T., J. Mesıas, V. Montecino, J. Rutlant, and S. Salinas (1998), Coastalocean circulation off western South America, Coastal Segment (6,E), inThe Sea, vol. 11, edited by A. Robinson and K. Brink, pp. 273–313,John Wiley, Hoboken, N. J.
Trowbridge, J. H., D. Chapman, and J. Candela (1998), Topographiceffects, straits and the bottom boundary layer, in The Sea, vol. 10, editedby K. Brink and A. Robinson, pp. 63–88, John Wiley, Hoboken, N. J.
Wooster, W., and J. Reid (1963), Eastern Boundary Currents, in The Sea,vol. 2, edited by M. N. Hill, pp. 253–276, John Wiley, Hoboken, N. J.
�����������������������M. Sobarzo, Department of Oceanography, University of Concepcion,
Concepcion, Chile. ([email protected])L. Djurfeldt, Department of Oceanography, Earth Sciences Center,
Goteborg University, Box 460, SE-405 30 Goteborg, Sweden. ([email protected])
C12012 SOBARZO AND DJURFELDT: COASTAL UPWELLING AND SUBMARINE CANYONS
20 of 20
C12012