
Price Formation in an Artificial Market: Limit Order Book Versus Matching of Supply and Demand
11
Price formation in an artificial market: limit order book versus matching of supply and demand Marco Raberto 1 , Silvano Cincotti 1 , Christian Dose 1 , Sergio M. Focardi 2 , and Michele Marchesi 3 1 DIBE, Universit` a di Genova, Via Opera Pia 11a, 16145 Genova, Italy {raberto,cincotti,dose}@dibe.unige.it 2 The Intertek Group, rue de Javel 94, 75015 Paris, France [email protected] 3 DIEE, Universit` a di Cagliari, Piazza d’Armi, 09123 Cagliari, Italy [email protected] Abstract In this paper, we present an extension of the Genoa artificial stock market (GASM) (Raberto et al., 2001) that includes a limit order book as mechanism for price formation. At every time step an agent is chosen with uniform dis- tribution to issue an order. The order can be a limit order or a market order in function on the agent decision making process. If the order is a limit order, it is stored in the book; if the order is a market order, a transaction occurs. Prices are formed at variables time steps, i.e., only when a market order is issued. We investigate how the new asynchronous trading mechanism affects the statistical properties of simulated prices. This computational experiment shows that fat tails of returns distribution can be recovered simply as a conse- quence of the limit order book without any additional assumption on agents behavior. 1 Introduction Electronic trading with limit order books continues to gain share of worldwide security trading. Issues of exchange design have gained importance in finance. We address these questions by means of a computer-simulated market, the Genoa artificial stock market (GASM) [1, 2, 3, 4]. GASM is an agent-based simulated market able to reproduce the main stylized facts observed in finan- cial markets, i.e., fat-tailed distribution of returns and volatility clustering. Over the last 10 years, a number of computer-simulated, artificial financial markets have been built; LeBaron [5] and Levy et al [6] offers a review of recent
Transcript of Price Formation in an Artificial Market: Limit Order Book Versus Matching of Supply and Demand
Price formation in an artificial market: limitorder book versus matching of supply anddemand
Marco Raberto1, Silvano Cincotti1, Christian Dose1, Sergio M. Focardi2,and Michele Marchesi3
1 DIBE, Universita di Genova, Via Opera Pia 11a, 16145 Genova, Italy{raberto,cincotti,dose}@dibe.unige.it
2 The Intertek Group, rue de Javel 94, 75015 Paris, France [email protected] DIEE, Universita di Cagliari, Piazza d’Armi, 09123 Cagliari, [email protected]
Abstract
In this paper, we present an extension of the Genoa artificial stock market(GASM) (Raberto et al., 2001) that includes a limit order book as mechanismfor price formation. At every time step an agent is chosen with uniform dis-tribution to issue an order. The order can be a limit order or a market orderin function on the agent decision making process. If the order is a limit order,it is stored in the book; if the order is a market order, a transaction occurs.Prices are formed at variables time steps, i.e., only when a market order isissued. We investigate how the new asynchronous trading mechanism affectsthe statistical properties of simulated prices. This computational experimentshows that fat tails of returns distribution can be recovered simply as a conse-quence of the limit order book without any additional assumption on agentsbehavior.
1 Introduction
Electronic trading with limit order books continues to gain share of worldwidesecurity trading. Issues of exchange design have gained importance in finance.We address these questions by means of a computer-simulated market, theGenoa artificial stock market (GASM) [1, 2, 3, 4]. GASM is an agent-basedsimulated market able to reproduce the main stylized facts observed in finan-cial markets, i.e., fat-tailed distribution of returns and volatility clustering.
Over the last 10 years, a number of computer-simulated, artificial financialmarkets have been built; LeBaron [5] and Levy et al [6] offers a review of recent

2 Authors Suppressed Due to Excessive Length
work in this field. Following the pioneering work done at the Santa Fe Institute[7], the attention of researchers has been mainly focused on modeling agentoptimization and learning capabilities and little effort has been devoted tostudy how the market microstructure and the finiteness of financial resourcesaffect market prices. The Genoa Artificial Stock Market (GASM) has beenconceived mainly to address these problems.
In this paper, we address the issue of how the market microstructure affectsstatistical properties of simulated prices, with quasi zero-intelligence agents.The paper is organized as follows: Section 1 is a description of two differentprice formation mechanisms; Section 2 presents the model and computationalexperiments are presented in Section 3. Section 4 provides the conclusions ofthe study and directions for future research.
2 Mechanisms for price formation
In previous computational experiments [1, 2, 3, 4], the price formation processwas performed by means of a clearing house [8], where buy and sell limitorders are accumulated over time and the market is cleared periodically atthe intersection of demand and supply curves. The rationale of the clearinghouse is a key tenet of economic theory: prices are at equilibrium when supplyand demand match [9]. However, the clearing house is only an approximatedescription of the way stock exchanges operate around the world. Progress ininformation technology and the increasing deregulation of exchanges have ledto a wide adoption of the limit order book for price formation.
The limit order book is a snapshot at a given instant of the queues of allbuy limit orders and sell limit orders, with their respective price and volume.Limit orders are organized in ascending order according to their limit prices.All buy limit orders are below the best buy limit order, i.e., the buy limitorder with the highest limit price (the bid price). The best buy limit order issituated below the best sell limit order, i.e., the sell limit order with the lowestlimit price (the ask price). All other sell limit orders are above the best selllimit order. Orders are stored in the book. A transaction occurs when a traderhits the quote (the bid or the ask price) on the opposite side of the market.If a trader issues a limit order, say a sell limit order, the order either adds tothe book if its limit price is above the bid price, or generates a trade at thebid if it is below or equal to the bid price. In the latter case, the limit orderbecomes a marketable limit order or more simply a market order. Conversely,if the order is a buy limit order it becomes a market order and is executed ifits limit price is above the ask price, else it is stored in the book. Limit orderswith the same limit price are prioritized by time of submission, with the oldestorder given the highest priority. Order’s execution often involves partial fillsbefore it is completed, but partial fills do not change the time priority.
In recent years, some studies about the statistical properties of stock orderbooks have appeared in the literature. Biais et al. [10] analyze the interaction
Title Suppressed Due to Excessive Length 3
between the order book and the order flow at the Paris stock exchange. Theyfind that the order flow is concentrated near the best quotes, while the depthof the book is somewhat larger at nearby valuations. Maslov and Mills [11]find evidences of a power law distribution for the size of limit orders andmarket orders. Bouchaud et al. [12] find that the incoming order limit pricesare, somewhat surprisingly, very broadly (power-law) distributed around thecurrent bid / ask. As regarding the average book shape, they also find thatthe average order book has a maximum away from the current bid / ask anda tail reflecting the statistics of the incoming orders. Lo et al. [13] estimate aneconometric model for limit-order execution times incorporating the effects ofexplanatory variables such as the limit price, the bid-ask spread and marketvolatility. They find that execution times are very sensitive to the limit price.Indeed, the time-to-execution of limit orders is a very important practicalissue for traders. The submission of a limit order implies a trade-off betweenthe advantage of obtaining a fixed price, and the disadvantage of an unknownorder execution time.
The above mentioned facts are the empirical basis for the estimation, test-ing and validation of any artificial financial market employing a limit orderbook for the price formation process.
3 Trading decision making with the the limit order book
A model of artificial trading by means of a limit order book is presented inthis section. Agents trade one single stock in exchange for cash. They aremodeled as liquidity traders; as a consequence, the decision making process isnearly random and depends on the finite amount of financial resources (cash+ stocks) they own. At the beginning of the simulation, cash and stocks areuniformly distributed among agents. Trading decisions can also depend on thevolatility of the market.
Trading is organized in M daily sections. Each trading day is subdivided inT elementary time steps, say seconds. During the trading day, at given timesteps th, a trader i is randomly chosen for issuing an order. Order waitingtimes τo
h = th − th−1 follow an exponential distribution with mean λo. Then,the order generation process is a Poisson process. Orders are cancelled aftertime Θ and at the beginning of each day the book is emptied.
A trader issues a buy or a sell order with probability 50%. Let us denotewith a(th−1) and with d(th−1) the values of the ask and of the bid pricesstored in the book at time step th−1. Let us suppose that the order issuedat time step th be a sell order, then we assume that the limit price si(th)associated to the sell order is given by:
si(th) = ni(th) · a(th−1) , (1)
where ni(th) is a random draw by trader i at time step th from a Gaussiandistribution with constant mean µ = 1 and standard deviation σ. If si(th) >
4 Authors Suppressed Due to Excessive Length
di(th−1), the limit order is stored in the book and no trades are recorded;else, the order becomes a market order and a transaction occurs at the pricep(th) = d(th−1). In the latter case, the sell order is partially or totally fulfilledand the bid price is updated. The quantity of stocks offered for sale is a randomfraction of the quantity of stocks owned by the trader.
If the order is a buy order, we assume that the associated limit price bi(th)is given by:
bi(th) = ni(th) · d(th−1) ; (2)
where ni(th) is determined as in the previous case. If bi(th) < a(th−1), the limitorder is stored in the book and no trades are recorded; else the order becomesa market order and a transaction occurs at the price p(th) = a(th−1). Thequantity of stocks ordered to buy depends on cash endowment of the traderand on the value of bi(th).
It is worth noting that, in our framework, agents compete for the provisionof liquidity. If an agent issues a buy order, its benchmark is the best limitbuy order given by the bid price. Being µ = 1, half times, he offers a morecompetitive buy order (if bi(th) > d(th−1)), which may result in a trade ifbi(th) ≥ a(th−1). The same applies for sell limit orders.
4 The computational experiment
The timing parameters of every simulations have been set as follows: M =1, 000 daily sections, each characterized by a length of T = 25, 200 s (corre-sponding to 7 hours of trading activity). The average order waiting times λo
have been set to 20 s and the orders lifespan to Θ = 600 s À λo. The numberof agents is set to 10,000. At the beginning of the simulation, the stock priceis set at 100.00 units of cash, say dollars, and each trader is endowed with anequal amount of cash and of shares of the risky stocks. These amounts are100,000 dollars and 1,000 shares, respectively.
Sell and buy limit prices are computed following Eq. 1 and Eq. 2 respec-tively. The random number ni(th) is a random draw by trader i from a Gaus-sian distribution with constant mean µ = 1 and standard deviation σ = 0.005.It is worth noting that, in the experiments reported in our previous studies[1, 2, 3, 4], σ depended linearly on the intra-day volatility of the stock. Thelink between limit prices and volatility took into account a realistic aspect oftrading psychology: when volatility is high, uncertainty as to the “true” priceof a stock grows and traders place orders with a broader distribution of limitprices. This dependence, which can be viewed as a volatility feedback, was akey feature in those experiments and was responsible of the fat tails in thedistribution of returns and of the clustering of volatility. Here, σ is constant;however, we find an intra-day leptokurtic distribution of returns even withoutthe volatility feedback effect.
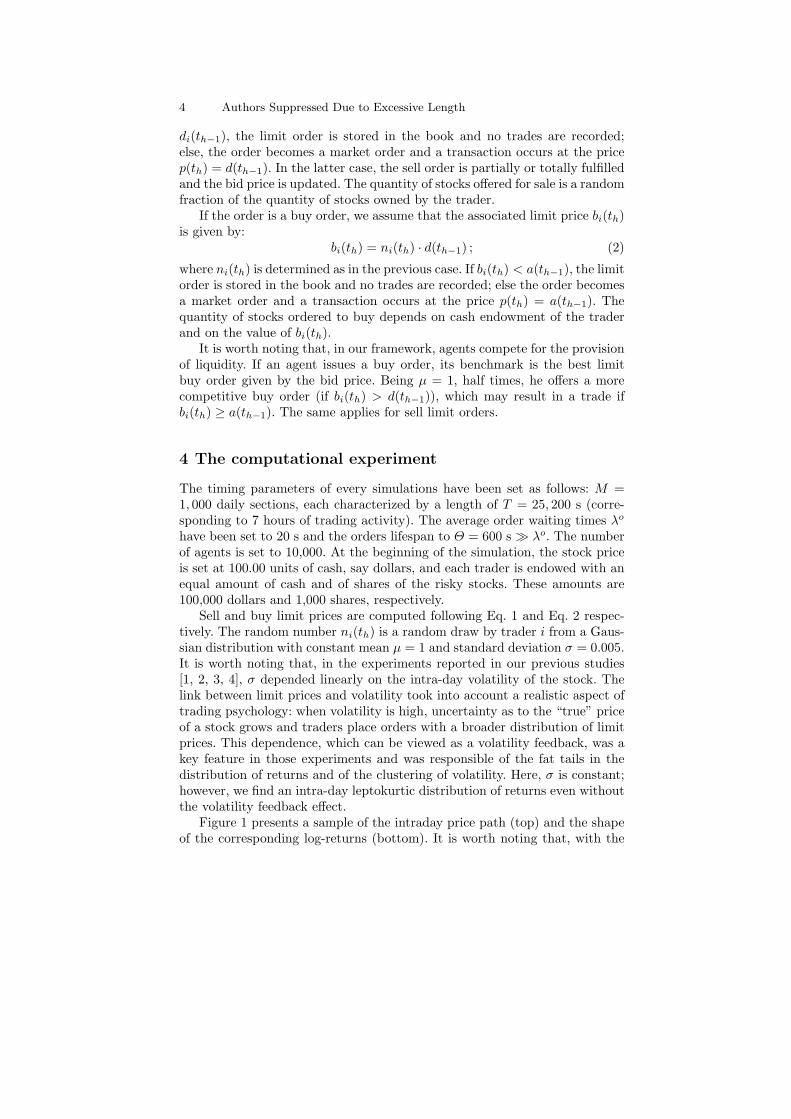
Figure 1 presents a sample of the intraday price path (top) and the shapeof the corresponding log-returns (bottom). It is worth noting that, with the
Title Suppressed Due to Excessive Length 5
1 2 3 4 5 6 7 8 9 1090
95
100
105
110
115
p ($
)
days
1 2 3 4 5 6 7 8 9 10−3
−2
−1
0
1
2
3
log
retu
rns
(%)
days
days
Fig. 1. A sample of the intraday price path (top) and corresponding log-returns(bottom) in the experiment with absence of volatility feedback.
limit order book as a mechanism for price formation, time intervals betweenconsecutive trades are not constant. In order to deal with returns related tohomogeneous time windows, log-return have been computed according to theprevious-tick interpolation [14, pag. 37] with a time window equal to 60 s.
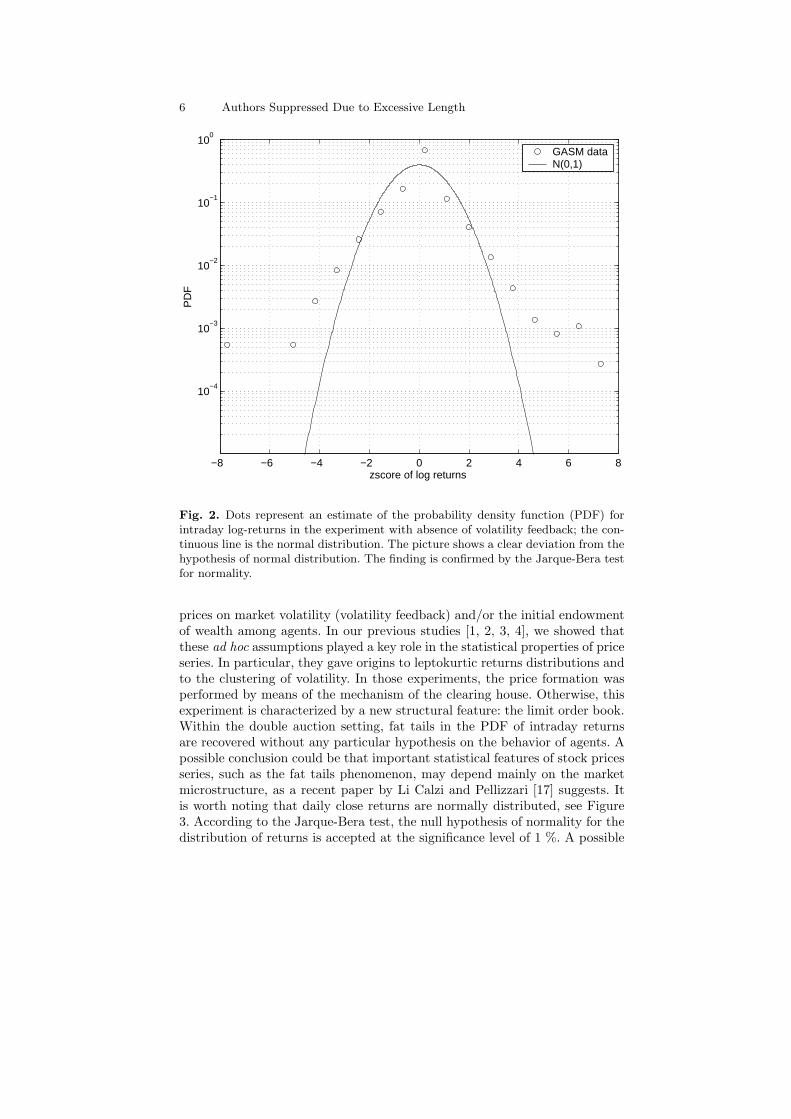
The intraday stock price is characterized by a sort of intermittent behav-ior with sudden jumps. This finding is confirmed by the probability densityfunction (PDF) of returns, Figure 2. The empirical PDF shows a clear de-parture form the assumption of normal distribution; indeed, according to theJarque-Bera test, the null hypothesis of normality for the distribution of re-turns is rejected at the significance level of 5 %. Recent empirical studies onthe the form of the estimated PDF of real prices returns have shown impor-tant deviations from the paradigm of the Gaussian distribution [15, 16]. Animportant stylized fact of real stock prices is thus recovered by our model. Itis worth noting that there are no particular ad hoc behavioral assumptionsabout the agents decision making process, such as the dependence of limit
6 Authors Suppressed Due to Excessive Length
−8 −6 −4 −2 0 2 4 6 8
10−4
10−3
10−2
10−1
100
PD
F
zscore of log returns
GASM dataN(0,1)
Fig. 2. Dots represent an estimate of the probability density function (PDF) forintraday log-returns in the experiment with absence of volatility feedback; the con-tinuous line is the normal distribution. The picture shows a clear deviation from thehypothesis of normal distribution. The finding is confirmed by the Jarque-Bera testfor normality.
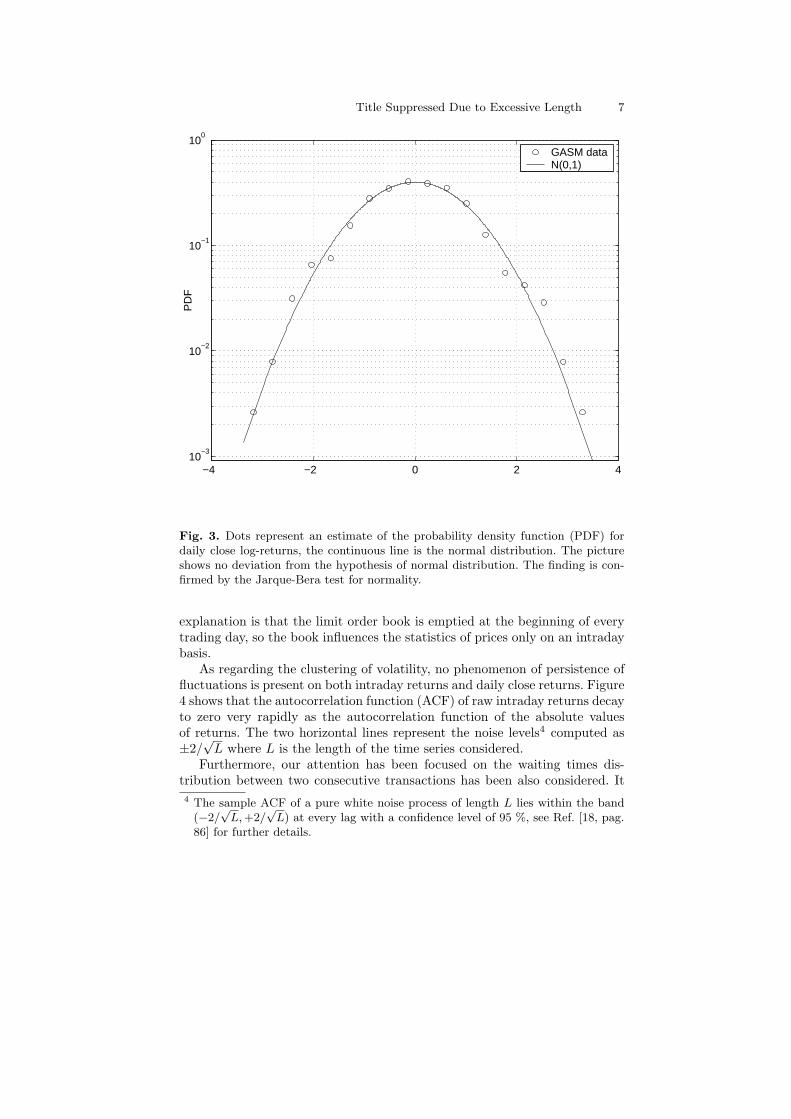
prices on market volatility (volatility feedback) and/or the initial endowmentof wealth among agents. In our previous studies [1, 2, 3, 4], we showed thatthese ad hoc assumptions played a key role in the statistical properties of priceseries. In particular, they gave origins to leptokurtic returns distributions andto the clustering of volatility. In those experiments, the price formation wasperformed by means of the mechanism of the clearing house. Otherwise, thisexperiment is characterized by a new structural feature: the limit order book.Within the double auction setting, fat tails in the PDF of intraday returnsare recovered without any particular hypothesis on the behavior of agents. Apossible conclusion could be that important statistical features of stock pricesseries, such as the fat tails phenomenon, may depend mainly on the marketmicrostructure, as a recent paper by Li Calzi and Pellizzari [17] suggests. Itis worth noting that daily close returns are normally distributed, see Figure3. According to the Jarque-Bera test, the null hypothesis of normality for thedistribution of returns is accepted at the significance level of 1 %. A possible
Title Suppressed Due to Excessive Length 7
−4 −2 0 2 410
−3
10−2
10−1
100
PD
F
GASM dataN(0,1)
Fig. 3. Dots represent an estimate of the probability density function (PDF) fordaily close log-returns, the continuous line is the normal distribution. The pictureshows no deviation from the hypothesis of normal distribution. The finding is con-firmed by the Jarque-Bera test for normality.
explanation is that the limit order book is emptied at the beginning of everytrading day, so the book influences the statistics of prices only on an intradaybasis.
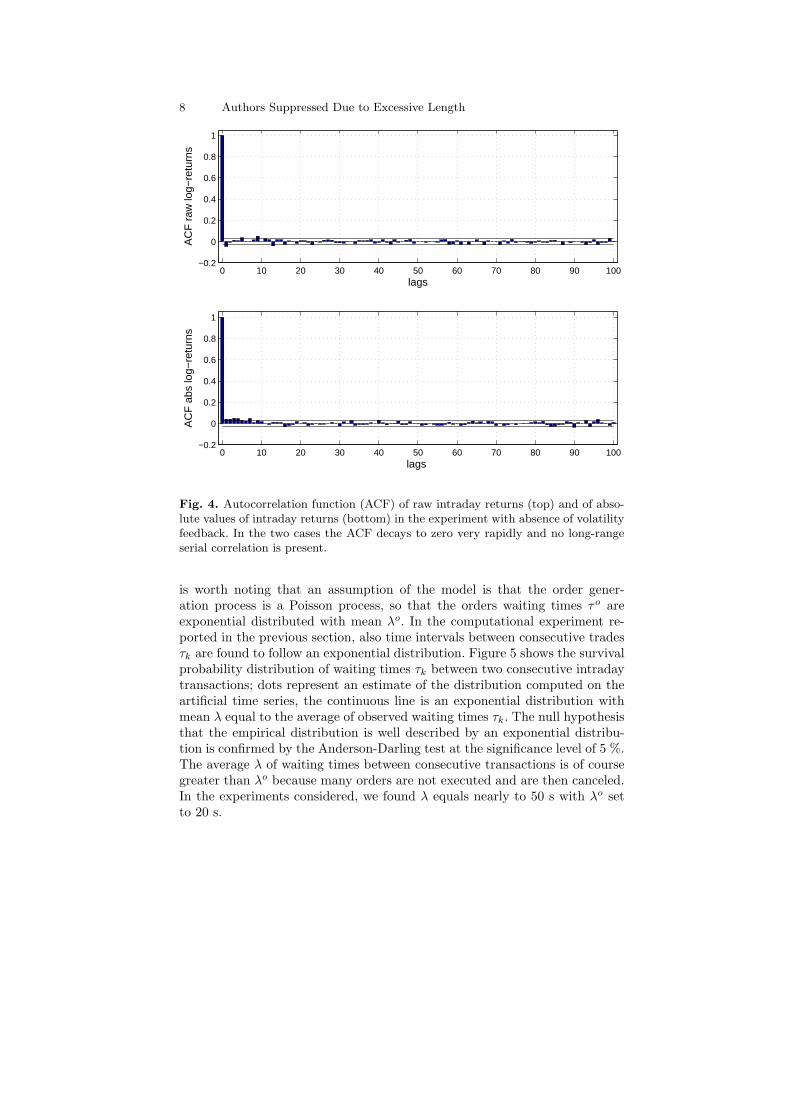
As regarding the clustering of volatility, no phenomenon of persistence offluctuations is present on both intraday returns and daily close returns. Figure4 shows that the autocorrelation function (ACF) of raw intraday returns decayto zero very rapidly as the autocorrelation function of the absolute valuesof returns. The two horizontal lines represent the noise levels4 computed as±2/
√L where L is the length of the time series considered.
Furthermore, our attention has been focused on the waiting times dis-tribution between two consecutive transactions has been also considered. It4 The sample ACF of a pure white noise process of length L lies within the band
(−2/√
L, +2/√
L) at every lag with a confidence level of 95 %, see Ref. [18, pag.86] for further details.
8 Authors Suppressed Due to Excessive Length
0 10 20 30 40 50 60 70 80 90 100−0.2
0
0.2
0.4
0.6
0.8
1
AC
F r
aw lo
g−re
turn
s
lags
0 10 20 30 40 50 60 70 80 90 100−0.2
0
0.2
0.4
0.6
0.8
1
AC
F a
bs lo
g−re
turn
s
lags
Fig. 4. Autocorrelation function (ACF) of raw intraday returns (top) and of abso-lute values of intraday returns (bottom) in the experiment with absence of volatilityfeedback. In the two cases the ACF decays to zero very rapidly and no long-rangeserial correlation is present.
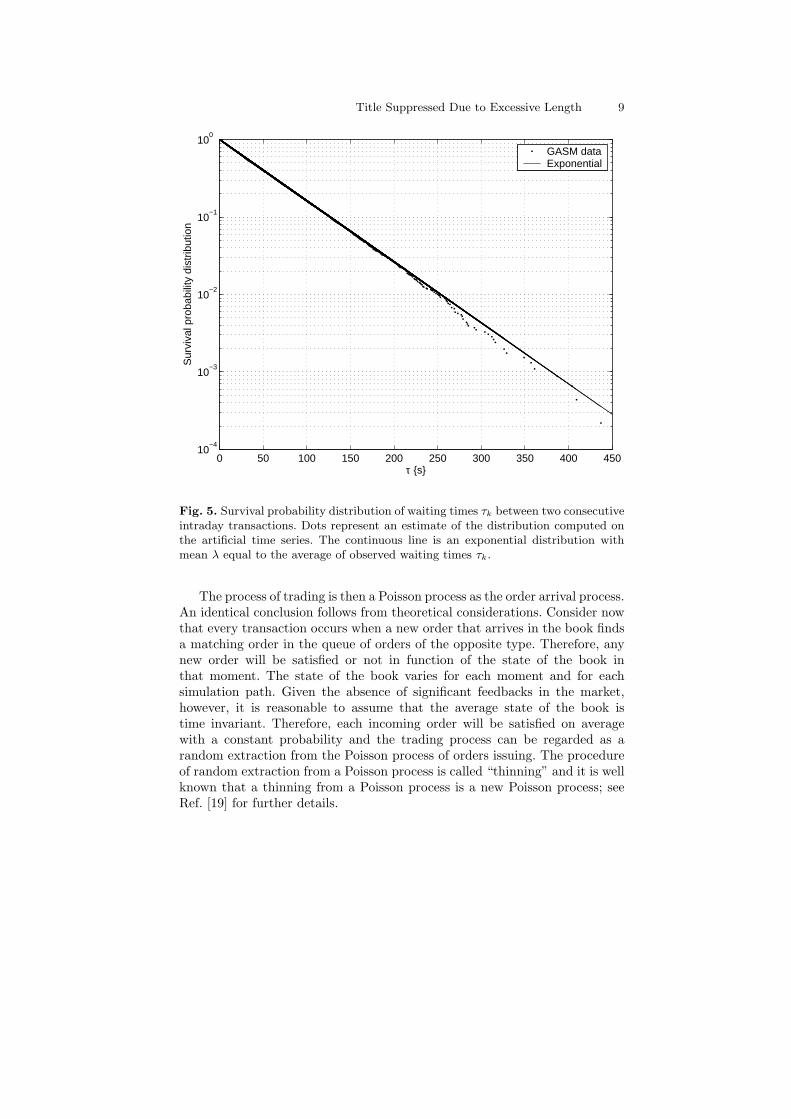
is worth noting that an assumption of the model is that the order gener-ation process is a Poisson process, so that the orders waiting times τo areexponential distributed with mean λo. In the computational experiment re-ported in the previous section, also time intervals between consecutive tradesτk are found to follow an exponential distribution. Figure 5 shows the survivalprobability distribution of waiting times τk between two consecutive intradaytransactions; dots represent an estimate of the distribution computed on theartificial time series, the continuous line is an exponential distribution withmean λ equal to the average of observed waiting times τk. The null hypothesisthat the empirical distribution is well described by an exponential distribu-tion is confirmed by the Anderson-Darling test at the significance level of 5 %.The average λ of waiting times between consecutive transactions is of coursegreater than λo because many orders are not executed and are then canceled.In the experiments considered, we found λ equals nearly to 50 s with λo setto 20 s.
Title Suppressed Due to Excessive Length 9
0 50 100 150 200 250 300 350 400 45010
−4
10−3
10−2
10−1
100
Sur
viva
l pro
babi
lity
dist
ribut
ion
τ {s}
GASM dataExponential
Fig. 5. Survival probability distribution of waiting times τk between two consecutiveintraday transactions. Dots represent an estimate of the distribution computed onthe artificial time series. The continuous line is an exponential distribution withmean λ equal to the average of observed waiting times τk.
The process of trading is then a Poisson process as the order arrival process.An identical conclusion follows from theoretical considerations. Consider nowthat every transaction occurs when a new order that arrives in the book findsa matching order in the queue of orders of the opposite type. Therefore, anynew order will be satisfied or not in function of the state of the book inthat moment. The state of the book varies for each moment and for eachsimulation path. Given the absence of significant feedbacks in the market,however, it is reasonable to assume that the average state of the book istime invariant. Therefore, each incoming order will be satisfied on averagewith a constant probability and the trading process can be regarded as arandom extraction from the Poisson process of orders issuing. The procedureof random extraction from a Poisson process is called “thinning” and it is wellknown that a thinning from a Poisson process is a new Poisson process; seeRef. [19] for further details.
10 Authors Suppressed Due to Excessive Length
5 Conclusions
This paper presents a computational experiment performed with an artifi-cial financial market where a limit order book is employed as price formationmechanism. From the seminal paper of Beja and Goldman [20] to more re-cent studies, see, e.g., Hommes [21] and Chiarella and Iori [22], statisticalproperties of stock prices have been successfully reproduced by means of het-erogeneous agents models. The innovation of this paper is that fat tails in thereturn distribution may arise even in the case of quasi zero-intelligence agentsand as a consequence of the limit order book without any additional assump-tion on agents behavior. As shown by our previous experiments, an artificialmarket with the clearing house mechanism does not show fat tails of returnsunless specific assumptions are made regarding volatility feedback of wealthdistribution among agents. This finding suggests that the microstructure ofthe market may play a key role in the formation of fat tails of returns. In addi-tion we have shown that the assumption of exponentially distributed waitingtimes between orders results in exponentially distributed waiting time, i.e.,Poisson process, for trades. Indeed, an empirical analysis recently made byone of the author (MR) on intraday data of the General Electric stock, tradedat the New York Stock Exchange, revealed that waiting times between con-secutive trades are well fitted by a stretched exponential [23]. Future researchwill explore the outcome as regarding the waiting times distribution od tradesof non exponentially distributed order waiting times and we will address ourattention to the link between our computational model and existing econo-metric models on asynchronous trading, see e.g. Lo and MacKinlay [24] andEngle and Russell [25].
Acknowledgments
Fruitful discussions with Giulia Iori and Enrico Scalas are acknowledged.This work has been supported by the the Italian Ministry of Education,University and Research (MIUR) under grant FIRB 2001, project RAMSESRBAU01KZ7Z.
References
1. Cincotti S, Focardi SM, Marchesi M, Raberto M (2003) Who wins? Study oflong-run trader survival in an artificial stock market, Physica A 324:227–233
2. Marchesi M, Cincotti S, Focardi SM, Raberto M (2003) The Genoa artificialstock market: microstructure and simulation. In: Cowan R, Jonard N (eds)Heterogenous agents, interactions and economic performance. Springer
3. Raberto M, Cincotti S, Focardi SM, Marchesi M (2001) Agent-based simulationof a financial market, Physica A 299:319–327
Title Suppressed Due to Excessive Length 11
4. Raberto M (2003) Modelling and implementation of an artificial financial mar-ket using object oriented technology: the Genoa artificial stock market. PhDThesis, University of Genoa, Italy
5. LeBaron B (2000) Agent-based computational finance: suggested readings andearly research, Journal of Economic Dynamics and Control 24:679–702
6. Levy M, Levy H, Solomon S (2000) Microscopic simulation of financial markets.Academic Press, New York
7. Palmer RG, Arthur WB, Holland JH, LeBaron BD, Tayler P (1994) Artificialeconomic life: a simple model of a stock market, Physica D 75:264–274
8. Mendelson H (1982) Market behavior in a clearing house, Econometrica50:1505–1524
9. Varian HL (2003) Intermediate microeconomics: a modern approach. W.W.Norton and Co.
10. Biais B, Hillion P, Spatt C (1995) An empirical analysis of the limit order bookand the order flow in the Paris bourse, Journal of Finance 50:1655–1689
11. Maslov S, Mills M (2001) Price fluctuations from the order book perspective:empirical facts and a simple model, Physica A 299:234–246
12. Bouchaud J-P, Mezard M, Potters M (2002) Statistical properties of stock orderbooks: empirical results and models, Quantitative Finance 2:251–256
13. Lo AW, MacKinlay AC, Zhang J (2002) Econometric models of limit-orderexecutions, Journal of Financial Economics 65:31-71
14. Dacorogna MM, Gencay R, Muller U, Olsen RB, Pictet OV (2001) An intro-duction to high frequency finance. Academic Press, New York
15. Bouchaud J-P, Potters M (2000) Theory of financial risks: from statisticalphysics to risk management. Cambridge University Press, Cambridge, UK
16. Mantegna RN, Stanley HE (2000) An introduction to econophysics: correlationsand complexity in finance. Cambridge University Press, Cambridge, UK
17. LiCalzi M, Pellizzari P (2003) Fundamentalists clashing over the book: a studyof order-driven stock markets, Quantitative Finance 3:470-480
18. Enders W (1995) Applied econometric time series. John Wiley and Sons19. Cox DR, Isham V (1980) Point processes. Chapman and Hall20. Beja A, Goldman MB (1980) On the dynamic behavior of prices in disequilib-
rium, Journal of Finance 35:235–24721. Hommes CH (2001) Financial markets as nonlinear adaptive evolutionary sys-
tems, Quantitative Finance 1:149-16722. Chiarella C, Iori G (2002) A simulation analysis of the microstructure of double
auction markets, Quantitative Finance 2:346-35323. Raberto M, Scalas E, Mainardi F (2002) Waiting-times and returns in high-
frequency financial data: an empirical study, Physica A 314:749-75524. Lo AW, MacKinlay AC (1990) An econometric analysis of nonsynchronous
trading, Journal of Econometrics 45:181-21125. Engle RF, Russell JR (1998) Autoregressive conditional duration: a new model
for irregularly spaced transaction data, Econometrica 66:1127-1162