Distal Pancreatectomy with Celiac Axis Resection (DP-CAR ...
Upload
independentCategory
view
5download
0
Original Article
Prevalence estimation of celiac disease in thegeneral adult population of Latvia using serologyand HLA genotyping
Marcis Leja1, Zakera Shums2, Liene Nikitina-Zake3,Mikus Gavars4, Ilze Kikuste4, Jay Milo2, Ilva Daugule4, Jelena Pahomova5,Valdis Pirags6, Vilnis Dzerve5, Janis Klovins3, Andrejs Erglis5 andGary L Norman2
AbstractBackground: Prevalence estimates for celiac disease (CD) depend on the method used. The role of deamidated gliadin
peptide (DGP) and genetic testing in epidemiological studies and diagnostic settings of celiac disease (CD) has still to be
established.
Objectives: The objective of this article is to assess the prevalence of CD in Latvia by combining serological tests with DQ2.5/
DQ8 testing.
Methods: A total of 1444 adults from a randomly selected cross-sectional general population sample were tested by ELISA
for tTG IgA, DGP IgA and IgG antibodies (QUANTA Lite�, Inova Diagnostics Inc). Samples with tTG IgA �20U were tested for
EMA IgA by indirect immunofluorescence assay, and all specimens with tTG IgA �15U were tested by QUANTA-Flash�
chemiluminescent assays (CIA) (Inova Diagnostics Inc) for tTG IgA, DGP IgA and IgG. DQ2.5/8 was detected in individuals
with any positive ELISA test and a subgroup of controls.
Results: Forty-three individuals (2.98%; 95% CI: 2.10–3.86%) tested positive by at least one ELISA test; 41.86% of the
serology-positive individuals (any test above the cutoff) were DQ positive. Six individuals (0.42%; 95% CI: 0.09–0.75%) were
triple ELISA positive, and DQ2.5 or DQ8 was positive in all; 0.35% (95% CI: 0.05–0.65%) were tTG IgA and EMA positive. Two
tTG IgA-negative cases were both DGP IgG and IgA positive, both being DQ positive; including them in the ‘‘serology-
positive’’ group would increase the prevalence to 0.49% (95% CI: 0.13–0.85%).
CIA tests revealed 2 tTG IgA-positive and EMA-negative cases with a positive genotype. DQ2.5 or DQ8 genotype was positive
in 28.6% of the serology-negative population.
Conclusions: Estimates of the prevalence of CD in Latvia based on the serogenetic testing approach range from 0.35% to
0.49% depending on the criteria used. There is a rationale for combining serological tests and DQ2.5/8 genotyping.
KeywordsCeliac disease, prevalence, Eastern Europe, tissue transglutaminase, deamidated gliadin peptide, chemiluminescent assays,
DQ2.5/8 genotype
Received: 16 August 2014; accepted: 1 January 2015
Introduction
The prevalence of celiac disease in Europe and NorthAmerica is generally considered approximately 0.7%–1.5%, although five- to eight-fold inter-country vari-ations have been observed among Northern, Westernand Southern European countries.1–3 Countries withthe highest prevalence include Finland,2,4–6 Sweden7,8
1University of Latvia, Faculty of Medicine, Riga East University Hospital,
Riga, Latvia2Inova Diagnostics Inc, San Diego, CA, USA3Latvian Biomedical Research and Study Centre, Riga, Latvia4University of Latvia, Riga, Latvia5Institute of Cardiology, University of Latvia, Riga, Latvia6University of Latvia, Faculty of Medicine, Pauls Stradins Clinical University
Hospital, Riga, Latvia
Corresponding author:Marcis Leja, Riga East Clinical University Hospital, University of Latvia, 6
Linezera iela, LV1006 Riga, Latvia.
Email: [email protected]
United European Gastroenterology Journal
2015, Vol. 3(2) 190–199
! Author(s) 2015
Reprints and permissions:
sagepub.co.uk/journalsPermissions.nav
DOI: 10.1177/2050640615569379
ueg.sagepub.com
(both countries located near Latvia), andGreat Britain.2,9
The prevalence of celiac disease has grown in parallelwith autoimmune and allergic disease; e.g. simultan-eous growth of celiac disease and diabetes mellitustype 1 has been well demonstrated.4 The epidemiologyof non-infectious diseases varies considerably amongdifferent areas in Europe. Our previous data obtainedfrom the International Study for Asthma and Allergiesin Childhood (ISAAC) demonstrated significantlylower prevalence of asthma, allergic rhinoconjunctivitisand atopic eczema symptoms in Latvia (and othercountries in Eastern Europe) compared to Nordiccountries.10 It is possible similar differences mayalso be seen in the prevalence of celiac disease.Kondrashova et al. compared two populations sharinga similar genotypic background but living under differ-ent socioeconomic and hygienic conditions in the bor-dering areas of Finland and Russian Karelia.11 Theyconcluded celiac disease was significantly more preva-lent in areas with better socioeconomic conditions andhygiene.
Currently the standard initial evaluation of patientswith suspected celiac disease includes testing forimmunoglobulin (Ig)A antibodies to tissue transgluta-minase (tTG IgA).12–14 Recently the use of deamidatedgliadin peptide (DGP) tests has emerged.15,16 DGP (inparticular, the DGP IgG test) may identify celiac dis-ease patients by negative tTG IgA and anti-endomysialIgA (EMA) tests,17 especially IgA-deficient individuals.
Almost all individuals with celiac disease are positivefor human leukocyte antigen (HLA)-DQ2.5 or DQ8genes. While absence of these genes makes the presenceof celiac disease extremely unlikely in most populationsand thus a strong negative predictor of disease, thesegenes are present in a considerable proportion of thegeneral population and are only of value to indicate theunlikely presence of celiac disease in those without thisgenetic background. In Western Europe, the allele fre-quency of DQ2 ranges from 5% to 20%, while that ofDQ8 ranges from 5% to 10%.1
Algorithms guiding the routine clinical use of celiacdisease-related serological and genetic assays are stillevolving. Recent guidelines of the European Societyof Paediatric Gastroenterology and Nutrition(ESPGAN)18 allow consideration of omitting duodenalbiopsies for diagnosing celiac disease in children basedon transglutaminase, EMA and DQ2/DQ8 test resultson particular occasions. Duodenal biopsy is generallyrequired for diagnosing the disease in adults althoughseveral studies have suggested adequate accuracy forserology alone along the lines of the ESPGAN guide-lines, taking into account cutoff levels for positivitymay also be useful for adult patients.19–22 It should benoted that the prevalence estimates of celiac disease are
substantially influenced by the method used in theassessment, i.e. whether seroprevalence only is con-sidered, or biopsy confirmation of the disease isrequired.23
Currently, the clinical value of adding the HLADQ2/DQ8 test to serology in diagnosing celiac diseasein adults is not well defined.24 The combination of ser-ology with HLA DQ testing has been suggested by afew authors to help guide selection of patients forendoscopy and small-bowel biopsy.25,26 However,Hadithi et al.24 have found that the combination ofserological and HLA DQ testing is as accurate aseither of these strategies alone, and have concludedthat for diagnostic purposes these non-invasive strate-gies cannot substitute for small-bowel biopsy. Recently,a serogenetic approach was proposed by Andersonet al.27 for determining the community prevalence ofceliac disease.
Limited information is available on the prevalence ofceliac disease in Eastern Europe. The objective of ourstudy was to assess the prevalence of celiac disease inLatvia based on serology testing alone or in combin-ation with genetic testing. We did not pre-define thecriteria for seropositivity since several serological aswell HLA DQ2/DQ8 testing methods were used. Weemployed conventional tTG IgA and DGP enzyme-linked immunosorbent assays (ELISAs) as well asnew chemiluminescent-based versions of these immuno-assays (CIA). Finally we tested all specimens with posi-tive results by any assay (tTG IgA, DGP IgG, or DGPIgA) for the presence of HLA DQ2.5/DQ8 genotypes tofurther clarify the serology results obtained on thestudy population. Using this methodology, we aimedto investigate the differences in the prevalence resultsof celiac disease under circumstances when differentnon-invasive diagnostic approaches are employed.
Methods
Study group selection
The study was performed as a sub-analysis of a largerrandomly selected cross-sectional sample of an adultgeneral population aged 24–74, the methodology ofwhich has been described elsewhere.28 With the primaryobjective of exploring cardiovascular risk factors, atotal of 6000 invitees equally spilt between age groupsand genders were randomly selected from the NationalLatvian population registry covering the entire countryin 2008–2009; of these, 3807 accepted the invitation andparticipated in the study. In exceptional cases, adultmembers of the family or partners were also included,but not actively invited; a minor proportion of themwere outside the invitation group age range. A sub-group of these individuals for whom serum samples
Leja et al. 191
were available was included in our study. Serum sam-ples received from the clinical laboratory following rou-tine clinical testing were stored at �70�C untiladditional testing was conducted. DNA samples wereprovided by the Latvia Genome Data Base group.
All specimens with positive results for any assaywere referred for genetic testing. In addition, at leastsix matched control cases to every serology-positiveindividual from the serology-negative group were gen-otyped to evaluate the DQ positivity in the serology-negative group.
Serology
All samples were blinded and tested by ELISA for tTGIgA (QUANTA Lite� h-tTG IgA ELISA), DGP IgA(QUANTA Lite� Gliadin IgA II ELISA) and DGPIgG (QUANTA Lite� Gliadin IgG II ELISA). Allkits were manufactured by Inova Diagnostics Inc,USA, and performed according to the manufacturer’sinstructions.
ELISA test results were classified as negative (<20units), weak positive (20–30 units), and moderate/strong positive (>30 units) according the manufac-turer’s recommendations.
All specimens positive by the tTG IgA ELISA assay(�20 units) were tested by indirect immunofluorescence(IFA) for the presence of anti-endomysial IgA antibo-dies (EMA) when sufficient serum was available.Primate distal esophagus tissue substrate (Nova Lite�
Endomysial test system, Inova Diagnostics) was used inthe IFA method; detection of EMA at a dilution of 1:5was interpreted as positive for EMA.
To further assess the performance of the ELISAassays, additional testing was performed on all speci-mens for which the tTG IgA ELISA test result wasabove 15 units (five units below the assay’s cutoff)using the QUANTA-Flash� tTG IgA, DGP IgA, andDGP IgG CIA assays (all assays United States Foodand Drug Administration (FDA) cleared) using theBIO-FLASH chemiluminescent instrument platform(Biokit s.a., Barcelona, Spain).
Genotyping
Direct sequencing of the second exon of the HLA-DQB1 gene and the second and third exons of theDQA1 gene was performed. DNA samples were dis-solved in water and aliquoted into 96-well polymerasechain reaction (PCR) plates or PCR tubes by TecanFreedom Evo robotic pipette. The final DNA amountwas 28 ng/well. The second exon of HLA-DQB1 andsecond and third exons of DQA1 genes were amplifiedand sequenced using the BigDye chemistry and ABIPrism 3100 (AME Bioscience, Toroed, Norway)
capillary electrophoresis sequencer. All chromatogramswere manually inspected and analyzed using the CLCBio Main Workbench package (CLC Bio Inc). Presenceof polymorphisms was confirmed by opposite strandanalysis. Allele calling was performed using theIMGT/HLA database29,30 sequence alignment tooland confirmed by manual alignment of allele sequencesfrom the HLA allele sequence database31 and sequencesobtained by sequencing. DQ 2.5- (HLA-DQA1*05-DQB1*02 in cis or trans) and/or DQ8- (HLA-DQA1*03-DQB1*03:02) positive cases were consideredthe high-risk genotypes for celiac disease.
Statistics
Descriptive statistics were used to characterize thestudy group and the proportion of the positive testresults according to the predefined criteria. Meanvalues, range, standard deviation (SD) and 95% confi-dence intervals (CI) of means were used to describe thedistribution of the measurement results.
Ethical considerations
The project was conducted in accordance with theHelsinki Declaration; the study protocol was approvedby the Ethics Committee of the Institute of Cardiology,University of Latvia; and genetic testing has beenapproved by the Central Medical Committee ofEthics in Latvia.
Results
A total of 1444 serum samples were available for thestudy. The cohort consisted of 982 (68%) women and462 men; median age was 57. Approximately 39% (558)of the samples were collected in Riga, the capital ofLatvia, with the remaining coming from other regionsof the country. The age distribution of study partici-pants was as follows: age <40 (217 cases, 15.0%); age40–54 (438 individuals, 30.3%); age 55–69 (542 individ-uals, 37.6%); >70 years (70 individuals, 17.1%).Altogether 64 individuals were outside the primary invi-tation group; seven were younger than 25 and 57 olderthan 74.
ELISA serology results
Conventional assay testing results are summarized inTable 1, while those obtained with CIA assays areshown in Table 2. Results were combined into severalpossible profiles and the estimated prevalence calcu-lated based on either serological test results only orby combining serological test interpretation with thepresence of DQ2.5 or DQ8 genotype. For the ELISA
192 United European Gastroenterology Journal 3(2)
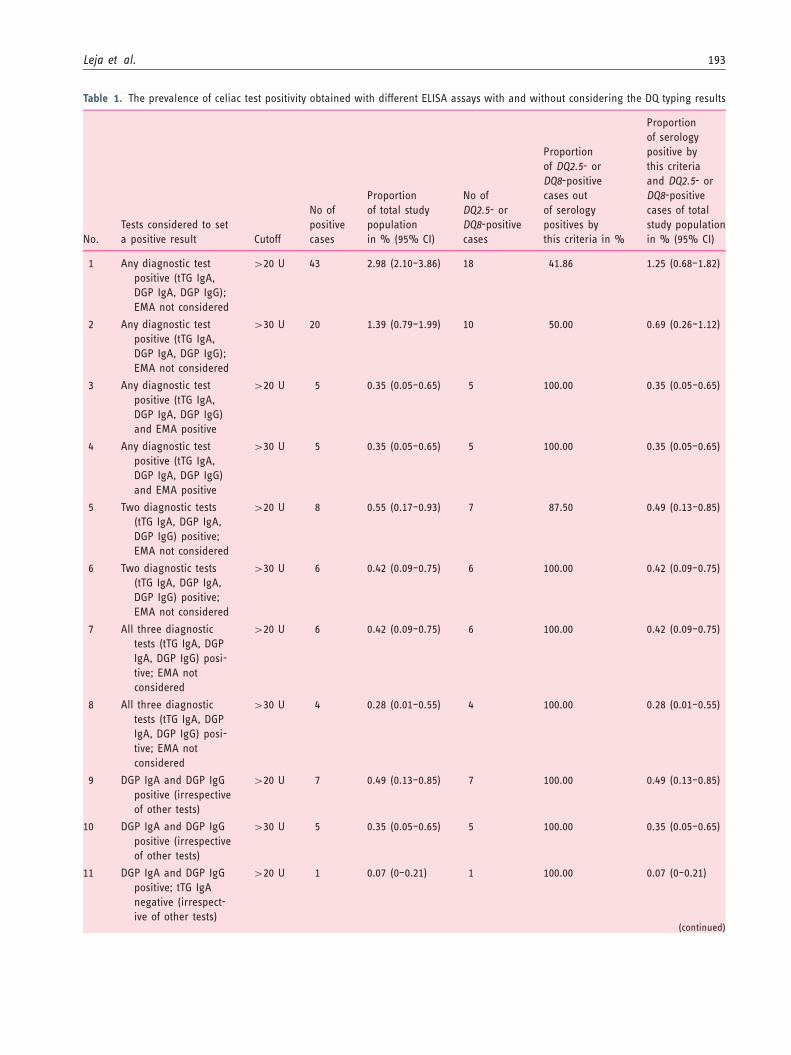
Table 1. The prevalence of celiac test positivity obtained with different ELISA assays with and without considering the DQ typing results
No.
Tests considered to set
a positive result Cutoff
No of
positive
cases
Proportion
of total study
population
in % (95% CI)
No of
DQ2.5- or
DQ8-positive
cases
Proportion
of DQ2.5- or
DQ8-positive
cases out
of serology
positives by
this criteria in %
Proportion
of serology
positive by
this criteria
and DQ2.5- or
DQ8-positive
cases of total
study population
in % (95% CI)
1 Any diagnostic test
positive (tTG IgA,
DGP IgA, DGP IgG);
EMA not considered
>20 U 43 2.98 (2.10–3.86) 18 41.86 1.25 (0.68–1.82)
2 Any diagnostic test
positive (tTG IgA,
DGP IgA, DGP IgG);
EMA not considered
>30 U 20 1.39 (0.79–1.99) 10 50.00 0.69 (0.26–1.12)
3 Any diagnostic test
positive (tTG IgA,
DGP IgA, DGP IgG)
and EMA positive
>20 U 5 0.35 (0.05–0.65) 5 100.00 0.35 (0.05–0.65)
4 Any diagnostic test
positive (tTG IgA,
DGP IgA, DGP IgG)
and EMA positive
>30 U 5 0.35 (0.05–0.65) 5 100.00 0.35 (0.05–0.65)
5 Two diagnostic tests
(tTG IgA, DGP IgA,
DGP IgG) positive;
EMA not considered
>20 U 8 0.55 (0.17–0.93) 7 87.50 0.49 (0.13–0.85)
6 Two diagnostic tests
(tTG IgA, DGP IgA,
DGP IgG) positive;
EMA not considered
>30 U 6 0.42 (0.09–0.75) 6 100.00 0.42 (0.09–0.75)
7 All three diagnostic
tests (tTG IgA, DGP
IgA, DGP IgG) posi-
tive; EMA not
considered
>20 U 6 0.42 (0.09–0.75) 6 100.00 0.42 (0.09–0.75)
8 All three diagnostic
tests (tTG IgA, DGP
IgA, DGP IgG) posi-
tive; EMA not
considered
>30 U 4 0.28 (0.01–0.55) 4 100.00 0.28 (0.01–0.55)
9 DGP IgA and DGP IgG
positive (irrespective
of other tests)
>20 U 7 0.49 (0.13–0.85) 7 100.00 0.49 (0.13–0.85)
10 DGP IgA and DGP IgG
positive (irrespective
of other tests)
>30 U 5 0.35 (0.05–0.65) 5 100.00 0.35 (0.05–0.65)
11 DGP IgA and DGP IgG
positive; tTG IgA
negative (irrespect-
ive of other tests)
>20 U 1 0.07 (0–0.21) 1 100.00 0.07 (0–0.21)
(continued)
Leja et al. 193
assays, profiles were evaluated using both the manufac-turer’s specified cutoff of �20 units, as well as a mod-ified cutoff of >30 units. For the CIA versions of theassays, the manufacturer’s cutoff of �20 units was used.
The tTG IgA was �20 units in 24 cases (1.66%), �30units in 11 cases (0.76%), �40 units in seven cases(0.48%), and �50 units in five cases (0.35%). TheDGP IgA result was �20 units in 17 cases (1.18%),�30 units in eight cases (0.55%), 40 units in five cases(0.35%), and 50 units in four cases (0.28%). The DGPIgG result was �20 units in 16 cases (1.11%); itexceeded 30 units in 11 cases (0.76%), 40 units inseven cases (0.48%), and 50 units in four cases (0.28%).
Six individuals (0.42%) were triple positive at �20 Ufor tTG IgA, DGP IgG, and DGP IgA, and four ofthese (0.28% of the entire group) had all three markers>30 U. Among the triple-positive group, the mean tTGIgA value was 180.7 (range 21.64–269.19; SD 95.67;95% CI of the mean 80.20–281.10), the mean DGPIgA was 108.77 (range 21.75–205.97; SD 66.33; 95%CI 39.16; 178.38), and the mean DGP IgG was 49.02(range 40.06–58.01; SD 6.98; 95% CI 41.69; 56.34). Allfour cases exceeding the 30-unit level for the ELISAtests were EMA positive. Of the remaining two individ-uals in whom at least one of the test results ranged
between 20 and 30 units, one was EMA positive andone was EMA negative.
Eight participants (0.55%) were positive by at leasttwo markers. Forty-three specimens (2.98%) were posi-tive by at least one marker with magnitude over 20units, while 20 cases (1.39%) were positive by at leastone marker with magnitude over 30 units.
CIA serology results
Serology results obtained using CIA were available for82 cases selected as described in the Methods section.The selection of the cases allowed us to compare theresult to the group of positive ELISA cases, but also tothe entire study population. Thirteen specimens (0.9%of the total study group) were positive by one or moreof the CIA assays. Using more stringent criteria of anytwo tests positive found seven (0.48%) individuals posi-tive. Five cases (0.35%) were triple positive. The differ-ence between the double and triple positive is a result oftwo tTG IgA-negative specimens being detected by theDGP IgG and IgA assays. All triple-positive specimenswere EMA positive. The two specimens that were onlyDGP IgG and IgA dual positive were EMA negative asexpected, since they were tTG negative.
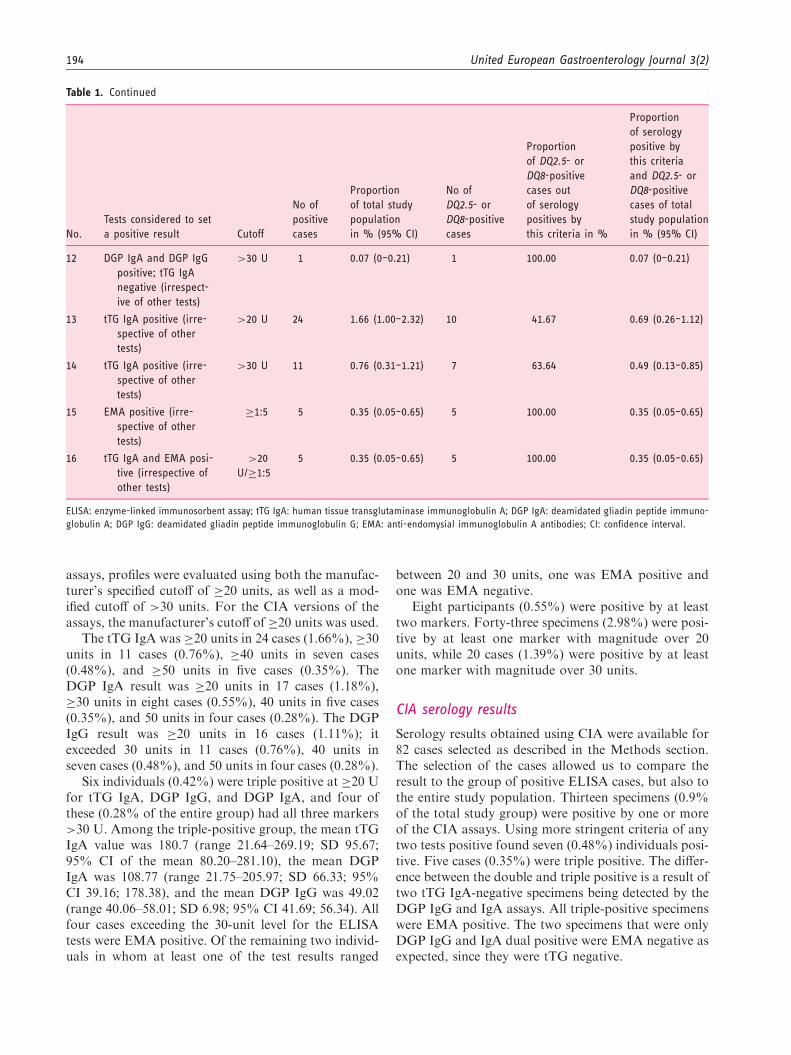
Table 1. Continued
No.
Tests considered to set
a positive result Cutoff
No of
positive
cases
Proportion
of total study
population
in % (95% CI)
No of
DQ2.5- or
DQ8-positive
cases
Proportion
of DQ2.5- or
DQ8-positive
cases out
of serology
positives by
this criteria in %
Proportion
of serology
positive by
this criteria
and DQ2.5- or
DQ8-positive
cases of total
study population
in % (95% CI)
12 DGP IgA and DGP IgG
positive; tTG IgA
negative (irrespect-
ive of other tests)
>30 U 1 0.07 (0–0.21) 1 100.00 0.07 (0–0.21)
13 tTG IgA positive (irre-
spective of other
tests)
>20 U 24 1.66 (1.00–2.32) 10 41.67 0.69 (0.26–1.12)
14 tTG IgA positive (irre-
spective of other
tests)
>30 U 11 0.76 (0.31–1.21) 7 63.64 0.49 (0.13–0.85)
15 EMA positive (irre-
spective of other
tests)
�1:5 5 0.35 (0.05–0.65) 5 100.00 0.35 (0.05–0.65)
16 tTG IgA and EMA posi-
tive (irrespective of
other tests)
>20
U/�1:5
5 0.35 (0.05–0.65) 5 100.00 0.35 (0.05–0.65)
ELISA: enzyme-linked immunosorbent assay; tTG IgA: human tissue transglutaminase immunoglobulin A; DGP IgA: deamidated gliadin peptide immuno-
globulin A; DGP IgG: deamidated gliadin peptide immunoglobulin G; EMA: anti-endomysial immunoglobulin A antibodies; CI: confidence interval.
194 United European Gastroenterology Journal 3(2)
HLA DQ testing results
All 43 individuals positive for any of the serologicaltests along with 280 individuals negative for all sero-logical tests were available for the analysis. In the ser-ology-negative group the prevalence of a positiveDQ2.5 genotype was 18.93%, the prevalence of aDQ8 genotype was 10.36%, but the combination of apositive DQ2.5 or DQ8 genotype was 28.57%. DQ2.2
was positive in 10.71%, of whom all were DQ2.5 andDQ8 negative.
In the group of 43 patients in whom at least oneserological test was positive, 37.21% were DQ2.5 posi-tive, 6.98% were DQ8 positive; 41.86% were positivefor either DQ2.5 or DQ8. A total of 46.5% of theDQ2.5/DQ8-negative cases in this subgroup wereDQ2.2 positive.
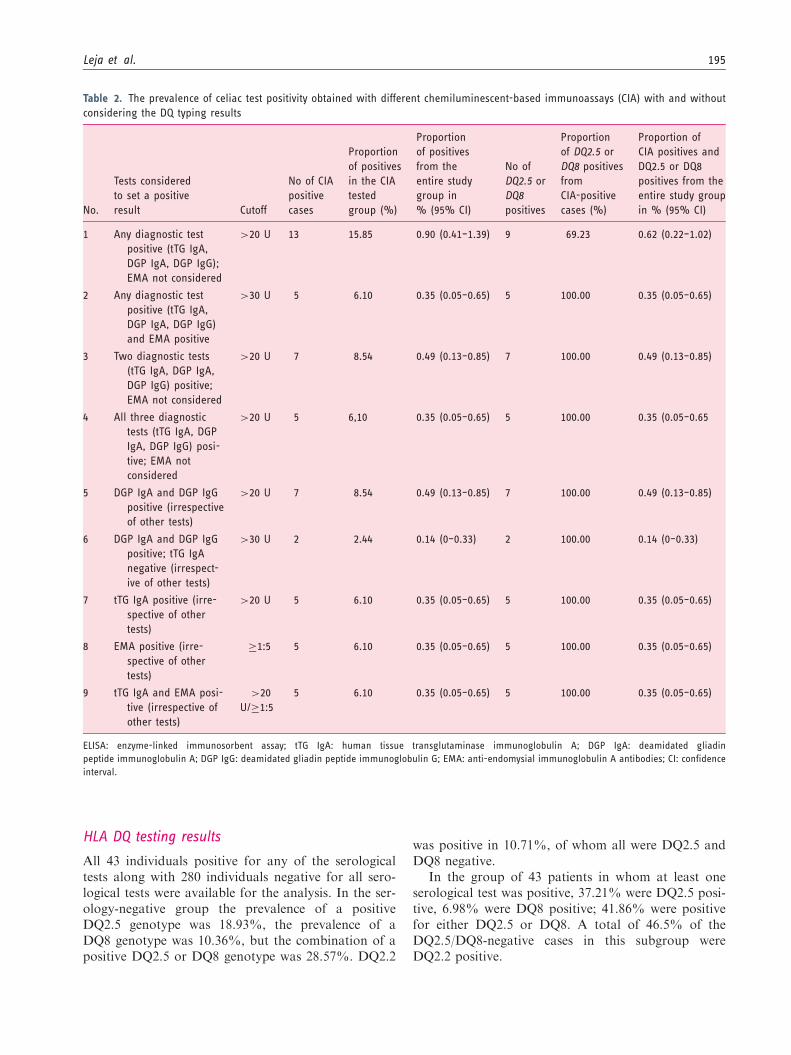
Table 2. The prevalence of celiac test positivity obtained with different chemiluminescent-based immunoassays (CIA) with and without
considering the DQ typing results
No.
Tests considered
to set a positive
result Cutoff
No of CIA
positive
cases
Proportion
of positives
in the CIA
tested
group (%)
Proportion
of positives
from the
entire study
group in
% (95% CI)
No of
DQ2.5 or
DQ8
positives
Proportion
of DQ2.5 or
DQ8 positives
from
CIA-positive
cases (%)
Proportion of
CIA positives and
DQ2.5 or DQ8
positives from the
entire study group
in % (95% CI)
1 Any diagnostic test
positive (tTG IgA,
DGP IgA, DGP IgG);
EMA not considered
>20 U 13 15.85 0.90 (0.41–1.39) 9 69.23 0.62 (0.22–1.02)
2 Any diagnostic test
positive (tTG IgA,
DGP IgA, DGP IgG)
and EMA positive
>30 U 5 6.10 0.35 (0.05–0.65) 5 100.00 0.35 (0.05–0.65)
3 Two diagnostic tests
(tTG IgA, DGP IgA,
DGP IgG) positive;
EMA not considered
>20 U 7 8.54 0.49 (0.13–0.85) 7 100.00 0.49 (0.13–0.85)
4 All three diagnostic
tests (tTG IgA, DGP
IgA, DGP IgG) posi-
tive; EMA not
considered
>20 U 5 6,10 0.35 (0.05–0.65) 5 100.00 0.35 (0.05–0.65
5 DGP IgA and DGP IgG
positive (irrespective
of other tests)
>20 U 7 8.54 0.49 (0.13–0.85) 7 100.00 0.49 (0.13–0.85)
6 DGP IgA and DGP IgG
positive; tTG IgA
negative (irrespect-
ive of other tests)
>30 U 2 2.44 0.14 (0–0.33) 2 100.00 0.14 (0–0.33)
7 tTG IgA positive (irre-
spective of other
tests)
>20 U 5 6.10 0.35 (0.05–0.65) 5 100.00 0.35 (0.05–0.65)
8 EMA positive (irre-
spective of other
tests)
�1:5 5 6.10 0.35 (0.05–0.65) 5 100.00 0.35 (0.05–0.65)
9 tTG IgA and EMA posi-
tive (irrespective of
other tests)
>20
U/�1:5
5 6.10 0.35 (0.05–0.65) 5 100.00 0.35 (0.05–0.65)
ELISA: enzyme-linked immunosorbent assay; tTG IgA: human tissue transglutaminase immunoglobulin A; DGP IgA: deamidated gliadin
peptide immunoglobulin A; DGP IgG: deamidated gliadin peptide immunoglobulin G; EMA: anti-endomysial immunoglobulin A antibodies; CI: confidence
interval.
Leja et al. 195
The proportion of the risk genotype (DQ2.5 or DQ8genotype) in the subgroups of positive serological testsis presented in Tables 1 and 2.
Discussion
Although celiac disease is considered common, the gen-eral estimates of 1%–1.5% are based on studies con-ducted mainly in Northern and Western Europe andcould be an overestimate for other regions ofEurope.23 Even in Western Europe, estimates of theprevalence of the disease vary, e.g. in Germany theprevalence in the adult population is estimated to beapproximately 0.3%.2,32
The present study is the first on celiac disease epi-demiology in Latvia, one of the three Baltic countries inNortheastern Europe where considerable political andsocioeconomic changes have taken place over the lastcentury. A previous study conducted in schoolchildrenfrom Estonia, another Baltic country, revealed a 0.34%prevalence of celiac disease.33,34 In Polish children theprevalence of confirmed celiac disease is 0.25%, but theprevalence of positive serology is 0.8%.35
Prevalence figures in epidemiological studies are sub-stantially influenced by the criteria set for diagnosingceliac disease.2 This was clearly demonstrated in ourstudy. If the standard cutoff value (�20 U) was used,a positive result was obtained in 2.98% of the popula-tion, suggesting a high seroprevalence of celiac disease.However, when more stringent criteria were applied,the results suggested a lower disease prevalence.Using a triple-positive criterion (tTG IgA, DGP IgA,and DGP IgG), positivity ranged between 0.28% and0.42% depending on the cutoff value used. Adding apositive EMA test as a requirement for positivitydecreased the prevalence to 0.35%. It should be men-tioned that our prevalence estimates have been basedon non-invasive testing only; therefore, the prevalenceof biopsy-confirmed celiac disease in this populationcould be even lower. Furthermore, since the proportionof women in our study group was higher than men andconsidering the fact that celiac disease is more prevalentin women,36 this could lead to an additional overesti-mation of the prevalence in the general population ofthe country.
Our study confirmed the usefulness of adding genetictesting to the conventional serology for establishing theprevalence figures of the disease as recently suggestedby Anderson et al.27 When the interpretative criteriafor celiac disease positivity was a positive result ofany ELISA test (cutoff �20 U), the DQ2.5/DQ8 posi-tivity was only 41.9%, suggesting that a proportion ofthe serology positives were unlikely to be true celiacs.By design, screening algorithms should have high sen-sitivity to detect all individuals with the specific disease,
in this case, celiac disease. Presumed false-positiveresults (usually low positives) are expected in screening,and follow-up testing is used to increase specificity ofthe testing. As criteria are made more stringent, theproportion of positive DQ test results increased; e.g.when test positivity by two ELISAs is required with acutoff of 20 U, the DQ2.5/8 test was positive in 87.5%cases, but when the cutoff limit was set to >30 U, theDQ2.5/8 test was positive in 100% of the cases.Similarly when all three serology tests were positive,DQ2.5/8 was positive in 100%. Correspondingly, forthe CIA assays, when any of the tTG IgA, DGP IgG,or DGP IgA tests were positive, 69.2% were DQ2.5 orDQ8 positive. When any two tests or three tests werepositive, 100% were DQ positive.
Based on the assumption that virtually all celiacsmust have HLA DQ2.5 or DQ8 genes, the combinedresults of ELISA, CIA, EMA, and DQ2.5/8 testing sug-gest at a minimum the prevalence of celiac disease inLatvia is approximately 0.35% (95% CI: 0.05–0.65%).This estimate is based on specimens being triple positive(tTG IgA, DGP IgA, DGP IgG), EMA positive andpossessing HLA DQ2.5 or DQ8. Inclusion of the twoindividuals who were DGP IgG and IgA dual positiveand DQ2.5 or DQ8 positive would increase the preva-lence to 0.49% (95% CI: 0.13–0.85%). We wouldspeculate that similar prevalence could also be presentin neighboring countries, e.g. other Baltic States or EastEuropean countries with similar socioeconomicbackgrounds.
The accepted standard for the serological screeningfor celiac disease is detection of IgA antibodies to tTG.There are many tTG assays available and overall mostshow greater than 93%–95% sensitivity and specifi-city.37 At least 0.21% of the Caucasian populationhas selective IgA deficiency and more than 2% of thepopulation presents with subnormal IgA levels.38
Individuals with IgA deficiency have a higher likelihoodof celiac disease than the general population,1 but thepresence of this condition could lead to misdiagnosis ifonly IgA-based tests are applied.7 Guidelines com-monly recommend simultaneous detection of totalserum IgA for ruling out IgA deficiency;14 however,the use of IgG-based tests is an alternative.39
EMA, performed and interpreted by experiencedindividuals, remains an extremely specific test forceliac disease, but its sensitivity is less than tTG IgA37
and clinically proven patients with the disease can bemissed if this is the only test employed. Moreover,many laboratories in Europe do not have the EMAtest available; e.g. EMA detection is currently not pro-vided by any laboratory in Latvia. Therefore, improvedserological or serogenetic approaches are of specialimportance to select individuals requiring further diag-nostic workup, including duodenal biopsies, and also to
196 United European Gastroenterology Journal 3(2)
avoid unnecessary investigations. A combination oftwo or more assays, especially the addition of DGPIgA and DGP IgG to tTG tests, was recently suggestedby Schyum and Rumessen.37 Our study confirms therationale for such an approach and suggests the add-ition of the HLA risk-genotype can assist in clarifyingresults.
In the present study we used tTG and DGP assays inthe conventional ELISA format as well as a new chemi-luminescent format. Chemiluminescence allows anassay with a high signal-to-noise ratio and widedynamic range.
The strongest evidence for the presence of celiacdisease is the case where all tests are positive. UsingELISA, six individuals (0.42%, six of 1444) werefound to be positive for tTG IgA, DGP IgG, andDGP IgA. All six were also DQ2.5 or DQ8 positive;five of these were EMA positive. CIA testing foundfive of the six also positive for all three assays, butfound one specimen tTG IgA negative (this specimenwas very low positive on the ELISA tTG IgA). TheCIA assay picked up two additional specimensthat were tTG IgA negative, but DGP IgG andIgA positive (and DQ2.5/DQ8 positive). TheELISA assay also picked up one of these two add-itional specimens.
The CIA and ELISA tests, in combination with theHLA DQ 2.5/DQ8 results, detected all five EMA-posi-tive cases. For specimens with double or triple positiv-ity by either CIA or ELISA and the presence of HLADQ2.5/DQ8 genotype, the EMA test did not add add-itional diagnostic value.
Our study has several limitations. By following theprotocol of the study, EMA tests and CIA tests werenot run on the entire study population partly because oflimited serum volume. However, since all specimenswithout EMA testing (except for one) were negativefor all celiac serology, it is exceedingly unlikely EMAtesting would have found additional positive specimens.A major limitation of the current study is the unavail-ability of duodenal biopsy results, therefore makingdefinitive diagnosis of celiac disease impossible.Follow-up of laboratory-positive individuals withendoscopic evaluation is being pursued, but is practic-ally difficult to accomplish.
In conclusion, our study suggests the prevalence ofceliac disease in Latvian adults is lower than in manyneighboring Nordic countries. Furthermore, ourresults suggest the rationale for combining severalserological tests, in particular the new CIA versionsof the tTG and DGP assays, may offer higherperformance than conventional ELISAs and thatthe addition of HLA DQ2.5/DQ8 genotyping canhelp clarify serology results and avoid unnecessaryendoscopies.
Conflict of interest
Gary L. Norman, Zakera Shums, and Jay Milo are employees
of Inova Diagnostics. All other authors have nothing todeclare.
Funding
This work was supported in part by the project of the
European Fund for Regional Development no. 2010/0302/2DP/2.1.1.1.0/10/APIA/VIAA/158 ‘‘Development of a gen-etic/serological biomarker diagnostic method for early iden-tification or premalignant lesions in patients with
autoimmune disease.’’ The collection of material and clinicaldata was performed within the National Research Program‘‘Main diseases threatening the life expectancy and life quality
of the Latvian population.’’
Acknowledgments
We thank all the individuals who consented to participate inthis study. The authors acknowledge the research group
involved in recruitment, questioning and sampling of thepopulation target group, in particular A. Rozenbergs,T. Bolsakova, N. Bricina, I. Lapsa, K. Rinkuzs,
G. Mitjuseva, L. Lagzdina, I. Roziska, L. Irmeja, L.Viskers, A. Mezals and I. Mezale. We acknowledge InovaDiagnostics Inc, San Diego, CA, USA, in particular
P. Martis and G. Lakos, for supporting the study with labora-tory diagnostics, as well as the Genome Database of LatvianPopulation and the Latvian Biomedical Research and Study
Centre for providing data, DNA samples and technicalassistance.
Author contributions include: M. Leja: principal design ofthe study, analysis of the results, writing of the manuscript;
Z. Shums, J. Milo, G. Norman: participation in the design ofthe study, serology testing, analysis of the results, writing themanuscript; L. Nikitina-Zake, M. Gavars, J. Klovins: HLA
DQ testing, data analysis and interpretation, participation inwriting the manuscript; I. Kikuste, I. Daugule, J. Pahomova,V. Pirags, V. Dzerve, A. Erglis: clinical data collection, par-
ticipation in writing the manuscript; all: final approval of themanuscript.
References
1. Kang JY, Kang AH, Green A, et al. Systematic review:
Worldwide variation in the frequency of coeliac disease
and changes over time. Aliment Pharmacol Ther 2013;
38: 226–245.2. Mustalahti K, Catassi C, Reunanen A, et al. The preva-
lence of celiac disease in Europe: Results of a centralized,
international mass screening project. Ann Med 2010; 42:
587–595.3. Rubio-Tapia A, Ludvigsson JF, Brantner TL, et al. The
prevalence of celiac disease in the United States. Am J
Gastroenterol 2012; 107: 1538–1544.4. Lohi S, Mustalahti K, Kaukinen K, et al. Increasing
prevalence of coeliac disease over time. Aliment
Pharmacol Ther 2007; 26: 1217–1225.
Leja et al. 197
5. Vilppula A, Collin P, Maki M, et al. Undetected coeliac
disease in the elderly: A biopsy-proven population-based
study. Dig Liver Dis 2008; 40: 809–813.6. Maki M, Mustalahti K, Kokkonen J, et al. Prevalence of
celiac disease among children in Finland. N Engl J Med
2003; 348: 2517–2524.7. Carlsson AK, Axelsson IE, Borulf SK, et al. Serological
screening for celiac disease in healthy 2.5-year-old chil-
dren in Sweden. Pediatrics 2001; 107: 42–45.
8. Walker MM, Murray JA, Ronkainen J, et al. Detection
of celiac disease and lymphocytic enteropathy by parallel
serology and histopathology in a population-based study.
Gastroenterology 2010; 139: 112–119.9. West J, Logan RF, Hill PG, et al. Seroprevalence, correl-
ates, and characteristics of undetected coeliac disease in
England. Gut 2003; 52: 960–965.10. Bjorksten B, Dumitrascu D, Foucard T, et al.
Prevalence of childhood asthma, rhinitis and eczema in
Scandinavia and Eastern Europe. Eur Respir J 1998; 12:
432–437.11. Kondrashova A, Mustalahti K, Kaukinen K, et al. Lower
economic status and inferior hygienic environment may
protect against celiac disease. Ann Med 2008; 40: 223–
231.
12. Clinical Resource Efficiency Support Team (Northern
Ireland). Guidelines for the diagnosis and management
of coeliac disease in adults, http://www.gain-ni.org/
index.php/guidelines-for-the-diagnosis-and-management-
of-coeliac-disease-in-adults (accessed 16 August 2014).
13. Bardella MT, Minoli G, Ravizza D, et al. Increased
prevalence of celiac disease in patients with dyspepsia.
Arch Intern Med 2000; 160: 1489–1491.14. Bai JC, Fried M, Corazza GR, et al.
World Gastroenterology Organisation global guide-
lines on celiac disease. J Clin Gastroenterol 2013; 47:
121–126.15. Vermeersch P, Geboes K, Marien G, et al. Diagnostic
performance of IgG anti-deamidated gliadin peptide anti-
body assays is comparable to IgA anti-tTG in celiac dis-
ease. Clin Chim Acta 2010; 411: 931–935.16. Sayed SK, Imam HM, Mahran AM, et al. Diagnostic
utility of deamidated gliadin peptide antibody in celiac
disease compared to anti-tissue transglutaminase and
IgA– endomysium antibodies. Egypt J Immunol 2012;
19: 41–52.17. Volta U, Granito A, Parisi C, et al. Deamidated gliadin
peptide antibodies as a routine test for celiac disease: A
prospective analysis. J Clin Gastroenterol 2010; 44:
186–190.
18. Husby S, Koletzko S, Korponay-Szab0 IR, et al.
European Society for Pediatric Gastroenterology,
Hepatology, and Nutrition guidelines for the diagnosis
of coeliac disease. J Pediatr Gastroenterol Nutr 2012;
54: 136–160.19. Hill PG and and Holmes GK. Coeliac disease: A biopsy
is not always necessary for diagnosis. Aliment Pharmacol
Ther 2008; 27: 572–577.
20. Vivas S, Ruiz de Morales JG, Riestra S, et al. Duodenal
biopsy may be avoided when high transglutaminase
antibody titers are present. World J Gastroenterol 2009;
15: 4775–4780.
21. Tortora R, Imperatore N, Capone P, et al. The presence
of anti-endomysial antibodies and the level of anti-tissue
transglutaminases can be used to diagnose adult coeliac
disease without duodenal biopsy. Aliment Pharmacol
Ther 2014; 40: 1223–1229.
22. Lakos G, Norman GL, Mahler M, et al. Analytical and
clinical comparison of two fully automated immunoassay
systems for the diagnosis of celiac disease. J Immunol Res
2014; 2014: 371263.23. Biagi F, Klersy C, Balduzzi D, et al. Are we not over-
estimating the prevalence of coeliac disease in the general
population? Ann Med 2010; 42: 557–561.24. Hadithi M, von Blomberg BM, Crusius JB, et al.
Accuracy of serologic tests and HLA-DQ typing for
diagnosing celiac disease. Ann Intern Med 2007; 147:
294–302.25. Collin P. New diagnostic findings in coeliac disease. Ann
Med 1999; 31: 399–405.26. Csizmadia CG, Mearin ML, Oren A, et al. Accuracy and
cost-effectiveness of a new strategy to screen for celiac
disease in children with Down syndrome. J Pediatrics
2000; 137: 756–761.
27. Anderson RP, Henry MJ, Taylor R, et al. A novel ser-
ogenetic approach determines the community prevalence
of celiac disease and informs improved diagnostic path-
ways. BMC Med 2013; 11: 1–13.28. Erglis A, Dzerve V, Pahomova-Strautina J, et al. A
population-based cross-sectional study of cardiovascular
risk factor in Latvia. Medicina (Kaunas) 2012; 48:
310–316.29. Robinson J, Halliwell JA, McWilliam H, et al. The
IMGT/HLA database. Nucleic Acids Res 2013;
41(Database issue): D1222–D1227.30. Robinson J, Malik A, Parham P, et al. IMGT/HLA data-
base—a sequence database for the human major histo-
compatibility complex. Tissue Antigens 2000; 55:
280–287.
31. Robinson J, Waller MJ, Parham P, et al. IMGT/HLA
and IMGT/MHC: Sequence databases for the study of
the major histocompatibility complex. Nucleic Acids Res
2003; 31: 311–314.32. Kratzer W, Kibele M, Akinli A, et al. Prevalence of celiac
disease in Germany: A prospective follow-up study.
World J Gastroenterol 2013; 19: 2612–2620.
33. Ress K, Harro M, Maaroos HI, et al. High prevalence of
coeliac disease: Need for increasing awareness among
physicians. Dig Liver Dis 2007; 39: 136–139.34. Lillemae K, Ress K, Harro J, et al. A 10-year serological
follow-up of celiac disease in an Estonian population. Eur
J Gastroenterol Hepatol 2012; 24: 55–58.35. Szaflarska-Popiawska A, Parzecka M, Muller L, et al.
Screening for celiac disease in Poland. Med Sci Monit
2009; 15: PH7–PH11.36. Abu-Zeid YA, Jasem WS, Lebwohl B, et al.
Seroprevalence of celiac disease among United Arab
Emirates healthy adult nationals: A gender disparity.
World J Gastroenterol 2014; 20: 15830–15836.
198 United European Gastroenterology Journal 3(2)

37. Schyum AC and and Rumessen JJ. Serological testing forceliac disease in adults. United European GastroenterologyJ 2013; 1: 319–325.
38. Weber-Mzell D, Kotanko P, Hauer AC, et al. Gender,age and seasonal effects on IgA deficiency: A study of7293 Caucasians. Eur J Clin Invest 2004; 34: 224–228.
39. Holt PD, Tandy NP and and Anstee DJ. Screening of
blood donors for IgA deficiency: A study of the donor
population of south-west England. J Clin Pathol 1977; 30:
1007–1010.
Leja et al. 199
Copyright © 2022 FDOKUMEN