pressure ulcer: prevalence, incidence, risk factors, and the ...
315
1 PRESSURE ULCER: PREVALENCE, INCIDENCE, RISK FACTORS, AND THE PREDICTIVE VALIDITY OF THE BRADEN Q AND THE GLAMORGAN RISK ASSESSMENT SCALES IN PAEDIATRICS LAILA HABIB ALLAH A Thesis submitted in partial fulfilment of the requirements of the degree of Doctor of Philosophy in Paediatric Nursing Through The School of Nursing and Midwifery De Montfort University U.K. April 2013
-
Upload
khangminh22 -
Category
Documents
-
view
0 -
download
0
Transcript of pressure ulcer: prevalence, incidence, risk factors, and the ...
1
PRESSURE ULCER: PREVALENCE,
INCIDENCE, RISK FACTORS, AND THE
PREDICTIVE VALIDITY OF THE BRADEN Q
AND THE GLAMORGAN RISK ASSESSMENT
SCALES IN PAEDIATRICS
LAILA HABIB ALLAH
A Thesis submitted in partial fulfilment of the requirements of the degree of Doctor of Philosophy in Paediatric Nursing
Through
The School of Nursing and Midwifery
De Montfort University
U.K.
April 2013

2
“The first step in the risk management process is to acknowledge the reality of risk.
Denial is a common tactic that substitutes deliberate ignorance for thoughtful
planning.”
Charles Tremper, Professor of Law and Psychology, USA
3
DEDICATION
‘’Who doesn’t thanks people doesn’t thank God’’
All praise and thanks are due to our merciful guide, ALLAH, who gave me the strength to go
through this long journey of hard work, tiredness, fears, and waits.
Thank you for giving me Hope and belief in my abilities to complete what I started with
patients, with tenacity and determination.
Thanks again and again for giving me all of my loved ones, who supported me all the way:
My Mum
Your love and care was the candle in my darkest days, and my safeguard against my fears
My Husband
My soul-mate Ahmad... I was lost for words when I started writing this... thanks for treating me
like a loving father holding his little girl’s hand to help her cross the road.
My little Daughters
Sadeen, 5 years, Rahaf, 2 years, and Hala, 10 months
Big Sorry my angels... for letting your childhood days pass while I’m here and not here at the
same time!!
My supportive sisters and brother...and my bigger beloved family
Without your help taking care of me and my girls, I would not be able to continue this work, and
focus on my study... I was reassured that my daughters were in safe hands thanks to you...
This work is specifically dedicated for my beloved dears, who left my life early before I
reached where I am; my dad, and my young sister; Abeer. I believe you are there watching
me now with a smile!
And finally... this work is dedicated to All Children who suffer illness and pain, rather than living happily and safe...

4
ACKNOWLEDGEMENT
It is the will of only One, who made all of this possible; ALLAH... to him are due my ultimate
thanks.
First of all, I would like to sincerely thank my first supervisor, Prof. Denis Anthony, for his
continuous guidance, support, and encouragement throughout this study, and especially for his
confidence in me. Your help, experience and thoughts have definitely added too much for my
learning experience, that I would never forget.
My heartfelt gratefulness also goes to Dr. Jane Willock, for her invaluable assistance and
instruction; I learned from the best. Thanks for spending your valuable time reading my lengthy
early drafts of the chapters of this thesis.
I would also thank Dr. Peter Norrie for serving as a member of my thesis supervisory team. His
comments were beneficial, especially in the early days of preparing this thesis; your guidance
helped me to guarantee my ethical approval, and to Dr. Mohammad Al-Saleh, thanks for
accepting to be an adviser for me in Jordan.
Additionally, I would like to thank the hospital personnel who helped me the best they could
during the data collection phase of this research work. Many thanks also go to the ethical
committees in the hospital, and in De Montfort University.
I sincerely appreciate the assistance rendered by staff in De Montfort University, especially
those in the Graduate School Office, the Faculty Research Office, and the School of Nursing for
their help in organising all the paperwork necessary and administrative facilitation of this work.
Special thanks are due to all patients and their families who participated in this study, for their
time and help; without you I could not accomplish this thesis. Thanks for every child tolerating
my skin assessment, without having any beneficence, except for the essence of knowledge and
the reduction of other children’s suffering.
Thanks for every mum and dad who agreed their child to participate, despite the hard time and
condition they suffered.
Finally, I would like to thank all the other people that I do not have room to name, who have helped me throughout my study over the last three years.
5
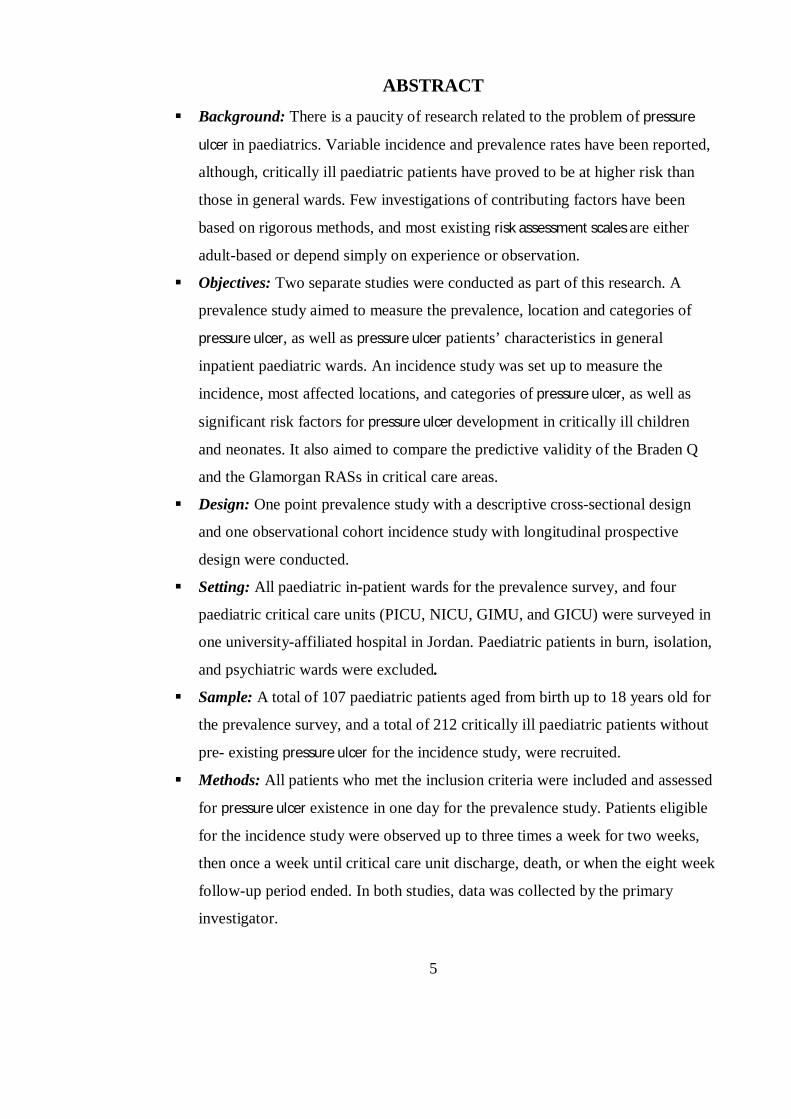
ABSTRACT Background: There is a paucity of research related to the problem of pressure
ulcer in paediatrics. Variable incidence and prevalence rates have been reported,
although, critically ill paediatric patients have proved to be at higher risk than
those in general wards. Few investigations of contributing factors have been
based on rigorous methods, and most existing risk assessment scales are either
adult-based or depend simply on experience or observation.
Objectives: Two separate studies were conducted as part of this research. A
prevalence study aimed to measure the prevalence, location and categories of
pressure ulcer, as well as pressure ulcer patients’ characteristics in general
inpatient paediatric wards. An incidence study was set up to measure the
incidence, most affected locations, and categories of pressure ulcer, as well as
significant risk factors for pressure ulcer development in critically ill children
and neonates. It also aimed to compare the predictive validity of the Braden Q
and the Glamorgan RASs in critical care areas.
Design: One point prevalence study with a descriptive cross-sectional design
and one observational cohort incidence study with longitudinal prospective
design were conducted.
Setting: All paediatric in-patient wards for the prevalence survey, and four
paediatric critical care units (PICU, NICU, GIMU, and GICU) were surveyed in
one university-affiliated hospital in Jordan. Paediatric patients in burn, isolation,
and psychiatric wards were excluded.
Sample: A total of 107 paediatric patients aged from birth up to 18 years old for
the prevalence survey, and a total of 212 critically ill paediatric patients without
pre- existing pressure ulcer for the incidence study, were recruited.
Methods: All patients who met the inclusion criteria were included and assessed
for pressure ulcer existence in one day for the prevalence study. Patients eligible
for the incidence study were observed up to three times a week for two weeks,
then once a week until critical care unit discharge, death, or when the eight week
follow-up period ended. In both studies, data was collected by the primary
investigator.
6
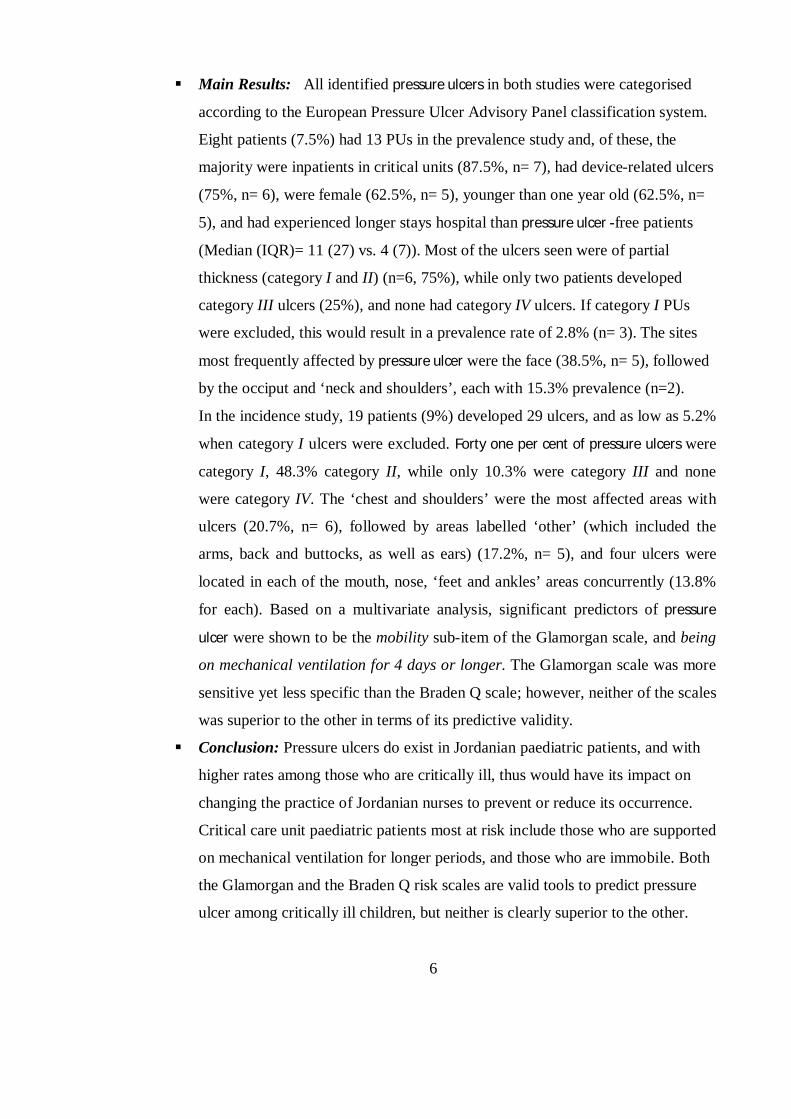
Main Results: All identified pressure ulcers in both studies were categorised
according to the European Pressure Ulcer Advisory Panel classification system.
Eight patients (7.5%) had 13 PUs in the prevalence study and, of these, the
majority were inpatients in critical units (87.5%, n= 7), had device-related ulcers
(75%, n= 6), were female (62.5%, n= 5), younger than one year old (62.5%, n=
5), and had experienced longer stays hospital than pressure ulcer -free patients
(Median (IQR)= 11 (27) vs. 4 (7)). Most of the ulcers seen were of partial
thickness (category I and II) (n=6, 75%), while only two patients developed
category III ulcers (25%), and none had category IV ulcers. If category I PUs
were excluded, this would result in a prevalence rate of 2.8% (n= 3). The sites
most frequently affected by pressure ulcer were the face (38.5%, n= 5), followed
by the occiput and ‘neck and shoulders’, each with 15.3% prevalence (n=2).
In the incidence study, 19 patients (9%) developed 29 ulcers, and as low as 5.2%
when category I ulcers were excluded. Forty one per cent of pressure ulcers were
category I, 48.3% category II, while only 10.3% were category III and none
were category IV. The ‘chest and shoulders’ were the most affected areas with
ulcers (20.7%, n= 6), followed by areas labelled ‘other’ (which included the
arms, back and buttocks, as well as ears) (17.2%, n= 5), and four ulcers were
located in each of the mouth, nose, ‘feet and ankles’ areas concurrently (13.8%
for each). Based on a multivariate analysis, significant predictors of pressure
ulcer were shown to be the mobility sub-item of the Glamorgan scale, and being
on mechanical ventilation for 4 days or longer. The Glamorgan scale was more
sensitive yet less specific than the Braden Q scale; however, neither of the scales
was superior to the other in terms of its predictive validity.
Conclusion: Pressure ulcers do exist in Jordanian paediatric patients, and with
higher rates among those who are critically ill, thus would have its impact on
changing the practice of Jordanian nurses to prevent or reduce its occurrence.
Critical care unit paediatric patients most at risk include those who are supported
on mechanical ventilation for longer periods, and those who are immobile. Both
the Glamorgan and the Braden Q risk scales are valid tools to predict pressure
ulcer among critically ill children, but neither is clearly superior to the other.

7
Key words: Paediatric, Pressure Ulcer, Incidence, Prevalence, Risk Assessment,
Risk Factors, Glamorgan, Braden Q, Risk Scale, Predictive Validity.
8
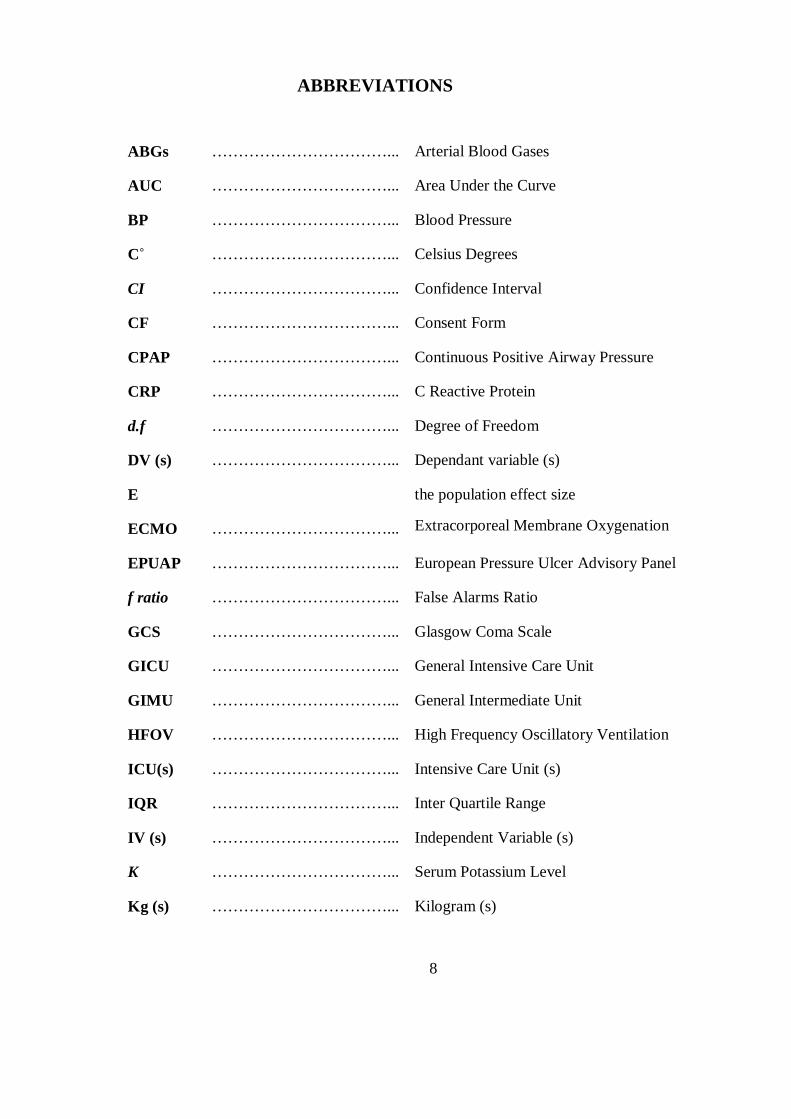
ABBREVIATIONS
ABGs ……………………………... Arterial Blood Gases
AUC ……………………………... Area Under the Curve
BP ……………………………... Blood Pressure
C˚ ……………………………... Celsius Degrees
CI ……………………………... Confidence Interval
CF ……………………………... Consent Form
CPAP ……………………………... Continuous Positive Airway Pressure
CRP ……………………………... C Reactive Protein
d.f ……………………………... Degree of Freedom
DV (s) ……………………………... Dependant variable (s)
E the population effect size
ECMO ……………………………... Extracorporeal Membrane Oxygenation
EPUAP ……………………………... European Pressure Ulcer Advisory Panel
f ratio ……………………………... False Alarms Ratio
GCS ……………………………... Glasgow Coma Scale
GICU ……………………………... General Intensive Care Unit
GIMU ……………………………... General Intermediate Unit
HFOV ……………………………... High Frequency Oscillatory Ventilation
ICU(s) ……………………………... Intensive Care Unit (s)
IQR ……………………………... Inter Quartile Range
IV (s) ……………………………... Independent Variable (s)
K ……………………………... Serum Potassium Level
Kg (s) ……………………………... Kilogram (s)
9
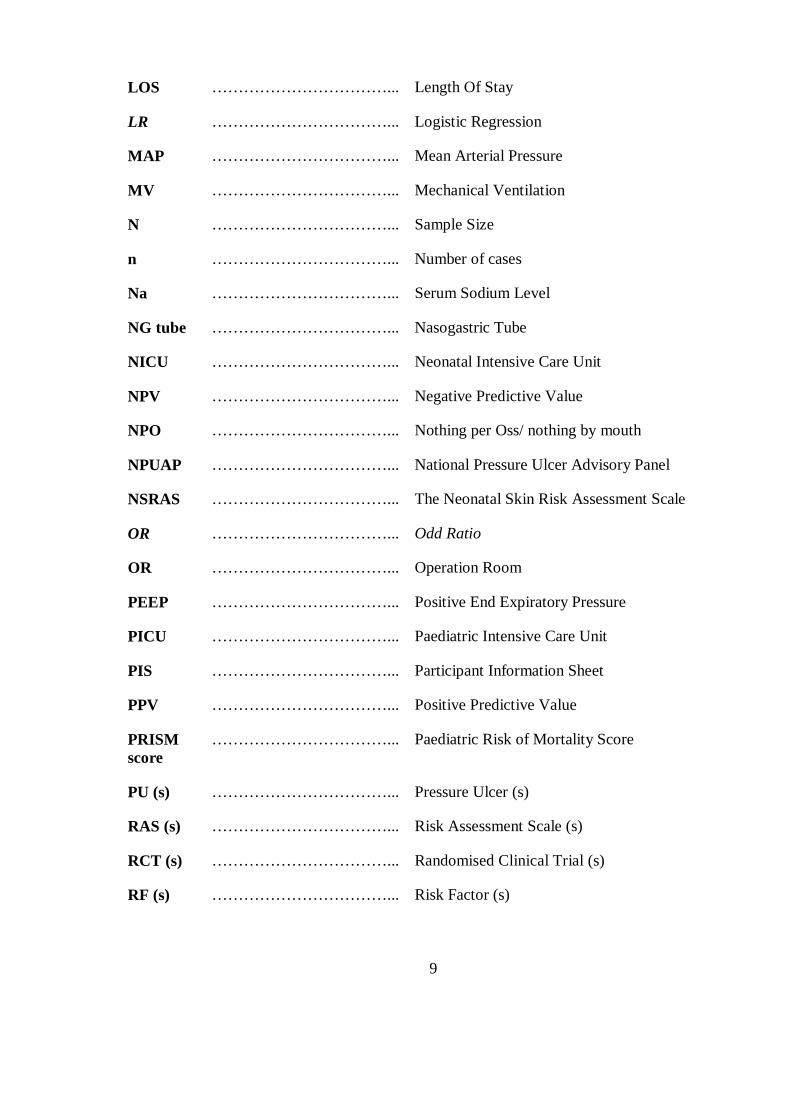
LOS ……………………………... Length Of Stay
LR ……………………………... Logistic Regression
MAP ……………………………... Mean Arterial Pressure
MV ……………………………... Mechanical Ventilation
N ……………………………... Sample Size
n ……………………………... Number of cases
Na ……………………………... Serum Sodium Level
NG tube ……………………………... Nasogastric Tube
NICU ……………………………... Neonatal Intensive Care Unit
NPV ……………………………... Negative Predictive Value
NPO ……………………………... Nothing per Oss/ nothing by mouth
NPUAP ……………………………... National Pressure Ulcer Advisory Panel
NSRAS ……………………………... The Neonatal Skin Risk Assessment Scale
OR ……………………………... Odd Ratio
OR ……………………………... Operation Room
PEEP ……………………………... Positive End Expiratory Pressure
PICU ……………………………... Paediatric Intensive Care Unit
PIS ……………………………... Participant Information Sheet
PPV ……………………………... Positive Predictive Value
PRISM score
……………………………... Paediatric Risk of Mortality Score
PU (s) ……………………………... Pressure Ulcer (s)
RAS (s) ……………………………... Risk Assessment Scale (s)
RCT (s) ……………………………... Randomised Clinical Trial (s)
RF (s) ……………………………... Risk Factor (s)
10
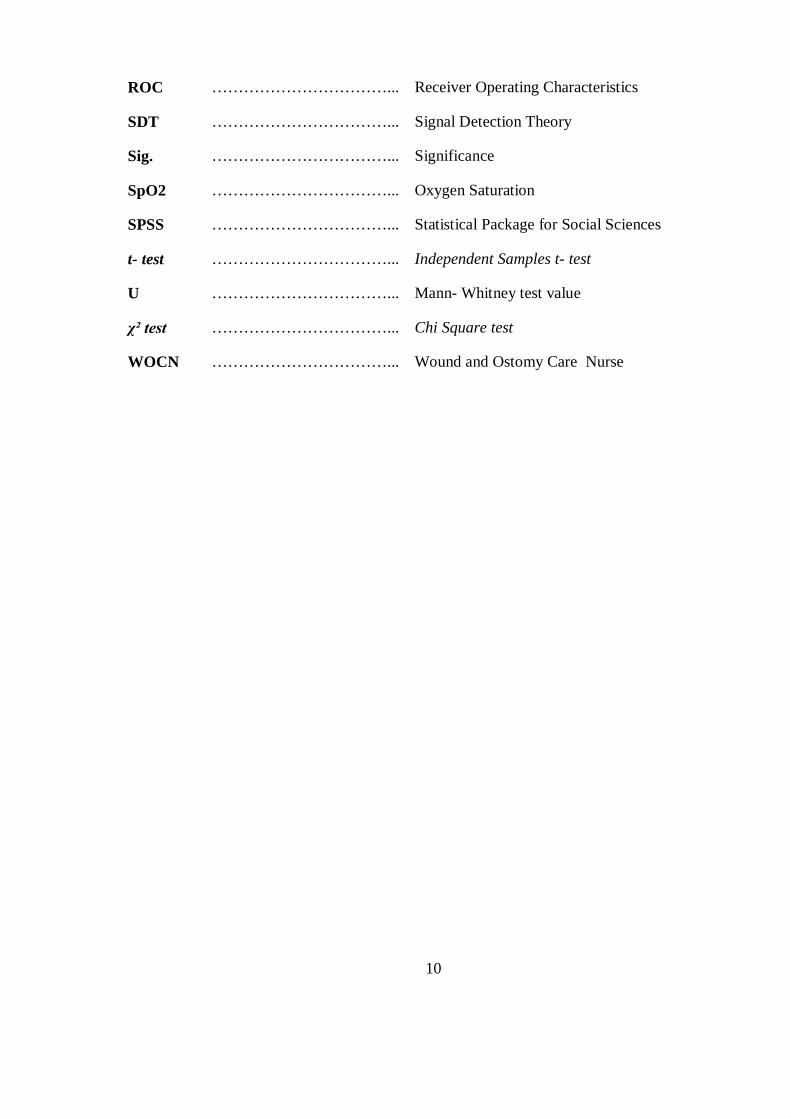
ROC ……………………………... Receiver Operating Characteristics
SDT ……………………………... Signal Detection Theory
Sig. ……………………………... Significance
SpO2 ……………………………... Oxygen Saturation
SPSS ……………………………... Statistical Package for Social Sciences
t- test ……………………………... Independent Samples t- test
U ……………………………... Mann- Whitney test value
χ² test ……………………………... Chi Square test
WOCN ……………………………... Wound and Ostomy Care Nurse
11
TABLE OF CONTENT
Dedication........ ............................................................................................................ 3
Acknowledgement ....................................................................................................... 4
Abstract........... ............................................................................................................ 5
ABBREVIATIONS ..................................................................................................... 8
Table of Content ....................................................................................................... 11
List of Tables.... ......................................................................................................... 17
List of Figures.. ......................................................................................................... 19
CHAPTER 1 .. Chapter One: Introduction ............................................................. 20
1.1 A Glance at the Chapter ................................................................................ 20 1.2 An Overview of the Problem ......................................................................... 21 1.3 Statement of the Research Problem ............................................................... 22 1.4 Research Aim ................................................................................................ 23 1.5 Research Terminology .................................................................................. 23 1.6 Background to the Research Problem ............................................................ 25
1.6.1 The scope of the problem ......................................................................... 25
1.6.2 The size of the problem ........................................................................... 26
1.6.3 The financial impact of the problem ......................................................... 26
1.7 Significance of the Study ............................................................................... 27 1.8 Context of the Study ...................................................................................... 28 1.9 Structure of the Thesis ................................................................................... 29 1.10 Summary ....................................................................................................... 32
CHAPTER 2 .. Chapter two: Literature Review ...................................................... 33
2.1 A Glance at the Chapter ................................................................................ 33 2.2 SEARCH STRATEGIES .................................................................................... 34
2.2.1 Inclusion Criteria ..................................................................................... 35
2.2.2 Exclusion Criteria .................................................................................... 35
2.2.3 Filtering Procedures ................................................................................. 35
2.2.4 The Evolution of Literature Search .......................................................... 38
2.3 Overview of Pressure Ulcers (PU) ................................................................. 39
12
2.3.1 The skin: .................................................................................................. 39
2.3.2 Pathophysiology of Ulcer Formation: ...................................................... 40
2.4 Pressure Ulcers in Paediatrics: Prevalence and Incidence .............................. 41
2.4.1 Paediatric Pressure Ulcer Prevalence ....................................................... 43
2.4.2 Paediatric Pressure Ulcer Incidence ......................................................... 45
2.5 PRESSURE ULCER RISK ASSESSMENT: FACTORS AND SCALES ...................... 48
2.5.1 Pressure Ulcer Risk Factors in PaediatricS ............................................... 49
2.5.1.1 RISK FACTOR CLASSIFICATIONS ..................................................... 49
2.5.1.2 RISK FACTORS IN PAEDIATRICS: BACKGROUND ............................. 50
a) Paediatric Risk in General Wards ....................................................... 52
b) Paediatric Risk in Critical Care Areas................................................. 55
2.5.2 PAEDIATRIC RISK ASSESSMENT SCALES (RASS) .................................... 62
2.5.2.1 The Glamorgan Paediatric Pressure Ulcer Risk Assessment Scale... 69
a) Content validity of the Glamorgan Scale: ........................................... 69
b) Sensitivity and Specificity / Predictive Validity of the Glamorgan Scale:
70
c) Inter-rater Reliability of the Glamorgan RAS: .................................... 72
2.5.2.2 The Braden Q Pressure Ulcer Risk Assessment Scale ..................... 74
a) Content Validity of the Braden Q RAS: .............................................. 76
b) Sensitivity and Specificity / Predictive Validity of the Braden Q RAS:
77
c) Inter-Rater Reliability of the Braden Q RAS: ..................................... 79
2.6 THEORETICAL FRAMEWORK OF THE STUDY .................................................. 81
2.6.1 Major Concepts and Propositions of SDT ................................................ 82
2.6.2 PROBABILITY OF OCCURRENCE CURVES ................................................. 84
2.7 SUMMARY ..................................................................................................... 87
CHAPTER 3 .. chapter three: Methodology ............................................................. 88
3.1 A Glance at the chapter ................................................................................. 88
13
3.2 the research approach .................................................................................... 89 3.3 the research design ........................................................................................ 90
3.3.1 Objectives: .............................................................................................. 90
3.3.2 Research Questions and Hypotheses ........................................................ 91
3.3.3 The Study Design .................................................................................... 92
3.3.3.1 Study One: The Cross-Sectional Point-Prevalence Study ................ 94
3.3.3.2 Study Two: Non-Experimental Prospective Longitudinal Descriptive
Correlation Cohort Study. ................................................................................ 95
3.4 the Study setting ............................................................................................ 97
3.4.1 Jordan and its healthcare system .............................................................. 99
3.5 the Study Sample ........................................................................................ 100
3.5.1 The Prevalence Study Sample: ............................................................... 100
Inclusion Criteria: .......................................................................................... 101
Exclusion Criteria:......................................................................................... 101
3.5.2 The Incidence Study Sample: ................................................................. 102
3.5.2.1 Sample size: ................................................................................. 104
3.6 Study instrument ......................................................................................... 105
3.6.1 The Prevalence Tool .............................................................................. 106
3.6.2 The Incidence Tool ................................................................................ 107
3.6.3 The Glamorgan Paediatric Pressure Ulcer Risk Assessment Scale.......... 108
3.6.4 The Braden Q Pressure Ulcer Risk Assessment Scale ............................ 110
3.7 the Pilot study: ............................................................................................ 111 3.8 Data collection procedures: ......................................................................... 113
3.8.1 The Prevalence Study: ........................................................................... 114
3.8.2 The Incidence study: .............................................................................. 115
3.9 Ethical considerations.................................................................................. 118 3.10 Statistical analysis plan................................................................................ 119 3.11 Theoretical Framework Reflection on the Research Methodology: .............. 121 3.12 Summary of the chapter............................................................................... 122
CHAPTER 4 .. chapter four: Results .................................................................... 124
14
4.1 A Glance at the Chapter .............................................................................. 124 4.2 Pre-analysis preparation of the data ............................................................. 125
4.2.1 Variable groups and operational definitions ........................................... 126
4.3 Statistical Results ........................................................................................ 131
4.3.1 Study One: Point Prevalence Survey. ..................................................... 132
4.3.1.1 Sample Description: ..................................................................... 133
4.3.1.2 Prevalence of Pressure Ulcers ....................................................... 134
a) Rate and Characteristics of PU-patients: ........................................... 134
4.3.2 Study Two: Incidence and Risk Factors Survey ..................................... 137
4.3.2.1 Sample Description....................................................................... 138
4.3.2.2 Incidence and Characteristics of PU-patients ................................ 141
4.3.2.3 Results of the univariate analysis .................................................. 144
a) Comparing PU and PU-free groups .................................................. 147
4.3.2.4 Results of Multivariate Analysis ................................................... 150
a) Logistic regression assumptions ....................................................... 151
b) Logistic Models ............................................................................... 154
4.3.3 Predictive Validity of the Paediatric Risk Assessment Scales Used ........ 157
4.3.3.1 The Glamorgan Risk Assessment Scale ........................................ 157
a) Sensitivity and Specificity/ Predictive values.................................... 159
4.3.3.2 Predictive Validity of the Braden Q Risk Scale for Paediatrics ...... 160
a) Sensitivity and Specificity/ Predictive Values ................................... 161
4.4 Summary of the Chapter .............................................................................. 162
CHAPTER 5 .. chapter five: Discussion ................................................................. 164
5.1 A GLANCE AT THE CHAPTER ....................................................................... 164 5.2 METHODOLOGICAL CONSIDERATIONS ........................................................ 165 5.3 STATISTICAL CONSIDERATIONS .................................................................. 167 5.4 THE IMPACT OF THE THEORETICAL FRAMEWORK ON THE STUDY’S MAIN FINDINGS............................................................................................................... 168
5.4.1 Previous Implications ............................................................................ 168
5.4.2 SDT Context within the Current Research ............................................. 169
15
5.4.3 The Main Concepts of the SDT and the Current Research ...................... 171
5.5 INTERPRETATIONS OF THE STUDY’S MAIN FINDINGS.................................. 178
5.5.1 The Prevalence Study ............................................................................ 178
5.5.1.1 The Prevalence Rate ..................................................................... 178
5.5.1.2 Most Affected Sites ...................................................................... 179
5.5.1.3 Pressure Ulcer Categories ............................................................. 181
5.5.1.4 General Characteristics of the PU-Patients .................................... 182
5.5.2 Incidence and Risk Factors Study .......................................................... 184
5.5.2.1 Pressure Ulcer Incidence: ............................................................. 185
a) Incidence Rate .................................................................................. 185
b) Most Affected Sites .......................................................................... 190
c) Pressure Ulcer Categories ................................................................. 193
d) General Characteristics of the Sample .............................................. 194
5.5.2.2 Risk Factors for PU development.................................................. 196
a) Risk Factors based on Univariate Analyses ...................................... 197
i) General Risk Factors / Predictors .................................................. 198
ii) Risk Factors (based on the Glamorgan RAS) ................................ 204
iii) Risk Factors (based on the Braden Q RAS) ................................... 211
b) Risk Factors/ Predictors based on Multivariate Analysis ................... 217
i) Model One: Braden Q Scale Sub-Items. ........................................ 218
ii) Model Two: Glamorgan Scale Sub-Items. ..................................... 218
iii) Model Three: General Predictors/ Risk Factors and the Braden Q
Sub-Items. ............................................................................................. 218
iv) Model Four: General Predictors/ Risk Factors and the Glamorgan
Sub-Items. ............................................................................................. 219
5.5.3 Predictive Validity of the Applied Paediatric Risk Assessment Scales ... 220
16
5.5.3.1 Glamorgan Risk Scale for Paediatrics ........................................... 220
5.5.3.2 The Braden Q Risk Assessment Scale ........................................... 221
5.5.3.3 Comparing the Predictive Validity of the Glamorgan and Braden Q
Risk Assessment Scales ................................................................................. 222
5.6 Summary of the chapter............................................................................... 227
CHAPTER 6 .. Chapter Six: Limitations, Recommendations and Conclusion ..... 229
6.1 A Glance at the Chapter .............................................................................. 229 6.2 Research Limitations ................................................................................... 230
6.2.1 Prevalence study .................................................................................... 230
6.2.2 Incidence study ...................................................................................... 231
6.3 Research Recommendations ........................................................................ 233
6.3.1 Clinical domain ..................................................................................... 233
6.3.2 Administration domain .......................................................................... 234
6.3.3 Research domain ................................................................................... 235
6.4 Contribution to Knowledge ......................................................................... 236 6.5 Research Conclusion ................................................................................... 237 6.6 Summary ..................................................................................................... 240
References........ ........................................................................................................ 241
Appendices Content ................................................................................................ 250
17
LIST OF TABLES
Table 2.1: The Intrinsic and Extrinsic Risk Factors for Pressure Ulcer ........................ 50
Table 2.2: Possible Responses of SDT ........................................................................ 83
Table 4.1: Children Excluded from the Prevalence Study .......................................... 133
Table 4.2: Prevalence Study Sample’ Characteristics ................................................ 134
Table 4.3: Total Number and Classification of PU According to its Source ............... 135
Table 4.4: The Characteristics of PU-patients in the Prevalence Study Sample .......... 137
Table 4.5: Excluded Patients’ Characteristics in the incidence Survey ....................... 138
Table 4.6: Demographical Characteristics of the Incidence Study Sample (n=212) .... 140
Table 4.7: Number of assessments in Incidence Study............................................... 141
Table 4.8: Pressure Ulcer Incidence Rate (N= 212) ................................................... 142
Table 4.9: Characteristics of PU-patients in Incidence Study ..................................... 142
Table 4.10: Total Number and Classification of PU According to its Source ............. 144
Table 4.11: The Results of Univariate Analysis for Categorical Risk Factors ............ 144
Table 4.12: The Results of Univariate Analysis for Continuous Risk Factors ............ 145
Table 4.13: Significant Risk Factors by Univariate Analysis (P≤0.05) ....................... 146
Table 4.14: Glamorgan’ and Braden Q’ Significant Sub-items by Univariate Analysis
................................................................................................................................. 147
Table 4.15: Descriptive for Significant Categorical Risk Factors based on Univariate
Analysis .................................................................................................................... 148

18
Table 4.16: Descriptive for the Significant Ordinal Risk Factors based on Univariate
Analysis .................................................................................................................... 149
Table 4.17: Descriptive for the Significant Continuous Risk Factors based on Univariate
Analysis .................................................................................................................... 150
Table 4.18: Testing for Linearity ............................................................................... 151
Table 4.19: Testing for Multicollinearity/ Significant Glamorgan Sub-items with
General Risk Factors ................................................................................................. 152
Table 4.20: Testing for Multicollinearity/ Significant Braden Q sub-items with General
Risk Factors .............................................................................................................. 153
Table 4.21: Model One/ Braden Q sub-items............................................................. 155
Table 4.22: Model Two/ Glamorgan sub-items ......................................................... 155
Table 4.23: Model Three/ Braden Q sub-items and General risk factors .................... 156
Table 4.24: Model Four/ Glamorgan sub-items and General risk factors ................... 157
Table 4.25: The AUC of the Glamorgan total score and its sub-items ........................ 157
Table 4.26: Glamorgan Risk classifications and PU Incidence .................................. 159
Table 4.27: The AUC of the Braden Q total score and its sub-items .......................... 161
Table 4.28: The Braden Q risk classifications and PU Incidence ............................... 162
Table 5.1: Summary of Possible Causes of Low PU Incidence Rate .......................... 188
Table 5.2: Summary of Possible Causes of Low NICU PU Incidence. ....................... 190
19
LIST OF FIGURES
Figure 1.1: Overview of the Thesis Structure .............................................................. 31
Figure 2.1: Search Strategies ...................................................................................... 37
Figure 2.2: SDT Probability Curves ............................................................................ 85
Figure 3.1: Jordan Map ............................................................................................. 100
Figure 3.2: Two Data Collection Sheets: Incidence & Prevalence. ............................ 108
Figure 3.3: Model of Research Methodology ............................................................ 123
Figure 4.1: Locations and Categories of Ulcers/ Prevalence study ............................. 136
Figure 4.2: Location and Categories of Ulcers ........................................................... 143
Figure 4.3: AUC for the Glamorgan Scale ................................................................. 158
Figure 4.4: AUC of the Braden Q Scale .................................................................... 161
Figure 5.1: The SDT’s Application to the Main Findings of the Research ................. 177
Figure 5.2: Summary of Risk Factor Classifications .................................................. 197
20
CHAPTER 1 .. CHAPTER ONE:
INTRODUCTION
1.1 A GLANCE AT THE CHAPTER
This chapter highlights the main inquiry of this research work, framing the main
problem of concern, and showing its trends and significance. Also, it shows the main
objectives of the current work, its context and structure.
21
1.2 AN OVERVIEW OF THE PROBLEM
Pressure ulcer (PU) is the main concern of this thesis, particularly in paediatrics. There
is an abundance of data about PU in adults (Quigley and Curley, 1996), yet a paucity of
research in paediatric care (Butler, 2007), despite numerous works showing that PUs
exist in children, especially those who cared for in critical care areas such as intensive
care units (ICUs) (Baharestani and Ratliff, 2007). To understand this problem
reasonably, there should be a comprehensible picture of the size of PU problem, the
factors that lead to its development and the characteristics of infants and children that
predispose them to its formation (Butler, 2007), in addition to proper risk assessment to
detect its occurrence. The lack of such information in the studied population initiated
the current work.
Accurate description of ulcers, the predisposing factors, and clear documentation of its
features is crucial for a proper prevention and management of this problem; hence,
assessment was the major focus in this work.
For the current work, PU in particular was discussed in terms of its prevalence in the
paediatric general population, its incidence and contributing factors in critically ill
children, as well as comparing two risk scales which are currently in use in paediatrics,
to show their abilities to predict children and infants’ risk for PU’ formation.
The assessment of PU is thus the main goal of this research. Assessment was noted as a
significant aspect in many disciplines, such as engineering, food industry, environment,
as well as medical field and nursing. To assess any problem of concern is the
preliminary step for further actions, to prevent or intervene correctly. PU risk
assessment is the same.
To establish a reliable prevention and management protocol for PU in patients,
predefined assessment strategies should be initiated (Parnham, 2012). No proper
intervention can be commenced without having enough information about the problem
characteristics and the predisposing factors for its occurrence (Sims and McDonald,
2003).
22
PU inquiry in paediatrics was chosen specifically because of the emerging significance
of the problem in terms of its size, contributing factors, duration and (high) financial
cost, as well as its devastating effects on children’s physical and psychological health
and wellbeing, especially in teenagers. The urgent need for research on this subject,
indicated by the paucity of identified literature regarding it, is compounded in the case
of Jordan, the location of this study.
In the setting of inquiry, which is representative of the general status in Jordanian
hospitals, no paediatric risk assessment strategies have been adopted, and no specific
paediatric risk assessment scales (RASs) have been used; hence all applied interventions
and prevention procedures, if existent, are based on nurses’ personal judgment or
individual efforts.
The abovementioned motivating factors thus inspired the current work, in addition to
the researcher’s own interest in PU problems in general, as gained from previous
clinical experience as an ICU nurse, such as experience with patients suffering from
ulcers, and the time and effort needed to treat them.
1.3 STATEMENT OF THE RESEARCH PROBLEM
Pressure ulcer in children and infants remains a relatively unexplored phenomenon for
clinical nurses; this because of the general perception that PU is an adult, not a
paediatric issue. A limited number of studies have investigated this problem, and a
limited number of these employed a credible research design and produced reliable
results. In addition, there is a dearth of evidence of PU contributing factors in
paediatrics, either in infants or in older children (Barnes, 2004).
Risk assessment scales that have been used previously in paediatrics’ settings were of
limited predictive abilities, have no established reliability, or have indefinite credibility
(Kottner et al., 2011).
It is necessary for nurses to have a recognised process of assessment, or a reliable tool
to be used to measure children’ risk for PU efficiently, rather than to base clinical
23
decisions on their own subjective opinion and experience, which predispose children to
the hazards of misclassification of risk (Ayello and Braden, 2002).
Furthermore, a clear picture of the true factors that increase patients’ risk of PU
development need to be established. On one hand, ignoring risk factors would increases
children’ suffering and risk to develop PUs, while considering all suspected factors as
risk factors, would consume high expenses by applying unnecessary intervention tools
or prevention measures (Willock and Maylor, 2004).
1.4 RESEARCH AIM
The main aim of this research is to estimate the size of PU problem in a paediatric
population in Jordan, while also considering the contributing factors of PU
development, specifically in critically ill children. The predictive validity of two major
paediatrics’ RASs will be also compared while conducting the incidence part. All these
are established to have a clear picture of the paediatrics’ PU in the Jordanian population
as a different data set to validate two appearing promising risk tools.
1.5 RESEARCH TERMINOLOGY
These are the definitions of the repeatedly used terms in this thesis wok, some based on
specific criteria, while others were mentioned as meant by the researcher.

24
- Pressure Ulcer (PU): ‘a localised area of skin damage with or without the
underlying tissue, usually on the bony prominences, as a result of pressure, shear
forces, or both’(EPUAP and NPUAP, 2009).
- Pressure Ulcer Classification System: staging/grading of identified pressure
ulcer, from category I (non-blanchable redness) to category IV (full thickness
tissue loss). In this thesis, the term ‘category’ was used to show stage/grade of
ulcers as recommended by the EPUAP and NPUAP guidelines (EPUAP and
NPUAP, 2009).
- Skin Breakdown: other types of skin damage that affect its intactness, but do
not result from pressure, friction or shear forces, such as tape burns, skin tears
and incontinence dermatitis (EPUAP and NPUAP, 2009).
- Risk Assessment Scale (RAS): a measure to identify individuals at risk who
need preventive procedures, their type of risk, and the contributing factors that
put these individuals at risk (Ayello and Braden, 2002).
- Paediatrics: this term was used to refer to all children and neonates, who aged
from birth (whatever the gestational age at birth) up to 18 years old. Neonates
referred to those who aged from birth up to one month old, while children
referred to those aged from one month up to 18 years old.
- The whole thesis work was referred to as ‘research’ or ‘research work’, while
‘study/ survey/ audit’ referred to each separate part of the research; the
incidence and the prevalence studies.
25
1.6 BACKGROUND TO THE RESEARCH PROBLEM
1.6.1 The scope of the problem
There is an emerging awareness of PU as a problem that affects the paediatric
population, especially in those who are critically ill or with debilitating conditions
(Baharestani and Ratliff, 2007). However, there is still a paucity of empirical evidence
upon which new guidelines for the clinical area can be established (Cockett, 2002).
Children and neonates have unique characteristics, based on their variant developmental
milestones; which necessitates a specified protocol of skin care.
To have a proper intervention and prevention procedures, there should be a proper
assessment, hence assessment is the preliminary step toward suitable prevention (Pallija
et al., 1999, Willock et al., 2000); however, little is known about paediatric risk
assessment, or the contributing factors for PU development in this population (Loman,
2000).
Pressure ulcers in children, as in adults, have many devastating negative effects, such as
pain, lengthy hospital stay (McCord et al., 2004, Pallija et al., 1999), and disfigurement
or permanent alopecia, which may affect the child’s body image and cause
embarrassment (Gershan and Esterly, 1993, McCord et al., 2004, Willock and Maylor,
2004). Any interruptions in a child’s skin, either by medical devices, incontinence,
wound or therapies, may cause them to be susceptible to infection (Noonan et al., 2006),
and PUs themselves can become infected (Brook, 2004). In severe cases, such
infections can lead to osteomyelitis (Bar-On et al., 2002, Willock and Maylor, 2004).
Pallija et al. (1999) found that paediatric PU patients are at more risk to have disturbed
body image, anxiety and depression, especially adolescents, because of their increased
concerns about their appearance, in addition to their beliefs that skin problems are an
indicator of poor health prognosis.
Furthermore, PU was identified to be a financial burden both on health organizations
and on individual patients, while being time- and effort-consuming as well (McCord et
al., 2004). Because of all these psychosocial, social and economic consequences on

26
children, families and communities, there is a belief that preventing PU occurrence is
much better than treating them after they occur (Quigley and Curley, 1996).
1.6.2 The size of the problem
Incidence and prevalence rates are two epidemiological terms used to calculate the size
of any existing condition or a problem either over a specified time period, or at one
point of time (Shields and Twycross, 2003). In paediatrics, the PU prevalence was
found to range between 0.47-27.7% for this specific group (Willock et al., 2000,
Baldwin, 2002, Suddaby et al., 2005, McLane et al., 2004, Schluer et al., 2009), while
incidence rate varied between 0.25% and 32.8% (Waterlow, 1997, Curley et al., 2003a,
Murdoch, 2002, Dixon and Ratliff, 2005, Willock et al., 2000, Baldwin, 2002, Huffines
and Logsdon, 1997).
Although there is no agreement about the size of the problem, there is evidence that
critically ill children are more likely to have PU than child patients among the general
paediatric’ population (Willock and Maylor, 2004, Murdoch, 2002, McCord et al.,
2004, McLane et al., 2004, Suddaby et al., 2005, Cockett, 2002).
Regardless of the studied population of paediatrics, from the previously mentioned
incidence and prevalence rates, it is manifest that children do suffer of PU, and in some
cases with relatively high percentages. Detailed data about incidence and prevalence
studies will be presented later in the literature review chapter.
1.6.3 The financial impact of the problem
There are several studies predicting the cost of this problem in adults, but not many
mentioned for paediatrics. The average cost of the care of inpatient child with a primary
diagnosis related to any skin problem has been found to be around $1,375 in one
hospital in the USA; the children hospital of medical centre of Akron (CHMCA) in
1995. However, this is lower than the cost of PU specific treatment for the adult
population, which was calculated by Lancellot (1996) as around $10,000-60,000 per
ulcer (Pallija et al., 1999). In the UK, the treatment cost of category I PUs is around
£1064, and £10,551 for category IV, while the total cost in the UK amounts to around
27
£1.4-2.1 billion annually (Bennett et al., 2004). These figures demonstrate the high
compound cost of treating PU in many health organisations; yet, specific paediatrics
related studies are needed to calculate the cost of PU treatment in this population.
1.7 SIGNIFICANCE OF THE STUDY
As explained previously, PUs do have negative impacts on patients’ health and
wellbeing, as well as being costly either on financial’ or human’ resources. All of this
make a huge burden on the health organisation to protect their patients from undesirable
hazards, while controlling expenses at the same time (McCord et al., 2004).
Thus, this thesis aims to discuss the PU problem, from size and assessment
perspectives, to generate a clearer understanding about this condition in paediatrics, and
more specifically in those who are critically ill. Literature about PUs in children and
neonates are scarce, and existing studies generally lack empirical evidence, or have a
descriptive nature (Willock et al., 2000).
Researchers believe that incidence and prevalence studies are necessary to establish
benchmarking data about PU (Noonan et al., 2011, McLane et al., 2004). Others argued
how using prospective incidence studies would help in exploring the performance of
paediatrics RASs in certain populations (Barnes, 2004).
Having well established empirical evidence of the size of PU problem, and the related
characteristics of ulcers, their most common locations, numbers, and classifications, as
well as the contributing factors of PU in children would certainly help in improving and
qualifying the existing prevention and interventions protocols, or even developing new
prevention policies (Butler, 2007, Willock et al., 2009).
Moreover, testing the available paediatrics RASs would help in approving their
reliability and predictive ability; a highly reliable and predictive tool is important to
detect patients at risk. However, there are still doubts about the actual effect of using
even a valid and reliable risk assessment tool in the reduction of the PU incidence rate
in the clinical practice (Anthony et al., 2009, Kottner et al., 2011).
28
On the other hand, Ayello and Braden (2002) discussed the effect of neglecting to use a
specific RAS in PU reporting, in which scenario only high risk patients would be
reported and would consequently receive the prevention aids. The authors observed that
using a formal risk assessment would help in identifying low and moderate risk patients,
and hence would improve the consistency of applying interventions for patients in all
risk group classifications.
Furthermore, Cockett (1998) described how using a specific RAS in one PICU had
enabled the early identification of PU risk patients, and increased nurses’ awareness of
PU risk, in addition to the engendering the improved usage of preventive measures in a
more consistent and timely manner, as well as improving the quality of documenting
and describing ulcers. Highly specific tools help in implementing justified prevention
procedures, and optimizing the use of nurses’ time, effort and costs.
To-date, there is scant evidence to prove the validity and reliability of any of the
paediatric’ RASs on all paediatric populations. For example, the Braden Q scale was
devised to be a valid tool for paediatrics, yet it was not proved valid on neonates aged
under 21 days old, nor for older children aged over eight (Noonan et al., 2011). In this
thesis, these age groups of children and neonates will be included in testing the Braden
Q RAS predictive validity.
In brief, identifying the true PU risks to patients and the risk factors that lead to PU
development in paediatrics would help in reducing the pain and suffering of patients, as
well as in improving the quality of life of chronically ill children. In addition, it would
decrease the negative consequences such as infection, sepsis, surgical intervening, and
even depression and embarrassment (Pickersgill, 1997, Brook, 2004).
1.8 CONTEXT OF THE STUDY
The research was conducted in one major setting in Jordan. It was divided into two
separate studies: study one, the prevalence study, and study two, the incidence and risk
factors. This was done to simplify the exposition of the thesis different areas. Each part
of the study has a different study design and research method, and a different sample.
29
The prevalence study was conducted through a cross-sectional point prevalence design,
with a sample of all hospital wards of inpatient children and neonates. In contrast, the
incidence study was a prospective observational cohort audit, with the sample being
critically ill children and neonates. However, both parts of the study were direct audits,
consisting of direct skin assessment of children, and recording their characteristics, or
suspected contributing factors, as detailed later in the data collection tool.
Moreover, collecting the risk factors and comparing the predictive validity of the two
used paediatrics scales (the Glamorgan and the Braden Q scales) was implemented
through the incidence part, because of the nature of the desired outcome, which will be
discussed in later chapters. Despite the fact that there are two separate studies in this
thesis, each deals with the same problem of interest, which is PU in paediatrics.
The prevalence study was intended to be conducted contemporaneously with the
incidence study, because of lacking any data about PU in the Jordanian paediatric
population. Prevalence was the initial step from which an estimate of the size of the
problem in Jordan was addressed. Later, the data extracted from the prevalence study
facilitated choosing the area of interest; the critical care units, where the incidence study
was accomplish; since the vast majority of PU cases in paediatrics were identified in
these units.
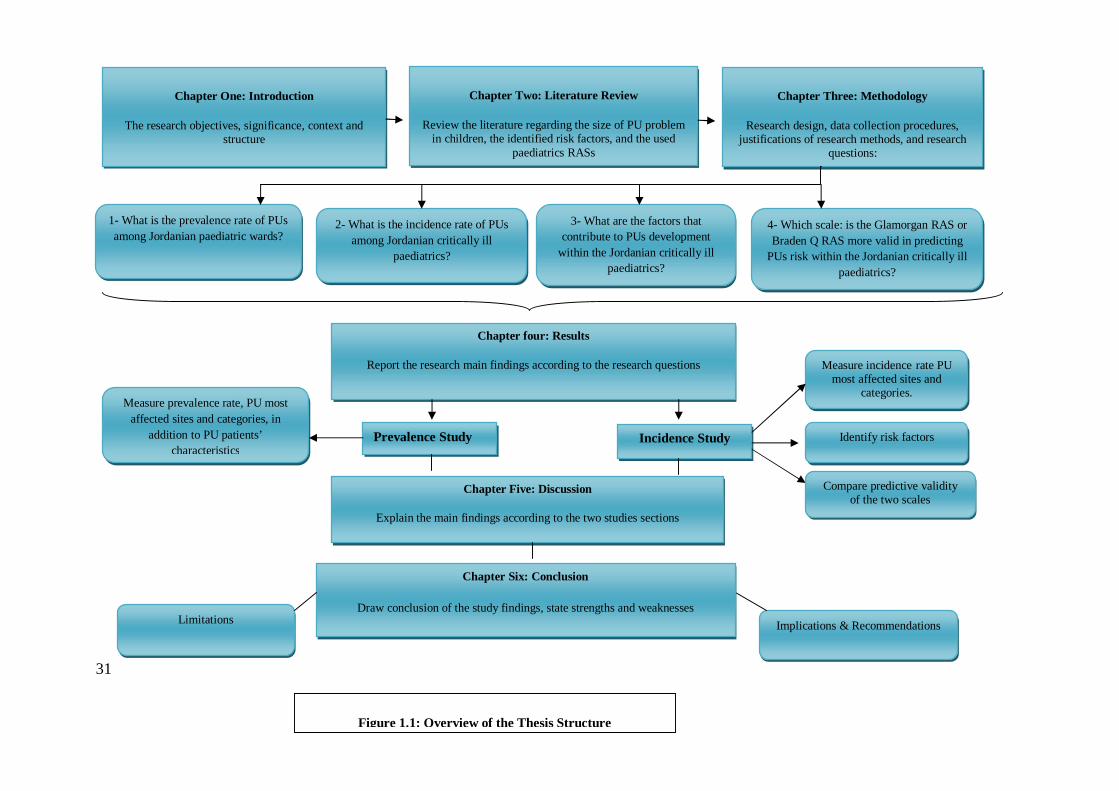
1.9 STRUCTURE OF THE THESIS
This thesis was written up within six chapters, as outlined in (figure 1.1), each of which
chapters have sections and subsections. Each starts with an overview of the chapter, and
concludes with a summary of the chapter’s content. This structure aimed to ease the
reader’s smooth transition and follow-up of presented data. The thesis chapters are:
Chapter One, the Introduction: constructed to give a brief overview of the whole
work of the thesis, the main aims of the study, the measure of inquiry, its size and
significance in clinical sector.
Chapter Two, the Literature Review: contains a critical analysis and elucidation of
the identified previous literature, and its relatedness to the main themes of this thesis,
30
which are the prevalence and incidence, and the risk assessment. The risk assessment
themes contained both the risk factors and the paediatrics risk scales. Also, this chapter
sheds light on the strengths and weaknesses of relevant previous researches, and
identifies the existing gaps. The applied theoretical framework was also discussed.
Chapter Three, the Methodology: explains the research methods used in each part of
the thesis, with justifications applied for each commenced strategy used throughout the
thesis, and the data collection process.
Chapter Four, the Results: presents the main findings of the study, within its two
separate studies. Also, the incidence study was discussed through three major sub-
sections: the incidence rate, the risk factors, and the predictive validity of the two
utilised scales.
Chapter Five, the Discussion: elaborates on the major findings of the two studies in
this thesis, extrapolated from the results chapter, with a thorough discussion of the
findings in relation to the thesis main questions, hypotheses and objectives. Also, the
theoretical framework concerning the results is demonstrated.
Chapter Six, the Conclusion: summarizes the main findings, including strengths,
limitations, and the implications for various practice fields, while illustrating the unique
contributions of this work to current knowledge.
31
Chapter One: Introduction
The research objectives, significance, context and structure
Chapter Three: Methodology
Research design, data collection procedures, justifications of research methods, and research
questions:
Chapter Two: Literature Review
Review the literature regarding the size of PU problem in children, the identified risk factors, and the used
paediatrics RASs
Chapter four: Results
Report the research main findings according to the research questions
Incidence Study Prevalence Study
1- What is the prevalence rate of PUs among Jordanian paediatric wards?
4- Which scale: is the Glamorgan RAS or Braden Q RAS more valid in predicting
PUs risk within the Jordanian critically ill paediatrics?
3- What are the factors that contribute to PUs development
within the Jordanian critically ill paediatrics?
2- What is the incidence rate of PUs among Jordanian critically ill
paediatrics?
Measure prevalence rate, PU most affected sites and categories, in
addition to PU patients’ characteristics
Measure incidence rate PU most affected sites and
categories.
Identify risk factors
Compare predictive validity of the two scales
Implications & Recommendations Limitations
Figure 1.1: Overview of the Thesis Structure
Chapter Five: Discussion
Explain the main findings according to the two studies sections
Chapter Six: Conclusion
Draw conclusion of the study findings, state strengths and weaknesses
32
1.10 SUMMARY
This chapter has introduced the research problem, the main aims and the objectives.
The background of PU problems in paediatrics has been elucidated, while
considering the size of the problem in this particular population, either through
incidence or prevalence surveys. Also, the financial cost of PU borne by health
organizations, as well as the negative consequences on the child’s health and
wellbeing, was addressed.
The major sections and trends of the thesis have been discussed, giving justification
of the research designs used in both studies research designs. The thesis chapters and
structure was summarised, with a brief description of each, to help in formulating a
preamble understanding of the flow of the following thesis chapters.

33
CHAPTER 2 .. CHAPTER TWO:
LITERATURE REVIEW
2.1 A GLANCE AT THE CHAPTER
This chapter reviews previous literature on the problem of interest in the current
research work. Firstly, the size of the PU problem in paediatrics in general is
underlined by investigating the available incidence and prevalence surveys.
Moreover, studies are highlighted which deal specifically with critically ill paediatric
patients, and the risk of PU in this particular population, as well as in general
paediatric patients is explored. Next, the paediatric RASs currently in use are
investigated, with focus on the Glamorgan and Braden Q scales in particular.
Finally, a description of the theoretical framework used is also provided with an
explanation of how it guides the whole research process.
34
2.2 SEARCH STRATEGIES
The literature review process began with an attempt to identify resources related to
the main themes of this thesis, namely the incidence and prevalence of PU in
paediatrics, and risk assessment for children who are critically ill. Subsequently, the
previously identified risk factors of PU were investigated and the performance of the
two paediatric RASs, the Braden Q and the Glamorgan, were compared. A number
of electronic databases were searched to locate the relevant literature, either through
the De Montfort University’ (DMU) library services, or via other identified
databases, such as Science Direct, using the Athens service.
The databases searched via the DMU website were the Cumulative Index to Nursing
and Allied Health Literature (CINAHL), the MEDLINE, the British Nursing Index
(BNI), the Applied Social Sciences Index and Abstracts (ASSIA) and the Cochrane
Database for Systematic Reviews (CDSR). In addition, an e-mail alert service
offered via the ‘Google Scholar’ website was made use of. This facilitated the early
identification of newly published literature related to the main enquiry of this
research, allowing the researcher to remain up to date with current work.
Searches within the databases named above were conducted using specific terms and
key words, which are listed in appendix (1.1). Having a list of terms or key words
enabled the researcher to focus the search within the scope of the current work,
preserving time and effort. Also, it helped prevent any articles related to the main
research enquiry being inadvertently missed.
In addition, a number of data resources were accessed which could not be located by
searching conventional databases. These were conference reports, theses, and some
official websites, such as those of the European Pressure Ulcer Advisory Panel
(EPUAP) and the National Pressure Ulcer Advisory Panel (NPUAP). Finally, the
reference list of each identified research paper was searched manually to locate any
relevant papers which may have been overlooked.
35
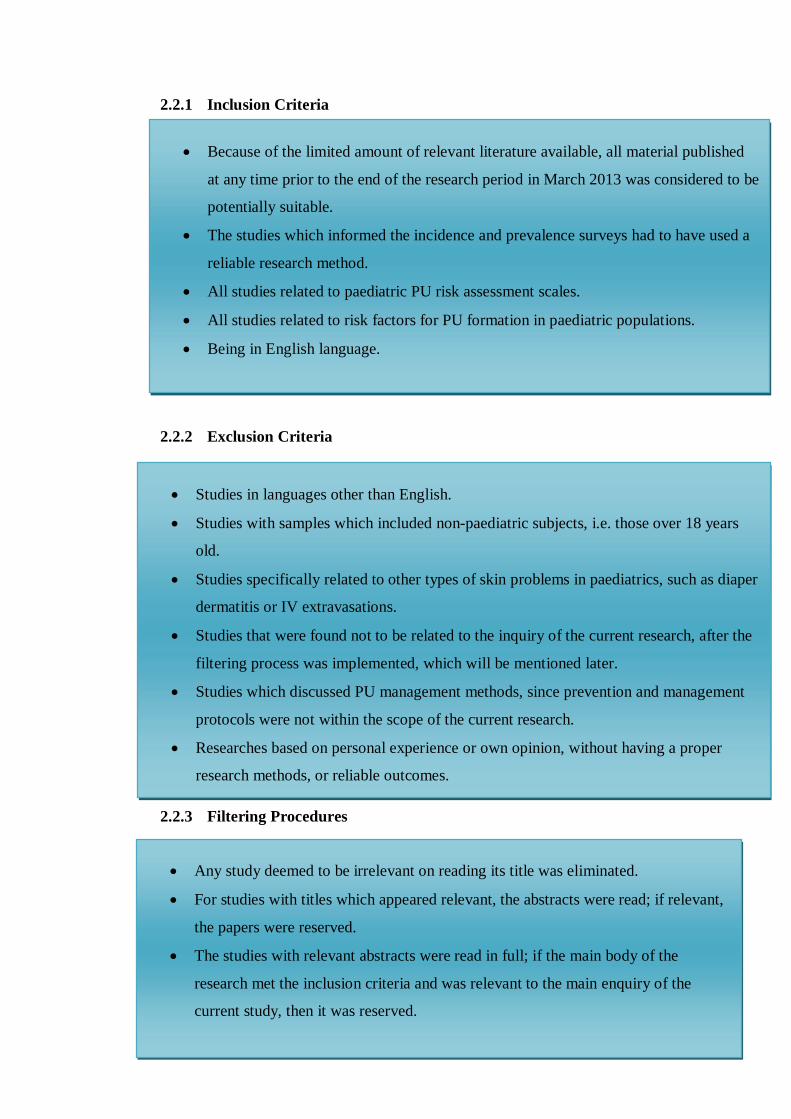
2.2.1 Inclusion Criteria
2.2.2 Exclusion Criteria
2.2.3 Filtering Procedures
Any study deemed to be irrelevant on reading its title was eliminated.
For studies with titles which appeared relevant, the abstracts were read; if relevant,
the papers were reserved.
The studies with relevant abstracts were read in full; if the main body of the
research met the inclusion criteria and was relevant to the main enquiry of the
current study, then it was reserved.
Studies in languages other than English.
Studies with samples which included non-paediatric subjects, i.e. those over 18 years
old.
Studies specifically related to other types of skin problems in paediatrics, such as diaper
dermatitis or IV extravasations.
Studies that were found not to be related to the inquiry of the current research, after the
filtering process was implemented, which will be mentioned later.
Studies which discussed PU management methods, since prevention and management
protocols were not within the scope of the current research.
Researches based on personal experience or own opinion, without having a proper
research methods, or reliable outcomes.
Because of the limited amount of relevant literature available, all material published
at any time prior to the end of the research period in March 2013 was considered to be
potentially suitable.
The studies which informed the incidence and prevalence surveys had to have used a
reliable research method.
All studies related to paediatric PU risk assessment scales.
All studies related to risk factors for PU formation in paediatric populations.
Being in English language.
36
In relation to the main themes adopted, there was a thorough investigation and
assessment of the target data, since all studies which informed in the incidence and
prevalence surveys were required to have a calculated percentage of the size of the
PU problem in a paediatric-only population. For the risk assessment component, all
identified contributing factors and characteristics were taken into consideration if
they came from studies which had well-defined methodological approaches and
clearly stated results. All identified paediatric-only PU RASs were analysed, with the
main focus being on the scales used in this study, the Glamorgan and the Braden Q.
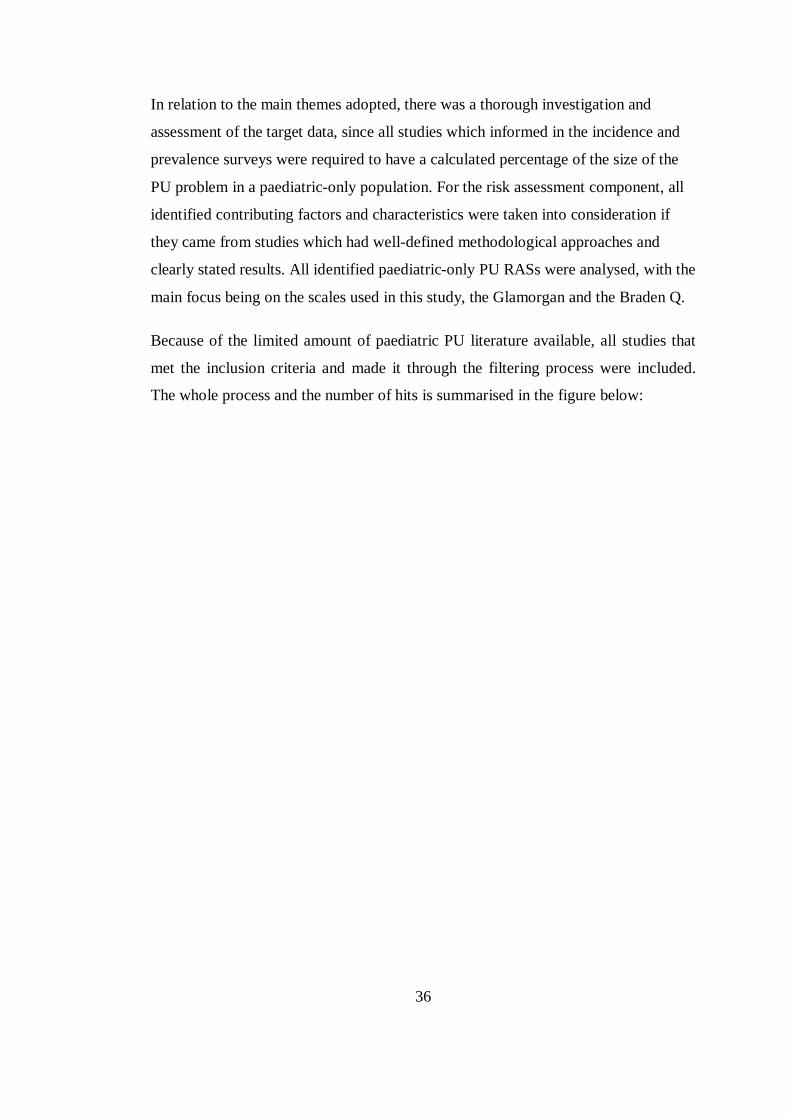
Because of the limited amount of paediatric PU literature available, all studies that
met the inclusion criteria and made it through the filtering process were included.
The whole process and the number of hits is summarised in the figure below:
37
PU / Incidence / Paediatrics / Pediatrics OR Child Articles identified using the key words: CINAHL= 40, BNI= 7, Medline= 50, CDSR= 8, ASSIA= 7, ASP= 5, Web of Knowledge= 9.
PU / Prevalence / Paediatrics / Pediatrics OR Child Articles identified using the key words: CINAHL= 48, BNI= 4, Medline= 39, CDSR= 4, ASSIA= 3, ASP= 7, Web of Knowledge= 16.
PU / Risk / Paediatrics / Pediatrics OR Child Articles identified using the keywords: CINAHL= 131, BNI= 18, Medline= 114, CDSR= 12, ASSIA= 21, ASP= 24, Web of Knowledge= 16.
128
30 18 50
71
Search Strategies
55 71
Figure 2.1: Search Strategies
Excluded (not relevant) after reading the titles and abstracts
Total after removing duplicates = 95
Total after removing duplicates = 94
Total after removing duplicates = 206
Studies assessed for eligibility = 40
Studies assessed for eligibility = 23
Studies assessed for eligibility = 82
Excluded (did not meet the inclusion and exclusion criteria)
Final number of studies included in the review = 11
Additional studies added using Google scholar and snow balling of the references
1 2 0
Final number of studies included in the review = 7
Final number of studies included in the review = 32
The quality of the included articles assessed using Hawker et al. (2002) scale
Risk Factors studies = 20
Risk Scales studies = 13
Duplicates removed
18 13
31
Reserved studies = 5 Reserved studies = 32 Reserved studies = 10
38
2.2.4 The Evolution of Literature Search
There is a paucity of research on PU in paediatrics compared to that of adults; for
this reason most of the literature found which related to children was included in this
study. Moreover, in Jordan particularly, there have only been a scant number of PU
studies, and none related to the paediatric population.
Some difficulty was encountered in trying to address the main themes of this study
with the existing literature at the beginning of the search process. However, the
number of related studies has recently increased, enhancing the literature review as
new incidence and prevalence studies were identified. For other issues such as
comparing the performance of the two scales, the Glamorgan and Braden Q,
however, there was not a large amount of supporting literature. Only two papers
were identified, one of them a retrospective (Anthony et al., 2010) and the other a
poster abstract (Long et al., 2011).
As regards the risk assessment theme, all paediatric RASs were mentioned and
discussed briefly, although the major focus was on the scales used in the data
collection process of this research. Also, many risk factors were discussed in
reference to the available paediatric PU studies, despite the fact that many of these
studies had a cross-sectional research design. Some difficulties were encountered
while discussing some of the paediatric literature in which the PU problem was
combined with other types of skin conditions, or in which some categories of PU
were treated as other types of skin breakdown, such as redness.
It was not possible to exclude such studies, however, because of their importance,
because their description of the skin breakdown is much like that of PU, or because
universal PU classification systems were used to describe the categories of these
breakdowns.
All the research publications consulted were entered into ‘EndNote’, a reference
management programme (EndNote, 2008), which was used to simplify the process
of sorting and storing references. It also helped with removing duplicated references,
as well as with adding citations and formulating the whole thesis’ reference list.
39
The whole process of searching for relevant literature was started in 2010, long
before the actual writing process commenced. However, further articles were
identified, and the search for newly published studies was maintained, as the
research proceeded between April 2010 and March 2013.
Finally, all incidence and prevalence studies which have been included in the
literature review of this thesis were evaluated for their quality based on the tool
developed by Hawker et al. (2002) (Appendix 1.2) although, in fact, any tool that can
be used to evaluate the quality of empirical studies included in any literature
synthesis would have been adequate, because there is none which is universally
recommended.
Hawker et al.’s (2002) tool was developed to describe different methods used to
systematically review a piece of research from different angles. It includes 9 areas to
be evaluated, starting with title and abstract, going through introduction and aims,
different methodological issues, and ending with the usefulness and applicability of
the study. Each aspect of the evaluated research is awarded a score from 4 (good) to
1 (very poor). The criteria upon which each study must be evaluated are mentioned
in the tool.
All incidence and prevalence studies accepted for the current review were assessed
using this tool to ensure the adequacy of all their elements. However, most of the
studies of paediatric PU identified here were limited in the details provided in terms
of their aims, samples, methodology, or were inadequate in other areas. Therefore, in
many cases the evaluation was limited to what was reported.
2.3 OVERVIEW OF PRESSURE ULCERS (PU)
2.3.1 The skin:
The skin is an important part of the human body. As a result of its importance in
protecting against the external environment, keeping body configuration and a
good body image, it is thought to represent the first line of the body’s defence
against external hazards (Pallija et al., 1999, Pasek et al., 2008). Also, skin is
40
important in assessing maturity in paediatric patients in general and in neonates
in particular since skin composes around 13% of a neonate’s weight compared
with 3% of a typical adult’s (Huffines and Logsdon, 1997).
Skin is composed mainly of two layers: the epidermis and the dermis. The
epidermis is the most outer layer and consists of dead cells which are shed and
replaced continuously. The dermis, on the other hand, consists of skin cells
which contain blood vessels and capillaries, sweat glands and nerve endings. If
these layers of the skin are exposed to continuous pressure, tissue ischemia and
necrosis may occur. Also, if left untreated, deeper tissue such as muscles and
bones might be affected (Hagelgans, 1993). Many clinical practices in neonatal
units affect the intactness and normal functioning of babies’ skin, which plays a
significant role in their risk of morbidity and mortality (Huffines and Logsdon,
1997).
Moreover, this organ is affected by environmental changes, such as the level of
moisture, temperature and friction or shear forces, which can lead to serious
conditions and diseases. One of these is PU.
2.3.2 Pathophysiology of Ulcer Formation:
The way PU develops is still not clear. Authors believe that ulceration is related
in some way to insufficient blood supply to the skin. Pressure on the outer skin in
turn puts pressure on blood capillaries, resulting in decreased blood flow,
diminished supply of nutrients and oxygenation, as well as the accumulation of
metabolic waste, which causes cell hypoxia, tissue necrosis and ulcer formation
(Brook, 2004).
However, it has been argued recently that the mechanisms which lead to PU
formation is composed of four major processes that affects three functional units
which are the cells, interstitial spaces, and the blood capillaries. The four
processes include local ischemia to the tissues, tissue injury from the reperfusion
effects, the impairment in the lymphatic fluid flow, and more the resulted
permanent cell deformity (Nixon et al., 2005). Furthermore, there are external
41
forces affects these four processes which are pressure, shear forces, and a mix of
microclimate related factors such as moisture and temperature which can affect
the cells wellbeing and hence its tolerance to the other forces.
Anyhow, the pressure forces was thought to be the major component of the
whole PU occurrence process; since this factor is always presented when the
shear forces occurs, and its duration and intensity would in some manner affect
the skin tissue tolerance (Defloor, 1999). So, a sustained unrelieved pressure
(intensive and for longer time periods), with or without a combination with the
other external forces would lead to PU development.
The micro capillary pressure that is needed to cause reduction in blood supply
was assessed by Landis (1930) cited in (Quigley and Curley, 1996), who found
that 32 mmHg is the closing pressure of arterial limbs of capillaries in adults. If
applied pressure exceeds this limit, the capillaries would close, and blood supply
would be reduced or obstructed, resulting in PU development. However, no
equivalent study on children has been undertaken, and the upper limit of pressure
in adults may not be a safe threshold for children and infants, since the degree of
pressure an adult’s skin can tolerate is not the same as in children because of
their different physiological conditions and states of maturity (Quigley and
Curley, 1996).
2.4 PRESSURE ULCERS IN PAEDIATRICS: PREVALENCE
AND INCIDENCE
Prevalence and incidence are two concepts used in epidemiology. They are
employed to measure the size of some event at a specific point of time, or during a
specified time period (Shields and Twycross, 2003). ‘Point prevalence’ has been
defined as: “measuring the proportion of all cases of a condition among a population,
considered at risk for developing that condition at one point of time” (Groeneveld et
al., 2004b, P. 109). ‘Incidence’ was defined by Craig et al. (2002) cited in (Willock
and Maylor, 2004, P. 56) as: “the number of new cases occurring in a defined
population over a specified period of time’’.
42
These two concepts are being increasingly utilized in health care disciplines,
including nursing. In the field of PU, pressure ulcer prevalence can be understood to
be the number of patients who have pressure ulcers within a group of assessed
patients at one point in time (Willock and Maylor, 2004). Most PU prevalence
studies have been carried out over one day (Willock et al., 2000, Schluer et al., 2009,
Noonan et al., 2006, McLane et al., 2004, Dixon and Ratliff, 2005) but they can be
done over a longer period of time. On the other hand, PU incidence is defined as
“the number of people who develop pressure ulcers in a specific population over a
specified period of time” (Willock and Maylor, 2004, P. 56).
Data collected through incidence studies can be comparable within the same area of
interest. By calculating the incidence rate, an event’s occurrence can be compared
between different populations, whatever the size of those populations (Shields and
Twycross, 2003). On the other hand, prevalence studies can measure an event only at
a particular point in time (Shields and Twycross, 2003), thus the size of any problem
might differ within the same population in different settings, or in different time
periods, according to the studied sample at that particular time.
Both prevalence and incidence of PU are significant indicators of patients’ quality of
care. This is because, hospitals usually estimate the size of a problem in a specific
population by conducting periodical prevalence and incidence studies (McLane et
al., 2004) and skin breakdown, PU, and many other skin issues are crucial indicators
of the quality of nursing care provided for patients in many health organisations
(Suddaby et al., 2005, Noonan et al., 2011, Noonan et al., 2006, McLane et al.,
2004). Moreover, Cockett (2002), in a review of research, concluded that skin care
was an integral part of each act of applied nursing care.
What is more, incidence can be used to evaluate the efficiency of the utilised risk
assessment scales, and the benefits of their use in different paediatric populations, as
well as to estimate the size of PU problems. This is usually done by testing the
scale’s ability to detect PU risk in a specific population (Barnes, 2004, Kottner et al.,
2011). Also, prevalence studies are thought to have the effect of limiting the negative
43
consequences of PU among children, by increasing the nurses’ awareness of the
problem, and related prevention methods (McLane et al., 2004).
Although PU is one of the conditions that is often measured in hospitals by
prevalence and incidence surveys, few studies have addressed the size of the PU
problem in paediatrics. Even the studies which are available mostly have limited
generalisability to specific populations, inadequate sample sizes, or unclear
methodology (Sims and McDonald, 2003, Cockett, 2002).
2.4.1 Paediatric Pressure Ulcer Prevalence
Willock et al. (2000) measured both the prevalence and incidence of PU in
paediatrics through two separate surveys with a gap of one month in-between. The
prevalence rate, based on a sample of 183 children and neonates from one hospital’s
paediatric wards, was 6.5% (n= 12) while the incidence rate was 7.2% (n= 6), based
on a sample of 82 children and neonates in the PICU, orthopaedic, and neurosurgical
wards. In addition to the small sample size of these studies, the prevalence rate
dropped to only 2.1% (n= 4), and the incidence to 3.6% (n=3), when blanchable
erythema was excluded from calculations. In other words, including this type of
erythema inflated the actual size of the problem in this population.
Baldwin (2002) also tried to estimate the size of the PU problem in children aged
from birth up to 21 years old, by conducting a mail survey which consulted 234
members of four paediatric health care databases in the USA. The data provided by
the members was used to estimate the incidence and prevalence of PU in this
population. Of 4429 paediatric inpatients in hospitals in 1998, 21 developed PU,
giving a prevalence of 0.47%, while incidence rate was 0.29%, since 337 patients
developed PU, out of 115,870 newly admitted patients for the same year.
However, Baldwin’s (2002) study has several drawbacks in terms of the reliability
and generalisability of its findings. Firstly there was a low response rate, as only
25% of questionnaires were returned. Also, the study design might have led to
under-reporting of the actual size of the problem, since it depended on nurses’
willingness and time to respond correctly to questionnaires. Moreover, target
44
hospitals were those with website addresses, but several hospitals could not be
accessed via the web, and this may have caused the exclusion of many potentially
affected children from the survey. Next, data collected by means other than direct
assessments of patients’ skin, might have under- or over-estimated the actual size of
the problem.
One multi-site study (McLane et al., 2004) also reported a considerably low
prevalence rate of 4% (n= 43). Although this study had a large sample size (n=
1064), covering a range of ages from neonates to children up to 17 years old, the fact
that some paediatric groups, such as burn patients, or those who were
physiologically unstable, were excluded might limit the generalisability of the
findings. The authors recommended the use of an incidence study to collect
benchmarking data about PU concurrently with the prevalence study.
Other prevalence studies have also been conducted in specific hospitals at multiple
points in time (Dixon and Ratliff, 2005, Suddaby et al., 2005), yet the way in which
they estimated the size of the problem was different. Dixon and Ratliff (2005)
surveyed five paediatric inpatients units (PICU, NICU, two general acute care units,
and a rehabilitation unit), to estimate the prevalence rate of PU in one hospital over
two years. In the first survey, two of 77 patients had PU, giving a prevalence rate of
3%; one year later, the prevalence was 4% (n= 3 out of 79 inpatients). Although
Dixon and Ratliff measured PU in children of various ages, from birth up to 21 years
old, their study’s small sample size might limit the usefulness of the results. Also,
investigating the size of the problem in these specific units might have over- or
under-estimated the size of the problem if compared with other paediatric wards.
Suddaby et al.’s (2005) five quarterly prevalence surveys of four paediatric inpatient
units (PICU, medical-surgical, oncology and adolescent units) revealed a much
higher prevalence rate of 23% (n= 80). However, the authors included other types of
skin breakdown, such as diaper dermatitis, as category I injuries, which might have
inflated the rate.
45
A significantly low PU prevalence rate was also reported in Noonan et al. (2006),
where just four patients out of a total 252 were found to have PU (1.6%),
Nonetheless, this rate increased when device-related ulcers were included (6.7%, n=
17). Nie (Nie, 2008) reported a PU prevalence of 10.7% among 266 children in one
hospital (n= 22). However, this was a short paper, in which prevalence was
calculated only for medical-surgical and ICU paediatric patients, which could have
affected the representativeness of the sample. In addition, the absence of descriptions
of affected areas and prevalent categories of ulcers, and incomplete explanations of
findings might limit the study’s comparability with other similar prevalence studies.
The highest PU prevalence rate reported in the literature was the result of a multi-site
study by Schluer et al. (2009), in which 43 of 155 inpatients had PU (27.7%). The
vast majority of ulcers found were device-related, which might have contributed to
the high prevalence of category I ulcers. Excluding this category would reduce the
prevalence to only 4.5% (n= 7), which is similar to that observed in previous
relevant studies.
A summary of all identified paediatric prevalence studies presented in (Appendix
1.3).
2.4.2 Paediatric Pressure Ulcer Incidence
Incidence rates were noticed to be higher than the prevalence rates in some studies,
especially when conducted in high risk populations, such as among children and
neonates in critical care units (Huffines and Logsdon, 1997, Curley et al., 2003a,
Zollo et al., 1996). An incidence of 16.9% (n= 10) of occipital PU was reported for
paediatric patients who had survived open heart surgery (Neidig et al., 1989) but this
rate fell sharply, to only 4.8%, after certain protocols to prevent such types of ulcers
had been implemented. However, this study was retrospective, depended on data
from patients’ charts, and had a limited sample size (n= 59) but, on the other hand, it
was the only study that has aimed to estimate the size of the PU problem in cardiac
paediatric patients.
46
One retrospective chart audit of 373 patients in a PICU (Schindler et al., 2007)
reported almost the same incidence of 18% (n= 71). However, this study divided the
incidence of skin injuries into three types: redness only (6.2%, n= 25), skin
breakdown only (8.5%, n= 34), and skin breakdown with redness (3.2%, n= 13),
using the NPUAP classification system. None of the children admitted to the PICU
during the study period (15 weeks) were excluded, which might strengthen the
generalisability of its findings to other PICU patients. Nevertheless, it’s retrospective
design, and the fact that it only included PICU patients might hinder it is findings
regarding the actual size of the problem, and the reported risk factors.
A higher incidence rate was reported in one matched case control study (Zollo et al.,
1996) of 271 patients in one PICU (26%, n= 65) over an 18 week period. However,
this was retrospective study, which again might affect the reliability of findings, and,
as in Willock et al. (2000), the inclusion of blanchable erythema might have inflated
the actual incidence rate of this sample, since it dropped to only 7% (n= 20) when
the category was excluded, along with non-blanchable erythema.
Curley et al. (2003a) also observed a high PU incidence in three PICUs, where 86 of
322 patients on bed-rest had developed PU (27%), although this rate would have
been even higher if the figure had been combined with an additional 27 device-
related ulcers. The prospective multi-site design of this study might strengthen its
results, yet the sample’s limited age range (21 days to 8 years old), and the fact that
children with congenital cardiac diseases were excluded, might limit the
generalisability of the findings to such groups of children and neonates.
In contrast, a lower incidence rate was reported in one early multi-site study
(Waterlow, 1997), in which 17 out of 302 inpatients had developed PU (5.6%),
although this low rate might be because the study population came from general
wards rather than critical care units as in previously discussed studies. Furthermore,
a much lower incidence rate was reported in one PICU (Murdoch, 2002), before and
after the application of a certain type of mattresses, where the incidence improved
from 0.9% (seven children developed ulcers out of 750) to 0.25% (two children
developed ulcers out of 790) over two years period. However, these findings

47
accounted for deep tissue ulcerations (category III and IV) only, plus, the calculation
of these rates was based on patients referred to the hospital tissue viability nurse, and
thus, any case missed by the nurse would have affected the reported incidence.
Two previous studies have discussed PU incidence specifically in neonates (Huffines
and Logsdon, 1997, Fujii et al., 2011). In the first study, six out of 32 patients in one
NICU developed PU (19%), while, in a later multi-site study, 14 out of 81 children
recruited from seven NICUs (16%) did so. Both studies had similar incidence rates
despite the fact that Huffines and Logsdon (1997) was a pilot descriptive study with
a small sample size, whereas Fujii et al. (2011) was a prospective multi-site audit,
and with a much larger sample.
In summary, as has been seen, the variation in reported paediatric prevalence and
incidence rates could be influenced by the inclusion of blanching erythema in PU
categorisation (Willock et al., 2000, Zollo et al., 1996), In addition to the exclusion
of non-blanchable erythema category in another study (Curley et al., 2003b) , which
was done to avoid the overestimation of the actual incidence rate by nurses who
misunderstand the actual description and classification of this category
Nurses can distinguish between category I PU, or non-blanchable erythema,
according to the EPUAP (2009), and other types of hyperactive erythema of the skin,
since the latter would usually disappear within at least half the duration of time
required initially to cause the skin erythema (Loman, 2000).
Also, the use of different terms and definitions to refer to PU and other types of skin
breakdown might be responsible for some of the variation in previous paediatric
studies, since several studies included other skin conditions in their PU incidence
and prevalence calculations (McLane et al., 2004, Zollo et al., 1996, Suddaby et al.,
2005) whereas a few others did not consider redness to be PU (Schindler et al.,
2007). Moreover, some studies considered pressure injuries resulting from medical
equipment to be different from mobility-related PU (Noonan et al., 2006, Curley et
al., 2003a).
48
A summary of all identified paediatric PU incidence studies are presented in
(Appendix 1.4).
2.5 PRESSURE ULCER RISK ASSESSMENT: FACTORS
AND SCALES
To gain a clear picture of any problem or phenomenon, the establishment of a good
base to start from and to build on is crucial. The assessment of a problem is the
initial step, upon which further steps, such as applying preventive actions, and
developing management policies, are performed (Quigley and Curley, 1996).
Pressure Ulcer in paediatrics is a problem that needs to be clearly described, so that
the health care provider can attempt to prevent its occurrence (Jones et al., 2001,
Pickersgill, 1997). The prevention of PU is an important aspect of care for this
population and is generally considered to be one of the quality indicators of the
nursing care provided (Curley et al., 2003b, Schluer et al., 2009). Although nursing
care cannot eliminate all of the contributing factors of PU development in children
nurses still play a significant role in the early detection and management of these
factors (Pallija et al., 1999).
Many measures to prevent PU are used in PICUs. However, none of these could be
evaluated for its effectiveness, without there being sufficient knowledge of the
patients’ risk (Curley et al., 2003b, Zollo et al., 1996). Thus, to help in inhibiting the
occurrence of PU, all factors which contribute to PU formation should be identified
(Pallija et al., 1999, Pickersgill, 1997, Zollo et al., 1996). In other words, in order to
understand the aetiology behind its development, nurses need to look beyond PU
itself, and need to have a systematic risk assessment tool that can be used to detect
PU risk in paediatric patients (Bedi, 1993).
PU risk factors have often been discussed in the literature with regard to adults, but
this is not the case for children. The limited number of available studies that discuss
paediatric PU risk factors has been commented on by many (Curley et al., 2003b,
49
Curley et al., 2003a, Schluer et al., 2009, Murdoch, 2002, Willock et al., 2000,
Loman, 2000, Garvin, 1997).
The research designs of most paediatric risk studies can be said to have limitations.
For example they may be descriptive (Willock et al., 2000, McLane et al., 2004,
Murdoch, 2002, Waterlow, 1997, Willock et al., 2005b, Baldwin, 2002, Dixon and
Ratliff, 2005), cross-sectional (Schluer et al., 2009, Suddaby et al., 2005), have used
a retrospective protocol (Neidig et al., 1989, Samaniego, 2004, Schindler et al.,
2007), have limited statistical analyses or unclear details (McCord et al., 2004, Zollo
et al., 1996, Gordon, 2008), or have a small sample size (Willock et al., 2000,
Huffines and Logsdon, 1997, Fujii et al., 2011, Manning and Curley, 2012). While
some authors have used adult risk scales to predict PU in children (Schluer et al.,
2009), a few others have used paediatric risk assessment scales which had no
approved statistical validity (Loman, 2000, Huffines and Logsdon, 1997, Murdoch,
2002, McLane et al., 2004).
2.5.1 Pressure Ulcer Risk Factors in PaediatricS
2.5.1.1 RISK FACTOR CLASSIFICATIONS
Risk factors related to PU development in children are usually classified in different
categories or sections; sometimes they are linked with specific groups of children
who have specific diseases, such as children with cardiac problems (Neidig et al.,
1989), respiratory problems (Schindler et al., 2007), orthopaedic patients
(Samaniego, 2004), premature babies (Fujii et al., 2011), and those with burns
(Gordon, 2008).
In addition, Braden and Bergstrom (1989) divided PU risk factors into two major
types: those which were caused by an increase in the intensity and duration of
pressure, such as immobility or low sensation, and those which were caused by a
reduction in patients’ tolerance to pressure, such as nutrition and pain. Additionally,
skin tolerance to pressure was divided into another two sub-types: intrinsic and
extrinsic (Quigley and Curley, 1996).
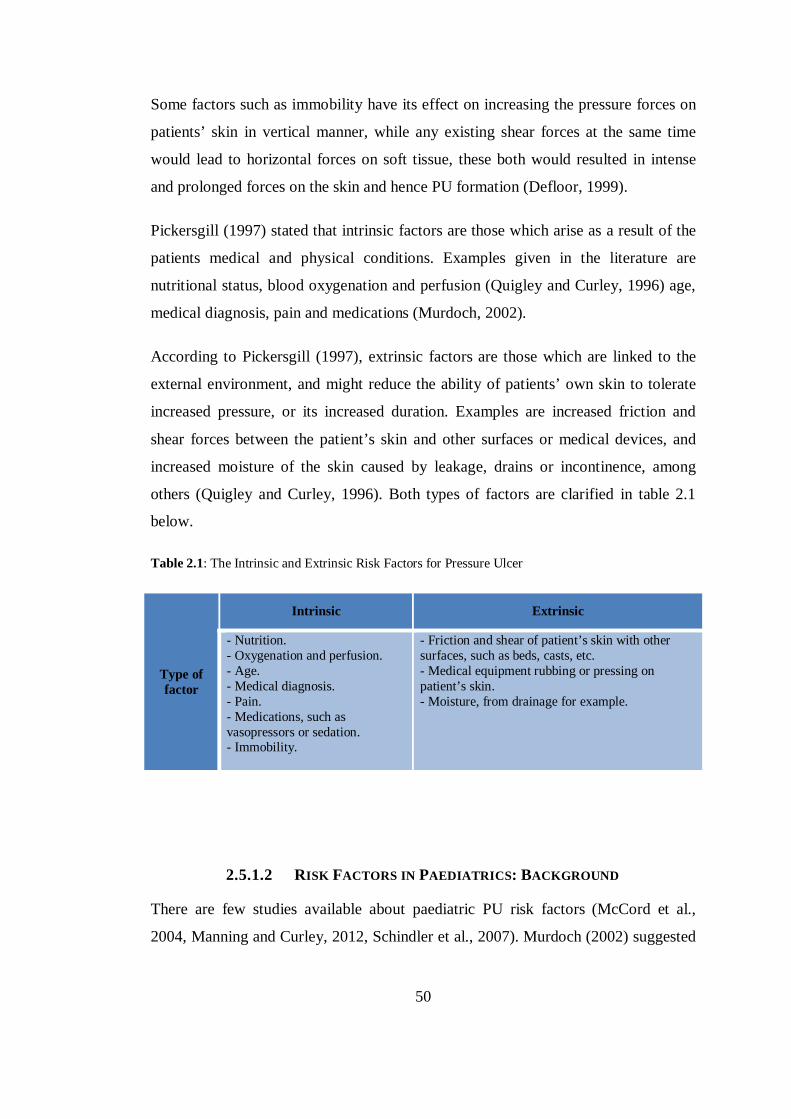
50
Some factors such as immobility have its effect on increasing the pressure forces on
patients’ skin in vertical manner, while any existing shear forces at the same time
would lead to horizontal forces on soft tissue, these both would resulted in intense
and prolonged forces on the skin and hence PU formation (Defloor, 1999).
Pickersgill (1997) stated that intrinsic factors are those which arise as a result of the
patients medical and physical conditions. Examples given in the literature are
nutritional status, blood oxygenation and perfusion (Quigley and Curley, 1996) age,
medical diagnosis, pain and medications (Murdoch, 2002).
According to Pickersgill (1997), extrinsic factors are those which are linked to the
external environment, and might reduce the ability of patients’ own skin to tolerate
increased pressure, or its increased duration. Examples are increased friction and
shear forces between the patient’s skin and other surfaces or medical devices, and
increased moisture of the skin caused by leakage, drains or incontinence, among
others (Quigley and Curley, 1996). Both types of factors are clarified in table 2.1
below.
Table 2.1: The Intrinsic and Extrinsic Risk Factors for Pressure Ulcer
Type of factor
Intrinsic Extrinsic
- Nutrition. - Oxygenation and perfusion. - Age. - Medical diagnosis. - Pain. - Medications, such as vasopressors or sedation. - Immobility.
- Friction and shear of patient’s skin with other surfaces, such as beds, casts, etc. - Medical equipment rubbing or pressing on patient’s skin. - Moisture, from drainage for example.
2.5.1.2 RISK FACTORS IN PAEDIATRICS: BACKGROUND
There are few studies available about paediatric PU risk factors (McCord et al.,
2004, Manning and Curley, 2012, Schindler et al., 2007). Murdoch (2002) suggested
51
using literature concerning adults as a preliminary base to identify risk factors in
paediatrics while research is ongoing, because, according to Murdoch, most
paediatric studies have depended on adult data. However, adult risk factors are not
always applicable in paediatrics, because of children’s distinctive anatomical,
physiological and psychological features, which are different to those of adults
(Murdoch, 2002, Bedi, 1993, Waterlow, 1997, Willock et al., 2000).
In infancy and early toddlerhood, the head is proportionally larger and heavier than
the body trunk so these young children are at higher risk of developing occipital and
ears PU while in a supine position (Willock et al., 2000, Neidig et al., 1989). As
children get older, their bodies will begin to match the proportions of adults’ bodies,
and thus the affected sites, such as the sacrum, heels, and trochanter, become much
the same as those seen in adult patients, (Murdoch, 2002).
This information might explain why Samaniego (2004) found that most of the ulcers
seen in a group of orthopaedic PU patients were in the lower extremities, especially
in the feet areas (50%, n= 25), since more than half of the patients were above the
age of 10 years old (n= 29). The author believed that, as the children got older, or
their neurological statuses deteriorated, they were at higher risk of sacral ulcers.
Furthermore, it is thought that, because infants and young children have limited hair
growth, and less subcutaneous tissue in the occipital area compared with adults, this
increases their risk of pressure and shearing forces in that area (Neidig et al., 1989).
Most of the studies of paediatric PU risk factors identified simply involved
descriptions of patients’ characteristics, without any significant correlations between
the predicted factors and PU occurrence being inferred (Baldwin, 2002, Samaniego,
2004, Dixon and Ratliff, 2005, Waterlow, 1997, Willock et al., 2005b, Willock et al.,
2000, McLane et al., 2004, Murdoch, 2002). A few more studies used statistical
analyses to infer significant associations between contributing factors and PU
development. However, most of these used questionable methodology since they
were, for example, retrospective or cross-sectional (Schindler et al., 2007, Manning
and Curley, 2012, Schluer et al., 2009, Suddaby et al., 2005), or depended on other
52
means to address risk factors (Gordon, 2008). Others used simple inferential
analyses, such as the univariate tests, to reveal the risk factors in their paediatric
populations, which are not as rigorous as the multivariate analyses (Willock et al.,
2007, McCord et al., 2004, Neidig et al., 1989).
Curley et al. (2003a), Zollo et al. (1996) and Fujii et al. (2011) were the only studies
identified which employed appropriate methods and advanced statistical analysis.
However, it can be said that Zollo et al. and Fujii et al. did not provide enough
details about the findings of some of the statistical tests.
a) Paediatric Risk in General Wards
Several studies have described the features of PU-patients in different paediatric
wards. Waterlow (1997), for example, studied children aged from birth up to 16
years old, who had suffered from severe illnesses, lengthy surgeries, and had more
devices attached to their skin such as splints, casts, or tubes than PU-free patients.
She suggested that this group’s increased risk of PU had resulted from a collection of
extrinsic factors such as pressure, friction or shear forces, and moisture, although
these findings did not achieve statistical significance.
Willcock et al. (2000) conducted a combined incidence and prevalence survey in
general paediatric units but only included PICU, orthopaedics and neurosurgical
units in the incidence study. The authors described a variety of characteristics which
could be linked with PU formation in this population, namely being over- or under-
weight, inadequate diet for the child’s age, hemodynamic instability, oedema,
dehydration, incontinence, or an abnormal skin condition. In addition, more than half
of the PU-patients were noticed to be less aware of pain and pressure, and the
majority suffered from impaired mobility. The patients also tended to be younger in
age, particularly those who developed occipital PU.
Baldwin et al. (2002) also report younger children to be especially prone to PU, and
mention medical devices such as tractions, as well as being sedated, hypotensive,
suffering from sepsis, spinal cord injury or severe illness as features associated with
PU- patients. However, due to problems associated with the mail survey design,
53
response rate, and the representativeness of the sample, this study is believed to be of
limited value.
One further multi-site cross-sectional survey (McLane et al., 2004) found that
children under 3 months old had a higher prevalence of PU occurrence. The PU
patients also appeared more likely to be immobile, intubated, to suffer from severe
illnesses, and to have had longer lengths of stay in the hospital. Despite the large
sample recruited for this survey, however, none of these observations were supported
by statistical evidence.
Young age was again correlated with PU in children in five quarterly cross-sectional
surveys carried out (Suddaby et al., 2005). Affected children were also described to
be smaller in weight, had more frequent episodes of diarrhoea, and were attached to
more medical devices than those who were free of PU. These children also scored
lower on the Starkid scale (this scale is discussed later on this section), although the
scale’s validity had not been previously tested. Moreover, these factors were also
shown to be associated with other types of skin breakdown such as diaper dermatitis.
Willock et al. (2005b), in another multisite survey of eleven hospitals, collected data
on 54 PU patients. The majority were found to have limited mobility, with more than
half being completely immobile, and also suffered from impaired nutrition, low
serum Albumin level, pain, and inappropriate self-care abilities for their age.
However, the absence of a comparison group of PU-free patients prevented the
authors from drawing any statistical relationships between these observed factors and
PU development.
In another publication, Willock et al. (2007) combined data from previous incidence
and prevalence surveys with multi-site data (Willock et al., 2005b, Willock et al.,
2000) and were able to propose a significant link between children’s restricted
mobility, or any difficulty in changing position, with PU formation. In addition,
persistent pyrexia, anaemia, prolonged surgery, and having equipment or surfaces
pressing on the skin were noticed to be significantly related to PU occurrence in
paediatrics. Having a larger sample size (n= 337), and lowering the significance
54
level (p< 0.01) might have reduced the chance of type I errors and enhanced the
power of the results. However, the results were proved only by univariate analysis,
and the study design was retrospective.
One further descriptive study (Dixon and Ratliff, 2005) named immobility as a
typical characteristic of paediatric PU-patients, and also described these children as
more likely to be critically ill, hypotensive, mechanically ventilated, oedematous,
and to have had longer lengths of stay in hospital. However, despite the fact that
these were presented as features of general paediatric patients, most were actually
related to children cared for in critical care units. Moreover, no statistically
significant relationship between any of these features and PU development was
established.
One additional multi-site cross-sectional survey (Schluer et al., 2009) tested factors
identified as being related to PU occurrence by both univariate and multivariate
analyses. The significant factors were a low Braden score of risk (using a cut-off
score of ≤ 20), along with characteristics related to the wards and institutions. Most
identified ulcers were device- related, and PU-patients had longer stays in hospital
than PU-free patients. However, the small sample size (n= 155) and the research
design may limit the generalisability of these features, also, the used scale was
argued before to be inappropriate for use in paediatric population (Kohr and Curley,
2009).
Two other studies discussed risk factors related to PU development but these were in
specific paediatric populations (Samaniego, 2004, Gordon, 2008). Samaniego’s
study (2004) was a retrospective charts audit of PU patients who visited one wound
clinic with orthopaedic- related illnesses, mainly Myelodysplasia, cerebral palsy, and
clubfeet. The identified risk factors were paralysis, insensate areas, high activity, and
immobility. However, these contributing factors were extracted from descriptive
statistics only and based on a small group of PU-patients (n= 50), thus the study’s
findings may only relate to this particular population of children. One further study
reported low activity as predictor of skin breakdown in neonates, yet this was not
tested statistically (Huffines and Logsdon, 1997).
55
Gordon (2008) investigated risk factors of PU occurrence in paediatric burn patients.
Several specific burn characteristics were agreed by 15 burn experts, using a
modified Delphi technique, to be associated with PU development. These were total
burned body surface area, number of splints, MAP < 60 mmhg for the past 24 hours,
incontinence, calories intake, unburned area exposed to wetness and, as in previously
mentioned literature, immobility was also related to PU occurrence in this
population. However, because no actual audit was performed, and the identified
factors were not tested statistically, in addition to the unique nature of burn-patients
skin, these findings might be limited to this particular population of children.
b) Paediatric Risk in Critical Care Areas
Although different populations of children and neonates were reported to be at risk
of PU formation (Willock et al., 2000, Samaniego, 2004, Pallija et al., 1999, Galvin
and Curley, 2012), it is generally agreed that the risk of PU is higher among
critically ill patients (Curley et al., 2003a, Willock et al., 2000, McCord et al., 2004,
Neidig et al., 1989, Zollo et al., 1996) who have specific characteristics that
predispose them to the higher risk. One prospective cohort study over 322 children
in three PICUs in the USA (Curley et al., 2003a) found that the most important
contributing factors for PU development in this group of patients were the use of
mechanical ventilation (MV), being hypotensive (MAP< 50 mmhg), and having
lower Braden Q scores (cut- off score ≤ 16).
Being on MV, or being intubated, is not a newly addressed risk factor for PU in this
group of children and neonates, but has often been discussed in other research (Zollo
et al., 1996, Fujii et al., 2011, Schindler et al., 2007, McLane et al., 2004, Dixon and
Ratliff, 2005, Manning and Curley, 2012). Yet, the MV itself could be not the actual
risk for these patients, but the fact that they would be immobilised for variant periods
might contribute to their increased risk of PU formation.
It has sometimes been argued that it is the use of special settings on the ventilator,
such as a high Positive End Expiratory Pressure (PEEP) level, or special types of
ventilation, like High Frequency Oscillatory Ventilation (HFOV), which contribute
56
to PU formation, rather than the intubation itself (Curley et al., 2003a, McCord et al.,
2004, Manning and Curley, 2012). McCord et al. (2004) found that using a level of
PEEP as high as 10 cm of water, is usually associated with children who are
unstable, or severely ill, which may mean that they are positioned less frequently by
nurses, and hence their risk of PU is increased.
A few other studies discussed how spending longer periods on MV would increase
the child’s risk of PU formation (Zollo et al., 1996, Neidig et al., 1989, Curley et al.,
2003a). For example, Neidig et al. (1989) observed that intubation for longer than 7
days was significantly related to PU development in children following open heart
surgery, because these children are usually haemodynamically unstable, so nurses
prefer not to perform positioning until they become more stable. In addition, there
are other factors which restrict head repositioning for this population such as the
presence of Jugular intravenous catheters, or head and neck oedema (Neidig et al.,
1989).
Cardiovascular instability has been previously identified as a typical feature of
patients affected with PU (Murdoch, 2002, Willock et al., 2000). Also, patients’
general physical condition was found to be highly predictive of their risk of skin
breakdown in one pilot study of neonates in ICU (Huffines and Logsdon, 1997).
Moreover, in Zollo et al. (1996), the mean length of ventilation for children with
intact skin was around 4 days, compared with a mean of 7 days for patients with skin
breakdown. However, multivariate analysis revealed only two significant risk
factors, which were race and the Paediatrics Risk of Mortality Score (PRISM).
Interestingly, this was the first and only study to highlight race as a risk factor for
skin breakdown in paediatrics; however, the authors explained that this may have
been due to an underestimation of category I and II ulcers in children with dark skin
since redness may be difficult to detect in this population. The PRISM score, on the
other hand, was also reported to be related to PU formation in children, and this
score would reflect the acuity of the child’s condition during their stay in ICU
(Schindler et al., 2007).
57
Hypotension and treating patients with vasopressors and inotropes have also been
discussed in the literature (Zollo et al., 1996, Curley et al., 2003a, Manning and
Curley, 2012, Murdoch, 2002). Maklebust (1987) explained how patients with low
blood pressure, on vasopressors, or who have a low cardiac output will compensate
by shifting blood supply from the non-vital organs like the skin, to vital organs such
as the heart or kidneys, for example. This could affect the proper response of the skin
to any local compression, and ischemia (Curley et al., 2003a).
Critically ill children of a younger age have also been said to have a higher risk of
PU development (Zollo et al., 1996, Neidig et al., 1989, Curley et al., 2003a,
Schindler et al., 2007). Neidig et al. (1989), for example, found that children aged 36
months and younger were at higher risk of developing occipital PU following open
heart surgery, and that all ten children who had developed occipital PU, out of a total
59 patients, were younger than 3 years old. The authors believed this was due to
disproportionate size and weight of infants’ and young children’s heads compared
with their bodies, as well as restricted mobility and positioning, their extremities
being restrained to avoid self extubation, and sedation use. All together, these factors
make the pressure more intense and prolonged (Neidig et al., 1989).
Sedation and neuromuscular blockers have been reported several times as being
significantly related to PU development in critically ill paediatric patients (Zollo et
al., 1996, Curley et al., 2003a). Such types of medications are thought to decrease the
normal process of children’s sensory perception and response to pain or pressure,
which would diminish the body’s natural protective reactions (Murdoch, 2002).
Willock et al. (2000) also noticed that children and infants had a significantly higher
incidence of occipital PU development, especially those admitted to the PICU. All
children in the incidence part of their study except for one had been admitted to
PICU, and over a third of those who developed PUs in the prevalence study were
inpatients in the PICU.
McCord et al. (2004) noted that the majority of identified PU cases had occurred in
infants and children less than 3 years old (66%, n= 37) and another study, which was
58
developed to test a new neonatal skin RAS, found that the mean age of neonates who
did develop skin breakdown was lower than that of the breakdown-free group (29.4
± 2.6 vs. 33.9± 3.8) (Huffines and Logsdon, 1997).
A lengthy stay in hospital or in ICU has been named as a risk factor for PU
development in acutely ill children (Zollo et al., 1996, Neidig et al., 1989, McCord et
al., 2004, Schindler et al., 2007). McCord et al. (2004) speculate that increasing the
LOS to more than 96 hours would usually be associated with longer periods of
immobilization, poor nutrition and weight loss, especially since most of children
admitted to the PICU would experience periods of NPO (Nothing per Os or nil by
mouth) during their stay.
Furthermore, PICU LOS was found to be significantly related to occipital PU
development in children following open heart surgery (Neidig et al., 1989). This was
thought to be because a PICU stay of longer than 8 days is usually associated with
longer periods of MV and intubation, longer periods of immobilization and limited
positioning, which places children at higher risk of pressure on the occiput area.
Also, shorter periods of ICU stays of 4 days and more were confirmed by both
univariate and multivariate analyses as being significantly associated with PU
occurrence in one PICU (Schindler et al., 2007).
Impaired nutrition and inadequate intake of calories were also found to be features of
PU-patients (Willock et al., 2000, Gordon, 2008), yet these studies were descriptive,
and did not focus on ICU patients in particular. Certain types of nutritional supply,
such as Total Parenteral Nutrition (TPN) have been said to increase patients’ risk of
PU category I and above, (Curley et al., 2003a). Although Curley et al. (2003a) did
not state how this could relate to an increased risk of PU; it could be explained in
some way by the acute health condition of children who receive it, or the effect of
pressure from the devices used with such type of nutrition, such as cannulas and
tubes.
However, weight loss and malnourishment predispose children to the loss of
subcutaneous tissues which increases the projection of bony prominences and hence
59
increases friction and shear, as well as pressure. Also, critically ill children would
burn calories at a higher rate than children who are not as seriously ill (Murdoch,
2002).
In addition, smaller children or those who lose weight during their ICU admission
are thought to have a higher incidence of PU formation (Fujii et al., 2011, McCord et
al., 2004, Huffines and Logsdon, 1997). Willock et al (2000) also reported that
excess weight could also increase children’s risk of PU, perhaps because of the
limited ability of overweight children to control their body position easily, especially
when in acute care conditions.
Young children, especially neonates, were shown to be at an increased risk of
developing PU as a result of their immature skin in a prospective multisite study of
seven NICUs (Fujii et al., 2011) which discussed the effect of skin texture on
neonatal vulnerability to PU. Neonates with skin texture scores 0 or 1 (using the
Dubowitz neonatal maturation assessment scale), were at significantly higher risk of
PU. The authors explained that children with immature skin would gain the lowest
scores on the previously mentioned scale, where 0 indicates extremely thin and
gelatine like skin and 1 represents skin that is very smooth and thin. Also, any child
born at less than 33 weeks gestation was believed to be at higher risk of PU
occurrence, due to the immature Dermoepidermal-junction of their skin.
There is agreement, however, that skin maturity in neonates is usually achieved
within 3 weeks (21 days) of birth, irrespective of their gestational age at delivery
(Fujii et al., 2011, Quigley and Curley, 1996, Curley et al., 2003a). Fujii et al. (2011)
reported that 8 out of 13 neonates who developed PUs had been born at under 33
weeks gestation, and 11 ulcers out of 14 developed within the first 21 days of life.
Children and neonates were thought to be different in both their skin response and
tolerance of pressure. Waterlow (1997), for instance, believed that neonates were
more at risk of extravasations, bruising or torn skin caused by infusions, heel pricks
or the strapping of tubes, as a result of their delicate immature skin. Consequently,
60
she recommended taking this difference into consideration while caring for neonates
and very young children.
Neonates, and more specifically underdeveloped preterm babies, are believed to have
several characteristics that affect their skin’s normal barrier functions, and increase
its risk of breakdown, these include; high skin permeability, which increases the
absorption of chemicals and drugs as well as increasing heat and water loss (Curley
et al., 2003a).
Fujii et al. (2011) discovered a number of other factors statistically related to PU
occurrence, namely incubator humidity and temperature, limited repositioning, and
the type of support surface used. However, all of these were extrapolated from the
use of univariate analysis only, which might affect the strength of evidence provided,
in addition to the fact that a small sample size was used (n= 81). Furthermore, all of
these factors might be specific to this particular population of neonates. The
increased risk of PU in patients cared for on special turning surfaces / beds, or the
late initiation of positioning of patients was also supported by McCord et al. (2004).
Children cared for on special surfaces, such as low-air-loss beds were thought to
have additional problems with increased friction and shear on the occiput, rather than
having pressure relieved (McCord et al., 2004).The authors identified the lack of
enough evidence of these beds efficacy in relieving or reducing pressure in
paediatrics.
Furthermore, the attachment of medical devices, such as catheters, electrocardiogram
(ECG) leads, splints, O2 saturation probes and nasal tubes, to patients’ skin has been
found to be significantly associated with PU occurrence in children and neonates
(Fujii et al., 2011, Manning and Curley, 2012, Murdoch, 2002). Murdoch (2002)
reported that one child developed severe ulcers as a result of being on a cervical
board for more than 36 hours. Fujii et al. (2011) also describe endotracheal
intubation as a risk factor for PU among NICU patients, yet the authors believe this
is not due to hypoxemia or impaired oxygenation issues; rather, it results from the
pressure of the nasal CPAP used on patients’ skin.
61
Oedema has also been named as an added risk factor for PU development. This
factor was reported once in relation to critically ill children (McCord et al., 2004),
and on another two occasions for general paediatric patients (Willock et al., 2000,
Dixon and Ratliff, 2005). Oedema is believed to increase the distance between the
capillary beds and adjacent cells, which reduces the rate of diffusion of oxygen and
nutrients to the affected area, and may impair the circulation and increase the risk of
PU to that area (McCord et al., 2004). Head and neck oedema was also reported to
be a feature that limited the head positioning in children following open heart
surgery, and hence increased their risk of occipital PU occurrence (Neidig et al.,
1989).
Other factors have been noted to be specific to some sub-sets of ICU patients. For
example, there may be an increased risk of occipital PU risk in patients with
ventricular septal heart defects following open heart surgery (Neidig et al., 1989).
Although the significance of this factor might be skewed, as 76% of children with
this condition were younger than 36 months old (13 out of 17 children), so the young
age of these patients might be the actual basis of the risk, rather than the diagnosis
itself. Furthermore, these patients would usually suffer from acute preoperative
symptoms, such as failure to thrive and congestive heart failure, which require urgent
surgical intervention, and it should be taken into consideration that around 29% of
children in the whole sample had had this diagnosis (Neidig et al., 1989).
In Zollo et al.’s case control study (1996), prolonged surgery, and having a higher
Paediatric Overall Performance Category (POPC) score were also documented as
factors contributing to skin breakdown in PICU children, although how the POPC is
scored, and how it performs in relation to PU, was not described in this study. It is
known, however, that this scale was developed to measure the neurological abilities
of paediatric patients, with a score range from 1 (normal) to 6 (brain death) (Fiser,
1992).
Additionally, a high score on the Ramsay scale was reported to be significantly
associated with category I and above PU in another PICU population (Curley et al.,
2003a). This score reflects the child’s level of response ranging from 1
62
(restless/agitated) to 6 (no response to painful stimuli). The ratings of both of these
scales might help demonstrate the effect of impaired neurological and sensory
responses on PU risk in children, since this would entail a poor response to pain and
pressure, and an unawareness of when to mobilise or change position, which would
increase the risk of PU formation, as discussed earlier. A summary of identified
paediatric PU risk factors studies is presented in (Appendix 1.5).
2.5.2 PAEDIATRIC RISK ASSESSMENT SCALES (RASS)
The first step in achieving successful prevention of any problem is performing a
proper assessment (Zollo et al., 1996). To make a reliable assessment, there is a need
for specific guidelines which enhance the assessment process. Such criteria or
guidelines will help individual assessors to maintain objectivity, and ensure a
systematic organized assessment process (Huffines and Logsdon, 1997).
Such criteria should also be accompanied by a comprehensive group of associative
factors or causative factors, which should cover most of the problem’s dimensions
(Anthony et al., 2009). However, in practical terms, that is almost impossible. No
criteria can include a huge number of factors and be easy to follow and use at the
same time (Willock et al., 2009). For that reason, experts have developed specific
tools that contain the most relevant and the most predictive risk factors. These are
called ‘risk assessment tools’.
A risk assessment tool or scale (RAS) is defined as an instrument which aims to
identify patients who are at risk, and to determine their level as well as their type of
risk (Willock et al., 2009).
The use of an appropriate, valid and reliable assessment tool for PU is recommended
for paediatrics as well as for adults (Loman, 2000, Kottner et al., 2011, Zollo et al.,
1996).This is said to be due to the unique characteristics of children, either
developmentally or according to their physical and psychological response to pain
(Garvin, 1997). Also, having a special paediatric RAS may play a role in
standardizing the preventive and therapeutic actions of nurses, as well as helping
63
ensure that time consuming and costly preventive measures are properly allocated,
only to those patients who are really in need of them (Zollo et al., 1996).
From another perspective, Some paediatrics RASs were designed to include
assessing all variant age groups of paediatrics, while others were developed to be
used only in a specific population of children, mostly the neonates. Few RASs were
designed specifically for neonates (McLane et al., 2004, Huffines and Logsdon,
1997), and this because of the thoughts that this particular population has its own
unique characteristics, that put them at a different level of PU risk. Neonates were
argued before for example to have premature skin texture especially if were
premature babies, that would lead them to lose water and absorb medications more
rapidly than other paediatrics’ age groups. This in its turn would result in increasing
the microclimatic processes on the neonate’s skin normal tolerance of pressure
(Huffines and Logsdon, 1997, Fujii et al., 2011).
From another perspective, having one scale that fits to all paediatric age groups was
discussed before to be necessary to score patients risk based on their different
developmental milestones (Willock et al., 2007). It might be difficult as well as
impractical to have several tools to measure risk for different age groups of
paediatric patients.
In my own opinion, a predictive tool is that one which is easy to fill in and follow in
practice, while at the same time is able to measure risk correctly on different age
groups according to their variable developmental levels; this would in some degree
preserve nurses’ time and efforts.
Thirteen scales which have been devised to measure PU risk in paediatrics were
identified. Four of these were established specifically for PICU populations (Bedi,
1993, Garvin, 1997, Cockett, 1998, Olding and PATTERSON, 1998b), two tools
were developed for neonates (Huffines and Logsdon, 1997, McLane et al., 2004) and
one for cardiac and general operation rooms (OR) (Galvin and Curley, 2012). The
remaining scales were designed for general paediatric wards (Quigley and Curley,
64
1996, Pickersgill, 1997, Willock et al., 2007, Barnes, 2004, Suddaby et al., 2005,
Waterlow, 1998).
Though RASs are not always perfect indicators of patients’ risk of developing PU,
they are thought to be useful in increasing bedside nurses’ objectivity in assessing
and identifying ulcers (Huffines and Logsdon, 1997). Also, these scales may help to
conserve health care resources and save time and money, as well as to standardize
nursing practice (Huffines and Logsdon, 1997, Barnes, 2004, Garvin, 1997). One
study which tried to develop a paediatric PU RAS concluded that RASs are
important because they are reminders for nurses of the patients who are at risk, and
of the related risk factors. Also, they are a means of recording information related to
PU existence, the care provided, and the required prevention and management
procedures (Barnes, 2004).
Prospective design is thought to be crucial for validating RASs because the scales’
risk scores work as predictors of PU occurrence (Kottner, 2011). For example,
Barnes (2004) has recommended the application of an incidence study to test her
newly developed paediatric RAS. Anthony et al. (2010) also recommended the use
of prospective design to compare predictive validity between three paediatric RASs,
the Glamorgan, Braden Q and Garvin .
Although it is generally agreed that paediatric patients are at risk of developing
pressure ulcers (Waterlow, 1997) , there is still no agreement about the best scale to
measure this risk in different populations of children. Before 1992, there was no risk
scale designed to be used in paediatrics, as the first report about a scoring system of
PUs for children was published in 1993 (Bedi, 1993). The Bedi tool, developed in
one paediatric unit where the majority of cases were cardiac, it was a version of the
adult Waterlow Card (1985) with modifications to its contents applicable to
paediatrics.
Bedi’s wound risk assessment chart was designed for children aged from birth up to
15 years old and consisted of 11 items: weight, continence, skin types, mobility,
appetite, age, general assessment, special risks, neurological deficit, major
65
surgery/trauma, and medications. Also, this tool included a special part for
describing the characteristics of wounds and swabs. Each item has a score range
between zero and eight. Children are deemed at risk with total scores of 10+, at high
risk with scores of 15+, and at very high risk with scores of 20+.
There are many RASs available for adults but only a limited number in paediatrics.
No RAS based on quantitative data has been established in paediatrics (Willock et
al., 2000) and most existing paediatric RASs are based on observation and clinical
experience, and lack empirical evidence (Loman, 2000).
The Glamorgan RAS is the only scale that has been developed based on the
statistical analysis of data collected by observing patients directly (Anthony et al.,
2010, Willock et al., 2007). Many RASs used in paediatrics are modified versions of
scales originally designed for adults. However, this has been found to be inadequate,
especially if used in the PICU (Bedi, 1993, Cockett, 1998, Olding and Patterson,
1998a).
Modified adult RASs are argued to be inappropriate for children because of their
different developmental and physiological characteristics. For example, immobility
and incontinence are normal conditions in some paediatric groups such as neonates
and differences such as these should be taken into consideration while estimating
children’s level of risk in regard to developing PU. Variations in age should also be
accounted for while considering the use of a paediatric RAS (Willock et al., 2000).
One tool, which was developed in a hospital by Pickersgill (1997) as a part of a
tissue viability policy, includes six items with total risk scores ranging from zero to
18, where zero is the lowest risk and 18 the highest. Items include: build and weight
for height, appetite, skin condition, mobility, elimination and drugs used. These
criteria were devised from Medley and Waterlow’s risk score charts.
Another tool, which was developed in 1998, especially for children in PICU,
contains 10 items with three to five sub-items for each (Cockett, 1998). The total risk
score ranges from 2 to 36, where 2 represent the lowest risk score and 36 the highest.
The items included are: weight, mobility, skin condition, diet, sedation,
66
hemodynamic status, respiratory status, incontinence, Glasgow Coma Scale score
and other special considerations including having a temperature less than 35˚C,
surgery longer than 4 hours, cast or splinted arm with intravenous fluids. These items
were established based on a search of the literature for any known risk factors among
paediatric and intensive care patients (Cockett, 1998).
For neonates, one study was found which aimed to design an instrument to measure
the risk of acquiring PU in this population. The Neonatal Skin Risk Assessment
Scale (NSRAS) (Huffines and Logsdon, 1997) was developed based on the adult
Braden Risk Scale and consisted of 6 sub-items (general physical condition, mental
state, mobility, activity, nutrition and moisture). Neonates’ physical condition was
scored according to their gestational age. A score of 1- was given to babies born at
38 weeks up to- post term, score 2 for 33-38 weeks, score 3 for 28-33 weeks, and a
score of 4 for a gestational age of less than 28 weeks.
The other sub-items were scored according to a specific description of each item.
Total scores ranged from 6 up to 24, with the lowest score indicating a lower risk
and highest scores signalling highest risk. This scale was then modified following an
inter-rater reliability test; the modified scale included only three sub-items (general
physical condition, activity, and nutrition) which had shown the best inter-rater
reliability (Huffines and Logsdon, 1997).
Another infant and neonatal RAS, the Neonatal / Infant Braden Q RAS, a
modification of the adult Braden Q scale, was developed to measure prevalence in
this particular population (McLane et al., 2004). The modifications were made by a
neonatal clinical nurse specialist and a Wound and Ostomy Care paediatric nurse
practitioner (WOCN) and included adding more descriptors for each sub-item to
account for the unique characteristics of neonates, and adding a new gestational age
category to target premature infants (McLane et al., 2004).
Garvin (1997) established an assessment and intervention tool for pressure-related
skin breakdown in paediatric patients. The tool consists of four categories (mobility,
sensory perception, nutrition and moisture), each of which has a classification of four
67
stages ranging from 1 (low risk) to 4 (highest risk). The total score ranges from 4 (no
risk) up to 16 (the highest risk). It is also includes intervention categories ranging
from level one to three. These interventions would be applied for each child
according to their risk score, based on the same tool.
Another scale which has been developed and used to assess children is the Pattold
risk scale. This scoring system was first developed by Olding and Patterson (1998)
to measure the risk of PU development in children in ICUs. The PICU unit was
chosen specifically because of the high frequency of skin damage noticed in this
particular unit (Jones et al., 2001, Willock and Maylor, 2004).
One section of the Pattold scale includes eight areas that were found to be significant
for skin integrity maintenance, and which were specified based on the authors’
experience as PICU nurses, and the results of two questionnaires posted out to
several PICUs within the UK. The areas are: cardiovascular, temperature,
respiratory, mobility, nutrition, continence, skin condition, and weight status. For
each, a score from 1 to 3 would be given after an examination of the child’s skin is
completed. This part of the scale is followed by sections detailing the type of action
and the equipment used.
This scale was then further modified by the addition of a skin assessment policy and
other factors related to PU management. The rest of the scale comprises a daily
evaluation of seven major areas of a child’s skin that are especially prone to skin
damage. These are the occiput, ears, nose, shoulders, sacrum, hips and heels. PU
characteristics would be documented in a specific part of the tool, and a
classification system with six different categories is provided. Ulcers range from
category I: redness (Blanchable-Erythema), to category VI: body cavities (including
two or more PUs that merge together into one cavity sore). The total score is then
calculated to classify patients into three possible categories of risk: low, medium,
and high (Jones et al., 2001).
Another attempt to develop a paediatric pressure ulcer risk assessment tool was made
by Barnes (2004). This tool consists of two pages. The first is composed of a list of
68
questions related to risk factors identified from previous literature, as recommended
by Waterlow (1998). The same page also has space for nurses to record any
preventive actions they have taken, and a table of suggested interventions. The
second page has space for the documentation of any details of skin assessment or any
change in skin integrity. Also, a body map is provided so that the location of the skin
problem can be clearly stated. Any child who is found to be at risk according to this
scale, would have a full assessment form filled in (Barnes, 2004).
Several amendments were later applied to this tool, including the addition of further
questions in the assessment section and the insertion of two more documents: the
skin assessment care plan and the wound care plan. Types of skin problems to be
focused on during assessment include persisting Erythema, non-Blanchable
hyperaemia, blisters, and discoloration, as well as oedema and localised heat or
purple discoloration, on the dark skin children (Barnes, 2004).
Another tool which was a modification of the Braden Q scale is the Starkid Skin
Scale (Suddaby et al., 2005) which was intended as a simple single-paged
measurement tool for skin breakdown in children. The scale was created by two
clinical nurse specialists who reworded and simplified the concepts that were
originally stated in the Braden Q scale. The newly developed tool consists of six sub-
items, as in the Braden Q, but activity and mobility have been combined as one
category, since the two concepts are thought to be closely related. One more
modification was the addition of a bold font for the key elements of each sub-score,
which is intended to draw nurses’ attention to the significant part of the scoring for
each item (Suddaby et al., 2005).
The last tool that was identified in the literature was the Braden Q+P scale (Galvin
and Curley, 2012), which is another modification of the Braden Q Scale. It was
developed as an assessment and prevention tool for pressure-related skin injuries, as
part of one hospital’s comprehensive PU prevention plan. It is applied to cardiac
surgery patients and main surgery patients, such as those undergoing orthopaedic
surgery, and it includes preoperative PU risk assessments, pre-procedure and post-
procedure skin assessments, positioning, and clinical interventions.
69
The tool is a one-page assessment of patient risk and a plan of preventive
interventions for PU, in which six out of seven of the Braden Q scale sub-items were
modified and included. The ‘activity’ sub-item was removed because all OR patients
are sedated. ‘Mobility’ was included under the ‘intensity and duration’ element, to
determine the effect of lengthy procedures on PU formation. Moreover, the scoring
is based on yes / no answers for each item, while each item on the scale has a
suggested list of preventive interventions designed to help stave off PU development
in surgical patients (Galvin and Curley, 2012).
2.5.2.1 The Glamorgan Paediatric Pressure Ulcer Risk Assessment Scale
This scale was developed based on data collected on 336 paediatric inpatients from
11 hospitals in the United Kingdom (UK) in 2007. Sixty one children were observed
to be affected with PU in a prevalence and incidence survey (Willock et al., 2007).
The characteristics of those children who had PU and those who did not were then
compared. By using the Chi Square(X²) statistical test, any characteristic found not
to be statistically significant (P> 0.01) was excluded from the scale, and eleven out
of the 17 variables identified were included in the scale as sub-items.
Some items were merged together, like immobility and difficult to position, as it was
thought by the authors that both of these terms measured the same variable, and
further amendments were made after a reliability study of the scale was undertaken
(Willock et al., 2008), which included further changes to the nutrition sub-item. The
final scale included 9 sub-items. The risk scores were adjusted so that patients with
higher scores would be those at higher risk of developing PU. The total scores were
classified as follows:
Total score of ≥ 10: at risk.
Total score of ≥ 15: high risk.
Total score of ≥ 20: very high risk.
a) Content validity of the Glamorgan Scale:
70
The content validity of the scale was ensured by its developers by the omission of
any item which was not found to be statistically significant. In addition, adjustments
were made to some sub-item scores which made them more valid in terms of being
able to predict the risk of PU occurrence in this population. These adjustments in
scoring aimed to reflect the significance of the association between each sub-item
and PU development. Immobility, for example, was given a higher score (20)
compared with the rest of the sub-items in the scale. This was justified by the strong
association that was found between this item and PU development. This is unlike
most PU risk scales, however, which tend to give the different sub-items the same
range of scores (Willock et al., 2009).
The main terms used in the Glamorgan RAS, with its related definitions and risk
scores are presented in (Appendix 1.8), based on special guidance on using the
Glamorgan, which was provided by the scale’s developer (Appendix 3.3).
b) Sensitivity and Specificity / Predictive
Validity of the Glamorgan Scale:
Sensitivity and specificity are crucial tests for a risk tool. A risk scale’s ability to
detect the occurrence or non-occurrence of a particular condition in a specific group
is highly dependent on these two concepts. Sensitivity is a measure which tests a
scale’s ability to detect the truly affected subjects of a certain condition in a larger
group of people. Specificity, on the other hand, is a measure which tests a scale’s
ability to identify subjects who truly would not go on to develop a specific condition
(Anthony, 1996).
The sensitivity and specificity of the Glamorgan scale was tested on the same
population that had also been used to develop the scale. Based on a risk score of 10,
the Glamorgan was 100% sensitive (the scale was able to classify all children who
did in fact develop PU as at risk), but only 50.2% specific, meaning that the scale
was able to correctly classify only 50.2% of the children who did not develop ulcers
as not at risk (Willock et al., 2009). In other words, all the children who did develop
71
PU scored 10 or more according to the Glamorgan scale, whereas only around 50%
of the children who did not develop PU scored less than 10.
As already noted, not only with the Glamorgan, but also in all other PU risk scales,
any effort to increase the sensitivity of the scale would result in a reduction of its
specificity (a higher number of false positives). Hence, the ability of scales to truly
detect subjects at risk of particular condition is usually tested by measuring their
predictive validity, rather than their specificity and sensitivity values alone.
Predictive validity is ‘the degree to which an instrument is able to predict an
observed criterion over future period of time’ (Polit and Beck, 2010, p.378). This is
usually measured by the Receiver Operating Characteristic Analysis (ROC), defined
as a technique to assess the classification ability of a certain test or scale (Anthony,
1996).
The predictive validity of the Glamorgan scale was tested through the ROC curve
based on the same sample as previously mentioned. The ROC curve is a plot of the
true positives (sensitivity) against the false positives (1- specificity) on a range of
different thresholds (Anthony, 1996). The area under the curve (AUC) is calculated
and used to help clarify that any randomly selected subject at risk of PU would have
a higher risk score than any randomly selected free-of-risk subject. The AUC for the
Glamorgan scale was found to be 0.912 (high predictive validity) (Anthony et al.,
2010). This score means that 91% of the time, a randomly selected child judged to be
at risk of PU would have a higher risk score than any randomly selected free-of-risk
child from the same sample (Willock et al., 2009).
Another recent abstract paper compared the predictive validity of the Glamorgan
with that of the Braden Q RAS. This revealed that the AUC for both scales were the
same, although the Glamorgan was slightly more sensitive that the Braden Q (Long
et al., 2011). However, no more details about these AUC values were provided.
An area under the curve equal to 1.0 for a risk scale means that this scale will be
100% accurate every time a risk subject is selected. If the area under the curve is
equal to 0.5, this would mean that there is no predictive value for this scale. When
72
the value under the curve is closer to 1.0, that means the scale has a higher predictive
ability (Anthony, 1996).
In summary, this scale was found to be predictive of PU formation in general
paediatric population, taking into consideration the different weightings of the
mobility and the equipment pressing on skin sub-items on the scale, this could also
reflect the significance of these particular sub-items, which would in its turn
increases the duration of time of any existing pressure, while at the same time
produces different friction and shear forces on patients’ skin, especially over bony
prominences while positioned or sliding down in their beds.
c) Inter-rater Reliability of the Glamorgan
RAS:
Inter-rater reliability is the consistency with which two or more researchers observe
and record the same behaviour in the same way on different occasions (Parahoo,
2006). The level of agreement or disagreement between researchers observing a
particular phenomenon is usually measured by calculating a correlation coefficient.
This coefficient can be found by asking two or more observers to record the same
event separately then comparing their findings. A correlation coefficient closer to 1.0
means more reliable findings and that the observers have a high degree of agreement
with each other in how they observed and recorded an event on separate occasions.
However, a correlation coefficient of less than 0.6 indicates a very low level of
agreement between the observers’ ratings and hence lower reliability (Parahoo,
2006).
The Glamorgan Risk Assessment Scale has been shown to be reliable in one study
(Willock et al., 2008) which compared the ratings of 15 randomly selected paediatric
nurses with the researcher’s own rating. Both the nurses and the researcher scored 15
children in one hospital independently. After that, their risk ratings were compared
using SPSS and it was found that there was 100% agreement between the risk ratings
of the researcher and the nurses in eight out of nine of the Glamorgan sub-items.
Inadequate nutrition was the only sub-item with 93% agreement with Cohen’s
73
Kappa 0.63 (P< 0.01). All other sub-items Cohen’s Kappa were 1.00 (P< 0.001).
These values of the correlation coefficients suggested strong reliability for the scale,
with even the nutrition sub-score showing good agreement.
Later, the authors changed the inadequate nutrition sub-item description to
inadequate nutrition - consult a dietician if in doubt, to reflect previous knowledge
of the child’s age, medical condition, previous body mass index and others. These
modifications were thought to be of benefit in enhancing the reliability and validity
of the scale. Willock et al. (2008) believe that any tool that is not reliable is not valid,
because it would not actually measure the phenomena it is supposed to measure.
In contrast to this, an observational study carried out in one hospital’s cardiac unit
investigated the inter-rater reliability and agreement issue of the Glamorgan sub-
items and total scores. The nurses’ inter-rater agreement on the existence or absence
of an item for each child was relatively high. The highest was the significant
anaemia sub-item score (P0= 100%), while the lowest agreement was for the
mobility sub-item (P0= 82%). However, the inter-rater reliability of the Glamorgan
total risk score, between the 27 nurses who randomly scored 30 children for PU risk
in groups of three nurses at a time, was low (Cohen’s Kappa 0.34 (95% CI 0.12-
0.57)). The agreement on the Glamorgan total score was 48% (Kottner et al., 2012).
According to Kottner et al. (2012), these figures indicate that the Glamorgan sub-
items were clearly described, so many nurses agreed on the existence or absence of
each feature for most children (inter-rater agreement) but, with low inter-rater
reliability coefficients’, indicating that nurses were unable to identify children at risk
of PU based on their sub-items and total score. More than half of the nurses
produced different scores for children’s total risk. However, this might be due to the
generally low risk of PU in this unit, which made it difficult to identify children at
risk efficiently (Kottner et al., 2012).
According to the studies discussed above, the Glamorgan Scale has low inter-rater
reliability when used in critical care units, such as the cardiac unit. This might be
74
related to its better performance in the paediatric general wards and specialities,
within which it was initially developed to be applied.
2.5.2.2 The Braden Q Pressure Ulcer Risk Assessment Scale
The early development of this tool was based on modifications to the adult Braden
RAS (Braden and Bergstrom, 1989). It was created to be used in paediatrics, and is
thought to be beneficial because of its diverse range of vital sub-items, which the
original authors believed to be the major causes of PU development (Quigley and
Curley, 1996). These items were actually derived from Braden and Bergstrom’s
conceptual model, which divided risk factors into two groups related to skin
tolerance and to the intensity and duration of the pressure (Bergstrom et al., 1987). In
addition, the adult Braden Scale is widely applied and tested in various hospital
wards including the ICUs (Quigley and Curley, 1996).
The Braden Q Scale is composed of seven sub-items; mobility, activity, moisture,
tissue perfusion & oxygenation, friction and shear, sensory perception and nutrition.
Each sub-item is scored from 1 to 4, with 4 representing the lowest level of risk and
one indicating the highest risk. The total score for any child should range from seven
(the highest risk) to 28 (no risk) (Quigley and Curley, 1996).
These sub-items are the same as those found in the adult Braden scale, but with the
addition of the seventh sub-item, tissue perfusion and oxygenation. This item was
added to reflect the unique paediatric developmental characteristics, and to optimize
the benefits of using data that are commonly available in paediatric intensive care
units. On the other hand, this sub-item also related to the original conceptual model
which was used to develop the adult Braden Scale (Quigley and Curley, 1996).
According to Braden and Bergstrom’s conceptual model (Braden and Bergstrom,
1987), the sub-items of the Braden Q Scale could be divided into two groups, one
related to the intensity and duration of pressure (mobility, activity and sensory
perception), and the other related to tissue tolerance to pressure, and divided further
into ‘intrinsic factors’; nutrition and tissue oxygenation and perfusion, and ‘extrinsic
factors’; friction and shear and skin moisture.
75
The modifications that were made to the adult Braden Scale in order to create the
Braden Q RAS include (Curley et al., 2003b):
Changing the definition of some sub-items, or adding a different description
such as in the case of the ‘very limited’ mobility sub-item. Also, considering
all patients who are unable to walk due to developmental perspectives as
‘walks frequently’ in the activity sub-score, and clarifying the definition of
sensory perception in a way which took the developmental stage of the child
into consideration.
Adding drainage as an option to be considered while scoring moisture, and
adding ‘routine diaper change’ to the ‘rarely moist’ sub-item. Also, linen
changing, a part of the moisture sub-item, was described in a more precise
manner, by considering hours rather than shifts.
Applying operational definitions to differentiate between friction and shear
forces. Also, splitting the Braden scale’s first level into two levels: ‘1-
Significant problem’ and ‘2 - Problem’ so that the scores would range from
one to four, along with the rest of the scale’s sub-items.
In terms of nutrition, ‘bottle or breast feeds’ were added as descriptors for
meals. ‘Albumin less than 2.5 mg/dl’ was added to the first level of the scale,
‘very poor’, and ‘less than 3 mg/dl’ was added to the second level,
‘inadequate’. Moreover, a new statement was added to the other three levels
to describe whether the child was on a normal diet or on enteral or parenteral
feeding, and whether this type of feeding adequately met the child’s calorie
expenditure.
Adding Tissue perfusion and Oxygenation as a seventh sub-item for the
scale. This sub-item has four levels to describe the child’s circulation and
tissue perfusion level and includes data related to blood pressure, capillary
refill time, PH level, O2 saturation and Haemoglobin level.
76
The amendments discussed above were thought by the authors to be beneficial, in
that they would reflect the unique paediatric developmental characteristics, and
optimize the benefits of using data that are commonly available in paediatric
intensive care units, such as information obtained by blood sampling, and non-
invasive technology. In addition, it was thought that one sub-item, nutrition, would
be helpful in estimating the prevalence of using enteral and parenteral feedings in
these units (Curley et al., 2003b).
The addition, the Tissue perfusion and Oxygenation sub-item was considered a
crucial indicator of PU risk, especially in ICUs. Patients with compromised
circulation would exhibit some sort of blood shifting from their non-vital organs,
including their skin, to vital organs, such as the heart or kidneys, as a way of
compensating for their diminished tissue perfusion. This decrease in skin perfusion
would increase patients’ risk for local compression and ischemia (Curley et al.,
2003b).
Also, patients’ hemodynamic instability was shown to be one of the major factors
that lead nurses to position patients in ICUs infrequently (Neidig et al., 1989).
Moreover, this sub-item was found to be related to the original conceptual model
which was used to develop the Adult Braden Scale (Quigley and Curley, 1996).
a) Content Validity of the Braden Q RAS:
The content validity of the Braden Q RAS was established by a group of paediatric
nurses with a special interest in skin issues. A total of 178 paediatric inpatients were
scored by this group of expert nurses, using the scale. At the same time, each child
was classified by a bed-side nurse into one of three risk categories, low, moderate or
high, based on the personal judgement of these nurses.
By combining the Braden Q scores with the bed-side nurses’ judgement, children
found at low risk for skin breakdown scored an average of 25 points. Children with
moderate risk scored, on average, 21 points and children with high risk were found
to score an average of 16 points. With confidence intervals indicating that children
who scored less than 23 points were at moderate to high risk, any child scoring less
77
than this cut-off point was classified as being at risk of skin breakdown according to
the Braden Q Scale (Quigley and Curley, 1996).
Furthermore, any child who scored 16 points or less on the Braden Q Scale was
classified as at high risk of developing PU and could be considered at risk of
acquiring category II and above PUs (Curley et al., 2003b). However, a cut-off score
of 16 was used to test the predictive validity of the Braden Q scale for this thesis.
This score was recommended by the authors of the scale to distinguish between
children ‘at risk’ and ‘not at risk’, and it is also believed to be useful in terms of
allowing nurses to make decisions about when to apply intervention measures aimed
at preventing PU, where any child scoring ≤ 16 should been prescribed prevention
aids. The authors believed that classifying risk as high, medium, or low is irrelevant
(Noonan et al., 2011).
The main terms and categories of the Braden Q RAS with their related definitions,
based on Noonan et al. (2011) are presented in (Appendix 1.9).
b) Sensitivity and Specificity / Predictive
Validity of the Braden Q RAS:
To determine the predictive validity of the Braden Q RAS, Curley et al. (2003a)
implemented a prospective cohort descriptive study in three PICUs, with a total
sample of 322 patients. The patients’ ages ranged between 21 days and eight years
old. Four major age categories were created and a maximum of 30 patients were
selected for each category from each PICU, to ensure the equality of sample age
across the study. These age groups were classified as a) infants (21 days to 12
months); b) toddler (12 to 36 months); c) preschool (3 to 5 years); and d) young
school (5 to 8 years).
Besides the principal investigator, the children were scored by a group of trained site
investigators and research assistants, at first as a team to ensure clarity of the scale’s
sub-items, and then ten children each were scored independently by the team
members until there was 90% agreement on the Braden Q scores. Two other nurses
blindly to others scored and assessed each child on admission, and three times each
78
week for the first two weeks, then weekly until the child discharged from the PICU.
This study resulted in an incidence rate of 27% for category II and above PUs
(Curley et al., 2003a).
Using data from the previous study (Curley et al., 2003a), excluding category I PUs,
the AUC was 0.83. With a cut-off score of 16, the sensitivity for the Braden Q was
0.88 and the specificity was 0.58. The ROC curve was then constructed for each sub-
item of the Braden Q RAS. Only 3 sub-items had an AUC greater than 0.7. These
sub-scales were mobility, sensory perception and tissue perfusion and oxygenation.
The Braden Q scale then was modified to include only these three sub-scales, which
contributed to an AUC > 0.7. The shorter version of the Braden Q Scale showed an
AUC of 0.84. With a cut-off score of 7, the sensitivity and specificity were 0.92, and
0.59 respectively (Curley et al., 2003b).
Even though the modified Braden Q Scale performed as well as the whole Braden Q
scale, the authors still recommended using the scale as a whole, especially since
other sub-items might be significant in other paediatric wards than ICUs. The
researchers recommended further work on this point (Curley et al., 2003b).
One study was set up to compare the predictive validity of the Glamorgan, Braden Q
and Garvin RASs (Anthony et al., 2010). Use of univariate statistical tests (Chi
square and Mann Whitney) showed that seven out of ten of the Glamorgan sub-items
were significant, compared with four out of seven in the Braden Q and two out of
four in the Garvin Scale.
The three scales were also tested through LR analysis, which showed five sub-items
of the Glamorgan, three of the Braden Q and two sub-items of the Garvin scale to be
significant (Anthony et al., 2010). The AUC of the Glamorgan total score was better
than that of the Braden Q or Garvin (0.912 vs. 0.694 and 0.641 respectively).
These findings indicated that the Glamorgan was superior to the other two scales in
terms predicting the risk of PU in the general paediatric population. However, this
finding may need further investigation since the study used a retrospective design
(Anthony et al., 2010). Furthermore, these values were calculated based on the same
79
data that was initially used to develop the Glamorgan scale. This may have unfairly
influenced the findings in a manner which meant that the Glamorgan emerged to be
the best of the three scales.
c) Inter-Rater Reliability of the Braden Q RAS:
Two studies have discussed the issue of the Braden Q scale’s inter-rater reliability
(Curley et al., 2003b, Noonan et al., 2006) although neither was established
specifically to measure this feature. One point prevalence survey (Noonan et al.,
2006) was conducted among 252 paediatric inpatients at one hospital, where the
Braden Q Scale was one of 12 data elements used in an audit tool to measure the
prevalence of skin breakdown.
Two hours of training was offered to the participating auditors, which was followed
by a 16- item test to assess inter-rater agreement on the Braden Q Scale sub-items,
and on assessing two other types of skin breakdown, as well as PU. The participants
were able independently to reach 100% agreement within one point of the Braden Q
Scale. For the same study, two expert nurses in PU also categorised all the identified
ulcers, these nurses had reached 90% agreement in categorising 50 PU’ photographs
prior to the audit (Noonan et al., 2006).
Another prospective cohort study was conducted on 322 inpatients to establish the
predictive validity of the Braden Q Scale (Curley et al., 2003b). Prior to data
collection, the primary investigator trained all site investigators and research
assistants (students and PICU nurses) on how to score the Braden Q and how to
categorise PUs.
The whole team scored PU as a group until clarity of the concepts included in the
scale’s sub-items was guaranteed. Ten patients were scored by each auditor
independently until 90% agreement of Braden Q scores was reached. Also, it was
required that the scoring of each sub-item of the scale would not vary from one
participant to another in more than one point.

80
As shown above, a number of studies have used their own varied methods to
measure inter-rater reliability for this scale. Training was usually provided to
auditors before each study was conducted but this means that there is a lack of
evidence available to show whether there would be agreement on the scoring without
such training being given. This is important because the point of using a specific
scale is for it to be clear enough for any bedside nurse to fill in when necessary,
without having been specially trained.
A further trial to measure the inter-rater reliability of another assessment tool for PU
and other skin breakdown in children and neonates, the Starkid skin scale, which was
a modification of the Braden Q scale, was conducted by (Suddaby et al., 2005). The
scale was shown to have inter-rater reliability of 0.85, with the nutrition sub-item
being the least reliable. The sensitivity of the scale was low (17.5%) but it was found
to have high specificity (98.5%) (Suddaby et al., 2005).
Finally, having a glance at this section, it would be noticeable that most paediatric
PU RASs originated from PU risk scales designed for adults, and that many others
are modifications of the paediatric Braden Q scale. Three out of the thirteen scales
identified were established based on the Waterlow risk scale (Pickersgill, 1997, Bedi,
1993, Waterlow, 1998) and two more were adult Braden scale modifications
(Huffines and Logsdon, 1997, Quigley and Curley, 1996).
Additionally, three of the scales were modifications of the paediatric Braden Q RAS,
where either certain categories had been omitted or new indicators had been added to
an existing category, to make the scale suitable for a particular population of children
(Suddaby et al., 2005, McLane et al., 2004, Galvin and Curley, 2012). In brief, more
than half of the scales found in the literature were modifications of other pre-existing
tools. A summary of all identified Paediatric RASs is provided in (Appendix 1.6).
81
2.6 THEORETICAL FRAMEWORK OF THE STUDY
Risk assessment has become a major task for nurses and all health care professionals. It
is very challenging to provide a high standard quality of care, and to detect any health
risks the patients may encounter during their hospital admission and the complex
environments of modern hospital wards, especially ICUs, make it more difficult for
nurses to recognise signals of patients risk properly (Despins et al., 2010).
Children and neonates admitted to ICUs have often been described in previous literature
to be at higher risk of adverse effects, including PU, more than the paediatric patients in
general wards (Zollo et al., 1996, Willock and Maylor, 2004, Curley et al., 2000).
Critical units were noticed to predispose children to a higher risk of PU development,
because of their high technology, use of invasive and complicated medical equipment,
and the acute physiological conditions of these children compared with children in
general wards (Garvin, 1997, Schindler et al., 2007).
All of these studies shown it is crucial to have a strategy to predict the possibility of
these high risk patients encountering harm, or being affected by factors which
contribute to PU. Since most of the time the nurse is the primary bedside carer for the
patient, and hence, he or she would spend the largest amount of time with them, any
risk, or hazard should be discovered first by the nurse (Despins et al., 2010).
Moreover, ICU nurses are required to identify risk in a complex surrounding
environment, which means they may be more chance of them missing a risk factor.
Nurses would encounter various inter-related factors amongst which some would
actually be associated with PU formation, while others would not. The acute condition
of ICU patients, the multiple use of complex devices, and the continuous application of
prevention and intervention measures, in addition to many other duties, such as paper
work and ward-related works, could all collectively have a negative effect on the
nurses’ abilities and their focus on risk and hazards. Within this very loud and busy
environment, the nurse still needs to detect any signal of patients’ risk as early as
possible.
82
The situation described in the previous paragraph closely reflects the assumptions of the
theoretical framework which was used in this study: the Signal Detection Theory (SDT)
(Green and Swets, 1966). It was selected to guide the current work because of the
relevance of its major concepts and propositions. According to this theory, any person
in an uncertain situation who needs to make a decision, would encounter some obstacles
in detecting signals from the surrounding noise (Abdi, 2007). However, these obstacles
would depend on both the observer’s response, and the amount of ‘noise’, as well as the
signal’s strength (Heeger, 2003).
2.6.1 Major Concepts and Propositions of SDT
SDT has been previously used as a framework to study decision making by people in
uncertain or vague situations, and has helped to show how an observer’s subjective
opinion, thoughts, and knowledge might affect his ability to identify an existing
physical stimulus (Wickens, 2001).
This theory has three major concepts as follows:
The Stimuli are the variables that exist in a certain experiment or situation. The
stimuli would be either noise only (no existence of the condition), or a signal
with noise (with the existence of the condition). A signal is the target stimulus
that needs to be detected correctly within a group of surrounding stimuli or
interfering information, called the noise (Wickens, 2001, Despins et al., 2010,
Abdi, 2007).
The Observer is the person in a certain experiment or situation who has a
decision to makes. This person needs to correctly classify the stimuli either as
being relevant (signal), or irrelevant (surrounding noise only). This decision
making process depends on several factors, such as the observer’s sensitivity in
detecting signals, where sensitivity is the ability of the observer to correctly
distinguish a true signal from other surrounding noisy stimuli. Sensitivity, in
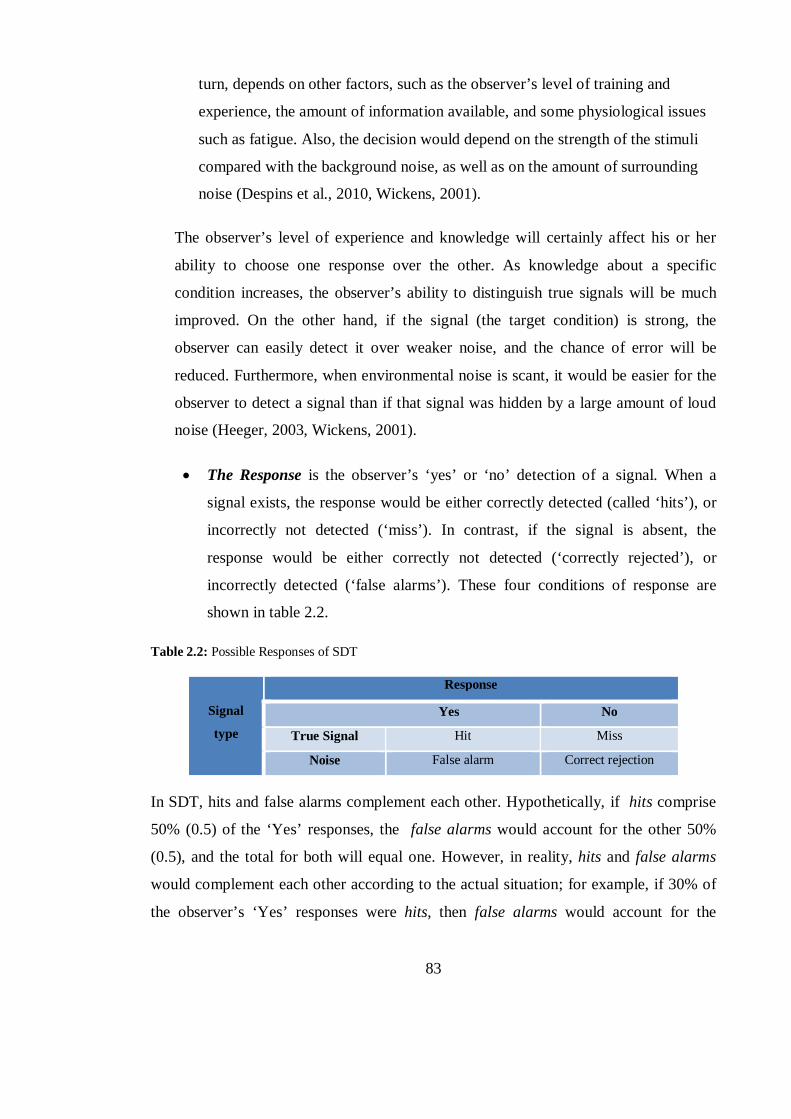
83
turn, depends on other factors, such as the observer’s level of training and
experience, the amount of information available, and some physiological issues
such as fatigue. Also, the decision would depend on the strength of the stimuli
compared with the background noise, as well as on the amount of surrounding
noise (Despins et al., 2010, Wickens, 2001).
The observer’s level of experience and knowledge will certainly affect his or her
ability to choose one response over the other. As knowledge about a specific
condition increases, the observer’s ability to distinguish true signals will be much
improved. On the other hand, if the signal (the target condition) is strong, the
observer can easily detect it over weaker noise, and the chance of error will be
reduced. Furthermore, when environmental noise is scant, it would be easier for the
observer to detect a signal than if that signal was hidden by a large amount of loud
noise (Heeger, 2003, Wickens, 2001).
The Response is the observer’s ‘yes’ or ‘no’ detection of a signal. When a
signal exists, the response would be either correctly detected (called ‘hits’), or
incorrectly not detected (‘miss’). In contrast, if the signal is absent, the
response would be either correctly not detected (‘correctly rejected’), or
incorrectly detected (‘false alarms’). These four conditions of response are
shown in table 2.2.
Table 2.2: Possible Responses of SDT
Signal
type
Response
Yes No
True Signal Hit Miss
Noise False alarm Correct rejection
In SDT, hits and false alarms complement each other. Hypothetically, if hits comprise
50% (0.5) of the ‘Yes’ responses, the false alarms would account for the other 50%
(0.5), and the total for both will equal one. However, in reality, hits and false alarms
would complement each other according to the actual situation; for example, if 30% of
the observer’s ‘Yes’ responses were hits, then false alarms would account for the
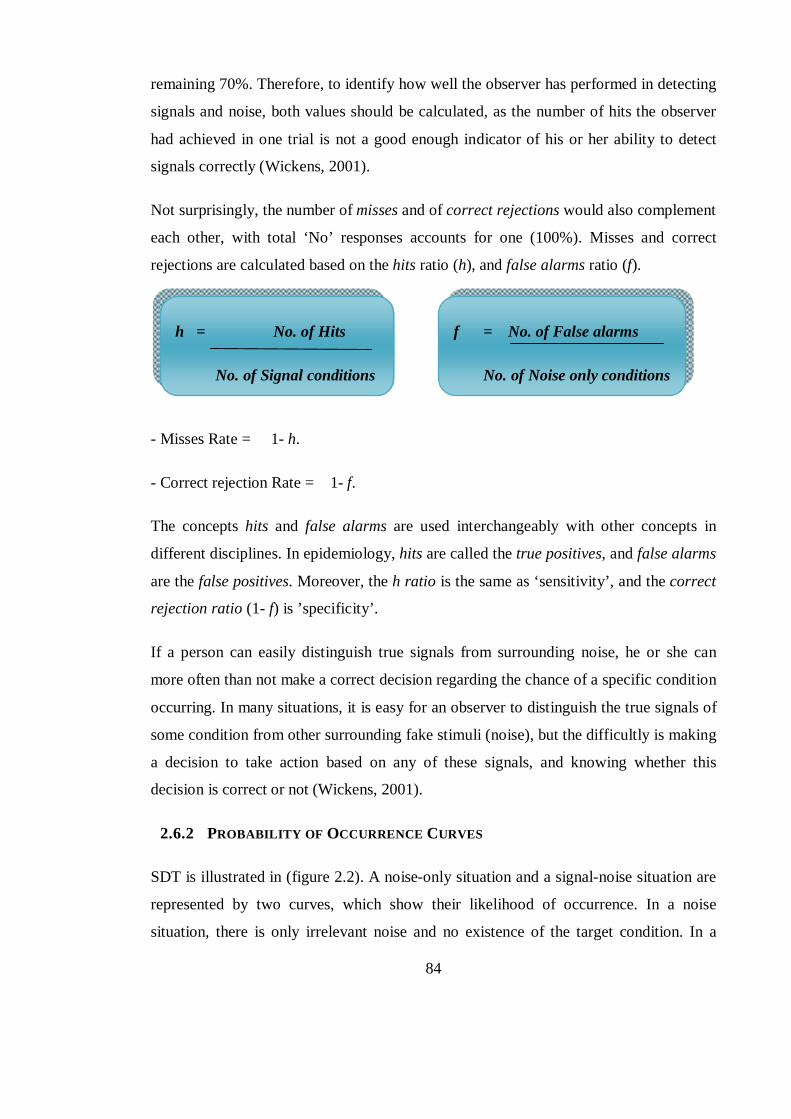
84
remaining 70%. Therefore, to identify how well the observer has performed in detecting
signals and noise, both values should be calculated, as the number of hits the observer
had achieved in one trial is not a good enough indicator of his or her ability to detect
signals correctly (Wickens, 2001).
Not surprisingly, the number of misses and of correct rejections would also complement
each other, with total ‘No’ responses accounts for one (100%). Misses and correct
rejections are calculated based on the hits ratio (h), and false alarms ratio (f).
- Misses Rate = 1- h.
- Correct rejection Rate = 1- f.
The concepts hits and false alarms are used interchangeably with other concepts in
different disciplines. In epidemiology, hits are called the true positives, and false alarms
are the false positives. Moreover, the h ratio is the same as ‘sensitivity’, and the correct
rejection ratio (1- f) is ’specificity’.
If a person can easily distinguish true signals from surrounding noise, he or she can
more often than not make a correct decision regarding the chance of a specific condition
occurring. In many situations, it is easy for an observer to distinguish the true signals of
some condition from other surrounding fake stimuli (noise), but the difficultly is making
a decision to take action based on any of these signals, and knowing whether this
decision is correct or not (Wickens, 2001).
2.6.2 PROBABILITY OF OCCURRENCE CURVES
SDT is illustrated in (figure 2.2). A noise-only situation and a signal-noise situation are
represented by two curves, which show their likelihood of occurrence. In a noise
situation, there is only irrelevant noise and no existence of the target condition. In a
h = No. of Hits
No. of Signal conditions
f = No. of False alarms
No. of Noise only conditions
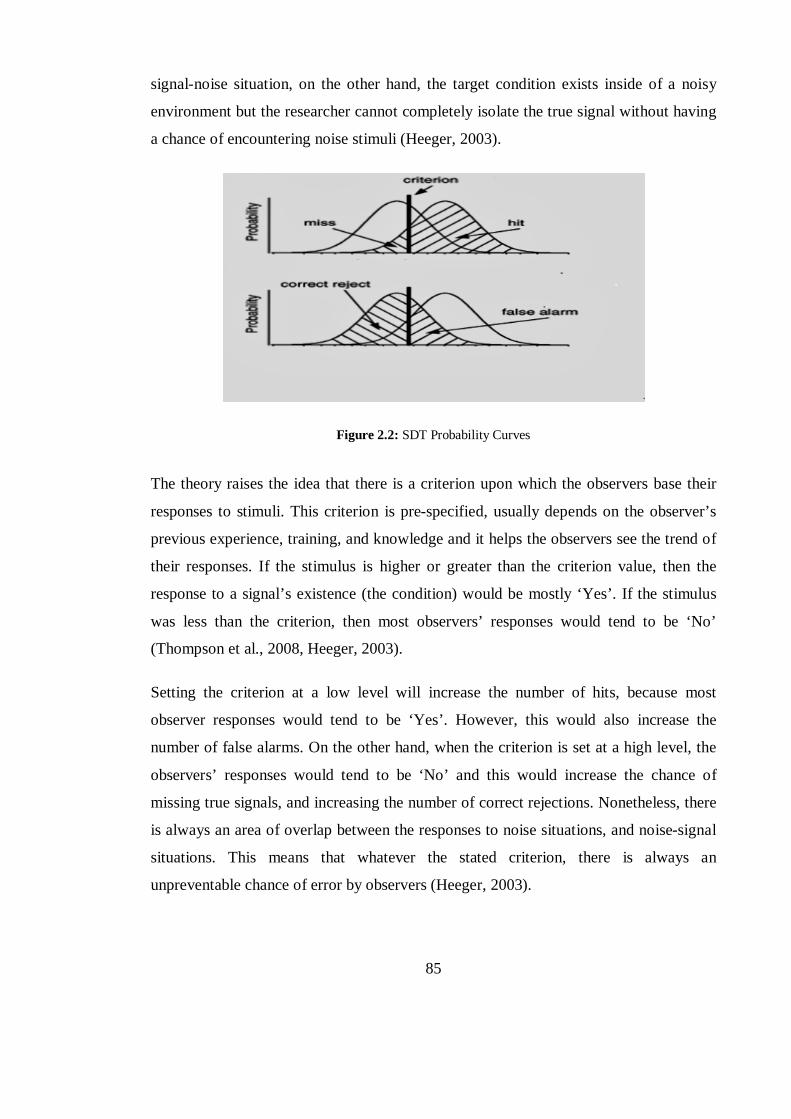
85
signal-noise situation, on the other hand, the target condition exists inside of a noisy
environment but the researcher cannot completely isolate the true signal without having
a chance of encountering noise stimuli (Heeger, 2003).
Figure 2.2: SDT Probability Curves
The theory raises the idea that there is a criterion upon which the observers base their
responses to stimuli. This criterion is pre-specified, usually depends on the observer’s
previous experience, training, and knowledge and it helps the observers see the trend of
their responses. If the stimulus is higher or greater than the criterion value, then the
response to a signal’s existence (the condition) would be mostly ‘Yes’. If the stimulus
was less than the criterion, then most observers’ responses would tend to be ‘No’
(Thompson et al., 2008, Heeger, 2003).
Setting the criterion at a low level will increase the number of hits, because most
observer responses would tend to be ‘Yes’. However, this would also increase the
number of false alarms. On the other hand, when the criterion is set at a high level, the
observers’ responses would tend to be ‘No’ and this would increase the chance of
missing true signals, and increasing the number of correct rejections. Nonetheless, there
is always an area of overlap between the responses to noise situations, and noise-signal
situations. This means that whatever the stated criterion, there is always an
unpreventable chance of error by observers (Heeger, 2003).
86
Many of the SDT’s concepts and propositions are key elements in the current study.
Since nurses, especially those who work in critical care units, need to correctly identify
the contributing risk factors of PU development among their patients, they are here the
observers, and detecting the true risk factors of PU is like detecting the true signals from
noise. For example, a child in PICU who has a low albumin level might be categorised
as at risk by nurses who believe that low albumin level is a risk factor for PU formation.
However, this factor has not yet been proven to be a true contributing factor of PU
occurrence in critically ill children.
The use of an RAS also could be said to be guided by the same theory, since nurses
would use the scale to make decisions about patients’ risk of PU occurrence based on a
specific criterion, the scale’s cut-off score. For example, a child who scores less than 16
on the Braden Q RAS would be classified by the nurse as at risk, yet it would be as yet
unknown whether the child would actually develop an ulcer later or not.
All of the findings of this research are discussed thoroughly, in light of this theory’s
main concepts and assumptions, later on in the discussion chapter.
87
2.7 SUMMARY
This chapter aimed to review previous literature regarding the problem of PU among
children and neonates. Prior research was crucial in enhancing the research process of
this study, in a way that sheds light on their main findings. Focusing on the strengths
and further investigating the weaknesses of previous research changed the way in which
the current study was carried out and improved its performance.
In this thesis, a number of specific search strategies were applied, including the use a
pre-specified list of key search terms to ensure that the literature search was focused
within the main inquiry of the current study. The major themes in this research were the
PU problem size in paediatrics, calculated through incidence and prevalence rates, and
PU risk in children, with a focus on both risk factors, and commonly used risk scales.
Moreover, a theoretical framework was chosen as a basis for the current work. Through
using the SDT, the research questions and hypotheses were formulated. Moreover, the
findings of the study could be discussed based on the main concepts and propositions of
the theory. Also, all the incidence and prevalence studies investigated, and the
established paediatric RASs examined, were summarised in specific tables in order to
facilitate their applicability and usage, and to clarify the main findings and properties of
each in a brief organised manner.
Finally, prevalence and incidence rates of PUs in paediatrics vary widely. This might be
explained by the fact that different studies have used different methods of data
collection, have taken place in different settings (multi-centre, or single sites), have
involved different populations (for example, burn, critically ill, or general ward
patients), and have used different data collection methods. Different studies may also
rely on different definitions of PU and other skin breakdown problems, or use different
classification systems. For example, which categories of ulcers are included or
excluded, and which skin problems are considered to be PUs, are thought to be
significant in causing variation across paediatric studies.
88
CHAPTER 3 .. CHAPTER THREE:
METHODOLOGY
3.1 A GLANCE AT THE CHAPTER
This chapter comprises a description of the methods used in this research. It contains
information about the study design, the data collection tools and procedures, the
research questions, and an explanation of the data analysis processes.
An explanation of how the sample for the study was chosen, rationales and any
justifications are also offered. In addition, this chapter includes details about the validity
of both the Glamorgan and the Braden Q risk scales, which were used to collect data
from the study sample.
In more detail, this chapter focuses on the research design of both the prevalence and
incidence studies. A thorough description of each study and a comparison between the
two is provided. The unique research design, procedures, sample, population, and data
analysis for each study are all mentioned.
Finally, a brief account of the theoretical framework is provided in order to help explain
how the main research questions were formulated and why the data collection and
analysis processes were applied.
89
3.2 THE RESEARCH APPROACH
Research is a basic element of all disciplines, which is adopted to help generate
knowledge, or to improve existing knowledge. It consists of a systematic process that
uses organised methods to answer a question or to understand a problem (Polit and
Beck, 2006).
Nursing is one discipline which requires continuous research in, for example, its
clinical, administrative, and educational branches. This work helps to clarify different
aspects of nursing care, and to answer evolving questions which might be encountered
by nurses on a daily basis.
There are two broad approaches to conducting research, the quantitative and qualitative
methods, in addition to the use of a mix of both, the mixed method. The Quantitative
approach is usually used to answer research questions related to problem size, like in
incidence and prevalence studies, or when the researcher is interested in identifying
measurable attributes of a phenomenon (Polit and Beck, 2006). The Qualitative method,
on the other hand, uses more in- depth methods such as interviews, to gain a deeper
insight into the phenomenon’ dimensions and variations.
However, nursing is a distinctive field with complex issues, especially considering that
the main subjects in nursing research are human individuals, who have a highly
complicated nature (Polit and Beck, 2006). As a result, a nursing researcher may need to
use more than one approach in order to obtain a full picture of the phenomenon under
investigation; this is called the Mixed Method approach.
In this thesis, however, the Quantitative approach is used due to the nature of the main
inquiry, the related research questions and the major hypotheses. The quantitative
approach is useful because it:
1- Allows the process of pressure ulcer (PU) development within the paediatric
population to be identified and described. Help in allocating children who are at
risk of PU development, to describe their characteristics and the identified risk
factors.
90
2- Is helpful in calculating the incidence and prevalence rates, to estimate the size
of this problem in the paediatric population.
3- Allows us to differentiate between the unique characteristics of PU children in
critical care units and those who remained PU-free, while exploring the PU
problem among critically ill children and neonates.
4- Helps to predict the risk of PU development in certain paediatric groups (the
critically ill children and neonates), based on the use of two risk assessment
scales (RASs), the Glamorgan and the Braden Q risk scale.
5- Classifies children, according to their risk scores, into groups (high risk, at risk,
or not at risk) based on the Glamorgan, and (at risk, not at risk) according to the
Braden Q RAS. It also classifies PUs into categories: I, II, III, IV according to
the European Pressure Ulcer Advisory Panel (EPUAP) guidelines (EPUAP and
NPUAP, 2009).
6- The results may enhance nurses’ use of Evidence-Based practice by generating
new statistically tested data.
3.3 THE RESEARCH DESIGN
3.3.1 Objectives:
This study aims to:
- Determine the size of the PU problem within the paediatric population in one
university hospital (KAUH) in Jordan by conducting point prevalence, and prospective
incidence studies.
- Underline the contributing factors (risk factors/ predictors) that predispose Jordanian
children in critical care units to PU development.
- Establish and compare the predictive validity of two paediatric risk assessment scales,
the Glamorgan RAS and the Braden Q Scale, among critically ill children.
91
3.3.2 Research Questions and Hypotheses
A research hypothesis is a prediction that is formulated by the researcher to answer the
research question and which can be tested empirically. Research questions help the
researcher to address the research problem as well as to guide the type of data to be
collected (Polit and Beck, 2006).
Research questions can be used to replace the purpose statement, as this may help in
focusing work and thoughts about the main problem and about the actual type of data
that needs to be collected. In quantitative research, these questions identify the
independent and dependent variables, the relationship between them and the population
under investigation (Polit and Beck, 2006).
To help direct the research and identify the correct type of data to be collected, this
study includes the following research questions:
1- What is the prevalence rate of PU among Jordanian paediatric inpatients?
2- What is the incidence rate of PU among Jordanian critically ill paediatric
inpatients?
3- What are the factors that contribute to PU development among the Jordanian
critically ill paediatrics?
4- Which scale, the Glamorgan RAS or the Braden Q RAS is more valid in
predicting PU risk among the Jordanian critically ill paediatric inpatients?
As explained above, the questions were formulated before the collection of data
commenced. For the incidence study, the independent variables (factors that contribute
to PU development) and the dependent variable (PU development) were identified,
while the population was specified as Jordanian critically ill paediatric inpatients. In
addition, the relationship between the use of the Glamorgan and Braden Q RASs and
the ability to actually predict the risk within the population under investigation was
addressed.
92
Another aim of the study was to investigate the relationship between the risk factors and
the development of PU, despite this not being clearly stated in the research question. It
is difficult to formulate a research question which explicitly seeks such a relationship
because of the nature of the independent factors, which is highly variant and branched.
As an attempt to answer, or to predict answers to, the previously mentioned research
questions, the following null hypotheses were formulated:
There is no statistically significant relationship between the identified
contributing factors and the development of PU among critically ill paediatric
inpatients in Jordan.
There is no statistically significant difference between the predictive validity of
the Glamorgan and Braden Q RASs in regard to the PU problem among
critically ill paediatric inpatients.
The first two research questions are descriptive in their nature, so no hypothesis was
formulated to answer them. In the case of the third and fourth questions, the hypotheses
were formulated in the null form to raise expectations regarding the relationship
between variables without prejudging the nature or direction of this relationship, and
also because this is a format that is statistically testable.
3.3.3 The Study Design
A research study design is a plan made by the researcher which incorporates all
methodological decisions that will be adopted during the research process and that will
outline the strategies that will be applied to create well organized, accurate and
interpretable results (Polit and Beck, 2010). Research design as a part of a quantitative
approach usually involves decisions about such issues as whether any intervention or
comparison will be made, the type of setting that the data collection will take place
within, the number of data collection sessions, and any plan to control the external
variables (Polit and Beck, 2010).
This research has involved two major study designs:
93
A) Study One: A non-experimental cross sectional point- prevalence study.
B) Study two: An experimental prospective longitudinal descriptive correlation
cohort study.
Although experimental designs are generally much preferred over other designs in
quantitative studies, due to their ability to infer causal relationships, to limit bias
through randomization and to control external variables (Polit and Beck, 2010), they are
still not applicable to all types of quantitative research.
In this thesis both experimental (incidence study) and non-experimental (prevalence
study) designs were used for the following reasons:
- The independent variables (risk factors for PU development) could not be
manipulated. Risk factors could be a medical problem or a health condition, such as
oedema or obesity amongst others, which could not be changed or unethical to be held
such as using sedative or inotropic medications, or the use of some medical equipment
such as oxygen probs.
- Experimental design was appropriate for answering the research questions related to
the prediction of the two scales performance (ability of the Glamorgan and Braden Q
RASs to detect risk in critically ill Jordanian children).
- A descriptive correlation design was more appropriate for investigating the
relationship between all identified risk factors and the development of PU because this
study is interested in describing the relationship between independent and dependent
variables without seeking to establish a causal connection. Otherwise, as mentioned
previously, it was unethical and impractical to manipulate independent variables
(predicting factors).
- This study is interested in observing the phenomenon (PU development), and
describing its different aspects (size of the problem at one point and through time by
measuring incidence and prevalence, staging of PU and describing the Glamorgan RAS
94
in terms of its ability to detect risk of the phenomena in the same population as
compared to the Braden Q RAS).
However, there are several disadvantages to using the non-experimental design, the
major two being its inability to reveal causal relationships between variables, and the
bias created by self-selection. Many nursing studies depend on correlation studies rather
than those which seek causal relationships because of the nature of most nursing
problems, which are not amenable to experimentation.
Also, the non-experimental design is thought to be more efficient in collecting a large
amount of data on one specific problem (Polit and Beck, 2010). In this study, a large
amount of data was sought to clearly explore the PU problem in the selected population
and to clearly identify significant predictors of PU development in paediatrics, because
of a scarcity of such data in this particular population compared with adults.
Self-selection is another negative aspect of conducting a non-experimental study. If the
researcher does not randomly select subjects but they are instead chosen for their unique
features, this may cause bias in interpreting findings. In such cases, any difference
between studied subjects, by chance only, could be a possible explanation of some
results rather than the existence of an actual relationship between variables.
For the incidence study of this research work, all the critically ill children who achieved
the required number of assessments (not less than two) were included. No specific
characteristics were sought and no specific conditions or diagnoses were followed, so as
to decrease the bias of the non-randomisation in the sample selection as much as
possible. The nature of the study required patients to be assessed more than once (more
than the initial assessment) to allow time for the outcome to be accurately detected (PU
development). In the prevalence study, however, all children who were inpatients on the
day of study, and who matched the inclusion criteria, were included in the survey.
3.3.3.1 Study One: The Cross-Sectional Point-Prevalence Study
Cross-sectional design involves collecting data at one point in time, or multiple points
over a short period of time (Polit and Beck, 2010). It was used in this study to collect
95
data about PU in children across all wards in one hospital in Jordan. The data was
collected in one day for all inpatients. This design was appropriate for answering the
research question regarding the size of the PU problem among paediatric inpatients in
Jordan. It allowed the percentage of affected children at one point in time to be
calculated, their characteristics to be described, and the categories of patients’ PUs, their
sites and their numbers, as well as their original source (either surface or device related
ulcers) to be identified.
This design was also thought to be more economically effective and easier for the
researcher in terms of managing the data collection and analysis. In addition, it is the
most commonly used design in prevalence studies, as mentioned in the literature review
chapter.
The shortcoming of this design is the inability to infer results related to changes over
time in the studied variables, because these changes might be the result of other external
variables such as social or technological factors. However, in this part of the thesis,
there was no attempt to infer any relations between the studied variables and the
development of PU. The data collected were descriptive in nature, used to describe the
characteristics of patients, both those who had PU and who were found free of ulcers on
the day of the study. Also, a description of the admission wards was included.
3.3.3.2 Study Two: Non-Experimental Prospective Longitudinal Descriptive Correlation Cohort Study.
A longitudinal study aims to collect data at multiple points in time over an extended
period (Polit and Beck, 2010). This design is used to help investigate processes that
evolve over time, or to study a phenomenon in which the time consequence is
important, in order to compare between two groups of subjects (after intervention, for
example). In addition, such a design could enhance the research control, as collecting
data before intervention can help the researcher establish initial group differences.
In this study, a longitudinal design was required to examine PU development, which is a
medical condition that evolves over time and also to compare the Glamorgan RAS with
the Braden Q Scale in terms of the ability of each to predict paediatric patients’ risk of
96
PU development; these children and neonates needed to be followed over time after
completing the initial RAS’s risk classification.
A prospective correlation design was used to help establish a link between the presumed
causes (risk factors / predictors) and the presumed effect (PU development). Also, the
prospective design was helpful in measuring the incidence of PU development among
critically ill children, because it is a time related problem, and in the follow-up of ulcer-
free children, to see if they would develop the problem over time or not.
Initial assessment of ulcer-free children in the critical units was carried out in order to
classify children according to their risk score based on the Glamorgan and the Braden Q
RASs. Subsequently, a follow up of all assessed children was conducted to identify
children who did actually develop PU during the study period. This feature of the
prospective design has enabled the researcher to describe the predictive ability of the
two scales within the studied population.
Other designs which entail a restricted study time period, such as the cross-sectional
design, would not have been useful for answering the related research questions,
because of their inability to detect relationships between variables (Polit and Beck,
2010). Prospective design is more costly than the retrospective design, but thought to be
stronger as it clarifies the conflict regarding the sequence of cause and effect. For
example, this study included an initial collection of data on the assumed contributing
factors among ulcer-free subjects, who were then followed over time (8 weeks), and
assessed for the outcome, PU development. There was no doubt, therefore, that, any
identified risk factors had preceded PU development and not vice versa.
However, the existence of a correlation between variables is not enough evidence that
the independent factor causes the dependent outcome (causative relationship), even if
the relationship is strong (Polit and Beck, 2010). For example, based on several
univariate and multivariate statistical analyses, the results of this study indicated that
some factors, such as age being less than one year and a longer length of stay in ICU,
had contributed to the development of PU. However, it would be inaccurate to say that
these factors had caused the occurrence of PU in this group of critically ill patients,
97
even though they proved to be significant statistically. This is because, in such non-
experimental correlation designs, the effects of other covariates cannot be controlled,
also, a randomised assignment of sample cannot be established (Polit and Beck, 2010).
3.4 THE STUDY SETTING
This study was conducted at a university hospital located in Irbid, the largest city in the
north of The Hashemite Kingdom of Jordan (HKJ), and the second largest city in the
whole Kingdom (DOS, 2011). The location allows the hospital to provide primary,
secondary and tertiary health care services to more than 1 million inhabitants of Irbid
and three other governorates in particular, and to the wider Jordanian population in
general.
It is a specialised referral medical centre with 683 beds in several wards, a number
which can be expanded to 800 in emergency situations. Usually, it receives advanced
cases that cannot be treated at other nearby hospitals, or which would need specialist
therapeutic and diagnostic procedures (KAUH, 2011).
This university affiliated hospital contains one Paediatric Intensive Care Unit (PICU)
with 12 beds for children aged from 1 month up to 14 years old, which treats medical,
surgical and cardiac intensive cases. It also contains one General Intensive Care Unit
(GICU) with 12 beds for children aged from 14 up to 18 years old, one General
Intermediate Care Unit (GIMU) with 10 beds for neurosurgical patients) which both
admit children, and finally one Neonatal Intensive Care Unit (NICU), which include 24
beds, for babies from birth up to 1 month old (KAUH, 2011).
For this research work, the hospital was chosen conveniently, however, many reasons
could justify that. This hospital is the largest in the north, and has many specialist
paediatric units, including a neonatal ICU, paediatric and general ICUs, medical and
surgical paediatric wards including orthopaedic and oncology wards, cardiac and
neurosurgical ICUs and intermediate care units.
The nature of the incidence study and the need to collect risk factors, in addition to the
description of the risk assessment scales, necessitated choosing a hospital which
98
contained as many critical care wards as possible which could be included in the study,
so as to attain a larger sample size and thus generate more reliable data.
The use of the computerised record system (MEDICOM) greatly assisted in establishing
and recording much of the required data. The system eased the researcher’s access to
each child’s current and previous medical records, laboratory test results, and some
demographical characteristics throughout the study period.
This study was carried out in one hospital only because it was necessary that the
children who took part were assessed frequently, and, due to the absence of an
assessment team, the researcher would not have been able to assess children in two
different locations. The choice to work individually without the support of a team or
other nurses was made for the following reasons:
- It was important to gather reliable data and, if assessments were being performed by a
number of different nurses or investigators, the data may not be comparable. Also, the
subjective grading of PUs may affect the reliability of the findings.
- There is a lack of information regarding PU in children among Jordanian nurses since
pressure ulcers are still thought to be an adult only problem. The researcher needed to
establish baseline data to convince Jordanian health care personnel that PU exists in
paediatrics, before any training or teaching sessions could be held.
- Because it is a phenomenon which has only recently been brought to light in Jordan,
nurses lacked the motivation to participate in collecting data regarding PUs, especially
ICU nurses who preferred to spend their time and effort focusing on what they deemed
to be more serious physiological issues, such as airway clearance, respiratory support
and so on.
- There was a lack of time and resources available to conduct training sessions for the
nurses or researchers who would have been required.
99
In addition to the reasons already given, no previous study regarding paediatric PU
prevalence and incidence had ever been conducted in Jordan which meant that any
large, representative hospital would have been suitable for the study.
3.4.1 Jordan and its healthcare system
Before detailing further the dimensions of the research sample and procedures, a brief
description of the country where the research was conducted is provided.
Jordan is a small country located in the Middle East; its formal name is the Hashemite
Kingdom of Jordan. Excluding the coastal border on the Aqaba Gulf, land borders
Jordan in all directions (Figure 3.1). Neighbouring countries are Iraq, Syria, Palestine
and Saudi Arabia, with which Jordan shares its longest border. The total area is 92.300
km², of which land makes up 99.6% (91.971 km²), and the remaining 329 km² is
represented by the Aqaba Gulf and the Dead Sea, which is the lowest point on Earth
(Central Intelligence Agency (CIA), 2009).
The last estimation made by the department of statistics (DOS) revealed that the total
population was 6,181,000 (DOS, 2011). Islam is the official religion of the country and
Arabic is the official language, but English is widely used in certain sectors, such as
trade, education, health, and government and banking.
The healthcare system:
The Jordanian healthcare system is one of the leaders in the region, and has a good
reputation in the Middle East (Library of Congress, 2006). According to the Ministry of
Health (MOH) in Jordan, the government spent about 7.2% of gross domestic product
(GDP) in 2008 on healthcare (MOH, 2008), which is close to the international average
of 9.3% (Library of Congress, 2006).
The total number of hospitals, either public or private, in Jordan is 103. The public
sector has three divisions. The first is the Ministry of Health (MOH), which runs 30
hospitals comprising 38.7% of the total number of Jordanian hospital beds. The second
is the military’s Royal Medical Services which operates 11 hospitals, and represents
19% of the total number of beds, while the third is made up of two university affiliated
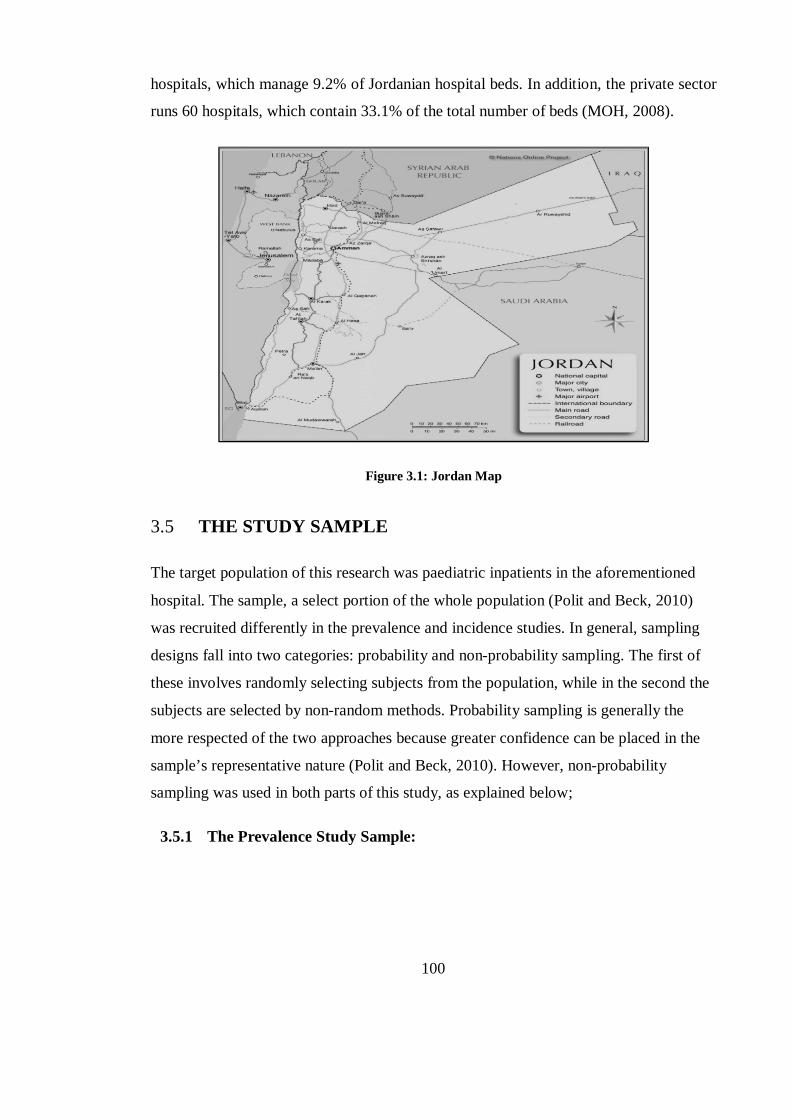
100
hospitals, which manage 9.2% of Jordanian hospital beds. In addition, the private sector
runs 60 hospitals, which contain 33.1% of the total number of beds (MOH, 2008).
Figure 3.1: Jordan Map
3.5 THE STUDY SAMPLE
The target population of this research was paediatric inpatients in the aforementioned
hospital. The sample, a select portion of the whole population (Polit and Beck, 2010)
was recruited differently in the prevalence and incidence studies. In general, sampling
designs fall into two categories: probability and non-probability sampling. The first of
these involves randomly selecting subjects from the population, while in the second the
subjects are selected by non-random methods. Probability sampling is generally the
more respected of the two approaches because greater confidence can be placed in the
sample’s representative nature (Polit and Beck, 2010). However, non-probability
sampling was used in both parts of this study, as explained below;
3.5.1 The Prevalence Study Sample:
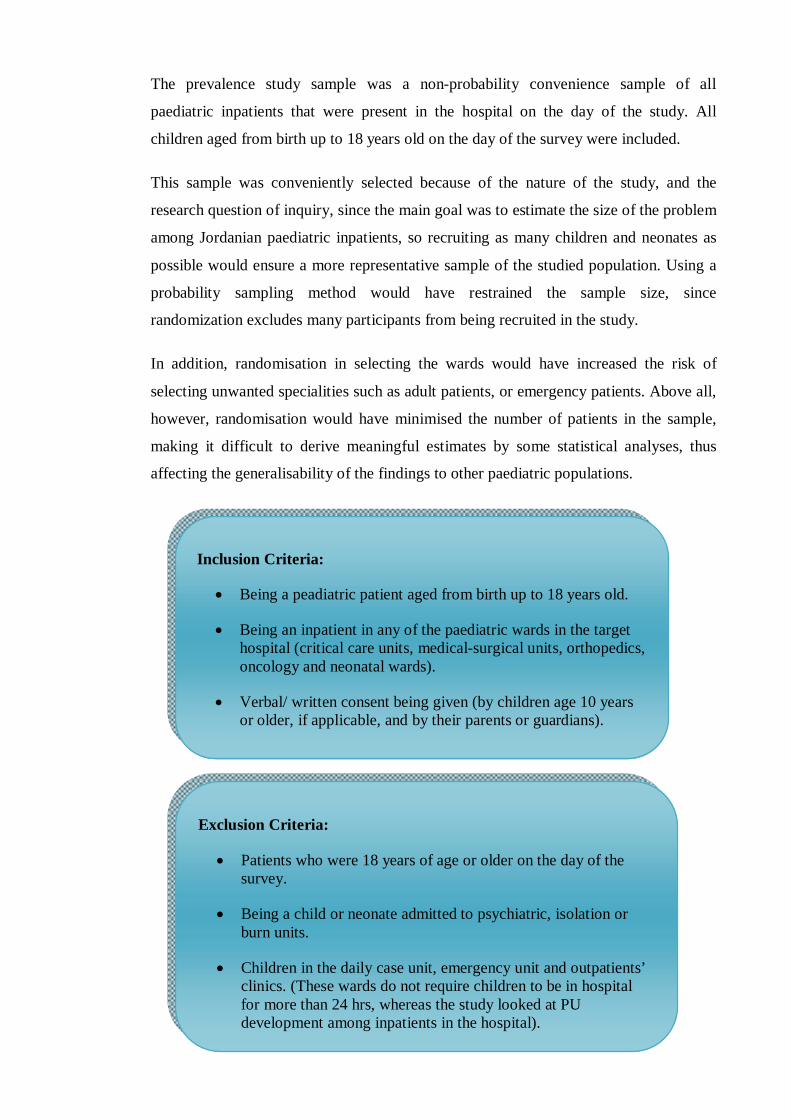
101
The prevalence study sample was a non-probability convenience sample of all
paediatric inpatients that were present in the hospital on the day of the study. All
children aged from birth up to 18 years old on the day of the survey were included.
This sample was conveniently selected because of the nature of the study, and the
research question of inquiry, since the main goal was to estimate the size of the problem
among Jordanian paediatric inpatients, so recruiting as many children and neonates as
possible would ensure a more representative sample of the studied population. Using a
probability sampling method would have restrained the sample size, since
randomization excludes many participants from being recruited in the study.
In addition, randomisation in selecting the wards would have increased the risk of
selecting unwanted specialities such as adult patients, or emergency patients. Above all,
however, randomisation would have minimised the number of patients in the sample,
making it difficult to derive meaningful estimates by some statistical analyses, thus
affecting the generalisability of the findings to other paediatric populations.
Inclusion Criteria:
Being a peadiatric patient aged from birth up to 18 years old.
Being an inpatient in any of the paediatric wards in the target hospital (critical care units, medical-surgical units, orthopedics, oncology and neonatal wards).
Verbal/ written consent being given (by children age 10 years or older, if applicable, and by their parents or guardians).
Exclusion Criteria:
Patients who were 18 years of age or older on the day of the survey.
Being a child or neonate admitted to psychiatric, isolation or burn units.
Children in the daily case unit, emergency unit and outpatients’ clinics. (These wards do not require children to be in hospital for more than 24 hrs, whereas the study looked at PU development among inpatients in the hospital).
102
There are a number of reasons why working with paediatric patients admitted to
psychiatric or isolation units may not have been sensible for the researcher on this
occasion. Dealing with patients in isolation units may unintentionally break sterility
circles, which may lead to the spread of nosocomial infections to children in other units.
Furthermore, working with psychiatric patients would usually require special
proficiency and experience, and extra training, since a lack of knowledge and skills
about how to treat such patients might increase safety hazards, for both the child and the
researcher. Also, children admitted with a psychiatric primary diagnosis would not
normally have physiological problems at the time of admission.
Likewise, special expertise would be needed to assess the skin of children in burns units
for PU existence, because of the nature of their condition. The skin may be, for
example, oedematous, lacerated, reddened or oozing and therefore this group were
excluded to decrease the chance of false negative or false positive PU findings. Also,
direct skin contact with these patients, who have large surface areas of damaged skin,
makes them more vulnerable to infection.
The prevalence sample was composed entirely of children and neonates who were
admitted to all the paediatric wards in the target hospital, and who had met the inclusion
criteria, on one day in November 2010.
3.5.2 The Incidence Study Sample:
This sample was obtained by means of ‘consecutive non-probability sampling’. This
type of sampling involves recruiting all available subjects from a specific population,
and who meet the inclusion criteria, over a specified period of time, or until a specified
sample size is reached (Polit and Beck, 2010).
For this study, critically ill children were the target population. This was because of the
considerably high risk of these children compared with the general paediatric
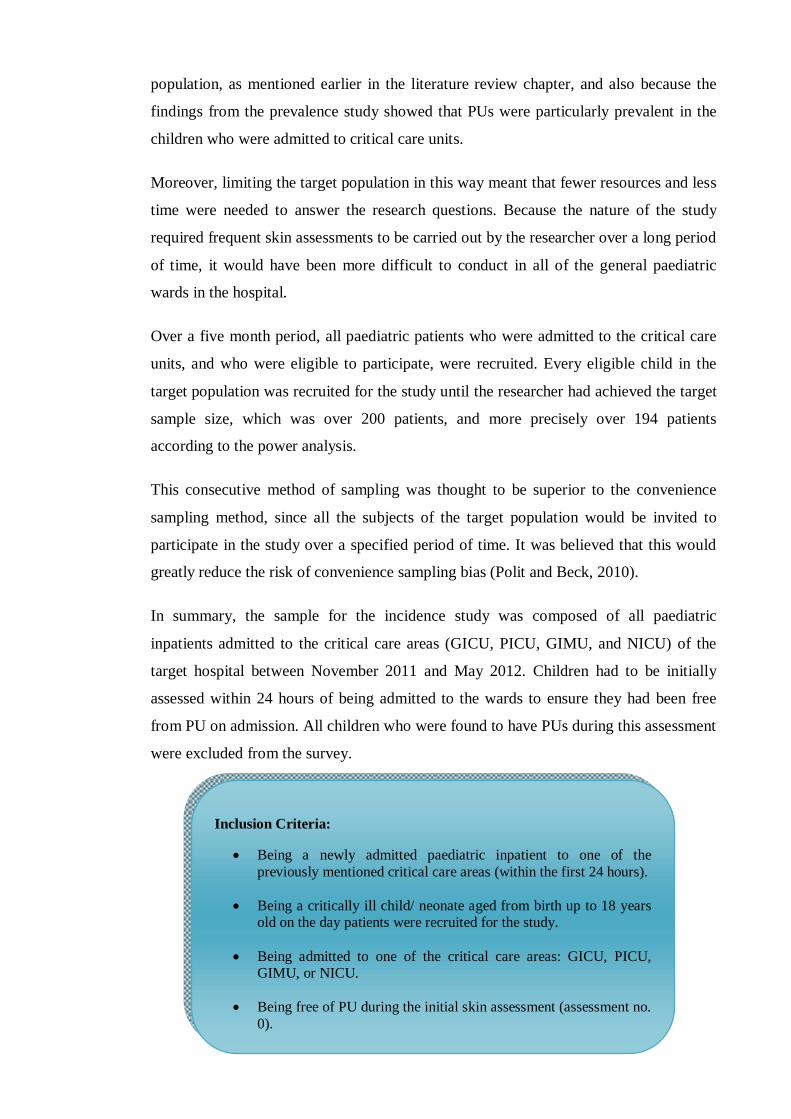
103
population, as mentioned earlier in the literature review chapter, and also because the
findings from the prevalence study showed that PUs were particularly prevalent in the
children who were admitted to critical care units.
Moreover, limiting the target population in this way meant that fewer resources and less
time were needed to answer the research questions. Because the nature of the study
required frequent skin assessments to be carried out by the researcher over a long period
of time, it would have been more difficult to conduct in all of the general paediatric
wards in the hospital.
Over a five month period, all paediatric patients who were admitted to the critical care
units, and who were eligible to participate, were recruited. Every eligible child in the
target population was recruited for the study until the researcher had achieved the target
sample size, which was over 200 patients, and more precisely over 194 patients
according to the power analysis.
This consecutive method of sampling was thought to be superior to the convenience
sampling method, since all the subjects of the target population would be invited to
participate in the study over a specified period of time. It was believed that this would
greatly reduce the risk of convenience sampling bias (Polit and Beck, 2010).
In summary, the sample for the incidence study was composed of all paediatric
inpatients admitted to the critical care areas (GICU, PICU, GIMU, and NICU) of the
target hospital between November 2011 and May 2012. Children had to be initially
assessed within 24 hours of being admitted to the wards to ensure they had been free
from PU on admission. All children who were found to have PUs during this assessment
were excluded from the survey.
Inclusion Criteria:
Being a newly admitted paediatric inpatient to one of the previously mentioned critical care areas (within the first 24 hours).
Being a critically ill child/ neonate aged from birth up to 18 years old on the day patients were recruited for the study.
Being admitted to one of the critical care areas: GICU, PICU, GIMU, or NICU.
Being free of PU during the initial skin assessment (assessment no. 0).
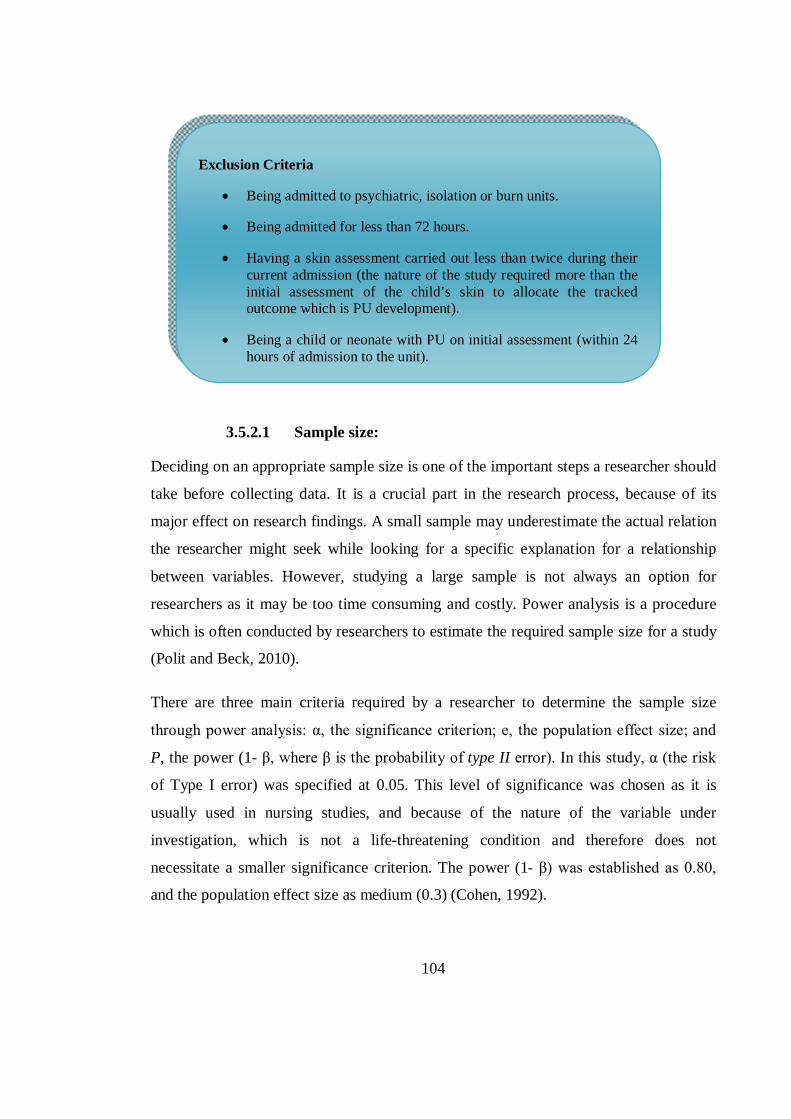
104
3.5.2.1 Sample size:
Deciding on an appropriate sample size is one of the important steps a researcher should
take before collecting data. It is a crucial part in the research process, because of its
major effect on research findings. A small sample may underestimate the actual relation
the researcher might seek while looking for a specific explanation for a relationship
between variables. However, studying a large sample is not always an option for
researchers as it may be too time consuming and costly. Power analysis is a procedure
which is often conducted by researchers to estimate the required sample size for a study
(Polit and Beck, 2010).
There are three main criteria required by a researcher to determine the sample size
through power analysis: α, the significance criterion; e, the population effect size; and
P, the power (1- β, where β is the probability of type II error). In this study, α (the risk
of Type I error) was specified at 0.05. This level of significance was chosen as it is
usually used in nursing studies, and because of the nature of the variable under
investigation, which is not a life-threatening condition and therefore does not
necessitate a smaller significance criterion. The power (1- β) was established as 0.80,
and the population effect size as medium (0.3) (Cohen, 1992).
Exclusion Criteria
Being admitted to psychiatric, isolation or burn units.
Being admitted for less than 72 hours.
Having a skin assessment carried out less than twice during their current admission (the nature of the study required more than the initial assessment of the child’s skin to allocate the tracked outcome which is PU development).
Being a child or neonate with PU on initial assessment (within 24 hours of admission to the unit).
105
A medium effect size (0.3) was set to be investigated as this is the norm in many
nursing studies and since the effect between variables sought in this study did not relate
to rare or life threatening conditions. A large effect size (0.5), which would require a
smaller sample size, may have weakened the findings of the study by being under-
representative of the studied population. Using a larger sample in searching for a small
effect size (0.1) would also have been difficult to achieve because it would have been
costly and time consuming for the researcher.
The G*Power 3 software (Faul et al., 2007) was used in this study to estimate the
sample size using the previously mentioned values. By applying a priori power analysis
using the LR test, the required sample size was found to be 194 subjects. Taking into
consideration, that the following values, were used: one tail, OR = 1.8 ‘the minimum
detectable odd ratio’, and Pro = 0.1 ‘the proportion of cases in total sample’. These
values were proposed based on those used in previous related literature.
3.6 STUDY INSTRUMENT
The study instrument is a tool used by the researcher throughout the research process to
address the problem in hand and collect the relevant data (Polit and Beck, 2010). A new
tool – the Data Collection Sheet - was developed for this study. The tool was composed
of two parts, one related to prevalence study data, and the other related to the incidence
study (Appendices 3.1 and 3.2).
The instrument was developed based on a thorough investigation of the data related to
adult and paediatric PU development in previous literature. The demographical data
section was adopted from previous relevant PU incidence and prevalence studies, and
aimed to include as many patient characteristics as possible.
The pressure ulcer prevalence rate was calculated by dividing the number of patients
with PUs by the total number of assessed patients on the day the audit was conducted
(Suddaby et al., 2005, McLane et al., 2004, Groeneveld et al., 2004a, Willock et al.,
2000). A specific section was provided on the tool to document findings related to PU
106
existence, categorising the severity of ulcers based on the EPUAP PU classification
systems (EPUAP and NPUAP, 2009), and recording the location and number of PUs.
Furthermore, the general characteristics of the prevalence sample were recorded so that
they could be used later in comparing the PU group with the PU-free group of patients.
Such characteristics included age, gender, LOS in hospital, and primary medical
diagnosis.
In the incidence study, the incidence rate was calculated by dividing the number of
patients who developed PU during the follow-up period (8 weeks) over the total number
of PU-free patients who were recruited at the beginning of the audit (Willock et al.,
2000). Information on the severity, location and number of PUs was provided. As in
prevalence part, the categorisation of ulcers was based on the EPUAP PU classification
system (EPUAP and NPUAP, 2009).
A specific section of the tool was designed to investigate any defined risk factors that
were detected in the incidence sample. These factors were collected from previous adult
and paediatric PU risk studies. Paediatric PU-experts’ opinions and the supervisory
team’s views were also sought in determining the relevant predictors of PU
development in this particular population. The last two sections of the incidence part of
the tool included the Glamorgan and the Braden Q RASs.
3.6.1 The Prevalence Tool
This data collection tool consisted of two main sections as follow:
- Section A): Included data related to the ward, such as type, number of beds, and
number of admitted patients. It also included the following patient characteristics: first
name, file number, medical diagnosis, date of admission, and LOS in hospital, as well
as, age, gender, and date of birth. If a patient had had previous hospitalisations was also
recorded.
107
- Section B): Included data about PU existence (Yes/No), and, if present, details about
the ulcers, such as number, category based on the EPUAP classification system
(EPUAP and NPUAP, 2009), location, and home or acquired.
3.6.2 The Incidence Tool
The incidence study tool consisted of five main sections, A, B, C, D, and E, These
included the following sets of data:
- Section A): included data related to the ward type, and the patient’s demographical
characteristics, such as, identification number (ID), file number, age and date of birth,
gender, newborn gestational age, medical diagnosis, previous hospitalisations, ICU
LOS, and date of admission. Also, data related to height, weight, and the vital signs (O2
saturation, blood pressure, heart rate, respiratory rate, and temperature) were added.
- Section B): included data about any PU developed during the follow-up period, which
is explained thoroughly in section 3.8, the study procedures. The details recorded were
the number of the newly located ulcers, their sites and categories. Also, these ulcers
were documented in specific tables in the tool, to clarify the exact date on which they
were first observed. A further table was added after the pilot study was conducted, to
document the date and outcome of each skin assessment, the initial and the follow-up.
- Section C): this part included all the pre-determined possible risk factors that were
planned to be collected during the incidence study, such as laboratory test results, type
of medications administered, medical devices used, skin condition, whether or not the
patient was on MV, whether paralysis existed or not, and consciousness level. Most
collected Risk factors were in the form of checklist, when applicable, for easier and
faster work.
A special table was added after the pilot study was completed to document the medical
devices being used, their type and number for each patient.
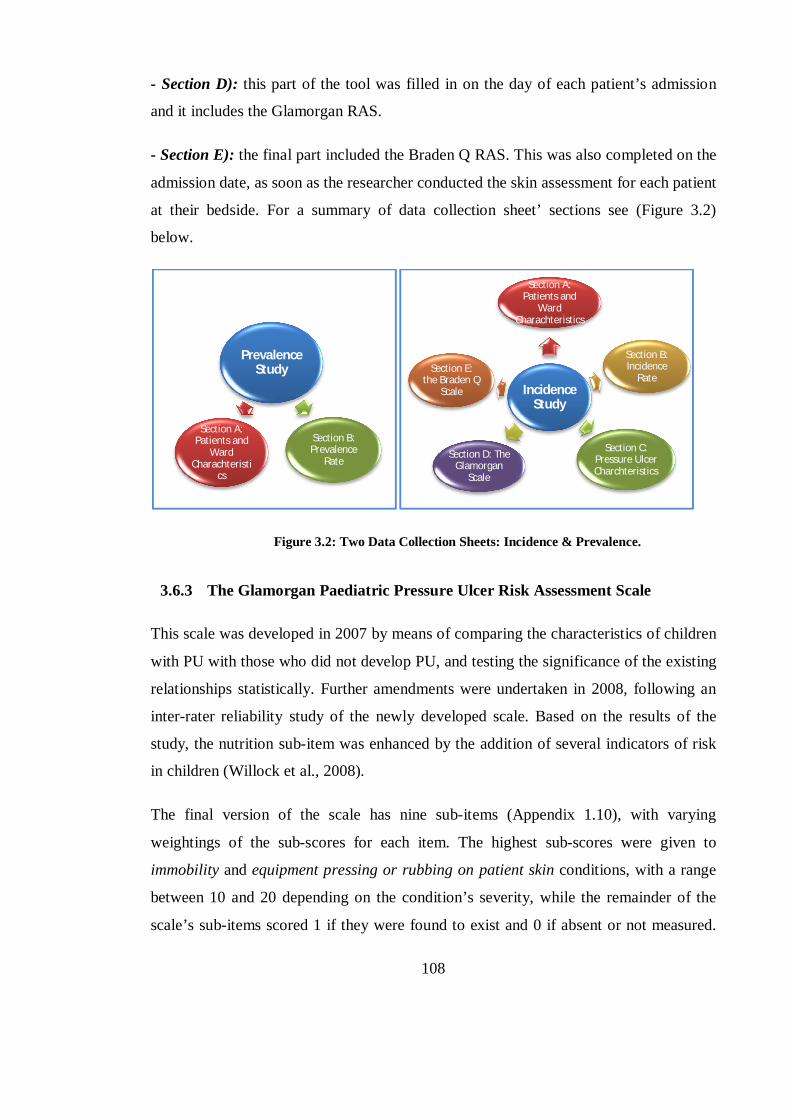
108
- Section D): this part of the tool was filled in on the day of each patient’s admission
and it includes the Glamorgan RAS.
- Section E): the final part included the Braden Q RAS. This was also completed on the
admission date, as soon as the researcher conducted the skin assessment for each patient
at their bedside. For a summary of data collection sheet’ sections see (Figure 3.2)
below.
Figure 3.2: Two Data Collection Sheets: Incidence & Prevalence.
3.6.3 The Glamorgan Paediatric Pressure Ulcer Risk Assessment Scale
This scale was developed in 2007 by means of comparing the characteristics of children
with PU with those who did not develop PU, and testing the significance of the existing
relationships statistically. Further amendments were undertaken in 2008, following an
inter-rater reliability study of the newly developed scale. Based on the results of the
study, the nutrition sub-item was enhanced by the addition of several indicators of risk
in children (Willock et al., 2008).
The final version of the scale has nine sub-items (Appendix 1.10), with varying
weightings of the sub-scores for each item. The highest sub-scores were given to
immobility and equipment pressing or rubbing on patient skin conditions, with a range
between 10 and 20 depending on the condition’s severity, while the remainder of the
scale’s sub-items scored 1 if they were found to exist and 0 if absent or not measured.
Prevalence Study
Section A: Patients and
Ward Charachteristi
cs
Section B: Prevalence
Rate
Incidence Study
Section A: Patients and
Ward Charachteristics
Section E: the Braden Q
Scale
Section B: Incidence
Rate
Section D: The Glamorgan
Scale
Section C: Pressure Ulcer Charchteristics
109
The total risk score ranges from 0- 42, where ≥10 indicates ‘risk’, ≥15 ‘high risk’, and
≥20 indicates ‘very high risk’ patients.
The main terms used in the Glamorgan RAS, along with its related definitions and risk
scores are based on special guidance on using the Glamorgan scale, which has been
provided by the scale’s developer (Appendices 3.3 and 3.4).
The Glamorgan Paediatric Risk Assessment Scale (Glamorgan RAS) was chosen for
this study for the following reasons:
It is a newly developed scale for paediatrics which, according to the authors,
needs to be tested within new settings and different populations. In this thesis,
the scale was tested among a new set of children, namely those who are admitted
to critical care units.
It is the first paediatric RAS which depended on statistical testing of patient
data. Other paediatric RASs have either been developed from patient
observations, expert opinions or have been modified from adult RASs (Willock
et al., 2009, Barnes, 2004, Willock and Maylor, 2004).
The scale appears to be a promising tool, since it was found to have higher
predictive validity compared with other paediatric RASs, even with scales that
are frequently used in paediatric; such as the Braden Q scale (Willock et al.,
2009, Anthony et al., 2010).
This scale is the only one in paediatrics that recognises the effect of ‘equipment
pressing or rubbing on the skin’ explicitly as a sub-item while giving it a high
risk score on the scale. Although there is a newly developed scale, the Braden
Q+ P scale (Galvin and Curley, 2012), that names any device attached to patient
skin as a category of risk, this was developed only for OR patients. Also, another
scale developed by Barnes (2004) lists splints and casts, as well as monitors
cables, as risk factors for PU development in children but there is no further
mention of other equipment.
110
This criterion is important for this study as many authors have pointed out that
children’s pressure areas are greatly affected by the use of medical equipment,
especially in ICUs (Suddaby et al., 2005, McCord et al., 2004, Zollo et al.,
1996). Problems may include tubes pressing or equipment rubbing on children’s
skin, and lying for long periods over tubes or even on needle caps, in addition to
the folds of the bed linen (Zollo et al., 1996, McCord et al., 2004).
3.6.4 The Braden Q Pressure Ulcer Risk Assessment Scale
This tool was developed in 1996, based on several modifications of the adult Braden
scale. As discussed thoroughly in the literature review chapter, the modifications
included the addition of a new sub-item (tissue perfusion and oxygenation), and new
indicators to clarify existing ones (such as adding Albumin level to the nutrition
descriptors).
The scale is composed of seven sub-items: mobility, activity, moisture, tissue perfusion
& oxygenation, friction and shear, sensory perception and nutrition. Each sub-item has
a score range from 1 to 4, with four being the most favourable and one indicating the
worst cases. The total score for each child should range between seven (the highest risk)
and 28 (where there is no risk at all) (Quigley and Curley, 1996).
The main terms and categories of the Braden Q RAS, with their related definitions, as
used in this research, were based on Noonan et al. (2011). These are presented in
(Appendix 1.9).
The Braden Q RAS was chosen for this study for the following reasons:
It is thought to be a valid and reliable paediatric-specific PU RAS (Noonan et
al., 2011).
It is the most widely used paediatric PU RAS that has been found or
discussed in paediatric literature (Loman, 2000, Curley et al., 2003b, Noonan
et al., 2006, Suddaby et al., 2005, Noonan et al., 2011). Also, many paediatric
111
studies used the original Braden Scale (Samaniego, 2004, Schluer et al.,
2009).
The authors recommend to test this scale with different samples and in
different settings. Studies should include children of more diverse age groups
and not exclude children with certain conditions such as congenital heart
diseases (Curley et al., 2003b, Noonan et al., 2011).
Taking confidence intervals into account, it was the first scale that tried to
define a cut-off risk score based on experts’ clinical judgment (Loman, 2000).
3.7 THE PILOT STUDY:
A pilot study, sometimes called a ‘feasibility study’, is a small scale version or a trial
that usually precedes the major study to ensure that the proposed research methods are
applicable (Polit and Beck, 2010). Piloting or testing the researcher’s data collection
tool or intended interventions helps determine their acceptability by subjects, or by
other investigators, and also allows the researcher to consider the cost and ease of the
planned research procedures (Parahoo, 2006).
The responses the researcher may get from such a trial help him or her to improve the
methodology and the research tool. They may also notify the researcher of any errors,
ranging from typing errors to much more serious problems that could affect the
structure or the proper functioning of the tool (Parahoo, 2006).
For this research, the data collection tool was sent to a small group of PU experts and
research colleagues (n=4), one of them with particular experience in paediatric PU. The
responses and feedback received helped in improving the tool in the following ways:
any identified errors were corrected and any part that was unfeasible in the clinical
fields was restructured, the section contents were changed to include more paediatric
suitable information, and the format of the tool was amended based on whether it was
considered easy to fill in and follow in practice.
112
In addition, an inter-rater reliability test between the researcher and a paediatric PU
expert was performed, to ensure reliable categorising of the identified PU grades during
the actual survey. The researcher assessed 10 PU photographs and categorised them
according to the EPUAP classification system as PU categories 1-4, erythema, and
moisture lesion. The researcher’s assessments were then compared to the expert
assessment and inter-rater reliability was determined using the percentage of agreement
and Cohen’s Kappa. The Kappa calculated for this study was 0.872 (p<0.001), and the
percentage of agreement between the researcher and the expert was 90%; both indicated
an excellent agreement.
Before the actual incidence study was conducted, the researcher also applied the tool to
a small group of children (n=5) admitted to one intensive care unit (i.e. PICU). The tool
was filled in for each child in one day, a week prior to the commencement of the main
data collection period. The gap of one week was chosen to allow sufficient time for the
researcher to conduct one more follow up visit to these patients.
The aim of the follow–up visit was to identify any obstacles the researcher may
encounter in the follow-up process, and to assess the ease of accomplishing it. The visit
was also an opportunity to gauge the accessibility of the hospital computer system for
obtaining patients data, and to estimate the time period the researcher would need to
perform the assessment on existing patients, while looking at the same time for new
recruits. The one day follow-up was not intended to perform an actual assessment of the
development of PU. Children in the pilot study were not included in the actual incidence
sample or in the statistical analysis.
The researcher assessed the ease of completing the tool, and documented notes on any
data for the children that were inaccessible. This helped to underline any obstacles
which may have to be confronted as the children’s skin assessments were carried out, or
the need for modifications to any section of the tool. In short, the implementation of the
tool on this small scale gave the researcher an overview of the advantages and
disadvantages that could be encountered during the actual data collection.
113
The PICU was selected as the site of the pilot study because of the variety of children of
different ages, including neonates, infants, and older children, who would be admitted.
Based on what has been outlined above, after the pilot study, the following amendments
were made to the data collection sheet:
- The prevalence and the incidence data were separated onto two different data
collection sheets (Appendices 3.1 and 3.2); this was for ease of collecting data and
managing information, since the studies involved two different samples of patients,
measuring different areas, and they were separated by more than one month.
- In the incidence tool, a follow–up table was added, with 12 columns to show the
maximum number of follow-up assessments and two rows indicating the date of
assessment and the outcome of the assessment (PU developed or not).
- Another table was inserted which would be filled in if any PU was observed. This
table included the PU’s characteristics, the date it was first observed on, and the reason
for the child’s participation in the survey being discontinued.
- A special table was added to document any existing medical devices, by ticking the
type, and writing the number of devices in the relevant space.
- Certain variables, such as ABGs, and PEEP level were added; because of their
necessity, mentioned in previous literature, as risk factors for PU occurrence, in ICU
patients.
- Certain variables were omitted because of their inapplicability to the paediatric
sample. These were, firstly, the presence of the ‘do not resuscitate’ order (DNR), which
none of the children in the studied units had, since it is mostly used for adults in this
hospital but not in paediatrics; secondly, paralysis, omitted because it would be covered
by the ‘mobility and activity’ sub-items of the two scales used; and thirdly, malignancy;
which was not observed in any child case during the data collection period.
3.8 DATA COLLECTION PROCEDURES:
114
Data collection was conducted on two separate dates, with one month in between, for
the two independent studies which formed this research (prevalence and incidence).
Each one is explained separately below. The data collection was accomplished by one
rater, the researcher. Many studies have shown that the number of raters seems not to
affect the prevalence rate (Kottner et al., 2009a, Kottner et al., 2009b). In fact, the
author believed that the quality of the researcher’s training is more important than the
number of the raters involved in assessing PU (Kottner et al., 2009b).
Furthermore, having only one rater conduct the study was thought to be beneficial in
terms of improving reliability, by decreasing the variation that could exist if more than
one rater was used. The use of a sole rater would improve consistency in reporting the
existence of PUs, their numbers, sites and categories. Also, it is not unusual to have one
rater in PU incidence and prevalence studies (Kim et al., 2009, Chan et al., 2009).
3.8.1 The Prevalence Study:
Initial preparations took place before this part of the study was carried out, to ensure an
appropriate allocation of time and resources. On the day of the study, the researcher
requested a list of all admitted paediatric inpatients aged from birth up to 18 years and
this was provided by the information technology department (ITD) of the hospital. The
included wards were surveyed sequentially, based on their level in the hospital, starting
with the lower ground up to the highest floor level.
Each floor had four wards, each was visited as applicable, depending on the admitted
cases. Any child who was not available at his or her bedside at the time of visiting the
ward was excluded from the study, although, in fact, this criterion only resulted in one
child being excluded.
After ethical approval was obtained from the target hospital (Appendix 2.2), the survey
was conducted over one day. On this particular day, the researcher completed the
physical assessment for the skin of each eligible child (as per the criteria mentioned
earlier). This took place at the bed side, in no longer than 10 minutes. Consent forms
were obtained from parents (Appendix 2.9), and from children (Appendix 2.11)
115
according to their age groups as applicable. Verbal consent was also taken immediately
before the assessment was started, to ensure that the child and parents understood the
study, and still agreed to participate.
The skin assessment involved examining the entire skin, and especially the areas which,
according to previous literature, are the most severely affected (head, especially occiput
and face, sacrum, heels and a long side any attached medical devices to the child skin).
The researcher carried out the assessment in the presence of the child’s bedside nurse, to
assure that the patient’s and researcher’s rights were preserved. Also, the nurse was able
to help with repositioning patients if this was difficult for the researcher to do alone,
either because of the child’s weight, or due to the existence of complicated medical
equipment being in place.
The categorisation of PU-cases in this study was based on the EPUAP classification
system (2009) (Appendix 1.7). After each assessment was carried out, the researcher
completed the sections of the prevalence data collection sheet. Data documented for
each child included general information about the ward, patient demographics, and the
characteristics, number, category and location of each identified pressure ulcer. These
details were recorded immediately to reduce the possibility of missing or inaccurate data
documentation. Other data were derived from patients’ hospital files (medical records)
as needed, before the skin assessment was initiated.
3.8.2 The Incidence study:
This study’ data were collected over five month’s period from December 2011- May
2012, with a follow-up period of up to eight weeks. This time period was chosen based
on the findings of other relevant PU incidence studies. One study which was carried out
in three PICUs revealed that most ulcers developed in the first two days after admission
(57%, n= 113), and all except one of the identified ulcers had developed before day
eight (Curley et al., 2003a).
Another multi-site incidence study which was conducted in neonatal ICUs revealed that
the vast majority of PUs had developed in the first 21 days following admission (78.6%,
116
n= 11) and, of these, six developed within the first week (54.5%) (Fujii et al., 2011).
One more incidence study of PU in adult patients observed that more than 80% of the
developed ulcers had occurred in the first 40 days after admission (n= 36). Of these,
around half developed within the first 20 days (40.1%, n= 18) (Onigbinde et al., 2012).
Children who had been admitted to the hospital’s ICUs (PICU, NICU, GICU, and
GIMU) were included in this incidence study. Any child admitted to the ICU on the
intended date of study was included and was examined within 24 hours of their
admission, a protocol which has been shared by several previous PU incidence studies
(Curley et al., 2003a, Chan et al., 2009, Kim et al., 2009).
Within the first 24 hours of a child’s admission to one of the previously mentioned
ICUs, the researcher conducted an initial skin assessment (no. 0). This assessment
helped the researcher in:
- Detecting the presence or absence of PU, taking into consideration that any child who
was found with PU at the initial assessment was to be excluded from this study.
- Collecting demographical and general data. This also depended on gathering data from
patients’ files, and extracting laboratory test results from the hospital’s computer
system.
- Recording details of any presumed predictors of patients’ risk of developing PU
during an ICU stay.
- Calculating the risk score for each child of developing PU, by employing both the
Glamorgan and Braden Q RASs. This subsequently aided in classifying children into
‘risk’, ‘high risk’, ‘very high risk’, and ‘no risk’ groups according to the Glamorgan
scale, or into ‘risk’ or ‘no risk’ groups according to the Braden Q scale.
For each child to be included in this study, he/she needed to have at least one follow-up
skin assessment after the initial assessment, to allow time to address any changes in the
child’s skin condition (i.e. the development of PU). Therefore, the total number of
assessments carried out ranged from 2 to 12, including the initial one (no. 0). The first
117
week of the child’s stay would include three skin assessments on fixed dates (no. 0; the
first one in the day of admission, no.1, on the third day following admission; and no. 2,
the third one, held on day number seven).
The second week included three similar assessments (nos. 3, 4, & 5), and then weekly
assessments were conducted until the patient died, was discharged from the ICU, or the
follow-up period finished without PU developing (up to 12 assessments by the end of
week eight). This protocol of setting out when the assessments would occur was
adopted from a similar study by Curley et al (2003b). This particular study was thought
to be the most relevant to the current work since it was implemented in PICU. The
timescale for assessments was also based on previous literature which recommended
carrying out the initial skin assessment within the first 24 hours (Curley et al., 2003b,
Chan et al., 2009).
In addition, on the recommendation of other relevant studies, the initial assessment was
conducted within 48 to 72 hours of admission (Reddy, 1990, Quigley and Curley, 1996)
seeing as the second assessment (no. 1) subsequent to the initial admission assessment
(no. 0) was performed on the third day following the child’s admission to the ICU.
Each of the studies cited above has claimed that the time between the cause and the
actual appearance of PU is up to three days. However, even in the adult literature, there
is no agreement about the best date to detect PU, especially those categorised I,
although it is generally thought that a PU of category II or higher, would take three to
five days to develop until it could be observed on the skin (Lindan, 1961, Reddy, 1990,
Dinsdale, 1973).
In this thesis, the majority of PUs were observed during the first observation day
following the initial assessment (42%, n=8) and the vast majority of PU-patients had
developed ulcers by the first and second observations (73.7%, n= 14), thus data
collected during the initial observations were used to compare the PU- and PU-free
patient groups. Similar findings were noted in (Curley et al., 2003b), in which data was
analysed based on the first observation, where 57% of ulcers were observed.
118
The skin assessment was a complete assessment of the child’s skin from head to toe
based on the researcher’s judgment with the naked eye. The outcome the researcher was
interested in throughout the frequent assessments was whether the child would develop
PU or not.
Even when it was noticed that a child had developed PU before the end of the follow-up
period, the assessments were continued, so that any changes in the developed PU (for
example, its category or any healing) and/or the development of further PUs could be
recorded.
Any PU observed during the study was documented with details of the ulcer’s category,
location and numbers. If an ulcer was found covered with Eschar, it was considered
category IV, as recommended by the EPUAP (EPUAP and NPUAP, 2009).
By the end of the initial skin assessment the researcher had completed all the sections in
the incidence data collection sheet, except for section B (PU characteristics table and
follow-up assessment table) which was filled in on the first day, and continued to be
throughout the follow-up period.
3.9 ETHICAL CONSIDERATIONS
Ethical approval for this study was obtained from the ethics committee of the Faculty of
Health and Life sciences at De Montfort University in 2010 (Appendix 2.1). In addition,
approval was received from the Ethics and Research Committee of the target hospital in
which the study took place in Jordan (Appendix 2.2).
For the prevalence survey, participant information sheets (PIS) and consent forms (CF)
for both the parents and children - when applicable - were given to the target population
before the study commenced (Appendices 2.3-2.12). Each participant was allowed a few
hours to decide if he or she would like to participate, while the researcher spent time
distributing the consents and information sheets in other units, before returning to start
the assessments with those who agreed to participate. This time allowed participants and
their parents/guardians to take their decision freely without feeling that they had been
rushed to do so.
119
For the incidence study, consent forms and participant information sheets were given to
each child or their parents on the day of the assessment, as soon as the patient was
admitted. Though, in most children cases, CFs were obtained from parents only,
because of the acute condition of these children when admitted. Time to read the PIS
and the CF was allowed before the actual assessment was carried out. A verbal
explanation of the study’s aims and procedures was given and verbal consent was
sought, immediately at the time of assessment, in addition to the consent form.
The confidentiality and anonymity of all participants was ensured throughout the study.
Participants’ names were not taken in full; instead, each participant’s first name only
and his/ her file number were used together to identify patients and access their files and
information, with minimal chance of error. The files all were used restrictively by the
researcher only.
Children and parents were assured throughout the entire study that they were free to
withdraw at any time without any obligations or penalties, and their children’s rights
and safety would be protected before, during and after the study took place. This was a
realistic possibility in this study because the researcher would need to inspect the child’s
entire body, which may cause embarrassment for the child, perhaps especially if he/she
was adolescent. The need for a complete physical assessment of the child’s body was,
however, highlighted in the PIS.
3.10 STATISTICAL ANALYSIS PLAN
Data were analysed using the SPSS version 17 (SPSS, 2008). Both descriptive and
inferential statistics were used in this study. Descriptive statistics, including frequency
distribution, central tendency measures, variability and correlation statistics, are used by
researchers to formulate and describe sets of data. On the other hand, inferential
statistics are usually used when a researcher is more interested in inferring conclusions
about the population by using data from the sample. In such cases, the researcher is
interested in building assumptions and testing hypotheses rather than in simply
describing variables or phenomena (Polit and Beck, 2010).
120
Descriptive analysis was performed for the demographical data using the median and
range for the categorical variables, whereas mean and standard deviation (SD) were
used for continuous variables. Moreover, descriptive statistics using percentages and
frequencies were used to summarise all the demographical variables, the ward
characteristics, and to calculate the overall prevalence and incidence rates. In addition,
they were used for calculating the number of skin assessments, number of ulcers and the
most affected areas.
Inferential statistical tests also were used depending on the nature of data. The study
sample was divided into two groups: PU-patients and PU-free patients. The chi-square
test (X²) was used for categorical variables, to examine the difference between patients
with PU and those free of ulcers in ICUs. For the same groups, the relationship between
IVs (risk factors / predictors) at least in ordinal level and the DV (PU development or
not) were tested using the Mann–Whitney U-test. On the other hand, variables with at
least ordinal level, and which were normally distributed, were measured using the
independent t-test. In fact, this test was used only once for assessing the relationship
between the serum potassium level (K) and PU development. Testing for normality was
carried out using the Kolmogorove-Smirnov Z test on the SPSS.
Four LR models were built to examine the significance of the relationship between the
predictors of PU (risk factors/ IVs) and its development (binary DV/ outcome). These
four models were established to make it easier for the researcher to deal with different
types of risk factors - general or scale sub-items - as well as to avoid redundancy in
testing closely related variables, such as in testing the mobility sub-item in each scale.
For example, as will be seen later in the results chapter, models one and two dealt
separately with the Braden Q scale sub-items and the Glamorgan sub-items. The third
and fourth models were created to test the relationship between the general identified
risk factors, and the Braden Q, as well as the Glamorgan significant sub-items, each in
turn. Also, the four models were created to identify the significant sub-items of each
risk assessment scale, while considering the OR for each sub-item, and for the scale’s
total risk score.
121
The predictive validity of the Glamorgan and the Braden Q risk scales was tested by
using the ROC curve through calculating the AUC for each tool, and then for each sub-
item of each scale, this indicated which variables of each scale could be removed,
enhanced or changed to improve the overall predictive ability and performance of the
scale. The AUC, sensitivity and specificity of each scale were specified by different cut-
off points; this helped in comparing the effectiveness of performance and classification
ability of each scale.
3.11 THEORETICAL FRAMEWORK REFLECTION ON THE
RESEARCH METHODOLOGY:
The theoretical framework used in this research focuses on the same areas of interest in
this research; the main two hypotheses in this research concerned the identification of
significantly related risk factors to PU development in a particular population - namely,
the paediatric ICU patients- and the comparative performance of two tested scales
regarding their ability to detect PU risk. The aim of gaining a full picture of children’s
risk in regard to PU development prompted this thesis to search for truly related risk
factors. It was hoped that these risk factors could be found by conducting a reliable and
valid study with evidence based results.
SDT proposed that any observer should be able to detect the true signal when
accompanied with other noise. Applying this proposition to nurses, it would be each
nurse’s responsibility to identify the true risk factors of PU development in children,
and to differentiate these factors from other unrelated factors. Having statistically
significant predictors of PU with which nurses are familiar, would help them to identify
risk children correctly as soon as they were assessed.
Moreover, this theory explained how each observer, or scale used by an observer,
should have a criterion upon which the observer or scale can be classified as being
specific and sensitive in detecting the true signals. In this research, the nurse’s ability to
use the Braden Q and the Glamorgan scales is based on a specific criterion which
classifies children as being at risk or not, or, in other words, the cut-off score for each
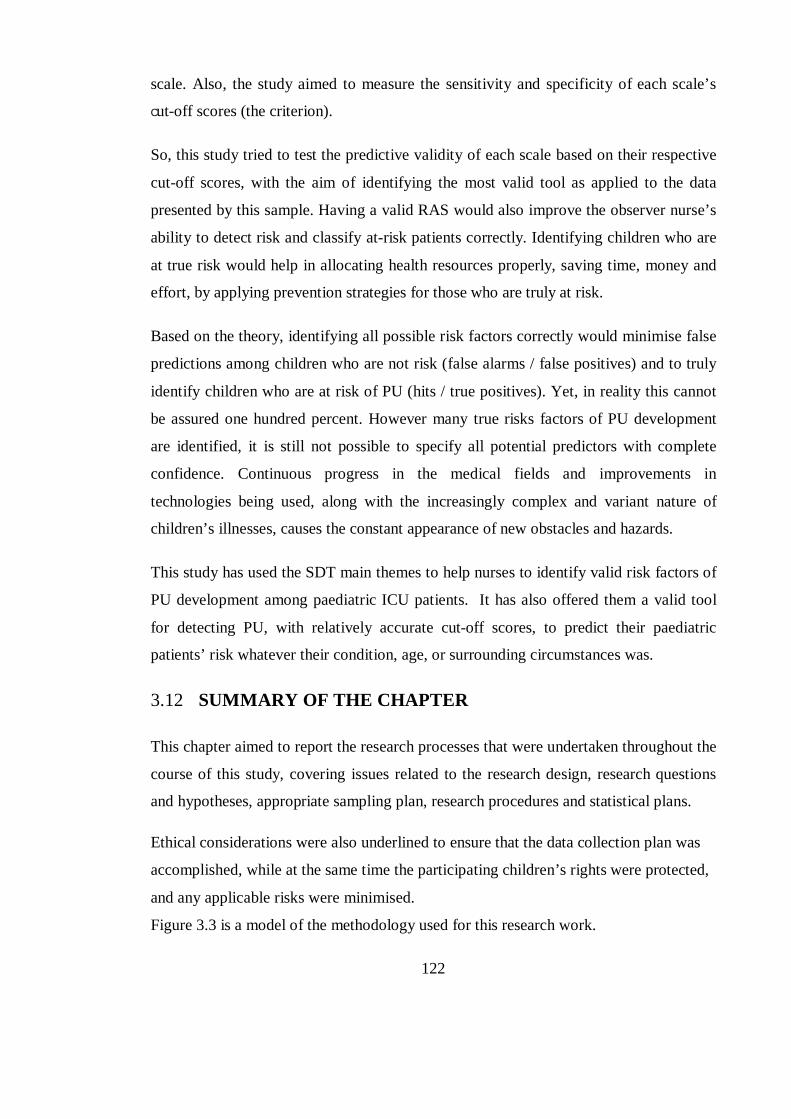
122
scale. Also, the study aimed to measure the sensitivity and specificity of each scale’s
Cut-off scores (the criterion).
So, this study tried to test the predictive validity of each scale based on their respective
cut-off scores, with the aim of identifying the most valid tool as applied to the data
presented by this sample. Having a valid RAS would also improve the observer nurse’s
ability to detect risk and classify at-risk patients correctly. Identifying children who are
at true risk would help in allocating health resources properly, saving time, money and
effort, by applying prevention strategies for those who are truly at risk.
Based on the theory, identifying all possible risk factors correctly would minimise false
predictions among children who are not risk (false alarms / false positives) and to truly
identify children who are at risk of PU (hits / true positives). Yet, in reality this cannot
be assured one hundred percent. However many true risks factors of PU development
are identified, it is still not possible to specify all potential predictors with complete
confidence. Continuous progress in the medical fields and improvements in
technologies being used, along with the increasingly complex and variant nature of
children’s illnesses, causes the constant appearance of new obstacles and hazards.
This study has used the SDT main themes to help nurses to identify valid risk factors of
PU development among paediatric ICU patients. It has also offered them a valid tool
for detecting PU, with relatively accurate cut-off scores, to predict their paediatric
patients’ risk whatever their condition, age, or surrounding circumstances was.
3.12 SUMMARY OF THE CHAPTER
This chapter aimed to report the research processes that were undertaken throughout the
course of this study, covering issues related to the research design, research questions
and hypotheses, appropriate sampling plan, research procedures and statistical plans.
Ethical considerations were also underlined to ensure that the data collection plan was
accomplished, while at the same time the participating children’s rights were protected,
and any applicable risks were minimised.
Figure 3.3 is a model of the methodology used for this research work.
123
Figure 3.3: Model of Research Methodology
- What is the incidence rate of the PU problem among Jordanian critically ill paediatrics? - What are the factors that contribute to PU development among the Jordanian critically ill paediatrics? - Which scale, the Glamorgan RAS or the Braden Q RAS, is more valid in predicting PU risk among Jordanian critically ill children?
- What is the prevalence rate of the PU problem in Jordanian paediatric wards?
Research Questions
Quantitative Research
Design Part One: Prevalence Study Part Two: Incidence Study
Prospective Cohort (over 8 weeks)
Cross Sectional (over one day)
N= 107 N= 212
Paediatric Intensive Care Units (ICUs) General Paediatrics Wards
Medical GIMU NICU GICU PICU
Surgical ICUs
Newborn
Direct skin assessment: (PU developed or not,
no., site, category).
Data Collection Data Collection
Risk assessment scales were filled
in (patients classified at risk /
not at risk)
Medical records review: (child demographical
information, ward characteristics, lab test results & other RFs)
Medical records review: (child demographical
information, and ward characteristics)
Direct skin assessment:
(existence or not of PU, no., site,
category).
Statistical Analysis (Descriptive) Statistical Analysis (descriptive & Inferential)
Significant RFs: by Univariate
& Multivariate analyses
Incidence Rate
Prevalence Rate
Predictive validity for each scale, by using
the ROC, specificity & sensitivity
124
CHAPTER 4 .. CHAPTER FOUR:
RESULTS
4.1 A GLANCE AT THE CHAPTER
This chapter discusses the results of the statistical analysis of the data collected. As
outlined in the methodology chapter, the study was divided into a cross sectional point
prevalence study and a descriptive non-experimental prospective cohort incidence
study.
In this chapter the results of both of these studies are included and the different
statistical approaches which were used, such as descriptive and inferential tests, are
described. Also, operational definitions for several risk factors and variables are offered
in order to provide a clearer picture of the observed variables. Quantitative data analysis
was used to identify the measurements of incidence and prevalence as well as to identify
risk factors, and measure the predictive validity of the Braden Q and the Glamorgan
RASs.
First, a brief description is given of how data were prepared before being analysed using
the Statistical Package for Social Sciences (SPSS) version 17.0.
125
4.2 PRE-ANALYSIS PREPARATION OF THE DATA
Prior to analysis, the data was prepared in a series of steps, which included:
- Clearing the data of errors.
- Re-checking any missing data (personal or system errors).
- Defining variables and giving them proper labels.
- Re-arranging certain variables, either by collapsing categories or changing
measurement levels.
- Comparing the SPSS data file with paper copies to ensure accurate data entry.
It was necessary to prepare the data before starting the analysis to be sure that there was
no missing data, there were no errors in data entry, no typing errors, or no mistakes
made in defining the variables. Missing data were re-checked to clarify the reasons for
their being missed, due to personal or system error, using descriptive frequency tables
on SPSS.
As already mentioned, all variables were given a clear definition (operational
definition), with a precise measurement level and specific calculations. This was
important so that each variable would not be mistaken with any other concept and so
that information about the way that each variable in this study was calculated and
considered was accurately presented.
Moreover, some types of data were rearranged in a manner which would facilitate
analysis. This was done, firstly, by collapsing categories of some variables since there
were some categorical variables with so many categories or sub-groups that it was
difficult to begin the analysis. An example of such a variable was the medical diagnosis
of each subject in the study. It was decided that medical diagnosis sub-groups with only
a limited number of subjects would be included in one sub-group called "other" and
126
diagnoses with no subjects identified during the data collection were omitted. The
gathering of sub-groups was based on existing literature and previous knowledge of
each variable.
Additionally, variables which were measured on a continuous scale had to be changed
to categorical measurements both for ease of grouping subjects for comparison, and
because some inferential statistics would be difficult to apply to continuous variables. In
some cases, continuous variables were made categorical for practical applicability, since
there were some variables for which the researcher was not interested in the actual
numeric value, but in the clinical meaning of the value.
For example, in the serum albumin test, the researcher was interested only in the tests
which showed low albumin values, since low albumin level is linked in previous
literature with PU development (Anthony et al., 2011, Willock et al., 2007), but not
with normal or high values. Here, the actual numeric value would not be as significant
to the results of the research as the classification of children into two groups; one with
low albumin levels, and the other with normal values. A suitable label and measurement
level for each variable was specified to ensure its clear identity. A precise measurement
level was a necessary precursor for a correct next step analysis.
Finally, all data entered were re-checked and compared with the data available on the
original data collection papers to minimize the risk of error.
4.2.1 Variable groups and operational definitions
As previously mentioned, each variable was given a specific operational definition, to
prevent misinterpretation within variables. There were 46 variables in this study,
divided into five groups purely for ease of classification and grouping. These five
groups were:
1. Variables that describe ward / patient condition.
2. Biological / laboratory (Lab) test related variables.
127
3. Variables that describe PUs (no., category, location etc.).
4. Glamorgan RAS’ sub-items.
5. Braden Q RAS’ sub-items.
These variables were subjected to different statistical tests, both descriptive and
inferential. The type of test used depended on the nature of the variable and its
relatedness to the observed outcome (whether PU developed or not). Also, some
variables were tested based on univariate analyses while others were tested on both
univariate and multivariate statistics. This choice depended on many factors, such as
level of measurement, level of significance, whether or not they violated multivariate
statistics assumptions and others, which will be explained later in this chapter.
Group one: Variables which describe ward / patient condition
This group includes variables which describe patients’ condition during ICU/ hospital
admission, namely age, gender, medical diagnosis, Glasgow coma scale score (GCS),
gestational age, development of any adhesive injury, need for MV, and positive end
expiratory pressure (PEEP) level. It also includes variables related to the admission
ward (type of ward/speciality), and other variables related to patients’ residence in the
ward, such as length of stay (LOS), number of follow-up assessments, and the reason
for follow-ups being discontinued.
Age was sub-divided into two groups. The first dealt with children aged less than one
year, whose ages were entered into SPSS as ‘age in days’. The second group included
children from 1 to 18 years old, who were labelled according to ‘age in years’. This was
done to facilitate data entry and analysis where such a wide age range existed, and also
in view of the fact that the vast majority of the sample were infants of less than one year
of age. Both variables were continuous.
Gender was a dichotomous variable (male/ female). Medical diagnosis was entered
under ‘case classification’, a categorical variable which included six sub-categories
(Respiratory, Cardiac and Circulatory, Metabolic, Infectious, Neurological, and Other).
128
‘Other’ diagnoses included gastric, morphologic and growth problems. The recorded
diagnosis was the primary medical diagnosis of patients when admitted to the ICU
(incidence study) or hospital (prevalence study). Gestational Age was entered both as a
continuous variable (weeks in uterus prior to delivery), and categorical (Full Term, if
GA ≥ 37 weeks or Preterm, if GA < 37 weeks).
Data related to patients being on mechanical ventilators was also gathered. There was
one dichotomous variable, describing whether a patient was on an MV at the first
assessment (assessment no. = 0) (yes/no). The level of PEEP on MV settings was also
observed (in this sample measured by H2O level), as was the duration the patient had
spent on the MV in days (continuous variable). A GCS score was also calculated
based on the paediatric/ infant GCS criteria which were used in the hospital where the
data collection was undertaken. This score ranged from a minimum score of 3
(unconscious) up to a maximum of 15 (fully conscious). This continuous variable was
important for measuring the motor, verbal and sensory responses of patients.
The final variable related to ‘adhesive injury’. The decision to collect information on
this variable was only taken once the data collection process was underway and it was
added because it was seen to be a highly prevalent problem, especially in NICU. It is a
dichotomous variable which establishes whether or not a child has sustained a skin
injury from plaster stripping or the application of adhesive products.
Other variables in this group were connected to the admission ward. In the incidence
study, the admission ward was one of 4 ICUs (PICU, GICU, NICU, and GIMU). In the
prevalence study, admission wards were grouped into four major categories (medical,
surgical, critical units, and newborn). Patients’ length of stay (LOS) in the ICU was
recorded as a continuous variable in days. However, LOS in the prevalence study refers
to the patient’s entire hospital stay, and not in a particular ward/ unit, up until the day
the survey commenced.
The number of observations carried out for each patient during the follow-up period in
the incidence study was calculated (as discussed earlier in the methodology chapter, this
129
could not be less than two and not more than twelve observations, including the initial
observation on admission).
The reason for discontinuing the study was recorded as a categorical variable as
follows: the patient was discharged, died, or the follow-up period (8 weeks) was ended.
Group two: Biological/ laboratory test related variables
This group of variables covers all important factors related to the patient’s physiological
condition during the relevant ICU admission. They include biological measures such as
the vital signs blood pressure (BP) and temperature, and other key indicators of a
patient’s condition such as acidemia, hypoxemia, and body weight. Also noted were the
results of certain laboratory tests which have been shown to be associated with PU
development in previous literature. Such diagnostic tests are: serum Potassium level
(K), Sodium (Na), Urea and Creatinine, glucose level, C reactive protein (CRP), and
Bilirubin level. All these were considered based on Pillitteri (2010).
Blood pressure reading (BP) means the non-invasive arterial blood pressure first
reading recorded on the initial assessment (assessment 0) on admission. It is measured
in mm Hg and recorded both as systolic and diastolic measures. This variable is
continuous.
Body temperature (Temp) refers to the external body temperature taken during the
initial assessment (0) on admission. It is a continuous variable measured in degrees
Celsius (C˚).
This variable was intended to be omitted from the multivariate analysis when the
regression model combined all risk factors with the Glamorgan sub-items. This was in
order to reduce the Multicollinearity effect (discussed later) when Temp was combined
with Hyperthermia sub-score on the Glamorgan scale.
Acidemia and Hypoxemia were measured based on the arterial blood gases (ABGs)
readings. This was done by documenting PH, PCO2, PO2, and HCO3 levels. Both of
the variables were recorded as dichotomous as the actual values were used to
demonstrate simply whether Acidemia/Hypoxemia existed or not (Yes/No). Acidemia
130
was considered to exist if (PH < 7.35; PCO2 > 45 mmhg or HCO3 < 22). Hypoxemia
was considered to occur if PO2 (< 80 mmhg).
Body weight was recorded as a continuous variable in Kilograms (Kgs). This was
omitted from the multivariate analysis to reduce duplication with the weight sub-item in
the Glamorgan RAS, and the weight changes in nutrition sub-item in the Braden Q
RAS. For the multivariate analysis, weight was taken into consideration based on the
weight centile charts as recommended by the Glamorgan risk scale. It was classed as a
categorical variable, recorded as either below 10th centile or 10th centile and above
(Appendix 3.4).
All laboratory tests were conducted on blood serum. The results were measured as
actual values and entered into the SPSS as continuous variables, except in the case of
the CRP value which was a dichotomous (negative/ positive) test. All of these tests
were recorded in the initial assessment (0), within 24 hours of admission.
Group three: Variables which describe PUs.
These variables involve descriptions related to the observed outcome (dependent
variable DV), which is PU development (Yes/ No). The descriptors include the number
of ulcers developed by each patient in the study and the category and location of the
most severe ulcers of each patient. Whether the patient had single or multiple ulcers was
also noted.
Categorising PUs was based on the EPUAP and NPUAP classification system, as
previously mentioned in the methodology chapter. All these variables were dealt with
through descriptive analysis, as they only describe the outcome (PU development) and
are not considered predictors of the outcome. Therefore, none were analysed by
inferential statistics.
Group four: Glamorgan RAS sub-items.
This group contains the Glamorgan RAS sub-items. There are nine sub-items
(Appendix 1.10), which were dichotomous variables - except for one ordinal variable
(mobility) – and were entered in both univariate and multivariate analyses. All,
131
however, were dealt with as ordinal variables, since they all originated from a
continuous measurement scale (risk scores). A description of each item was provided in
the methodology chapter.
Group five: Braden Q RAS’ sub-items.
This group contains the Braden Q RAS’ sub-items. There are 7 sub-items in total
(Appendix 1.11), which were all ordinal variables. They were entered in both univariate
and multivariate analyses. A description of each item was included in the methodology
chapter.
4.3 STATISTICAL RESULTS
Statistical analysis for this study involved both descriptive and inferential statistics.
Descriptive statistics were used for both categorical variables (as frequencies and
percentages), and for continuous variables (mean, median, and standard deviation
measures). Tables and graphs to show the descriptive nature of the sample will be
shown in each relevant section separately.
Inferential statistics were used to answer the research questions, and to test the research
hypotheses. Both univariate and multivariate statistics were used. Univariate analysis
for this data set included contingency tables (Cross-tabulation) and the Chi square test
(χ²). The Fishers’ Exact test was used in cases where the Chi square test assumption
was violated.
Contingency tables were used to show the frequencies and percentages of subjects in
each category whether they were PU patients or were PU-free. The Chi square test was
used to measure any significant difference in the proportion of patients with PU
compared to those without PU in regard to the independent variables that had been
tested. Fisher’s exact test replaced the Chi Square test in cases where the variables had
violated its assumption of frequency; more than 20% of frequencies were less than 5.
For continuous variables with normal distribution, the parametric independent t-test
was used. Only one variable (serum potassium) was found to be normally distributed.
132
For the purpose of testing the normality of the continuous variables’ distribution, the
one sample Kolmogorov-Smirnov test was applied. Variables which were not normally
distributed and were at least ordinal were tested with the non-parametric Mann Whitney
U test. These tests were used to identify whether there was a significant difference
between patients with PU compared to those who were free of PU, in relation to several
independent variables. As is the nature of univariate tests, the association between each
variable and the outcome was tested separately.
The next step was to enter all of the variables found to be significant inunivariate
analysis into logistic regression models (multivariate). This type of regression was
necessary in the current study because of the nature of the observed outcome (binary
DV), and the nature of the predictors (a mix of categorical and continuous IVs). Binary
logistic regression was used to test the relationship between a group of predictors all at
once, and one binary outcome (development of PU or not).
Receiver operating characteristics (ROC) was used to measure the predictive validity of
the two RASs used: Glamorgan and Braden Q. In this test, the area under the curve
(AUC) for both scales was measured and compared, in order to identify which scale was
more predictive in distinguishing patients who developed PUs from those who did not.
Also, each scale’s total score was compared with its sub-items (if at least ordinal) based
on their AUC. Categorical data are not suitable for testing with ROC as, unlike ordinal
and continuous data, they lack different thresholds which tests can be based on.
A significance level of 0.05 (α- level) was set for all tests used. This cut-off score was
based on previous similar PU incidence and risk factors studies of paediatric and adult.
This section will outline the results of the descriptive and inferential statistical testing
detailed above. There will be two separate discussions of the prevalence and the
incidence studies, because of their distinct samples, different study design, and variant
findings.
4.3.1 Study One: Point Prevalence Survey.
Descriptive Analysis
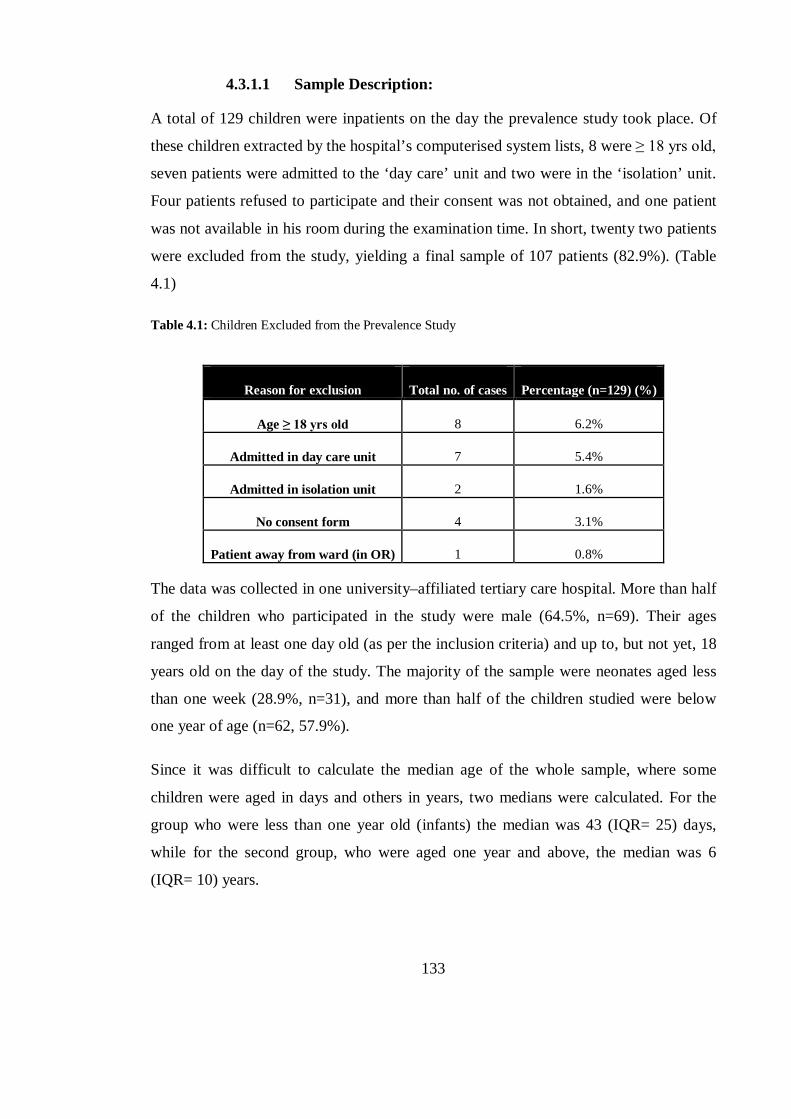
133
4.3.1.1 Sample Description:
A total of 129 children were inpatients on the day the prevalence study took place. Of
these children extracted by the hospital’s computerised system lists, 8 were ≥ 18 yrs old,
seven patients were admitted to the ‘day care’ unit and two were in the ‘isolation’ unit.
Four patients refused to participate and their consent was not obtained, and one patient
was not available in his room during the examination time. In short, twenty two patients
were excluded from the study, yielding a final sample of 107 patients (82.9%). (Table
4.1)
Table 4.1: Children Excluded from the Prevalence Study
Reason for exclusion Total no. of cases Percentage (n=129) (%)
Age ≥ 18 yrs old 8 6.2%
Admitted in day care unit 7 5.4%
Admitted in isolation unit 2 1.6%
No consent form 4 3.1%
Patient away from ward (in OR) 1 0.8%
The data was collected in one university–affiliated tertiary care hospital. More than half
of the children who participated in the study were male (64.5%, n=69). Their ages
ranged from at least one day old (as per the inclusion criteria) and up to, but not yet, 18
years old on the day of the study. The majority of the sample were neonates aged less
than one week (28.9%, n=31), and more than half of the children studied were below
one year of age (n=62, 57.9%).
Since it was difficult to calculate the median age of the whole sample, where some
children were aged in days and others in years, two medians were calculated. For the
group who were less than one year old (infants) the median was 43 (IQR= 25) days,
while for the second group, who were aged one year and above, the median was 6
(IQR= 10) years.
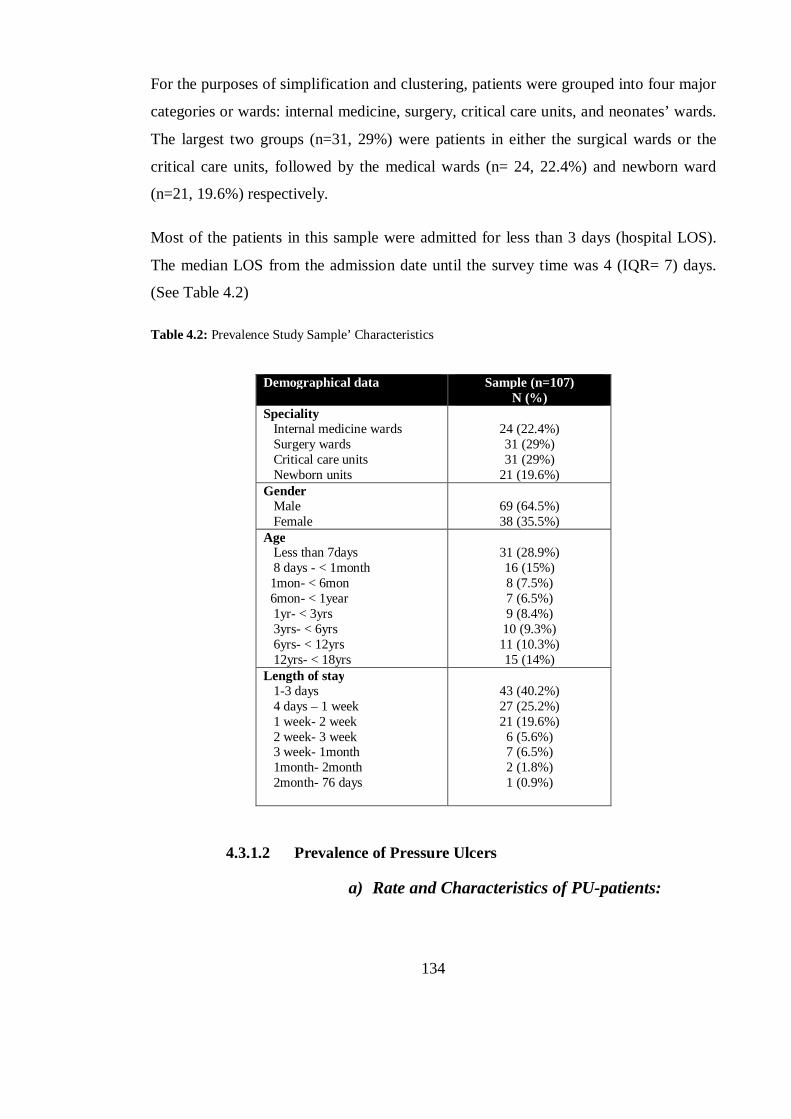
134
For the purposes of simplification and clustering, patients were grouped into four major
categories or wards: internal medicine, surgery, critical care units, and neonates’ wards.
The largest two groups (n=31, 29%) were patients in either the surgical wards or the
critical care units, followed by the medical wards (n= 24, 22.4%) and newborn ward
(n=21, 19.6%) respectively.
Most of the patients in this sample were admitted for less than 3 days (hospital LOS).
The median LOS from the admission date until the survey time was 4 (IQR= 7) days.
(See Table 4.2)
Table 4.2: Prevalence Study Sample’ Characteristics
Demographical data Sample (n=107) N (%)
Speciality Internal medicine wards Surgery wards Critical care units Newborn units
24 (22.4%) 31 (29%) 31 (29%)
21 (19.6%) Gender Male Female
69 (64.5%) 38 (35.5%)
Age Less than 7days 8 days - < 1month 1mon- < 6mon 6mon- < 1year 1yr- < 3yrs 3yrs- < 6yrs 6yrs- < 12yrs 12yrs- < 18yrs
31 (28.9%) 16 (15%) 8 (7.5%) 7 (6.5%) 9 (8.4%)
10 (9.3%) 11 (10.3%) 15 (14%)
Length of stay 1-3 days 4 days – 1 week 1 week- 2 week 2 week- 3 week 3 week- 1month 1month- 2month 2month- 76 days
43 (40.2%) 27 (25.2%) 21 (19.6%)
6 (5.6%) 7 (6.5%) 2 (1.8%) 1 (0.9%)
4.3.1.2 Prevalence of Pressure Ulcers
a) Rate and Characteristics of PU-patients:
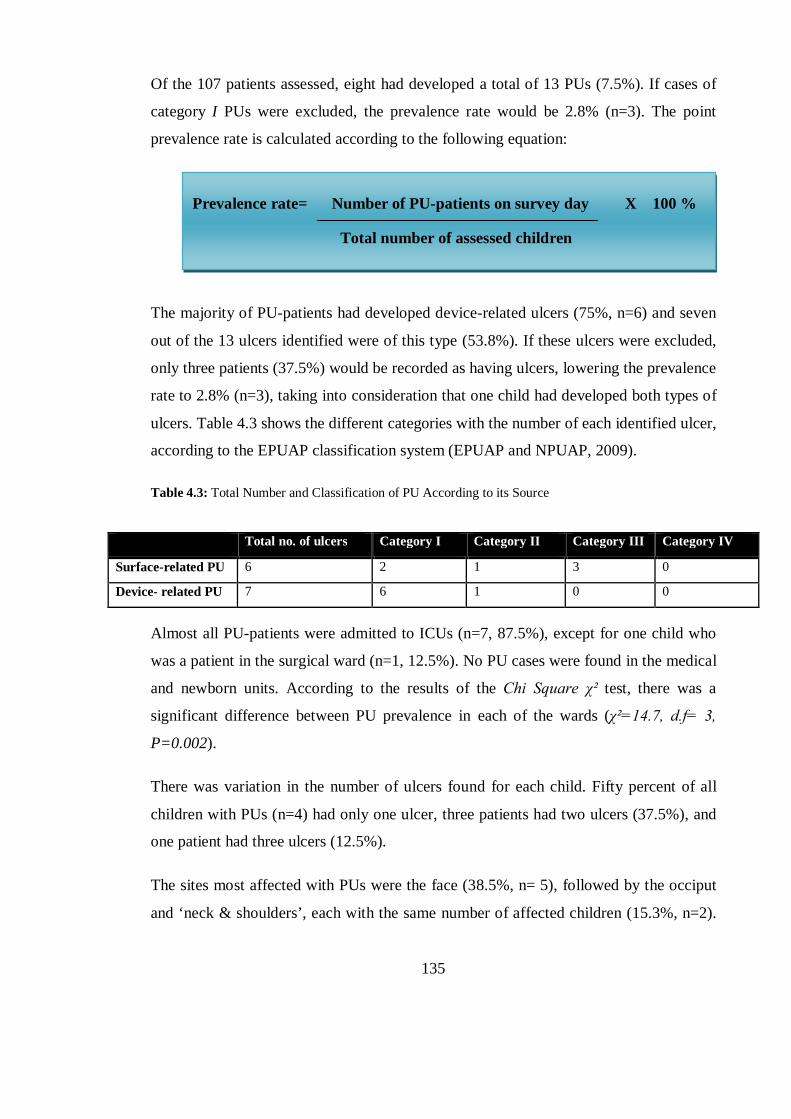
135
Of the 107 patients assessed, eight had developed a total of 13 PUs (7.5%). If cases of
category I PUs were excluded, the prevalence rate would be 2.8% (n=3). The point
prevalence rate is calculated according to the following equation:
The majority of PU-patients had developed device-related ulcers (75%, n=6) and seven
out of the 13 ulcers identified were of this type (53.8%). If these ulcers were excluded,
only three patients (37.5%) would be recorded as having ulcers, lowering the prevalence
rate to 2.8% (n=3), taking into consideration that one child had developed both types of
ulcers. Table 4.3 shows the different categories with the number of each identified ulcer,
according to the EPUAP classification system (EPUAP and NPUAP, 2009).
Table 4.3: Total Number and Classification of PU According to its Source
Total no. of ulcers Category I Category II Category III Category IV
Surface-related PU 6 2 1 3 0
Device- related PU 7 6 1 0 0
Almost all PU-patients were admitted to ICUs (n=7, 87.5%), except for one child who
was a patient in the surgical ward (n=1, 12.5%). No PU cases were found in the medical
and newborn units. According to the results of the Chi Square χ² test, there was a
significant difference between PU prevalence in each of the wards (χ²=14.7, d.f= 3,
P=0.002).
There was variation in the number of ulcers found for each child. Fifty percent of all
children with PUs (n=4) had only one ulcer, three patients had two ulcers (37.5%), and
one patient had three ulcers (12.5%).
The sites most affected with PUs were the face (38.5%, n= 5), followed by the occiput
and ‘neck & shoulders’, each with the same number of affected children (15.3%, n=2).
Prevalence rate= Number of PU-patients on survey day X 100 %
Total number of assessed children
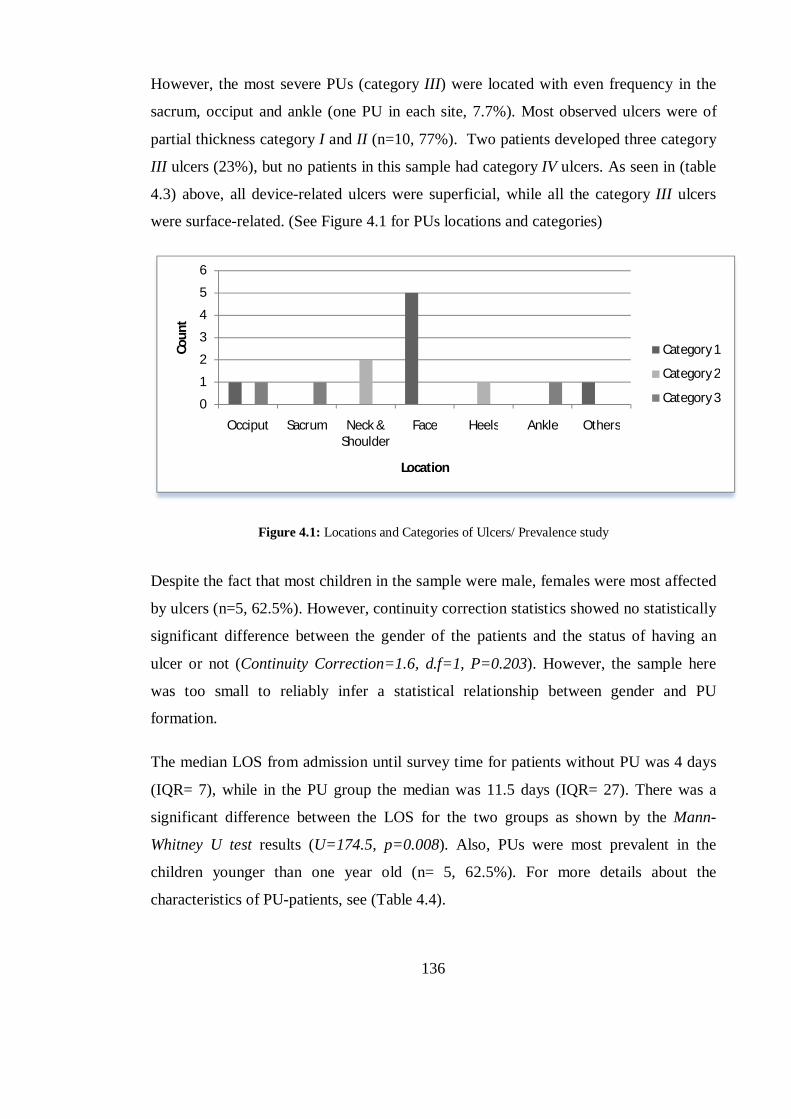
136
However, the most severe PUs (category III) were located with even frequency in the
sacrum, occiput and ankle (one PU in each site, 7.7%). Most observed ulcers were of
partial thickness category I and II (n=10, 77%). Two patients developed three category
III ulcers (23%), but no patients in this sample had category IV ulcers. As seen in (table
4.3) above, all device-related ulcers were superficial, while all the category III ulcers
were surface-related. (See Figure 4.1 for PUs locations and categories)
Figure 4.1: Locations and Categories of Ulcers/ Prevalence study
Despite the fact that most children in the sample were male, females were most affected
by ulcers (n=5, 62.5%). However, continuity correction statistics showed no statistically
significant difference between the gender of the patients and the status of having an
ulcer or not (Continuity Correction=1.6, d.f=1, P=0.203). However, the sample here
was too small to reliably infer a statistical relationship between gender and PU
formation.
The median LOS from admission until survey time for patients without PU was 4 days
(IQR= 7), while in the PU group the median was 11.5 days (IQR= 27). There was a
significant difference between the LOS for the two groups as shown by the Mann-
Whitney U test results (U=174.5, p=0.008). Also, PUs were most prevalent in the
children younger than one year old (n= 5, 62.5%). For more details about the
characteristics of PU-patients, see (Table 4.4).
0
1
2
3
4
5
6
Occiput Sacrum Neck & Shoulder
Face Heels Ankle Others
Coun
t
Location
Category 1
Category 2
Category 3
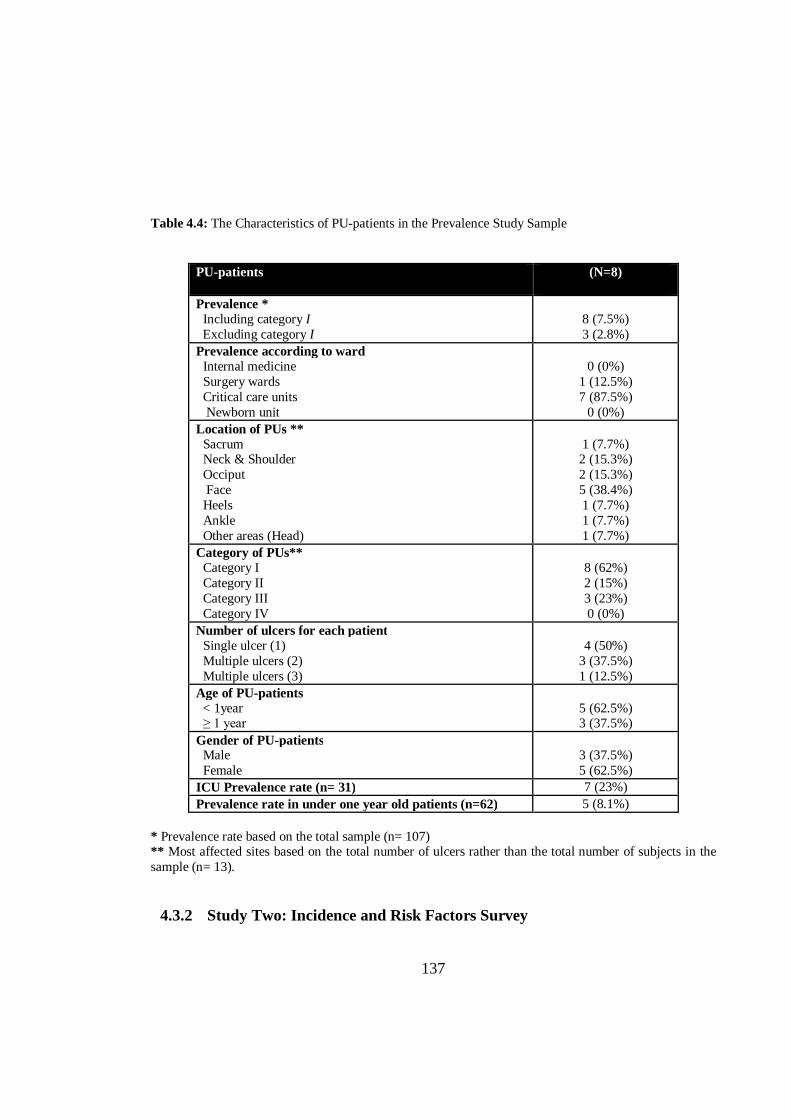
137
Table 4.4: The Characteristics of PU-patients in the Prevalence Study Sample
PU-patients (N=8)
Prevalence * Including category I Excluding category I
8 (7.5%) 3 (2.8%)
Prevalence according to ward Internal medicine Surgery wards Critical care units Newborn unit
0 (0%)
1 (12.5%) 7 (87.5%)
0 (0%) Location of PUs ** Sacrum Neck & Shoulder Occiput Face Heels Ankle Other areas (Head)
1 (7.7%) 2 (15.3%) 2 (15.3%) 5 (38.4%) 1 (7.7%) 1 (7.7%) 1 (7.7%)
Category of PUs** Category I Category II Category III Category IV
8 (62%) 2 (15%) 3 (23%) 0 (0%)
Number of ulcers for each patient Single ulcer (1) Multiple ulcers (2) Multiple ulcers (3)
4 (50%)
3 (37.5%) 1 (12.5%)
Age of PU-patients < 1year ≥ 1 year
5 (62.5%) 3 (37.5%)
Gender of PU-patients Male Female
3 (37.5%) 5 (62.5%)
ICU Prevalence rate (n= 31) 7 (23%) Prevalence rate in under one year old patients (n=62) 5 (8.1%)
* Prevalence rate based on the total sample (n= 107) ** Most affected sites based on the total number of ulcers rather than the total number of subjects in the sample (n= 13).
4.3.2 Study Two: Incidence and Risk Factors Survey
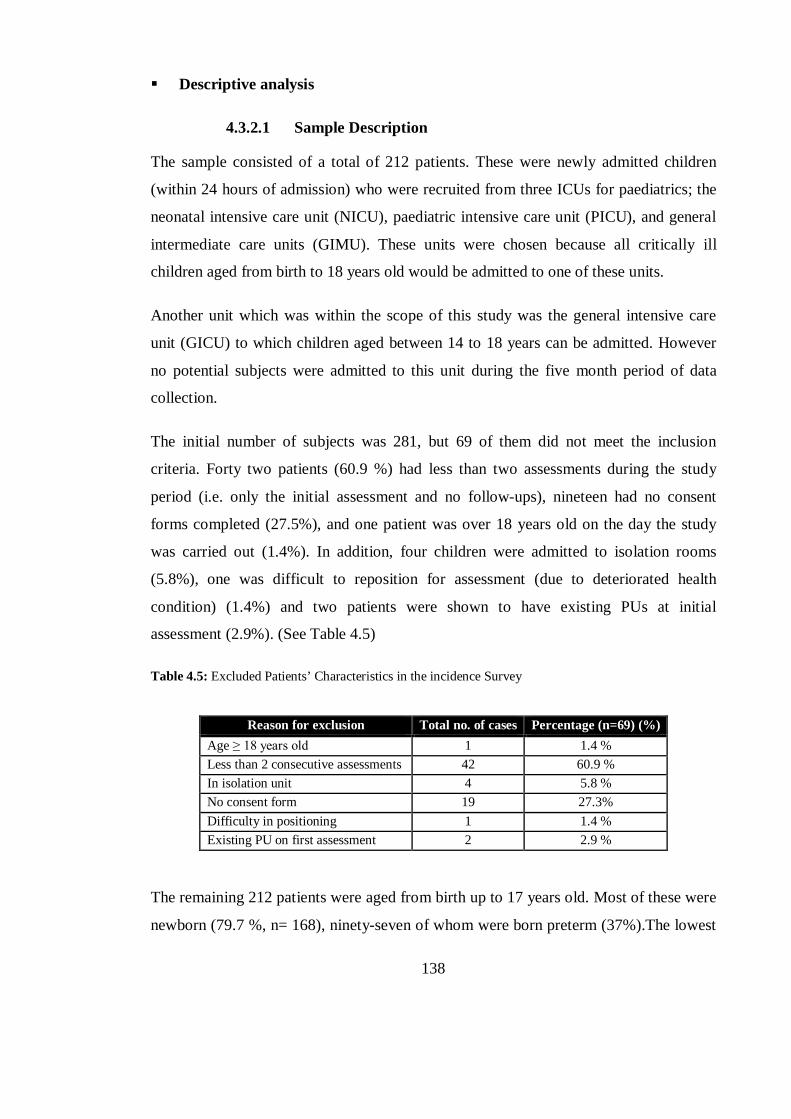
138
Descriptive analysis
4.3.2.1 Sample Description
The sample consisted of a total of 212 patients. These were newly admitted children
(within 24 hours of admission) who were recruited from three ICUs for paediatrics; the
neonatal intensive care unit (NICU), paediatric intensive care unit (PICU), and general
intermediate care units (GIMU). These units were chosen because all critically ill
children aged from birth to 18 years old would be admitted to one of these units.
Another unit which was within the scope of this study was the general intensive care
unit (GICU) to which children aged between 14 to 18 years can be admitted. However
no potential subjects were admitted to this unit during the five month period of data
collection.
The initial number of subjects was 281, but 69 of them did not meet the inclusion
criteria. Forty two patients (60.9 %) had less than two assessments during the study
period (i.e. only the initial assessment and no follow-ups), nineteen had no consent
forms completed (27.5%), and one patient was over 18 years old on the day the study
was carried out (1.4%). In addition, four children were admitted to isolation rooms
(5.8%), one was difficult to reposition for assessment (due to deteriorated health
condition) (1.4%) and two patients were shown to have existing PUs at initial
assessment (2.9%). (See Table 4.5)
Table 4.5: Excluded Patients’ Characteristics in the incidence Survey
Reason for exclusion Total no. of cases Percentage (n=69) (%) Age ≥ 18 years old 1 1.4 % Less than 2 consecutive assessments 42 60.9 % In isolation unit 4 5.8 % No consent form 19 27.3% Difficulty in positioning 1 1.4 % Existing PU on first assessment 2 2.9 %
The remaining 212 patients were aged from birth up to 17 years old. Most of these were
newborn (79.7 %, n= 168), ninety-seven of whom were born preterm (37%).The lowest
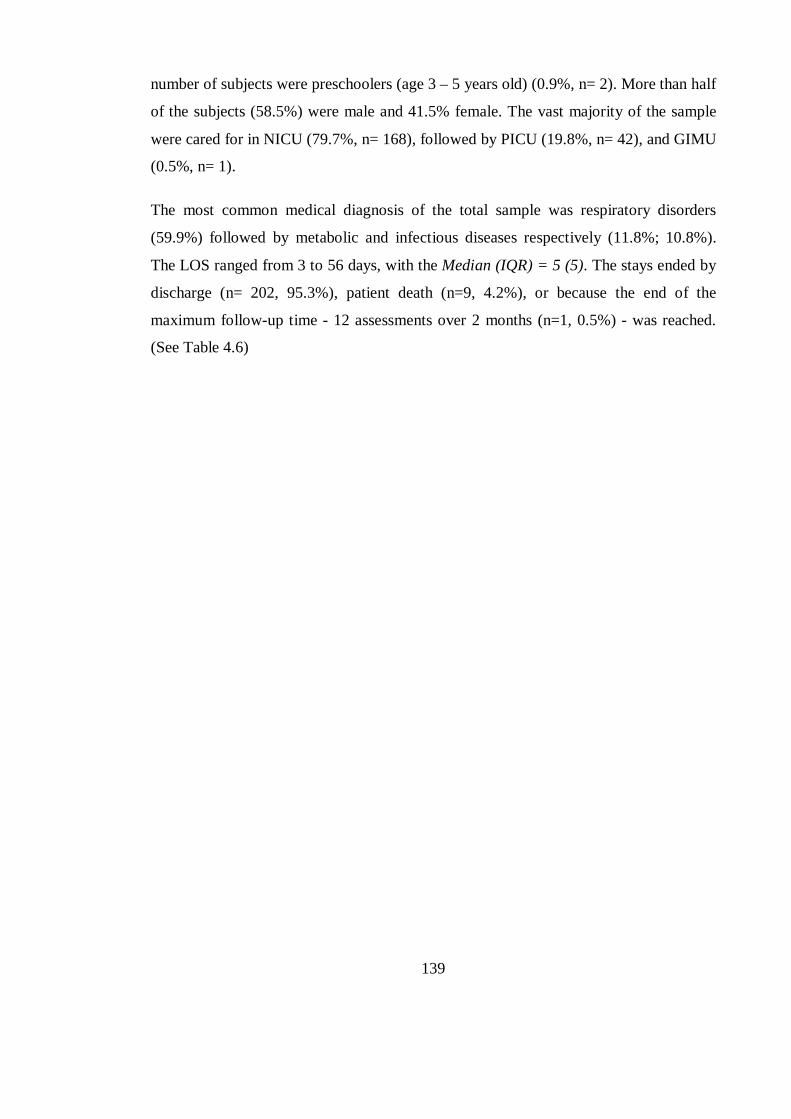
139
number of subjects were preschoolers (age 3 – 5 years old) (0.9%, n= 2). More than half
of the subjects (58.5%) were male and 41.5% female. The vast majority of the sample
were cared for in NICU (79.7%, n= 168), followed by PICU (19.8%, n= 42), and GIMU
(0.5%, n= 1).
The most common medical diagnosis of the total sample was respiratory disorders
(59.9%) followed by metabolic and infectious diseases respectively (11.8%; 10.8%).
The LOS ranged from 3 to 56 days, with the Median (IQR) = 5 (5). The stays ended by
discharge (n= 202, 95.3%), patient death (n=9, 4.2%), or because the end of the
maximum follow-up time - 12 assessments over 2 months (n=1, 0.5%) - was reached.
(See Table 4.6)
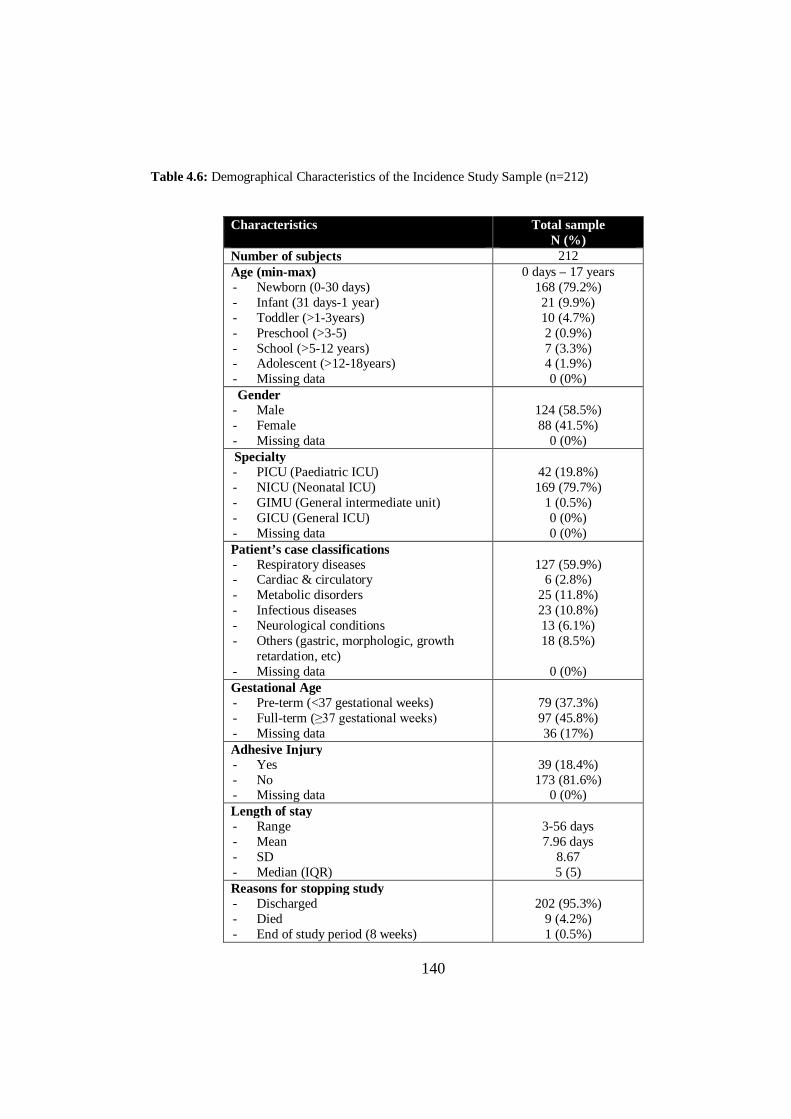
140
Table 4.6: Demographical Characteristics of the Incidence Study Sample (n=212)
Characteristics
Total sample N (%)
Number of subjects 212 Age (min-max) - Newborn (0-30 days) - Infant (31 days-1 year) - Toddler (>1-3years) - Preschool (>3-5) - School (>5-12 years) - Adolescent (>12-18years) - Missing data
0 days – 17 years 168 (79.2%) 21 (9.9%) 10 (4.7%) 2 (0.9%) 7 (3.3%) 4 (1.9%) 0 (0%)
Gender - Male - Female - Missing data
124 (58.5%) 88 (41.5%)
0 (0%) Specialty - PICU (Paediatric ICU) - NICU (Neonatal ICU) - GIMU (General intermediate unit) - GICU (General ICU) - Missing data
42 (19.8%) 169 (79.7%)
1 (0.5%) 0 (0%) 0 (0%)
Patient’s case classifications - Respiratory diseases - Cardiac & circulatory - Metabolic disorders - Infectious diseases - Neurological conditions - Others (gastric, morphologic, growth
retardation, etc) - Missing data
127 (59.9%)
6 (2.8%) 25 (11.8%) 23 (10.8%) 13 (6.1%) 18 (8.5%)
0 (0%)
Gestational Age - Pre-term (<37 gestational weeks) - Full-term (≥37 gestational weeks) - Missing data
79 (37.3%) 97 (45.8%) 36 (17%)
Adhesive Injury - Yes - No - Missing data
39 (18.4%) 173 (81.6%)
0 (0%) Length of stay - Range - Mean - SD - Median (IQR)
3-56 days 7.96 days
8.67 5 (5)
Reasons for stopping study - Discharged - Died - End of study period (8 weeks)
202 (95.3%)
9 (4.2%) 1 (0.5%)
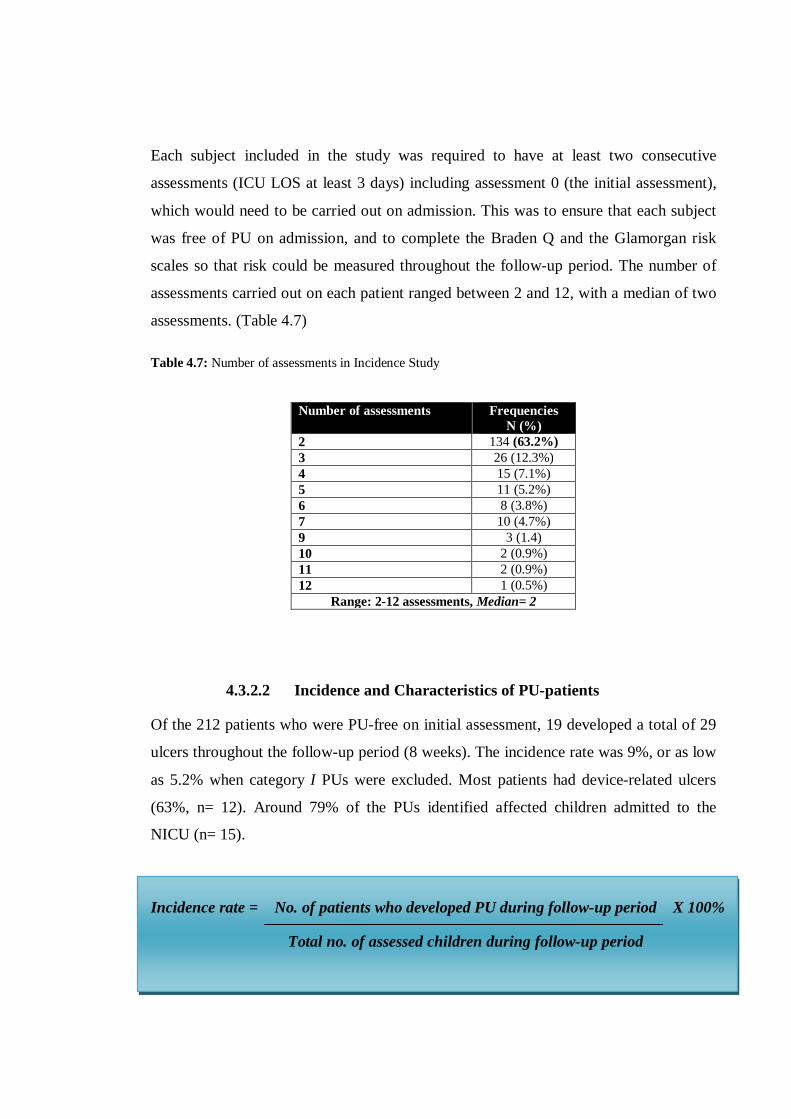
141
Each subject included in the study was required to have at least two consecutive
assessments (ICU LOS at least 3 days) including assessment 0 (the initial assessment),
which would need to be carried out on admission. This was to ensure that each subject
was free of PU on admission, and to complete the Braden Q and the Glamorgan risk
scales so that risk could be measured throughout the follow-up period. The number of
assessments carried out on each patient ranged between 2 and 12, with a median of two
assessments. (Table 4.7)
Table 4.7: Number of assessments in Incidence Study
Number of assessments Frequencies N (%)
2 134 (63.2%) 3 26 (12.3%) 4 15 (7.1%) 5 11 (5.2%) 6 8 (3.8%) 7 10 (4.7%) 9 3 (1.4) 10 2 (0.9%) 11 2 (0.9%) 12 1 (0.5%)
Range: 2-12 assessments, Median= 2
4.3.2.2 Incidence and Characteristics of PU-patients
Of the 212 patients who were PU-free on initial assessment, 19 developed a total of 29
ulcers throughout the follow-up period (8 weeks). The incidence rate was 9%, or as low
as 5.2% when category I PUs were excluded. Most patients had device-related ulcers
(63%, n= 12). Around 79% of the PUs identified affected children admitted to the
NICU (n= 15).
Incidence rate = No. of patients who developed PU during follow-up period X 100%
Total no. of assessed children during follow-up period
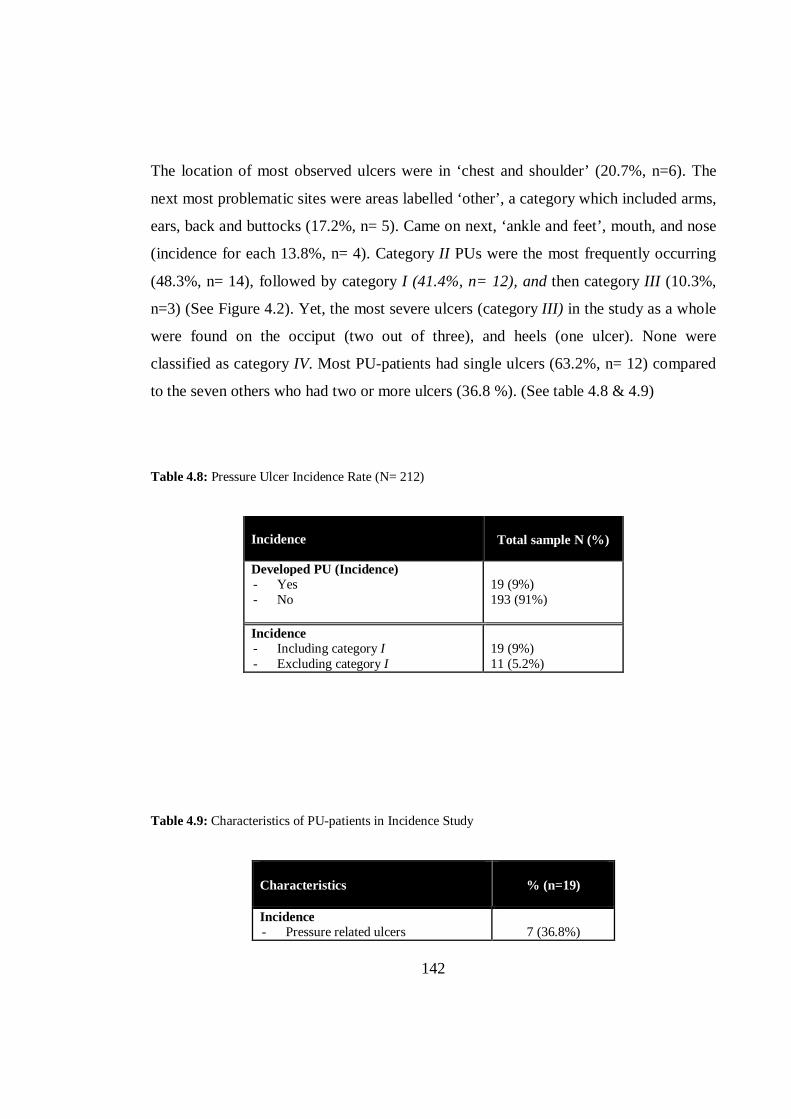
142
The location of most observed ulcers were in ‘chest and shoulder’ (20.7%, n=6). The
next most problematic sites were areas labelled ‘other’, a category which included arms,
ears, back and buttocks (17.2%, n= 5). Came on next, ‘ankle and feet’, mouth, and nose
(incidence for each 13.8%, n= 4). Category II PUs were the most frequently occurring
(48.3%, n= 14), followed by category I (41.4%, n= 12), and then category III (10.3%,
n=3) (See Figure 4.2). Yet, the most severe ulcers (category III) in the study as a whole
were found on the occiput (two out of three), and heels (one ulcer). None were
classified as category IV. Most PU-patients had single ulcers (63.2%, n= 12) compared
to the seven others who had two or more ulcers (36.8 %). (See table 4.8 & 4.9)
Table 4.8: Pressure Ulcer Incidence Rate (N= 212)
Incidence Total sample N (%)
Developed PU (Incidence) - Yes - No
19 (9%) 193 (91%)
Incidence - Including category I - Excluding category I
19 (9%) 11 (5.2%)
Table 4.9: Characteristics of PU-patients in Incidence Study
Characteristics % (n=19)
Incidence - Pressure related ulcers
7 (36.8%)
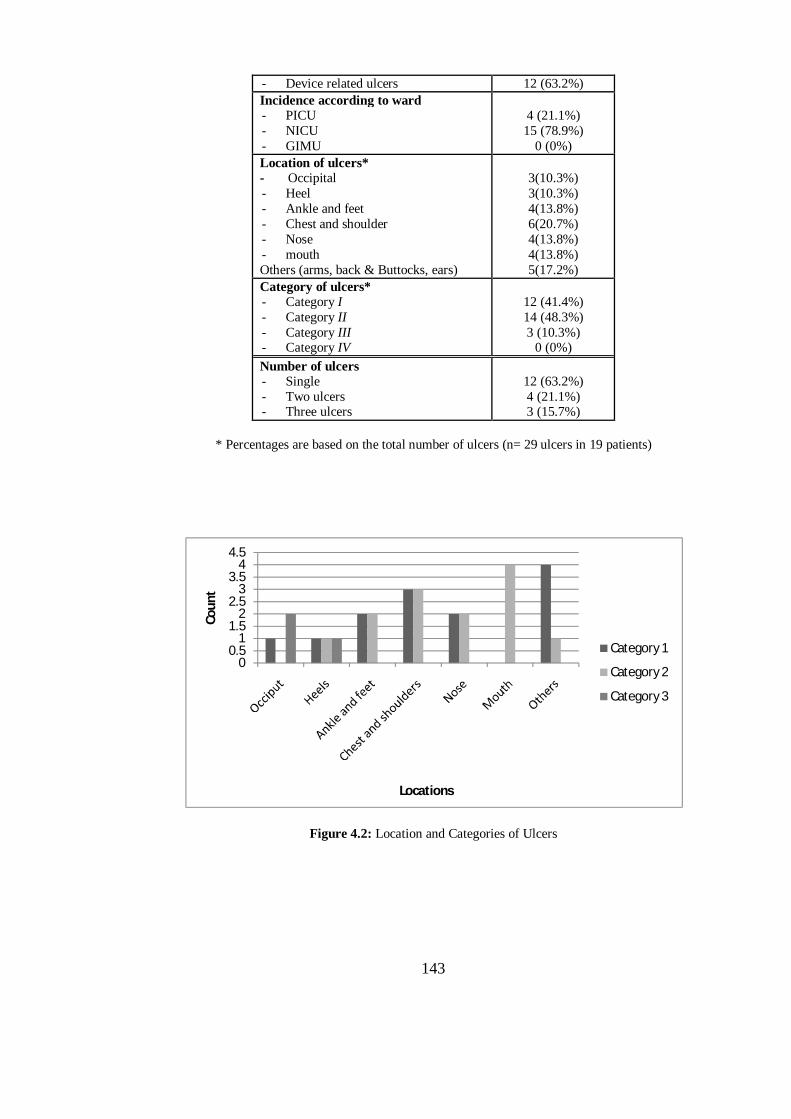
143
- Device related ulcers 12 (63.2%) Incidence according to ward - PICU - NICU - GIMU
4 (21.1%) 15 (78.9%)
0 (0%) Location of ulcers* - Occipital - Heel - Ankle and feet - Chest and shoulder - Nose - mouth Others (arms, back & Buttocks, ears)
3(10.3%) 3(10.3%) 4(13.8%) 6(20.7%) 4(13.8%) 4(13.8%) 5(17.2%)
Category of ulcers* - Category I - Category II - Category III - Category IV
12 (41.4%) 14 (48.3%) 3 (10.3%)
0 (0%) Number of ulcers - Single - Two ulcers - Three ulcers
12 (63.2%) 4 (21.1%) 3 (15.7%)
* Percentages are based on the total number of ulcers (n= 29 ulcers in 19 patients)
Figure 4.2: Location and Categories of Ulcers
00.5
11.5
22.5
33.5
44.5
Coun
t
Locations
Category 1
Category 2
Category 3
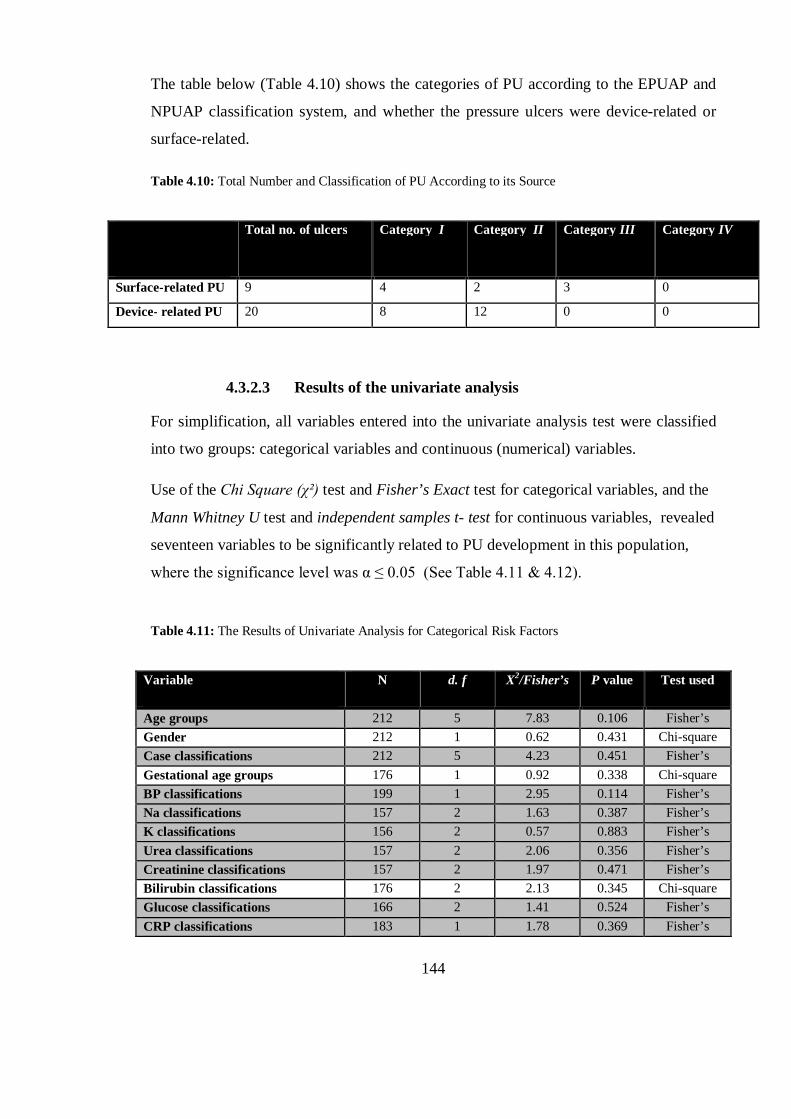
144
The table below (Table 4.10) shows the categories of PU according to the EPUAP and
NPUAP classification system, and whether the pressure ulcers were device-related or
surface-related.
Table 4.10: Total Number and Classification of PU According to its Source
Total no. of ulcers Category I Category II Category III Category IV
Surface-related PU 9 4 2 3 0
Device- related PU 20 8 12 0 0
4.3.2.3 Results of the univariate analysis
For simplification, all variables entered into the univariate analysis test were classified
into two groups: categorical variables and continuous (numerical) variables.
Use of the Chi Square (χ²) test and Fisher’s Exact test for categorical variables, and the
Mann Whitney U test and independent samples t- test for continuous variables, revealed
seventeen variables to be significantly related to PU development in this population,
where the significance level was α ≤ 0.05 (See Table 4.11 & 4.12).
Table 4.11: The Results of Univariate Analysis for Categorical Risk Factors
Variable
N d. f X2/Fisher’s P value Test used
Age groups 212 5 7.83 0.106 Fisher’s Gender 212 1 0.62 0.431 Chi-square Case classifications 212 5 4.23 0.451 Fisher’s Gestational age groups 176 1 0.92 0.338 Chi-square BP classifications 199 1 2.95 0.114 Fisher’s Na classifications 157 2 1.63 0.387 Fisher’s K classifications 156 2 0.57 0.883 Fisher’s Urea classifications 157 2 2.06 0.356 Fisher’s Creatinine classifications 157 2 1.97 0.471 Fisher’s Bilirubin classifications 176 2 2.13 0.345 Chi-square Glucose classifications 166 2 1.41 0.524 Fisher’s CRP classifications 183 1 1.78 0.369 Fisher’s

145
GCS classifications* 212 2 22.68 <0.001 Chi-square Being on MV* 212 1 20.4 <0.001 Chi-square Skin condition 212 2 4.32 0.080 Fisher’s Presence of Infection 212 1 0.055 0.815 Chi-square Presence of academia 196 1 2.36 0.124 Chi-square Presence of hypoxemia 191 1 0.01 0.921 Chi-square Equipment / Glamorgan* 212 1 11.94 0.001 Chi-square Anemia/ Glamorgan 212 1 1.15 0.604 Fisher’s Pyrexia/ Glamorgan 212 1 0.401 1.00 Fisher’s Poor perfusion/ Glamorgan 212 1 1.36 0.612 Fisher’s Nutrition/ Glamorgan* 212 1 4.28 0.038 Chi-square Albumin/ Glamorgan 212 1 0.104 1.00 Fisher’s Weight/ Glamorgan 212 1 1.54 0.215 Chi-square Incontinence/ Glamorgan 212 1 3.38 0.098 Fisher’s Glamorgan risk classification* 212 3 19.73 <0.001 Fisher’s Braden Q risk classifications* 212 1 10.51 0.003 Fisher’s * Significant at α≤ 0.05 in the univariate analysis Shaded variables: violate Chi Square χ² test assumptions.
Table 4.12: The Results of Univariate Analysis for Continuous Risk Factors
Variable
N Test used P value Mann-Whitney U/
t-test
Z score
Mobility/ Glamorgan* 212 MW test <0.001 1125 -3.428 Mobility / Braden Q* 212 MW test <0.001 1098 - 3.512 Nutrition / Braden Q 212 MW test 0.265 1572 -1.115 Tissue perfusion/ Braden Q* 212 MW test 0.01 1246.5 -2.531 Sensory perception/ Braden Q* 212 MW test <0.001 808.5 -4.270 Moisture/ Braden Q* 212 MW test <0.001 829.5 -4.649 Friction and shear/ Braden Q* 212 MW test <0.001 927.5 -3.657 Activity/ Braden Q* 212 MW test <0.001 785 -4.471 Age in years 24 MW test 0.559 32.5 -0.584 Age in days* 188 MW test <0.001 595 -3.527 LOS* 212 MW test <0.001 437 -5.570 Systolic BP 199 MW test 0.272 1448 -1.098 Diastolic BP 199 MW test 0.683 1612.5 -0.409 Mean BP 199 MW test 0.546 1566 -0.603 Serum Na 157 MW test 0.274 1108.5 -1.093 Serum K 156 t-test 0.186 1.328 d.f=154 Serum urea 157 MW test 0.499 1185.5 -0.676 Serum Creatinine 157 MW test 0.679 1234 -0.414 Serum Bilirubin 176 MW test 0.482 1211 -0.704 Serum glucose 168 MW test 0.881 1120.5 -0.150 GCS score* 212 MW test <0.001 712.5 -4.611 Duration on MV in days* 82 MW test <0.001 225 -3.767 PEEP level* 78 MW test 0.047 361.5 -1.989
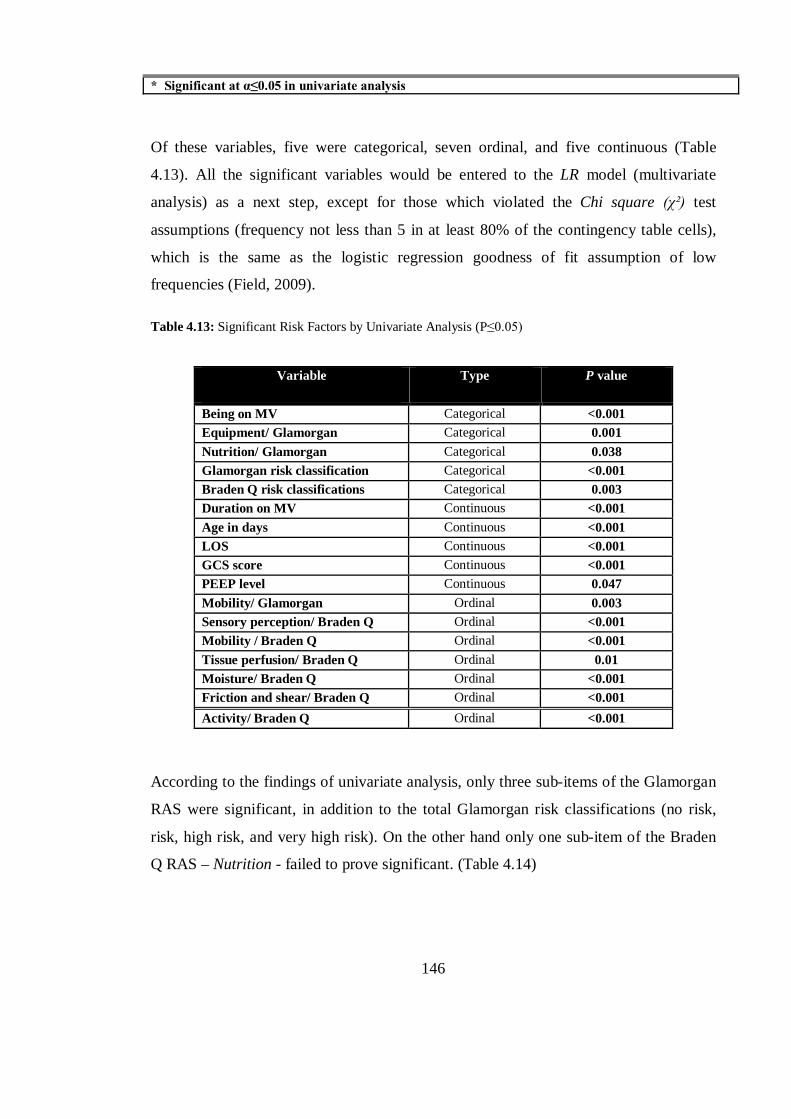
146
* Significant at α≤0.05 in univariate analysis
Of these variables, five were categorical, seven ordinal, and five continuous (Table
4.13). All the significant variables would be entered to the LR model (multivariate
analysis) as a next step, except for those which violated the Chi square (χ²) test
assumptions (frequency not less than 5 in at least 80% of the contingency table cells),
which is the same as the logistic regression goodness of fit assumption of low
frequencies (Field, 2009).
Table 4.13: Significant Risk Factors by Univariate Analysis (P≤0.05)
Variable
Type P value
Being on MV Categorical <0.001 Equipment/ Glamorgan Categorical 0.001 Nutrition/ Glamorgan Categorical 0.038 Glamorgan risk classification Categorical <0.001 Braden Q risk classifications Categorical 0.003 Duration on MV Continuous <0.001 Age in days Continuous <0.001 LOS Continuous <0.001 GCS score Continuous <0.001 PEEP level Continuous 0.047 Mobility/ Glamorgan Ordinal 0.003 Sensory perception/ Braden Q Ordinal <0.001 Mobility / Braden Q Ordinal <0.001 Tissue perfusion/ Braden Q Ordinal 0.01 Moisture/ Braden Q Ordinal <0.001 Friction and shear/ Braden Q Ordinal <0.001 Activity/ Braden Q Ordinal <0.001
According to the findings of univariate analysis, only three sub-items of the Glamorgan
RAS were significant, in addition to the total Glamorgan risk classifications (no risk,
risk, high risk, and very high risk). On the other hand only one sub-item of the Braden
Q RAS – Nutrition - failed to prove significant. (Table 4.14)

147
Table 4.14: Glamorgan’ and Braden Q’ Significant Sub-items by Univariate Analysis
Sub-item Glamorgan Braden Q P value (≤0.05) Glamorgan Braden Q
Mobility X X <0.001 <0.001 Activity X <0.001 Equipment X 0.001 Nutrition X 0.038 Sensory perception X <0.001 Tissue perfusion X 0.01 Friction and shear X <0.001 Moisture X <0.001 Risk classifications X X <0.001 0.003
a) Comparing PU and PU-free groups
While comparing children who developed PUs with those who did not, it was noticed
that the former group had a lower consciousness score (median= 11 vs. 14 GCS). Also,
these children spent more time on mechanical ventilators than the non-PU patients (n=
19, 89.5 % vs. n= 193, 33.7%).
By comparing GCS with the sensory perception score on the Braden Q RAS, it was
found that all children with PU had suffered from sensory limitations in different
degrees, with the highest number of ulcer sufferers with slightly limited (n=8, 42.1%)
and very limited sub-scales (n=7, 36.8%). The Braden Q sensory perception sub-item
and GCS were both shown by the Mann-Whitney U test to be highly significantly
associated with PU development (P< 0.001).
According to the Glamorgan RAS, the vast majority of children with PU had limited
mobility (n=12, 63%), poorer nutritional condition (n=18, 94.7%), and all were
supported by medical equipment. In contrast, PU-free patients were more mobile (n=53,
27.5%). However, nutritional problems and the existence of equipment pressing on

148
patients’ skin were also observed in the case of more than half of the PU-free patients
(69.4%, 56.5% respectively). (Table 4.15)
Table 4.15: Descriptive for Significant Categorical Risk Factors based on Univariate Analysis
Risk factors
PU Group PU-free Group Frequency
(%) N Frequency
(%) N
GCS classification - Full conscious (13-15) - Semi conscious (9-12) - Unconscious (3-8)
2 (10.5%) 13 (68.4%) 4 (21.1%)
19 127 (65.8%)
54 (28%) 12 (6.2%)
193
Being on MV - Yes - No
17 (89.5%) 2 (10.5%)
19 65 (33.7%) 128 (66.3%)
193
Duration on MV: - Four days and More - Less than 4 days
14 (73.7%) 3 (15.8%)
17 24 (36.9%) 41 (63.1%)
65
Braden Q risk classifications - At risk - No risk
9 (47.4%) 10 (52.6%)
19
32 (16.6%) 161 (83.4%)
193
Equipment/ Glamorgan - Presence of pressing equip - Absence of pressing equip
19 (100%)
0 (0%)
19 109 (56.5%) 84 (43.5%)
193
Inadequate nutrition/ Glamorgan - Yes - No
18 (94.7%) 1 (5.3%)
19 134 (69.4%) 59 (30.6%)
193
Glamorgan risk classification - Very high risk - High risk - At risk - No risk
12 (63.2%) 7 (36.8%)
0 (0%) 0 (0%)
19
42 (21.8%) 69 (35.8%)
8 (4.1%) 74 (38.3%)
193
Patients with pressure ulcers, according to the Braden Q sub-items, had moist skin
(incontinence, urine and faeces, sweating, drainage, etc) in more than 84% of cases (n=
16) compared with in only 31% (n= 61) of PU-free cases. Also, the vast majority of PU-
patients had complained of some degree of friction and shears forces (n= 18, 94.7%),
limited activity (n= 19, 100%), and diminished indicators of tissue perfusion and
oxygenation measures (n= 17, 89.4%). On the other hand, using both scales, mobility
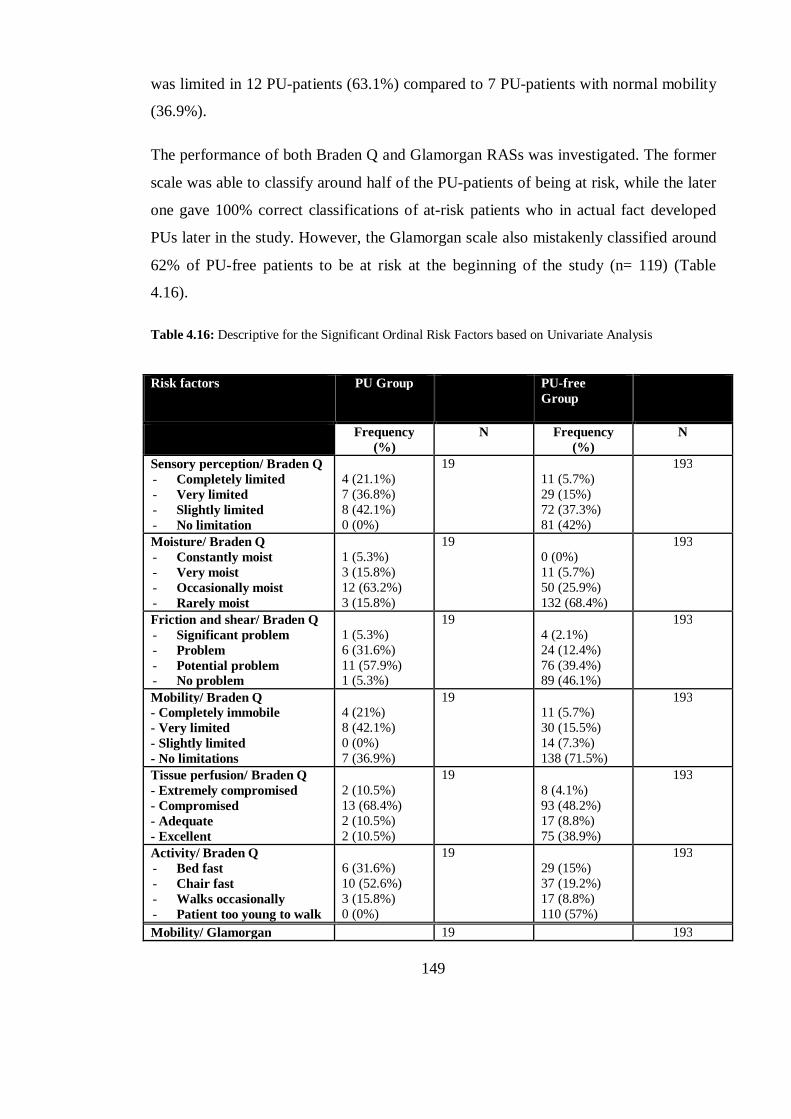
149
was limited in 12 PU-patients (63.1%) compared to 7 PU-patients with normal mobility
(36.9%).
The performance of both Braden Q and Glamorgan RASs was investigated. The former
scale was able to classify around half of the PU-patients of being at risk, while the later
one gave 100% correct classifications of at-risk patients who in actual fact developed
PUs later in the study. However, the Glamorgan scale also mistakenly classified around
62% of PU-free patients to be at risk at the beginning of the study (n= 119) (Table
4.16).
Table 4.16: Descriptive for the Significant Ordinal Risk Factors based on Univariate Analysis
Risk factors
PU Group PU-free Group
Frequency (%)
N Frequency (%)
N
Sensory perception/ Braden Q - Completely limited - Very limited - Slightly limited - No limitation
4 (21.1%) 7 (36.8%) 8 (42.1%) 0 (0%)
19
11 (5.7%) 29 (15%) 72 (37.3%) 81 (42%)
193
Moisture/ Braden Q - Constantly moist - Very moist - Occasionally moist - Rarely moist
1 (5.3%) 3 (15.8%) 12 (63.2%) 3 (15.8%)
19
0 (0%) 11 (5.7%) 50 (25.9%) 132 (68.4%)
193
Friction and shear/ Braden Q - Significant problem - Problem - Potential problem - No problem
1 (5.3%) 6 (31.6%) 11 (57.9%) 1 (5.3%)
19
4 (2.1%) 24 (12.4%) 76 (39.4%) 89 (46.1%)
193
Mobility/ Braden Q - Completely immobile - Very limited - Slightly limited - No limitations
4 (21%) 8 (42.1%) 0 (0%) 7 (36.9%)
19 11 (5.7%) 30 (15.5%) 14 (7.3%) 138 (71.5%)
193
Tissue perfusion/ Braden Q - Extremely compromised - Compromised - Adequate - Excellent
2 (10.5%) 13 (68.4%) 2 (10.5%) 2 (10.5%)
19 8 (4.1%) 93 (48.2%) 17 (8.8%) 75 (38.9%)
193
Activity/ Braden Q - Bed fast - Chair fast - Walks occasionally - Patient too young to walk
6 (31.6%) 10 (52.6%) 3 (15.8%) 0 (0%)
19
29 (15%) 37 (19.2%) 17 (8.8%) 110 (57%)
193
Mobility/ Glamorgan 19 193
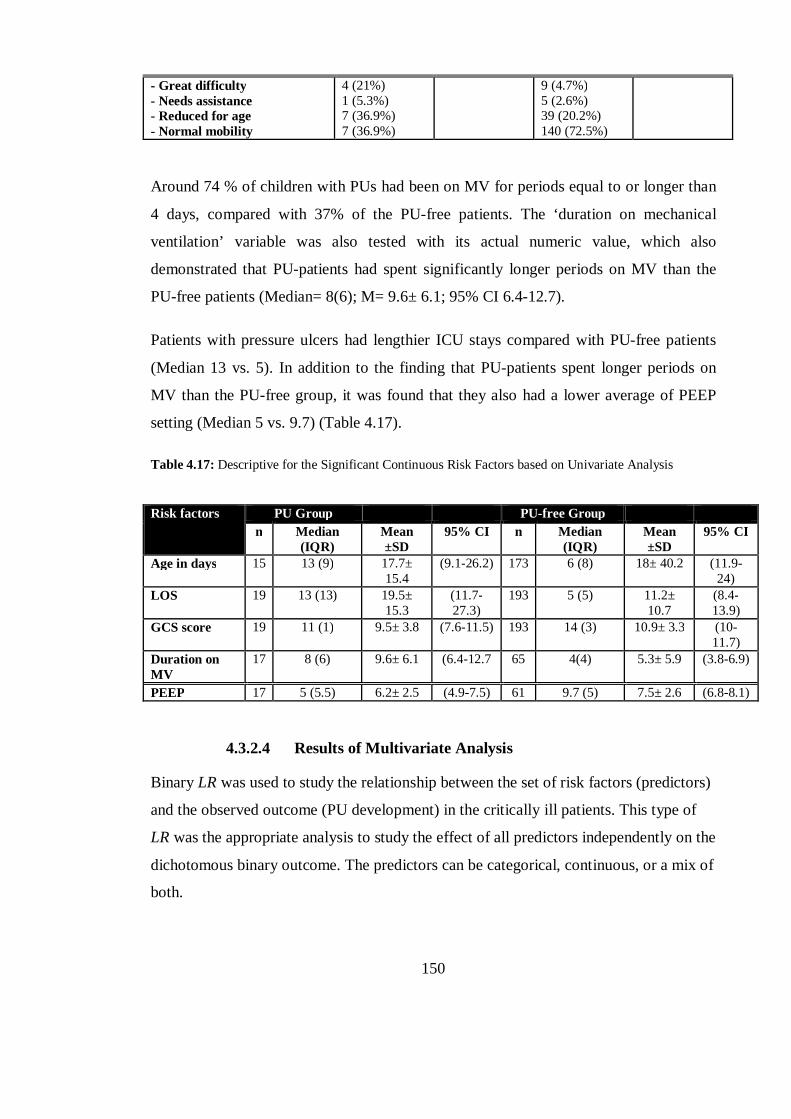
150
- Great difficulty - Needs assistance - Reduced for age - Normal mobility
4 (21%) 1 (5.3%) 7 (36.9%) 7 (36.9%)
9 (4.7%) 5 (2.6%) 39 (20.2%) 140 (72.5%)
Around 74 % of children with PUs had been on MV for periods equal to or longer than
4 days, compared with 37% of the PU-free patients. The ‘duration on mechanical
ventilation’ variable was also tested with its actual numeric value, which also
demonstrated that PU-patients had spent significantly longer periods on MV than the
PU-free patients (Median= 8(6); M= 9.6± 6.1; 95% CI 6.4-12.7).
Patients with pressure ulcers had lengthier ICU stays compared with PU-free patients
(Median 13 vs. 5). In addition to the finding that PU-patients spent longer periods on
MV than the PU-free group, it was found that they also had a lower average of PEEP
setting (Median 5 vs. 9.7) (Table 4.17).
Table 4.17: Descriptive for the Significant Continuous Risk Factors based on Univariate Analysis
Risk factors
PU Group PU-free Group n Median
(IQR) Mean ±SD
95% CI n Median (IQR)
Mean ±SD
95% CI
Age in days 15 13 (9) 17.7± 15.4
(9.1-26.2) 173 6 (8) 18± 40.2 (11.9- 24)
LOS 19 13 (13) 19.5± 15.3
(11.7-27.3)
193 5 (5) 11.2± 10.7
(8.4-13.9)
GCS score 19 11 (1) 9.5± 3.8 (7.6-11.5) 193 14 (3) 10.9± 3.3 (10-11.7)
Duration on MV
17 8 (6) 9.6± 6.1 (6.4-12.7 65 4(4) 5.3± 5.9 (3.8-6.9)
PEEP 17 5 (5.5) 6.2± 2.5 (4.9-7.5) 61 9.7 (5) 7.5± 2.6 (6.8-8.1)
4.3.2.4 Results of Multivariate Analysis
Binary LR was used to study the relationship between the set of risk factors (predictors)
and the observed outcome (PU development) in the critically ill patients. This type of
LR was the appropriate analysis to study the effect of all predictors independently on the
dichotomous binary outcome. The predictors can be categorical, continuous, or a mix of
both.
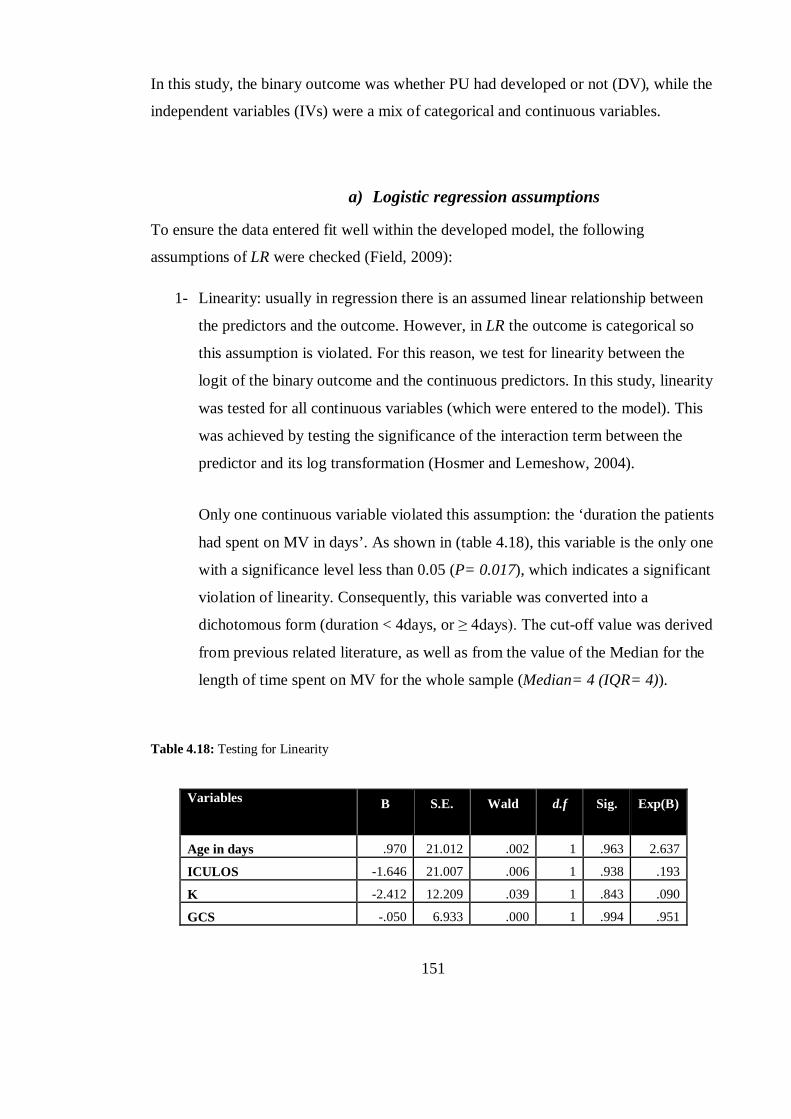
151
In this study, the binary outcome was whether PU had developed or not (DV), while the
independent variables (IVs) were a mix of categorical and continuous variables.
a) Logistic regression assumptions
To ensure the data entered fit well within the developed model, the following
assumptions of LR were checked (Field, 2009):
1- Linearity: usually in regression there is an assumed linear relationship between
the predictors and the outcome. However, in LR the outcome is categorical so
this assumption is violated. For this reason, we test for linearity between the
logit of the binary outcome and the continuous predictors. In this study, linearity
was tested for all continuous variables (which were entered to the model). This
was achieved by testing the significance of the interaction term between the
predictor and its log transformation (Hosmer and Lemeshow, 2004).
Only one continuous variable violated this assumption: the ‘duration the patients
had spent on MV in days’. As shown in (table 4.18), this variable is the only one
with a significance level less than 0.05 (P= 0.017), which indicates a significant
violation of linearity. Consequently, this variable was converted into a
dichotomous form (duration < 4days, or ≥ 4days). The cut-off value was derived
from previous related literature, as well as from the value of the Median for the
length of time spent on MV for the whole sample (Median= 4 (IQR= 4)).
Table 4.18: Testing for Linearity
Variables B S.E. Wald d.f Sig. Exp(B)
Age in days .970 21.012 .002 1 .963 2.637
ICULOS -1.646 21.007 .006 1 .938 .193
K -2.412 12.209 .039 1 .843 .090
GCS -.050 6.933 .000 1 .994 .951
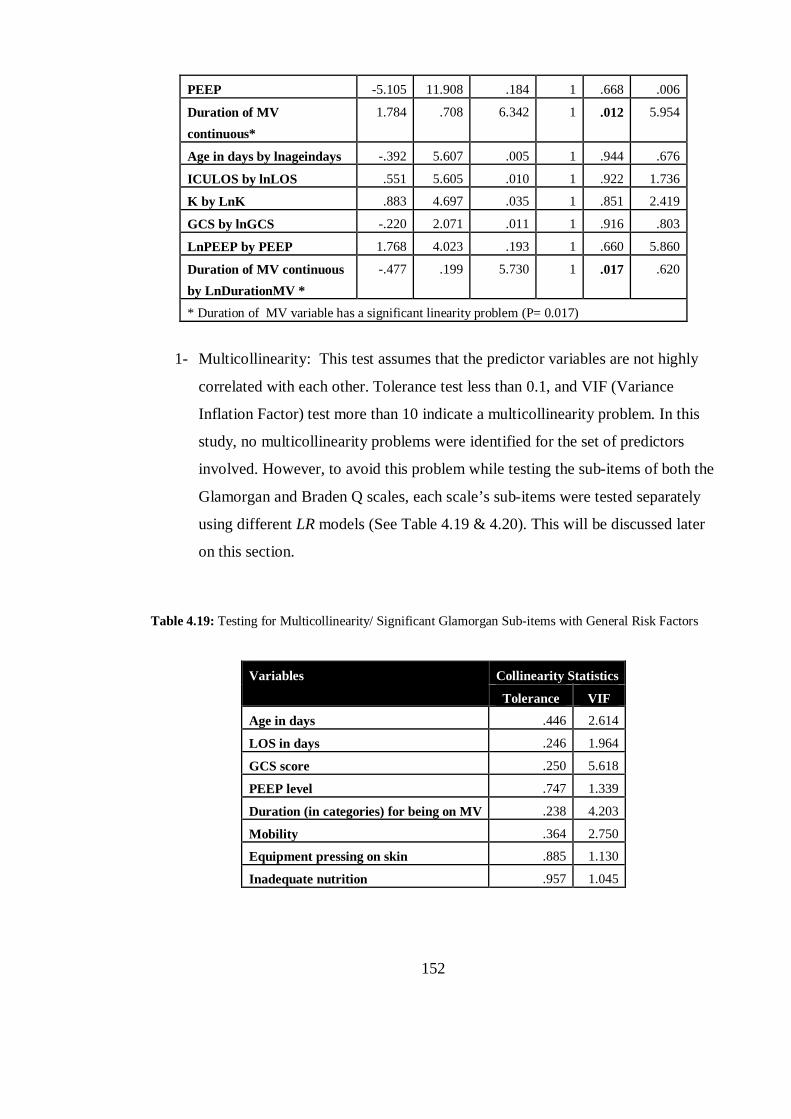
152
PEEP -5.105 11.908 .184 1 .668 .006
Duration of MV continuous*
1.784 .708 6.342 1 .012 5.954
Age in days by lnageindays -.392 5.607 .005 1 .944 .676
ICULOS by lnLOS .551 5.605 .010 1 .922 1.736
K by LnK .883 4.697 .035 1 .851 2.419
GCS by lnGCS -.220 2.071 .011 1 .916 .803
LnPEEP by PEEP 1.768 4.023 .193 1 .660 5.860
Duration of MV continuous by LnDurationMV *
-.477 .199 5.730 1 .017 .620
* Duration of MV variable has a significant linearity problem (P= 0.017)
1- Multicollinearity: This test assumes that the predictor variables are not highly
correlated with each other. Tolerance test less than 0.1, and VIF (Variance
Inflation Factor) test more than 10 indicate a multicollinearity problem. In this
study, no multicollinearity problems were identified for the set of predictors
involved. However, to avoid this problem while testing the sub-items of both the
Glamorgan and Braden Q scales, each scale’s sub-items were tested separately
using different LR models (See Table 4.19 & 4.20). This will be discussed later
on this section.
Table 4.19: Testing for Multicollinearity/ Significant Glamorgan Sub-items with General Risk Factors
Variables Collinearity Statistics
Tolerance VIF
Age in days .446 2.614
LOS in days .246 1.964
GCS score .250 5.618
PEEP level .747 1.339
Duration (in categories) for being on MV .238 4.203
Mobility .364 2.750
Equipment pressing on skin .885 1.130
Inadequate nutrition .957 1.045
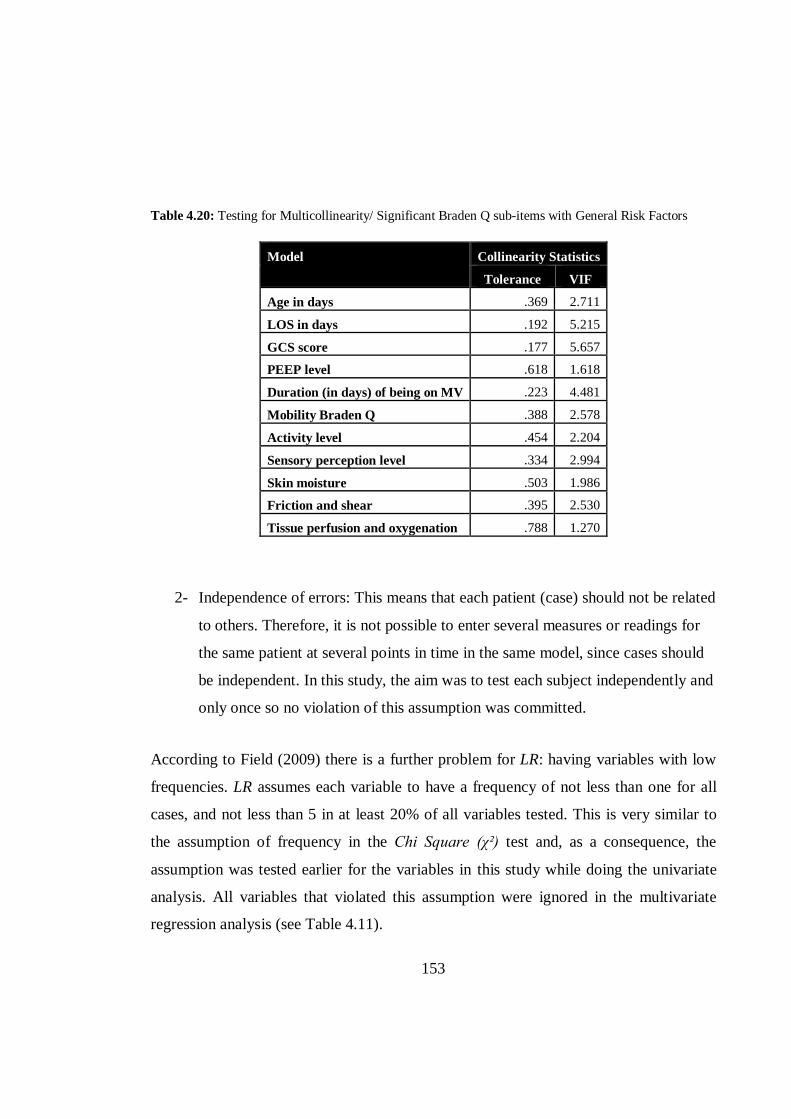
153
Table 4.20: Testing for Multicollinearity/ Significant Braden Q sub-items with General Risk Factors
Model Collinearity Statistics
Tolerance VIF
Age in days .369 2.711
LOS in days .192 5.215
GCS score .177 5.657
PEEP level .618 1.618
Duration (in days) of being on MV .223 4.481
Mobility Braden Q .388 2.578
Activity level .454 2.204
Sensory perception level .334 2.994
Skin moisture .503 1.986
Friction and shear .395 2.530
Tissue perfusion and oxygenation .788 1.270
2- Independence of errors: This means that each patient (case) should not be related
to others. Therefore, it is not possible to enter several measures or readings for
the same patient at several points in time in the same model, since cases should
be independent. In this study, the aim was to test each subject independently and
only once so no violation of this assumption was committed.
According to Field (2009) there is a further problem for LR: having variables with low
frequencies. LR assumes each variable to have a frequency of not less than one for all
cases, and not less than 5 in at least 20% of all variables tested. This is very similar to
the assumption of frequency in the Chi Square (χ²) test and, as a consequence, the
assumption was tested earlier for the variables in this study while doing the univariate
analysis. All variables that violated this assumption were ignored in the multivariate
regression analysis (see Table 4.11).
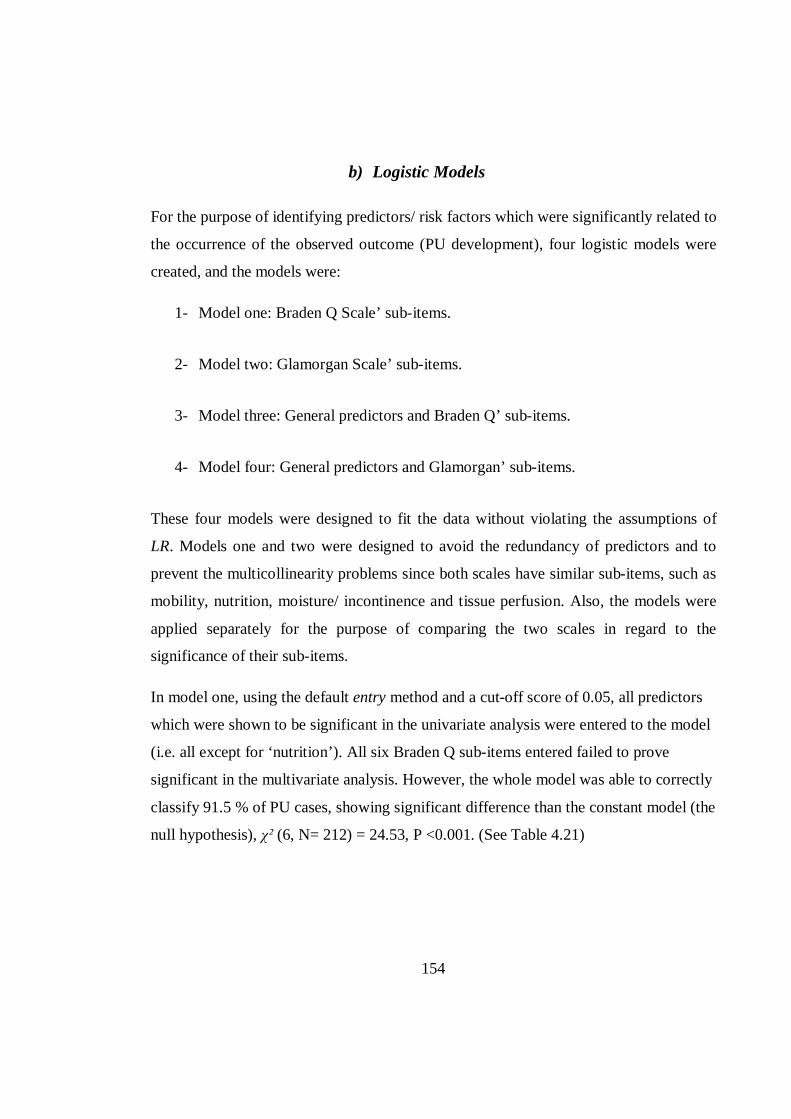
154
b) Logistic Models
For the purpose of identifying predictors/ risk factors which were significantly related to
the occurrence of the observed outcome (PU development), four logistic models were
created, and the models were:
1- Model one: Braden Q Scale’ sub-items.
2- Model two: Glamorgan Scale’ sub-items.
3- Model three: General predictors and Braden Q’ sub-items.
4- Model four: General predictors and Glamorgan’ sub-items.
These four models were designed to fit the data without violating the assumptions of
LR. Models one and two were designed to avoid the redundancy of predictors and to
prevent the multicollinearity problems since both scales have similar sub-items, such as
mobility, nutrition, moisture/ incontinence and tissue perfusion. Also, the models were
applied separately for the purpose of comparing the two scales in regard to the
significance of their sub-items.
In model one, using the default entry method and a cut-off score of 0.05, all predictors
which were shown to be significant in the univariate analysis were entered to the model
(i.e. all except for ‘nutrition’). All six Braden Q sub-items entered failed to prove
significant in the multivariate analysis. However, the whole model was able to correctly
classify 91.5 % of PU cases, showing significant difference than the constant model (the
null hypothesis), χ² (6, N= 212) = 24.53, P <0.001. (See Table 4.21)
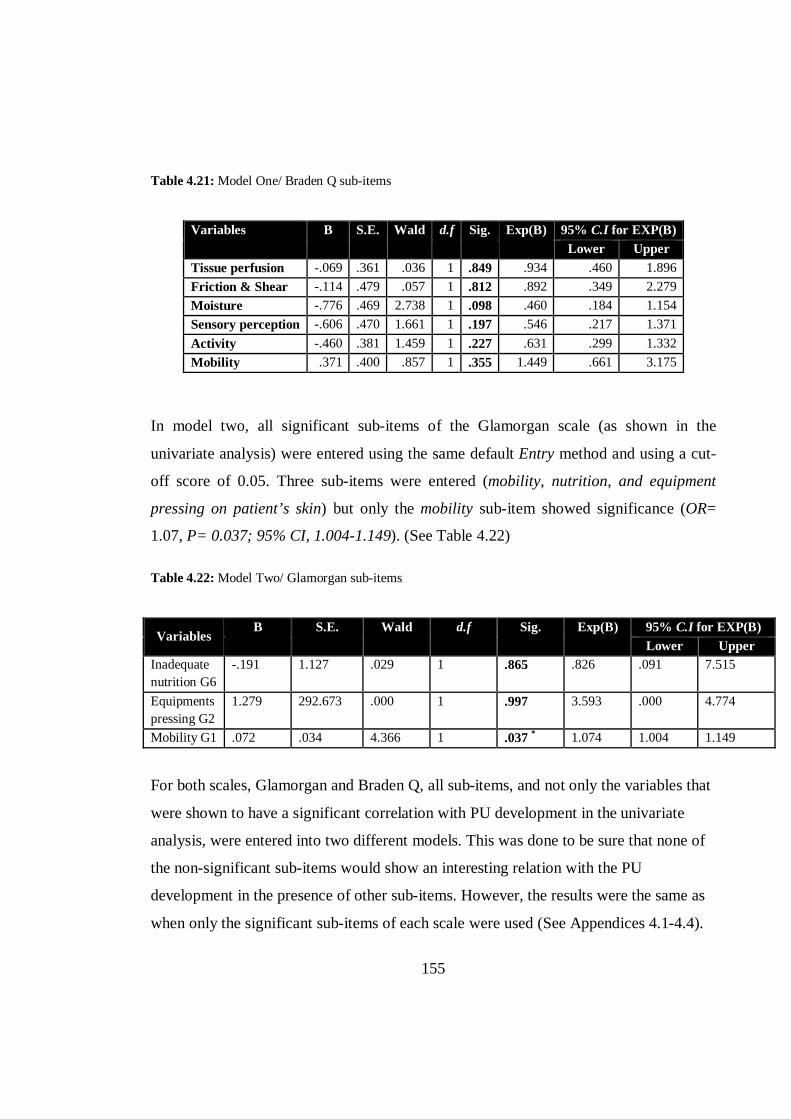
155
Table 4.21: Model One/ Braden Q sub-items
Variables B S.E. Wald d.f Sig. Exp(B) 95% C.I for EXP(B) Lower Upper
Tissue perfusion -.069 .361 .036 1 .849 .934 .460 1.896 Friction & Shear -.114 .479 .057 1 .812 .892 .349 2.279 Moisture -.776 .469 2.738 1 .098 .460 .184 1.154 Sensory perception -.606 .470 1.661 1 .197 .546 .217 1.371 Activity -.460 .381 1.459 1 .227 .631 .299 1.332 Mobility .371 .400 .857 1 .355 1.449 .661 3.175
In model two, all significant sub-items of the Glamorgan scale (as shown in the
univariate analysis) were entered using the same default Entry method and using a cut-
off score of 0.05. Three sub-items were entered (mobility, nutrition, and equipment
pressing on patient’s skin) but only the mobility sub-item showed significance (OR=
1.07, P= 0.037; 95% CI, 1.004-1.149). (See Table 4.22)
Table 4.22: Model Two/ Glamorgan sub-items
Variables B S.E. Wald d.f Sig. Exp(B) 95% C.I for EXP(B)
Lower Upper Inadequate nutrition G6
-.191 1.127 .029 1 .865 .826 .091 7.515
Equipments pressing G2
1.279 292.673 .000 1 .997 3.593 .000 4.774
Mobility G1 .072 .034 4.366 1 .037 * 1.074 1.004 1.149
For both scales, Glamorgan and Braden Q, all sub-items, and not only the variables that
were shown to have a significant correlation with PU development in the univariate
analysis, were entered into two different models. This was done to be sure that none of
the non-significant sub-items would show an interesting relation with the PU
development in the presence of other sub-items. However, the results were the same as
when only the significant sub-items of each scale were used (See Appendices 4.1-4.4).
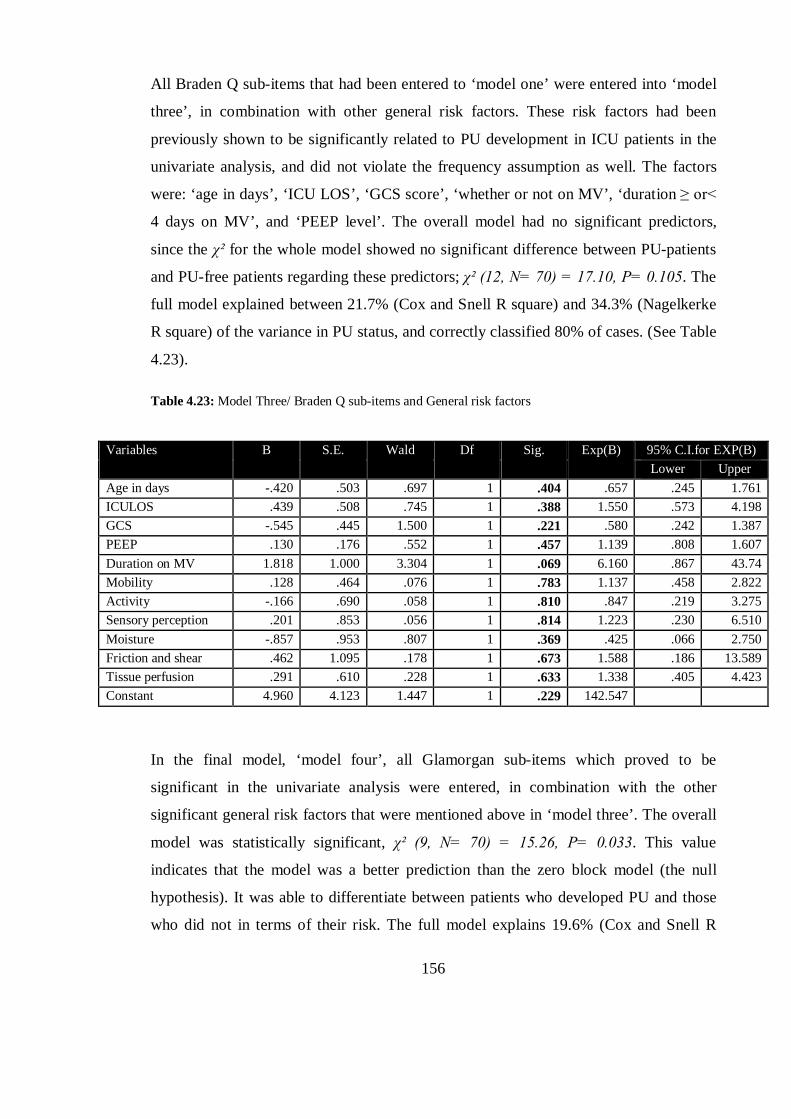
156
All Braden Q sub-items that had been entered to ‘model one’ were entered into ‘model
three’, in combination with other general risk factors. These risk factors had been
previously shown to be significantly related to PU development in ICU patients in the
univariate analysis, and did not violate the frequency assumption as well. The factors
were: ‘age in days’, ‘ICU LOS’, ‘GCS score’, ‘whether or not on MV’, ‘duration ≥ or<
4 days on MV’, and ‘PEEP level’. The overall model had no significant predictors,
since the χ² for the whole model showed no significant difference between PU-patients
and PU-free patients regarding these predictors; χ² (12, N= 70) = 17.10, P= 0.105. The
full model explained between 21.7% (Cox and Snell R square) and 34.3% (Nagelkerke
R square) of the variance in PU status, and correctly classified 80% of cases. (See Table
4.23).
Table 4.23: Model Three/ Braden Q sub-items and General risk factors
Variables B S.E. Wald Df Sig. Exp(B) 95% C.I.for EXP(B) Lower Upper
Age in days -.420 .503 .697 1 .404 .657 .245 1.761 ICULOS .439 .508 .745 1 .388 1.550 .573 4.198 GCS -.545 .445 1.500 1 .221 .580 .242 1.387 PEEP .130 .176 .552 1 .457 1.139 .808 1.607 Duration on MV 1.818 1.000 3.304 1 .069 6.160 .867 43.74 Mobility .128 .464 .076 1 .783 1.137 .458 2.822 Activity -.166 .690 .058 1 .810 .847 .219 3.275 Sensory perception .201 .853 .056 1 .814 1.223 .230 6.510 Moisture -.857 .953 .807 1 .369 .425 .066 2.750 Friction and shear .462 1.095 .178 1 .673 1.588 .186 13.589 Tissue perfusion .291 .610 .228 1 .633 1.338 .405 4.423 Constant 4.960 4.123 1.447 1 .229 142.547
In the final model, ‘model four’, all Glamorgan sub-items which proved to be
significant in the univariate analysis were entered, in combination with the other
significant general risk factors that were mentioned above in ‘model three’. The overall
model was statistically significant, χ² (9, N= 70) = 15.26, P= 0.033. This value
indicates that the model was a better prediction than the zero block model (the null
hypothesis). It was able to differentiate between patients who developed PU and those
who did not in terms of their risk. The full model explains 19.6% (Cox and Snell R
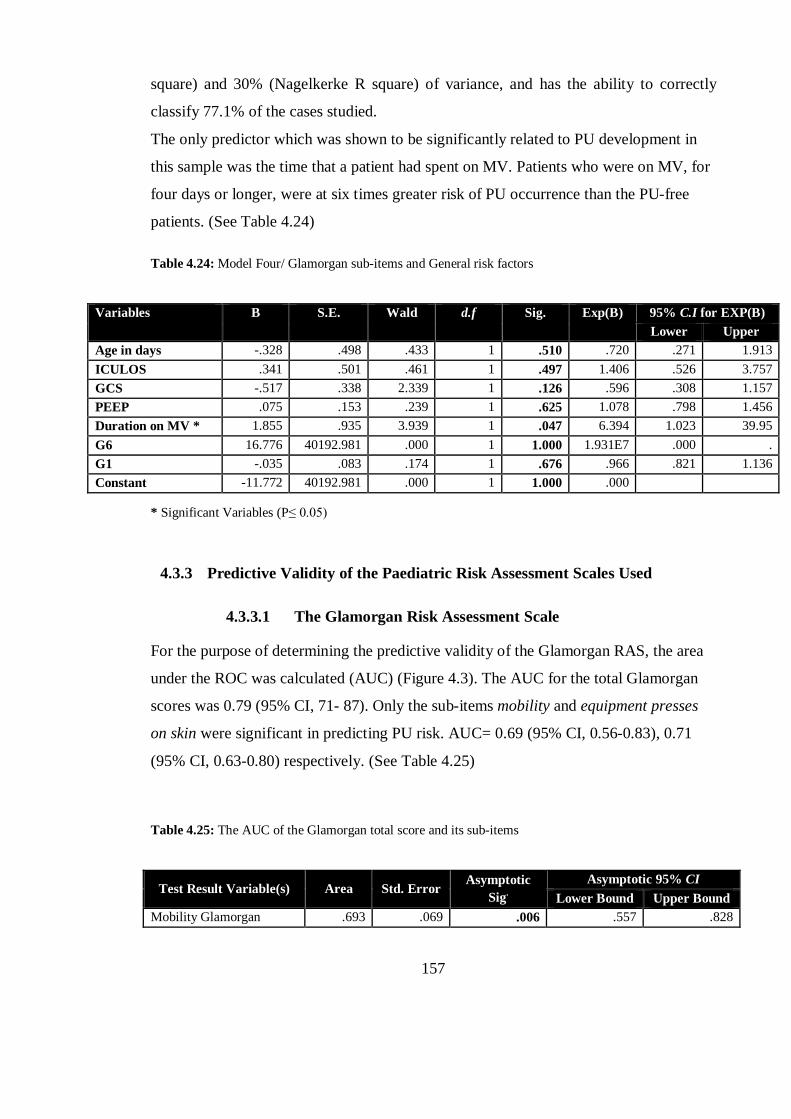
157
square) and 30% (Nagelkerke R square) of variance, and has the ability to correctly
classify 77.1% of the cases studied.
The only predictor which was shown to be significantly related to PU development in
this sample was the time that a patient had spent on MV. Patients who were on MV, for
four days or longer, were at six times greater risk of PU occurrence than the PU-free
patients. (See Table 4.24)
Table 4.24: Model Four/ Glamorgan sub-items and General risk factors
Variables B S.E. Wald d.f Sig. Exp(B) 95% C.I for EXP(B) Lower Upper
Age in days -.328 .498 .433 1 .510 .720 .271 1.913 ICULOS .341 .501 .461 1 .497 1.406 .526 3.757 GCS -.517 .338 2.339 1 .126 .596 .308 1.157 PEEP .075 .153 .239 1 .625 1.078 .798 1.456 Duration on MV * 1.855 .935 3.939 1 .047 6.394 1.023 39.95 G6 16.776 40192.981 .000 1 1.000 1.931E7 .000 . G1 -.035 .083 .174 1 .676 .966 .821 1.136 Constant -11.772 40192.981 .000 1 1.000 .000
* Significant Variables (P≤ 0.05)
4.3.3 Predictive Validity of the Paediatric Risk Assessment Scales Used
4.3.3.1 The Glamorgan Risk Assessment Scale
For the purpose of determining the predictive validity of the Glamorgan RAS, the area
under the ROC was calculated (AUC) (Figure 4.3). The AUC for the total Glamorgan
scores was 0.79 (95% CI, 71- 87). Only the sub-items mobility and equipment presses
on skin were significant in predicting PU risk. AUC= 0.69 (95% CI, 0.56-0.83), 0.71
(95% CI, 0.63-0.80) respectively. (See Table 4.25)
Table 4.25: The AUC of the Glamorgan total score and its sub-items
Test Result Variable(s) Area Std. Error Asymptotic
Sig. Asymptotic 95% CI
Lower Bound Upper Bound Mobility Glamorgan .693 .069 .006 .557 .828
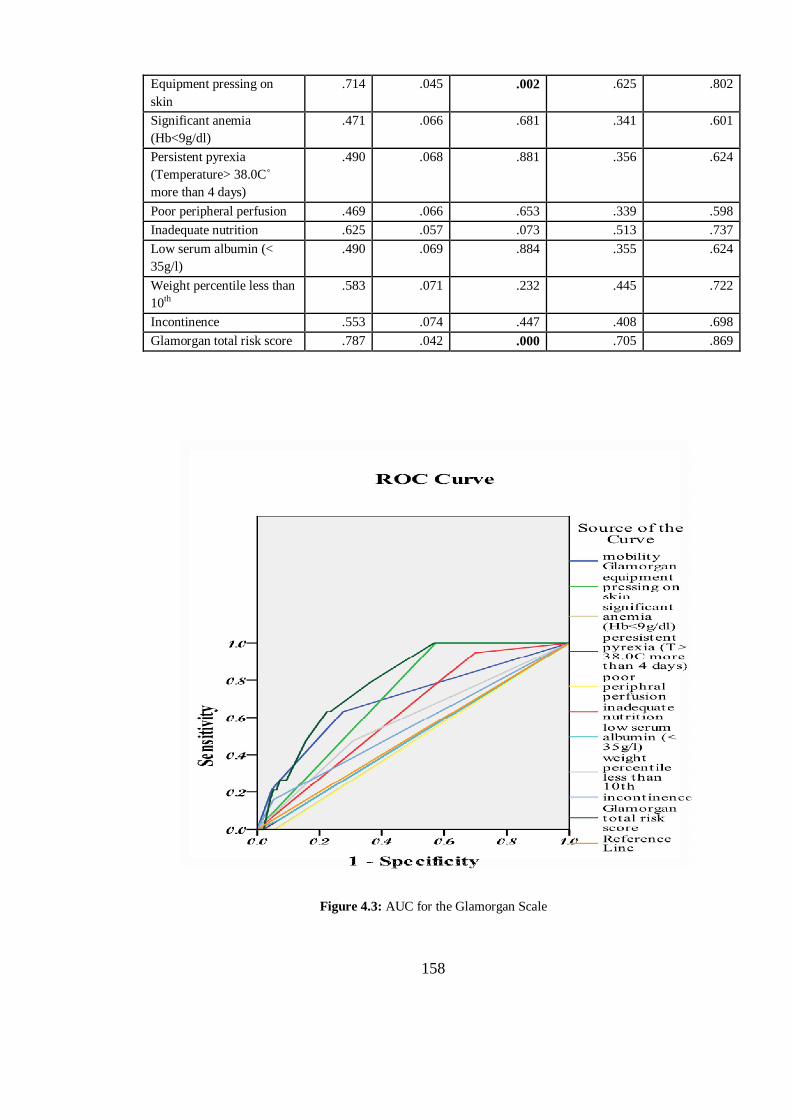
158
Equipment pressing on skin
.714 .045 .002 .625 .802
Significant anemia (Hb<9g/dl)
.471 .066 .681 .341 .601
Persistent pyrexia (Temperature> 38.0C˚ more than 4 days)
.490 .068 .881 .356 .624
Poor peripheral perfusion .469 .066 .653 .339 .598 Inadequate nutrition .625 .057 .073 .513 .737 Low serum albumin (< 35g/l)
.490 .069 .884 .355 .624
Weight percentile less than 10th
.583 .071 .232 .445 .722
Incontinence .553 .074 .447 .408 .698 Glamorgan total risk score .787 .042 .000 .705 .869
Figure 4.3: AUC for the Glamorgan Scale
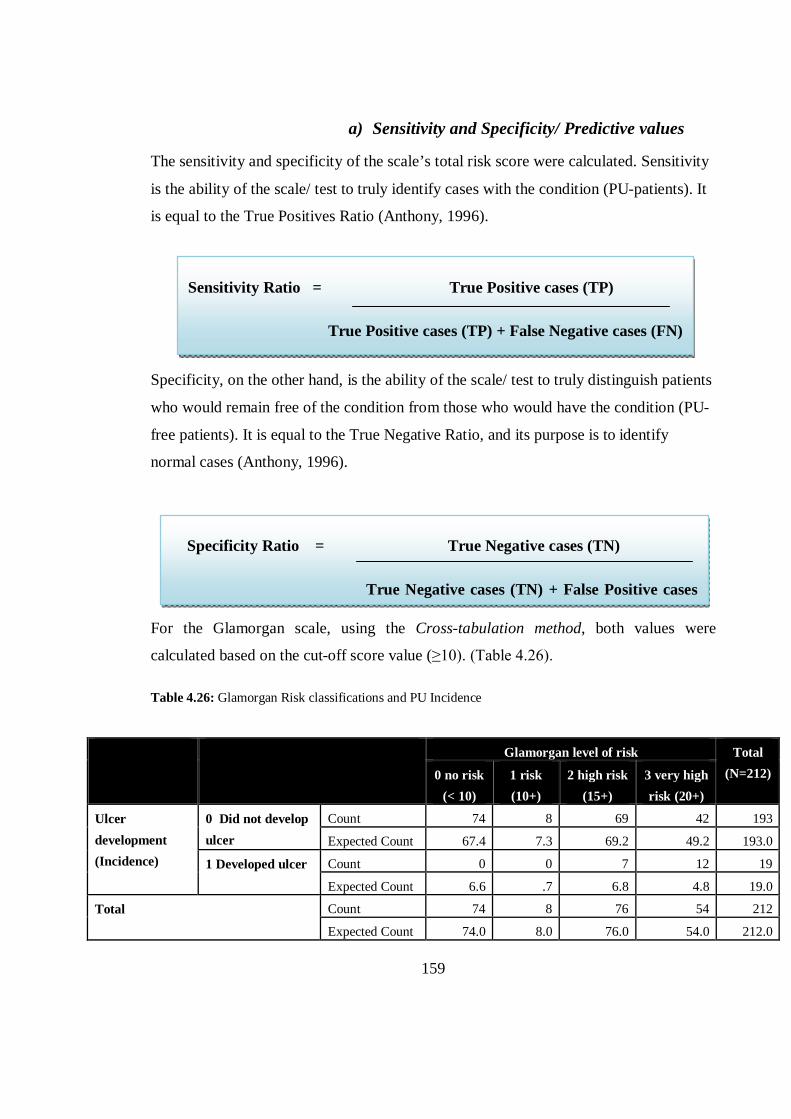
159
a) Sensitivity and Specificity/ Predictive values
The sensitivity and specificity of the scale’s total risk score were calculated. Sensitivity
is the ability of the scale/ test to truly identify cases with the condition (PU-patients). It
is equal to the True Positives Ratio (Anthony, 1996).
Specificity, on the other hand, is the ability of the scale/ test to truly distinguish patients
who would remain free of the condition from those who would have the condition (PU-
free patients). It is equal to the True Negative Ratio, and its purpose is to identify
normal cases (Anthony, 1996).
For the Glamorgan scale, using the Cross-tabulation method, both values were
calculated based on the cut-off score value (≥10). (Table 4.26).
Table 4.26: Glamorgan Risk classifications and PU Incidence
Glamorgan level of risk Total (N=212) 0 no risk
(< 10) 1 risk (10+)
2 high risk (15+)
3 very high risk (20+)
Ulcer development (Incidence)
0 Did not develop ulcer
Count 74 8 69 42 193
Expected Count 67.4 7.3 69.2 49.2 193.0
1 Developed ulcer Count 0 0 7 12 19
Expected Count 6.6 .7 6.8 4.8 19.0
Total Count 74 8 76 54 212
Expected Count 74.0 8.0 76.0 54.0 212.0
Sensitivity Ratio = True Positive cases (TP)
True Positive cases (TP) + False Negative cases (FN)
Specificity Ratio = True Negative cases (TN)
True Negative cases (TN) + False Positive cases
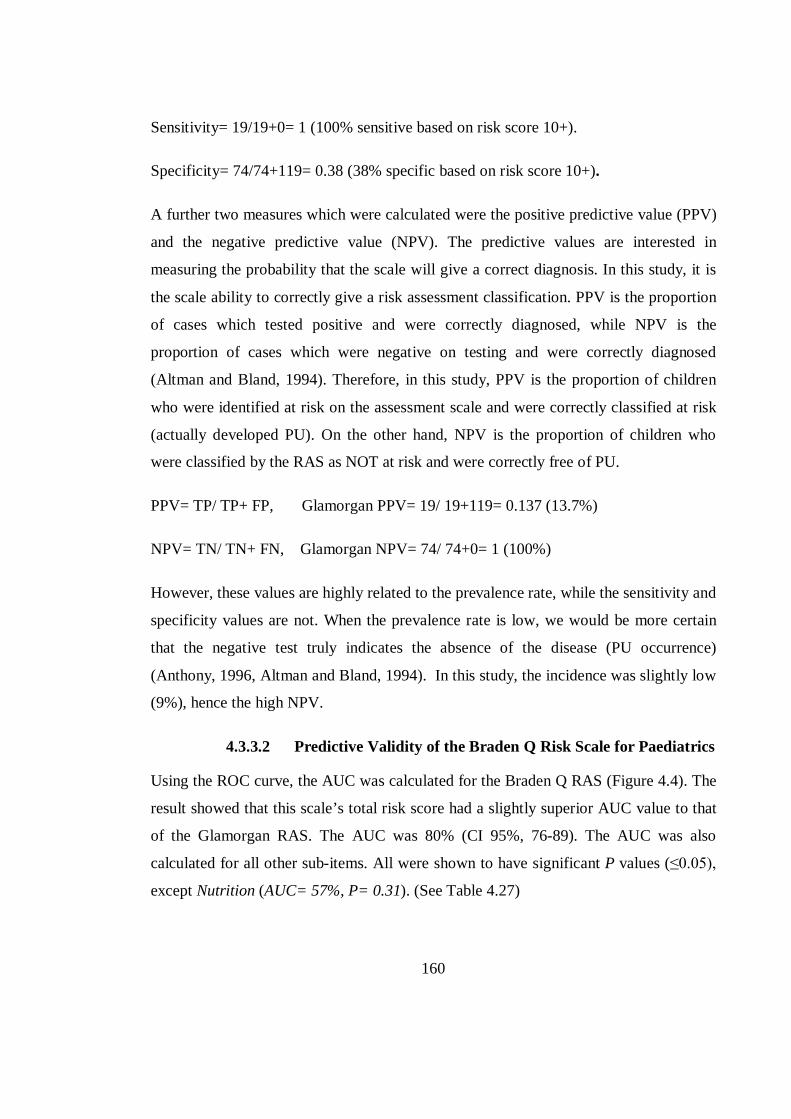
160
Sensitivity= 19/19+0= 1 (100% sensitive based on risk score 10+).
Specificity= 74/74+119= 0.38 (38% specific based on risk score 10+).
A further two measures which were calculated were the positive predictive value (PPV)
and the negative predictive value (NPV). The predictive values are interested in
measuring the probability that the scale will give a correct diagnosis. In this study, it is
the scale ability to correctly give a risk assessment classification. PPV is the proportion
of cases which tested positive and were correctly diagnosed, while NPV is the
proportion of cases which were negative on testing and were correctly diagnosed
(Altman and Bland, 1994). Therefore, in this study, PPV is the proportion of children
who were identified at risk on the assessment scale and were correctly classified at risk
(actually developed PU). On the other hand, NPV is the proportion of children who
were classified by the RAS as NOT at risk and were correctly free of PU.
PPV= TP/ TP+ FP, Glamorgan PPV= 19/ 19+119= 0.137 (13.7%)
NPV= TN/ TN+ FN, Glamorgan NPV= 74/ 74+0= 1 (100%)
However, these values are highly related to the prevalence rate, while the sensitivity and
specificity values are not. When the prevalence rate is low, we would be more certain
that the negative test truly indicates the absence of the disease (PU occurrence)
(Anthony, 1996, Altman and Bland, 1994). In this study, the incidence was slightly low
(9%), hence the high NPV.
4.3.3.2 Predictive Validity of the Braden Q Risk Scale for Paediatrics
Using the ROC curve, the AUC was calculated for the Braden Q RAS (Figure 4.4). The
result showed that this scale’s total risk score had a slightly superior AUC value to that
of the Glamorgan RAS. The AUC was 80% (CI 95%, 76-89). The AUC was also
calculated for all other sub-items. All were shown to have significant P values (≤0.05),
except Nutrition (AUC= 57%, P= 0.31). (See Table 4.27)
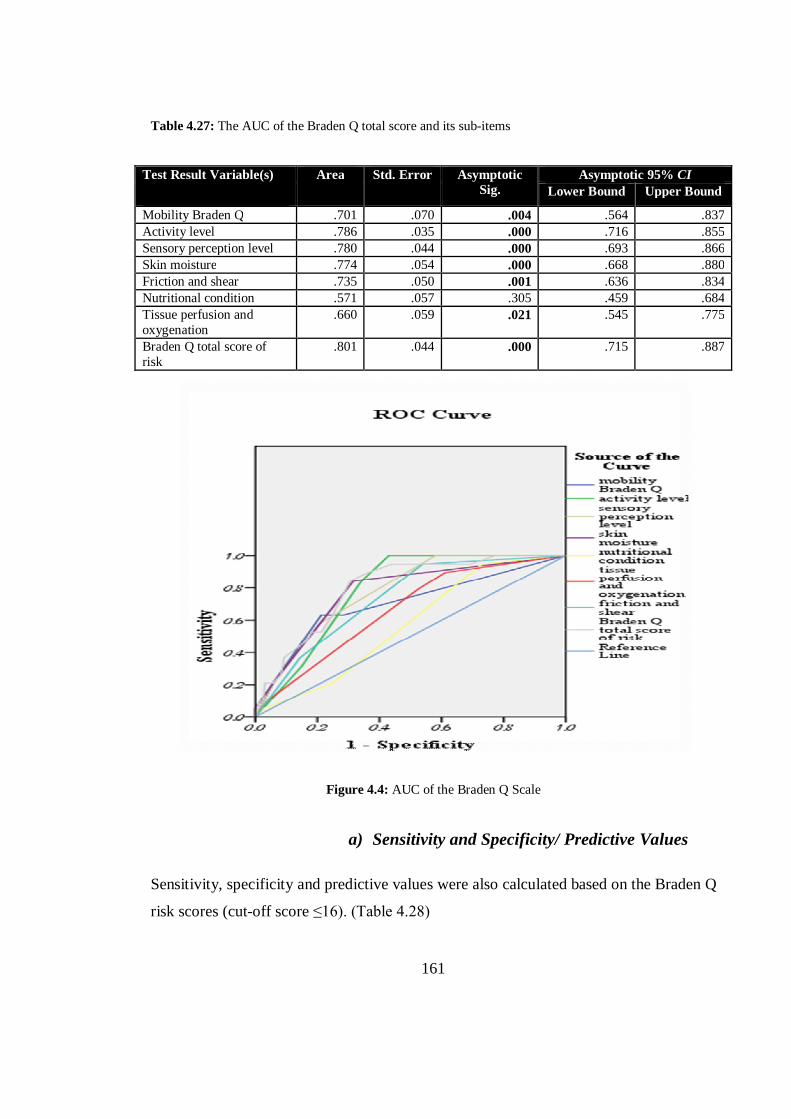
161
Table 4.27: The AUC of the Braden Q total score and its sub-items
Test Result Variable(s) Area Std. Error Asymptotic Sig.
Asymptotic 95% CI Lower Bound Upper Bound
Mobility Braden Q .701 .070 .004 .564 .837 Activity level .786 .035 .000 .716 .855 Sensory perception level .780 .044 .000 .693 .866 Skin moisture .774 .054 .000 .668 .880 Friction and shear .735 .050 .001 .636 .834 Nutritional condition .571 .057 .305 .459 .684 Tissue perfusion and oxygenation
.660 .059 .021 .545 .775
Braden Q total score of risk
.801 .044 .000 .715 .887
Figure 4.4: AUC of the Braden Q Scale
a) Sensitivity and Specificity/ Predictive Values
Sensitivity, specificity and predictive values were also calculated based on the Braden Q
risk scores (cut-off score ≤16). (Table 4.28)

162
Sensitivity= 9/ 9+10= 0.47 (47% sensitive, 16 cut-off score)
Specificity= 161/ 161+32= 0.83 (83% specific, 16 cut-off score)
PPV= 9/ 9+32= 0.219 (21.9%)
NPV= 161/ 161+10= 0.941 (94.1%)
Table 4.28: The Braden Q risk classifications and PU Incidence
Braden Q risk score
Total (n=212)
0 no risk
1 at risk
Ulcer development (Incidence)
0 Did not develop ulcer
Count 161 32 193 Expected Count 155.7 37.3 193.0
1 Developed ulcer Count 10 9 19 Expected Count 15.3 3.7 19.0
Total Count 171 41 212 Expected Count 171.0 41.0 212.0
4.4 SUMMARY OF THE CHAPTER
This chapter was a documentation of the main findings which resulted from the use of
different statistical tests, namely descriptive, univariate and multivariate inferential
statistical tests, and the ROC. The findings relate to different variables which were used
in each statistical test.
The main aims of performing a statistical analysis were to be able to answer the
research questions, to test hypotheses, and to identify the related risk factors of PU
development in children admitted to ICUs. Also, by using the ROC, the performance of
both scales used was tested. Their predictive abilities were measured and compared.

163
The use of descriptive analysis (frequency, mean, median, percentages), provided a
general overview of the selected sample demographics and characteristics. Univariate
analysis tools used were the Chi Square χ² test, Fishers’ Exact test, the Mann-Whitney
U test, and the independent samples t- test.
Seventeen different IVs were shown to be significantly associated with PU development
in this population: ‘being on MV’, ‘GCS’, ‘time patient spent on MV’, ‘PEEP level’,
‘age in days’, ‘ICU LOS’, and the mobility, equipment and nutrition sub-items of the
Glamorgan scale, in addition to the Glamorgan and Braden Q total risk scores, and all
sub-items of the Braden Q scale except nutrition.
However, use of LR revealed only one significant predictor of PU development:
‘duration of 4 days or longer on MV’. While the mobility sub-item of the Glamorgan
scale proved to be significant in LR, none of the Braden Q sub-items were.
Use of the ROC revealed a slightly superior performance of the Braden Q RAS over
that of the Glamorgan RAS. Yet, the sensitivity of the Glamorgan scale, based on a cut-
off score of ten or more was much better than that of the Braden Q (100% vs. 38%).
Using a cut-off score of 16 for the Braden Q, as recommended by authors (Noonan et
al., 2011), might be clinically unacceptable. On the other hand, the specificity of the
Braden Q was far superior to that of the Glamorgan scale (83% vs. 38%) using the same
cut-off scores for each scale.
164
CHAPTER 5 .. CHAPTER FIVE:
DISCUSSION
5.1 A GLANCE AT THE CHAPTER
This chapter addresses the methodological and statistical considerations of the research
conducted, while also simplifying and clarifying the numerical findings given in the
results chapter. First of all, the advantages and disadvantages of using the proposed
methodology and study design are discussed, and the limited ability of some variables
to explain the results is considered. Secondly, the uniqueness of this research in
comparison with previous studies on the same area of interest is assessed. Next, the
major findings will be discussed in light of the selected theoretical framework’s major
concepts and propositions and, finally, the key results will be compared with previous
literature regarding the size of the PU problem among paediatrics, and more precisely
its incidence among critically ill paediatric patients, as well as the PU risk factors, and
the predictive validity of the utilised RASs.

165
5.2 METHODOLOGICAL CONSIDERATIONS
This section of the chapter highlights some of the methodological issues related to the
study’s research design, and the research questions. The novelty and uniqueness of the
research methods used here are compared with other PU risk assessment studies, as well
as previous paediatric incidence and prevalence studies.
The strengths and weaknesses of the chosen research method are underlined in relation
to its ability to clarify the relation between the studied risk factors (set of specified
predictors) and the observed outcome (PU formation), and the predictive validity of the
two scales is determined, based on a longitudinal prospective design.
Although PU has been reported as a problem which affects children in many previous
incidence and prevalence studies (Willock et al., 2000, Zollo et al., 1996, Curley et al.,
2003a, Dixon and Ratliff, 2005, Fujii et al., 2011, Huffines and Logsdon, 1997, McLane
et al., 2004), none of these were conducted in Arab countries. So, this research is the
first of its kind to discuss PU in paediatrics in both Jordan and the wider Arab world, as
well as the fourth dealing with PU generally in Arabic countries (Saleh et al., 2009,
Abou El Enein and Zaghloul, 2011, Tubaishat et al., 2011), and the second in Jordan
(Tubaishat et al., 2011).
Moreover, the prevalence and incidence results of this study could be used as
benchmarking data in Jordanian hospitals on the size of the PU problem in paediatrics.
This, as mentioned in previous literature, is important for allocating health care
resources, saving money and effort, and improving quality of care for patients (Cockett,
2002, Kottner et al., 2010, Noonan et al., 2011). Also, it could help in adopting a PU
risk assessment scale, especially designed for paediatrics in Jordanian hospitals, which
would offer an alternative to the adult Braden scale which is used currently.
In addition, the incidence study in this research is one of only a few studies which have
assessed risk factors using a longitudinal prospective design (Zollo et al., 1996, Willock
et al., 2000, Curley et al., 2003a, McCord et al., 2004, Fujii et al., 2011). Several
paediatric studies have explored factors related to PU development based on cross-
166
sectional designs (Suddaby et al., 2005, Dixon and Ratliff, 2005), while others have
centred on reviewing patients’ medical records (Schluer et al., 2009, Neidig et al., 1989,
Murdoch, 2002), or have applied retrospective designs (Manning and Curley, 2012,
Samaniego, 2004, Neidig et al., 1989, Schindler et al., 2007). In general, these studies
lack satisfactory explanations of the methods used, adequate sample sizes, or good
enough descriptions of the statistical analyses.
Next, this study is unique in that it uses data collected prospectively to compare the
predictive performance of two paediatric risk scales over critically ill PU and PU-free
patients. One study (Anthony et al., 2010) compared the predictive validity of three
paediatrics RASs, the Braden Q, Glamorgan and Garvin, yet it was retrospective.
Another recent study (Long et al., 2011) compared the performance of the Glamorgan
and the Braden Q scales. However, although it was prospective, it lacked adequate
reporting of the research methods and the study’s main findings, since it was a poster
abstract.
Comparing this thesis with the solely identified prospective incidence study (Long et
al., 2011) revealed the uniqueness of the studied sample, the critically ill children and
neonates. Moreover, Long et al. (2011) did not aim to study the predisposing factors of
the paediatric patients’ PU risk, while this thesis does.
In last, the prospective design enabled the Glamorgan scale’s performance to be tested
on another population (Jordanian ICU patients), as recommended by the scale
developers, since the previously identified research study designed to test the scale’s
predictive ability, was performed on the same sample set that was initially used to
develop the scale (Willock et al., 2009).
For the Braden Q RAS, this study also enhanced the scale by testing its predictive
validity on large groups of children and neonates of different ages, as recommended
previously (Noonan et al., 2011). More specifically, the Braden Q scale was tested on
neonates and premature babies, as well as on children aged over 8 years old in this
thesis, whereas previous studies had used the Braden Q scale on children aged only
167
from 21 days up to 8 years. In addition, this research work aimed to identify how the
scale would perform if used to predict device-related ulcers.
5.3 STATISTICAL CONSIDERATIONS
Having a large set of predictors (risk factors/ IVs) demanded the use of a variety of
statistical approaches. More than 40 predictor variables were analysed by several
descriptive statistical tests calculating frequencies, percentages, means and standard
deviations. Moreover, these predictors were tested using both univariate and
multivariate analyses, as detailed in the Results Chapter.
The use of univariate tests identified a preliminary set of significant predictors of PU in
this population (children and neonates in ICUs), before an extra step was performed by
using LR test to reveal a more accurate set of PU predictors. The use of this advanced
form of analysis enabled the researcher to obtain more statistically accurate results.
Using all these types of statistical analyses on the collected data may offer a significant
contribution to our knowledge and understanding of paediatric PU.
Logistic regression was performed using the Entry (Enter) method on SPSS. In this
default method, the predictors are entered all together in one block, without any one
predictor being given priority over the others. This approach has been recommended by
statisticians to test theories, or when there is no previous knowledge about the order or
the importance of one variable over others (Field, 2009, Tabachnick and Fidell, 2007,
Marston, 2010).
The Entry method was necessary in the current research because of the researcher’s
intention to test all risk factors simultaneously, without giving any of them a pre-
specified priority over the others, in order to ensure an equal chance of investigation for
all variables. The Entry method is sometimes preferred because all variables would be
included and retained in the model. This is especially the case when dealing with
dummy variables - or categorical variables coded as 0 and 1 in regression models using
SPSS - because in other regression methods like Stepwise, a dummy variable may
removed if one of its sub-categories is not significant, even if the variable as a whole is
168
significant. However, dummy variables which have at least one significant category
should be retained in the model as a whole (Marston, 2010).
Conversely, the Entry method may cause some difficulty for data interpretation since a
predictor which correlates strongly with the observed outcome, may actually show little
predictive capability if entered with other predictors simultaneously (Field, 2009).
However, the use of another LR method, Stepwise, may also have its limitations. That is,
this method might cause statistical errors as findings are interpreted; because of the risk
of omitting variables based on statistical criteria such as Wald statistics, or the
Likelihood Ratio.
For the latter method of regression, some variables could be significant but only
removed of the built model by another variable based on these criteria (Tabachnick and
Fidell, 2007). Nevertheless, this method was also applied to the same set of predictors
for this study sample, in order to ensure no possible significant predictors of PU
occurrence were missed. No extra benefit was obtained by using this method, however,
since the same significant risk factors were identified by both the Stepwise and Entry
methods.
5.4 THE IMPACT OF THE THEORETICAL FRAMEWORK
ON THE STUDY’S MAIN FINDINGS
This section introduces the findings of the current research work based on the adopted
theory, the SDT. In first, the identified previous health- related studies are presented,
with explanation of the way of applying the SDT to their main inquiries, next; the
application of this theory major concepts and assumptions on the current work general
context and themes was addressed, and finally; how these concepts and propositions
were used to highlight the findings of this research work was provided.
5.4.1 Previous Implications
Many disciplines, such as psychology, mathematics, medicine, and radar studies, use
SDT in their research. In medicine, it is used in diagnostic related studies and, in
nursing particularly, for risk assessment studies. One study combined SDT with the
169
high reliability theory to produce a new theoretical framework, called the detection of
patient risk theory (Despins et al., 2010). The framework sought to describe how nurses
would perform in detecting patients’ risk, in view of health organizations’ patient safety
policies.
The way in which nurses would detect any sign of patient risk from the surrounding
environment was based on the SDT, and then their responses were assessed, though,
nurses’ decisions would be greatly influenced by the health organisation’s manner of
dealing with and protecting patient safety issues (Despins et al., 2010).
Nurses would try hard to detect factors which predispose patients to risk, although their
ability to do so was affected by the hospital’s degree of reliability. Therefore, nurses’
response to risk signals would be improved by patient safety being a priority (Despins et
al., 2010). It was also claimed that the nurses’ level of sensitivity in detecting risk
would affect their ability to identify actual risk. However, sensitivity was thought to be
a learned process which would be affected by a nurse’s level of knowledge, training,
and experience, as well as internal factors, such as fatigue, and the effect of the
complexity of the ward and hospital environment (Despins et al., 2010).
Another study (Thompson et al., 2008) investigated the effect of time pressure and
experience on nurses’ ability to take risk assessment decisions. Through the use of SDT,
it was shown that nurses under pressure in acute care units had low sensitivity in
detecting patient risk, while in cases where there was no time pressure, nurses with
longer experience were observed to have improved abilities to detect patients at risk and
intervene properly. According to the study, under time pressure circumstances, nurses in
acute care wards would perform poorly in regard to assessing patients’ risk, and hence
intervene less efficiently to avoid the hazard.
5.4.2 SDT Context within the Current Research
This theory helps to explain how an observer can take a decision in uncertain situations
(Wickens, 2001), such as when assessing patients’ risk of developing conditions like
PU. Taking decisions about risk is uncertain, because predicting an event’s chance of
170
occurrence is not the same as it actually happening. So, in classifying patients into risk
or no risk groups, not all patients who were classified as being at risk would actually
develop PU.
The main goal for nurses is to predict patients at risk of PU formation as early as
possible, and intervene accordingly to prevent the occurrence of PU or to avoid further
skin damage. The use of a RAS also helps to classify patients into risk groups based on
a specific criterion, or a pre-specified threshold, or cut-off score, and then apply
prevention measures as applicable.
It is crucial for nurses to detect children at actual risk of PU occurrence correctly and, at
the same time, to reduce effort and prevent resources being wasted through the improper
application of preventative interventions for those not at risk, and who would not
develop PU. In other words it is crucial to have a very sensitive and specific tool.
If a person can easily distinguish true signals from surrounding noise, he can correctly
take decisions about a condition’s chance of occurrence. That is, if nurses (Observer)
can easily recognise true risk factors of PU (Signals) in critically ill paediatric patients
over irrelevant factors (Noise), then they can classify children at risk successfully
(Decision), and so can intervene reasonably, avoiding time and effort being wasted on
false classifications.
However, even if the nurse was able to correctly distinguish true risk factors from other
irrelevant factors, and he/she was able to confirm that particular patient’s risk, this
might be not enough trigger for nurses to take preventive actions. According to the
theory it could be true that identifying correct signals of risk would help in correct
classifications of patients into risk or not risk groups efficiently, yet, this is not enough
to guarantee nurses taking prevention and management actions.
The theory reflects the need of correct identifying of risk factors to classify patients as
risk, but the direct impact of this true classification was not reflected on the actual nurse
practice and the true triggers of nurses to apply prevention properly. In fact, if a nurse
was aware of the true patient risk of PU formation and did not take any action to prevent
171
this risk this would be unethical in clinical practice and would result in further time and
resources wasting.
Despite the fact that identifying signals of particular conditions is, in many cases,
straightforward, taking decisions based on the appearance of any of these signals is
difficult. For example, one nurse might identify immobile children as being at risk of
PU development on the basis of his or her experience and previous knowledge that
immobile children are known for being unable to control their body position, and to
respond to pressure or pain appropriately, which would increase their PU risk. However,
she or he cannot say for certain that any immobile child would develop PU.
In previous example, the nurse can distinguish immobility as a true warning signal of
PU development, although, alone, this would not be enough to base a decision about
patient risk on. On the other hand, although a decision in itself is distinctive (patient at
risk or not at risk), contributing factors are not distinctive, and sometimes they might be
contradictory or overlap. For instance, some nurses may believe that children who have
dry skin are at risk of PU, whereas others might believe that excessive moisture on the
skin would increase the risk of ulcers developing.
5.4.3 The Main Concepts of the SDT and the Current Research
A description of how the main concepts of the SDT can be defined in relation to this
thesis is offered below;
The Stimuli:
The stimuli in this study are the group of identified contributing factors for PU
development. The true signal is an actual significantly related risk factor or predictor of
PU development. On the other hand, the noise is any factor present in the patients’
environment or related to their health condition which appears as if it may be a
contributing factor for PU development, but actually is not.
172
The Observer:
The nurse, or the RAS which is used by the nurse, is the observer. The nurse, as an
observer of stimuli, needs to have the ability to take the correct decision by detecting
true signals among false stimuli. However, this ability depends on many factors,
including nurses’ training, degree of experience, and level of knowledge. It also
depends on factors related to the observer’s physiological condition, such as their level
of fatigue, at the time of decision making (Wickens, 2001), since fatigued nurses tend to
have more negative responses to stimuli (deciding there is no risk), compared with non-
fatigued nurses (Wickens, 2001). For example, a nurse with a very busy schedule
working in a noisy environment may be too tired to notice any threat to patient safety.
Nurses, in many cases when uncertain, tend to choose the easiest way of responding by
classifying more patients as not at risk, to conserve time and effort. On the other hand,
nurses with a less demanding workload may prefer to classify patients as at risk for a
condition even when they are not completely sure, and intervene according to this
choice, which may take more time and energy, rather than to predispose patients for
possible risk (Wickens, 2001).
According to SDT, the observer’s ability to detect signals correctly is called sensitivity.
Thus, nurses’ training and knowledge, and their physical condition, affects their
sensitivity level. Also, the use of an RAS by the nurse affects sensitivity, since a well
defined scale which is able to correctly classify children who are at risk of PU is
considered more sensitive.
From another perspective, in SDT, the strength of the signal also affects the observer’s
sensitivity (Wickens, 2001). When the signal is stronger, it is easier for the observer to
detect. Here, nurses can more accurately detect risk factors when the patient has
stronger/ more obvious characteristics of PU risk. For example, an immobile patient
who is ventilated for a week and with restricted positioning’ times, would be at higher
risk of PU development than an ambulant child with a mild respiratory infection.

173
Similarly, when nurses use risk scale to classify patients at risk of PU development,
patients with higher risk scores might have a greater chance of developing ulcers than
those who had lower scores, the highest risk scores are stronger indicators of PU
development than the lowest scores (and vice versa for the Braden Q RAS). Yet, this is
correct when the scale is able to correctly classify patients into risk groups, if the scale
total score, or any of its sub-items show no real difference between PU risk patients and
those who are free or risk, then these scores would not be beneficial in reflecting these
patients true risk.
Observer sensitivity is also seen to be affected by the amount of existing noise
surrounding the true signal (Wickens, 2001). In this case, if an actual risk factor for PU
development is hidden by a very large number of surrounding irrelevant factors, it
would be more difficult for the observer nurse to correctly identify this factor, and thus
he/she would encounter greater difficulty in classifying patients at risk. This might
cause the nurse’s decision to be less sensitive, and predisposed to error (false positives
and false negatives).
For example, an ICU nurse could be very confused by the large number of PU risk
factors or predictors of patients present in the ICU environment, such as being on MV,
sedated, immobile, malnourished, on specific medications, having certain deficiencies,
or abnormal laboratory test results. However, this assumption supports the use of RAS,
since using a pre-specified checklist or RAS would decrease the number of possible
predictors of PU in ICU patients, allowing the nurse to be more focused and to more
easily ignore factors that hide the true risk.
Moreover, using the rule of thumb to validate any risk assessment scale, the researcher
would need at least 10 cases for each risk factor so the findings would be true (Coleman
et al., 2013). Yet, this would be very difficult to implement in paediatric PU cases, since
this problem in this population is not very prevalent, which would require hundreds of
PU patients to validate any existing RAS.
In spite of this, if the scale was not originally predictive, or included irrelevant factors
(noise rather than true signals), this may mean that it would be less sensitive and the

174
nurse’s decision would consequently be incorrect, thus putting children at greater risk of
PU development, and decreasing their chance of proper intervention and of PU being
prevented.
Therefore, the theory also supported the current study’s research question in regard to
the predictive validity of the two paediatric RASs used. That is to say, it has shown why
it is important to pursue this inquiry in the field of PU assessment. Testing the scales’
ability to predict risk, using the AUC of the ROC, sensitivity and specificity values, is
crucial in determining whether the use of these scales in the medical field should be
supported.
The Response:
The nurse’s response could be one of four possibilities: false positive, false negative,
true positive and true negative. These values were discussed in the Results Chapter.
When a nurse uses her clinical judgment, or uses a RAS, these are the four possible
responses:
SDT NURSE STATISTCALLY
Hit Child who had been classified at risk, did
develop PU True positive
False alarm Child who had been classified at risk, did not develop PU
False positive
Correct rejection
Child who had been classified not at risk, did not develop PU
True negative
Miss Child who had been classified not at risk, did develop PU
False negative
Based on the SDT, h ratio (hits ratio), and f ratio (false alarm ratio) are important,
because they complement each other. It is necessary to calculate these values to have a
full picture of the situation in which the nurse takes her decision. In our research, to test
the predictive ability of the two used scales, these values were calculated.
The h ratio is the same as the sensitivity, and f ratio is the same as the 1- specificity.
These two values are crucial in calculating the AUC, which tests the scale’s
175
performance in the ROC curve. The f ratio and h ratio are both significant values, to
measure the performance of any scale on different cut-off scores or thresholds.
Specificity and sensitivity values were calculated for the RASs used in the current study
in the results’ chapter, and are discussed more later in (section 5.5.3) of this chapter .
As previously discussed in the literature chapter, each observer has a specific criterion
on which their response depends. In this study, each scale’s cut-off score was the
criterion (≥ 10, Glamorgan and ≤16, Braden Q). If the patient achieved a score higher
than the criterion (or lower in the case of the Braden Q), the observer would respond
with ‘Yes’ or, in other words, the child would be classified as at risk of PU. Conversely,
if a child obtained a score lower than the criterion, the observer’s response would be
‘No’, which meant they were not at risk of PU. However, in situations where nurses use
their clinical judgment alone, without reference to a specific RAS, the criterion for each
nurse would be subjective, based on their own experience and knowledge. Hence, there
exists much variation in classifying children at risk of PU based on clinical judgment
alone.
Any attempt to increase the observer’s hits will reduce the number of correct rejections,
so increasing the h ratio would decrease the correct rejection ratio (1- f ratio). This is
also true in the current study where trying to improve the sensitivity of the scale would
diminish the specificity, and vice versa. Therefore, researchers usually try to choose a
threshold (criterion) for classifying patients, in which the scale would perform the best
in both sensitivity and specificity values.
In summary, the nurse (the observer) would encounter an uncertain situation (is the
patient at risk of PU development or not?) and he or she would try to take a correct
decision regarding risk classification (at risk or not at risk), by accurately detecting the
signal (true risk factors for PU development) amid any surrounding noise (irrelevant
factors in the hectic environment of the ICU). This decision would be based on a pre-
specified criterion (the nurse knowledge and/or the RAS cut-off score). The nurse’s
response would be correct (a true positive or true negative) or incorrect (a false positive
or false negative), although detecting positive cases (children with PUs) correctly is the
priority for nurses.
176
Using sensitive and specific RAS might improve nurses’ ability to detect PU risk in
critically ill children, by reducing the amount of noise (irrelevant factors). The RAS
should have a cut-off score (criterion) which makes it more sensitive, but not less
specific. Sensitivity is crucial in order to identify the number of children who are at
actual risk of PU development, and so reduce any further skin damage, suffering or pain
for these children. On the other hand, specificity is crucial to ensure the appropriate
allocation of health resources, and prevent time, effort, and equipment being wasted.
The following Figure (5.1) illustrates the SDT framework’s application to the current
study:
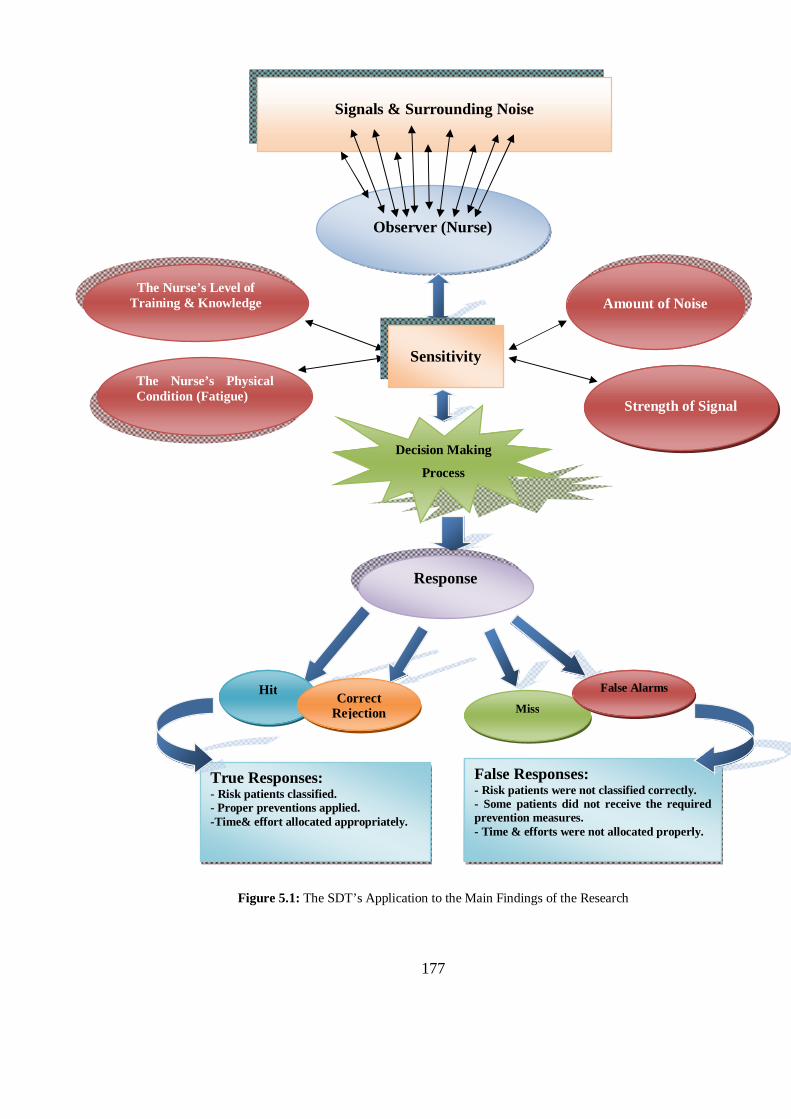
177
Figure 5.1: The SDT’s Application to the Main Findings of the Research
Observer (Nurse)
Decision Making
Process
Response
Hit Correct Rejection Miss
False Alarms
Signals & Surrounding Noise
True Responses: - Risk patients classified. - Proper preventions applied. -Time& effort allocated appropriately.
False Responses: - Risk patients were not classified correctly. - Some patients did not receive the required prevention measures. - Time & efforts were not allocated properly.
The Nurse’s Level of Training & Knowledge
The Nurse’s Physical Condition (Fatigue)
Amount of Noise
Strength of Signal
Sensitivity
178
5.5 INTERPRETATIONS OF THE STUDY’S MAIN FINDINGS
5.5.1 The Prevalence Study
This section of the chapter discusses the major findings of the point-prevalence survey,
including the prevalence rate, characteristics of children who had PU, the major sites of
PU, categories and numbers.
5.5.1.1 The Prevalence Rate
The prevalence rate (7.5%, n= 8) was similar to that reported in some previous
prevalence studies in paediatrics. Willock et al. (2000) found a prevalence rate of 6.5%
(n= 12) among 183 children admitted to one hospital in the UK, However, Willock et al.
included blanchable erythema in PU classification, as category I. Excluding this
category would decrease the prevalence rate to 2.1% (n= 4).
One further study (Noonan et al., 2006) which was carried out in a tertiary university-
affiliated hospital documented a PU prevalence rate as low as 1.6% (n= 4), despite the
setting for this research being very similar to that of our current study. However, the
prevalence rate would be similar to the current study’s if combined with the prevalence
of device-related ulcers (6.7%, n= 17).
Regardless of the fact that Noonan et al. (2006) considered device–related ulcers to be
another type of skin breakdown, of the total 252 assessed patients, ten patients had
ulcers from the use of a pulse oximeter, and three more from other medical devices. In
the current study, the prevalence rate would be only 2.8% (n= 3) if device-related ulcers
had been excluded.
The work of Nie (2008) also supports the findings of this thesis in a study of 266
paediatric patients in one hospital, which found a PU prevalence of 10.7% (n= 22), 19
of these were facility-acquired ulcers (9.2%).
On the other hand, in one large prevalence survey (McLane et al., 2004) of 1064
children in 9 hospitals in the USA, only 43 patients were found to have PU (4%).
However, the researchers found a higher prevalence rate of other types of skin
179
breakdown such as extravasations, diaper dermatitis, and plaster injuries, and the
calculated prevalence rate for all types of skin injuries combined was 18.9% (n= 201).
Another study (Dixon and Ratliff, 2005) reported similarly low prevalence rates to
McLane et al. (2004), of only 3% (n= 2 out of 77) and 4% (n=3 out of 79) respectively
in two prevalence studies, which took place one year apart. However, these surveys
were conducted in only five paediatric wards in one tertiary care university hospital in
the USA, which might affect the estimation of the actual size of PU in this population.
Baldwin (2002) reported a much lower prevalence rate of PU in her mail survey of 234
staff members of four USA health care databases. Prevalence data obtained relating to
PU in paediatrics revealed the prevalence rate to be just 0.47% (21 of a total 4429
paediatric inpatients had PU). However, the low response rate of the survey (25%, 51
questionnaires), may have affected the credibility of the findings.
By contrast, higher prevalence rates have also been documented in the literature. One
multisite study, for example, which was conducted in four paediatric institutions in
Switzerland, uncovered a relatively high PU prevalence rate, where 43 out of 155
assessed patients had PU (27.7%). However, this rate dropped to only 4.5% (n=7) when
category I PU (non-blanchable erythema) had been excluded (Schluer et al., 2009).
As seen in this section, including category I PUs or excluding them has its effect on the
variation in PU prevalence rate in paediatric population. In fact, such category is
described in many credible PU classification systems worldwide, such as the one used
here the EPUAP classification. Ignoring such type of ulceration from prevalence and
incidence studies might underestimating the actual size of the problem, and hence
improper prevention might be applied for patients suffering from such category of
ulceration and this might put them at higher risk of further damage in their skin into
more sever categories of ulcers.
5.5.1.2 Most Affected Sites
Several paediatric PU prevalence studies agree that the head (mainly the face and
occiput) is the site most commonly affected with PU (McLane et al., 2004, Willock et
180
al., 2000). This is supported by the results of the current study, which found that, of the
13 observed cases of PU, five were in the face (38%), jointly followed by occiput and
‘neck and shoulders’ (n= 2, 15%). Yet, the most severe ulcers (category III) were found
in the sacrum, occiput, and ankles (one ulcer in each site, 12.5%)
In McLane et al. (2004), 31% (n= 13) of PUs were located on the head, including the
occiput, head-other and nose and ears. This was followed by the seat area (20%, n=9)
and the foot area (19%, n= 8). Also, in Willock et al. (2000), the occiput and ears were
among the primary locations affected by PU, as occiput was the first most affected site
(n=4), followed by heel and ears (n= 3 patients for each). However, these findings were
based on a mix of prevalence and incidence data, from studies conducted at the same
hospital one month apart.
On the other hand, Suddaby et al. (2005) reported the buttock as the site most often
affected by PU (31%, n=25), followed by perineum (24%, n=19), and occiput (10%,
n=8). Around 88% of the occipital skin breakdown occurred among PICU patients
(n=7).
Furthermore, Schluer et al.’s (2009) findings on sites of PU differ from those of most
reports, as unspecified areas were documented as the most commonly affected with
ulcers (43.1%, n=25) followed by heels (15.6%, n= 9), ankles and ears (10.4%, n= 6 for
each). The unspecified areas could not be precisely described because the ulcers had
mostly developed in areas next to which equipment such as drain tubes or monitor
cables had been placed. However, the ears in their study were similarly mentioned in
other prevalence study of paediatric PU (Willock et al., 2000).
By contrast, Baldwin (2002) found ‘under the waist’ ulcers to be the most dominant
(78%, n= 16). Of these, the sacrum and coccyx were the most frequently affected areas
(40%, n= 6), followed by heels (27%, n= 4). Otherwise, the ‘above the waist’ ulcers
accounted for only 28% (n= 5) and in this group the occiput was the most predominant
site of ulcer formation (65%, n= 3). Suddaby et al. (2005) also give buttocks, perineum
and occiput as the locations most affected by skin breakdowns.
181
Another study (Dixon and Ratliff, 2005) named heels as the site affected by the highest
number of PU cases, (50%, n=3). This was followed by one case of sacral PU, one
ankle, and one in nares (17% for each). The nares (nostrils) are also one of the head
areas that might be worst affected by ulcerations, due to the use of nasal continuous
positive airway pressure (CPAP) in neonates specifically and in paediatrics in general.
One further study observed PU in the occiput and hands (Noonan et al., 2006). Two out
of four PU-patients had occipital ulcers, and another one suffered from hand ulcers due
to prolonged positioning in the OR, and one more had heel ulcer (Noonan et al., 2006).
However, this study identified other types of skin breakdown, including those related to
equipment pressing, such as nasal breakdown, and ulceration due to the use of a pulse
oximeter. Since there is high variety in types of skin breakdown were mentioned in
Noonan et al.’s study (12 including PU), none will be discussed here.
In a number of the previously mentioned studies (Waterlow, 1997, Willock et al., 2000,
Dixon and Ratliff, 2005, Baldwin, 2002, Schluer et al., 2009, McLane et al., 2004),
heels seem to also be a significant site for PU development in children as almost all of
them list heels among the first three areas of the body that are most frequently affected
by PU. In the current study, heel and ankle PUs were observed in two patients (15%).
5.5.1.3 Pressure Ulcer Categories
Most ulcers identified in paediatric PU studies have been of partial thickness, or, in
other words, belonging to category I or category II (Willock et al., 2000, McLane et al.,
2004, Baldwin, 2002, Noonan et al., 2006, Schluer et al., 2009). In the same way, 75%
of all identified ulcers in this study were of partial thickness (n= 6). Of these, around
63% were category I (n= 5), and 12% (n=1) were category II. Two patients’ ulcers were
classified as category III (25%) and none were category IV.
Pressure ulcer categories I and II usually refer to non-blanchable erythema and
superficial damage through the skin to the dermis (EPUAP and NPUAP, 2009).
However, in some studies, category I has included blanchable erythema, where any
redness to the skin, even if it blanches with a finger pressed against it, would count as a
182
PU. For example, this was the case in Willock et al. (2000). Other studies, however, do
not detail their classification systems for PU classifications (Baldwin, 2002, Nie, 2008).
In Dixon and Ratliff (2005), non-categorised ulcers, in addition to category I PUs, were
the most frequent, accounting for three ulcers in each category, of the total number of
ulcers identified in the two prevalence surveys. Moreover, in Suddaby et al.’s (2005),
77.5% of skin breakdowns were erythema (n= 62), using the AHCPR staging
guidelines, yet, they considered diaper dermatitis as category I ulcers.
5.5.1.4 General Characteristics of the PU-Patients
Of the 129 paediatric patients identified on the day of the study, 107 patients were
eligible to participate (83%). Most PU- patients had single ulcers (50%, n= 4), three had
two ulcers (37.5%), and one patient had three (12.5%). All except one of those patients
had facility-acquired ulcers (87.5%, n= 7). Previous literature has shown that children
usually suffer from multiple ulcers, without specifying the number of ulcers for each
child. For example, 43 children in McLane et al’ study (2004) had developed 64 PUs,
whereas in Suddaby et al.’s study (2005) 80 children were documented to have 100 skin
breakdowns.
In a very similar manner to this research, Willock et al. (2000) found that single ulcers
had affected most children (17 out of 18) in their study, and only one child had suffered
triple ulcers. However, Willock et al.’s findings were based on a mix of data from
prevalence and incidence studies which were carried out a month apart. Another multi-
site prevalence study (Schluer et al., 2009) also produced similar findings; of 43 PU
patients, thirty four had single ulcers (79%), seven had two (16%), and two had five
ulcers (5%).
In addition, like most of the ulcers observed in this research were facility-acquired,
McLane et al. (2004) also reported that more than half of PU cases in one PICU were
facility-acquired. Two more prevalence surveys, one multi-site and the other which took
place in a university children’s hospital, showed that all or almost all ulcers were
facility-acquired respectively (Noonan et al., 2006, Schluer et al., 2009). Dixon and
183
Ratliff (2005) also stated that all observed ulcers were hospital acquired except one heel
ulcer presented in one child on admission from another hospital.
As previously noted, it is clear that the vast majority of PUs affects children in hospitals
rather than at home, this sheds light on the deficient prevention programs that are used
in paediatric care current practice, also this emphasizes the need to establish unique PU
assessment and prevention protocols, which fit precisely with children and neonates,
according to each group’s developmental needs.
Almost 88% of the observed ulcers in the current work belonged to patients in critical
care units (n= 7). Only one case was observed in the surgical ward (12.5%), which was
that of a 7-year-old boy who had been previously admitted to the PICU several times
because he was left quadriplegic as a result of a road traffic accident (RTA). However,
unlike in some of the paediatric prevalence studies (Waterlow, 1997, Willock et al.,
2000, Schluer et al., 2009), no PU- patients were found in the medical wards.
Children in critical care units or who have been cared for in ICUs have been established
in the literature to have a higher prevalence rate of PU (Willock et al., 2000, Dixon and
Ratliff, 2005, McLane et al., 2004). More than a third of PU-patients were cared for in
the ICU in one study (42% , n= 5) (Willock et al., 2000). In another (McLane et al.,
2004) this was the case for around 14% of children affected with PU, and around 72%
had stayed in ICU at least once during their single admission, with a prevalence rate of
8.7% specifically in ICUs.
One study (Schluer et al., 2009), conversely, found that most ulcers were observed in
the rehabilitation unit (33%, n= 10), followed by surgical wards (30%, n= 10), neonatal
wards (27%, n= 11), and medical wards (24%, n= 12). This was explained in relation to
the nature of the patients in these units, who are immobile, in pain, or have delicate
sensitive skin, which increases their risk of improper positioning and, in turn, of PU.
Dixon and Ratliff (2005) also stated that most observed ulcers were identified in
neonatal, PICU, and rehabilitation units.

184
Most of the PU-patients identified in this study were less than one year old (62.5%, n=
5), which mirrors results of previous research. For example, seventeen out of 43 PU
patients in one study were one year old and younger (McLane et al., 2004), and 26% of
these children were younger than 3 months old (n= 11). Similarly, three patients out of
four who had occipital PU were less than one year old (Willock et al., 2000). In Schuler
et al. (2009), around 85% of children who were classified as at risk for PU development
were neonates (n= 35).
For the prevalence study sample of this thesis, the hospital LOS for PU-patients was
significantly higher than that of PU-free patients (U=174.5, p=0.008), with a median
(IQR) of 11.5 (27) days versus 4 (7) for PU- and PU-free patients respectively.
Paediatric patients with PU have been noted before to typically have longer periods of
stay in hospitals. Schluer et al. (2009), for instance, stated that hospital LOS was the
only significant difference between PU- and PU-free patients’ characteristics, with a
median of 25 days versus 9 days respectively (P= 0.019).
Interestingly, females were affected by PU development more than males in this study
(62.5%, n= 5), despite the fact that males constituted the largest portion of the current
sample (64.5%, n= 69). However, due to the small sample size, this was found not to
have any statistical significance (Continuity Correlation=1.6, d.f= 1, P=0.203). Yet, no
description of gender differences between PU-patients and PU-free patients were
reported in previous literature so it was difficult to draw conclusions, or to either
support or reject any propositions.
5.5.2 Incidence and Risk Factors Study
This section of the chapter discusses the major findings of the incidence survey. Based
on a prospective cohort observational study, the incidence rate is estimated, the main
affected sites are identified, and the most frequently observed categories of PU are
discussed. Moreover, a separate part clarifies the most widely encountered contributing
factors of PU development among paediatric patients in ICUs. These factors are
discussed with reference to the previously observed PU contributing risk factors among
185
different paediatric populations, the different statistical methods used, and the research
designs used.
Incidence studies play a significant role in the identification of new cases of a specified
problem over a certain period of time within a specific population (Shields and
Twycross, 2003). They are also thought to be important in locating any changes of a
specified condition or problem over a period of time, and allow the findings of different
studies to be compared more efficiently than in the case of cross sectional prevalence
studies (Shields and Twycross, 2003).
For this study, incidence data was used to estimate the size of the PU problem over an
eight week period among critically ill paediatric inpatients in Jordan. Studying risk
using a prospective design was crucial for investigating the factors associated with PU
risk in this population more accurately. Cross sectional designs identify factors that are
found to exist concurrently with identified PU cases at one point in time. However,
studies of this type cannot tell us if these factors precede PU development or if they
really contribute to PU formation.
The factors described in cross-sectional design studies could be discussed as special
characteristics of PU-patients but not as possible risk factors. In prospective studies,
including PU-free patients and observing the development of PU over time could help
to highlight the possible risk factors that lead to PU development.
However, the study of risk factors needs more rigorous study designs to reveal more
robust and accurate findings. An example would be the Randomised Clinical Trials
(RCTs), which are difficult to conduct in nursing studies, because of ethical dilemmas
surrounding their use (Willock et al., 2009), these issues might include controlling some
factors, such as holding medication or life supportive equipment to study their direct
effect on children’s skin, or withholding some of the preventive interventions to control
their effect on the incidence rate or the validity of the used assessment scales.
5.5.2.1 Pressure Ulcer Incidence:
a) Incidence Rate
186
Nineteen out of a total of 212 children and neonates recruited from three ICUs in one
university hospital developed 29 PUs (incidence rate of 9%). The rate was lower than
that documented in previous literature, and more precisely in studies carried out in
paediatric ICUs.
Willock et al.’s (2000) prospective study of 81 children in highly dependent units
(immobile patients) revealed a similar incidence rate to the current study (7%), yet, the
PICU incidence rate in Willock et al. was higher, 15%. However, omitting category I;
blanchable erythema, from this group would cause the incidence rate to fall to 9.4% (n=
3), which mirrors more closely the rate reported in this thesis.
Several studies of critically ill children have revealed incidence rates similar to Willock
et al.’s (Schindler et al., 2007, Fujii et al., 2011, Huffines and Logsdon, 1997, Neidig et
al., 1989), although blanchable erythema was not included while categorising ulcers in
these studies. Another study of 271 PICU patients revealed a 26% incidence rate of PU.
However, this also dropped to only 7% when blanchable and non-blanchable erythema,
were excluded (Zollo et al., 1996).
The discrepancy between the incidence rate reported in this thesis and those of other
related studies could be explained by:
- Having different definitions for PU categories based on the use of different PU
classification systems. For instance, some studies considered redness or blanchable
erythema as category I ulcers, while others did not. Willock et al. (2000) counted
blanchable erythema as category I, in line with their use of the Torrance classification
system. According to the authors, however, this was thought to inflate the actual
incidence rate, which was only 3.6% (n=3) if this category was excluded. For the
current incidence study, the EPUAP classification system of PU was used (EPUAP and
NPUAP, 2009), excluding category I PU (non-blanchable erythema) would result in a
5.2% (n= 11) incidence rate, which is closer to Zollo’s (1996) findings (7%, n= 20).
- Using different terminology in describing or while counting PU. For example, certain
terms are used interchangeably in some studies, such as referring to skin breakdown as
187
PU (Zollo et al., 1996), or considering redness as another type of skin breakdown
(Schindler et al., 2007), while others consider skin breakdown to be a broader term that
covers several skin problems in addition to PU, such as dermatitis, or intravenous
extravasations (Noonan et al., 2006). However, the use of standardised terminology in
prevalence and incidence studies is thought to be crucial to allow comparability across
variant populations and settings (Kottner et al., 2009b). That said, in this incidence
study, only cases of PU were investigated, and no other types of skin breakdown were
counted.
- Many paediatric PU incidence studies have investigated very specific populations of
children, for example, incidence of occipital ulcers in children post open heart surgery
(Neidig et al., 1989), or incidence of PU in orthopaedic patients visiting one wound care
clinic (Samaniego, 2004).
- Whether there was one, or several, data collectors. This may affect the reliability of the
study’s findings, since different assessors may vary in the way in which they categorise
ulcers. However, the accuracy of ulcers being identified by one rater as opposed to
multi-raters is still unclear (Kottner et al., 2009b).
Searching the literature, two studies were identified which surveyed the same
population as this incidence study, critically ill children (Curley et al., 2003a, McCord
et al., 2004). However, McCord et al.’s study had a different research design (case
control), with a smaller sample size (118 patients), and a larger number of studied risk
factors. No incidence rate was estimated for their sample, as the goal of the study was to
investigate the risk factors in this population. Curley et al. (2003a), on the other hand,
used a prospective design, and a larger sample size. Yet, their study excluded neonates
and premature babies as well as children over 8 years old, which may affect the
generalisability of its results, and the comparability of the size of the problem in other
PICU populations, as compared with the current study.
In Curley et al (2003a), 322 patients were recruited from three PICUs, and 86 of these
patients were seen to develop 199 PUs, giving an incidence rate of 27%. Adding an
extra 27 device-related ulcers would raise the incidence rate even more. Conversely, the
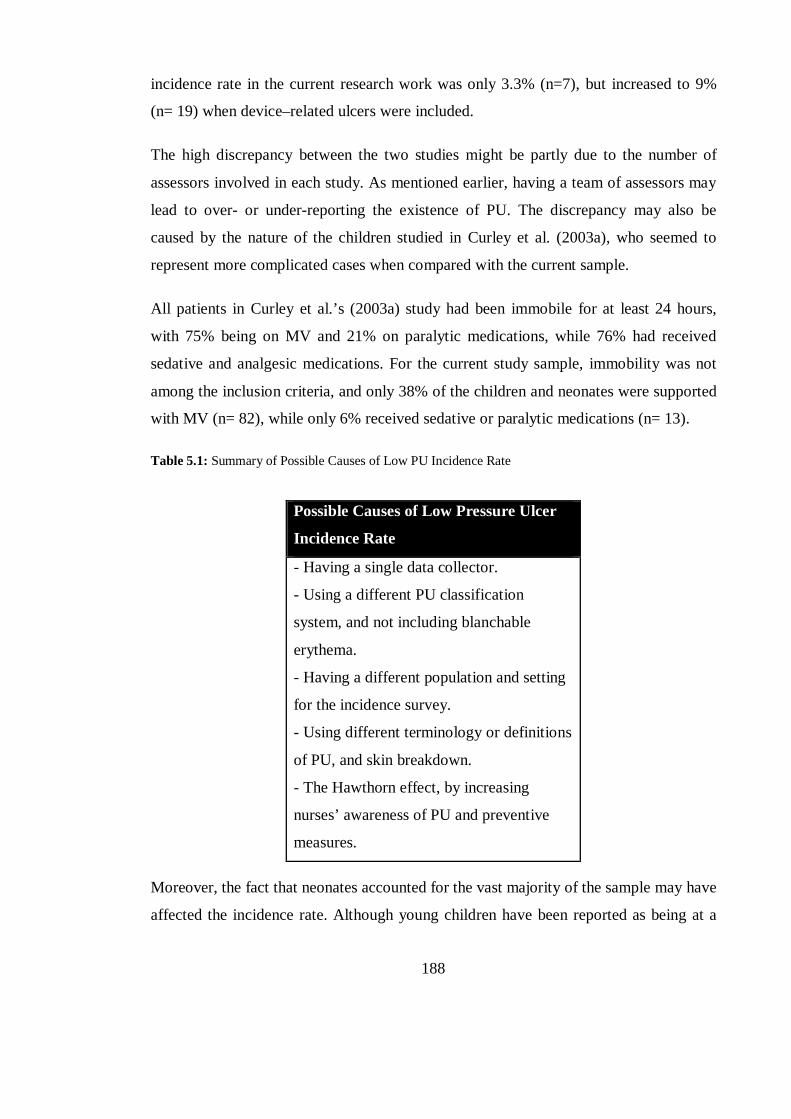
188
incidence rate in the current research work was only 3.3% (n=7), but increased to 9%
(n= 19) when device–related ulcers were included.
The high discrepancy between the two studies might be partly due to the number of
assessors involved in each study. As mentioned earlier, having a team of assessors may
lead to over- or under-reporting the existence of PU. The discrepancy may also be
caused by the nature of the children studied in Curley et al. (2003a), who seemed to
represent more complicated cases when compared with the current sample.
All patients in Curley et al.’s (2003a) study had been immobile for at least 24 hours,
with 75% being on MV and 21% on paralytic medications, while 76% had received
sedative and analgesic medications. For the current study sample, immobility was not
among the inclusion criteria, and only 38% of the children and neonates were supported
with MV (n= 82), while only 6% received sedative or paralytic medications (n= 13).
Table 5.1: Summary of Possible Causes of Low PU Incidence Rate
Possible Causes of Low Pressure Ulcer
Incidence Rate
- Having a single data collector.
- Using a different PU classification
system, and not including blanchable
erythema.
- Having a different population and setting
for the incidence survey.
- Using different terminology or definitions
of PU, and skin breakdown.
- The Hawthorn effect, by increasing
nurses’ awareness of PU and preventive
measures.
Moreover, the fact that neonates accounted for the vast majority of the sample may have
affected the incidence rate. Although young children have been reported as being at a
189
higher risk of developing PU (Neidig et al., 1989, Curley et al., 2003a, Schindler et al.,
2007), especially those of less than one year of age (McCord et al., 2004), no study has
reported an increased risk of PU occurrence in the neonatal population as compared
with that of other children’s age groups. For the possible causes of low incidence rate in
this research see (table 5.1).
Compared with previous neonatal PU surveys (Huffines and Logsdon, 1997, Fujii et al.,
2011), the mean age of the current neonatal sample was greater (M= 36.3 ± 3.2 (27- 42)
vs. 33 ± 3.9 (26-40), and 32.5 (24-41) respectively) and this might have played role in
generating a lower PU incidence rate than in the previous surveys. Of the 169 neonates
in the NICU, 15 had developed PUs (9%), compared with a 19% (n= 6), and 16%
(n=81) incidence rate observed in the NICU in the previous two studies respectively.
Premature babies were reported previously to have a higher incidence of PU
development, because of their immature skin features (Fujii et al., 2011, Curley et al.,
2003a).
Also, the fact that the cases found in the unit at the time of the study were less
complicated compared to those of the previous studies, may have played a role in
producing a lower incidence rate. Neonates with complicated conditions were mostly
excluded from this study either because their condition would not allow the type of
positioning which would facilitate the skin assessment, or because they died before any
follow-up assessments could be carried out. For example, only one baby boy was
established to have been on high frequency ventilation for a diaphragmatic hernia. This
baby died before a follow-up assessment was conducted (i.e. he underwent only the
initial assessment on admission, assessment= 0).
Moreover, it was noticed that a greater number of preventive interventions were
administered in the NICU during this research than in either of the other two units
surveyed (the PICU, and GIMU). Although it had not been intended to document any
preventive intervention in this work, this could be a reason for the low incidence rate
which was found for the NICU sample. Furthermore, in regard to the overall incidence
rate, it may be the case that a Hawthorn effect developed while the study was carried
out. That is, by increasing nurses’ awareness of PU prevention, the study itself may
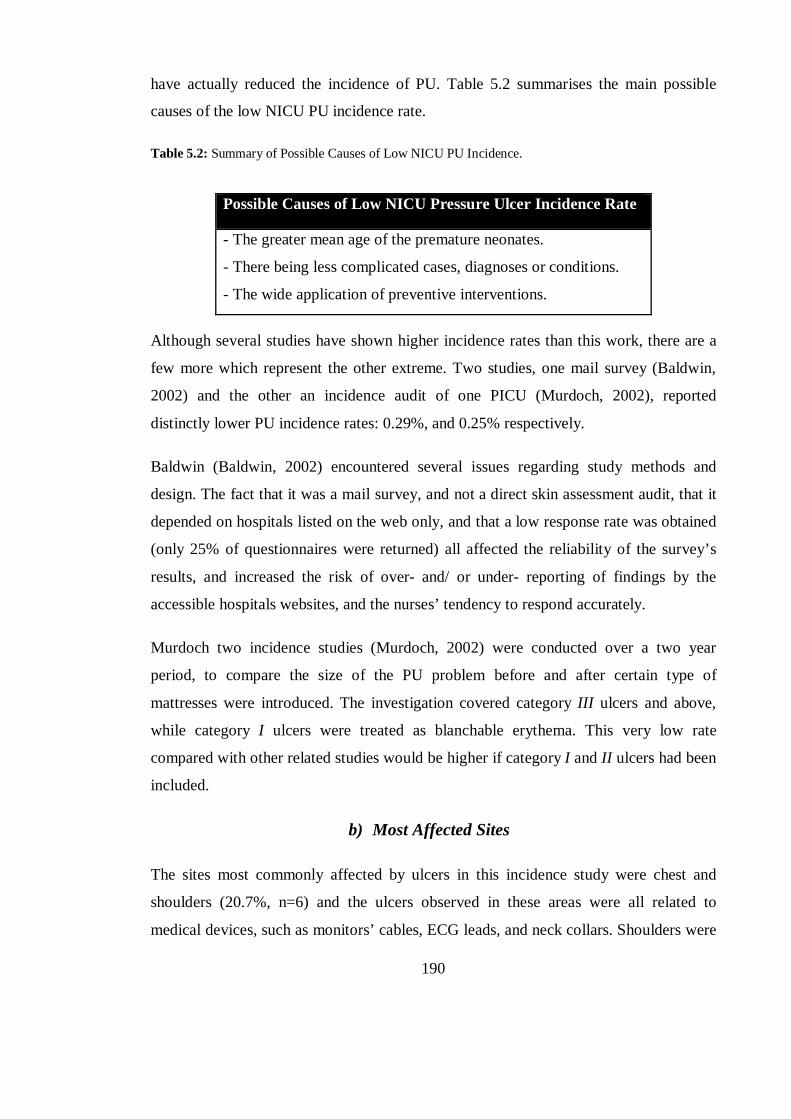
190
have actually reduced the incidence of PU. Table 5.2 summarises the main possible
causes of the low NICU PU incidence rate.
Table 5.2: Summary of Possible Causes of Low NICU PU Incidence.
Possible Causes of Low NICU Pressure Ulcer Incidence Rate
- The greater mean age of the premature neonates.
- There being less complicated cases, diagnoses or conditions.
- The wide application of preventive interventions.
Although several studies have shown higher incidence rates than this work, there are a
few more which represent the other extreme. Two studies, one mail survey (Baldwin,
2002) and the other an incidence audit of one PICU (Murdoch, 2002), reported
distinctly lower PU incidence rates: 0.29%, and 0.25% respectively.
Baldwin (Baldwin, 2002) encountered several issues regarding study methods and
design. The fact that it was a mail survey, and not a direct skin assessment audit, that it
depended on hospitals listed on the web only, and that a low response rate was obtained
(only 25% of questionnaires were returned) all affected the reliability of the survey’s
results, and increased the risk of over- and/ or under- reporting of findings by the
accessible hospitals websites, and the nurses’ tendency to respond accurately.
Murdoch two incidence studies (Murdoch, 2002) were conducted over a two year
period, to compare the size of the PU problem before and after certain type of
mattresses were introduced. The investigation covered category III ulcers and above,
while category I ulcers were treated as blanchable erythema. This very low rate
compared with other related studies would be higher if category I and II ulcers had been
included.
b) Most Affected Sites
The sites most commonly affected by ulcers in this incidence study were chest and
shoulders (20.7%, n=6) and the ulcers observed in these areas were all related to
medical devices, such as monitors’ cables, ECG leads, and neck collars. Shoulders were
191
mentioned as a frequent site of PU in one study (McCord et al., 2004)under the category
of ‘other’, and the ulcers in this area were thought to be caused by devices pressing on
the skin, friction and shear forces, or incontinence. Curley et al. (2003a) also cite the
chest as one of the sites worst affected by category III PUs (Curley et al., 2003a).
Occipital ulcers have been found to be one of the most frequent types of PU in children
– particularly neonates and young children - in many paediatric studies (Willock et al.,
2000, Murdoch, 2002, Neidig et al., 1989, McCord et al., 2004). In this study, only 3
ulcers affected the occiput (10.3%). This may be due to the fact that most of the ulcers
found were device-related and were therefore located in areas in direct contact with
equipments such as tubes and cables.
According to the main findings of this thesis, further areas badly affected by ulcers were
other parts of the head and face; such as the nose and mouth sites (13.8%, n= 4 for
each). These types of ulcers have been frequently documented in previous literature
(Zollo et al., 1996, Fujii et al., 2011, Curley et al., 2003a). In Curley et al.’s (2003a)
study, of the 60 superficial ulcers which were seen to develop, 19 were located on the
head (32%). Fujii et al. (2011) noticed that nasal ulcers were the most common type
amongst their neonatal population (50%, n=7) and this was thought to be a result of
using nasal CPAP machines. Likewise, this would explain nasal PU occurrence in the
current study since all nasal ulcers were a consequence of nasal CPAP usage, except for
one which resulted from the insertion of a nasogastric tube (NG tube).
One RCT (Yong et al., 2005) which studied all low birth-weight infants admitted to one
NICU, reported that nasal injuries linked to the use of a face mask occurred in 12
infants out of 41 (29%), compared to 17 infants out of 48 who developed nasal injuries
following the use of a prong (35%). However, the aim of this study was to differentiate
between children receiving CPAP by either a face mask or prong, and to measure the
associated risks of developing nasal injuries. No intention was made to track the
incidence rate of nasal injury; yet, this study did show that nasal trauma would occur
when using CPAP through both a nasal prong and facial mask.
192
Zollo et al. (1996) reported the nose as the most common site of PU in one PICU (28%,
n= 33). However, this percentage included other types of skin breakdown as well as
ulcers, such as tape burn. In this research, data on tape burn (an adhesive injury) was
collected separately and produced an incidence rate of 18.4% (n= 39). If the combined
incidence is calculated, the rate would be much higher in this incidence study (27.3%,
n= 58) and would be much closer to Zollo et al.’s (26%, n= 71).
Ankle and feet were found to be the second most common sites of PUs along with nose
and mouth in the incidence study of this thesis (13.8%, n= 4). These sites were similarly
mentioned in previous studies (McCord et al., 2004, Fujii et al., 2011, Samaniego,
2004). The feet were one of the areas worst affected by ulcers following nose in seven
NICUs (14%, n= 2) (Fujii et al., 2011). Many studies have also reported heel PUs
(Baldwin, 2002, Willock et al., 2000, Murdoch, 2002).
In a retrospective study of 50 orthopaedic patients with PU (Samaniego, 2004), most
ulcers recorded had affected the lower extremities of the body, particularly the feet, and
they were associated with the use of equipment such as orthoses, casts and wheelchairs.
The author highlighted the effect of patients’ age on ulceration sites in this population,
as sacral ulcers occurred more often as children increased in age. Moreover, most of the
children in this sample were aged between 15 and 19 (32%, n= 16). The comparatively
old age of the children may have played a role in the fact that more lower ulcers than
those which affected the upper extremities or head were found.
In addition to the previously mentioned study (Samaniego, 2004), Baldwin (2002)
found that children are like adults in terms of the sites on which their ulcers are found,
since most identified ulcers were observed in the areas under the waist, especially on the
sacrum or coccyx (40%), and heels (27%). This study, however, had several limitations
due to the chosen research design, as mentioned previously.
In the current incidence study, many ulcers were documented under the sub-item
‘others’. This category included ulcers which affected the back, buttocks, arms, and ears
(17.2%, n= 5). All these were device related; arm ulcers were a result of the friction of
cuff pressure on patients’ skin, and another was caused by an ID band used on one
193
neonate. One back and one buttock ulcers resulted from lying on monitor cables, and
one ear ulcer was caused by the use of face masks supplying O2.
One study (Zollo et al., 1996) found 16 buttock ulcers among 71 PU-patients in one
PICU (13.9%), while another documented some patients with ear and coccyx ulcers
(Curley et al., 2003a). Baldwin, in her mail survey (2002), also noticed 40% of under
the waist PUs in paediatric patients were located in the sacrum or coccyx.
c) Pressure Ulcer Categories
Most ulcers which were seen were superficial (89.7%, n= 26), as was also the case in
previous literature (Willock et al., 2000, Neidig et al., 1989, Zollo et al., 1996, Curley et
al., 2000, Fujii et al., 2011, Baldwin, 2002, Samaniego, 2004). In the current study,
category II PUs were the most prevalent (48.3%, n= 14) followed by category I ulcers
(41.4%, n= 12), then category III (10.3%, n= 3).
Category II ulcers were also documented before in previous paediatric incidence studies
as being the most prevalent category of identified ulcers. For example, in a study of
children who had survived open heart surgery, 50% of detected occipital ulcers were
category II (n=5), while five others were category I in one PICU (Neidig et al., 1989).
Another multisite survey of 81 neonates revealed that 68.6% (n=11) were category II,
followed by 21.4% (n= 3) category I ulcers (Fujii et al., 2011). Also, Baldwin’s mail
survey (2002) showed that category II PU were the most commonly occurring type.
Samaniego (2004) too, noticed that category II ulcers were the most frequently observed
in a retrospective study of 50 PU orthopaedic children (74%, n= 37).
The high incidence of superficial PUs in this incidence study might be a result of the
fact that most ulcers observed in this sample were device related (63%, n= 12) and most
of this type are usually category I and II (Schluer et al., 2009). Moreover, because
children were not assessed on a daily basis, the ulcers might have surfaced on days in
which there was no assessment (assessment was done three times weekly in the first two
weeks), hence being first observed as category II.
194
On the other hand, a few other studies have identified category I ulcers as the most
frequently occurring (Curley et al., 2003a, Willock et al., 2000). In Curley et al.,
category I ulcers were the most common (70%, n= 139), followed by category II (27%,
n= 54), then category III (3%, n=6). In Willock et al.’s (2000) study, all of the ulcers
identified were either blanchable or non-blanchable erythema (n= 6), and none were
classified as more sever categories.
Most PU-patients had a single ulcer (63.2%, n= 12), compared with seven patients with
multiple ulcers (36.8%) in the current study. Likewise, previous research has reported
single ulcers as the most frequently observed scenario in paediatric PU-patients
(Willock et al., 2000, Fujii et al., 2011, Neidig et al., 1989).
d) General Characteristics of the Sample
Of the total 281 patients identified as potential participants for this study, only 212 met
the inclusion criteria (75.4%). Most recruited children were in the NICU (79.7%, n=
168), followed by the PICU (19.8% n= 42), and GIMU (0.5%, n= 1). None were
recruited from the GICU during the five month long data collection period. These
patients were recruited between December 2011 and May 2012.
Most PU incidence studies of paediatric patients were conducted in PICUs (McCord et
al., 2004, Schindler et al., 2007, Curley et al., 2003a, Zollo et al., 1996, Murdoch, 2002)
and two identified took place in NICUs (Huffines and Logsdon, 1997, Fujii et al.,
2011). As in this study, a spotlight on paediatric critical care units was sought because
of the increased evidence that their patients are at higher risk of PU formation (Willock
and Maylor, 2004, Schmidt et al., 1998, Curley et al., 2000, Zollo et al., 1996, Neidig et
al., 1989).
Of the 69 patients excluded from this study of the research, the majority were omitted
because they underwent fewer the minimum requirement of two assessments (60.9%,
n= 42). For any child who was assessed only once (on admission), it was impossible to
track the development of any PU, so they had to be excluded. Moreover, 19 children
195
failed to give consent (27.3%), while four other children were cared for in isolation
units (5.8%) and were excluded because of their higher susceptibility to infection.
Two more children had been admitted to the ICU with home-acquired ulcers, one
patient was discovered to be over 18 years old, and another had a severely deteriorated
condition especially when repositioned or moved, which made it impossible for the
investigator to properly conduct the skin assessment. Children who were in isolation or
those with deteriorated conditions when positioned have also been excluded in previous
similar paediatric studies (Fujii et al., 2011, McLane et al., 2004).
Of the children included in the final sample, more than half were male (58.5%, n= 124),
and all were aged between 3 days and 17 years old, which is partially the same age
range covered by previous paediatric incidence studies (Willock et al., 2000, McCord et
al., 2004, Baldwin, 2002, Samaniego, 2004, Schindler et al., 2007, Willock et al.,
2005a). This age range was targeted so that no children - even preterm babies - would
be excluded. However, most of the study sample was composed of neonates (0 - 30 days
old) (79.2%, n=168), of which full term babies constituted 46% (n= 97) of the total
sample, and preterm babies constituted 37% (n=79). On the other hand, the age group
least well represented in the study were preschoolers (children age > 3 years up to five
years) (0.9%, n= 2).
In most cases, follow-up assessments were discontinued when the patient was
discharged (95.3%, n= 202), or due to the patient’s death (4.2%, n= 9). Only one patient
underwent the maximum number of assessments; that is, 12 over a two month period.
The relatively high number of patients who died during the study might be a reflection
of the severity and acuity of their health conditions; yet, none of these patients had
developed PU during the follow-up period. This might be related to the fact that their
death occurred soon after their admission, before they had a chance to develop PU. The
high mortality rate may have played some role in lowering the incidence rate of PU in
this sample.
The number of follow-up assessments carried out for each patient in the sample ranged
from two consecutive assessments up to the maximum of 12 assessments, including
196
assessment zero (the initial assessment), with a median of two assessments. The vast
majority of the patients had at least two follow-up assessments in addition to the initial
assessment (75.5%, n= 160). More specifically, more than half of the children had two
assessments (63.2%, n= 134), followed by those who had three (12.3%, n= 26), and four
assessments (7.1%, n= 15). Only one child had 12 assessments (0.5%); however,
another 4 children underwent more than 9 assessments (1.8%).
Most children in this sample had respiratory problems as the primary medical diagnosis
(59.9%, n= 127), followed by metabolic and infectious diseases respectively (11.8%, n=
25; and 10.8%, n= 23). Children admitted with respiratory diagnoses were thought to be
at a higher risk of PU occurrence (Schindler et al., 2007), than children who were
admitted to the PICU with different conditions (P= 0.008).
5.5.2.2 Risk Factors for PU development
To ease explaining the contributing factors for PU development in this study sample,
the discussion was divided under two major headings derived from the statistical
analysis: univariate and multivariate. Risk factors based on univariate analyses were
then classified under three major sub-headings: general risk factors, Glamorgan sub-
items, and Braden Q sub-items. As regards the multivariate heading, risk factors were
discussed with reference to four major models: the Braden Q sub-items, the Glamorgan
sub-items, the Braden Q sub-items with general risk factors / predictors, and the
Glamorgan sub-items with general risk factors / predictors. This was done for easier
identification and follow-up of the main findings. See diagram 5.2 below:
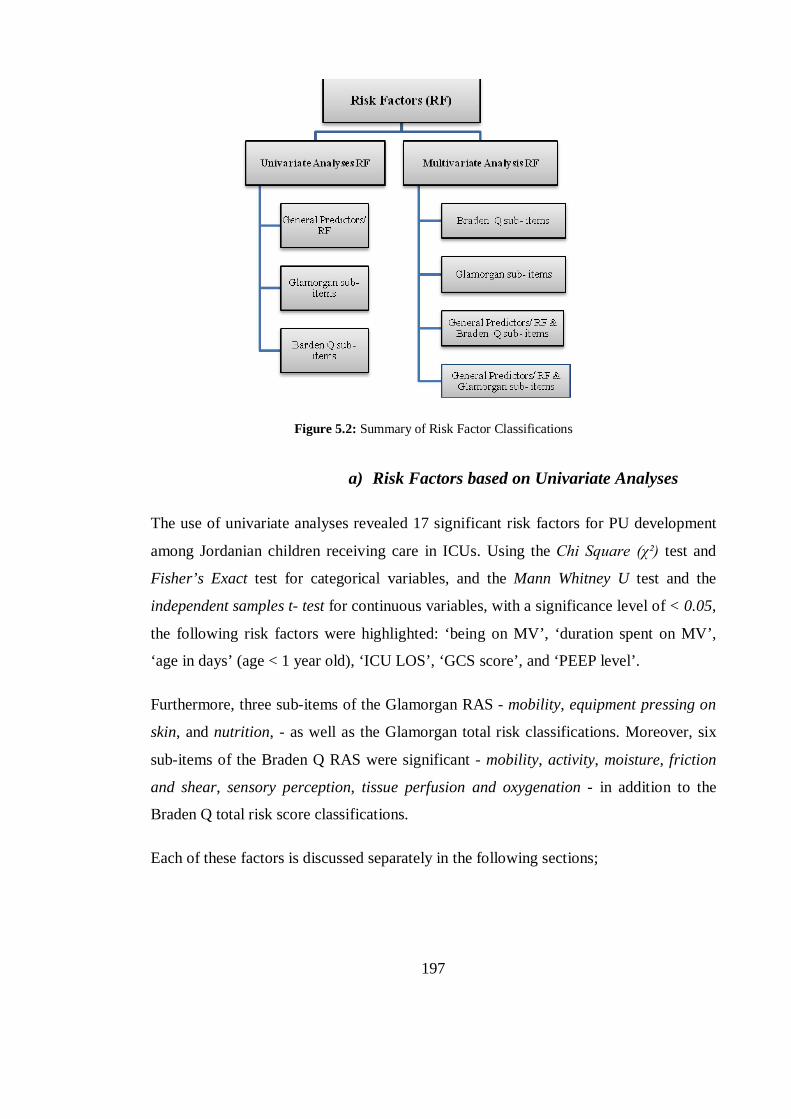
197
Figure 5.2: Summary of Risk Factor Classifications
a) Risk Factors based on Univariate Analyses
The use of univariate analyses revealed 17 significant risk factors for PU development
among Jordanian children receiving care in ICUs. Using the Chi Square (χ²) test and
Fisher’s Exact test for categorical variables, and the Mann Whitney U test and the
independent samples t- test for continuous variables, with a significance level of < 0.05,
the following risk factors were highlighted: ‘being on MV’, ‘duration spent on MV’,
‘age in days’ (age < 1 year old), ‘ICU LOS’, ‘GCS score’, and ‘PEEP level’.
Furthermore, three sub-items of the Glamorgan RAS - mobility, equipment pressing on
skin, and nutrition, - as well as the Glamorgan total risk classifications. Moreover, six
sub-items of the Braden Q RAS were significant - mobility, activity, moisture, friction
and shear, sensory perception, tissue perfusion and oxygenation - in addition to the
Braden Q total risk score classifications.
Each of these factors is discussed separately in the following sections;
198
i) General Risk Factors / Predictors
This group of risk factors includes predictors of PU which were identified using
univariate analyses. It contains general factors that are related to the PU patients’
characteristics, laboratory tests, or their stay in the unit, and that were collected initially
based on the related previous literature. The factors are ‘being on MV’, ‘use of PEEP’,
‘age in days’, ‘GCS score’, ‘ICU LOS’, and ‘duration spent on MV’, and all are
discussed below, except the last variable which is discussed later in the multivariate
analysis section.
Being on Mechanical Ventilation
This variable was found to be significantly related to PU development in this population
(χ²= 20.4; d.f. = 1; p<0.001). Patients who developed PU were found to be supported
on mechanical ventilation more often than those who remained PU-free, since 89.5% of
PU patients were on MV (n= 17), compared with 33.7% of the PU-free patients (n=65).
This finding was supported by several previous studies. Zollo et al. (1996), for example,
reported 59 patients out of 65 with impaired skin integrity were supported on MV,
compared with 50 out of another 65 PU-free patients. MV was also found to be a
significant risk factor for PU development in 322 children aged from 21 days up to 8
years in three PICUs (Curley et al., 2003a), where mechanically ventilated patients were
found to be eight times more at risk to develop PU than patients who were not
supported with MV, this result based on both univariate and multivariate analyses (OR=
7.84, 95% CI, 3.05-20.1, P<0.001).
Schindler et al. (2007) also found that mechanically ventilated paediatric patients had a
higher risk of developing skin breakdown and redness than PU-free patients (P< 0.001),
yet this difference failed to prove significant based on a multivariate analysis
(OR=1.71; 95% CI, 0.82-3.56, P=0.16). patients supported with specific types of MV,
such as HFOV, were also noticed in Curley et al. (2003a) to be at seven time more risk
to develop PU than patients not supported with such type of ventilation (OR= 7.32,
95%CI, 2.23-24.1, P= 0.001).
199
Furthermore, other studies have reported intubation as a risk factor, rather than mention
MV specifically. One multisite neonatal incidence study (Fujii et al., 2011) reported
endotracheal intubation as one of two highly significant risk factors for PU development
in this population (OR= 4; 95% CI, 1.04- 15.4, P= 0.042). MV was proved significant
by both univariate and stepwise LR. Another case control study (McCord et al., 2004)
which examined over 118 children in one 30-bed ICU, found that intubated children had
a higher risk of developing PU (P=0.002), although this factor was not significant with
the significance level set to < 0.002.
The effects of MV or of the intubation itself on children’s susceptibility to PU
development are believed to be different. Ventilated patients are usually sedated and
have poor perception so they cannot communicate any sense of pressure or discomfort,
which might increase their risk for PU (Curley et al., 2003a). On the other hand,
intubation affects the number of times the children would be repositioned, which
increases the magnitude and duration of pressure on their skin, resulting in PU
development. Furthermore, intubated children, and particularly neonates, would usually
be supported on nasal CPAP, which is thought to increase nose compression necrosis
and nasal deformities (Fujii et al., 2011).
The way intubation affects children’s risk of PU seems to be different than that of MV
itself, since MV indicates the patients’ difficult respiration, oxygen saturation and
hypoxia level, but intubation may increase the compression on patient’s skin by the
used tracheostomy or endotracheal tube, also, for this study, there was no significant
difference between the PU- and PU-free patients in relation to hypoxia.
Positive End Expiratory Pressure (PEEP level)
Positive end expiratory pressure (PEEP) is revealed to be significantly related to PU
development in this study of ICU patients (U= 361.5, Z score= -1.989, P= 0.047). PEEP
had been previously identified as a risk factor for PU development in one 30 bed PICU
case control study, where a high PEEP level was noticed to be closely correlated with
PU development (P= 0.002). However, the opposite was observed in this thesis. That is,
200
PU patients were seen to have lower PEEP levels compared with those delivered to the
PU-free patients (Median (IQR) = 5(5.5) vs. 9.7(5)).
McCord et al. (2004) suggest that high PEEP increases children’s risk of PU, because of
its indirect effect on reducing the frequency of positioning. That is, a high PEEP level is
usually applied to children with complicated cases, for whom nurses prefer to limit
positioning to avoid further deterioration.
However, the low level of PEEP observed in this research could be related to the high
number of neonates in the sample, since most mechanically ventilated PU patients were
neonates (73.6%, n=14 out of 19 PU-patients), and 64% of them were on a low PEEP
level (n= 9). Low PEEP settings of 3-5 cm H2O were recommended as the basic
ventilator setting that neonates should receive when MV is initiated, while older
children or those with more complicated cases were recommended to have higher PEEP
levels (Khilnani, 2011, Jaypee Brothers, 2006).
Thus, the default low PEEP level was the most common in this paediatric sample.
Moreover, a low PEEP of 3-4 cm H2O has been described as the physiologic level in
which children without muscle relaxant need to receive (Khilnani, 2011). That is also
applied to this sample, in which the vast majority of mechanically ventilated children
were not on sedative or paralytic medications.
Age in Days (less than one year old):
Infants (children under one year old) were the most affected with PU other than older
groups of children (78.9%, n=15). An age of less than one year old was found to be
significantly related to PU development based on the univariate analysis (U= 595, z score
= -3.527; P< 0.001), as in many previous paediatric studies (Neidig et al., 1989, Zollo
et al., 1996, Curley et al., 2003a, Huffines and Logsdon, 1997, Baldwin, 2002,
Schindler et al., 2007, Suddaby et al., 2005).
Critically ill children who are one year old or younger was reported to have the highest
risk of PU development of all age groups of children (OR= 1.27; 95% CI 1.02-1.57; P=
0.03) (Curley et al., 2003a). Moreover, those who are under two years old have been
201
reported to have double the risk of developing PU compared to older children, based on
multivariate analysis (OR= 2.57;95%CI 1.39-4.47; P= 0.002) (Schindler et al., 2007).
One more study (Zollo et al., 1996) found, through univariate analysis, that age is
significantly related to skin breakdown in PICU, although this failed to show
significance based on multivariate analysis.
Children under 3 years old have been noted to have a higher incidence of PU
occurrence than older children in many different populations, such as medical-surgical
ward patients (Suddaby et al., 2005), cardiac patients following open heart surgery
(Neidig et al., 1989), and general ward patients (McCord et al., 2004), also, in the
previously mentioned McCord et al’ study, 36% of PUs occurred in children aged one
year and younger (n= 21).
A few other studies have mentioned young age as a typical characteristic of children
who develop PU even though they did not explicitly study age as a risk factor (Willock
et al., 2000, Baldwin, 2002, Suddaby et al., 2005). For example, Baldwin (2002), found
that children under 10 years old accounted for 47% of the total number of ulcers
identified, yet, this descriptive data related to a mixed incidence and prevalence mail
survey. Also, Suddaby et al.’s (2005) study, as previously mentioned, had a
questionable cross-sectional research design, making it difficult to infer any relation
between young age and the occurrence of skin breakdown.
Willock et al. (2000) have also reported that PU-patients were infants and young age
children, specifically those with occipital PU. However, Samaniego’s (2004) findings
contrasted with those previously discussed as, in this study, teenagers (15-19 yrs) were
the age group most affected by PU (32%, n=16). However, this could be a unique result
for this specific orthopaedic population.
Glasgow Coma Scale Score (GCS)
The GCS is an indicator of patients’ level of consciousness, established by assessing
their eye opening response, as well as their verbal and motor abilities in responding to
202
an external stimulus (Holmes et al., 2008). A low GCS score indicates a lower level of
consciousness and higher possibility of brain injury.
Patients who have a diminished level of consciousness might be unable to sensate
pressure or pain, so they would be unable to change position accordingly, and this may
increase their risk of developing PU (Willock et al., 2000, Willock et al., 2005b).
Moreover, patients with low GCS scores are usually patients who are sedated, on MV,
or those who have serious head injuries which would also increase their risk of
responding poorly to pressure, and hence of PU occurrence (Willock et al., 2000).
For the current study, GCS appeared to have a significant correlation with PU
development (U= 712.5, Z score= -4.61, P < 0.001). PU patients showed lower GCS
scores compared with PU-free patients (Mean± SD= 9.5± 3.8, Median (IQR) = 11(1) vs.
Mean= 10.9± 3.3, median= 14(3)). This finding indicates that patients who developed
PU later in the study were less conscious and oriented compared with the more
conscious PU-free patients. Only one previous study (Willock et al., 2000) has reported
low consciousness level as a characteristic of 11 PU- paediatric patients out of 18
children with PU (72%), yet it was a descriptive mixed incidence and prevalence study.
Despite the paucity of paediatric literature which describes GCS as a risk factor for PU
development, it could be implicitly combined with many other factors that are well
documented in previous literature as PU risk factors, such as sedation application, and
MV usage (Curley et al., 2003a, Neidig et al., 1989). These measures would necessitate
reducing patients’ consciousness level, to relieve discomfort and counter resistance to
intubation. One study (Dixon and Ratliff, 2005) also identified children who were more
prone to ulcers to be those who received sedation, were on MV, immobile, hypotensive
and critically ill. However, these descriptive data were based on a cross-sectional
prevalence study.
The PRISM score (Paediatric Risk of Mortality Score) has also been named as one of
the risk factors for PU and skin breakdown occurrence in paediatrics (Zollo et al., 1996,
Schindler et al., 2007). It incorporates several indicators of patients’ physiological

203
health assessed within the first 24 hours of admission to PICU, and GCS is one of these
indicators (Butler, 2007).
Furthermore, achieving higher scores through the use of specific scales to measure
paediatric patients’ neurological response was found to be associated with PU
occurrence in ICU patients (Zollo et al., 1996, Curley et al., 2003a). Zollo et al. (1996)
found that children who achieved higher POPC scores were most affected with skin
injuries, as Curley et al. (2003a) who found that scoring high by Ramsay scale was
associated with higher risk of category II and above PUs. For these both mentioned
scales, higher scores mean poorer neurological response.
On the other hand, many paediatric RASs have a specific category to measure patients’
levels of perception, sensation and consciousness (Bedi, 1993, Quigley and Curley,
1996, Cockett, 1998, Barnes, 2004), and these are strongly linked with patients’ GCS
scores. For example; in the Braden Q RAS, which has appeared as a significant
indicator of PU development in paediatrics (Schluer et al., 2009, Curley et al., 2003a),
one of the sub-items is concerned with measuring sensory perception. According to the
authors, this could be based on measuring consciousness and/or measuring sensation
through the GCS or measuring sedation level using the State Behavioural Scale
(Noonan et al., 2011). However, risk scales and their sub-items are discussed later in
this chapter as distinct risk factors.
ICU Length of Stay (LOS)
Patients’ LOS (in days) in ICUs in this research have been shown to be significantly
related to PU occurrence (U= 437, Z score= -5.57, P<0.001). With a range from 3 days
up to 56 days, patients who developed PU spent significantly longer periods of time in
ICU compared with those who remained free of ulcers (median (IQR) = 13(13) vs. 5 (5)
respectively). However, this is often controversial, since it is not absolutely clear
whether the high LOS increased the risk of PU, or if having PU increased the need to
stay in hospital / ICU for lengthy periods.
204
A lengthy stay in ICU has already been reported as a factor which contributes to PU
development. Neidig et al. (1989) noted that children who survived open heart surgery
and who stayed in PICU for longer than eight days had a higher incidence of occipital
PU occurrence (χ²= 9.83, d.f. = 2, P= 0.007). Although the mean length of stay in the
ICU for the current sample was longer than in Neidig et al.’s study, the range difference
between PU patients and PU-free patients was almost the same ((19.5±15.3 vs.
11.2±10.7) and (12.9±12.6 vs. 4.9±5.2) respectively). On the other hand, Zollo et al.
(1996) noted a lower mean length of stay for skin breakdown patients than that
observed in the sample investigated for this thesis (9.75±12.7 vs. 19.5±15.3).
On the other hand, it has been observed elsewhere that shorter LOS is more closely
correlated with PU occurrence. For example, this was the case in McCord et al.’s case
control study (2004), where an ICU LOS as low as four days was attributed to the
higher incidence of PU in this population (P= 0.001). Using univariate and multivariate
analyses, Schindler et al. (2007) revealed the same length of stay risk period (4 days) in
patients with impaired skin integrity (OR= 1.17; 95% CI 1.09-1.25; P <0.001).
Lengthy periods in PICU have also been previously discussed as a contributing factor
for PU formation, because it is thought to be connected with having limited mobility
and fewer positioning times (McCord et al., 2004, Neidig et al., 1989). Sometimes, it
was also highlighted as an indication of the time the patients had spent being intubated
(Neidig et al., 1989). In addition, this factor may be interrelated with other risk factors,
such as suffering from poor nutrition and weight loss (McCord et al., 2004).
ii) Risk Factors (based on the Glamorgan RAS)
According to the univariate analyses, only three sub-items of the Glamorgan RAS were
significantly related to PU development among the critically ill children. These are:
mobility (U= 1125, Z score= -3.428, P< 0.001), existence of pressing equipments (χ²=
11.94, d.f= 1, P= 0.001), and nutrition (χ²= 4.28, d.f= 1, P= 0.038), in addition to the
Glamorgan total risk classifications: ‘no risk’, ‘risk’, ‘high risk’, and ‘very high risk’
(Fisher’s= 19.73, d.f= 3, P< 0.001). PU-patients were identified as having restricted
205
mobility (63%, n= 12), had a poorer nutritional condition (94.7%, n= 18), and all had
medical equipment pressing or surfaces rubbing against their skin (n= 19).
Restricted Mobility
Around 63% of all patients who developed PU in this incidence study had different
levels of immobility, which was assessed using the Glamorgan scale (n= 12). Based on
Glamorgan, 21% of PU-patients (n=4) suffered ‘great difficulty’ in positioning and
mobilisation, while seven patients had ‘some limitation’ in mobility that affected their
developmentally-appropriate physical movement, and an equal number had ‘normal
mobility’ for their age (36.9% for each category). Only one patient ‘needed assistance’
in mobilising and positioning (5.3%).
For this sub-item of the Glamorgan scale, any problem affecting child mobility,
physical activity, or positioning feasibility was counted as a risk indicator for PU
occurrence (See Appendix 1.8 for terminology of the Glamorgan RAS items).
Although almost all paediatric RASs have limited mobility as one of their risk
categories (Garvin, 1997, Cockett, 1998, Willock et al., 2007, Quigley and Curley,
1996, Bedi, 1993, Pickersgill, 1997, Huffines and Logsdon, 1997, Suddaby et al., 2005,
Olding and Patterson, 1998a, Barnes, 2004, Waterlow, 1998), the meaning of this term
varies widely. The Braden Q scale differentiates between mobility, which is defined as
the child’s ability to change position, or to move in bed, and activity level, which is
defined as the child’s ability to ambulate based on their developmental levels (Noonan
et al., 2011, Quigley and Curley, 1996). (See Appendix 1.9 for terminology of the
Braden Q RAS items).
The neonatal skin risk assessment tool NSRAS (Huffines and Logsdon, 1997), and the
modified neonatal / infant Braden Q RAS (McLane et al., 2004), were both developed
based on the original Braden Q RAS, and hence shared the same definitions of mobility
and activity sub-items, while at the same time took the different developmental levels of
children into consideration. The mobility sub-item in the NSRAS (Huffines and
Logsdon, 1997), however, was omitted from the inter-rater reliability pilot study of the

206
tool, because of its poor reliability score between different ratings and different
assessment days of 32 NICU’ patients.
Another newly developed scale, the Braden Q+P risk scale (Galvin and Curley, 2012),
based on the Braden Q, is used to predict surgical patients’ risk of developing ulcers,
before, during and after their operations. In this, activity level has been omitted since all
children in the operation room (OR) would be sedated. Also, the mobility sub-item is
measured according to the length of the surgery rather than by the child’s ability to
change position. How frequently the OR nurse changes the child’s position is also
documented.
Other paediatric scales do not distinguish the patient’s ability to control body position
from that of being able to ambulate. Most refer to mobility as the ability to change
position and walk in varying degrees, according to the child’s condition, such as being
restless or in need of assistance (Bedi, 1993, Cockett, 1998, Garvin, 1997, Pickersgill,
1997, Olding and Patterson, 1998a). However, the mobility and activity categories
should be able to distinguish risk between the different and varied age groups of
children and infants, based on their developmental levels (Willock et al., 2000)
Waterlow (1998) did not mention mobility explicitly in her paediatric version of the
Waterlow assessment tool; rather, a question related to the child’s physical abilities was
formulated. However, she did mention that any immobile child with a mix of other risk
factors would be much more susceptible to developing PU.
Children with restricted mobility have been previously said to have a higher risk of
developing PU and skin breakdown (Willock et al., 2000, Huffines and Logsdon, 1997,
Samaniego, 2004), and further studies have highlighted several risk factors that are
interrelated with patients’ mobility, such as taking paralytic and sedative medications
(Curley et al., 2003a, Zollo et al., 1996, McCord et al., 2004), being intubated or on MV
(Neidig et al., 1989, McCord et al., 2004, Curley et al., 2003a, Fujii et al., 2011,
Schindler et al., 2007), the need for positioning / infrequent positioning or using special
beds for turning (McCord et al., 2004, Fujii et al., 2011).
207
These factors are different from mobility itself, but have been noted to affect patients’
mobility and activity. Patients on sedation or who are mechanically ventilated are
unable to independently change their positions, or to move their body spontaneously on
feeling pressure or pain. Being unable to respond to prolonged pressure or intense
friction and shear forces, decreases the skin’s tolerance of these forces, which results in
compression on patients’ skin, ischemia, and necrosis (Neidig et al., 1989).
Murdoch (2002), reported the case of a 10 year old child who was admitted to hospital
with several spine fractures following an RTA. Because of the child’s delicate
condition, cardiac instability, and multiple fractures, he had been confined to a spinal
board for more than 36 hours. The child had developed category III and IV ulcers on
both the occiput and sacrum. According to Murdoch’s experience, any child who is not
fully well or immobile is at risk of developing PU, and so requires special care.
One incidence and prevalence study (Willock et al., 2000) found that most PU-patients
identified had impaired mobility (89%, n= 16). This was thought to decrease patients’
ability to turn or to change position when feeling pressure or pain. Another multi-site
study (Willock et al., 2005b) of 54 PU-patients reported that the majority had limited
mobility, and more than half were completely immobile. However, no statistical
significance of this feature was achieved.
One more retrospective chart audit of 50 patients who had PUs (Samaniego, 2004),
which took place in a hospital wound clinic, found that immobility is a risk factor for
PU development among orthopaedic patients. Around 14.6% of PU-patients (n=8) had
Myelodysplasia as the primary diagnosis. The mobility predictor, based on the Braden
RAS, gave the lowest scores for this particular population and lower scores, according
to this scale, indicate a higher risk of PU development (Mean ± SD= 2.3 ± 0.74).
Impaired Nutrition
All except one of the PU-patients in the current research complained of impaired
nutrition, as assessed according to the Glamorgan RAS (94.7%, n= 18), yet a high
percentage of PU-free patients did so as well (69.4%, n=134). Thus, based on this
208
Glamorgan sub-score, around three quarter the whole sample had suffered some sort of
nutritional problems (72%, n= 152). Impaired nutrition has also been noticed to be a
feature of PU-paediatric patients in previous studies (Huffines and Logsdon, 1997,
Willock et al., 2000, McCord et al., 2004, Murdoch, 2002).
In the current study, nutrition was scored according to the initial condition of the patient
on admission, even though it has been established elsewhere that it is best to score this
item over time (Curley et al., 2003a). Another reliability study (Huffines and Logsdon,
1997) found that the best inter-rater reliability coefficient of nutrition sub-score was on
the third day after the birth of neonates (r= 0.99), and the worst was on the first day (r=
0.77). However, in the univariate analysis, no significant difference was detected
between these different scores across seven follow-up days.
Therefore, the initial assessment was used to estimate children’s risk of PU in this
study, because the researcher was eager to make a decision about this sub-item’s ability
to predict patients’ risk in the early stages of their admission. Also, the high turnover
rate of patients admitted to the ICUs make it difficult to follow this item in these
patients for longer periods, since most of the sampled patients had ICU LOS less than
three days. However, assessing the nutritional condition of patients on the admission
day may account for the high percentage of PU-free patients who scored risk based on
this sub-item.
Impaired nutrition was one of the three most reliable indicators of skin breakdown in a
neonatal population in research by Huffines and Logsdon (Huffines and Logsdon,
1997), and in Willock et al. (2000), 16 out of 18 PU-patients were on diets that were
considered inappropriate for their age (89%). However, Willock et al.’s findings were
extracted from a descriptive data of a small sample, while Huffines and Logsdon’ study
was a pilot study conducted on a small sample of 32 neonates.
Moreover, based on a significance level of ≤ 0.05, the absence of nutrition was
established as a significant predictor of PU in critically ill children in one 30 bed PICU
(P= 0.04) (McCord et al., 2004). Ultimately, however, this item was omitted from the
study’s list of significant risk factors, since the authors considered only factors that had
209
a significance level of < 0.002 as predictors of PU, in an attempt to decrease the effect
of type I error.
Usually, most children admitted to critical care units would be NPO (Nothing per Oss)
at least at one point during their stay and even when feeding was initiated, there would
be a risk of it being ceased if signs of intolerance were observed. Also, food would be
given slowly most of the time, which could affect whether the children received
adequate nutrition (McCord et al., 2004).
Patients who are malnourished or have imbalanced diets are thought to be at risk of
weight loss which, in turn, increases bone prominence, which increases the patients’
risk of developing PU in particular areas (McCord et al., 2004). In addition, critically ill
children are at increased risk of inadequate nutrition and hence PU formation, because
of their high expenditure of calories, and sometimes the catabolic nature of their
diseases (Murdoch, 2002).
Existence of Equipment
In this thesis, all identified PU-patients were supported by medical devices (100%, n=
19), compared with only 56.5% of PU-free patients (n= 109). Twenty ulcers out of 29
were equipment-related ulcers (69%). Of these, the most prevalent type were ulcers
caused by ECG leads (25%, n= 5), followed by the endotracheal tube (20%, n= 4), and
nasal CPAP / tube (15%, n= 3). Several other types of medical devices were found to
cause ulceration in this sample, including ID bands, cuff pressure, cables, O2 probes,
NG tubes, face masks, and neck collars.
The following types of medical equipment have been established previously as
contributing factors for PU development: endotracheal intubation / CPAP / ECMO/
HFOV (Fujii et al., 2011, Yong et al., 2005, Gershan and Esterly, 1993), tubes and
syringe caps (McCord et al., 2004, Murdoch, 2002, Schluer et al., 2009, Noonan et al.,
2006), O2 probes (Curley et al., 2003a, Murdoch, 2002, Noonan et al., 2006), and
electrocardiogram leads (Murdoch, 2002).
210
Ulceration related to equipment usage has been documented repeatedly in paediatric
literature, especially among those who are critically ill (Curley et al., 2003a, Willock et
al., 2005b, Waterlow, 1997), and in orthopaedic patients (Samaniego, 2004). Most of
these types of ulcers are located in unspecified areas on the body. For example,
according to McCord et al. (2004), the face, chin, feet and shoulders were the most
frequently observed PU-affected areas in PICU patients as a result of either the use of
medical devices, incontinence, or friction and shear forces. In the current research, the
large number of device-related ulcers might explain the high incidence of ulcers in
unspecified body sites, labelled ‘others’.
In one study, 27 device- related ulcers were caused mostly by SpO2 probes (n= 14), in
addition to others resulting from the use of CPAP masks, casts and tracheotomies
(Curley et al., 2003a). Another study of orthopaedic patients highlighted several
external factors as being associated with PU development, including casts, orthoses, and
wheelchairs (Samaniego, 2004). Such medical equipments have also been discussed in
other previous studies (Willock et al., 2005b, Schluer et al., 2009, Waterlow, 1997).
Willock et al. (2005b) reported that more than half of the PU patients (n= 24) identified
in their incidence study, had PUs associated with devices.
Suddaby et al. (2005) noted the significance of this risk factor among PICU, adolescent,
medical-surgical, and oncology patients, finding that those supported by a variety of
medical devices were at a 46% higher risk of developing skin breakdown than patients
who were free of or had fewer devices involved in their care (OR= 1.46%, 95% CI 1.69,
P≤0.05).
Although some of these findings could be more closely related to one group of children
over other, critically ill children in general would usually require most of these
equipments to be used during their admission to the ICU. For example, immobile
children would need the use of a wheelchair even if they did not suffer from orthopaedic
problems. Also, splints are usually applied to ICU patients to protect the infusion lines
or as corrective casts (Waterlow, 1997).
211
Glamorgan Total Risk Score Classification
The risk classification of the Glamorgan sum score was highlighted as significantly
related to PU formation among Jordanian critically ill children (Fisher’s= 19.73, d.f. =
3, P <0.001). Even though this scale was able to correctly identify all PU patients
(n=19), it was unable to correctly identify 119 out of 139 of the PU-free children
(61.7%), which means that this scale was highly sensitive but less specific for this
population. However, this thesis did not aim to control nursing interventions targeted at
preventing ulcers, which might have caused the low specificity of the scale since proper
prevention protocols are thought to prevent actual PU occurrence, even if the child is at
actual risk.
iii) Risk Factors (based on the Braden Q RAS)
This section covers predictors of PU found as a result of using the Braden Q RAS.
According to univariate analyses, six out of seven Braden Q sub-items significantly
contribute to PU formation among critically ill patients. These are, mobility, activity,
sensory perception, moisture, friction and shear, as well as oxygenation and tissue
perfusion, in addition to the Braden Q total risk classifications. Nutrition was the only
sub-item which did not appear to be significant.
Mobility
Mobility was closely correlated to PU development in this population (U= 1098, Z
score= -3.512, P <0.001). Most PU-patients had some degree of ‘restricted mobility’
(63.1%, n= 12), with four patients ‘completely immobile’ (21%). On the other hand,
less than a third of PU-free patients had mobility problems (28.5%, n= 55), while 71.5%
had ‘no mobility limitations’ (138). Mobility was discussed as a risk factor for PU in
critically ill children and neonates in the previous section (risk factors based on the
Glamorgan RAS).
212
Activity
In the current study, around 32% of PU-patients were ‘bedridden’ (n= 6) and 53% had
severe ‘difficulty walking’ independently (n= 10). While 16% had the ability to ‘walk
occasionally’ (n= 3), none of the PU-patients had a completely ‘normal activity’ level.
By contrast, 57% of PU-free patients had a normal activity level for their age (n= 110).
Activity was strongly linked to PU development in critically ill paediatrics in this study
(U= 785, Z score= -4.471, P<0.001).
Compared with the mobility sub-item, activity seemed to be a more reliable predictor,
since mobility was only able to identify 60% of patients who developed PU to be at risk,
while 40% of those who were classified as not at risk did actually develop PU. On the
other hand, all patients who suffered activity problems did go on to develop PU; none of
the PU patients were categorised initially as normally active.
This could play a role in explaining the better performance of the Glamorgan immobility
sub-scores compared with the Braden Q mobility sub-scores in the LR models, and
indicate that a sub–item which combines mobility and activity issues is better than using
two different sub-items.
Such an assumption could be explained by the easier identification and scoring of these
two items by nurses. If they were combined as one sub-score, it would make it easier to
understand each sub-item by reducing confusion about their inter-related terms, and
facilitate identification of this risk factor. This would need further work before it could
be approved, however, especially since both the mobility and activity sub-scores of the
Braden Q showed no significant relationship with PU development in the multivariate
analysis. Nevertheless, using the ROC, activity was more predictive of the PU risk than
the mobility sub-score.
Although the Braden Q scale differentiates between activity (patient’s physical ability to
move and walk) and mobility (patient’s own ability to change his/her body positioning)
risk scores, most previous studies do not. One study, however, has discussed ‘high
activity’ as a risk factor for PU development among orthopaedic patients. High activity
213
was thought to increase patients’ friction with surfaces like beds, as a result of vigorous
movement, which might increase their chance of developing ulcers (Samaniego, 2004).
As can be seen, that the definition of ‘activity’ according to the Braden Q scale is
different from Samaniego’s study (2004). The latter connects activity to the patient’s
movement in their bed while Braden Q defines this type of movement as an indicator of
mobility rather than activity.
In one neonatal pilot study (Huffines and Logsdon, 1997) which was conducted to test
the reliability and validity of a RAS, it was found that nutrition, activity, and general
physical condition had the highest sensitivity and specificity in predicting skin
breakdown in neonates. Inter-rater reliability coefficients for the activity sub-item
ranged between 0.80 and 1.00 over a 21 day study period, which would indicate that
activity is a reliable predictor of skin breakdown formation within the first 21 days of
neonates’ lives; however, larger study with variant age groups is needed to confirm this
finding.
Sensory Perception
Patients’ ability to respond appropriately to pressure or pain stimuli was clearly related
to the formation of PU in this sample (U= 808.5, Z score= -4.27, P<0.001). All PU-
patients had complained of a ‘diminished level’ of sensation and / or consciousness
(n=19), and the majority of cases had ‘very limited’ perception (36.8%, n= 7).
Sensory perception as a general risk factor has been addressed in previous literature
(Samaniego, 2004, Pallija et al., 1999, Bar-On et al., 2002, Willock et al., 2005b,
Barnes, 2004). However, as mentioned earlier in the GCS score section, sensation or
consciousness level is interrelated with many other PU risk factors, such as using MV,
sedation, and being intubated, so these cannot always be discussed separately.
Moisture
Sixteen out of 19 PU-patients had moist skin (84.2%), versus three PU-patients who had
‘rarely moist’ skin (15.8%). For the current study, the degree of skin moisture (resulting
214
from drainage, vomit, incontinence, or other) was established to be significantly related
to PU development (U= 829.5, Z score= -4.649, P<0.001).
Moisture has been identified as a significant risk factor for skin breakdown and PU
development in prior research. Willock et al. (2000) identified dehydration as a
characteristic of PU patients (17%, n= 3), while dry or clammy skin were also observed
in around 50% of PU cases among children and neonates (n= 9). Nevertheless, the small
sample size and the descriptive nature of findings meant that researchers were not able
to infer any statistical significance for this factor in relation to the development of PU.
Suddaby et al. (2005) reported frequent episodes of diarrhoea to be one of the risk
factors for skin breakdown among children admitted to one medical-surgical unit, yet
this was usually associated with diaper dermatitis rather than pressure related injuries.
Murdoch (2002) has explained how excessive moisture from urine and faecal
incontinence would lead to changes in the skin pH level (normally around 5.5), which
may cause alteration in skin integrity and breakdown.
Another term related to moisture and usually considered a risk factor for PU formation
in children is incontinence. Through the use of univariate analysis, this has been shown
to be (Willock et al., 2007) to be a significant predictor of PU development in children
and neonates (P= 0.003). No further studies were identified that proved the same
findings in paediatrics. Though Willock et al. have used lower significance level
(p<0.01), the retrospective nature of the study might limit its findings. Moreover, no
further studies were identified that approved the same findings in paediatrics.
Although moisture constitutes a sub-score of many PU risk scales (McLane et al., 2004,
Garvin, 1997, Quigley and Curley, 1996, Huffines and Logsdon, 1997, Suddaby et al.,
2005, Barnes, 2004), and incontinence appears in others (Willock et al., 2007, Cockett,
1998, Bedi, 1993, Pickersgill, 1997, Olding and Patterson, 1998a), some previous
studies have shown neither to be significantly related with PU (Curley et al., 2003b,
Anthony et al., 2010).
215
In Anthony et al.’s (2010) retrospective study, which was developed to compare the
predictive capabilities of three paediatric RASs, moisture failed to show significance in
both the Garvin and the Braden Q scales, as did incontinence in the Glamorgan scale.
Curley et al. (2003b) investigated the predictive validity of the Braden Q scale, and
found that moisture, in addition to another four sub-items of the scale, were not
predictive of PU risk in ICU’ patients, with an AUC <0.60 (p= 0.08).
Friction and Shear Forces
This sub-item of the Braden Q scale was revealed to be significantly related to PU
formation for the population studied in this thesis (U= 927.5, Z score= -3.657,
P<0.001). The vast majority of PU-patients had some degree of friction and / or shear
problems (94.7%, n= 18), compared to only one patient who did not (5.3%), and
developed PU during the follow-up period.
Such forces were mainly observed in neonates in this study since neonates, and patients,
who had a deteriorated level of consciousness, were mostly agitated, or slid frequently
in their beds. This increased the risk of friction being created between patients’ skin and
the bed surface, and at the same time increased the shearing forces between the
immobile or sedated patients’ bodies and bed surfaces and linen as they were being
lifted and positioned by nurses, as was often required.
Continuous vigorous movements of children have been reported previously as one of
the factors which cause PU (Samaniego, 2004) because of the increased shearing and
friction with surrounding surfaces, such as those of beds and supportive casts.
According to Samaniego (2004), children who had casts, orthoses or prosthesis had the
lowest friction scores, indicating the highest risk of PU, based on the adult Braden scale
(Mean± SD= 1.0± 0.25).
Neidig et al. (1989) reported how children became agitated after being extubated from
MV following open heart surgery. These patients’ vigorous head movements would
increase the shearing and friction forces to this area, resulting in increased occipital PU
occurrence. In addition, restraints would often be used on these children to prevent self-
216
extubation, and falling from the bed while being weaned off sedation. The sites where
these were applied may also have suffered increased friction and shear. Children in pain
are also at risk of friction and shear forces, because unrelieved pain may increase
restlessness and agitation in bed (Murdoch, 2002).
Oxygenation and Tissue Perfusion
Around 79% of the PU-patients in this sample had ‘compromised’ oxygenation and
perfusion indicators (n= 15), two more had ‘adequate’ indicators (10.5%), while another
two had ‘no problem’ in this category of the Braden Q scale. The indicators of
oxygenation and tissue perfusion such as blood pressure, capillary refill, haemoglobin
level, and ABGs, were found to be significantly related to PU development among the
ICU’ patients (U= 1246, Z score= -2.531, P= 0.01).
This category, or some of its indicators, has also been discussed in previous literature,
According to Curley et al. in their incidence study (2003a), children with mean arterial
pressure (MAP) of 50 mmhg or less had double the risk of developing PU than the
children for whom MAP was greater than 50 mmhg (OR= 2.1, 95% CI 1.1-4.0, P=
0.028).
Patients who are haemodynamically unstable have been established in the literature to
have a higher incidence of developing PU than other children and neonates (Willock et
al., 2000, Murdoch, 2002, Gershan and Esterly, 1993). Also, when child is
haemodynamically unstable, positioning is not a priority for nurses, which may increase
their risk for PU occurrence further (Neidig et al., 1989).
The Braden Q Total Risk Score Classifications
The classifications of patients’ risk groups based on the total score of the Braden Q
were revealed to have a significant association with the occurrence of PU in this study’s
sample of critically ill children and neonates (Continuity Correction= 10.51, d.f = 1, P
=0.003). However, the scale was not able to predict around 53% of patients who
developed PU to be at risk (n=10), so it had low sensitivity. Yet, it was highly specific
217
in distinguishing children who classified as not at risk of PU, and who did not go on to
develop ulcers (83%, n= 161).
The failure of the Braden Q total risk score to correctly classify patients who develop
PU as being at risk was observed before (Noonan et al., 2006), where, the Braden Q
classified 6% of children to be at risk of PU, although only 1.6% (n= 4) actually
developed PU, and none of these were classified as at risk by the scale. However,
Noonan et al. still recommended the use of the Braden Q scale to assist in the
appropriate application of preventive interventions for children at risk of PU.
In another study which examined skin breakdown and redness risk in PICU (Schindler
et al., 2007), the Braden Q scale, with a cut-off score of less than 16, did not show any
significance. However, this was argued to be a result of nurses’ non-adherence to the
data collection protocols, and improper documentation of Braden Q risk scores or PU
categorisation, particularly during the first days following patients’ admission to the
PICU.
b) Risk Factors/ Predictors based on Multivariate
Analysis
Four major models were established based on the use of binary LR analysis. This
statistical test facilitates studying the correlation between several predictors (categorical
and / or continuous) and one dichotomous outcome. All previously mentioned risk
factors based on univariate analyses were entered again into LR models. This was
important in order to show the most significant predictor of PU development while
controlling the effect of the other predictors, something which cannot be done through
univariate analysis (Field, 2009).
Significant risk factors based on multivariate analysis are discussed in this section based
on the following four LR models;
1- Model one: Braden Q Scale sub-items.
2- Model two: Glamorgan Scale sub-items.
3- Model three: General predictors and Braden Q sub-items.
218
4- Model four: General predictors and Glamorgan sub-items.
i) Model One: Braden Q Scale Sub-Items.
Despite the fact that six out of seven sub-items of the Braden Q scale were highlighted
as significant risk factors for PU development based on univariate analyses, none were
found to be significant using LR. Anthony et al.’s retrospective study (Anthony et al.,
2010) reported three sub–items of the Braden Q scale, mobility, tissue perfusion and
oxygenation – as well as moisture - to be significant by LR.
ii) Model Two: Glamorgan Scale Sub-Items.
All significant risk factors of the Glamorgan RAS based on the univariate analyses –
namely, mobility, nutrition, equipment pressing on patients’ skin - were entered into LR
model two. Of these, mobility was the only one retained as a significant predictor of PU
development among critically ill patients (OR= 1.07, 95% CI 1.004-1.149, P= 0.037).
According to this finding, children who had restricted mobility had a 7% higher risk of
developing PU than the normally ambulant children, yet this percentage shows almost
no difference between ambulant children in regards PU development , since only seven
of the total 147 normally ambulant patients developed PU (4.8%) .
Previous studies that have reported the significance of this factor were discussed above
in the univariate analyses section. However, none of these used advance statistical tests
such as LR, except for one retrospective study (Anthony et al., 2010), in which mobility,
along with another four sub-items, of the Glamorgan scale were revealed by LR to be
significantly related to PU development.
iii) Model Three: General Predictors/ Risk Factors
and the Braden Q Sub-Items.
All significant sub-items of the Braden Q scale (mobility, activity, sensory perception,
friction and shear, moisture, and oxygenation and tissue perfusion), and all general risk
factors identified by univariate analyses (age in days, PEEP level, being on MV,
duration on MV≥ 4 days, ICU LOS, GCS score) were entered into this model.
219
The model failed to show significant difference between PU, and PU-free patients (χ²=
17.10, P= 0.105). None of these factors were identified to be significant predictors of
PU development for this sample.
iv) Model Four: General Predictors/ Risk Factors
and the Glamorgan Sub-Items.
All previously identified general risk factors and the significant sub-items of the
Glamorgan RAS were entered into this model. Of all of these, being ventilated for four
days or longer was the only significant predictor of children’s risk of developing PUs.
Children who had been on MV for four days or longer were at 6 times greater risk than
those who stayed ventilated for shorter periods (OR= 6.39, 95% CI 1.023-39.95, P=
0.047). The majority of PU-patients had been ventilated for more than four days
(73.7%, n= 14), and spent significantly longer periods on MV than the PU-free patients
(Mean± SD= 9.6± 6.1 vs. 5.3± 5.9).
Many studies have supported the findings of the current study (Curley et al., 2003a,
Zollo et al., 1996, Yong et al., 2005, Neidig et al., 1989). For example, Neidig et al.
(1989) found that the length of time a child spent intubated following open heart
surgery was significantly related to the development of occipital PUs. According to this
retrospective audit, any child who remained intubated for longer than 7 days would be
at higher risk of acquiring PU than those who were extubated earlier (10.1±11.5 vs.
3.4±4.9, P=0.0008).
Curley et al. (2003a) also noticed that children who remained for longer periods on MV
were at higher risk of developing category II and above PUs, yet this was lower than the
risk observed in the current research. According to Curley et al., PU children had 1.06
times the risk of acquiring category II and above PUs than the PU-free children, for
each 1- day increase on MV (OR= 1.06, 95% CI 1.03-1.10, P<0.001). Another PICU
incidence study (Zollo et al., 1996) found that the mean length of duration on MV for
paediatrics with impaired skin integrity was higher than that of those with intact skin
(Mean± SD= 7.75± 11.01 vs. 3.59± 8.79).
220
Moreover, in one RCT where LR was used (Yong et al., 2005), the duration patients had
spent on CPAP ventilation was the only significant predictor of nasal injury
development either if using prongs or facial masks on low birth weight neonates (OR=
1.04, P=0.003). These children’s risk of developing skin injury based on time spent on
MV was still lower than that identified in this research work. However, Yong et al.’s
study aimed to measure different types of nasal injury and not specifically PU.
Long periods on MV were thought to be significantly related to PU development,
because of their association with patients’ immobility and longer periods of ICU LOS.
Also, spending longer periods on MV would increase the need for sedation, which
might diminish the normal sensory response of patients to pain and pressure for longer
periods (Neidig et al., 1989, Curley et al., 2003a, Murdoch, 2002).
From another perspective, longer periods on MV may reflect the acuity of these
patients’ health conditions who are likely to experience restricted frequency of
positioning which, in turn, would increase the friction and shear forces, and then
increase the risk of PU development (Neidig et al., 1989).
5.5.3 Predictive Validity of the Applied Paediatric Risk Assessment Scales
5.5.3.1 Glamorgan Risk Scale for Paediatrics
The Glamorgan RAS was able to correctly classify PU-patients and PU-free patients in
this study. Based on the ROC, the total score of the Glamorgan RAS showed a
significant area under the curve (AUC= 0.79, 95% CI, 71˗˗ 87, P< 0.001). The current
AUC value of the Glamorgan total risk score is lower than has been mentioned
previously (Willock et al., 2009, Anthony et al., 2010).
However, the higher AUC value in the two earlier studies might be related to the fact
that they depended on the raw data that was used initially to develop the Glamorgan
scale. Moreover, the different population of children studied in this thesis (critically ill
paediatric patients) might affect the scale’s predictive abilities, since it was initially
developed to be used in general paediatric wards. Nevertheless, this thesis is not the first

221
work to report the Glamorgan scale’s limited performance in critical care areas (Kottner
et al., 2012).
Using a cut-off score of 10, the Glamorgan risk scale demonstrated a perfect sensitivity
of 100%, but low specificity of 38%. Whilst the overall Glamorgan total score was the
best predictor of PU development, the sub-items equipment pressing on skin (AUC
0.71, CI 0.63 – 0.80), and mobility (AUC 0.69, CI 0.56 – 0.83) were also effective.
However, using a cut-off score of 15 (indicating high risk), the Glamorgan was 100%
sensitive, and more specific (43%). Thus, the Glamorgan RAS may be best employed to
detect risk among high risk children rather than in low risk settings.
5.5.3.2 The Braden Q Risk Assessment Scale
Using a cut-off score of 16, the Braden Q scale was demonstrated to have a relatively
low sensitivity of 47%, and a moderately high specificity of 83% (AUC 0.80, CI 0.72 –
0.89). Whilst the overall Braden Q score was the best predictor of PU development,
sub-scores for activity (AUC 0.79, CI 0.72 – 0.86), sensory perception (AUC 0.78, CI
0.69 – 0.87), and skin moisture (AUC 0.77, CI 0.67 – 0.88) were also effective, with
almost similar AUC values.
Based on the same cut-off score (16), the Braden Q was shown to have better sensitivity
(0.88), but less specificity (58%) in one previous study (Curley et al., 2003b), although
it reported almost the same AUC (0.83, CI 0.76˗ 0.91) as was observed in this thesis.
According to Curley et al., only three sub-items of the Braden Q scale were significant,
with AUC > 0.7. These were mobility, sensory perception, and tissue perfusion and
oxygenation.
The same authors investigated the effect of eliminating non-significant sub-items of the
scale on the performance of the total score, under the ROC. The AUC was improved to
84% (CI 0.77-0.91), while sensitivity and specificity were enhanced to 92%, and 59%
respectively, where a cut-off score of 7 was used (Curley et al., 2003b).
Comparing the significant Braden Q sub-items in this thesis with those shown in the
previous study, all except nutrition were also significant. Following the Braden Q total
222
score, activity was the most predictive sub-item in this sample (AUC 0.79, CI 0.72 –
0.86, P < 0.001), whereas tissue perfusion and oxygenation was the least predictive of
PU risk (AUC 0.66, CI 0.55- 0.75, P =0.02).
One further study which estimated the AUC of the Braden Q risk scores was a
retrospective survey which aimed to compare this scale’s performance with that of
another two scales (Anthony et al., 2010), where, the AUC was noticed to be lower than
that described in Curley et al. (2003b) (AUC 0.70).
Nevertheless, as was shown earlier, the Braden Q had a low sensitivity based on the
recommended cut-off score of 16 by Noonan et al. (2011). Some authors (Quigley and
Curley, 1996, Loman, 2000) have argued that this score would identify only high risk
patients, while using a higher cut-off score might help in identifying patients with lower
risk of PU. The sensitivity and specificity of the Braden Q scale were considered in this
thesis based on a higher cut-off score of 23, which produced values which were more
clinically acceptable. The Braden Q scale’s performance was improved to 95% sensitive
and 66% specific. This score was considered by comparing specificity and sensitivity of
the scale total score on different thresholds, where the scale performed the best.
5.5.3.3 Comparing the Predictive Validity of the Glamorgan and Braden Q Risk Assessment Scales
The Braden Q RAS showed a slightly higher AUC than the Glamorgan RAS for this
study’s particular population (AUC= 0.80 vs. 0.79). However, if overlapping confidence
intervals are taken into consideration, this would suggest no significant difference
between the two scales.
Nevertheless, the Glamorgan was more sensitive than the Braden Q scale, when the
recommended cut-off scores for risk - 16 for Braden Q, and 10 for Glamorgan – were
applied (Noonan et al., 2011, Willock et al., 2009). This might be considered a good
reason for the Glamorgan scale to be used in paediatrics, since sensitivity is more
important than specificity when considering risk measures for any disease or health
problem.
223
Any scale which has the ability to correctly classify children who are at risk, is much
more beneficial than one which is able to correctly classify children whose risk scores
show they will remain free of ulcers. This is due to the importance of detecting patients
at risk, and hence being able to intervene accordingly, over the issue of allocating
preventive interventions to those who may not actually be at risk (Ayello and Braden,
2002).
On the other hand, the low specificity of the scale may be seen not as a clue that it has
failed to classify patients’ level of risk correctly but rather, this value could be affected
by the prevention measures and intervention aids provided by nurses (Willock et al.,
2008). Since the scale is a measure of the risk of the problem (PU development)
occurring, and not a measure of the actual problem’s existence (Kottner et al., 2011),
any appropriate preventive interventions applied to the children during the study’s
follow-up period could influence whether the problem actually occurs (Willock et al.,
2009, Moore and Cowman, 2008). This does not mean necessarily that these children
were not at risk at the beginning, or that the scale failed to estimate their risk according
to its scores.
In this thesis, there was no intention to control any preventive interventions applied by
nurses to limit PU formation, but this may have been one reason for the low specificity
of the Glamorgan scale. Although it was not within the scope of this study to document
them, many nursing prevention measures were observed in use within the Jordanian
critical paediatric units investigated, especially in the NICU. Examples were frequent
positioning and special head and body protective pads, use of which might explain the
low frequency of surface-related PU compared with equipment-related ulcers within this
unit. However, this phenomenon would require further study before being propagated to
neonatal critical units.
For all that it is preferable for clinical use to apply a highly sensitive tool even if having
adequate specificity level (Curley et al., 2003b). However, based on using the higher
cut-off scores, both the Glamorgan and Braden Q scales have shown improved
sensitivity and adequate specificity. With a cut off score of 15, the Glamorgan was
found to have perfect 100% sensitivity, and 44% specificity, while using a cut-off score
224
of 23, of the Braden Q had 95% sensitivity, as well as a considerable specificity value
of 66%. These cut-off scores might improve the performance of both scales in the
clinical field if such improvements in the sensitivity and specificity values can be
backed up by further research among different paediatric populations.
In one study that compared the performance of the Glamorgan, the Braden Q and
another paediatric risk assessment scale (Garvin), the authors found that the Glamorgan
was superior in terms of predictive validity, although the scales were tested based on the
same data set that was used initially to develop the Glamorgan scale (Anthony et al.,
2010). In addition, this was a retrospective study, which is not a preferred design for
this type of research, because it would not enable the researcher to score different sub-
items of the scale more accurately based on direct skin assessment of patients, also, it
would be biased by depending on the available documentation by nurses.
One recent study (Long et al., 2011) suggested similarity in both the Glamorgan and the
Braden Q RASs, based on the ROC. This study identified both scales as being
reasonable classifiers of patients’ risk of PU development, though the Glamorgan scale
was more sensitive in the studied sample. In the same study, seven out of nine sub-items
of the Glamorgan scale, compared with six out of seven Braden Q sub-items, were
revealed to be significantly different for PU patients and those who are free of ulcers.
In this thesis, only two sub-items out of nine from the Glamorgan scale were significant
based on the ROC in addition to the total risk score, namely mobility and equipment
pressing on patient’s skin. Conversely, all except for one ‘the nutrition sub-item’ of the
Braden Q scale were assessed as significant.
These findings were much the same when univariate analyses were used to study the
correlation between each scale’s sub-items and the development of PU in critically ill
children, when the impaired nutrition sub-item was included as a significant variable of
the Glamorgan RAS, in addition to mobility and existence of pressing equipment.
However, LR revealed only one Glamorgan sub-item, mobility, to be significant while
none of the Braden Q sub-items were recognized by LR as being significantly related to
PU development in this group of children.
225
The use of both univariate and multivariate analyses in another study (Anthony et al.,
2010) revealed that only five sub-items of the Glamorgan scale were significant
predictors of PU formation, mobility, pyrexia, low albumin level, incontinence, and
existence of equipment pressing on child’s skin. Similarly, only three Braden Q sub-
items were noticed to be significant: mobility, moisture, and tissue perfusion.
A further two values, the positive predictive value (PPV) and the negative predictive
value (NPV) were calculated for each scale. According to these values, the Glamorgan
scale was correct in classifying 13% of PU-patients of being at risk, while it was 100%
correct in classifying not-at-risk patients who really did not develop ulcers later. For the
Braden Q scale, it was able to correctly classify 21% of patients at risk of PU, who did
develop PUs later, and 94% able to correctly identify patients who were not at risk, and
who did not develop PU later on.
Based on these values, the Braden Q scale could be identified as a better classifier of
patients at risk of PU. However, sensitivity and specificity measures are considered
better indicators of patients’ risk than the predictive values, because the latter are
affected by the incidence and prevalence rate of all the cases in the sample.
As previously discussed, the performance of the Braden Q among the critically ill
population is almost equal to that of the Glamorgan scale, and although the former
achieved high specificity with the two cut-off scores tested, the latter was more
sensitive. Sensitivity is more important when applying the scale in clinical areas,
because of the need to truly detect patients who are at risk, and thus enable nurses to
intervene appropriately. This means that the Glamorgan scale could be given preference
over the Braden Q scale.
In more detailed inspection of each scale’s sub-items, the mobility sub-score of the
Glamorgan was found to be the most predictive of PU development, either by using the
AUC calculations, the univariate or the multivariate analyses. Also, its AUC was almost
the same as the AUC for the total risk score of the scale. This raises ideas about the
usefulness of using one single sub-item over using the whole scale. Yet, this proposal
could not be undertaken without further studies being conducted to support it.

226
On the other hand, for the Braden Q scale, activity level and sensory perception were
the most predictive sub-scores. However, both failed to show significance in the
multivariate analysis. Despite the fact that the mobility and activity sub–items were
tested by both the Glamorgan and Braden Q scales on the same population, only the
mobility sub-item of the Glamorgan scale was shown to have a significant association
with PU development based on LR.
This could be explained by the different definition of mobility used in each scale. While
the Glamorgan scale considers the child’s ability to change position, to walk and to
move freely as mobility indicators, the Braden Q scale uses the child’s ability to change
position purposefully as a mobility indicator but ambulation as a physical activity level
indicator. Thus, for example, any child who can change position in the bed, but cannot
walk out of bed without the help of a nurse, would score normally against the mobility
indicators of the Braden Q scale (score 4), yet this child would score 10 for this
category in the Glamorgan scale, which would mean that he or she is at some level of
risk.
227
5.6 SUMMARY OF THE CHAPTER
This chapter aimed to highlight the main results of the study without providing
excessive detail in regard to numerical findings. It has explained the main findings
clearly, in a way which has helped to underline their usefulness or limitations.
Also, this chapter has helped to assess the strengths and weaknesses of the study design
and methodological approach. Much strength was added to this study by the fact that a
prospective model was used, which is preferable to other study designs. Furthermore,
novelty was established because this study was the first to examine PU in children in
Jordan and the Arab world.
The findings may help in demonstrating the existence of the problem and its size in
paediatrics, when compared with previously published universal data. Also, the
characteristics of this particular group of children can be compared with those
previously assessed in other countries, such as the USA, the UK, and in Europe. It will
provide benchmarking data, which will further the appropriate allocation of health
resources, as well as help save time and money.
The distinctive prospective approach in comparing the validity of two major paediatric
RASs also contributed to the field of paediatric risk assessment. No previous studies
have compared paediatric scales for critically ill patients using this approach. The
findings of the risk assessment survey may assist in identifying children, especially in
ICUs, as a risk group for PU development as well as adults. In addition, it may highlight
the necessity of introducing a specific paediatric RAS in Jordanian hospitals, as well as
in other Arabic counties.
Finally, using a more advanced statistical approach to analyse the data can help to
identify evidence-based characteristics, and contributing factors which determine
children’s risk of PU development in this population. The multivariate analysis revealed
that the time a ventilated child would spend on MV was significantly related to PU
development in children in this study. Many other factors were also significant based on
the less restrictive univariate analyses.
228
On the other hand, this study’s generalisability may be affected by its modest sample
size, and the population of children included. Recruiting a larger sample size and
studying children in other hospital wards, in addition to the ICU, may help in future to
improve the reliability of the findings, and their generalisability.
229
CHAPTER 6 .. CHAPTER SIX: LIMITATIONS,
RECOMMENDATIONS AND CONCLUSION
6.1 A GLANCE AT THE CHAPTER
This chapter introduces the limitations encountered during this research, in both
prevalence and incidence studies. Recommendations for clinical, administration and
research health care domains are suggested. All identified shortcomings in this research
work are summarised, and the addition of this research to the clinical area’s existing
body of knowledge is discussed. A summary of the concluding observations is drawn
based on the research’s major findings in its two aforementioned studies.
230
6.2 RESEARCH LIMITATIONS
Several issues could affect the findings of this research work, as a consequence of using
different research designs in both prevalence and incidence studies, despite the fact that
maximum efforts were adopted and initiated to minimise such undesired consequences.
However, these limitations should be considered when interpreting the findings of the
current work, while they could be addressed in future work. These limitations are
discussed according to the different research methods used as outlined below.
6.2.1 Prevalence study
Though this prevalence survey is a major contribution to the paediatric PU literature in
general, and specifically for Jordan, it has several identified limitations, most notably
the small sample, recruited from only one hospital, which might not be representative of
the Jordanian population as a whole. This was due to the limited time, money and
personnel resources of the research; however, the hospital was chosen carefully,
because it is one of the largest university hospitals in all the region and in Jordan, and
such university hospitals represent around 10% of the total beds in Jordanian hospitals
(MOH, 2011).
Furthermore, regarding sampling design, this was selected by non-probability
convenience methods, which might limit the representativeness of the sample of the
paediatric population, due to the increased risk of self-selection bias, which is why
probability is a more respected approach than non-probability sampling in terms of the
confidence that can be placed in the representativeness of the sample (Polit and Beck,
2010).
From another perspective, excluding some paediatric groups from the study sample
could interfere with the generalisability of the findings, and under- or over-estimating
the actual size of the problem. Excluding burn, isolation, and psychiatric patients was
obligatory to the researcher whose priority was to ensure the safety of recruited children
and neonates, prevent infection and contamination spread through different surveyed
wards, and to reduce unexpected accidents with psychiatric patients. Adults and
231
outpatients patients were excluded because they were not within the scope of this study.
However, excluding some wards/specialities from PU prevalence surveys is not
uncommon; this could help in comparing the findings with other studies (McLane et al.,
2004, Noonan et al., 2006).
Moreover, the used study design of the prevalence survey itself is not preferred (cross-
sectional), because it measures the case of interest (PU existence) at one point of time in
one place (Shields and Twycross, 2003). Using cross-sectional design to infer a
relationship between two variables (predictor and outcome) is weak (Hoe and Hoare,
2012), so no relationships between variables was sought by this design, whereas cohort
study design is preferred; an incidence study was also performed.
This study did not observe the applied preventive interventions for paediatric children,
although this was recommended previously (EPUAP and NPUAP, 2009, Willock et al.,
2009). Investigating PU prevalence in the presence of applied preventive interventions
was argued to help in ascertaining the effect of providing proper preventive methods on
the measured size and risk of PU (Willock et al., 2009). However, this study was
focused on determining the size of the PU problem among paediatric Jordanian
inpatients, to establish an initial perception of the existence and magnitude of this
problem in this population. Further work could be done to address the used preventive
interventions in this population.
6.2.2 Incidence study
As mentioned in section (2.1), this sample was also recruited from the same university
hospital in Jordan, yet the target population was only critically ill children and neonates.
Recruiting only this group of children might limit the generalisability of findings to
other paediatric groups. Also, the small sample size might affected the power of the
findings, regarding the identified significant risk factors of PU occurrence, and the
predictive validity of the two utilised risk scales (Braden Q and Glamorgan). However,
this sample size was calculated based on using power analysis test to achieve an
accepted power of findings (P= 0.80).
232
Moreover, the used non-probability sampling method might hinder the generalisability
of the findings; as mentioned previously, probability sampling is preferred over non-
probability methods, since the former usually lacks representativeness of the target
population (Polit and Beck, 2010). However, the used consecutive sampling technique
has been found to be better than the usually used convenience sampling, especially if
subjects were recruited over a long period of time, because all target subjects who meet
the inclusion criteria are recruited in the sample (Polit and Beck, 2010).
Excluding some patients from the sample would reduce the generalisability of findings
to these patients, or potentially cause under- or over-reporting the PU incidence rate,
such as those in isolation or those who did not give consents. Also, some research
procedures, like including only children and neonates who achieved at least two
consecutive assessments, might cause the exclusion of further patients, who might have
different features that could affect the findings of the study.
From another perspective, the used research design had its limitations. Using
observational cohort design limits the ability to infer causal relationships between
identified risk actors and PU formation; only experimental design can do so (Polit and
Beck, 2010). However, the used prospective cohort study is more preferred than using
cross-sectional or case-study research designs (Hoe and Hoare, 2012). On the other
hand, non-experimental design could not control the effect of extraneous variables while
studying the problem of interest (Polit and Beck, 2010); in this study, the researcher was
unable to control the effect of applied preventive interventions on the observed outcome
(PU formation). The effect of proper prevention protocols reduces PU incidence rate, as
well as limiting the measured specificity of the risk assessment scales (Willock et al.,
2009, Moore and Cowman, 2008).
Additionally, as in the previous section, no data was gathered about the applied
interventions and prevention methods in these wards, which might limit the ability to
infer any possible relation between using these methods and the actual size of the
problem. Further future work is needed to investigate these in paediatric PU inpatients
in Jordan.
233
Finally, the used risk assessment scales (Braden Q and Glamorgan) were not formerly
tested for the Jordanian paediatric population, but some studies that show them to be
promising tools over other identified paediatric RASs; the validity and reliability of
these two scales was reported in previous studies (Quigley and Curley, 1996, Curley et
al., 2003b, Willock et al., 2008, Willock et al., 2009, Anthony et al., 2010), yet no
evidence was achieved to conclude the best scale to measure paediatric PU risk until the
moment.
6.3 RESEARCH RECOMMENDATIONS
Despite the study limitations given in the preceding section, the study is still deemed
important for paediatric nurses, establishing a better understanding of PU size, its
contributing factors and the predictive validity of the most commonly used paediatric
RASs. However, as it is a new subject being explored, suggestions for numerous
recommendations at the clinical, administrative and research domains are presented
below.
6.3.1 Clinical domain
Periodically conducting prevalence and incidence studies would increase nurses’
attention on the PU problem in paediatric care. It is not unusual for nurses to report PU
as an adult problem, yet on-going research proved that PU occurs in children and more
commonly in neonates and young age patients, as well as among children residing in
paediatric critical care units.
Using RASs specifically designed for paediatrics is recommended, since these tools
prove validity and reliability, and because they would be able to classify children into
risk groups with respect to their variant developmental levels, and the unique
characteristics of each age group.
Also, as noticed from the findings of this research, PU usually occurs at the early days
of admission, so encouraging the use of the risk scales as early as possible, definitely
within 24 hours of admission, and hence intervening sensibly based on the patients’
234
risk, through providing the most appropriate and accessible prevention aids and surfaces
available.
In Jordan in general, and specifically in the study setting, the adult Braden is the used
scale to assess risk in children. However, although not documented in this research,
filling the scale in was not undertaken by hospital’ nurses most of the time, which could
be related to the ICU nurses’ perception that skin assessment is not a priority for
children in critical conditions. Using this scale was reported before as not being suitable
for paediatric populations (Kohr and Curley, 2009); this might increase the risk that
such children be misclassified, resulting in inadequate application of preventive
interventions.
So this study could encourage Jordanian hospitals to adopt a credible PU classification
system such as that of the EPUAP, as well as adopting one predictive tool specifically
designed for paediatrics. The Jordanian nurses’ practice might improve by identifying
true risk factors of PU, and an evidence based preventive measures.
6.3.2 Administration domain
First, the findings of this research recommended that health organisations’
administrators and managers adopt a yearly survey of PU among paediatrics. This
should also be supported by on-going education and training sessions for nurses on the
method of assessing and documenting PU. These sessions would enhance nurses’
awareness of the existing problem, increase their abilities on using qualified risk scales,
classifying PU categories’ appropriately, and most importantly how to intervene
correctly and promptly.
Next, nurses’ documentations habitually show no appropriate categorisation of existing
PU, and often there is no documentation of identified PUs at all in patients’ records,
leading to the recommendation that internationally accepted classification systems of
PU is adopted, such as the EPUAP and the NPUAP classifications, as there is no
national classification system of PU used in Jordanian hospitals. It is also recommended
235
that a paediatric specified RAS usage, such as the Braden Q or the Glamorgan scales, is
applied in paediatric wards, rather than using adult scales, since it is more credited and
suitable for children’s unique developmental characteristics.
Finally, on-going support for nurses who report and intervene properly and swiftly to
PU cases should be granted. Furthermore, the proper intervention and prevention aids
and surfaces should be available and accessible for any child who appears to be at risk
of PU development, based on nurses’ judgment and RAS’ use. Identifying children who
are at risk of PU but withholding any prevention reasonably would have negative
consequences on both the patient health and wellbeing and on the health organization’s
material and financial resources.
6.3.3 Research domain
As addressed before, further research work is recommended regarding the incidence and
prevalence of PU in paediatric population, since little work has been done in this area
worldwide, particularly in Jordan and the Arab world in general, especially in
performing a prospective incidence study with adequate statistical inferences. The
findings of this work could be enhanced by use of a larger sample size, including
general paediatric patients’ cases, as well as a more credible research design, such as
experimental design.
Furthermore, as this work was an initial step toward investigating the PU practice of
Jordanian paediatric nurses, to shed light on its existence, magnitude, and how to
identify risk, further future work is recommended on the same population to investigate
the existing prevention and intervention protocols adopted by paediatric units, to assess
their types, availability, and their usefulness as well as applicability for this particular
population, since proper assessment is the first step in good prevention.
The effect of the existing prevention aids could be described in terms of children’s
actual development of PUs, specifically on those who were classified initially as being
at risk of PU occurrence, but did not develop a PU. The effect of such proper
236
intervention on the measured specificity of the RAS used should also be researched
further.
As observed in this study, there is another type of skin damage that was very prevalent
in paediatric patients, precisely in neonates: adhesive injuries. Such injuries had a
considerably high incidence in the studied NICU population for this research work,
which could result from tapes and other adhesive products used to secure nasal CPAP,
NG tubes, endotracheal tubes or IV cannulas. The identification of this prevalent
problem warrants the use of further precautions by nurses caring for neonates, and
further attention from researchers.
Finally, as PU is regarded as an adult-only problem in Jordanian hospitals, further work
should be commenced to explore the paediatric nurses’ knowledge and attitudes toward
PU assessment and prevention; any actual lack of knowledge identified in these nurses
should be amended, attitudes should be improved, and prompt clarification of the
problem should be issued.
6.4 CONTRIBUTION TO KNOWLEDGE
This research is the first of its kind in Jordan and the broader Arab world. Only two
studies about PU have been conducted in other Arab countries previously (Abou El
Enein and Zaghloul, 2011, Saleh et al., 2009), and only one in Jordan (Tubaishat et al.,
2011), yet all these were related to the adult population.
Moreover, this is the third of another two prospective incidence studies of PU in
critically ill paediatrics (Curley et al., 2003a, McCord et al., 2004), and another two
specifically for NICU patients (Fujii et al., 2011, Huffines and Logsdon, 1997),
although it has a different non-experimental observational cohort design than the case
control study of McCord et al. (2004), which also did not measure the incidence rate of
PU in this population, and had more variable sample age groups compared with Curley
et al.’s (2003a) sample, which consisted of children aged from 21 days up to 8 years
only.
237
On the other hand, the latter two studies had smaller sample sizes, and were only
designed to measure PU in neonates, while Huffines and Logsdon’ research (1997) was
only a pilot study to assess the reliability and predictive validity of their newly
developed NSRAS.
From another perspective, this is the first study to use prospective design to compare
two paediatric RASs predictive validity in critically ill paediatrics, except for one study
which compared the performance of the utilised two scales in general wards (Long et
al., 2011), but this was an abstract paper. Another retrospective study (Anthony et al.,
2010) compared these two scales with another scale (Garvin), yet, its findings could be
limited by the nature of the used research design, and by the use of the raw data initially
utilised to develop one of the tested scales (the Glamorgan).
Because of the paucity of paediatric PU studies in general, and in Jordan specifically,
this study could be the groundwork for other researches in relation to this area, and a
foundation for Jordanian and Arabic paediatric nursing studies on PU.
Moreover, this study confirms the PU occurrence in paediatric population which might
improve the current practice regarding PU prevention policies in Jordanian hospitals.
By comparing the practice in Jordan with other worldwide practice measures regarding
PU care and prevention, an evidence based methods can be adopted, while outdated
prevention methods can be stopped or reduced; such as massage of PU area. Also,
repeating yearly prevalence audits would increase the awareness of Jordanian nurses on
the PU problem, while at the same time would help in assessing the effectiveness of the
used preventive measures when comparing different prevalence rates in one setting over
several years.
6.5 RESEARCH CONCLUSION
The prevalence rate of PU in this paediatric population was found to be higher than in
most previous research, which could be a result of including device-related ulcers in
calculating the PU prevalence rate. Prevalence studies which included this type of ulcers
238
showed even greater prevalence (Schluer et al., 2009) than this research. Higher
prevalence rate in other studies was attributed to including other types of skin
breakdown in calculating PU prevalence rate (Suddaby et al., 2005). Moreover, the
fairly high prevalence rate in this research could be attributed to the larger number of
children who are younger than one year old, who represented more than half of the
prevalence sample, since these children were advised previously as being at higher risk
of PU formation than other children groups.
In the incidence study, the incidence rate in the critically ill children and neonates was
lower than previously reported, which could be related in some way to the variation
between this study and previous studies in the number of raters, acuity of children cases
in these units, proper prevention programs applied specifically in NICU, which
resembled the largest portion of the sample, as well as using different terms and
meanings of PU and skin breakdown. Furthermore, Hawthorn effect might reduce the
actual size of the problem, since nurses would pay more attention to PU assessment and
prevention during the study period conduction, which could lower that actual incidence
rate.
However, regarding the pointed intervention and prevention protocols, its
appropriateness and effect on PU incidence rate reduction cannot be guaranteed, since
this type of data was not collected or analysed for this research work, and this was only
based on the researcher’s own observation.
Based on the discussed findings in previous chapters, there was no significant difference
between the Glamorgan and the Braden Q risk scales regarding their predictive abilities
of PU occurrence in critically ill children and neonates. Though the Braden Q had
shown a little greater AUC of the ROC than did the Glamorgan, taking the overlapping
confidence intervals of these two scales had suggest no significant difference in their
performance.
Moreover, though the Glamorgan scale, based on the suggested cut-off score of risk by
authors, showed higher sensitivity than did the Braden Q, it had a lower specificity.
However, sensitivity was argued by previous research to be with higher value for the

239
clinical use than the specificity value, since prioritising child health risk of PU
occurrence, hence preventive interventions application is more crucial than proper
allocation of efforts and health resources.
On the other hand, considering higher cut-off scores of the two scales (23 for the Braden
Q and 15 for the Glamorgan) significantly improved the sensitivity of the former scale,
while the 100% sensitivity of the latter remained the same. Adequate specificity was
revealed by both scales. These cut-off scores was suggested based on comparing the
different sensitivities and specificities thresholds’ of each scale based on the ROC.
Furthermore, considering logistic regression models; the Glamorgan sub-score of
‘mobility’ was manifested as the only significant predictor of PU in this group of
children, while none of the Braden Q sub- scores was significant. This could raise the
question of the benefits of using one issued significant predictor rather than using the
whole scale in predicting paediatrics risk of PU, especially as this sub-score’ AUC was
almost the same as that of the total risk score; however, this needs further research.
In addition, a newly allocated risk factor of PU development in this research work was
suggested as a possible further enhancement in the two used scales’ sub-items
predictive abilities: the duration the child spends on MV, particularly in this population
of critically ill children. Although such a predictor could improve the scale ability to
assess children’s risk, the risk factor would not be appropriate as a sub-item in any scale
designed to measure PU risk in a general paediatric population, since MV is a feature
applied only to those who cared for in special care units.
Considering longer periods of time on MV (longer than four days/96 hours) was
suggested previously in paediatrics literature, though applying this to all paediatrics
would need further work with a larger sample size, and on diverse children and neonatal
specialities, including general hospital wards.
240
6.6 SUMMARY
This chapter emphasizes the main limitations regarding the incidence and prevalence
studies, the recommended implications for different health care domains, and the unique
addition of this work to the paediatrics PU body of knowledge, specifically in the risk
assessment field. Furthermore, the main conclusions related to the thesis major themes
were summarised; the identified size of PU problem in this population was highlighted
in terms of previous related literature; and the significant contributing factors of PU
formation in critically ill patients were clarified, and the predictive validity of both
utilised RASs were stated for this population.
241
REFERENCES
ABDI, H. (2007) Signal detection theory (SDT). Encyclopedia of measurement and statistics, 866-889.
ABOU EL ENEIN, N. Y. & ZAGHLOUL, A. A. (2011) Nurses' knowledge of prevention and management of pressure ulcer at a Health Insurance Hospital in Alexandria. International Journal of Nursing Practice, 17, 262-268.
ALTMAN, D. G. & BLAND, J. M. (1994) Statistics Notes: Diagnostic tests 2: predictive values. Bmj, 309, 102.
ANTHONY, D. (1996) Receiver operating characteristic analysis: an overview. Nurse researcher, 4, 75-88.
ANTHONY, D., PAPANIKOLAOU, P., PARBOTEEAH, S. & SALEH, M. (2009) Do risk assessment scales for pressure ulcers work? Journal of Tissue Viability, 9, 132-136.
ANTHONY, D., RAFTER, L., REYNOLDS, T. & ALJEZAWI, M. E. (2011) An evaluation of serum albumin and the sub-scores of the Waterlow score in pressure ulcer risk assessment. Journal of Tissue Viability, 20, 89-99.
ANTHONY, D., WILLOCK, J. & BAHARESTANI, M. (2010) A comparison of Braden Q, Garvin and Glamorgan risk assessment scales in paediatrics. J Tissue Viability, 19, 98-105.
AYELLO, E. A. & BRADEN, B. (2002) How and why to do pressure ulcer risk assessment. Advances in Skin & Wound Care, 15, 125-131.
BAHARESTANI, M. M. & RATLIFF, C. R. (2007) Pressure ulcers in neonates and children: an NPUAP white paper. Advances in Skin & Wound Care, 20, 208-220.
BALDWIN, K. M. (2002) Incidence and prevalence of pressure ulcers in children. Advances in Skin & Wound Care, 15, 121-124.
BAR-ON, E., WEIGL, D., PARVARI, R., KATZ, K., WEITZ, R. & STEINBERG, T. (2002) Congenital insensitivity to pain ORTHOPAEDIC MANIFESTATIONS. Journal of Bone & Joint Surgery, British Volume, 84, 252-257.
BARNES, S. (2004) The use of a pressure ulcer risk assessment tool for children. Nursing Times, 100, 56.
BEDI, A. (1993) A tool to fill the gap: developing a wound risk assessment chart for children. Professional Nurse, 9, 112.
242
BENNETT, G., DEALEY, C. & POSNETT, J. (2004) The cost of pressure ulcers in the UK. Age and ageing, 33, 230-235.
BERGSTROM, N., BRADEN, B. J., LAGUZZA, A. & HOLMAN, V. (1987) The Braden Scale for predicting pressure sore risk. Nurse Researcher, 36, 205-210.
BRADEN, B. & BERGSTROM, N. (1987) A conceptual schema for the study of the etiology of pressure sores. Rehabilitation Nursing, 12, 8-12.
BRADEN, B. J. & BERGSTROM, N. (1989) Clinical utility of the Braden scale for predicting pressure sore risk. Advances in Skin & Wound Care, 2, 44.
BROOK, I. (2004) Microbiology and Management of Decubitus Ulcers in Children. Journal of Developmental & Physical Disabilities, 16, 297-305.
BUTLER, C. T. (2007) Pediatric Skin Care: Guidelines for Assessment, Prevention, and Treatment. (Cover story). Dermatology Nursing. Jannetti Publications, Inc.
CHAN, W. S., PANG, S. M. C. & KWONG, E. W. Y. (2009) Assessing predictive validity of the modified Braden scale for prediction of pressure ulcer risk of orthopaedic patients in an acute care setting. Journal of Clinical Nursing, 18, 1565-1573.
COCKETT, A. (1998) Paediatric pressure sore risk assessment. Journal Of Tissue Viability, 8, 30-30.
COCKETT, A. (2002) A research review to identify the factors contributing to the development of pressure ulcers in paediatric patients. Journal Of Tissue Viability, 12, 16.
COHEN, J. (1992) A power primer. Psychological bulletin, 112, 155.
COLEMAN, S., GORECKI, C., NELSON, E. A., CLOSS, S. J., DEFLOOR, T., HALFENS, R., FARRIN, A., BROWN, J., SCHOONHOVEN, L. & NIXON, J. (2013) Patient risk factors for pressure ulcer development: Systematic review. International journal of nursing studies.
CRAIG, J. V., SMYTH, R. L., BEASLEY, C. & MULLALLY, S. (2002) The evidence-based practice manual for nurses, Churchill Livingstone Edinburgh.
CURLEY, M., QUIGLEY, S. & LIN, M. (2003a) Pressure ulcers in pediatric intensive care: Incidence and associated factors*. Pediatric Critical Care Medicine, 4, 284.
CURLEY, M. A. Q., RAZMUS, I. S., ROBERTS, K. E. & WYPIJ, D. (2003b) Predicting pressure ulcer risk in pediatric patients: the Braden Q Scale. Nursing Research, 52, 22-33.

243
CURLEY, M. A. Q., THOMPSON, J. E. & ARNOLD, J. H. (2000) The Effects of Early and Repeated Prone Positioning in Pediatric Patients With Acute Lung Injury. CHEST, 118, 156.
DEFLOOR, T. (1999) The risk of pressure sores: a conceptual scheme. Journal of Clinical Nursing, 8, 206-216.
DESPINS, L. A., SCOTT-CAWIEZELL, J. & ROUDER, J. N. (2010) Detection of patient risk by nurses: a theoretical framework. Journal of Advanced Nursing, 66, 465-474.
DINSDALE, S. (1973) Decubitus ulcers in swine: light and electron microscopy study of pathogenesis. Archives of physical medicine and rehabilitation, 54, 51.
DIXON, M. & RATLIFF, C. (2005) Pediatric pressure ulcer prevalence -- one hospital's experience. Ostomy Wound Management, 51, 44.
DOS (2011) The Hashemite Kingdom of Jordan, Department of Statistics. [pdf]. Available at: <<http://www.dos.gov.jo/sdb_pop/sdb_pop_a/sukan2009.pdf> > [Accessed 22 May 2011].
EPUAP & NPUAP (2009) European Pressure Ulcer Advisory Panel and National Pressure Ulcer Advisory Panel. Prevention and treatment of pressure ulcers: quick reference guide. Washington DC: National Pressure Ulcer Advisory Panel; 2009.
FAUL, F., ERDFELDER, E., LANG, A. G. & BUCHNER, A. (2007) G* Power 3: A flexible statistical power analysis program for the social, behavioral, and biomedical sciences. Behavior research methods, 39, 175.
FIELD, A. (2009) Discovering statistics using SPSS, London, Sage Publications Limited.
FISER, D. H. (1992) Assessing the outcome of pediatric intensive care. The Journal of pediatrics, 121, 68-74.
FUJII, K., SUGAMA, J., OKUWA, M., SANADA, H. & MIZOKAMI, Y. (2011) Incidence and risk factors of pressure ulcers in seven neonatal intensive care units in Japan: a multisite prospective cohort study. International Wound Journal, 7, 323-328.
GALVIN, P. A. & CURLEY, M. A. Q. (2012) The Braden Q+P: A Pediatric Perioperative Pressure Ulcer Risk Assessment and Intervention Tool. AORN Journal, 96, 261-270.
GARVIN, G. (1997) Wound and skin care for the PICU. Critical Care Nursing Quarterly, 20, 62-71.
244
GERSHAN, L. A. & ESTERLY, N. B. (1993) Scarring alopecia in neonates as a consequence of hypoxaemia-hypoperfusion. Archives of Disease in Childhood, 68, 591-593.
GORDON, M. D. (2008) Development of a new skin risk assessment scale for pediatric burn patients. Southern Online Journal of Nursing Research, 8, 1p.
GREEN, D. M. & SWETS, J. A. (1966) Signal detection theory and psychophysics, Wiley New York.
GROENEVELD, A., ANDERSON, M., ALLEN, S., BRESSMER, S., GOLBERG, M., MAGEE, B., MILNER, M. & YOUNG, S. (2004) The prevalence of pressure ulcers in a tertiary care pediatric and adult hospital. Journal of Wound Ostomy & Continence Nursing, 31, 108.
HAGELGANS, N. A. (1993) Pediatric skin care issues for the home care nurse... part 1. Pediatric nursing, 19, 499-507.
HAWKER, S., PAYNE, S., KERR, C., HARDEY, M. & POWELL, J. (2002) Appraising the evidence: reviewing disparate data systematically. Qualitative Health Research, 12, 1284-1299.
HEEGER, D. (2003) Signal detection theory handout. [online]. Available at: <<http://www-psych.stanford.edu/~lera/psych115s/notes/signal/>> [Accessed 29 March 2012].
HOE, J. & HOARE, Z. (2012) Understanding quantitative research: part 1. Nursing Standard, 27, 52-57.
HOLMES, J. F., PALCHAK, M. J., MACFARLANE, T. & KUPPERMANN, N. (2008) Performance of the pediatric Glasgow Coma Scale in children with blunt head trauma. Academic emergency medicine, 12, 814-819.
HOSMER, D. W. & LEMESHOW, S. (2004) Applied Logistic Regression, Wiley.
HUFFINES, B. & LOGSDON, M. C. (1997) The Neonatal Skin Risk Assessment Scale for Predicting Skin Breakdown in Neonates. Issues in Comprehensive Pediatric Nursing, 20, 103-114.
JAYPEE BROTHERS, M. P. (2006) Pediatric and Neonatal Mechanical Ventilation, Jaypee Brothers, Medical Publishers.
JONES, I., TWEED, C. & MARRON, M. (2001) Pressure area care in infants and children: Nimbus Paediatric System. British Journal Of Nursing (Mark Allen Publishing), 10, 789-795.
KAUH (2011) King Abdullah University Hospital (KAUH)- Jordan, 2011 <http://www.kauh.jo/kauh/english/index.aspx>.
245
KHILNANI, P. (2011) Pediatric & Neonatal Mechanical Ventilation, New Delhi, Jaypee Brothers, Medical Publishers.
KIM, E., LEE, S., LEE, E. & EOM, M. (2009) Comparison of the predictive validity among pressure ulcer risk assessment scales for surgical ICU patients. Australian Journal of Advanced Nursing, 26, 87-94.
KOHR, L. M. & CURLEY, M. A. Q. (2009) Small study finds 27.7% prevalence of pressure ulcers in paediatric hospitals in Switzerland, with many cases caused by external medical devices. Evidence-Based Nursing, 13, 21-21.
KOTTNER, J., HAUSS, A., SCHLER, A.-B. & DASSEN, T. (2011) Validation and clinical impact of paediatric pressure ulcer risk assessment scales: A systematic review. International Journal of Nursing Studies.
KOTTNER, J., KENZLER, M. & WILBORN, D. (2012) Interrater agreement, reliability and validity of the Glamorgan Paediatric Pressure Ulcer Risk Assessment Scale. Journal of Clinical Nursing.
KOTTNER, J., TANNEN, A. & DASSEN, T. (2009a) Hospital pressure ulcer prevalence rates and number of raters. Journal of Clinical Nursing, 18, 1550-1556.
KOTTNER, J., TANNEN, A., HALFENS, R. & DASSEN, T. (2009b) Does the number of raters influence the pressure ulcer prevalence rate? Applied Nursing Research, 22, 68-72.
KOTTNER, J., WILBORN, D. & DASSEN, T. (2010) Frequency of pressure ulcers in the paediatric population: A literature review and new empirical data. International Journal of Nursing Studies.
LANCELLOT, M. (1996) CNS combats pressure ulcers with skin and wound assessment team (SWAT). Clinical Nurse Specialist, 10, 154.
LANDIS, E. (1930) Micro-injection studies of capillary blood pressure in human skin. Heart, 15, 209.
LINDAN, O. (1961) Etiology of decubitus ulcers: an experimental study. Archives of physical medicine and rehabilitation, 42, 774-783.
LOMAN, D. G. (2000) Assessment of skin breakdown risk in children. Journal Of Child And Family Nursing, 3, 234-238.
LONG, D., PALMER, K., WOOLLETT, H., WILLOCK, J. & ANTHONY, D. (2011) Paediatric pressure area risk assessment: Reliability and validity of the Glamorgan and Braden Q scales. Australian Critical Care, 25, 140.
MAKLEBUST, J. (1987) Pressure ulcers: etiology and prevention. Nursing Clinics of North America, 22, 359-377.

246
MANNING, M. & CURLEY, Q. (2012) RS34 Risk Factors Associated With Occipital Pressure Ulcers in Hospitalized Children. American Journal of Critical Care, 21, e85-e85.
MARSTON, L. Introductory Statistics for Health and Nursing Using SPSS, SAGE Publications.
MCCORD, S., MCELVAIN, V., SACHDEVA, R., SCHWARTZ, P. & JEFFERSON, L. S. (2004) Risk factors associated with pressure ulcers in the pediatric intensive care unit. Journal of Wound Ostomy & Continence Nursing, 31, 179.
MCLANE, K. M., BOOKOUT, K., MCCORD, S., MCCAIN, J. & JEFFERSON, L. S. (2004) The 2003 National Pediatric Pressure Ulcer and Skin Breakdown Prevalence Survey: A Multisite Study. Journal of Wound Ostomy & Continence Nursing, 31, 168-178.
MOH (2011) Ministry of health (MOH)- Jordan, 2008. [online]. Avialble at: <http://www.moh.gov.jo> [Accessed 26 March 2011].
MOORE, Z. & COWMAN, S. (2008) Risk assessment tools for the prevention of pressure ulcers (Review). Cochrane Database of Systematic Reviews. JohnWiley & Sons, Ltd.
MURDOCH, V. (2002) Pressure care in the paediatric intensive care unit. Nursing Standard, 17, 71.
NEIDIG, J. R. E., KLEIBER, C. & OPPLIGER, R. A. (1989) Risk factors associated with pressure ulcers in the pediatric patient following open-heart surgery. Progress in Cardiovascular Nursing, 4, 99-106.
NIE, A. M. (2008) Pressure ulcer prevalence at a pediatric medical center... Scientific and clinical abstracts from the 40th Annual Wound, Ostomy and Continence Nurses Annual Conference. Journal of Wound, Ostomy & Continence Nursing, 35, S66-S66.
NIXON, J., CRANNY, G. & BOND, S. (2005) Pathology, diagnosis, and classification of pressure ulcers: comparing clinical and imaging techniques. Wound repair and regeneration, 13, 365-372.
NOONAN, C., QUIGLEY, S. & CURLEY, M. A. Q. (2006) Skin integrity in hospitalized infants and children: a prevalence survey. Journal of Pediatric Nursing, 21, 445-453.
NOONAN, C., QUIGLEY, S. & CURLEY, M. A. Q. (2011) Using the Braden Q Scale to Predict Pressure Ulcer Risk in Pediatric Patients. Journal of Pediatric Nursing.
OLDING, L. & PATTERSON, J. (1998a) Growing concern. Nursing Times, 94, 74.
247
OLDING, L. & PATTERSON, J. (1998b) Wound care growing concern. Pressure sores in paediatrics. Nursing Times, 94, 74.
ONIGBINDE, A. T., OGUNSANYA, G. I. & ONIYANGI, S. O. (2012) Pressure ulcer incidence among high-risk inpatients in Nigeria. British Journal of Nursing, S4-s10.
PALLIJA, G., MONDOZZI, M. & WEBB, A. A. (1999) Skin care of the pediatric patient. Journal of Pediatric Nursing, 14, 80-87.
PARAHOO, K. (2006) Nursing research: principles, process and issues, Hampshire, Palgrave Macmillan.
PARNHAM, A. (2012) Pressure ulcer risk assessment and prevention in children. Nursing Children & Young People, 24, 24-29.
PASEK, T. A., GEYSER, A., SIDONI, M., HARRIS, P., WARNER, J. A., SPENCE, A., TRENT, A., LAZZARO, L., BALACH, J., BAKOTA, A. & WEICHECK, S. (2008) Skin Care Team in the Pediatric Intensive Care Unit: A Model for Excellence. Critical Care Nurse, 28, 125-135.
PICKERSGILL, J. (1997) Taking the pressure off. Paediatric Nursing, 9, 25-27.
PILLITTERI, A. (2010) Maternal and child health nursing: Care of the childbearing and childrearing family, Philadelphia, Lippincott Williams & Wilkins.
POLIT, D. & BECK, C. (2006) Essentials of nursing research. Methods, appraisal and utilization, Philadelphia: Lippincott.
POLIT, D. & BECK, C. T. (2010) Essentials of nursing research: Appraising evidence for nursing practice, Philadelphia, Lippincott Williams & Wilkins.
QUIGLEY, S. M. & CURLEY, M. A. (1996) Skin integrity in the pediatric population: preventing and managing pressure ulcers. Journal Of The Society Of Pediatric Nurses: JSPN, 1, 7-18.
REDDY, N. (1990) Effects of mechanical stresses on lymph and interstitial fluid flows. Pressure Sores: Clinical Practice and Scientific Approach. Bader DL (Ed). London, Macmillan, 203–220.
SALEH, M., ANTHONY, D. & PARBOTEEAH, S. (2009) The impact of pressure ulcer risk assessment on patient outcomes among hospitalised patients. Journal of Clinical Nursing, 18, 1923-1929.
SAMANIEGO, I. A. (2004) A Sore Spot in Pediatrics: Risk Factors for Pressure Ulcers. Dermatology Nursing, 16, 153-159.

248
SCHINDLER, C. A., MIKHAILOV, T. A., FISCHER, K., LUKASIEWICZ, G., KUHN, E. M. & DUNCAN, L. (2007) Skin integrity in critically ill and injured children. American Journal of Critical Care, 16, 568-574.
SCHLUER, A., CIGNACCO, E., MULLER, M. & HALFENS, R. J. (2009) The prevalence of pressure ulcers in four paediatric institutions. Journal of Clinical Nursing, 18, 3244-3252.
SCHMIDT, J. E., BERENS, R. J., ZOLLO, M. B., WEISNER, M. & WEIGLE, C. G. M. (1998) Skin breakdown in children and high-frequency oscillatory ventilation. Archives of physical medicine and rehabilitation, 79, 1565-1569.
SHIELDS, L. & TWYCROSS, A. (2003) The difference between incidence and prevalence. Paediatric Nursing, 15, 50.
SIMS, A. & MCDONALD, R. (2003) An overview of paediatric pressure care. Journal Of Tissue Viability, 13, 144.
SPSS (2008) Statistical Package for Social Science. SPSS for Windows, version 16. SPSS Inc., Chicago, IL, USA.
SUDDABY, E. C., BARNETT, S. & FACTEAU, L. (2005) Skin breakdown in acute care pediatrics. Pediatric nursing, 31, 132-48.
TABACHNICK, B. G. & FIDELL, L. S. (2007) Using Multivariate Statistics, Boston, Pearson/Allyn & Bacon.
THOMPSON, C., DALGLEISH, L., BUCKNALL, T., ESTABROOKS, C., HUTCHINSON, A. M., FRASER, K., DE VOS, R., BINNEKADE, J., BARRETT, G. & SAUNDERS, J. (2008) The effects of time pressure and experience on nurses' risk assessment decisions: a signal detection analysis. Nursing Research, 57, 302-311.
TUBAISHAT, A., ANTHONY, D. & SALEH, M. (2011) Pressure ulcers in Jordan: A point prevalence study. Journal Of Tissue Viability, 20, 14-19.
WATERLOW, J. (1997) Pressure sore risk assessment in children. Paediatric Nursing, 9, 21-24.
WATERLOW, J. (1998) Pressure sores in children: risk assessment. Paediatric Nursing, 10, 22-23.
WICKENS, T. D. (2001) Elementary signal detection theory, Oxford University Press, USA.
WILLOCK, J., ANTHONY, D. & RICHARDSON, J. (2008) Inter-rater reliability of the Glamorgan Paediatric Pressure Ulcer Risk Assessment Scale. Paediatric Nursing, 20, 14-19.

249
WILLOCK, J., ASKEW, C., BOLLAND, R., MACIVER, H. & JAMES, N. (2005a) Multicentre research: lessons from the field. Paediatric Nursing, 17, 31-33.
WILLOCK, J., BAHARESTANI, M. & ANTHONY, D. (2007) A risk assessment scale for pressure ulcers in children. Nursing Times, 103, 32-33.
WILLOCK, J., BAHARESTANI, M. M. & ANTHONY, D. (2009) The development of the Glamorgan paediatric pressure ulcer risk assessment scale. Journal of Wound Care, 18, 17-21.
WILLOCK, J., HARRIS, C., HARRISON, J. & POOLE, C. (2005b) Identifying the characteristics of children with pressure ulcers. Nursing Times, 101, 40-43.
WILLOCK, J., HUGHES, J., TICKLE, S., ROSSITER, G., JOHNSON, C. & PYE, H. (2000) Pressure sores in children--the acute hospital perspective. Journal Of Tissue Viability, 10, 59-62.
WILLOCK, J. & MAYLOR, M. (2004) Pressure ulcers in infants and children. Nursing Standard, 18, 56.
YONG, S. C., CHEN, S. J. & BOO, N. Y. (2005) Incidence of nasal trauma associated with nasal prong versus nasal mask during continuous positive airway pressure treatment in very low birthweight infants: a randomised control study. Archives of Disease in Childhood-Fetal and Neonatal Edition, 90, F480-F483.
ZOLLO, M. B., GOSTISHA, M. L., BERENS, R. J., SCHMIDT, J. E. & WEIGLE, C. G. M. (1996) Altered skin integrity in children admitted to a pediatric intensive care unit. Journal of Nursing Care Quality, 11, 62-67.
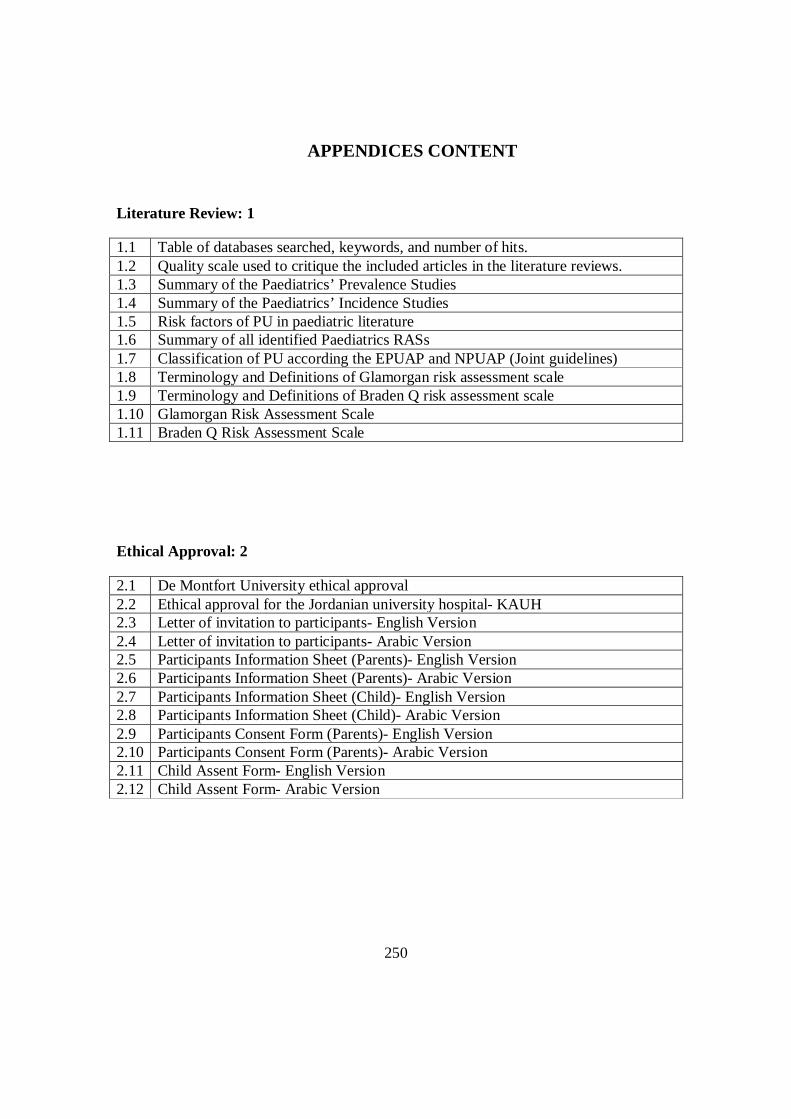
250
APPENDICES CONTENT
Literature Review: 1
1.1 Table of databases searched, keywords, and number of hits. 1.2 Quality scale used to critique the included articles in the literature reviews. 1.3 Summary of the Paediatrics’ Prevalence Studies 1.4 Summary of the Paediatrics’ Incidence Studies 1.5 Risk factors of PU in paediatric literature 1.6 Summary of all identified Paediatrics RASs 1.7 Classification of PU according the EPUAP and NPUAP (Joint guidelines) 1.8 Terminology and Definitions of Glamorgan risk assessment scale 1.9 Terminology and Definitions of Braden Q risk assessment scale 1.10 Glamorgan Risk Assessment Scale 1.11 Braden Q Risk Assessment Scale
Ethical Approval: 2
2.1 De Montfort University ethical approval 2.2 Ethical approval for the Jordanian university hospital- KAUH 2.3 Letter of invitation to participants- English Version 2.4 Letter of invitation to participants- Arabic Version 2.5 Participants Information Sheet (Parents)- English Version 2.6 Participants Information Sheet (Parents)- Arabic Version 2.7 Participants Information Sheet (Child)- English Version 2.8 Participants Information Sheet (Child)- Arabic Version 2.9 Participants Consent Form (Parents)- English Version 2.10 Participants Consent Form (Parents)- Arabic Version 2.11 Child Assent Form- English Version 2.12 Child Assent Form- Arabic Version
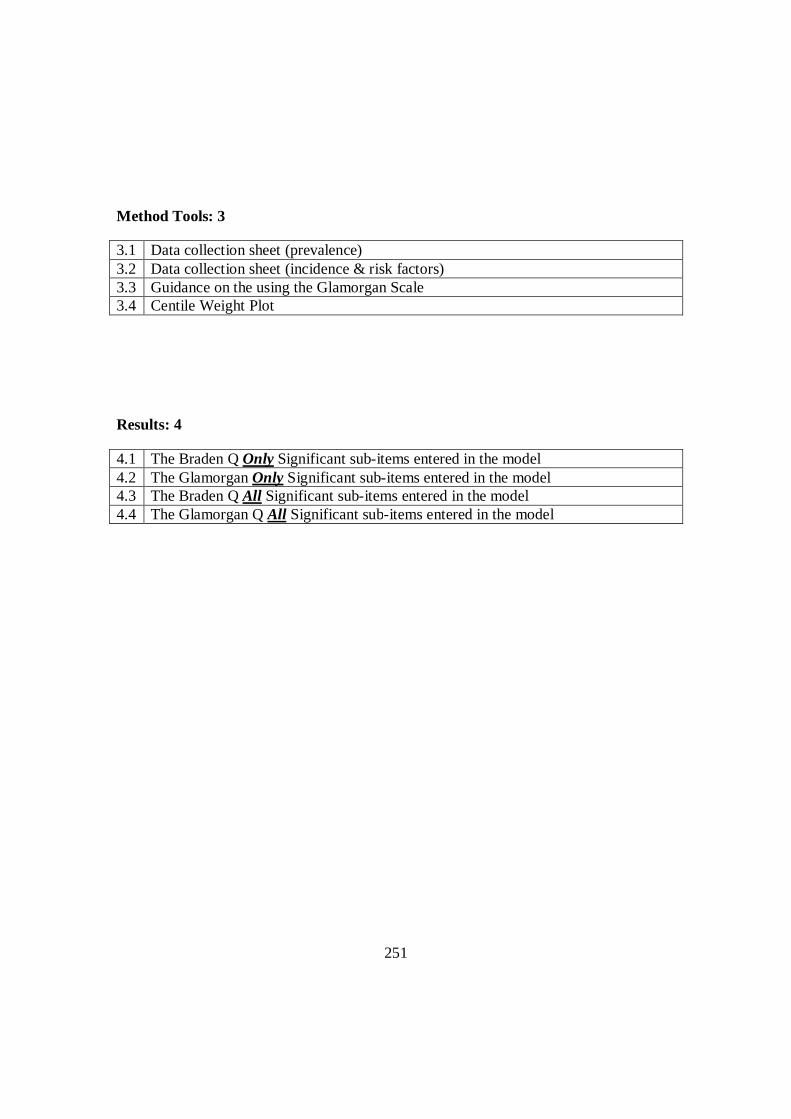
251
Method Tools: 3
3.1 Data collection sheet (prevalence) 3.2 Data collection sheet (incidence & risk factors) 3.3 Guidance on the using the Glamorgan Scale 3.4 Centile Weight Plot
Results: 4
4.1 The Braden Q Only Significant sub-items entered in the model 4.2 The Glamorgan Only Significant sub-items entered in the model 4.3 The Braden Q All Significant sub-items entered in the model 4.4 The Glamorgan Q All Significant sub-items entered in the model
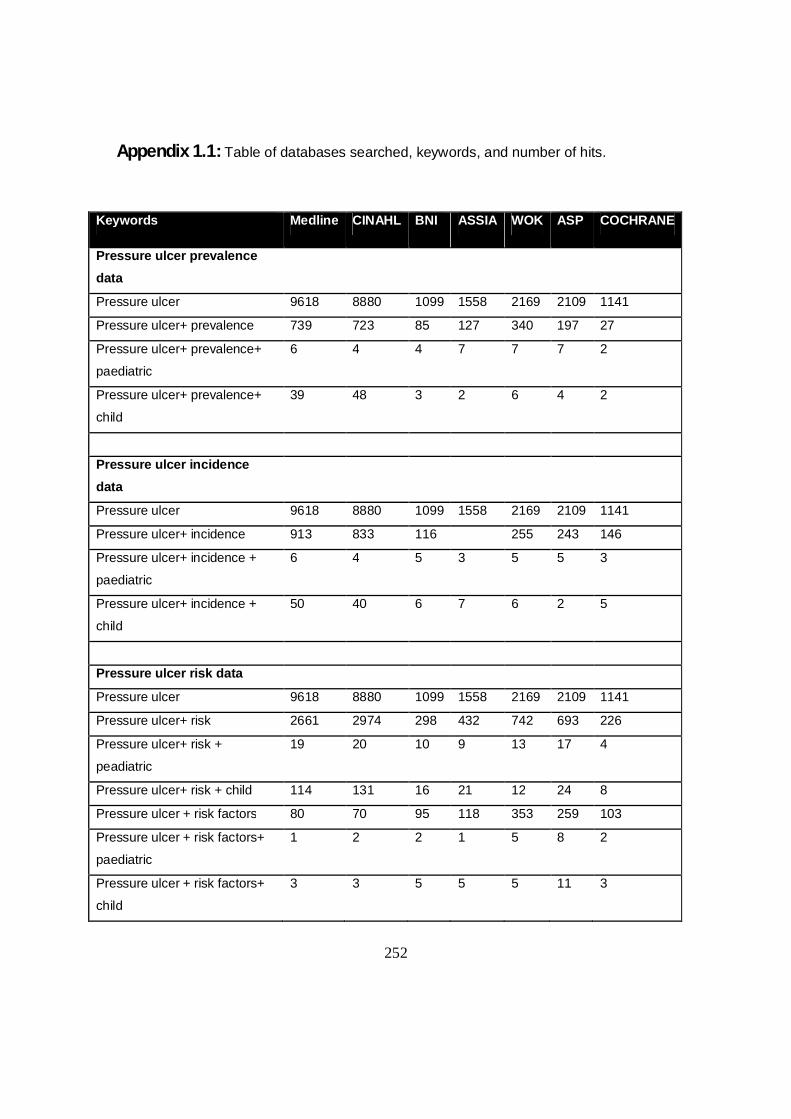
252
Appendix 1.1: Table of databases searched, keywords, and number of hits.
Keywords Medline CINAHL BNI ASSIA WOK ASP COCHRANE
Pressure ulcer prevalence data
Pressure ulcer 9618 8880 1099 1558 2169 2109 1141
Pressure ulcer+ prevalence 739 723 85 127 340 197 27
Pressure ulcer+ prevalence+
paediatric
6 4 4 7 7 7 2
Pressure ulcer+ prevalence+
child
39 48 3 2 6 4 2
Pressure ulcer incidence data
Pressure ulcer 9618 8880 1099 1558 2169 2109 1141
Pressure ulcer+ incidence 913 833 116 255 243 146
Pressure ulcer+ incidence +
paediatric
6 4 5 3 5 5 3
Pressure ulcer+ incidence +
child
50 40 6 7 6 2 5
Pressure ulcer risk data
Pressure ulcer 9618 8880 1099 1558 2169 2109 1141
Pressure ulcer+ risk 2661 2974 298 432 742 693 226
Pressure ulcer+ risk +
peadiatric
19 20 10 9 13 17 4
Pressure ulcer+ risk + child 114 131 16 21 12 24 8
Pressure ulcer + risk factors 80 70 95 118 353 259 103
Pressure ulcer + risk factors+
paediatric
1 2 2 1 5 8 2
Pressure ulcer + risk factors+
child
3 3 5 5 5 11 3
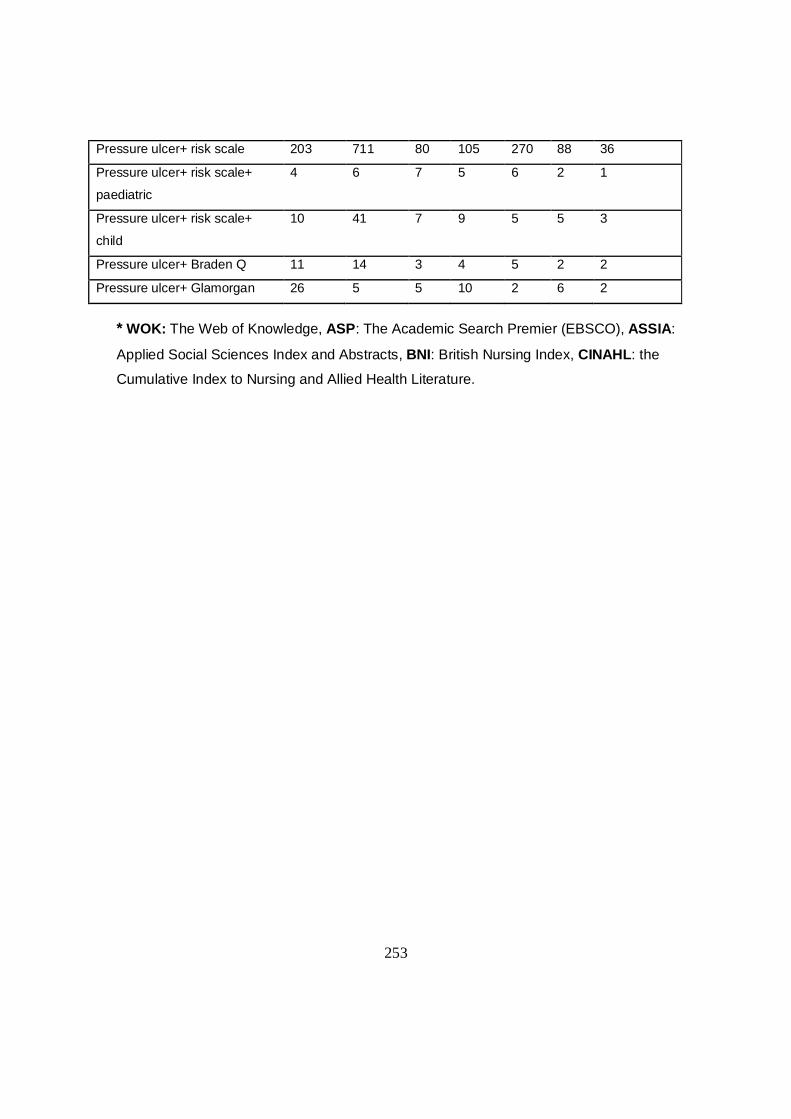
253
Pressure ulcer+ risk scale 203 711 80 105 270 88 36
Pressure ulcer+ risk scale+
paediatric
4 6 7 5 6 2 1
Pressure ulcer+ risk scale+
child
10 41 7 9 5 5 3
Pressure ulcer+ Braden Q 11 14 3 4 5 2 2
Pressure ulcer+ Glamorgan 26 5 5 10 2 6 2
* WOK: The Web of Knowledge, ASP: The Academic Search Premier (EBSCO), ASSIA:
Applied Social Sciences Index and Abstracts, BNI: British Nursing Index, CINAHL: the
Cumulative Index to Nursing and Allied Health Literature.
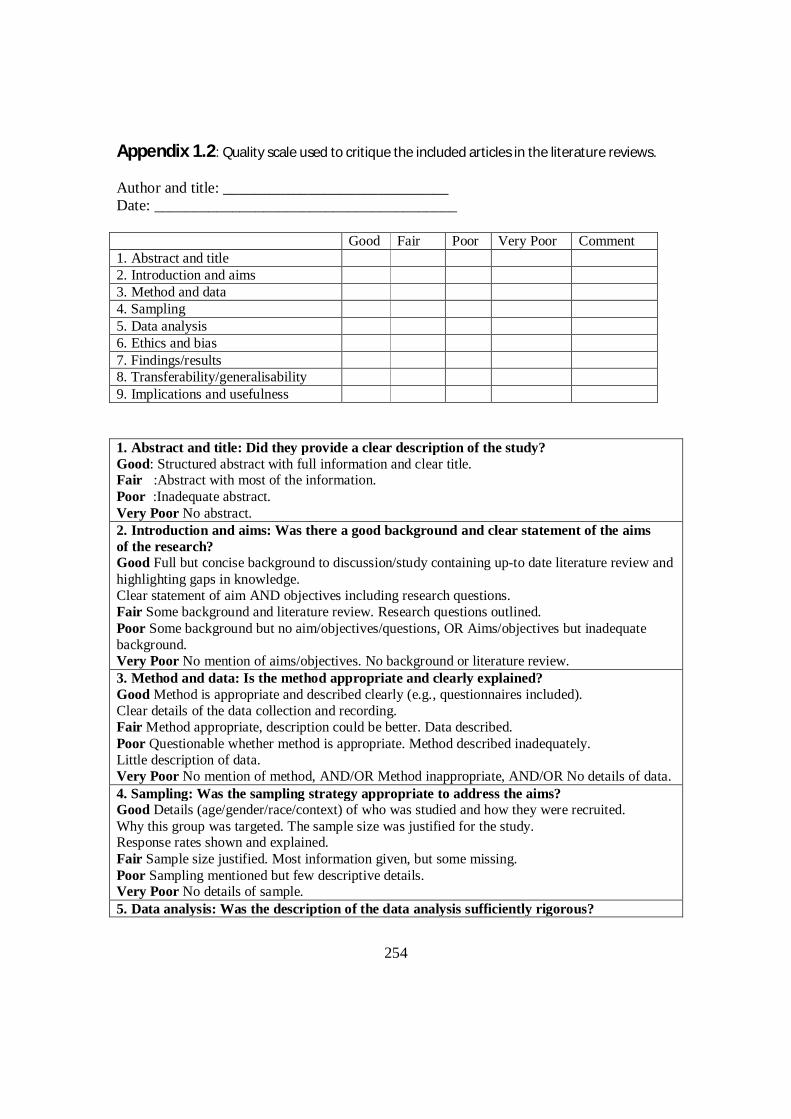
254
Appendix 1.2: Quality scale used to critique the included articles in the literature reviews.
Author and title: _____________________________ Date: _______________________________________ Good Fair Poor Very Poor Comment 1. Abstract and title 2. Introduction and aims 3. Method and data 4. Sampling 5. Data analysis 6. Ethics and bias 7. Findings/results 8. Transferability/generalisability 9. Implications and usefulness 1. Abstract and title: Did they provide a clear description of the study? Good: Structured abstract with full information and clear title. Fair :Abstract with most of the information. Poor :Inadequate abstract. Very Poor No abstract. 2. Introduction and aims: Was there a good background and clear statement of the aims of the research? Good Full but concise background to discussion/study containing up-to date literature review and highlighting gaps in knowledge. Clear statement of aim AND objectives including research questions. Fair Some background and literature review. Research questions outlined. Poor Some background but no aim/objectives/questions, OR Aims/objectives but inadequate background. Very Poor No mention of aims/objectives. No background or literature review. 3. Method and data: Is the method appropriate and clearly explained? Good Method is appropriate and described clearly (e.g., questionnaires included). Clear details of the data collection and recording. Fair Method appropriate, description could be better. Data described. Poor Questionable whether method is appropriate. Method described inadequately. Little description of data. Very Poor No mention of method, AND/OR Method inappropriate, AND/OR No details of data. 4. Sampling: Was the sampling strategy appropriate to address the aims? Good Details (age/gender/race/context) of who was studied and how they were recruited. Why this group was targeted. The sample size was justified for the study. Response rates shown and explained. Fair Sample size justified. Most information given, but some missing. Poor Sampling mentioned but few descriptive details. Very Poor No details of sample. 5. Data analysis: Was the description of the data analysis sufficiently rigorous?
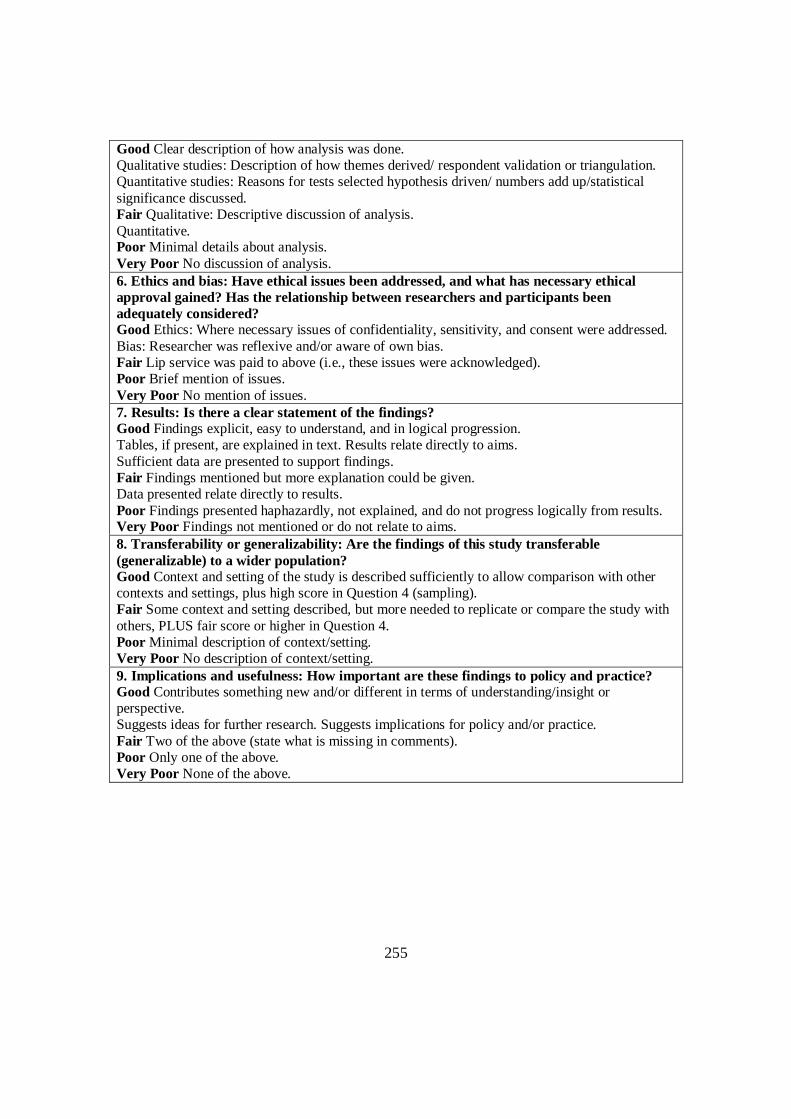
255
Good Clear description of how analysis was done. Qualitative studies: Description of how themes derived/ respondent validation or triangulation. Quantitative studies: Reasons for tests selected hypothesis driven/ numbers add up/statistical significance discussed. Fair Qualitative: Descriptive discussion of analysis. Quantitative. Poor Minimal details about analysis. Very Poor No discussion of analysis. 6. Ethics and bias: Have ethical issues been addressed, and what has necessary ethical approval gained? Has the relationship between researchers and participants been adequately considered? Good Ethics: Where necessary issues of confidentiality, sensitivity, and consent were addressed. Bias: Researcher was reflexive and/or aware of own bias. Fair Lip service was paid to above (i.e., these issues were acknowledged). Poor Brief mention of issues. Very Poor No mention of issues. 7. Results: Is there a clear statement of the findings? Good Findings explicit, easy to understand, and in logical progression. Tables, if present, are explained in text. Results relate directly to aims. Sufficient data are presented to support findings. Fair Findings mentioned but more explanation could be given. Data presented relate directly to results. Poor Findings presented haphazardly, not explained, and do not progress logically from results. Very Poor Findings not mentioned or do not relate to aims. 8. Transferability or generalizability: Are the findings of this study transferable (generalizable) to a wider population? Good Context and setting of the study is described sufficiently to allow comparison with other contexts and settings, plus high score in Question 4 (sampling). Fair Some context and setting described, but more needed to replicate or compare the study with others, PLUS fair score or higher in Question 4. Poor Minimal description of context/setting. Very Poor No description of context/setting. 9. Implications and usefulness: How important are these findings to policy and practice? Good Contributes something new and/or different in terms of understanding/insight or perspective. Suggests ideas for further research. Suggests implications for policy and/or practice. Fair Two of the above (state what is missing in comments). Poor Only one of the above. Very Poor None of the above.
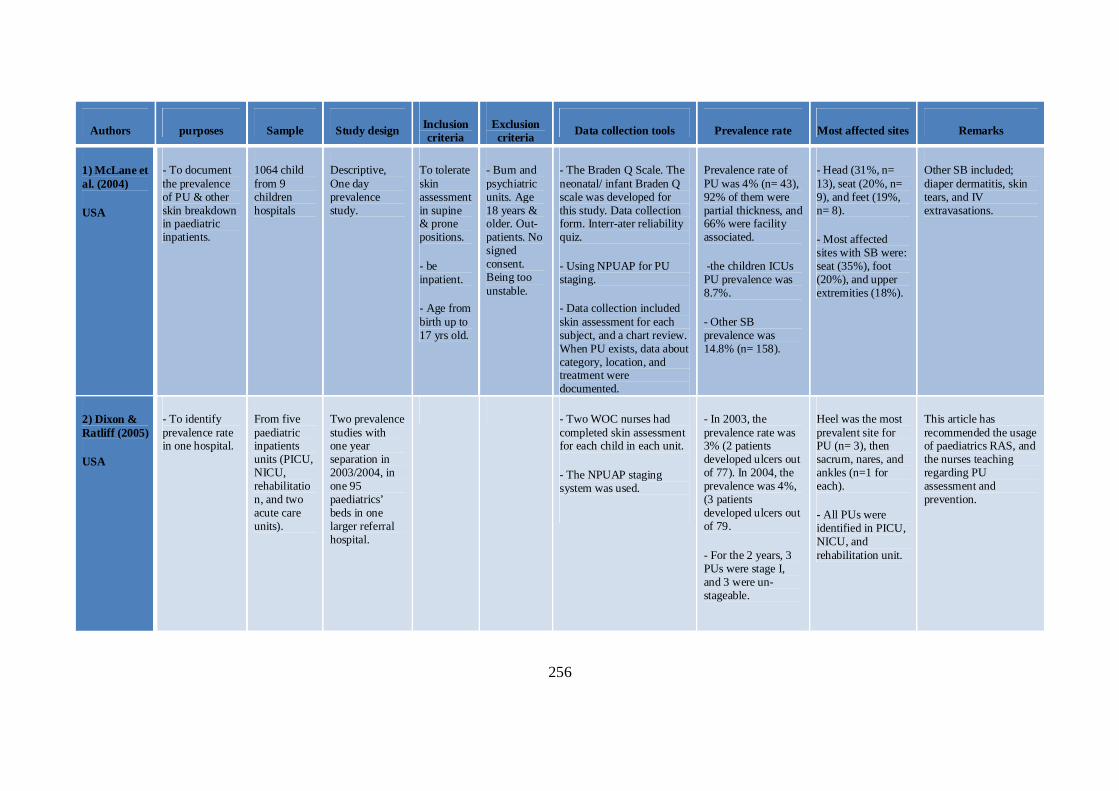
256
Authors purposes Sample Study design Inclusion criteria
Exclusion criteria Data collection tools Prevalence rate Most affected sites Remarks
1) McLane et al. (2004)
USA
- To document the prevalence of PU & other skin breakdown in paediatric inpatients.
1064 child from 9 children hospitals
Descriptive, One day prevalence study.
To tolerate skin assessment in supine & prone positions.
- be inpatient.
- Age from birth up to 17 yrs old.
- Burn and psychiatric units. Age 18 years & older. Out-patients. No signed consent. Being too unstable.
- The Braden Q Scale. The neonatal/ infant Braden Q scale was developed for this study. Data collection form. Interr-ater reliability quiz.
- Using NPUAP for PU staging.
- Data collection included skin assessment for each subject, and a chart review. When PU exists, data about category, location, and treatment were documented.
Prevalence rate of PU was 4% (n= 43), 92% of them were partial thickness, and 66% were facility associated.
-the children ICUs PU prevalence was 8.7%.
- Other SB prevalence was 14.8% (n= 158).
- Head (31%, n= 13), seat (20%, n= 9), and feet (19%, n= 8).
- Most affected sites with SB were: seat (35%), foot (20%), and upper extremities (18%).
Other SB included; diaper dermatitis, skin tears, and IV extravasations.
2) Dixon & Ratliff (2005)
USA
- To identify prevalence rate in one hospital.
From five paediatric inpatients units (PICU, NICU, rehabilitation, and two acute care units).
Two prevalence studies with one year separation in 2003/2004, in one 95 paediatrics’ beds in one larger referral hospital.
- Two WOC nurses had completed skin assessment for each child in each unit.
- The NPUAP staging system was used.
- In 2003, the prevalence rate was 3% (2 patients developed ulcers out of 77). In 2004, the prevalence was 4%, (3 patients developed ulcers out of 79.
- For the 2 years, 3 PUs were stage I, and 3 were un- stageable.
Heel was the most prevalent site for PU (n= 3), then sacrum, nares, and ankles (n=1 for each).
- All PUs were identified in PICU, NICU, and rehabilitation unit.
This article has recommended the usage of paediatrics RAS, and the nurses teaching regarding PU assessment and prevention.
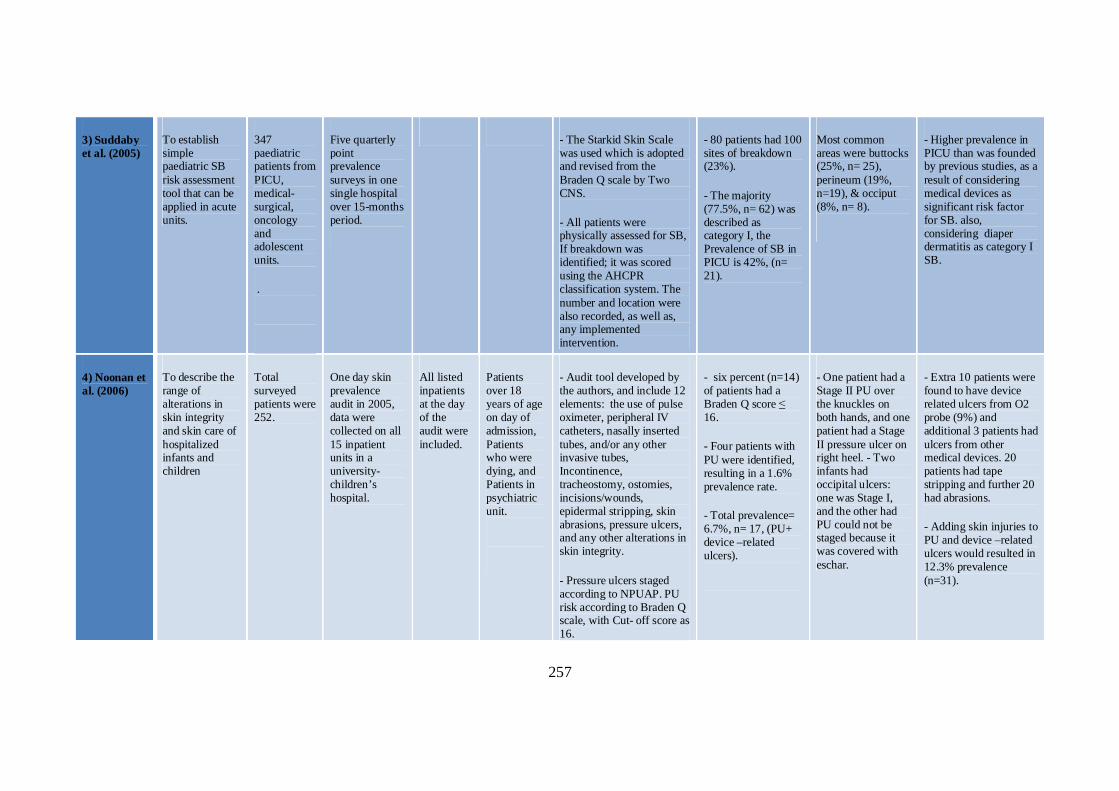
257
3) Suddaby et al. (2005)
To establish simple paediatric SB risk assessment tool that can be applied in acute units.
347 paediatric patients from PICU, medical-surgical, oncology and adolescent units.
.
Five quarterly point prevalence surveys in one single hospital over 15-months period.
- The Starkid Skin Scale was used which is adopted and revised from the Braden Q scale by Two CNS.
- All patients were physically assessed for SB, If breakdown was identified; it was scored using the AHCPR classification system. The number and location were also recorded, as well as, any implemented intervention.
- 80 patients had 100 sites of breakdown (23%).
- The majority (77.5%, n= 62) was described as category I, the Prevalence of SB in PICU is 42%, (n= 21).
Most common areas were buttocks (25%, n= 25), perineum (19%, n=19), & occiput (8%, n= 8).
- Higher prevalence in PICU than was founded by previous studies, as a result of considering medical devices as significant risk factor for SB. also, considering diaper dermatitis as category I SB.
4) Noonan et al. (2006)
To describe the range of alterations in skin integrity and skin care of hospitalized infants and children
Total surveyed patients were 252.
One day skin prevalence audit in 2005, data were collected on all 15 inpatient units in a university-children’s hospital.
All listed inpatients at the day of the audit were included.
Patients over 18 years of age on day of admission, Patients who were dying, and Patients in psychiatric unit.
- Audit tool developed by the authors, and include 12 elements: the use of pulse oximeter, peripheral IV catheters, nasally inserted tubes, and/or any other invasive tubes, Incontinence, tracheostomy, ostomies, incisions/wounds, epidermal stripping, skin abrasions, pressure ulcers, and any other alterations in skin integrity.
- Pressure ulcers staged according to NPUAP. PU risk according to Braden Q scale, with Cut- off score as 16.
- six percent (n=14) of patients had a Braden Q score ≤ 16.
- Four patients with PU were identified, resulting in a 1.6% prevalence rate.
- Total prevalence= 6.7%, n= 17, (PU+ device –related ulcers).
- One patient had a Stage II PU over the knuckles on both hands, and one patient had a Stage II pressure ulcer on right heel. - Two infants had occipital ulcers: one was Stage I, and the other had PU could not be staged because it was covered with eschar.
- Extra 10 patients were found to have device related ulcers from O2 probe (9%) and additional 3 patients had ulcers from other medical devices. 20 patients had tape stripping and further 20 had abrasions.
- Adding skin injuries to PU and device –related ulcers would resulted in 12.3% prevalence (n=31).

258
* AHCPR: Agency for Health Care Policy and Research, WOC nurse: wound and Ostomy care nurse, SB: skin breakdown. Appendix 1.3: Summary of the Paediatrics’ Prevalence Studies
5) Nie (2008) To establish a prevalence rate in one tertiary paediatric medical centre.
266 assessed inpatient children
One day prevalence survey in one hospital in 2007.
Patients admitted to ICU, and medical-surgical units.
None - Identified ulcers were documented for category, location
- Twenty two children had had PUs, prevalence rate= 10.7%.19 patients had facility acquired ulcers, with 9.2% prevalence rate.
Not mentioned. - A plan for another prevalence survey is intended to measure the outcome of introducing preventive interventions in 4 high risk units, 2 ICUs, one MV unit, and one rehabilitation unit.
6) Schluer et al. (2009)
- To identify the PU prevalence in paediatrics’ settings.
- To highlight the risk population, and the predisposing factors for PU development.
A convenience sample of 155 inpatients, 27% of them (n= 41) were neonates.
A multicentre, descriptive point prevalence study was conducted in four paediatric hospitals on 2006.
- should be inpatient at least for one day before the survey.
- Age from birth- 17 years old.
- The instrument of Bours et al. (1999) was used Which include:
- Characteristics of institution, the ward/ team, and patients (Demographical and clinical).
-Risk according to Braden.
- Severity based on EPUAP.
- Document the preventive interventions that were already in place.
- According to the tool used, 100 children had found at risk for PUs (64.5%).
- Prevalence rate was 27.7% (n= 43).
- Prevalence rate of Grade + II and PUs was 4.5%.
- 35% of all children in risk group did developed PUs (n=35), and 8 more children from the non-risk group did developed PUs.
- Nearly half of the pressure ulcers were located in an anatomic area which cannot be precisely specified (n = 25, 43%) then heels and ankles, ears.
The limitations of the study were: the Small sample size, heterogeneity of wards involved (51 from medical unit (33%), 33 surgical (21%), 30 in rehabilitation (19%), As well as, the absence of reliable and valid RAS.

259
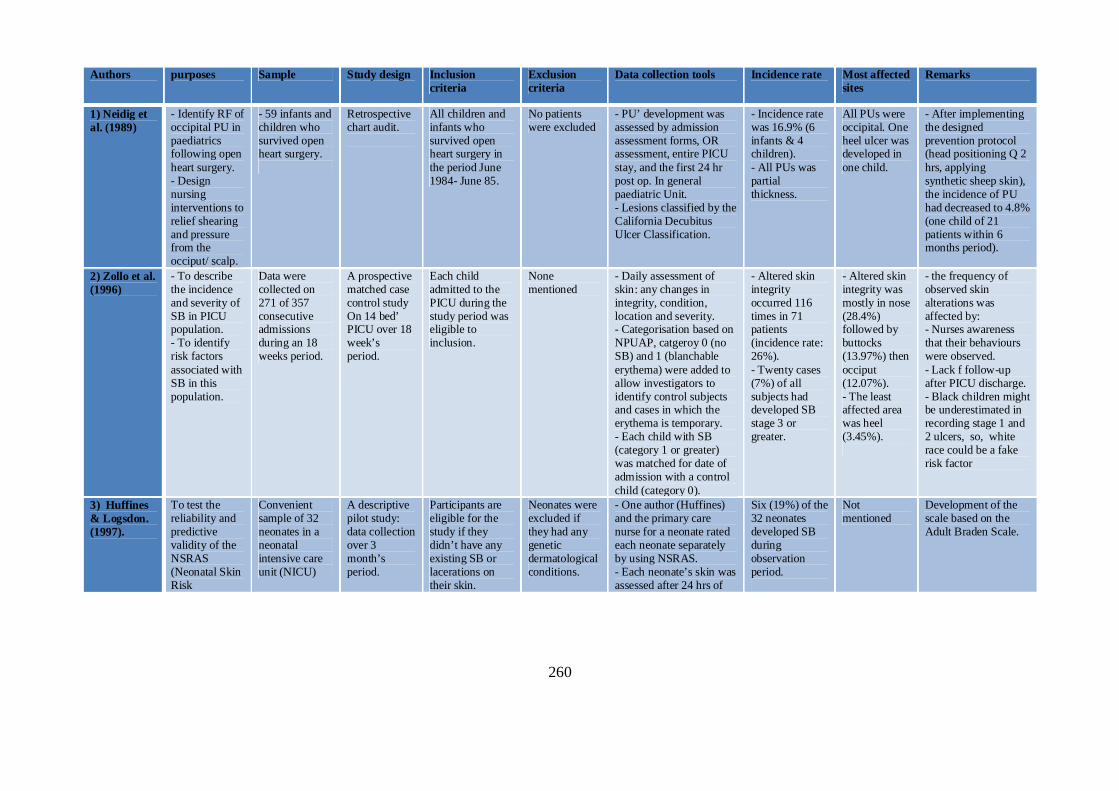
260
Authors purposes Sample Study design Inclusion criteria
Exclusion criteria
Data collection tools Incidence rate Most affected sites
Remarks
1) Neidig et al. (1989)
- Identify RF of occipital PU in paediatrics following open heart surgery. - Design nursing interventions to relief shearing and pressure from the occiput/ scalp.
- 59 infants and children who survived open heart surgery.
Retrospective chart audit.
All children and infants who survived open heart surgery in the period June 1984- June 85.
No patients were excluded
- PU’ development was assessed by admission assessment forms, OR assessment, entire PICU stay, and the first 24 hr post op. In general paediatric Unit. - Lesions classified by the California Decubitus Ulcer Classification.
- Incidence rate was 16.9% (6 infants & 4 children). - All PUs was partial thickness.
All PUs were occipital. One heel ulcer was developed in one child.
- After implementing the designed prevention protocol (head positioning Q 2 hrs, applying synthetic sheep skin), the incidence of PU had decreased to 4.8% (one child of 21 patients within 6 months period).
2) Zollo et al. (1996)
- To describe the incidence and severity of SB in PICU population. - To identify risk factors associated with SB in this population.
Data were collected on 271 of 357 consecutive admissions during an 18 weeks period.
A prospective matched case control study On 14 bed’ PICU over 18 week’s period.
Each child admitted to the PICU during the study period was eligible to inclusion.
None mentioned
- Daily assessment of skin: any changes in integrity, condition, location and severity. - Categorisation based on NPUAP, catgeroy 0 (no SB) and 1 (blanchable erythema) were added to allow investigators to identify control subjects and cases in which the erythema is temporary. - Each child with SB (category 1 or greater) was matched for date of admission with a control child (category 0).
- Altered skin integrity occurred 116 times in 71 patients (incidence rate: 26%). - Twenty cases (7%) of all subjects had developed SB stage 3 or greater.
- Altered skin integrity was mostly in nose (28.4%) followed by buttocks (13.97%) then occiput (12.07%). - The least affected area was heel (3.45%).
- the frequency of observed skin alterations was affected by: - Nurses awareness that their behaviours were observed. - Lack f follow-up after PICU discharge. - Black children might be underestimated in recording stage 1 and 2 ulcers, so, white race could be a fake risk factor
3) Huffines & Logsdon. (1997).
To test the reliability and predictive validity of the NSRAS (Neonatal Skin Risk
Convenient sample of 32 neonates in a neonatal intensive care unit (NICU)
A descriptive pilot study: data collection over 3 month’s period.
Participants are eligible for the study if they didn’t have any existing SB or lacerations on their skin.
Neonates were excluded if they had any genetic dermatological conditions.
- One author (Huffines) and the primary care nurse for a neonate rated each neonate separately by using NSRAS. - Each neonate’s skin was assessed after 24 hrs of
Six (19%) of the 32 neonates developed SB during observation period.
Not mentioned
Development of the scale based on the Adult Braden Scale.
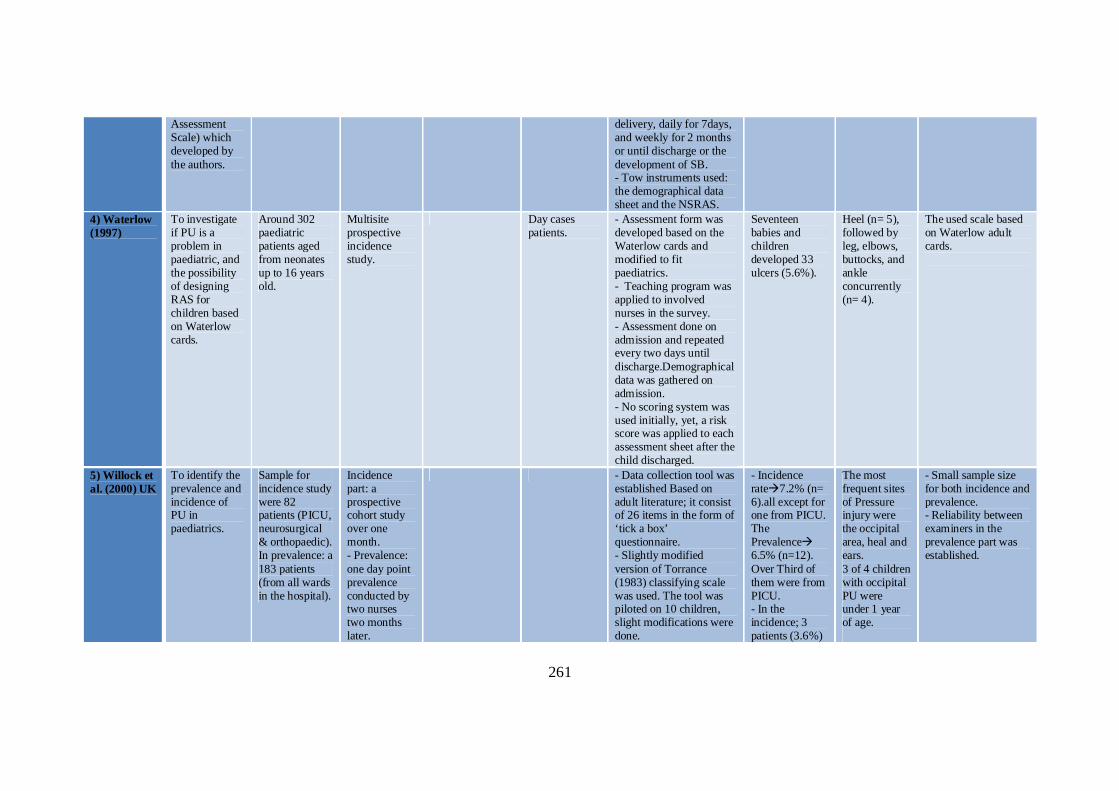
261
Assessment Scale) which developed by the authors.
delivery, daily for 7days, and weekly for 2 months or until discharge or the development of SB. - Tow instruments used: the demographical data sheet and the NSRAS.
4) Waterlow (1997)
To investigate if PU is a problem in paediatric, and the possibility of designing RAS for children based on Waterlow cards.
Around 302 paediatric patients aged from neonates up to 16 years old.
Multisite prospective incidence study.
Day cases patients.
- Assessment form was developed based on the Waterlow cards and modified to fit paediatrics. - Teaching program was applied to involved nurses in the survey. - Assessment done on admission and repeated every two days until discharge.Demographical data was gathered on admission. - No scoring system was used initially, yet, a risk score was applied to each assessment sheet after the child discharged.
Seventeen babies and children developed 33 ulcers (5.6%).
Heel (n= 5), followed by leg, elbows, buttocks, and ankle concurrently (n= 4).
The used scale based on Waterlow adult cards.
5) Willock et al. (2000) UK
To identify the prevalence and incidence of PU in paediatrics.
Sample for incidence study were 82 patients (PICU, neurosurgical & orthopaedic). In prevalence: a 183 patients (from all wards in the hospital).
Incidence part: a prospective cohort study over one month. - Prevalence: one day point prevalence conducted by two nurses two months later.
- Data collection tool was established Based on adult literature; it consist of 26 items in the form of ‘tick a box’ questionnaire. - Slightly modified version of Torrance (1983) classifying scale was used. The tool was piloted on 10 children, slight modifications were done.
- Incidence rate7.2% (n= 6).all except for one from PICU. The Prevalence 6.5% (n=12). Over Third of them were from PICU. - In the incidence; 3 patients (3.6%)
The most frequent sites of Pressure injury were the occipital area, heal and ears. 3 of 4 children with occipital PU were under 1 year of age.
- Small sample size for both incidence and prevalence. - Reliability between examiners in the prevalence part was established.
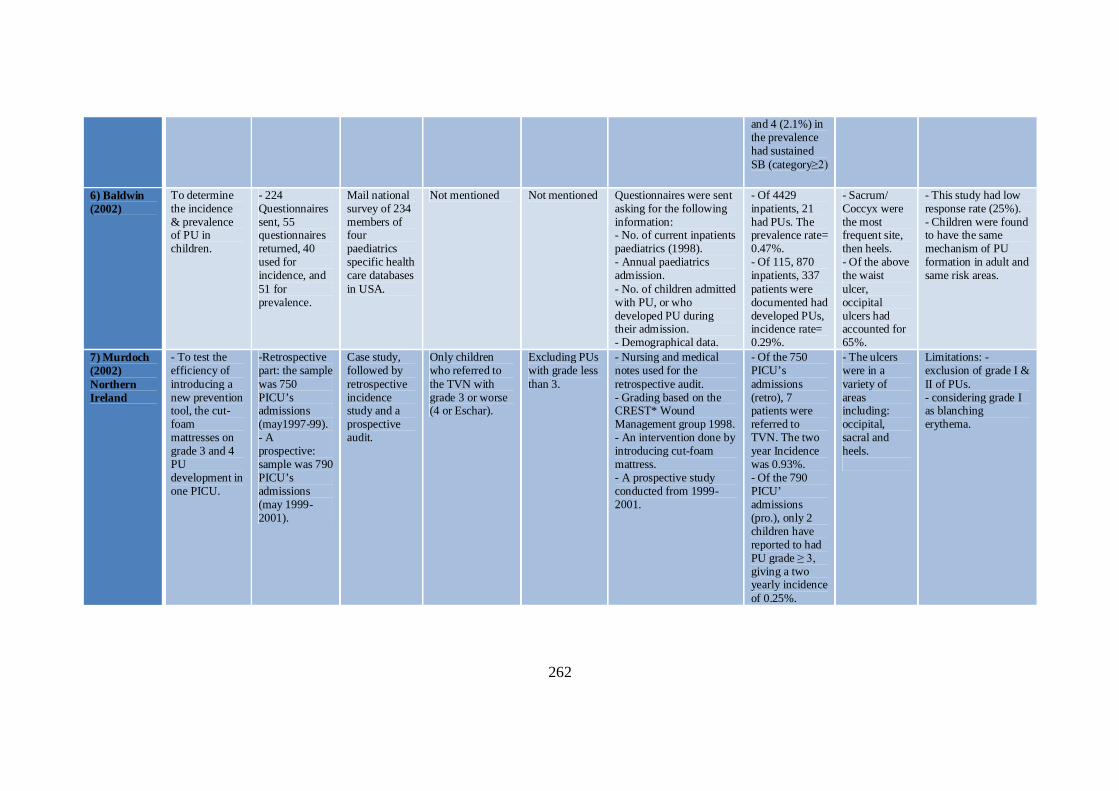
262
and 4 (2.1%) in the prevalence had sustained SB (category≥2)
6) Baldwin (2002)
To determine the incidence & prevalence of PU in children.
- 224 Questionnaires sent, 55 questionnaires returned, 40 used for incidence, and 51 for prevalence.
Mail national survey of 234 members of four paediatrics specific health care databases in USA.
Not mentioned Not mentioned Questionnaires were sent asking for the following information: - No. of current inpatients paediatrics (1998). - Annual paediatrics admission. - No. of children admitted with PU, or who developed PU during their admission. - Demographical data.
- Of 4429 inpatients, 21 had PUs. The prevalence rate= 0.47%. - Of 115, 870 inpatients, 337 patients were documented had developed PUs, incidence rate= 0.29%.
- Sacrum/ Coccyx were the most frequent site, then heels. - Of the above the waist ulcer, occipital ulcers had accounted for 65%.
- This study had low response rate (25%). - Children were found to have the same mechanism of PU formation in adult and same risk areas.
7) Murdoch (2002) Northern Ireland
- To test the efficiency of introducing a new prevention tool, the cut- foam mattresses on grade 3 and 4 PU development in one PICU.
-Retrospective part: the sample was 750 PICU’s admissions (may1997-99). - A prospective: sample was 790 PICU’s admissions (may 1999- 2001).
Case study, followed by retrospective incidence study and a prospective audit.
Only children who referred to the TVN with grade 3 or worse (4 or Eschar).
Excluding PUs with grade less than 3.
- Nursing and medical notes used for the retrospective audit. - Grading based on the CREST* Wound Management group 1998. - An intervention done by introducing cut-foam mattress. - A prospective study conducted from 1999-2001.
- Of the 750 PICU’s admissions (retro), 7 patients were referred to TVN. The two year Incidence was 0.93%. - Of the 790 PICU’ admissions (pro.), only 2 children have reported to had PU grade ≥ 3, giving a two yearly incidence of 0.25%.
- The ulcers were in a variety of areas including: occipital, sacral and heels.
Limitations: - exclusion of grade I & II of PUs. - considering grade I as blanching erythema.
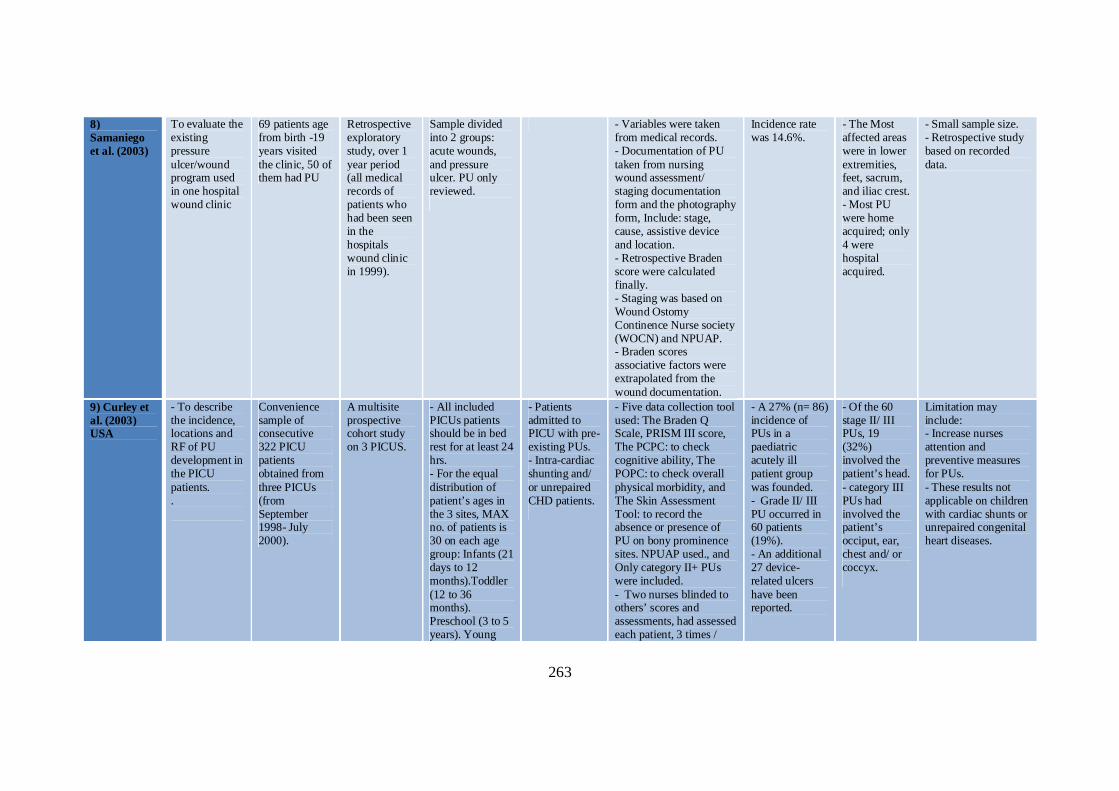
263
8) Samaniego et al. (2003)
To evaluate the existing pressure ulcer/wound program used in one hospital wound clinic
69 patients age from birth -19 years visited the clinic, 50 of them had PU
Retrospective exploratory study, over 1 year period (all medical records of patients who had been seen in the hospitals wound clinic in 1999).
Sample divided into 2 groups: acute wounds, and pressure ulcer. PU only reviewed.
- Variables were taken from medical records. - Documentation of PU taken from nursing wound assessment/ staging documentation form and the photography form, Include: stage, cause, assistive device and location. - Retrospective Braden score were calculated finally. - Staging was based on Wound Ostomy Continence Nurse society (WOCN) and NPUAP. - Braden scores associative factors were extrapolated from the wound documentation.
Incidence rate was 14.6%.
- The Most affected areas were in lower extremities, feet, sacrum, and iliac crest. - Most PU were home acquired; only 4 were hospital acquired.
- Small sample size. - Retrospective study based on recorded data.
9) Curley et al. (2003) USA
- To describe the incidence, locations and RF of PU development in the PICU patients. .
Convenience sample of consecutive 322 PICU patients obtained from three PICUs (from September 1998- July 2000).
A multisite prospective cohort study on 3 PICUS.
- All included PICUs patients should be in bed rest for at least 24 hrs. - For the equal distribution of patient’s ages in the 3 sites, MAX no. of patients is 30 on each age group: Infants (21 days to 12 months).Toddler (12 to 36 months). Preschool (3 to 5 years). Young
- Patients admitted to PICU with pre-existing PUs. - Intra-cardiac shunting and/ or unrepaired CHD patients.
- Five data collection tool used: The Braden Q Scale, PRISM III score, The PCPC: to check cognitive ability, The POPC: to check overall physical morbidity, and The Skin Assessment Tool: to record the absence or presence of PU on bony prominence sites. NPUAP used., and Only category II+ PUs were included. - Two nurses blinded to others’ scores and assessments, had assessed each patient, 3 times /
- A 27% (n= 86) incidence of PUs in a paediatric acutely ill patient group was founded. - Grade II/ III PU occurred in 60 patients (19%). - An additional 27 device-related ulcers have been reported.
- Of the 60 stage II/ III PUs, 19 (32%) involved the patient’s head. - category III PUs had involved the patient’s occiput, ear, chest and/ or coccyx.
Limitation may include: - Increase nurses attention and preventive measures for PUs. - These results not applicable on children with cardiac shunts or unrepaired congenital heart diseases.
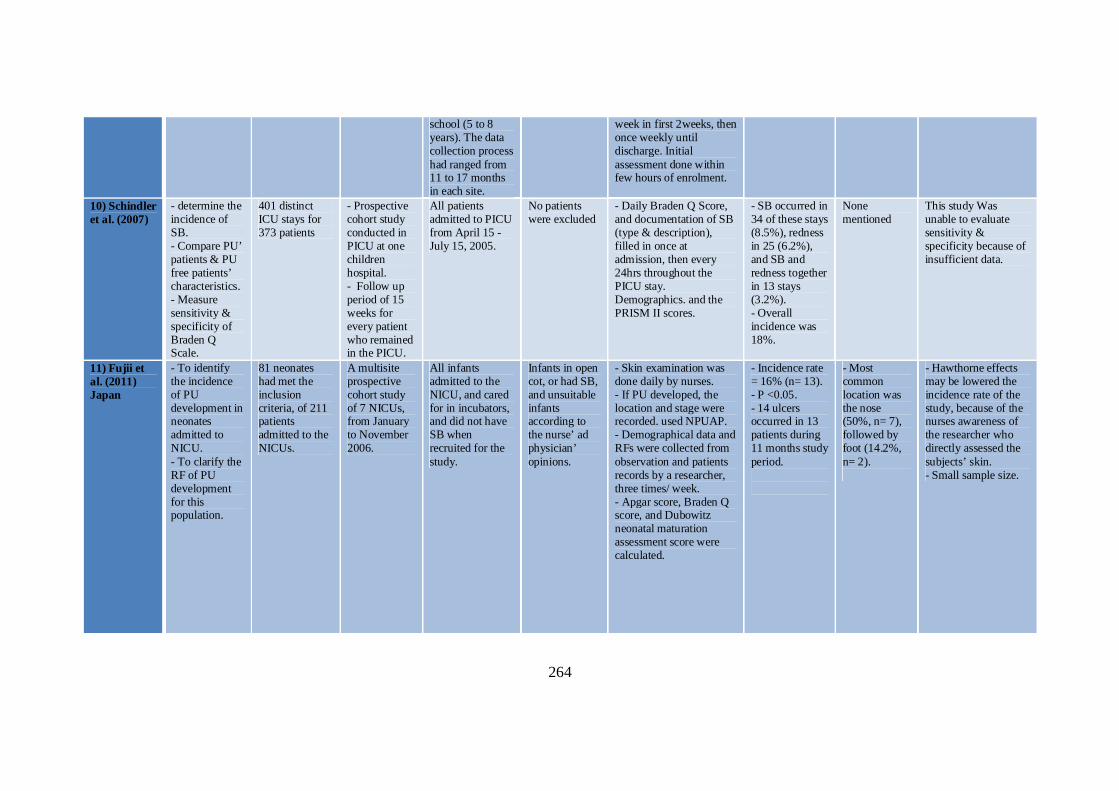
264
school (5 to 8 years). The data collection process had ranged from 11 to 17 months in each site.
week in first 2weeks, then once weekly until discharge. Initial assessment done within few hours of enrolment.
10) Schindler et al. (2007)
- determine the incidence of SB. - Compare PU’ patients & PU free patients’ characteristics. - Measure sensitivity & specificity of Braden Q Scale.
401 distinct ICU stays for 373 patients
- Prospective cohort study conducted in PICU at one children hospital. - Follow up period of 15 weeks for every patient who remained in the PICU.
All patients admitted to PICU from April 15 - July 15, 2005.
No patients were excluded
- Daily Braden Q Score, and documentation of SB (type & description), filled in once at admission, then every 24hrs throughout the PICU stay. Demographics. and the PRISM II scores.
- SB occurred in 34 of these stays (8.5%), redness in 25 (6.2%), and SB and redness together in 13 stays (3.2%). - Overall incidence was 18%.
None mentioned
This study Was unable to evaluate sensitivity & specificity because of insufficient data.
11) Fujii et al. (2011) Japan
- To identify the incidence of PU development in neonates admitted to NICU. - To clarify the RF of PU development for this population.
81 neonates had met the inclusion criteria, of 211 patients admitted to the NICUs.
A multisite prospective cohort study of 7 NICUs, from January to November 2006.
All infants admitted to the NICU, and cared for in incubators, and did not have SB when recruited for the study.
Infants in open cot, or had SB, and unsuitable infants according to the nurse’ ad physician’ opinions.
- Skin examination was done daily by nurses. - If PU developed, the location and stage were recorded. used NPUAP. - Demographical data and RFs were collected from observation and patients records by a researcher, three times/ week. - Apgar score, Braden Q score, and Dubowitz neonatal maturation assessment score were calculated.
- Incidence rate = 16% (n= 13). - P <0.05. - 14 ulcers occurred in 13 patients during 11 months study period.
- Most common location was the nose (50%, n= 7), followed by foot (14.2%, n= 2).
- Hawthorne effects may be lowered the incidence rate of the study, because of the nurses awareness of the researcher who directly assessed the subjects’ skin. - Small sample size.

265
* CREST: Clinical Resource Efficiency Support Team wound management group 1998, CHD: Congenital Heart Diseases, PRISM score: Paediatric Risk of Mortality Score, PCPC: Peadiatric Cerebral performance category, POPC: Paediatric Overall Performance Category, WOCN: Wound and Ostomy Care Nurse. SB: Skin Breakdown, PU: Pressure Ulcer, RF: Risk Factor.
Appendix 1.4: Summary of the Paediatrics’ Incidence Studies
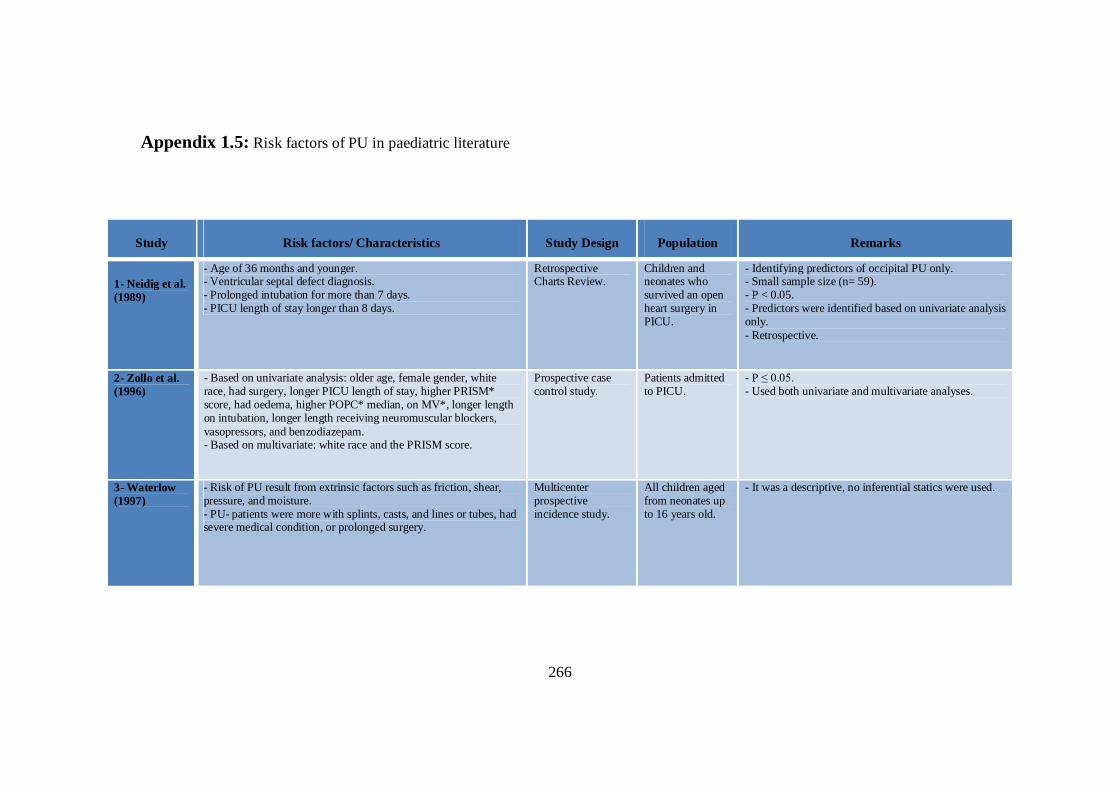
266
Appendix 1.5: Risk factors of PU in paediatric literature
Study Risk factors/ Characteristics Study Design Population Remarks
1- Neidig et al. (1989)
- Age of 36 months and younger. - Ventricular septal defect diagnosis. - Prolonged intubation for more than 7 days. - PICU length of stay longer than 8 days.
Retrospective Charts Review.
Children and neonates who survived an open heart surgery in PICU.
- Identifying predictors of occipital PU only. - Small sample size (n= 59). - P < 0.05. - Predictors were identified based on univariate analysis only. - Retrospective.
2- Zollo et al. (1996)
- Based on univariate analysis: older age, female gender, white race, had surgery, longer PICU length of stay, higher PRISM* score, had oedema, higher POPC* median, on MV*, longer length on intubation, longer length receiving neuromuscular blockers, vasopressors, and benzodiazepam. - Based on multivariate: white race and the PRISM score.
Prospective case control study.
Patients admitted to PICU.
- P ≤ 0.05. - Used both univariate and multivariate analyses.
3- Waterlow (1997)
- Risk of PU result from extrinsic factors such as friction, shear, pressure, and moisture. - PU- patients were more with splints, casts, and lines or tubes, had severe medical condition, or prolonged surgery.
Multicenter prospective incidence study.
All children aged from neonates up to 16 years old.
- It was a descriptive, no inferential statics were used.
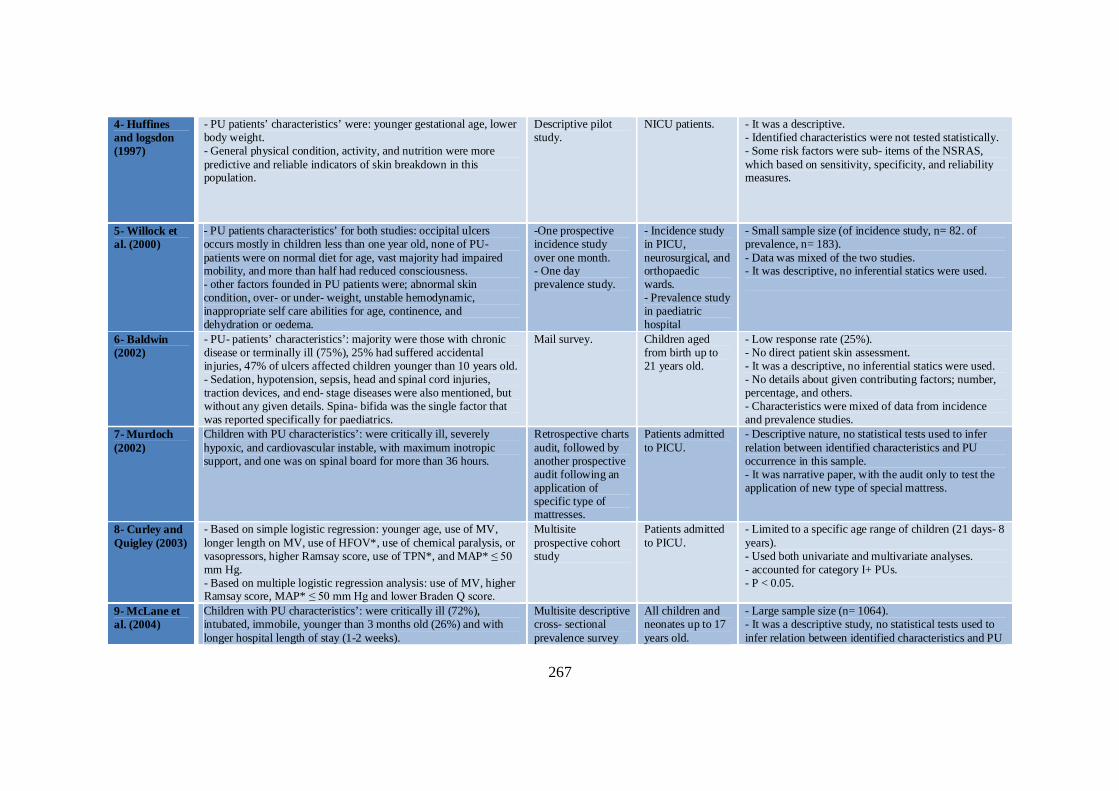
267
4- Huffines and logsdon (1997)
- PU patients’ characteristics’ were: younger gestational age, lower body weight. - General physical condition, activity, and nutrition were more predictive and reliable indicators of skin breakdown in this population.
Descriptive pilot study.
NICU patients. - It was a descriptive. - Identified characteristics were not tested statistically. - Some risk factors were sub- items of the NSRAS, which based on sensitivity, specificity, and reliability measures.
5- Willock et al. (2000)
- PU patients characteristics’ for both studies: occipital ulcers occurs mostly in children less than one year old, none of PU- patients were on normal diet for age, vast majority had impaired mobility, and more than half had reduced consciousness. - other factors founded in PU patients were; abnormal skin condition, over- or under- weight, unstable hemodynamic, inappropriate self care abilities for age, continence, and dehydration or oedema.
-One prospective incidence study over one month. - One day prevalence study.
- Incidence study in PICU, neurosurgical, and orthopaedic wards. - Prevalence study in paediatric hospital
- Small sample size (of incidence study, n= 82. of prevalence, n= 183). - Data was mixed of the two studies. - It was descriptive, no inferential statics were used.
6- Baldwin (2002)
- PU- patients’ characteristics’: majority were those with chronic disease or terminally ill (75%), 25% had suffered accidental injuries, 47% of ulcers affected children younger than 10 years old. - Sedation, hypotension, sepsis, head and spinal cord injuries, traction devices, and end- stage diseases were also mentioned, but without any given details. Spina- bifida was the single factor that was reported specifically for paediatrics.
Mail survey. Children aged from birth up to 21 years old.
- Low response rate (25%). - No direct patient skin assessment. - It was a descriptive, no inferential statics were used. - No details about given contributing factors; number, percentage, and others. - Characteristics were mixed of data from incidence and prevalence studies.
7- Murdoch (2002)
Children with PU characteristics’: were critically ill, severely hypoxic, and cardiovascular instable, with maximum inotropic support, and one was on spinal board for more than 36 hours.
Retrospective charts audit, followed by another prospective audit following an application of specific type of mattresses.
Patients admitted to PICU.
- Descriptive nature, no statistical tests used to infer relation between identified characteristics and PU occurrence in this sample. - It was narrative paper, with the audit only to test the application of new type of special mattress.
8- Curley and Quigley (2003)
- Based on simple logistic regression: younger age, use of MV, longer length on MV, use of HFOV*, use of chemical paralysis, or vasopressors, higher Ramsay score, use of TPN*, and MAP* ≤ 50 mm Hg. - Based on multiple logistic regression analysis: use of MV, higher Ramsay score, MAP* ≤ 50 mm Hg and lower Braden Q score.
Multisite prospective cohort study
Patients admitted to PICU.
- Limited to a specific age range of children (21 days- 8 years). - Used both univariate and multivariate analyses. - accounted for category I+ PUs. - P < 0.05.
9- McLane et al. (2004)
Children with PU characteristics’: were critically ill (72%), intubated, immobile, younger than 3 months old (26%) and with longer hospital length of stay (1-2 weeks).
Multisite descriptive cross- sectional prevalence survey
All children and neonates up to 17 years old.
- Large sample size (n= 1064). - It was a descriptive study, no statistical tests used to infer relation between identified characteristics and PU
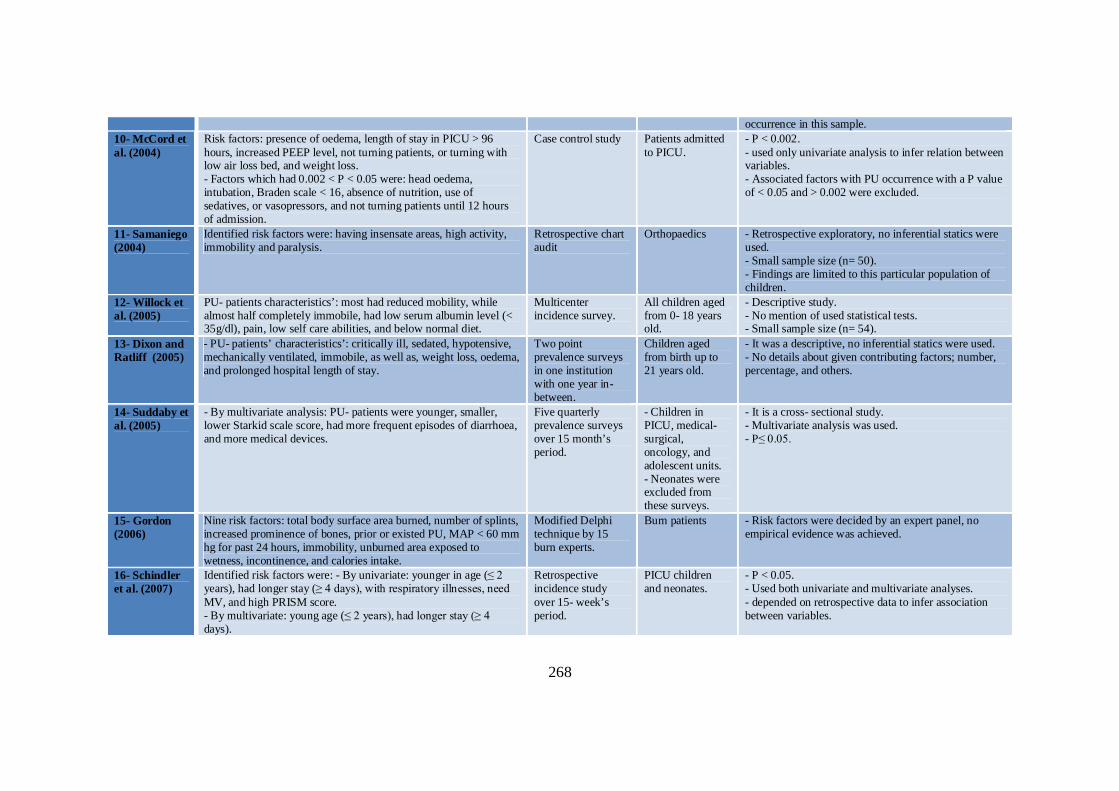
268
occurrence in this sample. 10- McCord et al. (2004)
Risk factors: presence of oedema, length of stay in PICU > 96 hours, increased PEEP level, not turning patients, or turning with low air loss bed, and weight loss. - Factors which had 0.002 < P < 0.05 were: head oedema, intubation, Braden scale < 16, absence of nutrition, use of sedatives, or vasopressors, and not turning patients until 12 hours of admission.
Case control study Patients admitted to PICU.
- P < 0.002. - used only univariate analysis to infer relation between variables. - Associated factors with PU occurrence with a P value of < 0.05 and > 0.002 were excluded.
11- Samaniego (2004)
Identified risk factors were: having insensate areas, high activity, immobility and paralysis.
Retrospective chart audit
Orthopaedics - Retrospective exploratory, no inferential statics were used. - Small sample size (n= 50). - Findings are limited to this particular population of children.
12- Willock et al. (2005)
PU- patients characteristics’: most had reduced mobility, while almost half completely immobile, had low serum albumin level (< 35g/dl), pain, low self care abilities, and below normal diet.
Multicenter incidence survey.
All children aged from 0- 18 years old.
- Descriptive study. - No mention of used statistical tests. - Small sample size (n= 54).
13- Dixon and Ratliff (2005)
- PU- patients’ characteristics’: critically ill, sedated, hypotensive, mechanically ventilated, immobile, as well as, weight loss, oedema, and prolonged hospital length of stay.
Two point prevalence surveys in one institution with one year in- between.
Children aged from birth up to 21 years old.
- It was a descriptive, no inferential statics were used. - No details about given contributing factors; number, percentage, and others.
14- Suddaby et al. (2005)
- By multivariate analysis: PU- patients were younger, smaller, lower Starkid scale score, had more frequent episodes of diarrhoea, and more medical devices.
Five quarterly prevalence surveys over 15 month’s period.
- Children in PICU, medical- surgical, oncology, and adolescent units. - Neonates were excluded from these surveys.
- It is a cross- sectional study. - Multivariate analysis was used. - P≤ 0.05.
15- Gordon (2006)
Nine risk factors: total body surface area burned, number of splints, increased prominence of bones, prior or existed PU, MAP < 60 mm hg for past 24 hours, immobility, unburned area exposed to wetness, incontinence, and calories intake.
Modified Delphi technique by 15 burn experts.
Burn patients - Risk factors were decided by an expert panel, no empirical evidence was achieved.
16- Schindler et al. (2007)
Identified risk factors were: - By univariate: younger in age (≤ 2 years), had longer stay (≥ 4 days), with respiratory illnesses, need MV, and high PRISM score. - By multivariate: young age (≤ 2 years), had longer stay (≥ 4 days).
Retrospective incidence study over 15- week’s period.
PICU children and neonates.
- P < 0.05. - Used both univariate and multivariate analyses. - depended on retrospective data to infer association between variables.
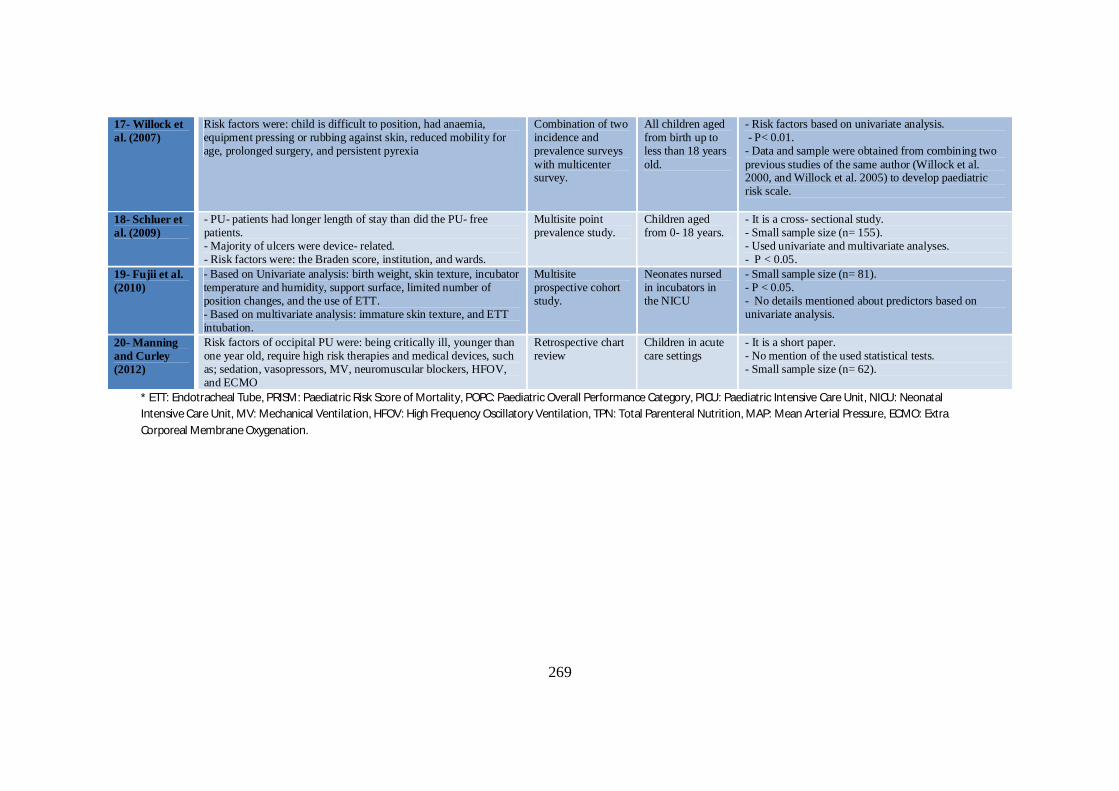
269
* ETT: Endotracheal Tube, PRISM: Paediatric Risk Score of Mortality, POPC: Paediatric Overall Performance Category, PICU: Paediatric Intensive Care Unit, NICU: Neonatal Intensive Care Unit, MV: Mechanical Ventilation, HFOV: High Frequency Oscillatory Ventilation, TPN: Total Parenteral Nutrition, MAP: Mean Arterial Pressure, ECMO: Extra Corporeal Membrane Oxygenation.
17- Willock et al. (2007)
Risk factors were: child is difficult to position, had anaemia, equipment pressing or rubbing against skin, reduced mobility for age, prolonged surgery, and persistent pyrexia
Combination of two incidence and prevalence surveys with multicenter survey.
All children aged from birth up to less than 18 years old.
- Risk factors based on univariate analysis. - P< 0.01. - Data and sample were obtained from combining two previous studies of the same author (Willock et al. 2000, and Willock et al. 2005) to develop paediatric risk scale.
18- Schluer et al. (2009)
- PU- patients had longer length of stay than did the PU- free patients. - Majority of ulcers were device- related. - Risk factors were: the Braden score, institution, and wards.
Multisite point prevalence study.
Children aged from 0- 18 years.
- It is a cross- sectional study. - Small sample size (n= 155). - Used univariate and multivariate analyses. - P < 0.05.
19- Fujii et al. (2010)
- Based on Univariate analysis: birth weight, skin texture, incubator temperature and humidity, support surface, limited number of position changes, and the use of ETT. - Based on multivariate analysis: immature skin texture, and ETT intubation.
Multisite prospective cohort study.
Neonates nursed in incubators in the NICU
- Small sample size (n= 81). - P < 0.05. - No details mentioned about predictors based on univariate analysis.
20- Manning and Curley (2012)
Risk factors of occipital PU were: being critically ill, younger than one year old, require high risk therapies and medical devices, such as; sedation, vasopressors, MV, neuromuscular blockers, HFOV, and ECMO
Retrospective chart review
Children in acute care settings
- It is a short paper. - No mention of the used statistical tests. - Small sample size (n= 62).
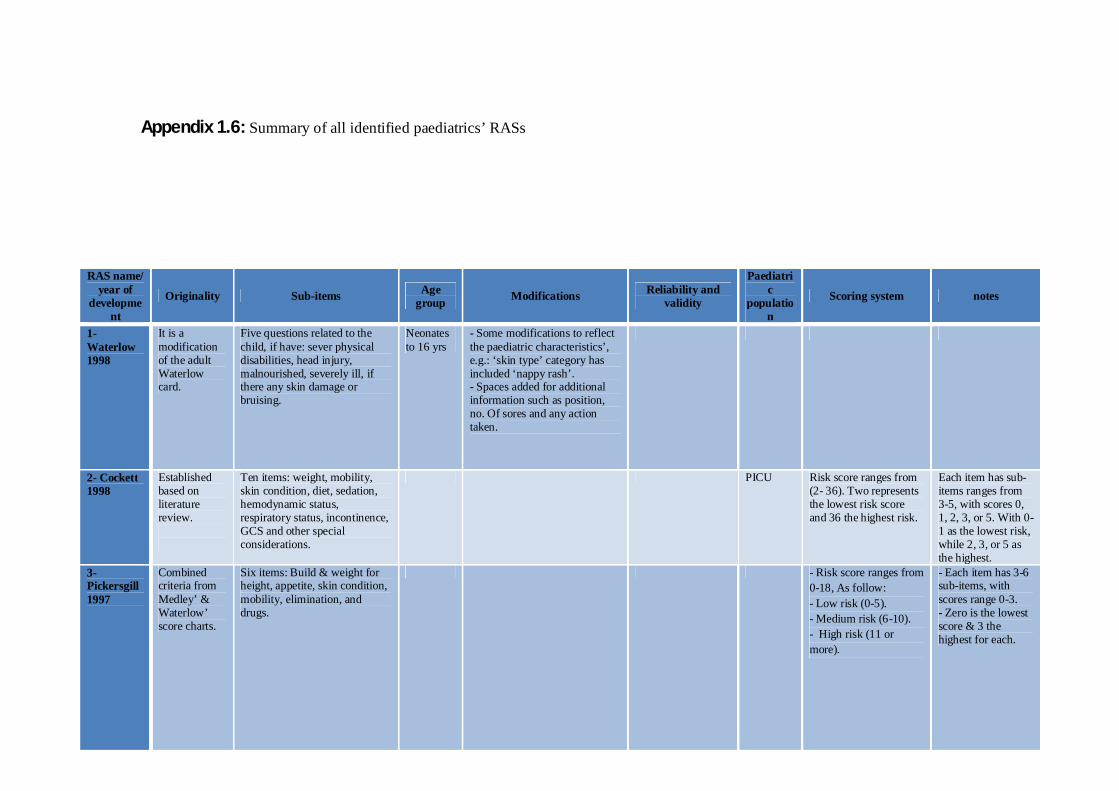
270
Appendix 1.6: Summary of all identified paediatrics’ RASs
RAS name/ year of
development
Originality Sub-items Age group Modifications Reliability and
validity
Paediatric
population
Scoring system notes
1- Waterlow 1998
It is a modification of the adult Waterlow card.
Five questions related to the child, if have: sever physical disabilities, head injury, malnourished, severely ill, if there any skin damage or bruising.
Neonates to 16 yrs
- Some modifications to reflect the paediatric characteristics’, e.g.: ‘skin type’ category has included ‘nappy rash’. - Spaces added for additional information such as position, no. Of sores and any action taken.
2- Cockett 1998
Established based on literature review.
Ten items: weight, mobility, skin condition, diet, sedation, hemodynamic status, respiratory status, incontinence, GCS and other special considerations.
PICU Risk score ranges from (2- 36). Two represents the lowest risk score and 36 the highest risk.
Each item has sub-items ranges from 3-5, with scores 0, 1, 2, 3, or 5. With 0-1 as the lowest risk, while 2, 3, or 5 as the highest.
3- Pickersgill 1997
Combined criteria from Medley’ & Waterlow’ score charts.
Six items: Build & weight for height, appetite, skin condition, mobility, elimination, and drugs.
- Risk score ranges from 0-18, As follow: - Low risk (0-5). - Medium risk (6-10). - High risk (11 or more).
- Each item has 3-6 sub-items, with scores range 0-3. - Zero is the lowest score & 3 the highest for each.
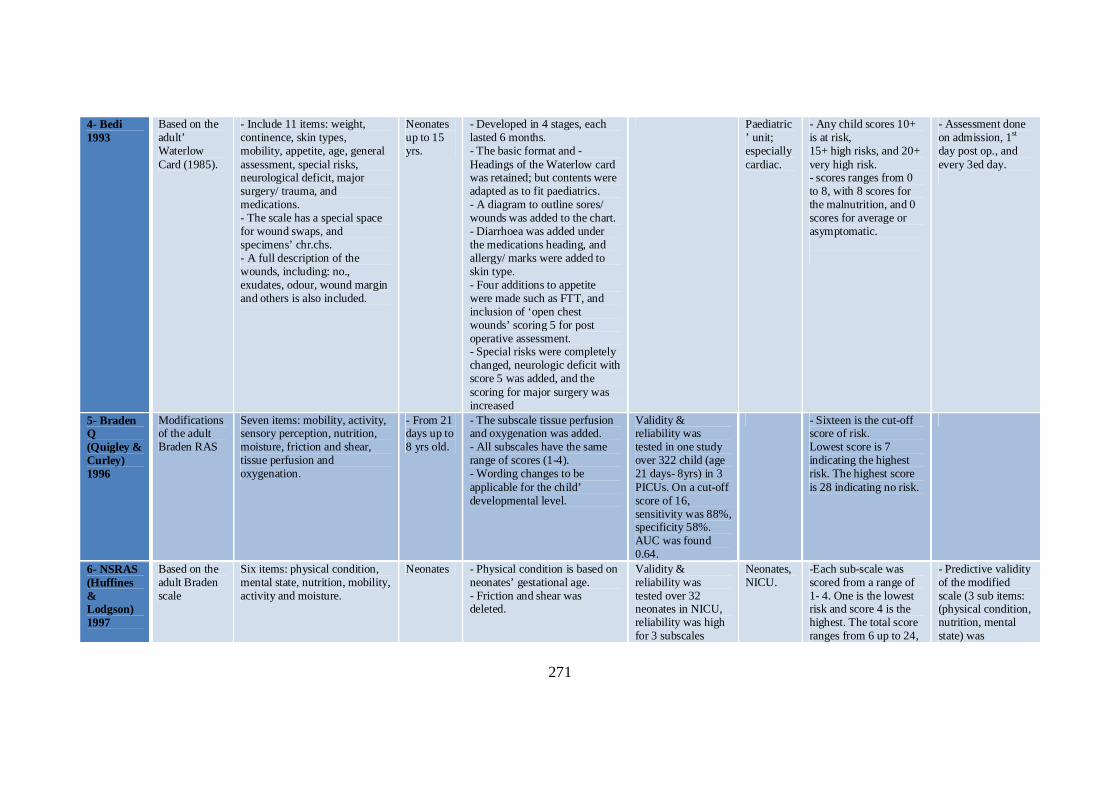
271
4- Bedi 1993
Based on the adult’ Waterlow Card (1985).
- Include 11 items: weight, continence, skin types, mobility, appetite, age, general assessment, special risks, neurological deficit, major surgery/ trauma, and medications. - The scale has a special space for wound swaps, and specimens’ chr.chs. - A full description of the wounds, including: no., exudates, odour, wound margin and others is also included.
Neonates up to 15 yrs.
- Developed in 4 stages, each lasted 6 months. - The basic format and - Headings of the Waterlow card was retained; but contents were adapted as to fit paediatrics. - A diagram to outline sores/ wounds was added to the chart. - Diarrhoea was added under the medications heading, and allergy/ marks were added to skin type. - Four additions to appetite were made such as FTT, and inclusion of ‘open chest wounds’ scoring 5 for post operative assessment. - Special risks were completely changed, neurologic deficit with score 5 was added, and the scoring for major surgery was increased
Paediatric’ unit; especially cardiac.
- Any child scores 10+ is at risk, 15+ high risks, and 20+ very high risk. - scores ranges from 0 to 8, with 8 scores for the malnutrition, and 0 scores for average or asymptomatic.
- Assessment done on admission, 1st day post op., and every 3ed day.
5- Braden Q (Quigley & Curley) 1996
Modifications of the adult Braden RAS
Seven items: mobility, activity, sensory perception, nutrition, moisture, friction and shear, tissue perfusion and oxygenation.
- From 21 days up to 8 yrs old.
- The subscale tissue perfusion and oxygenation was added. - All subscales have the same range of scores (1-4). - Wording changes to be applicable for the child’ developmental level.
Validity & reliability was tested in one study over 322 child (age 21 days- 8yrs) in 3 PICUs. On a cut-off score of 16, sensitivity was 88%, specificity 58%. AUC was found 0.64.
- Sixteen is the cut-off score of risk. Lowest score is 7 indicating the highest risk. The highest score is 28 indicating no risk.
6- NSRAS (Huffines & Lodgson) 1997
Based on the adult Braden scale
Six items: physical condition, mental state, nutrition, mobility, activity and moisture.
Neonates - Physical condition is based on neonates’ gestational age. - Friction and shear was deleted.
Validity & reliability was tested over 32 neonates in NICU, reliability was high for 3 subscales
Neonates, NICU.
-Each sub-scale was scored from a range of 1- 4. One is the lowest risk and score 4 is the highest. The total score ranges from 6 up to 24,
- Predictive validity of the modified scale (3 sub items: (physical condition, nutrition, mental state) was

272
(physical condition, nutrition, mental state) on day 14. While the other 3 subscales were very poor.
with lowest score indicating less risk and vice versa.
conducted with a cut-off score of 5. Shown 83% sensitivity and 81% specificity.
7- The Neonatal/ Infant Braden Q RAS. (McLane et al.) 2004
Modification of the Braden Q RAS
Eight items: general physical condition, mobility, activity, sensory perception, nutrition, moisture, friction and shear, tissue perfusion and oxygenation.
Children younger than 1 year old.
Adding more descriptors for each sub-scale that fits the neonates’ unique characteristics’. Also, adding a new gestational age category to target the premature infants.
Content validity was established by experience paediatric nurses & paediatric nutritionist.
NICU, infants in care units.
- The lowest score is 8 indicating the highest risk. The highest score is 29 indicating no risk. - Babies with GA >38 score 4, (33-38) scores 3, (28-33) score 2, and 1 for < 28wks.
8- Garvin 1997
Four categories: (mobility, sensory perception, nutrition, and moisture)
No specific age group mentioned.
- One cross sectional study has compared the predictive validity of Garvin with 2 other scales (Braden Q, Glamorgan) founded that: two of the four sub-scales were significant (mobility & sensory perception). - Using logistic regression two sub-scores were significant (mobility & moisture). The AUC was 64%.
- Four categories with range of scores from 1 (no risk) to 4 (high risk). Each range of total score has different intervention category as: score of 4-5 none, 6-7 level I, 8-12 level II, 13-16 level III intervention.
9- Pattold’s scoring system (Olding & Patterson) 1998
Eight areas: cardiovascular, temperature, respiratory, mobility, nutrition, continence, skin condition, and weight status.
No specific age group mentioned
Children in critical care units
- Eight categories with range of scores from 1 to 3. Total scores classify risk as: - Low (8-14), medium (15-20), high (>20).
Further aspects had been added to the scale which are action taken as prevention and equipment that had been used. Any
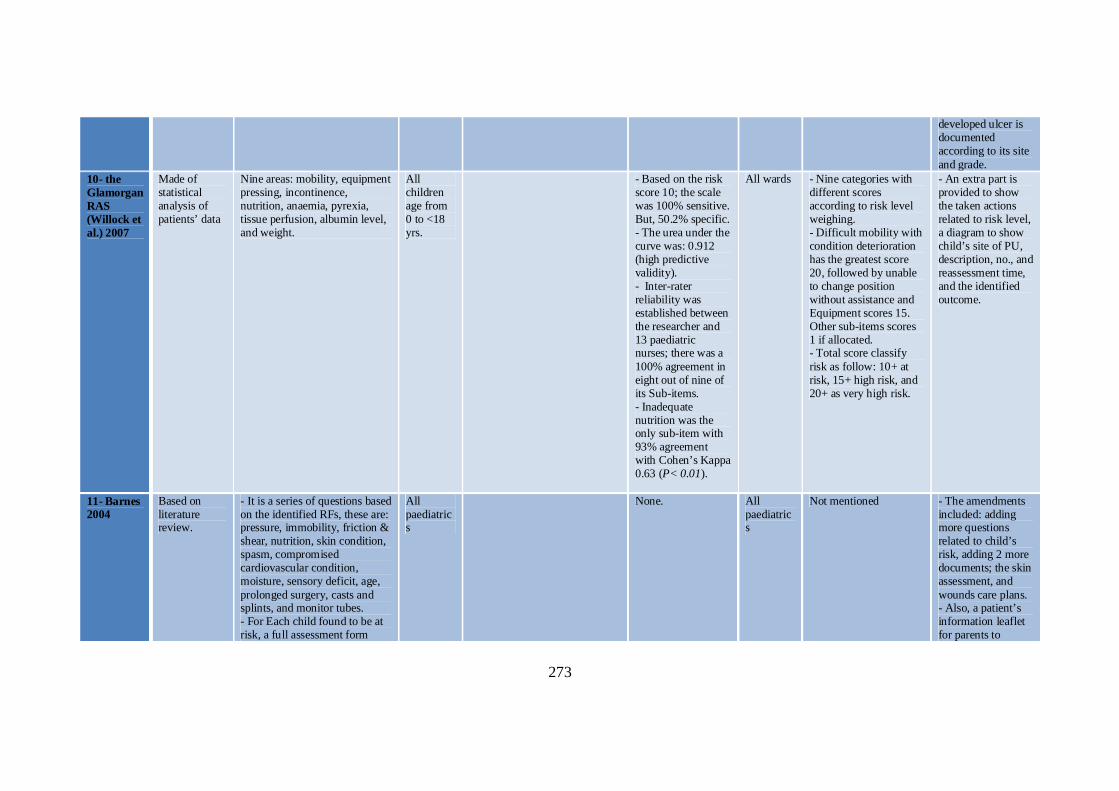
273
developed ulcer is documented according to its site and grade.
10- the Glamorgan RAS (Willock et al.) 2007
Made of statistical analysis of patients’ data
Nine areas: mobility, equipment pressing, incontinence, nutrition, anaemia, pyrexia, tissue perfusion, albumin level, and weight.
All children age from 0 to <18 yrs.
- Based on the risk score 10; the scale was 100% sensitive. But, 50.2% specific. - The urea under the curve was: 0.912 (high predictive validity). - Inter-rater reliability was established between the researcher and 13 paediatric nurses; there was a 100% agreement in eight out of nine of its Sub-items. - Inadequate nutrition was the only sub-item with 93% agreement with Cohen’s Kappa 0.63 (P< 0.01).
All wards - Nine categories with different scores according to risk level weighing. - Difficult mobility with condition deterioration has the greatest score 20, followed by unable to change position without assistance and Equipment scores 15. Other sub-items scores 1 if allocated. - Total score classify risk as follow: 10+ at risk, 15+ high risk, and 20+ as very high risk.
- An extra part is provided to show the taken actions related to risk level, a diagram to show child’s site of PU, description, no., and reassessment time, and the identified outcome.
11- Barnes 2004
Based on literature review.
- It is a series of questions based on the identified RFs, these are: pressure, immobility, friction & shear, nutrition, skin condition, spasm, compromised cardiovascular condition, moisture, sensory deficit, age, prolonged surgery, casts and splints, and monitor tubes. - For Each child found to be at risk, a full assessment form
All paediatrics
None. All paediatrics
Not mentioned - The amendments included: adding more questions related to child’s risk, adding 2 more documents; the skin assessment, and wounds care plans. - Also, a patient’s information leaflet for parents to
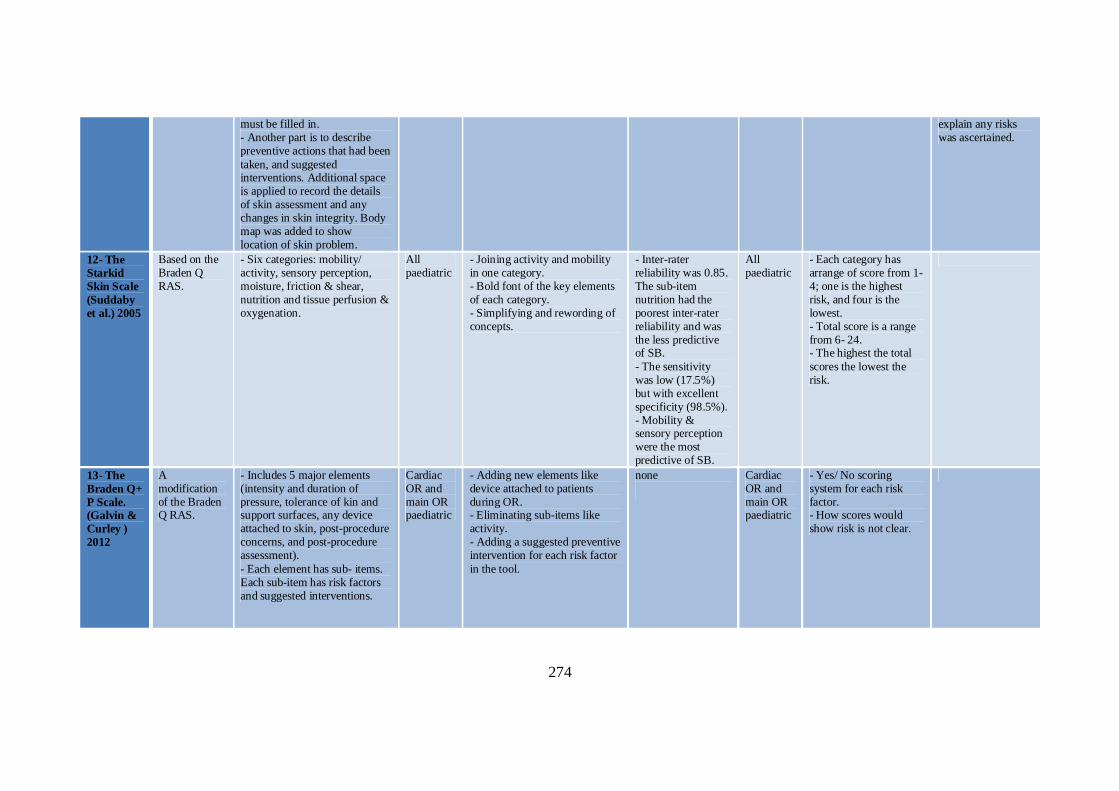
274
must be filled in. - Another part is to describe preventive actions that had been taken, and suggested interventions. Additional space is applied to record the details of skin assessment and any changes in skin integrity. Body map was added to show location of skin problem.
explain any risks was ascertained.
12- The Starkid Skin Scale (Suddaby et al.) 2005
Based on the Braden Q RAS.
- Six categories: mobility/ activity, sensory perception, moisture, friction & shear, nutrition and tissue perfusion & oxygenation.
All paediatric
- Joining activity and mobility in one category. - Bold font of the key elements of each category. - Simplifying and rewording of concepts.
- Inter-rater reliability was 0.85. The sub-item nutrition had the poorest inter-rater reliability and was the less predictive of SB. - The sensitivity was low (17.5%) but with excellent specificity (98.5%). - Mobility & sensory perception were the most predictive of SB.
All paediatric
- Each category has arrange of score from 1-4; one is the highest risk, and four is the lowest. - Total score is a range from 6- 24. - The highest the total scores the lowest the risk.
13- The Braden Q+ P Scale. (Galvin & Curley ) 2012
A modification of the Braden Q RAS.
- Includes 5 major elements (intensity and duration of pressure, tolerance of kin and support surfaces, any device attached to skin, post-procedure concerns, and post-procedure assessment). - Each element has sub- items. Each sub-item has risk factors and suggested interventions.
Cardiac OR and main OR paediatric
- Adding new elements like device attached to patients during OR. - Eliminating sub-items like activity. - Adding a suggested preventive intervention for each risk factor in the tool.
none
Cardiac OR and main OR paediatric
- Yes/ No scoring system for each risk factor. - How scores would show risk is not clear.
275
FTT: Failure To Thrive, Ch.Ch: Characteristics, OR: Operation Room, NSRAS: Neonatal Skin Risk Assessment Scale.
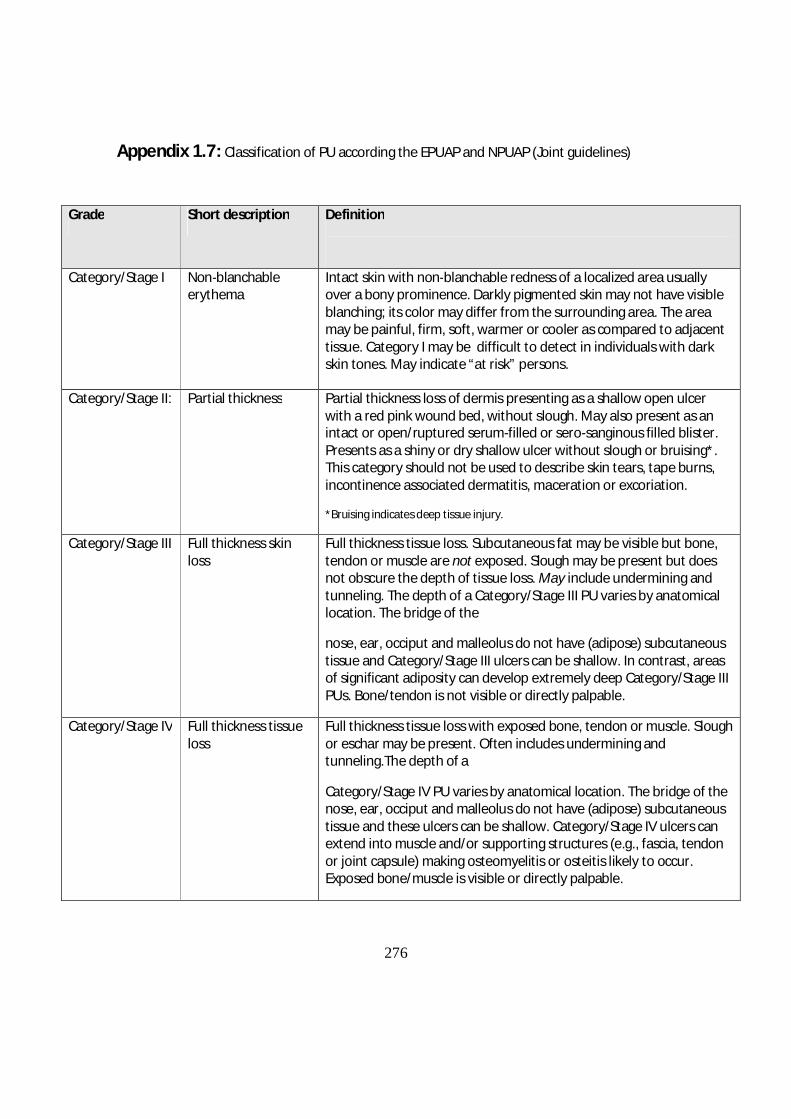
276
Appendix 1.7: Classification of PU according the EPUAP and NPUAP (Joint guidelines)
Grade Short description Definition
Category/Stage I Non-blanchable erythema
Intact skin with non-blanchable redness of a localized area usually over a bony prominence. Darkly pigmented skin may not have visible blanching; its color may differ from the surrounding area. The area may be painful, firm, soft, warmer or cooler as compared to adjacent tissue. Category I may be difficult to detect in individuals with dark skin tones. May indicate “at risk” persons.
Category/Stage II: Partial thickness Partial thickness loss of dermis presenting as a shallow open ulcer with a red pink wound bed, without slough. May also present as an intact or open/ruptured serum-filled or sero-sanginous filled blister. Presents as a shiny or dry shallow ulcer without slough or bruising*. This category should not be used to describe skin tears, tape burns, incontinence associated dermatitis, maceration or excoriation.
*Bruising indicates deep tissue injury.
Category/Stage III Full thickness skin loss
Full thickness tissue loss. Subcutaneous fat may be visible but bone, tendon or muscle are not exposed. Slough may be present but does not obscure the depth of tissue loss. May include undermining and tunneling. The depth of a Category/Stage III PU varies by anatomical location. The bridge of the
nose, ear, occiput and malleolus do not have (adipose) subcutaneous tissue and Category/Stage III ulcers can be shallow. In contrast, areas of significant adiposity can develop extremely deep Category/Stage III PUs. Bone/tendon is not visible or directly palpable.
Category/Stage IV Full thickness tissue loss
Full thickness tissue loss with exposed bone, tendon or muscle. Slough or eschar may be present. Often includes undermining and tunneling.The depth of a
Category/Stage IV PU varies by anatomical location. The bridge of the nose, ear, occiput and malleolus do not have (adipose) subcutaneous tissue and these ulcers can be shallow. Category/Stage IV ulcers can extend into muscle and/or supporting structures (e.g., fascia, tendon or joint capsule) making osteomyelitis or osteitis likely to occur. Exposed bone/muscle is visible or directly palpable.
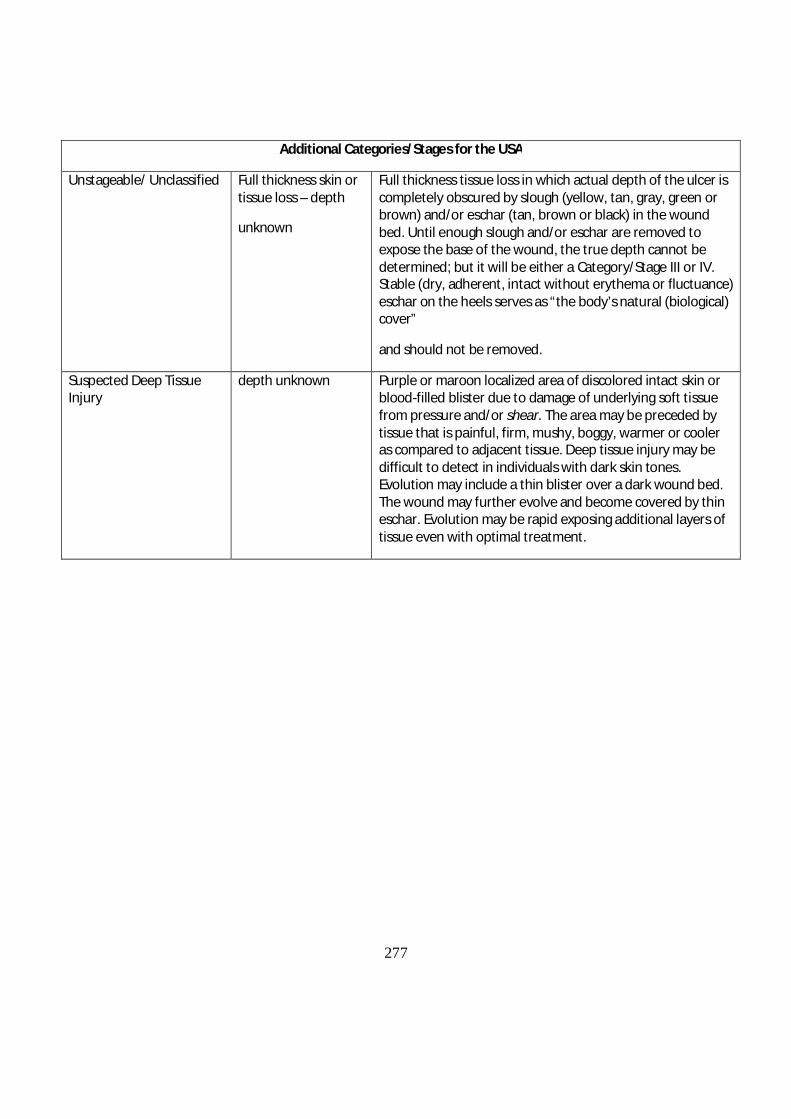
277
Additional Categories/Stages for the USA
Unstageable/ Unclassified Full thickness skin or tissue loss – depth
unknown
Full thickness tissue loss in which actual depth of the ulcer is completely obscured by slough (yellow, tan, gray, green or brown) and/or eschar (tan, brown or black) in the wound bed. Until enough slough and/or eschar are removed to expose the base of the wound, the true depth cannot be determined; but it will be either a Category/Stage III or IV. Stable (dry, adherent, intact without erythema or fluctuance) eschar on the heels serves as “the body’s natural (biological) cover”
and should not be removed.
Suspected Deep Tissue Injury
depth unknown Purple or maroon localized area of discolored intact skin or blood-filled blister due to damage of underlying soft tissue from pressure and/or shear. The area may be preceded by tissue that is painful, firm, mushy, boggy, warmer or cooler as compared to adjacent tissue. Deep tissue injury may be difficult to detect in individuals with dark skin tones. Evolution may include a thin blister over a dark wound bed. The wound may further evolve and become covered by thin eschar. Evolution may be rapid exposing additional layers of tissue even with optimal treatment.
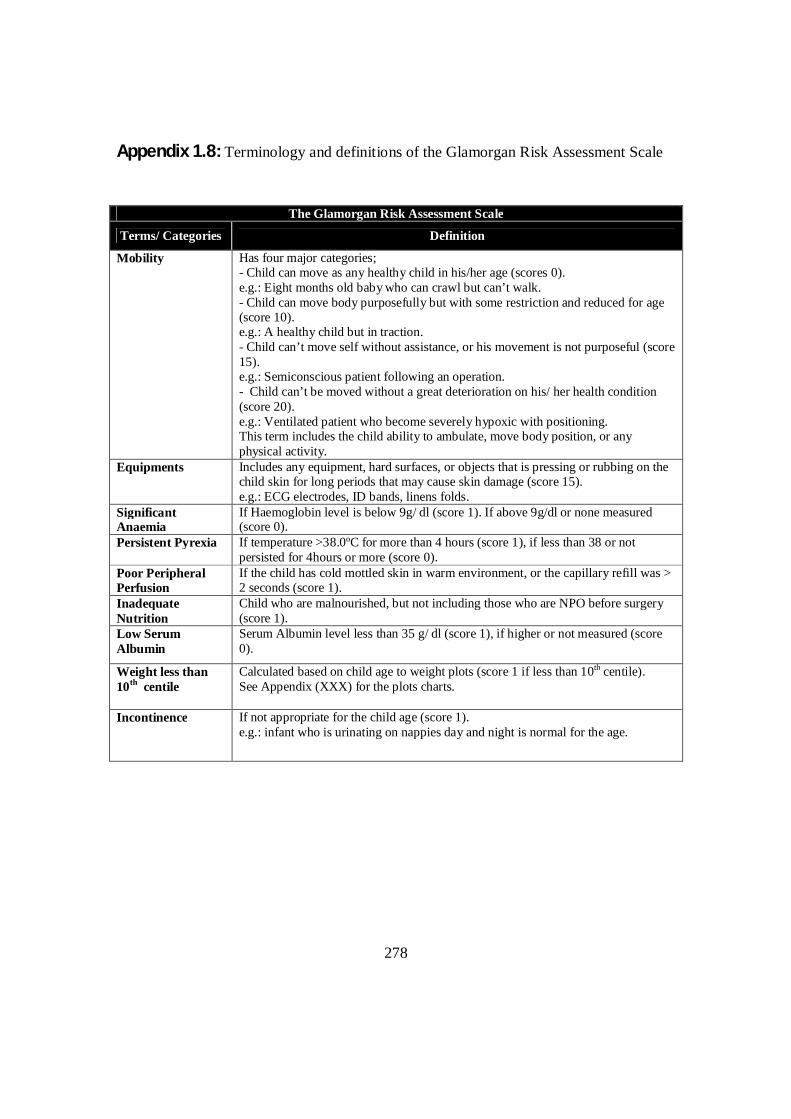
278
Appendix 1.8: Terminology and definitions of the Glamorgan Risk Assessment Scale
The Glamorgan Risk Assessment Scale
Terms/ Categories Definition
Mobility Has four major categories; - Child can move as any healthy child in his/her age (scores 0). e.g.: Eight months old baby who can crawl but can’t walk. - Child can move body purposefully but with some restriction and reduced for age (score 10). e.g.: A healthy child but in traction. - Child can’t move self without assistance, or his movement is not purposeful (score 15). e.g.: Semiconscious patient following an operation. - Child can’t be moved without a great deterioration on his/ her health condition (score 20). e.g.: Ventilated patient who become severely hypoxic with positioning. This term includes the child ability to ambulate, move body position, or any physical activity.
Equipments Includes any equipment, hard surfaces, or objects that is pressing or rubbing on the child skin for long periods that may cause skin damage (score 15). e.g.: ECG electrodes, ID bands, linens folds.
Significant Anaemia
If Haemoglobin level is below 9g/ dl (score 1). If above 9g/dl or none measured (score 0).
Persistent Pyrexia If temperature >38.0ºC for more than 4 hours (score 1), if less than 38 or not persisted for 4hours or more (score 0).
Poor Peripheral Perfusion
If the child has cold mottled skin in warm environment, or the capillary refill was > 2 seconds (score 1).
Inadequate Nutrition
Child who are malnourished, but not including those who are NPO before surgery (score 1).
Low Serum Albumin
Serum Albumin level less than 35 g/ dl (score 1), if higher or not measured (score 0).
Weight less than 10th centile
Calculated based on child age to weight plots (score 1 if less than 10th centile). See Appendix (XXX) for the plots charts.
Incontinence If not appropriate for the child age (score 1). e.g.: infant who is urinating on nappies day and night is normal for the age.
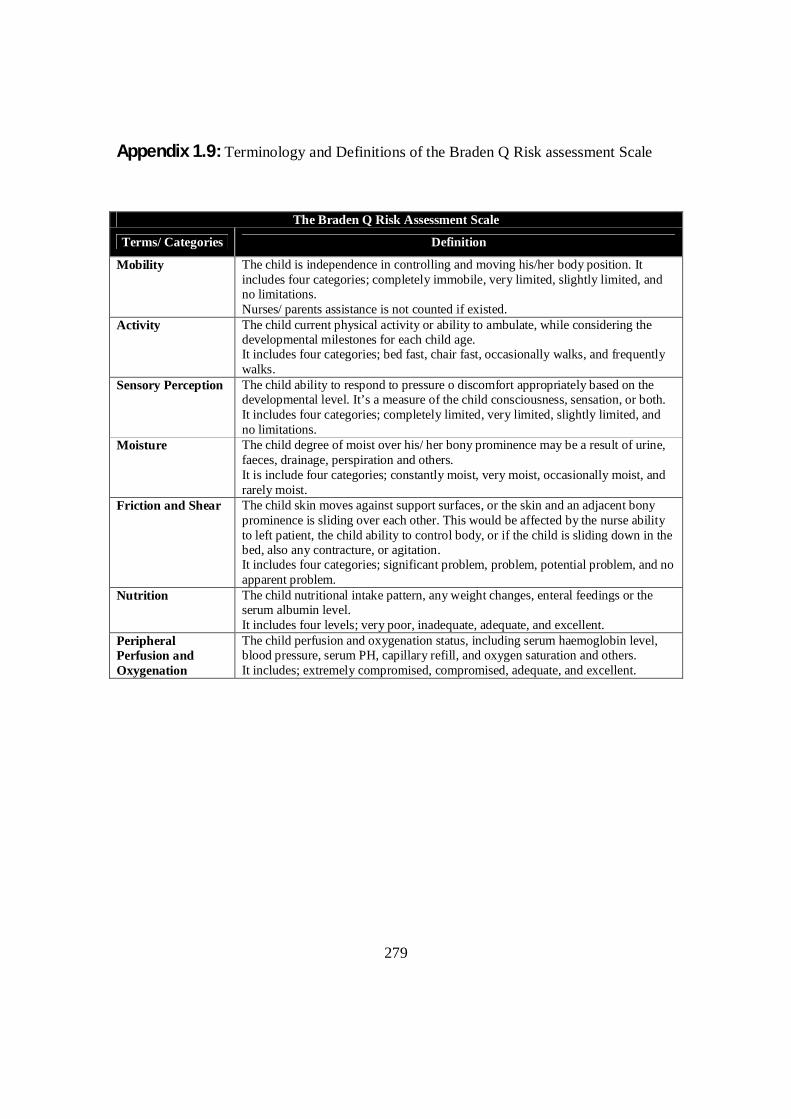
279
Appendix 1.9: Terminology and Definitions of the Braden Q Risk assessment Scale
The Braden Q Risk Assessment Scale
Terms/ Categories Definition
Mobility The child is independence in controlling and moving his/her body position. It includes four categories; completely immobile, very limited, slightly limited, and no limitations. Nurses/ parents assistance is not counted if existed.
Activity The child current physical activity or ability to ambulate, while considering the developmental milestones for each child age. It includes four categories; bed fast, chair fast, occasionally walks, and frequently walks.
Sensory Perception The child ability to respond to pressure o discomfort appropriately based on the developmental level. It’s a measure of the child consciousness, sensation, or both. It includes four categories; completely limited, very limited, slightly limited, and no limitations.
Moisture The child degree of moist over his/ her bony prominence may be a result of urine, faeces, drainage, perspiration and others. It is include four categories; constantly moist, very moist, occasionally moist, and rarely moist.
Friction and Shear The child skin moves against support surfaces, or the skin and an adjacent bony prominence is sliding over each other. This would be affected by the nurse ability to left patient, the child ability to control body, or if the child is sliding down in the bed, also any contracture, or agitation. It includes four categories; significant problem, problem, potential problem, and no apparent problem.
Nutrition The child nutritional intake pattern, any weight changes, enteral feedings or the serum albumin level. It includes four levels; very poor, inadequate, adequate, and excellent.
Peripheral Perfusion and Oxygenation
The child perfusion and oxygenation status, including serum haemoglobin level, blood pressure, serum PH, capillary refill, and oxygen saturation and others. It includes; extremely compromised, compromised, adequate, and excellent.
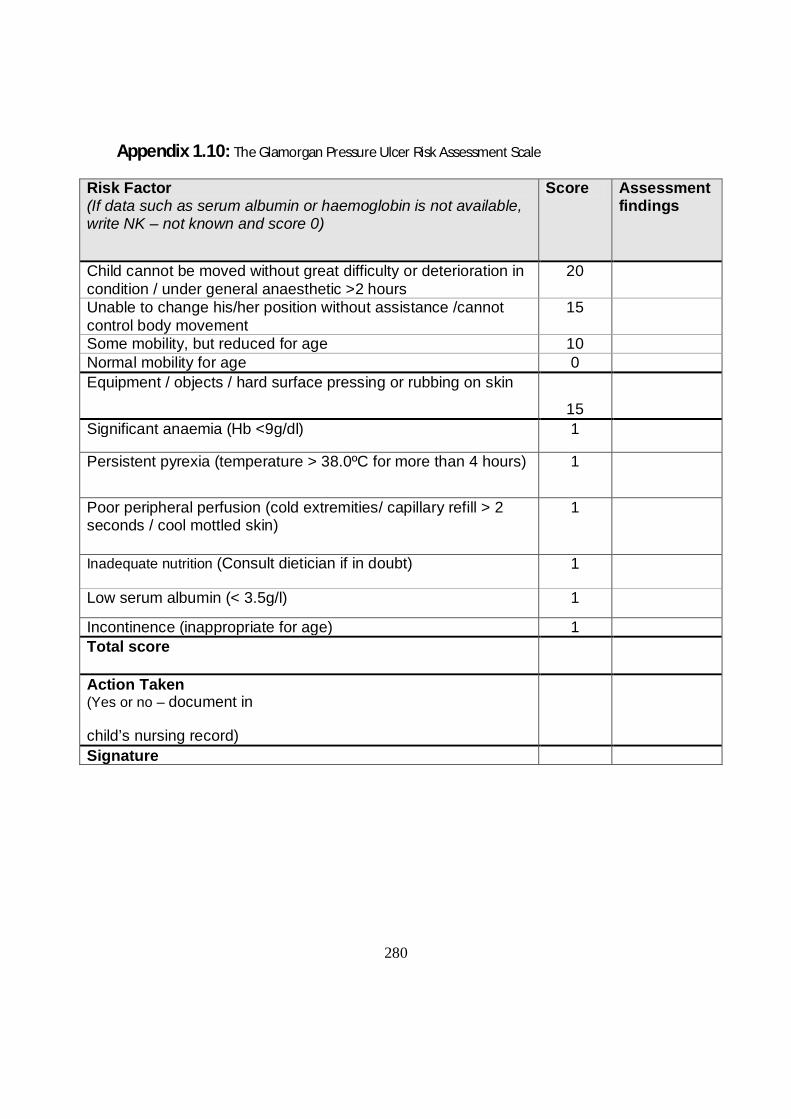
280
Appendix 1.10: The Glamorgan Pressure Ulcer Risk Assessment Scale
Risk Factor (If data such as serum albumin or haemoglobin is not available, write NK – not known and score 0)
Score Assessment findings
Child cannot be moved without great difficulty or deterioration in condition / under general anaesthetic >2 hours
20
Unable to change his/her position without assistance /cannot control body movement
15
Some mobility, but reduced for age 10 Normal mobility for age 0 Equipment / objects / hard surface pressing or rubbing on skin
15
Significant anaemia (Hb <9g/dl) 1
Persistent pyrexia (temperature > 38.0ºC for more than 4 hours) 1
Poor peripheral perfusion (cold extremities/ capillary refill > 2 seconds / cool mottled skin)
1
Inadequate nutrition (Consult dietician if in doubt) 1
Low serum albumin (< 3.5g/l) 1
Incontinence (inappropriate for age) 1 Total score
Action Taken (Yes or no – document in
child’s nursing record)
Signature
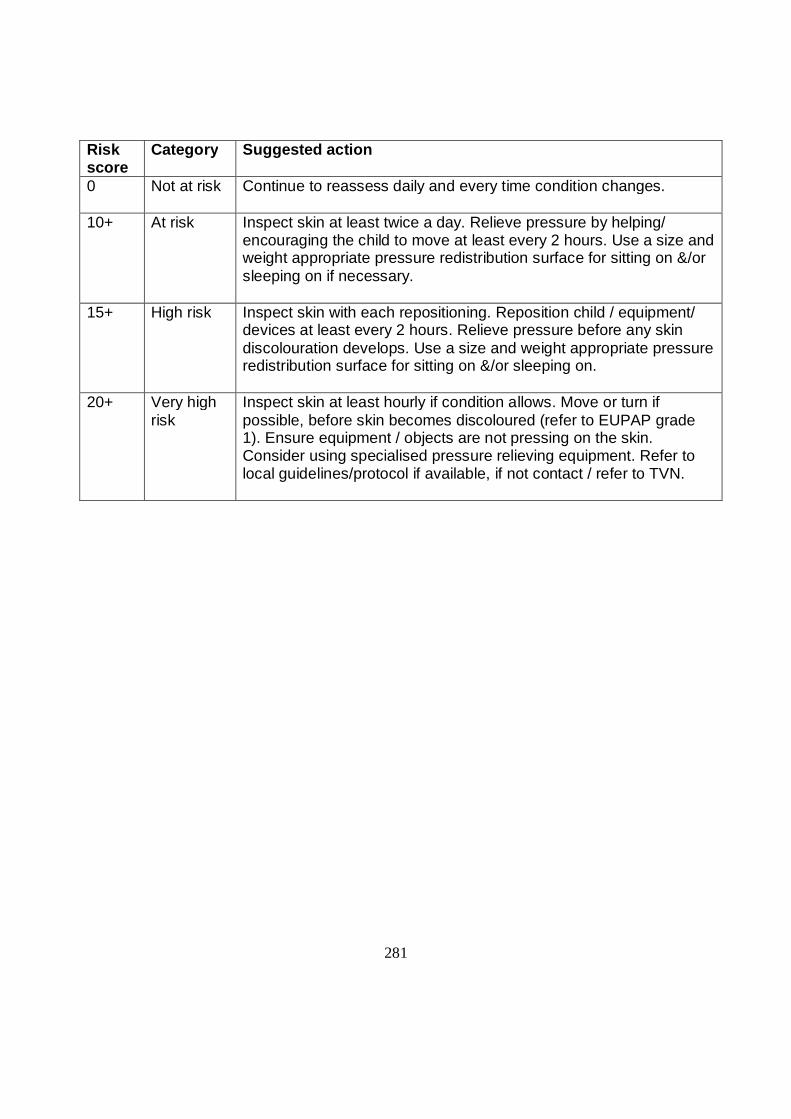
281
Risk score
Category Suggested action
0 Not at risk Continue to reassess daily and every time condition changes.
10+ At risk Inspect skin at least twice a day. Relieve pressure by helping/ encouraging the child to move at least every 2 hours. Use a size and weight appropriate pressure redistribution surface for sitting on &/or sleeping on if necessary.
15+ High risk Inspect skin with each repositioning. Reposition child / equipment/ devices at least every 2 hours. Relieve pressure before any skin discolouration develops. Use a size and weight appropriate pressure redistribution surface for sitting on &/or sleeping on.
20+ Very high risk
Inspect skin at least hourly if condition allows. Move or turn if possible, before skin becomes discoloured (refer to EUPAP grade 1). Ensure equipment / objects are not pressing on the skin. Consider using specialised pressure relieving equipment. Refer to local guidelines/protocol if available, if not contact / refer to TVN.

282
Appendix 1.11: The Braden Q Risk Assessment Scale
Intensity and Duration of Pressure Mobility 1. Completely
immobile: 2. Very limited: 3. Slightly limited: 4. No limitations: Score
The ability to changes and control body position
Does not make even slight changes in body or extremity position without assistance
Makes occasional slight changes in body or extremity position but unable to completely turn self independently
Makes frequent though slight changes in body or extremity position independently
Makes major and frequent changes in position without assistance
Activity 1. Bedfast: 2. Chair fast: 3. Walks occasionally:
4. All patients too young to ambulate or walks frequently:
The degree of physical activity
Confined to bed Ability to walk severely limited or nonexistent. Cannot bear own weight and/or must be assisted in to chair or wheelchair.
Walks occasionally during day, but for very short distances, with or without assistance. Spends majority of each shift in bed or chair.
Walks outside the room at least twice a day and inside room at least once every 2 hours during waking hours.
Sensory perception 1. Completely limited:
2. Very limited: 3. Slightly limited: 4. No impairment:
The ability to respond in a developmentally appropriate way to pressure-related discomfort
Unresponsive (does not moan, flinch, or grasp) to painful stimuli, due to diminished level of consciousness or sedation or limited ability to feel pain over most of the body surface
Responds only to painful stimuli. Cannot communicate discomfort except by moaning or restlessness or has sensory impairment which limits the ability to feel pain or discomfort over ½ of body
Responds to verbal commands, but cannot always communicate discomfort or need to be turned or has some sensory impairment which limits ability to feel pain or discomfort in 1 or 2 extremities
Responds to verbal commands. Has no sensory deficit, which limits ability to feel or communicate pain or discomfort
Tolerance of the Skin and Supporting Structure Moisture 1. Constantly
moist: 2. Very moist: 3. Occasionally
moist: 4. Rarely moist:
Degree to which skin is exposed to moisture
Skin is kept moist almost constantly by perspiration, urine, drainage, etc. Dampness is detected every time patient is moved or turned
Skin is often, but not always moist. Linen must be changed at least every 8 hours
Skin is occasionally moist, requiring linen change every 12 hours
Skin is usually dry, routine diaper changes, linen only requires changing every 24 hours
Friction and Shear 1. Significant problem:
2. Problem: 3. Potential problem:
4. No apparent problem:
Friction: occurs when skin moves against support surfaces Shear: occurs when skin and adjacent bony surface slide across
Spasticity, contracture, itching, or agitation leads to almost constant thrashing and friction
Requires moderate to maximum assistance in moving. Complete lifting without sliding against
Moves feebly or requires minimum assistance. During a move, skin probably slides to some extent against sheets, chair,
Able to completely lift patient during a position change. Moves in bed and in chair independently and has sufficient muscle strength to lift up completely during move.

283
one another
sheets is impossible. Frequently slides down in bed or chair, requiring frequent repositioning with maximum assistance.
restraints, or other devices. Maintains relative good position in chair or bed most of the time but occasionally slides down.
Maintains good position in bed or chair at all times.
Nutrition 1 Very poor: 2. Inadequate: 3. Adequate: 4. Excellent:
Usual food intake pattern
NPO and/or maintained on clear liquids, or IVs for more than 5 days or albumin less than 2.5 mg/dl or never eats a complete meal. Rarely eats more than ½ of any food offered. Protein intake includes only 2 servings of meat or dairy products per day. Takes fluids poorly. Does not take a liquid dietary supplement
Is on liquid diet or tube feedings/TPN which provides inadequate calories and minerals for age or albumin less than 3 mg/dl or rarely eats a complete meal and generally eats only ½ of any food offered. Protein intake includes only 3 servings of meat or dairy products per day. Occasionally will take a dietary supplement.
Is on tube feedings or TPN, which provide adequate calories and minerals for age or eats over half of most meals. Eats a total of 4 servings of protein (meat, dairy products) each day. Occasionally will refuse a meal, but will usually take a supplement if offered.
Is on a normal diet providing adequate calories for age. For example, eats/drinks most of every meal/feeding. Never refuses a meal. Usually eats a total of 4 or more servings of meat and dairy products. Occasionally eats between meals. Does not require supplementation
Tissue perfusion and oxygenation
1. Extremely compromised:
2. Compromised: 3. Adequate: 4. Excellent:
Hypotensive (MAP less than 50mmhg: less than in a newborn) or the patient does not physiologically tolerate position changes
Normotensive; oxygen saturation may be less than 95 percent or hemoglobin may be less than 10 mg/dl or capillary refill may be greater than 2 seconds;
Serum pH is less than 7.40
Normotensive; oxygen saturation may be less than 95 percent or hemoglobin may be less than 10 mg/dl or capillary refill may be greater than 2 seconds; Serum pH is normal
Normotensive; oxygen saturation greater than 95 percent; normal hemoglobin; and capillary refill less than 2 seconds.
Total
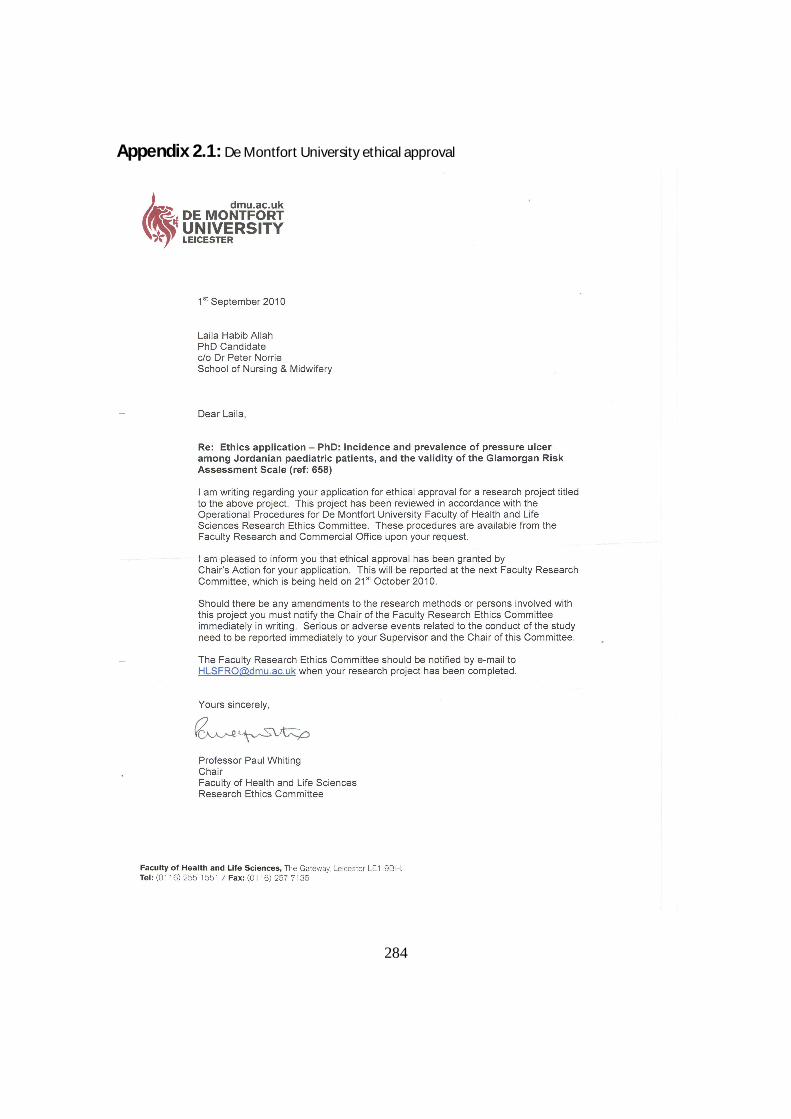
284
Appendix 2.1: De Montfort University ethical approval
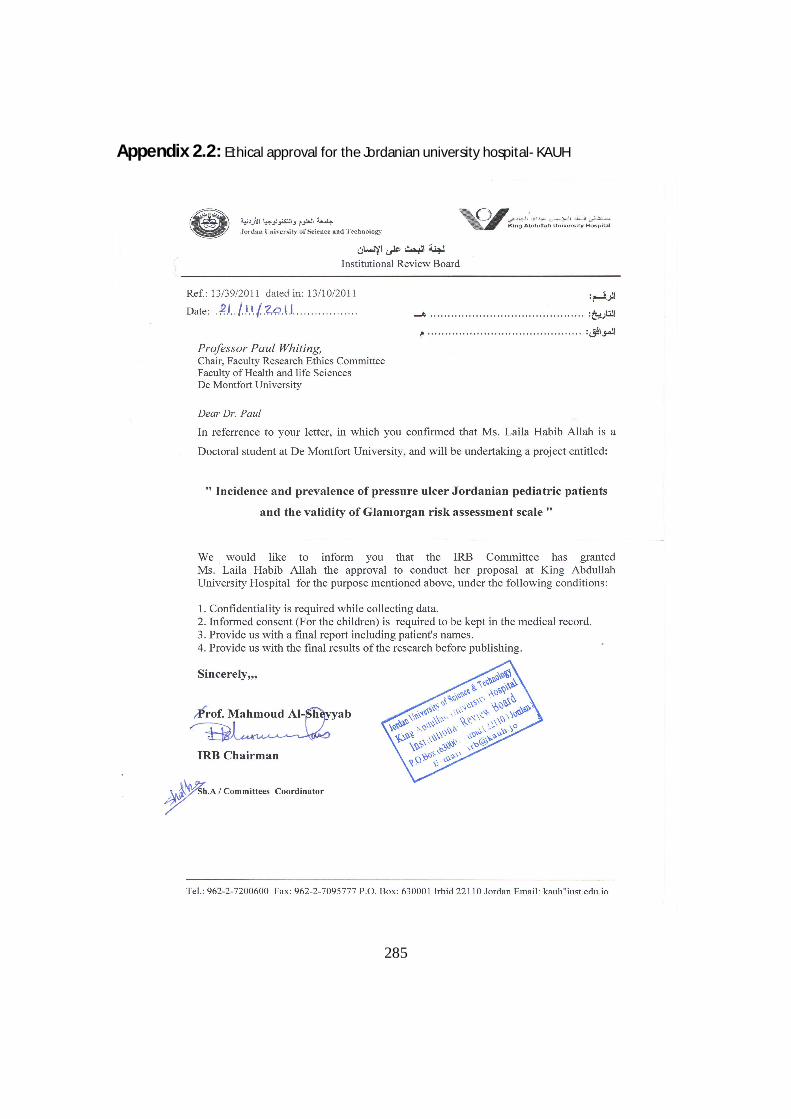
285
Appendix 2.2: Ethical approval for the Jordanian university hospital- KAUH
286
Appendix 2.3: Letter of Invitation to participants/ English Version
Research title: Incidence and prevalence of pressure ulcer among Jordanian paediatric patients, and the validity of The Glamorgan risk assessment scale.
Researcher: Laila Habib Allah
Invitation letter
We would like to invite you, on behalf of your child to take part in our research study.
Before you decide we would like you to understand why the research is being done and
what it would involve for you. The researcher will go through the Participant Information
Sheet with you and answer any questions you have. This should take about 5-10
minutes. Talk to others about the study if you wish. Part 1 tells you the purpose of this
study and what will happen to your child if you take part. Part 2 gives you more detailed
information about the conduct of the study. This study is part of a research project
leading to a PhD degree in Nursing from De Montfort University in England. It is a survey
including all paediatric inpatients in this hospital to determine the size of the pressure
ulcer problem within the paediatric population, and to determine which children are at
risk. Ask us if there is anything that is not clear.
If you think your child is able to give his or her own permission, an extra form,
appropriate for his/her age, can be provided to him/her, so he/she can decide personally
either to participate or not.
Thank you for taking part in this study
Laila Habib Allah
287
Appendix 2.4: Letter of Invitation to participants/ Arabic Version
ومقارنة , طفال المقیمین في أقسام العنایة الحثیثة في األردنالقروح الضغطیة لألنسبة حدوث Braden Q and Glamorgan) كفاء في قیاسھا ( اداتین
حبیب هللالیلى
جامعة دیمونت فورت كلیة العلوم الصحیة والحیاتیة
قسم التمریض
دعوة للمشاركة في بحث
نود أن نشرح , قبل أن یتخذ أي منكم قرارا, انني أدعوكم للمشاركة في ھذا البحث بالنیابة عن طفلكم
ھذا البحث یھدف لدراسة مشكلة التقرحات الضغطیة لدى األطفال ومعرفة األسباب . لھ عن البحث
ل ورقة الجزء األو: سیقوم الباحث بالشرح لك أكثر بالجزئین المرفقین, التي قد ترتبط بحدوثھ
ھذا البحث ھو جزء .دقائق 10ھذا لن یستغرق أكثر من , والجزء الثاني نموذج تفویض, المعلومات
اذا رغبت بمعلومات أكثر , من متطلبات نیل شھادة الدكتوراة من جامعة دیمونت فورت البریطانیة
. اذا أردت أن تخبر أحدا اخر عن البحث نحن ال نمانع. رجاءا قم بسؤالنا
ترى أن طفلك قادر على اتخاذ القرار بنفسھ أخبرنا ونحن سنقدم ورق معلومات خاصة اذا كنت
.وسیتمكن من اتخاذ القرار بنفسھ, باألطفال مناسبة لعمره ودرجة فھمھ
شكرا على وقتكم وعلى اخذكم ھذا الطلب بعین االعتبار
لیلى حبیب هللا

288
Appendix 2.5: Participants Information Sheet (parents, guardian) / English Version
This sheet has 2 parts. Part 1
1.1 What is the purpose of the study?
This study concerns the problem of pressure ulcers among children, and how common these are in Jordanian hospitals. We believe it can improve our understanding of the factors that make children prone to this problem. Pressure ulcer means any sores, redness or ulcerations that can be found by the researcher during an assessment of your child’s skin that could result from shearing, friction, device compression or any other conditions.
Skin assessment is an important part of children’s care in hospitals, especially those who are young or immobile, because it was found that such children are at higher risk of skin damage than any other children. This problem is important because it can delay child health progress, may increase the length of stay in hospital and it may increase the child’s risk of further infection and complications.
1.2 Why my child has been invited?
All children aged from birth to 18 years old currently admitted in the hospital are invited to participate.
1.3 Does my child have to take part?
No, It is up to you to decide whether your child to takes part or not. If you do decide to take part, you will be given this information sheet to keep and will be asked to sign a consent form.
1.4 What will happen to my child if he/she takes part?
A skin assessment will take place at the child’s bedside and will not take longer than 10 minutes to complete. It will focus specifically on the most common areas of this problem including sacrum, heal, hip, back of the head, ears and hands. Your child’s medical record will be reviewed by the researcher to collect some data regarding age, gender, medical diagnosis and blood tests which may found significant for the study.
1.5 How long will this assessment of my child’s skin take?
This skin examination will be repeated for your child on a daily basis until your Childs’ discharge, or up to 8 weeks which is the length of the study. If your child is found to have a pressure ulcer at the first day no further skin assessments will be done.
289
1.6 What are the possible risks and/or benefits of taking part?
There are no known risks for this study and I cannot promise you with any personal benefits from your child’s participation. However, the information I will get from this study will help in better understanding of this problem among children. Understanding the problem can help in minimizing its occurrence among children in the future.
If the information in Part 1 has interested you and you are considering participation, please read the additional information in Part 2 before making any decision.
Part 2
2.1 Will my child taking part in the study be kept confidential?
Your child data will not be shared with anyone. All personal information such as your child’s name will be removed from the data and will be replaced with a number. A list linking the number with your child name will be kept in a secure place, separate from your child’s information. If the results of the study are published, your child’s name will not be used and no information that discloses your child’s identity will be released or published without your specific consent to the disclosure.
2.2 What will happen if I don’t want my child to carry on with the study?
You are completely free to withdraw your child from the study at any time and without giving a reason. A decision to withdraw at any time, or a decision not to take part, will not affect the standard of care your child will receive.
2.3 What if there is a problem?
If you encounter any problem or for complaints, please don’t hesitate to contact:
- Dr. Peter Norrie (PhD supervisor) E-mail: [email protected] Charles Frears Campus De Montfort University 266 London Road, Leicester, UK LE2 1RQ Tel: 0044116 201 3914 Or: - Miss Shatha Ayoub Research Ethics Committee Coordinator King Abdullah University Hospital (KAUH). Jordan. Irbid (22110) P.O. Box 360001.
290
E-mail: [email protected] Tel: 0096227200610 ext.: 45011 2.4 What will happen to the results of the research study? The results of this study will be available from the researcher after completion; any participant can call or E-mail the researcher for a copy of the results. In addition, if you have any questions about the research now or later, or you have any questions regarding your child rights as a research participant, please contact me on my details below.
2.5 Who is organising and funding the research?
This study is being organized by the School of Nursing and Midwifery at De Montfort University in the UK.
2.6 Who has reviewed the study?
This study had been ethically approved by the Faculty of Health and Life Science Research Ethics Committee at De Montfort University, England. The research and ethics committee of this hospital have also approved this study.
Thank you for considering taking part in this research. The researcher will contact you soon. You can ask any questions you have and let him know whether you would like to take part or not.
Further information and contact details:
In UK: Laila Habib Allah De Montfort University Faculty of Health & Life Sciences School of Nursing & Midwifery, Charles Frears Campus Mary Seacole Research Centre 266 London Road Leicester LE2 1RQ United Kingdom Email: [email protected] Mobile: 00447743373329 In Jordan: Laila Habib Allah Al-afrah street, Al- Barha, Irbid, Jordan. Email: [email protected], Mobile: 00962777514857.

291
Appendix 2.6: Participants Information Sheet (parents, guardian) / Arabic Version
ومقارنة , طفال المقیمین في أقسام العنایة الحثیثة في األردنالقروح الضغطیة لألنسبة حدوث
في قیاسھا (Braden Q and Glamorgan)كفاءة اداتین لیلى حبیب هللا
جامعة دیمونت فورت كلیة العلوم الصحیة والحیاتیة
قسم التمریض
)نسخة الوالد(ورقة معلومات خاصة بالمرضى
2, 1ھذه الورقة تتضمن جزئان
1الجزء ما الھدف من الدراسة؟ -
ھذه الدراسة من شانھا , دراسة القروح الضغطیة التي من الممكن ان یكون طفلكم قد تعرض لھا .لھا وكیفیة الوقایة او العالج منھا حجم المشكلة في االردن للوقوف على االسباب المؤدیة تحدید
ماھي القروح الضغطیة؟ -
تصیب االطفال العاجزین عن الحركة ) وتعرف ایضا بالعقر او قروح الفراش(القروح الضغطیة خاصة عند الكاحل واالرداف –والمرضى في الفراش، تصیب عادة الجلد في اماكن فوق العظم
. واصابع الرجلین ومؤخرة الراس ماھو سبب ھذه الدراسة؟ -
ھذه الدراسة تجرى من اجل تحدید حجم مشكلة القروح الضغطیة في االردن حیث ان ھذه المعلومات غیر متوفرة لذلك، وعند تحدید حجم ھذه المشكلة بدقة فانھ باالمكان اعطاء توصیات الصحاب القرار
االت ظھورھا علما بانھا یمكن من اجل رسم سیاسات واضحة للحد من ھذه المشكلة والتخفیف من ح .باالضافة الى ان تكلفة عالج ھذه المشكلة باھظھ جدا. منعھا بشكل كبیر جدا
292
ماذا تتضمن ھذه الدراسة؟ -سوف یطلب منكم الباحث بالسماح لھ بمعاینة جلد الطفل لمعرفة ما اذا كان ھنالك احمرار او تشقق
سوف یطلب . ما ھو موضح في الصورة السابقةوخصوصا في االماكن االكثر عرضة ك. في الجلدمنكم الباحث بالسماح لھ بالطالع على ملف الطفل الطبي لمعرفة ما اذا كان ھناك ذكر للقروح
.الضغطیة فیھ، لن یتم نقل الملف الطبي من المكان كم ستستغرق؟ -
فل مدة لن تزید دقائق من وقتكم، كما قد یتطلب متابعة الط 10- 5سوف تستغرق ھذه الدراسة من .واذا وافقتم على المشاركة في ھذه الدراسة, اسابیع 8عن
الرجاء قراءة الجزء الثاني قبل اتخاذ القرار , اذا قرأت الجزء األول وكنت مھتما بالمشاركة
:بالمشاركة
2الجزء مالذي سیحدث للمعلومات؟ -
بقیة المرضى ویصار استخدامھا من سوف یتم جمع المعلومات التي التي یحصل علیھا منكم ومن اجل تكوین فكرة عن حجم المشكلة وسیتم تزوید مستشفاكم بذلك، حتى یتم التعامل بشكل فاعل مع
.الحاالت التي فیھا احتمال نشوء قروح ضغطیةسوف تساعد ھذة المعلومات ایضا على تحدید مخاطر نشوء االصابة بقروح الضغط بالضبط ،
اسیة التي یجب عى النظام الصحي والكادر الطبي وبخاصة التمریض ان وماھي االشیاء االس . یعملوھا من اجل التخفیف من ھذه المشكلة
سیتم ازالة بیاناتكم الشخصیة . سوف تستخدم معلوماتكم الشخصیة فقط للمساعدة بتحلیل المعلومات .قبل اصدار اي تقریر وسوف یتم اتالفھا فور االنتھاء من الدراسة
ستترتب اي مخاطر من المشاركة في ھذه الدراسة؟ ھل - .ان مشاركة الطفل في ھذه الدراسة لن تتدخل باي شكل من االشكال في عالجھ - .ان مشاركة الطفل اختیاریة طوعیة كلیا ولكم حریة تغییر رایكم في اي وقت تشاؤون - .تعتبر خصوصیاتكم وسریاتكم على راس اولویات الباحث - .حتفاظ باي معلومات من شانھا ان تشیر الى ھویاتكملن یتم اال - ماذا أفعل اذا واجھت مشكلة؟ -
:الرجاء ال تترد بالتواصل مع بیتر نوري. د
مشرف رسالة الدكتوراة بریطانیا - جامعة دیمونت فورت
[email protected] :البرید االلكتروني 266شارع لندن
293
لیستر 00441162013914: ت أو
االنسة شذى أیوب منسقة لجان أخالقیات البحث
مستشفى الملك المؤسس 22110اربد - األردن
[email protected]:البرید االلكتروني 45011فرعي 009267200610: ت المعلومات؟المزید من -
للحصول على اي معلومات اضافیة ارجو سؤال الباحث في االیام المحددة للدراسة عن اي شئ قد .یكون غیر واضح، واطلبوا منھ ان یشرح لكم بشل موسع
من ینظم البحث؟ -
.بریطانیا - جامعة دیمونت فورتكلیة التمریض من من أشرف على البحث؟ -
.بالمستشفى والجامعة لجنة أخالقیات البحث العلمي
:للمزید من المعلومات والتواصل :بریطانیافي
لیلى حبیب هللا بریطانیا - جامعة دیمونت فورت
كلیة التمریض لیستر - 266شارع لندن
[email protected] : البرید االلكتروني 90044774337332: ت
:في األردن لیلى حبیب هللا شارع األفراح
اربد - البارحة األردن
[email protected] : البرید االلكتروني 00962777514857: ت
شكرا على وقتكم وعلى اخذكم ھذا الطلب بعین االعتبار

294
Appendix 2.7: Participants Information Sheet (Child) / English Version
Study title: how often do children in Jordanian hospitals get broken and sore skin, and why?
My name is Laila; I am from De Montfort University. We are asking you to be in a research study. Research is a way to test new ideas. Research helps us learn new things.
1. Why are we doing this research? In our research study we want to learn more about skin problems in children. We want to know how many children in the hospital have skin problem and why.
2. Why have I been invited to take part? All children aged from birth till 18 years old and currently admitted in the hospital will be asked to join us in the study.
3. Do I have to take part? No, it is up to you. Taking part in the research is your choice. You can say Yes or No. Whatever you decide is OK. We will still take good care of you.
4. What will happen to me if I take part? I want to see you every day during your stay in the hospital, I just want to check your skin is still good and no harm has happened to it. I will check it while you stay in your bed on the areas that appear in the picture below. This check-up will not take more than 10 minutes.
5. Are there any worries and/or benefits if I take part? There are no known worries from this study. We cannot promise that the study will help you but we hope that the information we get when we finish the
295
research may increase our knowledge about children’s skin problems. This may help other children in the hospital later on.
6. What happens when the research project stops? No changes will happen to your medical care during the study or when it stops. Nurses and doctors will still take care of you all through your stay in the hospital.
7. What if there is a problem or something goes wrong? If anything goes wrong you can tell your parents or if you prefer you can tell the researcher and we will work to solve the problem together.
8. What if I don’t want to do the research anymore? If you say yes and change your mind later that is OK. You can stop being in the research at any time. If you want to stop, please tell us.
9. Will anyone else know I'm doing this? We will keep your information in confidence. This means we will only tell those who have a need or right to know. Wherever possible, we will only send out information that has your name and address removed.
10. Who has reviewed the study? Before any research goes ahead it has to be checked by a Research Ethics Committee. They make sure that the research is fair. The project has been checked by the De Montfort University Research Ethics Committee as well as the Hospital Ethics Committee.
Please talk this over with your parents before you decide whether or not to participate. Your parents have given their permission for you to take part in this study. Even though your parents said “yes,” you can still decide not to do this.
Take the time you need to make your choice. Ask us any questions you have. You can ask questions at any time.
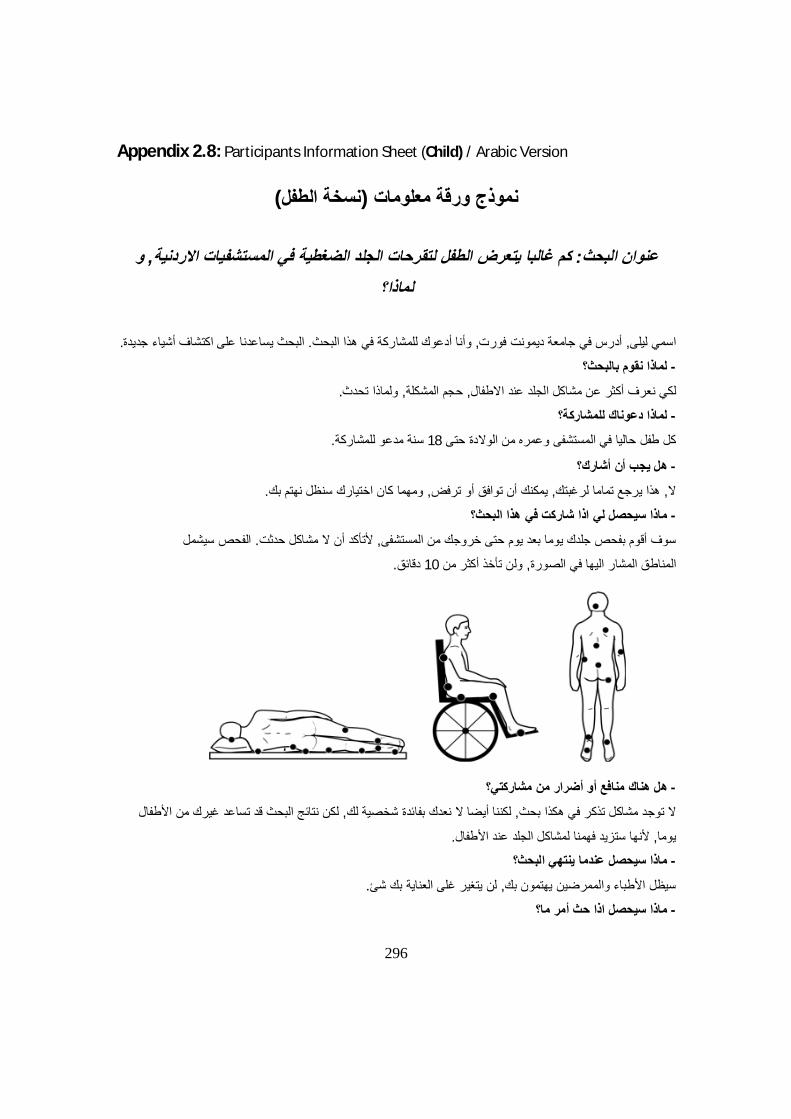
296
Appendix 2.8: Participants Information Sheet (Child) / Arabic Version
)الطفلنسخة (نموذج ورقة معلومات
و , كم غالبا یتعرض الطفل لتقرحات الجلد الضغطیة في المستشفیات االردنیة: عنوان البحث لماذا؟
.البحث یساعدنا على اكتشاف أشیاء جدیدة. وأنا أدعوك للمشاركة في ھذا البحث, أدرس في جامعة دیمونت فورت, اسمي لیلى
لماذا نقوم بالبحث؟ - .ولماذا تحدث, حجم المشكلة, الجلد عند االطفاللكي نعرف أكثر عن مشاكل
لماذا دعوناك للمشاركة؟ - .سنة مدعو للمشاركة 18كل طفل حالیا في المستشفى وعمره من الوالدة حتى
ھل یجب أن أشارك؟ - .ومھما كان اختیارك سنظل نھتم بك, یمكنك أن توافق أو ترفض, ھذا یرجع تماما لرغبتك, ال
اذا شاركت في ھذا البحث؟ماذا سیحصل لي - الفحص سیشمل . ألتأكد أن ال مشاكل حدثت, سوف أقوم بفحص جلدك یوما بعد یوم حتى خروجك من المستشفى
.دقائق 10ولن تأخذ أكثر من , المناطق المشار الیھا في الصورة
ھل ھناك منافع أو أضرار من مشاركتي؟ -
لكن نتائج البحث قد تساعد غیرك من األطفال , ال نعدك بفائدة شخصیة لك لكننا أیضا, ال توجد مشاكل تذكر في ھكذا بحث
.ألنھا ستزید فھمنا لمشاكل الجلد عند األطفال, یوما
ماذا سیحصل عندما ینتھي البحث؟ - .لن یتغیر غلى العنایة بك شئ, سیظل األطباء والممرضین یھتمون بك
ماذا سیحصل اذا حث أمر ما؟ -

297
.أو تخبرني لنحل المشكلة, دیكیمكنك أن تخبر وال
ماذا سیحصل اذا انسحبت؟ - .یمكنك اخبارنا متى شئت, ال بأس في ذلك, لن یكون ھناك أي عقوبات
ھل سیعرف أحد عن مشاركتي؟ - .كما أن اسمك لن یرد فیھا, ھذه المعلومات تحفظ بسریة, ال
من أشرف على ھذه الدراسة؟ - .للتأكد من صحة كل شئ, العلمي في المستشفى وفي جامعة دیمونت فورت لجنة االشراف على أخالقیات البحث
.لقد وافقو على مشاركتك لكن القرار النھائي یعود لك, الرجاء أن تناقش ھذا الموضوع مع والدیك
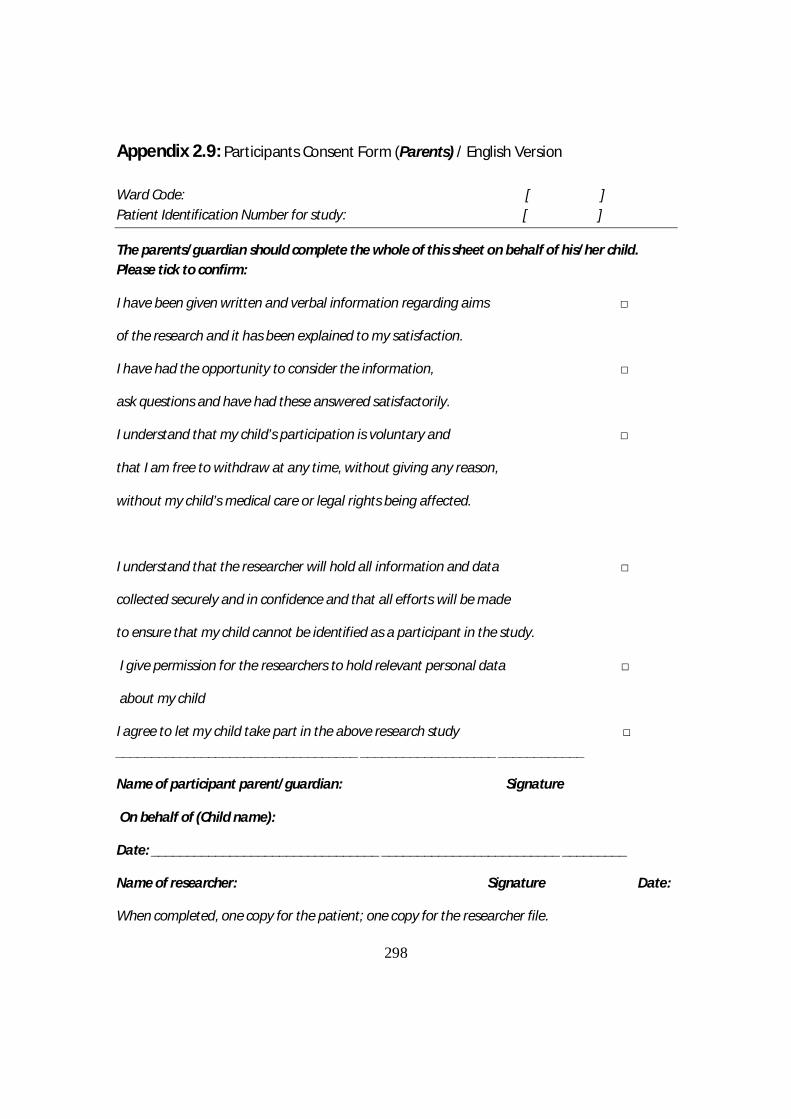
298
Appendix 2.9: Participants Consent Form (Parents) / English Version
Ward Code: [ ] Patient Identification Number for study: [ ]
The parents/guardian should complete the whole of this sheet on behalf of his/her child. Please tick to confirm:
I have been given written and verbal information regarding aims □
of the research and it has been explained to my satisfaction.
I have had the opportunity to consider the information, □
ask questions and have had these answered satisfactorily.
I understand that my child’s participation is voluntary and □
that I am free to withdraw at any time, without giving any reason,
without my child’s medical care or legal rights being affected.
I understand that the researcher will hold all information and data □
collected securely and in confidence and that all efforts will be made
to ensure that my child cannot be identified as a participant in the study.
I give permission for the researchers to hold relevant personal data □
about my child
I agree to let my child take part in the above research study □ __________________________________ ___________________ ____________
Name of participant parent/guardian: Signature
On behalf of (Child name):
Date: ________________________________ _________________________ _________
Name of researcher: Signature Date:
When completed, one copy for the patient; one copy for the researcher file.
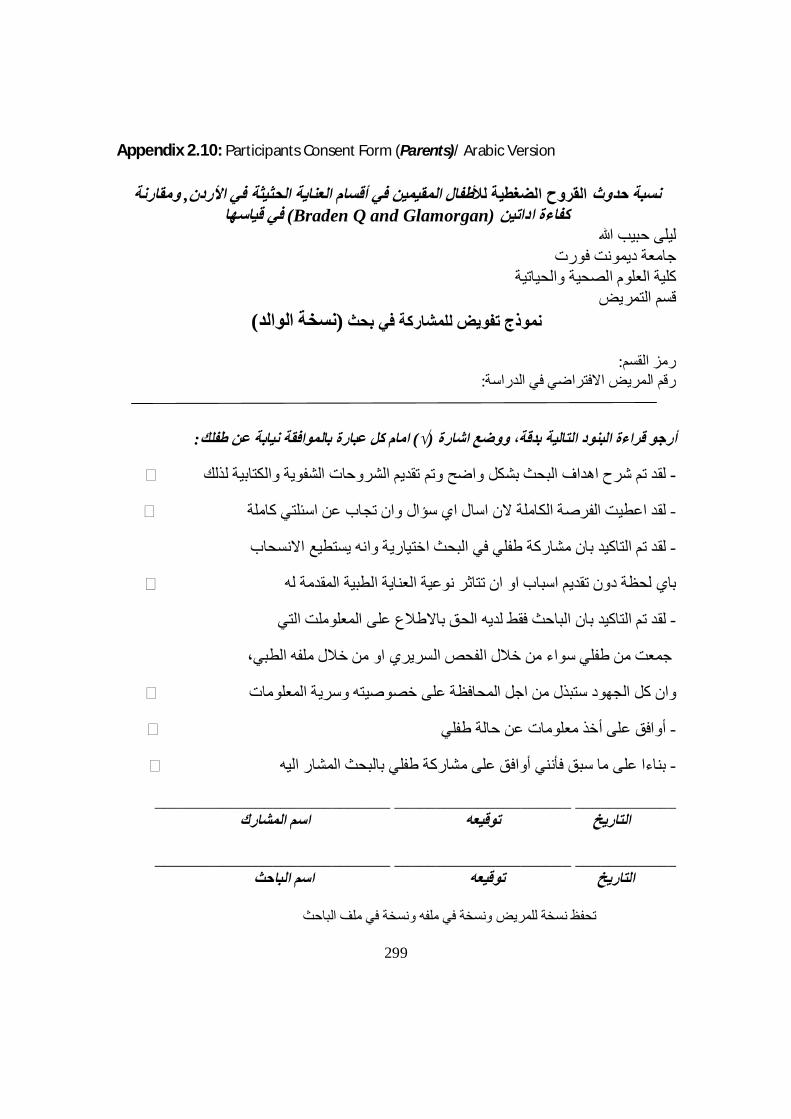
299
Appendix 2.10: Participants Consent Form (Parents)/ Arabic Version
ومقارنة , طفال المقیمین في أقسام العنایة الحثیثة في األردنالقروح الضغطیة لألنسبة حدوث في قیاسھا (Braden Q and Glamorgan)كفاءة اداتین
لیلى حبیب هللا دیمونت فورتجامعة
كلیة العلوم الصحیة والحیاتیة قسم التمریض
)نسخة الوالد(نموذج تفویض للمشاركة في بحث
: رمز القسم : رقم المریض االفتراضي في الدراسة
: امام كل عبارة بالموافقة نیابة عن طفلك) √(أرجو قراءة البنود التالیة بدقة، ووضع اشارة
لقد تم شرح اھداف البحث بشكل واضح وتم تقدیم الشروحات الشفویة والكتابیة لذلك -
لقد اعطیت الفرصة الكاملة الن اسال اي سؤال وان تجاب عن اسئلتي كاملة -
لقد تم التاكید بان مشاركة طفلي في البحث اختیاریة وانھ یستطیع االنسحاب -
حظة دون تقدیم اسباب او ان تتاثر نوعیة العنایة الطبیة المقدمة لھ باي ل
لقد تم التاكید بان الباحث فقط لدیھ الحق باالطالع على المعلوملت التي -
جمعت من طفلي سواء من خالل الفحص السریري او من خالل ملفھ الطبي،
لمحافظة على خصوصیتھ وسریة المعلومات وان كل الجھود ستبذل من اجل ا
أوافق على أخذ معلومات عن حالة طفلي -
بناءا على ما سبق فأنني أوافق على مشاركة طفلي بالبحث المشار الیھ -
____________________________ _____________________ ____________ اسم المشارك توقیعھ التاریخ
____________________________ _____________________ ____________
اسم الباحث توقیعھ التاریخ
تحفظ نسخة للمریض ونسخة في ملفھ ونسخة في ملف الباحث

300
Appendix 2.11: Child Assent Form / English Version
Study title: How often do children in Jordanian hospitals get broken and
sore skin, and why?
Child to circle all they agree with:
Has someone else explained this study to you? Yes/No
Do you understand what this study is about? Yes/No
Have you asked all the questions you want? Yes/No
Have you had your questions answered in a way you understand? Yes/No
Do you understand that it’s OK to stop taking part at any time Yes/No
Are you happy to take part? Yes/No
If any answer is “No” or you don’t want to take part, don’t sign your name!
If you do want to take part, you can write your name below:
Your name:
Date:
The researcher who explained this project to you needs to sign too:
Print Name:
Sign:
Date:
Thank you for your help
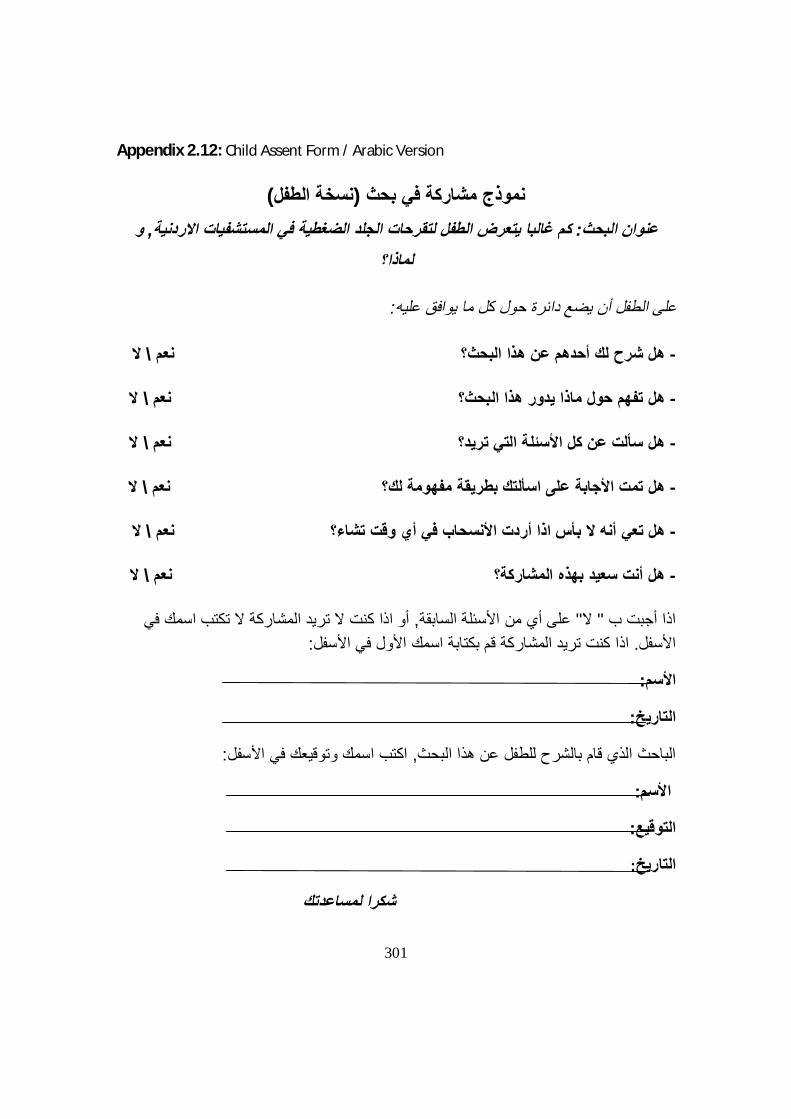
301
Appendix 2.12: Child Assent Form / Arabic Version
)نسخة الطفل(نموذج مشاركة في بحث و , في المستشفیات االردنیة كم غالبا یتعرض الطفل لتقرحات الجلد الضغطیة: عنوان البحث
لماذا؟
:على الطفل أن یضع دائرة حول كل ما یوافق علیھ
ال \ھل شرح لك أحدھم عن ھذا البحث؟ نعم -
ال \نعم ھل تفھم حول ماذا یدور ھذا البحث؟ -
ال \ھل سألت عن كل األسئلة التي ترید؟ نعم -
ال \ھل تمت األجابة على اسألتك بطریقة مفھومة لك؟ نعم -
ال \ي أي وقت تشاء؟ نعم ھل تعي أنھ ال بأس اذا أردت األنسحاب ف -
ال \ھل أنت سعید بھذه المشاركة؟ نعم -
أو اذا كنت ال ترید المشاركة ال تكتب اسمك في , على أي من األسئلة السابقة" ال" اذا أجبت ب :نت ترید المشاركة قم بكتابة اسمك األول في األسفلاذا ك. األسفل
:األسم
:التاریخ
:اكتب اسمك وتوقیعك في األسفل, الباحث الذي قام بالشرح للطفل عن ھذا البحث
:األسم
:التوقیع
:التاریخ
كشكرا لمساعدت
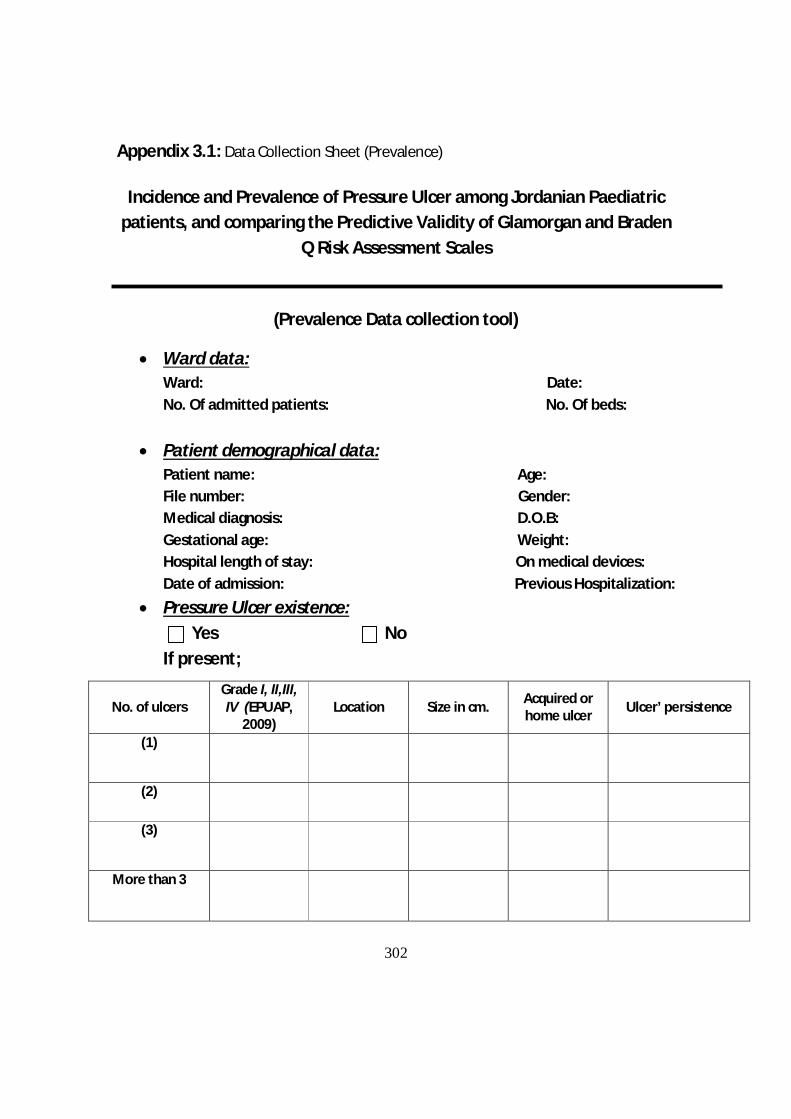
302
Appendix 3.1: Data Collection Sheet (Prevalence)
Incidence and Prevalence of Pressure Ulcer among Jordanian Paediatric patients, and comparing the Predictive Validity of Glamorgan and Braden
Q Risk Assessment Scales
(Prevalence Data collection tool)
Ward data: Ward: Date: No. Of admitted patients: No. Of beds:
Patient demographical data: Patient name: Age: File number: Gender: Medical diagnosis: D.O.B: Gestational age: Weight: Hospital length of stay: On medical devices: Date of admission: Previous Hospitalization:
Pressure Ulcer existence: Yes No If present;
No. of ulcers Grade I, II,III, IV (EPUAP,
2009) Location Size in cm. Acquired or
home ulcer Ulcer’ persistence
(1)
(2)
(3)
More than 3

303
Appendix 3.2: Data Collection Sheet (Incidence and risk factors)
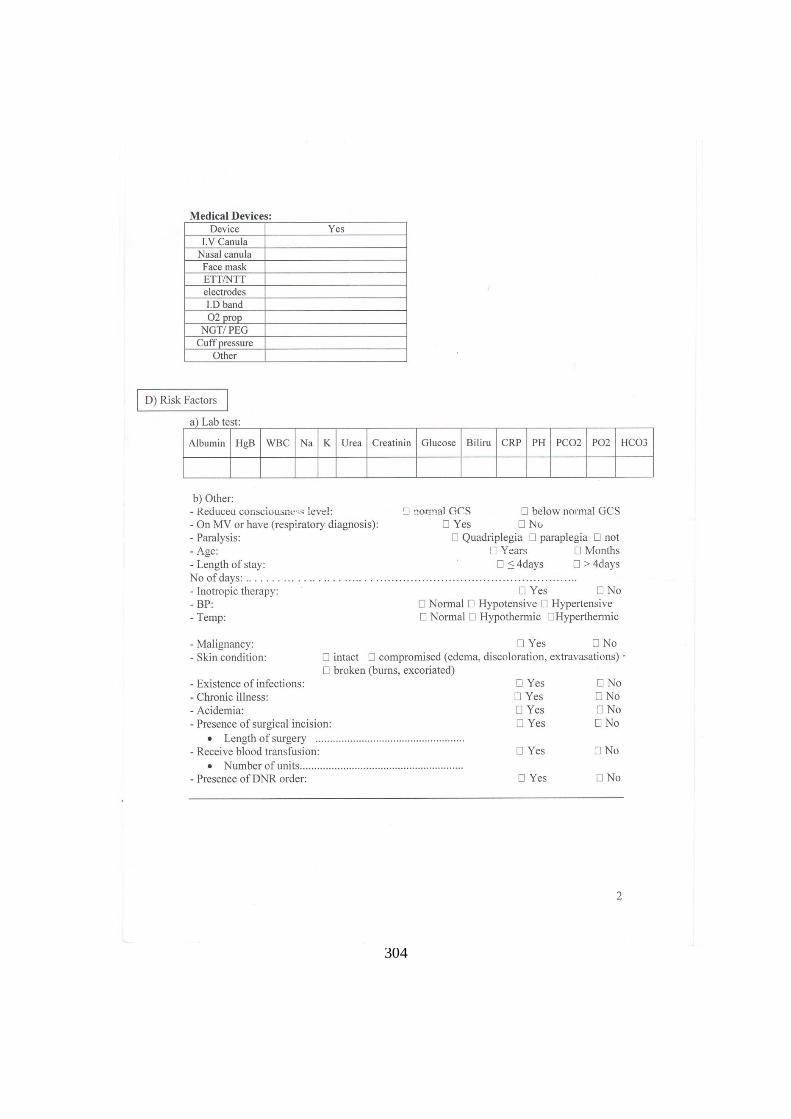
304
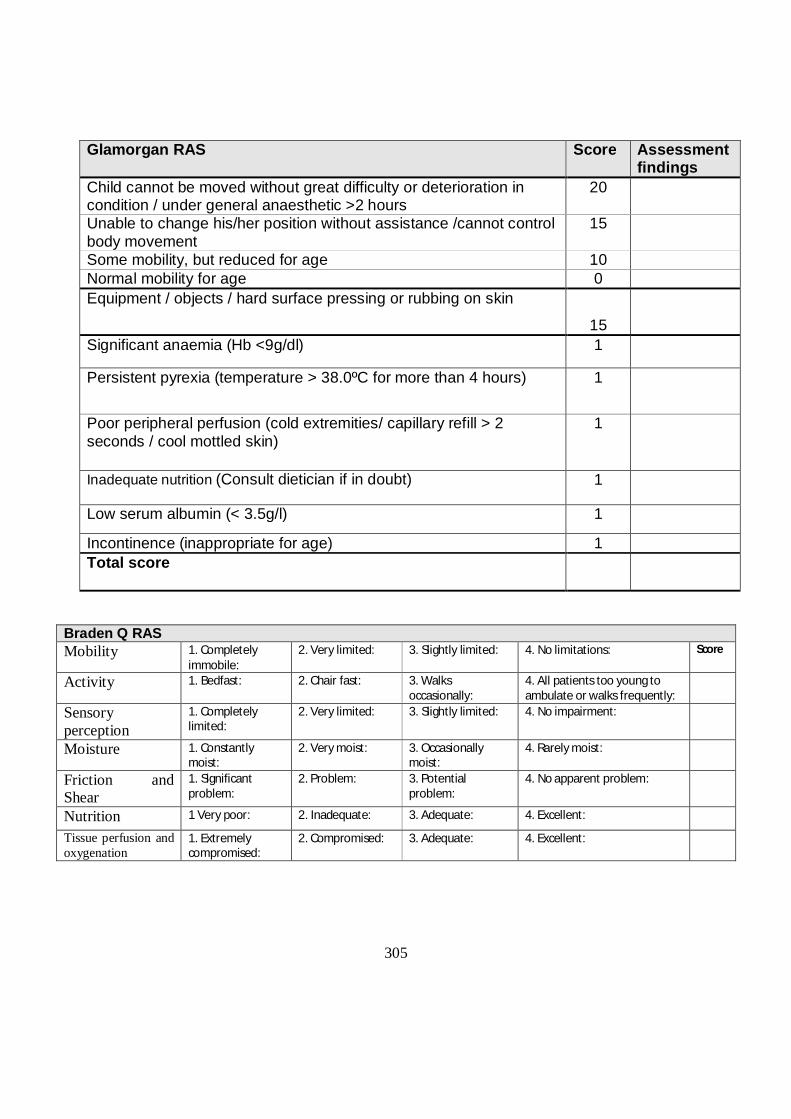
305
Glamorgan RAS Score Assessment findings
Child cannot be moved without great difficulty or deterioration in condition / under general anaesthetic >2 hours
20
Unable to change his/her position without assistance /cannot control body movement
15
Some mobility, but reduced for age 10 Normal mobility for age 0 Equipment / objects / hard surface pressing or rubbing on skin
15
Significant anaemia (Hb <9g/dl) 1
Persistent pyrexia (temperature > 38.0ºC for more than 4 hours) 1
Poor peripheral perfusion (cold extremities/ capillary refill > 2 seconds / cool mottled skin)
1
Inadequate nutrition (Consult dietician if in doubt) 1
Low serum albumin (< 3.5g/l) 1
Incontinence (inappropriate for age) 1 Total score
Braden Q RAS Mobility 1. Completely
immobile: 2. Very limited: 3. Slightly limited: 4. No limitations: Score
Activity 1. Bedfast: 2. Chair fast: 3. Walks occasionally:
4. All patients too young to ambulate or walks frequently:
Sensory perception
1. Completely limited:
2. Very limited: 3. Slightly limited: 4. No impairment:
Moisture 1. Constantly moist:
2. Very moist: 3. Occasionally moist:
4. Rarely moist:
Friction and Shear
1. Significant problem:
2. Problem: 3. Potential problem:
4. No apparent problem:
Nutrition 1 Very poor: 2. Inadequate: 3. Adequate: 4. Excellent:
Tissue perfusion and oxygenation
1. Extremely compromised:
2. Compromised: 3. Adequate: 4. Excellent:
306
Appendix 3.3: Guidance on using the Glamorgan Scale
The Glamorgan scale was developed using statistical analysis (chi square and regression analysis) of detailed patient data from children aged 3 days to 18 years. It is therefore suitable for use with children from birth to 18 years, and may be suitable pre-term neonates. A child’s risk of developing a pressure ulcer should be assessed on admission and every time his/her condition changes – for example – a child may be admitted as a day case for a minor operation. Initially they are fully mobile, and have nothing pressing or rubbing on the skin. They may then have an intravenous cannula sited (potentially cannula pressing on the skin – score 15), and then have a general anaesthetic (immobile, cannot be moved during the operation – score 20), this child is then at risk of skin damage from the cannula pressing (unless action is taken to adequately pad it) and at risk of skin damage from lying on a hard surface without moving during the operation unless action is taken to place a pressure distributing surface between the child and the theatre table such as an air-filled mattress overlay). On return to the ward the child will have limited mobility (score 10 - a soft hospital mattress may be adequate to prevent pressure damage). Mobility Child cannot be moved without great difficulty or deterioration in condition – such as a ventilated child who does not maintain oxygen saturations if the position is changed, or who may become hypotensive in a certain position. Children with cervical spine injuries are limited in the positions they can lie in. Some children with contracture deformities are only comfortable in limited positions. General anaesthetic – a child who is on the theatre table may not have their position changed during an operation. Unable to change his/her position without assistance – a child may be unable to move themselves, but carers can move the child and change his/her position (this does not cause any deterioration in the child’s condition). Cannot control body movement – the child can make movements but these may not be purposeful, and the child is unable to consciously change his/her own position. Some mobility but reduced for age – the child may be able to make purposeful movements and may have limited ability to change their own position but this is limited. For example – a child with developmental delay, or a child in traction who is able to make limited movements, or a child on bedrest. Normal mobility for age – the child has the same ability to move as a normal healthy child of that age. For example, a 1 week old infant is able to move his/her limbs but is not able to roll over; a 1 year old is able to roll over, bottom shuffle or crawl, sit up and pull up to standing. Objects on the skin Equipment / objects / hard surface pressing or rubbing on the skin - Any object pressing or rubbing on the skin for long enough or with enough force can cause pressure damage. For example, wings of IV cannula, pulse oximeter probes, plastic namebands on young infants,
307
oxygen or CPAP masks, ECG electrodes, ET tubes, NG tubes, tight clothing, arm sling with knot pressing on neck, plaster casts and splints, arm pressing on cot sides. The above risk factors are responsible for skin damage through pressure, friction or shear. If a child is fully mobile and does not have anything pressing or rubbing on the skin, they will not develop a pressure ulcer. The risk factors below increase the child’s risk of developing a pressure ulcer if the child has reduced mobility or objects pressing or rubbing on the skin, but if they occur in a mobile child with nothing pressing or rubbing on the skin will not cause a pressure ulcer to develop. Significant anaemia (Hb <9g/dl) – if the haemoglobin has been measured during this admission and is below 9g/dl – score 1. If the haemoglobin is 9g/dl or above, or the haemoglobin is unknown, score 0. Persistent pyrexia (temperature >38.0ºC for more than 4 hours) – score 1. If temperature is less than 38ºC, or pyrexia lasts less than 4 hours – score 0. Poor peripheral perfusion (cold extremities / capillary refill > 2 seconds / cool mottled skin) – in a child in a warm environment (i.e. not due to low environmental temperature) – score 1. Inadequate nutrition (discuss with a dietician if in doubt) – child who is malnourished (this does not include children who are just starved prior to surgery) – score 1. A child who has a normal nutritional intake scores 0. Low serum albumin (<35g/dl) – score 1. If serum albumin is 35 or above, or has not been measured – score 0. Weight less than 10th centile – score 1 - this can be calculated by plotting the child’s weight and age on a growth chart. If the child is above the 10th centile score 0. Incontinence (inappropriate for age) – score 1 – for example, a 4 year old child who needs to wear nappies during the day and night. Normal continence – score 0 – for example, a 5 year old who is dry during the day but may be occasionally incontinent during the night, a 12 month old who needs to wear nappies during the day and night. Incontinence itself does not increase risk of pressure ulcers, and any pressure ulcers may occur on parts of the body other than the nappy area. A child who is inappropriately incontinent may have physical or developmental problems that reduce their self care ability, mobility, or sensory awareness. Moisture lesions should not be confused with pressure ulcers. Document total score, however scores for individual risk factors should be acted on. If the child scores 10 or higher, he/she is at risk of developing a pressure ulcer unless action is taken to prevent it. This action may include normal nursing care, such as positioning, frequent changes of position (document how often position is changed), lying the child on a soft hospital mattress or on an air-filled mattress overlay, changing the position of pulse oximeter probes, ensuring the child is not lying on objects in the bed such as tubing or hard toys, or encouraging mobilisation.
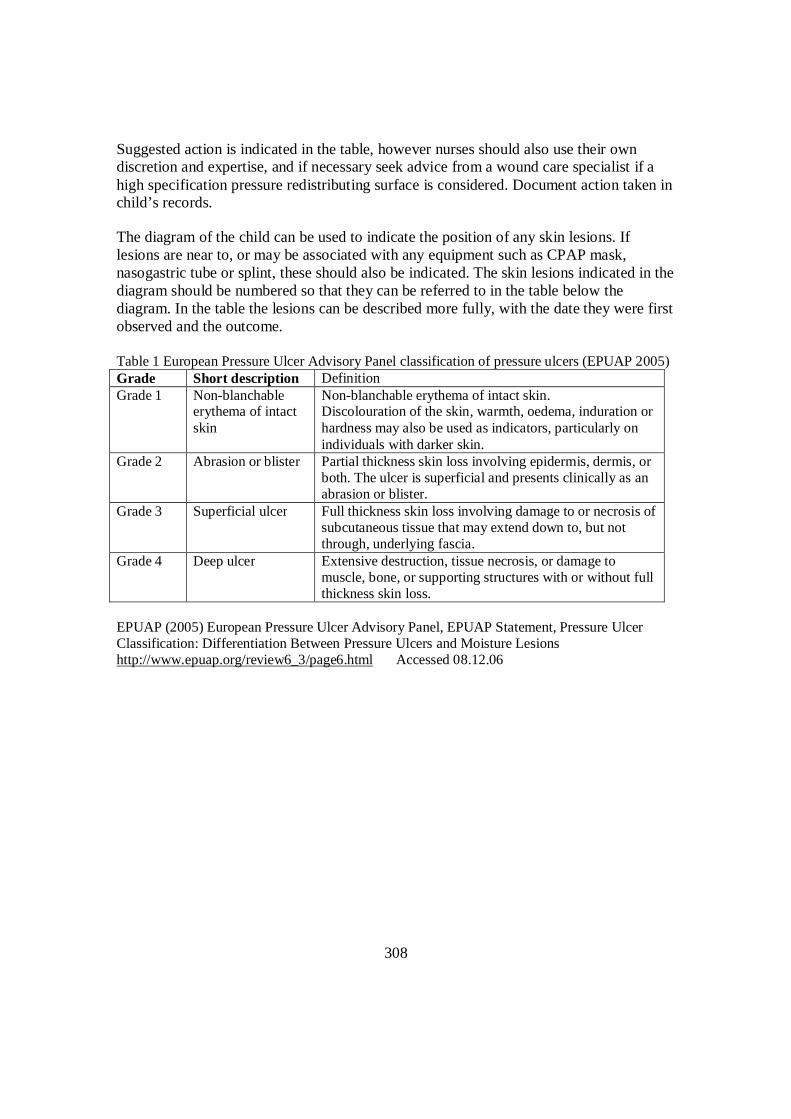
308
Suggested action is indicated in the table, however nurses should also use their own discretion and expertise, and if necessary seek advice from a wound care specialist if a high specification pressure redistributing surface is considered. Document action taken in child’s records. The diagram of the child can be used to indicate the position of any skin lesions. If lesions are near to, or may be associated with any equipment such as CPAP mask, nasogastric tube or splint, these should also be indicated. The skin lesions indicated in the diagram should be numbered so that they can be referred to in the table below the diagram. In the table the lesions can be described more fully, with the date they were first observed and the outcome. Table 1 European Pressure Ulcer Advisory Panel classification of pressure ulcers (EPUAP 2005) Grade Short description Definition Grade 1 Non-blanchable
erythema of intact skin
Non-blanchable erythema of intact skin. Discolouration of the skin, warmth, oedema, induration or hardness may also be used as indicators, particularly on individuals with darker skin.
Grade 2 Abrasion or blister Partial thickness skin loss involving epidermis, dermis, or both. The ulcer is superficial and presents clinically as an abrasion or blister.
Grade 3 Superficial ulcer Full thickness skin loss involving damage to or necrosis of subcutaneous tissue that may extend down to, but not through, underlying fascia.
Grade 4 Deep ulcer Extensive destruction, tissue necrosis, or damage to muscle, bone, or supporting structures with or without full thickness skin loss.
EPUAP (2005) European Pressure Ulcer Advisory Panel, EPUAP Statement, Pressure Ulcer Classification: Differentiation Between Pressure Ulcers and Moisture Lesions http://www.epuap.org/review6_3/page6.html Accessed 08.12.06
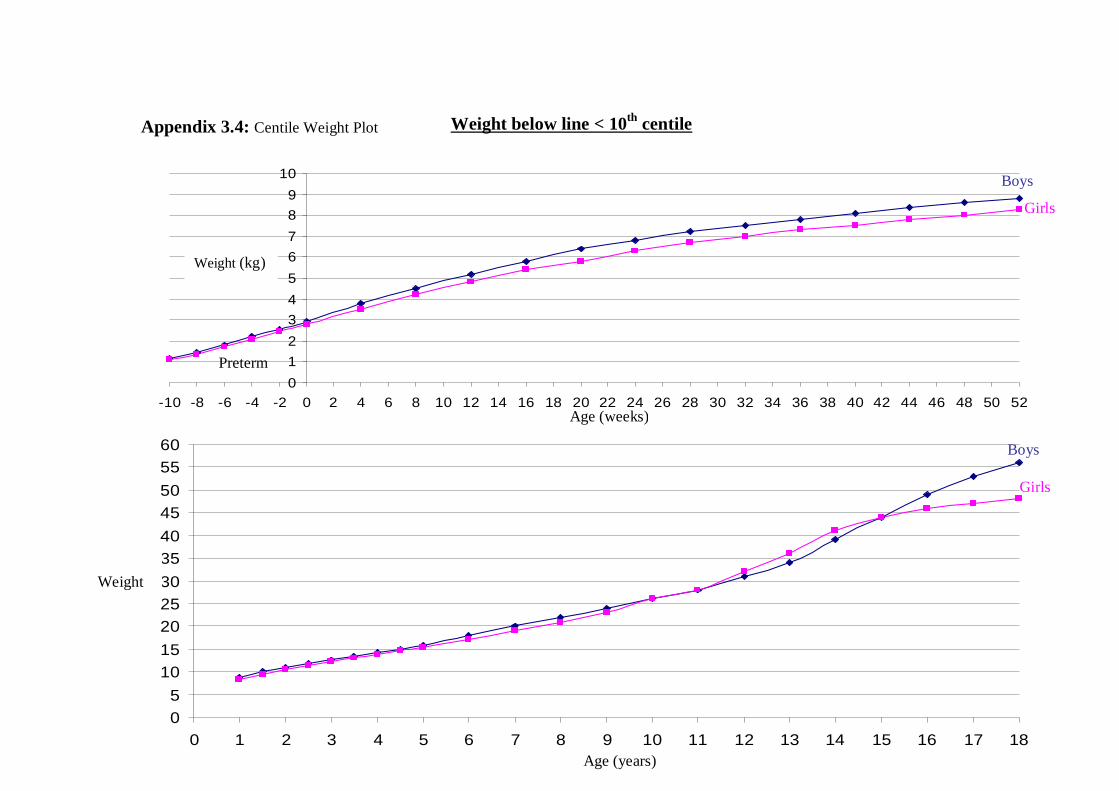
309
0123456789
10
-10 -8 -6 -4 -2 0 2 4 6 8 10 12 14 16 18 20 22 24 26 28 30 32 34 36 38 40 42 44 46 48 50 52
05
1015202530354045505560
0 1 2 3 4 5 6 7 8 9 10 11 12 13 14 15 16 17 18
Appendix 3.4: Centile Weight Plot Weight below line < 10th centile
Boys
Boys
Girls
Girls
Weight (kg)
Weight
(kg)
Age (weeks)
Age (years)
Preterm
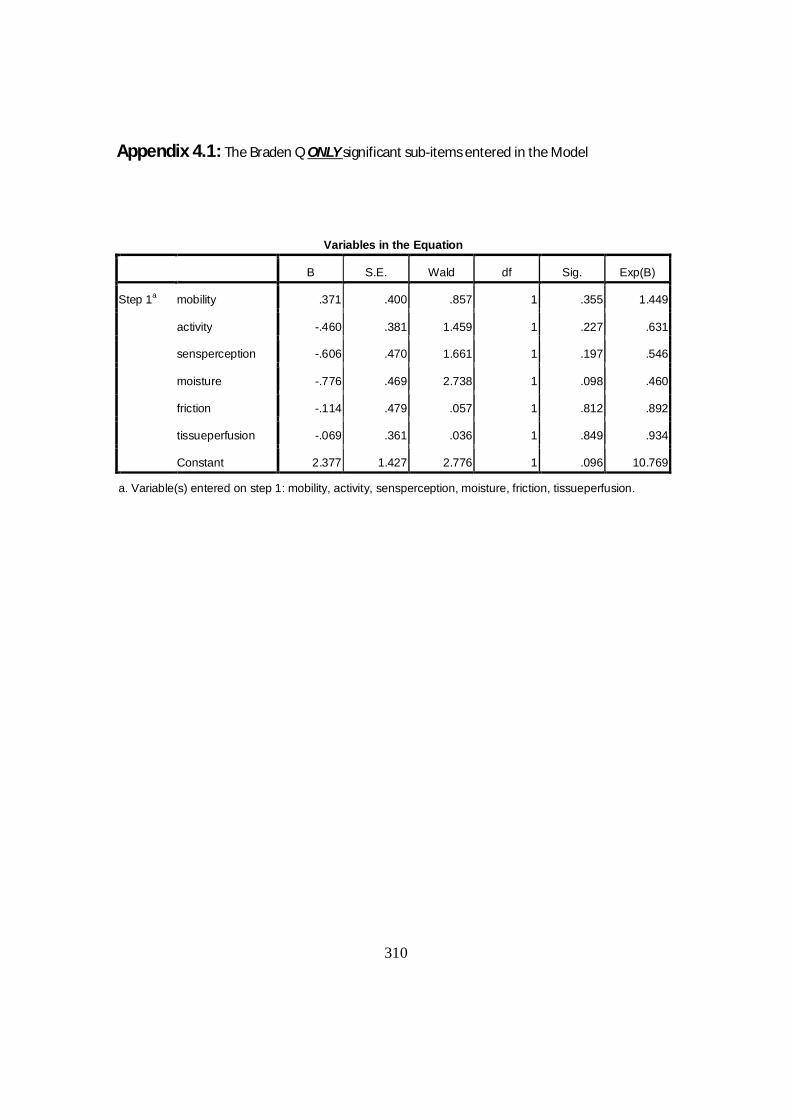
310
Appendix 4.1: The Braden Q ONLY significant sub-items entered in the Model
Variables in the Equation
B S.E. Wald df Sig. Exp(B)
Step 1a mobility .371 .400 .857 1 .355 1.449
activity -.460 .381 1.459 1 .227 .631
sensperception -.606 .470 1.661 1 .197 .546
moisture -.776 .469 2.738 1 .098 .460
friction -.114 .479 .057 1 .812 .892
tissueperfusion -.069 .361 .036 1 .849 .934
Constant 2.377 1.427 2.776 1 .096 10.769
a. Variable(s) entered on step 1: mobility, activity, sensperception, moisture, friction, tissueperfusion.
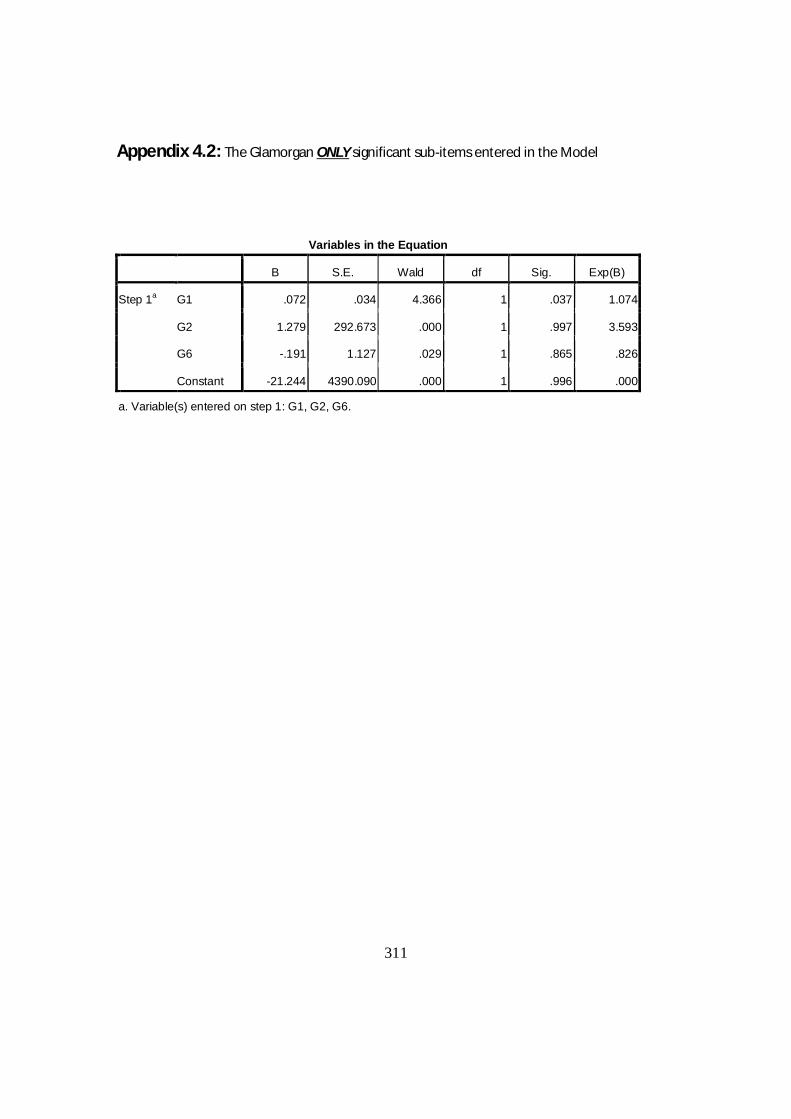
311
Appendix 4.2: The Glamorgan ONLY significant sub-items entered in the Model
Variables in the Equation
B S.E. Wald df Sig. Exp(B)
Step 1a G1 .072 .034 4.366 1 .037 1.074
G2 1.279 292.673 .000 1 .997 3.593
G6 -.191 1.127 .029 1 .865 .826
Constant -21.244 4390.090 .000 1 .996 .000
a. Variable(s) entered on step 1: G1, G2, G6.
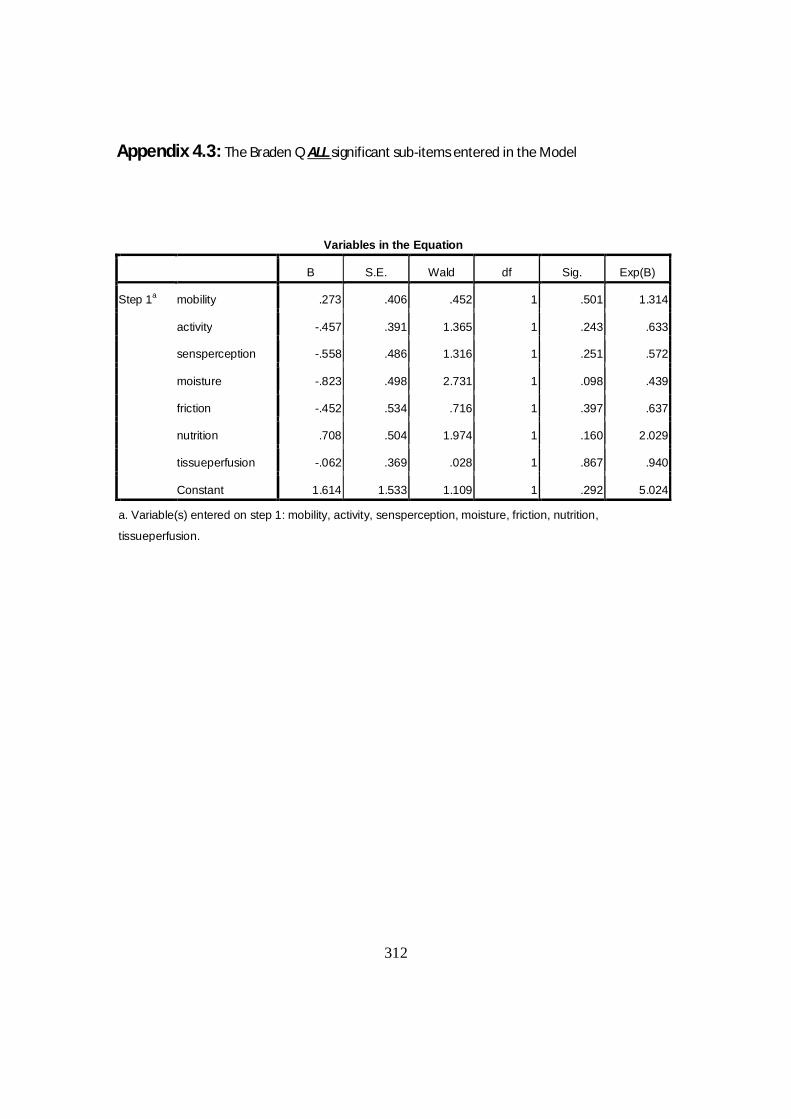
312
Appendix 4.3: The Braden Q ALL significant sub-items entered in the Model
Variables in the Equation
B S.E. Wald df Sig. Exp(B)
Step 1a mobility .273 .406 .452 1 .501 1.314
activity -.457 .391 1.365 1 .243 .633
sensperception -.558 .486 1.316 1 .251 .572
moisture -.823 .498 2.731 1 .098 .439
friction -.452 .534 .716 1 .397 .637
nutrition .708 .504 1.974 1 .160 2.029
tissueperfusion -.062 .369 .028 1 .867 .940
Constant 1.614 1.533 1.109 1 .292 5.024
a. Variable(s) entered on step 1: mobility, activity, sensperception, moisture, friction, nutrition,
tissueperfusion.
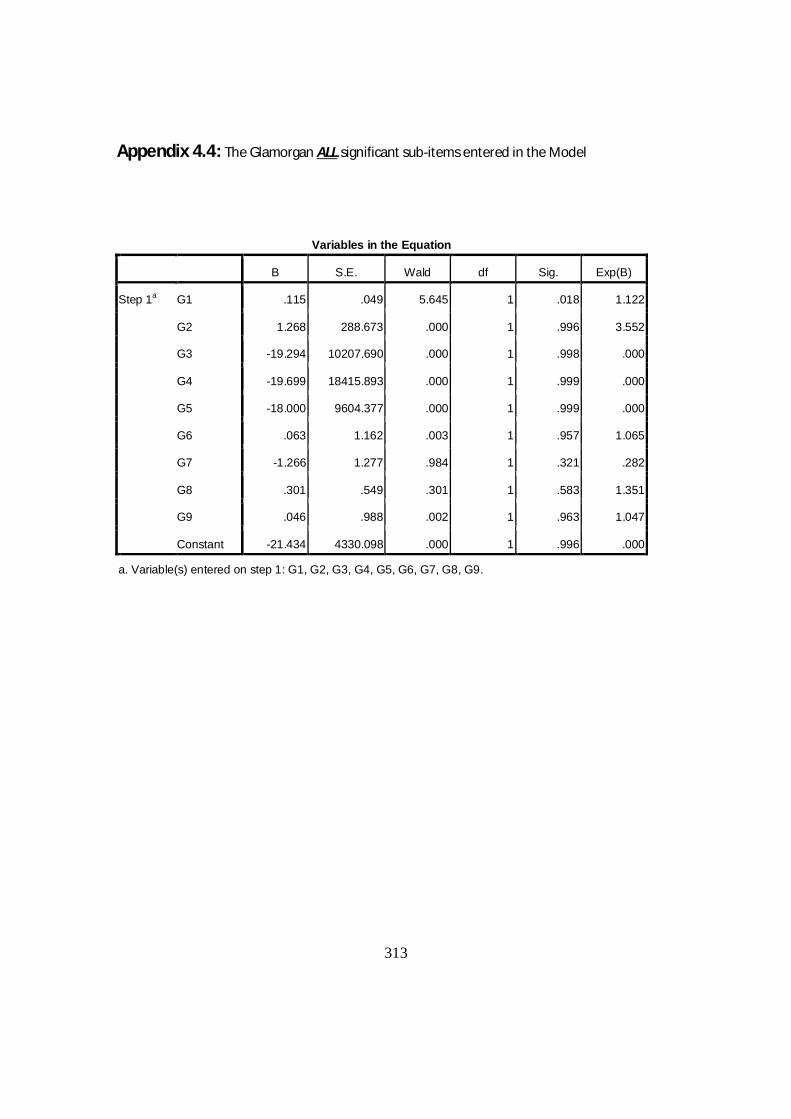
313
Appendix 4.4: The Glamorgan ALL significant sub-items entered in the Model
Variables in the Equation
B S.E. Wald df Sig. Exp(B)
Step 1a G1 .115 .049 5.645 1 .018 1.122
G2 1.268 288.673 .000 1 .996 3.552
G3 -19.294 10207.690 .000 1 .998 .000
G4 -19.699 18415.893 .000 1 .999 .000
G5 -18.000 9604.377 .000 1 .999 .000
G6 .063 1.162 .003 1 .957 1.065
G7 -1.266 1.277 .984 1 .321 .282
G8 .301 .549 .301 1 .583 1.351
G9 .046 .988 .002 1 .963 1.047
Constant -21.434 4330.098 .000 1 .996 .000
a. Variable(s) entered on step 1: G1, G2, G3, G4, G5, G6, G7, G8, G9.

314
THE END

315