Estimation of global and regional incidence and prevalence of abdominal aortic aneurysms 1990 to...
12
Estimation of Global and Regional Incidence and Prevalence of Abdominal Aortic Aneurysms 1990 to 2010 Uchechukwu K. A. Sampson*, Paul E. Norman y , F. Gerald R. Fowkes z , Victor Aboyans x , Yanna Song k , Frank E. Harrell, Jr. k , Mohammad H. Forouzanfar { , Mohsen Naghavi { , Julie O. Denenberg # , Mary M. McDermott**, Michael H. Criqui # , George A. Mensah yy , Majid Ezzati {,zz , Christopher Murray { Nashville, TN, USA; Fremantle, Western Australia, Australia; Edinburgh and London, United Kingdom; Limoges, France; Seattle, WA, USA; San Diego, CA, USA; Chicago, IL, USA; and Bethesda, MD, USA ABSTRACT The global burden of abdominal aortic aneurysm (AAA) has not been studied previously. Such information is important given the emergence of cardiovascular diseases in developing countries. We conducted a systematic literature review and estimated the global and regional incidence and prevalence of AAA in 21 world regions by age and sex. The search for prevalence and incidence of AAA using standard clinical and epidemiological terms was conducted using MEDLINE (1950 to 2010), EMBASE (1980 to 2010), AMED (1985 to 2010), CINAHL (1982 to 2010), and LILACS (2008 to 2010). Data abstracted from the systematic review served as priors for Bayesian meta-regression analyses. The analysis drew from 26 high-quality studies to estimate AAA prevalence and incidence. In 1990, the global age-specific prevalence rate per 100,000 ranged from 8.43 (95% CI: 7.03 to 10.14) in the 40 to 44 years age group to 2,422.53 (95% CI: 2,298.63 to 2,562.25) in the 75 to 79 years age group; the corresponding range in 2010 was 7.88 (95% CI: 6.54 to 9.59) to 2,274.82 (95% CI: 2,149.77 to 2,410.17). Prevalence was higher in developed versus developing nations, and the rates within each development stratum decreased between 1990 and 2010. Globally, the age- specific annual incidence rate per 100,000 in 1990 ranged from 0.89 (95% CI: 0.66 to 1.17) in 40 to 44 years age group to 176.08 (95% CI: 162.72 to 190.28) in the 75 to 79 years age group. In 2010, this range was 0.83 (95% CI: 0.61 to 1.11) to 164.57 (95% CI: 152.20 to 178.78). The highest prevalence in 1990 was in Australasia and North America high income regions: 382.65 (95% CI: 356.27 to 410.88) and 300.59 (95% CI: 280.93 to 321.54), respectively. Australasia had the highest prevalence in 2010, although the prevalence decreased to 310.27 (95% CI: 289.01 to 332.94). Regional prevalence increased in Oceania, tropical Latin America, Asia Pacific high income, Southern Sub-Saharan Africa (SSA), Central SSA, South Asia, Western SSA, and Central Asia. AAA global prevalence and incidence rates have decreased over the last 20 years. However, rising rates in some regions highlight the need for policies to enhance global disease surveillance and prevention. Abdominal aortic aneurysm (AAA) is a focal dilation of the abdominal aorta of at least 1.5 times the normal diameter or an absolute value of 3.0 cm or greater [1]. Known risk factors for AAA include male sex, atheroscle- rosis, smoking, hypertension, and history of AAA in a first- degree relative [2e4]. During the 20th century, many developed nations reported a consistent increase in the incidence and mortality associated with AAA [5e9]. The reported overall prevalence in developed countries was approximately 5%, and it was shown to be 4 times higher in men than in women [10,11], although women diag- nosed with AAA appear to have a worse prognosis than men [12,13]. AAA mortality is greatest among those pre- viously undiagnosed who may present with rupture; such individuals have up to 90% mortality rate if rupture occurs outside of the hospital [2,3,14e16]. The observed adverse epidemiological trends [5e9] led to targeted screening efforts as an important component of the management of AAA, and the benefit of screening was supported by systematic evidence review and synthesis of data from randomized controlled trials [17]. In this context, recent reports on the basis of data over the past 2 decades suggest that the mortality associated with AAA has declined in the United States, England, Wales, Australia, New Zea- land, and Sweden [18e22]. However, these country-level reports from developed nations are not enough to provide reliable global estimates of incidence and prevalence of AAA. To aid in the planning of policies and programs for the global The authors report no re- lationships that could be construed as a conflict of interest. The views expressed in this article are those of the authors and do not neces- sarily represent the views of the National Heart, Lung, and Blood Institute, National Institutes of Health, Department of Health and Human Services, or any other government entity. Supplementary data asso- ciated with this article can be found, in the online version, at http://dx.doi. org/10.1016/j.gheart.2 013.12.009. From the *Department of Medicine, Vanderbilt Uni- versity Medical Center (VUMC), Nashville, TN, USA; ySchool of Surgery, Univer- sity of Western Australia, Fremantle, Western Australia, Australia; zCentre for Population Health Sci- ences, University of Edin- burgh, Edinburgh, United Kingdom; xDepartment of Cardiology, Dupuytren Uni- versity Hospital and INSERM U1094, Tropical Neuro-epidemiology, Limoges, France; kDepartment of Biostatis- tics, VUMC, Nashville, TN, USA; {Institute for Health Metrics and Evaluation, Seattle, WA, USA; #Depart- ment of Family and Pre- ventive Medicine, University of California, San Diego, CA, USA; **Depart- ment of Medicine and Pre- ventive Medicine, Northwestern University Feinberg School of Medi- cine, Chicago, IL, USA; yyCenter for Translation Research and Implementa- tion Science (CTRIS), National Heart, Lung, and Blood Institute, National Institutes of Health, Bethesda, MD, USA; and zzSchool of Public Health, Imperial College London, United Kingdom. Corre- spondence: U.K.A. Sampson GLOBAL HEART, VOL. 9, NO. 1, 2014 159 March 2014: 159-170 REVIEW gREVIEW j
-
Upload
independent -
Category
Documents
-
view
1 -
download
0
Transcript of Estimation of global and regional incidence and prevalence of abdominal aortic aneurysms 1990 to...
REVIEW gREVIEWj
The authors report no re-
lationships that could beconstrued as a conflict ofinterest.The views expressed in thisarticle are those of theauthors and do not neces-sarily represent the views
Estimation of Global and Regional Incidence andPrevalence of Abdominal Aortic Aneurysms1990 to 2010Uchechukwu K. A. Sampson*, Paul E. Normany, F. Gerald R. Fowkesz, Victor Aboyansx, Yanna Songk,Frank E. Harrell, Jr.k, Mohammad H. Forouzanfar{, Mohsen Naghavi{, Julie O. Denenberg#,Mary M. McDermott**, Michael H. Criqui#, George A. Mensahyy, Majid Ezzati{,zz, Christopher Murray{
Nashville, TN, USA; Fremantle, Western Australia, Australia; Edinburgh and London, United Kingdom;Limoges, France; Seattle, WA, USA; San Diego, CA, USA; Chicago, IL, USA; and Bethesda, MD, USA
of the National Heart,Lung, and Blood Institute,National Institutes ofHealth, Department ofHealth and HumanServices, or any other
government entity.Supplementary data asso-ciated with this article canbe found, in the onlineversion, at http://dx.doi.org/10.1016/j.gheart.2013.12.009.
From the *Department ofMedicine, Vanderbilt Uni-versity Medical Center(VUMC), Nashville, TN, USA;ySchool of Surgery, Univer-sity of Western Australia,
Fremantle, WesternAustralia, Australia; zCentrefor Population Health Sci-ences, University of Edin-burgh, Edinburgh, UnitedKingdom; xDepartment ofCardiology, Dupuytren Uni-
versity Hospital andINSERM U1094, TropicalNeuro-epidemiology,Limoges, France;kDepartment of Biostatis-tics, VUMC, Nashville, TN,
USA; {Institute for Health
ABSTRACT
The global burden of abdominal aortic aneurysm (AAA) has not been studied previously. Such information isimportant given the emergence of cardiovascular diseases in developing countries. We conducted a systematicliterature review and estimated the global and regional incidence and prevalence of AAA in 21 world regionsby age and sex. The search for prevalence and incidence of AAA using standard clinical and epidemiologicalterms was conducted using MEDLINE (1950 to 2010), EMBASE (1980 to 2010), AMED (1985 to 2010),CINAHL (1982 to 2010), and LILACS (2008 to 2010). Data abstracted from the systematic review servedas priors for Bayesian meta-regression analyses. The analysis drew from 26 high-quality studies to estimateAAA prevalence and incidence. In 1990, the global age-specific prevalence rate per 100,000 ranged from8.43 (95% CI: 7.03 to 10.14) in the 40 to 44 years age group to 2,422.53 (95% CI: 2,298.63 to 2,562.25)in the 75 to 79 years age group; the corresponding range in 2010 was 7.88 (95% CI: 6.54 to 9.59) to2,274.82 (95% CI: 2,149.77 to 2,410.17). Prevalence was higher in developed versus developing nations,and the rates within each development stratum decreased between 1990 and 2010. Globally, the age-specific annual incidence rate per 100,000 in 1990 ranged from 0.89 (95% CI: 0.66 to 1.17) in 40 to 44years age group to 176.08 (95% CI: 162.72 to 190.28) in the 75 to 79 years age group. In 2010, thisrange was 0.83 (95% CI: 0.61 to 1.11) to 164.57 (95% CI: 152.20 to 178.78). The highest prevalence in1990 was in Australasia and North America high income regions: 382.65 (95% CI: 356.27 to 410.88) and300.59 (95% CI: 280.93 to 321.54), respectively. Australasia had the highest prevalence in 2010, althoughthe prevalence decreased to 310.27 (95% CI: 289.01 to 332.94). Regional prevalence increased in Oceania,tropical Latin America, Asia Pacific high income, Southern Sub-Saharan Africa (SSA), Central SSA, SouthAsia, Western SSA, and Central Asia. AAA global prevalence and incidence rates have decreased over thelast 20 years. However, rising rates in some regions highlight the need for policies to enhance globaldisease surveillance and prevention.
Metrics and Evaluation,Seattle, WA, USA; #Depart-ment of Family and Pre-ventive Medicine,University of California, SanDiego, CA, USA; **Depart-
ment of Medicine and Pre-ventive Medicine,Northwestern UniversityFeinberg School of Medi-cine, Chicago, IL, USA;yyCenter for TranslationResearch and Implementa-tion Science (CTRIS),National Heart, Lung, andBlood Institute, NationalInstitutes of Health,Bethesda, MD, USA; andzzSchool of Public Health,Imperial College London,United Kingdom. Corre-spondence: U.K.A. Sampson
Abdominal aortic aneurysm (AAA) is a focal dilation ofthe abdominal aorta of at least 1.5 times the normaldiameter or an absolute value of 3.0 cm or greater [1].Known risk factors for AAA include male sex, atheroscle-rosis, smoking, hypertension, and history of AAA in a first-degree relative [2e4]. During the 20th century, manydeveloped nations reported a consistent increase in theincidence and mortality associated with AAA [5e9]. Thereported overall prevalence in developed countries wasapproximately 5%, and it was shown to be 4 times higherin men than in women [10,11], although women diag-nosed with AAA appear to have a worse prognosis thanmen [12,13]. AAA mortality is greatest among those pre-viously undiagnosed who may present with rupture; such
GLOBAL HEART, VOL. 9, NO. 1, 2014March 2014: 159-170
individuals have up to 90% mortality rate if rupture occursoutside of the hospital [2,3,14e16].
The observed adverse epidemiological trends [5e9] ledto targeted screening efforts as an important component ofthe management of AAA, and the benefit of screening wassupported by systematic evidence review and synthesis ofdata from randomized controlled trials [17]. In this context,recent reports on the basis of data over the past 2 decadessuggest that the mortality associated with AAA has declinedin the United States, England, Wales, Australia, New Zea-land, and Sweden [18e22]. However, these country-levelreports from developed nations are not enough to providereliable global estimates of incidence and prevalence of AAA.To aid in the planning of policies and programs for the global
159
GLOBAL HEART© 2014 World HeartFederation (Geneva).Published by Elsevier Ltd.
All rights reserved.VOL. 9, NO. 1, 2014ISSN 2211-8160/$36.00.http://dx.doi.org/10.1016/j.gheart.2013.12.009
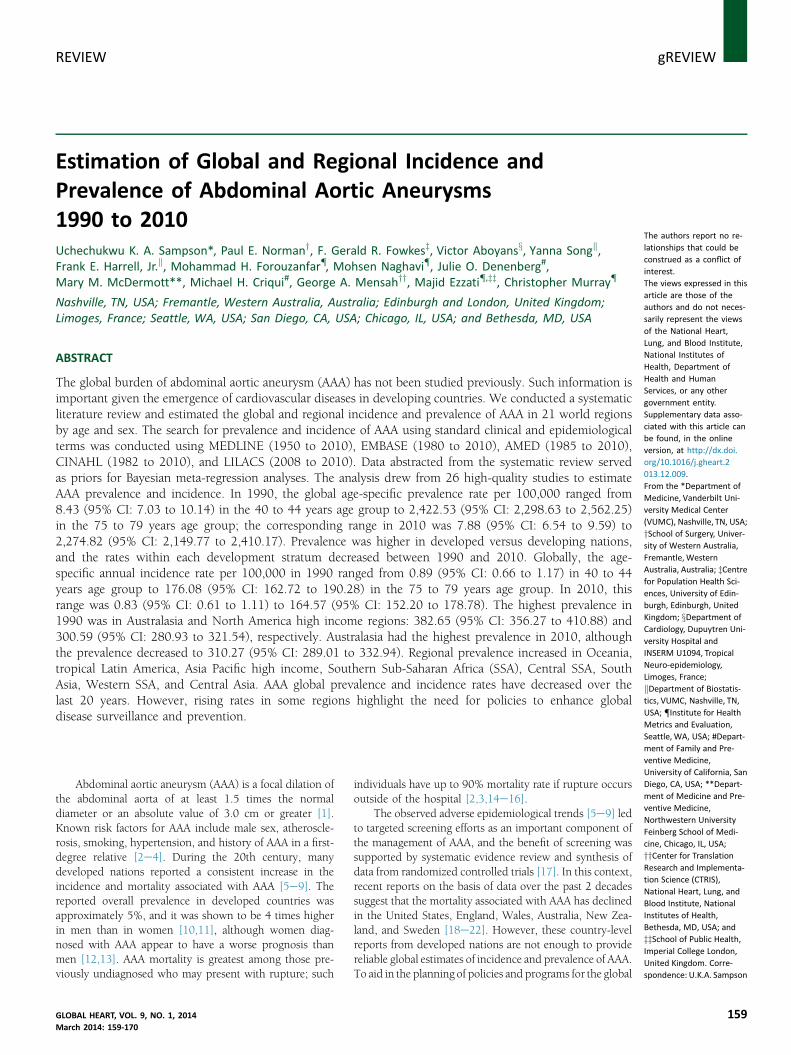
FIGURE 1. Literature review and data abstraction flow chart for AAA systematic analysis. Abdominal aortic aneurysm(AAA) studies included the definition of important clinical sequelae for AAA, which were intact AAA (infrarenal aorticdiameter �30 mm), fatal ruptured AAA, emergency surgical repair for ruptured AAA, and elective surgical repair of AAA(open or endovascular). GBD, global burden of disease.
j gREVIEW
160 GLOBAL HEART, VOL. 9, NO. 1, 2014March 2014: 159-170
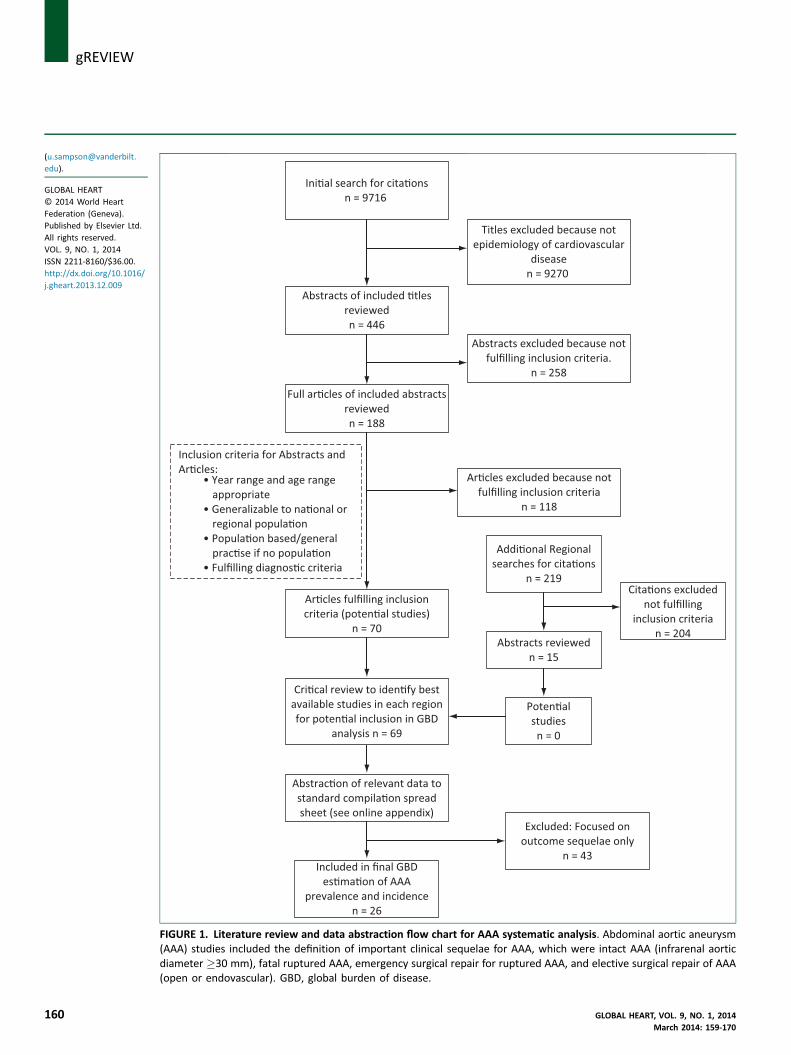
TABLE 1. Age-specific AAA prevalence rates per 100,000 population by country development status, 1990 and 2010
Region
Age group, yrs
25e29 30e34 35e39 40e44 45e49 50e54 55e59 60e64 65e69 70e74 75e79 �80
1990
Developed
Estimate 2.71 3.60 5.90 10.16 28.69 156.51 440.16 894.50 1,501.89 2,171.32 2,666.91 3,404.25
CI lower 2.03 2.72 4.74 8.09 25.04 145.54 411.89 849.48 1,429.27 2,068.36 2,536.17 3,243.10
CI upper 3.66 4.85 7.39 12.73 33.42 169.34 472.52 943.63 1,579.25 2,281.32 2,799.43 3,579.85
Developing
Estimate 2.04 2.78 4.62 7.70 21.07 117.95 332.82 685.27 1,165.47 1,709.27 2,190.06 2,882.98
CI lower 1.55 2.10 3.62 6.01 17.79 105.43 298.04 621.62 1,060.83 1,547.18 1,995.39 2,621.50
CI upper 2.73 3.78 6.03 10.04 25.06 131.86 373.11 754.73 1,286.28 1,893.16 2,413.17 3,158.70
Global
Estimate 2.19 2.98 4.95 8.43 23.33 130.46 368.44 764.26 1,301.44 1,890.59 2,422.53 3,174.85
CI lower 1.75 2.39 4.10 7.03 20.80 121.21 343.78 720.75 1,227.29 1,779.46 2,298.63 3,021.94
CI upper 2.81 3.84 6.10 10.14 26.35 140.66 396.87 812.47 1,379.98 2,013.09 2,562.25 3,339.34
2010
Developed
Estimate 2.43 3.24 5.31 9.06 25.71 142.12 397.73 827.97 1,402.69 1,943.94 2,478.62 3,158.28
CI lower 1.83 2.42 4.26 7.10 22.34 131.78 370.37 783.24 1,336.95 1,852.43 2,361.96 3,006.07
CI upper 3.14 4.23 6.64 11.56 30.11 153.14 424.92 871.27 1,474.43 2,038.61 2,603.68 3,314.10
Developing
Estimate 1.94 2.63 4.43 7.59 20.66 116.63 333.64 678.22 1,146.26 1,654.68 2,139.31 2,836.16
CI lower 1.50 2.01 3.53 5.96 17.64 104.44 296.61 613.62 1,042.59 1,497.68 1,943.86 2,599.24
CI upper 2.60 3.49 5.62 9.66 24.39 130.72 376.47 749.21 1,261.74 1,820.22 2,350.28 3,103.74
Global
Estimate 2.02 2.74 4.60 7.88 21.85 123.25 350.94 725.66 1,229.12 1,761.18 2,274.82 3,002.78
CI lower 1.62 2.17 3.79 6.54 19.42 113.63 322.47 677.33 1,154.16 1,658.85 2,149.77 2,861.13
CI upper 2.57 3.47 5.66 9.59 24.77 133.98 383.45 776.35 1,312.17 1,871.27 2,410.17 3,150.92
AAA, abdominal aortic aneurysm.
gREVIEWj
prevention and management of AAA, comprehensiveepidemiological surveillance is warranted, especially in lightof the current worldwide epidemiological transition andemergence of cardiovascular diseases in developing coun-tries. We conducted a systematic analysis of all the evidenceavailable in the public domain to identify high-qualitystudies of AAA epidemiology. Using the information fromthose studies and Bayesian meta-regression methods, weprovide the first comprehensive estimates of global andregional incidence and prevalence of AAA in 21 regionsworldwide from 1990 to 2010.
METHODSThe methods consisted of 2 main stages: 1) literaturesearch and extraction of data from studies on AAA inci-dence and prevalence and 2) statistical modeling ofregional and global incidence and prevalence of AAA onthe basis of the extracted data.
Literature search and data extractionImportant clinical sequelae (conditions) were defined forAAA a priori. Sequelae for AAA were intact AAA (infrarenal
GLOBAL HEART, VOL. 9, NO. 1, 2014March 2014: 159-170
aortic diameter �30 mm), fatal ruptured AAA, emergencysurgical repair for ruptured AAA, and elective surgicalrepair of AAA (open or endovascular). We conducted asystematic review of published literature on AAA. Theinitial search for prevalence and incidence of sequelae us-ing standard clinical and epidemiological terms was con-ducted using the following databases: MEDLINE (1950 to2010), EMBASE (1980 to 2010), AMED (1985 to 2010),CINAHL (1982 to 2010), and LILACS (2008 to 2010). Dueto a paucity of papers covering some regions and countries,a broader search using simply AAA was conducted forthese areas. Experts on AAA were approached, and refer-ence lists of included papers were scanned for additionalpapers. Papers considered for inclusion were evaluated fortheir quality and relevance prior to a final decision onwhich to include in the review. For each of the 21 globalregions, a “best available data” approach was employed.
Initial screening retrieved 9,716 titles of articles(Fig. 1), of which 446 abstracts were reviewed, resulting infull assessment of 188 full-text papers and final abstractionof data from 69 studies (Online Appendix). The extracteddata included study characteristics (e.g., setting, duration,design), diagnostic criteria, mean age of study participants,
161
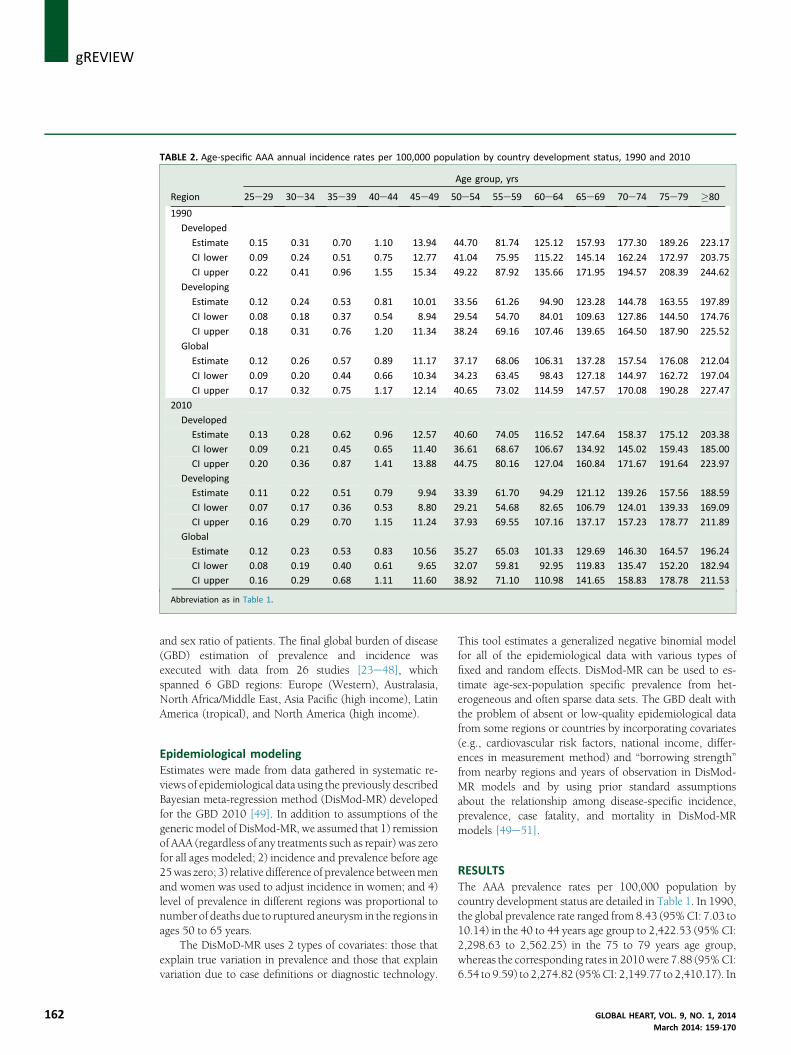
TABLE 2. Age-specific AAA annual incidence rates per 100,000 population by country development status, 1990 and 2010
Region
Age group, yrs
25e29 30e34 35e39 40e44 45e49 50e54 55e59 60e64 65e69 70e74 75e79 �80
1990
Developed
Estimate 0.15 0.31 0.70 1.10 13.94 44.70 81.74 125.12 157.93 177.30 189.26 223.17
CI lower 0.09 0.24 0.51 0.75 12.77 41.04 75.95 115.22 145.14 162.24 172.97 203.75
CI upper 0.22 0.41 0.96 1.55 15.34 49.22 87.92 135.66 171.95 194.57 208.39 244.62
Developing
Estimate 0.12 0.24 0.53 0.81 10.01 33.56 61.26 94.90 123.28 144.78 163.55 197.89
CI lower 0.08 0.18 0.37 0.54 8.94 29.54 54.70 84.01 109.63 127.86 144.50 174.76
CI upper 0.18 0.31 0.76 1.20 11.34 38.24 69.16 107.46 139.65 164.50 187.90 225.52
Global
Estimate 0.12 0.26 0.57 0.89 11.17 37.17 68.06 106.31 137.28 157.54 176.08 212.04
CI lower 0.09 0.20 0.44 0.66 10.34 34.23 63.45 98.43 127.18 144.97 162.72 197.04
CI upper 0.17 0.32 0.75 1.17 12.14 40.65 73.02 114.59 147.57 170.08 190.28 227.47
2010
Developed
Estimate 0.13 0.28 0.62 0.96 12.57 40.60 74.05 116.52 147.64 158.37 175.12 203.38
CI lower 0.09 0.21 0.45 0.65 11.40 36.61 68.67 106.67 134.92 145.02 159.43 185.00
CI upper 0.20 0.36 0.87 1.41 13.88 44.75 80.16 127.04 160.84 171.67 191.64 223.97
Developing
Estimate 0.11 0.22 0.51 0.79 9.94 33.39 61.70 94.29 121.12 139.26 157.56 188.59
CI lower 0.07 0.17 0.36 0.53 8.80 29.21 54.68 82.65 106.79 124.01 139.33 169.09
CI upper 0.16 0.29 0.70 1.15 11.24 37.93 69.55 107.16 137.17 157.23 178.77 211.89
Global
Estimate 0.12 0.23 0.53 0.83 10.56 35.27 65.03 101.33 129.69 146.30 164.57 196.24
CI lower 0.08 0.19 0.40 0.61 9.65 32.07 59.81 92.95 119.83 135.47 152.20 182.94
CI upper 0.16 0.29 0.68 1.11 11.60 38.92 71.10 110.98 141.65 158.83 178.78 211.53
Abbreviation as in Table 1.
j gREVIEW
162
and sex ratio of patients. The final global burden of disease(GBD) estimation of prevalence and incidence wasexecuted with data from 26 studies [23e48], whichspanned 6 GBD regions: Europe (Western), Australasia,North Africa/Middle East, Asia Pacific (high income), LatinAmerica (tropical), and North America (high income).
Epidemiological modelingEstimates were made from data gathered in systematic re-views of epidemiological data using the previously describedBayesian meta-regression method (DisMod-MR) developedfor the GBD 2010 [49]. In addition to assumptions of thegeneric model of DisMod-MR, we assumed that 1) remissionof AAA (regardless of any treatments such as repair) was zerofor all ages modeled; 2) incidence and prevalence before age25was zero; 3) relative difference of prevalence betweenmenand women was used to adjust incidence in women; and 4)level of prevalence in different regions was proportional tonumber of deaths due to ruptured aneurysm in the regions inages 50 to 65 years.
The DisMoD-MR uses 2 types of covariates: those thatexplain true variation in prevalence and those that explainvariation due to case definitions or diagnostic technology.
This tool estimates a generalized negative binomial modelfor all of the epidemiological data with various types offixed and random effects. DisMod-MR can be used to es-timate age-sex-population specific prevalence from het-erogeneous and often sparse data sets. The GBD dealt withthe problem of absent or low-quality epidemiological datafrom some regions or countries by incorporating covariates(e.g., cardiovascular risk factors, national income, differ-ences in measurement method) and “borrowing strength”from nearby regions and years of observation in DisMod-MR models and by using prior standard assumptionsabout the relationship among disease-specific incidence,prevalence, case fatality, and mortality in DisMod-MRmodels [49e51].
RESULTSThe AAA prevalence rates per 100,000 population bycountry development status are detailed in Table 1. In 1990,the global prevalence rate ranged from 8.43 (95%CI: 7.03 to10.14) in the 40 to 44 years age group to 2,422.53 (95% CI:2,298.63 to 2,562.25) in the 75 to 79 years age group,whereas the corresponding rates in 2010were 7.88 (95%CI:6.54 to 9.59) to 2,274.82 (95%CI: 2,149.77 to 2,410.17). In
GLOBAL HEART, VOL. 9, NO. 1, 2014March 2014: 159-170
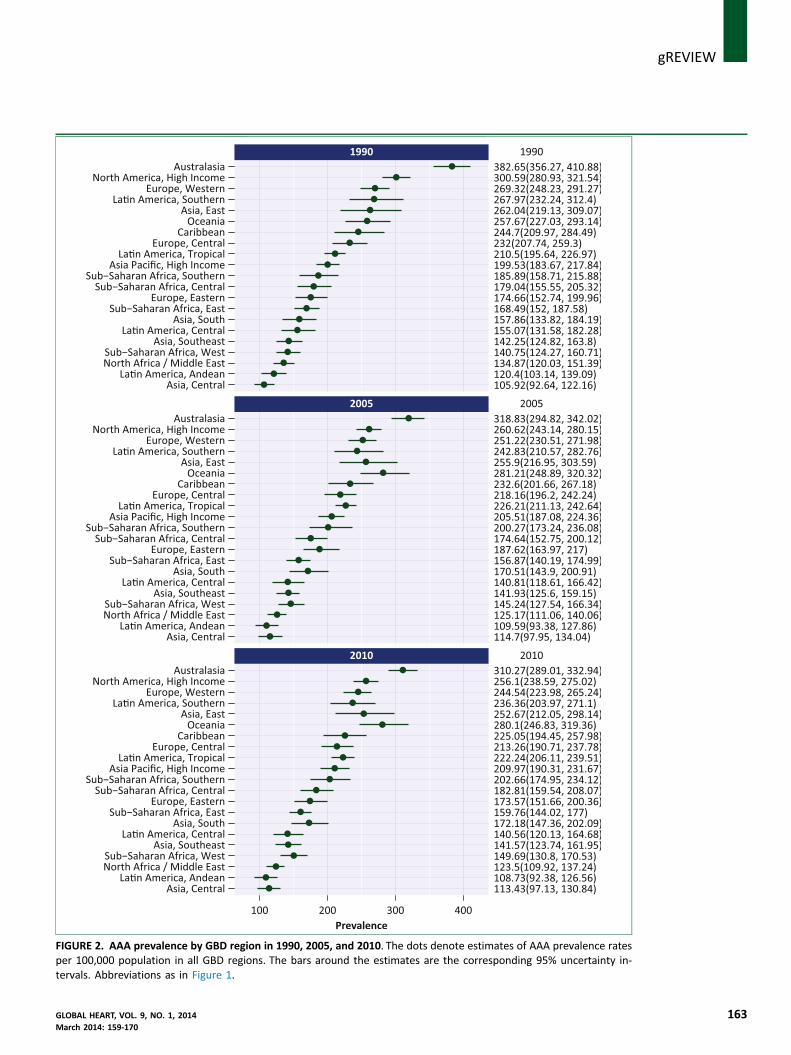
FIGURE 2. AAA prevalence by GBD region in 1990, 2005, and 2010. The dots denote estimates of AAA prevalence ratesper 100,000 population in all GBD regions. The bars around the estimates are the corresponding 95% uncertainty in-tervals. Abbreviations as in Figure 1.
gREVIEWj
GLOBAL HEART, VOL. 9, NO. 1, 2014 163March 2014: 159-170
A
B
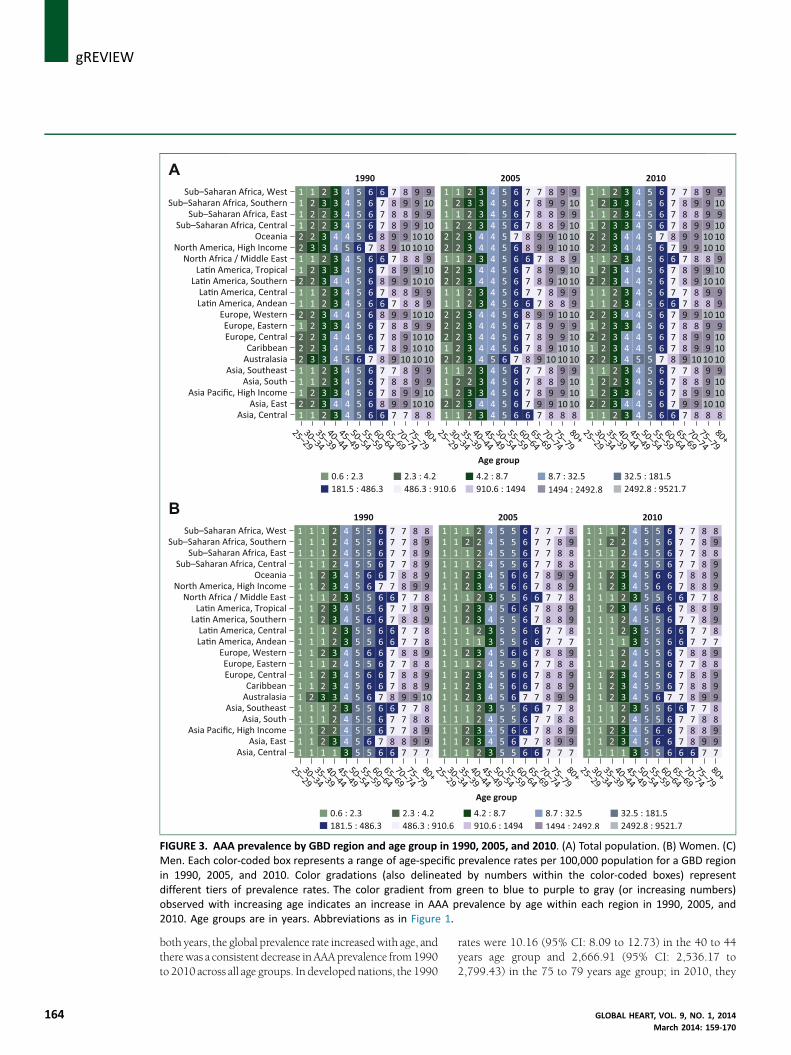
FIGURE 3. AAA prevalence by GBD region and age group in 1990, 2005, and 2010. (A) Total population. (B) Women. (C)Men. Each color-coded box represents a range of age-specific prevalence rates per 100,000 population for a GBD regionin 1990, 2005, and 2010. Color gradations (also delineated by numbers within the color-coded boxes) representdifferent tiers of prevalence rates. The color gradient from green to blue to purple to gray (or increasing numbers)observed with increasing age indicates an increase in AAA prevalence by age within each region in 1990, 2005, and2010. Age groups are in years. Abbreviations as in Figure 1.
j gREVIEW
164
both years, the global prevalence rate increasedwith age, andtherewas a consistent decrease inAAAprevalence from1990to 2010 across all age groups. In developed nations, the 1990
rates were 10.16 (95% CI: 8.09 to 12.73) in the 40 to 44years age group and 2,666.91 (95% CI: 2,536.17 to2,799.43) in the 75 to 79 years age group; in 2010, they
GLOBAL HEART, VOL. 9, NO. 1, 2014March 2014: 159-170
FIGURE 3. (continued).
gREVIEWj
were 9.06 (95% CI: 7.10 to 11.56) and 2,478.62 (95% CI:2,361.96 to 2,603.68), respectively. In developing nations,these rates were 7.70 (95% CI: 6.01 to 10.04) to 2,190.06(95% CI: 1,995.39 to 2,413.17) in 1990 and 7.59 (95% CI:5.96 to 9.66) to 2,139.31 (95% CI: 1,943.86 to 2,350.28),respectively. Across all age groups, the rates in developednations were higher than in developing countries in 1990and 2010.
Globally, the age-specific annual incidence rate per100,000 in 1990 ranged from 0.89 (95% CI: 0.66 to 1.17)in the 40 to 44 years age group to 176.08 (95% CI: 162.72to 190.28) in the 75 to 79 years age group, whereas thisrange in 2010 was 0.83 (95% CI: 0.61 to 1.11) to 164.57(95% CI: 152.20 to 178.78). Both globally and by countrydevelopment status, the incidence rates detailed inTable 2 mirror the observed prevalence rate pattern; that is,the rates increased with age and were higher in 1990 than2010 across all age groups. Furthermore, the incidencerates in developed nations were consistently higher than indeveloping nations.
Differences in regional prevalence rates of AAA areillustrated in Figure 2. The highest prevalence rates in 1990were in Australasia and North America high income:382.65 (95% CI: 356.27 to 410.88) and 300.59 (95% CI:280.93 to 321.54), respectively (Fig. 2). Australasiaremained at the top of the list in 2010, although the ratedropped to 310.27 (95% CI: 289.01 to 332.94); however,rates in the Oceania region rose from 257.67 (95% CI:227.03 to 293.14) in 1990, a fourth place position, to280.10 (95% CI: 246.83 to 319.36) in 2010, a secondplace position. Rates also declined in Western Europe from
GLOBAL HEART, VOL. 9, NO. 1, 2014March 2014: 159-170
269.32 (95% CI: 248.23 to 291.27) in 1990 to 244.54(95% CI: 223.98 to 265.24) in 2010.
Other instances of decline in regional rates were inSouthern Latin America, East Asia, Caribbean, CentralEurope, Eastern Europe, East Sub-Saharan Africa (SSA),Central Latin America, Southeast Asia, North Africa/MiddleEast, and Andean Latin America. In addition to Oceania,other increases in regional rates were observed in tropicalLatin America, Asia Pacific high income, Southern SSA,Central SSA, South Asia, West SSA, and Central Asia. Thepattern of increasing prevalence with age was preservedregionally (Fig. 3A) and within sex, as depicted by thecolor chart in Figures 3B and 3C. However, across all ages,the rates were distinctly higher among men across all agegroups. Regional differences in incidence rates (Fig. 4)were similar to differences in prevalence. Figures 5A, 5B,and 5C depict the increasing incidence rates with ageacross all regions, which were consistent within sex, albeitwith higher rates among men compared with women ofsimilar age groups.
DISCUSSIONThis systematic evaluation of the global epidemiology ofAAA provides evidence that the prevalence and incidenceof AAA have declined over the past 2 decades, which isconsistent with reports from individual countries [18e22].This study provides further evidence that the burden ofAAA increases with age and that men are affected morefrequently than women. At the global level, the incidenceand prevalence rates are higher in developed versus
165
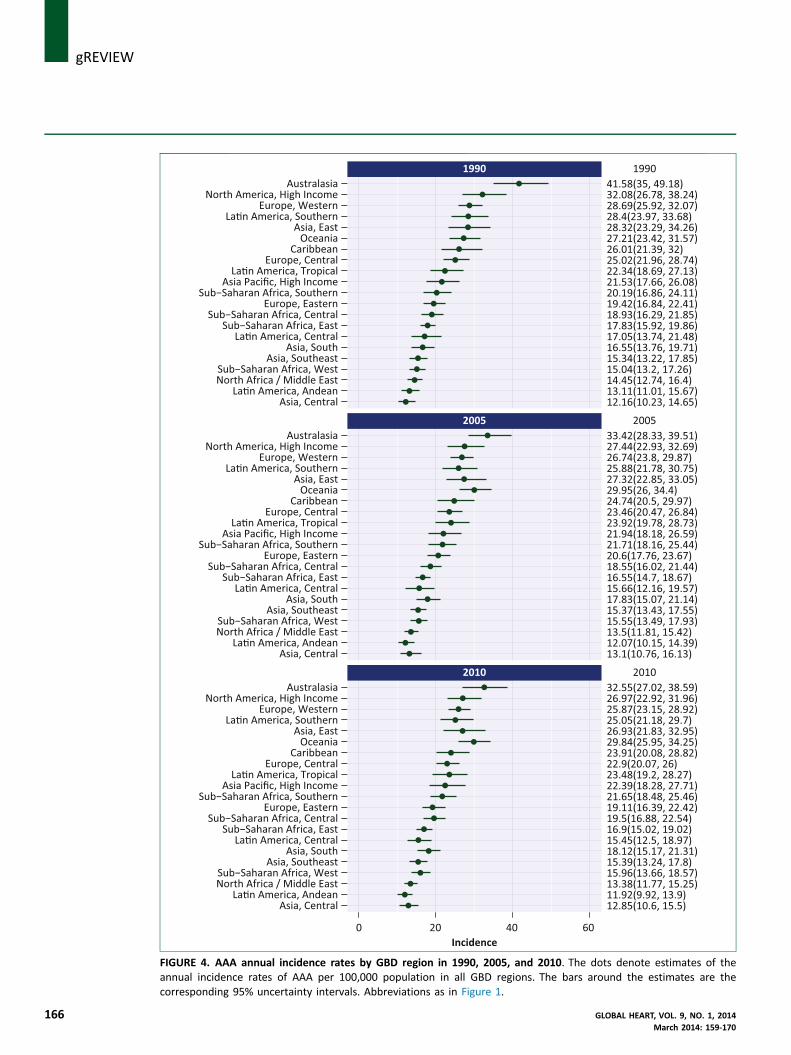
IGURE 4. AAA annual incidence rates by GBD region in 1990, 2005, and 2010. The dots denote estimates of thennual incidence rates of AAA per 100,000 population in all GBD regions. The bars around the estimates are the
j gREVIEW
166
Fa
corresponding 95% uncertainty intervals. Abbreviations as in Figure 1.GLOBAL HEART, VOL. 9, NO. 1, 2014March 2014: 159-170

FIGURE 5. AAA annual incidence rates by GBD region and age group in 1990, 2005, and 2010. (A) Total population. (B)Women. (C) Men. The charts delineate estimates of age-specific annual incidence rates of AAA per 100,000 populationfor all GBD regions. Each color-coded box represents a range of age-specific incidence rates for a GBD region. Colorgradations (also delineated by numbers within the color-coded boxes) represent different tiers of incidence rates. Thecolor gradient from green to blue to purple to gray (or increasing numbers) observed with increasing age indicates anincrease in AAA incidence by age within each region in 1990, 2005, and 2010. Age groups are in years. Abbreviations asin Figure 1.
gREVIEWj
GLOBAL HEART, VOL. 9, NO. 1, 2014 167March 2014: 159-170
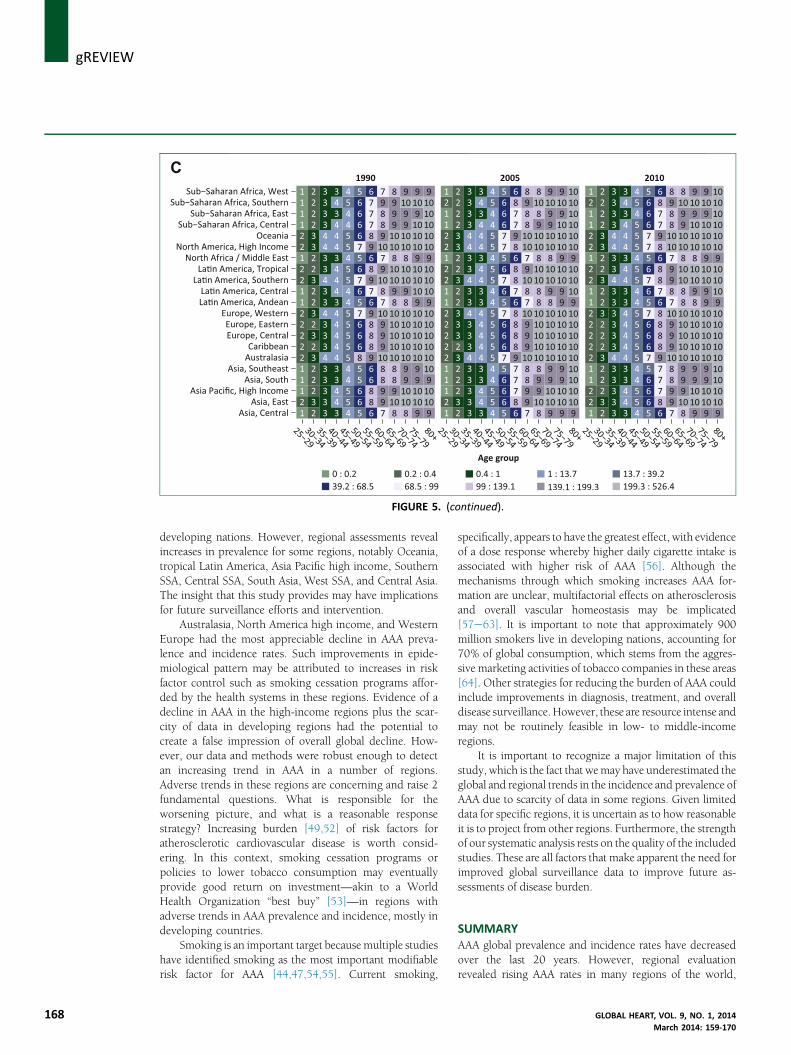
FIGURE 5. (continued).
j gREVIEW
168
developing nations. However, regional assessments revealincreases in prevalence for some regions, notably Oceania,tropical Latin America, Asia Pacific high income, SouthernSSA, Central SSA, South Asia, West SSA, and Central Asia.The insight that this study provides may have implicationsfor future surveillance efforts and intervention.
Australasia, North America high income, and WesternEurope had the most appreciable decline in AAA preva-lence and incidence rates. Such improvements in epide-miological pattern may be attributed to increases in riskfactor control such as smoking cessation programs affor-ded by the health systems in these regions. Evidence of adecline in AAA in the high-income regions plus the scar-city of data in developing regions had the potential tocreate a false impression of overall global decline. How-ever, our data and methods were robust enough to detectan increasing trend in AAA in a number of regions.Adverse trends in these regions are concerning and raise 2fundamental questions. What is responsible for theworsening picture, and what is a reasonable responsestrategy? Increasing burden [49,52] of risk factors foratherosclerotic cardiovascular disease is worth consid-ering. In this context, smoking cessation programs orpolicies to lower tobacco consumption may eventuallyprovide good return on investment—akin to a WorldHealth Organization “best buy” [53]—in regions withadverse trends in AAA prevalence and incidence, mostly indeveloping countries.
Smoking is an important target because multiple studieshave identified smoking as the most important modifiablerisk factor for AAA [44,47,54,55]. Current smoking,
specifically, appears to have the greatest effect, with evidenceof a dose response whereby higher daily cigarette intake isassociated with higher risk of AAA [56]. Although themechanisms through which smoking increases AAA for-mation are unclear, multifactorial effects on atherosclerosisand overall vascular homeostasis may be implicated[57e63]. It is important to note that approximately 900million smokers live in developing nations, accounting for70% of global consumption, which stems from the aggres-sive marketing activities of tobacco companies in these areas[64]. Other strategies for reducing the burden of AAA couldinclude improvements in diagnosis, treatment, and overalldisease surveillance.However, these are resource intense andmay not be routinely feasible in low- to middle-incomeregions.
It is important to recognize a major limitation of thisstudy, which is the fact that wemay have underestimated theglobal and regional trends in the incidence and prevalence ofAAA due to scarcity of data in some regions. Given limiteddata for specific regions, it is uncertain as to how reasonableit is to project from other regions. Furthermore, the strengthof our systematic analysis rests on the quality of the includedstudies. These are all factors that make apparent the need forimproved global surveillance data to improve future as-sessments of disease burden.
SUMMARYAAA global prevalence and incidence rates have decreasedover the last 20 years. However, regional evaluationrevealed rising AAA rates in many regions of the world,
GLOBAL HEART, VOL. 9, NO. 1, 2014March 2014: 159-170
gREVIEWj
which highlights the need to improve prevention, diag-nosis and treatment, and collection of disease surveillancedata globally.REFERENCES1. Aggarwal S, Qamar A, Sharma V, Sharma A. Abdominal aortic aneu-
rysm: a comprehensive review. Exp Clin Cardiol 2011;16:11–5.2. Kniemeyer HW, Kessler T, Reber PU, Ris HB, Hakki H, Widmer MK.
Treatment of ruptured abdominal aortic aneurysm, a permanentchallenge or a waste of resources? Prediction of outcome using amulti-organ-dysfunction score. Eur J Vasc Endovasc Surg 2000;19:190–6.
3. Gillum RF. Epidemiology of aortic aneurysm in the United States.
J Clin Epidemiol 1995;48:1289–98.4. Blanchard JF, Armenian HK, Friesen PP. Risk factors for abdominal
aortic aneurysm: results of a case-control study. Am J Epidemiol2000;151:575–83.
5. Fowkes FG, Rudan D, Rudan I, et al. Comparison of global estimatesof prevalence and risk factors for peripheral artery disease in 2000
and 2010: a systematic review and analysis. Lancet 2013;382:1329–40.
6. Filipovic M, Goldacre MJ, Roberts SE, Yeates D, Duncan ME, Cook-Mozaffari P. Trends in mortality and hospital admission rates forabdominal aortic aneurysm in England and Wales, 1979e1999. Br JSurg 2005;92:968–75.
7. Eickhoff JH. Incidence of diagnosis, operation and death from
abdominal aortic aneurysms in Danish hospitals: results from anation-wide survey, 1977e1990. Eur J Surg 1993;159:619–23.
8. Castleden WM, Mercer JC. Abdominal aortic aneurysms in WesternAustralia: descriptive epidemiology and patterns of rupture. Br J Surg1985;72:109–12.
9. Melton LJ 3rd, Bickerstaff LK, Hollier LH, et al. Changing incidence of
abdominal aortic aneurysms: a population-based study. Am J Epi-demiol 1984;120:379–86.
10. Derubertis BG, Trocciola SM, Ryer EJ, et al. Abdominal aortic aneu-rysm in women: prevalence, risk factors, and implications forscreening. J Vasc Surg 2007;46:630–5.
11. Scott RA, Bridgewater SG, Ashton HA. Randomized clinical trial of
screening for abdominal aortic aneurysm in women. Br J Surg 2002;89:283–5.
12. Norman PE, Powell JT. Abdominal aortic aneurysm: the prognosis inwomen is worse than in men. Circulation 2007;115:2865–9.
13. Guirguis-Blake J, Wolff TA. Screening for abdominal aortic aneurism.Am Fam Physician 2005;71:2154–5.
14. Upchurch GR Jr., Schaub TA. Abdominal aortic aneurysm. Am Fam
Physician 2006;73:1198–204.15. van der Vliet JA, Boll AP. Abdominal aortic aneurysm. Lancet 1997;
349:863–6.16. Blanchard JF. Epidemiology of abdominal aortic aneurysms. Epi-
demiol Rev 1999;21:207–21.17. Cosford PA, Leng GC. Screening for abdominal aortic aneurysm.
Cochrane Database Syst Rev 2007;(2):CD002945.18. About Compressed Mortality. Centers for Disease Control and Pre-
vention WONDER. Available at: http://wonder.cdc.gov/cmf-icd10.html. Accessed January 17, 2014.
19. About Compressed Mortality, 1979e1998. Centers for Disease Con-trol and Prevention WONDER. Available at: http://wonder.cdc.gov/cmf-icd9.html. Accessed January 17, 2014.
20. Anjum A, von Allmen R, Greenhalgh R, Powell JT. Explaining thedecrease in mortality from abdominal aortic aneurysm rupture. Br JSurg 2012;99:637–45.
21. Anjum A, Powell JT. Is the incidence of abdominal aortic aneurysmdeclining in the 21st century? Mortality and hospital admissions forEngland & Wales and Scotland. Eur J Vasc Endovasc Surg 2012;43:
161–6.22. Choke E, Vijaynagar B, Thompson J, Nasim A, Bown MJ, Sayers RD.
Changing epidemiology of abdominal aortic aneurysms in Englandand Wales: older and more benign? Circulation 2012;125:1617–25.
GLOBAL HEART, VOL. 9, NO. 1, 2014March 2014: 159-170
23. Freiberg MS, Arnold AM, Newman AB, Edwards MS, Kraemer KL,Kuller LH. Abdominal aortic aneurysms, increasing infrarenal aorticdiameter, and risk of total mortality and incident cardiovasculardisease events: 10-year follow-up data from the CardiovascularHealth Study. Circulation 2008;117:1010–7.
24. Newman AB, Arnold AM, Burke GL, O’Leary DH, Manolio TA. Car-diovascular disease and mortality in older adults with smallabdominal aortic aneurysms detected by ultrasonography: the Car-diovascular Health Study. Ann Intern Med 2001;134:182–90.
25. Scott RA, Ashton HA, Lamparelli MJ, Harris GJ, Stevens JW. A 14-yearexperience with 6 cm as a criterion for surgical treatment of
abdominal aortic aneurysm. Br J Surg 1999;86:1317–21.26. Kim LG, P Scott RA, Ashton HA, Thompson SG. A sustained mortality
benefit from screening for abdominal aortic aneurysm. Ann InternMed 2007;146:699–706.
27. Lindholt JS, Vammen S, Juul S, Fasting H, Henneberg EW. Optimalinterval screening and surveillance of abdominal aortic aneurysms.
Eur J Vasc Endovasc Surg 2000;20:369–73.28. Norman PE, Flicker L, Almeida OP, Hankey GJ, Hyde Z, Jamrozik K. Cohort
profile: the Health inMen Study (HIMS). Int J Epidemiol 2009;38:48–52.29. Morris GE, Hubbard CS, Quick CR. An abdominal aortic aneurysm
screening programme for all males over the age of 50 years. Eur JVasc Surg 1994;8:156–60.
30. Wilmink AB, Hubbard CS, Day NE, Quick CR. The incidence of small
abdominal aortic aneurysms and the change in normal infrarenalaortic diameter: implications for screening. Eur J Vasc Endovasc Surg2001;21:165–70.
31. Heather BP, Poskitt KR, Earnshaw JJ, Whyman M, Shaw E. Populationscreening reduces mortality rate from aortic aneurysm in men. Br JSurg 2000;87:750–3.
32. Scott RA, Vardulaki KA,Walker NM, Day NE, Duffy SW, Ashton HA. Thelong-term benefits of a single scan for abdominal aortic aneurysm(AAA) at age 65. Eur J Vasc Endovasc Surg 2001;21:535–40.
33. Lindholt JS, Juul S, Fasting H, Henneberg EW. Preliminary ten year re-sults from a randomised single centre mass screening trial forabdominal aortic aneurysm. Eur J Vasc Endovasc Surg 2006;32:608–14.
34. Ashton HA, Buxton MJ, Day NE, et al. The Multicentre Aneurysm
Screening Study (MASS) into the effect of abdominal aortic aneurysmscreening on mortality in men: a randomised controlled trial. Lancet2002;360:1531–9.
35. Norman PE, Jamrozik K, Lawrence-Brown MM, et al. Populationbased randomised controlled trial on impact of screening on mor-tality from abdominal aortic aneurysm. BMJ 2004;329:1259.
36. Bengtsson H, Bergqvist D, Ekberg O, Janzon L. A population basedscreening of abdominal aortic aneurysms (AAA). Eur J Vasc Surg1991;5:53–7.
37. Scott RA, Wilson NM, Ashton HA, Kay DN. Influence of screening onthe incidence of ruptured abdominal aortic aneurysm: 5-year resultsof a randomized controlled study. Br J Surg 1995;82:1066–70.
38. al-Zahrani HA, Rawas M, Maimani A, Gasab M, Aba al Khail BA.
Screening for abdominal aortic aneurysm in the Jeddah area, westernSaudi Arabia. Cardiovasc Surg 1996;4:87–92.
39. Adachi K, Iwasawa T, Ono T. Screening for abdominal aortic aneu-rysms during a basic medical checkup in residents of a Japanese ruralcommunity. Surg Today 2000;30:594–9.
40. Puech-Leão P, Molnar LJ, Oliveira IR, Cerri GG. Prevalence of
abdominal aortic aneurysms—a screening program in São Paulo,Brazil. São Paulo Med J 2004;122:158–60.
41. Sariosmanoglu N, Ugurlu B, Karacelik M, et al. A multicentre study ofabdominal aorta diameters in a Turkish population. J Int Med Res2002;30:1–8.
42. Boll AP, Verbeek AL, van de Lisdonk EH, van der Vliet JA. Highprevalence of abdominal aortic aneurysm in a primary care screening
programme. Br J Surg 1998;85:1090–4.43. Kyriakides C, Byrne J, Green S, Hulton NR. Screening of abdominal aortic
aneurysm: a pragmatic approach. Ann R Coll Surg Engl 2000;82:59–63.44. Simoni G, Pastorino C, Perrone R, et al. Screening for abdominal
aortic aneurysms and associated risk factors in a general population.Eur J Vasc Endovasc Surg 1995;10:207–10.
169
j gREVIEW
170
45. Chichester Aneurysm Screening Group, Viborg Aneurysm ScreeningStudy; Western Australian Abdominal Aortic Aneurysm Program;Multicentre Aneurysm Screening Study. A comparative study of theprevalence of abdominal aortic aneurysms in the United Kingdom,Denmark, and Australia. J Med Screen 2001;8:46–50.
46. Pleumeekers HJ, Hoes AW, van der Does E, et al. Aneurysms of theabdominal aorta in older adults. The Rotterdam Study. Am J Epi-demiol 1995;142:1291–9.
47. Singh K, Bonaa KH, Jacobsen BK, Bjork L, Solberg S. Prevalence of andrisk factors for abdominal aortic aneurysms in a population-basedstudy: the Tromso Study. Am J Epidemiol 2001;154:236–44.
48. Salem MK, Rayt HS, Hussey G, et al. Should Asian men be included inabdominal aortic aneurysm screening programmes? Eur J VascEndovasc Surg 2009;38:748–9.
49. Vos T, Flaxman AD, Naghavi M, et al. Years lived with disability (YLDs)for 1160 sequelae of 289 diseases and injuries 1990e2010: a sys-tematic analysis for the Global Burden of Disease Study 2010. Lancet
2012;380:2163–96.50. Murray CJ, Vos T, Lozano R, et al. Disability-adjusted life years (DALYs)
for 291 diseases and injuries in 21 regions, 1990e2010: a systematicanalysis for the Global Burden of Disease Study 2010. Lancet 2012;380:2197–223.
51. Forouzanfar MH, Moran AE, Flaxman AD, et al. Assessing the globalburden of ischemic heart disease, part 2: analytic methods and es-
timates of the global epidemiology of ischemic heart disease in 2010.Glob Heart 2012;7:331–42.
52. Lim SS, Vos T, Flaxman AD, et al. A comparative risk assessment ofburden of disease and injury attributable to 67 risk factors and riskfactor clusters in 21 regions, 1990e2010: a systematic analysisfor the Global Burden of Disease Study 2010. Lancet 2012;380:
2224–60.53. From burden to “best buys”: reducing the economic impact of non-
communicable diseases in low- and middle-income countries. World
Health Organization. Available at: http://www.who.int/nmh/publications/best_buys_summary.pdf. Accessed January 17, 2014.
54. Lindblad B, Borner G, Gottsater A. Factors associated with develop-ment of large abdominal aortic aneurysm in middle-aged men. Eur JVasc Endovasc Surg 2005;30:346–52.
55. Wanhainen A, Bergqvist D, Boman K, Nilsson TK, Rutegard J, Bjorck M.Risk factors associated with abdominal aortic aneurysm: a population-based studywith historical and current data. J Vasc Surg 2005;41:390–6.
56. Iribarren C, Darbinian JA, Go AS, Fireman BH, Lee CD, Grey DP.Traditional and novel risk factors for clinically diagnosed abdominalaortic aneurysm: the Kaiser Multiphasic Health Checkup Cohort
Study. Ann Epidemiol 2007;17:669–78.57. Ambrose JA, Barua RS. The pathophysiology of cigarette smoking and
cardiovascular disease: an update. J Am Coll Cardiol 2004;43:1731–7.58. Napoli C, Ignarro LJ. Nitric oxide and atherosclerosis. Nitric Oxide
2001;5:88–97.59. Morrow JD, Frei B, Longmire AW, et al. Increase in circulating prod-
ucts of lipid peroxidation (F2-isoprostanes) in smokers. Smoking as acause of oxidative damage. N Engl J Med 1995;332:1198–203.
60. Smith CJ, Fischer TH. Particulate and vapor phase constituents ofcigarette mainstream smoke and risk of myocardial infarction.Atherosclerosis 2001;158:257–67.
61. Craig WY, Palomaki GE, Haddow JE. Cigarette smoking and serumlipid and lipoprotein concentrations: an analysis of published data.
BMJ 1989;298:784–8.62. Stefanadis C, Vlachopoulos C, Tsiamis E, et al. Unfavorable effects of
passive smoking on aortic function in men. Ann Intern Med 1998;128:426–34.
63. MacSweeney ST, Young G, Greenhalgh RM, Powell JT. Mechanicalproperties of the aneurysmal aorta. Br J Surg 1992;79:1281–4.
64. Trade foreign policy, diplomacy and health: tobacco. Available at:http://www.who.int/trade/glossary/story089/en/. Accessed January17, 2014.
GLOBAL HEART, VOL. 9, NO. 1, 2014March 2014: 159-170