Intraluminal thrombus and risk of rupture in patient specific abdominal aortic aneurysm – FSI...
10
Intraluminal thrombus and risk of rupture in patient specific abdominal aortic aneurysm – FSI modelling Danny Bluestein a *, Kris Dumont a1 , Matthieu De Beule b2 , John Ricotta c3 , Paul Impellizzeri c4 , Benedict Verhegghe d5 and Pascal Verdonck e6 a Department of Biomedical Engineering, Stony Brook University, Stony Brook, NY, USA; b Laboratory for Research on Structural Models, Department of Structural Engineering, Ghent University, Ghent, Belgium; c Department of Surgery, Stony Brook University Hospital, Stony Brook University, Stony Brook, NY, USA; d Laboratory for Mechanical Construction and Production, Ghent University, Ghent, Belgium; e IBiTech, Institute Biomedical Technology, Ghent University, Ghent, Belgium ( Received 28 June 2007; final version received 31 March 2008 ) Recent numerical studies of abdominal aortic aneurysm (AAA) suggest that intraluminal thrombus (ILT) may reduce the stress loading on the aneurysmal wall. Detailed fluid structure interaction (FSI) in the presence and absence of ILT may help predict AAA rupture risk better. Two patients, with varied AAA geometries and ILT structures, were studied and compared in detail. The patient specific 3D geometries were reconstructed from CT scans, and uncoupled FSI approach was applied. Complex flow trajectories within the AAA lumen indicated a viable mechanism for the formation and growth of the ILT. The resulting magnitude and location of the peak wall stresses was dependent on the shape of the AAA, and the ILT appeared to reduce wall stresses for both patients. Accordingly, the inclusion of ILT in stress analysis of AAA is of importance and would likely increase the accuracy of predicting AAA risk of rupture. Keywords: intraluminal thrombus; abdominal aortic aneurysm; FSI modelling; risk of rupture 1. Background Abdominal aortic aneurysm (AAA) represents a common vascular pathology with possibly fatal implications. AAA is an irreversible dilation, i.e. ballooning, of an artery due to gradual wall weakening. As the aneurysm expands, it may eventually rupture. In the current clinical manage- ment of AAA patients, the maximum transverse dimension of the aneurysm is often used as the primary indicator of potential for rupture. Decisions to repair asymptomatic AAAs are currently based on diameter (5.5 cm) as a sole predictor of rupture, along with consideration of the risks associated with undergoing repair. Accordingly, repair is warranted when the risk of rupture exceeds that of the repair as to justify an elective surgical resection (Raghavan and Vorp 2000; Fillinger et al. 2002). As there exist aneurysms smaller than 5.5 cm that do rupture and larger ones that remain intact, there is a need to more accurately predict risk of rupture based on patient specific parameters other than diameter alone. Because frequent observation and a low threshold for intervention will not prevent all ruptures, further refinement of the ability to predict AAA rupture risk is essential. Current advances in imaging and software facilitate extraction of patient specific 3D data of human anatomy from clinical visualisation modalities that are common- place in the modern clinical practice. These imaging techniques can provide the basis for applying computational fluid dynamic (CFD) and finite elements analyses to patient specific geometries. Recently, such patient based CFDs models were reconstructed from medical images (Vorp et al. 1996a; Di Martino and Vorp 2003; Fillinger et al. 2003; Steinman et al. 2003), currently incorporating fluid structure interaction (FSI) modelling (Wolters et al. 2005; Leung et al. 2006; Papaharilaou et al. 2006), paving the way to use these techniques for diagnosis, surgical planning and follow up. AAA may be filled with intraluminal thrombus (ILT; Mower et al. 1997; Vorp et al. 1998; Schurink et al. 2000; Wang et al. 2002; Di Martino and Vorp 2003; Thubrikar et al. 2003). The effect ILT may have on the risk of rupture is debated. There has been an investigation on the pressure within the aneurysmal thrombus compared to the systemic pressure (Schurink et al. 2000). Results indicated that thrombus within the aneurysm did not reduce the mean and the pulse pressure near the aneurysmal wall, and as such the authors concluded that the thrombus will not reduce the risk of rupture of the aneurysm. Vorp et al. (1996a, 1996b, 2001) indicated that the presence of ILT alters the normal pattern of oxygen supply to the AAA wall. This hypoxic condition may lead to cell dysfunction through expressing extracellular matrix degrading factors, which may further lead to wall weakening and increased potential for rupture (Vorp et al. 1998, 2001; Kazi et al. 2003). However, parametric studies of well-organised thrombus of clearly defined shape (Di Martino and Vorp ISSN 1025-5842 print/ISSN 1476-8259 online q 2009 Taylor & Francis DOI: 10.1080/10255840802176396 http://www.informaworld.com *Corresponding author. Email: [email protected] Computer Methods in Biomechanics and Biomedical Engineering Vol. 12, No. 1, February 2009, 73–81
-
Upload
independent -
Category
Documents
-
view
0 -
download
0
Transcript of Intraluminal thrombus and risk of rupture in patient specific abdominal aortic aneurysm – FSI...

Intraluminal thrombus and risk of rupture in patient specific abdominal aorticaneurysm – FSI modelling
Danny Bluesteina*, Kris Dumonta1, Matthieu De Beuleb2, John Ricottac3, Paul Impellizzeric4, Benedict Verhegghed5 and
Pascal Verdoncke6
aDepartment of Biomedical Engineering, Stony Brook University, Stony Brook, NY, USA; bLaboratory for Research on Structural Models,Department of Structural Engineering, Ghent University, Ghent, Belgium; cDepartment of Surgery, Stony Brook University Hospital,Stony Brook University, Stony Brook, NY, USA; dLaboratory for Mechanical Construction and Production, Ghent University, Ghent,
Belgium; eIBiTech, Institute Biomedical Technology, Ghent University, Ghent, Belgium
(Received 28 June 2007; final version received 31 March 2008 )
Recent numerical studies of abdominal aortic aneurysm (AAA) suggest that intraluminal thrombus (ILT) may reduce thestress loading on the aneurysmal wall. Detailed fluid structure interaction (FSI) in the presence and absence of ILT may helppredict AAA rupture risk better. Two patients, with varied AAA geometries and ILT structures, were studied and comparedin detail. The patient specific 3D geometries were reconstructed from CT scans, and uncoupled FSI approach was applied.Complex flow trajectories within the AAA lumen indicated a viable mechanism for the formation and growth of the ILT.The resulting magnitude and location of the peak wall stresses was dependent on the shape of the AAA, and the ILTappeared to reduce wall stresses for both patients. Accordingly, the inclusion of ILT in stress analysis of AAA is ofimportance and would likely increase the accuracy of predicting AAA risk of rupture.
Keywords: intraluminal thrombus; abdominal aortic aneurysm; FSI modelling; risk of rupture
1. Background
Abdominal aortic aneurysm (AAA) represents a common
vascular pathology with possibly fatal implications. AAA
is an irreversible dilation, i.e. ballooning, of an artery due
to gradual wall weakening. As the aneurysm expands, it
may eventually rupture. In the current clinical manage-
ment of AAA patients, the maximum transverse dimension
of the aneurysm is often used as the primary indicator of
potential for rupture. Decisions to repair asymptomatic
AAAs are currently based on diameter (5.5 cm) as a sole
predictor of rupture, along with consideration of the risks
associated with undergoing repair. Accordingly, repair is
warranted when the risk of rupture exceeds that of the
repair as to justify an elective surgical resection (Raghavan
and Vorp 2000; Fillinger et al. 2002). As there exist
aneurysms smaller than 5.5 cm that do rupture and larger
ones that remain intact, there is a need to more accurately
predict risk of rupture based on patient specific parameters
other than diameter alone. Because frequent observation
and a low threshold for intervention will not prevent all
ruptures, further refinement of the ability to predict AAA
rupture risk is essential.
Current advances in imaging and software facilitate
extraction of patient specific 3D data of human anatomy
from clinical visualisation modalities that are common-
place in the modern clinical practice. These imaging
techniques can provide the basis for applying computational
fluid dynamic (CFD) and finite elements analyses to
patient specific geometries. Recently, such patient based
CFDs models were reconstructed from medical images
(Vorp et al. 1996a; Di Martino and Vorp 2003; Fillinger
et al. 2003; Steinman et al. 2003), currently incorporating
fluid structure interaction (FSI) modelling (Wolters et al.
2005; Leung et al. 2006; Papaharilaou et al. 2006), paving
the way to use these techniques for diagnosis, surgical
planning and follow up.
AAA may be filled with intraluminal thrombus (ILT;Mower et al. 1997; Vorp et al. 1998; Schurink et al. 2000;Wang et al. 2002; Di Martino and Vorp 2003; Thubrikaret al. 2003). The effect ILT may have on the risk of ruptureis debated. There has been an investigation on the pressurewithin the aneurysmal thrombus compared to the systemicpressure (Schurink et al. 2000). Results indicated thatthrombus within the aneurysm did not reduce the meanand the pulse pressure near the aneurysmal wall, and as
such the authors concluded that the thrombus will not
reduce the risk of rupture of the aneurysm. Vorp et al.
(1996a, 1996b, 2001) indicated that the presence of ILT
alters the normal pattern of oxygen supply to the AAA
wall. This hypoxic condition may lead to cell dysfunction
through expressing extracellular matrix degrading factors,
which may further lead to wall weakening and increased
potential for rupture (Vorp et al. 1998, 2001; Kazi et al.
2003). However, parametric studies of well-organised
thrombus of clearly defined shape (Di Martino and Vorp
ISSN 1025-5842 print/ISSN 1476-8259 online
q 2009 Taylor & Francis
DOI: 10.1080/10255840802176396
http://www.informaworld.com
*Corresponding author. Email: [email protected]
Computer Methods in Biomechanics and Biomedical Engineering
Vol. 12, No. 1, February 2009, 73–81

2003) and additional studies (Mower et al. 1997; Di
Martino and Vorp 2003; Thubrikar et al. 2003) indicated
that such thrombus reduces the effect of the pressure load
on the aneurysmal aortic wall. The presence of the
thrombus, the mechanical properties of the thrombus and
the eccentricity of the patient lumen influence the aortic
wall stress distribution (Mower et al. 1997; Wang et al.
2002; Di Martino and Vorp 2003; Thubrikar et al. 2003).
The relatively constant area of ILT over cardiac cycles
indicated the incompressibility and isotropic nature of this
tissue, suggesting a possible ‘mechanical cushioning
effect’ of the ILT (Vorp and Vande Geest 2005).
Thubrikar et al. (2003) found that even though thrombus
allows luminal pressure to transfer to the wall, it prevents
aneurysm rupture by reducing the strain on the wall. Other
experimental studies (Wang et al. 2002), including one
from Vorp’s group (2003), have shown that ILT reduces
peak wall stress, indicating that while the long-term
presence of ILT on rupture is harmful, the immediate
effects are beneficial (Leung et al. 2006).
Recent numerical studies of the AAA wall stress
calculation were based on patient specific image recon-
struction, but assumed uniform pressure inside the AAA
(Fillinger et al. 2002, 2003) and did not account for flow
induced stresses within the AAA, and for the different flow
patterns in the presence of ILT. Recent numerical studies
accounted for the interaction between the blood and the
vessel wall of the AAA (Li and Kleinstreuer 2005a, 2005b,
2005c; Wolters et al. 2005; Leung et al. 2006; Papaharilaou
et al. 2006). In addition, these studies have indicated that a
subset of small aneurysms have an unexpectedly high wall
stresses and are at a higher risk of rupture than would have
been predicted by traditional means.
In this paper, we present a patient specific analysis of
an uncoupled FSI between the fluid flow and the AAA wall
using a fluid solver (Fluent Inc., Lebanon, NH, USA) and a
solid solver (ABAQUS Inc., Providence, RI, USA) to
study the details of the fluid flow and wall mechanics and
to estimate whether the inclusion or exclusion of ILT
increases or decreases the wall stresses within the
anurysmal wall and how this may affect the prediction
of its risk of rupture.
2. Methods
2.1. 3D reconstruction of AAA
Images were reconstructed from patients diagnosed with
AAAs that have been evaluated with abdominal CT
angiograms as part of elective evaluation. These patients
are routinely referred to the Surgery Department, Stony
Brook University Hospital. Informed consent was
obtained retrospectively. The protocol was approved by
Stony Brook University Institutional Review Boards
Committees on Research Involving Human Subjects.
In order to create a numerical mesh for the FEM
analysis, the coordinate points/dimensions of the AAA
were obtained from the abdominal CT administered with
intravenous contrast. The initial imaging study of two
patient specific AAAs was translated into a 3D image
(Figure 1) using Medical Metrix Software (MMS Inc.,
West Lebanon, NH, USA). The 3D geometry of the patient
specific AAA geometry was reconstructed from the image
data using a customised Matlab program to trace the lumen
of the AAA. The vessel wall was assumed to have a
uniform thickness of 2 mm. The volumes were generated
using the CAD software Solidworks (Solidworks Corpor-
ation, Boston, MA, USA). The meshing of the volumes
was generated using Gambit (Fluent Inc.). The final
geometry included both the vessel wall and the ILT
(Figure 2).
2.2. Numerical methods
An uncoupled interaction between the blood flow and the
AAA wall was applied to study, the details of the blood
flow domain and its interaction with the wall mechanics,
using a fluid solver (Fluent Inc.) for the flow domain and a
solid solver (ABAQUS Inc.) for the ILT and wall domains.
For the flow domain, the inlet flow at the proximal aorta
was applied as uniform steady flow of 0.4 m/s, represent-
ing typical physiologic peak flow conditions during the
cardiac cycle. The fluid was assumed laminar and
Newtonian with a density of 1050 kg/m3 and viscosity of
0.004 kg/m per second, representing human blood proper-
ties at 378C.
Figure 1. Patient specific AAA reconstructed from CT scans oftwo patients (posterior view).
D. Bluestein et al.74

The pressure distribution resulting from the flow
calculation was superimposed on a uniform systolic
pressure of 120 mmHg (,16 kPa) and was applied as
boundary conditions for the vessel wall calculation using
ABAQUS. The material for characterising the AAA wall
was assumed to be hyperelastic, isotropic, incompressible
and homogenous, using the constitutive model proposed
by Raghavan and Vorp (2000). The strain–energy
function is given as:
W ¼ aðIB 2 3Þ þ bðIB 2 3Þ2;
where W is the strain–energy density, b is the left
Cauchy–Green tensor and IB is the first invariant of the left
Cauchy–Green tensor B; a and b are the model
parameters indicative of the mechanical properties of
the AAA wall. The model parameters were set to
a ¼ 17.4 N/cm2 and b ¼ 188.1 N/cm2, corresponding to
population mean values obtained from uniaxial loading
tests on excised AAA wall specimens (Raghavan and Vorp
2000). The ILT was modelled as an incompressible,
isotropic, homogenous, linear elastic material with Young
modulus E ¼ 0.11 MPa and Poisson ratio n ¼ 0.45,
representing population mean values obtained from
uniaxial loading tests performed on ILT specimens
harvested during AAA surgery (Di Martino and Vorp
2003; Vorp and Vande Geest 2005). In order to estimate the
effect of ILT inclusion on stress distribution within the
aneurysmal wall, two analyses were carried out for each
patient. One simulation was performed with the 3D
reconstructed ILT included in the geometry, while in the
other simulation the ILT was excluded.
2.2.1. Mesh convergence study
The computational grid, generated from first-order
tetrahedral elements (C3D4) which are compatible with
Fluent’s package finite volume approach, was created with
Gambit. Fluent was then used to create an ABAQUS
input file with first-order elements (C3D4). By means of
an in-house developed mesh converter the mesh was
subsequently converted to one that used second-order
‘modified’ elements (C3D10M). These second-order
elements allow for more accurate stress/displacement
calculations with ABAQUS. Specifically, the elements
used were hybrid type elements, as required for achieving
convergence with the hyperelastic material model used for
the AAA wall properties (ABAQUS 2004).
A mesh convergence study was performed on the AAA
without ILT (first patient). Stress/displacement analyses
with coarser and finer meshes showed negligible error,
when comparing the von Mises stress and total displace-
ment patterns. The resulting mesh that guaranteed mesh
density independence contained 29,558 elements for the
arterial wall.
3. Results
The reconstructed AAA wall and ILT surface that were
used for the numerical simulations are depicted in Figure 2
for each of the two subjects. These figures show the
reconstructed CT images of Figure 1 using the methods
described above. The AAA cases in Figure 2 are shown
using cross-sectioning to reveal the ILT shape (The ILT is
shown in red in Figures 1 and 2, and the lumen in yellow).
The ILT in the first AAA occupied a significant part of the
aneurysm volume. The second AAA ILT mostly occupied
the upper half of the aneurysm.
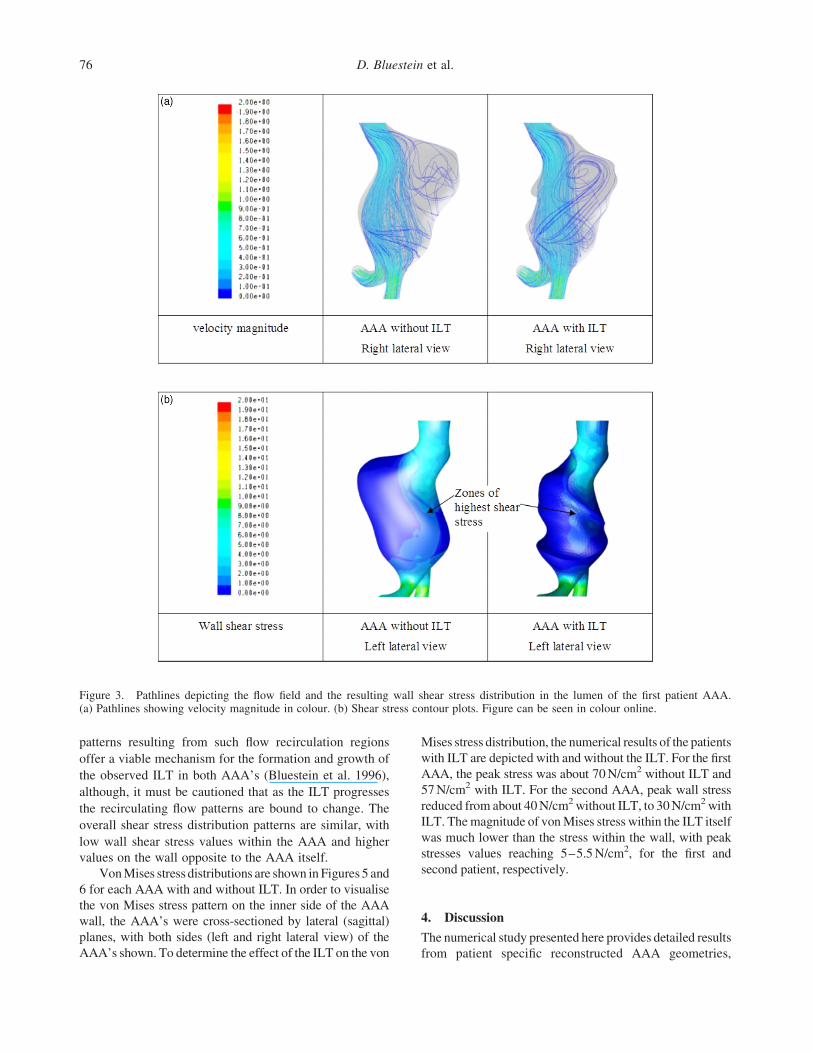
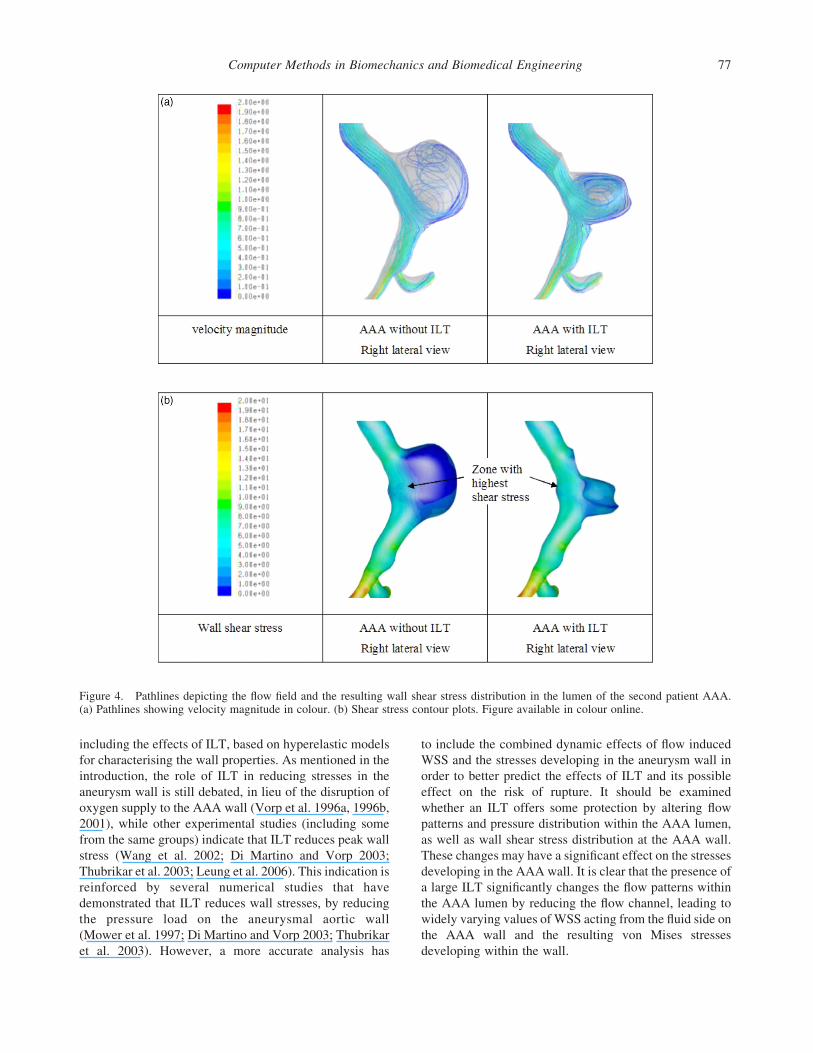
Pathlines and wall shear stresses (WSS) in both AAA
studied are depicted in Figures 3 and 4. Results are shown
in right and/or left lateral views. We have chosen to show
only the views, which depicted relevant differences in the
results within the specific patients for the AAA with and
without ILT. The highest shear stress values were found on
the anterior side of the AAA’s (as indicated in the Figures
3 and 4). Significant differences are noted when comparing
for each patient the case with or without the ILT. Those are
evident in the differing flow patterns (as indicated by the
pathlines) and the wall shear stress distributions with their
apparent different zones of maximal values (as indicated
by arrows in Figures 3 and 4). Significant differences were
also found in the maximal shear stress levels between the
two AAA cases. The shear stress levels on the anterior side
of the AAA was in the range of 10–20 N/m2 for patient 1,
while 70–80 N/m2 for patient 2. In both AAAs, with and
without ILT, a large amount of particles were recirculating
along complex flow trajectories with a long residence time
within the AAA (Figures 3(a) and 4(a)). The deposition
Figure 2. Reconstructed AAA geometry with thrombus in thelumen of the aneurysms used for the numerical simulations(posterior views).
Computer Methods in Biomechanics and Biomedical Engineering 75
patterns resulting from such flow recirculation regions
offer a viable mechanism for the formation and growth of
the observed ILT in both AAA’s (Bluestein et al. 1996),
although, it must be cautioned that as the ILT progresses
the recirculating flow patterns are bound to change. The
overall shear stress distribution patterns are similar, with
low wall shear stress values within the AAA and higher
values on the wall opposite to the AAA itself.
Von Mises stress distributions are shown in Figures 5 and
6 for each AAA with and without ILT. In order to visualise
the von Mises stress pattern on the inner side of the AAA
wall, the AAA’s were cross-sectioned by lateral (sagittal)
planes, with both sides (left and right lateral view) of the
AAA’s shown. To determine the effect of the ILT on the von
Mises stress distribution, the numerical results of the patients
with ILT are depicted with and without the ILT. For the first
AAA, the peak stress was about 70 N/cm2 without ILT and
57 N/cm2 with ILT. For the second AAA, peak wall stress
reduced from about 40 N/cm2 without ILT, to 30 N/cm2 with
ILT. The magnitude of von Mises stress within the ILT itself
was much lower than the stress within the wall, with peak
stresses values reaching 5–5.5 N/cm2, for the first and
second patient, respectively.
4. Discussion
The numerical study presented here provides detailed results
from patient specific reconstructed AAA geometries,
Figure 3. Pathlines depicting the flow field and the resulting wall shear stress distribution in the lumen of the first patient AAA.(a) Pathlines showing velocity magnitude in colour. (b) Shear stress contour plots. Figure can be seen in colour online.
D. Bluestein et al.76
including the effects of ILT, based on hyperelastic models
for characterising the wall properties. As mentioned in the
introduction, the role of ILT in reducing stresses in the
aneurysm wall is still debated, in lieu of the disruption of
oxygen supply to the AAA wall (Vorp et al. 1996a, 1996b,
2001), while other experimental studies (including some
from the same groups) indicate that ILT reduces peak wall
stress (Wang et al. 2002; Di Martino and Vorp 2003;
Thubrikar et al. 2003; Leung et al. 2006). This indication is
reinforced by several numerical studies that have
demonstrated that ILT reduces wall stresses, by reducing
the pressure load on the aneurysmal aortic wall
(Mower et al. 1997; Di Martino and Vorp 2003; Thubrikar
et al. 2003). However, a more accurate analysis has
to include the combined dynamic effects of flow induced
WSS and the stresses developing in the aneurysm wall in
order to better predict the effects of ILT and its possible
effect on the risk of rupture. It should be examined
whether an ILT offers some protection by altering flow
patterns and pressure distribution within the AAA lumen,
as well as wall shear stress distribution at the AAA wall.
These changes may have a significant effect on the stresses
developing in the AAA wall. It is clear that the presence of
a large ILT significantly changes the flow patterns within
the AAA lumen by reducing the flow channel, leading to
widely varying values of WSS acting from the fluid side on
the AAA wall and the resulting von Mises stresses
developing within the wall.
Figure 4. Pathlines depicting the flow field and the resulting wall shear stress distribution in the lumen of the second patient AAA.(a) Pathlines showing velocity magnitude in colour. (b) Shear stress contour plots. Figure available in colour online.
Computer Methods in Biomechanics and Biomedical Engineering 77

It should be noted that it is impossible to have a patient
based AAA in which ILT would not significantly alter
the lumen flow dynamics and the resultant wall stresses.
The rationale of the current study was to compare
an hypothetical clinical scenario (inclusion or exclusion of
the ILT) by demonstrating the role of the altered flow
dynamics due to the presence of ILT and its effect on the
wall stresses distribution and magnitude. The specific
Figure 5. von Mises stress distribution (N/m2) in the wall of the AAA of the first patient AAA. Figure available in colour online.
Figure 6. von Mises stress distribution (N/m2) in the wall of the AAA of the second patient AAA. Figure available in colour online.
D. Bluestein et al.78

question addressed by our study is whether the apparent
change in the lumen geometry with its resultant change in
the flow dynamics, and the potential cushioning effect of
the ILT interface, would serve to increase or reduce the
AAA wall stresses.
Based on the two aneurysms studied, it appears that the
presence of ILT significantly changes the stress distri-
bution patterns and also reduces the peak wall stress
(Figures 5 and 6, AAA without ILT versus AAA with ILT
(ILT not shown)). The numerical simulations of an AAA
with ILT included clearly indicate reduced stresses at the
location of the ILT as compared to the simulation of the
same patient aneurysm without the ILT.
The shape of the first AAA resembles an elongated sac
with a size between 5 and 6.5 cm. The second AAA is
spherical in shape and is much smaller in size, with a
diameter of about 4.3 cm. Comparing the size with the stress
results, it is clear that the size of the AAA remains an
important parameter for the decision making of the surgeon.
The largest AAA also has the largest stresses in the wall.
It should be emphasised, however, that the stress levels are
highly dependent on the geometry of the AAA and thus
patient specific. In this view, numerical simulations of the
wall stress distribution in AAA’s by our decoupled fluid–
structure approach could provide the surgeon additional and
useful information for predicting AAA rupture risk.
The authors are well aware of the fact that the
computed stress distribution is affected by assuming
uniform wall thickness, leading to an increase of the
uncertainty of the results as compared to the correct in vivo
conditions. This assumption is due to the inherent
limitations in the imaging technique and reconstruction.
However, as this approach was applied for both patients,
the value of the comparative results is still valid
(Papaharilaou et al. 2006). Although the analysis was of
patient specific AAA, the inlet velocity for each patient
was not available. Instead, a typical value of peak flow
conditions in AAA was applied for both patients. While
patient specific velocity would have a certain effect on the
results, for a parametric and comparative study such as
presented here keeping the same boundary conditions
for both patients appears to be a valid assumption.
The boundary conditions representing peak systolic flow
and pressure were of steady flow conditions, and a fully
coupled FSI approach with dynamic waveforms may yield
different results, although, those may vary only slightly
during peak systolic conditions when quasi-steady flow
conditions may possibly dominate.
Although the flow patterns and shear stress values in
both AAA studied showed similar flow patterns and shear
stress contours, we found a significant difference in the
wall shear stress values on the anterior side of the AAAs.
We found higher WSS on the anterior side of the AAA in
the patient with the smallest AAA. This could eventually
influence the progression of the disease process and give
an indication of progression of the disease and further
weakening of the AAA wall. The influence of the WSS on
the AAA should be studied in the future, by following up a
number of patients during the progression of the
aneurismal disease and performing the numerical simu-
lations according to this methodology. If the model shows
a correlation between wall shear stress values and
changing size of the AAA, it could help the diagnosis
and follow up of such AAA patients.
The significant difference in von Mises stresses within
the walls of both AAA’s between the two patients (stresses
in the first AAA were almost double the value of the stresses
in the second AAA; Figures 5 and 6), is a clear indication
that the risk of rupture in the first patient was much higher
than that in the second patient. The presence of the ILT
appears to be a stabilising factor for the AAA. A well
orientated ILT, which generates a channel like geometry
with streamlined flow patterns, appears to reduce the stress
in the AAA wall significantly. It should be cautioned that
our analysis did not include species transport (e.g. oxygen)
to the wall, so potential detrimental effects of the presence
of ILT mentioned in the literature could not be verified.
Some recent simulations include fully coupled fluid–
structure interaction of AAA. However, those are very time
consuming and currently are not able to provide results on a
short-term basis for clinical diagnostic purposes. For that
reason, we have applied a decoupled FSI between
commercially available solvers. Using this approach, we
were able to obtain an accurate estimation of the flow
patterns, WSS and von Mises wall stresses on a relatively
short-term basis. The current method is quite efficient
for providing fairly rapid results. The reconstruction of the
FEM volumes based on the patient specific CT-scan data
(MMSInc.) takes about 2–3 h ona moderate PC workstation.
The fluid flow analysis takes about 1 h, while the wall stress
analysis takes about 5 h on a single node of a computational
cluster (The BuMPer cluster; http://bumps.ugent.be/bum-
per). This demonstrates that a dedicated finite element
modelling is a valuable tool for a more accurate diagnosis
and prediction of rupture risk in patient specific AAA.
5. Conclusions
We seek a more accurate prediction of risk for rupture then
the standard diagnostic clinical practice which is based on
diameter (5.5 cm) as a sole predictor for AAA rupture. Our
analysis provides mapping of the actual stress distribution
within the wall, indicating areas of stress concentration that
may be prone to rupture (or their absence). This is achieved
by modelling the vessel wall and its interaction with the
flow patterns generated within a patient specific AAA lumen
in the presence and absence of ILT. A decoupled FSI
approach was applied between commercially available fluid
and solid solvers. While this represents only the peak
Computer Methods in Biomechanics and Biomedical Engineering 79

systolic flow conditions, using this approach, we were able to
obtain an accurate estimation of the flow patterns, WSS and
the resultant von Mises wall stresses distribution within the
AAA wall. A fully coupled dynamic FSI simulation may
yield slightly different results. We have demonstrated that
the inclusion of ILT in the stress analysis of patient specific
AAA is important and would likely increase the accuracy of
predicting AAA rupture. Compared to the current clinical
practice of predicting the risk of rupture by either the
maximal diameter of the AAA, or by a statistic analysis
between rupture risk and aneurysm diameter, the FSI
approach analyses the deformations in the aneurysm wall
and provides a detailed mapping of the ensuing stresses. This
can directly point to specific stress concentration regions,
which may lead to a much better predictor for risk of rupture
of the aneurysm based on the inherent variability among
patients. While we have applied an advanced hyperelastic
model to characterise better the wall mechanics, we
recognise that a diseased wall of AAAs is not necessarily
uniformly hyperelastic and is potentially embedded with
plaques and segments of calcified tissue. We will incorporate
such complexities in our numerical models accordingly, for
the purpose of calculating more accurately wall stress in a
diseased aorta, thereby increasing the predictive value of this
method for AAA risk of rupture. This study is motivated by
the need of helping the clinician to determine whether the
risks involved in an elective surgery to repair the AAA are
outweighed by its risk of rupture. Having this improved
technology in hand will allow decisions whether surgical
repair of the AAA is warranted with a greater degree of
confidence.
Acknowledgements
This work was done during the term of an EstablishedInvestigator Award from the American Heart Association(D.B.) under Grant 0340143N from the National AmericanHeart Association, and by the National Science Foundation underGrant No. 0302275 (D.B.). Written consent was obtained fromthe patients or their relatives for publication of study.
Notes
1. Email: [email protected]. Email: [email protected]. Email: [email protected]. Email: [email protected]. Email: [email protected]. Email: [email protected]
References
ABAQUS, I. 2004. Online documentation: version 6.5-1.,ABAQUS, Inc.
Bluestein D, Niu L, Schoephoerster RT, Dewanjee MK. 1996.Steady flow in an aneurysm model: correlation between fluid
dynamics and blood platelet deposition. J Biomech Eng.118(3):280–286.
Di Martino ES, Vorp DA. 2003. Effect of variation in intraluminalthrombus constitutive properties on abdominal aortic aneurysmwall stress. Ann Biomed Eng. 31(7):804–809.
Fillinger M, Raghavan M, Marra S, Cronenwett J, Kennedy F.2002. In vivo analysis of mechanical wall stress andabdominal aortic aneurysm rupture risk. J Vasc Surg. 36(3):589–597.
Fillinger M, Raghavan M, Marra S, Kennedy F. 2003. Predictionof rupture risk in abdominal aortic aneurysm duringobservation: wall stress versus diameter. J Vasc Surg.37(4):724–732.
Kazi M, 2003. Influence of intraluminal thrombus on structuraland cellular composition of abdominal aortic aneurysm wall.J Vasc Surg. 38(6):1283–1292.
Leung JH, Wright AR, Cheshire N, Crane J, Thom SA,Hughes AD, Xu Y. 2006. Fluid structure interaction ofpatient specific abdominal aortic aneurysms: a comparisonwith solid stress models. Biomed Eng Online. 5:33.
Li Z, Kleinstreuer C. 2005a. A new wall stress equation foraneurysm-rupture prediction. Ann Biomed Eng. 33(2):209–213.
Li Z, Kleinstreuer C. 2005b. Blood flow and structureinteractions in a stented abdominal aortic aneurysm model.Med Eng Phys. 27(5):369–382.
Li Z, Kleinstreuer C. 2005c. Fluid–structure interaction effectson sac-blood pressure and wall stress in a stented aneurysm.J Biomech Eng. 127(4):662–671.
Mower WR, Quinones WJ, Gambhir SS. 1997. Effect ofintraluminal thrombus on abdominal aortic aneurysm wallstress. J Vasc Surg. 26(4):602–608.
Papaharilaou Y, Ekaterinaris JA, Manousaki E, Katsamouris AN.2006. A decoupled fluid structure approach for estimatingwall stress in abdominal aortic aneurysms. J Biomech. 40(2):367–377.
Raghavan ML, Vorp DA. 2000. Toward a biomechanical toolto evaluate rupture potential of abdominal aorticaneurysm: identification of a finite strain constitutivemodel and evaluation of its applicability. J Biomech.33(4):475–482.
Schurink GWH, Van Baalen JM, Visser MJT, Van Bockel JH.2000. Thrombus within an aortic aneurysm does not reducepressure on the aneurysmal wall. J Vasc Surg. 31(3):501–506.
Steinman DA, Milner JS, Norley CJ, Lownie SP, HoldsworthDW. 2003. Image-based computational simulation of flowdynamics in a giant intracranial aneurysm. AJNR Am JNeuroradiol. 24(4):559–566.
Thubrikar MJ, Robicsec F, Labrosse M, Chervenkoff V, FowlerBL. 2003. Effect of thrombus on abdominal aortic aneurysmwall dilation and stress. J Cardiovasc Surg (Torino). 44(1):67–77.
Vorp DA, Vande Geest JP. 2005. Biomechanical determinants ofabdominal aortic aneurysm rupture. Arterioscler ThrombVasc Biol. 25(8):1558–1566.
Vorp DA, Federspiel WJ, Webster MW. 1996a. Does laminatedintraluminal thrombus within abdominal aortic aneurysmcause anoxia of the aortic wall? J Vasc Surg. 23(3):540–541.
Vorp DA, Mandarino WA, Webster MW, Gorcsan J. 1996b.Potential influence of intraluminal thrombus on abdominalaortic aneurysm as assessed by a new non-invasive method.Cardiovasc Surg. 4(6):732–739.
D. Bluestein et al.80

Vorp DA, Wang DHJ, Webster MW, Federspiel WJ. 1998. Effectof intraluminal thrombus thickness and bulge diameter on theoxygen diffusion in abdominal aortic aneurysm. J BiomechEng. 120(5):579–583.
Vorp DA, Lee PC, Wang DHJ, Makaroun MS, Nemoto EM,Ogawa S, Webster MW. 2001. Association of intraluminalthrombus in abdominal aortic aneurysm with local hypoxiaand wall weakening. J Vasc Surg. 34(2):291–299.
Wang DHJ, Makaroun MS, Webster MW, Vorp DA. 2002. Effectof intraluminal thrombus on wall stress in patient-specificmodels of abdominal aortic aneurysm. J Vasc Surg. 36(3):598–604.
Wolters B, Rutten M, Schurink G, Kose U, de Hart J, van deVosse F. 2005. A patient-specific computational model offluid–structure interaction in abdominal aortic aneurysms.Med Eng Phys. 27(10):871–883.
Computer Methods in Biomechanics and Biomedical Engineering 81