Presentación de PowerPoint - Grupo Nutresa
39
A FUTURE TOGETHER Grupo Nutresa S. A. Corporate Presentation
-
Upload
khangminh22 -
Category
Documents
-
view
3 -
download
0
Transcript of Presentación de PowerPoint - Grupo Nutresa

A FUTURE TOGETHERGrupo Nutresa S. A.
Corporate Presentation

PEOPLE 4Q16
37OF SALES
8,7
ONE OF THE LARGEST FOOD COMPANIES IN AMERICA
MARKET CAP OF
2017 EBITDA MARGIN 11,9%
OUTSIDE
COLOMBIA
BRANDS
46,6KEMPLOYEES
12,9KOUTSIDE COLOMBIA
18BRANDS SELL
MORE THAN
50 USD MM
CONSOLIDATED
MARKET SHARE
IN COLOMBIA
60%
DISTRIBUTION
DIVERSIFICATION
PRESENCE
COUNTRIES
MANIFACTURING
PLANTS
COUNTRIES
IN 5 CONTINENTS
PRODUCTS SOLD IN
No single commodity accounts
for more than 11% of COGS
~ 4,3
YEARS OF HISTORY
100
14
46 75
8 BUSINESS UNITS
SCALE
2017 SALES
KNOWLEDGE
CLOSE TO
USD billion
1,1USD billion
%
1,3CLIENTS SERVED
MILLION 13,5KSELLERS
COP trillion
12,8COP trillion
2 X $5,9 = $11,8 COP trillion
EBITDA MARGIN12% - 14%
BUSINESS MODEL PILLARS
2
7X
SUSTAINABILITY
~ 2,9USD billion

3
* T
MLU
C =
Tre
sm
onte
s L
ucchetti
Corporate
Structure

4
USD
1,7 BILLION
INVESTED IN 20SUCCESSFUL ACQUISITIONS
Costa
Ric
a
Colo
mb
ia
Colo
mb
ia
Colo
mb
ia
Pu
ert
o R
ico
Chile
Costa
Ric
a
Pa
na
ma
Colo
mb
ia
Me
xic
o
Pa
na
ma
Pa
na
ma
&
Nic
ara
gu
a
Colo
mb
ia
Colo
mb
ia
Colo
mb
ia
Colo
mb
ia
Costa
Ric
a
Costa
Ric
a
Pe
ru
Pa
na
ma
US
A
Dom
inic
an
Rep
ub
lic
Ma
laysia
Biscuits
Nestlé
2000 2002 2004 2005 2006 2007 2008 2009 2010 2011 2012 2013 2014
Ma
laysia
Colo
mb
ia
Chocolates
Nestlé
2015
Significant Expansion
since 2000
2016
Colo
mb
ia
Acquisitions (20) Mergers (5) New Businesses (3) Joint Ventures (3)

INTERNATIONAL
36,8%
5
USA
8,2%
DOMINICAN REP.& CARIBBEAN
1,8%
CHILE
8,1%
VENEZUELA
0%
MEXICO
3,6%
CENTRAL AMERICA
9,5%
COLOMBIA
63,2%
ECUADOR
1,4%
PERU2,3%
63,2%COLOMBIA
OTHER COUNTRIES1,9%
Sales by region 2017

Market shareColombia + TMLUC
Consolidated market share in Colombia: 59,8%
Biscuits Chocolates CoffeeCold Cuts
#2 Private labels 7,1% #2 Nestlé 11,8%#3 Mondelez 10,3%
#2 La Muñeca 31,7%(A) #2 Ferrero 8,6%(B) #2 Casa Lúker 25,3%(C) #1 Nestlé 71,1%(D) Frito Lay 25,4%
(A) #2 Águila Roja 26,3%(B) #1 Nestlé 44,2%
TMLUC
(A) #2 Carozzi 36,1%(B) #1 Carozzi 41,2%(C) #1 Nestlé 68,9%(D) #1 Frito Lay 56,4%(E) #1 Mondelez 56,4%
*ICB= Instant Cold BeveragesSource: Nielsen twelve month as of November 2017. ** Nielsen market share measurement methodology was updated, thus numbers for previous year can be different from those reported as of 4Q 2016(% share as in value and change vs. same period last year)
Ice Cream Pasta
6
Chocolate confectionery
69,4% (A)
+0,9%
Hot chocolate63,6% (B)
+0,2%
Milk modifiers23,6% (C)
-0,7%
Nuts55,0%
-1,0% (D)
Roast and ground
coffee (A)
51,3%-2,0%
Soluble coffee (B)
40,1%-1,1%
ICB*62,6% (A)
-1,5%
Pastas
27,6% (B)-0,8%
Coffee
18,1% (C)+1,2%
Potato Chips
15,6% (D)+1,9%
México ICB*
32,0% (E)-0,2%
ICE CREAM
ND 51,3%-0.4%
Retail Food
# 1 in Hamburguers
and Steakhouses categories in
Colombia
# 1 in Ice cream shops –Rep. Dom. &
CR
72.2%-1,3%
53,8%-1,3%
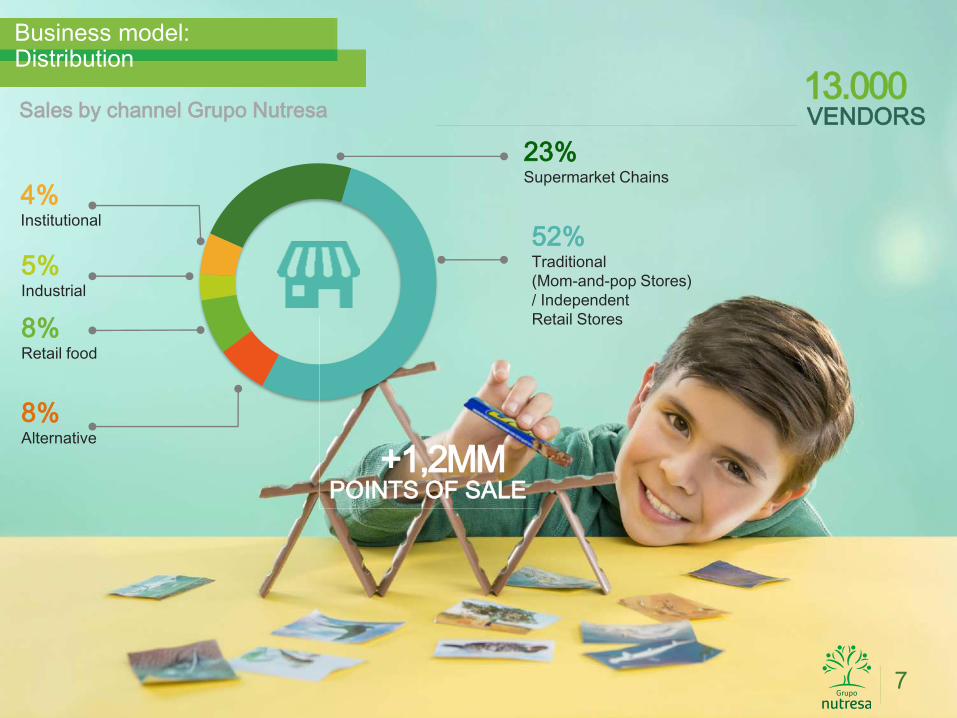
23%Supermarket Chains
8%Alternative
52%Traditional
(Mom-and-pop Stores)
/ Independent
Retail Stores
13.000VENDORSSales by channel Grupo Nutresa
8%Retail food
5%Industrial
7
4% Institutional
+1,2MMPOINTS OF SALE
Business model:Distribution

* TMLUC : Tresmontes Lucchetti
INTERNATIONAL SALES
BY BUSINESS UNIT
EBITDA BY
BUSINESS UNIT
TOTAL SALES BY
BUSINESS UNIT
12,0%11,9%
38% OF TOTAL SALES
38%
PASTA
ICE CREAM
COLD CUTS
BISCUITS
COFFEE
TMLUC*
CHOCOLATES
RETAIL FOOD
$8.696$8.676
$1.028$1.044
$1,084USD mm
8
COP mm 2017COP mm 2016
+0,2%
+1,5%
21%
20%
17%12%
11%
8%
5%
3%
-5,7%**
(Since October 2016, investments in Venezuela are accounted for as financial instruments)
21%
20%
20%
12%
12%
8%
4%
3%
31%
28%17%
13%
6%
5%
2017Sales by Business Units
**Including Venezuela 2016
USD -0,3%
COP -3,4%

Our Target Strategy• Current or new categories with a promising strategic fit
• Acquisition processes respectful of existing culture and people
• We prefer control
• Excellent management teams
• Leader brands
• High value added and differentiated products
• Solid and sustainable business models – No turnarounds.
• Go to market/distribution
• Highly innovative companies
• Preference for businesses with a sound strategy towards healthy
and nutritional products
Strategic Region
9
Health and NutritionSupport the growth of our healthy and nutritional products
portfolio with acquisitions:
• "Good for you" products, veggies, supplements, natural juices
and nectars, nuts, oats, soy products, dried fruits, aromatics,
sugar free, fat free reduced sugar/fats/salt , cereals & grains,
enriched or functional products, healthy claim products.
Interested +
Interested
Not interested
Not interested –
not in our region
SOUTHEAST
ASIA
M&A strategy

STRATEGY FOR OUR FIRST CENTURY 1920-2020
Our Centennial strategy aims to double our 2013 sales by 2020; with sustained profitability between 12% and 14% of the EBITDA margin. To achieve this, we offer our consumers foods and experiences of recognized and beloved brands, that nourish, generate wellness and pleasure, that are distinguished by the best price/value relation; widely available in our strategic region, managed by talented, innovative, committed and responsible people, who contribute to sustainable development
10
2x $5,9 = $11,8 COP trillion8% CAGR
“
“
Double 2013 sales
Main strategic goal

Commercial Risk
AggressiveFinancial and Operating Risks
ModerateReputation Risk
None
Main Risks Mitigating Factors
Volatility in prices of raw
materials
• Hedging policies, with levels of risk clearly defined and administered by a
specialized committee
• A highly trained team dedicated to monitoring and negotiating supplies and the
exchange rate
• Permanent search for new opportunities and schemes for efficient, competitive
global sourcing of raw materials
Involvement of business
due to a highly
competitive environment
• Significant distribution capabilities with a differentiated strategy to address
different segments
• Commercial management supported by the deep, integrated understanding of
the market
• Attractive proposals with a good price/value relation
• Recognized, beloved brands
• Portfolio innovation and differentiation
• Search for entry into new markets
Regulations in nutrition
and health matters in the
countries where Grupo
Nutresa is present
• Vidarium: Nutrition Research Center
• Active participation with governments to discuss regulations
• Monitoring and strict compliance of the regulations of each country
• Innovation to develop new products and improve existing ones
• Support for and participation in programs that promote healthy living
• Responsible management of marketing and advertising
11
Business risk

Board of Directors
FINANCE, AUDIT AND
RISK COMMITTEE
APPOINTMENT AND COMPENSATION COMMITTEE
CORPORATE GOVERNANCE AND
BOARD ISSUES COMMITTEE
STRATEGIC PLANNING AND
SUSTAINABILITY COMMITTEE
Independent Members Non - Independent Members
1 2 3 5
2 5 711
2 3
12
1 7
52
Antonio Mario Celia Martínez – Aparicio
Mauricio Reina Echeverri
Jaime Alberto Palacio Botero
Cipriano López González
1
2
3
4
4
CorporateGovernance
1
2
3
5 6
7
4
5
6
7
David Emilio Bojanini García
Gonzalo Alberto Pérez Rojas
María Clara Aristizábal Restrepo

460.123.458Ordinary shares listed in Colombia | ADR level 1TickerBVC: NUTRESAADR: GCHOY
Foreign Investors
13
Shareholder base
35,1%
9,8%8,3%
16,9%
29,9% +11,9 K SHAREHOLDERSOther
Other funds

Annexes
19

20
Our People
Human talent is one of our most
valuable assets. Our corporate
culture thrives on promoting a
participatory environment in
which skill development,
recognition and work/life
balance are top priorities toward
building a leadership brand.
Our Brands
Our brands are leaders in the
markets in which we do
business. They are recognized,
loved and seen as an integral
part of people's everyday lives.
Our brands are based on
nutritious, reliable products with
an excellent price/value ratio.
Our DistributionNetwork
An extensive network
supported by exclusive
distribution channels,
segments, and specialized
attention teams, allows us to
establish close client
relationships by having
products available at all times.
Excellence Level
Organizational Climate Score 18 BrandsWith sales of more than
USD 50 million
+ 1,3 millionPoints of Sale
Differenciating aspectsof our business model

Our people
Human – Talent ManagementMerco Talento confirmed Grupo
Nutresa as the second best Company
to work in Colombia and the most
attractive of the food industry in
Colombia.
THE FAMILY FRIENDLY COMPANY
CERTIFICATION
In Colombia
33,7K
Total
46,6K
Abroad
12,9K
83,4%Organizational climate
21
Human talent is one of our most valuable assets. Our
cultural
platform is supported by promoting participation
environments, developing skills of being and doing,
awarding
the people and building a brand of leadership, as well as a
balanced life for the people.
Business model:People

22
Biscuits
Chocolates
Cold Cuts
Coffee
TMLUC
Ice Cream
Pasta
Retail Food
Business model:Brands

Portfolio of
18 brands
22 brands
44 brands
28
selling over
USD$50 MM
market share in key markets
with #1
with over years of existence 20
present in more
than one marketbrands
23
Business model:Brands

Vision
• Market expansion in the strategic
region – diversification of
destinations
• Long–term objectives
• Autonomy and strategic coherence
Internationalization strategies
• Our own international distribution
• Creation of the brand
• Acquisitions–productive platforms
Our own model -
Developed in house
Consistency in implementationPersistence in the face of difficulties
Humility and a learning attitude Suitable teams
Human quality and basic competencies
Skill-specific people development
24
International expansionmodel

Exportablesurpluses
First steps
Sales bydistributors
Knowledgeof new markets
Lack of knowledge of the markets
Trainingqualified teams
By orderContinuous, more
profitable operation
Marginal profitability
Temporary alliances Value creation
Definion of the strategicregion based on“competitiveness”
Acquisitions inthe strategic region
Creation of Cordialsas Free – tradeagreements
Our exclusivedistribution
Companies withbrands and distribution
Brand developmentVehicle to exchange
platforms
Knowledgeof consumers
Synergies
Value networks
Appropriate portfolio Talent / cultures
Talent / cultures Value creation
PartnershipOur OwnDistribution
ProductivePlatformExports
25
Internationalphases

26
Corporate philosophyand performance

El Reconocimiento Emisores – IR otorgado por la Bolsa de Valores de Colombia S.A.
no es una certificación sobre la bondad de los valores inscritos ni sobre la solvencia del
emisor
27
7X
4X
Sustainablegrowth

30
Multiples as of December2017
10,0
14,2
10,2 10,1
12,6
16,7
12,9 12,0 12,1 12,5
9,8 10,0 9,9
17,0
20,3
14,713,1
18,1
23,8
18,5 18,016,5 17,3
13,4 14,0 14,1
0
5
10
15
20
25
2005 2006 2007 2008 2009 2010 2011 2012 2013 2014 2015 2016 2017
EV/EBITDA
EV/EBITDA Alimentos - food EV/EBITDA Total
FIGURES IN COP$ MM
(1) Calculated over total shareholder equity
(2) Food companies / 12 months
(3) Last 12 months
Indicators - as of December 31, 2017
Closing price 27.820 Dividend Yield (3) 2,1%
Closing price 12 months prior 24.900 Share Price Return (3) 11,7%
Max. 52 weeks 28.000 Total Return (3) 14,0%
Min. 52 weeks 23.120 Change in COLCAP (3) 12,0%
Market Cap. (COPMM) 12.800.635
Return on Equity (2) 8,2%
Intrinsic value (1) 19.452 Return on Invested Capital (2) 8,4%
P/E Ratio (2) 23,2
P/BV (2) 1,8 Outstanding Shares 460.123.458
EV / EBITDA (2) 10,6 Number of Shareholders 11.900
Earnings per Share (3) 913 Bursatility High
Dividend per share-month 44,5

Consolidated net debt2017
31* IFRS
399
1.5811.752
2.8082.906
2.596
0
500
1.000
1.500
2.000
2.500
3.000
3.500
Dic-12 Dic-13 Dic-14* Dic-15* Dic-16* Dic-17*
CO
P B
ILLI
ON
Net debt
Dic-12 Dic-13 Dic-14* Dic-15* Dic-16* Dic-17*
Net debt 399 1.581 1.752 2.808 2.906 2.596
Net debt / EBITDA 0,59 1,90 2,10 2,88 2,82 2,49
EBITDA / Interest 12,74 10,38 5,83 4,70 3,52 3,79
Interest / Sales 0,99% 1,36% 2,21% 2,61% 3,37% 3,17%

Raw materials
GRUPO NUTRESA
COMMODITIES INDEX
33
38,7%
14,7%10,7%
7,3%
7,0%
4,8%
4,8%
4,2%
4,0%
1,7%
2,1%
COGS BREAKDOWN (2017)
Packaging mat.Coffee
Pork
Wheat
Cocoa
Sugar
Oils & fats
Beef
Milk
Other
Poultry
The basket of raw materials included in the GNCI was updated as o f January 1st, 2017. The technical specifications of the GNCI may be obtained at:http://www.gruponutresa.com/inversionistas/resultados-y-publicaciones/resultados-trimestrales/?lang=en#2017-4
92
86
107
144
113
95
112
87
87
86
74
89
104
119
134
149
164
2008 2009 2010 2011 2012 2013 2014 2015 2016 2017
ICGN - MERCADO
This presentation and further detailed
information can be found in the following link in
our section "Grupo Nutresa Valuation Kit":
http://www.gruponutresa.com/es/content/grupo-
nutresa-valuation-kit-gnvk
Catherine ChaconInvestor Relations Director
Tel: (+574) 3258731
email: [email protected]
www.gruponutresa.com
For more information regarding Grupo Nutresa´s level 1ADR, please call
The Bank of New York Mellon marketing desk
NEW YORK
BNYM – Latin America
Gloria Mata
Telephone 212 815 5822
BNYM – Sell-Side
Kristen Resch
Telephone 212 815 2213
BNYM – Buy-Side
Angelo Fazio
Telephone 212 815 2892
BNYM – Sell-Side/Buy-Side
Mark Lewis
Telephone 44 207 964 6415
NEW YORK NEW YORK LONDON
35
Contact details

This document can contain forward looking statements related to Grupo Nutresa
S.A. and its subordinated companies, under assumptions and estimations made
by company management. For better illustration and decision making purposes
Grupo Nutresa’s figures are consolidated; for this reason they can differ from the
ones presented to official entities. Grupo Nutresa S.A. does not assume any
obligation to update or correct the information contained in this document.
“The Issuers Recognition – IR granted by the Colombian Stock Exchange is not a certification about thequality of the securities listed at the BVC nor the solvency of the issuer”
36
Disclaimer

4Q17 RESULTS

SALES PERBUSINESS UNIT
4Q - 2017
Colombia salesCOP 1.449,4 mm +0,7%Cop billion
38
International SalesUSD 286,2 mm +5,5%
COP 854,8 +4,5%Cop billion
4Q17 Sales
Colombia and international
Percentage variation in
volume (Q) and prices (P)
% chg. YoY Million dollars
% chg. YoY Billion pesos
Retail Food
Cold cuts Biscuits Chocolates Coffee
Cold Cuts Biscuits Chocolates CoffeeTMLUC
RetailFood
PastaIce cream
* Variation doesn’t include
Retail Food
456,9
232,4 227,5
150,6 133,0106,9
72,5
050
100150200250300350400450500
CO
P B
ILL
ION
17,4
81,0
58,1
80,8
30,6
18,1
0
10
20
30
40
50
60
70
80
90
US
D M
ILLIO
N
-3,6%
-1,7%
+1,2%+5,0%
-0,9%
Q: -2,0P: +1,9*
-1,2%
+6,3%
+14,7%
+0,8%
+9,6%
Q:-3,1
P:-0,6
Q:-3,8
P:+2,7
Q:+0,8
P:-2,5
Q:-0,9
P:+2,1
-10,4%
Q:+0,9
P:+4,1
Q:-2,9
P:+2,0
+9,7%
+31,4%

COP 2.304,2 +2,1%
39
Total
4Q17 Sales
% chg. YoY
Billion pesos
SALES PERBUSINESS UNIT
4Q - 2017
TOTAL SALES
Cold cuts Biscuits Chocolates CoffeeTMLUC PastaRetailFood
Ice cream
Billion pesos
508,9 474,3
400,9
241,3 242,0
187,1
106,9 73,0
0
100
200
300
400
500
600
CO
P B
ILL
ION
+2,0%
+4,4%
+5,0%
-0,2% -3,9%
-0,4%
+9,4%
-1,0 %

SALES PERBUSINESS UNIT
2017
Colombia salesCOP 5.495,4 mm +2,5%Cop billion
40
International SalesEx-Venezuela 2016
USD 1.083,9 mm +5,7%
COP 3.200,2 +2,4%Cop billion
Accumulated sales
Colombia and international
Percentage variation in
volume (Q) and prices (P)
% chg. YoY Million dollars
% chg. YoY Billion pesos
Retail Food
Cold cuts Biscuits Chocolates Coffee
Cold Cuts Biscuits Chocolates CoffeeTMLUC
RetailFood
PastaIce cream
* Variation doesn’t include
Retail Food
(Since October 2016, investments in
Venezuela are accounted as financial
instruments)
• Ex-Venezuela 2016
Including Venezuela 2016
USD -0,3%
COP -3,4%
1.660,2
877,0 919,4
594,2484,6 423,5
292,7
0200400600800
1.0001.2001.4001.6001.800
CO
P B
ILL
ION
55,5
301,9
184,1
331,5
138,2
71,9
0
50
100
150
200
250
300
350
US
D M
ILLIO
N
-1,1%
+3,2%
+4,5%
-3,0%+2,3%
Q: -2,6P: +4,6*
+2,6%
+4,3%
+5,6%
+3,0%
+4,0%
Q:-2,8
P:+1,8
Q: -3,8
P:+6,6
Q:-1,3
P:+4,6
Q:+3,8
P: +0,7
+9,3%
Q:-8,9
P: +6,6
Q:+1,5
P: +0,8
+8,7%
+34,5%*

1.824,2 1.768,4
1.463,7
978,2 1.002,0
697,0
423,5
293,6
0
200
400
600
800
1.000
1.200
1.400
1.600
1.800
2.000C
OP
BIL
LIO
N
Ex-Venezuela 2016
COP 8.695,6 +2,4%
41
Total
Accumulated sales
% chg. YoY
Billion pesos
SALES PERBUSINESS UNIT
2017
TOTAL SALES
Cold cuts Biscuits Chocolates CoffeeTMLUC PastaRetailFood
Ice cream
Billion pesos
Including Venezuela 2016: +0,2%
• Ex-Venezuela 2016
+1,8%
+3,0%
-3,0%
-0,3% +4,8%
+2,4%
+6,1%
+1,1%*

EBITDA
4Q17
EBITDA
COP 244,0 +6,7%Billion pesos
MARGIN 10,6%
42
Convention:
Cold cuts Biscuits Chocolates CoffeeTMLUC PastaRetail Food
Ice cream
51,6
56,3 53,3
27,0
19,1 21,7
10,7
5,3
0
10
20
30
40
50
60
CO
P B
ILL
ION
13,3%
+44,3%
11,6%
-17,1%
10,1%
+5,1%
11,9%
+10,8%
11,2%
+25,9%
10,0%
-4,0%
7,9%
-31,5%
7,3%
-8,5%

EBITDA
Full year 2017
EBITDA
Ex-Venezuela 2016
COP 1.044,2 +3,9%Billion pesos
MARGIN 12,0%
43
Convention:
Cold cuts Biscuits Chocolates CoffeeTMLUC PastaRetail Food
Ice cream
Including Venezuela
2016: 1,5%
• Ex-Venezuela 2016
209,5 220,4
206,5
126,9 120,8
86,2
42,3 29,1
0
50
100
150
200
250
CO
P M
ILE
S D
E M
ILL
ON
ES
14,1%
+40,8%
12,4%
-8,5%
11,5%
-4,6%*
12,5%+4,6%
13,0%
+31,9%
10,0%
-20,7%
12,1%
-22,1%
9,9%
+11,5%

Comprehensive
Income statement 4Q17
44For further details please check the notes of the financial statements on the following link:http://www.gruponutresa.com/inversionistas/resultados-y-publicaciones/resultados-trimestrales/?lang=en#2017-4
2017 - 4Q % Revenues 2016 - 4Q % Revenues % Var.
Continuing operations
Operating revenue 2.304.195 2.257.345 2,1%
Cost of goods sold (1.286.481) -55,8% (1.286.878) -57,0% 0,0%
Gross profit 1.017.714 44,2% 970.467 43,0% 4,9%
Administrative expenses (106.797) -4,6% (107.211) -4,7% -0,4%
Sales expenses (706.711) -30,7% (659.603) -29,2% 7,1%
Production expenses (37.668) -1,6% (40.685) -1,8% -7,4%
Exchange differences on operating assets and liabilit ies (1.075) 0,0% (1.065) 0,0% 0,9%
Other operating expenses, net 3.560 0,2% 4.708 0,2% -24,4%
Operating profit 169.023 7,3% 166.611 7,4% 1,4%
Financial income 3.661 0,2% 3.274 0,1% 11,8%
Financial expenses (67.764) -2,9% (85.987) -3,8% -21,2%
Portfolio dividends 65 0,0% 51 0,0% 27,5%
Exchange differences on non-operating assets and liabilit ies (5.867) -0,3% 26 0,0% N/A
Share of profit of associates and joint ventures 5.853 0,3% 3.949 0,2% 48,2%
Other income (expenses), net (23) 0,0% 28.492 1,3% -100,1%
Income before tax and non-controlling interest 104.948 4,6% 116.416 5,2% -9,9%
Current income tax (25.079) -1,1% (37.143) -1,6% -32,5%
Deferred income tax 17.240 0,7% 5.954 0,3% 189,6%
Profit after taxes from continuous operations 97.109 4,2% 85.227 3,8% 13,9%
Discontinued operations, after income tax 105 0,0% (1.652) -0,1% -106,4%
Net profit for the period 97.214 4,2% 83.575 3,7% 16,3%
Non-controlling interest 1.265 0,1% 918 0,0% 37,8%
Profit for the period attributable to controlling interest 95.949 4,2% 82.657 3,7% 16,1%
EBITDA 243.961 10,6% 228.625 10,1% 6,7%

Comprehensive Income
Full year 2017
45For further details please check the notes of the financial statements on the following link:http://www.gruponutresa.com/inversionistas/resultados-y-publicaciones/resultados-trimestrales/?lang=en#2017-4
2017 % Revenues 2017 % Revenues % Var.
Continuing operations
Operating revenue 8.695.604 8.676.640 0,2%
Cost of goods sold (4.855.635) -55,8% (4.966.031) -57,2% -2,2%
Gross profit 3.839.969 44,2% 3.710.609 42,8% 3,5%
Administrative expenses (399.846) -4,6% (401.100) -4,6% -0,3%
Sales expenses (2.551.874) -29,3% (2.384.866) -27,5% 7,0%
Production expenses (139.088) -1,6% (147.694) -1,7% -5,8%
Exchange differences on operating assets and liabilit ies 255 0,0% 15.873 0,2% -98,4%
Other operating expenses, net 25.109 0,3% 22.149 0,3% 13,4%
Operating profit 774.525 8,9% 814.971 9,4% -5,0%
Financial income 13.941 0,2% 10.982 0,1% 26,9%
Financial expenses (307.548) -3,5% (324.637) -3,7% -5,3%
Portfolio dividends 54.386 0,6% 50.545 0,6% 7,6%
Exchange differences on non-operating assets and liabilit ies (21.401) -0,2% (8.642) -0,1% 147,6%
Loss on net monetary posit ion - 0,0% (32.946) -0,4% -100,0%
Share of profit of associates and joint ventures 5.994 0,1% 6.103 0,1% -1,8%
Other income 3.290 0,0% 28.492 0,3% -88,5%
Income before tax and non-controlling interest 523.187 6,0% 544.868 6,3% -4,0%
Current income tax (144.956) -1,7% (172.866) -2,0% -16,1%
Deferred income tax 47.179 0,5% 29.533 0,3% 59,8%
Profit after taxes from continuous operations 425.410 4,9% 401.535 4,6% 5,9%
Discontinued operations, after income tax (1.070) 0,0% (1.844) 0,0% -42,0%
Net profit for the period 424.340 4,9% 399.691 4,6% 6,2%
Non-controlling interest 4.133 0,0% 3.957 0,0% 4,4%
Profit for the period attributable to controlling interest 420.207 4,8% 395.734 4,6% 6,2%
EBITDA 1.044.179 12,0% 1.028.953 11,9% 1,5%

Statement of FinancialPosition 2017
46
For further details please check the notes of the financial statements on the following link:http://www.gruponutresa.com/inversionistas/resultados-y-publicaciones/resultados-trimestrales/?lang=en#2017-4
December 2017 December 2016 % Var.
ASSETS
Current assets
Cash and cash equivalents 435.643 219.322 98,6%
Trade and other receivables 957.568 889.197 7,7%
Inventories 982.816 1.028.417 -4,4%
Biological assets 81.518 75.677 7,7%
Other current assets 221.475 246.832 -10,3%
Non-current assets held for sale 6.557 100.330 -93,5%
Total current assets 2.685.577 2.559.775 4,9%
Non-current assets
Trade and other receivables 26.509 23.495 12,8%
Investments in associated and joint ventures 180.451 164.510 9,7%
Other f inancial non-current assets 4.133.963 3.885.206 6,4%
Property, plant and equipment, net 3.395.671 3.390.946 0,1%
Investment properties 72.306 71.842 0,6%
Goodwill 2.118.226 2.034.454 4,1%
Other intangible assets 1.181.350 1.163.671 1,5%
Deferred tax assets 415.072 356.994 16,3%
Other non-current assets 100.352 48.661 106,2%
Total non-current assets 11.623.900 11.139.779 4,3%
TOTAL ASSETS 14.309.477 13.699.554 4,5%

47
For further details please check the notes of the financial statements on the following link:http://www.gruponutresa.com/inversionistas/resultados-y-publicaciones/resultados-trimestrales/?lang=en#2017-4
Statement of FinancialPosition 2017
December 2017 December 2016 % Var.
LIABILITIES
Current liabilities
Financial obligations 557.133 847.689 -34,3%
Trade and other payables 993.241 888.840 11,7%
Tax charges 207.776 163.362 27,2%
Employee benefits liabilit ies 172.730 161.592 6,9%
Current provisions 9.820 2.734 N/A
Other current liabilit ies 14.261 49.746 -71,3%
Total current liabilities 1.954.961 2.113.963 -7,5%
Non-current liabilities
Financial obligations 2.474.077 2.277.429 8,6%
Trade and other payables 158 158 0,0%
Employee benefits liabilit ies 226.574 216.744 4,5%
Deferred tax liabilit ies 702.967 705.700 -0,4%
Other non-current liabilit ies 559 600 -6,8%
Total non-current liabilities 3.404.335 3.200.631 6,4%
TOTAL LIABILITIES 5.359.296 5.314.594 0,8%
SHAREHOLDER EQUITY
Equity attributable to the controlling interest 8.907.656 8.346.719 6,7%
Non-controlling interest 42.525 38.241 11,2%
TOTAL SHAREHOLDER EQUITY 8.950.181 8.384.960 6,7%
TOTAL LIABILITIES AND EQUITY 14.309.477 13.699.554 4,5%

Disclaimer
This document can contain forward looking statements related to Grupo Nutresa
S.A. and its subordinated companies, under assumptions and estimations made
by company management. For better illustration and decision making purposes
Grupo Nutresa’s figures are consolidated; for this reason they can differ from the
ones presented to official entities. Grupo Nutresa S.A. does not assume any
obligation to update or correct the information contained in this document.
“The IR Recognition granted by Bolsa de Valores de Colombia S.A. (the Colombian Securities Exchange) is not a
certification of the registered securities or the solvency of the issuer.”
51