Preliminary Economic Assessment for the Springpole Gold ...
236
Preliminary Economic Assessment for the Springpole Gold Project, Ontario, Canada Report Prepared for Report Prepared by SRK Consulting (Canada) Inc. 2CG026.000 Effective Date: March 25, 2013 Amended: October 7, 2016
-
Upload
khangminh22 -
Category
Documents
-
view
1 -
download
0
Transcript of Preliminary Economic Assessment for the Springpole Gold ...
Preliminary Economic Assessment for the Springpole Gold Project, Ontario, Canada
Report Prepared for
Report Prepared by
SRK Consulting (Canada) Inc.
2CG026.000
Effective Date: March 25, 2013
Amended: October 7, 2016
2CG026.000 – Gold Canyon Resources Inc. Preliminary Economic Assessment for the Springpole Gold Project, Canada Page i
AD/NW 2CG026 000_Springpole_PEA_TechnicalReport_20161014_FNL October 7, 2016
Preliminary Economic Assessment for the Springpole Gold Project, Ontario, Canada
Prepared for: Prepared by:
Gold Canyon Resources Inc. Suite 810–609 Granville Street P.O. Box 10356, Pacific Centre Vancouver, BC V7Y 1G5 Canada
SRK Consulting (Canada) Inc. 2200–1066 West Hastings Street Vancouver, BC V6E 3X2 Canada
Tel: +1 604 682 3234 Tel 2: +1 888 242 3234 Fax: +1 604 682 0537 Web: www.goldcanyon.ca Email: [email protected]
Tel: +1 604 681 4196 Web: www.srk.com
SRK Project Number: 2CG026.000
Effective date: March 25, 2013 Signature date: October 7, 2016
Authored by:
Dr. Gilles Arseneau, PGeo Associate Consultant (Geology) Dr. Adrian Dance, PEng Principal Consultant (Metallurgy) John Duncan, PEng Principal Consultant (Water Resources Engineering) Chris Elliott, FAusIMM Principal Consultant (Mining) Mark Liskowich, PGeo Principal Consultant (Environmental)
Bruce Murphy, FSAIMM Principal Consultant (Geotechnical) Michael Royle, PGeo Principal Consultant (Hydrogeology) Dr. Maritz Rykaart, PEng Principal Consultant (Geotechnical Engineering) Dino Pilotto, PEng Principal Consultant (Mining)
Peer Reviewed by:
Neil Winkelmann, FAusIMM Principal Consultant (Mining)
Acknowledgement: SRK would like to acknowledge the support and collaboration provided by Gold Canyon personnel. Their collaboration was greatly appreciated and instrumental to the success of this report. Cover: Springpole camp March 2013 (source: The Northern Sun News)

2CG026.000 – Gold Canyon Resources Inc. Preliminary Economic Assessment for the Springpole Gold Project, Canada Page ii
AD/NW 2CG026 000_Springpole_PEA_TechnicalReport_20161014_FNL October 7, 2016
Disclaimer This report was prepared as a National Instrument 43-101Technical Report for Gold Canyon
Resources Inc. (Gold Canyon) by SRK Consulting (Canada) Inc. (SRK). The quality of information,
conclusions, and estimates contained herein is consistent with the level of effort involved in SRK’s
services, based on: (i) information available at the time of preparation, (ii) data supplied by outside
sources, and (iii) the assumptions, conditions, and qualifications set forth in this report. This report is
intended for use by Gold Canyon subject to the terms and conditions of its contract with SRK and
relevant securities legislation. The contract permits Gold Canyon to file this report as a Technical
Report with Canadian securities regulatory authorities pursuant to National Instrument 43-101,
Standards of Disclosure for Mineral Projects. Except for the purposes legislated under provincial
securities law, any other uses of this report by any third party is at that party’s sole risk. The
responsibility for this disclosure remains with Gold Canyon. The user of this document should ensure
that this is the most recent Technical Report for the property as it is not valid if a new Technical
Report has been issued.
Important Notice This preliminary economic assessment (PEA) report is intended to provide an initial review of the
Gold Canyon Resources Inc. Springpole Gold Project’s potential and is preliminary in nature. The
PEA includes inferred mineral resources that are considered too speculative geologically to have the
economic considerations applied to them that would enable them to be categorized as mineral
reserves, and there is no certainty that the PEA based on these mineral resources will be realized.
Mineral resources that are not mineral reserves do not have demonstrated economic viability.
Copyright This report is protected by copyright vested in SRK Consulting (Canada) Inc. It may not be
reproduced or transmitted in any form or by any means whatsoever to any person without the written
permission of the copyright holder, other than in accordance with stock exchange and other
regulatory authority requirements.
2CG026.000 – Gold Canyon Resources Inc. Preliminary Economic Assessment for the Springpole Gold Project, Canada Page iii
AD/NW 2CG026 000_Springpole_PEA_TechnicalReport_20161014_FNL October 7, 2016
Executive Summary SRK Consulting (Canada) Inc. was retained by Gold Canyon Resources Inc. of Vancouver, British
Columbia, to prepare a technical report summarizing the mineral resources for the Springpole Gold
Project. The mineral resource estimate forms the basis of this preliminary economic assessment
(PEA) prepared by SRK.
Project Concept
The proposed Springpole Gold Project concept is to develop a low-grade, greenfield gold and silver
bulk tonnage deposit with open pit mining and conventional milling methods. The production rate
was assumed to be 20,000 tonnes per day (t/d) with a total of 72.4 million tonnes (Mt) of mineralized
material mined and processed during the project life. The overall strip ratio (the ratio of waste rock to
economic mineralized rock) of the mine is approximately 1:7 and the average grade of the plant feed
is estimated at 1.2 grams per tonne (g/t) of gold and 6.0 g/t of silver.
Property Description and Ownership
The Springpole Gold Project is located 110 km northeast of Red Lake, Ontario, and is 100%
controlled by Gold Canyon. The project’s land position comprises 30 patented claims and 300
unpatented, contiguous mining claims and 6 leased unpatented mining claims totalling an area of
approximately 32,448 hectares (80,181 acres).
During late spring, summer, and early fall, the project is accessible by float-plane direct to Springpole
Lake or Birch Lake. During winter, an ice road approximately 85 km long is constructed from the
South Bay landing point on Confederation Lake to a point about 1 km from the Springpole camp.
Geology and Mineralization
The Springpole area is underlain by a polyphase alkali, trachyte intrusive displaying autolithic
breccia. The intrusive is comprised of a system of multiple phases of trachyte that is believed to be
part of the roof zone of a larger syenite intrusive; fragments displaying phaneritic textures were
observed from deeper drill cores in the southeast portion of the Portage zone. Early intrusive phases
consist of megacrystic feldspar phenocrysts of albite and orthoclase feldspar in an aphanitic
groundmass Successive phases show progressively finer grained porphyritic texture while the final
intrusive phases are aphanitic. Within the country rocks to the north and east are trachyte and
lamprophyre dikes and sills that source from the trachyte- or syenite-porphyry intrusive system.
The main intrusive complex appears to contain many of the characteristics of alkaline, porphyry style
mineralization associated with diatreme breccias (e.g., Cripple Creek, Colorado). This style of
mineralization is characterized by the Portage zone and portions of the East Extension zone where
mineralization is hosted by diatreme breccia in aphanitic trachyte. It is suspected that the ductile
shearing and brittle faulting have played a significant role in redistributing structurally controlled
blocks of the mineralized rock. Diamond drilling in the winter of 2010 revealed a more complex
alteration with broader, intense zones of potassic alteration replacing the original rock mass with
biotite and pyrite. In the core area of the deposit where fine grained disseminated gold mineralization
occurs with biotite, the primary potassic alteration mineral, gold displays a good correlation with
potassium/rubidium.
2CG026.000 – Gold Canyon Resources Inc. Preliminary Economic Assessment for the Springpole Gold Project, Canada Page iv
AD/NW 2CG026 000_Springpole_PEA_TechnicalReport_20161014_FNL October 7, 2016
Exploration Status
The initial geologic and engineering studies at the end of 2009 resulted in the establishment of
systematic drill sections at 50 m intervals across the three identified prospect areas, namely Portage
zone, East Extension zone, and Camp zone. The subsequently developed drill program lead to a
multi-phase drill campaign starting in the summer of 2010 and ending in the summer of 2012,
resulting in completion of 77,275 m of diamond core drilling in 196 drill holes. During the course of
the 2010, 2011, and 2012 programs, drilling identified a precious metal deposit of significant strike,
depth and width within the Portage zone.
Mineral Resource and Mineral Reserve Estimates
The mineral resource model prepared by SRK considers 512 core boreholes drilled by Gold Canyon
and previous owners of the property during the period of 2003 to 2012. The resource estimation
work was completed by Dr. Gilles Arseneau, PGeo (APEGBC #23474), an appropriate independent
qualified person as this term is defined in NI 43-101. The effective date of the resource statement is
October 17, 2012.
The revised mineral resource estimate (October 17, 2012) was based on a gold price of $1,400/oz
and a silver price of $15/oz, both considered reasonable economic assumptions by SRK. To
establish a reasonable prospect of economic extraction in an open pit context, the resources were
defined within an optimized pit shell with pit walls set at 45°. Assumed recoveries of 80% for gold
and 60% for silver were used. (Note: A silver recovery assumption of 85% was used for mine design
and evaluation based on more recent data.) Mining costs were estimated at $2/tonne (t) of total
material, processing costs estimated at $12/t and general and administrative (G&A) costs estimated
at $2/t. A cut-off grade (COG) of 0.4 g/t gold was calculated, and is considered to be an
economically reasonable value corresponding with breakeven mining costs. Approximately 90% of
the revenue for the proposed project is derived from gold and 10% from silver.
Note: For the mine development (Whittle™ optimization) and economic analysis in this PEA,
updated input parameters were used.
Mineral resources were estimated by ordinary kriging using Gemcom block modelling software in
10 m x 10 m x 6 m blocks. Grade estimates were based on capped, 3 m composited assay data.
Capping levels were set at 25 g/t for gold and 200 g/t for silver. Blocks were classified as indicated
mineral resources if at least two drill holes and six composites were found within a 60 m x 60 m x 40
m search ellipse. All other interpolated blocks were classified as inferred mineral resource. Mineral
resources were then validated using Gemcom GEMS (6.4) software.
This resource model includes mineralized material in the Main, East Extension and Portage zones
spanning from geologic sections 0-1, 500 m in the northwest to 0-250 m in the southeast. Along the
axis of the Portage zone, resource modelling includes mineralized material generally ranging from
the surface to a depth of 340-440 m below surface.
Mineral resources that are not mineral reserves do not have demonstrated economic viability. There
is no certainty that all or any part of the mineral resources would be converted into mineral reserves.
The estimate of mineral resources may be materially affected by environmental, permitting, legal,
title, taxation, sociopolitical, marketing, or other relevant issues. The quantity and grade of reported
2CG026.000 – Gold Canyon Resources Inc. Preliminary Economic Assessment for the Springpole Gold Project, Canada Page v
AD/NW 2CG026 000_Springpole_PEA_TechnicalReport_20161014_FNL October 7, 2016
inferred resources in this estimation are uncertain in nature. There has been insufficient exploration
to define these inferred resources as an indicated or measured mineral resource. It is uncertain if
further exploration will result in upgrading them to an indicated or measured mineral resource
category.
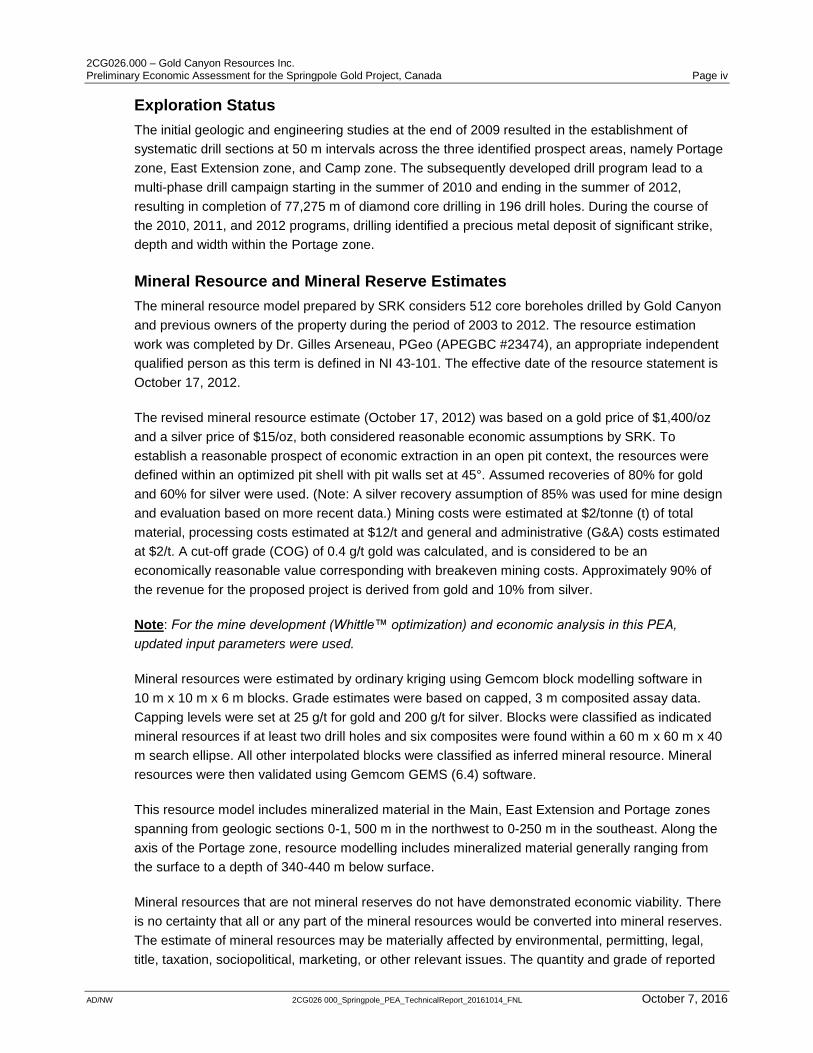
The mineral resources in this report were estimated using current Canadian Institute of Mining,
Metallurgy and Petroleum (CIM) standards, definitions and guidelines. The updated resource
estimate is summarized in Table i.
Table i: Mineral Resource Statement, Springpole Gold Project (October 17, 2012)
Category Quantity
Grade Contained Metal
Au Ag Au Ag
Mt g/t g/t Moz Moz
Open Pit**
Indicated 128.2 1.07 5.7 4.41 23.8
Inferred 25.7 0.83 3.2 0.69 2.7
Source: Springpole Gold Project, Northwestern Ontario, SRK Consulting, October 17, 2012 Note: Mineral resources are reported in relation to a conceptual pit shell. Mineral resources are not
mineral reserves and do not have demonstrated economic viability. All figures are rounded to reflect the relative accuracy of the estimate. All composites have been capped where appropriate.
**Open pit mineral resources are reported at a COG of 0.4 g/t gold. COGs are based on a gold price of $1,400/oz and a gold processing recovery of 80% and a silver price of $15/oz and a silver processing recovery of 60%.
Inferred resources were used in the life of mine (LOM) plan with inferred resources representing
10% of the material planned for processing. Mineral reserves can only be estimated as a result of an
economic evaluation as part of a preliminary feasibility study or a feasibility study of a mineral
project. Accordingly, at the present level of development, there are no mineral reserves at the
Springpole Gold Project.
Mine Development and Operations
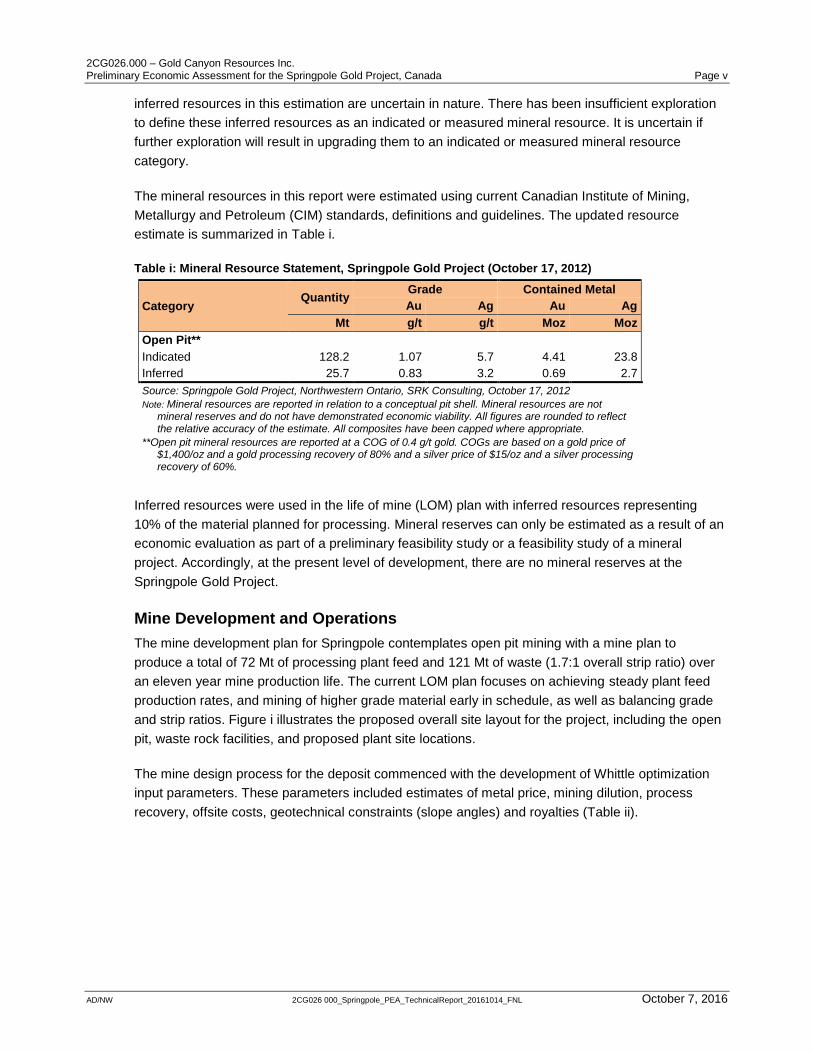
The mine development plan for Springpole contemplates open pit mining with a mine plan to
produce a total of 72 Mt of processing plant feed and 121 Mt of waste (1.7:1 overall strip ratio) over
an eleven year mine production life. The current LOM plan focuses on achieving steady plant feed
production rates, and mining of higher grade material early in schedule, as well as balancing grade
and strip ratios. Figure i illustrates the proposed overall site layout for the project, including the open
pit, waste rock facilities, and proposed plant site locations.
The mine design process for the deposit commenced with the development of Whittle optimization
input parameters. These parameters included estimates of metal price, mining dilution, process
recovery, offsite costs, geotechnical constraints (slope angles) and royalties (Table ii).
2CG026.000 – Gold Canyon Resources Inc. Preliminary Economic Assessment for the Springpole Gold Project, Canada Page vi
AD/NW 2CG026 000_Springpole_PEA_TechnicalReport_20161014_FNL October 7, 2016
Figure i: Overall Springpole Site Plan

2CG026.000 – Gold Canyon Resources Inc. Preliminary Economic Assessment for the Springpole Gold Project, Canada Page vii
AD/NW 2CG026 000_Springpole_PEA_TechnicalReport_20161014_FNL October 7, 2016
Table ii: Mine Planning Optimization Input Parameters
Item Unit Value
Metal Prices
Au $/oz 1,300
Ag $/oz 25
Recovery to Doré
Au % 80
Ag % 85
Smelter Payables
Au in doré % 99.5
Au deduction in doré g/t 0
Ag in doré % 98
Ag deduction in doré g/t 0
Offsite Costs
Au refining/transportation charge $/oz pay Au 5
Other Parameters
Royalties % 3
Operating Costs
Open Pit Waste mining Cost $/t 2.4
OP Mineralized material Mining Cost $/t 2.4
OP Processing and G&A Cost $/t milled 13.02
Overall Pit Slope Angles degrees 35 to 50
Mining Dilution % 5
Mining Recovery % 100
Strip ratio (est.) t:t 1.7
Internal Net Smelter Return cut-off $/t 13.67
Processing rate t/day 20,000
*The open pit mineable resources are reported at an internal cut-off value of $13.67/t based on input parameters above.
Whittle software was used to determine the optimal mining shells with the assumed overall slope
angles based on a preliminary geotechnical assessment. Preliminary phases were selected and
preliminary mine planning and scheduling was then conducted on these selected optimal shells. The
mineable resources for the deposit are presented in Table iii. Indicated and inferred resources were
used in the LOM plan of which indicated resources represent about 90% (~ 65 Mt) of the material
planned to be processed. Mineral resources that are not mineral reserves do not have demonstrated
economic viability. There is no certainty that all or any part of the mineral resources would be
converted into mineral reserves. Mineral reserves can only be estimated as a result of an economic
evaluation as part of a pre-feasibility study or a feasibility study of a mineral project. Accordingly, at
the present level of development there are no mineral reserves at the project.
2CG026.000 – Gold Canyon Resources Inc. Preliminary Economic Assessment for the Springpole Gold Project, Canada Page viii
AD/NW 2CG026 000_Springpole_PEA_TechnicalReport_20161014_FNL October 7, 2016
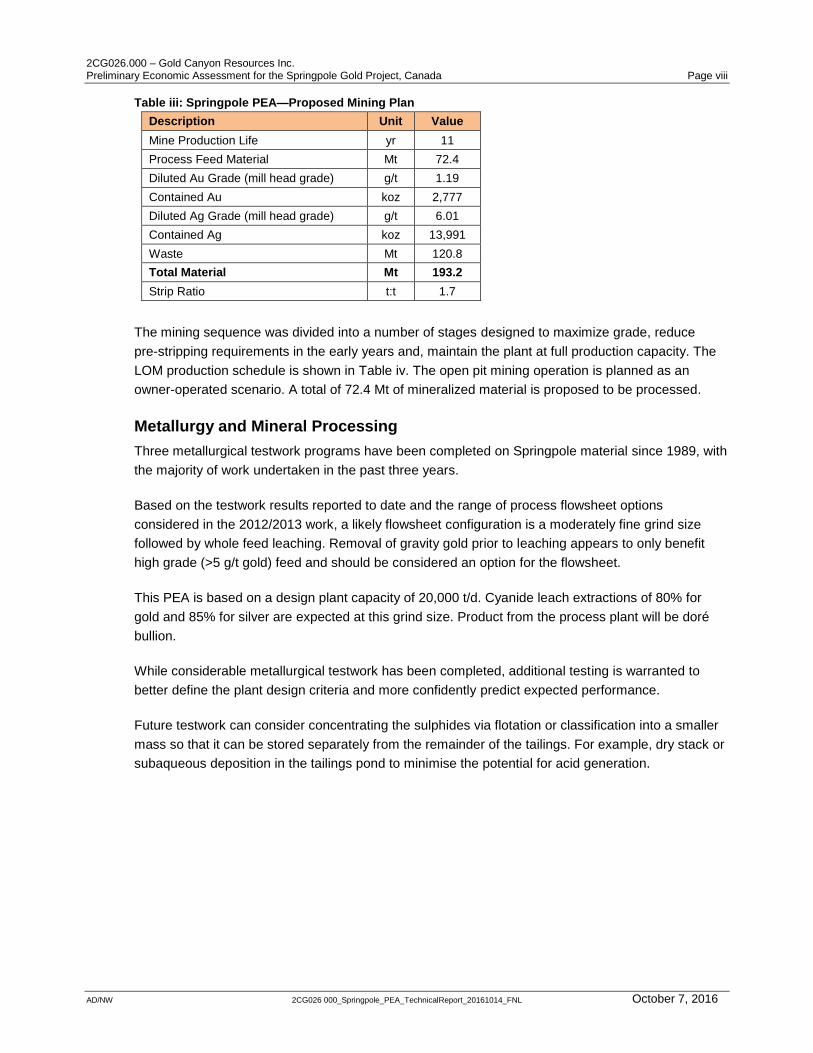
Table iii: Springpole PEA—Proposed Mining Plan
Description Unit Value
Mine Production Life yr 11
Process Feed Material Mt 72.4
Diluted Au Grade (mill head grade) g/t 1.19
Contained Au koz 2,777
Diluted Ag Grade (mill head grade) g/t 6.01
Contained Ag koz 13,991
Waste Mt 120.8
Total Material Mt 193.2
Strip Ratio t:t 1.7
The mining sequence was divided into a number of stages designed to maximize grade, reduce
pre-stripping requirements in the early years and, maintain the plant at full production capacity. The
LOM production schedule is shown in Table iv. The open pit mining operation is planned as an
owner-operated scenario. A total of 72.4 Mt of mineralized material is proposed to be processed.
Metallurgy and Mineral Processing
Three metallurgical testwork programs have been completed on Springpole material since 1989, with
the majority of work undertaken in the past three years.
Based on the testwork results reported to date and the range of process flowsheet options
considered in the 2012/2013 work, a likely flowsheet configuration is a moderately fine grind size
followed by whole feed leaching. Removal of gravity gold prior to leaching appears to only benefit
high grade (>5 g/t gold) feed and should be considered an option for the flowsheet.
This PEA is based on a design plant capacity of 20,000 t/d. Cyanide leach extractions of 80% for
gold and 85% for silver are expected at this grind size. Product from the process plant will be doré
bullion.
While considerable metallurgical testwork has been completed, additional testing is warranted to
better define the plant design criteria and more confidently predict expected performance.
Future testwork can consider concentrating the sulphides via flotation or classification into a smaller
mass so that it can be stored separately from the remainder of the tailings. For example, dry stack or
subaqueous deposition in the tailings pond to minimise the potential for acid generation.
CG026.000 – Gold Canyon Resources Inc. Preliminary Economic Assessment for the Springpole Gold Project, Canada Page ix
AD/NW 2CG026 000_Springpole_PEA_TechnicalReport_20161014_FNL October 7, 2016
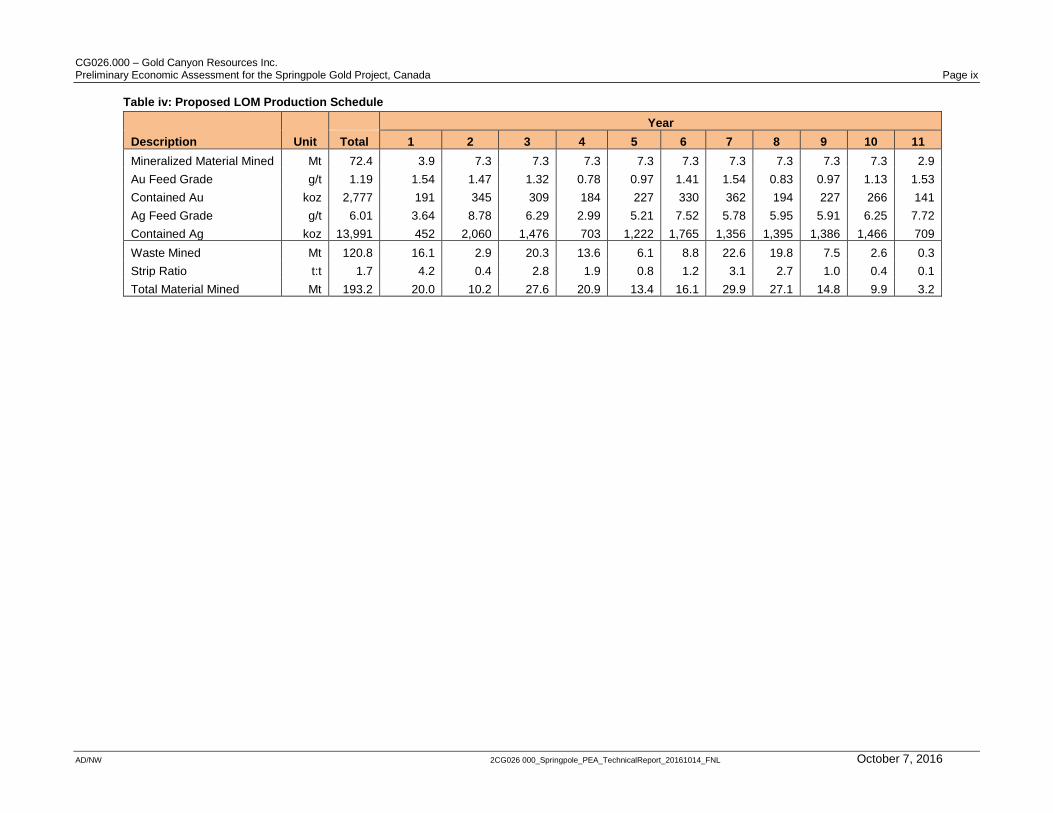
Table iv: Proposed LOM Production Schedule
Description Unit
Year
Total 1 2 3 4 5 6 7 8 9 10 11
Mineralized Material Mined Mt 72.4 3.9 7.3 7.3 7.3 7.3 7.3 7.3 7.3 7.3 7.3 2.9
Au Feed Grade g/t 1.19 1.54 1.47 1.32 0.78 0.97 1.41 1.54 0.83 0.97 1.13 1.53
Contained Au koz 2,777 191 345 309 184 227 330 362 194 227 266 141
Ag Feed Grade g/t 6.01 3.64 8.78 6.29 2.99 5.21 7.52 5.78 5.95 5.91 6.25 7.72
Contained Ag koz 13,991 452 2,060 1,476 703 1,222 1,765 1,356 1,395 1,386 1,466 709
Waste Mined Mt 120.8 16.1 2.9 20.3 13.6 6.1 8.8 22.6 19.8 7.5 2.6 0.3
Strip Ratio t:t 1.7 4.2 0.4 2.8 1.9 0.8 1.2 3.1 2.7 1.0 0.4 0.1
Total Material Mined Mt 193.2 20.0 10.2 27.6 20.9 13.4 16.1 29.9 27.1 14.8 9.9 3.2
2CG026.000 – Gold Canyon Resources Inc. Preliminary Economic Assessment for the Springpole Gold Project, Canada Page x
AD/NW 2CG026 000_Springpole_PEA_TechnicalReport_20161014_FNL October 7, 2016
Waste Management
The waste rock facility is planned to be located immediately adjacent to the final pit limits. Given the
deposit configuration and extraction sequence, no backfilling into previously mined out areas has
been planned for Springpole.
The waste rock facility would be built in a series of lifts in a “bottom-up” approach, and the facility
would be constructed by placing material at its natural angle of repose (approximately 1.5H:1V) with
safety berms spaced at regular intervals giving an overall operational slope of 2:1. The total design
capacity of the waste rock facility is 121 Mt.
Roughly 72 Mt of thickened tailings (about 60% solids by mass) will be centrally discharged at a site
located about 5 km southeast of the proposed mill site. This results in an estimated 45 Mm3 of
tailings to be stored, based on conservative estimates for a tailings density of 1.6 t/m3.
Due to the flat topographical relief of the project area, the tailings will be contained by a ring dam
which will prevent migration of tailings, lake bed sediments, and any free water. The tailings facility is
designed such that the dams will remain at the initial starter dam height of 2 m, except in the areas
were a higher dam is required to contain lake bed sediments or prevent the tailings from encroaching
on nearby lakes.
To minimize pre-production capital cost, a dam continuously raised over the LOM would be the
preferred construction method. However, due to the need to contain lake bed sediments (from dike
construction), the initial ring dam will be constructed to the final dam height in all but a few areas,
and only minimal raises (less than 1 m) would be required in the remaining areas.
Three dewatering dikes with a total length of approximately 510 m will be constructed in Springpole
Lake to allow a portion of the lake to be dewatered. The dikes will be constructed to elevation 391 m
above mean sea level, which allows 3 m of freeboard above the lake level.The dikes will be
constructed under wet conditions; therefore, two silt curtains will be deployed downstream of the dike
locations to prevent high suspended solids in the remainder of the lake. Prior to the placement of fill
material, the foundation of the dam will be dredged to remove any soft lakebed sediments. The rock
fill material will be placed, and then the grout curtain and plastic concrete cut-off wall will be built
through the completed dike.
An estimated 21.7 Mm3 of water will have to be drained from the area of Springpole Lake within the
dewatering dikes. Of this, ~80% (17.4 Mm3) is estimated to be clean water which can be discharged
directly over the dewatering dikes into Springpole Lake, inside the silt curtain. The remaining 20%
(4.3 Mm3) is assumed to be “murky” (i.e., have suspended solids higher than the allowable discharge
limits). The murky water will be pumped to the tailings management facility (TMF) which will act as a
sedimentation pond; no tailings will be in the TMF at this time. Clear water from the TMF will be
pumped to Springpole Lake. Steps will be taken during the dewatering process to reduce the amount
of sediments that become suspended in the water, including silt curtains around the water intake
area.
2CG026.000 – Gold Canyon Resources Inc. Preliminary Economic Assessment for the Springpole Gold Project, Canada Page xi
AD/NW 2CG026 000_Springpole_PEA_TechnicalReport_20161014_FNL October 7, 2016
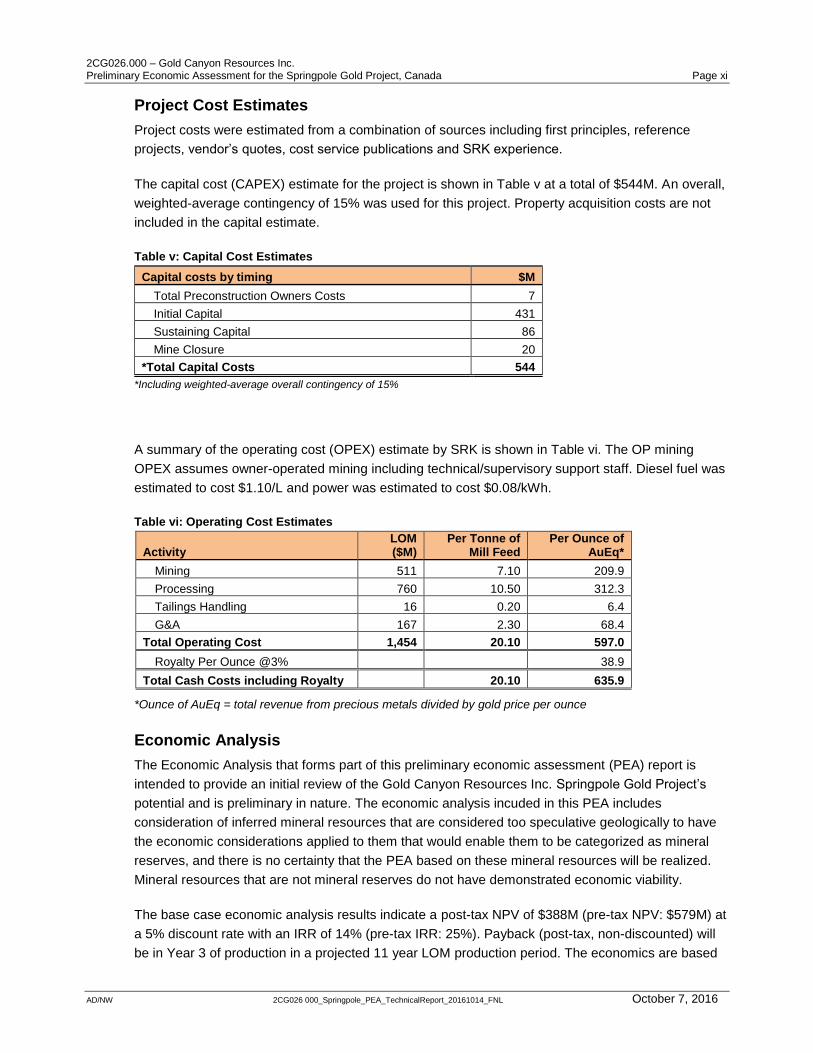
Project Cost Estimates
Project costs were estimated from a combination of sources including first principles, reference
projects, vendor’s quotes, cost service publications and SRK experience.
The capital cost (CAPEX) estimate for the project is shown in Table v at a total of $544M. An overall,
weighted-average contingency of 15% was used for this project. Property acquisition costs are not
included in the capital estimate.
Table v: Capital Cost Estimates
Capital costs by timing $M
Total Preconstruction Owners Costs 7
Initial Capital 431
Sustaining Capital 86
Mine Closure 20
*Total Capital Costs 544
*Including weighted-average overall contingency of 15%
A summary of the operating cost (OPEX) estimate by SRK is shown in Table vi. The OP mining
OPEX assumes owner-operated mining including technical/supervisory support staff. Diesel fuel was
estimated to cost $1.10/L and power was estimated to cost $0.08/kWh.
Table vi: Operating Cost Estimates
Activity LOM ($M)
Per Tonne of Mill Feed
Per Ounce of AuEq*
Mining 511 7.10 209.9
Processing 760 10.50 312.3
Tailings Handling 16 0.20 6.4
G&A 167 2.30 68.4
Total Operating Cost 1,454 20.10 597.0
Royalty Per Ounce @3% 38.9
Total Cash Costs including Royalty 20.10 635.9
*Ounce of AuEq = total revenue from precious metals divided by gold price per ounce
Economic Analysis
The Economic Analysis that forms part of this preliminary economic assessment (PEA) report is
intended to provide an initial review of the Gold Canyon Resources Inc. Springpole Gold Project’s
potential and is preliminary in nature. The economic analysis incuded in this PEA includes
consideration of inferred mineral resources that are considered too speculative geologically to have
the economic considerations applied to them that would enable them to be categorized as mineral
reserves, and there is no certainty that the PEA based on these mineral resources will be realized.
Mineral resources that are not mineral reserves do not have demonstrated economic viability.
The base case economic analysis results indicate a post-tax NPV of $388M (pre-tax NPV: $579M) at
a 5% discount rate with an IRR of 14% (pre-tax IRR: 25%). Payback (post-tax, non-discounted) will
be in Year 3 of production in a projected 11 year LOM production period. The economics are based
2CG026.000 – Gold Canyon Resources Inc. Preliminary Economic Assessment for the Springpole Gold Project, Canada Page xii
AD/NW 2CG026 000_Springpole_PEA_TechnicalReport_20161014_FNL October 7, 2016
on a base case of $1,300/oz long-term gold price, $25/oz long-term silver price, and production rate
of 20,000 t/d over 365 d/yr. Direct operating costs are estimated to be $636/oz of AuEq. Total capital
costs are estimated at $544M, consisting of initial capital costs of $438M, and ongoing sustaining
capital of $106M.
Sensitivity analysis indicates that, at base case metal price assumptions, the project may be able to
absorb significant escalation in capital and operating costs and remain a potentially viable economic
proposition.
Conclusions
Industry standard mining, process design, construction methods, and economic evaluation practices
were used to assess the Springpole Gold Project. Based on current knowledge and assumptions,
the results of this study indicate that the project has positive economics within the preliminary
parameters of a PEA and should be advanced to the next level of study - either preliminary feasibility
or feasibility.
The preliminary economic assessment is preliminary in nature; it includes inferred mineral resources
that are considered too speculative geologically to have the economic considerations applied to
them that would enable them to be categorized as mineral reserves, and there is no certainty that
the preliminary economic assessment will be realized.
While a significant amount of information is still required to do a complete assessment, at this point
there do not appear to be any fatal flaws for the project. The study achieved its original objective of
providing a preliminary review of the potential economic viability of the Springpole Gold Project.
Risks and Opportunities
As with almost all mining ventures, there are a large number of risks and opportunities that can affect
the outcome of the project. Most of these risks and opportunities are based on uncertainty, such as
lack of scientific information (test results, drill results, etc.) or the lack of control over external factors
(metal price, exchange rates, etc.).
Subsequent higher-level engineering studies would be required to further refine these risks and
opportunities, identify new risks and opportunities, and define strategies for risk mitigation or
opportunity implementation.
The principal risks identified for the Springpole Gold Project are summarized as follows:
Geological interpretation and mineral resource classification (10% of the resources used in the
mine plan are Inferred);
Due to a relatively small number of metallurgical samples tested, larger variations in mineralogy
and metal recovery may exist than have been observed to date;
Geotechnical and hydrogeological considerations;
No information on baseline groundwater quality;
No physical characterization of the tailings material has been done;

2CG026.000 – Gold Canyon Resources Inc. Preliminary Economic Assessment for the Springpole Gold Project, Canada Page xiii
AD/NW 2CG026 000_Springpole_PEA_TechnicalReport_20161014_FNL October 7, 2016
Construction management and cost containment during development of the project;
High exposure to potential escalation of costs associated with latent ground conditions due to
need for dewatering dykes and large, shallow TSF;
The permitting period associated with the project could be significantly longer than assumed in
this study;
Increased OPEX and/or CAPEX; and
Reduced metal prices.
The following opportunities may improve the project economics:
Metallurgical testwork has indicated that gold recoveries up to 90% are possible with a finer
grind. Trade-off studies should be carried out to determine whether it’s feasible to incorporate a
finer grind process into the flowsheet;
Pit optimization work with the Whittle software identified a number of potential pit shells (or
phases) and the selected pit shell provides higher grades, lower strip ratio, and reduced capital
and operating expense;
Recently completed geotechnical drilling for pit slope stability analysis may increase pit slopes
angles over those used in this PEA;
There are other geophysical targets around the current resource, particularly to the southwest of
the current resource. Additional drilling has the potential to add resources;
Investigations may reveal that sufficient quantities of low permeability material for core
construction may be available on-site and bedrock may be located at a shallower depth than
assumed in the cost estimate;
Lake dewatering could occur at a faster rate if the water was discharged into several different
lakes;
The potential to upgrade the mineral resource classification of the deposit; and
Improved metal prices.
Recommendations
SRK believes the project should be taken to the next level of engineering study and economic
assessment, typically a pre-feasibility study. It is estimated that a pre-feasibility, along with all of the
accompanying engineering and field work would cost approximately $5M (excluding additional
resource development drilling programs). Some of the activities involved to advance the project
include:
Additional metallurgical testwork;
Initiate project permitting;
Consummate agreements with First Nations groups; and
Convert remaining inferred resources to indicated resources.
2CG026.000 – Gold Canyon Resources Inc. Preliminary Economic Assessment for the Springpole Gold Project, Canada Page xiv
AD/NW 2CG026 000_Springpole_PEA_TechnicalReport_20161014_FNL October 7, 2016
Table of Contents
Disclaimer .................................................................................................................. ii
Important Notice ........................................................................................................ ii
Copyright ................................................................................................................... ii
Executive Summary ................................................................................................. iii Project Concept .............................................................................................................. iii Property Description and Ownership .............................................................................. iii Geology and Mineralization ............................................................................................ iii Exploration Status .......................................................................................................... iv Mineral Resource and Mineral Reserve Estimates ......................................................... iv Mine Development and Operations ................................................................................. v Metallurgy and Mineral Processing ................................................................................ viii Waste Management ........................................................................................................ x Project Cost Estimates ................................................................................................... xi Economic Analysis ......................................................................................................... xi Conclusions ................................................................................................................... xii Risks and Opportunities ................................................................................................ xii Recommendations ........................................................................................................ xiii
Table of Contents ................................................................................................... xiv
List of Tables ........................................................................................................... xx
List of Figures ....................................................................................................... xxiii
1 Introduction and Terms of Reference ................................................................ 1 1.1 Source of Information ........................................................................................... 1 1.2 Site Visits ............................................................................................................. 2 1.3 Springpole Gold Project ....................................................................................... 2
2 Reliance on Other Experts .................................................................................. 3
3 Property Description and Location .................................................................... 4 3.1 Project Location ................................................................................................... 4 3.2 Land Area ............................................................................................................ 4 3.3 Mineral Tenure ..................................................................................................... 6
3.4 Environmental Liabilities....................................................................................... 9 3.5 Permits ................................................................................................................. 9
4 Accessibility, Climate, Local Resources, Infrastructure and Physiography 10 4.1 Accessibility ....................................................................................................... 10 4.2 Local Resources and Infrastructure .................................................................... 10 4.3 Climate and Physiography ................................................................................. 10
5 History ................................................................................................................ 12 5.1 Fall 2007 Program .............................................................................................. 14 5.2 Summer–Fall 2009 Program .............................................................................. 15 5.3 Core Re-Logging Program ................................................................................. 15
2CG026.000 – Gold Canyon Resources Inc. Preliminary Economic Assessment for the Springpole Gold Project, Canada Page xv
AD/NW 2CG026 000_Springpole_PEA_TechnicalReport_20161014_FNL October 7, 2016
6 Geological Setting and Mineralization ............................................................. 18 6.1 Regional Geology............................................................................................... 18 6.2 Property Geology ............................................................................................... 19
6.3 Structure ............................................................................................................ 20 6.4 Alteration ............................................................................................................ 21 6.5 Mineralization ..................................................................................................... 21
7 Deposit Types .................................................................................................... 23 7.1 Depositional Environment .................................................................................. 23
8 Exploration ......................................................................................................... 26
9 Drilling ................................................................................................................ 27 9.1 Gold Canyon Drilling .......................................................................................... 27 9.2 2007 Diamond Drilling Program ......................................................................... 27 9.3 Winter 2008 Drill Program .................................................................................. 28 9.4 2010 Drill Program ............................................................................................. 29 9.5 2011 Drill Program ............................................................................................. 32 9.6 2012 Drill Program ............................................................................................. 35 9.7 Drill Collar Surveying .......................................................................................... 37 9.8 Oriented Core Surveying .................................................................................... 38 9.9 Down-Hole Surveying ........................................................................................ 38 9.10 Drilling Pattern and Density ................................................................................ 38
10 Sample Preparation, Analyses, and Security .................................................. 39 10.1 Core Drilling Sampling ....................................................................................... 39
10.2 Sample Security ................................................................................................. 40 10.3 Sample Preparation and Analytical Procedures ................................................. 41
10.4 Bulk Density Data............................................................................................... 42 10.5 Quality Assurance and Quality Control Programs............................................... 43
10.6 SRK Comments ................................................................................................. 45
11 Data Verification ................................................................................................ 46 11.1 Verifications by SRK .......................................................................................... 46
12 Mineral Processing and Metallurgical Testing ................................................ 48 12.1 Lakefield Research 1989 .................................................................................... 48
12.2 SGS Mineral Services 2011 ............................................................................... 50
2CG026.000 – Gold Canyon Resources Inc. Preliminary Economic Assessment for the Springpole Gold Project, Canada Page xvi
AD/NW 2CG026 000_Springpole_PEA_TechnicalReport_20161014_FNL October 7, 2016
12.3 SGS Lakefield 2012 ........................................................................................... 53
12.4 SGS Lakefield 2013 ........................................................................................... 61
13 Mineral Resource Estimates ............................................................................. 64 13.1 Introduction ........................................................................................................ 64 13.2 Resource Estimation Procedures ....................................................................... 64 13.3 Drill Hole Database ............................................................................................ 65 13.4 Core Recovery ................................................................................................... 66 13.5 Geological Domains ........................................................................................... 67 13.6 Surface Topography ........................................................................................... 69 13.7 Compositing ....................................................................................................... 69 13.8 Grade Capping ................................................................................................... 70 13.9 Statistical Analysis and Variography................................................................... 71 13.10 Block Model and Grade Estimation .................................................................... 72
13.11 Model Validation ................................................................................................ 74 13.12 Mineral Resource Classification ......................................................................... 76 13.13 Mineral Resource Statement .............................................................................. 77 13.14 Grade Sensitivity Analysis .................................................................................. 78 13.15 Previous Mineral Resource Estimates ................................................................ 81
14 Mineral Reserve Estimates ............................................................................... 82
15 Mining Methods ................................................................................................. 83 15.1 Open Pit Optimization ........................................................................................ 83
15.2 Open Pit Mine Design ........................................................................................ 90 15.3 Mine Sequence/Phasing .................................................................................... 92 15.4 Open Pit Mine Operation .................................................................................... 94
15.5 Mine Schedule ................................................................................................... 95 15.6 Rock Geotechnical Information ........................................................................ 101
15.7 Hydrogeology ................................................................................................... 105
2CG026.000 – Gold Canyon Resources Inc. Preliminary Economic Assessment for the Springpole Gold Project, Canada Page xvii
AD/NW 2CG026 000_Springpole_PEA_TechnicalReport_20161014_FNL October 7, 2016
15.8 Hydrology ......................................................................................................... 109
15.9 Surface Water Management ............................................................................ 111
16 Processing Recovery Methods ...................................................................... 113 16.1 Process Flowsheet ........................................................................................... 113 16.2 Expected Plant Performance ............................................................................ 114
17 Project Infrastructure ...................................................................................... 117 17.1 Waste Rock Facilities ....................................................................................... 117 17.2 Tailings Management Facility ........................................................................... 117
17.3 Dewatering Dikes ............................................................................................. 122
17.4 Infrastructure .................................................................................................... 126
18 Market Studies, Pricing, and Contracts ......................................................... 130 18.1 Market Studies ................................................................................................. 130 18.2 Pricing .............................................................................................................. 130 18.3 Contracts ......................................................................................................... 130
19 Environmental Studies, Permitting and Social Setting ................................ 131 19.1 General ............................................................................................................ 131 19.2 Environmental Regulatory Setting .................................................................... 131
19.3 Environmental Assessment Project Requirements ........................................... 133 19.4 Environmental Licensing Process .................................................................... 134
19.5 Social Setting ................................................................................................... 135
19.6 Preliminary Reclamation Plan .......................................................................... 136
20 Capital and Operating Costs .......................................................................... 138 20.1 Capital Costs .................................................................................................... 138
20.2 Operating Costs ............................................................................................... 144
21 Economic Analysis .......................................................................................... 146 21.1 Important Notice ............................................................................................... 146
2CG026.000 – Gold Canyon Resources Inc. Preliminary Economic Assessment for the Springpole Gold Project, Canada Page xviii
AD/NW 2CG026 000_Springpole_PEA_TechnicalReport_20161014_FNL October 7, 2016
21.2 Introduction ...................................................................................................... 146 21.3 Key Assumptions ............................................................................................. 146
21.4 Mining .............................................................................................................. 151
21.5 Processing ....................................................................................................... 151
21.6 Overall Capital Costs ....................................................................................... 151 21.7 Overall Operating Costs ................................................................................... 152 21.8 Taxes and Royalties ......................................................................................... 153
21.9 Working Capital ................................................................................................ 154 21.10 Base Case Valuations ...................................................................................... 154
21.11 Sensitivities ...................................................................................................... 158
21.12 Conclusions and Recommendations ................................................................ 160
22 Adjacent Properties ......................................................................................... 161
23 Other Relevant Data and Information ............................................................ 163
24 Interpretation and Conclusions...................................................................... 164 24.1 Geology ........................................................................................................... 164 24.2 Mineral Processing and Metallurgy .................................................................. 164
24.3 Mineral Resource Estimate .............................................................................. 166 24.4 Mining .............................................................................................................. 167
24.5 Geotechnical .................................................................................................... 168 24.6 Hydrogeology ................................................................................................... 168
24.7 Hydrology ......................................................................................................... 169
24.8 Tailings Management Facility ........................................................................... 170
24.9 Dewatering Dikes ............................................................................................. 171
24.10 Project Infrastructure ........................................................................................ 171
24.11 Environmental Studies and Permitting .............................................................. 172
2CG026.000 – Gold Canyon Resources Inc. Preliminary Economic Assessment for the Springpole Gold Project, Canada Page xix
AD/NW 2CG026 000_Springpole_PEA_TechnicalReport_20161014_FNL October 7, 2016
24.12 Economic Analysis ........................................................................................... 173 24.13 Summary of Risks and Opportunities ............................................................... 173
25 Recommendations .......................................................................................... 175 25.1 Quality Assurance and Quality Control Program .............................................. 175 25.2 Mineral Resource ............................................................................................. 175 25.3 Resource Development Program ..................................................................... 175 25.4 Metallurgical Testwork Program ....................................................................... 176 25.5 Hydrogeological Characterization ..................................................................... 176 25.6 Hydrological Monitoring .................................................................................... 178 25.7 Tailings Management Facility ........................................................................... 178 25.8 Dewatering Dike ............................................................................................... 178 25.9 Infrastructure .................................................................................................... 178 25.10 Environmental Studies ..................................................................................... 179 25.11 Economic Evalutation Recommendations ........................................................ 179 25.12 Estimated Total Cost of Recommendations ...................................................... 179 25.13 Closure ............................................................................................................ 180
26 Acronyms and Abbreviations ......................................................................... 181
27 References ....................................................................................................... 182
28 Date and Signature Page ................................................................................ 185
APPENDIX A .......................................................................................................... 186
APPENDIX B .......................................................................................................... 187
APPENDIX C .......................................................................................................... 188
APPENDIX D .......................................................................................................... 189
APPENDIX E ........................................................................................................... 190
APPENDIX F ........................................................................................................... 191
2CG026.000 – Gold Canyon Resources Inc. Preliminary Economic Assessment for the Springpole Gold Project, Canada Page xx
AD/NW 2CG026 000_Springpole_PEA_TechnicalReport_20161014_FNL October 7, 2016
List of Tables
Table i: Mineral Resource Statement*, Springpole Project ...................................................................... v
Table ii: Mine Planning Optimization Input Parameters ......................................................................... vii
Table iii: PEA Proposed Mining Plan ..................................................................................................... viii
Table iv: LOM Production Schedule ........................................................................................................ ix
Table v: Capital Cost Estimates ............................................................................................................... x
Table vi: Operating Cost Estimates .......................................................................................................... x
Table 5.1: Summary of Historic Drilling at Springpole 1986-2006 ........................................................ 14
Table 5.2: Historic Significant Intercepts from 2009 Re-Sampling Program ......................................... 17
Table 9.1: Summary Data of 2007 Winter Diamond Drill Program ....................................................... 28
Table 9.2: Summary of Significant Drill Results from 2007 Drill Program ............................................. 28
Table 9.3: Winter 2008 Diamond Drill Hole Program Summary ............................................................ 29
Table 9.4: Significant Drill Intersections from 2008 Drilling Program .................................................... 29
Table 9.5: 2010 Diamond Drill Program Summary Data ....................................................................... 31
Table 9.6: Summary of Significant Gold and Silver Assays from 2010 Drill Holes ............................... 31
Table 9.7: 2011 Diamond Drill Hole Program Summary Data ............................................................... 33
Table 9.8: Significant Intercepts from 2011 Diamond Core Drilling Program ........................................ 34
Table 9.9: 2012 Diamond Drill Hole Program Summary Data ............................................................... 36
Table 9.10: Significant Intercepts from 2012 Diamond Core Drilling Program ...................................... 37
Table 10.1: SGS Multi-Element Analysis Method ICM14B ................................................................... 42
Table 10.2: Summary of Wax Bulk Density Measurements .................................................................. 43
Table 11.1: Assays from Duplicated Samples Collected During Site Visit ............................................ 47
Table 12.1: Sample Head Analysis (Lakefield 1989) ............................................................................ 49
Table 12.2: As Received Cyanidation Results (Lakefield 1989) ........................................................... 49
Table 12.3: Medium Crush Cyanidation Results (Lakefield 1989) ........................................................ 49
Table 12.4: Fine Cyanidation Results (Lakefield 1989) ......................................................................... 50
Table 12.5: Fine Carbon in Leach Results (Lakefield 1989) ................................................................. 50
Table 12.6: Sample Identification and Inventory (SGS 2011) ............................................................... 51
Table 12.7: Head Analysis (SGS 2011) ................................................................................................. 51
Table 12.8: Bottle Roll Leach Test Conditions (SGS 2011) .................................................................. 52
Table 12.9: Gold Leach Results (SGS 2011) ........................................................................................ 52
Table 12.10: Silver Leach Results (SGS 2011) ..................................................................................... 53
Table 12.11: Sample Identification and Inventory (SGS 2012) ............................................................. 54
Table 12.12: Head Analysis (SGS 2012) ............................................................................................... 54
Table 12.13: Screen Metallics Assay (SGS 2012) ................................................................................ 55
Table 12.14: Main Minerals by QEMSCAN RMS (SGS 2012) .............................................................. 55
Table 12.15: Rougher Flotation Test Results (SGS 2012) .................................................................... 57

2CG026.000 – Gold Canyon Resources Inc. Preliminary Economic Assessment for the Springpole Gold Project, Canada Page xxi
AD/NW 2CG026 000_Springpole_PEA_TechnicalReport_20161014_FNL October 7, 2016
Table 12.16: Gravity Tailing Leach Test Results (SGS 2012)............................................................... 58
Table 12.17: Rougher Concentrate Leach Test Results (SGS 2012) ................................................... 59
Table 12.18: Whole Feed Intensive Leach Test Results (SGS 2012) ................................................... 59
Table 12.19: Whole Feed Intensive Leach Test Results (SGS 2013 vs. 2012) .................................... 62
Table 12.20: Rougher Concentrate Leach Test Results (SGS 2013) ................................................... 62
Table 13.1: Capping Levels for Springpole ........................................................................................... 70
Table 13.2: Basic Univariate Statistical Information for Raw Assay Data ............................................. 71
Table 13.3: Basic Univariate Statistical Information for 3 m Composites .............................................. 71
Table 13.4: Gold and Silver Spherical Correlogram Parameters by Domain ........................................ 72
Table 13.5: Block Model Setup Parameters .......................................................................................... 72
Table 13.6: Search Parameters by Zone and Metal .............................................................................. 73
Table 13.7: Bulk Density of Unestimated Blocks in the Model .............................................................. 73
Table 13.8: Assumptions Considered for Conceptual Open Pit Optimization ....................................... 77
Table 13.9: Mineral Resource Statement* (October 17, 2012) ............................................................. 78
Table 13.10: Indicated Block Model Quantities and Grade Estimates* at Cut-off Grades .................... 79
Table 13.11: Inferred Block Model Quantities and Grade Estimates* at Cut-off Grades ...................... 79
Table 13.12: Mineral Resource Statement of April 6, 2012 ................................................................... 81
Table 15.1: Mine Planning Optimization Input Parameters ................................................................... 83
Table 15.2: Cut-Off Grade Calculations Used in Pit Optimization ......................................................... 84
Table 15.3: Overall Optimization Results .............................................................................................. 86
Table 15.4 Resources to Be Extracted in LOM Plan ............................................................................. 89
Table 15.5: Resources to Be Extracted in LOM Plan by Classification ................................................. 89
Table 15.6: Springpole Pit/Phase Tonnages and Grades ..................................................................... 92
Table 15.7: Major Open Pit Equipment Requirements .......................................................................... 95
Table 15.8: Proposed LOM Open Pit Production Schedule .................................................................. 96
Table 15.9: Slope Angle Recommendations ....................................................................................... 102
Table 15.10: Average Monthly Run-Off and Precipitation Distribution ................................................ 110
Table 19.1: Required Federal Approvals ............................................................................................. 134
Table 19.2: Required Provincial Approvals ......................................................................................... 135
Table 20.1: Open Pit Equipment CAPEX Summary ............................................................................ 138
Table 20.2: Springpole Process Plant Capital Cost Estimate (20,000 t/d) .......................................... 139
Table 20.3: Summary of Infrastructure CAPEX and Sustaining Capital ............................................. 140
Table 20.4: Summary of Key TMF Construction Quantities ................................................................ 141
Table 20.5: Summary of Key Dike and Lake Dewatering Construction Quantities ............................. 141
Table 20.6: Summary of TMF CAPEX and Sustaining Capital ........................................................... 142
Table 20.7: Summary of Dike and Lake Dewatering CAPEX and Sustaining Capital ........................ 142
Table 20.8: Preliminary Cost Estimate for Surface Water Management ............................................. 143
Table 20.9: Springpole Process Plant Operating Cost Estimate (20,000 t/d) ..................................... 144
2CG026.000 – Gold Canyon Resources Inc. Preliminary Economic Assessment for the Springpole Gold Project, Canada Page xxii
AD/NW 2CG026 000_Springpole_PEA_TechnicalReport_20161014_FNL October 7, 2016
Table 21.1: Summary of Economic Parameters and Results .............................................................. 146
Table 21.2: Base Case Production Schedule ...................................................................................... 148
Table 21.3: Base Case Revenue Calculation ...................................................................................... 150
Table 21.4: Mine Operating Unit Costs (USD) .................................................................................... 151
Table 21.5: Capital Cost Summary ...................................................................................................... 152
Table 21.6: Capital Cost Breakdown ................................................................................................... 152
Table 21.7: Life of Mine Operating Cost .............................................................................................. 153
Table 21.8: Operating Unit Costs ........................................................................................................ 153
Table 21.9: Summary Economics ........................................................................................................ 155
Table 21.10: Annual Cashflow Summary ............................................................................................ 156
Table 21.11: Effect of Variation in Commodity Prices and Operating Costs on Post Tax NPV5 ......... 158
Table 21.12: Effect of Variation in Commodity Prices and Capital Costs on Post Tax NPV5 ............. 158
Table 21.13: Effect of Variation in Operating and Capital Costs on Post Tax NPV5 ........................... 159
Table 25.1: Proposed Budget for the Resource Development Program ............................................. 176
Table 25.2: Estimated Cost for Recommended Work ......................................................................... 179
2CG026.000 – Gold Canyon Resources Inc. Preliminary Economic Assessment for the Springpole Gold Project, Canada Page xxiii
AD/NW 2CG026 000_Springpole_PEA_TechnicalReport_20161014_FNL October 7, 2016
List of Figures
Figure i: Overall Springpole Site Plan ...................................................................................................... vi
Figure 3.1: Springpole Gold Project Location Map .................................................................................. 5
Figure 3.2: Springpole Gold Project Land Tenure Map ........................................................................... 6
Figure 4.1: Typical Winter Landscape in the Project Area .................................................................... 11
Figure 6.1: Springpole Gold Project – Regional Geology ...................................................................... 19
Figure 9.1: Springpole Gold Project Historical 2007 and 2008 Drill Hole Collar Location Map ............ 27
Figure 9.2: Springpole Gold Project - 2010 Drill Hole Collar Location Map .......................................... 30
Figure 9.3: Springpole Gold Project - 2011 Drill Hole Collar Location Map .......................................... 32
Figure 9.4: Springpole Gold Project – 2012 Drill Hole Collar Location Map ......................................... 35
Figure 12.1: Gold Leach Kinetic Curves for SGS 2011 Samples .......................................................... 53
Figure 12.2: Gold Occurrence in Gravity Concentrates ........................................................................ 56
Figure 12.3: Diagnostic Leach Gold Distribution ................................................................................... 60
Figure 13.1: Comparison of Historic and Recent Drilling for the Portage Zone .................................... 65
Figure 13.2 Comparison of Historic and Recent Drilling for the Camp and East Extension Zones ...... 66
Figure 13.3: Gold Grade versus Core Recovery Relationship .............................................................. 67
Figure 13.4: Geological Domains for Springpole Gold Project .............................................................. 68
Figure 13.5: Cross Section 1100NW Looking NW Showing Portage and East Extension Domains .... 68
Figure 13.6: Histogram of Sample Lengths within Mineralized Domains .............................................. 69
Figure 13.7: Comparison of Sample Length and Average Gold Grade ................................................ 70
Figure 13.8: Comparison of gold grades for well-informed blocks ........................................................ 74
Figure 13.9: Comparison of Silver Grades for Well-Informed Blocks .................................................... 74
Figure 13.10: Swatch Plots for gold for (a) the East Extension, (b) the Camp, and (c) the Portage Zone ....................................................................................................................................... 75
Figure 13.11: Swatch Plot for Silver within the Portage Zone ............................................................... 76
Figure 13.12: Grade Tonnage Curves for the Springpole Indicated Mineral Resource ........................ 80
Figure 13.13: Grade Tonnage Curves for the Springpole Inferred Mineral Resource .......................... 80
Figure 15.1: Open Pit Optimization Cumulative Results ....................................................................... 87
Figure 15.2: Open Pit Optimization Incremental Value Results ............................................................ 88
Figure 15.3: Open Pit Optimization Incremental Tonnage Results ....................................................... 88
Figure 15.4: Plan View of Springpole Ultimate Pit Limits ...................................................................... 91
Figure 15.5: Typical Long Section through Springpole Pit Shells ......................................................... 92
Figure 15.6: Springpole Gold Project – Pit Stage Summary ................................................................. 93
Figure 15.7: Pit Stage Mill Feed Summary ............................................................................................ 94
Figure 15.8: Process Tonnes, Waste Tonnes and Strip Ratio by Period .............................................. 97
Figure 15.9: Mineralized Tonnes and Grade by Phase and Period ...................................................... 98
Figure 15.10: Overall Site Plan .............................................................................................................. 99
Figure 15.11: Rock Mass Assessment and Preliminary Domains....................................................... 103
2CG026.000 – Gold Canyon Resources Inc. Preliminary Economic Assessment for the Springpole Gold Project, Canada Page xxiv
AD/NW 2CG026 000_Springpole_PEA_TechnicalReport_20161014_FNL October 7, 2016
Figure 15.12: Slope Design Sectors and Recommendations.............................................................. 104
Figure 15.13: Springpole Mine Layout ................................................................................................. 106
Figure 15.14: Mean Monthly Lake Evaporation for Five Stations Around the Springpole Site ........... 110
Figure 15.15: Springpole Surface Water Management ....................................................................... 112
Figure 16.1: Springpole Process Flowsheet ........................................................................................ 113
Figure 16.2: 48 Hour Whole Feed Leach Residue vs. Head Grade .................................................... 114
Figure 16.3: Whole Feed Gold Leach Extraction vs. Grind Size ......................................................... 115
Figure 16.4: Whole Feed Silver Leach Extraction vs. Grind Size........................................................ 116
Figure 16.5: Whole Feed Silver Leach Extraction vs. Gold Extraction ................................................ 116
Figure 17.1: Springpole Gold Project Tailings Management Facility .................................................. 121
Figure 17.2: Springpole Gold Project Dewatering Dike Locations ...................................................... 125
Figure 18.1: Historical Gold Prices ...................................................................................................... 130
Figure 20.1: Breakdown of Major Process Capital Costs .................................................................... 140
Figure 21.1: Sensitivity Analysis .......................................................................................................... 159
Figure 22.1: Springpole Gold Project—Location of Adjacent Properties ............................................ 161
2CG026.000 – Gold Canyon Preliminary Economic Assessment for the Springpole Gold Project, Canada Page 1
AD/NW 2CG026 000_Springpole_PEA_TechnicalReport_20161014_FNL October 7, 2016
1 Introduction and Terms of Reference
This report comprises a National Instrument (NI) 43-101 and Form 43-101F compliant technical
report that summarizes the findings of an independent resource estimate and preliminary economic
assessment of the Springpole Gold Project in northwest Ontario, Canada. SRK Consulting (Canada)
Inc. prepared this report in collaboration with Gold Canyon Resources Inc. (TSX: GCU) at the
request of Mr. Troy J. Fierro, CEO and director of the company, which currently owns a 100%
interest in the Springpole Gold Project. SRK is not an insider, associate, or an affiliate of Gold
Canyon and does not hold any interest in the Springpole Gold Project.
The contents of this report reflect various technical and economic conditions at the time of writing.
Given the nature of the mining business, these conditions can change significantly over relatively
short periods of time. Accordingly, actual results may be significantly more or less favourable.
In addition, this report may include technical information that requires subsequent calculations to
derive subtotals, totals, and weighted averages. Such calculations inherently involve a degree of
rounding and consequently introduce a margin of error. Where these occur, SRK does not consider
them to be material. The estimate of mineral resources conforms to the Canadian Institute of Mining,
Metallurgy and Petroleum (CIM) Definition Standards for Mineral Resources and Mineral Reserves.
These standards were prepared by the CIM Standing Committee on Reserve Definitions and
adopted by CIM council on November 27, 2010. They are referred to in NI 43-101 Standards of
Disclosure for Mineral Projects.
The economic analysis provides only a preliminary overview of the project economics based on
broad, factored assumptions. As per CIM guidelines, reserves can only be declared with a
preliminary feasibility-level study.
The mineral resources used in the life of mine (LOM) plan and economic analysis include inferred
material. Inferred mineral resources are considered too speculative geologically to have economic
considerations applied to them for categorization as mineral reserves, and there is no certainty the
inferred resources will be upgraded to a higher resource category. Consequently, there is no
certainty the results of this PEA will be realized.
This report is considered current as of March 25, 2013.
1.1 Source of Information
This report is based, in part, on internal company technical reports and maps, published government
reports, company letters and memoranda, and public information (Section 27). Several sections from
reports authored by other consultants are directly quoted in this report and are referenced
accordingly. SRK has not conducted detailed land status evaluations and has relied upon previous
qualified reports, public documents, and statements by Mr. Fierro regarding property status and legal
title to the project.
In addition to the site visits described below, a qualified person carried out a study of all relevant
parts of the available literature, documented results concerning the project, and held discussions
regarding all pertinent aspects of the project with technical personnel from the company.

2CG026.000 – Gold Canyon Preliminary Economic Assessment for the Springpole Gold Project, Canada Page 2
AD/NW 2CG026 000_Springpole_PEA_TechnicalReport_20161014_FNL October 7, 2016
1.2 Site Visits
In accordance with NI 43-101 guidelines, Dr. Gilles Arseneau, PGeo, associate consultant with SRK,
visited the project between February 10 and 12, 2012, for two days and again on August 8 and 9,
2012. An additional site visit to the Springpole property was conducted by Dino Pilotto, PEng;
Dr. Maritz Rykaart, PEng; and Bruce Murphy, FSAIMM from November 27 to 29, 2012, accompanied
by Jim Muntzert, senior project manager for Gold Canyon.
The purpose of these site visits was to review the digitalization of the exploration database and
validation procedures, review exploration procedures, define geological modelling procedures,
examine drill core, interview project personnel, and collect all relevant information needed for
preparing the revised mineral resource estimate and preliminary economic assessment. The site
visits also aimed at investigating the geological and structural controls on the distribution of the gold
mineralization to aid the construction of three dimensional gold mineralization domains.
SRK was given full access to relevant data and conducted interviews of Gold Canyon personnel to
obtain information on past exploration work and to understand procedures used to collect, record,
store, and analyze historical and current exploration data. During the visits, particular attention was
given to the treatment and validation of historical drilling data.
1.3 Springpole Gold Project
Abbreviations
A list of abbreviations and acronyms used throughout this report are provided in Section 26.
Units and Currency
Unless otherwise stated, all units used in this report are metric. Gold and silver assay values are
reported in grams per tonne (g/t) unless some other unit is specifically stated. The currency used
throughout this report is in U.S. dollars unless otherwise noted.

2CG026.000 – Gold Canyon Preliminary Economic Assessment for the Springpole Gold Project, Canada Page 3
AD/NW 2CG026 000_Springpole_PEA_TechnicalReport_20161014_FNL October 7, 2016
2 Reliance on Other Experts
The associated QP has not carried out an independent review of mineral titles, but has relied on
information provided by Gold Canyon and on a legal title opinion provided by McMillan LLP, Toronto,
Ontario, dated July 3, 2012.
Although copies of the tenure documents, operating licences, permits, and work contracts were
reviewed, an independent verification of land title and tenure was not performed. SRK has not
verified the legality of any underlying agreement(s) that may exist concerning the licences or other
agreement(s) between third parties, but has relied on the clients solicitor to have conducted the
proper legal due diligence. This reliance is limited to Section 3.3 of this report.
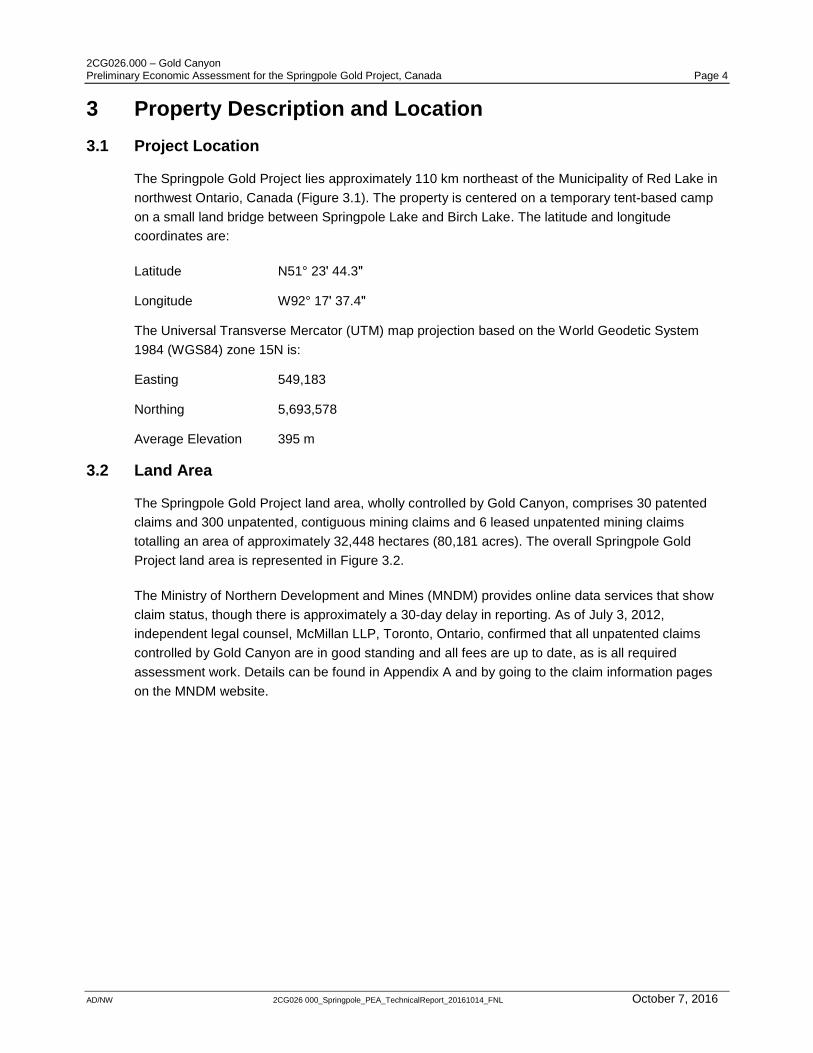
2CG026.000 – Gold Canyon Preliminary Economic Assessment for the Springpole Gold Project, Canada Page 4
AD/NW 2CG026 000_Springpole_PEA_TechnicalReport_20161014_FNL October 7, 2016
3 Property Description and Location
3.1 Project Location
The Springpole Gold Project lies approximately 110 km northeast of the Municipality of Red Lake in
northwest Ontario, Canada (Figure 3.1). The property is centered on a temporary tent-based camp
on a small land bridge between Springpole Lake and Birch Lake. The latitude and longitude
coordinates are:
Latitude N51° 23ʹ 44.3ʺ
Longitude W92° 17ʹ 37.4ʺ
The Universal Transverse Mercator (UTM) map projection based on the World Geodetic System
1984 (WGS84) zone 15N is:
Easting 549,183
Northing 5,693,578
Average Elevation 395 m
3.2 Land Area
The Springpole Gold Project land area, wholly controlled by Gold Canyon, comprises 30 patented
claims and 300 unpatented, contiguous mining claims and 6 leased unpatented mining claims
totalling an area of approximately 32,448 hectares (80,181 acres). The overall Springpole Gold
Project land area is represented in Figure 3.2.
The Ministry of Northern Development and Mines (MNDM) provides online data services that show
claim status, though there is approximately a 30-day delay in reporting. As of July 3, 2012,
independent legal counsel, McMillan LLP, Toronto, Ontario, confirmed that all unpatented claims
controlled by Gold Canyon are in good standing and all fees are up to date, as is all required
assessment work. Details can be found in Appendix A and by going to the claim information pages
on the MNDM website.
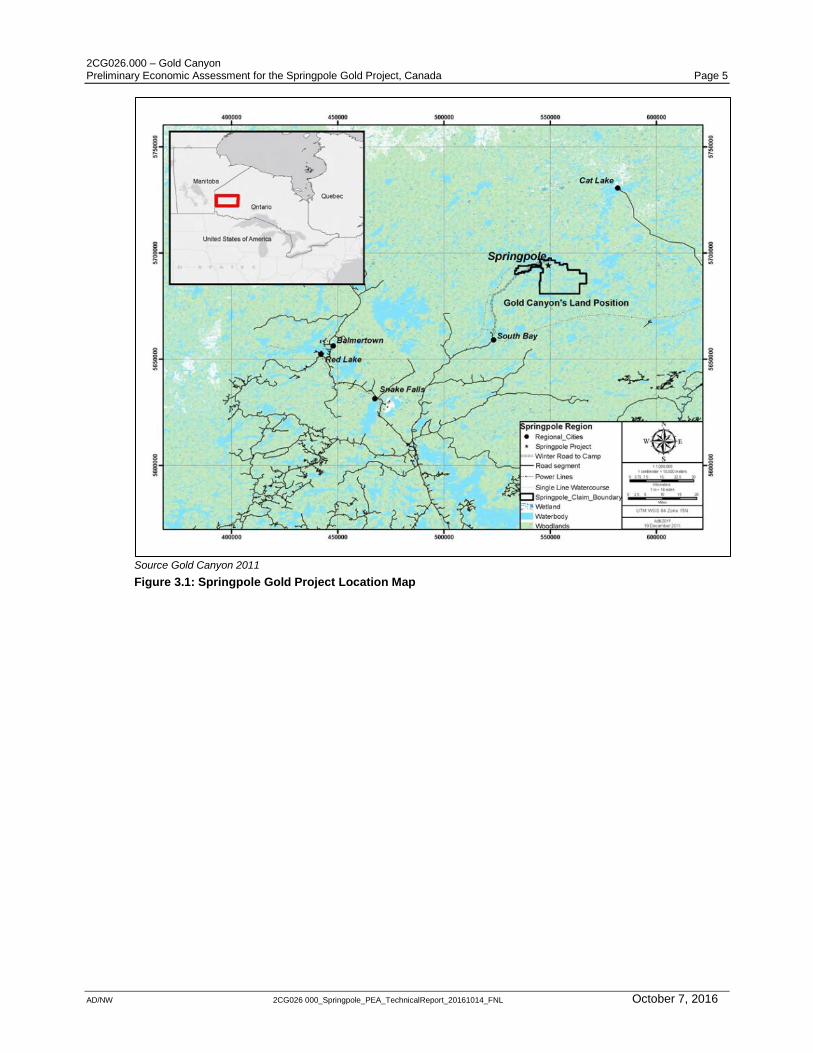
2CG026.000 – Gold Canyon Preliminary Economic Assessment for the Springpole Gold Project, Canada Page 5
AD/NW 2CG026 000_Springpole_PEA_TechnicalReport_20161014_FNL October 7, 2016
Source Gold Canyon 2011
Figure 3.1: Springpole Gold Project Location Map
2CG026.000 – Gold Canyon Preliminary Economic Assessment for the Springpole Gold Project, Canada Page 6
AD/NW 2CG026 000_Springpole_PEA_TechnicalReport_20161014_FNL October 7, 2016
Source Gold Canyon 2011
Figure 3.2: Springpole Gold Project Land Tenure Map
3.3 Mineral Tenure
Claim Ownership
Gold Canyon acquired ownership of five patented claims in 1993 (11229, 11230, 11231, 12868, and
12869) covering a total area of 96.54 ha (238.55 acres) from Milestone Exploration Limited, a
predecessor entity by way of amalgamation of Jubilee Gold Inc. These claims are subject to a 3%
net smelter royalty (NSR) on all minerals mined, produced, and sold from these patented claims,
provided the monthly average gold price is $700 or more. The NSR was increased to 5%, together
with a NSR of 1 to 2.5% on other adjoining properties in which Gold Canyon conducted any mining
operations.
2CG026.000 – Gold Canyon Preliminary Economic Assessment for the Springpole Gold Project, Canada Page 7
AD/NW 2CG026 000_Springpole_PEA_TechnicalReport_20161014_FNL October 7, 2016
In 2010, Gold Canyon renegotiated the applicable NSR on these patented claims with Jubilee This
agreement terminated any applicable royalty on adjoining claims and set the applicable NSR rate
payable upon commencement of commercial production at 3% with advance royalty payments of
$70,000/yr, adjusted using the yearly Consumer Price Index.
Gold Canyon retained an option to acquire 1% of the NSR for $1,000,000 at any time. In
consideration of the renegotiated royalties, the company agreed that previously paid advanced
royalties would be forfeited and not credited to any NSR subsequently payable to Jubilee. The
company paid Jubilee $50,000 and issued to it 100,000 common shares and agreed to issue a
further 100,000 common shares on each anniversary date up to the fifth anniversary of TSX Venture
Exchange approval of the new agreement.
Gold Canyon may terminate all royalty obligations by transfer of the patented claims back to Jubilee.
Gold Canyon retains a right of first refusal on any sale of the remaining royalty interest on certain
terms and conditions. The five patented claims identified above are fee simple parcels with mining
and surface rights attached to all five claims registered with the Land Registry Office, Kenora,
Ontario. The company has confirmed via independent legal counsel the five claims have been
surveyed, are in good standing, and the property taxes are paid to date.
Leased Claims from Shirley Frahm
Gold Canyon leases 10 patented claims (11233-11235, 12896-12901, and 13043) covering a total
area of 182.25 hectares (450.34 acres) from Shirley Frahm of Rochelle, Illinois, USA. These 10
patented claims are fee simple parcels with mining and surface rights attached to all 10 patented
claims registered, together with the notices of lease, with the Land Registry Office in Kenora,
Ontario. The lease is for a term of 21 years less one day and terminates on April 14, 2031. The lease
stipulates Gold Canyon is to pay all applicable property taxes related to the 10 claims during the
lease term together with advance royalty payments on a sliding scale of $50,000/yr (2011-2016),
$60,000 (2016-2021), and $80,000 (2021-2031). These payments are to be credited to future NSR
payables, if any.
A 3% NSR is payable upon commencement of commercial production. On the 10 patented claims,
Gold Canyon retained an option to acquire up to 2% of the NSR for $1,000,000 per 1% at any time.
Gold Canyon has the right to access the 10 claims to conduct mining operations and produce all
ores, minerals, and metals that are or may be found therein or thereon— provided the company has
reserved a small portion of aggregate surface area for the recreational use of Ms. Frahm.
Gold Canyon holds an option to acquire the 10 patented claims and would be required to do so upon
the commencement of commercial production on these or certain adjoining patented claims,
exercisable by the company within five years of date of the lease agreement. This option term is
renewable for a further period of five years by providing notice and a $25,000 payment to Ms.
Frahm. The consideration payable is, at the option of Gold Canyon on exercise or at the option of
Ms. Frahm upon commencement of commercial production, either (a) a $5M with Ms. Frahm
retaining a 1% NSR or (b) $4M with Ms. Frahm retaining a 2% NSR. Gold Canyon retains a right of
first refusal on any sale of the remaining royalty interest on certain terms and conditions. The
company has confirmed via independent legal counsel the 10 patented claims have been surveyed,
are in good standing, and the property taxes are paid to date.
2CG026.000 – Gold Canyon Preliminary Economic Assessment for the Springpole Gold Project, Canada Page 8
AD/NW 2CG026 000_Springpole_PEA_TechnicalReport_20161014_FNL October 7, 2016
Lease Claims from Springpole Group
Gold Canyon has an option and lease to a further 15 patented claims (11236, 12867, 12871-12874,
12902-12909) covering a total area of 310.19 hectares (766.5 acres) from a group of individuals
and/or companies collectively referred to as the “Springpole Group”. These 15 patented claims are
fee simple parcels with mining and surface rights attached to all 15 patented claims registered,
together with the notice of option and lease, with the Land Registry Office, Kenora, Ontario. The term
of the option is for five years with five renewal option periods of five years each. These options can
be exercised by Gold Canyon before expiry of the earlier option period by confirmation of good
standing of the agreement and payment of a $50,000 renewal fee.
Gold Canyon is required to make option payments in the aggregate amount of $35,000/yr and to
expend an aggregate of C$300,000 on mining operations in each option term as a condition of any
renewal and to pay all property taxes related to these patented claims. Gold Canyon is granted
during the option term, the exclusive lease, the right and interest to enter upon the 15 patented
claims, the right to conduct mining operations, and the right to have quiet possession thereof. The
company also has the right, at its discretion to make any use or uses of the 15 patented claims
consistent with the foregoing including the construction of roads, railways, conveyors, plants,
buildings, and aircraft landing areas, as well as the alteration of the surface of the property subject to
all applicable laws. Gold Canyon has reserved a small portion of aggregate surface area for the
recreational use of a cabin by the members of the Springpole Group.
Gold Canyon holds an option to acquire the 15 claims and would be required to do so upon the
commencement of commercial production at any time during the option period by payment of an
aggregate of $2M. Upon exercise of the purchase option, Gold Canyon must also acquire the cabin
on the property for the lesser of fair market value or $20,000. A 3% NSR is applicable during the
option term upon commencement of commercial production or a 1% NSR if the purchase option is
exercised prior to commercial production. Gold Canyon can acquire the remaining 1% NSR by a
payment of $500,000. The company has confirmed via independent legal counsel that the 15
patented claims have been surveyed, are in good standing, and the property taxes are paid to date.
Claims Leased from the Crown
In Ontario, Crown Lands are available to licenced prospectors for the purposes of mineral
exploration. A licenced prospector must first stake an unpatented mining claim to gain the exclusive
right to prospect on Crown Land. Claims can also be staked in areas where surface rights are not
owned by the Crown if the ground is open for staking and mineral rights can be obtained. Claim
staking is governed by the Ontario Mining Act and is administered through the Provincial Mining
Recorder and Mining Lands Consultant Office of the MNDM. A total of 300 contiguous unpatented
mining claims covering approximately 31,776 ha (78,520 acres) make up the greater area of the
Springpole Gold Project and have been staked directly by Gold Canyon. A list of these unpatented
claims including township/area, claim number, recording date, claim due date, and status is included
in Appendix A.
An additional six unpatented mining claims (KRL562895 to KRL562900) and related Crown leases
for surface rights were acquired by Gold Canyon from an individual in July 2011 for an aggregate
payment of $300,000. These claims are subject to a 3% NSR rate payable upon commencement of
2CG026.000 – Gold Canyon Preliminary Economic Assessment for the Springpole Gold Project, Canada Page 9
AD/NW 2CG026 000_Springpole_PEA_TechnicalReport_20161014_FNL October 7, 2016
commercial production with advance royalty payments of $50,000/yr. Gold Canyon retained an
option to acquire all or a portion of the applicable NSR at a rate of $500,000 per 1% of the NSR at
any time. Gold Canyon has permitted the vendor to use a small portion of the property subject to the
Crown leases, including a vacation home, for recreational purposes provided Gold Canyon was
granted a 20 year option to purchase the vacation home for the price determined by an AACI
valuator. The vacation home is required to be purchased upon commencement of commercial
production.
Subsequent to the acquisition, the Crown leases were to expire. In consultation with the MNDM,
Gold Canyon applied for the lease of these claims to be renewed for an additional 21 years, effective
August 31, 2011. As of March 13, 2012, Gold Canyon has confirmed via independent legal counsel
that it has complied with all the requirements for lease renewal and that payment has been received
by the MNDM. Gold Canyon subsequently received the lease renewal from the Crown Lands Office.
Claim Maintenance
All unpatented claims are liable for inspection at any time by the MNDM and may be cancelled for
irregularities or fraud in the staking process. Disputes of mining claims by third parties are accepted
after one year of the recording date or after the first unit of assessment work is filed and approved. A
claim remains valid as long as the claim holder properly completes and files the assessment work as
required by the Mining Act and the Minister approves the assessment work.
To keep an unpatented mining claim current, the mining claim holder must perform $400 per mining
claim unit worth of approved assessment work per year, immediately following the initial staking
date. The claim holder has two years to file one year worth of assessment work.
Surface rights are separate from mining rights. Should any method of mining be appropriate, other
than those claims for which Crown leases were issued, the surface rights would need to be secured.
3.4 Environmental Liabilities
PDAC’s Excellence in Environmental Stewardship e-toolkit (PDAC 2009) is used to ensure best
practice methods are applied to mineral exploration at Springpole. Improvements to critical areas
that affect the environment are underway at all times in an attempt to reduce the environmental
footprint of exploration activities. No material environmental liabilities or public hazards associated
with the Springpole Gold Project are known to exist on the property. A temporary camp (~0.5 ha)
with wood frame tents was erected for ongoing drilling campaigns. There has been occasional
surface clearing related to past drilling work.
3.5 Permits
GCU complies with permit, notice and consultation requirements as they relate to the on-going
exploration work on the project. Legislation that requires material permits and notices include the
provincial Mining Act, Public Lands Act, Lakes and Rivers Improvement Act, Ontario Water
Resources Act, as well as the federal Fisheries Act.
Gold Canyon has initiated negotiations with surrounding First Nations communities, but to date no
formal memorandum of understanding agreements have been signed.
2CG026.000 – Gold Canyon Preliminary Economic Assessment for the Springpole Gold Project, Canada Page 10
AD/NW 2CG026 000_Springpole_PEA_TechnicalReport_20161014_FNL October 7, 2016
4 Accessibility, Climate, Local Resources, Infrastructure and Physiography
4.1 Accessibility
During late spring, summer, and early fall, the Springpole Gold Project is accessible by floatplane
direct to Springpole Lake or Birch Lake. All fuel, food, and material supplies are flown in from Red
Lake or Pickle Lake, Ontario, or from Winnipeg, Manitoba, with flight distances of 110 km, 167 km,
and 370 km, respectively. The closest road access at present is the landing at the old South Bay
Mine on Confederation Lake, approximately 50 km away by air.
During winter, an ice road approximately 85 km long is constructed from the South Bay landing point
on Confederation Lake to a point about 1 km from Springpole Lake camp (Figure 3.1). During
breakup in spring and freeze-up in fall, access to Springpole is by helicopter.
4.2 Local Resources and Infrastructure
There is no existing infrastructure within 50 km of the Springpole Gold Project area. Businesses in
Red Lake, a long established mining community 110 km to the southwest, provide the majority of the
camp’s supply needs. The nearest emergency medical facilities are at the Margaret Cochenour
Hospital in Red Lake.
The nearest major city is Winnipeg, Manitoba, which is approximately 370 km southwest of
Springpole and about a 1.3 hour flight by Cessna Caravan.
4.3 Climate and Physiography
January temperatures range between -40°C and 0°C, and July temperatures range between 20°C
and 40°C.
Springpole and Birch Lakes are part of the Albany River system, which flows eastward into Cat River
and then northward into Hudson Bay. The property is underlain by glaciated terrain characteristic of
a large part of the Canadian Shield. Land areas are generally of low relief with less than 30 m of
local elevation and are separated by a series of interconnected, shallow lakes.
Tree cover consists of mature spruce, balsam, birch and poplar. Black spruce and muskeg swamps
occupy low-lying areas. Glacial till is generally less than 1 m in thickness. Outcrops are limited and
small and are generally covered by a thick layer of moss or muskeg.
Figure 4.1 displays the typical landscape of the Springpole Gold Project area. Note the drill rig
working on Springpole Lake near the shore.
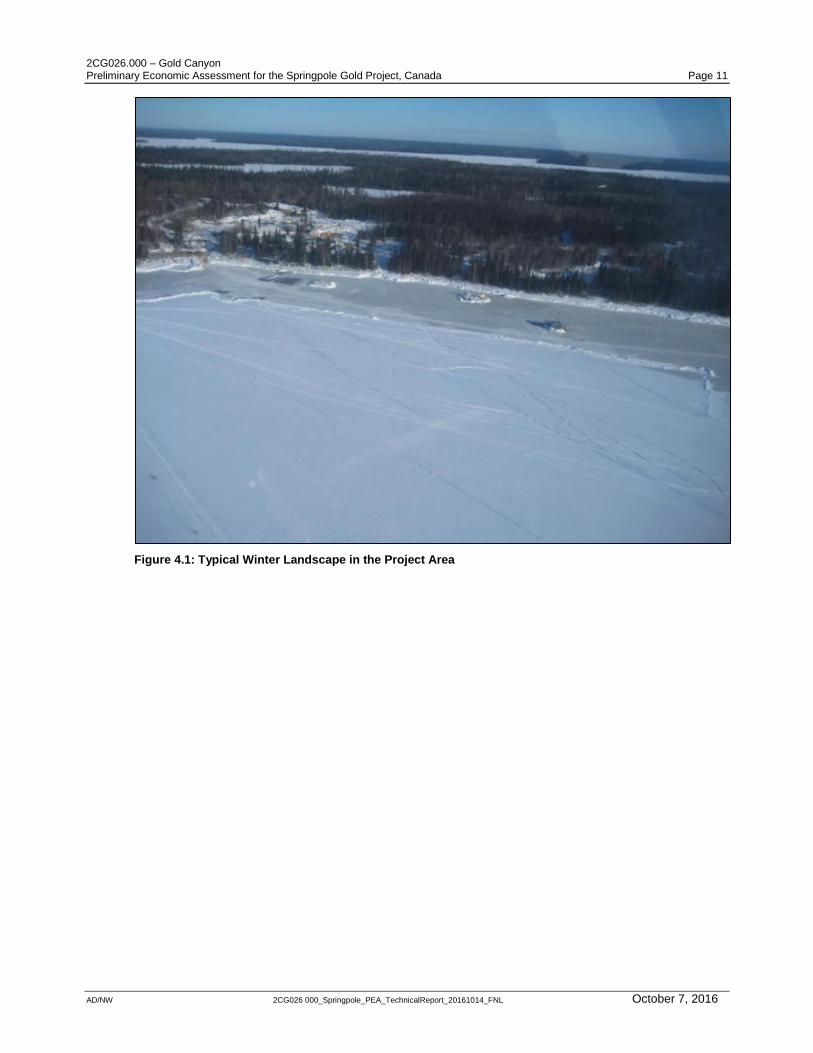
2CG026.000 – Gold Canyon Preliminary Economic Assessment for the Springpole Gold Project, Canada Page 11
AD/NW 2CG026 000_Springpole_PEA_TechnicalReport_20161014_FNL October 7, 2016
Figure 4.1: Typical Winter Landscape in the Project Area

2CG026.000 – Gold Canyon Preliminary Economic Assessment for the Springpole Gold Project, Canada Page 12
AD/NW 2CG026 000_Springpole_PEA_TechnicalReport_20161014_FNL October 7, 2016
5 History
The history of the Springpole Gold Project prior to 2006 is excerpted from the Technical Report and
Resource Estimate on the Springpole Lake Gold Property (Armstrong et al 2006). Drill log
compilation and assay data compilation have formed an important part of the work presented in this
report.
Gold exploration on the property was carried out during two main periods, one during the 1920s to
1940s, and a second period from 1985 to the present.
In 1925, the discovery of gold at Red Lake brought prospectors into the Springpole Lake area.
Visible gold in outcrop on the property was first discovered north of the Birch-Springpole Lake
portage and prospected by Northern Aerial Mineral Exploration Ltd. in 1928 (Harding 1936). The
showing was initially covered with eight claims around 1933 by prospector Tom Dunkin, who then
completed the first stripping and shallow trenching in 1934.
Between 1933 and 1936, the Windigokan Sturgeon Mining Syndicate conducted extensive trenching
and prospecting, including 10 short holes totalling 458.5 m (1,504 ft). The claims were then
transferred to Springpole Mines Ltd. who carried out limited trenching and prospecting in 1945.
The Casey Summit Mine (later renamed the Casummit Mine), approximately 10 km to the north,
started operation around this time. This mine ultimately produced 101,975 oz of gold and 9,788 oz of
silver (Beakhouse 1990) and is the only significant past producer of precious metals in the Birch-
Springpole Lake area.
This early prospecting activity and production from the Casummit Mine region prompted a more
detailed geological investigation of the vicinity by the Ontario Department of Mines. The Birch Lake
area was mapped at a scale of 1:63,360 by Harding (1936).
Reconnaissance-style mapping of the Birch-Springpole Lake area has since been repeated four
times:
1. To study volcanic characteristics of selected Superior Province greenstone belts (Goodwin
1967),
2. To extend volcanic stratigraphy hosting the South Bay base metal mine into the Springpole area
(Thurston et al. 1981),
3. To stimulate gold exploration in the area after closure of several mines near Red Lake (Good et
al. 1988), and
4. To study the stratigraphy of epiclastic and volcaniclastic facies units, northern Birch-Uchi
greenstone belt (Devaney 2001a).
The area remained dormant until 1985 when Goldfields Canadian Mining, Ltd. (GFCM) optioned the
Frahm claims and, in 1986, the Milestone claims and Maple Leaf (now Springpole Group) claims.
GFCM conducted an airborne (Aerodat) geophysical survey in 1985 over the entire claim group. On
2CG026.000 – Gold Canyon Preliminary Economic Assessment for the Springpole Gold Project, Canada Page 13
AD/NW 2CG026 000_Springpole_PEA_TechnicalReport_20161014_FNL October 7, 2016
the 30 patented claims (Frahm, Milestone, and Springpole Group), line cutting was done at both 30.5
m (100ft) centers (Milestone claims) and 61 m (200ft) centers (Frahm and Springpole Group
claimes). Subsequently, geological mapping, humus geochemistry, and ground geophysics (VLF,
Mag, and IP) were conducted over the grids.
From 1986 through 1989, GFCM completed 118 diamond drill holes in seven drill phases totalling
38,349 m (125,816 ft). In addition, during 1986 and 1987, approximately 116,119 m2 (1.25 ft2) of
mechanical stripping was carried out by the company, and four petrographic reports were produced.
As a result of this work, GFCM identified several gold-bearing zones on the property that included:
the Portage zone, entirely under the lake but the largest of the zones and, therefore, the main
focus of the bulk of the exploration work;
the Jasper zone, a deep narrow higher grade zone in a banded iron formation horizon; and
several smaller but higher grade zones on the land portion of the property and close to surface,
including the Main zone, Vein zone, Hillside zone, Camp zone, North Porphyry zone and East
Extension zone.
Late in 1989, GFCM entered into a 50/50 joint venture with the combined interests of Noranda and
Akiko-Lori Resources Ltd.
From 1989 through 1992 Noranda conducted an IP survey over the central portion of the Portage
zone under Springpole Lake and tested the property with eighteen core holes totalling 6,195 m
(20,323 ft). The majority of the drilling was conducted on the Portage zone.
At the same time, and under a separate option agreement with BP Resources Canada, Noranda
completed a seven core hole drill program around the east margins of Springpole Lake on claims
then owned by BP Resources. BP Resources in turn completed lake-bottom sediment sampling of
Springpole Lake east of Johnson Island.
In 1992, Noranda dropped its interest in the property leaving Akiko-Lori to carry out further
exploration while carrying its 50% partnership with GFCM. During 1993 and 1994, Akiko-Lori/Akiko
Gold completed an additional 15 diamond drill holes on the Portage zone totalling 4,850 m (15,913
ft).
By 1995, Akiko Gold was reorganized into Gold Canyon Resources Inc. and GFCM's interest was
acquired by Santa Fe Mining as part of an asset exchange with London based Hanson Plc., which
controlled GFCM. During 1995, a joint venture between Gold Canyon and Santa Fe carried out an
exploration program consisting of remapping of the main area, of some of the existing drill core, and
a reinterpretation of the geology.
During the 1995 and 1996 programs, Santa Fe drilled an additional 69 holes totalling 15,085 m
(49,492 ft) on the Springpole Gold Project proper and two drill holes on Johnson Island. By late
1996, the takeover of Santa Fe by Newmont Gold Company was nearing completion. Just prior to
the merger with Newmont, Santa Fe exchanged their 50% interest in the property for a tax credit that
left Gold Canyon with a 100% ownership. After Santa Fe’s departure, Gold Canyon continued
exploration in 1997 and 1998 with another 51 core holes totalling 5,642 m (18,510 ft).
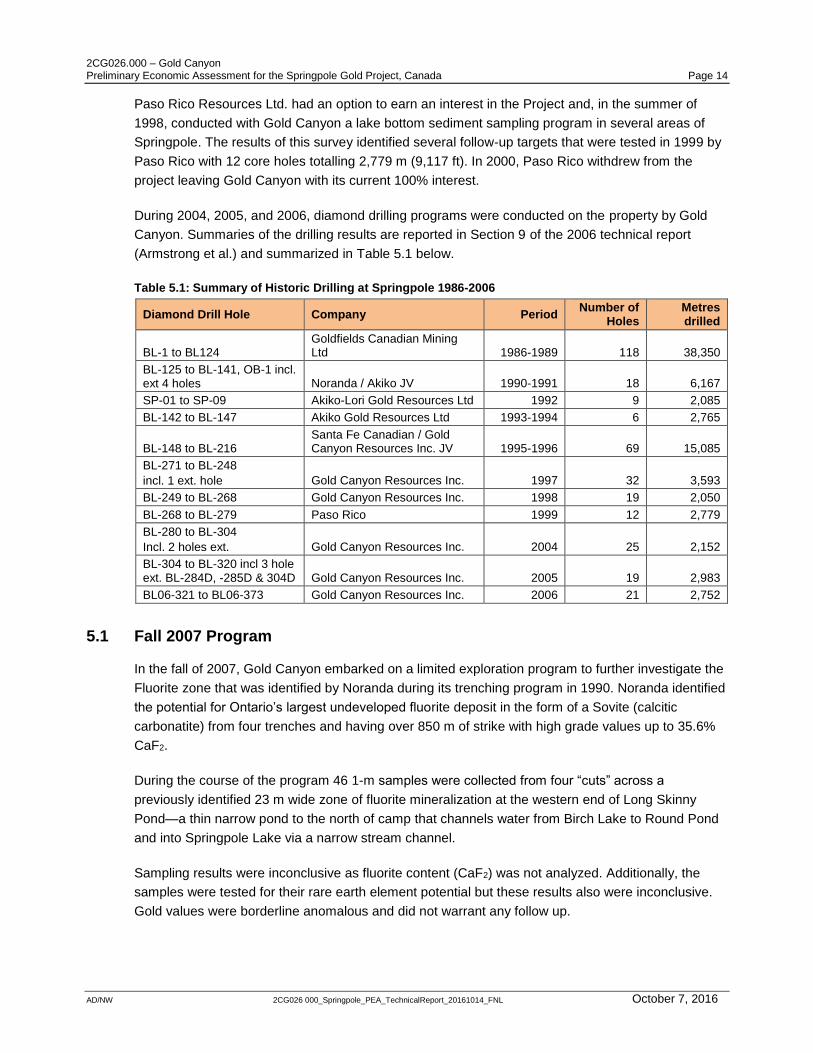
2CG026.000 – Gold Canyon Preliminary Economic Assessment for the Springpole Gold Project, Canada Page 14
AD/NW 2CG026 000_Springpole_PEA_TechnicalReport_20161014_FNL October 7, 2016
Paso Rico Resources Ltd. had an option to earn an interest in the Project and, in the summer of
1998, conducted with Gold Canyon a lake bottom sediment sampling program in several areas of
Springpole. The results of this survey identified several follow-up targets that were tested in 1999 by
Paso Rico with 12 core holes totalling 2,779 m (9,117 ft). In 2000, Paso Rico withdrew from the
project leaving Gold Canyon with its current 100% interest.
During 2004, 2005, and 2006, diamond drilling programs were conducted on the property by Gold
Canyon. Summaries of the drilling results are reported in Section 9 of the 2006 technical report
(Armstrong et al.) and summarized in Table 5.1 below.
Table 5.1: Summary of Historic Drilling at Springpole 1986-2006
Diamond Drill Hole Company Period Number of
Holes Metres drilled
BL-1 to BL124 Goldfields Canadian Mining Ltd 1986-1989 118 38,350
BL-125 to BL-141, OB-1 incl. ext 4 holes Noranda / Akiko JV 1990-1991 18 6,167
SP-01 to SP-09 Akiko-Lori Gold Resources Ltd 1992 9 2,085
BL-142 to BL-147 Akiko Gold Resources Ltd 1993-1994 6 2,765
BL-148 to BL-216 Santa Fe Canadian / Gold Canyon Resources Inc. JV 1995-1996 69 15,085
BL-271 to BL-248
incl. 1 ext. hole Gold Canyon Resources Inc. 1997 32 3,593
BL-249 to BL-268 Gold Canyon Resources Inc. 1998 19 2,050
BL-268 to BL-279 Paso Rico 1999 12 2,779
BL-280 to BL-304
Incl. 2 holes ext. Gold Canyon Resources Inc. 2004 25 2,152
BL-304 to BL-320 incl 3 hole ext. BL-284D, -285D & 304D Gold Canyon Resources Inc. 2005 19 2,983
BL06-321 to BL06-373 Gold Canyon Resources Inc. 2006 21 2,752
5.1 Fall 2007 Program
In the fall of 2007, Gold Canyon embarked on a limited exploration program to further investigate the
Fluorite zone that was identified by Noranda during its trenching program in 1990. Noranda identified
the potential for Ontario’s largest undeveloped fluorite deposit in the form of a Sovite (calcitic
carbonatite) from four trenches and having over 850 m of strike with high grade values up to 35.6%
CaF2.
During the course of the program 46 1-m samples were collected from four “cuts” across a
previously identified 23 m wide zone of fluorite mineralization at the western end of Long Skinny
Pond—a thin narrow pond to the north of camp that channels water from Birch Lake to Round Pond
and into Springpole Lake via a narrow stream channel.
Sampling results were inconclusive as fluorite content (CaF2) was not analyzed. Additionally, the
samples were tested for their rare earth element potential but these results also were inconclusive.
Gold values were borderline anomalous and did not warrant any follow up.
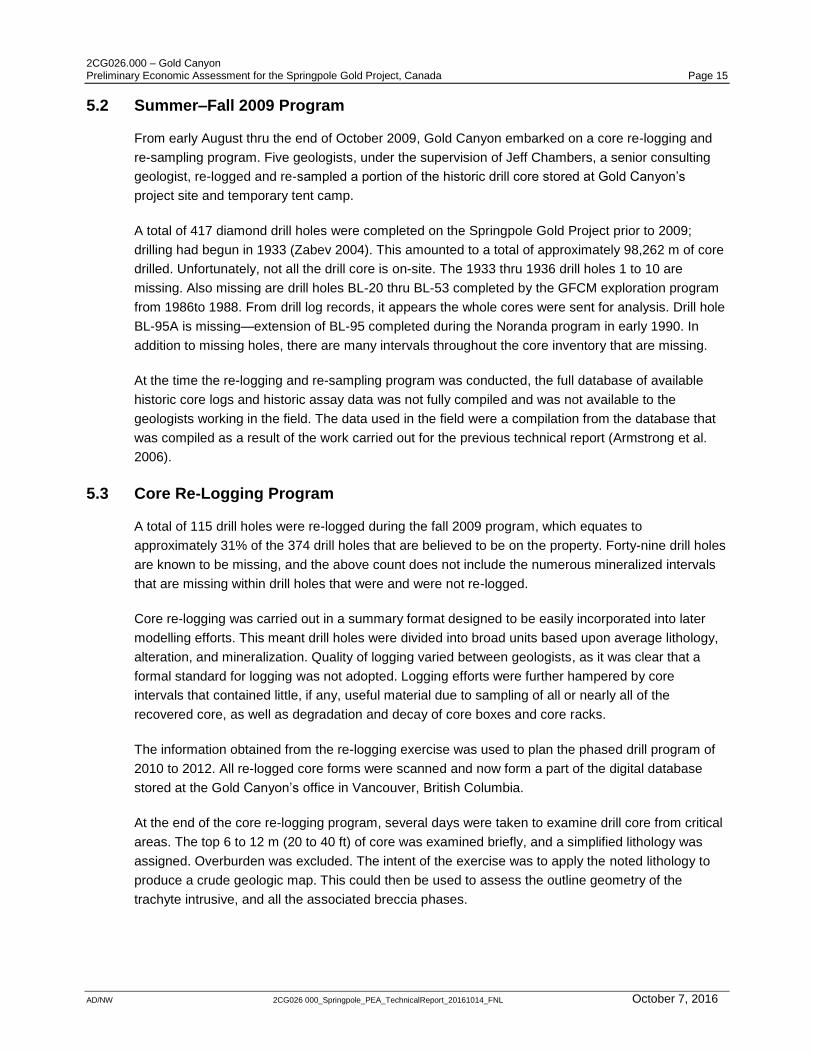
2CG026.000 – Gold Canyon Preliminary Economic Assessment for the Springpole Gold Project, Canada Page 15
AD/NW 2CG026 000_Springpole_PEA_TechnicalReport_20161014_FNL October 7, 2016
5.2 Summer–Fall 2009 Program
From early August thru the end of October 2009, Gold Canyon embarked on a core re-logging and
re-sampling program. Five geologists, under the supervision of Jeff Chambers, a senior consulting
geologist, re-logged and re-sampled a portion of the historic drill core stored at Gold Canyon’s
project site and temporary tent camp.
A total of 417 diamond drill holes were completed on the Springpole Gold Project prior to 2009;
drilling had begun in 1933 (Zabev 2004). This amounted to a total of approximately 98,262 m of core
drilled. Unfortunately, not all the drill core is on-site. The 1933 thru 1936 drill holes 1 to 10 are
missing. Also missing are drill holes BL-20 thru BL-53 completed by the GFCM exploration program
from 1986to 1988. From drill log records, it appears the whole cores were sent for analysis. Drill hole
BL-95A is missing—extension of BL-95 completed during the Noranda program in early 1990. In
addition to missing holes, there are many intervals throughout the core inventory that are missing.
At the time the re-logging and re-sampling program was conducted, the full database of available
historic core logs and historic assay data was not fully compiled and was not available to the
geologists working in the field. The data used in the field were a compilation from the database that
was compiled as a result of the work carried out for the previous technical report (Armstrong et al.
2006).
5.3 Core Re-Logging Program
A total of 115 drill holes were re-logged during the fall 2009 program, which equates to
approximately 31% of the 374 drill holes that are believed to be on the property. Forty-nine drill holes
are known to be missing, and the above count does not include the numerous mineralized intervals
that are missing within drill holes that were and were not re-logged.
Core re-logging was carried out in a summary format designed to be easily incorporated into later
modelling efforts. This meant drill holes were divided into broad units based upon average lithology,
alteration, and mineralization. Quality of logging varied between geologists, as it was clear that a
formal standard for logging was not adopted. Logging efforts were further hampered by core
intervals that contained little, if any, useful material due to sampling of all or nearly all of the
recovered core, as well as degradation and decay of core boxes and core racks.
The information obtained from the re-logging exercise was used to plan the phased drill program of
2010 to 2012. All re-logged core forms were scanned and now form a part of the digital database
stored at the Gold Canyon’s office in Vancouver, British Columbia.
At the end of the core re-logging program, several days were taken to examine drill core from critical
areas. The top 6 to 12 m (20 to 40 ft) of core was examined briefly, and a simplified lithology was
assigned. Overburden was excluded. The intent of the exercise was to apply the noted lithology to
produce a crude geologic map. This could then be used to assess the outline geometry of the
trachyte intrusive, and all the associated breccia phases.

2CG026.000 – Gold Canyon Preliminary Economic Assessment for the Springpole Gold Project, Canada Page 16
AD/NW 2CG026 000_Springpole_PEA_TechnicalReport_20161014_FNL October 7, 2016
A total of 2,580 samples were taken from the historic drill core. This included 132 standards, blanks,
and duplicates, totalling approximately 5% of the number of samples collected. All samples were
taken from drill core that was re-sampled by cutting the remaining drill core in half. This resulted in
either a half or a quarter of the core remaining, depending on whether the interval had been sampled
originally. Due to the small core diameter, core was not cut to less than one-quarter to preserve
material for future reference. Table 5.2 represents significant intercepts from historic drilling
combined with the re-sampling work outlined here.
At the end of the core re-sampling program, 14 samples for thin-section petrographic analysis and 3
samples for mineral petrographic analysis were collected. The samples collected were deemed
representative of the principal lithologies occurring across the Springpole Gold Project.
2CG026.000 – Gold Canyon Preliminary Economic Assessment for the Springpole Gold Project, Canada Page 17
AD/NW 2CG026 000_Springpole_PEA_TechnicalReport_20161014_FNL May 3, 2013
Table 5.2: Historic Significant Intercepts from 2009 Re-Sampling Program
Main Zone Portage Zone East Extension & Main Zone
Drill Hole From To Interval
Au grade
Drill Hole From To Interval
Au grade
Drill Hole From To Interval
Au grade
(m) (m) (m) (g/t) (m) (m) (m) (g/t) (m) (m) (m) (g/t)
01 22.48 27.14 4.65 6.04 92-01 100.43 118.44 18.01 3.72 BL12 25.92 38.72 12.80 1.85
BL1 43.90 53.96 10.06 4.57 92-04 194.66 204.88 10.22 7.11 BL115 99.38 110.98 11.59 2.73
BL102 42.38 49.08 6.70 11.60 92-06 175.45 191.80 16.34 5.58 BL162 35.98 56.41 20.43 1.15
BL103 29.27 34.45 5.18 2.44 BL100 158.23 178.66 20.43 3.53 BL163 7.10 28.05 20.95 4.78
BL11 214.63 224.09 9.45 6.53 BL121 104.91 140.55 35.64 7.57 incl 16.16 28.05 11.89 7.92
BL11 295.42 317.38 21.96 1.75 BL122 163.41 241.16 77.75 1.57 BL163 88.20 102.44 14.23 2.07
BL157 60.68 62.20 1.52 206.74 incl 166.77 177.13 10.36 6.70 BL165 9.45 39.94 30.49 2.92
BL160 16.46 26.53 10.06 16.19 BL125 110.13 117.53 7.40 2.41 incl 17.98 33.23 15.24 4.38
BL161 4.48 25.61 21.13 3.61 BL125 150.74 158.74 8.00 5.68 BL166 10.36 24.39 14.02 1.42
BL183 105.80 119.82 14.02 1.33 BL126 104.33 120.13 15.80 2.60 BL168 72.26 87.50 15.24 1.60
BL190 110.06 111.28 1.22 15.70 BL127 123.53 131.73 8.20 7.07 BL172 18.14 39.63 21.49 10.44
BL197 40.30 54.60 14.30 1.54 BL128 174.04 211.65 37.61 2.13 incl 25.92 29.27 3.35 50.50
BL198 87.68 99.99 12.31 1.52 BL129 139.04 185.05 46.01 1.57 BL202 40.24 68.97 28.73 1.73
BL209 455.48 456.34 0.85 182.06 BL131 91.32 238.26 146.94 1.09 BL204 44.82 53.96 9.14 20.53
BL23 77.65 87.50 9.85 9.60 Incl 199.05 214.05 15.00 2.06 incl 45.73 47.16 1.43 136.58
incl 86.89 87.50 0.61 109.37 BL132 234.66 258.97 24.31 2.06 BL217 14.66 42.07 27.41 14.96
BL25 200.97 233.54 32.57 1.66 BL26 93.29 154.27 60.98 2.29 incl 14.66 15.24 0.58 46.18
BL264 5.18 45.73 40.55 4.56 BL308 154.76 179.27 24.51 1.29 incl 19.55 22.26 2.71 39.08
incl 5.18 13.72 8.54 7.04 BL308 214.45 321.34 106.89 2.35 incl 35.06 42.07 7.01 35.37
incl 34.39 42.56 8.17 8.96 Incl 225.06 241.49 16.43 5.81 BL220 16.25 54.52 38.26 3.54
BL280 15.85 23.14 7.28 4.59 BL310 98.08 118.54 20.46 1.77 incl 16.25 17.38 1.12 54.17
BL282D 95.70 97.41 1.70 17.84 BL310 136.62 151.53 14.91 2.91 BL221 2.13 17.34 15.21 2.92
BL285D 20.63 26.53 5.89 2.23 BL311 133.23 145.43 12.19 2.48 BL222 3.66 28.66 25.00 5.85
BL3 4.27 55.48 51.21 2.14 Incl 134.75 137.49 2.74 6.91 incl 17.38 18.76 1.38 73.03
incl 45.12 50.00 4.88 14.87 BL312 36.89 66.16 29.27 1.43 BL225 3.05 26.22 23.16 2.66
BL300 45.73 49.69 3.96 4.01 BL33 258.94 274.69 15.75 1.22 incl 21.95 26.22 4.26 12.13
BL302 27.44 31.53 4.09 3.73 BL41 110.37 134.63 24.27 2.70 227 87.95 92.98 5.03 5.25
BL303 44.82 63.94 19.12 5.00 BL41 164.63 282.92 118.29 1.64 BL228 43.29 67.84 24.55 18.63
BL305 67.56 68.90 1.34 23.87 Incl 233.84 263.11 29.27 2.92 incl 65.25 66.16 0.91 120.99
BL306 23.88 63.85 39.97 1.01 Incl 235.67 242.99 7.32 5.15 BL292 20.63 40.67 20.04 10.28
incl 33.84 38.29 4.45 4.76 BL42 101.52 127.44 25.92 1.05 incl 37.62 39.24 1.62 49.99
BL307 16.31 49.78 33.47 1.21 BL67 196.95 218.30 21.34 2.11 BL296 53.72 103.54 49.81 3.87
BL354 85.03 85.79 0.76 30.31 BL69 216.77 219.82 3.05 21.07 incl 59.40 59.84 0.45 102.00
BL356 36.89 40.91 4.02 31.67 BL79 248.78 253.35 4.57 6.09 incl 63.91 65.37 1.46 47.85
incl 39.94 40.91 0.97 127.13 BL80 448.47 460.67 12.20 2.52 incl 85.97 87.50 1.53 32.16
BL68 150.15 284.36 134.21 1.41 BL85 344.59 380.80 36.21 1.40 BL328 8.99 54.02 45.03 3.25
incl 150.15 181.16 31.01 1.88 BL88 297.52 350.91 53.38 1.97 incl 41.34 49.69 8.35 8.61
incl 217.98 243.90 25.92 2.30 BL90 65.86 76.04 10.18 3.92 BL330 33.84 34.45 0.61 16.59
BL7 50.61 68.90 18.28 1.57 BL93 169.20 178.66 9.45 2.25 BL336 173.72 174.60 0.88 14.02
BL9 25.00 37.20 12.20 4.23 BL94 264.03 271.65 7.62 2.09 BL340 25.46 39.97 14.51 15.54
incl 28.87 34.76 5.89 7.18 BL95 396.04 417.11 21.07 1.66 incl 35.34 39.97 4.63 43.64
BL96 39.63 58.71 19.08 2.89 BL99 198.47 314.33 115.86 1.53 BL343 25.70 56.13 30.43 4.33
incl 53.56 58.72 5.15 8.49 incl 25.70 29.64 3.94 27.38
BL98 39.94 73.48 33.54 1.16
2CG026.000 – Gold Canyon Preliminary Economic Assessment for the Springpole Gold Project, Canada Page 18
AD/NW 2CG026 000_Springpole_PEA_TechnicalReport_20161014_FNL October 7, 2016
6 Geological Setting and Mineralization
6.1 Regional Geology
The following excerpt is quoted from Devaney (2001b) and provides the most concise geologic
description of the regional geology of the Springpole-Birch Lake area:
The Birch-Uchi Greenstone Belt (Figure 6.1) is the portion of the Uchi Sub-province with an
arcuate, concave to the southeast, (i.e., a major oroclinal bend between the Red Lake and
Meen-Dempster portions of the sub-province). Studies of the southern part of the Birch-Uchi
greenstone belt as a rootless greenstone belt only a few kilometres thick, have revealed a
long (ca. 3.0 to 2.7 Ga), multistage history of crustal development. Based on mapping,
lithogeochemistry, and radiometric dating, the supracrustal rocks of the greenstone belt were
subdivided into three stratigraphic group-scale units (listed in decreasing age): the Balmer,
Woman and Confederation assemblages. This three-part subdivision was applied to most of
the Uchi Subprovince. The Confederation assemblage is thought to be a continental margin
(Andean-type) arc succession, versus the less certain tectono-stratigraphic context of the
other assemblages. Workers performing recent and ongoing studies of the southern Birch-
Uchi greenstone belt and the Red Lake greenstone belt (i.e., the Western Uchi Subprovince
NATMAP Project) have proposed some modifications and additions to the Balmer-Woman-
Confederation stratigraphic scheme. As discussed herein, some relatively small
conglomeratic units likely form a synorogenic, discontinuously distributed, post-
Confederation assemblage in the Birch-Uchi greenstone belt. Radiometrically dated plutons
within the Birch-Uchi greenstone belt are of post-Confederation assemblage, ca. 2725-2700
Ma age.
The northern margin of the Birch-Uchi greenstone belt forms a pattern of sub-regional scale
cusps of supracrustal strata alternating with batholiths. Basaltic units are prominent around
the periphery of the greenstone belt and may be part of the Woman assemblage but the
accuracy of this stratigraphic assignment is unknown. Based on a ca. 2740 Ma age of
Shabumeni Lake [intermediate to felsic fragmental] volcanic rocks at a site near the northern
greenstone belt margin, suggested that Confederation assemblage age rocks make up the
bulk of the greenstone belt.
It is noteworthy that in many of the regional geology descriptions of the Birch-Uchi Greenstone Belt,
especially those in the vicinity of Springpole and Birch Lakes, the structural geology is poorly
understood. Many authors make relatively brief mention of the complexities that dominate the
geology and geomorphology of the low lying areas. However, the Archean Orogenic gold deposit
model developed by various authors has been applied to the mineral deposits of the Archean
Superior Province. Recent concise summaries of these orogenic gold deposits can be found Groves
et al. (1998), Hagemann and Cassidy (2000), Goldfarb et al. (2005), and Robert et al.(2005).
Orogenic gold deposits are epigenetic, structurally controlled gold deposits that are hosted in
orogenic belts. They are generally accepted as having formed during late stages of continental
collision. Most of the discovered orogenic gold deposits in the world occur in greenstone belts
situated on the margins or within Archean cratons in North America, Australia, and southern Africa.
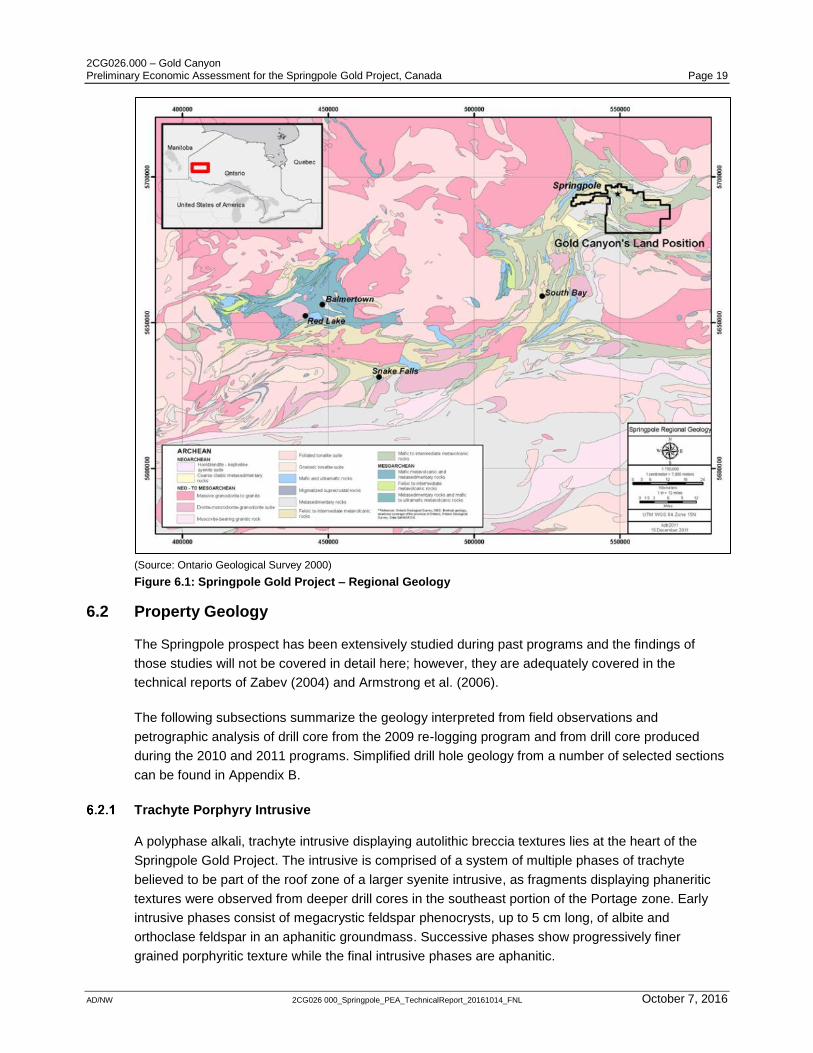
2CG026.000 – Gold Canyon Preliminary Economic Assessment for the Springpole Gold Project, Canada Page 19
AD/NW 2CG026 000_Springpole_PEA_TechnicalReport_20161014_FNL October 7, 2016
(Source: Ontario Geological Survey 2000)
Figure 6.1: Springpole Gold Project – Regional Geology
6.2 Property Geology
The Springpole prospect has been extensively studied during past programs and the findings of
those studies will not be covered in detail here; however, they are adequately covered in the
technical reports of Zabev (2004) and Armstrong et al. (2006).
The following subsections summarize the geology interpreted from field observations and
petrographic analysis of drill core from the 2009 re-logging program and from drill core produced
during the 2010 and 2011 programs. Simplified drill hole geology from a number of selected sections
can be found in Appendix B.
Trachyte Porphyry Intrusive
A polyphase alkali, trachyte intrusive displaying autolithic breccia textures lies at the heart of the
Springpole Gold Project. The intrusive is comprised of a system of multiple phases of trachyte
believed to be part of the roof zone of a larger syenite intrusive, as fragments displaying phaneritic
textures were observed from deeper drill cores in the southeast portion of the Portage zone. Early
intrusive phases consist of megacrystic feldspar phenocrysts, up to 5 cm long, of albite and
orthoclase feldspar in an aphanitic groundmass. Successive phases show progressively finer
grained porphyritic texture while the final intrusive phases are aphanitic.

2CG026.000 – Gold Canyon Preliminary Economic Assessment for the Springpole Gold Project, Canada Page 20
AD/NW 2CG026 000_Springpole_PEA_TechnicalReport_20161014_FNL October 7, 2016
In 2009 and 2010, Gold Canyon carried out petrographic studies (Saunders and McIntosh 2009,
2010) of historic drill core and drill core from the drill holes SP10-001 through SP11-006. The study
confirmed trachyte intrusive is the dominant lithology within the project area and is a host to
mineralization. Interpretation of the intrusive complex is complicated by a mixture of overprinted
regional and local metamorphic events related to burial and tectonism Pervasive alteration and
metamorphism have reduced the original porphyry intrusive to a complex alteration assemblage
dominated by sericite, biotite, pyrite, calcite/dolomite, and quartz. Primary igneous textures are
remarkably well preserved in places and give indications to the possible genesis of the initial phase
of gold mineralization. Within the country rocks to the north and east are trachyte and lamprophyre
dikes and sills that source from the trachyte - or syenite-porphyry intrusive system.
Confederation Age Volcanic and Siliciclastic Rocks
The country rocks pre-date the alkali intrusive and are composed of a complex sequence of altered
and metamorphosed intermediate andesitic volcanic rocks and associated volcaniclastics,
siliciclastic sedimentary rocks, chemical sediments including banded iron formation (BIF), and
coarse pebble conglomerates. Devaney (2001a) indicates that the sediments are likely of the
Confederation assemblage dating at around 2,740 Ma, representing the proximal portions of a mixed
volcanic-sedimentary basin.
“Timiskaming-type” Conglomerates
Barron (1996) states pebble conglomerate outcrops between Springpole Lake and Birch Lake
contain clasts of the trachyte porphyry, suggesting that the “Timiskaming-type” conglomerates
postdate intrusion. Devaney (2001a) suggests these arcuate form conglomerates represent late
orogenic, deformed, dextral sense strike-slip (pull-apart) basins of “Timiskaming-type,” late Archean,
post Confederation assemblage age rocks.
6.3 Structure
Deformation has added complexity to the apparent geometry of, and the potential of, the Springpole
gold deposit. Gravity and magnetic surveys carried out across the Springpole Gold Project
demonstrate that several phases of deformation are evident. Banded iron formations describe north-
northwest facing tight to isoclinal antiforms and synforms, and are illustrated on the property geologic
map produced during the Summer 2005 Mapping Program (Armstrong et al. 2006) and are evident
as strong magnetic anomalies on the aeromagnetic surveys conducted by Fugro.
In 2011, SRK was contracted to carry out a preliminary study of the structural controls on
mineralized deposit geometry. The study found the deposit was subjected to several deformational
events including, but not limited to:
Early folding resulting in tight to isoclinal fold geometries and development of associated shear
zones,
Intermediate large scale, potentially deep rooted shear zones, and
Late stage brittle faulting.
2CG026.000 – Gold Canyon Preliminary Economic Assessment for the Springpole Gold Project, Canada Page 21
AD/NW 2CG026 000_Springpole_PEA_TechnicalReport_20161014_FNL October 7, 2016
Further study is required to definitively establish the relationship of the timing of deformational events
with respect to economic mineralization.
6.4 Alteration
All rocks on the property exhibit pervasive alteration that consists of multiple overprinted phases.
Distinguishing between the individual phases will take considerable study on a microscopic scale.
The country rocks and alkali intrusive rocks exhibit pervasive green-schist facies metamorphism and
alteration, probably the result of burial. This manifests as chlorite, calcite, and pyrite in the
intermediate volcanic rocks, pyritization of the banded iron formation, and sericite-pyrite alteration
within the alkali intrusive associated rocks.
Studies conducted as a part of the exploration work carried out from the fall of 2009 and the
winter/spring of 2010 show there is evidence of early alteration phases. These probably resulted
from magmatic hydrothermal fluids associated with porphyry gold mineralization and the associated
epithermal/mesothermal style gold mineralization. This occurs as potassic and phyllic/sericitic
alteration: K-feldspar, biotite, and muscovite (sericite), respectively, and is nearly pervasive in the
alkali intrusive rocks and surrounding country rocks. Regional metamorphism has subsequently
altered the primary hydrothermal mineral assemblages, but textures have been preserved with the
exception of areas of high strain (e.g., northwest trending shear zones).
Advanced argillic alteration appears throughout the trachyte intrusive and occurs in some of the late
stage lamprophyre dikes though on a small scale. It is difficult to assess at what stage argillic
alteration occurs, but it appears to define an envelope around the Portage zone potassic-
alteration/mineralization, suggesting an origin more in keeping with zoned alteration associated with
epithermal-style porphyry intrusive hosted gold deposits.
6.5 Mineralization
Porphyry Style Mineralization
The main intrusive complex appears to contain many of the characteristics of alkaline, porphyry-style
mineralization associated with diatreme breccias (e.g., Cripple Creek, Colorado). Direct comparison
with drill core from the two sites shows a number of consistent textures and styles of mineralization.
A recent observation made from drilling, combined with the airborne magnetic survey, shows the
potentially economic gold mineralization is coincident with an unexplained geophysical anomaly.
This style of mineralization is characterized by the Portage zone and portions of the East Extension
zone where mineralization is hosted by diatreme breccia in aphanitic trachyte. It is suspected the
ductile shearing and brittle faulting have played a significant role in redistributing structurally
controlled blocks of the mineralized rock. Yet confirmed is a form of porphyry style alteration zoning
consisting of an outer zone of phyllic (sericite) dominant alteration with narrow zones of advanced
argillic alteration characterized by illite and kaolinite, and a core zone of intense potassic alteration
characterized by biotite and K-feldspar.
Multi-element analysis conducted during the 1992 program on the Portage zone, combined with gold
assays, gave the first indication of the style of mineralization at Springpole. Diamond drilling in the
winter of 2010 revealed a more complex alteration with broader, intense zones of potassic alteration
2CG026.000 – Gold Canyon Preliminary Economic Assessment for the Springpole Gold Project, Canada Page 22
AD/NW 2CG026 000_Springpole_PEA_TechnicalReport_20161014_FNL October 7, 2016
replacing the original rock mass with biotite and pyrite. The expected alteration zone envelopes or
shells are very difficult to define due to complex sheared geometry and poorly defined contact zones
of the deposit. In the core area of the deposit where fine grained disseminated gold mineralization
occurs with biotite, the primary potassic alteration mineral, gold, displays a good correlation with
potassium/rubidium.
Lode Gold Mineralization
The intrusion of the trachyte complex into the volcanic pile, as well as the chemical and siliciclastic
sedimentary rocks in a near surface environment, produced mesothermal to epithermal style lode
vein mineralization. The difference between mesothermal and epithermal mineralization regimes is
the temperature and pressure of the mineralizing fluids.
Higher temperature (mesothermal) fluids would have existed within the emplaced intrusive,
associated with the diatreme breccias, and in the immediately adjacent wall rock/country rocks. In
the porphyry intrusive, and at the contact between intrusive and wall rock in the East Extension
zone, and localized within the Main zone, mesothermal style quartz-biotite-calcite-sulfide veins with
occasional tourmaline are observed with occasional coarse, visible gold.
Further from the intrusive complex and wall rock contact zones, where meteoric fluids have a greater
influence, epithermal style vein textures and mineralization styles dominate. These consist of banded
to sucrosic quartz-calcite veins with a lower temperature mineral assemblage including sericite,
minor biotite, possible adularia, calcite, dolomite and ankerite; here gold-silver and tellurium alloys
dominate including electrum and gold-silver tellurides.
Gold Remobilization during Metamorphism
As evidenced from the high degree of deformation, both ductile and brittle—in the form of isoclinal
folding, ductile shear zones with protomylonite and blastomylonite textures, and brittle fault
textures— the Springpole Prospect has been subjected to alteration and metamorphism. These
processes alone have remobilized gold in epithermal quartz veins that were the principal motivation
for exploring Springpole in the late 1980s and early 1990s, when shear zone hosted gold deposits
were the targets of choice in the Red Lake area.
2CG026.000 – Gold Canyon Preliminary Economic Assessment for the Springpole Gold Project, Canada Page 23
AD/NW 2CG026 000_Springpole_PEA_TechnicalReport_20161014_FNL October 7, 2016
7 Deposit Types
Mineralization at the Springpole Gold Project is dominated by large tonnage, low grade disseminated
porphyry-style or epithermal-style gold mineralization associated with the emplacement of the alkali
trachyte intrusive. Textures observed in the extensive repository of drill core appear to confirm the
disseminated gold-silver-sulfide mineralization, the mesothermal to epithermal lode vein gold
mineralization, and branded iron-formation hosted gold mineralization are all the result of the
emplacement of multiple phases of trachyte porphyry and associated diatreme breccias,
hydrothermal breccias, dikes and sills.
The initial exploration on the property was conducted on the assumption the mineralization was a
typical example of Archean mesothermal, sulfide-hosted lode gold type. While this model has not
been completely ruled out, it has been replaced in favor of a high level emplacement porphyry
model. Barron’s thesis (1996) work presented strong evidence the gold and associated fluorite
mineralization at Springpole are genetically related to the high level emplacement of a large, alkaline
porphyry intrusive and breccia pipe complex.
Barron considered the Springpole Complex to be the end product of magmatic fractionation
processes and of fluids that evolved from magmatic to hydrothermal in the high level, sub-volcanic
porphyry environment. These processes produced a low grade gold-porphyry-epithermal type
deposit and associated high-grade veins and breccia pipes.
Santa Fe geologists felt the nature of the mineralization at Springpole had many similarities with
deposits of the Cripple Creek District, Colorado, including the Cresson Mine. Detailed mapping on
the land based portions of the property by Santa Fe geologists showed that most, if not all, of the
gold mineralization on the Springpole Gold Project is spatially associated with the feldspar porphyry
diatreme dikes, veins, and diatreme breccia. The following is a brief description of this model in the
Springpole area.
7.1 Depositional Environment
Based upon the abundance and size of epizonal trachyte porphyry intrusive masses and the
widespread brecciation and alteration centered on the Portage zone, Barron (1996) considered this
area to be the apex of a buried syenite stock. A high emplacement level for the Portage zone and
surrounding porphyry is further supported by the lack of contact metamorphic effects in the enclosing
country rocks. Trachyte clasts within the basal conglomerate overlying the intrusive complex indicate
it was subjected to surface erosion.
The rarity of trachyte clasts and their restriction to the base of the conglomerate unit would seem to
indicate erosion over a short time interval. The lack of voluminous trachyte flows suggests there was
no markedly positive volcanic edifice. Barron (1996) concluded that collectively these features
suggested that the Portage zone and surrounding Main and East Extension zones existed as a small
island of maar craters of low relief in a rapidly deepening shallow basin.
This interpretation has its closest modern analogue in the Ladolam Gold Deposit, Lihir Island, Papua
New Guinea. Mineralization at Lihir is believed to be less than 500,000 years old and is telescoped
upon an earlier porphyry environment (Carman 2003) Deposition of gold is still an active process at

2CG026.000 – Gold Canyon Preliminary Economic Assessment for the Springpole Gold Project, Canada Page 24
AD/NW 2CG026 000_Springpole_PEA_TechnicalReport_20161014_FNL October 7, 2016
Ladolam as the hydrothermal system remains active. Host rocks at Ladolam can be divided into
three groups (Carman 2003):
Mafic lavas composed of alkali basalt, porphyritic trachybasalt, trachyandesite, and rare trachyte
and phonolite;
Alkali intrusions that are composed of multi-phase porphyry stocks with the most voluminous
phase being biotite monzonite; and
Ladolam Breccia Complex that is composed of porphyry breccias and volcanic breccias.
Porphyry breccias are dominantly monzonite composition and occur as poorly sorted, massive,
matrix supported breccias with some rounding of clasts caused by magmatic milling; the clasts are
supported by a cement of altered rock flour and anhydrite. The volcanic breccias are massive,
moderately to poorly sorted, rock flour matrix supported breccias containing mafic clasts.
Mineralization/alteration at Ladolam can also be sub-divided into three broad phases:
Biotite-orthoclase-anhydrite ± magnetite with minor copper-gold-molybdenum disseminated
porphyry mineralization and veinlets;
Refractory sulfide-gold mineralization associated with pervasive adularia-pyrite (leucoxene-illite)
alteration near surfacethat comprises the bulk of the near surface bulk mineable mineralized
material; and
Quartz-calcite-adularia-pyrite-marcasite ±electrum stockwork veins.
If the Ladolam Gold deposit is accepted as a reasonable genetic analogue to the Springpole deposit,
then the following genetic model can be applied. This model is adapted from Barron’s thesis (1996),
Zabev’s genetic summary (2004), and the genetic model of Armstrong et al. (2006), as well as
observations made during the 2009 through 2012 diamond drilling programs.
Springpole Genetic Model
The follow list summarizes the genetic model of Springpole Gold Project area:
Intrusion into the lower crust of parental alkaline primitive and anhydrous magma slightly
enriched in incompatible elements including fluorine.
Fractionation at depth, precipitation of hornblende and apatite as early crystalline phases. The
magma becomes increasingly anhydrous. Gold is retained in the melt.
Diapiric uprise from 4 to 8 km levels into hydrous wall rock with the apex of the magma chamber
at <2 km depth. Continued fractionation producing an increasingly fluorine-rich melt. Feldspar of
extreme composition is precipitated and the lowered solidus allows emplacement of porphyry
dykes and sills to very high crustal levels.
High diffusivities and convection promotes water partitioning from wall rock into magma.
2CG026.000 – Gold Canyon Preliminary Economic Assessment for the Springpole Gold Project, Canada Page 25
AD/NW 2CG026 000_Springpole_PEA_TechnicalReport_20161014_FNL October 7, 2016
The magma is quickly saturated and the sudden pressure is released (possibly from venting)
prompting the immiscible separation of fluorine and carbon dioxide-rich phases, which escapes
to high structural levels. Breccia pipes with rock fluorite and rounded clasts indicating turbulent
fluidized and erosional vertical emplacement.
Fluid pressures generate dyke offshoots.
Fluorine escapes from brecciated wall-rock causing biotization or fluoritization of breccia and
wall rock. Ultimately, the fluorine-water-carbon dioxide vapors condense, resulting in the
precipitation of fluorite and calcite. Magmatic gold-rich fluids permeate the breccia and
surrounding porphyry, depositing porphyry style, disseminated, pyritic mineralization. The
fractures along the margins of breccia pipes acts as preferred sites for later deposition of quartz,
electrum and tellurides.
Intrusion of a series of lamprophyre and carbonatite dikes, sills and veinlets—due to the intensity
of deformation.
The complex is then buried by conglomerates derived from the complex and other areas
(Devaney 2001b).
Continued intense deformation and associated metamorphism manifesting as folding, strike-slip
faulting and shearing, coupled with regional green schist metamorphism of the region obscures
primary textures and likely leads to some (possibly minor) degree of precious metal
remobilization.
2CG026.000 – Gold Canyon Preliminary Economic Assessment for the Springpole Gold Project, Canada Page 26
AD/NW 2CG026 000_Springpole_PEA_TechnicalReport_20161014_FNL October 7, 2016
8 Exploration
Current exploration work on the property consists mainly of an ongoing drilling program carried out
by Gold Canyon and discussed in detail in the following section of the report.
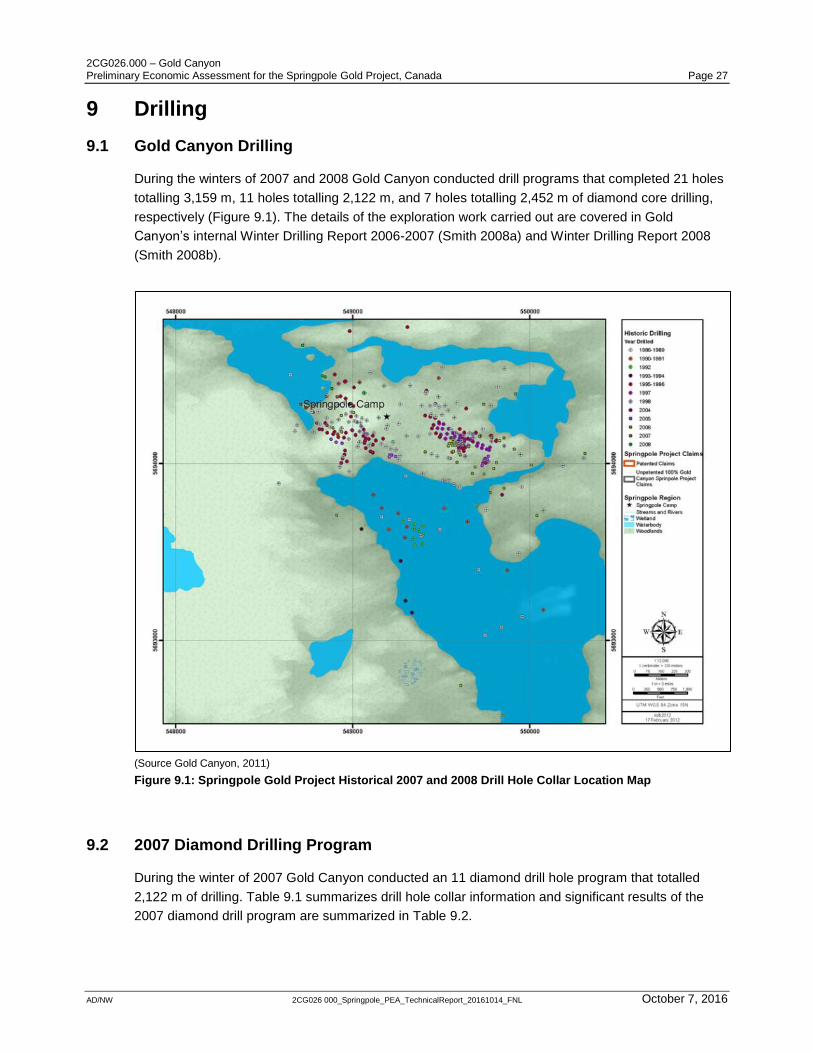
2CG026.000 – Gold Canyon Preliminary Economic Assessment for the Springpole Gold Project, Canada Page 27
AD/NW 2CG026 000_Springpole_PEA_TechnicalReport_20161014_FNL October 7, 2016
9 Drilling
9.1 Gold Canyon Drilling
During the winters of 2007 and 2008 Gold Canyon conducted drill programs that completed 21 holes
totalling 3,159 m, 11 holes totalling 2,122 m, and 7 holes totalling 2,452 m of diamond core drilling,
respectively (Figure 9.1). The details of the exploration work carried out are covered in Gold
Canyon’s internal Winter Drilling Report 2006-2007 (Smith 2008a) and Winter Drilling Report 2008
(Smith 2008b).
(Source Gold Canyon, 2011)
Figure 9.1: Springpole Gold Project Historical 2007 and 2008 Drill Hole Collar Location Map
9.2 2007 Diamond Drilling Program
During the winter of 2007 Gold Canyon conducted an 11 diamond drill hole program that totalled
2,122 m of drilling. Table 9.1 summarizes drill hole collar information and significant results of the
2007 diamond drill program are summarized in Table 9.2.
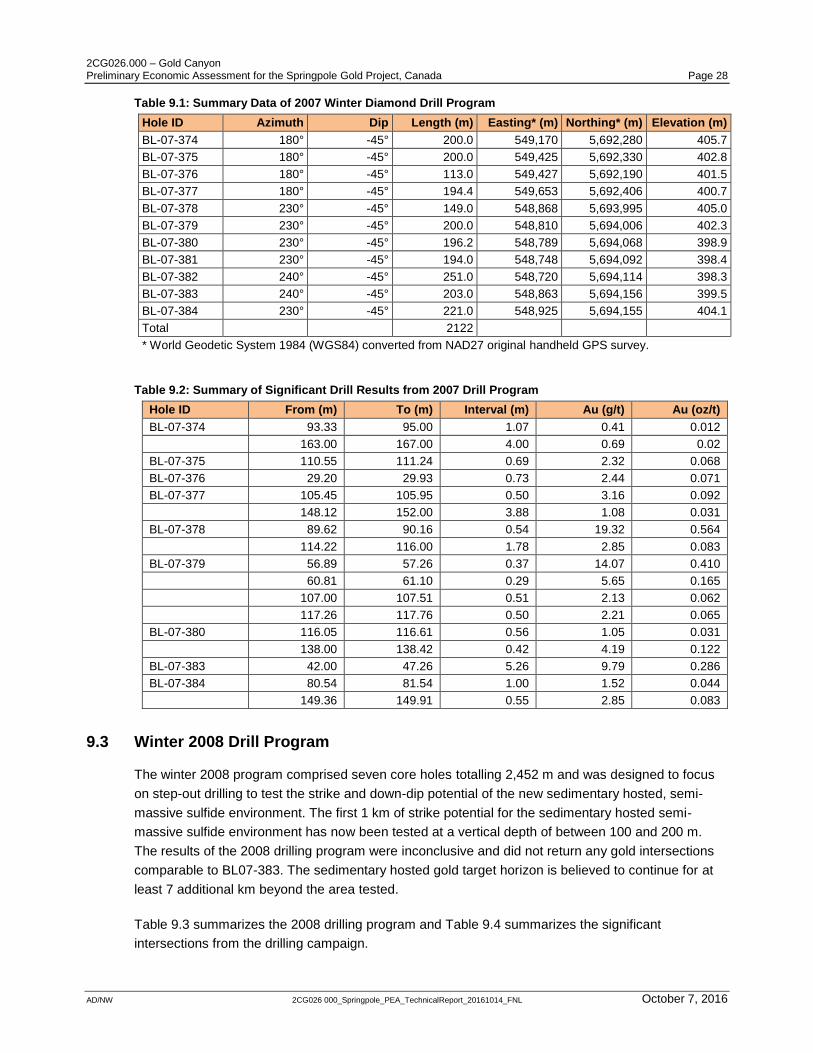
2CG026.000 – Gold Canyon Preliminary Economic Assessment for the Springpole Gold Project, Canada Page 28
AD/NW 2CG026 000_Springpole_PEA_TechnicalReport_20161014_FNL October 7, 2016
Table 9.1: Summary Data of 2007 Winter Diamond Drill Program
Hole ID Azimuth Dip Length (m) Easting* (m) Northing* (m) Elevation (m)
BL-07-374 180° -45° 200.0 549,170 5,692,280 405.7
BL-07-375 180° -45° 200.0 549,425 5,692,330 402.8
BL-07-376 180° -45° 113.0 549,427 5,692,190 401.5
BL-07-377 180° -45° 194.4 549,653 5,692,406 400.7
BL-07-378 230° -45° 149.0 548,868 5,693,995 405.0
BL-07-379 230° -45° 200.0 548,810 5,694,006 402.3
BL-07-380 230° -45° 196.2 548,789 5,694,068 398.9
BL-07-381 230° -45° 194.0 548,748 5,694,092 398.4
BL-07-382 240° -45° 251.0 548,720 5,694,114 398.3
BL-07-383 240° -45° 203.0 548,863 5,694,156 399.5
BL-07-384 230° -45° 221.0 548,925 5,694,155 404.1
Total 2122
* World Geodetic System 1984 (WGS84) converted from NAD27 original handheld GPS survey.
Table 9.2: Summary of Significant Drill Results from 2007 Drill Program
Hole ID From (m) To (m) Interval (m) Au (g/t) Au (oz/t)
BL-07-374 93.33 95.00 1.07 0.41 0.012
163.00 167.00 4.00 0.69 0.02
BL-07-375 110.55 111.24 0.69 2.32 0.068
BL-07-376 29.20 29.93 0.73 2.44 0.071
BL-07-377 105.45 105.95 0.50 3.16 0.092
148.12 152.00 3.88 1.08 0.031
BL-07-378 89.62 90.16 0.54 19.32 0.564
114.22 116.00 1.78 2.85 0.083
BL-07-379 56.89 57.26 0.37 14.07 0.410
60.81 61.10 0.29 5.65 0.165
107.00 107.51 0.51 2.13 0.062
117.26 117.76 0.50 2.21 0.065
BL-07-380 116.05 116.61 0.56 1.05 0.031
138.00 138.42 0.42 4.19 0.122
BL-07-383 42.00 47.26 5.26 9.79 0.286
BL-07-384 80.54 81.54 1.00 1.52 0.044
149.36 149.91 0.55 2.85 0.083
9.3 Winter 2008 Drill Program
The winter 2008 program comprised seven core holes totalling 2,452 m and was designed to focus
on step-out drilling to test the strike and down-dip potential of the new sedimentary hosted, semi-
massive sulfide environment. The first 1 km of strike potential for the sedimentary hosted semi-
massive sulfide environment has now been tested at a vertical depth of between 100 and 200 m.
The results of the 2008 drilling program were inconclusive and did not return any gold intersections
comparable to BL07-383. The sedimentary hosted gold target horizon is believed to continue for at
least 7 additional km beyond the area tested.
Table 9.3 summarizes the 2008 drilling program and Table 9.4 summarizes the significant
intersections from the drilling campaign.

2CG026.000 – Gold Canyon Preliminary Economic Assessment for the Springpole Gold Project, Canada Page 29
AD/NW 2CG026 000_Springpole_PEA_TechnicalReport_20161014_FNL October 7, 2016
Table 9.3: Winter 2008 Diamond Drill Hole Program Summary
Hole ID Azimuth Dip Length (m) Easting* (m) Northing* (m) Elevation (m)
BL08-385 240° -45° 208.00 548,895 5,694,201 400.0
BL08-386 215° -45° 272.00 548,856 5,694,267 400.0
BL08-387 215° -45° 395.00 548,841 5,694,273 400.0
BL08-388 215° -60° 356.00 548,841 5,694,273 400.0
BL08-389 258° -45° 356.00 548,841 5,694,273 400.0
BL08-390 268° -45° 446.00 548,841 5,694,273 400.0
BL08-391 240° -45° 419.00 548,730 5,694,446 400.0
*Note: Universal Transverse Mercator (UTM) datum projection is North American Datum 1927 (NAD27)
Table 9.4: Significant Drill Intersections from 2008 Drilling Program
Hole ID From (m) To (m) Interval (m) Au (g/t) Au (oz/t)
BL08-385 74.00 75.56 1.56 3.28 0.10
167.39 168.39 1.00 2.37 0.07
BL08-386 99.28 100.25 0.97 2.53 0.08
222.44 223.24 0.80 13.17 0.38
BL08-387 193.06 194.00 0.94 1.59 0.05
292.71 296.67 3.96 1.63 0.05
BL08-389 167.00 168.23 1.23 2.04 0.06
207.00 207.93 0.93 1.78 0.06
305.92 307.59 1.67 1.47 0.04
345.50 346.52 1.02 5.98 0.17
9.4 2010 Drill Program
Winter 2010 drilling operations began on February 17th with mobilization of two Longyear 38 drills
from Boart-Longyear International’s (BLI) base in Red Lake. Drilling commenced on February 23,
2010. A total of six diamond drill holes (SP10-001 thru SP10-006) were drilled for a total of 1,774.5
m of HQ drilling (Figure 9.2). A summary of the 2010 drilling can be found in Table 9.5.
BLI pulled out of the drill program and demobilized the drills on March 10, 2010, citing critical ice
thickness problems with the access ice road to Springpole camp from the South Bay Mine landing. In
doing so, BLI failed to complete drill holes SP10-005 and SP10-006, and both holes ended in altered
and mineralized rock. Significant intercepts of the 2010 drill program are listed in
Table 9.6.
Drilling was suspended during the ice break-up on Springpole Lake and Birch Lake as the project
has no land access route. Rodren Drilling Ltd of Winnipeg, Manitoba, was awarded the drilling
contract in spring 2010 and mobilization of two Boyles 37 drills to the project site by helicopter began
in June 2010. Drilling commenced on July 5, 2010, and ended on October 17, 2010. A total of
8,664.2 m of HQ core drilling was completed in 23 drill holes, averaging 44.23 m of drilling per 24-
hour shift, including time for moving the drill between drill sites.
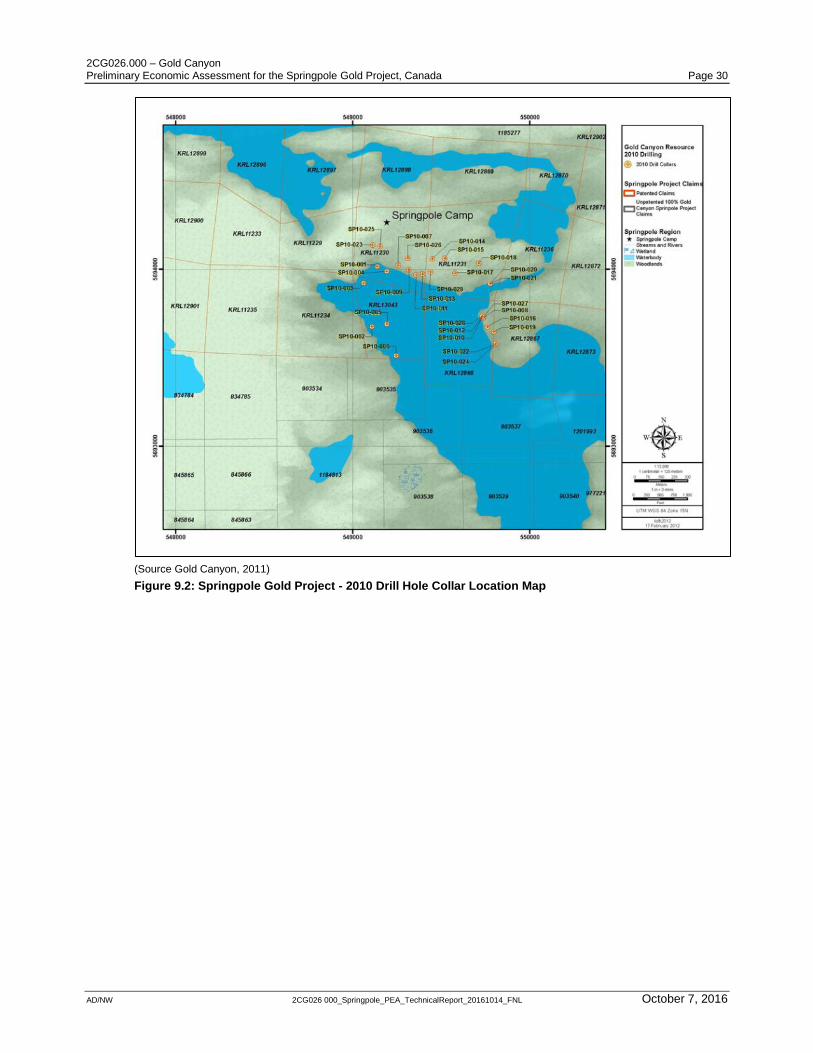
2CG026.000 – Gold Canyon Preliminary Economic Assessment for the Springpole Gold Project, Canada Page 30
AD/NW 2CG026 000_Springpole_PEA_TechnicalReport_20161014_FNL October 7, 2016
(Source Gold Canyon, 2011)
Figure 9.2: Springpole Gold Project - 2010 Drill Hole Collar Location Map
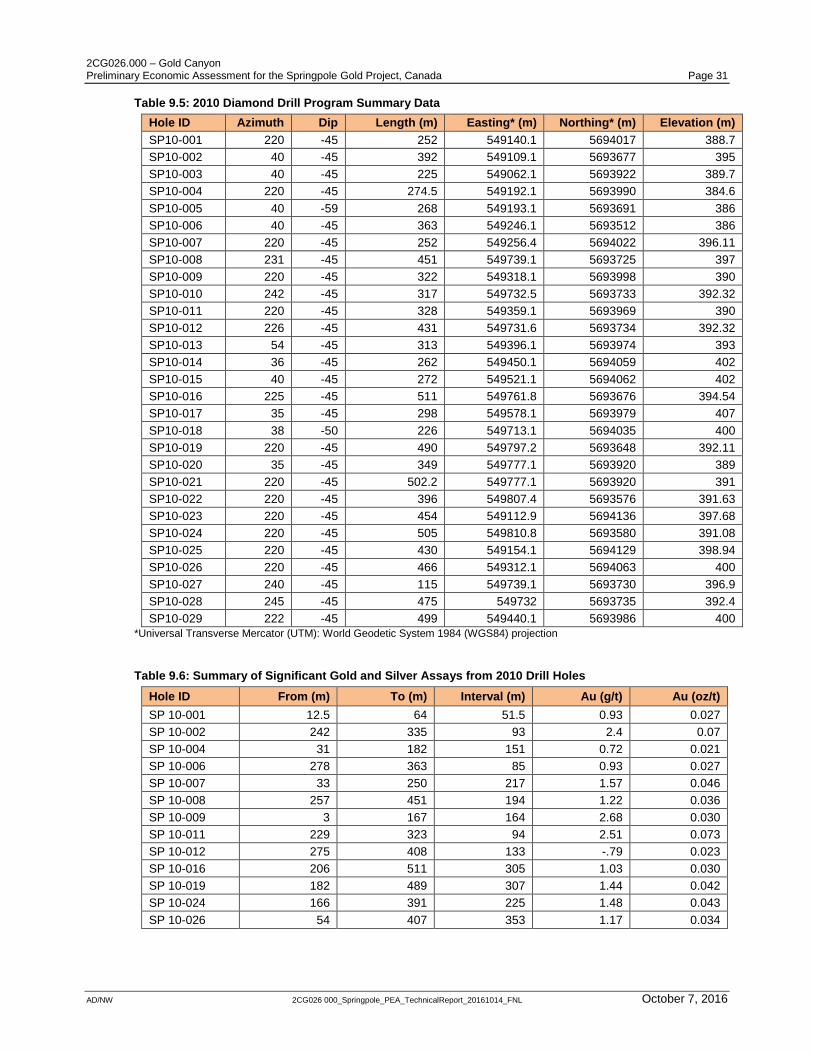
2CG026.000 – Gold Canyon Preliminary Economic Assessment for the Springpole Gold Project, Canada Page 31
AD/NW 2CG026 000_Springpole_PEA_TechnicalReport_20161014_FNL October 7, 2016
Table 9.5: 2010 Diamond Drill Program Summary Data
Hole ID Azimuth Dip Length (m) Easting* (m) Northing* (m) Elevation (m)
SP10-001 220 -45 252 549140.1 5694017 388.7
SP10-002 40 -45 392 549109.1 5693677 395
SP10-003 40 -45 225 549062.1 5693922 389.7
SP10-004 220 -45 274.5 549192.1 5693990 384.6
SP10-005 40 -59 268 549193.1 5693691 386
SP10-006 40 -45 363 549246.1 5693512 386
SP10-007 220 -45 252 549256.4 5694022 396.11
SP10-008 231 -45 451 549739.1 5693725 397
SP10-009 220 -45 322 549318.1 5693998 390
SP10-010 242 -45 317 549732.5 5693733 392.32
SP10-011 220 -45 328 549359.1 5693969 390
SP10-012 226 -45 431 549731.6 5693734 392.32
SP10-013 54 -45 313 549396.1 5693974 393
SP10-014 36 -45 262 549450.1 5694059 402
SP10-015 40 -45 272 549521.1 5694062 402
SP10-016 225 -45 511 549761.8 5693676 394.54
SP10-017 35 -45 298 549578.1 5693979 407
SP10-018 38 -50 226 549713.1 5694035 400
SP10-019 220 -45 490 549797.2 5693648 392.11
SP10-020 35 -45 349 549777.1 5693920 389
SP10-021 220 -45 502.2 549777.1 5693920 391
SP10-022 220 -45 396 549807.4 5693576 391.63
SP10-023 220 -45 454 549112.9 5694136 397.68
SP10-024 220 -45 505 549810.8 5693580 391.08
SP10-025 220 -45 430 549154.1 5694129 398.94
SP10-026 220 -45 466 549312.1 5694063 400
SP10-027 240 -45 115 549739.1 5693730 396.9
SP10-028 245 -45 475 549732 5693735 392.4
SP10-029 222 -45 499 549440.1 5693986 400
*Universal Transverse Mercator (UTM): World Geodetic System 1984 (WGS84) projection
Table 9.6: Summary of Significant Gold and Silver Assays from 2010 Drill Holes
Hole ID From (m) To (m) Interval (m) Au (g/t) Au (oz/t)
SP 10-001 12.5 64 51.5 0.93 0.027
SP 10-002 242 335 93 2.4 0.07
SP 10-004 31 182 151 0.72 0.021
SP 10-006 278 363 85 0.93 0.027
SP 10-007 33 250 217 1.57 0.046
SP 10-008 257 451 194 1.22 0.036
SP 10-009 3 167 164 2.68 0.030
SP 10-011 229 323 94 2.51 0.073
SP 10-012 275 408 133 -.79 0.023
SP 10-016 206 511 305 1.03 0.030
SP 10-019 182 489 307 1.44 0.042
SP 10-024 166 391 225 1.48 0.043
SP 10-026 54 407 353 1.17 0.034
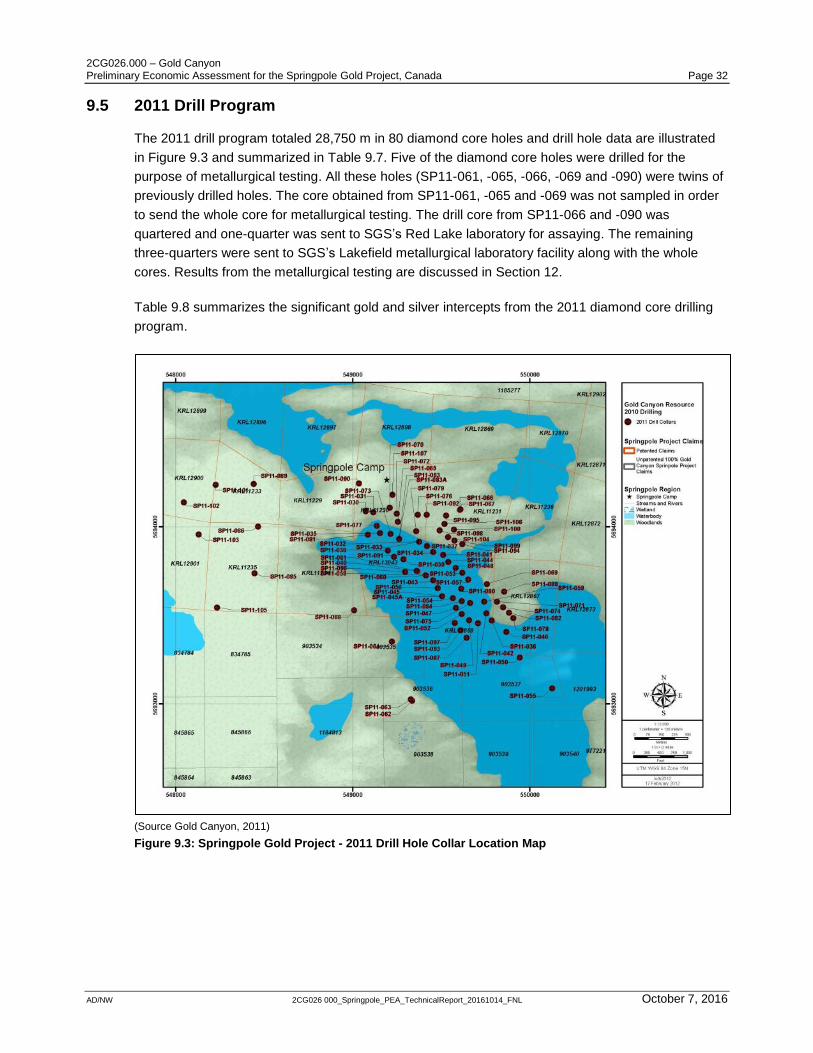
2CG026.000 – Gold Canyon Preliminary Economic Assessment for the Springpole Gold Project, Canada Page 32
AD/NW 2CG026 000_Springpole_PEA_TechnicalReport_20161014_FNL October 7, 2016
9.5 2011 Drill Program
The 2011 drill program totaled 28,750 m in 80 diamond core holes and drill hole data are illustrated
in Figure 9.3 and summarized in Table 9.7. Five of the diamond core holes were drilled for the
purpose of metallurgical testing. All these holes (SP11-061, -065, -066, -069 and -090) were twins of
previously drilled holes. The core obtained from SP11-061, -065 and -069 was not sampled in order
to send the whole core for metallurgical testing. The drill core from SP11-066 and -090 was
quartered and one-quarter was sent to SGS’s Red Lake laboratory for assaying. The remaining
three-quarters were sent to SGS’s Lakefield metallurgical laboratory facility along with the whole
cores. Results from the metallurgical testing are discussed in Section 12.
Table 9.8 summarizes the significant gold and silver intercepts from the 2011 diamond core drilling
program.
(Source Gold Canyon, 2011)
Figure 9.3: Springpole Gold Project - 2011 Drill Hole Collar Location Map
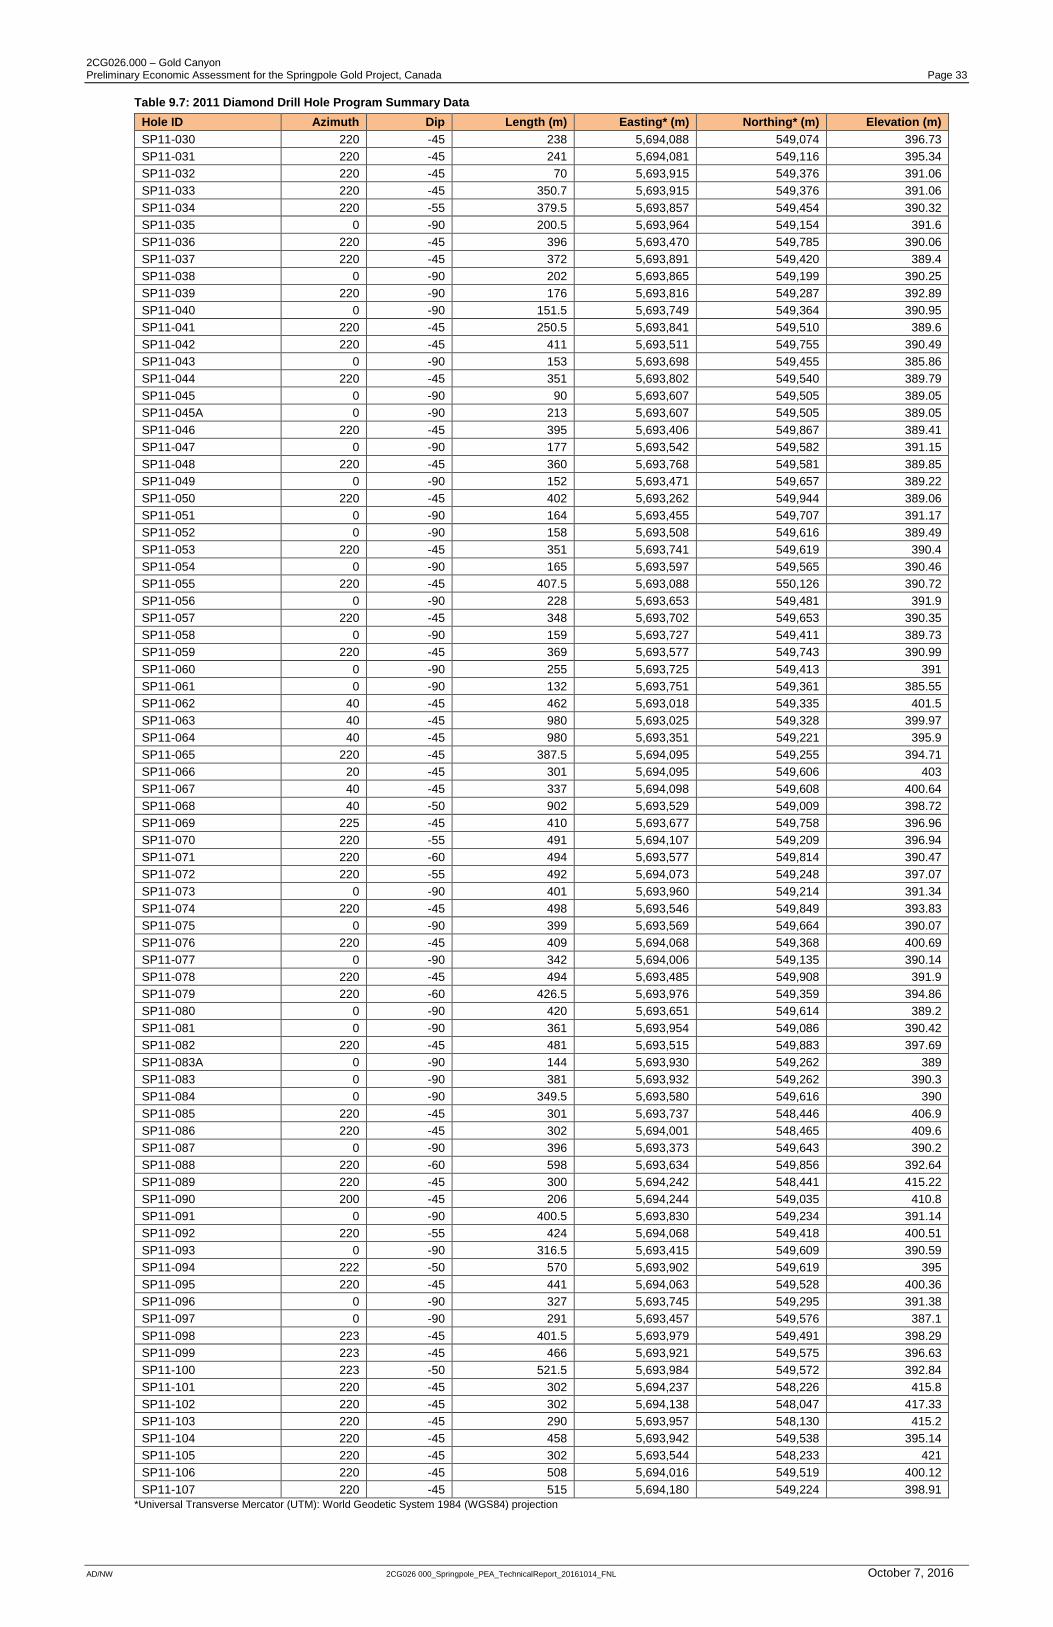
2CG026.000 – Gold Canyon Preliminary Economic Assessment for the Springpole Gold Project, Canada Page 33
AD/NW 2CG026 000_Springpole_PEA_TechnicalReport_20161014_FNL October 7, 2016
Table 9.7: 2011 Diamond Drill Hole Program Summary Data
Hole ID Azimuth Dip Length (m) Easting* (m) Northing* (m) Elevation (m)
SP11-030 220 -45 238 5,694,088 549,074 396.73
SP11-031 220 -45 241 5,694,081 549,116 395.34
SP11-032 220 -45 70 5,693,915 549,376 391.06
SP11-033 220 -45 350.7 5,693,915 549,376 391.06
SP11-034 220 -55 379.5 5,693,857 549,454 390.32
SP11-035 0 -90 200.5 5,693,964 549,154 391.6
SP11-036 220 -45 396 5,693,470 549,785 390.06
SP11-037 220 -45 372 5,693,891 549,420 389.4
SP11-038 0 -90 202 5,693,865 549,199 390.25
SP11-039 220 -90 176 5,693,816 549,287 392.89
SP11-040 0 -90 151.5 5,693,749 549,364 390.95
SP11-041 220 -45 250.5 5,693,841 549,510 389.6
SP11-042 220 -45 411 5,693,511 549,755 390.49
SP11-043 0 -90 153 5,693,698 549,455 385.86
SP11-044 220 -45 351 5,693,802 549,540 389.79
SP11-045 0 -90 90 5,693,607 549,505 389.05
SP11-045A 0 -90 213 5,693,607 549,505 389.05
SP11-046 220 -45 395 5,693,406 549,867 389.41
SP11-047 0 -90 177 5,693,542 549,582 391.15
SP11-048 220 -45 360 5,693,768 549,581 389.85
SP11-049 0 -90 152 5,693,471 549,657 389.22
SP11-050 220 -45 402 5,693,262 549,944 389.06
SP11-051 0 -90 164 5,693,455 549,707 391.17
SP11-052 0 -90 158 5,693,508 549,616 389.49
SP11-053 220 -45 351 5,693,741 549,619 390.4
SP11-054 0 -90 165 5,693,597 549,565 390.46
SP11-055 220 -45 407.5 5,693,088 550,126 390.72
SP11-056 0 -90 228 5,693,653 549,481 391.9
SP11-057 220 -45 348 5,693,702 549,653 390.35
SP11-058 0 -90 159 5,693,727 549,411 389.73
SP11-059 220 -45 369 5,693,577 549,743 390.99
SP11-060 0 -90 255 5,693,725 549,413 391
SP11-061 0 -90 132 5,693,751 549,361 385.55
SP11-062 40 -45 462 5,693,018 549,335 401.5
SP11-063 40 -45 980 5,693,025 549,328 399.97
SP11-064 40 -45 980 5,693,351 549,221 395.9
SP11-065 220 -45 387.5 5,694,095 549,255 394.71
SP11-066 20 -45 301 5,694,095 549,606 403
SP11-067 40 -45 337 5,694,098 549,608 400.64
SP11-068 40 -50 902 5,693,529 549,009 398.72
SP11-069 225 -45 410 5,693,677 549,758 396.96
SP11-070 220 -55 491 5,694,107 549,209 396.94
SP11-071 220 -60 494 5,693,577 549,814 390.47
SP11-072 220 -55 492 5,694,073 549,248 397.07
SP11-073 0 -90 401 5,693,960 549,214 391.34
SP11-074 220 -45 498 5,693,546 549,849 393.83
SP11-075 0 -90 399 5,693,569 549,664 390.07
SP11-076 220 -45 409 5,694,068 549,368 400.69
SP11-077 0 -90 342 5,694,006 549,135 390.14
SP11-078 220 -45 494 5,693,485 549,908 391.9
SP11-079 220 -60 426.5 5,693,976 549,359 394.86
SP11-080 0 -90 420 5,693,651 549,614 389.2
SP11-081 0 -90 361 5,693,954 549,086 390.42
SP11-082 220 -45 481 5,693,515 549,883 397.69
SP11-083A 0 -90 144 5,693,930 549,262 389
SP11-083 0 -90 381 5,693,932 549,262 390.3
SP11-084 0 -90 349.5 5,693,580 549,616 390
SP11-085 220 -45 301 5,693,737 548,446 406.9
SP11-086 220 -45 302 5,694,001 548,465 409.6
SP11-087 0 -90 396 5,693,373 549,643 390.2
SP11-088 220 -60 598 5,693,634 549,856 392.64
SP11-089 220 -45 300 5,694,242 548,441 415.22
SP11-090 200 -45 206 5,694,244 549,035 410.8
SP11-091 0 -90 400.5 5,693,830 549,234 391.14
SP11-092 220 -55 424 5,694,068 549,418 400.51
SP11-093 0 -90 316.5 5,693,415 549,609 390.59
SP11-094 222 -50 570 5,693,902 549,619 395
SP11-095 220 -45 441 5,694,063 549,528 400.36
SP11-096 0 -90 327 5,693,745 549,295 391.38
SP11-097 0 -90 291 5,693,457 549,576 387.1
SP11-098 223 -45 401.5 5,693,979 549,491 398.29
SP11-099 223 -45 466 5,693,921 549,575 396.63
SP11-100 223 -50 521.5 5,693,984 549,572 392.84
SP11-101 220 -45 302 5,694,237 548,226 415.8
SP11-102 220 -45 302 5,694,138 548,047 417.33
SP11-103 220 -45 290 5,693,957 548,130 415.2
SP11-104 220 -45 458 5,693,942 549,538 395.14
SP11-105 220 -45 302 5,693,544 548,233 421
SP11-106 220 -45 508 5,694,016 549,519 400.12
SP11-107 220 -45 515 5,694,180 549,224 398.91
*Universal Transverse Mercator (UTM): World Geodetic System 1984 (WGS84) projection
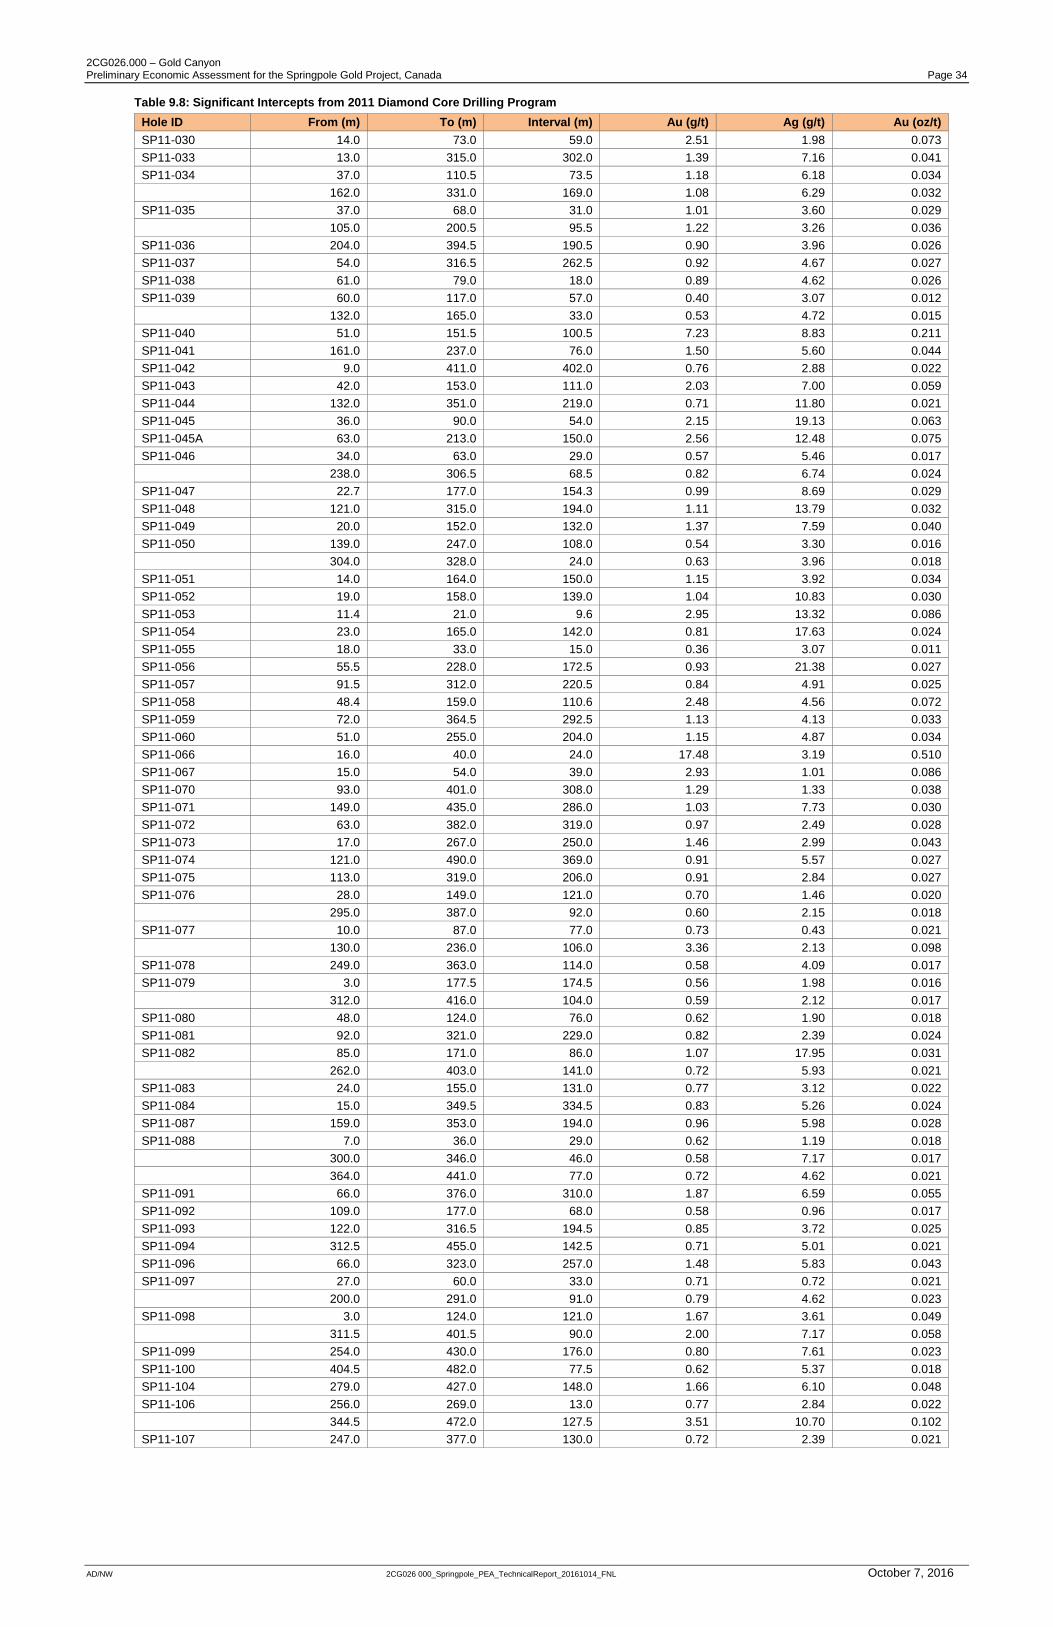
2CG026.000 – Gold Canyon Preliminary Economic Assessment for the Springpole Gold Project, Canada Page 34
AD/NW 2CG026 000_Springpole_PEA_TechnicalReport_20161014_FNL October 7, 2016
Table 9.8: Significant Intercepts from 2011 Diamond Core Drilling Program
Hole ID From (m) To (m) Interval (m) Au (g/t) Ag (g/t) Au (oz/t)
SP11-030 14.0 73.0 59.0 2.51 1.98 0.073
SP11-033 13.0 315.0 302.0 1.39 7.16 0.041
SP11-034 37.0 110.5 73.5 1.18 6.18 0.034
162.0 331.0 169.0 1.08 6.29 0.032
SP11-035 37.0 68.0 31.0 1.01 3.60 0.029
105.0 200.5 95.5 1.22 3.26 0.036
SP11-036 204.0 394.5 190.5 0.90 3.96 0.026
SP11-037 54.0 316.5 262.5 0.92 4.67 0.027
SP11-038 61.0 79.0 18.0 0.89 4.62 0.026
SP11-039 60.0 117.0 57.0 0.40 3.07 0.012
132.0 165.0 33.0 0.53 4.72 0.015
SP11-040 51.0 151.5 100.5 7.23 8.83 0.211
SP11-041 161.0 237.0 76.0 1.50 5.60 0.044
SP11-042 9.0 411.0 402.0 0.76 2.88 0.022
SP11-043 42.0 153.0 111.0 2.03 7.00 0.059
SP11-044 132.0 351.0 219.0 0.71 11.80 0.021
SP11-045 36.0 90.0 54.0 2.15 19.13 0.063
SP11-045A 63.0 213.0 150.0 2.56 12.48 0.075
SP11-046 34.0 63.0 29.0 0.57 5.46 0.017
238.0 306.5 68.5 0.82 6.74 0.024
SP11-047 22.7 177.0 154.3 0.99 8.69 0.029
SP11-048 121.0 315.0 194.0 1.11 13.79 0.032
SP11-049 20.0 152.0 132.0 1.37 7.59 0.040
SP11-050 139.0 247.0 108.0 0.54 3.30 0.016
304.0 328.0 24.0 0.63 3.96 0.018
SP11-051 14.0 164.0 150.0 1.15 3.92 0.034
SP11-052 19.0 158.0 139.0 1.04 10.83 0.030
SP11-053 11.4 21.0 9.6 2.95 13.32 0.086
SP11-054 23.0 165.0 142.0 0.81 17.63 0.024
SP11-055 18.0 33.0 15.0 0.36 3.07 0.011
SP11-056 55.5 228.0 172.5 0.93 21.38 0.027
SP11-057 91.5 312.0 220.5 0.84 4.91 0.025
SP11-058 48.4 159.0 110.6 2.48 4.56 0.072
SP11-059 72.0 364.5 292.5 1.13 4.13 0.033
SP11-060 51.0 255.0 204.0 1.15 4.87 0.034
SP11-066 16.0 40.0 24.0 17.48 3.19 0.510
SP11-067 15.0 54.0 39.0 2.93 1.01 0.086
SP11-070 93.0 401.0 308.0 1.29 1.33 0.038
SP11-071 149.0 435.0 286.0 1.03 7.73 0.030
SP11-072 63.0 382.0 319.0 0.97 2.49 0.028
SP11-073 17.0 267.0 250.0 1.46 2.99 0.043
SP11-074 121.0 490.0 369.0 0.91 5.57 0.027
SP11-075 113.0 319.0 206.0 0.91 2.84 0.027
SP11-076 28.0 149.0 121.0 0.70 1.46 0.020
295.0 387.0 92.0 0.60 2.15 0.018
SP11-077 10.0 87.0 77.0 0.73 0.43 0.021
130.0 236.0 106.0 3.36 2.13 0.098
SP11-078 249.0 363.0 114.0 0.58 4.09 0.017
SP11-079 3.0 177.5 174.5 0.56 1.98 0.016
312.0 416.0 104.0 0.59 2.12 0.017
SP11-080 48.0 124.0 76.0 0.62 1.90 0.018
SP11-081 92.0 321.0 229.0 0.82 2.39 0.024
SP11-082 85.0 171.0 86.0 1.07 17.95 0.031
262.0 403.0 141.0 0.72 5.93 0.021
SP11-083 24.0 155.0 131.0 0.77 3.12 0.022
SP11-084 15.0 349.5 334.5 0.83 5.26 0.024
SP11-087 159.0 353.0 194.0 0.96 5.98 0.028
SP11-088 7.0 36.0 29.0 0.62 1.19 0.018
300.0 346.0 46.0 0.58 7.17 0.017
364.0 441.0 77.0 0.72 4.62 0.021
SP11-091 66.0 376.0 310.0 1.87 6.59 0.055
SP11-092 109.0 177.0 68.0 0.58 0.96 0.017
SP11-093 122.0 316.5 194.5 0.85 3.72 0.025
SP11-094 312.5 455.0 142.5 0.71 5.01 0.021
SP11-096 66.0 323.0 257.0 1.48 5.83 0.043
SP11-097 27.0 60.0 33.0 0.71 0.72 0.021
200.0 291.0 91.0 0.79 4.62 0.023
SP11-098 3.0 124.0 121.0 1.67 3.61 0.049
311.5 401.5 90.0 2.00 7.17 0.058
SP11-099 254.0 430.0 176.0 0.80 7.61 0.023
SP11-100 404.5 482.0 77.5 0.62 5.37 0.018
SP11-104 279.0 427.0 148.0 1.66 6.10 0.048
SP11-106 256.0 269.0 13.0 0.77 2.84 0.022
344.5 472.0 127.5 3.51 10.70 0.102
SP11-107 247.0 377.0 130.0 0.72 2.39 0.021
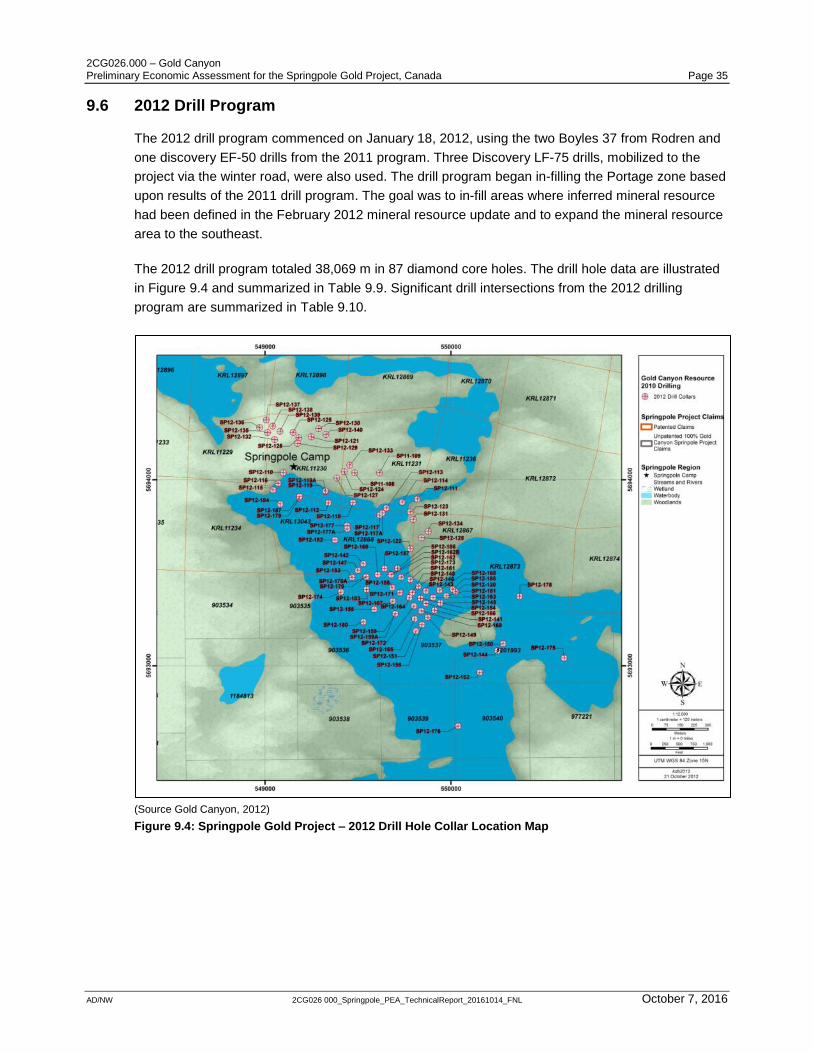
2CG026.000 – Gold Canyon Preliminary Economic Assessment for the Springpole Gold Project, Canada Page 35
AD/NW 2CG026 000_Springpole_PEA_TechnicalReport_20161014_FNL October 7, 2016
9.6 2012 Drill Program
The 2012 drill program commenced on January 18, 2012, using the two Boyles 37 from Rodren and
one discovery EF-50 drills from the 2011 program. Three Discovery LF-75 drills, mobilized to the
project via the winter road, were also used. The drill program began in-filling the Portage zone based
upon results of the 2011 drill program. The goal was to in-fill areas where inferred mineral resource
had been defined in the February 2012 mineral resource update and to expand the mineral resource
area to the southeast.
The 2012 drill program totaled 38,069 m in 87 diamond core holes. The drill hole data are illustrated
in Figure 9.4 and summarized in Table 9.9. Significant drill intersections from the 2012 drilling
program are summarized in Table 9.10.
(Source Gold Canyon, 2012)
Figure 9.4: Springpole Gold Project – 2012 Drill Hole Collar Location Map
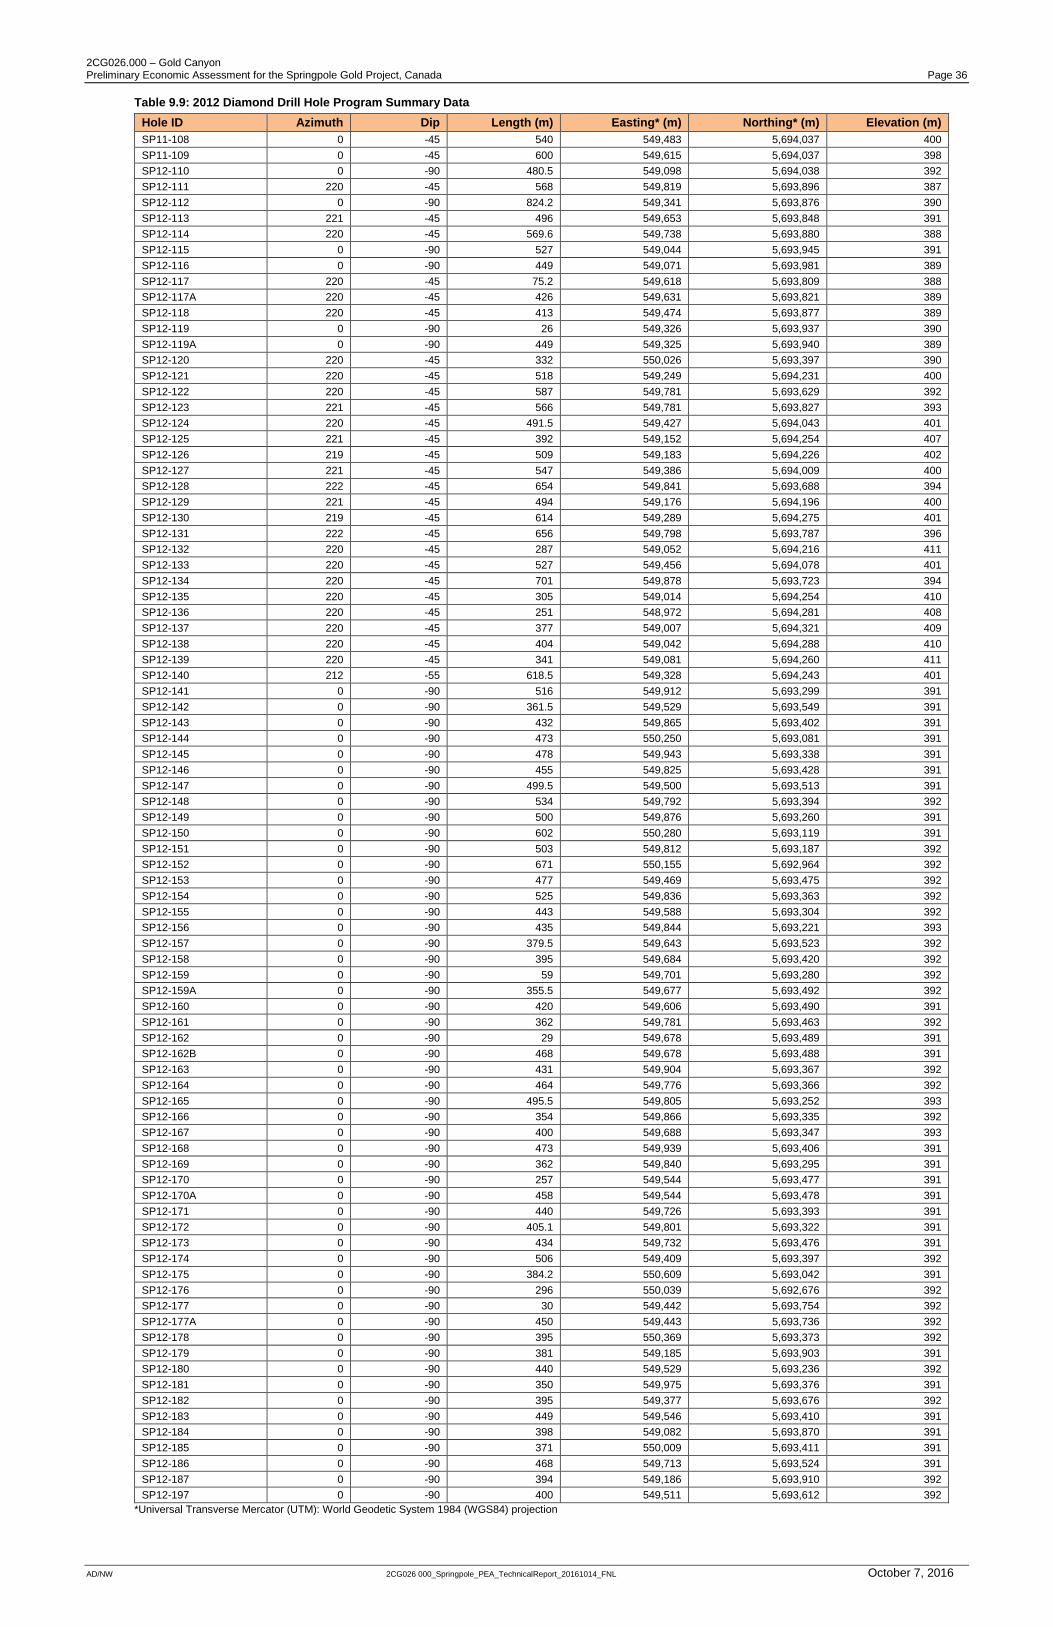
2CG026.000 – Gold Canyon Preliminary Economic Assessment for the Springpole Gold Project, Canada Page 36
AD/NW 2CG026 000_Springpole_PEA_TechnicalReport_20161014_FNL October 7, 2016
Table 9.9: 2012 Diamond Drill Hole Program Summary Data
Hole ID Azimuth Dip Length (m) Easting* (m) Northing* (m) Elevation (m)
SP11-108 0 -45 540 549,483 5,694,037 400
SP11-109 0 -45 600 549,615 5,694,037 398
SP12-110 0 -90 480.5 549,098 5,694,038 392
SP12-111 220 -45 568 549,819 5,693,896 387
SP12-112 0 -90 824.2 549,341 5,693,876 390
SP12-113 221 -45 496 549,653 5,693,848 391
SP12-114 220 -45 569.6 549,738 5,693,880 388
SP12-115 0 -90 527 549,044 5,693,945 391
SP12-116 0 -90 449 549,071 5,693,981 389
SP12-117 220 -45 75.2 549,618 5,693,809 388
SP12-117A 220 -45 426 549,631 5,693,821 389
SP12-118 220 -45 413 549,474 5,693,877 389
SP12-119 0 -90 26 549,326 5,693,937 390
SP12-119A 0 -90 449 549,325 5,693,940 389
SP12-120 220 -45 332 550,026 5,693,397 390
SP12-121 220 -45 518 549,249 5,694,231 400
SP12-122 220 -45 587 549,781 5,693,629 392
SP12-123 221 -45 566 549,781 5,693,827 393
SP12-124 220 -45 491.5 549,427 5,694,043 401
SP12-125 221 -45 392 549,152 5,694,254 407
SP12-126 219 -45 509 549,183 5,694,226 402
SP12-127 221 -45 547 549,386 5,694,009 400
SP12-128 222 -45 654 549,841 5,693,688 394
SP12-129 221 -45 494 549,176 5,694,196 400
SP12-130 219 -45 614 549,289 5,694,275 401
SP12-131 222 -45 656 549,798 5,693,787 396
SP12-132 220 -45 287 549,052 5,694,216 411
SP12-133 220 -45 527 549,456 5,694,078 401
SP12-134 220 -45 701 549,878 5,693,723 394
SP12-135 220 -45 305 549,014 5,694,254 410
SP12-136 220 -45 251 548,972 5,694,281 408
SP12-137 220 -45 377 549,007 5,694,321 409
SP12-138 220 -45 404 549,042 5,694,288 410
SP12-139 220 -45 341 549,081 5,694,260 411
SP12-140 212 -55 618.5 549,328 5,694,243 401
SP12-141 0 -90 516 549,912 5,693,299 391
SP12-142 0 -90 361.5 549,529 5,693,549 391
SP12-143 0 -90 432 549,865 5,693,402 391
SP12-144 0 -90 473 550,250 5,693,081 391
SP12-145 0 -90 478 549,943 5,693,338 391
SP12-146 0 -90 455 549,825 5,693,428 391
SP12-147 0 -90 499.5 549,500 5,693,513 391
SP12-148 0 -90 534 549,792 5,693,394 392
SP12-149 0 -90 500 549,876 5,693,260 391
SP12-150 0 -90 602 550,280 5,693,119 391
SP12-151 0 -90 503 549,812 5,693,187 392
SP12-152 0 -90 671 550,155 5,692,964 392
SP12-153 0 -90 477 549,469 5,693,475 392
SP12-154 0 -90 525 549,836 5,693,363 392
SP12-155 0 -90 443 549,588 5,693,304 392
SP12-156 0 -90 435 549,844 5,693,221 393
SP12-157 0 -90 379.5 549,643 5,693,523 392
SP12-158 0 -90 395 549,684 5,693,420 392
SP12-159 0 -90 59 549,701 5,693,280 392
SP12-159A 0 -90 355.5 549,677 5,693,492 392
SP12-160 0 -90 420 549,606 5,693,490 391
SP12-161 0 -90 362 549,781 5,693,463 392
SP12-162 0 -90 29 549,678 5,693,489 391
SP12-162B 0 -90 468 549,678 5,693,488 391
SP12-163 0 -90 431 549,904 5,693,367 392
SP12-164 0 -90 464 549,776 5,693,366 392
SP12-165 0 -90 495.5 549,805 5,693,252 393
SP12-166 0 -90 354 549,866 5,693,335 392
SP12-167 0 -90 400 549,688 5,693,347 393
SP12-168 0 -90 473 549,939 5,693,406 391
SP12-169 0 -90 362 549,840 5,693,295 391
SP12-170 0 -90 257 549,544 5,693,477 391
SP12-170A 0 -90 458 549,544 5,693,478 391
SP12-171 0 -90 440 549,726 5,693,393 391
SP12-172 0 -90 405.1 549,801 5,693,322 391
SP12-173 0 -90 434 549,732 5,693,476 391
SP12-174 0 -90 506 549,409 5,693,397 392
SP12-175 0 -90 384.2 550,609 5,693,042 391
SP12-176 0 -90 296 550,039 5,692,676 392
SP12-177 0 -90 30 549,442 5,693,754 392
SP12-177A 0 -90 450 549,443 5,693,736 392
SP12-178 0 -90 395 550,369 5,693,373 392
SP12-179 0 -90 381 549,185 5,693,903 391
SP12-180 0 -90 440 549,529 5,693,236 392
SP12-181 0 -90 350 549,975 5,693,376 391
SP12-182 0 -90 395 549,377 5,693,676 392
SP12-183 0 -90 449 549,546 5,693,410 391
SP12-184 0 -90 398 549,082 5,693,870 391
SP12-185 0 -90 371 550,009 5,693,411 391
SP12-186 0 -90 468 549,713 5,693,524 391
SP12-187 0 -90 394 549,186 5,693,910 392
SP12-197 0 -90 400 549,511 5,693,612 392
*Universal Transverse Mercator (UTM): World Geodetic System 1984 (WGS84) projection

2CG026.000 – Gold Canyon Preliminary Economic Assessment for the Springpole Gold Project, Canada Page 37
AD/NW 2CG026 000_Springpole_PEA_TechnicalReport_20161014_FNL October 7, 2016
Table 9.10: Significant Intercepts from 2012 Diamond Core Drilling Program
Hole ID From (m) To (m) Interval (m) Au (g/t) Au (oz/t)
SP12-127 251 398 147 1.14 0.03
SP12-128 230 549 319 1.02 0.03
SP12-131 301.3 546 244.7 0.80 0.023
SP12-146 77 91 14 5.03 0.147
SP12-158 16.7 60.2 43.5 1.81 0.053
SP12-160 23 384 361 1.08 0.032
SP12-163 130.9 265.0 134.1 0.91 0.027
SP12-181 157 225 68 0.72 0.021
SP12-183 202 385 183 0.61 0.018
SP12-186 114 240 126 1.17 0.034
9.7 Drill Collar Surveying
All historic holes drilled prior to 2010 were surveyed using various earth projections, either
NAD27 (North American Datum 1927) Canada, WGS or NAD83 projections. In September 2006,
W.J. Bowman Ltd of Dryden, Ontario, surveyed 275 historic drill hole collars from collar numbers
BL-1 thru BL-373. For the purposes of inclusion in the data set for 3-D modelling, all the historic
collar locations were converted to the UTM WGS84 projection.
For the 2007 and 2008 drill programs, the drill hole collars were located and surveyed using a
handheld GPS and recorded in UTM NAD27 Canada projection. For the purposes of this report
all the collar survey information has been converted to WGS84 and field checked against collar
locations using handheld Trimble GeoXH DGPS.
The 2010 to 2012 drill hole collars were initially surveyed using handheld GPS devices. During
the initial phases of the offshore 2010 drill program, drill hole collars on the lake ice were
surveyed by handheld, real-time differential GPS with an average accuracy of 4 to 5 m and
recorded in UTM NAD27 Canada projection. On-shore drill holes were initially located with
handheld GPS and once the drill hole was complete, the hole location was temporarily marked;
subsequently, the collars were surveyed using a Trimble GeoXH handheld DGPS device with an
external antenna giving submetre (~10 cm) location accuracy.
For the offshore 2011 and 2012 drill program, with drills mounted on barges, the drill sites were
marked by floating buoy and located using the Trimble GeoXH from a boat. All onshore drill
collars were located and subsequently surveyed using the Trimble GeoXH. At the beginning of
the winter 2011 drill program, the UTM WGS84 projection was adopted as the standard for
surveying drill collars and others surface landmarks. All previously recorded UTM measurements
were converted accordingly.
All drill site locations for inclined drill holes, onshore or offshore on the ice, were marked using
two to four painted laths aligned along strike either side of the proposed drill hole location. These
laths were used as fore- and back-sights for setting the drill location and orientation. Inclination of
the drill hole was checked on the drill head, prior to commencing drilling, using either a Brunton
compass or inclinometer accurate to half of one degree.
2CG026.000 – Gold Canyon Preliminary Economic Assessment for the Springpole Gold Project, Canada Page 38
AD/NW 2CG026 000_Springpole_PEA_TechnicalReport_20161014_FNL October 7, 2016
9.8 Oriented Core Surveying
Oriented core measurements were collected from a total of 44 drill holes. Oriented core is used to
evaluate the structural geology by allowing the geologists to measure the real angular
relationships, as opposed to apparent angles. The tool used was the ACT 2 from Reflex
Technologies. This system is fully digital, using infra-red and digital technology to make
measurements easier to record in the field by the drill crew. There were significant problems
encountered during the winter 2011 drill program due to tool failures. Some oriented core
information was collected, but too little to be of widespread use.
Where down-hole poor ground conditions were encountered, the oriented core tool proved to be
of little value due to the incompetent nature of intensely altered and mineralized rock. Wherever
competent rock was encountered, oriented core data were collected.
9.9 Down-Hole Surveying
All drill holes during the 2010 drill program were surveyed using a Reflex Technologies single EZ-
Shot or EZ-Trax down-hole survey system. Drill holes were surveyed once completed – this
procedure was used because of the chance that bad ground conditions encountered in the drill
holes increased the risk of cave-in when pulling the drill string backwards to conduct a survey.
Cave-in can result in increased cost due to time spent reaming the drill hole clean back to the
bottom, or from the possibility of sticking the drill string, causing loss of drilling tools. The
presence of magnetite in banded iron formation and relatively unaltered trachyte or greenstone
caused problems with respect to azimuth readings and also the azimuth of the drill traces. This
required many repetitions of the down-hole survey readings, which in some cases resulted in an
inability to record consistent data.
For the 2011 and 2012 programs, the Reflex Down-Hole Gyro survey system was adopted with
the EZ-Trax or EZ-Shot down-hole survey tools as back up. The Reflex Gyro is built around a
digital micro-gyro, which consists of a silicon sensor chip and an integrated circuit assembled in a
ceramic (non-magnetic) package. The gyro provides directional data (azimuth and dip) at any
interval from inside the drill rods. This system is used to provide azimuth and inclination data in
rocks with strong magnetic fields, because the gyros operate independently of the earth’s
magnetic field. The system also records ambient temperature as well as collecting basic gravity
measurements. The gyro system was successfully applied to the majority of the 2011 and 2012
drill programs.
Data recorded from the down-hole surveys were incorporated into 3-D planning and modelling.
9.10 Drilling Pattern and Density
The overall drill pattern approximate a 50 m grid along the long axis of the Portage zone and
about 45 to 65 m spacing down the dip of the mineralized zone. SRK is of the opinion that the drill
spacing and density is appropriate for this type of deposit and style of mineralization.
2CG026.000 – Gold Canyon Preliminary Economic Assessment for the Springpole Gold Project, Canada Page 39
AD/NW 2CG026 000_Springpole_PEA_TechnicalReport_20161014_FNL October 7, 2016
10 Sample Preparation, Analyses, and Security
10.1 Core Drilling Sampling
Detailed descriptions of the drill core were carried out under the supervision of a senior geologist,
a member in good standing of the APGO (Association of Professional Geologists of Ontario) and
AIPG (American Institute of Professional Geologists). The core logging was carried out on-site in
a dedicated core logging facility. Drill log data were recorded onto paper logs that were later
scanned and digitized.
Core was laid out 30 to 40 boxes at a time. First, the core was photographed in 15 m batches
prior to logging or sampling. This is followed by a geotechnical log that records quantitative and
qualitative engineering data including detailed recovery data and rock quality designation. Any
discrepancies between marker blocks and measured core length were addressed and resolved at
this stage. The core was then marked up for sampling.
For the 2010 and 2011 drill programs, all the drill core intervals were sampled using sample
intervals of 1 m. During the 2012 drilling program, Gold Canyon changed its standard sample
length from 1 to 2 m lengths. However, in zones of poor recovery, 1.5 or 3 m samples were
sometimes collected. Samples over the standard sample length were typically half core samples
and whole core was generally only taken in intervals of poor core recovery across the sampled
interval. Sampling marks were made on the core and sample tickets were stapled into the core
boxes at the beginning of each sample interval. Quality control samples were inserted into the
sample stream.
Inserting quality control samples involved the addition of certified blanks, certified gold standards,
and field and laboratory duplicates. Field duplicates were collected by quartering the core in the
sampling facility on-site. Laboratory duplicates were collected by splitting the first coarse reject
and crushing and then generating a second analytical pulp. Blank, standards and duplicates
made up 10% of the total sample stream. Sample tickets were marked blank, field or laboratory
duplicate, or standard, and a sample tag was stapled into the core box within the sample stream.
Geological descriptions were recorded for all core recovered. Separate columns in the log allow
description of the lithology, alteration style, intensity of alteration, relative degree of alteration,
sulphide percentage, rock colour, vein type, and veining density. A separate column was
reserved for written notes on lithology, mineralization, structure, vein orientations/relations etc.
The header page listed the hole number, collar coordinates, final depth, start/end dates, and the
name of the core logging geologist.
Core Sampling, Handling and Chain-of-Custody
Following the logging and core marking procedures described above, the core was passed to the
sampling facility. Core sampling was performed by experienced sampling technicians from
Ackewance Exploration & Services of Red Lake, Ontario, and quality control was maintained
through regular verification by on-site geologists. Core was broken, as necessary, into
manageable lengths. Pieces were removed from the box without disturbing the sample tags, were
2CG026.000 – Gold Canyon Preliminary Economic Assessment for the Springpole Gold Project, Canada Page 40
AD/NW 2CG026 000_Springpole_PEA_TechnicalReport_20161014_FNL October 7, 2016
cut in half lengthwise with a diamond saw, and then both halves were carefully repositioned in the
box. When a complete hole was processed in this manner, one half was collected for assay while
the other half remained in the core box as a witness. The remaining core in the boxes was then
photographed at 51 cm (20 inch) intervals. All logs and photographs were then submitted to the
senior geologist/project manager for review and were archived. Data were backed up.
The sampling technician packed one half of the split core sample intervals into transparent vinyl
sample bags that were sequentially numbered to match the sample number sequences in the
sample tag booklets used by the core-logging geologists. The numbered, blank portion of the
triplicate sample tag was placed in the bag with the sample; the portion was marked with the
sample interval remained stapled into the bottom of the core box at the point where the sample
interval begins. Sample bags were then sealed with plastic tags. Sealed sample bags were
packed into rice sacks five samples at a time. All sacks were individually labeled with the name of
the company, number of samples contained therein, and the number sequence of the samples
therein. Sacks were assigned sequential numbers on a per shipment basis. A project geologist
then checked the sample shipment and creates a shipping manifest for the sample batch. A copy
was given to the project manager and a copy was sent along with the sample shipment. A copy of
the sample shipment form was also sent via e-mail to the analytical laboratory.
The project geologist prepared the sample submission form for the assay laboratory. This form
identifies the number of sample sacks as well as the sequence of sample numbers to be
submitted. Due to the remote location, the shipment was then loaded on to a plane or helicopter
and flown direct to Red Lake where representatives of the commercial analytical laboratory met
the incoming flight and took the samples to the laboratory by pickup truck.
Once at the laboratory, a manager checked the rice sacks and sample numbers on the
submission form. The laboratory then split the received sample manifest into batches for analysis,
assigned a work order to the batch, and sent a copy of the mineral analysis acknowledgement
form to the project manager.
Aluminum tags embossed with the hole number, box number, and box interval (from/to) were
prepared and stapled onto the ends of each core box. Core boxes were cross-stacked on pallets
and then moved to on-site storage.
10.2 Sample Security
Core samples collected at the drill site were held in closed core boxes sealed with fiber tape; at
various times of day, camp staff collected the core boxes that were then delivered to the core
logging facility. All core logging, sampling and storage took place at the Springpole Gold Project
site. Following the logging and marking of core (described in the preceding section), all core
preparation and sampling was performed by technicians from Ackewance of Red Lake, Ontario,
under the supervision of the project manager. All on-site sampling activities were directly
supervised by the project manager.
2CG026.000 – Gold Canyon Preliminary Economic Assessment for the Springpole Gold Project, Canada Page 41
AD/NW 2CG026 000_Springpole_PEA_TechnicalReport_20161014_FNL October 7, 2016
10.3 Sample Preparation and Analytical Procedures
Analytical Laboratories
All primary assay work since the 2010 drill program has been performed by SGS Laboratories in
Red Lake (gold), Ontario and Don Mills (silver and multi-element) in Toronto, Ontario. The SGS
Red Lake and Don Mills facilities are certified and conform to requirements CAN-P-1579 and
CAN-P-4E (ISO/IEC 17025:2005). Certification is accredited for precious metals including gold
and silver and 52 element geochemical analyses.
Analytical Procedures
All samples received by SGS Red Lake were processed through a sample tracking system that is
an integral part of the company’s laboratory information management system. This system
utilizes bar coding and scanning technology that provides complete chain of custody records for
every stage in the sample preparation and analytical process.
Samples were dried, and then crushed to 70% of the sample passing 2 mm (-70 mesh). A 250 g
sample was split off the crushed material, and pulverized to 85% passing 75 micron (-200 mesh).
A 30 g split of the pulp was used for gold fire assay and a 2 g split was used for silver analysis.
Crushing and pulverizing equipment was cleaned with barren wash material between sample
preparation batches and, where necessary, between highly mineralized samples. Sample
preparation stations were also equipped with dust extraction systems to reduce the risk of sample
contamination. Once the gold assay was complete, a pulp was sent to the SGS Toronto facility for
silver and possibly for multi-element geochemical analysis.
As part of the standard internal quality control procedures used by the laboratory, each batch of
75 Springpole core samples included four blanks, four internal standards, and eight duplicate
samples. In the event that any reference material or duplicate result would fall outside the
established control limits, the sample batches would be re-assayed.
Pulps and rejects of the samples were stored by SGS at its Red Lake facility at the request of
Gold Canyon.
Gold, Silver and Multi-Element Analysis
Prepared samples were analyzed for gold by fire assay with atomic absorption finish. Samples
returning assays in excess of 10g/t gold are re-analyzed with a gravimetric finish.
Prepared pulp samples shipped from SGS Red Lake to SGS Toronto are analyzed for silver by
three-acid digestion with atomic absorption finish.
During the winter 2010 program, prepared samples were analyzed for 52 elements by acid
digestion (3:1 HCl: HNO3). The list of elements is included in Table 10.1.

2CG026.000 – Gold Canyon Preliminary Economic Assessment for the Springpole Gold Project, Canada Page 42
AD/NW 2CG026 000_Springpole_PEA_TechnicalReport_20161014_FNL October 7, 2016
Table 10.1: SGS Multi-Element Analysis Method ICM14B
Elements Limits Element Limits Element Limits
Ag 0.01 – 10 ppm Hg 0.01 ppm - 1% Se 1 ppm - 0.1%
Al 0.01 - 15% In 0.02 ppm - 0.05% Sn 0.3 ppm - 0.1%
As 1 ppm - 1% K 0.01 - 25% Sr 0.5 ppm - 1%
B 10 ppm - 1% La 0.1 ppm - 1% Ta 0.05 ppm - 1%
Ba 5 ppm - 1% Li 1 ppm - 5% Tb 0.02 ppm – 1%
Be 0.1 ppm - 0.01% Lu 0.01 ppm - 0.1% Te 0.05 ppm - 0.1%
Bi 0.02 ppm - 1% Mg 0.01 - 15% Th 0.1 ppm - 1%
Ca 0.01 - 15% Mn 2 ppm - 1% Ti 0.01 - 15%
Cd 0.01 ppm - 1% Mo 0.05 ppm - 1% TI 0.02 ppm - 1%
Ce 0.05 ppm - 0.1% Na 0.01 - 15% U 0.05 ppm - 1%
Co 0.1 ppm - 1% Nb 0.05 ppm - 0.1% V 1 ppm - 1%
Cr 1 ppm - 1% Ni 0.5 ppm - 1% W 0.1 ppm - 1%
Cs 0.05 ppm - 0.1% P 50 ppm - 1% Y 0.05 ppm - 1%
Cu 0.5 ppm - 1% Pb 0.2 ppm - 1% Yb 0.1 ppm - 0.01%
Fe 0.01% - 15% Rb 0.2 ppm - 1% Zn 1 ppm - 1%
10.4 Bulk Density Data
Bulk density was obtained for select core samples using the paraffin wax method at SGS
Lakefield Research Ltd. laboratory in Lakefield, Ontario. The bulk density of a sample is the
weight of the sample divided by the volume of the sample including voids.
The procedure as applied by SGS metallurgical laboratory was as follows:
1) Oven-dry the samples and then cool to room temperature.
2) Label and weigh each sample in grams.
3) Coat the sample with paraffin wax heated in a container immersed in boiling water.
4) Repeatedly immerse the sample in the wax until completely sealed.
5) Avoid heating the sample.
6) Weigh the waxed sample and record.
7) Weigh the waxed samples (g)by suspending in water and recording the displaced volume
(mL) and the water temperature (ºC).
8) Remove the wax by placing in boiling water, or freezing the core and chipping off if return of
the sample is required.
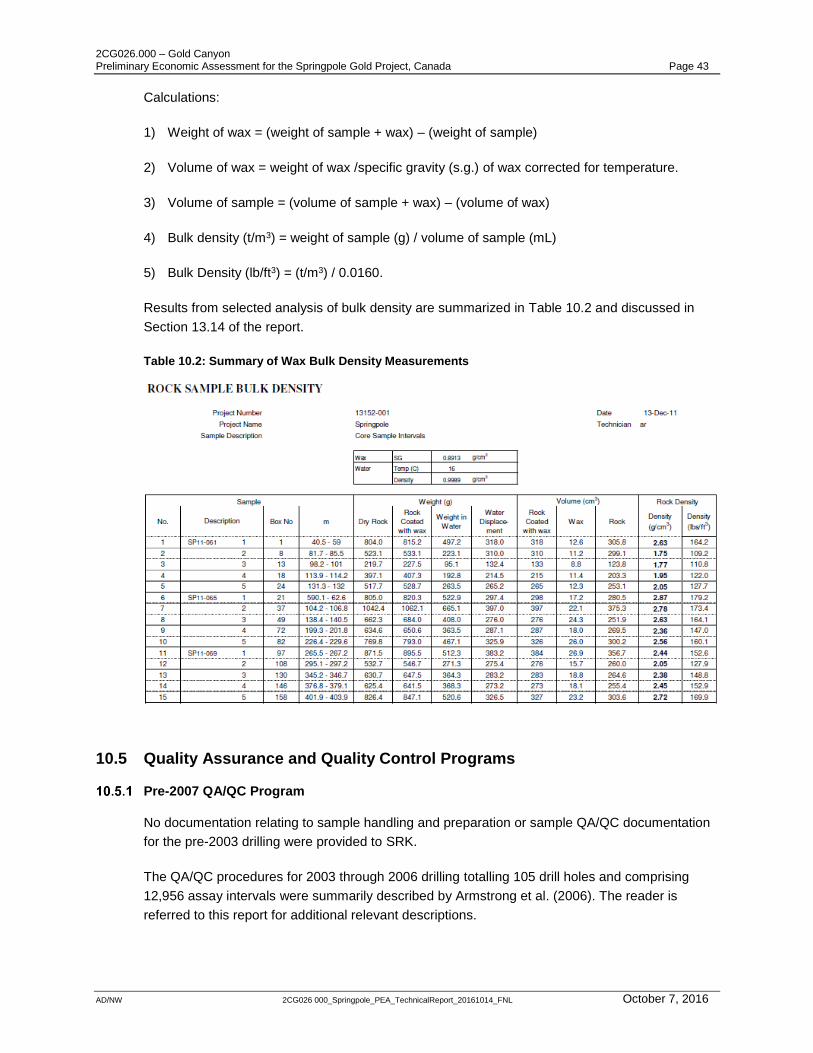
2CG026.000 – Gold Canyon Preliminary Economic Assessment for the Springpole Gold Project, Canada Page 43
AD/NW 2CG026 000_Springpole_PEA_TechnicalReport_20161014_FNL October 7, 2016
Calculations:
1) Weight of wax = (weight of sample + wax) – (weight of sample)
2) Volume of wax = weight of wax /specific gravity (s.g.) of wax corrected for temperature.
3) Volume of sample = (volume of sample + wax) – (volume of wax)
4) Bulk density (t/m3) = weight of sample (g) / volume of sample (mL)
5) Bulk Density (lb/ft3) = (t/m3) / 0.0160.
Results from selected analysis of bulk density are summarized in Table 10.2 and discussed in
Section 13.14 of the report.
Table 10.2: Summary of Wax Bulk Density Measurements
10.5 Quality Assurance and Quality Control Programs
Pre-2007 QA/QC Program
No documentation relating to sample handling and preparation or sample QA/QC documentation
for the pre-2003 drilling were provided to SRK.
The QA/QC procedures for 2003 through 2006 drilling totalling 105 drill holes and comprising
12,956 assay intervals were summarily described by Armstrong et al. (2006). The reader is
referred to this report for additional relevant descriptions.
2CG026.000 – Gold Canyon Preliminary Economic Assessment for the Springpole Gold Project, Canada Page 44
AD/NW 2CG026 000_Springpole_PEA_TechnicalReport_20161014_FNL October 7, 2016
P&E Mining Consultants checked a total of 1,725 entries in the database against the original
certificates. According to the report, “A few data entry errors were observed and corrected.”;
however, the total number of errors is not presented (Armstrong et al. 2006).
The QA/QC program for 2003to 2007 consisted of:
Resubmission of approximately 10% of the sample pulps to a second laboratory (ALS
Chemex);
Insertion of two commercial standard reference materials (standards submitted every 30th
sample); and
Insertion of blanks.
There were no field or bulk reject duplicates submitted. Also, no pulp duplicates were submitted
to the primary laboratory.
Due to the lack of detailed documentation, particularly for pre-2003 drilling, SRK elected to use
the pre-2003 drilling only in estimating the proportionately minor East Extension and Camp
zones. The Portage zone was estimated using only 2003 and later drill holes. The East Extension
and Camp zones as now defined correspond to the deposits estimated by P&E in their 2006
study (Armstrong, 2006),
Also, because of the lack of documentation, the current estimates for the East Extension zone
were restricted to the inferred resource category, although P&E classified these zones as
measured, indicated, and inferred resources in their report (Armstrong, 2006), recommended that
Gold Canyon continue the program of re-sampling and re-logging of the core for the pre-2007
drilling with focus on the mineralized intervals, to replace the missing duplicate field and pulp
duplicate including appropriate insertion of blanks and standards that would demonstrate
compliance with current NI 43-101 standards. The drill hole density in these areas was more than
adequate for generating resource categories above inferred if appropriate sample methodologies
and duplicates samples were included with the results.
2007/2008 QA/QC Program
A total of 18 drill holes were completed in 2007 and 2008 comprising a total of 1,374 assay
intervals. These samples were assayed for gold only by the Accurassay Laboratories of Thunder
Bay, Ontario. SRK checked a total of 137 samples representing 10% of the total against the
original certificates. No errors were found.
No program was set up for duplicates, standards, or blanks for this drilling program. The
laboratory ran their own set of duplicates for internal monitoring purposes; however, that data
were not available to SRK.
2CG026.000 – Gold Canyon Preliminary Economic Assessment for the Springpole Gold Project, Canada Page 45
AD/NW 2CG026 000_Springpole_PEA_TechnicalReport_20161014_FNL October 7, 2016
2010 to 2012 QA/QC Program
A total of 196 drill holes, comprising 76,875 m, were completed and assayed in time for inclusion
into this study. The vast majority of these drill holes targeted the Portage zone. The drill hole
samples generated by the 2010 to 2012 drill programs were assayed by SGS Red Lake and SGS
Mineral Services of Toronto, Ontario.
In 2010, Gold Canyon instituted a QA/QC program consisting of commercial standard reference
materials for gold, and it instituted, consistent with current industry practice, blanks, field
duplicates, and pulp duplicates. In addition, a “round robin” program was instituted in 2011 with
ACT Labs of Red Lake, Ontario, that compared pulp re-assay results against the original SGS
results for 469 samples.
SGS conducted their own program of internal duplicate analysis as well. The results of this
program were also analyzed by SRK as a valuable comparison against the “blind” pulp duplicates
submitted. Results are presented in Appendix C.
A summary of the blanks and standards submissions are presented below:
A total of 1,336 field duplicates were submitted for gold.
A total of 1,359 field duplicates were submitted for silver.
A total of 1,303 lab or pulp duplicates were submitted for gold.
A total of 1,302 pulp duplicates were submitted for silver.
A total of 1,377 commercial gold standards were submitted from a set of 14 different
commercial standards.
No commercial standards were submitted for silver.
A total of 1,371 blanks were submitted with the gold assays.
A total of 1,006 blanks were submitted with the silver assays.
The total submissions for gold duplicates, standards and blanks was 5,387; 10.1% of the samples
assayed for gold. The total submissions for silver duplicates, and blanks was 3,667 or 7% of the
total samples assayed for silver.
10.6 SRK Comments
In the opinion of SRK, the sampling preparation, security and analytical procedures used by Gold
Canyon for gold analyses are acceptable but not fully consistent with generally accepted industry
best practices because of the lack of standard reference material for silver. However, because of
the relative low economic value of silver, SRK concludes that the assay data are adequate for
use in resource estimation. SRK recommends that Gold Canyon establishes a written QA/QC
protocol for the acceptance of assay batches with respect to the performance of standard
reference material, duplicates and blanks. SRK also recommends that Gold Canyon procure
some standard reference material for silver before the beginning of the next drilling campaign.
2CG026.000 – Gold Canyon Preliminary Economic Assessment for the Springpole Gold Project, Canada Page 46
AD/NW 2CG026 000_Springpole_PEA_TechnicalReport_20161014_FNL October 7, 2016
11 Data Verification
Independent data verification was carried out by P&E and described in their technical report
(Armstrong et. al 2006) for data collected from 2003 through 2006.
Of the 18 drill holes completed in 2007 and 2008, comprising a total of 1,374 assay intervals
analyzed for gold, SRK checked a total of 137 samples representing 10% of the total against the
original certificates. No errors were found.
A total of 3,135 assay values for gold and 3,161 assay values for silver in the database were
compared against the original protected PDF assay certificates submitted by SGS Red Lake.
These totals represent 10.1% and 10.4% of the total number of assays for gold and silver,
respectively.
Of the original assay values checked against certificates, the focus was on values material to any
resource estimate, either higher-grade intervals or very low grade intervals in proximity to higher-
grade intervals. The average grade of gold samples verified was 2.05 g/t gold. The average grade
of silver samples checked was 8.27 g/t silver.
Only two errors were found for gold:
The gold value of sample interval SP10-028 from 433 m to 436 m (sample number 8287)
found to have an entered value of 5.96 g/t gold against a value on the assay certificate of
9.00 g/t gold.
The gold value of sample interval SP11-076 from 69 to 70 m (sample number 14583) having
the value of 0.45 oz/t incorrectly placed in the parts per billion column.
No errors were found with respect to silver assays.
This represents an error rate of 0.064% in gold assays and an error rate of 0.0% in silver assays.
This error rate is well within acceptable industry standards.
11.1 Verifications by SRK
Site Visit
SRK carried out visits to the Springpole site on February 10 and 11, 2012, and again on August 8
and 9, 2012. During the site visits, core logging procedures were reviewed. Several sections of
core from the Portage, Camp, and East Extension zones were examined. Sampling procedures
and handling were observed. The deposit geology, alteration, and core recovery data were
observed for the Portage zone. SRK was fully assisted during the site visit by Gold Canyon
personnel and was given full access to data during the site visit. Gold Canyon field personnel
were very helpful and fully cooperative during both site visits.
During the site visit, SRK re-logged mineralized sections of drill core from the Springpole deposit
and checked geological units against the recorded written logs. Down-hole survey data entered in
the digital database were checked against data entered on paper logs at the site and no errors
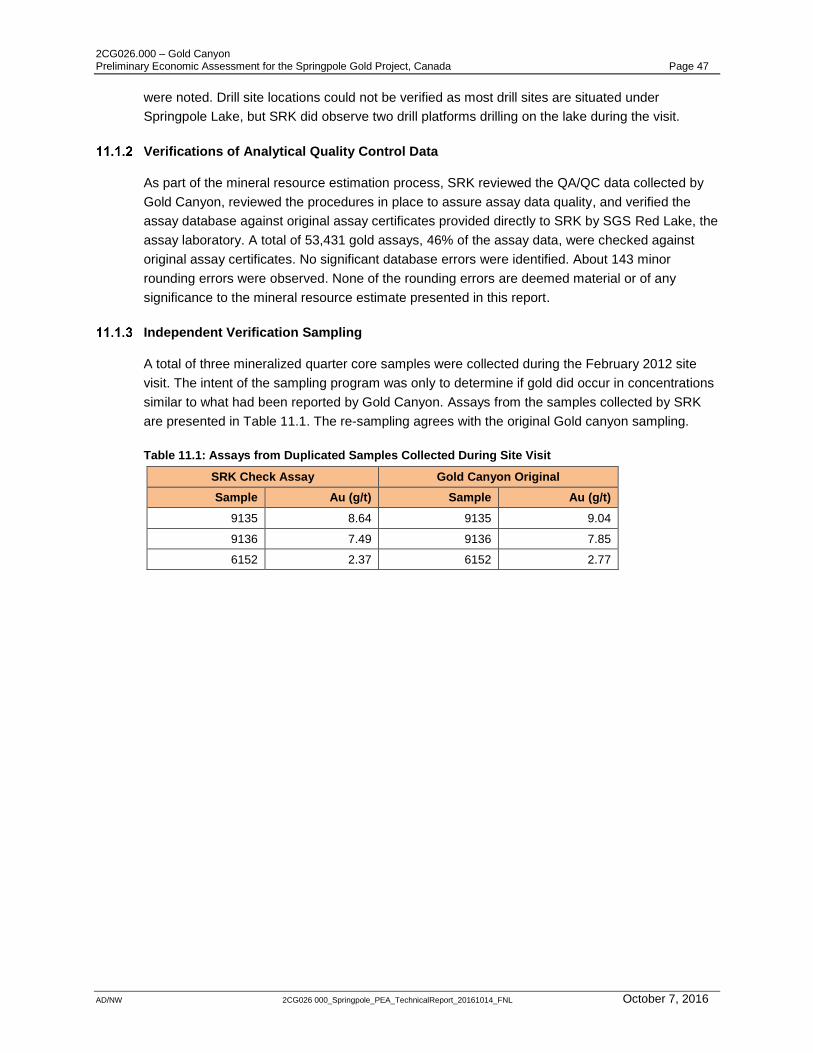
2CG026.000 – Gold Canyon Preliminary Economic Assessment for the Springpole Gold Project, Canada Page 47
AD/NW 2CG026 000_Springpole_PEA_TechnicalReport_20161014_FNL October 7, 2016
were noted. Drill site locations could not be verified as most drill sites are situated under
Springpole Lake, but SRK did observe two drill platforms drilling on the lake during the visit.
Verifications of Analytical Quality Control Data
As part of the mineral resource estimation process, SRK reviewed the QA/QC data collected by
Gold Canyon, reviewed the procedures in place to assure assay data quality, and verified the
assay database against original assay certificates provided directly to SRK by SGS Red Lake, the
assay laboratory. A total of 53,431 gold assays, 46% of the assay data, were checked against
original assay certificates. No significant database errors were identified. About 143 minor
rounding errors were observed. None of the rounding errors are deemed material or of any
significance to the mineral resource estimate presented in this report.
Independent Verification Sampling
A total of three mineralized quarter core samples were collected during the February 2012 site
visit. The intent of the sampling program was only to determine if gold did occur in concentrations
similar to what had been reported by Gold Canyon. Assays from the samples collected by SRK
are presented in Table 11.1. The re-sampling agrees with the original Gold canyon sampling.
Table 11.1: Assays from Duplicated Samples Collected During Site Visit
SRK Check Assay Gold Canyon Original
Sample Au (g/t) Sample Au (g/t)
9135 8.64 9135 9.04
9136 7.49 9136 7.85
6152 2.37 6152 2.77
2CG026.000 – Gold Canyon Preliminary Economic Assessment for the Springpole Gold Project, Canada Page 48
AD/NW 2CG026 000_Springpole_PEA_TechnicalReport_20161014_FNL October 7, 2016
12 Mineral Processing and Metallurgical Testing
To date, three metallurgical testwork programs have been completed on Springpole material:
Lakefield Research, Lakefield, Ontario (1989)—a preliminary program of whole feed leaching
on two samples.
SGS Mineral Services, Vancouver, British Columbia (2011)—a follow up program of leaching
on eight samples.
SGS Lakefield, Lakefield, Ontario (2012/2013)—comminution, whole feed leaching,
flotation/leaching on six samples.
Reports were issued at the completion of all programs and are listed in the References
(Section 27). This section discusses the testwork completed during these programs, as well as
expected plant performance on the selected process flowsheet.
12.1 Lakefield Research 1989
In 1989, preliminary metallurgical testing on two types of material from the Portage zone was
completed by Lakefield Research on behalf of Goldfields Canadian Mining Ltd.
The purpose of this testwork was to investigate gold extraction by direct, whole feed cyanidation
at different feed sizes, as well as carbon in leach (CIL) extraction at fine grinds on two composite
samples produced from core intersections received from Goldfields.
Sample Preparation
The two samples of core received were described as typical Portage zone (Sample 1) and
intensely broken altered (Sample 2). Lakefield prepared composites for their test program from
these two samples, labelled Composite A and Composite B, respectively.
The combined mass of sample received was 34 kilograms. For each composite, two 2.5 kg
charges of “as received” material were riffled out and the remainder was crushed to -10 mesh or -
2 mm. A head assay sample was riffled out and the remaining sample was made into test
charges.
Head Analysis
Head analyses for the two composite samples are shown in Table 12.1. The precious metal
grades were moderate to low and the sulphur levels relatively high, depending on gold
association which may present challenges to cyanide leaching. Other elements analyzed did not
raise major concerns.
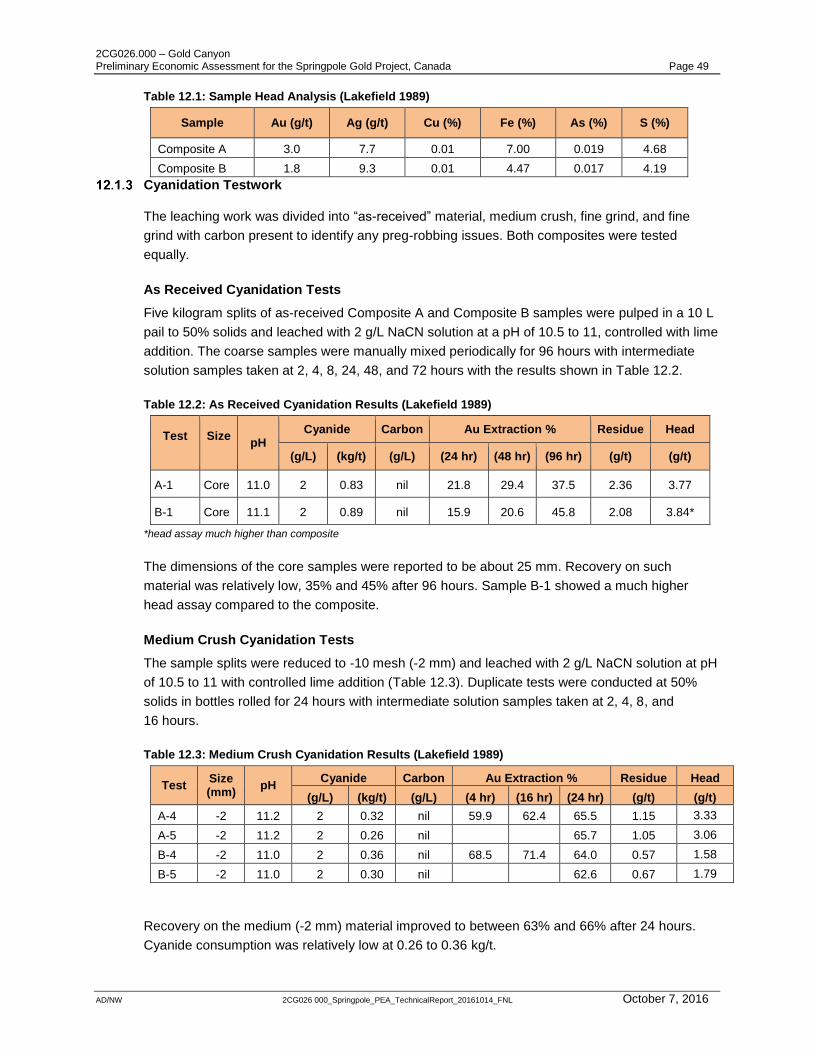
2CG026.000 – Gold Canyon Preliminary Economic Assessment for the Springpole Gold Project, Canada Page 49
AD/NW 2CG026 000_Springpole_PEA_TechnicalReport_20161014_FNL October 7, 2016
Table 12.1: Sample Head Analysis (Lakefield 1989)
Sample Au (g/t) Ag (g/t) Cu (%) Fe (%) As (%) S (%)
Composite A 3.0 7.7 0.01 7.00 0.019 4.68
Composite B 1.8 9.3 0.01 4.47 0.017 4.19
Cyanidation Testwork
The leaching work was divided into “as-received” material, medium crush, fine grind, and fine
grind with carbon present to identify any preg-robbing issues. Both composites were tested
equally.
As Received Cyanidation Tests
Five kilogram splits of as-received Composite A and Composite B samples were pulped in a 10 L
pail to 50% solids and leached with 2 g/L NaCN solution at a pH of 10.5 to 11, controlled with lime
addition. The coarse samples were manually mixed periodically for 96 hours with intermediate
solution samples taken at 2, 4, 8, 24, 48, and 72 hours with the results shown in Table 12.2.
Table 12.2: As Received Cyanidation Results (Lakefield 1989)
Test
Size
pH Cyanide Carbon Au Extraction % Residue Head
(g/L) (kg/t) (g/L) (24 hr) (48 hr) (96 hr) (g/t) (g/t)
A-1 Core 11.0 2 0.83 nil 21.8 29.4 37.5 2.36 3.77
B-1 Core 11.1 2 0.89 nil 15.9 20.6 45.8 2.08 3.84*
*head assay much higher than composite
The dimensions of the core samples were reported to be about 25 mm. Recovery on such
material was relatively low, 35% and 45% after 96 hours. Sample B-1 showed a much higher
head assay compared to the composite.
Medium Crush Cyanidation Tests
The sample splits were reduced to -10 mesh (-2 mm) and leached with 2 g/L NaCN solution at pH
of 10.5 to 11 with controlled lime addition (Table 12.3). Duplicate tests were conducted at 50%
solids in bottles rolled for 24 hours with intermediate solution samples taken at 2, 4, 8, and
16 hours.
Table 12.3: Medium Crush Cyanidation Results (Lakefield 1989)
Test Size (mm)
pH Cyanide Carbon Au Extraction % Residue Head
(g/L) (kg/t) (g/L) (4 hr) (16 hr) (24 hr) (g/t) (g/t)
A-4 -2 11.2 2 0.32 nil 59.9 62.4 65.5 1.15 3.33
A-5 -2 11.2 2 0.26 nil 65.7 1.05 3.06
B-4 -2 11.0 2 0.36 nil 68.5 71.4 64.0 0.57 1.58
B-5 -2 11.0 2 0.30 nil 62.6 0.67 1.79
Recovery on the medium (-2 mm) material improved to between 63% and 66% after 24 hours.
Cyanide consumption was relatively low at 0.26 to 0.36 kg/t.
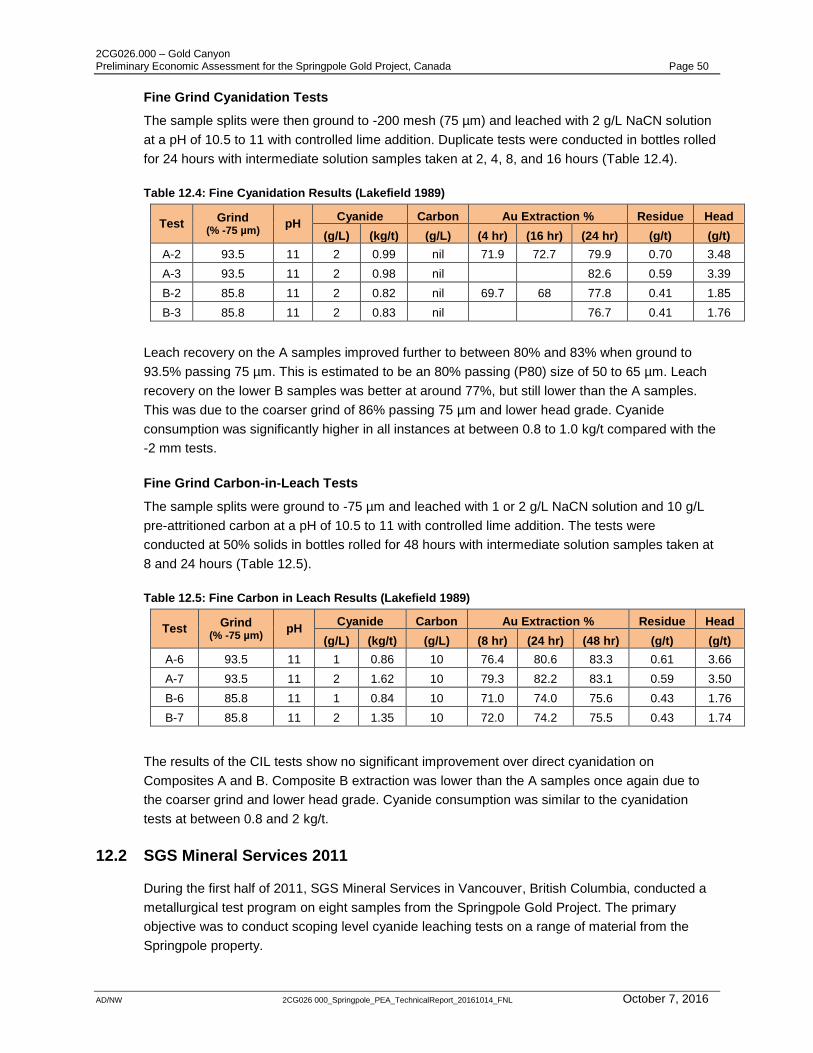
2CG026.000 – Gold Canyon Preliminary Economic Assessment for the Springpole Gold Project, Canada Page 50
AD/NW 2CG026 000_Springpole_PEA_TechnicalReport_20161014_FNL October 7, 2016
Fine Grind Cyanidation Tests
The sample splits were then ground to -200 mesh (75 µm) and leached with 2 g/L NaCN solution
at a pH of 10.5 to 11 with controlled lime addition. Duplicate tests were conducted in bottles rolled
for 24 hours with intermediate solution samples taken at 2, 4, 8, and 16 hours (Table 12.4).
Table 12.4: Fine Cyanidation Results (Lakefield 1989)
Test Grind
(% -75 µm) pH
Cyanide Carbon Au Extraction % Residue Head
(g/L) (kg/t) (g/L) (4 hr) (16 hr) (24 hr) (g/t) (g/t)
A-2 93.5 11 2 0.99 nil 71.9 72.7 79.9 0.70 3.48
A-3 93.5 11 2 0.98 nil 82.6 0.59 3.39
B-2 85.8 11 2 0.82 nil 69.7 68 77.8 0.41 1.85
B-3 85.8 11 2 0.83 nil 76.7 0.41 1.76
Leach recovery on the A samples improved further to between 80% and 83% when ground to
93.5% passing 75 µm. This is estimated to be an 80% passing (P80) size of 50 to 65 µm. Leach
recovery on the lower B samples was better at around 77%, but still lower than the A samples.
This was due to the coarser grind of 86% passing 75 µm and lower head grade. Cyanide
consumption was significantly higher in all instances at between 0.8 to 1.0 kg/t compared with the
-2 mm tests.
Fine Grind Carbon-in-Leach Tests
The sample splits were ground to -75 µm and leached with 1 or 2 g/L NaCN solution and 10 g/L
pre-attritioned carbon at a pH of 10.5 to 11 with controlled lime addition. The tests were
conducted at 50% solids in bottles rolled for 48 hours with intermediate solution samples taken at
8 and 24 hours (Table 12.5).
Table 12.5: Fine Carbon in Leach Results (Lakefield 1989)
Test Grind
(% -75 µm) pH
Cyanide Carbon Au Extraction % Residue Head
(g/L) (kg/t) (g/L) (8 hr) (24 hr) (48 hr) (g/t) (g/t)
A-6 93.5 11 1 0.86 10 76.4 80.6 83.3 0.61 3.66
A-7 93.5 11 2 1.62 10 79.3 82.2 83.1 0.59 3.50
B-6 85.8 11 1 0.84 10 71.0 74.0 75.6 0.43 1.76
B-7 85.8 11 2 1.35 10 72.0 74.2 75.5 0.43 1.74
The results of the CIL tests show no significant improvement over direct cyanidation on
Composites A and B. Composite B extraction was lower than the A samples once again due to
the coarser grind and lower head grade. Cyanide consumption was similar to the cyanidation
tests at between 0.8 and 2 kg/t.
12.2 SGS Mineral Services 2011
During the first half of 2011, SGS Mineral Services in Vancouver, British Columbia, conducted a
metallurgical test program on eight samples from the Springpole Gold Project. The primary
objective was to conduct scoping level cyanide leaching tests on a range of material from the
Springpole property.

2CG026.000 – Gold Canyon Preliminary Economic Assessment for the Springpole Gold Project, Canada Page 51
AD/NW 2CG026 000_Springpole_PEA_TechnicalReport_20161014_FNL October 7, 2016
Sample Preparation
Identification and inventory of the eight Springpole samples are shown in Table 12.6.
Table 12.6: Sample Identification and Inventory (SGS 2011)
Sample Hole ID From (m) To (m) Sample
Weight (kg) Zone/Material
Met 1 SP11-044 183 186 2.0 Portage Sulphide
Met 2 SP11-042 19 20 3.9 Portage Sulphide
Met 3 SP10-022 301 302 3.4 Portage Sulphide
Met 4 SP10-008 301 302 3.2 Portage Sulphide
Met 5 SP11-040 108 109 2.6 Oxide
Met 6 SP10-011 4 5 2.8 Portage Bridge
Met 7 SP10-026 290 291 3.8 Portage Sulphide
Met 8 SP11-031 31 32 4.3 Portage/Main
The samples were stage crushed to -2 mm, blended and riffled into 1 kilogram charges for
cyanidation bottle leach tests. A 150 g sample was also split from each sample and submitted for
gold, silver, arsenic, iron, sulfur, and multi-element inductively coupled plasma (ICP) scan head
analyses. Due to the small amount of Gold Canyon Met 1 sample, only 900 g grind calibration
and bottle cyanidation charges were prepared.
Head Analysis
Head analyses for the eight samples are shown in Table 12.7.
Table 12.7: Head Analysis (SGS 2011)
Sample Au (g/t) Ag (g/t) As (g/t) Sb (g/t) Fe (%) S (%)
Met 1 2.2 2.1 35 0.55 2.87 1.32
Met 2 1.3 1.7 42 0.82 5.59 2.33
Met 3 1.4 4.6 10 0.71 5.82 1.84
Met 4 1.3 3.9 33 0.56 5.61 4.10
Met 5 3.0 1.0 42 4.21 5.10 0.05
Met 6 1.5 1.9 74 1.70 2.57 1.40
Met 7 1.6 7.8 268 10.1 8.24 7.09
Met 8 1.7 1.5 194 1.69 6.99 4.16
Arsenic and antimony levels were low (except for Met 7 and 8) while the sulphur content of most
samples was relatively high and, depending on gold association, may present challenges to
cyanide leaching. Sample Met 5 was likely oxidized and clearly different in mineralogy.
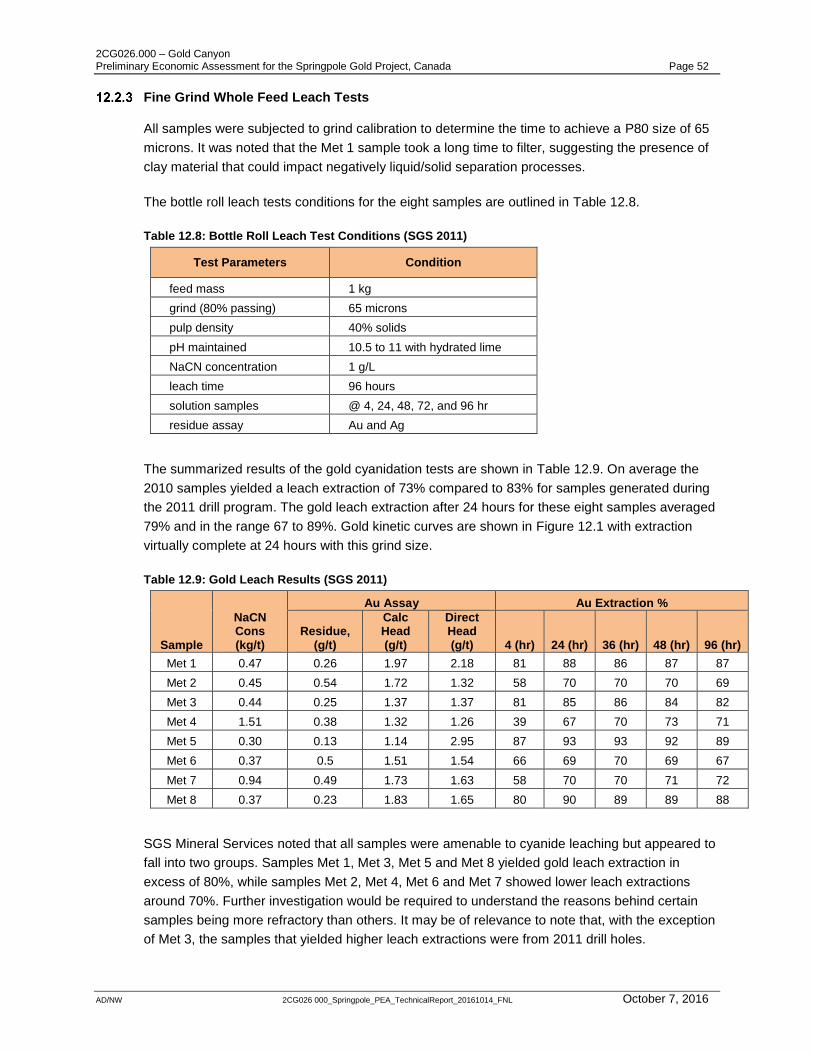
2CG026.000 – Gold Canyon Preliminary Economic Assessment for the Springpole Gold Project, Canada Page 52
AD/NW 2CG026 000_Springpole_PEA_TechnicalReport_20161014_FNL October 7, 2016
Fine Grind Whole Feed Leach Tests
All samples were subjected to grind calibration to determine the time to achieve a P80 size of 65
microns. It was noted that the Met 1 sample took a long time to filter, suggesting the presence of
clay material that could impact negatively liquid/solid separation processes.
The bottle roll leach tests conditions for the eight samples are outlined in Table 12.8.
Table 12.8: Bottle Roll Leach Test Conditions (SGS 2011)
Test Parameters Condition
feed mass 1 kg
grind (80% passing) 65 microns
pulp density 40% solids
pH maintained 10.5 to 11 with hydrated lime
NaCN concentration 1 g/L
leach time 96 hours
solution samples @ 4, 24, 48, 72, and 96 hr
residue assay Au and Ag
The summarized results of the gold cyanidation tests are shown in Table 12.9. On average the
2010 samples yielded a leach extraction of 73% compared to 83% for samples generated during
the 2011 drill program. The gold leach extraction after 24 hours for these eight samples averaged
79% and in the range 67 to 89%. Gold kinetic curves are shown in Figure 12.1 with extraction
virtually complete at 24 hours with this grind size.
Table 12.9: Gold Leach Results (SGS 2011)
Sample
NaCN Cons (kg/t)
Au Assay Au Extraction %
Residue, (g/t)
Calc Head (g/t)
Direct Head (g/t) 4 (hr) 24 (hr) 36 (hr) 48 (hr) 96 (hr)
Met 1 0.47 0.26 1.97 2.18 81 88 86 87 87
Met 2 0.45 0.54 1.72 1.32 58 70 70 70 69
Met 3 0.44 0.25 1.37 1.37 81 85 86 84 82
Met 4 1.51 0.38 1.32 1.26 39 67 70 73 71
Met 5 0.30 0.13 1.14 2.95 87 93 93 92 89
Met 6 0.37 0.5 1.51 1.54 66 69 70 69 67
Met 7 0.94 0.49 1.73 1.63 58 70 70 71 72
Met 8 0.37 0.23 1.83 1.65 80 90 89 89 88
SGS Mineral Services noted that all samples were amenable to cyanide leaching but appeared to
fall into two groups. Samples Met 1, Met 3, Met 5 and Met 8 yielded gold leach extraction in
excess of 80%, while samples Met 2, Met 4, Met 6 and Met 7 showed lower leach extractions
around 70%. Further investigation would be required to understand the reasons behind certain
samples being more refractory than others. It may be of relevance to note that, with the exception
of Met 3, the samples that yielded higher leach extractions were from 2011 drill holes.
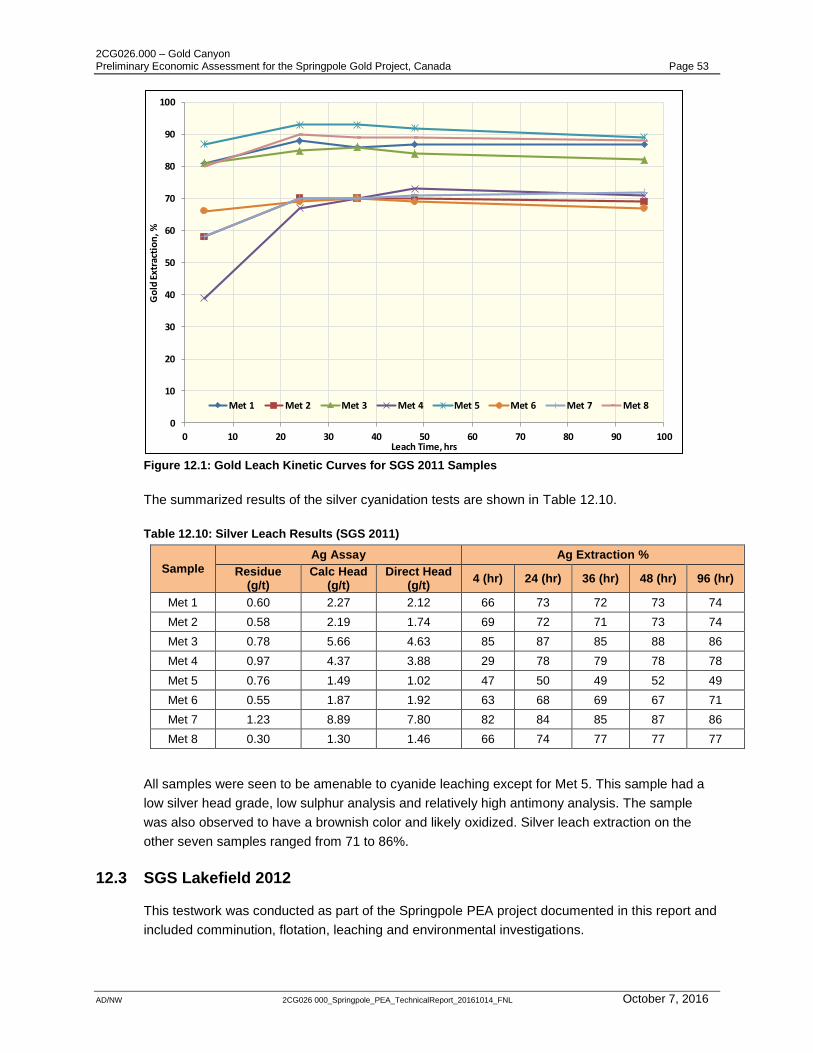
2CG026.000 – Gold Canyon Preliminary Economic Assessment for the Springpole Gold Project, Canada Page 53
AD/NW 2CG026 000_Springpole_PEA_TechnicalReport_20161014_FNL October 7, 2016
Figure 12.1: Gold Leach Kinetic Curves for SGS 2011 Samples
The summarized results of the silver cyanidation tests are shown in Table 12.10.
Table 12.10: Silver Leach Results (SGS 2011)
Sample
Ag Assay Ag Extraction %
Residue (g/t)
Calc Head (g/t)
Direct Head (g/t)
4 (hr) 24 (hr) 36 (hr) 48 (hr) 96 (hr)
Met 1 0.60 2.27 2.12 66 73 72 73 74
Met 2 0.58 2.19 1.74 69 72 71 73 74
Met 3 0.78 5.66 4.63 85 87 85 88 86
Met 4 0.97 4.37 3.88 29 78 79 78 78
Met 5 0.76 1.49 1.02 47 50 49 52 49
Met 6 0.55 1.87 1.92 63 68 69 67 71
Met 7 1.23 8.89 7.80 82 84 85 87 86
Met 8 0.30 1.30 1.46 66 74 77 77 77
All samples were seen to be amenable to cyanide leaching except for Met 5. This sample had a
low silver head grade, low sulphur analysis and relatively high antimony analysis. The sample
was also observed to have a brownish color and likely oxidized. Silver leach extraction on the
other seven samples ranged from 71 to 86%.
12.3 SGS Lakefield 2012
This testwork was conducted as part of the Springpole PEA project documented in this report and
included comminution, flotation, leaching and environmental investigations.
0
10
20
30
40
50
60
70
80
90
100
0 10 20 30 40 50 60 70 80 90 100
Go
ld E
xtra
ctio
n, %
Leach Time, hrs
Met 1 Met 2 Met 3 Met 4 Met 5 Met 6 Met 7 Met 8

2CG026.000 – Gold Canyon Preliminary Economic Assessment for the Springpole Gold Project, Canada Page 54
AD/NW 2CG026 000_Springpole_PEA_TechnicalReport_20161014_FNL October 7, 2016
Sample Preparation
Five samples were taken from individual holes, twinned to earlier drill holes from 2010 and 2011.
Three were from the Portage zone (two sulphides and one oxide) and one from each of the East
Extension, Camp, and Main zones. It was decided to separate SP11-61 into low grade (LG) and
high grade (HG) samples, bringing the total to six. Table 12.11 shows the hole IDs and intervals
sampled.
Table 12.11: Sample Identification and Inventory (SGS 2012)
Hole ID From (m) To (m) Weight (kg) Comments
SP11-61 50 150 150 Portage Zone (Oxide)
SP11-65 31 250 150 Portage Zone
SP11-66 16 40 58 East Pit Extension
SP11-69 206 511 150 Portage Zone
SP11-90 10 124 50 Camp/Main Zone
Head Analysis
Head assays showed the samples to be 3 to 4 g/t gold with 1 to 6 g/t silver and similar to the
average grade of the resource. Sample 66 from the East Extension zone was much higher in gold
at 12 g/t (Table 12.12). Sample 61 was much lower in sulphur but higher in arsenic and was later
shown to be highly oxidized with iron sulphide minerals converted to oxides (similar to Met 5 from
2011).
Table 12.12: Head Analysis (SGS 2012)
Sample Au (g/t) Ag (g/t) As (g/t) Sb (g/t) Fe (%) S (%)
SP11-61 LG 2.3 2 129 12 6.6 0.05
SP11-61 HG 4.8 <0.5 143 10 9.2 0.05
SP11-65 1.9 4 63 <10 7.1 5.1
SP11-66 12 2 38 <10 4.8 3.2
SP11-69 1.2 6 <30 <10 7.0 4.0
SP11-90 1.2 1 36 <10 7.5 2.0
Duplicate screen metallic assays were performed at 150 mesh (106 µm) with the average results
shown in Table 12.13. With the exception of the high grade 66 sample, most showed limited
amounts of coarse gold, with only 1 to 5% present in the coarse fraction.
Full ICP analysis was completed on the sample heads with no deleterious elements noted.
A QEMSCAN Rapid Mineral Scan (RMS) was performed on the sample heads for the
mineralogical assemblage. The main minerals are summarized in Table 12.14. Pyrite is the
principal sulphide mineral in most of the samples with it converted to iron oxides in sample 61.
Feldspar, mica and quartz are the most abundant host minerals.
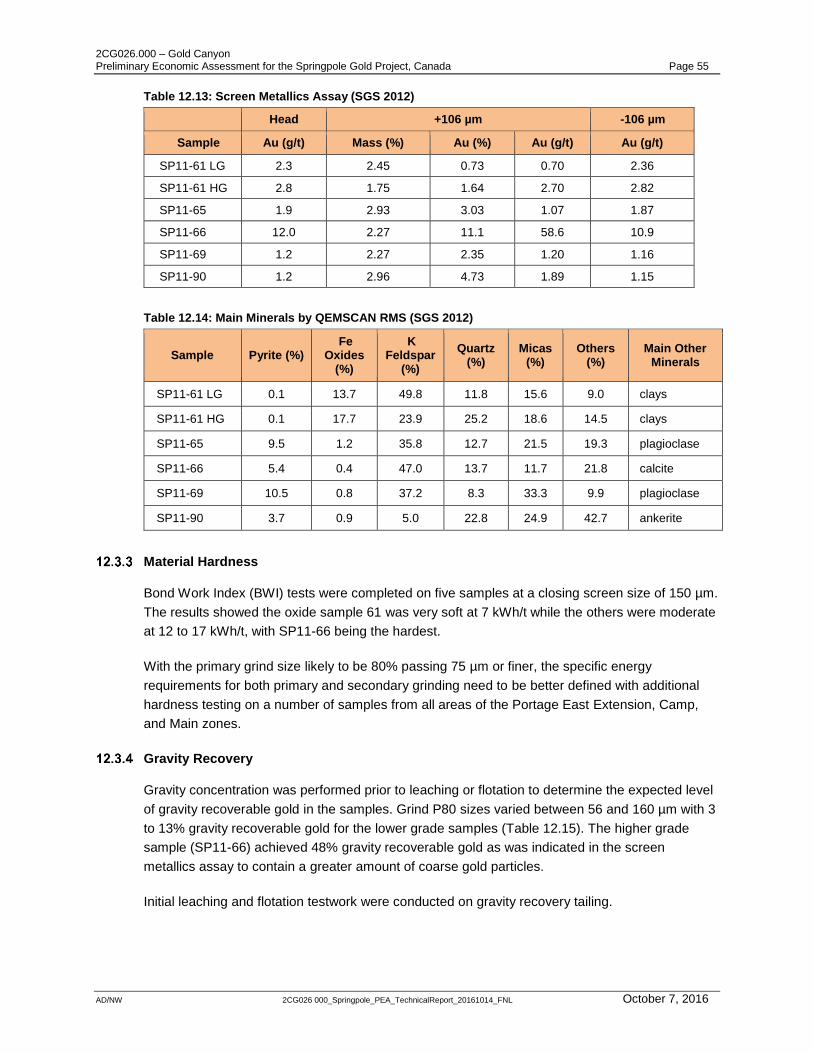
2CG026.000 – Gold Canyon Preliminary Economic Assessment for the Springpole Gold Project, Canada Page 55
AD/NW 2CG026 000_Springpole_PEA_TechnicalReport_20161014_FNL October 7, 2016
Table 12.13: Screen Metallics Assay (SGS 2012)
Head +106 µm -106 µm
Sample Au (g/t) Mass (%) Au (%) Au (g/t) Au (g/t)
SP11-61 LG 2.3 2.45 0.73 0.70 2.36
SP11-61 HG 2.8 1.75 1.64 2.70 2.82
SP11-65 1.9 2.93 3.03 1.07 1.87
SP11-66 12.0 2.27 11.1 58.6 10.9
SP11-69 1.2 2.27 2.35 1.20 1.16
SP11-90 1.2 2.96 4.73 1.89 1.15
Table 12.14: Main Minerals by QEMSCAN RMS (SGS 2012)
Sample Pyrite (%) Fe
Oxides (%)
K Feldspar
(%)
Quartz (%)
Micas (%)
Others (%)
Main Other Minerals
SP11-61 LG 0.1 13.7 49.8 11.8 15.6 9.0 clays
SP11-61 HG 0.1 17.7 23.9 25.2 18.6 14.5 clays
SP11-65 9.5 1.2 35.8 12.7 21.5 19.3 plagioclase
SP11-66 5.4 0.4 47.0 13.7 11.7 21.8 calcite
SP11-69 10.5 0.8 37.2 8.3 33.3 9.9 plagioclase
SP11-90 3.7 0.9 5.0 22.8 24.9 42.7 ankerite
Material Hardness
Bond Work Index (BWI) tests were completed on five samples at a closing screen size of 150 µm.
The results showed the oxide sample 61 was very soft at 7 kWh/t while the others were moderate
at 12 to 17 kWh/t, with SP11-66 being the hardest.
With the primary grind size likely to be 80% passing 75 µm or finer, the specific energy
requirements for both primary and secondary grinding need to be better defined with additional
hardness testing on a number of samples from all areas of the Portage East Extension, Camp,
and Main zones.
Gravity Recovery
Gravity concentration was performed prior to leaching or flotation to determine the expected level
of gravity recoverable gold in the samples. Grind P80 sizes varied between 56 and 160 µm with 3
to 13% gravity recoverable gold for the lower grade samples (Table 12.15). The higher grade
sample (SP11-66) achieved 48% gravity recoverable gold as was indicated in the screen
metallics assay to contain a greater amount of coarse gold particles.
Initial leaching and flotation testwork were conducted on gravity recovery tailing.

2CG026.000 – Gold Canyon Preliminary Economic Assessment for the Springpole Gold Project, Canada Page 56
AD/NW 2CG026 000_Springpole_PEA_TechnicalReport_20161014_FNL October 7, 2016
A mineralogical study of the gold occurrence in the gravity concentrates was undertaken using
the QEMSCAN Trace Mineral Search (TMS) mapping routine. The distribution of gold (and gold
minerals) for each sample are shown in Figure 12.2.
Figure 12.2: Gold Occurrence in Gravity Concentrates
Between 89 and 343 gold grains were identified during the QEMSCAN TMS with the high grade
sample 66 producing the largest number of observed grains. The two Portage zone samples (65
and 69) showed gold was associated with petzite, a telluride mineral. Liberated gold grains were
generally 20 µm in size while exposed gold grains were finer at <5 µm for the two Portage
samples. Sample 69 showed 34% of the gold particles (only 89 observed) were locked in gangue.
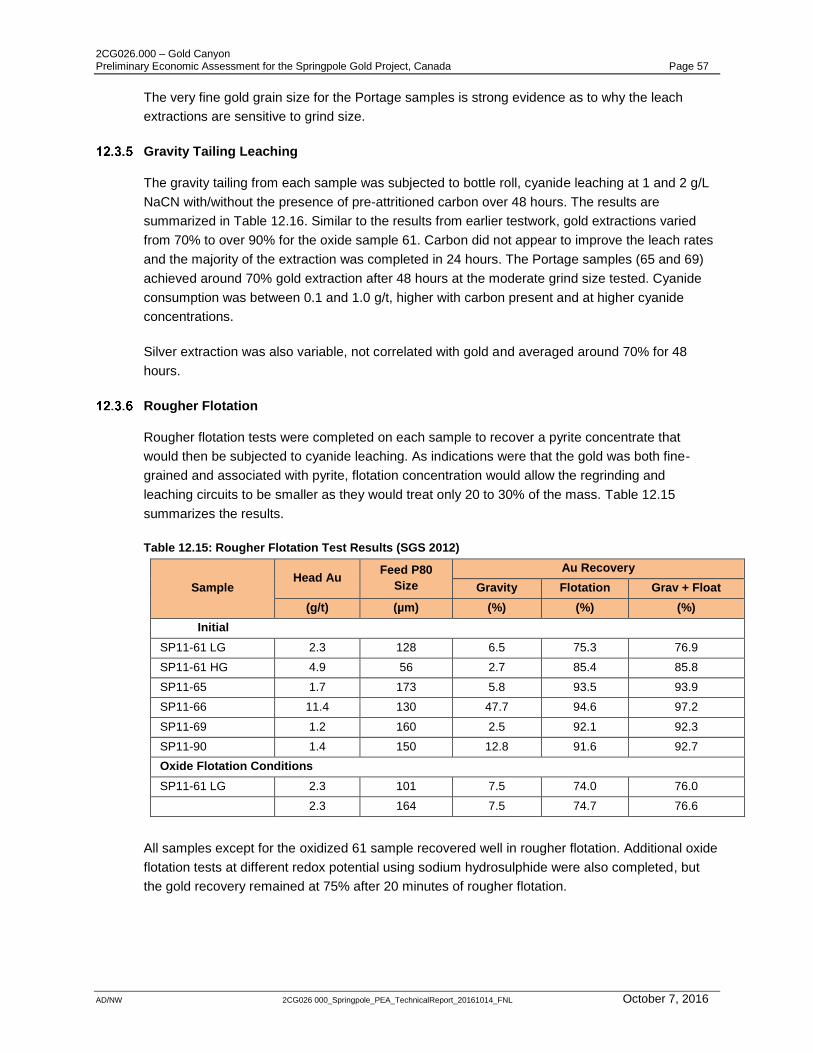
2CG026.000 – Gold Canyon Preliminary Economic Assessment for the Springpole Gold Project, Canada Page 57
AD/NW 2CG026 000_Springpole_PEA_TechnicalReport_20161014_FNL October 7, 2016
The very fine gold grain size for the Portage samples is strong evidence as to why the leach
extractions are sensitive to grind size.
Gravity Tailing Leaching
The gravity tailing from each sample was subjected to bottle roll, cyanide leaching at 1 and 2 g/L
NaCN with/without the presence of pre-attritioned carbon over 48 hours. The results are
summarized in Table 12.16. Similar to the results from earlier testwork, gold extractions varied
from 70% to over 90% for the oxide sample 61. Carbon did not appear to improve the leach rates
and the majority of the extraction was completed in 24 hours. The Portage samples (65 and 69)
achieved around 70% gold extraction after 48 hours at the moderate grind size tested. Cyanide
consumption was between 0.1 and 1.0 g/t, higher with carbon present and at higher cyanide
concentrations.
Silver extraction was also variable, not correlated with gold and averaged around 70% for 48
hours.
Rougher Flotation
Rougher flotation tests were completed on each sample to recover a pyrite concentrate that
would then be subjected to cyanide leaching. As indications were that the gold was both fine-
grained and associated with pyrite, flotation concentration would allow the regrinding and
leaching circuits to be smaller as they would treat only 20 to 30% of the mass. Table 12.15
summarizes the results.
Table 12.15: Rougher Flotation Test Results (SGS 2012)
Sample Head Au
Feed P80
Size
Au Recovery
Gravity Flotation Grav + Float
(g/t) (µm) (%) (%) (%)
Initial
SP11-61 LG 2.3 128 6.5 75.3 76.9
SP11-61 HG 4.9 56 2.7 85.4 85.8
SP11-65 1.7 173 5.8 93.5 93.9
SP11-66 11.4 130 47.7 94.6 97.2
SP11-69 1.2 160 2.5 92.1 92.3
SP11-90 1.4 150 12.8 91.6 92.7
Oxide Flotation Conditions
SP11-61 LG 2.3 101 7.5 74.0 76.0
2.3 164 7.5 74.7 76.6
All samples except for the oxidized 61 sample recovered well in rougher flotation. Additional oxide
flotation tests at different redox potential using sodium hydrosulphide were also completed, but
the gold recovery remained at 75% after 20 minutes of rougher flotation.
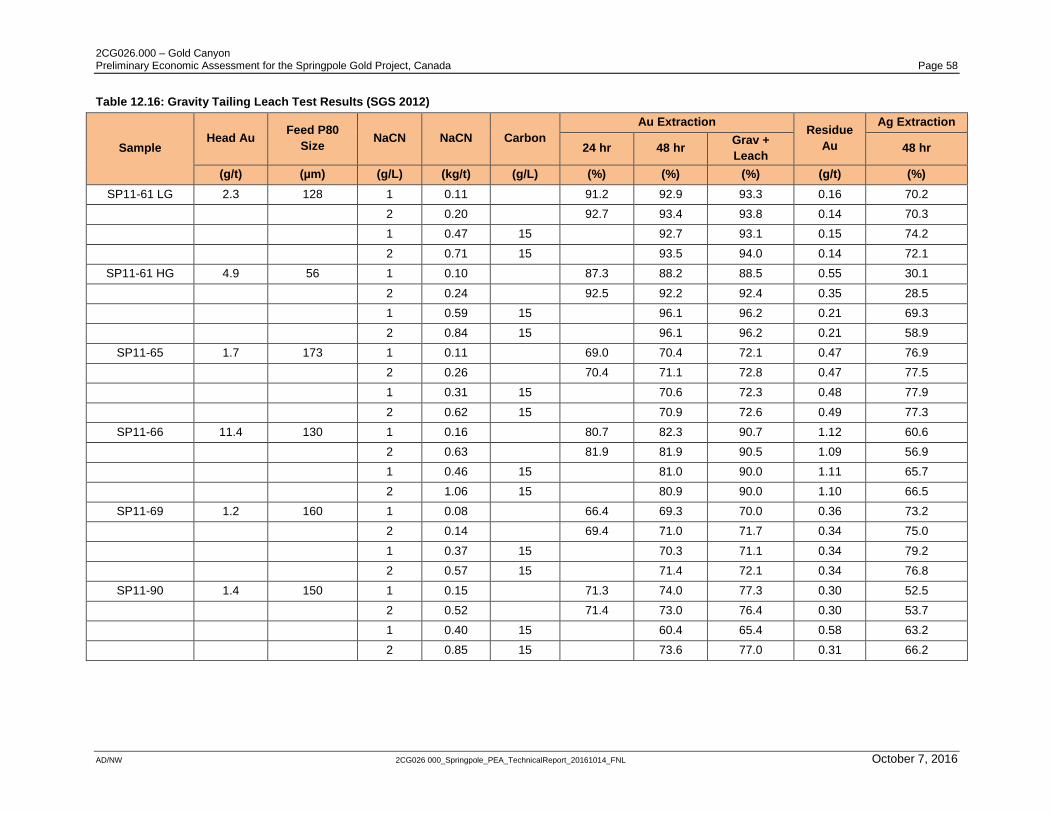
2CG026.000 – Gold Canyon Preliminary Economic Assessment for the Springpole Gold Project, Canada Page 58
AD/NW 2CG026 000_Springpole_PEA_TechnicalReport_20161014_FNL October 7, 2016
Table 12.16: Gravity Tailing Leach Test Results (SGS 2012)
Sample Head Au
Feed P80
Size NaCN NaCN Carbon
Au Extraction Residue
Au
Ag Extraction
24 hr 48 hr Grav +
Leach 48 hr
(g/t) (µm) (g/L) (kg/t) (g/L) (%) (%) (%) (g/t) (%)
SP11-61 LG 2.3 128 1 0.11 91.2 92.9 93.3 0.16 70.2
2 0.20 92.7 93.4 93.8 0.14 70.3
1 0.47 15 92.7 93.1 0.15 74.2
2 0.71 15 93.5 94.0 0.14 72.1
SP11-61 HG 4.9 56 1 0.10 87.3 88.2 88.5 0.55 30.1
2 0.24 92.5 92.2 92.4 0.35 28.5
1 0.59 15 96.1 96.2 0.21 69.3
2 0.84 15 96.1 96.2 0.21 58.9
SP11-65 1.7 173 1 0.11 69.0 70.4 72.1 0.47 76.9
2 0.26 70.4 71.1 72.8 0.47 77.5
1 0.31 15 70.6 72.3 0.48 77.9
2 0.62 15 70.9 72.6 0.49 77.3
SP11-66 11.4 130 1 0.16 80.7 82.3 90.7 1.12 60.6
2 0.63 81.9 81.9 90.5 1.09 56.9
1 0.46 15 81.0 90.0 1.11 65.7
2 1.06 15 80.9 90.0 1.10 66.5
SP11-69 1.2 160 1 0.08 66.4 69.3 70.0 0.36 73.2
2 0.14 69.4 71.0 71.7 0.34 75.0
1 0.37 15 70.3 71.1 0.34 79.2
2 0.57 15 71.4 72.1 0.34 76.8
SP11-90 1.4 150 1 0.15 71.3 74.0 77.3 0.30 52.5
2 0.52 71.4 73.0 76.4 0.30 53.7
1 0.40 15 60.4 65.4 0.58 63.2
2 0.85 15 73.6 77.0 0.31 66.2
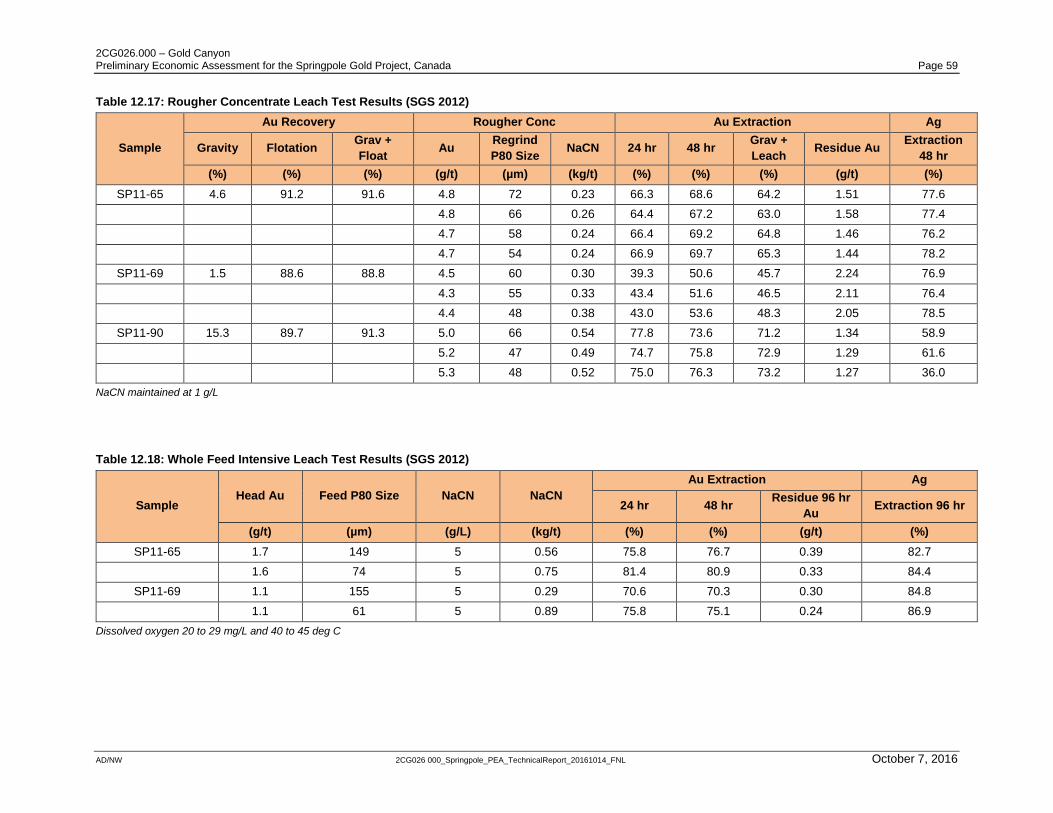
2CG026.000 – Gold Canyon Preliminary Economic Assessment for the Springpole Gold Project, Canada Page 59
AD/NW 2CG026 000_Springpole_PEA_TechnicalReport_20161014_FNL October 7, 2016
Table 12.17: Rougher Concentrate Leach Test Results (SGS 2012)
Sample
Au Recovery Rougher Conc Au Extraction Ag
Gravity Flotation Grav +
Float Au
Regrind
P80 Size NaCN 24 hr 48 hr
Grav +
Leach Residue Au
Extraction
48 hr
(%) (%) (%) (g/t) (µm) (kg/t) (%) (%) (%) (g/t) (%)
SP11-65 4.6 91.2 91.6 4.8 72 0.23 66.3 68.6 64.2 1.51 77.6
4.8 66 0.26 64.4 67.2 63.0 1.58 77.4
4.7 58 0.24 66.4 69.2 64.8 1.46 76.2
4.7 54 0.24 66.9 69.7 65.3 1.44 78.2
SP11-69 1.5 88.6 88.8 4.5 60 0.30 39.3 50.6 45.7 2.24 76.9
4.3 55 0.33 43.4 51.6 46.5 2.11 76.4
4.4 48 0.38 43.0 53.6 48.3 2.05 78.5
SP11-90 15.3 89.7 91.3 5.0 66 0.54 77.8 73.6 71.2 1.34 58.9
5.2 47 0.49 74.7 75.8 72.9 1.29 61.6
5.3 48 0.52 75.0 76.3 73.2 1.27 36.0
NaCN maintained at 1 g/L
Table 12.18: Whole Feed Intensive Leach Test Results (SGS 2012)
Sample Head Au Feed P80 Size NaCN NaCN
Au Extraction Ag
24 hr 48 hr Residue 96 hr
Au Extraction 96 hr
(g/t) (µm) (g/L) (kg/t) (%) (%) (g/t) (%)
SP11-65 1.7 149 5 0.56 75.8 76.7 0.39 82.7
1.6 74 5 0.75 81.4 80.9 0.33 84.4
SP11-69 1.1 155 5 0.29 70.6 70.3 0.30 84.8
1.1 61 5 0.89 75.8 75.1 0.24 86.9
Dissolved oxygen 20 to 29 mg/L and 40 to 45 deg C
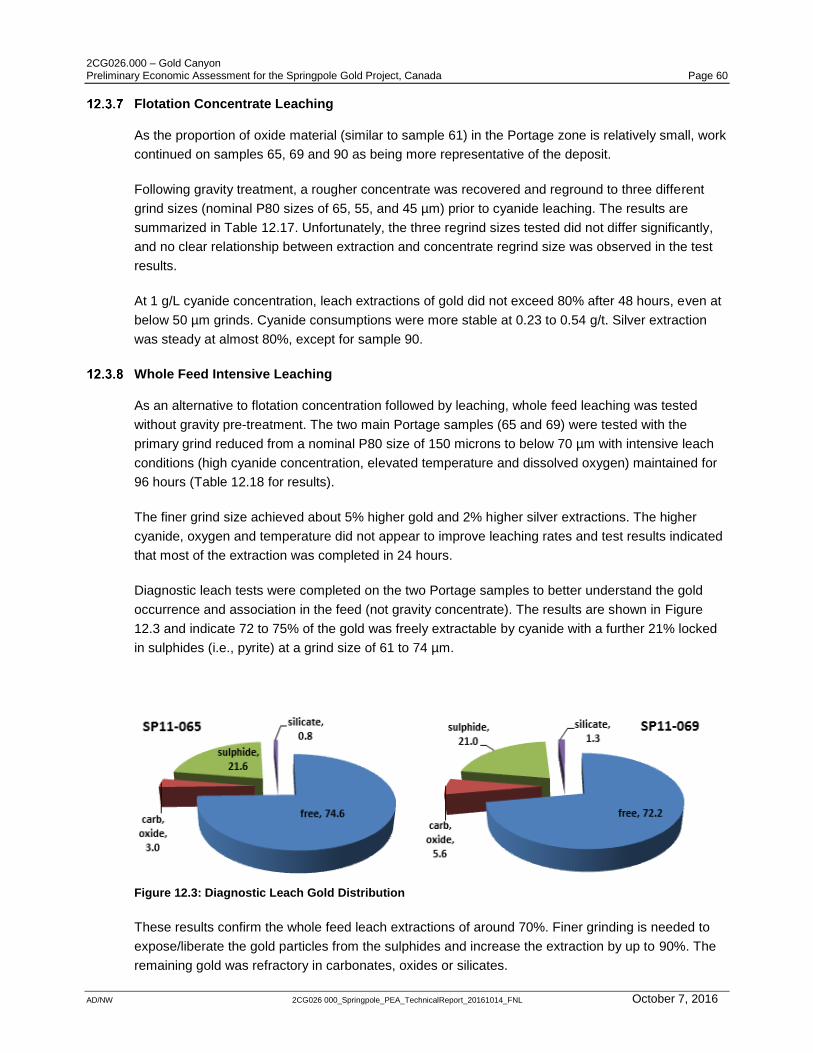
2CG026.000 – Gold Canyon Preliminary Economic Assessment for the Springpole Gold Project, Canada Page 60
AD/NW 2CG026 000_Springpole_PEA_TechnicalReport_20161014_FNL October 7, 2016
Flotation Concentrate Leaching
As the proportion of oxide material (similar to sample 61) in the Portage zone is relatively small, work
continued on samples 65, 69 and 90 as being more representative of the deposit.
Following gravity treatment, a rougher concentrate was recovered and reground to three different
grind sizes (nominal P80 sizes of 65, 55, and 45 µm) prior to cyanide leaching. The results are
summarized in Table 12.17. Unfortunately, the three regrind sizes tested did not differ significantly,
and no clear relationship between extraction and concentrate regrind size was observed in the test
results.
At 1 g/L cyanide concentration, leach extractions of gold did not exceed 80% after 48 hours, even at
below 50 µm grinds. Cyanide consumptions were more stable at 0.23 to 0.54 g/t. Silver extraction
was steady at almost 80%, except for sample 90.
Whole Feed Intensive Leaching
As an alternative to flotation concentration followed by leaching, whole feed leaching was tested
without gravity pre-treatment. The two main Portage samples (65 and 69) were tested with the
primary grind reduced from a nominal P80 size of 150 microns to below 70 µm with intensive leach
conditions (high cyanide concentration, elevated temperature and dissolved oxygen) maintained for
96 hours (Table 12.18 for results).
The finer grind size achieved about 5% higher gold and 2% higher silver extractions. The higher
cyanide, oxygen and temperature did not appear to improve leaching rates and test results indicated
that most of the extraction was completed in 24 hours.
Diagnostic leach tests were completed on the two Portage samples to better understand the gold
occurrence and association in the feed (not gravity concentrate). The results are shown in Figure
12.3 and indicate 72 to 75% of the gold was freely extractable by cyanide with a further 21% locked
in sulphides (i.e., pyrite) at a grind size of 61 to 74 µm.
Figure 12.3: Diagnostic Leach Gold Distribution
These results confirm the whole feed leach extractions of around 70%. Finer grinding is needed to
expose/liberate the gold particles from the sulphides and increase the extraction by up to 90%. The
remaining gold was refractory in carbonates, oxides or silicates.

2CG026.000 – Gold Canyon Preliminary Economic Assessment for the Springpole Gold Project, Canada Page 61
AD/NW 2CG026 000_Springpole_PEA_TechnicalReport_20161014_FNL October 7, 2016
Due to the presence of telluride minerals identified in the gravity concentrate scan, thiosulphate
leaching was performed on SP11-65 and SP11-69 as an alternative lixiviant. Initial tests showed 29
and 39% gold extraction for the two samples. Follow up tests which included resin showed 29 and
47% gold extraction after 24 hours with silver extractions of 58 and 52%, respectively.
Alternate leaching agents were not considered further as the relationship between cyanide leach
extraction and particle size was well defined in the 2012 testwork results.
Geochemical Analysis
Whole rock, ICP and solid phase analysis were completed on a number of flotation tailings and leach
residues and the content of the associated solutions was also analysed.
Acid Base Accounting (ABA) was conducted as well as ageing tests over 28 days on the rougher
flotation tailings. In general, the flotation tailings samples were not net acid generating as the
sulphide minerals had been recovered to concentrate. The whole feed leach residues contained up
to 16% sulphur and were net acid generating, with net to acid producing ratios (NP:AP) under 1.
If the process flowsheet is whole feed leaching, it can be expected—based on analyses to date—
that the leach residues will be net acid generating.
12.4 SGS Lakefield 2013
Test results showed gravity recovery was beneficial for higher grade material and whole feed
leaching was sensitive to grind size as the gold particles were either fine (<5 µm for the two Portage
samples) or locked with pyrite or gangue.
It was decided to re-test the two Portage samples without gravity recovery, at a very fine grind size
and intensive leach conditions to see if gold extraction could be improved. As the Bond Work Index
results suggested a relatively soft to moderate hardness, a primary grind of finer than 70 µm may
prove to be economic if 85% or higher gold extraction was demonstrated.
Following the fine grind leach tests, additional rougher flotation tests followed by ultrafine regrinding
was investigated to see how the flotation concentrate leaching was influenced by particle size.
Fine Grind Leach Tests
Both samples SP11-65 and SP11-69 were cyanide leached for 48 hours after being ground to a P80
size of around 38 µm and 30 µm. Cyanide levels were maintained at 5 g/L, oxygen levels were
elevated along with the slurry temperature using a heat jacket. The results of the four tests are
summarized in Table 12.19.
Compared to the earlier tests done on 61 to 74 micron feed, the 30 to 38 micron test results showed
a 5 to 10% increase in 48 hour gold extraction. Grind size estimates were based on a laser-sizing
method; therefore, subject to some error or variation due to the small sample size used.
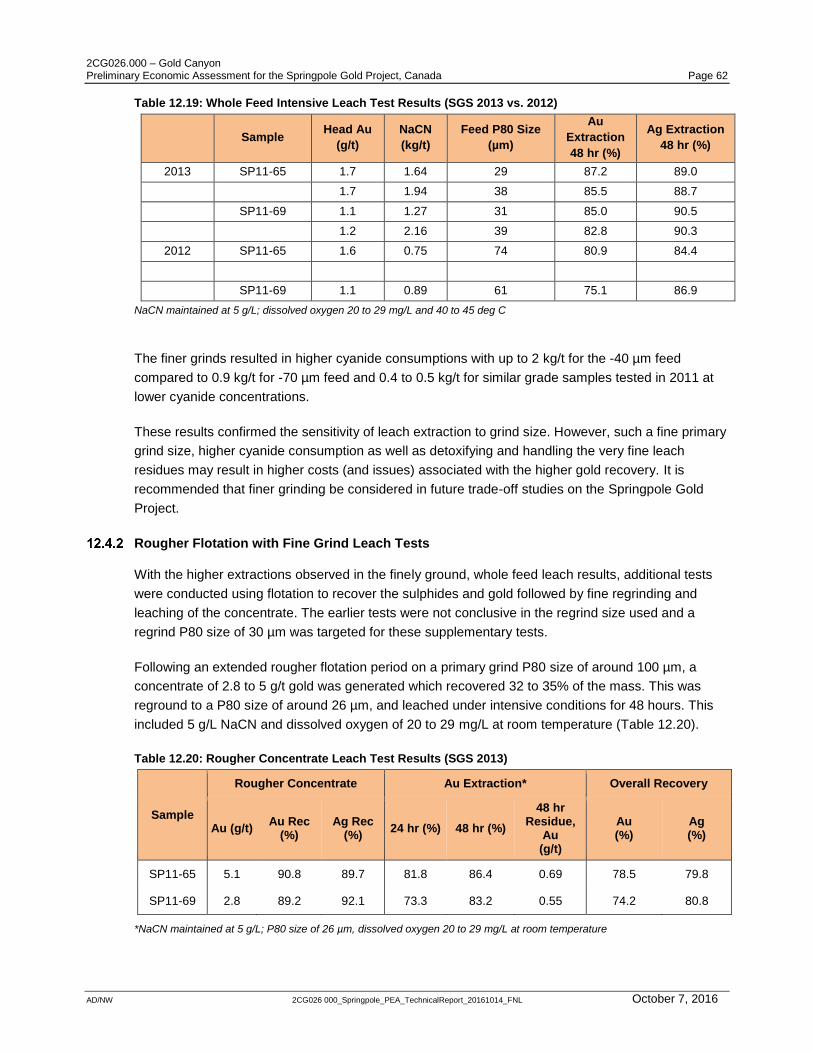
2CG026.000 – Gold Canyon Preliminary Economic Assessment for the Springpole Gold Project, Canada Page 62
AD/NW 2CG026 000_Springpole_PEA_TechnicalReport_20161014_FNL October 7, 2016
Table 12.19: Whole Feed Intensive Leach Test Results (SGS 2013 vs. 2012)
Sample Head Au
(g/t)
NaCN
(kg/t)
Feed P80 Size
(µm)
Au
Extraction
48 hr (%)
Ag Extraction
48 hr (%)
2013 SP11-65 1.7 1.64 29 87.2 89.0
1.7 1.94 38 85.5 88.7
SP11-69 1.1 1.27 31 85.0 90.5
1.2 2.16 39 82.8 90.3
2012 SP11-65 1.6 0.75 74 80.9 84.4
SP11-69 1.1 0.89 61 75.1 86.9
NaCN maintained at 5 g/L; dissolved oxygen 20 to 29 mg/L and 40 to 45 deg C
The finer grinds resulted in higher cyanide consumptions with up to 2 kg/t for the -40 µm feed
compared to 0.9 kg/t for -70 µm feed and 0.4 to 0.5 kg/t for similar grade samples tested in 2011 at
lower cyanide concentrations.
These results confirmed the sensitivity of leach extraction to grind size. However, such a fine primary
grind size, higher cyanide consumption as well as detoxifying and handling the very fine leach
residues may result in higher costs (and issues) associated with the higher gold recovery. It is
recommended that finer grinding be considered in future trade-off studies on the Springpole Gold
Project.
Rougher Flotation with Fine Grind Leach Tests
With the higher extractions observed in the finely ground, whole feed leach results, additional tests
were conducted using flotation to recover the sulphides and gold followed by fine regrinding and
leaching of the concentrate. The earlier tests were not conclusive in the regrind size used and a
regrind P80 size of 30 µm was targeted for these supplementary tests.
Following an extended rougher flotation period on a primary grind P80 size of around 100 µm, a
concentrate of 2.8 to 5 g/t gold was generated which recovered 32 to 35% of the mass. This was
reground to a P80 size of around 26 µm, and leached under intensive conditions for 48 hours. This
included 5 g/L NaCN and dissolved oxygen of 20 to 29 mg/L at room temperature (Table 12.20).
Table 12.20: Rougher Concentrate Leach Test Results (SGS 2013)
Sample
Rougher Concentrate Au Extraction* Overall Recovery
Au (g/t) Au Rec
(%) Ag Rec
(%) 24 hr (%) 48 hr (%)
48 hr Residue,
Au (g/t)
Au (%)
Ag (%)
SP11-65 5.1 90.8 89.7 81.8 86.4 0.69 78.5 79.8
SP11-69 2.8 89.2 92.1 73.3 83.2 0.55 74.2 80.8
*NaCN maintained at 5 g/L; P80 size of 26 µm, dissolved oxygen 20 to 29 mg/L at room temperature

2CG026.000 – Gold Canyon Preliminary Economic Assessment for the Springpole Gold Project, Canada Page 63
AD/NW 2CG026 000_Springpole_PEA_TechnicalReport_20161014_FNL October 7, 2016
These results showed that, even with very fine regrinding, the overall gold recovery was 75 to 79%
by concentrating the sulphides with flotation followed by leaching. Overall silver recovery was around
80% with fine regrinding.
The advantage of this flowsheet is the potentially acid-generating sulphides are concentrated in 25 to
35% of the feed and can be handled easier than leaching all of the feed. The cyanide detoxification
circuit can also be considerably smaller.
However, whole feed leaching at a grind P80 size of 70 µm will achieve slightly better gold recovery
compared to flotation plus fine regrinding ahead of leaching. The option of a finer primary grind size
ahead of whole feed leaching will increase cyanide costs and make the leach residues more difficult
to detox, thicken and possibly filter; however, should be investigated further in the future.
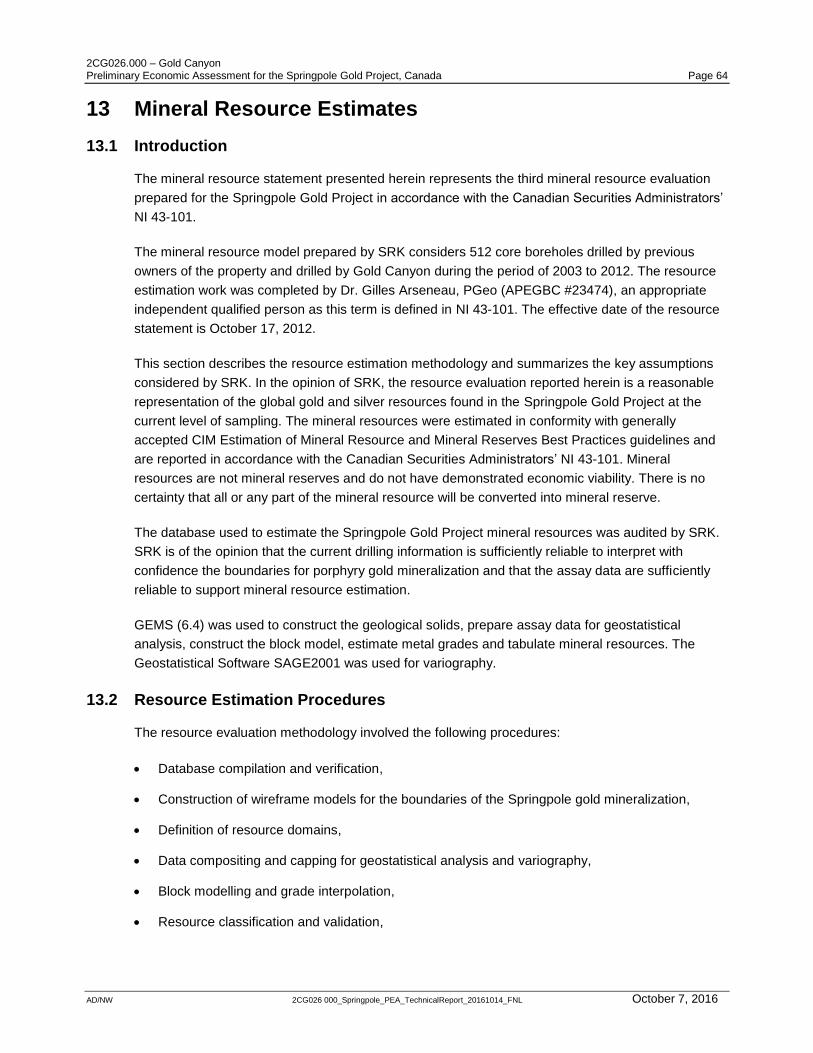
2CG026.000 – Gold Canyon Preliminary Economic Assessment for the Springpole Gold Project, Canada Page 64
AD/NW 2CG026 000_Springpole_PEA_TechnicalReport_20161014_FNL October 7, 2016
13 Mineral Resource Estimates
13.1 Introduction
The mineral resource statement presented herein represents the third mineral resource evaluation
prepared for the Springpole Gold Project in accordance with the Canadian Securities Administrators’
NI 43-101.
The mineral resource model prepared by SRK considers 512 core boreholes drilled by previous
owners of the property and drilled by Gold Canyon during the period of 2003 to 2012. The resource
estimation work was completed by Dr. Gilles Arseneau, PGeo (APEGBC #23474), an appropriate
independent qualified person as this term is defined in NI 43-101. The effective date of the resource
statement is October 17, 2012.
This section describes the resource estimation methodology and summarizes the key assumptions
considered by SRK. In the opinion of SRK, the resource evaluation reported herein is a reasonable
representation of the global gold and silver resources found in the Springpole Gold Project at the
current level of sampling. The mineral resources were estimated in conformity with generally
accepted CIM Estimation of Mineral Resource and Mineral Reserves Best Practices guidelines and
are reported in accordance with the Canadian Securities Administrators’ NI 43-101. Mineral
resources are not mineral reserves and do not have demonstrated economic viability. There is no
certainty that all or any part of the mineral resource will be converted into mineral reserve.
The database used to estimate the Springpole Gold Project mineral resources was audited by SRK.
SRK is of the opinion that the current drilling information is sufficiently reliable to interpret with
confidence the boundaries for porphyry gold mineralization and that the assay data are sufficiently
reliable to support mineral resource estimation.
GEMS (6.4) was used to construct the geological solids, prepare assay data for geostatistical
analysis, construct the block model, estimate metal grades and tabulate mineral resources. The
Geostatistical Software SAGE2001 was used for variography.
13.2 Resource Estimation Procedures
The resource evaluation methodology involved the following procedures:
Database compilation and verification,
Construction of wireframe models for the boundaries of the Springpole gold mineralization,
Definition of resource domains,
Data compositing and capping for geostatistical analysis and variography,
Block modelling and grade interpolation,
Resource classification and validation,

2CG026.000 – Gold Canyon Preliminary Economic Assessment for the Springpole Gold Project, Canada Page 65
AD/NW 2CG026 000_Springpole_PEA_TechnicalReport_20161014_FNL October 7, 2016
Assessment of “reasonable prospects for economic extraction” and selection of appropriate
cut-off grades (COGs), and
Preparation of the mineral resource statement.
13.3 Drill Hole Database
The Springpole Gold Project currently consists of three separate mineralized zones: East Extension,
Camp or Main and Portage. The Portage zone is by far the largest of the three and represents more
than 90% of the stated resource.
The entire Springpole database consists of 601 drill holes totalling 173,660 m. Of these, 89 drill
holes totalling 27,808 m were discarded, 60 holes because of uncertainty relating to sampling
methods and QA/QC, 27 holes because they were not drilled near the resource area, and 2 holes
because assay results were not received at the time the resource was estimated
Of the 571 post-1986 drill holes, only those dating from 2003 through 2012 (331 drill holes) have
documentation supporting a level of data verification and QA/QC sampling and analysis consistent
with current NI 43-101 standards. Consequently, different restrictions were placed on which data
could be used in which domain.
Due to the lack of detailed documentation—particularly for pre-2003 drilling and because of the
apparent bias of the historical drilling in the Portage zone (Figure 13.1)—SRK decided to include the
1986–2003 drilling only in estimating the proportionately minor East Extension and Camp zones.
Figure 13.1: Comparison of Historic and Recent Drilling for the Portage Zone
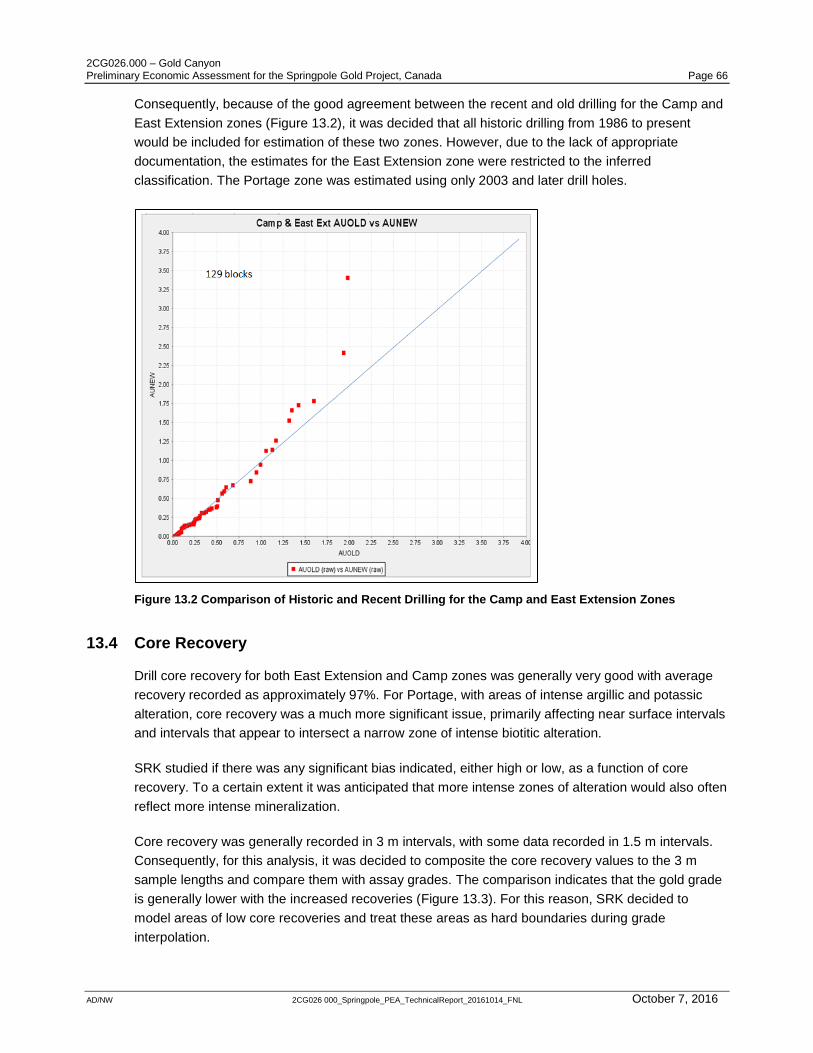
2CG026.000 – Gold Canyon Preliminary Economic Assessment for the Springpole Gold Project, Canada Page 66
AD/NW 2CG026 000_Springpole_PEA_TechnicalReport_20161014_FNL October 7, 2016
Consequently, because of the good agreement between the recent and old drilling for the Camp and
East Extension zones (Figure 13.2), it was decided that all historic drilling from 1986 to present
would be included for estimation of these two zones. However, due to the lack of appropriate
documentation, the estimates for the East Extension zone were restricted to the inferred
classification. The Portage zone was estimated using only 2003 and later drill holes.
Figure 13.2 Comparison of Historic and Recent Drilling for the Camp and East Extension Zones
13.4 Core Recovery
Drill core recovery for both East Extension and Camp zones was generally very good with average
recovery recorded as approximately 97%. For Portage, with areas of intense argillic and potassic
alteration, core recovery was a much more significant issue, primarily affecting near surface intervals
and intervals that appear to intersect a narrow zone of intense biotitic alteration.
SRK studied if there was any significant bias indicated, either high or low, as a function of core
recovery. To a certain extent it was anticipated that more intense zones of alteration would also often
reflect more intense mineralization.
Core recovery was generally recorded in 3 m intervals, with some data recorded in 1.5 m intervals.
Consequently, for this analysis, it was decided to composite the core recovery values to the 3 m
sample lengths and compare them with assay grades. The comparison indicates that the gold grade
is generally lower with the increased recoveries (Figure 13.3). For this reason, SRK decided to
model areas of low core recoveries and treat these areas as hard boundaries during grade
interpolation.
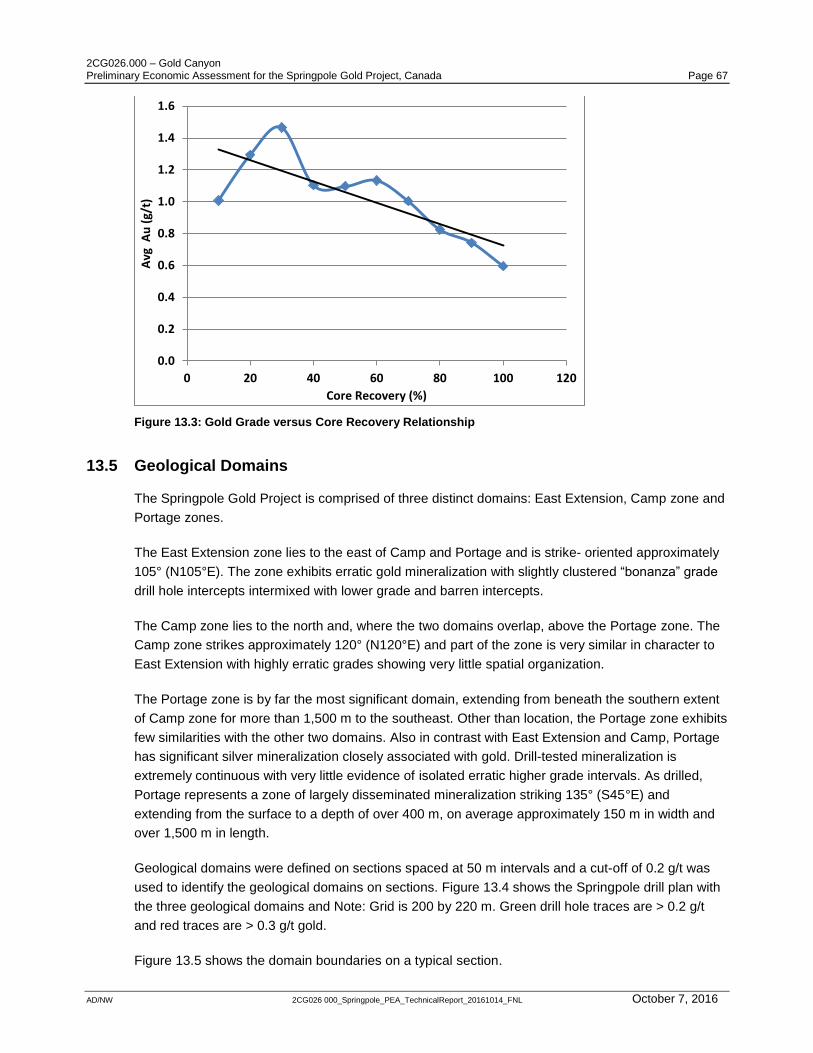
2CG026.000 – Gold Canyon Preliminary Economic Assessment for the Springpole Gold Project, Canada Page 67
AD/NW 2CG026 000_Springpole_PEA_TechnicalReport_20161014_FNL October 7, 2016
Figure 13.3: Gold Grade versus Core Recovery Relationship
13.5 Geological Domains
The Springpole Gold Project is comprised of three distinct domains: East Extension, Camp zone and
Portage zones.
The East Extension zone lies to the east of Camp and Portage and is strike- oriented approximately
105° (N105°E). The zone exhibits erratic gold mineralization with slightly clustered “bonanza” grade
drill hole intercepts intermixed with lower grade and barren intercepts.
The Camp zone lies to the north and, where the two domains overlap, above the Portage zone. The
Camp zone strikes approximately 120° (N120°E) and part of the zone is very similar in character to
East Extension with highly erratic grades showing very little spatial organization.
The Portage zone is by far the most significant domain, extending from beneath the southern extent
of Camp zone for more than 1,500 m to the southeast. Other than location, the Portage zone exhibits
few similarities with the other two domains. Also in contrast with East Extension and Camp, Portage
has significant silver mineralization closely associated with gold. Drill-tested mineralization is
extremely continuous with very little evidence of isolated erratic higher grade intervals. As drilled,
Portage represents a zone of largely disseminated mineralization striking 135° (S45°E) and
extending from the surface to a depth of over 400 m, on average approximately 150 m in width and
over 1,500 m in length.
Geological domains were defined on sections spaced at 50 m intervals and a cut-off of 0.2 g/t was
used to identify the geological domains on sections. Figure 13.4 shows the Springpole drill plan with
the three geological domains and Note: Grid is 200 by 220 m. Green drill hole traces are > 0.2 g/t
and red traces are > 0.3 g/t gold.
Figure 13.5 shows the domain boundaries on a typical section.
0.0
0.2
0.4
0.6
0.8
1.0
1.2
1.4
1.6
0 20 40 60 80 100 120
Avg
Au
(g/
t)
Core Recovery (%)
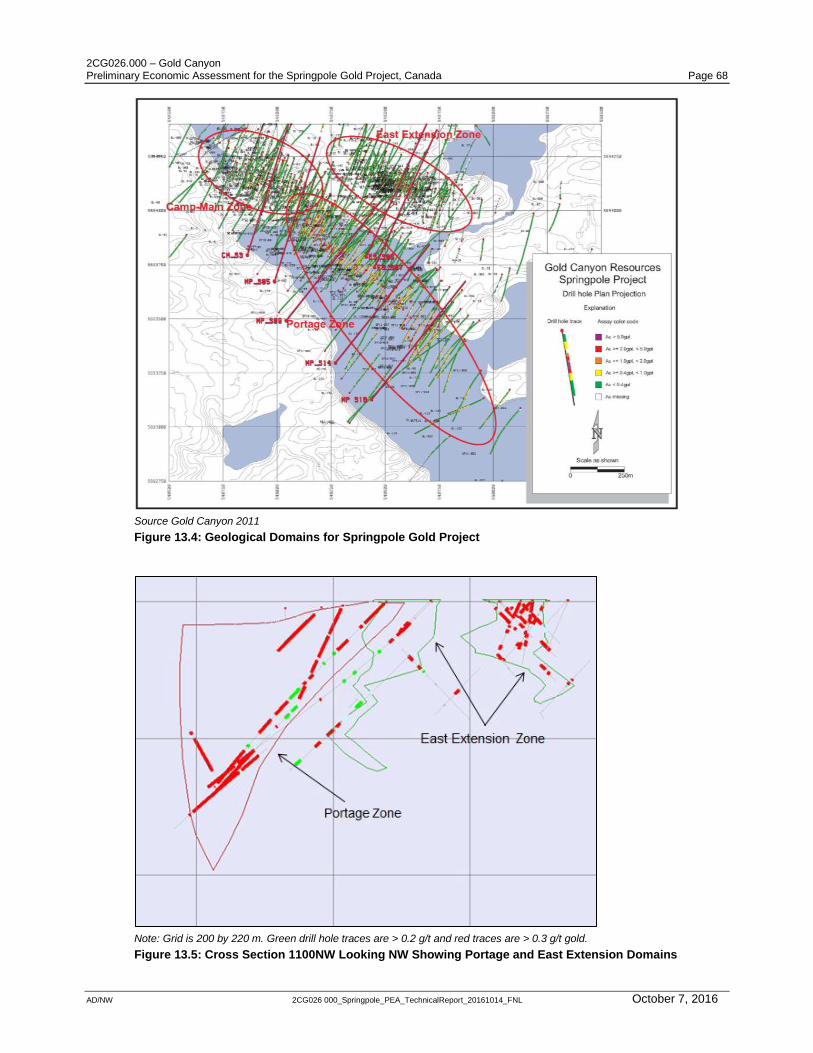
2CG026.000 – Gold Canyon Preliminary Economic Assessment for the Springpole Gold Project, Canada Page 68
AD/NW 2CG026 000_Springpole_PEA_TechnicalReport_20161014_FNL October 7, 2016
Source Gold Canyon 2011
Figure 13.4: Geological Domains for Springpole Gold Project
Note: Grid is 200 by 220 m. Green drill hole traces are > 0.2 g/t and red traces are > 0.3 g/t gold.
Figure 13.5: Cross Section 1100NW Looking NW Showing Portage and East Extension Domains
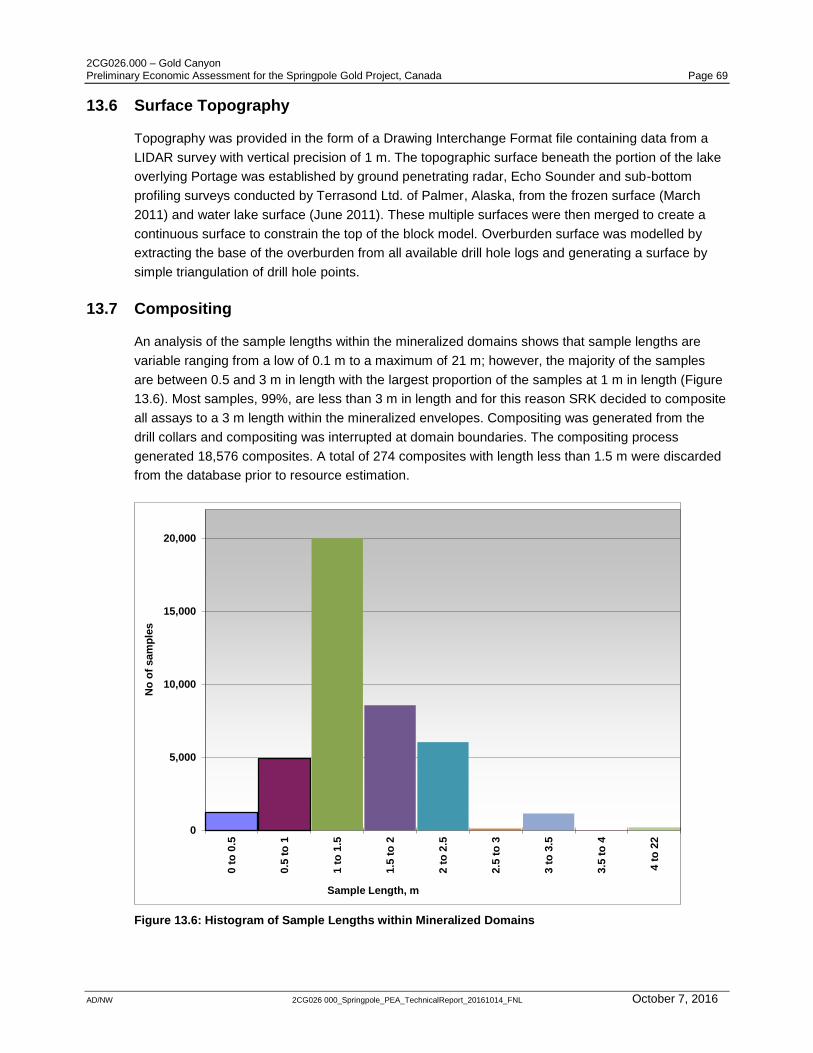
2CG026.000 – Gold Canyon Preliminary Economic Assessment for the Springpole Gold Project, Canada Page 69
AD/NW 2CG026 000_Springpole_PEA_TechnicalReport_20161014_FNL October 7, 2016
13.6 Surface Topography
Topography was provided in the form of a Drawing Interchange Format file containing data from a
LIDAR survey with vertical precision of 1 m. The topographic surface beneath the portion of the lake
overlying Portage was established by ground penetrating radar, Echo Sounder and sub-bottom
profiling surveys conducted by Terrasond Ltd. of Palmer, Alaska, from the frozen surface (March
2011) and water lake surface (June 2011). These multiple surfaces were then merged to create a
continuous surface to constrain the top of the block model. Overburden surface was modelled by
extracting the base of the overburden from all available drill hole logs and generating a surface by
simple triangulation of drill hole points.
13.7 Compositing
An analysis of the sample lengths within the mineralized domains shows that sample lengths are
variable ranging from a low of 0.1 m to a maximum of 21 m; however, the majority of the samples
are between 0.5 and 3 m in length with the largest proportion of the samples at 1 m in length (Figure
13.6). Most samples, 99%, are less than 3 m in length and for this reason SRK decided to composite
all assays to a 3 m length within the mineralized envelopes. Compositing was generated from the
drill collars and compositing was interrupted at domain boundaries. The compositing process
generated 18,576 composites. A total of 274 composites with length less than 1.5 m were discarded
from the database prior to resource estimation.
Figure 13.6: Histogram of Sample Lengths within Mineralized Domains
0
5,000
10,000
15,000
20,000
0 t
o 0
.5
0.5
to
1
1 t
o 1
.5
1.5
to
2
2 t
o 2
.5
2.5
to
3
3 t
o 3
.5
3.5
to
4
4 t
o 2
2
No
of
sam
ple
s
Sample Length, m

2CG026.000 – Gold Canyon Preliminary Economic Assessment for the Springpole Gold Project, Canada Page 70
AD/NW 2CG026 000_Springpole_PEA_TechnicalReport_20161014_FNL October 7, 2016
13.8 Grade Capping
The primary goal of grade capping is to identify and restrict the influence of suspected “outlier”
grades in an estimate.
Grade capping for the Springpole Gold Project was carried out in two stages. First the assay data
were investigated to determine if sample length could bias the average grade. An analysis of gold
grade against sample length seems to indicate that sample length of less than 1 m has a significantly
higher average grade than other sample lengths, indicating these samples were taken over a
specific geological domain, perhaps quartz veins or narrow siliceous zones with visible gold (Figure
13.7). Most short sample lengths seem to have been taken from the Camp and East Extension
zones; for this reason, SRK decided to treat these short sample lengths as a separate statistical
population and caped these short assays prior to compositing. SRK capped all gold assays for
sample lengths less than 1 m to 100 g/t gold prior to compositing.
All assays were then composited to 3 m lengths and all 3 m composites were evaluated for outliers
by examining their distribution on cumulative probability plots and capped as outlined in Table 13.1.
Figure 13.7: Comparison of Sample Length and Average Gold Grade
Table 13.1: Capping Levels for Springpole
Element 3 m Composite Capping Level
Au 25 g/t
Ag 200 g/t
0
2
4
6
8
10
12
0 0.5 1 1.5 2 2.5 3
Ave
rag
e g
rad
e A
u (
g/t
)
Sample length, m
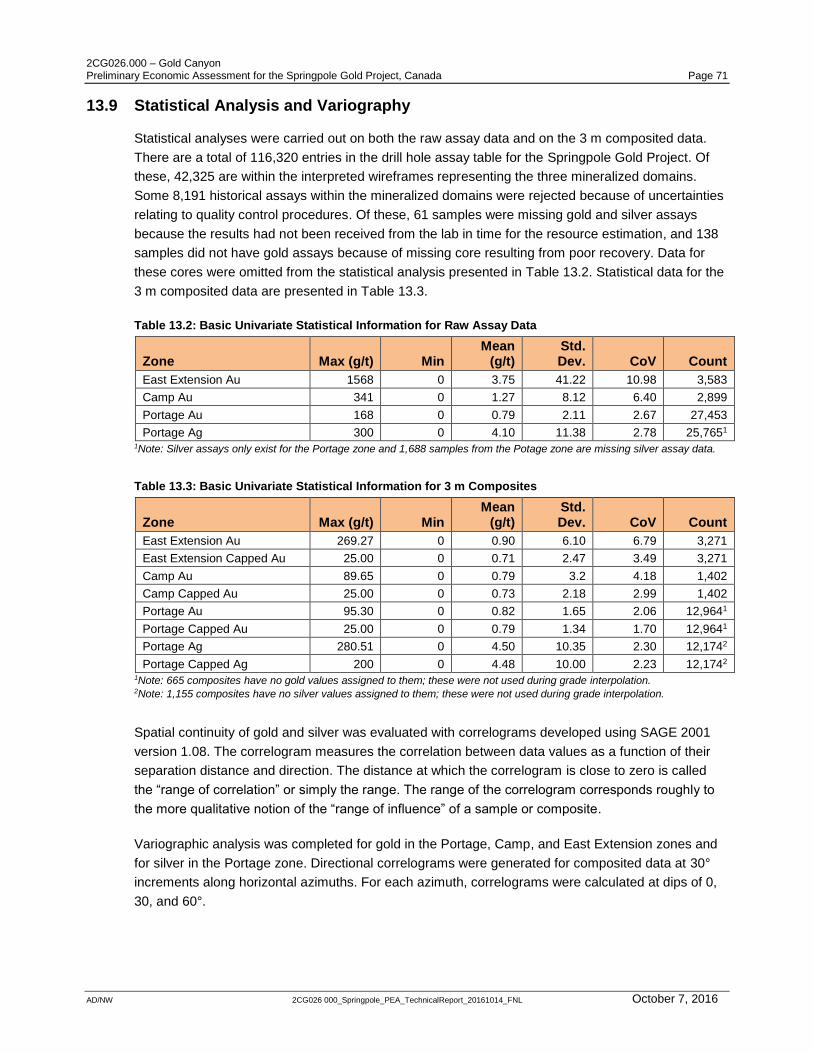
2CG026.000 – Gold Canyon Preliminary Economic Assessment for the Springpole Gold Project, Canada Page 71
AD/NW 2CG026 000_Springpole_PEA_TechnicalReport_20161014_FNL October 7, 2016
13.9 Statistical Analysis and Variography
Statistical analyses were carried out on both the raw assay data and on the 3 m composited data.
There are a total of 116,320 entries in the drill hole assay table for the Springpole Gold Project. Of
these, 42,325 are within the interpreted wireframes representing the three mineralized domains.
Some 8,191 historical assays within the mineralized domains were rejected because of uncertainties
relating to quality control procedures. Of these, 61 samples were missing gold and silver assays
because the results had not been received from the lab in time for the resource estimation, and 138
samples did not have gold assays because of missing core resulting from poor recovery. Data for
these cores were omitted from the statistical analysis presented in Table 13.2. Statistical data for the
3 m composited data are presented in Table 13.3.
Table 13.2: Basic Univariate Statistical Information for Raw Assay Data
Zone Max (g/t) Min Mean
(g/t) Std. Dev. CoV Count
East Extension Au 1568 0 3.75 41.22 10.98 3,583
Camp Au 341 0 1.27 8.12 6.40 2,899
Portage Au 168 0 0.79 2.11 2.67 27,453
Portage Ag 300 0 4.10 11.38 2.78 25,7651 1Note: Silver assays only exist for the Portage zone and 1,688 samples from the Potage zone are missing silver assay data.
Table 13.3: Basic Univariate Statistical Information for 3 m Composites
Zone Max (g/t) Min Mean
(g/t) Std. Dev. CoV Count
East Extension Au 269.27 0 0.90 6.10 6.79 3,271
East Extension Capped Au 25.00 0 0.71 2.47 3.49 3,271
Camp Au 89.65 0 0.79 3.2 4.18 1,402
Camp Capped Au 25.00 0 0.73 2.18 2.99 1,402
Portage Au 95.30 0 0.82 1.65 2.06 12,9641
Portage Capped Au 25.00 0 0.79 1.34 1.70 12,9641
Portage Ag 280.51 0 4.50 10.35 2.30 12,1742
Portage Capped Ag 200 0 4.48 10.00 2.23 12,1742 1Note: 665 composites have no gold values assigned to them; these were not used during grade interpolation. 2Note: 1,155 composites have no silver values assigned to them; these were not used during grade interpolation.
Spatial continuity of gold and silver was evaluated with correlograms developed using SAGE 2001
version 1.08. The correlogram measures the correlation between data values as a function of their
separation distance and direction. The distance at which the correlogram is close to zero is called
the “range of correlation” or simply the range. The range of the correlogram corresponds roughly to
the more qualitative notion of the “range of influence” of a sample or composite.
Variographic analysis was completed for gold in the Portage, Camp, and East Extension zones and
for silver in the Portage zone. Directional correlograms were generated for composited data at 30°
increments along horizontal azimuths. For each azimuth, correlograms were calculated at dips of 0,
30, and 60°.
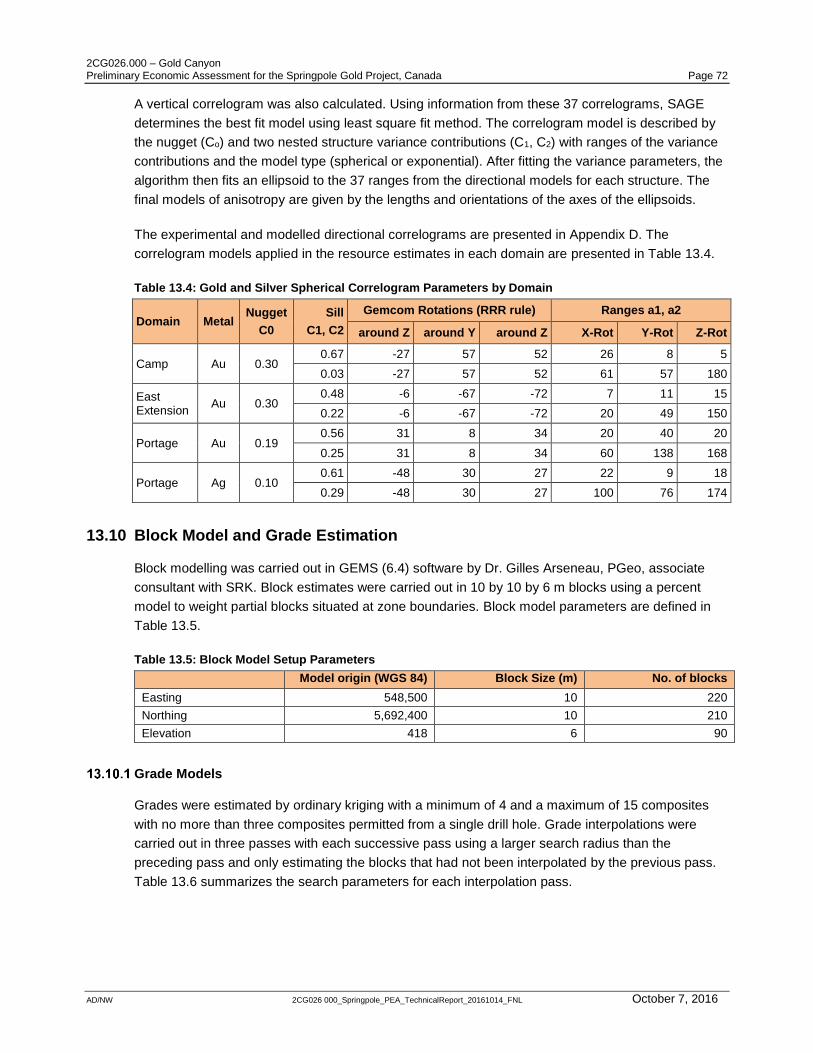
2CG026.000 – Gold Canyon Preliminary Economic Assessment for the Springpole Gold Project, Canada Page 72
AD/NW 2CG026 000_Springpole_PEA_TechnicalReport_20161014_FNL October 7, 2016
A vertical correlogram was also calculated. Using information from these 37 correlograms, SAGE
determines the best fit model using least square fit method. The correlogram model is described by
the nugget (Co) and two nested structure variance contributions (C1, C2) with ranges of the variance
contributions and the model type (spherical or exponential). After fitting the variance parameters, the
algorithm then fits an ellipsoid to the 37 ranges from the directional models for each structure. The
final models of anisotropy are given by the lengths and orientations of the axes of the ellipsoids.
The experimental and modelled directional correlograms are presented in Appendix D. The
correlogram models applied in the resource estimates in each domain are presented in Table 13.4.
Table 13.4: Gold and Silver Spherical Correlogram Parameters by Domain
Domain Metal Nugget
C0
Sill
C1, C2
Gemcom Rotations (RRR rule) Ranges a1, a2
around Z around Y around Z X-Rot Y-Rot Z-Rot
Camp Au 0.30 0.67 -27 57 52 26 8 5
0.03 -27 57 52 61 57 180
East Extension
Au 0.30 0.48 -6 -67 -72 7 11 15
0.22 -6 -67 -72 20 49 150
Portage Au 0.19 0.56 31 8 34 20 40 20
0.25 31 8 34 60 138 168
Portage Ag 0.10 0.61 -48 30 27 22 9 18
0.29 -48 30 27 100 76 174
13.10 Block Model and Grade Estimation
Block modelling was carried out in GEMS (6.4) software by Dr. Gilles Arseneau, PGeo, associate
consultant with SRK. Block estimates were carried out in 10 by 10 by 6 m blocks using a percent
model to weight partial blocks situated at zone boundaries. Block model parameters are defined in
Table 13.5.
Table 13.5: Block Model Setup Parameters
Model origin (WGS 84) Block Size (m) No. of blocks
Easting 548,500 10 220
Northing 5,692,400 10 210
Elevation 418 6 90
Grade Models
Grades were estimated by ordinary kriging with a minimum of 4 and a maximum of 15 composites
with no more than three composites permitted from a single drill hole. Grade interpolations were
carried out in three passes with each successive pass using a larger search radius than the
preceding pass and only estimating the blocks that had not been interpolated by the previous pass.
Table 13.6 summarizes the search parameters for each interpolation pass.
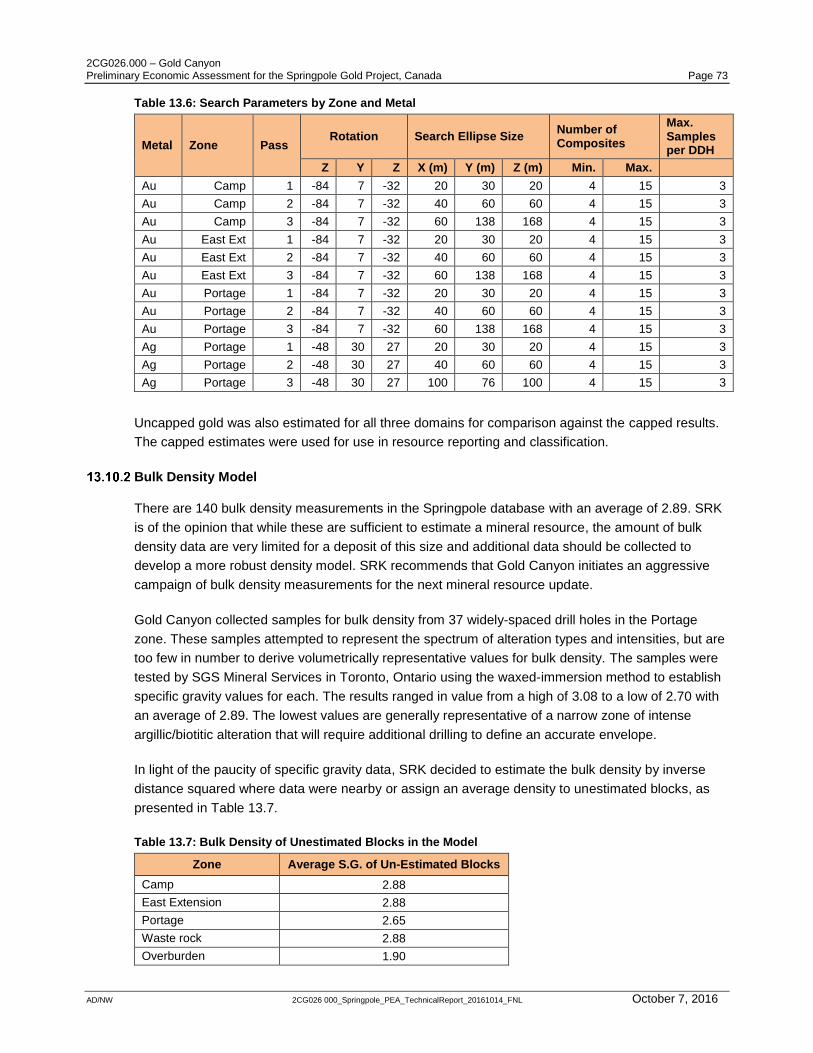
2CG026.000 – Gold Canyon Preliminary Economic Assessment for the Springpole Gold Project, Canada Page 73
AD/NW 2CG026 000_Springpole_PEA_TechnicalReport_20161014_FNL October 7, 2016
Table 13.6: Search Parameters by Zone and Metal
Metal Zone Pass Rotation Search Ellipse Size
Number of Composites
Max. Samples per DDH
Z Y Z X (m) Y (m) Z (m) Min. Max.
Au Camp 1 -84 7 -32 20 30 20 4 15 3
Au Camp 2 -84 7 -32 40 60 60 4 15 3
Au Camp 3 -84 7 -32 60 138 168 4 15 3
Au East Ext 1 -84 7 -32 20 30 20 4 15 3
Au East Ext 2 -84 7 -32 40 60 60 4 15 3
Au East Ext 3 -84 7 -32 60 138 168 4 15 3
Au Portage 1 -84 7 -32 20 30 20 4 15 3
Au Portage 2 -84 7 -32 40 60 60 4 15 3
Au Portage 3 -84 7 -32 60 138 168 4 15 3
Ag Portage 1 -48 30 27 20 30 20 4 15 3
Ag Portage 2 -48 30 27 40 60 60 4 15 3
Ag Portage 3 -48 30 27 100 76 100 4 15 3
Uncapped gold was also estimated for all three domains for comparison against the capped results.
The capped estimates were used for use in resource reporting and classification.
Bulk Density Model
There are 140 bulk density measurements in the Springpole database with an average of 2.89. SRK
is of the opinion that while these are sufficient to estimate a mineral resource, the amount of bulk
density data are very limited for a deposit of this size and additional data should be collected to
develop a more robust density model. SRK recommends that Gold Canyon initiates an aggressive
campaign of bulk density measurements for the next mineral resource update.
Gold Canyon collected samples for bulk density from 37 widely-spaced drill holes in the Portage
zone. These samples attempted to represent the spectrum of alteration types and intensities, but are
too few in number to derive volumetrically representative values for bulk density. The samples were
tested by SGS Mineral Services in Toronto, Ontario using the waxed-immersion method to establish
specific gravity values for each. The results ranged in value from a high of 3.08 to a low of 2.70 with
an average of 2.89. The lowest values are generally representative of a narrow zone of intense
argillic/biotitic alteration that will require additional drilling to define an accurate envelope.
In light of the paucity of specific gravity data, SRK decided to estimate the bulk density by inverse
distance squared where data were nearby or assign an average density to unestimated blocks, as
presented in Table 13.7.
Table 13.7: Bulk Density of Unestimated Blocks in the Model
Zone Average S.G. of Un-Estimated Blocks
Camp 2.88
East Extension 2.88
Portage 2.65
Waste rock 2.88
Overburden 1.90
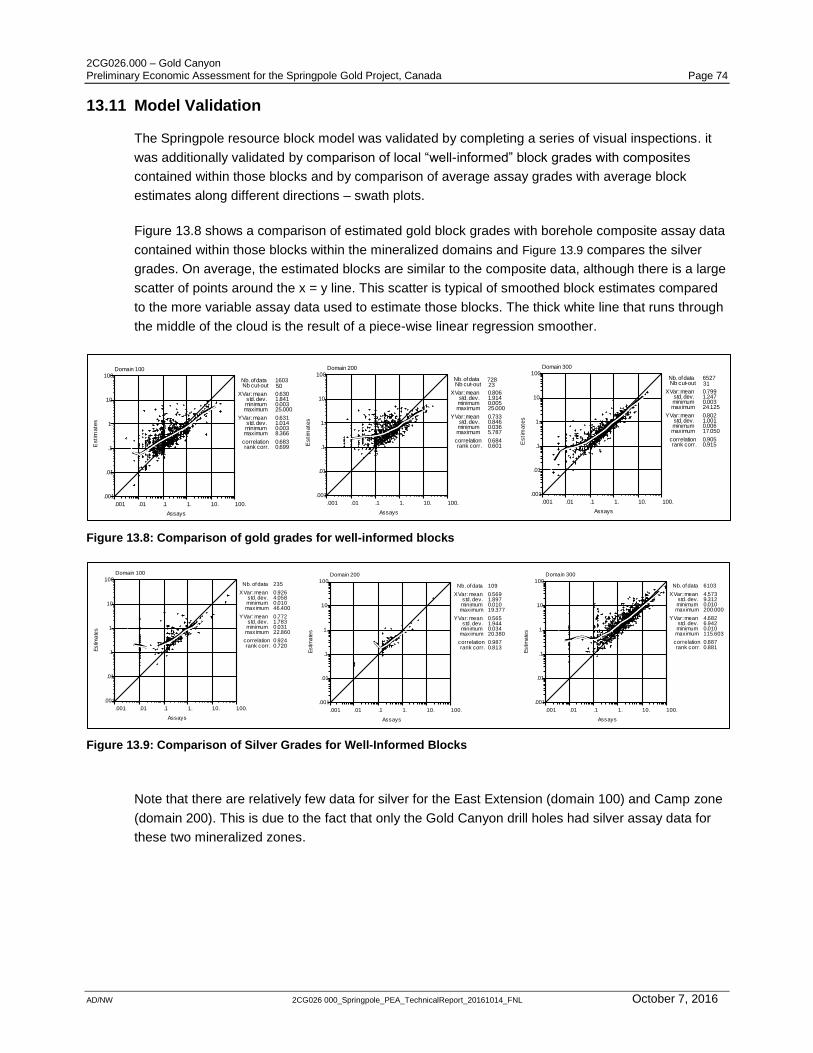
2CG026.000 – Gold Canyon Preliminary Economic Assessment for the Springpole Gold Project, Canada Page 74
AD/NW 2CG026 000_Springpole_PEA_TechnicalReport_20161014_FNL October 7, 2016
13.11 Model Validation
The Springpole resource block model was validated by completing a series of visual inspections. it
was additionally validated by comparison of local “well-informed” block grades with composites
contained within those blocks and by comparison of average assay grades with average block
estimates along different directions – swath plots.
Figure 13.8 shows a comparison of estimated gold block grades with borehole composite assay data
contained within those blocks within the mineralized domains and Figure 13.9 compares the silver
grades. On average, the estimated blocks are similar to the composite data, although there is a large
scatter of points around the x = y line. This scatter is typical of smoothed block estimates compared
to the more variable assay data used to estimate those blocks. The thick white line that runs through
the middle of the cloud is the result of a piece-wise linear regression smoother.
Figure 13.8: Comparison of gold grades for well-informed blocks
Figure 13.9: Comparison of Silver Grades for Well-Informed Blocks
Note that there are relatively few data for silver for the East Extension (domain 100) and Camp zone
(domain 200). This is due to the fact that only the Gold Canyon drill holes had silver assay data for
these two mineralized zones.
Estim
ate
s
Assays
Domain 100
.001 .01 .1 1. 10. 100.
.001
.01
.1
1.
10.
100.Nb. of data 1603Nb cut-out 50
X Var: mean 0.630std. dev. 1.841minimum 0.003maximum 25.000
Y Var: mean 0.631std. dev. 1.014minimum 0.003maximum 8.366
correlation 0.683rank corr. 0.699 E
stim
ate
s
Assays
Domain 200
.001 .01 .1 1. 10. 100.
.001
.01
.1
1.
10.
100.Nb. of data 728Nb cut-out 23
X Var: mean 0.806std. dev. 1.914minimum 0.005maximum 25.000
Y Var: mean 0.733std. dev. 0.846minimum 0.036maximum 5.787
correlation 0.684rank corr. 0.601 E
sti
ma
tes
Assays
Domain 300
.001 .01 .1 1. 10. 100.
.001
.01
.1
1.
10.
100.Nb. of data 6527Nb cut-out 31
X Var: mean 0.799std. dev. 1.247minimum 0.003maximum 24.125
Y Var: mean 0.802std. dev. 1.001minimum 0.006maximum 17.050
correlation 0.905rank corr. 0.915
Es
tima
tes
Assays
Domain 100
.001 .01 .1 1. 10. 100.
.001
.01
.1
1.
10.
100.Nb. of data 235
X Var: mean 0.926std. dev. 4.058minimum 0.010maximum 46.400
Y Var: mean 0.772std. dev. 1.783minimum 0.031maximum 22.860
correlation 0.924rank corr. 0.720
Es
tima
tes
Assays
Domain 200
.001 .01 .1 1. 10. 100.
.001
.01
.1
1.
10.
100.Nb. of data 109
X Var: mean 0.569std. dev. 1.897minimum 0.010maximum 19.377
Y Var: mean 0.565std. dev. 1.944minimum 0.034maximum 20.380
correlation 0.987rank corr. 0.813
Es
tima
tes
Assays
Domain 300
.001 .01 .1 1. 10. 100.
.001
.01
.1
1.
10.
100.Nb. of data 6103
X Var: mean 4.573std. dev. 9.312minimum 0.010maximum 200.000
Y Var: mean 4.682std. dev. 6.942minimum 0.010maximum 115.603
correlation 0.887rank corr. 0.881
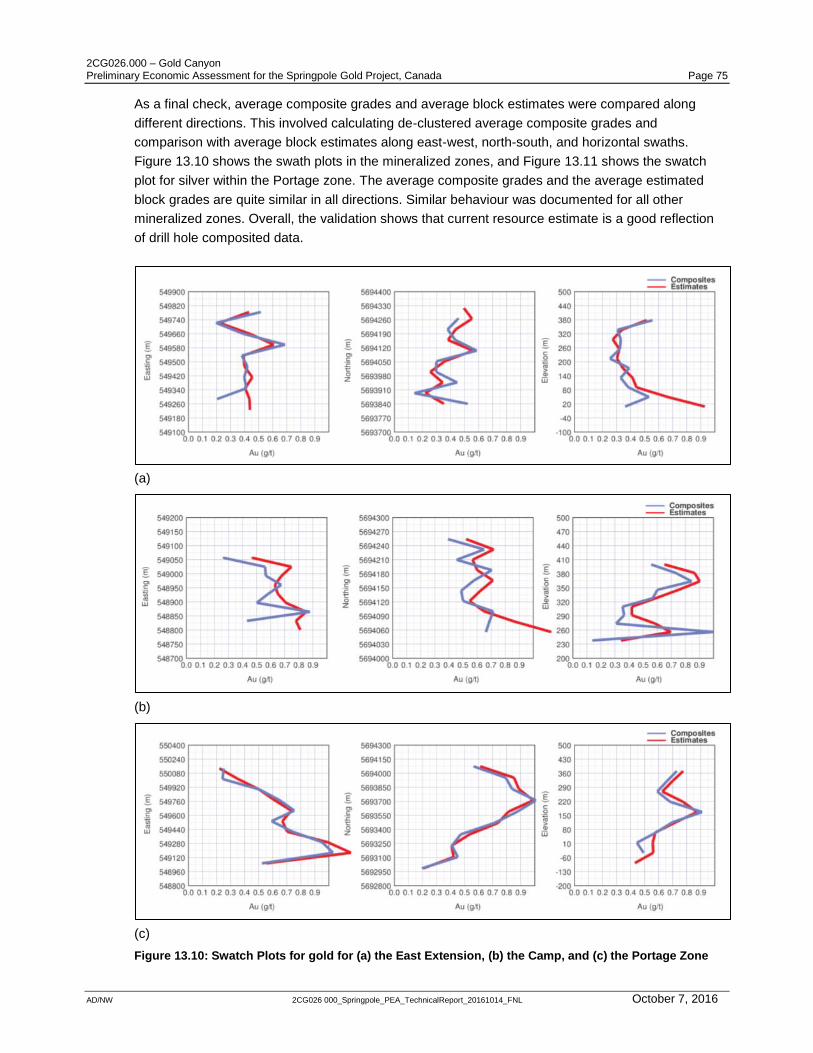
2CG026.000 – Gold Canyon Preliminary Economic Assessment for the Springpole Gold Project, Canada Page 75
AD/NW 2CG026 000_Springpole_PEA_TechnicalReport_20161014_FNL October 7, 2016
As a final check, average composite grades and average block estimates were compared along
different directions. This involved calculating de-clustered average composite grades and
comparison with average block estimates along east-west, north-south, and horizontal swaths.
Figure 13.10 shows the swath plots in the mineralized zones, and Figure 13.11 shows the swatch
plot for silver within the Portage zone. The average composite grades and the average estimated
block grades are quite similar in all directions. Similar behaviour was documented for all other
mineralized zones. Overall, the validation shows that current resource estimate is a good reflection
of drill hole composited data.
(a)
(b)
(c)
Figure 13.10: Swatch Plots for gold for (a) the East Extension, (b) the Camp, and (c) the Portage Zone
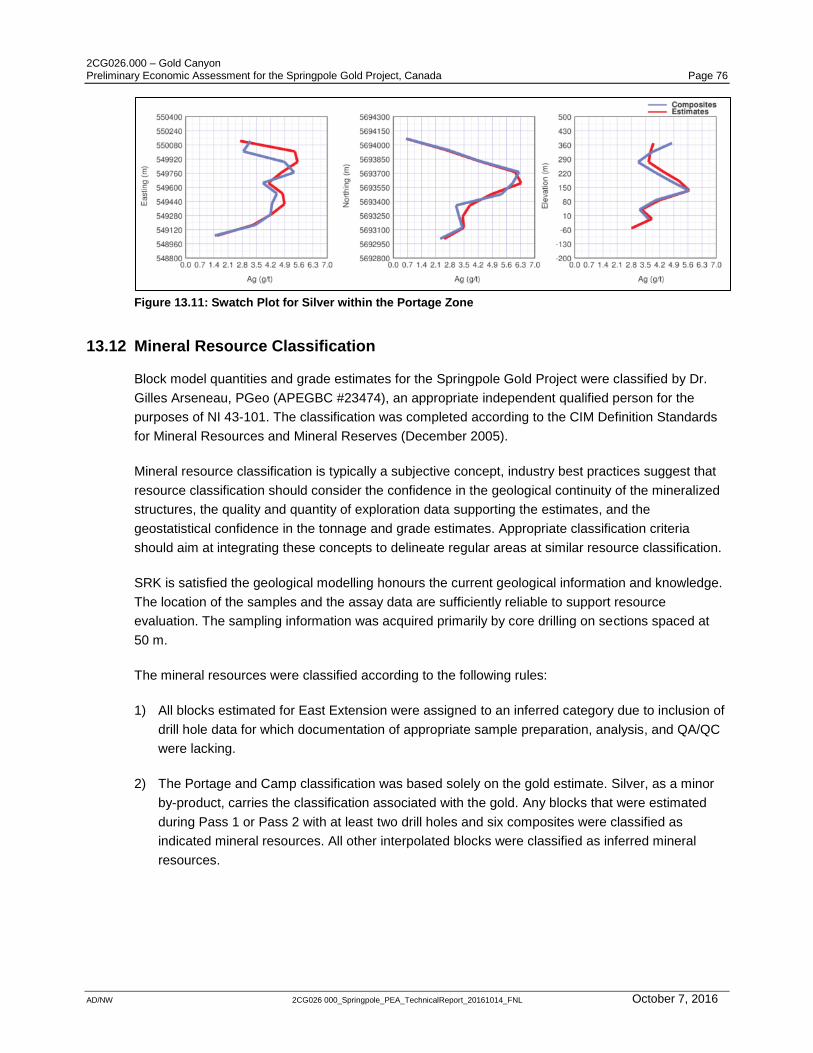
2CG026.000 – Gold Canyon Preliminary Economic Assessment for the Springpole Gold Project, Canada Page 76
AD/NW 2CG026 000_Springpole_PEA_TechnicalReport_20161014_FNL October 7, 2016
Figure 13.11: Swatch Plot for Silver within the Portage Zone
13.12 Mineral Resource Classification
Block model quantities and grade estimates for the Springpole Gold Project were classified by Dr.
Gilles Arseneau, PGeo (APEGBC #23474), an appropriate independent qualified person for the
purposes of NI 43-101. The classification was completed according to the CIM Definition Standards
for Mineral Resources and Mineral Reserves (December 2005).
Mineral resource classification is typically a subjective concept, industry best practices suggest that
resource classification should consider the confidence in the geological continuity of the mineralized
structures, the quality and quantity of exploration data supporting the estimates, and the
geostatistical confidence in the tonnage and grade estimates. Appropriate classification criteria
should aim at integrating these concepts to delineate regular areas at similar resource classification.
SRK is satisfied the geological modelling honours the current geological information and knowledge.
The location of the samples and the assay data are sufficiently reliable to support resource
evaluation. The sampling information was acquired primarily by core drilling on sections spaced at
50 m.
The mineral resources were classified according to the following rules:
1) All blocks estimated for East Extension were assigned to an inferred category due to inclusion of
drill hole data for which documentation of appropriate sample preparation, analysis, and QA/QC
were lacking.
2) The Portage and Camp classification was based solely on the gold estimate. Silver, as a minor
by-product, carries the classification associated with the gold. Any blocks that were estimated
during Pass 1 or Pass 2 with at least two drill holes and six composites were classified as
indicated mineral resources. All other interpolated blocks were classified as inferred mineral
resources.
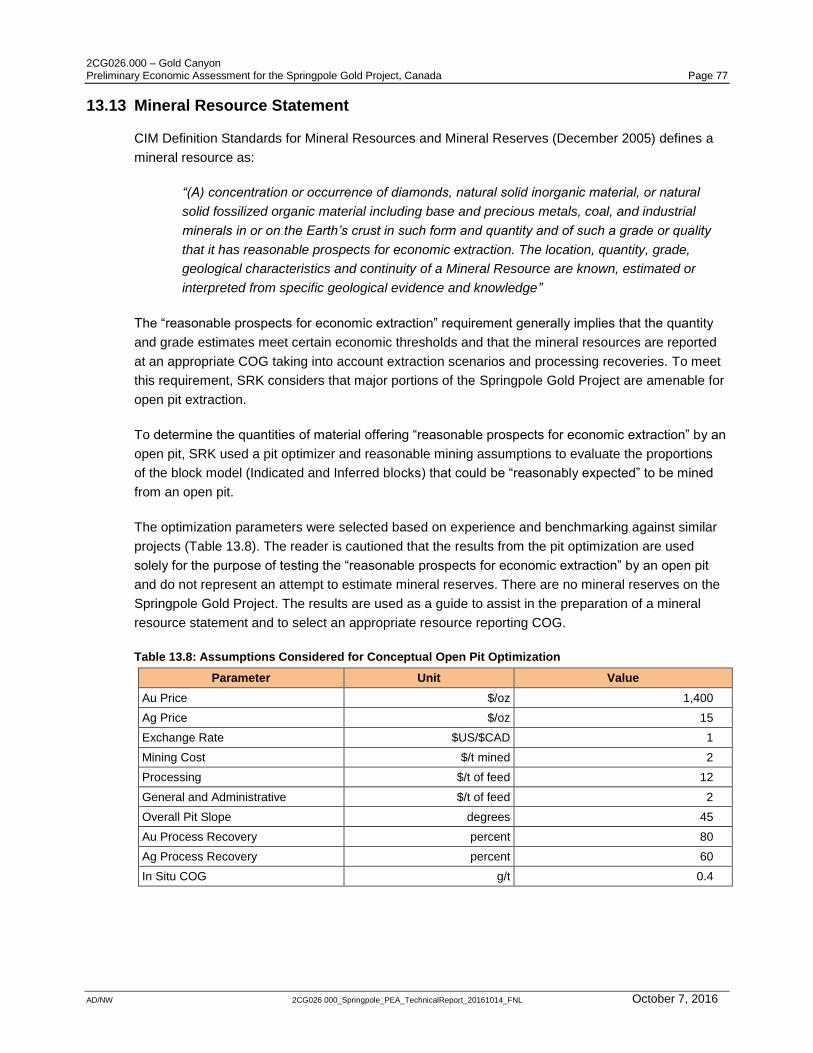
2CG026.000 – Gold Canyon Preliminary Economic Assessment for the Springpole Gold Project, Canada Page 77
AD/NW 2CG026 000_Springpole_PEA_TechnicalReport_20161014_FNL October 7, 2016
13.13 Mineral Resource Statement
CIM Definition Standards for Mineral Resources and Mineral Reserves (December 2005) defines a
mineral resource as:
“(A) concentration or occurrence of diamonds, natural solid inorganic material, or natural
solid fossilized organic material including base and precious metals, coal, and industrial
minerals in or on the Earth’s crust in such form and quantity and of such a grade or quality
that it has reasonable prospects for economic extraction. The location, quantity, grade,
geological characteristics and continuity of a Mineral Resource are known, estimated or
interpreted from specific geological evidence and knowledge”
The “reasonable prospects for economic extraction” requirement generally implies that the quantity
and grade estimates meet certain economic thresholds and that the mineral resources are reported
at an appropriate COG taking into account extraction scenarios and processing recoveries. To meet
this requirement, SRK considers that major portions of the Springpole Gold Project are amenable for
open pit extraction.
To determine the quantities of material offering “reasonable prospects for economic extraction” by an
open pit, SRK used a pit optimizer and reasonable mining assumptions to evaluate the proportions
of the block model (Indicated and Inferred blocks) that could be “reasonably expected” to be mined
from an open pit.
The optimization parameters were selected based on experience and benchmarking against similar
projects (Table 13.8). The reader is cautioned that the results from the pit optimization are used
solely for the purpose of testing the “reasonable prospects for economic extraction” by an open pit
and do not represent an attempt to estimate mineral reserves. There are no mineral reserves on the
Springpole Gold Project. The results are used as a guide to assist in the preparation of a mineral
resource statement and to select an appropriate resource reporting COG.
Table 13.8: Assumptions Considered for Conceptual Open Pit Optimization
Parameter Unit Value
Au Price $/oz 1,400
Ag Price $/oz 15
Exchange Rate $US/$CAD 1
Mining Cost $/t mined 2
Processing $/t of feed 12
General and Administrative $/t of feed 2
Overall Pit Slope degrees 45
Au Process Recovery percent 80
Ag Process Recovery percent 60
In Situ COG g/t 0.4
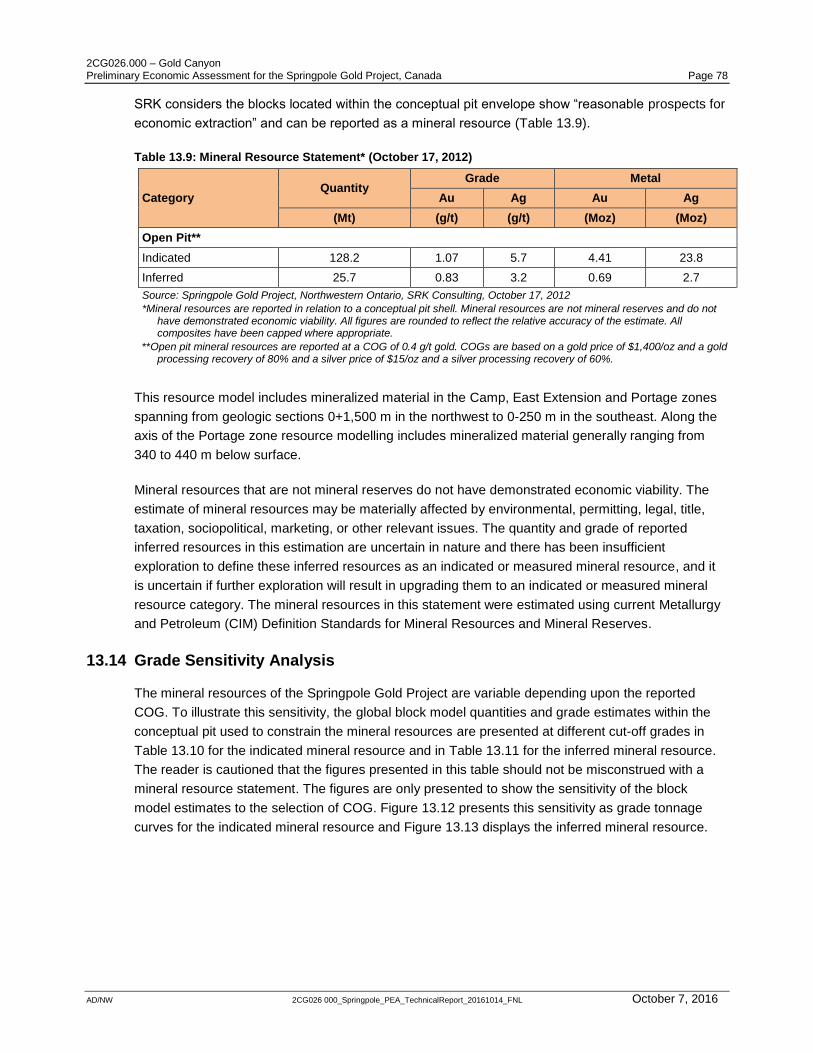
2CG026.000 – Gold Canyon Preliminary Economic Assessment for the Springpole Gold Project, Canada Page 78
AD/NW 2CG026 000_Springpole_PEA_TechnicalReport_20161014_FNL October 7, 2016
SRK considers the blocks located within the conceptual pit envelope show “reasonable prospects for
economic extraction” and can be reported as a mineral resource (Table 13.9).
Table 13.9: Mineral Resource Statement* (October 17, 2012)
Category Quantity
Grade Metal
Au Ag Au Ag
(Mt) (g/t) (g/t) (Moz) (Moz)
Open Pit**
Indicated 128.2 1.07 5.7 4.41 23.8
Inferred 25.7 0.83 3.2 0.69 2.7
Source: Springpole Gold Project, Northwestern Ontario, SRK Consulting, October 17, 2012
*Mineral resources are reported in relation to a conceptual pit shell. Mineral resources are not mineral reserves and do not have demonstrated economic viability. All figures are rounded to reflect the relative accuracy of the estimate. All composites have been capped where appropriate.
**Open pit mineral resources are reported at a COG of 0.4 g/t gold. COGs are based on a gold price of $1,400/oz and a gold processing recovery of 80% and a silver price of $15/oz and a silver processing recovery of 60%.
This resource model includes mineralized material in the Camp, East Extension and Portage zones
spanning from geologic sections 0+1,500 m in the northwest to 0-250 m in the southeast. Along the
axis of the Portage zone resource modelling includes mineralized material generally ranging from
340 to 440 m below surface.
Mineral resources that are not mineral reserves do not have demonstrated economic viability. The
estimate of mineral resources may be materially affected by environmental, permitting, legal, title,
taxation, sociopolitical, marketing, or other relevant issues. The quantity and grade of reported
inferred resources in this estimation are uncertain in nature and there has been insufficient
exploration to define these inferred resources as an indicated or measured mineral resource, and it
is uncertain if further exploration will result in upgrading them to an indicated or measured mineral
resource category. The mineral resources in this statement were estimated using current Metallurgy
and Petroleum (CIM) Definition Standards for Mineral Resources and Mineral Reserves.
13.14 Grade Sensitivity Analysis
The mineral resources of the Springpole Gold Project are variable depending upon the reported
COG. To illustrate this sensitivity, the global block model quantities and grade estimates within the
conceptual pit used to constrain the mineral resources are presented at different cut-off grades in
Table 13.10 for the indicated mineral resource and in Table 13.11 for the inferred mineral resource.
The reader is cautioned that the figures presented in this table should not be misconstrued with a
mineral resource statement. The figures are only presented to show the sensitivity of the block
model estimates to the selection of COG. Figure 13.12 presents this sensitivity as grade tonnage
curves for the indicated mineral resource and Figure 13.13 displays the inferred mineral resource.
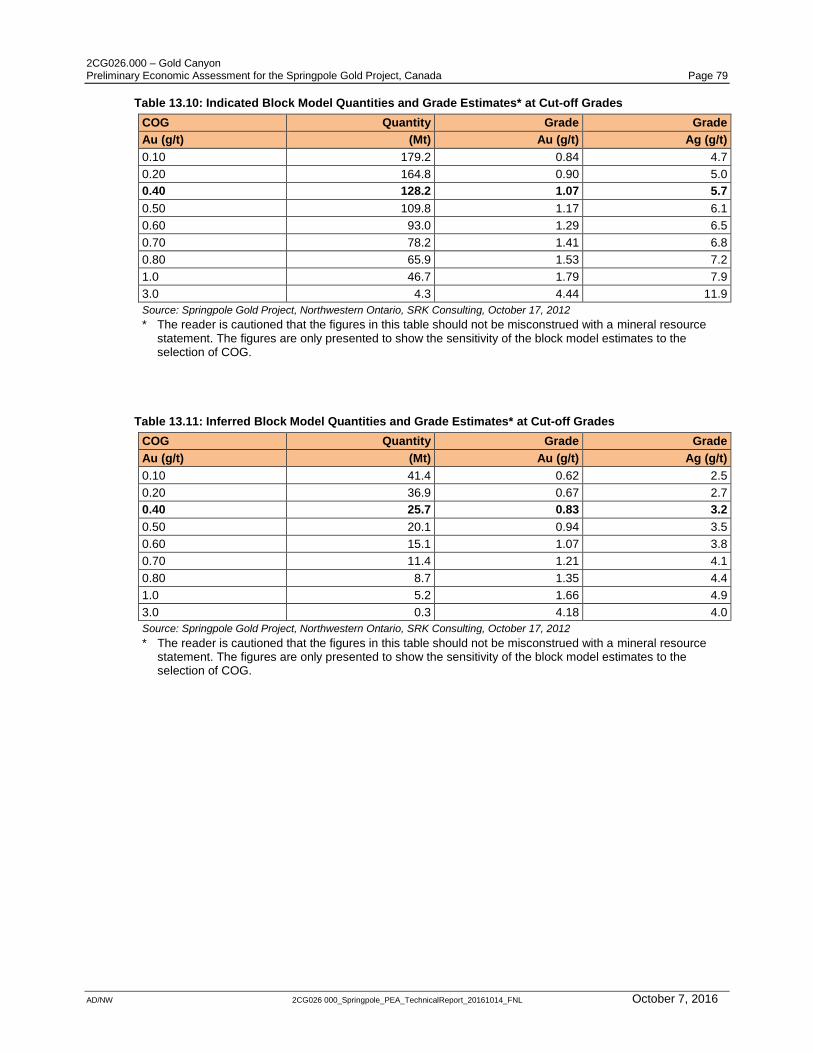
2CG026.000 – Gold Canyon Preliminary Economic Assessment for the Springpole Gold Project, Canada Page 79
AD/NW 2CG026 000_Springpole_PEA_TechnicalReport_20161014_FNL October 7, 2016
Table 13.10: Indicated Block Model Quantities and Grade Estimates* at Cut-off Grades
COG Quantity Grade Grade
Au (g/t) (Mt) Au (g/t) Ag (g/t)
0.10 179.2 0.84 4.7
0.20 164.8 0.90 5.0
0.40 128.2 1.07 5.7
0.50 109.8 1.17 6.1
0.60 93.0 1.29 6.5
0.70 78.2 1.41 6.8
0.80 65.9 1.53 7.2
1.0 46.7 1.79 7.9
3.0 4.3 4.44 11.9
Source: Springpole Gold Project, Northwestern Ontario, SRK Consulting, October 17, 2012
* The reader is cautioned that the figures in this table should not be misconstrued with a mineral resource statement. The figures are only presented to show the sensitivity of the block model estimates to the selection of COG.
Table 13.11: Inferred Block Model Quantities and Grade Estimates* at Cut-off Grades
COG Quantity Grade Grade
Au (g/t) (Mt) Au (g/t) Ag (g/t)
0.10 41.4 0.62 2.5
0.20 36.9 0.67 2.7
0.40 25.7 0.83 3.2
0.50 20.1 0.94 3.5
0.60 15.1 1.07 3.8
0.70 11.4 1.21 4.1
0.80 8.7 1.35 4.4
1.0 5.2 1.66 4.9
3.0 0.3 4.18 4.0
Source: Springpole Gold Project, Northwestern Ontario, SRK Consulting, October 17, 2012
* The reader is cautioned that the figures in this table should not be misconstrued with a mineral resource statement. The figures are only presented to show the sensitivity of the block model estimates to the selection of COG.

2CG026.000 – Gold Canyon Preliminary Economic Assessment for the Springpole Gold Project, Canada Page 80
AD/NW 2CG026 000_Springpole_PEA_TechnicalReport_20161014_FNL October 7, 2016
Figure 13.12: Grade Tonnage Curves for the Springpole Indicated Mineral Resource
Figure 13.13: Grade Tonnage Curves for the Springpole Inferred Mineral Resource
0
0.5
1
1.5
2
2.5
3
3.5
4
4.5
5
0
20
40
60
80
100
120
140
160
180
200
0 0.5 1 1.5 2 2.5 3 3.5
Ave
rage
Gra
de
Au
(g/
t)
Mt
Cut-off grade Au (g/t)
MTons Indicated
Au (g/t) Indicated
0
0.5
1
1.5
2
2.5
3
3.5
4
4.5
0
5
10
15
20
25
30
35
40
45
0 0.5 1 1.5 2 2.5 3 3.5
Ave
rage
Gra
de
Au
(g/
t)
Mt
Cut-off grade Au (g/t)
MTons Inferred
Au (g/t) Inferred
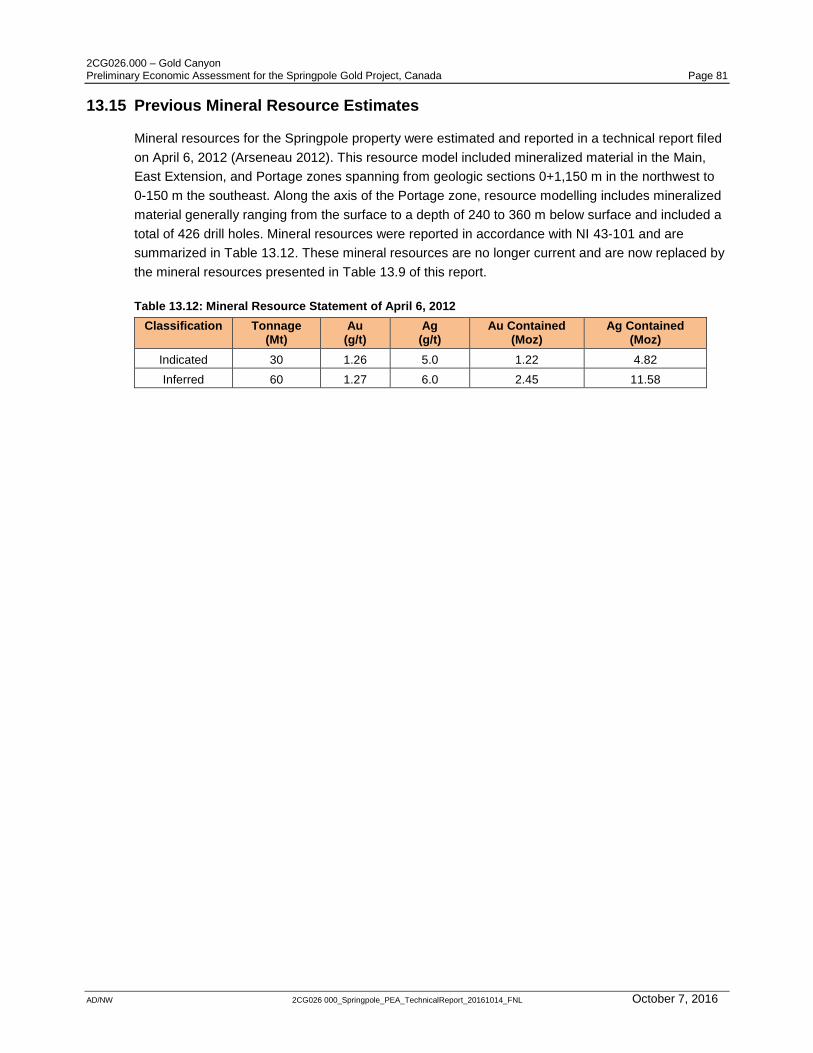
2CG026.000 – Gold Canyon Preliminary Economic Assessment for the Springpole Gold Project, Canada Page 81
AD/NW 2CG026 000_Springpole_PEA_TechnicalReport_20161014_FNL October 7, 2016
13.15 Previous Mineral Resource Estimates
Mineral resources for the Springpole property were estimated and reported in a technical report filed
on April 6, 2012 (Arseneau 2012). This resource model included mineralized material in the Main,
East Extension, and Portage zones spanning from geologic sections 0+1,150 m in the northwest to
0-150 m the southeast. Along the axis of the Portage zone, resource modelling includes mineralized
material generally ranging from the surface to a depth of 240 to 360 m below surface and included a
total of 426 drill holes. Mineral resources were reported in accordance with NI 43-101 and are
summarized in Table 13.12. These mineral resources are no longer current and are now replaced by
the mineral resources presented in Table 13.9 of this report.
Table 13.12: Mineral Resource Statement of April 6, 2012
Classification Tonnage (Mt)
Au (g/t)
Ag (g/t)
Au Contained (Moz)
Ag Contained (Moz)
Indicated 30 1.26 5.0 1.22 4.82
Inferred 60 1.27 6.0 2.45 11.58
2CG026.000 – Gold Canyon Preliminary Economic Assessment for the Springpole Gold Project, Canada Page 82
AD/NW 2CG026 000_Springpole_PEA_TechnicalReport_20161014_FNL October 7, 2016
14 Mineral Reserve Estimates
Inferred resources were used in the LOM plan with inferred resources representing 10% of the
material planned for processing. Mineral resources that are not mineral reserves do not have
demonstrated economic viability. There is no certainty that all or any part of the mineral resources
would be converted into mineral reserves. Mineral reserves can only be estimated as a result of an
economic evaluation as part of a preliminary feasibility study or a feasibility study of a mineral
project. Accordingly, at the present level of development, there are no mineral reserves at the
Springpole Gold Project.
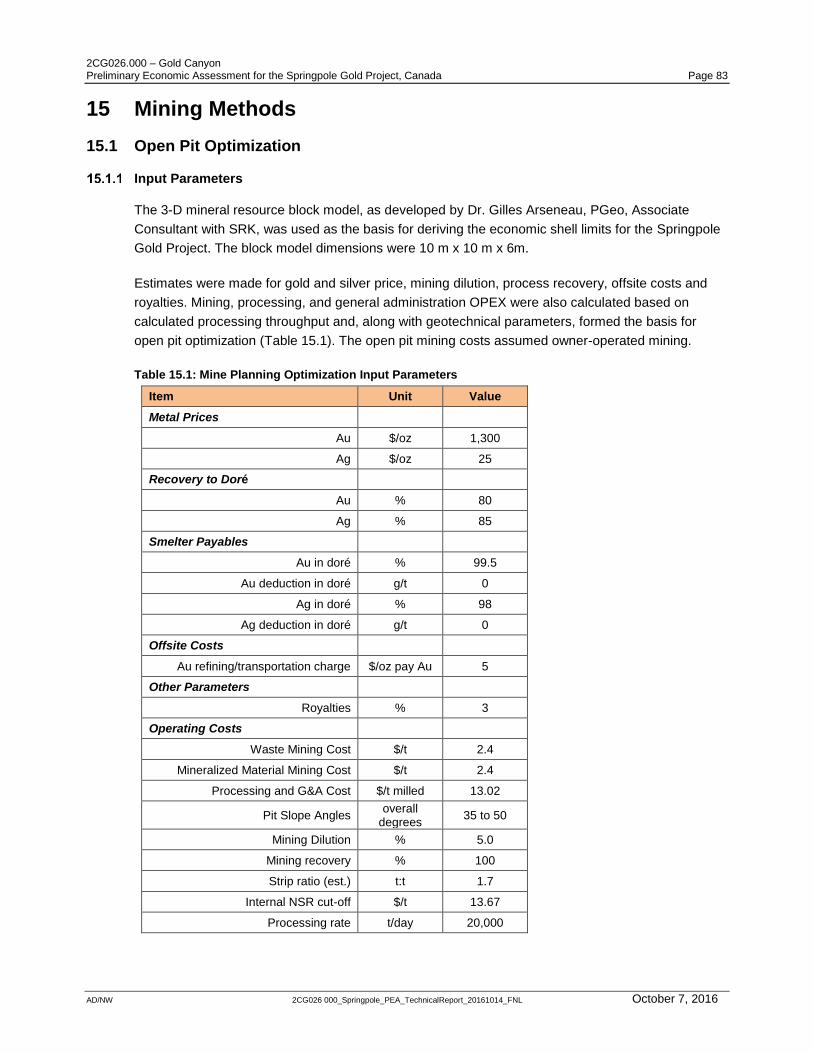
2CG026.000 – Gold Canyon Preliminary Economic Assessment for the Springpole Gold Project, Canada Page 83
AD/NW 2CG026 000_Springpole_PEA_TechnicalReport_20161014_FNL October 7, 2016
15 Mining Methods
15.1 Open Pit Optimization
Input Parameters
The 3-D mineral resource block model, as developed by Dr. Gilles Arseneau, PGeo, Associate
Consultant with SRK, was used as the basis for deriving the economic shell limits for the Springpole
Gold Project. The block model dimensions were 10 m x 10 m x 6m.
Estimates were made for gold and silver price, mining dilution, process recovery, offsite costs and
royalties. Mining, processing, and general administration OPEX were also calculated based on
calculated processing throughput and, along with geotechnical parameters, formed the basis for
open pit optimization (Table 15.1). The open pit mining costs assumed owner-operated mining.
Table 15.1: Mine Planning Optimization Input Parameters
Item Unit Value
Metal Prices
Au $/oz 1,300
Ag $/oz 25
Recovery to Doré
Au % 80
Ag % 85
Smelter Payables
Au in doré % 99.5
Au deduction in doré g/t 0
Ag in doré % 98
Ag deduction in doré g/t 0
Offsite Costs
Au refining/transportation charge $/oz pay Au 5
Other Parameters
Royalties % 3
Operating Costs
Waste Mining Cost $/t 2.4
Mineralized Material Mining Cost $/t 2.4
Processing and G&A Cost $/t milled 13.02
Pit Slope Angles overall
degrees 35 to 50
Mining Dilution % 5.0
Mining recovery % 100
Strip ratio (est.) t:t 1.7
Internal NSR cut-off $/t 13.67
Processing rate t/day 20,000
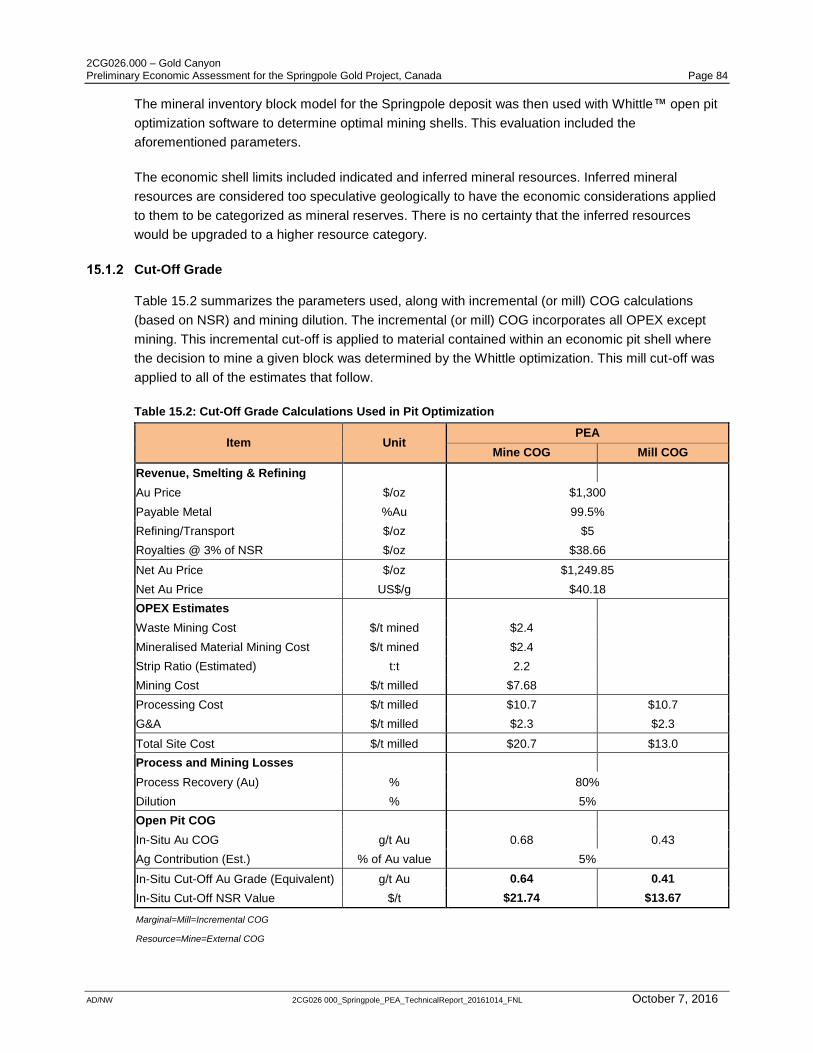
2CG026.000 – Gold Canyon Preliminary Economic Assessment for the Springpole Gold Project, Canada Page 84
AD/NW 2CG026 000_Springpole_PEA_TechnicalReport_20161014_FNL October 7, 2016
The mineral inventory block model for the Springpole deposit was then used with Whittle™ open pit
optimization software to determine optimal mining shells. This evaluation included the
aforementioned parameters.
The economic shell limits included indicated and inferred mineral resources. Inferred mineral
resources are considered too speculative geologically to have the economic considerations applied
to them to be categorized as mineral reserves. There is no certainty that the inferred resources
would be upgraded to a higher resource category.
Cut-Off Grade
Table 15.2 summarizes the parameters used, along with incremental (or mill) COG calculations
(based on NSR) and mining dilution. The incremental (or mill) COG incorporates all OPEX except
mining. This incremental cut-off is applied to material contained within an economic pit shell where
the decision to mine a given block was determined by the Whittle optimization. This mill cut-off was
applied to all of the estimates that follow.
Table 15.2: Cut-Off Grade Calculations Used in Pit Optimization
Item Unit PEA
Mine COG Mill COG
Revenue, Smelting & Refining
Au Price $/oz $1,300
Payable Metal %Au 99.5%
Refining/Transport $/oz $5
Royalties @ 3% of NSR $/oz $38.66
Net Au Price $/oz $1,249.85
Net Au Price US$/g $40.18
OPEX Estimates
Waste Mining Cost $/t mined $2.4
Mineralised Material Mining Cost $/t mined $2.4
Strip Ratio (Estimated) t:t 2.2
Mining Cost $/t milled $7.68
Processing Cost $/t milled $10.7 $10.7
G&A $/t milled $2.3 $2.3
Total Site Cost $/t milled $20.7 $13.0
Process and Mining Losses
Process Recovery (Au) % 80%
Dilution % 5%
Open Pit COG
In-Situ Au COG g/t Au 0.68 0.43
Ag Contribution (Est.) % of Au value 5%
In-Situ Cut-Off Au Grade (Equivalent) g/t Au 0.64 0.41
In-Situ Cut-Off NSR Value $/t $21.74 $13.67
Marginal=Mill=Incremental COG
Resource=Mine=External COG
2CG026.000 – Gold Canyon Preliminary Economic Assessment for the Springpole Gold Project, Canada Page 85
AD/NW 2CG026 000_Springpole_PEA_TechnicalReport_20161014_FNL October 7, 2016
It should be noted that the gold COGs are for comparative purposes only, as the NSR cut-off was
used for Whittle optimization and mineral inventory estimates. The incremental NSR cut-off value of
$13.67/t was applied to the mineral inventory estimates that follow. This equates to an incremental
gold COG of approximately 0.41 g/t gold).
Optimization Results
A series of optimized shells were generated for the Springpole deposit based on varying revenue
factors. The results were analyzed with shells chosen as the basis for ultimate limits and preliminary
phase selection.
The results of the pit optimization evaluation on the deposit for varying revenue factors values are
summarized in Table 15.3 and Figure 15.1 to Figure 15.3 for inferred and indicated resources. Note
the NPV in this optimization summary does not take into account CAPEX and is used only as a
guide in shell selection and determination of the mining shapes. The actual NPV of the project is
summarized in the economics section of this report.
Whittle produces both “best case” (i.e., mine out shell 1, the smallest shell, and then mine out each
subsequent shell from the top down, before starting the next shell) and “worst case” (mine each
bench completely to final limits before starting next bench) scenarios. These two scenarios provide a
bracket for the range of possible outcomes. The shells were produced based on varying revenue
factors (0.3 through to 1.4 of base case) to produce the series of nested shells with the NPV results
shown.
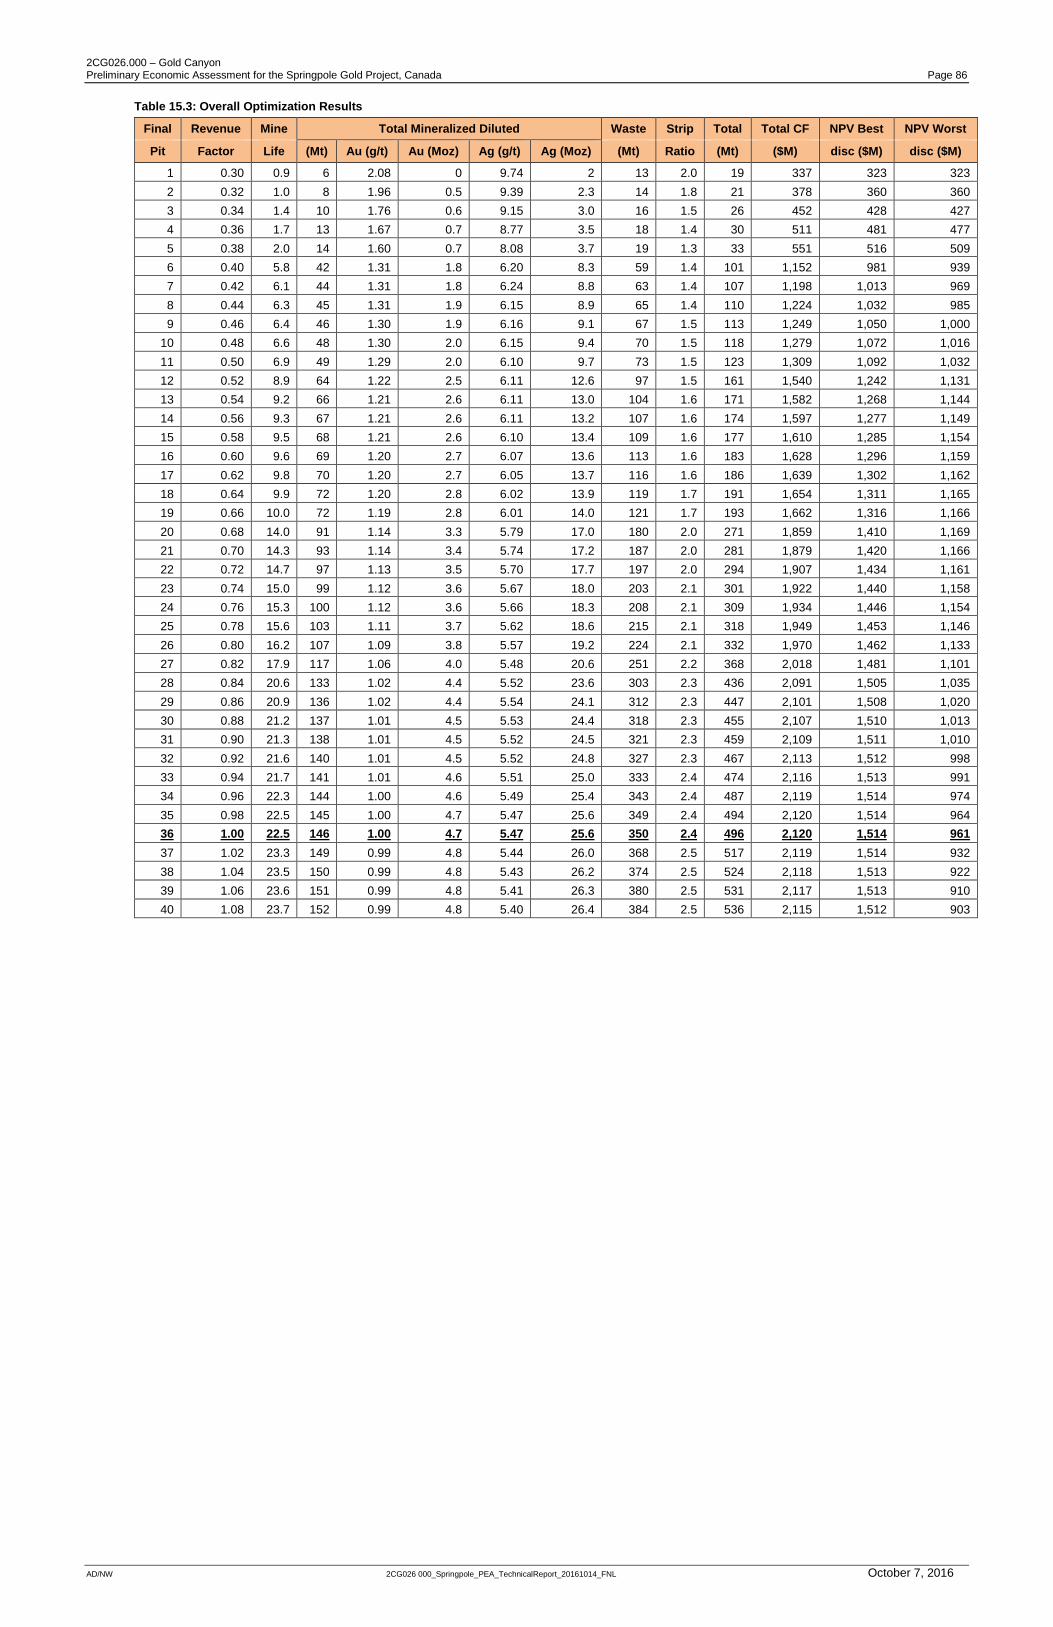
2CG026.000 – Gold Canyon Preliminary Economic Assessment for the Springpole Gold Project, Canada Page 86
AD/NW 2CG026 000_Springpole_PEA_TechnicalReport_20161014_FNL October 7, 2016
Table 15.3: Overall Optimization Results
Final Revenue Mine Total Mineralized Diluted Waste Strip Total Total CF NPV Best NPV Worst
Pit Factor Life (Mt) Au (g/t) Au (Moz) Ag (g/t) Ag (Moz) (Mt) Ratio (Mt) ($M) disc ($M) disc ($M)
1 0.30 0.9 6 2.08 0 9.74 2 13 2.0 19 337 323 323
2 0.32 1.0 8 1.96 0.5 9.39 2.3 14 1.8 21 378 360 360
3 0.34 1.4 10 1.76 0.6 9.15 3.0 16 1.5 26 452 428 427
4 0.36 1.7 13 1.67 0.7 8.77 3.5 18 1.4 30 511 481 477
5 0.38 2.0 14 1.60 0.7 8.08 3.7 19 1.3 33 551 516 509
6 0.40 5.8 42 1.31 1.8 6.20 8.3 59 1.4 101 1,152 981 939
7 0.42 6.1 44 1.31 1.8 6.24 8.8 63 1.4 107 1,198 1,013 969
8 0.44 6.3 45 1.31 1.9 6.15 8.9 65 1.4 110 1,224 1,032 985
9 0.46 6.4 46 1.30 1.9 6.16 9.1 67 1.5 113 1,249 1,050 1,000
10 0.48 6.6 48 1.30 2.0 6.15 9.4 70 1.5 118 1,279 1,072 1,016
11 0.50 6.9 49 1.29 2.0 6.10 9.7 73 1.5 123 1,309 1,092 1,032
12 0.52 8.9 64 1.22 2.5 6.11 12.6 97 1.5 161 1,540 1,242 1,131
13 0.54 9.2 66 1.21 2.6 6.11 13.0 104 1.6 171 1,582 1,268 1,144
14 0.56 9.3 67 1.21 2.6 6.11 13.2 107 1.6 174 1,597 1,277 1,149
15 0.58 9.5 68 1.21 2.6 6.10 13.4 109 1.6 177 1,610 1,285 1,154
16 0.60 9.6 69 1.20 2.7 6.07 13.6 113 1.6 183 1,628 1,296 1,159
17 0.62 9.8 70 1.20 2.7 6.05 13.7 116 1.6 186 1,639 1,302 1,162
18 0.64 9.9 72 1.20 2.8 6.02 13.9 119 1.7 191 1,654 1,311 1,165
19 0.66 10.0 72 1.19 2.8 6.01 14.0 121 1.7 193 1,662 1,316 1,166
20 0.68 14.0 91 1.14 3.3 5.79 17.0 180 2.0 271 1,859 1,410 1,169
21 0.70 14.3 93 1.14 3.4 5.74 17.2 187 2.0 281 1,879 1,420 1,166
22 0.72 14.7 97 1.13 3.5 5.70 17.7 197 2.0 294 1,907 1,434 1,161
23 0.74 15.0 99 1.12 3.6 5.67 18.0 203 2.1 301 1,922 1,440 1,158
24 0.76 15.3 100 1.12 3.6 5.66 18.3 208 2.1 309 1,934 1,446 1,154
25 0.78 15.6 103 1.11 3.7 5.62 18.6 215 2.1 318 1,949 1,453 1,146
26 0.80 16.2 107 1.09 3.8 5.57 19.2 224 2.1 332 1,970 1,462 1,133
27 0.82 17.9 117 1.06 4.0 5.48 20.6 251 2.2 368 2,018 1,481 1,101
28 0.84 20.6 133 1.02 4.4 5.52 23.6 303 2.3 436 2,091 1,505 1,035
29 0.86 20.9 136 1.02 4.4 5.54 24.1 312 2.3 447 2,101 1,508 1,020
30 0.88 21.2 137 1.01 4.5 5.53 24.4 318 2.3 455 2,107 1,510 1,013
31 0.90 21.3 138 1.01 4.5 5.52 24.5 321 2.3 459 2,109 1,511 1,010
32 0.92 21.6 140 1.01 4.5 5.52 24.8 327 2.3 467 2,113 1,512 998
33 0.94 21.7 141 1.01 4.6 5.51 25.0 333 2.4 474 2,116 1,513 991
34 0.96 22.3 144 1.00 4.6 5.49 25.4 343 2.4 487 2,119 1,514 974
35 0.98 22.5 145 1.00 4.7 5.47 25.6 349 2.4 494 2,120 1,514 964
36 1.00 22.5 146 1.00 4.7 5.47 25.6 350 2.4 496 2,120 1,514 961
37 1.02 23.3 149 0.99 4.8 5.44 26.0 368 2.5 517 2,119 1,514 932
38 1.04 23.5 150 0.99 4.8 5.43 26.2 374 2.5 524 2,118 1,513 922
39 1.06 23.6 151 0.99 4.8 5.41 26.3 380 2.5 531 2,117 1,513 910
40 1.08 23.7 152 0.99 4.8 5.40 26.4 384 2.5 536 2,115 1,512 903
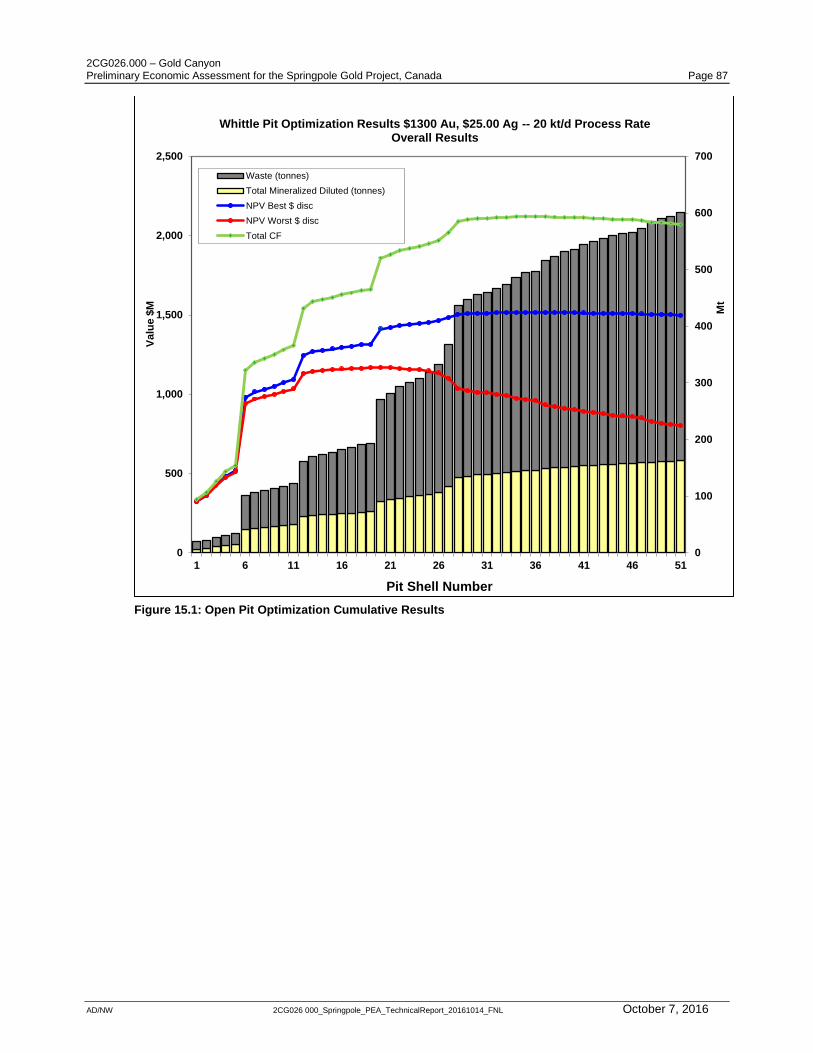
2CG026.000 – Gold Canyon Preliminary Economic Assessment for the Springpole Gold Project, Canada Page 87
AD/NW 2CG026 000_Springpole_PEA_TechnicalReport_20161014_FNL October 7, 2016
Figure 15.1: Open Pit Optimization Cumulative Results
0
100
200
300
400
500
600
700
0
500
1,000
1,500
2,000
2,500
1 6 11 16 21 26 31 36 41 46 51
Mt
Valu
e $
M
Pit Shell Number
Whittle Pit Optimization Results $1300 Au, $25.00 Ag -- 20 kt/d Process RateOverall Results
Waste (tonnes)
Total Mineralized Diluted (tonnes)
NPV Best $ disc
NPV Worst $ disc
Total CF

2CG026.000 – Gold Canyon Preliminary Economic Assessment for the Springpole Gold Project, Canada Page 88
AD/NW 2CG026 000_Springpole_PEA_TechnicalReport_20161014_FNL October 7, 2016
Figure 15.2: Open Pit Optimization Incremental Value Results
Figure 15.3: Open Pit Optimization Incremental Tonnage Results
-100
0
100
200
300
400
500
1 6 11 16 21 26 31 36 41 46 51
Valu
e $
M
Pit Shell Number
Whittle Pit Optimization Results $1300 Au, $25.00 Ag -- 20 kt/d Process RateIncremental Value
NPV best incr. $ disc
NPV worst incr. $ disc
0
5
10
15
20
25
30
0
1
2
3
4
5
6
7
8
1 6 11 16 21 26 31 36 41 46 51
Incr.
Min
era
lized
Mate
rial (M
t)
Str
ip R
ati
o (
t:t)
Pit Shell Number
Whittle Pit Optimization Results $1300 Au, $25.00 Ag -- 20 kt/d Process RateIncremental Mineralized Tonnage and Strip Ratio
Incr. Diluted tonne mineralized
Incr. strip ratio
Overall Strip Ratio
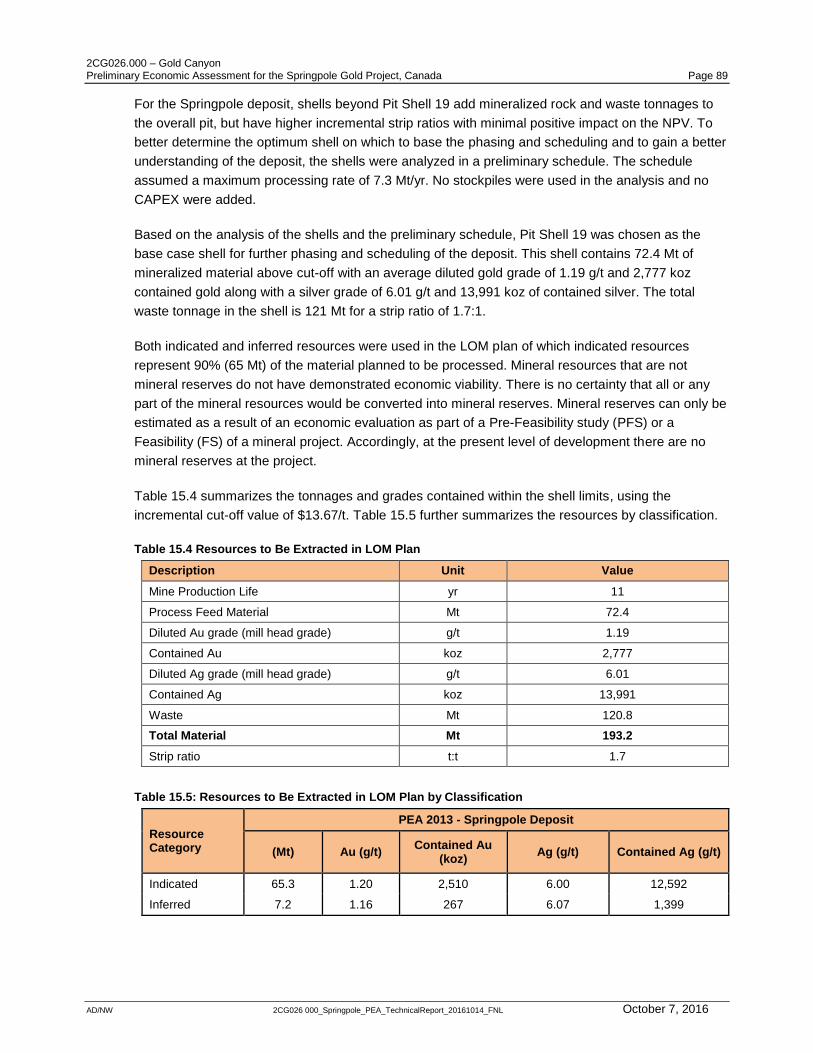
2CG026.000 – Gold Canyon Preliminary Economic Assessment for the Springpole Gold Project, Canada Page 89
AD/NW 2CG026 000_Springpole_PEA_TechnicalReport_20161014_FNL October 7, 2016
For the Springpole deposit, shells beyond Pit Shell 19 add mineralized rock and waste tonnages to
the overall pit, but have higher incremental strip ratios with minimal positive impact on the NPV. To
better determine the optimum shell on which to base the phasing and scheduling and to gain a better
understanding of the deposit, the shells were analyzed in a preliminary schedule. The schedule
assumed a maximum processing rate of 7.3 Mt/yr. No stockpiles were used in the analysis and no
CAPEX were added.
Based on the analysis of the shells and the preliminary schedule, Pit Shell 19 was chosen as the
base case shell for further phasing and scheduling of the deposit. This shell contains 72.4 Mt of
mineralized material above cut-off with an average diluted gold grade of 1.19 g/t and 2,777 koz
contained gold along with a silver grade of 6.01 g/t and 13,991 koz of contained silver. The total
waste tonnage in the shell is 121 Mt for a strip ratio of 1.7:1.
Both indicated and inferred resources were used in the LOM plan of which indicated resources
represent 90% (65 Mt) of the material planned to be processed. Mineral resources that are not
mineral reserves do not have demonstrated economic viability. There is no certainty that all or any
part of the mineral resources would be converted into mineral reserves. Mineral reserves can only be
estimated as a result of an economic evaluation as part of a Pre-Feasibility study (PFS) or a
Feasibility (FS) of a mineral project. Accordingly, at the present level of development there are no
mineral reserves at the project.
Table 15.4 summarizes the tonnages and grades contained within the shell limits, using the
incremental cut-off value of $13.67/t. Table 15.5 further summarizes the resources by classification.
Table 15.4 Resources to Be Extracted in LOM Plan
Description Unit Value
Mine Production Life yr 11
Process Feed Material Mt 72.4
Diluted Au grade (mill head grade) g/t 1.19
Contained Au koz 2,777
Diluted Ag grade (mill head grade) g/t 6.01
Contained Ag koz 13,991
Waste Mt 120.8
Total Material Mt 193.2
Strip ratio t:t 1.7
Table 15.5: Resources to Be Extracted in LOM Plan by Classification
Resource Category
PEA 2013 - Springpole Deposit
(Mt) Au (g/t) Contained Au
(koz) Ag (g/t) Contained Ag (g/t)
Indicated 65.3 1.20 2,510 6.00 12,592
Inferred 7.2 1.16 267 6.07 1,399

2CG026.000 – Gold Canyon Preliminary Economic Assessment for the Springpole Gold Project, Canada Page 90
AD/NW 2CG026 000_Springpole_PEA_TechnicalReport_20161014_FNL October 7, 2016
15.2 Open Pit Mine Design
Mine planning for the Springpole deposit was conducted using a combination of software packages,
including MINTEC Inc. MineSight™ and Gemcom GEMS™ (6.4) and Whittle™ . The base 3-D block
model was analyzed using GEMS (6.4). The phase selection and production scheduling was
undertaken with the use of MineSight and Whittle software.
For the Springpole deposit, the ultimate shell limits, along with the associated phasing (a total of
three phases selected that correspond to Whittle shell 5, 7, and 19) were based on the shell analysis
described in this report. Preliminary waste dumps were then designed to account for the material
produced in each mining phase and shell.
Shell 19 was chosen as the mining shape limit for the deposit. Figure 15.4 and Figure 15.5 represent
plan and section views of the ultimate pit shape.

2CG026.000 – Gold Canyon Preliminary Economic Assessment for the Springpole Gold Project, Canada Page 91
AD/NW 2CG026 000_Springpole_PEA_TechnicalReport_20161014_FNL October 7, 2016
Figure 15.4: Plan View of Springpole Ultimate Pit Limits
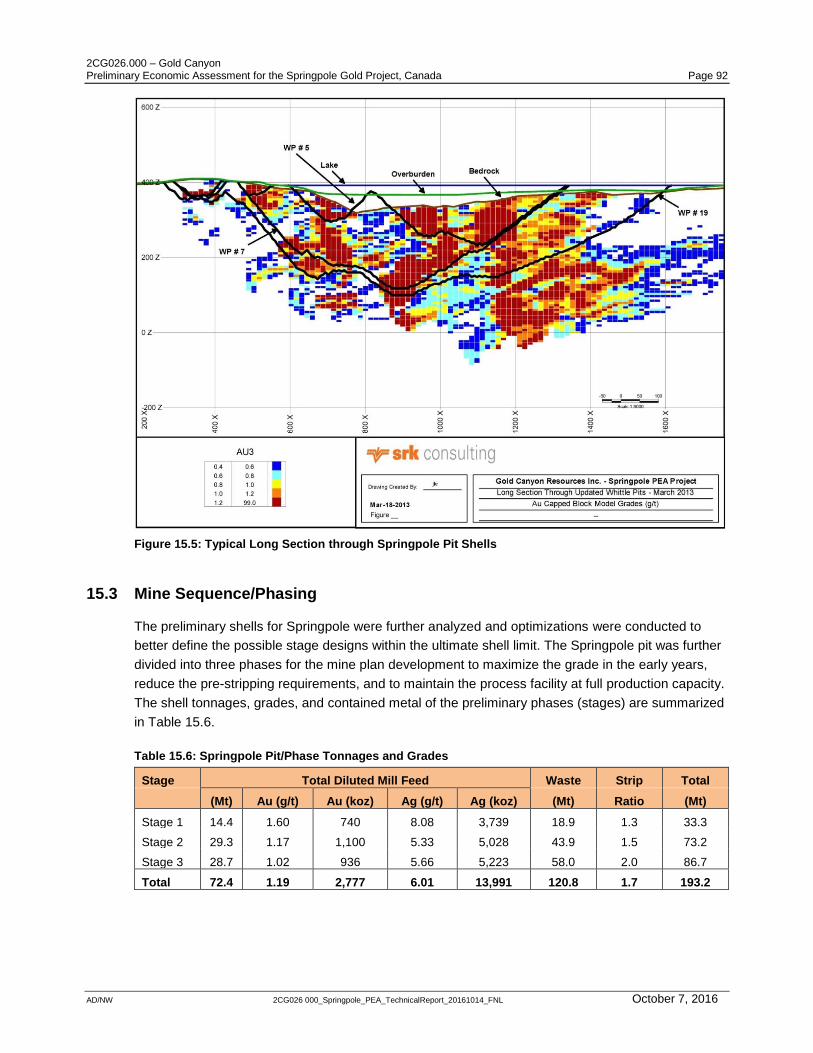
2CG026.000 – Gold Canyon Preliminary Economic Assessment for the Springpole Gold Project, Canada Page 92
AD/NW 2CG026 000_Springpole_PEA_TechnicalReport_20161014_FNL October 7, 2016
Figure 15.5: Typical Long Section through Springpole Pit Shells
15.3 Mine Sequence/Phasing
The preliminary shells for Springpole were further analyzed and optimizations were conducted to
better define the possible stage designs within the ultimate shell limit. The Springpole pit was further
divided into three phases for the mine plan development to maximize the grade in the early years,
reduce the pre-stripping requirements, and to maintain the process facility at full production capacity.
The shell tonnages, grades, and contained metal of the preliminary phases (stages) are summarized
in Table 15.6.
Table 15.6: Springpole Pit/Phase Tonnages and Grades
Stage Total Diluted Mill Feed Waste Strip Total
(Mt) Au (g/t) Au (koz) Ag (g/t) Ag (koz) (Mt) Ratio (Mt)
Stage 1 14.4 1.60 740 8.08 3,739 18.9 1.3 33.3
Stage 2 29.3 1.17 1,100 5.33 5,028 43.9 1.5 73.2
Stage 3 28.7 1.02 936 5.66 5,223 58.0 2.0 86.7
Total 72.4 1.19 2,777 6.01 13,991 120.8 1.7 193.2
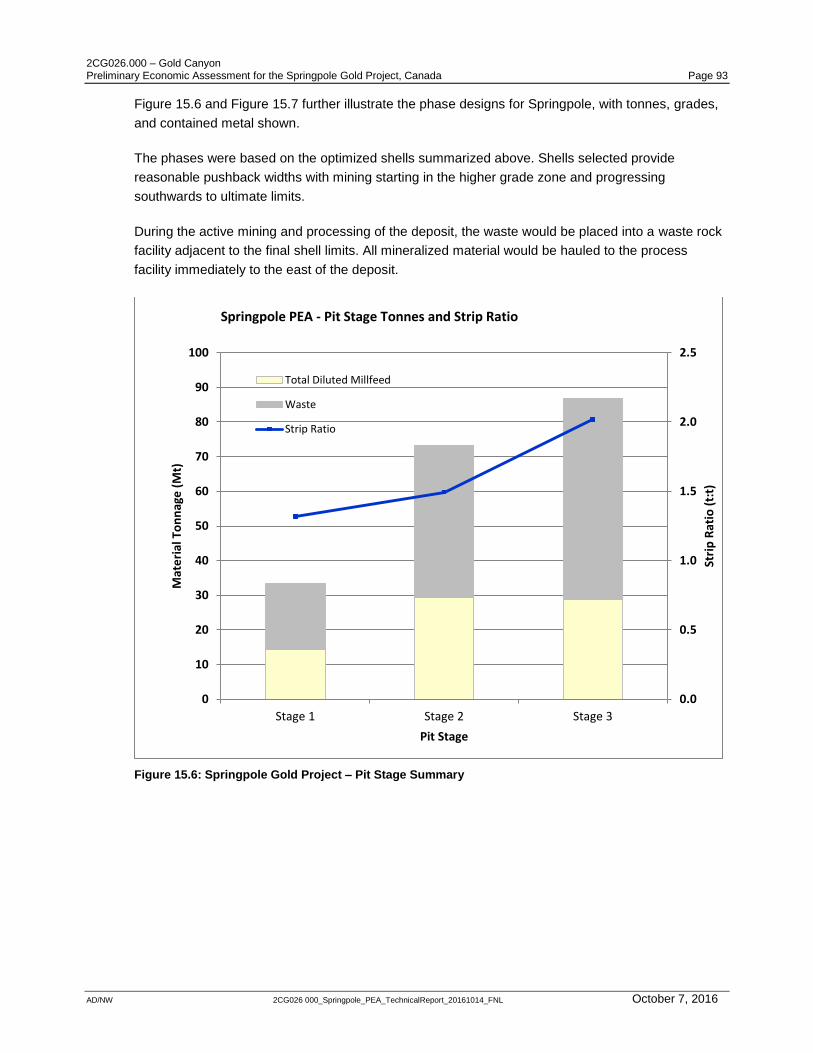
2CG026.000 – Gold Canyon Preliminary Economic Assessment for the Springpole Gold Project, Canada Page 93
AD/NW 2CG026 000_Springpole_PEA_TechnicalReport_20161014_FNL October 7, 2016
Figure 15.6 and Figure 15.7 further illustrate the phase designs for Springpole, with tonnes, grades,
and contained metal shown.
The phases were based on the optimized shells summarized above. Shells selected provide
reasonable pushback widths with mining starting in the higher grade zone and progressing
southwards to ultimate limits.
During the active mining and processing of the deposit, the waste would be placed into a waste rock
facility adjacent to the final shell limits. All mineralized material would be hauled to the process
facility immediately to the east of the deposit.
Figure 15.6: Springpole Gold Project – Pit Stage Summary
0.0
0.5
1.0
1.5
2.0
2.5
0
10
20
30
40
50
60
70
80
90
100
Stage 1 Stage 2 Stage 3St
rip
Rat
io (
t:t)
Mat
eri
al T
on
nag
e (
Mt)
Pit Stage
Springpole PEA - Pit Stage Tonnes and Strip Ratio
Total Diluted Millfeed
Waste
Strip Ratio
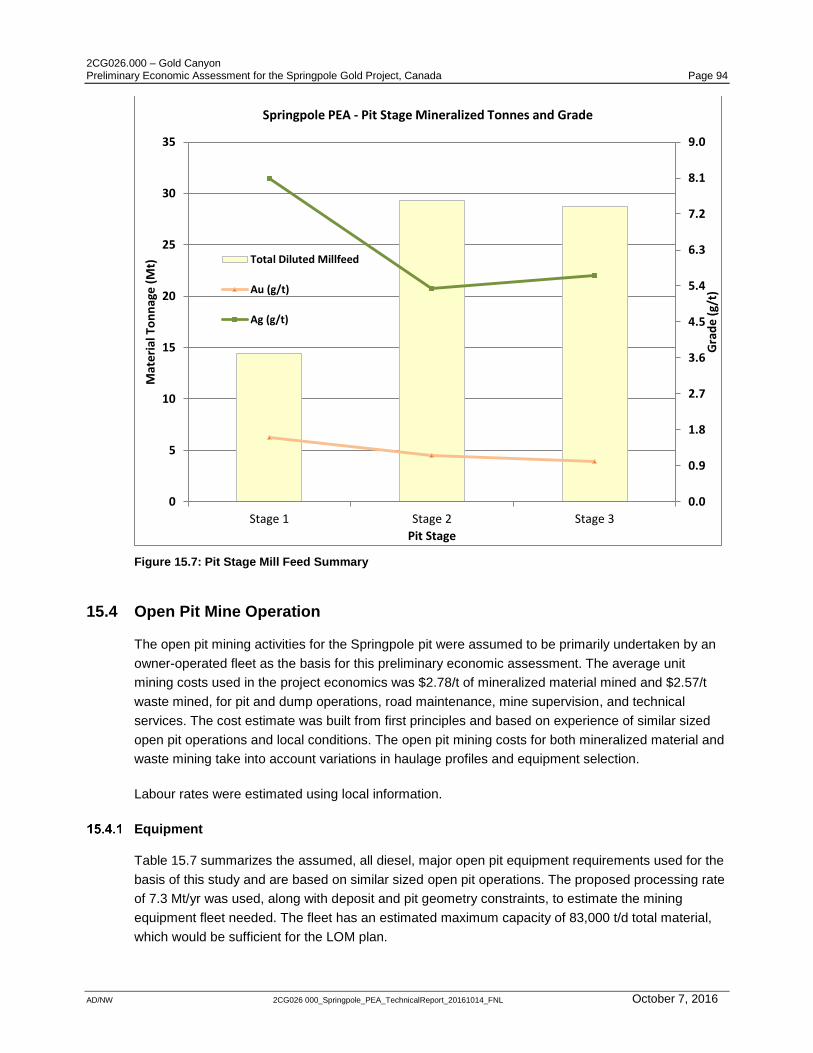
2CG026.000 – Gold Canyon Preliminary Economic Assessment for the Springpole Gold Project, Canada Page 94
AD/NW 2CG026 000_Springpole_PEA_TechnicalReport_20161014_FNL October 7, 2016
Figure 15.7: Pit Stage Mill Feed Summary
15.4 Open Pit Mine Operation
The open pit mining activities for the Springpole pit were assumed to be primarily undertaken by an
owner-operated fleet as the basis for this preliminary economic assessment. The average unit
mining costs used in the project economics was $2.78/t of mineralized material mined and $2.57/t
waste mined, for pit and dump operations, road maintenance, mine supervision, and technical
services. The cost estimate was built from first principles and based on experience of similar sized
open pit operations and local conditions. The open pit mining costs for both mineralized material and
waste mining take into account variations in haulage profiles and equipment selection.
Labour rates were estimated using local information.
Equipment
Table 15.7 summarizes the assumed, all diesel, major open pit equipment requirements used for the
basis of this study and are based on similar sized open pit operations. The proposed processing rate
of 7.3 Mt/yr was used, along with deposit and pit geometry constraints, to estimate the mining
equipment fleet needed. The fleet has an estimated maximum capacity of 83,000 t/d total material,
which would be sufficient for the LOM plan.
0.0
0.9
1.8
2.7
3.6
4.5
5.4
6.3
7.2
8.1
9.0
0
5
10
15
20
25
30
35
Stage 1 Stage 2 Stage 3
Gra
de
(g/
t)
Mat
eri
al T
on
nag
e (
Mt)
Pit Stage
Springpole PEA - Pit Stage Mineralized Tonnes and Grade
Total Diluted Millfeed
Au (g/t)
Ag (g/t)
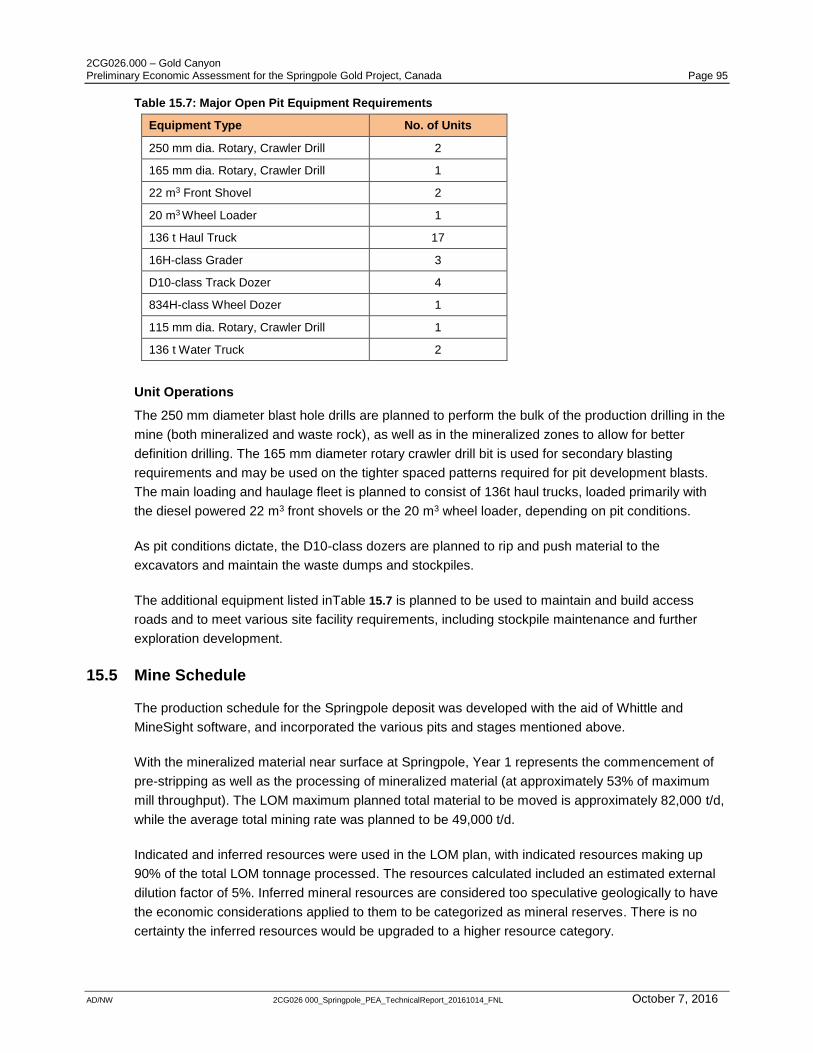
2CG026.000 – Gold Canyon Preliminary Economic Assessment for the Springpole Gold Project, Canada Page 95
AD/NW 2CG026 000_Springpole_PEA_TechnicalReport_20161014_FNL October 7, 2016
Table 15.7: Major Open Pit Equipment Requirements
Equipment Type No. of Units
250 mm dia. Rotary, Crawler Drill 2
165 mm dia. Rotary, Crawler Drill 1
22 m3 Front Shovel 2
20 m3 Wheel Loader 1
136 t Haul Truck 17
16H-class Grader 3
D10-class Track Dozer 4
834H-class Wheel Dozer 1
115 mm dia. Rotary, Crawler Drill 1
136 t Water Truck 2
Unit Operations
The 250 mm diameter blast hole drills are planned to perform the bulk of the production drilling in the
mine (both mineralized and waste rock), as well as in the mineralized zones to allow for better
definition drilling. The 165 mm diameter rotary crawler drill bit is used for secondary blasting
requirements and may be used on the tighter spaced patterns required for pit development blasts.
The main loading and haulage fleet is planned to consist of 136t haul trucks, loaded primarily with
the diesel powered 22 m3 front shovels or the 20 m3 wheel loader, depending on pit conditions.
As pit conditions dictate, the D10-class dozers are planned to rip and push material to the
excavators and maintain the waste dumps and stockpiles.
The additional equipment listed inTable 15.7 is planned to be used to maintain and build access
roads and to meet various site facility requirements, including stockpile maintenance and further
exploration development.
15.5 Mine Schedule
The production schedule for the Springpole deposit was developed with the aid of Whittle and
MineSight software, and incorporated the various pits and stages mentioned above.
With the mineralized material near surface at Springpole, Year 1 represents the commencement of
pre-stripping as well as the processing of mineralized material (at approximately 53% of maximum
mill throughput). The LOM maximum planned total material to be moved is approximately 82,000 t/d,
while the average total mining rate was planned to be 49,000 t/d.
Indicated and inferred resources were used in the LOM plan, with indicated resources making up
90% of the total LOM tonnage processed. The resources calculated included an estimated external
dilution factor of 5%. Inferred mineral resources are considered too speculative geologically to have
the economic considerations applied to them to be categorized as mineral reserves. There is no
certainty the inferred resources would be upgraded to a higher resource category.
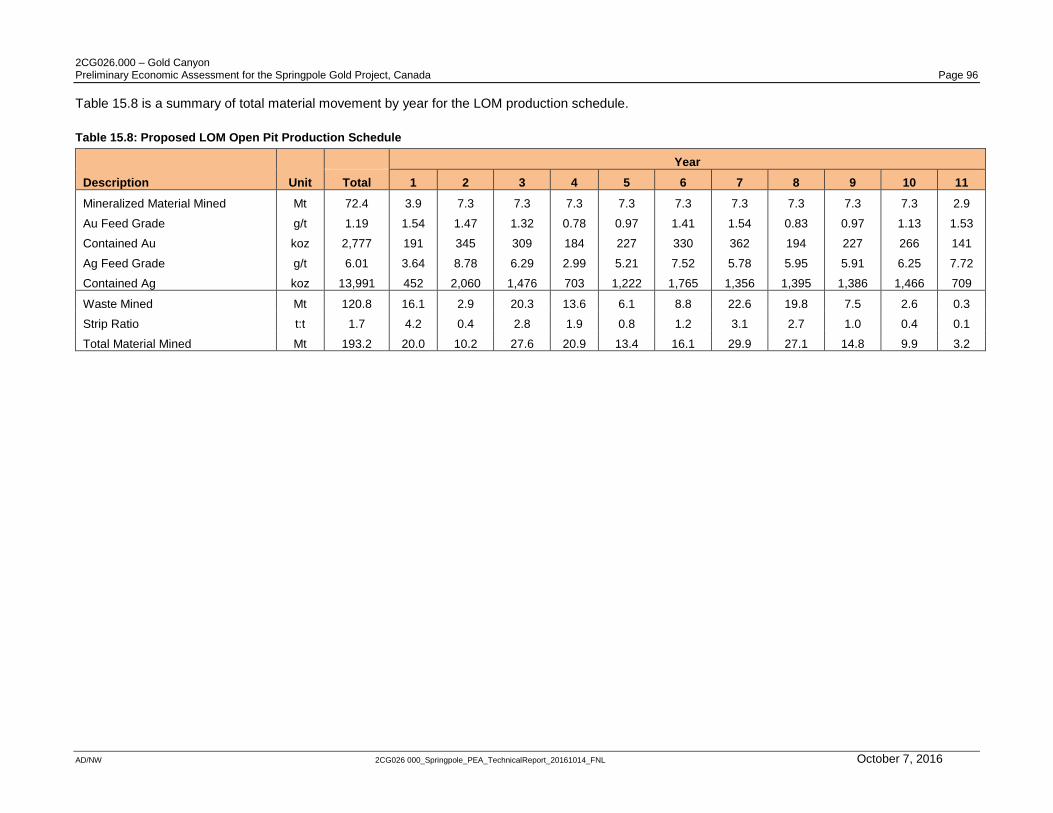
2CG026.000 – Gold Canyon Preliminary Economic Assessment for the Springpole Gold Project, Canada Page 96
AD/NW 2CG026 000_Springpole_PEA_TechnicalReport_20161014_FNL October 7, 2016
Table 15.8 is a summary of total material movement by year for the LOM production schedule.
Table 15.8: Proposed LOM Open Pit Production Schedule
Description Unit
Year
Total 1 2 3 4 5 6 7 8 9 10 11
Mineralized Material Mined Mt 72.4 3.9 7.3 7.3 7.3 7.3 7.3 7.3 7.3 7.3 7.3 2.9
Au Feed Grade g/t 1.19 1.54 1.47 1.32 0.78 0.97 1.41 1.54 0.83 0.97 1.13 1.53
Contained Au koz 2,777 191 345 309 184 227 330 362 194 227 266 141
Ag Feed Grade g/t 6.01 3.64 8.78 6.29 2.99 5.21 7.52 5.78 5.95 5.91 6.25 7.72
Contained Ag koz 13,991 452 2,060 1,476 703 1,222 1,765 1,356 1,395 1,386 1,466 709
Waste Mined Mt 120.8 16.1 2.9 20.3 13.6 6.1 8.8 22.6 19.8 7.5 2.6 0.3
Strip Ratio t:t 1.7 4.2 0.4 2.8 1.9 0.8 1.2 3.1 2.7 1.0 0.4 0.1
Total Material Mined Mt 193.2 20.0 10.2 27.6 20.9 13.4 16.1 29.9 27.1 14.8 9.9 3.2
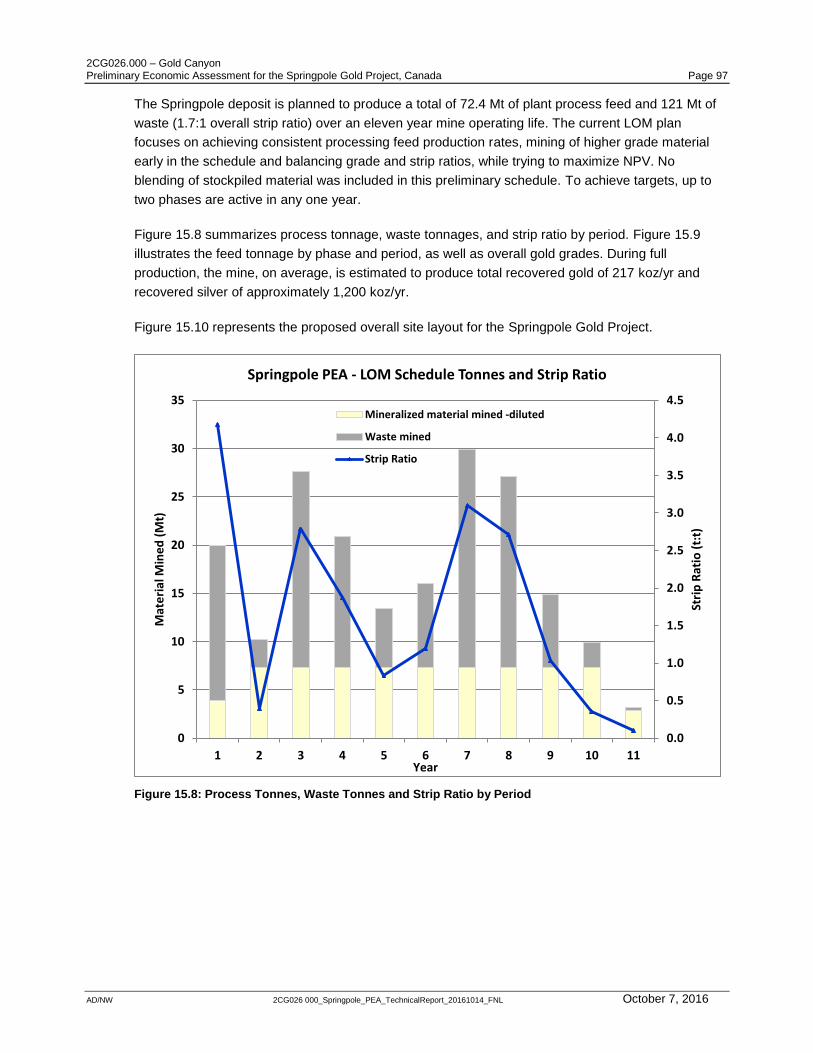
2CG026.000 – Gold Canyon Preliminary Economic Assessment for the Springpole Gold Project, Canada Page 97
AD/NW 2CG026 000_Springpole_PEA_TechnicalReport_20161014_FNL October 7, 2016
The Springpole deposit is planned to produce a total of 72.4 Mt of plant process feed and 121 Mt of
waste (1.7:1 overall strip ratio) over an eleven year mine operating life. The current LOM plan
focuses on achieving consistent processing feed production rates, mining of higher grade material
early in the schedule and balancing grade and strip ratios, while trying to maximize NPV. No
blending of stockpiled material was included in this preliminary schedule. To achieve targets, up to
two phases are active in any one year.
Figure 15.8 summarizes process tonnage, waste tonnages, and strip ratio by period. Figure 15.9
illustrates the feed tonnage by phase and period, as well as overall gold grades. During full
production, the mine, on average, is estimated to produce total recovered gold of 217 koz/yr and
recovered silver of approximately 1,200 koz/yr.
Figure 15.10 represents the proposed overall site layout for the Springpole Gold Project.
Figure 15.8: Process Tonnes, Waste Tonnes and Strip Ratio by Period
0.0
0.5
1.0
1.5
2.0
2.5
3.0
3.5
4.0
4.5
0
5
10
15
20
25
30
35
1 2 3 4 5 6 7 8 9 10 11
Stri
p R
atio
(t:
t)
Mat
eri
al M
ine
d (
Mt)
Year
Springpole PEA - LOM Schedule Tonnes and Strip Ratio
Mineralized material mined -diluted
Waste mined
Strip Ratio
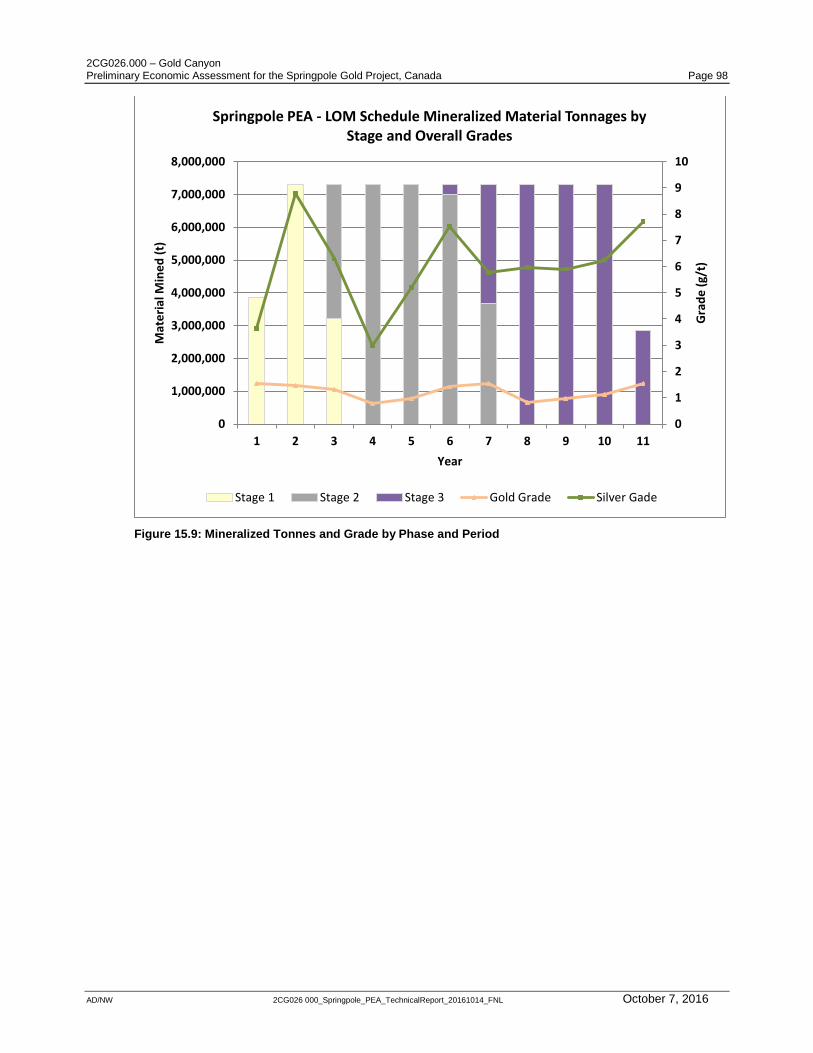
2CG026.000 – Gold Canyon Preliminary Economic Assessment for the Springpole Gold Project, Canada Page 98
AD/NW 2CG026 000_Springpole_PEA_TechnicalReport_20161014_FNL October 7, 2016
Figure 15.9: Mineralized Tonnes and Grade by Phase and Period
0
1
2
3
4
5
6
7
8
9
10
0
1,000,000
2,000,000
3,000,000
4,000,000
5,000,000
6,000,000
7,000,000
8,000,000
1 2 3 4 5 6 7 8 9 10 11
Gra
de
(g/
t)
Mat
eri
al M
ine
d (
t)
Year
Springpole PEA - LOM Schedule Mineralized Material Tonnages by Stage and Overall Grades
Stage 1 Stage 2 Stage 3 Gold Grade Silver Gade
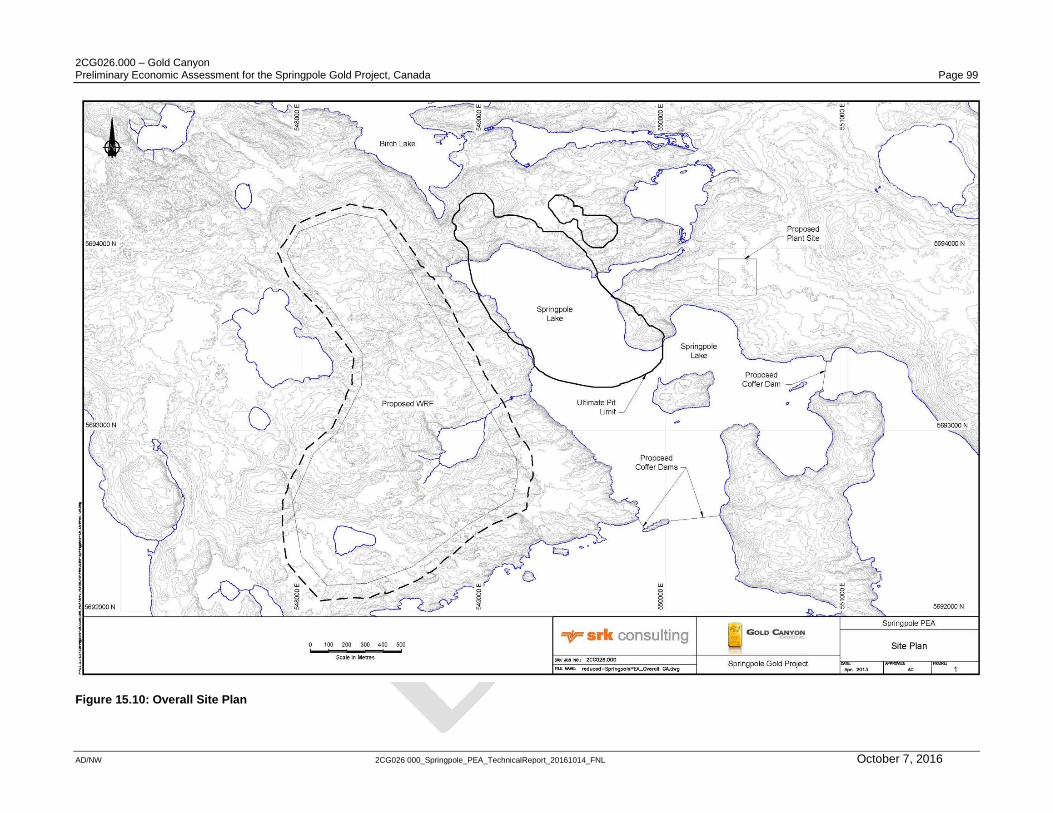
2CG026.000 – Gold Canyon Preliminary Economic Assessment for the Springpole Gold Project, Canada Page 99
AD/NW 2CG026 000_Springpole_PEA_TechnicalReport_20161014_FNL October 7, 2016
Figure 15.10: Overall Site Plan
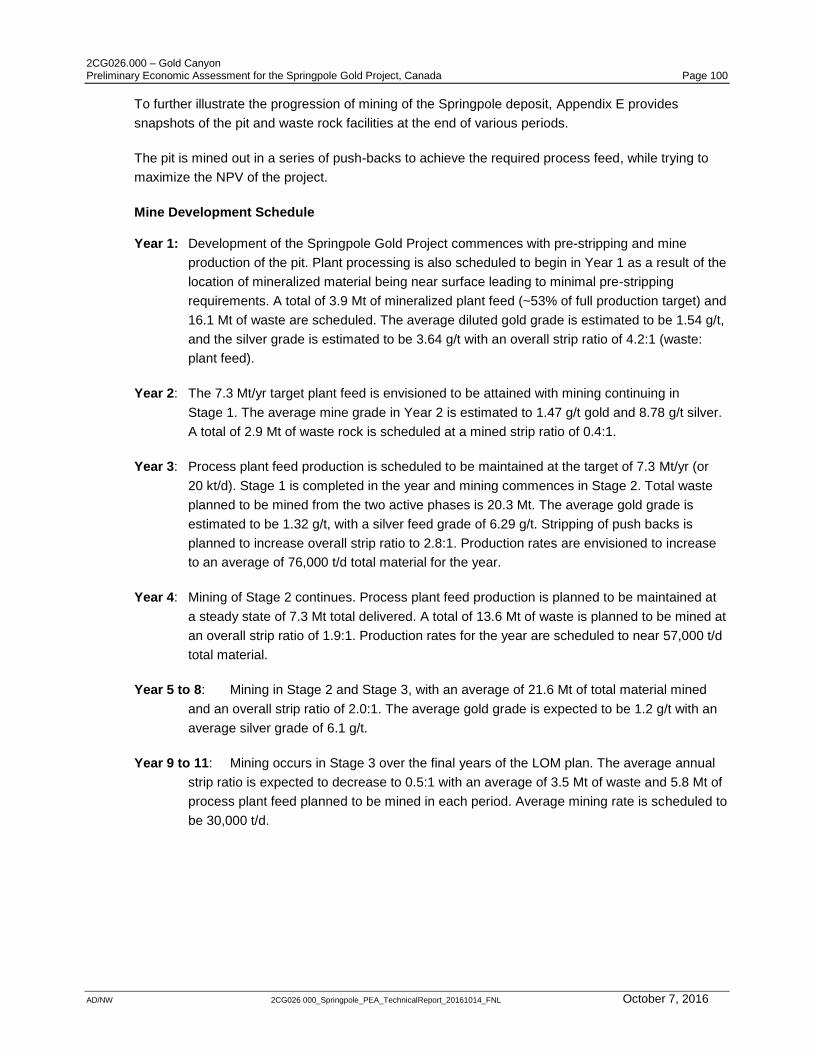
2CG026.000 – Gold Canyon Preliminary Economic Assessment for the Springpole Gold Project, Canada Page 100
AD/NW 2CG026 000_Springpole_PEA_TechnicalReport_20161014_FNL October 7, 2016
To further illustrate the progression of mining of the Springpole deposit, Appendix E provides
snapshots of the pit and waste rock facilities at the end of various periods.
The pit is mined out in a series of push-backs to achieve the required process feed, while trying to
maximize the NPV of the project.
Mine Development Schedule
Year 1: Development of the Springpole Gold Project commences with pre-stripping and mine
production of the pit. Plant processing is also scheduled to begin in Year 1 as a result of the
location of mineralized material being near surface leading to minimal pre-stripping
requirements. A total of 3.9 Mt of mineralized plant feed (~53% of full production target) and
16.1 Mt of waste are scheduled. The average diluted gold grade is estimated to be 1.54 g/t,
and the silver grade is estimated to be 3.64 g/t with an overall strip ratio of 4.2:1 (waste:
plant feed).
Year 2: The 7.3 Mt/yr target plant feed is envisioned to be attained with mining continuing in
Stage 1. The average mine grade in Year 2 is estimated to 1.47 g/t gold and 8.78 g/t silver.
A total of 2.9 Mt of waste rock is scheduled at a mined strip ratio of 0.4:1.
Year 3: Process plant feed production is scheduled to be maintained at the target of 7.3 Mt/yr (or
20 kt/d). Stage 1 is completed in the year and mining commences in Stage 2. Total waste
planned to be mined from the two active phases is 20.3 Mt. The average gold grade is
estimated to be 1.32 g/t, with a silver feed grade of 6.29 g/t. Stripping of push backs is
planned to increase overall strip ratio to 2.8:1. Production rates are envisioned to increase
to an average of 76,000 t/d total material for the year.
Year 4: Mining of Stage 2 continues. Process plant feed production is planned to be maintained at
a steady state of 7.3 Mt total delivered. A total of 13.6 Mt of waste is planned to be mined at
an overall strip ratio of 1.9:1. Production rates for the year are scheduled to near 57,000 t/d
total material.
Year 5 to 8: Mining in Stage 2 and Stage 3, with an average of 21.6 Mt of total material mined
and an overall strip ratio of 2.0:1. The average gold grade is expected to be 1.2 g/t with an
average silver grade of 6.1 g/t.
Year 9 to 11: Mining occurs in Stage 3 over the final years of the LOM plan. The average annual
strip ratio is expected to decrease to 0.5:1 with an average of 3.5 Mt of waste and 5.8 Mt of
process plant feed planned to be mined in each period. Average mining rate is scheduled to
be 30,000 t/d.
2CG026.000 – Gold Canyon Preliminary Economic Assessment for the Springpole Gold Project, Canada Page 101
AD/NW 2CG026 000_Springpole_PEA_TechnicalReport_20161014_FNL October 7, 2016
15.6 Rock Geotechnical Information
Slope Design Review
A scoping level review of available geotechnical and structural data for the purposes of open pit
slope design was completed. This review was based on all available diamond drill core logs and
included an on-site rock-core review. A core-photo review of ten drill holes was used to estimate the
rock quality designation, solid core recovery, intact rock strength (IRS), and the geological strength
index (GSI). These estimates were used to guide preliminary domain delineation used for the slope
design guidelines. Additional details of the slope design review, and ancillary data, are presented in
Appendix F.
Geotechnical data collection is on-going, with a 2013 drill-program designed and implemented to
better understand the rock mass characteristics and enable slope design and stability analysis at an
appropriate level of study.
Lithological and Rock Mass Information
A 3-D wireframe geological model was not available for review, and insufficient data were collected
for the geotechnical model to be built at this stage. Individual drill logs have been recorded for rock
drilling on the property, and they include lithological and alteration descriptions of major lithologies.
Total core recovery and rock quality designation has been relatively consistently and correctly
recorded for most of the drilling evaluated for the property. Empirical rock strength estimates are
recorded for more recent (2011 onward) drill core recovered. No unconfined strength, point load test,
or joint-condition data have been acquired to-date.
Structural Information
Faults within the proposed Springpole open pits and immediate vicinity have not been mapped or
modelled. In the absence of these data (and to gain a preliminary understanding of the possible fault
trends and their influence on the proposed pit) the topography and bathymetry in the form of a digital
elevation model was interpreted for lineaments and zones of weakness possibly associated with rock
mass damage in fault zones. This information assisted with the preliminary domain delineation (as
described in Section 15.6.5).
Seismicity Potential
The Springpole property is located within in a low seismic hazard zone.
Drill Core Review and Rock Mass Characterization
Ten drill holes were selected to represent the rock mass likely to be encountered in the proposed pit
walls. The core-box photographs, in conjunction with all available logs, were viewed and rated for
solid screen recovery, GSI, and IRS. The solid screen recovery estimates were compared with the
logged rock quality designation, and relatively good agreement was found between the two. The IRS
estimates from core-box photographs was compared to the field strength estimates and some
inconsistencies were found in the drill hole data acquired on-site. For this reason, the IRS estimates
from core-box photographs (with field calibration from the site-visit) were used for rock mass
assessment and design guidelines.
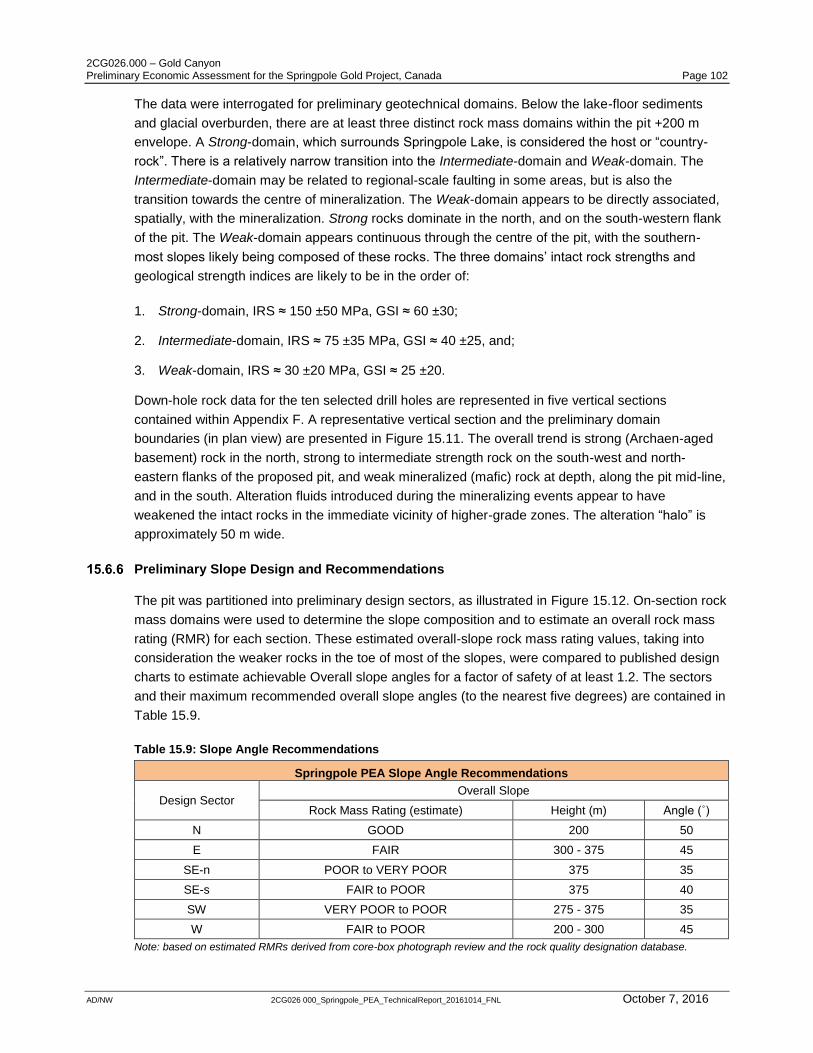
2CG026.000 – Gold Canyon Preliminary Economic Assessment for the Springpole Gold Project, Canada Page 102
AD/NW 2CG026 000_Springpole_PEA_TechnicalReport_20161014_FNL October 7, 2016
The data were interrogated for preliminary geotechnical domains. Below the lake-floor sediments
and glacial overburden, there are at least three distinct rock mass domains within the pit +200 m
envelope. A Strong-domain, which surrounds Springpole Lake, is considered the host or “country-
rock”. There is a relatively narrow transition into the Intermediate-domain and Weak-domain. The
Intermediate-domain may be related to regional-scale faulting in some areas, but is also the
transition towards the centre of mineralization. The Weak-domain appears to be directly associated,
spatially, with the mineralization. Strong rocks dominate in the north, and on the south-western flank
of the pit. The Weak-domain appears continuous through the centre of the pit, with the southern-
most slopes likely being composed of these rocks. The three domains’ intact rock strengths and
geological strength indices are likely to be in the order of:
1. Strong-domain, IRS ≈ 150 ±50 MPa, GSI ≈ 60 ±30;
2. Intermediate-domain, IRS ≈ 75 ±35 MPa, GSI ≈ 40 ±25, and;
3. Weak-domain, IRS ≈ 30 ±20 MPa, GSI ≈ 25 ±20.
Down-hole rock data for the ten selected drill holes are represented in five vertical sections
contained within Appendix F. A representative vertical section and the preliminary domain
boundaries (in plan view) are presented in Figure 15.11. The overall trend is strong (Archaen-aged
basement) rock in the north, strong to intermediate strength rock on the south-west and north-
eastern flanks of the proposed pit, and weak mineralized (mafic) rock at depth, along the pit mid-line,
and in the south. Alteration fluids introduced during the mineralizing events appear to have
weakened the intact rocks in the immediate vicinity of higher-grade zones. The alteration “halo” is
approximately 50 m wide.
Preliminary Slope Design and Recommendations
The pit was partitioned into preliminary design sectors, as illustrated in Figure 15.12. On-section rock
mass domains were used to determine the slope composition and to estimate an overall rock mass
rating (RMR) for each section. These estimated overall-slope rock mass rating values, taking into
consideration the weaker rocks in the toe of most of the slopes, were compared to published design
charts to estimate achievable Overall slope angles for a factor of safety of at least 1.2. The sectors
and their maximum recommended overall slope angles (to the nearest five degrees) are contained in
Table 15.9.
Table 15.9: Slope Angle Recommendations
Springpole PEA Slope Angle Recommendations
Design Sector Overall Slope
Rock Mass Rating (estimate) Height (m) Angle (˚)
N GOOD 200 50
E FAIR 300 - 375 45
SE-n POOR to VERY POOR 375 35
SE-s FAIR to POOR 375 40
SW VERY POOR to POOR 275 - 375 35
W FAIR to POOR 200 - 300 45
Note: based on estimated RMRs derived from core-box photograph review and the rock quality designation database.
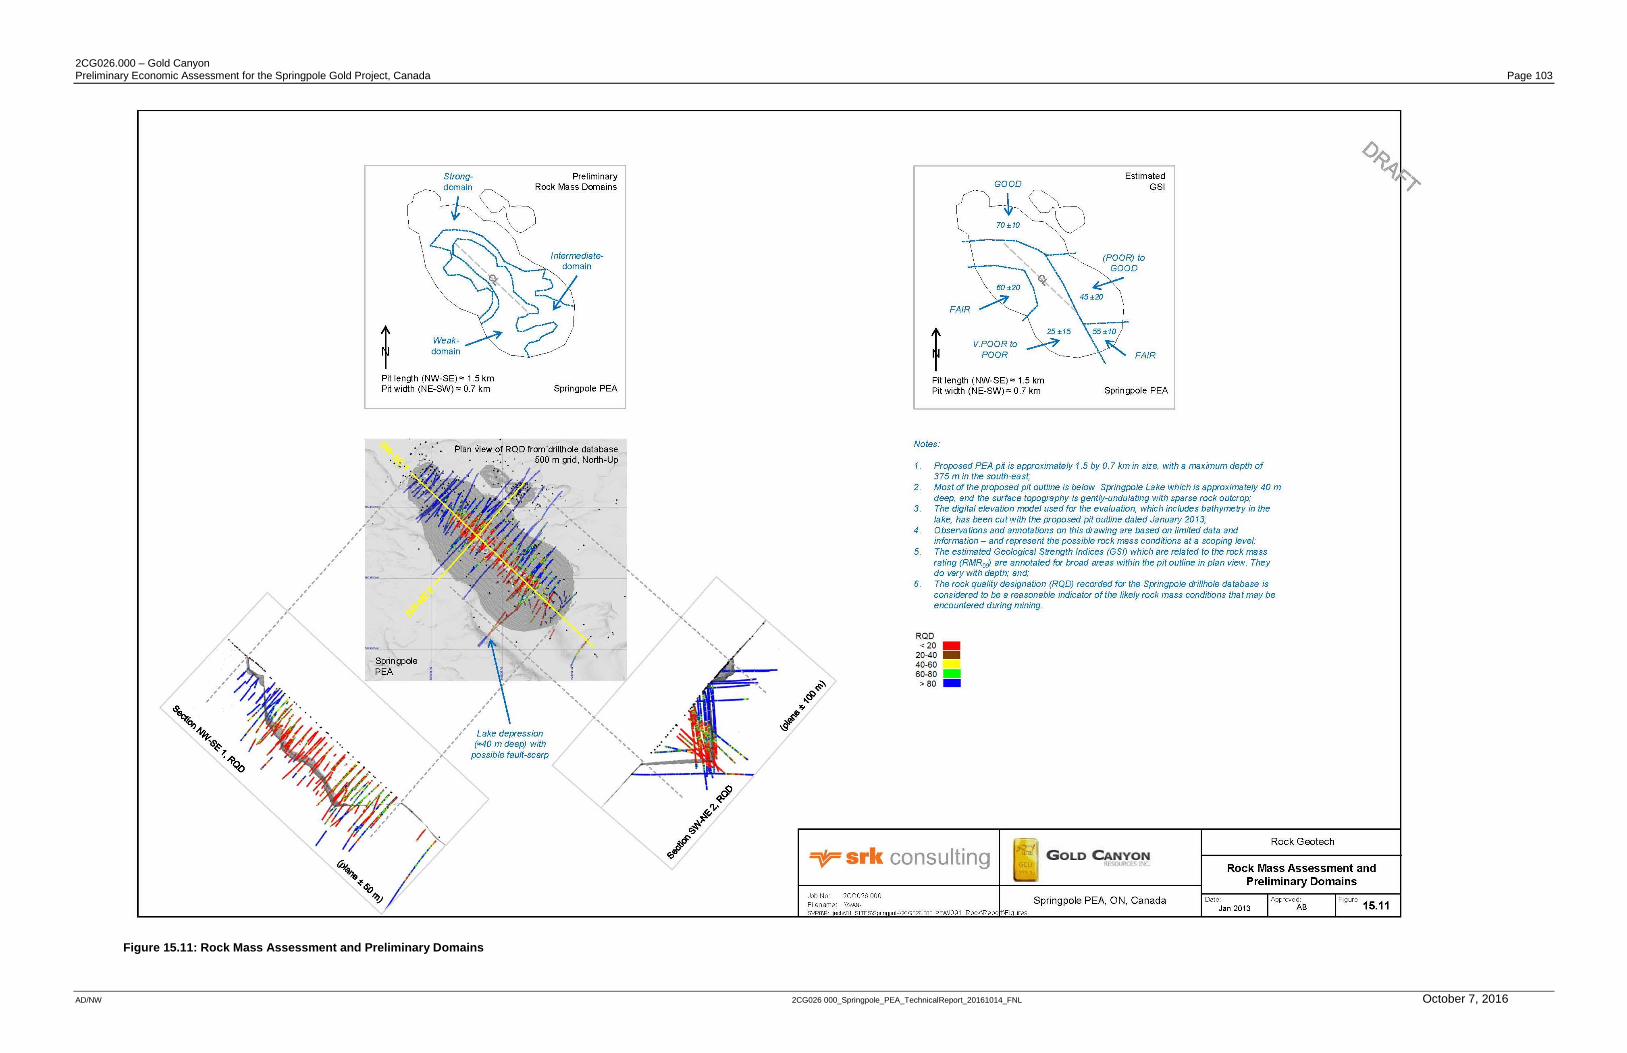
2CG026.000 – Gold Canyon Preliminary Economic Assessment for the Springpole Gold Project, Canada Page 103
AD/NW 2CG026 000_Springpole_PEA_TechnicalReport_20161014_FNL October 7, 2016
Figure 15.11: Rock Mass Assessment and Preliminary Domains
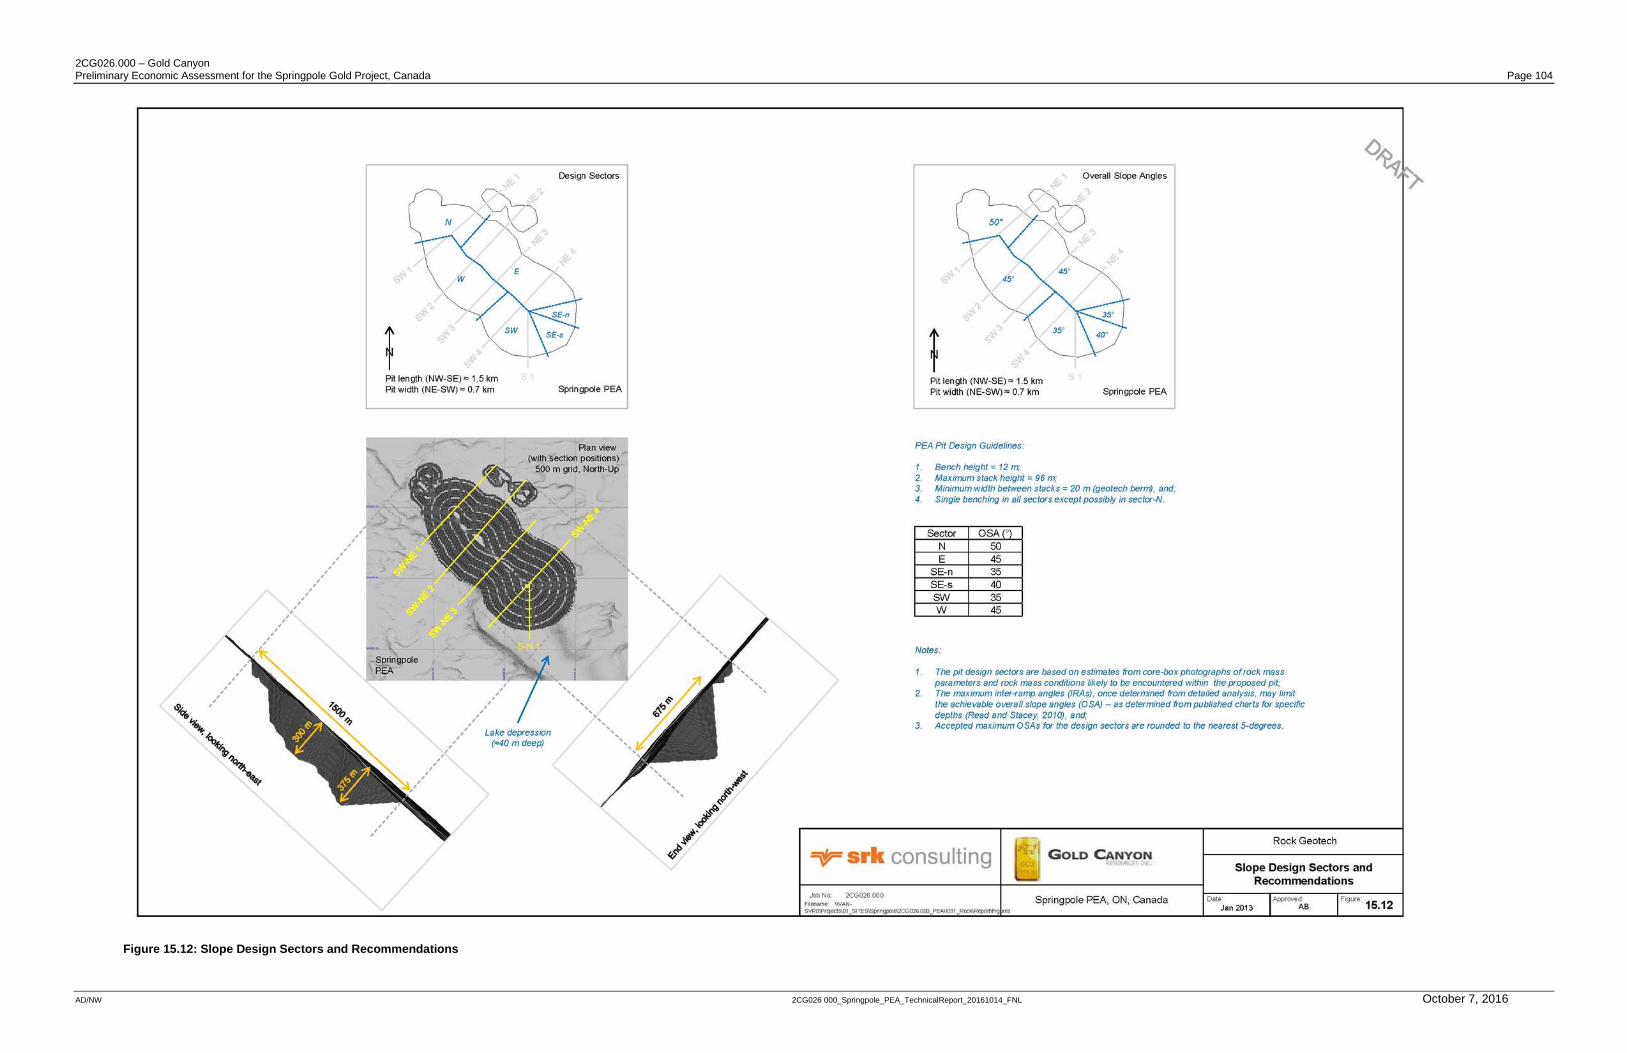
2CG026.000 – Gold Canyon Preliminary Economic Assessment for the Springpole Gold Project, Canada Page 104
AD/NW 2CG026 000_Springpole_PEA_TechnicalReport_20161014_FNL October 7, 2016
Figure 15.12: Slope Design Sectors and Recommendations
2CG026.000 – Gold Canyon Preliminary Economic Assessment for the Springpole Gold Project, Canada Page 105
AD/NW 2CG026 000_Springpole_PEA_TechnicalReport_20161014_FNL October 7, 2016
The pit design guidelines for these sectors (as detailed in Figure 15.12) are based on:
Bench heights of 12 m, using a maximum stack height of 96 m,
A minimum width of 20 m between stacks, and
Single benching, with the possibility of double-benches in the stronger rocks of N-sector, if the
fabric orientation is favorable.
There is possibly an up-side improvement in slope design-angles if a significant increase in the
confidence of the geotechnical data (and model) can be achieved. What may ultimately control
achievable slope angles (apart from hydrogeological constraints) is the Weak to Intermediate-
domain spatial arrangement, and anisotropy in the host rock in the Strong-domain. To achieve a pre-
feasibility level of confidence for the slope design input parameters:
Design and implement an oriented-core geotechnical drill program to log the rock mass and
acquire intact rock and joint samples.
Do laboratory and field tests to adequately characterize the intact rock strength and joint
properties of the main rock types.
Map and describe all major faults, as viewed in drill core and rock outcrop within 200 m of the pit
crest and integrate them with the regional structural interpretation.
Produce robust 3-D digital wireframe models of lithology, alteration with intensity, and structures.
Characterize the rock mass using an appropriate rock mass rating system (for example RMR89),
and map the geotechnical domains within a 3-D model.
15.7 Hydrogeology
This section presents a review of hydrogeological considerations for Gold Canyon’s Springpole Gold
Project. The objectives of this review were to:
Provide a general analysis and review of the project's hydrogeological characteristics as they
relate to mining and infrastructure.
Provide preliminary recommendations for water management.
Mine Plan
The proposed general layout for the Springpole mine is presented in Figure 15.13. SRK understands
the deposit will be mined using a series of open pits with a maximum depth of approximately 300 m.
The outline of these pits overlaps a small portion of Springpole Lake. For the PEA, it is proposed that
a series of three coffer dams be constructed at the southern end of the pit area (Figure 15.12) and
the lake water pumped out. Details of the lake pumping are provided in Section 15.8.
The mine waste facilities are also presented in Figure 15.13. The waste rock dumps will be located
to the southwest of the pit. Tailings will be stored in uncemented paste (or thickened) form at the
management facility located approximately 3 km to the southeast of the pit.
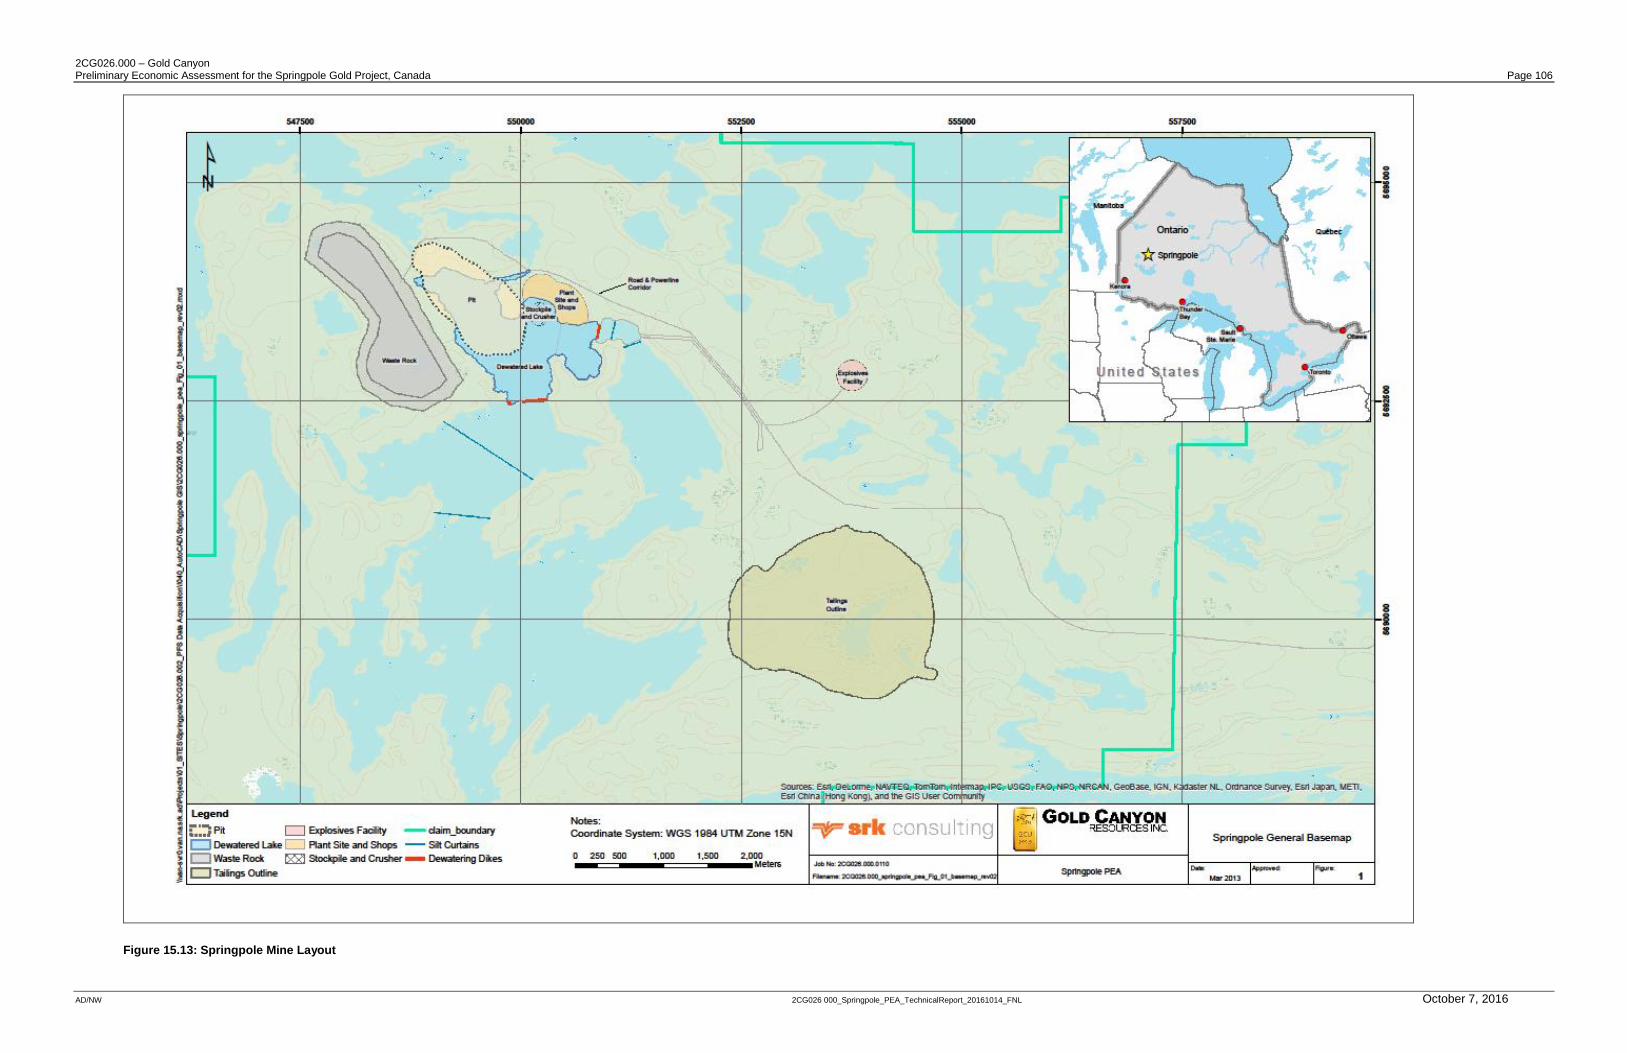
2CG026.000 – Gold Canyon Preliminary Economic Assessment for the Springpole Gold Project, Canada Page 106
AD/NW 2CG026 000_Springpole_PEA_TechnicalReport_20161014_FNL October 7, 2016
Figure 15.13: Springpole Mine Layout
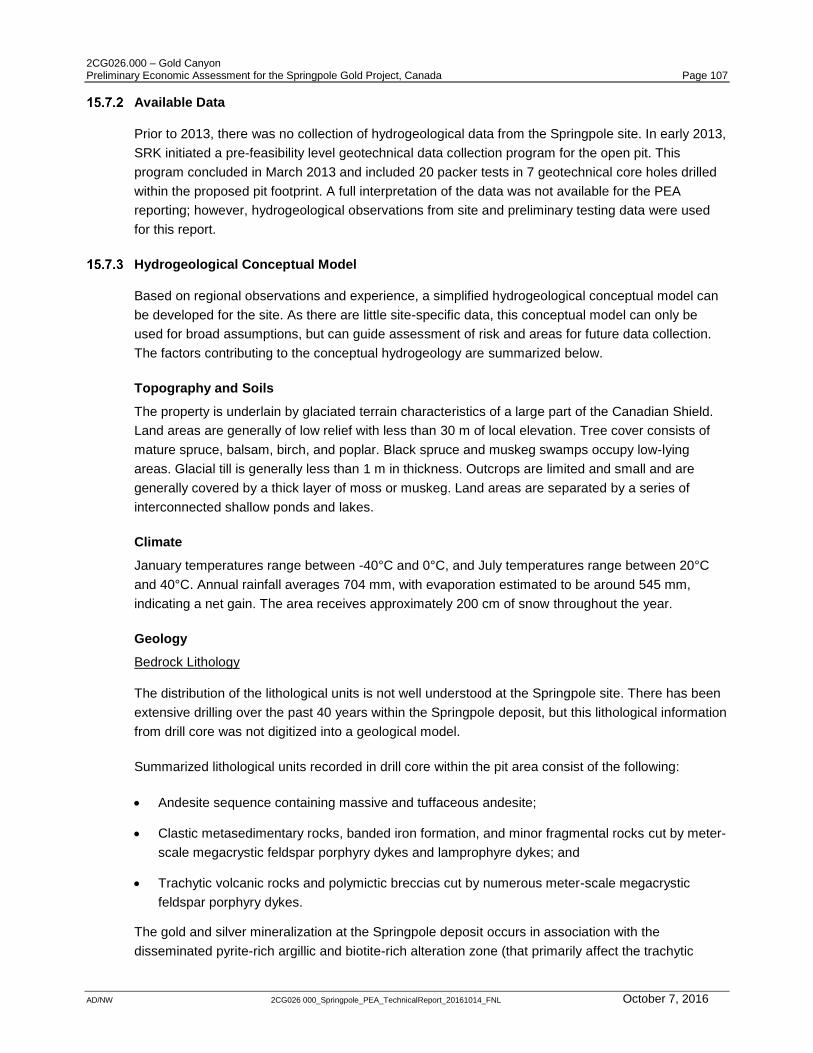
2CG026.000 – Gold Canyon Preliminary Economic Assessment for the Springpole Gold Project, Canada Page 107
AD/NW 2CG026 000_Springpole_PEA_TechnicalReport_20161014_FNL October 7, 2016
Available Data
Prior to 2013, there was no collection of hydrogeological data from the Springpole site. In early 2013,
SRK initiated a pre-feasibility level geotechnical data collection program for the open pit. This
program concluded in March 2013 and included 20 packer tests in 7 geotechnical core holes drilled
within the proposed pit footprint. A full interpretation of the data was not available for the PEA
reporting; however, hydrogeological observations from site and preliminary testing data were used
for this report.
Hydrogeological Conceptual Model
Based on regional observations and experience, a simplified hydrogeological conceptual model can
be developed for the site. As there are little site-specific data, this conceptual model can only be
used for broad assumptions, but can guide assessment of risk and areas for future data collection.
The factors contributing to the conceptual hydrogeology are summarized below.
Topography and Soils
The property is underlain by glaciated terrain characteristics of a large part of the Canadian Shield.
Land areas are generally of low relief with less than 30 m of local elevation. Tree cover consists of
mature spruce, balsam, birch, and poplar. Black spruce and muskeg swamps occupy low-lying
areas. Glacial till is generally less than 1 m in thickness. Outcrops are limited and small and are
generally covered by a thick layer of moss or muskeg. Land areas are separated by a series of
interconnected shallow ponds and lakes.
Climate
January temperatures range between -40°C and 0°C, and July temperatures range between 20°C
and 40°C. Annual rainfall averages 704 mm, with evaporation estimated to be around 545 mm,
indicating a net gain. The area receives approximately 200 cm of snow throughout the year.
Geology
Bedrock Lithology
The distribution of the lithological units is not well understood at the Springpole site. There has been
extensive drilling over the past 40 years within the Springpole deposit, but this lithological information
from drill core was not digitized into a geological model.
Summarized lithological units recorded in drill core within the pit area consist of the following:
Andesite sequence containing massive and tuffaceous andesite;
Clastic metasedimentary rocks, banded iron formation, and minor fragmental rocks cut by meter-
scale megacrystic feldspar porphyry dykes and lamprophyre dykes; and
Trachytic volcanic rocks and polymictic breccias cut by numerous meter-scale megacrystic
feldspar porphyry dykes.
The gold and silver mineralization at the Springpole deposit occurs in association with the
disseminated pyrite-rich argillic and biotite-rich alteration zone (that primarily affect the trachytic
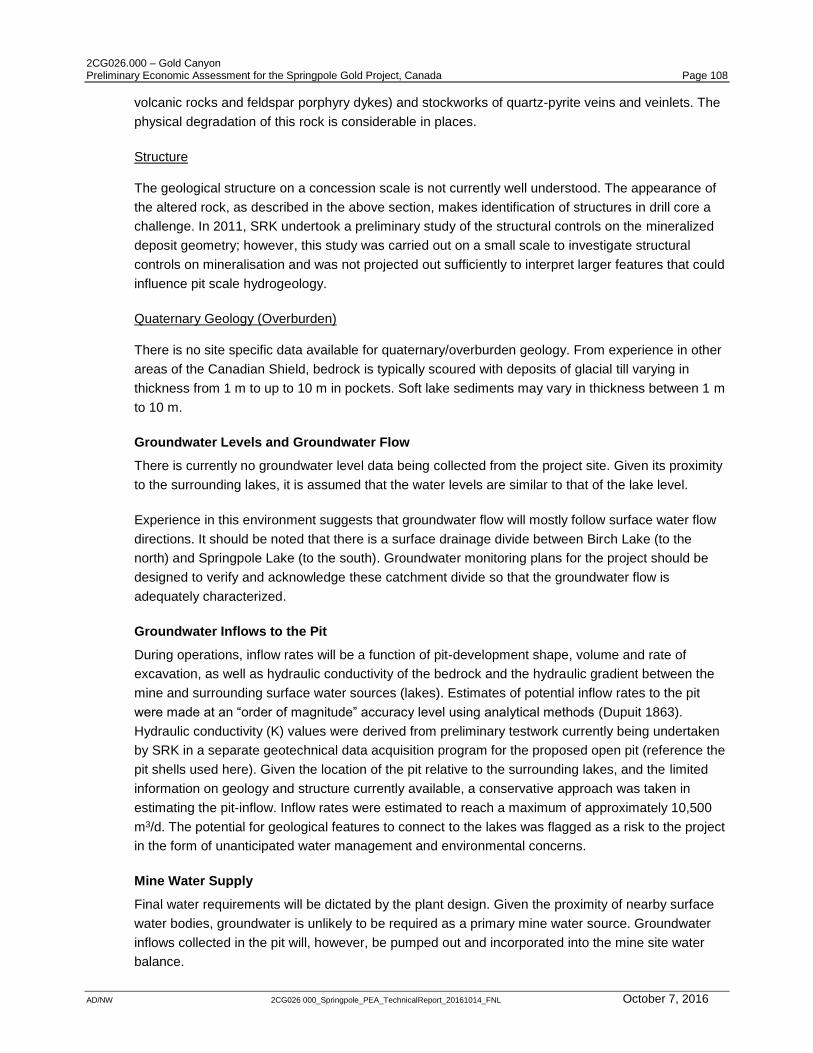
2CG026.000 – Gold Canyon Preliminary Economic Assessment for the Springpole Gold Project, Canada Page 108
AD/NW 2CG026 000_Springpole_PEA_TechnicalReport_20161014_FNL October 7, 2016
volcanic rocks and feldspar porphyry dykes) and stockworks of quartz-pyrite veins and veinlets. The
physical degradation of this rock is considerable in places.
Structure
The geological structure on a concession scale is not currently well understood. The appearance of
the altered rock, as described in the above section, makes identification of structures in drill core a
challenge. In 2011, SRK undertook a preliminary study of the structural controls on the mineralized
deposit geometry; however, this study was carried out on a small scale to investigate structural
controls on mineralisation and was not projected out sufficiently to interpret larger features that could
influence pit scale hydrogeology.
Quaternary Geology (Overburden)
There is no site specific data available for quaternary/overburden geology. From experience in other
areas of the Canadian Shield, bedrock is typically scoured with deposits of glacial till varying in
thickness from 1 m to up to 10 m in pockets. Soft lake sediments may vary in thickness between 1 m
to 10 m.
Groundwater Levels and Groundwater Flow
There is currently no groundwater level data being collected from the project site. Given its proximity
to the surrounding lakes, it is assumed that the water levels are similar to that of the lake level.
Experience in this environment suggests that groundwater flow will mostly follow surface water flow
directions. It should be noted that there is a surface drainage divide between Birch Lake (to the
north) and Springpole Lake (to the south). Groundwater monitoring plans for the project should be
designed to verify and acknowledge these catchment divide so that the groundwater flow is
adequately characterized.
Groundwater Inflows to the Pit
During operations, inflow rates will be a function of pit-development shape, volume and rate of
excavation, as well as hydraulic conductivity of the bedrock and the hydraulic gradient between the
mine and surrounding surface water sources (lakes). Estimates of potential inflow rates to the pit
were made at an “order of magnitude” accuracy level using analytical methods (Dupuit 1863).
Hydraulic conductivity (K) values were derived from preliminary testwork currently being undertaken
by SRK in a separate geotechnical data acquisition program for the proposed open pit (reference the
pit shells used here). Given the location of the pit relative to the surrounding lakes, and the limited
information on geology and structure currently available, a conservative approach was taken in
estimating the pit-inflow. Inflow rates were estimated to reach a maximum of approximately 10,500
m3/d. The potential for geological features to connect to the lakes was flagged as a risk to the project
in the form of unanticipated water management and environmental concerns.
Mine Water Supply
Final water requirements will be dictated by the plant design. Given the proximity of nearby surface
water bodies, groundwater is unlikely to be required as a primary mine water source. Groundwater
inflows collected in the pit will, however, be pumped out and incorporated into the mine site water
balance.
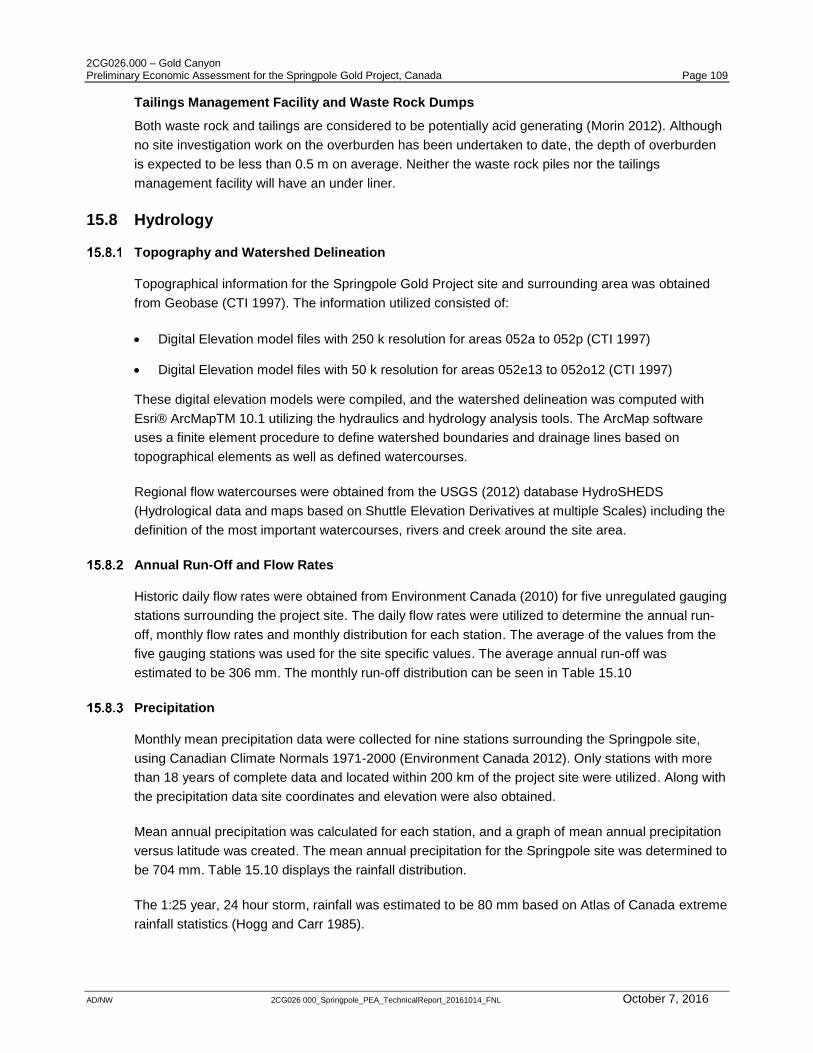
2CG026.000 – Gold Canyon Preliminary Economic Assessment for the Springpole Gold Project, Canada Page 109
AD/NW 2CG026 000_Springpole_PEA_TechnicalReport_20161014_FNL October 7, 2016
Tailings Management Facility and Waste Rock Dumps
Both waste rock and tailings are considered to be potentially acid generating (Morin 2012). Although
no site investigation work on the overburden has been undertaken to date, the depth of overburden
is expected to be less than 0.5 m on average. Neither the waste rock piles nor the tailings
management facility will have an under liner.
15.8 Hydrology
Topography and Watershed Delineation
Topographical information for the Springpole Gold Project site and surrounding area was obtained
from Geobase (CTI 1997). The information utilized consisted of:
Digital Elevation model files with 250 k resolution for areas 052a to 052p (CTI 1997)
Digital Elevation model files with 50 k resolution for areas 052e13 to 052o12 (CTI 1997)
These digital elevation models were compiled, and the watershed delineation was computed with
Esri® ArcMapTM 10.1 utilizing the hydraulics and hydrology analysis tools. The ArcMap software
uses a finite element procedure to define watershed boundaries and drainage lines based on
topographical elements as well as defined watercourses.
Regional flow watercourses were obtained from the USGS (2012) database HydroSHEDS
(Hydrological data and maps based on Shuttle Elevation Derivatives at multiple Scales) including the
definition of the most important watercourses, rivers and creek around the site area.
Annual Run-Off and Flow Rates
Historic daily flow rates were obtained from Environment Canada (2010) for five unregulated gauging
stations surrounding the project site. The daily flow rates were utilized to determine the annual run-
off, monthly flow rates and monthly distribution for each station. The average of the values from the
five gauging stations was used for the site specific values. The average annual run-off was
estimated to be 306 mm. The monthly run-off distribution can be seen in Table 15.10
Precipitation
Monthly mean precipitation data were collected for nine stations surrounding the Springpole site,
using Canadian Climate Normals 1971-2000 (Environment Canada 2012). Only stations with more
than 18 years of complete data and located within 200 km of the project site were utilized. Along with
the precipitation data site coordinates and elevation were also obtained.
Mean annual precipitation was calculated for each station, and a graph of mean annual precipitation
versus latitude was created. The mean annual precipitation for the Springpole site was determined to
be 704 mm. Table 15.10 displays the rainfall distribution.
The 1:25 year, 24 hour storm, rainfall was estimated to be 80 mm based on Atlas of Canada extreme
rainfall statistics (Hogg and Carr 1985).
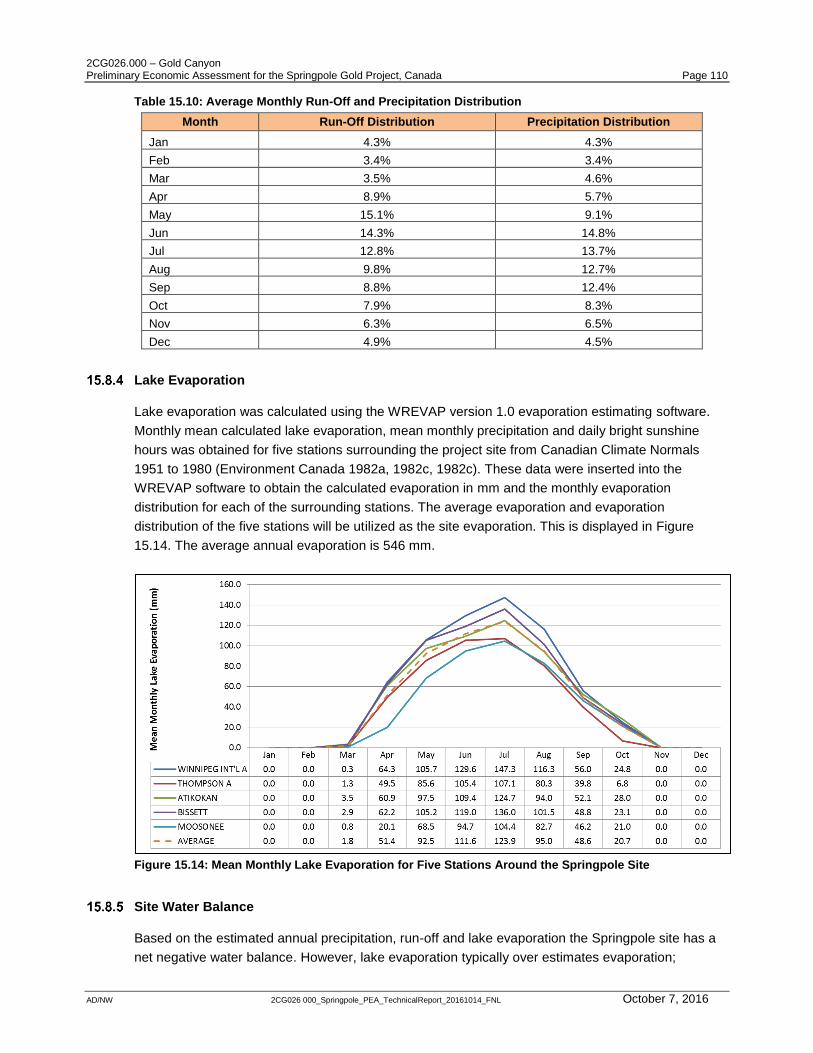
2CG026.000 – Gold Canyon Preliminary Economic Assessment for the Springpole Gold Project, Canada Page 110
AD/NW 2CG026 000_Springpole_PEA_TechnicalReport_20161014_FNL October 7, 2016
Table 15.10: Average Monthly Run-Off and Precipitation Distribution
Month Run-Off Distribution Precipitation Distribution
Jan 4.3% 4.3%
Feb 3.4% 3.4%
Mar 3.5% 4.6%
Apr 8.9% 5.7%
May 15.1% 9.1%
Jun 14.3% 14.8%
Jul 12.8% 13.7%
Aug 9.8% 12.7%
Sep 8.8% 12.4%
Oct 7.9% 8.3%
Nov 6.3% 6.5%
Dec 4.9% 4.5%
Lake Evaporation
Lake evaporation was calculated using the WREVAP version 1.0 evaporation estimating software.
Monthly mean calculated lake evaporation, mean monthly precipitation and daily bright sunshine
hours was obtained for five stations surrounding the project site from Canadian Climate Normals
1951 to 1980 (Environment Canada 1982a, 1982c, 1982c). These data were inserted into the
WREVAP software to obtain the calculated evaporation in mm and the monthly evaporation
distribution for each of the surrounding stations. The average evaporation and evaporation
distribution of the five stations will be utilized as the site evaporation. This is displayed in Figure
15.14. The average annual evaporation is 546 mm.
Figure 15.14: Mean Monthly Lake Evaporation for Five Stations Around the Springpole Site
Site Water Balance
Based on the estimated annual precipitation, run-off and lake evaporation the Springpole site has a
net negative water balance. However, lake evaporation typically over estimates evaporation;
2CG026.000 – Gold Canyon Preliminary Economic Assessment for the Springpole Gold Project, Canada Page 111
AD/NW 2CG026 000_Springpole_PEA_TechnicalReport_20161014_FNL October 7, 2016
therefore, it is possible that the site may have a net zero water balance. A detailed water balance for
site activities was not performed at this time.
15.9 Surface Water Management
Preliminary Design Assumptions
Diversion ditches, sumps, and ponds will be required to manage the surface water at the Springpole
site. The following assumptions were used for the preliminary design of the water management plan.
Lake dewatering is considered a part of the scope of the dewatering dikes and will not be
included in the preliminary surface water management plan.
Water management for project infrastructure such as roads and pads would be included in the
infrastructure design.
Surface water will be separated into contact and non-contact water.
Non-contact water is assumed to be of discharge quality. Contact water is assumed not to be of
discharge quality, based on preliminary geochemical testing. Contact water will be sent to the
mill for treatment and reuse. Non-contact water will be diverted or pumped to the closest water
body.
Contact water will be considered all run-off from:
Waste rock piles (190 ha)
Ore stockpiles (5 ha)
Pits (70 ha)
Tailings Management Facility (365 ha)
Plant and Shop area (25 ha)
Pollution control ponds are not required to contain run-off from the pit or tailings management
facility as the management of this water is already accounted for elsewhere.
Diversion structures, ditches, and ponds for non-contact water are assumed to be unlined.
Diversion structures, ditches, and ponds for contact water are assumed to be lined.
Sedimentation and pollution control ponds will be sized to contain the 1:25 year 24 hour storm
event.
Design
The water management structures for the waste rock dump and tailings facility consist of 9,000 m of
diversion ditches and several pollution control ponds to collect run-off from the waste rock. These
can be seen in Figure 15.15. Pollution control ponds have a maximum depth of 2 m. Ponds have a
freeboard of 0.5 m, 3 m wide crest and side slopes of 2H:1V on the upstream side and 1.5H:1V on
the downstream side.
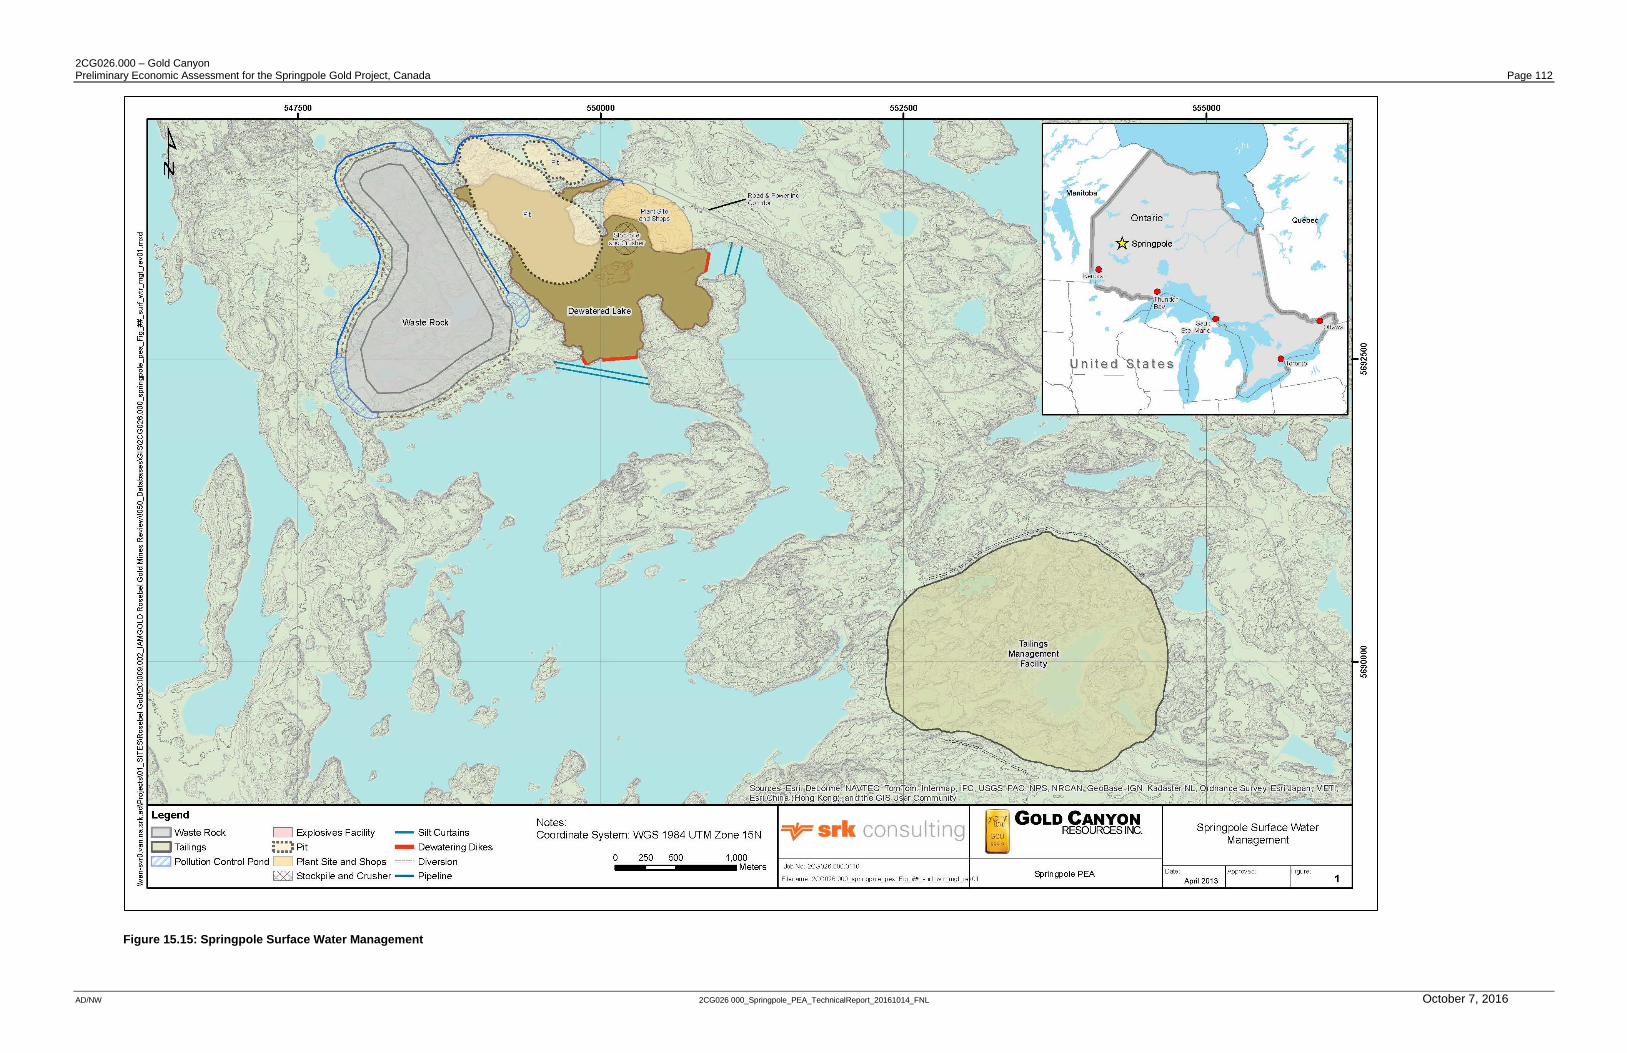
2CG026.000 – Gold Canyon Preliminary Economic Assessment for the Springpole Gold Project, Canada Page 112
AD/NW 2CG026 000_Springpole_PEA_TechnicalReport_20161014_FNL October 7, 2016
Figure 15.15: Springpole Surface Water Management
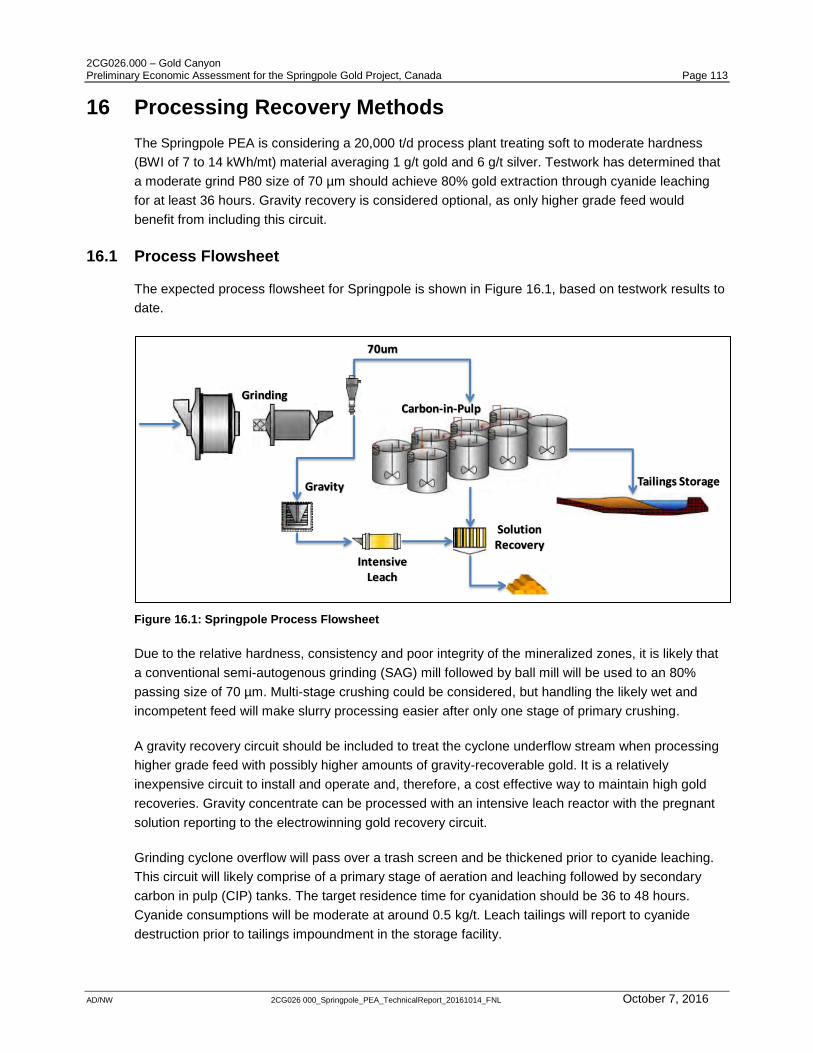
2CG026.000 – Gold Canyon Preliminary Economic Assessment for the Springpole Gold Project, Canada Page 113
AD/NW 2CG026 000_Springpole_PEA_TechnicalReport_20161014_FNL October 7, 2016
16 Processing Recovery Methods
The Springpole PEA is considering a 20,000 t/d process plant treating soft to moderate hardness
(BWI of 7 to 14 kWh/mt) material averaging 1 g/t gold and 6 g/t silver. Testwork has determined that
a moderate grind P80 size of 70 µm should achieve 80% gold extraction through cyanide leaching
for at least 36 hours. Gravity recovery is considered optional, as only higher grade feed would
benefit from including this circuit.
16.1 Process Flowsheet
The expected process flowsheet for Springpole is shown in Figure 16.1, based on testwork results to
date.
Figure 16.1: Springpole Process Flowsheet
Due to the relative hardness, consistency and poor integrity of the mineralized zones, it is likely that
a conventional semi-autogenous grinding (SAG) mill followed by ball mill will be used to an 80%
passing size of 70 µm. Multi-stage crushing could be considered, but handling the likely wet and
incompetent feed will make slurry processing easier after only one stage of primary crushing.
A gravity recovery circuit should be included to treat the cyclone underflow stream when processing
higher grade feed with possibly higher amounts of gravity-recoverable gold. It is a relatively
inexpensive circuit to install and operate and, therefore, a cost effective way to maintain high gold
recoveries. Gravity concentrate can be processed with an intensive leach reactor with the pregnant
solution reporting to the electrowinning gold recovery circuit.
Grinding cyclone overflow will pass over a trash screen and be thickened prior to cyanide leaching.
This circuit will likely comprise of a primary stage of aeration and leaching followed by secondary
carbon in pulp (CIP) tanks. The target residence time for cyanidation should be 36 to 48 hours.
Cyanide consumptions will be moderate at around 0.5 kg/t. Leach tailings will report to cyanide
destruction prior to tailings impoundment in the storage facility.
GrindingCarbon-in-Pulp
Gravity
IntensiveLeach
SolutionRecovery
Tailings Storage
70um
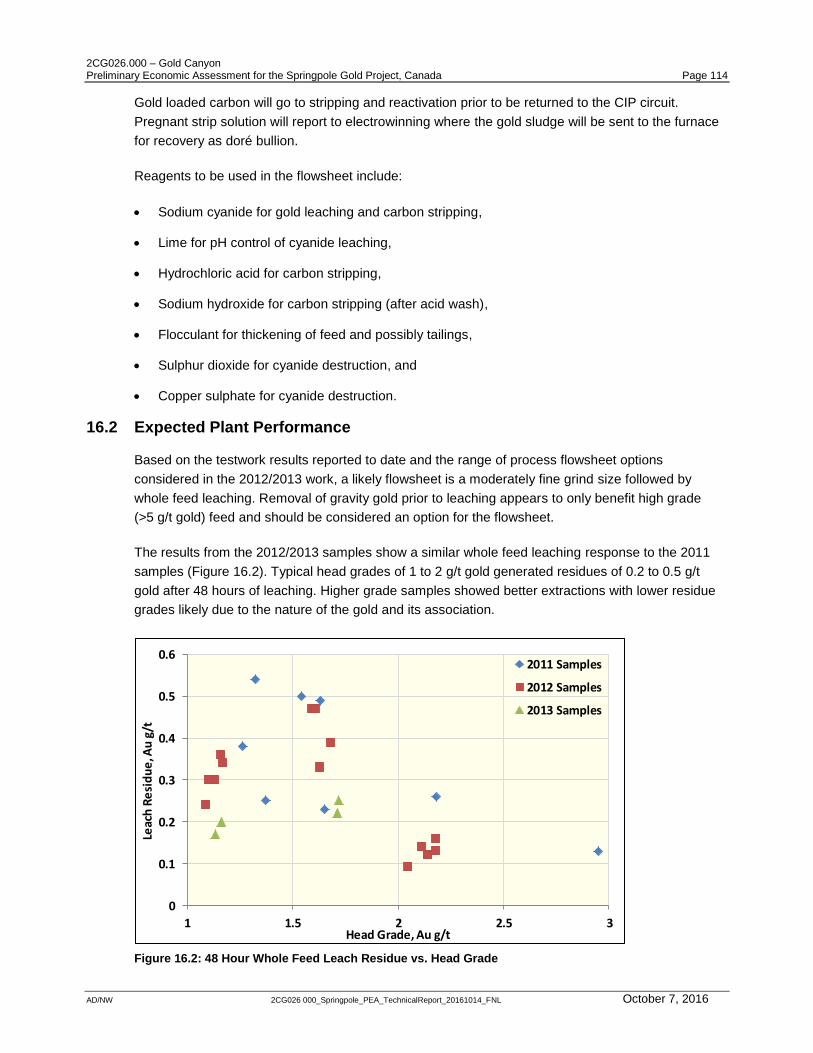
2CG026.000 – Gold Canyon Preliminary Economic Assessment for the Springpole Gold Project, Canada Page 114
AD/NW 2CG026 000_Springpole_PEA_TechnicalReport_20161014_FNL October 7, 2016
Gold loaded carbon will go to stripping and reactivation prior to be returned to the CIP circuit.
Pregnant strip solution will report to electrowinning where the gold sludge will be sent to the furnace
for recovery as doré bullion.
Reagents to be used in the flowsheet include:
Sodium cyanide for gold leaching and carbon stripping,
Lime for pH control of cyanide leaching,
Hydrochloric acid for carbon stripping,
Sodium hydroxide for carbon stripping (after acid wash),
Flocculant for thickening of feed and possibly tailings,
Sulphur dioxide for cyanide destruction, and
Copper sulphate for cyanide destruction.
16.2 Expected Plant Performance
Based on the testwork results reported to date and the range of process flowsheet options
considered in the 2012/2013 work, a likely flowsheet is a moderately fine grind size followed by
whole feed leaching. Removal of gravity gold prior to leaching appears to only benefit high grade
(>5 g/t gold) feed and should be considered an option for the flowsheet.
The results from the 2012/2013 samples show a similar whole feed leaching response to the 2011
samples (Figure 16.2). Typical head grades of 1 to 2 g/t gold generated residues of 0.2 to 0.5 g/t
gold after 48 hours of leaching. Higher grade samples showed better extractions with lower residue
grades likely due to the nature of the gold and its association.
Figure 16.2: 48 Hour Whole Feed Leach Residue vs. Head Grade
0
0.1
0.2
0.3
0.4
0.5
0.6
1 1.5 2 2.5 3
Leac
h R
esi
du
e, A
u g
/t
Head Grade, Au g/t
2011 Samples
2012 Samples
2013 Samples
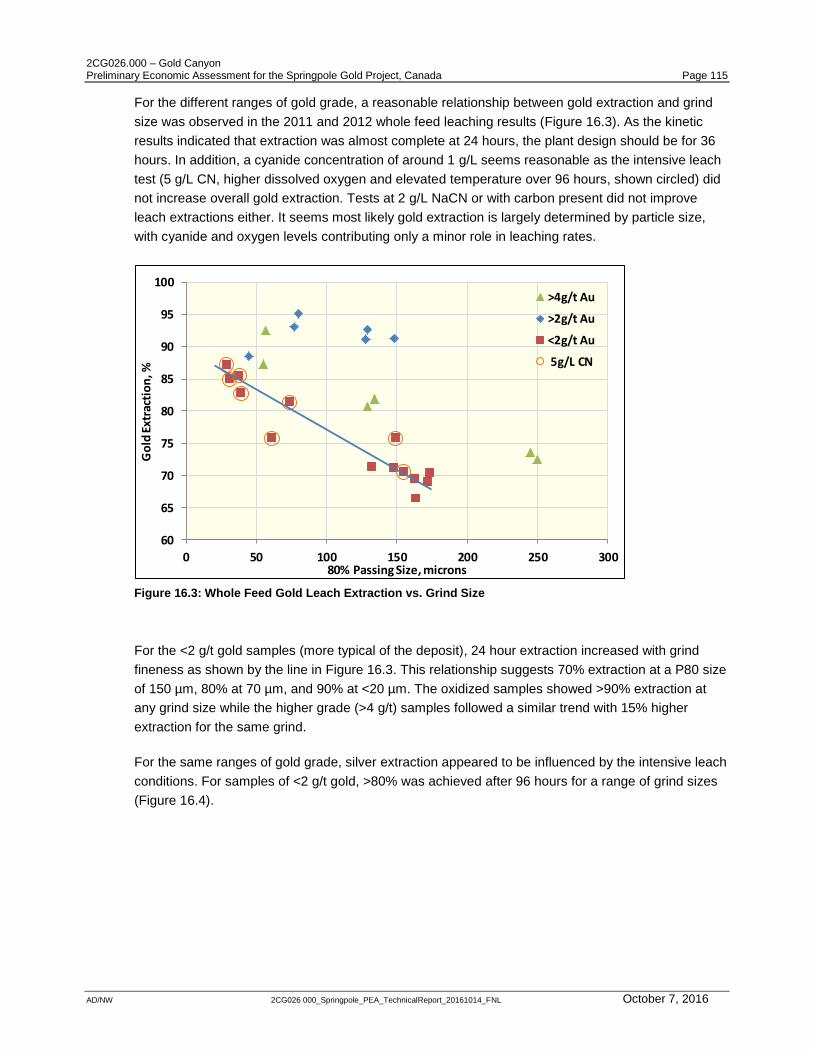
2CG026.000 – Gold Canyon Preliminary Economic Assessment for the Springpole Gold Project, Canada Page 115
AD/NW 2CG026 000_Springpole_PEA_TechnicalReport_20161014_FNL October 7, 2016
For the different ranges of gold grade, a reasonable relationship between gold extraction and grind
size was observed in the 2011 and 2012 whole feed leaching results (Figure 16.3). As the kinetic
results indicated that extraction was almost complete at 24 hours, the plant design should be for 36
hours. In addition, a cyanide concentration of around 1 g/L seems reasonable as the intensive leach
test (5 g/L CN, higher dissolved oxygen and elevated temperature over 96 hours, shown circled) did
not increase overall gold extraction. Tests at 2 g/L NaCN or with carbon present did not improve
leach extractions either. It seems most likely gold extraction is largely determined by particle size,
with cyanide and oxygen levels contributing only a minor role in leaching rates.
Figure 16.3: Whole Feed Gold Leach Extraction vs. Grind Size
For the <2 g/t gold samples (more typical of the deposit), 24 hour extraction increased with grind
fineness as shown by the line in Figure 16.3. This relationship suggests 70% extraction at a P80 size
of 150 µm, 80% at 70 µm, and 90% at <20 µm. The oxidized samples showed >90% extraction at
any grind size while the higher grade (>4 g/t) samples followed a similar trend with 15% higher
extraction for the same grind.
For the same ranges of gold grade, silver extraction appeared to be influenced by the intensive leach
conditions. For samples of <2 g/t gold, >80% was achieved after 96 hours for a range of grind sizes
(Figure 16.4).
60
65
70
75
80
85
90
95
100
0 50 100 150 200 250 300
Go
ld E
xtra
ctio
n, %
80% Passing Size, microns
>4g/t Au
>2g/t Au
<2g/t Au
5g/L CN
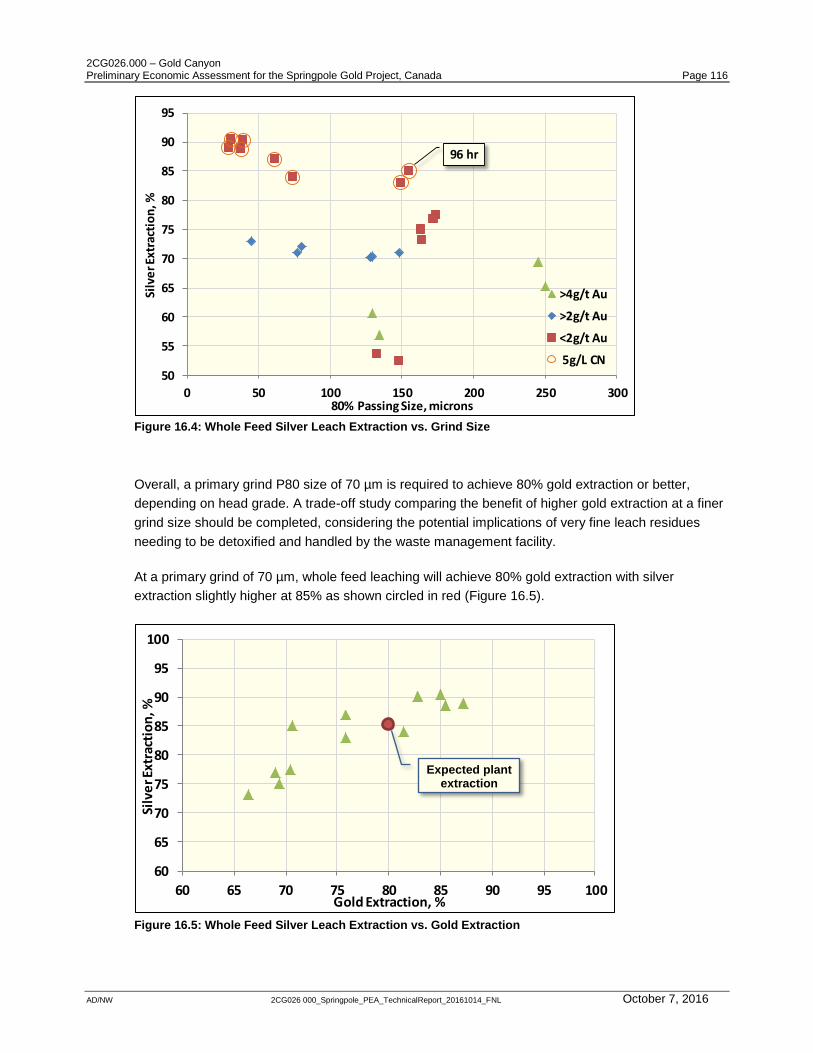
2CG026.000 – Gold Canyon Preliminary Economic Assessment for the Springpole Gold Project, Canada Page 116
AD/NW 2CG026 000_Springpole_PEA_TechnicalReport_20161014_FNL October 7, 2016
Figure 16.4: Whole Feed Silver Leach Extraction vs. Grind Size
Overall, a primary grind P80 size of 70 µm is required to achieve 80% gold extraction or better,
depending on head grade. A trade-off study comparing the benefit of higher gold extraction at a finer
grind size should be completed, considering the potential implications of very fine leach residues
needing to be detoxified and handled by the waste management facility.
At a primary grind of 70 µm, whole feed leaching will achieve 80% gold extraction with silver
extraction slightly higher at 85% as shown circled in red (Figure 16.5).
Figure 16.5: Whole Feed Silver Leach Extraction vs. Gold Extraction
50
55
60
65
70
75
80
85
90
95
0 50 100 150 200 250 300
Silv
er E
xtra
ctio
n, %
80% Passing Size, microns
>4g/t Au
>2g/t Au
<2g/t Au
5g/L CN
96 hr
60
65
70
75
80
85
90
95
100
60 65 70 75 80 85 90 95 100
Silv
er E
xtra
ctio
n, %
Gold Extraction, %
Expected plant extraction
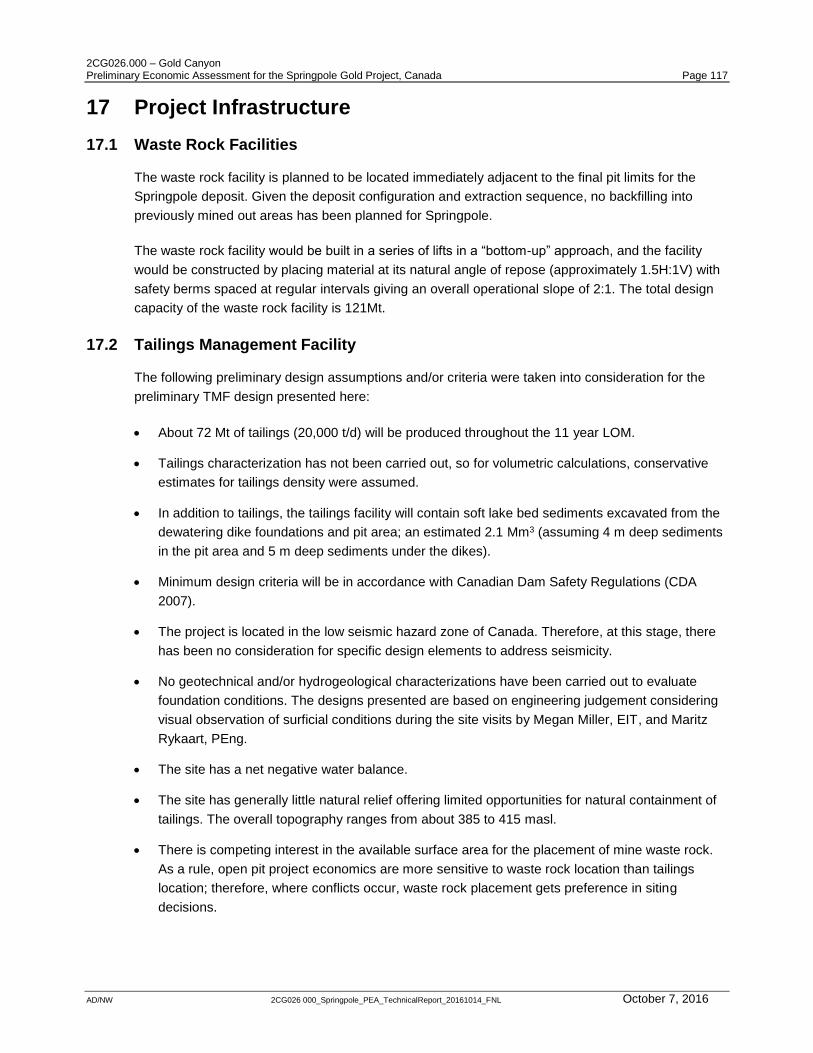
2CG026.000 – Gold Canyon Preliminary Economic Assessment for the Springpole Gold Project, Canada Page 117
AD/NW 2CG026 000_Springpole_PEA_TechnicalReport_20161014_FNL October 7, 2016
17 Project Infrastructure
17.1 Waste Rock Facilities
The waste rock facility is planned to be located immediately adjacent to the final pit limits for the
Springpole deposit. Given the deposit configuration and extraction sequence, no backfilling into
previously mined out areas has been planned for Springpole.
The waste rock facility would be built in a series of lifts in a “bottom-up” approach, and the facility
would be constructed by placing material at its natural angle of repose (approximately 1.5H:1V) with
safety berms spaced at regular intervals giving an overall operational slope of 2:1. The total design
capacity of the waste rock facility is 121Mt.
17.2 Tailings Management Facility
The following preliminary design assumptions and/or criteria were taken into consideration for the
preliminary TMF design presented here:
About 72 Mt of tailings (20,000 t/d) will be produced throughout the 11 year LOM.
Tailings characterization has not been carried out, so for volumetric calculations, conservative
estimates for tailings density were assumed.
In addition to tailings, the tailings facility will contain soft lake bed sediments excavated from the
dewatering dike foundations and pit area; an estimated 2.1 Mm3 (assuming 4 m deep sediments
in the pit area and 5 m deep sediments under the dikes).
Minimum design criteria will be in accordance with Canadian Dam Safety Regulations (CDA
2007).
The project is located in the low seismic hazard zone of Canada. Therefore, at this stage, there
has been no consideration for specific design elements to address seismicity.
No geotechnical and/or hydrogeological characterizations have been carried out to evaluate
foundation conditions. The designs presented are based on engineering judgement considering
visual observation of surficial conditions during the site visits by Megan Miller, EIT, and Maritz
Rykaart, PEng.
The site has a net negative water balance.
The site has generally little natural relief offering limited opportunities for natural containment of
tailings. The overall topography ranges from about 385 to 415 masl.
There is competing interest in the available surface area for the placement of mine waste rock.
As a rule, open pit project economics are more sensitive to waste rock location than tailings
location; therefore, where conflicts occur, waste rock placement gets preference in siting
decisions.
2CG026.000 – Gold Canyon Preliminary Economic Assessment for the Springpole Gold Project, Canada Page 118
AD/NW 2CG026 000_Springpole_PEA_TechnicalReport_20161014_FNL October 7, 2016
Preliminary geotechnical testing carried out on the tailings suggests that the tailings will be acid
generating, and therefore that complete environmental containment will be required for the
tailings management facility. Since the containment dams are expected to be founded on
competent bedrock a complete under liner is not included.
Options Analysis for the Tailings Management Facility
Alternate Deposition Methods
Alternate deposition methods considered for the project included:
Conventional low solids content (typically less than 30%) slurry, deposited in an on-land facility;
Conventional low solids content (typically less than 30%) slurry, deposited in a nearby lake;
Thickened tailings slurry (solids content typically between 30 and 60%), but still pumpable with
centrifugal pumps;
Cycloned tailings, using the overflow to construct the embankments;
Uncemented thickened tailings (solids content typically in excess of 60%) requiring positive
displacement pumps; and
Filtered (i.e., dry-stack tailings) tailings.
Due to the low topographical relief and lack of natural containment basins, ring-dams will be required
for any on-land tailings deposition strategy. Therefore, tailings deposition methods that result in
smaller containment dams are preferred. Conventional low solids content tailings would require the
largest containment dams and were therefore not considered further. Thickened tailings slurry offers
only a slight advantage in this regard and was therefore also dismissed. Cyclone tailings could be a
cost effective method as additional borrow material is not needed to build the dams. However, this
deposition strategy is operationally challenging in cold climates and borrow material would be
required to construct the starter dams.
Sub-aqueous deposition of conventional low solids content slurry in a nearby lake could be done
with little or no dam construction. Permitting of lake disposal would be environmentally and
socio/economically challenging, and has, therefore, not been evaluated further.
Filtered tailings would require the smallest containment dams; however, the proposed production
rate would require a significant capital investment in filter presses with a correspondingly high
operational cost. Therefore, this option was not evaluated further.
Uncemented paste tailings (or more accurately, thickened tailings to the point where there is only a
minor amount of bleed water) was, therefore, selected as the preferred tailings deposition strategy
as it requires the least amount of containment dams to be constructed, while being more amenable
to cold weather operation.
It should be noted that this is a high level evaluation, and considering the level of study, a more
comprehensive evaluation of deposition strategies would be warranted during future stages of this
project.
2CG026.000 – Gold Canyon Preliminary Economic Assessment for the Springpole Gold Project, Canada Page 119
AD/NW 2CG026 000_Springpole_PEA_TechnicalReport_20161014_FNL October 7, 2016
Alternate Retaining Structures
Hydraulically placed sub-aerial thickened tailings require construction of retaining structures. The
alternative retaining structure technologies considered included:
Earth fill dams,
Lined rock fill dams, or
In-pit deposition (mined out open pit).
In-pit disposal into a mined out open pit was considered but dismissed since the proposed mine
development sequence does not provide for suitable locations.
The construction of a low permeability core earth fill dam requires the availability of suitable low
permeability materials, within tight engineering tolerances. No borrow characterization study was
carried out, and, based on the reconnaissance site visit; it is unlikely that large quantities of suitable
materials would be readily available. Therefore, at this stage, the preferred dam design is a
geosynthetically lined rock fill dam.
Alternate TMF Sites
Based on the lay of the land, the closest viable area to the mill that did not require a major stream or
lake crossing was selected for the TMF. A high level reconnaissance desk top search for alternate
sites was carried out, but ultimately only the currently earmarked location was given any real
consideration. Within the confines of this general area, there is some room for minor optimization
during future development stages.
Environmental and socio-economic criteria have only been considered in broad terms in this site
evaluation, and it is therefore biased towards technical and economic criteria. As the project
advances and more information become available about baseline conditions and potential
environmental effects, the analysis should be revisited to confirm that the identified preferred option
remains valid.
Tailings Management Facility Design
Roughly 72 Mt of thickened tailings (about 60% solids by mass) will be centrally discharged at a site
located about 5 km southeast of the proposed mill site. This results in an estimated 45 Mm3 of
tailings to be stored, based on conservative estimates for a tailings density of 1.6 t/m3. The centrally
discharged tailings will have a positive beach angle of 4% from a central discharge point. This
assumed beach angle should be confirmed with testwork during later studies on the project.
Due to the flat topographical relief of the project area, the tailings will be contained by a ring dam
which will prevent migration of tailings, lake bed sediments, and any free water. The tailings facility is
designed such that the dams will remain at the initial starter dam height of 2 m, except in the areas
were a higher dam is required to contain lake bed sediments or prevent the tailings from encroaching
on nearby lakes.
To minimize pre-production capital cost, a dam continuously raised over the LOM would be the
preferred construction method. However, due to the need to contain lake bed sediments (from dike

2CG026.000 – Gold Canyon Preliminary Economic Assessment for the Springpole Gold Project, Canada Page 120
AD/NW 2CG026 000_Springpole_PEA_TechnicalReport_20161014_FNL October 7, 2016
construction), the initial ring dam will be constructed to the final dam height in all but a few areas,
and only minimal raises (less than 1 m) would be required in the remaining areas. The savings
offered by deferring that construction is not significant and, as a result, all tailings dam construction
is considered pre-production capital.
Dam
The tailings ring dam will be approximately 7,355 m in length, with a maximum height of 9 m. With
the exception of the lake sediment storage area and areas where the tailings will encroach on
surrounding lakes, the 2 m high ring dam has no defined crest elevation and will generally follow the
original ground elevation. The minimum crest elevation in the region required for lake sediment
storage is 401 masl, which includes a 2 m freeboard.
The tailings dam is assumed to be a run-of-quarry (Type A material) rock fill dam with a bituminous
liner system on the upstream side. The liner system will extend into a trench excavated to bedrock
where it will be tied into the bedrock with a concrete pony wall. Foundation preparation will consist of
excavating all overburden material (Type C material) to expose bedrock.
The upstream side of the dam will have side slopes of 3H:1V to facilitate liner placement; the
downstream slope will have 2H:1V slopes. The crest will be 5 m wide in areas where the dam is less
than 3 m high and 10 m wide elsewhere. The dam crest will be utilized as an access road for
maintenance. Figure 17.1 demonstrates a typical dam cross section.
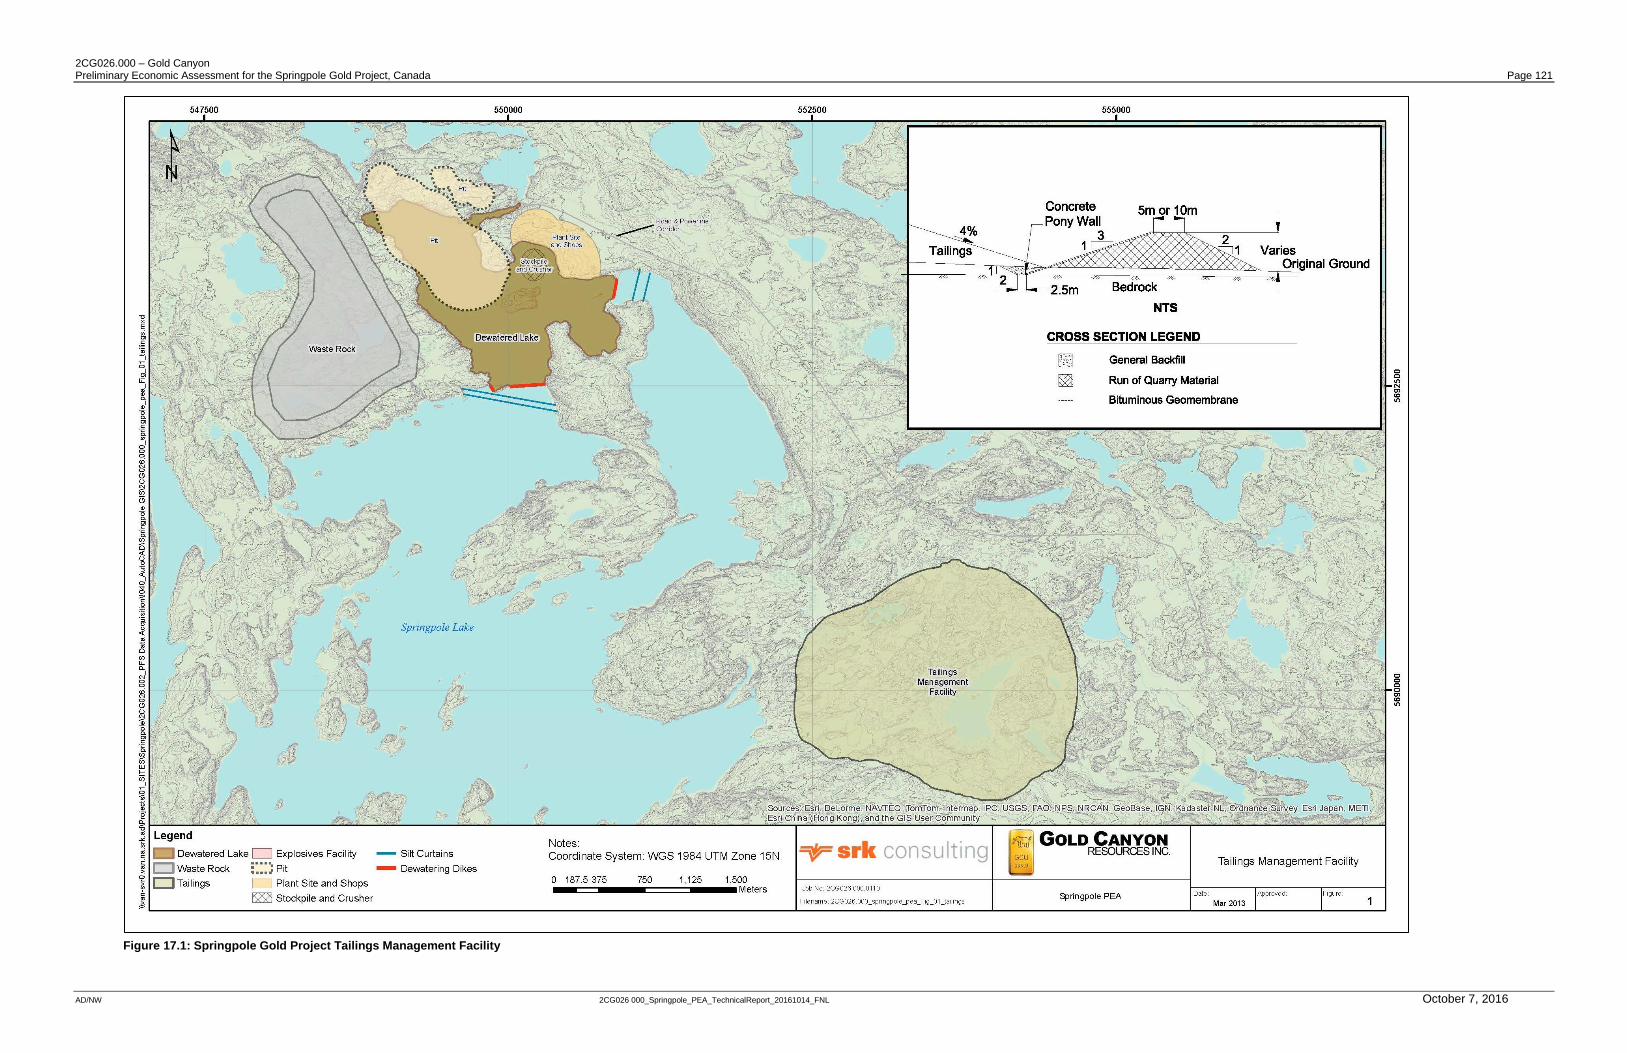
2CG026.000 – Gold Canyon Preliminary Economic Assessment for the Springpole Gold Project, Canada Page 121
AD/NW 2CG026 000_Springpole_PEA_TechnicalReport_20161014_FNL October 7, 2016
Figure 17.1: Springpole Gold Project Tailings Management Facility
2CG026.000 – Gold Canyon Preliminary Economic Assessment for the Springpole Gold Project, Canada Page 122
AD/NW 2CG026 000_Springpole_PEA_TechnicalReport_20161014_FNL October 7, 2016
Water Management
During lake dewatering (prior to the placement of tailings), the TMF dam will be used as a settlement
pond for water with high total suspended solids and retention of dredged lakebed sediments.
During tailings operations, surface water draining towards the facility will be diverted away from the
tailings facility with a diversion ditch. Surface water which collects within the TMF will be collected
and pumped back to the mill for reuse/treatment.
Tailings Management
Tailings will be thickened and pumped via two 400 mm diameter heat traced and insulated HDPE
pipelines to the tailings management facility a distance of 5.6 km. The tailings will be discharged via
a single spigot located in a tower at the centre of the facility. This spigot point will continuously be
raised and rotated as deposition advances. A 150 mm diameter heat traced and insulated HDPE
return water pipeline will lead back to the plant.
Closure and Reclamation
Once mining operations cease, the dams surrounding the tailings facility will be flattened and
contoured to allow for natural drainage. Assuming that the tailings composition does not pose an
acid rock drainage risk or metal leaching risk, the tailings will be covered with a simple soil cover
from a locally available borrow source. The covered tailings surface would be re-vegetated.
17.3 Dewatering Dikes
The following preliminary design assumptions and/or criteria were taken into consideration for the
dewatering dike design:
Minimum design criteria will be in accordance with Canadian Dam Safety Regulations (CDA
2007).
The project is located in the low seismic hazard zone of Canada. Therefore, at this stage, there
has been no consideration for specific design elements to address seismicity.
A series of geotechnical drill holes were completed in 2012 at multiple candidate dike locations.
These drill holes managed to measure depth to bedrock; however there was no recovery of any
overburden soils or lake bed sediments. The designs presented are based on engineering
judgement considering the available data supported by visual observation of surficial conditions
during the site visit by Megan Miller, EIT and Maritz Rykaart, PEng.
To allow sufficient time to construct the dikes and dewater the contained lake, the dikes will be
constructed two years before mining starts.
Mine sequencing does not allow mine waste rock to be available for dike construction. A
dedicated rock quarry will therefore have to be developed..
2CG026.000 – Gold Canyon Preliminary Economic Assessment for the Springpole Gold Project, Canada Page 123
AD/NW 2CG026 000_Springpole_PEA_TechnicalReport_20161014_FNL October 7, 2016
Alternate Dike Technology
Alternate construction technologies considered for the dike include:
Complete dewatering of Springpole Lake followed by conventional dike construction under dry
conditions; and
In-water construction which would not require dewatering of Springpole Lake.
Springpole Lake is a very large lake and dewatering of it to allow dry construction would not be
practical or cost effective. In-water construction is, therefore, proposed. To ensure a watertight seal,
sheet pile, slurry wall, and grout curtain construction technologies were considered.
Comparison of rock depths from preliminary drill holes in the general vicinity of the proposed dikes
and lake bathymetry at the drill hole locations suggest lake sediment thickness between 0.6 m and
8 m, with an average thickness of 4 m. The lake sediments overly reasonably intact rock, although a
transition zone of weathered rock is to be expected. Given this limited amount of data, the viability of
sheet piles and a slurry wall to produce a good seal is limited due to constructability concerns.
Therefore, at this time, a grout curtain has been assumed to be the preferred method.
Alternate Dike Locations
Several locations were proposed for the dewatering dikes as illustrated in Figure 17.2. The general
intent was to find locations that minimized the area of lake dewatering, while ensuring that the dikes
would be located outside of possible pit expansion footprints (at least 100 m from the final pit rim). In
addition, locations with shallow water are preferred as it would allow for optimized dike construction.
Based on these criteria dikes C1, C2, and D were selected as the preferred locations, requiring a
total lake area of 162 ha to be dewatered, containing about 21.7 Mm3 of water.
Dike Design
Design Concept
Three dewatering dikes with a total length of approximately 510 m will be constructed in Springpole
Lake to allow a portion of the lake to be dewatered. The dikes will be constructed to elevation 391 m
above mean sea level, which allows 3 m of freeboard above the lake level.
The dikes will be constructed under wet conditions; therefore, two silt curtains will be deployed
downstream of the dike locations to prevent high suspended solids in the remainder of the lake. Prior
to the placement of fill material, the foundation of the dam will be dredged to remove any soft
lakebed sediments. The rock fill material will be placed, and then the grout curtain and plastic
concrete cut-off wall will be built through the completed dike.
The dikes will be constructed with a 12 m wide crest which will act as an access road during
construction in wet conditions and the sides of the dikes will slope at angle of repose. The dike will
consist of an upstream rip-rap layer (Type D material) over a layer of run-of-quarry rock (Type A
material), an inner layer of bedding material (Type B material), through which the plastic concrete
slurry wall will be constructed, and finally a downstream layer of run-of-quarry (Type A material) rock.
The typical cross section of the dewatering dikes can be seen in Figure 17.2.

2CG026.000 – Gold Canyon Preliminary Economic Assessment for the Springpole Gold Project, Canada Page 124
AD/NW 2CG026 000_Springpole_PEA_TechnicalReport_20161014_FNL October 7, 2016
A 1 m thick plastic concrete slurry wall will be constructed through the center of the dike and extend
a minimum of 1 m into bedrock to provide a water retaining seal. A three row grout curtain cut-off
wall will extend 5 m into the bedrock to prevent seepage.
Prior to dike construction, an assumed 5 m of soft lake bed sediments would be removed from within
the footprint of the dewatering dikes. These lake bed sediments would be deposited in the TMF.
Lake bathymetry was available for all three of the dike locations selected. Average dike heights were
determined to be 1.2, 2.3 and 5.1 m for dikes C1, C2, and D, respectively. The maximum overall dike
height, above the lakebed surface, is 8.2 m for dike D.
Quantities associated with the dewatering dikes were calculated based on average lake depth and
assumed geometry.

2CG026.000 – Gold Canyon Preliminary Economic Assessment for the Springpole Gold Project, Canada Page 125
AD/NW 2CG026 000_Springpole_PEA_TechnicalReport_20161014_FNL October 7, 2016
Figure 17.2: Springpole Gold Project Dewatering Dike Locations
2CG026.000 – Gold Canyon Preliminary Economic Assessment for the Springpole Gold Project, Canada Page 126
AD/NW 2CG026 000_Springpole_PEA_TechnicalReport_20161014_FNL October 7, 2016
Lake Dewatering
An estimated 21.7 Mm3 of water will have to be drained from the area of Springpole Lake within the
dewatering dikes. Of this, 80% (17.4 Mm3) is estimated to be clean water which can be discharged
directly over the dewatering dikes into Springpole Lake, inside the silt curtain. The remaining
4.3 Mm3 (20%) is assumed to be ‘murky’ (i.e., have suspended solids higher than the allowable
discharge limits). The murky water will be pumped to the TMF which will act as a sedimentation
pond; no tailings will be in the TMF at this time. Clear water from TMF will be pumped to Springpole
Lake. Steps will be taken during the dewatering process to reduce the amount of sediments that
become suspended in the water, including silt curtains around the water intake area.
Due to project economics, it is preferred that the lake be drained within one year of dike completion.
In order to dewater the lake in this time period, the dewatering flow rate will be 0.6 m3/s (assuming
dewatering 365 d/y, 24 hr/d). This dewatering rate is within the range of other planned and actual
lake dewatering rates (BHP 1995, 1999, and 2001; Diavik 2003; Agnico-Eagle 2010; De Beers
2010). Additionally, literature from other lake dewatering projects indicates that dewatering during
the winter months results in less suspended solids. Preliminary hydrological evaluations indicate that
the 0.6 m3/s dewatering rate is possible.
Water Management
During operations, surface water will be diverted from entering the drained portion of Springpole
Lake. Management of direct precipitation and seepage into the pit will be included in the mine
dewatering activities.
Closure and Reclamation
When mining ceases, pumping will cease and water will be allowed to re-enter the drained lake bed
and pit. Once the lake has reached the natural lake level the dewatering dikes will be breached and
the above water portions removed. Before breaching of the dikes, silt curtains will be installed. These
silt curtains will remain in-place until water sediments reach acceptable levels.
17.4 Infrastructure
Roads
Two Lane Access Corridor Road
This 12 m wide, two-lane unpaved, 39 km access corridor road extends from the Springpole deposit
along the Birch River before it connects up with the planned Wenasaga Road (Gold Canyon 2012).
This will be the primary access road for the project. The primary normal design vehicles for the road
are Super B-Train trucks for hauling of supplies and equipment. Heavy equipment and oversize
vehicles will occasionally use the road, especially during the project construction phase.
Road construction will consist of clearing and grubbing of the right of way corridor, prior to placing of
an approximately 0.5 m thick compacted sub-base layer sourced from locally developed and
approved borrow sources (which has been assumed to be no more than 10 km apart, for a maximum
haul distance of 5 km). Based on a cursory review of the alignment using low resolution
topographical mapping, it is anticipated that only basic cut/fill techniques will be required to construct
the road.
2CG026.000 – Gold Canyon Preliminary Economic Assessment for the Springpole Gold Project, Canada Page 127
AD/NW 2CG026 000_Springpole_PEA_TechnicalReport_20161014_FNL October 7, 2016
The unpaved road surface will require ongoing maintenance consisting of re-grading and
topdressing the running surface to reduce the wear on the haul truck and heavy equipment tires.
Topdressing will be sourced from the local borrow sources used during construction. For the purpose
of the cost estimate, it has been assumed that annually on average at least 3 cm of new topdressing
will be applied to the running surface of the road.
Single Lane Access Roads
There are four 7 m wide single lane access roads located throughout the project area:
A 5 km section from the Mill to the South Dike,
A 1 km section from the Access Corridor Road to the Explosives Facility,
A 0.3 km section from the Access Corridor Road to the Landfill, and
A 0.2 km section from the Access Corridor Road to the Overburden Dump.
The primary design vehicles for these roads are light trucks, although it is expected that heavy
equipment will infrequently travel on these roads.
Construction and maintenance of these roads will be similar to the Access Corridor Road.
Stream Crossings
Two major stream crossings are required along the Access Corridor Road. A 5 m wide, 3 m high and
14 m long arched culvert will be constructed at the Deaddog Stream Crossing. The Birch River
Crossing will require a 90 m long pre-fabricated bridge. Both crossings will be clear span bridges that
are in accordance with requirements of the Ministry of Natural Resources and the Department of
Fisheries and Oceans
Routine surface water management along all roads will be done through crowning of the roads. In 11
key areas along the Access Corridor Road, surface water will be allowed to cross the road via
0.45 m diameter corrugated steel culverts. No culverts have been identified for the single lane
access roads.
Buildings
The buildings discussed below will be of modular design or consist of fully contained prefabricated
components. They will be shipped to site either as complete units or will require minimal on-site
construction, plumbing, and electrical work.
General Maintenance Shop
This is a pre-engineered, insulated sprung structure with a concrete slab on-grade measuring 30 m
in length and 25 m in width. This facility will be used for general facility maintenance and upkeep.
Waste Management Building
This open floor plan structure measuring 13 m by 20 m will be used for sorting and handling all the
waste produced from building construction and operation activities. If permitting allows, an
incinerator associated with the Waste Management Building would be used to burn unpainted
2CG026.000 – Gold Canyon Preliminary Economic Assessment for the Springpole Gold Project, Canada Page 128
AD/NW 2CG026 000_Springpole_PEA_TechnicalReport_20161014_FNL October 7, 2016
construction material and domestic waste, which would reduce the volume being transported to the
landfill. Hazardous and recyclable waste will be transported off-site.
Emergency Response Building
This will be a framed structure measuring 10 m in length by 20 m in width and will house all the
equipment and facilities to handle site emergencies
Mine Maintenance Shop
This is a framed structure measuring 30 m by 25 m and will be used for general service for mine site
surface infrastructure, haul trucks and heavy equipment as well as light vehicles. The building will be
equipped with overhead cranes, workbenches and equipment, as well as areas allocated to permit
maintenance and fabrication activities.
Light Vehicle Maintenance Shop
This pre-engineered sprung structure with a concrete slab on-grade will be used for the maintenance
of light vehicles. The shop will measure 30 m in length by 25 m in width. This building will also be
equipped with overhead cranes, workbenches and equipment, as well as areas allocated to permit
maintenance and fabrication activities.
Assay Laboratory
This building will be a framed structure measuring 20 m by 22 m. It will have areas allocated for
sample preparation and analyses. The assay laboratory is a climate controlled, “clean” building.
Warehousing and Storage
This will be another pre-engineered insulated sprung structure with a concrete slab on-grade. It will
measure 25 m in length by 30 m in width. This building will handle all inventories on-site and house
stock that must be protected from the environment. It will be associated with a lay-down yard for
larger pieces of equipment and materials.
Camp
This will be composed of modular structures that will be transported to site then connected together.
The camp will accommodate 300 people in single rooms with dormitory style washrooms. This
facility will also contain a kitchen, a mess hall, and recreation facilities.
Water Treatment Plant
This will be a packaged reverse osmosis treatment plant. The treatment plant will be self-contained
within a couple of SeaCans which, when connected together, measures 13 by 9 m.
Sewage Treatment Plant
This will also be a packaged bio-reactor treatment plant with a sludge filter press. Just like the Water
Treatment Plant, it has been assumed the Sewage Treatment Plant will be contained within a couple
of SeaCans which, when connected together, measures 13 by 9 m.

2CG026.000 – Gold Canyon Preliminary Economic Assessment for the Springpole Gold Project, Canada Page 129
AD/NW 2CG026 000_Springpole_PEA_TechnicalReport_20161014_FNL October 7, 2016
Fuel Storage
Substantial storage of fuel will not be required on-site due to the easy access to the nearby highway.
Some fuel storage will be required for the mine, haul, and light vehicle fleets, as well as for the heavy
equipment and production of ammonium nitrate/fuel oil, a bulk explosive. For the cost estimate, it
has been assumed a 5 ML fuel tank farm, within a bunded area is to be constructed at the mine site.
This structure will be shipped as pre-formed panels and trussed which will require on-site erection
and fabrication.
Office Complex
It is estimated the mine site will have an office staff of 200 people. Several administration buildings
will be required. For the purposes of the cost estimate, four buildings measuring 20 by 20 m were
assumed. These will be modular buildings with interior furnishings to allow for all the administrative
and day-to-day activities needed for the mine to operate.
Mine Truck Shop
This will also be a framed structure measuring 55 m by 30 m used to service the mining fleet for
mine specific operations. This building will also be equipped with overhead cranes, workbenches
and equipment, as well as areas allocated to permit maintenance and fabrication activities.
Power Lines
A 60 km long by 23 m wide right-of-way will be cleared, grubbed and prepared for the installation of
a 115 kV wood pole transmission line using 636,000 mils conductor. The right-of-way will start from
Highway 105 near Ear Falls and travel a further 90 km alongside the existing Hydro One corridor
overland where it will connect to and follow the access corridor road to the project site.
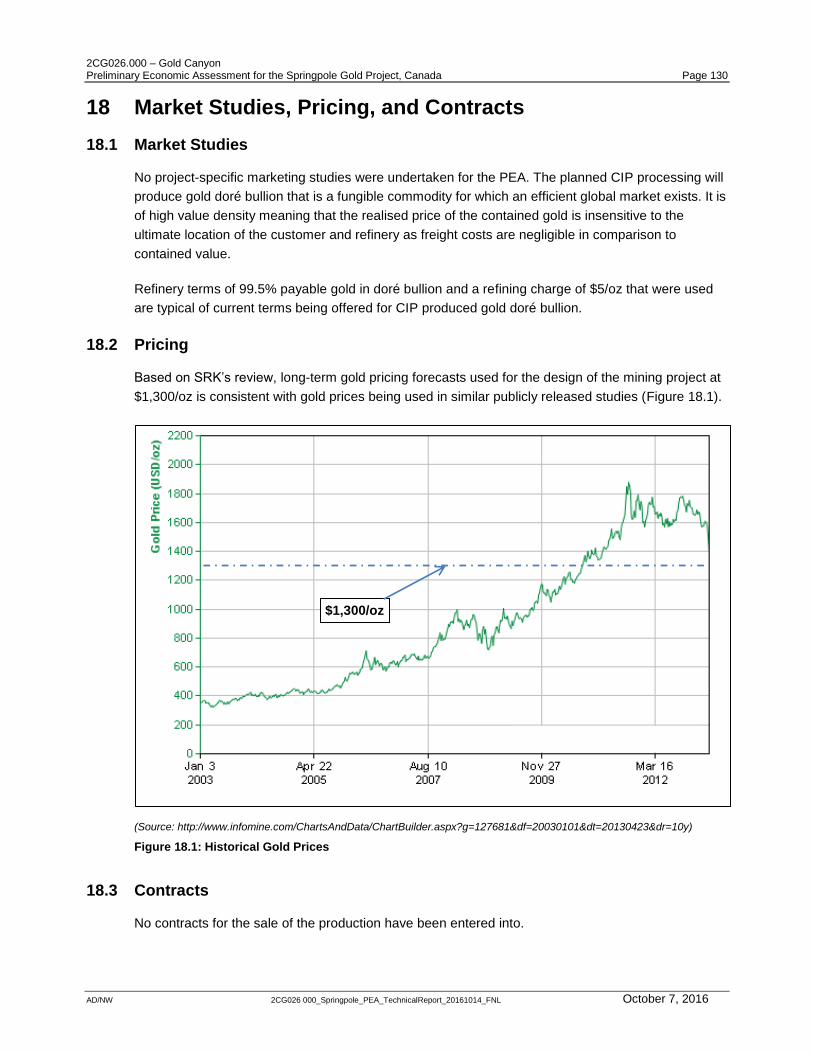
2CG026.000 – Gold Canyon Preliminary Economic Assessment for the Springpole Gold Project, Canada Page 130
AD/NW 2CG026 000_Springpole_PEA_TechnicalReport_20161014_FNL October 7, 2016
18 Market Studies, Pricing, and Contracts
18.1 Market Studies
No project-specific marketing studies were undertaken for the PEA. The planned CIP processing will
produce gold doré bullion that is a fungible commodity for which an efficient global market exists. It is
of high value density meaning that the realised price of the contained gold is insensitive to the
ultimate location of the customer and refinery as freight costs are negligible in comparison to
contained value.
Refinery terms of 99.5% payable gold in doré bullion and a refining charge of $5/oz that were used
are typical of current terms being offered for CIP produced gold doré bullion.
18.2 Pricing
Based on SRK’s review, long-term gold pricing forecasts used for the design of the mining project at
$1,300/oz is consistent with gold prices being used in similar publicly released studies (Figure 18.1).
(Source: http://www.infomine.com/ChartsAndData/ChartBuilder.aspx?g=127681&df=20030101&dt=20130423&dr=10y)
Figure 18.1: Historical Gold Prices
18.3 Contracts
No contracts for the sale of the production have been entered into.
$1,300/oz
2CG026.000 – Gold Canyon Preliminary Economic Assessment for the Springpole Gold Project, Canada Page 131
AD/NW 2CG026 000_Springpole_PEA_TechnicalReport_20161014_FNL October 7, 2016
19 Environmental Studies, Permitting and Social Setting
19.1 General
The Springpole Gold Project is located in an area of Northwest Ontario which has hosted mineral
exploration and mining projects for most of the previous century. The Springpole Gold Project
property has a history of gold exploration being carried out during two main periods, one during the
1920s to 1940s, and a second period from 1985 to the present. Previous exploration activities on the
property have comprised surface drilling, geophysical surveys, geological mapping, and exploration
trail development. The exploration activities have resulted in a network of exploration trails and minor
disturbances to the environment due to line cutting, trenching, and surface stripping.
19.2 Environmental Regulatory Setting
The environmental assessment (EA) and permitting framework for metal mining in Canada is well
established. The federal and provincial EA processes provide a mechanism for reviewing major
projects to assess potential impacts. Following a successful EA, the operation undergoes a licensing
and permitting phase to allow operations to proceed. The project is then regulated through all
phases (construction, operation, closure, and post-closure) by both federal and provincial
departments and agencies.
Federal Environmental Assessment Process
In the spring of 2012, the1992 Canadian Environmental Assessment Act was amended and replaced
(CEAA 2012). Two significant results of the updated act were the redefinition of what “triggers” a
federal EA and the introduction of legislated time periods within a federal EA, if it is required.
Under CEAA 2012, an EA focuses on potential adverse environmental effects that are within federal
jurisdiction including:
Fish and fish habitat,
Other aquatic species,
Migratory birds,
Federal lands,
Effects that cross provincial or international boundaries,
Effects that impact on Aboriginal peoples such as their use of lands and resources for traditional
purposes, and
Environmental changes that are directly linked or necessarily incidental to any federal decisions
about a project.
2CG026.000 – Gold Canyon Preliminary Economic Assessment for the Springpole Gold Project, Canada Page 132
AD/NW 2CG026 000_Springpole_PEA_TechnicalReport_20161014_FNL October 7, 2016
With respect to the Springpole Gold Project, there are two main methods in which a federal EA could
be required under CEAA 2012:
1. A proposed project will require an EA if the project is described in the Regulations Designating
Physical Activities (CEAA 2012).
2. Section 14(2) of CEAA 2012 allows the Minister of Environment to (by order) designate a
physical activity that is not prescribed by regulation if, in the Minister’s opinion, either the
carrying out of that physical activity may cause adverse environmental effects or public concerns
related to those effects may warrant the designation.
With respect to item one above, Section 15 of the Regulations Designating Physical Activities (2012)
states:
15. The construction, operation, decommissioning and abandonment of
(a) a metal mine, other than a gold mine, with an ore production capacity of 3000 t/d or
more;
(b) a metal mine with ore input capacity of 4,000 t/d or more;
(c) a gold mine, other than a placer mine, with an ore production capacity of 600 t/d or more.
If the proposed project is captured under Section 15 of the Regulations Designating Physical
Activities (2012), which is the case for the Springpole Gold Project, the proponent is required to
submit a project description to the Canadian Environmental Assessment Agency for screening. The
agency will then screen the project to determine if a federal EA is required. If a federal assessment is
required, the minister then determines what type of EA the project will require. There are two types
of EAs conducted under CEAA 2012: an environmental assessment by “responsible authority”
(standard EA) and an environmental assessment by a review panel. Both types of assessments can
be conducted by the federal government alone or in conjunction with another jurisdiction. The
responsible authority in the case of base and precious metal mining is the CEAA.
Under CEAA 2012, the federal government may also delegate any part of an environmental
assessment to the province. At the province’s request, the agency may also substitute the provincial
process for a federal EA if the provincial EA process meets the requirements of CEAA 2012. Both
processes have the potential to streamline the EA process.
In addition to the federally legislated requirements defining the need for an environmental
assessment, the federal government introduced the Major Projects Management Office (MPMO) in
2007. The MPMO role is to provide a management and coordinating role for major resource
development projects in Canada. The authority and mandate of the office is provided through a
committee comprised of deputy ministers from federal departments typically identified as
“responsible authorities” in the conduct of a federal environmental assessment. The MPMO has no
legislative authority. The MPMO would self-determine their level of involvement in the assessment
as part of the original screening process.

2CG026.000 – Gold Canyon Preliminary Economic Assessment for the Springpole Gold Project, Canada Page 133
AD/NW 2CG026 000_Springpole_PEA_TechnicalReport_20161014_FNL October 7, 2016
Provincial Environmental Assessment Process
In the Province of Ontario, the Environmental Assessment Act (EAA) is administered by the Ministry
of Environment (MOE). The Act promotes responsible environmental decision making and ensures
that interested persons have an opportunity to comment on projects that may affect them. Under the
act, the environment is broadly defined and includes the natural, social, cultural, and economic
environment.
Mining projects in Ontario are not usually subject to the EAA because the act does not apply to
private companies unless designated by regulation or the proponent has volunteered to be subject to
the requirements of the EAA. However, some of the activities associated with the development of a
mining project may be subject to the requirements of the EAA through existing class EAs (Class EA)
or regulations. Such activities include:
Granting permits on Crown land, disposition of Crown resources;
Constructing power generation or transmission facilities;
Constructing infrastructure related to provincial transportation facilities; and
Establishing a waste management facility.
19.3 Environmental Assessment Project Requirements
The proposed project will need to be screened under the CEAA 2012. The requirement of a federal
EA will become clearer once consultations with CEAA for the development of a project description
are completed; however, it is expected that a federal assessment of the proposed project will be
required given the project’s potential impacts on fish, fish habitat, and other aquatic species.
It is anticipated the project will require multiple class EAs or individual EAs to develop the mining
project. Gold Canyon may decide to enter into a Voluntary Agreement with the MOE to subject the
Springpole Gold Project to one EA instead of multiple EAs.
The Springpole Gold Project is likely to require a federal and/or provincial EA before it can proceed.
Completion of an individual EA, following its initiation, would require approximately 12 to 24 months.
Based on current CEAA 2012 guidance documents and the act’s new legislated timelines, a
standard EA would require 12 to 24 months from the commencement of the federal EA. In the event
the final design of the project dictates an amendment to Schedule II of the Metal Mining Effluent
Regulations, the time necessary to complete the environmental assessment and subsequent
licensing phase would be increased.
Ontario and Canada honour an EA cooperation agreement that harmonizes the two assessment
processes to run concurrently under a single administrative process. This process is typically
administered jointly by Ontario’s Assessment Branch and the CEAA regional office located in
Toronto, Ontario. Combining the assessment requirements of both jurisdictions under this
cooperation agreement would make it possible to streamline the assessment process.
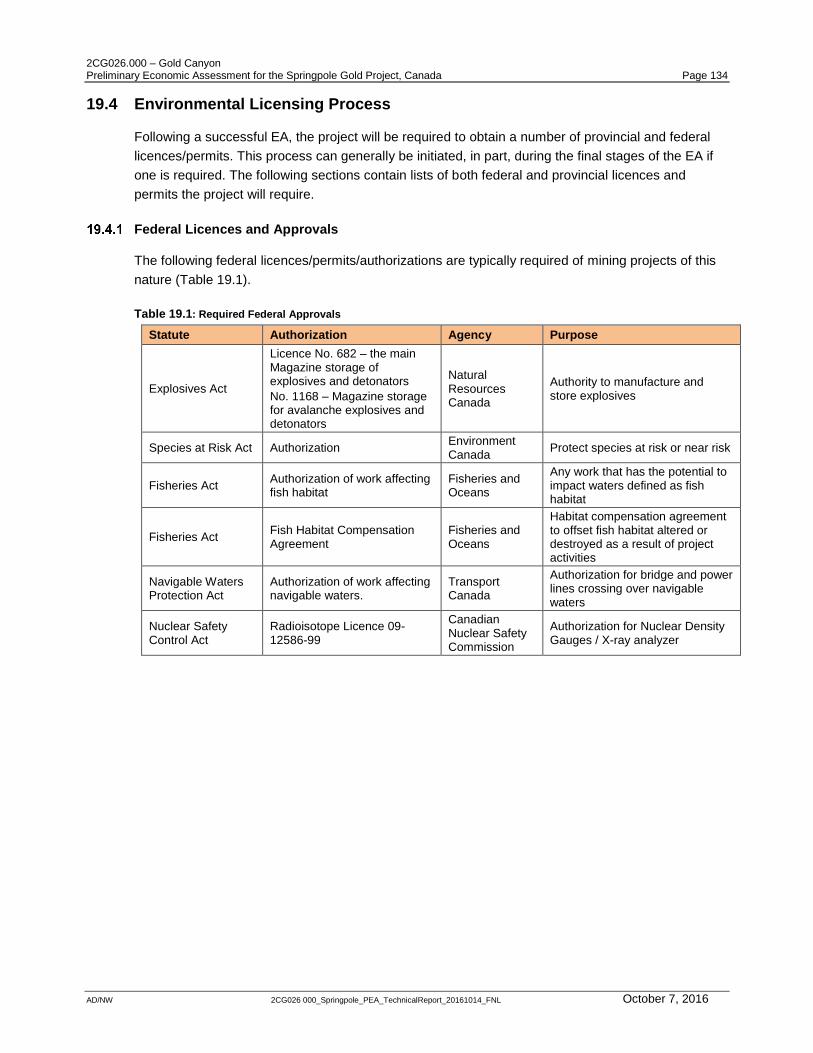
2CG026.000 – Gold Canyon Preliminary Economic Assessment for the Springpole Gold Project, Canada Page 134
AD/NW 2CG026 000_Springpole_PEA_TechnicalReport_20161014_FNL October 7, 2016
19.4 Environmental Licensing Process
Following a successful EA, the project will be required to obtain a number of provincial and federal
licences/permits. This process can generally be initiated, in part, during the final stages of the EA if
one is required. The following sections contain lists of both federal and provincial licences and
permits the project will require.
Federal Licences and Approvals
The following federal licences/permits/authorizations are typically required of mining projects of this
nature (Table 19.1).
Table 19.1: Required Federal Approvals
Statute Authorization Agency Purpose
Explosives Act
Licence No. 682 – the main Magazine storage of explosives and detonators
No. 1168 – Magazine storage for avalanche explosives and detonators
Natural Resources Canada
Authority to manufacture and store explosives
Species at Risk Act Authorization Environment Canada
Protect species at risk or near risk
Fisheries Act Authorization of work affecting fish habitat
Fisheries and Oceans
Any work that has the potential to impact waters defined as fish habitat
Fisheries Act Fish Habitat Compensation Agreement
Fisheries and Oceans
Habitat compensation agreement to offset fish habitat altered or destroyed as a result of project activities
Navigable Waters Protection Act
Authorization of work affecting navigable waters.
Transport Canada
Authorization for bridge and power lines crossing over navigable waters
Nuclear Safety Control Act
Radioisotope Licence 09-12586-99
Canadian Nuclear Safety Commission
Authorization for Nuclear Density Gauges / X-ray analyzer
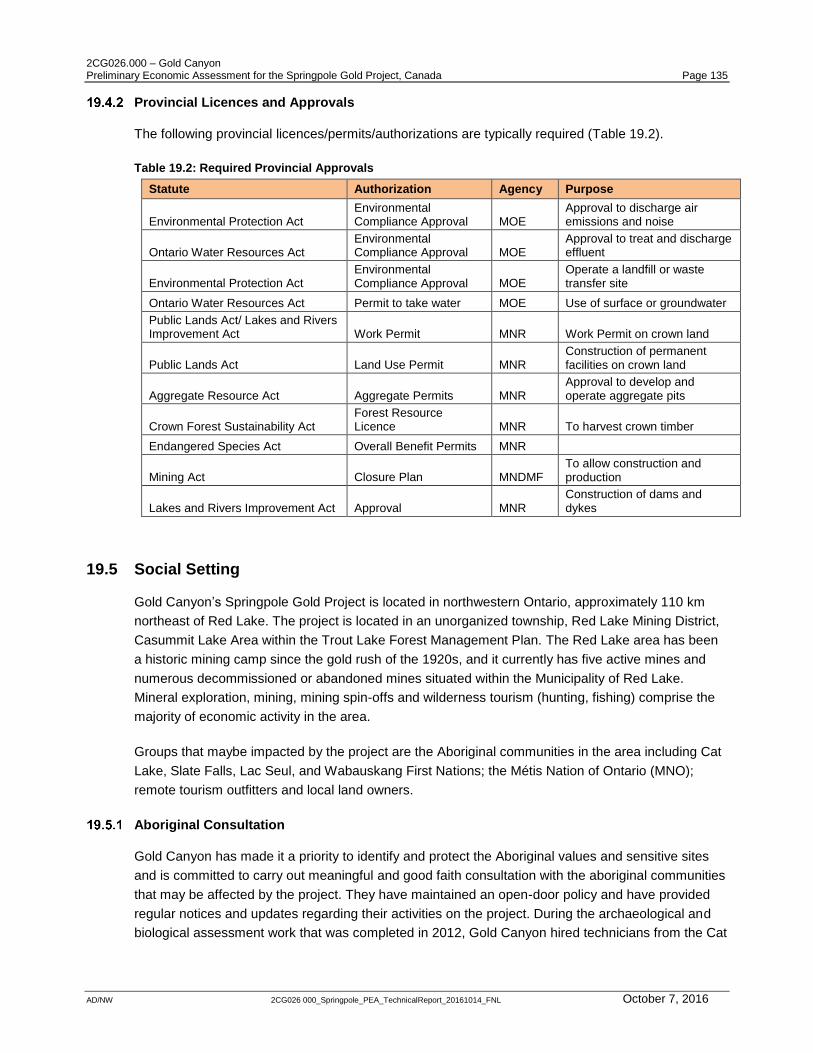
2CG026.000 – Gold Canyon Preliminary Economic Assessment for the Springpole Gold Project, Canada Page 135
AD/NW 2CG026 000_Springpole_PEA_TechnicalReport_20161014_FNL October 7, 2016
Provincial Licences and Approvals
The following provincial licences/permits/authorizations are typically required (Table 19.2).
Table 19.2: Required Provincial Approvals
Statute Authorization Agency Purpose
Environmental Protection Act Environmental Compliance Approval MOE
Approval to discharge air emissions and noise
Ontario Water Resources Act Environmental Compliance Approval MOE
Approval to treat and discharge effluent
Environmental Protection Act Environmental Compliance Approval MOE
Operate a landfill or waste transfer site
Ontario Water Resources Act Permit to take water MOE Use of surface or groundwater
Public Lands Act/ Lakes and Rivers Improvement Act Work Permit MNR Work Permit on crown land
Public Lands Act Land Use Permit MNR Construction of permanent facilities on crown land
Aggregate Resource Act Aggregate Permits MNR Approval to develop and operate aggregate pits
Crown Forest Sustainability Act Forest Resource Licence MNR To harvest crown timber
Endangered Species Act Overall Benefit Permits MNR
Mining Act Closure Plan MNDMF To allow construction and production
Lakes and Rivers Improvement Act Approval MNR Construction of dams and dykes
19.5 Social Setting
Gold Canyon’s Springpole Gold Project is located in northwestern Ontario, approximately 110 km
northeast of Red Lake. The project is located in an unorganized township, Red Lake Mining District,
Casummit Lake Area within the Trout Lake Forest Management Plan. The Red Lake area has been
a historic mining camp since the gold rush of the 1920s, and it currently has five active mines and
numerous decommissioned or abandoned mines situated within the Municipality of Red Lake.
Mineral exploration, mining, mining spin-offs and wilderness tourism (hunting, fishing) comprise the
majority of economic activity in the area.
Groups that maybe impacted by the project are the Aboriginal communities in the area including Cat
Lake, Slate Falls, Lac Seul, and Wabauskang First Nations; the Métis Nation of Ontario (MNO);
remote tourism outfitters and local land owners.
Aboriginal Consultation
Gold Canyon has made it a priority to identify and protect the Aboriginal values and sensitive sites
and is committed to carry out meaningful and good faith consultation with the aboriginal communities
that may be affected by the project. They have maintained an open-door policy and have provided
regular notices and updates regarding their activities on the project. During the archaeological and
biological assessment work that was completed in 2012, Gold Canyon hired technicians from the Cat
2CG026.000 – Gold Canyon Preliminary Economic Assessment for the Springpole Gold Project, Canada Page 136
AD/NW 2CG026 000_Springpole_PEA_TechnicalReport_20161014_FNL October 7, 2016
Lake, Slate Falls, and Lac Seul First Nations to help complete the assessment work and to be
liaisons to their communities and participate in the open-house information sessions.
In the spring of 2012, the Chiefs from the First Nation communities of Cat Lake, Slate Falls, and Lac
Seul signed an internal protocol agreement to work together for the purpose of negotiations with
Gold Canyon. Gold Canyon is also engaged in regular meetings with a working group that is
comprised of members from each of the partnership First Nations.
Gold Canyon has had introductory meetings with the Wabauskang First Nation. It is anticipated that
there will be future meetings to discuss various parts of the project as they develop and progress.
Gold Canyon has had an introductory meeting with the MNO to provide information about the
Springpole Gold Project and has provided notification of the project to the Lands and Resources
Branch of the MNO. Additional meetings are anticipated as the various parts of the project develop
and progress.
Public Consultation
Gold Canyon has identified many relevant stakeholders in the region including Domtar, the Red Lake
Local Citizen’s Committee, the Township of Ear Falls, local tourist operators, outfitters, commercial
bait fisherman, bear licence holders and private landowners. Introductory presentations and updates
about the project have been delivered by Gold Canyon. Gold Canyon is committed to advancing the
consultation process with the affected stakeholders in the region to seek feedback and to help
identify concerns so that the appropriate mitigation measures may be developed.
19.6 Preliminary Reclamation Plan
The final closure plan for the proposed project will be developed for the entire project as part of the
assessment and licensing process in accordance with Ontario legislation, a financial bond will also
be required in accordance with the Ontario Mining Act.
Conceptually, the closure of the proposed project will consist of the following main components:
decontamination,
asset removal,
demolition and disposal, and
reclamation of all impacted areas.
All project components will be decontaminated as necessary. Surplus chemicals and other
hazardous materials will be removed and stored in designated temporary storage facilities within the
facility footprint until such time that they can be resold or permanently stored in a licenced facility.
All salvageable or recyclable components will be dismantled and stored in a designated lay down
area to allow for secondary decontamination and eventual shipment off-site. All infrastructure that
cannot be salvaged and re-used will be demolished and disposed of in an approved facility.
2CG026.000 – Gold Canyon Preliminary Economic Assessment for the Springpole Gold Project, Canada Page 137
AD/NW 2CG026 000_Springpole_PEA_TechnicalReport_20161014_FNL October 7, 2016
Following any required re-grading, an appropriate cover for the tailings management facility, as well
as any remaining waste rock storage piles, will be developed and constructed.
The open pit will be allowed to flood, and, once the water quality is acceptable the coffer dams will
be breached, the pit area will again form part of Springpole Lake.
The impacted areas including the tailings and waste rock covers will be vegetated with an
appropriate seed mixture designed to enhance natural re-vegetation of the site.
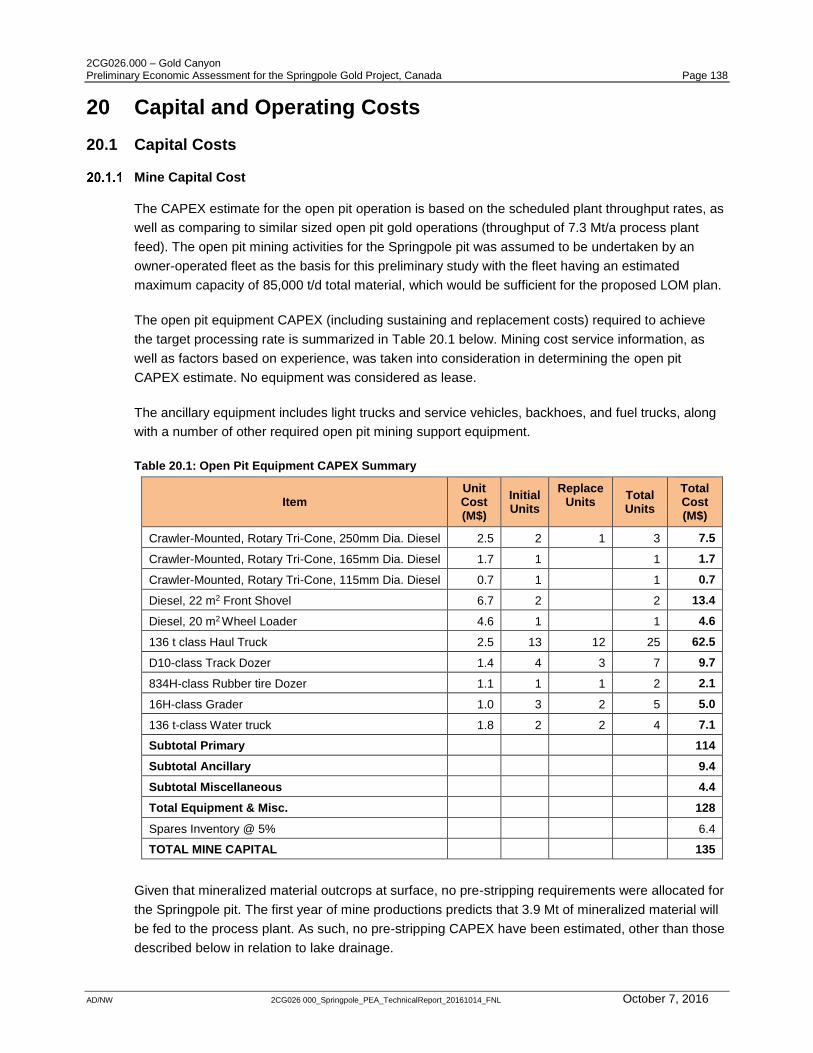
2CG026.000 – Gold Canyon Preliminary Economic Assessment for the Springpole Gold Project, Canada Page 138
AD/NW 2CG026 000_Springpole_PEA_TechnicalReport_20161014_FNL October 7, 2016
20 Capital and Operating Costs
20.1 Capital Costs
Mine Capital Cost
The CAPEX estimate for the open pit operation is based on the scheduled plant throughput rates, as
well as comparing to similar sized open pit gold operations (throughput of 7.3 Mt/a process plant
feed). The open pit mining activities for the Springpole pit was assumed to be undertaken by an
owner-operated fleet as the basis for this preliminary study with the fleet having an estimated
maximum capacity of 85,000 t/d total material, which would be sufficient for the proposed LOM plan.
The open pit equipment CAPEX (including sustaining and replacement costs) required to achieve
the target processing rate is summarized in Table 20.1 below. Mining cost service information, as
well as factors based on experience, was taken into consideration in determining the open pit
CAPEX estimate. No equipment was considered as lease.
The ancillary equipment includes light trucks and service vehicles, backhoes, and fuel trucks, along
with a number of other required open pit mining support equipment.
Table 20.1: Open Pit Equipment CAPEX Summary
Item Unit Cost (M$)
Initial Units
Replace Units
Total Units
Total Cost (M$)
Crawler-Mounted, Rotary Tri-Cone, 250mm Dia. Diesel 2.5 2 1 3 7.5
Crawler-Mounted, Rotary Tri-Cone, 165mm Dia. Diesel 1.7 1 1 1.7
Crawler-Mounted, Rotary Tri-Cone, 115mm Dia. Diesel 0.7 1 1 0.7
Diesel, 22 m2 Front Shovel 6.7 2 2 13.4
Diesel, 20 m2 Wheel Loader 4.6 1 1 4.6
136 t class Haul Truck 2.5 13 12 25 62.5
D10-class Track Dozer 1.4 4 3 7 9.7
834H-class Rubber tire Dozer 1.1 1 1 2 2.1
16H-class Grader 1.0 3 2 5 5.0
136 t-class Water truck 1.8 2 2 4 7.1
Subtotal Primary 114
Subtotal Ancillary 9.4
Subtotal Miscellaneous 4.4
Total Equipment & Misc. 128
Spares Inventory @ 5% 6.4
TOTAL MINE CAPITAL 135
Given that mineralized material outcrops at surface, no pre-stripping requirements were allocated for
the Springpole pit. The first year of mine productions predicts that 3.9 Mt of mineralized material will
be fed to the process plant. As such, no pre-stripping CAPEX have been estimated, other than those
described below in relation to lake drainage.
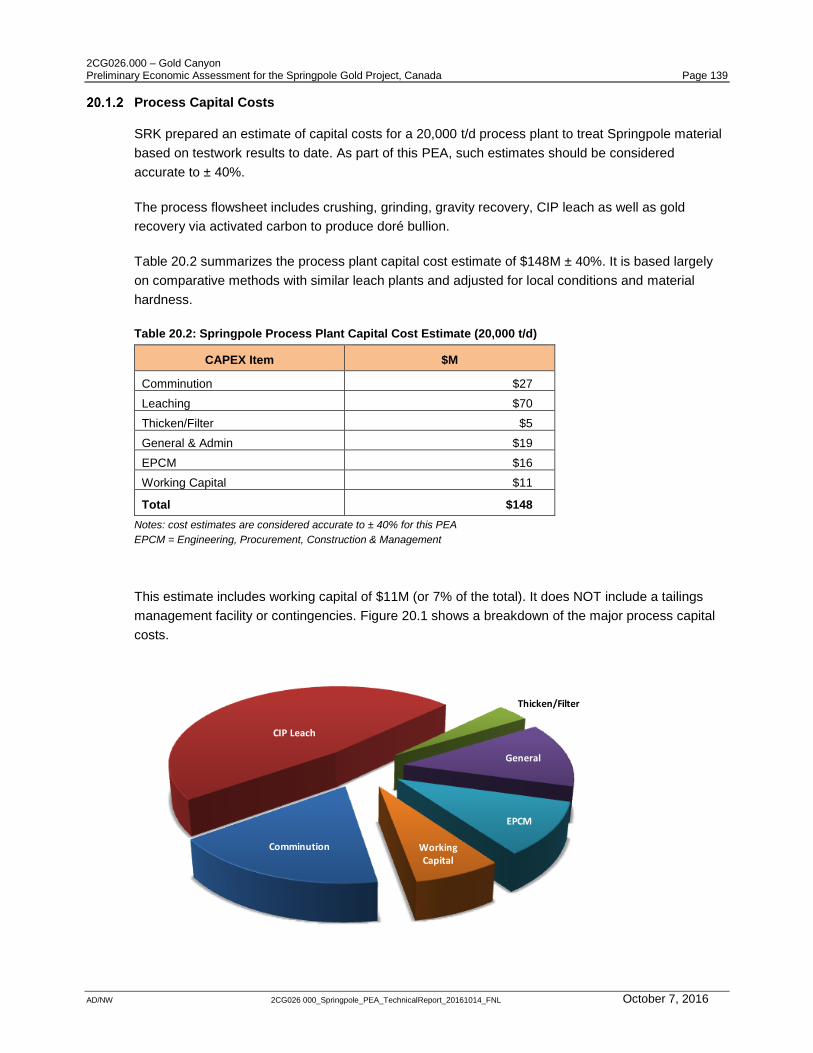
2CG026.000 – Gold Canyon Preliminary Economic Assessment for the Springpole Gold Project, Canada Page 139
AD/NW 2CG026 000_Springpole_PEA_TechnicalReport_20161014_FNL October 7, 2016
Process Capital Costs
SRK prepared an estimate of capital costs for a 20,000 t/d process plant to treat Springpole material
based on testwork results to date. As part of this PEA, such estimates should be considered
accurate to ± 40%.
The process flowsheet includes crushing, grinding, gravity recovery, CIP leach as well as gold
recovery via activated carbon to produce doré bullion.
Table 20.2 summarizes the process plant capital cost estimate of $148M ± 40%. It is based largely
on comparative methods with similar leach plants and adjusted for local conditions and material
hardness.
Table 20.2: Springpole Process Plant Capital Cost Estimate (20,000 t/d)
CAPEX Item $M
Comminution $27
Leaching $70
Thicken/Filter $5
General & Admin $19
EPCM $16
Working Capital $11
Total $148
Notes: cost estimates are considered accurate to ± 40% for this PEA
EPCM = Engineering, Procurement, Construction & Management
This estimate includes working capital of $11M (or 7% of the total). It does NOT include a tailings
management facility or contingencies. Figure 20.1 shows a breakdown of the major process capital
costs.
Comminution
CIP Leach
Thicken/Filter
General
EPCM
WorkingCapital
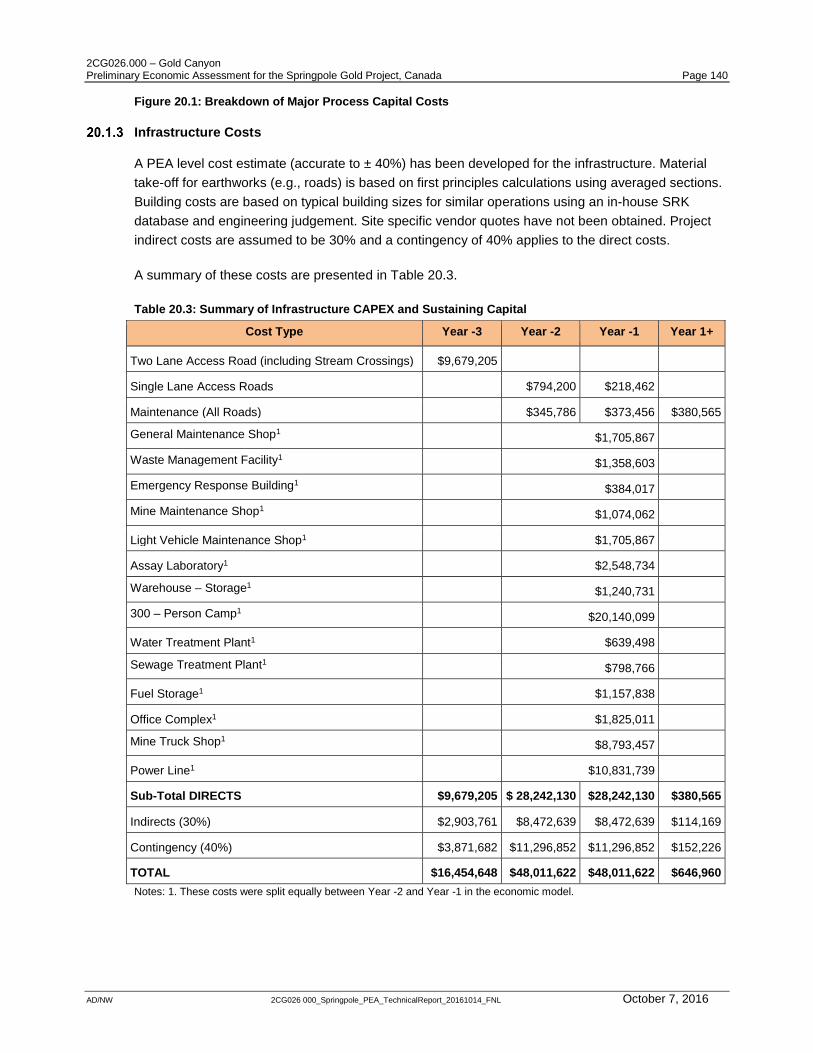
2CG026.000 – Gold Canyon Preliminary Economic Assessment for the Springpole Gold Project, Canada Page 140
AD/NW 2CG026 000_Springpole_PEA_TechnicalReport_20161014_FNL October 7, 2016
Figure 20.1: Breakdown of Major Process Capital Costs
Infrastructure Costs
A PEA level cost estimate (accurate to ± 40%) has been developed for the infrastructure. Material
take-off for earthworks (e.g., roads) is based on first principles calculations using averaged sections.
Building costs are based on typical building sizes for similar operations using an in-house SRK
database and engineering judgement. Site specific vendor quotes have not been obtained. Project
indirect costs are assumed to be 30% and a contingency of 40% applies to the direct costs.
A summary of these costs are presented in Table 20.3.
Table 20.3: Summary of Infrastructure CAPEX and Sustaining Capital
Cost Type Year -3 Year -2 Year -1 Year 1+
Two Lane Access Road (including Stream Crossings) $9,679,205
Single Lane Access Roads $794,200 $218,462
Maintenance (All Roads) $345,786 $373,456 $380,565
General Maintenance Shop1 $1,705,867
Waste Management Facility1 $1,358,603
Emergency Response Building1 $384,017
Mine Maintenance Shop1 $1,074,062
Light Vehicle Maintenance Shop1 $1,705,867
Assay Laboratory1 $2,548,734
Warehouse – Storage1 $1,240,731
300 – Person Camp1 $20,140,099
Water Treatment Plant1 $639,498
Sewage Treatment Plant1 $798,766
Fuel Storage1 $1,157,838
Office Complex1 $1,825,011
Mine Truck Shop1 $8,793,457
Power Line1 $10,831,739
Sub-Total DIRECTS $9,679,205 $ 28,242,130 $28,242,130 $380,565
Indirects (30%) $2,903,761 $8,472,639 $8,472,639 $114,169
Contingency (40%) $3,871,682 $11,296,852 $11,296,852 $152,226
TOTAL $16,454,648 $48,011,622 $48,011,622 $646,960
Notes: 1. These costs were split equally between Year -2 and Year -1 in the economic model.
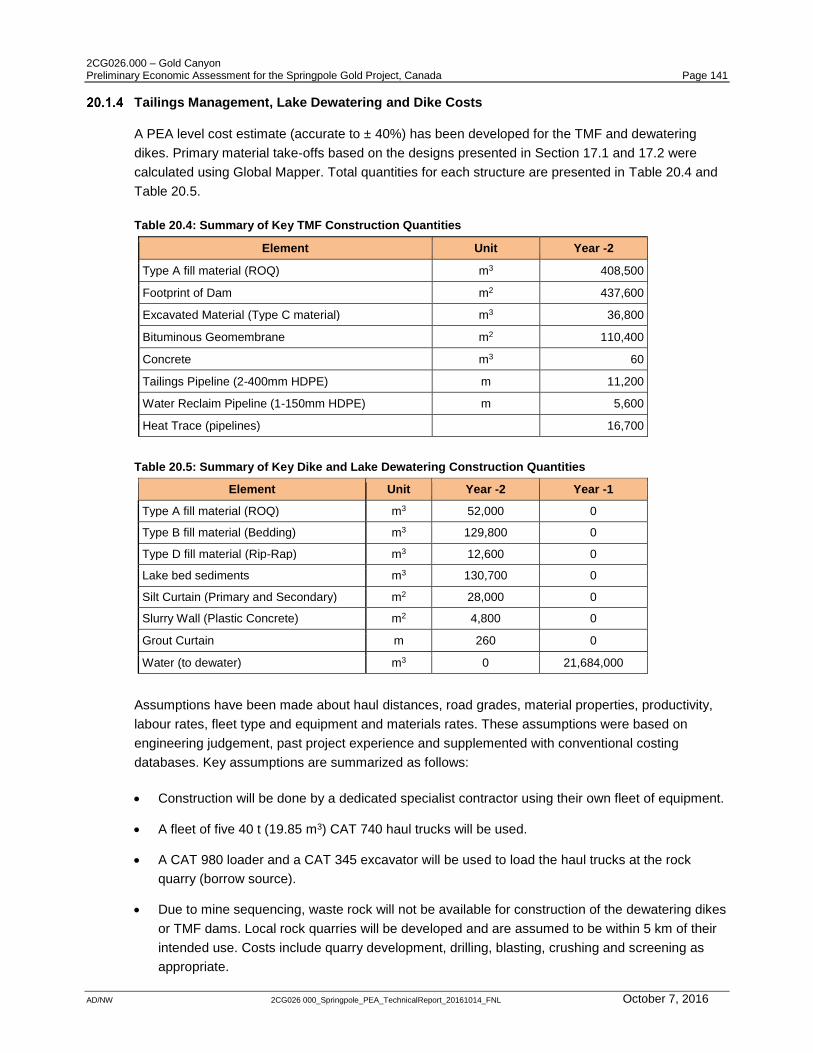
2CG026.000 – Gold Canyon Preliminary Economic Assessment for the Springpole Gold Project, Canada Page 141
AD/NW 2CG026 000_Springpole_PEA_TechnicalReport_20161014_FNL October 7, 2016
Tailings Management, Lake Dewatering and Dike Costs
A PEA level cost estimate (accurate to ± 40%) has been developed for the TMF and dewatering
dikes. Primary material take-offs based on the designs presented in Section 17.1 and 17.2 were
calculated using Global Mapper. Total quantities for each structure are presented in Table 20.4 and
Table 20.5.
Table 20.4: Summary of Key TMF Construction Quantities
Element Unit Year -2
Type A fill material (ROQ) m3 408,500
Footprint of Dam m2 437,600
Excavated Material (Type C material) m3 36,800
Bituminous Geomembrane m2 110,400
Concrete m3 60
Tailings Pipeline (2-400mm HDPE) m 11,200
Water Reclaim Pipeline (1-150mm HDPE) m 5,600
Heat Trace (pipelines) 16,700
Table 20.5: Summary of Key Dike and Lake Dewatering Construction Quantities
Element Unit Year -2 Year -1
Type A fill material (ROQ) m3 52,000 0
Type B fill material (Bedding) m3 129,800 0
Type D fill material (Rip-Rap) m3 12,600 0
Lake bed sediments m3 130,700 0
Silt Curtain (Primary and Secondary) m2 28,000 0
Slurry Wall (Plastic Concrete) m2 4,800 0
Grout Curtain m 260 0
Water (to dewater) m3 0 21,684,000
Assumptions have been made about haul distances, road grades, material properties, productivity,
labour rates, fleet type and equipment and materials rates. These assumptions were based on
engineering judgement, past project experience and supplemented with conventional costing
databases. Key assumptions are summarized as follows:
Construction will be done by a dedicated specialist contractor using their own fleet of equipment.
A fleet of five 40 t (19.85 m3) CAT 740 haul trucks will be used.
A CAT 980 loader and a CAT 345 excavator will be used to load the haul trucks at the rock
quarry (borrow source).
Due to mine sequencing, waste rock will not be available for construction of the dewatering dikes
or TMF dams. Local rock quarries will be developed and are assumed to be within 5 km of their
intended use. Costs include quarry development, drilling, blasting, crushing and screening as
appropriate.
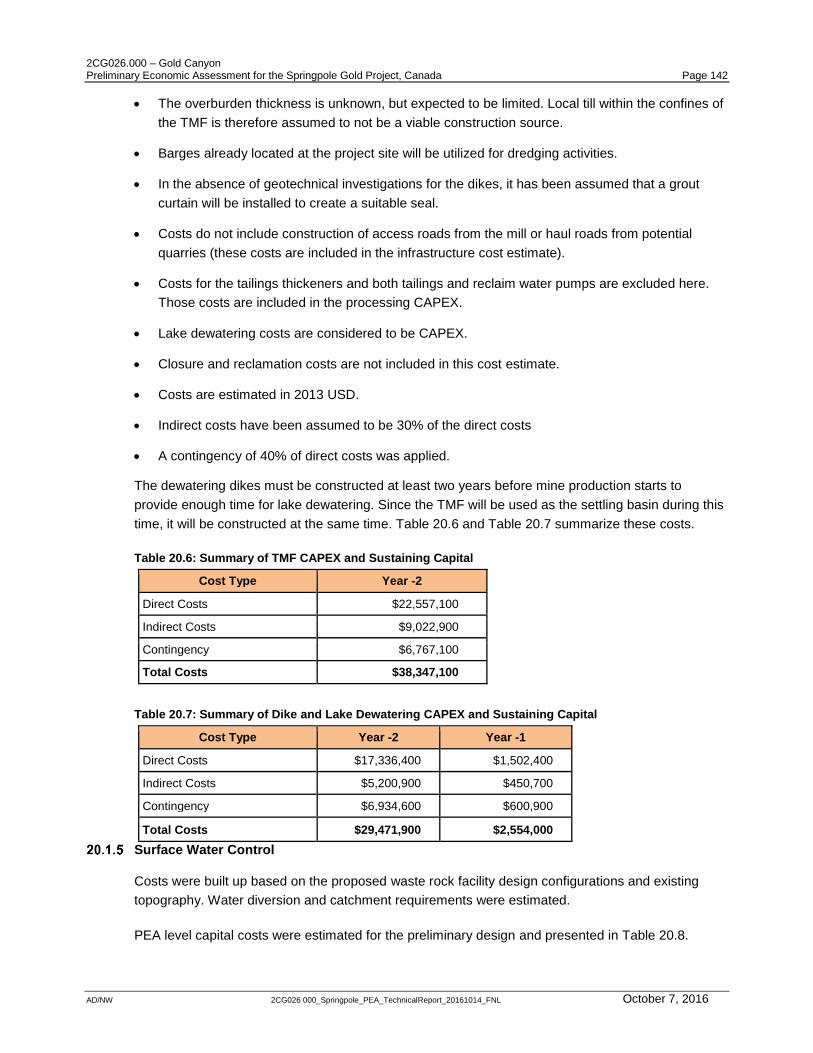
2CG026.000 – Gold Canyon Preliminary Economic Assessment for the Springpole Gold Project, Canada Page 142
AD/NW 2CG026 000_Springpole_PEA_TechnicalReport_20161014_FNL October 7, 2016
The overburden thickness is unknown, but expected to be limited. Local till within the confines of
the TMF is therefore assumed to not be a viable construction source.
Barges already located at the project site will be utilized for dredging activities.
In the absence of geotechnical investigations for the dikes, it has been assumed that a grout
curtain will be installed to create a suitable seal.
Costs do not include construction of access roads from the mill or haul roads from potential
quarries (these costs are included in the infrastructure cost estimate).
Costs for the tailings thickeners and both tailings and reclaim water pumps are excluded here.
Those costs are included in the processing CAPEX.
Lake dewatering costs are considered to be CAPEX.
Closure and reclamation costs are not included in this cost estimate.
Costs are estimated in 2013 USD.
Indirect costs have been assumed to be 30% of the direct costs
A contingency of 40% of direct costs was applied.
The dewatering dikes must be constructed at least two years before mine production starts to
provide enough time for lake dewatering. Since the TMF will be used as the settling basin during this
time, it will be constructed at the same time. Table 20.6 and Table 20.7 summarize these costs.
Table 20.6: Summary of TMF CAPEX and Sustaining Capital
Cost Type Year -2
Direct Costs $22,557,100
Indirect Costs $9,022,900
Contingency $6,767,100
Total Costs $38,347,100
Table 20.7: Summary of Dike and Lake Dewatering CAPEX and Sustaining Capital
Cost Type Year -2 Year -1
Direct Costs $17,336,400 $1,502,400
Indirect Costs $5,200,900 $450,700
Contingency $6,934,600 $600,900
Total Costs $29,471,900 $2,554,000
Surface Water Control
Costs were built up based on the proposed waste rock facility design configurations and existing
topography. Water diversion and catchment requirements were estimated.
PEA level capital costs were estimated for the preliminary design and presented in Table 20.8.
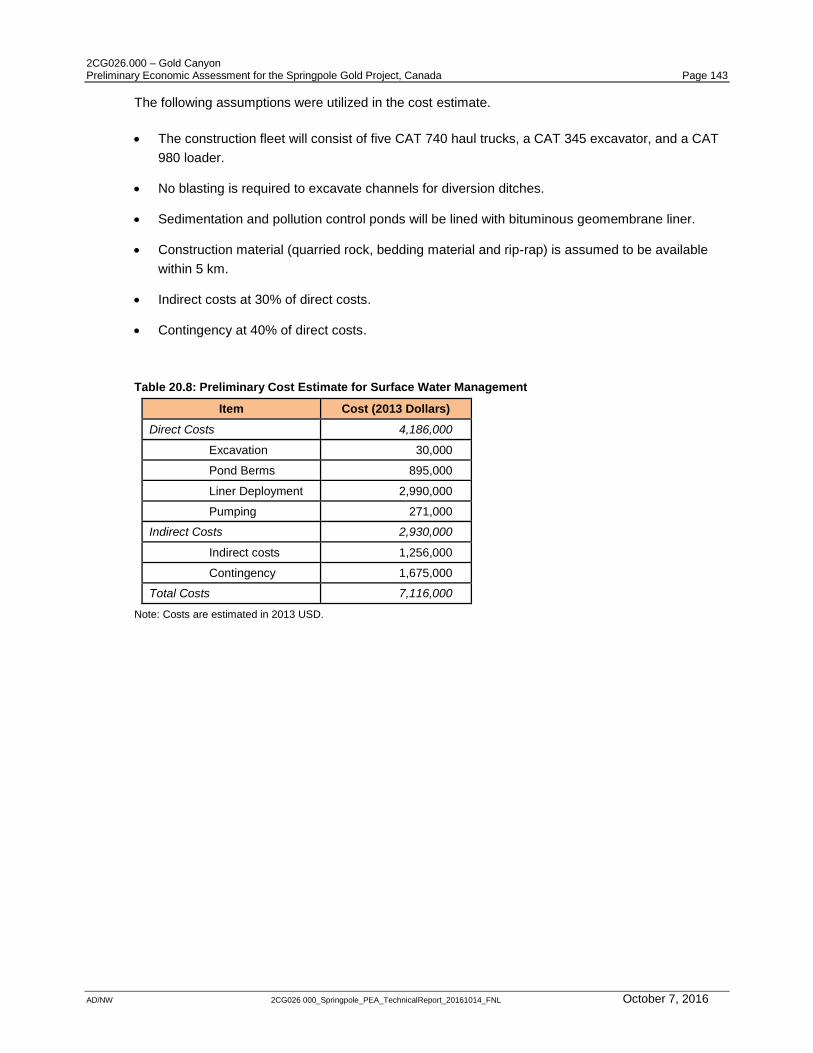
2CG026.000 – Gold Canyon Preliminary Economic Assessment for the Springpole Gold Project, Canada Page 143
AD/NW 2CG026 000_Springpole_PEA_TechnicalReport_20161014_FNL October 7, 2016
The following assumptions were utilized in the cost estimate.
The construction fleet will consist of five CAT 740 haul trucks, a CAT 345 excavator, and a CAT
980 loader.
No blasting is required to excavate channels for diversion ditches.
Sedimentation and pollution control ponds will be lined with bituminous geomembrane liner.
Construction material (quarried rock, bedding material and rip-rap) is assumed to be available
within 5 km.
Indirect costs at 30% of direct costs.
Contingency at 40% of direct costs.
Table 20.8: Preliminary Cost Estimate for Surface Water Management
Item Cost (2013 Dollars)
Direct Costs 4,186,000
Excavation 30,000
Pond Berms 895,000
Liner Deployment 2,990,000
Pumping 271,000
Indirect Costs 2,930,000
Indirect costs 1,256,000
Contingency 1,675,000
Total Costs 7,116,000
Note: Costs are estimated in 2013 USD.
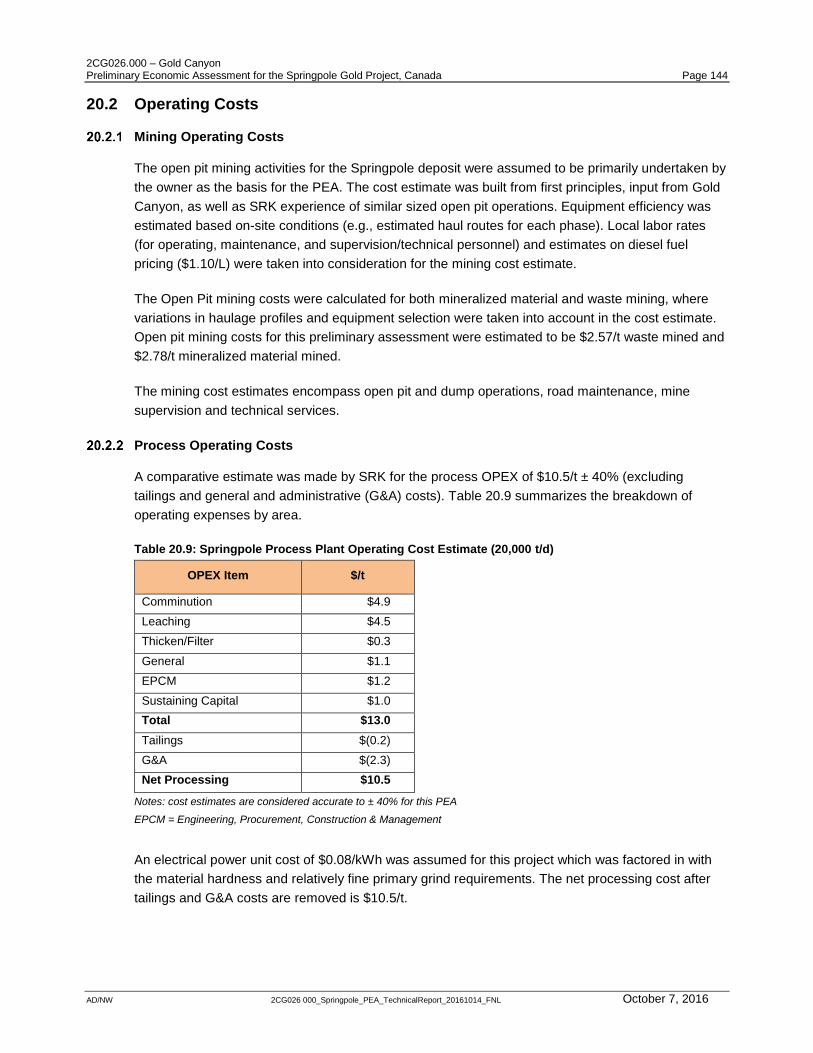
2CG026.000 – Gold Canyon Preliminary Economic Assessment for the Springpole Gold Project, Canada Page 144
AD/NW 2CG026 000_Springpole_PEA_TechnicalReport_20161014_FNL October 7, 2016
20.2 Operating Costs
Mining Operating Costs
The open pit mining activities for the Springpole deposit were assumed to be primarily undertaken by
the owner as the basis for the PEA. The cost estimate was built from first principles, input from Gold
Canyon, as well as SRK experience of similar sized open pit operations. Equipment efficiency was
estimated based on-site conditions (e.g., estimated haul routes for each phase). Local labor rates
(for operating, maintenance, and supervision/technical personnel) and estimates on diesel fuel
pricing ($1.10/L) were taken into consideration for the mining cost estimate.
The Open Pit mining costs were calculated for both mineralized material and waste mining, where
variations in haulage profiles and equipment selection were taken into account in the cost estimate.
Open pit mining costs for this preliminary assessment were estimated to be $2.57/t waste mined and
$2.78/t mineralized material mined.
The mining cost estimates encompass open pit and dump operations, road maintenance, mine
supervision and technical services.
Process Operating Costs
A comparative estimate was made by SRK for the process OPEX of $10.5/t ± 40% (excluding
tailings and general and administrative (G&A) costs). Table 20.9 summarizes the breakdown of
operating expenses by area.
Table 20.9: Springpole Process Plant Operating Cost Estimate (20,000 t/d)
OPEX Item $/t
Comminution $4.9
Leaching $4.5
Thicken/Filter $0.3
General $1.1
EPCM $1.2
Sustaining Capital $1.0
Total $13.0
Tailings $(0.2)
G&A $(2.3)
Net Processing $10.5
Notes: cost estimates are considered accurate to ± 40% for this PEA
EPCM = Engineering, Procurement, Construction & Management
An electrical power unit cost of $0.08/kWh was assumed for this project which was factored in with
the material hardness and relatively fine primary grind requirements. The net processing cost after
tailings and G&A costs are removed is $10.5/t.

2CG026.000 – Gold Canyon Preliminary Economic Assessment for the Springpole Gold Project, Canada Page 145
AD/NW 2CG026 000_Springpole_PEA_TechnicalReport_20161014_FNL October 7, 2016
Grinding media and liner wear were considered typical and the labour cost is for 95 process
employees (staff + hourly) with a 42% burden applied. The OPEX includes sustaining capital which
has been estimated at $1/t.
Tailings, Dewatering Dike and Surface Water Management Operating Costs
OPEX for the TMF consist of operating the secondary thickener, and subsequently pumping tailings
from the secondary thickener to the central TMF discharge point. This point has to be raised over the
LOM. This cost equates to $0.83/t. The cost of pumping tailings slurry to the secondary thickener,
and subsequently pumping recycle water back to the mill, is included in the mill operating cost.
No operating costs were included for the dewatering dikes. It is assumed that any water seeping
through the dikes will be included in the mining water management costs. Yearly operating costs for
surface water management are estimated to be $33,000, assuming pumps are operating 50% of the
time.
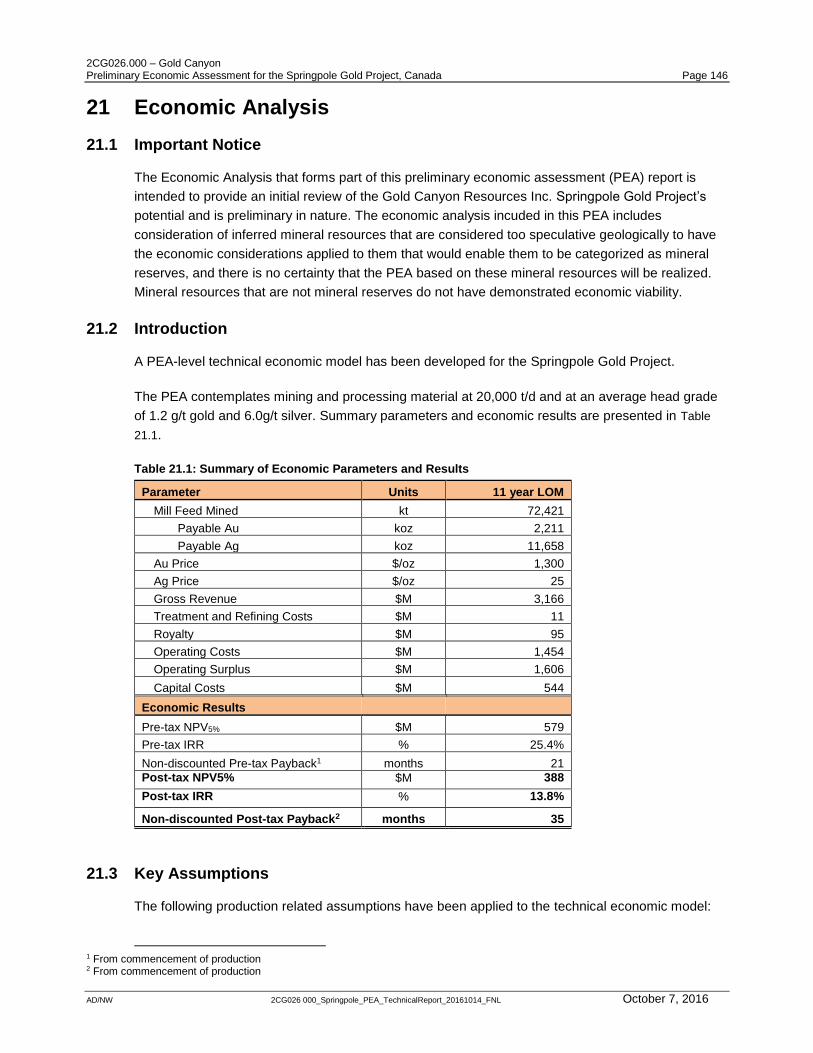
2CG026.000 – Gold Canyon Preliminary Economic Assessment for the Springpole Gold Project, Canada Page 146
AD/NW 2CG026 000_Springpole_PEA_TechnicalReport_20161014_FNL October 7, 2016
21 Economic Analysis
21.1 Important Notice
The Economic Analysis that forms part of this preliminary economic assessment (PEA) report is
intended to provide an initial review of the Gold Canyon Resources Inc. Springpole Gold Project’s
potential and is preliminary in nature. The economic analysis incuded in this PEA includes
consideration of inferred mineral resources that are considered too speculative geologically to have
the economic considerations applied to them that would enable them to be categorized as mineral
reserves, and there is no certainty that the PEA based on these mineral resources will be realized.
Mineral resources that are not mineral reserves do not have demonstrated economic viability.
21.2 Introduction
A PEA-level technical economic model has been developed for the Springpole Gold Project.
The PEA contemplates mining and processing material at 20,000 t/d and at an average head grade
of 1.2 g/t gold and 6.0g/t silver. Summary parameters and economic results are presented in Table
21.1.
Table 21.1: Summary of Economic Parameters and Results
Parameter Units 11 year LOM
Mill Feed Mined kt 72,421
Payable Au koz 2,211
Payable Ag koz 11,658
Au Price $/oz 1,300
Ag Price $/oz 25
Gross Revenue $M 3,166
Treatment and Refining Costs $M 11
Royalty $M 95
Operating Costs $M 1,454
Operating Surplus $M 1,606
Capital Costs $M 544
Economic Results
Pre-tax NPV5% $M 579
Pre-tax IRR % 25.4%
Non-discounted Pre-tax Payback1 months 21
Post-tax NPV5% $M 388
Post-tax IRR % 13.8%
Non-discounted Post-tax Payback2 months 35
21.3 Key Assumptions
The following production related assumptions have been applied to the technical economic model:
1 From commencement of production 2 From commencement of production
2CG026.000 – Gold Canyon Preliminary Economic Assessment for the Springpole Gold Project, Canada Page 147
AD/NW 2CG026 000_Springpole_PEA_TechnicalReport_20161014_FNL October 7, 2016
Production rate at maximum of 20,000 t/d over 365 d/yr.
Pre-production period of five years.
In addition, the following general assumptions have been applied for mine design and economic
evaluation:
A base case discount factor of 5% has been applied for NPV calculations. SRK considers this to
be typical for gold projects of this type and in this location. .
An average LOM sales price of $1,300/oz gold.
An average LOM sales price of $25/oz silver.
Net smelter royalty of 3% on revenue.
Working capital days have been assumed at 45 days for creditors and 45 debtors.
Modelling Practice
The project was evaluated using an Excel® based discounted cashflow model. The periods used
were annual. The model used real, un-escalated Q1 2013 USD.
The asset-level model assumes a simple all-equity project ownership and financing. No
consideration of equipment leasing, project financing, bonding, metal strips, royalty sales (except for
existing government and private royalties) forward sales, hedging, or any other financial
arrangements was undertaken. No consideration was given to the structure of the ownership
company.
The valuation was undertaken on a pre-tax and post-tax basis.
Construction Schedule
For the purposes of economic evaluation, five years of pre-production were assumed, comprising
three years for permitting and two years for construction.
Delays to commencement of construction do not materially alter the economic potential of the
underlying project, but it must be recognised that costs associated with permitting, studies and
management activities will accrue during the pre-construction phase. It should be noted that the
impact of costs associated with a delayed construction schedule on the economics of the overall
project have not been considered in modelled scenarios.
Production Schedule
The mining production schedule evaluated was generated by SRK as described in Section 15.5 and
is reproduced in Table 21.2.
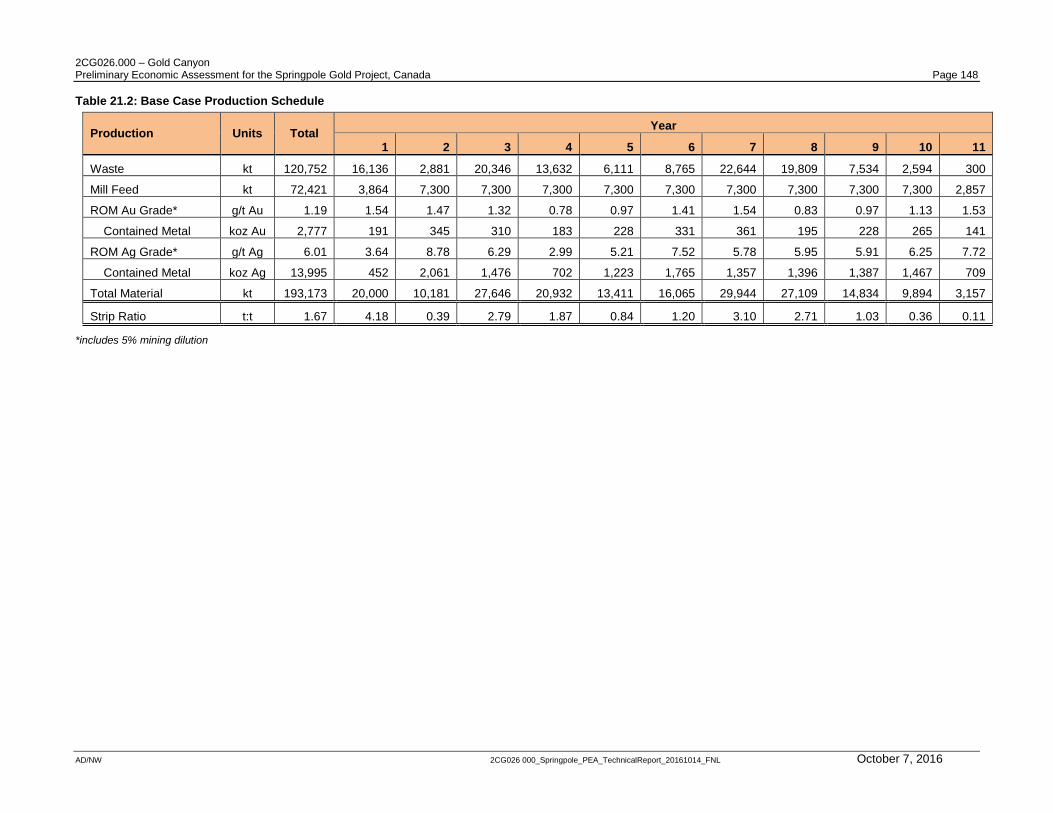
2CG026.000 – Gold Canyon Preliminary Economic Assessment for the Springpole Gold Project, Canada Page 148
AD/NW 2CG026 000_Springpole_PEA_TechnicalReport_20161014_FNL October 7, 2016
Table 21.2: Base Case Production Schedule
Production Units Total Year
1 2 3 4 5 6 7 8 9 10 11
Waste kt 120,752 16,136 2,881 20,346 13,632 6,111 8,765 22,644 19,809 7,534 2,594 300
Mill Feed kt 72,421 3,864 7,300 7,300 7,300 7,300 7,300 7,300 7,300 7,300 7,300 2,857
ROM Au Grade* g/t Au 1.19 1.54 1.47 1.32 0.78 0.97 1.41 1.54 0.83 0.97 1.13 1.53
Contained Metal koz Au 2,777 191 345 310 183 228 331 361 195 228 265 141
ROM Ag Grade* g/t Ag 6.01 3.64 8.78 6.29 2.99 5.21 7.52 5.78 5.95 5.91 6.25 7.72
Contained Metal koz Ag 13,995 452 2,061 1,476 702 1,223 1,765 1,357 1,396 1,387 1,467 709
Total Material kt 193,173 20,000 10,181 27,646 20,932 13,411 16,065 29,944 27,109 14,834 9,894 3,157
Strip Ratio t:t 1.67 4.18 0.39 2.79 1.87 0.84 1.20 3.10 2.71 1.03 0.36 0.11
*includes 5% mining dilution
2CG026.000 – Gold Canyon Preliminary Economic Assessment for the Springpole Gold Project, Canada Page 149
AD/NW 2CG026 000_Springpole_PEA_TechnicalReport_20161014_FNL October 7, 2016
Mine Life
The LOM is 11 production years. The first year of production includes near-surface material that
does not require pre-stripping in year 1. Both mineralized material and waste mining ends in
Year 11.
Commodity Pricing
The base case economic evaluation uses long-term commodity prices of $1,300/oz for gold and
$25/oz for silver. Sales prices have been applied to all LOM production without escalation or
hedging.
SRK considers the use of these prices for design and evaluation to be reasonable and to lie within
the range of published price assumptions recently used for studies of this type.
Revenue Calculations
Revenue is determined by applying selected metal prices to the annual payable metal contained in
doré, minus refining and royalty payments. Detailed calculation of revenue is presented in Table
21.3.
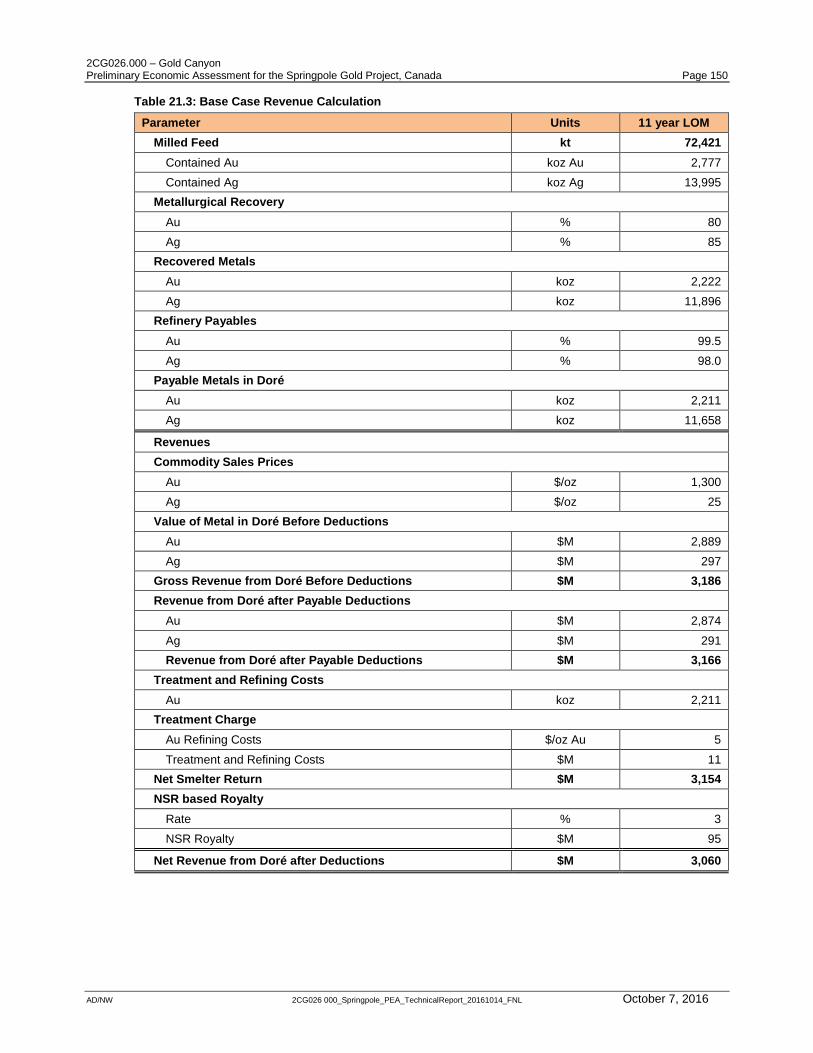
2CG026.000 – Gold Canyon Preliminary Economic Assessment for the Springpole Gold Project, Canada Page 150
AD/NW 2CG026 000_Springpole_PEA_TechnicalReport_20161014_FNL October 7, 2016
Table 21.3: Base Case Revenue Calculation
Parameter Units 11 year LOM
Milled Feed kt 72,421
Contained Au koz Au 2,777
Contained Ag koz Ag 13,995
Metallurgical Recovery
Au % 80
Ag % 85
Recovered Metals
Au koz 2,222
Ag koz 11,896
Refinery Payables
Au % 99.5
Ag % 98.0
Payable Metals in Doré
Au koz 2,211
Ag koz 11,658
Revenues
Commodity Sales Prices
Au $/oz 1,300
Ag $/oz 25
Value of Metal in Doré Before Deductions
Au $M 2,889
Ag $M 297
Gross Revenue from Doré Before Deductions $M 3,186
Revenue from Doré after Payable Deductions
Au $M 2,874
Ag $M 291
Revenue from Doré after Payable Deductions $M 3,166
Treatment and Refining Costs
Au koz 2,211
Treatment Charge
Au Refining Costs $/oz Au 5
Treatment and Refining Costs $M 11
Net Smelter Return $M 3,154
NSR based Royalty
Rate % 3
NSR Royalty $M 95
Net Revenue from Doré after Deductions $M 3,060
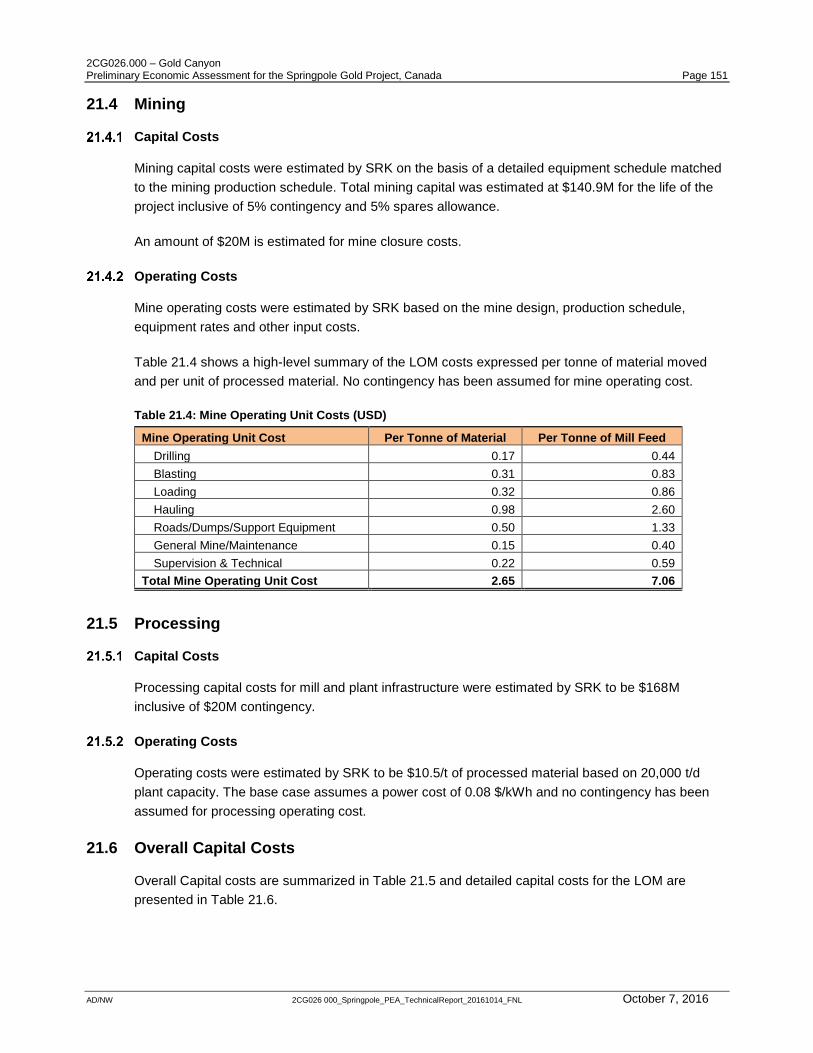
2CG026.000 – Gold Canyon Preliminary Economic Assessment for the Springpole Gold Project, Canada Page 151
AD/NW 2CG026 000_Springpole_PEA_TechnicalReport_20161014_FNL October 7, 2016
21.4 Mining
Capital Costs
Mining capital costs were estimated by SRK on the basis of a detailed equipment schedule matched
to the mining production schedule. Total mining capital was estimated at $140.9M for the life of the
project inclusive of 5% contingency and 5% spares allowance.
An amount of $20M is estimated for mine closure costs.
Operating Costs
Mine operating costs were estimated by SRK based on the mine design, production schedule,
equipment rates and other input costs.
Table 21.4 shows a high-level summary of the LOM costs expressed per tonne of material moved
and per unit of processed material. No contingency has been assumed for mine operating cost.
Table 21.4: Mine Operating Unit Costs (USD)
Mine Operating Unit Cost Per Tonne of Material Per Tonne of Mill Feed
Drilling 0.17 0.44
Blasting 0.31 0.83
Loading 0.32 0.86
Hauling 0.98 2.60
Roads/Dumps/Support Equipment 0.50 1.33
General Mine/Maintenance 0.15 0.40
Supervision & Technical 0.22 0.59
Total Mine Operating Unit Cost 2.65 7.06
21.5 Processing
Capital Costs
Processing capital costs for mill and plant infrastructure were estimated by SRK to be $168M
inclusive of $20M contingency.
Operating Costs
Operating costs were estimated by SRK to be $10.5/t of processed material based on 20,000 t/d
plant capacity. The base case assumes a power cost of 0.08 $/kWh and no contingency has been
assumed for processing operating cost.
21.6 Overall Capital Costs
Overall Capital costs are summarized in Table 21.5 and detailed capital costs for the LOM are
presented in Table 21.6.
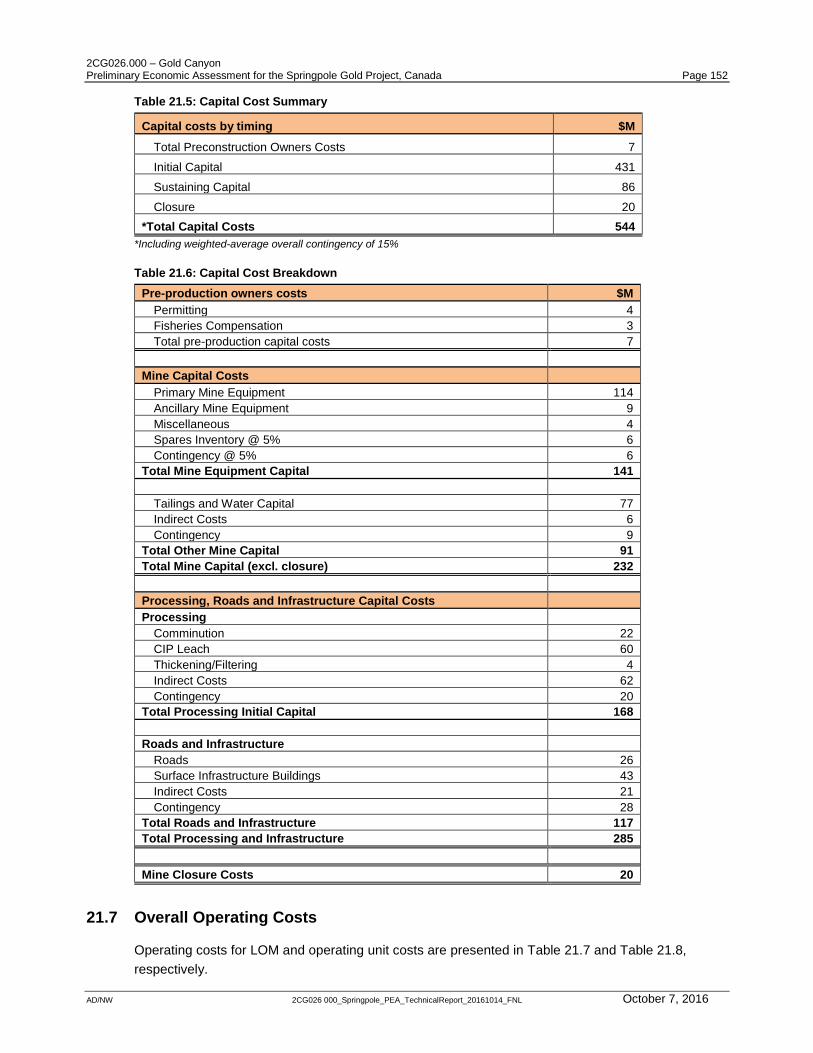
2CG026.000 – Gold Canyon Preliminary Economic Assessment for the Springpole Gold Project, Canada Page 152
AD/NW 2CG026 000_Springpole_PEA_TechnicalReport_20161014_FNL October 7, 2016
Table 21.5: Capital Cost Summary
Capital costs by timing $M
Total Preconstruction Owners Costs 7
Initial Capital 431
Sustaining Capital 86
Closure 20
*Total Capital Costs 544
*Including weighted-average overall contingency of 15%
Table 21.6: Capital Cost Breakdown
Pre-production owners costs $M
Permitting 4
Fisheries Compensation 3
Total pre-production capital costs 7
Mine Capital Costs
Primary Mine Equipment 114
Ancillary Mine Equipment 9
Miscellaneous 4
Spares Inventory @ 5% 6
Contingency @ 5% 6
Total Mine Equipment Capital 141
Tailings and Water Capital 77
Indirect Costs 6
Contingency 9
Total Other Mine Capital 91
Total Mine Capital (excl. closure) 232
Processing, Roads and Infrastructure Capital Costs Processing
Comminution 22
CIP Leach 60
Thickening/Filtering 4
Indirect Costs 62
Contingency 20
Total Processing Initial Capital 168
Roads and Infrastructure
Roads 26
Surface Infrastructure Buildings 43
Indirect Costs 21
Contingency 28
Total Roads and Infrastructure 117
Total Processing and Infrastructure 285
Mine Closure Costs 20
21.7 Overall Operating Costs
Operating costs for LOM and operating unit costs are presented in Table 21.7 and Table 21.8,
respectively.
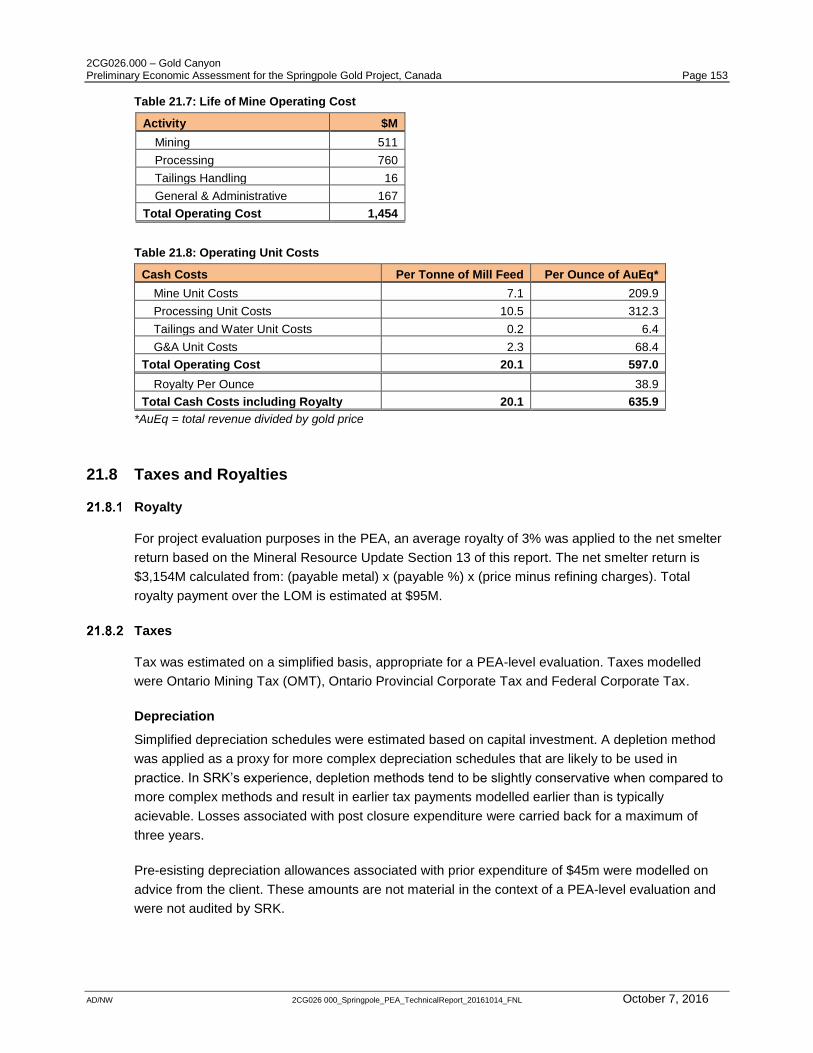
2CG026.000 – Gold Canyon Preliminary Economic Assessment for the Springpole Gold Project, Canada Page 153
AD/NW 2CG026 000_Springpole_PEA_TechnicalReport_20161014_FNL October 7, 2016
Table 21.7: Life of Mine Operating Cost
Activity $M
Mining 511
Processing 760
Tailings Handling 16
General & Administrative 167
Total Operating Cost 1,454
Table 21.8: Operating Unit Costs
Cash Costs Per Tonne of Mill Feed Per Ounce of AuEq*
Mine Unit Costs 7.1 209.9
Processing Unit Costs 10.5 312.3
Tailings and Water Unit Costs 0.2 6.4
G&A Unit Costs 2.3 68.4
Total Operating Cost 20.1 597.0
Royalty Per Ounce 38.9
Total Cash Costs including Royalty 20.1 635.9
*AuEq = total revenue divided by gold price
21.8 Taxes and Royalties
Royalty
For project evaluation purposes in the PEA, an average royalty of 3% was applied to the net smelter
return based on the Mineral Resource Update Section 13 of this report. The net smelter return is
$3,154M calculated from: (payable metal) x (payable %) x (price minus refining charges). Total
royalty payment over the LOM is estimated at $95M.
Taxes
Tax was estimated on a simplified basis, appropriate for a PEA-level evaluation. Taxes modelled
were Ontario Mining Tax (OMT), Ontario Provincial Corporate Tax and Federal Corporate Tax.
Depreciation
Simplified depreciation schedules were estimated based on capital investment. A depletion method
was applied as a proxy for more complex depreciation schedules that are likely to be used in
practice. In SRK’s experience, depletion methods tend to be slightly conservative when compared to
more complex methods and result in earlier tax payments modelled earlier than is typically
acievable. Losses associated with post closure expenditure were carried back for a maximum of
three years.
Pre-esisting depreciation allowances associated with prior expenditure of $45m were modelled on
advice from the client. These amounts are not material in the context of a PEA-level evaluation and
were not audited by SRK.
2CG026.000 – Gold Canyon Preliminary Economic Assessment for the Springpole Gold Project, Canada Page 154
AD/NW 2CG026 000_Springpole_PEA_TechnicalReport_20161014_FNL October 7, 2016
Ontario Mining Tax
The assumption was made that the mine was “remote” for the purposes of OMT caluations and
accordingly a rate of 5% was applied. Royalties were included in the basis of calculation for this tax.
Ontario Provincial Corporate Tax
A rate of 10% was applied to taxable income.
Federal Corporate Tax
A rate of 15% was applied to taxable income. Note the provicnical and federal taxes are applied to
the same basis. Neither is deductible for estimation of the other.
21.9 Working Capital
A high level estimation of working capital has been incorporated into the cashflow. This comprises
estimates of accounts receivable terms, accounts payable terms and stores stock levels.
21.10 Base Case Valuations
Important Notice
The Economic Analysis that forms part of this preliminary economic assessment (PEA) report is
intended to provide an initial review of the Gold Canyon Resources Inc. Springpole Gold Project’s
potential and is preliminary in nature. The economic analysis incuded in this PEA includes
consideration of inferred mineral resources that are considered too speculative geologically to have
the economic considerations applied to them that would enable them to be categorized as mineral
reserves, and there is no certainty that the PEA based on these mineral resources will be realized.
Mineral resources that are not mineral reserves do not have demonstrated economic viability.
Results
The primary economic evaluation measures used were total LOM cashflow, NPV of this cashflow at
a 5% discount rate, the internal rate of return of the project cashflows, and the payback period on a
non-discounted basis. Table 21.9 summarizes the high level economic outputs from the modelling.
Note that payback is quoted from the commencement of production.
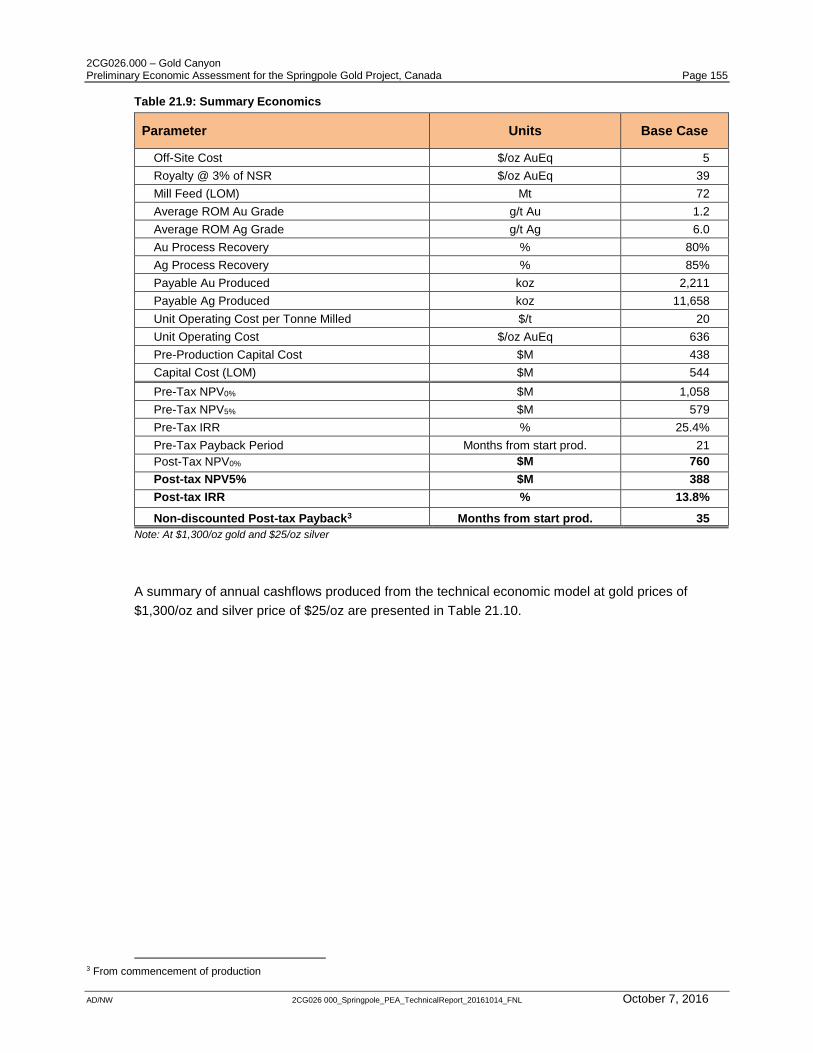
2CG026.000 – Gold Canyon Preliminary Economic Assessment for the Springpole Gold Project, Canada Page 155
AD/NW 2CG026 000_Springpole_PEA_TechnicalReport_20161014_FNL October 7, 2016
Table 21.9: Summary Economics
Parameter Units Base Case
Off-Site Cost $/oz AuEq 5
Royalty @ 3% of NSR $/oz AuEq 39
Mill Feed (LOM) Mt 72
Average ROM Au Grade g/t Au 1.2
Average ROM Ag Grade g/t Ag 6.0
Au Process Recovery % 80%
Ag Process Recovery % 85%
Payable Au Produced koz 2,211
Payable Ag Produced koz 11,658
Unit Operating Cost per Tonne Milled $/t 20
Unit Operating Cost $/oz AuEq 636
Pre-Production Capital Cost $M 438
Capital Cost (LOM) $M 544
Pre-Tax NPV0% $M 1,058
Pre-Tax NPV5% $M 579
Pre-Tax IRR % 25.4%
Pre-Tax Payback Period Months from start prod. 21
Post-Tax NPV0% $M 760
Post-tax NPV5% $M 388
Post-tax IRR % 13.8%
Non-discounted Post-tax Payback3 Months from start prod. 35
Note: At $1,300/oz gold and $25/oz silver
A summary of annual cashflows produced from the technical economic model at gold prices of
$1,300/oz and silver price of $25/oz are presented in Table 21.10.
3 From commencement of production
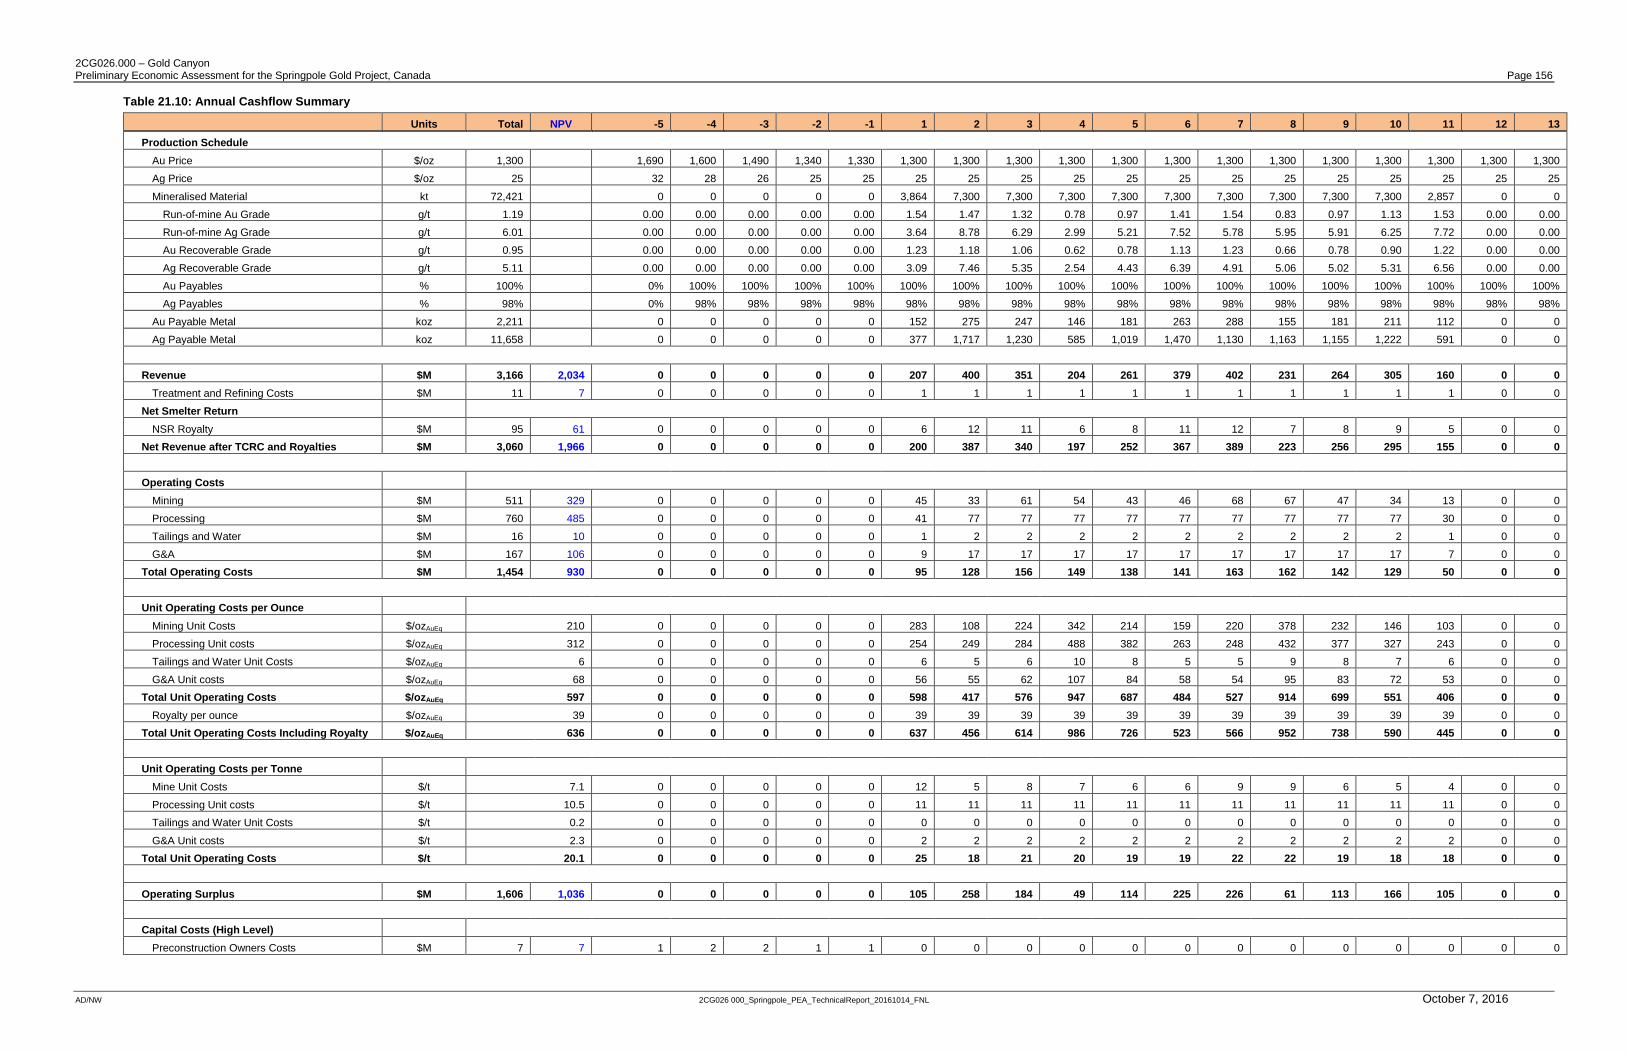
2CG026.000 – Gold Canyon Preliminary Economic Assessment for the Springpole Gold Project, Canada Page 156
AD/NW 2CG026 000_Springpole_PEA_TechnicalReport_20161014_FNL October 7, 2016
Table 21.10: Annual Cashflow Summary
Units Total NPV -5 -4 -3 -2 -1 1 2 3 4 5 6 7 8 9 10 11 12 13
Production Schedule
Au Price $/oz 1,300 1,690 1,600 1,490 1,340 1,330 1,300 1,300 1,300 1,300 1,300 1,300 1,300 1,300 1,300 1,300 1,300 1,300 1,300
Ag Price $/oz 25 32 28 26 25 25 25 25 25 25 25 25 25 25 25 25 25 25 25
Mineralised Material kt 72,421 0 0 0 0 0 3,864 7,300 7,300 7,300 7,300 7,300 7,300 7,300 7,300 7,300 2,857 0 0
Run-of-mine Au Grade g/t 1.19 0.00 0.00 0.00 0.00 0.00 1.54 1.47 1.32 0.78 0.97 1.41 1.54 0.83 0.97 1.13 1.53 0.00 0.00
Run-of-mine Ag Grade g/t 6.01 0.00 0.00 0.00 0.00 0.00 3.64 8.78 6.29 2.99 5.21 7.52 5.78 5.95 5.91 6.25 7.72 0.00 0.00
Au Recoverable Grade g/t 0.95 0.00 0.00 0.00 0.00 0.00 1.23 1.18 1.06 0.62 0.78 1.13 1.23 0.66 0.78 0.90 1.22 0.00 0.00
Ag Recoverable Grade g/t 5.11 0.00 0.00 0.00 0.00 0.00 3.09 7.46 5.35 2.54 4.43 6.39 4.91 5.06 5.02 5.31 6.56 0.00 0.00
Au Payables % 100% 0% 100% 100% 100% 100% 100% 100% 100% 100% 100% 100% 100% 100% 100% 100% 100% 100% 100%
Ag Payables % 98% 0% 98% 98% 98% 98% 98% 98% 98% 98% 98% 98% 98% 98% 98% 98% 98% 98% 98%
Au Payable Metal koz 2,211 0 0 0 0 0 152 275 247 146 181 263 288 155 181 211 112 0 0
Ag Payable Metal koz 11,658 0 0 0 0 0 377 1,717 1,230 585 1,019 1,470 1,130 1,163 1,155 1,222 591 0 0
Revenue $M 3,166 2,034 0 0 0 0 0 207 400 351 204 261 379 402 231 264 305 160 0 0
Treatment and Refining Costs $M 11 7 0 0 0 0 0 1 1 1 1 1 1 1 1 1 1 1 0 0
Net Smelter Return
NSR Royalty $M 95 61 0 0 0 0 0 6 12 11 6 8 11 12 7 8 9 5 0 0
Net Revenue after TCRC and Royalties $M 3,060 1,966 0 0 0 0 0 200 387 340 197 252 367 389 223 256 295 155 0 0
Operating Costs
Mining $M 511 329 0 0 0 0 0 45 33 61 54 43 46 68 67 47 34 13 0 0
Processing $M 760 485 0 0 0 0 0 41 77 77 77 77 77 77 77 77 77 30 0 0
Tailings and Water $M 16 10 0 0 0 0 0 1 2 2 2 2 2 2 2 2 2 1 0 0
G&A $M 167 106 0 0 0 0 0 9 17 17 17 17 17 17 17 17 17 7 0 0
Total Operating Costs $M 1,454 930 0 0 0 0 0 95 128 156 149 138 141 163 162 142 129 50 0 0
Unit Operating Costs per Ounce
Mining Unit Costs $/ozAuEq 210 0 0 0 0 0 283 108 224 342 214 159 220 378 232 146 103 0 0
Processing Unit costs $/ozAuEq 312 0 0 0 0 0 254 249 284 488 382 263 248 432 377 327 243 0 0
Tailings and Water Unit Costs $/ozAuEq 6 0 0 0 0 0 6 5 6 10 8 5 5 9 8 7 6 0 0
G&A Unit costs $/ozAuEq 68 0 0 0 0 0 56 55 62 107 84 58 54 95 83 72 53 0 0
Total Unit Operating Costs $/ozAuEq 597 0 0 0 0 0 598 417 576 947 687 484 527 914 699 551 406 0 0
Royalty per ounce $/ozAuEq 39 0 0 0 0 0 39 39 39 39 39 39 39 39 39 39 39 0 0
Total Unit Operating Costs Including Royalty $/ozAuEq 636 0 0 0 0 0 637 456 614 986 726 523 566 952 738 590 445 0 0
Unit Operating Costs per Tonne
Mine Unit Costs $/t 7.1 0 0 0 0 0 12 5 8 7 6 6 9 9 6 5 4 0 0
Processing Unit costs $/t 10.5 0 0 0 0 0 11 11 11 11 11 11 11 11 11 11 11 0 0
Tailings and Water Unit Costs $/t 0.2 0 0 0 0 0 0 0 0 0 0 0 0 0 0 0 0 0 0
G&A Unit costs $/t 2.3 0 0 0 0 0 2 2 2 2 2 2 2 2 2 2 2 0 0
Total Unit Operating Costs $/t 20.1 0 0 0 0 0 25 18 21 20 19 19 22 22 19 18 18 0 0
Operating Surplus $M 1,606 1,036 0 0 0 0 0 105 258 184 49 114 225 226 61 113 166 105 0 0
Capital Costs (High Level)
Preconstruction Owners Costs $M 7 7 1 2 2 1 1 0 0 0 0 0 0 0 0 0 0 0 0 0

2CG026.000 – Gold Canyon Preliminary Economic Assessment for the Springpole Gold Project, Canada Page 157
AD/NW 2CG026 000_Springpole_PEA_TechnicalReport_20161014_FNL October 7, 2016
Units Total NPV -5 -4 -3 -2 -1 1 2 3 4 5 6 7 8 9 10 11 12 13
Initial Capital $M 431 373 0 0 17 200 214 0 0 0 0 0 0 0 0 0 0 0 0 0
Sustaining Capital $M 86 56 0 0 0 0 0 7 15 1 1 1 23 31 6 1 0 0 0 0
Closure $M 20 9 0 0 0 0 0 0 0 0 0 0 0 0 0 0 0 0 10 10
Total Capital Costs $M 544 445 1 2 19 201 215 7 15 1 1 1 23 31 6 1 0 0 10 10
Working Capital $M 4 11 0 0 0 0 0 21 22 -7 -17 7 14 2 -20 5 6 -12 -16 0
Pre-tax Cash Flow US$m 1,058 579 -1 -2 -19 -201 -215 78 222 190 64 106 189 192 75 107 160 117 6 -10
Ontario Mining Tax US$m 56 36 0 0 0 0 0 2 10 8 1 3 8 9 1 3 5 5 1 0
Ontario Provincial Corporate Tax US$m 147 94 0 0 0 0 0 6 27 20 2 8 22 23 3 6 14 13 2 0
Federal Corporate Tax US$m 98 63 0 0 0 0 0 4 18 13 2 5 15 15 2 4 9 9 2 0
Post-tax Cash Flow US$m 760 388 -1 -2 -19 -201 -215 69 167 149 60 89 143 145 70 94 132 90 1 -10
Note: At $1,300/oz gold and $25/oz silver.
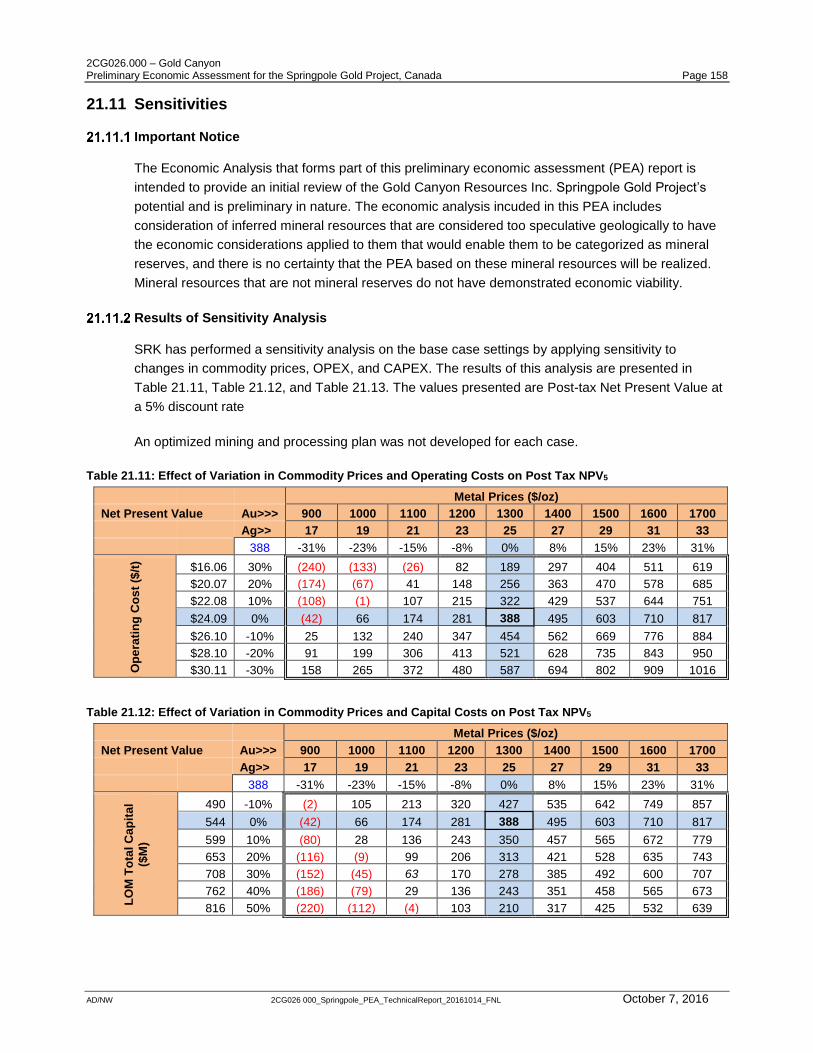
2CG026.000 – Gold Canyon Preliminary Economic Assessment for the Springpole Gold Project, Canada Page 158
AD/NW 2CG026 000_Springpole_PEA_TechnicalReport_20161014_FNL October 7, 2016
21.11 Sensitivities
Important Notice
The Economic Analysis that forms part of this preliminary economic assessment (PEA) report is
intended to provide an initial review of the Gold Canyon Resources Inc. Springpole Gold Project’s
potential and is preliminary in nature. The economic analysis incuded in this PEA includes
consideration of inferred mineral resources that are considered too speculative geologically to have
the economic considerations applied to them that would enable them to be categorized as mineral
reserves, and there is no certainty that the PEA based on these mineral resources will be realized.
Mineral resources that are not mineral reserves do not have demonstrated economic viability.
Results of Sensitivity Analysis
SRK has performed a sensitivity analysis on the base case settings by applying sensitivity to
changes in commodity prices, OPEX, and CAPEX. The results of this analysis are presented in
Table 21.11, Table 21.12, and Table 21.13. The values presented are Post-tax Net Present Value at
a 5% discount rate
An optimized mining and processing plan was not developed for each case.
Table 21.11: Effect of Variation in Commodity Prices and Operating Costs on Post Tax NPV5
Metal Prices ($/oz)
Net Present Value Au>>> 900 1000 1100 1200 1300 1400 1500 1600 1700
Ag>> 17 19 21 23 25 27 29 31 33
388 -31% -23% -15% -8% 0% 8% 15% 23% 31%
Op
era
tin
g C
os
t ($
/t)
$16.06 30% (240) (133) (26) 82 189 297 404 511 619
$20.07 20% (174) (67) 41 148 256 363 470 578 685
$22.08 10% (108) (1) 107 215 322 429 537 644 751
$24.09 0% (42) 66 174 281 388 495 603 710 817
$26.10 -10% 25 132 240 347 454 562 669 776 884
$28.10 -20% 91 199 306 413 521 628 735 843 950
$30.11 -30% 158 265 372 480 587 694 802 909 1016
Table 21.12: Effect of Variation in Commodity Prices and Capital Costs on Post Tax NPV5
Metal Prices ($/oz)
Net Present Value Au>>> 900 1000 1100 1200 1300 1400 1500 1600 1700
Ag>> 17 19 21 23 25 27 29 31 33
388 -31% -23% -15% -8% 0% 8% 15% 23% 31%
LO
M T
ota
l C
ap
ita
l
($M
)
490 -10% (2) 105 213 320 427 535 642 749 857
544 0% (42) 66 174 281 388 495 603 710 817
599 10% (80) 28 136 243 350 457 565 672 779
653 20% (116) (9) 99 206 313 421 528 635 743
708 30% (152) (45) 63 170 278 385 492 600 707
762 40% (186) (79) 29 136 243 351 458 565 673
816 50% (220) (112) (4) 103 210 317 425 532 639
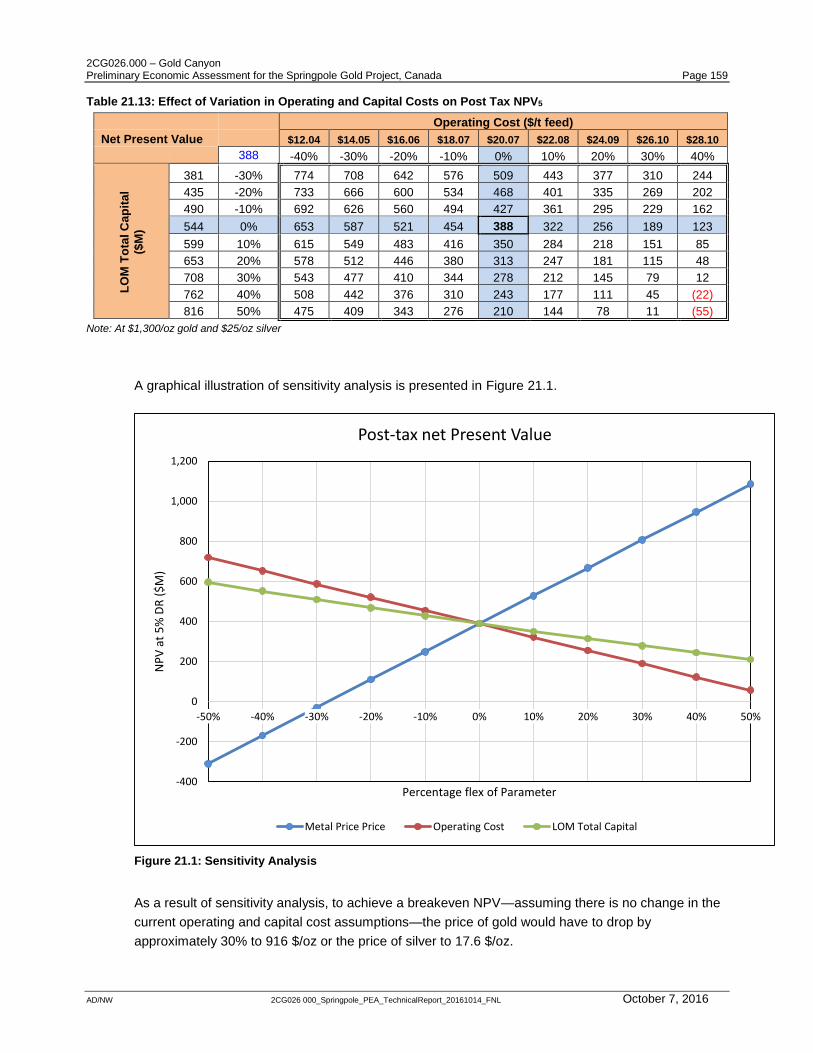
2CG026.000 – Gold Canyon Preliminary Economic Assessment for the Springpole Gold Project, Canada Page 159
AD/NW 2CG026 000_Springpole_PEA_TechnicalReport_20161014_FNL October 7, 2016
Table 21.13: Effect of Variation in Operating and Capital Costs on Post Tax NPV5
Operating Cost ($/t feed)
Net Present Value $12.04 $14.05 $16.06 $18.07 $20.07 $22.08 $24.09 $26.10 $28.10
388 -40% -30% -20% -10% 0% 10% 20% 30% 40%
LO
M T
ota
l C
ap
ita
l
($M
)
381 -30% 774 708 642 576 509 443 377 310 244
435 -20% 733 666 600 534 468 401 335 269 202
490 -10% 692 626 560 494 427 361 295 229 162
544 0% 653 587 521 454 388 322 256 189 123
599 10% 615 549 483 416 350 284 218 151 85
653 20% 578 512 446 380 313 247 181 115 48
708 30% 543 477 410 344 278 212 145 79 12
762 40% 508 442 376 310 243 177 111 45 (22)
816 50% 475 409 343 276 210 144 78 11 (55)
Note: At $1,300/oz gold and $25/oz silver
A graphical illustration of sensitivity analysis is presented in Figure 21.1.
Figure 21.1: Sensitivity Analysis
As a result of sensitivity analysis, to achieve a breakeven NPV—assuming there is no change in the
current operating and capital cost assumptions—the price of gold would have to drop by
approximately 30% to 916 $/oz or the price of silver to 17.6 $/oz.
-400
-200
0
200
400
600
800
1,000
1,200
-50% -40% -30% -20% -10% 0% 10% 20% 30% 40% 50%
NP
V a
t 5
% D
R (
$M
)
Percentage flex of Parameter
Post-tax net Present Value
Metal Price Price Operating Cost LOM Total Capital
2CG026.000 – Gold Canyon Preliminary Economic Assessment for the Springpole Gold Project, Canada Page 160
AD/NW 2CG026 000_Springpole_PEA_TechnicalReport_20161014_FNL October 7, 2016
21.12 Conclusions and Recommendations
Important Notice
The Economic Analysis that forms part of this preliminary economic assessment (PEA) report is
intended to provide an initial review of the Gold Canyon Resources Inc. Springpole Gold Project’s
potential and is preliminary in nature. The economic analysis incuded in this PEA includes
consideration of inferred mineral resources that are considered too speculative geologically to have
the economic considerations applied to them that would enable them to be categorized as mineral
reserves, and there is no certainty that the PEA based on these mineral resources will be realized.
Mineral resources that are not mineral reserves do not have demonstrated economic viability.
Conclusions and Recommendations
The economic analysis of the PEA indicates that a conventional open-pit mining and milling
operation has reasonable prospect of being an economic exploitation strategy. On the basis of the
assumptions used in the this PEA, the a base case post-tax NPV5% of $388M (pre-tax NPV: $579M)
and an IRR of 14% (pre-tax IRR: 25%) on an initial investment of $438M is estimated.
The need for lake drainage is a significant cost to the project and is subject to a higher level of
uncertainty in terms of cost and schedule. Nevertheless, sensitivity analysis inidcates that, at base
case metal price assumptions, the project may be able to absorb significant escalation in capital and
operating costs and potentially remain a viable economic proposition.

2CG026.000 – Gold Canyon Preliminary Economic Assessment for the Springpole Gold Project, Canada Page 161
AD/NW 2CG026 000_Springpole_PEA_TechnicalReport_20161014_FNL October 7, 2016
22 Adjacent Properties
SRK has not done the necessary work to verify the information presented in this section of the
report. The information presented in this section of the report is not necessarily indicative of the
mineralization on the Springpole property.
The largest adjacent property holder is Perry English with a large property position to the west of the
Springpole Gold Project claim block and surrounding Gold Canyon’s Horseshoe Island claim block
(Figure 22.1). Perry English has an agreement with Rubicon Minerals Corporation (Rubicon) in
which the claims held are developed thru the English Royalty Division (ERD) of Rubicon. The ERD
has a program of acquiring mineral properties and then optioning them to mineral exploration
companies. The claims are listed as being owned by Perry English and the MNDM records do not
show the details of the joint venture agreements. Information contained here was obtained from
Rubicon’s website (www.rubiconminerals.com/projects/English-Royalty-Division).
Source: Gold Canyon 2011
Figure 22.1: Springpole Gold Project—Location of Adjacent Properties

2CG026.000 – Gold Canyon Preliminary Economic Assessment for the Springpole Gold Project, Canada Page 162
AD/NW 2CG026 000_Springpole_PEA_TechnicalReport_20161014_FNL October 7, 2016
Strike Graphite Corporation has optioned a claim package from the ERD to the east of the
Springpole Gold Project totalling 1,600 ha. The prospects have a history of gold exploration
dominated by trenching and drilling in the 1980s. Mineralization is hosted within sedimentary rock
packages associated with felsic and intermediate intrusive. The website describes gold
mineralization hosted by various sulphide minerals including pyrite, pyrrhotite and arsenopyrite.
Information contained here was obtained from Strike’s website (www.strikegraphite.com/satterly-lake.html).
Mainstream Minerals Corporation has a package of 13 claims covering 2,080 ha staked on the east
shore of Birch Lake. Historic exploration work has shown significant gold showings hosted within
banded iron formations. There is no indication of any recent exploration work on the prospect.
Information contained here was obtained from Mainstream’s website
(www.mainstreamminerals.com/properties/birch-lake).
Pelangio Exploration Inc. holds a claim package consisting of twenty eight contiguous unpatented
claims totalling 453 ha and covers a series of small islands in Birch Lake. The Birch Lake property is
subject to an option agreement with Trade Winds Ventures Inc. Trade Winds last completed
exploration on the property in 2004 and 2005. This comprised drilling seven diamond drill holes that
intersected gold mineralization in several drill holes including 115.89 g/t gold over 2.90 m in drill hole
TWBL-096. Information contained here was obtained from Pelangio’s website
(www.pelangio.com/Projects/Canada).
AurCrest Gold Inc. holds 31 claims immediately north of the Springpole claim block called the
Richardson Lake prospect. The prospect comprises four separate claims blocks totalling 5,876 ha
including an option from Rubicon’s ERD. At the time of writing this report AurCrest had released
results from five diamond drill holes for a total of 802 m from its winter 2011/2012 drill program.
Highlights include 3 m averaging 3.96 g/t gold including 0.5 m of 7.88 g/t gold from drill hole RL12-
03. Information contained here was obtained from AurCrest’s website (www.aurcrestgold.com).
Cangold Limited holds claims that surround the Argosy Gold Mine and comprise forty-four patented
and fifty-seven unpatented claims totalling 1,616 ha. The last exploration work on the property
consisted of nine diamond drill holes totalling 1,814.8 m of drilling in 2004. Highlights of the drilling
include mineralized intercepts of 52.73 g/t gold over 0.3 m from drill hole AM04-01 which tested the
No. 5 vein. Cangold continues to be involved with the prospect and believes that the Argosy Mine
hosts the potential for up to 1M ounces of gold. Information contained here was obtained from
Cangold’s website (www.cangold.ca/s/Argosy.asp).
Sphere Resources Inc. has eight unpatented claims north of the Springpole Gold Project. No
mention is made of any exploration activity in respect of these claims on the company website.
Information contained here was obtained from Sphere’s website (www.sphereresources.com).

2CG026.000 – Gold Canyon Preliminary Economic Assessment for the Springpole Gold Project, Canada Page 163
AD/NW 2CG026 000_Springpole_PEA_TechnicalReport_20161014_FNL October 7, 2016
23 Other Relevant Data and Information
There are no other relevant data available about the Springpole Gold Project that has not been
included or discussed in this report.
2CG026.000 – Gold Canyon Preliminary Economic Assessment for the Springpole Gold Project, Canada Page 164
AD/NW 2CG026 000_Springpole_PEA_TechnicalReport_20161014_FNL October 7, 2016
24 Interpretation and Conclusions
Industry standard mining, process design, construction methods, and economic evaluation practices
were used to assess the Springpole Gold Project. Based on current knowledge and assumptions,
the results of this study indicate that the project may have positive economics within the very
preliminary parameters of a PEA. and should be advanced to the next level of study - either
preliminary feasibility or feasibility.
The preliminary economic assessment is preliminary in nature; it includes inferred mineral resources
that are considered too speculative geologically to have the economic considerations applied to
them that would enable them to be categorized as mineral reserves, and there is no certainty that
the preliminary economic assessment will be realized.
While a significant amount of information is still required to do a complete assessment, at this point
there do not appear to be any fatal flaws for the project. The study achieved its original objective of
providing a preliminary review of the potential economic viability of the Springpole Gold Project.
24.1 Geology
The quality assurance/quality control program instituted by Gold Canyon and conducted by SGS is
of a standard generally consistent with current industry practice. SRK acknowledges that the QA/QC
procedures have evolved rather recently and much of what is presented above is “catch up” work. In
that respect Gold Canyon have done well to bring the database, at least from 2007 onward up to an
acceptable industry standard. The principal exceptions lie with:
Lack of documentation on QA/QC procedures for drilling prior to 2003;
Blank analyses suggest intermittent contamination introduced at some stage of material storage
or processing; and
The lack of standard reference materials for silver.
The analysis for gold and silver confirms an acceptable degree of reproducibility of samples for gold
and a very good reproducibility for silver.
There is no evidence of bias in either gold or silver as a function of grade but the company needs to
implement written QA/QC procedures for deciding which assay batches are acceptable or not and
which samples need to be re-assayed because of failed QA.
The drill hole database from 2003 through 2012 is of a standard acceptable for public reporting of
resources according to NI 43-101 guidelines.
24.2 Mineral Processing and Metallurgy
The investigations to date on Springpole mineralized material have allowed the following conclusions
to be reached:
The presence of coarse gold in higher grade portions of the East Extension and Camp zones
suggests that gravity concentration should be included in the comminution circuit.
2CG026.000 – Gold Canyon Preliminary Economic Assessment for the Springpole Gold Project, Canada Page 165
AD/NW 2CG026 000_Springpole_PEA_TechnicalReport_20161014_FNL October 7, 2016
Cyanidation of a finely milled product looks promising.
Flotation is an option that requires further investigation.
Heap leaching does not appear attractive.
To further develop the likely process routes, further mineralogical, and metallurgical investigations
are recommended.
This PEA is based on a design plant capacity of 20,000 t/d.
Based on the testwork results to date, a recommended flowsheet of whole feed leaching after
grinding to a P80 size of 70 µm is proposed. A gravity circuit can be included for higher grade feed
material. Cyanide leach extractions of 80% for gold and 85% for silver are expected at this grind
size. Product from the process plant will be doré bullion.
Risks
While considerable metallurgical testwork has been completed to date in three programs on different
samples, additional testwork is warranted to better define the plant design criteria and more
confidently predict expected performance.
To date, a relatively small number of composite samples have been used for flowsheet development.
Additional samples should be collected for variability testing. These samples should each come from
a small area of the deposit (e.g., a single drill hole interval or series of intervals from nearby holes).
Each sample should be tested on the expected flowsheet to quantify variability in performance for
different parts of the deposit. These samples also should be hardness tested using a number of
methods to determine their resistance to SAG milling, ball milling and possibly fine grinding.
Additional testwork needs to be done to confirm cyanide detoxification can be completed
successfully and within normal reagent cost levels. Thickening and filtering characteristics should be
confirmed so that unexpected dewatering costs are not needed. For whole feed leaching, the plant
tailings will likely be acid generating and the associated costs with treatment/handling of this material
need to be estimated.
Future testwork can consider concentrating the sulphides via flotation or classification into a smaller
mass so that it can be stored separately from the remainder of the tailings. For example, dry stack or
subaqueous deposition in the tailings pond to minimise the potential for acid generation.
Opportunities
The testwork conducted to date has identified a number of options that should be considered in
trade-off studies; namely the effect of primary grind size on whole feed leach extraction. With a finer
grind, it appears that gold recoveries up to 90% are achievable, but at the expense of higher grinding
power, media wear and in particular, use of specialised grinding equipment for target P80 grind sizes
below 40 µm. In addition, with a whole feed leaching flowsheet, grinding all the feed finer will lead to
issues of detoxifying and handling the very fine leach residues.

2CG026.000 – Gold Canyon Preliminary Economic Assessment for the Springpole Gold Project, Canada Page 166
AD/NW 2CG026 000_Springpole_PEA_TechnicalReport_20161014_FNL October 7, 2016
The option of concentrating the gold and sulphides with flotation should continue to be investigated
in future testwork. However, it is recommended that a more thorough mineralogical investigation of
the flotation concentrate be conducted prior to any leach testing. The grain size and association of
gold particles should reveal why the flotation concentrate is somewhat resistant to cyanidation at the
same grind sizes. Such information was not possible through the diagnostic leach tests previously
conducted.
24.3 Mineral Resource Estimate
Review of the pre-2003 data lead to some drill hole data for Portage zone, East Extension, and
Camp zones being excluded from the mineral resource estimate. A systematic re-sampling of the
available drill core stored on-site at the Springpole Gold Project would enable the reclassification of
the East Extension zone into indicated resource category without the need to carry out an additional,
extensive drilling campaign. This re-sampling exercise would involve ground survey of drill collar
locations in respect of historic records as well as the inclusion of a systematic program of certified
blanks, certified gold and silver standards, and field and pulp duplicates where sufficient drill core
remains.
The same is not true of pre-2003 drill cores from Portage zone—the inability to accurately verify the
original drill collar locations by any means in respect of surveyed UTM or mining grid locations
combined with the paucity of material due to initially very low core recovery excludes this data set for
resource estimation.
The current mineral resources for the Springpole Gold Project prepared by SRK consider 512 core
boreholes drilled by Gold Canyon and previous owners of the property during the period of 2003 to
2012. The resource estimation work was completed by Dr. Gilles Arseneau, PGeo (APEGBC
#23474), an appropriate independent qualified person as this term is defined in NI 43-101. The
effective date of the resource statement is October 17, 2012.
In the opinion of SRK, the resource evaluation reported herein is a reasonable representation of the
global gold and silver resources found in the Springpole Gold Project at the current level of sampling.
The mineral resources have been estimated in conformity with generally accepted CIM Estimation of
Mineral Resource and Mineral Reserves Best Practices guidelines and are reported in accordance
with the Canadian Securities Administrators’ NI 43-101 and at a 0.4 g/t gold cut-off include 128.2 Mt
grading 1.07 g/t gold classified as indicated mineral resource and 25.7 Mt grading 0.83 g/t gold
classified as inferred mineral resource.
The revised mineral resource estimate (October 17, 2012) was based on a gold price of $1,400/oz
and a silver price of $15/oz. These are considered reasonable economic assumptions by SRK. To
establish a reasonable prospect of economic extraction in an open pit context, the resources were
defined within an optimized pit shell with pit walls set at 45° . Assumed processing recoveries of 80%
for gold and 60% for silver were used. Mining costs were estimated at $2/t of total material,
processing costs estimated at $12/t and G&A costs estimated at $2/t. A COG of 0.4 g/t gold was
calculated and is considered to be an economically reasonable value corresponding with breakeven
mining costs. Approximately 90% of the revenue for the proposed project is derived from gold and
10% from silver.
2CG026.000 – Gold Canyon Preliminary Economic Assessment for the Springpole Gold Project, Canada Page 167
AD/NW 2CG026 000_Springpole_PEA_TechnicalReport_20161014_FNL October 7, 2016
Note: For the mine development (Whittle optimization) and economic analysis in this PEA, updated
input parameters were used.
Industry standard mining, process design, construction methods and economic evaluation practices
were used to assess the Springpole Gold Project. In SRK’s opinion, there is adequate geological and
other pertinent data available to generate a PEA.
Based on current knowledge and assumptions, the results of this study show that the project has the
potential for positive economics (within the very preliminary parameters of a PEA) and should be
advanced to the next level of study; a preliminary feasibility study.
As with almost all mining ventures, there are a large number of risks and opportunities that can
influence the outcome of the Springpole Gold Project. Most of these risks and opportunities are
based on a lack of scientific information (test results, drill results, etc.) or the lack of control over
external drivers (metal price, exchange rates, etc.). The following section identifies the most
significant potential risks and opportunities currently identified for the project, almost all of which are
common to mining projects at this early stage of project development.
Subsequent higher-level engineering studies would need to further refine these risks and
opportunities, identify new ones, and define mitigation or opportunity implementation plans.
While a significant amount of information is still required to do a complete assessment, at this point
there do not appear to be any fatal flaws for the project.
The study achieved its original objective of providing a preliminary review of the potential economic
viability of the Springpole Gold Project.
24.4 Mining
It is proposed that the Springpole deposit is amenable to be developed as an open pit mine. Mining
of the deposit is planned to produce a total of 72 Mt of processing plant feed and 121 Mt of waste
(1.7:1 overall strip ratio) over an eleven year mine production life.
Risks
The current understanding of the project is based upon limited and time sensitive information.
Changes in the understanding of the project, the ability to convert resources to reserves and market
conditions could affect the project’s economic viability.
Opportunities
With additional data, the project should be subjected to a series of strategic option reviews aimed at
determining the most valuable strategy for exploiting the resource including the LOM schedule.
Planning and executing the project at the correct scale, with the optimum mine design and
processing systems will result in the maximum possible value to shareholders and other economic
stakeholders.

2CG026.000 – Gold Canyon Preliminary Economic Assessment for the Springpole Gold Project, Canada Page 168
AD/NW 2CG026 000_Springpole_PEA_TechnicalReport_20161014_FNL October 7, 2016
Pit optimization work has identified larger pit shells which are economic with current input
parameters with the Whittle software identified a number of potential pit shells (or phases) and the
selected pit shell provides higher grades, lower strip ratio, and reduced capital and operating
expense.
If conditions change such that a larger pit shell is selected to recover more resources, infrastructure
such as the proposed cofferdam should not be impacted. Consideration in the location and design of
the cofferdam took this possibility into consideration.
24.5 Geotechnical
There is possibly an up-side improvement in slope design-angles if a significant increase in the
confidence of the geotechnical data (and model) can be achieved. What may ultimately control
achievable slope angles (apart from hydrogeological constraints) is the Weak to Intermediate-
domain spatial arrangement, and anisotropy in the host rock in the Strong-domain. To achieve a pre-
feasibility level of confidence for the slope design input parameters:
Design and implement an oriented-core geotechnical drill program to log the rock mass and
acquire intact rock and joint samples.
Do laboratory and field tests to adequately characterize the intact rock strength and joint
properties of the main rock types.
Map and describe all major faults, as viewed in drill core and rock outcrop within 200 m of the pit
crest and integrate them with the regional structural interpretation.
Produce robust 3-D digital wireframe models of lithology, alteration with intensity, and structures.
Characterize the rock mass using an appropriate rock mass rating system (for example RMR89), and
map the geotechnical domains within a 3-D model.
24.6 Hydrogeology
Hydrogeological data are limited for the Springpole site. Based on experience from other northern
mining operations in Canada, the following conclusions have been developed for the Springpole
Gold Project:
Management of groundwater within the pit may be required through conventional methods such
as dewatering wells and sumps to reduce mine trafficability issues, although this should be
within reasonable mining costs.
Elevated pore pressures may develop during excavation of the pit in both overburden and
bedrock. Without adequate hydrogeological data collection, the assumption for the PEA is that
water and potential excess pressures can be managed and will not impact the slope design.
Groundwater quality is unknown. Groundwater will likely be used in the mine water supply and
excess is typically sent to the mill pond if its quality is below groundwater discharge guideline
limits.
Recommendations for pre-feasibility level studies are provided in the following section.
2CG026.000 – Gold Canyon Preliminary Economic Assessment for the Springpole Gold Project, Canada Page 169
AD/NW 2CG026 000_Springpole_PEA_TechnicalReport_20161014_FNL October 7, 2016
Risks
In general, hydrogeological uncertainties for the Springpole property include:
The mine will be located within the existing (dewatered) lake footprint. The hydrogeology of the
project area has not been fully characterised with respect to groundwater flow directions,
transmissive features, and the potential for hydraulic connection to the surrounding lake.
Seepage may be anticipated through and beneath the coffer dams.
Limited understanding of the geological and structural models will result in low confidence of the
distribution of hydraulic conductivity within—and in the vicinity of—the proposed pit, resulting in
uncertainty relating to the magnitude of possible groundwater inflows to the pit.
No information on baseline groundwater quality.
These uncertainties correspond to the following potential risks:
Higher than anticipated groundwater flow. Resulting from highly transmissive features such
as structures or highly permeable horizons, or weathered/altered zones, there is a risk of higher
than anticipated inflows to the pit, resulting in high pumping requirements / management costs.
Geological and structural models to be developed further to increase confidence in the
conceptual hydrogeological model. Seepage through coffer dams has not been assessed and
may result in unanticipated seepage rates leading to high water management/ treatment costs.
Elevated pore pressures. In low hydraulic conductivity bedrock, drainage of groundwater may
not be able to keep up with the excavation of the pit, resulting in a buildup of pore pressures in
the pit walls that may lead to geotechnical instability if not accounted for or mitigated.
Hydrogeological investigations of the lithological units will identify areas within the vicinity of the
proposed pits that may require management, with respect to depressurisation.
High inflow rates and groundwater compartmentalization. Uncertainty in the structural model
may result in potentially high hydraulic conductivity zones (faults) in connection with lakes that
may result in significantly high pit inflows. If not anticipated, such features can cause instability in
lower slopes or lead to problematic inflows that require management. Low permeability structural
features (relative to the surrounding bedrock) can result in compartmentalization of remnant
pressures (in overburden and bedrock) within the excavated slopes that may also create
unstable conditions. Structures on a concession scale require study to understand the degree of
groundwater flow anisotropy.
Trafficability issues. The mineralized zone consists of highly altered rock that may require
focussed water management in high seepage areas to avoid poor working conditions.
Groundwater may have to be treated prior to discharge. Quality of groundwater into the open
pit may not be suitable for discharge without treatment. Water treatment may be required.
24.7 Hydrology
Stream flows, annual average precipitation and evaporation were estimated for the Springpole site
based on nearby gauging and weather stations. This information was used in the preliminary design
of the surface water management.
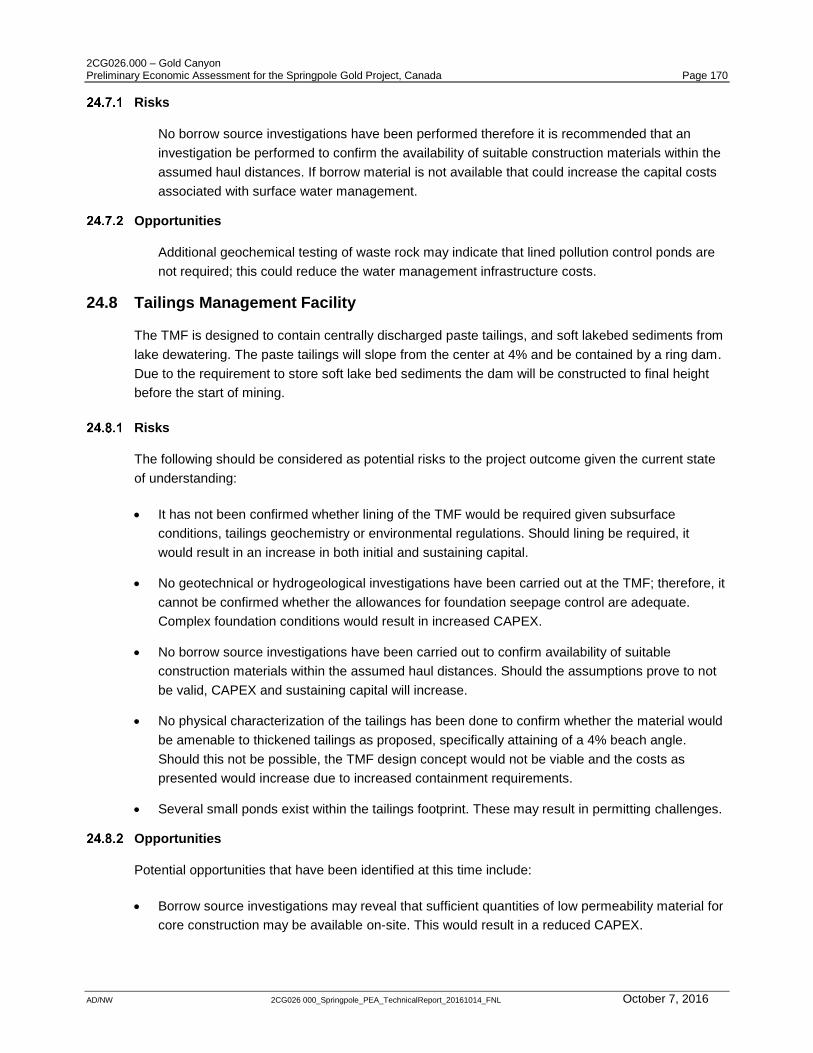
2CG026.000 – Gold Canyon Preliminary Economic Assessment for the Springpole Gold Project, Canada Page 170
AD/NW 2CG026 000_Springpole_PEA_TechnicalReport_20161014_FNL October 7, 2016
Risks
No borrow source investigations have been performed therefore it is recommended that an
investigation be performed to confirm the availability of suitable construction materials within the
assumed haul distances. If borrow material is not available that could increase the capital costs
associated with surface water management.
Opportunities
Additional geochemical testing of waste rock may indicate that lined pollution control ponds are
not required; this could reduce the water management infrastructure costs.
24.8 Tailings Management Facility
The TMF is designed to contain centrally discharged paste tailings, and soft lakebed sediments from
lake dewatering. The paste tailings will slope from the center at 4% and be contained by a ring dam.
Due to the requirement to store soft lake bed sediments the dam will be constructed to final height
before the start of mining.
Risks
The following should be considered as potential risks to the project outcome given the current state
of understanding:
It has not been confirmed whether lining of the TMF would be required given subsurface
conditions, tailings geochemistry or environmental regulations. Should lining be required, it
would result in an increase in both initial and sustaining capital.
No geotechnical or hydrogeological investigations have been carried out at the TMF; therefore, it
cannot be confirmed whether the allowances for foundation seepage control are adequate.
Complex foundation conditions would result in increased CAPEX.
No borrow source investigations have been carried out to confirm availability of suitable
construction materials within the assumed haul distances. Should the assumptions prove to not
be valid, CAPEX and sustaining capital will increase.
No physical characterization of the tailings has been done to confirm whether the material would
be amenable to thickened tailings as proposed, specifically attaining of a 4% beach angle.
Should this not be possible, the TMF design concept would not be viable and the costs as
presented would increase due to increased containment requirements.
Several small ponds exist within the tailings footprint. These may result in permitting challenges.
Opportunities
Potential opportunities that have been identified at this time include:
Borrow source investigations may reveal that sufficient quantities of low permeability material for
core construction may be available on-site. This would result in a reduced CAPEX.
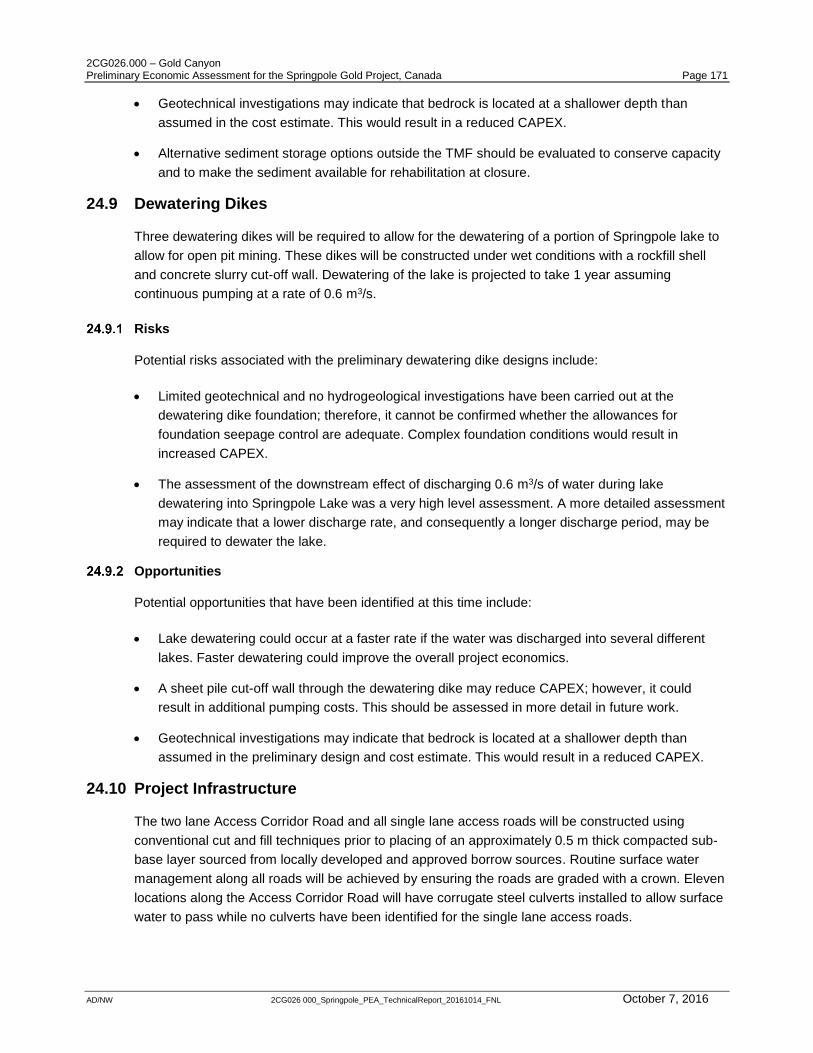
2CG026.000 – Gold Canyon Preliminary Economic Assessment for the Springpole Gold Project, Canada Page 171
AD/NW 2CG026 000_Springpole_PEA_TechnicalReport_20161014_FNL October 7, 2016
Geotechnical investigations may indicate that bedrock is located at a shallower depth than
assumed in the cost estimate. This would result in a reduced CAPEX.
Alternative sediment storage options outside the TMF should be evaluated to conserve capacity
and to make the sediment available for rehabilitation at closure.
24.9 Dewatering Dikes
Three dewatering dikes will be required to allow for the dewatering of a portion of Springpole lake to
allow for open pit mining. These dikes will be constructed under wet conditions with a rockfill shell
and concrete slurry cut-off wall. Dewatering of the lake is projected to take 1 year assuming
continuous pumping at a rate of 0.6 m3/s.
Risks
Potential risks associated with the preliminary dewatering dike designs include:
Limited geotechnical and no hydrogeological investigations have been carried out at the
dewatering dike foundation; therefore, it cannot be confirmed whether the allowances for
foundation seepage control are adequate. Complex foundation conditions would result in
increased CAPEX.
The assessment of the downstream effect of discharging 0.6 m3/s of water during lake
dewatering into Springpole Lake was a very high level assessment. A more detailed assessment
may indicate that a lower discharge rate, and consequently a longer discharge period, may be
required to dewater the lake.
Opportunities
Potential opportunities that have been identified at this time include:
Lake dewatering could occur at a faster rate if the water was discharged into several different
lakes. Faster dewatering could improve the overall project economics.
A sheet pile cut-off wall through the dewatering dike may reduce CAPEX; however, it could
result in additional pumping costs. This should be assessed in more detail in future work.
Geotechnical investigations may indicate that bedrock is located at a shallower depth than
assumed in the preliminary design and cost estimate. This would result in a reduced CAPEX.
24.10 Project Infrastructure
The two lane Access Corridor Road and all single lane access roads will be constructed using
conventional cut and fill techniques prior to placing of an approximately 0.5 m thick compacted sub-
base layer sourced from locally developed and approved borrow sources. Routine surface water
management along all roads will be achieved by ensuring the roads are graded with a crown. Eleven
locations along the Access Corridor Road will have corrugate steel culverts installed to allow surface
water to pass while no culverts have been identified for the single lane access roads.

2CG026.000 – Gold Canyon Preliminary Economic Assessment for the Springpole Gold Project, Canada Page 172
AD/NW 2CG026 000_Springpole_PEA_TechnicalReport_20161014_FNL October 7, 2016
Two major stream crossings will be required along the Access Corridor Road. An arched culvert will
be constructed at the Deaddog Stream Crossing while a pre-fabricated bridge will be constructed at
the Birch River Crossing.
Surface infrastructure earthworks will use also conventional cut and fill techniques to provide suitably
graded areas to place the buildings and allow for surface drainage. The buildings will be of modular
design or consist of fully contained prefabricated components. These structures will require minimal
on-site construction, plumbing, and electrical work.
The Fuel Tank Farm should be located on a blasted bedrock foundation. Compacted engineered
backfill will be used to bring up to the appropriate grades and provide suitable bedding material for
the lined containment facility as well as be used for pedestal supports for the fuel tanks.
Risks
The following should be considered as potential risks to the project outcome given the current state
of understanding:
No geotechnical or hydrogeological investigations have been carried out along the road
alignments or within the surface infrastructure footprint; therefore, it cannot be confirmed
whether complex foundation conditions are required which would result in increased CAPEX.
No borrow source investigations have been carried out to confirm availability of suitable
construction materials within the assumed haul distances. Should the assumptions prove to not
be valid, CAPEX will increase.
The surface infrastructure component sizes have not been finalized. Increasing building sizes or
the number of buildings will increase CAPEX costs.
Opportunities
Potential opportunities that have been identified at this time include:
Given the location and climate, it is possible that road maintenance may be less than currently
allowed for in the cost estimate.
24.11 Environmental Studies and Permitting
The potential impacts the project may have on Springpole and/or Birch Lake are considered to be
the more environmentally and socially sensitive components of the project. Gold Canyon is
cognizant of these sensitivities and has taken steps to design the project with these sensitivities in
mind. To that end, the project is designed to avoid direct interaction with the Birch Lake watershed,
and all baseline studies carried out to date are structured to identify areas of risk so they can be
protected to minimize impact during the development of the project or totally avoided.
The development of the open pit into Springpole Lake will require the isolation of a portion of the lake
throughout the 11 year mine life of the project and for a number of years following depletion of all
mineralized material before the coffer dams can be breached or removed. Fish habitat compensation
will be required as a result of this advancement into the lake. However, following decommissioning
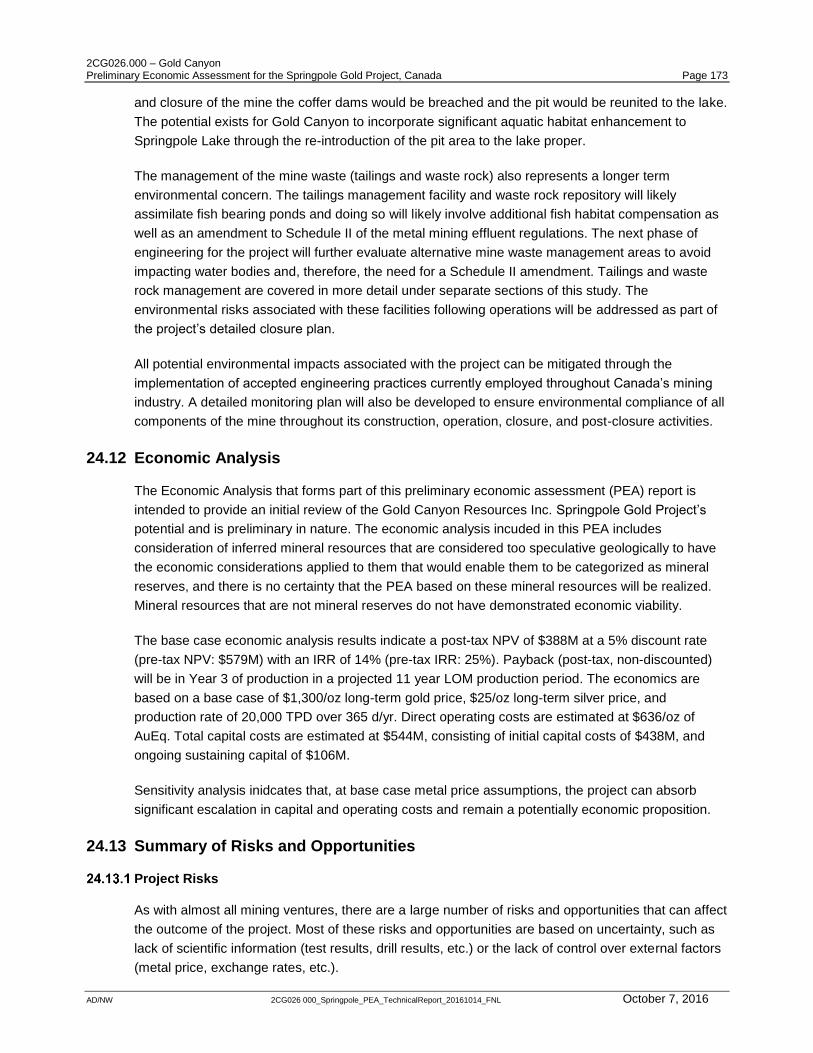
2CG026.000 – Gold Canyon Preliminary Economic Assessment for the Springpole Gold Project, Canada Page 173
AD/NW 2CG026 000_Springpole_PEA_TechnicalReport_20161014_FNL October 7, 2016
and closure of the mine the coffer dams would be breached and the pit would be reunited to the lake.
The potential exists for Gold Canyon to incorporate significant aquatic habitat enhancement to
Springpole Lake through the re-introduction of the pit area to the lake proper.
The management of the mine waste (tailings and waste rock) also represents a longer term
environmental concern. The tailings management facility and waste rock repository will likely
assimilate fish bearing ponds and doing so will likely involve additional fish habitat compensation as
well as an amendment to Schedule II of the metal mining effluent regulations. The next phase of
engineering for the project will further evaluate alternative mine waste management areas to avoid
impacting water bodies and, therefore, the need for a Schedule II amendment. Tailings and waste
rock management are covered in more detail under separate sections of this study. The
environmental risks associated with these facilities following operations will be addressed as part of
the project’s detailed closure plan.
All potential environmental impacts associated with the project can be mitigated through the
implementation of accepted engineering practices currently employed throughout Canada’s mining
industry. A detailed monitoring plan will also be developed to ensure environmental compliance of all
components of the mine throughout its construction, operation, closure, and post-closure activities.
24.12 Economic Analysis
The Economic Analysis that forms part of this preliminary economic assessment (PEA) report is
intended to provide an initial review of the Gold Canyon Resources Inc. Springpole Gold Project’s
potential and is preliminary in nature. The economic analysis incuded in this PEA includes
consideration of inferred mineral resources that are considered too speculative geologically to have
the economic considerations applied to them that would enable them to be categorized as mineral
reserves, and there is no certainty that the PEA based on these mineral resources will be realized.
Mineral resources that are not mineral reserves do not have demonstrated economic viability.
The base case economic analysis results indicate a post-tax NPV of $388M at a 5% discount rate
(pre-tax NPV: $579M) with an IRR of 14% (pre-tax IRR: 25%). Payback (post-tax, non-discounted)
will be in Year 3 of production in a projected 11 year LOM production period. The economics are
based on a base case of $1,300/oz long-term gold price, $25/oz long-term silver price, and
production rate of 20,000 TPD over 365 d/yr. Direct operating costs are estimated at $636/oz of
AuEq. Total capital costs are estimated at $544M, consisting of initial capital costs of $438M, and
ongoing sustaining capital of $106M.
Sensitivity analysis inidcates that, at base case metal price assumptions, the project can absorb
significant escalation in capital and operating costs and remain a potentially economic proposition.
24.13 Summary of Risks and Opportunities
Project Risks
As with almost all mining ventures, there are a large number of risks and opportunities that can affect
the outcome of the project. Most of these risks and opportunities are based on uncertainty, such as
lack of scientific information (test results, drill results, etc.) or the lack of control over external factors
(metal price, exchange rates, etc.).

2CG026.000 – Gold Canyon Preliminary Economic Assessment for the Springpole Gold Project, Canada Page 174
AD/NW 2CG026 000_Springpole_PEA_TechnicalReport_20161014_FNL October 7, 2016
Subsequent higher-level engineering studies would be required to further refine these risks and
opportunities, identify new risks and opportunities, and define strategies for risk mitigation or
opportunity implementation.
The principal risks identified for the Springpole Gold Project are summarized as follows:
Geological interpretation and mineral resource classification (10% of the resources used in the
mine plan are Inferred);
Due to a relatively small number of metallurgical samples tested, larger variations in mineralogy
and metal recovery may exist than have been observed to date;
Geotechnical and hydrogeological considerations;
No information on baseline groundwater quality;
No physical characterization of the tailings material has been done;
Construction management and cost containment during development of the project;
The permitting period associated with the project could be significantly longer than assumed in
this study;
Increased OPEX and/or CAPEX; and
Reduced metal prices.
Project Opportunities
The following opportunities may improve the project economics:
Metallurgical testwork has indicated that gold recoveries up to 90% are possible with a finer
grind. Trade-off studies should be carried out to determine whether it’s feasible to incorporate a
finer grind process into the flowsheet;
Pit optimization work with the Whittle software identified a number of larger potential pit shells (or
phases) and the selected pit shell provides higher grades, lower strip ratio, and reduced capital
and operating expense;
Recently completed geotechnical drilling for pit slope stability analysis may increase pit slopes
angles over those used in this PEA;
There are other geophysical targets around the current resource, particularly to the southwest of
the current resource. Additional drilling has the potential to add resources;
Investigations may reveal that sufficient quantities of low permeability material for core
construction may be available on-site and bedrock may be located at a shallower depth than
assumed in the cost estimate;
Lake dewatering could occur at a faster rate if the water was discharged into several different
lakes;
The potential to upgrade the mineral resource classification of the deposit; and
Improved metal prices.

2CG026.000 – Gold Canyon Preliminary Economic Assessment for the Springpole Gold Project, Canada Page 175
AD/NW 2CG026 000_Springpole_PEA_TechnicalReport_20161014_FNL October 7, 2016
25 Recommendations
SRK recommends the following next phase work program for the Springpole Gold Project.
25.1 Quality Assurance and Quality Control Program
SRK recommends a remedial program of re-sampling of the core for the pre-2007 drilling with focus
on the mineralized intervals, to replace the missing field and pulp duplicate information and including
appropriate insertion of blanks and standards that would demonstrate compliance with current NI 43-
101 standards. The drill hole density in these areas is more than adequate for generating resource
categories above inferred; all that is missing is adequate demonstration of reproducibility of results.
SRK recommends that a silver standard be introduced as a regular routine with all new assay
batches sent to the laboratory for analysis. SRK recommends that Gold Canyon consider re-
assaying some of the available pulps with a silver standard to assure the robustness of the silver
data in the Springpole database.
SRK recommends that Gold Canyon implements a written protocol for QA/QC data review so that
quick action can be taken if sample batches fall outside of the acceptable QA/QC acceptance
guidelines.
25.2 Mineral Resource
SRK recommends dedicated program of s.g. measurement on core sufficient to establish
volumetrically representative values for s.g.
25.3 Resource Development Program
SRK recommends a work program for the Springpole Gold Project including incremental step-out
and infill drilling adjacent to the Portage zone, especially to the southeast and southwest to expand
the resource and better define the extent of mineralization. This drilling will use the established drill
section spacing of 50 m with infill between sections where deemed necessary. Assuming a total of
38 holes with an average hole length of 400 m, this comes to 15,200 m. This drilling could be
accomplished within a 12-month period. Drilling can be undertaken from the ice during the winter
and utilizing Gold Canyon’s four drill barges during spring, summer and fall. In addition to drilling in
and around the Portage zone, an additional 5,000 m of drilling should be allocated to testing new
exploration targets, especially ones proximal to the existing deposits.
The recommended work program is expected to cost approximately $11.5M as outlined in Table
25.1.
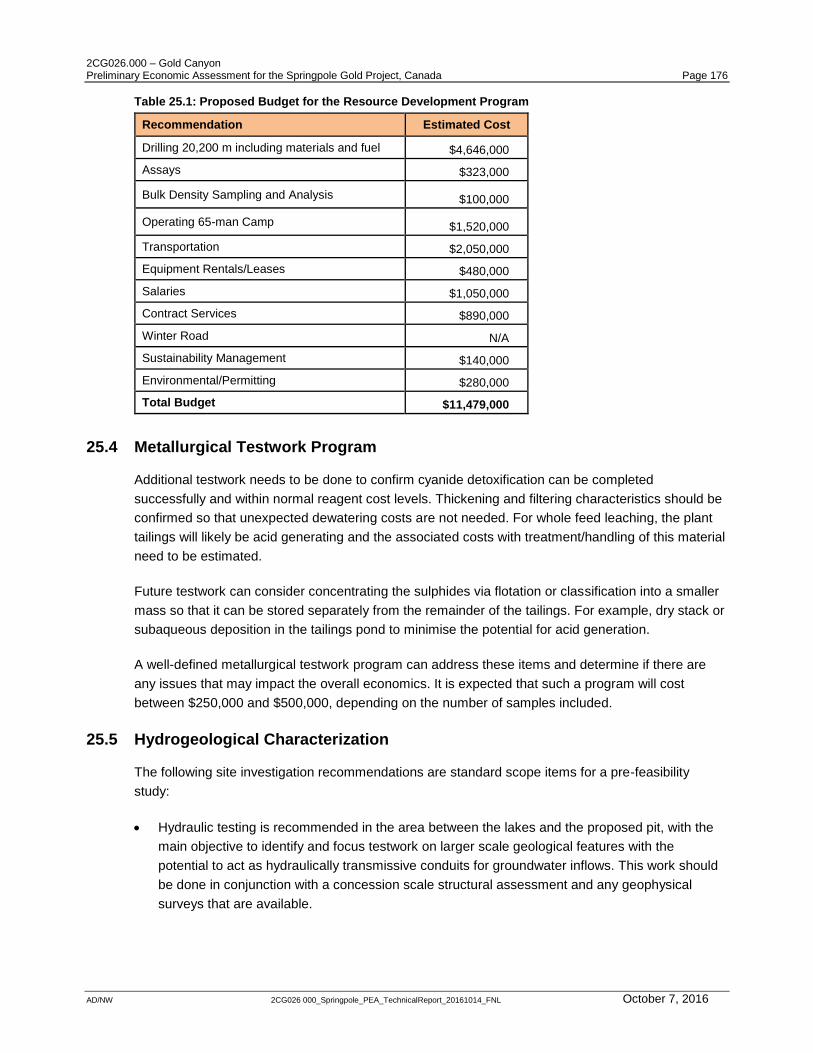
2CG026.000 – Gold Canyon Preliminary Economic Assessment for the Springpole Gold Project, Canada Page 176
AD/NW 2CG026 000_Springpole_PEA_TechnicalReport_20161014_FNL October 7, 2016
Table 25.1: Proposed Budget for the Resource Development Program
Recommendation Estimated Cost
Drilling 20,200 m including materials and fuel $4,646,000
Assays $323,000
Bulk Density Sampling and Analysis $100,000
Operating 65-man Camp $1,520,000
Transportation $2,050,000
Equipment Rentals/Leases $480,000
Salaries $1,050,000
Contract Services $890,000
Winter Road N/A
Sustainability Management $140,000
Environmental/Permitting $280,000
Total Budget $11,479,000
25.4 Metallurgical Testwork Program
Additional testwork needs to be done to confirm cyanide detoxification can be completed
successfully and within normal reagent cost levels. Thickening and filtering characteristics should be
confirmed so that unexpected dewatering costs are not needed. For whole feed leaching, the plant
tailings will likely be acid generating and the associated costs with treatment/handling of this material
need to be estimated.
Future testwork can consider concentrating the sulphides via flotation or classification into a smaller
mass so that it can be stored separately from the remainder of the tailings. For example, dry stack or
subaqueous deposition in the tailings pond to minimise the potential for acid generation.
A well-defined metallurgical testwork program can address these items and determine if there are
any issues that may impact the overall economics. It is expected that such a program will cost
between $250,000 and $500,000, depending on the number of samples included.
25.5 Hydrogeological Characterization
The following site investigation recommendations are standard scope items for a pre-feasibility
study:
Hydraulic testing is recommended in the area between the lakes and the proposed pit, with the
main objective to identify and focus testwork on larger scale geological features with the
potential to act as hydraulically transmissive conduits for groundwater inflows. This work should
be done in conjunction with a concession scale structural assessment and any geophysical
surveys that are available.
2CG026.000 – Gold Canyon Preliminary Economic Assessment for the Springpole Gold Project, Canada Page 177
AD/NW 2CG026 000_Springpole_PEA_TechnicalReport_20161014_FNL October 7, 2016
Secondary objectives would be to characterise the hydrogeological properties of the bedrock,
which will be used to constrain estimates of groundwater inflow. This work should continue the
PFS data collection for the geotechnical program, which consisted of packer testing within the pit
area. Drill holes for testing should be located during site investigation programs for the TMF and
waste rock dumps. The testing program should consider:
Short-duration tests within all geotechnical drill holes (e.g., packer testing).
Short-duration tests within at least two hydrogeological drill holes targeting areas outside of
open pit area.
Contingency should be included for longer-term testing (e.g., airlift testing) with observation
wells if preliminary analyses indicate that there are areas with relatively high permeability.
Final design of this program will not be possible until the structural review is completed.
SRK estimates the cost of this hydrogeological characterization program to be $60,000 assuming
that a drilling rig is on site and a five hole program will take six weeks to complete. This cost does
not include long-term test pumping.
Groundwater monitoring. Groundwater monitoring wells to be sited and installed with well
screens to isolate key aquifer horizons. The construction of the wells should take into
consideration any overburden and geology that is encountered. Multi-depth wells should be
considered in key areas to monitor water levels in significant overburden and bedrock lithology.
Locations of the wells should be up-gradient and down-gradient of any mine infrastructure. Wells
should be constructed to best practise guidelines to ensure that sampling, hydraulic testing and
groundwater measurements are representative of the zone they are in. A water level monitoring
database should be established with regular measurements taken on a weekly basis. This can
either be done manually with a water level meter, or automatically by installing pressure
transducers with integrated dataloggers into selected boreholes. A combination of these
methods is recommended to ensure calibration against logger readings.
Groundwater quality Groundwater quality should be characterized to establish baseline
conditions using the monitoring wells described in the preceding paragraph, and should consider
shallow (within overburden) and deep (base of pit) groundwater regimes. This work is typically
undertaken as part of the environmental baseline study. Water quality data will be used in the
load balance, and in cost estimates for potential treatment options. This work should be initiated
as soon as possible to ensure seasonal groundwater data are captured.
A site water balance is recommended to be developed at an early stage so that all aspects of
groundwater, surface water and process water around the project site are quantified.
2CG026.000 – Gold Canyon Preliminary Economic Assessment for the Springpole Gold Project, Canada Page 178
AD/NW 2CG026 000_Springpole_PEA_TechnicalReport_20161014_FNL October 7, 2016
25.6 Hydrological Monitoring
It is recommended that the following be installed at the Springpole site to obtain a better
understanding of the site hydrology and to help define the specific site water management
requirements in the future phases of the project:
Gauging stations at the outflows from Springpole Lake
Meteorological station
This monitoring will also be required for baseline studies to support the environmental assessment.
SRK’s estimate for the cost of these two automated level sensors is approximately $100,000.
25.7 Tailings Management Facility
It is recommended that the following studies be undertaken to confirm the tailings management plan
design:
Complete a detailed geotechnical/geohydrological investigation of the tailings management
facility including boreholes and test pits. Packer testing, and in situ characterization is required,
as well as sampling and submitting of samples to geotechnical testing laboratories for
engineering property classification. It is estimated that the cost of this program is likely to be
$200,000 to $300,000.
Carry out detailed physical and rheological testing on representative tailings samples to confirm
the thickening characteristics of the tailings and the ultimate beach angle. The cost of this
program is estimated to be $30,000 to $60,000.
Carry out a preliminary borrow source characterization study to identify candidate construction
materials (including for the dewatering dike and main access road route). This should include an
initial air photo interpretation, followed up by preliminary ground reconnaissance. This study is
estimated to cost between $50,000 and $100,000.
25.8 Dewatering Dike
A comprehensive geotechnical investigation must be carried out at the proposed dike locations to
confirm foundation conditions. The investigation method must be capable of determining the in-situ
geotechnical properties of the lake bed sediments and other overburden. Samples must be retrieved
for laboratory testing. The cost of this program is estimated between $180,000 and $280,000.
25.9 Infrastructure
A reconnaissance survey of the road and power line routes need to be carried out to confirm the
general ground conditions at these sites. The cost of this is estimated to be $10,000 to $25,000
depending on how much helicopter support would be required. In addition, a geotechnical
investigation needs to be carried out at the two major river crossing sites to confirm foundation
conditions. The cost of this investigation is estimated to be $75,000 to $150,000.
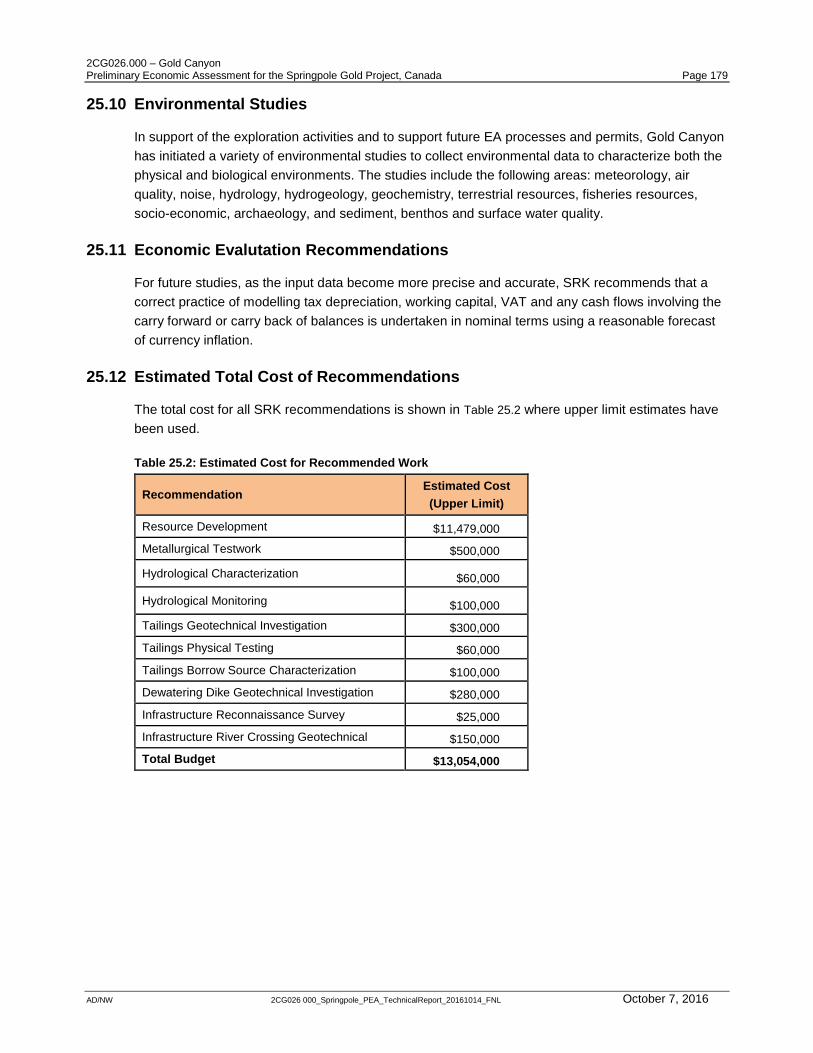
2CG026.000 – Gold Canyon Preliminary Economic Assessment for the Springpole Gold Project, Canada Page 179
AD/NW 2CG026 000_Springpole_PEA_TechnicalReport_20161014_FNL October 7, 2016
25.10 Environmental Studies
In support of the exploration activities and to support future EA processes and permits, Gold Canyon
has initiated a variety of environmental studies to collect environmental data to characterize both the
physical and biological environments. The studies include the following areas: meteorology, air
quality, noise, hydrology, hydrogeology, geochemistry, terrestrial resources, fisheries resources,
socio-economic, archaeology, and sediment, benthos and surface water quality.
25.11 Economic Evalutation Recommendations
For future studies, as the input data become more precise and accurate, SRK recommends that a
correct practice of modelling tax depreciation, working capital, VAT and any cash flows involving the
carry forward or carry back of balances is undertaken in nominal terms using a reasonable forecast
of currency inflation.
25.12 Estimated Total Cost of Recommendations
The total cost for all SRK recommendations is shown in Table 25.2 where upper limit estimates have
been used.
Table 25.2: Estimated Cost for Recommended Work
Recommendation Estimated Cost
(Upper Limit)
Resource Development $11,479,000
Metallurgical Testwork $500,000
Hydrological Characterization $60,000
Hydrological Monitoring $100,000
Tailings Geotechnical Investigation $300,000
Tailings Physical Testing $60,000
Tailings Borrow Source Characterization $100,000
Dewatering Dike Geotechnical Investigation $280,000
Infrastructure Reconnaissance Survey $25,000
Infrastructure River Crossing Geotechnical $150,000
Total Budget $13,054,000

2CG026.000 – Gold Canyon Preliminary Economic Assessment for the Springpole Gold Project, Canada Page 180
AD/NW 2CG026 000_Springpole_PEA_TechnicalReport_20161014_FNL October 7, 2016
25.13 Closure
SRK believes the project should be taken to the next level of engineering study and economic
assessment, typically a pre-feasibility study. It is estimated that a pre-feasibility, along with all of the
accompanying engineering work would cost approximately $3.5M (exclusive of the
recommendations listed above and the additional geology and drilling program required). Some of
the activities involved to advance the project include:
Initiate project permitting;
Consummate agreements with First Nations groups; and
Convert remaining inferred resources to indicated resources.

2CG026.000 – Gold Canyon Preliminary Economic Assessment for the Springpole Gold Project, Canada Page 181
AD/NW 2CG026 000_Springpole_PEA_TechnicalReport_20161014_FNL October 7, 2016
26 Acronyms and Abbreviations
Acronyms Other
AP Acid potential oC degree Celsius
CIM Canadian Institute of Mining,
Metallurgy and Petroleum AuEq total revenue divided by gold price
COG cut-off grade G&A general and administrative
IP induced polarization hr hour
LOM life of mine kWh kilowatt hour
Mag magnetic M million
NI 43-101 National Instrument 43-101 masl m above sea level
NSR net smelter return ppm parts per million
NP neutralization potential s second
NPV net present value Mt/yr million tonnes per year
SRK SRK Consulting (Canada) Inc. s.g. specific gravity
VLF very low frequency t/d tonnes per day
Conversion Factors
1 oz 31.1035 g
1 tonne 2,204.62 lb
Distance
µm micron (micrometre)
cm centimetre
Ha hectare
km kilometre
m metre
mm millimetre
Elements and Compounds
Au gold
Ag silver
CN cyanide
Cu copper
Fe iron
NaCN sodium cyanide
S sulphur
Mass
g gram
kg kilogram
lb pound
Mt million tonnes
oz troy ounce
t tonne (metric ton)
kt kilotonne
koz thousand ounces
Pressure
MPa megapascal
Volume
ft3 cubic foot
L litre
m2 square metre
m3 cubic metre
2CG026.000 – Gold Canyon Preliminary Economic Assessment for the Springpole Gold Project, Canada Page 182
AD/NW 2CG026 000_Springpole_PEA_TechnicalReport_20161014_FNL October 7, 2016
27 References
Agnico-Eagle, 2010: Meadowbank—Project Situation and the Impact in the Community, (PowerPoint
Presentation).
Armstrong T., Puritch E., Yassa A., 2006: Technical Report and Resource Estimate on the
Springpole Lake Gold Property, Red Lake Mining Division, Northwestern Ontario for Gold Canyon
Resources Inc., P & E Mining Consultants.
Arseneau, G., 2012: Independent Technical Report for the Springpole Gold Project, NW Ontario,
Canada, 226p.
Barron, K.M., 1996: The Petrological and Metallogenic Significance of the Alkaline Igneous Centre at
the Springpole Gold Prospect, Northwestern Ontario: Ph.D. Thesis for Department of Earth
Sciences, University of Western Ontario, London, Ontario.
Beakhouse, G.P., 1990: Geology of the Casummit Lake area, District of Kenora (Patricia Portion),
pp. 18-21: In Summary of Field Work and Other Activities 1990, Ontario Geological Survey,
Miscellaneous Paper 151.
BHP Diamonds Inc. 1995: NWT Diamonds Project Project description, Volume I, Section 2 – Project
Description. Issued by BHP. 1995. Available at:
http://www.monitoringagency.net/LinkClick.aspx?fileticket=OAJ78I26YDQ%3D&tabid=111&mid=580 (accessed Jan 2013)
BHP Diamonds Inc. 1999: Ekati Diamond Mine, Project Description – Proposed Development of
BHP Diamonds Inc. 2001: Ekati Diamond Mine, Water Licence N7L2-1616 Amendment to Allow
Dewatering of Fox Lake and Subsequent Mining of the Fox Kimberlite Pipe, Information Package,
January 2001.
[CDA] Canadian Dam Association, 2007: Dam Safety Guidelines. 2007.
Carman, G.D., 2003: Geology, Mineralisation and Hydrothermal Evolution of the Ladolam gold
Deposit, Lihir Island, Papua New Guinea: Society of Economic Geologists, Special Publication No.
10, 247-284.
[CEAA] Canadian Environmental Assessment Act, 2012: (S.C. 2012, c.19, s.52)
[CTI] Center for Topographic Information, Government of Canada, Natural Resources Canada, Earth
Sciences Sector, Mapping Information Branch, 1997: Canadian Digital Elevation Data. August 13,
1997. www.geobase.ca
De Beers Canada Inc. 2010: Gahcho Kue Project Environmental Impact Statement, Section 3 –
Project Description. Project Number 09-1365-1004. December 2010.
Devaney, J.R., 2001a: Stratigraphy of Epiclastic and Volcaniclastic Facies Units, Northern Birch-Uchi
Greenstone belt, Uchi SUBPROVINCE; Ontario Geological Survey, Open File Report 6030, 49p.
Devaney, J.R. 2001b: Sedimentology and Volcanology of Selected Tectonized Stratigraphic Units,
Southern Birch-Uchi Greenstone Belt, Uchi Subprovince; Ontario Geological Survey, Open File
Report 6031, 47p.
Diavik Diamond Mines Inc., 2003: Diavik Constructing the Legacy, the Story of the Construction of
the Diavik Diamond Mine, March 2003.
2CG026.000 – Gold Canyon Preliminary Economic Assessment for the Springpole Gold Project, Canada Page 183
AD/NW 2CG026 000_Springpole_PEA_TechnicalReport_20161014_FNL October 7, 2016
Dupuit, J., 1863: Etudes Theoriques et Pratiques Sur le Mouvement Des Eaux Dans Les Canaux
Decouverts et a Travers les Terrains permeables, 2eme Edition; Dunot, Paris,
Environment Canada. 1982a: Mean Rainfall, Canadian Climate Normals 1951-1980 Volume 3:
Precipitation. 1982.
Environment Canada. 1982b: Total Bright Sunshine, Canadian Climate Normals 1951-1980 Volume
7: Bright Sunshine Isolation. 1982.
Environment Canada. 1982c: Calculated Lake Evaporation (mm), Canadian Climate Normals 1951-
1980 Volume 9: Soil Temperature, Lake Evaporation, days with….blowing snow, hail, fog, smoke or
haze, frost. 1982.Gold Canyon Resources Inc., 2012: Springpole Gold Access Corridor Project:
Draft Environmental Study Report, October 2012
Environment Canada. 2010: Water Survey of Canada, Hydrometric Data. April 30, 2010
http://www.wsc.ec.Gold Canyon.ca/applications/H2O/HydromatD-eng.cfm (Accessed November
2012.)
Environment Canada. 2012: National Climate Data and Information Archive, Canadian Climate
Normals 1971-2000. November 29, 2012 http://www.climate.weatheroffice.Gold
Canyon.ca/climate_normals (Accessed November 2012)
Goldfarb, R.J., Baker, T., Dube, B., Groves, D.I., Craig, J.R. Hart, Gosselin, P., 2005: Distribution,
Character, and Genesis of Gold Deposits in Metamorphic Terranes in Society of Economic
Geologists, 100 Hundredth Anniversary Volume 1905-2005, pp. 407-450.
Good, D.J., 1988: Geology of the East Half of the Birch Lake Area: Ontario Geological Survey, Open
File Report 5685.
Goodwin, AM., 1967: Volcanic studies in the Birch-Uchi Lakes Area of Ontario: Ontario Department
of Mines, Miscellaneous Paper 6, 96p.
Groves, D.I., Goldfarb, R.J., Gebre-Mariam, M., Hagemann, S.G. and Robert, F. 1998: Orogenic
Gold Deposits: a Proposed Classification in the Context of Their Crustal Distribution and
Relationship to Other Gold Deposit Types; Ore Geology Reviews, v.13, p.7–27.
Hagemann, S.G. and Cassidy, K.F. 2000: Archean orogenic Lode Gold Deposits; Society of
Economic Geologists, Reviews in Economic Geology, v.13, p.9-68.
Harding, W.D., 1936: Geology of the Birch-Springpole Lakes Area: Ontario Department of Mines,
Annual Report for 1936, Vol. 45, Part 4, 33p.
Hogg, W. D. and Carr, D. A., 1985: Rainfall Frequency Atlas for Canada. Environment Canada,
Atmospheric Environment Services, 1985.
Lakefield Research, 1989: “An Investigation of the Recovery of Gold from Springpole Ore Samples
submitted by Goldfields Canada, Progress Report No. 1. May 1989.
Morin K. A., 2012: Springpole Lake Gold Project - First Round of Core Samples for the Prediction of
Minesite-Drainage Chemistry and Metal Leaching and Acid Rock Drainage (ML-ARD). September.
Ontario Geological Survey, 2000: Bedrock Geology, Seamless Coverage of the Province of Ontario;
Ontario Geological Survey, ERLIS Data Set 6: Revised, scale 1:1 000 000.
PDAC, 2009: Excellence in Environmental Stewardship e-toolkit. Prospector’s and Developers
Association of Canada. Toronto (ON): Canada.
2CG026.000 – Gold Canyon Preliminary Economic Assessment for the Springpole Gold Project, Canada Page 184
AD/NW 2CG026 000_Springpole_PEA_TechnicalReport_20161014_FNL October 7, 2016
Robert, F.K., Poulsen, H., Cassidy, K.F., Hodgson, C.J., 2005: Gold Metallogeny of the Superior and
Yilgarn Cratons in Society of Economic Geologists, 100 Hundredth Anniversary Volume 1905-2005,
pp. 1001-1034.
Saunders, R. and McIntosh A., 2009: Petrographic Analysis of Selected Core Samples, Springpole
Property, Ontario. Internal Report, Gold Canyon Resources Inc.
Saunders, R. and McIntosh A., 2010: Petrographic Analysis of Selected Drill Core Samples,
Springpole 2010 Winter Core Program. Internal Report, Gold Canyon Resources Inc.
SGS Canada Inc., 2011: “An Investigation into the Springpole Gold Project Prepared for Gold
Canyon Resources Inc.”, Project 50138-001 – Final Report, June 20, 2011.
SGS Canada Inc., 2013a: “An Investigation into Gold Recovery From the Springpole Ore Samples
Prepared for Gold Canyon Resources Inc.”, Project 13152-001 Progress Report 1 – Final Report,
Apr 9, 2013.
SGS Canada Inc., 2013b: “An Investigation into Gold Recovery From the Springpole Ore Samples
Prepared for Gold Canyon Resources Inc.”, Project 13152-001 – Final Report, Jan 18, 2013.
Smith G., 2008a: Winter Drilling Reports 2006 & 2007, Springpole Gold Project, Red Lake Mining
District, District of Ontario. Gold Canyon Resources Inc.
Smith G., 2008b: Winter Drilling Report 2008, Springpole Gold Project, Red Lake Mining District,
District of Ontario. Gold Canyon Resources Inc.
Thurston, P.C., Jackson, M.C., Pirie, I., 1981: Precambrian Geology of the Birch Lake Area, Kenora
District, Patricia Portion: Ontario Geological Survey, Preliminary Map P.2387, Scale 1:50,000.
USGS, HydroSHEDS, 2012: Hydrological Data and Maps Based on Shuttle Elevation Derivatives at
Multiples Scales. November 29, 2012 http://hydrosheds.cr.usgs.gov/index.php. Accessed November 2012.
Zabev B., 2004: Technical Report on the Springpole Lake Property, Red Lake Mining Division, NW
Ontario for Gold Canyon Resources Inc.

2CG026.000 – Gold Canyon Preliminary Economic Assessment for the Springpole Gold Project, Canada Page 185
AD/NW 2CG026 000_Springpole_PEA_TechnicalReport_20161014_FNL October 7, 2016
28 Date and Signature Page
This technical report was written by the following “Qualified Persons” and contributing authors. The
effective date of this technical report is March 25, 2013 and the signature date is October 7, 2016.
Qualified Person Signature Date
Dr. Gilles Arseneau, PGeo “original signed” October 7, 2016
Dr. Adrian Dance, PEng “original signed” October 7, 2016
John Duncan, PEng “original signed” October 7, 2016
Chris Elliott, FAusIMM “original signed” October 7, 2016
Mark Liskowich, PGeo “original signed” October 7, 2016
Bruce Murphy, FSAIMM “original signed” October 7, 2016
Dino Pilotto, PEng “original signed” October 7, 2016
Michael Royle, PGeo “original signed” October 7, 2016
Dr. Maritz Rykaart, PEng “original signed” October 7, 2016
Reviewed by
“Original signed”
Neil Winkelmann, FAusIMM
Project Reviewer
All data used as source material plus the text, tables, figures, and attachments of this document have been reviewed and prepared in accordance with generally accepted professional engineering and environmental practices.
APPENDIX A Mineral Tenure Information and Legal Title Opinion

mcminanll,July3, 2012
Gold Canyon Resources Inc.810-609GranvilleStreetP.O. Box 10356 Pacific CentreVancouver, BC V7Y 1G5
Dundee Securities Ltd.1 Adelaide St. E., Suite 2000Toronto, ON M5C 2V9
Gowling Lafleur Henderson LLP1 First Canadian Place100 King Street WestSuite 1600Toronto, ON M5X 1G5
Fraser Mackenzie LimitedSuite 1100, 48 Yonge StreetToronto, ON M5E 1G6
CIBC World Markets Inc.161 Bay Street, 7th FloorToronto, ON M5J 2S8
Haywood Securities Inc.Brookfield Place, 181 Bay St.Suite 2910, PO Box 808Toronto, ON M5J 2T3
Dahlman Rose & Company, LLC1301 Avenue of the Americas44th Floor, New York, NY, USA,10019
Dear Sirs/Mesdames:
Re: Gold Canyon Resources Inc. - Short Form Prospectus Offering
We have acted as local counsel in the Province of Ontario for Gold CanyonResources Inc. (the "Corporation") in connection with certain searches and investigations oftitle to:
1. certain patented lands, listed in Appendix A of this letter, in which we are advisedthe Corporation has an interest (collectively, the "Patented Lands"), whichinterest is registered or unregistered, as set forth below; and
2. certain unpatented mining claims registered in the name of the Corporation, listedin Appendix B of this letter (the "Unpatented Claims").
We have subsearched title to the Patented Lands and have reviewed uncertifiedcopies of the Mining Recorder's electronic registers for the Unpatented Claims (the "OntarioMine Claim Database") developed and maintained by the Mines and Mineral Division of theMinistry of Northern Development, Mines and Forestry (the "Ministry") and have relied uponthe instruments of record available for public examination in the Land Registry Office of theLand Titles Division of Kenora. In addition, we have searched for executions outstanding

MBDOCS_5999845.4
against the registered owners of the Patented Lands with the Sheriff for the Judicial District of Kenora as of June 29, 2012.
As instructed, we have made no other searches, investigations or inquires with respect to the opinions expressed herein including, without limitation, any inquiries as to access and inquires of authorities regarding realty taxes, provincial land taxes, mining taxes, fees exigible as expressed on the Crown grant such as assurance fees, building and zoning compliance, utilities, unregistered easements, conservation or environmental matters. In addition, we have not examined any surveys of the Patented Lands or the Unpatented Claims for the purposes of this opinion and have not reviewed any of the encumbrances outstanding against the Patented Lands or the Unpatented Claims. In particular, we have not made any searches of adjoining lands to the Patented Lands to confirm compliance with the Planning Act (Ontario).
In conducting the searches and giving the opinions contained herein, we have assumed:
1. The authenticity of all documents that were submitted to us as originals;
2. The conformity with originals of all documents submitted or presented to us as certified or notarial copies;
3. The identity and capacity of all individuals acting or purporting to act as public officials;
4. The genuineness and authenticity of all signatures on all documents submitted or presented to us; and
5. The accuracy and completeness of the records maintained by any office of public record.
For greater clarity, our opinion is an independent opinion of our firm, however, to the extent that the uncertified copies of the Unpatented Claims posted in the Ontario Mine Claim Database developed and maintained by the Ministry are based on any assumptions or are subject to any limitations, qualifications or exceptions, our opinion given in reliance thereon is also based on each assumption and our opinion is made subject to each such limitation, qualification or exception. Further information regarding the Mining Claims Database developed and maintained by the Ministry can be found on the Ministry’s website.
We are solicitors qualified in the Province of Ontario, Canada and accordingly no opinion is expressed herein as to the laws of any jurisdiction other than Ontario and the laws of Canada applicable thereto.
Based upon the foregoing, and subject to the qualifications noted below and expressed in the schedules attached, we are of the opinion that:
1. As of June 28, 2012 (being the date of our searches), the registered owners of the Patented Lands are as indicated in Appendix A under the subheading ‘Springpole
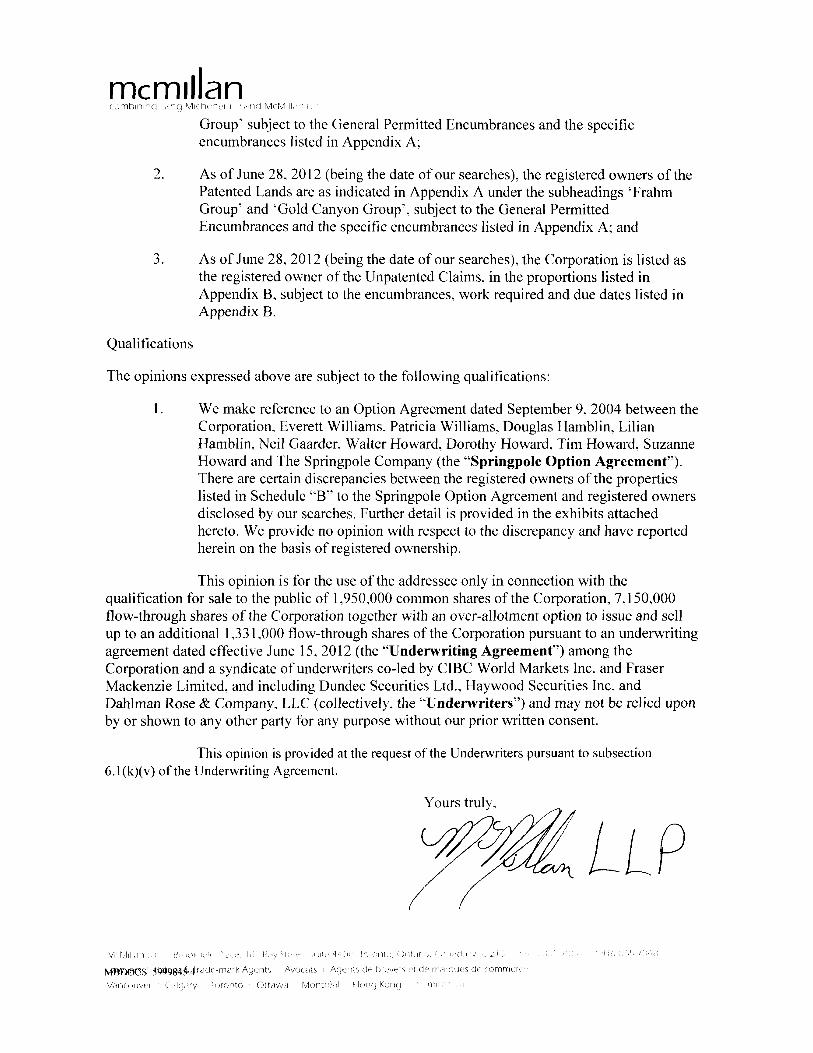
mcmmancombining Ling Michrnci h ^ ' d n d McMilirin i
Group' subject to the General Permitted Encumbrances and the specificencumbrances listed in Appendix A;
2. As of June 28, 2012 (being the date of our searches), the registered owners of thePatented Lands are as indicated in Appendix A under the subheadings 'FrahmGroup' and 'Gold Canyon Group', subject to the General PermittedEncumbrances and the specific encumbrances listed in Appendix A; and
3. As of June 28, 2012 (being the date of our searches), the Corporation is listed asthe registered owner of the Unpatented Claims, in the proportions listed inAppendix B, subject to the encumbrances, work required and due dates listed inAppendix B.
Qualifications
The opinions expressed above are subject to the following qualifications:
1. We make reference to an Option Agreement dated September 9, 2004 between theCorporation, Everett Williams, Patricia Williams, Douglas Hamblin, LilianHamblin, Neil Gaarder, Walter Howard, Dorothy Howard, Tim Howard, SuzanneHoward and The Springpole Company (the "Springpole Option Agreement").There are certain discrepancies between the registered owners of the propertieslisted in Schedule "B" to the Springpole Option Agreement and registered ownersdisclosed by our searches. Further detail is provided in the exhibits attachedhereto. We provide no opinion with respect to the discrepancy and have reportedherein on the basis of registered ownership.
This opinion is for the use of the addressee only in connection with thequalification for sale to the public of 1,950,000 common shares of the Corporation, 7,150,000flow-through shares of the Corporation together with an over-allotment option to issue and sellup to an additional 1,331,000 flow-through shares of the Corporation pursuant to an underwritingagreement dated effective June 15. 2012 (the "Underwriting Agreement") among theCorporation and a syndicate of underwriters co-led by CIBC World Markets Inc. and EraserMackenzie Limited, and including Dundee Securities Ltd., Haywood Securities Inc. andDahlman Rose & Company, LLC (collectively, the "Underwriters") and may not be relied uponby or shown to any other party for any purpose without our prior written consent.
This opinion is provided at the request of the Underwriters pursuant to subsection6.1(k)(v) of the Underwriting Agreement.
Yours truly,
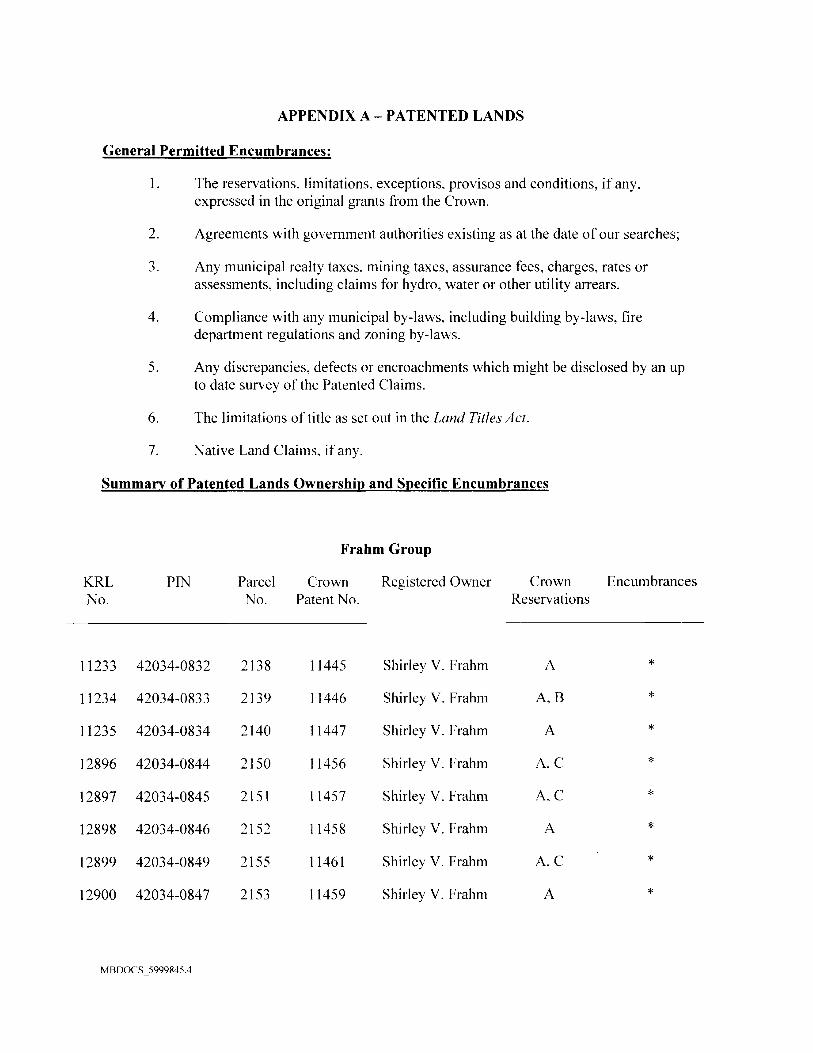
APPENDIX A - PATENTED LANDS
General Permitted Encumbrances:
1. The reservations, limitations, exceptions, provisos and conditions, if any,expressed in the original grants from the Crown.
2. Agreements with government authorities existing as at the date of our searches;
3. Any municipal realty taxes, mining taxes, assurance fees, charges, rates orassessments, including claims for hydro, water or other utility arrears.
4. Compliance with any municipal by-laws, including building by-laws, firedepartment regulations and zoning by-laws.
5. Any discrepancies, defects or encroachments which might be disclosed by an upto date survey of the Patented Claims.
6. The limitations of title as set out in the Land Titles Act.
7. Native Land Claims, if any.
Summary of Patented Lands Ownership and Specific Encumbrances
Frahm Group
KRLNo.
11233
11234
11235
12896
12897
12898
12899
12900
PIN
42034-0832
42034-0833
42034-0834
42034-0844
42034-0845
42034-0846
42034-0849
42034-0847
ParcelNo.
2138
2139
2140
2150
2151
2152
2155
2153
CrownPatent No.
11445
11446
11447
11456
11457
11458
11461
11459
Registered Owner
Shirley V. Frahm
Shirley V. Frahm
Shirley V. Frahm
Shirley V. Frahm
Shirley V. Frahm
Shirley V. Frahm
Shirley V. Frahm
Shirley V. Frahm
CrownReservations
A
A, B
A
A, C
A, C
A
A, C
A
Encumbrances
*
*
*
*
*
*
*
*
MBDOCS 5999845.4
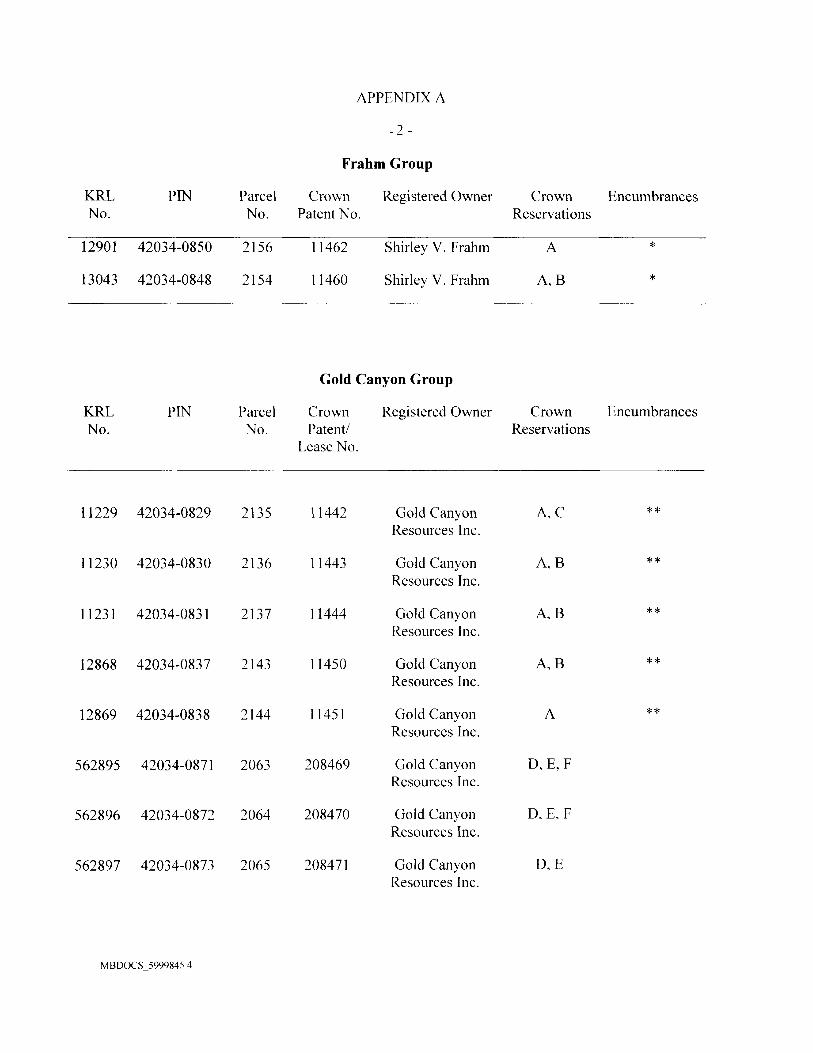
APPENDIX A
- 2 -
Frahm Group
KRLNo.
12901
13043
KRLNo.
11229
11230
11231
12868
12869
562895
562896
562897
PIN
42034-0850
42034-0848
PIN
42034-0829
42034-0830
42034-0831
42034-0837
42034-0838
42034-0871
42034-0872
42034-0873
ParcelNo.
2156
2154
ParcelNo.
2135
2136
2137
2143
2144
2063
2064
2065
Crown Registered OwnerPatent No.
11462
11460
Gold
CrownPatent/
Lease No
11442
11443
11444
11450
11451
208469
208470
208471
Shirley V. Frahm
Shirley V. Frahm
Canyon Group
Registered Owner
Gold CanyonResources Inc.
Gold CanyonResources Inc.
Gold CanyonResources Inc.
Gold CanyonResources Inc.
Gold CanyonResources Inc.
Gold CanyonResources Inc.
Gold CanyonResources Inc.
Gold CanyonResources Inc.
Crown EncumbrancesReservations
A *
A, B *
Crown EncumbrancesReservations
A, C **
A, B **
A, B **
A,B **
A **
D,E,F
D,E,F
D, E
MBDOCS 5999845.4
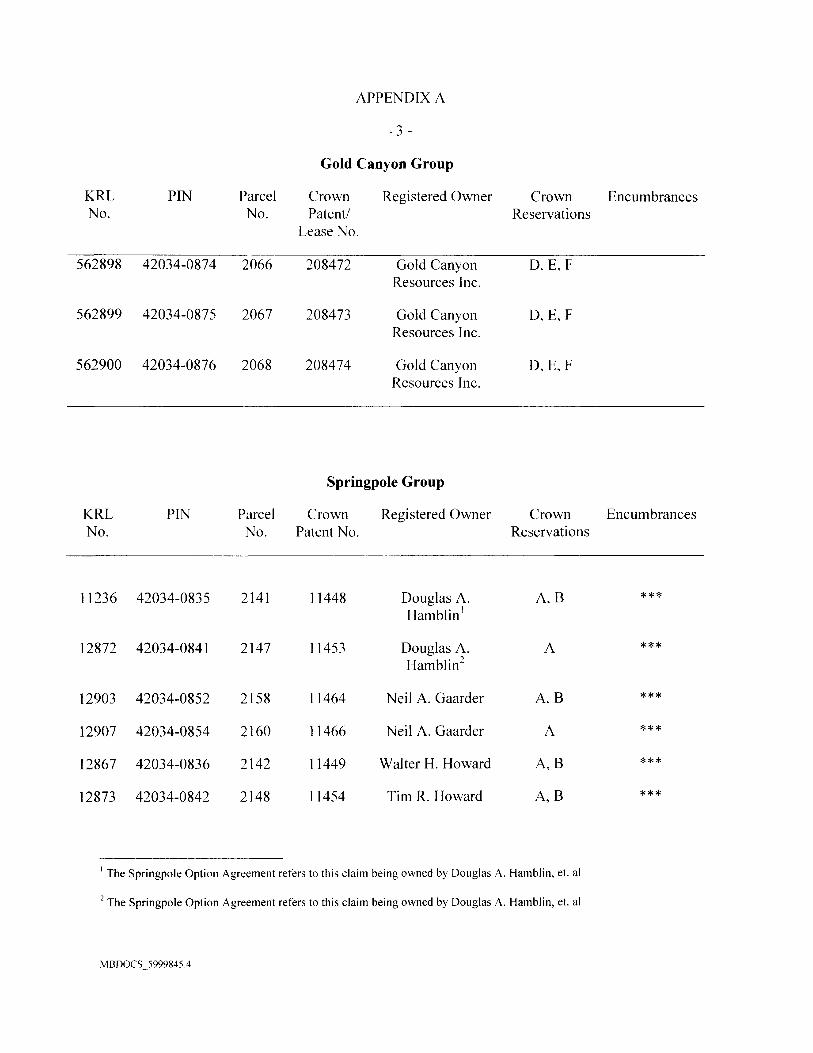
APPENDIX A
-3 -
Gold Canyon Group
KRLNo.
562898
562899
562900
PIN
42034-0874
42034-0875
42034-0876
ParcelNo.
2066
2067
2068
CrownPatent/
Lease No.
208472
208473
208474
Registered Owner
Gold CanyonResources Inc.
Gold CanyonResources Inc.
Gold CanyonResources Inc.
Crown EncumbrancesReservations
D,E,F
D, E, F
D,E ,F
Springpole Group
KRLNo.
11236
12872
12903
12907
12867
12873
PIN
42034-0835
42034-0841
42034-0852
42034-0854
42034-0836
42034-0842
ParcelNo.
2141
2147
2158
2160
2142
2148
CrownPatent No.
11448
11453
11464
11466
11449
11454
Registered Owner
Douglas A.Hamblin1
Douglas A.Hamblin
Neil A. Gaarder
Neil A. Gaarder
Walter H. Howard
Tim R. Howard
Crown EncumbrancesReservations
A. B ***
^ ***
A,B ***
^ ***
A, B ***
A, B ***
1 The Springpole Option Agreement refers to this claim being owned by Douglas A. Hamblin, et. al
2 The Springpole Option Agreement refers to this claim being owned by Douglas A. Hamblin, et. al
MBDOCS 5999845.4
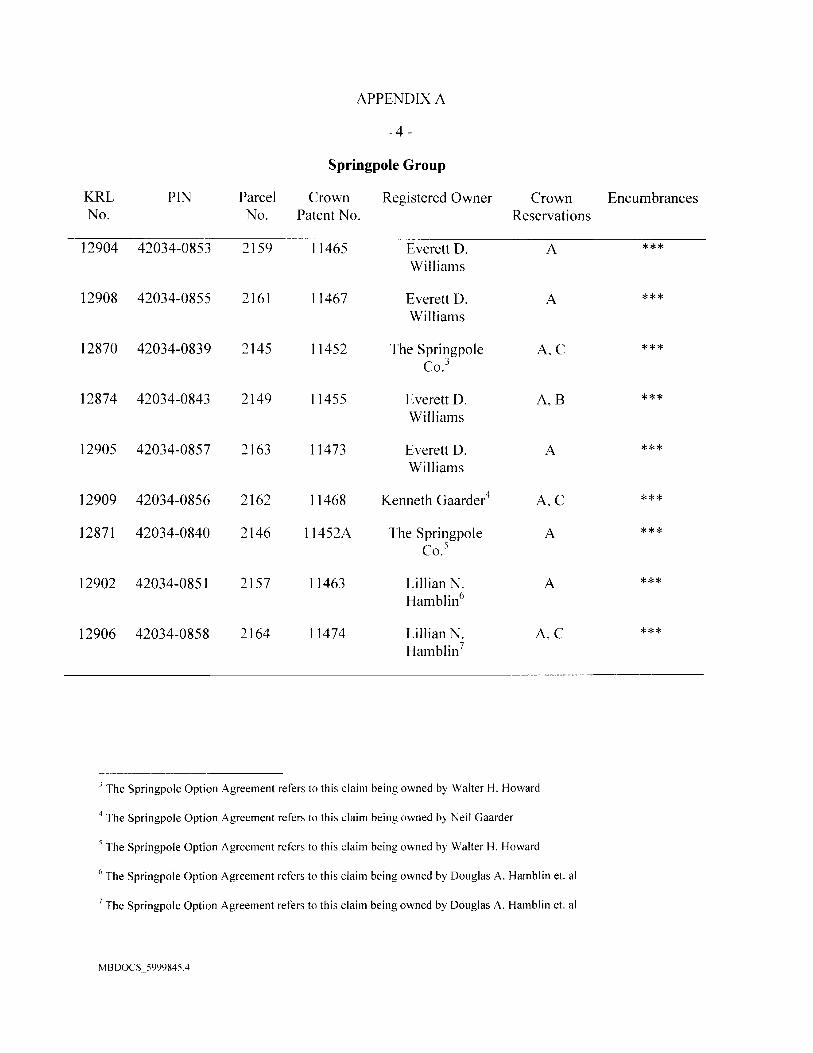
APPENDIX A
- 4 -
Springpole Group
KRLNo.
12904
12908
12870
12874
12905
12909
12871
12902
12906
PIN
42034-0853
42034-0855
42034-0839
42034-0843
42034-0857
42034-0856
42034-0840
42034-0851
42034-0858
ParcelNo.
2159
2161
2145
2149
2163
2162
2146
2157
2164
CrownPatent No.
11465
11467
11452
11455
11473
11468
11452A
11463
11474
Registered Owner
Everett D.Williams
Everett D.Williams
The SpringpoleCo.3
Everett D.Williams
Everett D.Williams
Kenneth Gaarder4
The SpringpoleCo.5
Lillian N.Hamblin6
Lillian N.Hamblin7
Crown EncumbrancesReservations
^ ***
A ***
A, C ***
A, B ***
A ***
A C ***
A ***
A ***
A, C ***
' The Springpole Option Agreement refers to this claim being owned by Walter H. Howard
4 The Springpole Option Agreement refers to this claim being owned by Neil Gaarder
The Springpole Option Agreement refers to this claim being owned by Walter H. Howard
6 The Springpole Option Agreement refers to this claim being owned by Douglas A. Hamblin et. al
7 The Springpole Option Agreement refers to this claim being owned by Douglas A. Hamblin et. al
MBDOCS 5999845.4

APPENDIX A
- 5 -
Notes to Reservations
Notation Explanation
A. Crown Reservations
1. 5% of acreage for roads and right to lay roads where Crownor its officers deem necessary
2. All trees standing or being on said lands, together with theright to enter lands to remove timber
3. Free use, passage and enjoyment of, in, over and upon allnavigable waters found on or under or flowing through land
4. Right of access to shores of all rivers, streams and lakes forall vessels, boats and persons together with right to use somuch of the banks thereof, not exceeding one chain in depthfrom waters edge as may be necessary for fishery purposes
5. Assurance Fees of 1/4 percent on value of land and oftimber and minerals removed therefrom and 1/10 percent onbuildings (not less than $1) which must be paid before anydealing therewith
Exceptions and Reservations in Land Titles Parcels
1. Any unpaid Provincial or Municipal taxes, charges, rates,assessments and school and water rates or charges imposed inrespect of statute labour
2. Conditions contained in section 101 of the Mining Act (now section91(1) of Mining Act, R.S.O. 1990, c. M.I 4) requiring that all ores orminerals raised or removed from land shall be treated and refinedwithin Canada
3. Exceptions and qualifications mentioned in section 9 of Land TitlesAct. R.S.O. 1937 (now s. 45 of Land Titles Act, R.S.O. 1990, c. L.5)
B. Surface rights only on and over a strip of land one chain in perpendicularwidth along the shore of Springpole Lake
MBDOCS 5999845.4
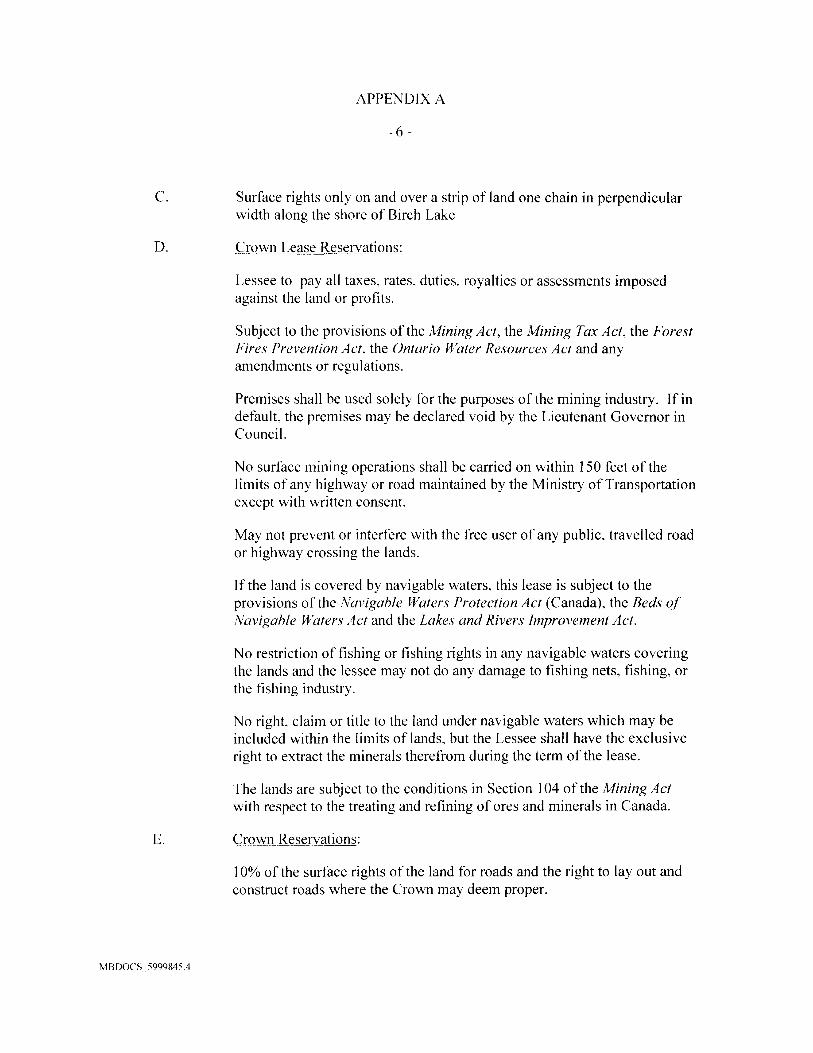
APPENDIX A
- 6 -
C. Surface rights only on and over a strip of land one chain in perpendicularwidth along the shore of Birch Lake
D. Crown Lease Reservations:
Lessee to pay all taxes, rates, duties, royalties or assessments imposedagainst the land or profits.
Subject to the provisions of the Mining Act, the Mining Tax Act, the ForestFires Prevention Act. the Ontario Water Resources Act and anyamendments or regulations.
Premises shall be used solely for the purposes of the mining industry. If indefault, the premises may be declared void by the Lieutenant Governor inCouncil.
No surface mining operations shall be carried on within 150 feet of thelimits of any highway or road maintained by the Ministry of Transportationexcept with written consent.
May not prevent or interfere with the free user of any public, travelled roador highway crossing the lands.
If the land is covered by navigable waters, this lease is subject to theprovisions of the Navigable Waters Protection Act (Canada), the Beds ofNavigable Waters Act and the Lakes and Rivers Improvement Act.
No restriction of fishing or fishing rights in any navigable waters coveringthe lands and the lessee may not do any damage to fishing nets, fishing, orthe fishing industry.
No right, claim or title to the land under navigable waters which may beincluded within the limits of lands, but the Lessee shall have the exclusiveright to extract the minerals therefrom during the term of the lease.
The lands are subject to the conditions in Section 104 of the Mining Actwith respect to the treating and refining of ores and minerals in Canada.
E. Crown Reservations:
10% of the surface rights of the land for roads and the right to lay out andconstruct roads where the Crown may deem proper.
MBDOCS 5999845.4

APPENDIX A
- 7 -
The surface rights on and over any public or colonization road or anyhighway crossing the land at the date of the lease.
All deposits of sand, gravel and peat together with the right of the Crown toenter and remove same without compensation.
Use of the land for all such works as may be necessary for the developmentof water power and the development, transmission and distribution ofelectrical power, natural gas, petroleum and petroleum products, includingthe construction, maintenance and operation of roads, railroads,transmission lines and stations, flumes, pipelines, dams, power houses andother works and structures.
The right to grant without compensation to any person or corporation theright of way necessary for the construction and operation of one or morerailways over or across the land without hindrance from the lessee wheresuch railway or railways shall not manifestly or materially interfere withthe mining operations carried on upon the premises.
All timber and trees standing, being or hereafter found growing upon theland, and the right to enter upon such land to carry on forestry, to cut andremove any timber or trees thereon, and to make necessary roads for suchpurposes.
The free use, passage and enjoyment of, in, over, and upon all navigablewaters on, under, or flowing through any part of the land, and thereservation of right of access to the shores of all the rivers, streams, andlakes for all vessels, boats, and persons, together with the right to use thewater banks that does not exceed one chain in depth from the highwatermark as may be necessary for fishery or public purposes.
F. Surface rights only on and over a strip of land along the shore of BirchLake and which strip of land is bounded by the high water mark of saidlake and by a line every point of which is distant 400 feet from the nearestpoint on the said high water mark.
MBDOCS 5999845.4
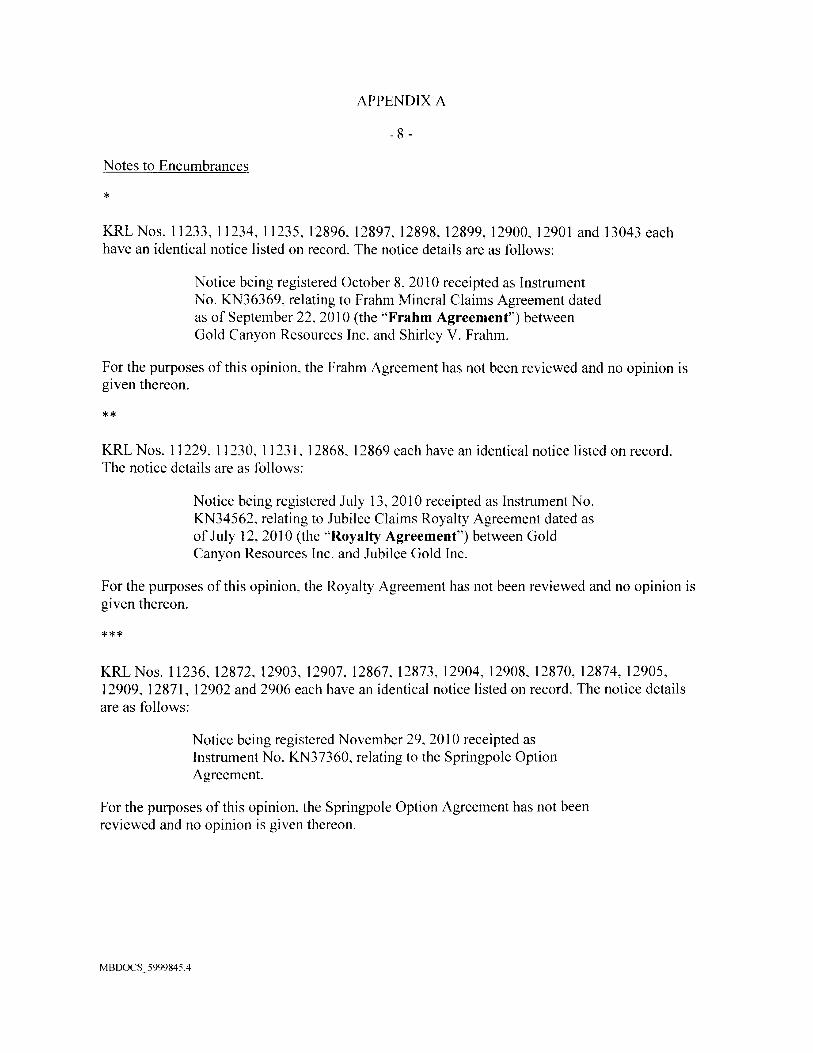
APPENDIX A
- 8 -
Notes to Encumbrances
KRLNos. 11233, 11234, 11235, 12896, 12897, 12898, 12899, 12900, 12901 and 13043 eachhave an identical notice listed on record. The notice details are as follows:
Notice being registered October 8, 2010 receipted as InstrumentNo. KN36369, relating to Frahm Mineral Claims Agreement datedas of September 22, 2010 (the "Frahm Agreement") betweenGold Canyon Resources Inc. and Shirley V. Frahm.
For the purposes of this opinion, the Frahm Agreement has not been reviewed and no opinion isgiven thereon.
**
KRL Nos. 11229. 11230,11231,12868, 12869 each have an identical notice listed on record.The notice details are as follows:
Notice being registered July 13, 2010 receipted as Instrument No.KN34562, relating to Jubilee Claims Royalty Agreement dated asof July 12, 2010 (the "Royalty Agreement") between GoldCanyon Resources Inc. and Jubilee Gold Inc.
For the purposes of this opinion, the Royalty Agreement has not been reviewed and no opinion isgiven thereon.
***
KRLNos. 11236, 12872, 12903, 12907, 12867, 12873, 12904, 12908, 12870, 12874, 12905,12909, 12871, 12902 and 2906 each have an identical notice listed on record. The notice detailsare as follows:
Notice being registered November 29, 2010 receipted asInstrument No. KN37360, relating to the Springpole OptionAgreement.
For the purposes of this opinion, the Springpole Option Agreement has not beenreviewed and no opinion is given thereon.
MBDOCS 5999845.4
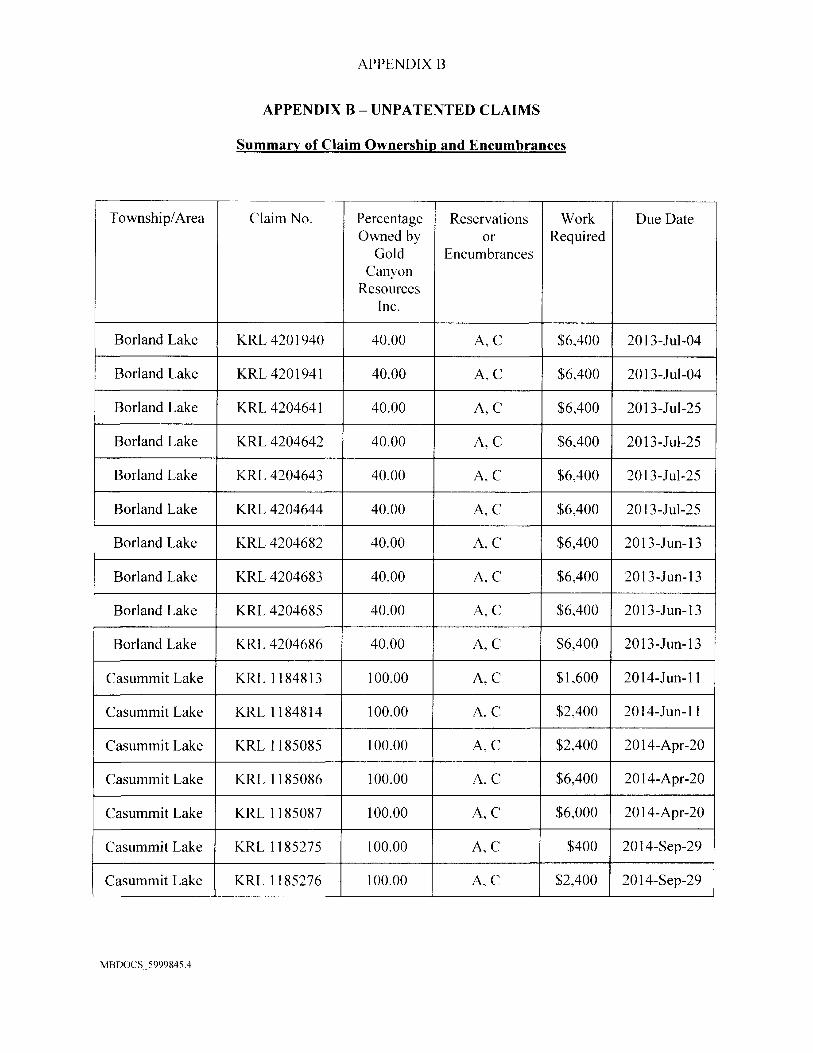
APPENDIX B
APPENDIX B - UNPATENTED CLAIMS
Summary of Claim Ownership and Encumbrances
Township/Area
Borland Lake
Borland Lake
Borland Lake
Borland Lake
Borland Lake
Borland Lake
Borland Lake
Borland Lake
Borland Lake
Borland Lake
Casummit Lake
Casummit Lake
Casummit Lake
Casummit Lake
Casummit Lake
Casummit Lake
Casummit Lake
Claim No.
KRL 420 1940
KRL 420 1941
KRL 4204641
KRL 4204642
KRL 4204643
KRL 4204644
KRL 4204682
KRL 4204683
KRL 4204685
KRL 4204686
KRL 1184813
KRL 1184814
KRL 1185085
KRL 1185086
KRL 1185087
KRL 1185275
KRL 1185276
PercentageOwned by
GoldCanyon
ResourcesInc.
40.00
40.00
40.00
40.00
40.00
40.00
40.00
40.00
40.00
40.00
100.00
100.00
100.00
100.00
100.00
100.00
100.00
Reservationsor
Encumbrances
A, C
A, C
A, C
A, C
A, C
A, C
A, C
A, C
A, C
A, C
A,C
A, C
A, C
A, C
A, C
A, C
A, C
WorkRequired
$6,400
$6,400
$6,400
$6,400
$6,400
$6,400
$6,400
$6,400
$6,400
$6,400
$1,600
$2,400
$2,400
$6,400
$6,000
$400
$2,400
Due Date
2013-M-04
2013-Jul-04
2013-Jul-25
2013-Jul-25
2013-Jul-25
2013-M-25
2013-Jun-13
2013-Jun-13
2013-Jun-13
2013-Jun-13
2014-Jun-ll
2014-Jun-ll
2014-Apr-20
2014-Apr-20
2014-Apr-20
2014-Sep-29
2014-Sep-29
MBDOCS 5999845.4
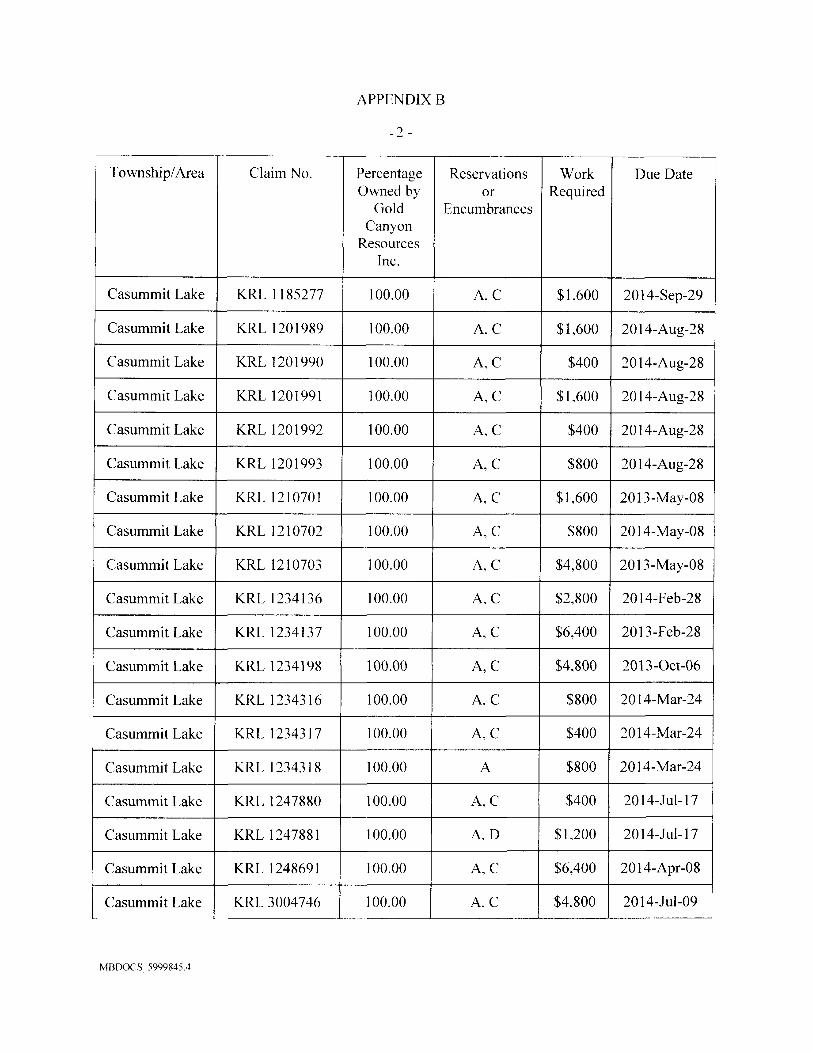
APPENDIX B
- 2 -
Township/Area
Casummit Lake
Casummit Lake
Casummit Lake
Casummit Lake
Casummit Lake
Casummit Lake
Casummit Lake
Casummit Lake
Casummit Lake
Casummit Lake
Casummit Lake
Casummit Lake
Casummit Lake
Casummit Lake
Casummit Lake
Casummit Lake
Casummit Lake
Casummit Lake
Casummit Lake
Claim No.
KRL 1185277
KRL 1201989
KRL 1201990
KRL 1201991
KRL 1201992
KRL 1201993
KRL 1210701
KRL 1210702
KRL 1210703
KRL 1234136
KRL 1234137
KRL 1234198
KRL 12343 16
KRL 1234317
KRL 12343 18
KRL 1247880
KRL 1247881
KRL 1248691
KRL 3004746
PercentageOwned by
GoldCanyon
ResourcesInc.
100.00
100.00
100.00
100.00
100.00
100.00
100.00
100.00
100.00
100.00
100.00
100.00
100.00
100.00
100.00
100.00
100.00
100.00
100.00
Reservationsor
Encumbrances
A. C
A, C
A, C
A, C
A, C
A, C
A, C
A,C
A, C
A, C
A, C
A, C
A, C
A, C
A
A, C
A. D
A, C
A, C
WorkRequired
$1,600
$1,600
$400
$1,600
$400
$800
$1,600
$800
$4,800
$2,800
$6,400
$4,800
$800
$400
$800
$400
$1,200
$6,400
$4,800
Due Date
2014-Sep-29
2014-Aug-28
2014-Aug-28
2014-Aug-28
2014-Aug-28
2014-Aug-28
2013-May-08
2014-May-08
2013-May-08
2014-Feb-28
2013-Feb-28
20I3-Oct-06
2014-Mar-24
2014-Mar-24
2014-Mar-24
2014-M-17
2014-Jul-17
2014-Apr-08
2014-Jul-09
MBDOCS 5999845.4
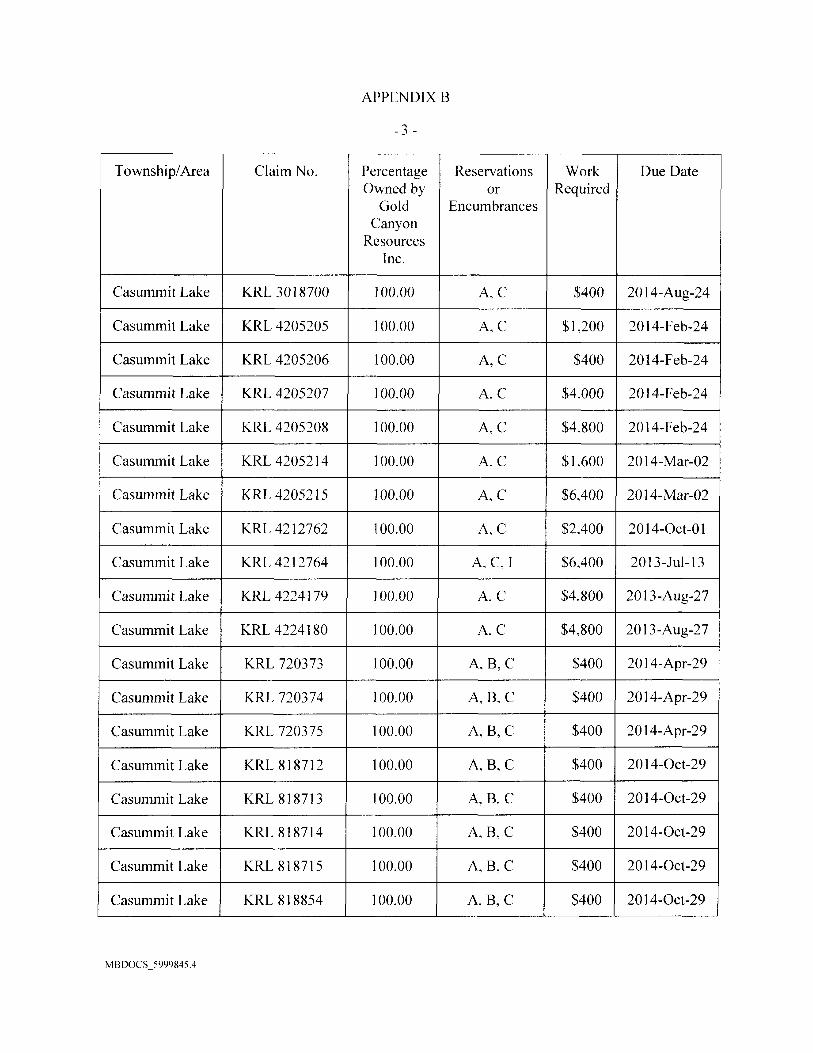
APPENDIX B
-3 -
Township/ Area
Casummit Lake
Casummit Lake
Casummit Lake
Casummit Lake
Casummit Lake
Casummit Lake
Casummit Lake
Casummit Lake
Casummit Lake
Casummit Lake
Casummit Lake
Casummit Lake
Casummit Lake
Casummit Lake
Casummit Lake
Casummit Lake
Casummit Lake
Casummit Lake
Casummit Lake
Claim No.
KRL 301 8700
KRL 4205205
KRL 4205206
KRL 4205207
KRL 4205208
KRL 42052 14
KRL 42052 15
KRL 42 12762
KRL 42 12764
KRL 4224 179
KRL 4224 180
KRL 720373
KRL 720374
KRL 720375
KRL 818712
KRL 818713
KRL 818714
KRL 8 1871 5
KRL 8 18854
PercentageOwned by
GoldCanyon
ResourcesInc.
100.00
100.00
100.00
100.00
100.00
100.00
100.00
100.00
100.00
100.00
100.00
100.00
100.00
100.00
100.00
100.00
100.00
100.00
100.00
Reservationsor
Encumbrances
A, C
A, C
A, C
A, C
A, C
A. C
A, C
A,C
A, C, I
A, C
A, C
A, B, C
A, B, C
A, B, C
A, B, C
A, B, C
A, B, C
A , B , C
A, B, C
WorkRequired
$400
$1.200
$400
$4,000
$4,800
$1,600
$6,400
$2,400
$6,400
$4,800
$4,800
$400
$400
$400
$400
$400
$400
$400
$400
Due Date
2014-Aug-24
2014-Feb-24
2014-Feb-24
2014-Feb-24
2014-Feb-24
2014-Mar-02
2014-Mar-02
2014-Oct-Ol
2013-Jul-13
2013-Aug-27
2013-Aug-27
2014-Apr-29
2014-Apr-29
2014-Apr-29
2014-Oct-29
2014-Oct-29
2014-Oct-29
2014-Oct-29
2014-Oct-29
MBDOCS 5999845.4
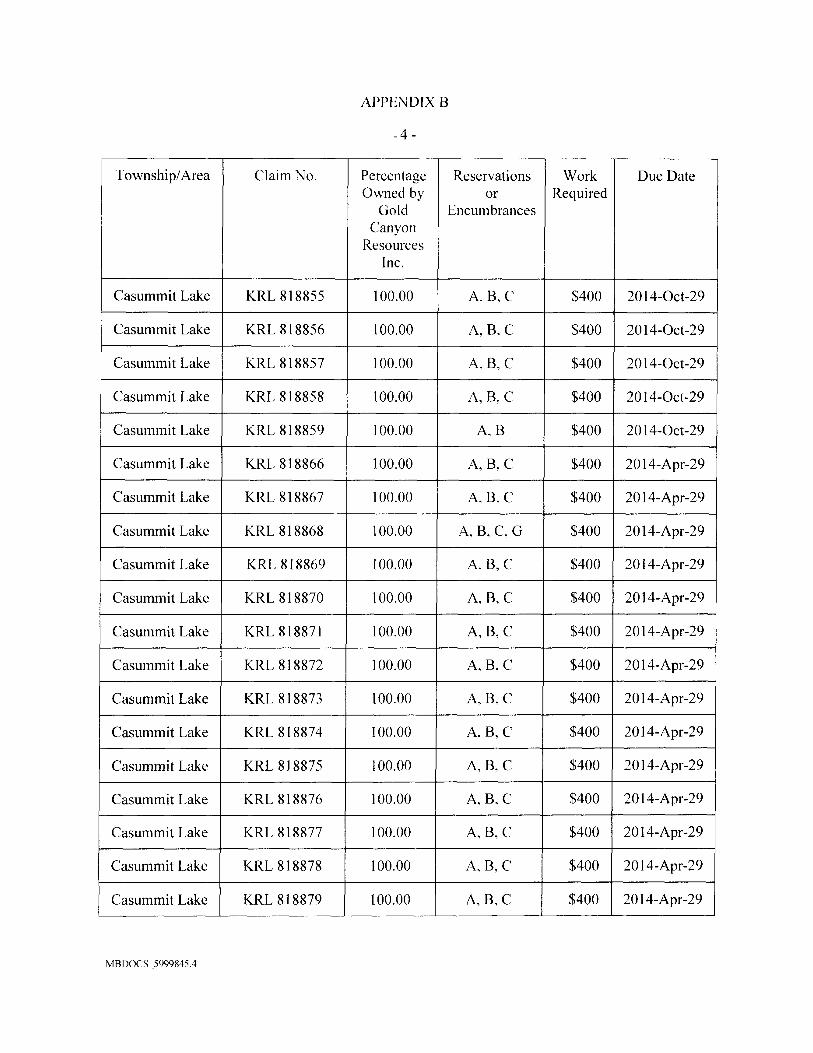
APPENDIX B
- 4 -
Township/ Area
Casummit Lake
Casummit Lake
Casummit Lake
Casummit Lake
Casummit Lake
Casummit Lake
Casummit Lake
Casummit Lake
Casummit Lake
Casummit Lake
Casummit Lake
Casummit Lake
Casummit Lake
Casummit Lake
Casummit Lake
Casummit Lake
Casummit Lake
Casummit Lake
Casummit Lake
Claim No.
KRL818855
KRL818856
KRL818857
KRL 818858
KRL 818859
KRL 8 18866
KRL 818867
KRL 8 18868
KRL 8 18869
KRL 818870
KRL 8 18871
KRL 8 18872
KRL 8 18873
KRL 8 18874
KRL 8 18875
KRL 8 18876
KRL 8 18877
KRL 8 18878
KRL 8 18879
PercentageOwned by
GoldCanyon
ResourcesInc.
100.00
100.00
100.00
100.00
100.00
100.00
100.00
100.00
100.00
100.00
100.00
100.00
100.00
100.00
100.00
100.00
100.00
100.00
100.00
Reservationsor
Encumbrances
A, B, C
A,B, C
A,B,C
A,B, C
A,B
A, B, C
A,B, C
A, B, C, G
A, B, C
A, B, C
A, B, C
A, B, C
A, B, C
A, B, C
A, B, C
A, B, C
A, B, C
A, B, C
A,B, C
WorkRequired
$400
$400
$400
$400
$400
$400
$400
$400
$400
$400
$400
$400
$400
$400
$400
$400
$400
$400
$400
Due Date
2014-Oct-29
2014-Oct-29
2014-Oct-29
2014-Oct-29
2014-Oct-29
2014-Apr-29
2014-Apr-29
2014-Apr-29
2014-Apr-29
2014-Apr-29
2014-Apr-29
2014-Apr-29
2014-Apr-29
2014-Apr-29
2014-Apr-29
2014-Apr-29
2014-Apr-29
2014-Apr-29
2014-Apr-29
MBDOCS 5999845.4

APPENDIX B
- 5 -
Township/ Area
Casummit Lake
Casummit Lake
Casummit Lake
Casummit Lake
Casummit Lake
Casummit Lake
Casummit Lake
Casummit Lake
Casummit Lake
Casummit Lake
Casummit Lake
Casummit Lake
Casummit Lake
Casummit Lake
Casummit Lake
Casummit Lake
Casummit Lake
Casummit Lake
Casummit Lake
Claim No.
KRL 818891
KRL818892
KRL 8 18893
KRL 834734
KRL 834783
KRL 834784
KRL 834785
KRL 834788
KRL 845861 *
KRL 845862 *
KRL 845863 *
KRL 845864 *
KRL 845865 *
KRL 845866 *
KRL 870087
KRL 870237
KRL 903534
KRL 903535
KRL 903536
PercentageOwned by
GoldCanyon
ResourcesInc.
100.00
100.00
100.00
100.00
100.00
100.00
100.00
100.00
100.00
100.00
100.00
100.00
100.00
100.00
100.00
100.00
100.00
100.00
100.00
Reservationsor
Encumbrances
A, B, C
A,B,C
A, B, C
A.B,C
A, B,C
A, B, C
A, B, C
A, B, C
A, B, C
A,B,C
A, B, C
A, B, C
A, B, C
A, B
A, B, C
A, B, C
A, B, C
A,B,C
A,B,C
WorkRequired
$400
$400
$400
$400
$400
$400
$400
$400
$400
$400
$400
$400
$400
$400
$400
$400
$400
$400
$400
Due Date
2014-Apr-29
2014-Apr-29
2014-Apr-29
2014-Mar-05
2014-Mar-05
2014-Mar-05
2014-Mar-05
2014-Mar-05
2014-May-24
2014-May-24
2014-May-24
2014-May-24
2014-May-24
2014-May-24
2014-Aug-31
2014-Aug-06
2014-Apr-18
2014-Apr-18
2014-Apr-18
MBDOCS 5999845.4
SRK Consulting (Canada) Inc. Suite 2200 - 1066 West Hastings Street Vancouver, BC V6E 3X2
T: +1.604.681.4196 F: +1.604.687.5532
www.srk.com
Local Offices: Saskatoon Sudbury Toronto Vancouver Yellowknife
Group Offices: Africa Asia Australia Europe North America South America
QP Certificate_DANCE_FOR SEDAR
CERTIFICATE OF QUALIFIED PERSON
To accompany the report entitled: Preliminary Economic Assessment for the Springpole Gold Project, Ontario, Canada, amended October 7, 2016 and effective March 25, 2013.
I, Adrian Dance, residing in West Vancouver BC, do hereby certify that:
1) I am a Principal Consultant with the firm of SRK Consulting (Canada) Inc. (“SRK”) with an office at Suite 2200-1066 West Hastings Street, Vancouver, BC, Canada.
2) I am a graduate of the University of British Columbia in 1987 where I obtained a Bachelor of Applied Science and a graduate of the University of Queensland in 1992 where I obtained a Doctorate. I have practiced my profession continuously since 1992 including eight years as a consultant and have experience working in a number of gold operations around the world.
3) I am a Professional Engineer registered with the Association of Professional Engineers & Geoscientists of British Columbia, license number 37151.
4) I have not personally visited the project area. 5) I have read the definition of “qualified person” set out in National Instrument 43-101 and certify that by virtue
of my education, affiliation to a professional association and past relevant work experience, I fulfill the requirements to be a “qualified person” for the purposes of National Instrument 43-101 and this technical report has been prepared in compliance with National Instrument 43-101 and Form 43-101F1.
6) I, as a qualified person, am independent of the issuer as defined in Section 1.5 of National Instrument 43-101. 7) I am the co-author of this report and responsible for Sections 12, 16, 20.1.2, 20.2.2, 24.2 and 25.4 of the
report and accept professional responsibility for those sections of this technical report. 8) I have had no prior involvement with the subject property. 9) I have read National Instrument 43-101 and confirm that this technical report has been prepared in
compliance therewith. 10) I have not received, nor do I expect to receive, any interest, directly or indirectly, in the Springpole Gold
Project or securities of Gold Canyon Resources Inc. 11) That, as of the date of this certificate, to the best of my knowledge, information and belief, this technical report
contains all scientific and technical information that is required to be disclosed to make the technical report not misleading.
Vancouver October 7, 2016
“original signed”____ Adrian Dance, PEng. Principal Consultant
SRK Consulting (Canada) Inc. Suite 2200 - 1066 West Hastings Street Vancouver, BC V6E 3X2
T: +1.604.681.4196 F: +1.604.687.5532
www.srk.com
Local Offices: Saskatoon Sudbury Toronto Vancouver Yellowknife
Group Offices: Africa Asia Australia Europe North America South America
QP Certificate_DUNCAN_FOR SEDAR
CERTIFICATE OF QUALIFIED PERSON
To accompany the report entitled: Preliminary Economic Assessment for the Springpole Gold Project, Ontario, Canada, amended October 7, 2016 and effective March 25, 2013.
I, John F. Duncan, P.Eng residing at 4402 West 7th Avenue, Vancouver, BC V6T 1W9 do hereby certify that:
1) I am a Principal Consultant for SRK Consulting (Canada) Inc. (“SRK”) with an office at Suite 2200 – 1066 West Hastings Street, Vancouver, British Columbia, Canada.
2) I am a graduate of the University of Manitoba in 1986, 1992 and 1998; where I obtained a Bachelor of Science, Bachelor of Science in Civil Engineering and a Master of Engineering.
3) I am a Professional Engineer registered with the Professional Engineers Ontario (#100024399) and the Association of Professional Engineers and Geoscientists of Manitoba (#8330).
4) I have not personally inspected the subject project. 5) I have read the definition of “qualified person” set out in National Instrument 43-101 and certify that by virtue of
my education, affiliation to a professional association and past relevant work experience, I fulfill the requirements to be a “qualified person” for the purposes of National Instrument 43-101 and this technical report has been prepared in compliance with National Instrument 43-101 and Form 43-101F1.
6) As a qualified person, I am independent of the issuer as defined in Section 1.5 of National Instrument 43-101. 7) I am the co-author of this report and responsible for Sections 15.8, 15.9, 24.7 and 25.6 of the report and
accept professional responsibility for those sections of this technical report. 8) I have had no prior involvement with the subject property. 9) I have read National Instrument 43-101 and confirm that this technical report has been prepared in compliance
therewith. 10) I have not received, nor do I expect to receive, any interest, directly or indirectly, in the Springpole Gold Project
or securities of Gold Canyon Resources Inc. 11) That, as of the date of this certificate, to the best of my knowledge, information and belief, this technical report
contains all scientific and technical information that is required to be disclosed to make the technical report not misleading.
Vancouver October 7, 2016
“original signed”____ John Duncan, PEng Principal Hydrotechnical Consultant
SRK Consulting (Canada) Inc. Suite 2200 - 1066 West Hastings Street Vancouver, BC V6E 3X2
T: +1.604.681.4196 F: +1.604.687.5532
www.srk.com
Local Offices: Saskatoon Sudbury Toronto Vancouver Yellowknife
Group Offices: Africa Asia Australia Europe North America South America
QP Certificate_ELLIOTT_FOR SEDAR
CERTIFICATE OF QUALIFIED PERSON
To accompany the report entitled: Preliminary Economic Assessment for the Springpole Gold Project, Ontario, Canada, amended October 7, 2016 and effective March 25, 2013.
I, Christopher Elliott, residing at 1095 Clements Ave, North Vancouver, BC, V7R 2L3 do hereby certify that:
1) I, Christopher Elliott, declare that I am a Fellow of The Australasian Institute of Mining and Metallurgy (AusIMM),
employed as a Principal Mining Consultant with the firm of SRK Consulting (Canada) Inc. (“SRK”) with an office at Suite 2200, 1066 West Hastings Street, Vancouver, British Columbia, Canada.
2) I am a graduate of the Ballarat CAE with a Bachelor of Engineering and of Macquarie University with a Graduate Diploma of Geoscience. I have practiced my profession continuously since 1986. I have worked as a Mining Engineer continuously for a total of 26 years since my graduation from University.
3) I am registered as a Fellow of The Australasian Institute of Mining and Metallurgy (AusIMM). 4) I have not personally visited the project area. 5) I have read the definition of “qualified person” set out in National Instrument 43-101 and certify that by virtue of
my education, affiliation to a professional association and past relevant work experience, I fulfill the requirements to be a “qualified person” for the purposes of National Instrument 43-101 and this technical report has been prepared in compliance with National Instrument 43-101 and Form 43-101F1.
6) As a qualified person, I am independent of the issuer as defined in Section 1.5 of National Instrument 43-101. 7) I am the co-author of this report and responsible for the Executive Summary, Section 18, 21, 24.12, 24.13, 25.8
and 25.11 and accept professional responsibility for those sections of this technical report; 8) I have had no prior involvement with the subject property. 9) I have read National Instrument 43-101 and confirm that this technical report has been prepared in compliance
therewith. 10) I have not received, nor do I expect to receive, any interest, directly or indirectly, in the Springpole Gold Project
or securities of Gold Canyon Resources Inc. 11) That, as of the date of this certificate, to the best of my knowledge, information and belief, this technical report
contains all scientific and technical information that is required to be disclosed to make the technical report not misleading.
Vancouver, October 7, 2016
“original signed”____ Christopher Elliott Principal Consultant (Mining) SRK Consulting (Canada), Inc.
SRK Consulting (Canada) Inc. Suite 2200 - 1066 West Hastings Street Vancouver, BC V6E 3X2
T: +1.604.681.4196 F: +1.604.687.5532
www.srk.com
Local Offices: Saskatoon Sudbury Toronto Vancouver Yellowknife
Group Offices: Africa Asia Australia Europe North America South America
QP Certificate_LISKOWICH_FOR SEDAR
CERTIFICATE OF QUALIFIED PERSON
To accompany the report entitled: Preliminary Economic Assessment for the Springpole Gold Project, Ontario, Canada, dated October 7, 2016 and effective March 25, 2013.
I, Mark Liskowich, residing at Saskatoon, Saskatchewan, do hereby certify that:
1) I am a Professional Geologist, employed as a Principal Consultant with SRK Consulting (Canada) Inc. 2) I am a member of the Association of Professional Engineers and Geoscientists of Saskatchewan. I graduated
with a B.Sc. (Geology) degree from the University of Regina in May 1989. 3) I have practised my profession within the mineral exploration, mining industry since 1989. I have been directly
involved, professionally in the environmental and social management of mineral exploration and mining projects covering a wide range of commodities since 1992 with both the public and private sector. My areas of expertise are environmental management, environmental auditing, and project permitting, licensing, public and regulatory consultation.
4) I have not personally inspected the subject project. 5) I have read the definition of “qualified person” set out in National Instrument 43-101 and certify that by virtue of
my education, affiliation to a professional association and past relevant work experience, I fulfill the requirements to be a “qualified person” for the purposes of National Instrument 43-101 and this technical report has been prepared in compliance with National Instrument 43-101 and Form 43-101F1;
6) As a qualified person, I am independent of the issuer as defined in Section 1.5 of National Instrument 43-101. 7) I am the co-author of this report and responsible for sections 19, 24.11, 25.7, 25.10 and 25.13 of the report
and accept professional responsibility for those sections of this technical report. 8) I have had no prior involvement with the subject property. 9) I have read National Instrument 43-101 and confirm that this technical report has been prepared in compliance
therewith. 10) I have not received, nor do I expect to receive, any interest, directly or indirectly, in the Springpole Gold Project
or securities of Gold Canyon Resources Inc. 11) That, as of the date of this certificate, to the best of my knowledge, information and belief, this technical report
contains all scientific and technical information that is required to be disclosed to make the technical report not misleading.
Saskatoon, Saskatchewan October 7, 2016
“original signed”____ Mark Liskowich, PGeo Principal Consultant, Geoenvironmental

SRK Consulting (Canada) Inc. Suite 2200 - 1066 West Hastings Street Vancouver, BC V6E 3X2
T: +1.604.681.4196 F: +1.604.687.5532
www.srk.com
Local Offices: Saskatoon Sudbury Toronto Vancouver Yellowknife
Group Offices: Africa Asia Australia Europe North America South America
QP Certificate_ROYLE_FOR SEDAR
CERTIFICATE OF QUALIFIED PERSON
To accompany the report entitled: Preliminary Economic Assessment for the Springpole Gold Project, Ontario, Canada, amended October 7, 2016 and effective March 25, 2013.
I, Michael Royle, residing at 3853 Lewister Road, North Vancouver do hereby certify that:
1) I am a Principal Hydrogeologist with the firm of SRK Consulting (Canada) Inc. (“SRK”) with an office at Suite 2200-1066 West Hastings Street, Vancouver, BC, Canada.
2) I am a graduate of the University of British Columbia in 1987 and the University of New South Wales in 1992 where I obtained a B.Sc. and an M.App.Sci. respectively. I have practiced my profession continuously since 1987, predominantly in the field of mining hydrogeology.
3) I am a Professional Geoscientist registered with the APEGBC (registration number: 27830). 4) I have not personally visited the project area. 5) I have read the definition of “qualified person” set out in National Instrument 43-101 and certify that by virtue
of my education, affiliation to a professional association and past relevant work experience, I fulfill the requirements to be a “qualified person” for the purposes of National Instrument 43-101 and this technical report has been prepared in compliance with National Instrument 43-101 and Form 43-101F1.
6) As a qualified person, I am independent of the issuer as defined in Section 1.5 of National Instrument 43-101. 7) I am the co-author of this report and responsible for sections 15.7, 24.6, and 25.5 of the report and accept
professional responsibility for those sections of this technical report. 8) I have had no prior involvement with the subject property. 9) I have read National Instrument 43-101 and confirm that this technical report has been prepared in
compliance therewith. 10) I have not received, nor do I expect to receive, any interest, directly or indirectly, in the Springpole Gold
Project or securities of Gold Canyon Resources Inc. 11) That, as of the date of this certificate, to the best of my knowledge, information and belief, this technical report
contains all scientific and technical information that is required to be disclosed to make the technical report not misleading.
Vancouver, BC October 7, 2016
“Original signed”____________ Michael Royle, M.App.Sci., P.Geo. Principal Hydrogeologist

SRK Consulting (Canada) Inc. Suite 2200 - 1066 West Hastings Street Vancouver, BC V6E 3X2
T: +1.604.681.4196 F: +1.604.687.5532
www.srk.com
Local Offices: Saskatoon Sudbury Toronto Vancouver Yellowknife
Group Offices: Africa Asia Australia Europe North America South America
QP Certificate_ARSENEAU_FOR SEDAR_GGC
CERTIFICATE OF QUALIFIED PERSON
To accompany the report entitled: Preliminary Economic Assessment for the Springpole Gold Project, Ontario, Canada, amended October 7, 2016 and effective March 25, 2013.
I, Dr. Gilles Arseneau, P. Geo., residing in North Vancouver, B.C. do hereby certify that:
1) I am an Associate Consultant with the firm of SRK Consulting (Canada) Inc. (“SRK”) with an office at Suite 2200-1066 West Hastings Street, Vancouver, BC, Canada.
2) I graduated with a B.Sc. in Geology from the University of New Brunswick in 1979; an M.Sc. in Geology from the University of Western Ontario in 1984 and a Ph.D. in Geology from the Colorado School of Mines in 1995. I have practiced my profession continuously since 1995. I have worked in exploration in North and South America and have extensive experience with Archean gold deposits and porphyry hosted precious metal mineralization such as the Springpole Gold Project.
3) I am a Professional Geoscientist registered with the Association of Professional Engineers and Geoscientists of British Columbia, registration number 23474.
4) I have personally inspected the Springpole Gold Project on February 10 to 12, 2012 and on August 8th and 9th, 2012. 5) I have read the definition of “qualified person” set out in National Instrument 43-101 and certify that by virtue of my
education, affiliation to a professional association and past relevant work experience, I fulfill the requirements to be a “qualified person” for the purposes of National Instrument 43-101 and this technical report has been prepared in compliance with National Instrument 43-101 and Form 43-101F1.
6) I, as a qualified person, am independent of the issuer as defined in Section 1.5 of National Instrument 43-101. 7) I am the co-author of this report and responsible for section 1 through 11, 13, 14, 22, 23, 24.1, 24.3, 25.1 to 25.3
and appendices B, C and D, and accept professional responsibility for those sections of this technical report. 8) I have had prior involvement with the subject property. I am the author of a technical report entitled Mineral
Resource Update for the Springpole Gold Project NW Ontario, Canada, dated November 30, 2012 and a technical report entitled “Independent Technical Report for the Springpole Gold Project NW Ontario, Canada” dated April 10, 2012, with and effective date of December 15, 2011; “Independent Technical Report for the Springpole Gold Project NW Ontario, Canada” dated April 10, 2012, with and effective date of December 15, 2011.
9) I have read National Instrument 43-101 and confirm that this technical report has been prepared in compliance therewith.
10) I have not received, nor do I expect to receive, any interest, directly or indirectly, in the Springpole Gold Project or securities of Gold Canyon Resources Inc.
11) That, as of the date of this certificate, to the best of my knowledge, information and belief, this technical report contains all scientific and technical information that is required to be disclosed to make the technical report not misleading.
“original signed”____ Dr. Gilles Arseneau, P. Geo. Associate Consultant October 7, 2016
SRK Consulting (Canada) Inc. Suite 2200 - 1066 West Hastings Street Vancouver, BC V6E 3X2
T: +1.604.681.4196 F: +1.604.687.5532
www.srk.com
Local Offices: Saskatoon Sudbury Toronto Vancouver Yellowknife
Group Offices: Africa Asia Australia Europe North America South America
QP Certificate_MURPHY_FOR SEDAR_GGC
CERTIFICATE OF QUALIFIED PERSON
To accompany the report entitled: Preliminary Economic Assessment for the Springpole Gold Project, Ontario, Canada, amended October 7, 2016 and effective March 25, 2013.
I, Bruce Andrew Murphy, residing at #306 – 3980 Inlet Crescent, North Vancouver, British Columbia do hereby certify that:
1) I am a Practice Leader with the firm of SRK Consulting (Canada) Inc. (“SRK”) with an office at Suite 2200-1066 West Hastings Street, Vancouver, BC, Canada.
2) I am a graduate of the University of the Witwatersrand, Johannesburg in 1996; I obtained a MSc. Degree in Engineering (Mining). I have practiced my profession continuously since 1990, working in the operational and consulting filed of mining rock mechanics.
3) I am a Fellow of the South African Institute of Mining and Metallurgy (FSAIMM). 4) I have personally inspected the subject project on November 27-29, 2012. 5) I have read the definition of “qualified person” set out in National Instrument 43-101 and certify that by virtue of
my education, affiliation to a professional association and past relevant work experience, I fulfill the requirements to be a “qualified person” for the purposes of National Instrument 43-101 and this technical report has been prepared in compliance with National Instrument 43-101 and Form 43-101F1.
6) As a qualified person, I am independent of the issuer as defined in Section 1.5 of National Instrument 43-101. 7) I am the co-author of this report and responsible for sections 15.6, 24.5 and appendix F of the report and
accept professional responsibility for those sections of this technical report. 8) I have had no prior involvement with the subject property. 9) I have read National Instrument 43-101 and confirm that this technical report has been prepared in compliance
therewith. 10) I have not received, nor do I expect to receive, any interest, directly or indirectly, in the Springpole Gold Project
or securities of Gold Canyon Resources Inc. 11) That, as of the date of this certificate, to the best of my knowledge, information and belief, this technical report
contains all scientific and technical information that is required to be disclosed to make the technical report not misleading.
Vancouver October 7, 2016
“original signed”____ Bruce Murphy, FSAIMM Practice Leader
Jdsmining.ca Vancouver Office Kelowna Office T 604.687.7545 f 604.689.5041 t 250.763.6369 f 250.763.6302 #860 – 625 Howe Street Vancouver, BC V6C 2T6 #200 – 532 Leon Avenue, Kelowna, BC V1Y 6J6
CERTIFICATE OF QUALIFIED PERSON
To accompany the report entitled: Preliminary Economic Assessment for the Springpole Gold Project, Ontario, Canada, amended October 7, 2016 and effective March 25, 2013.
I, Dino Pilotto, residing at 1457 Vernon Drive, Gibsons BC do hereby certify that:
1) I am a Senior Engineer with the firm of JDS Energy & Mining Inc. (“JDS”) with an office at Suite 860-625 Howe Street, Vancouver, BC, Canada.
2) I am a graduate of the University of BC with a Bachelor of Applied Science in Mining and Mineral Process Engineering, 1987. I have practiced my profession as a mining engineer professional continuously since 1987.
3) I am a Professional Engineer registered with the Province of Alberta (#M88762) and Saskatchewan (#14782).
4) I have personally inspected the subject project November 27-19, 2012. 5) I have read the definition of “qualified person” set out in National Instrument 43-101 and certify that by
virtue of my education, affiliation to a professional association and past relevant work experience, I fulfill the requirements to be a “qualified person” for the purposes of National Instrument 43-101 and this technical report has been prepared in compliance with National Instrument 43-101 and Form 43-101F1.
6) I, as a qualified person, am independent of the issuer as defined in Section 1.5 of National Instrument 43-101.
7) I am the co-author of this report and responsible for sections 15.1 to 15.5, 20.1.1, 20.2.1, 24.4, 25.12 and appendix E of the report and accept professional responsibility for those sections of this technical report.
8) I have had no prior involvement with the subject property. 9) I have read National Instrument 43-101 and confirm that this technical report has been prepared in
compliance therewith. 10) I have not received, nor do I expect to receive, any interest, directly or indirectly, in the Springpole Gold
Project or securities of Gold Canyon Resources Inc. 11) That, as of the date of this certificate, to the best of my knowledge, information and belief, this technical
report contains all scientific and technical information that is required to be disclosed to make the technical report not misleading.
“original signed”____
Dino Pilotto, P.Eng. Senior Engineer Vancouver BC October 7, 2016
SRK Consulting (Canada) Inc. Suite 2200 - 1066 West Hastings Street Vancouver, BC V6E 3X2
T: +1.604.681.4196 F: +1.604.687.5532
www.srk.com
Local Offices: Saskatoon Sudbury Toronto Vancouver Yellowknife
Group Offices: Africa Asia Australia Europe North America South America
QP Certificate_RYKAART_FOR SEDAR
CERTIFICATE OF QUALIFIED PERSON
To accompany the report entitled: Preliminary Economic Assessment for the Springpole Gold Project, Ontario, Canada, amended October 7, 2016 and effective March 25, 2013.
I, Ewoud Maritz Rykaart, residing at 140 Street, Surrey, BC do hereby certify that:
1) I am a Practice Leader with the firm of SRK Consulting (Canada) Inc. (“SRK”) with an office at Suite 2200-1066 West Hastings Street, Vancouver, BC, Canada.
2) I am a graduate of the Rand Afrikaans University in 1991 and 1993; I obtained B.Eng. and M.Eng degrees in Civil Engineering. In 2001, I graduated with a PhD in geotechnical engineering from the university of Saskatchewan. I have practiced my profession continuously since January 1992. My working career has been exclusively as a Consultant for the mining industry, designing and constructing water and waste management structures.
3) I am a Professional Engineer registered with the Association of Professional Engineers and Geoscientists of British Columbia.
4) I have personally inspected the subject project on November 27-29, 2012. 5) I have read the definition of “qualified person” set out in National Instrument 43-101 and certify that by virtue of
my education, affiliation to a professional association and past relevant work experience, I fulfill the requirements to be a “qualified person” for the purposes of National Instrument 43-101 and this technical report has been prepared in compliance with National Instrument 43-101 and Form 43-101F1.
6) As a qualified person, I am independent of the issuer as defined in Section 1.5 of National Instrument 43-101. 7) I am the co-author of this report and responsible for sections 17, 20.1.3-5, 20.2.3, 24.8-10 and 25.9 of the
report and accept professional responsibility for those sections of this technical report. 8) I have had no prior involvement with the subject property. 9) I have read National Instrument 43-101 and confirm that this technical report has been prepared in compliance
therewith. 10) I have not received, nor do I expect to receive, any interest, directly or indirectly, in the Springpole Gold Project
or securities of Gold Canyon Resources Inc. 11) That, as of the date of this certificate, to the best of my knowledge, information and belief, this technical report
contains all scientific and technical information that is required to be disclosed to make the technical report not misleading.
Vancouver October 7, 2016
“original signed”____ EM Rykaart, PhD, PEng Practice Leader