Preliminary report Monte Iato 2013, Antike Kunst 57, 2014, 92-113.
Upload
khangminh22Category
view
0download
0
AMC Consultants Pty Ltd
ABN 58 008 129 164
4 Greenhill Road WAYVILLE SA 5034
T +61 8 8201 1800 F +61 8 8201 1899 E [email protected]
ADELAIDE
+61 8 8201 1800
BRISBANE
+61 7 3839 0099
MELBOURNE
+61 3 8601 3300
PERTH
+61 8 6330 1100
TORONTO
+1 416 640 1212
VANCOUVER
+1 604 669 0044
MAIDENHEAD
+44 1628 778 256
www.amcconsultants.com
KAMOA 2013
PRELIMINARY ECONOMIC ASSESSMENT
KAMOA COPPER PROJECT
Ivanhoe Mines Limited
812022
November 2013
IVANHOE MINES LIMITED Kamoa Copper Project
AMC 812022 : November : 2013 : 812022KamoaFinalEffDate131115rev0 i
IMPORTANT NOTICE
This notice is an integral component of the Kamoa 2013 Preliminary Economic Assessment (Kamoa 2013 PEA) and should be read in its entirety and must accompany every copy made of the Kamoa 2013 PEA. The Kamoa 2013 PEA has been prepared using the Canadian National Instrument 43-101 Standards of Disclosure for Mineral Projects.
The Kamoa 2013 PEA has been prepared for Ivanhoe Mines Limited (Ivanhoe) by AMC Consultants Pty Ltd (AMC), AMEC E&C Services Inc, (AMEC), SRK Consulting Inc (SRK), Stantec Consulting International LLC (Stantec), Hatch Ltd (Hatch) and Golder Associates Africa Pty Ltd (Golder) as the Report Contributors. The Kamoa 2013 PEA is based on information and data supplied to the Report Contributors by Ivanhoe and other parties. The quality of information, conclusions, and estimates contained herein is consistent with the level of effort involved in the services of the Report Contributors, based on: i) information available at the time of preparation, ii) data supplied by outside sources, and iii) the assumptions, conditions, and qualifications set forth in this report. Each portion of the report is intended for use by Ivanhoe subject to the terms and conditions of its contract with the Report Contributors. Except for the purposes legislated under Canadian provincial and territorial securities law, any other uses of the report, by any third party, is at that party’s sole risk.
This report is a Preliminary Economic Assessment (PEA) and includes an economic analysis that is based, in part, on Inferred Mineral Resources. Inferred Mineral Resources are considered too speculative geologically to have the economic considerations applied to them that would allow them to be categorized as Mineral Reserves, and there is no certainty that the results will be realized. Mineral Resources are not Mineral Reserves as they do not have demonstrated economic viability. The results of the PEA represent forward-looking information. The forward-looking information includes metal price assumptions, cash flow forecasts, projected capital and operating costs, metal recoveries, mine life and production rates, and other assumptions used in the PEA. Readers are cautioned that actual results may vary from those presented. The factors and assumptions used to develop the forward-looking information, and the risks that could cause the actual results to differ materially are presented in the body of this report under each relevant section.
The conclusions and estimates stated in the Kamoa 2013 PEA are to the accuracy stated in the Kamoa 2013 PEA only and rely on assumptions stated in the Kamoa 2013 PEA. The results of further work may indicate that the conclusions, estimates and assumptions in the Kamoa 2013 PEA need to be revised or reviewed.
The Report Contributors have used their experience and industry expertise to produce the estimates and approximations in the Kamoa 2013 PEA. Where the Report Contributors have made those estimates and approximations, they are subject to qualifications and assumptions and it should also be noted that all estimates and approximations contained in the Kamoa 2013 PEA will be prone to fluctuations with time and changing industry circumstances.
The Kamoa 2013 PEA should be construed in light of the methodology, procedures and techniques used to prepare the Kamoa 2013 PEA. Sections or parts of the Kamoa 2013 PEA should not be read or removed from their original context.
The Kamoa 2013 PEA is intended to be used by Ivanhoe, subject to the terms and conditions of its contract with the Report Contributors. Recognizing that Ivanhoe has legal and regulatory obligations, the Report Contributors have consented to the filing of the Kamoa 2013 PEA with Canadian Securities Administrators and its System for Electronic Document Analysis and Retrieval ("SEDAR").
IVANHOE MINES LIMITED Kamoa Copper Project
AMC 812022 : November : 2013 : 812022KamoaFinalEffDate131115rev0 ii
Title Page
Project Name: KAMOA COPPER PROJECT
Title: Kamoa 2013 Preliminary Economic Assessment
Location: Katanga Province.
Democratic Republic of the Congo
Effective Date of Technical Report: 15 November 2013
Effective Date of Mineral Resources:
Underground Mineral Resources: 10 December 2012
Open Pit Mineral Resources: 12 January 2013
Effective Date of Drilling Database: 1 October 2013
Qualified Persons:
Bernard Peters, B. Eng. (Mining), FAusIMM (201743), employed by AMC Consultants as Mining Manager was responsible for: Sections 1.1, 1.2, 1.3, 1.4, 1.14.1, 1.16.2, 1.16.3.4; 1.15; 1.17.2; Section 2; Section 3; Section 4; Section 5.4; Section 15; Sections 16.1, 16.4; Sections 18.3.1; Section 19; Sections 21.1, 21.8.2, 21.10, 21.12; Section 22; Section 23; Section 24; Section 25.2; Section 26.4; Section 27.
Dr Harry Parker, SME Registered Member (2460450), Technical Director, AMEC was responsible for: Sections 1.5 to 1.9, 1.11, 1.12, 1.16.1, 1.18.1; Section 2; Section 3; Section 6; Section 7; Section 8; Section 9; Sections 10.1 to 10.7, 10.11 to 10.13; Sections 11.1 to 11.2, 11.4 to 11.11; Sections 12.1 to 12.4, 12.6; Section 14; Section 25.1; Sections 26.1 to 26.2; Section 27.
Gordon Seibel, SME Registered Member (2894840), Principal Geologist, AMEC was responsible for: Sections 1.5 to 1.9, 1.11, 1.12, 1.16.1, 1.16.3; 1.18.1; Section 2; Section 3; Section 6; Section 7; Section 8; Section 9; Sections 10.1 to 10.7, 10.11 to 10.13; Sections 11.1 to 11.2, 11.4 to 11.11; Sections 12.1 to 12.4, 12.6; Section 14; Section 25.1; Sections 26.1 to 26.2; Section 27.
Jarek Jakubec, C. Eng., MIMMM (509147), employed by SRK Consulting Inc., as Corporate Consultant, was responsible for: Section 2; Section 3; Section 10.8; Section 12.5; Section 16.2; Section 27.
Mel Lawson, B. Eng. (Mining), SME Registered Member (1859650), employed by Stantec Consulting International LLC as Mining Principal was responsible for: Section 1.13, 1.16.3, 1.18.2; Section 2; Section 3; Section 16.1; 16.3; Section 21.2; Section 25.3; Section 26.3; Section 27.
Arne Weissenberger, P.Eng ECSA (20100369) employed by Hatch as Mechanical Engineer was responsible for: Sections 1.10, 1.14, 1.16; Section 2; Section 3; Sections 5.1, 5.3; Section 10.10; Section 11.3; Section 13; Section 17, Sections 18.1; 18.2; 18.3.2; 18.3.3; 18.7 to 18.13; 18.15 to 18.19; Sections 21.3, 21.4, 21.7.3, 21.7.4, 21.8.1, , 21.9, 21.11; Section 27.
Francois Marais, P.Eng SAICE (830215) employed by Golder Associates Africa (Pty) Ltd as Strategic Advisor: Engineering was responsible for: Section 2.3; 2.4. Section 3.3; Section 5.5; Section 10.9; Section 18.4; 18.5; 18.6; 18.14; Section 20; Section 21.5 to 21.7.

IVANHOE MINES LIMITED Kamoa Copper Project
AMC 812022 : November : 2013 : 812022KamoaFinalEffDate131115rev0 i
Signature Page
Project Name: KAMOA COPPER PROJECT
Title: Kamoa 2013 Preliminary Economic Assessment
Location: Katanga Province.
Democratic Republic of the Congo
Effective Date of Technical Report: 15 November 2013
/s B F Peters Date of Signing: Bernard Peters FAusIMM (201743), Manager Mining, AMC Consultants
/s H M Parker Date of Signing: Harry Parker SME Registered Member (2460450), Technical Director, AMEC
/s G Seibel Date of Signing: Gordon Seibel SME Registered Member (2894840), Principal Geologist, AMEC
/s J Jakubec Date of Signing: Jarek Jakubec C. Eng. MIMMM, SRK Consulting Inc
/s M Lawson Date of Signing: Mel Lawson SME Registered Member (1859650), Mining Principal, Stantec Consulting International LLC
/s A Weissenberger Date of Signing: Arne Weissenberger, PEng ECSA (20100369) Mechanical Engineer, Hatch
/s F Marais Date of Signing: Francois Marais, P.Eng SAICE (830215) Strategic Advisor: Engineering, Golder Associates Africa (Pty) Ltd
IVANHOE MINES LIMITED Kamoa Copper Project
AMC 812022 : November : 2013 : 812022KamoaFinalEffDate131115rev0 ii
CONTENTS
1 SUMMARY .............................................................................................................. 1 Introduction ................................................................................................ 1 Kamoa 2013 PEA ...................................................................................... 2
1.2.1 Summary of Financial Results ....................................................... 2 Property Description and Location ............................................................ 7 Mineral and Surface Rights, Royalities, and Agreements ......................... 8 Geology and Mineralization ....................................................................... 8 History and Exploration ............................................................................. 9 Drilling ..................................................................................................... 10 Sample Preparation, Analyses, and Security .......................................... 11 Data Verification ...................................................................................... 12 Metallurgical Testwork ............................................................................. 12 Mineral Resource Estimates ................................................................... 13
1.11.1 Mineral Resource Statement ....................................................... 14 1.11.2 Factors Which May Affect the Resource Estimates ..................... 17
Exploration Target ................................................................................... 18 Mining ...................................................................................................... 19 Infrastructure ........................................................................................... 21
1.14.1 Power .......................................................................................... 21 Recovery Methods .................................................................................. 22
1.15.1 Concentrator Description ............................................................. 22 1.15.2 Smelter Description ..................................................................... 23 1.15.3 Sulphuric Acid Plant .................................................................... 24
Conclusions ............................................................................................. 24 1.16.1 Minerals Resource Estimate Update ........................................... 24 1.16.2 Kamoa 2013 PEA ........................................................................ 25 1.16.3 Underground Mining .................................................................... 26
1.16.3.1 Underground Mining Methods ..................................... 26 1.16.3.2 Underground Mining Accesses ................................... 26 1.16.3.3 Production Schedules ................................................. 26 1.16.3.4 Open Pit Potential ....................................................... 27
1.16.4 Recovery Methods ....................................................................... 27 Recommendations .................................................................................. 29
1.17.1 Further Assessment .................................................................... 29 1.17.2 Drill Programme ........................................................................... 29 1.17.3 Underground Mining .................................................................... 29 1.17.4 Capital Optimization .................................................................... 30
2 INTRODUCTION ................................................................................................... 31 Ivanhoe Mines Ltd. .................................................................................. 31 Terms of Reference ................................................................................. 31 Qualified Persons .................................................................................... 32 Site Visits and Scope of Personal Inspection .......................................... 33 Effective Dates ........................................................................................ 34 Information Sources and References ...................................................... 34
3 RELIANCE ON OTHER EXPERTS ....................................................................... 35 Mineral Tenure ........................................................................................ 35
IVANHOE MINES LIMITED Kamoa Copper Project
AMC 812022 : November : 2013 : 812022KamoaFinalEffDate131115rev0 iii
Surface Rights ......................................................................................... 35 Environmental and Work Program Permitting ......................................... 36 Taxation and Royalties ............................................................................ 37
4 PROPERTY DESCRIPTION AND LOCATIONS ................................................... 38 Property and Title in the Democratic Republic of Congo ........................ 38
4.1.1 Introduction .................................................................................. 38 4.1.2 Mineral Property Title .................................................................. 39 4.1.3 DRC Mining Code Review and 2013 Decrees............................. 41 4.1.4 Exploration Permits ..................................................................... 41 4.1.5 Exploitation Permits ..................................................................... 42 4.1.6 Surface Rights Title ..................................................................... 44 4.1.7 Environmental Regulations .......................................................... 44 4.1.8 Royalties ...................................................................................... 45
Mineral Tenure ........................................................................................ 45 Surface Rights ......................................................................................... 48 Royalties and Encumbrances .................................................................. 48 Property Agreements .............................................................................. 48 Permits .................................................................................................... 48 Environmental Liabilities .......................................................................... 48 Social License ......................................................................................... 48 Comments on Section 4 .......................................................................... 48
5 ACCESSIBILITY, CLIMATE, LOCAL RESOURCES, INFRASTRUCTURE, AND PHYSIOGRAPHY ............................................................................................... 50
Accessibility ............................................................................................. 50 5.1.1 Air ................................................................................................ 50 5.1.2 Road ............................................................................................ 50 5.1.3 Rail .............................................................................................. 50
Climate .................................................................................................... 51 Local Resources and Infrastructure ........................................................ 51 Power ...................................................................................................... 51 Physiography ........................................................................................... 52 Comments on Section 5 .......................................................................... 52
6 HISTORY ............................................................................................................... 54
7 GEOLOGICAL SETTING AND MINERALIZATION ............................................... 55 Regional Geology .................................................................................... 55
7.1.1 Lufilian Orogeny .......................................................................... 58 Project Geology ....................................................................................... 59 Deposits .................................................................................................. 60
7.3.1 Lithology ...................................................................................... 62 7.3.2 Structure ...................................................................................... 65 7.3.3 Metamorphism ............................................................................. 70 7.3.4 Alteration ..................................................................................... 70 7.3.5 Mineralization .............................................................................. 70
Comments on Section 7 .......................................................................... 74
8 DEPOSIT TYPES .................................................................................................. 75 Comments on Section 8 .......................................................................... 76
IVANHOE MINES LIMITED Kamoa Copper Project
AMC 812022 : November : 2013 : 812022KamoaFinalEffDate131115rev0 iv
9 EXPLORATION ..................................................................................................... 78 Grids and Surveys ................................................................................... 78 Geological Mapping ................................................................................. 78 Geochemical Sampling ........................................................................... 78 Geophysics .............................................................................................. 79 Petrology, Mineralogy, and Research Studies ........................................ 79 Geotechnical and Hydrological Studies ................................................... 80 Metallurgical Studies ............................................................................... 80 Exploration Potential ............................................................................... 80 Comments on Section 9 .......................................................................... 82
10 DRILLING .............................................................................................................. 83 Introduction .............................................................................................. 83 Drill Methods ........................................................................................... 87 Geological Logging .................................................................................. 87 Core Handling ......................................................................................... 88 Recovery ................................................................................................. 88 Collar Surveys ......................................................................................... 89 Downhole Surveys .................................................................................. 89
10.7.1 Oriented Drill Core ....................................................................... 90 Geotechnical Drilling ............................................................................... 90 Hydrogeological Drilling ........................................................................... 92 Metallurgical Drilling ................................................................................ 95 Sample Length/True Thickness ............................................................... 96 Drilling Since the Mineral Resource Database Close-Off Date ............... 96 Comments on Section 10 ...................................................................... 101
11 SAMPLE PREPARATION, ANALYSES, AND SECURITY .................................. 102 Witness Sampling .................................................................................. 102 Sampling Methods ................................................................................. 102
11.2.1 Geochemical Sampling .............................................................. 102 11.2.2 RC Sampling ............................................................................. 102 11.2.3 Core Sampling ........................................................................... 103
Metallurgical Sampling .......................................................................... 104 Specific Gravity Determinations ............................................................ 104 Analytical and Test Laboratories ........................................................... 104 Sample Preparation and Analysis ......................................................... 105 Sample Analysis .................................................................................... 106
11.7.1 Genalysis Laboratory ................................................................. 106 11.7.2 Ultra Trace Laboratory ............................................................... 106
Quality Assurance and Quality Control (QA/QC) .................................. 107 11.8.1 Blanks ........................................................................................ 107 11.8.2 Duplicates .................................................................................. 108 11.8.3 Certified Reference Materials .................................................... 108
Databases ............................................................................................. 108 Sample Security .................................................................................... 109 Comments on Section 11 ...................................................................... 109
12 DATA VERIFICATION ......................................................................................... 111 AMEC Verification ................................................................................. 111
12.1.1 2009 Verification ........................................................................ 111
IVANHOE MINES LIMITED Kamoa Copper Project
AMC 812022 : November : 2013 : 812022KamoaFinalEffDate131115rev0 v
12.1.2 2010 Verification ........................................................................ 111 12.1.3 2011–2012 Verification .............................................................. 111 12.1.4 2013 Verification ........................................................................ 112
QA/QC Review ...................................................................................... 112 12.2.1 Screen Tests ............................................................................. 112 12.2.2 Certified Reference Materials .................................................... 113 12.2.3 Check Assays ............................................................................ 114 12.2.4 Duplicate Assays ....................................................................... 115 12.2.5 Blanks ........................................................................................ 116 12.2.6 Acid Soluble Copper Determinations ......................................... 116 12.2.7 2013 Checks .............................................................................. 116 12.2.8 2013 ALS Chemex Check Assays ............................................. 117
Site Visits ............................................................................................... 117 12.3.1 Field Drill Collar Check .............................................................. 117 12.3.2 Drilling and Core Storage .......................................................... 117 12.3.3 Inspection of Drill Core .............................................................. 119 12.3.4 Sample Preparation Facilities .................................................... 120
AMEC's Copper Grade Check Sampling ............................................... 120 Geotechnical and Structural Logging .................................................... 121 Comments on Section 12 ...................................................................... 122
13 MINERAL PROCESSING AND METALLURGICAL TESTING ............................ 124 Overview of Metallurgical Testwork ....................................................... 124 Metallurgical Samples ........................................................................... 125 Mintek Flotation Testwork Phase 1 (2010) ............................................ 127
13.3.1 Flotation Testing and Results .................................................... 127 Mintek Testwork Phase 2 (2010 to 2011) .............................................. 129
13.4.1 Variability Sample Testing ......................................................... 129 13.4.2 Variability Sample Composite Testing ....................................... 129
Xstrata Process Support (XPS) Testwork ............................................. 129 13.5.1 Metallurgical Samples ............................................................... 130 13.5.2 Mineralogy ................................................................................. 131 13.5.3 Circuit Development .................................................................. 134 13.5.4 Variability of Composite Samples .............................................. 136 13.5.5 Preliminary Results – Open Pit .................................................. 139 13.5.6 Deleterious Elements ................................................................ 140
Conclusions Pertinent to the Kamoa 2013 PEA .................................... 141 Comminution Testwork .......................................................................... 142
13.7.1 Sample Selection ....................................................................... 142 13.7.2 Comminution Results and Interpretation ................................... 143
13.7.2.1 Testwork Scope ........................................................ 143 13.7.2.2 SMC results .............................................................. 144 13.7.2.3 Bond Rod Work Index (BRWI) results ....................... 146 13.7.2.4 Bond Ball Work Index (BBWI) results ....................... 148 13.7.2.5 Bond Abrasion Results ............................................. 150
Comminution Discussion ....................................................................... 152 Recovery Algorithms ............................................................................. 153 Comments on Section 13 ...................................................................... 155
14 MINERAL RESOURCE ESTIMATES .................................................................. 157

IVANHOE MINES LIMITED Kamoa Copper Project
AMC 812022 : November : 2013 : 812022KamoaFinalEffDate131115rev0 vi
Composites for Mineral Resource Estimates Amenable to Underground Mining Methods ..................................................................................... 157
Exploratory Data Analysis ..................................................................... 158 14.2.1 Univariate Statistics ................................................................... 164 14.2.2 Bivariate Statistics ..................................................................... 165
Oxide-Sulphide Domaining .................................................................... 165 Structural Model .................................................................................... 166
14.4.1 Copper Resource Model ............................................................ 168 14.4.2 KPS Stratigraphic Model ........................................................... 170
Model Validation .................................................................................... 171 14.5.1 Visual ......................................................................................... 171 14.5.2 Nearest Neighbour .................................................................... 175 14.5.3 Local Bias Checks (Swath Plots) ............................................... 176
Classification of Mineral Resources ...................................................... 178 14.6.1 Inferred Mineral Resource ......................................................... 178 14.6.2 Indicated Mineral Resource ....................................................... 178 14.6.3 Measured Mineral Resource ..................................................... 179
Reasonable Prospects of Economic Extraction .................................... 181 Mineral Resource Statement ................................................................. 182 Factors That May Affect the Mineral Resource Estimate ...................... 186 Exploration Targets ............................................................................... 186
14.10.1 Exploration Target Adjacent to Indicated and Inferred Mineral Resources ..................................................................... 187
Additional Exploration Potential ............................................................. 187 Other Models and/or Tabulations .......................................................... 190
14.12.1 Open Pit Seam Models .................................................. 190 14.12.2 Supergene/Hypogene .................................................... 192
Comments on Section 14 ...................................................................... 196
15 MINERAL RESERVE ESTIMATES ..................................................................... 197
16 MINING METHODS ............................................................................................. 198 Introduction ............................................................................................ 198 Geotechnical ......................................................................................... 198
16.2.1 Kamoa Geotechnical Field Data – Draft (May 2010) ................. 198 16.2.2 Kamoa Site Visit Report (August 2010) ..................................... 198 16.2.3 Structural Data Review .............................................................. 199 16.2.4 Geotechnical Evaluation ............................................................ 202
16.2.4.1 KPS Geotechnical Grade .......................................... 202 16.2.4.2 KPS Geotechnical Grade Recommended Exclusions
Zones ............................................................................. 204 16.2.4.3 Geotechnical Parameter Evaluation .......................... 205
16.2.5 Mining Design Factors ............................................................... 209 16.2.5.1 Factor of Safety and Pillar Design ............................ 209 16.2.5.2 Panels and Boundary Pillars ..................................... 209 16.2.5.3 Ground Support ........................................................ 209
Underground Mining .............................................................................. 210 16.3.1 Underground Mining Methods ................................................... 212 16.3.2 Underground Mining Accesses .................................................. 217 16.3.3 Production Schedules ................................................................ 219
IVANHOE MINES LIMITED Kamoa Copper Project
AMC 812022 : November : 2013 : 812022KamoaFinalEffDate131115rev0 vii
16.3.3.1 Mining Sections ......................................................... 219 16.3.3.2 Mine Infrastructure .................................................... 225 16.3.3.3 Mine-to-Mill Optimization (Blasting) .......................... 227 16.3.3.4 Mine Equipment Requirements ................................. 227
Open Pit Potential ................................................................................. 233 16.4.1 Preliminary Open Pit Optimization ............................................. 234 16.4.2 Preliminary Open Pit Design ..................................................... 235
17 RECOVERY METHODS...................................................................................... 238 Introduction ............................................................................................ 238 Design Criteria ....................................................................................... 239
17.2.1 ROM Composition ..................................................................... 239 Concentrator Basis of Design ................................................................ 240 Future Concentrator Expansion Requirements ..................................... 240 Concentrator Description ....................................................................... 241
17.5.1 Receiving, Conveying, Stockpiling, and Crushing ..................... 241 17.5.2 Primary Milling ........................................................................... 242 17.5.3 Secondary Milling ...................................................................... 243 17.5.4 Primary and Secondary Milling Media ....................................... 243 17.5.5 Flotation Circuit General ............................................................ 243 17.5.6 Primary and Secondary Rougher Flotation Circuit .................... 243 17.5.7 Concentrate Regrind Mills ......................................................... 244 17.5.8 Thickening Circuits .................................................................... 246 17.5.9 Reagents, Services and Utilities ................................................ 247 17.5.10 Concentrator Equipment Specifications and List ........... 247
Smelter .................................................................................................. 250 17.6.1 Concentrate Drying .................................................................... 251 17.6.2 Direct to Blister Process ............................................................ 251 17.6.3 Slag Cleaning ............................................................................ 252 17.6.4 Refining Furnaces and Blister Casting ...................................... 253 17.6.5 Gas Handling ............................................................................. 254 17.6.6 Sulphuric Acid Plant .................................................................. 255 17.6.7 Services and Utilities ................................................................. 256 17.6.8 Equipment Specifications and List ............................................. 256
Processing Production Schedule .......................................................... 257 Comments on Section 17 ...................................................................... 261
18 PROJECT INFRASTRUCTURE .......................................................................... 263 Introduction ............................................................................................ 263 Site Plan and Layout ............................................................................. 263 Power .................................................................................................... 265
18.3.1 Generation ................................................................................. 265 18.3.2 Transmission and Substations................................................... 268 18.3.3 Power Consumption .................................................................. 268
Tailings Dam ......................................................................................... 271 18.4.1 TSF Site 5d ................................................................................ 273 18.4.2 Mupenda TSF Site ..................................................................... 273 18.4.3 Mupenda – TSF – Design Attributes.......................................... 274
18.4.3.1 Mupenda TSF Liner Study ........................................ 276 18.4.3.2 Relaxation of Liner System ....................................... 277

IVANHOE MINES LIMITED Kamoa Copper Project
AMC 812022 : November : 2013 : 812022KamoaFinalEffDate131115rev0 viii
18.4.3.3 Mupenda Geotechnical Site Zonation ....................... 277 18.4.3.4 Assumptions ............................................................. 278 18.4.3.5 Proposed Liner Solution ............................................ 279 18.4.3.6 Final Waste Disposal ................................................ 281
18.4.4 Opportunity for Separate Phase 1 TSF ..................................... 282 Preliminary Geotechnical Investigations in Relation to the TSF and other
Project Development Areas ................................................................... 282 18.5.1 Road Aggregates and Construction Materials Specifications .... 282 18.5.2 Foundation Investigation for Mine Infrastructure and Tailings
Storage Facility Site Selection ................................................... 283 18.5.3 Preliminary Liquefaction Assessment ........................................ 283 18.5.4 Potential Liquefaction from Blasting .......................................... 284 18.5.5 Fault Hazard Evaluation ............................................................ 284
Geochemistry ........................................................................................ 285 18.6.1 Waste Rock Geochemistry ........................................................ 285 18.6.2 Tailings Geochemistry ............................................................... 288
Communications .................................................................................... 293 Waste Management .............................................................................. 293 Roads and Earthworks .......................................................................... 293
18.9.1 Main access road ...................................................................... 293 18.9.2 Other roads ................................................................................ 295 18.9.3 Terracing and Earthworks.......................................................... 295
Rail 296 18.10.1 Ndola – Durban Rail Corridor ......................................... 296
18.10.1.1 Ndola – Livingstone (Zambia section) ..................... 297 18.10.1.2 Livingstone – Beitbridge (Zimbabwe section) ......... 298 18.10.1.3 Beitbridge – Durban (South Africa section) ............. 298
18.10.2 Kolwezi – Lobito Corridor ............................................... 299 18.10.2.1 Rail siding at Kamoa ............................................... 299 18.10.2.2 Kolwezi to Dilolo ...................................................... 300 18.10.2.3 Dilolo to Luau .......................................................... 300 18.10.2.4 Luau to Lobito ......................................................... 300 18.10.2.5 Lobito Rail Terminal ................................................ 301 18.10.2.6 Lobito Port Terminal ................................................ 301
Logistics ................................................................................................ 301 18.11.1 Overview ........................................................................ 301 18.11.2 Inbound Project Logistics – Phases 1 and 2 .................. 302 18.11.3 Outbound Product Logistics – 2017 to 2022 .................. 303 18.11.4 Outbound Product Logistics – 2022 onwards ................ 303
Airports .................................................................................................. 304 Consumables and Services ................................................................... 304
18.13.1 Fuel ................................................................................ 304 18.13.2 Maintenance .................................................................. 304 18.13.3 Power Lines ................................................................... 304 18.13.4 Bridges ........................................................................... 304 18.13.5 Weather ......................................................................... 305 18.13.6 Logistics Companies for Project Logistics ..................... 305 18.13.7 Operational Inbound Logistics – Reagents and
Consumables ............................................................................. 305
IVANHOE MINES LIMITED Kamoa Copper Project
AMC 812022 : November : 2013 : 812022KamoaFinalEffDate131115rev0 ix
18.13.1 Schedule ........................................................................ 305 Water and Wastewater Systems ........................................................... 305
18.14.1 Water Demand ............................................................... 305 18.14.2 Bulk Water ..................................................................... 306 18.14.3 Potable Water ................................................................ 307 18.14.1 Storm Water Infrastructure ............................................. 307
18.14.1.1 Storm Water Management Plan .............................. 307 18.14.1.2 Pollution Control Dams ........................................... 310 18.14.1.3 Pumps and Pipelines .............................................. 310 18.14.1.4 Key Preliminary Surface Water Design Properties . 313
18.14.2 Wastewater .................................................................... 314 18.14.3 Potential Water Treatment ............................................. 314
Fire Protection and Detection ................................................................ 315 Hospital and Medical Facilities .............................................................. 316 Mine, Concentrator and Smelter Building Requirements ...................... 316
18.17.1 Single Story Brick Buildings ........................................... 316 18.17.2 Structural Steel Buildings ............................................... 316 18.17.3 Additional Building ......................................................... 316
Permanent Housing ............................................................................... 317 18.18.1 Accommodation ............................................................. 317 18.18.2 Facilities ......................................................................... 317 18.18.3 Roads and Services ....................................................... 318
Temporary Facilities .............................................................................. 318
19 MARKET STUDIES AND CONTRACTS ............................................................. 319 Introduction ............................................................................................ 319 Copper Concentrate Treatment & Refining Charges (TC/Rc) ............... 319 Sulphuric Acid Credit ............................................................................. 320 Potential Sources for Concentrate Sale in Zambia ............................... 320
19.4.1 Mopani Copper Mines (MCM) – Mufulira Copper Smelter ......... 320 19.4.2 Chambishi Copper Smelter Limited (CCS) ................................ 320 19.4.3 Konkola Copper Mines plc (KCM) ............................................. 320 19.4.4 First Quantum Kansanshi Smelter ............................................. 321
Blister Charges ...................................................................................... 321 19.5.1 Payments ................................................................................... 321 19.5.2 Deductions ................................................................................. 321
20 ENVIRONMENTAL STUDIES, PERMITTING, AND SOCIAL OR COMMUNITY IMPACT ............................................................................................................. 322
Introduction ............................................................................................ 322 20.1.1 EIS Process ............................................................................... 322 20.1.2 ESHIA ........................................................................................ 322 20.1.3 Legal Register ........................................................................... 323
Legislation ............................................................................................. 326 Public Consultation and Key Issues ...................................................... 326
20.3.1 Current Stakeholder Process..................................................... 326 20.3.2 Future Stakeholder Consultation ............................................... 326 20.3.3 Key Stakeholder Issues Recorded ............................................ 327 20.3.4 Plan of Study ............................................................................. 327
Key Impacts and Mitigation ................................................................... 328
IVANHOE MINES LIMITED Kamoa Copper Project
AMC 812022 : November : 2013 : 812022KamoaFinalEffDate131115rev0 x
20.4.1 Mitigation Hierarchy ................................................................... 329 Hydrology .............................................................................................. 330
20.5.1 Surface Water Monitoring for Agricultural Catchments Research ................................................................................... 330
Hydrogeology and Groundwater Quality ............................................... 330 Hydrogeological studies have been conducted by Golder Associates in
2010 and again in 2012. ............................................................ 330 20.6.1 Hydrogeological Units ................................................................ 330 20.6.3 Conceptual Hydrogeological Model ........................................... 337 20.6.4 Forward Hydrogeological Programme ....................................... 337
Geochemistry Acid Rock Drainage (ARD) and Metal Leaching (ML) Potential ................................................................................................ 337 20.7.1 Social / Stakeholder Engagement ............................................. 338 20.7.2 Relocation Action Plan (RAP) .................................................... 339 20.7.3 Other Community Opportunities / Needs ................................... 339 20.7.4 Agricultural Aspects Earmarked for Development ..................... 340 20.7.5 Cost Per Household To Relocate Off The Mine Lease Areas ... 340
21 CAPITAL AND OPERATING COSTS .................................................................. 341 Summary ............................................................................................... 341 Underground Mining Cost Estimates ..................................................... 344
21.2.1 Underground Capital Costs ....................................................... 345 21.2.2 Underground Mine Operating Costs .......................................... 351 21.2.3 Underground Personnel Requirements ..................................... 353
Concentrator .......................................................................................... 354 21.3.1 Concentrator Capital costs ........................................................ 354
21.3.1.1 General ..................................................................... 354 21.3.1.2 Estimating: Mechanical and Platework - General ..... 355 21.3.1.3 Mechanical – Concentrator ....................................... 355 21.3.1.4 Earthworks and Roads .............................................. 356 21.3.1.5 Civil Works and Structural Steelwork ........................ 356 21.3.1.6 Piping, Electrical and Instrumentation ....................... 356
21.3.2 Concentrator Operating Costs ................................................... 356 Smelter .................................................................................................. 359
21.4.1 Smelter Capital Costs ................................................................ 359 21.4.1.1 General ..................................................................... 359 21.4.1.2 Estimating: Mechanical and Platework – General ..... 359 21.4.1.3 Mechanical – Smelter ............................................... 360 21.4.1.4 Earthworks and Roads .............................................. 360 21.4.1.5 Civil Works and Structural Steelwork ........................ 360 21.4.1.6 Piping, Electrical, and Instrumentation ...................... 361
21.4.2 Smelter Operating costs ............................................................ 361 21.4.2.1 General ..................................................................... 361
Infrastructure ......................................................................................... 363 21.5.1 Tailings Storage Facility ............................................................ 363
21.5.1.1 Basis of the Capital Cost Estimate ............................ 363 21.5.1.2 Phase 1 TSF vs. Separate Phase 1 TSF – Comment on
Difference in Cost .......................................................... 363 21.5.1.3 Basis of the Operations Cost Estimate ..................... 364 21.5.1.4 Basis of the Closure Cost Estimate........................... 364
IVANHOE MINES LIMITED Kamoa Copper Project
AMC 812022 : November : 2013 : 812022KamoaFinalEffDate131115rev0 xi
21.5.2 Opportunity for Separate Phase 1 TSF ..................................... 364 21.5.2.1 Basis of Design for a Separate Phase 1 TSF ........... 364 21.5.2.2 Cost ........................................................................... 365
Bulk Water Supply Capital and Operating Costs - Kamoa Wellfield...... 365 21.6.1 Basis of Design .......................................................................... 365 21.6.2 Bulk Water Supply – Costing ..................................................... 365
21.6.2.1 Pumps and Pipelines and Associated Works ............ 365 21.6.3 Wellfield Development Captal and Operating Costs the
Wellfield ..................................................................................... 367 21.6.3.1 Mutaka Dam – Contingency Item .............................. 367
Storm Water Management Infrastructure Costs .................................... 368 21.7.1 Construction Cost Estimate for Storm Water Management ....... 368
21.7.1.1 Storm Water Management Infrastructure Capital Summary........................................................................ 371
21.7.2 Relocation Action Plan Cost Estimate ....................................... 371 21.7.3 Housing Village .......................................................................... 371 21.7.4 Other Site Wide Infrastructure ................................................... 372
21.7.4.1 Roads/Paving/Drainage ............................................ 372 21.7.4.2 Earthworks ................................................................ 372 21.7.4.3 Architectural .............................................................. 373 21.7.4.4 MV Electrification ...................................................... 373 21.7.4.5 Fencing ..................................................................... 373 21.7.4.6 Rail ............................................................................ 373 21.7.4.7 Temporary Facilities – Construction camp ................ 373 21.7.4.8 Temporary Facilities – Site Offices ........................... 373 21.7.4.9 Temporary Facilities – Bonded Warehouse .............. 374 21.7.4.10 Temporary Facilities – Laydown Area ..................... 374 21.7.4.11 Infrastructure Maintenance Costs ........................... 374
Indirect Capital Costs ............................................................................ 374 21.8.1 EPCM ........................................................................................ 374 21.8.2 Owner’s Cost ............................................................................. 374 21.8.3 Contingency ............................................................................... 375
General and Administration Costs ......................................................... 375 Power Infrastructure Rehabilitation and Upgrade.................................. 376 Transport Operating Costs .................................................................... 377 Closure Costs ........................................................................................ 378 Comments on Section 21 ...................................................................... 378
22 ECONOMIC ANALYSIS ...................................................................................... 379 Summary of Financial Results ............................................................... 379 Democratic Republic of Congo Fiscal Environment .............................. 380 Model Assumptions ............................................................................... 380
22.3.1 Pricing and Discount Rate Assumptions ................................... 380 22.3.2 Taxation ..................................................................................... 381 22.3.3 Royalties .................................................................................... 381 22.3.4 Key Taxes .................................................................................. 381 22.3.5 Case Overview and Results ...................................................... 383
Cost and Production Benchmarking ...................................................... 391 Comments on Section 22 ...................................................................... 393
IVANHOE MINES LIMITED Kamoa Copper Project
AMC 812022 : November : 2013 : 812022KamoaFinalEffDate131115rev0 xii
23 ADJACENT PROPERTIES.................................................................................. 394
24 OTHER RELEVANT DATA AND INFORMATION ............................................... 395
25 INTERPRETATION AND CONCLUSIONS ......................................................... 396 Mineral Resource Estimate Update ....................................................... 396 Kamoa 2013 PEA .................................................................................. 396 Underground Mining .............................................................................. 397
25.3.1 Underground Mining Methods ................................................... 397 25.3.2 Underground Mining Accesses .................................................. 397 25.3.3 Production Schedules ................................................................ 397 25.3.4 Logistics ..................................................................................... 398 25.3.5 Risk ............................................................................................ 398
26 RECOMMENDATIONS ....................................................................................... 400 Drilling ................................................................................................... 400
26.1.1 Kansoko Sud, Makalu, Kansoko Nord and Kansoko Centrale .. 400 26.1.2 Kakula and Kakula NE ............................................................... 401 26.1.3 Kamoa Sud ................................................................................ 401 26.1.4 Other Exploration ....................................................................... 401
Programme Details ................................................................................ 401 Underground Mining .............................................................................. 403 Further Assessment .............................................................................. 404
27 REFERENCES .................................................................................................... 405
TABLES
Table 1.1 Financial Results ........................................................................... 3 Table 1.2 Mining and Processing Production Statistics ................................. 3 Table 1.3 Unit Operating Costs ..................................................................... 5 Table 1.4 Operating Costs and Revenues..................................................... 5 Table 1.5 Capital Investment Summary......................................................... 6 Table 1.6 Indicated and Inferred Mineral Resources, Domain 1 ................. 15 Table 1.7 Additional Open Pit Resource Using a 0.5% Cut-Off ................... 16 Table 1.8 Tonnage and Grade Ranges for Exploration Target.................... 18 Table 1.9 Kamoa 2013 Mineral Resources at US$52/t within Mining Sections ..................................................................................................... 20 Table 4.1 Permit Summary Table ................................................................ 46 Table 7.1 Stratigraphic Sequence, Congolese (Katangang) Copperbelt ..... 56 Table 7.2 Stratigraphic Sequence for the Kamoa Project Area ................... 63 Table 10.1 Drilling Summary Table (1 October 2013) ................................... 85 Table 10.2 Other Drilling (1 October 2013) ................................................... 87 Table 10.3 Example Drill Intercept Summary Table .................................... 100 Table 11.1 Detection Limits for Ultra Trace ICPMS Analytical Method ....... 107 Table 11.2 Detection Limits for Ultra Trace ICPOES Analytical Method ..... 107 Table 13.1 Mintek Phase 1 Flotation Testing Composites – Head Assays . 127 Table 13.2 Dual Regrind Circuit Results ..................................................... 128 Table 13.3 Mineralized Material Composite Flotation Result, MF2 ............. 129 Table 13.4 Phase 2, Phase 3, and Phase 4 Metallurgical Composite Samples ................................................................................................... 130
IVANHOE MINES LIMITED Kamoa Copper Project
AMC 812022 : November : 2013 : 812022KamoaFinalEffDate131115rev0 xiii
Table 13.5 Trace Element Analysis of Concentrates Obtained from the Frozen Flowsheet ................................................................................... 140
Table 13.6 Bench Scale Comminution Testwork by Phases ....................... 144 Table 13.7 SMC Results on Phase 1 Samples............................................ 145 Table 13.8 SMC Results on Phase 2 Samples............................................ 145 Table 13.9 SMC Results on Phase 4 Samples............................................ 145 Table 13.10 JKTech Drop Weight Test/SMC Mineralization Classification ... 146 Table 13.11 BRWI Results on Phase 1 Samples .......................................... 147 Table 13.12 BRWI Results on Phase 2 Samples .......................................... 147 Table 13.13 BRWI Result on Phase 4 Sample .............................................. 147 Table 13.14 BBWI Results on Phase 1 Samples .......................................... 148 Table 13.15 BBWI Results on Phase 2 Samples .......................................... 149 Table 13.16 BBWI Results on Phase 4 Samples .......................................... 150 Table 13.17 Mineralization Hardness Classification ...................................... 150 Table 13.18 Bond Abrasion Results on Phase 1 Sample .............................. 151 Table 13.19 Bond Abrasion Results on Phase 2 Samples ............................ 151 Table 13.20 Bond Abrasion Results on Phase 4 Samples ............................ 151 Table 13.21 Classification of Mineralization Abrasiveness ............................ 152 Table 13.22 Testwork Used to Develop Recovery Algorithm ........................ 153 Table 13.23 Input Values Used for Recovery Algorithm ................................ 153 Table 14.1 SMZ Composite Statistics.......................................................... 158 Table 14.2 Block Model Parameters ........................................................... 168 Table 14.3 Estimation Parameters .............................................................. 169 Table 14.4 Mean Grades for Composites and Models (no cut-off applied) . 176 Table 14.5 Reasonable Prospects for Economic Extraction Recoveries ..... 181 Table 14.6 Indicated and Inferred Mineral Resource, Domain 1 (cut-off 1% Cu) ................................................................................................... 183 Table 14.7 Sensitivity of Mineral Resources to Cut-Off Grade .................... 184 Table 14.8 Tonnage and Grade Ranges for Exploration Target.................. 188 Table 14.9 Additional Open Pit Resource using a 0.5% Cut-Off ................. 191 Table 14.10 Mineral Resource Categorized as Supergene at Different Cut-Offs ................................................................................................... 194 Table 14.11 Mineral Resources Categorized as Hypogene at Different Cut-Offs ................................................................................................... 195 Table 16.1 Recommended Exclusion Zone Percentage Ranges (April 2011) .. ................................................................................................... 205 Table 16.2 Amount of Variable Ground Conditions in Structural Domains .. 205 Figure 16.6 Plan View of Three Fresh Geotechnical Domains (North, Central,
South) And Planned Mining Units .............................................. 206 Table 16.3 Summary of Geotechnical Parameters per Geotechnical Domain .. ................................................................................................... 207 Table 16.4 Summary of Intact Rock Strength Estimates per Geotechnical
Domain (Standard Deviation in Parenthesis) ............................. 208 Table 16.5 Kamoa 2013 Mineral Resources at US$52/t within Mining Sections ................................................................................................... 211 Table 16.6 Guidelines for Room-and- Pillar Extraction Ratios Based on
Mineralization Thickness and Depth Below Surface .................. 214 Table 16.7 Room-and-Pillar Sizes Within Stoping Panels ........................... 216 Table 16.8 Mining Access Trade-Off ........................................................... 218
IVANHOE MINES LIMITED Kamoa Copper Project
AMC 812022 : November : 2013 : 812022KamoaFinalEffDate131115rev0 xiv
Table 16.9 Kamoa 3013 PEA Inventory ...................................................... 219 Table 16.10 Underground Mine Production Schedule ................................... 223 Table 16.11 Primary Development Requirements for Kamoa Project ........... 226 Table 16.12 Drill and Blast Design for Primary Ramps (6.5 meters high by
5.5 meters wide) ........................................................................ 227 Table 16.13 Drill and Blast Design for Production Headings (5 meters high by
8 meters wide) ........................................................................... 227 Table 16.14 Fixed Mine Equipment ............................................................... 228 Table 16.15 Fixed Mine Equipment (continued) ............................................ 229 Table 16.16 Underground Mobile Equipment List ......................................... 230 Table 16.17 Underground Mine Production Schedule ................................... 231 Table 16.18 Underground Mine Production Schedule (Continued) ............... 232 Table 16.19 Pit Design Results ..................................................................... 233 Table 16.20 Open Pit NSR Calculation Parameters ...................................... 234 Table 16.21 Results from Pit Optimization .................................................... 235 Table 16.22 Pit Design Parameters ............................................................... 235 Table 17.1 Concentrators Feed Composition .............................................. 239 Table 17.2 Design Criteria ........................................................................... 239 Table 17.3 Concentrator Basis of Design .................................................... 240 Table 17.4 Concentrator Equipment Requirements Summary Table – 3 Mtpa . ................................................................................................... 248 Table 17.5 Concentrator Equipment Requirements Summary Table – 8 Mtpa . ................................................................................................... 249 Table 17.6 Projected Concentrator Water, Power, and Consumables ........ 250 Table 17.7 Smelter Equipment Requirement Summary Table .................... 256 Table 17.8 Projected Smelter Water, Power, and Consumables ................ 257 Table 17.9 Processing Production Schedule Years 1 to 10 ........................ 258 Table 17.10 Processing Production Schedule Years 11 to 20 ...................... 259 Table 17.11 Processing Production Schedule Years 21 to 30 ...................... 260 Table 18.1 Estimated Annual Operational Power Consumption .................. 269 Table 18.2 Summary of Insitu Permeabilities and Compliance with DRC
Regulations ................................................................................ 277 Table 18.3 Liner Solution Configuration and Resulting Average Permeability .. ................................................................................................... 279 Table 18.4 Bentonite Cost Calculation ........................................................ 280 Table 18.5 DRC Mining Code (Annexure XI)............................................... 288 Table 18.6 Analytical Results (inorganic) of TCLP Extract of Tailings Samples
Compared to the DRC Mining Code for Low and High Risk Waste . ................................................................................................... 289
Figure 18.12 Potential Main Access Routes to Kamoa................................... 294 Table 18.7 Estimated Water Demand ......................................................... 306 Table 18.8 Pollution Control Dam Capacities .............................................. 310 Table 18.9 The Characteristics of the Pipelines From Each PCD ............... 311 Table 18.10 Pollution Control Dam Capacities .............................................. 313 Table 20.1 Hydrogeological System ............................................................ 331 Table 20.2 Estimated Volumes of Potential Groundwater Inflow ................. 336 Table 21.1 Unit Operating Costs ................................................................. 341 Table 21.2 Operating Costs ......................................................................... 342 Table 21.3 Capital Investment Summary..................................................... 343

IVANHOE MINES LIMITED Kamoa Copper Project
AMC 812022 : November : 2013 : 812022KamoaFinalEffDate131115rev0 xv
Table 21.4 Underground Production and Cost Summary for 300 ktpa of Blister Copper and 30 Year Mine Plan .................................................. 344
Table 21.5 Underground Capital Cost Summary ......................................... 346 Table 21.6 Underground 30 Year Mine Plan Operating Cost Summary ...... 351 Table 21.7 Personnel Requirement at Completion of Portals (Year 16) ...... 353 Table 21.8 Concentrate Capital Cost per Area ............................................ 354 Table 21.9 Summary of Concentrator Operating Costs............................... 358 Table 21.10 Smelter Capital cost per Area .................................................... 359 Table 21.11 Summary of Smelter Operating Costs ....................................... 362 Table 21.12 Mupenda TSF Capital Summary ............................................... 364 Table 21.13 Cost Comparison – Separate Phase 1 TSF vs. Phase 1 Mupenda
Capital Expenditure ................................................................... 365 Table 21.14 Cost Summary of Bulk Water Supply System ........................... 366 Table 21.15 Cost Summary of Storm Water Management System Infrastructure ................................................................................................... 370 Table 21.16 Infrastructure - Site Facilities and Temporary Works ................. 372 Table 21.17 Summary of Power Station Rehabilitation Costs ....................... 377 Table 22.1 Financial Results ....................................................................... 379 Table 22.2 Mining and Processing Production Statistics ............................. 380 Table 22.3 Financial Results ....................................................................... 384 Table 22.4 Mining and Processing Production Statistics ............................. 384 Table 22.5 Unit Operating Costs ................................................................. 386 Table 22.6 Operating Costs and Revenues................................................. 386 Table 22.7 Capital Investment Summary..................................................... 387 Table 22.8 Metal Price Sensitivity ............................................................... 388 Table 22.9 Acid Price and Copper Price Sensitivities.................................. 388 Table 22.10 Additional Sensitivities ............................................................... 389 Table 22.11 Cash Flow .................................................................................. 390 Table 26.1 Kamoa Proposed Drill Programme ............................................ 403
FIGURES
Figure 1.1 Processing Production ............................................................................... 4 Figure 1.2 Concentrate and Metal Production ............................................................ 4 Figure 1.3 Cumulative Cash Flow ............................................................................... 7 Figure 1.4 Mining Panel Layout by Mining Section ................................................... 21 Figure 1.5 Flotation Circuit ........................................................................................ 22 Figure 1.6 Flow Sheet Schematic of the Direct-to-Blister Smelting Process ............ 24 Figure 4.1 Project Location Map ............................................................................... 38 Figure 4.2 Project Tenure Plan ................................................................................. 47 Figure 7.1 Geological Setting Central African Copperbelt ........................................ 56 Figure 7.2 Regional Geology Map, Kamoa Region .................................................. 60 Figure 7.3 Kamoa Project – Structural Interpretation ................................................ 61 Figure 7.4 Drillhole Location Map Showing Section Line 8811900N ........................ 66 Figure 7.5 Drill Section at 8811900N (Eastern Portion – looking north) ................... 67 Figure 7.6 Drill Section at 8811900N (Central Portion – looking north) .................... 68 Figure 7.7 Drill Section at 8811900N (Western Portion –looking north) ................... 69 Figure 7.8 Clast Rimmed by Chalcopyrite (L) and Oxide Equivalent (R) .................. 71 Figure 7.9 Grade Profiles for DKMC-DD004 and DKMC DD005 .............................. 72
IVANHOE MINES LIMITED Kamoa Copper Project
AMC 812022 : November : 2013 : 812022KamoaFinalEffDate131115rev0 xvi
Figure 8.1 Mineralization Zonation Schematic, Kamoa Deposit ............................... 77 Figure 9.1 Location Map, Geochemical, and Aircore Drill Anomalies ....................... 81 Figure 10.1 Drillhole Collar Location Map Kamoa Deposit Area ................................. 84 Figure 10.2 Drillholes Locations in December 2012 Mineral Resource Estimate
(Domain 1) and Exploration Target Definition (Domain 2) ....................... 86 Figure 10.3 Geotechnical Drill Collar Plan .................................................................. 91 Figure 10.4 Groundwater Boreholes Drilled And Tested In 2010 And 2012 ............... 93 Figure 10.5 Hydrogeological Drillhole Location Map .................................................. 94 Figure 10.6 Metallurgical Drillhole Location Map ........................................................ 97 Figure 10.7 Drillhole Intercept Length versus Estimated True Thickness ................... 98 Figure 10.8 Plan View Showing Drillholes with Assay Results Completed Since
Construction of the 2012 Resource Model (Larger Circle) ...................... 99 Figure 12.1 On-Site Core-Logging Facility ................................................................ 118 Figure 12.2 On-Site Core-Storage Facility ................................................................ 119 Figure 13.1 Metallurgical Sample Map ..................................................................... 126 Figure 13.2 Dual Regrind Circuit Flow Sheet ............................................................ 128 Figure 13.3 Modal Mineralogy of Hypogene and Supergene Feed Composites ...... 131 Figure 13.4 Cu Mineralogy of Hypogene and Supergene Feed Composites ........... 132 Figure 13.5 QEMSCAN Image of Locked Copper in Flotation Scavenger Tail ......... 133 Figure 13.6 Mineral Grain Size Distribution for Hypogene at a p80 of 75 micron ..... 134 Figure 13.7 Evolution of the Kamoa Flowsheet ........................................................ 135 Figure 13.8 The Milestone Flowsheet ....................................................................... 135 Figure 13.9 Variability Results for the Milestone Flowsheet (Dec 2012) .................. 137 Figure 13.10 Variability Results for the Frozen Flowsheet (May 2013) ...................... 138 Figure 13.11 Preliminary Open Pit Results ................................................................. 139 Figure 13.12 Sample Location of Phase 2 Comminution Testwork ........................... 143 Figure 13.13 Relationship between Feed Grade and Recovery in the NSR Model .... 154 Figure 13.14 Relationship between Feed Grade and Mass Pull in the NSR model ... 155 Figure 14.1 SMZ Composite Cu; Histogram and Cumulative Probability Plot .......... 159 Figure 14.2 SMZ Composite ASCu; Histogram and Cumulative Probability Plot ..... 160 Figure 14.3 RATIO (ASCu/Cu); Histogram and Cumulative Probability Plot ............ 161 Figure 14.4 Density Histogram and Density Assays Cumulative Probability Plot ..... 162 Figure 14.5 SMZ True Thickness Histogram and Cumulative Probability Plot ......... 163 Figure 14.6 Scatter Plot of Total Copper (%) versus True Thickness (m) ................ 164 Figure 14.7 Perspective Schematic View of the ASCu:Cu Ratio .............................. 166 Figure 14.8 Perspective Schematic View of Structural Zones that Include the Faults and
Domes Used to Define the Structural Zones ......................................... 167 Figure 14.9 Depth of SMZ (meters below surface; Domain 1) .................................. 170 Figure 14.10 Total Copper (Cu%, Domain 1) ............................................................. 171 Figure 14.11 Acid Soluble Copper (ASCu%, Domain 1) ............................................. 172 Figure 14.12 Ratio of ASCu/Cu (%) ............................................................................ 173 Figure 14.13 True Thickness (m, Domain 1) .............................................................. 174 Figure 14.14 Total Copper Times True Thickness (% m, Domain 1) .......................... 175 Figure 14.15 Swath Plots for Total Copper Times True Thickness (% m) .................. 177 Figure 14.16 Total Copper Continuity ......................................................................... 179 Figure 14.17 True Thickness Continuity ..................................................................... 180 Figure 14.18 Stratigraphic Position Continuity ............................................................ 180 Figure 14.19 Geometry of Higher-Grade Mineralization Defined Using a 2.0% Cu Cut-
Off (left) and 2.5% Cu Cut-Off (right) ..................................................... 185
IVANHOE MINES LIMITED Kamoa Copper Project
AMC 812022 : November : 2013 : 812022KamoaFinalEffDate131115rev0 xvii
Figure 14.20 Location of Exploration Target and Drillholes ........................................ 188 Figure 14.21 Map Showing Areas of Additional Exploration Potential ........................ 189 Figure 14.22 Depth Below Topography vs Cumulative Tonnes and Total Cu Grade . 192 Figure 14.23 Mineralized Material Classification Types .............................................. 193 Figure 16.1 Interpreted Fault Structures as 3D Wireframes (labeled). Second
Derivative Aeromagnetic Image as Background .................................... 200 Figure 16.2 Plan View of the Recommended Structural Domains, 14 in Total, for
Geotechnical Assessment. Second Derivative Aeromagnetic Image as Background ............................................................................................ 201
Figure 16.3 Plan View Showing Strike Orientations for Joints With Dips >50 Degrees in Individual Domains. Second Derivative Aeromagnetic Image as Background ............................................................................................ 202
Figure 16.4 Representative Core Photos showing KPS Geotechnical Weathering Categories ............................................................................................. 203
Figure 16.5 Plan Views of the Hangingwall 10m Above the Mineralization in Drill Core, Showing the Relative Length of Rock in the Two Defined Weathering Categories and Structural Domains ....................................................... 204
Figure 16.7 Kamoa Mineralization at US$52 NSR/t Cut-Off (showing Mining Sections) ................................................................................................ 212
Figure 16.8 Example Of Room And Pillar Mining Of Dipping Resource ................... 213 Figure 16.9 Mining Panel Layout by Mining Section ................................................. 214 Figure 16.10 Typical Layout of Drift-and-Fill Stoping Panel (Primary and
Secondary) ............................................................................................ 215 Figure 16.11 Typical Plan Layout of Room-and-Pillar Stoping Panel (for depth less than
350 meters) ............................................................................................ 216 Figure 16.12 Typical Plan Layout of Room-and-Pillar Stoping Panel (for depths between
350–800 meters) .................................................................................... 217 Figure 16.13 Portal and Access Design ...................................................................... 218 Figure 16.14 30 Year Mine Plan for Production by Portal ........................................... 221 Figure 16.15 Underground Production Schedule ........................................................ 222 Figure 16.16 Annual Production by Mining Method .................................................... 224 Figure 16.17 Underground Mining Schedule, by Mineralization Type ........................ 225 Figure 16.18 Kamoa Open Pit Designs and Waste Rock Dumps ............................... 234 Figure 16.19 Preliminarily Pit Design Cross Section AA' and BB' .............................. 236 Figure 16.20 Preliminarily Pit Design Cross Section CC' and DD' .............................. 236 Figure 16.21 Preliminarily Pit Design Cross Section EE' and FF' ............................... 237 Figure 17.1 Flotation Circuit ...................................................................................... 246 Figure 17.2 Flow Sheet Schematic of the Direct-to-Blister Smelting Process .......... 251 Figure 18.1 Site Conceptual Infrastructure Layout Plan ........................................... 264 Figure 18.2 Power Plants Locations ......................................................................... 266 Figure 18.3 Example Existing Power Transmission Lines in Proximity to Kamoa
Site ......................................................................................................... 267 Figure 18.4 Estimated Operational Power Consumption .......................................... 271 Figure 18.5 TSF Options ........................................................................................... 272 Figure 18.6 Optimised Engineering Concept Layout for Mupenda ........................... 274 Figure 18.7 Mupenda TSF Phase 1 - Embankment Accross Valley Within Ultimate
Phase 2 Footprint .................................................................................. 276 Figure 18.8 Approximate Zonation of the Mupenda Site .......................................... 278 Figure 18.9 High Level Proposed Waste Management Schematic .......................... 281
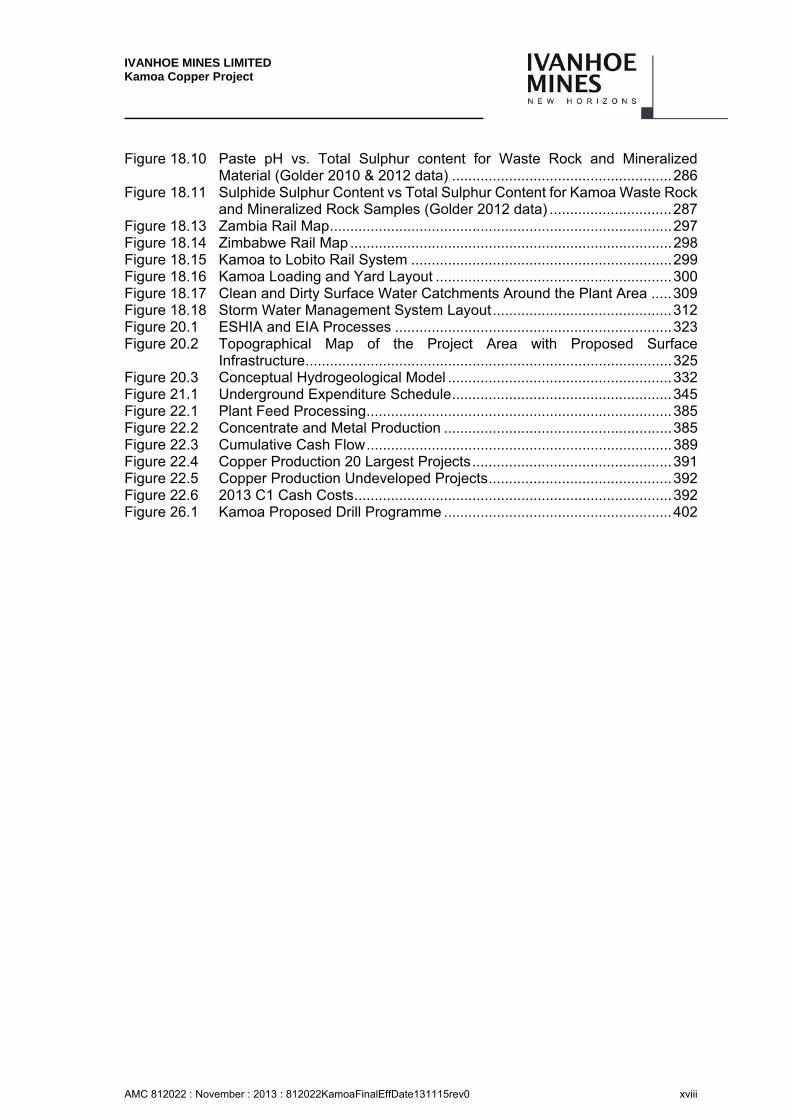
IVANHOE MINES LIMITED Kamoa Copper Project
AMC 812022 : November : 2013 : 812022KamoaFinalEffDate131115rev0 xviii
Figure 18.10 Paste pH vs. Total Sulphur content for Waste Rock and Mineralized Material (Golder 2010 & 2012 data) ...................................................... 286
Figure 18.11 Sulphide Sulphur Content vs Total Sulphur Content for Kamoa Waste Rock and Mineralized Rock Samples (Golder 2012 data) .............................. 287
Figure 18.13 Zambia Rail Map .................................................................................... 297 Figure 18.14 Zimbabwe Rail Map ............................................................................... 298 Figure 18.15 Kamoa to Lobito Rail System ................................................................ 299 Figure 18.16 Kamoa Loading and Yard Layout .......................................................... 300 Figure 18.17 Clean and Dirty Surface Water Catchments Around the Plant Area ..... 309 Figure 18.18 Storm Water Management System Layout ............................................ 312 Figure 20.1 ESHIA and EIA Processes .................................................................... 323 Figure 20.2 Topographical Map of the Project Area with Proposed Surface
Infrastructure .......................................................................................... 325 Figure 20.3 Conceptual Hydrogeological Model ....................................................... 332 Figure 21.1 Underground Expenditure Schedule ...................................................... 345 Figure 22.1 Plant Feed Processing ........................................................................... 385 Figure 22.2 Concentrate and Metal Production ........................................................ 385 Figure 22.3 Cumulative Cash Flow ........................................................................... 389 Figure 22.4 Copper Production 20 Largest Projects ................................................. 391 Figure 22.5 Copper Production Undeveloped Projects ............................................. 392 Figure 22.6 2013 C1 Cash Costs .............................................................................. 392 Figure 26.1 Kamoa Proposed Drill Programme ........................................................ 402
IVANHOE MINES LIMITED Kamoa Copper Project
AMC 812022 : November : 2013 : 812022KamoaFinalEffDate131115rev0 1
1 SUMMARY
Introduction
This report is a Preliminary Economic Assessment (PEA) prepared for Ivanhoe Mines Ltd. (Ivanhoe or the Company), to provide an independent Technical Report (the Report) for Ivanhoe’s 95% owned Kamoa Copper Project (the Project) located in the Democratic Republic of Congo (DRC).
The Kamoa Project is a newly discovered, very large, stratiform copper deposit with adjacent prospective exploration areas within the Central African Copperbelt, located approximately 25 kilometres west of the town of Kolwezi and about 270 kilometres west of the provincial capital of Lubumbashi. Ivanhoe holds its 95% interest in the Kamoa Project through a subsidiary company, African Minerals Barbados Limited SPRL (AMBL). A 5%, non-dilutable interest in AMBL was transferred to the government of the DRC on September 11, 2012, for no consideration, pursuant to the DRC Mining Code. The company also has offered to sell an additional 15% interest to the government of the DRC on commercial terms to be negotiated.
The Kamoa 2013 PEA includes an economic analysis that is based, in part, on Inferred Mineral Resources. Inferred Mineral Resources are considered too speculative geologically to have the economic considerations applied to them that would allow them to be categorized as Mineral Reserves, and there is no certainty that the results will be realized. Mineral Resources are not Mineral Reserves as they do not have demonstrated economic viability. The results of the Kamoa 2013 PEA represent forward-looking information. The forward-looking information includes metal price assumptions, cash flow forecasts, projected capital and operating costs, metal recoveries, mine life and production rates, and other assumptions used in the Kamoa 2013 PEA. Readers are cautioned that actual results may vary from those presented. The factors and assumptions used to develop the forward-looking information, and the risks that could cause the actual results to differ materially are presented in the body of this report under each relevant section.

IVANHOE MINES LIMITED Kamoa Copper Project
AMC 812022 : November : 2013 : 812022KamoaFinalEffDate131115rev0 2
Kamoa 2013 PEA
1.2.1 Summary of Financial Results
The plan described in the study is for the construction and operation of a long-term underground mine, concentrator processing facility and smelter operation and associated infrastructure. The Kamoa 2013 PEA envisages the production of copper concentrate for the initial years of production followed by the construction of a large smelter and mine expansion to produce blister copper. Ivanhoe believes this approach has several advantages and highlights which include:
A large mine and smelter would be developed using a two-phased approach.
A smaller-scale start-up would establish an operating platform to support expansion.
Early cash flows would be generated from the sale of high-grade copper concentrate.
Low pre-production capital requirement of approximately US$1.4 billion.
Steady-state production target of 300,000 tonnes per year of blister copper, which would establish Kamoa as one of the world’s largest copper mines, with the highest grade.
Cash costs of US$1.19 per pound of copper would rank Kamoa near the bottom of the global cash-cost curve.
Pre-tax Net Present Value, at an 8% discount rate, of US$4.3 billion.
After-tax Net Present Value, at an 8% discount rate, of US$2.6 billion.
Pre-tax internal rate of return of 18.4%; after-tax IRR of 15.3%.
The Kamoa 2013 PEA is a Preliminary Economic Assessment (PEA) and includes an economic analysis that is based, in part, on Inferred Mineral Resources. Inferred Mineral Resources are considered too speculative geologically to have the economic considerations applied to them that would allow them to be categorized as Mineral Reserves, and there is no certainty that the results will be realized. Mineral Resources are not Mineral Reserves as they do not have demonstrated economic viability.
The PEA reflects a two-phased approach to development of the Kamoa Project. The first phase of mining would target high-grade copper mineralization from shallow, underground resources to yield a high-value concentrate. The second phase would entail a major expansion of the mine and mill and construction of a smelter to produce blister copper. The initial mining rate and concentrator feed capacity is 3 Mtpa followed in year five by an additional 8 Mtpa expansion in concentrator capacity and the construction of a smelter with a capacity to produce 300 ktpa of copper. The production scenario schedules 326 Mt to be mined and milled at an average copper grade of 3.0%Cu over a 30-year mine life, producing 7.8 Mt of payable blister copper (plus 0.5 Mt of payable copper in concentrate, in the initial concentrate phase) over the life of the project.
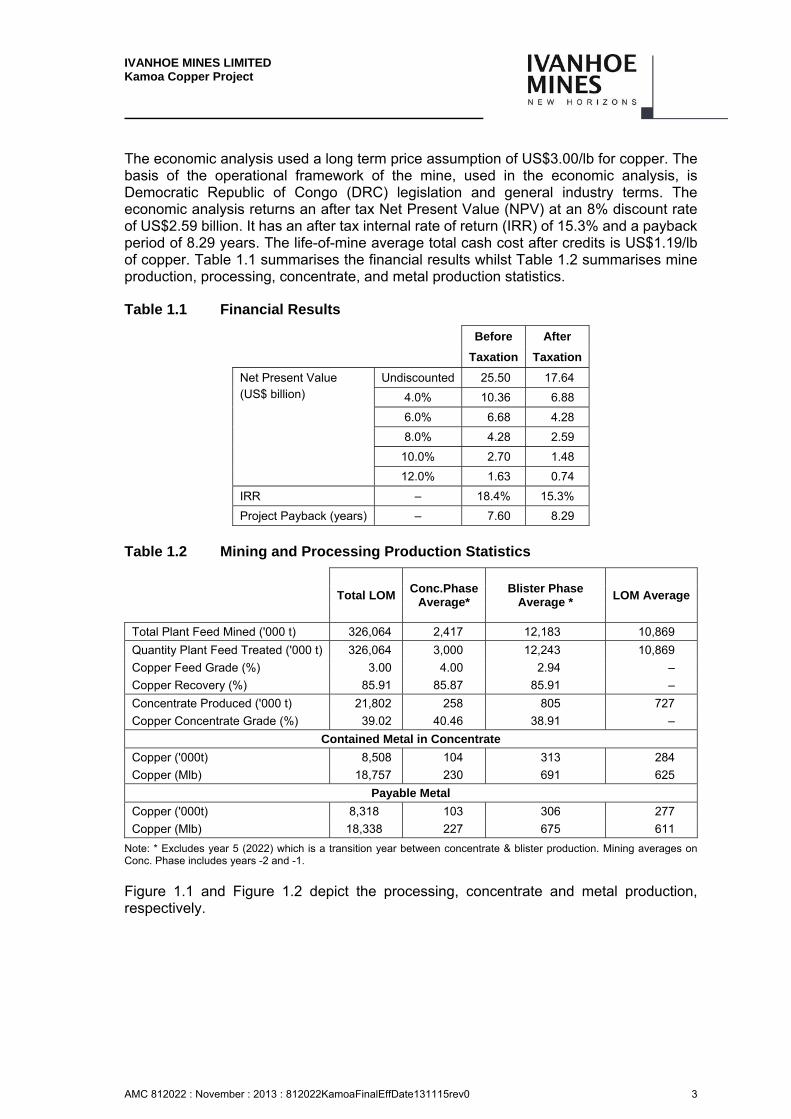
IVANHOE MINES LIMITED Kamoa Copper Project
AMC 812022 : November : 2013 : 812022KamoaFinalEffDate131115rev0 3
The economic analysis used a long term price assumption of US$3.00/lb for copper. The basis of the operational framework of the mine, used in the economic analysis, is Democratic Republic of Congo (DRC) legislation and general industry terms. The economic analysis returns an after tax Net Present Value (NPV) at an 8% discount rate of US$2.59 billion. It has an after tax internal rate of return (IRR) of 15.3% and a payback period of 8.29 years. The life-of-mine average total cash cost after credits is US$1.19/lb of copper. Table 1.1 summarises the financial results whilst Table 1.2 summarises mine production, processing, concentrate, and metal production statistics.
Table 1.1 Financial Results
Before After
Taxation Taxation
Net Present Value (US$ billion)
Undiscounted 25.50 17.64
4.0% 10.36 6.88
6.0% 6.68 4.28
8.0% 4.28 2.59
10.0% 2.70 1.48
12.0% 1.63 0.74
IRR – 18.4% 15.3%
Project Payback (years) – 7.60 8.29
Table 1.2 Mining and Processing Production Statistics
Total LOM
Conc.PhaseAverage*
Blister Phase Average *
LOM Average
Total Plant Feed Mined ('000 t) 326,064 2,417 12,183 10,869
Quantity Plant Feed Treated ('000 t) 326,064 3,000 12,243 10,869
Copper Feed Grade (%) 3.00 4.00 2.94 –
Copper Recovery (%) 85.91 85.87 85.91 –
Concentrate Produced ('000 t) 21,802 258 805 727
Copper Concentrate Grade (%) 39.02 40.46 38.91 –
Contained Metal in Concentrate
Copper ('000t) 8,508 104 313 284
Copper (Mlb) 18,757 230 691 625
Payable Metal
Copper ('000t) 8,318 103 306 277
Copper (Mlb) 18,338 227 675 611
Note: * Excludes year 5 (2022) which is a transition year between concentrate & blister production. Mining averages on Conc. Phase includes years -2 and -1.
Figure 1.1 and Figure 1.2 depict the processing, concentrate and metal production, respectively.

IVANHOE MINES LIMITED Kamoa Copper Project
AMC 812022 : November : 2013 : 812022KamoaFinalEffDate131115rev0 4
Figure 1.1 Processing Production
Note: Figure by AMC, 2013.
Figure 1.2 Concentrate and Metal Production
Note: Figure by AMC, 2013.
Table 1.3 summarises unit operating costs, whilst Table 1.4 provides a breakdown of operating costs and revenue.
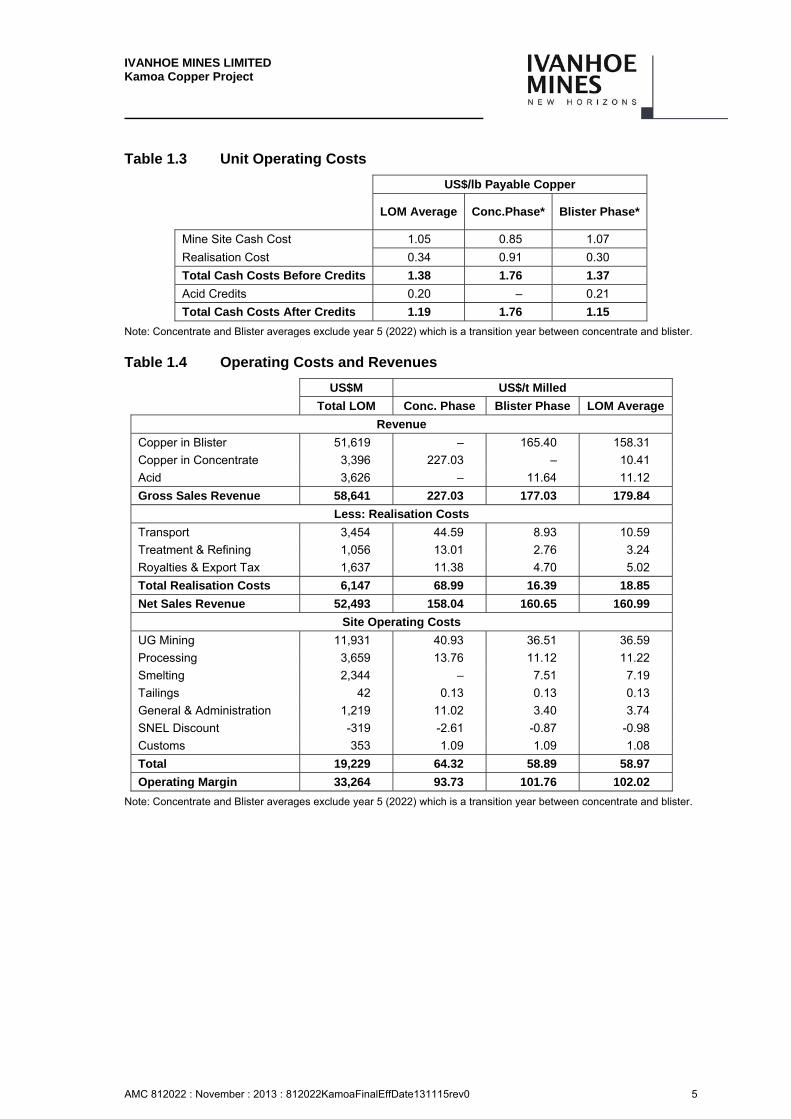
IVANHOE MINES LIMITED Kamoa Copper Project
AMC 812022 : November : 2013 : 812022KamoaFinalEffDate131115rev0 5
Table 1.3 Unit Operating Costs
US$/lb Payable Copper
LOM Average Conc.Phase* Blister Phase*
Mine Site Cash Cost 1.05 0.85 1.07
Realisation Cost 0.34 0.91 0.30
Total Cash Costs Before Credits 1.38 1.76 1.37
Acid Credits 0.20 – 0.21
Total Cash Costs After Credits 1.19 1.76 1.15
Note: Concentrate and Blister averages exclude year 5 (2022) which is a transition year between concentrate and blister.
Table 1.4 Operating Costs and Revenues
US$M US$/t Milled
Total LOM Conc. Phase Blister Phase LOM Average
Revenue
Copper in Blister 51,619 – 165.40 158.31
Copper in Concentrate 3,396 227.03 – 10.41
Acid 3,626 – 11.64 11.12
Gross Sales Revenue 58,641 227.03 177.03 179.84
Less: Realisation Costs
Transport 3,454 44.59 8.93 10.59
Treatment & Refining 1,056 13.01 2.76 3.24
Royalties & Export Tax 1,637 11.38 4.70 5.02
Total Realisation Costs 6,147 68.99 16.39 18.85
Net Sales Revenue 52,493 158.04 160.65 160.99
Site Operating Costs
UG Mining 11,931 40.93 36.51 36.59
Processing 3,659 13.76 11.12 11.22
Smelting 2,344 – 7.51 7.19
Tailings 42 0.13 0.13 0.13
General & Administration 1,219 11.02 3.40 3.74
SNEL Discount -319 -2.61 -0.87 -0.98
Customs 353 1.09 1.09 1.08
Total 19,229 64.32 58.89 58.97
Operating Margin 33,264 93.73 101.76 102.02
Note: Concentrate and Blister averages exclude year 5 (2022) which is a transition year between concentrate and blister.
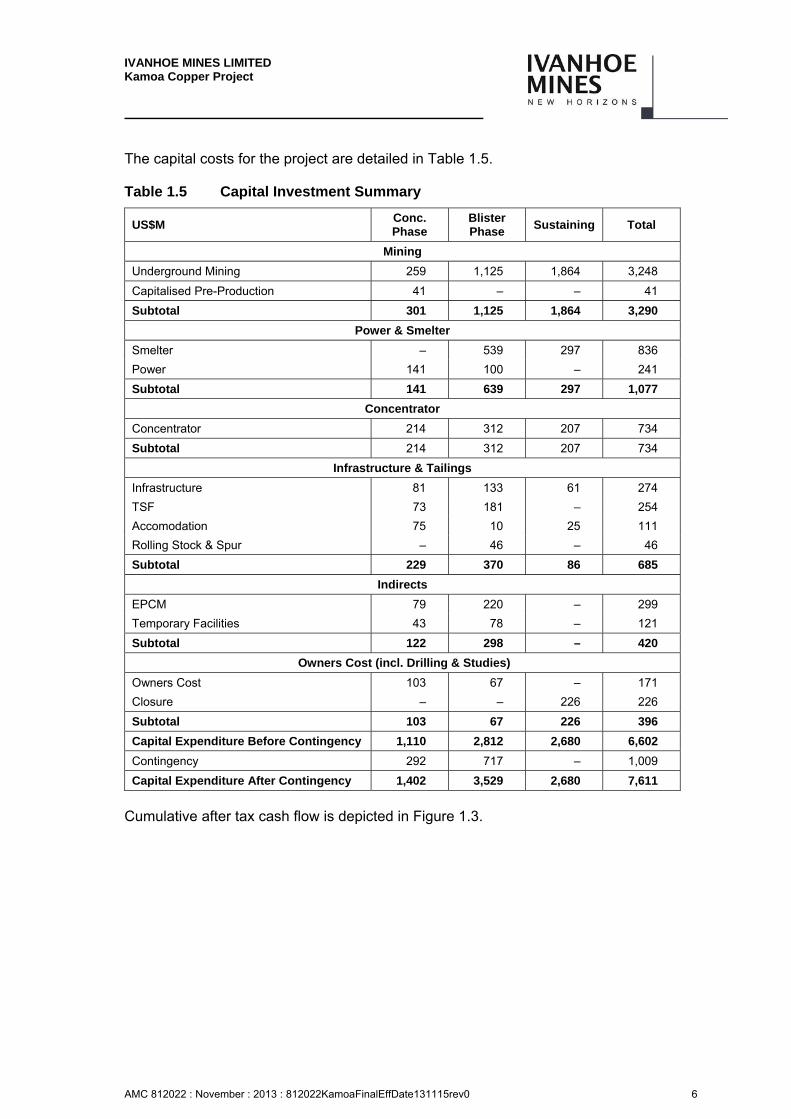
IVANHOE MINES LIMITED Kamoa Copper Project
AMC 812022 : November : 2013 : 812022KamoaFinalEffDate131115rev0 6
The capital costs for the project are detailed in Table 1.5.
Table 1.5 Capital Investment Summary
US$M Conc. Phase
Blister Phase
Sustaining Total
Mining
Underground Mining 259 1,125 1,864 3,248
Capitalised Pre-Production 41 – – 41
Subtotal 301 1,125 1,864 3,290
Power & Smelter
Smelter – 539 297 836
Power 141 100 – 241
Subtotal 141 639 297 1,077
Concentrator
Concentrator 214 312 207 734
Subtotal 214 312 207 734
Infrastructure & Tailings
Infrastructure 81 133 61 274
TSF 73 181 – 254
Accomodation 75 10 25 111
Rolling Stock & Spur – 46 – 46
Subtotal 229 370 86 685
Indirects
EPCM 79 220 – 299
Temporary Facilities 43 78 – 121
Subtotal 122 298 – 420
Owners Cost (incl. Drilling & Studies)
Owners Cost 103 67 – 171
Closure – – 226 226
Subtotal 103 67 226 396
Capital Expenditure Before Contingency 1,110 2,812 2,680 6,602
Contingency 292 717 – 1,009
Capital Expenditure After Contingency 1,402 3,529 2,680 7,611
Cumulative after tax cash flow is depicted in Figure 1.3.
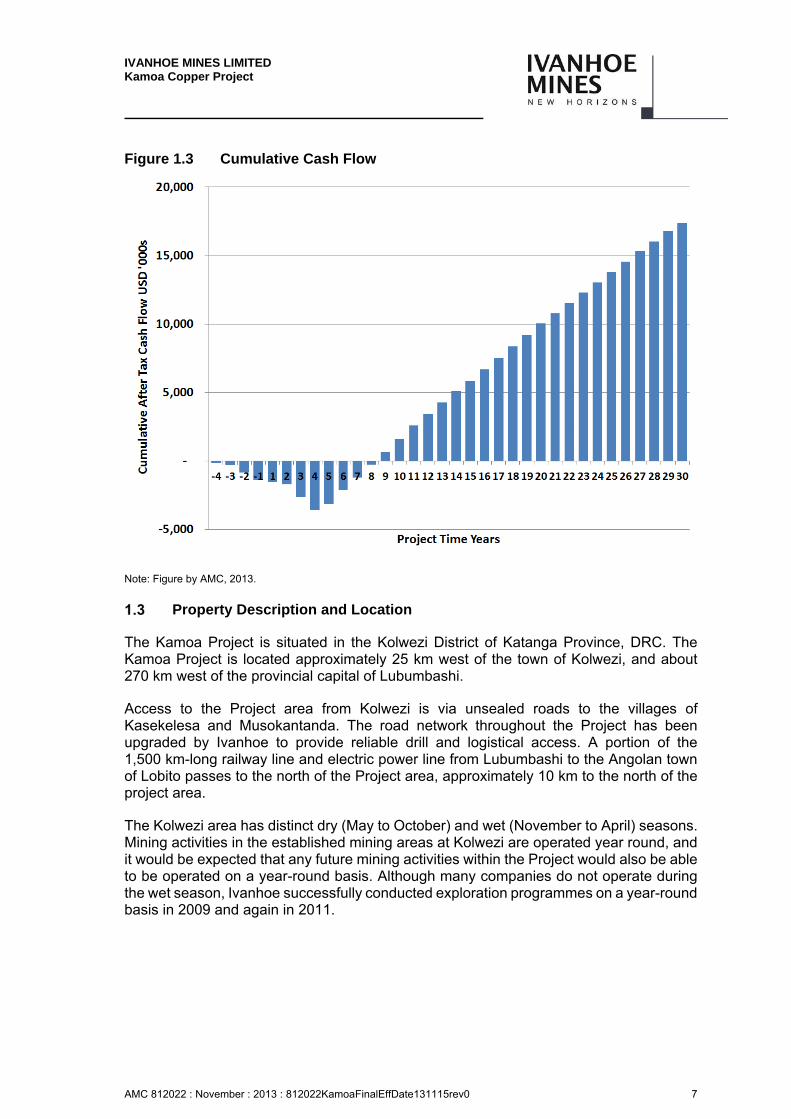
IVANHOE MINES LIMITED Kamoa Copper Project
AMC 812022 : November : 2013 : 812022KamoaFinalEffDate131115rev0 7
Figure 1.3 Cumulative Cash Flow
Note: Figure by AMC, 2013.
Property Description and Location
The Kamoa Project is situated in the Kolwezi District of Katanga Province, DRC. The Kamoa Project is located approximately 25 km west of the town of Kolwezi, and about 270 km west of the provincial capital of Lubumbashi.
Access to the Project area from Kolwezi is via unsealed roads to the villages of Kasekelesa and Musokantanda. The road network throughout the Project has been upgraded by Ivanhoe to provide reliable drill and logistical access. A portion of the 1,500 km-long railway line and electric power line from Lubumbashi to the Angolan town of Lobito passes to the north of the Project area, approximately 10 km to the north of the project area.
The Kolwezi area has distinct dry (May to October) and wet (November to April) seasons. Mining activities in the established mining areas at Kolwezi are operated year round, and it would be expected that any future mining activities within the Project would also be able to be operated on a year-round basis. Although many companies do not operate during the wet season, Ivanhoe successfully conducted exploration programmes on a year-round basis in 2009 and again in 2011.
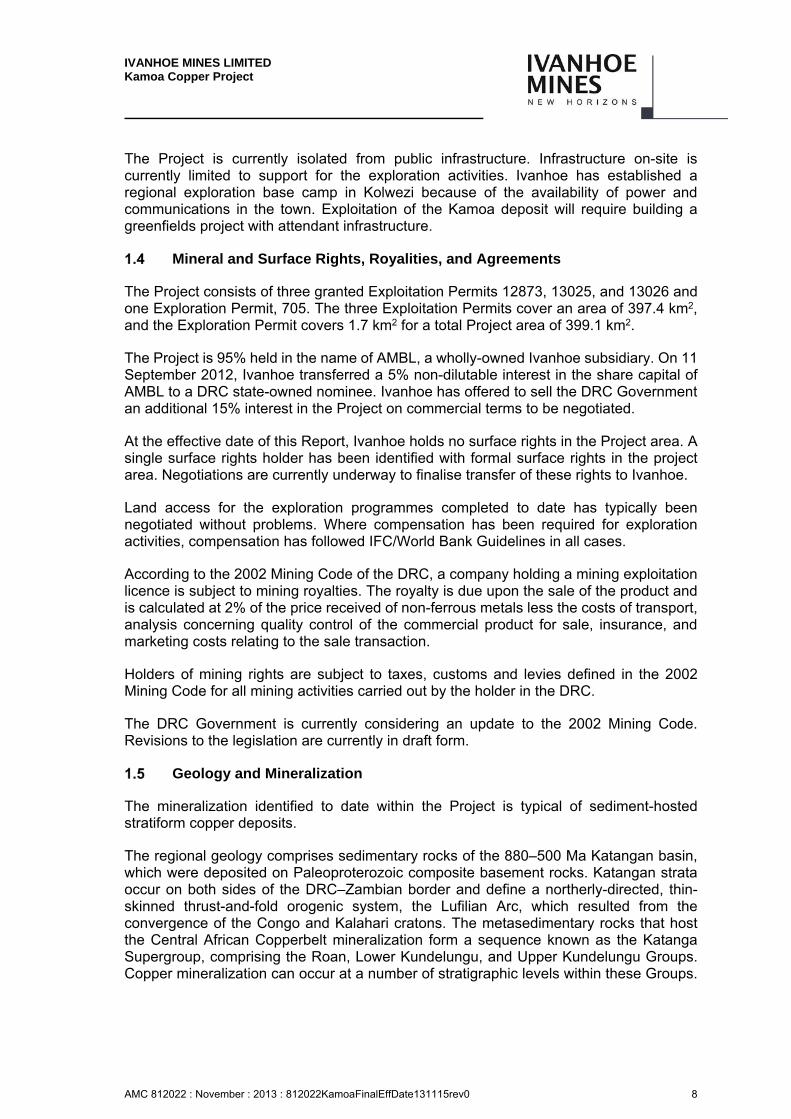
IVANHOE MINES LIMITED Kamoa Copper Project
AMC 812022 : November : 2013 : 812022KamoaFinalEffDate131115rev0 8
The Project is currently isolated from public infrastructure. Infrastructure on-site is currently limited to support for the exploration activities. Ivanhoe has established a regional exploration base camp in Kolwezi because of the availability of power and communications in the town. Exploitation of the Kamoa deposit will require building a greenfields project with attendant infrastructure.
Mineral and Surface Rights, Royalities, and Agreements
The Project consists of three granted Exploitation Permits 12873, 13025, and 13026 and one Exploration Permit, 705. The three Exploitation Permits cover an area of 397.4 km2, and the Exploration Permit covers 1.7 km2 for a total Project area of 399.1 km2.
The Project is 95% held in the name of AMBL, a wholly-owned Ivanhoe subsidiary. On 11 September 2012, Ivanhoe transferred a 5% non-dilutable interest in the share capital of AMBL to a DRC state-owned nominee. Ivanhoe has offered to sell the DRC Government an additional 15% interest in the Project on commercial terms to be negotiated.
At the effective date of this Report, Ivanhoe holds no surface rights in the Project area. A single surface rights holder has been identified with formal surface rights in the project area. Negotiations are currently underway to finalise transfer of these rights to Ivanhoe.
Land access for the exploration programmes completed to date has typically been negotiated without problems. Where compensation has been required for exploration activities, compensation has followed IFC/World Bank Guidelines in all cases.
According to the 2002 Mining Code of the DRC, a company holding a mining exploitation licence is subject to mining royalties. The royalty is due upon the sale of the product and is calculated at 2% of the price received of non-ferrous metals less the costs of transport, analysis concerning quality control of the commercial product for sale, insurance, and marketing costs relating to the sale transaction.
Holders of mining rights are subject to taxes, customs and levies defined in the 2002 Mining Code for all mining activities carried out by the holder in the DRC.
The DRC Government is currently considering an update to the 2002 Mining Code. Revisions to the legislation are currently in draft form.
Geology and Mineralization
The mineralization identified to date within the Project is typical of sediment-hosted stratiform copper deposits.
The regional geology comprises sedimentary rocks of the 880–500 Ma Katangan basin, which were deposited on Paleoproterozoic composite basement rocks. Katangan strata occur on both sides of the DRC–Zambian border and define a northerly-directed, thin-skinned thrust-and-fold orogenic system, the Lufilian Arc, which resulted from the convergence of the Congo and Kalahari cratons. The metasedimentary rocks that host the Central African Copperbelt mineralization form a sequence known as the Katanga Supergroup, comprising the Roan, Lower Kundelungu, and Upper Kundelungu Groups. Copper mineralization can occur at a number of stratigraphic levels within these Groups.
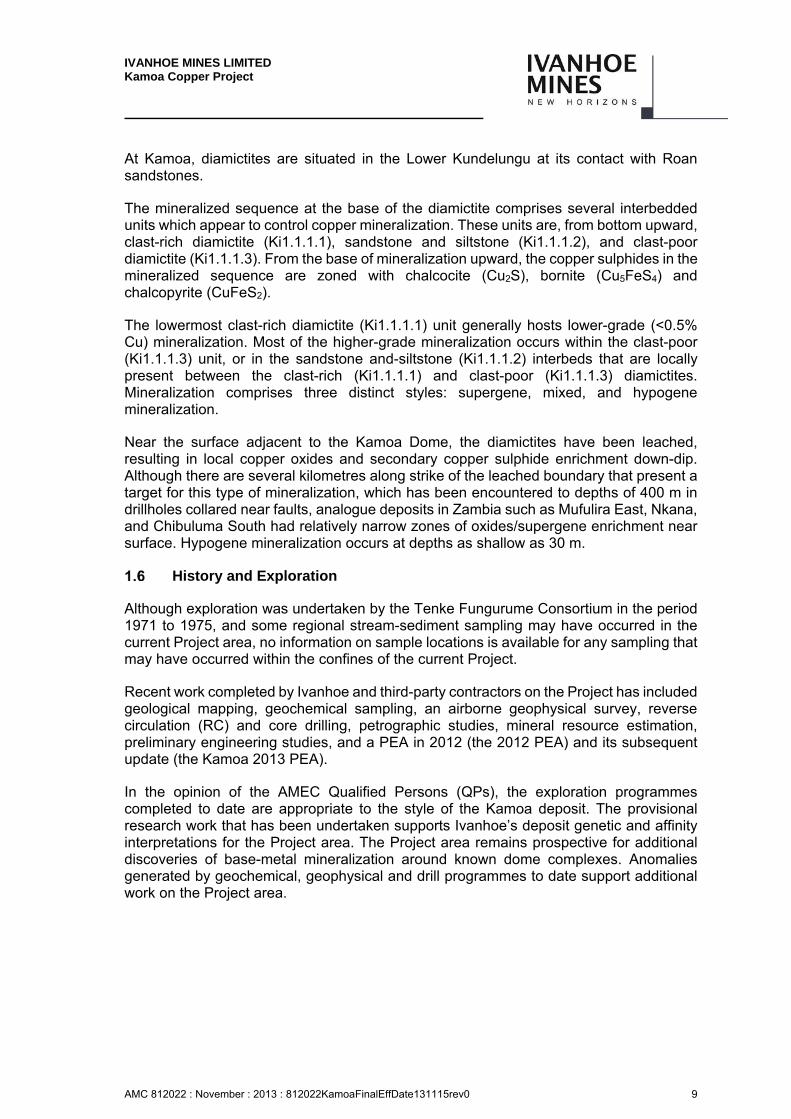
IVANHOE MINES LIMITED Kamoa Copper Project
AMC 812022 : November : 2013 : 812022KamoaFinalEffDate131115rev0 9
At Kamoa, diamictites are situated in the Lower Kundelungu at its contact with Roan sandstones.
The mineralized sequence at the base of the diamictite comprises several interbedded units which appear to control copper mineralization. These units are, from bottom upward, clast-rich diamictite (Ki1.1.1.1), sandstone and siltstone (Ki1.1.1.2), and clast-poor diamictite (Ki1.1.1.3). From the base of mineralization upward, the copper sulphides in the mineralized sequence are zoned with chalcocite (Cu2S), bornite (Cu5FeS4) and chalcopyrite (CuFeS2).
The lowermost clast-rich diamictite (Ki1.1.1.1) unit generally hosts lower-grade (<0.5% Cu) mineralization. Most of the higher-grade mineralization occurs within the clast-poor (Ki1.1.1.3) unit, or in the sandstone and-siltstone (Ki1.1.1.2) interbeds that are locally present between the clast-rich (Ki1.1.1.1) and clast-poor (Ki1.1.1.3) diamictites. Mineralization comprises three distinct styles: supergene, mixed, and hypogene mineralization.
Near the surface adjacent to the Kamoa Dome, the diamictites have been leached, resulting in local copper oxides and secondary copper sulphide enrichment down-dip. Although there are several kilometres along strike of the leached boundary that present a target for this type of mineralization, which has been encountered to depths of 400 m in drillholes collared near faults, analogue deposits in Zambia such as Mufulira East, Nkana, and Chibuluma South had relatively narrow zones of oxides/supergene enrichment near surface. Hypogene mineralization occurs at depths as shallow as 30 m.
History and Exploration
Although exploration was undertaken by the Tenke Fungurume Consortium in the period 1971 to 1975, and some regional stream-sediment sampling may have occurred in the current Project area, no information on sample locations is available for any sampling that may have occurred within the confines of the current Project.
Recent work completed by Ivanhoe and third-party contractors on the Project has included geological mapping, geochemical sampling, an airborne geophysical survey, reverse circulation (RC) and core drilling, petrographic studies, mineral resource estimation, preliminary engineering studies, and a PEA in 2012 (the 2012 PEA) and its subsequent update (the Kamoa 2013 PEA).
In the opinion of the AMEC Qualified Persons (QPs), the exploration programmes completed to date are appropriate to the style of the Kamoa deposit. The provisional research work that has been undertaken supports Ivanhoe’s deposit genetic and affinity interpretations for the Project area. The Project area remains prospective for additional discoveries of base-metal mineralization around known dome complexes. Anomalies generated by geochemical, geophysical and drill programmes to date support additional work on the Project area.
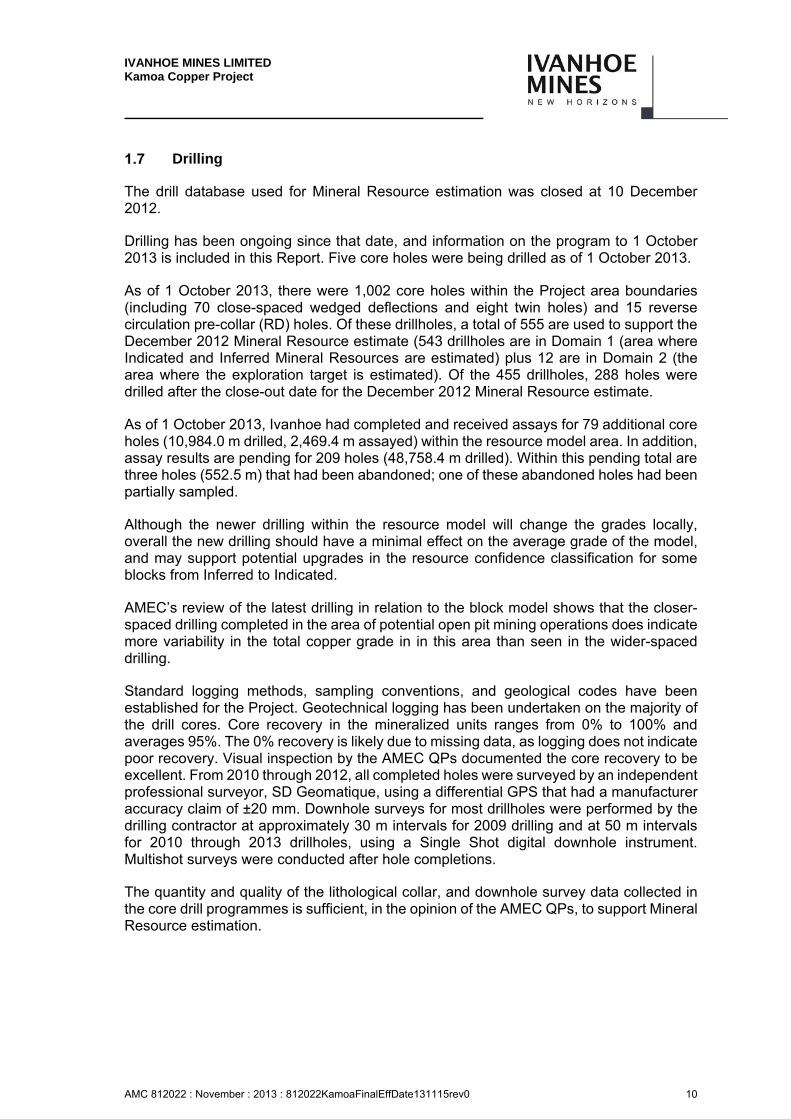
IVANHOE MINES LIMITED Kamoa Copper Project
AMC 812022 : November : 2013 : 812022KamoaFinalEffDate131115rev0 10
Drilling
The drill database used for Mineral Resource estimation was closed at 10 December 2012.
Drilling has been ongoing since that date, and information on the program to 1 October 2013 is included in this Report. Five core holes were being drilled as of 1 October 2013.
As of 1 October 2013, there were 1,002 core holes within the Project area boundaries (including 70 close-spaced wedged deflections and eight twin holes) and 15 reverse circulation pre-collar (RD) holes. Of these drillholes, a total of 555 are used to support the December 2012 Mineral Resource estimate (543 drillholes are in Domain 1 (area where Indicated and Inferred Mineral Resources are estimated) plus 12 are in Domain 2 (the area where the exploration target is estimated). Of the 455 drillholes, 288 holes were drilled after the close-out date for the December 2012 Mineral Resource estimate.
As of 1 October 2013, Ivanhoe had completed and received assays for 79 additional core holes (10,984.0 m drilled, 2,469.4 m assayed) within the resource model area. In addition, assay results are pending for 209 holes (48,758.4 m drilled). Within this pending total are three holes (552.5 m) that had been abandoned; one of these abandoned holes had been partially sampled.
Although the newer drilling within the resource model will change the grades locally, overall the new drilling should have a minimal effect on the average grade of the model, and may support potential upgrades in the resource confidence classification for some blocks from Inferred to Indicated.
AMEC’s review of the latest drilling in relation to the block model shows that the closer-spaced drilling completed in the area of potential open pit mining operations does indicate more variability in the total copper grade in in this area than seen in the wider-spaced drilling.
Standard logging methods, sampling conventions, and geological codes have been established for the Project. Geotechnical logging has been undertaken on the majority of the drill cores. Core recovery in the mineralized units ranges from 0% to 100% and averages 95%. The 0% recovery is likely due to missing data, as logging does not indicate poor recovery. Visual inspection by the AMEC QPs documented the core recovery to be excellent. From 2010 through 2012, all completed holes were surveyed by an independent professional surveyor, SD Geomatique, using a differential GPS that had a manufacturer accuracy claim of ±20 mm. Downhole surveys for most drillholes were performed by the drilling contractor at approximately 30 m intervals for 2009 drilling and at 50 m intervals for 2010 through 2013 drillholes, using a Single Shot digital downhole instrument. Multishot surveys were conducted after hole completions.
The quantity and quality of the lithological collar, and downhole survey data collected in the core drill programmes is sufficient, in the opinion of the AMEC QPs, to support Mineral Resource estimation.
IVANHOE MINES LIMITED Kamoa Copper Project
AMC 812022 : November : 2013 : 812022KamoaFinalEffDate131115rev0 11
Sample Preparation, Analyses, and Security
Pre-February 2010, determination of the sample intervals took into account lithological and alteration boundaries. The entire length of core from 4 m (or one core-tray length whichever is convenient) above the first presence of mineralization and/or the mineralized zone is sampled on nominal whole 1 m intervals to the end of the hole, which is generally 5 m below the Ki1.1/R4.2 contact. Most intervals with visual estimates of >0.1% Cu are sampled at 1.5 m intervals or less.
After February 2010, the sampling of the KPS (Ki1.1.2) and mineralized basal diamictite was sampled on nominal 1 m sample intervals (dependent on geological controls). The Kamoa pyritic siltstone (Ki1.1.2) was sampled every 1 m, and composites were made over 3 m for analytical purposes. A 3 m shoulder is sampled above the first visible sign of copper mineralization in each drillhole.
A total of 12,500 specific gravity measurements were performed on samples taken from drill core using a water immersion method.
Two independent laboratories have been used for primary sample analysis, Genalysis Laboratory Services Pty. Ltd. (Genalysis; from 2007 part of the Intertek Minerals Group), and Ultra Trace Geoanalytical Laboratory (Ultra Trace, from 2008 owned and operated by the Bureau Veritas Group). Both laboratories are located in Perth, Western Australia, and both have ISO 17025 accreditation. ALS Chemex of Vancouver, British Columbia, acted as the check laboratory for drill core samples from part of the 2009 program and for 2010 through 2013 drilling. ALS Chemex is ISO:9000:2008 registered and ISO:17025-accredited. It is likely that the 2013 check assay program will be completed near the end of 2013 or, alternatively, at the end of the current drill program.
Sawn drill core is sampled on 1 m intervals, and then the sawn core is crushed to nominal 2 mm using jaw crushers. A quarter split (500 g to 1,000 g) is pulverized in the same manner as the reverse circulation (RC) samples. The remaining coarse reject material is retained. A 100 g split is sent for assay; three 50 g samples are kept as government witness samples, 30 g is split for Niton (X-ray fluorescence or XRF) analysis, and approximately 80 g of pulp is retained as a reference sample. Certified reference materials and blanks are included with the sample submissions.
Analytical methods have changed over the Project duration. Samples typically are analyzed for Cu, Fe, As, S, and Ag. A suite of additional elements have been requested, in particular in the early drilling phases. Acid-soluble copper (ASCu) assays are now being undertaken.
In the opinion of the AMEC QPs, the sampling methods are acceptable, are consistent with industry-standard practice, and adequate for Mineral Resource estimation purposes.
IVANHOE MINES LIMITED Kamoa Copper Project
AMC 812022 : November : 2013 : 812022KamoaFinalEffDate131115rev0 12
Data Verification
AMEC reviewed the sample chain of custody, quality assurance and control procedures, and qualifications of analytical laboratories. AMEC is of the opinion that the procedures and QA/QC control are acceptable to support Mineral Resource estimation. AMEC also audited the assay database, core logging, and geological interpretations on a number of occasions between 2009 and 2013, and has found no material issues with the data as a result of these audits.
In the opinion of the AMEC QPs, the data verification programmes undertaken on the data collected from the Project support the geological interpretations, and the analytical and database quality and the data collected can support Mineral Resource estimation.
Metallurgical Testwork
The first metallurgical testwork on Kamoa mineralization was carried out in 2010 using drill cores from the shallow, Kamoa Sud area of the deposit. The samples were subjected to comminution and flotation tests at Mintek laboratories in Johannesburg.
The Mintek comminution testwork indicated that the mineralized rock is competent with respect to SAG milling, that the Bond ball mill work index results are modest and in the range of 14 to 16 kWh/t and can be classified as low abrasive. Due to milling efficiency considerations, mineralized materials with these properties are best processed in crush/ball mill circuits rather than SAG milling circuits. These comminution results showed that the Kamoa mineralization is moderately harder than typical Copperbelt ores.
The Mintek flotation testwork showed that the mineralization was amenable to treatment by conventional sulphide flotation but with the proviso that a significant amount of regrinding is required. Flotation recoveries were lower than expected for Copperbelt ores due to a non-floating copper sulphide population locked in silicates at sulphide phase sizes of 10 µm or finer. The economic copper minerals include chalcopyrite, bornite and chalcocite.
In the period from 2011 to 2013, the range of sampling was increased to include samples from all major areas of the expanded resource, viz. Kamoa Sud, Kansoko Centrale and Kansoko Nord. Samples were also taken from Kamoa Ouest; however this area does not form part of the Kamoa 2013 PEA mine plan.
Circuit development work during this period was primarily conducted at Xstrata Process Support (XPS) Laboratories in Sudbury, Ontario. A flowsheet was developed which was tailored to the fine grained nature of the deposit. The circuit relied on a traditional MF2 approach to partially liberate particles, followed by fine regrinding of concentrates to achieve a concentrate grade suitable for smelting. Separate treatment of the primary and secondary rougher concentrates allowed for separately optimised cleaner flotation of fast and slow floating species.
This configuration became known as the Milestone flowsheet and forms the basis of the NSR model and mine plan. The circuit was tested on various composites from across the resource and was able to achieve a recovery of 85.4% and concentrate copper grade of
IVANHOE MINES LIMITED Kamoa Copper Project
AMC 812022 : November : 2013 : 812022KamoaFinalEffDate131115rev0 13
32.8% for Hypogene material, and a recovery of 83.2% and concentrate copper grade of 45.1% for Supergene material.
In the first half of 2013, the focus of development work shifted towards a reduction in the silica content of the final concentrate. Adjustments were made to the reagent dosages, as well as the grinding media type, resulting in an improvement to 86.7% recovery at 37.0% copper grade for Hypogene material, and 82.9% recovery at 51.4% copper grade for Supergene material. Silica levels in the final concentrate also dropped from 19.1% to 13.1% for Hypogene and from 26.0% to 18.1% for Supergene material.
Although these improvements were not realized in time to be incorporated into the mine plan and NSR for the Kamoa 2013 PEA, the updated Supergene and Hypogene results were incorporated into the financial model, and form the basis of the Kamoa 2013 PEA.
Testwork was also conducted on potential open pit material from shallow areas of Kamoa Ouest in the first half of 2013. This material was found to produce reasonable recoveries, but poor concentrate grades.
Mineral Resource Estimates
The cut-off date for exporting the drillholes from the database was 10 December 2012. The perimeter of the mineralization was defined using 555 mostly vertical, mineralized core drillholes that excluded barren leached drillholes where the mineralization approaches the surface.
The best single mineralized intercept (SMZ) for each of the 555 holes within the resource boundary was selected using the criteria of a minimum copper grade of 1% Cu, and a minimum downhole length of three metres. In the event that the assays in a drillhole could not be combined to meet the above criteria, the highest-grade composite was formed that met the three metre minimum length.
The mineral resource area was divided into 10 structural domains, and a digital terrain model (dtm) was constructed through the SMZ centroids to define the geometry of the mineralization within each structural domain.
A prototype gridded-seam block model was established using 100 m x 100 m blocks in the X and Y directions and a single block in the vertical direction. The Z value of the block centroid was set to the vertical midpoint of the SMZ surface using the SMZ dtm.
True thickness, total copper weighted by vertical thickness and acid-soluble copper were estimated into the block model using inverse distance to the second power.
The vertical height of the resource model blocks was set to the estimated vertical thickness of the mineralization.
Resources were classified using a nominal 400 m drillhole spacing for classification of Indicated and a nominal 800 m spacing for Inferred.
IVANHOE MINES LIMITED Kamoa Copper Project
AMC 812022 : November : 2013 : 812022KamoaFinalEffDate131115rev0 14
AMEC used a 1% Cu cut-off grade as a base case to declare Mineral Resources. This choice of cut-off is based on many years of experience on the Zambian Copperbelt at mines with similar mineralization such as Konkola, Nchanga, Nkana, and Mufulira where the 1% cut-off is a natural cut-off. The 1% Cu cut-off is also a “natural” cut-off for the Kamoa deposit, with most SMZ intercepts grading a few tenths of a percent copper above and below the composite and well over 1% Cu within the SMZ composite. To test the 1% cut-off grade and various sensitivity cases for the purposes of assessing reasonable prospects of economic extraction, AMEC performed a conceptual analysis based on the metallurgical recovery algorithms, operating costs and economic parameters used in the 2012 PEA.
Two seam models were constructed below and above over the entire extent of the underground model using a 0.5% Cu cut-off to help evaluate the open-pit potential for future studies.
1.11.1 Mineral Resource Statement
The Mineral Resources have been defined taking into account the 2010 CIM Definition Standards for Mineral Resources and Mineral Reserves. Dr. Harry Parker, SME Registered Member, and Gordon Seibel, SME Registered Member, both employees of AMEC, are the Qualified Persons for the Mineral Resource estimates.
Mineral Resources are stated in terms of total copper (Cu). Mineral Resources are reported at a base case total copper cut-off grade of 1% Cu and a minimum assumed thickness of 3 m and are summarised in Table 1.6.
Table 1.7 tabulates the additional Mineral Resources that may be gained if the 0.5% Cu skins adjacent to the underground resource model are mined using an open-pit mining method.
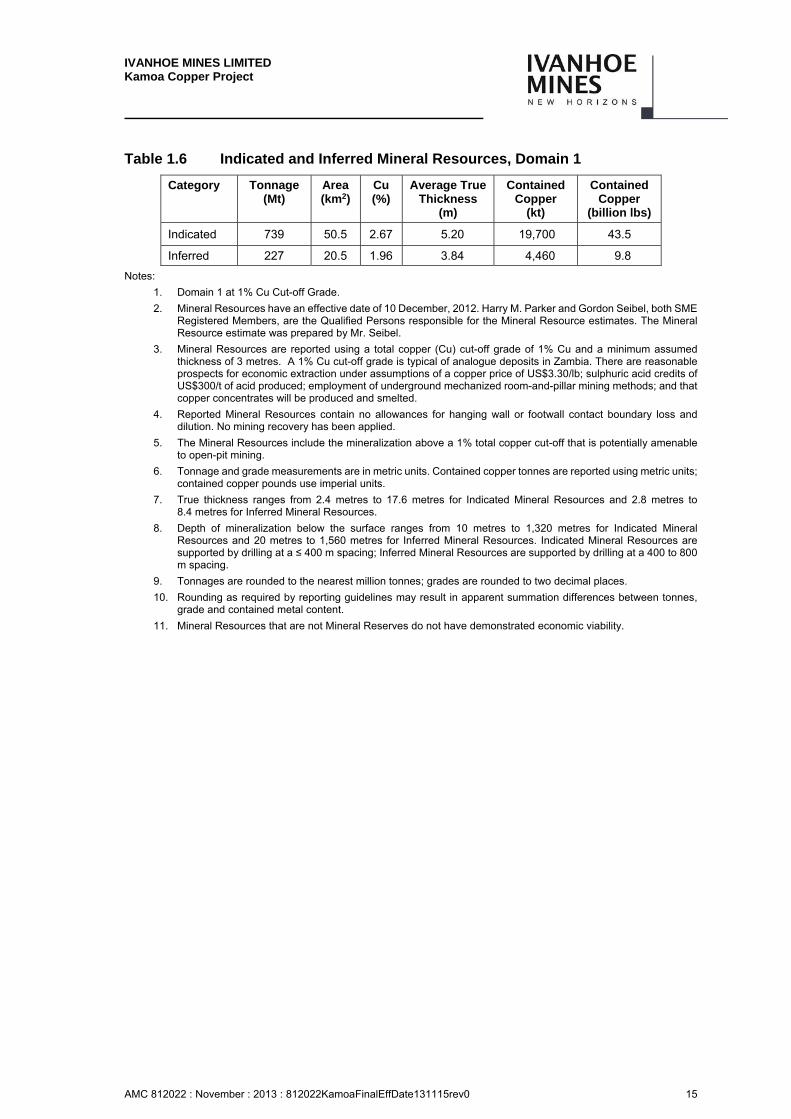
IVANHOE MINES LIMITED Kamoa Copper Project
AMC 812022 : November : 2013 : 812022KamoaFinalEffDate131115rev0 15
Table 1.6 Indicated and Inferred Mineral Resources, Domain 1
Category Tonnage (Mt)
Area(km2)
Cu (%)
Average True Thickness
(m)
Contained Copper
(kt)
Contained Copper
(billion lbs)
Indicated 739 50.5 2.67 5.20 19,700 43.5
Inferred 227 20.5 1.96 3.84 4,460 9.8
Notes:
1. Domain 1 at 1% Cu Cut-off Grade.
2. Mineral Resources have an effective date of 10 December, 2012. Harry M. Parker and Gordon Seibel, both SME Registered Members, are the Qualified Persons responsible for the Mineral Resource estimates. The Mineral Resource estimate was prepared by Mr. Seibel.
3. Mineral Resources are reported using a total copper (Cu) cut-off grade of 1% Cu and a minimum assumed thickness of 3 metres. A 1% Cu cut-off grade is typical of analogue deposits in Zambia. There are reasonable prospects for economic extraction under assumptions of a copper price of US$3.30/lb; sulphuric acid credits of US$300/t of acid produced; employment of underground mechanized room-and-pillar mining methods; and that copper concentrates will be produced and smelted.
4. Reported Mineral Resources contain no allowances for hanging wall or footwall contact boundary loss and dilution. No mining recovery has been applied.
5. The Mineral Resources include the mineralization above a 1% total copper cut-off that is potentially amenable to open-pit mining.
6. Tonnage and grade measurements are in metric units. Contained copper tonnes are reported using metric units; contained copper pounds use imperial units.
7. True thickness ranges from 2.4 metres to 17.6 metres for Indicated Mineral Resources and 2.8 metres to 8.4 metres for Inferred Mineral Resources.
8. Depth of mineralization below the surface ranges from 10 metres to 1,320 metres for Indicated Mineral Resources and 20 metres to 1,560 metres for Inferred Mineral Resources. Indicated Mineral Resources are supported by drilling at a ≤ 400 m spacing; Inferred Mineral Resources are supported by drilling at a 400 to 800 m spacing.
9. Tonnages are rounded to the nearest million tonnes; grades are rounded to two decimal places.
10. Rounding as required by reporting guidelines may result in apparent summation differences between tonnes, grade and contained metal content.
11. Mineral Resources that are not Mineral Reserves do not have demonstrated economic viability.

IVANHOE MINES LIMITED Kamoa Copper Project
AMC 812022 : November : 2013 : 812022KamoaFinalEffDate131115rev0 16
Table 1.7 Additional Open Pit Resource Using a 0.5% Cut-Off
Indicated Mineral Resources (cumulative)
Depth Below Topo (m)
Tonnage Mt
Cu (%)
Contained Copper (kt)
Contained Copper (billion lbs)
25 1.1 0.71 8 0.0
50 28 0.70 197 0.4
75 60 0.70 418 0.9
100 96 0.69 660 1.5
125 121 0.69 836 1.8
150 146 0.69 1,010 2.2
175 173 0.69 1,200 2.6
200 197 0.69 1,360 3.0
Inferred Mineral Resources (cumulative)
Depth Below Topo (m)
Tonnage Mt
Cu (%)
Contained Copper (kt)
Contained Copper(billion lbs)
25 0.4 0.58 2 0.0
50 0.5 0.60 3 0.0
75 2 0.67 16 0.0
100 10 0.69 66 0.1
125 19 0.68 130 0.3
150 36 0.66 234 0.5
175 51 0.66 333 0.7
200 69 0.66 453 1.0
Notes:
1. Base case is highlighted.
2. Mineral Resources have an effective date of January 12, 2013. Harry M. Parker and Gordon Seibel, both SME Registered Members, are the Qualified Persons responsible for the Mineral Resource estimates. The Mineral Resource estimate was prepared by Mr. Seibel.
3. Base case of a maximum pit depth of 100 m highlighted. There are reasonable prospects for economic extraction because analogue open pits in Zambia and the DRC with similar grades and economics exist with a similar depth.
4. Mineral Resources are reported using a total copper (Cu) cut-off grade of 0.5% Cu and no minimum thickness. A 0.5% Cu cut-off grade is typical of open pit deposits in the DRC.
5. Indicated Mineral Resources are supported by drilling at a ≤ 400 m spacing; Inferred Mineral Resources are supported by drilling at a 400 to 800 m spacing.
6. Tonnages are rounded to the nearest million tonnes; grades are rounded to two decimal places.
7. Rounding as required by reporting guidelines may result in apparent summation differences between tonnes, grade and contained metal content.
8. Tonnage and grade measurements are in metric units. Contained copper tonnes are reported using metric units; contained copper pounds use imperial units.
IVANHOE MINES LIMITED Kamoa Copper Project
AMC 812022 : November : 2013 : 812022KamoaFinalEffDate131115rev0 17
1.11.2 Factors Which May Affect the Resource Estimates
Factors which may affect the Mineral Resource estimate include:
Commodity prices and exchange rates.
Cut-off grades.
Faulting
– The presence of local faulting could disrupt the productivity of a highly-mechanized operation. In addition, the amount of contact dilution related to local undulations in the SMZ has yet to be determined. Ivanhoe plans to mitigate these risks with further infill drilling and an exploratory decline.
Metallurgical recoveries
– Metallurgical testwork indicates the need for multiple grinding and flotation steps. Metallurgical variability testwork has been initiated and is in early stages.
– Some metallurgical test results have indicated a portion of the material amenable to open pit mining may produce poor quality concentrate that could negatively affect the economics of processing a portion of this material. Metallurgical testwork on this material is ongoing.
Mining plan.
– Mining recovery could be lower and dilution increased where the dip locally increases on the flanks of the domes. An exploration decline is being considered which would provide an appropriate trial of the conceptual room-and-pillar mining method on the Kamoa deposit in terms of costs, dilution, and mining recovery. A decline would provide access to data and metallurgical samples at a bulk scale that cannot be collected at the scale of a drill sample. Location of an exploration decline(s) and the extent of the decline are dependent on further studies.
Infrastructure
– Exploitation will require building a greenfields project with attendant infrastructure.
Political setting
– The DRC is emerging from a period of political instability, and the fiscal and political regime under which mining operations might occur are uncertain. There is provision within the DRC Mining Code for the Government to change the DRC Mining Code and mining rights by decree.

IVANHOE MINES LIMITED Kamoa Copper Project
AMC 812022 : November : 2013 : 812022KamoaFinalEffDate131115rev0 18
Exploration Target
The area inside the model perimeter surrounding the Indicated and Inferred Mineral Resources is considered an exploration target. The ranges of the exploration target tonnages and grades are summarised in Table 1.8.
Tonnage and grade ranges were estimated using an inverse distance to the fifth power for Domain 2 and applying a ±20% variance to the resulting tonnage and grade estimate.
AMEC cautions that the potential quantity and grade of the exploration target is conceptual in nature, and that it is uncertain if additional drilling will result in the exploration target being delineated as a Mineral Resource.
Table 1.8 Tonnage and Grade Ranges for Exploration Target
Target Low-range Tonnage Mt
High-range Tonnage Mt
Low-range Grade (%Cu)
High-range Grade (%Cu)
Total 520 790 1.6 2.5
IVANHOE MINES LIMITED Kamoa Copper Project
AMC 812022 : November : 2013 : 812022KamoaFinalEffDate131115rev0 19
Mining
The PEA Inventory was determined for Kamoa by adjusting the US$52/t NSR mineral resource for mining thickness, recovery, and dilution using the assumptions of the 2013 PEA mine plan. Using the Vulcan Envisage three-dimensional (3D) underground design software package, blocks within the mineral resource were then identified for inclusion in the mine plan.
The PEA Inventory is a subset of the Mineral Resource reported in the Kamoa 2013 PEA and is the Mineral Resources within the mine designs prepared for the Kamoa 2013 PEA. The PEA Inventory includes Inferred Mineral Resources. Inferred Mineral Resources are considered too speculative geologically to have the economic considerations applied to them that would allow them to be categorized as Mineral Reserves, and there is no certainty that the results will be realized. Mineral Resources are not Mineral Reserves, as they do not have demonstrated economic viability.
The mining rate to achieve the 300 ktpa blister copper occurs in Year 6 at an approximate rate of 11 Mtpa. Near the end of the 30 year mine plan, as the average mine grade declines; the mining rate is in excess of 14 Mtpa. This 30 year mine plan results in production of 326 Mt of the PEA Inventory at a grade of 3.00% Cu, leaving 308 Mt at 1.85% Cu remaining in the Mineral Resource at the end of the 30 year mine plan.
Apart from total Cu grade, other variables recorded in the block model include the thickness of the mineralization zone (thick) and the depth below surface (dist2surf). A minimum mining thickness of 3.5 meters was used for this study. Any blocks less than 3.5 meters thick were diluted to 3.5 meters using the average grade of the adjacent hanging wall and footwall blocks. Appropriate mining recovery and dilution factors were then used to generate the block values discussed in the following paragraph.
The low dip and the flat geometry of the resource make it conducive to room-and-pillar mining in the shallow portions of the deposit, transitioning to drift-and-fill mining in the deeper sections. Room-and-pillar panels are designed to be 80 meters wide and 500 meters long with in-panel extraction ratios ranging from 60%–80%, depending on the panel depth below surface. Partial extraction of the barrier pillars (up to 50%) is planned at the end of mining of each section. The overall extraction ratio in the room-and-pillar areas is expected to be between 56%–82% depending on the depth below surface. Higher in-panel extraction ratios (up to 95%) are expected within the drift-and-fill areas with an overall extraction ratio of 85% after partial extraction of barrier pillars.
The average unplanned mining dilution was estimated at approximately 10% at a grade of 0.60% Cu. This is the average grade of a 0.5 meter dilution envelope immediately above and below the primary mineralized zone. The dilution values will depend on mineralization continuity and hangingwall (HW) stability, both of which need to be confirmed by the underground exposure.
If HW stability is worse than currently anticipated, for example due to fracturing and joint continuity, the dilution value will be higher. The mineral resources at US$52/t shown by mining section are in Table 1.9.
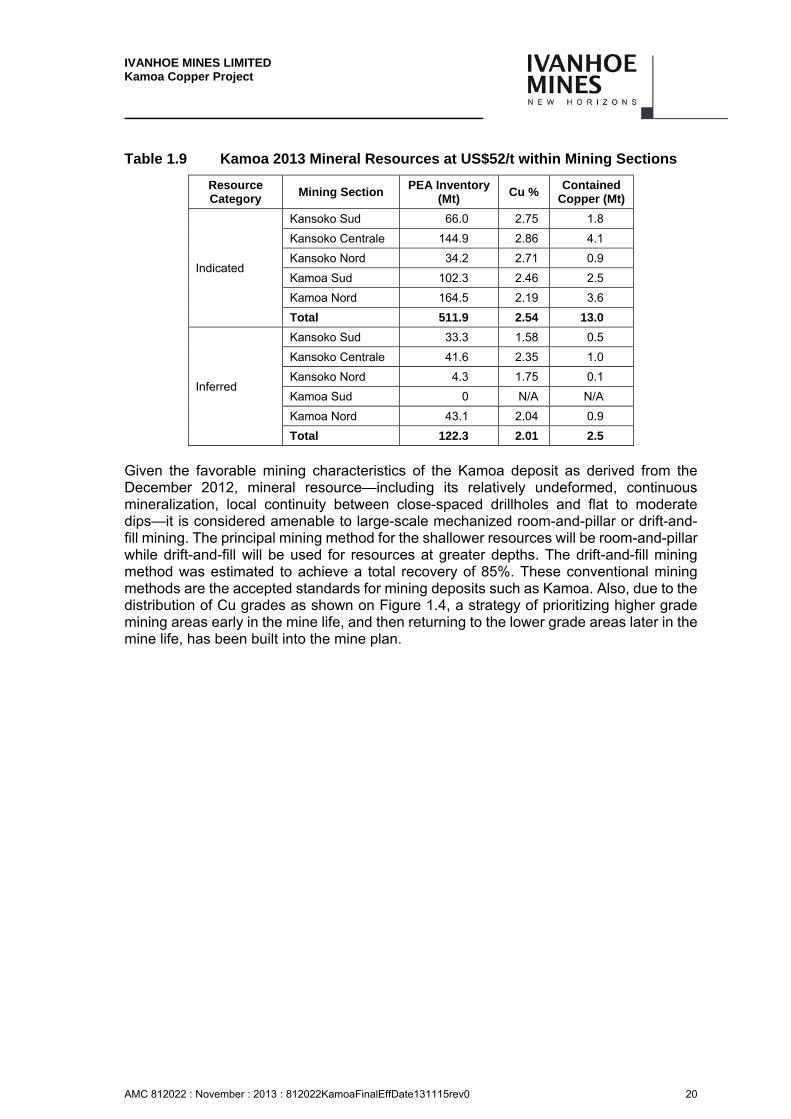
IVANHOE MINES LIMITED Kamoa Copper Project
AMC 812022 : November : 2013 : 812022KamoaFinalEffDate131115rev0 20
Table 1.9 Kamoa 2013 Mineral Resources at US$52/t within Mining Sections
Resource Category
Mining Section PEA Inventory
(Mt) Cu %
Contained Copper (Mt)
Indicated
Kansoko Sud 66.0 2.75 1.8
Kansoko Centrale 144.9 2.86 4.1
Kansoko Nord 34.2 2.71 0.9
Kamoa Sud 102.3 2.46 2.5
Kamoa Nord 164.5 2.19 3.6
Total 511.9 2.54 13.0
Inferred
Kansoko Sud 33.3 1.58 0.5
Kansoko Centrale 41.6 2.35 1.0
Kansoko Nord 4.3 1.75 0.1
Kamoa Sud 0 N/A N/A
Kamoa Nord 43.1 2.04 0.9
Total 122.3 2.01 2.5
Given the favorable mining characteristics of the Kamoa deposit as derived from the December 2012, mineral resource—including its relatively undeformed, continuous mineralization, local continuity between close-spaced drillholes and flat to moderate dips—it is considered amenable to large-scale mechanized room-and-pillar or drift-and-fill mining. The principal mining method for the shallower resources will be room-and-pillar while drift-and-fill will be used for resources at greater depths. The drift-and-fill mining method was estimated to achieve a total recovery of 85%. These conventional mining methods are the accepted standards for mining deposits such as Kamoa. Also, due to the distribution of Cu grades as shown on Figure 1.4, a strategy of prioritizing higher grade mining areas early in the mine life, and then returning to the lower grade areas later in the mine life, has been built into the mine plan.
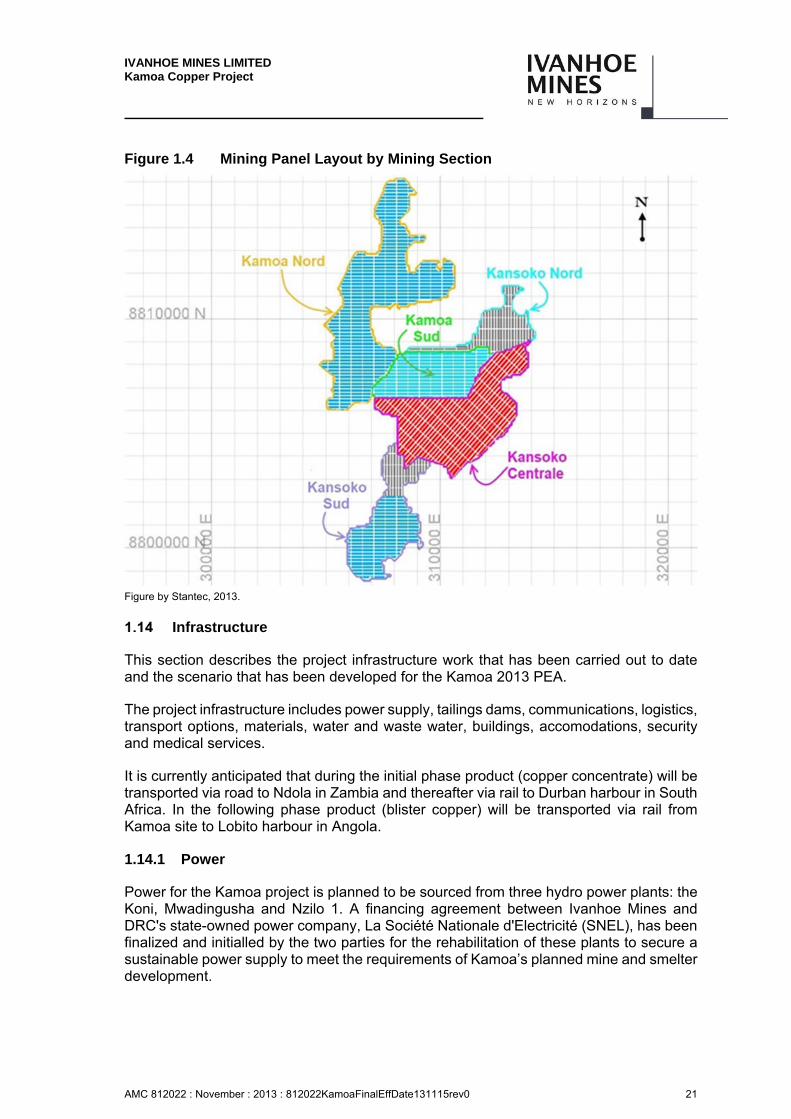
IVANHOE MINES LIMITED Kamoa Copper Project
AMC 812022 : November : 2013 : 812022KamoaFinalEffDate131115rev0 21
Figure 1.4 Mining Panel Layout by Mining Section
Figure by Stantec, 2013.
Infrastructure
This section describes the project infrastructure work that has been carried out to date and the scenario that has been developed for the Kamoa 2013 PEA.
The project infrastructure includes power supply, tailings dams, communications, logistics, transport options, materials, water and waste water, buildings, accomodations, security and medical services.
It is currently anticipated that during the initial phase product (copper concentrate) will be transported via road to Ndola in Zambia and thereafter via rail to Durban harbour in South Africa. In the following phase product (blister copper) will be transported via rail from Kamoa site to Lobito harbour in Angola.
1.14.1 Power
Power for the Kamoa project is planned to be sourced from three hydro power plants: the Koni, Mwadingusha and Nzilo 1. A financing agreement between Ivanhoe Mines and DRC's state-owned power company, La Société Nationale d'Electricité (SNEL), has been finalized and initialled by the two parties for the rehabilitation of these plants to secure a sustainable power supply to meet the requirements of Kamoa’s planned mine and smelter development.

IVANHOE MINES LIMITED Kamoa Copper Project
AMC 812022 : November : 2013 : 812022KamoaFinalEffDate131115rev0 22
Kamoa will be powered by electricity from the national grid and on-site diesel generators until rehabilitation of the existing plants has been completed.
Recovery Methods
1.15.1 Concentrator Description
ROM mineralized material will be conveyed from the primary crusher, situated underground, to the surface via an incline conveyor and then via overland conveyor to the crushing plant. A final crushed product size of -12 mm is achieved via two stages of surface crushing. Crushed material is then milled to a P80 of 75 µm via ball milling before being fed to the primary rougher flotation circuit. Primary rougher flotation tailings are fed to the secondary ball mill where they are milled to a P80 of 38 µm. Secondary mill product is fed to the secondary rougher flotation bank. Primary and secondary rougher concentrates report to separate regrind circuits. The P80 of the primary rougher regrind mill circuit is 15 µm and the secondary is 10 µm.
The primary and secondary rougher concentrates report to separate cleaning circuits, as shown in Figure 1.5. The rougher regrind mill product is fed to the rougher cleaner bank, consisting of a primary bank and a scavenger bank. The rougher scavenger cleaner tailings are fed to the final tailings thickener. The primary and scavenger cleaner concentrates are combined and fed to the re-cleaner bank. The re-cleaner concentrate is fed to the final concentrate thickener. The re-cleaner tailings, along with the secondary rougher concentrate, are transferred to the secondary rougher regrind mill, the product of which is fed to the secondary rougher cleaner bank.
The secondary rougher cleaner concentrate is re-cleaned and is fed to the final concentrate thickener. The tailings from both the secondary rougher cleaner banks (cleaner and re-cleaner) are fed to the final tailings thickener.
Figure 1.5 Flotation Circuit
Figure by Hatch, 2013.
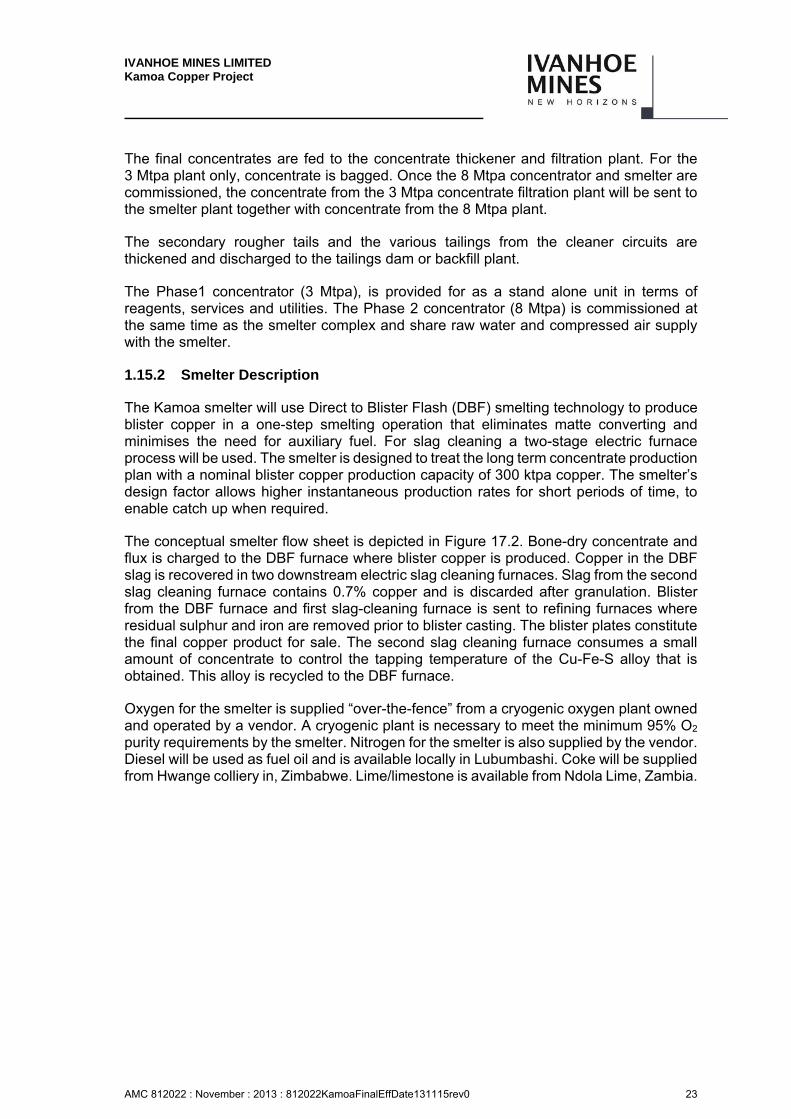
IVANHOE MINES LIMITED Kamoa Copper Project
AMC 812022 : November : 2013 : 812022KamoaFinalEffDate131115rev0 23
The final concentrates are fed to the concentrate thickener and filtration plant. For the 3 Mtpa plant only, concentrate is bagged. Once the 8 Mtpa concentrator and smelter are commissioned, the concentrate from the 3 Mtpa concentrate filtration plant will be sent to the smelter plant together with concentrate from the 8 Mtpa plant.
The secondary rougher tails and the various tailings from the cleaner circuits are thickened and discharged to the tailings dam or backfill plant.
The Phase1 concentrator (3 Mtpa), is provided for as a stand alone unit in terms of reagents, services and utilities. The Phase 2 concentrator (8 Mtpa) is commissioned at the same time as the smelter complex and share raw water and compressed air supply with the smelter.
1.15.2 Smelter Description
The Kamoa smelter will use Direct to Blister Flash (DBF) smelting technology to produce blister copper in a one-step smelting operation that eliminates matte converting and minimises the need for auxiliary fuel. For slag cleaning a two-stage electric furnace process will be used. The smelter is designed to treat the long term concentrate production plan with a nominal blister copper production capacity of 300 ktpa copper. The smelter’s design factor allows higher instantaneous production rates for short periods of time, to enable catch up when required.
The conceptual smelter flow sheet is depicted in Figure 17.2. Bone-dry concentrate and flux is charged to the DBF furnace where blister copper is produced. Copper in the DBF slag is recovered in two downstream electric slag cleaning furnaces. Slag from the second slag cleaning furnace contains 0.7% copper and is discarded after granulation. Blister from the DBF furnace and first slag-cleaning furnace is sent to refining furnaces where residual sulphur and iron are removed prior to blister casting. The blister plates constitute the final copper product for sale. The second slag cleaning furnace consumes a small amount of concentrate to control the tapping temperature of the Cu-Fe-S alloy that is obtained. This alloy is recycled to the DBF furnace.
Oxygen for the smelter is supplied “over-the-fence” from a cryogenic oxygen plant owned and operated by a vendor. A cryogenic plant is necessary to meet the minimum 95% O2 purity requirements by the smelter. Nitrogen for the smelter is also supplied by the vendor. Diesel will be used as fuel oil and is available locally in Lubumbashi. Coke will be supplied from Hwange colliery in, Zimbabwe. Lime/limestone is available from Ndola Lime, Zambia.
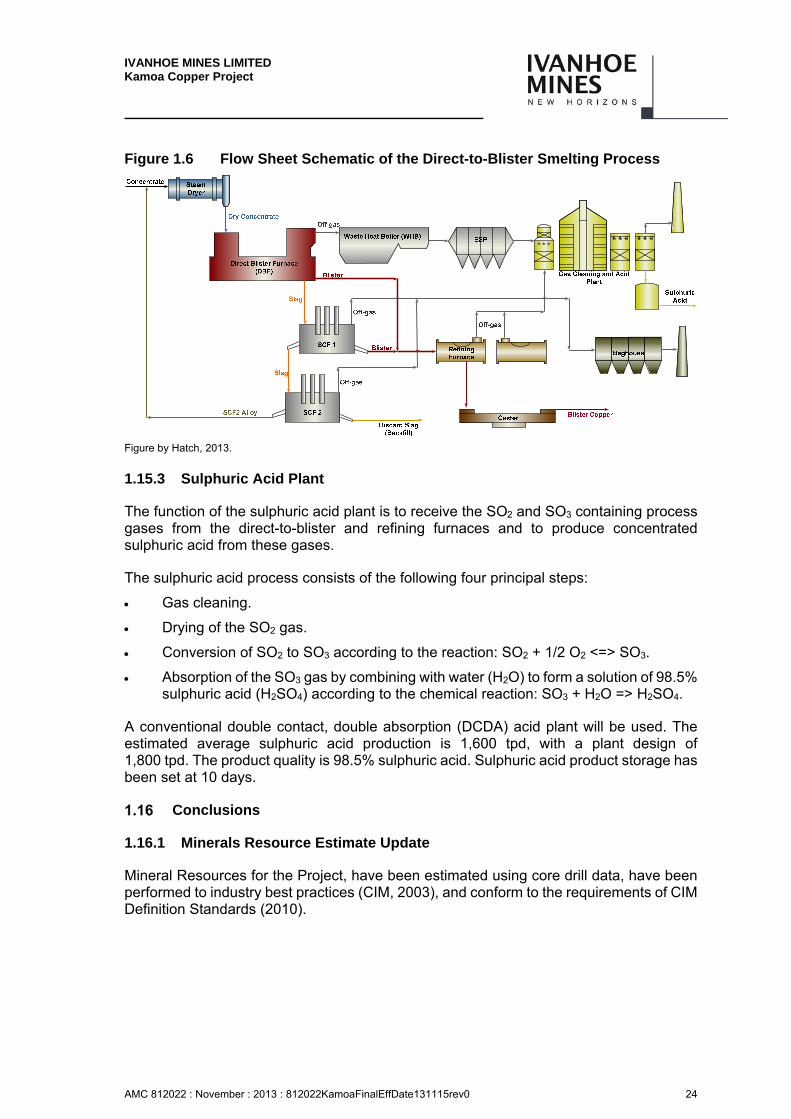
IVANHOE MINES LIMITED Kamoa Copper Project
AMC 812022 : November : 2013 : 812022KamoaFinalEffDate131115rev0 24
Figure 1.6 Flow Sheet Schematic of the Direct-to-Blister Smelting Process
Figure by Hatch, 2013.
1.15.3 Sulphuric Acid Plant
The function of the sulphuric acid plant is to receive the SO2 and SO3 containing process gases from the direct-to-blister and refining furnaces and to produce concentrated sulphuric acid from these gases.
The sulphuric acid process consists of the following four principal steps:
Gas cleaning.
Drying of the SO2 gas.
Conversion of SO2 to SO3 according to the reaction: SO2 + 1/2 O2 <=> SO3.
Absorption of the SO3 gas by combining with water (H2O) to form a solution of 98.5% sulphuric acid (H2SO4) according to the chemical reaction: SO3 + H2O => H2SO4.
A conventional double contact, double absorption (DCDA) acid plant will be used. The estimated average sulphuric acid production is 1,600 tpd, with a plant design of 1,800 tpd. The product quality is 98.5% sulphuric acid. Sulphuric acid product storage has been set at 10 days.
Conclusions
1.16.1 Minerals Resource Estimate Update
Mineral Resources for the Project, have been estimated using core drill data, have been performed to industry best practices (CIM, 2003), and conform to the requirements of CIM Definition Standards (2010).
IVANHOE MINES LIMITED Kamoa Copper Project
AMC 812022 : November : 2013 : 812022KamoaFinalEffDate131115rev0 25
Areas of uncertainty that may materially impact the Mineral Resource estimates include:
• Drill spacing is insufficient to determine if any local faulting exists, or the effects of any such faulting on lithology and grade continuity assumptions. Local faulting could disrupt the productivity of a highly-mechanized underground mining operation. In addition, the amount of contact dilution related to local undulations in the SMZ has yet to be determined. Ivanhoe plans to mitigate these risks with information derived from further infill drilling and an exploratory decline.
• Assumptions used to generate the data for consideration of reasonable prospects of economic extraction are based on conceptual analyses and may change with further study. Mining recovery could be lower and dilution increased where the dip locally increases on the flanks of the domes. An exploration decline is being considered which would provide an appropriate trial of the conceptual room-and-pillar mining method on the Kamoa deposit in terms of costs, dilution, and mining recovery. A decline would provide access to data and metallurgical samples at a bulk scale that cannot be collected at the scale of a drill sample. Location of an exploration decline(s) and the extent of the decline are dependent on further studies.
• Long-term commodity price assumptions.
• Long-term exchange rate assumptions.
• Operating and capital cost assumptions. Exploitation will require building a greenfields mining project with attendant infrastructure.
• Metal recovery assumptions. Metallurgical testwork indicates the need for multiple grinding and flotation steps. Metallurgical variability testwork has been initiated and is in early stages.
• The fiscal and political regime under which mining operations might occur are uncertain. There is provision within the 2002 Mining Code for the DRC Government to change the 2002 Mining Code and mining rights by decree and a draft revision to the 2002 Mining Code has been circulated. There is also a risk that the DRC Government could change the current royalty, duty, and taxation regime.
1.16.2 Kamoa 2013 PEA
Further study work should be undertaken to optimise the project production rate by considering concentrator and smelter capacities that are matched to the mine production, transport constraints and the available power supply.
It is recommended that a further round of study include trade-off analysis of capacity and capital to identify additional optimisations for the Project’s production rate.
IVANHOE MINES LIMITED Kamoa Copper Project
AMC 812022 : November : 2013 : 812022KamoaFinalEffDate131115rev0 26
1.16.3 Underground Mining
1.16.3.1 Underground Mining Methods
This report is a Preliminary Economic Assessment (PEA) and includes an economic analysis that is based, in part, on Inferred Mineral Resources. Inferred Mineral Resources are considered too speculative geologically to have the economic considerations applied to them that would allow them to be categorized as Mineral Reserves, and there is no certainty that the results will be realized. Mineral Resources are not Mineral Reserves as they do not have demonstrated economic viability.
The Kamoa deposit is favorable for large scale mechanized room-and-pillar mining at shallower depths and drift-and-fill mining at depths below 550 meters. Additional geotechnical data will be required to ensure the mining methods are suitable, the excavation and pillar dimensions are appropriate, and ground support requirements are adequate. Further evaluation to identify the required ground support regime for the Kamoa pyritic siltstone needs to be carried out. This could affect the estimates of the initial development productivities.
The Kamoa deposit appears to be relatively un-deformed (based on the current drill spacing and the lack of underground exposure), is continuously mineralized with good local continuity and flat to moderate dips. Additional infill drilling will be required to test for the presence of minor faults, which may result in changes in the roof and floor positions, increased dilution, and increased waste development. This drilling will also assist in validating local dip changes that may result in lower productivities. This drilling, along with further detailed mineralization continuity studies, should help validate hanging and footwall continuity.
Additional hydrological data and studies will be required to confirm that groundwater inflows will not significantly impact underground costs and schedules. The water handling allowance included in the Kamoa 2013 PEA and the effects on ground conditions and productivities can then be further assessed.
1.16.3.2 Underground Mining Accesses
The thickness of the Kalahari sand in the overburden sequence may dictate the location of the ventilation raises and increase the costs of ventilation for the mine.
1.16.3.3 Production Schedules
Although the deposit appears to provide significant resources, and mining will be conducted in multiple sections, there may be a risk of having to schedule additional mining areas to ensure that the number of required active stopes is met and maintained. This could increase the ramp up periods for build up to full production.
Backfill requirements of approximately 4.0 Mtpa produces logistical complication that must be further analyzed in determining the drift-and-fill mining rates. Further design of the backfill, along with the availability of material to be used in the paste backfill, must also be analyzed.
IVANHOE MINES LIMITED Kamoa Copper Project
AMC 812022 : November : 2013 : 812022KamoaFinalEffDate131115rev0 27
Total personnel requirements for the mine operation are estimated to be in excess of 1,000 people. Sourcing and training a skilled workforce to achieve this level presents challenges, especially in a remote location.
1.16.3.4 Open Pit Potential
The open pit resource represents an opportunity to reduce the time required for production ramp-up in future expansions or as a readily available source of plant feed if delays were to be experienced in underground production. Mine planning work has shown that there is open pit potential at Kamoa. Open pit was not included in the production schedule for the Kamoa 2013 PEA as the underground production schedule meets the plant capacity requirements. The open pit portion of the mineral resource represents an opportunity to reduce the time required for production ramp-up in future expansions or as a readily available source of plant feed if delays were to be experienced in underground production.
1.16.4 Recovery Methods
Concentrator
The flotation circuit configuration has been investigated extensively and is deemed to be well developed. The circuit relies on proven technology with a relatively low risk of scale up or technological flaws.
Confirmatory work is required with respect to cleaner recycle streams and points of entry, however the circuit development testwork discussed in Section 13.5.3 indicates that any improvements are likely to be incremental at best.
A highly probable recycle stream incorporated on the flowsheets at the moment is the primary recleaner tails which reports to the secondary regrind circuit to reduce the particle size to a P80 of 10 µm and floated again in the secondary cleaner circuit. This cleaner arrangement is confirmed with XPS testwork.
The secondary recleaner tails is a potential recycle stream that may be included in the flowsheet, but already contains relatively high silica values and combined with the extreme fineness of grind of this stream, may result in more silica contamination. An alternative flotation technology is considered a better alternative to maintain copper recoveries and grade, whilst limiting silica entrainment to the concentrate. This will be tested in Phase 5 and during the mini pilot plant campaign.
Detailed bench scale recycle testwork is scheduled for the Phase 5 work at Mintek. Furthermore, proper recycle testing will be performed during pilot plant testwork planned during the PFS phase of project.
Although such recyles are not included in the testwork flowsheet, the intention is to design the circuit with sufficient flexibility that streams can be easily redirected during commissioning and operations as required. A prime example of this will be the secondary rougher recleaner tails, which can be directed to final tails, or to the secondary rougher regrind mill for further grinding. The concentrate from the last 3 cells in the secondary rougher recleaner bank is likely to be very high in silica.

IVANHOE MINES LIMITED Kamoa Copper Project
AMC 812022 : November : 2013 : 812022KamoaFinalEffDate131115rev0 28
The flexibility to divert these concentrate streams from final concentrate, to the feed of the secondary rougher recleaner feed will also be included in the piping design.
Further work in Phase 5 is also planned to confirm the primary and secondary grind sizes of 80% passing 75 and 38 microns respectively. These grind size were established early on in Phase 1 of the project and confirmatory work is required to determine if these grinds are still optimal for the expanded resource. Similary, the primary and secondary concentrate regrind sizes of 80% passing 15 and 10 microns respectively, will be confirmed by testwork. Changes to the current grind sizes will only be made if they are found to result in improvements in recovery and/or concentrate grade.
Future drilling will focus on obtaining representative samples for circuit development, as well as variability samples to determine the operating window required. A further bulk sample for minipilot plant testing is planned in order to confirm the final mass balance values for detailed design.
Smelter
Direct to blister (DBF) technology is well suited to smelt concentrate with the composition expected from the test work that had been completed on samples representing the underground mining operations.
Other trade-off studies may also be considered under the pre-feasibility study. These include the following:
Secondary Slag-Cleaning
Cobalt is not an important by product for the Kamoa Copper Project and an electric furnace may not be required for secondary slag cleaning. Instead, slag from SCF1 may be slow-cooled, milled and floated for further copper recovery.
Power Generation and Overall Energy Optimisation
In the current flowsheet configuration steam from the waste heat boiler on the DBF is used in the concentrate steam dryer. It would also be possible to use the steam for power generation. Energy recovery from waste heat in the acid plant would also be considered under an overall energy optimisation study.
Acid Plant Technology
Process gas from the DBF has a high SO2 gas content that is not suitable for conventional double contact, double absorption acid plants without the addition of dilution air. Other technologies that treat higher strength SO2 gas stream will be evaluated for the smelter.
The power generation study will also provide guidance on whether energy recovery in the acid plant will be pursued.
IVANHOE MINES LIMITED Kamoa Copper Project
AMC 812022 : November : 2013 : 812022KamoaFinalEffDate131115rev0 29
Recommendations
1.17.1 Further Assessment
The Kamoa 2013 PEA is a Preliminary Economic Assessment (PEA) and includes an economic analysis that is based, in part, on Inferred Mineral Resources. Inferred Mineral Resources are considered too speculative geologically to have the economic considerations applied to them that would allow them to be categorized as Mineral Reserves, and there is no certainty that the results will be realized. Mineral Resources are not Mineral Reserves as they do not have demonstrated economic viability.
With the additional data collection and the findings of the Kamoa 2013 PEA Ivanhoe is in a position to progress studies to a pre-feasibility stage of assessment.
1.17.2 Drill Programme
AMEC has recommended a work programme consisting of one phase of drilling. The recommended drilling has been broken down by localities within the deposit, and totals 96,205 m, including allocations for exploration, infill, metallurgical, geotechnical, and condemnation purposes. The program is estimated at US$52.5 M.
Ivanhoe is currently undertaking a drilling programme that encompasses metallurgical, geotechnical, civil geotechnical and hydrogeological holes. Additional planned holes will be a combination of exploration, Mineral Resource expansion and Mineral Resource delineation to target potential upgrades in Mineral Resource confidence categories and zones of additional mineralized material. The focus of this drilling will be down dip expansion of the Kansoko trend, extension of the mineralization to the western extents of the mining license, and exploration drilling at Kakula for both hypogene and shallow supergene targets. Additional engineering drill holes, including metallurgical drilling will be completed. An allocation has been made for sterilisation drilling using the Ivanhoe-owned landcruiser-mounted diamond drill rig.
1.17.3 Underground Mining
The following is a list of recommendations for the Kamoa project.
• Continue infill drilling programme to upgrade resource categorization, enhance geotechnical database and application to mine design and ground support, and better understand the continuity of the deposit and impacts on productivities and dilution.
• Consider an underground exploration programme to attain first-hand information on actual mining conditions and to validate design assumptions.
• Complete hydrological studies and data evaluation to better determine impacts on underground mining conditions and productivities.
• Undertake backfill plant design along with an evaluation and sourcing of suitable materials for paste fill.
IVANHOE MINES LIMITED Kamoa Copper Project
AMC 812022 : November : 2013 : 812022KamoaFinalEffDate131115rev0 30
• Conduct a survey of the local workforce to determine available skill levels. The mining productivities and costs have assumed that skilled tradesmen are available to fill the critical mine operational positions.
1.17.4 Capital Optimization
• Given the significant Mineral Resource tonnage estimated and its large lateral extent, potential mining rates could increase, through operating in multiple mining areas and a series of production expansions to maximize extraction of the Mineral Resource. If mining rates were to increase further this may allow for a more efficient use of deployed capital.
IVANHOE MINES LIMITED Kamoa Copper Project
AMC 812022 : November : 2013 : 812022KamoaFinalEffDate131115rev0 31
2 INTRODUCTION
Ivanhoe Mines Ltd.
Ivanhoe is a mineral exploration and development company, whose principal properties are located in Africa. The Ivanhoe strategy is to build a global, commodity-diversified mining and exploration company. Ivanhoe has focused on exploration within the Central African Copperbelt and the Bushveld Complex.
Ivanhoe currently has three key assets: (i) the Kamoa Project; (ii) the Platreef Project, and (iii) the Kipushi Project. In addition, Ivanhoe holds interests in prospective mineral properties in the DRC, South Africa, Gabon, and Australia, including a land package of ~9,000 km2 in the Central African Copperbelt with drill-ready grass-roots prospects.
Advancing the Kamoa and Platreef Projects from discovery to production is a key near-term objective. The Kamoa Project is 95% held in the name of African Minerals (Barbados) Ltd. Sprl (AMBL), a wholly-owned Ivanhoe subsidiary. For the purposes of this report, the name “Ivanhoe” refers interchangeably to Ivanhoe’s predecessor companies, Ivanplats Limited, Ivanhoe Nickel and Platinum Ltd., and the current subsidiary companies. The remaining 5% Project interest is held by the Government of the DRC.
Terms of Reference
The Kamoa 2013 PEA is an Independent Technical Report on the Kamoa Copper Project (the Project) prepared for Ivanhoe Mines Limited (Ivanhoe) as part of the Ivanhoe strategy for development of the Project.
The Kamoa 2013 PEA is a Preliminary Economic Assessment with an effective date of 15 November 2013 that has been prepared using the June 2011 edition of Canadian National Instrument 43-101 Standards of Disclosure for Mineral Projects.
The following companies have undertaken work in preparation of the Kamoa 2013 PEA:
AMC Consultants: Overall report preparation, open pit potential and financial model.
AMEC: Mineral Resource estimation.
SRK Consulting Inc.: Mine geotechnical recommendations.
Stantec Inc.: Underground mine plan.
Hatch: Process and infrastructure.
Golder Associates Africa: Environmental, hydrology, hydrogeology, geochemistry and Tailings Storage Facility (TSF).
This Report uses metric measurements. The currency used is U.S. dollars (US$).
IVANHOE MINES LIMITED Kamoa Copper Project
AMC 812022 : November : 2013 : 812022KamoaFinalEffDate131115rev0 32
Qualified Persons
The following people served as the Qualified Persons (QPs) as defined in National Instrument 43-101, Standards of Disclosure for Mineral Projects, and in compliance with Form 43 101F1:
Bernard Peters, B. Eng. (Mining), FAusIMM (201743), employed by AMC Consultants as Mining Manager was responsible for: Sections 1.1, 1.2, 1.3, 1.4, 1.14.1, 1.16.2, 1.16.3.4; 1.15; 1.18; Section 2; Section 3; Section 4; Section 5.4; Section 15; Sections 16.1, 16.4; Sections 18.3.1; Section 19; Sections 21.1, 21.8.2, 21.10, 21.12; Section 22; Section 23; Section 24; Section 25.2; Section 26.4; Section 27.
Dr Harry Parker, SME Registered Member (2460450), Technical Director, AMEC was responsible for: Sections 1.5 to 1.9, 1.11, 1.12, 1.16.1, 1.18.1; Section 2; Section 3; Section 6; Section 7; Section 8; Section 9; Sections 10.1 to 10.7, 10.11 to 10.13; Sections 11.1 to 11.2, 11.4 to 11.11; Sections 12.1 to 12.4, 12.6; Section 14; Section 25.1; Sections 26.1 to 26.2; Section 27.
Gordon Seibel, SME Registered Member (2894840), Principal Geologist, AMEC was responsible for: Sections 1.5 to 1.9, 1.11, 1.12, 1.16.1, 1.16.3; 1.18.1; Section 2; Section 3; Section 6; Section 7; Section 8; Section 9; Sections 10.1 to 10.7, 10.11 to 10.13; Sections 11.1 to 11.2, 11.4 to 11.11; Sections 12.1 to 12.4, 12.6; Section 14; Section 25.1; Sections 26.1 to 26.2; Section 27.
Jarek Jakubec, C. Eng., MIMMM (509147), employed by SRK Consulting Inc., as Corporate Consultant, was responsible for: Section 2; Section 3; Section 10.8; Section 12.5; Section 16.2; Section 27.
Mel Lawson, B. Eng. (Mining), SME Registered Member (1859650), employed by Stantec Consulting International LLC as Mining Principal was responsible for: Section 1.13, 1.16.3, 1.18.2; Section 2; Section 3; Section 16.1; 16.3; Section 21.2; Section 25.3; Section 26.3; Section 27.
Arne Weissenberger, P.Eng ECSA (20100369) employed by Hatch as Mechanical Engineer was responsible for: Sections 1.10, 1.14, 1.16; Section 2; Section 3; Sections 5.1, 5.3; Section 10.10; Section 11.3; Section 13; Section 17, Sections 18.1; 18.2; 18.3.2; 18.3.3; 18.7 to 18.13; 18.15 to 18.19; Sections 21.3, 21.4, 21.7.3, 21.7.4, 21.8.1, , 21.9, 21.11; Section 27.
Francois Marais, P.Eng SAICE (830215) employed by Golder Associates Africa (Pty) Ltd as Strategic Advisor: Engineering was responsible for: Section 2.3; 2.4. Section 3.3; Section 5.5; Section 10.9; Section 18.4; 18.5; 18.6; 18.14; Section 20; Section 21.5 to 21.7.
IVANHOE MINES LIMITED Kamoa Copper Project
AMC 812022 : November : 2013 : 812022KamoaFinalEffDate131115rev0 33
Site Visits and Scope of Personal Inspection
Site visits were performed as follows.
Mr Bernard Peters visited the site from 15 February 2010 to 17 February 2010 and again 27 to 30 April 2010; and again on 15 November 2012. The site visits included briefings from Ivanhoe geology and exploration personnel, site inspections of potential areas for mining, plant and infrastructure, discussions with other QPs and review of the existing infrastructure and facilities in the local area around the Project site.
Dr Harry Parker visited the Kamoa Project from 1 to 3 May 2009, from 27 to 30 April 2010, and again from 12–14 November, 2012. The site visits included presentations by Ivanhoe and African Mining Consultants’ staff, inspection of core and surface outcrops, viewing drill platforms and sample cutting and logging areas, and discussions of geology and mineralization interpretations with Ivanhoe’s staff.
Mr Gordon Seibel visited the Project from 9 to 10 February, 2011, from 5 to 8 November 2011, and again from 12–14 November, 2012. During the site visits, Mr. Seibel inspected drill core, reviewed drill collar locations of new drilling in the field, took independent witness core samples, inspected the on-site sample preparation facility, and observed the sampling methodology and security measures from drill stem to laboratory pickup. The site visits also included discussions of geology and mineralization interpretations with Ivanhoe’s staff, focusing on deposit strike, dip, and faulting geometries.
Mr Jarek Jakubec visited the Kamoa Project from 27 to 30 April 2010. The site visit included attending presentations by Ivanhoe and AMEC staff, inspection of core and surface outcrops, review of the geotechnical logging procedures, and point load testing and structural interpretations with Ivanhoe’s staff.
Mr Mel Lawson visited the Kamoa Project on 15 November 2012. During the site visit, Mr Lawson attended a briefing by local staff, undertook a camp tour, drill core inspection (both general and from the proposed Centrale portal), and conducted a general site reconnaissance driving tour and inspection of the proposed Centrale portal site. Mr Lawson also attended a Kamoa Project kick-off meeting in Johannesburg from 12–13 November, 2012, prior to visiting site.
Mr Arne Weissenberger visited the Kamoa Project from 11 February 2013 to 13 February 2013. The site visit included briefings from Ivanhoe site personnel and inspections of potential areas for mining, plant and infrastructure.
Mr Francois Marais visited the site from 4 to 7 August 2013. The site visit included visits to the following project components:
• The two short listed tailings storage facility (TSF) sites – Mupenda and Site 5d.
• Proposed borehole abstraction points for production water.
• Proposed decline shaft portions for future opencast areas.
• Borrow areas for the TSF embankment construction material.
• Various villages within the concession area.
IVANHOE MINES LIMITED Kamoa Copper Project
AMC 812022 : November : 2013 : 812022KamoaFinalEffDate131115rev0 34
Effective Dates
The report has a number of effective dates, as follows:
• Date of the last supply of information on the ongoing drilling programs and the latest database copy: 1 October 2013. Information available from this data supply was used to validate the geological model.
• Date of drillhole database close-out date for updated Mineral Resource estimate: 10 December 2012.
• Date of Mineral Resource update for mineralization amenable to underground mining methods: 10 December 2012.
• Date of the Mineral Resource estimate for mineralization amenable to open-pit mining methods: 12 January 2013.
• Date of the supply of legal information supporting mineral tenure that supports the Kamoa 2013 PEA: 15 November 2013.
Information Sources and References
Reports and documents listed in Section 3 and Section 27 of this Report were used to support preparation of the Report. Additional information was provided by Ivanhoe personnel as requested. Supplemental information was also provided to the QPs by third-party consultants retained by Ivanhoe in their areas of expertise.

IVANHOE MINES LIMITED Kamoa Copper Project
AMC 812022 : November : 2013 : 812022KamoaFinalEffDate131115rev0 35
3 RELIANCE ON OTHER EXPERTS
The QPs, as authors of Kamoa 2013 PEA, have relied on, and believe there is a reasonable basis for this reliance, upon the following Other Expert reports as noted below. Individual QP responsibilities for the sections are listed on the Title Page.
Mineral Tenure
The QPs have not reviewed the mineral tenure, nor independently verified the legal status, ownership of the Project area, underlying property agreements or permits. The QPs have fully relied upon and disclaim responsibility for, information derived from legal experts for this information through the following document:
• Cabemery and Partners Pty Ltd., 2012: Validity of (I) Exploration Permits Relating To The Mining Project Of Kamoa Held By The Company African Minerals (Barbados) Ltd Sprl, (Ii) Their Renewal And (Iii) Transformation Of Some Of Them Into Exploitation Permits, addressed to Ivanplats Limited, BMO Nesbitt Burns Inc., Morgan Stanley Canada Limited and AMC Consultants Pty Ltd, 5 September 2012.
• Garcia, S., 2013: Kamoa Copper Project: unpublished letter prepared by representatives of Ivanhoe for AMC, 4 November 2013.
This information was used in Section 4.2 of the Report and Section 14.8 for assessment of reasonable prospects of economic extraction.
The QPs have also fully relied upon, and disclaim responsibility for, information supplied by Ivanhoe staff from legal experts for information relating to mineral tenure, ownership of the Project area, underlying property agreements and permits through the following documents:
• Geraghty, L., 2010: PR 702 to 706: Copies of Original Signed Permit Certificates: unpublished internal email to AMEC, dated 8 September 2010.
• Garcia, S., 2013: Kamoa Copper Project: unpublished letter prepared by representatives of Ivanhoe for AMC, 4 November 2013.
This information was used in Section 4 of the Report, and Section 14.8 for assessment of reasonable prospects of economic extraction.
Surface Rights
The QPs have fully relied upon, and disclaim responsibility for, information supplied by Ivanhoe’s Kinshasa-based lawyer for information relating to payment of land and surface rights taxes and payment due dates for 2009–2012 through the following documents:
• Cabemery and Partners Pty Ltd., 2012: Validity Of (I) Exploration Permits Relating To The Mining Project Of Kamoa Held By The Company African Minerals (Barbados) Ltd Sprl, (Ii) Their Renewal And (Iii) Transformation Of Some Of Them Into Exploitation Permits, addressed to Ivanplats Limited, BMO Nesbitt Burns Inc., Morgan Stanley Canada Limited and AMC Consultants Pty Ltd, 5 September 2012.
• Garcia, S., 2013: Kamoa Copper Project: unpublished letter prepared by representatives of Ivanhoe for AMC, 4 November 2013.
IVANHOE MINES LIMITED Kamoa Copper Project
AMC 812022 : November : 2013 : 812022KamoaFinalEffDate131115rev0 36
This information was used in Section 4 of the Report and Section 14.8 for assessment of reasonable prospects of economic extraction.
The QPs have fully relied upon, information supplied by Ivanhoe staff and experts retained by Ivanhoe for information relating to the status of the current Surface Rights as follows:
• Rogers, T., 2010: Land tax and Surface Rights Fees: unpublished internal email to AMEC, dated 8 September 2010.
• African Mining Consultants, 2009: Greater Kamoa Project, The Democratic Republic of Congo, Environmental Impact Assessment Scoping Study: unpublished report prepared by African Mining Consultants for African Minerals (Barbados) Ltd. Sprl, June 2009.
• Broughton, D., 28 May 2012: Email confirming tenure, permits and payments.
• Garcia, S., 2013: Kamoa Copper Project: unpublished letter prepared by representatives of Ivanhoe for AMC, 4 November 2013.
• Geraghty, L., 2013: Surface Rights Payment Kamoa: unpublished internal emails to AMEC, 30 September 2013 with attachments.
This information was used in Section 4 of the Report and Section 14.8 for assessment of reasonable prospects of economic extraction.
Environmental and Work Program Permitting
The QPs have obtained information regarding the environmental and work program permitting status of the Project through opinions and data supplied by experts retained by Ivanhoe, and from information supplied by Ivanhoe staff. The AMEC QPs have fully relied upon, and disclaim responsibility for, information derived from such experts through the following document:
• Garcia, S., 2013: Kamoa Copper Project: unpublished letter prepared by representatives of Ivanhoe for AMC, 4 November 2013.
This information was used in Section 20 of the Report.
• African Mining Consultants, 2009d: Greater Kamoa Project, The Democratic Republic of Congo, Environmental Impact Assessment Scoping Study: unpublished report prepared by African Mining Consultants for African Minerals (Barbados) Ltd., Sprl, dated June 2009.
This information was used in Section 20 of the Report and Section 14.8 for assessment of reasonable prospects of economic extraction.
Environmental Impact Study, by African Mining Consultants, dated April 2011, representing the original Environmental Impact Study approved by DRC Government.
Environmental Social and Health gap analysis, by Golder dated March 2012 – Report No.:P1613890, containing the Environmental Social and Health gap analysis to assist in compiling the Environmental and Work Program – Permitting.
IVANHOE MINES LIMITED Kamoa Copper Project
AMC 812022 : November : 2013 : 812022KamoaFinalEffDate131115rev0 37
Kamoa Stakeholder Engagement Plan by Golder, dated September 2012. Report No.: 11613890-11388-2 containing the Stakeholder Engagement Plan for the permitting of project components.
Environmental Social and Health Constraints, by Golder dated August 2012. Report No.: 11613890-11594-4 - Environmental Social and Health Constrains and Design Criteria assisting in the permitting process.
Kamoa Environmental Social and Health Impact Assessment Scoping Study (Draft) by Golder dated August 2013, containing the detailed scoping report for IFC ESHIA.
Kamoa Environmental Impact Study Terms of Reference (Draft) by Golder, dated August 2013 which contains the Terms of Reference Report for DRC regulations as part of the permitting ptocess.
Taxation and Royalties
The QPs have fully relied upon, and disclaim responsibility for, information supplied by Ivanhoe staff and experts retained by Ivanhoe for information relating to the status of the current royalties and taxation regime for the Project as follows:
• KPMG Services Proprietary Limited, 2013: Letter from M Saloojee, Z Ravat, L Kiyombo to M Cloete and M Bos regarding Updated Commentary On Specific Tax Consequences Applicable To An Operating Mine In The Democratic Republic Of Congo, dated 18 October 2013.
• Garcia, S., 2013: Kamoa Copper Project: unpublished letter prepared by representatives of Ivanhoe for AMC, 4 November 2013.
This information was used in Section 0 of the Report and Section 14.8 for assessment of reasonable prospects of economic extraction.
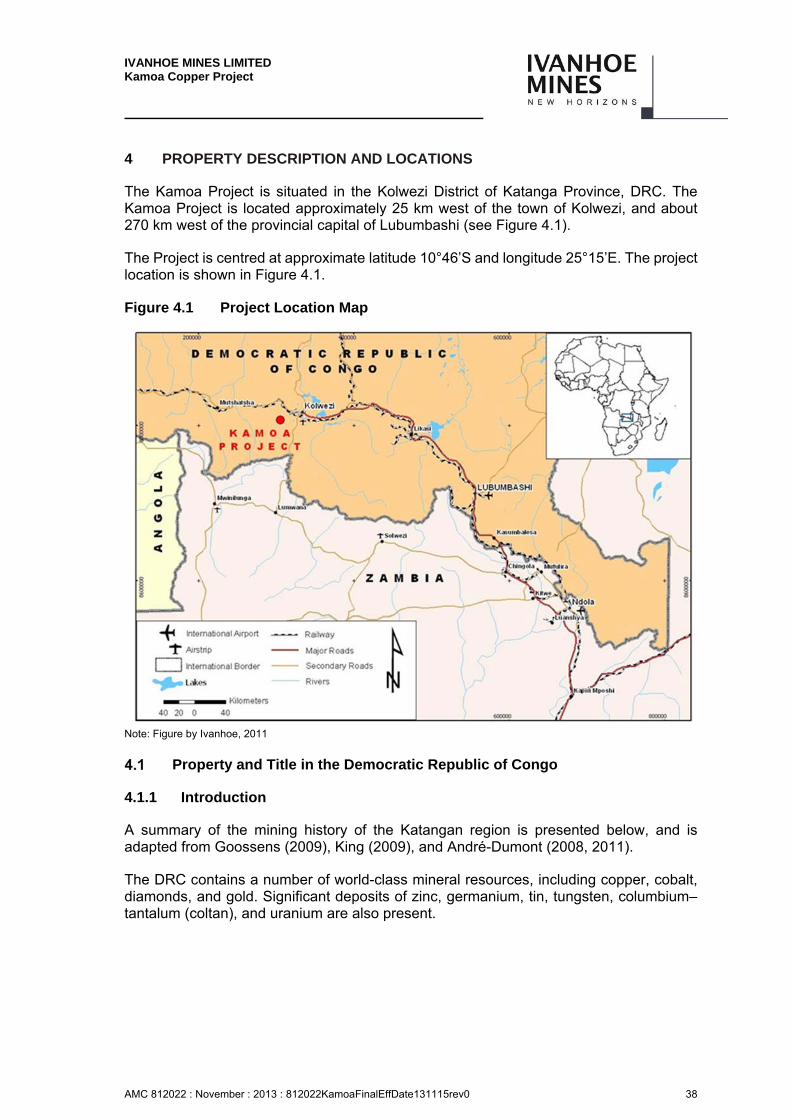
IVANHOE MINES LIMITED Kamoa Copper Project
AMC 812022 : November : 2013 : 812022KamoaFinalEffDate131115rev0 38
4 PROPERTY DESCRIPTION AND LOCATIONS
The Kamoa Project is situated in the Kolwezi District of Katanga Province, DRC. The Kamoa Project is located approximately 25 km west of the town of Kolwezi, and about 270 km west of the provincial capital of Lubumbashi (see Figure 4.1).
The Project is centred at approximate latitude 10°46’S and longitude 25°15’E. The project location is shown in Figure 4.1.
Figure 4.1 Project Location Map
Note: Figure by Ivanhoe, 2011
Property and Title in the Democratic Republic of Congo
4.1.1 Introduction
A summary of the mining history of the Katangan region is presented below, and is adapted from Goossens (2009), King (2009), and André-Dumont (2008, 2011).
The DRC contains a number of world-class mineral resources, including copper, cobalt, diamonds, and gold. Significant deposits of zinc, germanium, tin, tungsten, columbium–tantalum (coltan), and uranium are also present.
IVANHOE MINES LIMITED Kamoa Copper Project
AMC 812022 : November : 2013 : 812022KamoaFinalEffDate131115rev0 39
The DRC has a long base-metal mining history, commencing with the formation of the Union Miniere du Haut Katanga in 1906 and first industrial production of copper in 1911, from l’Etoile (Ruashi), a very rich copper oxide deposit located a few kilometres from Lubumbashi. Just prior to 1960, the DRC was the world’s fourth-largest producer of copper and supplied 55% of the world’s cobalt from deposits in Katanga. Following independence from Belgium in 1960, production gradually decreased due to a combination of factors that included political unrest, political and social environments within the country, declining investment in infrastructure, and lack of capital (Goossens, 2009).
In 1967, the DRC (then called Zaire) government nationalized private enterprise, creating the state-owned mining company Générale des Carrières et des Mines (Gécamines). Despite controlling rich mineral deposits, the state company became unprofitable over time (Goossens, 2009). There followed, through war and disinvestment, a further destruction of general transport, energy, and telecommunications infrastructure.
A number of mineral concessions were granted by the DRC government from 1997 to 2001 to companies that wished to enter joint ventures with Gécamines. During 2007, following the first democratic elections in decades, the government of the DRC announced an initiative to review the mining agreements granted between 1997 and 2006 for Gécamines properties. This review did not affect the Kamoa Project.
4.1.2 Mineral Property Title
The following summary on mineral title is adapted from André-Dumont (2013), and the 2002 DRC Mining Code.
All mineral rights in the DRC are state-owned, and the holder of mining rights gains ownership of the mineral products for sale.
The main legislation governing mining activities is the Mining Code (Law No. 007/2002) dated 11 July 2002 (the 2002 Mining Code). The applications of the Mining Code are provided by the Mining Regulations enacted by Decree No. 038/2003 of 26 March 2003 (the 2003 Mining Regulations). The legislation incorporates environmental requirements.
The Ministry of Mines regulates the Mining Registry, Directorate of Mines, and the Geological Directorate in the DRC under the 2002 Mining Code. The main administrative entities in charge of regulating mining activities in the DRC as provided by the Mining Code are:
• President of the DRC: can enact mining regulations, exercises powers by decree.
• Minister of Mines: jurisdiction over the granting, refusal and cancellation of mining rights, can exercise powers by decree.
• Mining Registry: (Cadastre Minier; a public entity supervised by the Minister of Mines and the Minister of Finance) conducts administrative proceedings concerning the application for, and registration of, mining rights, as well as the withdrawal, cancellation and expiry of those rights.
• Directorate of Mines: responsible for inspecting and supervising mining activities with regard to safety, health, work practices, production, transport, sales, and social matters.
IVANHOE MINES LIMITED Kamoa Copper Project
AMC 812022 : November : 2013 : 812022KamoaFinalEffDate131115rev0 40
• Mining Environment Protection Department: responsible for definition and implementation of mining regulations concerning environmental protection, and technical evaluation of rehabilitation and mitigation plans; supervises and reviews environmental impact studies, and environmental management plans.
Under the 2002 Mining Code, mining rights are regulated by Exploration, Exploitation, Small-Scale Exploitation, and Tailing Exploitation Permits.
There are no distinctions between mining rights that may be acquired by DRC domestic parties and those that may be acquired by a foreign company.
Foreign companies must elect domicile with an authorised DRC domestic mining and quarry agent and act through this intermediary. The mining or quarry agent acts on behalf of, and in the name of, the foreign national or foreign legal entity with the mining authorities, mostly for the purposes of communication.
Foreign companies need not have a domestic partner, but a company that wishes to obtain an Exploitation Permit must transfer 5% (non-dilutable) of its share capital to the DRC State.
The 2002 Mining Code provides for a specific recourse system for mining right holders through three separate avenues that may be used to resolve mining disputes or threats over mining rights: administrative recourse, judicial recourse, or national or international arbitral recourse, depending on the nature of the dispute or threat.
The DRC is divided into mining cadastral grids using a WGS84 Geographic coordinate system outlined in the 2003 Mining Regulations. This grid defines uniform quadrangles, or cadastral squares, typically 84.955 ha in area, which can be selected as a “Perimeter” to a mining right. A perimeter under the 2002 Mining Code is:
“in the form of a polygon consisting of entire contiguous quadrangles subject to the limits relating to the borders of the National Territory and those relating to reserved prohibited areas and protected areas as set forth in the Mining Regulations. The geographical location of the Perimeter is identified by the coordinates at the centre of each quadrangle which make up the Perimeter.”
Perimeters are exclusive, and may not overlap. Perimeters are indicated on 1:200,000 scale maps that are maintained by the Mining Registry.
Within two months of issuance of a mining or quarry Exploitation Permit, the holder is expected to survey the perimeter. The survey consists of placing a survey marker at each corner of the perimeter, and placing a post indicating the name of the holder, the number of the title and that of the identification of the survey marker.
IVANHOE MINES LIMITED Kamoa Copper Project
AMC 812022 : November : 2013 : 812022KamoaFinalEffDate131115rev0 41
4.1.3 DRC Mining Code Review and 2013 Decrees
When the 2002 Mining Code was introduced, the DRC Government indicated that after a 10-year period, a review would be undertaken. In February 2013, a draft law on the revision of the 2002 Mining Code was circulated by the DRC Minister of Mines. The proposed amendments to the 2002 Mining Code contained in the draft law include more onerous formalities and conditions for obtaining mining rights. The changes to the 2002 Mining Code have not been finalized and are are yet to be enacted.
During 2013, the DRC Minister of Mines passed two new decrees. The first, dated 5 April 2013, bans the export of copper and cobalt concentrates, and includes a reduced moisture content requirement for concentrates intended for export. A moratorium up to December 31, 2013 was subsequently granted as there is not sufficient electricity available in the DRC to beneficiate the concentrate in country. Since the energy deficit issue may not be resolved before the end of 2013, it is highly probable that at the expiry of the moratorium period, another moratorium on the ban on export of copper and cobalt concentrates be granted to mining operators. The decree also limits the costs that are deductible against mining royalty assessments. The Decree encountered many legal and practical challenges and it was recognized that the mining industry currently faces an energy shortage making it difficult to transform concentrates in the DRC. (Emery Mukendi Wafwana & Associés, 2013).
The second decree, dated 17 April 2013, requires mining operators to only use Congolese companies for supplies and works, though it has an exemption for “external expertise or a qualified foreign company” (McGuireWoods, 2013). There has been objection to this decree that argues it is contrary to the 2002 Mining Code. It is expected that the exemption for external expertise would be applied to Kamoa because of the nature of the project.
4.1.4 Exploration Permits
Exploration Permits as defined in the 2002 Mining Code allow the holder to:
“carry out mineral exploration work for mineral substances classified as mines, substances for which the licence has been granted, and associated substances if the holder applies for the licence to be extended to include these substances”.
At the time of Exploration Permit application, a holder specifies which minerals, and/or precious stones, to which the permit will apply. The 2002 Mining Code makes provision for this list to be formally extended to include additional commodities where research results justify such extensions.
Under the 2002 Mining Code, permits are granted for all minerals other than precious stones for a term of five years, and are renewable twice for a period of five years each renewal.
No individual Exploration Permit can exceed a surface area of 400 km2. No company can hold more than 50 Exploration Permits in the DRC, and the area of all permits within the DRC may not exceed 20,000 km2.
IVANHOE MINES LIMITED Kamoa Copper Project
AMC 812022 : November : 2013 : 812022KamoaFinalEffDate131115rev0 42
Although applications are not subject to technical or environmental review, the applicant is subject to a requirement to prove appropriate supporting finances.
Renewal applications automatically require a 50% ground surrender with each application. If an entire Exploration Permit, or part of an Exploration Permit, is converted to an Exploitation Permit, the portion that has been converted is no longer subject to ground surrender requirements.
Additional criteria can apply to mineral Exploration Permits under the 2002 Mining Code:
“The holder is authorized to take samples of the mineral substances within the Perimeter indicated on his Mineral Exploration Licence in order to carry out analyses or industrial assays in the laboratory or plant of his choice”.
However, under the 2002 Mining Code:
“The holder of a Mineral Exploration Licence is required to submit to the Geology Directorate of the Ministry of Mines a duplicate sample of all of the samples or samples batches taken within the Perimeter of his title”.
An Exploration Permit holder can convert part of the permit into an Exploitation Permit, or a small-scale Exploitation Permit, and still maintain the rights to explore on the remainder of the Exploration Permit, subject to conditions laid out in the 2002 Mining Code.
4.1.5 Exploitation Permits
Exploitation permits are valid for 30 years, renewable for 15 year periods until the end of the mine's life, if conditions laid out in the 2002 Mining Code are met.
Granting of a permit is dependent on a number of factors that are defined in the 2002 Mining Code, including:
a) Demonstration of the existence of a deposit which can be economically exploited, by presenting a feasibility study under the laws of the DRC, accompanied by a technical framework plan for the development, construction, and exploitation work for the mine.
b) Demonstration of the existence of the financial resources required for the carrying out of his project, according to a financing plan for the development, construction and exploitation work for the mine, as well as the rehabilitation plan for the site when the mine is closed. This plan specifies each type of financing, the sources of planned financing and justification of their possible availability.
c) Obtain in advance the approval of the project’s EIS1 and the EMPP2.
d) Transfer to the Government 5% of the shares in the registered capital of the company applying for the licence. These shares are free of all charges and cannot be diluted.
1 EIS = Environmental Impact Statement 2 EMPP = Environmental Management Protection Plan
IVANHOE MINES LIMITED Kamoa Copper Project
AMC 812022 : November : 2013 : 812022KamoaFinalEffDate131115rev0 43
The Exploitation Permit, as defined in the 2002 Mining Code, allows the holder the exclusive right to:
“carry out, within the Perimeter over which it has been granted, and during its term of validity, exploration, development, construction and exploitation works in connection with the mineral substances for which the licence has been granted, and associated substances if he has applied for an extension.”
In addition, it entitles, without restriction, the holder to:
a) Enter the Exploitation Perimeter to conduct mining operations.
b) Build the installations and infrastructures required for mining exploitation.
c) Use the water and wood within the mining Perimeter for the requirements of the mining exploitation, complying with the requirements set forth in the EIS and the EMPP.
d) Use, transport and freely sell his products originating from within the Exploitation Perimeter.
e) Proceed with concentration, metallurgical or technical treatment operations, as well as the transformation of the mineral substances extracted from the deposit within the Exploitation Perimeter.
f) Proceed to carry out works to extend the mine.
The Exploitation Permit expires at the end of the appropriate term of validity if no renewal is applied for in accordance with the provisions of the 2002 Mining Code, or when the deposit that is being mined is exhausted.
For renewal purposes under the 2002 Mining Code, a holder must, in addition to supplying proof of payment of the filing costs for an Exploitation Permit, show that the holder has:
• Not breached the holder’s obligations to maintain the validity of the licence.
• Demonstrated the fact that the deposit is not exhausted by updating the feasibility study under the laws of the DRC.
• Demonstrated the existence of the financial resources required to continue to carry out his project, according to the financing plan and exploitation work in the mine, as well as the rehabilitation plan for the site when the mine will be closed. This plan details each type of financing planned and reasons of its possible availability.
• Obtained the approval for the updating of the EIS and EMPP.
• Undertaken in good faith to actively carry on with his exploitation.
Under the 2002 Mining Code, the sale of mining products which originate from the Exploitation Permit is “free”, meaning that the holder of an Exploitation Permit may sell any licensed products to a customer of choice, at “prices freely negotiated”.
IVANHOE MINES LIMITED Kamoa Copper Project
AMC 812022 : November : 2013 : 812022KamoaFinalEffDate131115rev0 44
Under the Mining Regulations, a mining rights holder must pay a levy on the total surface area of a mining title (Article 238 of the 2002 Mining Code). Levies are defined in the 2003 Mining Regulations on a per hectare basis, and increase on a sliding scale for each year that the mining title is held, until the fourth year, after which the rate remains constant. In this Report, this levy is referred to as a “surface rights fee”.
An additional duty (Article 199 of the 2002 Mining Code), meant to cover service and management costs of the Mining Registry and the Ministry of Mines, and payable annually to the Mining Registry, is levied on the number of quadrangles held by a title holder. Different levels of duties are levied depending on the number of years a mining title is held, and whether the title is an Exploration or Exploitation Permit. In this Report, this tax is referred to as a “land tax”.
4.1.6 Surface Rights Title
The following summary on surface rights title is adapted from André-Dumont (2008, 2011), and the 2002 Mining Code.
The DRC State has exclusive rights to the land, (Land Law No. 73-021 dated 20 July 1973), but can grant surface rights to private or public parties. Surface rights are distinguished from mining rights, since surface rights do not entail the right to exploit minerals or precious stones. Conversely, a mining right does not entail any surface occupation right over the surface, other than that required for the operation.
The 2002 Mining Code states that subject to any rights of third parties over the surface concerned, the holder of an exploitation mining right has, with the authorisation of the governor of the province concerned, and on the advice of the Administration of Mines, the right to occupy within a granted mining perimeter the land necessary for mining and associated industrial activities, including the construction of industrial plants and dwellings, water use, dig canals and channels, and establish means of communication and transport of any type.
Any occupation of land that deprives surface right holders from using the surface, or any modification rendering the land unfit for cultivation, entails an obligation on the part of the mining rights holder to pay fair compensation to the surface right holders. The mining rights holder is also liable for damage caused to the occupants of the land in connection with any mining activity, even if such an activity has been properly permitted and authorised.
4.1.7 Environmental Regulations
The following summary on environmental regulations is adapted from André-Dumont (2008, 2011), and the 2002 Mining Code.
All exploration, mining and quarrying operations must have an approved environmental plan, and the holders of the right to conduct such operations are responsible for compliance with the rehabilitation requirements stipulated in the plan. When applying for an exploitation permit or an exploration permit, a company must complete an environmental impact study to be filed with the environmental plan.
IVANHOE MINES LIMITED Kamoa Copper Project
AMC 812022 : November : 2013 : 812022KamoaFinalEffDate131115rev0 45
On approval, the applicant must provide security for rehabilitation by means of a bank guarantee. Funds posted as security are not at the disposal of the DRC government and are to be used for the rehabilitation of a mining site.
Exploration Permit
Each Exploration Permit in the DRC requires an exploration impact and remediation plan (PAR). The PAR sets out the type of exploration activity in the area and describes what measures will be carried out to ensure impacts are minimised and any significant damage is repaired. Environmental reviews are required to be carried out at regular intervals, in support of annual environmental reporting requirements.
Exploitation Permit
Environmental obligations for conversion of an Exploration Permit to an Exploitation Permit under the Mining Code require the preparation of an environmental impact study and an environmental management plan for a development project, both of which must be updated if a renewal of an Exploitation Permit is sought. The Mining Code has provision for a biennial environmental audit. If a company does not pass this audit, it may lose its permit.
Upon mine closure, shafts must be filled, covered or enclosed, and a certificate obtained confirming compliance with environmental obligations under the terms of the approved environmental impact study and environmental management plan.
4.1.8 Royalties
A company holding a mining exploitation licence is subject to mining royalties. The royalty is due upon the sale of the product and is calculated at 2% of the price received of non-ferrous metals sold less the costs of transport, analysis concerning quality control of the commercial product for sale, insurance and marketing costs relating to the sale transaction.
The holder of the mining licence will benefit from a tax credit equal to a third of the mining royalties paid on products sold to a transformation entity located in the National Territory. Mining royalties paid may be deducted for income tax purposes.
Mineral Tenure
The Project consists of three granted Exploitation Permits 12873, 13025 and 13026 and one Exploration Permit, 705 (Table 4.1 and Figure 4.2). The permits are held in the name of AMBL. The three Exploitation Permits cover an area of 397.4 km2, and the Exploration Permit covers 1.7 km2 for a total Project area of 399.1 km2.
Prior to grant, the Exploitation Permits were appropriately surveyed in accordance with DRC requirements. Exploration Permits are delineated by latitude/longitude co-ordinates and do not require survey.
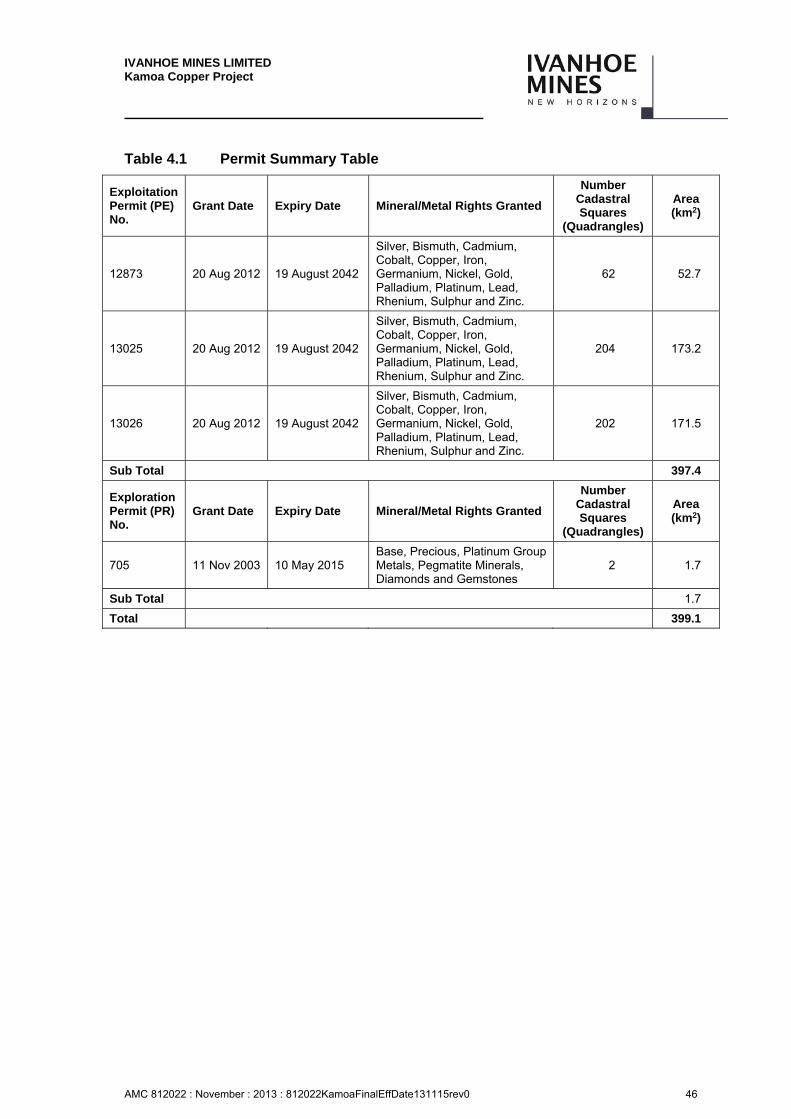
IVANHOE MINES LIMITED Kamoa Copper Project
AMC 812022 : November : 2013 : 812022KamoaFinalEffDate131115rev0 46
Table 4.1 Permit Summary Table
Exploitation Permit (PE) No.
Grant Date Expiry Date Mineral/Metal Rights Granted
Number Cadastral Squares
(Quadrangles)
Area (km2)
12873 20 Aug 2012 19 August 2042
Silver, Bismuth, Cadmium, Cobalt, Copper, Iron, Germanium, Nickel, Gold, Palladium, Platinum, Lead, Rhenium, Sulphur and Zinc.
62 52.7
13025 20 Aug 2012 19 August 2042
Silver, Bismuth, Cadmium, Cobalt, Copper, Iron, Germanium, Nickel, Gold, Palladium, Platinum, Lead, Rhenium, Sulphur and Zinc.
204 173.2
13026 20 Aug 2012 19 August 2042
Silver, Bismuth, Cadmium, Cobalt, Copper, Iron, Germanium, Nickel, Gold, Palladium, Platinum, Lead, Rhenium, Sulphur and Zinc.
202 171.5
Sub Total 397.4
Exploration Permit (PR) No.
Grant Date Expiry Date Mineral/Metal Rights Granted
Number Cadastral Squares
(Quadrangles)
Area (km2)
705 11 Nov 2003 10 May 2015 Base, Precious, Platinum Group Metals, Pegmatite Minerals, Diamonds and Gemstones
2 1.7
Sub Total 1.7
Total 399.1
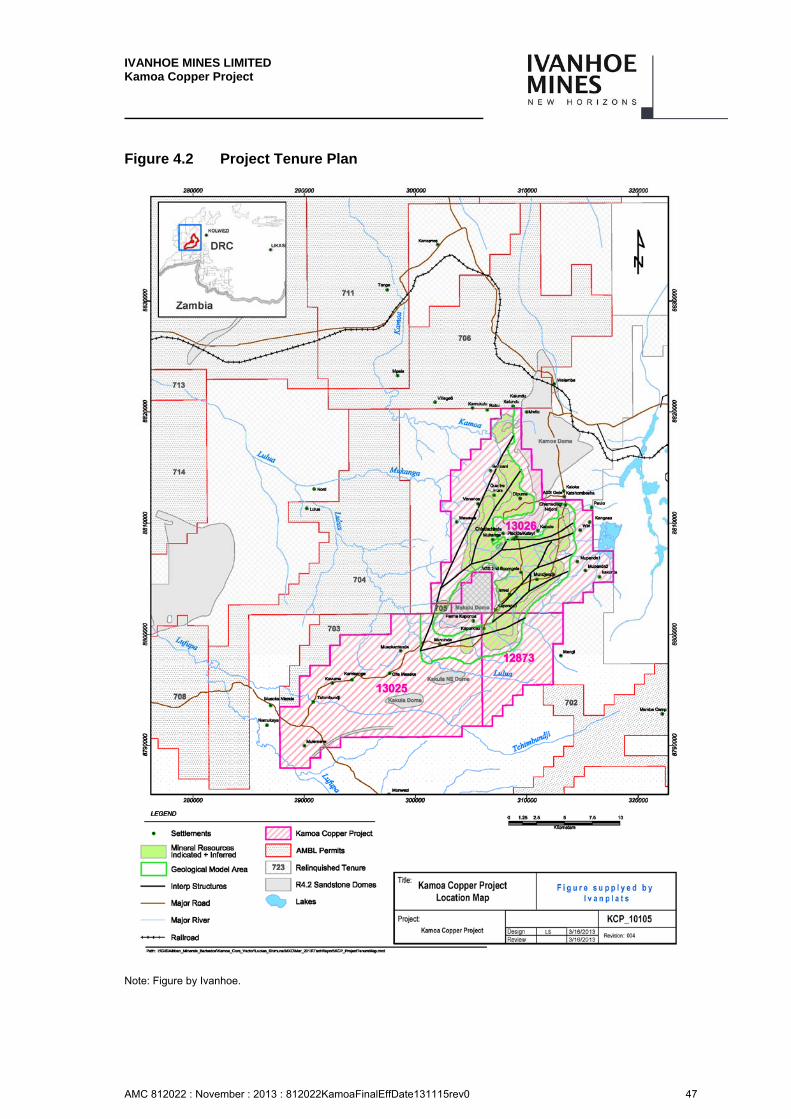
IVANHOE MINES LIMITED Kamoa Copper Project
AMC 812022 : November : 2013 : 812022KamoaFinalEffDate131115rev0 47
Figure 4.2 Project Tenure Plan
Note: Figure by Ivanhoe.
IVANHOE MINES LIMITED Kamoa Copper Project
AMC 812022 : November : 2013 : 812022KamoaFinalEffDate131115rev0 48
Ivanhoe advised the QPs that the company had pro-rata paid the required surface fees for the Exploitation Permits to the DRC government, as this pre-payment was a pre-condition of grant of the permits. The surface rights fee is due by 31 March of each year; land taxes are due by 1 February of each year. Ivanhoe advised the QPs that the required land tax payments for 2013 were made for the three Exploitation Permits and Exploration Permit 705, and that the company has paid the required fees for 2013.
Ivanhoe is also actively exploring in other areas of the DRC, with Exploration Permit tenure holdings which are at a grass-roots exploration stage.
Surface Rights
At the effective date of this Report, Ivanhoe holds no surface rights in the Project area. A single surface rights holder has been identified with formal surface rights in the project area. Negotiations are currently underway to finalise transfer of these rights to Ivanhoe.
Land access for the exploration programmes completed to date has typically been negotiated without problems. Where compensation has been required for exploration activities, compensation has followed IFC/World Bank Guidelines in all cases.
Royalties and Encumbrances
A discussion of the royalty considerations payable to the DRC Government is included in Section 4.1.8.
Property Agreements
There are no agreements in place that are relevant to the Report.
Permits
Project permitting considerations are discussed in Section 20.
Environmental Liabilities
Environmental risks and liabilities to the Project are discussed in Section 20.
Social License
Considerations of social licence in support of Project development activities are discussed in Section 20.
Comments on Section 4
The information discussed in this section supports the assumptions and results in the Technical Report:
• Information from legal experts supports that the mining tenure held is valid and is sufficient to support declaration of Mineral Resources.
IVANHOE MINES LIMITED Kamoa Copper Project
AMC 812022 : November : 2013 : 812022KamoaFinalEffDate131115rev0 49
• Surface rights have yet to be obtained. The Project area is sparsely inhabited, and Ivanhoe’s investigations to date have identified only one surface rights holder; however, some additional surface rights within the area of the Project may be expected to be held by private individuals. Surface rights are currently being negotiated as part of a formal resettlement consultation process being done in compliance with DRC law and IFC standards
• Ivanhoe will need to apply for additional specialist permits as appropriate to the jurisdiction to allow mining operations.
• Ivanhoe has offered to sell the DRC Government an additional 15% interest in the Project on commercial terms to be negotiated.
• The proposed amendments to the 2002 Mining Code contained in the draft law include more onerous formalities and conditions for obtaining mining rights. The changes to the 2002 Mining Code have not been finalized and are are yet to be enacted.
• To the extent known, there are no other significant factors and risks that may affect access, title, or the right or ability to perform work on the property.
IVANHOE MINES LIMITED Kamoa Copper Project
AMC 812022 : November : 2013 : 812022KamoaFinalEffDate131115rev0 50
5 ACCESSIBILITY, CLIMATE, LOCAL RESOURCES, INFRASTRUCTURE, AND PHYSIOGRAPHY
Accessibility
5.1.1 Air
The city of Lubumbashi in the DRC, located 290 km east of the Kamoa deposit, can be accessed by an international airfield. Alternatively, the international airport at the Zambian city of Ndola, 200 km south-east of Lubumbashi, can be used.
The closest major township to the Project is Kolwezi 25 km to the east. There are regular flights from Lubumbashi to Kolwezi, with the flying time being approximately 45 minutes.
5.1.2 Road
Kolwezi is connected to Lubumbashi and Ndola by road. Travel time by car from Kolwezi to Lubumbashi is currently four hours. The route is a combination of tarred and gravel roads, which have recently been refurbished and are in reasonable condition.
Access to the Project area from Kolwezi is via gravel roads to the villages of Kasekelesa and Musokantanda. Some of the gravel road network throughout the Project has been upgraded by Ivanhoe to provide drill and logistical access.
5.1.3 Rail
Until 2012 the rail line of approximate 740 km between Ndola (border with DRC) and Livingstone (border with Zimbabwe) was managed under concession by RSZ (Railway System of Zambia). This concession was revoked in September 2012 and is currently run under management of the Zambian government.
The operation of the 470-kilometer section between Bulawayo and Victoria Falls (Livingstone) on the Zambia border is carried out by the National Railways of Zimbabwe (NRZ) with NLL (NLPI Logistics) responsible for the financing and marketing of the line, per the agreement between NLL and NRZ. The 350-kilometer railway line from Beitbridge (the border post between South Africa and Zimbabwe) to Bulawayo (the most industrialised city in Zimbabwe) was built in record time, with the construction phase lasting only 18 months. Implemented in Zimbabwe on a Build-Operate-Transfer basis by Beitbridge Bulawayo Railway BBR, it is now run by the NRZ.
Transnet Freight Rail (TFR) is the rail operator of the freight rail network in South Africa and Transnet owns the assets. The railway system has sections running at world class standards, maintaining high volumes over long distances. TFR has an investment plan based on a forecasted volume increase and new rail customers, which includes an upgrade of the line and a purchase of additional rolling stock to manage increased demand. TFR is a South African government-owned company.
A large port such as Durban exports bulk break-bulk and containers fed by block trains of 100 or more wagons.
IVANHOE MINES LIMITED Kamoa Copper Project
AMC 812022 : November : 2013 : 812022KamoaFinalEffDate131115rev0 51
The condition of and access to the current rail infrastructure in the DRC make rail a less viable option for inbound project logistics. A more detailed discussion of the rail networks in Section 18.
Climate
The climate in the area follows a distinct pattern of wet and dry seasons. Rainfall of approximately 1,225 mm is experienced annually in the region with the majority of rainfall events occurring during the period of October through to March (the wet season), with peak precipitation being experienced between December to February. The dry season occurs from April to September. The average air temperature remains very similar throughout the year, averaging approximately 22°C. At Kamoa the average annual temperatures vary between 16 and 28°C, with the average being 20.6°C. Winds at the Kamoa Copper Project (KCP) are expected to originate from the east-south-east 20% of the time and south-east 14 % of the time. Wind speeds are moderate to strong, with a low percentage (11.25%) of calm conditions (<1 m/s).
Local Resources and Infrastructure
The Project is currently isolated from public infrastructure. Infrastructure on-site is currently limited to support for the exploration activities. Ivanhoe has established a regional exploration base camp in Kolwezi because of the availability of power and communications in the town.
Exploitation of the Kamoa deposit will require building a greenfields project with attendant infrastructure.
Processing infrastructure exists in the Kolwezi mining district, but it is unknown whether this could be utilized by the Project. The infrastructure requirements envisaged in the Kamoa 2013 PEA are discussed in Section 18.
Power
Power for the Kamoa project is planned to be sourced from three hydro power plants: the Koni, Mwadingusha and Nzilo 1 power stations. All three require refurbishing. The three plants combined could produce over 200 MW. Prior to completion of the refurbishments, development and construction activities at Kamoa will be powered by electricity sourced from the grid and on-site diesel generators.
In June 2011 Ivanhoe signed a Memorandum of Understanding (2011 MOU) with the Democratic Republic of Congo’s state-owned power company, SNEL. The 2011 MOU led to the signing of a pre-financing agreement with SNEL in June 2012 under which SNEL granted Ivanhoe an exclusive right to conduct full rehabilitation on the Mwadingusha and Koni plants following completion of a feasibility report. A study to rehabilitate the Mwadingusha and Koni power plants was carried out by Stucky Ltd in 2013 (Stucky Report). Since this study the production rates have been amended to 3 Mtpa and 11 Mtpa. Further studies will be required to assess these more modest power requirements in the initial phase of the project. As well as the plant refurbishment the alignment for the new high-voltage line to the Kamoa site is also required for power supply to the project.
IVANHOE MINES LIMITED Kamoa Copper Project
AMC 812022 : November : 2013 : 812022KamoaFinalEffDate131115rev0 52
This line is planned to be used at a reduced voltage during the construction phase and at the full rated voltage for production in 2018.
In 2013, Ivanhoe signed an additional Memorandum of Understanding (2013 MOU) with SNEL to upgrade a third hydroelectric power plant, Nzilo 1. Ivanhoe and SNEL plan to conduct a Feasibility Study to assess the scope of work and cost of restoration. It is proposed to upgrade the Nzilo 1 hydroelectric power plant to its design capacity of 111 megawatts (MW).
Physiography
The Project Area is at the edge of a north-north-east to south-south-west trending ridge which is incised by numerous streams and rivers. The elevation of the Project area ranges from 1,300 metres (m) to 1,540 m average metres above sea level (amsl), with current exploration activities in areas of elevation from 1,450 m to 1,540 m amsl. The local topography of the Project is affected by the drainage catchments of the Mukanga, Kamoa and Lulua Rivers and the Kalundu, Kansoko and Kabulo Streams.
The Project lies just north of the watershed separating the Zambezi and Congo drainage basins. Mukanga, Lwampeko, Kansoko, and Kamoa are the main streams in the Project area. These are the main sources of potable water for the local communities, Wetland areas in the general Project area include dambos (water-filled depressions), marshes, and wet plateau sands.
The Project is generally well vegetated with Central Zambezian Miombo woodland, characterized by broadleaf deciduous woodland and savannas interspersed with grassland, wetlands, and riparian forests. Grasslands on the Kalahari Sand plateau, together with riparian forests, are the most common vegetation type after Miombo woodland. Riparian forest dominates adjacent to watercourses.
There are no known migratory routes of endangered animal species within the Project area. Information gathered from interviews with local people indicates that the only protected species in the Project area are tortoises, which occur across the whole area. The partially-protected felis serval (serval) is also found within the area. Poaching has severely diminished the numbers of larger mammals.
The most common vegetation disturbance is agriculture, and in particular the practice of slash-and-burn cultivation. There is currently little evidence of commercial logging, probably due to the poor road infrastructure. Woodland is only cleared or partially logged near villages where the need for agricultural land and firewood (charcoal) is greatest. No plant species threatened by extinction were found in the Project area during the surveys.
Comments on Section 5
The existing and planned access, infrastructure, availability of staff, the existing power, water, and communications facilities, the methods whereby goods could be transported to any proposed mine, and any planned modifications or supporting studies are reasonably well-established. There is sufficient area in the Project tenure to support construction of plant, mining and disposal infrastructure.
IVANHOE MINES LIMITED Kamoa Copper Project
AMC 812022 : November : 2013 : 812022KamoaFinalEffDate131115rev0 53
The requirements to establish such infrastructure are reasonably well understood by Ivanhoe. It is expected that any future mining operations will be able to be conducted year-round.
IVANHOE MINES LIMITED Kamoa Copper Project
AMC 812022 : November : 2013 : 812022KamoaFinalEffDate131115rev0 54
6 HISTORY
During the period between 1971 and 1975, the Tenke Fungurume Consortium (consisting of Amoco, Charter, Mitsui, BRGM and L. Tempelsman, and operated as the Societé Internationale Des Mines du Zaire (SIMZ)), undertook grass-roots exploration over an area that extended south-west from Kolwezi toward the Zambian border. A helicopter-supported regional stream-sediment sampling programme was completed in 1971. No sample location information is available for any sampling that may have occurred within the confines of the current Project.
In 2003, Ivanhoe acquired a significant ground holding, including the permit areas that now comprise the Project. Work completed to date includes data compilation, acquisition of satellite imagery, geological mapping, stream sediment and soil geochemical sampling, an airborne geophysical survey that collected total field magnetic intensity, horizontal and longitudinal magnetic gradient, multi-channel radiometric, linear and barometric, altimetric and positional data, acquisition of whole-rock major and trace element data from selected intervals of mineralized zone and footwall sandstone in drillhole DKMC_DD019, and aircore, reverse circulation (RC) and core (DDC) drilling.
A first-time Mineral Resource estimate was prepared by AMEC for the Project in 2009, and the estimate has been updated in 2010, 2011, and 2012.
IVANHOE MINES LIMITED Kamoa Copper Project
AMC 812022 : November : 2013 : 812022KamoaFinalEffDate131115rev0 55
7 GEOLOGICAL SETTING AND MINERALIZATION
The discussion in this section has been prepared from published papers on regional geology as cited, and is also based on discussions with, and presentations made by, Ivanhoe (David Broughton and David Edwards) and African Mining Consultants (Thomas Rogers and Steffen Kalbskopf) personnel.
Regional Geology
The regional geological setting for the Project is indicated in Figure 7.1.
The metallogenic province of the Central African Copperbelt is hosted in meta-sedimentary rocks of the Neoproterozoic Katanga Basin. Katangan strata occur on both sides of the DRC–Zambian border and define a northerly-directed, thin-skinned thrust-and-fold orogenic system, the Lufilian Arc, which resulted from the convergence of the Congo and Kalahari cratons. The metallogenic province is divided into two distinct districts, the Zambian and Congolese or Katangan Copperbelts.
The Katangan Basin overlies a composite basement made up of older, multiply-deformed and metamorphosed, intrusions that are mostly of granitic affinity and supracrustal metavolcanic–sedimentary sequences. In Zambia, this basement is mainly Paleoproterozoic in age (2,100–1,900 Ma), whereas in the Project area in western Katanga, only Mesoproterozoic basement (~1,100–1,300 Ma) is known. Rainaud et al., (2005) have presented evidence for older (unexposed) Archean basement in the DRC segment.
The 5–10 km thick Katanga Supergroup in the DRC sector is traditionally subdivided into the Roan (code R), Lower Kundelungu or Kundelungu Inferieur code (Ki), and Upper Kundelungu or Kundelungu Superieur (Ks) Groups, based on two regionally extensive diamictites. Table 7.1 summarizes the typical stratigraphic sequence for the DRC sector.

IVANHOE MINES LIMITED Kamoa Copper Project
AMC 812022 : November : 2013 : 812022KamoaFinalEffDate131115rev0 56
Figure 7.1 Geological Setting Central African Copperbelt
Note: Figure by Ivanhoe, 2012.
Table 7.1 Stratigraphic Sequence, Congolese (Katangang) Copperbelt
Group Subgroup Formation Member Lithology Mineralization
Ks: Upper Kundelungu
Plateaux Ks3 – Arkoses, sandstones. –
Ks2: Kiubo Ks2.1/2.2 – Similar to Ks1.3, but with increasing sandstone, sandy shale and siltstone
–
Ks1: Kalule Ks1.2/1.3 – Alternating sandstone and shale at top, Ks1.3; micaceous and calcareous shales; dolomitic limestone at base.
–
Ks2.1.1 Petit Conglomerat
Tillite/diamictite. –
Ki: Lower Kundelungu
Ki2: Monwezi Ki2.1/2.2. – Coarse sandstone (greywacke); calcareous shale towards south.
–
Ki1: Likasi Ki1.3 – Argillaceous sandstone (calcareous); minor siltstone.
–
Ki1.2.2 Kakontwe Dolomitic limestone in south. –
Ki1.2 – Alternating finely bedded shales, sandy shale and dolomite at top.
–
Ki1.1 Grand Conglomerat
Tillite; minor sandstone; interbedded pyritic sandy siltstone (KPS).
Kamoa
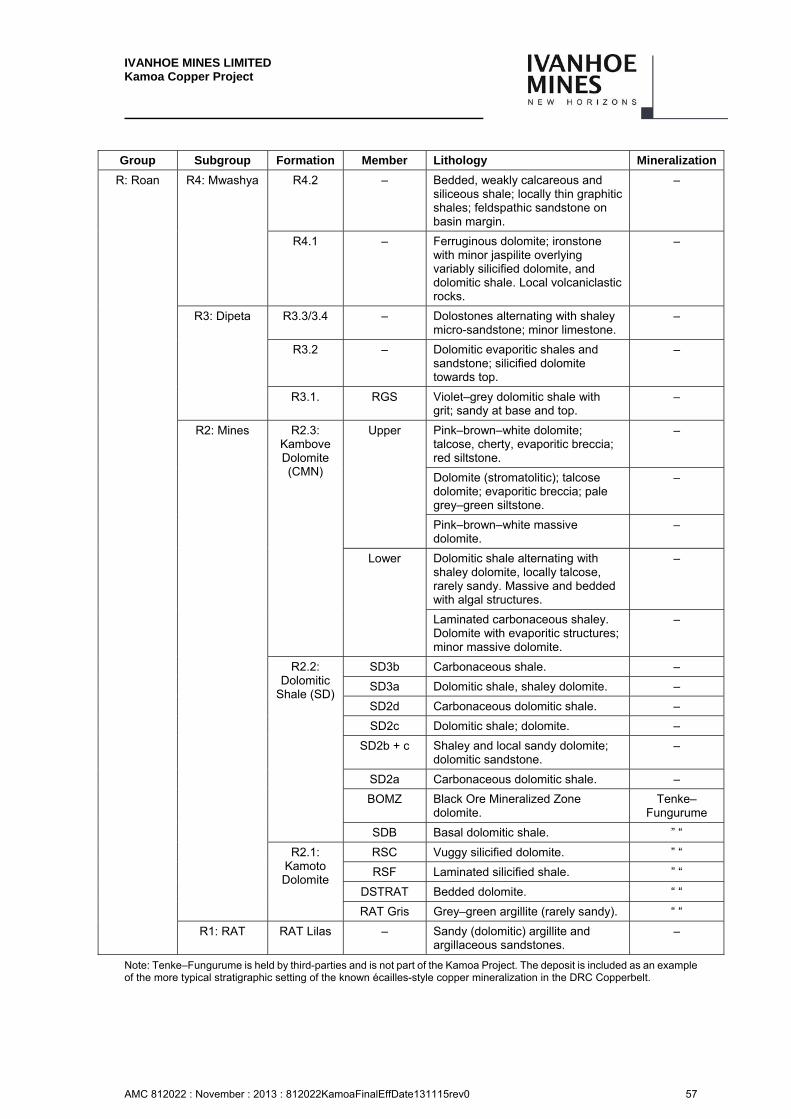
IVANHOE MINES LIMITED Kamoa Copper Project
AMC 812022 : November : 2013 : 812022KamoaFinalEffDate131115rev0 57
Group Subgroup Formation Member Lithology Mineralization
R: Roan R4: Mwashya R4.2 – Bedded, weakly calcareous and siliceous shale; locally thin graphitic shales; feldspathic sandstone on basin margin.
–
R4.1 – Ferruginous dolomite; ironstone with minor jaspilite overlying variably silicified dolomite, and dolomitic shale. Local volcaniclastic rocks.
–
R3: Dipeta R3.3/3.4 – Dolostones alternating with shaley micro-sandstone; minor limestone.
–
R3.2 – Dolomitic evaporitic shales and sandstone; silicified dolomite towards top.
–
R3.1. RGS Violet–grey dolomitic shale with grit; sandy at base and top.
–
R2: Mines R2.3: Kambove Dolomite (CMN)
Upper Pink–brown–white dolomite; talcose, cherty, evaporitic breccia; red siltstone.
–
Dolomite (stromatolitic); talcose dolomite; evaporitic breccia; pale grey–green siltstone.
–
Pink–brown–white massive dolomite.
–
Lower Dolomitic shale alternating with shaley dolomite, locally talcose, rarely sandy. Massive and bedded with algal structures.
–
Laminated carbonaceous shaley. Dolomite with evaporitic structures; minor massive dolomite.
–
R2.2: Dolomitic
Shale (SD)
SD3b Carbonaceous shale. –
SD3a Dolomitic shale, shaley dolomite. –
SD2d Carbonaceous dolomitic shale. –
SD2c Dolomitic shale; dolomite. –
SD2b + c Shaley and local sandy dolomite; dolomitic sandstone.
–
SD2a Carbonaceous dolomitic shale. –
BOMZ Black Ore Mineralized Zone dolomite.
Tenke–Fungurume
SDB Basal dolomitic shale. ” “
R2.1: Kamoto Dolomite
RSC Vuggy silicified dolomite. ” “
RSF Laminated silicified shale. ” “
DSTRAT Bedded dolomite. “ “
RAT Gris Grey–green argillite (rarely sandy). “ “
R1: RAT RAT Lilas – Sandy (dolomitic) argillite and argillaceous sandstones.
–
Note: Tenke–Fungurume is held by third-parties and is not part of the Kamoa Project. The deposit is included as an example of the more typical stratigraphic setting of the known écailles-style copper mineralization in the DRC Copperbelt.
IVANHOE MINES LIMITED Kamoa Copper Project
AMC 812022 : November : 2013 : 812022KamoaFinalEffDate131115rev0 58
Nomenclature has informally been revised to the Roan, N’Guba (code Ng; formerly Lower Kundelungu) and Kundelungu (code Ku) Groups. However, geological and lithological descriptions in this Report use the traditional nomenclature.
The metasedimentary rocks of the Roan Group were deposited in an environment that was initially terrestrial in character, but evolved to a marine character during a regional transgression. In the basal Roan Group, temporarily anoxic conditions in a lagoonal to mudflat environment prevailed, giving rise to intercalations of evaporite-bearing rocks in the siliclastic–carbonate successions. Extensive evaporite deposits are interpreted to have formed during Roan time, but are no longer present, probably as a result of erosion.
The tectonic setting of the Roan Group is somewhat uncertain due to orogenic overprinting. The most common interpretation has Roan Group sediments accumulating in fault-bounded sub-basins (R1), which evolved from a continental rift basin filled by syn-rift siliclastic rocks, to a laterally extensive carbonate platform (R2, R3).
Mineralization in the majority of the Katangan Copperbelt orebodies such as at Kolwezi and Tenke–Fungurume (refer Figure 7.1) is hosted in the Mines supergroup (R2). The mineralization at Kamoa differs from these deposits in that it is located in the Grand Conglomerat unit (Ki1.1) at the base of the lower Kundelungu Group.
7.1.1 Lufilian Orogeny
The Katangan basin was inverted3 during the Pan-African Lufilian orogeny, from approximately 580 Ma to 500 Ma.
The Lufilian Arc can be divided into subregions, of which the Katangan (Congo) Copperbelt in the DRC belongs to an outer terrane of the arc, the External Fold and Thrust Belt. This terrane is considered to be composed of a stack of thin-skinned and generally north-verging folds and thrust sheets. The thrust sheets occur together with megabreccias that may have a tectonic origin. Alternate explanations for the breccias include sedimentary sources, or salt tectonism.
All of the Mines Subgroup copper (± cobalt) orebodies of the Katangan Copperbelt occur as megafragments (écailles) up to kilometres in size, within this megabreccia.
The Kolwezi district comprises megaframents of the Mines Subgroup emplaced above the level of Ks2.1 strata.
West of the External Fold and Thrust Belt, in north-western Zambia, the Western Foreland (Foreland) comprises weakly deformed, autochthonous, siliciclastic and volcanic rocks of Roan age, and overlying Lower Kundelungu diamictite (Key et al, 2001). The Kamoa Project area is considered by Ivanhoe to form part of the Foreland.
3 Basin inversion is the process of shortening an extensional sedimentary basin whereby the basin fill is uplifted and partially extruded, and pre-existing faults are re-activated.
IVANHOE MINES LIMITED Kamoa Copper Project
AMC 812022 : November : 2013 : 812022KamoaFinalEffDate131115rev0 59
At least two periods of magmatism accompanied deposition of the Katanga Supergroup. A period of extensional mafic magmatism, broadly co-eval with deposition of the Mwashya Subgroup and Lower Kundelungu Group sediments, comprises a series of (alkaline) gabbroic intrusions and mafic volcanism dated at around 750 Ma (Selley et al., 2005).
Project Geology
The Project lies within the interpreted extension of the Western Foreland unit of north-western Zambia (Key et al., 2001). In the Project area, the basement is Kibaran Group metasedimentary rocks. Figure 7.2 summarizes the Project geological setting.
Geological mapping and magnetic data indicate that the majority of the Foreland located west of Kolwezi in the Ivanhoe permits is underlain at surface by the Grand Conglomerat diamictite (Ki1.1). This unit constitutes a regional exploration target, as the base of the diamictite is considered a regionally-prospective redox boundary. The Project comprises the eastern part of this target area, where Ivanhoe has focused exploration, and has discovered Zambian Copperbelt-style copper mineralization.
The majority of the Project area, and the area containing the Indicated and Inferred Mineral Resources discussed in Section 14 of this Report, lie on a broad, gentle plateau between two major north-north-east-trending structures. To the east, and identified primarily by airborne magnetics, is the Kansoko Trend which is the interpreted boundary with the External Fold and Thrust Belt. The geology of the Kansoko Trend is currently poorly defined. To the west is a prominent escarpment and magnetic feature named the West Scarp Fault.
Between these structures a series of gentle domes occur, where the Grand Conglomerat is eroded, and the underlying Roan sandstones are exposed.
Three major structural blocks have been identified in the Kamoa area:
• A deep graben (or half graben) to the west of the West Scarp Fault. This is in-filled by Lower Kundelungu diamictite (Grand Conglomerat) (Ki1.1) and associated sediments which probably rest unconformably upon andesitic/mafic igneous and volcanic rocks in parts of Exploration Permit 704 (outside the Project area). The downward displacement of the West Scarp Fault is approximately 350 m to 400 m.
• An area between the West Scarp Fault and the Kansoko Trend, where the domes occur. The domes comprise Roan-age, medium- to coarse-grained feldspathic sandstone and siliciclastic rocks (footwall feldspathic sandstone–RFS) which in the north pass downwards into pebbly immature grits and conglomerates.

IVANHOE MINES LIMITED Kamoa Copper Project
AMC 812022 : November : 2013 : 812022KamoaFinalEffDate131115rev0 60
Figure 7.2 Regional Geology Map, Kamoa Region
Note: Figure by Ivanhoe, modified by AMEC, 2013.
• A north-north-east to south-south-west-trending belt, the Kansoko Trend, approximately 3 km wide commencing approximately 1 km to 2 km east of the Kamoa and Makalu domes. This belt is underlain by a thick, easterly-dipping sequence of weakly carbonaceous and pyrrhotite-bearing diamictite and siltstone (Ki1.1) with subordinate andesitic (or mafic), sill-like bodies towards the north-east.
In addition to these structures, several other faults have been interpreted within the Project (Figure 7.3).
Deposits
The Project is located in a broadly-folded terrane centred on the Kamoa and Makalu domes (refer to Figure 7.3) between the West Scarp Fault and Kansoko Trend. The domes form erosional windows exposing the redox boundary between the underlying hematitic (oxidised) Roan sandstones (red-beds), and the overlying carbonaceous and sulphidic (reduced) Grand Conglomerat diamictite (host to mineralization). Unlike the tectonically-dismembered deposits of the Katangan Copperbelt, and the External Fold and Thrust Belt, the host rocks at Kamoa are intact and relatively undisturbed.
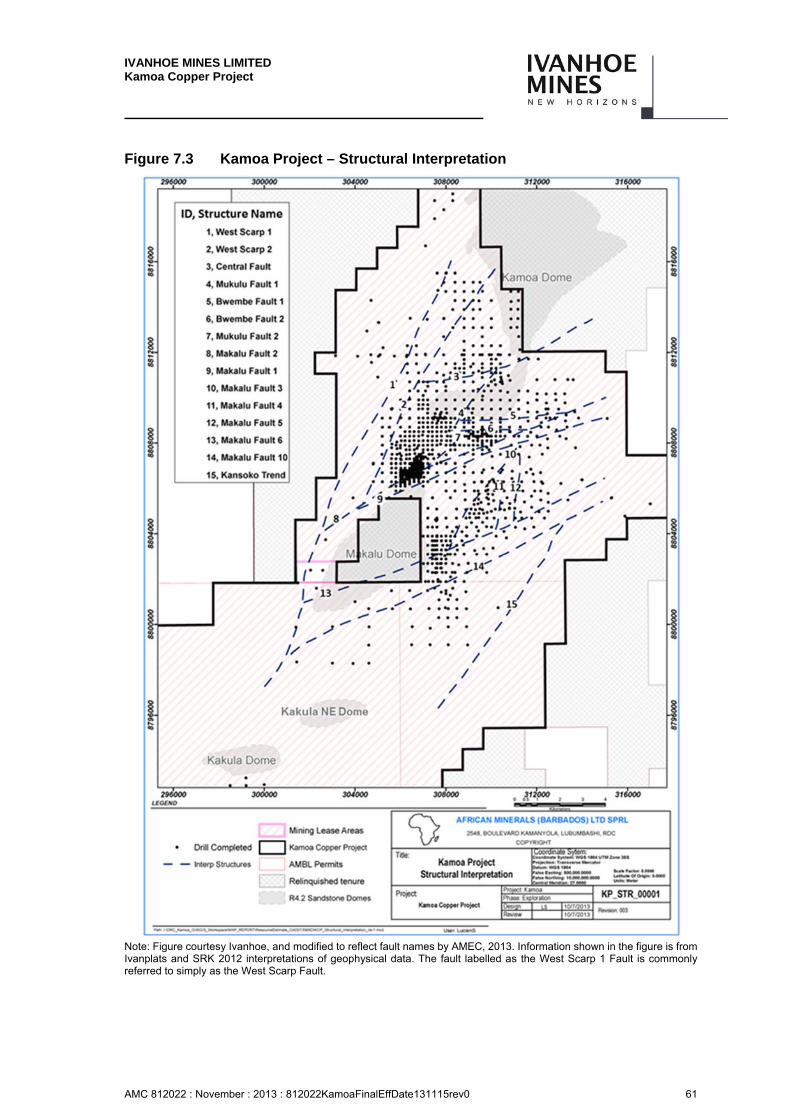
IVANHOE MINES LIMITED Kamoa Copper Project
AMC 812022 : November : 2013 : 812022KamoaFinalEffDate131115rev0 61
Figure 7.3 Kamoa Project – Structural Interpretation
Note: Figure courtesy Ivanhoe, and modified to reflect fault names by AMEC, 2013. Information shown in the figure is from Ivanplats and SRK 2012 interpretations of geophysical data. The fault labelled as the West Scarp 1 Fault is commonly referred to simply as the West Scarp Fault.
IVANHOE MINES LIMITED Kamoa Copper Project
AMC 812022 : November : 2013 : 812022KamoaFinalEffDate131115rev0 62
7.3.1 Lithology
The main stratigraphic units encountered in the Kamoa Project are summarized in Table 7.2.
The base of the KPS (Ki1.1.2) has been used as a reference stratigraphic horizon during resource modelling. The centre of the mineralized intercepts used as the basis for the Mineral Resource estimate can occur above or below this reference horizon.
Igneous Rocks
Andesite/dolerite sills and vesicular to massive lava have been identified in the Project area:
• Andesite/dolerite sills or flows: These occur as one or more, 5 m to 80 m thick, apparently concordant tabular bodies in the northern end of the Kansoko Trend.
• Vesicular to massive lava: Drillhole DKMC_DDD032 in Exploration Permit 704 penetrated >200 m of vesicular to massive and brecciated and altered, pale green to light grey–green lava grading into a fine-grained igneous rock, probably of andesitic composition.
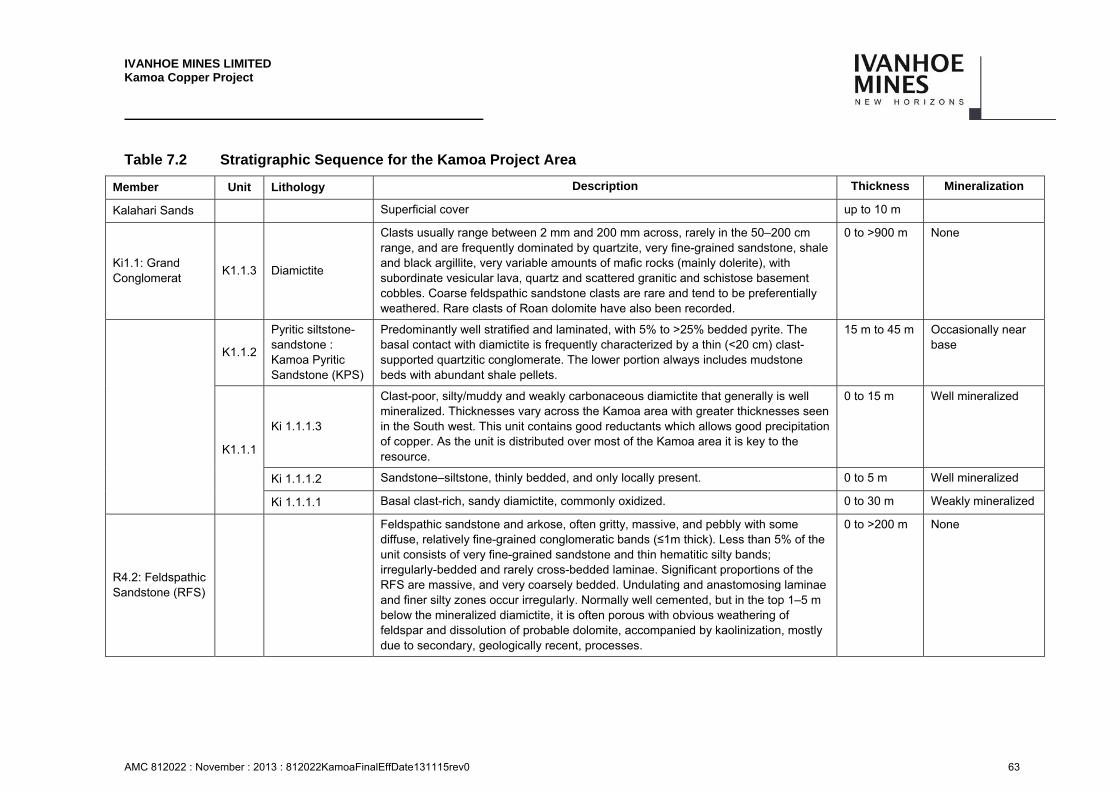
IVANHOE MINES LIMITED Kamoa Copper Project
AMC 812022 : November : 2013 : 812022KamoaFinalEffDate131115rev0 63
Table 7.2 Stratigraphic Sequence for the Kamoa Project Area
Member Unit Lithology Description Thickness Mineralization
Kalahari Sands Superficial cover up to 10 m
Ki1.1: Grand Conglomerat
K1.1.3 Diamictite
Clasts usually range between 2 mm and 200 mm across, rarely in the 50–200 cm range, and are frequently dominated by quartzite, very fine-grained sandstone, shale and black argillite, very variable amounts of mafic rocks (mainly dolerite), with subordinate vesicular lava, quartz and scattered granitic and schistose basement cobbles. Coarse feldspathic sandstone clasts are rare and tend to be preferentially weathered. Rare clasts of Roan dolomite have also been recorded.
0 to >900 m None
K1.1.2
Pyritic siltstone- sandstone : Kamoa Pyritic Sandstone (KPS)
Predominantly well stratified and laminated, with 5% to >25% bedded pyrite. The basal contact with diamictite is frequently characterized by a thin (<20 cm) clast-supported quartzitic conglomerate. The lower portion always includes mudstone beds with abundant shale pellets.
15 m to 45 m Occasionally near base
K1.1.1
Ki 1.1.1.3
Clast-poor, silty/muddy and weakly carbonaceous diamictite that generally is well mineralized. Thicknesses vary across the Kamoa area with greater thicknesses seen in the South west. This unit contains good reductants which allows good precipitation of copper. As the unit is distributed over most of the Kamoa area it is key to the resource.
0 to 15 m Well mineralized
Ki 1.1.1.2 Sandstone–siltstone, thinly bedded, and only locally present. 0 to 5 m Well mineralized
Ki 1.1.1.1 Basal clast-rich, sandy diamictite, commonly oxidized. 0 to 30 m Weakly mineralized
R4.2: Feldspathic Sandstone (RFS)
Feldspathic sandstone and arkose, often gritty, massive, and pebbly with some diffuse, relatively fine-grained conglomeratic bands (≤1m thick). Less than 5% of the unit consists of very fine-grained sandstone and thin hematitic silty bands; irregularly-bedded and rarely cross-bedded laminae. Significant proportions of the RFS are massive, and very coarsely bedded. Undulating and anastomosing laminae and finer silty zones occur irregularly. Normally well cemented, but in the top 1–5 m below the mineralized diamictite, it is often porous with obvious weathering of feldspar and dissolution of probable dolomite, accompanied by kaolinization, mostly due to secondary, geologically recent, processes.
0 to >200 m None
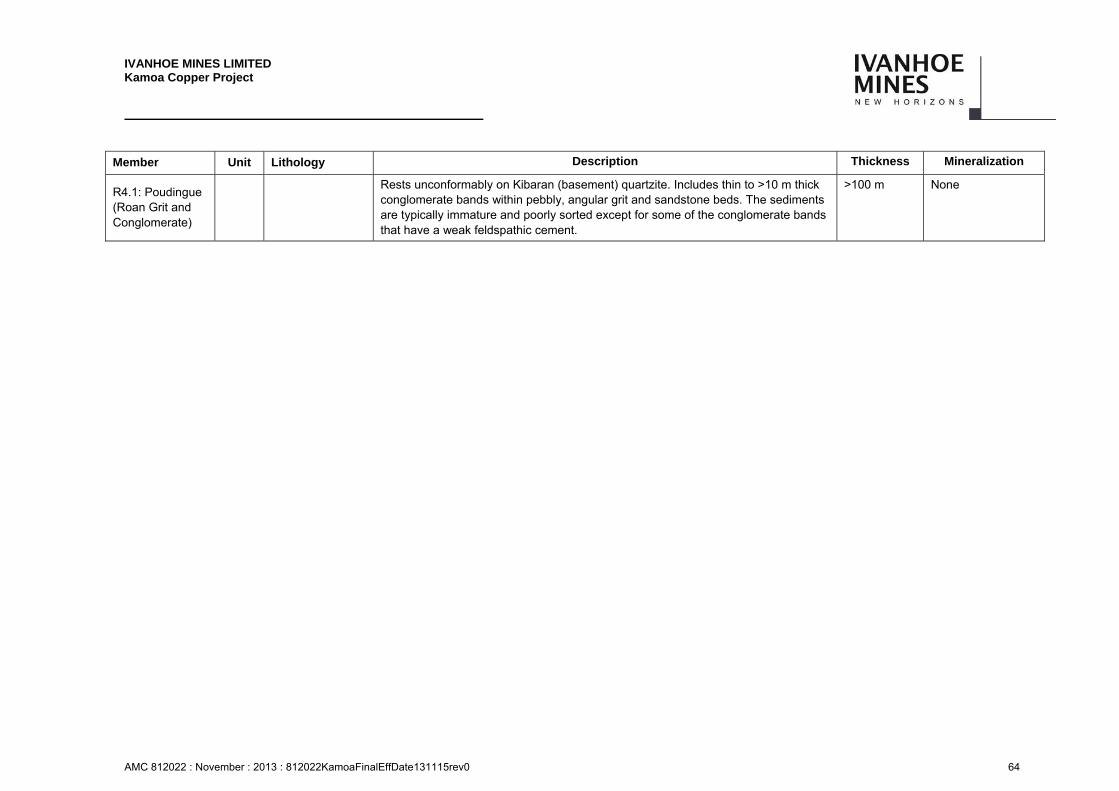
IVANHOE MINES LIMITED Kamoa Copper Project
AMC 812022 : November : 2013 : 812022KamoaFinalEffDate131115rev0 64
Member Unit Lithology Description Thickness Mineralization
R4.1: Poudingue (Roan Grit and Conglomerate)
Rests unconformably on Kibaran (basement) quartzite. Includes thin to >10 m thick conglomerate bands within pebbly, angular grit and sandstone beds. The sediments are typically immature and poorly sorted except for some of the conglomerate bands that have a weak feldspathic cement.
>100 m None
IVANHOE MINES LIMITED Kamoa Copper Project
AMC 812022 : November : 2013 : 812022KamoaFinalEffDate131115rev0 65
Saprolite and Regolith Units
Thicknesses of as much as 10 m of superficial Kalahari sands occur mostly west of the West Scarp Fault and in the southern part of the Project area.
7.3.2 Structure
A fence diagram, along 8811900 N, shows the relationship of the lithologies and mineralization thicknesses encountered in the drilling hung on the base of the KPS (Ki1.1.2). The location of the section line is indicated in Figure 7.4. The mineralization intercepts shown on Figure 7.5, Figure 7.6, and Figure 7.7 were developed using a 1% Cu cut-off over a minimum 3 m of downhole length. Thicknesses shown represent vertical thicknesses; true thicknesses will be slightly less than those shown. The fence diagram shows that the mineralization is continuous, but the detailed stratigraphic position of intercepts used for resource modelling can vary from drillhole to drillhole.
East of the Kamoa Dome along the Kansoko Trend, the Lower Kundelungu succession dips 15° to 21° to the south-east. To the west of the Kamoa Dome, the Ki1.1 strata dip westward at 5° to 9°, towards a basin centred close to drillhole DKMC_DD021 that is informally termed the Kamoa north-west basin.
The West Scarp Fault has a west-side down-throw of approximately 350 m to 400 m. West of the West Scarp Fault, the Ki1.1 strata appear to dip at less than 10° westward and southward. The West Scarp Fault is probably not a single plane, but a broad zone of brittle dislocations.
A third major magnetic structure, the Unguza Structure, forms a curvilinear shape, commencing east of drillhole DKMC_DD013 on line 8811900mN for approximately 11.5 km to the south-west as far as the Achana Fault. The structure has been identified by a prominent contrast in magnetic lineaments as well as by a similar escarpment to that created by the West Scarp Fault.
In the Mineral Resource area, approximately 25 structures have been identified by SRK based on geophysical data, and lithological discontinuities interpreted from the drillhole data. For the Mineral Resource estimate, these structures were spatially compared to the inflections in the geometry of the selected mineralized zone (SMZ), and nine were identified as sufficiently offsetting the mineralization based on currently available data. These structures were then used as boundaries to divide the mineralization into structural zones wherein the mineralization inside each structural zone maintains a similar strike and dip.
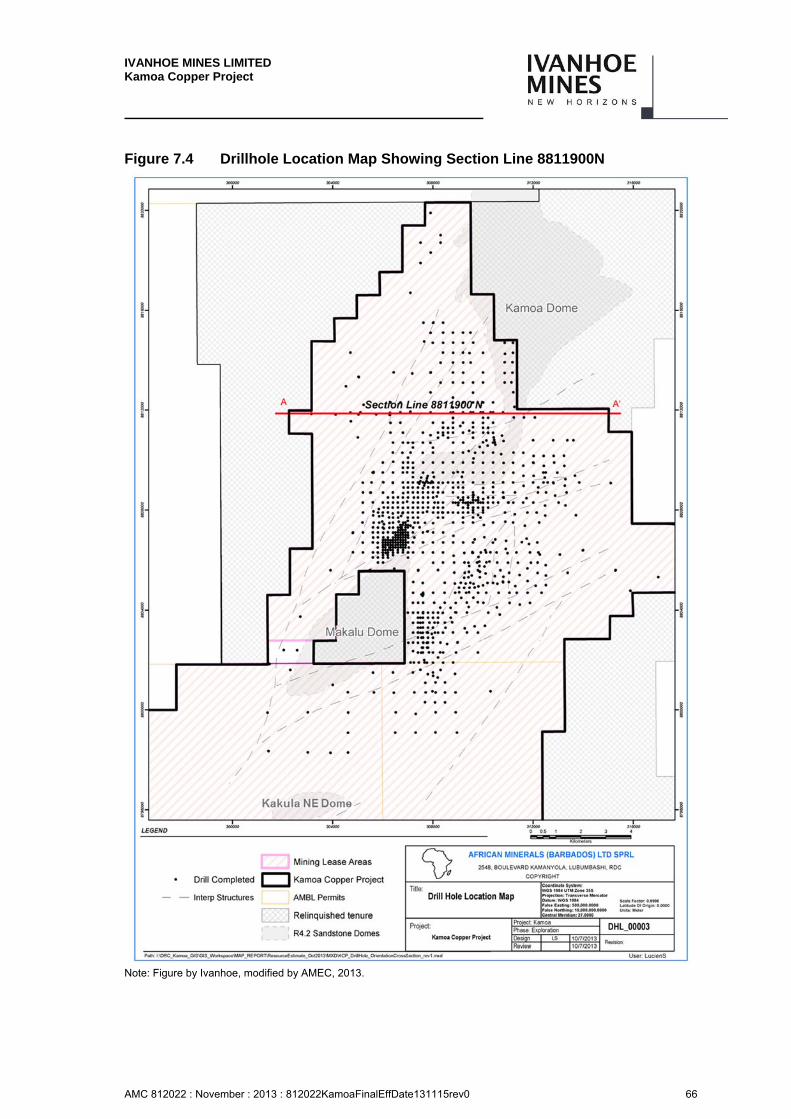
IVANHOE MINES LIMITED Kamoa Copper Project
AMC 812022 : November : 2013 : 812022KamoaFinalEffDate131115rev0 66
Figure 7.4 Drillhole Location Map Showing Section Line 8811900N
Note: Figure by Ivanhoe, modified by AMEC, 2013.
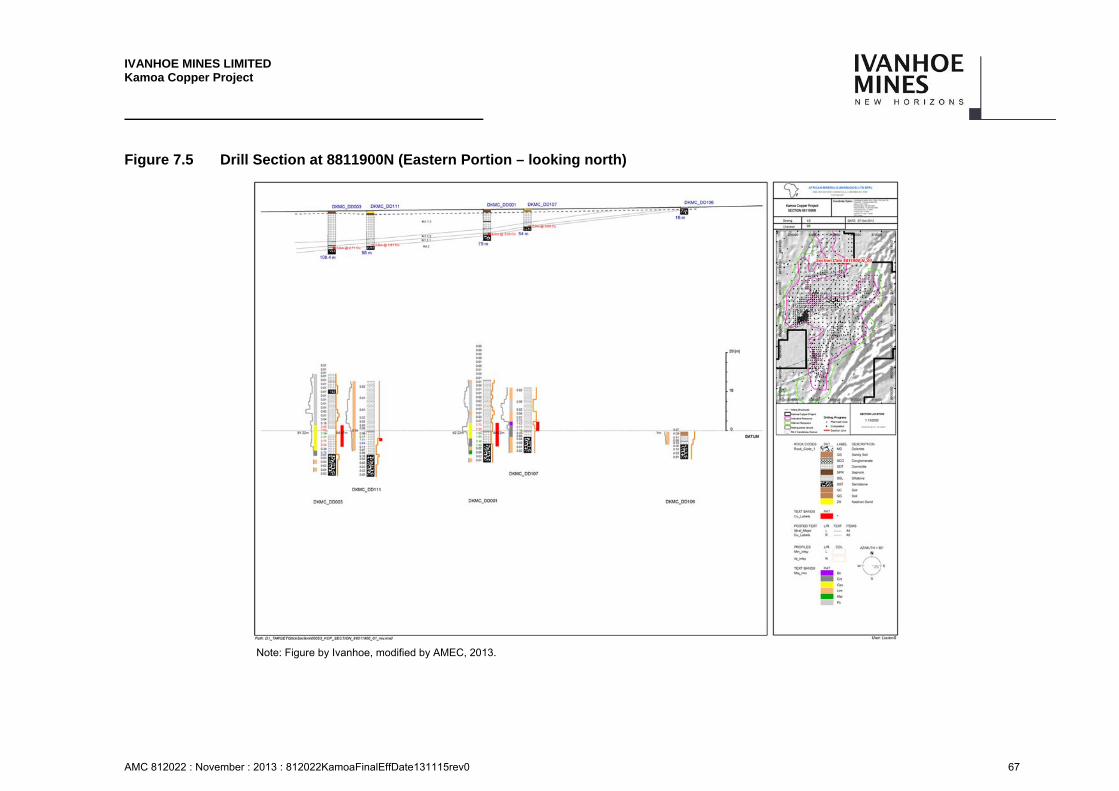
IVANHOE MINES LIMITED Kamoa Copper Project
AMC 812022 : November : 2013 : 812022KamoaFinalEffDate131115rev0 67
Figure 7.5 Drill Section at 8811900N (Eastern Portion – looking north)
Note: Figure by Ivanhoe, modified by AMEC, 2013.
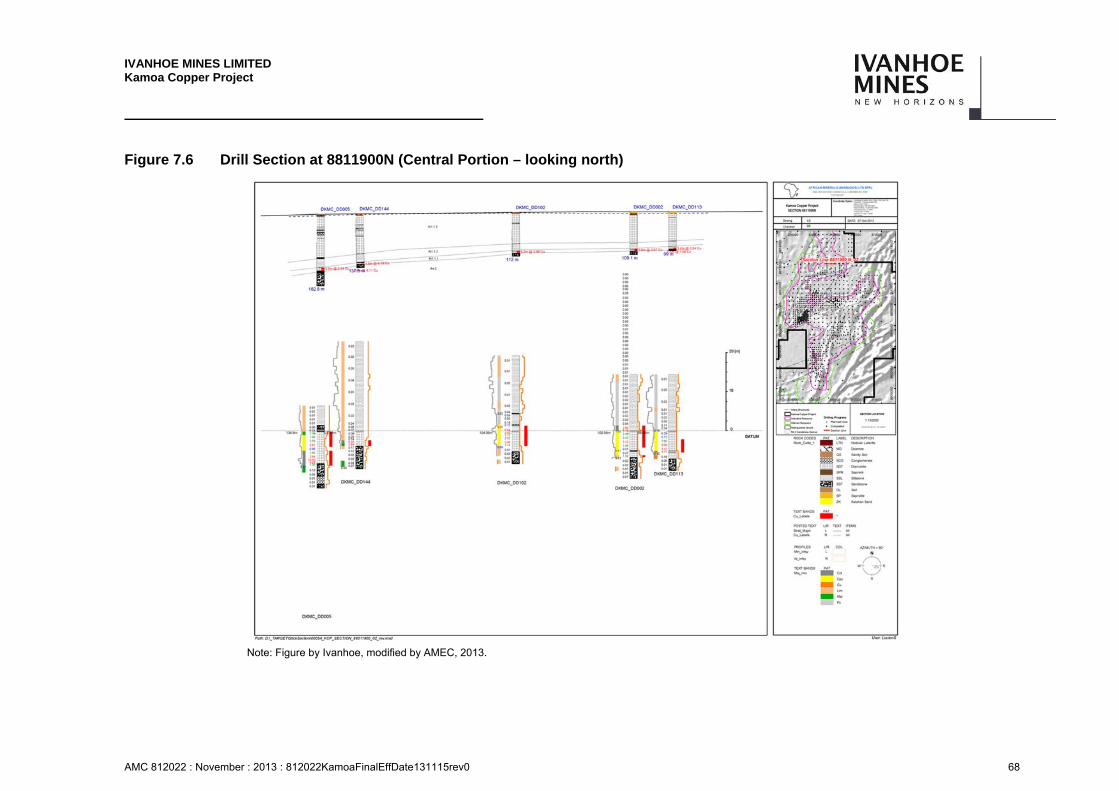
IVANHOE MINES LIMITED Kamoa Copper Project
AMC 812022 : November : 2013 : 812022KamoaFinalEffDate131115rev0 68
Figure 7.6 Drill Section at 8811900N (Central Portion – looking north)
Note: Figure by Ivanhoe, modified by AMEC, 2013.
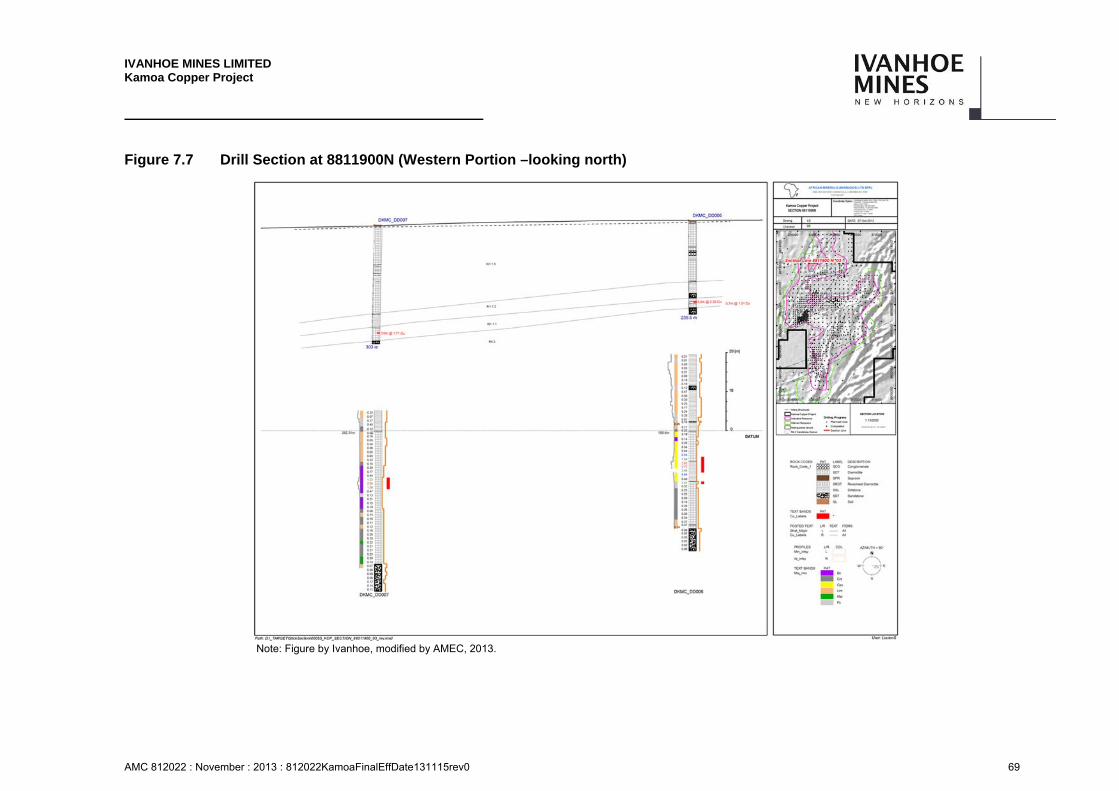
IVANHOE MINES LIMITED Kamoa Copper Project
AMC 812022 : November : 2013 : 812022KamoaFinalEffDate131115rev0 69
Figure 7.7 Drill Section at 8811900N (Western Portion –looking north)
Note: Figure by Ivanhoe, modified by AMEC, 2013.
IVANHOE MINES LIMITED Kamoa Copper Project
AMC 812022 : November : 2013 : 812022KamoaFinalEffDate131115rev0 70
7.3.3 Metamorphism
The Katangan rocks in the Project area contain chlorite, and are weakly metamorphosed to lower greenschist facies.
7.3.4 Alteration
Alteration in sediment-hosted copper deposits is typically subtle, and comprises low-temperature diagenetic minerals. At Kamoa, core logging indicates that alteration minerals include carbonate, chlorite, sericite, potassium feldspar, and hematite.
Carbonate occurs in minor amounts in the Ki1.1.1 rocks, as up to 5% approximately 1 mm size disseminated rhombohedra. The matrix to the Ki1.1.1.1 sandy clast-poor diamictite weathers to a pale beige/buff colour, suggestive of fine-grained, slightly ferroan dolomite in the matrix. The footwall R4.2 sandstones contain disseminated, and patchy to lensoidal, dolomite–calcite, commonly pinkish in colouration.
A later, overprinting, bleached, probably albitic–dolomitic alteration is locally present adjacent to quartz–carbonate–sulphide veins near the West Scarp Fault.
7.3.5 Mineralization
The genetic model developed by Ivanhoe reflects modern interpretations for formation of the Copperbelt. During basin closure and broad folding, oxidizing saline brines migrated up-dip through Roan Supergroup rocks and leached copper. The brines encountered a redox boundary at the base of a diamictite, the Grand Conglomerat. This caused the precipitation of copper sulphide minerals in the basal Grand Conglomerat below a hanging wall interbed of pyritic siltstone–sandstone.
The mineralized sequence at the base of the diamictite comprises several interbedded units that appear to control mineralization (refer to Table 7.2).
From the base upward, the copper sulphides are zoned with chalcocite (Cu2S), bornite (Cu5FeS4) and chalcopyrite (CuFeS2). A lowermost clast-rich diamictite unit (Ki1.1.1.1) is thought by Ivanhoe to be only weakly reducing, and generally hosts lower-grade (<0.5% Cu) mineralization throughout the unit. Copper sulphides tend to be of greatest abundance where this clast-rich diamictite is thin or absent, such that the overlying units lie directly on the Roan sandstones. The reducing capacity of the overlying clast-poor diamictite is considered by Ivanhoe to be better than the lower clast-rich diamictite, and it is in contact with the reducing environment provided by the carbonaceous, pyritic diamictite above (Ki1.1.2). Most of the higher-grade mineralization occurs within the clast-poor unit (Ki1.1.1.3), or in the intervening, locally present, sandstone and siltstone (Ki1.1.1.2) that lies between the clast-poor and clast-rich units.
Near the surface, the diamictites have been leached. There may be some oxide copper and secondary sulphide enrichment down-dip, as for example in holes drilled adjacent to the edges of the Kamoa Dome. There are several kilometres of surficial boundary that present a target for this type of mineralization, which has been encountered to depths of 400 m in drillholes near faults.
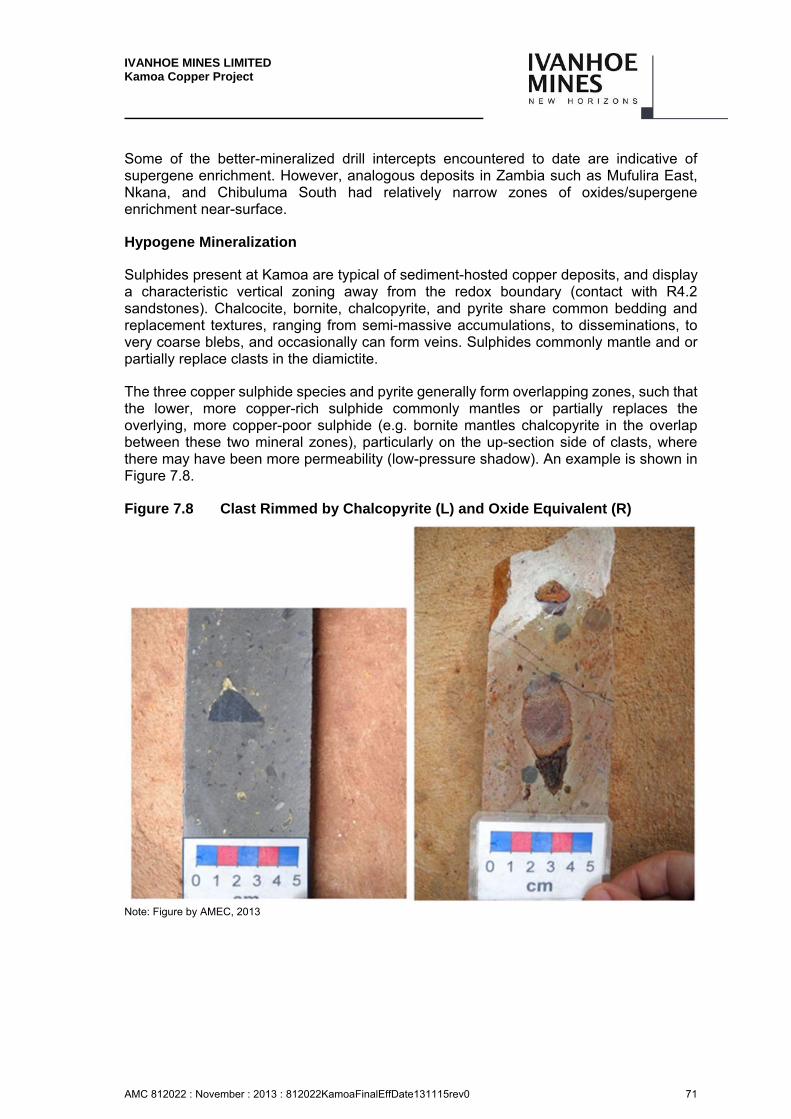
IVANHOE MINES LIMITED Kamoa Copper Project
AMC 812022 : November : 2013 : 812022KamoaFinalEffDate131115rev0 71
Some of the better-mineralized drill intercepts encountered to date are indicative of supergene enrichment. However, analogous deposits in Zambia such as Mufulira East, Nkana, and Chibuluma South had relatively narrow zones of oxides/supergene enrichment near-surface.
Hypogene Mineralization
Sulphides present at Kamoa are typical of sediment-hosted copper deposits, and display a characteristic vertical zoning away from the redox boundary (contact with R4.2 sandstones). Chalcocite, bornite, chalcopyrite, and pyrite share common bedding and replacement textures, ranging from semi-massive accumulations, to disseminations, to very coarse blebs, and occasionally can form veins. Sulphides commonly mantle and or partially replace clasts in the diamictite.
The three copper sulphide species and pyrite generally form overlapping zones, such that the lower, more copper-rich sulphide commonly mantles or partially replaces the overlying, more copper-poor sulphide (e.g. bornite mantles chalcopyrite in the overlap between these two mineral zones), particularly on the up-section side of clasts, where there may have been more permeability (low-pressure shadow). An example is shown in Figure 7.8.
Figure 7.8 Clast Rimmed by Chalcopyrite (L) and Oxide Equivalent (R)
Note: Figure by AMEC, 2013
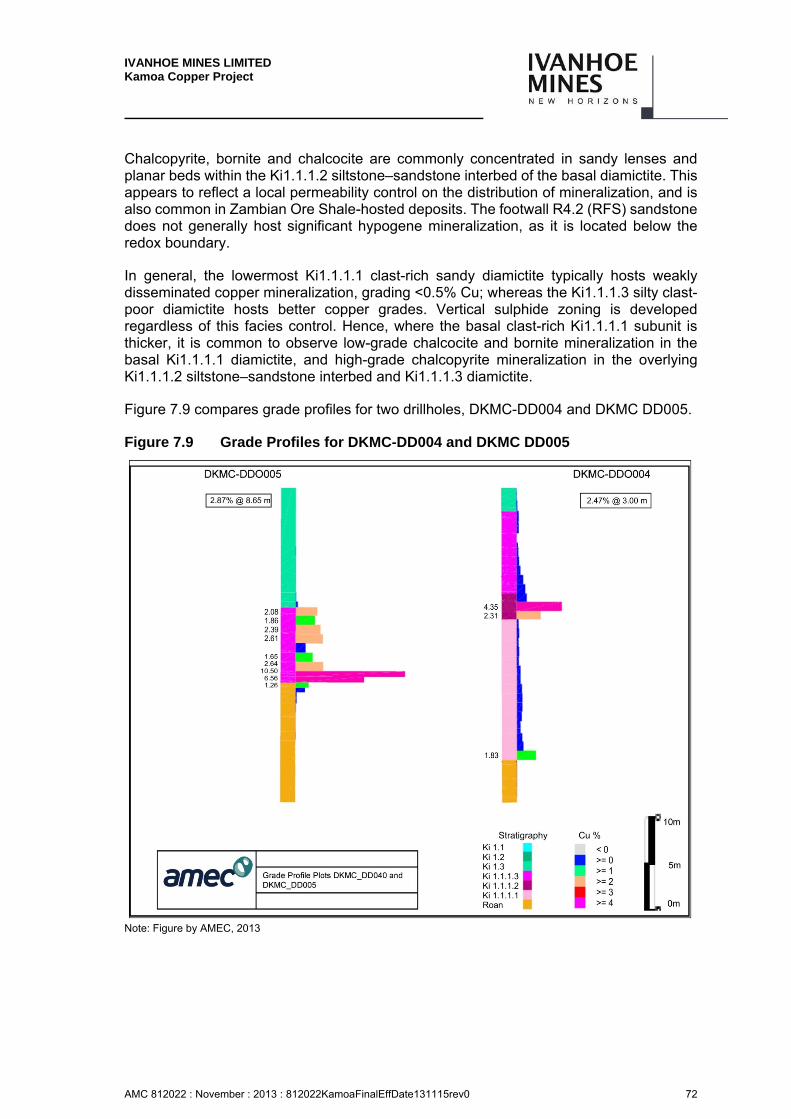
IVANHOE MINES LIMITED Kamoa Copper Project
AMC 812022 : November : 2013 : 812022KamoaFinalEffDate131115rev0 72
Chalcopyrite, bornite and chalcocite are commonly concentrated in sandy lenses and planar beds within the Ki1.1.1.2 siltstone–sandstone interbed of the basal diamictite. This appears to reflect a local permeability control on the distribution of mineralization, and is also common in Zambian Ore Shale-hosted deposits. The footwall R4.2 (RFS) sandstone does not generally host significant hypogene mineralization, as it is located below the redox boundary.
In general, the lowermost Ki1.1.1.1 clast-rich sandy diamictite typically hosts weakly disseminated copper mineralization, grading <0.5% Cu; whereas the Ki1.1.1.3 silty clast- poor diamictite hosts better copper grades. Vertical sulphide zoning is developed regardless of this facies control. Hence, where the basal clast-rich Ki1.1.1.1 subunit is thicker, it is common to observe low-grade chalcocite and bornite mineralization in the basal Ki1.1.1.1 diamictite, and high-grade chalcopyrite mineralization in the overlying Ki1.1.1.2 siltstone–sandstone interbed and Ki1.1.1.3 diamictite.
Figure 7.9 compares grade profiles for two drillholes, DKMC-DD004 and DKMC DD005.
Figure 7.9 Grade Profiles for DKMC-DD004 and DKMC DD005
Note: Figure by AMEC, 2013
IVANHOE MINES LIMITED Kamoa Copper Project
AMC 812022 : November : 2013 : 812022KamoaFinalEffDate131115rev0 73
In drillhole DKMC-DD004, there is a thick sequence of clast-rich diamictite (Ki1.1.1.1); the copper grades are diffuse, and there is a sharp increase in grade going into the siltstone-sandstone interbed Ki1.1.1.2, but only over 2 m. The copper-bearing solutions mainly precipitated copper sulphides in the less reduced, less permeable, clast-poor diamictite.
In contrast, drillhole DKMC-DD005 has no clast-rich diamictite, and copper-bearing solutions precipitated a rich intercept of copper sulphides within the more reduced and permeable clast-poor diamictite. Proximity to pyritic, carbonaceous material within the KPS (Ki1.1.2) unit with pyritic, carbonaceous material probably contributed to formation of a very strong redox boundary.
For most drillholes at Kamoa, the grade profile shows a sharp increase from less than 0.5% Cu to over 1% Cu at the top and bottom of continuous zones grading over 1% Cu. Thus 1% Cu is a “natural” cut-off, and this is also typical of deposits of the Zambian Copperbelt and the shale-hosted copper deposits of northern Michigan, USA.
Virtually all of the significant copper mineralization occurs within the basal Ki1.1.1 diamictite sequence, with the vertically-overlying pyrite zone occurring within the Ki1.1.2 siltstone–sandstone (KPS). This unit contains 5% to >25% pyrite, both as obvious, very coarsely recrystallized, subhedral to euhedral grains, and as very fine-grained, possibly framboidal disseminations. The lowermost 3 m to 5 m of the Ki1.1.2 unit generally contains only fine-grained pyrite, but it may also locally host copper mineralization.
Carrollite (Cu(Co,Ni)2S4) is common in the Mines Subgroup deposits of the Katangan Copperbelt, and in many of the Zambian Ore Shale deposits, but to date is rare at Kamoa.
Sphalerite ((Zn,Fe)S) mineralization is common, but weakly developed (typically<0.1% Zn), in the transition between the chalcopyrite and overlying pyrite zones. Sphalerite displays the same textures as the copper sulphides, indicating it is part of the same mineralizing process. West of the West Scarp Fault, sphalerite can form distinct and higher-grade zones in siltstone–sandstone interbeds within the diamictite.
Supergene and Secondary Mineralization
In many instances chalcocite occurs in the same manner as bornite and chalcopyrite, and is considered a hypogene (primary) phase. However, in shallow intersections or in areas of deep weathering, chalcocite also forms distinct zones, unrelated to the normal vertical hypogene zoning, and is interpreted as a supergene phase. In such cases it can be recognized by association with other supergene phases, such as cuprite and native copper, and by its mantling iron-bearing sulphides (chalcopyrite and pyrite) in contrast to the normal paragenetic sequence.
Cuprite (Cu2O) is uncommon and normally occurs in the same environment and mode as supergene chalcocite, but takes the form of tiny specks, as blebs in contact with chalcocite, and as fracture fillings and along rare bedding planes. It most commonly occurs in the basal zone just above the RFS (R4.2) and is a hallmark of secondary copper redistribution. Native copper is found as crystalline plates along oxidized joints and occasionally as specks and veinlets, particularly within a few decimetres of the RFS.

IVANHOE MINES LIMITED Kamoa Copper Project
AMC 812022 : November : 2013 : 812022KamoaFinalEffDate131115rev0 74
It commonly replaces chalcocite in this horizon and has been found as bedding-parallel veinlets in siltstone and replacement blebs in weathered basal diamictite. Native copper seldom constitutes >1.0% of the total volume of any zone.
Malachite (Cu2(CO3)(OH)2) is uncommon, occurring mostly in fractures related to faults and joints, and replacing oxidized copper sulphides in weathered clasts. It also forms by weathering of chalcocite, and has been redistributed into the RFS in a few places along joints and in the porous matrix, accounting for 0.1–0.4% Cu.
Azurite (Cu3(CO3)3(OH)2), chrysocolla ((Cu,Al2)H2Si2O5(OH)4 – nH2O), and libethinite (Cu2(PO4)(OH)) have also been identified.
Comments on Section 7
The AMEC QPs note the following:
• The understanding of the deposit setting, lithologies, and geological, structural, and alteration controls on mineralization is sufficient to support estimation of Mineral Resources.
• Mineralization at Kamoa has been defined over an irregularly-shaped area of 20 km x 15 km. The mineralization is typically stratiform, and vertically zoned. The dip of the mineralized body ranges from 0° to 10° near-surface above the Kamoa dome, to 15° to 20° on the flanks of the dome. The stratigraphic position of the mineralized intercepts vary on a local basis.
• Geological controls on the mineralization, the mineralization style, mineralization setting, and the mineralogy are sufficiently well understood to support declaration of Mineral Resources.
• Typically contaminants are not a problem for Copperbelt deposits. The initial 2010 drilling programme had assayed for a large number of potential contaminants, including As, Zn, Pb, Mn, and Fe. Increased concentrations of As (typically 50 to 150 ppm) and Zn (0.1 to 0.5%) were found in local areas where the copper mineralization occurs near the contact with the KPS. This assaying was discontinued by Ivanhoe in 2010–2011, because AMEC considered contaminant levels to be low. Reid (2010a) showed good correlation between trace and minor element assays with Niton (X-ray fluorescence or XRF) results. Therefore, Niton results for holes drilled since 2010 should be adequate to identify any areas where contaminants would be of concern.
IVANHOE MINES LIMITED Kamoa Copper Project
AMC 812022 : November : 2013 : 812022KamoaFinalEffDate131115rev0 75
8 DEPOSIT TYPES
The mineralization identified to date within the Project is typical of sediment-hosted stratiform copper deposits. Such deposits can be hosted in either marine or red-bed sediments. Major global examples of the deposits include the Kupferschiefer (Poland), most of the deposits within the Central African Copperbelt (such as Konkola, Nkana, Nchanga, Mufulira, Tenke–Fungurume, and Kolwezi), Redstone (Canada), and White Pine (USA).
Common features of sediment-hosted copper deposits are (Kirkham, 1989; Hitzman et al., 2005):
• Geological setting: Intracratonic rift; fault-bounded graben/trough, or basin margin, or epicontinental shallow-marine basin near paleo-equator; partly evaporitic on the flanks of basement highs; sabkha terrains; basal sediments highly permeable. Sediment-hosted stratiform copper deposits occur in rocks ranging in age from Early Proterozoic to late Tertiary, but predominate in late Mesoproterozoic to late Neoproterozoic and late Palaeozoic rocks.
• Deposit types:
– Kupferschiefer-type: host rocks are reduced facies and may include siltstone, shale, sandstone, and dolomite; these rocks typically overlie oxidized sequences of hematite-bearing, coarser grained, continental siliciclastic sedimentary rocks (red-beds). As the host rocks were typically deposited during transgression over the red-bed sequence, these deposits tend to have exceptional lateral extents. The Central African Copperbelt deposits are typical of the Kupferschiefer-type.
– Red-bed-type: isolated non-red rocks within continental red-bed sequences. Occur typically at the interface between red (hematite-bearing) and grey (relatively reduced, commonly pyrite-bearing) sandstone, arkose, or conglomerate. The configuration of the mineralized zone varies from sheet-like, with extensive horizontal dimensions, to tabular or roll-front geometries, with limited horizontal dimensions.
• Mineralization: Deposits consist of relatively thin (generally <30 m and commonly less than 3 m) sulphide-bearing zones, typically consisting of hematite–chalcocite– bornite–chalcopyrite–pyrite. Some native copper is also present in zones of supergene enrichment. Galena and sphalerite may occur with chalcopyrite or between the chalcopyrite and pyrite zones. Minerals are finely disseminated, stratabound, and locally stratiform. Framboidal or colloform pyrite is common. Copper minerals typically replace pyrite and cluster around carbonaceous clots or fragments.
• Mineralization timing: Sulphides and associated non-sulphide minerals of the host rocks in all deposits display textures and fabrics indicating that all were precipitated after host-rock deposition. Timing of mineralization relative to the timing of host-rock deposition is variable, and may take place relatively early in the diagenetic history of the host sediments or may range to very late in the diagenetic or postdiagenetic history of the sedimentary rocks.
IVANHOE MINES LIMITED Kamoa Copper Project
AMC 812022 : November : 2013 : 812022KamoaFinalEffDate131115rev0 76
• Transport/Pathway: Porosity in clastic rocks, upward and lateral fluid migration; marginal basin faults may be important; low-temperature brines; metal-chloride complexes.
• Metal deposition: Metals were characteristically deposited at redox boundaries where oxic, evaporite-derived brines containing metals extracted from red-bed aquifers encountered reducing conditions.
• Mineralization controls: Reducing low pH environment such as marine black shale; fossil wood, and algal mats are important as well as abundant biogenic sulphides and pyritic sediments. High permeability of footwall sediments is critical. Boundaries between hydrocarbon fluids or other reduced fluids and oxidized fluids in permeable sediments are common sites of deposition.
• Alteration: Metamorphosed red-beds may have a purple or violet colour caused by finely disseminated hematite.
Comments on Section 8
Many features of the mineralization identified within the Project to date are analogous with the Polish Kupferschiefer-type deposits and the stratabound, sediment-hosted, Zambian Ore Shale deposits, in particular the Konkola and Mufulira deposits.
Key features of the Kamoa deposit include:
• Laterally continuous, has been drill tested over an area of 20 km x 15 km.
• Associated with a 35 km-long regional structural corridor bounded by the West Scarp Fault and Kansoko Trend.
• Strong host-rock control and restriction of the mineralization to a redox boundary zone between oxidized footwall hematitic sandstone and reduced, sulphidic host diamictites and siltstone-sandstone rocks.
• Presence of the replacement, blebby, and matrix textures that are typical of sediment-hosted copper deposits.
• Vertical zoning of disseminated copper sulphide minerals from chalcocite to bornite to chalcopyrite; association with cobalt, silver (but thus far not in economically significant quantities); refer to Figure 8.1.
• Hypogene minerals are chalcopyrite, bornite and chalcocite, with the predominant copper sulphide species varying spatially throughout the deposit. For example recent deep drilling along the Kansoko Trend has intersected mixtures of bornite and chalcocite.
• Occurrence of very fine-grained, bedded, disseminated copper sulphides in the intermediate sandy siltstone unit (Ki1.1.1.2) within the basal diamictite is typical of Zambian “Ore Shale”- style mineralization.
The virtual absence of carbonate rocks and the absence of widespread silicification both as host-rock alteration and in veins is atypical of the Mines Subgroup-hosted deposits of the Katangan Copperbelt (e.g. Tenke–Fungurume). Locally minor dolomite replacement of sulphidic clast rims in the basal diamictite and scattered tiny carbonate ± quartz veinlets with occasional sulphides can occur at Kamoa.

IVANHOE MINES LIMITED Kamoa Copper Project
AMC 812022 : November : 2013 : 812022KamoaFinalEffDate131115rev0 77
Figure 8.1 Mineralization Zonation Schematic, Kamoa Deposit
Note: Figure is schematic and not to scale. The true thicknesses of drilled composites range from 2.7–18 m with an average of 5.6 m. Leached zone ranges from 0 to 30 m vertical depth from surface. Supergene zone ranges from 30 m to 100 m vertical depth from surface. Hypogene typically extends from 100 m vertical depth to more than 1,560 m.
The Supergene/Hypogene interface is typically at less than 100 m depth; locally it can be deeper in the vicinity of faults and fractures. Figure by Ivanhoe, 2012.
The Kamoa deposit is currently unique within the DRC west of the External Fold and Thrust Belt that hosts the operating mines of the Katangan sector of the Copperbelt, in that it is a large deposit that is relatively undeformed in contrast to the “écailles”-type deposits.
The AMEC QPs consider the deposit model developed by Ivanhoe for the Project is appropriate to the style of mineralization that has been identified.
IVANHOE MINES LIMITED Kamoa Copper Project
AMC 812022 : November : 2013 : 812022KamoaFinalEffDate131115rev0 78
9 EXPLORATION
Prior to commencement of on-ground exploration in 2004, Ivanhoe commissioned data acquisition in 2003 by African Mining Consultants and The Mineral Corporation. This work comprised collation of the following:
• Landsat 7 ETM+ imagery.
• Shuttle Radar Topographic Mission (SRTM) digital elevation model.
• Geological maps (1:20,000 to 1:2,000,000 scale; Francois (1996) and (1997)).
• Mineral occurrence maps.
• Russian topographic maps for the Katanga Province (1: 250,000 scale).
The collated data were used to identify areas that were considered more prospective within Ivanhoe’s then tenure holdings.
Grids and Surveys
All surveys to date are in UTM co-ordinates, using the WGS84 projection, Zone 35S.
In 2004, a topographic survey, as part of the airborne magnetic-radiometric survey was flown over the Project, resulting in production of a topographic contour map that is accurate to 12 m. Ivanhoe obtained higher resolution, light detection and ranging (LiDAR)-based, topographic data over the Project area in 2012.
Geological Mapping
Project mapping has been performed at 1:150,000, 1:100,000, and 1:5,000 scales where outcrop permits. Over most of the Kamoa region, there is little or no significant geological exposure. There is one small outcrop on the Kamoa dome, identified by Ivanhoe to be a basal conglomerate of the Lower Roan Poudingue, located near its unconformable contact with Kibaran quartzite below.
A reconnaissance field mapping programme occurred between August and October, 2010 at the Kakula prospect, situated south of the Makalu Dome. The purpose of this programme was to delineate the edge of the sandstone dome and its contact with the overlying diamictite known to crop out (outcrop) in this area. This contact forms a Kamoa-style target type, and previous surface geochemical programmes have delineated elevated copper associated with this contact. Mapping has successfully delineated the contact, and this information will be used for planning future drilling for the area.
Geochemical Sampling
Geochemical and aircore drill sampling programmes were conducted as part of first-pass exploration and used to help vector into mineralization. Geochemical sampling programmes included stream sediment, soil and termite mound sampling.

IVANHOE MINES LIMITED Kamoa Copper Project
AMC 812022 : November : 2013 : 812022KamoaFinalEffDate131115rev0 79
Geophysics
During 2004, a regional airborne geophysical survey was flown by Fugro Airborne Surveys (Pty.) Ltd. on behalf of Ivanhoe. The data recorded included total field magnetic intensity, horizontal and longitudinal magnetic gradient, multi-channel radiometric, linear and barometric, altimetric and positional data. The survey was flown at a terrain clearance of 80 m, and covered an area of 7,900 km2, for approximately 36,775 line kilometres of survey. The Project area is a small portion of the survey area. Tie lines were spaced at 2,500 m, and the tie line trend was 225°. The traverse lines were spaced at 250 m, and the traverse line trend was 135°. Quality control of the data was maintained during both survey programmes by independent consulting geophysicist Steven McMullan. Data processing was completed using Oasis Montaj software from Geosoft Inc. of Toronto, Canada. The programme identified a number of magnetic lineaments that reflect underlying structures. One major structural set is interpreted to be a suture zone between the thrust and fold belt to the east and stable Proterozoic sediments that have been draped over domes and fill broad basins in the Kamoa area. A second structural set relates to normal, post-mineralization faults, which appear to have large displacements.
In 2011, Gap Geophysics Australia and Quik_Log Geophysics conducted downhole electromagnetics (EM) surveys on three holes, DKMC_DD322, DKMC_DD325 and DKMC_DD330. The data collected included natural gamma, density, sonic, magnetic susceptibility, three component magnetics, resistivity, conductivity, induced polarization and acoustic data (fractures). This was intended to be an orientation study on the effectiveness of using downhole geophysics as a future tool and determination of which instruments/tests provide useful information. Preliminary results suggested that the televiewer may be a useful tool in conjunction with the geotechnical logging.
As well, in 2011, an EM orientation survey line was completed to test the effectiveness of EM as a possible exploration tool. The line was completed east-west across Kansoko coincident with one drill section line to facilitate comparison with the geologic record logged in drillholes. Results were inconclusive.
A ground magnetic survey was completed over the Kamoa area during 2011–2012. Instruments purchased by Ivanhoe were used by locally-employed teams. The ground magnetic data are currently being compiled to help with geology and structure mapping.
Petrology, Mineralogy, and Research Studies
Whole-rock major and trace element data were collected by Ivanhoe in 2009 from the mineralized zone and footwall sandstone in drill hole DKMC_DD019. Analyses were completed at Ultra Trace laboratories, and included a standard (10 element plus SO3 and LOI) X-ray fluorescence (XRF) major element suite, and a 46-element inductively coupled plasma (ICP) trace element suite. Results indicated possible K2O enrichment commensurate with potassic (feldspar–sericite) alteration.
A MSc study was completed at the Colorado School of Mines on the stratigraphy, diagenetic and hydrothermal alteration and mineralization and an accompanying paper has been accepted to be published in Economic Geology (Schmandt, D., Broughton, D., Hitzman, M., Plink-Bjorklund, P., Edwards, D., and Humphrey, J., in prep).
IVANHOE MINES LIMITED Kamoa Copper Project
AMC 812022 : November : 2013 : 812022KamoaFinalEffDate131115rev0 80
The main conclusions from the study are:
1. The Grand Conglomérat diamictite was formed by glacially-derived mass transport and sedimentary gravity flows in a tectonically active, locally anoxic marine environment,
2. The early diagenetic framboidal and later cubic pyrite associated with the copper mineralization may be indicative of early hydrothermal activity,
3. Later hydrothermal alteration mineral assemblages within the lower Grand Conglomérat are stratigraphically zoned, trending from a potassic and silicification assemblage in the lowermost stratigraphic units to a dominantly magnesium alteration assemblage higher up in the stratigraphy,
4. Sulfur isotope studies indicate that most of the sulfur in the copper sulfides was derived from early diagenetic iron sulfide, and
5. Fluid inclusion analyses indicate that the mineralization-forming fluid was saline, ~23 to 26 wt% NaCl wt equivalent, and had homogenization temperatures (Th) ranging from 210° to 240°C.
In addition, a research PhD, being conducted through the University of Toronto, is currently in progress on the depositional setting of the Kamoa deposit.
Geotechnical and Hydrological Studies
Geotechnical studies completed in support of the Kamoa 2013 PEA are discussed in Section 16.
Metallurgical Studies
Metallurgical studies and testwork completed on the Project are summarized in Section 13.
Exploration Potential
The Kamoa Project area is underlain mainly by subcropping Grand Conglomerat diamictite, at the base of which occurs at the Kamoa target, and thus the entire area underlain by diamictite can be considered prospective for discovery of extensions to the Kamoa mineralization, and for new zones of mineralization within this same horizon. With more drilling, the exploration potential for expanding the area of known mineralization that is hosted in diamictite is excellent.
Exploration identified a number of priority grass-roots exploration prospects within the Project (Figure 9.1), based on geological interpretations, stream-sediment and soil sampling, and aircore, RC, and core drilling. The most prospective of these occur at the Kakula and Kakula Northeast Domes, which are situated along strike to the southwest, and are analogues of the Kamoa and Makalu Domes where the Kamoa mineralization was initially discovered.
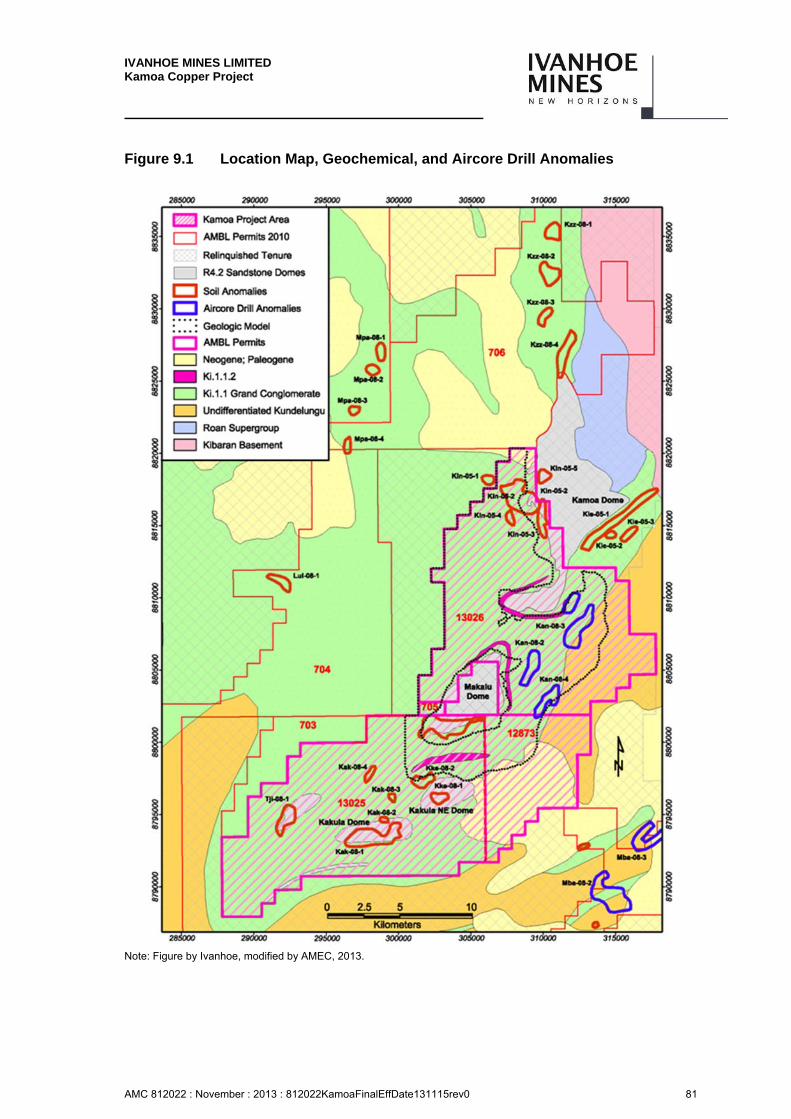
IVANHOE MINES LIMITED Kamoa Copper Project
AMC 812022 : November : 2013 : 812022KamoaFinalEffDate131115rev0 81
Figure 9.1 Location Map, Geochemical, and Aircore Drill Anomalies
Note: Figure by Ivanhoe, modified by AMEC, 2013.
IVANHOE MINES LIMITED Kamoa Copper Project
AMC 812022 : November : 2013 : 812022KamoaFinalEffDate131115rev0 82
To test its exploration concept, Ivanhoe conducted regional widely-spaced exploration drilling in 2009 in the area underlain by diamictite west and north of the 2009 Kamoa Inferred Mineral Resource. While copper mineralization was commonly intersected in the basal part of the diamictite, grades and thicknesses were generally significantly lower than were found at Kamoa.
In addition, and by analogy with the Zambian and Katangan districts of the Central African Copperbelt, it is possible that multiple (“stacked”) redox horizons and associated stratiform copper zones exist within the Roan sequence, hidden below the diamictite. Because of the difficulty in detecting or predicting mineralization below the diamictite hanging wall, Ivanhoe considers that the most reliable means of evaluating this hypothesis is with wide-spaced drillholes. This approach is predicated on the assumption that stratiform copper deposits are laterally extensive, and are at the kilometre scale.
Comments on Section 9
In the opinion of the AMEC QPs:
The exploration programmes completed to date are appropriate to the style of the Kamoa deposit.
The research work that has been undertaken supports Ivanhoe’s genetic and affinity interpretations for the Project area.
The Project area remains prospective for additional discoveries of base-metal mineralization around known dome complexes.
Anomalies generated by geochemical and drill programmes to date support additional work on the Project area.
IVANHOE MINES LIMITED Kamoa Copper Project
AMC 812022 : November : 2013 : 812022KamoaFinalEffDate131115rev0 83
10 DRILLING
Introduction
Drilling on the Project has been undertaken in a number of aircore, RC, and core campaigns from May 2006. Aircore and RC holes were used for reconnaissance follow-up of geochemical anomalies. Core holes were used for reconnaissance exploration and deposit delineation, and for Mineral Resource estimation. Drill programmes were completed by contract drill crews, typically supervised by African Mining Consultants or Ivanhoe staff.
The drill database used for Mineral Resource estimation was closed at 10 December 2012. Drilling has been ongoing since that date, and information on the programme to 1 October 2013 is included in this Report. Drillhole collar locations are shown for the entire Project in Figure 10.1. Drilling is summarized in Table 10.1 by area. For the remainder of this report, the 15 RC pre-collar (RD) holes are included with the core drillholes in any reference to core drilling. Five core holes were being drilled as at 1 October 2013.
As at 1 October 2013, there were 1,002 core holes within the Project area boundaries (including 70 close-spaced wedged deflections and eight twin holes). Of these drillholes, a total of 555 are used to support the December 2012 Mineral Resource estimate (543 drillholes are in Domain 1; area where Indicated and Inferred Mineral Resources are estimated) plus 12 are in Domain 2; the area where the exploration target is estimated) (Figure 10.2). The remaining 455 drillholes are categorized by purpose in Table 10.2. Of the 455 drillholes, 288 holes were drilled after the close-out date for the December 2012 Mineral Resource estimate.
For the post-database closeout drilling, the exploration drillholes are approximately 800 m-spaced step-out drillholes designed to investigate mineralization to the south of the Makalu Dome. The resource drillholes are sited at 100 m spacing to more clearly define mineralization in the areas identified as potential open pits, to provide additional close-spaced information adjacent to existing drillholes, and to define location of the bedrock contact around the margin of the domes. As of 1 October 2013, Ivanhoe had completed and received assays for 79 additional core holes (10,984.0 m drilled, 2,469.4 m assayed) within the resource model area. In addition, assay results are pending for 209 holes (48,758.4 m). Of the pending total, three holes (552.5 m) have been abandoned; and one of the abandoned holes had been partially sampled.
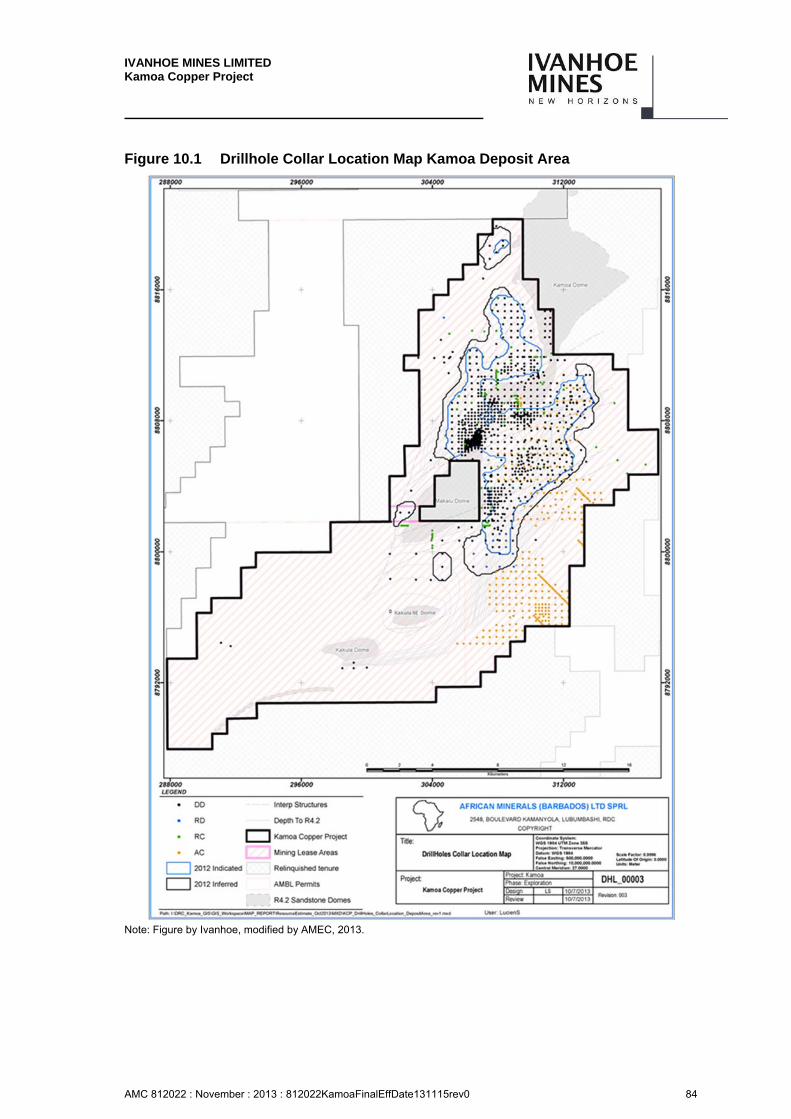
IVANHOE MINES LIMITED Kamoa Copper Project
AMC 812022 : November : 2013 : 812022KamoaFinalEffDate131115rev0 84
Figure 10.1 Drillhole Collar Location Map Kamoa Deposit Area
Note: Figure by Ivanhoe, modified by AMEC, 2013.
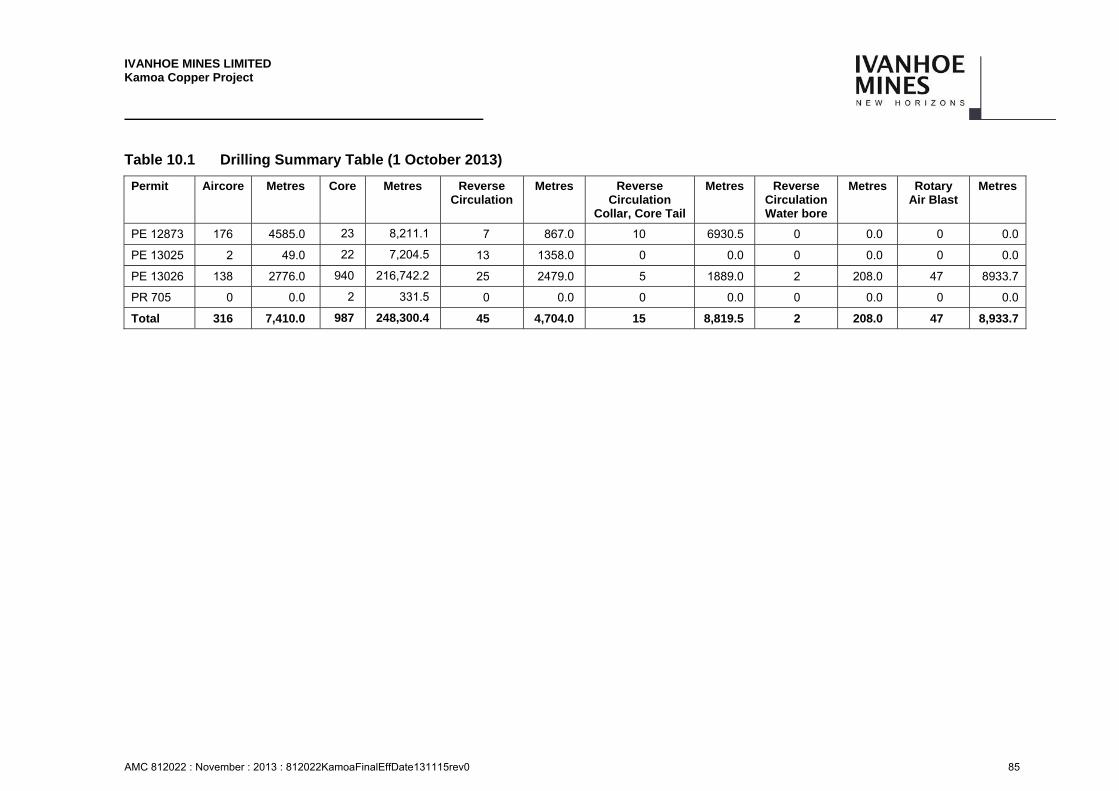
IVANHOE MINES LIMITED Kamoa Copper Project
AMC 812022 : November : 2013 : 812022KamoaFinalEffDate131115rev0 85
Table 10.1 Drilling Summary Table (1 October 2013)
Permit Aircore Metres Core Metres Reverse Circulation
Metres Reverse Circulation
Collar, Core Tail
Metres Reverse Circulation Water bore
Metres Rotary Air Blast
Metres
PE 12873 176 4585.0 23 8,211.1 7 867.0 10 6930.5 0 0.0 0 0.0
PE 13025 2 49.0 22 7,204.5 13 1358.0 0 0.0 0 0.0 0 0.0
PE 13026 138 2776.0 940 216,742.2 25 2479.0 5 1889.0 2 208.0 47 8933.7
PR 705 0 0.0 2 331.5 0 0.0 0 0.0 0 0.0 0 0.0
Total 316 7,410.0 987 248,300.4 45 4,704.0 15 8,819.5 2 208.0 47 8,933.7
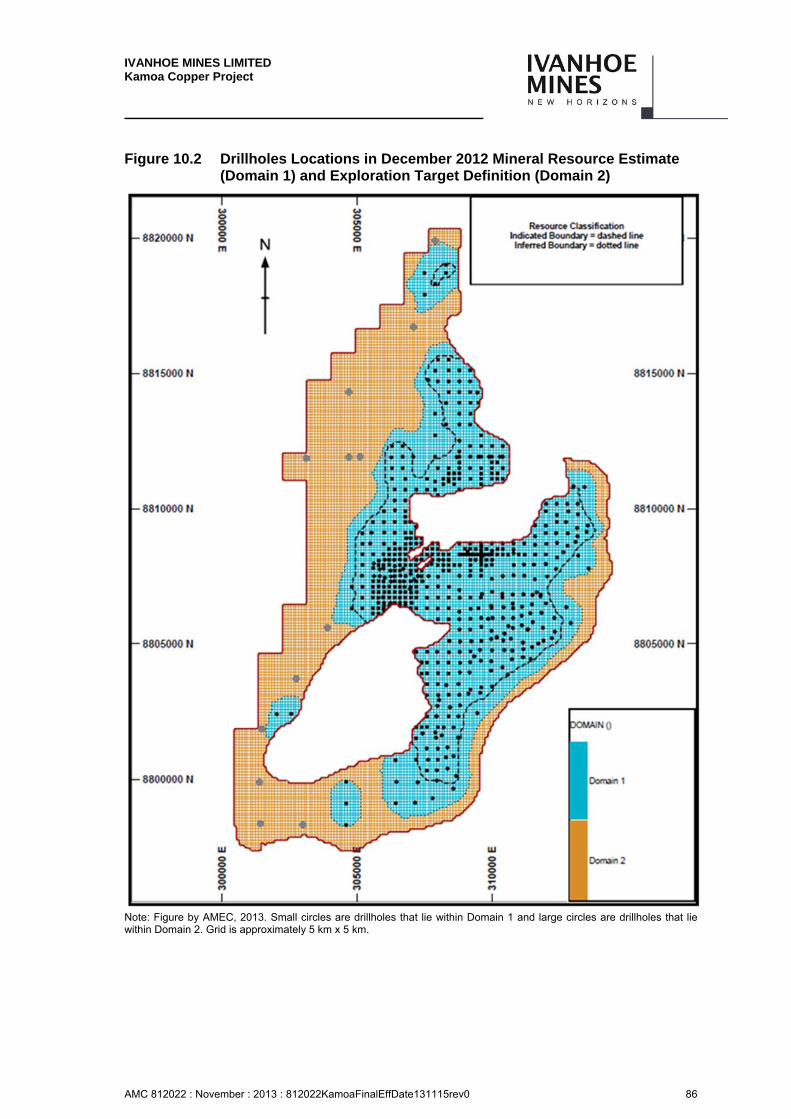
IVANHOE MINES LIMITED Kamoa Copper Project
AMC 812022 : November : 2013 : 812022KamoaFinalEffDate131115rev0 86
Figure 10.2 Drillholes Locations in December 2012 Mineral Resource Estimate (Domain 1) and Exploration Target Definition (Domain 2)
Note: Figure by AMEC, 2013. Small circles are drillholes that lie within Domain 1 and large circles are drillholes that lie within Domain 2. Grid is approximately 5 km x 5 km.
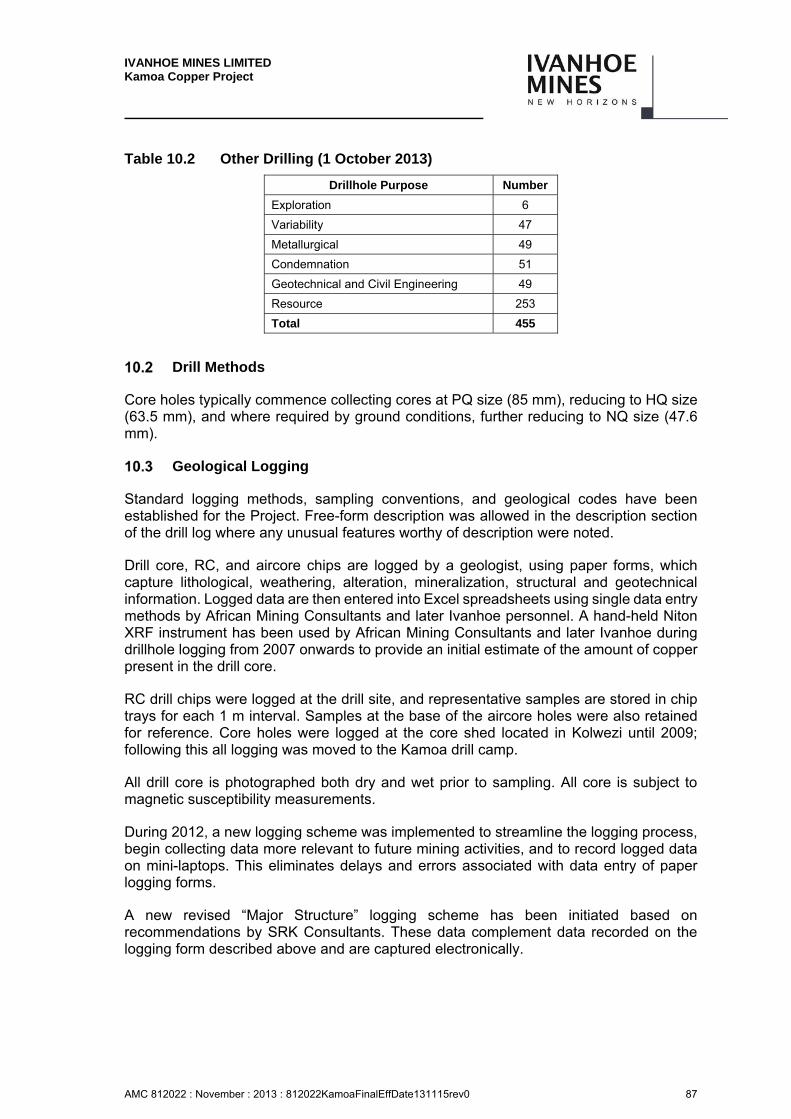
IVANHOE MINES LIMITED Kamoa Copper Project
AMC 812022 : November : 2013 : 812022KamoaFinalEffDate131115rev0 87
Table 10.2 Other Drilling (1 October 2013)
Drillhole Purpose Number
Exploration 6
Variability 47
Metallurgical 49
Condemnation 51
Geotechnical and Civil Engineering 49
Resource 253
Total 455
Drill Methods
Core holes typically commence collecting cores at PQ size (85 mm), reducing to HQ size (63.5 mm), and where required by ground conditions, further reducing to NQ size (47.6 mm).
Geological Logging
Standard logging methods, sampling conventions, and geological codes have been established for the Project. Free-form description was allowed in the description section of the drill log where any unusual features worthy of description were noted.
Drill core, RC, and aircore chips are logged by a geologist, using paper forms, which capture lithological, weathering, alteration, mineralization, structural and geotechnical information. Logged data are then entered into Excel spreadsheets using single data entry methods by African Mining Consultants and later Ivanhoe personnel. A hand-held Niton XRF instrument has been used by African Mining Consultants and later Ivanhoe during drillhole logging from 2007 onwards to provide an initial estimate of the amount of copper present in the drill core.
RC drill chips were logged at the drill site, and representative samples are stored in chip trays for each 1 m interval. Samples at the base of the aircore holes were also retained for reference. Core holes were logged at the core shed located in Kolwezi until 2009; following this all logging was moved to the Kamoa drill camp.
All drill core is photographed both dry and wet prior to sampling. All core is subject to magnetic susceptibility measurements.
During 2012, a new logging scheme was implemented to streamline the logging process, begin collecting data more relevant to future mining activities, and to record logged data on mini-laptops. This eliminates delays and errors associated with data entry of paper logging forms.
A new revised “Major Structure” logging scheme has been initiated based on recommendations by SRK Consultants. These data complement data recorded on the logging form described above and are captured electronically.
IVANHOE MINES LIMITED Kamoa Copper Project
AMC 812022 : November : 2013 : 812022KamoaFinalEffDate131115rev0 88
Historic data from oriented core logging will be integrated with these data. Highlights of the “Major Structure” log are:
Populates two databases, one based on intervals (From/To) and one based on point data (Depth and optional Thickness). The intervals table will mainly contain faults and other damaged zones, while the points table will contain veins, bedding, and discrete fractures/joints.
Data are captured for the entire drillhole. Where possible, orientated data will be captured.
Logging is based on the philosophy of “structural core mapping”, attempting to create an interpreted structural log that illustrates the “character” of the core in a particular drillhole, with the main focus being fault and damage zones. For the interval table, the result is a brief summary log of structures for most holes, and this is complimented by the points table and by the “Detailed Geotech” log being produced by geologists.
Historic core from key areas within the project is being re-logged. If noted, new data are added to the geological logging form.
One sample from each core run is now subjected to magnetic susceptibility, specific gravity, spectral gamma and point load testing.
Core Handling
Core was obtained using wire-line methods and was washed prior to placement in core trays. Aluminium core trays were placed near the core barrel so that the core was placed in the tray in the same orientation as it came out of the barrel. Rubble, which was rarely encountered, was piled to about the length of the whole core that its volume would represent. Trays were marked with the prospect/deposit name, drillhole identity number, the intersection interval (start and final depths in that box), an arrow indicating which side is down-the-hole, and the sequential box number (e.g. Box 6 of 57).
Any break in the core made during removal from the barrel was marked with an “x” on the core. When breakage of the core was required to fill the box, edged tools were used, and the end of every run was marked.
Transport of core boxes to the core shed was undertaken daily by Ivanhoe personnel supervised by either Ivanhoe’s or African Mining Consultants’ geologists. Core-handling logs were completed that included documentation of all personnel involved in any step during the logging and sampling procedures.
Recovery
Core recovery was determined prior to sampling. Typically, a recovery measurement was completed on-site prior to transporting the core, and before detailed logging was completed. Standard core recovery forms were usually completed for each hole by the field assistant or geologist. Core recovery was also measured by the driller and was included in drilling records.
IVANHOE MINES LIMITED Kamoa Copper Project
AMC 812022 : November : 2013 : 812022KamoaFinalEffDate131115rev0 89
Core recovery in the mineralized units ranges from 0% to 100% and averages 95%. Where 0% recovery has been recorded, this is likely due to missing data, as logging does not indicate poor recovery. Visual inspection by AMEC documented the core recovery to be excellent.
Collar Surveys
All drill sites surveyed were supervised by either Ivanhoe or African Mining Consultants personnel using a hand-held GPS that is typically accurate to within about 7 m.
From 2010 through 2013, all completed holes were surveyed by an independent professional surveyor, SD Geomatique, using a differential GPS that was accurate to within 20 mm. Since 11 December, 2012, Ivanhoe has added an additional 288 holes to the database. A total of 66 holes remain to be surveyed. It is expected that SD Geomatique will complete the collar surveys in due course.
Downhole Surveys
Core hole orientations ranged from azimuths of 0° to 360°, with downhole inclinations that ranged from -24.5º to vertical. The inclination of -24.5° was contained in hole DKMC_DD452 at a depth of 1,137 m. Most holes were vertical or subvertical, with 712 of the core holes having collar inclinations that ranged from -50° to vertical.
Core hole depths ranged from a minimum of 42 m to a maximum of 1,706 m, averaging about 250 m.
Downhole surveys for most drillholes were performed by the drilling contractor at approximately 30 m intervals for 2009 drilling and at 50 m intervals for 2010 through 2013 drillholes, using a Single Shot digital downhole instrument that is calibrated every two weeks. The instrument records inclination, azimuth, temperature and magnetic susceptibility at each survey depth. Once the hole is completed, a Reflex Multi Shot survey instrument is used to re-survey the hole to confirm the Single Shot readings.
Several core holes were not downhole surveyed. These holes were either short holes (total depth less than 100 m) or abandoned holes, and the missing surveys do not materially impact the Mineral Resource estimate.
The downhole survey readings are recorded by the driller on the daily drilling record sheets, and the survey certificate supplied by the drilling contractor. The site geologist then enters the downhole data on the drillhole summary sheet.
A total of 404 of the 555 core holes used in resource modeling (see Section 14) were vertical holes (inclination less than -80°) ranging in total depth from 42 m to 1,706 m, and have end-of-hole deviations averaging 3.4 m in easting and 0.4 m in northing. The maximum deviation was 117 m west noted in drillhole DKMC_DD577, which had a total depth of 1,439 m, and 63.4 m north, noted in drillhole DKMC_DD617, which had a total depth of 1,143 m. The remaining 151 holes used in resource modeling were inclined with inclinations ranging from -80° to -24.5°. The average deviation for the inclined holes was 0.7° per 100 m.
IVANHOE MINES LIMITED Kamoa Copper Project
AMC 812022 : November : 2013 : 812022KamoaFinalEffDate131115rev0 90
Given the relatively flat-lying nature of the mineralized units, the majority of the core hole intercepts are more or less normal to the orientation of the mineralized bodies.
10.7.1 Oriented Drill Core
Where core is sufficiently competent to allow orientation surveys to be performed, Ivanhoe collects structural information for geotechnical and geological studies. Initially the spear method was utilized. Although use of the Reflex ACT tool was initiated at drillhole DKMK_DD130, reliable readings were not obtained until drillhole DKMC_DD197, as the operators needed to gain familiarity with the instrument in order to obtain accurate measurements. The results of the programme confirmed shallow to sub-horizontal dips.
Geotechnical Drilling
Since the close-out date for data included in the December 2012 Mineral Resource estimate, Ivanhoe has completed an additional 20 (total depth 6,178.6 m) geotechnical drillholes. There are also 20 (total depth 358.5 m) holes identified as civil geotechnical holes.
Collar locations of geotechnical drillholes completed as at 11 March 2013 are shown in Figure 10.3.
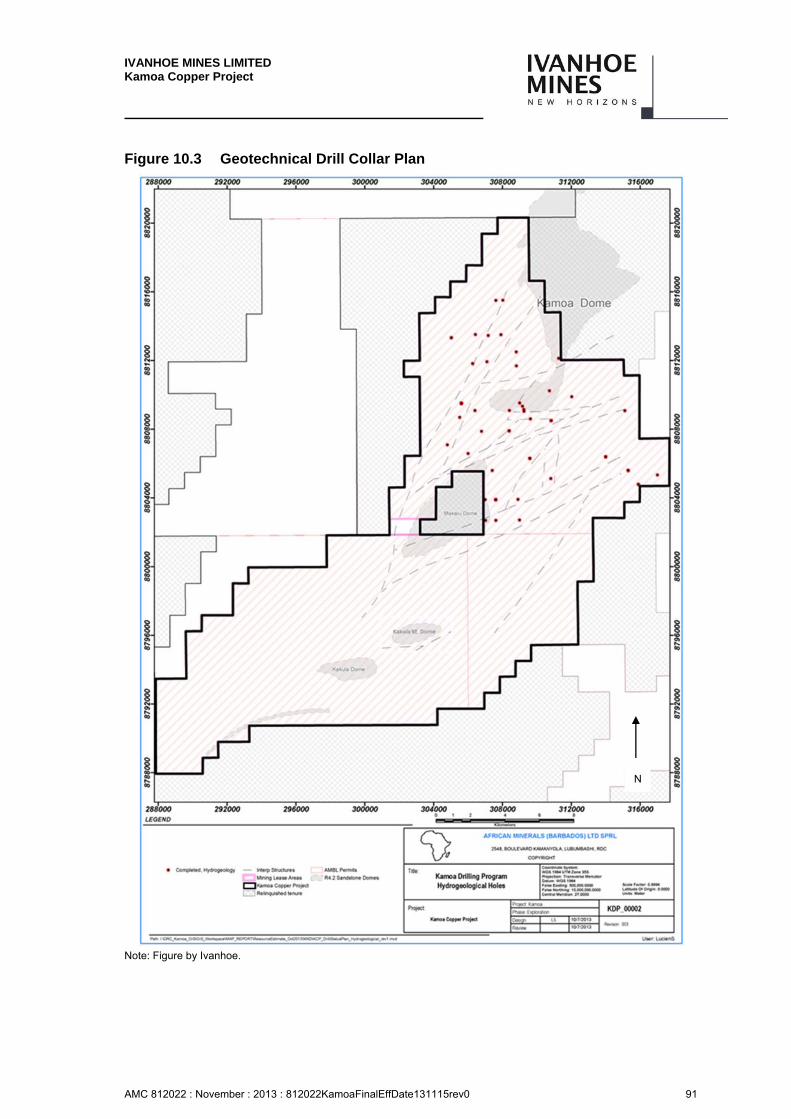
IVANHOE MINES LIMITED Kamoa Copper Project
AMC 812022 : November : 2013 : 812022KamoaFinalEffDate131115rev0 91
Figure 10.3 Geotechnical Drill Collar Plan
Note: Figure by Ivanhoe.
N
IVANHOE MINES LIMITED Kamoa Copper Project
AMC 812022 : November : 2013 : 812022KamoaFinalEffDate131115rev0 92
Hydrogeological Drilling
Golder Associates drilled 16 hydrogeological drillholes (total 2,300 m) during 2010 in order to provide an overview of the groundwater conditions across the concession area and to obtain baseline hydrogeological data.
The location of these drillholes is shown in Figure 10.5. A further 30 hydrogeological drillholes were completed in 2012 to augment the initial data and expand the baseline further south to cover the Kansoko Sud area. The location of these drillholes is also shown on Figure 10.5. During October 2013 a further 10 boreholes (644m) were drilled, 8 of these holes are positioned around the footprint of the Mupenda tailings storage facility as monitoring points to provide detailed information on the groundwater conditions at this site, and 2 were drilled to provide water supply for the initial start up activities on the mine site. The location of these drillholes is also shown on Figure 10.5.
Ivanhoe has also completed two hydrogeology core holes (total depth 208 m) and 47 rotary air blast (RAB) hydrogeology holes (total 8,933.7 m).
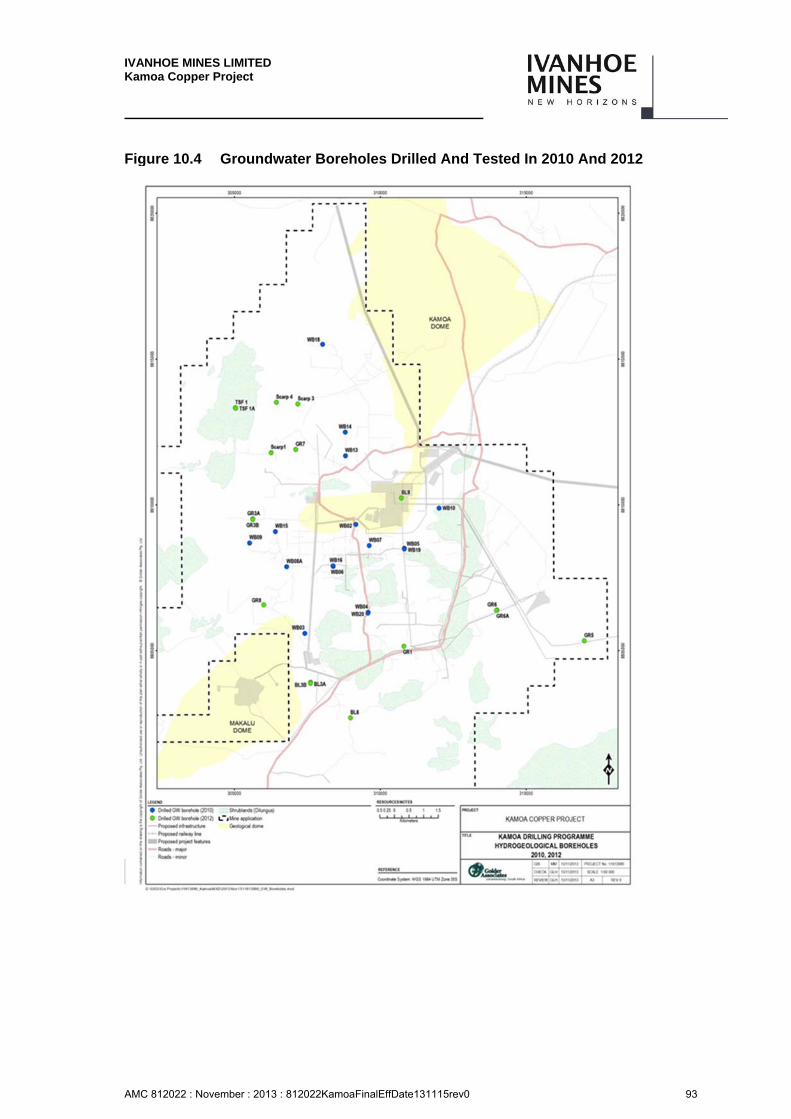
IVANHOE MINES LIMITED Kamoa Copper Project
AMC 812022 : November : 2013 : 812022KamoaFinalEffDate131115rev0 93
Figure 10.4 Groundwater Boreholes Drilled And Tested In 2010 And 2012
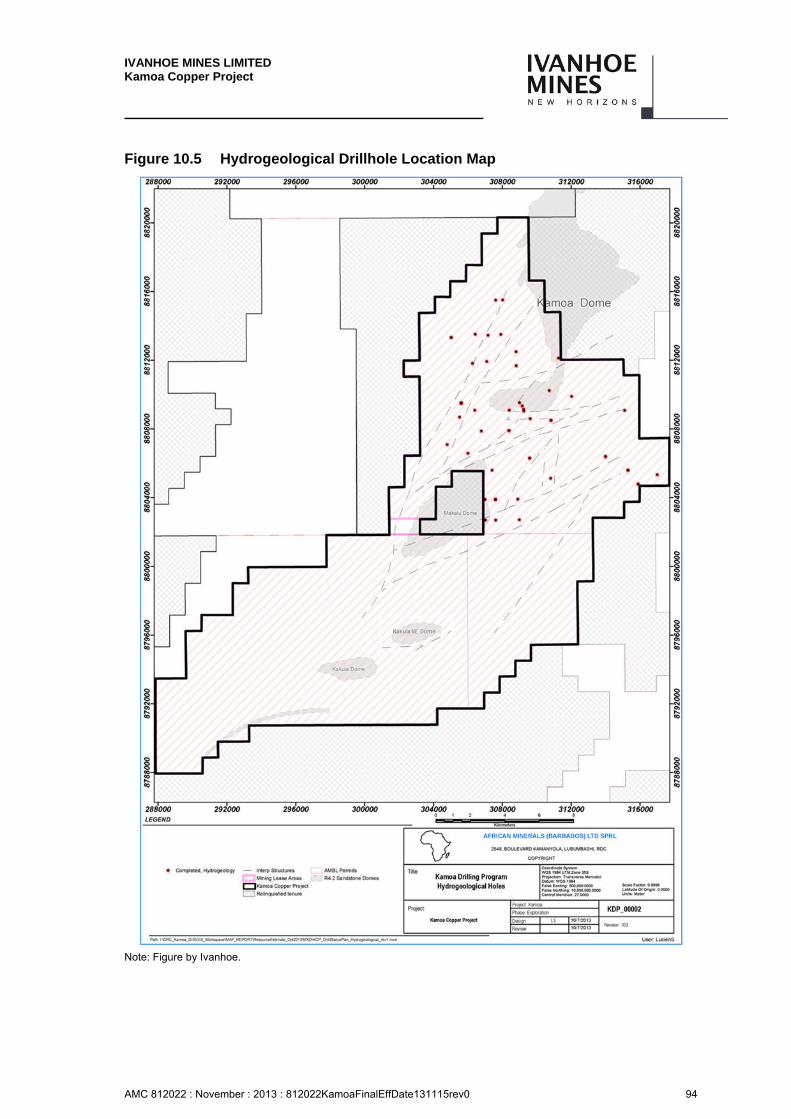
IVANHOE MINES LIMITED Kamoa Copper Project
AMC 812022 : November : 2013 : 812022KamoaFinalEffDate131115rev0 94
Figure 10.5 Hydrogeological Drillhole Location Map
Note: Figure by Ivanhoe.
IVANHOE MINES LIMITED Kamoa Copper Project
AMC 812022 : November : 2013 : 812022KamoaFinalEffDate131115rev0 95
Metallurgical Drilling
The Project database contained 23 metallurgical holes (total depth 4,599m) as of 11 March 2013. An additional 52 metallurgical holes were completed between 12 March 2013 and 14 August 2013 (total depth 12,728.8m). A preliminary programme of metallurgical testwork was carried out by Mintek (Johannesburg, South Africa) between May and June 2010 using 12 composite samples (total of 119.8 m) from 12 core holes from the Kamoa Project. The samples were selected from drill core material mainly derived from the relatively high-grade and shallow Kamoa Sud area. In this area, supergene, mixed and hypogene mineralization occurs.
Some samples from the deeper hypogene mineralization in the eastern part of the deposit were also tested.
These samples were obtained for the purposes of gaining a general understanding of the metallurgical response of the deposit and were not intended to be used to quantify metallurgical parameters for the various geometallurgical units. The Mintek 2010 metallurgical samples were selected from available cores representing known areas within the deposit for the purpose of conducting scouting tests. These were the first metallurgical samples collected from the deposit, and the limitations of the samples were well understood at the time they were collected.
Later in 2010, samples were collected from an additional six drillholes situated away from the previous Kamoa Sud area. Two of the drillhole samples were taken from the Kamoa Centrale region, north of the Kamoa Dome, and four drillhole samples were taken from mineralization along the Kansoko Trend, south-east of Kamoa Sud.
The sampling performed for the Xstrata Process Support (XPS) testwork was carried out in greater detail, and with reference to more extensive drilling and a more advanced mining concept for the deposit. XPS collected samples from 34 holes totalling 258 m, which included mineralization from the Kansoko Centrale (hypogene) and Kamoa Ouest (mixed supergene and hypogene mineralization) for further metallurgical testing.
During early 2013, Ivanhoe collected a suite of samples from the area of the proposed open pits to support flotation and comminution variability testwork for phase 4. Comminution testwork was conducted at Mintek, and flotation variability testwork was conducted at XPS.
The locations of drillholes completed for (or were partially used in) metallurgical testing up to and including Phase 4are shown incc The database was closed for estimation of the updated Mineral Resources on 10 December 2012. As of 1 October 2013, Ivanhoe had completed and received assays for 79 additional core holes (10,984.0 m drilled, 2,469.4 m assayed) within the resource model area. In addition, assay results are pending for 209 holes (48,758.4 m drilled). Of the pending total, three holes (552.5 m) had been abandoned; one of the abandoned holes had been partially sampled. The database was closed for estimation of the updated Mineral Resources on 10 December 2012. As of 1 October 2013, Ivanhoe had completed and received assays for 79 additional core holes (10,984.0 m drilled, 2,469.4 m assayed) within the resource model area. In addition, assay results are pending for 209 holes (48,758.4 m drilled).
IVANHOE MINES LIMITED Kamoa Copper Project
AMC 812022 : November : 2013 : 812022KamoaFinalEffDate131115rev0 96
Of the pending total, three holes (552.5 m) had been abandoned; one of the abandoned holes had been partially sampled (Figure 10.6).
Sample Length/True Thickness
Drill intersections, due to the orientation of the drillholes, are typically greater than the true thickness of the mineralization; however, for the majority of mineralized intercepts a reduction of less than 10% in the intercept length is required to correct to true thickness (Figure 10.7). Intercepts in vertical drillholes, due to the shallow to flat dip of the mineralization, will approximate true thickness; the 151 holes that were inclined at 25° to 80° will have drilled intersections that are greater than the true thickness of mineralization. In some cases the “angle” holes have been purposely drilled sub-perpendicular to the mineralization, and for these holes the intercepted and true thickness will be similar.
Drilling Since the Mineral Resource Database Close-Off Date
The database was closed for estimation of the updated Mineral Resources on 10 December 2012. As of 1 October 2013, Ivanhoe had completed and received assays for 79 additional core holes (10,984.0 m drilled, 2,469.4 m assayed) within the resource model area. In addition, assay results are pending for 209 holes (48,758.4 m drilled). Of the pending total, three holes (552.5 m) had been abandoned; one of the abandoned holes had been partially sampled.
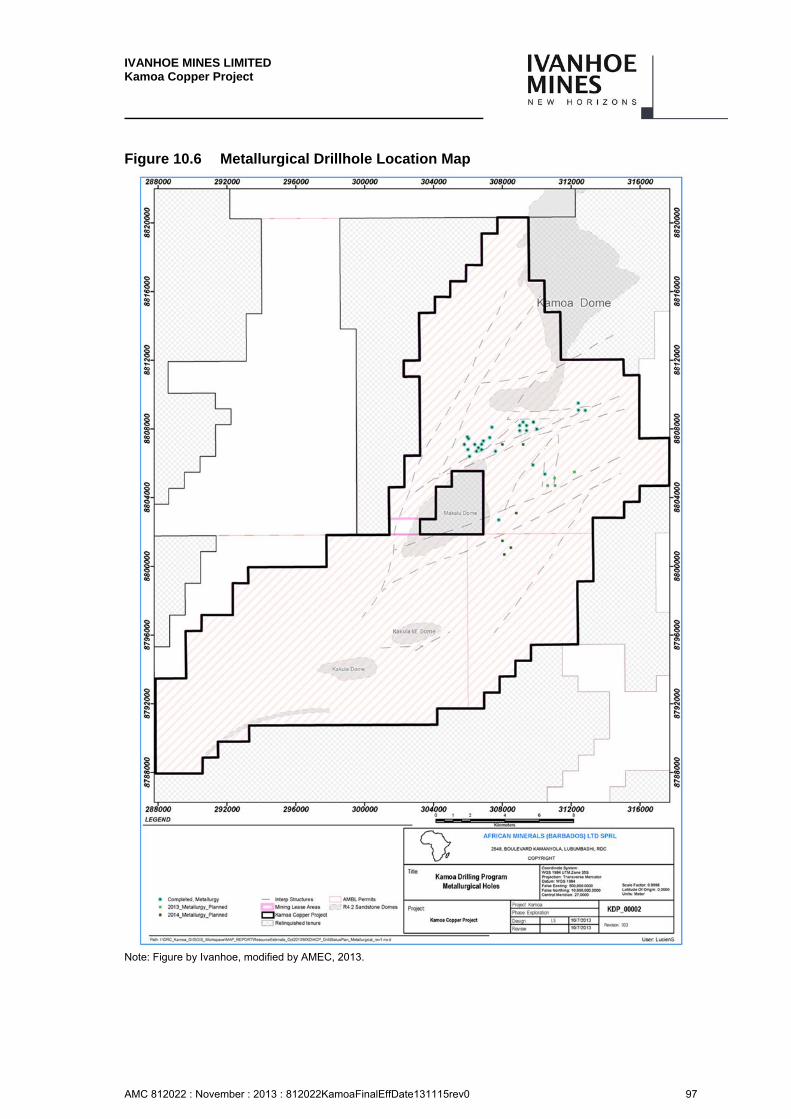
IVANHOE MINES LIMITED Kamoa Copper Project
AMC 812022 : November : 2013 : 812022KamoaFinalEffDate131115rev0 97
Figure 10.6 Metallurgical Drillhole Location Map
Note: Figure by Ivanhoe, modified by AMEC, 2013.
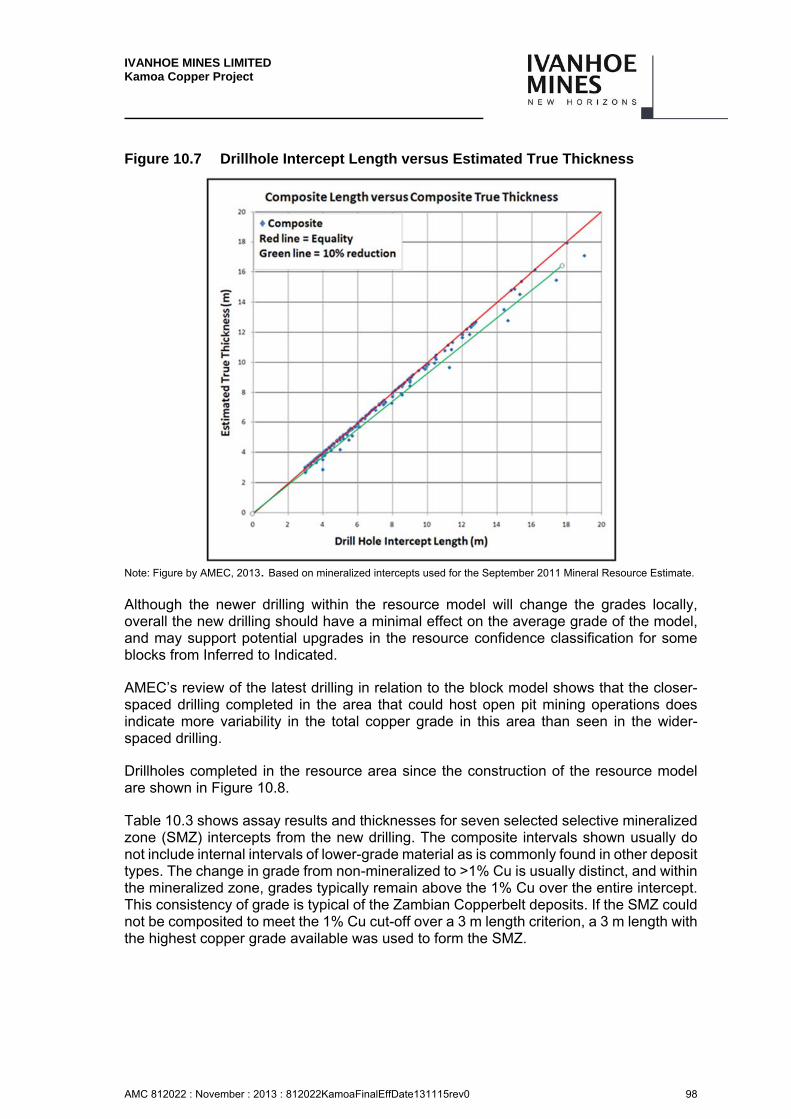
IVANHOE MINES LIMITED Kamoa Copper Project
AMC 812022 : November : 2013 : 812022KamoaFinalEffDate131115rev0 98
Figure 10.7 Drillhole Intercept Length versus Estimated True Thickness
Note: Figure by AMEC, 2013. Based on mineralized intercepts used for the September 2011 Mineral Resource Estimate.
Although the newer drilling within the resource model will change the grades locally, overall the new drilling should have a minimal effect on the average grade of the model, and may support potential upgrades in the resource confidence classification for some blocks from Inferred to Indicated.
AMEC’s review of the latest drilling in relation to the block model shows that the closer-spaced drilling completed in the area that could host open pit mining operations does indicate more variability in the total copper grade in this area than seen in the wider-spaced drilling.
Drillholes completed in the resource area since the construction of the resource model are shown in Figure 10.8.
Table 10.3 shows assay results and thicknesses for seven selected selective mineralized zone (SMZ) intercepts from the new drilling. The composite intervals shown usually do not include internal intervals of lower-grade material as is commonly found in other deposit types. The change in grade from non-mineralized to >1% Cu is usually distinct, and within the mineralized zone, grades typically remain above the 1% Cu over the entire intercept. This consistency of grade is typical of the Zambian Copperbelt deposits. If the SMZ could not be composited to meet the 1% Cu cut-off over a 3 m length criterion, a 3 m length with the highest copper grade available was used to form the SMZ.
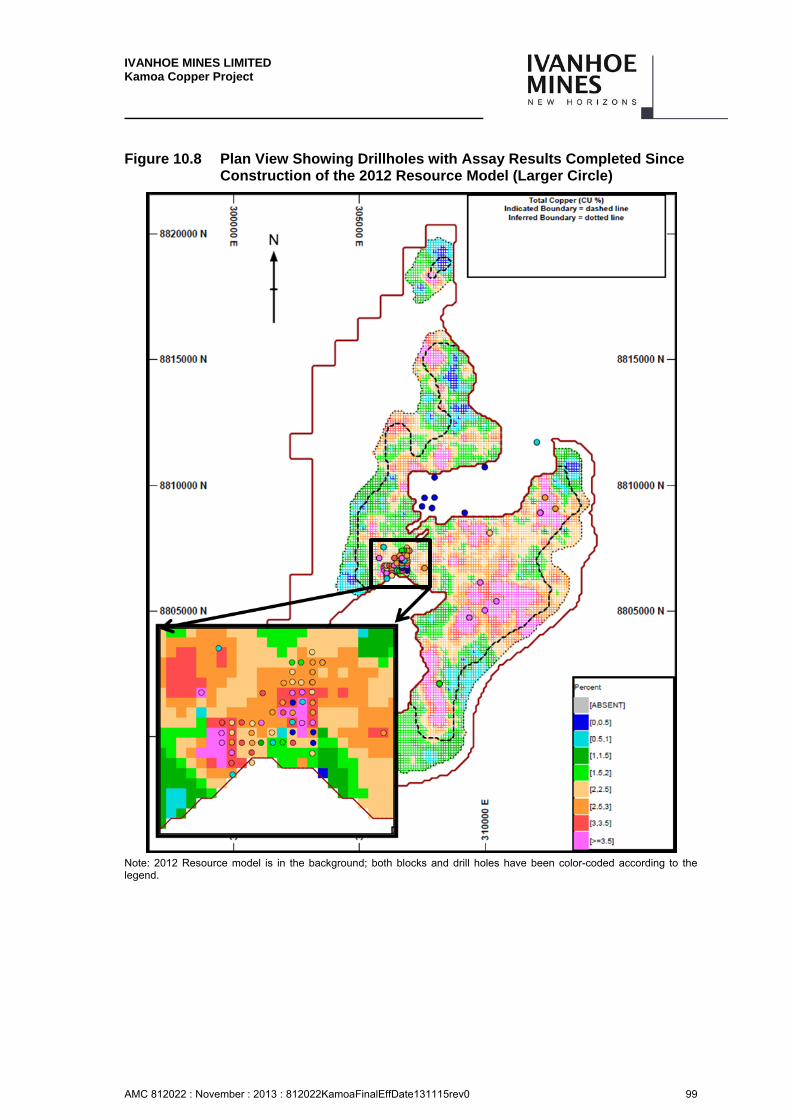
IVANHOE MINES LIMITED Kamoa Copper Project
AMC 812022 : November : 2013 : 812022KamoaFinalEffDate131115rev0 99
Figure 10.8 Plan View Showing Drillholes with Assay Results Completed Since Construction of the 2012 Resource Model (Larger Circle)
Note: 2012 Resource model is in the background; both blocks and drill holes have been color-coded according to the legend.
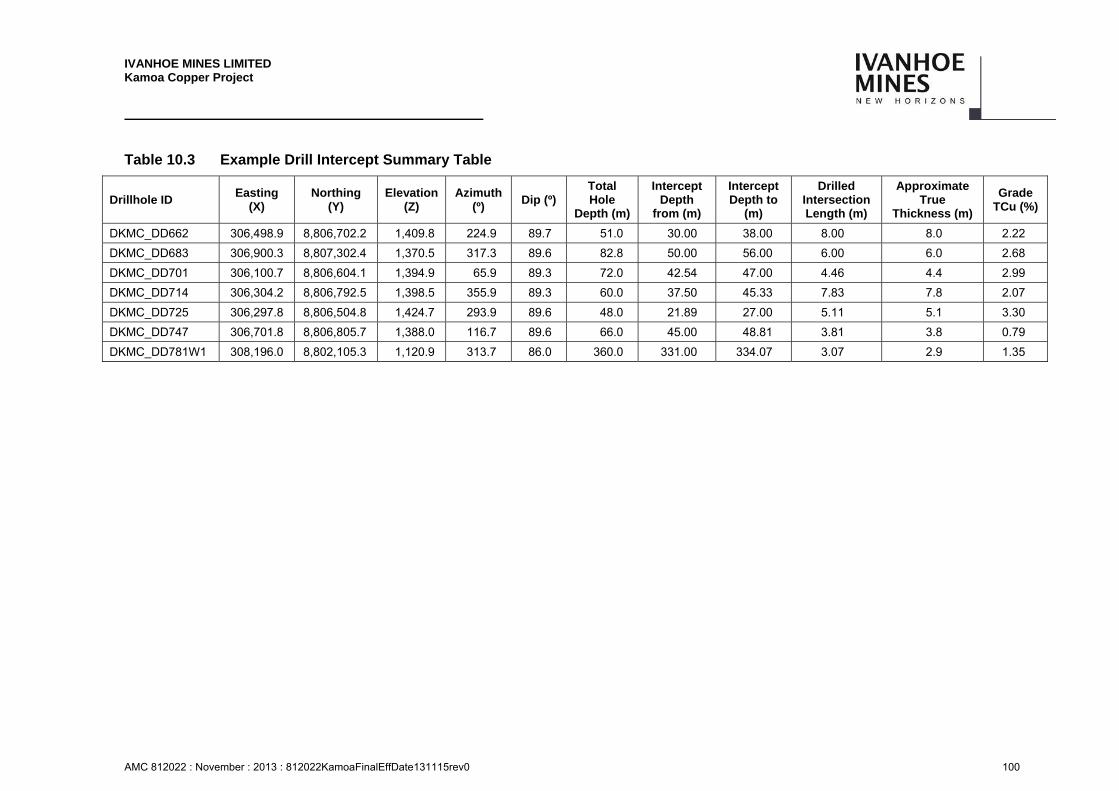
IVANHOE MINES LIMITED Kamoa Copper Project
AMC 812022 : November : 2013 : 812022KamoaFinalEffDate131115rev0 100
Table 10.3 Example Drill Intercept Summary Table
Drillhole ID Easting
(X) Northing
(Y) Elevation
(Z) Azimuth
(º) Dip (º)
Total Hole
Depth (m)
Intercept Depth
from (m)
Intercept Depth to
(m)
Drilled Intersection Length (m)
Approximate True
Thickness (m)
Grade TCu (%)
DKMC_DD662 306,498.9 8,806,702.2 1,409.8 224.9 89.7 51.0 30.00 38.00 8.00 8.0 2.22
DKMC_DD683 306,900.3 8,807,302.4 1,370.5 317.3 89.6 82.8 50.00 56.00 6.00 6.0 2.68
DKMC_DD701 306,100.7 8,806,604.1 1,394.9 65.9 89.3 72.0 42.54 47.00 4.46 4.4 2.99
DKMC_DD714 306,304.2 8,806,792.5 1,398.5 355.9 89.3 60.0 37.50 45.33 7.83 7.8 2.07
DKMC_DD725 306,297.8 8,806,504.8 1,424.7 293.9 89.6 48.0 21.89 27.00 5.11 5.1 3.30
DKMC_DD747 306,701.8 8,806,805.7 1,388.0 116.7 89.6 66.0 45.00 48.81 3.81 3.8 0.79
DKMC_DD781W1 308,196.0 8,802,105.3 1,120.9 313.7 86.0 360.0 331.00 334.07 3.07 2.9 1.35
IVANHOE MINES LIMITED Kamoa Copper Project
AMC 812022 : November : 2013 : 812022KamoaFinalEffDate131115rev0 101
Comments on Section 10
In the opinion of the AMEC QPs, the quantity and quality of the lithological, geotechnical, collar, and downhole survey data collected in the core drill programmes is sufficient to support Mineral Resource estimation as follows:
Drill intersections, due to the orientation of the drillholes, are typically slightly greater than the true thickness of the mineralization.
Drillhole orientations are generally appropriate for the mineralization style.
Core logging meets industry standards for sediment-hosted copper exploration.
Collar surveys were performed using industry-standard instrumentation.
Downhole surveys provide appropriate representation of the trajectories of the core holes.
Core recoveries are typically excellent.
The SMZ can include both lower- and higher-grade mineralization; however, the change in grade from non-mineralized to >1% Cu is usually distinct, and within the mineralized zone, grades typically remain above the 1% Cu over the entire intercept.
No material factors were identified with the data collection from the drill programmes that could affect Mineral Resource estimation.
IVANHOE MINES LIMITED Kamoa Copper Project
AMC 812022 : November : 2013 : 812022KamoaFinalEffDate131115rev0 102
11 SAMPLE PREPARATION, ANALYSES, AND SECURITY
Witness Sampling
Ivanhoe collects and maintains “witness samples”, which are reference pulp samples required by the Government of the DRC for all samples being sent out of the DRC for analysis.
An additional government requirement is that quarter-core is also retained for witness samples. The first three core holes at Kamoa were quarter-core sampled to adhere to governmental requirements, and these witness samples have been stored in the Kamoa sample storage facility. Quarter-core sampling ceased in January 2008, and all samples subsequent to that date have been half-core samples. Should such a request be made, Ivanhoe will provide either quarter core samples to the DRC Government from the archived half core or sample pulps as appropriate.
Sampling Methods
11.2.1 Geochemical Sampling
Stream-sediment samples were collected from suitable drainages, as 2 kg to 5 kg samples, and the sample location points were recorded using a GPS. Samples were subsequently dried and sieved to -150 µm at the mobile exploration base camp. An appropriate subsample was selected from the sieved sample, and the subsamples were placed into paper bags for laboratory despatch.
Soil samples were collected from the B horizon depth (30 cm to 40 cm) as 4–5 kg samples, and the sample location points were recorded using a GPS. Soil samples were transported to the appropriate mobile base camp for drying and sieving to minus 80 mesh. An appropriate subsample was selected from the sieved sample, and the subsamples were placed into paper bags for laboratory despatch.
Aircore drill samples were typically taken at the point of blade refusal, which corresponds to the base of the drillhole. One sample was taken per drillhole, and each sample typically weighed about 2 kg to 5 kg. A representative sample is retained for each hole and is placed in chip trays that are stored in the Kolwezi storage facility.
11.2.2 RC Sampling
Reverse circulation (RC) samples were taken at 1 m length intervals and riffled down into two samples of approximately 1 kg each in the field using a three-stage Jones riffle-splitter, one for reference and one for homogenization with the next metre sample, to create a 2 m composite sample. All reject material was disposed of in the field. During sampling, duplicate samples were typically taken at a frequency of one duplicate for each group of 20 samples.
Homogenization was achieved by mixing the 1 kg samples in clean plastic bowls, and then splitting the homogenized sample using a single-stage Jones riffle-splitter to produce one sample for assay and one composite sample for reference. The 1 kg sample for analysis was submitted to the Kolwezi sample preparation facility.
IVANHOE MINES LIMITED Kamoa Copper Project
AMC 812022 : November : 2013 : 812022KamoaFinalEffDate131115rev0 103
Prepared and reference samples were placed in courier boxes for submission to the analytical laboratory, and for submission to the DRC government geological department as part of the obligation to supply witness samples.
11.2.3 Core Sampling
Drillholes DMAK_DD001 to DMAK_DD003 were subject to quarter-core sampling in 2006; quarter-core sampling was discontinued in January 2008.
The current core sampling procedure from January 2008 to date is as follows.
Sampling positions for un-oxidized core are marked (after the completion of the geotechnical logging) along projected orientation lines.
Pre-February 2010, determination of the sample intervals took into account lithological and alteration boundaries. The entire length of core from 4 m (or one core-tray length whichever is convenient) above the first presence of mineralization and/or the mineralized zone is sampled on nominal whole 1 m intervals to the end of the hole, which is generally 5 m below the Ki1.1/R4.2 contact. Most intervals with visual estimates of >0.1% Cu are sampled at 1.5 m intervals or less.
After February 2010, the sampling of the KPS (Ki1.1.2) and mineralized basal diamictite was conducted as follows:
The mineralized zone was sampled on 1 m sample intervals (dependent on geological controls).
The Kamoa pyritic siltstone (Ki1.1.2) was sampled every 1 m, and composites were made over 3 m for analytical purposes. (Note that there is a 3 m shoulder left above the first visible sign of copper mineralization in each drillhole).
After March 2011, 9 m composite samples were collected in the hanging wall and analysed by Niton. The results are used to characterize the geochemisty of the hanging wall material.
Sample numbers, core quality, and “from” and “to” depths were recorded on a standard sample sheet.
Start and end of each sample were marked off.
Core is cut in half for sampling (along the projected orientation lines) using a standard diamond saw. The cut line (for splitting) is typically offset from the core orientation line by 2 cm clockwise looking downhole, with the half section that contains the core orientation line retained in the core trays for geological logging and record purposes. The half-core along the right hand side of the projected orientation lines is sampled and sent to the preparation laboratory.
Oxide-zone samples are split using a palette knife, and the same sample protocol that is used for un-oxidized core is then applied.
Where core is broken and cannot be cut, samplers use judgment and experience to collect half of the core from the tray. Core samplers have been trained by geologists.
IVANHOE MINES LIMITED Kamoa Copper Project
AMC 812022 : November : 2013 : 812022KamoaFinalEffDate131115rev0 104
One-half core samples not sent for preparation are placed in metal trays and stored at the Kamoa core shed (official core storage facility). The core storage facility is comprised of three lockable buildings with 24-hour security personnel in place.
Metallurgical Sampling
The Mintek metallurgical samples were selected from available coarse reject material obtained from the core hole assay sample preparation. This material is prepared from the sawn drill core which is crushed to a nominal 2 mm using jaw crushers. A quarter split (500 g to 1,000 g) is pulverized and submitted for assay. The remaining coarse reject material is retained.
The Xstrata Process Support (XPS) metallurgical samples were half HQ core; the core was then individually crushed to -3.36 mm topsize, followed by blending and sub-sampling by spinning riffler into 2.0 kg replicate test charges.
Upon receipt at the testing laboratories all metallurgical test samples were placed in refrigerated storage to inhibit oxidation.
Samples collected in 2013 for Phase 4 (Open Pit) consisted of a mixture of whole PQ and half PQ core. Comminution tests used sections of full core and half core, while metallurgical tests were done on 2 x quarter core sections.
Specific Gravity Determinations
Specific gravity measurements were performed using a water immersion method by Ivanhoe personnel supervised by either Ivanhoe’s personnel or African Mining Consultants’ geologists. Samples were conventionally weighed in air and then in water. As a check, African Mining Consultants took carefully-measured cylinders of dry core, calculated a volume and weighed them dry to arrive at a specific gravity. The cylinders were then weighed in water and the specific gravity calculated by the same method as for all other samples. The relative difference was <2%. The scales were regularly calibrated using set weights, and also using clean quartz crystals, to give a constant specific gravity of 2.64 for the quartz crystals.
A total of 12,500 specific gravity measurements were performed on samples taken from drill core.
Analytical and Test Laboratories
Two independent laboratories have been used for primary sample analysis, Genalysis Laboratory Services Pty. Ltd. (Genalysis; from 2007 part of the Intertek Minerals Group), and Ultra Trace Geoanalytical Laboratory (Ultra Trace, from 2008 owned and operated by the Bureau Veritas Group). Both laboratories are located in Perth, Western Australia, and both have ISO 17025 accreditation.
Genalysis performed soil and stream-sediment analysis for the Project for the period 2004 to June 2005.
IVANHOE MINES LIMITED Kamoa Copper Project
AMC 812022 : November : 2013 : 812022KamoaFinalEffDate131115rev0 105
Subsequent to June 2005, all analyses, including drill samples, have been performed by Ultra Trace, with Genalysis used as a check laboratory for 2009 core samples.
ALS Vancouver, British Columbia, acted as the check laboratory for drill core samples from part of the 2009 programme and for 2010 through 2013 drilling. ALS Chemex is ISO:9000:2008 registered and ISO:17025-accredited. It is expected that the 2013 check assays will be performed toward the end of 2013, or at the end of the drill programme.
Sample Preparation and Analysis
A mobile sample preparation facility housed in a shipping container was purchased in Zambia in 2006, and relocated to Kolwezi in the DRC. This facility contains two jaw crushers and two LM2® puck-and-bowl pulverizers. The laboratory is managed by Ivanhoe personnel and was monitored by Richard Carver of GCXplore Ltd. between 2006 and 2009.
A 500 g to 1,000 g RC sample is reduced to >90% -75 µm, using the LM2® puck and bowl pulverizers. Two samples are subsequently split from the pulp; one 30 g sample is sent for analysis, and the second 100 g split is retained as a reference sample, and is stored in Kolwezi. Aircore samples from the 2008 drilling were processed in a similar manner to the RC samples.
All drill-core samples collected prior to November 2010 were processed by the Kolwezi facility; subsequently they have been processed at the new Kamoa site facility. Core samples are delivered from the core logging facility to the sample preparation facility by truck. Prepared samples are shipped to the analytical laboratory in sealed sacks that are accompanied by appropriate paperwork, including the original sample preparation request numbers and chain-of-custody forms. On arrival at the sample preparation facility, samples are checked, and the sample forms are signed. Sacks are not opened until sample preparation commences.
Sawn drill core is sampled on 1 m intervals, and then the sawn core is crushed to nominal 2 mm using jaw crushers. A quarter split (500 g to 1,000 g) is pulverized in the same manner as the RC samples. The remaining coarse reject material is retained. A 100 g split is sent for assay; three 50 g samples are kept as government witness samples, 30 g for Niton analysis, and approximately 80 g of pulp is retained as a reference sample.
About 5% (approximately one in 20) of the crushed samples have a 2 mm screen test performed, and a further 5% at the pulverization stage are checked using a 75 µm screen test. Pulp bags of the pulverized material are then labelled and bagged for shipment by air to Western Australia. From 2010, Ivanhoe has been weighing the pulp samples and records the weight prior to shipping.
Certified reference materials and blanks are included with the sample submissions. Ivanhoe commissioned a second, dedicated sample preparation facility on-site at Kamoa in November 2010. The equipment at the facility includes a TM Terminator Jaw crusher, Labtech Essa LM-2® pulverizer and a riffle splitter. This facility has been in use since drillhole DKMC_DD209.
IVANHOE MINES LIMITED Kamoa Copper Project
AMC 812022 : November : 2013 : 812022KamoaFinalEffDate131115rev0 106
Sample Analysis
11.7.1 Genalysis Laboratory
In 2004, all soil and stream-sediment samples were analyzed by Genalysis. The -50 µm sieved sample, as received by the laboratory, was pulped to 90% passing -75 µm. The analytical method used for Au, Pt, and Pd involved reading by inductively coupled plasma-mass spectrometer (ICPMS) following a 25 g lead collector fire assay (Genalysis method FA25/MS). The elements Cu, Co, Ni, Fe, Mn, Ag, As, Zn, and Bi were determined using inductively coupled plasma (ICP) optical emission spectroscopy (OES) following a hydrofluoric–nitric–perchloric–hydrochloric acid digestion (Genalysis AT/OES method).
From January to June 2005, soil and stream-sediment samples were analyzed for a suite that ranged from five to 16 elements, depending on the analytical request from the geologist. Genalysis performed a 10 g aqua-regia digest with inductively coupled plasma optical emission spectroscopy/mass spectrometer (ICP-OES/MS) finish, analyzing for elements that could include Cu, Co, Ni, Fe, Mn, Ag, As, Zn, Bi, Mo, Ba, Ti, Cr, Pb, and Au.
11.7.2 Ultra Trace Laboratory
For all soil and stream-sediment samples, a 4 g sample was taken from the pulps, and digested using an aqua-regia digest. Samples were analyzed for Cu, Co, Ni, Zn, As, Mo, Au, Ag, Ba, Bi, Cr, Fe, Mn, Pb, and U via ICP-OES/MS.
Aircore, RC and diamond drillhole samples for all programmes from 2008 to February 2009 were analyzed for Cu, Zn, Co (ICP-OES), and Pb, Zn, Mo, Au, Ag, and U (ICP-MS) using a 4 gram subsample of the pulp using an aqua-regia digest (Ultra Trace method AR105, (ICP-OES) or AR305/AR001 (ICP-MS).
From January to July 2010, drill core samples were also analyzed for Ca, Co, Cr, Cu, Fe, Mn, Ni, S, and Zn (ICPOES), and Ag, As, Au, Ba, Bi, Mo, Pb, Se, Te and U (ICP- MS) using a 4 gram subsample of the pulp using mixed acid digest (Ultra Trace method ICP102 (ICP -AES) or ICP302/AR001 (ICP-MS).
Diamond drill samples from January 2010 onward were also analyzed for acid-soluble copper (ASCu) using a 5% sulphuric acid leach method at room temperature for 60 minutes. AMEC recommends that samples obtained in 2008 and 2009 be submitted for ASCu analysis. As of 1 October 2013, this had not been undertaken.
Samples subsequent to August 2010 were subjected to different analytical procedures that were requested based on the sample stratigraphic location. Samples within the KPS (Ki1.1.2) were analyzed for Cu, S (Ultra Trace method MA101, ICP-AES), and As (Ultra Trace method MA102, ICP-MS). Samples within the mineralized basal diamictite were analysed for Cu, Fe, S (Ultra Trace method MA101), Ag, and As (Ultra Trace method MA102).
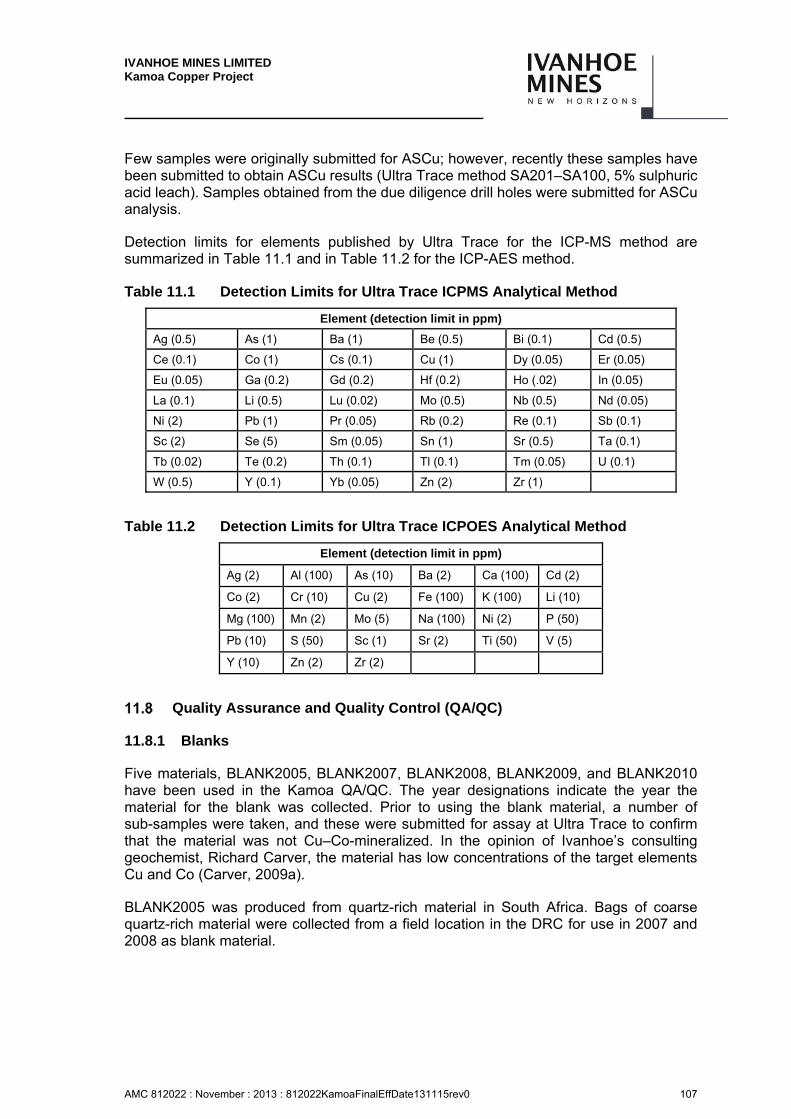
IVANHOE MINES LIMITED Kamoa Copper Project
AMC 812022 : November : 2013 : 812022KamoaFinalEffDate131115rev0 107
Few samples were originally submitted for ASCu; however, recently these samples have been submitted to obtain ASCu results (Ultra Trace method SA201–SA100, 5% sulphuric acid leach). Samples obtained from the due diligence drill holes were submitted for ASCu analysis.
Detection limits for elements published by Ultra Trace for the ICP-MS method are summarized in Table 11.1 and in Table 11.2 for the ICP-AES method.
Table 11.1 Detection Limits for Ultra Trace ICPMS Analytical Method
Element (detection limit in ppm)
Ag (0.5) As (1) Ba (1) Be (0.5) Bi (0.1) Cd (0.5)
Ce (0.1) Co (1) Cs (0.1) Cu (1) Dy (0.05) Er (0.05)
Eu (0.05) Ga (0.2) Gd (0.2) Hf (0.2) Ho (.02) In (0.05)
La (0.1) Li (0.5) Lu (0.02) Mo (0.5) Nb (0.5) Nd (0.05)
Ni (2) Pb (1) Pr (0.05) Rb (0.2) Re (0.1) Sb (0.1)
Sc (2) Se (5) Sm (0.05) Sn (1) Sr (0.5) Ta (0.1)
Tb (0.02) Te (0.2) Th (0.1) Tl (0.1) Tm (0.05) U (0.1)
W (0.5) Y (0.1) Yb (0.05) Zn (2) Zr (1)
Table 11.2 Detection Limits for Ultra Trace ICPOES Analytical Method
Element (detection limit in ppm)
Ag (2) Al (100) As (10) Ba (2) Ca (100) Cd (2)
Co (2) Cr (10) Cu (2) Fe (100) K (100) Li (10)
Mg (100) Mn (2) Mo (5) Na (100) Ni (2) P (50)
Pb (10) S (50) Sc (1) Sr (2) Ti (50) V (5)
Y (10) Zn (2) Zr (2)
Quality Assurance and Quality Control (QA/QC)
11.8.1 Blanks
Five materials, BLANK2005, BLANK2007, BLANK2008, BLANK2009, and BLANK2010 have been used in the Kamoa QA/QC. The year designations indicate the year the material for the blank was collected. Prior to using the blank material, a number of sub-samples were taken, and these were submitted for assay at Ultra Trace to confirm that the material was not Cu–Co-mineralized. In the opinion of Ivanhoe’s consulting geochemist, Richard Carver, the material has low concentrations of the target elements Cu and Co (Carver, 2009a).
BLANK2005 was produced from quartz-rich material in South Africa. Bags of coarse quartz-rich material were collected from a field location in the DRC for use in 2007 and 2008 as blank material.
IVANHOE MINES LIMITED Kamoa Copper Project
AMC 812022 : November : 2013 : 812022KamoaFinalEffDate131115rev0 108
Material for BLANK2009 was collected in the Lualaba River, by Nzilo, about 40 km from Kolwezi. The material in these bags was then crushed to -2 mm ready for use as a blank in the pulverising stage of the sample preparation.
BLANK2010 is a coarse silica material obtained from ALS Chemex; it is inserted into the sample preparation stage prior to the crushing of samples.
The BLANK2008 and BLANK2009 material was continued to be used for the 2010 drill programmes. BLANK2010 has been used in the 2010 through 2013 drill programmes. One blank per 20 samples was inserted prior to the samples being pulverized.
11.8.2 Duplicates
One duplicate was taken every 20 samples. This was achieved by taking a second 1 kg split of the drill interval being sampled for the reverse circulation drilling. For the diamond drilling, a preparation duplicate was created for every 20th sample by taking a second split following the crushing stage of the sample preparation. AMEC also compiled Ultra Trace’s QC control duplicates (same-pulp same-batch laboratory duplicates) from the laboratory reports.
11.8.3 Certified Reference Materials
Certified reference materials (CRMs) were sourced from independent companies, Geostats and Ore Research (OREAS), both located in Australia, and African Mineral Standards (AMIS), a division of Set Point Technology, located in South Africa. To date, a total of 63 CRMs have been used, although there are 20 CRMs commonly used. For the 2005 RC programme, these CRMs were inserted in Zambia by an African Mining Consultants representative, who placed the CRMs in sample number positions as indicated by the field geologist. Since 2006, CRMs have been inserted by Ivanhoe personnel in Kolwezi, and since November 2010 have been inserted by Ivanhoe personnel at the Kamoa Project site.
Databases
Project data are stored in various digital files. Geological logs, collar, and downhole survey data were hand-entered at the Kolwezi office into Word and Excel files. Data are currently entered at the Kamoa (site) office, and no longer in Kolwezi. Assay data are imported directly from electronic files provided by the assay laboratory.
Original hard-copy data are stored in Ivanhoe’s Kamoa site office. Digital data are regularly backed up in compliance with internal company control procedures. The backup media are securely stored off-site.
IVANHOE MINES LIMITED Kamoa Copper Project
AMC 812022 : November : 2013 : 812022KamoaFinalEffDate131115rev0 109
Sample Security
Transport and security procedures from the sample site to the sample preparation facilities and thence to the laboratory are discussed in Section 11.5.
Paper records are kept for all assay and QA/QC data, geological logging and specific gravityinformation, and downhole and collar coordinate surveys. All paper records are filed by drillhole for quick location and retrieval of any information desired. Assays, downhole surveys, and collar surveys are stored in the same file as the geological logging information. In addition, sample preparation and laboratory assay protocols from the laboratories are monitored and kept on file.
RC and aircore chip trays are stored in the Kolwezi compound. Half and quarter core reference samples are stored in metal trays in a purpose-designated core storage shed. Prior to July 2010, sample rejects and pulps for core, RC, and aircore samples were catalogued and stored in the Kolwezi compound. Since July 2010, all new core samples are stored at a lockable storage facility at the Kamoa camp. Historical core has been moved from Kolwezi to the facility at the Kamoa camp. The RC and aircore samples remain at the Kolwezi storage facility.
Comments on Section 11
The AMEC QPs note:
A description of the geology and mineralization of the deposits, which includes rock types, geological controls and widths of mineralized zones, is given in Section 7.
A description of the sampling methods, location, type, nature, and spacing of samples is included in Section 9 and Section 10, with appropriate location plans to show the density of sampling and areas sampled.
A description of the drilling programmes, including sampling and recovery factors, are included in Section 10. Review of these programmes indicates that there are no issues that could affect Mineral Resource estimation.
In the absence of detailed comparisons between RC and core samples, in the AMEC QPs’ opinion, Ivanhoe made the correct decision to exclude RC samples from the dataset used for Mineral Resource estimation for both the estimate supporting the 2012 PEA and for this current update.
The core drill sample results have outlined a large area of continuous mineralization on the flanks of the Kamoa and Makalu domes. The exploration is as yet incomplete, with only part of the area having been drilled at the 800 m spacing that the AMEC QPs consider to be the minimum spacing required at present to estimate Inferred Mineral Resources at Kamoa.
Drilling to date indicates that the size of the sampled area is representative of the distribution and orientation of the mineralization. Holes have been drilled sub-perpendicular to the mineralization, and local infill drilling has been completed to 400 m, 200 m, and 100 m spacings.
IVANHOE MINES LIMITED Kamoa Copper Project
AMC 812022 : November : 2013 : 812022KamoaFinalEffDate131115rev0 110
A summary of typical drillhole intercepts is shown in Table 10.3 and Figure 7.5 to Figure 7.7 in Section 7 using a 1.0% Cu cut-off grade. The intercept table confirms that sampling was representative of the copper grades in the deposits, reflecting areas of higher and lower grades.
Data validation of the drilling and sampling programme is discussed in Section 12, and the discussion includes review of database audit results, independent sampling, and QA/QC.
In the opinion of the AMEC QPs, the sampling methods acceptable, consistent with industry-standard practice, and adequate for Mineral Resource estimation purposes, based on the following:
Data are collected following company-approved sampling protocols.
Sampling has been performed in accordance with industry-standard practices.
Sample intervals of 1 m for RC drilling, and approximately 1 m for core drilling, broken at lithological and mineralization changes in the core, are typical of sample intervals used for Copperbelt-style mineralization in the industry.
Samples are taken for assay depending on location, stratigraphic position, and observation of copper mineralization.
Sampling is considered to be representative of the true thicknesses of mineralization. Not all drill core is sampled; sampling depends on location in the stratigraphic sequence and logging of visible copper-bearing minerals.
The specific gravity determination procedure is consistent with industry-standard procedures. There are sufficient specific gravity determinations to support the specific gravity values utilized to estimate the resource tonnage.
Preparation and analytical procedures are in line with industry-standard methods for Copperbelt-style copper mineralization, and suitable for the deposit type.
The QA/QC programme comprising blank, CRM, and duplicate samples used on the Project meets QA/QC submission rates and industry-accepted standards.
Sample security has relied upon the fact that the samples were always attended or locked in the on-site sample preparation facility. The chain-of-custody procedure consists of filling out sample submittal forms that are sent to the laboratory with sample shipments to make certain that all samples are received by the laboratory.
Current sample-storage procedures and storage areas are consistent with industry standards.

IVANHOE MINES LIMITED Kamoa Copper Project
AMC 812022 : November : 2013 : 812022KamoaFinalEffDate131115rev0 111
12 DATA VERIFICATION
AMEC Verification
12.1.1 2009 Verification
AMEC reviewed the data available to support Mineral Resource estimation as of end June, 2009. Reviews included checking of collar co-ordinates, drill collar elevations and orientations, downhole and collar survey data, geological and mineralization logging, and assay and specific gravity data. No significant errors were noted that could affect Mineral Resource estimation.
Reviews were also performed on CRM, blank and duplicate analytical data and screen tests; no biases that could affect Mineral Resource estimation were observed.
12.1.2 2010 Verification
AMEC reviewed the data available to support Mineral Resource estimation as of end July, 2010 (Long, 2010, Reid 2010b). Reviews included checking of collar co-ordinates, drill collar elevations and orientations, downhole and collar survey data, geological and mineralization logging, and assay and specific gravity data. No significant errors were noted that could affect Mineral Resource estimation.
Reviews were also performed on CRM, blank and duplicate analytical data and screen tests, no biases that could affect Mineral Resource estimation were observed.
AMEC suggested changes to improve the mineral abundance logging in order to reduce overestimation of sulphide mineral abundances.
12.1.3 2011–2012 Verification
From September 2011 to December 2012, AMEC conducted monthly audits of the additional collar, downhole survey, geology and assay data collected to ensure the data quality has been maintained. Any discrepancies noted were supplied to site, and corrections to the database were implemented. In December 2012, it was decided to perform quarterly audits from that point onwards.
AMEC reviewed the data available to support Mineral Resource estimation as of end December 2012. No significant errors were noted that could affect Mineral Resource estimation.
Reviews were also performed on CRM, blank and duplicate analytical data and screen tests, no biases that could affect Mineral Resource estimation were observed.
AMEC checked the drill data collected subsequent to August 2012 used to support the updated Mineral Resource estimate for data integrity. Following the checks, AMEC concluded that the error rates for survey, assay and critical geological databases were within acceptable bounds (1%) for the 2012 updated database.
IVANHOE MINES LIMITED Kamoa Copper Project
AMC 812022 : November : 2013 : 812022KamoaFinalEffDate131115rev0 112
Similar database audits were conducted in March and August 2013, and the error rates were found to be within acceptable bounds. Ivanhoe is currently implementing an acQuire database. When the data have been migrated to acQuire, a comprehensive database audit will need to be conducted.QA/QC Review.
AMEC reviewed the QA/QC data collected from 2008 to August 2012 (Reid, 2012). An updated memorandum by AMEC (Yennamani, 2012) discussed the QA/QC data reviewed from August 2012 to December 2012.
12.1.4 2013 Verification
Similar database audits were conducted in March and August 2013, and the error rates were found to be within acceptable bounds. Ivanhoe is currently implementing an acQuire database. When the data have been migrated to acQuire, a comprehensive database audit will need to be conducted.
AMEC reviewed the QA/QC data collected from 2008 to August 2012 (Reid, 2012). An updated memorandum by AMEC (Yennamani, 2012) discussed the QA/QC data reviewed from August 2012 to December 2012. AMEC also conducted audits in March, August and October of 2013. The August and October audits are reported in a single memorandum (Yennamani, 2013). AMEC also conducted audits in March, August and October of 2013. The August and October audits are reported in a single memorandum (Yennamani, 2013b).
QA/QC Review
12.2.1 Screen Tests
Screen tests to monitor crusher output before splitting and pulverizer output (pulps) were routinely conducted by both the sample preparation facility on-site and by Ultra Trace; results were reviewed by Carver (2009c).
The crusher output specification is 70% passing 2 mm (10 mesh). Only 10 results from 4,446 tests were below the specification of 70% passing 2 mm. The pulveriser output specification is 90% passing 75 µm (200 mesh). Only 51 results from 3,809 were below this specification.
Ultra Trace tested every 20th sample pulp by wet-screening a weighed portion through a 75 µm (200 mesh) screen. Results indicate adequate performance, with a median value of 95% passing 75 µm. A total of 760 results from 4,212 samples were below the specification of 90% passing 75 µm. If results revealed poor comminution, the samples were typically submitted for regrinding. A review of the regrind results shows results of over 90% passing 75 µm were achieved.
IVANHOE MINES LIMITED Kamoa Copper Project
AMC 812022 : November : 2013 : 812022KamoaFinalEffDate131115rev0 113
12.2.2 Certified Reference Materials
Sample submissions included packets of certified reference materials (CRMs) purchased from commercial vendors Ore Research (OREAS), African Mineral Standards (AMIS) and Geostats Pty. Ltd. The primary CRMs are from OREAS and AMIS. African Mineral CRM AMIS118 was introduced in October 2009, AMIS120 and AMIS050 were introduced in February 2010, AMIS163 was introduced in July 2011, and OREAS CRM 166 was introduced in December 2010.
Due to the low numbers of Geostats CRMs submitted, AMEC’s analysis of QA/QC results was limited to the OREAS and AMIS CRM results. The suite of CRMs used over the course of the Project has partially changed, with addition of higher-grade CRMs to better cover the grade range for copper. Not all CRMs are certified for all the elements requested for assay, and which elements a CRM was assayed for varies with the requests of the submission in which it was placed.
Outliers observed in the plots may be a consequence of mis-identifying which CRM was inserted. In March 2013, AMEC supplied Ivanhoe a list of 55 CRM samples suspected of being mislabeled. A review of the October 2013 database indicated these samples had been investigated and corrected by Ivanhoe staff.
After removing outliers, AMEC plotted Ultra Trace copper results against certified values. Linear fits on the plots suggest an overall low bias of 3% over the period examined.
After excluding these outliers, AMEC calculated the average result for each element for each CRM for the remaining CRM samples. Compared to certified values of OREAS 45P, Ultra Trace is biased low by 16% to 20% on all evaluated elements. OREAS describes 45P as a ferruginous soil overlying a pyroxenite/gabbro contact, mixed with a barren soil. The consistent bias across all elements suggests a cause other than calibration; for example, the material may be a hygroscopic laterite that was not dry at the time of sample weigh-out. In most other cases, biases exceeding 10% occur at very low concentrations, and the absolute difference associated with the bias is quite small.
AMEC reviewed 561 CRM results obtained from December 2012 to 1 October 2013 and found only two results showing large disagreement with the certified value. These are likely due to mislabelling the CRM in the database.
In the opinion of the AMEC QPs, with the exception of the OREAS 45P CRM, the overall relative bias for the various CRMs is within 5%, and the assay accuracy is sufficient to support Mineral Resource estimation.
IVANHOE MINES LIMITED Kamoa Copper Project
AMC 812022 : November : 2013 : 812022KamoaFinalEffDate131115rev0 114
12.2.3 Check Assays
Previous Check Assays
Check assays were performed prior to 2010 using a different, multi-acid digestion method; check assays were compared with the original values, and found to be acceptable at grades above 0.1% Cu. Results confirm that significant copper mineralization is hosted in sulphides, but copper is also occurring in other minerals (less soluble in aqua-regia) in the more weakly mineralized samples. Comparison of Genalysis to Ultra Trace results indicated that Genalysis Cu results are three relative percent to six relative percent higher than Ultra Trace for the three samples with copper grades greater than 15% Cu. This degree of disagreement is acceptable. The agreement between Ultra Trace and Genalysis for cobalt is good; thus the cobalt assays are likely to be accurate.
2010 ALS Chemex Check Assays
From January to July 2010, sample pulps previously assayed by Ultra Trace, along with inserted blind CRMs, were submitted to ALS Chemex (Vancouver, Canada) and were assayed for total and acid-soluble Cu, Co, Fe, Mn, As, Pb, Zn and S (two methods). The 767 sample pulps submitted included 22 blanks and 39 CRMs.
The blanks show sufficiently low values, reflective of the detection limits. The CRMs indicate ALS Chemex results have good accuracy for copper, a low bias for Pb and Zn, and somewhat erratic results for sulphur. There are some significant differences at near-detection grades, caused by higher detection limits of the ALS Chemex results; below-detection results were set equal to half the detection limit. The lower detection limit of the Ultra Trace results produces a negative intercept artefact, in cases where a significant number of results are below the Chemex detection limit.
Results for elements other than Pb had no outliers, or outliers that had no significant impact on the linear fit calculation. Linear regression parameters were calculated by the Reduction to Major Axis method. These all showed agreement between Ultra Trace and ALS Chemex within 10% (slope 1 ± 0.1), and all except arsenic agree within 5%.
2011 ALS Chemex Check Assays
No samples had been submitted to a check assay laboratory since 2010. In late 2011 AMEC provided Ivanhoe with a list representing a random 5% selection of samples within and adjacent to the SMZ. These samples were submitted to ALS Chemex (Vancouver, Canada) and were assayed for total and acid-soluble Cu, Co, Fe, Mn, As, Pb, Zn and S (two methods). The 1,053 sample pulps submitted included 102 blanks and 130 CRMs.
The results for the blank samples do not show signs of sample contamination and are typically below or near detection limits with the exception of Fe. The results for Fe range from around 0.5% to just over 1.0 % Fe; it is likely the blank sample contains low levels of Fe.
The CRMs indicate ALS Chemex results have acceptable accuracy for Cu and Co. The results for Fe tend to be biased low for CRMs below 6% Fe and accurate for higher grades.
IVANHOE MINES LIMITED Kamoa Copper Project
AMC 812022 : November : 2013 : 812022KamoaFinalEffDate131115rev0 115
Lead is typically biased low, Zn is acceptable, and S is biased low for CRMs over 10%. This is apparent in the scatterplots for S assays.
Comparisons did not have outliers that could significantly impact on the linear fit calculation. Linear regression parameters were calculated by the RMA method. These all showed agreement between Ultra Trace and ALS Chemex within 10% (slope 1 ± 0.1), and all except S agree within 5%. This is very good agreement.
2012 ALS Chemex Check Assays
In late 2012 AMEC provided Ivanhoe with a list representing a random 5% selection of samples within and adjacent to the SMZ. These samples were submitted to ALS Chemex (Vancouver, Canada) and were assayed for total and acid-soluble Cu, Co, Fe, Mn, As, Pb, Zn and S (two methods). The 1,048 sample pulps submitted included 47 blanks and 114 CRMs. The samples had not been analyzed for Mn, Pb and Zn by Ultra Trace.
The results for the blank samples do not show signs of sample contamination and are typically below or near detection limits with the exception of Fe. The results for Fe range from around 0.5% to just over 1.0 % Fe; it is likely the blank sample contains low levels of Fe. Since the blank material used in 2012 is identical to the blank material used in 2011, this result is expected.
The CRMs indicate ALS Chemex results have acceptable accuracy for Cu with the exception of AMIS0120 where ALS Chemex is biased 9.9% low. This is noted in the Cu scatterplots. ASCu results for AMIS050 indicate acceptable accuracy. The results for Fe are biased low for all CRMs, especially for grades below 6%. Sulphur is biased low for CRMs over 10%. This is apparent in the scatterplot for S assays.
A few sample pairs considered as outliers were removed from the analysis. Linear regression parameters were calculated by the RMA method. These all showed agreement between Ultra Trace and ALS Chemex within 10% (slope 1 ± 0.1), and all except As agree within 5%. This is very good agreement.
12.2.4 Duplicate Assays
Coarse-reject (i.e. a second split of crusher output) duplicates were included in all submissions to Ultra Trace. Precision of these results indicates that better precision could be achieved by improving the crushing and splitting steps of sample preparation. AMEC evaluated the duplicate samples by calculating the Absolute Value of the Relative Difference (AVRD), equal to two times the absolute value of the pair difference divided by the pair mean:
AVRD = 2 * | A - B | (A + B)

IVANHOE MINES LIMITED Kamoa Copper Project
AMC 812022 : November : 2013 : 812022KamoaFinalEffDate131115rev0 116
Duplicate pairs of this type have good precision if 90% of mineralized pairs (i.e. samples with grades well above the analytical detection limit and at or above the lowest probable mineralized material–waste cut-off grade for a mining operation) agree within ± 20% (pair difference divided by pair mean). Ninety percent of pulp duplicate pairs having Cu greater than 1,000 ppm agree within 10%. AMEC finds the assay precision is acceptable for Mineral Resource estimation.
12.2.5 Blanks
AMEC reviewed the results for 1,882 blank samples submitted for analysis. In the opinion of Ivanhoe’s consulting geochemist, Richard Carver, the blank material has low concentrations of the target elements Cu and Co (Carver, 2009a). Though the results indicate that there is likely some carry over contamination of Cu at the sample preparation facility, the amount of contamination is not sufficiently high to materially affect project assay results, and thus AMEC considers that there is no significant risk to the Mineral Resource estimate.
12.2.6 Acid Soluble Copper Determinations
In 2009 African Mining Consultants selected approximately 431 samples for acid-soluble copper (ASCu) analysis at Ultra Trace; of these samples, 97 were also submitted to Genalysis for ASCu determination. The ASCu results are consistent with mineralogical observations in the drill logs, with higher average values of soluble copper where the observation indicates the presence of weathering, chalcocite of probable supergene origin, or copper oxide minerals such as malachite. Chalcocite and other sulphides are partially leached by ASCu assay procedures. The ratio of acid soluble to total copper is low (0.15 is typical) in well-mineralized samples (e.g. Cu >0.5%).
Genalysis leach results were substantially lower than the Ultra Trace results. The protocol at Genalysis used a much higher ratio of sample to acid; this will slow the reaction kinetics, and has possible wetting issues (depending upon the robustness of the agitation and the tendency of the pulp to clump).
The greater excess of acid used in the Ultra Trace protocol will dissolve more partially-soluble minerals. Hence Ultra Trace assays will report a higher ASCu content than will Genalysis assays, due to the differing methods.
AMEC notes that there is a need to correlate ASCu with metallurgical recovery, particularly in partially leached zones.
12.2.7 2013 Checks
The QA/QC data were reviewed by AMEC in March 2013 and October 2013, and no issues were noted.
AMEC reviewed 561 CRM results obtained since December 2012 and found no biases greater than 4% (this excluded a single result for OREAS 45P).
IVANHOE MINES LIMITED Kamoa Copper Project
AMC 812022 : November : 2013 : 812022KamoaFinalEffDate131115rev0 117
12.2.8 2013 ALS Chemex Check Assays
At the effective date of the Report, no samples have been submitted for check analysis. It is likely samples will be selected at the end of 2013 or at the end of the current drill campaign and submitted to a check laboratory.
Site Visits
Site visit dates and the scopes of personal inspection by the QPs are discussed in Section 2.
12.3.1 Field Drill Collar Check
Field drill collar checks were completed as follows:
In 2009 AMEC used a hand-held GPS unit to check the coordinates of five drillholes in the field.
During the 2010 visit AMEC used a hand-held GPS and Brunton Compass to check the coordinates and orientation of six drillholes in the field.
AMEC used a hand-held GPS unit to check the location of 10 drillholes during the February 2011 site visit, 15 holes during the November 2011 site visit, and 11 holes during the November 2012 site visit.
No errors were noted in the collar surveys, and all results were within the error margin of a hand-held GPS.
12.3.2 Drilling and Core Storage
Drilling was being conducted during the 2010 AMEC visit, and HQ core (63 mm diameter core) was observed being recovered using an ALF-70 machine that appeared to be in good condition.
Prior to 2010, core from the barren zones was stored in aluminum boxes under tarpaulins in a field camp that was visited by AMEC.
In 2010, a new core-logging facility and new secure core-storage facility were constructed at the Kamoa site. As of July 2010, all new core samples are stored at the new facility. Mineralized core prior to 2010 has now been moved to this new facility; the historical RC and aircore samples remain at the Kolwezi storage facility. Figure 12.1 and Figure 12.2 show the logging facility and core storage respectively.

IVANHOE MINES LIMITED Kamoa Copper Project
AMC 812022 : November : 2013 : 812022KamoaFinalEffDate131115rev0 118
Figure 12.1 On-Site Core-Logging Facility
Note: Photograph by AMEC, 2011.
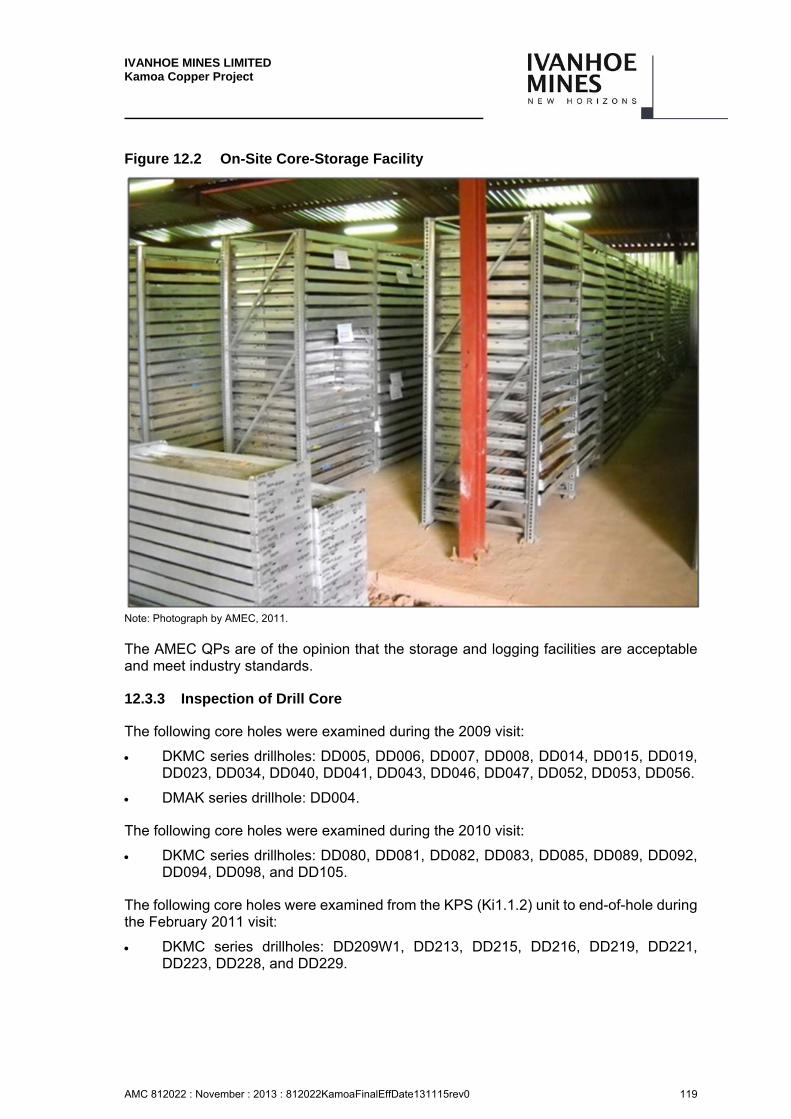
IVANHOE MINES LIMITED Kamoa Copper Project
AMC 812022 : November : 2013 : 812022KamoaFinalEffDate131115rev0 119
Figure 12.2 On-Site Core-Storage Facility
Note: Photograph by AMEC, 2011.
The AMEC QPs are of the opinion that the storage and logging facilities are acceptable and meet industry standards.
12.3.3 Inspection of Drill Core
The following core holes were examined during the 2009 visit:
DKMC series drillholes: DD005, DD006, DD007, DD008, DD014, DD015, DD019, DD023, DD034, DD040, DD041, DD043, DD046, DD047, DD052, DD053, DD056.
DMAK series drillhole: DD004.
The following core holes were examined during the 2010 visit:
DKMC series drillholes: DD080, DD081, DD082, DD083, DD085, DD089, DD092, DD094, DD098, and DD105.
The following core holes were examined from the KPS (Ki1.1.2) unit to end-of-hole during the February 2011 visit:
DKMC series drillholes: DD209W1, DD213, DD215, DD216, DD219, DD221, DD223, DD228, and DD229.
IVANHOE MINES LIMITED Kamoa Copper Project
AMC 812022 : November : 2013 : 812022KamoaFinalEffDate131115rev0 120
The following core holes were examined from the KPS (Ki1.1.2) unit to end-of-hole during the November 2011 visit:
DKMC series drillholes: DD015, DD211, DD235, DD236, DD260, DD267, DD270, DD325, and DD387.
The following core holes were examined from the KPS (Ki1.1.2) unit to end-of-hole during the November 2012 visit:
DKMC series drillholes: DD267, DD432, DD453, DD523, DD533, DD577, and DD613.
Logging details were noted, in general, to match the features that AMEC observed in the inspected cores.
12.3.4 Sample Preparation Facilities
The sample preparation facilities operated by African Mining Consultants and supervised by Richard Carver in Kolwezi were briefly examined during the 2009 and 2010 site visits.
During the 2011 and 2012 site visits, AMEC toured the Kamoa-site sample preparation facility and was satisfied with the operation. The procedures had not changed from the previous operation.
AMEC's Copper Grade Check Sampling
In 2009, AMEC selected 21 sample intervals from drill core boxes. The half core in the boxes was re-sawn, and quarter-core samples were taken by African Mining Consultants under AMEC’s direction, and submitted, along with CRMs and blanks, to SGS Lakefield.
SGS Lakefield, an independent laboratory that is located in Lakefield, Ontario, Canada, was selected by AMEC to process samples, as the laboratory is not affiliated with Genalysis or Ultra Trace, and had not previously been used for sample analysis for the Project. SGS Lakefield is ISO 17025-certified, and has passed the most recent copper proficiency testing conducted by the Standards Council of Canada.
For the 2009 samples, the correlation between the laboratories was good. The ratio of the mean Ultra Trace to SGS assays for Cu was 1.01.
In 2010, AMEC selected 22 sample intervals from eight drill core boxes. The half core in the boxes was re-sawn, and quarter-core samples were taken under AMEC’s direction, and submitted, along with CRMs and blanks, to ALS Chemex.
ALS Chemex, an independent laboratory that is located in Vancouver, British Columbia, Canada, was selected by AMEC to process samples, as the laboratory is not affiliated with Genalysis or Ultra Trace, and had not previously been used for sample analysis for the Project. ALS Chemex is ISO9000:2008 registered and ISO 17025 accredited.
The correlation between laboratories was found to be good. The ratios of Ultra Trace to ALS Chemex were 1.06 and 1.07 for Cu and ASCu respectively.
IVANHOE MINES LIMITED Kamoa Copper Project
AMC 812022 : November : 2013 : 812022KamoaFinalEffDate131115rev0 121
In February 2011, AMEC selected 11 sample intervals from drill core boxes. The half core in the boxes was re-sawn, and quarter-core samples were taken under AMEC’s direction, and submitted, along with CRMs and blanks, to Ultra Trace in Australia. The blank and CRM (98P) results indicate acceptable performance.
Ultra Trace assayed the AMEC-selected core samples for total copper and minor elements. These new results from Ultra Trace were compared to the original Ultra Trace results (ratio of witness to original assays of 0.99 for Cu without the two outlier pairs and 0.93 with the two outlier pairs).
In November 2011, AMEC selected eight sample intervals from drill core boxes. The half core in the boxes was re-sawn, and quarter-core samples were taken under AMEC’s direction, and submitted, along with CRMs and blanks, to Ultra Trace in Australia. AMEC’s samples were found to be comparable to the original Ultra Trace results; AMEC’s Cu results were 4% lower than the original assays, while the ASCu results were 2% higher.
In November 2012, AMEC selected eleven sample intervals from drill core boxes. The half core in the boxes was re-sawn, and quarter-core samples were taken under AMEC’s direction, and submitted, along with CRMs and blanks, to Ultra Trace in Australia. Ultra Trace’s witness sample results averaged 10% lower than the original Ultra Trace assays.
Geotechnical and Structural Logging
SRK completed three site visits to the Kamoa Copper Project during 2011 for the purposes of geotechnical and structural logging QA/QC and data quality control. Ross Greenwood, Ryan Campbell, and Desiré Tshibanda completed geotechnical logging QA/QC, training, and data quality review during 22–27 June, 2011. From 5–12 August 2011, Ross Greenwood and Desiré Tshibanda completed geotechnical logging QA/QC, reviewed changes implemented to logging practices, and conducted additional data quality reviews 12–17 August 2011, Wayne Barnett, SRK completed a review of structural data collection and the structural geology model, and provided input for future data collection and interpretation. The site visits and accompanying memoranda are considered to satisfy tasks within SRK’s scoping level proposal issued to Ivanhoe on 29 May 2011.
Findings from the visits have been documented in two memoranda which provide outline on-site protocols, quality control reviews, details of the findings, recommendations for future data collection, and update aspects of various geotechnical and mining studies. Limited on-site data analysis and preliminary findings are also documented. Recommendations have been made for regular follow-up visits as the project study level, data quantity, and required level of detail increases.
The geotechnical data collection is acceptable at this stage of the project, but there are a number of areas that require improvement as the project continues:
Geotechnical data collection: Geotechnical parameter collection is considered to be fair, with ongoing issues noted relating to RQD measurements (inclusion of mechanical breaks). However, the identification of natural versus mechanical breaks is being completed to a high standard. Intact rock strength is locally underestimated; however, in most cases the patterns of strength change are being identified.

IVANHOE MINES LIMITED Kamoa Copper Project
AMC 812022 : November : 2013 : 812022KamoaFinalEffDate131115rev0 122
Orientation data collection: Alpha orientation measurements (angle of the break to the core axis) are being collected to a very high standard. Conversely beta measurements (angle of the maximum dip of the fracture related to the reference line) are being collected poorly with errors noted in identification of maximum dip vector, downhole direction, and actual measurement.
Geotechnical database: The Kamoa geotechnical database was considered to be of fair quality during the audit. While some inherent issues existed, the process of filtering and cleaning the dataset will improve the quality of the geotechnical dataset. SRK understand that significant work has been undertaken recently to improve this.
Geotechnical recommendations: Several changes have been made to structural and geotechnical data collection processes recently based on the recommendations by SRK in August 2010 and June 2011. Time should be taken to make sure that these changes are carried out correctly during the early stages of implementation. Additional quality control checks by Kamoa’s geotechnical engineers have been recommended at all stages of data collection.
Structural geology findings: The status of the structural data being collected has been reviewed. It was decided that the current fault network interpretation cannot be further developed with current information. More detailed structural logging has been recommended and the data capture is underway. Once a more complete set of structural logs are available for the available drill core, further interpretation should be undertaken to improve the structural/geotechnical domains.
Comments on Section 12
In the opinion of the AMEC QPs, the data verification programmes undertaken on the data collected from the Project support the geological interpretations, and the analytical and database quality. Therefore, the collected data can support Mineral Resource estimation. Principal findings from the data verification are as follows:
The accuracy of the current surface topography is estimated to be ±12 m. Ivanhoe has obtained high resolution topgraphic data based on a LiDAR survey conducted in 2012. AMEC compared the collar elevation data to these data and found 62 drillholes with collar elevation discrepancies of over three metres. A list of these drillholes was sent to Ivanhoe for investigation.
Sample data collected adequately reflect deposit dimensions, true widths of mineralization, and the style of deposit.
Drill collar data were verified by comparing database values to records obtained from the survey contractor.
Verification of downhole survey data was completed.
Excessively high error rates were noted in some of the non-crucial geology fields and specific gravity data in 2010. This was not noted in the 2011 or 2012 audits.
The quality assurance programme for the core drilling on the Project demonstrates sufficient accuracy and precision of the copper assays for use in estimating Mineral Resources for copper.
IVANHOE MINES LIMITED Kamoa Copper Project
AMC 812022 : November : 2013 : 812022KamoaFinalEffDate131115rev0 123
Acid-soluble copper is generally low; there is a need to correlate ASCu with metallurgical recovery, particularly in partially leached zones within 100 m of the surface.
AMEC’s independent sampling of 73 drill core intervals, with assaying by independent laboratories that were selected by AMEC supports the Cu and Co grades reported by Ivanhoe.
AMEC provided Ivanhoe with a list representing a random 5% selection of samples within and adjacent to the SMZ. These samples were submitted to ALS Chemex for check analysis. Appropriate numbers of blanks and CRMs were included with this submission. Good agreement was obtained between UltraTrace, the primary laboratory, and ALS Chemex.
AMEC provided Ivanhoe with a list of drillhole intercepts to be selected to provide data for a quarter-core study; however, AMEC does not know if this study has been implemented.
IVANHOE MINES LIMITED Kamoa Copper Project
AMC 812022 : November : 2013 : 812022KamoaFinalEffDate131115rev0 124
13 MINERAL PROCESSING AND METALLURGICAL TESTING
Overview of Metallurgical Testwork
The first metallurgical testwork on Kamoa mineralization was carried out in 2010 using drill cores from the shallow, Kamoa Sud area of the deposit. The samples were subjected to comminution and flotation tests at Mintek laboratories in Johannesburg, South Africa.
The Mintek comminution testwork indicated that the mineralized rock is competent with respect to Semi-Autogenous Grind (SAG) milling, that the Bond Ball Mill Work Index (BBWI) results are modest and in the range of 14 to 16 kWh/t and that the mineralization rock can be classified as a low abrasive mineralized rock with a Bond Abrasion Index in the viscinity of 0.14. Due to milling efficiency considerations, mineralized materials with these properties are best processed in crush/ball mill circuits rather than SAG milling circuits. These comminution results showed that the Kamoa mineralization is moderately harder than typical Copperbelt ores.
The Mintek flotation testwork showed that the mineralization was amenable to treatment by conventional sulphide flotation but with the provision that a significant amount of regrinding is required. Flotation recoveries were lower than expected for Copperbelt ores due to a non-floating copper sulphide population locked in silicates at sulphide phase sizes of 10 µm or finer. The economic copper minerals include chalcopyrite, bornite and chalcocite.
Between 2011 and 2013, the range of sampling was increased to include samples from all major areas of the expanded resource, namely, Kamoa Sud, Kansoko Sud, Kansoko Centrale and Kansoko Nord. Samples were also taken from Kamoa Ouest, however this area does not form part of the Kamoa 2013 PEA mine plan.
Circuit development work during this period was primarily conducted at Xstrata Process Support (XPS) Laboratories in Sudbury, Ontario, Canada. A flowsheet was developed which was tailored to the fine grained nature of the deposit. The circuit relied on a traditional mill-float-mill-float (MF2) approach to partially liberate particles, followed by fine regrinding of concentrates to achieve a concentrate grade suitable for smelting. Separate treatment of the primary and secondary rougher concentrates allowed for separately optimised cleaner flotation of fast and slow species.
This configuration became known as the Milestone Flowsheet and forms the basis of the Net Smelter Return (NSR) model for the mine plan. The circuit was tested on various composites from across the resource and was able to achieve a recovery of 85.4% and copper grade of 32.8% for Hypogene material, and a recovery of 83.2% and copper grade of 45.1% for Supergene material. The major ecomonic minerals were chalcopyrite, bornite and chalcocite.
In the first half of 2013, the focus of development work shifted towards a reduction in the silica content of the final concentrate in order to reduce the need for lime flux in the smelter. Adjustments were made to the reagent dosages, as well as the grinding media type, resulting in an improvement to 86.7% recovery at 37.0% copper grade for Hypogene material, and 82.9% recovery at 51.4% copper grade for Supergene material.
IVANHOE MINES LIMITED Kamoa Copper Project
AMC 812022 : November : 2013 : 812022KamoaFinalEffDate131115rev0 125
Silica levels in the final concentrate also dropped from 19.1% to 13.1% for Hypogene and from 26.0% to 18.1% for Supergene.
The improvements were not realized in time to be incorporated into the mine plan and NSR calculations. The results were incorporated into the financial model and form the basis of the Kamoa 2013 PEA.
Testwork was also conducted on potential open pit material from shallow areas of Kamoa Ouest in the first half of 2013.
Metallurgical Samples
Metallurgical drilling has been conducted from 2010 to 2013 and has covered a wide range of the deposit, as illustrated in Figure 13.1. The sampling campaign is divided into four successive phases. Phase 1 samples were taken from deeper areas of Kamoa Sud in close proximity to the Kamoa dome. In Phase 2 the resource was considerably expanded, and drilling began in a wider region covering Kansoko Centrale and Kansoko Nord for Hypogene samples, as well as Kamoa Ouest for Supergene.
In Phase 3, sampling consisted of a mixture of deep material from Kansoko Centrale and Kansoko Sud together with shallow material from Kamoa Ouest. Phase 4 consisted of an open pit sampling campaign in the Kamoa Ouest area.
The metallurgical drilling coverage provides a broad spectrum of samples from across the resource. However metallurgical drilling has yet to be conducted in the Southern areas of Kansoko Sud which are the focus of the first years of mining. This drilling has been prioritsied and is planned for the second half of 2013.
The bulk of the development work has been conducted on the Phase 2 Hypogene composite which consists of samples from the Kansoko Centrale and Kansoko Nord areas. The metallurgical response of composites taken from other areas of the resource has also been evaluated.
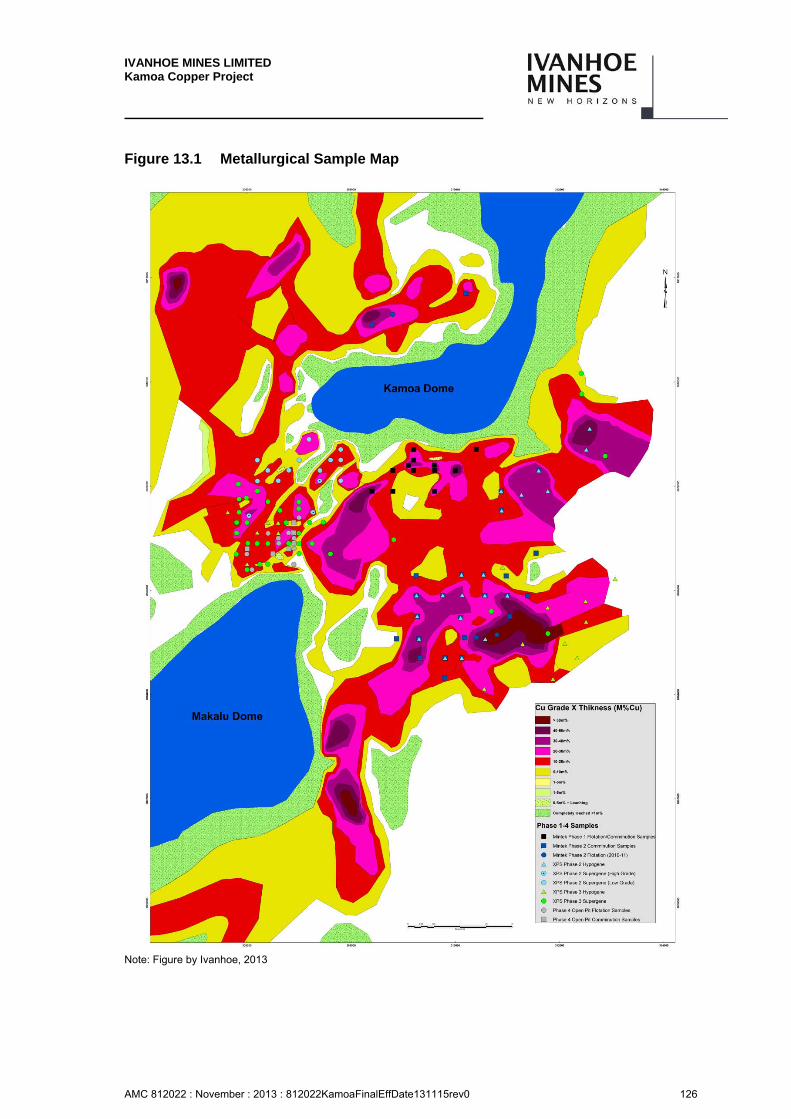
IVANHOE MINES LIMITED Kamoa Copper Project
AMC 812022 : November : 2013 : 812022KamoaFinalEffDate131115rev0 126
Figure 13.1 Metallurgical Sample Map
Note: Figure by Ivanhoe, 2013
IVANHOE MINES LIMITED Kamoa Copper Project
AMC 812022 : November : 2013 : 812022KamoaFinalEffDate131115rev0 127
Mintek Flotation Testwork Phase 1 (2010)
The Mintek flotation testwork was the first programme conducted on mineralization from the Kamoa deposit. As such the programme was intended to be a basic investigation of typical mineralized material response rather than a definitive test series. Information was used to derive the ballpark grades and recoveries which could be achieved without significant flowsheet optimisation. This information has not been used as a basis for the 2013 PEA, but is described below for completeness.
The Phase 1 programme commenced with a focus on maximizing rougher recovery using a simple reagent scheme (collector plus frother) and by varying rougher grind conditions and flotation pH.
The programme then progressed to investigating cleaning options including the use of dispersants and depressants for gangue minerals and the benefits of regrinding for improving concentrate grades. The programme ceased when the concepts were proven to the point of producing concentrates of copper concentrate greater than 25%.
Samples were selected to represent what were the three important mineralized material types at the time. These mineralized types were Hypogene, Supergene and intervals where both Supergene and Hypogene were present (Mixed). All samples were taken from a relatively shallow location close to the southern edge of the Kamoa Dome that had been extensively drilled and represented the most significant resource area at the time. Sample selections were made from core already drilled, logged, crushed, and sub-sampled for assay. Drillhole collar locations for the drilling used in metallurgical sampling are included in Figure 13.1.
The summary head analyses of the Mintek test composites are provided in Table 13.1.
Table 13.1 Mintek Phase 1 Flotation Testing Composites – Head Assays
Units Master Composite Supergene Mixed Hypogene
Total Cu % 2.97 3.3 3.63 1.68
Total S % 1.9 1 3.1 3.3
Al % 4.5 3.9 3.5 4.1
Si % 18.6 17.7 17.3 18.9
13.3.1 Flotation Testing and Results
Rougher plus scavenger flotation was typically able to recover between 80% and 85% of the copper when grinding (in one or two stages) was taken down to 90% -75 µm. The reagent scheme used was simple and consisted of a xanthate and a polyglycol frother; no pH adjustment was carried out.
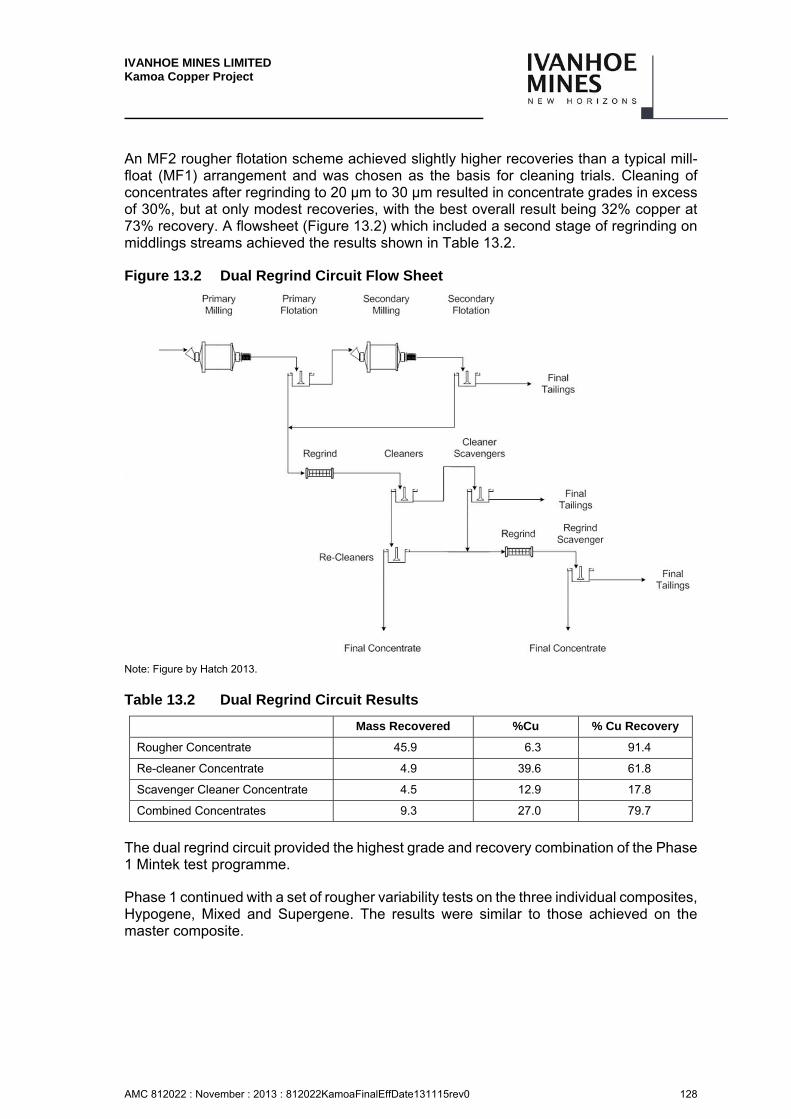
IVANHOE MINES LIMITED Kamoa Copper Project
AMC 812022 : November : 2013 : 812022KamoaFinalEffDate131115rev0 128
An MF2 rougher flotation scheme achieved slightly higher recoveries than a typical mill-float (MF1) arrangement and was chosen as the basis for cleaning trials. Cleaning of concentrates after regrinding to 20 µm to 30 µm resulted in concentrate grades in excess of 30%, but at only modest recoveries, with the best overall result being 32% copper at 73% recovery. A flowsheet (Figure 13.2) which included a second stage of regrinding on middlings streams achieved the results shown in Table 13.2.
Figure 13.2 Dual Regrind Circuit Flow Sheet
Note: Figure by Hatch 2013.
Table 13.2 Dual Regrind Circuit Results
Mass Recovered %Cu % Cu Recovery
Rougher Concentrate 45.9 6.3 91.4
Re-cleaner Concentrate 4.9 39.6 61.8
Scavenger Cleaner Concentrate 4.5 12.9 17.8
Combined Concentrates 9.3 27.0 79.7
The dual regrind circuit provided the highest grade and recovery combination of the Phase 1 Mintek test programme.
Phase 1 continued with a set of rougher variability tests on the three individual composites, Hypogene, Mixed and Supergene. The results were similar to those achieved on the master composite.
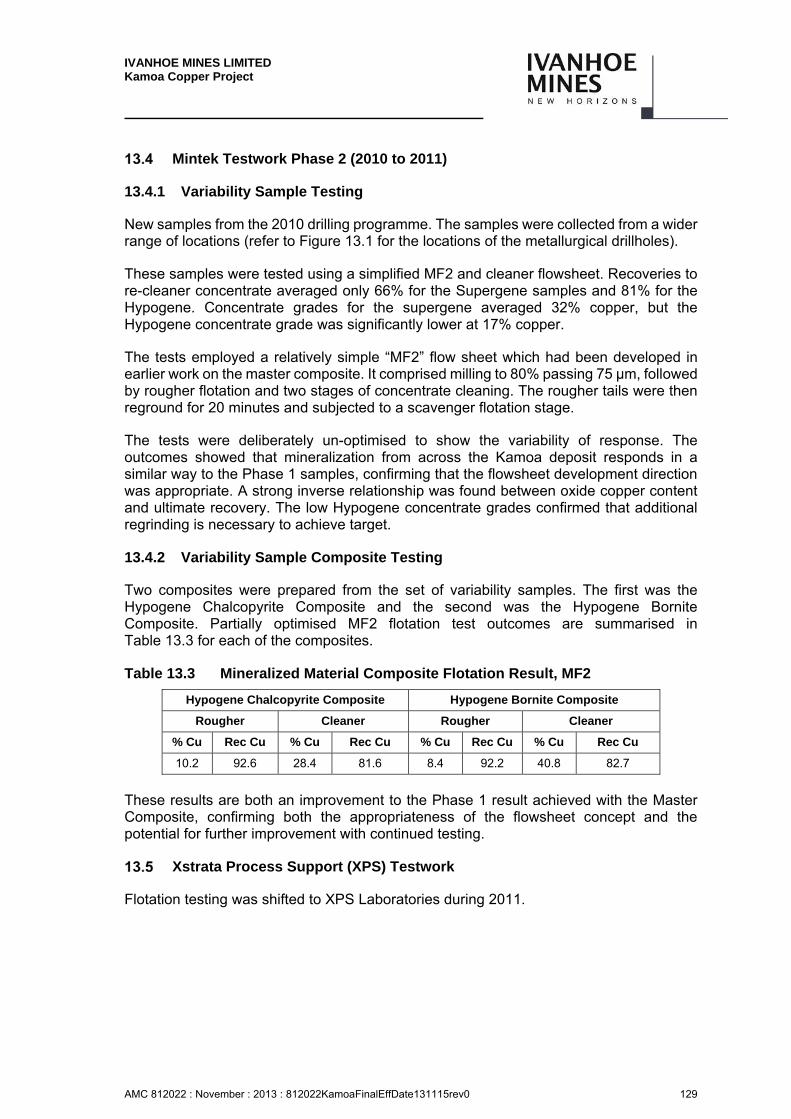
IVANHOE MINES LIMITED Kamoa Copper Project
AMC 812022 : November : 2013 : 812022KamoaFinalEffDate131115rev0 129
Mintek Testwork Phase 2 (2010 to 2011)
13.4.1 Variability Sample Testing
New samples from the 2010 drilling programme. The samples were collected from a wider range of locations (refer to Figure 13.1 for the locations of the metallurgical drillholes).
These samples were tested using a simplified MF2 and cleaner flowsheet. Recoveries to re-cleaner concentrate averaged only 66% for the Supergene samples and 81% for the Hypogene. Concentrate grades for the supergene averaged 32% copper, but the Hypogene concentrate grade was significantly lower at 17% copper.
The tests employed a relatively simple “MF2” flow sheet which had been developed in earlier work on the master composite. It comprised milling to 80% passing 75 µm, followed by rougher flotation and two stages of concentrate cleaning. The rougher tails were then reground for 20 minutes and subjected to a scavenger flotation stage.
The tests were deliberately un-optimised to show the variability of response. The outcomes showed that mineralization from across the Kamoa deposit responds in a similar way to the Phase 1 samples, confirming that the flowsheet development direction was appropriate. A strong inverse relationship was found between oxide copper content and ultimate recovery. The low Hypogene concentrate grades confirmed that additional regrinding is necessary to achieve target.
13.4.2 Variability Sample Composite Testing
Two composites were prepared from the set of variability samples. The first was the Hypogene Chalcopyrite Composite and the second was the Hypogene Bornite Composite. Partially optimised MF2 flotation test outcomes are summarised in Table 13.3 for each of the composites.
Table 13.3 Mineralized Material Composite Flotation Result, MF2
Hypogene Chalcopyrite Composite Hypogene Bornite Composite
Rougher Cleaner Rougher Cleaner
% Cu Rec Cu % Cu Rec Cu % Cu Rec Cu % Cu Rec Cu
10.2 92.6 28.4 81.6 8.4 92.2 40.8 82.7
These results are both an improvement to the Phase 1 result achieved with the Master Composite, confirming both the appropriateness of the flowsheet concept and the potential for further improvement with continued testing.
Xstrata Process Support (XPS) Testwork
Flotation testing was shifted to XPS Laboratories during 2011.
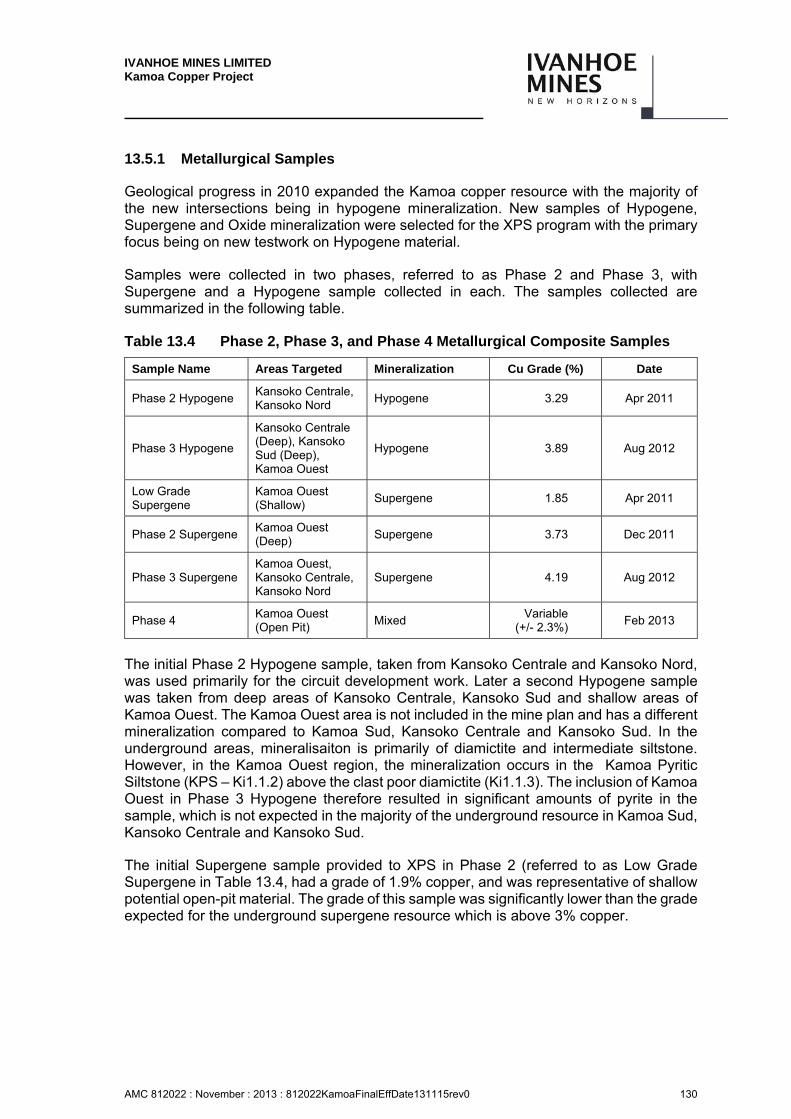
IVANHOE MINES LIMITED Kamoa Copper Project
AMC 812022 : November : 2013 : 812022KamoaFinalEffDate131115rev0 130
13.5.1 Metallurgical Samples
Geological progress in 2010 expanded the Kamoa copper resource with the majority of the new intersections being in hypogene mineralization. New samples of Hypogene, Supergene and Oxide mineralization were selected for the XPS program with the primary focus being on new testwork on Hypogene material.
Samples were collected in two phases, referred to as Phase 2 and Phase 3, with Supergene and a Hypogene sample collected in each. The samples collected are summarized in the following table.
Table 13.4 Phase 2, Phase 3, and Phase 4 Metallurgical Composite Samples
Sample Name Areas Targeted Mineralization Cu Grade (%) Date
Phase 2 Hypogene Kansoko Centrale, Kansoko Nord
Hypogene 3.29 Apr 2011
Phase 3 Hypogene
Kansoko Centrale (Deep), Kansoko Sud (Deep), Kamoa Ouest
Hypogene 3.89 Aug 2012
Low Grade Supergene
Kamoa Ouest (Shallow)
Supergene 1.85 Apr 2011
Phase 2 Supergene Kamoa Ouest (Deep)
Supergene 3.73 Dec 2011
Phase 3 Supergene Kamoa Ouest, Kansoko Centrale, Kansoko Nord
Supergene 4.19 Aug 2012
Phase 4 Kamoa Ouest (Open Pit)
Mixed Variable
(+/- 2.3%) Feb 2013
The initial Phase 2 Hypogene sample, taken from Kansoko Centrale and Kansoko Nord, was used primarily for the circuit development work. Later a second Hypogene sample was taken from deep areas of Kansoko Centrale, Kansoko Sud and shallow areas of Kamoa Ouest. The Kamoa Ouest area is not included in the mine plan and has a different mineralization compared to Kamoa Sud, Kansoko Centrale and Kansoko Sud. In the underground areas, mineralisaiton is primarily of diamictite and intermediate siltstone. However, in the Kamoa Ouest region, the mineralization occurs in the Kamoa Pyritic Siltstone (KPS – Ki1.1.2) above the clast poor diamictite (Ki1.1.3). The inclusion of Kamoa Ouest in Phase 3 Hypogene therefore resulted in significant amounts of pyrite in the sample, which is not expected in the majority of the underground resource in Kamoa Sud, Kansoko Centrale and Kansoko Sud.
The initial Supergene sample provided to XPS in Phase 2 (referred to as Low Grade Supergene in Table 13.4, had a grade of 1.9% copper, and was representative of shallow potential open-pit material. The grade of this sample was significantly lower than the grade expected for the underground supergene resource which is above 3% copper.
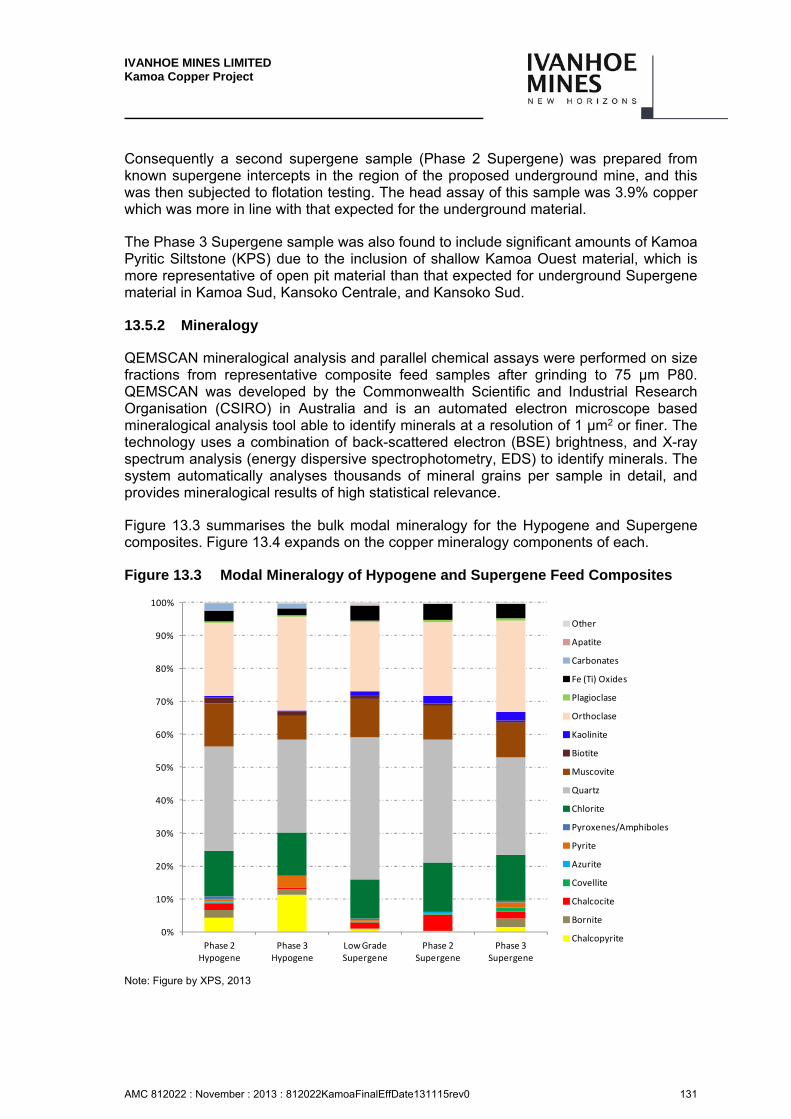
IVANHOE MINES LIMITED Kamoa Copper Project
AMC 812022 : November : 2013 : 812022KamoaFinalEffDate131115rev0 131
Consequently a second supergene sample (Phase 2 Supergene) was prepared from known supergene intercepts in the region of the proposed underground mine, and this was then subjected to flotation testing. The head assay of this sample was 3.9% copper which was more in line with that expected for the underground material.
The Phase 3 Supergene sample was also found to include significant amounts of Kamoa Pyritic Siltstone (KPS) due to the inclusion of shallow Kamoa Ouest material, which is more representative of open pit material than that expected for underground Supergene material in Kamoa Sud, Kansoko Centrale, and Kansoko Sud.
13.5.2 Mineralogy
QEMSCAN mineralogical analysis and parallel chemical assays were performed on size fractions from representative composite feed samples after grinding to 75 µm P80. QEMSCAN was developed by the Commonwealth Scientific and Industrial Research Organisation (CSIRO) in Australia and is an automated electron microscope based mineralogical analysis tool able to identify minerals at a resolution of 1 µm2 or finer. The technology uses a combination of back-scattered electron (BSE) brightness, and X-ray spectrum analysis (energy dispersive spectrophotometry, EDS) to identify minerals. The system automatically analyses thousands of mineral grains per sample in detail, and provides mineralogical results of high statistical relevance.
Figure 13.3 summarises the bulk modal mineralogy for the Hypogene and Supergene composites. Figure 13.4 expands on the copper mineralogy components of each.
Figure 13.3 Modal Mineralogy of Hypogene and Supergene Feed Composites
Note: Figure by XPS, 2013
0%
10%
20%
30%
40%
50%
60%
70%
80%
90%
100%
Phase 2 Hypogene
Phase 3 Hypogene
Low Grade Supergene
Phase 2 Supergene
Phase 3 Supergene
Other
Apatite
Carbonates
Fe (Ti) Oxides
Plagioclase
Orthoclase
Kaolinite
Biotite
Muscovite
Quartz
Chlorite
Pyroxenes/Amphiboles
Pyrite
Azurite
Covellite
Chalcocite
Bornite
Chalcopyrite
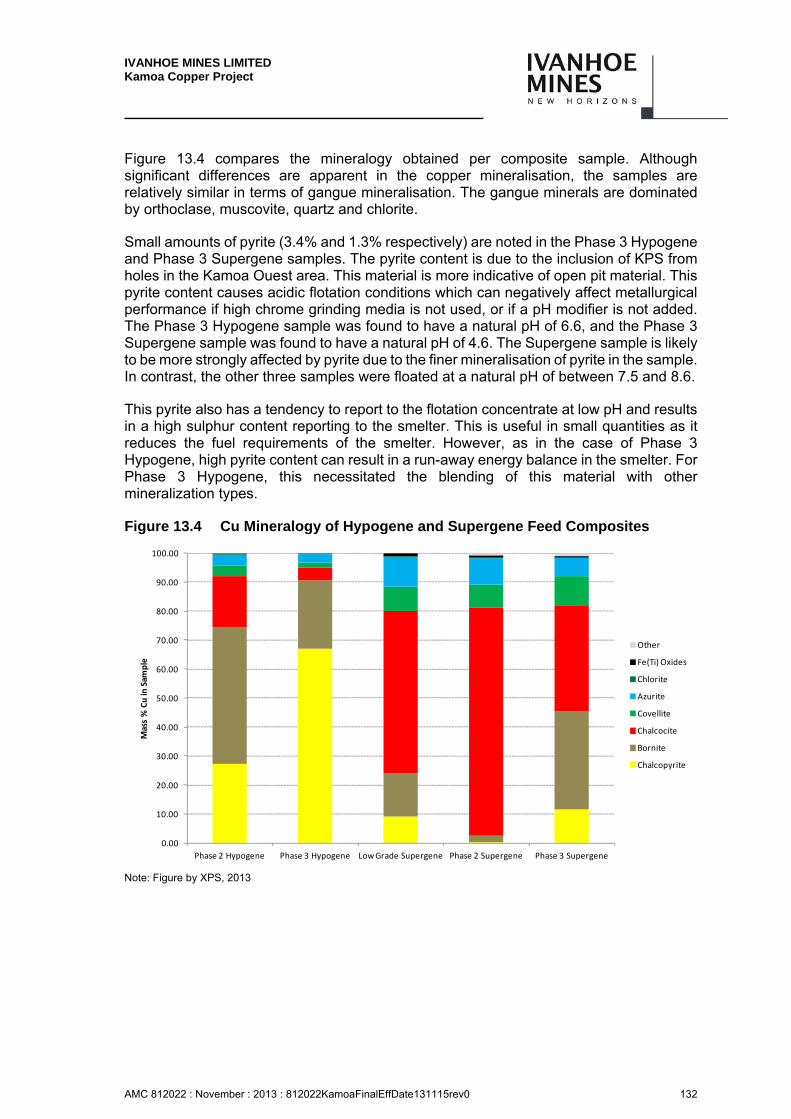
IVANHOE MINES LIMITED Kamoa Copper Project
AMC 812022 : November : 2013 : 812022KamoaFinalEffDate131115rev0 132
Figure 13.4 compares the mineralogy obtained per composite sample. Although significant differences are apparent in the copper mineralisation, the samples are relatively similar in terms of gangue mineralisation. The gangue minerals are dominated by orthoclase, muscovite, quartz and chlorite.
Small amounts of pyrite (3.4% and 1.3% respectively) are noted in the Phase 3 Hypogene and Phase 3 Supergene samples. The pyrite content is due to the inclusion of KPS from holes in the Kamoa Ouest area. This material is more indicative of open pit material. This pyrite content causes acidic flotation conditions which can negatively affect metallurgical performance if high chrome grinding media is not used, or if a pH modifier is not added. The Phase 3 Hypogene sample was found to have a natural pH of 6.6, and the Phase 3 Supergene sample was found to have a natural pH of 4.6. The Supergene sample is likely to be more strongly affected by pyrite due to the finer mineralisation of pyrite in the sample. In contrast, the other three samples were floated at a natural pH of between 7.5 and 8.6.
This pyrite also has a tendency to report to the flotation concentrate at low pH and results in a high sulphur content reporting to the smelter. This is useful in small quantities as it reduces the fuel requirements of the smelter. However, as in the case of Phase 3 Hypogene, high pyrite content can result in a run-away energy balance in the smelter. For Phase 3 Hypogene, this necessitated the blending of this material with other mineralization types.
Figure 13.4 Cu Mineralogy of Hypogene and Supergene Feed Composites
Note: Figure by XPS, 2013
0.00
10.00
20.00
30.00
40.00
50.00
60.00
70.00
80.00
90.00
100.00
Phase 2 Hypogene Phase 3 Hypogene Low Grade Supergene Phase 2 Supergene Phase 3 Supergene
Mass % Cu in
Sam
ple
Other
Fe(Ti) Oxides
Chlorite
Azurite
Covellite
Chalcocite
Bornite
Chalcopyrite
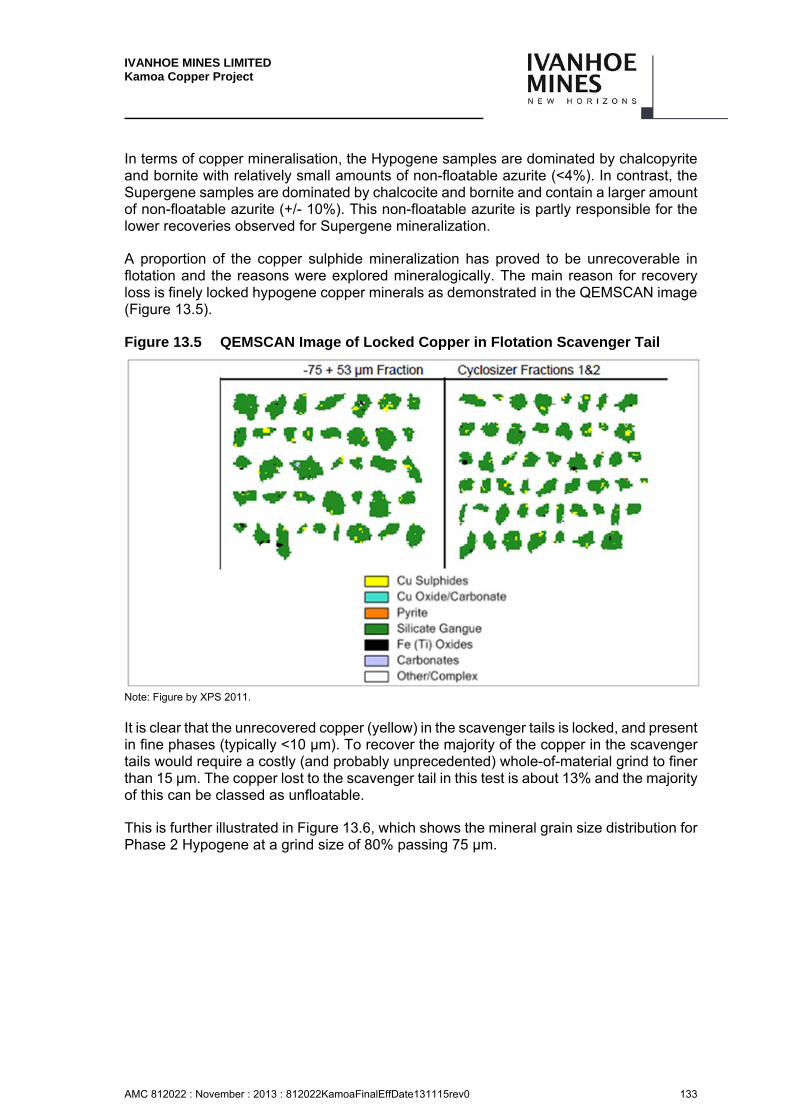
IVANHOE MINES LIMITED Kamoa Copper Project
AMC 812022 : November : 2013 : 812022KamoaFinalEffDate131115rev0 133
In terms of copper mineralisation, the Hypogene samples are dominated by chalcopyrite and bornite with relatively small amounts of non-floatable azurite (<4%). In contrast, the Supergene samples are dominated by chalcocite and bornite and contain a larger amount of non-floatable azurite (+/- 10%). This non-floatable azurite is partly responsible for the lower recoveries observed for Supergene mineralization.
A proportion of the copper sulphide mineralization has proved to be unrecoverable in flotation and the reasons were explored mineralogically. The main reason for recovery loss is finely locked hypogene copper minerals as demonstrated in the QEMSCAN image (Figure 13.5).
Figure 13.5 QEMSCAN Image of Locked Copper in Flotation Scavenger Tail
Note: Figure by XPS 2011.
It is clear that the unrecovered copper (yellow) in the scavenger tails is locked, and present in fine phases (typically <10 µm). To recover the majority of the copper in the scavenger tails would require a costly (and probably unprecedented) whole-of-material grind to finer than 15 µm. The copper lost to the scavenger tail in this test is about 13% and the majority of this can be classed as unfloatable.
This is further illustrated in Figure 13.6, which shows the mineral grain size distribution for Phase 2 Hypogene at a grind size of 80% passing 75 µm.
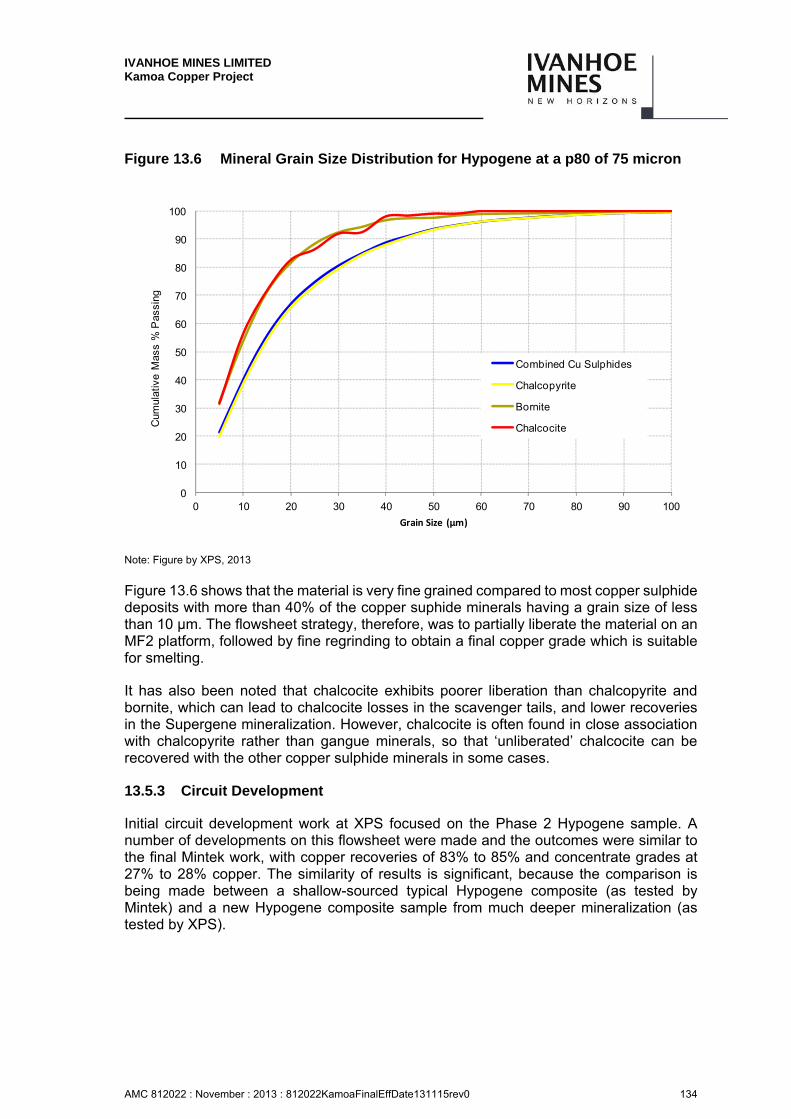
IVANHOE MINES LIMITED Kamoa Copper Project
AMC 812022 : November : 2013 : 812022KamoaFinalEffDate131115rev0 134
Figure 13.6 Mineral Grain Size Distribution for Hypogene at a p80 of 75 micron
Note: Figure by XPS, 2013
Figure 13.6 shows that the material is very fine grained compared to most copper sulphide deposits with more than 40% of the copper suphide minerals having a grain size of less than 10 µm. The flowsheet strategy, therefore, was to partially liberate the material on an MF2 platform, followed by fine regrinding to obtain a final copper grade which is suitable for smelting.
It has also been noted that chalcocite exhibits poorer liberation than chalcopyrite and bornite, which can lead to chalcocite losses in the scavenger tails, and lower recoveries in the Supergene mineralization. However, chalcocite is often found in close association with chalcopyrite rather than gangue minerals, so that ‘unliberated’ chalcocite can be recovered with the other copper sulphide minerals in some cases.
13.5.3 Circuit Development
Initial circuit development work at XPS focused on the Phase 2 Hypogene sample. A number of developments on this flowsheet were made and the outcomes were similar to the final Mintek work, with copper recoveries of 83% to 85% and concentrate grades at 27% to 28% copper. The similarity of results is significant, because the comparison is being made between a shallow-sourced typical Hypogene composite (as tested by Mintek) and a new Hypogene composite sample from much deeper mineralization (as tested by XPS).
0
10
20
30
40
50
60
70
80
90
100
0 10 20 30 40 50 60 70 80 90 100
Cum
ulat
ive
Mas
s %
Pas
sing
Grain Size (µm)
Combined Cu Sulphides
Chalcopyrite
Bornite
Chalcocite
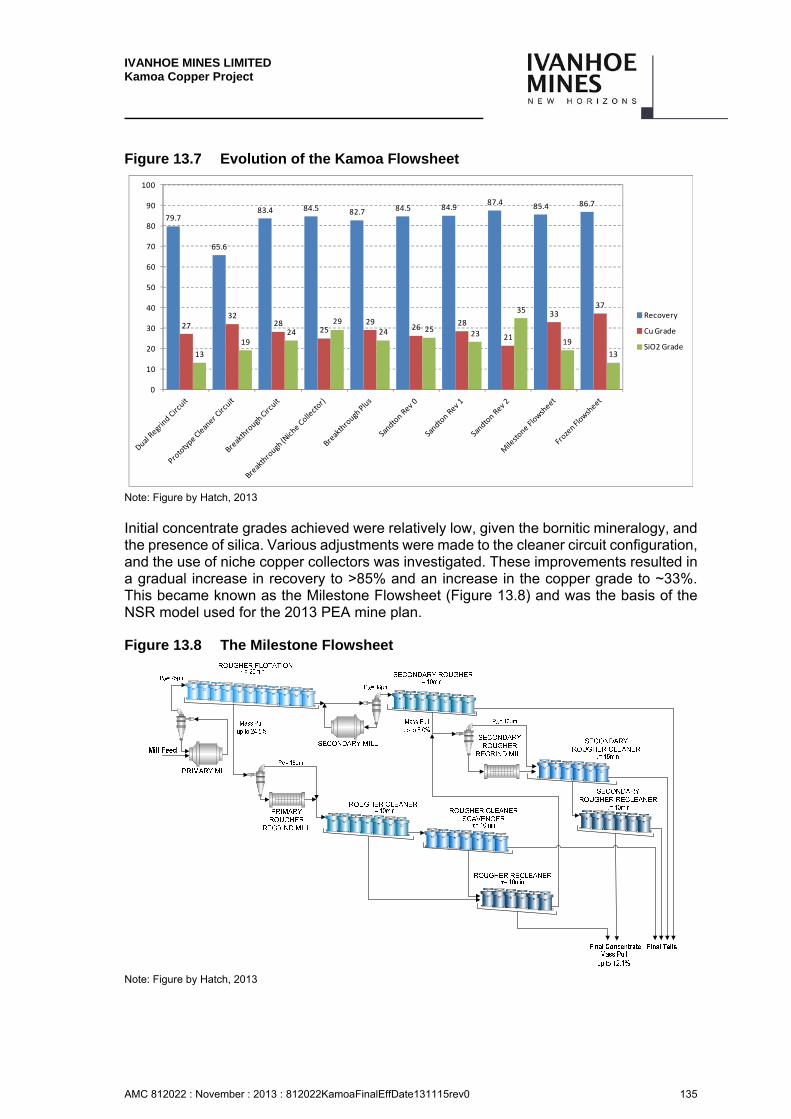
IVANHOE MINES LIMITED Kamoa Copper Project
AMC 812022 : November : 2013 : 812022KamoaFinalEffDate131115rev0 135
Figure 13.7 Evolution of the Kamoa Flowsheet
Note: Figure by Hatch, 2013
Initial concentrate grades achieved were relatively low, given the bornitic mineralogy, and the presence of silica. Various adjustments were made to the cleaner circuit configuration, and the use of niche copper collectors was investigated. These improvements resulted in a gradual increase in recovery to >85% and an increase in the copper grade to ~33%. This became known as the Milestone Flowsheet (Figure 13.8) and was the basis of the NSR model used for the 2013 PEA mine plan.
Figure 13.8 The Milestone Flowsheet
Note: Figure by Hatch, 2013
79.7
65.6
83.4 84.5 82.7 84.5 84.987.4 85.4 86.7
2732
2825
2926
28
21
3337
13
1924
2924 25
23
35
19
13
0
10
20
30
40
50
60
70
80
90
100
Recovery
Cu Grade
SiO2 Grade
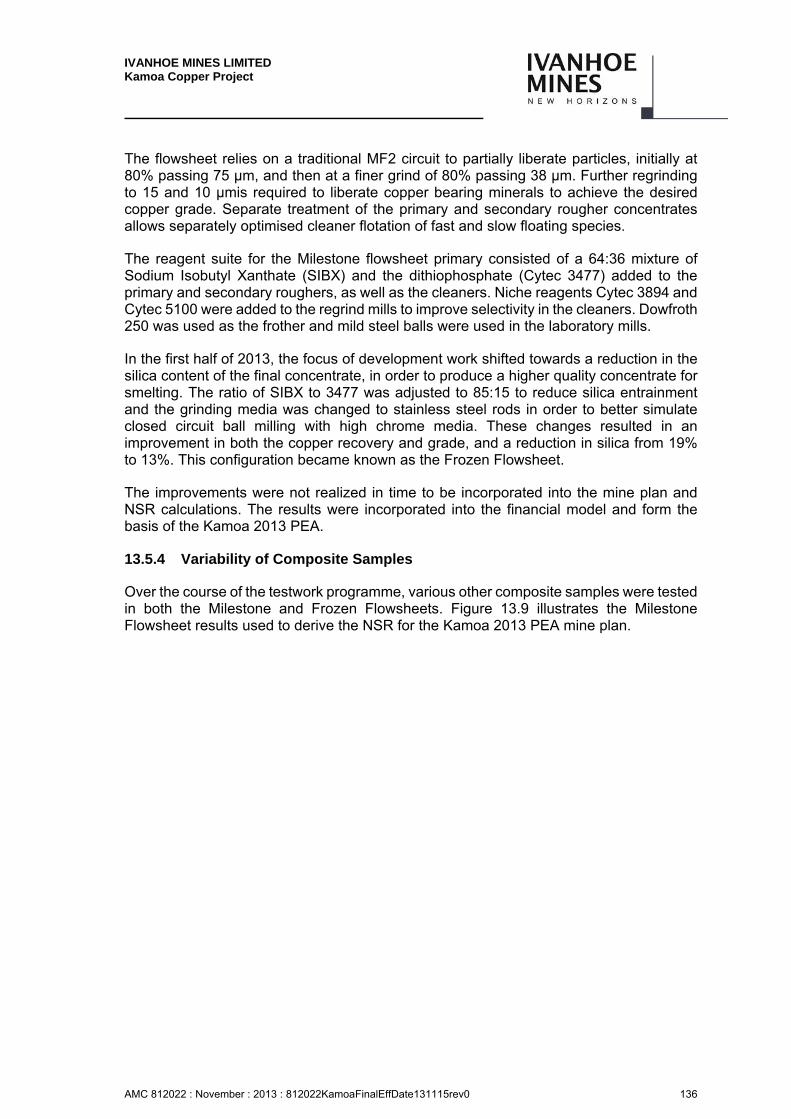
IVANHOE MINES LIMITED Kamoa Copper Project
AMC 812022 : November : 2013 : 812022KamoaFinalEffDate131115rev0 136
The flowsheet relies on a traditional MF2 circuit to partially liberate particles, initially at 80% passing 75 µm, and then at a finer grind of 80% passing 38 µm. Further regrinding to 15 and 10 µmis required to liberate copper bearing minerals to achieve the desired copper grade. Separate treatment of the primary and secondary rougher concentrates allows separately optimised cleaner flotation of fast and slow floating species.
The reagent suite for the Milestone flowsheet primary consisted of a 64:36 mixture of Sodium Isobutyl Xanthate (SIBX) and the dithiophosphate (Cytec 3477) added to the primary and secondary roughers, as well as the cleaners. Niche reagents Cytec 3894 and Cytec 5100 were added to the regrind mills to improve selectivity in the cleaners. Dowfroth 250 was used as the frother and mild steel balls were used in the laboratory mills.
In the first half of 2013, the focus of development work shifted towards a reduction in the silica content of the final concentrate, in order to produce a higher quality concentrate for smelting. The ratio of SIBX to 3477 was adjusted to 85:15 to reduce silica entrainment and the grinding media was changed to stainless steel rods in order to better simulate closed circuit ball milling with high chrome media. These changes resulted in an improvement in both the copper recovery and grade, and a reduction in silica from 19% to 13%. This configuration became known as the Frozen Flowsheet.
The improvements were not realized in time to be incorporated into the mine plan and NSR calculations. The results were incorporated into the financial model and form the basis of the Kamoa 2013 PEA.
13.5.4 Variability of Composite Samples
Over the course of the testwork programme, various other composite samples were tested in both the Milestone and Frozen Flowsheets. Figure 13.9 illustrates the Milestone Flowsheet results used to derive the NSR for the Kamoa 2013 PEA mine plan.
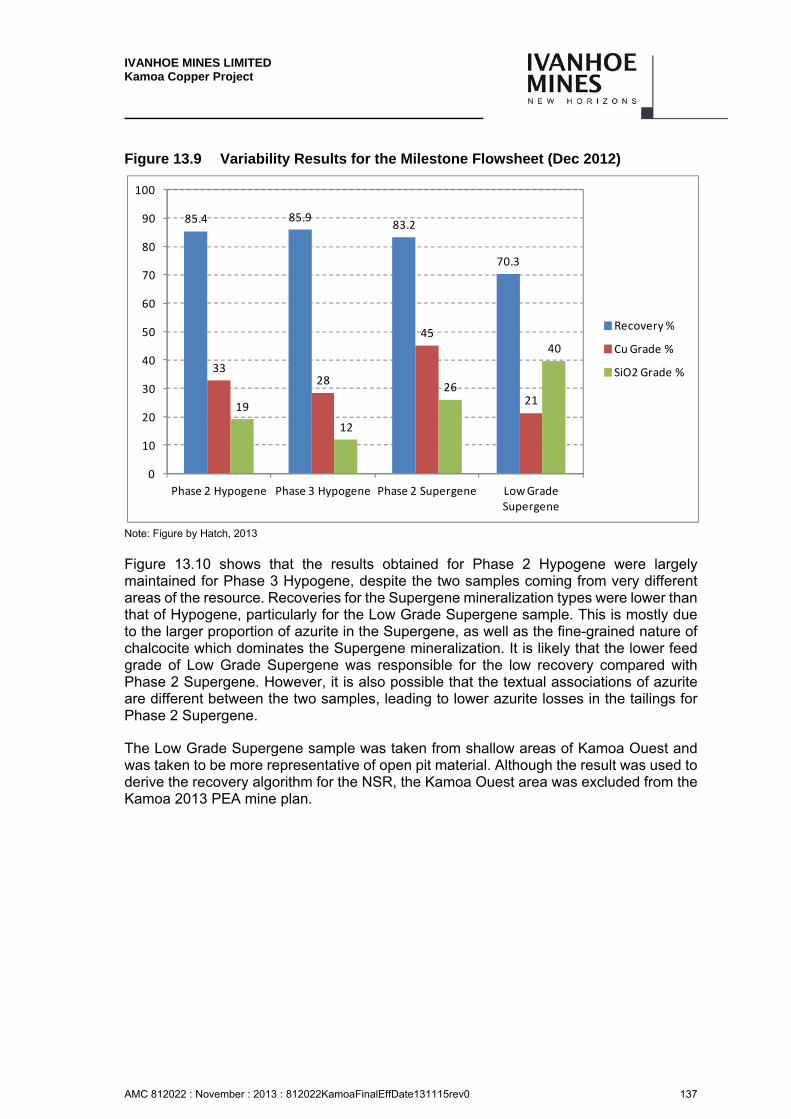
IVANHOE MINES LIMITED Kamoa Copper Project
AMC 812022 : November : 2013 : 812022KamoaFinalEffDate131115rev0 137
Figure 13.9 Variability Results for the Milestone Flowsheet (Dec 2012)
Note: Figure by Hatch, 2013
Figure 13.10 shows that the results obtained for Phase 2 Hypogene were largely maintained for Phase 3 Hypogene, despite the two samples coming from very different areas of the resource. Recoveries for the Supergene mineralization types were lower than that of Hypogene, particularly for the Low Grade Supergene sample. This is mostly due to the larger proportion of azurite in the Supergene, as well as the fine-grained nature of chalcocite which dominates the Supergene mineralization. It is likely that the lower feed grade of Low Grade Supergene was responsible for the low recovery compared with Phase 2 Supergene. However, it is also possible that the textual associations of azurite are different between the two samples, leading to lower azurite losses in the tailings for Phase 2 Supergene.
The Low Grade Supergene sample was taken from shallow areas of Kamoa Ouest and was taken to be more representative of open pit material. Although the result was used to derive the recovery algorithm for the NSR, the Kamoa Ouest area was excluded from the Kamoa 2013 PEA mine plan.
85.4 85.983.2
70.3
3328
45
2119
12
26
40
0
10
20
30
40
50
60
70
80
90
100
Phase 2 Hypogene Phase 3 Hypogene Phase 2 Supergene Low Grade Supergene
Recovery %
Cu Grade %
SiO2 Grade %
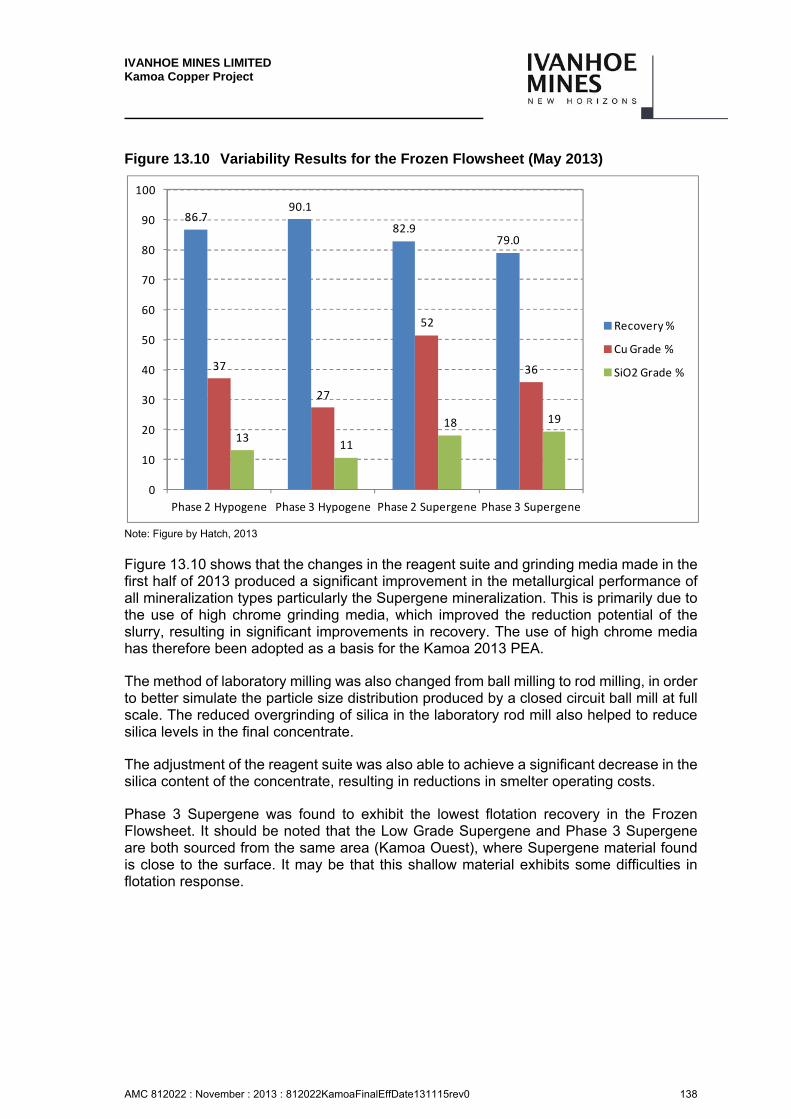
IVANHOE MINES LIMITED Kamoa Copper Project
AMC 812022 : November : 2013 : 812022KamoaFinalEffDate131115rev0 138
Figure 13.10 Variability Results for the Frozen Flowsheet (May 2013)
Note: Figure by Hatch, 2013
Figure 13.10 shows that the changes in the reagent suite and grinding media made in the first half of 2013 produced a significant improvement in the metallurgical performance of all mineralization types particularly the Supergene mineralization. This is primarily due to the use of high chrome grinding media, which improved the reduction potential of the slurry, resulting in significant improvements in recovery. The use of high chrome media has therefore been adopted as a basis for the Kamoa 2013 PEA.
The method of laboratory milling was also changed from ball milling to rod milling, in order to better simulate the particle size distribution produced by a closed circuit ball mill at full scale. The reduced overgrinding of silica in the laboratory rod mill also helped to reduce silica levels in the final concentrate.
The adjustment of the reagent suite was also able to achieve a significant decrease in the silica content of the concentrate, resulting in reductions in smelter operating costs.
Phase 3 Supergene was found to exhibit the lowest flotation recovery in the Frozen Flowsheet. It should be noted that the Low Grade Supergene and Phase 3 Supergene are both sourced from the same area (Kamoa Ouest), where Supergene material found is close to the surface. It may be that this shallow material exhibits some difficulties in flotation response.
86.790.1
82.979.0
37
27
52
36
1311
18 19
0
10
20
30
40
50
60
70
80
90
100
Phase 2 Hypogene Phase 3 Hypogene Phase 2 Supergene Phase 3 Supergene
Recovery %
Cu Grade %
SiO2 Grade %
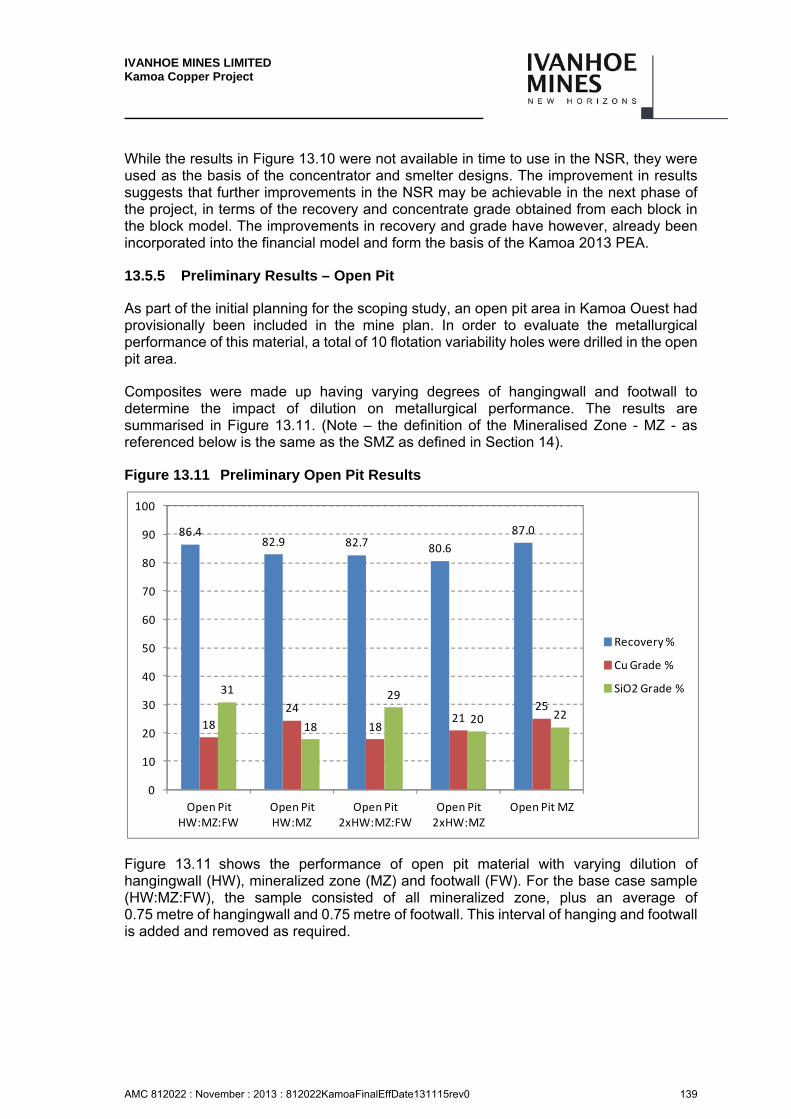
IVANHOE MINES LIMITED Kamoa Copper Project
AMC 812022 : November : 2013 : 812022KamoaFinalEffDate131115rev0 139
While the results in Figure 13.10 were not available in time to use in the NSR, they were used as the basis of the concentrator and smelter designs. The improvement in results suggests that further improvements in the NSR may be achievable in the next phase of the project, in terms of the recovery and concentrate grade obtained from each block in the block model. The improvements in recovery and grade have however, already been incorporated into the financial model and form the basis of the Kamoa 2013 PEA.
13.5.5 Preliminary Results – Open Pit
As part of the initial planning for the scoping study, an open pit area in Kamoa Ouest had provisionally been included in the mine plan. In order to evaluate the metallurgical performance of this material, a total of 10 flotation variability holes were drilled in the open pit area.
Composites were made up having varying degrees of hangingwall and footwall to determine the impact of dilution on metallurgical performance. The results are summarised in Figure 13.11. (Note – the definition of the Mineralised Zone - MZ - as referenced below is the same as the SMZ as defined in Section 14).
Figure 13.11 Preliminary Open Pit Results
Figure 13.11 shows the performance of open pit material with varying dilution of hangingwall (HW), mineralized zone (MZ) and footwall (FW). For the base case sample (HW:MZ:FW), the sample consisted of all mineralized zone, plus an average of 0.75 metre of hangingwall and 0.75 metre of footwall. This interval of hanging and footwall is added and removed as required.
86.482.9 82.7 80.6
87.0
18
24
1821
25
31
18
29
20 22
0
10
20
30
40
50
60
70
80
90
100
Open Pit HW:MZ:FW
Open Pit HW:MZ
Open Pit 2xHW:MZ:FW
Open Pit 2xHW:MZ
Open Pit MZ
Recovery %
Cu Grade %
SiO2 Grade %

IVANHOE MINES LIMITED Kamoa Copper Project
AMC 812022 : November : 2013 : 812022KamoaFinalEffDate131115rev0 140
Results indicate that the inclusion of the footwall interval in the sample leads to silica grades in excess of 29% and copper grades of less than 18%. This increase in silica grade has a significant impact on the smelter performance, leading to high viscosity slags, additional heating costs and large volumes of limestone for flux.
13.5.6 Deleterious Elements
Testwork to date has shown that there are no penalty elements present that reachproblematic levels in the concentrate. The main impurity element is silica, and testwork is being undertaken to minimise silica recovery.
Saleable concentrates generated from the Frozen Flowsheet are summarized in Table 13.5 below.
Table 13.5 Trace Element Analysis of Concentrates Obtained from the Frozen Flowsheet
Phase 2
Hypogene Phase 3
Hypogene Phase 2
Supergene Phase 3
Supergene Open Pit
HW:MZ:FW
Mass Pull 7.7 13 6.0 9.5 11
Cu 37.01 27.29 51.52 35.82 18.49
S 24.62 29.32 13.12 20.12 21.22
Fe 18.32 24.96 5.22 12.78 16.75
SiO2 13.11 10.68 18.09 19.38 30.85
CaO 0.14 0.11 0.26 0.07 0.09
MgO 0.75 0.64 0.85 0.76 0.97
Al2O3 3.33 2.71 4.00 4.97 6.96
As(%) 0.005 0.013 0.01 0.013 0.014
Bi(%) 0.009 0.008 0.006 0.01 0.012
Cd(%) 0.0002 0.0002 0.005 0.0002 0.005
Cl (%) 0.0016 0.02 0.01 0.054 0.005
Co (%) 0.053 0.072 0.008 0.12 0.124
Hg (ppm) 0.49 0.77 0.638 0.89 0.84
Pb(%) 0.022 0.026 0.008 0.12 0.033
Sb(%) 0.01 0.0001 0.005 0.001 0.005
Se(%) 0.01 0.001 0.005 0.002 0.005
Te(%) 0.01 0.001 0.005 0.001 0.005
Zn(%) 0.055 0.109 0.020 0.016 0.036
F(%) 0.029 0.035 0.010 0.058 TBA
IVANHOE MINES LIMITED Kamoa Copper Project
AMC 812022 : November : 2013 : 812022KamoaFinalEffDate131115rev0 141
Conclusions Pertinent to the Kamoa 2013 PEA
The Kamoa flowsheet has been developed over extensive testwork from 2010 to 2013 at both Mintek and XPS. The flowsheet has been tested using a broad range of samples, taken from wide area across the deposit. Important outcomes of the testwork are:
The metallurgical drilling coverage corresponds fairly well with the Kamoa 2013 PEA mine plan, although samples have yet to be taken from the southern part of Kansoko Sud which is the dominant mining area in the first five years. Metallurgical drilling is currently underway in this area, and the results have been prioritised as an input into the next phase of the project.
Material is very fine grained compared to most copper sulphide mineralization, with up to 40% of copper sulphides <10 µm. A whole-of-ore grind to the liberation size would not be economical at this size.
An MF2 configuration is used to partially liberate minerals before regrinding to achieve a suitable concentrate grade for Direct-to-Blister Flash (DBF) smelting technology.
Separate treatment of the primary and secondary rougher concentrates allows separately optimised cleaner flotation of fast and slow species.
Hypogene recoveries in the Milestone Flowsheet were between 85% and 86% with concentrate grades of 28% to 33% copper. These recoveries have since been improved to 86% to 90% recovery and 27% to 37% copper in the Frozen Flowsheet as a result of changes to the grinding media and reagent suite.
Supergene recoveries were more variable than Hypogene, with recoveries between 70 and 84% with concentrate grades of between 21% to 40% copper in the Milestone Flowsheet.
Supergene recoveries for deeper regions of the mineral deposit generally yield better recoveries than shallow samples. This is particularly relevant for the Kamoa Ouest region, where the mineralization includes KPS, which is believed to have a negative impact on grade and recovery.
Recent improvements in the Frozen Flowsheet have improved Supergene recoveries to between 79% and 83% recovery and 36% to 52% copper.
The use of high chrome media produces improvements in the slurry reduction potential which improves flotation performance, particularly for Supergene mineralization. High chrome media has been adopted as the basis for the Kamoa 2013 PEA.
The NSR has been based on the Milestone flowsheet results (i.e. before improvements in reagents and ginding media). Recent improvements in the flowsheet have resulted in further increases in recovery and grade which are likely to improve the NSR results in future phases of the project.
The NSR has been based on a different data set to the concentrator and smelter design. This discrepancy will be addressed in the next phase of the project and will possibly lead to higher estimates of recovery in the next NSR iteration.
The open pit area in Kamoa Ouest yielded lower quality concentrate grades.
IVANHOE MINES LIMITED Kamoa Copper Project
AMC 812022 : November : 2013 : 812022KamoaFinalEffDate131115rev0 142
Comminution Testwork
Bench scale comminution testwork was conducted in order to characterise the hardness of the Kamoa deposit and derive parameters to be used for the selection and design of the comminution circuit. The testwork was conducted during three different phases of the project testwork:
Phases 1 and 2, using samples from underground drill cores,
Phase 4 using samples from drill cores from the open pit mining areas.
Since the open pit mining areas are not part of the current mining plan, the results are reported but were not used in the design.
13.7.1 Sample Selection
Mineralisation at Kamoa occurs in three distinct lithologies, mainly comprising siltstone and diamictite with isolated mineralisation of the pyritic siltstone hanging wall formation in isolated areas. The uppermost siltstone is the KPS (Ki1.1.2). This is usually unmineralized with respect to copper (but it does contain pyrite) and occurs in the hangingwall of the Selected Mineralized Zone (SMZ) in most areas, but does contain part of the SMZ in the Kamoa Ouest sector. Below the KPS is the clast-poor diamictite (Ki1.1.3). Then there is an “intermediate” siltstone Ki1.1.1.2 that is not always present. Below this is the clast-rich diamictite (Ki1.1.1.1). The clast-rich diamictite generally contains the greater part of the mineralisation.
Samples were selected from different areas of the Kamoa deposit for different phases of comminution testwork.
Phase 1 testwork samples were selected mainly from the Kamoa Sud area and based on three different lithologies: clast-rich diamictite, clast-poor diamictite and lower pyritic siltstone. Due to the relatively thin nature of the mineralized zone, it was not possible to obtain adequate quantities of samples as continuous runs of drill core. Consequently “composite” samples of quartered NQ (47.6 mm) drill core were collected. These composite samples had a generally consistent appearance, but derived from different boreholes in the initial Kamoa Sud area.
The Phase 2 samples were selected from Kamoa Sud, Kansoko Sud and Kansoko Central. In total, eight composite samples were constituted for bench scale comminution testwork representing various horizons from the hanging wall to the foot wall. No comminution tests were performed as part of the Phase 3 test program.
The Phase 4 samples were selected from drill cores emanating from the open pit area. Comminution bench scale variability testwork was conducted on six individual cores.
Figure 13.12 indicates the locations for the Phase 2 samples.
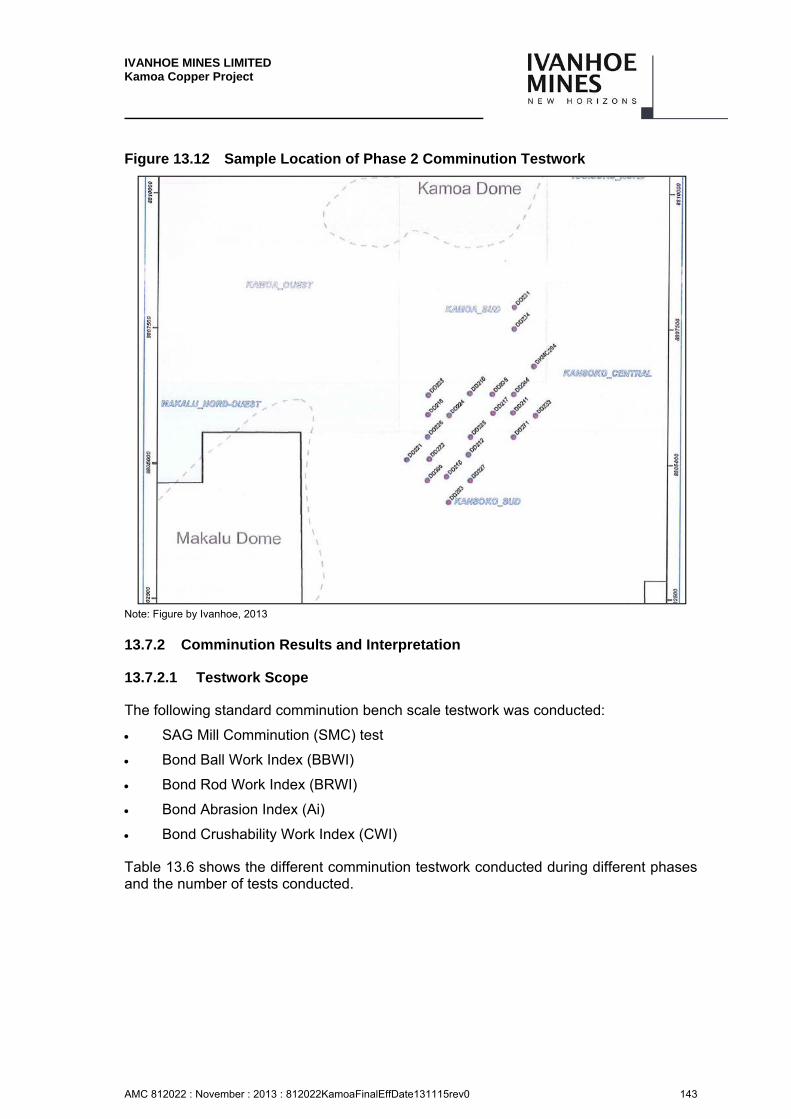
IVANHOE MINES LIMITED Kamoa Copper Project
AMC 812022 : November : 2013 : 812022KamoaFinalEffDate131115rev0 143
Figure 13.12 Sample Location of Phase 2 Comminution Testwork
Note: Figure by Ivanhoe, 2013
13.7.2 Comminution Results and Interpretation
13.7.2.1 Testwork Scope
The following standard comminution bench scale testwork was conducted:
SAG Mill Comminution (SMC) test
Bond Ball Work Index (BBWI)
Bond Rod Work Index (BRWI)
Bond Abrasion Index (Ai)
Bond Crushability Work Index (CWI)
Table 13.6 shows the different comminution testwork conducted during different phases and the number of tests conducted.
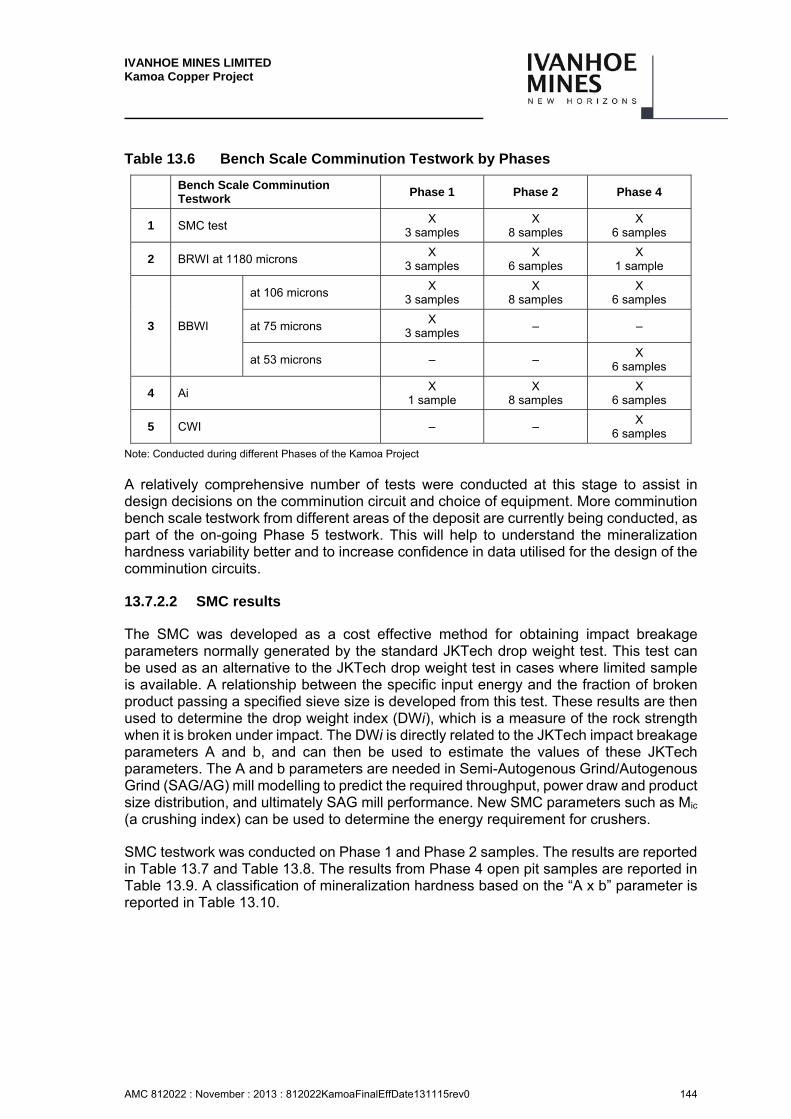
IVANHOE MINES LIMITED Kamoa Copper Project
AMC 812022 : November : 2013 : 812022KamoaFinalEffDate131115rev0 144
Table 13.6 Bench Scale Comminution Testwork by Phases
Bench Scale Comminution Testwork
Phase 1 Phase 2 Phase 4
1 SMC test X
3 samples X
8 samples X
6 samples
2 BRWI at 1180 microns X
3 samples X
6 samples X
1 sample
3 BBWI
at 106 microns X
3 samples X
8 samples X
6 samples
at 75 microns X
3 samples – –
at 53 microns – – X
6 samples
4 Ai X
1 sample X
8 samples X
6 samples
5 CWI – – X
6 samples
Note: Conducted during different Phases of the Kamoa Project
A relatively comprehensive number of tests were conducted at this stage to assist in design decisions on the comminution circuit and choice of equipment. More comminution bench scale testwork from different areas of the deposit are currently being conducted, as part of the on-going Phase 5 testwork. This will help to understand the mineralization hardness variability better and to increase confidence in data utilised for the design of the comminution circuits.
13.7.2.2 SMC results
The SMC was developed as a cost effective method for obtaining impact breakage parameters normally generated by the standard JKTech drop weight test. This test can be used as an alternative to the JKTech drop weight test in cases where limited sample is available. A relationship between the specific input energy and the fraction of broken product passing a specified sieve size is developed from this test. These results are then used to determine the drop weight index (DWi), which is a measure of the rock strength when it is broken under impact. The DWi is directly related to the JKTech impact breakage parameters A and b, and can then be used to estimate the values of these JKTech parameters. The A and b parameters are needed in Semi-Autogenous Grind/Autogenous Grind (SAG/AG) mill modelling to predict the required throughput, power draw and product size distribution, and ultimately SAG mill performance. New SMC parameters such as Mic (a crushing index) can be used to determine the energy requirement for crushers.
SMC testwork was conducted on Phase 1 and Phase 2 samples. The results are reported in Table 13.7 and Table 13.8. The results from Phase 4 open pit samples are reported in Table 13.9. A classification of mineralization hardness based on the “A x b” parameter is reported in Table 13.10.
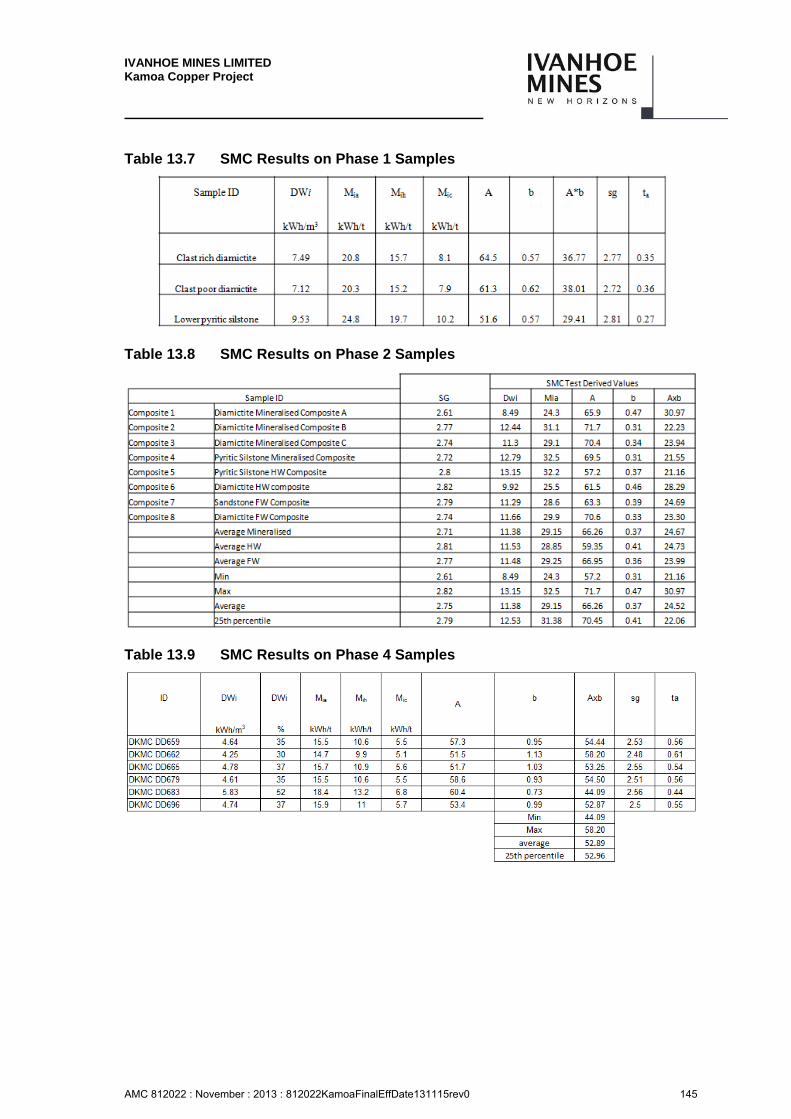
IVANHOE MINES LIMITED Kamoa Copper Project
AMC 812022 : November : 2013 : 812022KamoaFinalEffDate131115rev0 145
Table 13.7 SMC Results on Phase 1 Samples
Table 13.8 SMC Results on Phase 2 Samples
Table 13.9 SMC Results on Phase 4 Samples
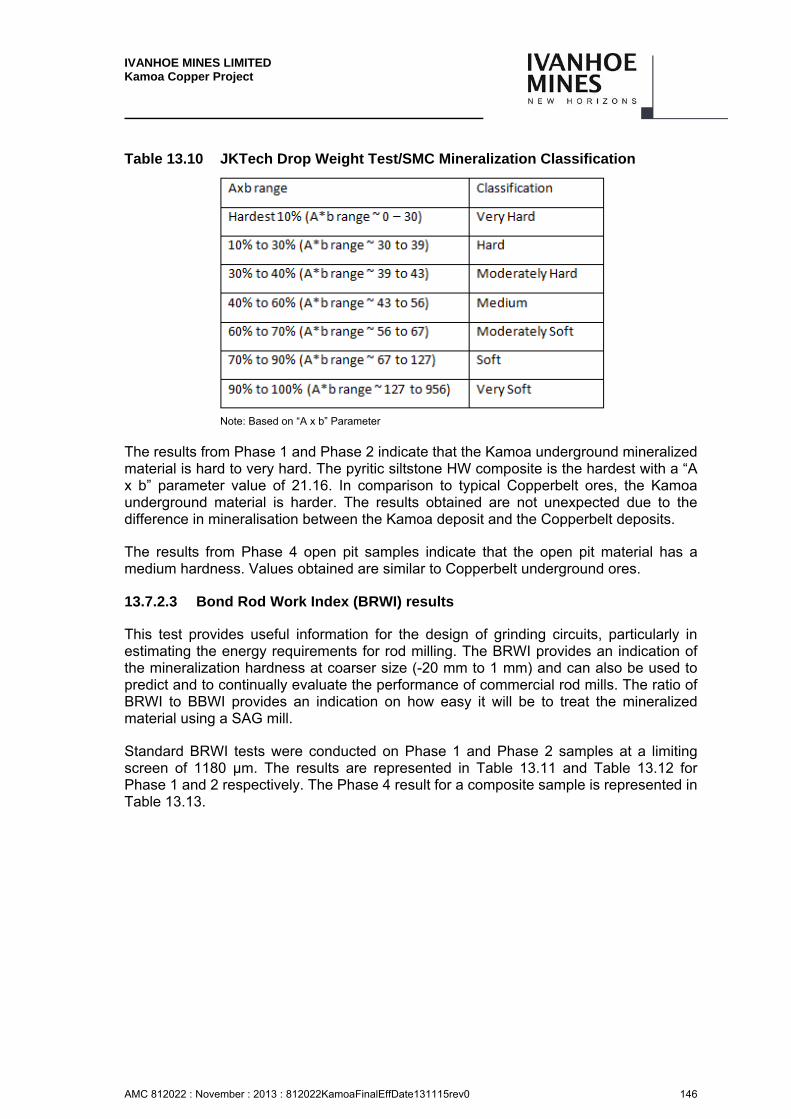
IVANHOE MINES LIMITED Kamoa Copper Project
AMC 812022 : November : 2013 : 812022KamoaFinalEffDate131115rev0 146
Table 13.10 JKTech Drop Weight Test/SMC Mineralization Classification
Note: Based on “A x b” Parameter
The results from Phase 1 and Phase 2 indicate that the Kamoa underground mineralized material is hard to very hard. The pyritic siltstone HW composite is the hardest with a “A x b” parameter value of 21.16. In comparison to typical Copperbelt ores, the Kamoa underground material is harder. The results obtained are not unexpected due to the difference in mineralisation between the Kamoa deposit and the Copperbelt deposits.
The results from Phase 4 open pit samples indicate that the open pit material has a medium hardness. Values obtained are similar to Copperbelt underground ores.
13.7.2.3 Bond Rod Work Index (BRWI) results
This test provides useful information for the design of grinding circuits, particularly in estimating the energy requirements for rod milling. The BRWI provides an indication of the mineralization hardness at coarser size (-20 mm to 1 mm) and can also be used to predict and to continually evaluate the performance of commercial rod mills. The ratio of BRWI to BBWI provides an indication on how easy it will be to treat the mineralized material using a SAG mill.
Standard BRWI tests were conducted on Phase 1 and Phase 2 samples at a limiting screen of 1180 µm. The results are represented in Table 13.11 and Table 13.12 for Phase 1 and 2 respectively. The Phase 4 result for a composite sample is represented in Table 13.13.
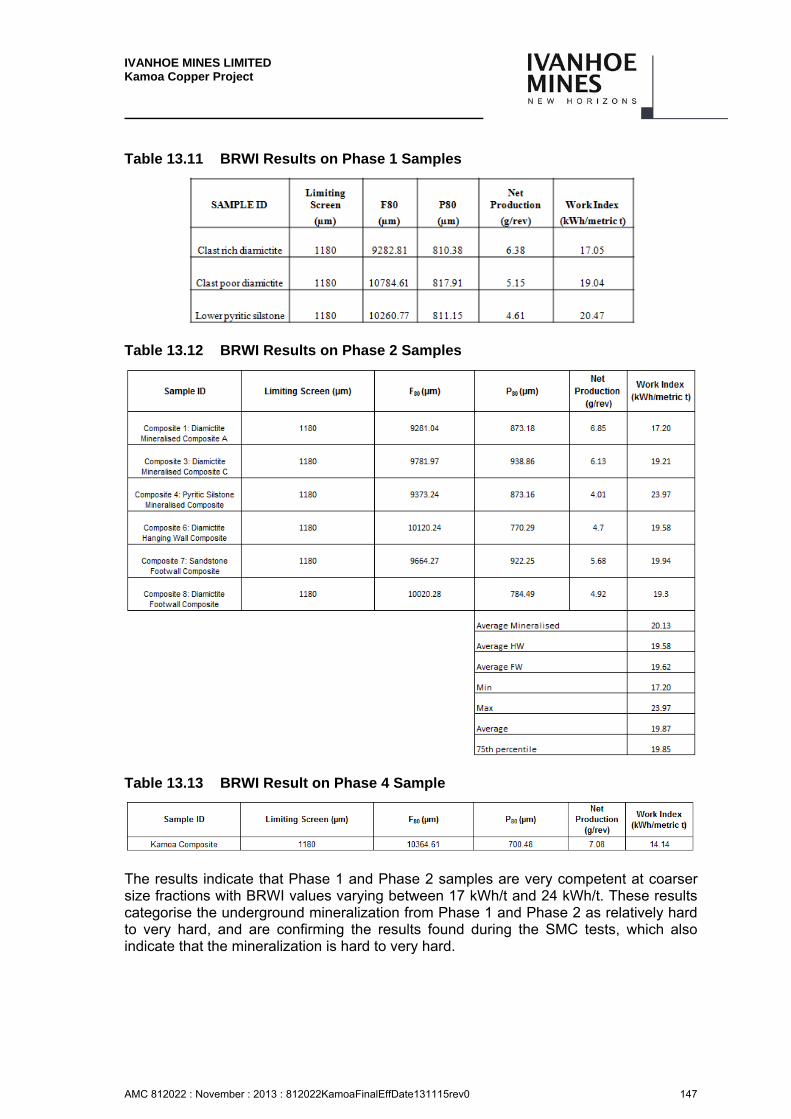
IVANHOE MINES LIMITED Kamoa Copper Project
AMC 812022 : November : 2013 : 812022KamoaFinalEffDate131115rev0 147
Table 13.11 BRWI Results on Phase 1 Samples
Table 13.12 BRWI Results on Phase 2 Samples
Table 13.13 BRWI Result on Phase 4 Sample
The results indicate that Phase 1 and Phase 2 samples are very competent at coarser size fractions with BRWI values varying between 17 kWh/t and 24 kWh/t. These results categorise the underground mineralization from Phase 1 and Phase 2 as relatively hard to very hard, and are confirming the results found during the SMC tests, which also indicate that the mineralization is hard to very hard.
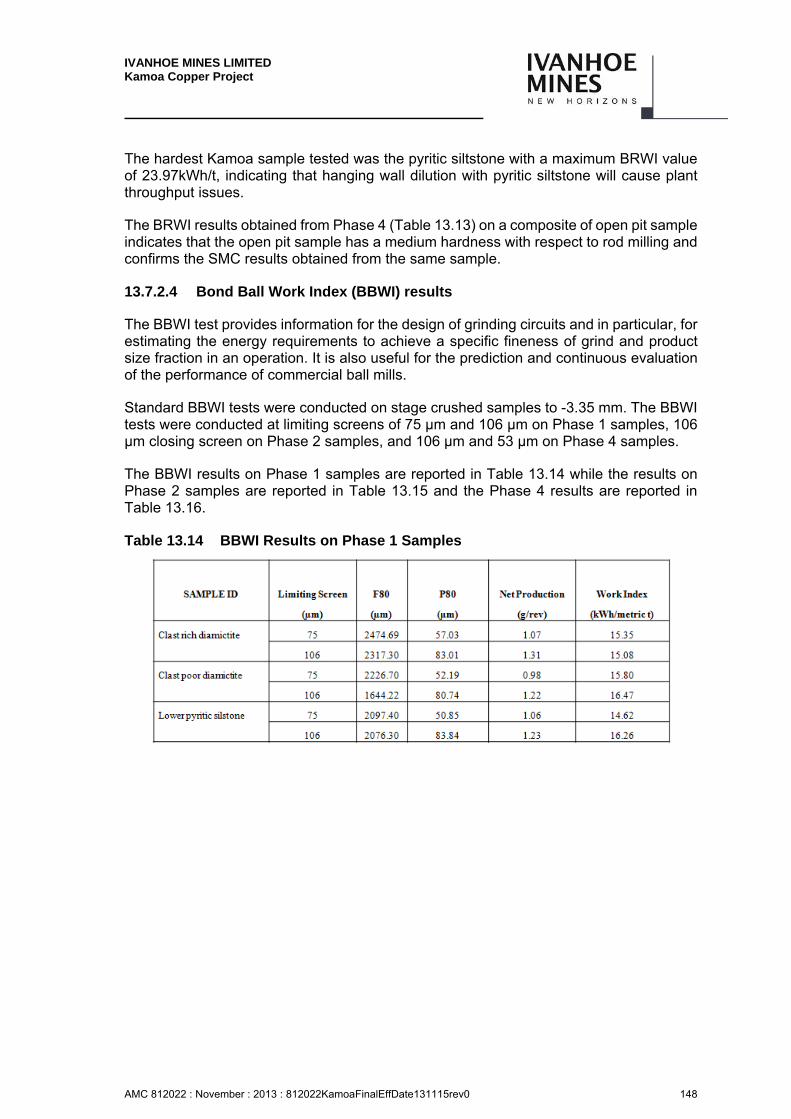
IVANHOE MINES LIMITED Kamoa Copper Project
AMC 812022 : November : 2013 : 812022KamoaFinalEffDate131115rev0 148
The hardest Kamoa sample tested was the pyritic siltstone with a maximum BRWI value of 23.97kWh/t, indicating that hanging wall dilution with pyritic siltstone will cause plant throughput issues.
The BRWI results obtained from Phase 4 (Table 13.13) on a composite of open pit sample indicates that the open pit sample has a medium hardness with respect to rod milling and confirms the SMC results obtained from the same sample.
13.7.2.4 Bond Ball Work Index (BBWI) results
The BBWI test provides information for the design of grinding circuits and in particular, for estimating the energy requirements to achieve a specific fineness of grind and product size fraction in an operation. It is also useful for the prediction and continuous evaluation of the performance of commercial ball mills.
Standard BBWI tests were conducted on stage crushed samples to -3.35 mm. The BBWI tests were conducted at limiting screens of 75 µm and 106 µm on Phase 1 samples, 106 µm closing screen on Phase 2 samples, and 106 µm and 53 µm on Phase 4 samples.
The BBWI results on Phase 1 samples are reported in Table 13.14 while the results on Phase 2 samples are reported in Table 13.15 and the Phase 4 results are reported in Table 13.16.
Table 13.14 BBWI Results on Phase 1 Samples
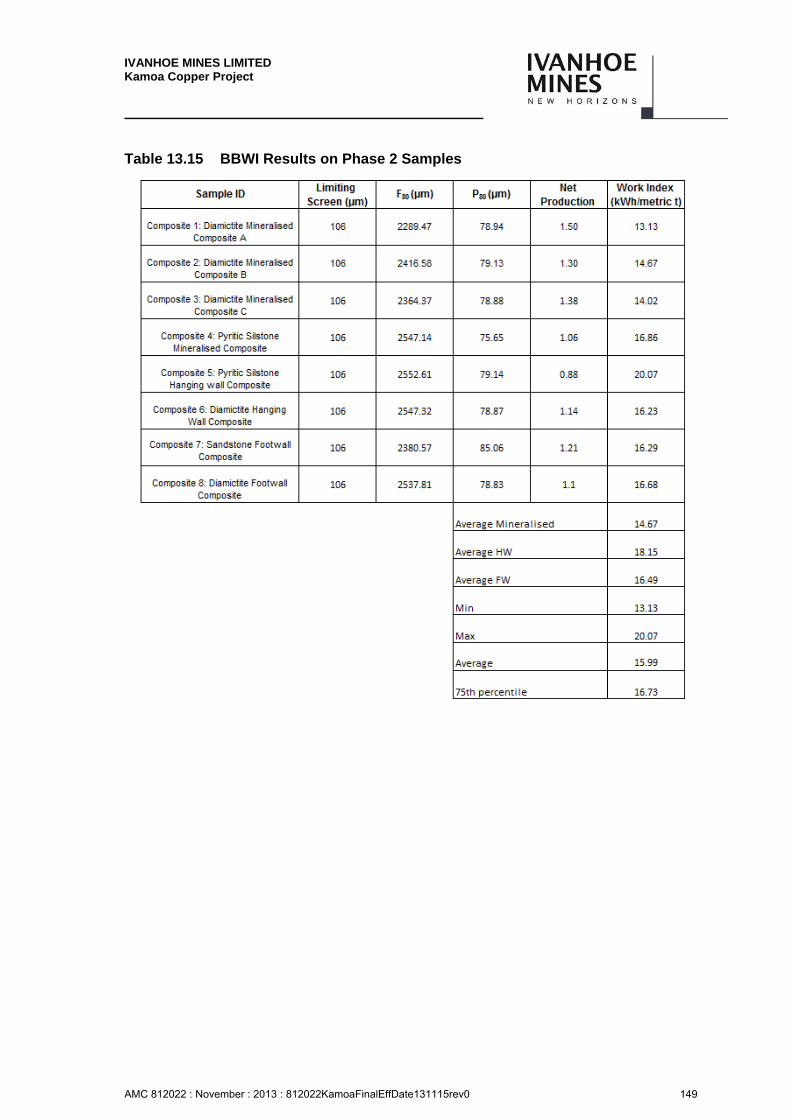
IVANHOE MINES LIMITED Kamoa Copper Project
AMC 812022 : November : 2013 : 812022KamoaFinalEffDate131115rev0 149
Table 13.15 BBWI Results on Phase 2 Samples
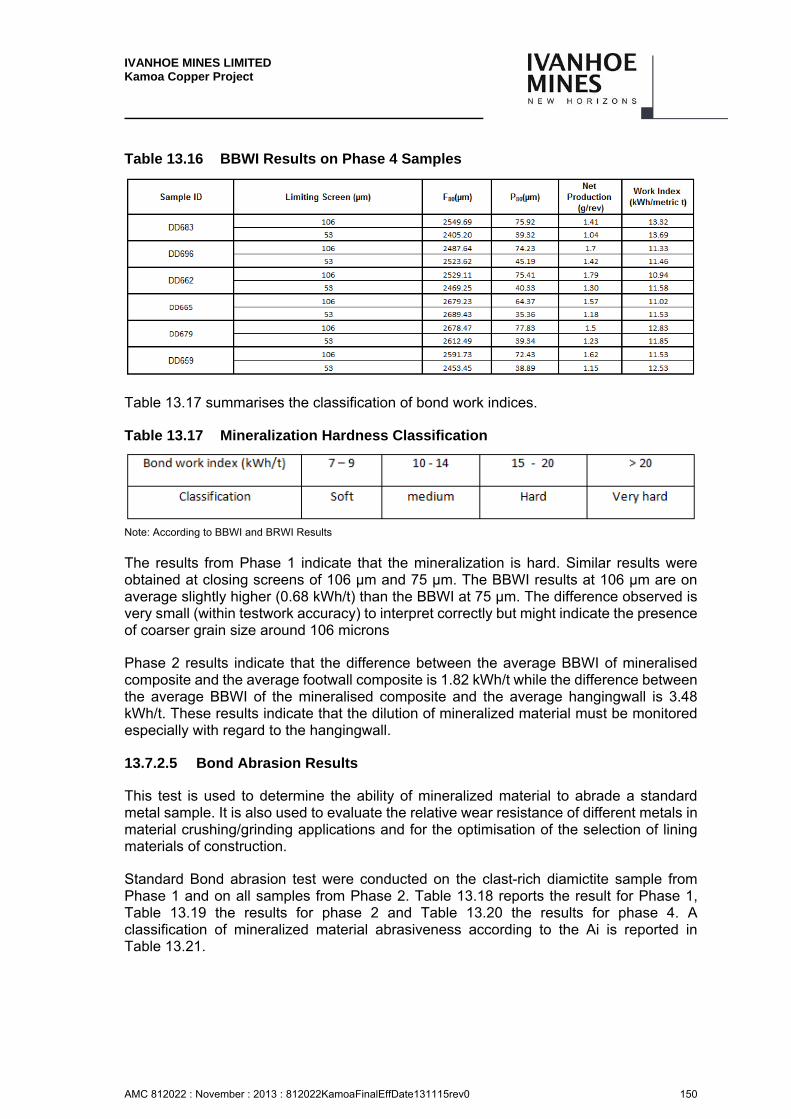
IVANHOE MINES LIMITED Kamoa Copper Project
AMC 812022 : November : 2013 : 812022KamoaFinalEffDate131115rev0 150
Table 13.16 BBWI Results on Phase 4 Samples
Table 13.17 summarises the classification of bond work indices.
Table 13.17 Mineralization Hardness Classification
Note: According to BBWI and BRWI Results
The results from Phase 1 indicate that the mineralization is hard. Similar results were obtained at closing screens of 106 µm and 75 µm. The BBWI results at 106 µm are on average slightly higher (0.68 kWh/t) than the BBWI at 75 µm. The difference observed is very small (within testwork accuracy) to interpret correctly but might indicate the presence of coarser grain size around 106 microns
Phase 2 results indicate that the difference between the average BBWI of mineralised composite and the average footwall composite is 1.82 kWh/t while the difference between the average BBWI of the mineralised composite and the average hangingwall is 3.48 kWh/t. These results indicate that the dilution of mineralized material must be monitored especially with regard to the hangingwall.
13.7.2.5 Bond Abrasion Results
This test is used to determine the ability of mineralized material to abrade a standard metal sample. It is also used to evaluate the relative wear resistance of different metals in material crushing/grinding applications and for the optimisation of the selection of lining materials of construction.
Standard Bond abrasion test were conducted on the clast-rich diamictite sample from Phase 1 and on all samples from Phase 2. Table 13.18 reports the result for Phase 1, Table 13.19 the results for phase 2 and Table 13.20 the results for phase 4. A classification of mineralized material abrasiveness according to the Ai is reported in Table 13.21.

IVANHOE MINES LIMITED Kamoa Copper Project
AMC 812022 : November : 2013 : 812022KamoaFinalEffDate131115rev0 151
Table 13.18 Bond Abrasion Results on Phase 1 Sample
Table 13.19 Bond Abrasion Results on Phase 2 Samples
Table 13.20 Bond Abrasion Results on Phase 4 Samples
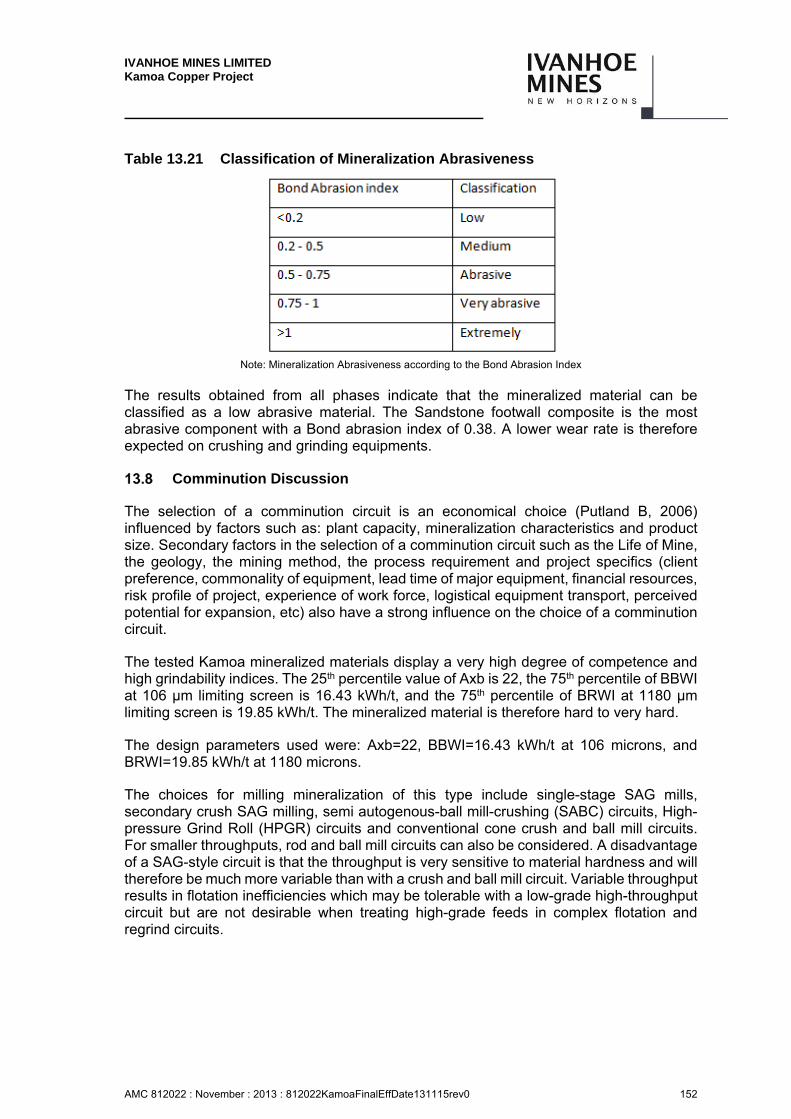
IVANHOE MINES LIMITED Kamoa Copper Project
AMC 812022 : November : 2013 : 812022KamoaFinalEffDate131115rev0 152
Table 13.21 Classification of Mineralization Abrasiveness
Note: Mineralization Abrasiveness according to the Bond Abrasion Index
The results obtained from all phases indicate that the mineralized material can be classified as a low abrasive material. The Sandstone footwall composite is the most abrasive component with a Bond abrasion index of 0.38. A lower wear rate is therefore expected on crushing and grinding equipments.
Comminution Discussion
The selection of a comminution circuit is an economical choice (Putland B, 2006) influenced by factors such as: plant capacity, mineralization characteristics and product size. Secondary factors in the selection of a comminution circuit such as the Life of Mine, the geology, the mining method, the process requirement and project specifics (client preference, commonality of equipment, lead time of major equipment, financial resources, risk profile of project, experience of work force, logistical equipment transport, perceived potential for expansion, etc) also have a strong influence on the choice of a comminution circuit.
The tested Kamoa mineralized materials display a very high degree of competence and high grindability indices. The 25th percentile value of Axb is 22, the 75th percentile of BBWI at 106 µm limiting screen is 16.43 kWh/t, and the 75th percentile of BRWI at 1180 µm limiting screen is 19.85 kWh/t. The mineralized material is therefore hard to very hard.
The design parameters used were: Axb=22, BBWI=16.43 kWh/t at 106 microns, and BRWI=19.85 kWh/t at 1180 microns.
The choices for milling mineralization of this type include single-stage SAG mills, secondary crush SAG milling, semi autogenous-ball mill-crushing (SABC) circuits, High-pressure Grind Roll (HPGR) circuits and conventional cone crush and ball mill circuits. For smaller throughputs, rod and ball mill circuits can also be considered. A disadvantage of a SAG-style circuit is that the throughput is very sensitive to material hardness and will therefore be much more variable than with a crush and ball mill circuit. Variable throughput results in flotation inefficiencies which may be tolerable with a low-grade high-throughput circuit but are not desirable when treating high-grade feeds in complex flotation and regrind circuits.
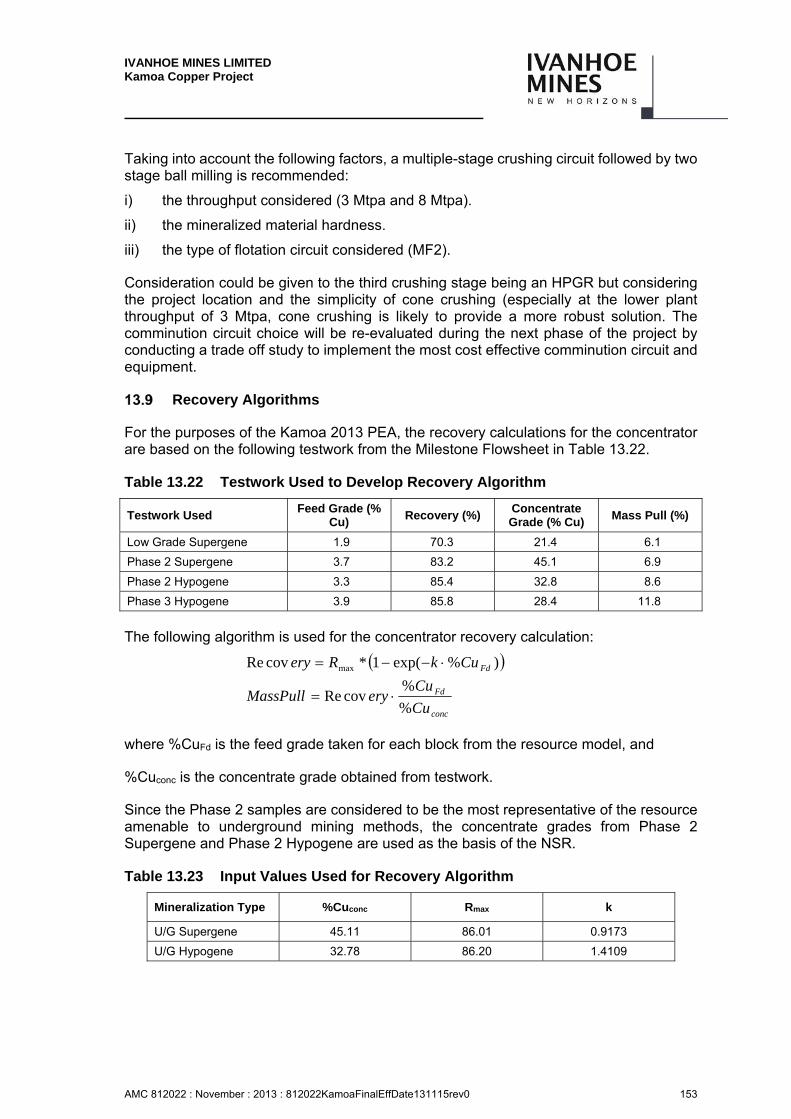
IVANHOE MINES LIMITED Kamoa Copper Project
AMC 812022 : November : 2013 : 812022KamoaFinalEffDate131115rev0 153
Taking into account the following factors, a multiple-stage crushing circuit followed by two stage ball milling is recommended:
i) the throughput considered (3 Mtpa and 8 Mtpa).
ii) the mineralized material hardness.
iii) the type of flotation circuit considered (MF2).
Consideration could be given to the third crushing stage being an HPGR but considering the project location and the simplicity of cone crushing (especially at the lower plant throughput of 3 Mtpa, cone crushing is likely to provide a more robust solution. The comminution circuit choice will be re-evaluated during the next phase of the project by conducting a trade off study to implement the most cost effective comminution circuit and equipment.
Recovery Algorithms
For the purposes of the Kamoa 2013 PEA, the recovery calculations for the concentrator are based on the following testwork from the Milestone Flowsheet in Table 13.22.
Table 13.22 Testwork Used to Develop Recovery Algorithm
Testwork Used Feed Grade (%
Cu) Recovery (%)
Concentrate Grade (% Cu)
Mass Pull (%)
Low Grade Supergene 1.9 70.3 21.4 6.1
Phase 2 Supergene 3.7 83.2 45.1 6.9
Phase 2 Hypogene 3.3 85.4 32.8 8.6
Phase 3 Hypogene 3.9 85.8 28.4 11.8
The following algorithm is used for the concentrator recovery calculation:
conc
Fd
Fd
Cu
CueryMassPull
CukRery
%
%covRe
)%exp(1*covRe max
where %CuFd is the feed grade taken for each block from the resource model, and
%Cuconc is the concentrate grade obtained from testwork.
Since the Phase 2 samples are considered to be the most representative of the resource amenable to underground mining methods, the concentrate grades from Phase 2 Supergene and Phase 2 Hypogene are used as the basis of the NSR.
Table 13.23 Input Values Used for Recovery Algorithm
Mineralization Type %Cuconc Rmax k
U/G Supergene 45.11 86.01 0.9173
U/G Hypogene 32.78 86.20 1.4109
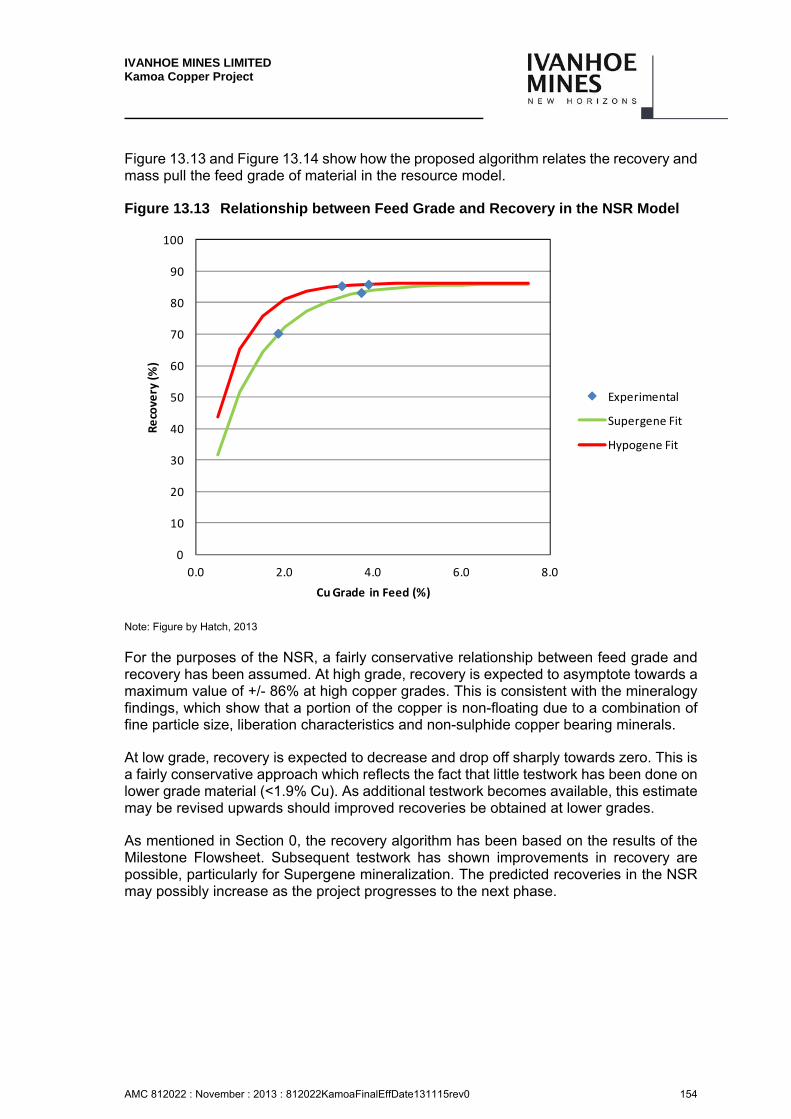
IVANHOE MINES LIMITED Kamoa Copper Project
AMC 812022 : November : 2013 : 812022KamoaFinalEffDate131115rev0 154
Figure 13.13 and Figure 13.14 show how the proposed algorithm relates the recovery and mass pull the feed grade of material in the resource model.
Figure 13.13 Relationship between Feed Grade and Recovery in the NSR Model
Note: Figure by Hatch, 2013
For the purposes of the NSR, a fairly conservative relationship between feed grade and recovery has been assumed. At high grade, recovery is expected to asymptote towards a maximum value of +/- 86% at high copper grades. This is consistent with the mineralogy findings, which show that a portion of the copper is non-floating due to a combination of fine particle size, liberation characteristics and non-sulphide copper bearing minerals.
At low grade, recovery is expected to decrease and drop off sharply towards zero. This is a fairly conservative approach which reflects the fact that little testwork has been done on lower grade material (<1.9% Cu). As additional testwork becomes available, this estimate may be revised upwards should improved recoveries be obtained at lower grades.
As mentioned in Section 0, the recovery algorithm has been based on the results of the Milestone Flowsheet. Subsequent testwork has shown improvements in recovery are possible, particularly for Supergene mineralization. The predicted recoveries in the NSR may possibly increase as the project progresses to the next phase.
0
10
20
30
40
50
60
70
80
90
100
0.0 2.0 4.0 6.0 8.0
Recovery (%)
Cu Grade in Feed (%)
Experimental
Supergene Fit
Hypogene Fit
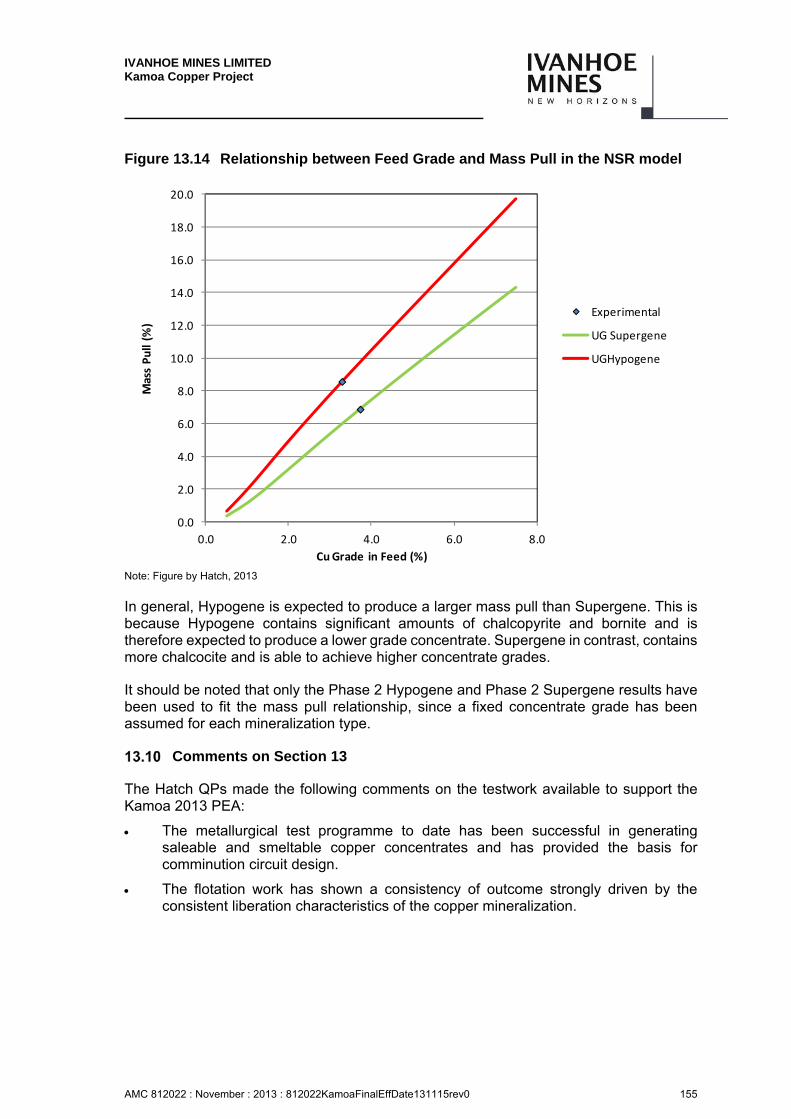
IVANHOE MINES LIMITED Kamoa Copper Project
AMC 812022 : November : 2013 : 812022KamoaFinalEffDate131115rev0 155
Figure 13.14 Relationship between Feed Grade and Mass Pull in the NSR model
Note: Figure by Hatch, 2013
In general, Hypogene is expected to produce a larger mass pull than Supergene. This is because Hypogene contains significant amounts of chalcopyrite and bornite and is therefore expected to produce a lower grade concentrate. Supergene in contrast, contains more chalcocite and is able to achieve higher concentrate grades.
It should be noted that only the Phase 2 Hypogene and Phase 2 Supergene results have been used to fit the mass pull relationship, since a fixed concentrate grade has been assumed for each mineralization type.
Comments on Section 13
The Hatch QPs made the following comments on the testwork available to support the Kamoa 2013 PEA:
The metallurgical test programme to date has been successful in generating saleable and smeltable copper concentrates and has provided the basis for comminution circuit design.
The flotation work has shown a consistency of outcome strongly driven by the consistent liberation characteristics of the copper mineralization.
0.0
2.0
4.0
6.0
8.0
10.0
12.0
14.0
16.0
18.0
20.0
0.0 2.0 4.0 6.0 8.0
Mass Pull (%
)
Cu Grade in Feed (%)
Experimental
UG Supergene
UGHypogene

IVANHOE MINES LIMITED Kamoa Copper Project
AMC 812022 : November : 2013 : 812022KamoaFinalEffDate131115rev0 156
The circuit developed has been tested on a range of composite samples taken from across the deposit. Indications are that the recoverable copper to concentrate is in the vicininty of 86% to 90% for the dominant Hypogene material and between 79% and 83% for the less prevalent Supergene mineralization. Concentrate grades of between of 27% and 37% are expected for Hypogene, with higher grades of 36 to 52% for Supergene mineralization.
A conservative approach has been taken on the NSR algorithms where a maximum recovery of ~86% is assumed. Recovery is also assumed to drop off rapidly as the feed grade decreases.
The NSR algorithm is based on the results of the Milestone Flowsheet as of December 2012. Further developments have lead to improvements in both concentrate grade and recovery, which are expected to improve the NSR in future phases of the project. These improvements have however already been included in the financial model.
Areas of uncertainty that may materially impact the findings include:
Although metallurgical drilling coverage has covered a wide range of the mining area, samples have yet to be taken from the Southern part of Kansoko Sud. This area is the dominant mining area for the first 5 years of the mine plan. Metallurgical drilling is currently underway in this area and the results have been prioritised as an input to the next phase of the project.
If the flotation response of the Kansoko Sud area shows significantly different behaviour to that obtained from the test work to date, it may affect the circuit configuration chosen for the 3 Mtpa plant and the recovery and grade obtained in the first five years of mining.
The relationship between recovery and feed grade in the NSR model will be confirmed by variability testing. This may affect the calculated revenue per block in the mine plan and may therefore have a material impact on the mining model.
IVANHOE MINES LIMITED Kamoa Copper Project
AMC 812022 : November : 2013 : 812022KamoaFinalEffDate131115rev0 157
14 MINERAL RESOURCE ESTIMATES
The underground and open pit resource models discussed in this section were constructed by Gordon Seibel, R.M. SME, of AMEC.
The AMEC QPs consider that the Mineral Resource models and Mineral Resource estimates derived from those models are consistent with Canadian Institute of Mining Metallurgy and Petroleum (CIM) Definition Standards (2010) and the relevant CIM Best Practice Guidelines (2003).
Composites for Mineral Resource Estimates Amenable to Underground Mining Methods
Mineral Resource estimates used 543 drillhole intercepts (including six twins) over an area of approximately 80 km2 (Domain 1) where the drillhole spacing is close enough (100 m to 800 m) to allow mineralization to be classified as Indicated and Inferred (refer to Figure 10.2). The area outside of Inferred and Indicated Mineral Resources, but within the Project boundary (Domain 2), is approximately 63 km2 in extent and was modeled to help estimate ranges of tonnages and grades of a potential exploration target using an additional 12 drillholes with drillhole spacings of up to several kilometres.
Collar, survey, lithology and assay files were exported from the Ivanhoe’s Access® database as csv files, imported into Datamine Studio® mining software, and combined into a “holes” file. The holes file was then exported to Excel®, and a SMZ selection field was added, and set to a default value of “0”. The highest-grade single intercepts were then selected, and the SMZ selection field was flagged as “1” by hand if the following criteria were met:
Minimum downhole length 3 m (locally adjusted to approximate 3 m vertical thickness for angled core holes).
Total copper (Cu) grades greater than 1% Cu.
The 1% Cu cut-off was used as it is considered a natural cut-off, and is commonly used in similar deposits. The SMZ were first composited manually in Excel®. In the event that a hole did not meet the minimum grade ≥1% Cu and length greater than 3 m criteria, the highest-grade composite was formed over a 3 m downhole length.
These composites were included in the resource estimations to define the geometry of the SMZ, and to introduce a degree of lateral dilution into the model. However, in a few cases, two composites could be formed within a single drillhole at different elevations. In these cases, only the highest-grade composite was used to introduce a degree of conservatism, as it has not yet been determined whether multiple SMZs can be extracted. Statistics for the SMZs are given in Table 14.1.
The “holes” file with the SMZ selection field was then imported into Datamine mining software, and Cu assays greater than 16% were set to 16%, and ASCu assays greater than their corresponding Cu assays, were set to the Cu grade.
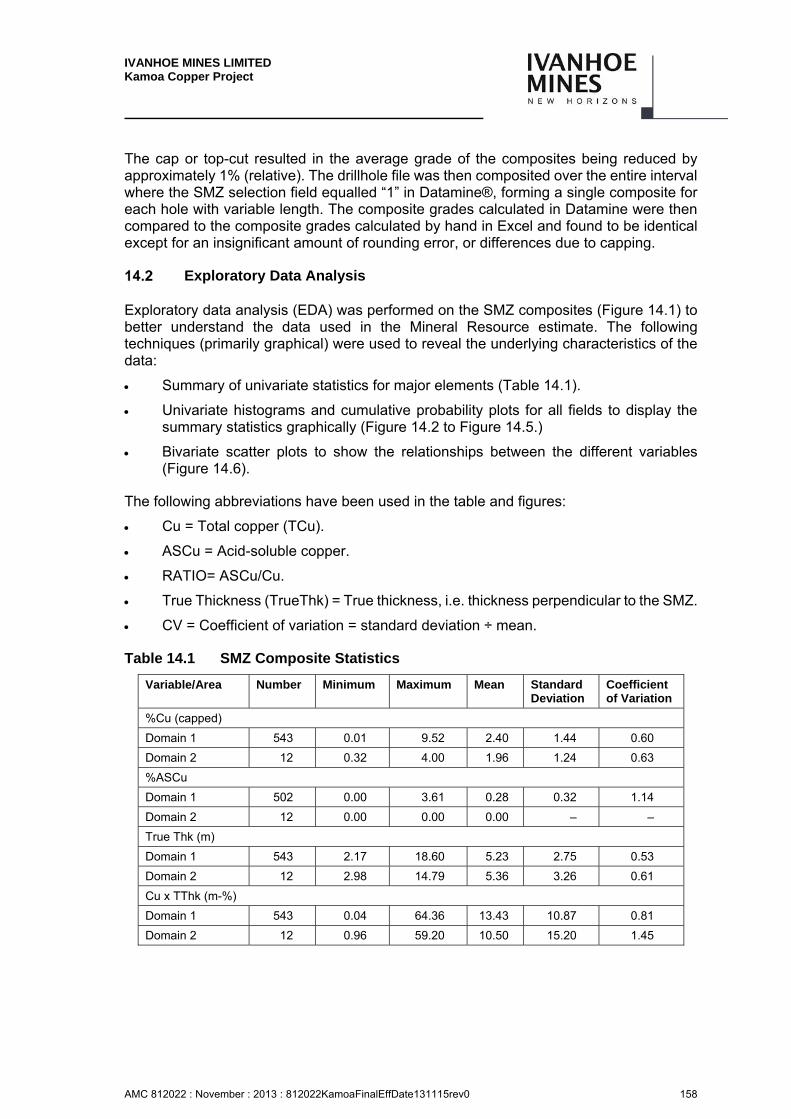
IVANHOE MINES LIMITED Kamoa Copper Project
AMC 812022 : November : 2013 : 812022KamoaFinalEffDate131115rev0 158
The cap or top-cut resulted in the average grade of the composites being reduced by approximately 1% (relative). The drillhole file was then composited over the entire interval where the SMZ selection field equalled “1” in Datamine®, forming a single composite for each hole with variable length. The composite grades calculated in Datamine were then compared to the composite grades calculated by hand in Excel and found to be identical except for an insignificant amount of rounding error, or differences due to capping.
Exploratory Data Analysis
Exploratory data analysis (EDA) was performed on the SMZ composites (Figure 14.1) to better understand the data used in the Mineral Resource estimate. The following techniques (primarily graphical) were used to reveal the underlying characteristics of the data:
Summary of univariate statistics for major elements (Table 14.1).
Univariate histograms and cumulative probability plots for all fields to display the summary statistics graphically (Figure 14.2 to Figure 14.5.)
Bivariate scatter plots to show the relationships between the different variables (Figure 14.6).
The following abbreviations have been used in the table and figures:
Cu = Total copper (TCu).
ASCu = Acid-soluble copper.
RATIO= ASCu/Cu.
True Thickness (TrueThk) = True thickness, i.e. thickness perpendicular to the SMZ.
CV = Coefficient of variation = standard deviation ÷ mean.
Table 14.1 SMZ Composite Statistics
Variable/Area Number Minimum Maximum Mean Standard Deviation
Coefficient of Variation
%Cu (capped)
Domain 1 543 0.01 9.52 2.40 1.44 0.60
Domain 2 12 0.32 4.00 1.96 1.24 0.63
%ASCu
Domain 1 502 0.00 3.61 0.28 0.32 1.14
Domain 2 12 0.00 0.00 0.00 – –
True Thk (m)
Domain 1 543 2.17 18.60 5.23 2.75 0.53
Domain 2 12 2.98 14.79 5.36 3.26 0.61
Cu x TThk (m-%)
Domain 1 543 0.04 64.36 13.43 10.87 0.81
Domain 2 12 0.96 59.20 10.50 15.20 1.45
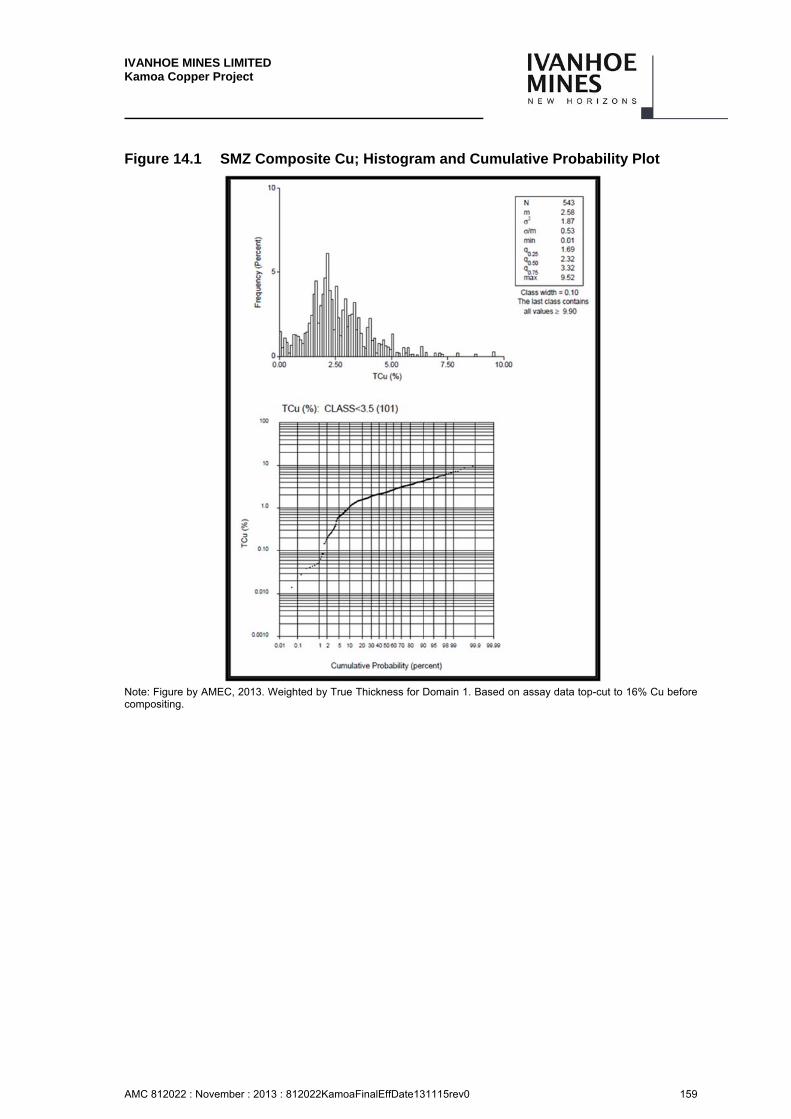
IVANHOE MINES LIMITED Kamoa Copper Project
AMC 812022 : November : 2013 : 812022KamoaFinalEffDate131115rev0 159
Figure 14.1 SMZ Composite Cu; Histogram and Cumulative Probability Plot
Note: Figure by AMEC, 2013. Weighted by True Thickness for Domain 1. Based on assay data top-cut to 16% Cu before compositing.
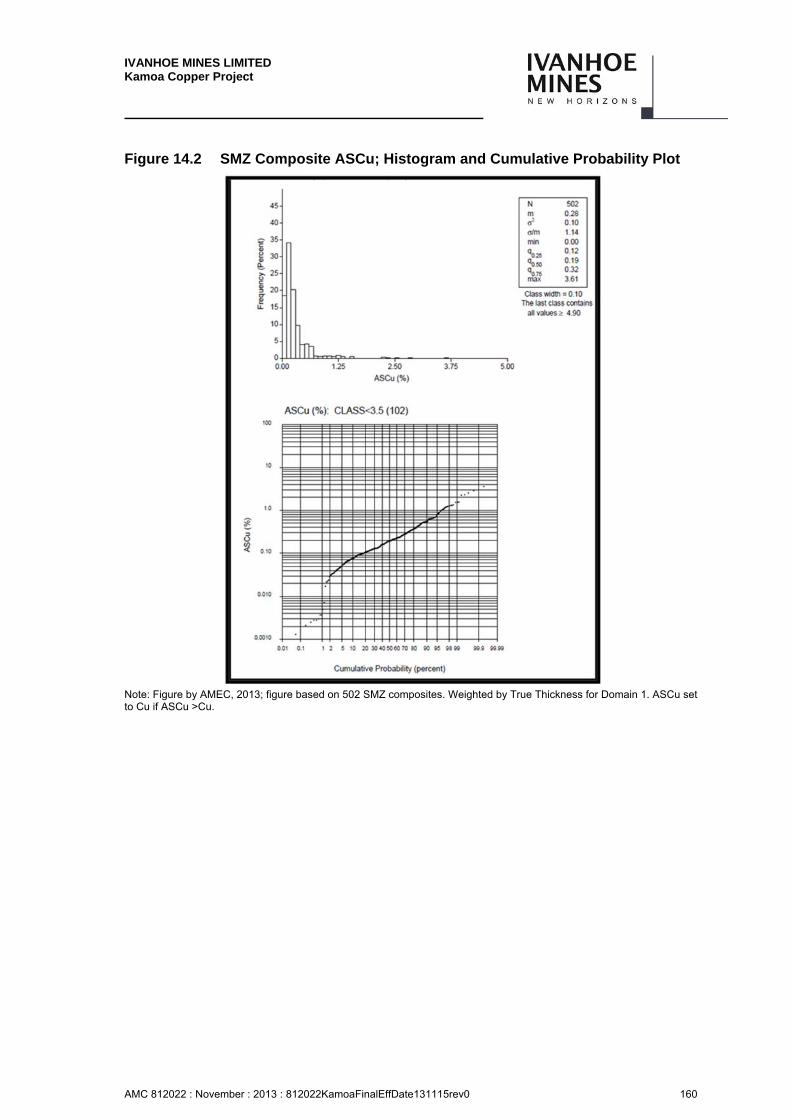
IVANHOE MINES LIMITED Kamoa Copper Project
AMC 812022 : November : 2013 : 812022KamoaFinalEffDate131115rev0 160
Figure 14.2 SMZ Composite ASCu; Histogram and Cumulative Probability Plot
Note: Figure by AMEC, 2013; figure based on 502 SMZ composites. Weighted by True Thickness for Domain 1. ASCu set to Cu if ASCu >Cu.
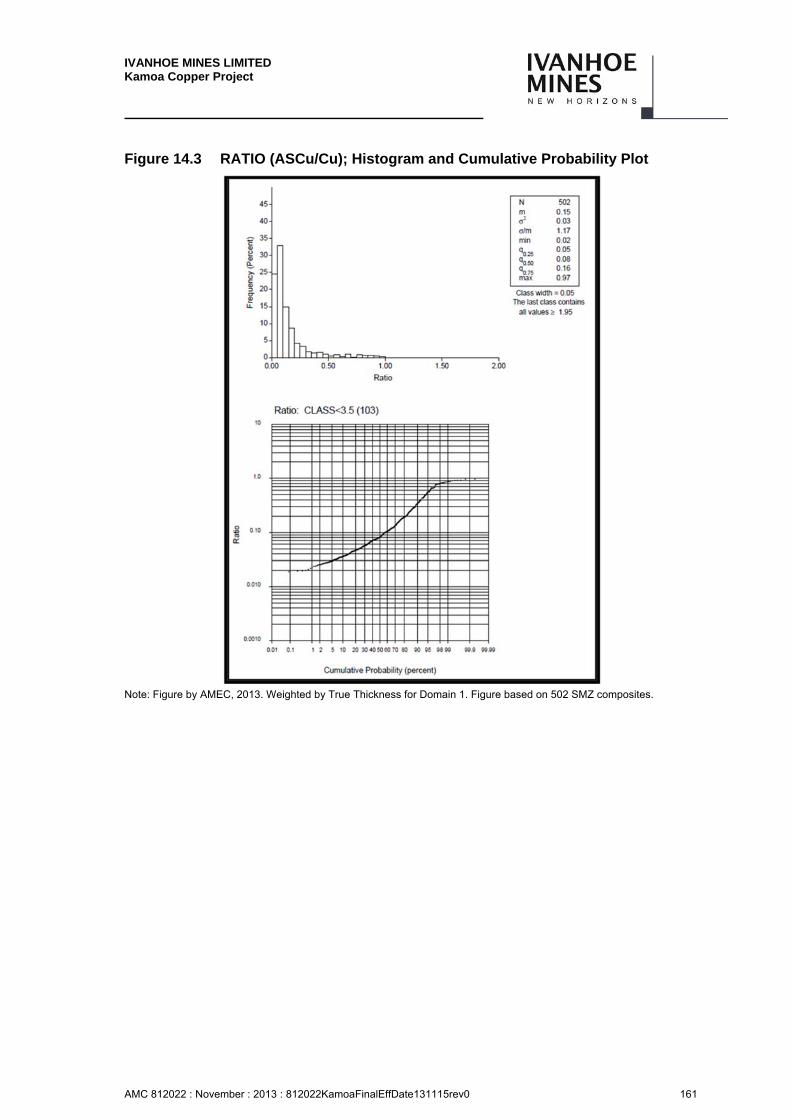
IVANHOE MINES LIMITED Kamoa Copper Project
AMC 812022 : November : 2013 : 812022KamoaFinalEffDate131115rev0 161
Figure 14.3 RATIO (ASCu/Cu); Histogram and Cumulative Probability Plot
Note: Figure by AMEC, 2013. Weighted by True Thickness for Domain 1. Figure based on 502 SMZ composites.
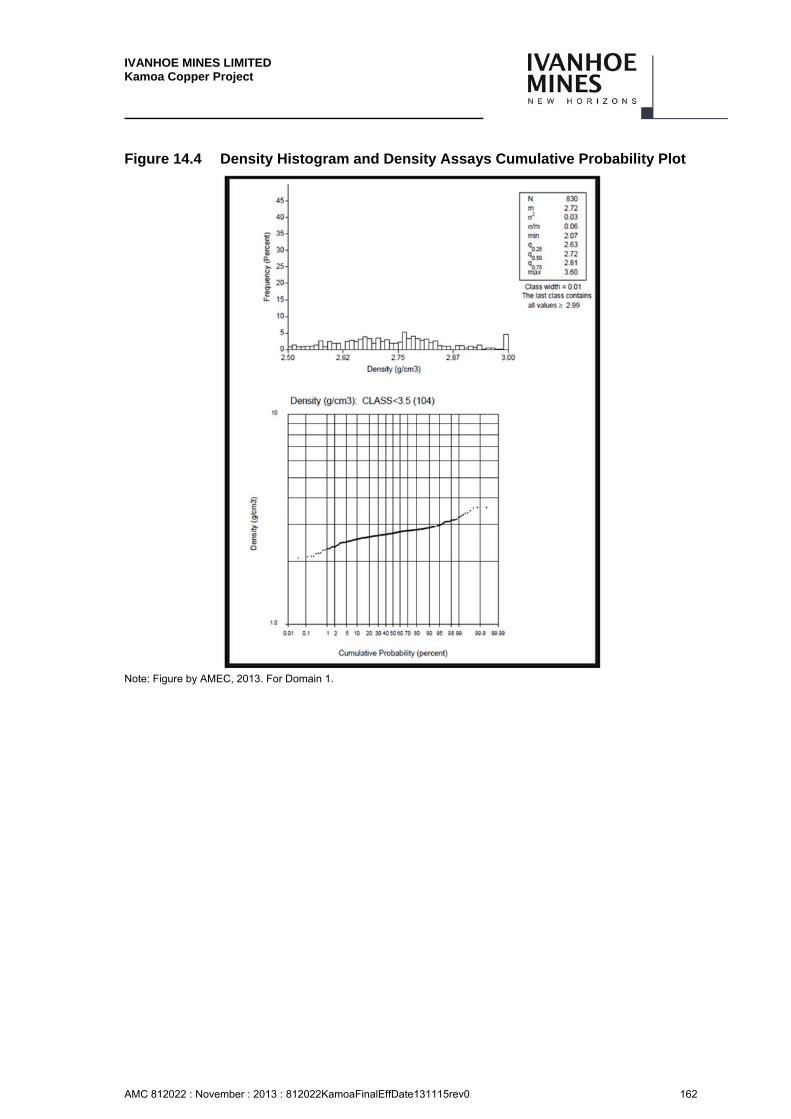
IVANHOE MINES LIMITED Kamoa Copper Project
AMC 812022 : November : 2013 : 812022KamoaFinalEffDate131115rev0 162
Figure 14.4 Density Histogram and Density Assays Cumulative Probability Plot
Note: Figure by AMEC, 2013. For Domain 1.
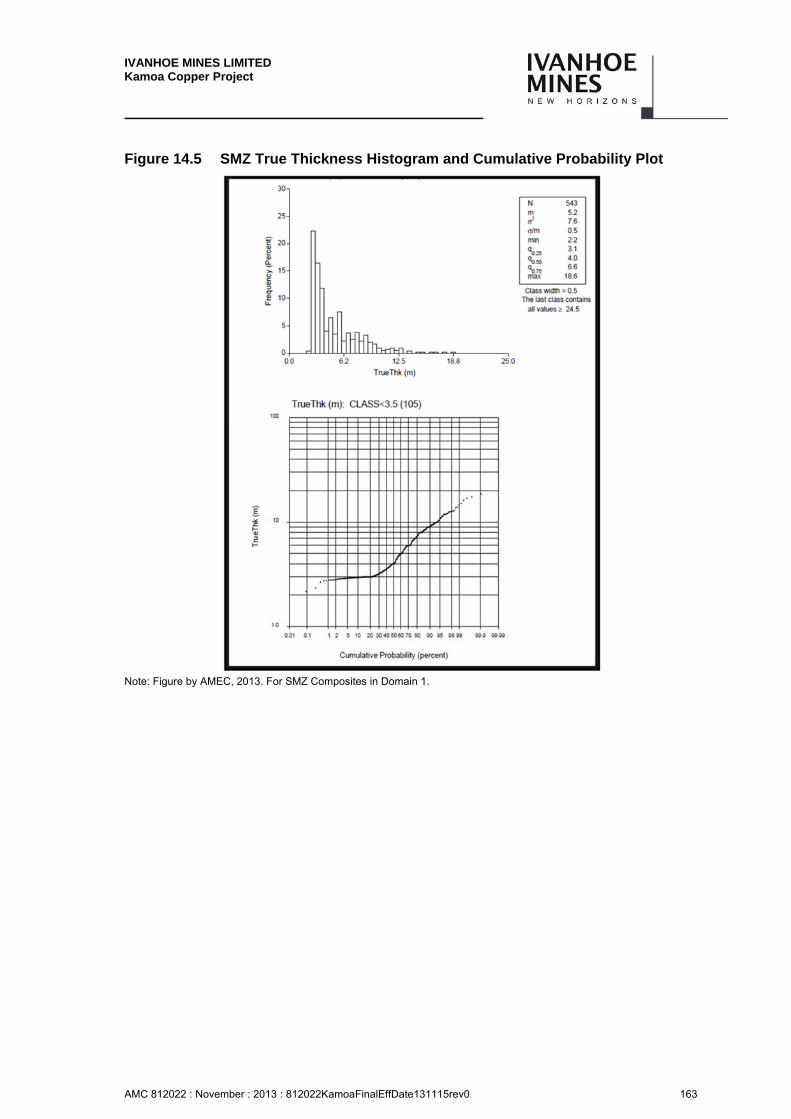
IVANHOE MINES LIMITED Kamoa Copper Project
AMC 812022 : November : 2013 : 812022KamoaFinalEffDate131115rev0 163
Figure 14.5 SMZ True Thickness Histogram and Cumulative Probability Plot
Note: Figure by AMEC, 2013. For SMZ Composites in Domain 1.
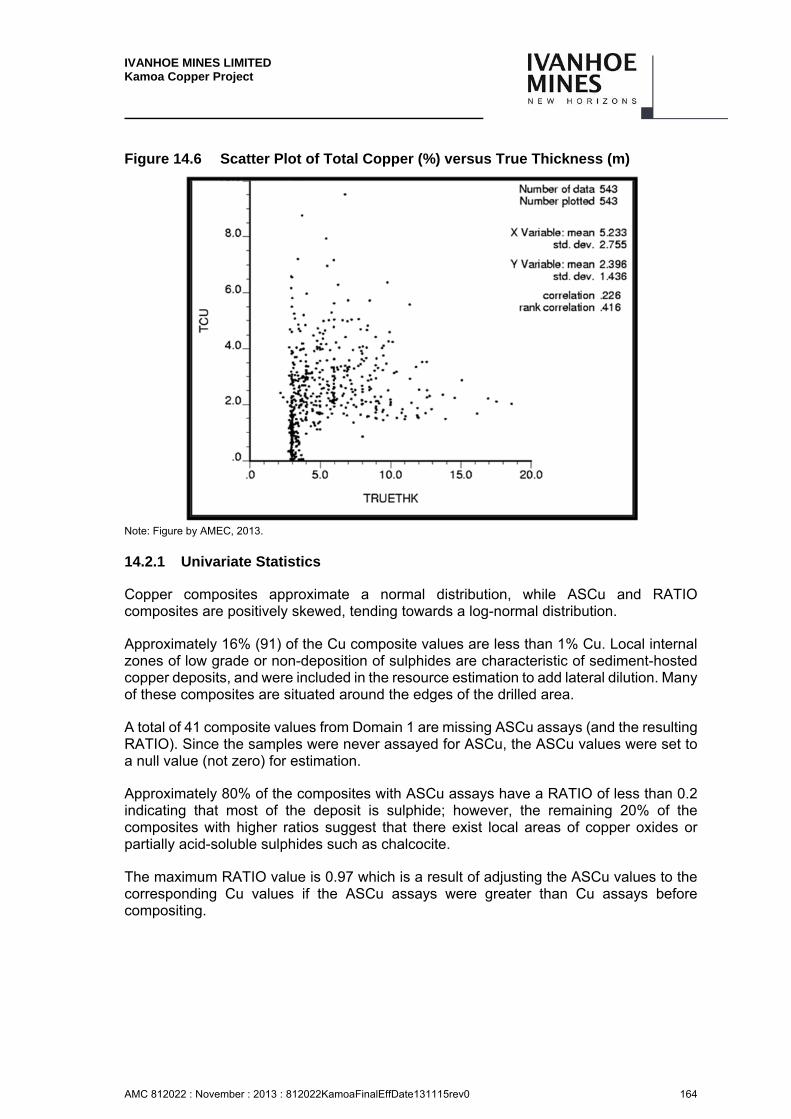
IVANHOE MINES LIMITED Kamoa Copper Project
AMC 812022 : November : 2013 : 812022KamoaFinalEffDate131115rev0 164
Figure 14.6 Scatter Plot of Total Copper (%) versus True Thickness (m)
Note: Figure by AMEC, 2013.
14.2.1 Univariate Statistics
Copper composites approximate a normal distribution, while ASCu and RATIO composites are positively skewed, tending towards a log-normal distribution.
Approximately 16% (91) of the Cu composite values are less than 1% Cu. Local internal zones of low grade or non-deposition of sulphides are characteristic of sediment-hosted copper deposits, and were included in the resource estimation to add lateral dilution. Many of these composites are situated around the edges of the drilled area.
A total of 41 composite values from Domain 1 are missing ASCu assays (and the resulting RATIO). Since the samples were never assayed for ASCu, the ASCu values were set to a null value (not zero) for estimation.
Approximately 80% of the composites with ASCu assays have a RATIO of less than 0.2 indicating that most of the deposit is sulphide; however, the remaining 20% of the composites with higher ratios suggest that there exist local areas of copper oxides or partially acid-soluble sulphides such as chalcocite.
The maximum RATIO value is 0.97 which is a result of adjusting the ASCu values to the corresponding Cu values if the ASCu assays were greater than Cu assays before compositing.
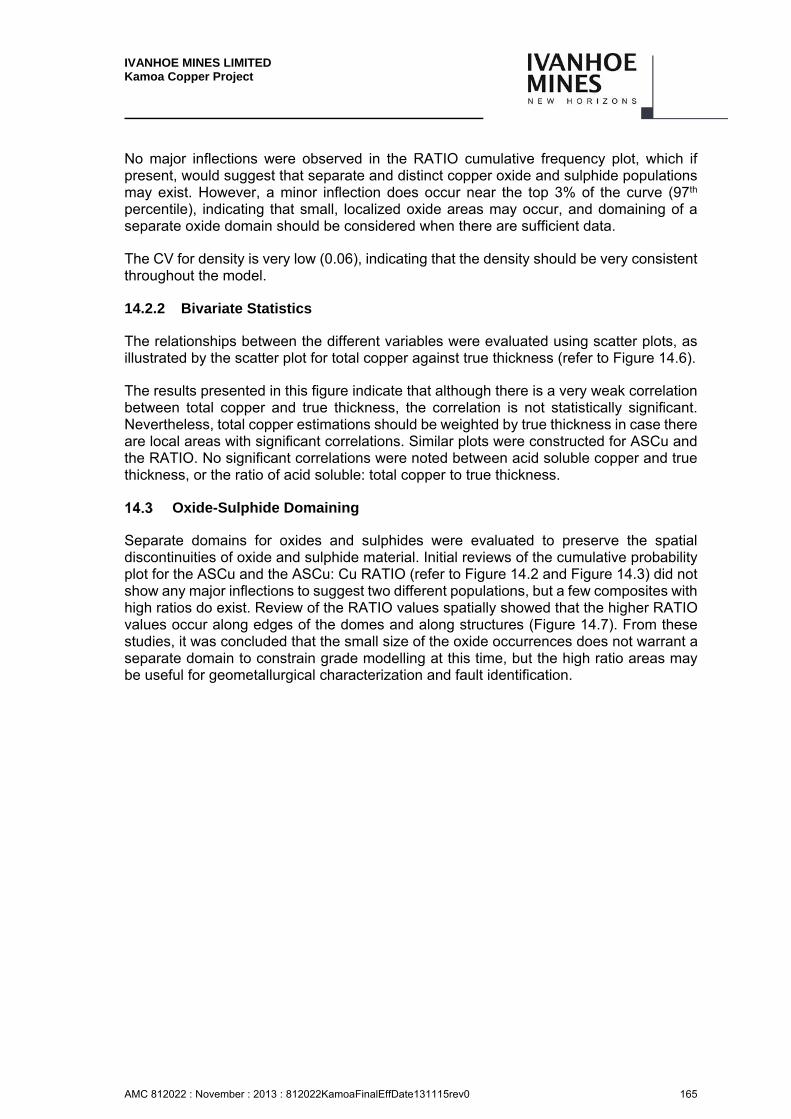
IVANHOE MINES LIMITED Kamoa Copper Project
AMC 812022 : November : 2013 : 812022KamoaFinalEffDate131115rev0 165
No major inflections were observed in the RATIO cumulative frequency plot, which if present, would suggest that separate and distinct copper oxide and sulphide populations may exist. However, a minor inflection does occur near the top 3% of the curve (97th percentile), indicating that small, localized oxide areas may occur, and domaining of a separate oxide domain should be considered when there are sufficient data.
The CV for density is very low (0.06), indicating that the density should be very consistent throughout the model.
14.2.2 Bivariate Statistics
The relationships between the different variables were evaluated using scatter plots, as illustrated by the scatter plot for total copper against true thickness (refer to Figure 14.6).
The results presented in this figure indicate that although there is a very weak correlation between total copper and true thickness, the correlation is not statistically significant. Nevertheless, total copper estimations should be weighted by true thickness in case there are local areas with significant correlations. Similar plots were constructed for ASCu and the RATIO. No significant correlations were noted between acid soluble copper and true thickness, or the ratio of acid soluble: total copper to true thickness.
Oxide-Sulphide Domaining
Separate domains for oxides and sulphides were evaluated to preserve the spatial discontinuities of oxide and sulphide material. Initial reviews of the cumulative probability plot for the ASCu and the ASCu: Cu RATIO (refer to Figure 14.2 and Figure 14.3) did not show any major inflections to suggest two different populations, but a few composites with high ratios do exist. Review of the RATIO values spatially showed that the higher RATIO values occur along edges of the domes and along structures (Figure 14.7). From these studies, it was concluded that the small size of the oxide occurrences does not warrant a separate domain to constrain grade modelling at this time, but the high ratio areas may be useful for geometallurgical characterization and fault identification.
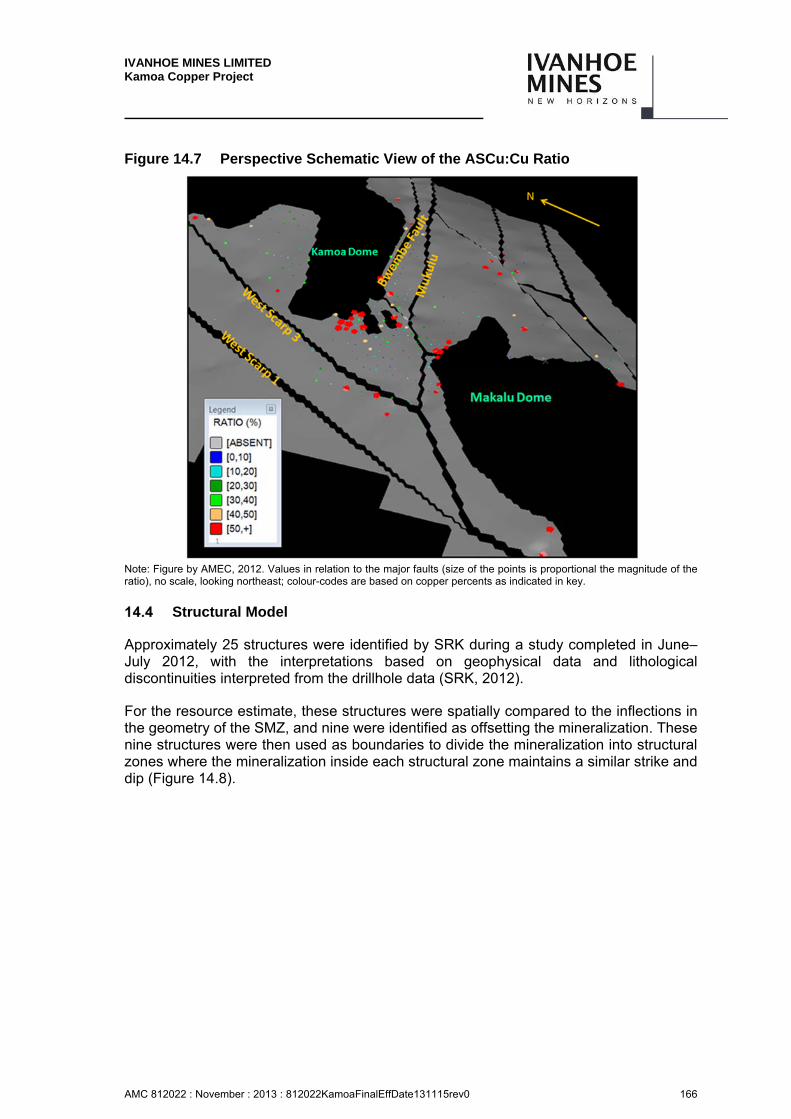
IVANHOE MINES LIMITED Kamoa Copper Project
AMC 812022 : November : 2013 : 812022KamoaFinalEffDate131115rev0 166
Figure 14.7 Perspective Schematic View of the ASCu:Cu Ratio
Note: Figure by AMEC, 2012. Values in relation to the major faults (size of the points is proportional the magnitude of the ratio), no scale, looking northeast; colour-codes are based on copper percents as indicated in key.
Structural Model
Approximately 25 structures were identified by SRK during a study completed in June–July 2012, with the interpretations based on geophysical data and lithological discontinuities interpreted from the drillhole data (SRK, 2012).
For the resource estimate, these structures were spatially compared to the inflections in the geometry of the SMZ, and nine were identified as offsetting the mineralization. These nine structures were then used as boundaries to divide the mineralization into structural zones where the mineralization inside each structural zone maintains a similar strike and dip (Figure 14.8).
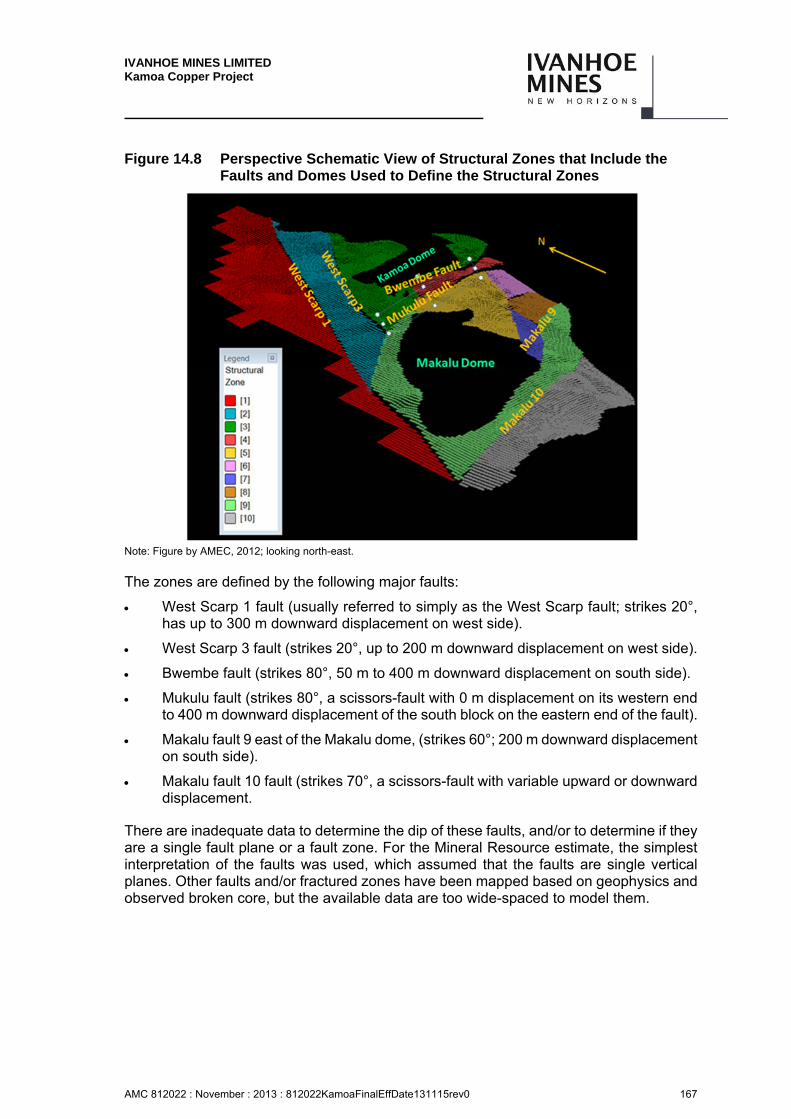
IVANHOE MINES LIMITED Kamoa Copper Project
AMC 812022 : November : 2013 : 812022KamoaFinalEffDate131115rev0 167
Figure 14.8 Perspective Schematic View of Structural Zones that Include the Faults and Domes Used to Define the Structural Zones
Note: Figure by AMEC, 2012; looking north-east.
The zones are defined by the following major faults:
West Scarp 1 fault (usually referred to simply as the West Scarp fault; strikes 20°, has up to 300 m downward displacement on west side).
West Scarp 3 fault (strikes 20°, up to 200 m downward displacement on west side).
Bwembe fault (strikes 80°, 50 m to 400 m downward displacement on south side).
Mukulu fault (strikes 80°, a scissors-fault with 0 m displacement on its western end to 400 m downward displacement of the south block on the eastern end of the fault).
Makalu fault 9 east of the Makalu dome, (strikes 60°; 200 m downward displacement on south side).
Makalu fault 10 fault (strikes 70°, a scissors-fault with variable upward or downward displacement.
There are inadequate data to determine the dip of these faults, and/or to determine if they are a single fault plane or a fault zone. For the Mineral Resource estimate, the simplest interpretation of the faults was used, which assumed that the faults are single vertical planes. Other faults and/or fractured zones have been mapped based on geophysics and observed broken core, but the available data are too wide-spaced to model them.
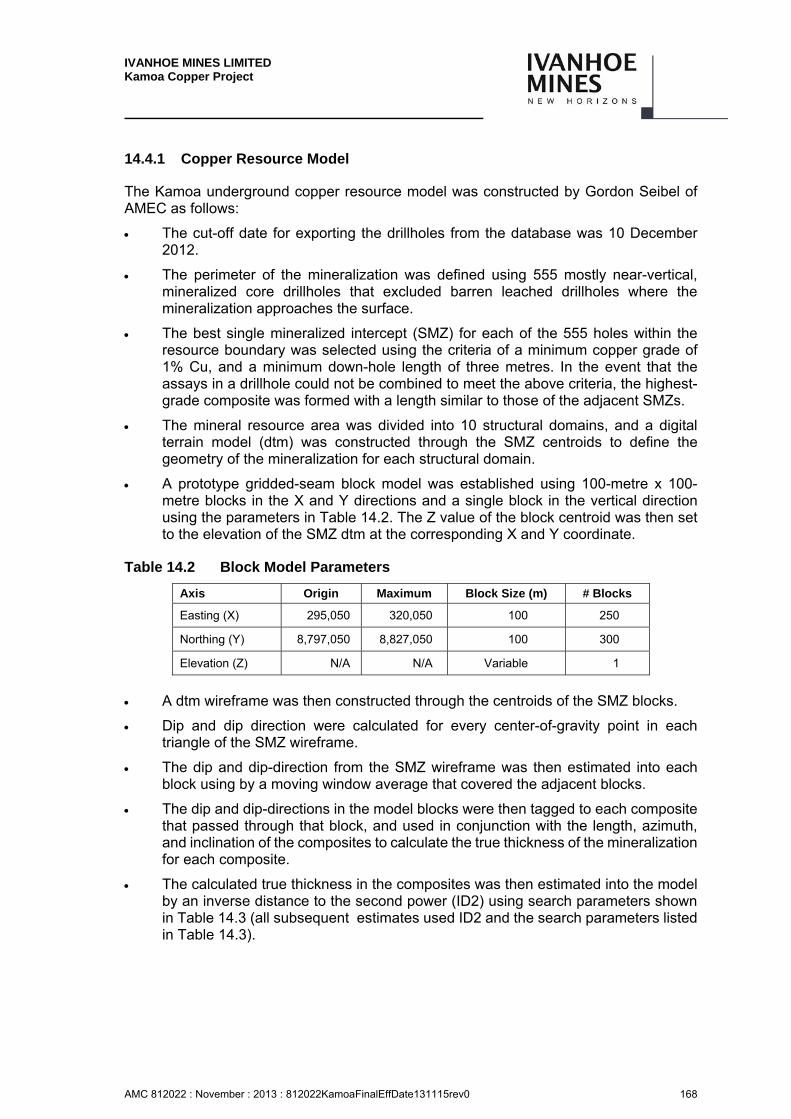
IVANHOE MINES LIMITED Kamoa Copper Project
AMC 812022 : November : 2013 : 812022KamoaFinalEffDate131115rev0 168
14.4.1 Copper Resource Model
The Kamoa underground copper resource model was constructed by Gordon Seibel of AMEC as follows:
The cut-off date for exporting the drillholes from the database was 10 December 2012.
The perimeter of the mineralization was defined using 555 mostly near-vertical, mineralized core drillholes that excluded barren leached drillholes where the mineralization approaches the surface.
The best single mineralized intercept (SMZ) for each of the 555 holes within the resource boundary was selected using the criteria of a minimum copper grade of 1% Cu, and a minimum down-hole length of three metres. In the event that the assays in a drillhole could not be combined to meet the above criteria, the highest-grade composite was formed with a length similar to those of the adjacent SMZs.
The mineral resource area was divided into 10 structural domains, and a digital terrain model (dtm) was constructed through the SMZ centroids to define the geometry of the mineralization for each structural domain.
A prototype gridded-seam block model was established using 100-metre x 100-metre blocks in the X and Y directions and a single block in the vertical direction using the parameters in Table 14.2. The Z value of the block centroid was then set to the elevation of the SMZ dtm at the corresponding X and Y coordinate.
Table 14.2 Block Model Parameters
Axis Origin Maximum Block Size (m) # Blocks
Easting (X) 295,050 320,050 100 250
Northing (Y) 8,797,050 8,827,050 100 300
Elevation (Z) N/A N/A Variable 1
A dtm wireframe was then constructed through the centroids of the SMZ blocks.
Dip and dip direction were calculated for every center-of-gravity point in each triangle of the SMZ wireframe.
The dip and dip-direction from the SMZ wireframe was then estimated into each block using by a moving window average that covered the adjacent blocks.
The dip and dip-directions in the model blocks were then tagged to each composite that passed through that block, and used in conjunction with the length, azimuth, and inclination of the composites to calculate the true thickness of the mineralization for each composite.
The calculated true thickness in the composites was then estimated into the model by an inverse distance to the second power (ID2) using search parameters shown in Table 14.3 (all subsequent estimates used ID2 and the search parameters listed in Table 14.3).
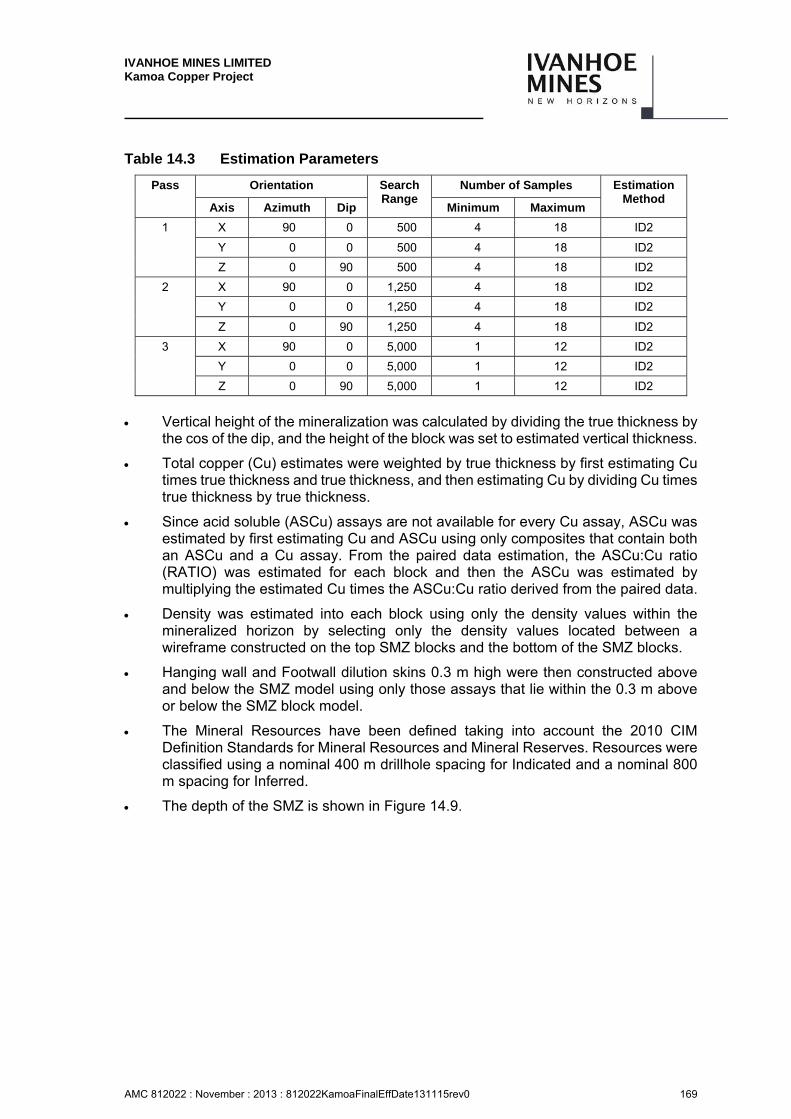
IVANHOE MINES LIMITED Kamoa Copper Project
AMC 812022 : November : 2013 : 812022KamoaFinalEffDate131115rev0 169
Table 14.3 Estimation Parameters
Pass Orientation Search Range
Number of Samples Estimation Method
Axis Azimuth Dip Minimum Maximum
1 X 90 0 500 4 18 ID2
Y 0 0 500 4 18 ID2
Z 0 90 500 4 18 ID2
2 X 90 0 1,250 4 18 ID2
Y 0 0 1,250 4 18 ID2
Z 0 90 1,250 4 18 ID2
3 X 90 0 5,000 1 12 ID2
Y 0 0 5,000 1 12 ID2
Z 0 90 5,000 1 12 ID2
Vertical height of the mineralization was calculated by dividing the true thickness by
the cos of the dip, and the height of the block was set to estimated vertical thickness.
Total copper (Cu) estimates were weighted by true thickness by first estimating Cu times true thickness and true thickness, and then estimating Cu by dividing Cu times true thickness by true thickness.
Since acid soluble (ASCu) assays are not available for every Cu assay, ASCu was estimated by first estimating Cu and ASCu using only composites that contain both an ASCu and a Cu assay. From the paired data estimation, the ASCu:Cu ratio (RATIO) was estimated for each block and then the ASCu was estimated by multiplying the estimated Cu times the ASCu:Cu ratio derived from the paired data.
Density was estimated into each block using only the density values within the mineralized horizon by selecting only the density values located between a wireframe constructed on the top SMZ blocks and the bottom of the SMZ blocks.
Hanging wall and Footwall dilution skins 0.3 m high were then constructed above and below the SMZ model using only those assays that lie within the 0.3 m above or below the SMZ block model.
The Mineral Resources have been defined taking into account the 2010 CIM Definition Standards for Mineral Resources and Mineral Reserves. Resources were classified using a nominal 400 m drillhole spacing for Indicated and a nominal 800 m spacing for Inferred.
The depth of the SMZ is shown in Figure 14.9.
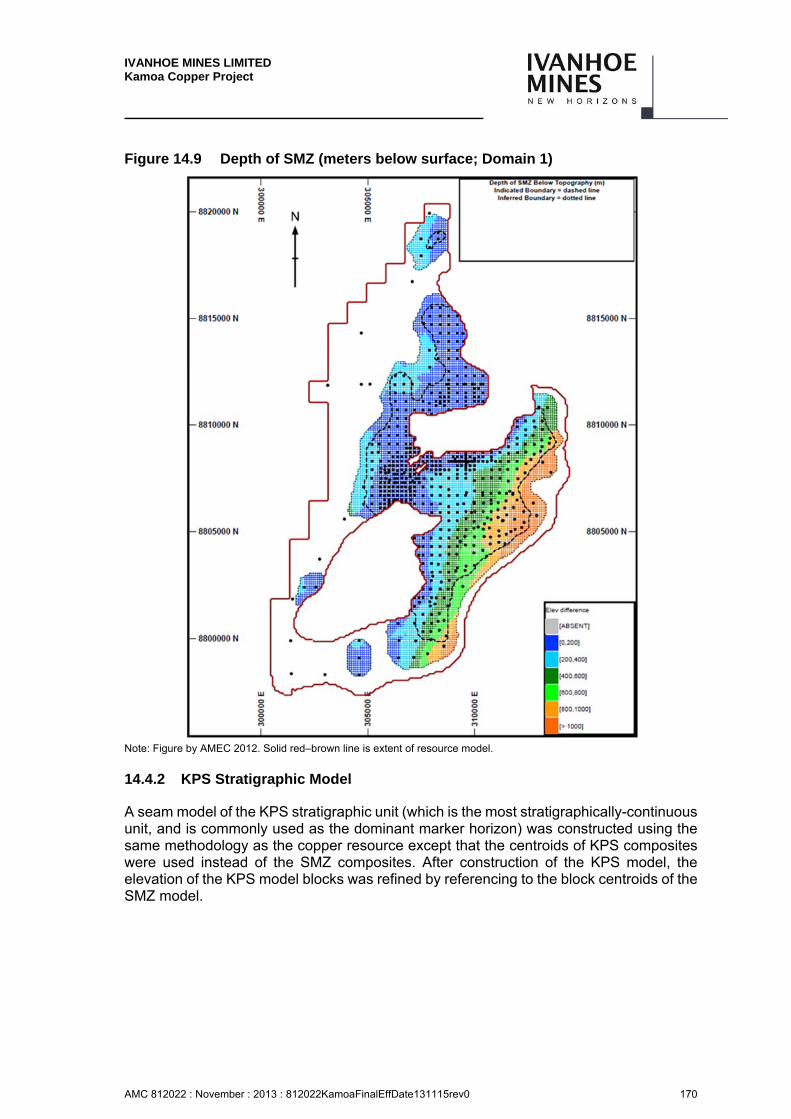
IVANHOE MINES LIMITED Kamoa Copper Project
AMC 812022 : November : 2013 : 812022KamoaFinalEffDate131115rev0 170
Figure 14.9 Depth of SMZ (meters below surface; Domain 1)
Note: Figure by AMEC 2012. Solid red–brown line is extent of resource model.
14.4.2 KPS Stratigraphic Model
A seam model of the KPS stratigraphic unit (which is the most stratigraphically-continuous unit, and is commonly used as the dominant marker horizon) was constructed using the same methodology as the copper resource except that the centroids of KPS composites were used instead of the SMZ composites. After construction of the KPS model, the elevation of the KPS model blocks was refined by referencing to the block centroids of the SMZ model.
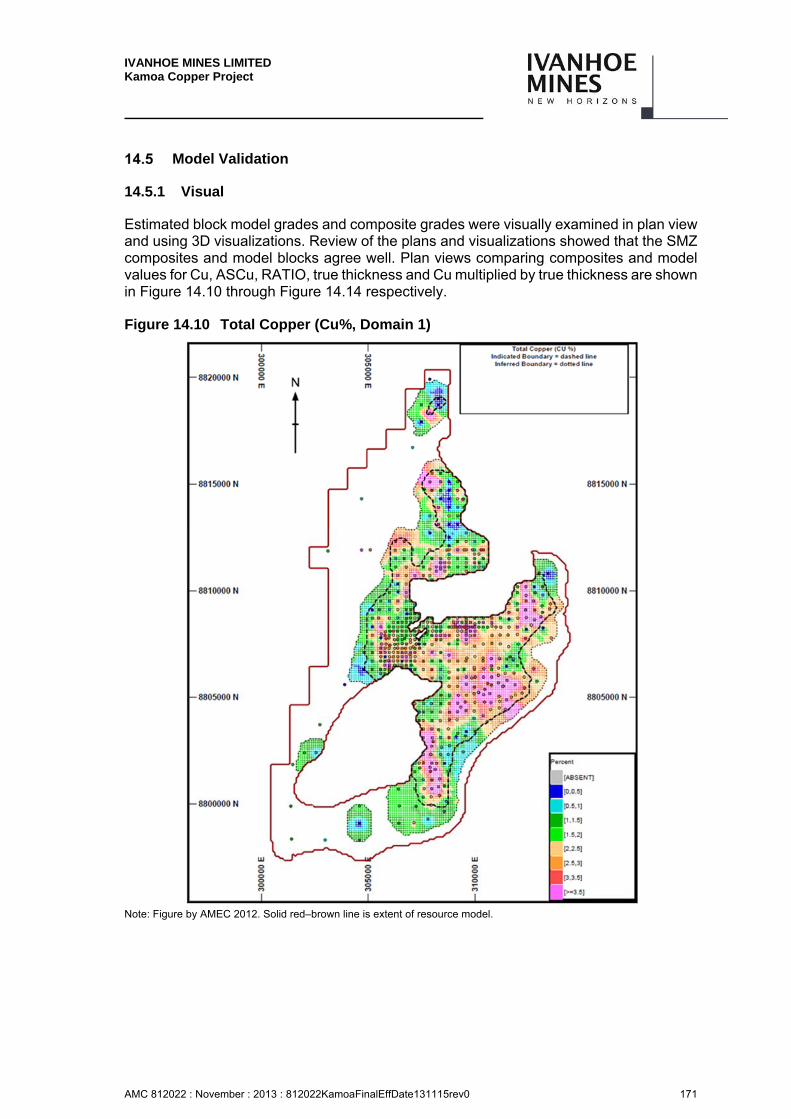
IVANHOE MINES LIMITED Kamoa Copper Project
AMC 812022 : November : 2013 : 812022KamoaFinalEffDate131115rev0 171
Model Validation
14.5.1 Visual
Estimated block model grades and composite grades were visually examined in plan view and using 3D visualizations. Review of the plans and visualizations showed that the SMZ composites and model blocks agree well. Plan views comparing composites and model values for Cu, ASCu, RATIO, true thickness and Cu multiplied by true thickness are shown in Figure 14.10 through Figure 14.14 respectively.
Figure 14.10 Total Copper (Cu%, Domain 1)
Note: Figure by AMEC 2012. Solid red–brown line is extent of resource model.
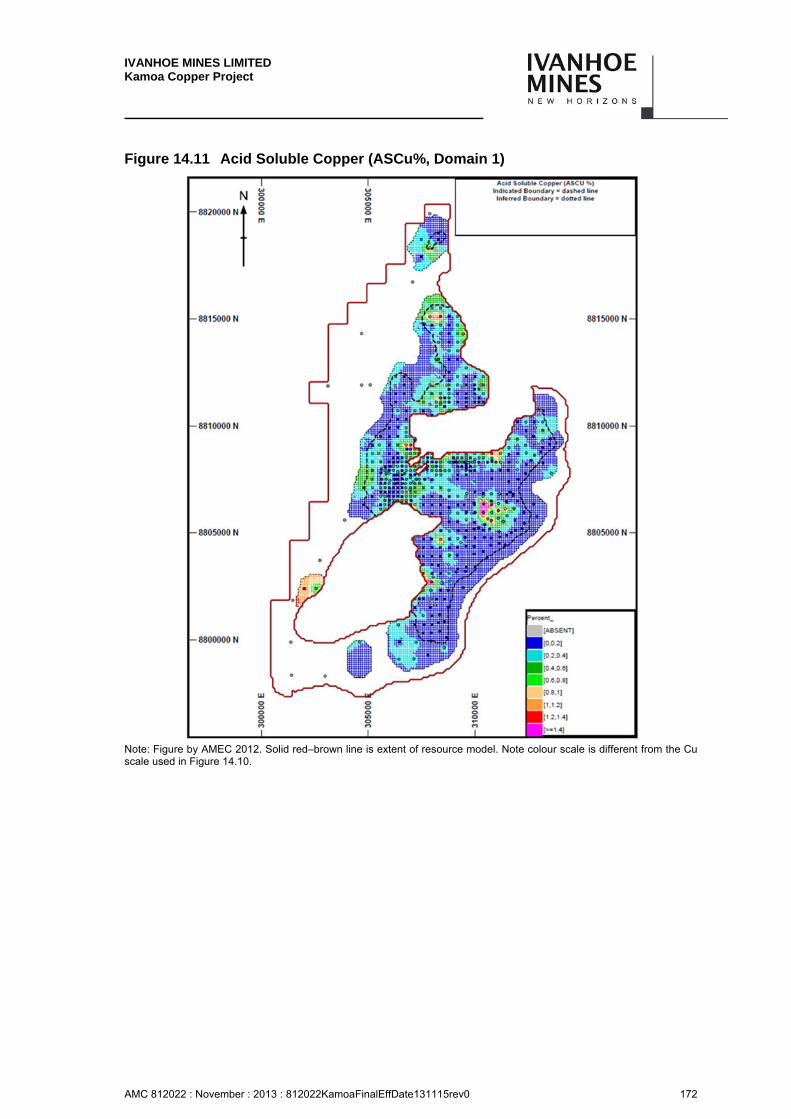
IVANHOE MINES LIMITED Kamoa Copper Project
AMC 812022 : November : 2013 : 812022KamoaFinalEffDate131115rev0 172
Figure 14.11 Acid Soluble Copper (ASCu%, Domain 1)
Note: Figure by AMEC 2012. Solid red–brown line is extent of resource model. Note colour scale is different from the Cu scale used in Figure 14.10.
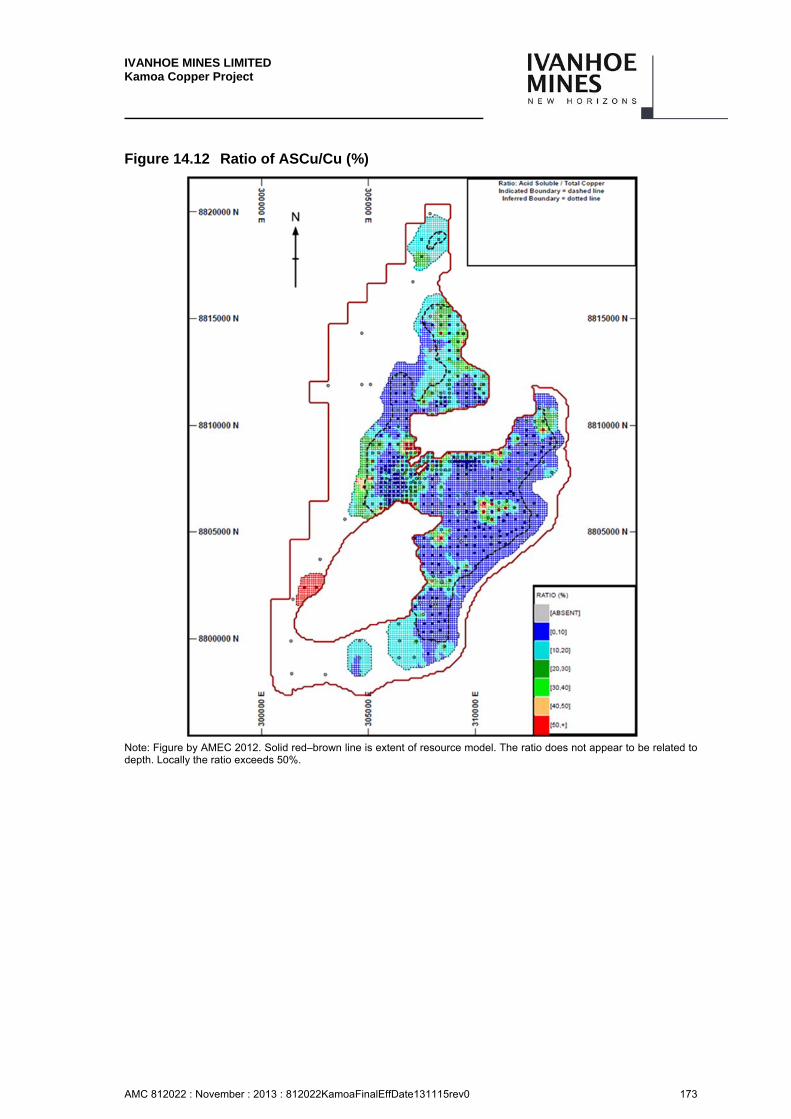
IVANHOE MINES LIMITED Kamoa Copper Project
AMC 812022 : November : 2013 : 812022KamoaFinalEffDate131115rev0 173
Figure 14.12 Ratio of ASCu/Cu (%)
Note: Figure by AMEC 2012. Solid red–brown line is extent of resource model. The ratio does not appear to be related to depth. Locally the ratio exceeds 50%.
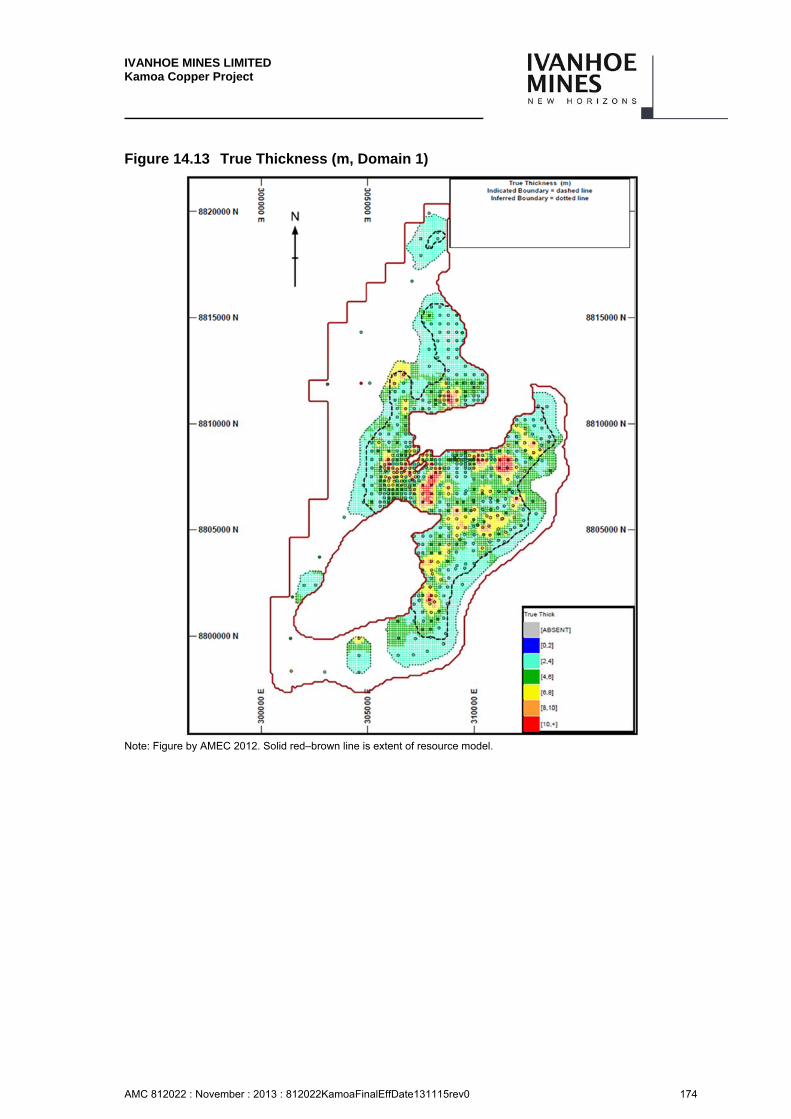
IVANHOE MINES LIMITED Kamoa Copper Project
AMC 812022 : November : 2013 : 812022KamoaFinalEffDate131115rev0 174
Figure 14.13 True Thickness (m, Domain 1)
Note: Figure by AMEC 2012. Solid red–brown line is extent of resource model.
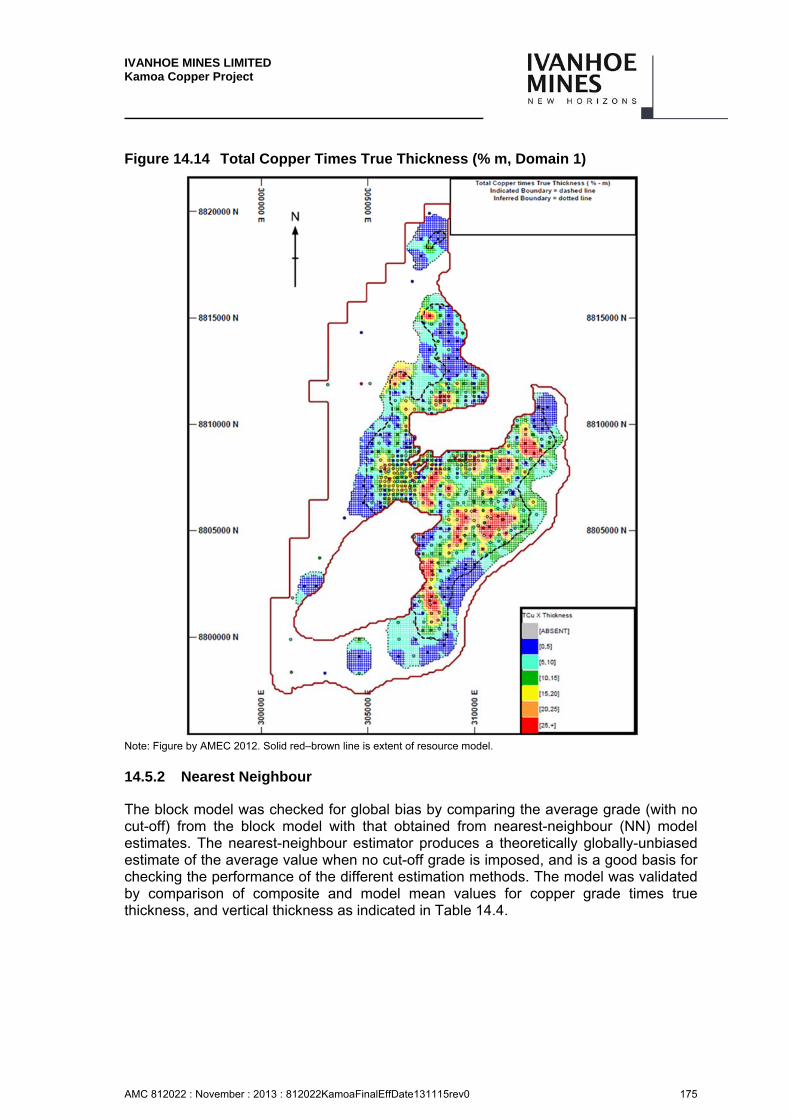
IVANHOE MINES LIMITED Kamoa Copper Project
AMC 812022 : November : 2013 : 812022KamoaFinalEffDate131115rev0 175
Figure 14.14 Total Copper Times True Thickness (% m, Domain 1)
Note: Figure by AMEC 2012. Solid red–brown line is extent of resource model.
14.5.2 Nearest Neighbour
The block model was checked for global bias by comparing the average grade (with no cut-off) from the block model with that obtained from nearest-neighbour (NN) model estimates. The nearest-neighbour estimator produces a theoretically globally-unbiased estimate of the average value when no cut-off grade is imposed, and is a good basis for checking the performance of the different estimation methods. The model was validated by comparison of composite and model mean values for copper grade times true thickness, and vertical thickness as indicated in Table 14.4.
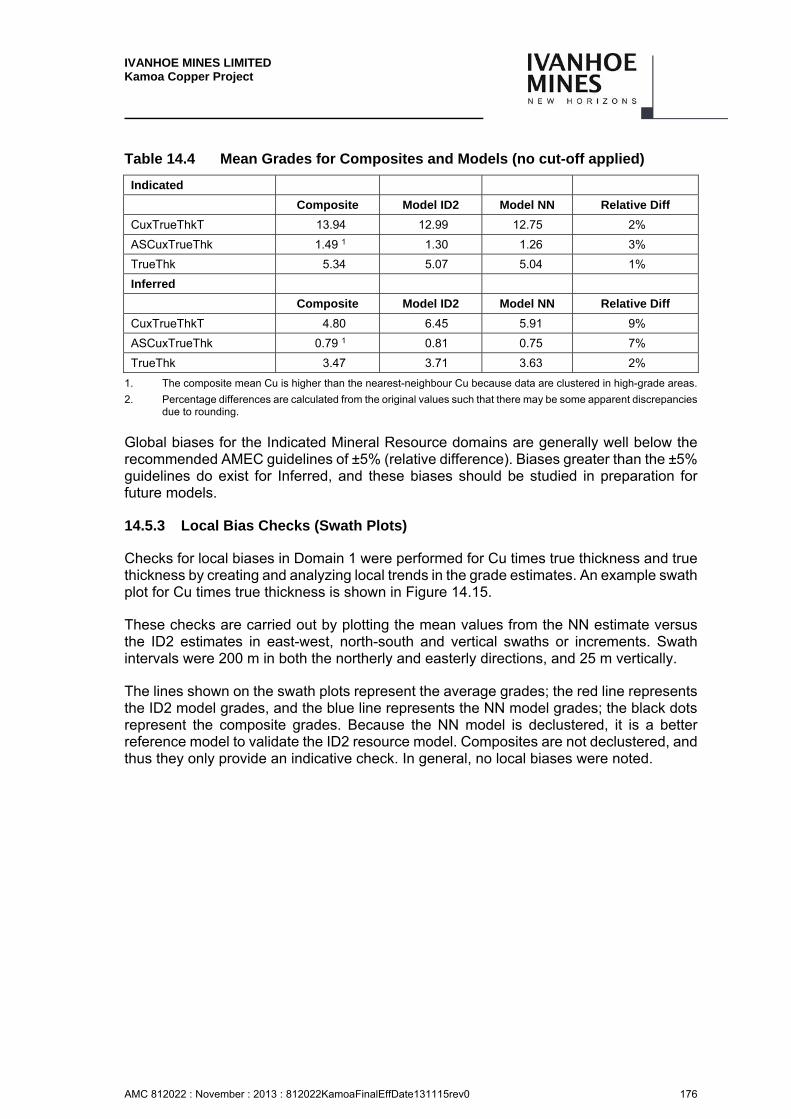
IVANHOE MINES LIMITED Kamoa Copper Project
AMC 812022 : November : 2013 : 812022KamoaFinalEffDate131115rev0 176
Table 14.4 Mean Grades for Composites and Models (no cut-off applied)
Indicated
Composite Model ID2 Model NN Relative Diff
CuxTrueThkT 13.94 12.99 12.75 2%
ASCuxTrueThk 1.49 1 1.30 1.26 3%
TrueThk 5.34 5.07 5.04 1%
Inferred
Composite Model ID2 Model NN Relative Diff
CuxTrueThkT 4.80 6.45 5.91 9%
ASCuxTrueThk 0.79 1 0.81 0.75 7%
TrueThk 3.47 3.71 3.63 2%
1. The composite mean Cu is higher than the nearest-neighbour Cu because data are clustered in high-grade areas.
2. Percentage differences are calculated from the original values such that there may be some apparent discrepancies due to rounding.
Global biases for the Indicated Mineral Resource domains are generally well below the recommended AMEC guidelines of ±5% (relative difference). Biases greater than the ±5% guidelines do exist for Inferred, and these biases should be studied in preparation for future models.
14.5.3 Local Bias Checks (Swath Plots)
Checks for local biases in Domain 1 were performed for Cu times true thickness and true thickness by creating and analyzing local trends in the grade estimates. An example swath plot for Cu times true thickness is shown in Figure 14.15.
These checks are carried out by plotting the mean values from the NN estimate versus the ID2 estimates in east-west, north-south and vertical swaths or increments. Swath intervals were 200 m in both the northerly and easterly directions, and 25 m vertically.
The lines shown on the swath plots represent the average grades; the red line represents the ID2 model grades, and the blue line represents the NN model grades; the black dots represent the composite grades. Because the NN model is declustered, it is a better reference model to validate the ID2 resource model. Composites are not declustered, and thus they only provide an indicative check. In general, no local biases were noted.
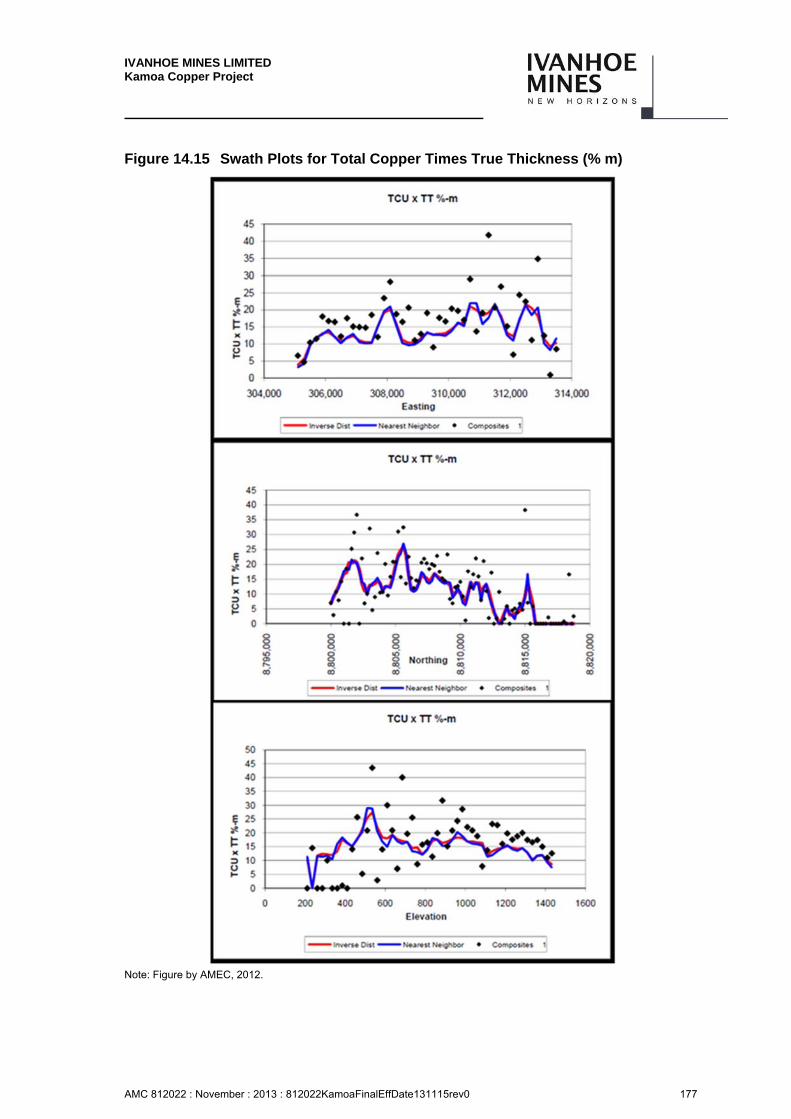
IVANHOE MINES LIMITED Kamoa Copper Project
AMC 812022 : November : 2013 : 812022KamoaFinalEffDate131115rev0 177
Figure 14.15 Swath Plots for Total Copper Times True Thickness (% m)
Note: Figure by AMEC, 2012.
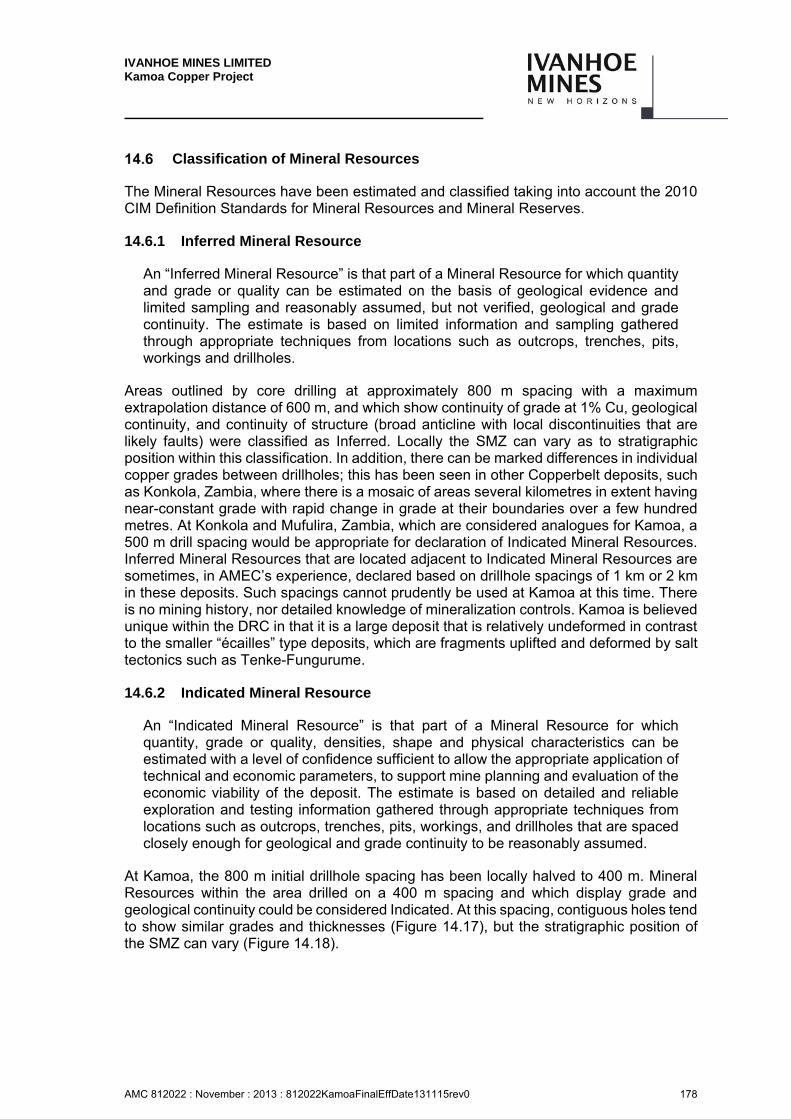
IVANHOE MINES LIMITED Kamoa Copper Project
AMC 812022 : November : 2013 : 812022KamoaFinalEffDate131115rev0 178
Classification of Mineral Resources
The Mineral Resources have been estimated and classified taking into account the 2010 CIM Definition Standards for Mineral Resources and Mineral Reserves.
14.6.1 Inferred Mineral Resource
An “Inferred Mineral Resource” is that part of a Mineral Resource for which quantity and grade or quality can be estimated on the basis of geological evidence and limited sampling and reasonably assumed, but not verified, geological and grade continuity. The estimate is based on limited information and sampling gathered through appropriate techniques from locations such as outcrops, trenches, pits, workings and drillholes.
Areas outlined by core drilling at approximately 800 m spacing with a maximum extrapolation distance of 600 m, and which show continuity of grade at 1% Cu, geological continuity, and continuity of structure (broad anticline with local discontinuities that are likely faults) were classified as Inferred. Locally the SMZ can vary as to stratigraphic position within this classification. In addition, there can be marked differences in individual copper grades between drillholes; this has been seen in other Copperbelt deposits, such as Konkola, Zambia, where there is a mosaic of areas several kilometres in extent having near-constant grade with rapid change in grade at their boundaries over a few hundred metres. At Konkola and Mufulira, Zambia, which are considered analogues for Kamoa, a 500 m drill spacing would be appropriate for declaration of Indicated Mineral Resources. Inferred Mineral Resources that are located adjacent to Indicated Mineral Resources are sometimes, in AMEC’s experience, declared based on drillhole spacings of 1 km or 2 km in these deposits. Such spacings cannot prudently be used at Kamoa at this time. There is no mining history, nor detailed knowledge of mineralization controls. Kamoa is believed unique within the DRC in that it is a large deposit that is relatively undeformed in contrast to the smaller “écailles” type deposits, which are fragments uplifted and deformed by salt tectonics such as Tenke-Fungurume.
14.6.2 Indicated Mineral Resource
An “Indicated Mineral Resource” is that part of a Mineral Resource for which quantity, grade or quality, densities, shape and physical characteristics can be estimated with a level of confidence sufficient to allow the appropriate application of technical and economic parameters, to support mine planning and evaluation of the economic viability of the deposit. The estimate is based on detailed and reliable exploration and testing information gathered through appropriate techniques from locations such as outcrops, trenches, pits, workings, and drillholes that are spaced closely enough for geological and grade continuity to be reasonably assumed.
At Kamoa, the 800 m initial drillhole spacing has been locally halved to 400 m. Mineral Resources within the area drilled on a 400 m spacing and which display grade and geological continuity could be considered Indicated. At this spacing, contiguous holes tend to show similar grades and thicknesses (Figure 14.17), but the stratigraphic position of the SMZ can vary (Figure 14.18).

IVANHOE MINES LIMITED Kamoa Copper Project
AMC 812022 : November : 2013 : 812022KamoaFinalEffDate131115rev0 179
The mosaic textures of the distributions of grade and thickness are revealed, but the geometries of mosaic pieces are uncertain. Locally, a closer than 400 m drillhole spacing was used near faults to reflect the uncertainty due to the structural complexity.
14.6.3 Measured Mineral Resource
A “Measured Mineral Resource” is that part of a Mineral Resource for which quantity, grade or quality, densities, shape, and physical characteristics are so well established that they can be estimated with confidence sufficient to allow the appropriate application of technical and economic parameters, to support production planning and evaluation of the economic viability of the deposit. The estimate is based on detailed and reliable exploration, sampling and testing information gathered through appropriate techniques from locations such as outcrops, trenches, pits, workings, and drill holes that are spaced closely enough to confirm both geological and grade continuity.
Figure 14.16 and Figure 14.17 show two fences of holes at 100 m spacing. Drillholes on these lines show excellent continuity of grade and thickness, and the stratigraphic position of the SMZ (Figure 14.18) typically varies by only a few metres from core hole to core hole. At a 100 m spacing, it should be possible to define minor faults and their displacements. Therefore, a 100 m spacing is suitable for declaring Measured Mineral Resources.
Figure 14.16 Total Copper Continuity
Note: Figure by AMEC, 2012.
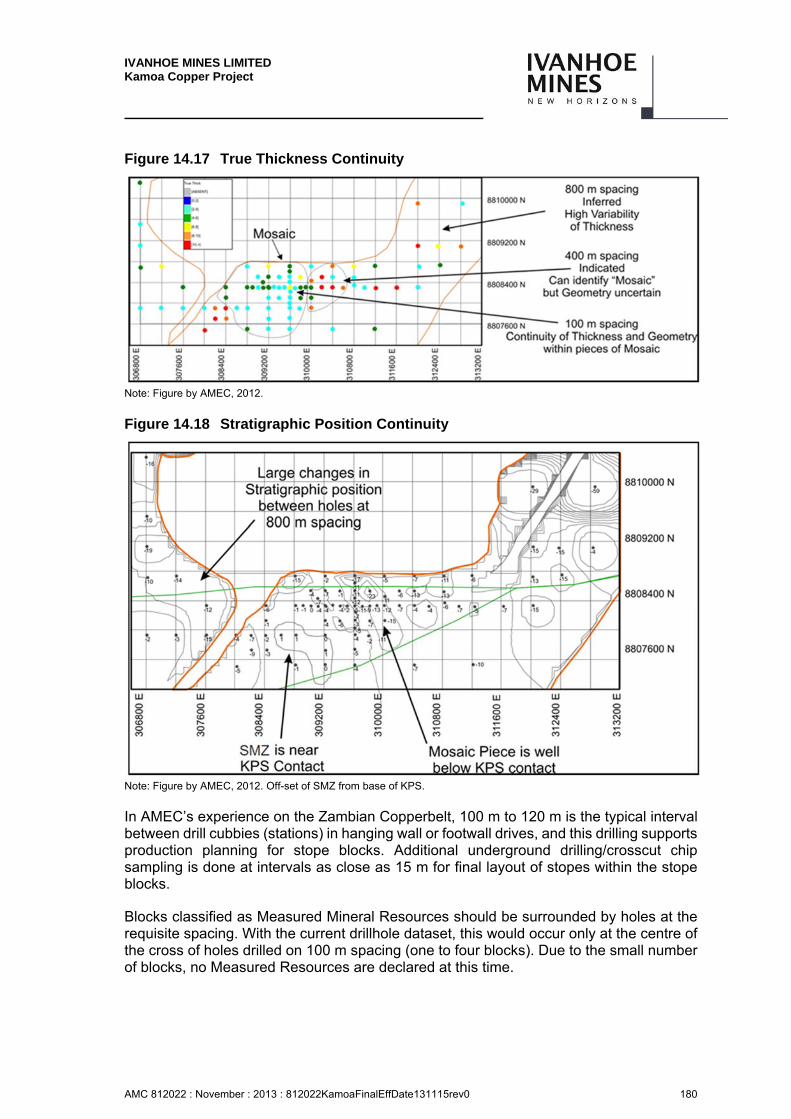
IVANHOE MINES LIMITED Kamoa Copper Project
AMC 812022 : November : 2013 : 812022KamoaFinalEffDate131115rev0 180
Figure 14.17 True Thickness Continuity
Note: Figure by AMEC, 2012.
Figure 14.18 Stratigraphic Position Continuity
Note: Figure by AMEC, 2012. Off-set of SMZ from base of KPS.
In AMEC’s experience on the Zambian Copperbelt, 100 m to 120 m is the typical interval between drill cubbies (stations) in hanging wall or footwall drives, and this drilling supports production planning for stope blocks. Additional underground drilling/crosscut chip sampling is done at intervals as close as 15 m for final layout of stopes within the stope blocks.
Blocks classified as Measured Mineral Resources should be surrounded by holes at the requisite spacing. With the current drillhole dataset, this would occur only at the centre of the cross of holes drilled on 100 m spacing (one to four blocks). Due to the small number of blocks, no Measured Resources are declared at this time.
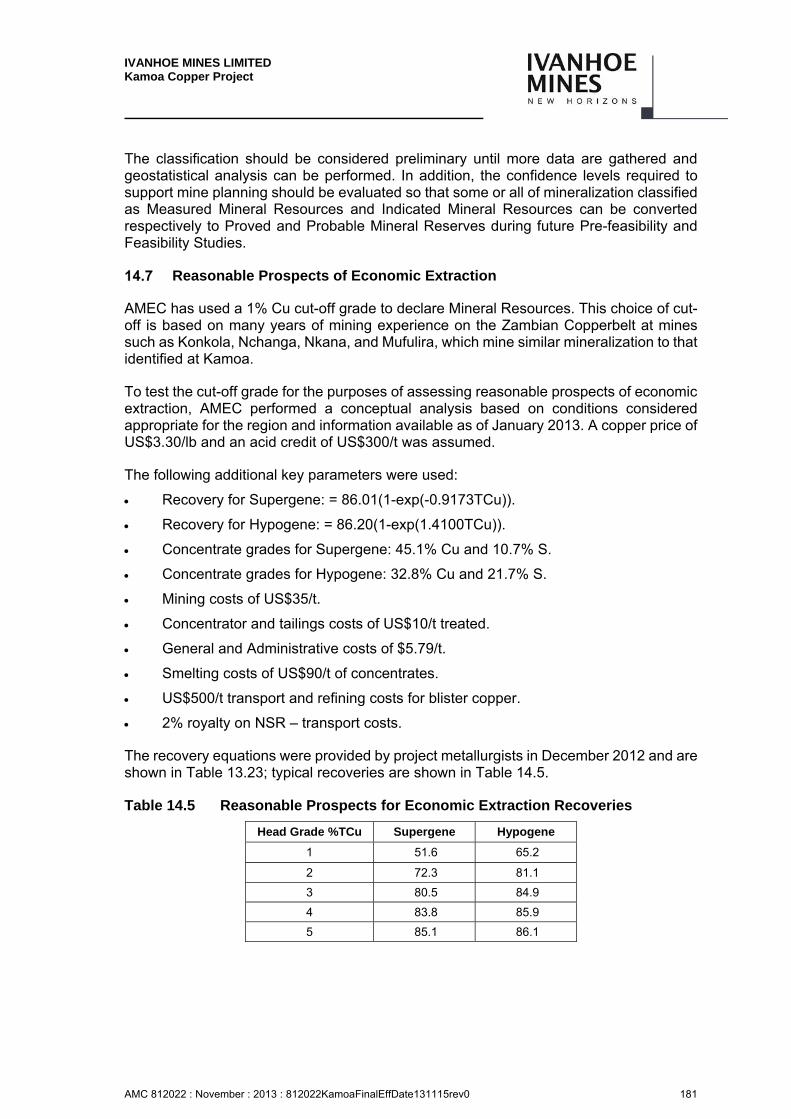
IVANHOE MINES LIMITED Kamoa Copper Project
AMC 812022 : November : 2013 : 812022KamoaFinalEffDate131115rev0 181
The classification should be considered preliminary until more data are gathered and geostatistical analysis can be performed. In addition, the confidence levels required to support mine planning should be evaluated so that some or all of mineralization classified as Measured Mineral Resources and Indicated Mineral Resources can be converted respectively to Proved and Probable Mineral Reserves during future Pre-feasibility and Feasibility Studies.
Reasonable Prospects of Economic Extraction
AMEC has used a 1% Cu cut-off grade to declare Mineral Resources. This choice of cut-off is based on many years of mining experience on the Zambian Copperbelt at mines such as Konkola, Nchanga, Nkana, and Mufulira, which mine similar mineralization to that identified at Kamoa.
To test the cut-off grade for the purposes of assessing reasonable prospects of economic extraction, AMEC performed a conceptual analysis based on conditions considered appropriate for the region and information available as of January 2013. A copper price of US$3.30/lb and an acid credit of US$300/t was assumed.
The following additional key parameters were used:
Recovery for Supergene: = 86.01(1-exp(-0.9173TCu)).
Recovery for Hypogene: = 86.20(1-exp(1.4100TCu)).
Concentrate grades for Supergene: 45.1% Cu and 10.7% S.
Concentrate grades for Hypogene: 32.8% Cu and 21.7% S.
Mining costs of US$35/t.
Concentrator and tailings costs of US$10/t treated.
General and Administrative costs of $5.79/t.
Smelting costs of US$90/t of concentrates.
US$500/t transport and refining costs for blister copper.
2% royalty on NSR – transport costs.
The recovery equations were provided by project metallurgists in December 2012 and are shown in Table 13.23; typical recoveries are shown in Table 14.5.
Table 14.5 Reasonable Prospects for Economic Extraction Recoveries
Head Grade %TCu Supergene Hypogene
1 51.6 65.2
2 72.3 81.1
3 80.5 84.9
4 83.8 85.9
5 85.1 86.1
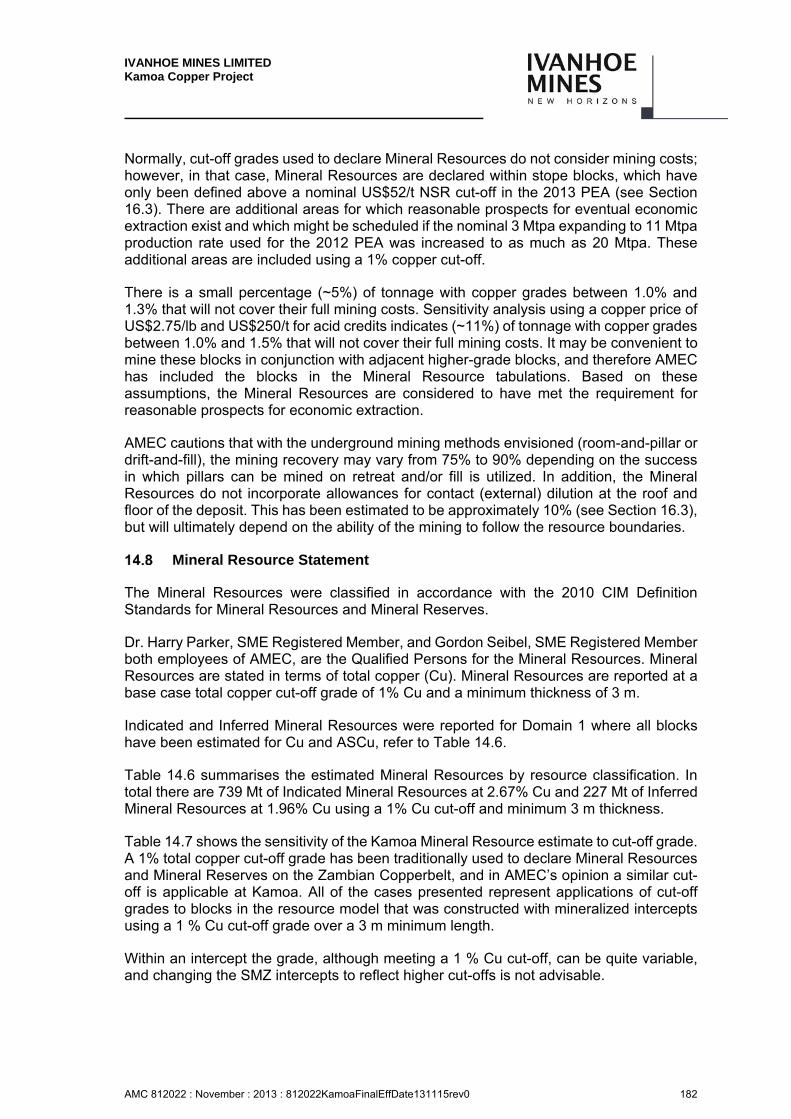
IVANHOE MINES LIMITED Kamoa Copper Project
AMC 812022 : November : 2013 : 812022KamoaFinalEffDate131115rev0 182
Normally, cut-off grades used to declare Mineral Resources do not consider mining costs; however, in that case, Mineral Resources are declared within stope blocks, which have only been defined above a nominal US$52/t NSR cut-off in the 2013 PEA (see Section 16.3). There are additional areas for which reasonable prospects for eventual economic extraction exist and which might be scheduled if the nominal 3 Mtpa expanding to 11 Mtpa production rate used for the 2012 PEA was increased to as much as 20 Mtpa. These additional areas are included using a 1% copper cut-off.
There is a small percentage (~5%) of tonnage with copper grades between 1.0% and 1.3% that will not cover their full mining costs. Sensitivity analysis using a copper price of US$2.75/lb and US$250/t for acid credits indicates (~11%) of tonnage with copper grades between 1.0% and 1.5% that will not cover their full mining costs. It may be convenient to mine these blocks in conjunction with adjacent higher-grade blocks, and therefore AMEC has included the blocks in the Mineral Resource tabulations. Based on these assumptions, the Mineral Resources are considered to have met the requirement for reasonable prospects for economic extraction.
AMEC cautions that with the underground mining methods envisioned (room-and-pillar or drift-and-fill), the mining recovery may vary from 75% to 90% depending on the success in which pillars can be mined on retreat and/or fill is utilized. In addition, the Mineral Resources do not incorporate allowances for contact (external) dilution at the roof and floor of the deposit. This has been estimated to be approximately 10% (see Section 16.3), but will ultimately depend on the ability of the mining to follow the resource boundaries.
Mineral Resource Statement
The Mineral Resources were classified in accordance with the 2010 CIM Definition Standards for Mineral Resources and Mineral Reserves.
Dr. Harry Parker, SME Registered Member, and Gordon Seibel, SME Registered Member both employees of AMEC, are the Qualified Persons for the Mineral Resources. Mineral Resources are stated in terms of total copper (Cu). Mineral Resources are reported at a base case total copper cut-off grade of 1% Cu and a minimum thickness of 3 m.
Indicated and Inferred Mineral Resources were reported for Domain 1 where all blocks have been estimated for Cu and ASCu, refer to Table 14.6.
Table 14.6 summarises the estimated Mineral Resources by resource classification. In total there are 739 Mt of Indicated Mineral Resources at 2.67% Cu and 227 Mt of Inferred Mineral Resources at 1.96% Cu using a 1% Cu cut-off and minimum 3 m thickness.
Table 14.7 shows the sensitivity of the Kamoa Mineral Resource estimate to cut-off grade. A 1% total copper cut-off grade has been traditionally used to declare Mineral Resources and Mineral Reserves on the Zambian Copperbelt, and in AMEC’s opinion a similar cut-off is applicable at Kamoa. All of the cases presented represent applications of cut-off grades to blocks in the resource model that was constructed with mineralized intercepts using a 1 % Cu cut-off grade over a 3 m minimum length.
Within an intercept the grade, although meeting a 1 % Cu cut-off, can be quite variable, and changing the SMZ intercepts to reflect higher cut-offs is not advisable.
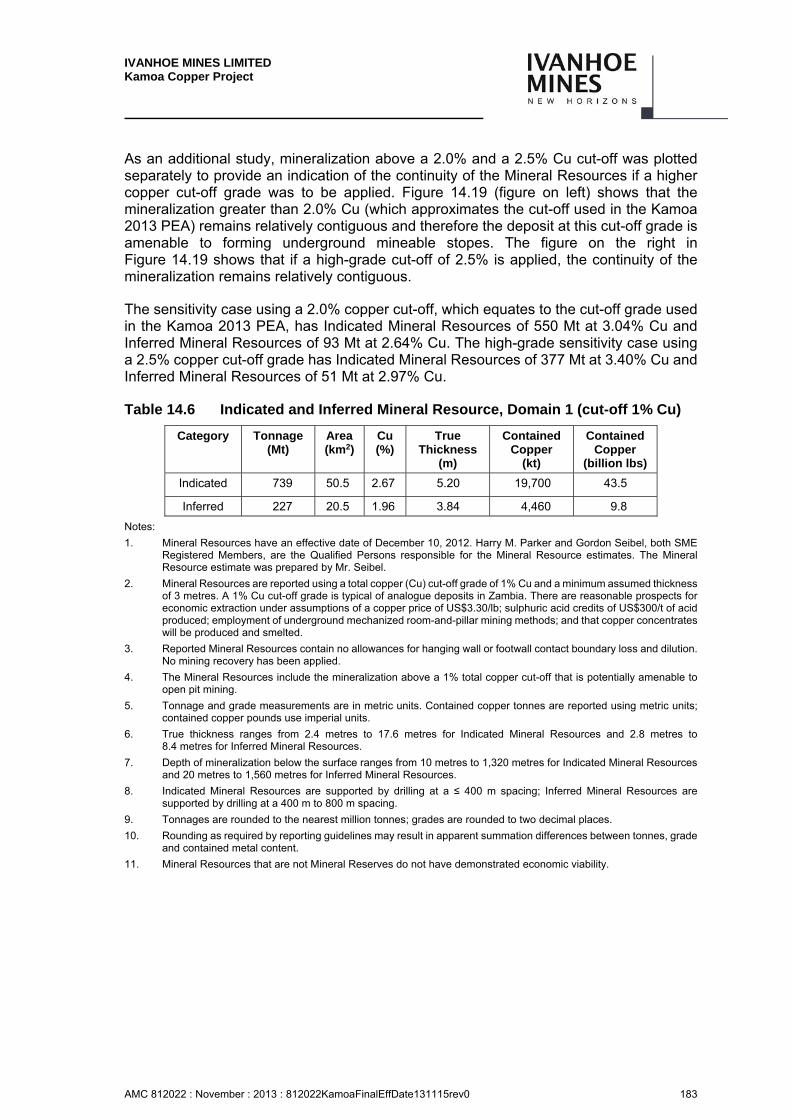
IVANHOE MINES LIMITED Kamoa Copper Project
AMC 812022 : November : 2013 : 812022KamoaFinalEffDate131115rev0 183
As an additional study, mineralization above a 2.0% and a 2.5% Cu cut-off was plotted separately to provide an indication of the continuity of the Mineral Resources if a higher copper cut-off grade was to be applied. Figure 14.19 (figure on left) shows that the mineralization greater than 2.0% Cu (which approximates the cut-off used in the Kamoa 2013 PEA) remains relatively contiguous and therefore the deposit at this cut-off grade is amenable to forming underground mineable stopes. The figure on the right in Figure 14.19 shows that if a high-grade cut-off of 2.5% is applied, the continuity of the mineralization remains relatively contiguous.
The sensitivity case using a 2.0% copper cut-off, which equates to the cut-off grade used in the Kamoa 2013 PEA, has Indicated Mineral Resources of 550 Mt at 3.04% Cu and Inferred Mineral Resources of 93 Mt at 2.64% Cu. The high-grade sensitivity case using a 2.5% copper cut-off grade has Indicated Mineral Resources of 377 Mt at 3.40% Cu and Inferred Mineral Resources of 51 Mt at 2.97% Cu.
Table 14.6 Indicated and Inferred Mineral Resource, Domain 1 (cut-off 1% Cu)
Category Tonnage (Mt)
Area(km2)
Cu (%)
True Thickness
(m)
Contained Copper
(kt)
Contained Copper
(billion lbs)
Indicated 739 50.5 2.67 5.20 19,700 43.5
Inferred 227 20.5 1.96 3.84 4,460 9.8
Notes:
1. Mineral Resources have an effective date of December 10, 2012. Harry M. Parker and Gordon Seibel, both SME Registered Members, are the Qualified Persons responsible for the Mineral Resource estimates. The Mineral Resource estimate was prepared by Mr. Seibel.
2. Mineral Resources are reported using a total copper (Cu) cut-off grade of 1% Cu and a minimum assumed thickness of 3 metres. A 1% Cu cut-off grade is typical of analogue deposits in Zambia. There are reasonable prospects for economic extraction under assumptions of a copper price of US$3.30/lb; sulphuric acid credits of US$300/t of acid produced; employment of underground mechanized room-and-pillar mining methods; and that copper concentrates will be produced and smelted.
3. Reported Mineral Resources contain no allowances for hanging wall or footwall contact boundary loss and dilution. No mining recovery has been applied.
4. The Mineral Resources include the mineralization above a 1% total copper cut-off that is potentially amenable to open pit mining.
5. Tonnage and grade measurements are in metric units. Contained copper tonnes are reported using metric units; contained copper pounds use imperial units.
6. True thickness ranges from 2.4 metres to 17.6 metres for Indicated Mineral Resources and 2.8 metres to 8.4 metres for Inferred Mineral Resources.
7. Depth of mineralization below the surface ranges from 10 metres to 1,320 metres for Indicated Mineral Resources and 20 metres to 1,560 metres for Inferred Mineral Resources.
8. Indicated Mineral Resources are supported by drilling at a ≤ 400 m spacing; Inferred Mineral Resources are supported by drilling at a 400 m to 800 m spacing.
9. Tonnages are rounded to the nearest million tonnes; grades are rounded to two decimal places.
10. Rounding as required by reporting guidelines may result in apparent summation differences between tonnes, grade and contained metal content.
11. Mineral Resources that are not Mineral Reserves do not have demonstrated economic viability.

IVANHOE MINES LIMITED Kamoa Copper Project
AMC 812022 : November : 2013 : 812022KamoaFinalEffDate131115rev0 184
Table 14.7 Sensitivity of Mineral Resources to Cut-Off Grade
Indicated Mineral Resources (cumulative)
Cut-Off %Cu Tonnage Mt
Area (km2)
Cu (%)
Contained Copper
(kt)
Contained Copper (billion
lbs)
3.00 224 13.6 3.85 8,630 19.0
2.50 377 23.9 3.40 12,800 28.3
2.00 550 34.9 3.04 16,700 36.9
1.75 622 39.9 2.91 18,100 39.8
1.50 675 44.0 2.81 18,900 41.7
1.25 709 47.3 2.74 19,400 42.8
1.00 739 50.5 2.67 19,700 43.5
0.80 755 52.3 2.63 19,900 43.8
0.60 763 53.1 2.61 19,900 44.0
Inferred Mineral Resources (cumulative)
Cut-Off %Cu Tonnage Mt
Area (km2)
Cu (%)
Contained Copper
(kt)
Contained Copper (billion
lbs)
3.00 19 1.4 3.40 635 1.4
2.50 51 3.8 2.97 1,520 3.4
2.00 93 7.4 2.64 2,450 5.4
1.75 115 9.5 2.49 2,870 6.3
1.50 164 14.0 2.23 3,670 8.1
1.25 196 17.2 2.10 4,100 9.1
1.00 227 20.5 1.96 4,460 9.8
0.80 249 23.0 1.87 4,660 10.3
0.60 261 24.3 1.82 4,740 10.4
Notes:
1. Mineral Resources have an effective date of 10 December 2012. Harry M. Parker and Gordon Seibel, both SME Registered Members, are the Qualified Persons responsible for the Mineral Resource estimates. The Mineral Resource estimate was prepared by Mr. Seibel.
2. Base case estimate at 1% copper cut-off is highlighted. Mineral Resources are reported using a total copper (Cu) cut-off grade of 1% Cu and a minimum assumed thickness of 3 metres. A 1% Cu cut-off grade is typical of analogue deposits in Zambia. There are reasonable prospects for economic extraction under assumptions of a copper price of US$3.30/lb; sulphuric acid credits of US$300/t of acid produced, employment of underground mechanized room-and-pillar mining methods; and that copper concentrates will be produced and smelted.
3. Indicated Mineral Resources are supported by drilling at a ≤ 400 m spacing; Inferred Mineral Resources are supported by drilling at a 400 m to 800 m spacing.
4. Tonnages are rounded to the nearest million tonnes; grades are rounded to two decimal places.
5. Rounding as required by reporting guidelines may result in apparent summation differences between tonnes, grade and contained metal content.
6. Tonnage and grade measurements are in metric units. Contained copper tonnes are reported using metric units; contained copper pounds use imperial units.
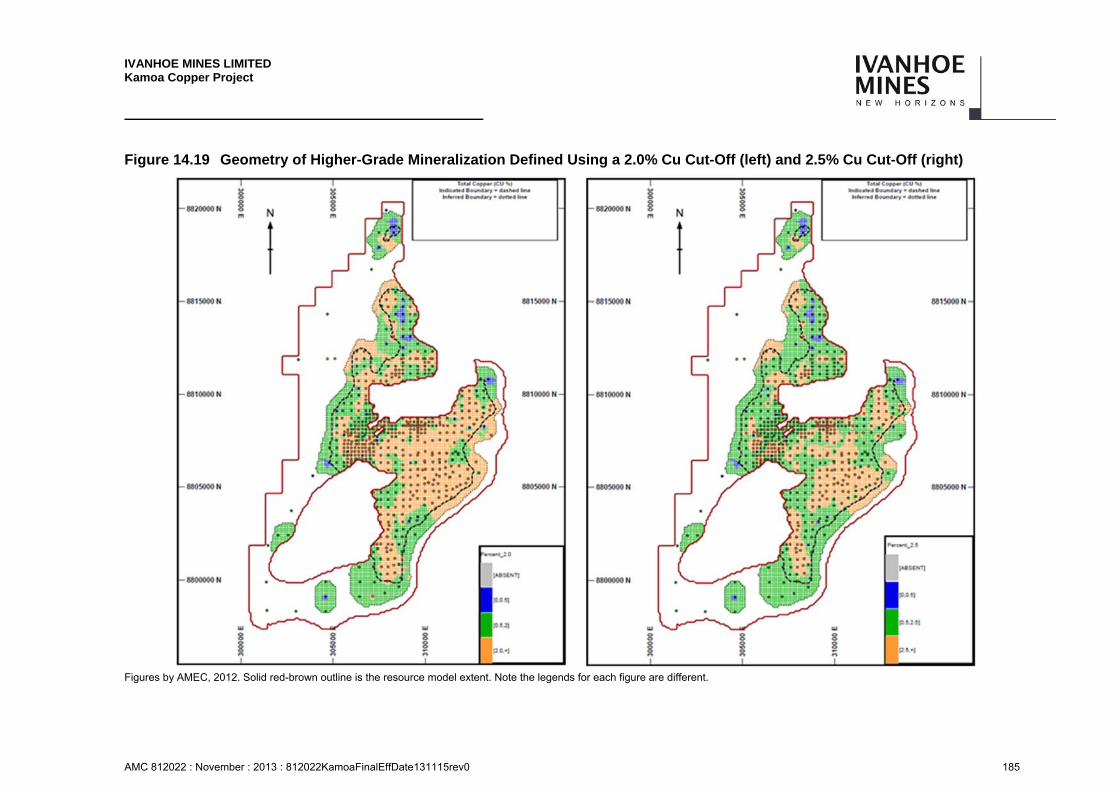
IVANHOE MINES LIMITED Kamoa Copper Project
AMC 812022 : November : 2013 : 812022KamoaFinalEffDate131115rev0 185
Figure 14.19 Geometry of Higher-Grade Mineralization Defined Using a 2.0% Cu Cut-Off (left) and 2.5% Cu Cut-Off (right)
Figures by AMEC, 2012. Solid red-brown outline is the resource model extent. Note the legends for each figure are different.
IVANHOE MINES LIMITED Kamoa Copper Project
AMC 812022 : November : 2013 : 812022KamoaFinalEffDate131115rev0 186
Factors That May Affect the Mineral Resource Estimate
Factors which may affect the Mineral Resource estimate include:
Commodity prices and exchange rates
Cut-off grade
Faulting
– The presence of local faulting could disrupt the productivity of a highly-mechanized operation. In addition, the amount of contact dilution related to local undulations or faulting in the SMZ has yet to be determined. Ivanhoe plans to mitigate these risks with further in-fill drilling and an exploratory decline.
Metallurgical recoveries
– Metallurgical testwork indicates the need for multiple grinding and flotation steps. Metallurgical variability testwork has been initiated and is in early stages.
– Some metallurgical test results have indicated a portion of the material amenable to open pit mining may produce poor quality concentrate that could negatively affect the economics of processing a portion of this material. Metallurgical testwork on this material is ongoing.
Mining plan
– Mining recovery could be lower and dilution increased where the dip locally increases on the flanks of the domes. An exploration decline is being considered which would provide an appropriate trial of the conceptual room-and-pillar mining method on the Kamoa deposit in terms of costs, dilution, and mining recovery. A decline would provide access to data and metallurgical samples at a bulk scale that cannot be collected at the scale of a drill sample. Location of an exploration decline(s) and the extent of the decline are dependent on further studies.
Infrastructure
– Exploitation will require building a greenfields project with attendant infrastructure.
Political setting
– The DRC is emerging from a period of political instability, and the fiscal and political regime under which mining operations might occur are uncertain. There is provision within the DRC Mining Code for the Government to change the DRC Mining Code and mining rights by decree.
Exploration Targets
Canadian disclosure standards under NI 43-101 allow the estimated quantities of an exploration target to be disclosed as a range of tonnes and grade.
IVANHOE MINES LIMITED Kamoa Copper Project
AMC 812022 : November : 2013 : 812022KamoaFinalEffDate131115rev0 187
14.10.1 Exploration Target Adjacent to Indicated and Inferred Mineral Resources
The area inside the model perimeter surrounding the Indicated and Inferred Mineral Resources is shown in Figure 14.20. The ranges of exploration target tonnages and grades are summarised in Table 14.8. Tonnages and grades were estimated using an inverse distance to the fifth power for Domain 2 and applying a ±20% variance to the tonnages and grades. In aggregate, the target could contain from 520 Mt to 790 Mt grading 1.6% Cu to 2.5% Cu.
AMEC cautions that the potential quantity and grade of the exploration target is conceptual in nature, and that it is uncertain if additional drilling will result in the exploration target being delineated as a Mineral Resource.
Additional Exploration Potential
The eastern boundary of the Mineral Resources is defined solely by the current limit of drilling, at depths ranging from 600 m to 1,560 m along a strike length of 10 km. Some of the best grade-widths of mineralization occur here, and in addition, high-grade bornite-dominant mineralization is common. Beyond these drillholes the mineralization and the deposit are untested and open to expansion, even beyond the exploration target defined in Section 14.10.
Other exploration prospects exist along strike to the south where additional copper-in-soil anomalies are associated with footwall domes (Kakula and Kakula Northeast) analogous to the Kamoa and Makalu domes (Figure 14.21). There is insufficient information to project a range of tonnage and grade for these exploration prospects, although some of the area that has been drill tested (four drillholes) have identified thick, low-grade mineralization with similar stratigraphy to that around the Makalu dome. There is still exploration potential over a large area, but it will require wide-spaced drilling to properly test these prospect areas.
In addition, and by analogy with the Zambian and Katangan districts of the Central African Copperbelt, it is possible that multiple (“stacked”) redox horizons and associated stratiform copper zones exist within the Roan sequence, hidden below the diamictite of the Grand Conglomerat. Ivanhoe plans to drill several deep boreholes to test this hypothesis during the next two years.
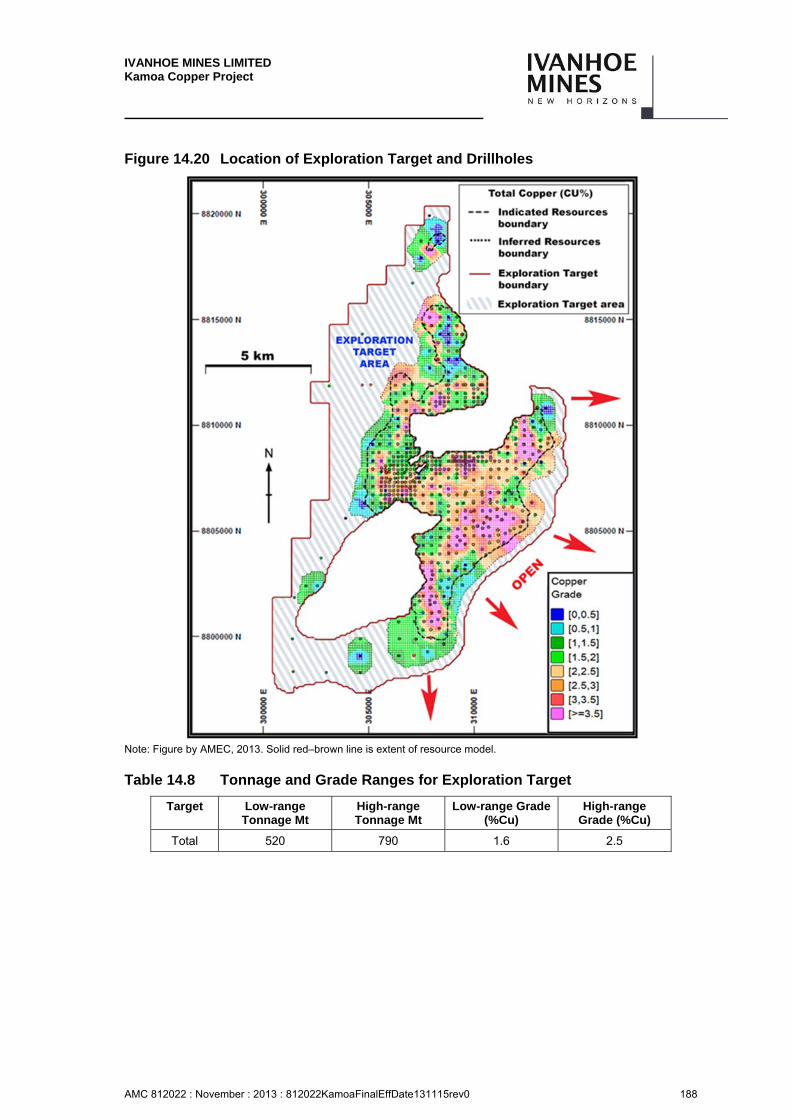
IVANHOE MINES LIMITED Kamoa Copper Project
AMC 812022 : November : 2013 : 812022KamoaFinalEffDate131115rev0 188
Figure 14.20 Location of Exploration Target and Drillholes
Note: Figure by AMEC, 2013. Solid red–brown line is extent of resource model.
Table 14.8 Tonnage and Grade Ranges for Exploration Target
Target Low-range Tonnage Mt
High-range Tonnage Mt
Low-range Grade (%Cu)
High-range Grade (%Cu)
Total 520 790 1.6 2.5
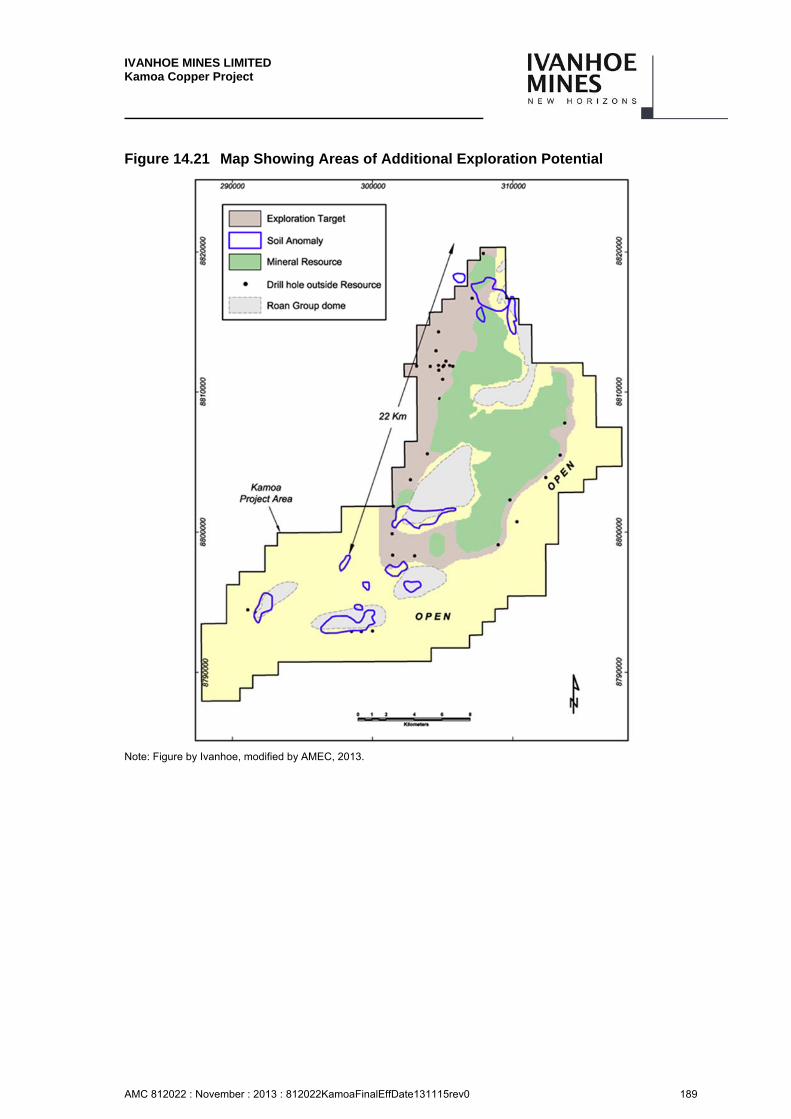
IVANHOE MINES LIMITED Kamoa Copper Project
AMC 812022 : November : 2013 : 812022KamoaFinalEffDate131115rev0 189
Figure 14.21 Map Showing Areas of Additional Exploration Potential
Note: Figure by Ivanhoe, modified by AMEC, 2013.
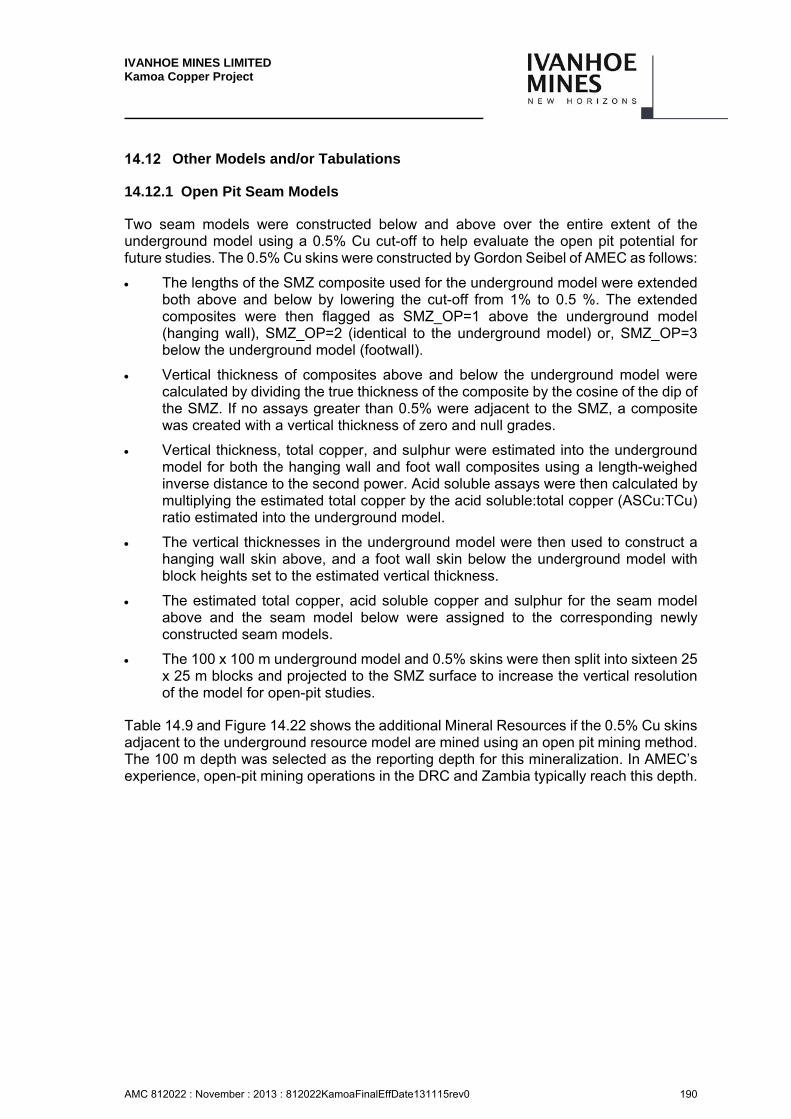
IVANHOE MINES LIMITED Kamoa Copper Project
AMC 812022 : November : 2013 : 812022KamoaFinalEffDate131115rev0 190
Other Models and/or Tabulations
14.12.1 Open Pit Seam Models
Two seam models were constructed below and above over the entire extent of the underground model using a 0.5% Cu cut-off to help evaluate the open pit potential for future studies. The 0.5% Cu skins were constructed by Gordon Seibel of AMEC as follows:
The lengths of the SMZ composite used for the underground model were extended both above and below by lowering the cut-off from 1% to 0.5 %. The extended composites were then flagged as SMZ_OP=1 above the underground model (hanging wall), SMZ_OP=2 (identical to the underground model) or, SMZ_OP=3 below the underground model (footwall).
Vertical thickness of composites above and below the underground model were calculated by dividing the true thickness of the composite by the cosine of the dip of the SMZ. If no assays greater than 0.5% were adjacent to the SMZ, a composite was created with a vertical thickness of zero and null grades.
Vertical thickness, total copper, and sulphur were estimated into the underground model for both the hanging wall and foot wall composites using a length-weighed inverse distance to the second power. Acid soluble assays were then calculated by multiplying the estimated total copper by the acid soluble:total copper (ASCu:TCu) ratio estimated into the underground model.
The vertical thicknesses in the underground model were then used to construct a hanging wall skin above, and a foot wall skin below the underground model with block heights set to the estimated vertical thickness.
The estimated total copper, acid soluble copper and sulphur for the seam model above and the seam model below were assigned to the corresponding newly constructed seam models.
The 100 x 100 m underground model and 0.5% skins were then split into sixteen 25 x 25 m blocks and projected to the SMZ surface to increase the vertical resolution of the model for open-pit studies.
Table 14.9 and Figure 14.22 shows the additional Mineral Resources if the 0.5% Cu skins adjacent to the underground resource model are mined using an open pit mining method. The 100 m depth was selected as the reporting depth for this mineralization. In AMEC’s experience, open-pit mining operations in the DRC and Zambia typically reach this depth.
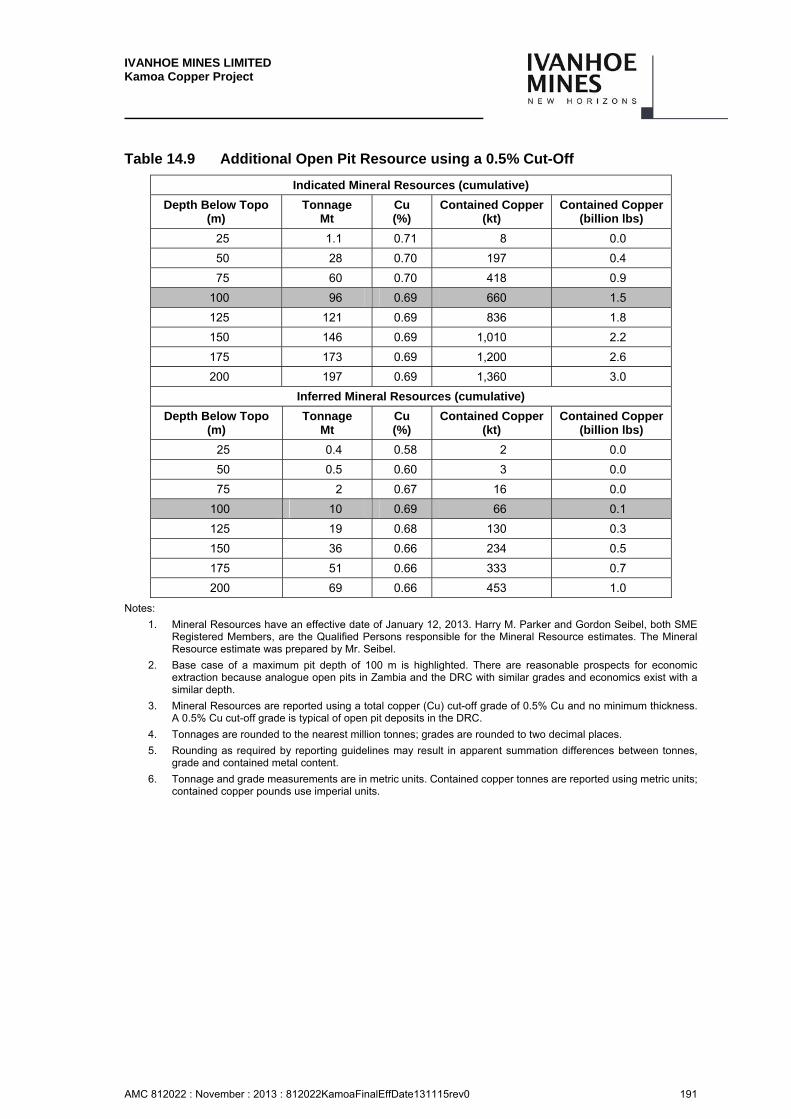
IVANHOE MINES LIMITED Kamoa Copper Project
AMC 812022 : November : 2013 : 812022KamoaFinalEffDate131115rev0 191
Table 14.9 Additional Open Pit Resource using a 0.5% Cut-Off
Indicated Mineral Resources (cumulative)
Depth Below Topo (m)
Tonnage Mt
Cu (%)
Contained Copper (kt)
Contained Copper(billion lbs)
25 1.1 0.71 8 0.0
50 28 0.70 197 0.4
75 60 0.70 418 0.9
100 96 0.69 660 1.5
125 121 0.69 836 1.8
150 146 0.69 1,010 2.2
175 173 0.69 1,200 2.6
200 197 0.69 1,360 3.0
Inferred Mineral Resources (cumulative)
Depth Below Topo (m)
Tonnage Mt
Cu (%)
Contained Copper (kt)
Contained Copper(billion lbs)
25 0.4 0.58 2 0.0
50 0.5 0.60 3 0.0
75 2 0.67 16 0.0
100 10 0.69 66 0.1
125 19 0.68 130 0.3
150 36 0.66 234 0.5
175 51 0.66 333 0.7
200 69 0.66 453 1.0
Notes:
1. Mineral Resources have an effective date of January 12, 2013. Harry M. Parker and Gordon Seibel, both SME Registered Members, are the Qualified Persons responsible for the Mineral Resource estimates. The Mineral Resource estimate was prepared by Mr. Seibel.
2. Base case of a maximum pit depth of 100 m is highlighted. There are reasonable prospects for economic extraction because analogue open pits in Zambia and the DRC with similar grades and economics exist with a similar depth.
3. Mineral Resources are reported using a total copper (Cu) cut-off grade of 0.5% Cu and no minimum thickness. A 0.5% Cu cut-off grade is typical of open pit deposits in the DRC.
4. Tonnages are rounded to the nearest million tonnes; grades are rounded to two decimal places.
5. Rounding as required by reporting guidelines may result in apparent summation differences between tonnes, grade and contained metal content.
6. Tonnage and grade measurements are in metric units. Contained copper tonnes are reported using metric units; contained copper pounds use imperial units.
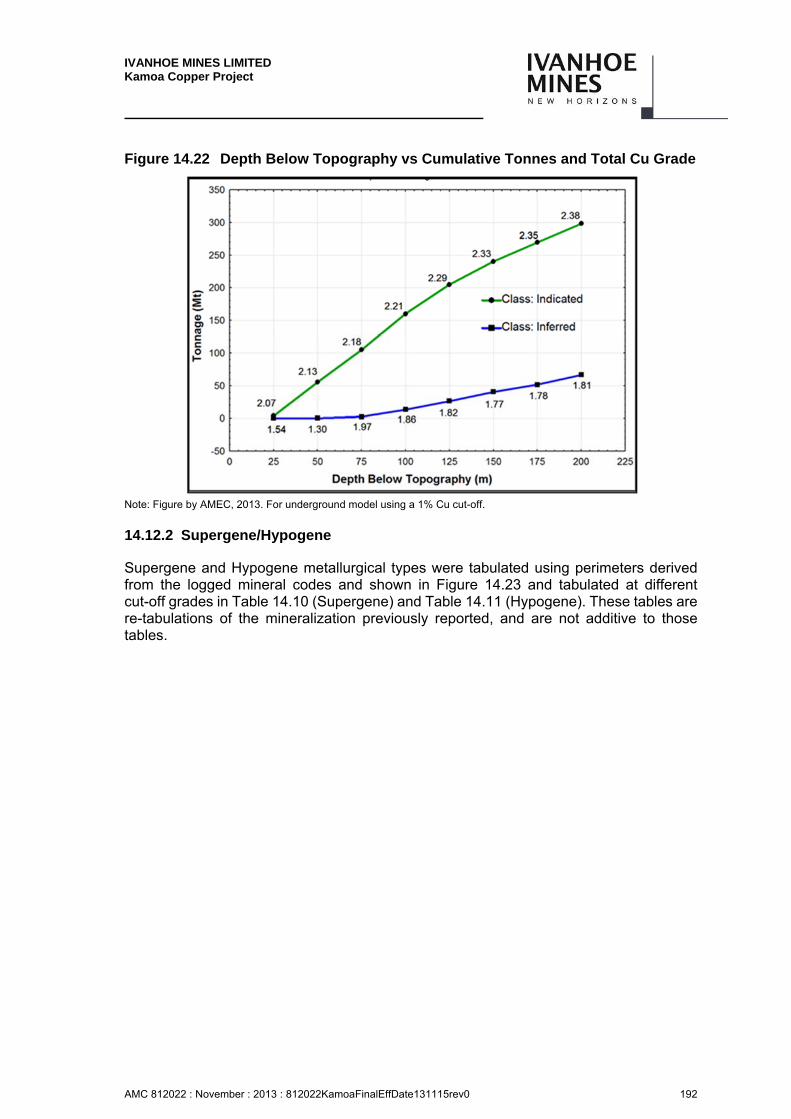
IVANHOE MINES LIMITED Kamoa Copper Project
AMC 812022 : November : 2013 : 812022KamoaFinalEffDate131115rev0 192
Figure 14.22 Depth Below Topography vs Cumulative Tonnes and Total Cu Grade
Note: Figure by AMEC, 2013. For underground model using a 1% Cu cut-off.
14.12.2 Supergene/Hypogene
Supergene and Hypogene metallurgical types were tabulated using perimeters derived from the logged mineral codes and shown in Figure 14.23 and tabulated at different cut-off grades in Table 14.10 (Supergene) and Table 14.11 (Hypogene). These tables are re-tabulations of the mineralization previously reported, and are not additive to those tables.
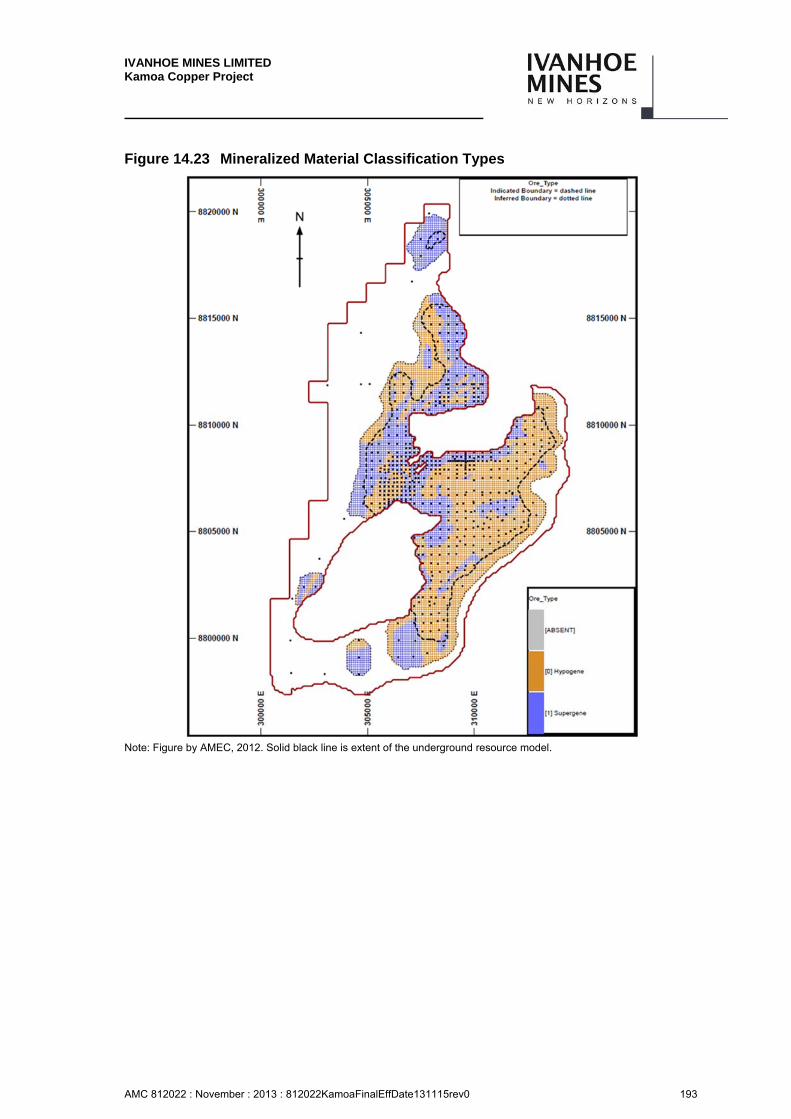
IVANHOE MINES LIMITED Kamoa Copper Project
AMC 812022 : November : 2013 : 812022KamoaFinalEffDate131115rev0 193
Figure 14.23 Mineralized Material Classification Types
Note: Figure by AMEC, 2012. Solid black line is extent of the underground resource model.
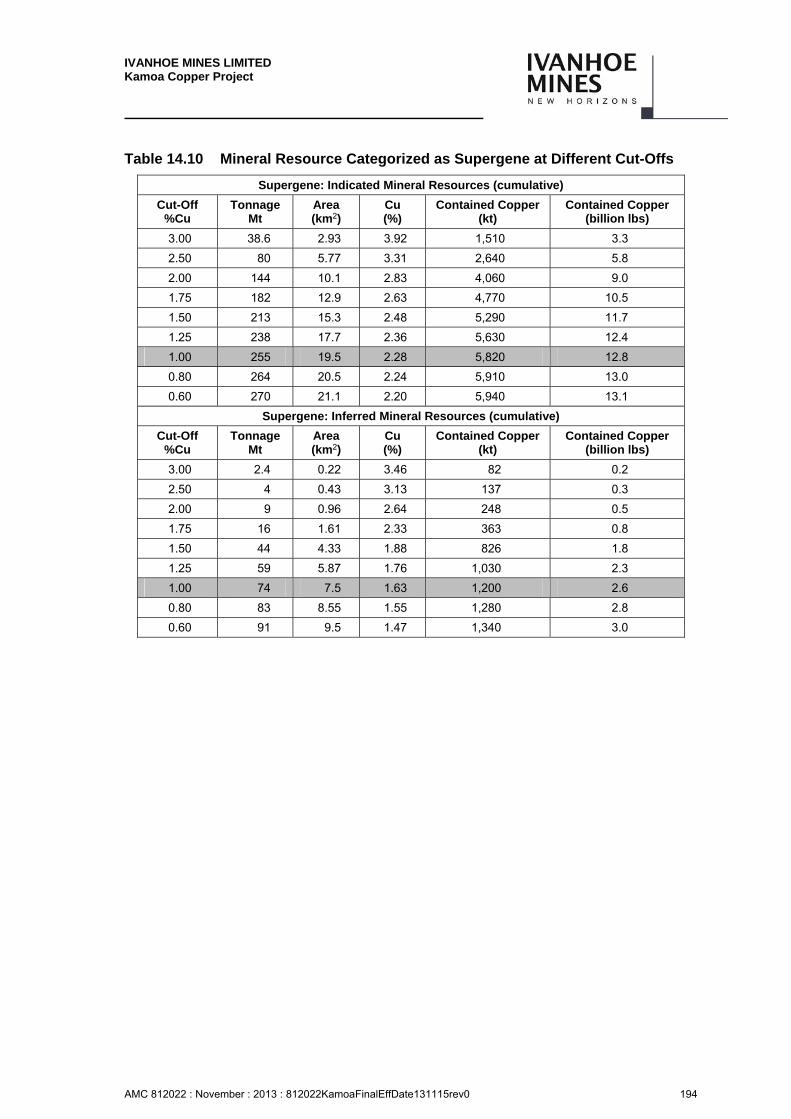
IVANHOE MINES LIMITED Kamoa Copper Project
AMC 812022 : November : 2013 : 812022KamoaFinalEffDate131115rev0 194
Table 14.10 Mineral Resource Categorized as Supergene at Different Cut-Offs
Supergene: Indicated Mineral Resources (cumulative)
Cut-Off %Cu
Tonnage Mt
Area (km2)
Cu (%)
Contained Copper (kt)
Contained Copper (billion lbs)
3.00 38.6 2.93 3.92 1,510 3.3
2.50 80 5.77 3.31 2,640 5.8
2.00 144 10.1 2.83 4,060 9.0
1.75 182 12.9 2.63 4,770 10.5
1.50 213 15.3 2.48 5,290 11.7
1.25 238 17.7 2.36 5,630 12.4
1.00 255 19.5 2.28 5,820 12.8
0.80 264 20.5 2.24 5,910 13.0
0.60 270 21.1 2.20 5,940 13.1
Supergene: Inferred Mineral Resources (cumulative)
Cut-Off %Cu
Tonnage Mt
Area (km2)
Cu (%)
Contained Copper (kt)
Contained Copper (billion lbs)
3.00 2.4 0.22 3.46 82 0.2
2.50 4 0.43 3.13 137 0.3
2.00 9 0.96 2.64 248 0.5
1.75 16 1.61 2.33 363 0.8
1.50 44 4.33 1.88 826 1.8
1.25 59 5.87 1.76 1,030 2.3
1.00 74 7.5 1.63 1,200 2.6
0.80 83 8.55 1.55 1,280 2.8
0.60 91 9.5 1.47 1,340 3.0
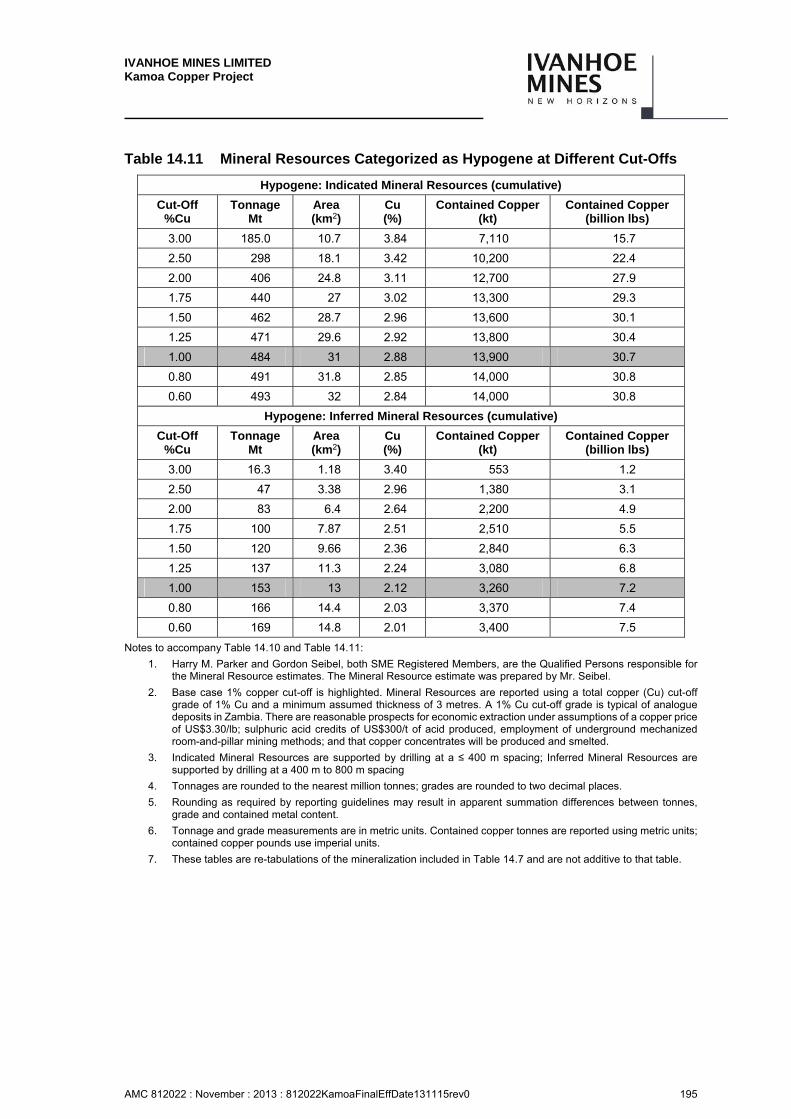
IVANHOE MINES LIMITED Kamoa Copper Project
AMC 812022 : November : 2013 : 812022KamoaFinalEffDate131115rev0 195
Table 14.11 Mineral Resources Categorized as Hypogene at Different Cut-Offs
Hypogene: Indicated Mineral Resources (cumulative)
Cut-Off %Cu
Tonnage Mt
Area (km2)
Cu (%)
Contained Copper (kt)
Contained Copper (billion lbs)
3.00 185.0 10.7 3.84 7,110 15.7
2.50 298 18.1 3.42 10,200 22.4
2.00 406 24.8 3.11 12,700 27.9
1.75 440 27 3.02 13,300 29.3
1.50 462 28.7 2.96 13,600 30.1
1.25 471 29.6 2.92 13,800 30.4
1.00 484 31 2.88 13,900 30.7
0.80 491 31.8 2.85 14,000 30.8
0.60 493 32 2.84 14,000 30.8
Hypogene: Inferred Mineral Resources (cumulative)
Cut-Off %Cu
Tonnage Mt
Area (km2)
Cu (%)
Contained Copper (kt)
Contained Copper (billion lbs)
3.00 16.3 1.18 3.40 553 1.2
2.50 47 3.38 2.96 1,380 3.1
2.00 83 6.4 2.64 2,200 4.9
1.75 100 7.87 2.51 2,510 5.5
1.50 120 9.66 2.36 2,840 6.3
1.25 137 11.3 2.24 3,080 6.8
1.00 153 13 2.12 3,260 7.2
0.80 166 14.4 2.03 3,370 7.4
0.60 169 14.8 2.01 3,400 7.5
Notes to accompany Table 14.10 and Table 14.11:
1. Harry M. Parker and Gordon Seibel, both SME Registered Members, are the Qualified Persons responsible for the Mineral Resource estimates. The Mineral Resource estimate was prepared by Mr. Seibel.
2. Base case 1% copper cut-off is highlighted. Mineral Resources are reported using a total copper (Cu) cut-off grade of 1% Cu and a minimum assumed thickness of 3 metres. A 1% Cu cut-off grade is typical of analogue deposits in Zambia. There are reasonable prospects for economic extraction under assumptions of a copper price of US$3.30/lb; sulphuric acid credits of US$300/t of acid produced, employment of underground mechanized room-and-pillar mining methods; and that copper concentrates will be produced and smelted.
3. Indicated Mineral Resources are supported by drilling at a ≤ 400 m spacing; Inferred Mineral Resources are supported by drilling at a 400 m to 800 m spacing
4. Tonnages are rounded to the nearest million tonnes; grades are rounded to two decimal places.
5. Rounding as required by reporting guidelines may result in apparent summation differences between tonnes, grade and contained metal content.
6. Tonnage and grade measurements are in metric units. Contained copper tonnes are reported using metric units; contained copper pounds use imperial units.
7. These tables are re-tabulations of the mineralization included in Table 14.7 and are not additive to that table.
IVANHOE MINES LIMITED Kamoa Copper Project
AMC 812022 : November : 2013 : 812022KamoaFinalEffDate131115rev0 196
Comments on Section 14
Mineral Resources for the Project, have been estimated using core drill data, have been performed to industry best practices (CIM, 2003), and conform to the requirements of CIM Definition Standards (2010).
Areas of uncertainty that may materially impact the Mineral Resource estimates include:
Drill spacing is insufficient to determine if any local faulting exists, or the effects of any such faulting on lithology and grade continuity assumptions. Local faulting could disrupt the productivity of a highly-mechanized operation. In addition, the amount of contact dilution related to local undulations in the SMZ has yet to be determined. Ivanhoe plans to mitigate these risks with further infill drilling.
Assumptions used to generate the data for consideration of reasonable prospects of economic extraction. Mining recovery could be lower and dilution increased where the dip locally increases on the flanks of the domes. An exploration decline is being considered which would provide an appropriate trial of the conceptual room-and-pillar mining method on the Kamoa deposit in terms of costs, dilution, and mining recovery. A decline would provide access to data and metallurgical samples at a bulk scale that cannot be collected at the scale of a drill sample. Location of an exploration decline(s) and the extent of the decline are dependent on further studies.
Long-term commodity price assumptions.
Long-term exchange rate assumptions.
Operating and capital assumptions. Exploitation will require building a greenfields project with attendant infrastructure.
Metal recovery assumptions. Metallurgical testwork indicates the need for multiple grinding and flotation steps. Metallurgical variability testwork has been initiated and is in early stages.
Some metallurgical test results have indicated a portion of the material amenable to open pit mining may produce poor quality concentrate that could negatively affect the economics. Metallurgical testwork on this material is ongoing.
The fiscal and political regime under which mining operations might occur are uncertain. There is provision within the 2002 Mining Code for the Government to change the 2002 Mining Code and mining rights by decree. There is also a risk that the DRC Government could change the current royalty, duty, and taxation regime.
IVANHOE MINES LIMITED Kamoa Copper Project
AMC 812022 : November : 2013 : 812022KamoaFinalEffDate131115rev0 197
15 MINERAL RESERVE ESTIMATES
No Mineral Reserves have been estimated for the Project.

IVANHOE MINES LIMITED Kamoa Copper Project
AMC 812022 : November : 2013 : 812022KamoaFinalEffDate131115rev0 198
16 MINING METHODS
Introduction
The preliminary mine plan presented in this section is partly based on Inferred Mineral Resources that are considered too speculative geologically to have the economic considerations applied to them that would enable them to be categorized as Mineral Reserves, and there is no certainty that the Preliminary Economic Assessment based on these Mineral Resources will be realized.
Geotechnical
SRK has been involved in the geotechnical and mining aspects at Kamoa since early 2010. This section briefly summarises SRK’s previous work on the programme.
16.2.1 Kamoa Geotechnical Field Data – Draft (May 2010)
This section of the Kamoa 2013 PEA presents findings from the initial SRK on-site geotechnical review conducted by Jarek Jakubec (April, 2010). The document considers the current geotechnical logging approach, in context to proposed mining activities and recommends changes to the geotechnical data collection system and certain on-site processes.
The document also lays out criteria for the geotechnical grade logging of the KPS (Kamoa pyritic siltstone; Ki1.1.2) unit.
16.2.2 Kamoa Site Visit Report (August 2010)
This report summarised the Kamoa site visits undertaken by Dr. Wayne Barnett in July, 2010. The objectives of the site visit were to:
1. Review progress in geotechnical characterization and field work recommended by SRK in March 2010.
2. Formulate an opinion on the structural deformation of the deposit and how it could impact the geotechnical characterization of the deposit.
Output from this work included comment on geotechnical logging QA/QC, recommended alterations to data collection procedures and a preliminary 3D structural model.
Geotechnical Evaluation of Kamoa Hanging Wall Rock Conditions (March, 2011)
SRK provided Ivanhoe with a geotechnical assessment in PowerPoint® format (December, 2010) of the KPS unit, that was understood to comprise the hangingwall of the Kamoa zone of mineralization. This investigation together with the previous geotechnical data provided information to make recommendations on the extraction ratios for different domains on a scoping level.
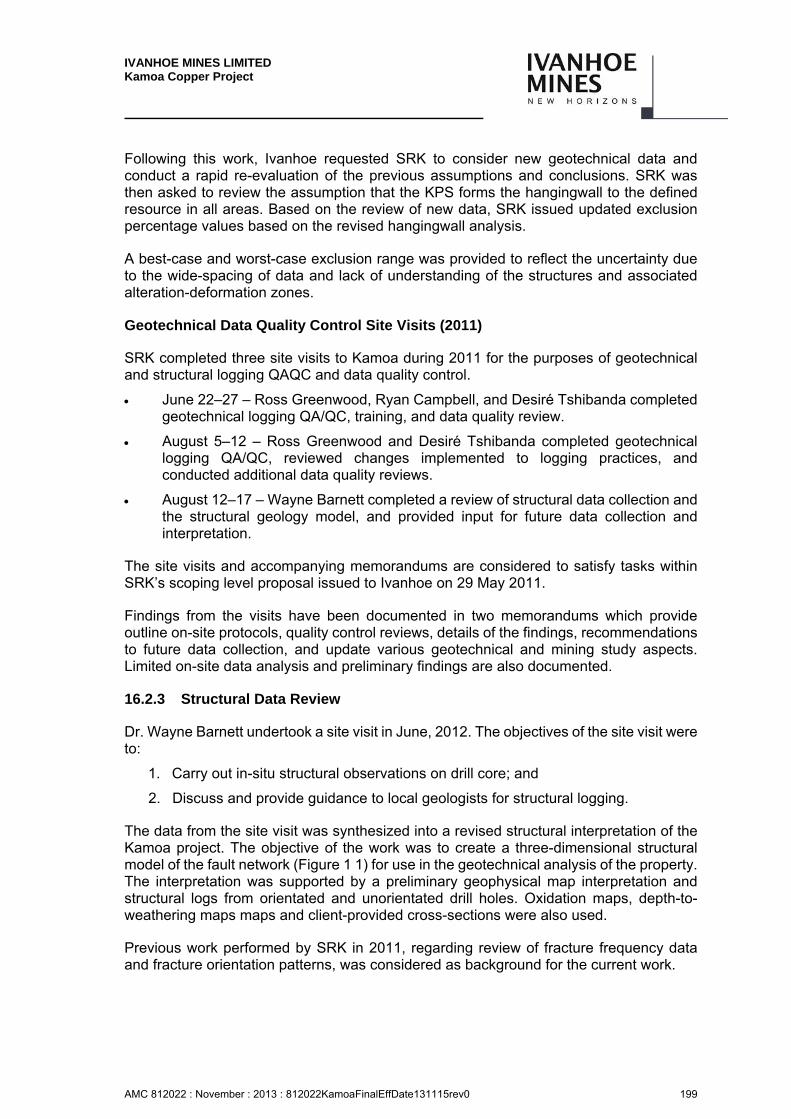
IVANHOE MINES LIMITED Kamoa Copper Project
AMC 812022 : November : 2013 : 812022KamoaFinalEffDate131115rev0 199
Following this work, Ivanhoe requested SRK to consider new geotechnical data and conduct a rapid re-evaluation of the previous assumptions and conclusions. SRK was then asked to review the assumption that the KPS forms the hangingwall to the defined resource in all areas. Based on the review of new data, SRK issued updated exclusion percentage values based on the revised hangingwall analysis.
A best-case and worst-case exclusion range was provided to reflect the uncertainty due to the wide-spacing of data and lack of understanding of the structures and associated alteration-deformation zones.
Geotechnical Data Quality Control Site Visits (2011)
SRK completed three site visits to Kamoa during 2011 for the purposes of geotechnical and structural logging QAQC and data quality control.
June 22–27 – Ross Greenwood, Ryan Campbell, and Desiré Tshibanda completed geotechnical logging QA/QC, training, and data quality review.
August 5–12 – Ross Greenwood and Desiré Tshibanda completed geotechnical logging QA/QC, reviewed changes implemented to logging practices, and conducted additional data quality reviews.
August 12–17 – Wayne Barnett completed a review of structural data collection and the structural geology model, and provided input for future data collection and interpretation.
The site visits and accompanying memorandums are considered to satisfy tasks within SRK’s scoping level proposal issued to Ivanhoe on 29 May 2011.
Findings from the visits have been documented in two memorandums which provide outline on-site protocols, quality control reviews, details of the findings, recommendations to future data collection, and update various geotechnical and mining study aspects. Limited on-site data analysis and preliminary findings are also documented.
16.2.3 Structural Data Review
Dr. Wayne Barnett undertook a site visit in June, 2012. The objectives of the site visit were to:
1. Carry out in-situ structural observations on drill core; and
2. Discuss and provide guidance to local geologists for structural logging.
The data from the site visit was synthesized into a revised structural interpretation of the Kamoa project. The objective of the work was to create a three-dimensional structural model of the fault network (Figure 1 1) for use in the geotechnical analysis of the property. The interpretation was supported by a preliminary geophysical map interpretation and structural logs from orientated and unorientated drill holes. Oxidation maps, depth-to-weathering maps maps and client-provided cross-sections were also used.
Previous work performed by SRK in 2011, regarding review of fracture frequency data and fracture orientation patterns, was considered as background for the current work.
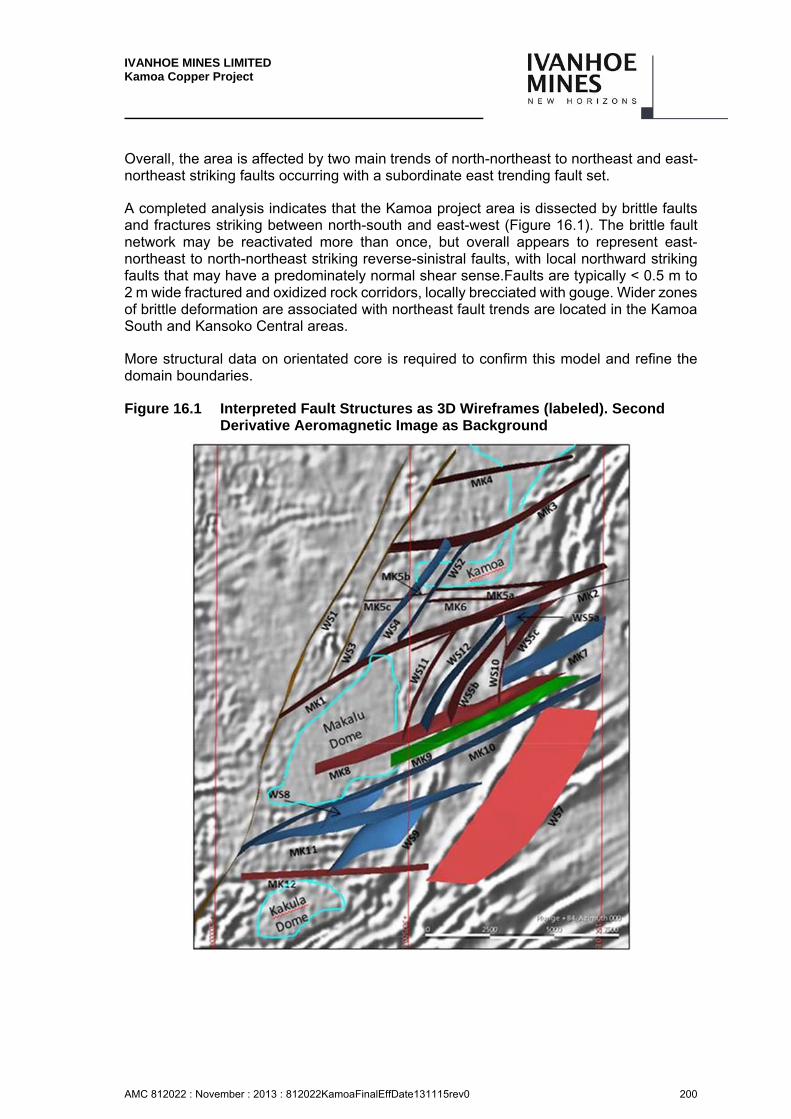
IVANHOE MINES LIMITED Kamoa Copper Project
AMC 812022 : November : 2013 : 812022KamoaFinalEffDate131115rev0 200
Overall, the area is affected by two main trends of north-northeast to northeast and east-northeast striking faults occurring with a subordinate east trending fault set.
A completed analysis indicates that the Kamoa project area is dissected by brittle faults and fractures striking between north-south and east-west (Figure 16.1). The brittle fault network may be reactivated more than once, but overall appears to represent east-northeast to north-northeast striking reverse-sinistral faults, with local northward striking faults that may have a predominately normal shear sense.Faults are typically < 0.5 m to 2 m wide fractured and oxidized rock corridors, locally brecciated with gouge. Wider zones of brittle deformation are associated with northeast fault trends are located in the Kamoa South and Kansoko Central areas.
More structural data on orientated core is required to confirm this model and refine the domain boundaries.
Figure 16.1 Interpreted Fault Structures as 3D Wireframes (labeled). Second Derivative Aeromagnetic Image as Background
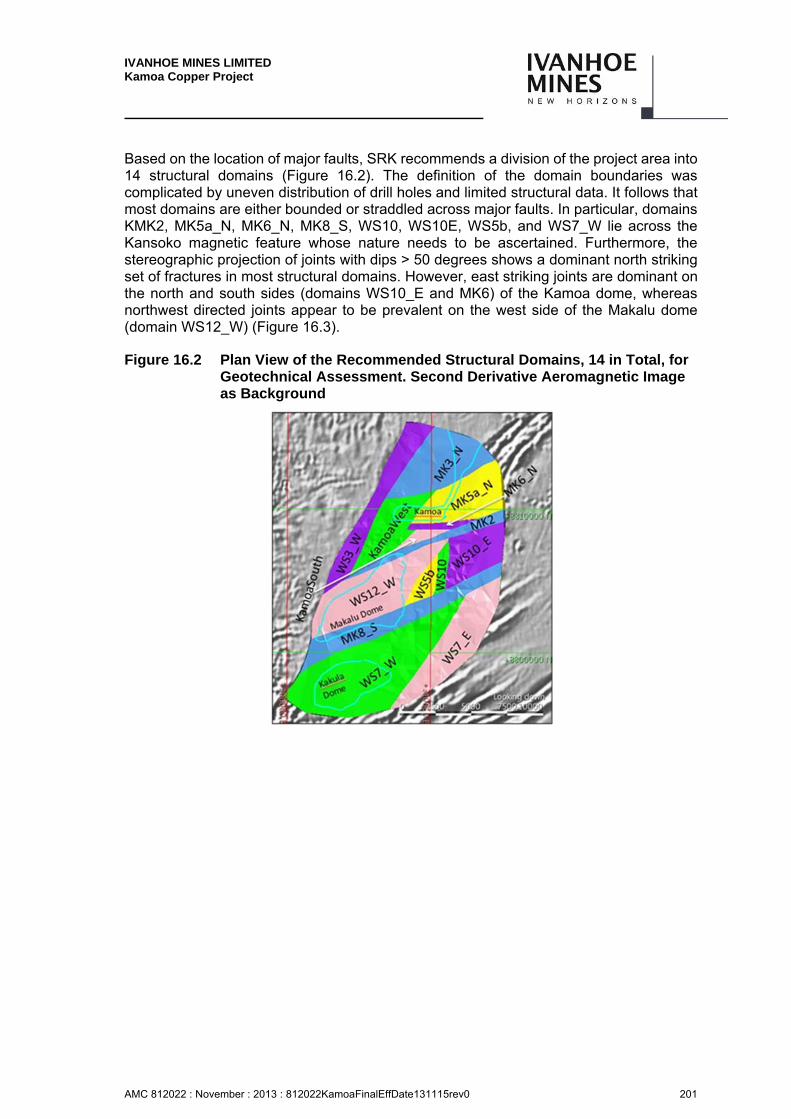
IVANHOE MINES LIMITED Kamoa Copper Project
AMC 812022 : November : 2013 : 812022KamoaFinalEffDate131115rev0 201
Based on the location of major faults, SRK recommends a division of the project area into 14 structural domains (Figure 16.2). The definition of the domain boundaries was complicated by uneven distribution of drill holes and limited structural data. It follows that most domains are either bounded or straddled across major faults. In particular, domains KMK2, MK5a_N, MK6_N, MK8_S, WS10, WS10E, WS5b, and WS7_W lie across the Kansoko magnetic feature whose nature needs to be ascertained. Furthermore, the stereographic projection of joints with dips > 50 degrees shows a dominant north striking set of fractures in most structural domains. However, east striking joints are dominant on the north and south sides (domains WS10_E and MK6) of the Kamoa dome, whereas northwest directed joints appear to be prevalent on the west side of the Makalu dome (domain WS12_W) (Figure 16.3).
Figure 16.2 Plan View of the Recommended Structural Domains, 14 in Total, for Geotechnical Assessment. Second Derivative Aeromagnetic Image as Background
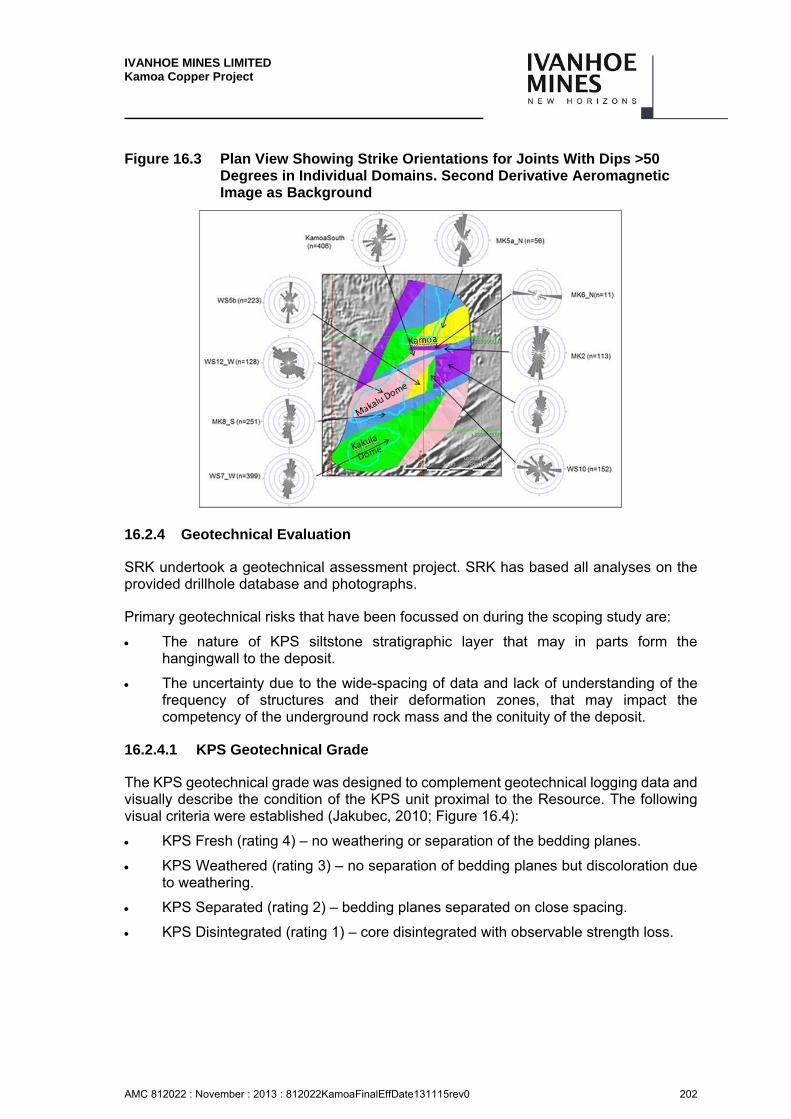
IVANHOE MINES LIMITED Kamoa Copper Project
AMC 812022 : November : 2013 : 812022KamoaFinalEffDate131115rev0 202
Figure 16.3 Plan View Showing Strike Orientations for Joints With Dips >50 Degrees in Individual Domains. Second Derivative Aeromagnetic Image as Background
16.2.4 Geotechnical Evaluation
SRK undertook a geotechnical assessment project. SRK has based all analyses on the provided drillhole database and photographs.
Primary geotechnical risks that have been focussed on during the scoping study are:
The nature of KPS siltstone stratigraphic layer that may in parts form the hangingwall to the deposit.
The uncertainty due to the wide-spacing of data and lack of understanding of the frequency of structures and their deformation zones, that may impact the competency of the underground rock mass and the conituity of the deposit.
16.2.4.1 KPS Geotechnical Grade
The KPS geotechnical grade was designed to complement geotechnical logging data and visually describe the condition of the KPS unit proximal to the Resource. The following visual criteria were established (Jakubec, 2010; Figure 16.4):
KPS Fresh (rating 4) – no weathering or separation of the bedding planes.
KPS Weathered (rating 3) – no separation of bedding planes but discoloration due to weathering.
KPS Separated (rating 2) – bedding planes separated on close spacing.
KPS Disintegrated (rating 1) – core disintegrated with observable strength loss.
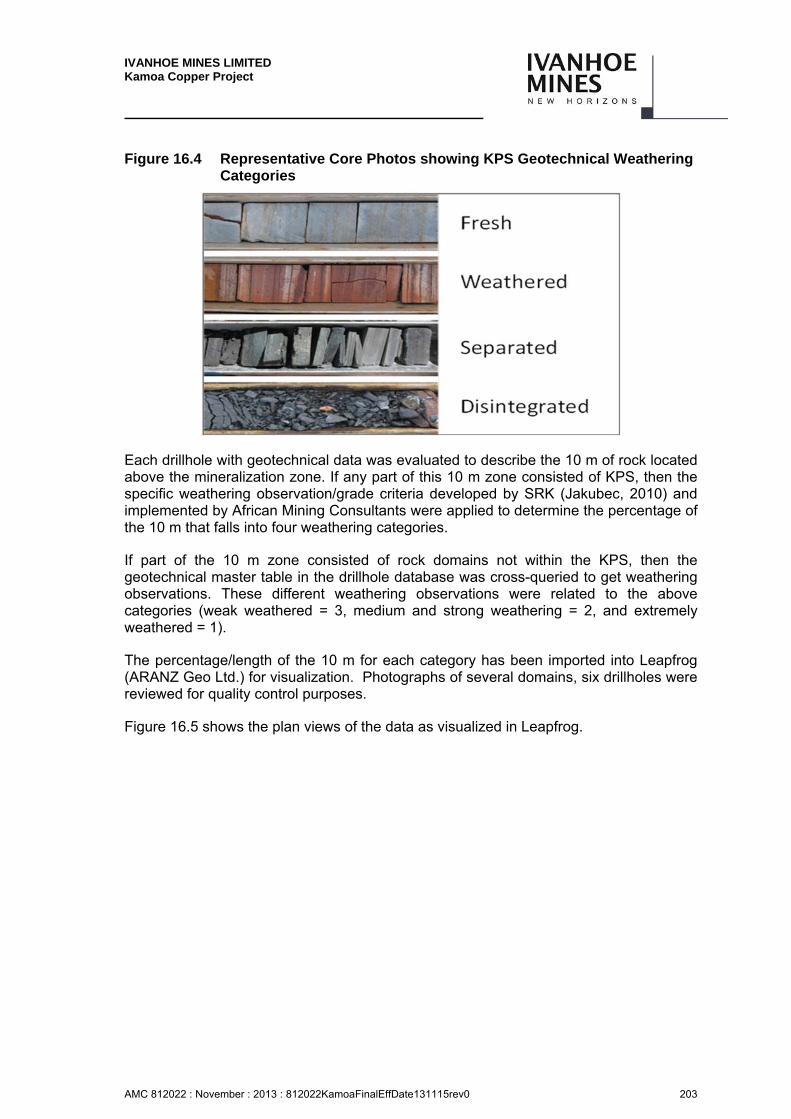
IVANHOE MINES LIMITED Kamoa Copper Project
AMC 812022 : November : 2013 : 812022KamoaFinalEffDate131115rev0 203
Figure 16.4 Representative Core Photos showing KPS Geotechnical Weathering Categories
Each drillhole with geotechnical data was evaluated to describe the 10 m of rock located above the mineralization zone. If any part of this 10 m zone consisted of KPS, then the specific weathering observation/grade criteria developed by SRK (Jakubec, 2010) and implemented by African Mining Consultants were applied to determine the percentage of the 10 m that falls into four weathering categories.
If part of the 10 m zone consisted of rock domains not within the KPS, then the geotechnical master table in the drillhole database was cross-queried to get weathering observations. These different weathering observations were related to the above categories (weak weathered = 3, medium and strong weathering = 2, and extremely weathered = 1).
The percentage/length of the 10 m for each category has been imported into Leapfrog (ARANZ Geo Ltd.) for visualization. Photographs of several domains, six drillholes were reviewed for quality control purposes.
Figure 16.5 shows the plan views of the data as visualized in Leapfrog.
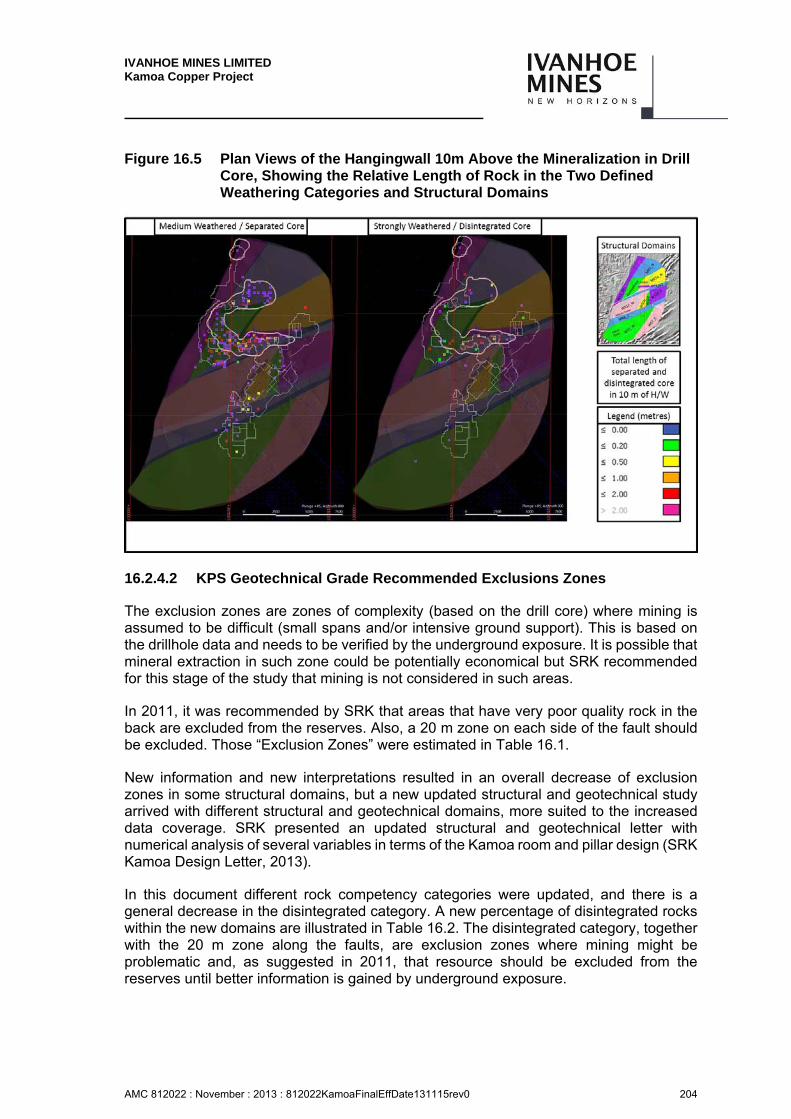
IVANHOE MINES LIMITED Kamoa Copper Project
AMC 812022 : November : 2013 : 812022KamoaFinalEffDate131115rev0 204
Figure 16.5 Plan Views of the Hangingwall 10m Above the Mineralization in Drill Core, Showing the Relative Length of Rock in the Two Defined Weathering Categories and Structural Domains
16.2.4.2 KPS Geotechnical Grade Recommended Exclusions Zones
The exclusion zones are zones of complexity (based on the drill core) where mining is assumed to be difficult (small spans and/or intensive ground support). This is based on the drillhole data and needs to be verified by the underground exposure. It is possible that mineral extraction in such zone could be potentially economical but SRK recommended for this stage of the study that mining is not considered in such areas.
In 2011, it was recommended by SRK that areas that have very poor quality rock in the back are excluded from the reserves. Also, a 20 m zone on each side of the fault should be excluded. Those “Exclusion Zones” were estimated in Table 16.1.
New information and new interpretations resulted in an overall decrease of exclusion zones in some structural domains, but a new updated structural and geotechnical study arrived with different structural and geotechnical domains, more suited to the increased data coverage. SRK presented an updated structural and geotechnical letter with numerical analysis of several variables in terms of the Kamoa room and pillar design (SRK Kamoa Design Letter, 2013).
In this document different rock competency categories were updated, and there is a general decrease in the disintegrated category. A new percentage of disintegrated rocks within the new domains are illustrated in Table 16.2. The disintegrated category, together with the 20 m zone along the faults, are exclusion zones where mining might be problematic and, as suggested in 2011, that resource should be excluded from the reserves until better information is gained by underground exposure.
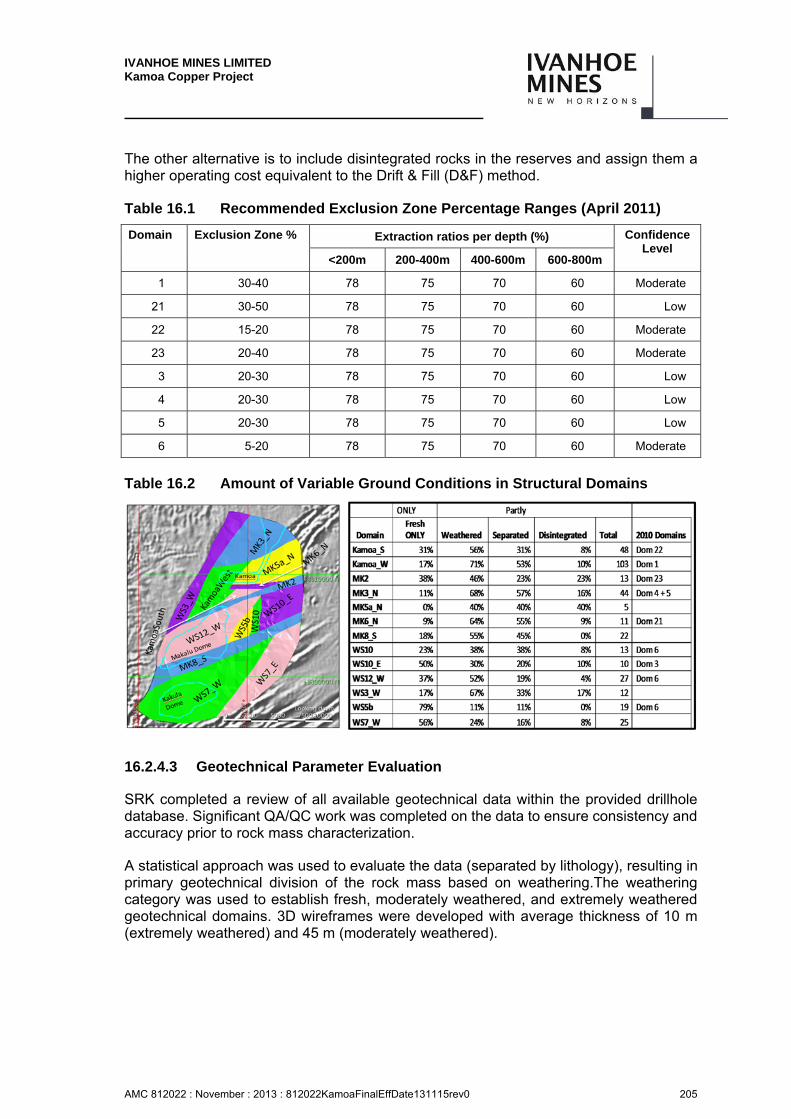
IVANHOE MINES LIMITED Kamoa Copper Project
AMC 812022 : November : 2013 : 812022KamoaFinalEffDate131115rev0 205
The other alternative is to include disintegrated rocks in the reserves and assign them a higher operating cost equivalent to the Drift & Fill (D&F) method.
Table 16.1 Recommended Exclusion Zone Percentage Ranges (April 2011)
Domain Exclusion Zone % Extraction ratios per depth (%) Confidence Level
<200m 200-400m 400-600m 600-800m
1 30-40 78 75 70 60 Moderate
21 30-50 78 75 70 60 Low
22 15-20 78 75 70 60 Moderate
23 20-40 78 75 70 60 Moderate
3 20-30 78 75 70 60 Low
4 20-30 78 75 70 60 Low
5 20-30 78 75 70 60 Low
6 5-20 78 75 70 60 Moderate
Table 16.2 Amount of Variable Ground Conditions in Structural Domains
16.2.4.3 Geotechnical Parameter Evaluation
SRK completed a review of all available geotechnical data within the provided drillhole database. Significant QA/QC work was completed on the data to ensure consistency and accuracy prior to rock mass characterization.
A statistical approach was used to evaluate the data (separated by lithology), resulting in primary geotechnical division of the rock mass based on weathering.The weathering category was used to establish fresh, moderately weathered, and extremely weathered geotechnical domains. 3D wireframes were developed with average thickness of 10 m (extremely weathered) and 45 m (moderately weathered).
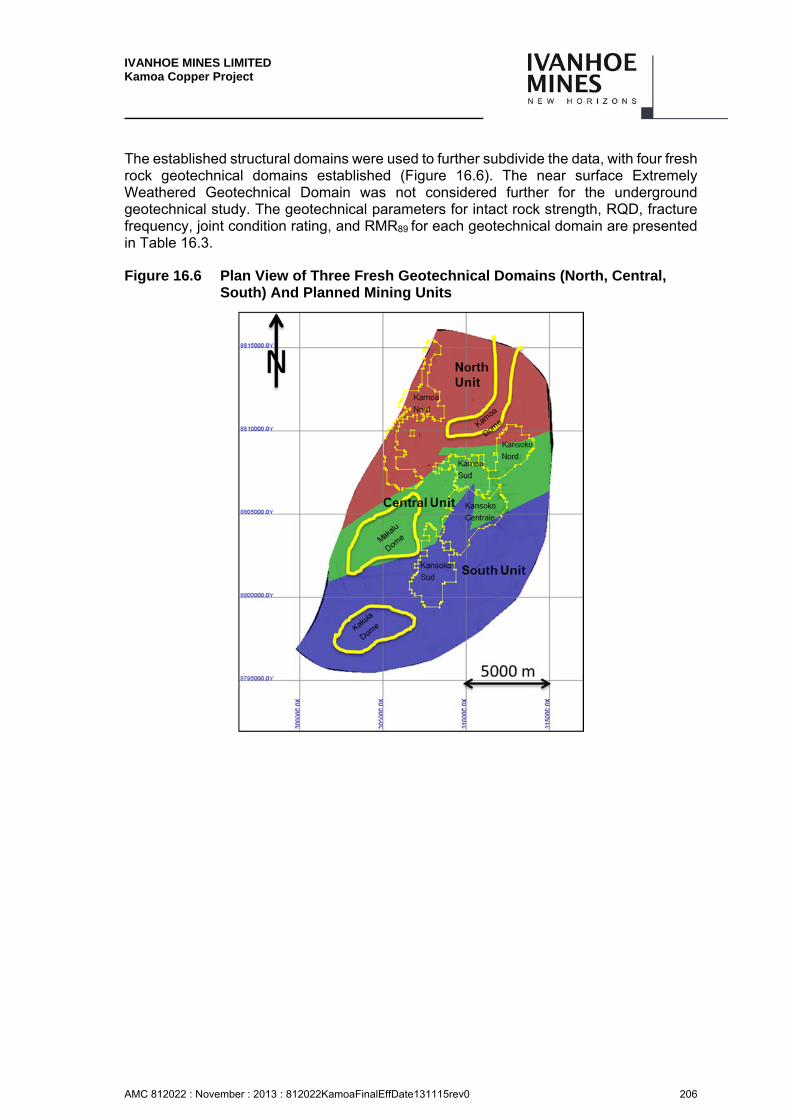
IVANHOE MINES LIMITED Kamoa Copper Project
AMC 812022 : November : 2013 : 812022KamoaFinalEffDate131115rev0 206
The established structural domains were used to further subdivide the data, with four fresh rock geotechnical domains established (Figure 16.6). The near surface Extremely Weathered Geotechnical Domain was not considered further for the underground geotechnical study. The geotechnical parameters for intact rock strength, RQD, fracture frequency, joint condition rating, and RMR89 for each geotechnical domain are presented in Table 16.3.
Figure 16.6 Plan View of Three Fresh Geotechnical Domains (North, Central, South) And Planned Mining Units
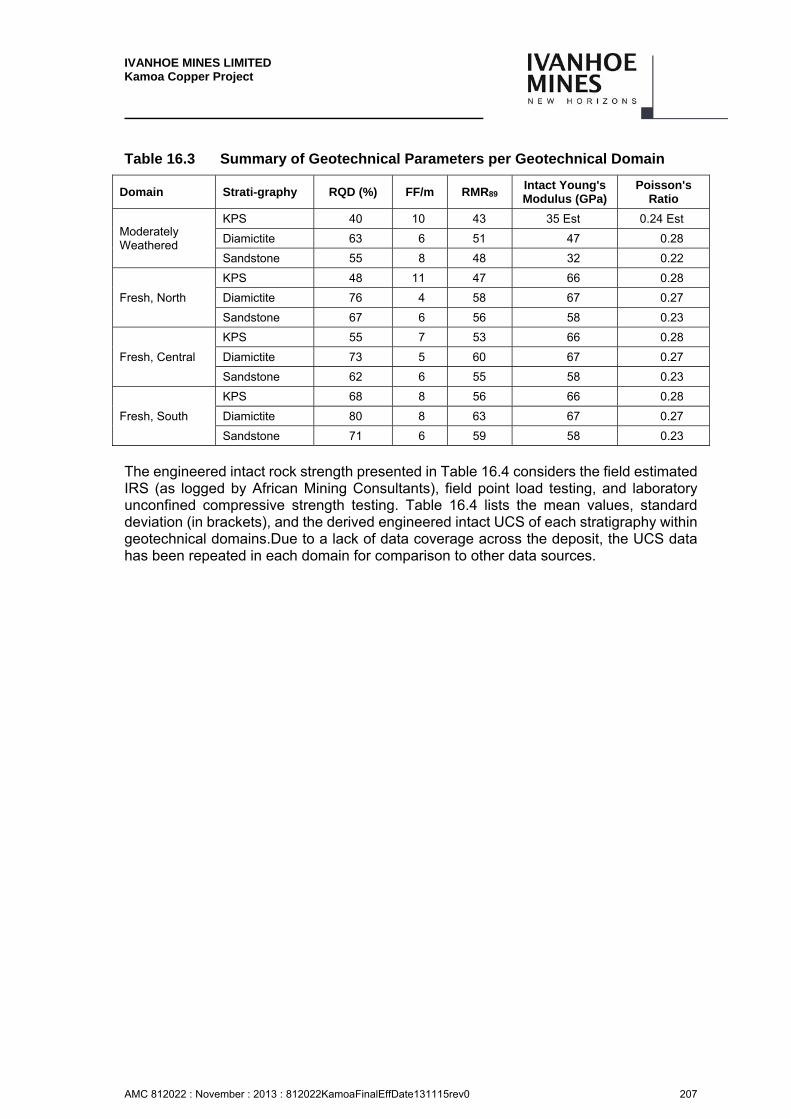
IVANHOE MINES LIMITED Kamoa Copper Project
AMC 812022 : November : 2013 : 812022KamoaFinalEffDate131115rev0 207
Table 16.3 Summary of Geotechnical Parameters per Geotechnical Domain
Domain Strati-graphy RQD (%) FF/m RMR89 Intact Young's Modulus (GPa)
Poisson's Ratio
Moderately Weathered
KPS 40 10 43 35 Est 0.24 Est
Diamictite 63 6 51 47 0.28
Sandstone 55 8 48 32 0.22
Fresh, North
KPS 48 11 47 66 0.28
Diamictite 76 4 58 67 0.27
Sandstone 67 6 56 58 0.23
Fresh, Central
KPS 55 7 53 66 0.28
Diamictite 73 5 60 67 0.27
Sandstone 62 6 55 58 0.23
Fresh, South
KPS 68 8 56 66 0.28
Diamictite 80 8 63 67 0.27
Sandstone 71 6 59 58 0.23
The engineered intact rock strength presented in Table 16.4 considers the field estimated IRS (as logged by African Mining Consultants), field point load testing, and laboratory unconfined compressive strength testing. Table 16.4 lists the mean values, standard deviation (in brackets), and the derived engineered intact UCS of each stratigraphy within geotechnical domains.Due to a lack of data coverage across the deposit, the UCS data has been repeated in each domain for comparison to other data sources.
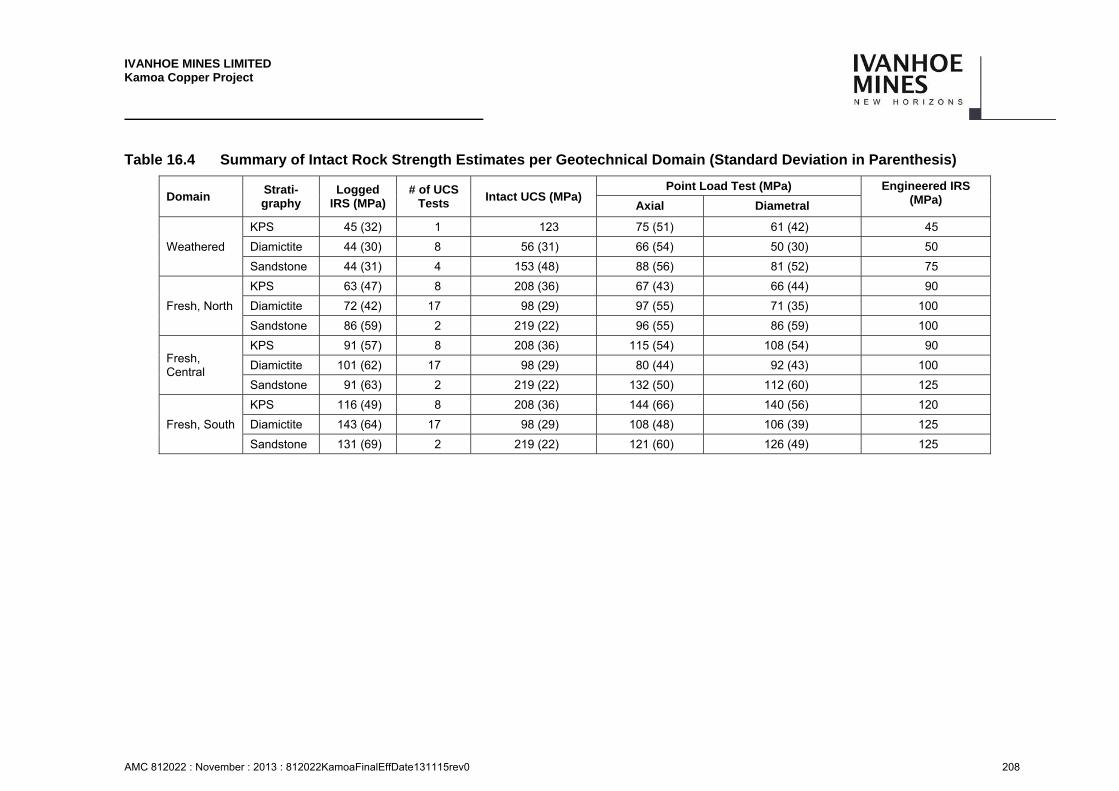
IVANHOE MINES LIMITED Kamoa Copper Project
AMC 812022 : November : 2013 : 812022KamoaFinalEffDate131115rev0 208
Table 16.4 Summary of Intact Rock Strength Estimates per Geotechnical Domain (Standard Deviation in Parenthesis)
Domain Strati-graphy
Logged IRS (MPa)
# of UCS Tests
Intact UCS (MPa) Point Load Test (MPa) Engineered IRS
(MPa) Axial Diametral
Weathered
KPS 45 (32) 1 123 75 (51) 61 (42) 45
Diamictite 44 (30) 8 56 (31) 66 (54) 50 (30) 50
Sandstone 44 (31) 4 153 (48) 88 (56) 81 (52) 75
Fresh, North
KPS 63 (47) 8 208 (36) 67 (43) 66 (44) 90
Diamictite 72 (42) 17 98 (29) 97 (55) 71 (35) 100
Sandstone 86 (59) 2 219 (22) 96 (55) 86 (59) 100
Fresh, Central
KPS 91 (57) 8 208 (36) 115 (54) 108 (54) 90
Diamictite 101 (62) 17 98 (29) 80 (44) 92 (43) 100
Sandstone 91 (63) 2 219 (22) 132 (50) 112 (60) 125
Fresh, South
KPS 116 (49) 8 208 (36) 144 (66) 140 (56) 120
Diamictite 143 (64) 17 98 (29) 108 (48) 106 (39) 125
Sandstone 131 (69) 2 219 (22) 121 (60) 126 (49) 125

IVANHOE MINES LIMITED Kamoa Copper Project
AMC 812022 : November : 2013 : 812022KamoaFinalEffDate131115rev0 209
16.2.5 Mining Design Factors
16.2.5.1 Factor of Safety and Pillar Design
SRK recommends that in this stage of the knowledge and uncertainty about the geological and geotechnical nature of the deposit, that a Factor of Safety (FoS) to be used should be in the range of 1.4 – 1.6 to ensure stable pillars. SRK also recommend to use pillar width/height ratio equal or higher than 1.5.
16.2.5.2 Panels and Boundary Pillars
For practical mining purposes, and in order to achieve higher extraction ratios and contain any potential pillar instability (pillar run), SRK recommends adopting the panel and boundary pillar mining concept. With numerical modelling completed on the Kansoko mining area, SRK have demonstrated the impact of variable mining panel widths and variable width of the boundary pillars.
The panel width and the size of the boundary pillar are based primarily on the mine operational requirements (material handling, ventilation etc.). Once SRK have the preferred geometry from an operational point of view, SRK will analyze the closest design from the stability point of view for the selected FoS.
16.2.5.3 Ground Support
In 2011 the following ground support was recommended:
“The ground support criteria utilized for all development includes threaded rebar and wire mesh with a bolt spacing of 1.5 m. Cable bolts are provided at all intersections where the LHDs load into the feeder-breaker. The ground support design package is at a conceptual level and generalized to meet the minimum support requirements.”
SRK recommends keeping the same ground support. The length of the bolts should be 3 m.
IVANHOE MINES LIMITED Kamoa Copper Project
AMC 812022 : November : 2013 : 812022KamoaFinalEffDate131115rev0 210
Underground Mining
The PEA Inventory was determined for Kamoa by adjusting the US$52/t NSR mineral resource for mining thickness, recovery, and dilution using the assumptions of the 2013 PEA mine plan. The PEA inventory was based on a Datamine block model developed for the December 2012 Mineral Resource estimate. These resources include the hypogene mineralization as well as the supergene mineralization in the Kamoa resource area. Using the Vulcan Envisage three-dimensional (3D) underground design software package, blocks within the mineral resource were then identified for inclusion in the mine plan. The PEA Inventory is a subset of the Mineral Resource reported in the Kamoa 2013 PEA. The PEA Inventory includes Inferred Mineral Resources. Inferred Mineral Resources are considered too speculative geologically to have the economic considerations applied to them that would allow them to be categorized as Mineral Reserves, and there is no certainty that the results will be realized. Mineral Resources are not Mineral Reserves, as they do not have demonstrated economic viability.
The part of the PEA Inventory that has been used in the production schedule is 326 Mt at 3.00 %Cu and is scheduled over a period of 30 years, producing 7.8 Mt of blister copper (in addition to 520 kt of copper in concentrate, in the initial concentrate phase).
Apart from total Cu grade, other variables recorded in the block model include the thickness of the mineralization zone (thick) and the depth below surface (dist2surf). A minimum mining thickness of 3.5 meters was used for this study. Any blocks less than 3.5 meters thick were diluted to 3.5 meters using the average grade of the adjacent hanging wall and footwall blocks. Appropriate mining recovery and dilution factors were then used to generate the block values discussed in the following paragraph.
The low dip and the flat structure of the resource make it conducive to room-and-pillar mining in the shallow portions of the deposit, transitioning to drift-and-fill mining in the deeper sections. Room-and-pillar panels are designed to be 80 meters wide and 500 meters long with in-panel extraction ratios ranging from 60%–80%, depending on the panel depth below surface. Partial extraction of the barrier pillars (up to 50%) is planned at the end of mining of each section. The overall extraction ratio in the room-and-pillar areas is expected to be between 56%–82% depending on the depth below surface. Higher in-panel extraction ratios (up to 95%) are expected within the drift-and-fill areas with an overall extraction ratio of 85% after partial extraction of barrier pillars.
The average unplanned mining dilution was estimated at approximately 10% at a grade of 0.60% Cu. This is the average grade of a 0.5 meter dilution envelope immediately above and below the primary mineralized zone. The dilution values will depend on mineralization continuity and hangingwall (HW) stability, both of which need to be confirmed by the underground exposure. If HW stability is worse than currently anticipated, for example due to fracturing and joint continuity, the dilution value will be higher. The mineral resources at US$52/t shown by mining section are in Table 16.5.
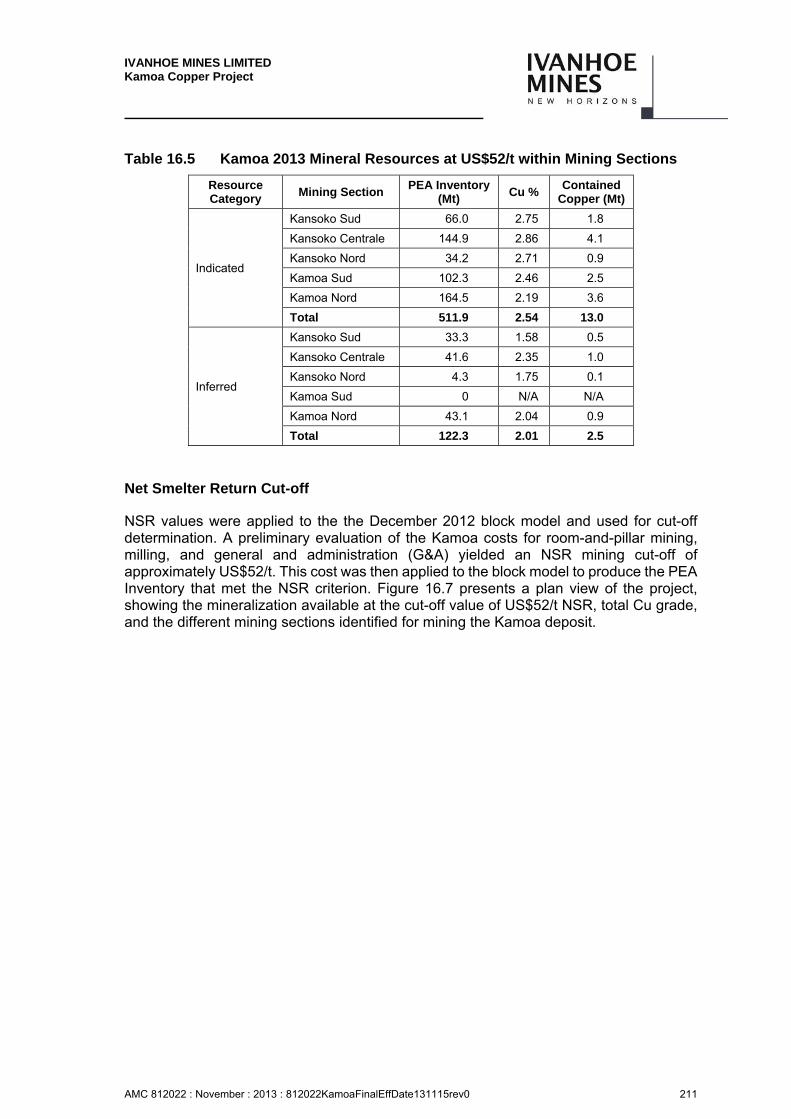
IVANHOE MINES LIMITED Kamoa Copper Project
AMC 812022 : November : 2013 : 812022KamoaFinalEffDate131115rev0 211
Table 16.5 Kamoa 2013 Mineral Resources at US$52/t within Mining Sections
Resource Category
Mining Section PEA Inventory
(Mt) Cu %
Contained Copper (Mt)
Indicated
Kansoko Sud 66.0 2.75 1.8
Kansoko Centrale 144.9 2.86 4.1
Kansoko Nord 34.2 2.71 0.9
Kamoa Sud 102.3 2.46 2.5
Kamoa Nord 164.5 2.19 3.6
Total 511.9 2.54 13.0
Inferred
Kansoko Sud 33.3 1.58 0.5
Kansoko Centrale 41.6 2.35 1.0
Kansoko Nord 4.3 1.75 0.1
Kamoa Sud 0 N/A N/A
Kamoa Nord 43.1 2.04 0.9
Total 122.3 2.01 2.5
Net Smelter Return Cut-off
NSR values were applied to the the December 2012 block model and used for cut-off determination. A preliminary evaluation of the Kamoa costs for room-and-pillar mining, milling, and general and administration (G&A) yielded an NSR mining cut-off of approximately US$52/t. This cost was then applied to the block model to produce the PEA Inventory that met the NSR criterion. Figure 16.7 presents a plan view of the project, showing the mineralization available at the cut-off value of US$52/t NSR, total Cu grade, and the different mining sections identified for mining the Kamoa deposit.
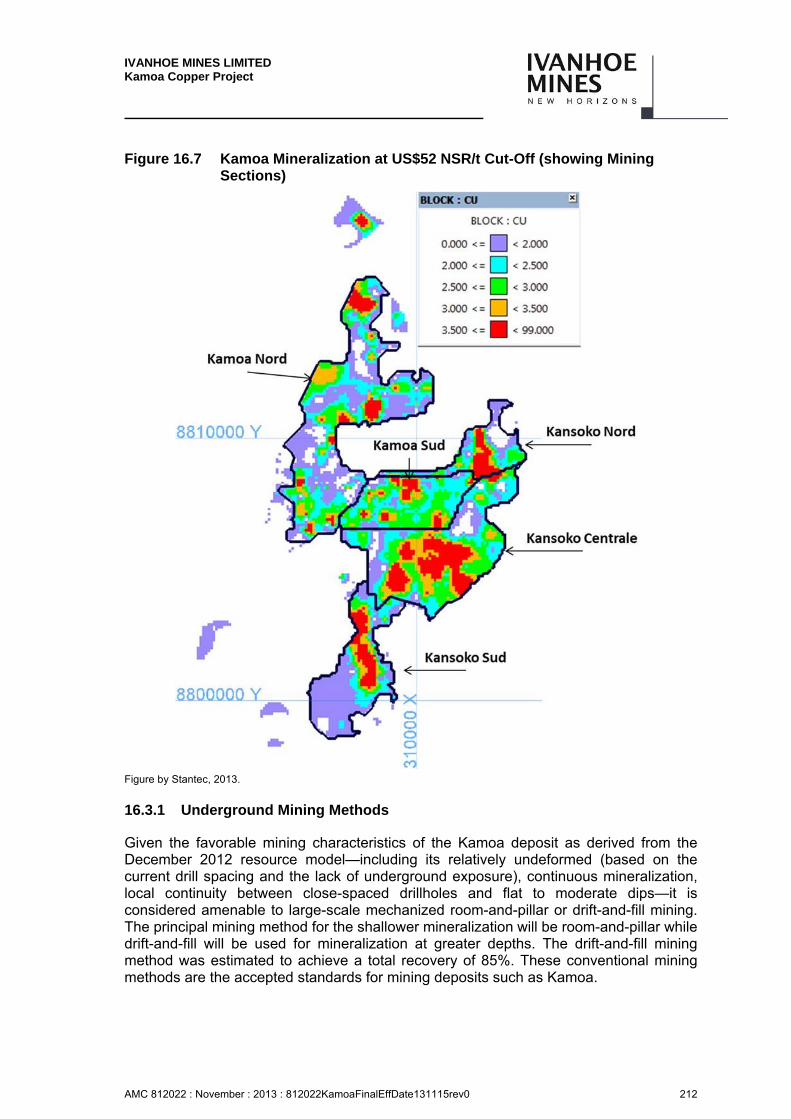
IVANHOE MINES LIMITED Kamoa Copper Project
AMC 812022 : November : 2013 : 812022KamoaFinalEffDate131115rev0 212
Figure 16.7 Kamoa Mineralization at US$52 NSR/t Cut-Off (showing Mining Sections)
Figure by Stantec, 2013.
16.3.1 Underground Mining Methods
Given the favorable mining characteristics of the Kamoa deposit as derived from the December 2012 resource model—including its relatively undeformed (based on the current drill spacing and the lack of underground exposure), continuous mineralization, local continuity between close-spaced drillholes and flat to moderate dips—it is considered amenable to large-scale mechanized room-and-pillar or drift-and-fill mining. The principal mining method for the shallower mineralization will be room-and-pillar while drift-and-fill will be used for mineralization at greater depths. The drift-and-fill mining method was estimated to achieve a total recovery of 85%. These conventional mining methods are the accepted standards for mining deposits such as Kamoa.
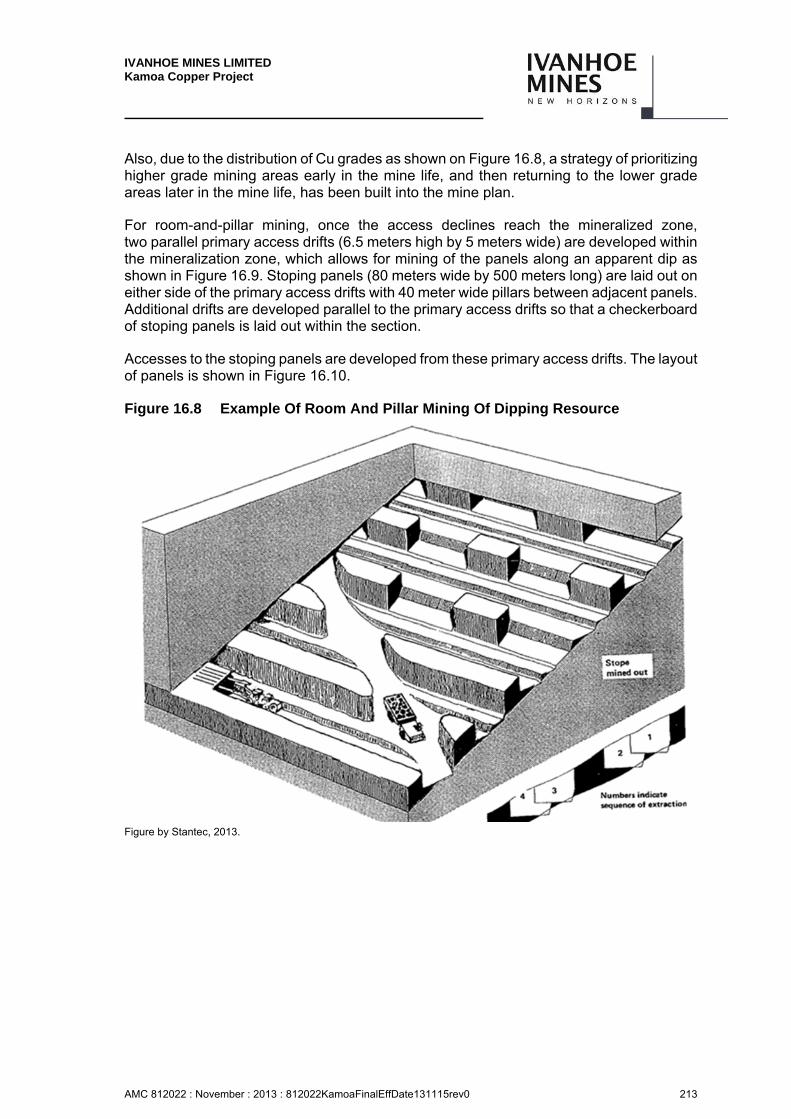
IVANHOE MINES LIMITED Kamoa Copper Project
AMC 812022 : November : 2013 : 812022KamoaFinalEffDate131115rev0 213
Also, due to the distribution of Cu grades as shown on Figure 16.8, a strategy of prioritizing higher grade mining areas early in the mine life, and then returning to the lower grade areas later in the mine life, has been built into the mine plan.
For room-and-pillar mining, once the access declines reach the mineralized zone, two parallel primary access drifts (6.5 meters high by 5 meters wide) are developed within the mineralization zone, which allows for mining of the panels along an apparent dip as shown in Figure 16.9. Stoping panels (80 meters wide by 500 meters long) are laid out on either side of the primary access drifts with 40 meter wide pillars between adjacent panels. Additional drifts are developed parallel to the primary access drifts so that a checkerboard of stoping panels is laid out within the section.
Accesses to the stoping panels are developed from these primary access drifts. The layout of panels is shown in Figure 16.10.
Figure 16.8 Example Of Room And Pillar Mining Of Dipping Resource
Figure by Stantec, 2013.
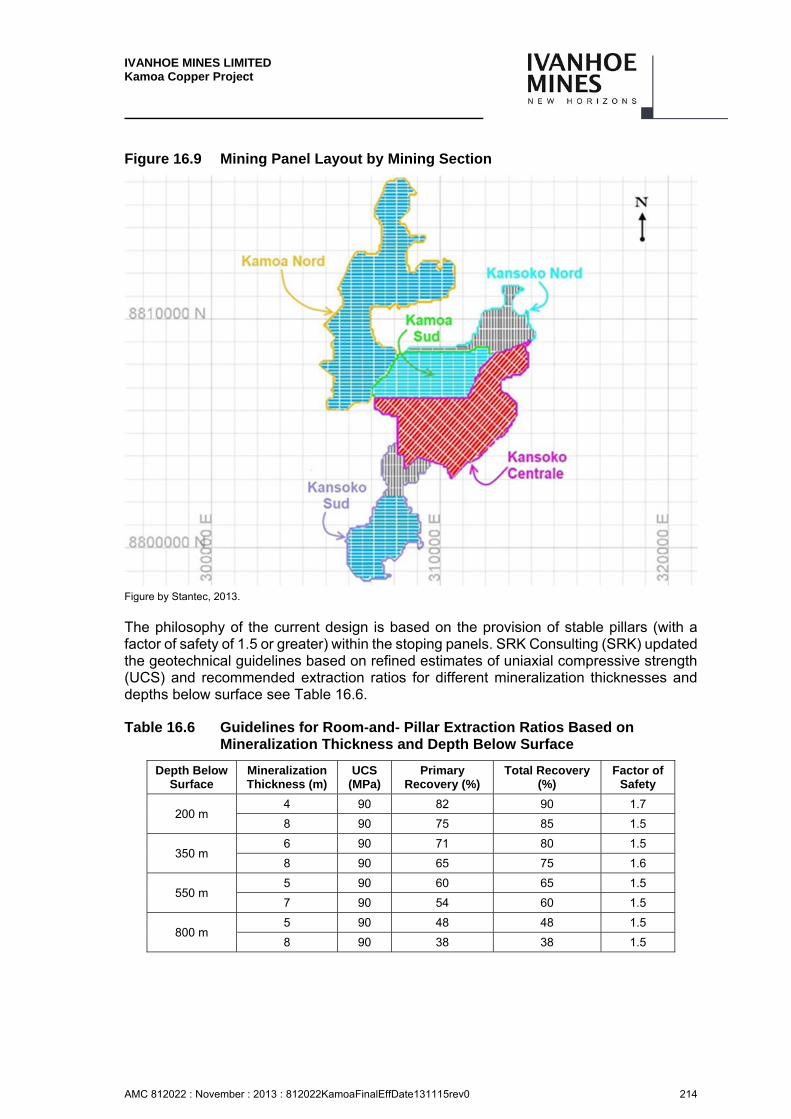
IVANHOE MINES LIMITED Kamoa Copper Project
AMC 812022 : November : 2013 : 812022KamoaFinalEffDate131115rev0 214
Figure 16.9 Mining Panel Layout by Mining Section
Figure by Stantec, 2013.
The philosophy of the current design is based on the provision of stable pillars (with a factor of safety of 1.5 or greater) within the stoping panels. SRK Consulting (SRK) updated the geotechnical guidelines based on refined estimates of uniaxial compressive strength (UCS) and recommended extraction ratios for different mineralization thicknesses and depths below surface see Table 16.6.
Table 16.6 Guidelines for Room-and- Pillar Extraction Ratios Based on Mineralization Thickness and Depth Below Surface
Depth Below Surface
Mineralization Thickness (m)
UCS (MPa)
Primary Recovery (%)
Total Recovery (%)
Factor of Safety
200 m 4 90 82 90 1.7
8 90 75 85 1.5
350 m 6 90 71 80 1.5
8 90 65 75 1.6
550 m 5 90 60 65 1.5
7 90 54 60 1.5
800 m 5 90 48 48 1.5
8 90 38 38 1.5
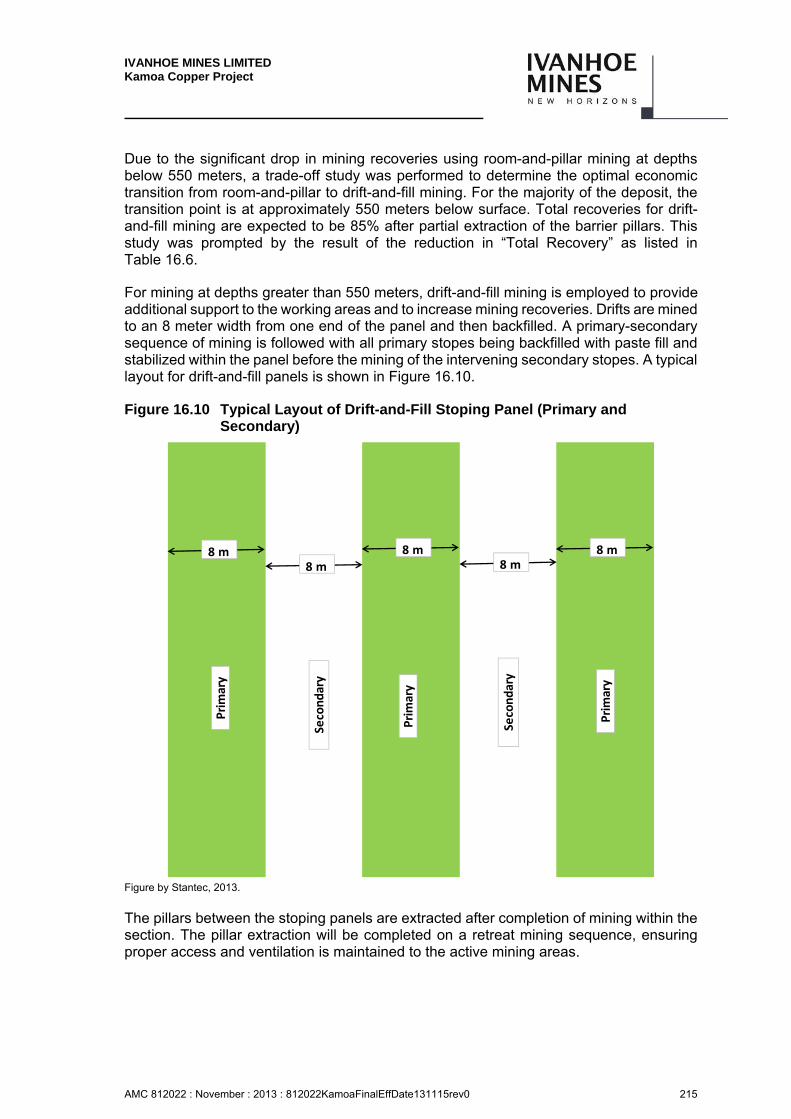
IVANHOE MINES LIMITED Kamoa Copper Project
AMC 812022 : November : 2013 : 812022KamoaFinalEffDate131115rev0 215
Due to the significant drop in mining recoveries using room-and-pillar mining at depths below 550 meters, a trade-off study was performed to determine the optimal economic transition from room-and-pillar to drift-and-fill mining. For the majority of the deposit, the transition point is at approximately 550 meters below surface. Total recoveries for drift-and-fill mining are expected to be 85% after partial extraction of the barrier pillars. This study was prompted by the result of the reduction in “Total Recovery” as listed in Table 16.6.
For mining at depths greater than 550 meters, drift-and-fill mining is employed to provide additional support to the working areas and to increase mining recoveries. Drifts are mined to an 8 meter width from one end of the panel and then backfilled. A primary-secondary sequence of mining is followed with all primary stopes being backfilled with paste fill and stabilized within the panel before the mining of the intervening secondary stopes. A typical layout for drift-and-fill panels is shown in Figure 16.10.
Figure 16.10 Typical Layout of Drift-and-Fill Stoping Panel (Primary and Secondary)
Figure by Stantec, 2013.
The pillars between the stoping panels are extracted after completion of mining within the section. The pillar extraction will be completed on a retreat mining sequence, ensuring proper access and ventilation is maintained to the active mining areas.
8 m8 m
8 m8 m
8 m
Primary
Secondary
Primary
Secondary
Primary

IVANHOE MINES LIMITED Kamoa Copper Project
AMC 812022 : November : 2013 : 812022KamoaFinalEffDate131115rev0 216
SRK has provided geotechnical parameters for the design of the underground openings. The geotechnical information is utilized for determining space, appropriate mining methods, and the dimensions for the drifts and pillars as shown in Table 16.7. The parameters are preliminary and are applicable only in areas of competent ground. Since the overall characterization of the structural integrity of the deposit is in question, the current rock mass assumptions regarding pillar and hanging wall stability have to be confirmed by the underground exposures. Likewise, the design spans for both room-and-pillar and drift-and-fill have to be confirmed by further numerical modelling analyses. These design criteria were used to develop room-and-pillar sizes within the stoping panels as shown in Table 16.7. The layout within a room-and-pillar stoping panel for depth less than 350 meters is presented in Figure 16.11 and the layout for a panel for depths between 350–800 meters is shown in Figure 16.12.
Table 16.7 Room-and-Pillar Sizes Within Stoping Panels
Depth Below Surface
Mineralization Thickness (meters)
Room Width (meters)
Pillar Width (meters)
<350 meters 6 10 8
8 10 10
350-800 meters 5 8 12
7 8 14
Drift-and-Fill 5 8 8
8 8 8
Figure 16.11 Typical Plan Layout of Room-and-Pillar Stoping Panel (for depth
less than 350 meters)
Figure by Stantec, 2013.
(a) Mineralization thickness <= 6 m (b) Mineralization thickness > 6 m
8 m10 m
8 m
8 m10 m
8 m
10 m
10 m10 m
10 m
10 m10 m 10 m
10 m
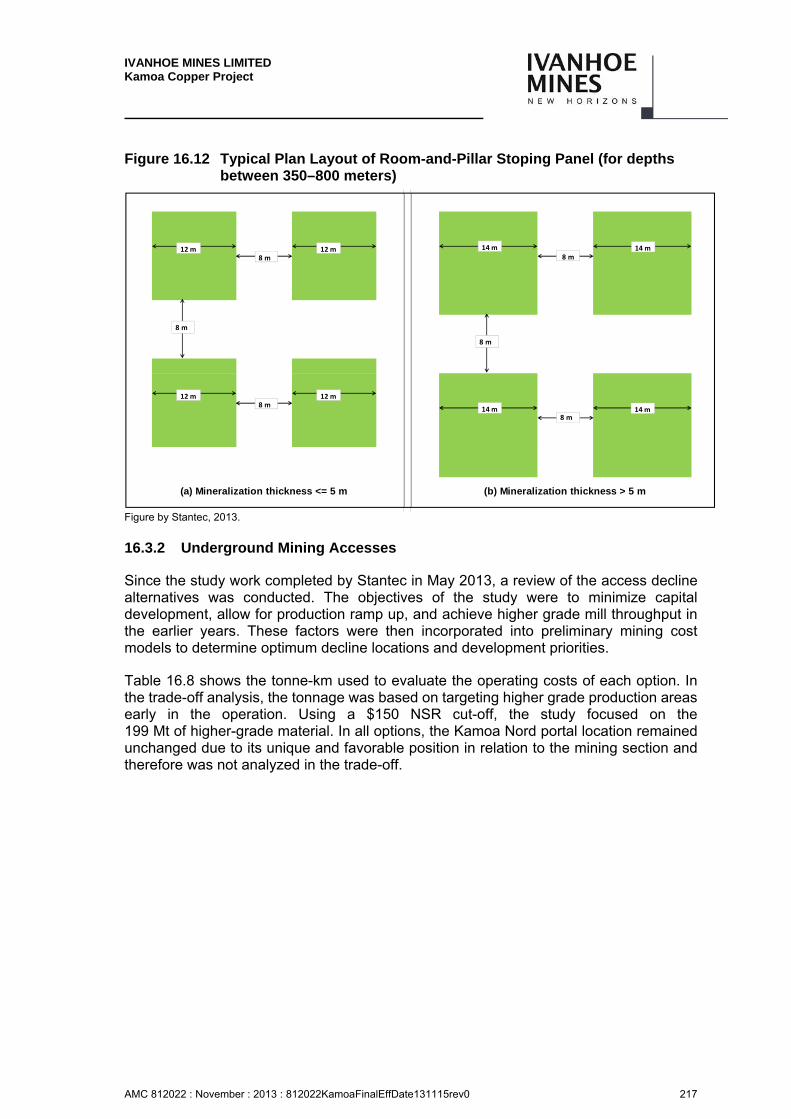
IVANHOE MINES LIMITED Kamoa Copper Project
AMC 812022 : November : 2013 : 812022KamoaFinalEffDate131115rev0 217
Figure 16.12 Typical Plan Layout of Room-and-Pillar Stoping Panel (for depths between 350–800 meters)
Figure by Stantec, 2013.
16.3.2 Underground Mining Accesses
Since the study work completed by Stantec in May 2013, a review of the access decline alternatives was conducted. The objectives of the study were to minimize capital development, allow for production ramp up, and achieve higher grade mill throughput in the earlier years. These factors were then incorporated into preliminary mining cost models to determine optimum decline locations and development priorities.
Table 16.8 shows the tonne-km used to evaluate the operating costs of each option. In the trade-off analysis, the tonnage was based on targeting higher grade production areas early in the operation. Using a $150 NSR cut-off, the study focused on the 199 Mt of higher-grade material. In all options, the Kamoa Nord portal location remained unchanged due to its unique and favorable position in relation to the mining section and therefore was not analyzed in the trade-off.
(a) Mineralization thickness <= 5 m (b) Mineralization thickness > 5 m
12 m8 m
8 m
12 m
12 m8 m
12 m
14 m8 m
14 m
14 m8 m
14 m
8 m
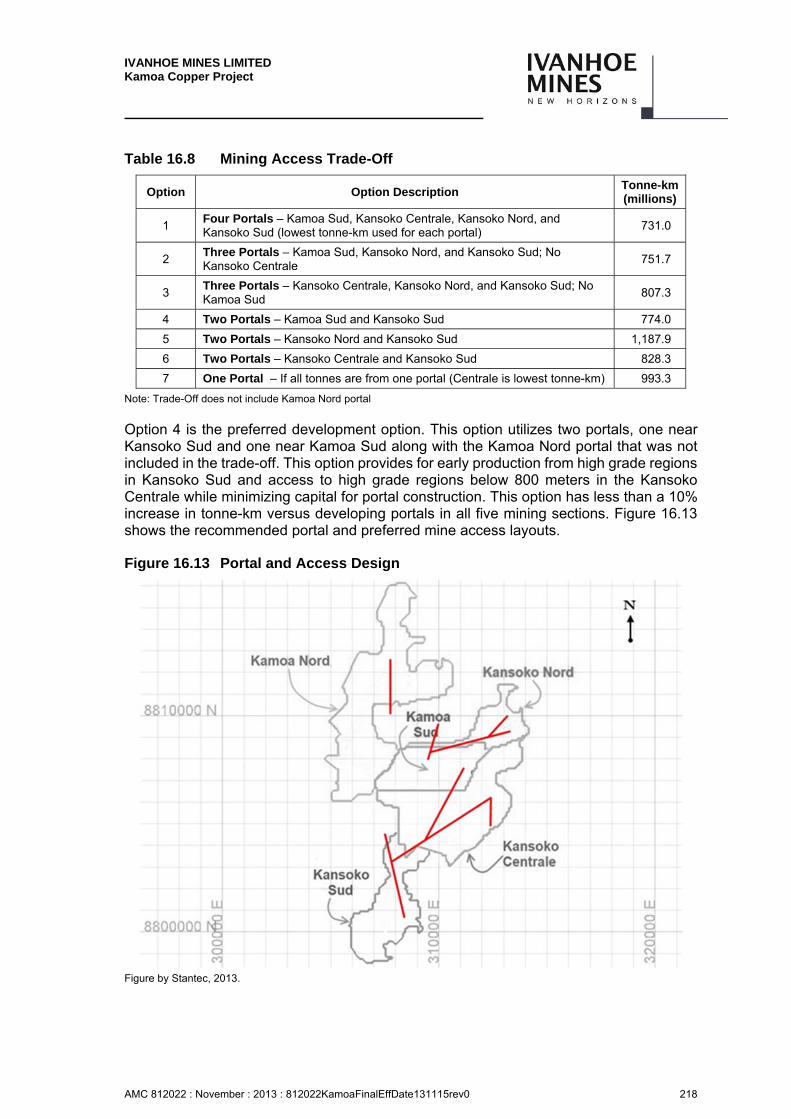
IVANHOE MINES LIMITED Kamoa Copper Project
AMC 812022 : November : 2013 : 812022KamoaFinalEffDate131115rev0 218
Table 16.8 Mining Access Trade-Off
Option Option Description Tonne-km (millions)
1 Four Portals – Kamoa Sud, Kansoko Centrale, Kansoko Nord, and Kansoko Sud (lowest tonne-km used for each portal)
731.0
2 Three Portals – Kamoa Sud, Kansoko Nord, and Kansoko Sud; No Kansoko Centrale
751.7
3 Three Portals – Kansoko Centrale, Kansoko Nord, and Kansoko Sud; No Kamoa Sud
807.3
4 Two Portals – Kamoa Sud and Kansoko Sud 774.0
5 Two Portals – Kansoko Nord and Kansoko Sud 1,187.9
6 Two Portals – Kansoko Centrale and Kansoko Sud 828.3
7 One Portal – If all tonnes are from one portal (Centrale is lowest tonne-km) 993.3
Note: Trade-Off does not include Kamoa Nord portal
Option 4 is the preferred development option. This option utilizes two portals, one near Kansoko Sud and one near Kamoa Sud along with the Kamoa Nord portal that was not included in the trade-off. This option provides for early production from high grade regions in Kansoko Sud and access to high grade regions below 800 meters in the Kansoko Centrale while minimizing capital for portal construction. This option has less than a 10% increase in tonne-km versus developing portals in all five mining sections. Figure 16.13 shows the recommended portal and preferred mine access layouts.
Figure 16.13 Portal and Access Design
Figure by Stantec, 2013.
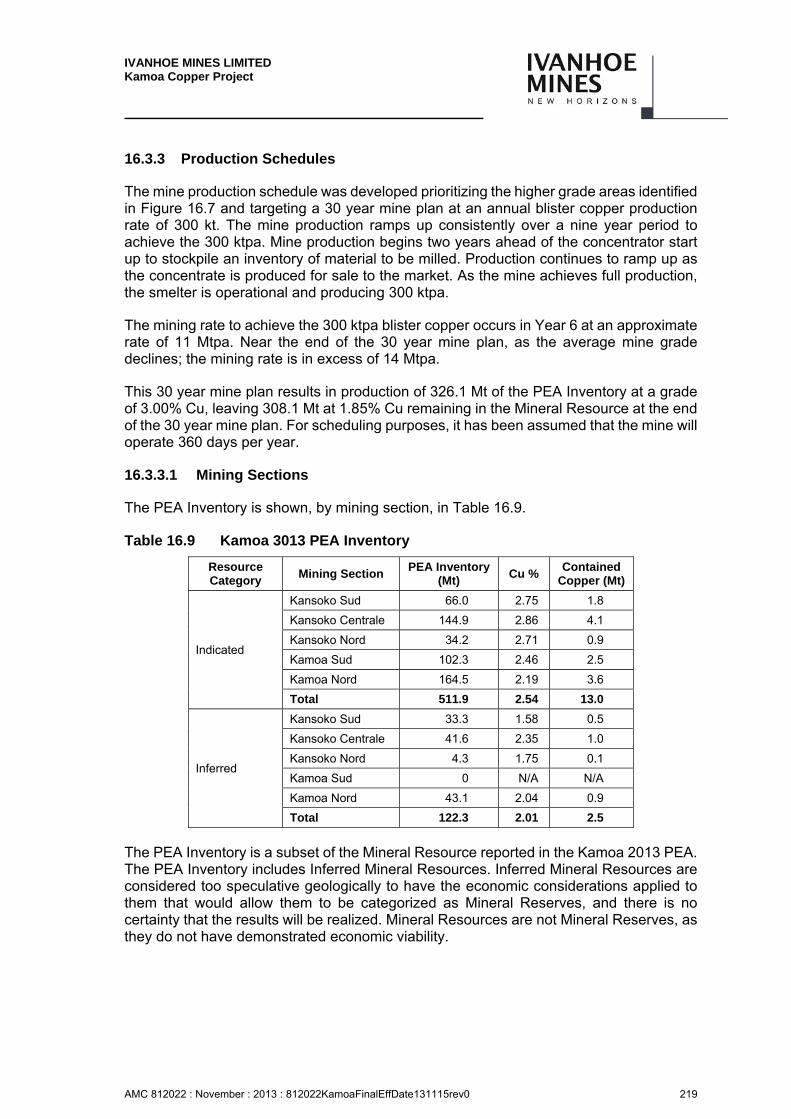
IVANHOE MINES LIMITED Kamoa Copper Project
AMC 812022 : November : 2013 : 812022KamoaFinalEffDate131115rev0 219
16.3.3 Production Schedules
The mine production schedule was developed prioritizing the higher grade areas identified in Figure 16.7 and targeting a 30 year mine plan at an annual blister copper production rate of 300 kt. The mine production ramps up consistently over a nine year period to achieve the 300 ktpa. Mine production begins two years ahead of the concentrator start up to stockpile an inventory of material to be milled. Production continues to ramp up as the concentrate is produced for sale to the market. As the mine achieves full production, the smelter is operational and producing 300 ktpa.
The mining rate to achieve the 300 ktpa blister copper occurs in Year 6 at an approximate rate of 11 Mtpa. Near the end of the 30 year mine plan, as the average mine grade declines; the mining rate is in excess of 14 Mtpa.
This 30 year mine plan results in production of 326.1 Mt of the PEA Inventory at a grade of 3.00% Cu, leaving 308.1 Mt at 1.85% Cu remaining in the Mineral Resource at the end of the 30 year mine plan. For scheduling purposes, it has been assumed that the mine will operate 360 days per year.
16.3.3.1 Mining Sections
The PEA Inventory is shown, by mining section, in Table 16.9.
Table 16.9 Kamoa 3013 PEA Inventory
Resource Category
Mining Section PEA Inventory
(Mt) Cu %
Contained Copper (Mt)
Indicated
Kansoko Sud 66.0 2.75 1.8
Kansoko Centrale 144.9 2.86 4.1
Kansoko Nord 34.2 2.71 0.9
Kamoa Sud 102.3 2.46 2.5
Kamoa Nord 164.5 2.19 3.6
Total 511.9 2.54 13.0
Inferred
Kansoko Sud 33.3 1.58 0.5
Kansoko Centrale 41.6 2.35 1.0
Kansoko Nord 4.3 1.75 0.1
Kamoa Sud 0 N/A N/A
Kamoa Nord 43.1 2.04 0.9
Total 122.3 2.01 2.5
The PEA Inventory is a subset of the Mineral Resource reported in the Kamoa 2013 PEA. The PEA Inventory includes Inferred Mineral Resources. Inferred Mineral Resources are considered too speculative geologically to have the economic considerations applied to them that would allow them to be categorized as Mineral Reserves, and there is no certainty that the results will be realized. Mineral Resources are not Mineral Reserves, as they do not have demonstrated economic viability.
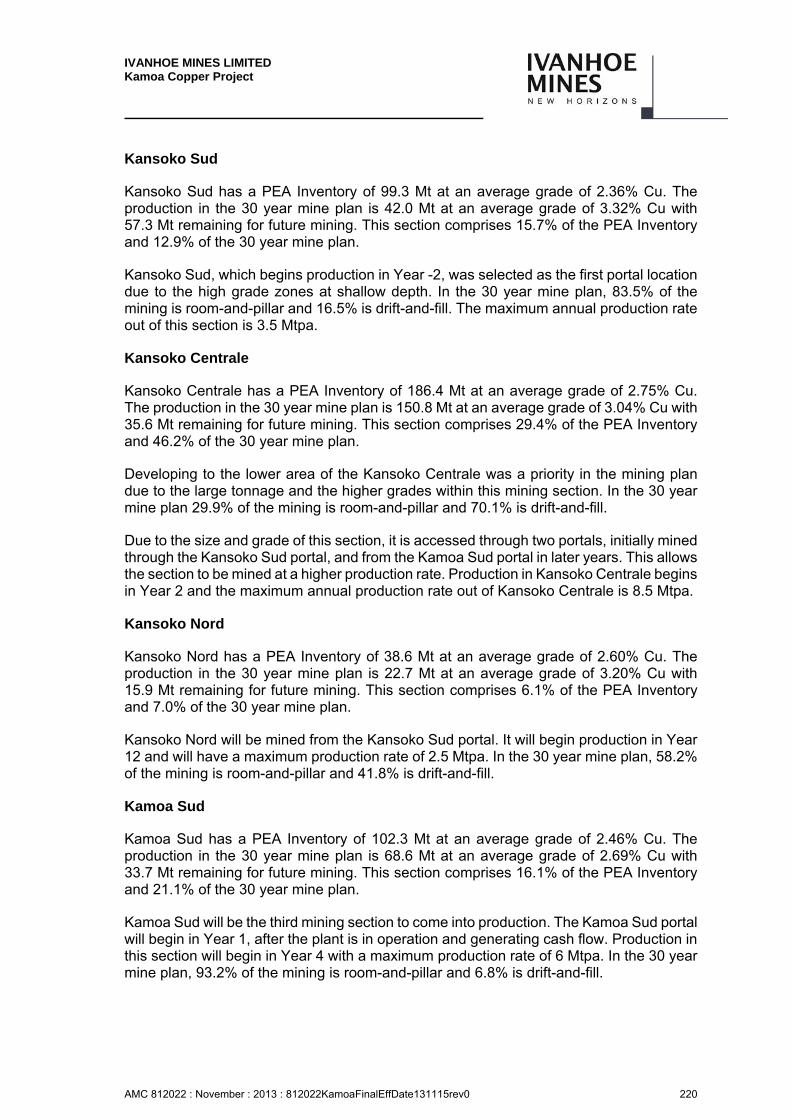
IVANHOE MINES LIMITED Kamoa Copper Project
AMC 812022 : November : 2013 : 812022KamoaFinalEffDate131115rev0 220
Kansoko Sud
Kansoko Sud has a PEA Inventory of 99.3 Mt at an average grade of 2.36% Cu. The production in the 30 year mine plan is 42.0 Mt at an average grade of 3.32% Cu with 57.3 Mt remaining for future mining. This section comprises 15.7% of the PEA Inventory and 12.9% of the 30 year mine plan.
Kansoko Sud, which begins production in Year -2, was selected as the first portal location due to the high grade zones at shallow depth. In the 30 year mine plan, 83.5% of the mining is room-and-pillar and 16.5% is drift-and-fill. The maximum annual production rate out of this section is 3.5 Mtpa.
Kansoko Centrale
Kansoko Centrale has a PEA Inventory of 186.4 Mt at an average grade of 2.75% Cu. The production in the 30 year mine plan is 150.8 Mt at an average grade of 3.04% Cu with 35.6 Mt remaining for future mining. This section comprises 29.4% of the PEA Inventory and 46.2% of the 30 year mine plan.
Developing to the lower area of the Kansoko Centrale was a priority in the mining plan due to the large tonnage and the higher grades within this mining section. In the 30 year mine plan 29.9% of the mining is room-and-pillar and 70.1% is drift-and-fill.
Due to the size and grade of this section, it is accessed through two portals, initially mined through the Kansoko Sud portal, and from the Kamoa Sud portal in later years. This allows the section to be mined at a higher production rate. Production in Kansoko Centrale begins in Year 2 and the maximum annual production rate out of Kansoko Centrale is 8.5 Mtpa.
Kansoko Nord
Kansoko Nord has a PEA Inventory of 38.6 Mt at an average grade of 2.60% Cu. The production in the 30 year mine plan is 22.7 Mt at an average grade of 3.20% Cu with 15.9 Mt remaining for future mining. This section comprises 6.1% of the PEA Inventory and 7.0% of the 30 year mine plan.
Kansoko Nord will be mined from the Kansoko Sud portal. It will begin production in Year 12 and will have a maximum production rate of 2.5 Mtpa. In the 30 year mine plan, 58.2% of the mining is room-and-pillar and 41.8% is drift-and-fill.
Kamoa Sud
Kamoa Sud has a PEA Inventory of 102.3 Mt at an average grade of 2.46% Cu. The production in the 30 year mine plan is 68.6 Mt at an average grade of 2.69% Cu with 33.7 Mt remaining for future mining. This section comprises 16.1% of the PEA Inventory and 21.1% of the 30 year mine plan.
Kamoa Sud will be the third mining section to come into production. The Kamoa Sud portal will begin in Year 1, after the plant is in operation and generating cash flow. Production in this section will begin in Year 4 with a maximum production rate of 6 Mtpa. In the 30 year mine plan, 93.2% of the mining is room-and-pillar and 6.8% is drift-and-fill.
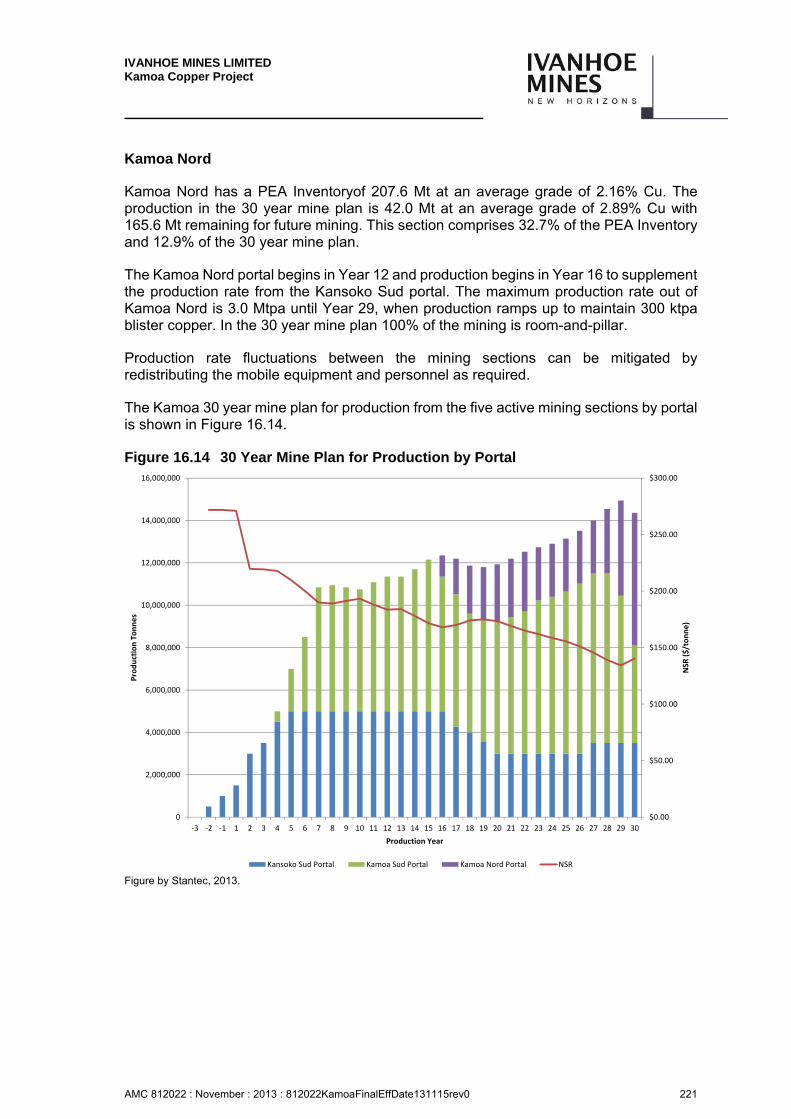
IVANHOE MINES LIMITED Kamoa Copper Project
AMC 812022 : November : 2013 : 812022KamoaFinalEffDate131115rev0 221
Kamoa Nord
Kamoa Nord has a PEA Inventoryof 207.6 Mt at an average grade of 2.16% Cu. The production in the 30 year mine plan is 42.0 Mt at an average grade of 2.89% Cu with 165.6 Mt remaining for future mining. This section comprises 32.7% of the PEA Inventory and 12.9% of the 30 year mine plan.
The Kamoa Nord portal begins in Year 12 and production begins in Year 16 to supplement the production rate from the Kansoko Sud portal. The maximum production rate out of Kamoa Nord is 3.0 Mtpa until Year 29, when production ramps up to maintain 300 ktpa blister copper. In the 30 year mine plan 100% of the mining is room-and-pillar.
Production rate fluctuations between the mining sections can be mitigated by redistributing the mobile equipment and personnel as required.
The Kamoa 30 year mine plan for production from the five active mining sections by portal is shown in Figure 16.14.
Figure 16.14 30 Year Mine Plan for Production by Portal
Figure by Stantec, 2013.
$0.00
$50.00
$100.00
$150.00
$200.00
$250.00
$300.00
0
2,000,000
4,000,000
6,000,000
8,000,000
10,000,000
12,000,000
14,000,000
16,000,000
‐3 ‐2 ‐1 1 2 3 4 5 6 7 8 9 10 11 12 13 14 15 16 17 18 19 20 21 22 23 24 25 26 27 28 29 30
NSR
($/tonne)
Production Tonnes
Production Year
Kansoko Sud Portal Kamoa Sud Portal Kamoa Nord Portal NSR
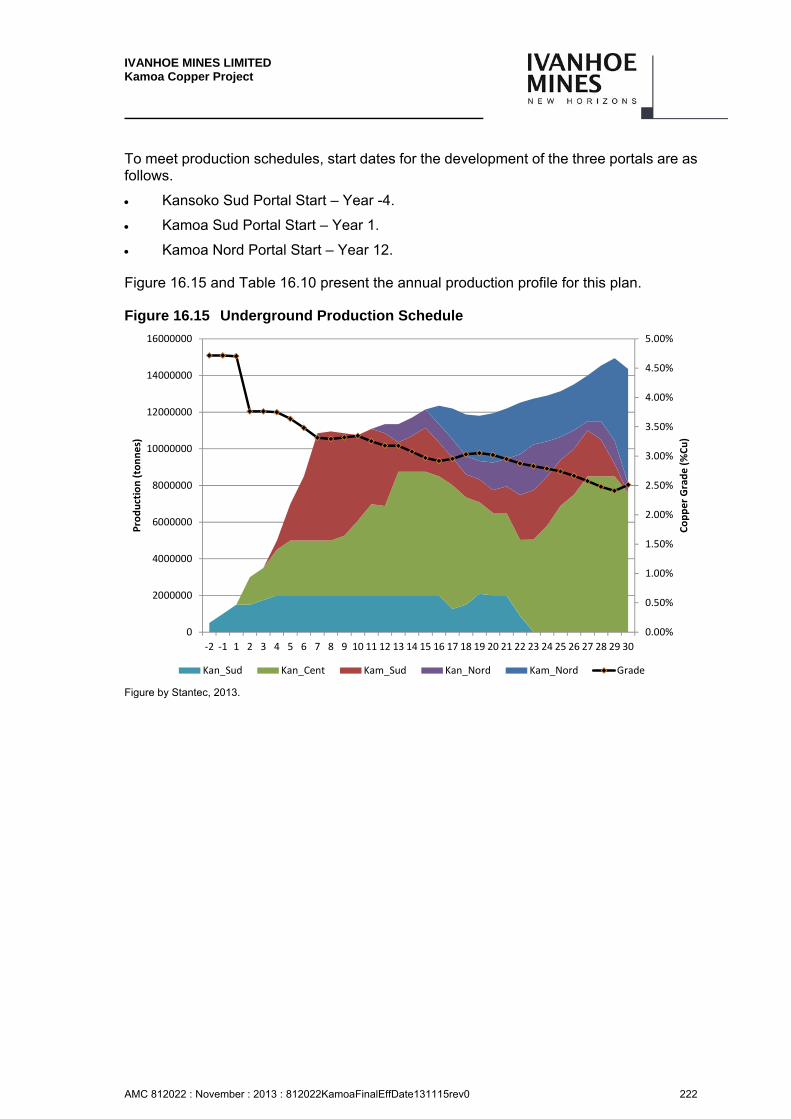
IVANHOE MINES LIMITED Kamoa Copper Project
AMC 812022 : November : 2013 : 812022KamoaFinalEffDate131115rev0 222
To meet production schedules, start dates for the development of the three portals are as follows.
Kansoko Sud Portal Start – Year -4.
Kamoa Sud Portal Start – Year 1.
Kamoa Nord Portal Start – Year 12.
Figure 16.15 and Table 16.10 present the annual production profile for this plan.
Figure 16.15 Underground Production Schedule
Figure by Stantec, 2013.
0.00%
0.50%
1.00%
1.50%
2.00%
2.50%
3.00%
3.50%
4.00%
4.50%
5.00%
0
2000000
4000000
6000000
8000000
10000000
12000000
14000000
16000000
‐2 ‐1 1 2 3 4 5 6 7 8 9 10 11 12 13 14 15 16 17 18 19 20 21 22 23 24 25 26 27 28 29 30
Copper Grade (%Cu)
Production (tonnes)
Kan_Sud Kan_Cent Kam_Sud Kan_Nord Kam_Nord Grade
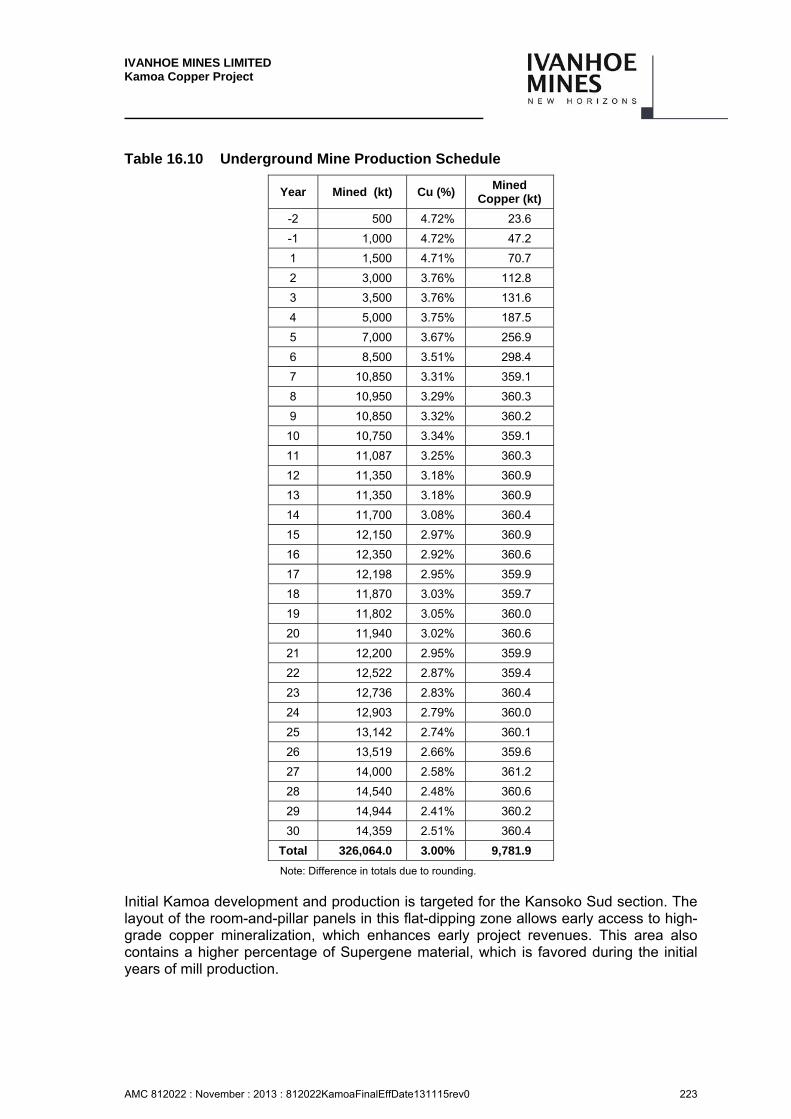
IVANHOE MINES LIMITED Kamoa Copper Project
AMC 812022 : November : 2013 : 812022KamoaFinalEffDate131115rev0 223
Table 16.10 Underground Mine Production Schedule
Year Mined (kt) Cu (%) Mined
Copper (kt)
-2 500 4.72% 23.6
-1 1,000 4.72% 47.2
1 1,500 4.71% 70.7
2 3,000 3.76% 112.8
3 3,500 3.76% 131.6
4 5,000 3.75% 187.5
5 7,000 3.67% 256.9
6 8,500 3.51% 298.4
7 10,850 3.31% 359.1
8 10,950 3.29% 360.3
9 10,850 3.32% 360.2
10 10,750 3.34% 359.1
11 11,087 3.25% 360.3
12 11,350 3.18% 360.9
13 11,350 3.18% 360.9
14 11,700 3.08% 360.4
15 12,150 2.97% 360.9
16 12,350 2.92% 360.6
17 12,198 2.95% 359.9
18 11,870 3.03% 359.7
19 11,802 3.05% 360.0
20 11,940 3.02% 360.6
21 12,200 2.95% 359.9
22 12,522 2.87% 359.4
23 12,736 2.83% 360.4
24 12,903 2.79% 360.0
25 13,142 2.74% 360.1
26 13,519 2.66% 359.6
27 14,000 2.58% 361.2
28 14,540 2.48% 360.6
29 14,944 2.41% 360.2
30 14,359 2.51% 360.4
Total 326,064.0 3.00% 9,781.9
Note: Difference in totals due to rounding.
Initial Kamoa development and production is targeted for the Kansoko Sud section. The layout of the room-and-pillar panels in this flat-dipping zone allows early access to high-grade copper mineralization, which enhances early project revenues. This area also contains a higher percentage of Supergene material, which is favored during the initial years of mill production.
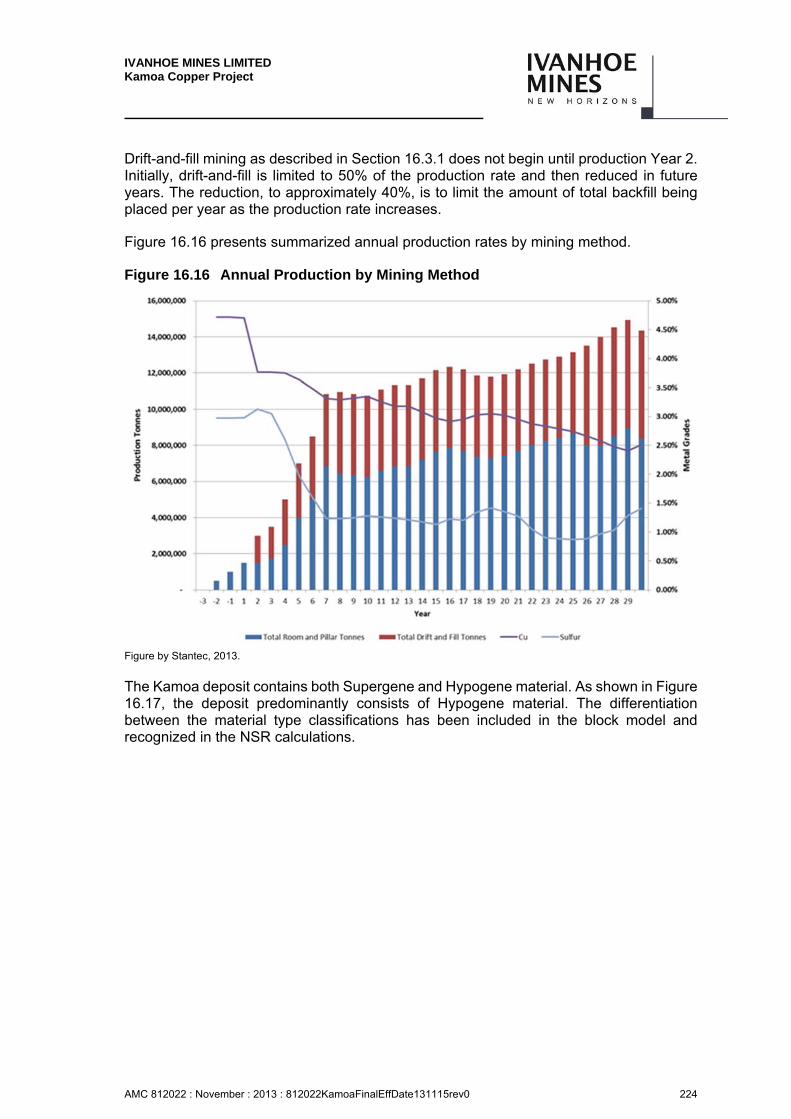
IVANHOE MINES LIMITED Kamoa Copper Project
AMC 812022 : November : 2013 : 812022KamoaFinalEffDate131115rev0 224
Drift-and-fill mining as described in Section 16.3.1 does not begin until production Year 2. Initially, drift-and-fill is limited to 50% of the production rate and then reduced in future years. The reduction, to approximately 40%, is to limit the amount of total backfill being placed per year as the production rate increases.
Figure 16.16 presents summarized annual production rates by mining method.
Figure 16.16 Annual Production by Mining Method
Figure by Stantec, 2013.
The Kamoa deposit contains both Supergene and Hypogene material. As shown in Figure 16.17, the deposit predominantly consists of Hypogene material. The differentiation between the material type classifications has been included in the block model and recognized in the NSR calculations.
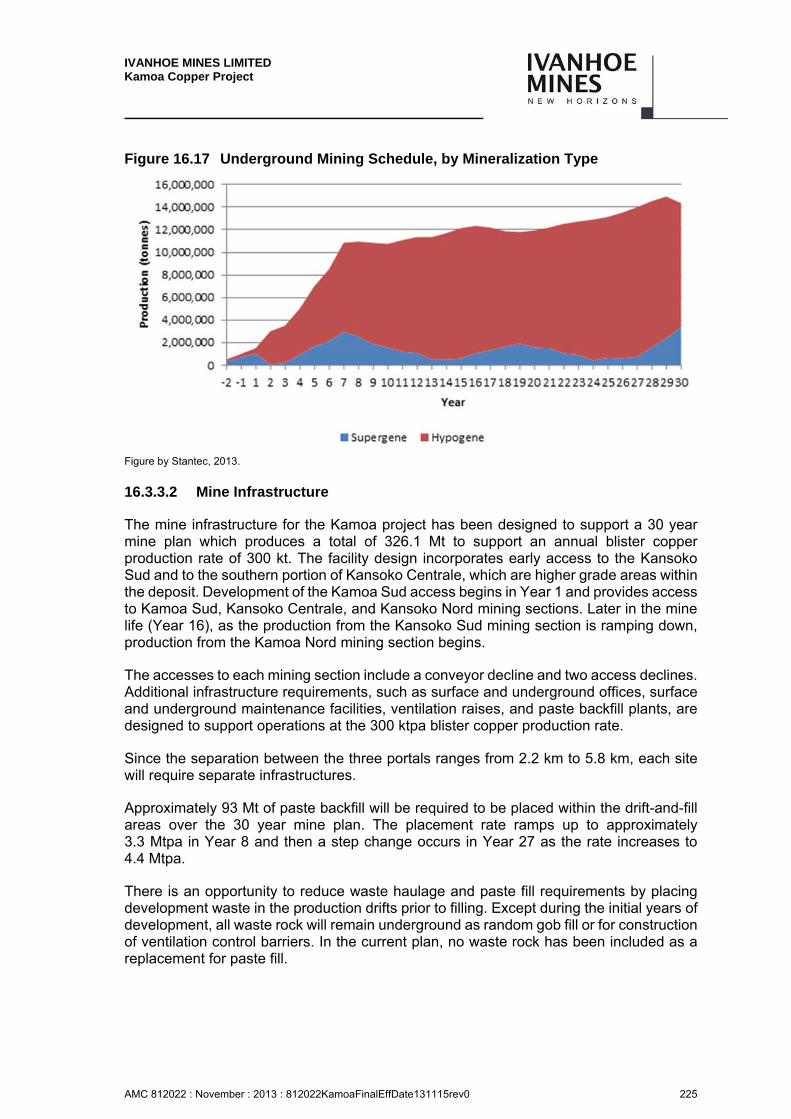
IVANHOE MINES LIMITED Kamoa Copper Project
AMC 812022 : November : 2013 : 812022KamoaFinalEffDate131115rev0 225
Figure 16.17 Underground Mining Schedule, by Mineralization Type
Figure by Stantec, 2013.
16.3.3.2 Mine Infrastructure
The mine infrastructure for the Kamoa project has been designed to support a 30 year mine plan which produces a total of 326.1 Mt to support an annual blister copper production rate of 300 kt. The facility design incorporates early access to the Kansoko Sud and to the southern portion of Kansoko Centrale, which are higher grade areas within the deposit. Development of the Kamoa Sud access begins in Year 1 and provides access to Kamoa Sud, Kansoko Centrale, and Kansoko Nord mining sections. Later in the mine life (Year 16), as the production from the Kansoko Sud mining section is ramping down, production from the Kamoa Nord mining section begins.
The accesses to each mining section include a conveyor decline and two access declines. Additional infrastructure requirements, such as surface and underground offices, surface and underground maintenance facilities, ventilation raises, and paste backfill plants, are designed to support operations at the 300 ktpa blister copper production rate.
Since the separation between the three portals ranges from 2.2 km to 5.8 km, each site will require separate infrastructures.
Approximately 93 Mt of paste backfill will be required to be placed within the drift-and-fill areas over the 30 year mine plan. The placement rate ramps up to approximately 3.3 Mtpa in Year 8 and then a step change occurs in Year 27 as the rate increases to 4.4 Mtpa.
There is an opportunity to reduce waste haulage and paste fill requirements by placing development waste in the production drifts prior to filling. Except during the initial years of development, all waste rock will remain underground as random gob fill or for construction of ventilation control barriers. In the current plan, no waste rock has been included as a replacement for paste fill.

IVANHOE MINES LIMITED Kamoa Copper Project
AMC 812022 : November : 2013 : 812022KamoaFinalEffDate131115rev0 226
A summary of the primary development requirements for the Kamoa project are presented in Table 16.11. Development of the main access declines will be in mineralized material whenever possible, but some of the development will be in un-mineralized waste. The volumetric differentiation between the two rock types has not been assessed at this time. Allowances are made within the estimates for muck bays and cross-overs from the two parallel declines.
Table 16.11 Primary Development Requirements for Kamoa Project
Section Development Type Height
(m) Width
(m) Total
Length (m) Comments
Kansoko Centrale
Lateral Development
Conveyor Decline 6.5 5.5 12,794 –
Main Access Decline 6.5 5.5 25,588 –
Vertical Development
Ventilation Raise 8,818 3 m diameter
Kansoko Sud
Lateral Development
Conveyor Decline 6.5 5.5 4,210 –
Main Access Decline 6.5 5.5 8,420 –
Vertical Development
Ventilation Raise 1,812 3 m diameter
Kansoko Nord
Lateral Development
Conveyor Decline 6.5 5.5 4,353 –
Main Access Decline 6.5 5.5 8,706 –
Vertical Development
Ventilation Raise 3,008 3 m diameter
Kamoa Sud
Lateral Development
Conveyor Decline 6.5 5.5 2,504 –
Main Access Decline 6.5 5.5 5,008 –
Vertical Development
Ventilation Raise 2,305 3 m diameter
Kamoa Nord
Lateral Development
Conveyor Decline 6.5 5.5 4,788 –
Main Access Decline 6.5 5.5 9,576 –
Vertical Development
Ventilation Raise 1,019 3 m diameter
The ground support criteria utilized for all development includes threaded rebar and wire mesh with a bolt spacing of 1.5 meters. The ground support design package is at a conceptual level and generalized to meet the minimum support requirements as specified by SRK.
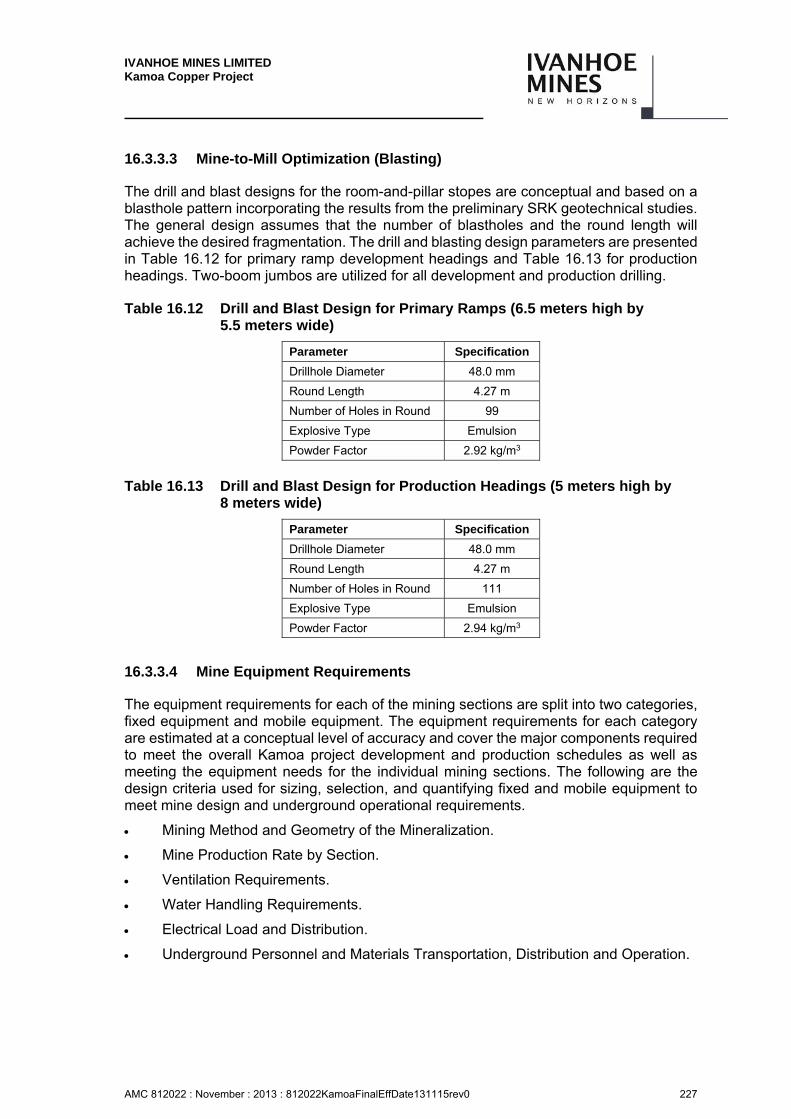
IVANHOE MINES LIMITED Kamoa Copper Project
AMC 812022 : November : 2013 : 812022KamoaFinalEffDate131115rev0 227
16.3.3.3 Mine-to-Mill Optimization (Blasting)
The drill and blast designs for the room-and-pillar stopes are conceptual and based on a blasthole pattern incorporating the results from the preliminary SRK geotechnical studies. The general design assumes that the number of blastholes and the round length will achieve the desired fragmentation. The drill and blasting design parameters are presented in Table 16.12 for primary ramp development headings and Table 16.13 for production headings. Two-boom jumbos are utilized for all development and production drilling.
Table 16.12 Drill and Blast Design for Primary Ramps (6.5 meters high by 5.5 meters wide)
Parameter Specification
Drillhole Diameter 48.0 mm
Round Length 4.27 m
Number of Holes in Round 99
Explosive Type Emulsion
Powder Factor 2.92 kg/m3
Table 16.13 Drill and Blast Design for Production Headings (5 meters high by
8 meters wide)
Parameter Specification
Drillhole Diameter 48.0 mm
Round Length 4.27 m
Number of Holes in Round 111
Explosive Type Emulsion
Powder Factor 2.94 kg/m3
16.3.3.4 Mine Equipment Requirements
The equipment requirements for each of the mining sections are split into two categories, fixed equipment and mobile equipment. The equipment requirements for each category are estimated at a conceptual level of accuracy and cover the major components required to meet the overall Kamoa project development and production schedules as well as meeting the equipment needs for the individual mining sections. The following are the design criteria used for sizing, selection, and quantifying fixed and mobile equipment to meet mine design and underground operational requirements.
Mining Method and Geometry of the Mineralization.
Mine Production Rate by Section.
Ventilation Requirements.
Water Handling Requirements.
Electrical Load and Distribution.
Underground Personnel and Materials Transportation, Distribution and Operation.
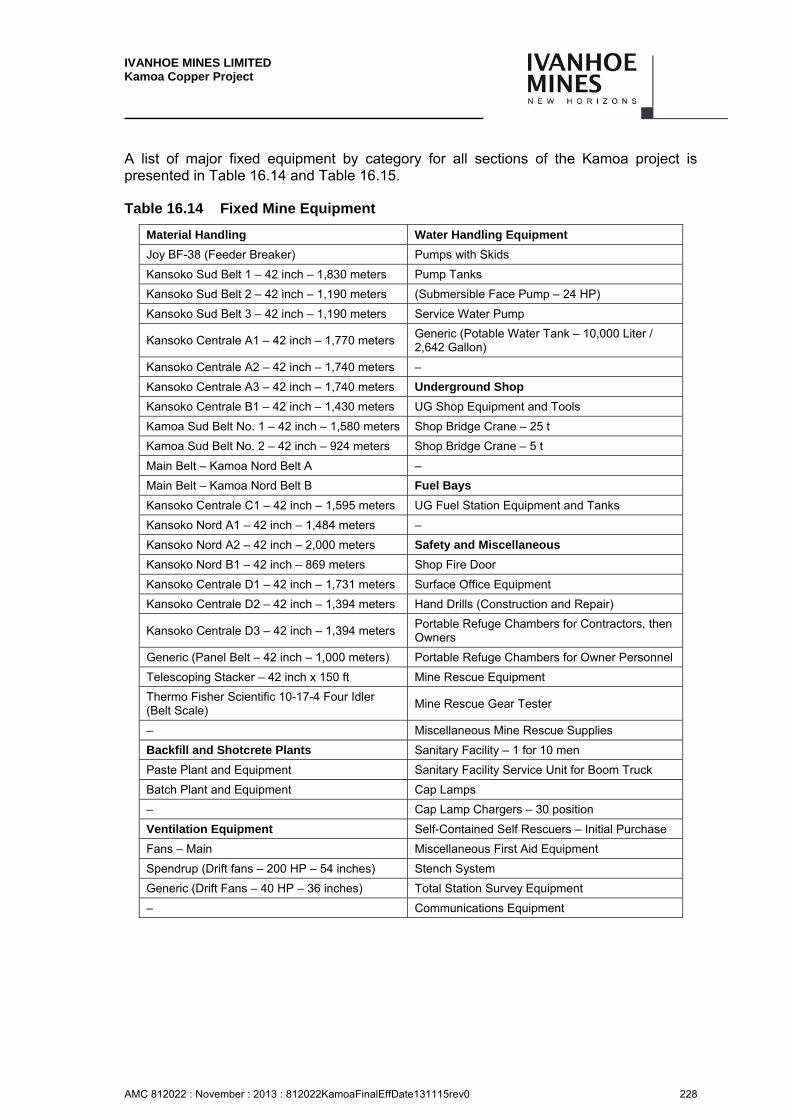
IVANHOE MINES LIMITED Kamoa Copper Project
AMC 812022 : November : 2013 : 812022KamoaFinalEffDate131115rev0 228
A list of major fixed equipment by category for all sections of the Kamoa project is presented in Table 16.14 and Table 16.15.
Table 16.14 Fixed Mine Equipment
Material Handling Water Handling Equipment
Joy BF-38 (Feeder Breaker) Pumps with Skids
Kansoko Sud Belt 1 – 42 inch – 1,830 meters Pump Tanks
Kansoko Sud Belt 2 – 42 inch – 1,190 meters (Submersible Face Pump – 24 HP)
Kansoko Sud Belt 3 – 42 inch – 1,190 meters Service Water Pump
Kansoko Centrale A1 – 42 inch – 1,770 meters Generic (Potable Water Tank – 10,000 Liter / 2,642 Gallon)
Kansoko Centrale A2 – 42 inch – 1,740 meters –
Kansoko Centrale A3 – 42 inch – 1,740 meters Underground Shop
Kansoko Centrale B1 – 42 inch – 1,430 meters UG Shop Equipment and Tools
Kamoa Sud Belt No. 1 – 42 inch – 1,580 meters Shop Bridge Crane – 25 t
Kamoa Sud Belt No. 2 – 42 inch – 924 meters Shop Bridge Crane – 5 t
Main Belt – Kamoa Nord Belt A –
Main Belt – Kamoa Nord Belt B Fuel Bays
Kansoko Centrale C1 – 42 inch – 1,595 meters UG Fuel Station Equipment and Tanks
Kansoko Nord A1 – 42 inch – 1,484 meters –
Kansoko Nord A2 – 42 inch – 2,000 meters Safety and Miscellaneous
Kansoko Nord B1 – 42 inch – 869 meters Shop Fire Door
Kansoko Centrale D1 – 42 inch – 1,731 meters Surface Office Equipment
Kansoko Centrale D2 – 42 inch – 1,394 meters Hand Drills (Construction and Repair)
Kansoko Centrale D3 – 42 inch – 1,394 meters Portable Refuge Chambers for Contractors, then Owners
Generic (Panel Belt – 42 inch – 1,000 meters) Portable Refuge Chambers for Owner Personnel
Telescoping Stacker – 42 inch x 150 ft Mine Rescue Equipment
Thermo Fisher Scientific 10-17-4 Four Idler (Belt Scale)
Mine Rescue Gear Tester
– Miscellaneous Mine Rescue Supplies
Backfill and Shotcrete Plants Sanitary Facility – 1 for 10 men
Paste Plant and Equipment Sanitary Facility Service Unit for Boom Truck
Batch Plant and Equipment Cap Lamps
– Cap Lamp Chargers – 30 position
Ventilation Equipment Self-Contained Self Rescuers – Initial Purchase
Fans – Main Miscellaneous First Aid Equipment
Spendrup (Drift fans – 200 HP – 54 inches) Stench System
Generic (Drift Fans – 40 HP – 36 inches) Total Station Survey Equipment
– Communications Equipment
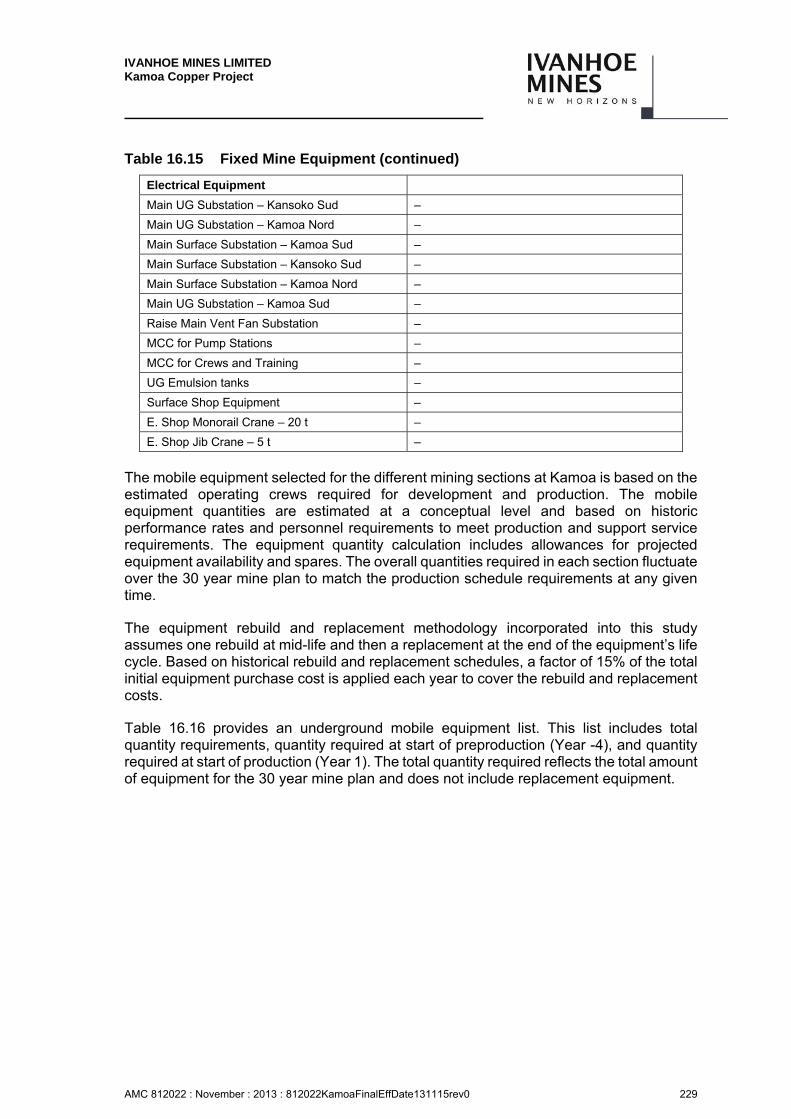
IVANHOE MINES LIMITED Kamoa Copper Project
AMC 812022 : November : 2013 : 812022KamoaFinalEffDate131115rev0 229
Table 16.15 Fixed Mine Equipment (continued)
Electrical Equipment
Main UG Substation – Kansoko Sud –
Main UG Substation – Kamoa Nord –
Main Surface Substation – Kamoa Sud –
Main Surface Substation – Kansoko Sud –
Main Surface Substation – Kamoa Nord –
Main UG Substation – Kamoa Sud –
Raise Main Vent Fan Substation –
MCC for Pump Stations –
MCC for Crews and Training –
UG Emulsion tanks –
Surface Shop Equipment –
E. Shop Monorail Crane – 20 t –
E. Shop Jib Crane – 5 t –
The mobile equipment selected for the different mining sections at Kamoa is based on the estimated operating crews required for development and production. The mobile equipment quantities are estimated at a conceptual level and based on historic performance rates and personnel requirements to meet production and support service requirements. The equipment quantity calculation includes allowances for projected equipment availability and spares. The overall quantities required in each section fluctuate over the 30 year mine plan to match the production schedule requirements at any given time.
The equipment rebuild and replacement methodology incorporated into this study assumes one rebuild at mid-life and then a replacement at the end of the equipment’s life cycle. Based on historical rebuild and replacement schedules, a factor of 15% of the total initial equipment purchase cost is applied each year to cover the rebuild and replacement costs.
Table 16.16 provides an underground mobile equipment list. This list includes total quantity requirements, quantity required at start of preproduction (Year -4), and quantity required at start of production (Year 1). The total quantity required reflects the total amount of equipment for the 30 year mine plan and does not include replacement equipment.
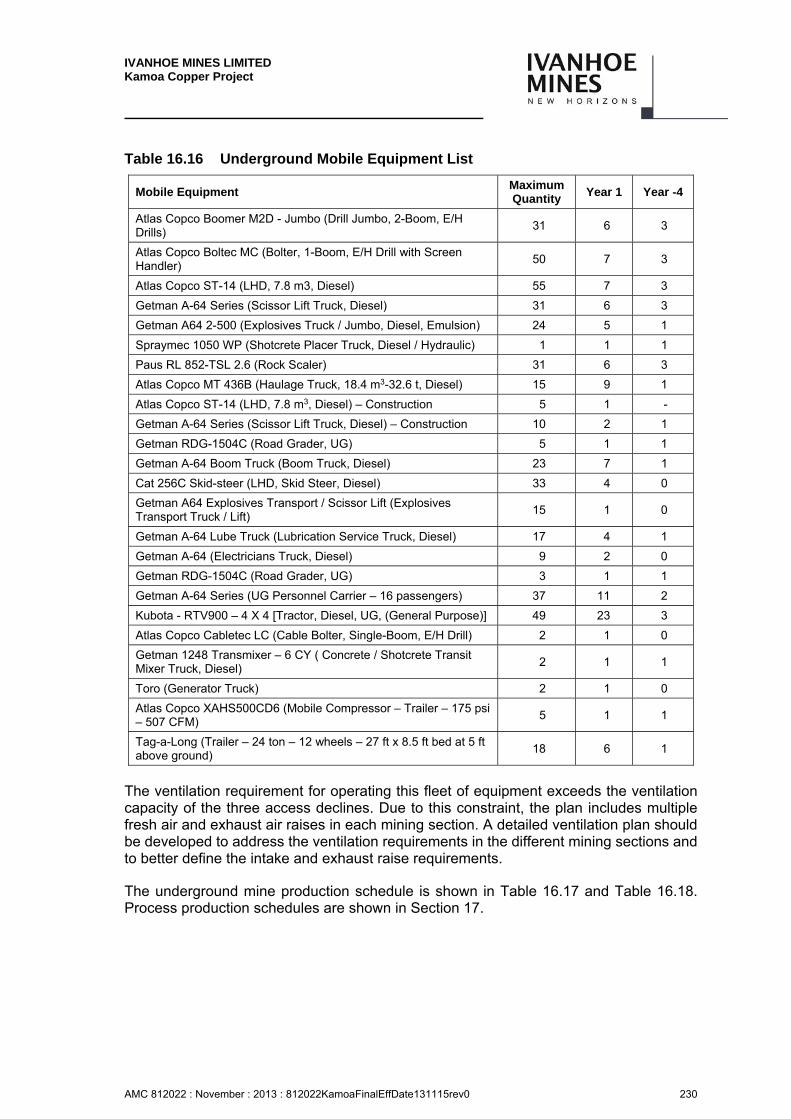
IVANHOE MINES LIMITED Kamoa Copper Project
AMC 812022 : November : 2013 : 812022KamoaFinalEffDate131115rev0 230
Table 16.16 Underground Mobile Equipment List
Mobile Equipment Maximum Quantity
Year 1 Year -4
Atlas Copco Boomer M2D - Jumbo (Drill Jumbo, 2-Boom, E/H Drills)
31 6 3
Atlas Copco Boltec MC (Bolter, 1-Boom, E/H Drill with Screen Handler)
50 7 3
Atlas Copco ST-14 (LHD, 7.8 m3, Diesel) 55 7 3
Getman A-64 Series (Scissor Lift Truck, Diesel) 31 6 3
Getman A64 2-500 (Explosives Truck / Jumbo, Diesel, Emulsion) 24 5 1
Spraymec 1050 WP (Shotcrete Placer Truck, Diesel / Hydraulic) 1 1 1
Paus RL 852-TSL 2.6 (Rock Scaler) 31 6 3
Atlas Copco MT 436B (Haulage Truck, 18.4 m3-32.6 t, Diesel) 15 9 1
Atlas Copco ST-14 (LHD, 7.8 m3, Diesel) – Construction 5 1 -
Getman A-64 Series (Scissor Lift Truck, Diesel) – Construction 10 2 1
Getman RDG-1504C (Road Grader, UG) 5 1 1
Getman A-64 Boom Truck (Boom Truck, Diesel) 23 7 1
Cat 256C Skid-steer (LHD, Skid Steer, Diesel) 33 4 0
Getman A64 Explosives Transport / Scissor Lift (Explosives Transport Truck / Lift)
15 1 0
Getman A-64 Lube Truck (Lubrication Service Truck, Diesel) 17 4 1
Getman A-64 (Electricians Truck, Diesel) 9 2 0
Getman RDG-1504C (Road Grader, UG) 3 1 1
Getman A-64 Series (UG Personnel Carrier – 16 passengers) 37 11 2
Kubota - RTV900 – 4 X 4 [Tractor, Diesel, UG, (General Purpose)] 49 23 3
Atlas Copco Cabletec LC (Cable Bolter, Single-Boom, E/H Drill) 2 1 0
Getman 1248 Transmixer – 6 CY ( Concrete / Shotcrete Transit Mixer Truck, Diesel)
2 1 1
Toro (Generator Truck) 2 1 0
Atlas Copco XAHS500CD6 (Mobile Compressor – Trailer – 175 psi – 507 CFM)
5 1 1
Tag-a-Long (Trailer – 24 ton – 12 wheels – 27 ft x 8.5 ft bed at 5 ft above ground)
18 6 1
The ventilation requirement for operating this fleet of equipment exceeds the ventilation capacity of the three access declines. Due to this constraint, the plan includes multiple fresh air and exhaust air raises in each mining section. A detailed ventilation plan should be developed to address the ventilation requirements in the different mining sections and to better define the intake and exhaust raise requirements.
The underground mine production schedule is shown in Table 16.17 and Table 16.18. Process production schedules are shown in Section 17.
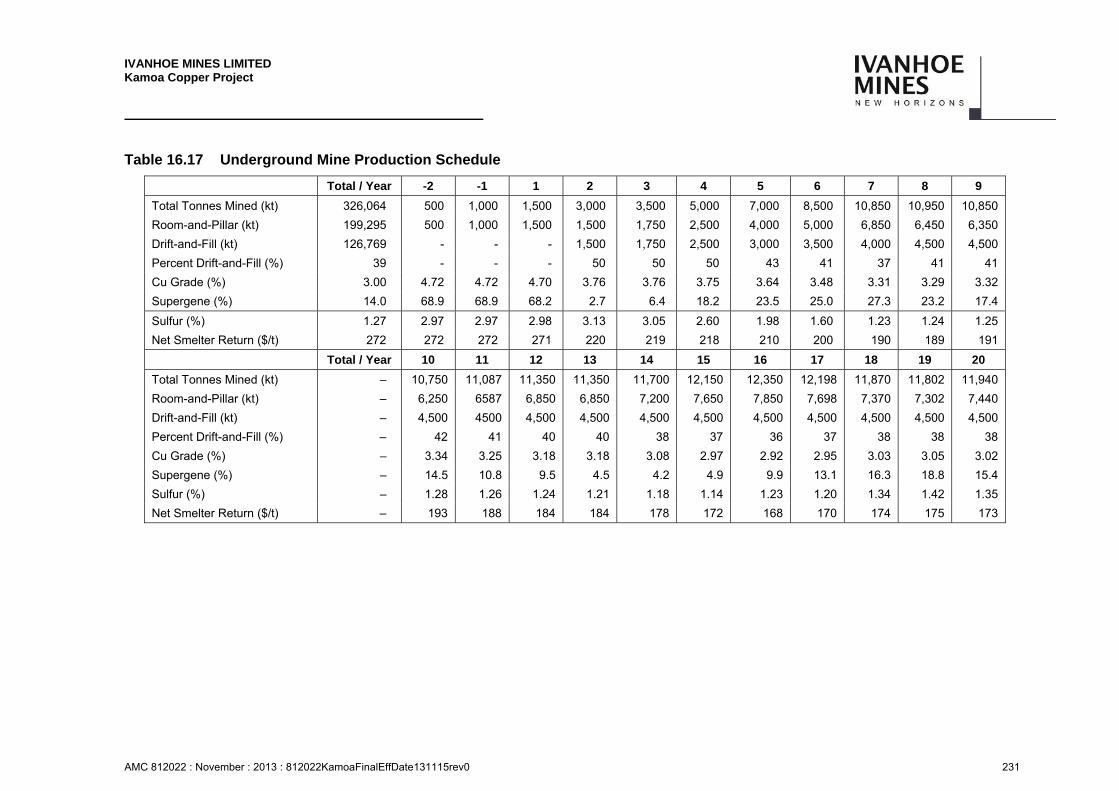
IVANHOE MINES LIMITED Kamoa Copper Project
AMC 812022 : November : 2013 : 812022KamoaFinalEffDate131115rev0 231
Table 16.17 Underground Mine Production Schedule
Total / Year -2 -1 1 2 3 4 5 6 7 8 9
Total Tonnes Mined (kt) 326,064 500 1,000 1,500 3,000 3,500 5,000 7,000 8,500 10,850 10,950 10,850
Room-and-Pillar (kt) 199,295 500 1,000 1,500 1,500 1,750 2,500 4,000 5,000 6,850 6,450 6,350
Drift-and-Fill (kt) 126,769 - - - 1,500 1,750 2,500 3,000 3,500 4,000 4,500 4,500
Percent Drift-and-Fill (%) 39 - - - 50 50 50 43 41 37 41 41
Cu Grade (%) 3.00 4.72 4.72 4.70 3.76 3.76 3.75 3.64 3.48 3.31 3.29 3.32
Supergene (%) 14.0 68.9 68.9 68.2 2.7 6.4 18.2 23.5 25.0 27.3 23.2 17.4
Sulfur (%) 1.27 2.97 2.97 2.98 3.13 3.05 2.60 1.98 1.60 1.23 1.24 1.25
Net Smelter Return ($/t) 272 272 272 271 220 219 218 210 200 190 189 191
Total / Year 10 11 12 13 14 15 16 17 18 19 20
Total Tonnes Mined (kt) – 10,750 11,087 11,350 11,350 11,700 12,150 12,350 12,198 11,870 11,802 11,940
Room-and-Pillar (kt) – 6,250 6587 6,850 6,850 7,200 7,650 7,850 7,698 7,370 7,302 7,440
Drift-and-Fill (kt) – 4,500 4500 4,500 4,500 4,500 4,500 4,500 4,500 4,500 4,500 4,500
Percent Drift-and-Fill (%) – 42 41 40 40 38 37 36 37 38 38 38
Cu Grade (%) – 3.34 3.25 3.18 3.18 3.08 2.97 2.92 2.95 3.03 3.05 3.02
Supergene (%) – 14.5 10.8 9.5 4.5 4.2 4.9 9.9 13.1 16.3 18.8 15.4
Sulfur (%) – 1.28 1.26 1.24 1.21 1.18 1.14 1.23 1.20 1.34 1.42 1.35
Net Smelter Return ($/t) – 193 188 184 184 178 172 168 170 174 175 173
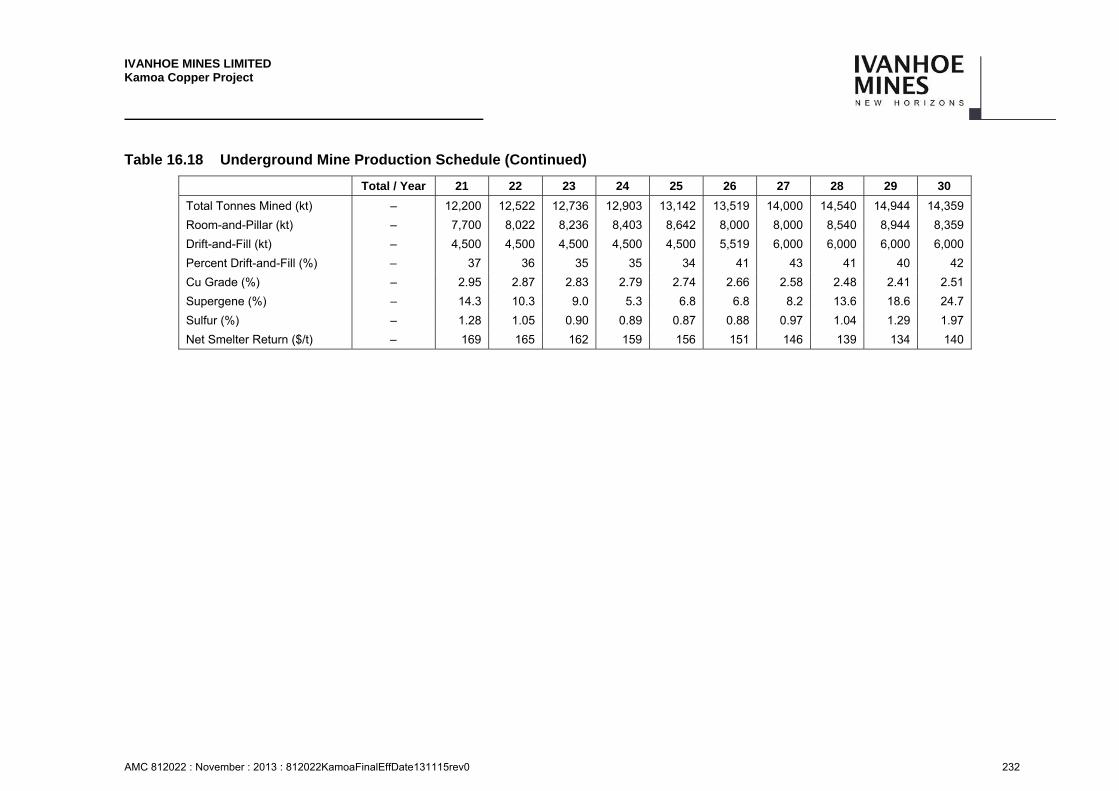
IVANHOE MINES LIMITED Kamoa Copper Project
AMC 812022 : November : 2013 : 812022KamoaFinalEffDate131115rev0 232
Table 16.18 Underground Mine Production Schedule (Continued)
Total / Year 21 22 23 24 25 26 27 28 29 30
Total Tonnes Mined (kt) – 12,200 12,522 12,736 12,903 13,142 13,519 14,000 14,540 14,944 14,359
Room-and-Pillar (kt) – 7,700 8,022 8,236 8,403 8,642 8,000 8,000 8,540 8,944 8,359
Drift-and-Fill (kt) – 4,500 4,500 4,500 4,500 4,500 5,519 6,000 6,000 6,000 6,000
Percent Drift-and-Fill (%) – 37 36 35 35 34 41 43 41 40 42
Cu Grade (%) – 2.95 2.87 2.83 2.79 2.74 2.66 2.58 2.48 2.41 2.51
Supergene (%) – 14.3 10.3 9.0 5.3 6.8 6.8 8.2 13.6 18.6 24.7
Sulfur (%) – 1.28 1.05 0.90 0.89 0.87 0.88 0.97 1.04 1.29 1.97
Net Smelter Return ($/t) – 169 165 162 159 156 151 146 139 134 140
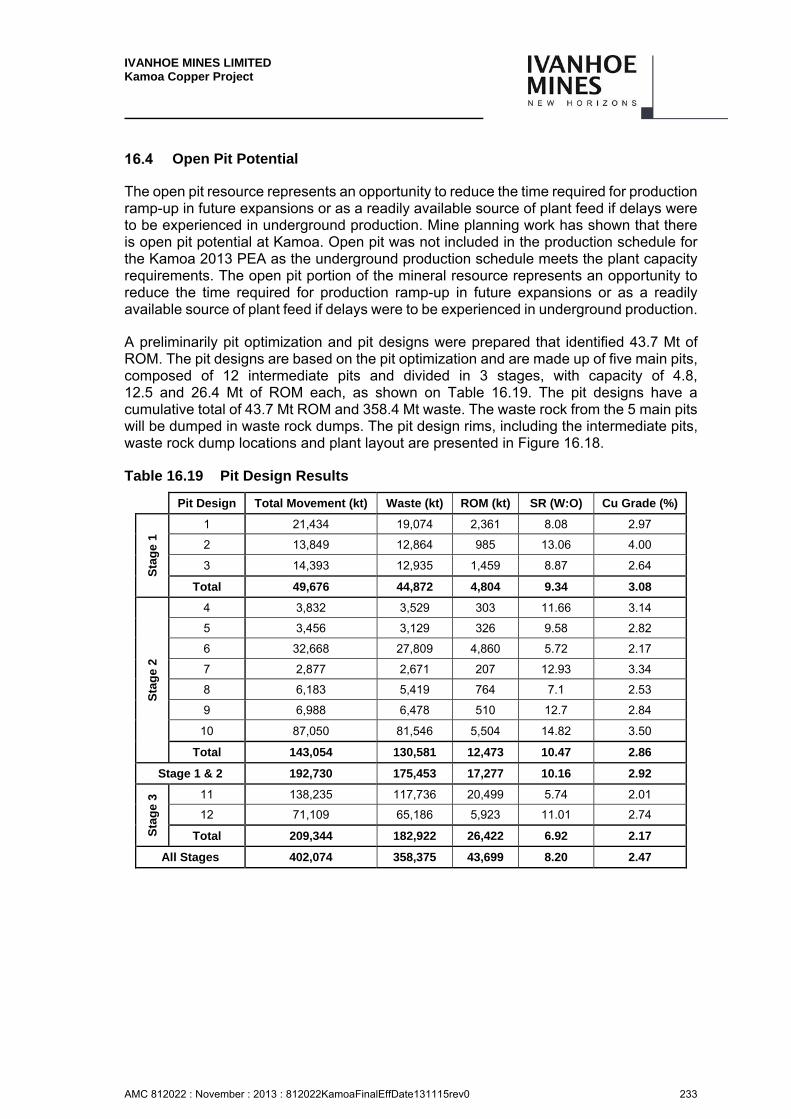
IVANHOE MINES LIMITED Kamoa Copper Project
AMC 812022 : November : 2013 : 812022KamoaFinalEffDate131115rev0 233
Open Pit Potential
The open pit resource represents an opportunity to reduce the time required for production ramp-up in future expansions or as a readily available source of plant feed if delays were to be experienced in underground production. Mine planning work has shown that there is open pit potential at Kamoa. Open pit was not included in the production schedule for the Kamoa 2013 PEA as the underground production schedule meets the plant capacity requirements. The open pit portion of the mineral resource represents an opportunity to reduce the time required for production ramp-up in future expansions or as a readily available source of plant feed if delays were to be experienced in underground production.
A preliminarily pit optimization and pit designs were prepared that identified 43.7 Mt of ROM. The pit designs are based on the pit optimization and are made up of five main pits, composed of 12 intermediate pits and divided in 3 stages, with capacity of 4.8, 12.5 and 26.4 Mt of ROM each, as shown on Table 16.19. The pit designs have a cumulative total of 43.7 Mt ROM and 358.4 Mt waste. The waste rock from the 5 main pits will be dumped in waste rock dumps. The pit design rims, including the intermediate pits, waste rock dump locations and plant layout are presented in Figure 16.18.
Table 16.19 Pit Design Results
Pit Design Total Movement (kt) Waste (kt) ROM (kt) SR (W:O) Cu Grade (%)
Sta
ge
1 1 21,434 19,074 2,361 8.08 2.97
2 13,849 12,864 985 13.06 4.00
3 14,393 12,935 1,459 8.87 2.64
Total 49,676 44,872 4,804 9.34 3.08
Sta
ge
2
4 3,832 3,529 303 11.66 3.14
5 3,456 3,129 326 9.58 2.82
6 32,668 27,809 4,860 5.72 2.17
7 2,877 2,671 207 12.93 3.34
8 6,183 5,419 764 7.1 2.53
9 6,988 6,478 510 12.7 2.84
10 87,050 81,546 5,504 14.82 3.50
Total 143,054 130,581 12,473 10.47 2.86
Stage 1 & 2 192,730 175,453 17,277 10.16 2.92
Sta
ge
3 11 138,235 117,736 20,499 5.74 2.01
12 71,109 65,186 5,923 11.01 2.74
Total 209,344 182,922 26,422 6.92 2.17
All Stages 402,074 358,375 43,699 8.20 2.47
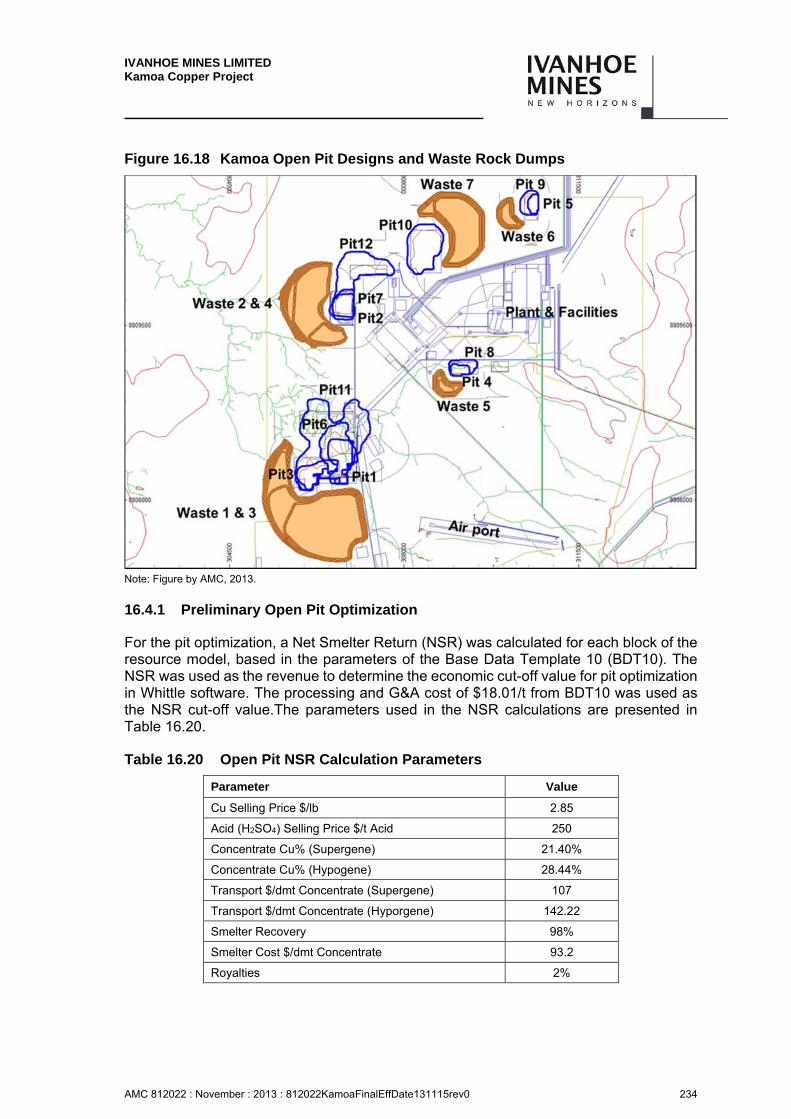
IVANHOE MINES LIMITED Kamoa Copper Project
AMC 812022 : November : 2013 : 812022KamoaFinalEffDate131115rev0 234
Figure 16.18 Kamoa Open Pit Designs and Waste Rock Dumps
Note: Figure by AMC, 2013.
16.4.1 Preliminary Open Pit Optimization
For the pit optimization, a Net Smelter Return (NSR) was calculated for each block of the resource model, based in the parameters of the Base Data Template 10 (BDT10). The NSR was used as the revenue to determine the economic cut-off value for pit optimization in Whittle software. The processing and G&A cost of $18.01/t from BDT10 was used as the NSR cut-off value.The parameters used in the NSR calculations are presented in Table 16.20.
Table 16.20 Open Pit NSR Calculation Parameters
Parameter Value
Cu Selling Price $/lb 2.85
Acid (H2SO4) Selling Price $/t Acid 250
Concentrate Cu% (Supergene) 21.40%
Concentrate Cu% (Hypogene) 28.44%
Transport $/dmt Concentrate (Supergene) 107
Transport $/dmt Concentrate (Hyporgene) 142.22
Smelter Recovery 98%
Smelter Cost $/dmt Concentrate 93.2
Royalties 2%
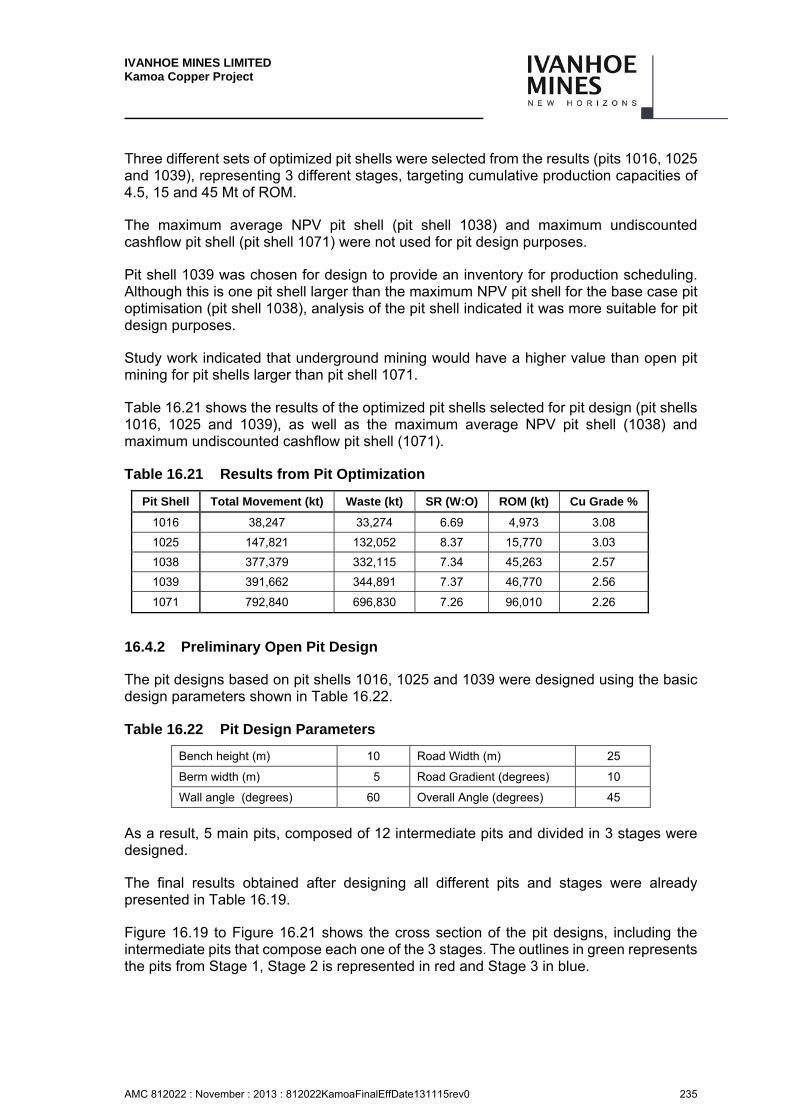
IVANHOE MINES LIMITED Kamoa Copper Project
AMC 812022 : November : 2013 : 812022KamoaFinalEffDate131115rev0 235
Three different sets of optimized pit shells were selected from the results (pits 1016, 1025 and 1039), representing 3 different stages, targeting cumulative production capacities of 4.5, 15 and 45 Mt of ROM.
The maximum average NPV pit shell (pit shell 1038) and maximum undiscounted cashflow pit shell (pit shell 1071) were not used for pit design purposes.
Pit shell 1039 was chosen for design to provide an inventory for production scheduling. Although this is one pit shell larger than the maximum NPV pit shell for the base case pit optimisation (pit shell 1038), analysis of the pit shell indicated it was more suitable for pit design purposes.
Study work indicated that underground mining would have a higher value than open pit mining for pit shells larger than pit shell 1071.
Table 16.21 shows the results of the optimized pit shells selected for pit design (pit shells 1016, 1025 and 1039), as well as the maximum average NPV pit shell (1038) and maximum undiscounted cashflow pit shell (1071).
Table 16.21 Results from Pit Optimization
Pit Shell Total Movement (kt) Waste (kt) SR (W:O) ROM (kt) Cu Grade %
1016 38,247 33,274 6.69 4,973 3.08
1025 147,821 132,052 8.37 15,770 3.03
1038 377,379 332,115 7.34 45,263 2.57
1039 391,662 344,891 7.37 46,770 2.56
1071 792,840 696,830 7.26 96,010 2.26
16.4.2 Preliminary Open Pit Design
The pit designs based on pit shells 1016, 1025 and 1039 were designed using the basic design parameters shown in Table 16.22.
Table 16.22 Pit Design Parameters
Bench height (m) 10 Road Width (m) 25
Berm width (m) 5 Road Gradient (degrees) 10
Wall angle (degrees) 60 Overall Angle (degrees) 45
As a result, 5 main pits, composed of 12 intermediate pits and divided in 3 stages were designed.
The final results obtained after designing all different pits and stages were already presented in Table 16.19.
Figure 16.19 to Figure 16.21 shows the cross section of the pit designs, including the intermediate pits that compose each one of the 3 stages. The outlines in green represents the pits from Stage 1, Stage 2 is represented in red and Stage 3 in blue.

IVANHOE MINES LIMITED Kamoa Copper Project
AMC 812022 : November : 2013 : 812022KamoaFinalEffDate131115rev0 236
Figure 16.19 Preliminarily Pit Design Cross Section AA' and BB'
Note: Figure by AMC, 2013.
Figure 16.20 Preliminarily Pit Design Cross Section CC' and DD'
Note: Figure by AMC, 2013.
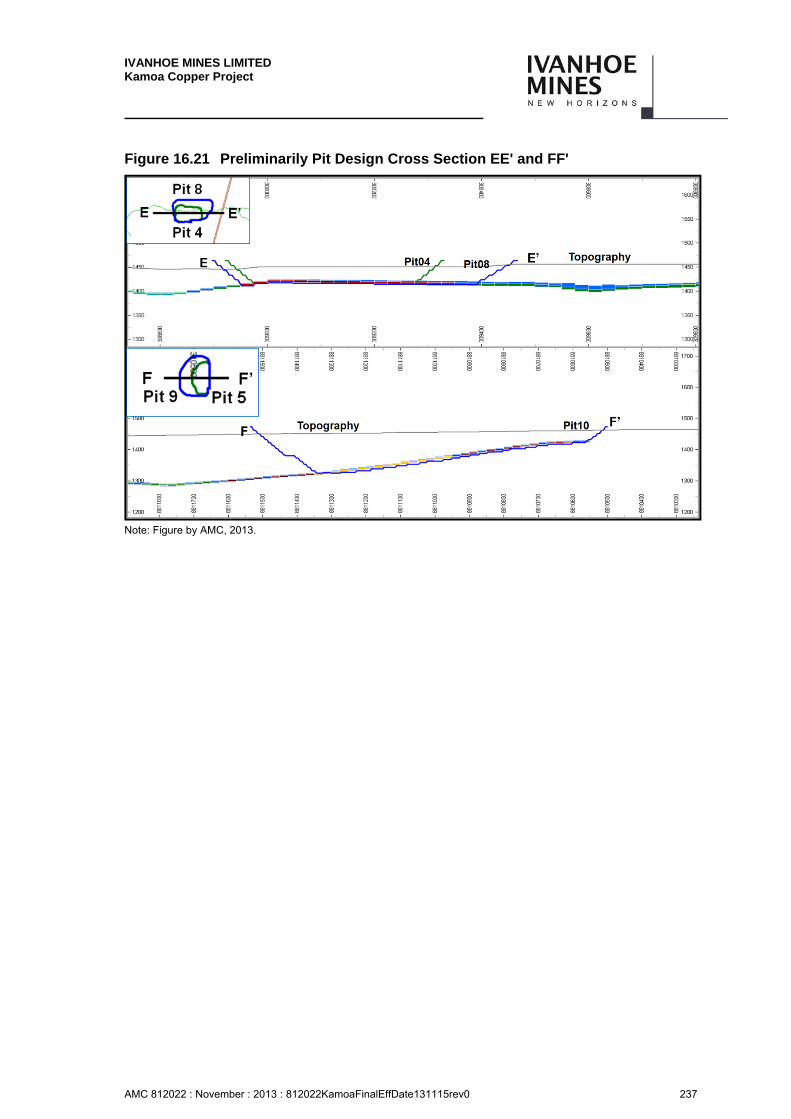
IVANHOE MINES LIMITED Kamoa Copper Project
AMC 812022 : November : 2013 : 812022KamoaFinalEffDate131115rev0 237
Figure 16.21 Preliminarily Pit Design Cross Section EE' and FF'
Note: Figure by AMC, 2013.
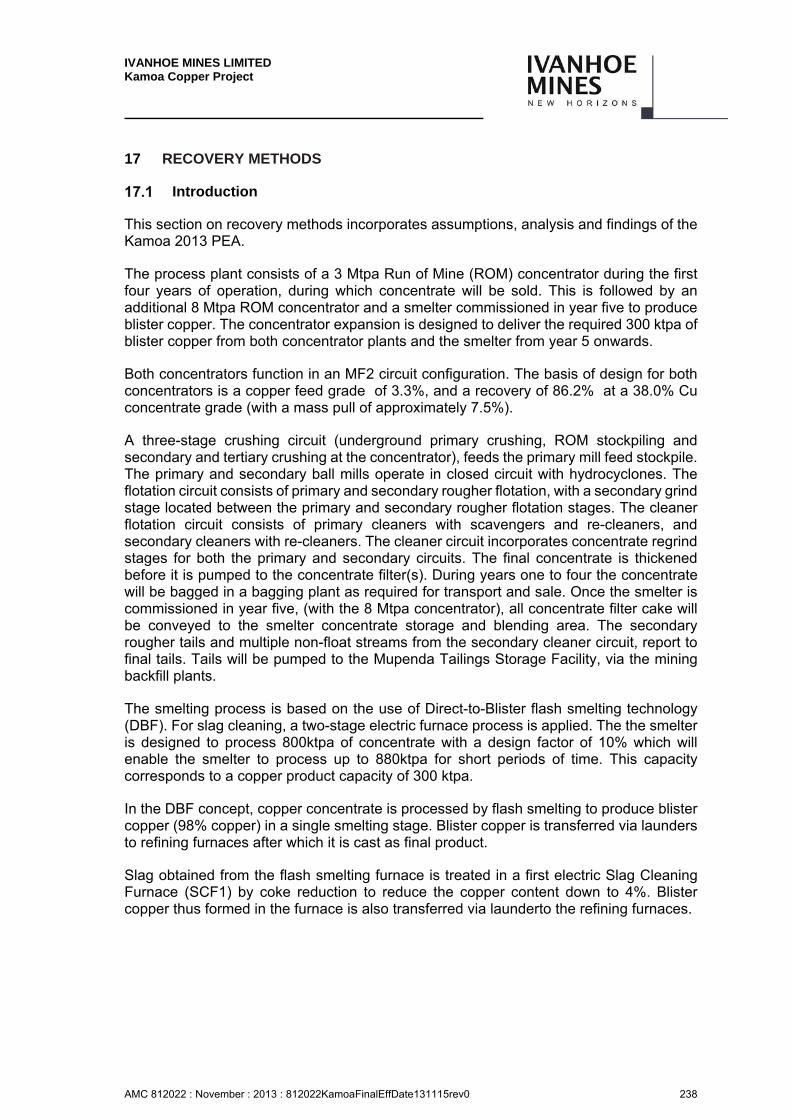
IVANHOE MINES LIMITED Kamoa Copper Project
AMC 812022 : November : 2013 : 812022KamoaFinalEffDate131115rev0 238
17 RECOVERY METHODS
Introduction
This section on recovery methods incorporates assumptions, analysis and findings of the Kamoa 2013 PEA.
The process plant consists of a 3 Mtpa Run of Mine (ROM) concentrator during the first four years of operation, during which concentrate will be sold. This is followed by an additional 8 Mtpa ROM concentrator and a smelter commissioned in year five to produce blister copper. The concentrator expansion is designed to deliver the required 300 ktpa of blister copper from both concentrator plants and the smelter from year 5 onwards.
Both concentrators function in an MF2 circuit configuration. The basis of design for both concentrators is a copper feed grade of 3.3%, and a recovery of 86.2% at a 38.0% Cu concentrate grade (with a mass pull of approximately 7.5%).
A three-stage crushing circuit (underground primary crushing, ROM stockpiling and secondary and tertiary crushing at the concentrator), feeds the primary mill feed stockpile. The primary and secondary ball mills operate in closed circuit with hydrocyclones. The flotation circuit consists of primary and secondary rougher flotation, with a secondary grind stage located between the primary and secondary rougher flotation stages. The cleaner flotation circuit consists of primary cleaners with scavengers and re-cleaners, and secondary cleaners with re-cleaners. The cleaner circuit incorporates concentrate regrind stages for both the primary and secondary circuits. The final concentrate is thickened before it is pumped to the concentrate filter(s). During years one to four the concentrate will be bagged in a bagging plant as required for transport and sale. Once the smelter is commissioned in year five, (with the 8 Mtpa concentrator), all concentrate filter cake will be conveyed to the smelter concentrate storage and blending area. The secondary rougher tails and multiple non-float streams from the secondary cleaner circuit, report to final tails. Tails will be pumped to the Mupenda Tailings Storage Facility, via the mining backfill plants.
The smelting process is based on the use of Direct-to-Blister flash smelting technology (DBF). For slag cleaning, a two-stage electric furnace process is applied. The the smelter is designed to process 800ktpa of concentrate with a design factor of 10% which will enable the smelter to process up to 880ktpa for short periods of time. This capacity corresponds to a copper product capacity of 300 ktpa.
In the DBF concept, copper concentrate is processed by flash smelting to produce blister copper (98% copper) in a single smelting stage. Blister copper is transferred via launders to refining furnaces after which it is cast as final product.
Slag obtained from the flash smelting furnace is treated in a first electric Slag Cleaning Furnace (SCF1) by coke reduction to reduce the copper content down to 4%. Blister copper thus formed in the furnace is also transferred via launderto the refining furnaces.
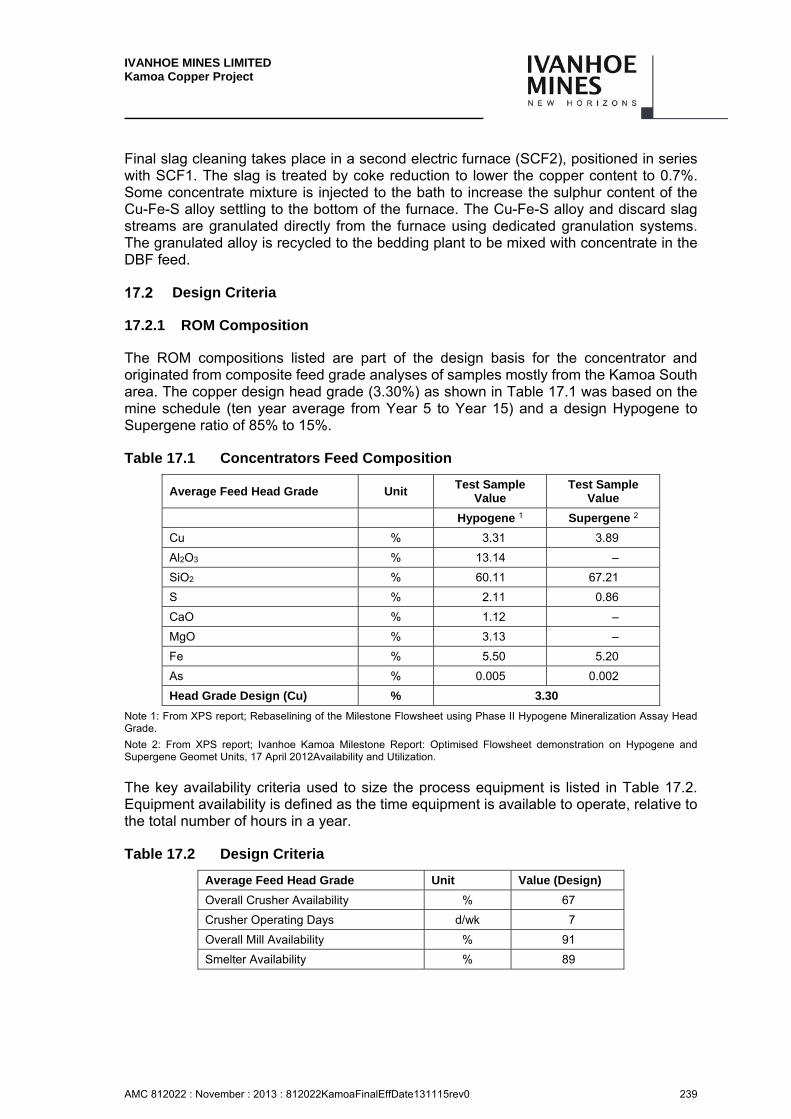
IVANHOE MINES LIMITED Kamoa Copper Project
AMC 812022 : November : 2013 : 812022KamoaFinalEffDate131115rev0 239
Final slag cleaning takes place in a second electric furnace (SCF2), positioned in series with SCF1. The slag is treated by coke reduction to lower the copper content to 0.7%. Some concentrate mixture is injected to the bath to increase the sulphur content of the Cu-Fe-S alloy settling to the bottom of the furnace. The Cu-Fe-S alloy and discard slag streams are granulated directly from the furnace using dedicated granulation systems. The granulated alloy is recycled to the bedding plant to be mixed with concentrate in the DBF feed.
Design Criteria
17.2.1 ROM Composition
The ROM compositions listed are part of the design basis for the concentrator and originated from composite feed grade analyses of samples mostly from the Kamoa South area. The copper design head grade (3.30%) as shown in Table 17.1 was based on the mine schedule (ten year average from Year 5 to Year 15) and a design Hypogene to Supergene ratio of 85% to 15%.
Table 17.1 Concentrators Feed Composition
Average Feed Head Grade Unit Test Sample
Value Test Sample
Value
Hypogene 1 Supergene 2
Cu % 3.31 3.89
Al2O3 % 13.14 –
SiO2 % 60.11 67.21
S % 2.11 0.86
CaO % 1.12 –
MgO % 3.13 –
Fe % 5.50 5.20
As % 0.005 0.002
Head Grade Design (Cu) % 3.30
Note 1: From XPS report; Rebaselining of the Milestone Flowsheet using Phase II Hypogene Mineralization Assay Head Grade.
Note 2: From XPS report; Ivanhoe Kamoa Milestone Report: Optimised Flowsheet demonstration on Hypogene and Supergene Geomet Units, 17 April 2012Availability and Utilization.
The key availability criteria used to size the process equipment is listed in Table 17.2. Equipment availability is defined as the time equipment is available to operate, relative to the total number of hours in a year.
Table 17.2 Design Criteria
Average Feed Head Grade Unit Value (Design)
Overall Crusher Availability % 67
Crusher Operating Days d/wk 7
Overall Mill Availability % 91
Smelter Availability % 89

IVANHOE MINES LIMITED Kamoa Copper Project
AMC 812022 : November : 2013 : 812022KamoaFinalEffDate131115rev0 240
These availability figures are in line with industry norms for these types of operations.
A utilisation of 100% was used for all calculations. Utilisation is defined as the percentage of the available time a piece of equipment evaluated is actually operating.
Concentrator Basis of Design
The concentrator design is based on an average head grade of 3.3% corresponding to the average head grade over the first 16 years of operation (Table 17.3). The ROM feed is taken to be 85% Hypogene and 15% Supergene based on the Life-of-Mine average. Any deviations from this head grade are accounted for by the 10% safety factor for the 3 Mtpa and a 5% safety factor for the 8 Mtpa concentrators.
Table 17.3 Concentrator Basis of Design
Option 3.0 Mtpa 8.0 Mtpa Source
ROM Feed (Mtpa) 3 8 AMBL
Feed Grade (% Cu) 3.3 3.3 AMBL
Safety Factor (%) 10 5 AMBL
Relative Abundance - U/G Hypogene (%) 85 85 AMBL
Relative Abundance - U/G Supergene (%) 15 15 AMBL
Concentrate Grade - U/G Hypogene (%) 37.01 37.01 TW
Concentrate Grade - U/G Supergene (%) 45.11 45.11 TW
Concentrate Grade – Blend (%) 38.00 38.00 CAL
Recovery - U/G Hypogene (%) 86.68 86.68 TW
Recovery - U/G Supergene (%) 83.20 83.20 TW
Recovery – Blend (%) 86.16 86.16 CAL
Mass Pull - U/G Hypogene (%) 7.7 7.7 CAL
Mass Pull - U/G Supergene (%) 6.1 6.1 CAL
Mass Pull – Blend (%) 7.5 7.5 CAL
Concentrate Production - Blend (ktpa) 224 599 CAL
Copper Production - Blend (ktpa) 84 223 CAL
Concentrate Production - U/G Hypogene (%) 88 88 CAL
Concentrate Production - U/G Supergene (%) 12 12 CAL
Future Concentrator Expansion Requirements
The PEA Mining Production Schedule indicates that the average copper head grade declines progressively over time. The two concentrator plants are designed for a combined ROM throughput capacity of 11 Mtpa. In order to sustain a smelter copper production of 300 ktpa, the combined concentrator ROM throughput needs to be increased progressively over time to keep pace with the declining head grade. The peak ROM throughput requirement is 14.9 Mtpa in 2046.
IVANHOE MINES LIMITED Kamoa Copper Project
AMC 812022 : November : 2013 : 812022KamoaFinalEffDate131115rev0 241
A preliminary assessment indicated that the installed total concentrator capacity of 11 Mtpa is sufficient for the first 10 years of operation (starting from the commissioning of the 3 Mtpa concentrator).
A preliminary assessment was conducted to determine what additional equipment may be required to handle the increased throughput (above 11 Mtpa), and this formed the basis for calculating the concentrator expansion costs as incorporated into the project financial calculations.
The current study contemplates two expansions of 2Mtpa each in years 9/10 and 21/22, respectively, to accommodate the increased mine production.
The expansion requirements of the concentrator capacity will be evaluated in further detail in the next study phase.
Concentrator Description
17.5.1 Receiving, Conveying, Stockpiling, and Crushing
Mineralized material will be conveyed from the primary crusher, situated underground, to the surface via an incline conveyor at each portal. A slewing stacker will provide the facility to discharge ROM material onto a pad (for emergency stockpiling in close vicinity) or directly onto an overland conveyor system for transfer of the material to the concentrator plant ROM stockpile.
The emergency stockpile at each portal is required to allow for continuous mining operations in the event of non-availability of downstream equipment up to the ROM stockpiles. A maximum emergency ROM stockpile capacity of 16 hours is envisaged at each portal. Material from this emergency ROM stockpile can be reclaimed and reintroduced onto the overland conveyor by means of a front end loader. If additional storage is required, material can be hauled from the emergency stockpile to the start-up / ramp up stockpile area at each portal.A start-up stockpile of around 1.5 Mt is required near the Kansoko Sud portal, to cater for early mining operations that commence two years before the first concentrator (3 Mtpa) is commissioned. Prior to the commissioning of the second concentrator (8 Mtpa), an additional stockpile is to be created close to the Kamoa Sud portal (ramp-up stockpile). Approximately 2.5 Mt of ROM material is to be stored at the Kamoa Sud and Kansoko Sud portals as a ramp-up stockpile. A feed system is allowed for on the overland ROM conveyor to load this stockpile material when it is required.
An overland ROM conveying system is installed from Kansoko Sud, up to the ROM stockpile for the 3 Mtpa concentrator. This conveyor system is sized to handle the full production from Kansoko Sud and the additional capacity when the Kamoa Sud and Kamoa Nord portals are brought into production.
The overland ROM conveying system will require three extensions:
Extension to tie into the the Kamoa Sud mining portal when it is started.
Extension with an additional feed conveyor to the 8 Mtpa concentrator ROM stockpile, for start-up of the second concentrator.
IVANHOE MINES LIMITED Kamoa Copper Project
AMC 812022 : November : 2013 : 812022KamoaFinalEffDate131115rev0 242
Extension to tie into the the Kamoa Nordmining portal when it is started.
Separate ROM stockpiles are required for the 3 Mtpa and 8 Mtpa concentrators, both allowing 24 hours live storage capacity. Mineralized material is withdrawn from the ROM stockpile via feeders and conveyed to the secondary screen. The secondary screen oversize is conveyed to the secondary crusher feed bin, which is designed to ensure a continuous feed to a single cone crusher.
Secondary screen undersize, secondary crusher product and tertiary crusher product are combined on the conveyor feeding the tertiary screens feed bins. A total of five tertiary screens are required for the 8 Mtpa option and two for the 3 Mtpa option.
The tertiary screen oversize (+12 mm) is conveyed to the tertiary cone crushers feed bins which feed the one tertiary cone crusher in the 3 Mtpa concentrator and the three in the 8 Mtpa concentrator. To ensure choke feed conditions, each crusher (secondary and tertiary), is preceded by a surge bin and is fed with a variable speed vibrating feeder.
The tertiary screen undersize (-12 mm) feeds the mill feed stockpile (one stockpile for each option, each with a 12-hour live capacity. Mineralized material (with a particle size of P80 = 9mm), is withdrawn from the mill feed stockpile via feeders to feed the primary ball mills (one mill for the 3 Mtpa concentrator, and two mills for the 8 Mtpa concentrator). There is a primary mill feed weightometer on each of the feed conveyors to the primary mills.
All fine spillage from the crushing circuit is pumped to the primary mill discharge sump whilst coarse particles are prevented from entering the spillage pump and can be cleaned up manually.
17.5.2 Primary Milling
Crushed mineralized material (-12 mm) is fed into the ball mills (one overflow mill, 22 ft Ø x 36 ft EGL, 8.8 MW installed power for the 3 Mtpa concentrator and two overflow mills, both 23 ft Ø x 39 ft EGL, 11 MW installed power for the 8 Mtpa concentrator). Each mill has a fixed speed dual pinion drive, with an operating speed of 75% Net Critical Speed (NCs). The design ball charge is 35% with a maximum operating charge of 40%.
The mill discharge trommel screen oversize reports to the scats bin and the primary mill product (trommel undersize) gravitates to the mill discharge sump. The trommel undersize is diluted with process water before being pumped to the classification cyclone cluster with a variable speed cyclone feed pump. The mill operates in closed circuit with hydrocyclones with a 250% nominal recirculating load (design 300%). The cyclone overflow (P80 of 75 µm) gravitates to the primary rougher feed surge tank at a slurry density of about 30% solids, equivalent to 1.3 t/m3.
IVANHOE MINES LIMITED Kamoa Copper Project
AMC 812022 : November : 2013 : 812022KamoaFinalEffDate131115rev0 243
17.5.3 Secondary Milling
Primary rougher flotation tails are pumped to the secondary mill densifying cyclones. The underflow of the densifier feeds the secondary ball mill (one overflow mill, 17 ft Ø x 29 ft EGL with a single pinion fixed speed 4 MW drive for the 3 Mtpa concentrator, and one overflow mill, 22 ft Ø x 37 ft EGL with a dual pinion fixed speed 10 MW drive for the 8 Mtpa concentrator). Mills operate at a critical speed of 75% NCs. The design ball charge is 35% with a maximum operating charge of 40%.
The mill discharge trommel screen oversize reports to the scats bin and the secondary mill product (trommel undersize) gravitates to the mill discharge sump. The trommel undersize is diluted with the densifying cyclones overflow before being pumped to the secondary classification cyclone cluster.
The mill operates in closed circuit with the classifying hydrocyclones with a 250% nominal recirculating load (design 300%). The classifying cyclone overflow (P80 of 38 µm) gravitates to the secondary rougher feed surge tank at a slurry density of 30% solids, which is equivalent to 1.3 t/m3.
17.5.4 Primary and Secondary Milling Media
The media used for both ball mills is high chrome steel with the secondary mill balls being smaller diameter (35 mm) than the primary mill balls (60 mm). Steel balls are added to all mills using a ball charger (onto the feed belt for the primary mills and the densifier cyclone underflow feed hopper for the secondary mills). A dedicated ball kibble, magnet, and hoist arrangement is used to keep the charger hopper filled with mill steel. This is a semi-automated operation and steel is added as required. Spillage from the respective milling circuits reports to the corresponding mill discharge sumps. Scats from both mills, typically worn media and a small amount of oversize rock particles, are discharged into respective kibbles for circuit removal.
17.5.5 Flotation Circuit General
Froth collection launders and piping are designed to incorporate flexibility with regards to the routing of the various streams.
Spillage generated within the respective rougher flotation circuits is pumped to the corresponding rougher feed surge tanks or the mill discharge sumps. Spillage from the cleaner circuit is pumped to the regrind mill feed sump. Flows are measured using magnetic flow meters where applicable. All flotation cells incorporate a master/slave configuration for dart valves. The air flow into each cell is controlled via the SCADA system.
17.5.6 Primary and Secondary Rougher Flotation Circuit
Primary mill cyclone overflow passes over two parallel linear screens to remove woodchips from the underground mine. The screen undersize reports to the rougher feed surge tank with a residence time of 10 minutes. This is sufficient residence time to allow for reagent conditioning and to smooth the flotation feed flow rate in the short term i.e. mitigation of volumetric surges.

IVANHOE MINES LIMITED Kamoa Copper Project
AMC 812022 : November : 2013 : 812022KamoaFinalEffDate131115rev0 244
Collector is added to the cyclone overflow launder ahead of the surge tank and frother is added to the surge tank discharge into the first rougher cell.
The flotation feed is pumped via two pumps (one operating, one standby – both Variable Speed Drive, VSD) to the rougher flotation bank. A vezin sampler arrangement is configured to sample the flotation feed. Secondary mill cyclone overflow reports to the secondary rougher feed surge tank. Frother and collector are also added to this tank. The flotation feed is pumped via two pumps (one operating, one standby – both VSD) to the secondary rougher flotation bank.
The primary rougher bank consists of nine, 200 m3 cells for the 8 Mtpa and ten 70 m3 cells for the 3 Mtpaconcentrators. Each bank has a collective residence time of 50 minutes (mass pull approximately 15%). The primary rougher tails are pumped to the secondary mill discharge sump.
The secondary rougher bank consists of seven, 200 m3 cells for the 8 Mtpa plant and eight 70 m3 cells for the 3 Mtpa concentrators with a collective residence time of 37.5 minutes (mass pull approximately 8%). The scavenger tails are pumped to the final tails thickener.
17.5.7 Concentrate Regrind Mills
Primary Rougher Concentrate
The rougher concentrate reports to the regrind mill circuit. The type of mill selected for this application is the Isamill. Three (3) fixed speed models will be used: the M10000 IsaMill with 3000 kW installed power, the M5000 Isamill with 1500 kW installed power, and the M3000 IsaMill with 800 kW installed power. The 3 Mtpa plant uses one M5000 and one M3000 in the primary regrind application while the 8 Mtpa uses two M10000 in the same application. The regrind mill duty and equipment selection will be confirmed during a later study phase after detailed testwork and trade off studies have been conducted.
The combined primary rougher concentrates are pumped via froth pumps to a tank before being pumped to densifying hydrocyclones. The densifying cyclones produce an underflow density of 50% solids, suitable for IsaMill feed. The cyclone overflow and the regrind mill product are combined in a sump before being pumped to the cleaners. Ceramic grinding media is used in the IsaMill. The P80 of the rougher regrind mill circuit is 15 µm.
Secondary Rougher Concentrate
The secondary rougher concentrate and the re-cleaner tail report to the second regrind mill circuit. The type of mill selected for this application is expected to be comparable to that selected for the primary rougher concentrate regrind. The regrind mill duty and equipment selection will be confirmed during a later study phase after detailed testwork and trade off studies have been conducted.
IVANHOE MINES LIMITED Kamoa Copper Project
AMC 812022 : November : 2013 : 812022KamoaFinalEffDate131115rev0 245
The combined secondary rougher concentrates and the re-cleaner tails are pumped via froth pumps to a tank before being pumped to densifying hydrocyclones. The densifying cyclones produce an underflow density of 50% solids, suitable for IsaMill feed. The cyclone overflow and the regrind mill product are combined in a sump before being pumped to the cleaners. Ceramic media is used. The 3 Mtpa plant uses one M5000 and one M3000 in the secondary regrind application while the 8 Mtpa will use two M10000 and one M3000 in the same application. The P80 of the secondary regrind mill circuit is 10 µm.
Cleaner Circuit Configuration
The rougher and secondary rougher concentrates report separately to cleaning circuits (cleaning and scavenging with re-cleaning at both stages), as shown in Figure 17.1. Frother and collector are added to the head of each bank. The rougher regrind mill product and the densifying cyclone overflow are combined and pumped to the rougher cleaner bank, consisting of a primary bank and a scavenger bank. The rougher scavenger cleaner tails are pumped to the final tails thickener.
The primary and scavenger concentrates are combined and pumped to the re-cleaner bank. The re-cleaner concentrate is pumped to the final concentrate thickener. The re-cleaner tails, along with the secondary rougher concentrate, are transferred to the secondary rougher regrind mill, the product of which is fed to the secondary rougher cleaner bank.
The secondary rougher cleaner concentrate is re-cleaned and is pumped to the final concentrate thickener. The tails from both the secondary rougher cleaner banks (cleaner and re-cleaner) are pumped to the final tails thickener. Automatic samplers are included on the tails of each flotation bank and the circuit is to be designed to facilitate manual sampling of the concentrate from each cell. A further automatic sampler is included for sampling the combined final concentrate.
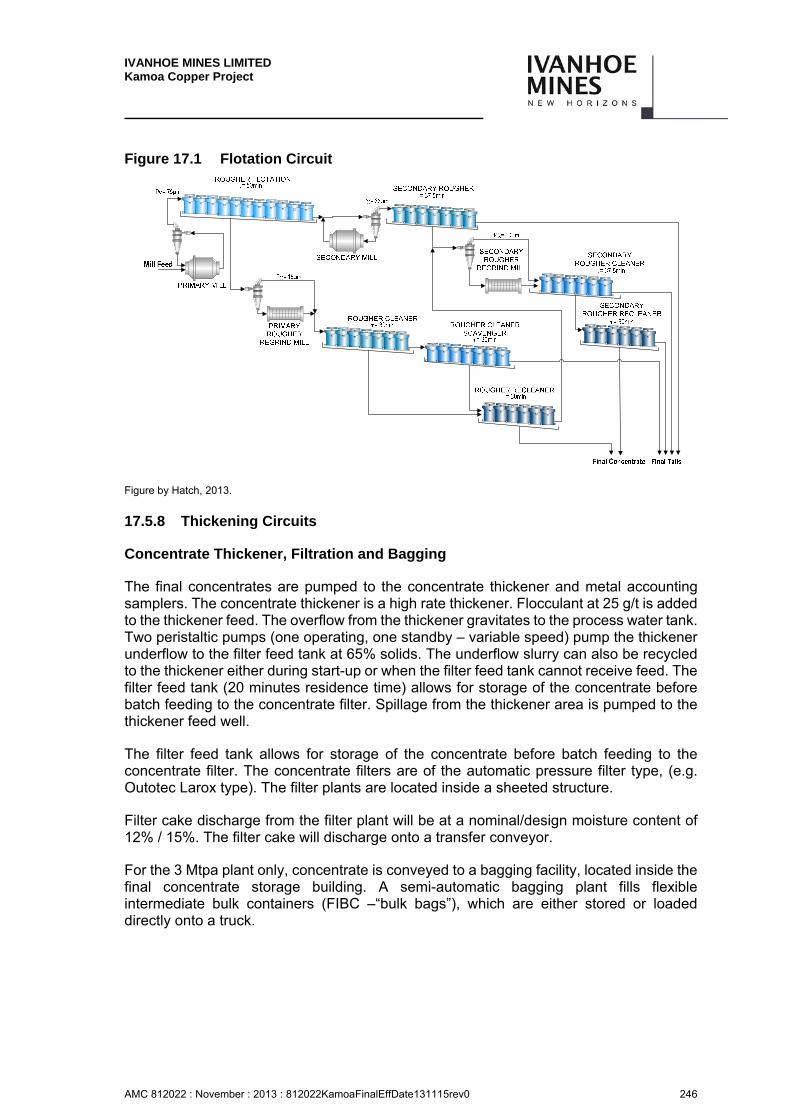
IVANHOE MINES LIMITED Kamoa Copper Project
AMC 812022 : November : 2013 : 812022KamoaFinalEffDate131115rev0 246
Figure 17.1 Flotation Circuit
Figure by Hatch, 2013.
17.5.8 Thickening Circuits
Concentrate Thickener, Filtration and Bagging
The final concentrates are pumped to the concentrate thickener and metal accounting samplers. The concentrate thickener is a high rate thickener. Flocculant at 25 g/t is added to the thickener feed. The overflow from the thickener gravitates to the process water tank. Two peristaltic pumps (one operating, one standby – variable speed) pump the thickener underflow to the filter feed tank at 65% solids. The underflow slurry can also be recycled to the thickener either during start-up or when the filter feed tank cannot receive feed. The filter feed tank (20 minutes residence time) allows for storage of the concentrate before batch feeding to the concentrate filter. Spillage from the thickener area is pumped to the thickener feed well.
The filter feed tank allows for storage of the concentrate before batch feeding to the concentrate filter. The concentrate filters are of the automatic pressure filter type, (e.g. Outotec Larox type). The filter plants are located inside a sheeted structure.
Filter cake discharge from the filter plant will be at a nominal/design moisture content of 12% / 15%. The filter cake will discharge onto a transfer conveyor.
For the 3 Mtpa plant only, concentrate is conveyed to a bagging facility, located inside the final concentrate storage building. A semi-automatic bagging plant fills flexible intermediate bulk containers (FIBC –“bulk bags”), which are either stored or loaded directly onto a truck.
IVANHOE MINES LIMITED Kamoa Copper Project
AMC 812022 : November : 2013 : 812022KamoaFinalEffDate131115rev0 247
Once the 8 Mtpa concentrator and smelter are commissioned, the concentrate from the 3 Mtpa concentrate filtration plant will be conveyed to the smelter plant, together with concentrate from the 8 Mtpa plant. This will require the addition of new transfer conveyor/s.
Tailings Thickener
The secondary rougher tails and the various tailings from the cleaner circuits are collected in a central sump and pumped to the tailings thickener via a guard cyclone and metal accounting samplers. Various reagent spillage streams are also pumped to the tailings thickener. The tails thickener is a high rate thickener. Flocculant at 50 g/t is added to the thickener feed. The overflow from the thickener gravitates to the process water tank. Underflow is collected in a sump before centrifugal pumps deliver the final tailings to the tailings dam at 50% solids (via an intermediate booster pump station and mine backfilling plants). The slurry can also be recycled to the thickener either during start-up or when the tailings system is unavailable. Spillage from the thickener area is pumped to the thickener feed well. The final tails stream is sampled for metal accounting purposes before it enters the tailings thickener.
17.5.9 Reagents, Services and Utilities
The Phase1 concentrator (3 Mtpa), is provided for as a stand alone unit in terms of reagents, services and utilities. The Phase 2 concentrator (8 Mtpa) is commissioned at the same time as the smelter complex and share raw water and compressed air supply.
Reagent plants, located close to the flotation circuit, provide for the mixing and supply of the necessary reagents for flotation. Individual peristaltic pumps and piping are installed for the addition point of each reagent.
Dedicated blowers supply manifold air for the flotation cells.
Raw water from a wellfield is collected and stored in a raw water dam. Filtration and treatment plants produce a range of water qualities as required for potable water, gland seal water, boiler feed water, cooling water, granulation water, fire water and process water usage. Distribution systems for each water type are included, ensuring delivery of sufficient quantity at the required pressure.
Compressed air is supplied and distributed for the use of general plant requirements and filter presses. A dried air (dew point <0°C) supply is available for air actuated instruments and valves.
17.5.10 Concentrator Equipment Specifications and List
Table 17.4 and Table 17.5 provide a summary of the major mechanical equipment for the proposed 3 Mtpa and 8 Mtpa concentrators respectively. This list forms the basis of the concentrator capital cost estimate.
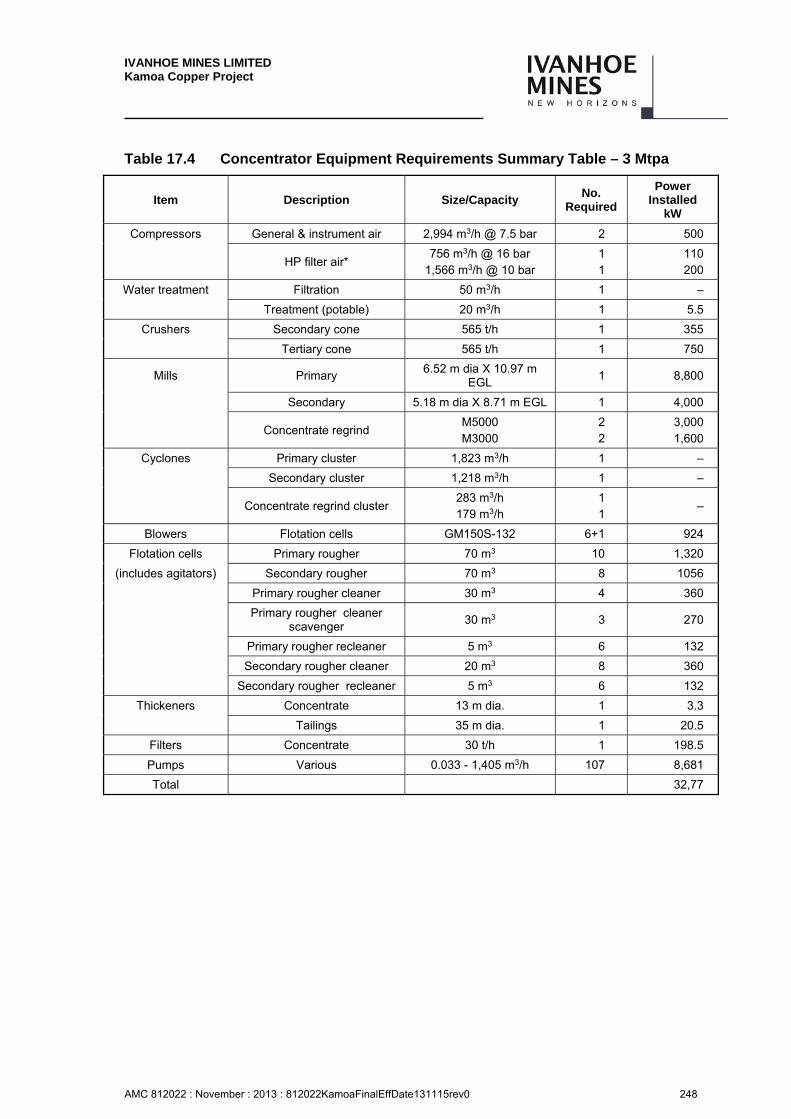
IVANHOE MINES LIMITED Kamoa Copper Project
AMC 812022 : November : 2013 : 812022KamoaFinalEffDate131115rev0 248
Table 17.4 Concentrator Equipment Requirements Summary Table – 3 Mtpa
Item Description Size/Capacity No.
Required
Power Installed
kW
Compressors General & instrument air 2,994 m3/h @ 7.5 bar 2 500
HP filter air* 756 m3/h @ 16 bar
1,566 m3/h @ 10 bar 1 1
110 200
Water treatment Filtration 50 m3/h 1 –
Treatment (potable) 20 m3/h 1 5.5
Crushers Secondary cone 565 t/h 1 355
Tertiary cone 565 t/h 1 750
Mills Primary 6.52 m dia X 10.97 m
EGL 1 8,800
Secondary 5.18 m dia X 8.71 m EGL 1 4,000
Concentrate regrind M5000 M3000
2 2
3,000 1,600
Cyclones Primary cluster 1,823 m3/h 1 –
Secondary cluster 1,218 m3/h 1 –
Concentrate regrind cluster 283 m3/h 179 m3/h
1 1
–
Blowers Flotation cells GM150S-132 6+1 924
Flotation cells Primary rougher 70 m3 10 1,320
(includes agitators) Secondary rougher 70 m3 8 1056
Primary rougher cleaner 30 m3 4 360
Primary rougher cleaner
scavenger 30 m3 3 270
Primary rougher recleaner 5 m3 6 132
Secondary rougher cleaner 20 m3 8 360
Secondary rougher recleaner 5 m3 6 132
Thickeners Concentrate 13 m dia. 1 3.3
Tailings 35 m dia. 1 20.5
Filters Concentrate 30 t/h 1 198.5
Pumps Various 0.033 - 1,405 m3/h 107 8,681
Total 32,77
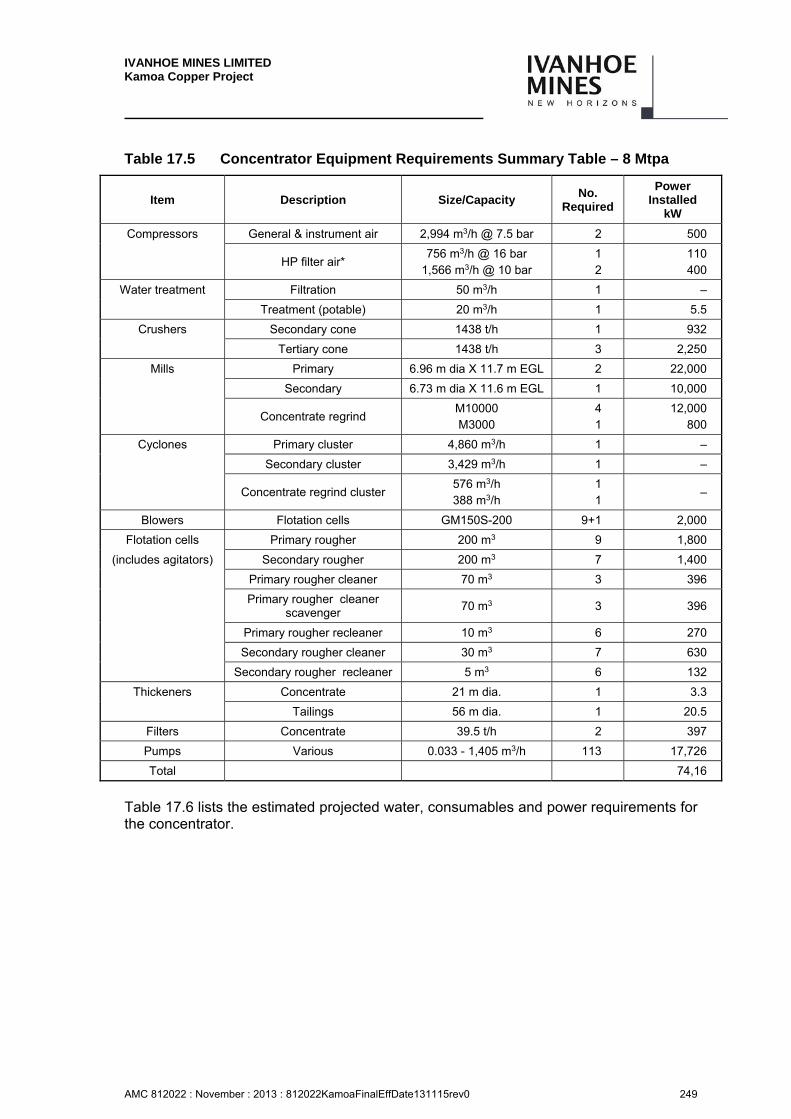
IVANHOE MINES LIMITED Kamoa Copper Project
AMC 812022 : November : 2013 : 812022KamoaFinalEffDate131115rev0 249
Table 17.5 Concentrator Equipment Requirements Summary Table – 8 Mtpa
Item Description Size/Capacity No.
Required
Power Installed
kW
Compressors General & instrument air 2,994 m3/h @ 7.5 bar 2 500
HP filter air* 756 m3/h @ 16 bar
1,566 m3/h @ 10 bar 1 2
110 400
Water treatment Filtration 50 m3/h 1 –
Treatment (potable) 20 m3/h 1 5.5
Crushers Secondary cone 1438 t/h 1 932
Tertiary cone 1438 t/h 3 2,250
Mills Primary 6.96 m dia X 11.7 m EGL 2 22,000
Secondary 6.73 m dia X 11.6 m EGL 1 10,000
Concentrate regrind M10000 M3000
4 1
12,000 800
Cyclones Primary cluster 4,860 m3/h 1 –
Secondary cluster 3,429 m3/h 1 –
Concentrate regrind cluster 576 m3/h 388 m3/h
1 1
–
Blowers Flotation cells GM150S-200 9+1 2,000
Flotation cells Primary rougher 200 m3 9 1,800
(includes agitators) Secondary rougher 200 m3 7 1,400
Primary rougher cleaner 70 m3 3 396
Primary rougher cleaner
scavenger 70 m3 3 396
Primary rougher recleaner 10 m3 6 270
Secondary rougher cleaner 30 m3 7 630
Secondary rougher recleaner 5 m3 6 132
Thickeners Concentrate 21 m dia. 1 3.3
Tailings 56 m dia. 1 20.5
Filters Concentrate 39.5 t/h 2 397
Pumps Various 0.033 - 1,405 m3/h 113 17,726
Total 74,16
Table 17.6 lists the estimated projected water, consumables and power requirements for the concentrator.
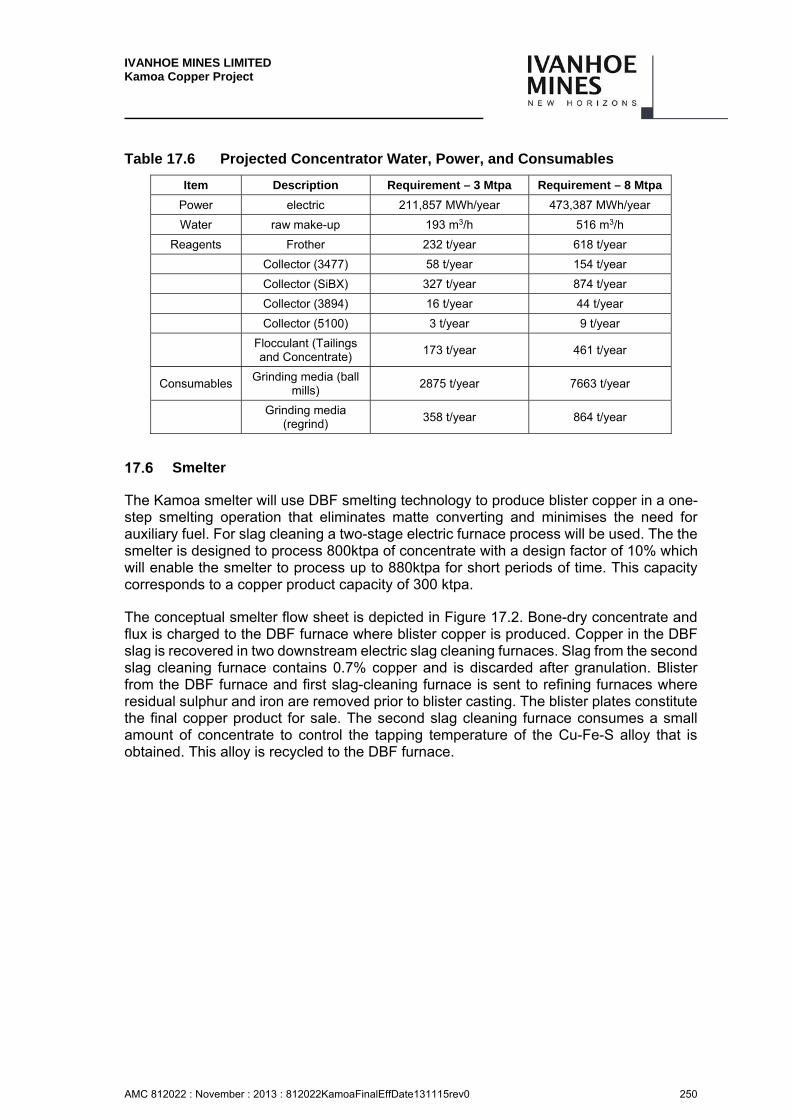
IVANHOE MINES LIMITED Kamoa Copper Project
AMC 812022 : November : 2013 : 812022KamoaFinalEffDate131115rev0 250
Table 17.6 Projected Concentrator Water, Power, and Consumables
Item Description Requirement – 3 Mtpa Requirement – 8 Mtpa
Power electric 211,857 MWh/year 473,387 MWh/year
Water raw make-up 193 m3/h 516 m3/h
Reagents Frother 232 t/year 618 t/year
Collector (3477) 58 t/year 154 t/year
Collector (SiBX) 327 t/year 874 t/year
Collector (3894) 16 t/year 44 t/year
Collector (5100) 3 t/year 9 t/year
Flocculant (Tailings and Concentrate)
173 t/year 461 t/year
Consumables Grinding media (ball
mills) 2875 t/year 7663 t/year
Grinding media
(regrind) 358 t/year 864 t/year
Smelter
The Kamoa smelter will use DBF smelting technology to produce blister copper in a one-step smelting operation that eliminates matte converting and minimises the need for auxiliary fuel. For slag cleaning a two-stage electric furnace process will be used. The the smelter is designed to process 800ktpa of concentrate with a design factor of 10% which will enable the smelter to process up to 880ktpa for short periods of time. This capacity corresponds to a copper product capacity of 300 ktpa.
The conceptual smelter flow sheet is depicted in Figure 17.2. Bone-dry concentrate and flux is charged to the DBF furnace where blister copper is produced. Copper in the DBF slag is recovered in two downstream electric slag cleaning furnaces. Slag from the second slag cleaning furnace contains 0.7% copper and is discarded after granulation. Blister from the DBF furnace and first slag-cleaning furnace is sent to refining furnaces where residual sulphur and iron are removed prior to blister casting. The blister plates constitute the final copper product for sale. The second slag cleaning furnace consumes a small amount of concentrate to control the tapping temperature of the Cu-Fe-S alloy that is obtained. This alloy is recycled to the DBF furnace.
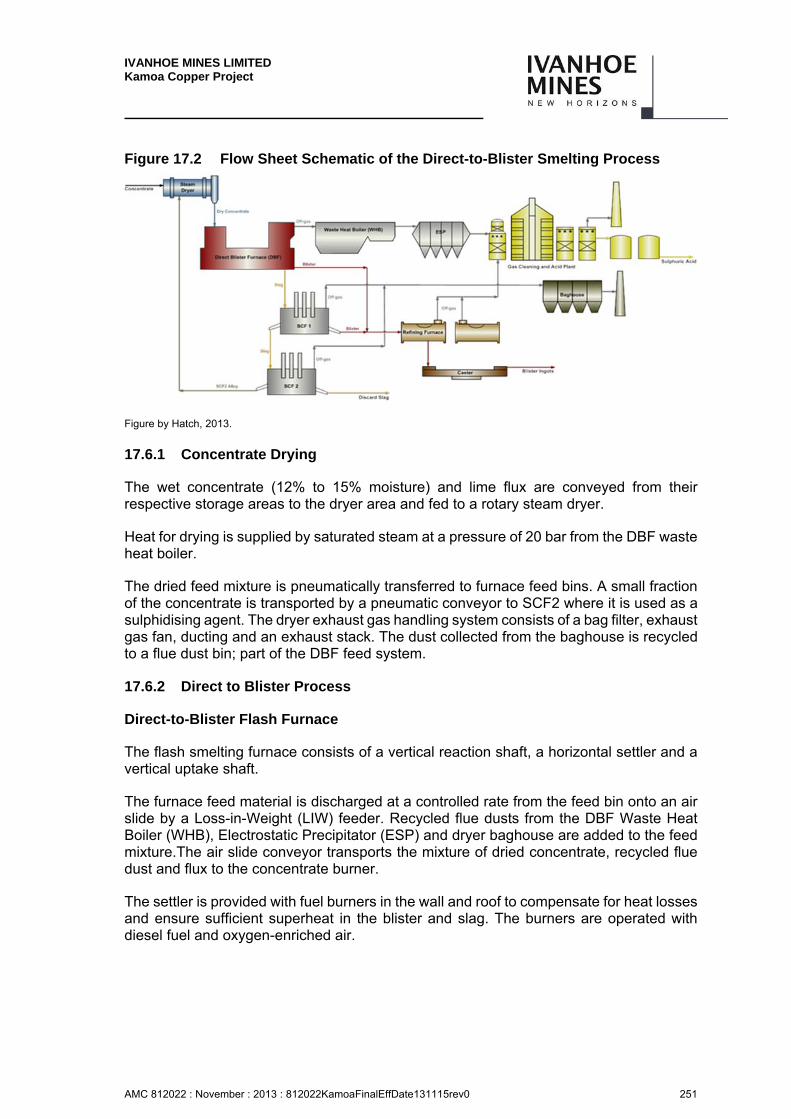
IVANHOE MINES LIMITED Kamoa Copper Project
AMC 812022 : November : 2013 : 812022KamoaFinalEffDate131115rev0 251
Figure 17.2 Flow Sheet Schematic of the Direct-to-Blister Smelting Process
Figure by Hatch, 2013.
17.6.1 Concentrate Drying
The wet concentrate (12% to 15% moisture) and lime flux are conveyed from their respective storage areas to the dryer area and fed to a rotary steam dryer.
Heat for drying is supplied by saturated steam at a pressure of 20 bar from the DBF waste heat boiler.
The dried feed mixture is pneumatically transferred to furnace feed bins. A small fraction of the concentrate is transported by a pneumatic conveyor to SCF2 where it is used as a sulphidising agent. The dryer exhaust gas handling system consists of a bag filter, exhaust gas fan, ducting and an exhaust stack. The dust collected from the baghouse is recycled to a flue dust bin; part of the DBF feed system.
17.6.2 Direct to Blister Process
Direct-to-Blister Flash Furnace
The flash smelting furnace consists of a vertical reaction shaft, a horizontal settler and a vertical uptake shaft.
The furnace feed material is discharged at a controlled rate from the feed bin onto an air slide by a Loss-in-Weight (LIW) feeder. Recycled flue dusts from the DBF Waste Heat Boiler (WHB), Electrostatic Precipitator (ESP) and dryer baghouse are added to the feed mixture.The air slide conveyor transports the mixture of dried concentrate, recycled flue dust and flux to the concentrate burner.
The settler is provided with fuel burners in the wall and roof to compensate for heat losses and ensure sufficient superheat in the blister and slag. The burners are operated with diesel fuel and oxygen-enriched air.
IVANHOE MINES LIMITED Kamoa Copper Project
AMC 812022 : November : 2013 : 812022KamoaFinalEffDate131115rev0 252
Copper cooling elements are installed in the reaction shaft walls, settler walls, settler roof, uptake shaft and tapholes. Cooling water flows in a closed circuit and is continuously cooled by heat exchangers.
The bottom of the settler is cooled with hearth cooling air fans to prevent blister penetration in the hearth lining.
Flash Smelting Process
The dry charge mixture and oxygen-enriched air form a homogeneous suspension in the reaction shaft. As the suspension moves down the reaction shaft, the concentrate dissociates, ignites and undergoes controlled partial oxidation generating a large amount of heat, which melts the partially oxidised concentrate and gangue minerals.
The reaction shaft temperature is controlled by the oxygen enrichment of process air and the combustion of diesel fuel injected through the reaction shaft lance. To compensate for heat losses in the settler, diesel fuel is fed through the burners located in the settler roof. The extent of sulphide oxidation (i.e. the sulphur content of blister copper) is controlled by the ratio of oxygen to concentrate.
At the bottom of the reaction shaft, the flow of the gas particle stream is deflected by 90° as the gas flows along the settler. Most of the molten matte/slag droplets settle from the gas stream and collect in a molten bath where the oxidation reactions run to completion. The immiscible slag and blister phases separate and form two layers in the settler according to their specific densities.
The process is operated under highly oxidizing conditions resulting in blister copper with a sulphur content below 1%. Consequently, the copper content of slag is in the range of 18%. More than half of the primary copper in the concentrate is recovered in the DBF blister product.
Blister is periodically tapped through launders to the refining furnaces. The slag is tapped through tap holes in the side wall of the settler and transferred by launder to the first electric slag cleaning furnace (SCF1).
17.6.3 Slag Cleaning
Molten slag is transferred via launder from the DBF to SCF1. Reverts are recycled to SCF1. Coke is used to recover oxidised copper from the slag and control magnetite formation. SCF1 generates blister grade copper. The molten slag from SCF1 is transferred via launder to the second slag cleaning furnace (SCF2) where coke and a small amount of concentrate are added. Copper-iron alloy containing a small amount of sulphur is tapped from SCF2 and granulated for recycle to the DBF. The granulated alloy is blended and dried with the concentrate.
Slag containing about 0.7% copper is granulated and discarded.
IVANHOE MINES LIMITED Kamoa Copper Project
AMC 812022 : November : 2013 : 812022KamoaFinalEffDate131115rev0 253
SCF Feed System
The feed system consists of five feed bins for coke and reverts. The bins are filled intermittently by a common feed system. Material from the feed bin is discharged, weighed and dosed batch-wise into the furnace using vibrating feeders. The weighed coke batch is discharged into the furnace via the feed chutes located on the furnace roof. Ventilation air from the furnace roof hoods is collected and used as dilution air in the water-cooled off-gas incinerators.
Slag Cleaning Furnaces
The two electric furnaces have a conventional design with sufficient sidewall and hearth cooling to dissipate process heat fluxes.
In the first furnace (SCF1) the copper content of slag is reduced to 4%. Coke is used to reduce ferric iron to ferrous iron to control magnetite formation. Copper separates from the slag as blister, which is transferred to the refining furnaces. Slag is laundered to SCF2 for further copper recovery.
In SCF2 more copper is reduced from the slag through the addition of coke. A small amount of concentrate is added to control the liquidus temperature of the copper-iron alloy that is obtained. Concentrate is taken from the storage bin by screw feeders to a pressure feeder and then conveyed with compressed air via tubes to lances immersed in the slag. Sulphidising is carried out batch-wise, one batch for each slag reduction cycle.
The stripped slag contains less than% copper and is discarded after granulation.
The sulphidised Cu-Fe alloy is granulated after tapping and recycled to the DBF.
17.6.4 Refining Furnaces and Blister Casting
Refining Furnaces
In the refining furnaces, blister from the DBF and SCF1 is oxidised to remove residual sulphur and iron before casting of the blister plates. The reduction step that follows oxidation in the refining of anode copper will not be required because the product will be blister copper.
Oxidation is carried out by blowing air through tuyères (gas injection ports) into molten copper. After oxidation the oxygen content of the blister copper is about 0.8%. The slag that forms during refining is skimmed off and recycled to SCF1.
IVANHOE MINES LIMITED Kamoa Copper Project
AMC 812022 : November : 2013 : 812022KamoaFinalEffDate131115rev0 254
Blister Casting
The blister casting system comprises an intermediate ladle, casting ladle on automated load cells, blister casting wheels with blister moulds, take-off devices and cooling tanks. Casting is initiated when one of the refining furnaces is tilted to discharge blister via an intermediate ladle to a casting ladle on load cells. The casting ladle casts the copper into two casting moulds concentrically located in the casting wheel. After casting, the plates are cooled under water sprays before they are removed for final cooling in a cooling tank. Blister plates are lifted by a crane from the cooling tank to temporary storage (10-day storage capacity) and dispatch.
17.6.5 Gas Handling
The DBF process gas flows upwards through the uptake shaft and then to a waste heat boiler (WHB) for cooling. Part of the flue dust is separated from the gas stream in the WHB. The gas flows to an electrostatic precipitator (ESP) where the remaining dust is recovered.
During cooling in the WHB, the oxidic flue dust tends to form sulphates. To control the rate of sulphate formation, sulphation air and oxygen are drawn into the WHB in a controlled fashion.
The de-dusted gas is routed to a wet gas cleaning plant (WGCP) and eventually a sulphuric acid plant (SAP) to capture sulphur dioxide (SO2) and sulphur trioxide (SO3).
Wet Gas Cleaning Plant
After the ESP, the gas is further cooled in a quench tower/particulate scrubber. The quench tower / particulate scrubber uses intimate mixing of the off-gas and scrubbing liquor to cool the gas to its adiabatic saturation temperature and remove particulates from the gas stream. The quench tower/particulate scrubber partially removes water soluble constituents, such as chlorides and SO3 to form weak acidic blowdown.
The clean DBF scrubber off-gas is combined with the refining furnace scrubber off-gas and directed to the packed gas cooling tower which reduces the temperature of the off-gas through direct cooling as the off-gas passes over a bed of wetted packing media in the cooler. As the gas cools, water vapour is condensed and recycled to the quench tower/particulate scrubber, then bled from the system through a condensate collection tank. The coolant within the packed gas cooler is a re-circulating weak acid that is distributed over the packing, collected at the bottom of the tower and then pumped through plate heat exchangers back to the distributor.
The packed gas cooler plate heat exchangers cool the weak acid through heat exchange with cooling water supplied from an evaporative cooling tower. Gas exiting the packed cooler is further cleaned in Wet Electrostatic Precipitators (WESPs) in order to meet inlet criteria for the acid plant such as particulate, acid mist concentration, and temperature. The WESPs removes acid mist and fine dust from the off-gas.
IVANHOE MINES LIMITED Kamoa Copper Project
AMC 812022 : November : 2013 : 812022KamoaFinalEffDate131115rev0 255
Refining Furnace Gas Handling
SO2 containing gas from the refining furnaces is directly cooled in a quench/particulate scrubber. Draft is provided from a wet gas fan downstream from the quencher/scrubber. The outlet of the fan connects to a duct that is directed to the packed gas cooler / gas cooling tower to be mixed with quenched DBF off-gas.
Off-Gas and Ventilation Gas Handling
SCF1 and SCF 2 off-gases are post-combusted and diluted in the off-gas incinerator. Combustion and dilution of the off-gas is carried out using air and collected ventilation gases. The combusted and diluted SCF off-gas is further cooled by mixing in the ventilation gas collected from the DBF and casting areas. The gas is then cleaned in a bag filter and finally discharged via a stack.
17.6.6 Sulphuric Acid Plant
The function of the sulphuric acid plant is to receive the SO2 and SO3 containing process gases from the direct-to-blister and refining furnaces and to produce concentrated sulphuric acid from these gases.
The sulphuric acid process consists of the following four principal steps:
Gas cleaning.
Drying of the SO2 gas.
Conversion of SO2 to SO3 according to the reaction: SO2 + 1/2 O2 <=> SO3.
Absorption of the SO3 gas by combining with water (H2O) to form a solution of 98.5% sulphuric acid (H2SO4) according to the chemical reaction:
– SO3 + H2O => H2SO4.
A conventional double contact, double absorption (DCDA) acid plant will be used.
Off-gas from the wet gas cleaning plant has a combined flowrate of 45,000 to 85,000 Nm3/h with an SO2 content of 20 % to 25% depending on the sulphur content of the concentrate and operation of the refining furnaces.
The gas contact section operates with a design flow of 150,000 Nm3/h at 12 volume % of SO2.
The refining furnace off-gas also serves as an additional oxygen source for the sulphuric acid plant providing the required oxygen for the sulphur dioxide to sulphur trioxide conversion reaction. Additional atmospheric air is added via the drying tower to ensure a maximum SO2 content of 12% and a suitable oxygen to SO2 ratio.
The estimated average sulphuric acid production is 1,600 tpd, with a plant design of 1,800 tpd. The product quality is 98.5% sulphuric acid. Sulphuric acid product storage has been set at 10 days.
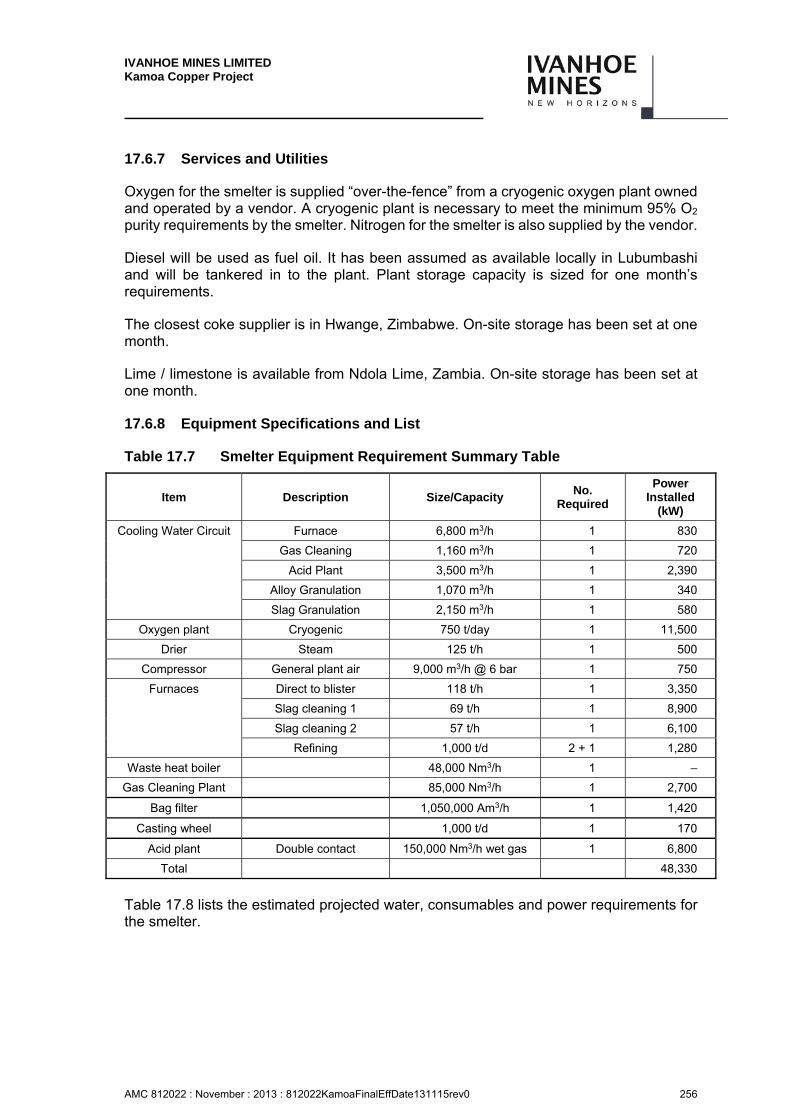
IVANHOE MINES LIMITED Kamoa Copper Project
AMC 812022 : November : 2013 : 812022KamoaFinalEffDate131115rev0 256
17.6.7 Services and Utilities
Oxygen for the smelter is supplied “over-the-fence” from a cryogenic oxygen plant owned and operated by a vendor. A cryogenic plant is necessary to meet the minimum 95% O2 purity requirements by the smelter. Nitrogen for the smelter is also supplied by the vendor.
Diesel will be used as fuel oil. It has been assumed as available locally in Lubumbashi and will be tankered in to the plant. Plant storage capacity is sized for one month’s requirements.
The closest coke supplier is in Hwange, Zimbabwe. On-site storage has been set at one month.
Lime / limestone is available from Ndola Lime, Zambia. On-site storage has been set at one month.
17.6.8 Equipment Specifications and List
Table 17.7 Smelter Equipment Requirement Summary Table
Item Description Size/Capacity No.
Required
Power Installed
(kW)
Cooling Water Circuit Furnace 6,800 m3/h 1 830
Gas Cleaning 1,160 m3/h 1 720
Acid Plant 3,500 m3/h 1 2,390
Alloy Granulation 1,070 m3/h 1 340
Slag Granulation 2,150 m3/h 1 580
Oxygen plant Cryogenic 750 t/day 1 11,500
Drier Steam 125 t/h 1 500
Compressor General plant air 9,000 m3/h @ 6 bar 1 750
Furnaces Direct to blister 118 t/h 1 3,350
Slag cleaning 1 69 t/h 1 8,900
Slag cleaning 2 57 t/h 1 6,100
Refining 1,000 t/d 2 + 1 1,280
Waste heat boiler 48,000 Nm3/h 1 –
Gas Cleaning Plant 85,000 Nm3/h 1 2,700
Bag filter 1,050,000 Am3/h 1 1,420
Casting wheel 1,000 t/d 1 170
Acid plant Double contact 150,000 Nm3/h wet gas 1 6,800
Total 48,330
Table 17.8 lists the estimated projected water, consumables and power requirements for the smelter.
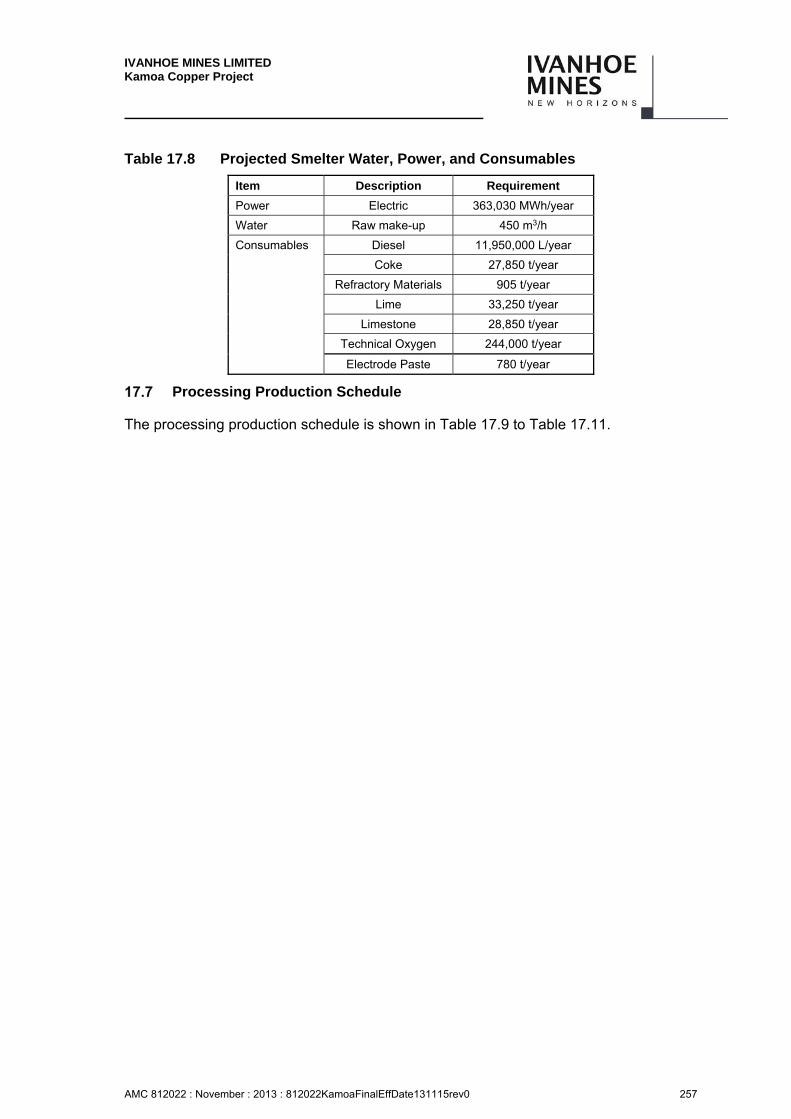
IVANHOE MINES LIMITED Kamoa Copper Project
AMC 812022 : November : 2013 : 812022KamoaFinalEffDate131115rev0 257
Table 17.8 Projected Smelter Water, Power, and Consumables
Item Description Requirement
Power Electric 363,030 MWh/year
Water Raw make-up 450 m3/h
Consumables Diesel 11,950,000 L/year
Coke 27,850 t/year
Refractory Materials 905 t/year
Lime 33,250 t/year
Limestone 28,850 t/year
Technical Oxygen 244,000 t/year
Electrode Paste 780 t/year
Processing Production Schedule
The processing production schedule is shown in Table 17.9 to Table 17.11.
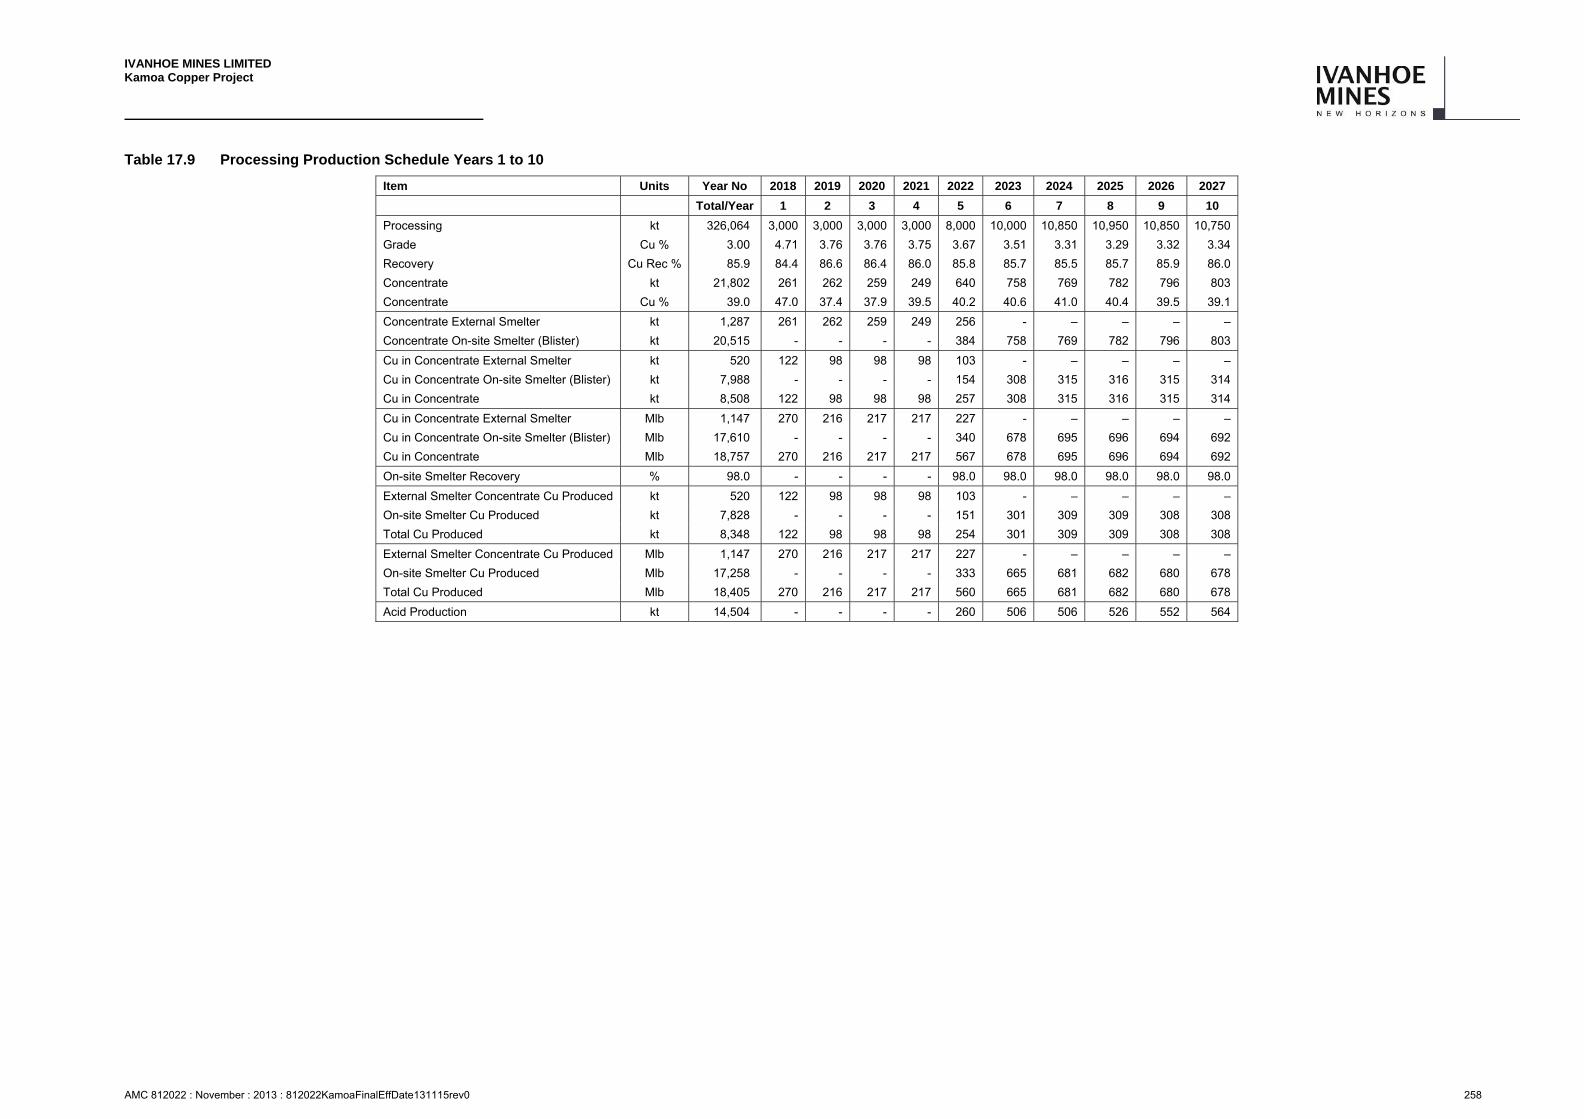
IVANHOE MINES LIMITED Kamoa Copper Project
AMC 812022 : November : 2013 : 812022KamoaFinalEffDate131115rev0 258
Table 17.9 Processing Production Schedule Years 1 to 10
Item Units Year No 2018 2019 2020 2021 2022 2023 2024 2025 2026 2027
Total/Year 1 2 3 4 5 6 7 8 9 10
Processing kt 326,064 3,000 3,000 3,000 3,000 8,000 10,000 10,850 10,950 10,850 10,750
Grade Cu % 3.00 4.71 3.76 3.76 3.75 3.67 3.51 3.31 3.29 3.32 3.34
Recovery Cu Rec % 85.9 84.4 86.6 86.4 86.0 85.8 85.7 85.5 85.7 85.9 86.0
Concentrate kt 21,802 261 262 259 249 640 758 769 782 796 803
Concentrate Cu % 39.0 47.0 37.4 37.9 39.5 40.2 40.6 41.0 40.4 39.5 39.1
Concentrate External Smelter kt 1,287 261 262 259 249 256 - – – – –
Concentrate On-site Smelter (Blister) kt 20,515 - - - - 384 758 769 782 796 803
Cu in Concentrate External Smelter kt 520 122 98 98 98 103 - – – – –
Cu in Concentrate On-site Smelter (Blister) kt 7,988 - - - - 154 308 315 316 315 314
Cu in Concentrate kt 8,508 122 98 98 98 257 308 315 316 315 314
Cu in Concentrate External Smelter Mlb 1,147 270 216 217 217 227 - – – – –
Cu in Concentrate On-site Smelter (Blister) Mlb 17,610 - - - - 340 678 695 696 694 692
Cu in Concentrate Mlb 18,757 270 216 217 217 567 678 695 696 694 692
On-site Smelter Recovery % 98.0 - - - - 98.0 98.0 98.0 98.0 98.0 98.0
External Smelter Concentrate Cu Produced kt 520 122 98 98 98 103 - – – – –
On-site Smelter Cu Produced kt 7,828 - - - - 151 301 309 309 308 308
Total Cu Produced kt 8,348 122 98 98 98 254 301 309 309 308 308
External Smelter Concentrate Cu Produced Mlb 1,147 270 216 217 217 227 - – – – –
On-site Smelter Cu Produced Mlb 17,258 - - - - 333 665 681 682 680 678
Total Cu Produced Mlb 18,405 270 216 217 217 560 665 681 682 680 678
Acid Production kt 14,504 - - - - 260 506 506 526 552 564

IVANHOE MINES LIMITED Kamoa Copper Project
AMC 812022 : November : 2013 : 812022KamoaFinalEffDate131115rev0 259
Table 17.10 Processing Production Schedule Years 11 to 20
Item Units Year No 2028 2029 2030 2031 2032 2033 2034 2035 2036 2037
Total/Year 11 12 13 14 15 16 17 18 19 20
Processing kt 326,064 11,087 11,350 11,350 11,700 12,150 12,350 12,198 11,870 11,802 11,940
Grade Cu % 3.00 3.25 3.18 3.18 3.08 2.97 2.92 2.95 3.03 3.05 3.02
Recovery Cu Rec % 85.9 86.1 86.1 86.3 86.3 86.2 86.0 85.9 85.8 85.7 85.9
Concentrate kt 21,802 815 818 831 829 829 815 807 797 792 802
Concentrate Cu % 39.0 38.6 38.4 37.7 37.6 37.7 38.5 38.9 39.4 39.7 39.2
Concentrate External Smelter kt 1,287 – – – – – – – – – –
Concentrate On-site Smelter (Blister) kt 20,515 815 818 831 829 829 815 807 797 792 802
Cu in Concentrate External Smelter kt 520 – – – – – – – – – –
Cu in Concentrate On-site Smelter (Blister) kt 7,988 314 314 313 312 313 313 314 314 315 315
Cu in Concentrate kt 8,508 314 314 313 312 313 313 314 314 315 315
Cu in Concentrate External Smelter Mlb 1,147 – – – – – – – – – –
Cu in Concentrate On-site Smelter (Blister) Mlb 17,610 693 692 690 688 690 691 692 692 694 693
Cu in Concentrate Mlb 18,757 693 692 690 688 690 691 692 692 694 693
On-site Smelter Recovery % 98.0 98.0 98.0 98.0 98.0 98.0 98.0 98.0 98.0 98.0 98.0
External Smelter Concentrate Cu Produced kt 520 – – – – – – – – – –
On-site Smelter Cu Produced kt 7,828 308 308 307 306 307 307 308 308 308 308
Total Cu Produced kt 8,348 308 308 307 306 307 307 308 308 308 308
External Smelter Concentrate Cu Produced Mlb 1,147 – – – – – – – – – –
On-site Smelter Cu Produced Mlb 17,258 679 678 676 674 676 677 678 678 680 680
Total Cu Produced Mlb 18,405 679 678 676 674 676 677 678 678 680 680
Acid Production kt 14,504 583 589 613 613 610 586 571 555 545 561
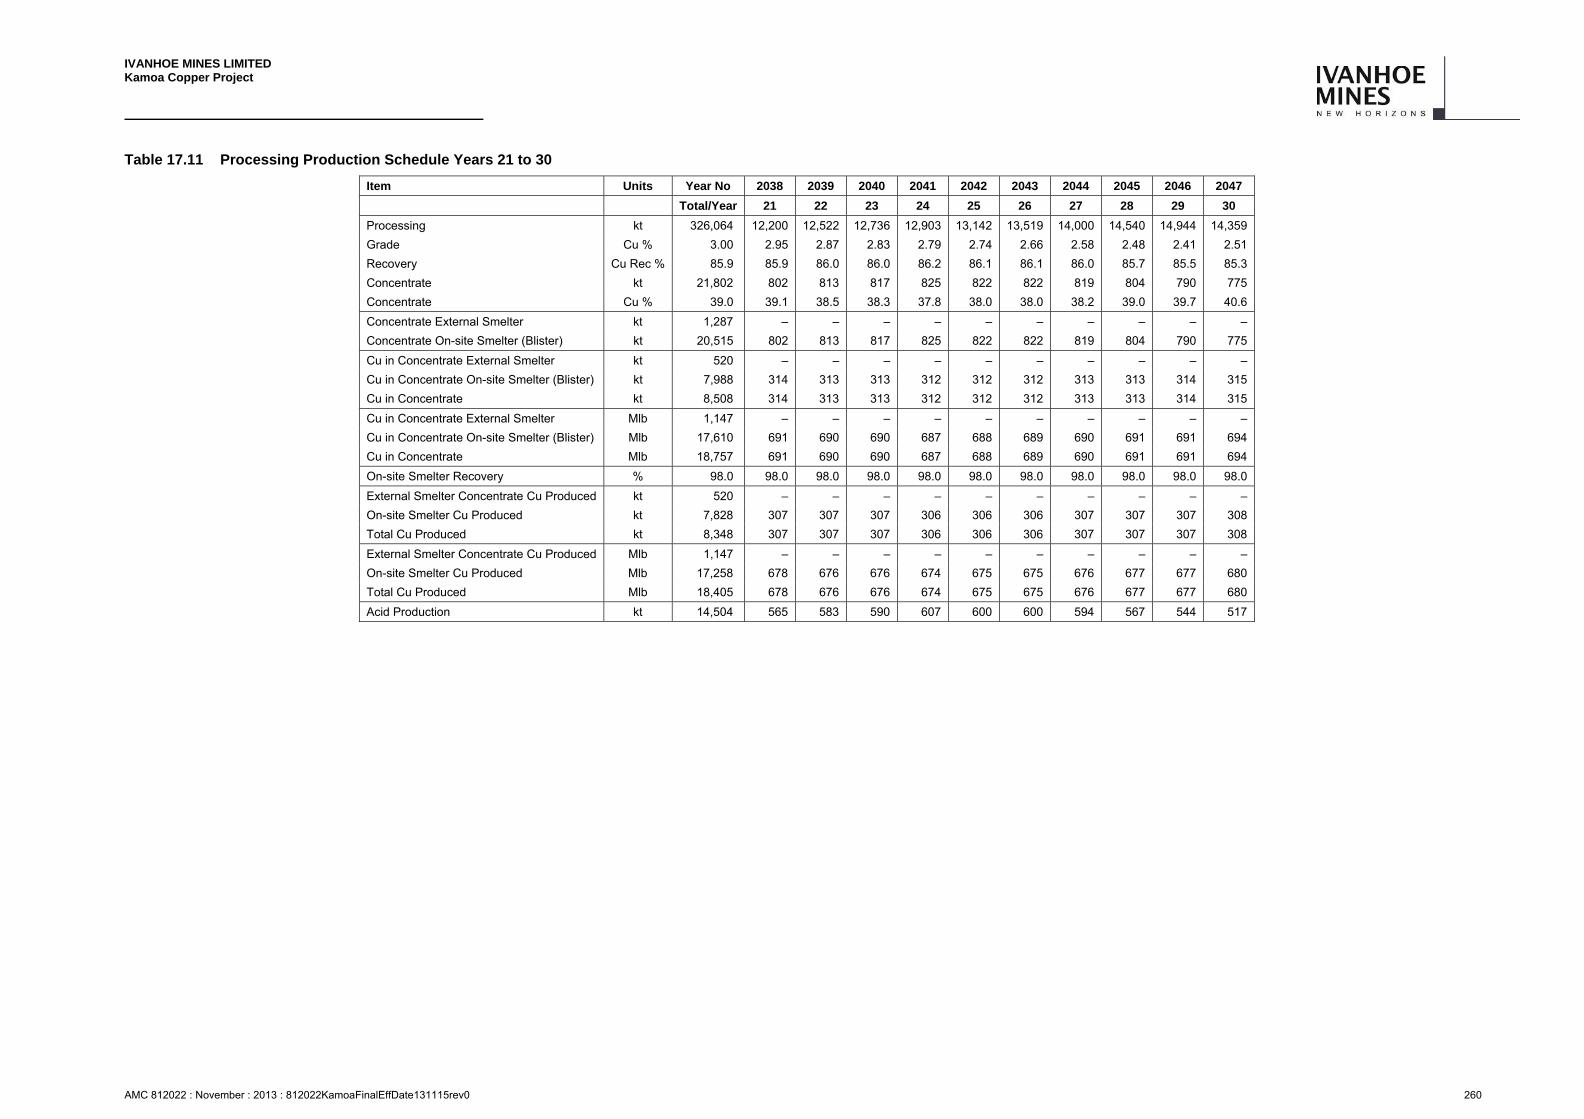
IVANHOE MINES LIMITED Kamoa Copper Project
AMC 812022 : November : 2013 : 812022KamoaFinalEffDate131115rev0 260
Table 17.11 Processing Production Schedule Years 21 to 30
Item Units Year No 2038 2039 2040 2041 2042 2043 2044 2045 2046 2047
Total/Year 21 22 23 24 25 26 27 28 29 30
Processing kt 326,064 12,200 12,522 12,736 12,903 13,142 13,519 14,000 14,540 14,944 14,359
Grade Cu % 3.00 2.95 2.87 2.83 2.79 2.74 2.66 2.58 2.48 2.41 2.51
Recovery Cu Rec % 85.9 85.9 86.0 86.0 86.2 86.1 86.1 86.0 85.7 85.5 85.3
Concentrate kt 21,802 802 813 817 825 822 822 819 804 790 775
Concentrate Cu % 39.0 39.1 38.5 38.3 37.8 38.0 38.0 38.2 39.0 39.7 40.6
Concentrate External Smelter kt 1,287 – – – – – – – – – –
Concentrate On-site Smelter (Blister) kt 20,515 802 813 817 825 822 822 819 804 790 775
Cu in Concentrate External Smelter kt 520 – – – – – – – – – –
Cu in Concentrate On-site Smelter (Blister) kt 7,988 314 313 313 312 312 312 313 313 314 315
Cu in Concentrate kt 8,508 314 313 313 312 312 312 313 313 314 315
Cu in Concentrate External Smelter Mlb 1,147 – – – – – – – – – –
Cu in Concentrate On-site Smelter (Blister) Mlb 17,610 691 690 690 687 688 689 690 691 691 694
Cu in Concentrate Mlb 18,757 691 690 690 687 688 689 690 691 691 694
On-site Smelter Recovery % 98.0 98.0 98.0 98.0 98.0 98.0 98.0 98.0 98.0 98.0 98.0
External Smelter Concentrate Cu Produced kt 520 – – – – – – – – – –
On-site Smelter Cu Produced kt 7,828 307 307 307 306 306 306 307 307 307 308
Total Cu Produced kt 8,348 307 307 307 306 306 306 307 307 307 308
External Smelter Concentrate Cu Produced Mlb 1,147 – – – – – – – – – –
On-site Smelter Cu Produced Mlb 17,258 678 676 676 674 675 675 676 677 677 680
Total Cu Produced Mlb 18,405 678 676 676 674 675 675 676 677 677 680
Acid Production kt 14,504 565 583 590 607 600 600 594 567 544 517
IVANHOE MINES LIMITED Kamoa Copper Project
AMC 812022 : November : 2013 : 812022KamoaFinalEffDate131115rev0 261
Comments on Section 17
Concentrator
The flotation circuit configuration has been investigated extensively and is deemed to be relatively solved. The circuit relies on proven technology with a relatively low risk of scale up or technological flaws.
Some confirmatory work is required with respect to cleaner recycle streams and points of entry, however the circuit development testwork discussed in Section 13.5.3 indicates that any improvements are likely to be incremental at best.
A highly probable recycle stream incorporated on the flowsheets at the moment is the primary recleaner tails which reports to the secondary regrind circuit to reduce the particle size to a P80 of 10 µm and floated again in the secondary cleaner circuit. This is cleaner arrangement is confirmed with XPS testwork.
The secondary recleaner tails is a potential recycle stream that may be included in the flowsheet, but already contains relatively high silica values and combined with the extreamly fineness of grind of this stream, may result in more silica contamination. An alternative flotation technology is considered a better alternative to maintain copper recoveries and grade, whilst limiting silica entrainment to the concentrate. This will be tested before (Phase 5), and more during the next project phase (pilot plant campaign).
Detailed bench scale recycle testwork is scheduled for the Phase 5 work at Mintek. Furthermore, proper recycle testing will be preformed during pilot plant testwork planned during the PFS phase of project.
Although such recyles are not included in the testwork flowsheet, the intention is to design the circuit with sufficient flexibility that streams can be easily redirected during commissioning and operations as required. A prime example of this will be the secondary rougher recleaner tails, which can be directed to final tails, or to the secondary rougher regrind mill for further grinding. The concentrate from the last 3 cells in the secondary rougher recleaner bank is likely to be very high in silica. The flexibility to divert these concentrate streams from final concentrate, to the feed of the secondary rougher recleaner feed will also be included in the piping design. Since piping is factorised in the current scoping study, this level of detail can only be included in future phases of the project.
Further work in Phase 5 is also planned to confirm the primary and secondary grind sizes of 80% passing 75 and 38 microns respectively. These grind size were established early on in Phase 1 of the project and confirmatory work is required to determine if these grinds are still optimal for the expanded resource. Changes to the current grind sizes will only be made if they are found to result in improvements in recovery and/or concentrate grade.
IVANHOE MINES LIMITED Kamoa Copper Project
AMC 812022 : November : 2013 : 812022KamoaFinalEffDate131115rev0 262
Smelter
Direct-to-Blister technology is well suited to smelt concentrate with the composition expected from the test work that has been completed on ore samples representing the underground mining operations.
A number of trade-off studies will be considered during the Pre-feasibility Study. These include the following:
Secondary Slag-cleaning
An electric furnace may not be required for secondary slag cleaning. Instead, slag from SCF1 may be slow-cooled, milled and floated for further copper recovery.
Power Generation and Overall Energy Optimisation
In the current flowsheet configuration, steam from the DBF waste heat boiler is used for concentrate drying. It would also be possible to use the steam for power generation. Energy recovery from waste heat in the acid plant would also be considered under an overall energy optimisation study.
Acid Plant Technology
Process gas from the DBF has a high SO2 gas content that is not suitable for conventional double contact, double absorption acid plants without the addition of dilution air. Other technologies that treat higher strength SO2 gas stream will be evaluated for the smelter.
The power generation study will also provide guidance on whether energy recovery in the acid plant will be pursued.
The timing of smelter construction and ramp-up will have to be ciritically assessed during the next phase to ensure that production targets are met, with a minimum ramp-up to full production allowance of 1 year recommended and allowed for in the financial model. The financial model currently contemplates 50% smelter production (150 ktpa blister copper) in year 5 and reaches steady-state production in year 6 of 300 ktpa.
IVANHOE MINES LIMITED Kamoa Copper Project
AMC 812022 : November : 2013 : 812022KamoaFinalEffDate131115rev0 263
18 PROJECT INFRASTRUCTURE
Introduction
This section describes the project infrastructure work that has been carried out to date and the scenario that has been developed for the Kamoa 2013 PEA.
The project infrastructure includes power supply, tailings dams, communications, logistics, transport options, materials, water and waste water, buildings, accomodations, security and medical services.
It is currently anticipated that phase 1 product (Concentrate) will be transported via road to Ndola in Zambia and thereafter via rail to Durban harbour in South Africa. Phase 2 product (blister copper) will be transported via rail from Kamoa site to Lobito harbour in Angola.
Power for the Kamoa project is planned to be sourced from three hydro power plants: the Koni, Mwadingusha and Nzilo 1 power stations. All three require refurbishing. The three plants combined could produce over 200 MW. Prior to completion of the refurbishments, development and construction activities at Kamoa will be powered by electricity sourced from the grid and on-site diesel generators.
Site Plan and Layout
A site plan (Figure 18.1) displays the locations of the proposed plant site, underground mining location, waste rock storage facilities and the tailings facility.
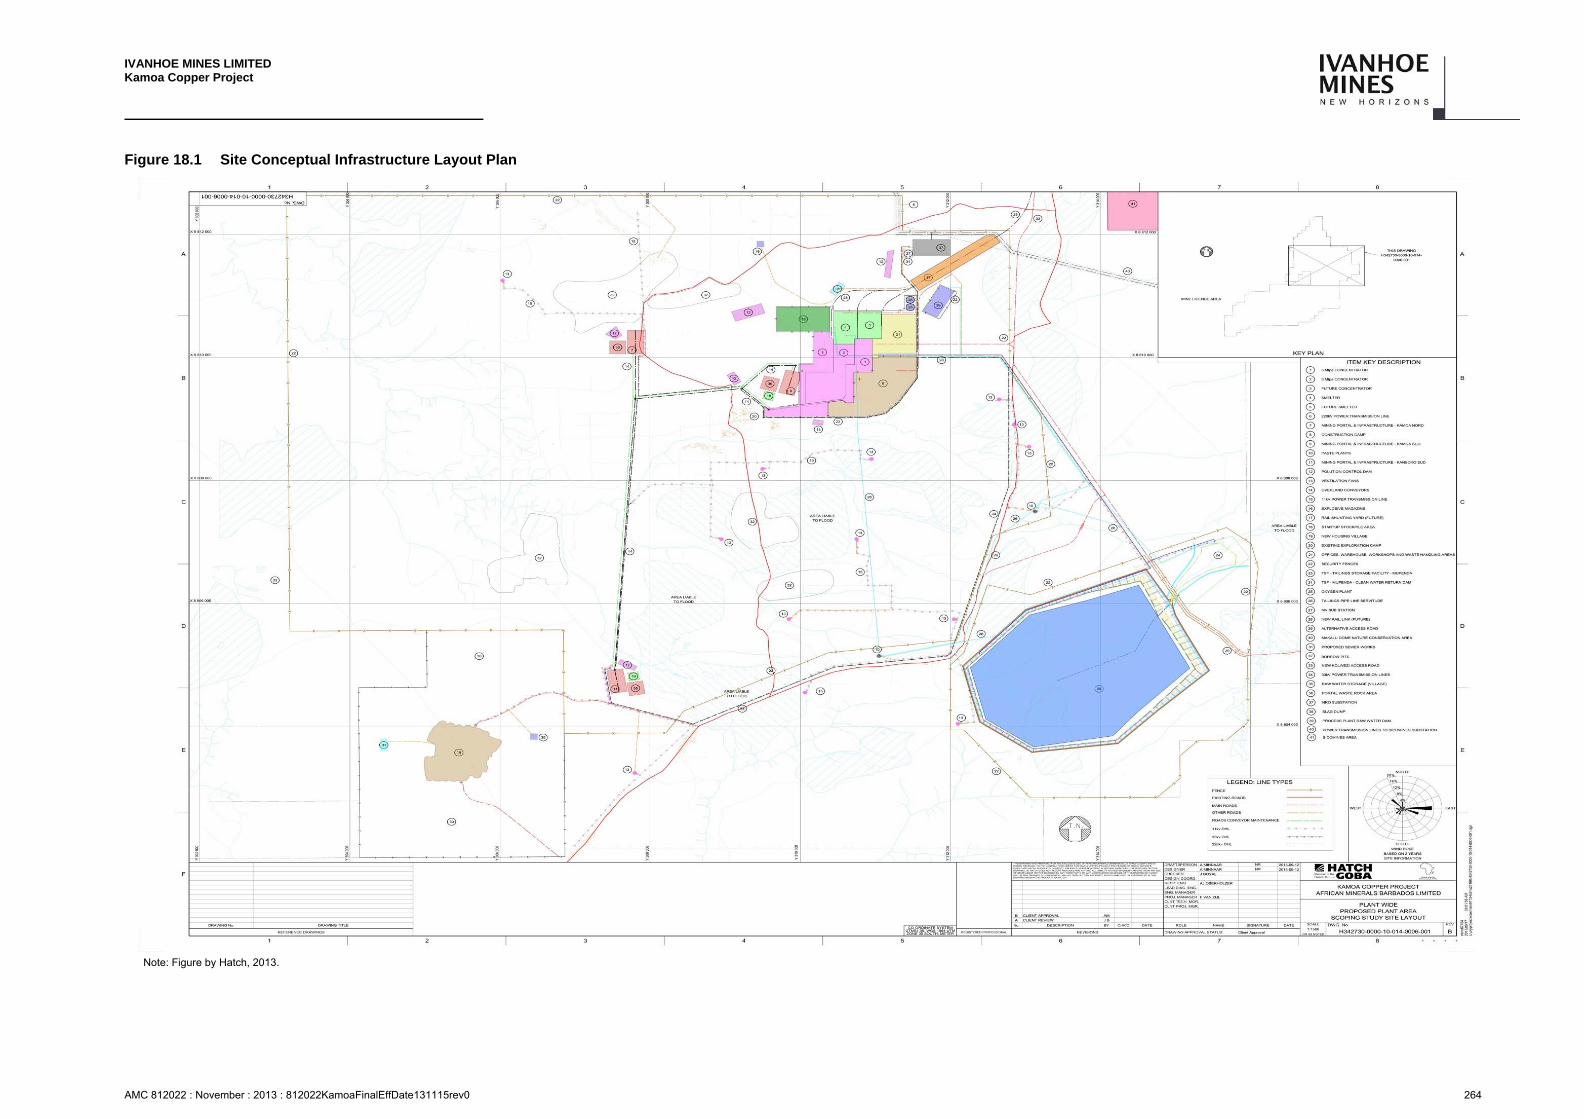
IVANHOE MINES LIMITED Kamoa Copper Project
AMC 812022 : November : 2013 : 812022KamoaFinalEffDate131115rev0 264
Figure 18.1 Site Conceptual Infrastructure Layout Plan
Note: Figure by Hatch, 2013.
IVANHOE MINES LIMITED Kamoa Copper Project
AMC 812022 : November : 2013 : 812022KamoaFinalEffDate131115rev0 265
Power
18.3.1 Generation
Power for the Kamoa project is planned to be sourced from three hydro power plants: the Koni, Mwadingusha and Nzilo 1 power stations. All three require refurbishing. The three plants combined could produce over 200 MW. Prior to completion of the refurbishments, development and construction activities at Kamoa will be powered by electricity sourced from the grid and on-site diesel generators.
In June 2011 Ivanhoe signed a Memorandum of Understanding (2011 MOU) with the Democratic Republic of Congo’s state-owned power company, SNEL. The 2011 MOU led to the signing of a pre-financing agreement with SNEL in June 2012 under which SNEL granted Ivanhoe an exclusive right to conduct full rehabilitation on the Mwadingusha and Koni plants following completion of a feasibility report on the work. A study to rehabilitate the Mwadingusha and Koni power plants was carried out by Stucky Ltd in 2013 (Stucky Report). Since this study the production rates have been amended to 3 Mtpa and 11 Mtpa. Further studies will be required to assess these more modest power requirements. As well as the plant refurbishment the alignment for the new high-voltage line to the Kamoa site is also required for power supply to the project. This line is planned to be used at a reduced voltage during the construction phase and at the full rated voltage for production in 2018.
In 2013, Ivanhoe signed an additional Memorandum of Understanding (2013 MOU) with SNEL to upgrade a third hydroelectric power plant, Nzilo 1. Ivanhoe and SNEL plan to conduct a Feasibility Study to assess the scope of work and cost of restoration. It is proposed to upgrade the Nzilo 1 hydroelectric power plant to its design capacity of 111 megawatts (MW). Figure 18.2 shows the locations of the existing power plants in relation to the Kamoa site. Figure 18.3 shows the state of electrical powerline infrastructure in proximity to the Project area.
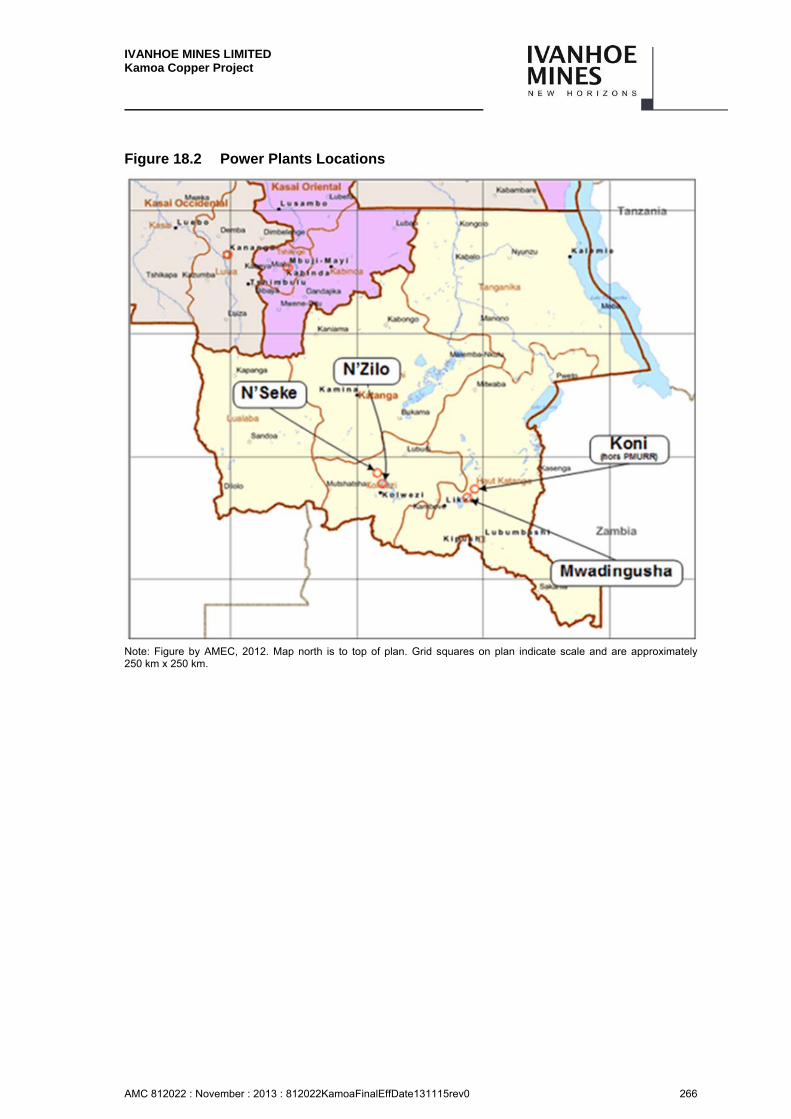
IVANHOE MINES LIMITED Kamoa Copper Project
AMC 812022 : November : 2013 : 812022KamoaFinalEffDate131115rev0 266
Figure 18.2 Power Plants Locations
Note: Figure by AMEC, 2012. Map north is to top of plan. Grid squares on plan indicate scale and are approximately 250 km x 250 km.

IVANHOE MINES LIMITED Kamoa Copper Project
AMC 812022 : November : 2013 : 812022KamoaFinalEffDate131115rev0 267
Figure 18.3 Example Existing Power Transmission Lines in Proximity to Kamoa Site
Note: Photograph by Ivanhoe, 2012.
Mwadingusha Hydroelectric Power Plant
The Mwadingusha (M’usha) hydro power plant is located on the Lufira River, approximately 70 km from the city of Likashi in the district of Katanga in the DRC. The hydro facility was built in 1928 and comprises six turbines with an installed generation capacity of 71 MW at a gross hydrostatic head of 114 m. Turbines 4 and 5 were installed in 1938, whilst turbine 6 was installed in 1953. Of the turbines installed, only turbines 4, 5, and 6 are currently operational.
Koni Hydroelectric Power Plant
Koni is located 7 km upstream of M’usha and was built in 1946 with an installed generation capacity of 42 MW at a hydrostatic head of 56 m. The turbine hall comprises three turbines, only turbine 2 is currently operational.
Greenfield Hydro Site
In order to meet the Project’s long term power requirements, which could reach 250 MW, a greenfields hydroelectric facility may also be required. In November 2011, Ivanhoe signed an MOU with the Ministry of Energy of DRC to conduct an identification of the most suitable greenfields site amongst five potential sites already designated by the ministry. Ivanhoe plans to conduct a due diligence and a conceptual assessment in this regard. Such a due diligence is likely to be followed by more detailed studies for the chosen site(s).
IVANHOE MINES LIMITED Kamoa Copper Project
AMC 812022 : November : 2013 : 812022KamoaFinalEffDate131115rev0 268
18.3.2 Transmission and Substations
Three existing 120 kV transmission lines deliver power to SNEL’s transmission infrastructure through the RO and Shilatembo substations as detailed below.
120 kV transmission line between Koni and M’usha.
120 kV transmission line between M’usha and RO substation.
120 KV transmission line between M’usha and Shilatembo substation.
In order to achieve high power availability over the longer-term a new double 220 kV circuit transmission line will be required to feed Kamoa. However in the interim, 80 MW can be supplied to the Project over a new 10 km transmission line from the SCK substation in Kolwezi to a new 220/33 kV substation at Kamoa. A high level design was conducted by Stucky in 2013 which included three phases for this new substation. . Ivanhoe advised that the current plan is to have 10 MW of construction power available on site. Phase 2 of the power supply will be the supply of 100 MW operational power. These plans are not final as further assessment for power transmission will depend on the greenfield hydro power location and capacity. Basic design and routing of transmission infrastructure to site have been completed by Stucky.
18.3.3 Power Consumption
The estimated annual operational power consumption for the Kamoa project is provided in Table 18.1. This power consumption is summarised in Figure 18.4. The estimate for the mining power consumption has been provided by Stantec. The power consumption estimates for the village, the construction of the camp and offices, the concentrator (Phases 1 and 2) and the smelter have been provided by Hatch.
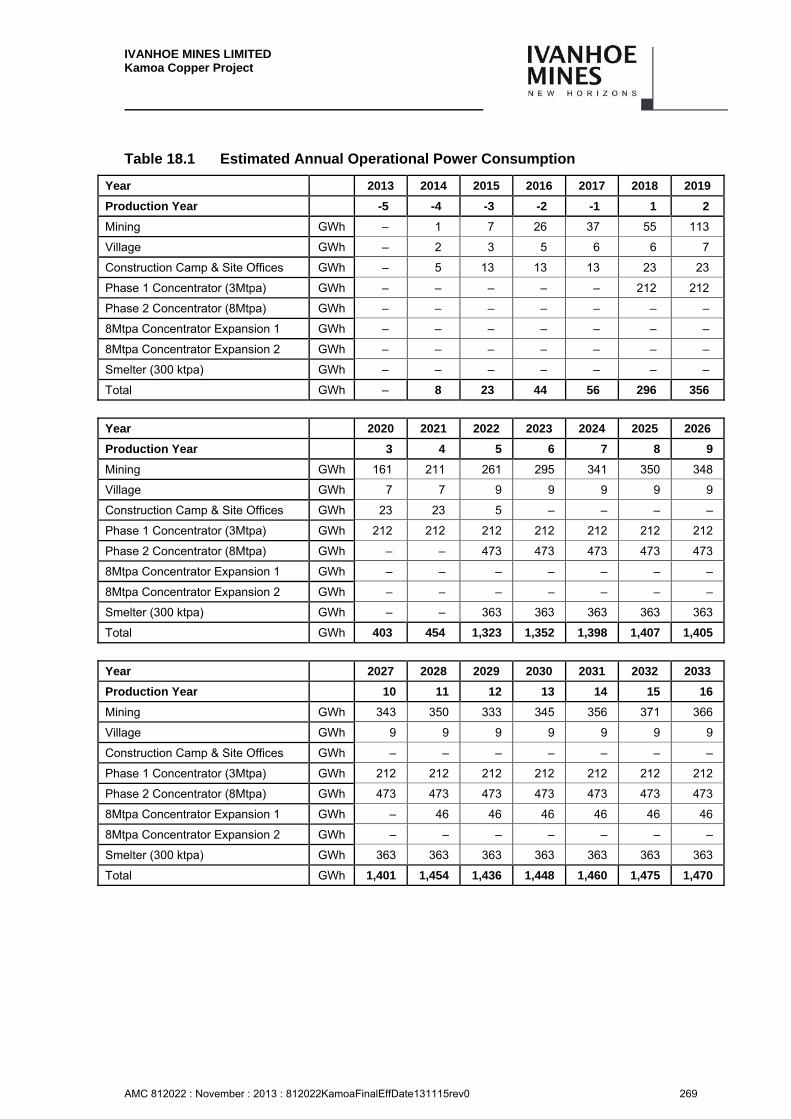
IVANHOE MINES LIMITED Kamoa Copper Project
AMC 812022 : November : 2013 : 812022KamoaFinalEffDate131115rev0 269
Table 18.1 Estimated Annual Operational Power Consumption
Year 2013 2014 2015 2016 2017 2018 2019
Production Year -5 -4 -3 -2 -1 1 2
Mining GWh – 1 7 26 37 55 113
Village GWh – 2 3 5 6 6 7
Construction Camp & Site Offices GWh – 5 13 13 13 23 23
Phase 1 Concentrator (3Mtpa) GWh – – – – – 212 212
Phase 2 Concentrator (8Mtpa) GWh – – – – – – –
8Mtpa Concentrator Expansion 1 GWh – – – – – – –
8Mtpa Concentrator Expansion 2 GWh – – – – – – –
Smelter (300 ktpa) GWh – – – – – – –
Total GWh – 8 23 44 56 296 356
Year 2020 2021 2022 2023 2024 2025 2026
Production Year 3 4 5 6 7 8 9
Mining GWh 161 211 261 295 341 350 348
Village GWh 7 7 9 9 9 9 9
Construction Camp & Site Offices GWh 23 23 5 – – – –
Phase 1 Concentrator (3Mtpa) GWh 212 212 212 212 212 212 212
Phase 2 Concentrator (8Mtpa) GWh – – 473 473 473 473 473
8Mtpa Concentrator Expansion 1 GWh – – – – – – –
8Mtpa Concentrator Expansion 2 GWh – – – – – – –
Smelter (300 ktpa) GWh – – 363 363 363 363 363
Total GWh 403 454 1,323 1,352 1,398 1,407 1,405
Year 2027 2028 2029 2030 2031 2032 2033
Production Year 10 11 12 13 14 15 16
Mining GWh 343 350 333 345 356 371 366
Village GWh 9 9 9 9 9 9 9
Construction Camp & Site Offices GWh – – – – – – –
Phase 1 Concentrator (3Mtpa) GWh 212 212 212 212 212 212 212
Phase 2 Concentrator (8Mtpa) GWh 473 473 473 473 473 473 473
8Mtpa Concentrator Expansion 1 GWh – 46 46 46 46 46 46
8Mtpa Concentrator Expansion 2 GWh – – – – – – –
Smelter (300 ktpa) GWh 363 363 363 363 363 363 363
Total GWh 1,401 1,454 1,436 1,448 1,460 1,475 1,470
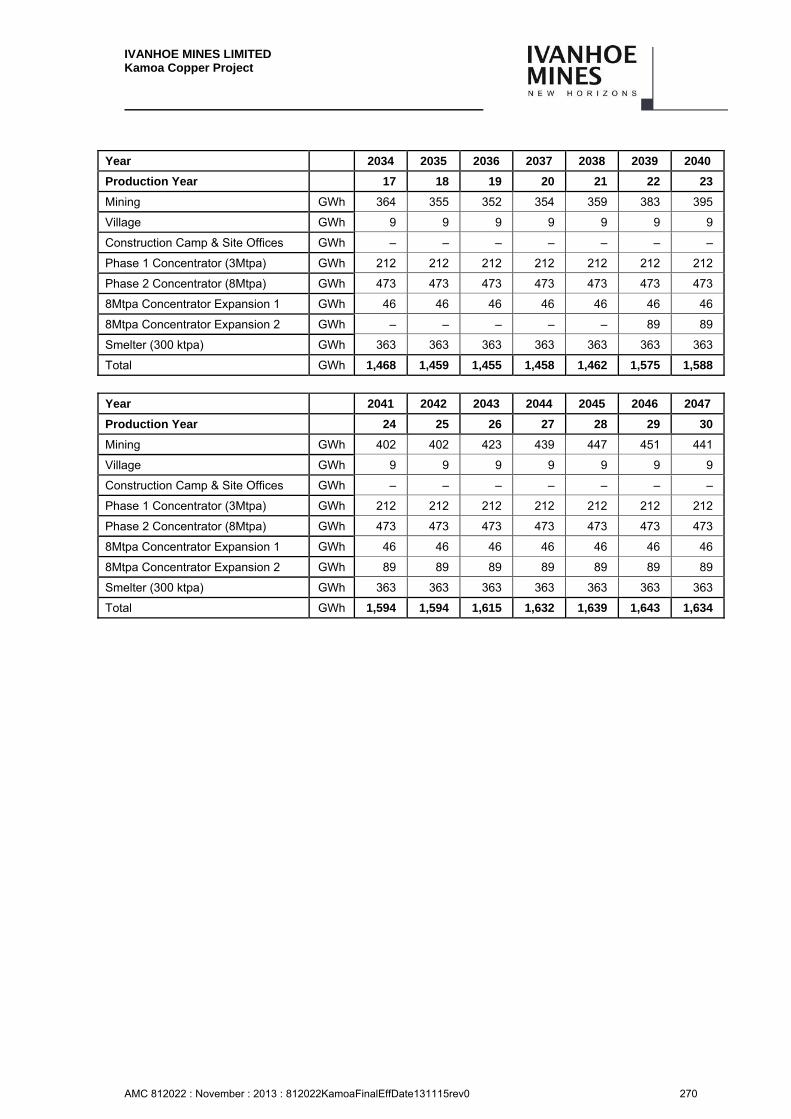
IVANHOE MINES LIMITED Kamoa Copper Project
AMC 812022 : November : 2013 : 812022KamoaFinalEffDate131115rev0 270
Year 2034 2035 2036 2037 2038 2039 2040
Production Year 17 18 19 20 21 22 23
Mining GWh 364 355 352 354 359 383 395
Village GWh 9 9 9 9 9 9 9
Construction Camp & Site Offices GWh – – – – – – –
Phase 1 Concentrator (3Mtpa) GWh 212 212 212 212 212 212 212
Phase 2 Concentrator (8Mtpa) GWh 473 473 473 473 473 473 473
8Mtpa Concentrator Expansion 1 GWh 46 46 46 46 46 46 46
8Mtpa Concentrator Expansion 2 GWh – – – – – 89 89
Smelter (300 ktpa) GWh 363 363 363 363 363 363 363
Total GWh 1,468 1,459 1,455 1,458 1,462 1,575 1,588
Year 2041 2042 2043 2044 2045 2046 2047
Production Year 24 25 26 27 28 29 30
Mining GWh 402 402 423 439 447 451 441
Village GWh 9 9 9 9 9 9 9
Construction Camp & Site Offices GWh – – – – – – –
Phase 1 Concentrator (3Mtpa) GWh 212 212 212 212 212 212 212
Phase 2 Concentrator (8Mtpa) GWh 473 473 473 473 473 473 473
8Mtpa Concentrator Expansion 1 GWh 46 46 46 46 46 46 46
8Mtpa Concentrator Expansion 2 GWh 89 89 89 89 89 89 89
Smelter (300 ktpa) GWh 363 363 363 363 363 363 363
Total GWh 1,594 1,594 1,615 1,632 1,639 1,643 1,634
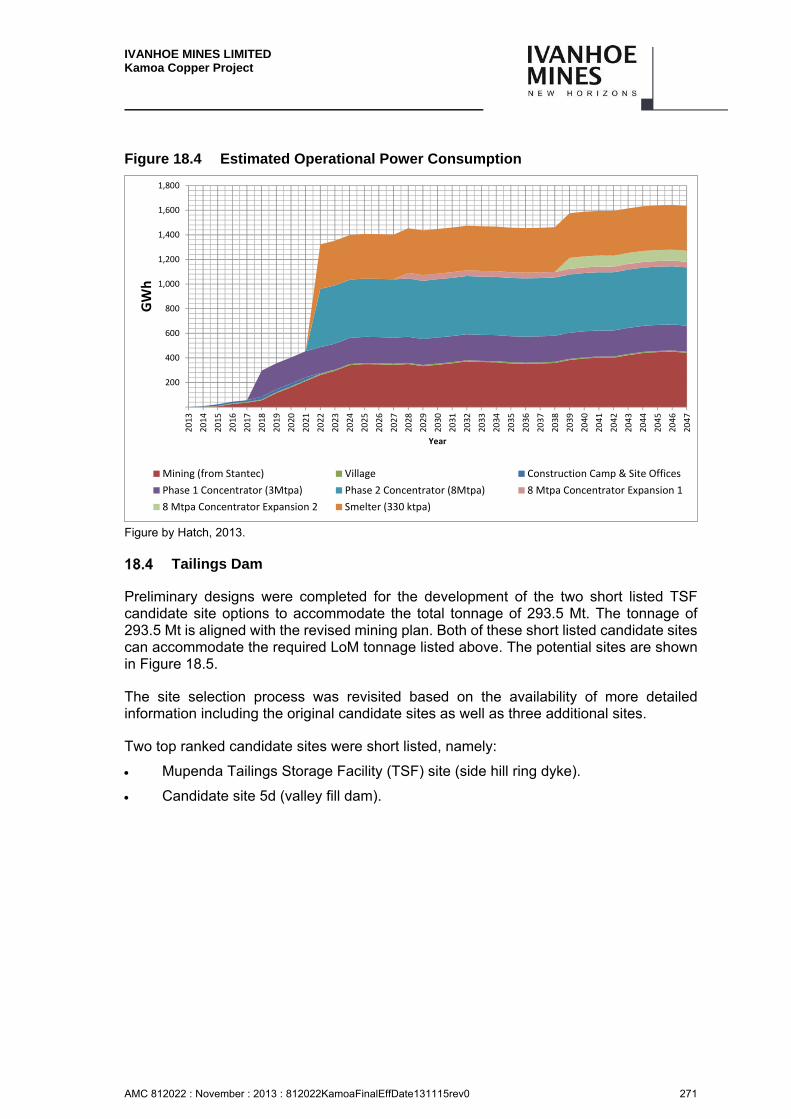
IVANHOE MINES LIMITED Kamoa Copper Project
AMC 812022 : November : 2013 : 812022KamoaFinalEffDate131115rev0 271
Figure 18.4 Estimated Operational Power Consumption
Figure by Hatch, 2013.
Tailings Dam
Preliminary designs were completed for the development of the two short listed TSF candidate site options to accommodate the total tonnage of 293.5 Mt. The tonnage of 293.5 Mt is aligned with the revised mining plan. Both of these short listed candidate sites can accommodate the required LoM tonnage listed above. The potential sites are shown in Figure 18.5.
The site selection process was revisited based on the availability of more detailed information including the original candidate sites as well as three additional sites.
Two top ranked candidate sites were short listed, namely:
Mupenda Tailings Storage Facility (TSF) site (side hill ring dyke).
Candidate site 5d (valley fill dam).
200
400
600
800
1,000
1,200
1,400
1,600
1,80020
13
2014
2015
2016
2017
2018
2019
2020
2021
2022
2023
2024
2025
2026
2027
2028
2029
2030
2031
2032
2033
2034
2035
2036
2037
2038
2039
2040
2041
2042
2043
2044
2045
2046
2047
GWh
Year
Mining (from Stantec) Village Construction Camp & Site Offices
Phase 1 Concentrator (3Mtpa) Phase 2 Concentrator (8Mtpa) 8 Mtpa Concentrator Expansion 1
8 Mtpa Concentrator Expansion 2 Smelter (330 ktpa)
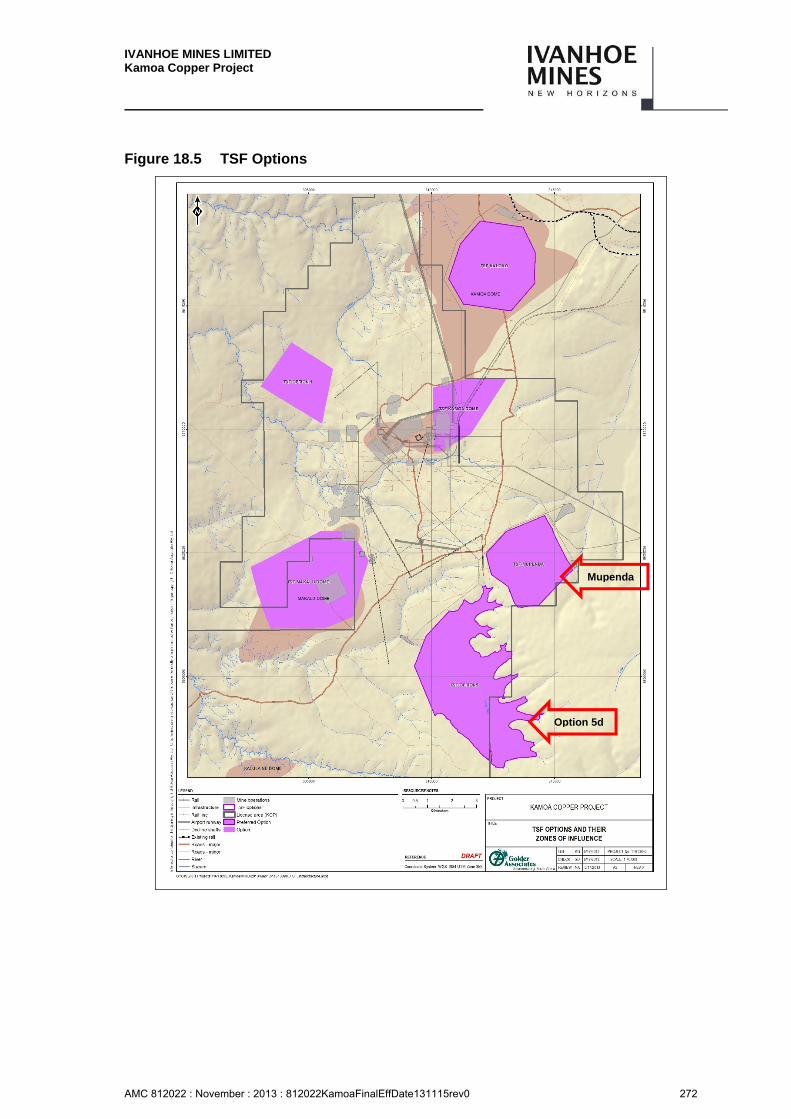
IVANHOE MINES LIMITED Kamoa Copper Project
AMC 812022 : November : 2013 : 812022KamoaFinalEffDate131115rev0 272
Figure 18.5 TSF Options
Mupenda
Option 5d
IVANHOE MINES LIMITED Kamoa Copper Project
AMC 812022 : November : 2013 : 812022KamoaFinalEffDate131115rev0 273
18.4.1 TSF Site 5d
The outcome of the preliminary design at site 5d indicates that complexities will be encountered during development of site 5d with regard to:
Surface water management.
Ground water management within the basin of the valley site.
Decant and return water system.
Potential impact on downstream users of the Lulua stream.
These complexities and uncertainties will make this site less attractive for development.
18.4.2 Mupenda TSF Site
The Mupenda TSF site is located within the upper part of the catchment.
The lower part of this catchment has been impacted by an existing dormant tailings facility.
This option lends itself to phased development for the first four years of tailings depositioning and Phase 2 (ultimate phase) to accommodate the LoM tonnages.
The Mupenda TSF candidate site is selected as the preferred TSF due to the following fundamental reasons:
Site is located within upper part of a catchment area.
The lower part of the catchment has been impacted by an existing dormant Tailings Storage Facility.
Small water flows within the Luilu river catchment area where the proposed Mupenda TSF will be located.
This option lends itself to a phased development for the first four years of tailings depositioning (Phase 1) and Phase 2 (ultimate phase) to accommodate the LoM tonnages.
The following optimised concept layout was developed for the Mupenda TSF site, refer to Figure 18.6 below.
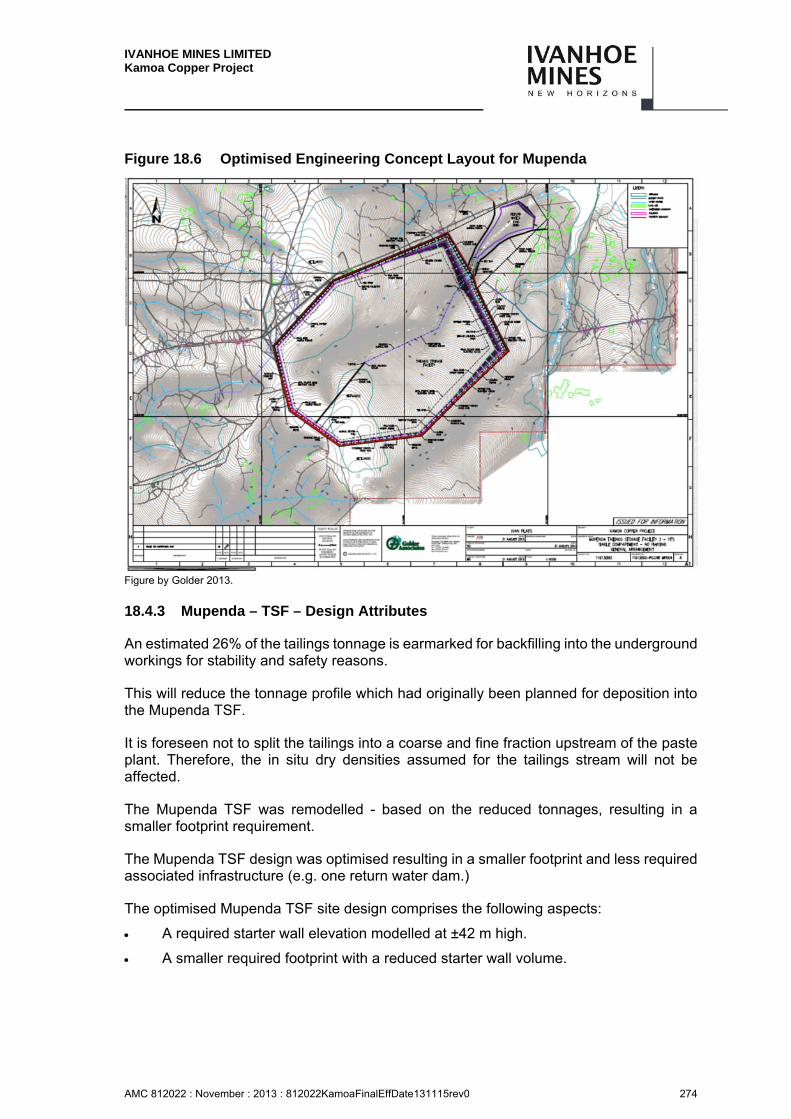
IVANHOE MINES LIMITED Kamoa Copper Project
AMC 812022 : November : 2013 : 812022KamoaFinalEffDate131115rev0 274
Figure 18.6 Optimised Engineering Concept Layout for Mupenda
Figure by Golder 2013.
18.4.3 Mupenda – TSF – Design Attributes
An estimated 26% of the tailings tonnage is earmarked for backfilling into the underground workings for stability and safety reasons.
This will reduce the tonnage profile which had originally been planned for deposition into the Mupenda TSF.
It is foreseen not to split the tailings into a coarse and fine fraction upstream of the paste plant. Therefore, the in situ dry densities assumed for the tailings stream will not be affected.
The Mupenda TSF was remodelled - based on the reduced tonnages, resulting in a smaller footprint requirement.
The Mupenda TSF design was optimised resulting in a smaller footprint and less required associated infrastructure (e.g. one return water dam.)
The optimised Mupenda TSF site design comprises the following aspects:
A required starter wall elevation modelled at ±42 m high.
A smaller required footprint with a reduced starter wall volume.
IVANHOE MINES LIMITED Kamoa Copper Project
AMC 812022 : November : 2013 : 812022KamoaFinalEffDate131115rev0 275
A final (at year 30) estimated TSF elevation of ±72 m high.
A rate of rise at final height of 1.22 m/yr.
A reduced TSF footprint plan area.
The reduced footprint still allows for phased construction consisting of Phase 1 and Phase 2 (Ultimate Phase).
Mupenda TSF Phase 1 comprises within the Ultimate footprint:
– A starter embankment closing off the valley
– Return water dam (ultimate)
– Intermediate penstock system and permanent outlet pipe
– Engineered bentonite enriched barrier (BCEL)
Refer to Figure 18.7 below:
The Mupenda TSF’s northern wall will only cross the western stream as a result of the reduced footprint, which is some distance from the eastern stream.
Water management considerations.
One return water dam will be required.
– The implementation of an under-drain system will control leachate from the site.
Deposition methodologies.
– Self-raise deposition methodologies will be adopted once the starter wall crest level has been reached and the rate of rise has reduced to less than 2 m per annum. The starter wall crest height is estimated to be at 43 m above ground level at this stage.
Estimated pre-production capital.
– The phase 1 development will amount to 73.0 million USD.
– The phase 2 development will require180.8 million USD.
– The total cost for the TSF will amount to 253.8 million USD
Tailings will be transported via a tailings delivery scheme consisting of pumps, a pipeline, agitator tank and booster pump station at the tailings facility.
Return water will be decanted, recycled and pumped back to the plant.
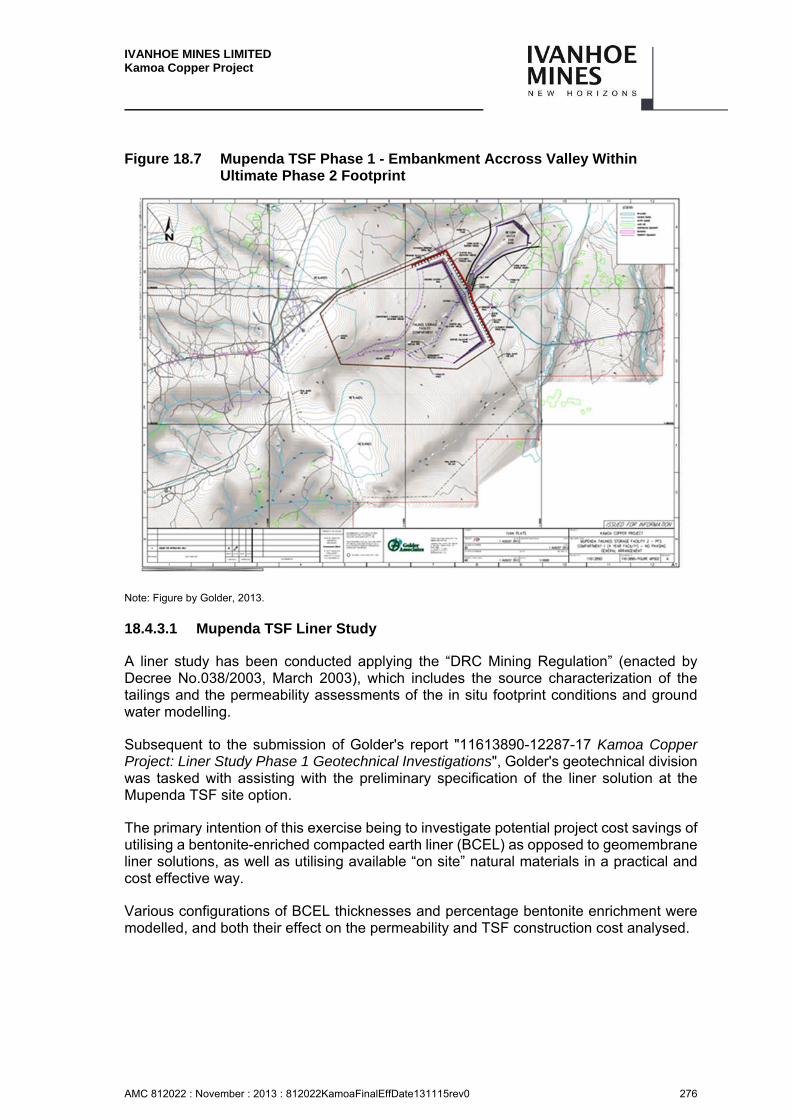
IVANHOE MINES LIMITED Kamoa Copper Project
AMC 812022 : November : 2013 : 812022KamoaFinalEffDate131115rev0 276
Figure 18.7 Mupenda TSF Phase 1 - Embankment Accross Valley Within Ultimate Phase 2 Footprint
Note: Figure by Golder, 2013.
18.4.3.1 Mupenda TSF Liner Study
A liner study has been conducted applying the “DRC Mining Regulation” (enacted by Decree No.038/2003, March 2003), which includes the source characterization of the tailings and the permeability assessments of the in situ footprint conditions and ground water modelling.
Subsequent to the submission of Golder's report "11613890-12287-17 Kamoa Copper Project: Liner Study Phase 1 Geotechnical Investigations", Golder's geotechnical division was tasked with assisting with the preliminary specification of the liner solution at the Mupenda TSF site option.
The primary intention of this exercise being to investigate potential project cost savings of utilising a bentonite-enriched compacted earth liner (BCEL) as opposed to geomembrane liner solutions, as well as utilising available “on site” natural materials in a practical and cost effective way.
Various configurations of BCEL thicknesses and percentage bentonite enrichment were modelled, and both their effect on the permeability and TSF construction cost analysed.
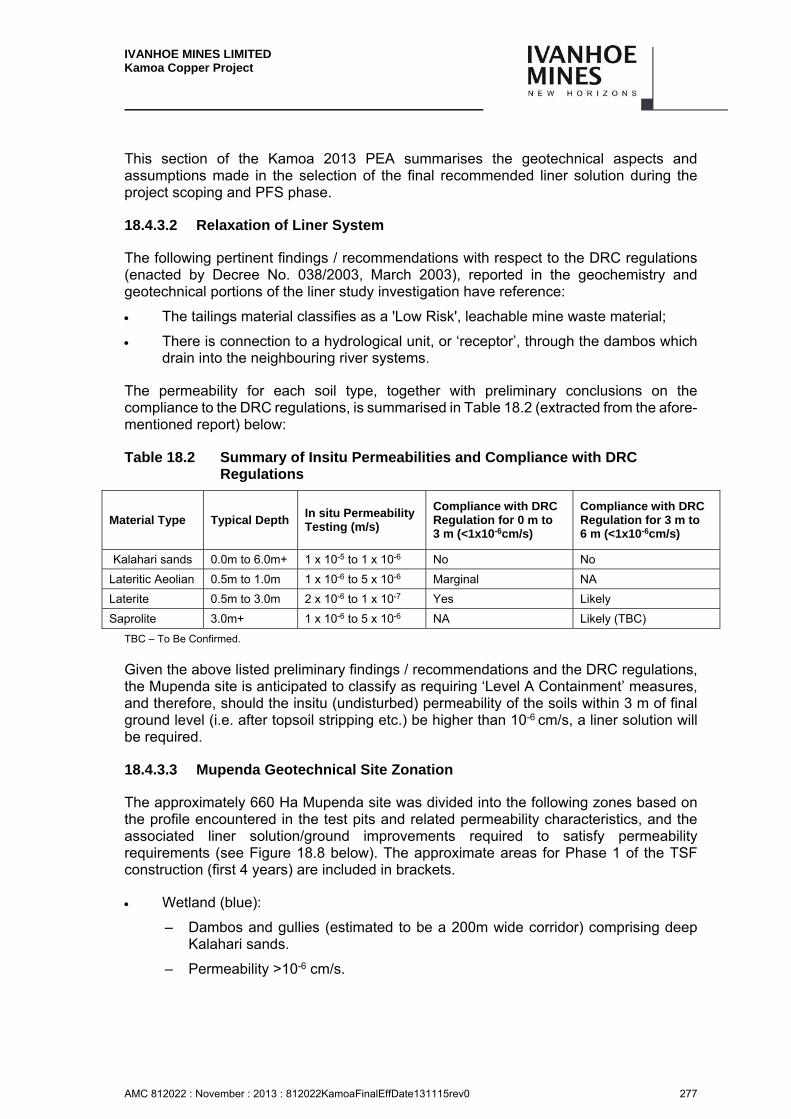
IVANHOE MINES LIMITED Kamoa Copper Project
AMC 812022 : November : 2013 : 812022KamoaFinalEffDate131115rev0 277
This section of the Kamoa 2013 PEA summarises the geotechnical aspects and assumptions made in the selection of the final recommended liner solution during the project scoping and PFS phase.
18.4.3.2 Relaxation of Liner System
The following pertinent findings / recommendations with respect to the DRC regulations (enacted by Decree No. 038/2003, March 2003), reported in the geochemistry and geotechnical portions of the liner study investigation have reference:
The tailings material classifies as a 'Low Risk', leachable mine waste material;
There is connection to a hydrological unit, or ‘receptor’, through the dambos which drain into the neighbouring river systems.
The permeability for each soil type, together with preliminary conclusions on the compliance to the DRC regulations, is summarised in Table 18.2 (extracted from the afore-mentioned report) below:
Table 18.2 Summary of Insitu Permeabilities and Compliance with DRC Regulations
Material Type Typical Depth In situ Permeability Testing (m/s)
Compliance with DRC Regulation for 0 m to 3 m (<1x10⁻⁶cm/s)
Compliance with DRC Regulation for 3 m to 6 m (<1x10⁻⁶cm/s)
Kalahari sands 0.0m to 6.0m+ 1 x 10⁻⁵ to 1 x 10⁻⁶ No No
Lateritic Aeolian 0.5m to 1.0m 1 x 10⁻⁶ to 5 x 10⁻⁶ Marginal NA
Laterite 0.5m to 3.0m 2 x 10⁻⁶ to 1 x 10⁻⁷ Yes Likely
Saprolite 3.0m+ 1 x 10⁻⁶ to 5 x 10⁻⁶ NA Likely (TBC)
TBC – To Be Confirmed.
Given the above listed preliminary findings / recommendations and the DRC regulations, the Mupenda site is anticipated to classify as requiring ‘Level A Containment’ measures, and therefore, should the insitu (undisturbed) permeability of the soils within 3 m of final ground level (i.e. after topsoil stripping etc.) be higher than 10-6 cm/s, a liner solution will be required.
18.4.3.3 Mupenda Geotechnical Site Zonation
The approximately 660 Ha Mupenda site was divided into the following zones based on the profile encountered in the test pits and related permeability characteristics, and the associated liner solution/ground improvements required to satisfy permeability requirements (see Figure 18.8 below). The approximate areas for Phase 1 of the TSF construction (first 4 years) are included in brackets.
Wetland (blue):
– Dambos and gullies (estimated to be a 200m wide corridor) comprising deep Kalahari sands.
– Permeability >10-6 cm/s.

IVANHOE MINES LIMITED Kamoa Copper Project
AMC 812022 : November : 2013 : 812022KamoaFinalEffDate131115rev0 278
– Approximate area = 225 Ha (Phase 1 = 90 Ha).
Borrow (orange) and remainder (unshaded):
– Lateritic aeolian, laterite and saprolite profile encountered across the remainder of the site (orange represents the area of potential laterite borrow areas).
– Permeability <10-6 cm/s.
– Approximate area = 225 Ha (Phase 1 = 160 Ha).
Figure 18.8 Approximate Zonation of the Mupenda Site
Note Figure by Golder, 2013. Note that areas are based on weighted estimates.
18.4.3.4 Assumptions
The following key assumptions were made in the assessment of the suitability and costs of the liner solution:
The permeability characteristics of the soils listed in the table above are preliminary, as stated in the aforementioned report, and are based on limited laboratory and insitu test results and literature. These will be confirmed in subsequent stages of the investigation.
The permeability of the saprolite soils are assumed to be <10-6 cm/s.
The permeabilities listed in the table above are for the soils in their natural state (undisturbed) and since no information on compacted or bentonite enriched permeabilities are available as yet, the following assumptions were made with respect to the decrease in permeability caused by compaction and/or bentonite enrichment:
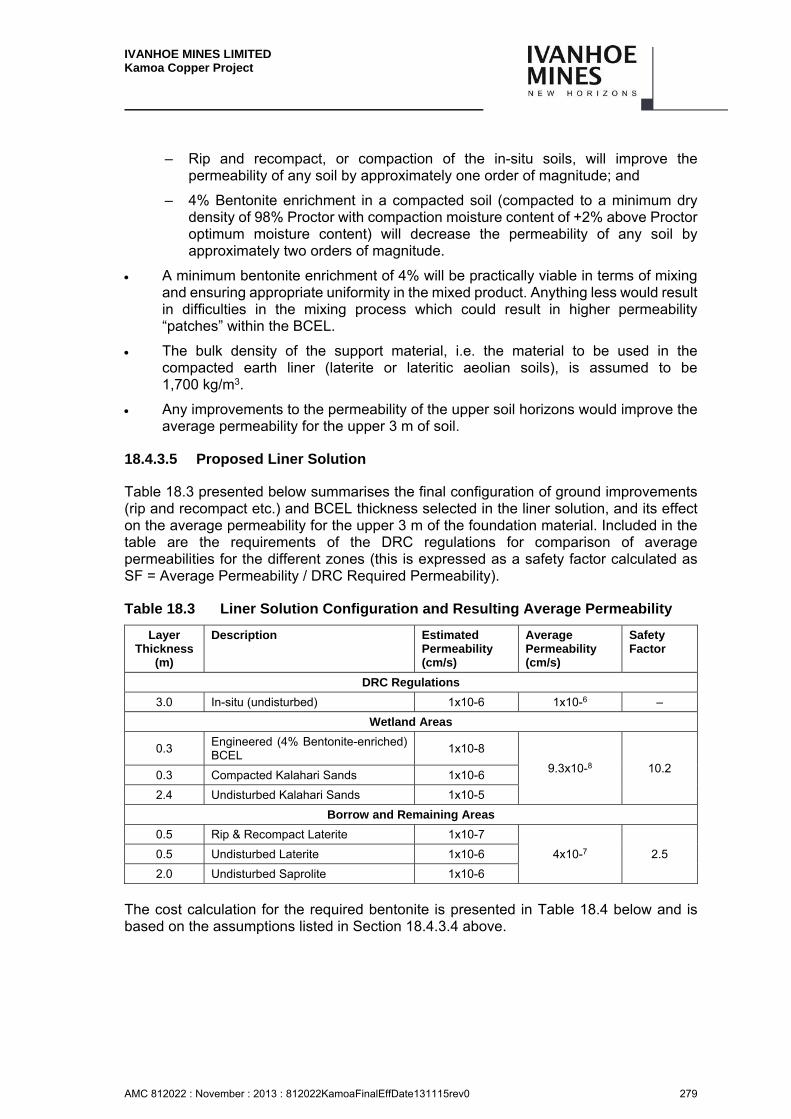
IVANHOE MINES LIMITED Kamoa Copper Project
AMC 812022 : November : 2013 : 812022KamoaFinalEffDate131115rev0 279
– Rip and recompact, or compaction of the in-situ soils, will improve the permeability of any soil by approximately one order of magnitude; and
– 4% Bentonite enrichment in a compacted soil (compacted to a minimum dry density of 98% Proctor with compaction moisture content of +2% above Proctor optimum moisture content) will decrease the permeability of any soil by approximately two orders of magnitude.
A minimum bentonite enrichment of 4% will be practically viable in terms of mixing and ensuring appropriate uniformity in the mixed product. Anything less would result in difficulties in the mixing process which could result in higher permeability “patches” within the BCEL.
The bulk density of the support material, i.e. the material to be used in the compacted earth liner (laterite or lateritic aeolian soils), is assumed to be 1,700 kg/m3.
Any improvements to the permeability of the upper soil horizons would improve the average permeability for the upper 3 m of soil.
18.4.3.5 Proposed Liner Solution
Table 18.3 presented below summarises the final configuration of ground improvements (rip and recompact etc.) and BCEL thickness selected in the liner solution, and its effect on the average permeability for the upper 3 m of the foundation material. Included in the table are the requirements of the DRC regulations for comparison of average permeabilities for the different zones (this is expressed as a safety factor calculated as SF = Average Permeability / DRC Required Permeability).
Table 18.3 Liner Solution Configuration and Resulting Average Permeability
Layer Thickness
(m)
Description Estimated Permeability (cm/s)
Average Permeability (cm/s)
Safety Factor
DRC Regulations
3.0 In-situ (undisturbed) 1x10⁻⁶ 1x10⁻⁶ –
Wetland Areas
0.3 Engineered (4% Bentonite-enriched) BCEL
1x10⁻⁸
9.3x10⁻⁸ 10.2 0.3 Compacted Kalahari Sands 1x10⁻⁶
2.4 Undisturbed Kalahari Sands 1x10⁻⁵
Borrow and Remaining Areas
0.5 Rip & Recompact Laterite 1x10⁻⁷
4x10⁻⁷ 2.5 0.5 Undisturbed Laterite 1x10⁻⁶
2.0 Undisturbed Saprolite 1x10⁻⁶
The cost calculation for the required bentonite is presented in Table 18.4 below and is based on the assumptions listed in Section 18.4.3.4 above.
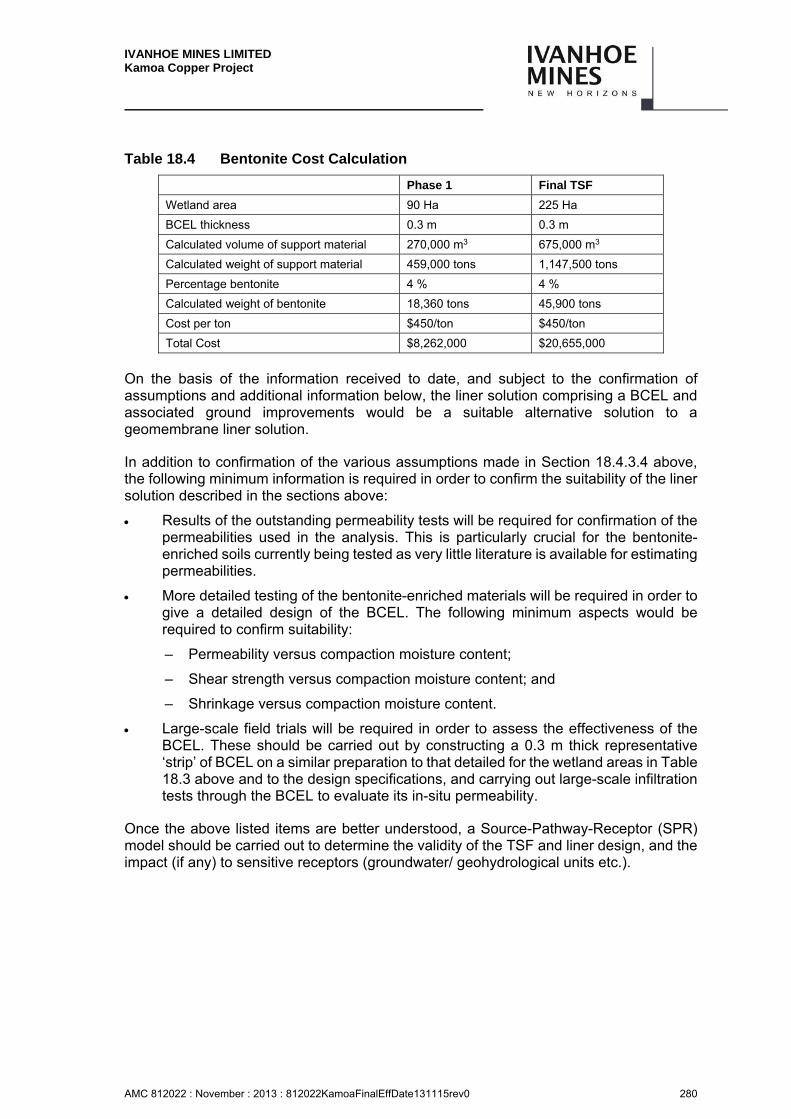
IVANHOE MINES LIMITED Kamoa Copper Project
AMC 812022 : November : 2013 : 812022KamoaFinalEffDate131115rev0 280
Table 18.4 Bentonite Cost Calculation
Phase 1 Final TSF
Wetland area 90 Ha 225 Ha
BCEL thickness 0.3 m 0.3 m
Calculated volume of support material 270,000 m3 675,000 m3
Calculated weight of support material 459,000 tons 1,147,500 tons
Percentage bentonite 4 % 4 %
Calculated weight of bentonite 18,360 tons 45,900 tons
Cost per ton $450/ton $450/ton
Total Cost $8,262,000 $20,655,000
On the basis of the information received to date, and subject to the confirmation of assumptions and additional information below, the liner solution comprising a BCEL and associated ground improvements would be a suitable alternative solution to a geomembrane liner solution.
In addition to confirmation of the various assumptions made in Section 18.4.3.4 above, the following minimum information is required in order to confirm the suitability of the liner solution described in the sections above:
Results of the outstanding permeability tests will be required for confirmation of the permeabilities used in the analysis. This is particularly crucial for the bentonite-enriched soils currently being tested as very little literature is available for estimating permeabilities.
More detailed testing of the bentonite-enriched materials will be required in order to give a detailed design of the BCEL. The following minimum aspects would be required to confirm suitability:
– Permeability versus compaction moisture content;
– Shear strength versus compaction moisture content; and
– Shrinkage versus compaction moisture content.
Large-scale field trials will be required in order to assess the effectiveness of the BCEL. These should be carried out by constructing a 0.3 m thick representative ‘strip’ of BCEL on a similar preparation to that detailed for the wetland areas in Table 18.3 above and to the design specifications, and carrying out large-scale infiltration tests through the BCEL to evaluate its in-situ permeability.
Once the above listed items are better understood, a Source-Pathway-Receptor (SPR) model should be carried out to determine the validity of the TSF and liner design, and the impact (if any) to sensitive receptors (groundwater/ geohydrological units etc.).
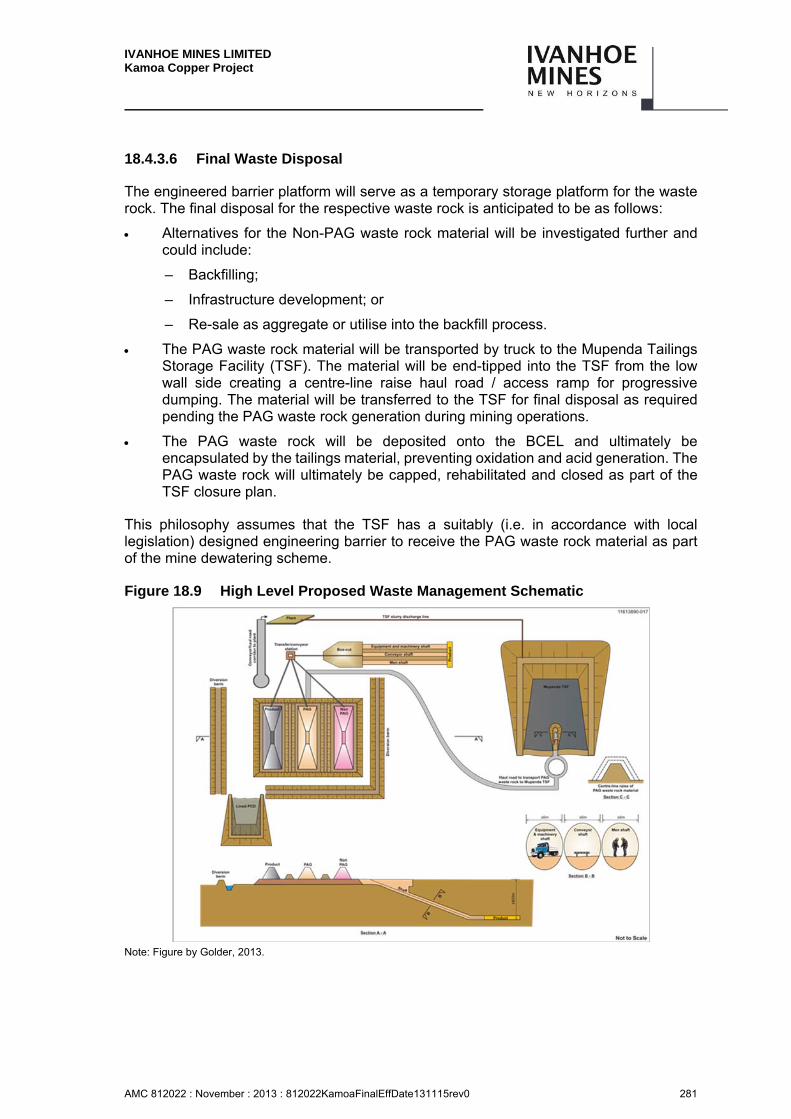
IVANHOE MINES LIMITED Kamoa Copper Project
AMC 812022 : November : 2013 : 812022KamoaFinalEffDate131115rev0 281
18.4.3.6 Final Waste Disposal
The engineered barrier platform will serve as a temporary storage platform for the waste rock. The final disposal for the respective waste rock is anticipated to be as follows:
Alternatives for the Non-PAG waste rock material will be investigated further and could include:
– Backfilling;
– Infrastructure development; or
– Re-sale as aggregate or utilise into the backfill process.
The PAG waste rock material will be transported by truck to the Mupenda Tailings Storage Facility (TSF). The material will be end-tipped into the TSF from the low wall side creating a centre-line raise haul road / access ramp for progressive dumping. The material will be transferred to the TSF for final disposal as required pending the PAG waste rock generation during mining operations.
The PAG waste rock will be deposited onto the BCEL and ultimately be encapsulated by the tailings material, preventing oxidation and acid generation. The PAG waste rock will ultimately be capped, rehabilitated and closed as part of the TSF closure plan.
This philosophy assumes that the TSF has a suitably (i.e. in accordance with local legislation) designed engineering barrier to receive the PAG waste rock material as part of the mine dewatering scheme.
Figure 18.9 High Level Proposed Waste Management Schematic
Note: Figure by Golder, 2013.
IVANHOE MINES LIMITED Kamoa Copper Project
AMC 812022 : November : 2013 : 812022KamoaFinalEffDate131115rev0 282
18.4.4 Opportunity for Separate Phase 1 TSF
The TSF design concept used for the scoping study includes a small valley-fill TSF for Phase 1 built within the footprint of the final Phase 2 Mupenda TSF. This is ideal in terms of only having to manage and rehabilitate one TSF for the life-of-mine. However, it necessitates investing more into Phase 1 than would be required if a separate stand-alone TSF was built for Phase 1. This presents a significant opportunity to investigate during the next stage of the study.
Alternatively, a TSF designed as an impoundment system only for the first 2 years of production (a total of 4.5 Mt of tailings) would require a footprint of approximately 30 hectares and be 12 m high.
If a suitably flat site can be identified with favourable geotechnical and hydrological conditions, such a facility would cost approximately $22 million (including an allowance of $1.0M for owner’s costs, $0.5M for EPCM and $4.1M for contingency). This compares to a pre-production cost of $91 million for the Phase 1 valley-fill system as presently planned (including an allowance of $4.5M for owner’s costs, $2.2M for EPCM and $11M for contingency).
The Mupenda TSF would ultimately still need to be built as presently planned, but only starting in year 1 instead of year -2. Therefore the total capex for all tailings facilities over the life of the mine would increase by $22 M but the major capex cash flow for the Mupenda TSF would be deferred by 2 years, resulting in a potential economic benefit..
Preliminary Geotechnical Investigations in Relation to the TSF and other Project Development Areas
Golder Associates Africa (Pty) Ltd was appointed by African Minerals Barbados Limited, a subsidiary of Ivanhoe Mines Limited, to provide engineering and environmental consulting services for the Kamoa project which included a wide range of preliminary geotechnical engineering studies. A summary of these studies is presented herein.
18.5.1 Road Aggregates and Construction Materials Specifications
In order to optimize the Client’s aggregate sourcing operations, specification reports were provided on the suitability of the commercially available and local materials (near surface/outcropping rocks and natural gravels) for use as road aggregates and construction materials (concrete aggregates, filter/ drainage materials, earthworks etc.).
Commercially available aggregates (near the Kamoa concession area) were inspected and potential borrow areas within the concession area, where laterites suitable for use in road pavements and earthworks could potentially be borrowed, were earmarked for future investigation.
IVANHOE MINES LIMITED Kamoa Copper Project
AMC 812022 : November : 2013 : 812022KamoaFinalEffDate131115rev0 283
18.5.2 Foundation Investigation for Mine Infrastructure and Tailings Storage Facility Site Selection
Geotechnical investigations comprising drilling, test pitting and associated in-situ and laboratory testing have been carried out for the various infrastructure components related to the mining operations. These infrastructure components included the plant and construction laydown area, slag dump, ±5 km tailings delivery and return water pipeline alignments, ±7 km conveyor belt alignments, borrow materials sourcing and the construction village.
In addition to the above, various site options were investigated for the location of the tailings storage facility (TSF). There were TSF Option 1 located in the north-west portion of the site, TSF Option 5D situated along a river valley in the south-eastern portion of the site, and Mupenda located on the eastern extent of the site (Mupenda is currently the preferred option).
Recommendations were made in terms for the following geotechnical properties of the foundation soils:
Excavatibility
Shear Strength
Stiffness
Engineering Use
Foundations
Permeability
Dispersivity
Corrosivity
General Site Preparation
Particular emphasis was placed on assessing the permeability of overburden soils within the footprint of the TSF sites in order to satisfy DRC liner requirements. Additional permeability testing to investigate the suitability, and feasibility, of bentonite enriched soil liners were carried out as an alternative to geomembrane (HDPE / LLDE) liner solutions.
18.5.3 Preliminary Liquefaction Assessment
A preliminary liquefaction potential analysis was carried out for the foundation soils (Kalahari Sands) at TSF Option 1 according to the National Center for Earthquake Engineering Research (NCEER) 1996 workshop summary report, using the results of the SPT testing (i.e. the (N1)60 value) and nominal grading and index testing carried out on the retrieved representative SPT samples.

IVANHOE MINES LIMITED Kamoa Copper Project
AMC 812022 : November : 2013 : 812022KamoaFinalEffDate131115rev0 284
Two main parameters are required to perform a liquefaction analysis; a normalized measure of the cyclic shear stresses due to earthquake loading, which can be expressed in terms of the cyclic stress ratio (CSR); and the soil resistance to liquefaction assessed by means of the cyclic resistance ratio (CRR). The safety factor against liquefaction is then expressed as SF=CRR/CSR.
18.5.4 Potential Liquefaction from Blasting
The potential liquefaction risk from underground blasting is low. In general, not only strong ground motions (which you get locally from blasts) are needed to cause substantial liquefaction, but also a longer duration of shaking is necessary. Production blasting typically does not have a long enough duration to induce widespread liquefaction in tailings, and certainly not in well-engineered structures like tailings embankments.
There is, typically, a greater potential for earthquake-induced liquefaction as the duration of earthquake shaking is often long enough to induce the necessary pore pressure response for widespread liquefaction in tailings and saturated sandy fill materials. This is; however, dependent on a combination of the following aspects:
The magnitude and frequency of earthquake ground motions. A preliminary assessment was carried during the scoping studies, and detailed probabilistic and deterministic assessments are planned for detailed feasibility (DFS) investigations.
Foundation conditions either amplify or dampen ground vibrations. Thick deposits of softer materials can amplify earthquake ground motions and the average shear-wave velocity in the upper 30 m (Vs30) is a key parameter in order to quantify this amplification. This is scheduled for the DFS investigations, particularly for the Kalahari Sand deposits beneath portions of the Mupenda TSF.
The pore pressure response of the tailings material under undrained/dynamic loading conditions characterises the susceptibility of the tailings to liquefaction. These assessments will form part of the detailed characterisation of the tailings once a greater sample volume is available from the pilot plant i.e. during DFS investigations.
Once all aspects contributing to the liquefaction potential of the tailings are better understood, the associated risk, if any, would be mitigated by implementing key modifications to the TSF design (slope angles, foundation improvements etc.).
18.5.5 Fault Hazard Evaluation
(The fault hazard evaluation was carried out by Alan Hull of Golder’s Irvine Office in California, USA). Because parts of Africa are known to have seismically active faults, the development of a major facility within or near the African Rift Valley raises the potential for damage to major mine infrastructure from the effects of surface fault rupture and/or strong earthquake shaking. In particular, major permanent facilities such as tailings storage facilities should not be located where known or potential surface fault rupture has occurred or could occur in the future.
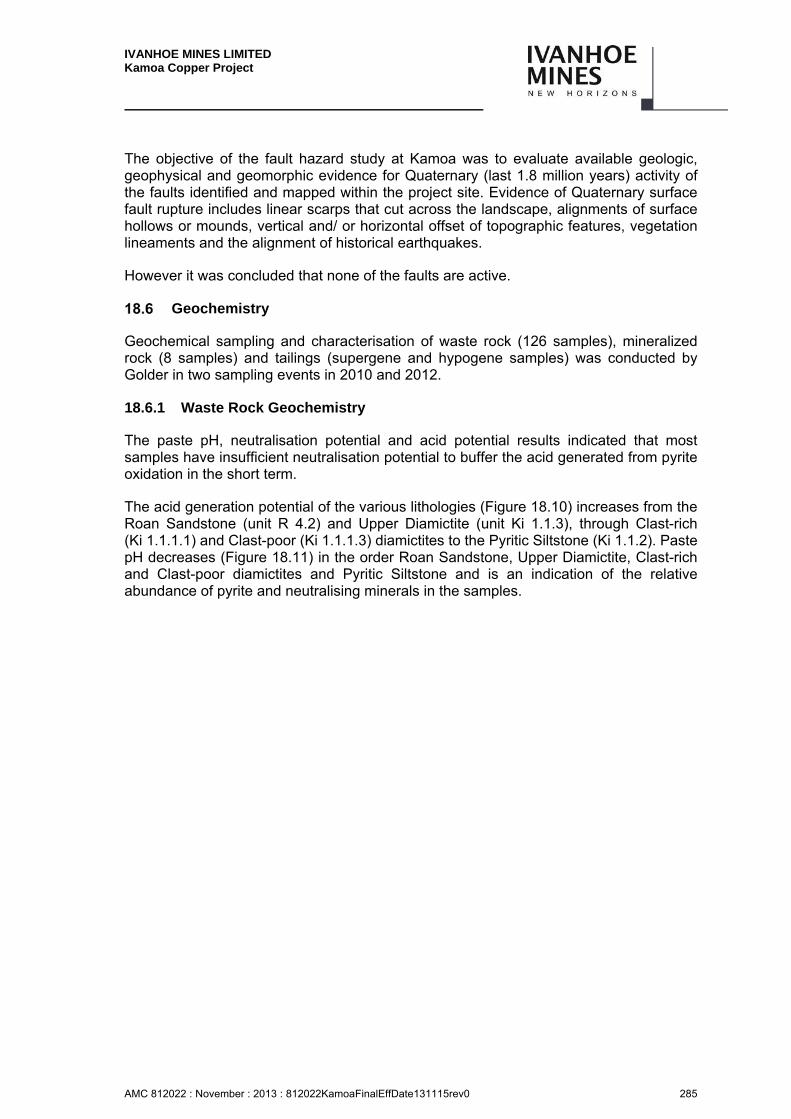
IVANHOE MINES LIMITED Kamoa Copper Project
AMC 812022 : November : 2013 : 812022KamoaFinalEffDate131115rev0 285
The objective of the fault hazard study at Kamoa was to evaluate available geologic, geophysical and geomorphic evidence for Quaternary (last 1.8 million years) activity of the faults identified and mapped within the project site. Evidence of Quaternary surface fault rupture includes linear scarps that cut across the landscape, alignments of surface hollows or mounds, vertical and/ or horizontal offset of topographic features, vegetation lineaments and the alignment of historical earthquakes.
However it was concluded that none of the faults are active.
Geochemistry
Geochemical sampling and characterisation of waste rock (126 samples), mineralized rock (8 samples) and tailings (supergene and hypogene samples) was conducted by Golder in two sampling events in 2010 and 2012.
18.6.1 Waste Rock Geochemistry
The paste pH, neutralisation potential and acid potential results indicated that most samples have insufficient neutralisation potential to buffer the acid generated from pyrite oxidation in the short term.
The acid generation potential of the various lithologies (Figure 18.10) increases from the Roan Sandstone (unit R 4.2) and Upper Diamictite (unit Ki 1.1.3), through Clast-rich (Ki 1.1.1.1) and Clast-poor (Ki 1.1.1.3) diamictites to the Pyritic Siltstone (Ki 1.1.2). Paste pH decreases (Figure 18.11) in the order Roan Sandstone, Upper Diamictite, Clast-rich and Clast-poor diamictites and Pyritic Siltstone and is an indication of the relative abundance of pyrite and neutralising minerals in the samples.
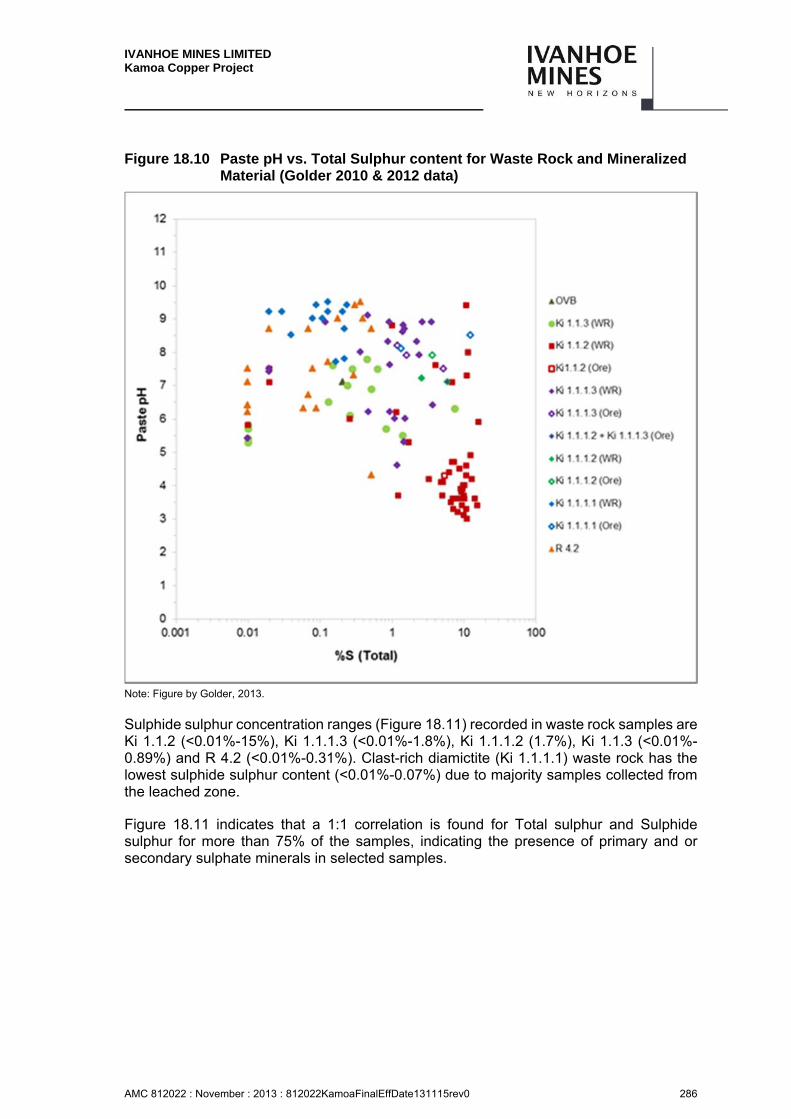
IVANHOE MINES LIMITED Kamoa Copper Project
AMC 812022 : November : 2013 : 812022KamoaFinalEffDate131115rev0 286
Figure 18.10 Paste pH vs. Total Sulphur content for Waste Rock and Mineralized Material (Golder 2010 & 2012 data)
Note: Figure by Golder, 2013.
Sulphide sulphur concentration ranges (Figure 18.11) recorded in waste rock samples are Ki 1.1.2 (<0.01%-15%), Ki 1.1.1.3 (<0.01%-1.8%), Ki 1.1.1.2 (1.7%), Ki 1.1.3 (<0.01%-0.89%) and R 4.2 (<0.01%-0.31%). Clast-rich diamictite (Ki 1.1.1.1) waste rock has the lowest sulphide sulphur content (<0.01%-0.07%) due to majority samples collected from the leached zone.
Figure 18.11 indicates that a 1:1 correlation is found for Total sulphur and Sulphide sulphur for more than 75% of the samples, indicating the presence of primary and or secondary sulphate minerals in selected samples.
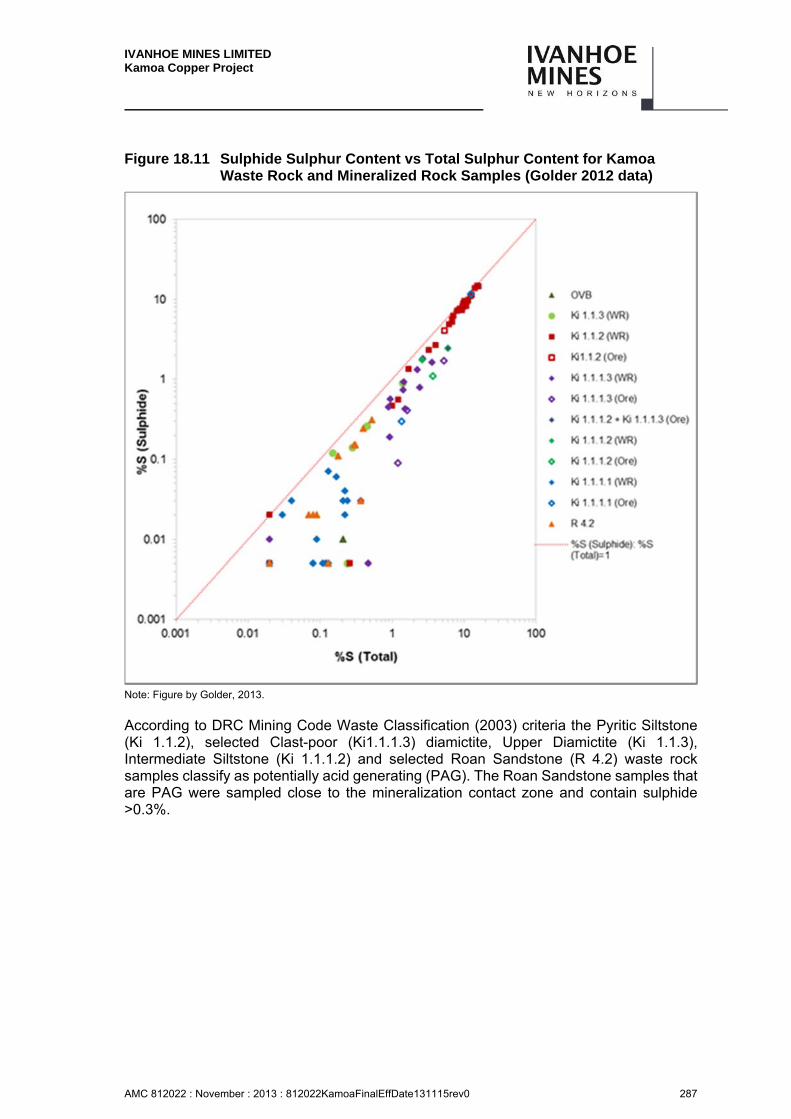
IVANHOE MINES LIMITED Kamoa Copper Project
AMC 812022 : November : 2013 : 812022KamoaFinalEffDate131115rev0 287
Figure 18.11 Sulphide Sulphur Content vs Total Sulphur Content for Kamoa Waste Rock and Mineralized Rock Samples (Golder 2012 data)
Note: Figure by Golder, 2013.
According to DRC Mining Code Waste Classification (2003) criteria the Pyritic Siltstone (Ki 1.1.2), selected Clast-poor (Ki1.1.1.3) diamictite, Upper Diamictite (Ki 1.1.3), Intermediate Siltstone (Ki 1.1.1.2) and selected Roan Sandstone (R 4.2) waste rock samples classify as potentially acid generating (PAG). The Roan Sandstone samples that are PAG were sampled close to the mineralization contact zone and contain sulphide >0.3%.
IVANHOE MINES LIMITED Kamoa Copper Project
AMC 812022 : November : 2013 : 812022KamoaFinalEffDate131115rev0 288
Table 18.5 DRC Mining Code (Annexure XI)
PAG Sulphide Sulphur > 0.3
Mining waste is considered potentially acid-generating where: the sulphide content is greater than 0.3% and acid generation potential has been confirmed by kinetic tests or, failing such tests, where static tests show that:
The net acid neutralization potential is less than 20 kg CaCO3/t, OR
The Neutralising Potential Ratio defined as the ratio between the
Neutralising potential and the Acid potential, is lower than 3.
** DRC Mining Regulations Article 58 of Decree No 038/2003 Annexure IX and Annexure XI (March 2003).
The mine water quality is expected to range from acidic to circum-neutral based on short term leach test results with sulphate, Al, Cu, Cr, Fe, Mn, Ni, Pb, Sb, Se, and Zn identified as potential constituent of interest during operational phase.
18.6.2 Tailings Geochemistry
The Kamoa supergene and hypogene tailings sample tested was found to be Non-PAG (according to the DRC Mining Code) due to the low sulphide sulphur content (<0.01 – 0.05%) and is assumed to be representative of the final tailings material. The Environmental Protection Agency’s Synthetic Precipitation Leaching Procedure (SLP) (EPA Method 1312) was used to assess the mobility of chemical constituents from the Kamoa tailings samples. The result using deionised water and acid rain lixiviates indicated that circum-neutral to slightly acid pH (7.7 to 5.6) and TDS ranging from 300 mg/l -580 mg/l ) can be expected from the tailings material. The following chemical constituents exceeded World Bank, DRC, S.A Effluent and Drinking water and WHO Drinking Water Guideline4 and can therefore be expected in the tailings materials seepage and run-off:
Hypogene:
– Deionised water leach: pH; Al, Cu, Fe and U.
– Acid rain leach: pH; As, Cu, Mn, U and Zn.
Supergene:
– Deionised water leach: pH; NH3, Cu and Mn.
– Acid rain leach: pH; NH3, NO3, As, Cu, Mn, Ni, Se, U and Zn.
Article 58 of the DRC Mining Code (Annexure IX of Decree No 038/2003), requires that mine waste be characterised as either Low or High risk Waste, with specific mitigation measures required for High Risk Waste prescribed within the Code.
4 Intended for internal Ivanhoe usage and assessment of mine components only and does not apply to compliance or permitting.
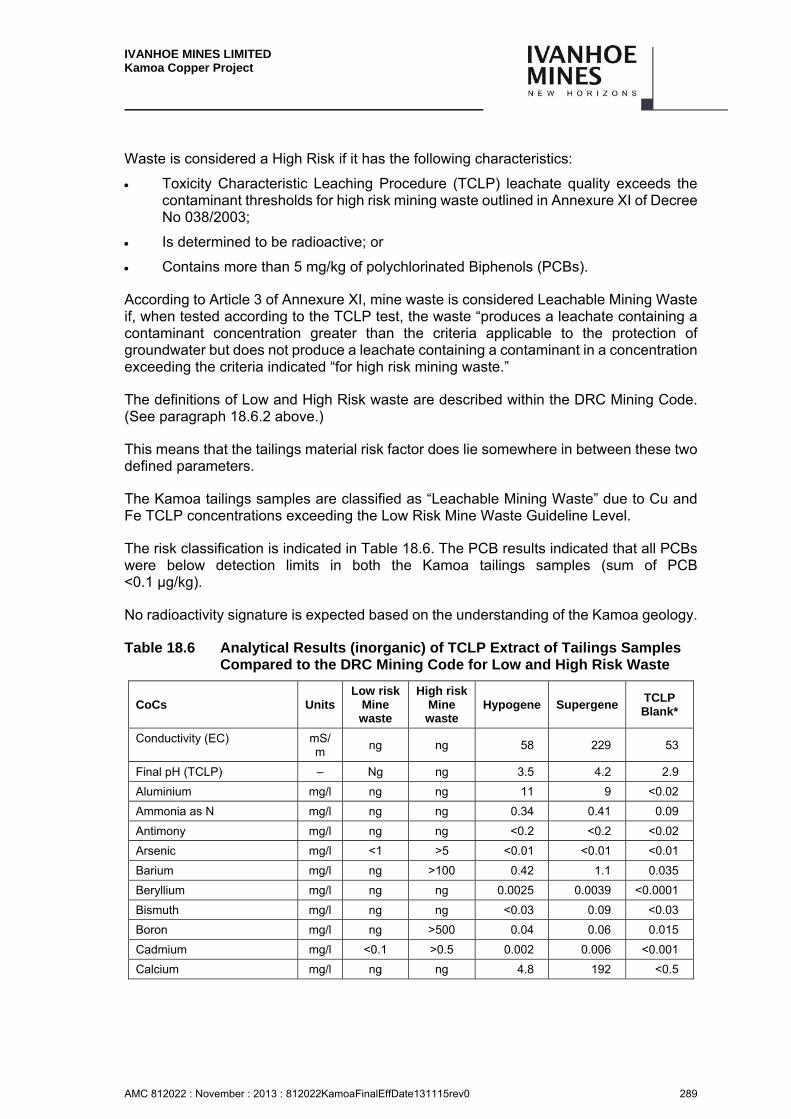
IVANHOE MINES LIMITED Kamoa Copper Project
AMC 812022 : November : 2013 : 812022KamoaFinalEffDate131115rev0 289
Waste is considered a High Risk if it has the following characteristics:
Toxicity Characteristic Leaching Procedure (TCLP) leachate quality exceeds the contaminant thresholds for high risk mining waste outlined in Annexure XI of Decree No 038/2003;
Is determined to be radioactive; or
Contains more than 5 mg/kg of polychlorinated Biphenols (PCBs).
According to Article 3 of Annexure XI, mine waste is considered Leachable Mining Waste if, when tested according to the TCLP test, the waste “produces a leachate containing a contaminant concentration greater than the criteria applicable to the protection of groundwater but does not produce a leachate containing a contaminant in a concentration exceeding the criteria indicated “for high risk mining waste.”
The definitions of Low and High Risk waste are described within the DRC Mining Code. (See paragraph 18.6.2 above.)
This means that the tailings material risk factor does lie somewhere in between these two defined parameters.
The Kamoa tailings samples are classified as “Leachable Mining Waste” due to Cu and Fe TCLP concentrations exceeding the Low Risk Mine Waste Guideline Level.
The risk classification is indicated in Table 18.6. The PCB results indicated that all PCBs were below detection limits in both the Kamoa tailings samples (sum of PCB <0.1 µg/kg).
No radioactivity signature is expected based on the understanding of the Kamoa geology.
Table 18.6 Analytical Results (inorganic) of TCLP Extract of Tailings Samples Compared to the DRC Mining Code for Low and High Risk Waste
CoCs Units Low risk
Mine waste
High risk Mine waste
Hypogene Supergene TCLP Blank*
Conductivity (EC) mS/m
ng ng 58 229 53
Final pH (TCLP) – Ng ng 3.5 4.2 2.9
Aluminium mg/l ng ng 11 9 <0.02
Ammonia as N mg/l ng ng 0.34 0.41 0.09
Antimony mg/l ng ng <0.2 <0.2 <0.02
Arsenic mg/l <1 >5 <0.01 <0.01 <0.01
Barium mg/l ng >100 0.42 1.1 0.035
Beryllium mg/l ng ng 0.0025 0.0039 <0.0001
Bismuth mg/l ng ng <0.03 0.09 <0.03
Boron mg/l ng >500 0.04 0.06 0.015
Cadmium mg/l <0.1 >0.5 0.002 0.006 <0.001
Calcium mg/l ng ng 4.8 192 <0.5
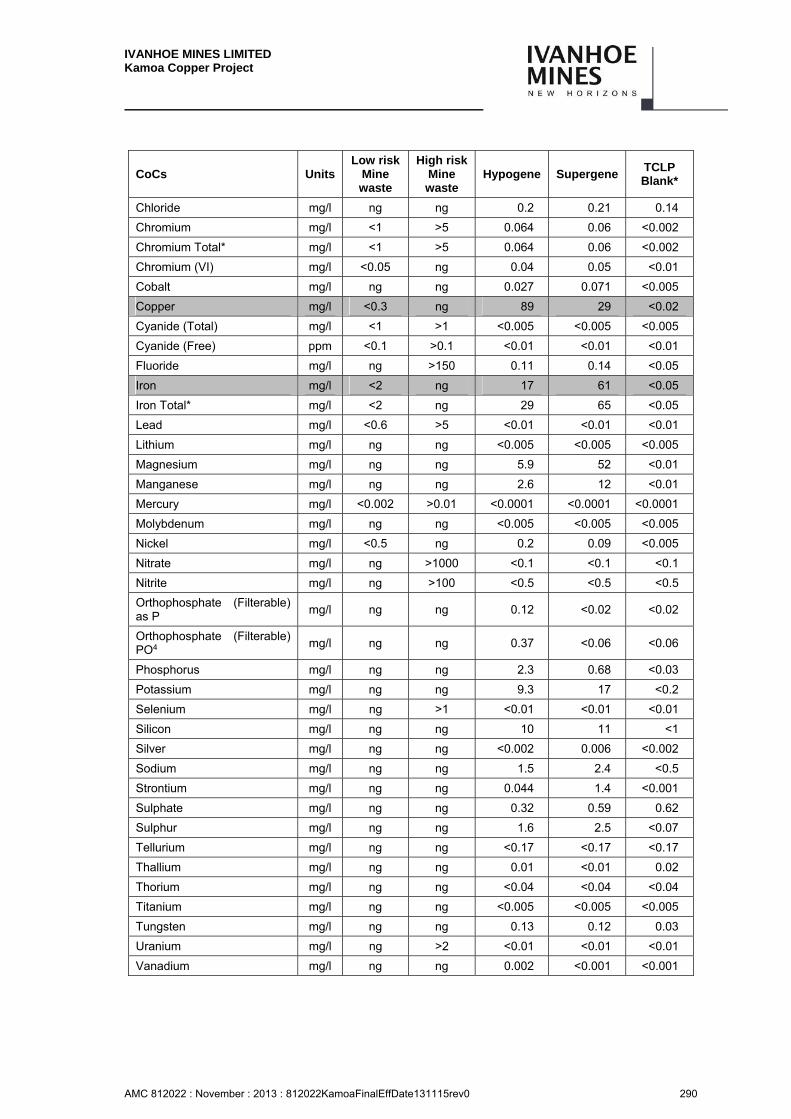
IVANHOE MINES LIMITED Kamoa Copper Project
AMC 812022 : November : 2013 : 812022KamoaFinalEffDate131115rev0 290
CoCs Units Low risk
Mine waste
High risk Mine waste
Hypogene Supergene TCLP Blank*
Chloride mg/l ng ng 0.2 0.21 0.14
Chromium mg/l <1 >5 0.064 0.06 <0.002
Chromium Total* mg/l <1 >5 0.064 0.06 <0.002
Chromium (VI) mg/l <0.05 ng 0.04 0.05 <0.01
Cobalt mg/l ng ng 0.027 0.071 <0.005
Copper mg/l <0.3 ng 89 29 <0.02
Cyanide (Total) mg/l <1 >1 <0.005 <0.005 <0.005
Cyanide (Free) ppm <0.1 >0.1 <0.01 <0.01 <0.01
Fluoride mg/l ng >150 0.11 0.14 <0.05
Iron mg/l <2 ng 17 61 <0.05
Iron Total* mg/l <2 ng 29 65 <0.05
Lead mg/l <0.6 >5 <0.01 <0.01 <0.01
Lithium mg/l ng ng <0.005 <0.005 <0.005
Magnesium mg/l ng ng 5.9 52 <0.01
Manganese mg/l ng ng 2.6 12 <0.01
Mercury mg/l <0.002 >0.01 <0.0001 <0.0001 <0.0001
Molybdenum mg/l ng ng <0.005 <0.005 <0.005
Nickel mg/l <0.5 ng 0.2 0.09 <0.005
Nitrate mg/l ng >1000 <0.1 <0.1 <0.1
Nitrite mg/l ng >100 <0.5 <0.5 <0.5
Orthophosphate (Filterable) as P
mg/l ng ng 0.12 <0.02 <0.02
Orthophosphate (Filterable) PO4
mg/l ng ng 0.37 <0.06 <0.06
Phosphorus mg/l ng ng 2.3 0.68 <0.03
Potassium mg/l ng ng 9.3 17 <0.2
Selenium mg/l ng >1 <0.01 <0.01 <0.01
Silicon mg/l ng ng 10 11 <1
Silver mg/l ng ng <0.002 0.006 <0.002
Sodium mg/l ng ng 1.5 2.4 <0.5
Strontium mg/l ng ng 0.044 1.4 <0.001
Sulphate mg/l ng ng 0.32 0.59 0.62
Sulphur mg/l ng ng 1.6 2.5 <0.07
Tellurium mg/l ng ng <0.17 <0.17 <0.17
Thallium mg/l ng ng 0.01 <0.01 0.02
Thorium mg/l ng ng <0.04 <0.04 <0.04
Titanium mg/l ng ng <0.005 <0.005 <0.005
Tungsten mg/l ng ng 0.13 0.12 0.03
Uranium mg/l ng >2 <0.01 <0.01 <0.01
Vanadium mg/l ng ng 0.002 <0.001 <0.001
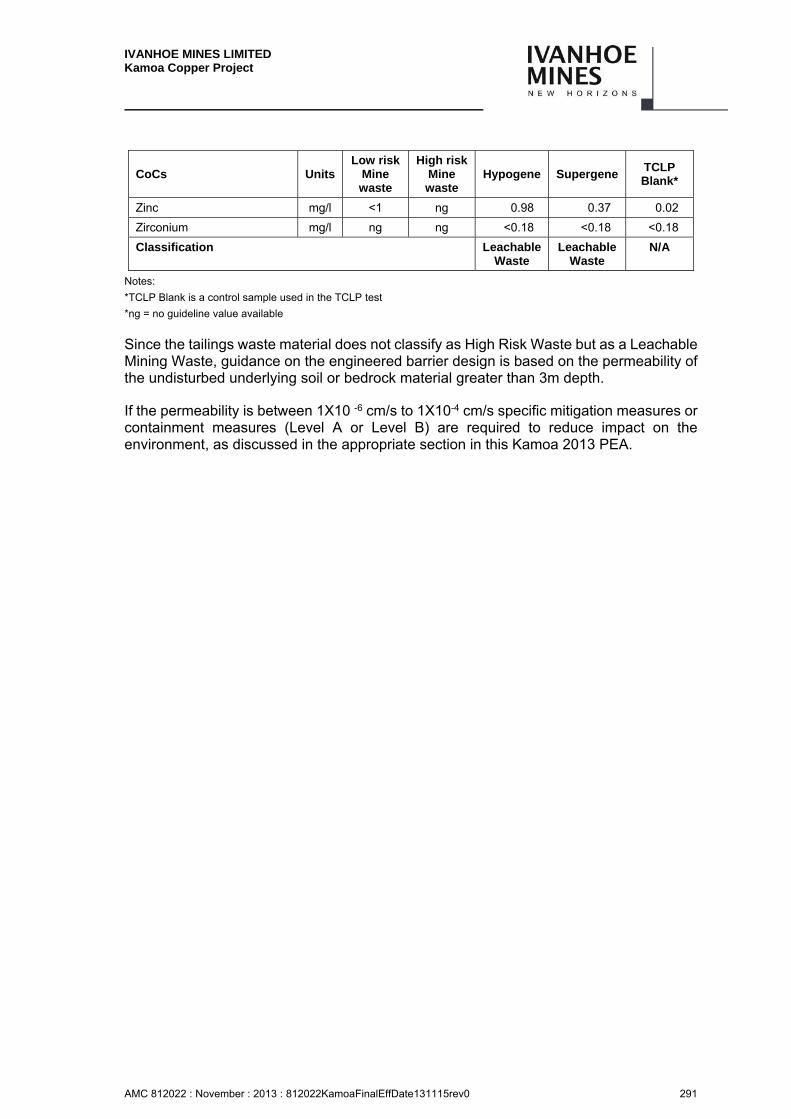
IVANHOE MINES LIMITED Kamoa Copper Project
AMC 812022 : November : 2013 : 812022KamoaFinalEffDate131115rev0 291
CoCs Units Low risk
Mine waste
High risk Mine waste
Hypogene Supergene TCLP Blank*
Zinc mg/l <1 ng 0.98 0.37 0.02
Zirconium mg/l ng ng <0.18 <0.18 <0.18
Classification LeachableWaste
Leachable Waste
N/A
Notes:
*TCLP Blank is a control sample used in the TCLP test
*ng = no guideline value available
Since the tailings waste material does not classify as High Risk Waste but as a Leachable Mining Waste, guidance on the engineered barrier design is based on the permeability of the undisturbed underlying soil or bedrock material greater than 3m depth.
If the permeability is between 1X10 -6 cm/s to 1X10⁻⁴ cm/s specific mitigation measures or containment measures (Level A or Level B) are required to reduce impact on the environment, as discussed in the appropriate section in this Kamoa 2013 PEA.

IVANHOE MINES LIMITED Kamoa Copper Project
AMC 812022 : November : 2013 : 812022KamoaFinalEffDate131115rev0 292
18.6.3 Engineered Stockpile Area
The decline shafts will be developed by initially excavating a box-cut and then sinking three (3) x 6 m diameter shafts as follows:
Shaft 1 for equipment and machinery;
Shaft 2 for a conveyor; and
Shaft 3 for men access.
The sinking of the three shafts will produce waste rock material which will be required to be temporarily stored. A small percentage of the waste rock material may be Potentially Acid Generating (PAG) waste rock material and will require to be selectively handled.
During mining operations, three (3) materials are expected to be conveyed to surface, namely:
Raw product material;
PAG Waste rock material; and
Non-PAG waste rock material.
– The three aforementioned materials require a suitably designed temporary stockpiling area within close vicinity to the box-cut and conveyor network.
18.6.3.1 Engineered Stockpile Area at Each Decline Shaft Area
An engineered platform / stockpile area will be designed and constructed using compacted laterite materials to accommodate the anticipated volumes as follows:
PAG waste rock material from the initial decline shaft development or underground mining;
Non-PAG waste rock material from the initial decline shafts; and
Temporary storage stockpile of raw product material.
– The platform will be compartmented with the aid of earth berms to avoid cross contamination of the respective materials.
18.6.3.2 Stormwater Management
The footprint of the box-cut and engineered platform will be assumed to be a “dirty” area. The area will be bunded by earth berms and all contaminated surface water will be conveyed under gravity towards a dedicated lined Pollution Control Dam (PCD). The water quality will be predicted by a geochemical model and classified accordingly with local legislation which will determine the engineering barrier design for the respective surface stormwater infrastructure and PCD.
IVANHOE MINES LIMITED Kamoa Copper Project
AMC 812022 : November : 2013 : 812022KamoaFinalEffDate131115rev0 293
18.6.3.3 Costing
Reference is made to a discussion between Ivanhoe, Hatch Goba, and Golder where the following was agreed:
Hatch Goba will cost the facilities as proposed;
Golder will accommodate the PAG within the TSF as proposed (assuming low volumes will be encountered during mining); and
Golder will design the PCD and the excess water will be pumped to the plant site as part of the mine dewatering scheme.
Communications
Current site communications comprise satellite phones and a Very Small Apeture Terminal (VSAT) internet link. Cell phone service is available on site as well as in Kolwezi. This will be used for construction and operations. Increased bandwidth and coverage across the whole site will be provided.
Waste Management
Currently land fill sites or waste collection facilities in the Kolwezi area are limited. So are hazardous waste management contractors or services based in Kolwezi that can deal with oils, batteries, bio hazardous waste etc.
An integrated approach to waste management for Kamoa will be needed. This would involve reduction, reuse, recycling and would be done onsite through waste separation. Some of the methods incorporated would be through composting, alternative uses based on stockpiling areas and storage for other disposal (for hazardous chemicals like oils, batteries, vehicle filters and old parts etc).
This approach will be developed further during the pre-feasibility phase.
Roads and Earthworks
18.9.1 Main access road
A reliable and safe main access road from Kolwezi to the Kamoa project will be required.
Two alternative route alignments for access from Kolwezi to the proposed Kamoa mine area were investigated.
Alternative 1 (northern alignment) is a combination of the new alignment from the Kamoa Process Plant Site towards the N39 and the upgrading of a section of the existing N39 route alignment before Luilu and the section between Luilu and Kolwezi
Alternative 2 (southern alignment) is mainly a new alignment from the Kamoa Process Plant Site to Kolwezi. Alternative 2 was divided into alternative 2A and 2B which follows different alignments Figure 18.12 shows these potential access road alignments.
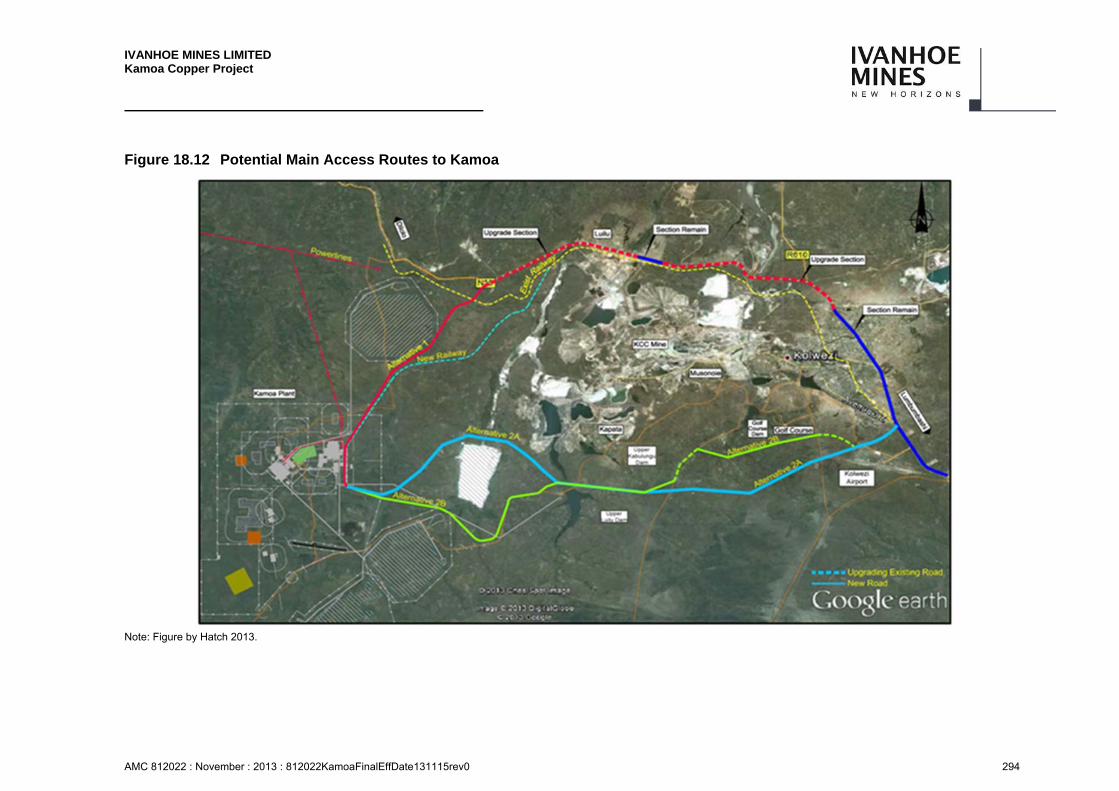
IVANHOE MINES LIMITED Kamoa Copper Project
AMC 812022 : November : 2013 : 812022KamoaFinalEffDate131115rev0 294
Figure 18.12 Potential Main Access Routes to Kamoa
Note: Figure by Hatch 2013.
IVANHOE MINES LIMITED Kamoa Copper Project
AMC 812022 : November : 2013 : 812022KamoaFinalEffDate131115rev0 295
Alternative 1 is approximately 7 km longer than alternative 2. The length of sections to be upgraded are however very similar for alternatives 1 and 2.
From a mine accessibility point of view, alternative 2 is the recommended route. However, land ownership, environmental and social issues are more problematic on alternative 2. For both alternatives new road servitudes will have to be obtained. This servitude will be finalized during future phases of the project.
It is proposed that the access route to the Kamoa Mine should be a bitumen surfaced road within a 30m minimum road reserve. Typically the road will be designed for a design speed of 80 km/h and operating speed may vary from 60 km/h to 80 km/h depending on the surrounding locations and constraints. The roads will have a surface width of 9 m with two 3,5 m bitumen surfaced lanes and 1,0m surfaced shoulders. An additional 1,5 m gravel shoulder has been added to both sides for a total formation width of 12 m. The inclusion of gravel shoulders is mainly for the recovery area if a vehicle breaks down during the pre-feasibility phase, alternative 1 will be developed further to a preliminary design status.
18.9.2 Other roads
The following facilities will be allowed inside the plant and mine area:
Plant roads. All plant roads will be surfaced. The 3 Mtpa concentrator roads will initially however only be graveled and only surfaced as part of the construction of the 8 Mtpa concentrator roads.
Plant to portals roads. Initially a 6 m wide gravel road will be provided. This road will be upgraded to a surfaced road during phase 2 of the project.
Plant to tailings storage facilities. A 6 m wide gravel road will be provided.
Service roads (conveyor, ventilation fans, slurry pipelines). 4 m gravel roads will be provided as serviced roads.
Village access road. A 6 m gravel road will be provided.
Village roads. Variant road widths will be provided, depending on the hierarchy of the road in the village. All roads will initially be gravel roads. During phase 2 of the project, the roads around the town centre will be paved.
18.9.3 Terracing and Earthworks
The terrace shall be designed with suitable grading for quick elimination of surface runoff and keeping in mind optimization of cut and fill earthworks quantities. Stepped terraces shall be proposed to accommodate mechanical and process requirements on the plant. The Kamoa site has been identified to consist of collapsible soils of low bearing capacity that shall prove inadequate to support heavy structural foundation loads. The terrace layerworks shall be designed for removal of unsuitable insitu soil and backfilling with structural fill layers to provide a stable founding medium for structural foundations to carry heavy mechanical and process equipment.
IVANHOE MINES LIMITED Kamoa Copper Project
AMC 812022 : November : 2013 : 812022KamoaFinalEffDate131115rev0 296
Rail
18.10.1 Ndola – Durban Rail Corridor
Until 2012 the rail line of approximate 740 km between Ndola (border with DRC) and Livingstone (border with Zimbabwe) was managed under concession by RSZ (Railway System of Zambia). This concession was revoked in September 2012 and is currently run under management of the Zambian government.
The operation of the 470-kilometer section between Bulawayo and Victoria Falls (Livingstone) on the Zambia border is carried out by the National Railways of Zimbabwe (NRZ) with NLL (NLPI Logistics) responsible for the financing and marketing of the line, per the agreement between NLL and NRZ. The 350-kilometer railway line from Beitbridge (the border post between South Africa and Zimbabwe) to Bulawayo (the most industrialised city in Zimbabwe) was built in record time, with the construction phase lasting only 18 months. Implemented in Zimbabwe on a Build-Operate-Transfer basis by Beitbridge Bulawayo Railway BBR, which is in itself a subsidiary or part of the NLPI group..
Transnet Freight Rail (TFR) is the rail operator of the freight rail network in South Africa and Transnet owns the assets. The railway system has sections running at world class standards, maintaining high volumes over long distances. TFR has an investment plan based on a forecasted volume increase and new rail customers, which includes an upgrade of the line and a purchase of additional rolling stock to manage increased demand. TFR is a South African government-owned company.
A large port such as Durban exports bulk break-bulk and containers fed by block trains of 100 or more wagons. Another major port in South Africa is Richards Bay, which accommodates shipping of several commodities.
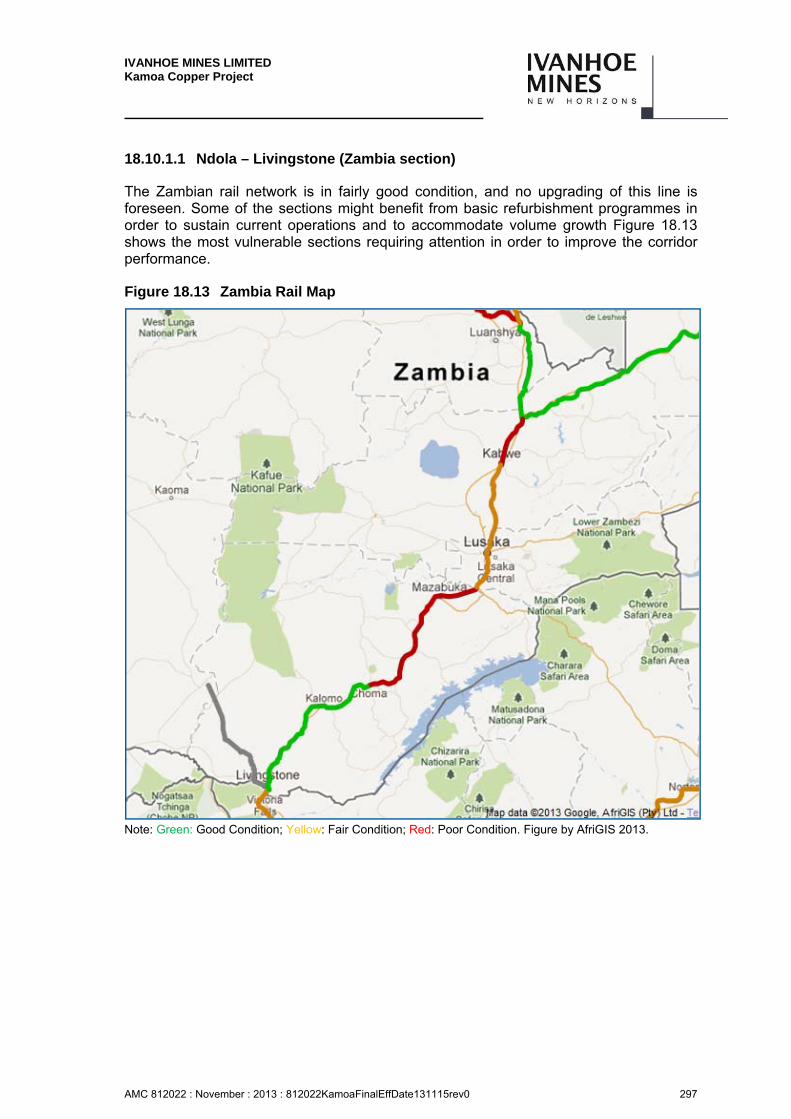
IVANHOE MINES LIMITED Kamoa Copper Project
AMC 812022 : November : 2013 : 812022KamoaFinalEffDate131115rev0 297
18.10.1.1 Ndola – Livingstone (Zambia section)
The Zambian rail network is in fairly good condition, and no upgrading of this line is foreseen. Some of the sections might benefit from basic refurbishment programmes in order to sustain current operations and to accommodate volume growth Figure 18.13 shows the most vulnerable sections requiring attention in order to improve the corridor performance.
Figure 18.13 Zambia Rail Map
Note: Green: Good Condition; Yellow: Fair Condition; Red: Poor Condition. Figure by AfriGIS 2013.
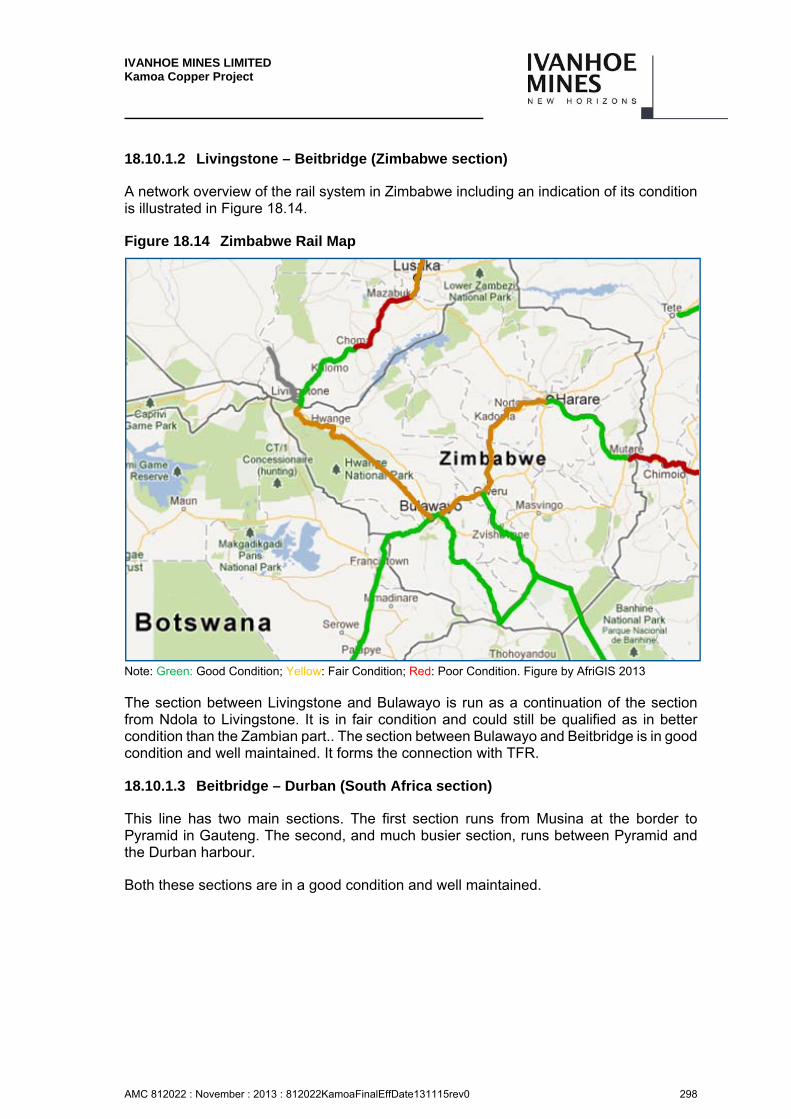
IVANHOE MINES LIMITED Kamoa Copper Project
AMC 812022 : November : 2013 : 812022KamoaFinalEffDate131115rev0 298
18.10.1.2 Livingstone – Beitbridge (Zimbabwe section)
A network overview of the rail system in Zimbabwe including an indication of its condition is illustrated in Figure 18.14.
Figure 18.14 Zimbabwe Rail Map
Note: Green: Good Condition; Yellow: Fair Condition; Red: Poor Condition. Figure by AfriGIS 2013
The section between Livingstone and Bulawayo is run as a continuation of the section from Ndola to Livingstone. It is in fair condition and could still be qualified as in better condition than the Zambian part.. The section between Bulawayo and Beitbridge is in good condition and well maintained. It forms the connection with TFR.
18.10.1.3 Beitbridge – Durban (South Africa section)
This line has two main sections. The first section runs from Musina at the border to Pyramid in Gauteng. The second, and much busier section, runs between Pyramid and the Durban harbour.
Both these sections are in a good condition and well maintained.
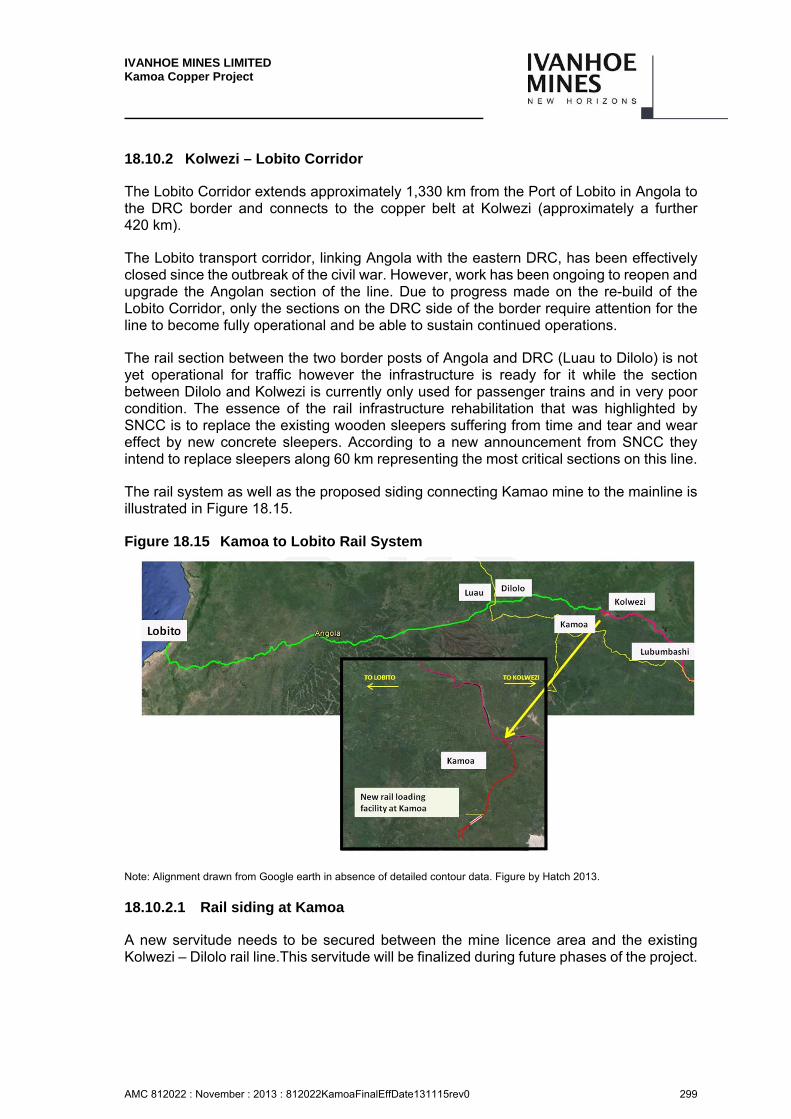
IVANHOE MINES LIMITED Kamoa Copper Project
AMC 812022 : November : 2013 : 812022KamoaFinalEffDate131115rev0 299
18.10.2 Kolwezi – Lobito Corridor
The Lobito Corridor extends approximately 1,330 km from the Port of Lobito in Angola to the DRC border and connects to the copper belt at Kolwezi (approximately a further 420 km).
The Lobito transport corridor, linking Angola with the eastern DRC, has been effectively closed since the outbreak of the civil war. However, work has been ongoing to reopen and upgrade the Angolan section of the line. Due to progress made on the re-build of the Lobito Corridor, only the sections on the DRC side of the border require attention for the line to become fully operational and be able to sustain continued operations.
The rail section between the two border posts of Angola and DRC (Luau to Dilolo) is not yet operational for traffic however the infrastructure is ready for it while the section between Dilolo and Kolwezi is currently only used for passenger trains and in very poor condition. The essence of the rail infrastructure rehabilitation that was highlighted by SNCC is to replace the existing wooden sleepers suffering from time and tear and wear effect by new concrete sleepers. According to a new announcement from SNCC they intend to replace sleepers along 60 km representing the most critical sections on this line.
The rail system as well as the proposed siding connecting Kamao mine to the mainline is illustrated in Figure 18.15.
Figure 18.15 Kamoa to Lobito Rail System
Note: Alignment drawn from Google earth in absence of detailed contour data. Figure by Hatch 2013.
18.10.2.1 Rail siding at Kamoa
A new servitude needs to be secured between the mine licence area and the existing Kolwezi – Dilolo rail line.This servitude will be finalized during future phases of the project.
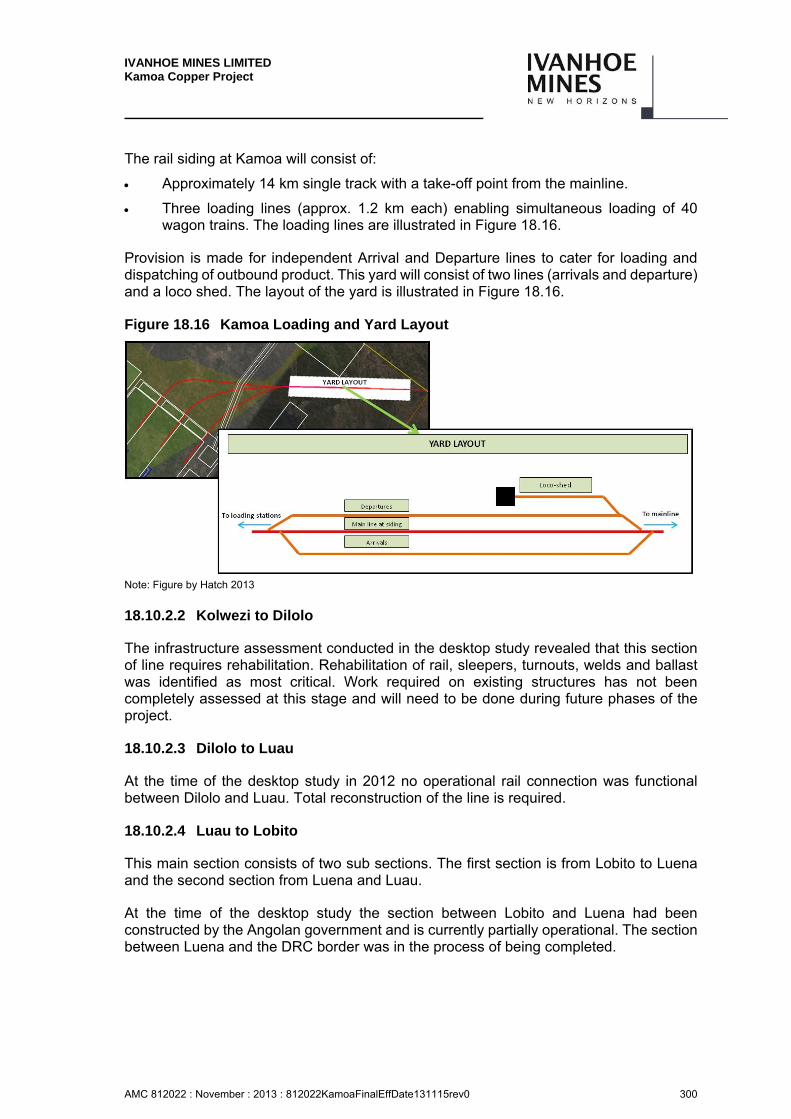
IVANHOE MINES LIMITED Kamoa Copper Project
AMC 812022 : November : 2013 : 812022KamoaFinalEffDate131115rev0 300
The rail siding at Kamoa will consist of:
Approximately 14 km single track with a take-off point from the mainline.
Three loading lines (approx. 1.2 km each) enabling simultaneous loading of 40 wagon trains. The loading lines are illustrated in Figure 18.16.
Provision is made for independent Arrival and Departure lines to cater for loading and dispatching of outbound product. This yard will consist of two lines (arrivals and departure) and a loco shed. The layout of the yard is illustrated in Figure 18.16.
Figure 18.16 Kamoa Loading and Yard Layout
Note: Figure by Hatch 2013
18.10.2.2 Kolwezi to Dilolo
The infrastructure assessment conducted in the desktop study revealed that this section of line requires rehabilitation. Rehabilitation of rail, sleepers, turnouts, welds and ballast was identified as most critical. Work required on existing structures has not been completely assessed at this stage and will need to be done during future phases of the project.
18.10.2.3 Dilolo to Luau
At the time of the desktop study in 2012 no operational rail connection was functional between Dilolo and Luau. Total reconstruction of the line is required.
18.10.2.4 Luau to Lobito
This main section consists of two sub sections. The first section is from Lobito to Luena and the second section from Luena and Luau.
At the time of the desktop study the section between Lobito and Luena had been constructed by the Angolan government and is currently partially operational. The section between Luena and the DRC border was in the process of being completed.
IVANHOE MINES LIMITED Kamoa Copper Project
AMC 812022 : November : 2013 : 812022KamoaFinalEffDate131115rev0 301
After completion this line will be able to accommodate trains of 20TAL at 40 or 100 wagons per train. Indications are that this line will have a capacity of between 6 Mtpa and 20 Mtpa.
18.10.2.5 Lobito Rail Terminal
A port terminal connection is required to receive and dispatch trains. This terminal will comprise of two 600m loops for arrivals and departures, a 1 km tie-in as well as associated infrastructure (i.e. control rooms, weighbridges, fencing and security). At this stage it is assumed that the rail terminal will have the necessary capacity. This has however not been confirmed at this stage and will need to be done during future phases of the project.
18.10.2.6 Lobito Port Terminal
The Port of Lobito is well equipped for container handling and the terminal has recently been upgraded.
At this stage it is assumed that the terminal will have the capacity to handle the Kamoa Blister to be transferred from rail wagons into containers and transferred to the container terminal for loading vessels to China. This has not been assessed at this stage and will need to be done during future phases of the project.
There are 25 cranes with lifting capacity from 3 to 22 tonnes, 44 different trucks, of which 19 are for Full Container, 6 for voids, floating crane with a lifting capacity of 120 tonnes and other means for handling miscellaneous loads.
For loading and unloading merchandise onboard vessels, there are 28 electric cranes and container cranes of diverse makes with capacities varying between 3 tonnes and 22 tonnes. There are four machines of 27 and 48 tonnes, to facilitate container handling.
In conclusion, the decision to have an operational line between Kolwezi and Lobito port is not exclusively dependant on the rehabilitation of the rail infrastructure; however, it needs joint agreement from both countires’ respective governments in addition to completing an institutional framework that should govern these operations.
Logistics
18.11.1 Overview
Kamoa is 25 km from Kolwezi and accessible by existing dirt and tar roads. The condition of the roads to Kolwezi from the relevant border posts ranges from fair to poor. The ability to transit these roads is made more difficult according to the season, with dust being a problem in the dry season and rain in the wet season.
The DRC is a land-locked country and goods from outside of Africa are generally transported by sea to Durban or Richards Bay in South Africa.
Walvis Bay in Namibia, Beira and Maputo in Mozambique and Dar-es-Salaam in Tanzania are alternative ports. All three ports are suitable with big potential. Currently Beira and Walvis Bay have no rail arriving to them; however there is an existing road network.
IVANHOE MINES LIMITED Kamoa Copper Project
AMC 812022 : November : 2013 : 812022KamoaFinalEffDate131115rev0 302
18.11.2 Inbound Project Logistics – Phases 1 and 2
An optimal route for inbound project cargo, based on indications from initial transport studies, is via the ports of Durban or Richards Bay, then transport either via Zimbabwe (abnormal loads) or Botswana (normal loads) and then Zambia to the DRC.
In the light of the current transport mode performances in and out of the DRC, the optimal solution for the time being remains a combination of both rail and road transport, in order to compensate some of the drawbacks that may occur on one or the other of these transport modes. For example, several improvements are needed in terms of rail infrastructure within the DRC and also with regard to customs clearance, while there exist better rail transport efficiency between Ndola and Durban. So if rail transport underperforms for a specific reason within the DRC then road transport between DRC (i.e. Kolwezi or Lubumsbashi) and Ndola could be a suitable alternative option, assuming that products would then be moved by rail between Durban or Richards Bay and Ndola, for both inbound and outbound material.
The port of Dar-es-Salaam is also being currently used for imports into the DRC and may be considered as a suitable alternative.
Various river crossings exist en route from South Africa to the Kamoa site. A logistics transport envelope has been determined along this route, highlighting specific constraints in terms of weight and dimensions. Options to move heavier abnormal pieces by using special rigging equipment and the potential use of railway bridges have also been evaluated.
The recommended routes for the transport of project cargo are as follows:
Abnormal loads from South Africa to Kamoa
– Durban/Johannesburg via Beitbridge Zimbabwean border, Chirundu Zambia border to Kasumbulesa DRC border, from there via Lubumbashi, Likasi and Kolwezi to Kamoa site.
– The Kopolowe River bridge near Likasi has restrictions due to its box design, which limits height and width to 4.8 m and 6.6 m respectively. The official weight limit of this bridge is 45 tonnes; however, loads of up to 80 tonnes spread over many axles (using a special heavy-haul trailer with six to ten axles) have been allowed to cross. However, to cross the Kapolowe bridge with abnormal loads a rail bridge close to the road can be considered as an alternative, based on rail transport.
– The maximum weight restriction on Lualaba bridge (close to Kolwezi) is 45 tonnes. Alternatively a ferry (owned by Gecamines) may be used (maximum gross weight of 90–100 tonnes allowed). The privately owned Kamoto Copper Company barge can accommodate loads of up to 120 tonnes.
Normal loads from South Africa to Kamoa
– Durban/Johannesburg via Martinsdrift or Lobatse Botswana border, into Zambia via the border crossing using the Kazungula ferry; then via Livingstone, Lusaka, Kitwe, Chingola, Kasumbalesa, Lubumbashi to Kamoa.
IVANHOE MINES LIMITED Kamoa Copper Project
AMC 812022 : November : 2013 : 812022KamoaFinalEffDate131115rev0 303
– Restrictions as detailed for abnormal loads for the Lualaba and Kopolowe River bridges will apply.
Where project cargo is required urgently, such can potentially be air-freighted to either Kolwezi or Lubumbashi airports. Infrastructure constraints at Kolwezi airport prevent the landing of abnormal cargo.
18.11.3 Outbound Product Logistics – 2017 to 2022
After the commissioning of phase 1, concentrate will be carried by road freight (trucks) from Kamoa site to Ndola. At Ndola, product concentrate will be off-loaded from trucks and loaded onto rail wagons for rail transport from Ndola to Durban handling terminal.
It is currently assumed that the Ndolahub with all terminal options available, as well as the Durban handling terminal will have capacity to handle the concentrate (loading, off-loading, stuffing of containers, etc.). No other additional handling equipment has been included. This will have to be verified in future studies.
In Durban harbour concentrate will be off-loaded from the railway line, packed into containers, loaded onto trucks and transferred into the port stack for the vessel. A stock pile will have to be managed (in a controlled environment with adequate security) at the handling/transfer terminal in Durban harbour for the concentrate while potentially waiting for a connecting vessel. This will avoid cost associated with container storage and other port charges.
18.11.4 Outbound Product Logistics – 2022 onwards
After the commissioning of phase 2, blister copper will be loaded onto rail wagons at Kamoa site for rail transport to Lobito port terminal which is expected to have opened for operations by then.
It is currently assumed that the Lobito handling terminal, as well as the Lobito port terminal, will have capacity to handle the blister copper (loading, off loading, stuffing of containers, etc.). No other additional handling equipment has been included. This will have to be verified in future studies.
In Lobito harbour the blister copper will be off-loaded from the railway line, packed into containers, loaded onto trucks and transferred into the port stack for the vessel.
It is assumed that the blister copper will be stacked in a controlled environment with adequate security and preservation, until such time as volumes allow for export preparation to proceed. This will take place at the handling/transfer terminal in Lobito harbour, thereby avoiding costs associated with container storage and other port charges. This will have to be verified in future studies.
IVANHOE MINES LIMITED Kamoa Copper Project
AMC 812022 : November : 2013 : 812022KamoaFinalEffDate131115rev0 304
Airports
Lubumbashi International Airport in DRC has an elevation of 1,197 m above mean sea level. It has one runway designated 07/25 with an asphalt surface measuring 3,203 m by 50 m. This airport is regularly serviced by the following airlines: South African Airways (operated by South African Express), ITAB (DRC domestic airline), Kenya Airways, Ethiopian Airlines, Congo Express, and a number of smaller airlines and private charters.
Kolwezi Airport serves Kolwezi, the capital city of the Lualaba District of the Katanga Province in the DRC. The airport is located about 6 km south of Kolwezi. The airport has an elevation of 1,526 m above mean sea level. It has one runway designated 11/29 with an asphalt surface measuring 1,750 m by 30 m. This airport is largely serviced by ITAB, and a number of smaller airlines and private charters.
The two airports will be utilised to transport people, goods and material to the project site during both the life cycle of the Project and the operations phase.
Consumables and Services
18.13.1 Fuel
Transport fuel and fuelling infrastructure is available along all of the required routes, albeit fuel quality and standards between countries is likely to vary. This may prove a problem in future, particularly if certain countries impose higher emission standards (EURO VI) on vehicles and the quality of fuel required to meet these standards is not available in each of the countries transited.
18.13.2 Maintenance
There are no commercial type break down facilities between Chingola, Zambia and Lubumbashi; however, there are commercially-owned breakdown rigs with a towing capacity of up to 30 t.
18.13.3 Power Lines
Power lines crossing roads are evident in places and the impact thereof on the transport of abnormal loads needs to be investigated.
18.13.4 Bridges
A preliminary bridge assessment has been undertaken. However, a more in-depth investigation is required particularly with respect to abnormal loads. This will be undertaken during subsequent project development phases. The Kapolowe Bridge (30 km from Likasi) and the bridge at the Lualaba River (35 km from Kolwezi) in particular require a more in-depth investigation with respect to abnormal loads.

IVANHOE MINES LIMITED Kamoa Copper Project
AMC 812022 : November : 2013 : 812022KamoaFinalEffDate131115rev0 305
18.13.5 Weather
The impact of weather on the movement of vehicles over river crossing and dirt roads has not been ascertained. This will be undertaken during subsequent project development phases.
18.13.6 Logistics Companies for Project Logistics
The provision of logistics services should be structured in a way that will best negate the risk associated with transport and freight forwarding for the project. To achieve this, a primary freight forwarding contractor should be appointed for the international component of the route. A secondary partner should be considered, to assist with supply from South Africa and other over flow requirements, if required. A local DRC customs clearing/broker partnership should also be established. It should further be ensured that the applicable protocols are implemented, to allow goods to move on a duty free basis between countries of supply and/or transit. Central warehousing facilities should be set up, to consolidate transport loads and to ensure that bonds are not retained on shipping containers.
18.13.7 Operational Inbound Logistics – Reagents and Consumables
During the operational phase, reagents and consumables should be sourced and transported from South Africa, unless suitable reagents and/or consumables can be sourced in the DRC and/or in neighbouring countries. Reagents and consumables procured from outside of South Africa should be moved through Durban harbour, unless other routes are found to be more economical. For suitable reagents and consumables the railway should be considered as an option.
The routing of reagents and consumables to Kamoa will be the subject of a future, separate transport study.
18.13.1 Schedule
From the above, it is evident that the movement of goods and materials to and from site will require extensive planning and monitoring to ensure on time arrival.
Water and Wastewater Systems
18.14.1 Water Demand
Based on figures originally received from AMEC (2012), the estimated water demand for the 3 Mtpa scenario and the 11 Mtpa scenario are given in Table 18.7.

IVANHOE MINES LIMITED Kamoa Copper Project
AMC 812022 : November : 2013 : 812022KamoaFinalEffDate131115rev0 306
Table 18.7 Estimated Water Demand
Mining Scenario 3Mtpa 11Mtpa
Description Units
Mining Water Requirement m3/day 160 560
Concentrator Water Requirement m3/day 4,800 17,540
Smelter Water Requirement m3/day – 10,723
Potable Water Requirement m3/day 140 500
Total Daily Requirement m3/day 5,100 29,323
Total Daily Requirement M/day 5.1 29.3
The estimated raw water demand for each of these scenarios is 5.1 ML/d for the first 4 years and an additional 24.2 ML/d from year 5 and onwards, making a total of 29.3 ML/d. The water requirements are based on the assumption that 40% of the tailings water is returned. It is also noted that the water demand for the smelter has been estimated by rationing demand figures received previously, and hence needs to be confirmed.
Water storage assumes a raw water dam and a storm water dam. The process plant design has a fire water tank, gland service water tank and a tank for process water reticulation.
18.14.2 Bulk Water
The assessment of the bulk water supplies has been undertaken with the view of supplying the estimated water demand for the 3 Mtpa mining scenario for the first 4 years and 11 Mtpa mining scenario from year 5 onwards.
Two potential sources have been identified for the bulk water supply:
The aquifer developed within the sandstone forming the Kamoa and Makalu Domes and the footwall to the mining operations, and
The Mutaka Dam approximately 13 km to the east of the plant area. This is an existing dam constructed in 1978 as a clean water diversion dam to prevent water in this tributary of the Luilu River flowing into the mining areas of Kolwezi.
The source of bulk water will be 5 boreholes (3 production and 2 standby holes) for the first 4 years, delivering 20 l/s for 24 hours per day. From year 5 onwards either an additional 9 boreholes (8 production holes and 1 standby hole) delivering 20 l/s for 24 hours per day could be implemented, and/or water supplied from the Mutaka Dam could supplement the additional water requirements. The use of Mutaka Dam for water supply is considered as a contingency at this stage.
This dam is owned by Gecamines. The water is not used presently and Gecamines has provided AMBL with written permission to use the water.
The initial development of the bulk water supply will comprise the drilling, testing and equipping of the 5 production boreholes drawing on the Kamoa Dome sandstone aquifer close to the plant area.

IVANHOE MINES LIMITED Kamoa Copper Project
AMC 812022 : November : 2013 : 812022KamoaFinalEffDate131115rev0 307
The bulk water supply could be augmented by groundwater inflow into the underground workings. The volume of mine water inflow will be determined in the future.
Process water for the planned mining operation could be obtained from underground water collection, recycling of process water, water management ponds and from re-treatment of water from waste piles. During additional Project advancement studies, appropriate sources of process water would be identified.
18.14.3 Potable Water
Potable water for local villages is currently obtained from local rivers and streams. All watercourses occurring within a 5 km radius of a village are considered extraction points for potable water. In most villages, hand-dug wells supplement domestic water supply when natural watercourses dry up. Potable water for any future mining operation will be sourced from bore holes. The Lufupa River, located to the south-west of the Project, is also a potential water source, but has not been investigated.
Potable water for the mining operation will be obtained from groundwater and the bulk water supply system. Potable water for ablution facilities, kitchens and emergency stations (eyewash and showers) will be obtained from the bulk water system and treated by means of disinfection only (chlorination). An appropriate drinking water standard will be applied to indicators such as bacterial content, residual chlorine, turbidity and dissolved solids.
18.14.1 Storm Water Infrastructure
The Department in Charge of the Protection of the Mining Environment in the Democratic Republic of Congo (DRC) requires that an Environmental Impact Study (EIS) is performed for any proposed mining activity within the DRC. The EIS is prepared using the Mining Regulations, Annex IX (Walmsley, B. & Tshipala K.E., 2012). Article 19 of Annexure IX requires that all mines develop measures to reduce the inflow of uncontaminated runoff water into the mining site water management system. Article 82 of Annexure IX requires that the sizing of any water retention structures accommodates for the water contribution resulting from a projected 24 hour flood with a return period of 100 years. The sizing of the storm water management plan, the pollution control dams and the pipelines with their required pumps are all based on these regulations.
Potable water will be distributed via pipe racks and sleeper ways along with other services where possible and underground as necessary.
18.14.1.1 Storm Water Management Plan
The assumptions made for this investigation are as follows:
Due to the lack of sufficient data closer to the Kamoa site, the Solwezi rainfall data was used to analyse the 1 in 100 year return period 24 hour rainfall event.
The storm water management plan and pipeline system was developed based on the most current site arrangement information available to Golder Associates Africa.
IVANHOE MINES LIMITED Kamoa Copper Project
AMC 812022 : November : 2013 : 812022KamoaFinalEffDate131115rev0 308
Only the diversion channels for diverting clean water entering into dirty water areas were designed. The internal systems within dirty water areas are being determined by the designers of the plant, sewage plant and decline shafts.
The main pipelines and pumps transporting dirty water from the pollution control dams (PCDs) were sized. Shorter pipelines between the underground shafts, the plant and HV and rail yard and the PCDs need to be determined at a more detailed level of design.
A higher detailed storm water management plan and pipeline system will be developed as the mining project progresses. The storm water management plan included in this document is done at a high level and should be considered a conceptual plan.
The clean and dirty water sub catchments were identified and discretized based on the topography of the Kamoa site area. These catchments can be seen on the layout in Figure 18.17.
Manning’s ‘n’ coefficient used in the model for the impervious areas and pervious areas were 0.01 and 0.13 respectively due to the catchment areas being predominantly within the mining site area and therefore largely range land.
The soils were identified as being in the silt loam group. The model uses these criteria to incorporate infiltration into the analysis using the Green-Ampt infiltration method. The typical infiltration parameters for the silt loam group are a suction head of 166.8 mm, a hydraulic conductivity of 6.8 mm/hr. and an initial deficit of 0.368 for input into the model.
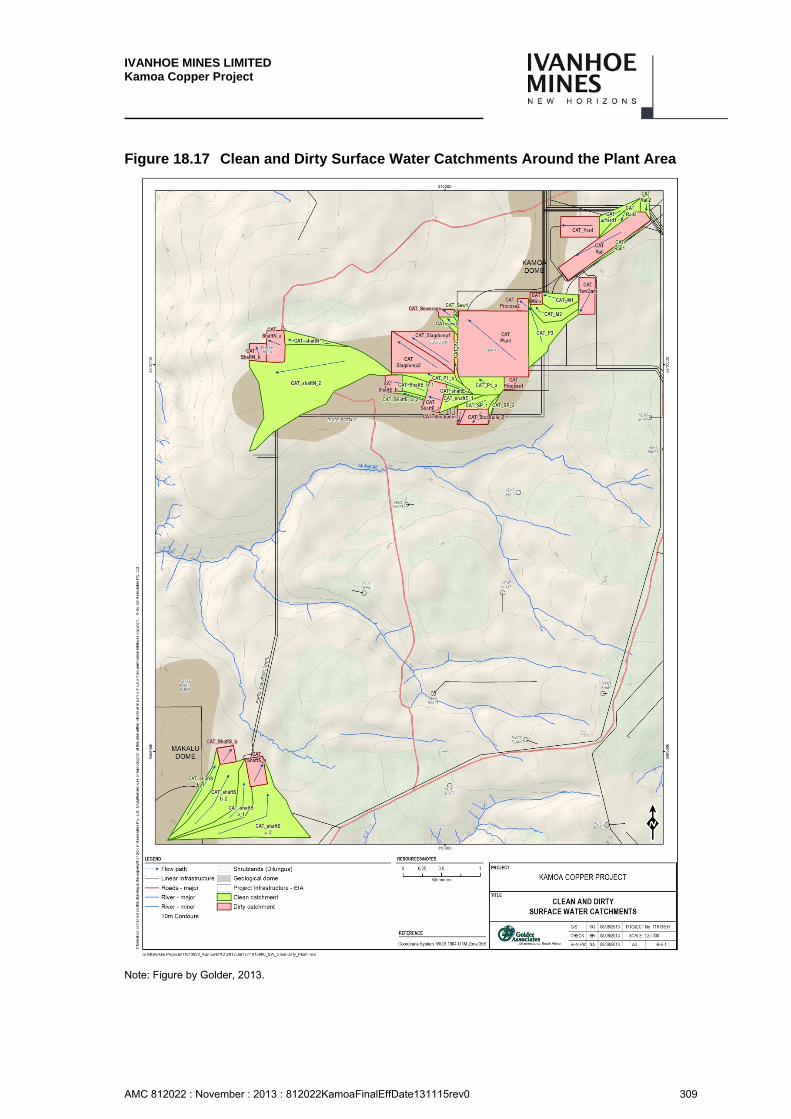
IVANHOE MINES LIMITED Kamoa Copper Project
AMC 812022 : November : 2013 : 812022KamoaFinalEffDate131115rev0 309
Figure 18.17 Clean and Dirty Surface Water Catchments Around the Plant Area
Note: Figure by Golder, 2013.
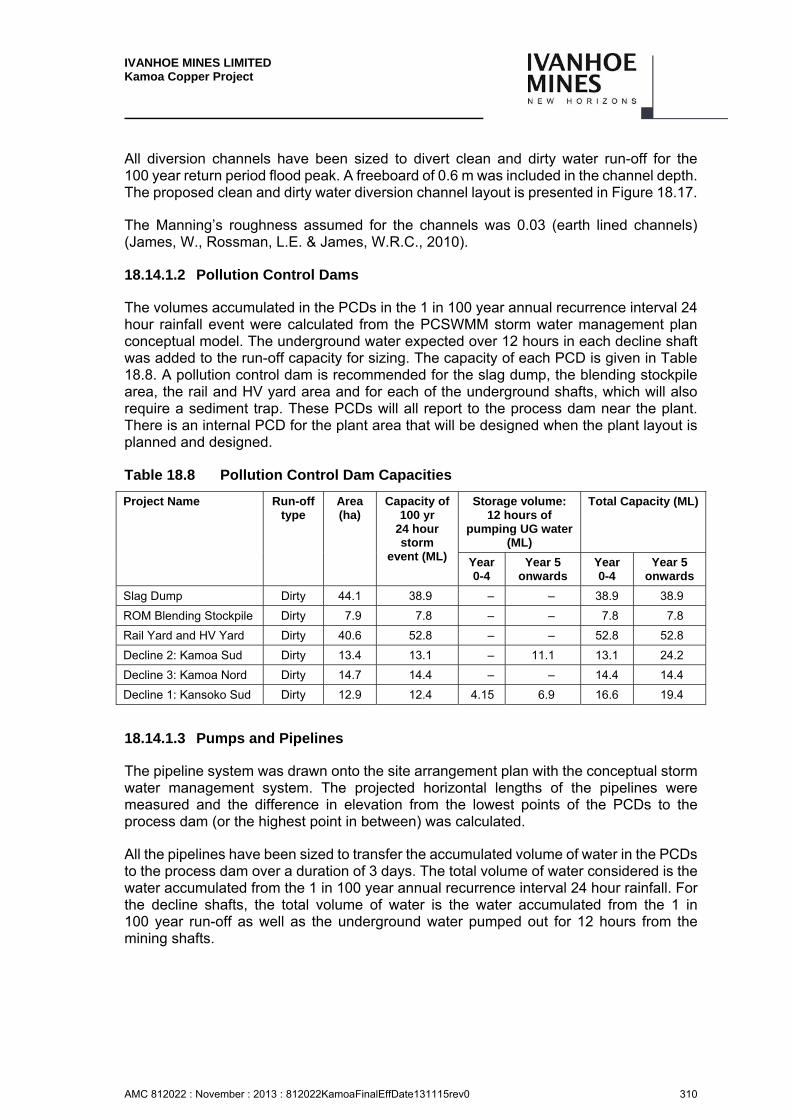
IVANHOE MINES LIMITED Kamoa Copper Project
AMC 812022 : November : 2013 : 812022KamoaFinalEffDate131115rev0 310
All diversion channels have been sized to divert clean and dirty water run-off for the 100 year return period flood peak. A freeboard of 0.6 m was included in the channel depth. The proposed clean and dirty water diversion channel layout is presented in Figure 18.17.
The Manning’s roughness assumed for the channels was 0.03 (earth lined channels) (James, W., Rossman, L.E. & James, W.R.C., 2010).
18.14.1.2 Pollution Control Dams
The volumes accumulated in the PCDs in the 1 in 100 year annual recurrence interval 24 hour rainfall event were calculated from the PCSWMM storm water management plan conceptual model. The underground water expected over 12 hours in each decline shaft was added to the run-off capacity for sizing. The capacity of each PCD is given in Table 18.8. A pollution control dam is recommended for the slag dump, the blending stockpile area, the rail and HV yard area and for each of the underground shafts, which will also require a sediment trap. These PCDs will all report to the process dam near the plant. There is an internal PCD for the plant area that will be designed when the plant layout is planned and designed.
Table 18.8 Pollution Control Dam Capacities
Project Name Run-off type
Area (ha)
Capacity of 100 yr
24 hour storm
event (ML)
Storage volume: 12 hours of
pumping UG water (ML)
Total Capacity (ML)
Year 0-4
Year 5 onwards
Year 0-4
Year 5 onwards
Slag Dump Dirty 44.1 38.9 – – 38.9 38.9
ROM Blending Stockpile Dirty 7.9 7.8 – – 7.8 7.8
Rail Yard and HV Yard Dirty 40.6 52.8 – – 52.8 52.8
Decline 2: Kamoa Sud Dirty 13.4 13.1 – 11.1 13.1 24.2
Decline 3: Kamoa Nord Dirty 14.7 14.4 – – 14.4 14.4
Decline 1: Kansoko Sud Dirty 12.9 12.4 4.15 6.9 16.6 19.4
18.14.1.3 Pumps and Pipelines
The pipeline system was drawn onto the site arrangement plan with the conceptual storm water management system. The projected horizontal lengths of the pipelines were measured and the difference in elevation from the lowest points of the PCDs to the process dam (or the highest point in between) was calculated.
All the pipelines have been sized to transfer the accumulated volume of water in the PCDs to the process dam over a duration of 3 days. The total volume of water considered is the water accumulated from the 1 in 100 year annual recurrence interval 24 hour rainfall. For the decline shafts, the total volume of water is the water accumulated from the 1 in 100 year run-off as well as the underground water pumped out for 12 hours from the mining shafts.

IVANHOE MINES LIMITED Kamoa Copper Project
AMC 812022 : November : 2013 : 812022KamoaFinalEffDate131115rev0 311
For optimal design, the average velocity in the pipes was taken as 1.2 m/s. The pipeline system consists of circular HDPE pipes with a roughness of 0.03 mm (Chadwick, A. Morfett, J. & Borthwick, M., 2004). The friction factor was calculated using the Barr equation, as it is an explicit formula and allows for a straight forward calculation of this parameter. The pipeline lengths and static head were measured off a topographic plan of the pipeline system. The total head was calculated from the sum of the static head and the friction head in the pipeline. The total head was used to find the appropriate pump size required. The lengths and sizes of each pipeline from the PCDs can be seen in Table 18.9.
Table 18.9 The Characteristics of the Pipelines From Each PCD
Name of PCD Actual
Length of pipe (m)
Flow in pipe
(m3/s)
Internal Diam.
(m)
Friction Factor (Barr Equ)
Friction Head (m)
Static head (m)
Total Head (m)
Slag Dump 1,638 0.150 0.40 0.014 4.3 20.5 24.8
ROM Blending Stockpile 2,520 0.030 0.18 0.017 17.4 12.5 29.9
Rail Yard and HV Yard 730 0.204 0.47 0.014 1.6 2 3.6
Decline 2: Kamoa Sud 3,495 0.093 0.31 0.015 12.2 32.5 44.7
Decline 3: Kamoa Nord 2,997 0.083 0.30 0.015 11.2 16.5 27.7
Decline 1: Kansoko Sud 9,121 0.075 0.28 0.015 36.4 30 66.4
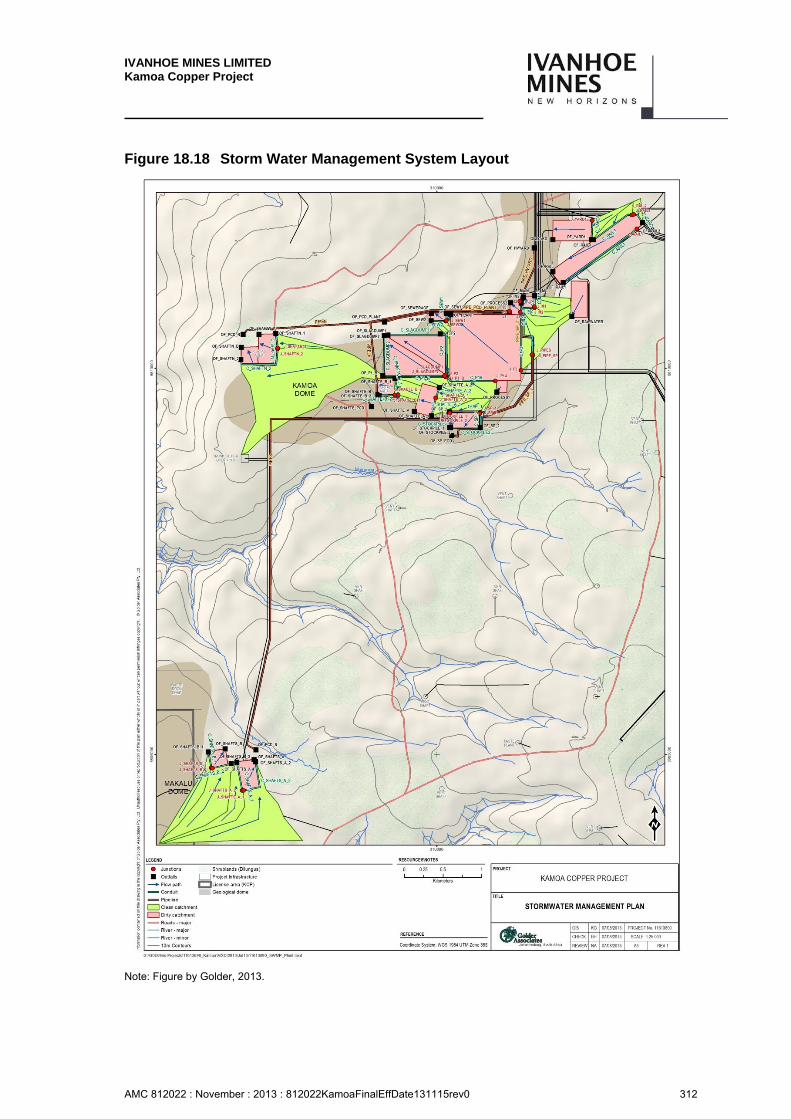
IVANHOE MINES LIMITED Kamoa Copper Project
AMC 812022 : November : 2013 : 812022KamoaFinalEffDate131115rev0 312
Figure 18.18 Storm Water Management System Layout
Note: Figure by Golder, 2013.
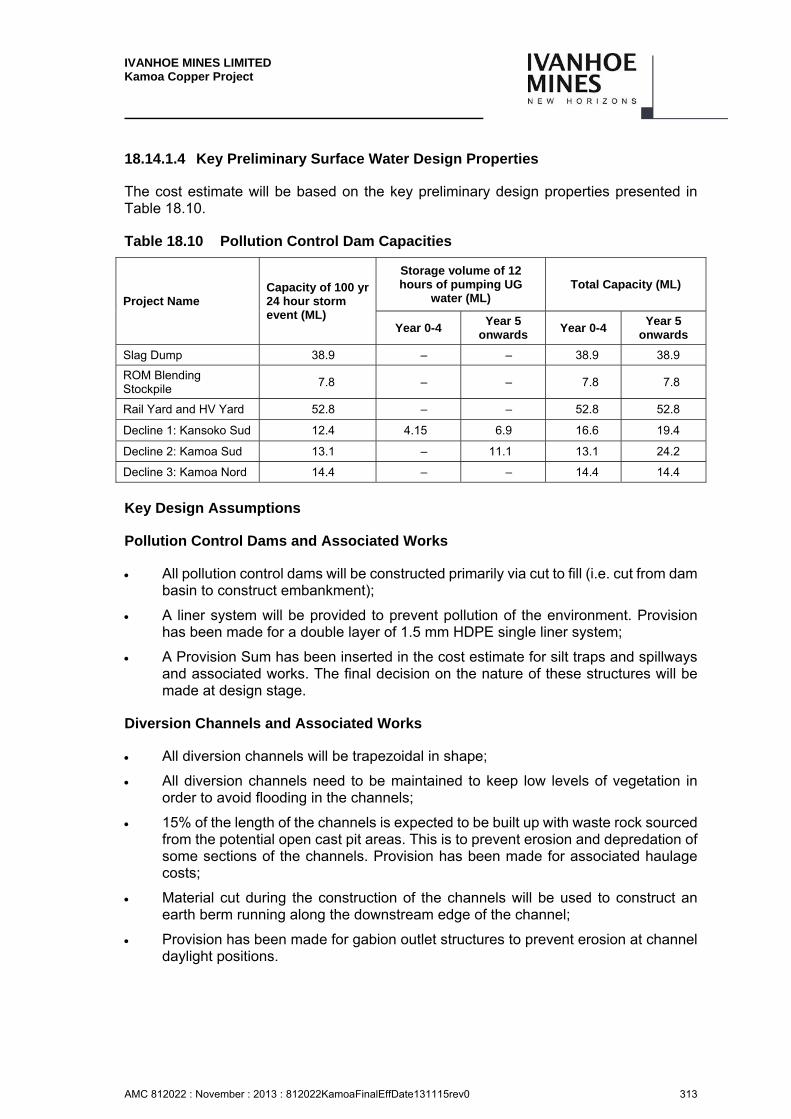
IVANHOE MINES LIMITED Kamoa Copper Project
AMC 812022 : November : 2013 : 812022KamoaFinalEffDate131115rev0 313
18.14.1.4 Key Preliminary Surface Water Design Properties
The cost estimate will be based on the key preliminary design properties presented in Table 18.10.
Table 18.10 Pollution Control Dam Capacities
Project Name Capacity of 100 yr 24 hour storm event (ML)
Storage volume of 12 hours of pumping UG
water (ML) Total Capacity (ML)
Year 0-4 Year 5
onwards Year 0-4
Year 5 onwards
Slag Dump 38.9 – – 38.9 38.9
ROM Blending Stockpile
7.8 – – 7.8 7.8
Rail Yard and HV Yard 52.8 – – 52.8 52.8
Decline 1: Kansoko Sud 12.4 4.15 6.9 16.6 19.4
Decline 2: Kamoa Sud 13.1 – 11.1 13.1 24.2
Decline 3: Kamoa Nord 14.4 – – 14.4 14.4
Key Design Assumptions
Pollution Control Dams and Associated Works
All pollution control dams will be constructed primarily via cut to fill (i.e. cut from dam basin to construct embankment);
A liner system will be provided to prevent pollution of the environment. Provision has been made for a double layer of 1.5 mm HDPE single liner system;
A Provision Sum has been inserted in the cost estimate for silt traps and spillways and associated works. The final decision on the nature of these structures will be made at design stage.
Diversion Channels and Associated Works
All diversion channels will be trapezoidal in shape;
All diversion channels need to be maintained to keep low levels of vegetation in order to avoid flooding in the channels;
15% of the length of the channels is expected to be built up with waste rock sourced from the potential open cast pit areas. This is to prevent erosion and depredation of some sections of the channels. Provision has been made for associated haulage costs;
Material cut during the construction of the channels will be used to construct an earth berm running along the downstream edge of the channel;
Provision has been made for gabion outlet structures to prevent erosion at channel daylight positions.
IVANHOE MINES LIMITED Kamoa Copper Project
AMC 812022 : November : 2013 : 812022KamoaFinalEffDate131115rev0 314
Pumps and Pipelines and Associated Works
The Mine will provide electrical power at each pump station;
Only little civil work will be required to install the pumps at all the required places;
Submersible pumps will be acceptable to be used;
Stainless Steel pumps will only be required at the PCD’s;
Pipes can be laid on top of the ground;
Jointing of Pipes can be done with continuous welding.
18.14.2 Wastewater
Sewage from kitchens and ablutions will drain via underground sewers to a sewage treatment plant and treated to produce an effluent of a suitably safe standard for process use.
Floor washings that contain organic contaminants, from kitchens and ablution blocks, will also drain via the sewers to the treatment plant. Floor washings that are potentially contaminated with mineral oils (workshops, refuelling and lube and diesel storage areas) will drain to the run-off dam.
Sludge from the sewage plant will be pumped out with tailings or dried on constructed drying beds and buried.
Other wastewater streams and by-products such as acid are covered under plant process design.
18.14.3 Potential Water Treatment
It is predicted that during the initial stages of mining, all excess water will be re-used at the plant as make-up.
However, as mining progresses with bigger voids forming, larger volumes of ground water could be expected within the underground workings, which will require dewatering.
The mine water is not expected to be acid. Initial treatment will largely involve settlement, removal of oil and grease, etc. High concentrations of nitrate may also have to be removed as well as other heavy metals.
However, as the water balance turn positive over the life of mine including seasonal fluctuations, the acidity of the water could increase, necessitating treatment by installation of a Water Treatment Plant.
A high level capital cost estimate to address acidity, presence of metals and salts in the mine water will amount to approximately 1 Mill USD for a Water Treatment Plant with a capacity to treat 1 ML of water / day.
The operational costs will amount to approximately 0.4 to 0.6 USD / day / ML.
IVANHOE MINES LIMITED Kamoa Copper Project
AMC 812022 : November : 2013 : 812022KamoaFinalEffDate131115rev0 315
The cost for a Water Treatment Plant could be either provided for through the Contingency provision for the project or from the closure cost provision for the Mine, in the event that water treatment would be required beyond closure.
Fire Protection and Detection
The fire protection and detection system for the surface plant and infrastructure (excluding all underground mining which is covered separately) will be developed in consultation with and subject to final approval from the Owner’s risk assessors. The system will be designed to comply with DRC legislation (where applicable), the project Health and Safety standard/s, project specifications and fire protection standards as adopted by the Project.
The development of the fire protection and detection system will take into account all high risk areas of the plant, as these may require specialised fire systems. The overall system will include a combination of passive measures (e.g. fire walls, physical isolation etc) and active systems (eg. fire detection, fire water systems, gas suppression systems, etc).
The plant will be developed in phases. The practicality of having a single or multiple fire systems (ie one central fire water storage system and pump house, or multiple systems) will be assessed in more detail in the next phase of the Project. Factors that could influence this decision would include timing of the expansion phases, significantly increased water storage and pumping requirements for later phases, geographic distances between plants, etc.
Fire detection equipment will include a Fire Indicator Panel FIP) located in the main control room area, and local intelligent Sub Fire Indicator Panels (SFIP) as required located around the site.
The fire detection system will be independent of the Process Control System (PCS) and will be specified as part of the overall Fire Protection System for the plant, which will also include the Fire Water System, Gas Suppression Systems and any other specialised systems (if required for high risk areas).
Fire water storage will be a dedicated water supply volume, sized in accordance with the requirements of the applicable fire standard. The fire water pump house will be designed with a high degree of reliability, and would typically include a jockey pump (to maintain system pressure under normal non-fire conditions), as well as electric and back-up diesel fire water pumps.
The water supply would be capable of providing the required maximum firewater flows for any single fire event. Fire water will be distributed around the plants via a fire water reticulation network, which will connect to a network of hydrants, hose reels, sprinkler systems, deluge systems, and / or foam systems as required.
Buildings and offices will be equipped with hose reels and portable extinguishers, in accordance with the governing building standards and project specifications.
Gas suppression systems will typically be used for critical areas such as electrical rooms, control rooms, server rooms etc. Hand-held extinguishers will be distributed around the plant and in all buildings.
IVANHOE MINES LIMITED Kamoa Copper Project
AMC 812022 : November : 2013 : 812022KamoaFinalEffDate131115rev0 316
The size of the site will require the availability of at least one fire fighting vehicle (4 x 4 capabilities) is available to deal with fire events in remote areas of the site.
Hospital and Medical Facilities
The clinic and first-aid facility will be housed together at a suitable position near the main gate. Medical equipment, including an ambulance, will be provided. Medical evacuation for ex-patriot employees will be provided by an outside contracting service.
Mine, Concentrator and Smelter Building Requirements
Buildings will be phased according to the timeframe for the implementation of the mining portal, 3 Mtpa and 8 Mtpa concentrators and 300 ktpa smelter development. The phasing will either require new buildings or expansion of initially provided buildings. The following buildings will form part of the project infrastructure:
18.17.1 Single Story Brick Buildings
Administration building/offices.
Clinic and first aid station.
Tea room/canteen.
Plant security office.
Change house.
Control room.
Laboratory.
Gate house & security.
Laundry.
Training.
Mess Complex
Satellite ablutions.
Substations
18.17.2 Structural Steel Buildings
Plant and Mine workshop (light crane loads).
Plant store.
18.17.3 Additional Building
Explosive Storage.
IVANHOE MINES LIMITED Kamoa Copper Project
AMC 812022 : November : 2013 : 812022KamoaFinalEffDate131115rev0 317
Permanent Housing
18.18.1 Accommodation
A permanent village will be constructed to provide accommodation for employess not residng in the Kolwezi/Kamoa region. Kolwezi residents will be transported to Kamoa daily by a company bus service. All houses will be four-bedroom units (each bedroom with ensuite bathroom). Some of these units will in future be converted into family units.
18.18.2 Facilities
The following facilities will be included:
Mess complex
Recreation centre
Swimming pool
Sports facilities
Administation offices
First aid room
Laundry
Fire trailer
Gate house and bus loading area
Refuse removal
IVANHOE MINES LIMITED Kamoa Copper Project
AMC 812022 : November : 2013 : 812022KamoaFinalEffDate131115rev0 318
18.18.3 Roads and Services
The following roads and services will be provided:
Perimeter security fence.
Paved roads designed to an appropriate residential standard around the town centre.
Gravel access roads to housing units.
Parking.
Stormwater drainage.
Water reticulation, sized for fire flows and provided with hydrants.
Sewer reticulation.
Sewage treatment.
Street lighting.
Transmitters and receivers for mobile telephones.
Internal and external communications.
Temporary Facilities
To facilitate the execution of the project, various temporary facilities need to be put in place. These facilities include:
Construction Camp: A construction camp to accommodate the construction workers during execution will be erected. The camp will include bedrooms, ablution facilities, dining area and kitchen, recreation area as well as admin offices and guard house. Services such as water, sewer and electricity will be provided.
To accommodate phase 1 of the project, a 3000 bed camp will be erected. This will have 3 phases to accommodate the ramp-up of the phase 1 construction; i.e. phase 1A (200 beds), phase 1B (additional 400 beds) and phase 1C (additional 2400 beds). The construction camp will be expanded during phase 2 of the project to accommodate the additional construction workers.
Construction Site Offices: Site offices will be needed for the client site team as well as the EPCM consultants. These offices will include ablutions and conference rooms and will have facilities to communicate with head offices and receive and print construction drawings.
Laydown areas: Contractors will need prepared areas to establish their site offices and areas to store construction material, equipment and vehicles. Fenced terrace areas with water, sewer and electrical connections will be provided.
Customs Clearance Area: To facilitate the smooth delivery and release of construction material ordered from outside the DRC, a customs clearance area will be created on site from which a customs clearance official will check, register and release all imported construction material. Fenced terrace areas with office, small store, water, sewer and electrical connections will be provided.

IVANHOE MINES LIMITED Kamoa Copper Project
AMC 812022 : November : 2013 : 812022KamoaFinalEffDate131115rev0 319
19 MARKET STUDIES AND CONTRACTS
Introduction
The Kamoa copper project will be executed in two phases. The final product from the first phase will be a copper concentrate grading approximately 40% copper with no payable precious metals, blister copper only will be produced during the second phase. Phase 1 production will commence by 2018 with a capacity of approximately 250 ktpa copper concentrate containing approximately 100 ktpa of copper. Blister copper production will commence by 2022 with a capacity of approximately 300 ktpa blister copper, concentrate sale will cease after year 2022.
For the purpose of the Kamoa 2013 PEA it is assumed that all final products will be sold off shore where industry standard terms as well as transport costs can be applied. It must be noted however that there is potential to sell copper concentrate to smelters in Zambia and or merchants where more favourable terms may be possible. Initial indications are that three smelters located in Zambia require additional concentrate feed. Sulphuric acid produced as a by product of blister copper production will be sold locally.
Copper Concentrate Treatment & Refining Charges (TC/Rc)
The Kamoa copper project will produce a 40% copper concentrate between 2018 and 2022. Therefore the mine will need to negotiate with the local smelters and or merchants the annual commercial terms. The present TC/Rc’s for the Zambian smelters reflect the difficultly and expense of shipping copper concentrate offshore. In simple terms, a smelter would calculate the cost of shipping concentrate offshore and add this cost to the annual ‘benchmark’ settlement.
In the last 10 years the ‘benchmark’ TC/Rc has averaged about $70 and 7 cents. This cannot continue because mine production is and will continue to increase for the next 5 or 6 years. As has happened in the past, when mine production increases and a surplus of concentrate develops, smelters are built. China continues to build new smelters and expand many of their smelters. Their cheap labour and financing allows them to build even when the concentrate terms don’t really support building new smelters, at least not in the western world. With the increased concentrate production/availability the Chinese will probably build more smelters. Most likely they will shut the most inefficient ones and build more efficient/larger smelters. So in the next five to six years one can expect to see terms peaking over $100 and 10 cents. It is expected that history will repeat itself and there will be more smelting capacity than concentrate and terms will come off their peak around 2020 and then head reduce further.
Based on the above market outlook a long term concentrate treatment charge of $80/dmt concentrate and refining charge of 8 cents per pound of copper in concentrate has been used.
The following is the copper payable scale for the various grades of copper concentrate; <30% deduct 1.0 unit, <33% deduct 1.1 units, <36% deduct 1.2 units, <40% deduct 1.3 units and >40% deduct 1.4 units.
IVANHOE MINES LIMITED Kamoa Copper Project
AMC 812022 : November : 2013 : 812022KamoaFinalEffDate131115rev0 320
Sulphuric Acid Credit
A detailed marketing study has been carried out for the Katanga province of the DRC and the Zambian Copperbelt. The Congolese copper belt is a net acid consuming area. The majority of the copper and cobalt in the area is in the form of copper or cobalt oxides, and a leach SX/EW process is utilized to produce final product. This process is acid consuming and a number of the operations on the copper belt operate sulphur burning acid plants to produce acid, others purchase acid from Zambia or from overseas via the ports such as Walvis Bay or Durban. The sulphuric acid price is rather volatile; operators in the DRC are reported as currently paying US$300/t to US$400/ t and prices have been up to US$800 per tonne in previous years. It is estimated that the full production cost of producing sulphuric acid in a sulphur burning acid plant in the Katanga province of the DRC is approximately US$246/t excluding the capital cost of the sulphur burning acid plant. For the purpose of the study a long term acid credit of US$250/t has been used.
Potential Sources for Concentrate Sale in Zambia
19.4.1 Mopani Copper Mines (MCM) – Mufulira Copper Smelter
MCM is majority owned by Glencore International and First Quantum Minerals Ltd holds minority interest.
The MCM smelter (ISASMELT) has a nominal smelting capacity of 300 ktpa copper. They do not produce enough concentrate from their own mines and therefore must purchase or toll concentrate from third parties. Brookhunt are expecting production will be approximately 220 ktpa of cathode from 2013 onwards.
19.4.2 Chambishi Copper Smelter Limited (CCS)
CCS is owned 60% by Yunnan Copper and 40% by China Nonferrous Metal Mining Company (CNMC) and the smelter began operation in 2009. The smelter is located about 30km east of Chingola. Brookhunt are expecting the ISASMELT process will produce 250 ktpa in 2013 and 2014 growing to 275 ktpa in 2015 of blister copper; they do not have a refinery. Their feed grade ranges between 28% and 48% copper with an average target of 32%. Approximately 50% of the concentrate feed is produced from their mine and the balance is purchased from Barrick (Lumwana), First Quantum (Kansanshi) and other small mines in the area. The blister is shipped to various locations/customers in China, Korea, Germany and India.
19.4.3 Konkola Copper Mines plc (KCM)
KCM is a subsidiary of Vendanta Resources which owns 79.4% of the outstanding shares. The remaining 20.6% is held by ZCCM-IH, a Lusaka and Euronext listed company that is 87.6% owned by the Zambian Government and 12.4% by public shareholders.
The nominal smelting capacity is 300 ktpa using the OUTOTEC technology. KCM is presently running at 240 ktpa. It appeared that the OUTOTEC process had more difficulty processing different grades of copper concentrate than the ISASMELT.
IVANHOE MINES LIMITED Kamoa Copper Project
AMC 812022 : November : 2013 : 812022KamoaFinalEffDate131115rev0 321
Their own mines produce about 50% of their feed and the balance is purchased from Barrick (Lumwana) and First Quantum (Kansanshi). The final product (blister and cathode) is shipped to their rod plant in Dubai and to customers in China.
19.4.4 First Quantum Kansanshi Smelter
First Quantum is presently building an ISASMELT smelter with a capacity of 300 ktpa copper and is expected to be in operating in 2014. However it is anticipated they will supply their entire copper concentrate feed.
Blister Charges
The following are indications of the present and long term blister market. The terms are negotiated annually.
19.5.1 Payments
Copper Payment – after a deduction of 0.3 % copper, the buyer shall pay the seller the agreed copper content at the official LME cash settlement quotation for Grade ‘A’ copper, averaged over the quotational period.
19.5.2 Deductions
Refining Charge – the buyer and seller will also negotiate a blister refining charge expressed in a rate per metric tonne. The present annual refining charge is between $90 and $130/t. A long term refining charge of $110/t has been used for blister.
IVANHOE MINES LIMITED Kamoa Copper Project
AMC 812022 : November : 2013 : 812022KamoaFinalEffDate131115rev0 322
20 ENVIRONMENTAL STUDIES, PERMITTING, AND SOCIAL OR COMMUNITY IMPACT
Introduction
This section on environmental, permitting and social and community impacts incorporates assumptions, analysis and findings related to the Kamoa 2013 PEA.
The environmental permitting processes for the Kamoa Copper project consist of two legs, namely the:
ESHIA (Environmental, Health and Social Impact assessment) which has to comply with international financing standards.
Regulatory EIS – based on the DRC environmental legislation.
The Kamoa Copper project will require both these processes.
A mine licence, to develop the Kamoa Copper Project was awarded to AMBL in August 2012. As part of the Mine License application, an EIS based on the Mine License area and its attributes at the time, was submitted and approved.
20.1.1 EIS Process
The development of infrastructure for the mining project will include inter alia:
Process Plant
TSF
Return water system
Pollution control system
Mine infrastructure
The development, construction and operation of the infrastructure will have an impact on the environment and therefore baseline studies and environmental impact studies will be conducted as part of the EIS application and regulatory submission.An extensive stakeholder engagement process is being conducted for permitting purposes.
20.1.2 ESHIA
The ESHIA is a requirement for international financing and include investigation into the environment, social and potential health impacts the project may have on the people and the environment, compliant to specific Financier standards. The processes for the ESHIA and EIA are described in Figure 20.1.
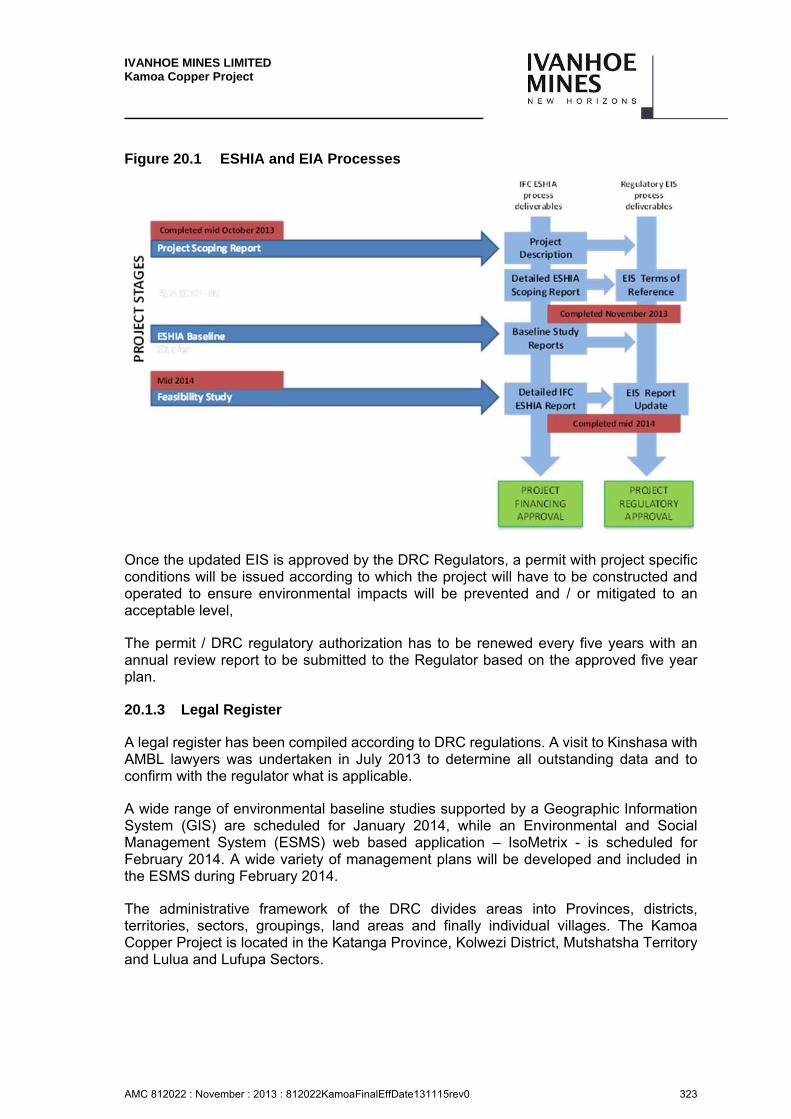
IVANHOE MINES LIMITED Kamoa Copper Project
AMC 812022 : November : 2013 : 812022KamoaFinalEffDate131115rev0 323
Figure 20.1 ESHIA and EIA Processes
Once the updated EIS is approved by the DRC Regulators, a permit with project specific conditions will be issued according to which the project will have to be constructed and operated to ensure environmental impacts will be prevented and / or mitigated to an acceptable level,
The permit / DRC regulatory authorization has to be renewed every five years with an annual review report to be submitted to the Regulator based on the approved five year plan.
20.1.3 Legal Register
A legal register has been compiled according to DRC regulations. A visit to Kinshasa with AMBL lawyers was undertaken in July 2013 to determine all outstanding data and to confirm with the regulator what is applicable.
A wide range of environmental baseline studies supported by a Geographic Information System (GIS) are scheduled for January 2014, while an Environmental and Social Management System (ESMS) web based application – IsoMetrix - is scheduled for February 2014. A wide variety of management plans will be developed and included in the ESMS during February 2014.
The administrative framework of the DRC divides areas into Provinces, districts, territories, sectors, groupings, land areas and finally individual villages. The Kamoa Copper Project is located in the Katanga Province, Kolwezi District, Mutshatsha Territory and Lulua and Lufupa Sectors.
IVANHOE MINES LIMITED Kamoa Copper Project
AMC 812022 : November : 2013 : 812022KamoaFinalEffDate131115rev0 324
Two Groupings are included in the concession area for the Project, Mwilu and Musokantanda, with land areas (chef de terre) Mpala and Muvunda.
The Project area is characterised by scattered, undeveloped rural villages and hamlets divided between the two groupings of Mwilu and Musokantanda. A total of 32 villages fall within the mine license area. The population in the area has been recorded as 4,311 people, indicating a population density of approximately 10 people per square kilometre. Local communities rely extensively on agriculture and the environment, and can be described as relatively poor.
The health services in the study area are poor. Common diseases include tuberculosis (TB), which is a major national concern and local level health concern, and is often associated with HIV/AIDS infection; malaria and malnutrition.
Monitoring of groundwater and surface water resources indicate that water quality in the area is generally good, and is well below the guideline limits, apart from the copper concentration.
Ecologically, the Project Area lies within the Central Zambezian Miombo Ecoregion. This ecoregion covers a large area, stretching north-east from Angola including the south-east section of the Democratic Republic of the Congo, the northern half of Zambia, a large section of western Tanzania, southern Burundi and northern and western Malawi. The climate is tropical, with a long dry season, up to seven months, which leaves the forest vulnerable to fires, and a rainy season from November to March. The woodland is interspersed with Dambos, (grassy wetlands), which may constitute up to thirty per cent of the region. The woodlands in the study area contain typical Miombo flora of high trees with a poorly defined shrub layer, and typically has more evergreen trees than in most Miombo woodlands. Approximately 50–75% of the study area is currently considered to be degraded due to agriculture and charcoal production. Sensitive habitats include shrublands and wetlands (Dilungus and Dambos) and the Miombo forest to the east of the Project area.
Radiation surveys carried out indicated that radiation levels are comparable with global background levels i.e. they did not indicate enhanced natural background levels and hence posed no enhanced background radiological risk to the public.
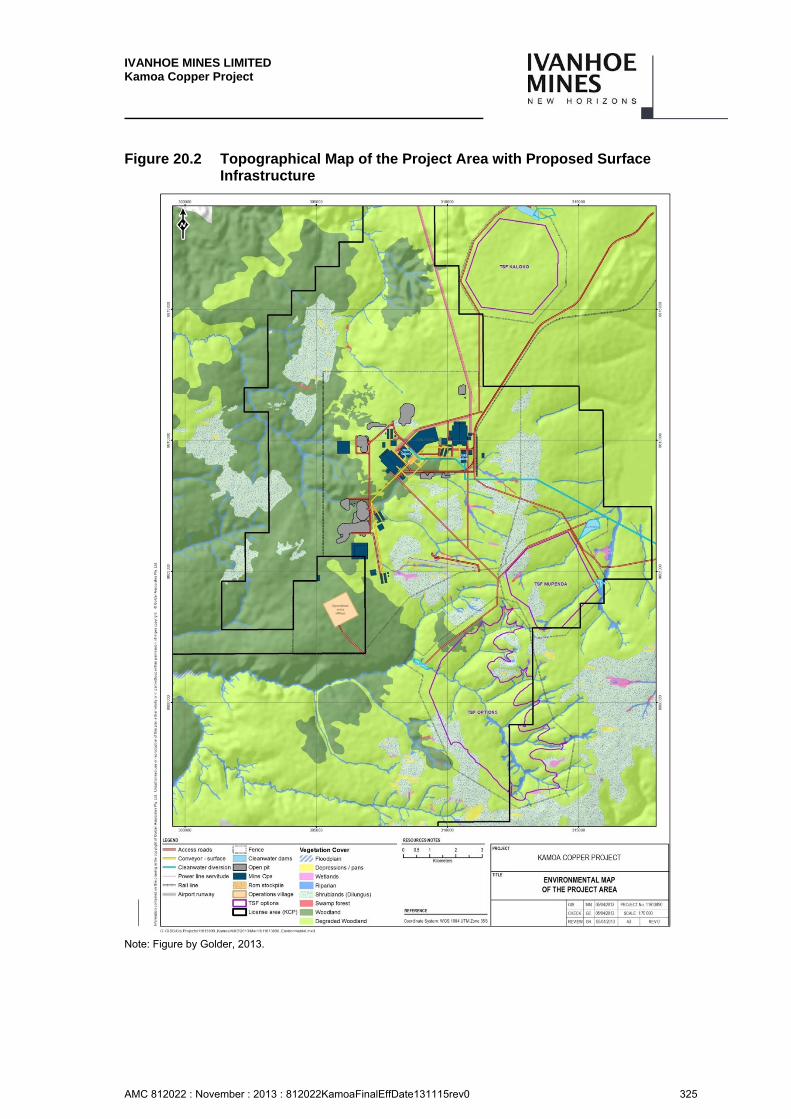
IVANHOE MINES LIMITED Kamoa Copper Project
AMC 812022 : November : 2013 : 812022KamoaFinalEffDate131115rev0 325
Figure 20.2 Topographical Map of the Project Area with Proposed Surface Infrastructure
Note: Figure by Golder, 2013.
IVANHOE MINES LIMITED Kamoa Copper Project
AMC 812022 : November : 2013 : 812022KamoaFinalEffDate131115rev0 326
Legislation
The EIS update and ESHIA are being undertaken to comply with the following regulations and standards respectively:
DRC mining and environmental regulations, specifically – the Mining Code (Law No. 007/2002 of 11 July 2002) and the Mining Regulations, (Decree No. 038/2003 of 26 March 2003); and
International Finance Corporation (IFC) Performance Standards on Environmental and Social Sustainability (January 2012).
Public Consultation and Key Issues
The Public has been consulted on an on-going basis throughout the Project. AMBL have community liaison officers who engage with local communities on a regular basis and during the previous EIS, held a number of public meetings and consulted with the local authorities.
20.3.1 Current Stakeholder Process
The current EIS update and ESHIA process has included an extensive stakeholder engagement process inclusive of:
Community capacity building, carried out in September 2012, to provide more information to communities about the Project, DRC legislation and international standards, what can be expected from a modern mining operation and how communities can be involved in the process;
Feedback and presentation of the resettlement process, November 2012, to inform local communities of the delay in the Project and to advise them of the resettlement process, a key concern previously registered by the community;
Terms of Reference consultation, a wide spread 3 week consultation programme carried out in April 2013, engaging with a broad spectrum of stakeholders, in Kinshasa, Lubumbashi, Kolwezi and extensively in the Project Area. The consultation was carried out by 4 teams of AMBL and Golder representatives. The objective of the consultation was to consult on the scope of work proposed for the EIS.
20.3.2 Future Stakeholder Consultation
The future stakeholder consultation process will include:
On-going consultation and focus groups in the Project Area carried out by AMBL CLOs and Golder social specialists involved in the Resettlement Action Plan and social studies;
Feedback to stakeholders regarding the final Terms of Reference report approved by the DRC government;
Environmental and Social impact and management planning consultation – a widespread consultation on the findings of the EIS and proposed mitigation;
IVANHOE MINES LIMITED Kamoa Copper Project
AMC 812022 : November : 2013 : 812022KamoaFinalEffDate131115rev0 327
Feedback to stakeholders regarding the decision made on the EIS by the DRC government; and
On-going consultation by AMBL CLOs throughout the Project life.
A stakeholder engagement plan has been developed for the Project which contains the guideline principles and processes for continued stakeholder engagement as per IFC requirements. So far over 6,000 stakeholders have been communicated with, and over 1,000 comments recorded.
20.3.3 Key Stakeholder Issues Recorded
To date the key issues recorded are:
Queries about employment opportunities, and AMBL recruitment policy and principles;
Concern about potential resettlement;
Request for agricultural, health and educational support;
Concern about mining companies transparency, trust and credibility; and
Concern about noise and air quality impacts.
20.3.4 Plan of Study
The specialist studies being undertaken for the Project include:
Climate, air quality and greenhouse gases;
Noise and vibration;
Soils, land use and land capability;
Surface water hydrology;
Groundwater (drilling modelling and testing);
Geochemistry (characterisation of acid rock and metal leaching potential from all potential sources);
Radiation;
Terrestrial, aquatic and wetland Ecology;
Social;
Economics;
Health;
Archaeology;
Visual; and
Development of a web based Environmental and Social Management System.
Most baseline studies are 90% complete, with extensive baseline data collected for the Project over the last 3 years.
IVANHOE MINES LIMITED Kamoa Copper Project
AMC 812022 : November : 2013 : 812022KamoaFinalEffDate131115rev0 328
Impact assessment and mitigation planning is on-going. The team carrying out the ESHIA includes Golder, SHAPE (health professionals), African Mining Consultants (consulting team who carried out the original EIS), specialist Wetland Consulting Services and local archaeological, soils and consultation specialists.
Key Impacts and Mitigation
Key potential impacts that have been identified to date include:
Greenhouse gas emissions from processes and operations (transportation, smelter, underground operations and waste management);
Increased dust in the local area due to vehicles, construction works, dust from exposed areas (stockpiles, open pits, haul roads etc.), conveyors, ventilation shafts, transfer and loading areas;
Smelter and acid plant emissions which could result in a poorer air quality;
Increased noise caused by traffic, ventilation shafts, processing, ore haulage, and mining activities;
Vibration due to blasting (during the development of the open pit and underground operations) as well as from crushing and milling processes at the plant, which could affect local communities;
Topographical changes resulting from WRD, TSF, Open Pit and Plant developments affecting the visual landscape and surface water drainage patterns;
Potential subsidence and caving above underground mined areas, resulting in changes to the surface topography, potentially affecting surface water drainage (flooding or surface water disruption), and potentially the health and safety of local communities;
Loss of topsoil as a result of land clearance;
Increased erosion of soils in exposed cleared areas;
Contamination of soils due to dust and other air quality impacts;
Potential contamination of water sources throughout the Project life from the exploration stage and through to beyond closure;
Seepage of contaminated water into groundwater aquifers;
Reduction in groundwater availability due to mine dewatering (open pit and underground operations) and due to groundwater pumping for bulk water supply for the Project potentially affecting groundwater users (local communities);
Potential increase in radiation levels due to underground mining (release of radon gases);
Site clearance and Project development causing loss of habitat particularly of the shrub lands, wetlands and Miombo forest;
Increased risk to wildlife due to increases in Project traffic and increased population (from hunting);
Employment opportunities;
IVANHOE MINES LIMITED Kamoa Copper Project
AMC 812022 : November : 2013 : 812022KamoaFinalEffDate131115rev0 329
Direct and indirect economic benefits related to capital expenditure, operational expenditure, fiscal impacts and salaries and wages;
Changes in GDP, employment, income, and tax revenue;
Opportunities for community development and skills development;
In-migration of opportunity seekers and temporary construction and permanent workers;
Increased demand for land;
Increased pressure on land and/or natural resources;
Restriction and/or loss of access routes, land and/or natural resources;
Impacts on agricultural potential and livelihoods;
Physical and economic displacement of households;
Community safety and security impacts related to increased traffic and criminal activities; and
Community health impacts related to increased social pathologies such as sexually transmitted diseases (associated with population influx and increased sex worker trade) and substance abuse.
20.4.1 Mitigation Hierarchy
For the impacts identified, a process is applied to reduce negative impacts and enhance positive benefits of a Project. This process is called the mitigation hierarchy, of which the governing principle is to achieve no net loss and preferably a net positive impact on people and the environment as a result of the Project.
The mitigation hierarchy states the following:
1. The preferred mitigation measure is avoidance – impacts are avoided through effective planning;
2. Then minimisation – impacts are minimised by applying best practice impact reduction measures such as containing smelter emissions;
3. Then rehabilitation or restoration – impacts can be healed or restored (for example replanting vegetation in cleared areas);
4. Then compensation for unavoidable impacts for example – compensation in the form of money or replacement of impacted land or houses; and
5. Finally enhancement of positive benefits – for example providing assistance to the local community.
IVANHOE MINES LIMITED Kamoa Copper Project
AMC 812022 : November : 2013 : 812022KamoaFinalEffDate131115rev0 330
Hydrology
20.5.1 Surface Water Monitoring for Agricultural Catchments Research
Golder Associates implemented a surface water monitoring programme to assess flows, discharges, rainfall, catchment analysis and to initiate the development of an Agricultural Catchments Research Unit (ACRU) model for the Project area.
The monitoring programme has been implemented and data collected over two hydrological years from the beginning of 2011.
Limited information is available regarding the runoff of the Lulua, Mukanga, Kalundu and Kamoa catchment but the runoff has been estimated as 24.1%, 56.3% and 41.6% for the Lulua, Mukanga and Kamoa Rivers respectively;
Two rain gauges were set up, one in the north and one in the south of the mining concession in January 2011. These are in addition to the one operating at the Kamoa camp.
Eight sites within the concessionaire monitored monthly for discharge.
Hydrogeology and Groundwater Quality
Hydrogeological studies have been conducted by Golder Associates in 2010 and again in 2012.
20.6.1 Hydrogeological Units
The geological and hydrogeological data gathered has provided an overview of the groundwater conditions across the Project area and enabled the baseline hydrogeological situation to be described. The various units forming the hydrogeological system of the area is summarised in Table 20.1 below.

IVANHOE MINES LIMITED Kamoa Copper Project
AMC 812022 : November : 2013 : 812022KamoaFinalEffDate131115rev0 331
Table 20.1 Hydrogeological System
Lithology Hydrogeological Designation
Aquifer Occurrence
Kalahari Sand Sand Preserved on Dilungus on plateau and in lowland west of escarpment
Upper Kundulungu Sandstone and Siltstone This formation is present in the east of the concession, to the east of the north south trending watershed.
Upper Diamictite U-SDT Ubiquitous away from sandstone dome. Weathered and deeply fractured. Intercalations of siltstone and sandstone. Forms the hanging wall
Pyritic Siltstone KPS Where fractured significant groundwater intersections,
otherwise semi impermeable. Forms the lower part of the hanging wall
Basal Diamictite – Mineralised Zone
B-SDT Minor water strikes to dry
Contact zone with Roan Sandstone
B-SDT/B-SST Contact zone characterised by a narrow zone of relatively minor water strikes
Roan Sandstone – deep regional aquifer
B-SST Outcropping on Plateau – Kamoa and Makalu Domes. Characterised by deep water levels >120mbgl and well developed permeability.
Kalahari Aquifer
The Kalahari aquifer is a primary unconfined aquifer with occurrence in the study area limited to the Dilungus. The thickness of these unconsolidated sandy deposits is generally 10 to 12 m with only a small area south-east of the Kamoa Dome in which the thickness is projected at +/-30 m.
The importance of this aquifer in the overall hydrogeological context of the area is that it provides a recharge source for the secondary aquifers that occur lower in the stratigraphic sequence. This is also illustrated by the groundwater contour map Figure 20.3 Conceptual Hydrogeological Model where the highest elevations of the groundwater contours coincide with the spatial extent of the Kalahari sands. These Dilungus also act like a sponge and release water to support base flow in the drainages during the dry season, and hence are environmentally significant.
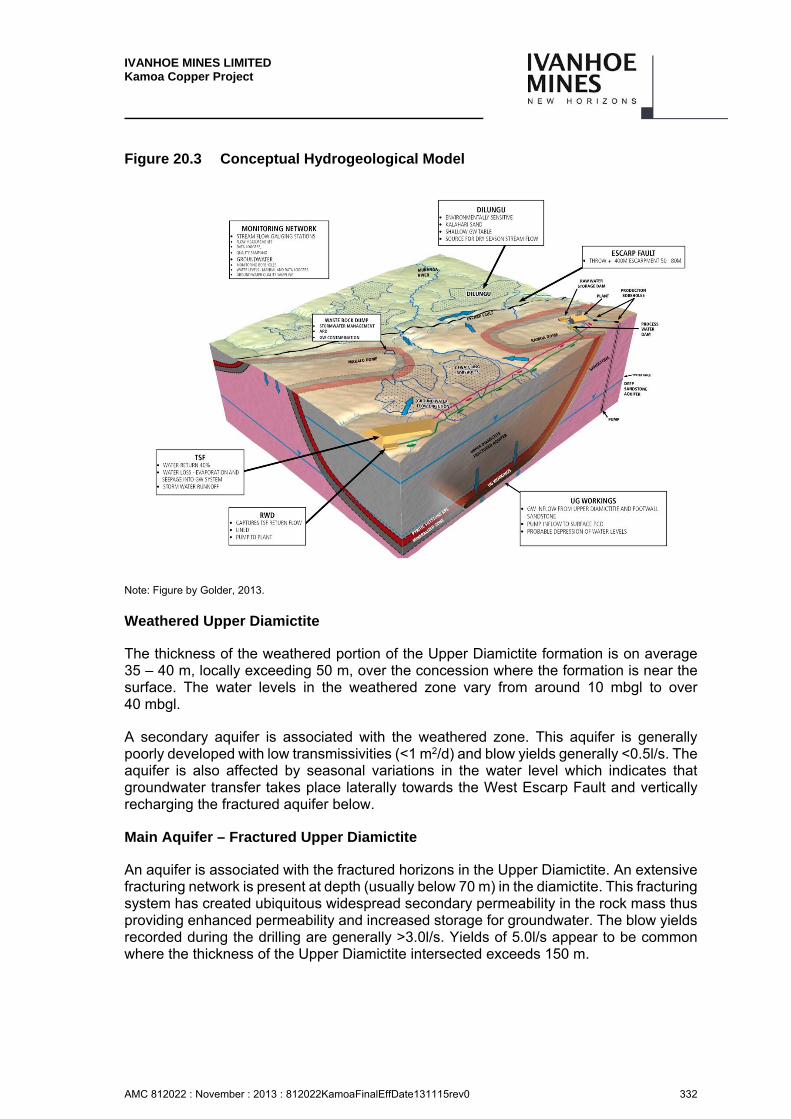
IVANHOE MINES LIMITED Kamoa Copper Project
AMC 812022 : November : 2013 : 812022KamoaFinalEffDate131115rev0 332
Figure 20.3 Conceptual Hydrogeological Model
Note: Figure by Golder, 2013.
Weathered Upper Diamictite
The thickness of the weathered portion of the Upper Diamictite formation is on average 35 – 40 m, locally exceeding 50 m, over the concession where the formation is near the surface. The water levels in the weathered zone vary from around 10 mbgl to over 40 mbgl.
A secondary aquifer is associated with the weathered zone. This aquifer is generally poorly developed with low transmissivities (<1 m2/d) and blow yields generally <0.5l/s. The aquifer is also affected by seasonal variations in the water level which indicates that groundwater transfer takes place laterally towards the West Escarp Fault and vertically recharging the fractured aquifer below.
Main Aquifer – Fractured Upper Diamictite
An aquifer is associated with the fractured horizons in the Upper Diamictite. An extensive fracturing network is present at depth (usually below 70 m) in the diamictite. This fracturing system has created ubiquitous widespread secondary permeability in the rock mass thus providing enhanced permeability and increased storage for groundwater. The blow yields recorded during the drilling are generally >3.0l/s. Yields of 5.0l/s appear to be common where the thickness of the Upper Diamictite intersected exceeds 150 m.

IVANHOE MINES LIMITED Kamoa Copper Project
AMC 812022 : November : 2013 : 812022KamoaFinalEffDate131115rev0 333
Pyritic Siltstone and Basal Diamictite
The 2012 programme has confirmed that the pyritic siltstone is extensively fractured and characterised by medium transmissivity, while the groundwater properties of the basal diamictite are poorly developed.
It is concluded that the pyritic siltstone is unlikely to form an effective barrier to groundwater ingress into the mining void of the basal sandstone, but that groundwater occurrence within the mineralised zone itself is likely to be very limited.
Basal Sandstone
The sandstone making up the Kamoa and Makalu Dome NE-SW trending anticline forms the footwall to the mining sequence. The current programme has confirmed the sandstone can be sub-divided into 2 distinct hydrogeological units controlled by the various beds within the sandstone, as follows.
Contact Zone with Basal Diamictite
The contact zone with the basal diamictite appears to be 5–20m or so thick and comprises partly cemented and sometimes fractured porous sandstone, characterised by T values of between 0.5m2/d and 50m2/d. Recoveries were good confirming the presence of recharge.
The data indicate that where the fractured footwall contact is relatively shallow, up to between 80–120 mbgl on the flanks of the Kamoa and Makalu Domes, the fractured contact appears to be unsaturated. The evidence for this is:
Core inspection of the sandstone clearly indicates highly fractured conditions below the contact with the Lower Diamictite.
Water levels in the sandstone are below the contact with the Lower Diamictite in the areas surrounding the domes.
The presence of unsaturated conditions in the footwall sandstone is important since piezometric heads from the sandstone aquifer are unlikely to be high in the proposed open pit(s) areas where these are close to Kamoa dome.
Main Sandstone Aquifer
The drilling programme has confirmed that a significant regional aquifer is present at depth in the Basal Sandstone. The aquifer comprises variously weathered and fractured horizons at depths of below 120 m or so below ground level. A deep core hole drilled on the Kamoa dome indicates that the aquifer may extend to depths of about 350 m, below which the sandstone becomes massive. This part of the sandstone sequence is characterised by high transmissivity values (100 m2/d to 700 m2/d) resulting in minimal drawdown during testing. Water level recoveries after testing were complete confirming good recharge.
IVANHOE MINES LIMITED Kamoa Copper Project
AMC 812022 : November : 2013 : 812022KamoaFinalEffDate131115rev0 334
This aquifer has been targeted as a potential source for the bulk water supply to the mine and a programme to confirm the magnitude and sustainability of the groundwater resources is planned.
Relationship between the main aquifer and footwall contact
Within the Kamoa and Makalu Domes the water level is between 100–120 m or more below ground level. This means that the piezometric head of the main aquifer acting on the underground mining void will be substantial and increase as mining increases in depth. However, the drilling undertaken so far suggests that the sandstone beds forming the aquifer are separated from the sandstone forming the contact zone by possibly up to 100 m of sandstone with lower groundwater potential. Accordingly, ingress from the deep sandstone aquifer is likely to be constrained by the intervening beds.
Water levels in the Upper Diamictite are variable throughout the concession, ranging between 10 and 20 metres below ground level close to the domes an the West Scarp fault, deepening to the south where levels >100 mbgl are recorded.
The groundwater flow in the main aquifer is mostly towards the west and north-west.
Groundwater flow is to the east from east of the main watershed trending north south across the eastern side of the concession area.
It appears that the West Scarp Fault acts as a discharge zone, capturing groundwater flow to the west. The convergence of piezometric heads of the main and deeper aquifers towards the fault zone would support the finding that both aquifers discharge into the West Scarp Fault Zone.
The Kamoa Dome anticline acts as a barrier to groundwater flow, and forces groundwater flow in the Upper Diamictite aquifer to move around the dome to the south.
The water level in the sandstone of the Kamoa Dome anticline at >120 mbgl is below that of the main aquifer and it can be concluded that the main aquifer does not laterally recharge the sandstone.
An important finding of the study is that groundwater occurrence is widespread and relatively well developed. The fact that the main aquifer is fractured, possesses relatively high permeability’s and is formed in the hanging wall, means that proactive groundwater management will be necessary for mining. Dewatering will be needed. The ongoing studies, including numerical groundwater modelling, will confirm the requirement and forms of dewatering activities.
Groundwater Monitoring programme
A monthly water level monitoring programme based upon the boreholes drilled in 2010 commenced in November 2010. This has been expanded to incorporate the boreholes drilled in 2012.
Groundwater samples have been collected at approximately 3 monthly intervals from 12 key boreholes since June 2012.
IVANHOE MINES LIMITED Kamoa Copper Project
AMC 812022 : November : 2013 : 812022KamoaFinalEffDate131115rev0 335
The groundwater monitoring data are being used to develop a baseline understanding of seasonal water level fluctuations and groundwater quality, prior to the commencement of mining operations.
Groundwater Quality
Village Wells
African Mining Consultants collected and analysed groundwater samples from local village wells from March 2010 to January 2011.
None of the groundwater samples contained measurable amounts of cyanide, nitrite, fluoride, manganese, aluminium, chromium, nickel, lead, zinc, cadmium, cobalt, arsenic, selenium or mercury in the monthly samples collected from March 2010 to January 2011. It is recommended that monitoring be maintained for these elements on a quarterly basis for at least another annual cycle before elimination from the sampling parameters.
Copper concentrations in the sampled boreholes ranged from a minimum of zero (GW03) to a maximum of 0.66 mg/l (GW02). Seasonal effects appear to be slightly off-set when compared to surface water patterns, with higher concentrations occurring later in the wet and dry seasons.
pH levels vary in each borehole, generally, from pH 5.5 to pH 7.5. However GW01 experienced a pH of 2.4 when initially sampled in March 2010. This incident has not repeated itself in the borehole up to January 2011.
Electrical conductivities in the groundwater samples are highest towards the end of the wet season (March 2010) and decrease throughout the sampled period. The highest conductivities were experienced in GW06 (378 μS/cm), GW05 (245 μS/cm) and GW04 (156 μS/cm).
The total dissolved solids in the groundwater closely reflect the patterns of electrical conductivity. GW06 displayed the highest dissolved solids of 265 mg/l.
Sulphates are present in groundwater with the highest concentrations being 46 mg/l at GW03, which is north-east of the Project area.
Samples from the Groundwater Monitoring Programme
The groundwater quality monitoring programme has been operational since October 2010, as noted in the section above.
The overall groundwater quality is very good with EC varying between 5 and 10 mS/m well within the WHO classification of good groundwater quality with EC values < 70 mS/m.
The pH of the groundwater is slightly acidic (pH varies between 5.5 and 6.8)
The macro-chemistry classifies the water as a Ca/Mg-HCO3/SO4 with low levels of SiO2 (2-5 mg/l).
Nitrate (NO3-N) values are low (<0.5 mg/l). The source of SO4 is probably related to the regional geology.

IVANHOE MINES LIMITED Kamoa Copper Project
AMC 812022 : November : 2013 : 812022KamoaFinalEffDate131115rev0 336
Total hardness is in the order of 15 mg/l CaCO3, classifying the water as soft (within the 0 – 50mg/l CaCO3 range)
The long-term groundwater quality trend in most of the monitoring boreholes is relatively stable with no specific trend evident in any of the macro constituents. Some seasonal oscillations in the groundwater quality do occur; these variations are, however, within the appropriate quality classes.
The quality confirms the recently recharged nature of the groundwater.
20.6.2 Groundwater Inflow to Underground Workings
The hydrogeological work has confirmed that groundwater inflow into the underground mine workings will occur. At this stage the volume of groundwater ingress has yet to be determined, however, the flowing considerations are relevant:
At Kamoa the deposit comprises a lower diamictite (glacial till) overlain by a siltstone and a thick sequence of low to medium permeability fractured diamictite; this compares to the Kolwezi mines and elsewhere further east on the DRC and the Zambian Copper Belt where the deposit lies within a sequence of saturated and highly permeable karstic dolomite which give rise to large inflows of groundwater.
Compared to the mines in Kolwezi and further east on the copperbelt, groundwater ingress will be significantly reduced due to the lack of dolomite in the mining sequence.
Groundwater ingress will occur from both the hanging wall (upper diamictite and pyritic siltstone) and the footwall sandstone contact aquifer.
Based upon the available data a rough estimate of groundwater inflow into the underground workings of 0.2 – 0.5 m3/ton of rock mined can be assumed.
Using this assumption an early estimate of potential volumes of water make and thus volumes that will need to be pumped from the planned declines is shown in Table 20.2 below.
Table 20.2 Estimated Volumes of Potential Groundwater Inflow
Decline Years Tonnage
(Mtpa) Volume (m3/d)
1 0–4 3 4,150
– 5 onward 5 6,930
2 5 onward 8 11,100
3 16 onward 5.2 7,200
The estimated volumes shown in Table 20.2 have been used as the basis for the calculation of the volumes of the PCDs at the Declines.
The forward programme includes the incorporation of the mine plan into the numerical groundwater model to simulate groundwater inflows into the underground mine workings over time. This will provide a higher level of confidence to the estimation of water management needs for the underground operation.
IVANHOE MINES LIMITED Kamoa Copper Project
AMC 812022 : November : 2013 : 812022KamoaFinalEffDate131115rev0 337
20.6.3 Conceptual Hydrogeological Model
A simplified conceptual hydrogeological model of the Kamoa Mining area is presented in Figure 20.3. This illustrates the relationship between the various facets making up the overall groundwater system in relation to the planned underground mining, together with an indication of potential water flows.
20.6.4 Forward Hydrogeological Programme
The forward programme will include groundwater related aspects such as:
Assessing the impact of groundwater occurrence on the mining operation including the calculation of mine water ingress, as mentioned above.
Assessing the potential impact of the mining infrastructure, tailings dams and waste rock dumps, on the groundwater regime, in particular:
– depression of groundwater levels due to dewatering
– quantification of potential seepage from mining facilities,
– delineation of the migration of any contaminant plume with time, (the source-pathway-receptor approach), and
– recommendations for mitigation, such as the need to provide an engineered barrier to the tailings facility,
Confirming the suitability, magnitude and sustainability of the Roan sandstone aquifer in relation to the estimated water demand for the mining operation.
Develop a site wide groundwater management programme as part of the overall water management programme for the mine.
Implementing a focussed monitoring network to meet local and international compliance.
Geochemistry Acid Rock Drainage (ARD) and Metal Leaching (ML) Potential
Geochemical sampling and characterisation of waste rock (126 samples), mineralized rock (8 samples) and tailings (supergene and hypogene samples) was conducted by Golder in two sampling events in 2010 and 2012. The preliminary geochemistry study assessed the Acid Rock Drainage (ARD) and Metal Leaching (ML) potential associated with the geological materials that will be disturbed by the planned mining operations and could impact surface water and groundwater resources.
The laboratory analyses involved standard static tests; including sulphur speciation, acid base accounting, mineralogy, net acid generation and short term leach tests and kinetic tests conducted by accredited laboratories in South Africa.
The kinetic tests (using humidity cells) have been set up for 3 waste rock and 1 mineralized rock sample to assess the long term acid generation and metal leaching rates.
IVANHOE MINES LIMITED Kamoa Copper Project
AMC 812022 : November : 2013 : 812022KamoaFinalEffDate131115rev0 338
Four (4) Cu-Fe-sulphide minerals occur in varying proportions; chalcocite (Cu2S) dominates at the base of the mineralised zone, followed by bornite (Cu5FeS4), chalcopyrite (CuFeS2) and pyrite (FeS2). However, all sulphides can occur together in the same rock implying varying acid generation potential that is dictated by pyrite content. The ARD and ML potential is also associated with the copper mineralization that will be mined, as well as processed waste (copper tailings) that will be produced from the mineralized material beneficiation process.
The paste pH, neutralisation potential and acid potential results indicated that most samples have insufficient neutralisation potential to buffer the acid generated from sulphide oxidation in the short term. Selected samples were found to have excess neutralisation potential from Ca-Mg-CO3 minerals and can be considered for ARD and ML risk reduction measures. The acid generation potential of the various lithologies present increases from the Roan Sandstone (unit R 4.2) and Upper Diamictite (unit Ki 1.1.3), through Clast-rich (Ki 1.1.1.1) and Clast-poor (Ki 1.1.1.3) diamictites to the Pyritic Siltstone (Ki 1.1.2). Similarly paste pH decreases in the order Roan Sandstone, Upper Diamictite, Clast-rich and Clast-poor diamictites and Pyritic Siltstone. Mine water quality is expected to range from acidic to circum-neutral based on leach results with sulphate, Al, Cu, Cr, Fe, Mn, Ni, Pb, Sb, Se and Zn identified as potential contaminants during operational phase.
An evaluation of the acid generation potential and neutralisation potential according to MEND (2009) criteria classified the Clast-poor diamictites and Pyritic Siltstone samples as Potentially Acid Generating (PAG) and Roan Sandstone and Clast-rich as Uncertain or Not Potentially Acid Generating (Non-PAG). The supergene and hypogene tailings sample was found to be Non-PAG due to the low sulphide sulphur content (<0.01 – 0,05%). The tailings samples were classified as “Leachable Mining Waste” due to Cu and Fe Toxicity Characteristic Leaching Procedure concentrations exceeding the Low Risk Mine Waste Guideline Level as prescribed within the DRC Mining Code (Article 58, Annexure IX of Decree No 038/2003).
The future programme will involve the running of site/field kinetic testing for the waste rock and mineralized material in order to develop site specific drainage characteristics and oxidation/metal leaching rates.
Additional geochemical sampling and characterisation of all materials will also be conducted to develop a robust geochemical baseline to support mine planning and environmental impact assessment, including laboratory kinetic testing to assess likely long-term drainage quality taking acid generating and acid neutralising reactions into account.
20.7.1 Social / Stakeholder Engagement
A number of villages (approximately 30) in the surrounding vicinity of the Kamoa project were consulted as part of the social studies and associated stakeholder engagement process.
IVANHOE MINES LIMITED Kamoa Copper Project
AMC 812022 : November : 2013 : 812022KamoaFinalEffDate131115rev0 339
20.7.1.1 Consultation process
Several public consultation meetings (approximately 50 meetings in the local area) were held as part of the stakeholder engagement process. Meetings were also held with smaller Focus Groups to introduce and share information with local communities about the project.
Household sample surveys were conducted to determine the extent of potential relocation and similar impacts on the community.
20.7.2 Relocation Action Plan (RAP)
Village chiefs were consulted as part of the RAP. As a result of consultation with the village chiefs a Resettlement Working Group (RWG) was established. The RWG will form the primary consultation vehicle between affected households and RAP and AMBL.
20.7.2.1 Relocation Action Plan Studies and Surveys
The surveys (census and structures inventory) are in the process of being completed. Once these are complete the moratorium will be called and a restricted access zone will be established. The RWG is meeting about once a month to assist in the planning process.
20.7.2.2 Number of House Holds Potentially Affected.
It is estimated that around 600 households would have to be physically relocated; Field and crop surveys may increase the number of affected households to 1,000.
Changes in project planning and infrastructure options currently prevent confirmed numbers.
The surveys are scheduled to be completed by the end of October 2013.
20.7.3 Other Community Opportunities / Needs
There are many social community needs. The most urgent need thus far has been water supply as communities’ access to water is poor. As a result, food security is low, hygiene practices are poor and significant time is spent to collect water and food.
Many opportunities to improve local community life are being identified as a result of the community surveys including providing water supply and health services.
The communities’ needs are currently very basic (i.e. food and water). Any other development (e.g. schools) is regarded as secondary. AMBL with the assistance of specialist consultants are developing a community development strategy.
The Eco-Livelihoods programme currently implemented by AMBL is yielding good results and opportunity for expansion has been identified.

IVANHOE MINES LIMITED Kamoa Copper Project
AMC 812022 : November : 2013 : 812022KamoaFinalEffDate131115rev0 340
20.7.4 Agricultural Aspects Earmarked for Development
The Eco-Livelihoods programme is currently handling most of the agricultural aspects for Ivanhoe. A good opportunity to expand this programme has presented itself, especially through the upcoming proposed resettlement of local communities. The Eco-Livelihoods programme can be utilized to improve agricultural practices which will improve people’s livelihoods.
Some options include introducing a variety of different crops, improved agricultural practices and improved varieties of cassava.
20.7.5 Cost Per Household To Relocate Off The Mine Lease Areas
The resettlement plan is still being developed.
A capital cost allowance has been made for resettlement and associated costs and is discussed in Section 21.
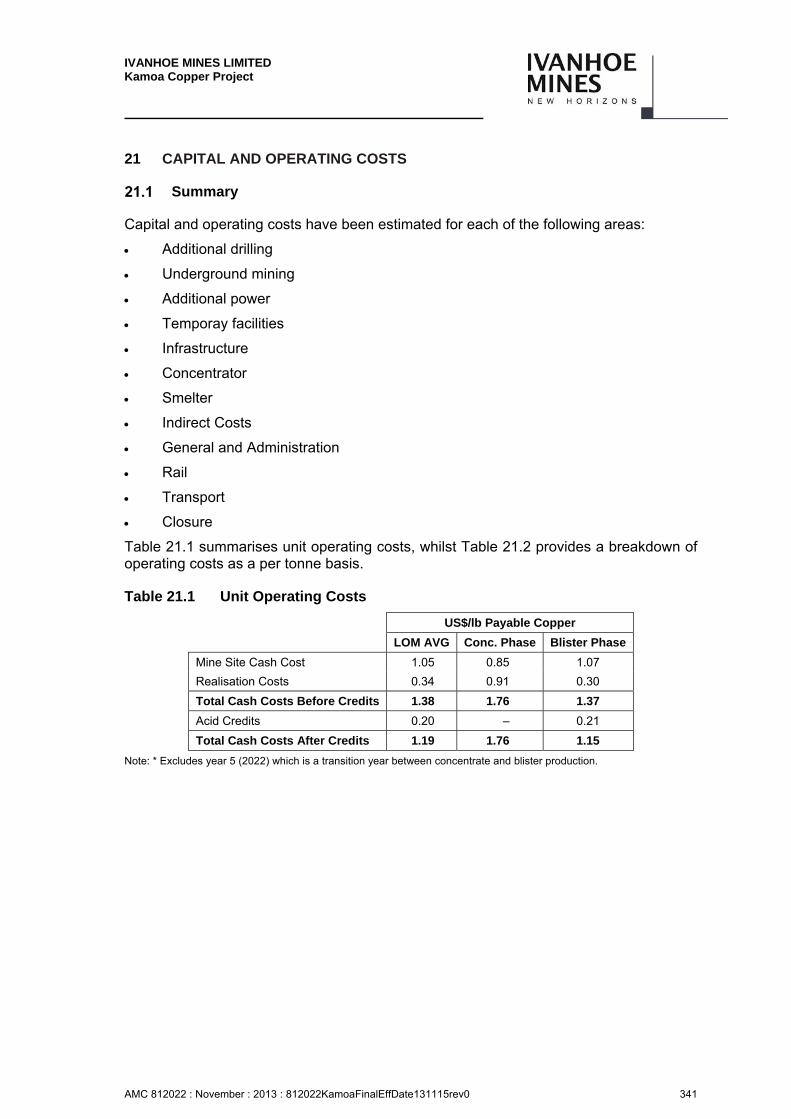
IVANHOE MINES LIMITED Kamoa Copper Project
AMC 812022 : November : 2013 : 812022KamoaFinalEffDate131115rev0 341
21 CAPITAL AND OPERATING COSTS
Summary
Capital and operating costs have been estimated for each of the following areas:
Additional drilling
Underground mining
Additional power
Temporay facilities
Infrastructure
Concentrator
Smelter
Indirect Costs
General and Administration
Rail
Transport
Closure
Table 21.1 summarises unit operating costs, whilst Table 21.2 provides a breakdown of operating costs as a per tonne basis.
Table 21.1 Unit Operating Costs
US$/lb Payable Copper
LOM AVG Conc. Phase Blister Phase
Mine Site Cash Cost 1.05 0.85 1.07
Realisation Costs 0.34 0.91 0.30
Total Cash Costs Before Credits 1.38 1.76 1.37
Acid Credits 0.20 – 0.21
Total Cash Costs After Credits 1.19 1.76 1.15
Note: * Excludes year 5 (2022) which is a transition year between concentrate and blister production.
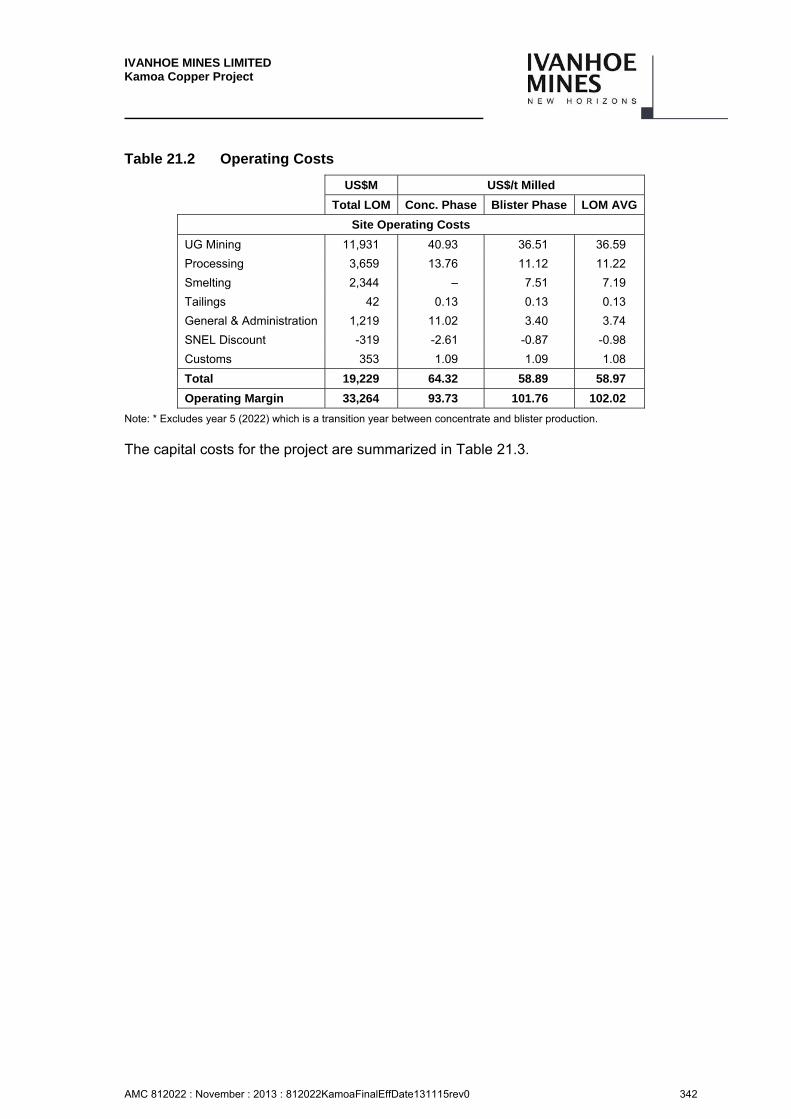
IVANHOE MINES LIMITED Kamoa Copper Project
AMC 812022 : November : 2013 : 812022KamoaFinalEffDate131115rev0 342
Table 21.2 Operating Costs
US$M US$/t Milled
Total LOM Conc. Phase Blister Phase LOM AVG
Site Operating Costs
UG Mining 11,931 40.93 36.51 36.59
Processing 3,659 13.76 11.12 11.22
Smelting 2,344 – 7.51 7.19
Tailings 42 0.13 0.13 0.13
General & Administration 1,219 11.02 3.40 3.74
SNEL Discount -319 -2.61 -0.87 -0.98
Customs 353 1.09 1.09 1.08
Total 19,229 64.32 58.89 58.97
Operating Margin 33,264 93.73 101.76 102.02
Note: * Excludes year 5 (2022) which is a transition year between concentrate and blister production.
The capital costs for the project are summarized in Table 21.3.
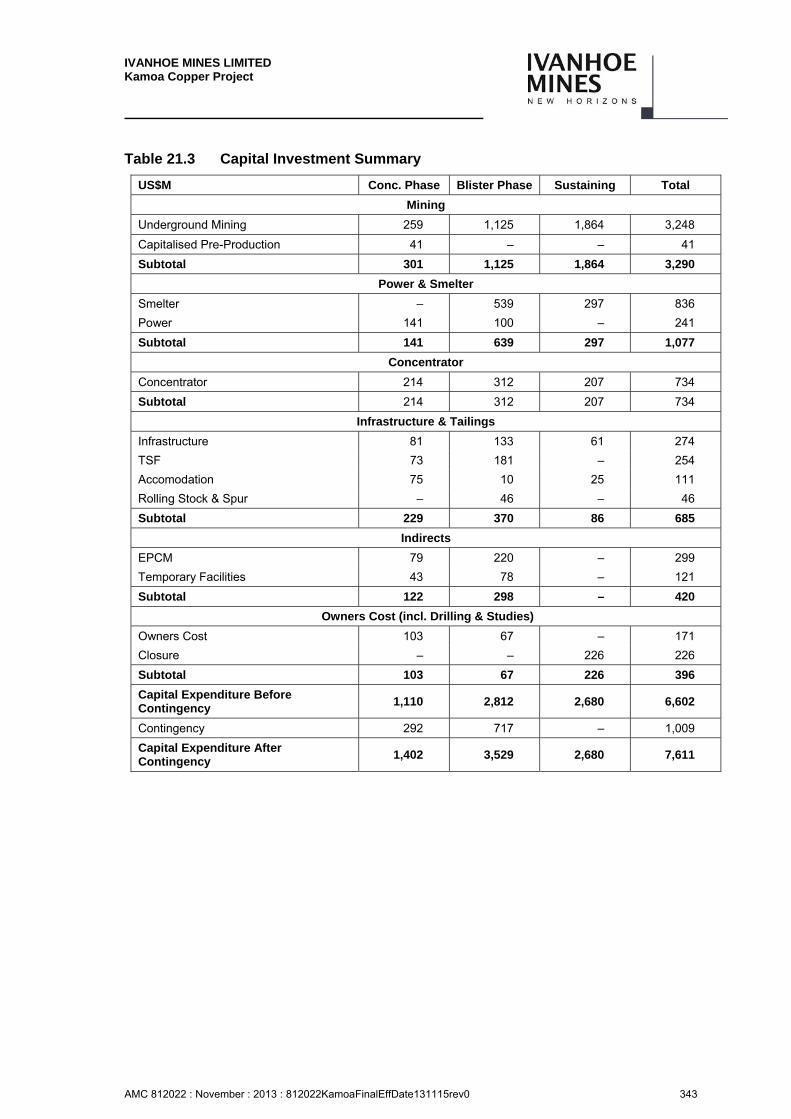
IVANHOE MINES LIMITED Kamoa Copper Project
AMC 812022 : November : 2013 : 812022KamoaFinalEffDate131115rev0 343
Table 21.3 Capital Investment Summary
US$M Conc. Phase Blister Phase Sustaining Total
Mining
Underground Mining 259 1,125 1,864 3,248
Capitalised Pre-Production 41 – – 41
Subtotal 301 1,125 1,864 3,290
Power & Smelter
Smelter – 539 297 836
Power 141 100 – 241
Subtotal 141 639 297 1,077
Concentrator
Concentrator 214 312 207 734
Subtotal 214 312 207 734
Infrastructure & Tailings
Infrastructure 81 133 61 274
TSF 73 181 – 254
Accomodation 75 10 25 111
Rolling Stock & Spur – 46 – 46
Subtotal 229 370 86 685
Indirects
EPCM 79 220 – 299
Temporary Facilities 43 78 – 121
Subtotal 122 298 – 420
Owners Cost (incl. Drilling & Studies)
Owners Cost 103 67 – 171
Closure – – 226 226
Subtotal 103 67 226 396
Capital Expenditure Before Contingency
1,110 2,812 2,680 6,602
Contingency 292 717 – 1,009
Capital Expenditure After Contingency
1,402 3,529 2,680 7,611
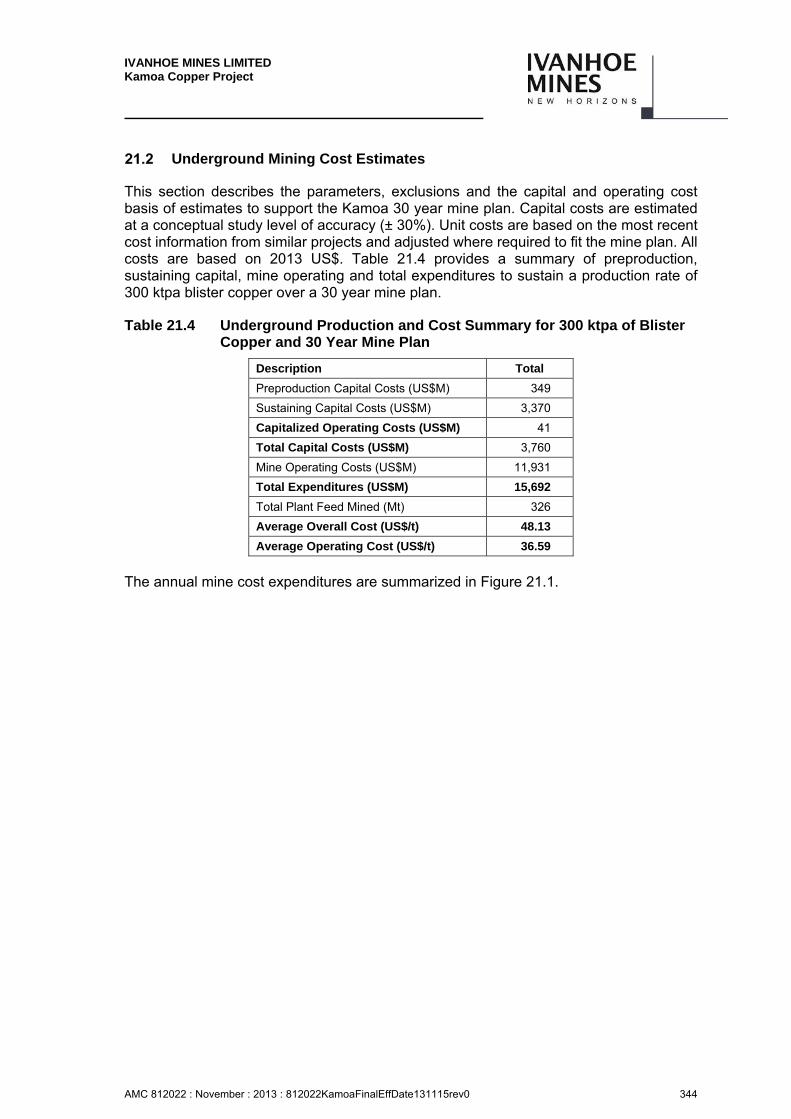
IVANHOE MINES LIMITED Kamoa Copper Project
AMC 812022 : November : 2013 : 812022KamoaFinalEffDate131115rev0 344
Underground Mining Cost Estimates
This section describes the parameters, exclusions and the capital and operating cost basis of estimates to support the Kamoa 30 year mine plan. Capital costs are estimated at a conceptual study level of accuracy (± 30%). Unit costs are based on the most recent cost information from similar projects and adjusted where required to fit the mine plan. All costs are based on 2013 US$. Table 21.4 provides a summary of preproduction, sustaining capital, mine operating and total expenditures to sustain a production rate of 300 ktpa blister copper over a 30 year mine plan.
Table 21.4 Underground Production and Cost Summary for 300 ktpa of Blister Copper and 30 Year Mine Plan
Description Total
Preproduction Capital Costs (US$M) 349
Sustaining Capital Costs (US$M) 3,370
Capitalized Operating Costs (US$M) 41
Total Capital Costs (US$M) 3,760
Mine Operating Costs (US$M) 11,931
Total Expenditures (US$M) 15,692
Total Plant Feed Mined (Mt) 326
Average Overall Cost (US$/t) 48.13
Average Operating Cost (US$/t) 36.59
The annual mine cost expenditures are summarized in Figure 21.1.
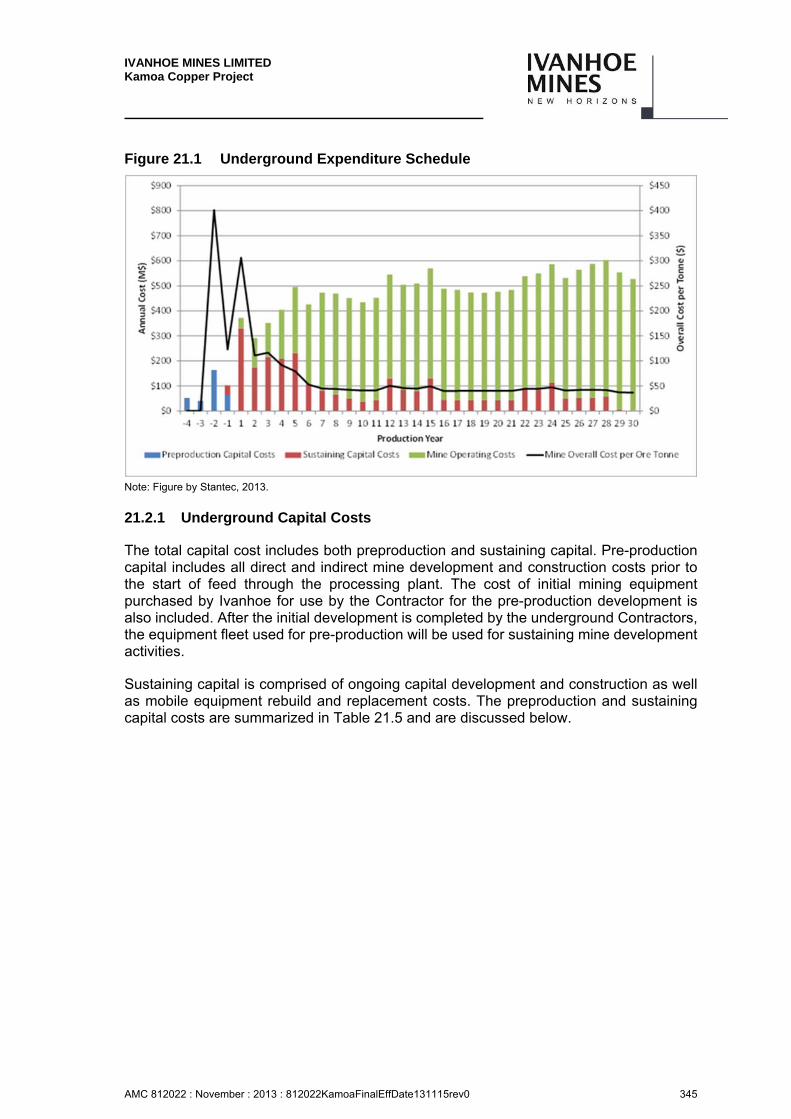
IVANHOE MINES LIMITED Kamoa Copper Project
AMC 812022 : November : 2013 : 812022KamoaFinalEffDate131115rev0 345
Figure 21.1 Underground Expenditure Schedule
Note: Figure by Stantec, 2013.
21.2.1 Underground Capital Costs
The total capital cost includes both preproduction and sustaining capital. Pre-production capital includes all direct and indirect mine development and construction costs prior to the start of feed through the processing plant. The cost of initial mining equipment purchased by Ivanhoe for use by the Contractor for the pre-production development is also included. After the initial development is completed by the underground Contractors, the equipment fleet used for pre-production will be used for sustaining mine development activities.
Sustaining capital is comprised of ongoing capital development and construction as well as mobile equipment rebuild and replacement costs. The preproduction and sustaining capital costs are summarized in Table 21.5 and are discussed below.
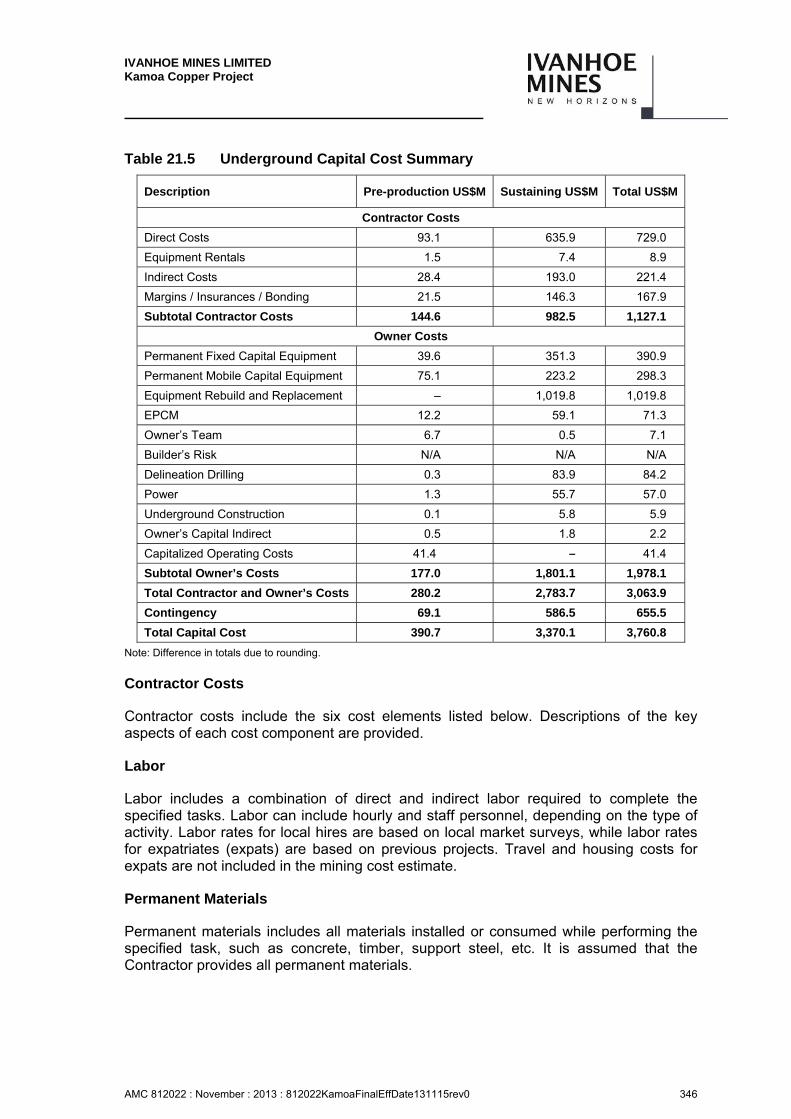
IVANHOE MINES LIMITED Kamoa Copper Project
AMC 812022 : November : 2013 : 812022KamoaFinalEffDate131115rev0 346
Table 21.5 Underground Capital Cost Summary
Description Pre-production US$M Sustaining US$M Total US$M
Contractor Costs
Direct Costs 93.1 635.9 729.0
Equipment Rentals 1.5 7.4 8.9
Indirect Costs 28.4 193.0 221.4
Margins / Insurances / Bonding 21.5 146.3 167.9
Subtotal Contractor Costs 144.6 982.5 1,127.1
Owner Costs
Permanent Fixed Capital Equipment 39.6 351.3 390.9
Permanent Mobile Capital Equipment 75.1 223.2 298.3
Equipment Rebuild and Replacement – 1,019.8 1,019.8
EPCM 12.2 59.1 71.3
Owner’s Team 6.7 0.5 7.1
Builder’s Risk N/A N/A N/A
Delineation Drilling 0.3 83.9 84.2
Power 1.3 55.7 57.0
Underground Construction 0.1 5.8 5.9
Owner’s Capital Indirect 0.5 1.8 2.2
Capitalized Operating Costs 41.4 – 41.4
Subtotal Owner’s Costs 177.0 1,801.1 1,978.1
Total Contractor and Owner’s Costs 280.2 2,783.7 3,063.9
Contingency 69.1 586.5 655.5
Total Capital Cost 390.7 3,370.1 3,760.8
Note: Difference in totals due to rounding.
Contractor Costs
Contractor costs include the six cost elements listed below. Descriptions of the key aspects of each cost component are provided.
Labor
Labor includes a combination of direct and indirect labor required to complete the specified tasks. Labor can include hourly and staff personnel, depending on the type of activity. Labor rates for local hires are based on local market surveys, while labor rates for expatriates (expats) are based on previous projects. Travel and housing costs for expats are not included in the mining cost estimate.
Permanent Materials
Permanent materials includes all materials installed or consumed while performing the specified task, such as concrete, timber, support steel, etc. It is assumed that the Contractor provides all permanent materials.
IVANHOE MINES LIMITED Kamoa Copper Project
AMC 812022 : November : 2013 : 812022KamoaFinalEffDate131115rev0 347
Equipment Rentals
Equipment rentals include specialized equipment required by the Contractor while performing the specified construction tasks. This equipment is not purchased by the Owner and has limited use. Items that fall into this category include cranes, manlifts, etc.
Service and Supplies
Service and supplies includes consumable items such as explosives, drilling costs, pipelines, ventilation duct, small tools, etc. associated with the specific task.
Subcontractors
Subcontractors includes Subcontractor costs associated with the specific task, such as drain hole drilling, diamond drilling, assaying, etc.
Contractor Indirect Costs
Contractor indirect costs include costs incurred by the Contractor to complete specific mine development and construction activities but are not included in any direct capital cost items.
An assessment will be made of Contractor indirect costs during preproduction. The costs are estimated on a basis of 30% of the Contractor direct costs, including equipment rentals. The Contractor indirect costs include the items listed below.
Supervision labor.
Mechanical and electrical maintenance labor.
Temporary surface support equipment rentals (compressors, generators, fans, wash/dry trailers, office trailer, pickup trucks, etc.).
Operating costs for the temporary support equipment.
Service and supply costs (sustaining freight, phone / fax, safety and supplies, office supplies, sewage / garbage disposal, etc.).
Owner Costs
Permanent Fixed and Mobile Capital Equipment
Permanent fixed and mobile capital equipment includes the costs associated with purchasing fixed and mobile equipment. In addition, rebuild and replacement costs are assessed against mobile equipment. Data from other recent projects was used to develop permanent capital equipment costs.
IVANHOE MINES LIMITED Kamoa Copper Project
AMC 812022 : November : 2013 : 812022KamoaFinalEffDate131115rev0 348
To assess permanent fixed and mobile capital equipment costs, equipment lists are developed from infrastructure designs and operating parameters. Once an equipment list is compiled, purchase, rebuild, and replacement costs are estimated. Following are the key elements used to develop the cost database.
Item Description – Identifies and sometimes provides a brief technical description of the equipment duty requirements or capacity.
Base Cost – A base cost as quoted by a Vendor or taken from a historical cost database.
Development Allowance – A 5% allowance to cover the cost of miscellaneous components, fuels, lubricants, and services required to commission a piece of equipment.
Spares Allowance – A 10% cost allowance for spare parts required on site. When provided, the cost of spares recommended by the Vendor is included. Similarly, engineering judgment is used to reduce or eliminate spares allowances for identical units that appear in multiple equipment list areas.
Freight Allowance – A cost allowance for delivering equipment to site. An allowance of 25% of the base cost was used for materials and 10% of the base cost was used for mobile equipment.
Total Cost – A summation of the base cost, development allowance, spares allowance, and freight allowance all escalated into current terms, if necessary. The total cost excludes sales tax and contingency.
Equipment Rebuild and Replacement
Once equipment lists and base unit costs are developed, mobile equipment rebuild and replacement unit costs are estimated. In general, these costs are based on annual operating hours and estimates of the average life to rebuild and replacement, which varies to suit the type of equipment. For this evaluation, an annual allowance was estimated at 15% of new equipment value for all mobile equipment.
Engineering, Procurement, and Construction Management
Engineering, procurement, and construction management (EPCM) costs are determined as a 7.5% allowance. The EPCM cost is assessed against the “Total direct capital costs – (less mobile equipment + mobile equipment replacement and rebuilds) + contractor rentals + contractor indirects + delineation drilling.”
IVANHOE MINES LIMITED Kamoa Copper Project
AMC 812022 : November : 2013 : 812022KamoaFinalEffDate131115rev0 349
Owner’s Team
The Underground Owner’s Team cost may include a manager, mine clerk, and mine engineer. Costs include labor, surface transportation operating costs, permanent equipment costs, and miscellaneous costs to support the Owner’s team during the pre-production period. The cost represents an assessment of a 3% allowance against the “Total direct capital costs + contractor rentals + contractor indirects + delineation drilling.”
Builder’s Risk Insurance
Builder’s risk insurance is not included in the mining costs but is included in the overall project cost estimate.
Delineation Drilling
Delineation drilling is drilling associated with determining the extents of the mining zones just prior to mining each zone. Drilling will involve a limited number of diamond drillholes drilled from a close proximity to the mining zone.
Power
Power quantities were determined based on loads and usage as evaluated at a conceptual level. Power costs associated with this project are assessed at a calculated rate of US$0.0569 per kWh before the SNEL discount for the power generation rehabilitation capital expenditure.
Based on the June 2011 MOU with SNEL, the capital cost of the rehabilitation will be financed by Ivanhoe through a loan to SNEL. The loan including interest will be repaid by SNEL through a deduction from the Company’s monthly power bills incurred over the life of the mine. For the financial analysis a 40% discount to the power charges has been assumed until the SNEL loan has been repaid.
Underground Construction
Underground construction performed by the Owner includes items such as underground shops, explosive magazines, fuel stations, capital boreholes, and other miscellaneous construction.
Owner’s Capital Indirect
Owner’s capital indirect costs include costs incurred by the Owner to complete specific capital construction activities but are not included in any direct capital cost items.
The costs are estimated at 30% of the Owner’s direct capital costs and include the cost items listed below.
Supervision labor.
Mechanical and electrical maintenance labor.
IVANHOE MINES LIMITED Kamoa Copper Project
AMC 812022 : November : 2013 : 812022KamoaFinalEffDate131115rev0 350
Temporary surface support equipment rentals (compressors, generators, fans, wash / dry trailers, office trailer, pickup trucks, etc.).
Operating costs for the temporary support equipment.
Service and supply costs (sustaining freight, phone / fax, safety and supplies, office supplies, sewage / garbage disposal, etc.).
Training of underground miners during the pre-production period. After that time, training is charged as a mine operating cost.
Contingency
A capital contingency of 10% is assessed against mobile equipment and mobile equipment replacements, while a capital contingency of 30% is assessed against all other capital. The contingency provides additional project capital for expenditures that may or may not be required, due to the level of engineering detail in the study.
Capital Cost Criteria and Assumptions
All capital mine development work is performed by a Contractor.
The estimates are based on the following qualifications.
Pre-production Costs
– Costs are based on constant 2013 US$.
– Pre-production Contractor crews will work seven days per week, two shifts per day, and 12 hours per shift.
– Five days per year are allowed as non-production days.
– A Contractor provides all underground equipment, except mobile equipment, which will be purchased by the Owner and operated by the Contractor during the pre-production period.
– Contractor’s margins / insurances are assessed at 17.5%.
Quantity Development
– The design engineering team developed all quantities included in, associated with, or related to the scope of work based on conceptual mine designs.
– A mine equipment list was developed based on the infrastructure design and production productivities. A major portion of the equipment prices are based on industry averages and historical data from similar projects.
Exclusions
The following services and facilities are not included in the capital cost estimates.
Escalation.
Finance and Interest Charges.
Land Acquisitions, Rights-of-Way, and Licenses.

IVANHOE MINES LIMITED Kamoa Copper Project
AMC 812022 : November : 2013 : 812022KamoaFinalEffDate131115rev0 351
Disposal of Hazardous Materials (if any).
DRC Liscense or Operating Fees.
21.2.2 Underground Mine Operating Costs
Unit operating costs were prepared for room-and-pillar stoping, drift-and-fill stoping, and paste backfill placement. Annual operating costs were generated based on the tonnes produced each year. A summary of the 30 year mine plan total and average operating costs (including operating costs during the preproduction period) can be found in Table 21.6.
Table 21.6 Underground 30 Year Mine Plan Operating Cost Summary
Description Total Cost
($M) Unit Cost ($/t Mined)
Production Direct Costs 5,843.4 17.92
Backfill 1,584.8 4.86
Materials Handling 457.8 1.40
Operating Construction 70.2 0.22
Training 16.1 0.05
Indirect Operating Costs 2,391.7 7.34
Power Costs 520.1 1.60
Undefined Allowance 1,088.4 3.34
Total Operating Cost 11,972.7 36.72
Capitalized Op. Costs -41.3 -0.13
Op. Cost Excluding Capitalized Costs
11,931.4 36.59
Operating Cost Estimate Scope Definition
Mine operating cost estimates are intended to cover all underground operating expenses. The operating costs are subdivided into the following cost centers.
Production Direct Costs
Production includes the costs to drill, blast, ground support, and muck the mineralized material from the panels to the dedicated materials handling system (see description under Materials Handling Costs later in this section). It also includes non-capital development, such as remaining lateral waste development (footwall, stope access, and miscellaneous excavation), which will be performed by the Owner’s personnel.
Paste Backfill Costs
Paste backfill includes costs associated with fill preparation, cement costs and freight, backfill plant operating costs, operating labor, and delivery costs. The paste backfill is assumed to have a binder content of 4%. The paste backfill design needs to be reviewed in more detail.
IVANHOE MINES LIMITED Kamoa Copper Project
AMC 812022 : November : 2013 : 812022KamoaFinalEffDate131115rev0 352
Materials Handling Costs
Materials handling costs are the costs associated with the movement of the mineralized material once it is dumped from the loader on to the Stamler feeder breaker for transfer and loading on to the mine conveying system(s). Movement of the material from the production face to the conveyor belts is covered under the production direct costs.
In the early production years, the material handling cost may involve trucking material until the conveyor belt system is in place.
Operating Construction
Operating construction involves construction by the Owner of items such as fuel stations, fuel boreholes, underground shops, underground magazines, drop raises, sumps, refuge stations, etc.
Training
Due to the size of the workforce and the location of Kamoa, a training programme will be required to prepare workers for underground mining tasks. This estimate used three months of training per individual and also includes a training labor allowance for a 12% turnover rate. The operating training allowance does not cover the preproduction period where the cost has been capitalized.
Indirect Operating Costs
Indirect operating costs include pumping, ventilation, compressed air, mine service crews, mechanics and electricians for mine operations, and mine site staff personnel.
Power Costs
Power costs were estimated based on power loads developed from calculated underground equipment and infrastructure requirements. The unit costs associated with these power loads was US$0.0569 per kWh before the SNEL discount for the power generation rehabilitation capital expenditure. A more detailed analysis will be required as more detailed design work is advanced. For the financial analysis a 40% discount to the power charges has been assumed until the SNEL loan has been repaid.
Undefined Allowance
An allowance of 10% of operating costs has been included for items that will likely occur, but for which there is presently insufficient data to specify in detail. Items such as additional ground support, future ground support rehabilitation, and additional miscellaneous excavation requirements are examples.
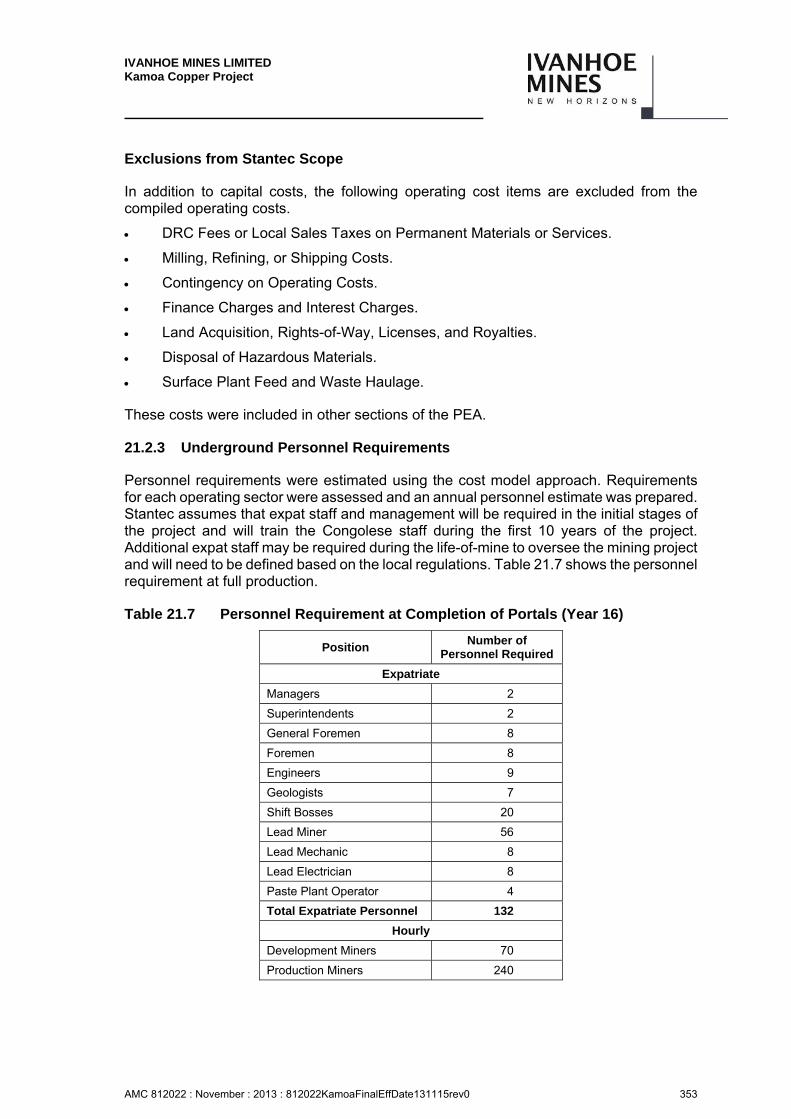
IVANHOE MINES LIMITED Kamoa Copper Project
AMC 812022 : November : 2013 : 812022KamoaFinalEffDate131115rev0 353
Exclusions from Stantec Scope
In addition to capital costs, the following operating cost items are excluded from the compiled operating costs.
DRC Fees or Local Sales Taxes on Permanent Materials or Services.
Milling, Refining, or Shipping Costs.
Contingency on Operating Costs.
Finance Charges and Interest Charges.
Land Acquisition, Rights-of-Way, Licenses, and Royalties.
Disposal of Hazardous Materials.
Surface Plant Feed and Waste Haulage.
These costs were included in other sections of the PEA.
21.2.3 Underground Personnel Requirements
Personnel requirements were estimated using the cost model approach. Requirements for each operating sector were assessed and an annual personnel estimate was prepared. Stantec assumes that expat staff and management will be required in the initial stages of the project and will train the Congolese staff during the first 10 years of the project. Additional expat staff may be required during the life-of-mine to oversee the mining project and will need to be defined based on the local regulations. Table 21.7 shows the personnel requirement at full production.
Table 21.7 Personnel Requirement at Completion of Portals (Year 16)
Position Number of
Personnel Required
Expatriate
Managers 2
Superintendents 2
General Foremen 8
Foremen 8
Engineers 9
Geologists 7
Shift Bosses 20
Lead Miner 56
Lead Mechanic 8
Lead Electrician 8
Paste Plant Operator 4
Total Expatriate Personnel 132
Hourly
Development Miners 70
Production Miners 240
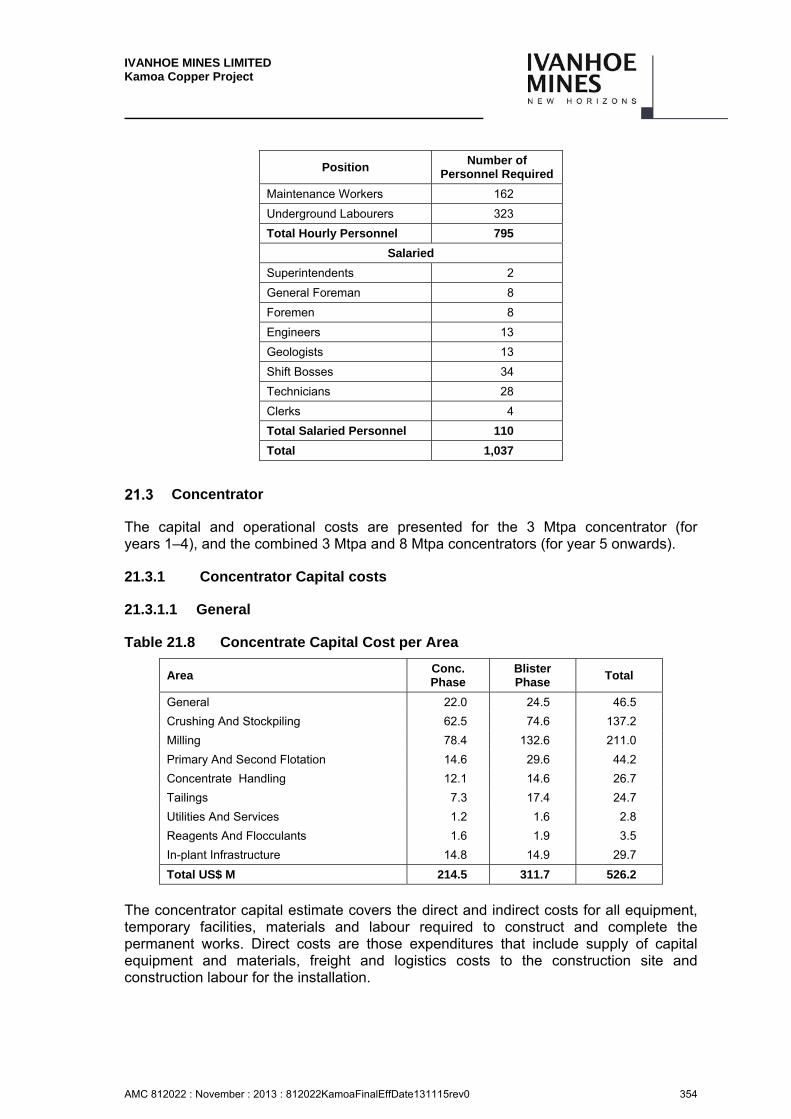
IVANHOE MINES LIMITED Kamoa Copper Project
AMC 812022 : November : 2013 : 812022KamoaFinalEffDate131115rev0 354
Position Number of
Personnel Required
Maintenance Workers 162
Underground Labourers 323
Total Hourly Personnel 795
Salaried
Superintendents 2
General Foreman 8
Foremen 8
Engineers 13
Geologists 13
Shift Bosses 34
Technicians 28
Clerks 4
Total Salaried Personnel 110
Total 1,037
Concentrator
The capital and operational costs are presented for the 3 Mtpa concentrator (for years 1–4), and the combined 3 Mtpa and 8 Mtpa concentrators (for year 5 onwards).
21.3.1 Concentrator Capital costs
21.3.1.1 General
Table 21.8 Concentrate Capital Cost per Area
Area Conc. Phase
Blister Phase
Total
General 22.0 24.5 46.5
Crushing And Stockpiling 62.5 74.6 137.2
Milling 78.4 132.6 211.0
Primary And Second Flotation 14.6 29.6 44.2
Concentrate Handling 12.1 14.6 26.7
Tailings 7.3 17.4 24.7
Utilities And Services 1.2 1.6 2.8
Reagents And Flocculants 1.6 1.9 3.5
In-plant Infrastructure 14.8 14.9 29.7
Total US$ M 214.5 311.7 526.2
The concentrator capital estimate covers the direct and indirect costs for all equipment, temporary facilities, materials and labour required to construct and complete the permanent works. Direct costs are those expenditures that include supply of capital equipment and materials, freight and logistics costs to the construction site and construction labour for the installation.
IVANHOE MINES LIMITED Kamoa Copper Project
AMC 812022 : November : 2013 : 812022KamoaFinalEffDate131115rev0 355
Indirect costs are those expenditures covering engineering, procurement and construction management (EPCM) services, together with the supervision of commissioning of the works.
In addition to the two-phased concentrator capital estimate, an allowance has also been made for sustaining capital for the life of mine.
The capital cost is estimated at a Scoping Study level of accuracy.
The concentrator sustaining capital was calculated on the basis of 0.2% of the plant capital costs. In addition, an additional sustaining capital allowance was made for a two-phased expansion of the concentrators in later years, to account for increased ROM throughput as a result of decreasing copper head grades, to maintain smelter output.
21.3.1.2 Estimating: Mechanical and Platework - General
The estimating approach for the concentrators was to obtain quotations for all major process/mechanical equipment. Delivery to site and vendor recommended commissioning spares, strategic and 2-year spares were included. Operating and maintenance spares were included in the operating expenditure.
An overall site plot plan and concentrator plant 3-D model was developed to a suitable level of detail to support the development of the estimate.
The mechanical supply costs were used as a basis for estimating costs for other trades such as in-plant piping, electrical and instrumentation.
Major platework items were calculated from the model. An allowance was made for lesser platework items.
21.3.1.3 Mechanical – Concentrator
Short-form enquiries were prepared and issued for all major mechanical equipment. This category represented more than 90% of the total process plant mechanical equipment supply costs and included the following:
Crushers
Conveyors
Ball mills & relining equipment
Regrind mills
Cyclones
Flotation Cells and Blowers
Feeders and screens
Concentrate filters
Thickeners
Slurry and Froth pumps
IVANHOE MINES LIMITED Kamoa Copper Project
AMC 812022 : November : 2013 : 812022KamoaFinalEffDate131115rev0 356
Bulk bagging system
Feeders
Costs for other mechanical equipment were sourced either by e-mail or from Hatch data base costs.
21.3.1.4 Earthworks and Roads
Earthworks quantities for the Concentrator were derived from the 3-D model as preliminary quantity take-offs. Pricing was done from quotes obtained from a Contractor in the DRC, as well as DRC database costs.
Concentrator in-plant road requirements were based on site access as reflected on the overall plot plan and 3-D model. Based on a preliminary assessment of loading conditions for these roads, a typical road design criteria was applied to determine quantities.
21.3.1.5 Civil Works and Structural Steelwork
Concrete and structural steel estimating was developed using the concentrator plot plan and model to derive quantities. Labour rates obtained from Chinese SMEIP contractors were used as the basis for pricing the labour.
21.3.1.6 Piping, Electrical and Instrumentation
All in-plant piping, electrical and instrumentation costs were factored from the mechanical equipment costs, unless included as part of a turnkey package (e.g. the acid plant in the smelter).
Overland piping quantities for the tailings discharge system (from process plant to TSF) are based on a preliminary pumping assessment.
21.3.2 Concentrator Operating Costs
The operating cost estimate includes the fixed cost components (including maintenance and labour), and variable cost components, including reagents, grinding media, liners, and power. The estimates exclude mining, security, environmental monitoring, head/corporate office costs, transport, insurance, tailings dam operation and site closure and rehabilitation.
Operating costs for the Concentrator are reported as an annual cost, as well as on a cost/tonne ROM feed and cost/tonne of final copper product. The personnel requirements for the Concentrators were developed based on similar operations. The estimated staffing requirements for the concentrators are 199 during years 1-4 (3 Mtpa concentrator only), and an additional 176 from year 5 onwards (8 Mtpa concentrator added). Note that this figure excludes general administrative staff but includes dedicated concentrator maintenance personnel.

IVANHOE MINES LIMITED Kamoa Copper Project
AMC 812022 : November : 2013 : 812022KamoaFinalEffDate131115rev0 357
The Concentrator unit costs are based on an annual production of 3 million tpa (Mtpa) ROM (years 1-4), 11 Mtpa ROM (year 5 onwards) and 365 days/annum operation at 91.3% availability.
The estimated long term concentrator operating cost (concentrator only) is US$ 394.7/t copper.
A summary of the plant operating costs is given in Table 21.9 below. All costs are exclusive of import duties, withholding tax, taxes or other government required costs unless otherwise noted. The following aspects have been included in the estimate:
This estimate is based on pricing data current to second quarter of 2013
Workforce requirement includes supervision, operations and maintenance. The labour rates used were provided by Ivanhoe based on current DRC operations and a survey performed for other operations in the DRC.
Reagent usage and costs have been based on test work, metallurgical modelling and budget prices.
Grinding media consumption for ball mills and regrind mills are based on a combination of current industry norms and vendor recommendations, and costs are based on budget quotes from multiple vendors. The same applies to wear rates for liners.
Logistics costs are based on a combination of costs from freight forwarding agents and vendor quotes.
Water costs for fresh water make-up for the concentrator are accounted for in the overall power demand. No licence fees or abstraction fees have been considered for water usage.
Maintenance costs have been factored from direct capital costs scaled according to throughput.
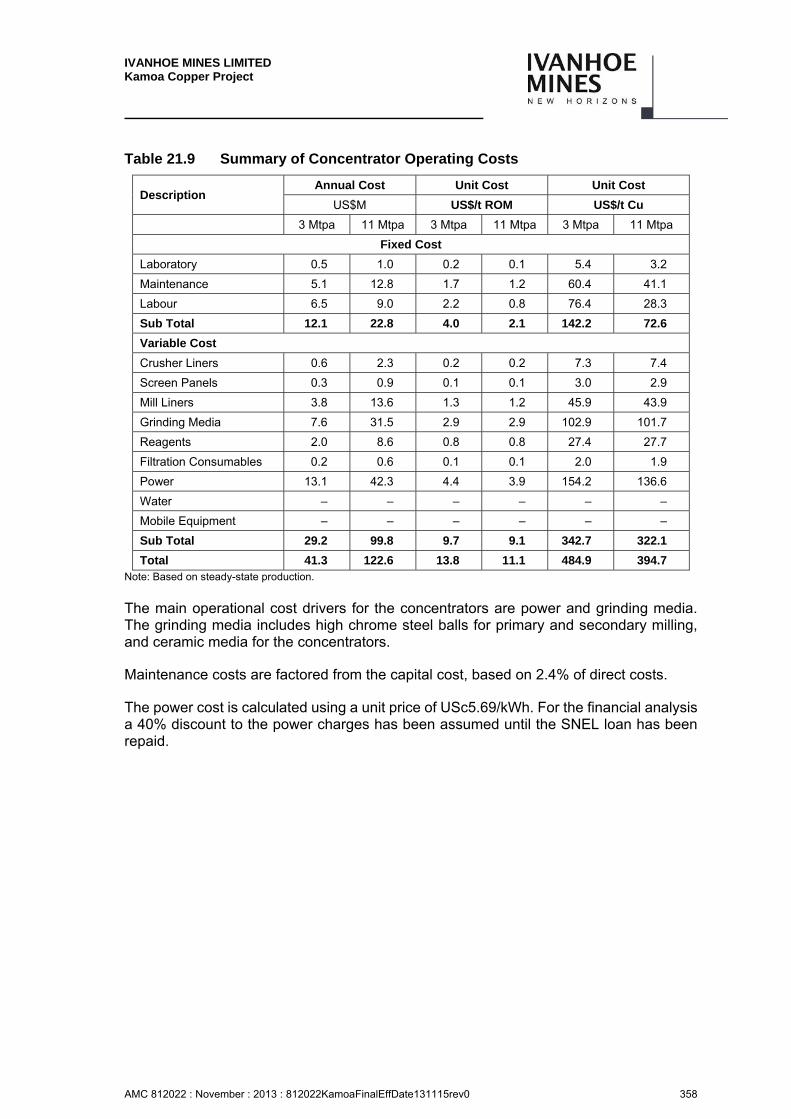
IVANHOE MINES LIMITED Kamoa Copper Project
AMC 812022 : November : 2013 : 812022KamoaFinalEffDate131115rev0 358
Table 21.9 Summary of Concentrator Operating Costs
Description Annual Cost Unit Cost Unit Cost
US$M US$/t ROM US$/t Cu
3 Mtpa 11 Mtpa 3 Mtpa 11 Mtpa 3 Mtpa 11 Mtpa
Fixed Cost
Laboratory 0.5 1.0 0.2 0.1 5.4 3.2
Maintenance 5.1 12.8 1.7 1.2 60.4 41.1
Labour 6.5 9.0 2.2 0.8 76.4 28.3
Sub Total 12.1 22.8 4.0 2.1 142.2 72.6
Variable Cost
Crusher Liners 0.6 2.3 0.2 0.2 7.3 7.4
Screen Panels 0.3 0.9 0.1 0.1 3.0 2.9
Mill Liners 3.8 13.6 1.3 1.2 45.9 43.9
Grinding Media 7.6 31.5 2.9 2.9 102.9 101.7
Reagents 2.0 8.6 0.8 0.8 27.4 27.7
Filtration Consumables 0.2 0.6 0.1 0.1 2.0 1.9
Power 13.1 42.3 4.4 3.9 154.2 136.6
Water – – – – – –
Mobile Equipment – – – – – –
Sub Total 29.2 99.8 9.7 9.1 342.7 322.1
Total 41.3 122.6 13.8 11.1 484.9 394.7 Note: Based on steady-state production.
The main operational cost drivers for the concentrators are power and grinding media. The grinding media includes high chrome steel balls for primary and secondary milling, and ceramic media for the concentrators.
Maintenance costs are factored from the capital cost, based on 2.4% of direct costs.
The power cost is calculated using a unit price of USc5.69/kWh. For the financial analysis a 40% discount to the power charges has been assumed until the SNEL loan has been repaid.
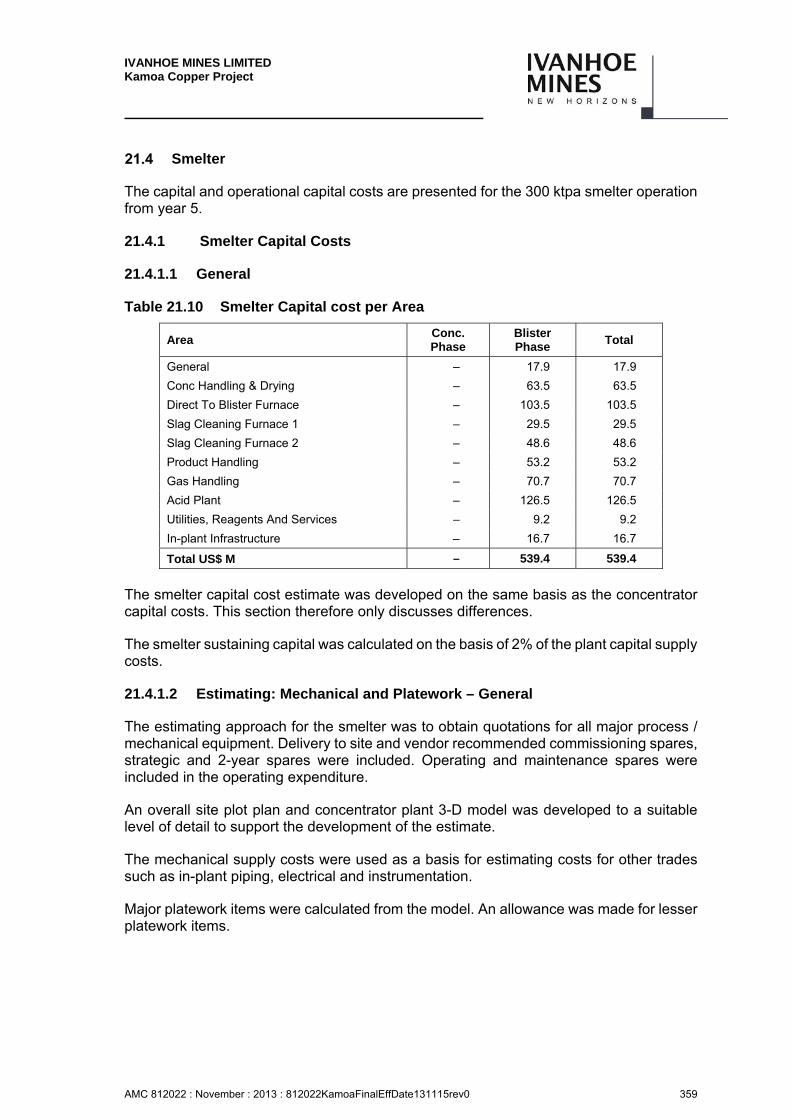
IVANHOE MINES LIMITED Kamoa Copper Project
AMC 812022 : November : 2013 : 812022KamoaFinalEffDate131115rev0 359
Smelter
The capital and operational capital costs are presented for the 300 ktpa smelter operation from year 5.
21.4.1 Smelter Capital Costs
21.4.1.1 General
Table 21.10 Smelter Capital cost per Area
Area Conc. Phase
Blister Phase
Total
General – 17.9 17.9
Conc Handling & Drying – 63.5 63.5
Direct To Blister Furnace – 103.5 103.5
Slag Cleaning Furnace 1 – 29.5 29.5
Slag Cleaning Furnace 2 – 48.6 48.6
Product Handling – 53.2 53.2
Gas Handling – 70.7 70.7
Acid Plant – 126.5 126.5
Utilities, Reagents And Services – 9.2 9.2
In-plant Infrastructure – 16.7 16.7
Total US$ M – 539.4 539.4
The smelter capital cost estimate was developed on the same basis as the concentrator capital costs. This section therefore only discusses differences.
The smelter sustaining capital was calculated on the basis of 2% of the plant capital supply costs.
21.4.1.2 Estimating: Mechanical and Platework – General
The estimating approach for the smelter was to obtain quotations for all major process / mechanical equipment. Delivery to site and vendor recommended commissioning spares, strategic and 2-year spares were included. Operating and maintenance spares were included in the operating expenditure.
An overall site plot plan and concentrator plant 3-D model was developed to a suitable level of detail to support the development of the estimate.
The mechanical supply costs were used as a basis for estimating costs for other trades such as in-plant piping, electrical and instrumentation.
Major platework items were calculated from the model. An allowance was made for lesser platework items.
IVANHOE MINES LIMITED Kamoa Copper Project
AMC 812022 : November : 2013 : 812022KamoaFinalEffDate131115rev0 360
21.4.1.3 Mechanical – Smelter
Short-form enquiries were prepared and issued for all major mechanical equipment. This category represented approximately 90% of the total process plant mechanical equipment cost and included the following:
Acid plant
Slag cleaning furnaces
Waste heat boiler
Gas cleaning plant
Refining Furnaces
Concentrate Steam Dryer
Cooling Towers
Baghouses
Acid Storage Tanks
Blister Casting Wheel
Cooling Water pumps
Cooling Towers
Cranes
Conveyors and stacker / reclaimers in bedding plant
Pressed Steel Tanks.
Costs for other mechanical equipment were sourced either by e-mail or from Hatch data base costs.
21.4.1.4 Earthworks and Roads
Earthworks quantities for the smelter were derived from the 3-D model as preliminary quantity take-offs. Pricing was done from quotes obtained from a Contractor in the DRC, as well as DRC database costs.
Smelter in-plant road requirements were based on site access as reflected on the overall plot plan and 3-D model. Based on a preliminary assessment of loading conditions for these roads, a typical road design criteria was applied to determine quantities.
21.4.1.5 Civil Works and Structural Steelwork
Concrete and structural steel estimating was developed using the smelter plot plan and model to derive quantities. Labour rates obtained from Chinese SMEIP contractors were used as the basis for pricing the labour.
IVANHOE MINES LIMITED Kamoa Copper Project
AMC 812022 : November : 2013 : 812022KamoaFinalEffDate131115rev0 361
21.4.1.6 Piping, Electrical, and Instrumentation
All in-plant piping, electrical and instrumentation costs were factored from the mechanical equipment costs, unless included as part of a turnkey package (e.g. the acid plant).
21.4.2 Smelter Operating costs
21.4.2.1 General
The smelter operating cost estimate was developed on the same basis as the concentrator capital costs. This section therefore only discusses differences.
Operating costs for the smelter are reported as an annual cost, as well as on a cost/tonne concentrate feed and cost/tonne of final copper product. The personnel requirements for the smelter were developed based on similar operations. The estimated staffing requirement for the smelter is 209. Note that this figure excludes general administrative staff but includes plant maintenance personnel.
The smelter unit costs are based on an annual production of 300 ktpa blister copper and 365 days/annum operation at 89% availability.
The estimated long term smelter operating cost is US$ 334.8/t copper.
A summary of the plant operating costs is given in Table 21.11 below. All costs are exclusive of import duties, withholding tax, taxes or other government required costs unless otherwise noted. The following aspects have been included in the estimate:
This estimate is based on pricing data current to second quarter of 2013.
Workforce requirement includes supervision, operations and maintenance. The labour rates used were provided by Ivanhoe based on current DRC operations and a survey performed for other operations in the DRC.
Water costs for fresh water make-up for the smelter are accounted for in the overall power demand. No licence fees or abstraction fees have been considered for water usage.
Maintenance costs have been factored from direct capital costs scaled according to throughput.
Reagent usage and costs have been based on metallurgical modelling and budget prices for suppliers active in the DRC
Logistics costs are based on a combination of costs from freight forwarding agents and vendor quotes.
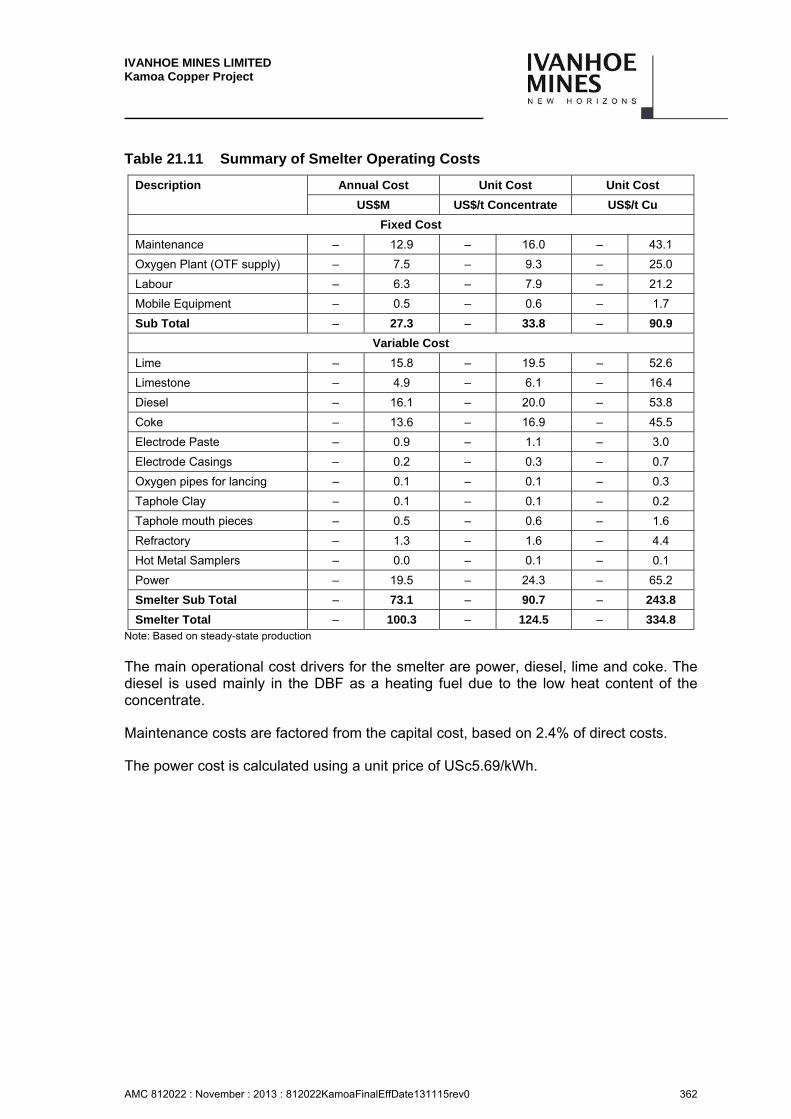
IVANHOE MINES LIMITED Kamoa Copper Project
AMC 812022 : November : 2013 : 812022KamoaFinalEffDate131115rev0 362
Table 21.11 Summary of Smelter Operating Costs
Description Annual Cost Unit Cost Unit Cost
US$M US$/t Concentrate US$/t Cu
Fixed Cost
Maintenance – 12.9 – 16.0 – 43.1
Oxygen Plant (OTF supply) – 7.5 – 9.3 – 25.0
Labour – 6.3 – 7.9 – 21.2
Mobile Equipment – 0.5 – 0.6 – 1.7
Sub Total – 27.3 – 33.8 – 90.9
Variable Cost
Lime – 15.8 – 19.5 – 52.6
Limestone – 4.9 – 6.1 – 16.4
Diesel – 16.1 – 20.0 – 53.8
Coke – 13.6 – 16.9 – 45.5
Electrode Paste – 0.9 – 1.1 – 3.0
Electrode Casings – 0.2 – 0.3 – 0.7
Oxygen pipes for lancing – 0.1 – 0.1 – 0.3
Taphole Clay – 0.1 – 0.1 – 0.2
Taphole mouth pieces – 0.5 – 0.6 – 1.6
Refractory – 1.3 – 1.6 – 4.4
Hot Metal Samplers – 0.0 – 0.1 – 0.1
Power – 19.5 – 24.3 – 65.2
Smelter Sub Total – 73.1 – 90.7 – 243.8
Smelter Total – 100.3 – 124.5 – 334.8 Note: Based on steady-state production
The main operational cost drivers for the smelter are power, diesel, lime and coke. The diesel is used mainly in the DBF as a heating fuel due to the low heat content of the concentrate.
Maintenance costs are factored from the capital cost, based on 2.4% of direct costs.
The power cost is calculated using a unit price of USc5.69/kWh.
IVANHOE MINES LIMITED Kamoa Copper Project
AMC 812022 : November : 2013 : 812022KamoaFinalEffDate131115rev0 363
Infrastructure
21.5.1 Tailings Storage Facility
21.5.1.1 Basis of the Capital Cost Estimate
The TSF cost estimate is based on a 30% level of engineering design.
The design is based on an accurate survey of the preferred Mupenda TSF site.
The TSF site design was based on a three dimensional (3D) model, capacity stage curve calculations and insitu dry density test results based on reputable geotechnical laboratory results.
The design was also underpinned by intrusive geotechnical fieldwork and associated laboratory test work.
The design was taken through a phase where typical detailswere generated for the:
– Underdrainage system
– Decant system
– Pollution control system
– Return water system
– Perimeter discharge pipeline
A Bill of Quantities (BoQ) was compiled to inform:
– An estimate utilizing 2013 market related rates
– An informal tender and budget quotation by a reputable in-country earth works and civil contractor.
The findings of the priced BoQ (P’s & G’s included) by the in-country contractor formed the basis of the Capital Estimate of the TSF:
– The rates / price include labour, fuel, plant and management.
The BoQ was priced in USD.
The BoQ was used as the basis to estimate the capital costs for Phase I (73.0 million USD) and Phase II (180.8 million USD) (Ultimate Phase) for implementation by assigning the required costs for each Phase to reflect the implementation costs per Phase.
A capital spread for Phase I and Phase II was then estimated.
No allowance was made for escalation.
The BoQ is summarized in Table 21.12 below.
21.5.1.2 Phase 1 TSF vs. Separate Phase 1 TSF – Comment on Difference in Cost
For more detail regarding the difference in cost, refer to Section 18.4.4 (Separate Phase 1 TSF) and Section 21.5.2 – Opportunity for Separate Phase 1 TSF
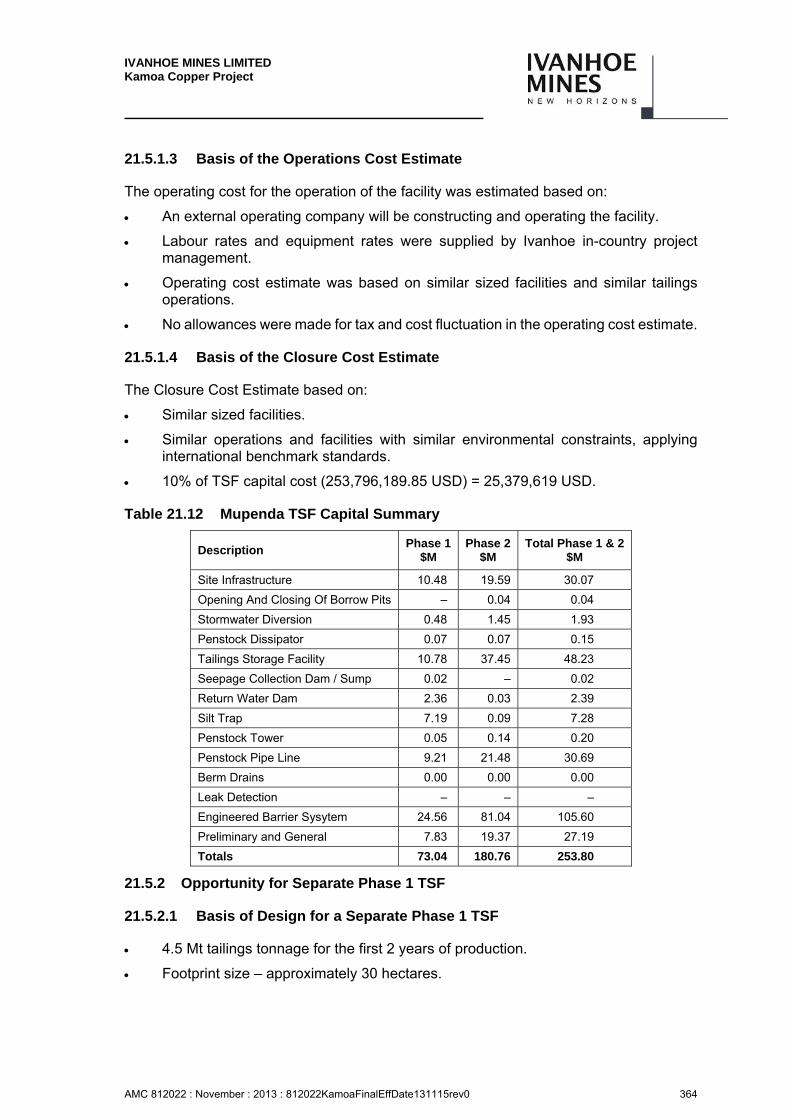
IVANHOE MINES LIMITED Kamoa Copper Project
AMC 812022 : November : 2013 : 812022KamoaFinalEffDate131115rev0 364
21.5.1.3 Basis of the Operations Cost Estimate
The operating cost for the operation of the facility was estimated based on:
An external operating company will be constructing and operating the facility.
Labour rates and equipment rates were supplied by Ivanhoe in-country project management.
Operating cost estimate was based on similar sized facilities and similar tailings operations.
No allowances were made for tax and cost fluctuation in the operating cost estimate.
21.5.1.4 Basis of the Closure Cost Estimate
The Closure Cost Estimate based on:
Similar sized facilities.
Similar operations and facilities with similar environmental constraints, applying international benchmark standards.
10% of TSF capital cost (253,796,189.85 USD) = 25,379,619 USD.
Table 21.12 Mupenda TSF Capital Summary
Description Phase 1
$M Phase 2
$M Total Phase 1 & 2
$M
Site Infrastructure 10.48 19.59 30.07
Opening And Closing Of Borrow Pits – 0.04 0.04
Stormwater Diversion 0.48 1.45 1.93
Penstock Dissipator 0.07 0.07 0.15
Tailings Storage Facility 10.78 37.45 48.23
Seepage Collection Dam / Sump 0.02 – 0.02
Return Water Dam 2.36 0.03 2.39
Silt Trap 7.19 0.09 7.28
Penstock Tower 0.05 0.14 0.20
Penstock Pipe Line 9.21 21.48 30.69
Berm Drains 0.00 0.00 0.00
Leak Detection – – –
Engineered Barrier Sysytem 24.56 81.04 105.60
Preliminary and General 7.83 19.37 27.19
Totals 73.04 180.76 253.80
21.5.2 Opportunity for Separate Phase 1 TSF
21.5.2.1 Basis of Design for a Separate Phase 1 TSF
4.5 Mt tailings tonnage for the first 2 years of production.
Footprint size – approximately 30 hectares.
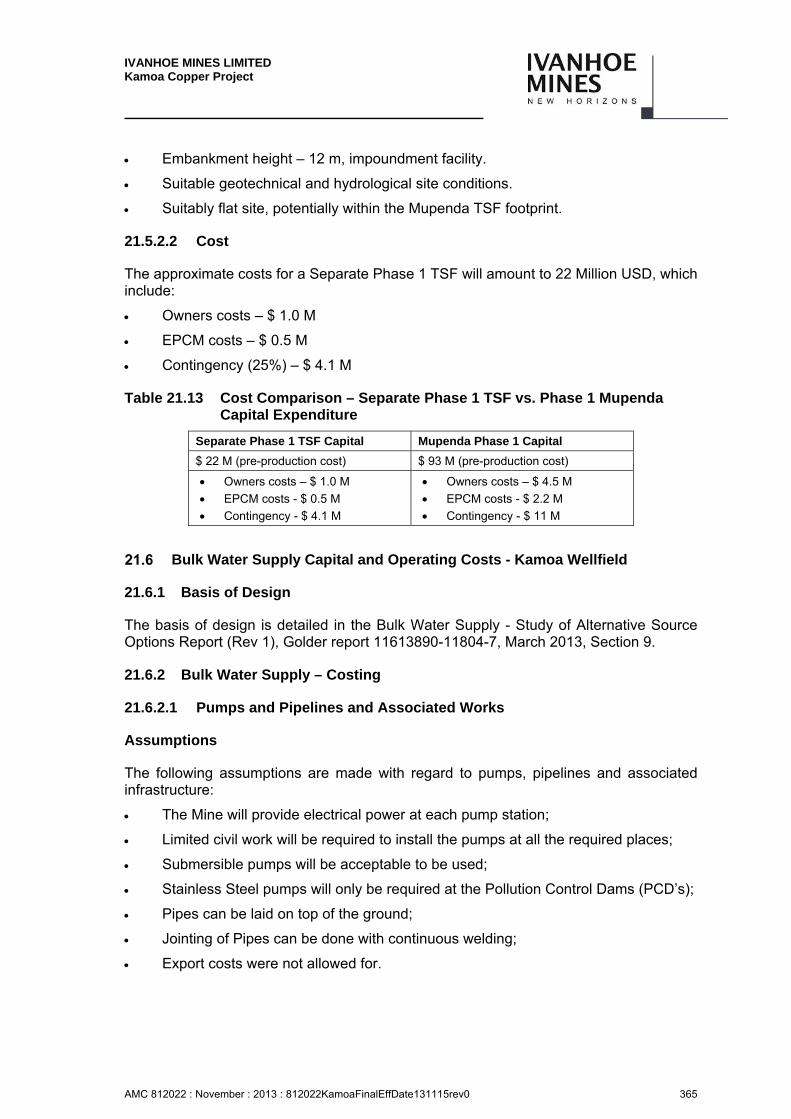
IVANHOE MINES LIMITED Kamoa Copper Project
AMC 812022 : November : 2013 : 812022KamoaFinalEffDate131115rev0 365
Embankment height – 12 m, impoundment facility.
Suitable geotechnical and hydrological site conditions.
Suitably flat site, potentially within the Mupenda TSF footprint.
21.5.2.2 Cost
The approximate costs for a Separate Phase 1 TSF will amount to 22 Million USD, which include:
Owners costs – $ 1.0 M
EPCM costs – $ 0.5 M
Contingency (25%) – $ 4.1 M
Table 21.13 Cost Comparison – Separate Phase 1 TSF vs. Phase 1 Mupenda Capital Expenditure
Separate Phase 1 TSF Capital Mupenda Phase 1 Capital
$ 22 M (pre-production cost) $ 93 M (pre-production cost)
Owners costs – $ 1.0 M
EPCM costs - $ 0.5 M
Contingency - $ 4.1 M
Owners costs – $ 4.5 M
EPCM costs - $ 2.2 M
Contingency - $ 11 M
Bulk Water Supply Capital and Operating Costs - Kamoa Wellfield
21.6.1 Basis of Design
The basis of design is detailed in the Bulk Water Supply - Study of Alternative Source Options Report (Rev 1), Golder report 11613890-11804-7, March 2013, Section 9.
21.6.2 Bulk Water Supply – Costing
21.6.2.1 Pumps and Pipelines and Associated Works
Assumptions
The following assumptions are made with regard to pumps, pipelines and associated infrastructure:
The Mine will provide electrical power at each pump station;
Limited civil work will be required to install the pumps at all the required places;
Submersible pumps will be acceptable to be used;
Stainless Steel pumps will only be required at the Pollution Control Dams (PCD’s);
Pipes can be laid on top of the ground;
Jointing of Pipes can be done with continuous welding;
Export costs were not allowed for.
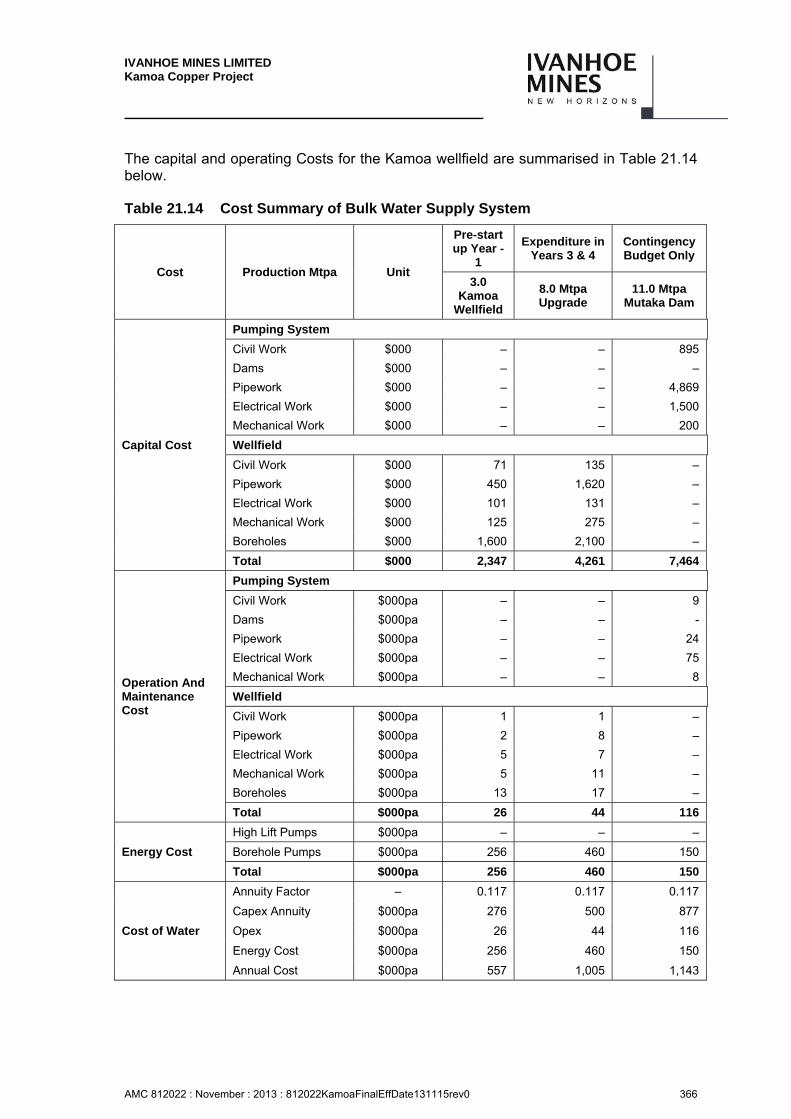
IVANHOE MINES LIMITED Kamoa Copper Project
AMC 812022 : November : 2013 : 812022KamoaFinalEffDate131115rev0 366
The capital and operating Costs for the Kamoa wellfield are summarised in Table 21.14 below.
Table 21.14 Cost Summary of Bulk Water Supply System
Cost Production Mtpa Unit
Pre-start up Year -
1
Expenditure in Years 3 & 4
Contingency Budget Only
3.0 Kamoa
Wellfield
8.0 Mtpa Upgrade
11.0 Mtpa Mutaka Dam
Capital Cost
Pumping System
Civil Work $000 – – 895
Dams $000 – – –
Pipework $000 – – 4,869
Electrical Work $000 – – 1,500
Mechanical Work $000 – – 200
Wellfield
Civil Work $000 71 135 –
Pipework $000 450 1,620 –
Electrical Work $000 101 131 –
Mechanical Work $000 125 275 –
Boreholes $000 1,600 2,100 –
Total $000 2,347 4,261 7,464
Operation And Maintenance Cost
Pumping System
Civil Work $000pa – – 9
Dams $000pa – – -
Pipework $000pa – – 24
Electrical Work $000pa – – 75
Mechanical Work $000pa – – 8
Wellfield
Civil Work $000pa 1 1 –
Pipework $000pa 2 8 –
Electrical Work $000pa 5 7 –
Mechanical Work $000pa 5 11 –
Boreholes $000pa 13 17 –
Total $000pa 26 44 116
Energy Cost
High Lift Pumps $000pa – – –
Borehole Pumps $000pa 256 460 150
Total $000pa 256 460 150
Cost of Water
Annuity Factor – 0.117 0.117 0.117
Capex Annuity $000pa 276 500 877
Opex $000pa 26 44 116
Energy Cost $000pa 256 460 150
Annual Cost $000pa 557 1,005 1,143
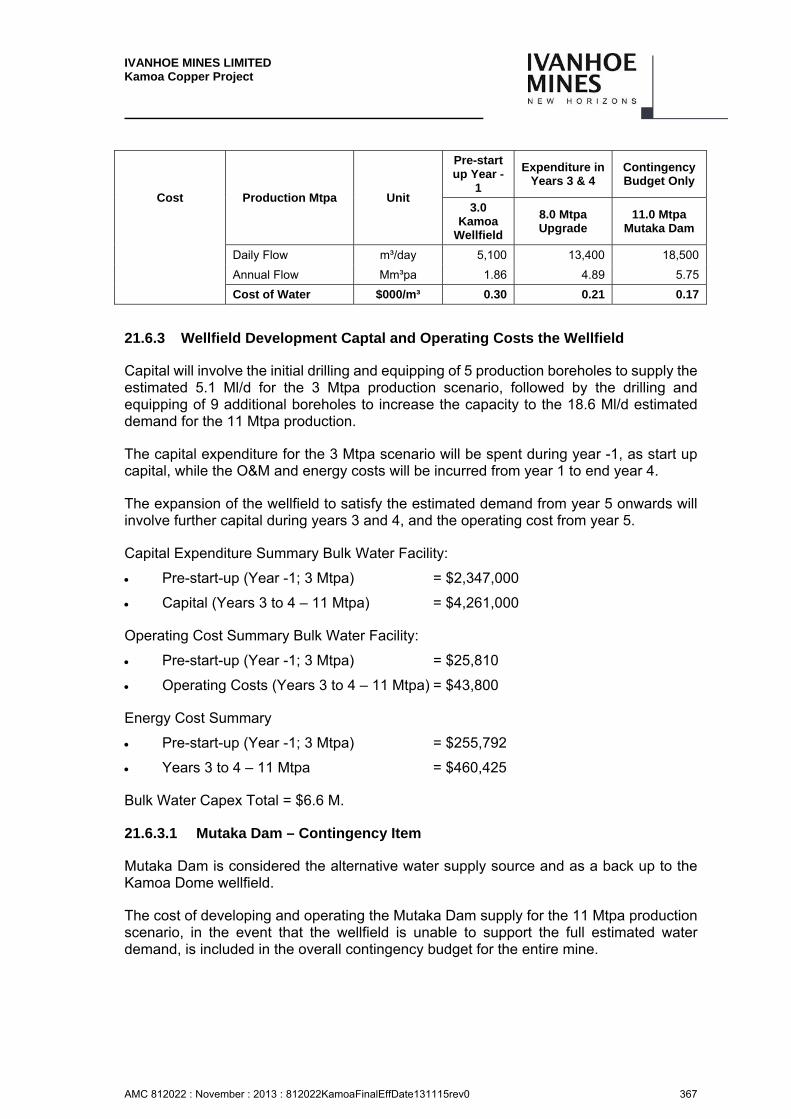
IVANHOE MINES LIMITED Kamoa Copper Project
AMC 812022 : November : 2013 : 812022KamoaFinalEffDate131115rev0 367
Cost Production Mtpa Unit
Pre-start up Year -
1
Expenditure in Years 3 & 4
Contingency Budget Only
3.0 Kamoa
Wellfield
8.0 Mtpa Upgrade
11.0 Mtpa Mutaka Dam
Daily Flow m³/day 5,100 13,400 18,500
Annual Flow Mm³pa 1.86 4.89 5.75
Cost of Water $000/m³ 0.30 0.21 0.17
21.6.3 Wellfield Development Captal and Operating Costs the Wellfield
Capital will involve the initial drilling and equipping of 5 production boreholes to supply the estimated 5.1 Ml/d for the 3 Mtpa production scenario, followed by the drilling and equipping of 9 additional boreholes to increase the capacity to the 18.6 Ml/d estimated demand for the 11 Mtpa production.
The capital expenditure for the 3 Mtpa scenario will be spent during year -1, as start up capital, while the O&M and energy costs will be incurred from year 1 to end year 4.
The expansion of the wellfield to satisfy the estimated demand from year 5 onwards will involve further capital during years 3 and 4, and the operating cost from year 5.
Capital Expenditure Summary Bulk Water Facility:
Pre-start-up (Year -1; 3 Mtpa) = $2,347,000
Capital (Years 3 to 4 – 11 Mtpa) = $4,261,000
Operating Cost Summary Bulk Water Facility:
Pre-start-up (Year -1; 3 Mtpa) = $25,810
Operating Costs (Years 3 to 4 – 11 Mtpa) = $43,800
Energy Cost Summary
Pre-start-up (Year -1; 3 Mtpa) = $255,792
Years 3 to 4 – 11 Mtpa = $460,425
Bulk Water Capex Total = $6.6 M.
21.6.3.1 Mutaka Dam – Contingency Item
Mutaka Dam is considered the alternative water supply source and as a back up to the Kamoa Dome wellfield.
The cost of developing and operating the Mutaka Dam supply for the 11 Mtpa production scenario, in the event that the wellfield is unable to support the full estimated water demand, is included in the overall contingency budget for the entire mine.
IVANHOE MINES LIMITED Kamoa Copper Project
AMC 812022 : November : 2013 : 812022KamoaFinalEffDate131115rev0 368
The capital costs would be incurred during years 3 and 4, and the operating costs from year 5.
Storm Water Management Infrastructure Costs
The capital expenditure for surface water management is based on the conceptual storm water management layout reflected in Figure 18.18 (Kamoa 2013 PEA report).
21.7.1 Construction Cost Estimate for Storm Water Management
The capital expenditure of the Storm Water Management for the Kamoa copper project is based on the conceptual storm water management plans indicated in Figure 18.18 in Section 18 of the Kamoa 2013 PEA.
The project aspects include the Plant, HV Yard, Rail Yard, Slag Dump, Blending Stockpile, Decline 1, Decline 2 and Decline 3.
Provision was made in each case for Channels, Pollution Control Dam, Pipes and Pumps, P&G.
The storm water management plan was sub-divided into the following sections for pricing purposes: pollution control dams and associated and diversion channels, earth berms and associated works (earthworks and civil works).
The cost estimate presented herewith is high level and intended for budget purposes only.
Assumptions for Storm Water Management Costs
The following assumptions were made when developing the cost estimates for the storm water management plan:
The estimate is based on July 2013 DRC construction rates;
The estimate is priced in US dollars;
Prices taken from South African construction rates were increased by 20% and converted to US dollars using an exchange rate of R10 to $1;
Petrol and labour are included in the rates;
No allowances were made for escalations;
P&G allowance of 15% was allowed for;
Engineering rates were assumed to be 12.5% of the total capital costs;
The haulage distance for the waste rock was calculated based on an assumption that the waste rock would be taken from the potential open pit areas positioned around the Kamoa site. Haulage distance was measured as the average distance from the furthest potential open cast pit to each of the facilities under consideration.
The soil characteristics are assumed to be suitable for construction of the PCD walls and the berms alongside each channel.
IVANHOE MINES LIMITED Kamoa Copper Project
AMC 812022 : November : 2013 : 812022KamoaFinalEffDate131115rev0 369
The work not allowed for in the schedule of quantities and rates include:
Box and key cut quantities and costs. The depths and configuration can only be finalised during the detailed and construction phases of the project;
Hard excavation and blasting;
All electrical, instrumentation an power supply items;
All taxes (in country taxes, etc.);
Costs for detailed design, tender documentation, code of practice, operation manual, quality assurance;
Costs for any studies and/or investigation required for the production of detailed designs of the infrastructure proposed herewith (e.g. water quality investigations, geotechnical investigation, topographic surveys etc.).
The cost summary for the Storm Water Management Infrastructure is reflected in Table 21.15 below.
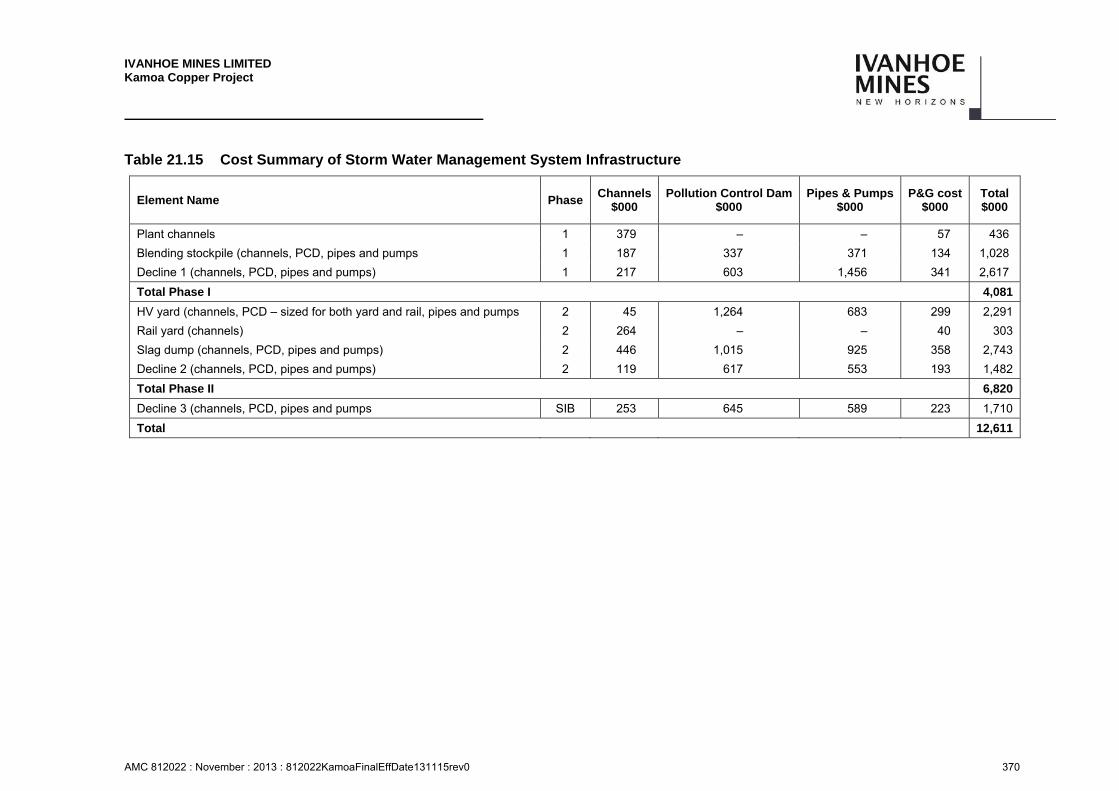
IVANHOE MINES LIMITED Kamoa Copper Project
AMC 812022 : November : 2013 : 812022KamoaFinalEffDate131115rev0 370
Table 21.15 Cost Summary of Storm Water Management System Infrastructure
Element Name Phase Channels
$000 Pollution Control Dam
$000 Pipes & Pumps
$000 P&G cost
$000 Total $000
Plant channels 1 379 – – 57 436
Blending stockpile (channels, PCD, pipes and pumps 1 187 337 371 134 1,028
Decline 1 (channels, PCD, pipes and pumps) 1 217 603 1,456 341 2,617
Total Phase I 4,081
HV yard (channels, PCD – sized for both yard and rail, pipes and pumps 2 45 1,264 683 299 2,291
Rail yard (channels) 2 264 – – 40 303
Slag dump (channels, PCD, pipes and pumps) 2 446 1,015 925 358 2,743
Decline 2 (channels, PCD, pipes and pumps) 2 119 617 553 193 1,482
Total Phase II 6,820
Decline 3 (channels, PCD, pipes and pumps SIB 253 645 589 223 1,710
Total 12,611
IVANHOE MINES LIMITED Kamoa Copper Project
AMC 812022 : November : 2013 : 812022KamoaFinalEffDate131115rev0 371
21.7.1.1 Storm Water Management Infrastructure Capital Summary
Phase 1 capital (year -2 to year 3) = 4,080,748 USD.
Phase 2 capital (year 4 to year 15) = 6,819,673 USD.
SIB (year 16 onwards) = 1,710,148 USD.
Total capital – Storm Water Management Infrastructure = 12,610,569 Mill USD.
21.7.2 Relocation Action Plan Cost Estimate
The budget assumption for resettlement and associated costs, such as restring public assets is included in the project capital cost.
21.7.3 Housing Village
The concept design of the village was done by GAPP Architects, with associated engineering design done by Hatch. PCC Quantity Surveyors utilised the drawings, specifications and finishing schedules to compile a detailed bill of quantities.
Pricing for the housing units were obtained from projects with which PCC have been involved with in the area. Installation and transport was factored. Adjustments were made for material that could be sourced locally in the DRC, as well as for bricks (to be manufactured on site).
Other buildings (in the town centre, gate house etc.) was priced per square meter. Furniture and fittings were allowed for as a percentage of the building cost.
Rates for terracing, roads, walkways, fencing, electrical reticulation, sewage and stormwater reticulation were obtained from similar projects in the DRC.
Village Maintenance Cost
2% of capital cost of the housing village was allowed for yearly maintenance as well as power and water consumption (included in G&A costs).
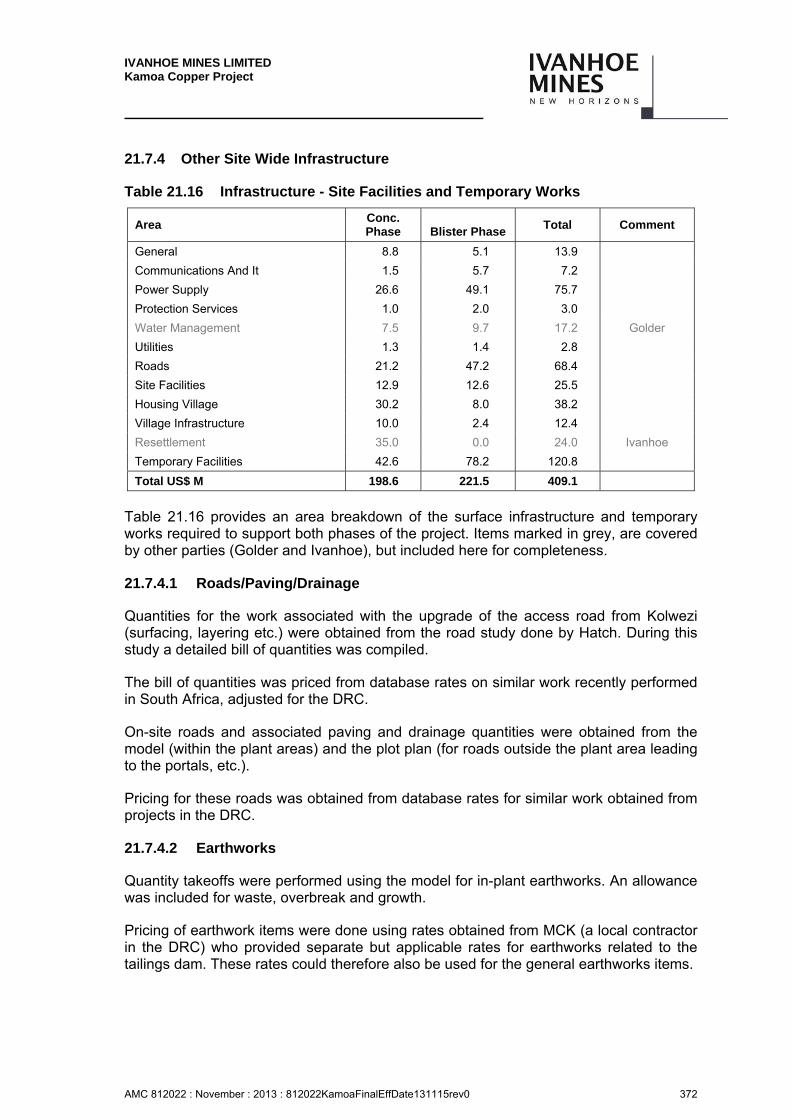
IVANHOE MINES LIMITED Kamoa Copper Project
AMC 812022 : November : 2013 : 812022KamoaFinalEffDate131115rev0 372
21.7.4 Other Site Wide Infrastructure
Table 21.16 Infrastructure - Site Facilities and Temporary Works
Area Conc. Phase Blister Phase
Total Comment
General 8.8 5.1 13.9
Communications And It 1.5 5.7 7.2
Power Supply 26.6 49.1 75.7
Protection Services 1.0 2.0 3.0
Water Management 7.5 9.7 17.2 Golder
Utilities 1.3 1.4 2.8
Roads 21.2 47.2 68.4
Site Facilities 12.9 12.6 25.5
Housing Village 30.2 8.0 38.2
Village Infrastructure 10.0 2.4 12.4
Resettlement 35.0 0.0 24.0 Ivanhoe
Temporary Facilities 42.6 78.2 120.8
Total US$ M 198.6 221.5 409.1
Table 21.16 provides an area breakdown of the surface infrastructure and temporary works required to support both phases of the project. Items marked in grey, are covered by other parties (Golder and Ivanhoe), but included here for completeness.
21.7.4.1 Roads/Paving/Drainage
Quantities for the work associated with the upgrade of the access road from Kolwezi (surfacing, layering etc.) were obtained from the road study done by Hatch. During this study a detailed bill of quantities was compiled.
The bill of quantities was priced from database rates on similar work recently performed in South Africa, adjusted for the DRC.
On-site roads and associated paving and drainage quantities were obtained from the model (within the plant areas) and the plot plan (for roads outside the plant area leading to the portals, etc.).
Pricing for these roads was obtained from database rates for similar work obtained from projects in the DRC.
21.7.4.2 Earthworks
Quantity takeoffs were performed using the model for in-plant earthworks. An allowance was included for waste, overbreak and growth.
Pricing of earthwork items were done using rates obtained from MCK (a local contractor in the DRC) who provided separate but applicable rates for earthworks related to the tailings dam. These rates could therefore also be used for the general earthworks items.
IVANHOE MINES LIMITED Kamoa Copper Project
AMC 812022 : November : 2013 : 812022KamoaFinalEffDate131115rev0 373
21.7.4.3 Architectural
Quantities for buildings, including control rooms, electrical substations, workshops, stores and offices have been measured in square meters (floor area) from the plot plan.
A rate per square meter has been used for the pricing of each building type. Current database prices from similar projects were used to price these items. The pricing included provision for structural elements, furnishing, finishes, plumbing and electrical work.
21.7.4.4 MV Electrification
For the medium voltage (MV) electrical items the electrical engineer compiled a single line diagram (SLD) as well as a detailed bill of quantities. The bill of quantities was priced from database prices available from recent studies and projects.
21.7.4.5 Fencing
Fencing quantities were obtained from the plotplan.
Pricing for these fences was obtained from database rates for similar work obtained from projects in the DRC.
21.7.4.6 Rail
An allowance was included in the capital estimate for the section of railway line from Kamoa site to where it joins the main line from Kolwezi to Lobito in Angola, as this will have to be constructed specifically for the Kamoa project. This allowance was based on database rates for similar sections of railway lines completed.
Capital required for any additional upgrade to any railway line has been included in the tariffs used for rail transport in the financial model and is not specifically included in the capital estimate.
21.7.4.7 Temporary Facilities – Construction camp
A vendor was approached to provide a budget price for a typical construction camp constructed in phases (phase 1A = 200 beds, phase 1B = 400 beds and phase 1C = 2400 beds) as envisage the case will be for the Kamoa project. This budget price covered manufacturing, supply and erection of the camp as well as maintenance and operations, including feeding of the camp. These prices were further used to estimate the 4000 bed phase 2 construction camp.
Rates for terracing, roads, walkways, fencing, electrical reticulation, sewage and stormwater reticulation were obtained from similar projects in the DRC.
21.7.4.8 Temporary Facilities – Site Offices
Square meter rates calculated from the vendor budget price for the construction camp was used for the site office estimate.
IVANHOE MINES LIMITED Kamoa Copper Project
AMC 812022 : November : 2013 : 812022KamoaFinalEffDate131115rev0 374
Rates for terracing, roads, walkways, fencing, electrical reticulation, sewage and stormwater reticulation were obtained from similar projects in the DRC.
Erection of communication systems and monthly costs thereof were obtained from similar project in the DRC.
21.7.4.9 Temporary Facilities – Bonded Warehouse
A rate per square meter was used for the pricing of the bonded warehouse, obtained from current database prices for similar buildings. The rate included provision for structural elements, furnishing, finishes, plumbing and electrical work.
21.7.4.10 Temporary Facilities – Laydown Area
Rates for terracing, roads, walkways, fencing, electrical reticulation, sewage and stormwater reticulation were obtained from similar projects in the DRC.
21.7.4.11 Infrastructure Maintenance Costs
Infrastructure maintenance costs were calculated as 2% of the total infrastructure capital (covered under G&A costs).
Roads were the only exception, with 5% allowed for maintenance in phase 1, and 2% from Phase 2. Tarring of roads constructed in Phase 1 will only take place during Phase 2, therefore a higher maintenance allowance has been included for Phase 1 roads.
Indirect Capital Costs
21.8.1 EPCM
These costs cover the project management, engineering (design), procurement, construction management, and commissioning management costs directly associated with the implementation of the project. This was determined by applying specific percentages to various parts of the work, based on the input that will be required from the EPCM Contractor.
21.8.2 Owner’s Cost
Ivanhoe have prepared a budget for Owners costs. The costs include drilling, sampling and assays, further studies for project development, environmental and community, administration. Owner’s costs have been calculated as a percentage of total capital cost based on analysis of a number of other projects. The Owners Costs for Phase 1 are 6.8% of the capital costs based on analysis of other greenfields projects. Phase 2 will be a brownfields expansion and an Owners Cost factor of 3.8% has been applied. These costs have been included in the capital estimate.
The state-owned local insurer Societe Nationale d'Assurances (SONAS) has a monopoly of most non-life classes of insurance in the DRC and applies a levy on insurances from outside the DRC.
IVANHOE MINES LIMITED Kamoa Copper Project
AMC 812022 : November : 2013 : 812022KamoaFinalEffDate131115rev0 375
Project insurances for the preproduction works and the construction were calculated using assumptions for the insurable portions of the capital costs, levies that may be paid to SONAS and factors based on other projects. These insurances during the construction of Phases 1 and 2 are: Construction All Risks (Property); Wrap-Up and Delay in Start-Up insurances. Separate operational insurance cover was estimated and included in the G&A costs.
21.8.3 Contingency
Contingency was applied by each consultant to the different areas using percentages in line with confidence in this level of estimate. This equated to an overall contingency allowance of 25% on all capital except Underground Mining, for which a specific contingency allowance was used as supplied by Stantec. Underground mining capital contingency is described in Section 21.2.1. A capital contingency of 10% is assessed against mobile equipment and mobile equipment replacements, while a capital contingency of 30% is assessed against all other capital. The contingency provides additional project capital for expenditures that may or may not be required, due to the level of engineering detail in the study. The contingency applied to the power plant rehabilitation was 30%.
General and Administration Costs
General and administration (G&A) costs were estimated based on labour numbers and other costs requirements for the administration, information technology, transportation, finance, insurance, commercial, procurement, warehousing, legal, environmental, community and government relations, human resources, safety, training, security, accommodation and messing, and further studies.
The messing and accommodation costs include the costs of all project personnel in the mining, processing, and general and administration departments.
G&A costs also include non processs related infrastructure maintenance costs.
The state-owned local insurer Societe Nationale d'Assurances (SONAS) has a monopoly of most non-life classes of insurance in the DRC and applies a levy on insurances from outside the DRC. Operational insurance cover were calculated using assumptions for the insurable portions of the property, levies that may be paid to SONAS and factors based on other projects. These insurances were applied after the construction periods of Phases 1 and 2. The coverage is for: Property; Business Interuption and Operational Commercial Liability insurances. Separate operational insurance cover was estimated and included in the G&A costs.
Long term average G&A costs based on estimated costs for the items discussed above are US$3.74/t plant feed.
IVANHOE MINES LIMITED Kamoa Copper Project
AMC 812022 : November : 2013 : 812022KamoaFinalEffDate131115rev0 376
Power Infrastructure Rehabilitation and Upgrade
The costs of the power plants rehabilitation have been estimated by Stucky LTD (Stucky) in 2013. Table 21.17 shows a summary of cost estimates for the power generation and transmission to site.
These estimated costs are based on equipment suited to the region in order to ensure long-term operations and provisioning from international equipment manufacturers.
Costs are stated in thousands of US dollars for equipment delivered on site, installed and commissioned, excluding national taxes and income tax.
The Stucky study was completed prior to the mining and processing work and a contingency of 30% was applied to allow for further analysis to integrate the power assumptions to be completed after the Kamoa 2013 PEA.
Costs for individual items were estimated without accounting for contingency and other costs. Contingency and other costs are evaluated on global cost estimates. Contingency and other costs were added to the global estimate for a given work component.
Based on the June 2011 Memorandum of Understanding (MOU) with SNEL, the capital cost of the rehabilitation will be financed by Ivanhoe through a loan to SNEL. The loan including interest will be repaid by SNEL through a deduction from the Company’s monthly power bills incurred over the life of the mine. For the financial analysis this has been assumed to be a 40% discount to the power charges and results in the discount being applied for 14 years from commencement of production.
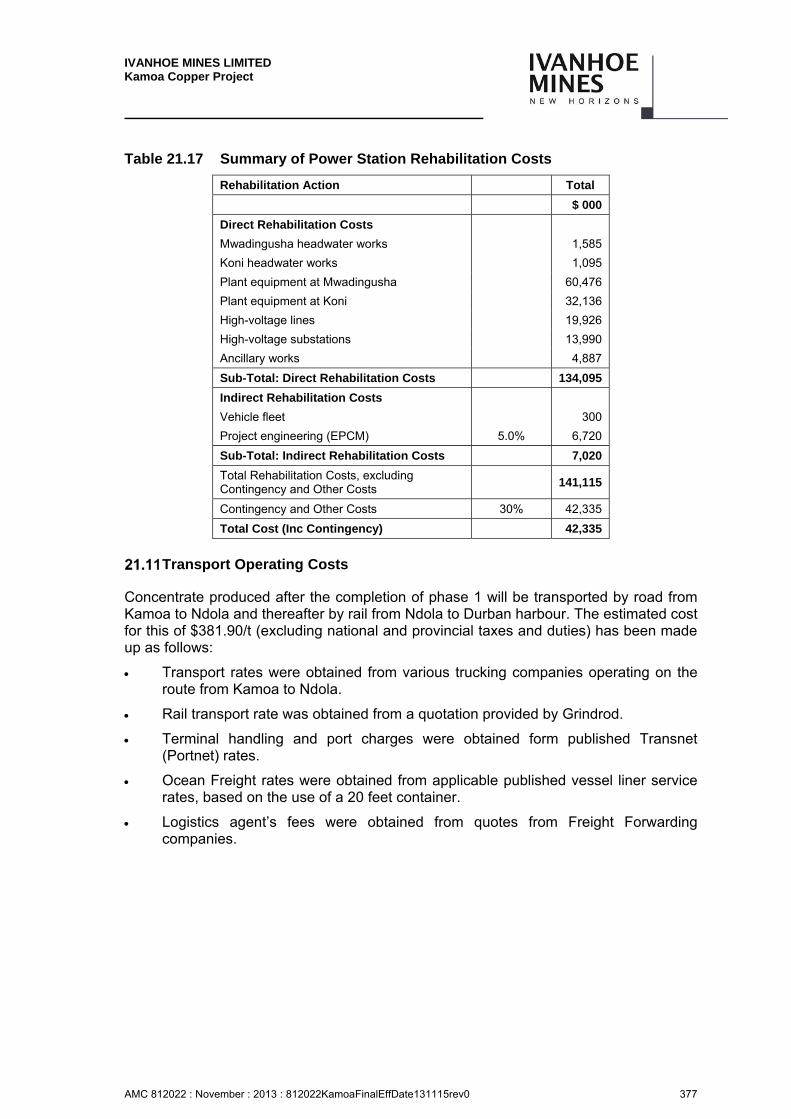
IVANHOE MINES LIMITED Kamoa Copper Project
AMC 812022 : November : 2013 : 812022KamoaFinalEffDate131115rev0 377
Table 21.17 Summary of Power Station Rehabilitation Costs
Rehabilitation Action Total
$ 000
Direct Rehabilitation Costs
Mwadingusha headwater works 1,585
Koni headwater works 1,095
Plant equipment at Mwadingusha 60,476
Plant equipment at Koni 32,136
High-voltage lines 19,926
High-voltage substations 13,990
Ancillary works 4,887
Sub-Total: Direct Rehabilitation Costs 134,095
Indirect Rehabilitation Costs
Vehicle fleet 300
Project engineering (EPCM) 5.0% 6,720
Sub-Total: Indirect Rehabilitation Costs 7,020
Total Rehabilitation Costs, excluding Contingency and Other Costs
141,115
Contingency and Other Costs 30% 42,335
Total Cost (Inc Contingency) 42,335
Transport Operating Costs
Concentrate produced after the completion of phase 1 will be transported by road from Kamoa to Ndola and thereafter by rail from Ndola to Durban harbour. The estimated cost for this of $381.90/t (excluding national and provincial taxes and duties) has been made up as follows:
Transport rates were obtained from various trucking companies operating on the route from Kamoa to Ndola.
Rail transport rate was obtained from a quotation provided by Grindrod.
Terminal handling and port charges were obtained form published Transnet (Portnet) rates.
Ocean Freight rates were obtained from applicable published vessel liner service rates, based on the use of a 20 feet container.
Logistics agent’s fees were obtained from quotes from Freight Forwarding companies.
IVANHOE MINES LIMITED Kamoa Copper Project
AMC 812022 : November : 2013 : 812022KamoaFinalEffDate131115rev0 378
Blister copper produced after the completion of phase 2 will be transported by rail from Kamoa to Lobito port in Angola. The estimated cost for this of $324.53/t (excluding national and provincial taxes and duties) has been made up as follows:
Rail transport rates were estimated based on prevailing rates currently being paid in sub-Saharan Africa.
Port charges for Lobito harbour were estimated based on published Angola Portnet official rates, as well as rates obtained from freight Forwarding companies for warehousing.
Ocean Freight rates were obtained from applicable published vessel liner service rates, based on the use of a 20 feet container.
Logistics agent’s fees were obtained from quotes from Freight Forwarding companies.
Closure Costs
An allowance has been made for Closure costs in the financial model. This equates to 10% of all capital expenditure (Phases 1 and 2, as well as Stay-in-business capital) excluding Mining, Power and Indirect costs.
Comments on Section 21
For Underground Mining costs were estimated at a conceptual study level of accuracy, with unit costs based on the most recent cost information from similar projects and adjusted where required to fit the mine plan.
Construction costs for the process plant have been developed based on using Chinese Contractor for a significant portion of the overall construction. The viability of utilising Chinese labour will be investigated during the next phase of this project.
On the Infrastructure and Plant estimate quantities were obtained from models and Bills of Quantities in 76% of the cases. Rates were obtained via budget quotes from vendors in 52% of the cases.
In the QP’s opinion the work completed adequately supports this level of study estimate.
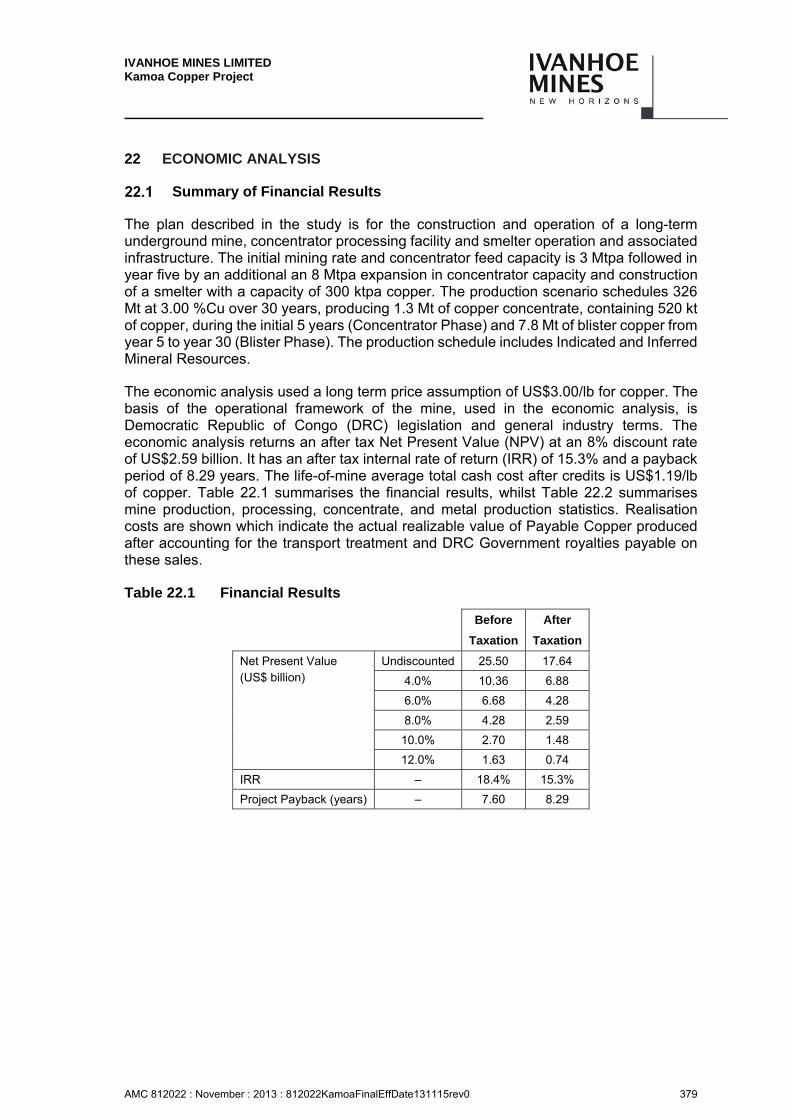
IVANHOE MINES LIMITED Kamoa Copper Project
AMC 812022 : November : 2013 : 812022KamoaFinalEffDate131115rev0 379
22 ECONOMIC ANALYSIS
Summary of Financial Results
The plan described in the study is for the construction and operation of a long-term underground mine, concentrator processing facility and smelter operation and associated infrastructure. The initial mining rate and concentrator feed capacity is 3 Mtpa followed in year five by an additional an 8 Mtpa expansion in concentrator capacity and construction of a smelter with a capacity of 300 ktpa copper. The production scenario schedules 326 Mt at 3.00 %Cu over 30 years, producing 1.3 Mt of copper concentrate, containing 520 kt of copper, during the initial 5 years (Concentrator Phase) and 7.8 Mt of blister copper from year 5 to year 30 (Blister Phase). The production schedule includes Indicated and Inferred Mineral Resources.
The economic analysis used a long term price assumption of US$3.00/lb for copper. The basis of the operational framework of the mine, used in the economic analysis, is Democratic Republic of Congo (DRC) legislation and general industry terms. The economic analysis returns an after tax Net Present Value (NPV) at an 8% discount rate of US$2.59 billion. It has an after tax internal rate of return (IRR) of 15.3% and a payback period of 8.29 years. The life-of-mine average total cash cost after credits is US$1.19/lb of copper. Table 22.1 summarises the financial results, whilst Table 22.2 summarises mine production, processing, concentrate, and metal production statistics. Realisation costs are shown which indicate the actual realizable value of Payable Copper produced after accounting for the transport treatment and DRC Government royalties payable on these sales.
Table 22.1 Financial Results
Before After
Taxation Taxation
Net Present Value (US$ billion)
Undiscounted 25.50 17.64
4.0% 10.36 6.88
6.0% 6.68 4.28
8.0% 4.28 2.59
10.0% 2.70 1.48
12.0% 1.63 0.74
IRR – 18.4% 15.3%
Project Payback (years) – 7.60 8.29

IVANHOE MINES LIMITED Kamoa Copper Project
AMC 812022 : November : 2013 : 812022KamoaFinalEffDate131115rev0 380
The Kamoa 2013 PEA is a Preliminary Economic Assessment (PEA) and includes an economic analysis that is based, in part, on Inferred Mineral Resources. Inferred Mineral Resources are considered too speculative geologically to have the economic considerations applied to them that would allow them to be categorized as Mineral Reserves, and there is no certainty that the results will be realized. Mineral Resources are not Mineral Reserves as they do not have demonstrated economic viability.
Table 22.2 Mining and Processing Production Statistics
Total LOM
Conc.PhaseAverage*
Blister Phase Average *
LOM Average
Total Plant Feed Mined ('000 t) 326,064 2,417 12,183 10,869
Quantity Plant Feed Treated ('000 t) 326,064 3,000 12,243 10,869
Copper Feed Grade (%) 3.00 4.00 2.94 –
Copper Recovery (%) 85.91 85.87 85.91 –
Concentrate Produced ('000 t) 21,802 258 805 727
Copper Concentrate Grade (%) 39.02 40.46 38.91 –
Contained Metal in Concentrate
Copper ('000t) 8,508 104 313 284
Copper (Mlb) 18,757 230 691 625
Payable Metal
Copper ('000t) 8,318 103 306 277
Copper (Mlb) 18,338 227 675 611
Note: * Excludes year 5 (2022) which is a transition year between concentrate & blister production. Mining averages on Conc. Phase includes years -2 and -1.
Democratic Republic of Congo Fiscal Environment
A Mining Code (Law No. 007/2002 of July 11, 2002) (2002 Mining Code) governs prospecting, exploration, exploitation, processing, transportation, and the sales of mineral substances.
Model Assumptions
22.3.1 Pricing and Discount Rate Assumptions
The Project level valuation model begins on 1 January 2014. It is presented in 2013 constant dollars, cash flows are assumed to occur evenly during each year and a mid-year discounting approach is taken.
The copper price used for the evaluation is US$3.00/lb copper. An acid price of US$250/t has also been used in the financial model. These prices were considered to be reasonable based on industry forecasts and prices used in other studies.
The product being sold is copper concentrate and blister copper and payment terms for the copper assume that the payable copper concentrate is 98.7% and blister copper is 99.7% of the copper content.
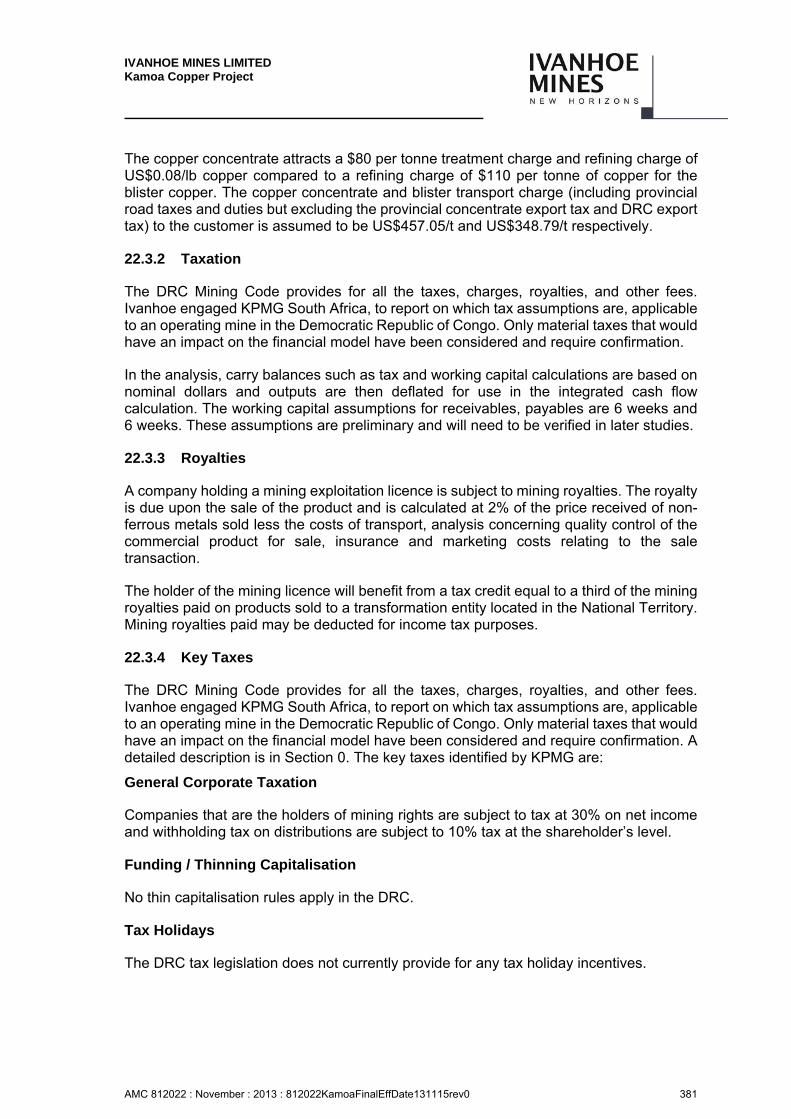
IVANHOE MINES LIMITED Kamoa Copper Project
AMC 812022 : November : 2013 : 812022KamoaFinalEffDate131115rev0 381
The copper concentrate attracts a $80 per tonne treatment charge and refining charge of US$0.08/lb copper compared to a refining charge of $110 per tonne of copper for the blister copper. The copper concentrate and blister transport charge (including provincial road taxes and duties but excluding the provincial concentrate export tax and DRC export tax) to the customer is assumed to be US$457.05/t and US$348.79/t respectively.
22.3.2 Taxation
The DRC Mining Code provides for all the taxes, charges, royalties, and other fees. Ivanhoe engaged KPMG South Africa, to report on which tax assumptions are, applicable to an operating mine in the Democratic Republic of Congo. Only material taxes that would have an impact on the financial model have been considered and require confirmation.
In the analysis, carry balances such as tax and working capital calculations are based on nominal dollars and outputs are then deflated for use in the integrated cash flow calculation. The working capital assumptions for receivables, payables are 6 weeks and 6 weeks. These assumptions are preliminary and will need to be verified in later studies.
22.3.3 Royalties
A company holding a mining exploitation licence is subject to mining royalties. The royalty is due upon the sale of the product and is calculated at 2% of the price received of non-ferrous metals sold less the costs of transport, analysis concerning quality control of the commercial product for sale, insurance and marketing costs relating to the sale transaction.
The holder of the mining licence will benefit from a tax credit equal to a third of the mining royalties paid on products sold to a transformation entity located in the National Territory. Mining royalties paid may be deducted for income tax purposes.
22.3.4 Key Taxes
The DRC Mining Code provides for all the taxes, charges, royalties, and other fees. Ivanhoe engaged KPMG South Africa, to report on which tax assumptions are, applicable to an operating mine in the Democratic Republic of Congo. Only material taxes that would have an impact on the financial model have been considered and require confirmation. A detailed description is in Section 0. The key taxes identified by KPMG are:
General Corporate Taxation
Companies that are the holders of mining rights are subject to tax at 30% on net income and withholding tax on distributions are subject to 10% tax at the shareholder’s level.
Funding / Thinning Capitalisation
No thin capitalisation rules apply in the DRC.
Tax Holidays
The DRC tax legislation does not currently provide for any tax holiday incentives.

IVANHOE MINES LIMITED Kamoa Copper Project
AMC 812022 : November : 2013 : 812022KamoaFinalEffDate131115rev0 382
Tax Losses
The aggregate exploration expenditure may be claimed.
Taxes on Products Sold
The tax rates will not change depending on whether concentrate or refined products are ultimately sold.
Royalties
The royalty is due upon the sale of the product and is calculated at 2% of the received price of non-ferrous metals less the costs of transport, analysis concerning quality control of the commercial product for sale, insurance and marketing costs relating to the sale transaction.
Depreciation
Specific mining assets dedicated to mining operations, with useful lives between 4 and 20 years are depreciated as follows:
First year: 60% depreciated based on the cost of the asset; and
For subsequent years: a declining balance depreciation is applied based on the tax years remaining over the life of the mine.
Non-mining assets are depreciated in accordance with the common law. The common low provides different depreciation rates for various assets, e.g. 10 years for plant and equipment.
VAT
VAT came into effect in the DRC in January 2012. VAT is levied on all supplies of goods and services at a rate of 16% and is not levied on any capital asset movements.
Customs/Import Duties
Customs duty will be applied separately to capital (Pre-Production 2%, Post Production 5%) and operating costs (3%) for direct cost line.
Export Taxes
National Export Tax
The fee is limited to 1% of the value of the export.
Provincial Export Tax On Concentrate
A provincial tax on the export of concentrate is levied on a per tonne basis and equates to US$60/t concentrate exported.

IVANHOE MINES LIMITED Kamoa Copper Project
AMC 812022 : November : 2013 : 812022KamoaFinalEffDate131115rev0 383
Provincial Export Road and Infrastructures Renovation Tax
A provincial export tax levied on any product exported from the Katanga province by road is also levied on a per tonne basis at a rate of US$50/t. During the first phase of the project, copper concentrate will be exported by road from Katanga to neighbouring countries, and will thus be subject to the Road tax.
During the second phase of the project, copper blister will be exported via rail from the Katanga Province; hence neither the concentrate tax nor the road tax should be applicable during the second phase of the project.
Withholding Taxes
A Withholding tax at the rate of 14% on services supplied by foreign companies established offshore to onshore companies applies. Mining companies are liable for movable property withholding tax at a rate of 10% in respect of dividends and other distributions paid. Non-mining companies are subject to withholding tax of 20%.
Dividend Distributions/Interest Repayments
Any dividend distributions made to the company as well as the DRC government will attract a withholding tax of 10%. A withholding tax of 20% applies if the loan is denominated in local DRC currency. If the loan is however denominated in foreign currency no withholding tax is payable. Interest payments to any local intermediate and holding companies attract a withholding tax of 20%.
Exceptional Tax on Expatriates
In the DRC an employer is liable for the exceptional tax on expatriate’s remuneration at a rate of 25%. Mining companies are subject to 10%. It is determined in terms of the salaries generated by the work carried out in the DRC, and is deductible for purposes of calculating the income tax payable.
22.3.5 Case Overview and Results
The plan described in the study is for the construction and operation of a long-term underground mine, concentrator processing facility and smelter operation and associated infrastructure. The initial mining rate and concentrator feed capacity is 3 Mtpa followed in year five by an additional an 8 Mtpa expansion in concentrator capacity and construction of a smelter with a capacity of 300 ktpa copper. The production scenario schedules 326 Mt at 3.00% Cu over 30 years, producing 1.3 Mt of copper concentrate, containing 520 kt of copper, during the initial 5 years (Concentrator Phase) and 7.8 Mt of blister copper from year 5 to year 30 (Blister Phase). The production schedule includes Indicated and Inferred Mineral Resources.
The economic analysis used a long term price assumption of US$3.00/lb for copper. The basis of the operational framework of the mine, used in the economic analysis, is Democratic Republic of Congo (DRC) legislation and general industry terms.
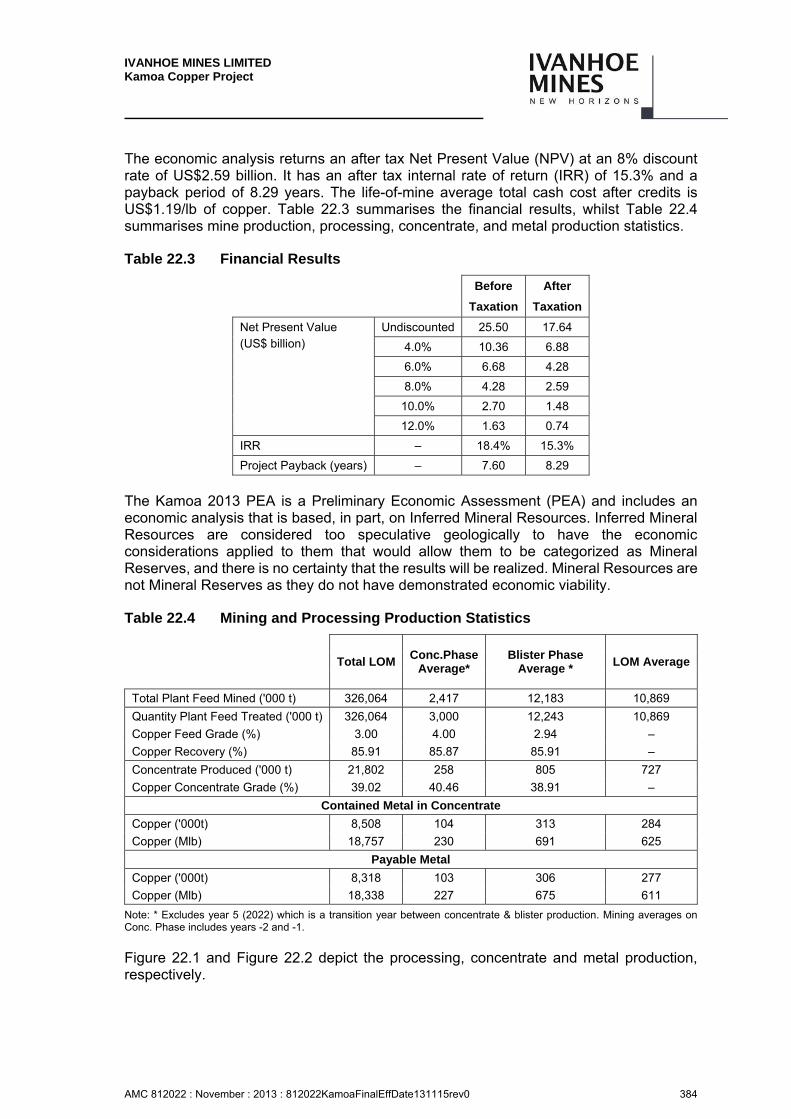
IVANHOE MINES LIMITED Kamoa Copper Project
AMC 812022 : November : 2013 : 812022KamoaFinalEffDate131115rev0 384
The economic analysis returns an after tax Net Present Value (NPV) at an 8% discount rate of US$2.59 billion. It has an after tax internal rate of return (IRR) of 15.3% and a payback period of 8.29 years. The life-of-mine average total cash cost after credits is US$1.19/lb of copper. Table 22.3 summarises the financial results, whilst Table 22.4 summarises mine production, processing, concentrate, and metal production statistics.
Table 22.3 Financial Results
Before After
Taxation Taxation
Net Present Value (US$ billion)
Undiscounted 25.50 17.64
4.0% 10.36 6.88
6.0% 6.68 4.28
8.0% 4.28 2.59
10.0% 2.70 1.48
12.0% 1.63 0.74
IRR – 18.4% 15.3%
Project Payback (years) – 7.60 8.29
The Kamoa 2013 PEA is a Preliminary Economic Assessment (PEA) and includes an economic analysis that is based, in part, on Inferred Mineral Resources. Inferred Mineral Resources are considered too speculative geologically to have the economic considerations applied to them that would allow them to be categorized as Mineral Reserves, and there is no certainty that the results will be realized. Mineral Resources are not Mineral Reserves as they do not have demonstrated economic viability.
Table 22.4 Mining and Processing Production Statistics
Total LOM
Conc.PhaseAverage*
Blister Phase Average *
LOM Average
Total Plant Feed Mined ('000 t) 326,064 2,417 12,183 10,869
Quantity Plant Feed Treated ('000 t) 326,064 3,000 12,243 10,869
Copper Feed Grade (%) 3.00 4.00 2.94 –
Copper Recovery (%) 85.91 85.87 85.91 –
Concentrate Produced ('000 t) 21,802 258 805 727
Copper Concentrate Grade (%) 39.02 40.46 38.91 –
Contained Metal in Concentrate
Copper ('000t) 8,508 104 313 284
Copper (Mlb) 18,757 230 691 625
Payable Metal
Copper ('000t) 8,318 103 306 277
Copper (Mlb) 18,338 227 675 611
Note: * Excludes year 5 (2022) which is a transition year between concentrate & blister production. Mining averages on Conc. Phase includes years -2 and -1.
Figure 22.1 and Figure 22.2 depict the processing, concentrate and metal production, respectively.
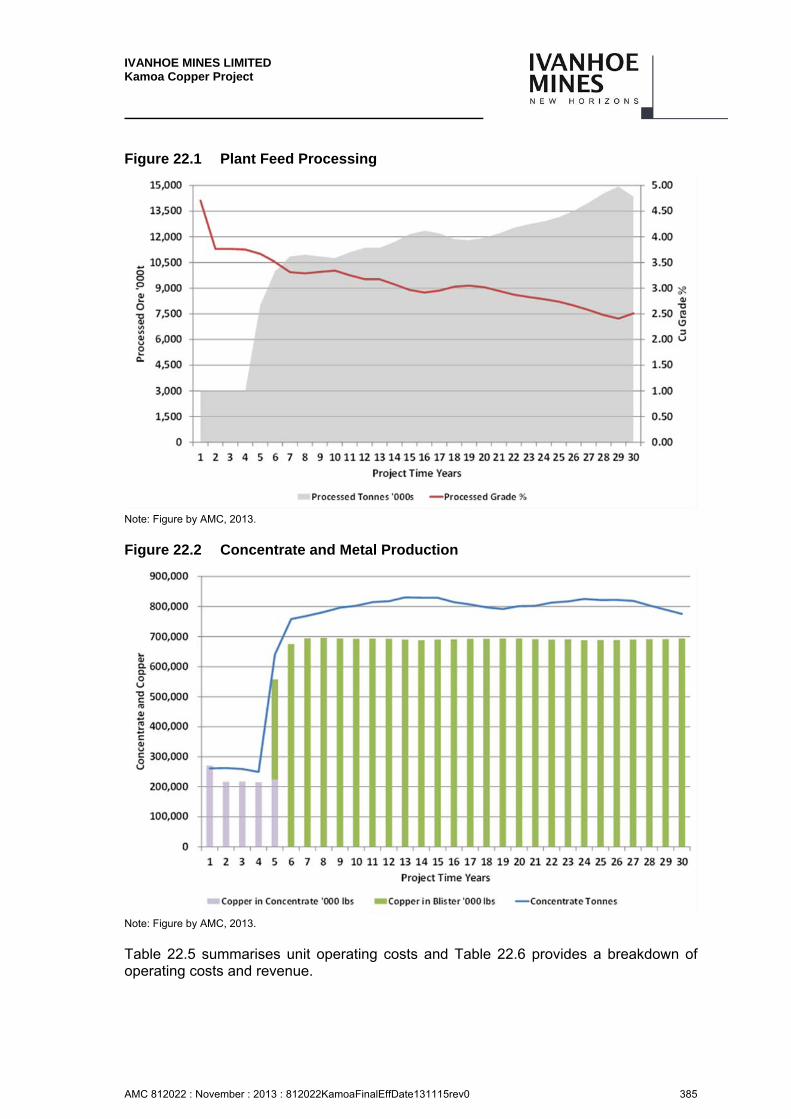
IVANHOE MINES LIMITED Kamoa Copper Project
AMC 812022 : November : 2013 : 812022KamoaFinalEffDate131115rev0 385
Figure 22.1 Plant Feed Processing
Note: Figure by AMC, 2013.
Figure 22.2 Concentrate and Metal Production
Note: Figure by AMC, 2013.
Table 22.5 summarises unit operating costs and Table 22.6 provides a breakdown of operating costs and revenue.
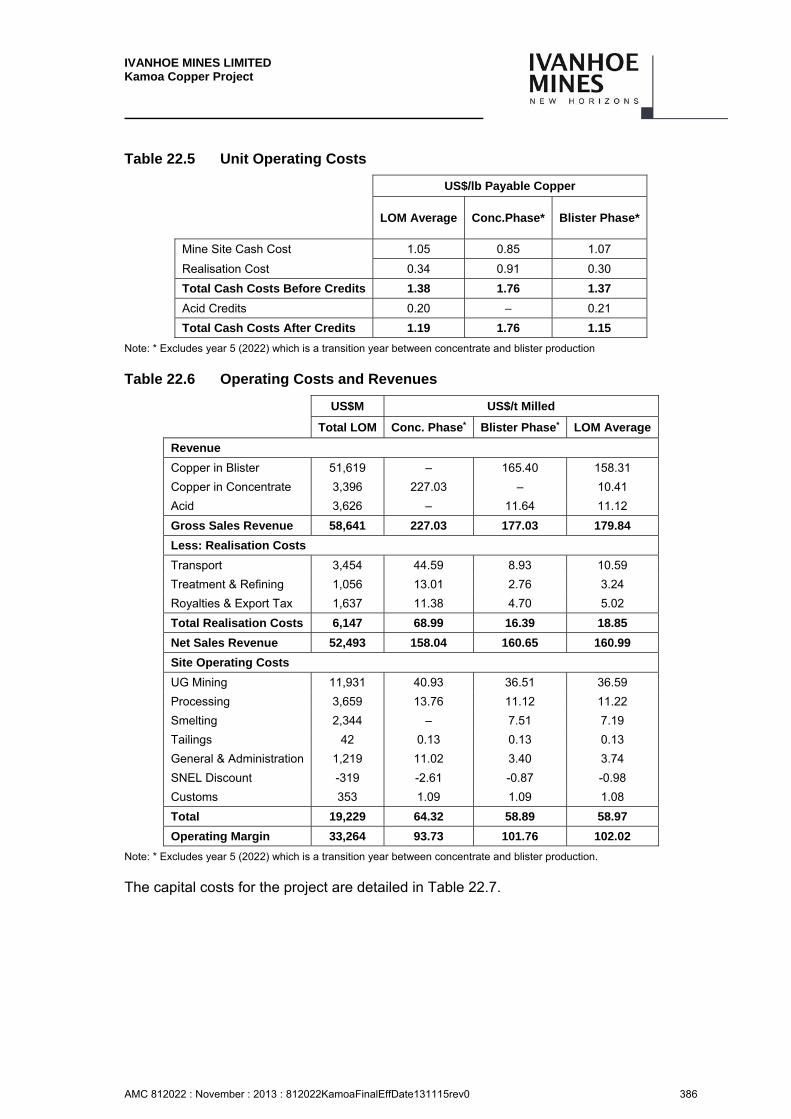
IVANHOE MINES LIMITED Kamoa Copper Project
AMC 812022 : November : 2013 : 812022KamoaFinalEffDate131115rev0 386
Table 22.5 Unit Operating Costs
US$/lb Payable Copper
LOM Average Conc.Phase* Blister Phase*
Mine Site Cash Cost 1.05 0.85 1.07
Realisation Cost 0.34 0.91 0.30
Total Cash Costs Before Credits 1.38 1.76 1.37
Acid Credits 0.20 – 0.21
Total Cash Costs After Credits 1.19 1.76 1.15
Note: * Excludes year 5 (2022) which is a transition year between concentrate and blister production
Table 22.6 Operating Costs and Revenues
US$M US$/t Milled
Total LOM Conc. Phase* Blister Phase* LOM Average
Revenue
Copper in Blister 51,619 – 165.40 158.31
Copper in Concentrate 3,396 227.03 – 10.41
Acid 3,626 – 11.64 11.12
Gross Sales Revenue 58,641 227.03 177.03 179.84
Less: Realisation Costs
Transport 3,454 44.59 8.93 10.59
Treatment & Refining 1,056 13.01 2.76 3.24
Royalties & Export Tax 1,637 11.38 4.70 5.02
Total Realisation Costs 6,147 68.99 16.39 18.85
Net Sales Revenue 52,493 158.04 160.65 160.99
Site Operating Costs
UG Mining 11,931 40.93 36.51 36.59
Processing 3,659 13.76 11.12 11.22
Smelting 2,344 – 7.51 7.19
Tailings 42 0.13 0.13 0.13
General & Administration 1,219 11.02 3.40 3.74
SNEL Discount -319 -2.61 -0.87 -0.98
Customs 353 1.09 1.09 1.08
Total 19,229 64.32 58.89 58.97
Operating Margin 33,264 93.73 101.76 102.02
Note: * Excludes year 5 (2022) which is a transition year between concentrate and blister production.
The capital costs for the project are detailed in Table 22.7.
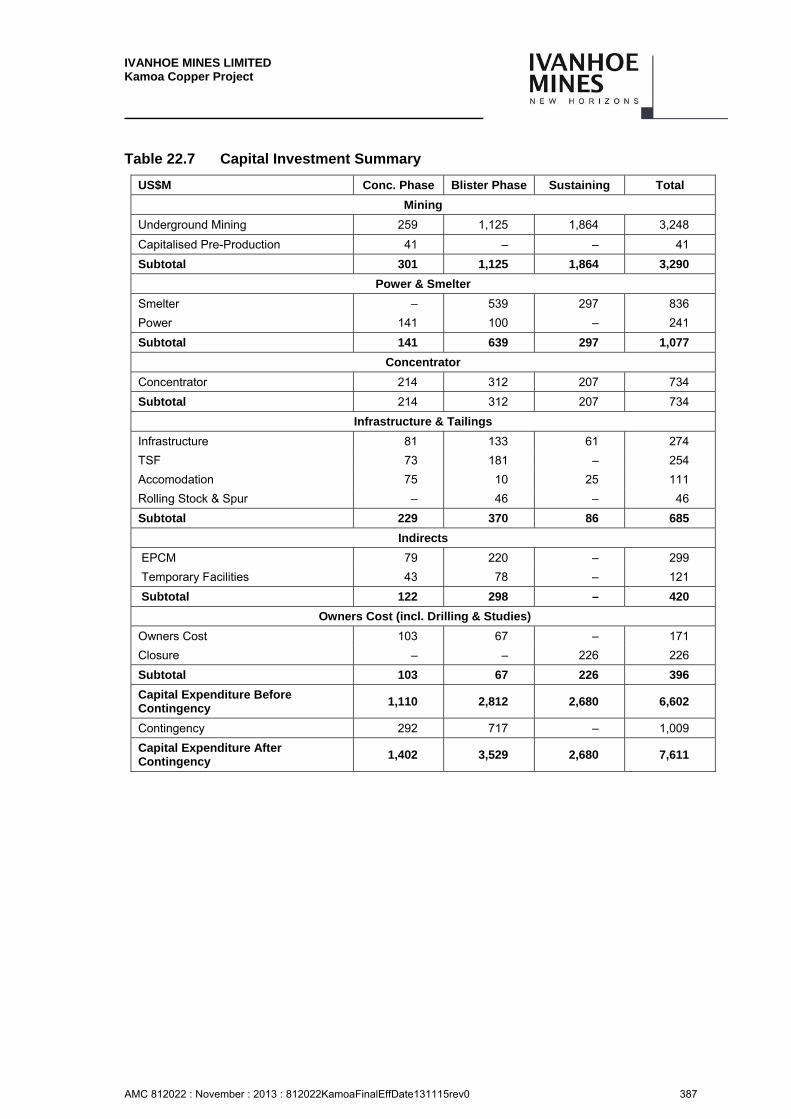
IVANHOE MINES LIMITED Kamoa Copper Project
AMC 812022 : November : 2013 : 812022KamoaFinalEffDate131115rev0 387
Table 22.7 Capital Investment Summary
US$M Conc. Phase Blister Phase Sustaining Total
Mining
Underground Mining 259 1,125 1,864 3,248
Capitalised Pre-Production 41 – – 41
Subtotal 301 1,125 1,864 3,290
Power & Smelter
Smelter – 539 297 836
Power 141 100 – 241
Subtotal 141 639 297 1,077
Concentrator
Concentrator 214 312 207 734
Subtotal 214 312 207 734
Infrastructure & Tailings
Infrastructure 81 133 61 274
TSF 73 181 – 254
Accomodation 75 10 25 111
Rolling Stock & Spur – 46 – 46
Subtotal 229 370 86 685
Indirects
EPCM 79 220 – 299
Temporary Facilities 43 78 – 121
Subtotal 122 298 – 420
Owners Cost (incl. Drilling & Studies)
Owners Cost 103 67 – 171
Closure – – 226 226
Subtotal 103 67 226 396
Capital Expenditure Before Contingency
1,110 2,812 2,680 6,602
Contingency 292 717 – 1,009
Capital Expenditure After Contingency
1,402 3,529 2,680 7,611
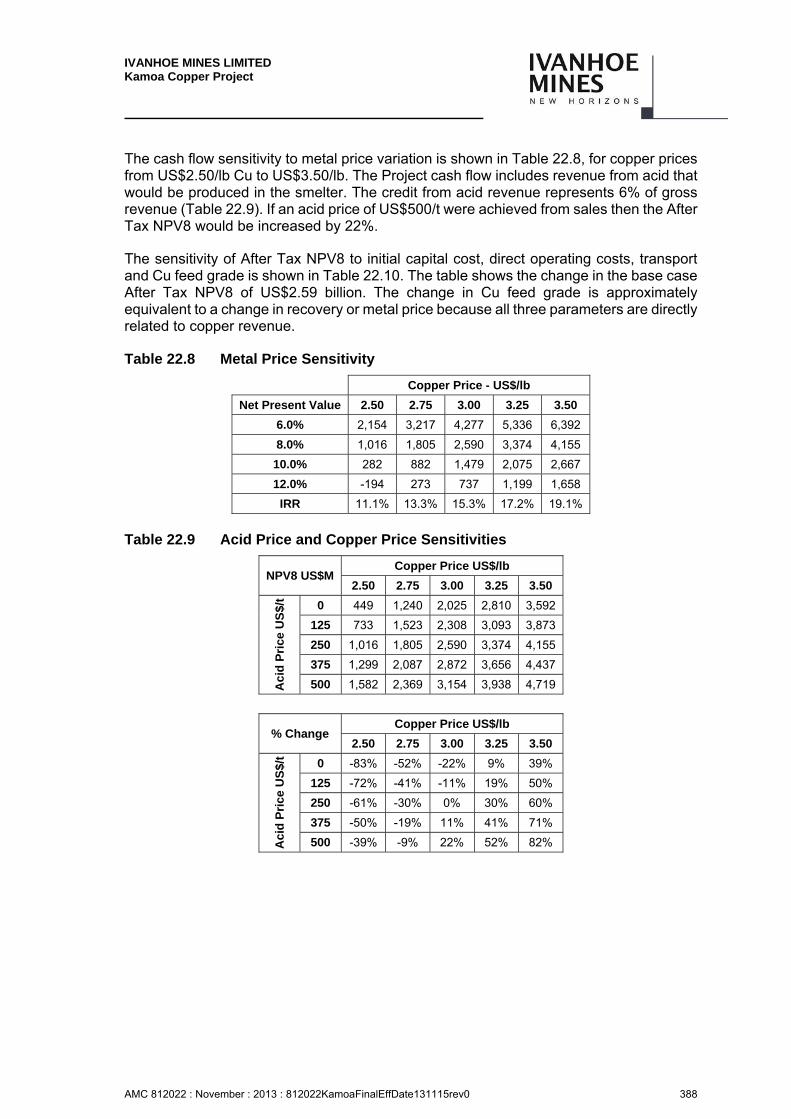
IVANHOE MINES LIMITED Kamoa Copper Project
AMC 812022 : November : 2013 : 812022KamoaFinalEffDate131115rev0 388
The cash flow sensitivity to metal price variation is shown in Table 22.8, for copper prices from US$2.50/lb Cu to US$3.50/lb. The Project cash flow includes revenue from acid that would be produced in the smelter. The credit from acid revenue represents 6% of gross revenue (Table 22.9). If an acid price of US$500/t were achieved from sales then the After Tax NPV8 would be increased by 22%.
The sensitivity of After Tax NPV8 to initial capital cost, direct operating costs, transport and Cu feed grade is shown in Table 22.10. The table shows the change in the base case After Tax NPV8 of US$2.59 billion. The change in Cu feed grade is approximately equivalent to a change in recovery or metal price because all three parameters are directly related to copper revenue.
Table 22.8 Metal Price Sensitivity
Copper Price - US$/lb
Net Present Value 2.50 2.75 3.00 3.25 3.50
6.0% 2,154 3,217 4,277 5,336 6,392
8.0% 1,016 1,805 2,590 3,374 4,155
10.0% 282 882 1,479 2,075 2,667
12.0% -194 273 737 1,199 1,658
IRR 11.1% 13.3% 15.3% 17.2% 19.1%
Table 22.9 Acid Price and Copper Price Sensitivities
NPV8 US$M Copper Price US$/lb
2.50 2.75 3.00 3.25 3.50
Aci
d P
rice
US
$/t
0 449 1,240 2,025 2,810 3,592
125 733 1,523 2,308 3,093 3,873
250 1,016 1,805 2,590 3,374 4,155
375 1,299 2,087 2,872 3,656 4,437
500 1,582 2,369 3,154 3,938 4,719
% Change Copper Price US$/lb
2.50 2.75 3.00 3.25 3.50
Aci
d P
rice
US
$/t
0 -83% -52% -22% 9% 39%
125 -72% -41% -11% 19% 50%
250 -61% -30% 0% 30% 60%
375 -50% -19% 11% 41% 71%
500 -39% -9% 22% 52% 82%
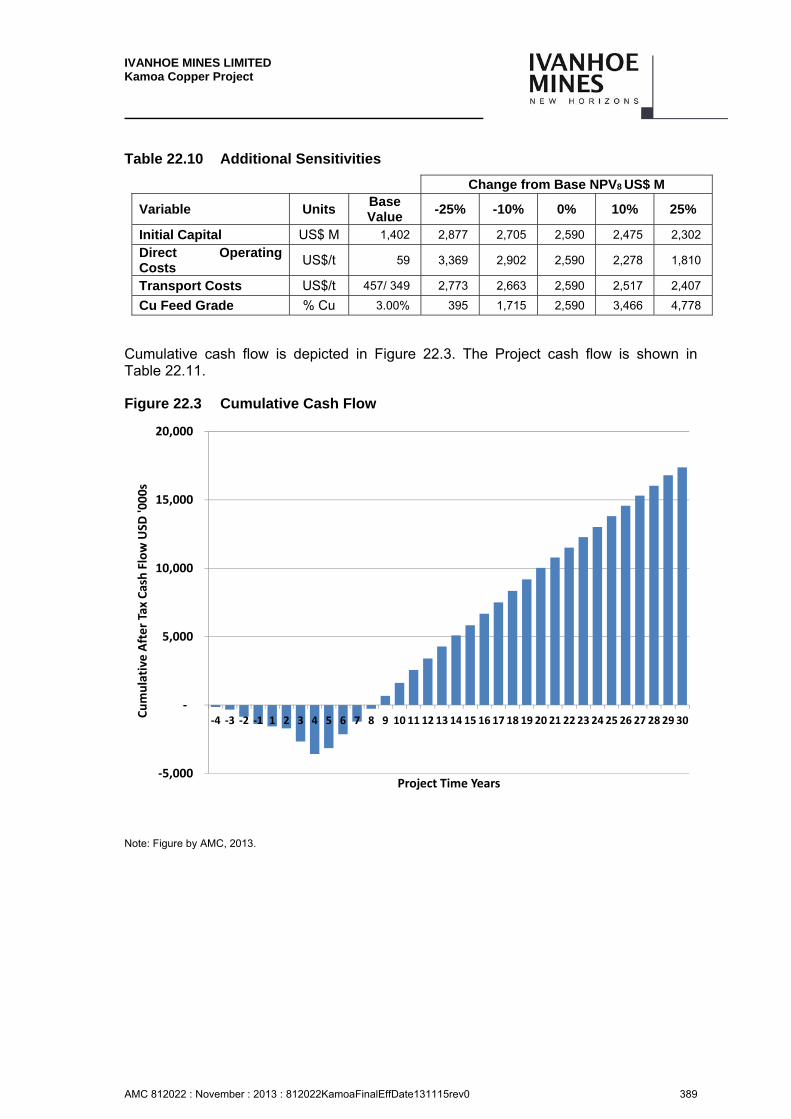
IVANHOE MINES LIMITED Kamoa Copper Project
AMC 812022 : November : 2013 : 812022KamoaFinalEffDate131115rev0 389
Table 22.10 Additional Sensitivities
Change from Base NPV8 US$ M
Variable Units Base Value
-25% -10% 0% 10% 25%
Initial Capital US$ M 1,402 2,877 2,705 2,590 2,475 2,302
Direct Operating Costs
US$/t 59 3,369 2,902 2,590 2,278 1,810
Transport Costs US$/t 457/ 349 2,773 2,663 2,590 2,517 2,407
Cu Feed Grade % Cu 3.00% 395 1,715 2,590 3,466 4,778
Cumulative cash flow is depicted in Figure 22.3. The Project cash flow is shown in Table 22.11.
Figure 22.3 Cumulative Cash Flow
Note: Figure by AMC, 2013.
‐5,000
‐
5,000
10,000
15,000
20,000
‐4 ‐3 ‐2 ‐1 1 2 3 4 5 6 7 8 9 10 11 12 13 14 15 16 17 18 19 20 21 22 23 24 25 26 27 28 29 30
Cumulative After Tax Cash Flow USD
'000s
Project Time Years

IVANHOE MINES LIMITED Kamoa Copper Project
AMC 812022 : November : 2013 : 812022KamoaFinalEffDate131115rev0 390
Table 22.11 Cash Flow
Project Year -5 -4 -3 -2 -1 1 2 3 4 5 6 to 10 11 to 20 20 to LOM SUM
US$M US$M US$M US$M US$M US$M US$M US$M US$M US$M US$M US$M US$M US$M
Gross Revenue – – – – – 800 640 642 643 1,733 10,789 21,723 21,672 58,641
Realization Costs – – – – – 216 207 206 199 304 1,003 2,008 2,004 6,147
Net Sales Revenue – – – – – 584 433 436 444 1,429 9,786 19,715 19,667 52,493
Site Operating Costs
Mining – – – – – 42 117 136 196 265 1,910 4,288 4,977 11,931
Processing – – – – – 41 41 41 41 89 594 1,310 1,500 3,659
Smelting – – – – – – – – – 46 470 913 914 2,344
Tailings – – – – – 0 0 0 0 1 7 15 17 42
Other – 0 2 2 2 24 27 26 25 20 53 305 416 901
Total Site Operating Costs – 0 2 2 2 108 185 203 262 422 3,034 6,832 7,824 18,876
Operating Surplus / (Deficit) – -0 -2 -2 -2 476 247 233 181 1,007 6,752 12,883 11,843 18,876
Indirect Costs – 1 2 7 7 742 289 443 523 531 2,013 1,849 1,532 7,940
Net Profit Before Income Tax – -2 -4 -8 -8 -266 -41 -210 -342 476 4,739 11,034 10,311 25,678
Income Tax – – – – – – – – – – 1,350 3,359 3,147 7,856
Net Profit After Income Tax – -2 -4 -8 -8 -266 -41 -210 -342 476 3,389 7,674 7,163 17,821
Capital Expenditure – -135 -199 -513 -515 -515 -410 -1,088 -1,085 -506 -546 -960 -1,140 -7,611
Depreciation – – – – – 733 280 425 503 516 1,934 1,685 1,352 7,429
Working Capital – 0 0 – – -133 30 -82 -1 -46 -10 6 235 -
Net Cash Flow After Tax – -136 -203 -521 -523 -181 -141 -954 -924 440 4,767 8,406 7,610 17,639
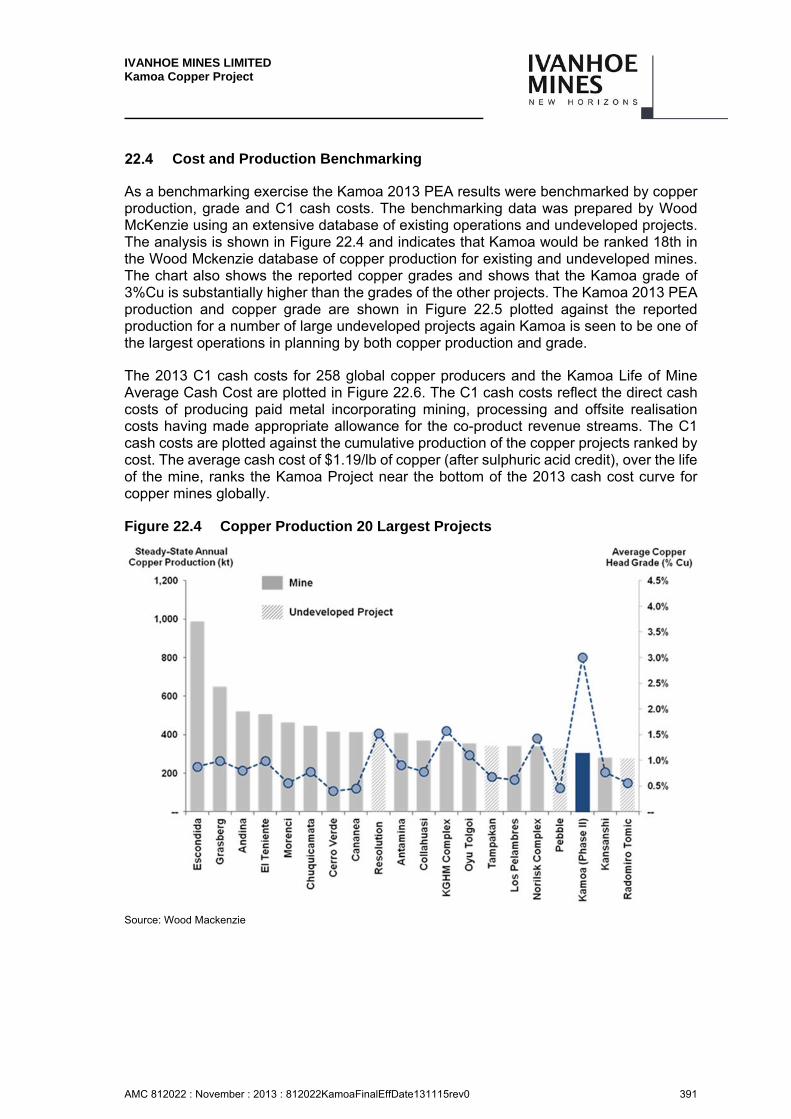
IVANHOE MINES LIMITED Kamoa Copper Project
AMC 812022 : November : 2013 : 812022KamoaFinalEffDate131115rev0 391
Cost and Production Benchmarking
As a benchmarking exercise the Kamoa 2013 PEA results were benchmarked by copper production, grade and C1 cash costs. The benchmarking data was prepared by Wood McKenzie using an extensive database of existing operations and undeveloped projects. The analysis is shown in Figure 22.4 and indicates that Kamoa would be ranked 18th in the Wood Mckenzie database of copper production for existing and undeveloped mines. The chart also shows the reported copper grades and shows that the Kamoa grade of 3%Cu is substantially higher than the grades of the other projects. The Kamoa 2013 PEA production and copper grade are shown in Figure 22.5 plotted against the reported production for a number of large undeveloped projects again Kamoa is seen to be one of the largest operations in planning by both copper production and grade.
The 2013 C1 cash costs for 258 global copper producers and the Kamoa Life of Mine Average Cash Cost are plotted in Figure 22.6. The C1 cash costs reflect the direct cash costs of producing paid metal incorporating mining, processing and offsite realisation costs having made appropriate allowance for the co-product revenue streams. The C1 cash costs are plotted against the cumulative production of the copper projects ranked by cost. The average cash cost of $1.19/lb of copper (after sulphuric acid credit), over the life of the mine, ranks the Kamoa Project near the bottom of the 2013 cash cost curve for copper mines globally.
Figure 22.4 Copper Production 20 Largest Projects
Source: Wood Mackenzie

IVANHOE MINES LIMITED Kamoa Copper Project
AMC 812022 : November : 2013 : 812022KamoaFinalEffDate131115rev0 392
Figure 22.5 Copper Production Undeveloped Projects
Source: Wood Mackenzie
Figure 22.6 2013 C1 Cash Costs
Source: Wood Mackenzie Note: 2013E Cash Cost is the C1 cash costs that are the direct cash costs of producing paid metal incorporating mining, processing and offsite realization costs, with allowance for the co-product revenue streams.
--
$0.50
$1.00
$1.50
$2.00
$2.50
$3.00
$3.50
2,000 4,000 6,000 8,000 10,000 12,000 14,000 16,000
2013
E C
ash
Co
st (
US
$/lb
Cu
)
Cumulative Paid Copper (kt Cu)
Kamoa Life of Mine Average: US$1.19/lb

IVANHOE MINES LIMITED Kamoa Copper Project
AMC 812022 : November : 2013 : 812022KamoaFinalEffDate131115rev0 393
Comments on Section 22
The information and analysis discussed in this section is suitable for use in a PEA and is based on the the marketing and tax assumptions provided by Ivanhoe and other experts.
IVANHOE MINES LIMITED Kamoa Copper Project
AMC 812022 : November : 2013 : 812022KamoaFinalEffDate131115rev0 394
23 ADJACENT PROPERTIES
There are no adjacent properties relevant to this Report.
IVANHOE MINES LIMITED Kamoa Copper Project
AMC 812022 : November : 2013 : 812022KamoaFinalEffDate131115rev0 395
24 OTHER RELEVANT DATA AND INFORMATION
This section not used.
IVANHOE MINES LIMITED Kamoa Copper Project
AMC 812022 : November : 2013 : 812022KamoaFinalEffDate131115rev0 396
25 INTERPRETATION AND CONCLUSIONS
Mineral Resource Estimate Update
Mineral Resources for the Project, have been estimated using core drill data, have been performed to industry best practices (CIM, 2003), and conform to the requirements of CIM Definition Standards (2010).
Areas of uncertainty that may materially impact the Mineral Resource estimates include:
Drill spacing is insufficient to determine if any local faulting exists, or the effects of any such faulting on lithology and grade continuity assumptions. Local faulting could disrupt the productivity of a highly-mechanized underground mining operation. In addition, the amount of contact dilution related to local undulations in the SMZ has yet to be determined. Ivanhoe plans to mitigate these risks with information derived from further infill drilling.
Assumptions used to generate the data for consideration of reasonable prospects of economic extraction are based on conceptual analyses and may change with further study. Mining recovery could be lower and dilution increased where the dip locally increases on the flanks of the domes. An exploration decline is being considered which would provide an appropriate trial of the conceptual room-and-pillar mining method on the Kamoa deposit in terms of costs, dilution, and mining recovery. A decline would provide access to data and metallurgical samples at a bulk scale that cannot be collected at the scale of a drill sample. Location of an exploration decline(s) and the extent of the decline are dependent on further studies.
Long-term commodity price assumptions.
Long-term exchange rate assumptions.
Operating and capital cost assumptions. Exploitation will require building a greenfields mining project with attendant infrastructure.
Metal recovery assumptions. Metallurgical testwork indicates the need for multiple grinding and flotation steps. Metallurgical variability testwork has been initiated and is in early stages.
Some metallurgical test results have indicated a portion of the material amenable to open pit mining may produce poor quality concentrate that could negatively affect the economics of processing a portion of this material. Metallurgical testwork on this material is ongoing.
The fiscal and political regime under which mining operations might occur are uncertain. There is provision within the 2002 Mining Code for the Government to change the 2002 Mining Code and mining rights by decree and a draft revision to the 2002 Mining Code has been circulated. There is also a risk that the DRC Government could change the current royalty, duty, and taxation regime.
Kamoa 2013 PEA
With the additional data collection and the findings of the Kamoa 2013 PEA Ivanhoe should consider whether it is appropriate to progress studies to a pre-feasibility stage of assessment.
IVANHOE MINES LIMITED Kamoa Copper Project
AMC 812022 : November : 2013 : 812022KamoaFinalEffDate131115rev0 397
Underground Mining
25.3.1 Underground Mining Methods
Mine design and associated work for the Kamoa deposit was prepared at a PEA level, which requires additional engineering and design to ensure the level of design is commensurate with future financial decisions for mining the Kamoa mineral resource.
The Kamoa deposit is favorable for large scale mechanized room-and-pillar mining at shallower depths and drift-and-fill mining at depths below 550 meters. Additional geotechnical data will be required to ensure the mining methods are suitable, the excavation and pillar dimensions are appropriate, and ground support requirements are adequate. Further evaluation of the potentially problematic Kamoa pyritic siltstone needs to be addressed for possible additional ground support and other remediation measures that could affect initial development productivities.
The Kamoa deposit appears to be relatively un-deformed continuously mineralized with good local continuity and flat to moderate dips. Additional infill drilling will be required to test for the presence of minor faults, which may result in changes in the roof and floor positions, increased dilution, and increased waste development. This drilling will also assist in validating local dip changes that may result in lower productivities. This drilling, along with further detailed mineralization continuity studies, should help validate hanging and footwall continuity.
Additional hydrological data and studies will be required to confirm that groundwater inflows will not significantly impact underground costs and schedules. The water handling allowance included in the Kamoa 2013 PEA and the effects on ground conditions and productivities can then be further assessed.
25.3.2 Underground Mining Accesses
The thickness of the Kalahari sand in the overburden sequence may dictate the location of the ventilation raises and increase the costs of ventilation for the mine.
25.3.3 Production Schedules
Although the deposit appears to provide significant resources and mining will be conducted in multiple sections, there may be a risk of having to schedule additional mining areas to ensure that the number of required active stopes is met and maintained. This could increase the ramp up periods for build up to full production.
Backfill requirements of approximately 4.0 Mtpa produces logistical complication that must be further analyzed in determining the drift-and-fill mining rates. Further design of the backfill, along with the availability of material to be used in the paste backfill, must also be analyzed.
Total personnel requirements for the mine operation are estimated to be in excess of 1,000 persons. Sourcing and training a skilled workforce to achieve this level presents challenges, especially in a remote location.
IVANHOE MINES LIMITED Kamoa Copper Project
AMC 812022 : November : 2013 : 812022KamoaFinalEffDate131115rev0 398
25.3.4 Logistics
Logistics to and from the DRC will present a significant challenge to the project during construction and operation. Significant effort is required during subsequent stages of the project to adequately prepare for these challenges.
25.3.5 Risk
The risks and uncertainties described below are not the only risks and uncertainties that Kamoa faces. Additional risks and uncertainties which have not been identified or are currently believed to be immaterial may also adversely affect the results. If any of the possible events described below occurs, Kamoa could be materially and adversely affected.
The economic feasibility has not yet been demonstrated.
Kamoa may not achieve its production estimates and the development into a commercially viable mine cannot be assured.
Kamoa requires significant infrastructure development in order to commence development and mining operations.
Future development depends on adequate infrastructure. In particular, reliable power sources, water supply, transportation and surface facilities are key determinants that are needed to develop a mine. The failure to address these infrastructure requirements could affect the ability to commence or continue production.
In addition, unusual or infrequent weather phenomena, government regulations or other interference in the provision or maintenance of such infrastructure, sabotage or terrorism, could have a material adverse effect on Ivanhoe’s business, financial condition, results of operations or prospects.
Kamoa will require approvals, licences and permits that it currently does not have, in order to continue its exploration and development activities, and if deemed viable, commence mining operations.
Kamoa will need substantial additional financing in the future and cannot assure that such financing will be available.
Title to the Project cannot be assured.
Any dispute, revocation or challenge of mineral title could have a material adverse effect.
Legal protections in the DRC may be limited.
Ivanhoe’s operations in the DRC are subject to numerous risks associated with operating in emerging economies.
There is a risk of direct government intervention in Ivanhoe’s mineral property interests in DRC.
The development and success of the Project will be largely dependent on the future price of copper.
Additional mineralization targeted by the next stages of drilling may not be present.
IVANHOE MINES LIMITED Kamoa Copper Project
AMC 812022 : November : 2013 : 812022KamoaFinalEffDate131115rev0 399
The expected mining extraction ratios might reduce after more detailed geotechnical studies are completed.
The ability of the Company to attract qualified personnel in DRC may be affected by crime, poor social institutions, legal restrictions and political and economic instability.
Currency fluctuations may affect the costs.
Mining operations are subject to laws and regulations relating to the protection and remediation of the environment.
As a participant in the resource extraction industry, Ivanhoe may face opposition from local and international groups.
The costs of complying with applicable laws and governmental regulations may have an adverse impact on the business.
Iinternal controls and procedures may not be sufficient to ensure compliance with its anti-bribery and anti-corruption requirements.
Ivanhoe’s insurance coverage does not cover all of its potential losses, liabilities and damages related to its business and certain risks are uninsured or uninsurable.
Mining is inherently dangerous and subject to factors or events beyond the Company’s control
It may not be possible to effect service of process and enforce judgments outside of Canada.
Competition in the mining industry may adversely affect the Company.
Ivanhoe is dependent on qualified personnel.
Labour disruptions and/or increased labour costs could have an adverse effect on the Project.
The Company faces certain risks in dealing with HIV/AIDS and tuberculosis.
IVANHOE MINES LIMITED Kamoa Copper Project
AMC 812022 : November : 2013 : 812022KamoaFinalEffDate131115rev0 400
26 RECOMMENDATIONS
Drilling
AMEC has recommended a work program consisting of one phase of drilling. The recommended drilling has been broken down by localities within the deposit, and totals 96,205 m, including allocations for exploration, infill, metallurgical, geotechnical, and condemnation purposes. The program is estimated at US$52.5 M.
The work program has been designed to progress knowledge across the Project. AMEC recommends prioritizing the program to benefit development of a mining strategy for the first 10–15 years of production.
Ivanhoe is currently undertaking a drilling program that encompasses metallurgical, geotechnical, civil geotechnical and hydrogeological holes. Additional planned holes will be a combination of exploration, Mineral Resource expansion and Mineral Resource delineation to target potential upgrades in Mineral Resource confidence categories and zones of additional mineralized material. The focus of this drilling will be down dip expansion of the Kansoko trend, extension of the mineralization to the western extents of the mining license, and exploration drilling at Kakula for both hypogene and shallow supergene targets. Additional engineering drill holes, including metallurgical drilling will be completed. An allocation has been made for sterilisation drilling using the Ivanhoe-owned landcruiser-mounted diamond drill rig.
26.1.1 Kansoko Sud, Makalu, Kansoko Nord and Kansoko Centrale
Infill drilling at 200 m centers is planned and currently in progress in Kansoko Sud, where initial mining is planned in the 2013 PEA in order to test the geological variability of this area. In addition, wedges are being drilled to complete a more detailed metallurgical analysis of this area and provide representative material for pilot plant testwork. The program is also designed to provide drill data in areas that previously have not been able to support Mineral Resource estimation due to the drill spacing. Additional metallurgical wedges will be drilled in 2014 at Makalu for metallurgical testwork data for later areas of the proposed mine life.
During 2014, a 200 m infill grid of drillholes is planned in the shallow areas to provide better definition of areas of supergene and hypogene material.
At Kansoko Centrale, metallurgical wedges for the initial period of the proposed mine life will be drilled during the remainder of 2013. These will produce material for the pilot plant testwork. In 2014 a “cross” of closely-spaced drillholes is planned on 100 m centers in Kansoko Centrale to test the variability of the hypogene mineralization and to determine the drill spacing that will be required to support higher confidence-category Mineral Resource estimates. Additional wedges will be drilled to provide more samples for metallurgical variability testwork.
Infill drilling is planned in Kansoko Sud/Makalu to 200 m centres to test geological variability of this high-grade area. This is currently considered a high priority for the initial drilling in 2014.
IVANHOE MINES LIMITED Kamoa Copper Project
AMC 812022 : November : 2013 : 812022KamoaFinalEffDate131115rev0 401
26.1.2 Kakula and Kakula NE
Drilling is planned over the Kakula and Kakula NE dome areas to evaluate previously identified soil geochemistry targets which had identified highly-anomalous copper values. The soil anomalies were followed up by four core holes in 2011, which intersected a thick, low-grade mineralized zone. A wide-spaced grid is planned to cover the area and test further for potential targets of Kamoa-type mineralization.
26.1.3 Kamoa Sud
Drilling in Kamoa Sud during 2014 will comprise only wedges from previously drilled holes for use in the metallurgical variability program. In addition, five holes will be drilled to infill the areas where the pierce point grid is wider due to excessive hole deviation during the previous drill programs.
26.1.4 Other Exploration
In 2014 deep drilling is planned with the intent of outlining additional mineralization downdip of the current area of Indicated Mineral Resources at Kansoko that may support future resource estimation. As part of this programme exploration drilling to the west of the Makalu dome in currently relatively untested areas will be completed. The drill holes will be sited to test for potential supergene zones and areas of elevated copper grades that may be able to be traced down-dip.
Programme Details
Figure 26.1 is a drill location plan for the Project. On this figure, drillholes completed and in progress as of 1 October are shown in black; the 2013 planned drilling is shown as green circles; 2014 planned Infill/variability drilling is shown as orange triangles; and 2014 planned exploration/resource expansion drilling is shown as blue triangles. The 2013 planned drilling shown in Kansoko Centrale and Kamoa Sud will predominantly be metallurgical wedges from existing holes, new holes will only be considered if re-entry of the original hole is not possible.
Table 26.1 summarizes the committed and planned drilling. Drilling for 2013–2014 is planned to the end of the first quarter of 2014, which coincides with the end of the wet season in the Congo. However, the current plan is for the majority of the drillholes to be completed by the end of 2013 to support more detailed engineering studies. A drilling cost of US$546/m was used for the proposed drilling budget of US$40.7 million.
A number of iterations of Mineral Resource estimate updates would be expected to be undertaken during the drill programmes. In the AMEC QPs’ opinion, the drilling contemplated is likely, by the end of the first quarter of 2014, to be at a sufficiently close spacing to support completion of detailed engineering studies on the Project.
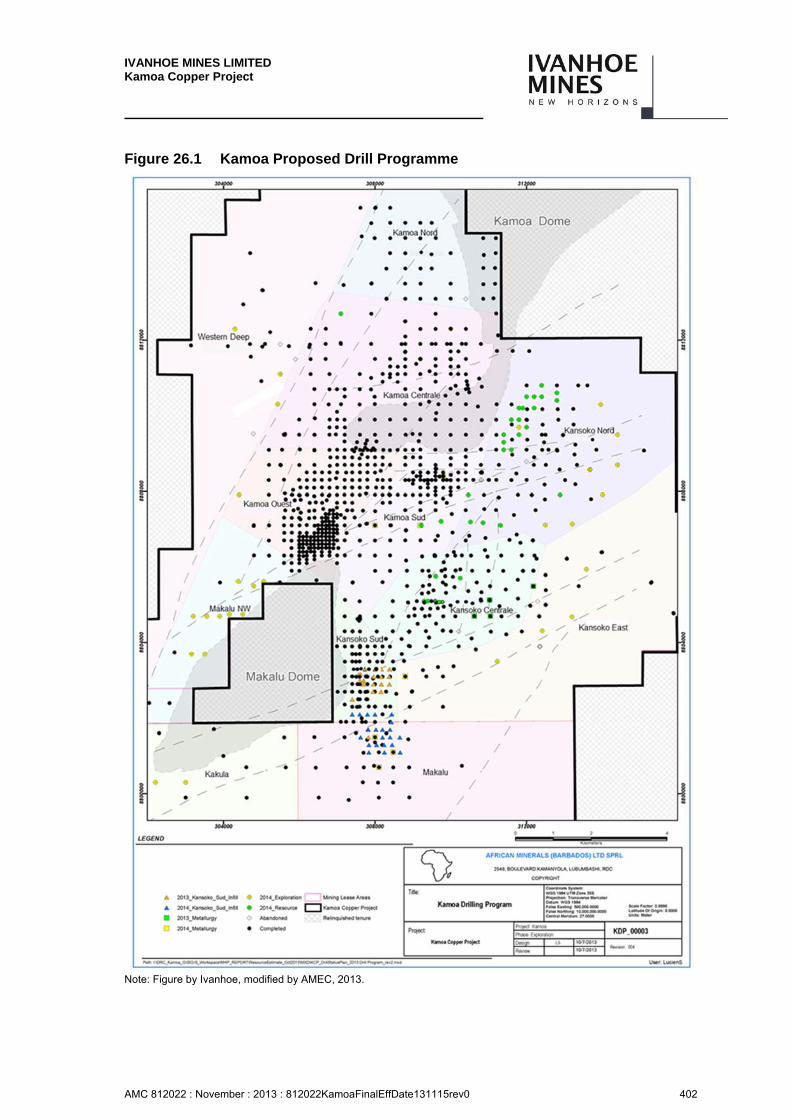
IVANHOE MINES LIMITED Kamoa Copper Project
AMC 812022 : November : 2013 : 812022KamoaFinalEffDate131115rev0 402
Figure 26.1 Kamoa Proposed Drill Programme
Note: Figure by Ivanhoe, modified by AMEC, 2013.
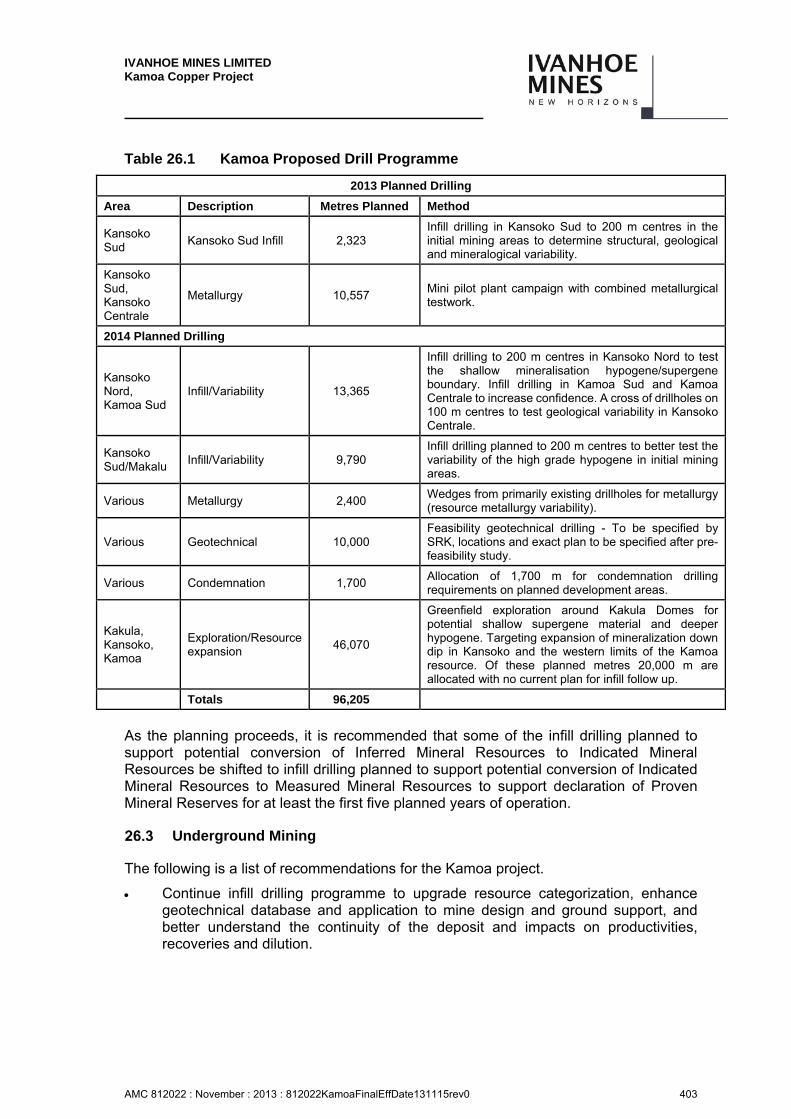
IVANHOE MINES LIMITED Kamoa Copper Project
AMC 812022 : November : 2013 : 812022KamoaFinalEffDate131115rev0 403
Table 26.1 Kamoa Proposed Drill Programme
2013 Planned Drilling
Area Description Metres Planned Method
Kansoko Sud
Kansoko Sud Infill 2,323 Infill drilling in Kansoko Sud to 200 m centres in the initial mining areas to determine structural, geological and mineralogical variability.
Kansoko Sud, Kansoko Centrale
Metallurgy 10,557 Mini pilot plant campaign with combined metallurgical testwork.
2014 Planned Drilling
Kansoko Nord, Kamoa Sud
Infill/Variability 13,365
Infill drilling to 200 m centres in Kansoko Nord to test the shallow mineralisation hypogene/supergene boundary. Infill drilling in Kamoa Sud and Kamoa Centrale to increase confidence. A cross of drillholes on 100 m centres to test geological variability in Kansoko Centrale.
Kansoko Sud/Makalu
Infill/Variability 9,790 Infill drilling planned to 200 m centres to better test the variability of the high grade hypogene in initial mining areas.
Various Metallurgy 2,400 Wedges from primarily existing drillholes for metallurgy (resource metallurgy variability).
Various Geotechnical 10,000 Feasibility geotechnical drilling - To be specified by SRK, locations and exact plan to be specified after pre-feasibility study.
Various Condemnation 1,700 Allocation of 1,700 m for condemnation drilling requirements on planned development areas.
Kakula, Kansoko, Kamoa
Exploration/Resource expansion
46,070
Greenfield exploration around Kakula Domes for potential shallow supergene material and deeper hypogene. Targeting expansion of mineralization down dip in Kansoko and the western limits of the Kamoa resource. Of these planned metres 20,000 m are allocated with no current plan for infill follow up.
Totals 96,205
As the planning proceeds, it is recommended that some of the infill drilling planned to support potential conversion of Inferred Mineral Resources to Indicated Mineral Resources be shifted to infill drilling planned to support potential conversion of Indicated Mineral Resources to Measured Mineral Resources to support declaration of Proven Mineral Reserves for at least the first five planned years of operation.
Underground Mining
The following is a list of recommendations for the Kamoa project.
Continue infill drilling programme to upgrade resource categorization, enhance geotechnical database and application to mine design and ground support, and better understand the continuity of the deposit and impacts on productivities, recoveries and dilution.
IVANHOE MINES LIMITED Kamoa Copper Project
AMC 812022 : November : 2013 : 812022KamoaFinalEffDate131115rev0 404
Consider an underground exploration programme to attain first-hand information on actual mining conditions and to validate design assumptions.
Complete hydrological studies and data evaluation to better determine impacts on underground mining conditions and productivities.
Undertake backfill plant design along with an evaluation and sourcing of suitable materials for paste fill.
Conduct a survey of the local workforce to determine available skill levels. The mining productivities and costs have assumed that skilled tradesmen are available to fill the critical mine operational positions.
Further Assessment
The Kamoa 2013 PEA is a Preliminary Economic Assessment (PEA) and includes an economic analysis that is based, in part, on Inferred Mineral Resources. Inferred Mineral Resources are considered too speculative geologically to have the economic considerations applied to them that would allow them to be categorized as Mineral Reserves, and there is no certainty that the results will be realized. Mineral Resources are not Mineral Reserves as they do not have demonstrated economic viability.
With the additional data collection and the findings of the Kamoa 2013 PEA Ivanhoe is in a position to progress studies to a pre-feasibility stage of assessment.
IVANHOE MINES LIMITED Kamoa Copper Project
AMC 812022 : November : 2013 : 812022KamoaFinalEffDate131115rev0 405
27 REFERENCES
African Mining Consultants, 2004: Mitigation and Rehabilitation Plan Lufupa Concession: unpublished internal report from African Mining Consultants to African Minerals (Barbados) Ltd. sprl, March, 2004.
African Mining Consultants, 2005a: Regional Sampling Protocol – D.R.Congo: unpublished internal spreadsheet, African Mining Consultants, May, 2005, 2 p.
African Mining Consultants, 2005b: Regional Soil Sampling Protocol – D.R.Congo: unpublished internal spreadsheet, African Mining Consultants, May, 2005, 2 p.
African Mining Consultants, 2005c: Regional Stream Sediment Protocol – D.R.Congo: unpublished internal spreadsheet, African Mining Consultants, May, 2005, 2 p.
African Mining Consultants, 2006a: Reverse Circulation Drilling Sampling Protocol – Exploration Drilling – D.R.Congo: unpublished internal spreadsheet, African Mining Consultants, April 2006, 1 p.
African Mining Consultants, 2006b: Collection and Transportation of Soil and Stream Sediments Protocol – D.R.Congo: unpublished internal spreadsheet, African Mining Consultants, April 2006, 1 p.
African Mining Consultants, 2008: Lufupa and Lufira Concessions, The Democratic Republic of Congo, Greater Kamoa District, Annual Report: unpublished internal report from African Mining Consultants to African Minerals (Barbados) Ltd. sprl, December, 2008.
African Mining Consultants, 2009a: Lufupa and Lufira Concessions, The Democratic Republic of Congo, Greater Kamoa District, Annual Exploration Report: unpublished internal report from African Mining Consultants to African Minerals (Barbados) Ltd. sprl, March, 2009.
African Mining Consultants, 2009b: Lufupa and Lufira Concessions, The Democratic Republic of Congo, Greater Kamoa District, Phase 1 Report: unpublished internal report from African Mining Consultants to African Minerals (Barbados) Ltd. sprl, March, 2009.
African Mining Consultants, 2009c: Lufupa and Lufira Concessions, The Democratic Republic of Congo, Greater Kamoa District, Diamond Drilling Procedures Manual: unpublished internal report from African Mining Consultants to African Minerals (Barbados) Ltd. sprl, March, 2009, 48 p.
African Mining Consultants, 2009d: Greater Kamoa Project, The Democratic Republic of Congo, Environmental Impact Assessment Scoping Study: unpublished report prepared by African Mining Consultants for African Minerals (Barbados) Ltd., sprl, June 2009.
African Mining Consultants, 2011: _A4_KCP_Structure_Upto240_20110328.pdf, PDF file depicting interpreted structures, March, 2011 1p.
IVANHOE MINES LIMITED Kamoa Copper Project
AMC 812022 : November : 2013 : 812022KamoaFinalEffDate131115rev0 406
AMEC Minproc, 2010: Desk Top Logistics Study Investigations: unpublished report prepared for Ivanplats, 2010.
Andre–Dumont, H., 2008: Democratic Republic of the Congo: report prepared by McGuireWoods LLP in Farrell, S., McDermott, R., and Snow, J., 2008 (eds): The regulation of exploration and extraction in 35 jurisdictions worldwide 2008, Mining 2008, Getting the Deal Through, accessed 2 June 2009, posted to http://www.mcguirewoods.com/news-resources/publications/international/miningdrcongo.pdf.
Andre–Dumont, H., 2011: Democratic Republic of the Congo: report prepared by McGuireWoods LLP in Bourassa M., and Turner, J., 2011 (eds): The regulation of exploration and extraction in 35 jurisdictions worldwide 2011, Mining 2011, Getting the Deal Through, accessed 17 February 2012, posted to http://www.mcguirewoods.com/news-resources/publications/international/miningdrcongo.pdf.
Andre–Dumont, H., 2011: Democratic Republic of the Congo: report prepared by McGuireWoods LLP in Bourassa M., and Turner, J., 2011 (edsMining in 31 jurisdictions worldwide 2013, Mining 2013, Getting the Deal Through, posted to http://www.mcguirewoods.com/news-resources/publications/international/miningdrcongo.pdf.
Broughton, D., 2009a: Kamoa Project: unpublished internal PowerPoint presentation, Ivanhoe Nickel and Platinum, March 2009.
Broughton, D., 2009b: Kamoa Research Program Proposed Study: unpublished internal memorandum, Ivanhoe Nickel and Platinum, May 2009.
Broughton, D.W. and Rogers, T, 2010: Discovery of the Kamoa Copper Deposit, Central African Copperbelt, D.R.C.: Special Publication 15, Society of Economic Geologists, Littleton, CO, pp287–297.
Canadian Institute of Mining, Metallurgy and Petroleum (CIM), 2003: Estimation of Mineral Resources and Mineral Reserves, Best Practice Guidelines: Canadian Institute of Mining, Metallurgy and Petroleum, November 23, 2003, http://www.cim.org/committees/estimation2003.pdf.
Canadian Institute of Mining, Metallurgy and Petroleum (CIM), 2010: CIM Standards for Mineral Resources and Mineral Reserves, Definitions and Guidelines: Canadian Institute of Mining, Metallurgy and Petroleum, November 2010, http://www.cim.org/UserFiles/File/CIM_DEFINITON_STANDARDS_Nov_2010.pdf.
Carver, R., 2009a: QA/QC Report on Kamoa Project Drilling in the DRC to 9th March 2009: unpublished internal report from GCXplore Pty. Ltd. to African Minerals (Barbados) Ltd. sprl, March, 2009, 21 p.
Chadwick, A. Morfett, J. & Borthwick, M. (2004). Hydraulics in civil and environmental engineering. London: Spon Press. 4th Edition.
IVANHOE MINES LIMITED Kamoa Copper Project
AMC 812022 : November : 2013 : 812022KamoaFinalEffDate131115rev0 407
Cibamba Diata E., 2010: Concern: Validity and Renewal of Exploration Permits Relating to the Mining Project Kamoa Held by the Company African Minerals (Barbados) Ltd SPRL, “AMBL”: unpublished legal opinion letter prepared for Ivanhoe Nickel and Platinum Limited, 10 September 2010.
Copperbelt University Institute of Environmental Management, 2009: Environmental Impact Statement for Area-D Open Pit Mining Project: unpublished report prepared for Mopani Mines Ltd., March 2009, accessed 10 June 2009, posted to http://www.necz.org.zm/news/comments/eis-reports/MCM/AreaDEIS.pdf.
Craig, R.F., 2004: Craig’s Soil Mechanics, Seventh Edition. Published by Taylor and Francis, April 2004.
David, D., 2010: Metallurgical Testwork Summary of Work Carried out on Ore Samples from the Kamoa Copper Project, unpublished report prepared for African Minerals Barbados Ltd. sprl, dated 5 November 2010.
Edwards, D., 2010: KCP … Due Diligence Report unpublished internal report from African Mining Consultants to African Minerals (Barbados) Ltd. sprl, December, 2010 26 p.
Francois, A., 1996: Information Concerning the Deposits Found in the Southern Shaba: unpublished internal report, Bureau of Geological Consultancy SA., 1996.
Francois, A., 1997: Summary of the Geology Concerning the Shaba Copper Arc: unpublished internal report, Bureau of Geological Consultancy SA., 1997.
Golder Associates Pty Ltd, 2011: Report 11613890-12287-17 Kamoa Copper Project: Liner Study Phase 1 Geotechnical Investigations.
Golder Associates Pty Ltd, 2011: Report 11613890-11804-7 Bulk Water Supply - Study of Alternative Source Options Report (Rev 1), March 2013
Goossens, P.J., 2009: Mineral Potential of the Democratic Republic of Congo: A Geologic Scandal?: Newsletter of the Society of Economic Geologists, No. 77, April 2009.
Government of the Democratic Republic of Congo, 2002: Mining Code: English translation of Mining Code, accessed 10 June 2009, posted to http://www.unites.uqam.ca/grama/pdf/DRC2002.pdf.
Hatch Ltd., 2012: Scoping Study Report for Kamoa Power Requirement: unpublished report prepared for Ivanplats, 2012.
Hitzman, M., Kirkham, R.V., Broughton, D., Thorson, J., and Selley, D., 2005: The Sediment-Hosted Stratiform Copper Ore System: in Hedenquist, J.W., Thompson, J.F.H., Goldfarb, R.J., Richards, J.P. (eds.), Economic Geology 100th Anniversary Volume, pp. 609–642.
Ivanplats Limited, 2012: Prospectus: unpublished report filed on Sedar, 10 September 2012.

IVANHOE MINES LIMITED Kamoa Copper Project
AMC 812022 : November : 2013 : 812022KamoaFinalEffDate131115rev0 408
Jakubec, J. (2010). Kamoa Geotechnical Field Data. SRK Consulting (Canada) Inc. memo.
Jakubec, J. (2013). Room-and-Pillar Design Criteria Discussion. SRK Consulting (Canada) Inc. letter prepared for Ivanhoe Mine Ltd.
James, W., Rossman, L.E. & James, W.R.C. (2010). User's guide to SWMM5 (13th ed.). Ontario: CHI.
JKTech Pty Ltd SMC Test Report on Three Samples from Kamoa Project JKTech Job No. 10002/P7 - May 2010 Submitted to African Minerals (Barbados) Ltd Tested at Mintek, Randburg, Transvaal, South Africa.
Key, R.M., Liyungu, A.K., Njamu, F.M., Somwe, V., Banda, J., Mosley, P.N., and Armstrong R.A., 2001: The Western Arm of the Lufilian Arc in NW Zambia and Its Potential for Copper Mineralization: Journal of African Earth Sciences, v. 33, pp. 503–528.
King, M., 2009: Democratic Republic of Congo Mining Report Q2 2009 - Companiesandmarkets.com Adds New Report: accessed 10 June 2009, unpublished report posted to http://www.pr-inside.com/democratic-republic-of-congo-mining-reportr1253828. htm.
Kirkham, R.V., 1989: Distribution, Settings, and Genesis of Sediment-hosted Stratiform Copper Deposits: Geological Association of Canada Special Paper 36, p 3–38.
Long S., 2010: Review of Kamoa Project 2006 to 2010 Assay Quality Assurance and Quality Control Data, unpublished memo prepared for African Minerals Barbados Ltd. sprl, 41p.
McGuireWoods LLP, 2013: Current DR Congo Mining Code under Revision: article posted to McGuireWoods website dated 30 May 2013, accessed 14 August 2013, http://www.mcguirewoods.com/Client-Resources/Alerts/2013/5/Current-DR-Congo-Mining-Code-Being-Revised.aspx
McGuireWoods LLP, 2013: Current DR Congo Mining Code under Revision: article posted to McGuireWoods website dated 30 May 2013, accessed 14 August 2013, http://www.mcguirewoods.com/Client-Resources/Alerts/2013/5/Current-DR-Congo-Mining-Code-Being-Revised.aspx
Mintek Nov 2010: Draft Report: Flotation test work on Copper Ore from the Kamoa Project, Democratic Republic of the Congo.
Mintek, 2011: Unpublished interim report: Kamoa Comminution Test work.
MRDI, 1997: Independent Technical Consultants Report: unpublished report prepared by Mineral Resources Development Inc. for Zambia Consolidated Copper Mines, Ltd, 5 November 1997.
IVANHOE MINES LIMITED Kamoa Copper Project
AMC 812022 : November : 2013 : 812022KamoaFinalEffDate131115rev0 409
Parker, H., 2000: Zambia Copper Investments Ltd., Financial Model Documentation, January, 2000: Report prepared by Mineral Resource Development Inc. UK for Zambia Copper Investments Ltd.
Parker, H., 2009: Kamoa Copper Project: unpublished Technical Report prepared by AMEC E&C Services Inc. for Ivanhoe Nickel and Platinum Ltd., effective date 4 July 2009.
Parker, H., 2010: Kamoa Copper Project Site Visit: unpublished memo prepared by AMEC E&C Services Inc. for African Minerals Barbados Ltd. sprl, dated 10 April 2010.
Parker, H., Seibel, G., and David, D. 2010: Kamoa Copper Project: unpublished Technical Report prepared by AMEC Minproc Inc. for Ivanhoe Nickel and Platinum Ltd., effective date 1 December 2010.
Peters, B.F, Parker, H.M., Seibel, G., Jakubek, J., Annavarapu, S., and David, D., 2012: Ivanplats Limited, Kamoa Project, Katanga Province, D.R.C., NI 43-101 Technical Report: unpublished technical report prepared for Ivanplats Limited by AMC Consultants, AMEC E&C Services Inc., SRK Consulting Inc and Stantec Inc., effective date 5 September 2012, 375 p.
Rainaud C., Master, S., Armstrong, R., Phillips, D., and Robb, L., 2005: Monazite U–Pb dating and 40Ar–39Ar Thermochronology of Metamorphic Events in the Central African Copperbelt during the Pan-African Lufilian Orogeny: Journal of African Earth Sciences, vol 42, pp. 183–199.
Reid D., 2010a: Kamoa Sulphide Mineralogy Study, unpublished memo prepared by AMEC E&C Services Inc. for African Minerals Barbados Ltd. sprl, 337 p.
Reid D., 2010b: Kamoa 2010 QAQC Review Study, unpublished memo prepared by AMEC E&C Services Inc. for African Minerals Barbados Ltd. sprl, 16p.
Reid D., 2011: Kamoa 2011 QAQC Review Study, unpublished memo prepared by AMEC E&C Services Inc. for Ivanhoe Nickel and Platinum Ltd., 17p.
Reid D., 2012: Kamoa 2012 QAQC Review Study, unpublished memo prepared by AMEC E&C Services Inc. for Ivanhoe Nickel and Platinum Ltd., in draft.
Saloojee M., Ravat Z., Kiyombo L., Ivanhoe Ltd : Updated commentary on specific tax consequences applicable to an operating mine in the Democratic Republic of Congo. unpublished letter prepared by KPMG Services Pty Ltd. for Ivanhoe Mines. 18 October 2013.
Schmandt, D., Broughton, D., Hitzman, M., Plink-Bjorklund, P., Edwards, D., and Humphrey, J., in prep: The Kamoa Copper Deposit, Democratic Republic of Congo: Stratigraphy, Diagenetic and Hydrothermal Alteration, and Mineralization: paper in preparation, Economic Geology.
SD Geomatique, 2011: Drill Hole Collar Surveys: unpublished internal note from SD Geomatique to African Minerals (Barbados) Ltd. sprl, 2 p.
IVANHOE MINES LIMITED Kamoa Copper Project
AMC 812022 : November : 2013 : 812022KamoaFinalEffDate131115rev0 410
Seibel G., 2011a: Kamoa Site Visit Report.pdf: unpublished internal AMEC E&C Services Inc report prepared for Ivanhoe Nickel and Platinum Ltd., April, 2011.
Selley, D., Broughton, D., Scott, R., Hitzman, M., Bull, S., Large, R., McGoldrick, P., Croaker, M., Pollington, N., Barra, F., 2005: A New Look at the Geology of the Zambian Copperbelt: in Hedenquist, J.W., Thompson, J.F.H., Goldfarb, R.J., Richards, J.P. (eds.), Economic Geology 100th Anniversary Volume, pp. 965–1,000.
SRK, 2012: Kamoa Structural Interpretation: unpublished internal report from SRK Consulting (Canada) Inc, November 2012.
Societé Internationale Des Mines du Zaire (SIMZ), 1975: 1970–1975 Exploration – A Review: unpublished internal report, 8 p.
Studt, F.E., Cornet, J., and Buttgenbach, H., 1908: Carte Geologique du Katanga et Notes Descriptives: Annales du Musee du Congo, Serie II, Tome 1; Etat Independent du Congo, Bruxelles. 99 pp.
Van Kempen, J. & Kalema Bwatunda, F.: DRC’s ban on export of copper and cobalt concentrates postponed until December 31, 2013. article posted to Cabemery website dated 20 August 2013 http://www.cabemery.org/2013/08/20/drcs-ban-on-export-of-copper-and-cobalt-concentrates-postponed-until-december-31-2013/
Van Kempen, J. & Kalema Bwatunda, F , Emery Mukendi Wafwana & Associates PC; DRC’s ban on export of copper and cobalt concentrates under analysis. article posted to Lexicology website dated 30 July 2013. http://www.lexology.com/library/detail.aspx?g=a1e6ea79-ff48-4518-8277-b9ada249411e
Walmsley, B. & Tshipala, K.E. (2012). Southern African Institue for Environmental Assessment. Retrieved May 23rd, 2013, from http://www.saiea.com/dbsa_book/drc.pdf.
Xstrata Process Support, XPS, 2011a: Ivanhoe Kamoa – Phase I Baseline Conditions: Hypogene Ore: Development of the Cleaner Circuit, Progress Report – 4011810, Unpublished Interim Report prepared for Mr Steve Amos, AMEC Minproc, March 2011.
Xstrata Process Support, 2011b: Progress Report 4011810: report prepared for Mr Steve Amos, AMEC Minproc. Ivanhoe Kamoa – Phase I Baseline Conditions: Hypogene Ore, 3 August 2011.
Xstrata Process Support 2011c: Progress Report 4011810: report prepared for Mr Steve Amos, AMEC Minproc. Ivanhoe Kamoa – Phase I Baseline Conditions: Supergene Ore: Treatment in the Breakthrough Cleaner Circuit, 13 October 2011.
Xstrata Process Support, 2011d: Progress Report 4011810: report prepared for Mr Steve Amos, AMEC Minproc. Ivanhoe Kamoa – Phase I Baseline Conditions: Hypogene Ore: Development of the Cleaner Circuit, 17 October 2011.
Yennanmani, A., 2012: December Database Check: unpublished memorandum from AMEC E&C Services Inc to Ivanplats Limited.
IVANHOE MINES LIMITED Kamoa Copper Project
AMC 812022 : November : 2013 : 812022KamoaFinalEffDate131115rev0 411
Yennamani, A., 2012: December 2012 Database Check: unpublished memorandum from AMEC E&C Services Inc to Ivanplats Limited.
Yennamani, A., 2013a: Kamoa Database March 2013 Audit: unpublished memorandum from AMEC E&C Services Inc to Ivanplats Limited.
Yennamani, A., 2013b: Kamoa Database August and October 2013 Audits: unpublished memorandum from AMEC E&C Services Inc to Ivanplats Limited.
Zambia Copper Investments Ltd., 2000, Circular to ZCI Shareholders, 89 pp.
Copyright © 2022 FDOKUMEN