UK Economic Outlook July 2013 - PwC
36
UK Economic Outlook July 2013 www.pwc.co.uk Feature articles: • Is the UK housing market on the road to recovery? • The trillion pound question – are gilts the next bubble to burst?
-
Upload
khangminh22 -
Category
Documents
-
view
2 -
download
0
Transcript of UK Economic Outlook July 2013 - PwC
UK Economic OutlookJuly 2013
www.pwc.co.uk
Feature articles:• Is the UK housing market on the road to recovery?•The trillion pound question – are gilts the next bubble to burst?

PwC firms help organisations and individuals create the value they are looking for. We’re a network of firms in 158 countries with more than 180,000 people who are committed to delivering quality in assurance, tax and advisory services. Tell us what matters to you and find out more by visiting us at www.pwc.com
This publication has been prepared for general guidance on matters of interest only, and does not constitute professional advice. You should not act upon the information contained in this publication without obtaining specific professional advice. No representation or warranty (express or implied) is given as to the accuracy or completeness of the information contained in this publication, and, to the extent permitted by law, PricewaterhouseCoopers LLP, its members, employees and agents do not accept or assume any liability, responsibility or duty of care for any consequences of you or anyone else acting, or refraining to act, in reliance on the information contained in this publication or for any decision based on it.

UK Economic Outlook July 2013 3
Highlights and key messages for business and public policy
• After a period of generally disappointing growth in 2011 and 2012, the UK economy has shown signs of recovery in the first half of 2013.
• In our main scenario we expect GDP growth to pick up gradually from 0.2% in 2012 to around 1% in 2013 and around 2% in 2014. Risks to growth remain weighted to the downside, due in particular to the possibility that the current relative calm in the Eurozone will not last.
• Services will remain the main engine of growth, but we also expect a gradual recovery in manufacturing and construction over the next 18 months.
• We expect London and the South East to continue to lead the recovery, but all regions should return to positive growth in 2013-14 (see Figure 1.1).
• Consumer price inflation is likely to remain above target at around 2.7% in 2013 and 2.4% in 2014. We expect some moderation in inflation next year unless there is any renewed rise in global commodity prices in 2014.
• Our main scenario for inflation implies a continued decline in real earnings growth in 2013-14, making six successive years of negative real growth. We would expect a gradual recovery in real earnings in 2015-17, but the level of real earnings in 2017 would nonetheless remain around 5% below its peak level in 2008.
• Subdued real earnings growth should, however, help to keep total UK employment growing at a healthy rate over the next five years, despite continued public sector job losses over this period.
• We expect to see a gradual recovery in house prices over the next few years. In cash terms, average UK house prices might be back to their 2007 peak level by the end of 2014, although in real inflation-adjusted terms this might not happen until 2021.
• The government’s recent initiatives to support the mortgage market should help to boost house prices in the short term, but the longer term priority should be to boost housing supply.
%
Figure 1.1 – PwC main scenario for growth by region
Source: PwC analysis
0.0
0.5
1.0
1.5
2.0
2.5
3.0
2013 2014
London East WalesSouthWest
SouthEast
EastMidlands
NorthEast
UKScotlandWestMidlands
Yorkshire andHumberside
NorthWest
NorthernIreland
• We do not expect any immediate major shift in monetary policy following the appointment of the new Governor of the Bank of England. In the longer term, however, the Monetary Policy Committee (MPC) will need to plot an exit strategy from current very loose monetary conditions. Our detailed analysis in this report suggests that this is likely to be associated with a rise in gilt yields back to more normal levels of around 4-5.5% by 2025.
• In general, higher interest rates will help savers but borrowers (including government) would be well-advised to lock in long-term funding at current relatively low rates where they can, while preparing for higher rates in the medium to long run.
Real GDP growth 1.0% 2.0%
Inflation (CPI) 2.7% 2.4%
2013 2014
Source: PwC main scenario projections
Table 1.1 – Key projections

UK Economic Outlook July 20134
Contents
Section Page
1 Summary 05
2 UK economic prospects 08
• 2.1 Recentdevelopmentsandthepresentsituation 08• 2.2 Economicgrowthprospects 12• 2.3 Outlookforinflation 15• 2.4 Fiscalandmonetarypolicyoptions 16• 2.5 Summaryandconclusions 17
3 Is the UK housing market on the road to recovery? 18
• 3.1 UKandregionalhousepricetrends 18• 3.2 RecentdevelopmentsinUKhousingsupplyandmortgageapprovals 20• 3.3 OutlookforUKhouseprices 23• 3.4 Summaryandconclusions 24
4 The trillion pound question – are gilts the next bubble to burst? 26
• 4.1 HistorictrendsinUKandothergovernmentbondyields 26• 4.2 Alternativemethodsforprojectinggiltyields 28• 4.3 Implicationsofrisinggiltyields 30• 4.4 Summaryandconclusions 31
Appendices
AOutlookfortheglobaleconomy 33BUKeconomictrends:1979-2012 34
Contacts and Services 35

UK Economic Outlook July 2013 5
Recent developments
The UK economy grew by 0.3% in the first quarter of 2013, ending fears of a return to technical recession after the post-Olympics fall in GDP in the fourth quarter of 2012. Growth in the first quarter was driven entirely by services, with manufacturing and particularly construction still acting as a drag on the economy.
The last few months have generally brought more positive news, with the latest PMI surveys indicating recovery in all major sectors of the economy and retail sales showing solid growth in May. A somewhat calmer situation in the Eurozone has generally supported equity markets since last autumn, despite some recent volatility. The US economy seems to be on the road to recovery. Emerging market performance has been more mixed, however, with Chinese growth slowing a little (but remaining high in absolute terms) and disappointing recent growth figures from India and particularly Brazil.
The strong improvement in UK employment in 2012 has slowed somewhat this year, but the underlying trend is still upward. The Chancellor’s Spending Review on 26th June confirmed there will be more pain to come in the public sector, but private sector job gains should continue to offset public sector losses.
Consumer price inflation (CPI) has been volatile in recent months and could climb back to around 3% over the summer, but it is being restrained by continued low earnings growth and some easing of past pressures from global commodity prices.
Future prospects
As shown in Table 1.1 our main scenario is for UK GDP growth to pick up to around 1% in 2013 and around 2% in 2014. This is slightly more optimistic than both the OBR and consensus forecasts, although the latter have been trending up over the past couple of months due to recent somewhat better than expected data.
Consumer spending growth is projected to follow a broadly similar pattern, but with somewhat weaker growth than GDP next year as real earnings continue to be squeezed. We do not expect positive real earnings growth to resume until 2015 and even then only at a modest pace. However, household incomes should be supported by continued employment growth and increases in non-employment income (notably pensioner benefits, which remain protected from the government’s spending cuts at least until 2015-16).
Investment growth has been disappointing in recent years, with the latest ONS estimates suggesting much weaker capital spending growth during 2012 than earlier thought. However, we expect a gradual recovery in investment over the course of this year and into 2014, helped by an easing of government capital spending cuts and some recovery in housebuilding activity.
Net exports made a significant negative contribution to growth in 2012, dragged down in particular by weakness in the Eurozone. We do not expect exports to lead the recovery in 2013-14, but their
1 – Summary
Projected % change on a year earlier
Figure 1.2 – Alternative UK GDP growth scenarios
-8
-6
-4
-2
0
2
4
6
Main Source: ONS, PwC scenariosStrong recoveryRenewed recession
Projections
Source: Office for Budget Responsibility (March 2013),HM Treasury survey of independent forecasts (average values in June 2013 survey) and PwC main scenario.
Indicator OBR forecasts Independent PwC(% real annual growth) (March 2013) forecasts Main scenario (June 2013) (July 2013) 2013 2014 2013 2014 2013 2014
GDP 0.6 1.8 0.9 1.6 1.0 2.0
Consumer spending 0.5 1.6 1.1 1.5 1.4 1.7
CPI inflation 2.8 2.4 2.7 2.4 2.7 2.4
Table 1.2 – Summary of UK economic prospects
contribution should be more positive. This should be associated with some upturn in manufacturing output in 2014.
However, significant rebalancing of UK growth towards exports, investment and manufacturing seems unlikely to emerge in the short term. We expect consumer
spending and services to remain the dominant drivers of UK growth in 2013-14.
As always there are many uncertainties inherent in our growth projections, as illustrated by the alternative scenarios in Figure 1.2. Risks are still somewhat weighted to the downside due to the possibility of

UK Economic Outlook July 20136
further adverse shocks in the Eurozone that could puncture fragile confidence at home and lead to a renewed recession (or at least stagnation). But there are also upside possibilities if these problems can be avoided and a virtuous circle of rising confidence and spending can be established as in past economic recoveries.
Inflation looks set to remain stubbornly above target at an average of around 2.7% in 2013, subsiding only slightly to 2.4% in 2014. Our main scenario here is very similar to the OBR and consensus forecasts as shown in Table 1.1. There could still be upside risks to this inflation outlook, however, if stronger global growth in 2014 pushes up commodity prices again.
Given persistent above target inflation we do not expect any significant further easing of monetary policy under the new Governor of the Bank of England, although he may make more use of forward guidance on interest rates as in the US and previously also Canada. In the longer term, the big challenge facing Mark Carney will be to negotiate a safe exit from current very loose monetary conditions without either crushing the recovery or losing control of inflation. This will be a difficult balancing act to pull off.
Are UK house prices on the road to recovery?
As discussed in more detail in Section 3, house prices rose significantly in the UK during the 10 years up to their peak in Q3 2007, but have since fallen by around 18% in real terms (but only 3% in cash terms). While average house price increases continue to be subdued by pre-2007 standards, they are now on an upward trend.
There have been considerable regional variations in house price trends. London and the Eastern and Southern regions of England have generally been more stable and witnessed an average growth rate higher than the UK average. Northern Ireland house prices have been much more volatile, exhibiting an extreme boom and bust pattern since the late 1990s. Northern regions and the Midlands have also performed slightly below the UK average in terms of house price rises, but have been more stable over time than Northern Ireland.
The House Price to Earnings ratio rose significantly in the boom period from 1997 to 2007 and, although it has fallen back since then, it remains high by historic standards. Affordability is therefore still an issue for many house buyers. While mortgage approvals are picking up gradually, housing completions remain subdued. The Help to Buy scheme has been received well by the industry and is
£ House price level
0
50000
100000
150000
200000
250000
300000
350000
4000002007 real price level Projections
High growth scenario Source: PwC analysis, ONSMain Scenario
Figure 1.3 – UK real house price projections to 2023 with high and low growth scenarios
Low growth scenario
2007 2008 2009 2010 2011 2012 2013 2014 2015 2016 2017 2018 2019 2020 2021 2022 2023
Are gilts the next bubble to burst?
As discussed in detail in Section 4, we do not believe that there is a large speculative bubble in gilts at present. This is because there are good reasons for the low long-term government bond rates seen in recent years in terms of the effects of quantitative easing (QE), high levels of investor risk aversion, pension fund requirements for long-term assets to match their liabilities, and bank regulatory regime changes since the crisis.
At the same time, recent yields look unsustainably low in the longer term given that QE is expected to unwind gradually over
likely to boost housing to increase housing supply will be needed to address longer term imbalances in the market that make UK house prices highly volatile.
We expect house prices to pick up gradually in the next four years at average rates of around 3-4% per annum – slightly higher on average than the consensus view. Based on this main scenario, average UK house prices might be back above their 2007 peak in cash terms as early as the end of 2014, but in real terms this might take until around 2021 (see Figure 1.3). However, there are still considerable uncertainties surrounding any such house price projections.
UK Economic Outlook July 2013 7
%
Figure 1.4 – Projections of 10 year gilt yields using alternative methods
0
1
2
3
4
5
6
Growth model (Method 3)
Source: Bank of England, PwC analysis, Consensus Economics survey
Forward yields (Method 1) Consensus forecastsBase rates + premia (Method 2)
2013 2014 2015 2016 2017 2018 2019 2020 2021 2022 2023 2024 2025
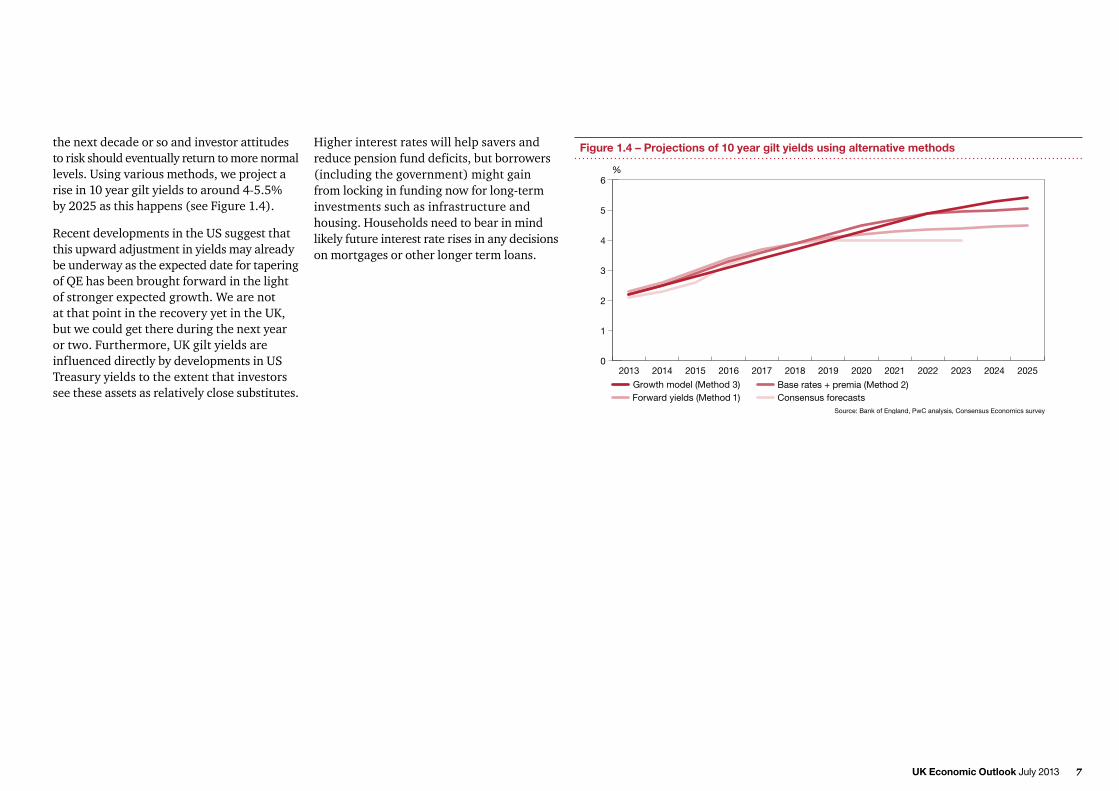
the next decade or so and investor attitudes to risk should eventually return to more normal levels. Using various methods, we project a rise in 10 year gilt yields to around 4-5.5% by 2025 as this happens (see Figure 1.4).
Recent developments in the US suggest that this upward adjustment in yields may already be underway as the expected date for tapering of QE has been brought forward in the light of stronger expected growth. We are not at that point in the recovery yet in the UK, but we could get there during the next year or two. Furthermore, UK gilt yields are influenced directly by developments in US Treasury yields to the extent that investors see these assets as relatively close substitutes.
Higher interest rates will help savers and reduce pension fund deficits, but borrowers (including the government) might gain from locking in funding now for long-term investments such as infrastructure and housing. Households need to bear in mind likely future interest rate rises in any decisions on mortgages or other longer term loans.

UK Economic Outlook July 20138
Key points
• The UK avoided a further technical recession with growth of 0.3% in Q1 2013, rebounding from a post-Olympics decline of 0.2% in Q4 2012.
• Growth continues to be led by the services sector, with manufacturing and construction experiencing negative growth in the year to Q1 2013. However, recent business surveys suggest some stabilisation in manufacturing and construction activity and we would expect these sectors to return to modestly positive growth over the next 18 months.
• Inflation remained well above target at 2.7% in May 2013 and it could rise further over the next few months. In our main scenario, we expect some moderation in inflation to around 2.4% in 2014, but upside risks remain from global commodity prices. Real earnings growth is likely to remain negative in both 2013 and 2014.
• We project growth for the UK as a whole to be around 1% in 2013, picking up gradually to around 2% in 2014 in our main scenario. As shown in Figure 2.1, all regions should return to modest growth this year, led by London. But downside risks remain given the continuing negative growth we expect in the Eurozone this year.
Introduction
In this section of the report we describe recent developments in the UK economy and review future prospects. The discussion covers:
2.1 Recent developments and the present situation
2.2 Economic growth prospects: national, sectoral and regional
2.3 Outlook for inflation
2.4 Monetary and fiscal policy options
2.5 Summary and conclusions
2.1 – Recent developments and the present situation
The UK economy grew by 0.3% in the first quarter of 2013 according to the latest estimates published by the ONS on 27th June. These confirmed that the UK avoided a further technical recession, recovering some momentum after a post-Olympics fall in real GDP of 0.2% in the final quarter of 2012. Over the year to Q1 2013, real GDP growth was 0.3%, or 0.5% excluding the volatile North Sea oil and gas sector.
Continuing the trend seen in recent years, this growth was driven by an expansion in domestic demand, which was 0.4% higher in real terms in Q1 2013 than in the corresponding quarter in 2012 (see Figure 2.2). This does, however, remain a
2 – UK Economic prospects
Figure 2.1 – UK business climate map
Source: ONS, Eurostat, PwC analysis.Note: Eurozone employment rate is from 2012 Q3.
*This means no change > 0.3%
Estimated average GDP growth in 2013 / Latest Employment rate (16-64)
UK outlook – cloudy but improving
Scotland
North West
Northern Ireland
North East
Wales
Yorkshire & Humberside69.30.7%
66.60.5%
66.60.5%
69.50.6%
70.60.9%
South West
East Midlands
74.60.9%
70.80.9%
South East
West Midlands
74.61.2%
London
East
74.70.9%
71.41.0%
Eurozone – still stormy
63.7-0.6%
71.80.9%
69.90.9% 70.41.4%
Increasing employment rate No change in the employment rate* Falling employment rate
% change p.a.
Figure 2.2 – Growth in the expenditure components of GDP in both real and nominal terms in Q1 2013, relative to Q1 2012
Source: ONS
-10
-8
-6
-4
-2
0
2
4
6
GDPTotal importsTotal exportsDomestic demandGeneral governmentFixed investmentHouseholds
Real Nominal
1.5
4.1
-8.3-7.7
0.8
-1.1
0.4
1.7
-0.8
0.3
-0.9-1.5
0.3
2.2

UK Economic Outlook July 2013 9
long way below pre-recession norms when domestic demand growth averaged around 3.5% per annum between 1998 and 20071.
Recent relatively modest domestic demand growth meant that import growth declined over the past year. Despite this, weak demand conditions in key export markets (most notably the Eurozone) led to a fall in real exports over the same period, so that the contribution of net exports to GDP growth remained marginally negative in the year to Q1 2013. However, increasing UK exports to non-EU countries in recent years are a more hopeful sign for the longer term health of the economy.
Fixed investment has also continued to decline, with a contraction in real terms of 8.3% in Q1 2013. While quarterly investment data may not be too reliable at this stage, the real decline of nearly 3% in the year to Q1 2013, relative to the year to Q1 2012, suggests that businesses remained cautious about growth prospects in the UK and its key export markets.
General government consumption continued to grow in the first quarter of 2013, although at a markedly slower rate than in 2012. Given the ongoing fiscal austerity programme, it seems likely that this slowdown will continue in future and growth could possibly turn negative.
The impact of high inflation in squeezing consumer spending can be seen in the fact that annual nominal growth in the latter of 4.1% translated to just 1.5% real growth in the year to Q1 2013 (see Figure 2.2). However, Q1 2013 did represent the sixth consecutive quarter of positive real household expenditure growth. This shows that, despite the pressure from high inflation, there are signs of life in the consumer. This issue is considered in more detail below.
Growth continues to be driven by the services sector
Figure 2.3 shows that growth has continued to be driven by services, with positive growth seen in sectors such as distribution, hotels and restaurants and business services and finance. This trend of services-driven growth has been witnessed throughout most of the recovery since Q3 2009 and is indicative of the failure of the UK economy to ‘rebalance’ towards manufacturing as some had hoped at the start of the recovery2.
Most non-services sectors continued to contract in the year to Q1 2013. As can be seen from Figure 2.3, there was a decline of 9.3% in mining and quarrying output in Q1 2013, relative to Q1 2012, which was predominantly due to weak North Sea oil and gas output. Significant declines were also evident in manufacturing and construction output over this period.
% change p.a.
Figure 2.3 – Sectoral output growth in Q1 2013, relative to Q1 2012
Source: ONS
-10
-8
-6
-4
-2
0
2
4
Mining & quarryingincl oil & gas
extraction
ConstructionManufacturingTransport, storage & comms
Business services& finance
Government &other services
Distribution, hotels& restaurants
Utilities
3.02.6
1.8
0.9
0.1
-2.6
-6.4
-9.3
Source: ONS Labour Force Survey
-250
-200
-150
-100
-50
0
50
100
150
200
250
300% change
Figure 2.4 – Change in employment by industry since the recession (Q4 2009 - Q1 2013, 000s)
1 Inflation Report, Bank of England, 8 May 2013.2 See Andrew Sentance’s post on the PwC Economics in Business blog for further analysis of the lack of rebalancing in the UK economy in recent years: http://pwc.blogs.com/economics_in_business/2013/04/why-the-uk-economy-is-not-rebalancing.html

UK Economic Outlook July 201310
While North Sea oil and gas output can be highly volatile and disassociated from long- term GDP growth trends, falls in manufacturing and construction output are more disappointing in what was hoped to be a recovery phase for the economy.
This point is reinforced by the data in Figure 2.4, which show the changes in employment across key sectors over the period since the recovery began in Q4 2009. This has been distributed unevenly across sectors, with growth being heavily focused on private sector services, and the largest employment declines being seen in construction and public administration. The latter reflects the fact that government cuts have focused particularly on local government, while areas such as health and education have been largely protected3.
Other important indications of the latest sectoral trends are provided by the CIPS/Markit Purchasing Managers Indices (PMIs). As can be seen from Figure 2.5, changes in purchasing activity in the services sector have been both positive (indicated by a PMI score above 50) and greater than in the manufacturing sector for all but one month in the last two years.
However, both services and manufacturing have shown increases in the index for each of the past four months. In addition, the last three months have seen the manufacturing index exceed 50, suggesting an increase in purchasing activity. This is the longest run of positive changes to the index in both sectors since the initial recovery faltered in late 2010, and suggests that improved output growth figures may be seen in the second quarter of this year. The construction sector PMI (not shown in the chart) also moved back into positive territory in May and June after a period of declining activity.
Signs of life for the consumer?
As discussed above, the latest figures show that household consumption expenditure has risen in real terms for six consecutive quarters since the end of 2011. This is despite high levels of inflation and associated negative real earnings growth (see Figure 2.6). The real earnings squeeze eased somewhat during 2012, but the recent upturn in the inflation rate has caused real earnings growth to become more negative again over the past few months.
Index
Figure 2.5 – Purchasing Managers’ Indices of business activity
30
35
40
45
50
55
60
65
Above 50 indicatesrising activity levels
Manufacturing Source: CIPS/MarkitServices
% change on a year earlier
Figure 2.6 – Real earnings growth
-4
-3
-2
-1
0
1
2
3
4
5
Source: ONS (defined as average earnings growth less CPI inflation rate)
3 These trends in employment are discussed in detail in our recent report on ‘Living with Austerity: public spending, jobs and the public mood’ (June 2013), which is available here: http://www.pwc.co.uk/government-public-sector/spending-review/index.jhtml

UK Economic Outlook July 2013 11
3.5% per annum. It should be noted, however, that this is largely due to price inflation, with retail sales volumes increasing by just 1.1% per annum over the same period.
Further positive news for some households is that house prices now appear to be on a gradual upward trend, after a rapid decline from the 2007 peak during the 2008-9 recession and a flat period in 2011-12. This has been supported in recent months by some increase in mortgage approvals, assisted by government schemes such as Help to Buy and Funding for Lending. Section 3 of this report provides a detailed discussion of house price trends and prospects, suggesting that this recent gradual upward trend should continue over the next few years.
However, the most important feature of the recovery which has boosted household spending has been the continued resilience of the labour market despite stagnant output growth. The unemployment rate fell again to 7.8% of the working age labour force in the three months to April 2013, while the claimant count fell to 1.51m in May.
This is not just a short term trend5 because, as shown in Figure 2.8, there has been strong growth in employment over the past three years. Almost all regions of the UK6 have seen a rise in total employment over this period, with growth led by London, Yorkshire and Humberside and the East of England.
Figure 2.7 highlights the importance of high rates of inflation in driving this trend, with the average annual increase in consumer prices having exceeded 3% from January 2009 to May 2013. This is more than one percentage point higher than the Bank of England target inflation rate. During a period of severe downward pressure on nominal wage growth in both the private and public sectors, this has led to the negative real earnings growth shown in Figure 2.6.
Breaking the Consumer Price Index (CPI) down into its component parts, the highest price increase over the year to May 2013 (as well as over the longer period shown in Figure 2.7) was seen in the education sector due in particular to the university tuition fee increases in September 2012. PwC analysis4
has shown that, excluding this exceptional rise in education costs, the rise in the cost of staple goods such as food and gas, electricity and water bills has meant that the poorest income groups have been hit the hardest by recent price rises.
Despite the combination of high inflation and low nominal earnings growth, consumer spending has been relatively resilient over the past few years. Retail sales by value are now 11% higher than their pre-recession peak in May 2008, and 16% higher than the trough in February 2009. This equates to an average annual increase in spending of over
Source: ONS
0
1
2
3
4
5
6
7
8% change
Figure 2.7 – Average annual inflation rate from January 2009 to May 2013, by component of the CPI
Source: ONS Labour Force Survey
-1
0
1
2
3
4
5
6
7% change
Figure 2.8 – Total employment change by region over past three years (Q1 2010 – Q1 2013)
LondonEast ofEngland
England WalesSouthWest
SouthEast
EastMidlands
NorthEast
UKScotlandWestMidlands
Yorks &Humberside
NorthWest
NorthernIreland
4 http://pwc.blogs.com/economics_in_business/2012/11/inflation-hits-richest-and-poorest-hardest.html5 In fact, the short term trend has been for the pace of labour market improvement in early 2013 to ease off somewhat, although the underlying trend in employment remains positive.6 Except the East Midlands, for which the small employment decline over this period is surprising given other indications that the region has performed broadly in line with the UK average for the past decade or so.

UK Economic Outlook July 201312
Relatively strong employment growth has also been seen in Wales and Scotland, which out-performed England and the UK as a whole over this period. The Spending Review on 26th June confirmed that more public sector job losses are likely but private sector job increases are expected to more than offset this over the next five years according to our recent report on this topic7.
A key driver of strong employment growth has been the fall in real earnings shown in Figure 2.6 above. This has helped to price people into jobs, which has cushioned the overall employment impact of the financial crisis. This in turn has limited the loss of employment-related skills and demonstrated the UK labour market’s flexibility.
However, the impact of these labour market trends on different age groups must also be considered. While employment amongst the over-50s in particular has increased rapidly, employment amongst individuals aged 16-24 has fallen by 2% over the past three years – the only age group to see such a decline over this period.
Are businesses ready to invest?
After falling very sharply during the recession of 2008-9, business investment has seen some recovery but to a lesser extent than in the aftermath of previous UK recessions.
Certainly the scale of the increase in investment seen so far does not match the rate of increase in equity markets since early 20098 (see Figure 2.9). This suggests that, in general, businesses remain relatively cautious about making major new investments in the UK.
The two key reasons for this caution are likely to be persistent credit constraints and demand uncertainty. Bank of England data show that, despite efforts to loosen credit constraints, lending to Small and Medium Enterprises (SMEs) in the year to Q1 2013 was 14% lower than in Q1 2012. This suggests that schemes such as Funding for Lending, which was introduced in July 2012, are failing so far to have a significant impact on banks’ behaviour in relation to SME lending in particular9. However, it is too early to pass final judgement on the impact of this scheme, which was revised earlier this year to give greater incentives for SME lending.
The second key constraint on business investment relates to demand uncertainty. As the UK’s primary export market, demand from the Eurozone will be important in determining the success of investments at many UK companies. As shown in Appendix A, estimated growth in the Eurozone remains negative in 2013, and there are large downside risks relating to the possibility of future
Index (January 2007 = 100)
US
UK
Eurozone
Figure 2.9 – Equity market indices
40
50
60
70
80
90
100
110
120
130
Euronext 100 Source: Thomson ReutersFTSE 100 Dow Jones Industrial
7 http://www.pwc.co.uk/government-public-sector/spending-review/index.jhtml8 Equity markets fell back in late June but this does not alter significantly the underlying upward trend since March 2009.9 There seems to have been more of a positive impact on mortgage lending.
flare-ups of the crisis in the region (the recent shifts in bond markets could be significant here). Similarly, the rapid growth of emerging markets, particularly in China, Brazil and India, has slowed somewhat of late. Such risks could reduce the desire for UK firms to expand their export potential. These factors, combined with relatively subdued UK domestic demand growth, appear to have led many businesses to abstain from major new investments in recent years and suggest that it will take time for investment to pick up strongly in the future.
2.2 – Economic growth prospects: national, sectoral and regional
We expect the gradual upward trend in UK economic activity seen so far in 2013 to continue through the remainder of the year. In this main scenario, we project average real GDP growth of around 1% in the year as a whole, picking up further to around its trend rate of 2% in 2014 (see Table 2.1). These GDP growth projections are very similar to those we made in our last UK Economic Outlook report in March, reflecting that the gradual economic recovery we expected at that time has proceeded more or less as anticipated.

UK Economic Outlook July 2013 13
These small differences may just reflect more recent UK growth data being somewhat more positive than the OBR and some other forecasters expected a few months ago. However, the broad profile of growth over time in our main scenario is not significantly different from that of the OBR or the consensus view – all three sources suggest a gradual economic recovery in 2013-14.
There is still considerable uncertainty over future growth prospects for the UK, particularly in light of potential developments in the Eurozone and global commodity prices. As usual, therefore, we have also considered two alternative UK growth scenarios, as shown in Figure 2.10. We can summarise these as follows:
• Our ‘strong recovery’ scenario sees a healthy rebound in UK growth to an average of around 1.5% in 2013, increasing to around 4% by the end of 2014. This scenario assumes a stronger recovery in the Eurozone over the next two years than in our main scenario, providing a significant boost to consumer and business confidence in the UK. This increases business investment and consumer spending, as well as external demand for UK exports. Other global economies are also assumed to grow faster in this scenario.
Our projection in Table 2.1 also envisages a gradual recovery in consumer spending growth. This is in line with our expectations of moderating inflation from mid-2013 onwards, which should help to reduce pressures on real disposable incomes. We have revised down our estimate for fixed investment growth in 2013 to reflect weak performance in recent quarters on latest revised ONS estimates, but we still believe that investment should show stronger growth through the remainder of 2013 and into 2014.
Net exports are also expected to contribute positively to GDP growth in 2013 and 2014, reversing the decline seen in 2012, as global macroeconomic conditions gradually improve in our main scenario (see Appendix A for more details of these global projections). But we are not anticipating strong export-led growth given continued difficulties in the Eurozone; domestic demand will remain the primary driver of UK growth in both years.
As a comparison of Tables 2.1 and 2.2 illustrates, our latest GDP projections are slightly more optimistic than those of the OBR (made in March) and the average of the independent forecasts surveyed by the Treasury in June (some of which forecasts were, however, made before June).
Source: latest ONS estimates for 2012, PwC main scenario for 2013-14.
(% real annual growth unless stated otherwise) 2012 2013 2014
GDP 0.2 1.0 2.0
Consumer spending10 1.2 1.4 1.7
Government consumption 2.8 1.1 0.8
Fixed investment 0.5 -4.3 2.4
Domestic demand 1.1 0.5 1.7
Net exports (contribution to GDP growth) -0.6 0.4 0.2
CPI inflation (%: annual average) 2.8 2.7 2.4
Table 2.1 – PwC main scenario for UK growth and inflation
10 We define this as household consumption expenditure not including consumption by not-for-profit institutions serving households, such as pension funds and life insurance companies.
Source: ONS, OBR Economic and Fiscal Outlook (March 2013), HM Treasury survey of independent forecasts (June 2013).
(% real YoY growth unless stated otherwise) Latest OBR forecasts Average estimates (March 2013) independent forecasts (June 2013)
Table 2.2 – Official and independent forecasts
2012 2013 2014 2013 2014
GDP 0.2 0.6 1.8 0.9 1.6
Manufacturing output -1.7 n/a n/a -0.6 1.5
Consumer spending 1.2 0.5 1.2 1.1 1.5
Fixed investment 0.5 2.2 6.7 1.3 4.7
Government consumption 2.8 0.4 -0.7 0.2 -0.7
Domestic demand 1.1 0.5 1.6 0.9 1.4
Exports 0.9 1.5 4.4 0.3 3.9
Imports 2.8 1.0 3.8 0.4 3.2
Current account (£ bn) -59 -44 -36 -48 -43
Unemployment claimant count (Q4, m) 1.59 1.6 1.6 1.58 1.54
UK Economic Outlook July 201314
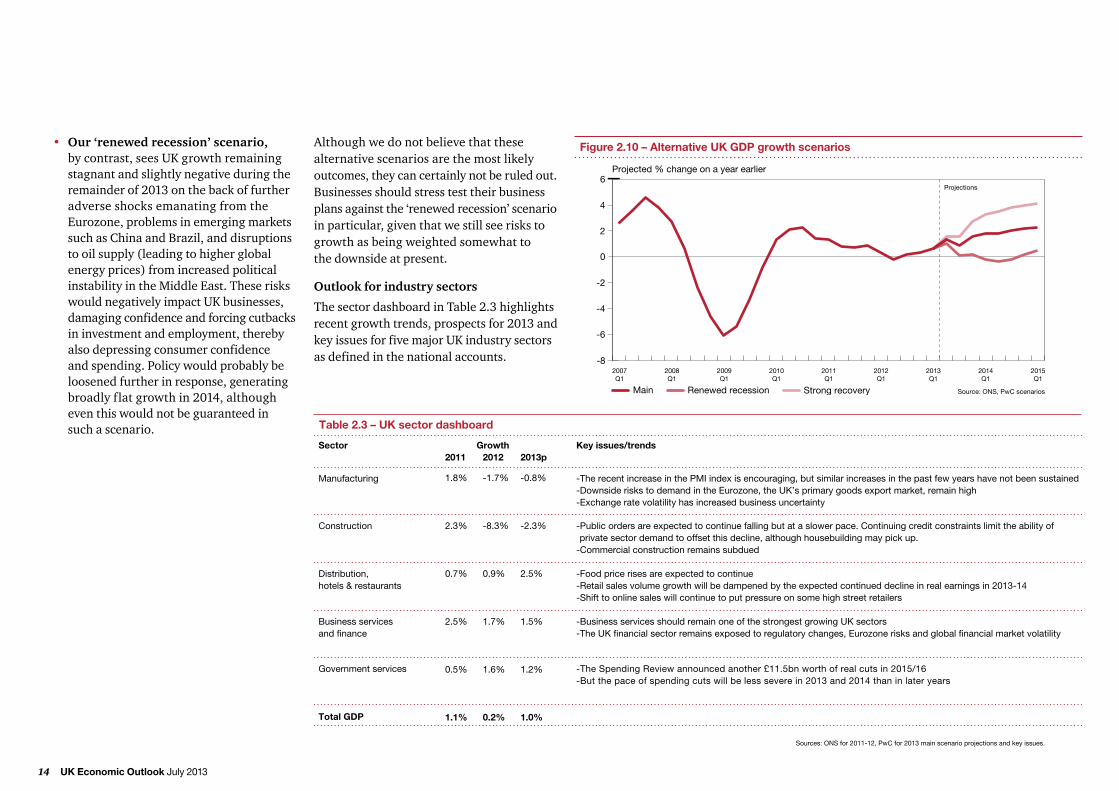
Although we do not believe that these alternative scenarios are the most likely outcomes, they can certainly not be ruled out. Businesses should stress test their business plans against the ‘renewed recession’ scenario in particular, given that we still see risks to growth as being weighted somewhat to the downside at present.
Outlook for industry sectors
The sector dashboard in Table 2.3 highlights recent growth trends, prospects for 2013 and key issues for five major UK industry sectors as defined in the national accounts.
• Our ‘renewed recession’ scenario, by contrast, sees UK growth remaining stagnant and slightly negative during the remainder of 2013 on the back of further adverse shocks emanating from the Eurozone, problems in emerging markets such as China and Brazil, and disruptions to oil supply (leading to higher global energy prices) from increased political instability in the Middle East. These risks would negatively impact UK businesses, damaging confidence and forcing cutbacks in investment and employment, thereby also depressing consumer confidence and spending. Policy would probably be loosened further in response, generating broadly flat growth in 2014, although even this would not be guaranteed in such a scenario.
Projected % change on a year earlier
Figure 2.10 – Alternative UK GDP growth scenarios
-8
-6
-4
-2
0
2
4
6
Main Source: ONS, PwC scenariosStrong recoveryRenewed recession
Projections
-The recent increase in the PMI index is encouraging, but similar increases in the past few years have not been sustained-Downside risks to demand in the Eurozone, the UK’s primary goods export market, remain high-Exchange rate volatility has increased business uncertainty
Manufacturing
Key issues/trendsSector
Total GDP
-Public orders are expected to continue falling but at a slower pace. Continuing credit constraints limit the ability of private sector demand to offset this decline, although housebuilding may pick up.-Commercial construction remains subdued
Construction
-Food price rises are expected to continue-Retail sales volume growth will be dampened by the expected continued decline in real earnings in 2013-14-Shift to online sales will continue to put pressure on some high street retailers
Distribution, hotels & restaurants
-Business services should remain one of the strongest growing UK sectors-The UK financial sector remains exposed to regulatory changes, Eurozone risks and global financial market volatility
Business services and finance
Table 2.3 – UK sector dashboard
-The Spending Review announced another £11.5bn worth of real cuts in 2015/16-But the pace of spending cuts will be less severe in 2013 and 2014 than in later years
Government services
Sources: ONS for 2011-12, PwC for 2013 main scenario projections and key issues.
Growth2011 2012 2013p
1.8% -1.7% -0.8%
2.3% -8.3% -2.3%
0.7% 0.9% 2.5%
2.5% 1.7% 1.5%
0.5% 1.6% 1.2%
1.1% 0.2% 1.0%

UK Economic Outlook July 2013 15
All UK regions should see positive growth in 2013 and 2014
As shown in Figure 2.11, economic growth is not likely to be distributed uniformly across the regions. Our estimates for 2013 range from 0.5% growth in the North East to 1.4% in London, while projected regional growth in 2014 ranges from around 1.5% to around 2.4%. This chart demonstrates that we do not expect a dramatic shift in relative regional fortunes over the next two years, with faster rates of growth again tending to be experienced in the South and Midlands. But all regions should follow the same broad upward trend in 2013-14 and the differences between regions are not large relative to the significant margins of uncertainty surrounding any such projections.
2.3 – Outlook for inflation
In our main scenario, we expect inflation on the consumer price index (CPI) measure, which is currently at 2.7% in the year to May 2013, to pick up to around 3% over the next couple of months. We expect inflation to moderate thereafter, falling very gradually towards its target rate of 2% as shown in Figure 2.12, but still averaging around 2.4% in 2014 as a whole. This is based on the expectation in our main scenario that a gradual revival in productivity should help restrain growth in domestic costs and temper inflationary pressures.
However, there are considerable uncertainties surrounding our main scenario for inflation, as reflected in the two alternative scenarios shown in Figure 2.12:
• In the ‘high inflation’ scenario, the combination of supply-side price shocks such as an increase in energy and commodity prices, and a stronger-than-expected rebound in demand pushes inflation to nearly 3.5% during next year.
• In the ‘low inflation’ scenario, weak growth in domestic demand, combined with a worsening global outlook and flagging demand for commodities, causes UK inflation to fall back towards target much earlier than expected in our main scenario, eventually falling to a little over 1% by the end of 2014 in this alternative scenario.
One notable longer term upside risk to inflation relates to the price of clothing and footwear. In the past these prices have been held down by cheap production by China and other emerging markets. However, rising income and education levels in these emerging markets, combined with increased consumer sensitivity to working conditions, will most likely lead to more rapidly increasing input costs in the medium term for clothing and footwear. This could reverse the historic downward pressure on the overall inflation rate from this source.
%
Figure 2.11 – PwC main scenario for growth by region
Source: PwC analysis
0.0
0.5
1.0
1.5
2.0
2.5
3.0
2013 2014
London East WalesSouthWest
SouthEast
EastMidlands
NorthEast
UKScotlandWestMidlands
Yorkshire andHumberside
NorthWest
NorthernIreland
Projected % change on a year earlier
Figure 2.12 – Alternative UK inflation (CPI) scenarios
0
1
2
3
4
5
Main Source: ONS, PwC analysisLow inflation High inflation
Inflation target = 2%
Projections

%
Figure 2.13 – Average nominal weekly earnings growth relative to the CPI inflation rate (2001-2017)
0
1.0
2.0
3.0
4.0
5.0
0.5
1.5
2.5
3.5
4.5
CPI Source: ONS for 2001-12, PwC analysis (main scenario) for 2013-17Average weekly earnings (excl bonus)
UK Economic Outlook July 201316
Outlook for real earnings growth
The impact of relatively high inflation has been to squeeze real earnings over the past five years, as shown in Figure 2.13 below. The impact of the recession was to reduce real earnings growth to just 0.1% in 2008, and then push it into negative territory for the following four years. Over the period 2008-2012 real earnings growth has averaged -1% per annum. In 2013, our main scenario is that the squeeze on real earnings will intensify with a -1.6% projected growth rate. This real earnings squeeze is projected to continue in 2014, although at a more modest rate of -0.6%.
We would then expect a gradual recovery in real earnings, but at an average real growth rate of only around 0.8% per annum in 2015-17, which would be around a third of the pre-crisis average rate of 2.3% per annum in 2001-711. Cumulatively, our main scenario projections imply that real earnings in 2014 would be around 7% lower than their peak level in 2008. The level of real earnings in 2014 would be back to approximately where it was in 2003.
By 2017, real earnings should have picked up a little, but will still be around 5% below their 2008 peak. We have not produced precise estimates of the period beyond 2017, but extrapolating forward would suggest that it might be around 2021 before real earnings get back to their 2008 peak levels.
2.4 – Monetary and fiscal policy options
The Bank of England’s Monetary Policy Committee (MPC) has kept monetary policy unchanged for the past year, with interest rates at 0.5% and the size of its asset purchase programme held constant at £375 billion. But recent decisions were not unanimous12 and further such quantitative easing (QE) cannot yet be ruled out if the growth seen in the first quarter of 2013 does not persist.
However, a more likely course of action for the Bank of England going forward is to follow the lead of the Federal Reserve and consider how to exit gradually from current very loose monetary policy if macroeconomic conditions continue to improve13. Managing this transition is likely to be the key challenge faced by incoming governor, Mark Carney, over the
11 This is indicative of the further de-coupling of wages growth, especially at the bottom end of the distribution, from growth in GDP. The so-called “pre-distributional” challenge; Resolution Foundation October 2012, Gaining from Growth: The Final Report of the Commission on Living Standards.12 The minutes of the February - June 2013 MPC meetings show that on each occasion three members of the committee, including the Governor, voted to increase the size of the Bank’s asset purchase programme by a further £25 billion to £400 billion. See, for example, the Bank of England Minutes of the Monetary Policy Committee meeting, 5 and 6 June 2013. We do not have the minutes for the July meeting at the time of going to print, so the vote that month is not yet known.13 See PwC’s Global Economy Watch – July 2013 for an interview with Andrew Sentance, Senior Economic Advisor at PwC, on the challenges faced by Mark Carney: http://www.pwc.co.uk/economic-services/global-economy-watch/index.jhtml
next few years as the resulting tightening in money policy could threaten to halt the economic recovery. However, failure to tighten policy in a timely manner would represent a considerable upside risk to inflation, so there is a difficult balance to be struck here.
As a result of the Spending Review on June 26th, an additional £11.5bn worth of real budget cuts were identified at detailed departmental
level in 2015/16. Overall spending totals were not changed materially from those set out in the Budget plans, however, so the macroeconomic impact of this review will not be significant compared to what we knew before this announcement. Furthermore, the pace of real spending cuts will be somewhat slower in 2013 and 2014 than in 2015 and later years according to plans set out at the time of the Budget.

UK Economic Outlook July 2013 17
2.5 – Summary and conclusions
The UK economy grew by an estimated 0.3% in Q1 2013, thus avoiding a technical recession. Although still significantly below pre-crisis growth rates, there are signs from recent business surveys that a gradual recovery is underway, led by private services sectors. We project growth for the UK as a whole to be around 1% in 2013, picking up gradually to around 2% in 2014 in our main scenario; this compares to average growth of just 0.2% in 2012.
Inflation remained well above target at 2.7% in May 2013 and we expect it to continue to be above target for some time, even with some moderation to an average rate of around 2.4% in 2014. This will contribute towards the real earnings squeeze of the past four years continuing in 2013-14, with positive real earnings growth not expected to resume
until 2015. This subdued real earnings growth rate should, however, enable employment to continue to grow at a reasonable rate, which will provide some support for consumer spending growth.
Considerable uncertainties continue to surround this main scenario, with risks to growth remaining weighted to the downside in relation to the Eurozone and possibly also a slowdown in some previously strong emerging markets. There are also upside possibilities for global growth next year, although in that case this could push up commodity prices and so feed through into higher UK inflation.
In summary, the economic environment remains challenging and the UK recovery is likely to remain relatively slow and bumpy.

UK Economic Outlook July 201318
3 – Is the UK housing market on the road to recovery?
Key points
• Average house prices have fallen by 18% in real terms since their last peak in Q3 2007. The fall has mainly been on account of subdued real earnings growth and restricted credit availability. In cash terms, however, UK house prices are only around 3% below their 2007 peak according to ONS data.
• Average house prices in the UK are now starting to recover and we expect this gradual upward trend to continue over the next few years. In cash terms, house prices could rise above their previous 2007 peak by the end of 2014, although this may take until 2021 in real terms according to our main scenario.
• There continue to be significant regional variations in house price trends. London and Northern Ireland are the main outliers while the rest of the UK has witnessed broadly similar house price trends on average since 1997. In Northern Ireland, house prices grew very rapidly between 1997 and 2007, but have since fallen back by nearly 60% in real terms. In London, average real house prices also grew strongly between 1997 and 2007, but have since fallen by only around 9%, which is only around half the real rate of decline for the UK as a whole. Helped by an influx of international money, London house prices are leading the current recovery in the market.
• While the value and number of mortgage approvals have risen slightly over the last couple of years, they remain a long way below 2007 peak levels. The recently announced Help to Buy scheme seems to be having a positive impact in the market in the short term.
• However, in the longer term other measures are likely to be needed to address more fundamental problems related to lack of housing supply and affordability for first time buyers.
Introduction
This article looks at national and regional trends in the UK housing market and presents our updated house price model including projections to 2023. We also provide (in Box 3.1) a brief synopsis of the recently announced Help to Buy scheme and early reactions to it. We have incorporated insights from PwC experts on the house building and mortgage lending industries in addition to those of our economics team.
The discussion is organised as follows:
3.1 UK and regional house price trends
3.2 Recent developments in UK housing supply and mortgage approvals
3.3 Outlook for UK house prices
3.4 Summary and conclusions
Further details of the model are contained in the Technical Annex.
Historical trends
Average UK house prices rose strongly in real terms up to 2007 (Figure 3.2). The housing market then crashed during 2008 with the onset of recession and prices have remained relatively subdued since then, despite a short-lived ‘false dawn’ in late 2009 and early 2010 (see Figure 3.3). Real earnings growth has remained negative for most of the last five years and credit conditions have been tight, particularly for first time buyers.
Since inflation has remained high in the UK (CPI inflation was 4.5% in 2011 and 2.8% in 2012, well above the target rate of 2%), house prices in real terms have continued to decline over the past two years despite a small rise in nominal (i.e. cash) terms.
3.1 – UK and regional house price trends
The analysis in this article is based on ONS house price indices. Data from ONS vary from that provided by Nationwide and Halifax, which have been the traditional sources of the data and are still widely used (including by PwC in previous such exercises). We decided to focus on the ONS data as they cover a larger sample size while Nationwide and Halifax base their house price indices only on their own mortgage approvals. A comparison of the three indices can be seen in Figure 3.1. Trends are broadly similar up to 2007, but somewhat stronger on the ONS index since 2007 (perhaps because the latter gives more weight to higher value properties, which have been rising more strongly in London in particular).
Index value
Figure 3.1 – Comparison between the 3 house price indices (ONS, Halifax and Nationwide),rebased to Q3 2007=100
0
20
40
60
80
100
120
Nationwide Source: ONS, Halifax, NationwideHalifaxONS
ONS
Nationwide
Halifax

UK Economic Outlook July 2013 19
0
50,000
100,000
150,000
200,000
250,000Peak Cash
Real
Average mix-adjusted house prices (real) in 1997 Q3 poundsSource: ONS, in real 1997 Q3 terms (when calculated in real terms, the data had been deflated using CPI)
Average mix-adjusted house prices (cash)
House prices (£)
Figure 3.2 – Average house prices levels in the UK
% growth
Figure 3.3 – Average real and nominal annual house price growth in the UK since Q3 1997
-20
-15
-10
-5
0
5
10
15
20
25
30Initial Peak
Final Peak False Dawn
Trough
Dip
Stall
Market revives
Average = 7.4% (nominal)
Average = 5.2% (real)
% growth p.a. (Real)
Source: ONS, PwC analysis (when calculated in real terms, the data had been deflated using CPI)
% growth p.a. (Nominal)
Ratio
Figure 3.4 – Average house prices to annual earnings ratio in the UK
0
1
2
3
4
5
6
7
8
9
10Peak8.6
Current7.4
4.5
Source: ONS
In the longer term, however, house prices have been on a strong upward trend with an annual average rate of increase of 7.4% in nominal terms between Q3 1997 and Q1 2013. In real terms, the average annual growth has been 5.2% over this period (Figure 3.3), which is well above real income growth as discussed further below in relation to affordability.
The housing market has also performed well in risk-adjusted terms in comparison with the equity market: the average return on the FTSE index was 9.5% in nominal terms and 4.2% in real terms over the period 1975-2012, while the returns on housing were 8.6% and 3.3% respectively. Therefore relative housing returns have been quite reasonable bearing in mind that house prices are much less volatile than equity prices.
Affordability
In relation to affordability, Figure 3.4 shows that the average house price to earnings ratio was around 4.5 in the latter part of 1997 (using ONS data – the ratios are lower using Nationwide or Halifax data). It then went up to 8.6 at the peak of the boom in 2007 before falling now to around 7.4. One reason why this ratio might still be high by historic standards is constrained housing supply. For those that can get mortgages, relatively low interest rates also help to make a higher house price to earnings ratio sustainable.
UK Economic Outlook July 201320
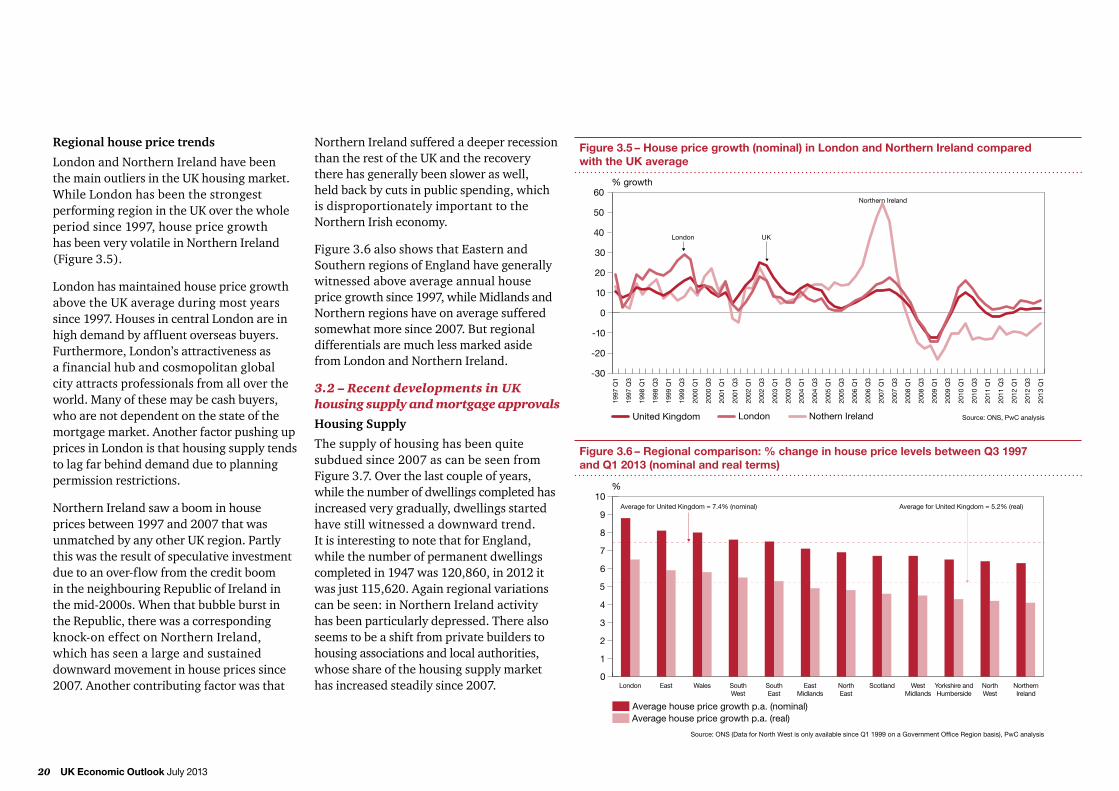
Regional house price trends
London and Northern Ireland have been the main outliers in the UK housing market. While London has been the strongest performing region in the UK over the whole period since 1997, house price growth has been very volatile in Northern Ireland (Figure 3.5).
London has maintained house price growth above the UK average during most years since 1997. Houses in central London are in high demand by affluent overseas buyers. Furthermore, London’s attractiveness as a financial hub and cosmopolitan global city attracts professionals from all over the world. Many of these may be cash buyers, who are not dependent on the state of the mortgage market. Another factor pushing up prices in London is that housing supply tends to lag far behind demand due to planning permission restrictions.
Northern Ireland saw a boom in house prices between 1997 and 2007 that was unmatched by any other UK region. Partly this was the result of speculative investment due to an over-flow from the credit boom in the neighbouring Republic of Ireland in the mid-2000s. When that bubble burst in the Republic, there was a corresponding knock-on effect on Northern Ireland, which has seen a large and sustained downward movement in house prices since 2007. Another contributing factor was that
Northern Ireland suffered a deeper recession than the rest of the UK and the recovery there has generally been slower as well, held back by cuts in public spending, which is disproportionately important to the Northern Irish economy.
Figure 3.6 also shows that Eastern and Southern regions of England have generally witnessed above average annual house price growth since 1997, while Midlands and Northern regions have on average suffered somewhat more since 2007. But regional differentials are much less marked aside from London and Northern Ireland.
3.2 – Recent developments in UK housing supply and mortgage approvals
Housing Supply
The supply of housing has been quite subdued since 2007 as can be seen from Figure 3.7. Over the last couple of years, while the number of dwellings completed has increased very gradually, dwellings started have still witnessed a downward trend. It is interesting to note that for England, while the number of permanent dwellings completed in 1947 was 120,860, in 2012 it was just 115,620. Again regional variations can be seen: in Northern Ireland activity has been particularly depressed. There also seems to be a shift from private builders to housing associations and local authorities, whose share of the housing supply market has increased steadily since 2007.
% growth
-30
-20
-10
0
10
20
30
40
50
60Northern Ireland
London UK
London Source: ONS, PwC analysisUnited Kingdom
Figure 3.5 – House price growth (nominal) in London and Northern Ireland compared with the UK average
Nothern Ireland
%
Figure 3.6 – Regional comparison: % change in house price levels between Q3 1997and Q1 2013 (nominal and real terms)
Source: ONS (Data for North West is only available since Q1 1999 on a Government Office Region basis), PwC analysis
0
1
2
3
4
5
6
7
8
9
10
Average house price growth p.a. (nominal)Average house price growth p.a. (real)
London East Wales SouthWest
SouthEast
EastMidlands
NorthEast
Scotland WestMidlands
Yorkshire andHumberside
NorthWest
NorthernIreland
Average for United Kingdom = 7.4% (nominal) Average for United Kingdom = 5.2% (real)

UK Economic Outlook July 2013 21
Figure 3.7 – Annual permanent dwellings started and completed in the United Kingdom
Source: Department for Communities and Local Government
0
50,000
100,000
150,000
200,000
250,000
All dwellings completed All dwellings started
1990 199319921991 1994 1995 1996 1997 1998 1999 2000 2001 20032002 2004 200720062005 20092008 2010 20122011
£mn value of approvals
Figure 3.8 – Value and number of mortgage approvals in the UK over the last 15 years
Source: Bank of England (monthly value/ number of approvals for house purchase to individuals)
0
2,000
4,000
6,000
8,000
10,000
12,000
14,000
16,000
18,000
20,000
Value of total approvals (£ mn) Number of total approvals
0
20,000
40,000
60,000
80,000
10,0000
12,0000
14,0000
16,0000Number of approvals
PwC experts on housebuilding think that confidence levels amongst builders are still relatively low as regards prospects for a strong recovery in the market. Another reason why supply is subdued is because of planning permission delays. Furthermore, after the housing market crash, not much cash was reinvested to get land ready to be built upon since the house builders were more concerned about bringing their debts down. For all these reasons, it is likely to take many years for the UK housing stock to rise to meet any increase in demand.
Mortgage approvals
Another challenge facing the housing market in recent years is that, as Figure 3.8 shows, the number as well as the value of mortgage approvals is still low, although they seem to be on a slightly upward trend more recently.
Most lenders now have adequate funding, so there is not a dearth of liquidity in the market. However, their lending is being constrained by lack of demand and tighter regulation. Conduct is a very important regulatory issue for banks and the size of conduct liabilities for them can be huge where problems arise. Very low interest rates are also disincentivising mortgage lending by banks due to a squeeze on spreads over deposit rates. Banks also
fear that, as and when interest rates rise, delinquencies might also increase given the persistent squeeze on household real incomes in recent years.
Government policy responses
During the past three years, the government has taken a number of measures to support housing and mortgage market activity. These have included a temporary stamp duty holiday for first time buyers paying up to £250,000 introduced in 2010, the First Buy scheme to help first-time buyers buying a new-build home in 2011, and the Funding for Lending scheme introduced in 2012 to incentivise banks and building societies to boost their lending. Most recently, the government introduced a ‘Help to Buy’ scheme in its 2013 Budget. The scheme is discussed in more detail in Box 3.1.
While all of these measures have helped to support the market in the short term, the longer term priority is to address underlying problems of inadequate housing supply. This would give a boost to the construction industry as well as to the household furniture and fittings industry, where demand is closely linked to housing market activity. Increased supply would also help to keep house prices down as and when prices recover.

UK Economic Outlook July 201322
The Help to Buy scheme is a £3.5 billion package that was introduced in the March 2013 Budget with the aim of helping up to 74,000 home buyers and boosting the construction industry.
The scheme has two parts:
1. The shared equity scheme came into effect on April 1, 2013.
This allows both first-time buyers and people moving up the property ladder to purchase new properties up to a value of £600,000 with a deposit of just 5%. The government provides an equity loan of 20 per cent, which is interest-free for the first five years, and the buyer takes out a mortgage for the remaining 75 per cent. This should enable the buyer to obtain a mortgage with a reasonably low interest rate.
2. The mortgage guarantee scheme comes into effect from January 2014.
This part of the scheme will see the government provide lenders with a guarantee of up to 15 per cent of the mortgage in an attempt to encourage banks and building societies to offer loans to borrowers with deposits as low as 5%. The scheme is available for new builds as well as existing homes and available to first-time buyers as well as existing homeowners.
1 UK Property transaction statistics, HMRC, April 20132 http://www.markiteconomics.com/Survey/PressRelease.mvc/885f7723342742888db8490f8013da933 http://www.bbc.co.uk/news/business-225811914 http://www.imf.org/external/np/ms/2013/052213.htm5 http://www.guardian.co.uk/money/2013/mar/26/help-to-buy-house-prices-obr6 http://www.rics.org/Global/Budget-2013-full-RICS-response.pdf7 http://www.hbf.co.uk/media-centre/news/view/positive-budget-for-housing/
“We mustn’t let this scheme turn into a permanent scheme. Now when is the right time to terminate it will depend on economic conditions at the time.”Mervyn King, Bank of England, 19 May 20133
“This measure may temporarily help boost confidence in the housing market, but there is a risk that, in the absence of an adequate supply response, the result would ultimately be mostly house price increases that would work against the aim of boosting access to housing.” International Monetary Fund, 22 May 20134
“The key is, is it just going to drive up house prices? By and large, in the short run the answer to that is yes. But in the medium term will the increased house prices stimulate more housebuilding, and our general answer to that would probably be ‘a bit’. But the historical evidence suggests not very much.”Stephen Nickell, Office for Budget Responsibility, 26 March 20135
“The range of measures announced under the Help to Buy scheme to kickstart the housing market are much needed. Helping those who cannot afford large deposits by using the government’s balance sheet to guarantee mortgages and using capital savings to offer shared equity loans on new-build for all buyers will help prevent prolonged market stagnation … However, government needs to be careful this doesn’t create another housing bubble.” Simon Rubinsohn, Royal Institution of Chartered Surveyors, 22 March 20136
“A lack of affordable mortgage availability remains the biggest constraint on housing supply, something government now clearly understands and is looking to address … Building the homes the country desperately needs can be a key driver of economic activity. Government must be praised for its attempts to stimulate [housing market] activity, but must also be wary to get the details right.” Stewart Baseley, Home Builders Federation, 20 March 20137
Box 3.1 - Help to Buy scheme
Reactions to the scheme
Reactions to the scheme have been somewhat mixed as can be seen from the quotes adjacent. Early data show that the scheme has had some immediate positive impact on the market, with the Home Builders Federation (HBF) recently announcing that 4,000 people have reserved a new home in the two months since the shared equity part of the scheme launched in April, although this needs to be seen in the context that there were over 930,000 residential property transactions in the UK during 20121. Also, as noted in the latest Markit housing index release, the scheme has boosted market sentiment significantly2.
On the other hand, some analysts have warned that the boost to demand from the scheme risks raising house prices too far in the longer term – putting properties further beyond the reach of first-time buyers that the scheme aims to help. Mervyn King has argued that the scheme should not extend beyond its current three year term to avoid distorting the mortgage and housing markets in the longer term and the IMF has expressed similar views.
In summary, the Help to Buy scheme should help to support a short term recovery in the housing market, but other measures will be needed to address underlying issues relating to lack of housing supply and affordability.

UK Economic Outlook July 2013 23
3.3 – Outlook for UK house prices
We have updated our UK house price model, which was first published in 2006 and has been regularly reviewed since then. Our model uses annual earnings, housing supply, credit conditions in the market and mortgage interest rates as explanatory variables for house price trends since 1975. Further technical details can be found in the Annex.
In the short term, we assume that average earnings will continue to grow relatively slowly, but with some upward trend over time to around 4% by the early 2020s. We also assume that credit conditions will improve gradually and interest rates will start rising later this decade (consistent with our discussion in Section 4 of this report). Based on these ‘main scenario’ assumptions, house prices are projected to grow by around 3-4% per annum in nominal terms until 2017. House price growth would then accelerate gradually to around 6.5% per annum by 2023, which is not far from its long run average growth rate since 1997. In cash terms, house prices might be back above their 2007 peak levels by the end of 2014 in our main scenario. In real terms, as discussed further below, this would only happen by around 2021 after adjusting for CPI inflation.
Projecting house prices always involves large uncertainties. To reflect this, we have also considered high and low growth scenarios as shown in Table 3.1.
In our high growth scenario, earnings growth reaches 4% by 2017, credit conditions improve quickly to be close to their long term average by 2017, but the cost of borrowing also rises quickly and housebuilding picks up. In our low growth scenario, earnings grow at under 2% until 2023, housing supply remains weak growth, credit conditions remain highly constrained but the cost of borrowing remains relatively low.
From Table 3.1 we can see that our main scenario is slightly more optimistic than the latest consensus forecast, but any differences are well within the margins of error indicated by our alternative scenarios and the range of independent forecasts. A low growth scenario would see very little house price growth over the period to 2017, while a high growth scenario would see house prices rising by around 7% per annum by 2016-17.
Real house price projections
We have also looked at real house price projections, which are more relevant for longer term comparisons. These are based on PwC CPI inflation projections of 2.7% in 2013, 2.4% in 2014 and then an average of 2.1% until 2017. In the longer run, CPI is assumed to be at its target rate of 2%. House price level projections in real terms relative to these CPI assumptions are illustrated in Figure 3.9.
*Based on ONS house price index – other forecasters use various different indicesSource: PwC analysis, ‘Forecasts for the UK economy: a comparison of independent forecasts’, HM Treasury (May 2013).
Table 3.1 – Comparison of PwC scenarios for annual nominal house price growth (%) with independent forecasts
PwC scenarios* Treasury survey of independent forecasters
Year Main High Low Average High Low
2013 1.9 3.8 0.0 1.2 2.5 -1.3
2014 3.0 5.5 0.4 1.9 5.6 -0.9
2015 3.2 5.9 0.7 3.3 7.7 -1.4
2016 4.0 7.0 1.1 3.9 6.4 -0.7
2017 4.5 7.2 1.9 3.7 5.2 0.5
£ House price level
0
50,000
100,000
150,000
200,000
250,000
300,000
350,000
400,0002007 real price level Projections
High growth scenario Source: PwC analysis, ONSMain Scenario
Figure 3.9 – UK real house price projections to 2023 with high and low growth scenarios
Low growth scenario
2007 2008 2009 2010 2011 2012 2013 2014 2015 2016 2017 2018 2019 2020 2021 2022 2023

UK Economic Outlook July 201324
In real terms, our model forecasts house prices to fall in 2013 before starting to make a gradual recovery from 2014 and ending up with 2.4% growth in 2017, rising to 4.4% real growth in the long run (2023). We can see that, in our main scenario, the level of real house prices would exceed its 2007 peak in 2021, while in our high growth scenario this could happen as early as 2018. In contrast, in our low growth scenario real house prices would remain well below their 2007 peak even in 2023, the final year of our projection period.
We have also performed some sensitivity tests in order to analyse how house prices might behave if any one of the key explanatory variables do not behave as assumed. The results of the analysis can be seen in Table 3.2.
We can see that house price projections are most affected by deviations in earnings growth. If earnings growth was kept constant at the current low rates, which is admittedly a very pessimistic assumption, the cumulative nominal increase in house prices would be just 24% over the period to 2023, as compared to a 61% rise in our main scenario. If credit conditions do not improve, growth in house
prices would cumulatively be around 6% lower than in our main scenario. If housing supply does not accelerate, then the growth will also be higher, but not to a large degree (64% vs 61%). It is perhaps surprising to see the minimal effect of keeping mortgage rates low. This result might be explained by the fact that, while lower mortgage rates boost demand for housing from potential buyers and so push up prices, lenders also have less incentive to expand credit when rates are low, which offsets the demand effect. As a result, in our model, mortgage rates only affect the short term path of house prices, not their long run equilibrium level.
3.4 – Summary and conclusions
House prices rose significantly in the UK over the 10 years up to their peak in Q3 2007, but have since fallen by around 18% in real terms (but only 3% in cash terms on the ONS index). While average house price increases continue to be subdued by pre-2007 standards, they are now on an upward trend.
There have been considerable regional variations in house price trends. London and the Eastern and Southern regions have been more stable and witnessed an average growth rate higher
than the UK average, but Northern Ireland has seen much more volatility, exhibiting an extreme boom and bust pattern since the late 1990s. Northern regions and the Midlands have also performed slightly below the UK average in terms of house price rises, but have been more stable.
The House Price to Earnings ratio rose significantly in the boom period from 1997 to 2007 and, although it has fallen back since then, it remains high by historic standards.Affordability is therefore still an issue for many house buyers. While mortgage approvals are picking up gradually, housing completions remain very subdued. The Help to Buy scheme has been received well by the industry and is likely to boost demand in the short term,
but measures to boost housing supply will be needed to address longer term imbalances in the market that tend to make house prices highly volatile.
We expect house prices to pick up gradually in the next four years at average rates of around 3-4% per annum, which is slightly higher on average than the consensus view. Based on this main scenario, average UK house prices might be back above their 2007 peak in cash terms as early as the end of 2014, but in real terms this might take until around 2021. However, there are still considerable uncertainties surrounding any such house price projections.
Source: PwC analysis
Main Earnings growth Credit Mortgage rates UK house scenario remains at conditions constant at building current low rates do not current levels remains at improve from current current levels low levels
Cumulative rise innominal house prices 61% 24% 55% 61% 64%to 2023
Table 3.2 – Sensitivity analysis: Comparison of current model results with alternative assumptions over 2013-2023

UK Economic Outlook July 2013 25
The PwC house price model consists of two parts: a long run equilibrium equation and a short run error correction model that indicates how house prices adjust back towards this equilibrium level.
In the long run, house prices are driven by three key variables: annual earnings, the ratio of the housing stock to the population (‘supply’) and a variable which reflects general credit conditions.
In the short run, changes in house prices are driven by: deviations from the long run equilibrium; changes in annual earnings; changes in the credit conditions variable; and the previous period’s mortgage interest rate (cost of borrowing). The coefficients for these model variables and other summary statistics for both models are shown in the tables below.
Our preferred model is somewhat different from the one we used last year although its basic structure is similar. As explained earlier,
we used ONS as the source of house price data since they cover a larger sample size than Nationwide or Halifax (previously we used the average price from those two sources). We modelled nominal house prices this year as opposed to real house prices last year, and the independent variables used in the short run model have changed somewhat.
These decisions were based on standard diagnostic tests that we performed in order to find the most appropriate model specification and the best fit equations for the data. The parameters of the model were estimated using the standard ordinary least squares (OLS) econometric technique based on annual data from 1975-2012. In the process, we investigated the possibility of using variables in real terms as well as different variables such as (including lags and differences where appropriate) unemploy-ment, population aged between 25 and 44, the exchange rate, and govern-ment bond yields, but these were not found to be significant at the 5% level.
Technical Annex: PwC House Price Model
R-squared = 0.98Dependent variable: Nominal house prices No. of observations=38
Coefficient t-statistics
Earnings 16.3 20.15
Supply -3636.8 -11.42
Credit 35067.8 7.54
Constant 1310908.0 11.14
Long run model (cointegrating equation)
R-squared = 0.60Dependent variable: Change in Nominal house prices No. of observations=37
Coefficient t-statistics
L. co-integrating equation residual -0.2 -2.37
D.Credit 18346.5 4.85
D.Earnings 8.79 2.8
L.Mortgage rate -771.5 -3.2
Constant 6302.1 2.06
Short run model
Note: ‘D’ refers to the first difference of a variable (i.e. change on previous year). ‘L’ refers to the lagged value of a variable in the previous year.All variables are in nominal terms. The critical value of the t-statistic at 5% significance level is 1.69 for degrees of freedom=36/37.
If the positive value of the observed t-statistic is greater than 1.69, then the corresponding coefficient is significant at the 95% confidence level.

UK Economic Outlook July 201326
Key points
• There may not be a speculative bubble in gilts, but current yields look unsustainably low.
• Using various methods, we project a rise in 10 year gilt yields to around 4-5.5% by 2025 as monetary policy gradually tightens and risk aversion returns to more normal levels.
• This will helps savers and reduce pension fund deficits, but borrowers (including the government) might gain from locking in funding now for long term investments such as infrastructure and housing.
Introduction
The total UK government debt stock is now around £1.2 trillion, having more than doubled in cash terms since 2007. The great majority of this debt (more than £1 trillion) is in the form of gilts1. With growth remaining subdued, the public debt to GDP ratio is now above 70% of GDP and set to reach around 85% of GDP by 2016/17 before flattening off according to the OBR. Two of the three major credit rating agencies2 downgraded the UK’s AAA status earlier this year in the light of these trends. Nevertheless, 10 year gilt yields in early July were still only around 2.4%, despite some increases in recent months3.
So are we looking at a large bubble in government bonds in the UK (and elsewhere) that will inevitably burst sooner or later with
consequent large rises in gilt yields? If this does happen, will it be a gradual adjustment over many years or could it occur more suddenly and dramatically? And who will be the key winners and losers from this process?
To explore these questions, we first look at historic trends in UK and other major sovereign bond yields and discuss why these yields have generally remained so low in recent years (Section 4.1). We then consider a number of alternative methods for projecting forward UK gilt yields over the next ten years (Section 4.2). Finally, we review the potential implications of these projected gilt yield increases for the government, pension funds, banks, companies and individuals (Section 4.3).
4.1 – Historic trends in UK and other government bond yields
Figure 4.1 shows that gilt yields have fallen to record lows in recent years, with only comparatively modest rises over the past couple of months. This is despite the fact that the stock of public debt has risen much faster than expected and is now projected by the OBR to reach a peak of over 85% of GDP by 2016/17. As shown in Figure 4.2, this compares to a projected peak of around 70% of GDP in 2013/14 in the OBR’s June 2010 forecast at the time when the coalition govern- ment’s austerity plans were first announced.
4 – The trillion pound question – are gilts the next bubble to burst?
%
UK
US
Japan
Figure 4.1 – 10 year government bond yields in US and UK relative to Japan
0
1
2
3
4
5
6
UK Source: BloombergUS Japan
% GDP
Figure 4.2 – UK public debt ratio projections made in 2010 and 2013
50
55
60
65
70
75
80
85
90
March 2013 Source: OBR projections at time of June 2010 and March 2013 BudgetsJune 2010
March 2013
June 2010
1 Gilts are UK government bonds with a maturity of one year or more. They come in conventional (nominal) and index-linked form.2 Moody’s downgraded the UK’s sovereign credit rating in February 2013 and Fitch followed in April. S&P has, however, reaffirmed the UK’s AAA rating.3 This followed increases in US Treasury bond yields following indications that the Fed may reduce the pace of its asset purchases under QE3 faster than expected. These recent US developments were discussed in more detail in the July issue of our Global Economy Watch report, which is available from: http://www.pwc.co.uk/economic-services/global-economy-watch/index.jhtml

UK Economic Outlook July 2013 27
The record low level of government bond yields in recent years is common to a number of other countries including the US. As Figure 4.1 shows, these have fallen towards (although not quite reached) the kind of low levels seen in Japan for the last two decades. Bond yields have risen in recent months, led by the US, but still remain very low by historic standards.
Low interest rates in the major advanced economies are related to exceptionally loose monetary policy, including large purchases of these bonds by major central banks. In the UK, gilt purchases under Quantitative Easing (QE) programmes totalling £375 billion have been equivalent to almost all gilt issuance since the programmes began in early 2009, and currently amount to around a third of the total outstanding stock of gilts.
Low government bond yields also reflect a number of other factors including:
• Risk aversion of investors leading to a flight to safety, which US and UK government bonds are still perceived to provide despite slight downgrades in their credit ratings.
• Institutional investors such as pension funds and insurance companies still needing to hold longer term government bonds as a major part of their portfolio in order to match their long-term liabilities.
• Increased demand from banks which need to hold government bonds as part of higher liquidity requirements under Basel III, Dodd-Frank and other post-crisis regulatory regimes4.
As discussed in a recent PwC Economics blog article5, these factors explain why the loss of AAA credit ratings for France, the US and the UK in the past couple of years did not lead to any immediate significant rise in bond yields (see Figure 4.3). Indeed the immediate trend in all three countries was for yields to fall further in the immediate period after the downgrade for the kind of reasons listed above.
All of this suggests that gilts may not at present constitute a purely speculative bubble because there are good reasons for the low yields seen in recent years. But with international bond markets becoming nervous in recent months as they see the end of QE in sight in the US, how long can this situation last?
%
Figure 4.3 – Bond yields around time of credit rating downgrades
Source: PwC analysis of Bloomberg data(horizontal axis shows years before and after loss of AAA rating)
France US UK
%
0
1
2
3
4
5
6
As at June 2012 Source: PwC analysis of Bank of England data
As at June 2007 (pre-crisis)
Figure 4.4 – Forward 10 year gilt yields as at June 2007, 2012 and 2013
As at June 2013
2007 2008 2009 2010 2011 2012 2013 2014 2015 2016 2017 2018 2019 2020 2021 2023 2024 2025 20262022 2027
4 Manmohan Singh, ‘The Changing Collateral Space’, IMF Working Paper, WP/13/25, January 2013.5 Robert Vaughan and Milos Bartosek, ‘Why are bond markets disregarding credit ratings?’, posted on PwC Economics in Business blog on 26 April 2013: http://pwc.blogs.com/economics_in_business/2013/04/why-are-bond-markets-disregarding-credit-ratings.html

UK Economic Outlook July 201328
4.2 – Alternative methods for projecting gilt yields
We have looked at three possible bases for projecting bond yields and have compared them with average independent forecasts. No single method is reliable on its own, but looking at these various different approaches should give a reasonable indication of how far and how fast gilt yields might rise over the next ten years. We focus here on 10 year nominal gilt yields as one of the most common benchmark rates.
Method 1: Forward yields
The most direct method is to look at forward gilt yields. Figure 4.46 shows that, in mid-June 2013, these were indicating a gradual rising trend for 10 year gilt yields to around 4.2% by 2020 and around 4.5% by 2025.
Interestingly, as the chart shows, estimates of where 10 year gilt yields will be in 2020 have not changed materially since before the crisis in June 2007, when they were showing a downward projected trend from an initial spot rate of over 5%. The forward yield curve has moved up slightly since last year, but the projection for where gilt yields will be in the mid-2020s has not changed significantly. It seems that market views on what a ‘normal’ level for gilt yields should be in the long run have remained fairly firmly anchored at around 4.5% despite significant shifts in spot yields over time.
Method 2: Base rates plus term premia
10 year gilt yields can be seen as an accumul-ation of shorter term interest rates over a ten year period. In addition, one might usually expect a ‘term premium’ due to the longer maturity that 10 year gilts need to be held. It is possible, given estimates of future short term rates, to estimate what this term premium is at any given time, although this will always be somewhat uncertain to the extent that expected future base rates cannot be observed directly.
Historically, some idea of the relationship can be seen from the long term relationship between 10 year gilt yields and base rates, as shown in Figure 4.5. The relationship between these two interest rates has varied considerably over time, but on average since 1985, the 10 year gilt yield has been higher by around 33 basis points. This provides an estimate of the maturity premium.
Another approach is to try to estimate historic term premia econometrically as in a recent Bank of England working paper7. This suggests an average term premia of around 50-70 basis points during what might be considered a relatively ‘normal period’ between 1998 (after Bank of England independence) and 2006 (before the global financial crisis began).
In summary, we might estimate a normal term premium between 10 year gilt yields and base rates of around 30-70 basis points. Our base case estimate is 50 basis points.
%
Figure 4.5 – Bank of England base rates and 10 year gilt yields
0
2
4
6
8
10
12
14
16
10 year gilt yields (%) Source: Bank of EnglandBoE base rates (%)
%
Figure 4.6 – Projections for base rates and 10 year gilt yields - Method 2
0
1
2
3
4
5
6
2013 2014 2015 2016 2017 2018 2019 2020 2021 2022 2023 2024 2025
BOE base rates (%) Source: PwC analysis10 year gilt yields (%)
6 This chart shows market expectations at three different dates of where 10 year gilt yields will be at certain subsequent dates. All data are for 10 year maturities at different dates, in contrast to some other kinds of forward yield curves showing rates for different maturities at a given point in time.7 Martin Andreason, ‘An estimated DGSE model: explaining variation in term premia’, Bank of England Working Paper No. 441, December 2011.

UK Economic Outlook July 2013 29
%
Average expected base rate over next 10 years 2.5
Actual ten year gilt yield (1/7/13) 2.4
Estimated term premium -0.1
Table 4.1 – Estimated term premium for 10 year gilt yields (1 July 2013)
Source: PwC analysis using data from Treasury and Bank of England
Looking ahead, the current term premium depends on how base rates will evolve in future. One reasonable assumption here is that they follow average independent forecasts (up to 2016) and then move up gradually to a long term normal level of around 4.5% by 2025 (see Figure 4.6). On this basis, we estimate the term premium for 10 year gilts in early July to have been negative at around -10 basis points, as shown in Table 4.1.
If we assume that base rates evolve as in Figure 4.6. while the term premium adjusts slowly over the next ten years back up to a more normal level of around +50 basis points, the implied path of gilt yields would be as shown in Figure 4.6. By 2025, gilt yields would be back up to around 5%.
Method 3: Econometric model linked to GDP growth
There are theoretical reasons going back to very early models by Frank Ramsey8 why interest rates and economic growth should be related in the long run. In particular, if interest rates remain below economic growth for long periods, this would destroy the incentive to save and invest.
However, these models rely on many simplifying assumptions that may not hold in reality. To test the relationship in practice we need to look at actual data using an econometric model.
Further details of the methodology we have used here are set out in the Annex. We use nominal GDP growth over the following ten years as an explanatory variable for nominal 10 year gilt yields, as well as a variable capturing the regime change after the shift to inflation targeting in the UK from late 1992. This regime change reduced expected inflation and so nominal gilt yields significantly, as confirmed by our econometric estimates. The relationship with future GDP growth is positive and highly statistically significant (with more than 99% confidence) as economic theory would suggest.
Looking forward, if we assume that nominal GDP growth follows OBR projections until 2017 and then settles at a long term average rate of just over 4%, we can derive projections for 10 year gilt yields (see Figure 4.7). These also show gilt yields rising steadily to just over 5% by 2025, similar to the results using our second method.
8 F.P. Ramsey (1928), ‘A mathematical theory of saving’, Economic Journal, 38, 152, pp 543-559.
%
Figure 4.7 – Assumed nominal GDP growth and projected 10 year gilt yields - Method 3
0
1
2
3
4
5
6
Q1 2023Q1 2022Q1 2021Q1 2020Q1 2019Q1 2018Q1 2017Q1 2016Q1 2015Q1 2014
Nominal GDP growth (%)Source: PwC analysis using Bank of England
data and OBR growth projections to 201710 year gilt yields (%)

UK Economic Outlook July 201330
Comparison with average independent forecasts
Figure 4.8 shows how 10 year gilt yields using our three methods compare with each other and with the average from the latest long-term forecasts surveyed by Consensus Economics in April 2013.
We can see that the broad shape of the pro-jections is similar in all four cases, although beyond 2020 it seems that Methods 2 and 3 project somewhat greater increases to around 5-5.5% by 2025, while forward yields peak at around 4.5%. The Consensus Economics survey shows an average forecast of around 4% in 2019-23, although this may have risen somewhat since April when the latest long-term survey was carried out.
In summary, whichever method we use there are good reasons to expect 10 year gilt yields to rise significantly over the next decade, perhaps to around 4-5.5% by 2025. They suggest that this will be a gradual process rather than happening suddenly, although experience shows that there could always be surprises here, particularly if markets start to re-evaluate their views on the future pace of UK monetary tightening, as seems to have occurred since late May in the US.
The next question is what implications will rising gilt yields have – who will be the winners and losers?
4.3 – Implications of rising gilt yields
(i) GovernmentFor the UK government (and indeed those elsewhere) higher bond yields are a clear negative in terms of increased debt service costs. They provide a powerful reason to halt the rise in public debt in the medium term to avoid these debt service costs rising out of control in the long run. It is true that higher gilt yields would only affect newly issued debt, but even so we estimate that annual debt service costs could be around £8-10 billion higher by 2025 if average gilt yields rise to around 4.5-5% by that date, rather than remaining at current levels.
At the same time, there is also a window of opportunity now for government to take advantage of current low gilt rates to fund long-term economic and social infrastructure (transport, communications, housing etc) in an affordable way. The government has made some moves recently to soften earlier sharp cuts in capital spending, as well as offering government guarantees to private sector investment in some cases, but there is a good case for looking at additional infrastructure investment in future years.
(ii) Pension schemes and insurance companies9 Defined benefit pension schemes use a long term measure of interest rates and implied inflation to measure their liabilities. Depending on the purpose for which the measurement is intended, the actual reference rate can vary:
• For calculation of liabilities for funding purposes (which drives required employer contributions) the rate used is a prudent measure of expected return. This tends to be described as a particular margin over long term gilts, so any rise in the gilt rate should translate into a higher discount rate.
• For the calculation of liabilities for accounting purposes, a yield equivalent to an AA long term corporate bond rate is used, so the effect of a rise in gilt yields will depend also upon the associated movement in corporate bond spreads. But in general, higher gilt yields will boost this rate to some degree.
Although this varies between schemes, an average pension scheme has real rate exposure to about 70% of liabilities and nominal rate exposure to the other 30%. Just about all pension schemes are less than 100% hedged against this exposure, with most having more than 50% exposure unhedged.
Therefore a rise in long term nominal rates will improve funding on nominal liabilities, but the impact on real liabilities is dependent upon the associated move in implied inflation. So long as expected inflation remains reasonably close to target, however, we would also expect real rates to rise materially as nominal gilt yields increase.
%
Figure 4.8 – Projections of 10 year gilt yields using alternative methods
0
1
2
3
4
5
6
Growth model (Method 3)
Source: Bank of England, PwC analysis, Consensus Economics survey
Forward yields (Method 1) Consensus forecastsBase rates + premia (Method 2)
2013 2014 2015 2016 2017 2018 2019 2020 2021 2022 2023 2024 2025
9 This sub-section draws on insights from Nicholas Secrett, director in our pensions advisory practice, and Shazia Azim, partner specialising in the insurance sector.

UK Economic Outlook July 2013 31
A large part of the deterioration in pension scheme funding levels over the last two years has been driven by the sharp decline in gilt rates in 2011. A number of schemes, however, have arrangements in place that will serve to lock in long-term gilt yields at around 4% as and when they do rise (e.g. by selling riskier assets like equities, property and commodities to buy long-term gilts, or via derivatives contracts). This could lead to some volatility in asset markets as these ‘trigger rates’ are approached.
It follows that the potential future rise in long-dated gilt yields with maturities over 15-20 years may be capped to some degree by these pension scheme reactions. However, short and medium-dated gilt yields may be less affected by this as they are less appropriate as a hedge for pension fund liabilities. Consequently, this kind of pension fund behaviour could cause future yield curves to become inverted, with long-term rates below medium-term rates, as indeed was sometimes seen in the UK in the years before the crisis.
If higher gilt yields reduce pension fund deficits, this should allow companies to reduce their contributions to defined benefit schemes, although it is unlikely to reverse the trend towards closure of these schemes given the risks they impose on employers. Lower deficits could also increase the number of insurer buy-outs of defined benefit schemes.
The implications for life insurance companies are likely to be broadly similar to those for pension schemes. The discount rate used to calculate liabilities for regulatory purposes will increase, so reducing the present value of those liabilities.
The impact of the asset side of the balance sheet for insurance companies is less clear, depending in particular on how higher gilt yields affect equities and other riskier assets. If higher gilt yields are driven mostly by higher expected economic growth, then equities could also rise. But if this most reflects tighter expected monetary policy for a given growth profile, then equities and other risky assets could suffer. Much will depend on the precise portfolio of the insurance company or pension fund and their attitude to risk.
(iii) Banks
Up to a point, banks might favour higher interest rates to the extent this gave them more room to widen the spread between their lending and deposit rates. This would make lending more profitable and could encourage them to expand their balance sheets in the longer term, reversing the recent trend to deleveraging.
On the other hand, higher interest rates could reduce the value of some of the assets that banks hold, particularly if the increase in yields is faster than expected. In the longer term, higher rates could also lead to increased
default rates on mortgages and other longer term loans, particularly where these were taken out at recent very low rates on a variable basis.
(iv) Non-financial companies
Higher gilt yields may not imply a fully proportionate rise in corporate bond and lending rates, but the direction of movement is likely to be the same. For companies involved in long-term investments, the opportunity is therefore the same as for governments, namely to try to lock in long term funding where possible now.
At the same time, caution is needed in assumptions on future borrowing costs when preparing financial plans and evaluating investments where funding cannot be locked in now for the lifetime of the assets concerned.
(v) Households
In general, rising interest rates will favour households that are net savers over those that are net borrowers. This will tend to be to the benefit of older and more affluent households at the expense of younger and less well-off households who need to borrow for house purchase or other reasons.
The potential for rates to rise significantly over the next ten years is certainly something that any household taking out a mortgage (or other long term loan) should consider carefully in assessing how much it is prudent to borrow.
4.4 Summary and conclusions
There may not be a purely speculative bubble in gilts, because there are good reasons for current low rates in terms of risk aversion, the effects of QE, pension fund behaviour and bank regulatory regime changes in recent years.
At the same time, recent yields look unsustainably low in the longer term since at least the first of these two factors is likely to unwind gradually over the next decade or so. Using various methods, we project a rise in 10 year gilt yields to around 4-5.5% by 2025 as this happens.
Recent developments in the US suggest that this upward adjustment in yields may already be underway as the expected date for tapering of QE has been brought forward in the light of stronger expected growth. We are not at that point yet in the recovery in the UK, but we could get there at some point over the next year or two and, in any event, gilt yields are not immune to developments in US Treasury yields10.
Higher interest rates will helps savers and reduce pension fund deficits, but borrowers (including the government) might gain from locking in funding now for long term investments such as infrastructure and housing. Households need to bear in mind likely future interest rate rises in any decisions on mortgages or other longer term loans.
10 There could also be adverse knock-on effects for Eurozone countries with high public debt levels. This might in turn feedback to have negative effects on the UK economy through trade, financial and confidence channels.

UK Economic Outlook July 201332
We estimated a number of econometric equations using quarterly data for the period from Q1 1985 to Q1 201311. In each case we looked at the relationship12 between nominal gilt yields and two key explanatory factors:
• Expected nominal GDP growth over the following ten years, which we proxy in three ways: actual growth over the previous ten years (Model 1), actual growth over the past year (Model 2), or actual realised growth over the next ten years.
• A ‘structural break’ variable relating to the introduction of inflation targeting in the UK at the end of 1992, which led to a sustained fall in expected inflation and so nominal gilt yields (real gilt yields also fell from around that date).
The three different methods of representing expected future GDP growth, given the latter cannot be observed directly, lead to three possible model specifications as shown in Table A4.1 below.
Model 2 is clearly the least satisfactory, showing that there is little relationship between current gilt yields and current GDP growth. This is perhaps not surprising since ten year gilt yields can only be expected to be related to long-term trend growth over the next ten years, not what growth happens to be at a point in time.
The other two models have much higher and broadly similar explanatory power, with their respective GDP growth variables having
Note: t-statistics in brackets greater than around 2 implies statistical significance at 95% confidence level.Source: PwC analysis using Bank of England and ONS data for period from Q1 1985-Q1 2013.
Coefficients shown for Model 1: using past Model 2: using GDP Model 3: using actual model variables with GDP growth over growth over last year GDP growth over t-statistics in brackets previous ten years following ten years
Expected GDP growth 0.92 -0.11 0.88 (12.8) (-0.4) (6.3)
Inflation targeting regime -0.01 0.66 -0.03 (-1.4) (6.9) (-8.0)
Constant 0.01 0.03 0.05 (0.7) (7.3) (5.2)
R-squared 0.81 0.46 0.82
Number of data points 113 113 77
Table A4.1 – Econometric modelling results: nominal gilt yields vs nominal GDP growth
Technical Annex: Econometric modelling of gilt yields and GDP growth
similar coefficients (around 0.9) and being highly statistically significant at confidence levels well above 99%. The main difference between models 1 and 3 is that the shift to inflation targeting, while a negative influence on gilt yields in both cases, is more statistically significant in Model 3 with forward-looking growth expectations, as opposed to adaptive backward-looking growth expectations (Model 1).
Based on forward-looking simulations we found that Model 3 gives somewhat more plausible results that match the forward yield curve data better, however, so we focused on this model in the main text.
Since markets should be forward looking, this model is also more consistent with economic theory. Using Model 1 would still, however, indicate a gradual rise in bond yields going forward, but at a somewhat slower pace.
11 The full period can be used for the second model using current nominal GDP growth or past GDP growth (with data for the latter variable extending back to Q1 1975). When using future nominal GDP growth, the data period for gilt yields has to end in Q1 2003 to allow ten years of future GDP growth data to be included.12 Our modelling approach is similar to that used in a recent paper by Europe Economics (2013), although that used real gilt yields and real GDP growth whereas we focus on nominal rates. The paper is available here: http://www.caa.co.uk/docs/78/HeathrowCostOfCapitalStudy.pdf
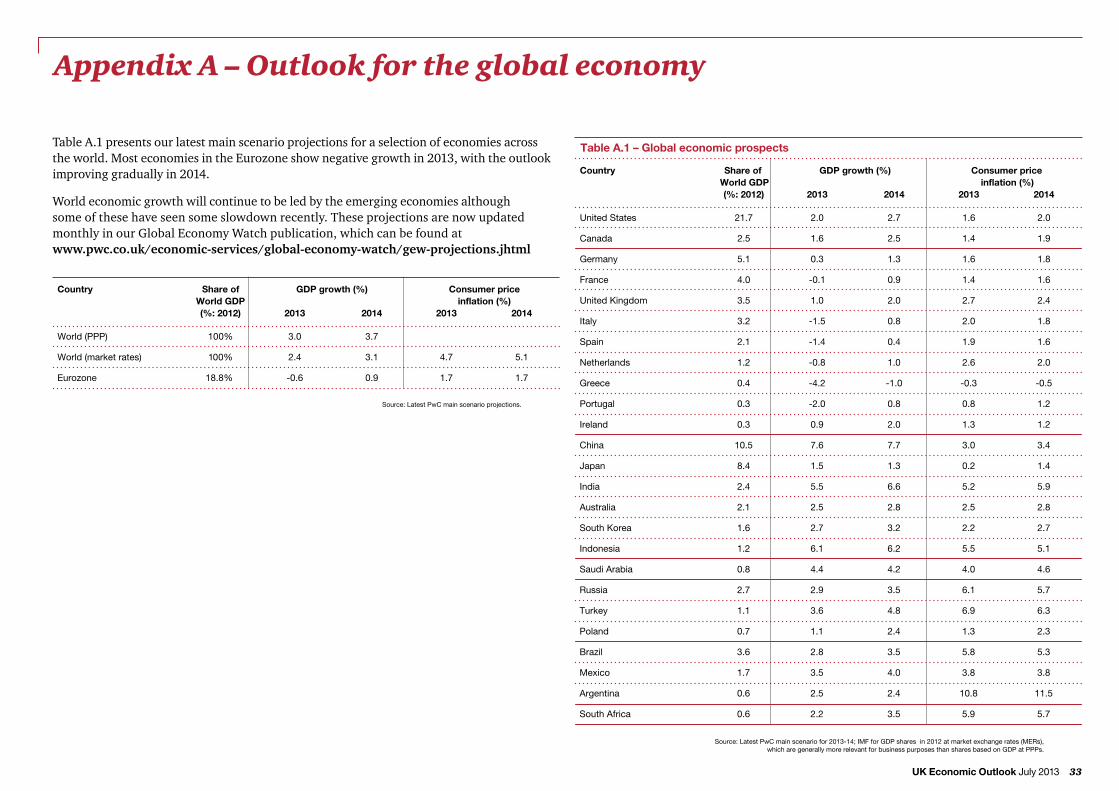
UK Economic Outlook July 2013 33
Source: Latest PwC main scenario for 2013-14; IMF for GDP shares in 2012 at market exchange rates (MERs),which are generally more relevant for business purposes than shares based on GDP at PPPs.
Country Share of GDP growth (%) Consumer price World GDP inflation (%) (%: 2012) 2013 2014 2013 2014
United States 21.7 2.0 2.7 1.6 2.0
Canada 2.5 1.6 2.5 1.4 1.9
Germany 5.1 0.3 1.3 1.6 1.8
France 4.0 -0.1 0.9 1.4 1.6
United Kingdom 3.5 1.0 2.0 2.7 2.4
Italy 3.2 -1.5 0.8 2.0 1.8
Spain 2.1 -1.4 0.4 1.9 1.6
Netherlands 1.2 -0.8 1.0 2.6 2.0
Greece 0.4 -4.2 -1.0 -0.3 -0.5
Portugal 0.3 -2.0 0.8 0.8 1.2
Ireland 0.3 0.9 2.0 1.3 1.2
China 10.5 7.6 7.7 3.0 3.4
Japan 8.4 1.5 1.3 0.2 1.4
India 2.4 5.5 6.6 5.2 5.9
Australia 2.1 2.5 2.8 2.5 2.8
South Korea 1.6 2.7 3.2 2.2 2.7
Indonesia 1.2 6.1 6.2 5.5 5.1
Saudi Arabia 0.8 4.4 4.2 4.0 4.6
Russia 2.7 2.9 3.5 6.1 5.7
Turkey 1.1 3.6 4.8 6.9 6.3
Poland 0.7 1.1 2.4 1.3 2.3
Brazil 3.6 2.8 3.5 5.8 5.3
Mexico 1.7 3.5 4.0 3.8 3.8
Argentina 0.6 2.5 2.4 10.8 11.5
South Africa 0.6 2.2 3.5 5.9 5.7
Table A.1 – Global economic prospects
Appendix A – Outlook for the global economy
Table A.1 presents our latest main scenario projections for a selection of economies across the world. Most economies in the Eurozone show negative growth in 2013, with the outlook improving gradually in 2014.
World economic growth will continue to be led by the emerging economies although some of these have seen some slowdown recently. These projections are now updated monthly in our Global Economy Watch publication, which can be found at www.pwc.co.uk/economic-services/global-economy-watch/gew-projections.jhtml
Source: Latest PwC main scenario projections.
Country Share of GDP growth (%) Consumer price World GDP inflation (%) (%: 2012) 2013 2014 2013 2014
World (PPP) 100% 3.0 3.7
World (market rates) 100% 2.4 3.1 4.7 5.1
Eurozone 18.8% -0.6 0.9 1.7 1.7

UK Economic Outlook July 201334
Appendix B – UK economic trends: 1979 – 2012
Source: ONS, Bank of England
* Pre-1997 data estimated** Public Sector Net Borrowing (calendar years)*** Peak-to-peak for GDP relative to trend
Average over economic cycles***
1979 - 1989 2.7 4.0 1.0 7.9 12.2 -0.8 2.5
1989 - 2000 2.7 3.3 1.0 3.3 8.3 -2.0 2.6
2000 - 2007 3.2 3.5 0.2 1.6 4.9 -2.2 1.6
Annual GDP Household Manufacturing Inflation 3 Month Current PSNB**averages growth expenditure output (CPI*) interest rate account (% of GDP) growth growth (% annual balance average) (% of GDP)
1979 2.8 5.0 -0.2 13.7 -0.5 4.71980 -2.0 0.1 -8.6 16.6 0.8 4.31981 -1.3 0.0 -6.1 13.9 1.9 3.41982 2.2 1.2 -0.1 12.3 0.8 2.61983 3.8 4.6 2.1 10.1 0.4 3.41984 2.9 2.8 3.7 10.0 -0.4 3.71985 3.9 4.3 2.9 12.2 -0.2 2.81986 4.3 7.1 1.4 10.9 -0.9 2.21987 5.2 6.2 4.8 9.7 -1.7 1.51988 5.6 8.4 7.3 10.4 -4.1 -0.81989 2.6 3.9 4.0 5.2 13.9 -4.9 -0.81990 1.8 2.4 -0.1 7.0 14.8 -3.8 0.71991 -1.8 -2.4 -5.0 7.5 11.5 -1.8 3.01992 0.9 1.5 -0.1 4.3 9.6 -2.1 6.51993 3.1 4.0 1.5 2.5 5.9 -1.9 7.81994 4.6 3.2 4.7 2.0 5.5 -1.0 6.61995 3.2 2.0 1.5 2.6 6.7 -1.4 5.31996 3.1 4.9 0.6 2.5 6.0 -0.9 3.71997 3.9 4.8 2.3 1.8 6.8 -0.1 1.91998 3.6 4.1 0.5 1.6 7.3 -0.4 -0.11999 2.9 5.2 0.5 1.3 5.4 -2.7 -1.32000 4.4 5.5 2.1 0.8 6.1 -2.9 -1.72001 2.2 3.8 -1.7 1.2 5.0 -2.3 -0.82002 2.3 4.0 -2.4 1.3 4.0 -2.1 1.82003 3.9 3.8 -0.5 1.4 3.7 -1.7 3.02004 3.2 3.2 1.9 1.3 4.6 -2.0 2.82005 3.2 2.9 -0.2 2.1 4.7 -1.8 3.02006 2.8 1.8 1.8 2.3 4.8 -2.8 2.22007 3.4 2.8 0.8 2.3 6.0 -2.2 2.42008 -0.8 -0.9 -2.8 3.6 5.5 -0.9 4.52009 -5.2 -3.6 -10.2 2.2 1.1 -1.4 10.62010 1.7 1.0 4.2 3.3 0.7 -2.7 9.92011 1.1 -0.5 1.8 4.5 0.9 -1.5 7.92012 0.2 1.2 -1.7 2.8 0.8 -3.8 8.1

UK Economic Outlook July 2013 35
Contacts and services
Competition policy and regulation,litigation support, financial economics,economics and business strategy
David LancefieldTim OgierNick ForrestLuisa AffusoDaniel Hanson
020 7213 2263020 7804 5207020 7804 5695020 7212 1832020 7804 5774
Oil and gasEnergy and water
Michael HurleyStuart Cook
020 7804 4465020 7804 7167
Environmental economics, climate change and sustainability
Richard GledhillGeoff LaneAndrew Thurley
020 7804 5026020 7213 4378020 7212 6503
Health Kalee Talvitie-BrownTim Wilson Ed Bramley-Harker
020 7212 4372020 7213 2147020 7804 5684
Macroeconomics Andrew SentanceJohn HawksworthWill Zimmern Richard Boxshall Esmond Birnie
020 7213 2068020 7213 1650020 7212 2750020 7213 207902890 415808
Project appraisal and financing, transport Julian Smith 020 7804 5940
Policy research and evaluationImpact assessment and benefits appraisalCustomer focused public servicesPublic sector research centre
David ArmstrongMark AmblerMark GrahamNick Jones
02890 415716020 7213 15910131 260 4054020 7213 1593
Regional and local economic development,inward investment
Ray Mills 0191 269 4284
Telecommunications and media David LancefieldAlastair MacPhersonMichael Hardt
020 7213 2263020 7213 4463020 7804 3112
Economics and Policy
UK Economic Outlook is published three times a year. John Hawksworth, Jonathan Bruce and Smita Mehta are the main authors of this July 2013 edition.
Please contact John Hawksworth ([email protected]) for information about the technical content of this report.
We produce a wide range of insights, economic briefings and projections on our website at: http://www.pwc.co.uk/the-economy/index.jhtml
We also deliver a range of macroeconomic consulting services for clients in the public and private sector, including:
• demand, revenue and cost forecasting;
• scenario and stress testing;
• public policy strategy; and
• policy appraisal including economic impact analysis and CGE modelling.
Please contact William Zimmern ([email protected]) if you want to talk about any of these areas.
We help our clients understand how big economic, demographic, social, and environmental changes affect their organisations by setting out scenarios that identify growth opportunities and risks on a global, regional, national and local level. We help make strategic and tactical, operational, pricing and investment decisions to support business value creation.
We also help clients achieve sustainable growth which meets the objectives of their business partners, influencers and broader stakeholder groups. We do this by working with businesses, government and regulators on competition and regulation issues, litigation support, bids and business cases, public policy and project appraisals, financial economics, the economics of sustainability and macroeconomics.
Please visit our website (www.pwc.co.uk/economics) or contact a member of the Economics and Policy team for more information about these services.
In response to reader feedback and PwC’s own sustainability drive this publication is no longer available in hardcopy form. This has enabled us to improve the functionality of the report as well as reduce our impact on global resources.
To receive future editions by e-mail please sign up on our website www.pwc.co.uk/the-economy or e-mail [email protected]

www.pwc.co.uk/economics© 2013 PricewaterhouseCoopers LLP. All rights reserved. In this document, “PwC” refers to PricewaterhouseCoopers LLP (a limited liability partnership in the United Kingdom),which is a member firm of PricewaterhouseCoopers International Limited, each member firm of which is a separate legal entity.
Designed by The Design Group 21487 (07/13)