Preliminary Economic Assessment of the Cordero Silver Project
354
Preliminary Economic Assessment of the Cordero Silver Project Chihuahua State, Mexico Effective Date: November 30, 2021 Prepared for: Discovery Silver Corp. 701-55 University Ave. Toronto, Ontario, Canada M5J 2Y1 Prepared by: Ausenco Engineering Canada Inc. 11 King St. West 15 th Floor Toronto, Ontario, Canada M5H 4C7 List of Qualified Persons: Tommaso Roberto Raponi, P. Eng. – Ausenco Engineering Canada Inc. Scott Elfen, P.E. – Ausenco Engineering Canada Inc. Gordon Zurowski, P. Eng. – AGP Mining Consultants Inc. James Cremeens, P.E., P.G. – Knight Piésold and Co. (USA) Keith Viles, P. Eng. – Knight Piésold and Co. (USA) Nadia M. Caira, P. Geo. – World Metals Inc. R. Mohan Srivastava, P. Geo. – RedDot3D Inc. Scott Weston, P. Geo. – Hemmera Envirochem Inc. Davood Hasanloo, P. Eng. – Hemmera Envirochem Inc.
-
Upload
khangminh22 -
Category
Documents
-
view
0 -
download
0
Transcript of Preliminary Economic Assessment of the Cordero Silver Project

Preliminary Economic Assessment
of the Cordero Silver Project
Chihuahua State, Mexico
Effective Date: November 30, 2021
Prepared for: Discovery Silver Corp.
701-55 University Ave.
Toronto, Ontario, Canada
M5J 2Y1
Prepared by: Ausenco Engineering Canada Inc.
11 King St. West
15th Floor
Toronto, Ontario, Canada
M5H 4C7
List of Qualified Persons:
Tommaso Roberto Raponi, P. Eng. – Ausenco Engineering Canada Inc.
Scott Elfen, P.E. – Ausenco Engineering Canada Inc.
Gordon Zurowski, P. Eng. – AGP Mining Consultants Inc.
James Cremeens, P.E., P.G. – Knight Piésold and Co. (USA)
Keith Viles, P. Eng. – Knight Piésold and Co. (USA)
Nadia M. Caira, P. Geo. – World Metals Inc.
R. Mohan Srivastava, P. Geo. – RedDot3D Inc.
Scott Weston, P. Geo. – Hemmera Envirochem Inc.
Davood Hasanloo, P. Eng. – Hemmera Envirochem Inc.

Important Notice
This report was prepared as a National Instrument 43-101 Technical Report for Discovery Silver Corp. (Discovery Silver) by Ausenco Engineering Canada
Inc. (Ausenco), AGP Mining Consultants Inc. (AGP), Knight Piésold and Co. (USA) (Knight Piésold), World Metals Inc. (World Metals), RedDot3D Inc.
(RedDot3D) and Hemmera Envirochem Inc. (Hemmera), collectively the Report Authors. The quality of information, conclusions, and estimates
contained herein is consistent with the level of effort involved in the Report Authors’ services, based on (i) information available at the time of
preparation, (ii) data supplied by outside sources, and (iii) the assumptions, conditions, and qualifications set forth in this report. This report is intended
for use by Discovery Silver Corp. subject to terms and conditions of its contracts with each of the Report Authors. Except for the purposes legislated
under Canadian provincial and territorial securities law, any other uses of this report by any third party are at that party’s sole risk.

Cordero Project P a g e i
Preliminary Economic Assessment of the Cordero Silver Project, Chihuahua State, Mexico January 2022
Table of Contents
1 SUMMARY .............................................................................................................................................................................................. 1
1.1 Introduction ............................................................................................................................................................................... 1
1.2 Property Description, Location and Ownership .................................................................................................................. 2
1.3 Geology and Mineralization ................................................................................................................................................... 2
1.4 Exploration ................................................................................................................................................................................ 3
1.5 Sample Preparation, Analysis and Security ........................................................................................................................ 3
1.6 Data Verification ....................................................................................................................................................................... 4
1.7 Metallurgical Testwork and Mineral Processing ................................................................................................................ 4
1.8 Mineral Resource Estimate .................................................................................................................................................... 5
1.9 Mining Methods ....................................................................................................................................................................... 7
1.10 Recovery Methods ................................................................................................................................................................... 7
1.11 Project Infrastructure ............................................................................................................................................................ 10
1.12 Market Studies and Contracts ............................................................................................................................................. 12
1.13 Environmental Studies, Permitting and Social or Community Impact ........................................................................ 13
1.14 Capital and Operating Costs ................................................................................................................................................ 14
1.15 Economic Analysis ................................................................................................................................................................ 16
1.16 Adjacent Properties ............................................................................................................................................................... 18
1.17 Conclusions ............................................................................................................................................................................ 18
1.18 Recommendations ................................................................................................................................................................ 19
2 INTRODUCTION .................................................................................................................................................................................. 24
2.1 Terms of Reference ............................................................................................................................................................... 24
2.2 Qualified Persons ................................................................................................................................................................... 24
2.3 Site Visits and Scope of Personal Inspection ................................................................................................................... 26
2.4 Effective Dates ....................................................................................................................................................................... 26
2.5 Information Sources & References .................................................................................................................................... 26
2.6 Previous Technical Reports ................................................................................................................................................. 26
2.7 Currency, Units, Abbreviations and Definitions ................................................................................................................ 27
3 RELIANCE ON OTHER EXPERTS ..................................................................................................................................................... 29
3.1 Introduction ............................................................................................................................................................................. 29
3.2 Property Agreements, Mineral Tenure, Surface Rights and Royalties ......................................................................... 29
3.3 Environmental Studies, Permitting, and Social or Community Impact ........................................................................ 29
3.4 Taxation ................................................................................................................................................................................... 29
3.5 Markets .................................................................................................................................................................................... 30
4 PROPERTY DESCRIPTION AND LOCATION .................................................................................................................................. 31
4.1 Property Location .................................................................................................................................................................. 31
4.2 Mineral Tenure and Permits ................................................................................................................................................ 31
4.3 Mineral Concessions ............................................................................................................................................................. 33

Cordero Project P a g e i i
Preliminary Economic Assessment of the Cordero Silver Project, Chihuahua State, Mexico January 2022
4.4 Royalties .................................................................................................................................................................................. 38
4.5 Environmental Liabilities, Factors and Risks Affecting Ability to Perform Work ....................................................... 39
5 ACCESSIBILITY, CLIMATE, LOCAL RESOURCES, INFRASTRUCTURE, AND PHYSIOGRAPHY ........................................... 40
5.1 Accessibility ............................................................................................................................................................................ 40
5.2 Climate ..................................................................................................................................................................................... 41
5.3 Local Resources ..................................................................................................................................................................... 41
5.4 Infrastructure .......................................................................................................................................................................... 42
5.5 Physiography .......................................................................................................................................................................... 43
6 HISTORY ............................................................................................................................................................................................... 44
6.1 Historical Mining .................................................................................................................................................................... 44
6.2 Recent History of Mineral Tenure and Exploration .......................................................................................................... 44
6.3 Property Results – Previous Owners ................................................................................................................................. 46
6.4 Previous Exploration History ............................................................................................................................................... 47
6.5 Production History ................................................................................................................................................................. 56
6.6 Historical Resources Estimates .......................................................................................................................................... 57
7 GEOLOGICAL SETTING AND MINERALIZATION .......................................................................................................................... 59
7.1 Regional Geology ................................................................................................................................................................... 59
7.2 Local Geology ......................................................................................................................................................................... 60
8 DEPOSIT TYPES .................................................................................................................................................................................. 75
8.1 Extensional (E)Type Intermediate Sulphidation Epithermal Systems (E-Type IS) ..................................................... 75
8.2 Carbonate-Hosted Pb, Zn (Ag, Cu, Au) ............................................................................................................................... 76
8.3 Conclusion .............................................................................................................................................................................. 78
9 EXPLORATION ..................................................................................................................................................................................... 79
9.1 Geophysics .............................................................................................................................................................................. 80
9.2 Detailed Geological Mapping ............................................................................................................................................... 80
9.3 Rock Sampling Methods ...................................................................................................................................................... 88
9.4 Geochemical Results ............................................................................................................................................................ 88
9.5 Interpretation of Results from Exploration Targets ........................................................................................................ 90
10 DRILLING .............................................................................................................................................................................................. 92
10.1 Program Overview ................................................................................................................................................................. 92
10.2 Phase I Drilling Campaign .................................................................................................................................................... 92
10.3 Procedures for Handling, Transporting, Logging and Sample Drill Core ..................................................................... 97
10.4 Summary and Interpretation of 2019-2021 Drill Programs ........................................................................................... 98
11 SAMPLE PREPARATION, ANALYSES, AND SECURITY ............................................................................................................. 109
11.1 Summary .............................................................................................................................................................................. 109
11.2 Levon 2009 to 2017 Drill Hole Samples ......................................................................................................................... 109
11.3 Sample Preparation, Analysis and Security for Discovery Silver’s Drilling Campaigns (2019-2021) .................. 110
11.4 Density Measurements ...................................................................................................................................................... 118
12 DATA VERIFICATION ....................................................................................................................................................................... 119
12.1 Database Verification ......................................................................................................................................................... 119

Cordero Project P a g e i i i
Preliminary Economic Assessment of the Cordero Silver Project, Chihuahua State, Mexico January 2022
12.2 Multiple Site Visits and Independent Sampling Supervision ...................................................................................... 119
12.3 QP Opinion ........................................................................................................................................................................... 121
13 MINERAL PROCESSING AND METALLURGICAL TESTING ..................................................................................................... 122
13.1 Chronology of Cordero Metallurgical Testwork Programs ......................................................................................... 122
13.2 METCON 2011 Program Summary ................................................................................................................................. 122
13.3 ALS Metallurgy 2013 Program Summary ...................................................................................................................... 123
13.4 2021 Metallurgical Testwork Summary ......................................................................................................................... 127
13.5 Column Heap Leach Testwork ......................................................................................................................................... 158
13.6 Recovery Modelling ............................................................................................................................................................ 159
14 MINERAL RESOURCE ESTIMATES ............................................................................................................................................... 161
14.1 Database .............................................................................................................................................................................. 161
14.2 Geological Modelling .......................................................................................................................................................... 162
14.3 Estimation Domains ........................................................................................................................................................... 166
14.4 Drill Hole Composite Intervals .......................................................................................................................................... 167
14.5 Capping of Grade Outliers ................................................................................................................................................. 168
14.6 Variography .......................................................................................................................................................................... 171
14.7 Grade Estimation ................................................................................................................................................................ 176
14.8 Density .................................................................................................................................................................................. 177
14.9 Block Model ......................................................................................................................................................................... 178
14.10 Validation .............................................................................................................................................................................. 181
14.11 Classification ....................................................................................................................................................................... 184
14.12 Mineral Resource Statement ............................................................................................................................................ 185
14.13 QP Opinion ........................................................................................................................................................................... 190
15 MINERAL RESERVE ESTIMATES .................................................................................................................................................. 191
16 MINING METHODS .......................................................................................................................................................................... 192
16.1 Overview ............................................................................................................................................................................... 192
16.2 Geotechnical Parameters .................................................................................................................................................. 192
16.3 Geological Model Importation .......................................................................................................................................... 196
16.4 Economic Pit Shell Development ..................................................................................................................................... 196
16.5 Dilution .................................................................................................................................................................................. 199
16.6 Pit Design ............................................................................................................................................................................. 200
16.7 Rock Storage Facilities ...................................................................................................................................................... 204
16.8 Mine Schedule ..................................................................................................................................................................... 205
16.9 Mine Plan Sequence ........................................................................................................................................................... 209
16.10 Mine Equipment Selection ................................................................................................................................................ 215
16.11 Grade Control ...................................................................................................................................................................... 216
17 RECOVERY METHODS .................................................................................................................................................................... 217
17.1 Overview ............................................................................................................................................................................... 217
17.2 Process Flowsheet ............................................................................................................................................................. 218
17.3 Plant Design ......................................................................................................................................................................... 220

Cordero Project P a g e i v
Preliminary Economic Assessment of the Cordero Silver Project, Chihuahua State, Mexico January 2022
18 PROJECT INFRASTRUCTURE ....................................................................................................................................................... 236
18.1 Overall Site Layout Development ..................................................................................................................................... 236
18.2 Site Preparation ................................................................................................................................................................... 238
18.3 Stockpiles ............................................................................................................................................................................. 238
18.4 Rock Storage Facilities ...................................................................................................................................................... 238
18.5 Mining Infrastructure .......................................................................................................................................................... 239
18.6 Roads and Logistics ........................................................................................................................................................... 240
18.7 On-Site Infrastructure ......................................................................................................................................................... 240
18.8 Off-Site Infrastructure ........................................................................................................................................................ 242
18.9 Heap Leach Facility ............................................................................................................................................................ 245
18.10 Tailings and Waste Disposal ............................................................................................................................................ 249
18.11 Site-Wide Water Management ......................................................................................................................................... 259
19 MARKET STUDIES AND CONTRACTS ......................................................................................................................................... 268
19.1 Market Studies .................................................................................................................................................................... 268
19.2 Commodities Price ............................................................................................................................................................. 268
19.3 Contracts .............................................................................................................................................................................. 268
20 ENVIRONMENTAL STUDIES, PERMITTING, AND SOCIAL OR COMMUNITY IMPACT ...................................................... 271
20.1 Environmental Considerations ......................................................................................................................................... 271
20.2 Waste Management and Water Management .............................................................................................................. 275
20.3 Closure and Reclamation Planning ................................................................................................................................. 276
20.4 Permitting Considerations ................................................................................................................................................ 276
20.5 Social Considerations ........................................................................................................................................................ 278
21 CAPITAL AND OPERATING COSTS .............................................................................................................................................. 282
21.1 Introduction .......................................................................................................................................................................... 282
21.2 Capital Costs ....................................................................................................................................................................... 282
21.3 Operating Costs .................................................................................................................................................................. 291
22 ECONOMIC ANALYSIS .................................................................................................................................................................... 304
22.1 Forward-Looking Information Cautionary Statements ................................................................................................ 304
22.2 Methodologies Used .......................................................................................................................................................... 305
22.3 Financial Model Parameters ............................................................................................................................................. 305
22.4 Economic Analysis ............................................................................................................................................................. 306
22.5 Sensitivity Analysis ............................................................................................................................................................. 311
23 ADJACENT PROPERTIES ............................................................................................................................................................... 314
24 OTHER RELEVANT DATA AND INFORMATION ......................................................................................................................... 315
25 INTERPRETATION AND CONCLUSIONS ..................................................................................................................................... 316
25.1 Introduction .......................................................................................................................................................................... 316
25.2 Mineral Tenure, Surface Rights, Water Rights, Royalties ............................................................................................ 316
25.3 Geology and Mineralization .............................................................................................................................................. 316
25.4 Exploration, Drilling, and Analytical Data Collection in Support of Resource Estimation ...................................... 317
25.5 Metallurgical Testwork ...................................................................................................................................................... 317

Cordero Project P a g e v
Preliminary Economic Assessment of the Cordero Silver Project, Chihuahua State, Mexico January 2022
25.6 Water Management ............................................................................................................................................................ 318
25.7 Mining ................................................................................................................................................................................... 319
25.8 Recovery Methods .............................................................................................................................................................. 320
25.9 Capital Cost Estimate ........................................................................................................................................................ 320
25.10 Operating Cost Estimate ................................................................................................................................................... 320
25.11 Economic Analysis ............................................................................................................................................................. 320
25.12 Risks & Opportunities ......................................................................................................................................................... 321
26 RECOMMENDATIONS ..................................................................................................................................................................... 324
26.1 Overall ................................................................................................................................................................................... 324
26.2 Exploration ........................................................................................................................................................................... 324
26.3 Metallurgical Characterization ......................................................................................................................................... 325
26.4 Mineral Resource Estimation ........................................................................................................................................... 326
26.5 Geometallurgical Model ..................................................................................................................................................... 326
26.6 Geotechnical Studies for Pit Slopes and Sectors ......................................................................................................... 326
26.7 Mine Engineering ................................................................................................................................................................ 327
26.8 Tailings Storage Facility Studies ...................................................................................................................................... 327
26.9 Water Management ............................................................................................................................................................ 328
26.10 Environmental Studies, Permitting, and Social or Community Impact ..................................................................... 328
27 REFERENCES .................................................................................................................................................................................... 329
ATTACHMENT 1: QUALIFIED PERSON CERTIFICATES .................................................................................................................. 331
List of Tables
Table 1-1: Sulphide Mineral Resources for the Cordero Project, with an Effective Date of October 20, 2021, above an NSR Cut-off of $7.25/t and within a Reporting Pit Shell .......................................................................... 6
Table 1-2: Oxide Mineral Resources for the Cordero Project, with an Effective Date of October 20, 2021, above an NSR Cut-off of $4.78/t and within a Reporting Pit Shell .......................................................................... 6
Table 1-3: Metal Payables ............................................................................................................................................................... 13
Table 1-4: Summary of TC and RC ................................................................................................................................................. 13
Table 1-5: Metal Prices for Economic Analysis ............................................................................................................................ 13
Table 1-6: Summary of Capital Costs ............................................................................................................................................ 15
Table 1-7: Summary of Operating Costs ....................................................................................................................................... 15
Table 1-8: Economic Analysis Summary ....................................................................................................................................... 17
Table 1-9: Post-Tax Sensitivity Summary ...................................................................................................................................... 18
Table 1-10: Proposed Budget Summary .......................................................................................................................................... 19
Table 2-1: Report Contributors ........................................................................................................................................................ 25
Table 2-2: Qualified Person Site Visits ........................................................................................................................................... 26
Table 2-3: Summary of Previous Technical Reports ................................................................................................................... 27
Table 2-4: List of Abbreviations ....................................................................................................................................................... 27
Table 4-1: Mineral Concessions Owned by Titán ......................................................................................................................... 33

Cordero Project P a g e v i
Preliminary Economic Assessment of the Cordero Silver Project, Chihuahua State, Mexico January 2022
Table 4-2: Surface Access Agreements with Local Landowners.............................................................................................. 36
Table 6-1: Historic Drilling Campaigns from 2000 to 2017 ........................................................................................................ 46
Table 6-2: Parameters Used to Calculate Silver Equivalent in 2014 Resource Estimate ..................................................... 57
Table 6-3: Summary of 2014 Resource Estimate ........................................................................................................................ 57
Table 6-4: Parameters used to Calculate Silver Equivalent in 2018 Resource Estimate ...................................................... 58
Table 6-5: Summary of 2018 Resource Estimate ........................................................................................................................ 58
Table 7-1: Ages of Magmatic Activity at Cordero Calculated from Re-Os and U-Pb Isotope Studies ............................... 63
Table 8-1: Characteristics of E-Type IS Deposits and Cordero Evidence ................................................................................ 75
Table 8-2: Characteristics of Carbonate-Replacement Deposits and Cordero Evidence ..................................................... 78
Table 9-1: Significant Analytical Results for Surface Rock Samples from Exploration Targets ......................................... 89
Table 10-1: Select Geological Logging Codes by Theme used for Core Logging at Cordero ................................................ 98
Table 10-2: Highlights from the 2019-2021 Drilling Campaigns ................................................................................................. 99
Table 11-1: Summary of Levon Diamond Drilling Campaigns from 2009 to 2017 ............................................................... 109
Table 11-2: Summary of Discovery Silver Diamond Drilling Campaigns from 2019 to 2021 ............................................. 109
Table 11-3: Analytes and Detection Ranges for the ME-ICP61 Multi-element ICP Suite from ALS ................................... 111
Table 11-4: Summary Table of Results for Certified Reference Materials ............................................................................. 114
Table 13-1: Summary of Previous Testwork Completed ........................................................................................................... 122
Table 13-2: Summary of Locked Cycle Test Results .................................................................................................................. 126
Table 13-3: 2021 Metallurgical Testwork Rock Type/Pit Phase Composites Head Grades ............................................... 128
Table 13-4: Summary of Pit Composite Galena and Sphalerite Liberation ............................................................................ 132
Table 13-5: Summary of Bond Ball Work Index Test Results ................................................................................................... 132
Table 13-6: Summary of SMC Test Results ................................................................................................................................. 133
Table 13-7: Summary of Abrasion Index Test Results ............................................................................................................... 133
Table 13-8: Summary of Abrasion Index Test Results ............................................................................................................... 133
Table 13-9: Summary of Dense Media Separation Results ....................................................................................................... 134
Table 13-10: Summary of Step 4 XRT Sensor Sorting Testwork Results ................................................................................. 135
Table 13-11: VOLC Master Composite Locked Cycle Test Results (LCT-3) ............................................................................. 151
Table 13-12: SEDS Master Composite Locked Cycle Test Results (LCT-4) ............................................................................. 152
Table 13-13: Breccia-Volcanics Composite Locked Cycle Test Results (LCT-1) .................................................................... 152
Table 13-14: Breccia-Sedimentary Locked Cycle Test Results (LCT-2) .................................................................................... 153
Table 13-15: VOLC MC LCT-3 Concentrate Quality ....................................................................................................................... 153
Table 13-16: SED MC LCT-4 Concentrate Quality ......................................................................................................................... 153
Table 13-17: Breccia-Volcanic LCT-1 Concentrate Quality .......................................................................................................... 154
Table 13-18: BRX Comp 1 LCT-2 Concentrate Quality ................................................................................................................. 154
Table 13-19: Low-Grade Samples Composite Head Grades ....................................................................................................... 154
Table 13-20: Low-Grade Samples Optimized Cleaner Concentrates Grades and Recoveries ............................................. 155
Table 13-21: Silver Recovery Projections ........................................................................................................................................ 159
Table 13-22: Lead Recovery Projections ......................................................................................................................................... 159
Table 13-23: Lead Grade Projections ............................................................................................................................................... 160
Table 13-24: Zinc Recovery Projections .......................................................................................................................................... 160
Table 13-25: Zinc Grade Projections ................................................................................................................................................ 160
Table 14-1: Capping Statistics for the High-Grade Sub-Domains ............................................................................................ 169

Cordero Project P a g e v i i
Preliminary Economic Assessment of the Cordero Silver Project, Chihuahua State, Mexico January 2022
Table 14-2: Capping Statistics for the Low-Grade Stockwork Sub-Domains ........................................................................ 170
Table 14-3: Variogram Model Parameters for Silver .................................................................................................................. 172
Table 14-4: Variogram Model Parameters for Gold .................................................................................................................... 173
Table 14-5: Variogram Model Parameters for Lead ................................................................................................................... 174
Table 14-6: Variogram Model Parameters for Zinc .................................................................................................................... 175
Table 14-7: Search Parameters for High-Grade Domains ......................................................................................................... 176
Table 14-8: Search Parameters for Low-Grade Stockwork Domains ...................................................................................... 177
Table 14-9: Dry Bulk Density Values .............................................................................................................................................. 178
Table 14-10: Pit Constraint Parameters .......................................................................................................................................... 187
Table 14-11: Sulphide Mineral Resources for the Cordero Project, with an Effective Date of October 20, 2021, above an NSR Cut-off of $7.25/t and within a Reporting Pit Shell ..................................................................... 188
Table 14-12: Oxide Mineral Resources for the Cordero Project, with an Effective Date of October 20, 2021, above an NSR Cut-off of $4.78/t and within a Reporting Pit Shell ..................................................................... 189
Table 16-1: Recommended Pit Slope Geometries for 10% Probability Failure ...................................................................... 192
Table 16-2: Pit Shell Parameter Assumptions ............................................................................................................................. 197
Table 16-3: Pit Shell Slopes ............................................................................................................................................................. 197
Table 16-4: Geotechnical Parameters for Pit Design.................................................................................................................. 200
Table 16-5: Final Design – Phases, Tonnages, and Grades ...................................................................................................... 201
Table 16-6: Rock Storage Capacities ............................................................................................................................................. 204
Table 16-7: Resource Summary of Scheduled Material ............................................................................................................ 205
Table 16-8: PEA Mine Schedule ...................................................................................................................................................... 206
Table 16-9: PEA Mine Schedule (Stockpiles and Material Movement) ................................................................................... 207
Table 16-10: Annual Total Tonnages Mined by Phase ................................................................................................................. 208
Table 17-1: Key Process Design Criteria ....................................................................................................................................... 222
Table 17-2: Reagent Consumption Summary .............................................................................................................................. 232
Table 17-3: Consumable Consumption Summary ...................................................................................................................... 233
Table 18-1: Stage 1 – Year -1 Power Demand ............................................................................................................................. 241
Table 18-2: Stage 2 – Year 1 Power Demand .............................................................................................................................. 241
Table 18-3: Stage 3 – Year 4 Power Demand .............................................................................................................................. 241
Table 18-4: Description of On-Site Buildings ................................................................................................................................ 242
Table 18-5: TSF Design Criteria ...................................................................................................................................................... 250
Table 18-6: Climate Stations Close to the Cordero site ............................................................................................................. 260
Table 18-7: Presa Parral (1981-2010)............................................................................................................................................ 260
Table 18-8: La Boquilla (1981-2010) .............................................................................................................................................. 260
Table 18-9: Rainfall Frequency Results (mm) .............................................................................................................................. 261
Table 18-10: Characteristics of Collection Ditches ....................................................................................................................... 265
Table 18-11: Characteristics of Diversion Channel and Ditches ................................................................................................. 265
Table 18-12: Summary of Excavation Estimates for Water Management Structures ........................................................... 265
Table 19-1: Metal Prices for Economic Analysis ......................................................................................................................... 268
Table 19-2: Metal Payables ............................................................................................................................................................. 269
Table 19-3: Summary of TC and RC .............................................................................................................................................. 269
Table 19-4: Concentrate Logistics Fees ........................................................................................................................................ 269

Cordero Project P a g e v i i i
Preliminary Economic Assessment of the Cordero Silver Project, Chihuahua State, Mexico January 2022
Table 19-5: Zinc Concentrate Penalties ........................................................................................................................................ 270
Table 19-6: Lead Concentrate Penalties ....................................................................................................................................... 270
Table 20-1: Climate Stations Close to the Cordero Site ............................................................................................................. 273
Table 20-2: Presa Parral (1981-2010)............................................................................................................................................ 273
Table 20-3: La Boquilla (1981-2010) .............................................................................................................................................. 273
Table 20-4: Valle De Zaragoza (1981-2010) ................................................................................................................................. 273
Table 20-5: Rainfall Frequency Results (mm) .............................................................................................................................. 274
Table 20-6: Environmental Permitting Status .............................................................................................................................. 277
Table 20-7: Areas of Importance for Local Stakeholders .......................................................................................................... 280
Table 21-1: Summary of Capital Costs ......................................................................................................................................... 282
Table 21-2: Mine Capital Cost Estimate (US$M) ......................................................................................................................... 283
Table 21-3: Mine Infrastructure Capital (US$M) .......................................................................................................................... 284
Table 21-4: Process and Infrastructure Capital Costs ............................................................................................................... 285
Table 21-5: WBS 2000 Building Costs ........................................................................................................................................... 287
Table 21-6: Indirect Costs ................................................................................................................................................................ 288
Table 21-7: Contract Mining Major Equipment List .................................................................................................................... 293
Table 21-8: Drill Pattern Size ........................................................................................................................................................... 293
Table 21-9: Design Powder Factors ............................................................................................................................................... 294
Table 21-10: Projected Workforce (Year 2) .................................................................................................................................... 295
Table 21-11: Open Pit Operating Costs – LOM Average .............................................................................................................. 295
Table 21-12: Overall Operating Costs for Oxide Processing Plant ............................................................................................. 296
Table 21-13: Overall Operating Costs for Sulphide Processing Plant ........................................................................................ 296
Table 21-14: Oxide Process Plant Labour Summary .................................................................................................................... 297
Table 21-15: Sulphide Process Plant Labour Summary ............................................................................................................... 298
Table 21-16: Summary of Power Costs .......................................................................................................................................... 298
Table 21-17: Summary of Reagent Consumption for Oxide Plant ............................................................................................. 299
Table 21-18: Summary of Reagent Consumption for Sulphide Plant ........................................................................................ 299
Table 21-19: Summary of Annual Consumable Use for Oxide Plant ......................................................................................... 300
Table 21-20: Summary of Annual Consumable Use in Sulphide Plant ...................................................................................... 300
Table 21-21: Maintenance Cost for Each Project Phase.............................................................................................................. 301
Table 21-22: Summary of G&A Operating Costs ........................................................................................................................... 302
Table 21-23: G&A Labour Roles ........................................................................................................................................................ 303
Table 22-1: Economic Analysis Summary .................................................................................................................................... 307
Table 22-2: Project Cash Flow ........................................................................................................................................................ 308
Table 22-3: Post-Tax Sensitivity Summary ................................................................................................................................... 311
Table 22-4: Post-Tax Sensitivity Analysis ..................................................................................................................................... 312
Table 26-1: Proposed Budget Summary ....................................................................................................................................... 324

Cordero Project P a g e i x
Preliminary Economic Assessment of the Cordero Silver Project, Chihuahua State, Mexico January 2022
List of Figures Figure 1-1: Location of the Cordero Project in Southern Chihuahua State, Mexico ................................................................. 2
Figure 1-2: Simplified Process Flow Diagram .................................................................................................................................. 8
Figure 1-3: Overall Block Flow Diagram ............................................................................................................................................ 9
Figure 1-4: Overall Site Layout .......................................................................................................................................................... 11
Figure 1-5: Post-Tax Project Economics ......................................................................................................................................... 16
Figure 4-1: Location of the Cordero Property in Chihuahua State, Mexico .............................................................................. 31
Figure 4-2: Cordero Mining Concessions and Surface Exploration Rights .............................................................................. 34
Figure 4-3: Cordero Mining Concessions and Surface Exploration Rights in the Immediate Vicinity of the 2021 Resource Modelling Area .................................................................................................................................... 35
Figure 4-4: Areas Covered by Access Agreements with Landowners ....................................................................................... 37
Figure 4-5: Concessions Covered by NSR Royalty Agreements, along with the 2021 Pit Outline ....................................... 38
Figure 5-1: Access to the Cordero Project ...................................................................................................................................... 40
Figure 5-2: Pico Prieto Headframe, Parral ...................................................................................................................................... 41
Figure 5-3: Producing Mines, Exploration Projects and Mining Infrastructure near Parral ................................................... 42
Figure 5-4: Cordero's Felsic Domal Features (Silicification and Jasperoid Veining) and Surrounding Scrub Vegetation ........................................................................................................................................................................ 43
Figure 6-1: Cordero Project Exploration Target Areas .................................................................................................................. 45
Figure 6-2: Levon 2010 Soil Sampling Coverage Showing Gold Soil Anomalies..................................................................... 50
Figure 6-3: Aeroquest 2010 EM Resistivity, Location of Rock Samples, and 2021 Resource Outline ................................ 51
Figure 6-4: Aeroquest 2010 Reduced-to-Pole Magnetics and 2021 Resource Outline .......................................................... 52
Figure 6-5: SJ Geophysics 3D IP Chargeability 2009-2010, for the 200 m Depth Slice ......................................................... 53
Figure 6-6: Map Showing Diamond Drill Hole Collars at the End of 2014 ................................................................................ 54
Figure 6-7: Map Showing Diamond Drill Hole Collars at the End of 2017 ................................................................................ 55
Figure 6-8: Orthophoto Showing Distribution of Surface Workings ........................................................................................... 56
Figure 7-1: Physiographic Provinces of Mexico ............................................................................................................................ 59
Figure 7-2: Cretaceous Mezcalera Formation (hatched) with Major Mineral Deposits along the Mexican Silver Belt .......................................................................................................................................................................... 61
Figure 7-3: Cordero Geological Features and Exploration Target Areas .................................................................................. 62
Figure 7-4: Fossil-Rich Sediments from Drill Hole C21-528 ........................................................................................................ 63
Figure 7-5: Schematic Stratigraphic Column in the Cordero Area, and Age Dates for Intrusive Rocks .............................. 64
Figure 7-6: Surface Geology in the Cordero Main Area where Mineral Resources have been Estimated, with Locations of Section Lines used in the Following Figures ...................................................................................... 65
Figure 7-7: Cross-Section CPL-14 .................................................................................................................................................... 66
Figure 7-8: Cross-Section CPL-21 .................................................................................................................................................... 66
Figure 7-9: Cross-Section CPL-33 .................................................................................................................................................... 67
Figure 7-10: Cross-Section CPL-44 .................................................................................................................................................... 67
Figure 7-11: Core Photographs for Main Lithologies at Cordero .................................................................................................. 68
Figure 7-12: Core Photographs for Different Breccia Types at Cordero ..................................................................................... 69
Figure 7-13: Core Photographs for Mineralization Styles at Cordero .......................................................................................... 70
Figure 7-14: Structural Geological Information Gathered in the 2021 Resource Estimation Area ......................................... 72

Cordero Project P a g e x
Preliminary Economic Assessment of the Cordero Silver Project, Chihuahua State, Mexico January 2022
Figure 7-15: Schematic showing Discovery Silver’s Conceptual Model for Mineralization in the Cordero Main Area .................................................................................................................................................................................... 73
Figure 8-1: E-Type IS above the Shoulder of a Deep Porphyry Molybdenum Deposit ............................................................ 76
Figure 8-2: Cross-Section through the Carbonate-Hosted Replacement Deposit (Sulphide Manto/Chimney) at the San Antonio Mine in the Santa Eulalia Mining District .................................................................................. 77
Figure 9-1: Potassium Spectral Band from Radiometric Survey over the Central Magmatic Belt ....................................... 81
Figure 9-2: Major Structural Features Identified by ASTER Structural Study ........................................................................... 82
Figure 9-3: Sansón Geological Map ................................................................................................................................................. 83
Figure 9-4: La Ceniza Geological Map ............................................................................................................................................. 85
Figure 9-5: Dos Mil Diez Geological Map ........................................................................................................................................ 86
Figure 9-6: Molino de Viento Geological Map ................................................................................................................................ 87
Figure 10-1: 2019 Diamond Drilling Totalling 5,905 m in 17 Holes by Discovery Silver ........................................................... 93
Figure 10-2: Discovery Silver’s 2020 Diamond Drilling Totalling 39,484 m in 99 Holes ........................................................... 94
Figure 10-3: Geotechnical/Piezometer Holes Drilled in 2021, Totalling 779 m in Two Holes ................................................. 95
Figure 10-4: 225 Holes in the Resource Modelling Area that were used for the Mineral Resource Estimate ..................... 96
Figure 10-5: Lithology Plan Map showing Locations of the Section Lines used in following Figures ................................ 100
Figure 10-6: Cross-Section CPL-20 showing Geological Interpretation and Silver Equivalent Grades .............................. 101
Figure 10-7: Cross-Section CPL-26 showing Geological Interpretation and Silver Equivalent Grades .............................. 102
Figure 10-8: Cross-Section CPL-31 showing Geological Interpretation and Silver Equivalent Grades .............................. 103
Figure 10-9: Cross-Section CPL-32 showing Geological Interpretation and Silver Equivalent Grades .............................. 104
Figure 10-10: Cross-Section CPL-33 showing Geological Interpretation and Silver Equivalent Grades .............................. 105
Figure 10-11: Cross-Section CPL-37 showing Geological Interpretation and Silver Equivalent Grades .............................. 106
Figure 10-12: Cross-Section CPL-38 showing Geological Interpretation and Silver Equivalent Grades .............................. 107
Figure 10-13: Cross-Section CPL-40 showing Geological Interpretation and Silver Equivalent Grades .............................. 108
Figure 11-1: Comparison of Pulp Duplicates for Gold ................................................................................................................. 115
Figure 11-2: Comparison of Pulp Duplicates for Silver ................................................................................................................ 115
Figure 11-3: Comparison of Silver from Pulp Duplicate Check Assays .................................................................................... 116
Figure 11-4: Comparison of Gold from Pulp Duplicate Check Assays ..................................................................................... 117
Figure 13-1: Locked Cycle Test Flowsheet Configuration .......................................................................................................... 125
Figure 13-2: Composite Sample Selection ..................................................................................................................................... 127
Figure 13-3: Pit 23 Lithology Composites Modal Mineralogy .................................................................................................... 129
Figure 13-4: Pit 29 Lithology Composites Modal Mineralogy .................................................................................................... 130
Figure 13-5: Pit 34 Lithology Composites Modal Mineralogy .................................................................................................... 131
Figure 13-6: Lithology/Pit Composites Lead Grade Recovery Curves ...................................................................................... 137
Figure 13-7: Lithology/Pit Composite Silver vs. Lead Recovery to the Lead Rougher .......................................................... 138
Figure 13-8: Lithology/Pit Composite Zinc Grade Versus Zinc Recovery ................................................................................ 139
Figure 13-9: Pre-flotation Test Series Lead Recovery Versus Grade Curves .......................................................................... 140
Figure 13-10: Pulp Density Sensitivity Tests Lead Grade vs. Recovery Curves (with Carbon Pre-float) .............................. 141
Figure 13-11: VOLC Master Composite Primary Grind vs. Recovery Sensitivity (Lead Grade Recovery Curves)............... 142
Figure 13-12: VOLC Master Composite Primary Grind vs. Recovery Sensitivity (Zinc Grade Recovery Curves) ................ 143
Figure 13-13: SEDS Master Composite Grind vs. Recovery Sensitivity (Lead Grade vs. Recovery) ...................................... 144
Figure 13-14: SEDS Master Composite Grind vs. Recovery Sensitivity (Zinc Grade vs. Recovery) ....................................... 145

Cordero Project P a g e x i
Preliminary Economic Assessment of the Cordero Silver Project, Chihuahua State, Mexico January 2022
Figure 13-15: VOLC Master Composite Depressant Sensitivity (Lead-Zinc Selectivity Curves) ............................................ 146
Figure 13-16: Cleaner Circuit Optimization Lead Grade vs. Recovery Curves ........................................................................... 148
Figure 13-17: Cleaner Circuit Optimization Zinc Grade vs. Recovery Curves ............................................................................ 149
Figure 13-18: VOLC MC and Breccia-Volcanics LCT Flowsheet Configuration (No Carbon Pre-float) ................................ 150
Figure 13-19: SEDS MC and BRX Comp 1 LCT Flowsheet (with Carbon Pre-float) ................................................................. 151
Figure 13-20: Lithology/Pit Composites Leach Response at Various Crush/Grind Sizes ...................................................... 156
Figure 13-21: Lithology/Pit Composite ½″ Bottle Roll Test Silver Kinetics Curves ................................................................... 157
Figure 13-22: Additional Transition/Oxide Composite 96-hour, 0.5-inch Leach Test Results ................................................ 158
Figure 14-1: Drill Hole Locations ...................................................................................................................................................... 162
Figure 14-2: Fault Blocks in the Cordero Main Area Where Resources were Estimated ...................................................... 163
Figure 14-3: Example of a Northeast-Facing Lithology Cross-Section ..................................................................................... 164
Figure 14-4: Geological Model in the Cordero Main Area Where Resources were Estimated ............................................. 165
Figure 14-5: Example of Northeast-facing Cross-Section through the Weathering Model showing Modelled Weathering Volumes, Drill Holes Coded with Weathering Type and Steeply Dipping Faults ........................ 166
Figure 14-6: Estimation Domains in the Cordero Main Area Where Resources were Estimated ........................................ 167
Figure 14-7: Histogram of Interval Length ..................................................................................................................................... 168
Figure 14-8: Example of Variogram Modelling .............................................................................................................................. 171
Figure 14-9: Locations of Lines used for Cross-Sections and Long-Sections ........................................................................ 178
Figure 14-10: Long-Section A-A′ through the Resource Block Model ......................................................................................... 179
Figure 14-11: Long-Section B-B′ through the Resource Block Model ......................................................................................... 179
Figure 14-12: Cross-Section C-C′ through the Resource Block Model ........................................................................................ 180
Figure 14-13: Cross-Section D-D′ through the Resource Block Model ........................................................................................ 180
Figure 14-14: Cross-Section E-E′ through the Resource Block Model ........................................................................................ 181
Figure 14-15: Scatterplot of Silver Composites vs. Silver Block Estimates ............................................................................... 182
Figure 14-16: Swath Plots Comparing Silver Estimates to Drill Hole Data ................................................................................ 183
Figure 14-17: Resource Classification .............................................................................................................................................. 184
Figure 14-18: Sulphide Resource Estimate – NSR Cut-off Sensitivity ........................................................................................ 188
Figure 14-19: Oxide Resource Estimate – NSR Cut-off Sensitivity.............................................................................................. 189
Figure 16-1: Summary of Pit Slope Recommendations .............................................................................................................. 193
Figure 16-2: Cordero Potential Profit vs. Price by Pit Shell ......................................................................................................... 198
Figure 16-3: Phase 1 Layout ............................................................................................................................................................. 201
Figure 16-4: Phase 2 Layout ............................................................................................................................................................. 202
Figure 16-5: Phase 3 Layout ............................................................................................................................................................. 203
Figure 16-6: Phase 4 Layout ............................................................................................................................................................. 204
Figure 16-7: Tonnage Mined by Phase ........................................................................................................................................... 208
Figure 16-8: Mill Tonnes and Silver Grade ..................................................................................................................................... 209
Figure 16-9: End of Year -2 (Pre-Production) ................................................................................................................................. 211
Figure 16-10: End of Year -1 ................................................................................................................................................................ 211
Figure 16-11: End of Year 1 ................................................................................................................................................................. 212
Figure 16-12: End of Year 2 ................................................................................................................................................................. 212
Figure 16-13: End of Year 3 ................................................................................................................................................................. 213
Figure 16-14: End of Year 4 ................................................................................................................................................................. 213

Cordero Project P a g e x i i
Preliminary Economic Assessment of the Cordero Silver Project, Chihuahua State, Mexico January 2022
Figure 16-15: End of Year 9 ................................................................................................................................................................. 214
Figure 16-16: End of Year 13 (Mining Complete) ............................................................................................................................ 214
Figure 16-17: End of Year 16 (Processing Complete) .................................................................................................................... 215
Figure 17-1: Overall Process Flow Diagram .................................................................................................................................. 219
Figure 18-1: Overall Site Layout ....................................................................................................................................................... 237
Figure 18-2: Truckshop, Washbay, Mine Warehouse, Tire Storage Area, Fuel Station, and Office ..................................... 240
Figure 18-3: Proposed CFE 230 kV Transmission Line from Camargo II to Cordero Mine Site .......................................... 244
Figure 18-4: Heap Leach Facility ...................................................................................................................................................... 246
Figure 18-5: TSF Stage 1 Plan .......................................................................................................................................................... 252
Figure 18-6: Tailings Storage Facility Plan ..................................................................................................................................... 253
Figure 18-7: Tailings Storage Facility Plan at Final Build-Out ..................................................................................................... 254
Figure 18-8: Tailings Storage Facility Sections and Details ........................................................................................................ 255
Figure 18-9: Tailings Storage Facility Height vs. Capacity and Rate of Tailings Rise ............................................................ 258
Figure 18-10: Project Location and Nearby Climate Stations ...................................................................................................... 259
Figure 18-11: Cordero Site Facilities ................................................................................................................................................. 262
Figure 18-12: Diversion Channels, Ditches and Ponds .................................................................................................................. 263
Figure 18-13: Collection Ditches ........................................................................................................................................................ 264
Figure 18-14: Schematic of Starter Phase Site-Wide Water Balance .......................................................................................... 266
Figure 18-15: Schematic of Final Phase Site-Wide Water Balance ............................................................................................. 267
Figure 20-1: Project Location and Nearby Climate Stations ...................................................................................................... 272
Figure 20-2: Property Rights at Cordero Project ........................................................................................................................... 279
Figure 22-1: Post-Tax Project Economics ...................................................................................................................................... 306
Figure 22-2: Post-Tax NPV and IRR Sensitivity Results .............................................................................................................. 313
Figure 23-1: Operating Mines and Exploration Projects near Cordero, and Discovery Silver’s Early-Stage Exploration Projects ..................................................................................................................................................... 314

Cordero Project P a g e 1
Preliminary Economic Assessment of the Cordero Silver Project, Chihuahua State, Mexico January 2022
1 SUMMARY
1.1 Introduction
Discovery Silver Corp. (Discovery Silver) commissioned Ausenco Engineering Canada Inc. (Ausenco) to compile a preliminary economic assessment (PEA) of the Cordero Project. The PEA was prepared in accordance with the Canadian disclosure requirements of National Instrument 43-101 (NI 43-101) and in accordance with the requirements of Form 43-101 F1.
The responsibilities of the engineering companies who were contracted by Discovery Silver to prepare this report are as follows:
• Ausenco managed and coordinated the work related to the report, supported Libertas Metallurgy Ltd. with the metallurgical test program, and developed PEA-level design and cost estimate for the process plant, general site infrastructure, and economic analysis.
• AGP Mining Consultants Inc. (AGP) designed the mine pit, mine production schedule, and mine capital and operating costs.
• Knight Piésold and Co. (USA) (Knight Piésold) completed geotechnical studies and developed the PEA-level design and cost estimate of the tailings storage facility.
• World Metals Inc. (World Metals) completed the work related to property description, accessibility, local resources, geological setting, deposit type, exploration work, drilling, exploration works, sample preparation and analysis, and data verification.
• RedDot3D Inc. (RedDot3D) developed the mineral resource estimate for the project.
• Hemmera Envirochem Inc. (Hemmera) conducted a review of the environmental studies completed by CIMA and conducted site wide water management.
Discovery Silver consolidated the metallurgical testwork performed by Levon Resources Ltd. (Levon), and in 2021 commissioned a new round of metallurgical studies to investigate how the sulphide and oxide mineralization at Cordero is amenable to different process flowsheets (i.e., flotation for the sulphides and heap leaching for the oxides).
Discovery Silver also formulated its own strategy for developing a mine at Cordero, one that envisions a phased approach. The first phase would focus on high-grade zones, followed by a second phase that expands into adjacent zones where the grades are generally lower but still moderate to high. A PEA of this strategy was started in the summer of 2021 based on the results of the new metallurgical studies.
The project has operated under an Environmental Protection Plan filed with the government that describes the reclamation procedures that will be required when exploration activities are completed. Environmental and social baseline studies have been completed for the project, and a study of surface and groundwater is currently underway.

Cordero Project P a g e 2
Preliminary Economic Assessment of the Cordero Silver Project, Chihuahua State, Mexico January 2022
1.2 Property Description, Location and Ownership
Cordero is a silver deposit owned by Discovery Silver in northern Mexico, in the south of the state of Chihuahua, approximately 600 km from the border with the United States (Figure 1-1). The project is accessed by vehicle 300 km southwest from Chihuahua City along State Highway 16 to the Parral turn-off to State Highway 24, then 150 km south on Highway 24 where an access road heads east for 10 km to the project site.
The deposit lies in a region that has a long history of silver mining dating back to the 1600s. In the hills where the Cordero deposit lies, there are several small mines with rich silver veins that reach the surface. In the past two decades, the possibility of a large bulk mining target at depth at Cordero was explored and tested through drilling carried out by Levon. Since 2019, when Discovery Silver acquired the project in a merger with Levon, drilling has continued, with a focus on high-grade zones at depth, well below the reach of the small-scale historical mines, but within reach for a modern industrial open pit operation.
Figure 1-1: Location of the Cordero Project in Southern Chihuahua State, Mexico
Source: RedDot3D, 2021.
1.3 Geology and Mineralization
Regionally, Cordero lies in an area where the sedimentary rocks of the Eastern Basin and Range geological province of Mexico meet the volcanic rocks of the Sierra Madre Occidental province. Locally, the rocks on the Cordero property are a mixture of sedimentary rocks and igneous rocks. There are three major belts of intrusions that cut across the property, all running southwest to northeast, parallel to the largest faults in the area.
The area that has been the focus of drilling in the past decade, and where the current resources lie, is a felsic domal feature that makes the distinctive hill in the central band of intrusions. This felsic intrusive complex straddles the Cordero Fault and

Cordero Project P a g e 3
Preliminary Economic Assessment of the Cordero Silver Project, Chihuahua State, Mexico January 2022
lies between two normal faults that stair-step the sedimentary and intrusive host rock units down to the southwest. To the northeast of the felsic domal feature, across the Mega Fault, lies La Ceniza, where a rhyodacite intrusion with skarn mineralization has been the focus of historical small-scale mining. To the southwest lies Pozo de Plata, a breccia complex where gold grades are higher. All of the intrusions are associated with breccias that often host strong mineralization.
The precious and base metal mineralization is strongly associated with sulphide minerals such as pyrite, galena, sphalerite, and chalcopyrite. Weathering has created a near-surface oxide layer, up to 40 m thick in places, where sulphide minerals are generally absent and where the precious metals, silver and gold, have higher grades.
Cordero has characteristics of several different deposit types. Much of it is similar to an extensional (E-type) intermediate sulphidation epithermal system on the shoulder of a buried porphyry molybdenum deposit that formed in a subduction related rift setting. Parts of Cordero resemble the carbonate-hosted Pb-Zn (Ag, Cu, Au) deposits further north in Chihuahua State. In the northeast of the resource modelling area, Cordero is dominated by skarn replacement styles which occur in carbonate-hosted Pb-Zn (Ag, Cu, Au) deposit types in which grades were enhanced immediately adjacent to the underlying La Ceniza Intrusive Complex as well as in the adjoining intrusive complex to the southwest.
1.4 Exploration
Exploration for a deep bulk mining target at Cordero began with the work of Valley High Ventures Ltd. Valley High carried out mapping and rock sampling at the surface, as well as gridded soil sampling, trenching, inspection of accessible underground workings, and relogging of existing drill core from the previous owner, Industrias Peñoles.
In 2009, Levon continued surface reconnaissance, began drilling, and commissioned several air and ground-based geophysical surveys (e.g., gravity, induced polarization, magnetic, electro-magnetic, magnetotelluric, and radiometric surveys). Most of Levon’s exploration work focused on the central belt, which hosts the principal target of the current resource estimate, the Cordero intrusive complex. During their decade of ownership, Levon drilled 292 diamond drill holes with a combined total length of 133,620 m.
Since it acquired the project in 2019, Discovery Silver has extended surface reconnaissance to cover other exploration targets identified by geophysics along the same central trend of intrusions that have hydrothermally altered rocks adjacent to them. This has included Molino do Viento and Dos Mil Diez to the southwest of the main Cordero target, and Sansón to the northeast. By July 2021, Discovery Silver had drilled an additional 225 diamond drill holes with a combined length of 97,522 m. Surface reconnaissance and exploration continue ahead of drill targeting.
1.5 Sample Preparation, Analysis and Security
Approximately half of the samples included in the current mineral resource estimate are from drilling programs conducted by Levon ending in 2017. The other half were generated by the Discovery Silver drill programs in 2019, 2020 and 2021.
All samples for the drill programs by Levon and Discovery Silver were prepared using the same ALS Method, Prep Core Prep-31 by crushing to 85% to minus 10 mesh then a split was pulverized to 95% minus 150 mesh (Levon) or 85% passing through 75 µm (Discovery Silver). From 2009 to 2012 and 2017 assays for Levon were performed by ALS Geochemistry (Vancouver). In 2013 and 2014 assays were performed by Activation Laboratories Ltd. (Activation) in Mexico. In 2019, 2020 and 2021 Discovery Silver used the ALS prep laboratory in Chihuahua, Mexico and ALS (Vancouver, Canada) for assaying. All of the laboratories named above are independent of Discovery Silver and accredited with the Standards Counsil of Canada to the ISO/IEC 17025 standard.

Cordero Project P a g e 4
Preliminary Economic Assessment of the Cordero Silver Project, Chihuahua State, Mexico January 2022
Levon submitted all pulverized splits for multi-element aqua-regia digestion with inductively coupled argon plasma (ICP) mass spectrometry (MS) detection (ALS Method Code ME-ICP41) with overlimit results re-analyzed using ICP-atomic emission spectroscopy (AES) and a 4-acid digest. Discovery Silver submitted all pulverized splits for multi-element aqua-regia (ALS Method Code ME-ICP61) with overlimit results reanalyzed using ICP-AES and a 4-acid digest. Gold analyses were conducted on a 30-gram sub-sample for fire assay with an AA-finish (Levon) and on a 50-gram sub-sample for fire assay (Discovery Silver). For the 2019 to 2021 drilling, Discovery analyzed sample over-limits > 10 g/t Au and > 1500 g/t Ag using fire assay on a 50-gram subsample (for gold) and 30-gram subsample (for silver) with a gravimetric finish. In addition, samples that assayed >100 g/t Ag the detection limit for ICP-MS, between 100 to 500 g/t Ag and >1.0% Zn and/or > 1.0% Pb were reassayed using the ALS Method Code ME-OG62.
The quality assurance/quality control (QA/QC) program consisted of the insertion of certified reference material (CRM) every 15th sample, blank sample insertions every 18th sample, and the insertion of core pulp duplicates every 100th sample. The sample preparation analysis and security program implemented by Discovery Silver was designed to support a large volume of data. Sample collection and handling procedures are documented and reviewed frequently. The laboratory analytical methods, detection limits, and grade assay limits are well-suited to the style and grade of the Cordero mineralization. The QA/QC methods implemented by Discovery Silver enabled an on-going assessment of sample security, assay accuracy, and possible contamination. The QP reviewed sample collection and handling procedures, laboratory analytical methods, QA/QC protocols, and the QA/QC program results and believes these methods are adequate to support the current Mineral Resource estimate.
1.6 Data Verification
Discovery Silver has developed an extensive dataset that is saved and managed using GeoInfo Solutions management software. World Metals reviewed the data compilation and audited the GeoInfo Tools database. World Metals conducted verification of the Cordero databases for precious and base metals by comparison of the database entries with assay certificates as well as by reviewing physical drill core for evidence of base metal mineralization. The database was also checked for incorrect entries, interval lengths, blank or zero-value assay results, out-of-sequence or missing intervals and value-fields. The QP believes the database provided by Cordero is reliable and is adequate to support the mineral resource estimate.
1.7 Metallurgical Testwork and Mineral Processing
Metallurgical testwork programs were conducted on 12 rock type and pit phase composites to develop the Cordero flowsheet. Three pit phases (P23, P29 and P34) were considered with four rock types (volcanic, breccia, sedimentary and oxide) selected per pit phase. P23 was representative of the first phase of mining with samples sourced from the Pozo de Plata zone. P29 was representative of the next phase of mining with samples mostly sourced from the northeast extension zone. P34 was representative of the final phase of mining with samples mostly sourced from the south corridor.
The 2021 testwork program focused on the following tests:
• mineralogical (QEMSCAN) analysis
• comminution testwork including Bond ball work index tests, SAG mill comminution testwork, and abrasion index tests
• pre-concentration testwork including dense media separation tests and X-ray transmission sensor sorting testwork

Cordero Project P a g e 5
Preliminary Economic Assessment of the Cordero Silver Project, Chihuahua State, Mexico January 2022
• preliminary leaching tests on oxide samples including column leach tests.
• flotation optimization tests including rougher recovery tests, tests on the optimal primary grind size, depressant dosage sensitivity tests, cleaner optimization tests, locked cycle tests, concentrate quality tests, and low-grade flotation tests.
The QEMSCAN analysis of 12 lithology composites indicates that the sulphide mineralogy is relatively coarse and liberates well, with little in the way of galena-sphalerite association or locking, and that the gangue mineralization is relatively straightforward and benign. Conventional, sequential lead-zinc flotation has repeatedly been shown to be a successful and robust choice for processing Cordero sulphide mineralized materials. Relatively low head grade material is able to be upgraded considerably at relatively coarse primary grinds (P80 = ~200 µm) with moderate reagent dosages. The choice of coarse primary grind with regrinding of the lead and zinc rougher concentrates is favourable due to the relatively hard characteristics of the mineralized material (Bond ball work index of 18 to 20 kWh/t).
At head grades close to the resource average (25-40 g/t Ag, 0.4-0.6% Pb and 0.5-0.8% Zn), the optimized flotation flowsheet produces remarkably clean lead and zinc flotation concentrates at impressive recoveries given the relatively low head grades. Locked cycle testing produced lead-silver concentrates grading >3,000 g/t Ag, 50-56% Pb and <5% Zn at silver and lead recoveries of 70-79% and 83-91%, respectively, and zinc concentrates graded 46-55% Zn at zinc recoveries ranging from 81-90%. Total silver recovery (lead and zinc concentrates combined) from locked cycle testing was 89%, 84%, 83% and 80% for the breccia-volcanic, breccia-sedimentary, volcanic, and sedimentary lithologies, respectively.
Testwork has shown that both the sulphides and oxide/transition zones of mineralization can be successfully processed to produce high-value lead-silver and zinc flotation concentrates (for the sulphides) and silver doré from oxide/transition material. Although silver recoveries for the oxide/transition material are higher through grinding and the use of a tank leach, it is likely that heap leaching will be the more favourable option due to lower capital and operating costs and the ability to decouple sulphide and oxide mineralized material production and process the different mineralized material types in parallel without constructing two full processing plants.
1.8 Mineral Resource Estimate
The new resource estimate for Cordero incorporates geological and structural domains based on lithological and structural controls that are better understood through recent drilling.
Ordinary kriging was used to interpolate silver, lead, zinc and gold grades into blocks and sub-blocks, using variogram models based on pairwise relative experimental variograms for the analysis of spatial continuity.
Resource classification was based on block-by-block metrics that relate to the proximity of nearby data. An optimized pit shell further constrains the reported mineral resource to fulfil the requirement for “reasonable prospects for eventual economic extraction”.
The mineral resource is split into sulphide and oxide portions. Since silver, lead, zinc, and gold all contribute to revenue, a net smelter return (NSR) is calculated as the net revenue from metal sales (taking into account metallurgical recoveries and payabilities) minus treatment costs and refining charges. Different NSR cut-offs are used for the sulphide and oxide mineralization since different processing options, with different costs, are appropriate for each type of mineralization.
Sulphide mineralization is categorized as all mineralization that is located beneath the oxide/transition boundary; it extends to depths of more than 800 m below surface. The $7.25/t NSR reporting cut-off used for sulphide mineralization is based on the estimated processing and G&A cost for standard flotation processing of this material.

Cordero Project P a g e 6
Preliminary Economic Assessment of the Cordero Silver Project, Chihuahua State, Mexico January 2022
Table 1-1 presents the mineral resource estimate for the sulphide material at Cordero. The tabulated grades and metal contents are in-situ estimates and do not include factors such as external dilution, mining losses, and process recovery losses. As such, these are mineral resources, not mineral reserves, and do not have demonstrated economic and technical viability.
Table 1-1: Sulphide Mineral Resources for the Cordero Project, with an Effective Date of October 20, 2021, above an NSR Cut-off of $7.25/t and within a Reporting Pit Shell
Class Tonnage
(Mt)
Grade Contained Metal
Ag (g/t)
Au (g/t)
Pb (%)
Zn (%)
AgEq (g/t)
Ag (Moz)
Au (koz)
Pb (Mlb)
Zn (Mlb)
AgEq (Moz)
Measured 128 22 0.08 0.31 0.52 52 89 328 881 1,470 212
Indicated 413 19 0.05 0.28 0.51 47 255 707 2,543 4,663 625
Meas. & Ind. 541 20 0.06 0.29 0.51 48 344 1,035 3,424 6,132 837
Inferred 108 14 0.03 0.19 0.38 34 49 99 451 909 119
Notes: 1. AgEq for sulphide mineral resources is calculated as Ag + (Au x 16.07) + (Pb x 32.55) + (Zn x 35.10); these factors are based on commodity prices of Ag – $24.00/oz, Au – $1,800/oz, Pb – $1.10/lb, Zn – $1.20/lb and assumed recoveries of Ag – 84%, Au – 18%, Pb – 87% and Zn – 88%. 2. Discovery Silver is not aware of any environmental, permitting, legal, title, taxation, socio-economic, marketing, or political factors that might materially affect the development of these mineral resource estimates. 3. The tabulated numbers have been rounded to reflect the level of precision appropriate for the estimates, and may appear to sum incorrectly due to rounding. Source: RedDot3D Inc., 2021.
Oxide/transition mineralization lies above the oxide/transition boundary, where the material is weathered (oxide) or partially weathered (transition). The depth of the oxide/transition zone varies across the deposit from approximately 20 m in the Pozo de Plata zone to depths of up to 100 m in certain areas in the South Corridor and in the far northeast of the deposit. The $4.78/t NSR reporting cut-off used for oxide/transition mineralization is based on the estimated processing and G&A costs for heap leaching this material. Since heap leaching will not recover lead and zinc, these are not reported for the oxide/transition mineral resources.
Table 1-2 presents the mineral resource estimate for the oxide/transition material at Cordero. The tabulated grades and metal contents are in-situ estimates and do not include factors such as external dilution, mining losses, and process recovery losses. As such, these are mineral resources, not mineral reserves, and do not have demonstrated economic and technical viability.
Table 1-2: Oxide Mineral Resources for the Cordero Project, with an Effective Date of October 20, 2021, above an NSR Cut-off of $4.78/t and within a Reporting Pit Shell
Class Tonnage
(Mt)
Grade Contained Metal
Ag (g/t)
Au (g/t)
AgEq (g/t)
Ag (Moz)
Au (koz)
AgEq (Moz)
% Oxide / % Transition
Measured 23 20 0.06 25 15 43 19 92% / 8%
Indicated 75 19 0.05 23 45 125 56 87% / 13%
Meas. & Ind. 98 19 0.05 23 60 168 74 88% / 12%
Inferred 35 16 0.04 20 18 44 22 63% / 37%
Notes: 1. AgEq for oxide/transition mineral resources is calculated as Ag + (Au x 87.5); this factor is based on commodity prices of Ag – $24.00/oz and Au – $1,800/oz and assumed heap leach recoveries of Ag – 60% and Au – 70%. 2. Discovery Silver is not aware of any environmental, permitting, legal, title, taxation, socio-economic, marketing, or political factors that might materially affect the development of these mineral resource estimates. 3. The tabulated numbers have been rounded to reflect the level of precision appropriate for the estimates and may appear to sum incorrectly due to rounding. Source: RedDot3D Inc., 2021.

Cordero Project P a g e 7
Preliminary Economic Assessment of the Cordero Silver Project, Chihuahua State, Mexico January 2022
1.9 Mining Methods
Mining of the Cordero deposit will be done by open pit methods utilizing a traditional drill, blast, load and haul sequence to deliver mill feed to the primary crusher for processing through the sulphide plant or placed on the heap leach pad. Waste material will be sent to either the rock storage facility (RSF) southeast of the pit or to the tailings storage facility (TSF) to the west of the pit.
The current geotechnical dataset is considered sufficient for PEA level-designs. Interramp pit slope angles (measured from bench crest to bench crest) range from 40° at the southwest side of the ultimate pit to 59° at the northeast side of the ultimate pit. Bench face angles range from 69° to 80°. Bench widths range from 8.5 to 16 m and have been designed to adequately retain rockfall.
Four pit phases were developed for the single open pit. Mining occurs on 10 m lifts with safety benches every 20 m using the provided geotechnical parameters by sector. Haul roads are designed at 35.4 m wide to accommodate 230-tonne class haul trucks.
The mine schedule plans to deliver 199 Mt of sulphide mill feed grading 31.1 g/t Ag, 0.09 g/t Au, 0.75% Zn and 0.46% Pb over a mine life of 14 years. Heap leach material processed included 20 Mt of leach crush material grading 41.5 g/t Ag, 0.09 g/t Au, 0.40% Zn and 0.34% Pb along with 9.1 Mt of ROM leach material grading 23.6 g/t Ag, 0.06 g/t Au, 0.37% Zn and 0.25% Pb. Waste tonnage totalling 491 Mt will be delivered to either the tailing storage facility or the rock storage facility. The overall strip ratio is 2.2:1.
The mine plan calls for the staged delivery of various feed types to the primary crusher. In Years -1 to 3, the crusher will size 5 Mt/a of oxide material suitable for heap leaching. Sulphide feed to the mill will start in Year 1 and continue at a rate of 20,000 t/d until Year 3. The sulphide plant will be expanded in Year 3, achieving a rate of 40,000 t/d in Year 5 (Year 4 is a ramp up year from 20,000 tpd to 40,000 tpd). This rate will be maintained for the remainder of the 16-year mine life. The peak mining rate will occur in Years 1 and 2 at 67 Mt/a, but holds steady thereafter at 65 Mt/a until Year 6 when it declines as the mine matures. Three sulphide stockpiles with a peak capacity of 64 Mt will be used to primarily store low-grade sulphide mill feed.
Dilution was applied on a block-by-block basis with consideration of the diluting material grade. This resulted in an increase in mill feed tonnage by 3% but only a 2.3% drop in silver grade.
It is assumed mining will be carried out by a mining contractor. The equipment fleet will be comprised of 91-tonne class haulage trucks with appropriately sized excavators and loaders. An estimate of capital and operating costs was developed based on the selected mining fleet, which is sufficient to meet the mine schedule needs.
1.10 Recovery Methods
The proposed design is based on a stage-wise expansion approach to treat the variable grades in the recovered mineralization while also considering a future increase in mill throughput. The various design phases are:
• The initial phase includes a heap leach operation to treat the oxide material and produce silver-gold doré barsThe second phase includes treatment of run-of-mine (ROM) oxide material in heap leach and treatment of sulphide material from the open pit in a sequential flotation plant producing lead-silver concentrate and zinc concentrate
• The final expansion phase will include expansion to the sulphide flotation capabilities in the future when the sulphide mill feed throughput is doubled.

Cordero Project P a g e 8
Preliminary Economic Assessment of the Cordero Silver Project, Chihuahua State, Mexico January 2022
• Year -1: Heap leach design is operated exclusively pending completion of Phase 1 sulphide flotation capacity.
• Year 1: Phase 1 Sulphide concentrator will be designed to process a throughput of 7.2 Mt/a while the 5.0 Mt/a heap leach operation is operated in parallel.
• Year 4: Phase 2 Sulphide concentrator will be designed to process a throughput of 14.4 Mt/a; however the Phase 2 expansion capital will be dedicated to the grinding, rougher and tailings thickening circuits only. As the oxide heap leach operation will be completed at this stage the oxide crushing circuit will be reallocated to the sulphide process plant to accommodate the increased throughput.
• Year 9: Phase 3 Sulphide concentrator will expand from the Phase 2 sulphide expansion by adding concentrate focused unit operations. During this stage the concentrate production will increase because of increasing feed grades to the process plant.
The simplified process flow diagram depicting the first four years of operation is shown in Figure 1-2, while the expanded flowsheet occurring in year five is shown in Figure 1-3.
Figure 1-2: Simplified Process Flow Diagram
Source: Discovery Silver, 2021.

Cordero Project P a g e 9
Preliminary Economic Assessment of the Cordero Silver Project, Chihuahua State, Mexico January 2022
Figure 1-3: Overall Block Flow Diagram
Source: Discovery Silver, 2021.
The Cordero site is a greenfield location consisting of an open pit mine that will utilize direct tipping to feed the gyratory crusher. The coarse primary crushed product will report to either an oxide stockpile or sulphide stockpile by means of a common conveyor and plough system. Material from each of the oxide and sulphide stockpiles will then be reclaimed and sent to the respective secondary and tertiary crushing circuits. Final crushed product will be stored in stockpiles before being reclaimed for specific operations: heap leach for oxide material and sequential flotation for sulphide material.
Material reclaimed from the fine oxide stockpile will be agglomerated with lime, cement, and water to bind fines to maintain solution flow through the heap. The agglomerates will be conveyed by means of grasshopper conveyors to the heap leach pad. The heap leach operation will use a cyanide solution to irrigate the heap leach pad and collect the pregnant solution in a pond. The pregnant solution will be pumped from the pond to a Merrill-Crowe circuit where silver-gold doré bars will be produced as a final product. Barren solution from the Merrill-Crowe circuit will be returned to the intermediate solution pond which will be used to irrigate the heap pad.
The sulphide flotation plant will reclaim material from the sulphide crushed material stockpile and convey it to a closed-circuit ball milling circuit. The cyclone overflow from the milling circuit will report to a sequential flotation circuit where lead-silver and zinc concentrates will be recovered. The concentrates will be thickened and filtered prior to loadout and

Cordero Project P a g e 1 0
Preliminary Economic Assessment of the Cordero Silver Project, Chihuahua State, Mexico January 2022
transportation. The tailing streams from the flotation circuit will report to a final tailings thickener and be pumped to the TSF.
1.11 Project Infrastructure
Infrastructure to support the Cordero project will consist of site civil work, a heap leach facility, site facilities/buildings, on-site roads, a water management system, and site electrical power. Site facilities will include both mine facilities and process facilities, as follows:
• Mine facilities include administration offices, a truckshop and a washbay.
• Process facilities include the process plant, crusher facilities, process plant workshop, and assay laboratory.
• Waste management facilities include a heap leach facility, TSF and RSF.
• Common facilities include a gatehouse and administration building.
• The mine and process facilities will be serviced with potable water, fire water, compressed air, power, diesel, communications utilities, and sanitary systems.
An overall site layout is provided in Figure 1-4.
The existing public road will be connected to the project for site access. The typical method of clearing, topsoil removal, and excavation will be employed, incorporating drains, safety bunds and backfilling with granular material and aggregates for road structure. Forest clearing and topsoil removal is expected to be required to allow construction of the processing plant and other buildings and facilities.
The site can be accessed by a series of unpaved roads from federal Highway 24, approximately 11 km to the west-southwest. Some of these roads are in flood-prone corridors and are unsuitable for mine construction and operation traffic. A new all-weather road will need to be constructed to access the mine site from Highway 24. The roads within the process plant area will be generally 6 m wide, integrated with process plant pad earthworks, and designed with adequate drainage.
The roads will allow access between the administration building, warehouses, mill building, crushing buildings, stockpile, mining truckshop, and the top of the mill feed stockpile.
The material mined from the pit will be diverted to four destinations depending on the grade and material type. The barren stripping material will be sent to the rock storage facility while the low-grade mineralized oxides will be sent to the heap leach pad without crushing and the higher grade oxides will be crushed and send to the heap leach pad. The mineralized sulphides will be crushed and sent to the mill feed stockpile. Mineralized sulphides mined during Year -1 will be stockpiled in the mill feed stockpile. Material from the mill feed stockpile will feed the primary crusher from Year 1 onwards. All mill feed is currently envisioned to be hauled from the pit rim by 240-tonne trucks.
Waste rock storage facilities are planned for waste material from the open pit. In general, design considerations assumed an overall reclaimed slope of 2:1 and a swell factor of 30%. Total waste rock capacity is 120 Mm3 or approximately 200 Mt. All stockpiles and rock storage facilities are planned to avoid existing waterbodies and water courses.
The mining infrastructure includes haul roads from the pit to the different areas on site, explosive facility, truckshop and truck washbay, mine warehouse, office and workshop.
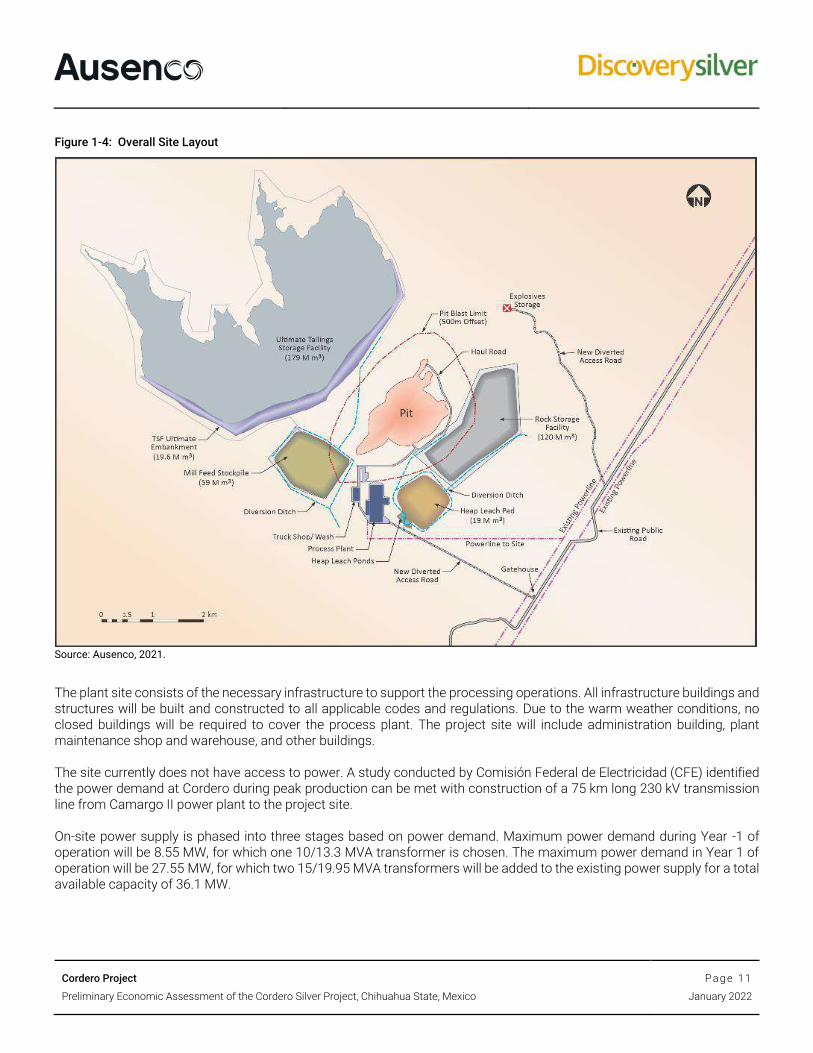
Cordero Project P a g e 1 1
Preliminary Economic Assessment of the Cordero Silver Project, Chihuahua State, Mexico January 2022
Figure 1-4: Overall Site Layout
Source: Ausenco, 2021.
The plant site consists of the necessary infrastructure to support the processing operations. All infrastructure buildings and structures will be built and constructed to all applicable codes and regulations. Due to the warm weather conditions, no closed buildings will be required to cover the process plant. The project site will include administration building, plant maintenance shop and warehouse, and other buildings.
The site currently does not have access to power. A study conducted by Comisión Federal de Electricidad (CFE) identified the power demand at Cordero during peak production can be met with construction of a 75 km long 230 kV transmission line from Camargo II power plant to the project site.
On-site power supply is phased into three stages based on power demand. Maximum power demand during Year -1 of operation will be 8.55 MW, for which one 10/13.3 MVA transformer is chosen. The maximum power demand in Year 1 of operation will be 27.55 MW, for which two 15/19.95 MVA transformers will be added to the existing power supply for a total available capacity of 36.1 MW.

Cordero Project P a g e 1 2
Preliminary Economic Assessment of the Cordero Silver Project, Chihuahua State, Mexico January 2022
The project lies within the Valle de Zaragoza aquifer, as designated by the National Water Commission (CONAGUA). This aquifer system is in an unrestricted zone and not subject to a ban on groundwater extraction. The mine site is located approximately 2 km north of the Arroyo San Juan, an intermittent stream flowing through alluvial materials which will be the potential source of water.
The heap leach facility for the project will be located west of the rock storage facility and east of the process plant. The heap leach pad has been designed in one phase to provide enough stacking area for the crushed and ROM mineralized material per the mine plan. Construction activities include preparing the pad foundation, installing the liner, installing the solution collection system, excavating the ponds, and constructing a perimeter diversion channel prior to commencing mineralized material stacking and leaching. The total capacity of the pad is 19 Mm3 (43 Mt of mineralized material).
Waste disposal for the Cordero Project includes waste rock storage facilities (RSF) and a tailings storage facility (TSF). The TSF is designed for a capacity of handling processing rate of 20,000 t/d during Years 1 to 3 and 40,000 t/d during Years 4 to 16. The total capacity of the TSF is designed for accommodating 250 Mt of tailings. The proposed TSF will be constructed in a broad, gently sloping basin located north of the mineralized trend currently subject to exploration. Local topographic relief is on the order of 300 m. Within the TSF area elevations range from approximately 1,550 to 1,650 masl. The TSF site is underlain by thin to sparse alluvium and residual soils over a bedrock foundation of Cretaceous Mezcalera Formation marine limestone. Water from the TSF is reclaimed and used in the process plant. The reclaim rate during 7.2 Mt/a production rate is 383 m3/h and during 14.4 Mt/a production is 767 m3/h.
The region has long, hot, and humid summers with convective showers and a peak seasonal rainfall in the hottest months. Total annual rainfall is 488.3 mm, of which 83% occurs in the four warmest months (June through September). Based on the rainfall frequency, the proposed water management structures include diversion channel, diversion ditches, collection ditches and collection ponds. The source of runoff water is from stockpile, excess from process plant, groundwater inflow to mining pit, surface runoff from precipitation, heap leach, and the RSF. The water is considered to be in contact with potentially acid generating material and hence is cannot be let into the environment before treatment. At Cordero, any excess water is disposed in the TSF.
The excavation quantities for diversion ditches, diversion channels, collection ditches and ponds, and the site-wide water balance model is further discussed in Section 18.11 of this report.
1.12 Market Studies and Contracts
Discovery Silver retained an external consultant for review of the treatment costs (TC), refining costs (RC) and transport costs, and metal payables. The market terms for this study are based on the terms proposed by the consultant as well as recently published terms from other similar studies.
The following metal payables as stated in Table 1-3 are used in this study. A summary of the treatment and refining costs is shown in Table 1-4.
The estimated transportation costs (trucking, port handling and ocean freight) are $128/wmt for Pb concentrate and
$116/wmt for Zn concentrate. Transportation costs assume trucking of the concentrate via containers to the international
port at Guaymas, Sonora, and then shipping via ocean freight to Asia.
The metal prices presented in Table 1-5 were used for financial modelling for this technical report.

Cordero Project P a g e 1 3
Preliminary Economic Assessment of the Cordero Silver Project, Chihuahua State, Mexico January 2022
Table 1-3: Metal Payables
Description Ag Au Pb Zn
Lead Concentrate
Average Concentrate Grade LOM 2,900 g/t 1.6 g/t 52% -
Payable Metal 95% 95% 95% -
Minimum Deduction 50 g/t 1 g/t 3 units -
Zinc Concentrate
Average Concentrate Grade LOM 300 g/t 0.5 g/t - 51%
Payable Metal 70% 70% - 85%
Deduction 3 oz/t 1 g/t - -
Source: Discovery Silver, 2021.
Table 1-4: Summary of TC and RC
Treatment & Refining Charges Units Spot Price 2021 Benchmark
Treatment Charge – Pb Concentrate $/dmt ~$60 $140
Treatment Charge – Zn Concentrate $/dmt ~$80 $160
Silver Refining Charge – Pb Concentrate $/oz ~$0.75 $1.50
Source: Discovery Silver, 2021
Table 1-5: Metal Prices for Economic Analysis
Metal Price
Silver $22.00/oz
Gold $1,600/oz
Lead $1.00/lb
Zinc $1.20/lb
Source: Discovery Silver, 2021.
1.13 Environmental Studies, Permitting and Social or Community Impact
1.13.1 Environmental Studies
An environmental baseline study was carried out by Interdisciplinary Consultants in Environment SC in 2021 (ICESC). The information from this study was used to request environmental permits and to describe the project’s environmental and socioeconomic setting. No risks of a legal, environmental or socioeconomic were identified.
There are opportunities related to mapping water use, particularly the need for additional studies to map the capacity of the aquifers. The project site covers a total surface area of 34,900 hectares and is contained within the Boquilla River hydrographical basin, and within sub-basin R. Molinas Nuevas. No natural body of water or permanent water flow is located within the project site.
The Cordero region has long, hot, and humid summers with convective showers and a peak seasonal rainfall in the hottest months. In winter, the air is generally mild during the day, but at night the temperature can drop rapidly to a few degrees below freezing.

Cordero Project P a g e 1 4
Preliminary Economic Assessment of the Cordero Silver Project, Chihuahua State, Mexico January 2022
The biological environment is typical of arid scrub lowlands in this part of the State of Chihuahua. Plant life is dominated by xerophytes. Wildlife at the project site is dominated by small, desert-adapted animals including rabbits, mice, fox, birds, skunks, snakes, lizards, coyotes, bobcats, wild boar (javelina) and mule deer. There are no declared or decreed natural protected areas within or bordering the project site. The project site lies within priority hydrological region (RHP) No. 39.
A third-party laboratory conducted sampling of materials from old mining facilities to quantify metals and determine the potential for acid rock drainage. At the time of writing, these tests were still in progress. Geochemical testing is also underway and if protection measures are needed, they will be added into the next phase of work. For information on waste rock management and the TSF, refer to Section 18.
Closure and reclamation of the mine will be conducted in accordance with Mexican law. The TSF, rock storage facility, and open pit will be reclaimed in a manner that minimizes environmental degradation and promotes the return of native vegetation. The process plant will be demolished, and the equipment and steel will be sold for salvage or scrap. Inert materials with no salvage value will be buried on site and then covered, revegetated, and reclaimed. Above-ground piping and other improvements will be removed and the land surface will be reseeded and restored.
1.13.2 Permitting Considerations
A variety of permits and authorizations will have to be obtained prior to construction and operations. In particular, authorization by SEMARNAT (Secretaria de Medio Ambiente y Recursos Naturales) following the Environmental Impact Assessment (EIA) will be required.
Permits that that will be required prior to construction of the mine, processing plant, and access roads, are listed in Section 20.4.
1.13.3 Social Considerations
From a socioeconomic perspective, the project is located near the metropolitan area of Hidalgo del Parral in southern Chihuahua. This region includes the municipalities of Allende, Belleza, Coronado, El Tule, Huejotitán, Matamoros, Santa Barbara, San Francisco del Oro, and Valle Zaragoza. In the study area, more than 16,000 hectares in 338 production units are in agricultural use.
1.14 Capital and Operating Costs
1.14.1 Capital Cost Estimate
The capital cost estimate conforms to Class 5 guidelines for a preliminary economic assessment level estimate with a ±50% accuracy according to the Association for the Advancement of Cost Engineering International (AACE International). The capital cost estimate was developed in Q4 2021 based on Ausenco’s in-house database of projects and studies as well as experience from similar operations.
The estimates are based on the following:
• open pit mining operation
• construction of a stage-wise process plant

Cordero Project P a g e 1 5
Preliminary Economic Assessment of the Cordero Silver Project, Chihuahua State, Mexico January 2022
• construction of associated tailings storage and management facilities
• additional on-site and off-site infrastructure
• Owner’s costs and provisions.
The total initial capital cost for the Cordero Project is US$368 million; the expansion capital cost is US$129 million; and the life-of-mine sustaining cost is US$208 million. The capital cost summary is presented in Table 1-6.
Table 1-6: Summary of Capital Costs
WBS Description WBS
Initial Capital Cost
(US$M)
Expansion Capital Cost (US$M)
Sustaining Capital Cost
(US$M) Total Cost
(US$M)
Y-2 Y-1 Y3 Y8 LOM
Mining 1000 $25.6 $0.7 -- -- $6.8 $33.1
On-Site Infrastructure 2000 $14.7 $9.0 $9.9 -- $16.0 $49.6
Oxide Plant 3000 $70.8 $1.5 -- -- $4.4 $76.7
Sulphide Plant 4000 $0.4 $95.5 $50.8 $22.7 $30.0 $199.3
Tailings Management 5000 -- $14.7 -- -- $95.3 $110.0
Off-Site Infrastructure 6000 $19.4 -- -- -- -- $19.4
Total Directs $130.9 $121.4 $60.7 $22.7 $152.5 $488.2
Project Indirects 7000 $21.8 $29.7 $16.9 $6.2 $3.8 $78.4
Owner's Costs 8000 $5.6 -- -- -- $22.4* $28.0
Provisions 9000 $28.4 $30.2 $15.9 $6.1 $29.3 $109.9
Total Indirects $55.8 $59.9 $32.8 $12.3 $55.5 $216.3
Project Total $186.7 $181.3 $93.5 $35.0 $208.0 $704.5
Note: *The LOM sustaining Owner’s cost is the net difference between reclamation costs and salvage value. Source: Ausenco, 2021.
1.14.2 Operating Cost Estimate
The average yearly operating cost for the project varies as the project undergoes numerous phases with different production rates and mineralized material types. Table 1-7 provides a summary of the operating costs considering the various phases.
Table 1-7: Summary of Operating Costs
Parameter Units Unit Cost
Mining – Mill Feed $/t mined $2.16
Mining – Waste $/t mined $2.04
Processing – Heap Leach Crushed $/t stacked $3.84
Processing – Heap Leach ROM $/t stacked $1.39
Processing – Milling (7.2 Mt/a) $/t milled $7.01
Processing – Milling (14.4 Mt/a) $/t milled $6.57
Site G&A (14.4 Mt/a) $/t milled $0.86 Source: AGP and Ausenco, 2021.

Cordero Project P a g e 1 6
Preliminary Economic Assessment of the Cordero Silver Project, Chihuahua State, Mexico January 2022
1.15 Economic Analysis
The economic analysis was performed assuming a 5% discount rate. Cash flows have been discounted to the start of construction, assuming that the project execution decision will be made, and major project financing will be carried out at this time.
The pre-tax NPV discounted at 5% is $1,858 million; the internal rate of return (IRR) is 50.3%, and payback period is 1.6 years. On a post-tax basis, the NPV discounted at 5% is $1,160 million, the IRR is 38.2%, and the payback period is 2.0 years.
Readers are cautioned that the PEA is preliminary in nature. It includes inferred mineral resources that are considered too speculative geologically to have the economic considerations applied to them that would enable them to be categorized as mineral reserves and there is no certainty that the PEA will be realized.
A summary of the post-tax project economics is shown graphically in Figure 1-5 and listed in Table 1-8.
Figure 1-5: Post-Tax Project Economics
Note: *Left axis is for free cash flow, and right axis for cumulative free cash flow. Source: Ausenco, 2021.
($400)
--
$400
$800
$1,200
$1,600
$2,000
($200)
--
$200
$400
$600
$800
Y-2 Y-1 Y1 Y2 Y3 Y4 Y5 Y6 Y7 Y8 Y9 Y10 Y11 Y12 Y13 Y14 Y15 Y16C
um
ula
tive
FC
F (
US
$M
)
Fre
e C
ash
Fo
w (
US
$M
)
Annual FCF Cumulative FCF
Payback Threshold*

Cordero Project P a g e 1 7
Preliminary Economic Assessment of the Cordero Silver Project, Chihuahua State, Mexico January 2022
Table 1-8: Economic Analysis Summary
Description Unit LOM Total / Avg.
General Assumptions
Silver Price US$/oz $22
Gold Price US$/oz $1,600
Lead Price US$/lb $1.00
Zinc Price US$/lb $1.20
Discount Rate % 5.0%
Production
Total Payable Silver koz 164,818
Total Payable Gold koz 83
Total Payable Lead Mlb 1,626
Total Payable Zinc Mlb 2,340
Total Payable Silver Equivalent koz 372,440
Operating Costs
Mining Cost* US$/t mined $2.13
Processing Cost - Heap leach crushed US$/t stacked $3.84
Processing Cost - Heap leach run of mine US$/t stacked $1.39
Processing Cost - Milling (7.2 Mt/a) US$/t milled $7.01
Processing Cost - Milling (14.4 Mt/a) US$/t milled $6.57
G&A Cost (14.4 Mt/a) US$/t milled $0.86
Cash Costs and All-in Sustaining Costs (Co-Product Basis)
Operating Cash Costs** US$/oz AgEq $8.34
Total Cash Costs*** US$/oz AgEq $12.07
All-in Sustaining Cost **** US$/oz AgEq $12.35
Capital Expenditures
Initial Capital US$M $368
Expansion Capital US$M $129
Sustaining Capital US$M $186
Closure Costs US$M $44
Salvage Costs US$M ($22)
Economics
Pre-tax NPV @ 5% US$M $1,858
Pre-tax IRR % 50%
Pre-tax Payback years 1.6
Post-tax NPV @ 5% US$M $1,160
Post-tax IRR % 38%
Post-tax Payback years 2.0
Notes: *Mining Cost excludes mineralized material rehandling cost. **Operating cash costs consist of mining costs, processing costs, site-level G&A. *** Total cash costs consist of operating cash costs plus transportation cost, royalties, treatment and refining charges. **** AISC consist of total cash costs plus sustaining capital, closure cost and salvage value. Source: Ausenco, 2021.

Cordero Project P a g e 1 8
Preliminary Economic Assessment of the Cordero Silver Project, Chihuahua State, Mexico January 2022
A sensitivity analysis was conducted on the base case pre-tax and post-tax NPV and IRR of the project, using the following variables: metal prices, discount rate, head grade, total operating cost, and total capital cost. Table 1-9 summarizes the post-tax sensitivity analysis results.
Table 1-9: Post-Tax Sensitivity Summary
Metal Prices Post-Tax NPV (5%) Total Capital Cost Total Operating Cost Head Grade
Base Case (-10%) (+10%) (-10%) (+10%) (-10%) (+10%)
(20.0%) $440 $486 $393 $585 $294 $206 $672
(10.0%) $802 $849 $756 $945 $658 $535 $1,068
-- $1,160 $1,206 $1,115 $1,300 $1,020 $861 $1,458
10.0% $1,515 $1,561 $1,469 $1,654 $1,375 $1,182 $1,848
20.0% $1,869 $1,915 $1,824 $2,009 $1,730 $1,501 $2,238
Metal Prices Post-Tax IRR (5%) Total Capital Cost Total Operating Cost Head Grade
Base Case (-10%) (+10%) (-10%) (+10%) (-10%) (+10%)
(20.0%) 20.3% 23.0% 18.0% 24.5% 15.9% 13.1% 26.7%
(10.0%) 29.7% 33.0% 27.0% 33.6% 25.9% 22.7% 36.3%
-- 38.2% 42.0% 35.0% 41.8% 34.6% 30.9% 45.1%
10.0% 46.1% 50.5% 42.4% 49.7% 42.5% 38.5% 53.5%
20.0% 53.7% 58.7% 49.5% 57.3% 50.2% 45.5% 61.7%
Source: Ausenco, 2021.
1.16 Adjacent Properties
One of this technical report’s QPs, Ms. Caira, has personally inspected the claim status on adjacent properties and can find no active mining claims adjacent the Cordero property. As noted in Section 6, a review of adjacent mining claims conducted by Levon in 2009 led to reclaiming mineral concessions that had been dropped earlier by Valley High Ventures Ltd. In 2013, Levon acquired the last remaining inlying mineral concession.
The Cordero Project lies in a region that has been a major producer of silver for centuries and continues to host several producing mines. The region is also a hub for exploration on new mineral deposits, including three early-stage exploration projects belonging to Discovery Silver: Puerto Rico, Minerva, and Monclova.
1.17 Conclusions
The total measured and indicated sulphide resources for the Cordero project are estimated at 541 Mt grading 20 g/t Ag, 0.06 g/t Au, 0.29% Pb, and 0.51% Zn. Additional inferred sulphide resources are estimated to be 108 Mt grading 14 g/t Ag, 0.03 g/t Au, 0.19% Pb, and 0.38% Zn for a total of 956 Moz AgEq.
The total measured and indicated oxide resources for the Cordero project are estimated at 98 Mt grading 19 g/t Ag and 0.05 g/t Au. Additional inferred oxide resources are estimated to be 35 Mt grading 16 g/t Ag and 0.04 g/t Au for a total of 96 Moz AgEq.

Cordero Project P a g e 1 9
Preliminary Economic Assessment of the Cordero Silver Project, Chihuahua State, Mexico January 2022
Based on the assumptions and parameters presented in this report, the PEA shows positive economics (i.e., $1,160 million post-tax NPV (5%) and 38.2% post-tax IRR). The PEA supports a decision to carry out additional detailed studies.
1.18 Recommendations
1.18.1 Overall
The results presented in this technical report demonstrate that the Cordero Project is technically and economically viable. It is recommended to continue developing the project through additional studies. Table 1-10 summarizes the proposed budget to advance the project through the pre-feasibility study stage.
Table 1-10: Proposed Budget Summary
Description Cost (US$M)
Exploration and Drilling $4.50
Metallurgical Characterization $0.70
Mineral Resources $5.50
Geotechnical Studies $0.24
Mine Engineering $0.20
Tailings Storage Facility $0.25
Water Management Studies $0.15
Environmental Studies, Permitting and Social or Community Impact $0.30
Total $11.84
Source: Ausenco, 2021.
1.18.2 Exploration
1.18.2.1 Drilling Programs
A four-stage approach to future drilling is recommended, as follows:
1. Stage 1 relates to definition drilling to the northeast of the current resource area. This stage would consist of infill drilling and step-out drilling from the end of where mineral resources have been estimated, using 20 holes averaging 450 m depth, spaced between 100 to 150 m apart for a total of 9,000 m. The Stage 1 delineation drill work program is estimated at US$2,000,000.
2. Stage 2 consists of sampling and exploration drilling based on targets from ongoing surface geological mapping. The higher priority targets include Dos Mil Diez and Molino de Viento in the southwest; Sansón to the northeast of La Ceniza; Valle and Mesa in the north at Porfido Norte; and La Perla in the south. This stage would involve a total of 5 to 10 holes averaging 300 m depth for 1,500 m in each target for a total of 7,500 meters in 25 holes. The Stage 2 exploration drill work program is estimated at US$ 1,685,000.
3. Stage 3 includes 3D IP surveys over Porfido Norte and the La Perla target in the south. The Stage 3 3D IP survey work program is estimated at US$ 185,500.

Cordero Project P a g e 2 0
Preliminary Economic Assessment of the Cordero Silver Project, Chihuahua State, Mexico January 2022
4. Stage 4 involves carrying out a radiometric survey over areas of the property not surveyed previously in 2010 to identify high-potassium hydrothermal centers known to host favourable mineralization. The Stage 4 radiometric survey work program is estimated at US$ 120,000.
The total cost for all four stages is approximately US$ 4,500,000, including a 15% contingency.
Several of the above stages can be completed in conjunction with other work programs.
Ongoing studies should also be carried out, including continued Leapfrog 3D modelling of the structural corridors, lithology, alteration, mineralization as well as continued SWIR/NIR TerraSpecTM work, petrographic work, and lithogeochemistry work to identify areas of deleterious elements, areas of increased clay content, total sulphide content, and areas of the different carbonate species.
Contingent on the success of the drilling and geophysical surveys, the drill programs should be expanded as needed.
1.18.2.2 Bulk Density Program
Following the cut-off date for drill hole data used in the mineral resource estimate, a program was initiated to measure the density of every 2 m sample interval using whole core. This program should continue since it will provide useful information to supplement the existing pulp density measurements as the project advances. The cost of this activity is included in exploration program cost.
1.18.3 Metallurgical Characterization
The metallurgical work outlined below is recommended for the next project phase.
• Additional comminution tests to further expand the comminution database is recommended to develop a robust comminution model and grinding circuit design. This will improve the future analysis of power requirements and equipment selection.
• Optimization of concentrate regrind sizing is required. Only limited testwork has been conducted to date and specific energy consumption testwork was not included.
• Further investigation between the impact of depressant dosages and silver recovery to the lead-silver concentrate is recommended. Operating at lower depressant dosages would likely lead to higher silver recovery to the lead-silver concentrate where payment terms are more favourable.
• Sensor sorting and/or dense media separation testwork should be further undertaken to determine the response of the low-grade stockpile material to preconcentration.
• Further expansion of the variability flotation database is recommended and testwork on higher grade production composites is required to allow models of robust head grade vs. recovery to be developed.
• No dewatering testwork (dynamic thickener tests and concentrate filtration) has been conducted to date and is recommended as part of the work in the next project phase.

Cordero Project P a g e 2 1
Preliminary Economic Assessment of the Cordero Silver Project, Chihuahua State, Mexico January 2022
• Additional column leach testing is required to provide more robust recovery data for the oxide/transition zones of mineralization. Samples should include the anticipated average oxide silver and gold grades and samples near the cut-off grade and the maximum annual grades. Testing should further address the impact of crush size on recovery.
• The use of 4 kg testwork charges for flotation testwork should be considered as standard going forward, especially for the low head grade samples.
The estimated cost of implementing the above recommendations for further metallurgical testwork is US$700,000, including a 15% contingency.
1.18.4 Mineral Resource Estimation
The work outlined below related to mineral resource estimation is recommended for the next project phase:
• Future resource updates should continue to explore the use of geological logging information to optimize the separation of structural domains into high-grade and low-grade subdomains.
• The impact of the low bias in lead and zinc assays done with an aqua regia digest in 2013 and 2014 should be assessed so that it can be quantified. It is likely that the impact is very small; but as project development advances, it would be useful to have this impact quantified.
• A small cross of closely spaced drill holes at approximately 10 m spacing should be drilled in a high-grade zone and a low-grade zone to improve the understanding of short-scale continuity. This will assist the analysis and interpretation of spatial continuity for future resource estimation studies and will provide useful information for planning a grade control system.
• Infill drilling should continue, both in inferred resource areas where confidence could move the resources into the indicated category, and similarly in indicated resource areas where confidence could move the resources into the measured category. By the time the project reaches its pre-feasibility study, it is prudent to have the majority of the mineral resources in the payback period drilled to the level of measured confidence.
The cost of implementing the above recommendations is estimated at US$5,500,000, including a 15% contingency. The vast majority of the proposed resource drilling is to expand resources in the Cordero Main area, where resources are currently estimated, and to increase the confidence of resource estimates from inferred to indicated, and from indicated to measured.
1.18.5 Geometallurgical Model
A geometallurgical model uses metallurgical responses for various mineralization types to predict the metal recoveries over time in the mine plan. Such a model should be generated to further examine opportunities for ROM leaching, heap leaching and improved mine sequencing on the sulphide material. The cost of this activity is captured under PFS budget.
1.18.6 Geotechnical Studies for Pit Slopes and Sectors
Additional data collection is required to advance the study to the next level. This includes developing a better understanding of the hydrogeological regime.

Cordero Project P a g e 2 2
Preliminary Economic Assessment of the Cordero Silver Project, Chihuahua State, Mexico January 2022
A program of geotechnical data collection needs to be completed on the final PEA design to better understand the lithologies based on further laboratory testwork. A slope stability analysis based on the acquired data may allow for improvements in the current wall slope parameters.
The cost of the recommended work including site investigation is estimated to be US$240,000.
1.18.7 Mine Engineering
The following mining-related studies and analyses should be completed as the project advances to the next study phase:
• The current assumption for grade control is the use of blast hole cuttings. Sampling protocols need to be established and assessed to determine if they would be applicable in normal mine operation. If not, an RC grade control program may be required to allow proper separation of heap and sulphide material as well as mill feed delineation.
• Additional information from further geotechnical drilling is required to develop a proper dewatering cost estimate.
• The current mining philosophy is the use of contract mining. Additional work needs to be completed to verify the cost benefit of this approach versus a leased owner fleet. This would include detailed discussions with local contractors to determine whether a hybrid approach of early-stage contract mining and later-stage owner-operated mining is more economically attractive.
• Additional scheduling studies with an updated geological model are warranted. The use of an ROM pile versus waste rock storage for some material may result in a net cashflow positive scenario. Further evaluation of the heap leach potential of oxide material may also prove to be economically beneficial to the project. The timing and cost of these scenarios need to be completed. The use of stockpiles was included in the PEA, but this needs further refinement to enhance the project.
• Further study is required to determine the nature of the waste rock and to classify it as potentially- or non-acidogenic. The results may require a change in storage strategy.
The cost of implementing the above recommendations is estimated at US$200,000.
1.18.8 Tailings Storage Facility Studies
Due to the conceptual nature of this study and the paucity of information available at the time of writing, assumptions have been made regarding the layout, MTOs, and construction of the proposed TSF. Material properties will be required to perform slope stability analyses and other geotechnical assessments to confirm that the TSF can be built as designed. A tailings distribution plan will be required which may lead to the conceptual staging requiring adjustment to contain the given capacities.
Additional studies and data collection will be required to advance project development beyond the conceptual level. Some, but not necessarily all, of the current data gaps that would need to be addressed in future studies include the following:
• A site reconnaissance visit should be conducted by a qualified engineering geologist to review the proposed TSF location and assess its suitability for the proposed facilities and potential presence of karsts.

Cordero Project P a g e 2 3
Preliminary Economic Assessment of the Cordero Silver Project, Chihuahua State, Mexico January 2022
• Geological and geotechnical site investigations should be carried out, including drilling and in-situ and laboratory testing, to understand subsurface soil and rock characteristics, material properties, and existing groundwater levels.
• The geochemistry of seepage from tailings materials needs to be investigated.
• Additional geotechnical testing of the anticipated tailings, waste rock, and other associated construction materials, (e.g., horizontal drain gravel and sand and candidate geomembranes) should be carried out.
• Hydrological information should be gathered from site-specific climate studies to detail ponds and channels.
• Hydrogeological information from desktop studies and site investigations should be gathered to better understand subsurface flow regimes.
• A trade-off study between dry stacking of tailings vs conventional disposal of tailings.
As additional information is obtained, assumptions made in this study can be verified or updated to advance the project to the next level of design. The cost of implementing the above recommendations is estimated at US$250,000.
1.18.9 Water Management
For the next phase of the work, a trade-off study should be completed for each pond volume versus its pumping rate to the TSF. The ponds should also be designed so particles less than 10 µm settle within each pond.
The water balance analysis shows excess runoff during both the starter and ultimate configurations. However, it should be noted that at the earlier stage of the mining operation, the amount of available water in the dry and wet season is less than the estimated available water from various available sources. A detailed integrated GoldSIM water balance model will be needed to integrate the daily/monthly water balance from the TSF impoundment, ponds for various facilities, and the process plant for every single year of mine life. The inputs and assumptions used in the current study should also be refined and investigated. For example, the current design assumes a constant pit dewatering rate through the mine life, which is adequate for a PEA-level study.
The cost of carrying out the above work is estimated at US$150,000
1.18.10 Environmental Studies, Permitting, and Social or Community Impact
It is recommended that a 3D hydrogeological model for the aquifers under the project site be compiled to confirm their available capacity and ability to accommodate current land use and the project’s future needs. It is also recommended that the model be used to make projections related to impact and the behaviour of the water table within the affected region and to ensure that there are no adverse impacts for agricultural users.
Geochemical studies should be progressed to understand the potential for acid rock drainage and metal leaching and to design the appropriate protection measures at the next stage if required.
Finally, it is recommended that project compliance with appropriate standards is verified should the project require outside financing.
The cost of carrying out the above work is estimated at US$300,000

Cordero Project P a g e 2 4
Preliminary Economic Assessment of the Cordero Silver Project, Chihuahua State, Mexico January 2022
2 INTRODUCTION
Discovery Silver Corp. (Discovery Silver) commissioned Ausenco Engineering Canada Inc. (Ausenco) to compile a preliminary economic assessment (PEA) of the Cordero Project. The PEA was prepared in accordance with the Canadian disclosure requirements of National Instrument 43-101 (NI 43-101) and in accordance with the requirements of Form 43-101 F1.
The responsibilities of the engineering companies who were contracted by Discovery Silver to prepare this report are as follows:
• Ausenco managed and coordinated the work related to the report, supported Libertas Metallurgy Ltd. with the metallurgical test program, and developed PEA-level design and cost estimate for the process plant, general site infrastructure, and economic analysis.
• AGP Mining Consultants Inc. (AGP) designed the mine pit, mine production schedule, and mine capital and operating costs.
• Knight Piésold and Co. (USA) (Knight Piésold) completed geotechnical studies and developed the PEA-level design and cost estimate of the tailings storage facility.
• World Metals Inc. (World Metals) completed the work related to property description, accessibility, local resources, geological setting, deposit type, exploration work, drilling, exploration works, sample preparation and analysis, and data verification.
• RedDot3D Inc. (RedDot3D) developed the mineral resource estimate for the project.
• Hemmera Envirochem Inc. (Hemmera) conducted a review of the environmental studies completed by CIMA and conducted site wide water management.
2.1 Terms of Reference
The report supports disclosures by Discovery Silver in a news release dated November 30, 2021 entitled, “Discovery Reports Preliminary Economic Assessment on Cordero with After-Tax NPV of US$1.2 B, IRR of 38% and Payback of 2.0 Years”.
Readers are cautioned that the PEA is preliminary in nature. It includes inferred mineral resources that are considered too speculative geologically to have the economic considerations applied to them that would enable them to be categorized as mineral reserves, and there is no certainty that the PEA will be realized.
2.2 Qualified Persons
The qualified persons (QPs) for this technical report are listed in Table 2-1. By virtue of their education, experience, professional association, and independence from Discovery Silver, the individuals presented in Table 2-1 are considered QPs as defined by NI 43-101. Report sections for which each QP is responsible are also listed in Table 2-1.

Cordero Project P a g e 2 5
Preliminary Economic Assessment of the Cordero Silver Project, Chihuahua State, Mexico January, 2022
Table 2-1: Report Contributors
Qualified Person Professional Designation
Position Employer Independent of
Discovery? Report Section
Tommaso Roberto Raponi P. Eng. Senior Mineral Processing Specialist
Ausenco Yes
1.1, 1.7, 1.10, 1.11, 1.12, 1.14, 1.15, 1.17, 1.18.1, 2, 3, 13, 17, 18 (except 18.9, 18.10, and 18.11), 19, 21 (except 21.2.1.1 and 21.3.2), 22, 24, 25.1, 25.5, 25.8, 25.9, 25.10, 25.11, 25.12.2.4, 26.1, 27
Scott Elfen P.E. Global Lead Geotechnical Services
Ausenco Yes 18.9
Gordon Zurowski P. Eng. Principal Mining Engineer AGP Yes 1.9, 1.18.5, 1.18.6, 1.18.7, 15, 16 (except 16.2), 21.2.1.1, 21.3.2, 25.7, 25.12.2.5, 26.5, 26.6, 26.7
James Cremeens P.E., P.G.
Chief Geotechnical Engineer Knight Piésold Yes 16.2
Keith Viles P. Eng. Senior Geotechnical Engineer Knight Piésold Yes 1.18.8, 18.10, 25.12.1.5, 25.12.2.3, 26.8
Nadia M. Caira P. Geo. Owner and President World Metals Yes
1.2, 1.3, 1.4, 1.5, 1.6, 1.16, 1.18.2, 1.18.3, 4, 5, 6, 7, 8, 9, 10, 11, 12, 23, 25.2, 25.3, 25.4, 25.12.1.1, 25.12.1.2, 25.12.1.3, 25.12.2.2, 26.2, 26.3
R. Mohan Srivastava P. Geo. Principal Geostatistician RedDot3D Yes 1.8, 1.18.4, 14, 26.4
Scott Weston P. Geo. Vice President, Business Development
Hemmera Yes 1.13, 1.18.10, 20, 25.12.1.4, 25.12.2.1, 26.10
Davood Hasanloo P. Eng. Senior Water Resources Engineer
Hemmera Yes 1.18.9, 18.11, 25.6, 26.9
Source: Ausenco, 2021.

Cordero Project P a g e 2 6
Preliminary Economic Assessment of the Cordero Silver Project, Chihuahua State, Mexico January 2022
2.3 Site Visits and Scope of Personal Inspection
A summary of the site visits completed by the QPs is presented in Table 2-2.
Table 2-2: Qualified Person Site Visits
Qualified Person Date of Site Visit Days on Site
Tommaso Roberto Raponi, P. Eng. Has not visited Site -
Scott Elfen, P.E. Has not visited Site -
Gordon Zurowski, P. Eng. Has not visited Site -
James Cremeens, P.E., P.G. Has not visited Site -
Keith Viles, P. Eng. Has not visited Site -
Nadia M. Caira, P. Geo. October 27, 2021 to November 12, 2021 17
R. Mohan Srivastava, P. Geo. Has not visited Site -
Scott Weston, P. Geo. Has not visited Site -
Davood Hasanloo, P. Eng. Has not visited Site -
Source: Ausenco, 2021.
Nadia M. Caira, the QP for geology, drilling, QA/QC and data verification, has visited the Cordero project site several times since October, 2019. Her most recent visit was from October 27 to November 12, 2021.
2.4 Effective Dates
This technical report has a number of significant dates, as follows:
• Cordero mineral resource estimate: October 20, 2021
• Financial analysis: November 30, 2021
The effective date of this report is based on the date of the financial analysis, which is November 30, 2021.
2.5 Information Sources & References
This technical report is based on internal company reports, maps, published government reports, and public information as listed in Section 27. It is also based on information cited in Section 3.
2.6 Previous Technical Reports
The Cordero project has been the subject of previous technical reports, as summarized in Table 2-3.

Cordero Project P a g e 2 7
Preliminary Economic Assessment of the Cordero Silver Project, Chihuahua State, Mexico January 2022
Table 2-3: Summary of Previous Technical Reports
Reference Company Name
M3 Engineering & Technology, 2012
Levon Resources Ltd. Cordero Project NI 43-101 Preliminary Economic Assessment
Independent Mining Consultants, 2012
Levon Resources Ltd. Cordero Project – June 2012 Mineral Resource Update – Chihuahua, Mexico – Technical Report
Independent Mining Consultants, 2014
Levon Resources Ltd. The Cordero Project September 2014 Mineral Resource Update, 2014
M3 Engineering & Technology and Independent Mining Consultants, 2018
Levon Resources Ltd. Cordero Project, NI 43-101 Technical Report, Preliminary Economic Assessment Update, Chihuahua, Mexico
World Metals & RedDot3D, 2021 Discovery Silver Corp. Mineral Resource Update of the Cordero Silver Project Chihuahua State, Mexico
Source: Ausenco, 2021.
2.7 Currency, Units, Abbreviations and Definitions
All units of measurement in this report are metric and all currencies are expressed in US dollars (US$ or USD) unless otherwise stated. Contained silver and gold metal is expressed as troy ounces (oz) where 1 ounce = 31.1035 grams. All material tonnes are expressed as dry tonnes (t) unless stated otherwise. A list of report abbreviations is provided in Table 2-4.
Table 2-4: List of Abbreviations
Acronym/ Abbreviation
Definition Acronym/
Abbreviation Definition
AMD Acid mine drainage ADS Advanced Drainage Systems
AACE Association for the Advancement of Cost Engineering
IBX Intrusive Breccia
MSB Mexican Silver Belt IS Intermediate Sulphidation
E Extensional EQA Environmental Quality Act
AP Acidity potential IAA Impact Assessment Act, 2019
EIA Environmental Impact Assessment ROM Run of Mine
AAS Atomic Absorption Spectrometry BBWI Bond Ball Work Index
QA Quality Assurance Ai Abrasion Index
QC Quality Control BC British Columbia
CRM Certified Reference Materials ON Ontario
CSV Comma Separated Values SMC Steve Morrell Comminution
LG Lerchs-Grossman RWI Bond Rod Mill Work Index
RF Revenue Factor IBCs Intermediate Bulk Containers
MIBC Methyl Isobutyl Carbinol TSF Tailings Storage Facility
RSF Rock Storage Facility ECCC Environment and Climate Change Canada
MEL Mechanical Equipment List CONAGUA Comisión Nacional del Agua
HDPE High-density Polyethylene PLS Pregnant Leach Solutions
REPDA Registro Público de Derechos de Agua CITES Convention on International Trade in Endangered Species of Wild Fauna and Flora
CFE Comisión Federal de Electricidad SEMARNAT Secretaria de Medio Ambiente y Recursos Naturales

Cordero Project P a g e 2 8
Preliminary Economic Assessment of the Cordero Silver Project, Chihuahua State, Mexico January 2022
Acronym/ Abbreviation
Definition Acronym/
Abbreviation Definition
LGEEPA Ley General Del Equilibrio Ecológico y la Protección al Ambiente
IMSS Instituto Mexicano del Seguro Social
SIEM Sistema de Información Empresarial Mexicano
LGDFS Ley General de Desarrollo Forestal Sustentable
ETJ Estudio Técnico Justificativo CUSTF Cambio de Uso de Suelo de Terrenos Forestales
ER Estudio de Riesgos PPA Plan de Prevención de Accidentes
LGPGIR Ley General para la Prevención y Gestión Integral de los Residuos
NOM Norma Oficial Mexicana
INEGI Instituto Nacional de Estadística y Geografía
DCF Discounted Cash Flow
RC Reverse Circulación IRR Internal Rate of Return
G&A General and Administrative NPV Net Present Value
EIS Environmental Impact Statement NPR Neutralization potential ratio
HVAC Heating, Ventilation and Air Conditioning g/L Gram per liter
NP Neutralization potential g/t Gram per tonne
Project Cordero Project hp Horsepower
JV Joint Venture ha Hectare
TISG Tailored Impact Statement Guidelines in Inch or inches
µm Micron kg Kilogram
LOM Life of Mine km Kilometer
°C Degree Celsius km2 Square kilometer
°F Degree Fahrenheit L Liter
° Azimuth/dip in degrees m Meter
µg Microgram M Mega (million)
a Annum m2 Square meter
Au Gold m3 Cubic meter
Ag Silver bcm Bank Cubic Meters
Pb Lead min Minute
Zn Zinc masl Meters above sea level
As Arsenic mm Millimeters
Fe Iron NOx Nitrogen oxide gases produced by diesel vehicles
Cd Cadmium oz/t, oz/st Ounce per tonne, Ounce per short ton
SiO2 Silicon dioxide oz Troy ounce (31.1035 g)
Hg Mercury ppb Parts per billion
F Fluorine ppm Part per million
Se Selenium % Percent
Mn Manganese s Second
Cl Chlorine ton, st Short ton
cal Calorie t, tonne Metric tonne
cm Centimeter dmt Dry metric tonne
d Day wmt Wet metric tonne
ft Foot or feet US$ or USD United States dollar
g Gram y Year
G Giga (billion)
Source: Ausenco, 2021.

Cordero Project P a g e 2 9
Preliminary Economic Assessment of the Cordero Silver Project, Chihuahua State, Mexico January 2022
3 RELIANCE ON OTHER EXPERTS
3.1 Introduction
The QPs have relied upon other expert reports which provided information regarding mineral rights, surface rights, property agreements, royalties, permitting, social and community impacts, taxation, and marketing for sections of this report.
3.2 Property Agreements, Mineral Tenure, Surface Rights and Royalties
The QPs have not independently reviewed ownership of the project area and any underlying property agreements, mineral tenure, surface rights, or royalties. The QPs have fully relied upon, and disclaim responsibility for, information derived from Discovery Silver and legal experts retained by Discovery Silver for this information through the following documents: various email exchanges with Discovery Silver representatives, Excel spreadsheets, previously completed work reports available on the MERN website, and documents filed on SEDAR by Discovery Silver.
This information is used in Section 4 of the report. The information is also used in support of the cut-off grade assumptions (royalties) for the mineral resource estimate (Section 14), and economic analysis (Section 22).
3.3 Environmental Studies, Permitting, and Social or Community Impact
The QPs have fully relied upon, and disclaim responsibility for, information derived from Discovery Silver and experts retained by Discovery Silver for information related to permitting, and social and community impacts through:
• CIMA, Discovery Silver’s environmental consultant
• VINFIDEM (2021). Estudio de Línea de Base Social Proyecto de Exploración Minera Avanzada Cordero. Mexico. Primera Edición.
• Consultores Interdisciplinarios en Medio Ambiente SC (2021). Estudio de Línea Base Ambiental Cordero. Mexico. Primera Edición.
This information is used in Section 20 of the report.
3.4 Taxation
The QPs have fully relied upon, and disclaim responsibility for, information supplied by experts retained by Discovery Silver for information related to taxation as applied to the financial model, as received by email from Discovery Silver on November 24, 2021. This information is used in the economic analysis (Section 22).

Cordero Project P a g e 3 0
Preliminary Economic Assessment of the Cordero Silver Project, Chihuahua State, Mexico January 2022
3.5 Markets
The QPs have fully relied upon, and disclaim responsibility for, information derived from Discovery Silver and experts retained by Discovery Silver for this information.
This information is used in Section 19 of the report. The information is also used in support of Section 22.

Cordero Project P a g e 3 1
Preliminary Economic Assessment of the Cordero Silver Project, Chihuahua State, Mexico January 2022
4 PROPERTY DESCRIPTION AND LOCATION
4.1 Property Location
The Cordero Property is situated in northern Mexico, in the southern part of the state of Chihuahua, approximately 35 km north of the town of Parral (Figure 4-1). The property is centered at 27° 16.62’ N latitude and -105° 36.21’ W longitude.
Figure 4-1: Location of the Cordero Property in Chihuahua State, Mexico
Source: World Metals, 2021.
4.2 Mineral Tenure and Permits
In Mexico, all mineral deposits are regarded as a national resource that belongs to the federal government. The use and exploitation of such national resources by private parties is only permitted under concessions granted by the federal

Cordero Project P a g e 3 2
Preliminary Economic Assessment of the Cordero Silver Project, Chihuahua State, Mexico January 2022
government. There is no distinction in Mexico between exploration and exploitation mining concessions. The Mining Law provides for mining concessions that allow the title holder to perform the following:
• exploration works on the ground for the purpose of identifying mineral deposits and quantifying and evaluating economically usable reserves
• works to prepare and develop the area containing the mineral deposits
• exploitation works to remove and extract mineral products from mineral deposits.
Mining concessions are granted for a term of 50 years from the date of their registration in the Public Registry of Mining and can be renewed for another 50 years if the title holder request the extension within five years before the expiration date.
The fees owed to the federal government are updated annually under Article 59 of the Mining Regulations, and include a fixed fee according to the area covered by the concession and additional fees for each hectare, which rise over the course of the concession. Currently, the annual concession fee per hectare (or any hectare fraction) during exploration is:
• US$ 0.40 in the first and second year of validity
• US$ 0.53 in the third and fourth year of validity
• US$ 1.24 in the fifth and sixth year of validity
• US$ 2.49 in the seventh and eighth year of validity
• US$ 4.97 in the ninth and tenth year of validity
• US$ 8.75 from the tenth year onward.
In addition to paying the annual mining concession fees, the title holder is required to perform the following:
• commence exploration or exploitation activities within 90 days of the concession being recorded with the Public Registry of Mining
• spend more than the annual fees on exploration, development, or production
• comply with technical safety and environmental standards
• allow inspection visits from the Ministry of Economy, and provide them with statistical, technical, and accounting reports in accordance with the Mining Regulations and the Mining Law
• provide the Mexican Geological Service with semi-annual reports of the works carried out and, once in production, with information on mineral production from the concessions.
During exploration, water permits are required, and the title holder must adhere to an environmental protection plan filed with the government.
All permits necessary for drilling and surface exploration activities at Cordero have been received and are in good standing.
Mining concessions do not confer direct surface property rights. Title holders are obliged to negotiate with the landowners for access rights and for any surface work they need to do, such as building roads or constructing a camp.

Cordero Project P a g e 3 3
Preliminary Economic Assessment of the Cordero Silver Project, Chihuahua State, Mexico January 2022
4.3 Mineral Concessions
4.3.1 Description
The Cordero property consists of the 26 titled mining concessions totalling 34,909 contiguous hectares owned by Minera Titán S.V. de C.V. Mexico (Titán), a wholly owned Mexican subsidiary of Discovery Silver Corp. (Discovery Silver). These are tabulated in Table 4-1 and shown in Figures 4-2 and 4-3. Competitors own one small claim that is situated outside the southern fringes of the La Perla prospect along the south margin of the property (the small grey rectangle shown on Figure 4-2). A detailed list of Minera Titán S.A. de C.V. mining concessions with expiry dates can be found in Table 4-2.
Table 4-1: Mineral Concessions Owned by Titán
Concession Name Title Claim Number Year Area (ha)
San Octavio 165481 30/09/1979 2.00
Cordero 171994 21/09/1983 218.87
Argentina 179438 09/12/1986 3.91
Catas Plateros 177836 29/04/1986 2.00
Sergio 214655 26/10/2001 9.82
El Santo Job 213841 03/07/2001 155.57
Todos Los Santos 238776 25/10/2011 2.50
Berta 182264 31/05/1988 16.53
Josefina 172145 26/09/1983 6.08
La Unidad 178498 08/08/1986 78.30
La Unidad Dos 212981 20/02/2001 175.76
Sansón 230434 03/10/2006 7510.83
Sansón I 231280 23/08/2006 950.00
Sansón 2 II 231281 23/08/2006 400.00
Sansón Fracc. 1 228104 04/10/2006 0.08
Sansón Fracc. 2 218105 04/10/2006 0.09
Titán I 235090 09/10/2009 8150.00
Titán II 241084 22/11/2012 100.00
Titán 235089 09/10/2009 1700.00
La Perla 240461 31/05/2012 400.00
Aida 189299 19/08/1981 16.00
San Pedro 215161 08/02/2002 1.94
Signos 244600 04/11/2015 3756.62
Oeste 244605 04/11/2015 3695.03
Ostra 246305 20/04/2018 3799.77
Volcán 246016 20/12/2021 3757.15
Total 34,908.83
Source: World Metals, 2021.

Cordero Project P a g e 3 4
Preliminary Economic Assessment of the Cordero Silver Project, Chihuahua State, Mexico January 2022
Figure 4-2: Cordero Mining Concessions and Surface Exploration Rights
Source: World Metals, 2021.

Cordero Project P a g e 3 5
Preliminary Economic Assessment of the Cordero Silver Project, Chihuahua State, Mexico January 2022
Figure 4-3: Cordero Mining Concessions and Surface Exploration Rights in the Immediate Vicinity of the 2021 Resource Modelling Area
Source: World Metals, 2021.

Cordero Project P a g e 3 6
Preliminary Economic Assessment of the Cordero Silver Project, Chihuahua State, Mexico January 2022
4.3.2 Access Agreements
Surface exploration rights for the Cordero claims are maintained by three separate signed and transferrable agreements between Titán, two private ranches (Rascón Agreements), and Rancho Cordero Ejido (Ejido Agreement). The two agreements with the private ranchers cover the central portion of the claims (Figure 4-4 on the following page), including the site of the Titán exploration camp including sleeping quarters, the field office, and several drill core storage buildings. The Ejido Agreement covers the area within 2 km southwest and west of the 2021 resource pit (Figure 4-4).
The Cordero access agreements and payment schedules are summarized in Table 4-2 below.
Table 4-2: Surface Access Agreements with Local Landowners
Landowner Company Signature Date Expiration Date Payment Schedule Notes
Ejido Rancho Cordero
Coro Minera de México, S.A. de C.V.
Minera Titán, S.A. de C.V. (Titán)
October 25, 2010
2021 extension signed
December 31, 2021 Monthly, payable bi-
monthly
When drilling, Titán pays a flat fee for each drill hole. In the case that roads are required, the fee doubles.
Rancho San Julián/Jose Alberto Rico Urbina
Titán
Renewed on January 2, 2014
2021 extension
signed
January 31, 2022 Annually, paid in 12
equal monthly payments
When drilling, Titán pays a flat fee for each drill hole. In the case that roads are required, the fee doubles.
Fernando Rascón Chavez. (Rancho San Juan)
Titán April 24, 2012 The time re-quired to carry out mining exploration work
(No payment for access)
Letter agreement. When drilling, Titán pays a flat fee for each drill hole. In the case that roads are required, the fee doubles.
Fernando Rascón (Lease of the core storage and field office-warehouse)
Titán
October 1, 2014
2021 extension signed
December 31, 2021 Monthly
Monthly fee for core storage and field office facilities renewal. The fee is adjusted according to the Consumer Price Index.
Enrique Prieto Rancho Santa Teresa Temporary occupancy
Titán October 2020 October 2030 Monthly
Molino de Viento Target. When drilling, Titán pays a flat fee for each drill hole. In the case that roads are required, the fee doubles.
Arturo Alvidrez Grado (Rancho San Geronimo) Temporary occupancy
Titán April 2020 April 2031 Monthly
La Perla Target. When drilling, Titán pays a flat fee for each drill hole. In the case that roads are required, the fee doubles.
Jesus Francisco Alvidrez (Rancho San Geronimo) Temporary occupancy
Titán April 2020 April 2031 Monthly
La Perla Target When drilling, Titán pays a flat fee for each drill hole. In the case that roads are required, the fee doubles.
Jorge Luis Valles Maldonado (San Julian Ranch & San Luis Ranch) Temporary occupancy
Titán August 2021 August 2031 Monthly
Porfido Norte Target (San Luis Ranch) and Exploration Targets south of Cordero area (San Julian Ranch). When drilling, Titán pays a flat fee for each drill hole. In the case that roads are required, the fee doubles.
Source: World Metals, 2021.

Cordero Project P a g e 3 7
Preliminary Economic Assessment of the Cordero Silver Project, Chihuahua State, Mexico January 2022
Figure 4-4: Areas Covered by Access Agreements with Landowners
Source: World Metals, 2021.

Cordero Project P a g e 3 8
Preliminary Economic Assessment of the Cordero Silver Project, Chihuahua State, Mexico January 2022
4.4 Royalties
For the San Pedro concession there is an agreement (the “Cordilleras Contract” in Figure 4-5) between Cordilleras and Titán that requires Titán to pay Cordilleras a 2% NSR royalty. Titán can assign the obligation of payment of the royalty to a third party by written notice sent to Cordilleras. In the event that Cordilleras decides to sell its right to receive the royalty, Titán will have the right of first refusal on the same terms and conditions that Cordilleras offered to a third party.
For the Josefina, Berta, La Unidad II, and La Unidad claims there is an agreement (the “Eloy Contract” in Figure 4-5) between Titán and two Concessionaires: Mr. Eloy Herrera Martínez and Cleotilde de la Rosa Ríos which requires Titán to pay a 1% NSR royalty to the Concessionaires. In the event that the Concessionaires decide to sell their right to receive the royalty, Titán will have the right of first refusal on the same terms and conditions that the Concessionaires offered to a third party.
Figure 4-5: Concessions Covered by NSR Royalty Agreements, along with the 2021 Pit Outline
Source: World Metals, 2021.

Cordero Project P a g e 3 9
Preliminary Economic Assessment of the Cordero Silver Project, Chihuahua State, Mexico January 2022
4.5 Environmental Liabilities, Factors and Risks Affecting Ability to Perform Work
The QP is not aware of any environmental liabilities to which the property is subject and is not aware of any significant factors or risks that might affect access, title or the right or ability to perform work on the property.

Cordero Project P a g e 4 0
Preliminary Economic Assessment of the Cordero Silver Project, Chihuahua State, Mexico January 2022
5 ACCESSIBILITY, CLIMATE, LOCAL RESOURCES, INFRASTRUCTURE,
AND PHYSIOGRAPHY
5.1 Accessibility
Access to Cordero by vehicle is 300 km southwest from Chihuahua City along State Highway 16 to the Parral turn-off to State Highway 24, and then 150 km south on Highway 24. The secondary property access road leaves Highway 24 at the 150 km road marker, heading east for 10 km through a series of private ranches and Ejido Cordero to the Cordero Project field offices. Total travel time is approximately 2.5 hours from Chihuahua City to the project site. An area map is shown in Figure 5-1.
Figure 5-1: Access to the Cordero Project
Source: World Metals, 2021.

Cordero Project P a g e 4 1
Preliminary Economic Assessment of the Cordero Silver Project, Chihuahua State, Mexico January 2022
5.2 Climate
The project lies in a semi-arid climatic zone of northeastern Mexico, where the average temperature ranges from 1°C to 21°C in January and from 18°C to 35°C in June. The average annual rainfall of approximately 20 centimeters falls mostly in July, August, and September. Exploration and related work can be carried out throughout the year, with the occasional requirement for four-wheel-drive vehicles during the wetter periods of the rainy season.
5.3 Local Resources
Chihuahua City is located 2.5 hours north of Cordero by road and is the closest major city center with a population of just over 1,000,000 inhabitants and with an international airport. The city of Torreón is located 5 hours southeast in the state of Coahuila, with an international airport and smelting facilities. A private 2,700 m airstrip suitable for jet traffic lies 25 km southeast of Cordero at Allende along the Parral-Jiménez Highway (Figure 5-2).
Figure 5-2: Pico Prieto Headframe, Parral
Source: World Metals, 2021.

Cordero Project P a g e 4 2
Preliminary Economic Assessment of the Cordero Silver Project, Chihuahua State, Mexico January 2022
5.4 Infrastructure
The nearest logistical support center is Hidalgo del Parral (Parral), where the project keeps a local support office. Parral is host to approximately 120,000 inhabitants and is one of Mexico’s oldest mining towns. Mining in Parral started in 1640 and has a long mining history with the head frame of the Pico Prieto Mine and mine infrastructure still present within the town limits (Figure 5-3). Several mines are still in operation around Parral within the nearby towns of Santa Barbara, and San Francisco del Oro, where Industrial Minera Mexico, S.A. de C.V (Santa Barbara Mine) and San Francisco Mines of Mexico Ltd. (Frisco Mine) respectively, are still operational (Figure 5-3).
Figure 5-3: Producing Mines, Exploration Projects and Mining Infrastructure near Parral
Source: World Metals, 2021.

Cordero Project P a g e 4 3
Preliminary Economic Assessment of the Cordero Silver Project, Chihuahua State, Mexico January 2022
The southern part of the Cordero project is crossed by a two-tower hydroelectric transmission line that comes within 6 km of the 2021 resource area. The power for this transmission line is generated in a hydroelectric plant 20 km to the north of the project. In 2010, the State of Chihuahua constructed another power line east of Highway 24 that cuts across the southwest corner of the Cordero Property. The existing transmission line described may not have enough capacity to supply the planned operation; however, additional lines could be built approximately 75 km to the northeast, where the Camargo II power plant near Santa Rosalía de Camargo is located. Alternative power sources including design and cost analysis for the project are being pursued.
5.5 Physiography
The Cordero property topography is gently rolling scrub-brush ranch land (Figure 5-4) with elevations that range from 1,500 to 1,700 m. The dominant vegetation in the area is desert scrub, with very little grassland. Cattle ranching is the dominant industry in the region.
Some areas have been cleared to grow alfalfa, sorghum, corn, wheat, or oats, which are irrigated from water wells that reach the water table at depths of between 60 to 100 m. Walnuts are also grown on some of the ranches.
Figure 5-4: Cordero's Felsic Domal Features (Silicification and Jasperoid Veining) and Surrounding Scrub Vegetation
Source: World Metals, 2021.

Cordero Project P a g e 4 4
Preliminary Economic Assessment of the Cordero Silver Project, Chihuahua State, Mexico January 2022
6 HISTORY
6.1 Historical Mining
Historical records and anecdotal information indicate that the region around Cordero had supported mining activity since the early 17th century when the Spanish established Real de San José at what is now the town of Hidalgo de Parral (or simply, “Parral”). The central plaza of Parral commemorates the discovery of the La Prieta Mine with a statue of the town’s founder holding a mining hammer in one hand and a nugget of mineralized material in the other.
At Cordero, 35 vertical shafts can still be found along with associated small prospect pits on outcrops of high-grade silver-lead-zinc veins. In shafts that remain accessible, small open stopes can be found at the bottom. There are no known records of production from these mines; but all accessible production voids are small.
By the mid-1800s, mining in southern Chihuahua State had become more organized. The Parral Silver Company, headquartered in New York, maintained detailed records of production and sales from the La Prieta and La Palmilla mines in the town of Parral, including their purchases of mineralized material from smaller operations in the region. The lack of commentary on production at Cordero, just to the north of Parral, suggests that mining on the higher ground of Cordero remained small in scale and unorganized into the late 19th century.
By the start of the 20th century, the American Smelting and Refining Company (Asarco) had become the most significant silver producer in the country and operated small mines on what is now the Cordero property, including La Luz, La Ceniza, and Josefina where they worked veins and high-grade sulphide mineralization. At the peak of Asarco’s activity in the 1940s, they built a small six-cell flotation mill at La Luz the remnants of which still exist. The lack of tailings around the old mill at La Luz, the largest of Asarco’s mines at Cordero, indicates that it was not operational for any significant length of time.
In 2013, Titán consolidated claim ownership in the district, bringing unorganized artisanal mining at Cordero to an end. In the past decade, production from small operations at Cordero has been from hand-sorted mineralized material that was transported to community mills in nearby Parral.
From the very earliest artisanal mining at Cordero, through to the past decade, a shallow water table has created difficulties with dewatering, making all of the historical mines at Cordero necessarily shallow. Although three centuries of mining confirm that Cordero hosts abundant silver, lead, zinc, and gold, historical mines have drawn their production only from some of the near-surface resources. Deeper mineralization remains untouched by past production.
6.2 Recent History of Mineral Tenure and Exploration
In 2000, Industrias Peñoles completed a review of the region for copper, molybdenum, and gold potential, and drilled a few short holes on the Sansón stock at the northeast end of the main Cordero Belt, and on the Valle stock, the westernmost of the stocks in the Porfido Norte Belt (Figure 6-1).
From 2006 to 2009, Valley High Ventures Ltd. (Valley High) owned the claims through their wholly-owned subsidiary, Coro Minera. Valley High carried out surface exploration work, compiled the project’s first comprehensive database, and organized drill core that had been stored in several different secure locations. By 2009, Valley High had dropped half of its claim holdings and entered into a joint venture agreement with Levon.

Cordero Project P a g e 4 5
Preliminary Economic Assessment of the Cordero Silver Project, Chihuahua State, Mexico January 2022
Figure 6-1: Cordero Project Exploration Target Areas
Source: Discovery Silver, 2021.

Cordero Project P a g e 4 6
Preliminary Economic Assessment of the Cordero Silver Project, Chihuahua State, Mexico January 2022
Beginning in 2009, Levon re-staked mineral claims that had been dropped by Valley High and added adjoining claims. By 2011, Levon had met their vesting requirements for 100% of the property and bought out Valley High. During the years when Levon had sole ownership of the property, from 2011 until 2019, a significant addition to the package of mineral concessions was the 2013 purchase of the Aida claim, a small concession in the center of the main resource area that had complicated advancing the project because it lay inside the region that an open pit operation would want to extract, as shown earlier in Figure 4-2.
In 2019, Levon merged with Discovery Metals Corp. In April 2021, Discovery Metals Corp. changed its name to Discovery Silver Corp., which currently has 100% ownership of the mineral rights that cover all of the land needed for a large open pit that targets Cordero’s bulk of mineralization at depth.
6.3 Property Results – Previous Owners
Discovery Silver has not been provided with the drill logs and sample information from the three holes drilled by Industrias Peñoles. The lack of this information has no effect on the current resource calculations since the Sansón and Valle stocks lie outside the area where resources are currently being estimated.
Work carried out by Valley High included geological mapping, rock sampling, gridded soil sampling, and trenching at the Sansón, La Ceniza, and the Cordero Main target areas (Figure 6-1). Historical data was compiled, including drill core stored in secure buildings being re-packaged, re-logged, re-sampled, and re-interpreted. Much of the historical drill core was not sampled despite showing many indicators of Ag-Pb-Zn mineralization: sphalerite and argentiferous galena mineralization in discrete veins, stockwork and breccias. Valley High’s core re-logging recognized the potential for bulk tonnage targets on the property. A subsequent review of mineralization in the accessible underground workings, however, indicated that mineralization might not extend into the wall rock from the veins that had been targeted by historical mining.
Levon carried out reconnaissance mapping which confirmed the importance of three magmatic hydrothermal belts. As a result of this finding, over the next few years Levon carried out several drilling campaigns in tandem with various airborne surveys as summarized in Table 6-1.
Table 6-1: Historic Drilling Campaigns from 2000 to 2017
Company Year Drill Holes Meters Notes
Industrias Peñoles 2001 3 Unknown Sansón Target
Levon Resources Ltd. 2009 8 2,844 C09-5 (discovery hole)
Levon Resources Ltd. 2010 89 35,857 Main Resource Area
Levon Resources Ltd. 2011 109 57,989 Main area; SW targets
Levon Resources Ltd. 2012 44 17,076 Valle, Perla, Molino de Viento, Main Area
Levon Resources Ltd. 2013 16 9,529 Main Resource Area
Levon Resources Ltd. 2014 8 4,662 Main Resource Area
Levon Resources Ltd. 2017 18 5,664 Resumed drilling after downturn
Totals 295 133,620
Source: World Metals, 2021.

Cordero Project P a g e 4 7
Preliminary Economic Assessment of the Cordero Silver Project, Chihuahua State, Mexico January 2022
6.4 Previous Exploration History
Mining activities at Cordero date back to the early 17th century with vertical shafts, narrow stopes, and pits as historical evidence. Silver, lead and zinc veins and vein- breccias with variable gold were exploited during the 1940s and 1950s, and more recently by artisanal miners until 2013 when Titán organized their departure. The recent production was from direct shipping to community mills in the town of Parral. Asarco explored Cordero for a short period and built a small flotation facility at the La Luz mine, the largest active mine in the Cordero area during the 1940s. The La Luz Mining operations were reported as suspended due to water issues.
6.4.1 Exploration by Industria Peñoles
• During 2000 and 2001, Peñoles completed a review of the region for porphyry copper and molybdenum potential at the Sansón stock at the northeast end of the Cordero Belt, and at the westernmost stock near the Porfido Norte belt, north of Sansón.
• Work by Peñoles included the completion of three drill holes at Sansón. This work’s sample results and drill core logs are currently unavailable to Titán.
6.4.2 Exploration by Valley High Ventures Ltd.
• In 2006, Valley High Ventures Ltd. (Valley High) initiated negotiations with claim and surface owners in the main Cordero area.
• In 2007, Valley High started surface exploration work at Cordero, through their wholly owned subsidiary Coro Minera.
• From 2007 to 2009, geologic mapping, rock sampling, gridded soil sampling and trenching were completed at the Sansón, La Ceniza and the Cordero domal feature target areas. Historical data was compiled, and drill core stored in secure buildings were re-packaged, re-logged, sampled, and interpreted. Much of the historical drill core was not sampled despite sphalerite and galena mineralization in various forms including, disseminate, vein, stockwork, and breccia. The core logging recognized the potential for bulk tonnage targets on the property, although a subsequent review of mineralization in those underground workings that were accessible gave the impression that mineralization did not continue significantly into the wall rock on either side of the veins mined.
• In 2009, Valley High dropped half of its claim holdings and sought a joint venture partner to advance the project.
6.4.3 Exploration by the Levon/Valley High Joint Venture
• In January 2009, Valley High signed an agreement with Levon, and the joint venture (JV) started work on the property on February 4, 2009.
• In August 2009, the land that was dropped by Valley High was re-staked by Levon, and any other adjoining land was acquired by Levon.
• In 2009, the initial reconnaissance mapping re-affirmed the importance of the large-scale magmatic-hydrothermal belts called Porfido Norte and the Cordero Belts.

Cordero Project P a g e 4 8
Preliminary Economic Assessment of the Cordero Silver Project, Chihuahua State, Mexico January 2022
• In 2009, eight drill holes C09-1 through C09-08 totalling 2,843.85 meters were completed. Holes C09-3, C09-05 (discovery hole), and C09-8 were significantly mineralized.
• At the end of 2009 and early 2010, a ground-based gravity survey was completed over the Pozo de Plata, and Dos Mil Diez targets by McGee Geophysics of Reno, Nevada and the data was inverted by Rock Geophysics, Reno Nevada, and integrated into the project data.
• In October 2009, a second drill program was initiated, and by year’s end, a total of 19,680 meters in 52 holes had been completed.
• In 2010, the JV focused exploration work on the central Cordero magmatic-hydrothermal belt with geological and structural mapping using a 1:12,500 air photo base in conjunction with soil sampling (Figure 6-2), and rock sampling.
• In 2010, SJ Geophysics of Vancouver, B.C., completed an initial 3D induced polarization (IP) survey along the main Cordero magmatic-hydrothermal belt. SJ Geophysics did not issue a formal report for the IP survey other than a logistics report; however, the resulting maps and images were incorporated into future drill hole planning.
• In 2010, Aeroquest Geophysics of Mississauga, Ontario (Aeroquest) completed an airborne electromagnetic survey (Figure 6-3), a magnetic survey (Figure 6-4), and a radiometric survey over the central Cordero Belt.
• In 2010, SJ Geophysics completed 3D inversions of the Aeroquest magnetometry data over the central Cordero Belt (Figure 6-4). Northeast of the current resource area, the magnetics revealed strong correlation with the deeper parts of the hydrothermal system, coincident with skarn-hornfels sulphide mineralization that has a stronger magnetic response. It also inferred a sizeable buried intrusive center, which implies a large hydrothermal-magmatic plumbing system and incumbent mineralization.
• Between January and June 2010, Levon diamond drilled a total of 35,857.02 meters in 89 holes for an aggregate total of 38,700.87 meters in 97 holes.
• In 2011, Levon diamond drilled 57,989.1 meters in 109 holes for an aggregate total of 96,689.97 meters in 206 drill holes. Compilation of drill hole data up to hole C11-160 was incorporated into a resource inventory at that time.
• In 2011, SJ Geophysics completed a 3D IP survey covering Molino de Viento (27.9 line-km), Dos Mil Diez (76.4 line-km), Pozo De Plata, Cordero Intrusive Complex, and La Ceniza Stock areas where the chargeability shows a strong multi-km long anomaly both within, and well outside the 2021 resource area to the northeast (Figure 6-5).
• In March 2011, Levon bought out their joint venture partner Valley High Ventures after meeting their vesting requirements for 100% of their property.
6.4.4 Exploration by the Levon Resources Ltd
• In 2012, Levon diamond drilled 44 holes (C12-207 through C12-250) totalling 17,075.7 meters.
• In February of 2012, SJ Geophysics Ltd. completed a 3D IP survey over La Perla totalling 4,490 north-south line-kms, at 200-meter spaced lines up to 2,300 meters in length.
• In 2012, Levon completed a magnetotelluric survey over Molino de Viento; however, the data is currently unavailable to Titán.

Cordero Project P a g e 4 9
Preliminary Economic Assessment of the Cordero Silver Project, Chihuahua State, Mexico January 2022
• In July of 2013, Levon purchased the 15.9-hectare inlying Aida Claim in the center of the resource area after a negotiation period of 7 years with the owners.
• In 2013, Levon diamond drilled 16 holes (C13-251 through C13-266) totalling 9,528.84 meters.
• In 2014, Levon diamond drilled 8 holes (C14-267 through C14-274) totalling 4,661.5 meters in 8 holes (Figure 6-6).
• From 2014 to 2016, an exploration hiatus occurred during a market downturn.
• In early 2017, Levon diamond drilled 18 holes (C17-275 through C17-292) totalling 5,664.0 meters bringing the aggregate total to 133,620.01 meters in 292 holes (Figure 6-7).
• In April 2019, Discovery Metals Corp. completed a technical review and property visit at Cordero, and then on May 30, 2019, announced that an Arrangement Agreement had been signed with Levon Resources Ltd.
• By August 2, 2019, the closing of the agreement with Levon was announced and the two companies merged.
• On September 17, 2019, Discovery Silver started drilling on the Cordero project.

Cordero Project P a g e 5 0
Preliminary Economic Assessment of the Cordero Silver Project, Chihuahua State, Mexico January 2022
Figure 6-2: Levon 2010 Soil Sampling Coverage Showing Gold Soil Anomalies
Source: Discovery Silver, 2021.

Cordero Project P a g e 5 1
Preliminary Economic Assessment of the Cordero Silver Project, Chihuahua State, Mexico January 2022
Figure 6-3: Aeroquest 2010 EM Resistivity, Location of Rock Samples, and 2021 Resource Outline
Source: Discovery Silver, 2021.

Cordero Project P a g e 5 2
Preliminary Economic Assessment of the Cordero Silver Project, Chihuahua State, Mexico January 2022
Figure 6-4: Aeroquest 2010 Reduced-to-Pole Magnetics and 2021 Resource Outline
Source: Discovery Silver, 2021.

Cordero Project P a g e 5 3
Preliminary Economic Assessment of the Cordero Silver Project, Chihuahua State, Mexico January 2022
Figure 6-5: SJ Geophysics 3D IP Chargeability 2009-2010, for the 200 m Depth Slice
Note: The Aida Claim, not owned during the survey in 2010, is blanked out. Source: Discovery Silver, 2021.

Cordero Project P a g e 5 4
Preliminary Economic Assessment of the Cordero Silver Project, Chihuahua State, Mexico January 2022
Figure 6-6: Map Showing Diamond Drill Hole Collars at the End of 2014
Source: World Metals, 2021.

Cordero Project P a g e 5 5
Preliminary Economic Assessment of the Cordero Silver Project, Chihuahua State, Mexico January 2022
Figure 6-7: Map Showing Diamond Drill Hole Collars at the End of 2017
Source: World Metals, 2021.

Cordero Project P a g e 5 6
Preliminary Economic Assessment of the Cordero Silver Project, Chihuahua State, Mexico January 2022
6.5 Production History
Evidence of past production at Cordero consists of 35 vertical shafts and approximately 104 mined-out stopes that come to surface. These locations can be readily seen in the aerial photography covering the property (Figure 6-8). The stopes vary between 1 m and 2 m in width and are characterized by oxides and sulphides of high-grade Ag-Pg-Zn ± Au veins and vein breccias, some of which outcrop on surface. Local workers, and former small-scale underground miners that used to work in these stopes reported that most of the production was direct shipping mineralized material, which was hand sorted, shipped, and processed in Parral.
The historical mines of La Luz, La Ceniza and Josefina show evidence of water pumping efforts and support the anecdotal knowledge that the Cordero project area has abundant groundwater. Local workers have reported that most of the vertical workings are excavated to the water table located at an approximate depth of 50 to 80 m.
No reliable records of the historical mining have been encountered to date.
Figure 6-8: Orthophoto Showing Distribution of Surface Workings
Source: World Metals, 2021.

Cordero Project P a g e 5 7
Preliminary Economic Assessment of the Cordero Silver Project, Chihuahua State, Mexico January 2022
6.6 Historical Resources Estimates
6.6.1 2014 Historical Resource Estimate
In April 2017, Levon filed a technical report on SEDAR that described a resource estimate done using all data available through April 2014 (Levon Resources Ltd., 2017). Although the SEDAR filing post-dates by a few years the effective date of work done in 2014, this resource estimate was prepared in accordance with the requirements of National Instrument 43-101 and can be regarded as a compliant historical resource. Although this resource estimate was prepared in accordance with National Instrument 43-101 no qualified person has done sufficient work to classify the historical estimate as current mineral resources, it has since been superseded, and Discovery Silver no longer relies on this mineral resource estimate.
This 2014 mineral resource was an inverse distance ID6 model constrained by an open pit shell. A silver equivalent grade was calculated for each block based on the metal grades, estimate of mill recovery for each metal and the metal prices (Table 6-2).
Table 6-2: Parameters Used to Calculate Silver Equivalent in 2014 Resource Estimate
Metal Mill Recovery (%) Metal Price
Silver 85 $20/oz
Gold 18 $1,250/oz
Zinc 81 $0.94/lb
Lead 80 $0.95/lb
Source: Levon, 2017.
Using a reporting cut off of 15 g/t AgEq (silver equivalent), a summary of the 2014 resource estimate is shown in Table 6-3.
Table 6-3: Summary of 2014 Resource Estimate
Class
Tonnage
(Mt)
Grade Contained Metal
Ag
(g/t)
Au
(g/t)
Pb
(%)
Zn
(%)
AgEq
(g/t)
Ag
(Moz)
Au
(Koz)
Pb
(Mlb)
Zn
(Mlb)
Indicated 848 18 0.05 0.25 0.48 41 448 1,366 4,742 8,953
Inferred 92 15 0.03 0.20 0.33 31 44 85 397 663
Source: Levon, 2017.
6.6.2 2018 Historical Resource Estimate
In 2018, Levon produced a PEA report with an effective date of March 1, 2018 that was prepared in accordance with NI 43-101, and that outlined a resource and an economic evaluation for the Cordero Project. No qualified person has done sufficient work to classify the historical estimate as current mineral resources and Discovery Silver is not treating the historical estimate as current mineral resources.
The 2018 mineral resource estimate was based on 263 drill holes making up 126,235 meters of drilling completed by the end of 2017. The mineral resource was estimated utilizing an inverse distance methodology and contemplated an open pit

Cordero Project P a g e 5 8
Preliminary Economic Assessment of the Cordero Silver Project, Chihuahua State, Mexico January 2022
geometry based on a standard flotation mill with separate zinc and lead circuits, mill recoveries, operating costs for processing, G&A and mining. A silver equivalent grade was calculated for each block based on the metal grades, estimate of mill recovery for each metal and the metal prices shown in Table 6-4.
Table 6-4: Parameters used to Calculate Silver Equivalent in 2018 Resource Estimate
Metal Mill Recovery (%) Metal Price
Silver 88.6 $17.14/oz
Gold 40 $1,262/oz
Zinc 72 $1.11/lb
Lead 84 $0.96/lb
Source: Levon, 2018.
Using a reporting cut off of 15 g/t AgEq, the summary of resource estimate is shown in Table 6-5.
Table 6-5: Summary of 2018 Resource Estimate
Class
Tonnage
(Mt)
Grade Contained Metal
Ag
(g/t)
Au
(g/t)
Pb
(%)
Zn
(%)
AgEq
(g/t)
Ag
(Moz)
Au
(Koz)
Pb
(Mlb)
Zn
(Mlb)
Indicated 990 13 0.04 0.17 0.37 32 408 1,273 3,775 8,030
Inferred 282 21 0.04 0.30 0.75 56 187 363 1,860 4,665
Source: Levon, 2018.

Cordero Project P a g e 5 9
Preliminary Economic Assessment of the Cordero Silver Project, Chihuahua State, Mexico January 2022
7 GEOLOGICAL SETTING AND MINERALIZATION
7.1 Regional Geology
7.1.1 General
The Cordero Project lies at the transition between two physiographic provinces, the Sierra Madre Occidental, a high plateau that is predominantly silicic igneous rock, and the eastern part of Mexico’s Basin and Range, that consists predominantly of sedimentary rocks (Figure 7-1).
Figure 7-1: Physiographic Provinces of Mexico
Source: Adapted from Campa, M.F.; Coney, P.J., 1983. Hammarstrom, J.; Robinson, G.; Ludington, S.; Gray, F.; Drenth, B.; Cendejas-Cruz, F.; Espinosa, E.; Pérez-Segura, E.; Valencia-Moreno, M.; Rodríguez-Castañeda, J.L.; Vásquez-Mendoza, R.; Zurcher, L., 2010.

Cordero Project P a g e 6 0
Preliminary Economic Assessment of the Cordero Silver Project, Chihuahua State, Mexico January 2022
The Sierra Madre Occidental is the result of multiple Cretaceous–Cenozoic magmatic and tectonic episodes related to subduction of the Farallon Plate beneath North America (Ferrari, Valencia-Moreno, Bryan, 2007).
The Mexican Orogeny involved two mountain-building events known as the Sevier and Laramide Orogenies that began approximately 80-90 million years ago during the late Cretaceous and ended approximately 40-50 million years ago during the early to mid-Eocene.
The Mexican Basin and Range is the southern continuation of the large geological province that goes by the same name in the western United States and covers much of western North America. The final stages of the orogeny were marked by block faulting that is the result of an extension and thinning of the crust beginning approximately 30-40 million years ago during the late-Eocene. The sedimentary rocks of the Basin and Range also show strike-slip and thrust style of faulting characteristic of the older compressional environment that marked the mountain building events. Both types of faults, the younger dip-slip faults, and the older strike-slip faults, play an important role as pathways for mineralized fluids that originate from deep magma sources driven upwards by the heat and pressure from the emplacement of magma at depth.
The marine sedimentary rocks of Mexico’s eastern Basin and Range Province include carbonates, siltstones and sandstones that formed in an inland sea referred to as the Western Interior Seaway which extended from the Gulf of Mexico, through Mexico up to the United States and Canada. Younger sediments were shed continuously into the growing sedimentary basin as it was pulled apart over time in a northeast-southwest direction.
7.1.2 Mexican Silver Belt
The Cordero Project lies within the Mexican Silver Belt (MSB), the largest silver province in the world, defined by a 1,500 km belt that extends from the states of Sonora and Chihuahua in the north to Oaxaca in the south. The MSB is host to several world-class mineral deposits including Santa Eulalia, Naica, Santa Barbara, Sombrerete, La Colorada, San Martin, Fresnillo, Guanajuato, and Taxco (Figure 7-2 on the following page).
7.2 Local Geology
The Cordero project area has limited outcrop up to approximately 20%, with a subdued topographic surface that averages approximately 1,550 m above sea level. Resistant Tertiary-age silicic volcanic/subvolcanic rocks pierce the horizontal landscape comprised of recessive and easily eroded marine sediments.
The Cordero property is a shallow-level magmatic system emplaced into an isolated sedimentary basin comprised of a series of compositionally similar, interconnected hypabyssal bodies. Emplacement-related textures have provided favourable permeability loci for mineralization, including a variety of intrusion-related structures.
The Cordero magmatic-hydrothermal system and emplacement-related structures have had a complex history while developing its shape into a disc-shaped laccolith with a deep keel, and a series of interconnected sills and dikes, with magmatic flow-related structures (flow-foliation/flow-banding), contact-related structures (bimictic breccia) syn-magmatic in origin, and fragmental structures in collapse breccias.
At Pozo de Plata (Figure 7-3), a polymictic rhyolitic intrusive breccia (IBX) is cut by mineralized hydrothermally altered milled matrix breccia. The IBX can occur elsewhere as unmineralized bodies. Additionally, the creation of space and permeability is provided by reactivated NNW- to NNE-trending axial planar shears along fold axes, where bedding plane faults and manto-replacement bodies have formed in favourable sedimentary horizons, as well as in extension-related faults where open-space fill is dominant in veins and vein breccias.

Cordero Project P a g e 6 1
Preliminary Economic Assessment of the Cordero Silver Project, Chihuahua State, Mexico January 2022
Figure 7-2: Cretaceous Mezcalera Formation (hatched) with Major Mineral Deposits along the Mexican Silver Belt
Source: Adapted from Goldhammer, R.K., 1999. Centeno-Garcia, E., 2017.

Cordero Project P a g e 6 2
Preliminary Economic Assessment of the Cordero Silver Project, Chihuahua State, Mexico January 2022
Figure 7-3: Cordero Geological Features and Exploration Target Areas
Source: Discovery Silver, 2021.

Cordero Project P a g e 6 3
Preliminary Economic Assessment of the Cordero Silver Project, Chihuahua State, Mexico January 2022
The Cordero Intrusive Complex that hosts most of the project’s current mineral resource comprises a rhyodacitic laccolith, sill, dike and breccia complex. A domal feature forms a resistant hill, the product of intense silicification. In this area, fluids from deep magma found interconnected pathways along several deep basement fault zones, such as the NE-SW trending Cordero, Todos Santos and Josefina faults, that control mineralization. Sheeted dikes have exploited the same northeast-trending Cordero Fault Zone and parallel fault strands; these dikes typically have a quartz-feldspar dacite composition, and are marked by clusters of coarse feldspar crystals, a texture known as “glomerophyric”.
Table 7-1 summarizes studies by Discovery Silver of age dating from isotope ratios in magmatic zircons and molybdenite mineralization at Cordero; these provide a consistent age for the various magmatic rocks: ranging from 36.96 ±0.31 to 37.71 +/- 0.38Ma Ma, and 38.5 ±0.16 Ma on molybdenite mineralization at La Ceniza.
Table 7-1: Ages of Magmatic Activity at Cordero Calculated from Re-Os and U-Pb Isotope Studies
Sample Location Method Age (Ma) Sample Description
C10-163 at 1037.6 m Re-Os (moly) 38.5 ± 0.16 La Ceniza quartz-molybdenite mineralization
C11-163 (1038.15 to 1046.5 m) U-Pb (zircon) 36.96 ± 0.31 Feldspar porphyry dikes
C19-307 (146.7 to 206.9 m) U-Pb (zircon) 37.71 ± 0.38 Plagioclase/K-feldspar/biotite/quartz rhyodacite
C20-336 (309.65 to 344.3 m) U-Pb (zircon) 37.39 ± 0.31 Hypabyssal flow banded rhyodacite
C21-446 (312.1 to 316.15 m) U-Pb (zircon) 37.24 ± 0.27 Quartz-dacite glomerophyric dikes
Notes: Re-Os dating was done at the University of Alberta (Creaser, 2021). U-Pb dating was done at the University of British Columbia (Wall, 2021) Source: World Metals, 2021.
The best-developed mineralization in the Cordero Main area occurs where intrusive igneous dikes and shallow-dipping sills are inter-fingered with marine sediments of the Mezcalera Formation, which consists of interbedded limestones, and sedimentary rocks composed of grains of fine clay (shale) to fine silt (siltstone) as well as larger grains of sand or quartz in sandstones.
The fossils seen in Mezcalera sediments (Figure 7-4) suggest that its original depositional environment was a shallow marine setting along a shelf-slope. Further evidence of a shallow marine depositional environment is provided by the cross-bedding seen in sandstones, which is indicative of wave action that is able to disturb the earlier unconsolidated sediments.
Figure 7-4: Fossil-Rich Sediments from Drill Hole C21-528
Source: World Metals, 2021.

Cordero Project P a g e 6 4
Preliminary Economic Assessment of the Cordero Silver Project, Chihuahua State, Mexico January 2022
For the 2021 resource estimation area, Figure 7-5 shows the Cordero schematic stratigraphic column where Cretaceous Mezcalera sediments are intruded by various Eocene and younger intrusive igneous rocks as well as extrusive volcanic rocks.
Figure 7-5: Schematic Stratigraphic Column in the Cordero Area, and Age Dates for Intrusive Rocks
Source: World Metals, 2021.

Cordero Project P a g e 6 5
Preliminary Economic Assessment of the Cordero Silver Project, Chihuahua State, Mexico January 2022
Figure 7-6 shows the near-surface geology in the resource estimation area, marked with the locations of four representative cross-section lines presented in Figure 7-7 through Figure 7-10.
Figure 7-6: Surface Geology in the Cordero Main Area where Mineral Resources have been Estimated, with Locations of Section Lines used in the Following Figures
Source: World Metals, 2021.

Cordero Project P a g e 6 6
Preliminary Economic Assessment of the Cordero Silver Project, Chihuahua State, Mexico January 2022
Figure 7-7: Cross-Section CPL-14
Source: World Metals, 2021.
Figure 7-8: Cross-Section CPL-21
Source: World Metals, 2021.

Cordero Project P a g e 6 7
Preliminary Economic Assessment of the Cordero Silver Project, Chihuahua State, Mexico January 2022
Figure 7-9: Cross-Section CPL-33
Source: World Metals, 2021.
Figure 7-10: Cross-Section CPL-44
Source: World Metals, 2021.

Cordero Project P a g e 6 8
Preliminary Economic Assessment of the Cordero Silver Project, Chihuahua State, Mexico January 2022
Figures 7-11 and 7-12 show photographs of drill core for the main lithologies and for the different types of breccia encountered at Cordero.
Figure 7-11: Core Photographs for Main Lithologies at Cordero
White flow banded rhyodacite
Rhyodacite (void-fill sulphide) cut by rhyodacite porphyry
Rhyodacite intrusive breccia
Lithic flow foliated rhyodacite
Glomerophyric dacitic porphyry
Seriate biotite rhyodacite with foreign magma
Hornfels Light Calc Sediment
Green Skarnoid (hydro-grossularite) sediment
Source: World Metals, 2021.

Cordero Project P a g e 6 9
Preliminary Economic Assessment of the Cordero Silver Project, Chihuahua State, Mexico January 2022
Figure 7-12: Core Photographs for Different Breccia Types at Cordero
Sedimentary collapse breccia
Rhyodacite-sediment collapse breccia cut by phreatic breccia
Rhyodacite peperite (fluidal), dark mud matrix breccia
Mud matrix breccia cut by veins of phreatic breccia
Mill matrix breccia (oxidized)
Mud matrix breccia
Source: World Metals, 2021.
7.2.1 Mineralogy
The Ag-Au-Pb-Zn content at Cordero is in sulphide minerals, with pyrite, sphalerite and galena accounting for the significant majority of metal content; lesser amounts of the metals of potential economic interest are contained in arsenopyrite, chalcopyrite, freibergite, argentite, rare pyrrhotite, and in the sulphosalts tetrahedrite and tennantite. Figure 7-13 shows several examples of select mineralization styles in drill core.
The primary gangue minerals are Ca-Fe-Mg carbonates and rhodochrosite in Mn-carbonates, adularia, quartz, barite, calcite, sericite, fluorite and chalcedony.

Cordero Project P a g e 7 0
Preliminary Economic Assessment of the Cordero Silver Project, Chihuahua State, Mexico January 2022
Figure 7-13: Core Photographs for Mineralization Styles at Cordero
Rhyodacite cut by sphalerite-galena veins
Rhyodacite sphalerite-cemented puzzle breccia
Barite-calcite fault-fill breccia with void-fill sphalerite
Rhyodacite sphalerite-galena crackle breccia
Sphalerite-galena cemented puzzle breccia
Sulphide-cemented milled matrix breccia
Argentiferous galena puzzle breccia
Argentiferous galena extension vein in hornfels
Source: World Metals, 2021.

Cordero Project P a g e 7 1
Preliminary Economic Assessment of the Cordero Silver Project, Chihuahua State, Mexico January 2022
The rocks were altered as hydrothermal fluids percolated through interconnected faults, fractures, stockwork and along permeable lithologic contacts. The principal type of chemical alteration was caused by fluids that removed certain minerals and replaced them with their potassium-bearing cousins: adularia (a potassium-bearing alumino-silicate), potassium feldspars (orthoclase or sanidine), illite (a potassium-bearing clay), and the potassium-bearing micas: muscovite, biotite and phengite. Potassium-rich alteration is widespread throughout the main Cordero magmatic hydrothermal belt and accounts, in part, for the strong coincidence between the potassium spectral band on the radiometric geophysical survey (Figure 9-1 in Section 9) and the intensity of Ag-Au-Pb-Zn mineralization.
Other alteration minerals include chlorite, chalcedony (a micro-crystalline form of reprecipitated silica) and buddingtonite, an ammonium mineral sourced from sedimentary rocks and associated with epithermal deposits.
The other type of alteration observed at Cordero is due to weathering and the percolation of oxygen-rich waters through the near-surface permeable layer. The common alteration minerals at shallow depths are jarosite, (iron hydroxy sulphate) goethite (iron oxyhydroxide), hematite (iron oxide), kaolinite and smectite (swelling clays) and gypsum (hydrated calcium sulphate).
7.2.2 Structural Geology
Since the mineralization at Cordero is principally due to hydrothermal fluids that carry metals in solution, metal grades are strongly influenced by the geometry of cracks in the rock. Faults and fractures provide the structural preparation and plumbing network through which metals can travel easily over long distances as long as the fluid temperature and pressure remain high enough to keep them dissolved in solution. Changes in the width or direction of open fractures, faults and lithologic contacts create opportunities for fluid pressure to drop, and for metals to precipitate at those locations. Bends in faults and changes in lithologic competency (how easily the rock fractures at the transition from rhyodacite to sediment) create favourable environments for the development of extensional dilation zones that enhance fluid flow paths as permeability increases along the strike of a fault-bend (at a “dilational jog”), but also may create the possibility for these favourable environments to become less favourable as fluid conduits tighten up under compression.
Discovery Silver continues to maintain a database of detailed information on structural geology features observed in surface mapping and in drill holes (Figure 7-14 on the following page). The current resource model benefits from the information on the location and orientation of the major faults, veins and breccias.
7.2.3 Conceptual Model of Mineralizing Processes
The conceptual model for the genesis of mineralization at Cordero is shown in Figure 7-15. Mineralized fluids from deep intrusions moved up faults and fractures at dilational jogs along a releasing bend, percolating out into the surrounding wall-rock. In places, particularly where aperture suddenly increases at lithologic contacts, at dilational jogs or at fault intersections, the fracture density increases forming wider damage (or structural) zones that are better mineralized with wide alteration halos. Some of these zones host veins and vein-breccias in more favourable fluid corridors. Mineralizing fluids were able to penetrate the host rocks away from open fractures, travelling through thin cracks and through the connected permeability of the intrusive rock and the porosity of the sedimentary host rock. The disseminate-style low-grade mineralization extends several hundred meters from the major faults and fault intersections, developing stockwork mineralization with small veinlets crisscrossing to form an inter-connected mineralization network.
In high-grade zones that are dominated by veins and vein-breccias their associated alteration halos and metal grades are continuous in directions parallel to the steeply NW-dipping NE-SW-trending faults.

Cordero Project P a g e 7 2
Preliminary Economic Assessment of the Cordero Silver Project, Chihuahua State, Mexico January 2022
Figure 7-14: Structural Geological Information Gathered in the 2021 Resource Estimation Area
Source: World Metals, 2021.

Cordero Project P a g e 7 3
Preliminary Economic Assessment of the Cordero Silver Project, Chihuahua State, Mexico January 2022
Figure 7-15: Schematic showing Discovery Silver’s Conceptual Model for Mineralization in the Cordero Main Area
Source: Adapted from Wang et al., 2019 from concepts presented recently in Downes, 2007 and Camprubi, A., and Albinson, T., 2007.

Cordero Project P a g e 7 4
Preliminary Economic Assessment of the Cordero Silver Project, Chihuahua State, Mexico January 2022
7.2.4 Other Styles of Mineralization on the Property
The preceding discussion of geological controls and the conceptual model for mineralization pertain to the area where mineral resources have been calculated. Elsewhere on the property, there are several other intrusive igneous bodies, including an unmapped felsic intrusive complex (e.g., La Perla near the southern edge), plugs, sills, and dikes (e.g., La Ceniza, which flanks Cordero Main to the northeast), and several other igneous centers where fissure fed rhyolitic ignimbrite and associated ash and crystal tuffs are prevalent (e.g., Molino de Viento near the western edge).
A variety of breccias occur across the Cordero property including syn-magmatic, phreatic, mill matrix, mud matrix and collapse breccias. Each of these is associated with its own unique characteristics, including a variety of geological controls, mineralization styles and mineral assemblages (not all different) some overlapping; these are reported in Section 9, which discusses the project’s exploration targets.

Cordero Project P a g e 7 5
Preliminary Economic Assessment of the Cordero Silver Project, Chihuahua State, Mexico January 2022
8 DEPOSIT TYPES
The deposits on the Cordero property do not fit neatly into a single deposit type in any of the systems commonly used to categorize mineral deposits into groups with a similar genesis. This is partly due to the fact that the property is large and hosts many different types and ages of intrusive igneous as well as extrusive igneous rock; but even within the Cordero Main area, observations from surface mapping and core logging are consistent with overlapping deposit types. Of the deposit types that have been described and named in the technical literature, the ones with most relevance to Cordero are as follows:
• extensional intermediate sulphidation epithermal systems like Real de Angeles in Zacatecas
• carbonate-hosted Pb, Zn (Ag, Cu, Au) in manto-style (skarn) and crosscutting chimney-style and felsic intrusive igneous contact-related massive sulphides like those at Santa Eulalia in northern Chihuahua
Although breccia-hosted deposits like Peñasquito have sometimes been used as an analogy for Cordero, the Peñasquito deposit has several characteristics not yet observed at Cordero.
8.1 Extensional (E)Type Intermediate Sulphidation Epithermal Systems (E-Type IS)
Intermediate sulphidation epithermal systems in extensional environments, some of which are spatially related to porphyry molybdenum systems, have recently been recognized and described in the technical literature (Wang, Qin, Song, Li, 2019). A schematic conceptual cross-section of this type of system is shown in Figure 8-1 on the following page. The identifying characteristics of this deposit type and their presence at Cordero are summarized in Table 8-1 below.
Table 8-1: Characteristics of E-Type IS Deposits and Cordero Evidence
E-Type IS Deposits Cordero
Primary Characteristics
Presence of Mn-carbonate in rhodochrosite Observed in mid to late hydrothermal stage
Presence of intermediate sulphidation minerals Pyrite, sphalerite, galena, chalcopyrite, tetrahedrite and tennantite
Light-coloured (Fe-poor) sphalerite Red-brown to honey sphalerite
High Ag:Au ratio (> 60) In Cordero Main Ag:Au is well above 100 on average
Extensional rift setting High potassium intrusive/extrusive rocks typical of rift setting
Secondary Characteristics
Large Ag endowment Silver accounts for >40% of in-situ metal value
Occur on flanks of porphyry molybdenum deposit at depth Porphyry molybdenum stockwork encountered in hole C11-163
Overlapping low sulphidation Arsenopyrite-rich veins +/-gold
Parent magma sourced from continental crust Pb-Pb isotope studies indicate input from continental crust fluids
Source: Adapted from Wang, L.; Qin, K.Z.; Song, G.X.; and Li, G.M., 2019.

Cordero Project P a g e 7 6
Preliminary Economic Assessment of the Cordero Silver Project, Chihuahua State, Mexico January 2022
Figure 8-1: E-Type IS above the Shoulder of a Deep Porphyry Molybdenum Deposit
Source: Adapted from Wang, L.; Qin, K.Z.; Song, G.X.; and Li, G.M., 2019.
All of the key characteristics described in the technical literature for E-type IS systems have been observed at Cordero, making this the single best deposit type model.
8.2 Carbonate-Hosted Pb, Zn (Ag, Cu, Au)
Northern Chihuahua State contains many carbonate-hosted lead-zinc deposits (with varying amounts of silver, gold and copper) that have formed in varied locations including skarn-replacement, massive sulphide along sill contacts, subvertical chimney-sulphide and in manto-sulphide. Nearby intrusive rock are the source of the heat and fluids that drive the chemical alteration and replacement over large volumes in the adjacent sedimentary rocks. Figure 8-2 shows a cross-section of this type of system at one of the mines in the Santa Eulalia mining district about 150 km north of Cordero.
The identifying characteristics of this deposit type and their presence at Cordero are summarized in Table 8-2. The only geologic feature noted in Table 8-2 that has not yet been directly observed is the presence of a granodiorite stock at depth; however, the existence of such a stock can be reasonably inferred from magnetic high domains in earlier surveys. The places on the Cordero property where carbonate-hosted Pb, Zn (Ag, Cu, Au) mineralization is best expressed are at La Ceniza, northeast of Cordero Main, and in the deeper parts of Cordero Main and Pozo de Plata.

Cordero Project P a g e 7 7
Preliminary Economic Assessment of the Cordero Silver Project, Chihuahua State, Mexico January 2022
Figure 8-2: Cross-Section through the Carbonate-Hosted Replacement Deposit (Sulphide Manto/Chimney) at the San Antonio Mine in the Santa Eulalia Mining District
Source: Megaw, P.K.M., and Miranda, M.A.G., 1988.

Cordero Project P a g e 7 8
Preliminary Economic Assessment of the Cordero Silver Project, Chihuahua State, Mexico January 2022
8.3 Conclusion
Cordero has many similarities with both of the deposit types described above. In the heart of Cordero Main, where the felsic domal feature dominates the mineral resource modelling area, the best model, is the E-type IS Epithermal System model.
The carbonate-hosted model with replacement mantos and crosscutting chimneys is best suited to the deeper parts of Cordero Main and the La Ceniza area that covers the north-eastern tip of the resource block model.
Table 8-2: Characteristics of Carbonate-Replacement Deposits and Cordero Evidence
Carbonate-hosted Pb, Zn, (Ag, Cu, Au) Cordero
Geochemistry
Silver values > 400 ppm Many silver assays in the 1000s of ppm
Multielement chemistry includes Au, Zn, Pb, Cu, Mn, Mo, As, W, V, and Cd
Multi-element chemistry includes Au, Zn, Pb, Cu, Mn, Mo, As, W, V, and Cd
Mineralogy
Silver-bearing manganese oxide Present
Skarn minerals Grossularite and andradite present
Molybdenite Present
Variety of sphalerite colours Marmatite (Fe-rich) to light (Fe-poor)
Barite Present in late-hydrothermal veins and faults
Fluorite Present in late-hydrothermal fluids
Structure
Deep crustal structural control WNW-ESE basement and transcurrent fault zones
Intrusive Source of Heat and Fluids
Presence of felsic intrusive rocks Rhyolites and rhyodacites present
Presence of granodiorite stock Not directly observed, but reasonably inferred through magnetics
Skarn in contact with dikes, sills or stocks All observed at Cordero
Zonation and Trends Away from the Causative Dike, Stock or Sill
Increasing Pb and Zn without Ag or Cu Locally developed increase in base metal grades to the northeast of Cordero Main
Open-space filling Very common
Collapse breccias Very common
Source: Adapted from Megaw, P.K.M., Barton, M.D., and Falce, J.I., 1996.

Cordero Project P a g e 7 9
Preliminary Economic Assessment of the Cordero Silver Project, Chihuahua State, Mexico January 2022
9 EXPLORATION
The deposit types discussed in the previous section are all challenging exploration targets for many reasons including the fact that approximately 80% of the Cordero Project is covered with alluvium and talus deposits.
A variety of geophysical tools have been utilized to aid in identifying areas of interest at Cordero, including the following:
• induced polarization (IP) surveys where high pyrite contents (5-20%), a key characteristic of all deposit types discussed in Section 8, is defined by IP-chargeability and resistive intrusive igneous complexes are defined by IP-resistivity as highs
• radiometric surveys where potassium (K%), a key characteristic of all deposit types discussed in Section 8, provides a guide to higher temperature alteration in potassium feldspar (e.g., orthoclase, sanidine) as well as potassium-bearing adularia-sericite, and hence may aid as a guide to erosion levels where adularia occurs at higher and cooler fluid emplacement levels
• magnetic surveys where magnetic highs might represent buried pyrrhotite-pyrite mineralization, an intrusion, or skarn-replacement horizon (pyrrhotite-magnetite)
• EM surveys where conductivity (or lack thereof) is measured and hydrothermal alteration might create an EM response; alteration along structures and key fault intersections are often highlighted with EM surveys.
In addition, structurally-controlled deposits are best defined by remote sensing tools including structural interpretations from satellite-based ASTER imagery to define the following:
• major regional long-range WNW-structures intersected by NE-trending structures that parallel major terrane boundaries
• structural/alteration targets at structural intersections
• magmatic-hydrothermal trends including domal and circular features.
Geological and geochemical mapping and sampling programs to define the following:
• high silver values (Ag), high copper (Cu) and/or high (Mo) values suggesting proximity to an intrusion-related hydrothermal systems
• vein-, stockwork-, breccia-, fault-, and shear-related IS mineralization
• alteration type and zonation from IS mineralization (adularia-sericite) outwards
• vein-gangue and vein-sulphide definition.

Cordero Project P a g e 8 0
Preliminary Economic Assessment of the Cordero Silver Project, Chihuahua State, Mexico January 2022
Figure 7-3 in Section 7 showed the main targets on the Cordero property. On this figure, the resource modelling area is shown in red. The following discussion on exploration summarizes the main activities on Cordero Main and other targets across the property.
9.1 Geophysics
The geophysical surveys conducted by previous owners have helped identify target areas. One of the strongest geophysical predictors of strong mineralization is the potassium spectral band of radiometric surveys. As shown in Figure 9-1, the strong potassium anomalies coincide with areas of strong Ag-Au-Pb-Zn mineralization that have been confirmed by drilling.
9.2 Detailed Geological Mapping
In 2021, the Discovery Silver team completed detailed geological mapping over known targets identified during historic exploration campaigns totalling an area of 15.1 km2. These targets include Sansón-La Ceniza (5.9 km2), Dos Mil Diez (6.4 km2), and Molino de Viento (2.0 km2). There is also a favourable tract between Dos Mil Diez and Molino de Viento (0.8 km2) that is abbreviated as DMD-MV in the discussion that follows. These mapped targets cover a favourable NE-trending, 15 km long, magmatic-hydrothermal corridor from Molino de Viento in the southwest to Sansón in the northeast (Figure 9-1). These targets have formed along two mineralized sinistral releasing bends (Figure 9-2 on the following page).
The targets were evaluated using a variety of datasets including an ASTER/structural interpretation (Figure 9-2), historic rock and soil geochemical sampling and geophysical surveys including airborne magnetics, electromagnetics, and ground-based 3D induced polarization as presented in Section 6 of this report.
Geological information collected in the field was plotted daily on fact maps followed by interpretive geological maps and then digitized by an in-house ArcGIS specialist. The representative rock samples collected for geochemical analysis are maintained by an in-house database administrator with geological data including location, lithology (composition, texture), alteration (assemblage), structure (type, orientation), mineralization (style, type) and any other relevant information like nearby historic pits.
9.2.1 Sansón Target
Sansón is the furthest northeast target along the Cordero magmatic-hydrothermal trend (Figure 9-2 and 9-3) and is described as follows:
• Sansón is underlain by a thick sequence of limestone, calcareous shale, calcarenite, cherty siltstone and sandstone, part of the Cretaceous Mezcalera Formation.
• Sediments are folded into a series of NW-trending chevron-folds that are locally overturned.
• The sedimentary sequence is intruded by a rhyodacitic sill complex that is folded into NW-trending folds, plunging to the northwest and the southeast.
• More reactive limey units of the sedimentary sequence show the effects of contact metamorphism in hornfels and skarn with local development of quartzite and garnet-bearing skarn.
• Sedimentary rocks and rhyodacitic sills are crosscut by NE-striking bodies of biotite-hornblende porphyry dikes.

Cordero Project P a g e 8 1
Preliminary Economic Assessment of the Cordero Silver Project, Chihuahua State, Mexico January 2022
Figure 9-1: Potassium Spectral Band from Radiometric Survey over the Central Magmatic Belt
Source: Discovery Silver, 2021.

Cordero Project P a g e 8 2
Preliminary Economic Assessment of the Cordero Silver Project, Chihuahua State, Mexico January 2022
Figure 9-2: Major Structural Features Identified by ASTER Structural Study
Source: Murphy, 2020.

Cordero Project P a g e 8 3
Preliminary Economic Assessment of the Cordero Silver Project, Chihuahua State, Mexico January 2022
Figure 9-3: Sansón Geological Map
Source: Discovery, 2021.

Cordero Project P a g e 8 4
Preliminary Economic Assessment of the Cordero Silver Project, Chihuahua State, Mexico January 2022
Sansón is crosscut by the northeast extension of the Cordero fault zone from the resource area.
• Sansón is crosscut by two major NE-trending strike slip faults, the Cordero Fault and the Campamento Fault as well as a series of NNE subsidiary faults.
• On the northwest side of Sansón jasperoid veins occur composed of chalcedony, pyrite, iron oxide and silica.
Southwest Sansón is crosscut by a NW-trending structure, interpreted as a steeply SW-dipping normal fault, the La Ceniza Fault, with a southwest downthrow, like the Mega Fault further to the southwest.
9.2.2 La Ceniza Target
The La Ceniza target (Figure 9-4) is located immediately southwest of Sansón with similar geological characteristics, including the following:
• Cretaceous Mezcalera formation sediments
• concordant intervals with hornfels contact metamorphism, dipping moderately to steeply the northeast
• rhyodacitic sills and lithic/contact/collapse breccias intrude sedimentary wall rocks, in the southwest and northeast
• NE-trending sheeted glomerophyric dacitic dike complex exploits the Cordero and parallel faults
• silver and base metal veins exploited by late-stage hydrothermal jasperoid-carbonate; the NE-trending extension of the veins exploited at the resource area.
• NW-trending, steep SW-dipping vein, vein-breccias cemented by carbonate/jasper in the SW parts of La Ceniza along structures parallel to the Mega Fault, a normal fault, down-thrown to the southwest, composed of a series of parallel fault strands
• directly continuous with current resource area.
9.2.3 Dos Mil Diez Target
The Dos Mil Diez target (Figure 9-5) consists of a refolded sequence of carbonate and shale assigned to the Cretaceous Mezcalera Formation, intruded by irregular shaped plugs, and a single NE-trending body of rhyodacitic porphyry. Mapped contact relationships indicate that the earlier porphyry is crosscut by rhyolitic welded ignimbrite and associated rhyolitic tuff along NNW-trending linear bodies, with rhyolitic quartz-feldspar porphyry, part of the late Tertiary ignimbrite along fissure-related volcanic structures.
In conjunction with the analysis of geochemical results, field mapping at Dos Mil Diez indicates that major anomalies are closely related to, or controlled by, NNW- to NW-trending structures. A recent discovery called the Francisco Vein was found along the main access road to the exploration camp under shallow overburden in a heavily covered area. The 40 cm vein contains silver-rich galena and sphalerite-cemented hydraulic breccia (“puzzle breccia”) with grades of: 0.42g/t Au; 2,530 g/t Ag; 21.75% Pb; and 7.4% Zn.

Cordero Project P a g e 8 5
Preliminary Economic Assessment of the Cordero Silver Project, Chihuahua State, Mexico January 2022
Figure 9-4: La Ceniza Geological Map
Source: Discovery, 2021.

Cordero Project P a g e 8 6
Preliminary Economic Assessment of the Cordero Silver Project, Chihuahua State, Mexico January 2022
Figure 9-5: Dos Mil Diez Geological Map
Source: Discovery, 2021.

Cordero Project P a g e 8 7
Preliminary Economic Assessment of the Cordero Silver Project, Chihuahua State, Mexico January 2022
9.2.4 Molino de Viento Target
The Molino de Viento target area (Figure 9-6) is crosscut by N- to NNW-trending volcanic sequence of coherent bodies of rhyodacitic volcanic/subvolcanic rocks with welded rhyolitic ignimbrite and rhyolitic crystalline-lithic ash tuffs with polymictic breccias with altered clasts of locally derived lithologies. This area requires further surface reconnaissance to determine if it is a true diatreme.
Figure 9-6: Molino de Viento Geological Map
Source: Discovery, 2021.

Cordero Project P a g e 8 8
Preliminary Economic Assessment of the Cordero Silver Project, Chihuahua State, Mexico January 2022
9.2.5 Between Dos Mil Diez and Molino de Viento
The geological mapping for the DMD-MV area is currently in progress. The geology of a target area immediately west of Dos Mil Diez is dominated by a volcanic sequence of rhyolitic welded ignimbrites (age date pending) with a distinctive texture that consists of centimeter-scale lenses (called “fiamme” from the Italian word for flame), intercalated with crystal-lithic tuff and wide bodies of coherent rhyolite porphyry. Rhyolitic pyroclastic rocks form along linear NW-trends, suggesting fissure-controlled volcanism. Geological mapping defined small bodies of dark grey to black magnetic quartz diorite with an age-date pending.
9.3 Rock Sampling Methods
During the regional geological mapping program, geologists conducted a systematic rock sampling program on bedrock exposures and in accessible historic pits and shafts. Float samples and dump samples of mining workings were not sampled. There is a significant proportion of geologically mapped areas covered by alluvium or talus deposits, so rock sample distribution varies target to target depending on bedrock exposures.
• Sampling methods included rock panel sampling over a specified outcrop area, and channel rock chip sampling perpendicular to mineralization of interest (structure, vein, breccia, fault, shear).
• In most cases, rock chips were obtained using chisel and a sledgehammer or, in rather flat surfaces, the field team used a rock cutting saw.
• Sampling protocol was aimed to obtain from 3 to 4 kg of rock sample, removing any contaminant material such as soil or other of biological origin (i.e., roots or plants).
• The rock samples collected were separated into barren wall rock versus mineralized wall rock by lithology type, alteration-type, structure-type and mineralization-styles to obtain a truly representative geochemical result, while avoiding sampling bias.
• Sample locations were determined using a hand-held Garmin GPS, and labelled by marking the sample bag and inserting a tag following an in-house numeration.
• A sampled area or channel was marked with fluorescent paint and aluminum tag with the sample number nailed on bedrock surface for future verification and follow up.
An Excel spreadsheet is updated daily to include all information pertaining to each rock sample (sample ID, coordinates, elevation, sample type, sampled media, lithology, alteration, structure, mineralization). By the end of October 2021, Discovery’s field geologists had collected a total of 624 rock samples: 363 rock chips on outcrops, and 261 channel samples were collected on well-exposed outcrops.
9.4 Geochemical Results
9.4.1 Analytical Methods, Quality Assurance, and Security
The regional rock sampling program used the same analytical methods, quality assurance and security protocols used for the drilling as summarized in Section 11 of this report.

Cordero Project P a g e 8 9
Preliminary Economic Assessment of the Cordero Silver Project, Chihuahua State, Mexico January 2022
9.4.2 Significant Surface Rock Sample Results
Table 9-1 summarizes the significant results from the analysis of surface rock samples.
Table 9-1: Significant Analytical Results for Surface Rock Samples from Exploration Targets
Target Trench No. Sample No. Width
(m)
Au
(g/t)
Ag
(g/t)
Cu
(ppm)
Pb
(ppm)
Zn
(ppm)
La Ceniza ECTRH-0001 800002 0.55 0.19 217 2000 84400 31400
La Ceniza ECTRH-0002
800003
1.30
0.255 128 1365 24400 86900
800004 1.25 297 2780 50400 23500
800005 0.089 197 2140 21000 7910
La Ceniza ECTRH-005 800012 0.70 0.128 82.6 48 778 503
La Ceniza ECTRH-0031 800066 0.50 0.683 387 1320 61600 5950
La Ceniza ECTRH-0032
800067
2.85
0.027 107 206 18600 5740
800068 0.144 113 206 18600 5740
800069 0.168 279 443 31800 13250
800070 0.031 164 403 48800 12400
800072 0.108 268 188 30700 5860
800073 0.063 232 137 8340 4440
La Ceniza ECTRH-0033 800074
0.80 0.03 234 3010 32000 27300
800075 0.09 109 942 20300 1240
La Ceniza ECTRH-0034
800076
1.30
0.036 154 378 12450 21800
800077 0.074 86.1 1220 21400 83400
800078 0.053 362 1710 64500 89000
La Ceniza ECTRH-0036 800082
0.80 0.34 81 1370 24900 71200
800084 0.506 89.5 1680 45600 16000
La Ceniza ECTRH-0037 800085 0.50 0.322 81.9 262 13950 3220
La Ceniza ECTRH-0039 800088 0.30 0.366 138 621 11500 18200
La Ceniza ECTRH-0041 800094 0.40 1.065 71.8 374 5600 6670
La Ceniza ECTRH-0043
800098
1.50
0.54 85.1 2940 47200 2770
800099 0.195 196 1300 9880 9710
800101 0.309 197 2320 4740 7340
La Ceniza ECTRH-0070 800161 0.50 0.064 231 702 16450 14900
La Ceniza ECTRH-0071 800162 0.45 0.117 115 899 13050 27500
La Ceniza ECTRH-0072 800163
1.40 0.354 131 1565 53300 822
800226 0.126 86.4 1175 28100 16250
La Ceniza ECTRH-0117 800238 0.50 0.079 184 197 10900 3940
La Ceniza ECTRH-0156 800288 0.60 0.736 1.7 104 33 45
La Ceniza ECTRH-0236 800396 0.50 2.45 12 9 943 603
La Ceniza ECTRH-0238 800398 0.60 0.168 88.1 20 778 315
La Ceniza ECTRH-0253 800415 0.40 0.42 2530 506 21750 7400
Dos Mil Diez ECTRH-0253 1034 0.40 1.155 19.4 17 64 445
Source: World Metals, 2021.

Cordero Project P a g e 9 0
Preliminary Economic Assessment of the Cordero Silver Project, Chihuahua State, Mexico January 2022
9.4.2.1 La Ceniza
One of the best samples (Sample # 800066) was from a 40 cm wide vein, open-space fill silver-rich galena and sphalerite vein, exploited by late-stage carbonate and jasperoid (field name for hematite-jarosite chalcedony) returning 0.68 g/t Au, 387 g/t Ag, 61.6% Pb, 1.32% Cu and 5.95% Zn.
9.4.2.2 Dos Mil Diez
One of the best samples (Sample #800415) collected from the new discovery at the Francisco vein from an open-space fill silver-rich galena and sphalerite puzzle breccia that returned values of 0.42 g/t Au, 2,530 g/t Ag, 21,750 ppm Pb, 7,400 ppm Zn with several other channel samples in the area returned values > 100 g/t Ag.
9.4.2.3 Sansón
One of the highest samples from the Ximena mine (Sample #800288) at Sansón returned 0.73 g/t Au and 1.7 g/t Ag with low levels of lead and zinc from a succession of limestones and shales assigned to the Mezcalera Formation crosscut by pyrite veinlets.
9.5 Interpretation of Results from Exploration Targets
9.5.1 Northeast Targets
The following comments are an interpretation of the exploration results on the northeast targets:
• Like the resource area, NNW-trending rhyodacitic sills and larger intrusive bodies exploit the Cretaceous sedimentary rocks of the Mezcalera Formation.
• Like the resource area, NE-trending glomerophyric dacitic dikes exploit the northeast extension of the Cordero Fault at La Ceniza and Sansón targets.
• Like the resource area, the La Ceniza target is host to skarn/hornfels with both manto-style replacement sulphide as well as crosscutting argentiferous galena and sphalerite veins NE- and NW-trending.
• At La Ceniza deep, porphyry Mo-(Cu) in quartz-molybdenite (chalcopyrite) stockwork crosscuts earlier hornfels/skarn and all are cut by pyrite-rich veins.
• NE-trending biotite/hornblende porphyry dikes exploit the Cordero Fault Zone and appear to be earlier than the glomerophyric dacite dikes.
• La Ceniza is dissected by several late extensional NW-trending, down-to-southwest normal faults comprised of a series of parallel fault strands including the Mega Fault, and the La Ceniza Fault with a significant downthrow between La Ceniza and Sansón targets.
• SW La Ceniza, towards the northeast part of the resource area, the Mega Fault has controlled the emplacement of late-stage hydrothermal carbonate veins and vein breccias that locally host mineralized vein clasts.

Cordero Project P a g e 9 1
Preliminary Economic Assessment of the Cordero Silver Project, Chihuahua State, Mexico January 2022
• Like the resource area, the La Ceniza and Sansón targets have chevron-folds best developed in the unmetamorphosed, less competent units (shale and siltstone) cut by rhyodacitic sills.
• NW Sansón target hosts significant Ag, Pb, Zn associated with NNE-trending structural corridors, exploited by late-stage jasperoid, part of the Campamento Fault (Camp Fault).
• In keeping with the resource interpretation, the northeast target areas of Cordero are a deeper expression of the Cordero magmatic hydrothermal system.
9.5.2 Southwest Targets
The following comments are an interpretation of the exploration results on the southwest targets:
• Southwest Cordero targets are dominated by rhyolitic welded ignimbrites with fiamme, intercalated with crystal-lithic tuffs as well as coherent bodies of rhyolitic quartz-feldspar porphyry, part of the last stage of the ignimbrite flare-up, controlled by NNW-trending fissure eruption features.
• The furthest west known target at Molino de Viento is a succession of volcanic rocks coincident with a series of nested circular features in map view. These rocks consist of coherent bodies of porphyritic volcanics, tuffs and possible diatreme facies.

Cordero Project P a g e 9 2
Preliminary Economic Assessment of the Cordero Silver Project, Chihuahua State, Mexico January 2022
10 DRILLING
10.1 Program Overview
Discovery Silver conducted a Phase I diamond drill campaign from September 2019 to December 2020. Phase I was restarted in January 2021 and continued until the creation of the updated resource model, essentially to hole C21-528. All the drill holes completed after those included in the resource estimation are considered part of Phase II drilling.
The continuation of the Phase II diamond drill program planned for early January 2022 will focus on infill and expansion drilling to support a pre-feasibility study as well as drill-testing of some of the high-priority exploration targets. From the start of drilling to July 2021 a total of 154 holes (from C19-293 to C21-517) were completed by Discovery Silver totalling 224,148 meters drilled with 84,803 samples collected for geochemical analysis. Drilling data to July 30, 2021 was used in the current mineral resource estimate.
10.2 Phase I Drilling Campaign
10.2.1 2019 Drilling
The Phase I drilling program started drilling at Cordero with one drill rig on September 17, 2019. A second drill was added on November 8, 2019 to advance production. This continued until mid-December 2019, breaking for Christmas.
• The Phase I program focussed on surface drilling in areas of known mineralization and lateral extensions proximal to historic workings with a focus of defining mineralization extensions, mappable lithological units, and to relate geological information captured in the historic drill database.
• Additionally, the goal was to define the edges of high-grade mineralization recognized in the historical data that was part of the 2018 PEA document by M3 Engineering and Technology on behalf of Levon Resources Ltd. (Levon Resources Ltd., 2018). Levon’s PEA pit and resource outline was centered on latitude 27°, 14.36′ N, longitude -105°, 34.09′ W.
• The orientation of drilling was intended to help with the core logging and cross-sectional interpretations. The dominant orientation of the drilling was at an azimuth of 135° at various inclinations ranging from -50° to -70°. This new orientation of drilling was successful at crossing and better delineating the dominant northeast orientation of high-grade mineralization that was recognized in the Levon historical database.
• The naming convention used by Levon was carried forward, and the first hole for Discovery Silver was named C19-293 ending in mid-December 2019 at C19-309 for the Christmas break. For 2019, Discovery Silver completed 5,905 meters in 17 drill holes (Figure 10-1).
• Surface collar locations were initially surveyed using a handheld GPS unit, followed by an ongoing professional survey by Geo Digital Imaging de México SA de CV by Javier Tolano Jr. (Eng) during monthly visits, with the last visit on September 2, 2021. The instrument used is an EMLID REACH RS2 Multi-Band RTK GNSS. The second survey captured drill collar locations ending September 2, 2021, and the Cordero property boundary.

Cordero Project P a g e 9 3
Preliminary Economic Assessment of the Cordero Silver Project, Chihuahua State, Mexico January 2022
10.2.2 2020 Drilling amid COVID-19 Closures
The exploration program started up again on January 7, 2020 with one drill, and by end of January, four diamond drills were operational.
During 2020, the program was reduced to one drill because government announcements regarding the COVID-19 Pandemic risks reported at the start of March 2020. Subsequently, the last drill was halted by the end of March when the Mexican Government mandated all work to stop.
Figure 10-1: 2019 Diamond Drilling Totalling 5,905 m in 17 Holes by Discovery Silver
Source: World Metals, 2021.

Cordero Project P a g e 9 4
Preliminary Economic Assessment of the Cordero Silver Project, Chihuahua State, Mexico January 2022
The program was restarted with four drills on June 27, 2020, after the Mexican Government announced a relaxation of COVID-19 closures. During 2020, diamond drill holes C20-310 through to C20-408 were completed for an annual total of 39,484 m in 99 drill holes.
At this point the total meterage had reached 45,389 m in 116 holes (Figure 10-2).
Figure 10-2: Discovery Silver’s 2020 Diamond Drilling Totalling 39,484 m in 99 Holes
Source: World Metals, 2021.
10.2.3 2021 Drilling
Good results and new insights to mineralizing controls allowed the program to continue in 2021. On January 11, 2021, the first drill was restarted, followed by three more drills within the next 10 days.

Cordero Project P a g e 9 5
Preliminary Economic Assessment of the Cordero Silver Project, Chihuahua State, Mexico January 2022
• Drill holes C21-409 through C21-528 were completed by the end of July 2021 when the decision was made to cut off the assay results to be used for the updated Cordero 2021 resource.
• Drilling continued during the compilation of the resource report, although only data from drill holes up to C21-506, -508, -509, -511, -513, -516, -518, -522, -523, -527, and -528 had results available that had passed the QA/QC filters to inform the resource calculation presented in this report.
• In May 2021, 778.8 m in two oriented core holes were completed to geotechnically sample proposed pit wall locations to better inform pit slope stabilities. Holes CG21-001 and -002 were reviewed and sampled by Knight Piésold for this purpose (Figure 10-3).
Figure 10-3: Geotechnical/Piezometer Holes Drilled in 2021, Totalling 779 m in Two Holes
Source: World Metals, 2021.

Cordero Project P a g e 9 6
Preliminary Economic Assessment of the Cordero Silver Project, Chihuahua State, Mexico January 2022
The resource database consists of 224,148 m of sampling in 517 drill holes. Of the total holes in the database, 221,839 m from 478 holes are included in the resource estimate area (Figure 10-4).
Total drilling in 2021 to the end of July was 62,746.3 m in 154 drill holes, excluding two geotechnical holes.
A total of 91,452 m (225 drill holes) was completed by Discovery Silver, supplementing the 253 holes drilled by Levon between 2009 and 2017. Lithology information from 195,553 m of drilling was used to support an updated geological model of the deposit.
Figure 10-4: 225 Holes in the Resource Modelling Area that were used for the Mineral Resource Estimate
Note: Drill holes by Discovery Silver are shown in red; holes drilled by Levon are shown in blue. Source: World Metals, 2021.

Cordero Project P a g e 9 7
Preliminary Economic Assessment of the Cordero Silver Project, Chihuahua State, Mexico January 2022
10.3 Procedures for Handling, Transporting, Logging and Sample Drill Core
10.3.1 Core Handling
Core handling procedures are as follows:
• Drill core is placed in to corrugated plastic core boxes at the drill by the driller helpers and is supervised by the driller.
• Hole depths between core runs are marked in meters with permanent markers on wooden blocks and inserted into the box rows at the end of every drill run.
• Any partial runs, core losses or cavities encountered are measured by the drillers and marked accordingly.
• The drill box bases and lids are marked with the “from” and “to” depths in meters to the nearest centimeter and are then tied with plastic chord to prevent any spillage during transport.
10.3.2 Core Transport
Core transport procedures are as follows:
• The core boxes are transported to the core logging facility twice a day by a Discovery Silver representative and placed on core logging tables for review by project geologists.
• Core technicians subsequently check the wooden core marker blocks for any errors, measure, and record core recoveries between core blocks, and subsequently wash any sediment or drill cuttings from the core in preparation for geologists to log the core.
• Core photos are taken of both wet and dry drill core for a complete record of the drill core produced.
10.3.3 Core Logging
The drill core is described in detail by geologists differentiating lithology-type, lithology-texture, alteration-type, alteration/mineralization-style, infill texture and infill type, structure and sulphide abundance within an electronic logging system called Geoinfo Solutions Tools, directly into laptop computers in the core shack.
A standardized logging system is used to ensure consistency of descriptions between logging geologists and the resulting core log is uploaded to the Access-DBMS database system at the project site for review by the senior geologist daily (Table 10-1).
This drill core information is plotted on hard copy cross- and long-sections and interpreted and then georeferenced and imported into a 3D geological modelling software and visualizer called “Leapfrog Geo” for interpretation purposes, to measure drilling success, and to inform any subsequent drill planning.

Cordero Project P a g e 9 8
Preliminary Economic Assessment of the Cordero Silver Project, Chihuahua State, Mexico January 2022
Table 10-1: Select Geological Logging Codes by Theme used for Core Logging at Cordero
Vein/Replacement Lithology Modifiers Structure Structure Modifiers In-fill Textures In-fill Type
VeinCalciteBarite BandedGangue Vein AltnUpperContact InfillTextBanded Barite
VeinCalciteFeathery BandedSulphide ContactDike Bedding InfillTextBandSulph Calcite
VeinCarbonate BrxCementCarbonate ContactLith BrxCrackle InfillTextBladed Fluorite
VeinChalcedony BrxCementOxide Fabric BrxFaultGouge InfillTextBotyroidal Jasperoid
VeinJaspDrusyCalcite BrxCementSulphide Fault BrxFloatingClast InfillTextCollofom DrusyCalcite
VeinJasperoid BrxDrusyCalcite FaultContact BrxHydrothermal InfillTextCrustiform Galena
VeinMxSulphide BrxJasperoid FlowFoliation BrxMilled InfilltextIntergrowths SphBlack
VeinQuartzCarb BrxPeperiteBlocky Fracture BrxPuzzle InfillTextVoids SphHoney
ReplaceCarbonate BrxPeperiteFluidal Breccia ContactUpper InfillTextVuggy SphRedBrwn
ReplaceJasperoid BrxPhreatic Lineation ContactLower InfillTextMassive Pyrite
ReplaceMxSulphide BrxPseudo Rubble Echelon InfillTextReplace Quartz
ReplaceChalcedony BrxSiliceous Shear FabricFlowBanding InfillTextEuhedral Silica
Source: World Metals, 2021.
10.3.4 Core Sampling
Drill core sampling is selected and marked by the geologists based on lithological, alteration and structural boundaries. Minimum sample widths are 0.30 m and maximum sample widths are generally 2.0 m. The maximum sample width is only rarely exceeded where drill core recovery is poor due to faulted intervals or where the end of hole remaining interval is less than 1.0 m and added to the last sample.
10.4 Summary and Interpretation of 2019-2021 Drill Programs
The drilling achieved by Discovery Silver and utilized in this 2021 resource update essentially infilled the mineralized body that was roughly defined by previous drill campaigns.
Drill core recoveries have been exceptionally high (greater than 95%) providing the confidence that the sampling program is representative of the rock mass that has been assayed.
Additional drilling by Discovery Silver has allowed updated interpretations of the structural controls, lithological controls, and definition of dominant fluid flow corridors of high-grade mineralization. These controls and domains have been used to accurately update the estimate of resources.
Highlights from the 2019 to 2021 drilling are presented in Table 10-2.
A series of cross-sections showing some of the highlights in Table 10-2 are presented in Figure 10-6 to Figure 10-13; for the section lines marked, see Figure 10-5.

Cordero Project P a g e 9 9
Preliminary Economic Assessment of the Cordero Silver Project, Chihuahua State, Mexico January 2022
Table 10-2: Highlights from the 2019-2021 Drilling Campaigns
Hole ID From To
Width
(m)
Ag
(g/t)
Au
(g/t)
Pb
(%)
Zn
(%)
AgEq1
(g/t)
C19-297 272.9 274 1.1 522 0.21 6.6 18.3 1533
C19-304 76.8 182.7 105.9 74 0.38 1.1 1.1 188
C20-310 51.1 52.3 1.2 904 0.08 5.4 8.08 1436
C20-314 135 241 106.1 51 0.37 0.97 0.56 139
C20-317 0 79 79 90 0.22 0.9 0.5 159
C20-319 140 308.8 168.8 70 0.1 1.5 1.9 207
C20-328 79.3 131.2 51.9 69 0.13 1.1 1.9 197
C20-328 105.9 107.2 1.3 1060 0.5 15.9 26.9 2777
C20-333 206.8 327.2 120.4 30 0.11 0.4 1.5 114
C20-342 147 148.4 1.4 700 0.74 16.1 14 1907
C20-343 66.9 468.6 401.7 49 0.07 1 1.1 134
including 243.5 355.7 112.3 96 0.08 2 1.8 247
C20-344 171.1 175.8 4.7 635 0.15 12.3 5.3 1299
C20-348 196.2 335.3 139.1 47 0.07 0.6 1.6 138
C20-349 145.6 149 3.4 421 0.42 8 10 1150
C20-351 224.8 226.8 2 532 0.38 8.8 8.1 1207
C20-373 281.2 407.3 126.1 40 0.1 0.4 1 103
C20-375 49.2 180.7 131.6 48 0.09 0.5 1.1 118
C20-381 95.6 96.9 1.3 1581 0.15 9.9 5.4 2166
C20-382 41.2 42.2 1 1280 4.24 1.6 3.4 1826
C20-383 44.4 47.2 2.9 992 0.73 12.9 2.4 1605
C20-383 83.4 84.1 0.7 1865 0.85 7 7.9 2510
C20-396 136.7 138 1.3 1607 2.06 5.2 8 2290
C20-405 312.4 440.5 128.2 65 0.05 1.2 1.3 165
C21-417 309.4 375.3 65.9 69 0.11 0.7 3.7 258
C21-425 517.8 660.8 143 39 0.13 0.4 1.3 120
C21-480 63.1 115.5 52.5 34 0.03 0.5 0.9 94
C21-421 304.5 308.6 4.1 520 0.11 3 9.8 1043
C21-421 402.8 404.1 1.3 495 0.17 5.6 8 1041
C21-423 132.7 133.8 1.1 913 0.97 12.2 4 1589
C21-431 164.9 166.1 1.2 997 0.25 8.9 9.7 1736
C21-432 150.8 152 1.1 723 0.16 3.7 10.9 1319
C21-435 92.2 93.4 1.1 1960 0.32 15.4 21.6 3424
C21-435 204.5 209 4.5 385 1.15 5.9 11.9 1179
C21-436 288.5 290 1.4 1385 0.49 7.5 10.9 2139
C21-437 4.8 63.6 58.8 87 0.05 0.9 0.8 157
including 59.8 63.6 3.8 576 0.12 5.2 8.2 1108
C21-457 404.8 405.8 1.1 1570 16.25 7 19 3934
C21-458 47.4 48.1 0.7 945 0.47 11.7 7.1 1688
C21-458 200.3 277.1 76.8 36 0.04 0.3 1.6 115
C21-459 86 87.4 1.3 420 0.32 8.8 14.9 1374
C21-475 126.6 127.3 0.7 1320 0.21 11 10.8 2169
C21-475 134.3 135.9 1.6 597 0.16 12.2 11.7 1522
C21-476 312.5 398.7 86.2 51 0.09 1.2 2.2 192
C21-479 204.7 337.3 132.6 78 0.11 1.7 2.8 260
C21-479 361.1 438.1 77.1 55 0.12 1.4 1.8 190
C21-481 39.3 256.6 217.3 75 0.45 1.1 1 194
C21-482 168.1 169.6 1.5 2552 2.33 13.3 13.3 3763
C21-485 87.6 88.6 1.1 1057 0.19 7.4 8.4 1681
C21-485 110 110.7 0.7 691 0.04 3.2 9.7 1209
C21-496 297.3 378.7 81.4 43 0.05 0.9 2.5 184
C21-510 75 148.1 73.1 104 0.06 0.8 2.5 241
including 80.6 82.2 1.6 2295 0.31 11.6 17.2 3446
C21-523 69 202.8 133.8 39 0.07 0.8 0.7 103
Note: 1AgEq calculated using prices of $16.50/oz Ag, $1,350/oz Au, $0.85/lb Pb and $1.00/lb Zn, with 100% metallurgical recoveries. Source: World Metals, 2021.

Cordero Project P a g e 1 0 0
Preliminary Economic Assessment of the Cordero Silver Project, Chihuahua State, Mexico January 2022
Figure 10-5: Lithology Plan Map showing Locations of the Section Lines used in following Figures
Source: World Metals, 2021.

Cordero Project P a g e 1 0 1
Preliminary Economic Assessment of the Cordero Silver Project, Chihuahua State, Mexico January 2022
Figure 10-6: Cross-Section CPL-20 showing Geological Interpretation and Silver Equivalent Grades
Source: Discovery Silver, 2021.

Cordero Project P a g e 1 0 2
Preliminary Economic Assessment of the Cordero Silver Project, Chihuahua State, Mexico January 2022
Figure 10-7: Cross-Section CPL-26 showing Geological Interpretation and Silver Equivalent Grades
Source: Discovery Silver, 2021.

Cordero Project P a g e 1 0 3
Preliminary Economic Assessment of the Cordero Silver Project, Chihuahua State, Mexico January 2022
Figure 10-8: Cross-Section CPL-31 showing Geological Interpretation and Silver Equivalent Grades
Source: Discovery Silver, 2021.

Cordero Project P a g e 1 0 4
Preliminary Economic Assessment of the Cordero Silver Project, Chihuahua State, Mexico January 2022
Figure 10-9: Cross-Section CPL-32 showing Geological Interpretation and Silver Equivalent Grades
Source: Discovery Silver, 2021.

Cordero Project P a g e 1 0 5
Preliminary Economic Assessment of the Cordero Silver Project, Chihuahua State, Mexico January 2022
Figure 10-10: Cross-Section CPL-33 showing Geological Interpretation and Silver Equivalent Grades
Source: Discovery Silver, 2021.

Cordero Project P a g e 1 0 6
Preliminary Economic Assessment of the Cordero Silver Project, Chihuahua State, Mexico January 2022
Figure 10-11: Cross-Section CPL-37 showing Geological Interpretation and Silver Equivalent Grades
Source: Discovery Silver, 2021.

Cordero Project P a g e 1 0 7
Preliminary Economic Assessment of the Cordero Silver Project, Chihuahua State, Mexico January 2022
Figure 10-12: Cross-Section CPL-38 showing Geological Interpretation and Silver Equivalent Grades
Source: Discovery Silver, 2021.

Cordero Project P a g e 1 0 8
Preliminary Economic Assessment of the Cordero Silver Project, Chihuahua State, Mexico January 2022
Figure 10-13: Cross-Section CPL-40 showing Geological Interpretation and Silver Equivalent Grades
Source: Discovery Silver, 2021.

Cordero Project P a g e 1 0 9
Preliminary Economic Assessment of the Cordero Silver Project, Chihuahua State, Mexico January 2022
11 SAMPLE PREPARATION, ANALYSES, AND SECURITY
11.1 Summary
Approximately half of the samples included in the current mineral resource estimate are from drilling programs conducted by Levon ending 2017 (Table 11-1). The other half of the samples were generated by Discovery Silver drill programs from 2019 to 2021 (Table 11-2). Total diamond drilling completed to date at Cordero is 231,142 m in 528 drill holes. A total of 5568.15 m of drill core from the 2021 program was not included in the 2021 mineral resource.
Table 11-1: Summary of Levon Diamond Drilling Campaigns from 2009 to 2017
Year No. of Holes Range of Hole IDs
Meters From To
2009 8 C09-1 C09-8 2,844
2010 89 C10-9 C10-97 35,857
2011 109 C11-98 C11-206 57,989
2012 44 C12-207 C12-250 17,076
2013 16 C13-251 C13-266 9,529
2014 8 C14-267 C14-274 4,662
2017 18 C17-275 C17-292 5,664
Total 292 133,620
Source: World Metals, 2021.
Table 11-2: Summary of Discovery Silver Diamond Drilling Campaigns from 2019 to 2021
Year No. of Holes Range of Hole IDs
Meter From To
2019 17 C19-292 C19-309 5,905
2020 99 C20-310 C20-408 39,484
2021 120 C21-409 C21-528 52,133
Total 236 97,522
Source: World Metals, 2021.
11.2 Levon 2009 to 2017 Drill Hole Samples
All drill core was sawn in half with mechanized core saws along the mark on the whole drill core and half of the core samples were submitted for sample preparation and assaying, while the second half was left in the core box for future reference and analytical testwork.

Cordero Project P a g e 1 1 0
Preliminary Economic Assessment of the Cordero Silver Project, Chihuahua State, Mexico January 2022
From 2009 to 2012, and in 2017, assays for the Levon drill samples were performed by ALS Geochemistry (ALS) in Vancouver, a commercial laboratory that is independent of Discovery Silver and accredited by the Standards Council of Canada to the ISO/IEC 17025 standard. Sample preparation and assaying involved the following steps:
1. Sawn 1/2 core samples were prepared for assaying at the preparation facility in Chihuahua, Mexico by drying and crushing to 85% minus 10 mesh, followed by riffle-splitting and pulverizing to 95% minus 150 mesh.
2. Assaying of the pulps was performed at ALS. Gold analyses were performed by 30-gram fire assay with an AA (atomic absorption) finish (ALS Method Code Au-AA23). Silver, zinc, and lead were analyzed as part of a multi- element inductively coupled argon plasma (ME-ICP41) package using an aqua regia digest with over-limit results re-analyzed using ICP-AES (atomic emission spectroscopy) and a four-acid digest.
For the years 2013 and 2014, assays were performed by Activation Laboratories Ltd. (ActLabs) in Mexico. ActLabs is independent of Discovery Silver and accredited by the Standards Council of Canada to the ISO/IEC 17025 standard. Sample preparation and assaying involved the following steps:
1. Samples were assayed for gold by fire assay with an atomic absorption spectrometry (AAS) finish and a 5- ppb gold detection limit. Base metals were determined as part of a 38-element ICP package using an aqua regia digest (nitric and hydrochloric acids). The elements in the ActLabs multi-element ICP package include the same elements as those in the ALS ICP package used later by Discovery (Table 11-3). In addition, the analyses included Hf, Sn, Y and Zr.
2. In accordance with its quality control protocol, Levon inserted standards, blanks, and core duplicates approximately every 20th sample. Levon primarily used reference materials prepared commercially as pulps by Western Management Consultants of Vancouver.
3. Up to six different reference materials were used for all the drill programs.
4. The blank material was from a rhyolite from a road quarry near Parral.
Out of approximately 66,300 samples submitted between 2009 and 2017, there were 7,157 blank samples submitted to monitor contamination and 6,650 reference materials submitted to monitor accuracy. The assays of reference material and blanks showed no significant divergences from recommended or expected values.
Levon also implemented a program of field duplicate checks, which were run on quarter-core splits obtained with a core-saw; these field duplicates confirmed that the procedures used to split were not biasing the assay results.
For the various drilling campaigns, referee laboratory samples were performed by ActLabs when ALS was contracted to do the assaying of drill core. When ActLabs was the primary laboratory in 2013 and 2014, ALS was the referee laboratory. For referee samples, every 20th coarse reject was delivered to the referee laboratory for sample pulp preparation and assay analysis.
11.3 Sample Preparation, Analysis and Security for Discovery Silver’s Drilling Campaigns (2019-2021)
A total of 70,946 drill core samples were submitted from 2019 through the end of July 2021 and were included in the mineral resource estimate. A total of 5,568.5 meters of core were drilled after July 2021 as part of the ongoing drill campaign; assays from these post-July holes were not included in the database used for resource estimation.

Cordero Project P a g e 1 1 1
Preliminary Economic Assessment of the Cordero Silver Project, Chihuahua State, Mexico January 2022
11.3.1 Sample Preparation
All core assays are from HQ drill core unless stated otherwise.
Core samples from the program were cut in half, using a diamond cutting saw, and transported to the ALS lab in Chihuahua City, Mexico, where pulps were prepared and subsequently sent for analysis to the ALS laboratory in Vancouver, Canada. Both ALS laboratories, the preparation laboratory in Mexico and the analytical laboratory in Canada, are independent of Discovery Silver and accredited by the Standards Council of Canada to the ISO/IEC 17025 standard.
All samples were prepared using ALS Method Core Prep-31 that includes:
• air dry if necessary (maximum 120°C if oven drying is necessary)
• crush entire sample to at least 70% passing 2 mm
• riffle split 250 grams
• pulverize approximately 250 grams to at least 85% passing 75 µm.
11.3.2 Sample Analysis
Samples were analyzed for gold using standard fire assay-AAS techniques (ALS Method Code Au-AA24) on a 50-gram sub-sample of pulp material; this method has a 5ppb detection limit.
Samples were also analyzed using a 33-element inductively coupled plasma method (ALS Method Code ME-ICP61). The method digests a 0.25-gram sample using a combination of three acids (nitric, perchloric, and hydrofluoric) with a final dissolution stage using hydrochloric acid; ICP-MS and ICP-AES are then used to measure the concentrations in solution, which can be converted to assay grades on a dry weight basis. This method is suitable for trace level and exploration samples. The elements and detection ranges of this analytical procedure are listed in Table 11-3.
Table 11-3: Analytes and Detection Ranges for the ME-ICP61 Multi-element ICP Suite from ALS
Analyte Lower limit Upper limit Analyte Lower limit Upper Limit Analyte Lower limit Upper limit
Ag (g/t) 0.5 100 Fe (%) 0.01 50 S (%) 0.01 10
Al (%) 0.01 50 Ga (ppm) 10 10000 Sb (ppm) 5 10000
As (ppm) 5 10000 K (%) 0.01 10 Sc (ppm) 1 10000
Ba (ppm) 5 10000 La (ppm) 10 10000 Sr (ppm) 1 10000
Be (ppm) 0.5 1000 Mg (%) 0.01 50 Th (ppm) 20 10000
Bi (ppm) 2 10000 Mn (ppm) 5 10000 Ti (%) 0.01 10
Ca (%) 0.01 50 Mo (ppm) 1 10000 Tl (ppm) 10 10000
Cd (ppm) 0.05 1000 Na (%) 0.01 10 U (ppm) 10 10000
Co (ppm) 1 10000 Ni (ppm) 1 10000 V (ppm) 1 10000
Cr (ppm) 1 10000 P (ppm) 10 10000 W (ppm) 10 10000
Cu (ppm) 0.02 10000 Pb (ppm) 2 10000 Zn (ppm) 10 10000
Source: World Metals, 2021.

Cordero Project P a g e 1 1 2
Preliminary Economic Assessment of the Cordero Silver Project, Chihuahua State, Mexico January 2022
Samples that assayed over 10 g/t Au were re-assayed by fire assay on a 50-gram sub-sample with a gravimetric finish. Samples that assayed over 1,500 g/t silver were re-assayed using a standard 30-gram fire assay with a gravimetric finish (ALS Method Code Ag-CON01).
Samples that assayed between 100 to 500 g/t silver and/or over 1% zinc and/or 1% lead were re-assayed using ALS Method Code ME-OG62. The method uses a 0.25-gram sample weight and the same four acids as Method Code ME-ICP61 but dilutions and calibrations are appropriate for higher grade samples.
The analytical methods for gold and over-limit silver are consistent with the methods used for earlier Levon drill programs.
After 2019, drill core was analyzed using an industry-standard four-acid “near-total” digestion. The Levon samples from 2013 and 2014 were analyzed using aqua regia to digest the sample; this approach is known to produce only a “partial” digestion, with the percentage of an element that is not dissolved by aqua regia varying from element to element. Since some elements in non-sulphide mineralogy may report lower with an aqua regia digest than they would with a four-acid digest, there is a possibility of a slight negative bias in resource estimates in the vicinity of samples from holes drilled in 2013 or 2014. No attempt has yet been made to quantify this bias, or to correct for it; but given the very limited amount of drilling done in those years, less than 10% of Levon’s holes (Table 11-1), the impact of having some aqua regia digest assays in the assay database is believed to be very minor.
11.3.3 Sample Security
Drill core is logged and sampled in a secure core storage facility located at the project site 40 km north of the city of Parral.
Drill core is placed into corrugated plastic core boxes at the drill site by the drillers. Tied core boxes are organized within the drill pad area and remain under the driller’s supervision until it is collection by Discovery Silver personnel. The core is collected twice a day and transported to the Discovery Silver core logging facility within 1.5 km of the drill site.
After the drill core is sawn in half and placed in plastic bags, groups of 4 to 5 sample bags are placed into large polyweave rice bags with their content marked on each bag. The bags are securely sealed and moved to a storage facility controlled by the company geologists. Twice per week, an ALS truck picks up the sample bags from site and delivers them directly to the ALS laboratory in Chihuahua for sample preparation.
The drilling area and camp site facilities are on a private property with restricted access to the public. The access gate remains locked at all times and only the landowners, drillers, and Discovery Silver personnel have a key to open the gate.
11.3.4 Quality Assurance and Quality Control
To ensure reliable sample assays, Discovery Silver has a rigorous quality assurance and quality control (QA/QC) program that monitors the chain of custody of samples and includes the insertion of blanks and certified reference materials (CRMs) at consistent intervals within each batch of samples.
The assays for quality control samples are reviewed as certificates received from the laboratory. Quality control failures on a batch basis are identified and followed up as required.

Cordero Project P a g e 1 1 3
Preliminary Economic Assessment of the Cordero Silver Project, Chihuahua State, Mexico January 2022
The following submission rates are used for quality control samples:
• Blanks are inserted every 18 samples.
• Standards are inserted every 15 samples.
• Checks of pulp duplicates are inserted every 100 samples.
11.3.4.1 Blanks
A landscaping rock, purchased from Home Depot locally, is used as the blank or barren sample material. It is a vesicular basaltic volcanic rock of reddish colour. It has a 3 cm average particle size and approximately 0.5 kg is submitted.
Maximum allowed values were set at 10 times detection limits which are Au (50 ppb), Ag (0.5 g/t), Pb (0.1%) and Zn (0.1%), respectively.
For the 4,474 blanks inserted with samples, only three values over the upper threshold were reported for gold, silver, and lead. There were only six zinc values over the upper threshold which was well within expected ranges.
11.3.4.2 Certified Reference Materials
Discovery Silver purchased commercially available CRMs from Ore Research & Exploration Pty Ltd. of Australia. The materials are fine-grained, well-homogenized and assayed at a minimum of 25 laboratories to determine expected values. The matrix of the materials is from a rhyodacitic volcaniclastic succession and mineralization assemblage includes sphalerite, chalcopyrite, and lesser galena with a gangue of pyrite, pyrrhotite and magnetite. The CRMs are submitted as received in foil packets that have been nitrogen-flushed to eliminate oxidation.
Both CRMs 621 and 623 have been used for the entire period. CRM 622 was used in 2019 to 2020. CRM 620 was introduced in 2020 and CRM 624 was introduced in 2021.
The expected results for reference materials are summarized in Table 11-4 along with the average of the reported results for 2019 to 2021. The average reported values agree within ±2% of the expected values for all the elements and CRMs.
There was a low number of QC failures (less than 1%). All QC failures were rigorously investigated and where necessary repeat assays were requested. ALS re-issued 40 corrected certificates and the revised assays were added to the database.

Cordero Project P a g e 1 1 4
Preliminary Economic Assessment of the Cordero Silver Project, Chihuahua State, Mexico January 2022
Table 11-4: Summary Table of Results for Certified Reference Materials
CRM Number
Number of Times Inserted
Expected Value
Standard Deviation
Average of Reported Values
Silver (g/t)
620 1520 38.5 1.530 38.8
621 1716 69.2 2.650 69.0
622 103 102.0 3.000 101.4
623 1887 20.4 1.060 20.44
624 95 45.3 1.260 45.8
Gold (g/t)
620 1520 0.685 0.021 0.68
621 1716 1.25 0.042 1.26
622 103 1.85 0.066 1.84
623 1887 0.827 0.039 0.825
624 95 1.16 0.053 1.17
Pb (%)
620 1520 0.774 0.022 0.78
621 1716 1.36 0.039 1.35
622 103 2.21 0.067 2.17
623 1887 0.25 0.007 0.25
624 95 0.624 0.019 0.61
Zn (%)
620 1520 3.15 0.097 3.14
621 1716 5.22 0.139 5.23
622 103 13.24 0.182 10.14
623 1887 1.03 0.030 1.01
624 95 2.40 0.078 2.36
Source: World Metals, 2021.
11.3.4.3 Pulp Duplicates
ALS Geochemistry includes pulp duplicates routinely to internally monitor the precision of its assays. For samples analyzed by ALS in 2020 and 2021, data for 2,463 routine internal lab pulp duplicates were retrieved from ALS Geochemistry’s Webtrieve client data management system. For samples with Pb and Zn greater than ten times the detection limit, approximately 90% of the Pb and Zn pulp duplicates agree within ±5%. For samples with silver and gold greater than ten times the detection limit, approximately 90% of the Au and Ag pulp duplicates agree within ±10%.
A comparison of pulp duplicates is shown in Figure 11-1 and Figure 11-2 for gold and silver, respectively. The blue lines represent ±20% error bars.

Cordero Project P a g e 1 1 5
Preliminary Economic Assessment of the Cordero Silver Project, Chihuahua State, Mexico January 2022
Figure 11-1: Comparison of Pulp Duplicates for Gold
Source: World Metals, 2021.
Figure 11-2: Comparison of Pulp Duplicates for Silver
Source: World Metals, 2021.

Cordero Project P a g e 1 1 6
Preliminary Economic Assessment of the Cordero Silver Project, Chihuahua State, Mexico January 2022
Precision for the pulp duplicates is within expectations for the analytical methods and generally improves with concentration, as is expected for all analytical methods.
11.3.4.4 Pulp Duplicate Check Assays
A total of 608 pulps prepared at ALS were submitted for check assay to Bureau Veritas Commodities Canada Ltd. (Bureau Veritas), a laboratory that is independent of Discovery Silver and accredited by the Standards Council of Canada to the ISO/IEC 17025 standard.
Both Pb and Zn were determined by Bureau Veritas using a four-acid digest and ICP finish, similar to the ALS method. Bureau Veritas only reported Pb up to 10%. There is no evidence of bias between the ALS and Bureau Veritas assays for Pb and Zn.
The silver assays at both laboratories agree, as shown in Figure 11-3. The blue lines represent ±20% error bars.
Figure 11-3: Comparison of Silver from Pulp Duplicate Check Assays
Source: World Metals, 2021.
Samples with silver greater than 10 g/t generally repeated within ±20% and did not demonstrate a bias up to 200 g/t silver. This is within an acceptable range. For context, the silver results for pulp duplicates analyzed at ALS were generally within ±10% so that approximately half of the variability is accounted for with sub-sampling the pulp.
For the 11 samples with silver over 200 g/t, ALS assays are higher, on average, by approximately 5%. The ALS method for this concentration range is a four-acid digest with an ICP finish but Bureau Veritas used a fire assay method (Method Code 550). It is not unusual for fire assay to under-report silver if the effect of volatilization is not accounted for properly.

Cordero Project P a g e 1 1 7
Preliminary Economic Assessment of the Cordero Silver Project, Chihuahua State, Mexico January 2022
There are two samples that plot as 200 g/t silver by Bureau Veritas but are values reported as greater than 200 g/t silver but not re-assayed by an over-range analytical method.
The gold assays at both laboratories agree well, as shown in Figure 11-4. The blue lines represent ±20% error bars.
Figure 11-4: Comparison of Gold from Pulp Duplicate Check Assays
Source: World Metals, 2021.
The gold values less than 0.05 g/t gold at ALS reproduce as less than 0.05 g/t gold at Bureau Veritas. Most of the results from the two laboratories agree within ±20%, but as expected, there is more variability in comparison of the gold results than for the other elements included in the technical report. The variability of the gold assays is expected and is related to sub-sampling of the pulp.
11.3.4.5 Core Duplicate
For the Levon drill programs, IMC reviewed duplicate assay data for holes C11-98 to C14-274 as part of its work for the development of the September 2014 mineral resource (Levon Resources Ltd., 2017). The 2017 Levon data provided to IMC consisted of 221 assays run on core duplicate samples prepared by ALS from holes C17-275 to C17-292, representing one duplicate assay approximately every 13th sample. IMC found a good agreement between the average of the assays from the original assays to the average from the check assays, and concluded that there was no systematic bias caused by the method of splitting the core.
Lynda Bloom of Analytical Solutions Ltd. (Analytical Solutions) reviewed the data for 593 drill core duplicates collected during the 2019 drilling campaign.

Cordero Project P a g e 1 1 8
Preliminary Economic Assessment of the Cordero Silver Project, Chihuahua State, Mexico January 2022
Core duplicates were prepared by sawing the second half of the drill core in half again, thus creating a quarter-core duplicate. The last quarter of the drill core was returned to the core box for archiving. The depth intervals were the same for the original and duplicate core samples.
Core duplicate assays are collected primarily to measure the expected sampling variability between two halves of the core. Most companies find it is prudent to retain some drill core for auditing purposes and therefore it is industry practice to only use a quarter core for the duplicate sample. As a result, the quarter core duplicates do not provide a true representation of the sampling error associated with routine submission of half of the core.
Analytical Solutions determined that better than 80% of the paired silver, gold, lead, and zinc assays agreed within ±50%. These results for half-core versus quarter-core duplicates from the Cordero project are typical of base metal projects.
There were 12 cases in the 2019 dataset that had ten-fold differences in the assays for two or more elements. These broad differences may be caused by the style of mineralization, sample numbering issues, analytical problems, or many other possible sources of error. However, no action is taken when there are extreme differences as it is not possible to set a quality expectation for core duplicates and it would be difficult to define a suitable corrective action.
Analytical Solutions determined that sufficient core duplicates had been collected at the Cordero project to provide guidance on the impact of splitting core. The 2019 data can be used to inform future resource models and further core duplicates are not required.
It is the opinion of the QP that the sample preparation, security, analytical procedures, and quality control practices of Discovery Silver meet or exceed industry standards and that data from Discovery Silver’s drill holes are acceptable for the estimation of mineral resources. Furthermore, the data collected by the previous owner, Levon, also has the reliability needed for use in resource estimates. Accordingly, the merging of the Levon and Discovery Silver databases is appropriate for the purposes of mineral resource estimation.
11.4 Density Measurements
For a total of 8,064 samples, approximately one in every 12 samples, the grain density of the dry pulp material was measured using ALS Method Code OA-GRA 08b.
Specific gravity was determined on a 3-gram split of the prepared pulp. The sample was weighed into an empty pycnometer. The pycnometer was then filled with a solvent (methanol or acetone) and weighed. From the weight of the sample and the solvent displaced, the specific gravity is calculated as follows:
𝐷𝑟𝑦 𝑔𝑟𝑎𝑖𝑛 𝑑𝑒𝑛𝑠𝑖𝑡𝑦 = 𝑊𝑒𝑖𝑔ℎ𝑡 𝑜𝑓 𝑠𝑎𝑚𝑝𝑙𝑒 (𝑔)
𝑊𝑒𝑖𝑔ℎ𝑡 𝑜𝑓 𝑠𝑜𝑙𝑣𝑒𝑛𝑡 𝑑𝑖𝑠𝑝𝑙𝑎𝑐𝑒𝑑 (𝑔) ∙ 𝑆𝑝𝑒𝑐𝑖𝑓𝑖𝑐 𝐺𝑟𝑎𝑣𝑖𝑡𝑦 𝑜𝑓 𝑡ℎ𝑒 𝑠𝑜𝑙𝑣𝑒𝑛𝑡
ALS uses a silica sand with a density of 2.76 for its internal monitoring of the accuracy of its density measurements.
These are grain density measurements that will run higher than in-situ dry bulk density because the pulp powder no longer has the porosity that the rock sample had before it was pulverized. For resource estimation, adjustment factors were developed for converting grain density measurements to reflect the lower dry bulk density. These were based on pulp density measurements and dry bulk density measurements done as part of the metallurgical testwork program.

Cordero Project P a g e 1 1 9
Preliminary Economic Assessment of the Cordero Silver Project, Chihuahua State, Mexico January 2022
12 DATA VERIFICATION
12.1 Database Verification
Discovery Silver has developed an extensive dataset for the Cordero Project that is stored and managed using a GeoInfo Tools database management system designed for the mining and mineral exploration industry. The QP has reviewed the data compilation and has audited the GeoInfo Tools database.
The QP verified the Cordero databases for gold, silver, lead, and zinc by comparing the database entries with original assay certificates in comma-separated-values (CSV) file format, obtained directly from ALS WebtrieveTM.
Assay data was verified for separate datasets from earlier exploration campaigns (2009-2014 and 2017) and Discovery Silver drilling campaigns (2019, 2020, and 2021). All drill hole data has been verified except for the three holes drilled by Industrias Peñoles in 2001 on the Sansón target, which lies outside the 2021 resource area.
Nadia M. Caira, the QP, and Gernot Wober, VP Exploration for Discovery Silver, oversaw the data verification assessment on 66,300 samples from 252 of the 292 drill holes that Levon collected between the years 2009 and 2017. A total of 70,946 drill core samples collected between 2019 and 2021 are included in the 2021 mineral resource estimate. Discovery Silver did not use 40 of the 292 historic drill holes that fall outside of the 2021 resource estimate.
The QP believes the databases provided by Discovery Silver to be reliable and does not consider the minor discrepancies encountered during the verification process to be of material impact to the 2021 resource data included in this estimate.
12.2 Multiple Site Visits and Independent Sampling Supervision
Nadia M. Caira, the QP, has conducted multiple site visits to the Cordero property between 2019 to mid-November 2021. During that time, Ms. Caira received an overview of the project from Discovery Silver Vice President Exploration, Gernot Wober or his designate. The various site visits included the following activities:
• site tours of surface exposures of old mine workings mineralization within the 2021 resource area and the collection of 180 surface rock samples from these mine workings
• verification of many drill pads during the various site visits via the FieldMove App, a geological field mapping and data collection application by Petroleum Experts Limited
• GIS verification of spatial locations of mine workings, drill hole pads, and surface exposures
• discussion of drill core handling and drill core sampling and data management procedures and protocols
• oversaw the collection, bagging, tagging, and shipping of the core samples for the 2021 resource estimate.
12.2.1 QP Due Diligence Mineralization Review
During the various site visits Ms. Caira oversaw the collection of the Discovery Silver due diligence samples collected for the 2021 resource estimate.

Cordero Project P a g e 1 2 0
Preliminary Economic Assessment of the Cordero Silver Project, Chihuahua State, Mexico January 2022
• During these site visits, several select drill holes in areas of interest were laid out at the nearest core logging facility, and mineralization was reviewed and compared to the current logging and assay database.
• Ms. Caira completed a sample collection from several intervals of interest as representative skeleton core samples for future reference. All the sample intervals and entire drill holes reviewed contained carbonate-cemented breccias with sphalerite-galena-pyrite in a progression from crackle or (stockwork) to puzzle- to mill-matrix breccias.
• In addition, certain intervals contained evidence for multiple events of veining of pyrite-galena superimposed on earlier sphalerite-galena with minor chalcopyrite and rare pyrrhotite. In addition, barite-sphalerite, pink rhodochrosite ± fluorite as well as late hydrothermal jasperoid-drusy calcite veins were present locally.
• Some of the intervals reviewed were strongly oxidized jarosite ± hematite, in the vicinity of jasperoid-drusy calcite veining as well as along faults.
12.2.2 QP Due Diligence Sampling Review
During the multiple site visits, the QP checked the sampling protocols during each site visit. The QP did not collect representative core samples for analysis during each of the numerous site visits. The QP did collect 180 surface samples during a site visit in mid-2021 from each of the numerous mine workings for assay, petrographic and for TerraSpecTM analyses. The assay results for that work have not yet been received. Each sample collected from the workings were mineralized by one or more sphalerite-cemented puzzle breccia, galena-pyrite veins, sphalerite-galena stockwork, and sphalerite-galena cemented fault breccia.
Ms. Caira trained and supervised the geologists that marked a line along each core piece to guide the core-saw technicians in each selected sample interval.
• Ms. Caira personally observed the core-sawing of many of the intervals and observed no irregularities, including core-saw cleaning after every sample, core sample cut along the marked line, and the placement of one-half core sample back in the correct location in the core box.
• Ms. Caira personally observed the sampling protocol during each site visit. One-half of the sawn whole core was placed into a pre-labelled sample bag marked with the designated sample number. Then the sample bag was sealed with a zip-tie.
• Ms. Caira personally observed the management of the standards, duplicate and blanks during all site visits.
• Ms. Caira observed the sample shipping protocol during each site visit. A dedicated 5-tonne truck drives directly from the ALS Chihuahua Preparation Lab to pick up the samples at the secure and gated project site and drives directly back the same day for delivery to the laboratory.
ALS is an independent global quality management laboratory that meets the requirements of ISO/IEC 17025:2017 specifications. All of the ALS hub laboratories throughout the world are independent of Discovery Silver and accredited to ISO/IEC 17025:2017 specifications.
The analytical procedure completed on the core samples followed those defined in Section 11.2 of this report.

Cordero Project P a g e 1 2 1
Preliminary Economic Assessment of the Cordero Silver Project, Chihuahua State, Mexico January 2022
12.3 QP Opinion
The Discovery Silver sampling and data verification protocols were overseen in all aspects by Ms. Caira during each site visit between October 2020 and November 2021. The mineralized intervals reviewed during each site visit match closely for silver, lead, and zinc with visually observed sphalerite, galena, and rare tetrahedrite, chalcopyrite and pyrrhotite.
The QP considers the due diligence results to be acceptable.
Based on a detailed evaluation of the QA/QC program, observation in all aspects of the sampling protocols, and review of mineralized drill core intervals with assays during each site visit, it is the QP’s opinion that the data is representative and suitable for use in the current 2021 Mineral Resource Estimate.

Cordero Project P a g e 1 2 2
Preliminary Economic Assessment of the Cordero Silver Project, Chihuahua State, Mexico January 2022
13 MINERAL PROCESSING AND METALLURGICAL TESTING
13.1 Chronology of Cordero Metallurgical Testwork Programs
Three phases of metallurgical testwork have been conducted on Cordero samples since 2011. The first two phases were completed under the previous ownership (Levon Resources, described in “NI 43-101 Technical Report Preliminary Economic Assessment Update”, April 18, 2018), and the most recent phase was carried out by Discovery Silver. A brief overview of the three testwork programs is provided in Table 13-1.
Table 13-1: Summary of Previous Testwork Completed
Year Laboratory Testwork Performed
2011 METCON, Tucson, AZ Preliminary Flotation Study – Composite mineral sample characterization, Bond ball work index tests, abrasion index tests and sequential lead-zinc rougher flotation.
2013 ALS Metallurgy, Kamloops, BC Metallurgical Evaluation of Cordero Deposit – QEMSCAN mineralogy analysis, batch rougher and cleaner flotation optimization, locked cycle tests
2021 Blue Coast Research, Parksville, BC
Oxide, Transition and Sulphide mineral testwork – QEMSCAN mineralogy analysis, Bond ball work index tests, Bond rod work index tests, SMC test, abrasion index tests. Flotation optimization testwork and locked cycle tests. Cyanidation bottle roll tests and preconcentration assessment
Source: Ausenco, 2021.
This section of the report aims to provide a summary of the work conducted to date on the Cordero project with emphasis on the most recent testwork program conducted at Blue Coast Research. It should also be noted that a fourth phase of testwork is underway at McClelland Laboratories in Reno, NV that focuses on column leach testwork of oxide material to provide amenability level heap leach data. The final report from this testwork was not available at the time of writing, so preliminary data only is included.
Oversight for the 2021 testwork programs was provided by Mr. David Middleditch of Libertas Metallurgy Ltd., and Mr. Tommaso Roberto Raponi, P. Eng., of Ausenco. This section of the technical report has been prepared by Mr. Middleditch with input from Ausenco.
13.2 METCON 2011 Program Summary
A brief overview of the METCON 2011 preliminary flotation study is provided below. The testwork program was overseen by M3 Engineering and samples arrived at the laboratory in April 2011. A total of 85 drill core intervals were received, from which 12 composites were prepared.
• Head assays of the twelve composites ranged from 0.26-4.40% Pb, 7-409 g/t Ag, and 0.30-4.18% Zn.

Cordero Project P a g e 1 2 3
Preliminary Economic Assessment of the Cordero Silver Project, Chihuahua State, Mexico January 2022
• Five of the 12 composites showed high total carbon content (i.e., >1% total carbon, but no organic carbon assays were completed).
• Gold grades were generally low at <0.5 g/t Au.
• An optical mineralogical analysis conducted by Terra Mineralogical Services (TMS) concluded that galena and sphalerite were the main minerals of economic interest with a number of silver carriers identified (galena, Ag-Sb sulphosalts, argentite, acanthite, freibergite and silver tellurides), suggesting that silver recoveries should track lead recoveries. In the absence of QEMSCAN, no quantitative statements around mineral grain size and liberation were made.
A series of comparative Bond ball work index (BBWI) tests were run by comparing laboratory grind times to a known sample. This method is indicative only and the BBWI data from the METCON report cannot be included in the overall project comminution database. The comparative work index results ranged from 9.7-15.4 kWh/t.
A total of five abrasion index (Ai) tests were conducted on crushed samples ranging from 0.030 to 0.095 at Phillips Enterprises LLC. These tests can be included in the project comminution database and will be summarized further in Section 13.4.4.
A rougher flotation test was conducted on each of the 12 composites at a target primary grind size of 80% passing 75 µm. Zinc sulphate and sodium cyanide were added to the primary mill with a lead collector. Following lead flotation, the zinc was activated by copper sulphate at pH 11.0 with a zinc selective collector. A pyrite float was also added to recover additional gold. The results of the test showed that lead recovery to lead concentrate was excellent (>90%) for 11 of the 12 composites, with relatively low (<25%) zinc misplacement to the lead concentrate observed. Silver recovery generally tracked the lead recovery to lead concentrate and was >73% for 11 of the 12 composites.
The results also showed that gold recovery to the lead and zinc rougher concentrates was generally low and gold recovery to the pyrite rougher was variable, suggesting that there is a mix of gold associations in the mineralized material, with a significant portion of it being refractory.
An evaluation of grind versus recovery was conducted on a single composite (composite 3, head grade 0.5% Pb, 0.6% Zn and 36 g/t Ag) at 80% passing sizes of (P80) of 74, 125 and 177 µm and showed no significant difference in metal recovery or lead/zinc selectivity suggesting that future testwork phases should include evaluation of coarser grinds. Though not exhaustive, the testwork conducted at METCON provided the project owners with enough confidence to proceed with a more thorough follow-up testwork program at ALS Metallurgy in Canada. As final concentrates were not produced from this program, it is not recommended that the results be included in the latest PEA recovery projections; rather, it is a useful piece of the flowsheet development story for Cordero.
13.3 ALS Metallurgy 2013 Program Summary
Commencing in December 2012, a testwork program was executed at ALS Metallurgy in Kamloops, BC, under the direction of M3 Engineering and on behalf of Levon Resources.
The program involved testing on four main production period composites including optimization testwork culminating in locked cycle testing using the optimized flowsheet and detailed mineralogical analysis via QEMSCAN. Below is a brief summary of the program:

Cordero Project P a g e 1 2 4
Preliminary Economic Assessment of the Cordero Silver Project, Chihuahua State, Mexico January 2022
• The composite head grades ranged from 0.18-0.36% Pb, 0.21-0.58% Zn and 16-27 g/t Ag. The gold grade was <0.12 g/t for all composites and total carbon ranged from 0.22-1.83%. Minor amounts of cadmium, arsenic and antimony were observed. It should be noted that the relatively low base metal and silver grades were targeted as Levon Resources envisioned a much larger, bulk tonnage operation on a larger resource with materially lower head grades.
• Mineralogical analysis via QEMSCAN indicate that galena is the main lead mineral although composites 1 and 1A both contained up to 28% of the lead in non-galena forms such as zinc oxides. Further analysis of the intervals from the drillholes that comprised these samples confirmed that shallow material, from depths of less than 50 m, was accidentally included in these composites, therefore potentially contaminating the sulphide flotation composites with oxide/transition material that would be expected to have a different mineral makeup. It should be noted that this was not known by Levon Resources at the time and proper sampling of the deposit for the 2021 PEA testwork characterized a sulphide-oxide “horizon” to avoid repeating this error.
• Zinc was again mostly observed in sphalerite, but composite 1 contained approximately 25% of the zinc in a manganese carbonate mineral which would be expected to have a negative impact on zinc recovery in a sulphide flotation process. This was again linked to poor sample selection for the PEA and inclusion of oxide material in the sulphide composites. The 2021 samples showed no indication of non-sulphide zinc in the sulphide zones.
• Pyrite was observed and represented between 2% and 4% of the modal mineral mass of the composites.
• Galena liberation at a primary grind P80 of 125 µm ranged from 23-60% and sphalerite liberation ranged from 55-61% which is lower than the 2021 PEA samples and likely linked to the lower head grades and/or contamination of the sulphide samples with oxide material.
No additional comminution testwork was conducted in the 2013 program. Optimization of the flotation testwork reagents and conditions was conducted on the composites at a nominal primary grind P80 of 125 µm, including the following
• zinc sulphate and NaCN dosage (used for zinc depression in the lead circuit)
• collector type and dosage in the lead circuit
• copper sulphate dosage (used for zinc activation in the zinc circuit)
• pH level in the zinc circuit (modulated with lime)
• collector dosage and type in the zinc circuit.
Cleaner circuit testwork on both the lead and zinc circuits included regrinding of the rougher concentrates (to P80 of 10-21 µm for lead and 15-42 µm for zinc) and three stages of cleaning per circuit; therefore, the flowsheet configuration and reagent chemistry are considered to be conventional for this type of deposit.
The program culminated in a locked cycle test on three of the four composites (Composite 1 was abandoned due to the high content of oxide minerals) using the optimized conditions from the batch rougher and cleaner tests and the flowsheet configuration shown in Figure 13-1. Results of the three locked cycle tests are summarized in Table 13-1.
Lead concentrate grades were good and ranged from 49-73% Pb, 2700-7200 g/t Ag, and 1.5-7.0% Zn. The lead recoveries to lead concentrate were variable and ranged from a low of 53% (Composite 1A) to a high of almost 90% (Composite 2). Silver recovery to lead concentrate appear to track lead recovery and ranged from 50-80%. The zinc misplacement to the lead concentrate was also consistently low (2-4%), suggesting that the grinding strategy and depressant dosages derived from this program were adequate.

Cordero Project P a g e 1 2 5
Preliminary Economic Assessment of the Cordero Silver Project, Chihuahua State, Mexico January 2022
Figure 13-1: Locked Cycle Test Flowsheet Configuration
Source: ALS Metallurgy, 2013.

Cordero Project P a g e 1 2 6
Preliminary Economic Assessment of the Cordero Silver Project, Chihuahua State, Mexico January 2022
Table 13-2: Summary of Locked Cycle Test Results
Product Weight
%
Assay (% or g/t) Distribution (%)
Pb Zn Fe S C Ag Au Pb Zn Fe S C Ag Au
Test 50: Composite 1A
Flotation Feed 100.0 0.18 0.21 2.40 2.37 1.84 23.0 0.09 100 100 100 100 100 100 100
Lead Concentrate 0.2 49.1 4.67 6.00 16.2 3.57 7153 4.47 53.2 4.20 0.50 1.30 0.40 60.0 10.0
Zinc Concentrate 0.4 3.07 44.1 11.7 34.0 1.04 1041 1.94 6.70 80.8 1.90 5.60 0.20 18.0 8.00
Zinc First Cleaner Tail 3.5 0.12 0.08 5.60 5.50 2.04 9.00 0.17 2.30 1.30 8.00 8.00 3.80 1.00 7.00
Zinc Rougher Tail 95.9 0.07 0.03 2.30 2.11 1.84 5.00 0.07 37.9 13.6 89.6 85.1 95.6 21.0 75.0
Test 39: Composite 2
Flotation Feed 100.0 0.35 0.40 2.60 2.73 0.55 27.0 0.11 100 100 100 100 100 100 100
Lead Concentrate 0.4 73.2 1.54 2.60 15.1 0.31 5070 2.64 89.5 1.60 0.40 2.30 0.20 80.0 10.0
Zinc Concentrate 0.6 1.38 52.4 7.10 31.1 0.14 333 1.23 2.50 82.5 1.70 7.10 0.20 8.00 7.00
Zinc First Cleaner Tail 5.5 0.08 0.13 6.40 6.19 0.73 11.0 0.25 1.30 1.70 13.6 12.4 7.10 2.00 12.0
Zinc Rougher Tail 93.5 0.02 0.06 2.30 2.28 0.55 3.00 0.08 6.70 14.1 84.2 78.1 92.5 10.0 71.1
Test 40: Composite 3
Flotation Feed 100.00 0.22 0.55 2.90 2.83 1.25 16.0 0.10 100 100 100 100 100 100 100
Lead Concentrate 0.3 50.6 6.96 7.30 19.8 0.88 2711 5.33 70.8 3.80 0.80 2.10 0.20 50.0 16.0
Zinc Concentrate 0.8 1.25 53.7 6.10 33.4 0.30 289 0.44 4.70 78.8 1.70 9.60 0.20 14.0 4.00
Zinc First Cleaner Tail 5.1 0.12 0.32 4.50 3.88 1.70 13.0 0.09 2.80 3.00 8.00 7.00 7.00 4.00 5.00
Zinc Rougher Tail 93.7 0.05 0.09 2.70 2.45 1.24 6.00 0.08 21.7 14.5 89.5 81.3 92.6 32.0 76.0
Source: ALS Metallurgy, 2013.

Cordero Project P a g e 1 2 7
Preliminary Economic Assessment of the Cordero Silver Project, Chihuahua State, Mexico January 2022
Zinc concentrate grade ranged from 44-54% Zn and 290-1000 g/t Ag with zinc recovery relatively consistent at 79-83%. Additional silver recovery into the zinc concentrate represented between 8-18% recovery, bringing total silver recovery for Composite 1A, 2 and 3 to 78%, 88% and 64%, respectively.
The results were generally encouraging, but lower lead and silver recoveries for composites 1A and 3 were of concern. Based on the findings of the recent Blue Coast Research testwork program, the omission of a pre-flotation stage for organic carbon in the ALS Metallurgy and METCON programs could be a cause for this. There were also concerns about the inclusion of oxide material in Composite 1A which could have played a part in the lower recoveries observed for this composite. It should be noted that consistently high recoveries were observed in the 2021 Blue Coast Research program, even for material with head grades lower than this study.
13.4 2021 Metallurgical Testwork Summary
13.4.1 Sample Selection & Representivity
The majority of the 2021 flowsheet development testwork was conducted on 12 rock type and pit phase composites. Three pit phases were considered (P23, P29, and P34) with four rock types per pit phase (volcanic, breccia, sedimentary, and oxide) selected. P23 was representative of the first phase of mining with samples sourced from the Pozo de Plata zone. P29 was representative of the next phase of mining with samples mostly sourced from the NE Extension zone. P34 was representative of the final phase of mining with samples mostly sourced from the South Corridor.
The samples were selected by Discovery Silver geologists to be representative of not just the grade of the various rock types within each mining phase, but also the spatial coverage with intervals being sourced from multiple holes within each phase. Sample selections were reviewed by Libertas Metallurgy before shipping to Blue Coast Research in Parksville, Canada for sample preparation and further analysis. Figure 13-2 shows the various intervals that comprised the PEA composite sample selections in relation to the PEA pit shell. The measured head grades for the 12 composites are summarized in Table 13-2.
Figure 13-2: Composite Sample Selection
Source: Discovery Silver, 2021.

Cordero Project P a g e 1 2 8
Preliminary Economic Assessment of the Cordero Silver Project, Chihuahua State, Mexico January 2022
Table 13-3: 2021 Metallurgical Testwork Rock Type/Pit Phase Composites Head Grades
Composite Ag (g/t) Pb (%) Zn (%)
P23 VOLC 37 0.55 0.63
P23 BRX 42 0.57 0.56
P23 SEDS 29 0.48 0.30
P23 OX 49 0.42 0.10
P29 VOLC 28 0.49 0.63
P29 BRX (Breccia-Volcanics) 40 0.58 0.79
P29 SEDS 25 0.41 0.53
P29 OX 50 0.41 0.20
P34 VOLC 37 0.38 0.81
P34 BRX 32 0.37 0.57
P34 SEDS 28 0.42 0.83
P34 OX 33 0.13 0.18
Source: Blue Coast Research, 2021.
13.4.2 Mineralogical (QEMSCAN) Analysis
As noted, mineralogical analysis of the 2011 and 2013 composite samples was conducted; however, some of this data has been questioned due to concerns over sample selection and sample quality as well as the inherent limitations of optical mineralogy per the TMS 2011 study. As part of the 2021 Blue Coast Research program, QEMSCAN mineralogical analysis was conducted on 12 carefully selected samples by lithology and pit phase. The analysis was conducted at ActLabs in Ancaster, ON under the direction of Blue Coast Research and Libertas Metallurgy Ltd. This recent work is therefore considered definitive for the Cordero project and past mineralogical testwork was discussed in previous sections for context only. The results are outlined in Figures 13-3 through 13-5 on the following pages.
Each sample was ground to a nominal P80 of 120 µm and sized into three size fractions (+75 µm, -75/+38 µm, and -38 µm).
Modal mineralogy indicates that the predominant sulphide mineral contained across the volcanic, sedimentary, and breccia samples was pyrite. Sphalerite and galena were present in the volcanic, sedimentary, and breccia samples to a lesser extent than pyrite. The oxide composites did not contain significant amounts of sulphide minerals.
The gangue mineralogy was dominated by quartz, plagioclase, K feldspar, Si/Al clays, and calcite. The sedimentary samples contained the largest concentration of calcite, while the oxide samples contained the least calcite. The oxide samples contained the most amount of Si/Al clays compared to the other lithologies.
Liberation of the sphalerite and galena for each composite is summarized in Table 13-4. Both minerals were generally well liberated in the sulphide composites at the primary grind P80 of 120 µm with sphalerite, on average, more liberated than galena at 89% versus 66%. This data points towards the opportunity for implementation of coarser primary grinds at Cordero and only moderate regrinding to achieve clean lead and zinc concentrates.

Cordero Project P a g e 1 2 9
Preliminary Economic Assessment of the Cordero Silver Project, Chihuahua State, Mexico January 2022
Figure 13-3: Pit 23 Lithology Composites Modal Mineralogy
Source: Blue Coast Research, 2021.

Cordero Project P a g e 1 3 0
Preliminary Economic Assessment of the Cordero Silver Project, Chihuahua State, Mexico January 2022
Figure 13-4: Pit 29 Lithology Composites Modal Mineralogy
Source: Blue Coast Research, 2021.

Cordero Project P a g e 1 3 1
Preliminary Economic Assessment of the Cordero Silver Project, Chihuahua State, Mexico January 2022
Figure 13-5: Pit 34 Lithology Composites Modal Mineralogy
Source: Blue Coast Research, 2021.

Cordero Project P a g e 1 3 2
Preliminary Economic Assessment of the Cordero Silver Project, Chihuahua State, Mexico January 2022
Table 13-4: Summary of Pit Composite Galena and Sphalerite Liberation
Composite Galena Liberation (%) Sphalerite Liberation (%)
P23 VOLC 74 90
P23 BRX 73 81
P23 SEDS 72 85
P23 OX 52 96
P29 VOLC 67 90
P29 BRX (Breccia-Volcanics) 69 85
P29 SEDS 78 85
P29 OX 61 99
P34 VOLC 56 88
P34 BRX 82 90
P34 SEDS 64 81
P34 OX 44 95
Average 66 89
Source: Blue Coast Research, 2021.
13.4.3 Comminution Testwork
Four master composites from the Blue Coast Research 2021 PEA (VOLC MC, SEDS MC, Breccia - Volcanics and Breccia - Sedimentary) were subjected to Bond ball work index testing at a closing screen size of 212 µm. The coarser than standard closing screen size was selected due to the coarser primary grinds that were established during flotation optimization testwork discussed later in this report. Work indices ranged from 17.6 kWh/t to 19.5 kWh/t, classifying Cordero material as “hard”. The results of the Bond ball work index tests are summarized in Table 13-5.
Table 13-5: Summary of Bond Ball Work Index Test Results
Composite ID Bulk Density
(t/m3)
F80
(µm)
P80
(µm)
Grams per Revolution
BWI
(kWh/t) Category
VOLC MC 2.64 2119 169 1.42 19.5 Hard
SEDS MC 2.71 1956 165 1.46 18.9 Hard
P29-BRX 2.68 1905 167 1.59 17.9 Hard
BRX Comp 1 2.66 2119 158 1.51 17.6 Hard
Source: Blue Coast Research, 2021.
All four of the Pit 23 samples along with the oxide samples from Pit 29 and Pit 34 were sent to SGS Minerals Services in Burnaby, BC for Steve Morrell comminution (SMC) and Bond abrasion index (Ai) testing. In addition to the six pit composites, a ROM composite was also sent to SGS for Bond rod mill work index (RWI) testing.
The Axb values from the SMC testwork indicates that the Cordero material falls into the medium hardness category in terms of impact breakage with an average Axb value of 52 excluding P23-OX. The Axb value of P23-OX was significantly different from the other samples tested, with an Axb value of 99, indicating that it falls into the soft category in terms of impact breakage. The SMC test results are summarized in Table 13-6.

Cordero Project P a g e 1 3 3
Preliminary Economic Assessment of the Cordero Silver Project, Chihuahua State, Mexico January 2022
Table 13-6: Summary of SMC Test Results
Sample ID
Bulk Density
(t/m3)
A b Axb Hardness Percentile
ta SCSE
(kWh/t)
P23-BRX 2.61 83.5 0.56 46.8 48 0.46 9.09
P23-OX 2.39 70.3 1.41 99.1 11 1.07 6.95
P23-SEDS 2.73 73.7 0.71 52.3 39 0.50 8.81
P23-VOLC 2.55 74.2 0.76 56.4 34 0.57 8.37
P29-OX 2.50 76.4 0.68 52.0 40 0.54 8.64
P34-OX 2.49 73.2 0.73 53.4 38 0.56 8.55
Source: Blue Coast Research, 2021.
The Bond Abrasion testwork conducted on the six pit composites shows that the Cordero material ranges from mildly abrasive in the P23-OX sample to moderately abrasive in the P34-OX sample. This is summarized in Table 13-7.
Table 13-7: Summary of Abrasion Index Test Results
Sample ID Ai (g) Percentile of Abrasion Category
P23-BRX 0.351 59 Medium
P23-OX 0.133 24 Mild
P23-SEDS 0.142 26 Slightly Abrasive
P23-VOLC 0.299 51 Medium
P29-OX 0.473 73 Moderately Abrasive
P34-OX 0.488 75 Moderately Abrasive
Source: Blue Coast Research, 2021.
It should be noted that these abrasion indices are significantly different from the results obtained by Phillips Enterprises as part of the METCON study in 2011. The origin of the 2011 samples is unknown but the data suggests that this material was significantly less abrasive. It is recommended that additional testwork be conducted to further increase the abrasion index database as the project evolves. The METCON study test results are outlined in Table 13-8.
Table 13-8: Summary of Abrasion Index Test Results
Composite ID Ai (g)
C09-4 0.0792
C10-9 0.0823
C10-46 0.0760
C11-102 0.0947
C11-115 0.0304
Source: METCON, 2011.

Cordero Project P a g e 1 3 4
Preliminary Economic Assessment of the Cordero Silver Project, Chihuahua State, Mexico January 2022
13.4.4 Preconcentration
As part of the Blue Coast Research 2021 testwork program a 5.0kg ROM composite grading 32 g/t Ag, 0.47% Pb, 0.73% Zn and 0.15 g/t Au was crushed to 100% passing 12.5 mm (½”) and wet screened at 1.18 mm to remove fine material. The fines were weighed and submitted for assay while the coarser material was subjected to dense media separation (DMS) amenability testing at four different specific gravities (3.05, 2.95, 2.85 and 2.75). The results for this test are summarized in Table 13-9.
Table 13-9: Summary of Dense Media Separation Results
Product
Weight Assays % Distribution
g % Au (g/t) Ag (g/t) Pb (%) Zn (%) Fe (%) S (%) Au (%)
Ag (%)
Pb (%)
Zn (%)
Fe (%)
S (%)
SG 3.05 Sink 237.3 4.9 0.96 220 3.35 4.74 20.0 24.4 31.0 34.0 35.5 31.9 25.9 28.1
SG 2.95 Sink 72.8 1.5 0.28 70 0.90 2.13 11.3 10.2 2.8 3.3 2.9 4.4 4.5 3.6
SG 2.85 Sink 180.7 3.8 0.24 45 0.63 1.42 8.21 7.71 5.8 5.3 5.1 7.3 8.1 6.8
SG 2.75 Sink 234.0 4.9 0.23 35 0.54 0.95 5.01 5.31 7.2 5.3 5.6 6.3 6.4 6.0
SG 2.75 Float 3202.5 66.7 0.05 11 0.15 0.27 1.81 1.91 22.1 22.4 21.1 24.5 31.6 29.6
-1.18 mm 871.2 18.2 0.26 53 0.76 1.03 4.97 6.14 31.1 29.8 29.8 25.5 23.6 25.9
Total 4798.4 100.0 0.15 32 0.47 0.73 3.83 4.29 100.0 100.0 100.0 100.0 100.0 100.0
Direct Head 4800.0 100.0 0.13 34 0.46 0.68 3.99 4.20 - - - - - -
Reconciliation 100.0 - 122.1 94.8 100.9 108.0 96.0 102.3 - - - - - -
SG 3.05 & Fines 1108.5 23.1 0.41 88 1.32 1.83 8.20 10.0 62.0 63.7 65.3 57.5 49.5 54.0
SG 2.95 & Fines 1181.3 24.6 0.40 87 1.29 1.85 8.39 10.0 64.8 67.1 68.2 61.9 54.0 57.6
SG 2.85 & Fines 1362.0 28.4 0.38 82 1.20 1.79 8.36 9.73 70.6 72.4 73.3 69.1 62.1 64.3
SG 2.75 & Fines 1596.0 33.3 0.36 75 1.11 1.67 7.87 9.09 77.9 77.6 78.9 75.5 68.4 70.4
Source: Blue Coast Research, 2021.
Mass recoveries to the sinks were generally low, resulting in high upgrades and high mass rejection but at the expense of metal recovery. The highest metal recovery to combined DMS sinks and fines was achieved at SG 2.75 where 67% of the mass was rejected to the floats. The upgraded product grades were 75 g/t Ag, 0.36 g/t Au, 1.11% Pb and 1.67% Zn at metal recoveries of 78%, 79%, 79% and 76% respectively. These recoveries are likely too low to justify preconcentration but the mass rejection profiles at the SGs tested suggest that further optimization at lower media SG would likely result in higher metal recoveries while still removing significant amounts of barren, waste material.
Also, during the Blue Coast Research 2021 testwork program, composites of sulphide and oxide material were shipped to Steinert in Kentucky, USA for sensor sorting testwork via XRT (X-ray transmission) technology. A 42 kg sulphide composite grading 25 g/t Ag, 0.42 g/t Au, 0.45% Pb and 0.40% Zn. Mass rejection to the waste stream with XRT technology was lower than the DMS testwork at Blue Coast Research, but recoveries to concentrate were significantly higher. The results for Step 4 of the XRT testwork at Steinert are summarized in Table 13-10.

Cordero Project P a g e 1 3 5
Preliminary Economic Assessment of the Cordero Silver Project, Chihuahua State, Mexico January 2022
Table 13-10: Summary of Step 4 XRT Sensor Sorting Testwork Results
Product Mass (kg)
Mass
(%)
Grade Recovery
Ag (g/t)
Au (g/t)
Pb (%)
Zn (%)
Ag (%)
Au (%)
Pb (%)
Zn (%)
Feed 42.2 100.0 25.5 0.42 0.45 0.4 100 100 100 100
Step 4 Conc. 32.0 75.8 31.8 0.52 0.57 0.48 95 93 97 91
Step 4 Waste 10.2 24.2 5.7 0.12 0.06 0.14 5 7 3 7
Source: Steinert, 2021.
XRT sensor sorting rejected approximately 24% of the sample mass with metal recovery losses of just 5%, 7%, 3% and 7% for silver, gold, lead and zinc respectively.
13.4.5 Flotation Optimization
The most significant body of flotation optimization testwork conducted to date on the Cordero project was executed during the Blue Coast Research 2021 testwork program commissioned by Discovery Silver and under the direction of Libertas Metallurgy Ltd. and Ausenco. A total of 74 batch rougher and cleaner tests and four locked cycle tests were conducted on the main “resource grade” samples from the main rock types (VOLC, SED, BRX, OX) and an additional 13 batch rougher and cleaner tests were completed on lower grade rock type composites representative of the stockpiled lower grade material.
The 12 rock type/pit phase composites were subjected to rougher flotation optimization testwork first, prior to the combination of various composites to make lithology master composites. The ALS Metallurgy flowsheet and reagent conditions were used as a starting point and optimized where required. Upon completion of the initial sighter tests on the oxide composites it was decided to not pursue flotation as an option for oxide material as flotation response was poor and the cyanidation bottle roll testwork being conducted in parallel was showing promise.
The reagent suite used for the initial sighter tests is outlined below.
Lead Circuit
• Soda Ash (Na2CO3) – pH modifier
• Zinc Sulphate (ZnSO4) – zinc depressant
• Sodium Cyanide (NaCN) – pyrite and zinc depressant
• Aerofloat 31 – dicresyldithiophosphoric acid, thiocarbanilide, cresylic acid mixture used as the primary lead sulphide collector
• Methyl Isobutyl Carbinol (MIBC) – alcohol-based frother.
Zinc Circuit
• Lime – pH modifier
• Copper Sulphate (CuSO4) – zinc sulphide activator

Cordero Project P a g e 1 3 6
Preliminary Economic Assessment of the Cordero Silver Project, Chihuahua State, Mexico January 2022
• Aero 5100 – allyl alkyl thionocarbamate used as the primary zinc sulphide collector
• Methyl Isobutyl Carbinol (MIBC) – alcohol-based frother.
Aero and Aerofloat reagents are manufactured by Solvay.
Initial Sighter Tests
The sighter rougher tests conducted on the 12 pit composites showed that samples from the same lithologies had consistent performance in the lead circuit with each other, the only exception being the P29-BRX composite which performed significantly better than its Pit 23 and Pit 34 counterparts (92% versus 50% lead recovery). The volcanic samples performed the best overall, averaging 90% lead recovery while the other samples performed significantly poorer. The results are depicted in Figure 13-6.
The initial sighter tests, demonstrated by Figure 13-7, also showed that the silver recovery had a linear relationship with lead recovery in the volcanic, sedimentary, and breccia lithologies. The oxide samples did not show the same relationship.
The zinc circuit also showed that the lithologies performed consistently with one another, however unlike in the lead circuit the sedimentary and breccia samples recovered more zinc than the volcanic samples on average, as shown by Figure 13-8. Again, the oxide samples had the poorest flotation performance of the four lithologies.
It was observed during the flotation of the three sedimentary and the two poorer performing breccia samples that carbonaceous material was present and was preferentially floating in the lead circuit. The carbonaceous material was concluded to be the main contributing factor to the poor lead metallurgy in the initial sighter tests. Carbon pre-float rougher tests were conducted on the P23-SEDS, P23-BRX, and P34-BRX composites to assess whether the carbon could be removed with minor silver, lead, and zinc losses while improving the flotation performance.
Significant improvements in lead circuit performance were achieved by the addition of the pre-flotation step and metal losses to the pre-flotation concentrate were low. The results are summarized in the grade recovery curves in Figure 13-9.
At five to six minutes of flotation, the carbon pre-float for P23-SEDS misplaced less than 5% of the silver and lead and was deemed to be successful. However, a five-minute pre-flotation stage misplaced over 14% of the silver and lead in the P23-BRX and P34-BRX composites and was deemed much less successful. Therefore, pre-flotation kinetics were completed and a shorter pre-flotation residence time of two minutes was derived, reducing silver and lead misplacement to <5% for the breccia composites.

Cordero Project P a g e 1 3 7
Preliminary Economic Assessment of the Cordero Silver Project, Chihuahua State, Mexico January 2022
Figure 13-6: Lithology/Pit Composites Lead Grade Recovery Curves
Source: Blue Coast Research, 2021.

Cordero Project P a g e 1 3 8
Preliminary Economic Assessment of the Cordero Silver Project, Chihuahua State, Mexico January 2022
Figure 13-7: Lithology/Pit Composite Silver vs. Lead Recovery to the Lead Rougher
Source: Blue Coast Research, 2021.

Cordero Project P a g e 1 3 9
Preliminary Economic Assessment of the Cordero Silver Project, Chihuahua State, Mexico January 2022
Figure 13-8: Lithology/Pit Composite Zinc Grade Versus Zinc Recovery
Source: Blue Coast Research, 2021.

Cordero Project P a g e 1 4 0
Preliminary Economic Assessment of the Cordero Silver Project, Chihuahua State, Mexico January 2022
Figure 13-9: Pre-flotation Test Series Lead Recovery Versus Grade Curves
Source: Blue Coast Research, 2021.
Additionally, the P23-SEDS, P23-BRX, and P34-BRX composites were subjected to flotation at a lower pulp density of approximately 22% solids. The lower pulp density showed improved lead metallurgy compared to the standard pulp density of approximately 38%. These results are demonstrated in Figure 13-10.
From the initial testwork of the individual pit composites it was concluded that the master composites should be based upon lithology, with the exception of the breccia-volcanics composite as its metallurgical performance more closely resembled the volcanic samples, while F23-BRX and P34-BRX more closely resembled the sedimentary samples.

Cordero Project P a g e 1 4 1
Preliminary Economic Assessment of the Cordero Silver Project, Chihuahua State, Mexico January 2022
Figure 13-10: Pulp Density Sensitivity Tests Lead Grade vs. Recovery Curves (with Carbon Pre-float)
Source: Blue Coast Research, 2021.
The following composites were created and taken into further optimization and ultimately locked cycle testing:
• VOLC master composite
• SED master composite
• breccia-volcanics composite
• breccia-sedimentary composite.

Cordero Project P a g e 1 4 2
Preliminary Economic Assessment of the Cordero Silver Project, Chihuahua State, Mexico January 2022
The initial flotation testwork also concluded that two primary flowsheets should be employed in this program. The first flowsheet would only include a standard sequential lead-zinc flotation scheme, while the second flowsheet would include a carbon pre-float stage ahead of lead flotation to eliminate the problematic carbonaceous material from the circuit.
13.4.5.1 Primary Grind vs. Recovery
The impact of primary grind on lead and zinc rougher performance was investigated via a series of grind versus recovery batch rougher tests for the VOLC and SEDS master composites. The range of primary grinds tested was P80 of ~100 µm to ~275 µm. The conditions were held constant for each batch of sensitivity tests with the only difference being the SEDS master composite tests employed a carbon pre-float ahead of the lead rougher. Zinc depressants (30 g/t ZnSO4, 10 g/t NaCN), lead collector (12 g/t 3418A), lead circuit pH 9.0, zinc activator (175 g/t copper sulphate), zinc collector (10 g/t 5100) and zinc rougher pH 11.0 were the conditions employed. The recovery curves for the primary grind tests are shown in Figure 13-11 for lead and Figure 13-12 for zinc. The metal grade vs. metal recovery curves for lead and zinc are outlined in Figures 13-13 and 13-14, respectively.
Figure 13-11: VOLC Master Composite Primary Grind vs. Recovery Sensitivity (Lead Grade Recovery Curves)
Source: Blue Coast Research, 2021.

Cordero Project P a g e 1 4 3
Preliminary Economic Assessment of the Cordero Silver Project, Chihuahua State, Mexico January 2022
Figure 13-12: VOLC Master Composite Primary Grind vs. Recovery Sensitivity (Zinc Grade Recovery Curves)
Source: Blue Coast Research, 2021.

Cordero Project P a g e 1 4 4
Preliminary Economic Assessment of the Cordero Silver Project, Chihuahua State, Mexico January 2022
Figure 13-13: SEDS Master Composite Grind vs. Recovery Sensitivity (Lead Grade vs. Recovery)
Source: Blue Coast Research, 2021.

Cordero Project P a g e 1 4 5
Preliminary Economic Assessment of the Cordero Silver Project, Chihuahua State, Mexico January 2022
Figure 13-14: SEDS Master Composite Grind vs. Recovery Sensitivity (Zinc Grade vs. Recovery)
Source: Blue Coast Research, 2021.
Lead rougher recoveries >90% were consistently achieved across the entire primary grand range for the VOLC master composite, with higher rougher concentrate grades achieved at the coarser grinds. For the SEDS mater composite the lead rougher recovery ranged from 83-88% with the higher recoveries again achieved at the coarser primary grinds. Silver recovery tracked lead recovery closely, approaching 86% for the VOLC master composite and 82% for the SEDS master composite.
Zinc rougher recoveries were also superior at the coarser grinds for both composites at 68-72% zinc recovery for the VOLC master composite and 85-88% for the SEDS master composite.
Upon completion of the grind sensitivity testwork a primary grind P80 of 200 µm was selected as the optimum. This was later validated on the breccia-volcanics composite and the breccia-sedimentary composite and shown to be effective also.

Cordero Project P a g e 1 4 6
Preliminary Economic Assessment of the Cordero Silver Project, Chihuahua State, Mexico January 2022
13.4.5.2 Depressant Dosage Sensitivity
A series of depressant dosage sensitivity tests were conducted on the VOLC master composite using the baseline (30 g/t ZnSO4 and 10 g/t NaCN), 2x, 4x and 8x dosages to determine the impact of increased dosages. Lower dosages were not tested as the original baseline levels used at ALS/METCON were considered to be at the low end of industry practice. All other variables were held constant with the exception of test F-58 where X5000 collector was used in place of 3418A. X5000 is a direct replacement for 3418A from a different supplier (Flottec) and has the same reagent chemistry. These results are shown by the lead-zinc sensitivity curves in Figure 13-15.
Figure 13-15: VOLC Master Composite Depressant Sensitivity (Lead-Zinc Selectivity Curves)
Source: Blue Coast Research, 2021.

Cordero Project P a g e 1 4 7
Preliminary Economic Assessment of the Cordero Silver Project, Chihuahua State, Mexico January 2022
The most favourable results were achieved using the 4x depressant dosage (120 g/t ZnSO4 and 40 g/t NaCN) where 91% lead recovery and 13% zinc misplacement to the lead rougher concentrate was achieved, compared to the baseline result of 92% lead recovery and 25% zinc misplacement. The data also suggests that X5000 gave slightly better selectivity and lead recovery versus 3418A, but as these reagents are chemically very similar, this may just be attributed to inter-test variability. Regardless, the decision was made to proceed with X5000 as the primary lead/silver collector due to its lower price compared to 3418A.
The same screening approach was not applied to the other composites however through optimization of the SEDS master composite, breccia-sedimentary and breccia-volcanics composite the same depressant dosage in the primary grind (120 g/t ZnSO4 and 40 g/t NaCN) was selected as the optimum. It should also be noted that the increased depressant dosages in the primary grind and lead circuit had a positive impact on the zinc circuit whereby higher zinc rougher concentrate grades and recoveries were achieved at the higher dosages. This may appear counter-intuitive but increasing the NaCN dosage likely had a depressing effect on the pyrite, which in turn enabled a more favourable flotation environment for zinc in the zinc circuit, allowing the zinc circuit to be operated at more moderate pH levels.
13.4.5.3 Cleaner Circuit Optimization
Cleaner circuit optimization was conducted on each of the four master composites and resulted in an optimized cleaner flowsheet for each circuit that was very similar for all composites both in terms of configuration and reagent dosages. Fourteen cleaner tests were conducted across the four main composites. The basic flowsheet configuration was considered to be conventional with sequential lead and zinc roughing with carbon pre-float after the primary grind where required, regrinding of each rougher concentrate and three stages of cleaning for each circuit. All tests were completed in open circuit with no advancement of the lead cleaner 1 tail to the zinc circuit.
The following cleaner circuit conditions were employed for the lead circuit:
• regrind of the lead rougher concentrate to a P80 of 20-30 µm
• 30-60 g/t ZnSO4 and 10-20 g/t NaCN in the regrind
• 2-6 g/t X5000 collector
• three stages of cleaning at pH 9.0 (maintained with soda ash).
The following cleaner circuit conditions were employed for the zinc circuit:
• regrind the zinc rougher concentrate to 20-30 µm with 125 g/t lime in the regrind mill
• 2 g/t 5100 collector
• three stages of cleaning at pH 11.5 (maintained with lime).
The lead and zinc grade recovery curves for the optimum cleaner tests for each composite are shown in Figures 13-16 and 13-17, respectively.

Cordero Project P a g e 1 4 8
Preliminary Economic Assessment of the Cordero Silver Project, Chihuahua State, Mexico January 2022
Figure 13-16: Cleaner Circuit Optimization Lead Grade vs. Recovery Curves
Source: Blue Coast Research, 2021.
0.0
10.0
20.0
30.0
40.0
50.0
60.0
70.0
40.0 50.0 60.0 70.0 80.0 90.0 100.0
Lead
Gra
de
, %
Lead Recovery, %
F-64: BRX Comp 1 F-65: P29 BRX Comp
F-66: SEDS Master Comp F-67: VOLC Master Comp

Cordero Project P a g e 1 4 9
Preliminary Economic Assessment of the Cordero Silver Project, Chihuahua State, Mexico January 2022
Figure 13-17: Cleaner Circuit Optimization Zinc Grade vs. Recovery Curves
Source: Blue Coast Research, 2021.
At a nominal lead concentrate grade of 50% Pb, the lead recovery to lead-silver concentrate ranged from ~83% to 91% with very low zinc misplacement of ~3-6%. Silver recoveries ranged from ~65-79% at high concentrate grades (>3000 g/t Ag).
At nominal zinc concentrate grades of 50% Zn, the zinc recovery to zinc concentrate ranged from ~78-86%. Additional silver recovery to the zinc concentrate ranged from 8-11% at grades ranging from 170-370 g/t Ag.
0.0
10.0
20.0
30.0
40.0
50.0
60.0
40.0 50.0 60.0 70.0 80.0 90.0 100.0
Zin
c G
rad
e, %
Zinc Recovery, %
F-64: BRX Comp 1 F-65: P29 BRX Comp
F-66: SEDS Master Comp F-67: VOLC Master Comp

Cordero Project P a g e 1 5 0
Preliminary Economic Assessment of the Cordero Silver Project, Chihuahua State, Mexico January 2022
13.4.5.4 Locked Cycle Tests
Each of the four main composites was subjected to a locked cycle test using the optimized batch rougher and cleaner test conditions and flowsheet configurations. Locked cycle tests simulate continuous operation by recycling intermediate streams to the next batch flotation cycle. Tests are typically run for six cycles. The flowsheets were identical with the exception of the requirement for a carbon pre-float ahead of the lead circuit, which was required for the SEDS master composite and BRX composite 1, but not for the VOLC master composite and breccia-volcanics composite. The flowsheet configurations are summarized in Figures 13-18 and 13-19.
Figure 13-18: VOLC MC and Breccia-Volcanics LCT Flowsheet Configuration (No Carbon Pre-float)
Source: Blue Coast Research, 2021.

Cordero Project P a g e 1 5 1
Preliminary Economic Assessment of the Cordero Silver Project, Chihuahua State, Mexico January 2022
Figure 13-19: SEDS MC and BRX Comp 1 LCT Flowsheet (with Carbon Pre-float)
Source: Blue Coast Research, 2021.
Each test was conducted over six cycles with the intermediate streams being advanced to the subsequent cycles per the flowsheet configurations shown above. All tests were considered to be stable, passing the laboratory QA/QC protocols and confirming steady state was achieved. The results for each locked cycle test are summarized in Tables 13-11 through 13-14 and discussed below.
Table 13-11: VOLC Master Composite Locked Cycle Test Results (LCT-3)
Product
Weight Assays Recovery
g % Au
(g/t) Ag
(g/t) Pb (%)
Zn
(%)
Au (%)
Ag (%)
Pb (%)
Zn (%)
Pb Cleaner 3 Concentrate 43.6 0.70 1.94 3318 50.1 5.77 12.7 70.1 85.2 6.20
Zn Cleaner 3 Concentrate 64.7 1.10 0.65 400 1.30 50.9 6.30 12.5 3.3 81.1
Zn Cleaner 1 Tail 293.4 4.90 1.30 36.0 0.19 0.57 57.3 5.10 2.10 4.10
Rougher Tail 5612.7 93.3 0.03 5.00 0.04 0.06 23.7 12.3 9.40 8.60
Calculated Head 6014.3 100 0.11 34.0 0.43 0.67 100 100 100 100
Source: Blue Coast Research, 2021.

Cordero Project P a g e 1 5 2
Preliminary Economic Assessment of the Cordero Silver Project, Chihuahua State, Mexico January 2022
LCT-3 (VOLC master composite) achieved a final lead concentrate grading 50% Pb at 85% lead recovery, 70% of the silver reported to the final lead concentrate with a grade of over 3,300 g/t. The final zinc concentrate produced by LCT-3 was 51% with a recovery of 81%.
Table 13-12: SEDS Master Composite Locked Cycle Test Results (LCT-4)
Product
Weight Assays Recovery
g % Au
(g/t) Ag
(g/t) Pb (%)
Zn
(%)
Au (%)
Ag (%)
Pb (%)
Zn (%)
Pre-float Concentrate 50.3 0.80 0.23 58.0 0.75 0.44 1.60 1.80 1.50 0.50
Pb Cleaner 3 Concentrate 39.7 0.70 2.33 2,886 54.0 2.90 13.0 70.1 82.9 2.60
Zn Cleaner 3 Concentrate 75.6 1.30 0.43 213 0.80 51.4 4.60 9.80 2.30 88.7
Zn Cleaner 1 Tail 284.4 4.70 0.71 21.0 0.19 0.48 28.2 3.70 2.10 3.10
Rougher Tail 5565.7 92.5 0.07 4.00 0.05 0.04 52.6 14.6 11.2 5.00
Calculated Head 6015.8 100 0.12 27.0 0.43 0.67 100 100 100 100
Source: Blue Coast Research, 2021.
LCT-4 (SEDS master composite) achieved a final lead concentrate grading 54% Pb at 83% lead recovery, 70% of the silver reported to the final lead concentrate with a grade of over 2800 g/t.
The final zinc concentrate produced by LCT-4 was 51% with a recovery of 89%. Metal losses to the carbon pre-float concentrate were minimal at less than 2%.
Table 13-13: Breccia-Volcanics Composite Locked Cycle Test Results (LCT-1)
Product
Weight Assays Recovery
g % Au
(g/t) Ag
(g/t) Pb (%)
Zn
(%)
Au (%)
Ag (%)
Pb (%)
Zn (%)
Pb Cleaner 3 Concentrate 57.0 0.90 3.14 2923 53.0 3.95 12.8 78.6 91.1 4.50
Zn Cleaner 3 Concentrate 97.1 1.60 0.97 237 1.07 46.3 6.70 10.8 3.10 89.6
Zn Cleaner 1 Tail 453.3 7.50 1.91 18.0 0.15 0.18 61.7 3.80 2.10 1.60
Rougher Tail 5434.4 89.9 0.05 3.00 0.02 0.04 18.8 6.80 3.70 4.20
Calculated Head 6014.8 100 0.23 35.0 0.55 0.83 100 100 100 100
Source: Blue Coast Research, 2021.
LCT-1 (breccia-volcanics composite) achieved a final lead concentrate grading 53% Pb at 91% lead recovery, 79% of the silver reported to the final lead concentrate with a grade of 2900 g/t. The final zinc concentrate produced by LCT-1 was 46% Zn at a zinc recovery of 90%.

Cordero Project P a g e 1 5 3
Preliminary Economic Assessment of the Cordero Silver Project, Chihuahua State, Mexico January 2022
Table 13-14: Breccia-Sedimentary Locked Cycle Test Results (LCT-2)
Product
Weight Assays Recovery
g % Au
(g/t) Ag
(g/t) Pb (%)
Zn
(%)
Au (%)
Ag (%)
Pb (%)
Zn (%)
Pre-float Concentrate 13.3 0.22 0.87 239 2.38 0.44 0.90 1.40 1.20 0.20
Pb Cleaner 3 Concentrate 43.9 0.73 3.38 3774 55.7 2.92 11.7 74.8 89.2 3.90
Zn Cleaner 3 Con 52.0 0.87 0.95 397 1.10 54.6 3.90 9.30 2.10 85.8
Zn Cleaner 1 Tail 178.5 2.98 1.91 30.0 0.20 1.01 26.9 2.40 1.30 5.50
Rougher Tail 5710.6 95.2 0.13 5.00 0.03 0.03 56.6 12.0 6.30 4.70
Calculated Head 5998.3 100 0.21 37.0 0.46 0.55 100 100 100 100
Source: Blue Coast Research, 2021.
LCT-2 (BRX composite 1) achieved a final lead concentrate grading 56% Pb at 89% lead recovery, 75% of the silver reported to the final lead concentrate with a grade of over 3700 g/t Ag. The final zinc concentrate produced by LCT-2 graded 55% Zn at a zinc recovery of 86%. Metal losses to the pre-float concentrate were minor and less than 1.5%.
13.4.5.5 Concentrate Quality
The final lead-silver and zinc concentrates from the locked cycle tests were submitted for concentrate quality analysis to determine the quantities of any potentially deleterious elements. The results for each of the four main composites are summarized in Table 13-15 through Table 13-18.
Table 13-15: VOLC MC LCT-3 Concentrate Quality
Product ID Hg
(g/t) Cl
(%) F
(%) As (%)
Cd (g/t)
Mn (g/t)
Sb (g/t)
Se (g/t)
Si (%)
LCT-3 Pb Cleaner 3 Concentrate 18.0 <0.01 <0.01 0.55 933 1127 5636 160 1.90
LCT-3 Zn Cleaner 3 Concentrate 16.0 0.02 <0.01 0.46 4915 9120 733 21.0 0.80
Source: Blue Coast Research, 2021.
Table 13-16: SED MC LCT-4 Concentrate Quality
Product ID Hg
(g/t) Cl
(%) F
(%) As (%)
Cd (g/t)
Mn (g/t)
Sb (g/t)
Se (g/t)
Si (%)
LCT-3 Pb Cleaner 3 Concentrate 8.00 <0.01 0.02 0.14 377 788 7332 443 5.31
LCT-3 Zn Cleaner 3 Concentrate 14.0 0.03 <0.01 0.03 4992 9263 696 20.0 1.48
Source: Blue Coast Research, 2021.

Cordero Project P a g e 1 5 4
Preliminary Economic Assessment of the Cordero Silver Project, Chihuahua State, Mexico January 2022
Table 13-17: Breccia-Volcanic LCT-1 Concentrate Quality
Product ID Hg
(g/t) Cl
(%) F
(%) As (%)
Cd (g/t)
Mn (g/t)
Sb (g/t)
Se (g/t)
Si (%)
LCT-3 Pb Cleaner 3 Concentrate 7.00 <0.01 <0.01 0.47 468 970 4079 230 1.60
LCT-3 Zn Cleaner 3 Concentrate 8.00 0.02 <0.01 0.26 3975 8251 337 20.0 1.99
Source: Blue Coast Research, 2021.
Table 13-18: BRX Comp 1 LCT-2 Concentrate Quality
Product ID Hg
(g/t) Cl
(%) F
(%) As (%)
Cd (g/t)
Mn (g/t)
Sb (g/t)
Se (g/t)
Si (%)
LCT-3 Pb Cleaner 3 Concentrate 13.0 <0.01 0.01 0.38 487 709 4613 439 3.67
LCT-3 Zn Cleaner 3 Concentrate 23.0 0.05 <0.01 0.11 5290 9826 1315 27.0 1.00
Source: Blue Coast Research, 2021.
Overall, the level of deleterious elements for both the lead-silver and zinc concentrates was low and only minor penalties would be expected for certain elements such as cadmium and manganese in the zinc concentrates and arsenic in the lead-silver concentrates.
13.4.5.6 Low-Grade Samples Flotation Testwork
Four additional low-grade (potential stockpile material) samples were subjected to the optimized flowsheet conditions to determine the metallurgical response of this material without preconcentration or sensor sorting prior to flotation. Low-grade SED, VOLC, BRX-VOLC and BRX-SED composites were assessed via bath rougher and cleaner flotation testwork and the head grades of these composites are shown in Table 13-19.
Table 13-19: Low-Grade Samples Composite Head Grades
Composite Ag (g/t) Pb (%) Zn (%) Fe (%)
Low-Grade VOLC 12.0 0.15 0.40 2.22
Low-Grade SED 17.0 0.16 0.28 3.52
Low-Grade BRX-VOLC 12.0 0.14 0.34 3.50
Low-Grade BRX-SED 21.0 0.27 0.28 4.27
Source: Blue Coast Research, 2021.
A total of 19 batch rougher and cleaner tests were undertaken across the four composites, culminating in an optimized cleaner test for each composite using the same basic flowsheet as the lithology/pit composites. Carbon pre-flotation was required for the low-grade SED and low-grade BRX-SED composites, but not for the low-grade VOLC and low-grade BRX-VOLC composites. The results for the optimized cleaner tests are summarized in Table 13-20.

Cordero Project P a g e 1 5 5
Preliminary Economic Assessment of the Cordero Silver Project, Chihuahua State, Mexico January 2022
Table 13-20: Low-Grade Samples Optimized Cleaner Concentrates Grades and Recoveries
Test/Product Mass
(%)
Grade Distribution
Ag (g/t)
Pb (%)
Zn (%)
Ag (%)
Pb (%)
Zn (%)
F-78 LG VOLC Final Pb Concentrate 0.2 2,143 38.0 6.38 44 56 4
F-78 LG VOLC Final Zn Concentrate 0.6 226 0.91 47.6 14 4 77
F-87 LG SED Final Pb Concentrate 0.2 3,819 57.0 1.73 55 79 1
F-87 LG SED Final Zn Concentrate 0.4 193 0.58 49.1 5 1 69
F-80 LG BRX-VOLC Pb Concentrate 0.2 2,856 47.1 4.1 58 74 3
F-80 LG-BRX VOLC Zn Concentrate 0.5 170 0.41 52.1 8 2 78
F-79 LG BRX-SED Pb Concentrate 0.4 3,734 59.0 2.0 73 82 3
F-79 LG BRX-SED Zn Concentrate 0.4 305 0.7 52.5 6 1 75
Source: Blue Coast Research, 2021.
Despite the low head grades, all low-grade composites performed reasonably well with lead-silver concentrates grading 2143-3819 g/t Ag, 38-59% Pb and 1.7-6.4% Zn being produced at silver recoveries ranging from 44% to 73% and lead recoveries ranging from 56% to 82%. Zinc concentrate grades ranged from 48-53% Zn and 170-305 g/t Ag at zinc recoveries ranging from 69% to 78%. It is anticipated that further recovery gains would be obtained by undertaking locked cycle tests on these composites.
13.4.6 Cyanidation of Oxide/Transition Material
The three oxide pit/lithology composites were subjected to bottle roll cyanidation testwork at Blue Coast Research to determine their amenability to leaching after a coarse crush (heap leach) and fine grind (tank leaching) and the following bottle roll test feed sizes were employed: 100% passing -12.5 mm, and 3.35 mm, P80 = ~300 µm and P80 = ~100 µm. Other variables were fixed (40% solids feed density, NaCN dosage of 1 g/L, pH 10.5-11.0) while the coarse crush tests had total residence times of 96 hours, the ground bottle roll tests had residence times of 48 hours. The particle size versus silver recovery relationship for the three composites is shown in Figure 13-20.
The highest extractions were achieved at the finest grind (P80 = ~100 µm) where 75-86% of the silver was recovered to pregnant leach solution (PLS). Even though the -12.5 mm (½ inch) material showed the lowest silver recoveries (average of 54%), the kinetics showed continued extraction after the 96 hours (shown in Figure 13-21), this indicates that the material has potential of increased silver recoveries at longer retention times and may lend itself to heap leaching.
An additional six transition-oxide samples also underwent 96-hour kinetic bottle roll tests at -12.5 mm and -6 mm (¼ inch). The transition-oxide material performed similarly to the three oxide samples at -12.5 mm (average 54% silver recovery), while the -6 mm inch tests averaged higher silver recoveries (63%), as shown in Figure 13-22. Upon completion of this testwork it was decided to conduct larger-scale column heap leach testwork at McClelland Labs in Reno, NV.

Cordero Project P a g e 1 5 6
Preliminary Economic Assessment of the Cordero Silver Project, Chihuahua State, Mexico January 2022
Figure 13-20: Lithology/Pit Composites Leach Response at Various Crush/Grind Sizes
Source: Blue Coast Research, 2021.

Cordero Project P a g e 1 5 7
Preliminary Economic Assessment of the Cordero Silver Project, Chihuahua State, Mexico January 2022
Figure 13-21: Lithology/Pit Composite ½″ Bottle Roll Test Silver Kinetics Curves
Source: Blue Coast Research, 2021.

Cordero Project P a g e 1 5 8
Preliminary Economic Assessment of the Cordero Silver Project, Chihuahua State, Mexico January 2022
Figure 13-22: Additional Transition/Oxide Composite 96-hour, 0.5-inch Leach Test Results
Source: Blue Coast Research, 2021.
13.5 Column Heap Leach Testwork
At the time of writing this report, a program of work was underway at McClelland Laboratories in Reno, NV on a single composite of oxide material grading ~60 g/t Ag. The scope of this work included the following:
• coarse bottle roll testing at 6 mm and 12.5 mm to confirm the Blue Coast Research bottle roll test results
• agglomeration and load permeability testwork
• column leach tests at 6 mm and 12.5 mm to confirm heap leach amenability of the Cordero oxide material.
The final results from this program are not yet available, but at the time of writing the latest cumulative leach results from column test solution assays suggest that silver recoveries of ~60% at the 6 mm crush size and ~50% at the 12.5 mm crush size are achievable.

Cordero Project P a g e 1 5 9
Preliminary Economic Assessment of the Cordero Silver Project, Chihuahua State, Mexico January 2022
13.6 Recovery Modelling
Recovery modelling was derived from locked cycle test data. As the process plant produces two concentrates, a lead-silver concentrate and a zinc concentrate, the silver, lead, and zinc recovery projections were modelled for both products. The maximum silver and lead recoveries projected in the lead-silver concentrate are 84% and 92%, respectively. The maximum zinc recovery projected in the zinc concentrate is 90%. The recovery and grade projection modelling results are summarized in Table 13-21 for silver, Tables 13-22 and 13-23 for lead, and Tables 13-24 and 13-25 for zinc.
Table 13-21: Silver Recovery Projections
Description Ag Head Grade Bins
0-10 g/t 10-20 g/t 20-30 g/t 30-40 g/t 40-50 g/t 50-60 g/t
Silver Recovery (%) to Ag/Pb Concentrate
BRX-VOLC N/A 60 70 79 83 84
BRX-SEDS N/A 74 74 75 77 80
VOLC N/A 55 65 70 75 80
SEDS N/A 57 70 75 83 84
Silver Recovery (%) to Zn Concentrate
BRX-VOLC N/A 9 10 11 11 11
BRX-SEDS N/A 7 8 9 10 12
VOLC N/A 13 13 13 13 13
SEDS N/A 7 10 10 10 10
Total Silver Recovery (%)
BRX-VOLC N/A 69 80 90 94 95
BRX-SEDS N/A 81 82 84 87 92
VOLC N/A 68 78 83 88 93
SEDS N/A 64 80 85 93 94
Source: Blue Coast Research, 2021.
Table 13-22: Lead Recovery Projections
Description Pb Head Grade Bins
0.1-0.2% 0.2-0.3% 0.4-0.5% 0.5-0.6% 0.6-0.7% +0.7%
Lead Recovery (%) to Ag/Pb Concentrate
BRX-VOLC 75 80 85 91 91 92
BRX-SEDS 80 83 89 90 91 92
VOLC 65 70 85 88 90 90
SEDS 80 81 83 85 87 89
Lead Recovery (%) to Zn Concentrate
BRX-VOLC 2.0 2.0 2.0 3.0 3.0 3.0
BRX-SEDS 1.0 1.0 2.0 2.0 2.0 2.0
VOLC 3.9 3.9 3.3 3.3 3.3 3.3
SEDS 1.5 1.5 2.3 2.3 2.3 2.3
Total Lead Recovery (%)
BRX-VOLC 77 82 87 94 94 95
BRX-SEDS 81 84 91 92 93 94
VOLC 69 74 88 91 93 93
SEDS 82 83 85 87 89 91
Source: Blue Coast Research, 2021.

Cordero Project P a g e 1 6 0
Preliminary Economic Assessment of the Cordero Silver Project, Chihuahua State, Mexico January 2022
Table 13-23: Lead Grade Projections
Description Pb Head Grade Bins
0.1-0.2% 0.2-0.3% 0.4-0.5% 0.5-0.6% 0.6-0.7% +0.7%
Lead Grade (Pb %) to Ag/Pb Concentrate
BRX-VOLC 47 47 47 53 53 55
BRX-SEDS 52 52 56 56 56 56
VOLC 39 42 50 50 50 55
SEDS 54 54 54 54 54 56
Lead Grade (Pb %) to Zn Concentrate
BRX-VOLC 0.4 0.4 0.4 1.1 1.1 1.1
BRX-SEDS 0.7 0.7 0.7 1.1 1.1 1.1
VOLC 0.9 0.9 1.3 1.3 1.3 1.3
SEDS 0.6 0.6 0.8 0.8 0.8 0.8
Source: Blue Coast Research, 2021.
Table 13-24: Zinc Recovery Projections
Description Zn Head Grade Bins
0.3-0.5% 0.5-0.6% 0.6-0.7% 0.7-0.8% 0.8-1.0% +1.0%
Zinc Recovery (%) to Zn Concentrate
BRX-VOLC 80 82 84 85 86 88
BRX-SEDS 80 85 86 87 88 89
VOLC 75 78 81 83 85 86
SEDS 69 80 85 89 90 90
Zinc Misplacement (%) to Ag/Pb Concentrate
BRX-VOLC 3 3 3 5 6 7
BRX-SEDS 3 4 4 4 5 6
VOLC 4 4 6 6 7 7
SEDS 2 2 2 3 4 5
Total Zinc Recovery (%)
BRX-VOLC 83 85 87 90 92 95
BRX-SEDS 83 89 90 91 93 95
VOLC 79 82 87 89 92 93
SEDS 71 82 87 92 94 95
Source: Blue Coast Research, 2021.
Table 13-25: Zinc Grade Projections
Description Zn Head Grade Bins
0.3-0.5% 0.5-0.6% 0.6-0.7% 0.7-0.8% 0.8-1.0% +1.0%
Zinc Grade (Zn %) to Zn Concentrate
BRX-VOLC 52 52 52 52 52 52
BRX-SEDS 53 55 55 55 55 55
VOLC 50 50 51 51 51 51
SEDS 50 50 50 51 52 52
Zinc Grade (Zn %) to Ag/Pb Concentrate
BRX-VOLC 4 4 4 4 4 4
BRX-SEDS 2 3 3 3 3 3
VOLC 6 6 6 6 6 6
SEDS 2 2 3 3 3 3
Source: Blue Coast Research, 2021.

Cordero Project P a g e 1 6 1
Preliminary Economic Assessment of the Cordero Silver Project, Chihuahua State, Mexico January 2022
14 MINERAL RESOURCE ESTIMATES
The current mineral resource estimate was calculated for Discovery Silver by Rockridge Consulting, with continuous assistance and review from this report’s QP for mineral resources, R. Mohan Srivastava of RedDot3D Inc.
The current resource estimate is based on a drill dataset consisting of 224,000 m of drilling (517 drill holes), of which 92,000 m of drilling (225 drill holes) were completed by Discovery Silver. The mineral resource estimate incorporates geological and structural domains based on lithological and structural controls that are better understood through recent drilling.
Ordinary kriging was used to interpolate Ag, Pb, Zn and Au grades into blocks and sub-blocks, using variogram models based on pairwise relative experimental variograms for the analysis of spatial continuity.
Resource classification was based on block-by-block metrics that relate to the proximity of nearby data. An optimized pit shell further constrains the reported mineral resource to fulfill the requirement for “reasonable prospects for eventual economic extraction”.
The mineral resource is split into sulphide and oxide portions. Since silver, lead, zinc and gold all contribute to revenue, a net smelter return (NSR) is calculated as the net revenue from metal sales (taking into account metallurgical recoveries and payabilities) minus treatment costs and refining charges. Different NSR cut-offs are used for the sulphide and oxide mineralization since different processing options, with different costs, are appropriate for each type of mineralization.
14.1 Database
The resource database consists of a total of 224,148 m of sampling in 517 drill holes. Of the total holes in the database, 221,839 m of sampling from 478 holes are included in the resource estimate area. A total of 91,713 m (225 drill holes) was completed with the remainder drilled historically between 2009 and 2017. Lithology from 195,553 m of drilling was used to support an updated geological model of the deposit.
The database was supplied by Discovery Silver in the form of an Access database. Records were checked to ensure each drill hole had assay, survey, and collar information. The database was audited to generate master data tables in .csv format. For statistical analysis and grade estimation, missing assays were assigned an absent value. Drill hole information in this database includes older historical data gathered by operators of the project before the Discovery Silver exploration campaign. Drilling data was provided in the UTM NAD 27, Zone 13 grid coordinate system. Drill spacing is generally just below 50 m in the densely drilled portions of the project. A plan view showing the drill hole locations within the resource boundary is presented in (Figure 14-1).

Cordero Project P a g e 1 6 2
Preliminary Economic Assessment of the Cordero Silver Project, Chihuahua State, Mexico January 2022
Figure 14-1: Drill Hole Locations
Source: Rockridge Consulting, 2021.
14.2 Geological Modelling
14.2.1 Structural Model
Completely new and very detailed structural domains were modelled using surface maps, geology maps, 3D IP data, locations of surface workings, oriented core readings and logged lithologies in drill holes. Results from structural studies completed by other consultants were also considered. The detailed structural model was inspected to identify the magnitude of displacements and only faults with significant displacements were selected to be the bounding surfaces for fault blocks. This resulted in the creation of 13 blocks bounded by major structures as shown in Figure 14-2.

Cordero Project P a g e 1 6 3
Preliminary Economic Assessment of the Cordero Silver Project, Chihuahua State, Mexico January 2022
Figure 14-2: Fault Blocks in the Cordero Main Area Where Resources were Estimated
Source: Rockridge Consulting, 2021.
14.2.2 Lithology Model
Six distinct lithologies were formed by grouping together similar assemblages identified from the drill logging records:
• calcareous siltstone
• rhyodacite breccia
• phreatic breccia
• rhyodacite volcanics and intrusives
• hornfels
• glomerophyric dike.

Cordero Project P a g e 1 6 4
Preliminary Economic Assessment of the Cordero Silver Project, Chihuahua State, Mexico January 2022
These units were modelled within the previously created fault blocks. Interpreted geological cross-sections and long sections were georeferenced and used in conjunction with drill holes coded with lithology and modelled in 50 m steps. A surface geology map was also used to define contacts on the topography surface. The intrusive method of creating lithological units was used in Leapfrog to model each unit. Manual edits were used to clean up contacts to coincide with contacts on the interpreted sections. An example showing the 3D Leapfrog model overlain on an interpreted section is shown in Figure 14-3.
Grade information was inspected across lithological boundaries and seems mostly mildly gradational between breccia and igneous lithologies except for breccia/siltstone contacts and a very sharp grade break at the glomerophyric dike contacts. However, structural breaks did show abrupt changes in grades.
Figure 14-3: Example of a Northeast-Facing Lithology Cross-Section
Source: Rockridge Consulting, 2021.

Cordero Project P a g e 1 6 5
Preliminary Economic Assessment of the Cordero Silver Project, Chihuahua State, Mexico January 2022
The geological model was truncated against the topography surface. An overburden horizon above the other lithologies was also modelled. The bottom of this horizon was used as a boundary to truncate the tops of lithological units. It must be noted that the overburden is 2 m or less in most cases. The lithology model with overburden stripped away is shown in Figure 14-4.
Figure 14-4: Geological Model in the Cordero Main Area Where Resources were Estimated
Source: Rockridge Consulting, 2021.

Cordero Project P a g e 1 6 6
Preliminary Economic Assessment of the Cordero Silver Project, Chihuahua State, Mexico January 2022
14.2.3 Weathering Model
Contacts in drilling logs differentiating the weathered near-surface material from the unweathered underlying rock as well as a transition zone were used to model surfaces for oxide, transitional and fresh material. These surfaces were modelled and used as hard boundaries for density values as well as coding blocks into each category in the block model. A section of the weathering model is shown in Figure 14-5.
Figure 14-5: Example of Northeast-facing Cross-Section through the Weathering Model showing Modelled Weathering Volumes, Drill Holes Coded with Weathering Type and Steeply Dipping Faults
Source: Rockridge Consulting, 2021.
14.3 Estimation Domains
Adjacent fault blocks that were deemed to be hosting the same mineralization were combined and fault blocks showing clear breaks in mineralization were split to create six final estimation domains. Within each of these six domains there are two sub-domains: a high-grade sub-domain and a medium- to low-grade stockwork domain. The sub-domains were created by modelling grade interpolants using trends in each of the six main domains by using a 50 g/t AgEq cut-off and structural trends based on fault and vein orientations.

Cordero Project P a g e 1 6 7
Preliminary Economic Assessment of the Cordero Silver Project, Chihuahua State, Mexico January 2022
An additional sub-domain representing a mostly barren glomerophyric dike was also modelled. Hard boundaries for the block model were then applied to these 13 estimation domains. A graphic representation of the estimation domains is provided in the plan map in Figure 14-6.
Figure 14-6: Estimation Domains in the Cordero Main Area Where Resources were Estimated
Source: Rockridge Consulting, 2021.
14.4 Drill Hole Composite Intervals
The data was examined to determine a suitable composite interval. The chosen interval should standardize the assay intervals to give an equal weight to each record, but still reflect the variability in the original data as far as possible. A composite interval that is too large will over-smooth the data and tend to artificially increase the continuity between samples (the range of the variogram), whereas a composite interval that is too small will tend to understate the short-range variability of the data (the nugget).
The Cordero drill core was predominantly sampled at an interval of 2 m or less (Figure 14-7). Assay records were assigned a domain code and then composited to approximate 2 m intervals. The composite interval was varied around an average

Cordero Project P a g e 1 6 8
Preliminary Economic Assessment of the Cordero Silver Project, Chihuahua State, Mexico January 2022
of the selected 2 m interval while keeping as close as possible to a full 2 m. This was done where required to avoid excessively short interval composites from forming at domain boundaries or at the ends of holes.
For the 2 m composites, all grade distributions are positively skewed and exhibit quite low standard deviation to mean ratios (coefficient of variation) in the high-grade sub-domain and only moderately high ratios in the medium- to low-grade stockwork sub-domains.
Figure 14-7: Histogram of Interval Length
Source: Rockridge Consulting, 2021.
14.5 Capping of Grade Outliers
The presence of high-grade outlier values was investigated as these values could adversely influence the estimate. The location of the high-grade outliers was not concentrated in one area, but rather disseminated throughout each domain for all estimation domains and for all elements. Appropriate cutting limits were selected by studying coefficient of variation plots, probability plots, and decile analyses plots.
Blocks were estimated with uncapped as well as capped values to assess the impact of the capping levels. The average silver grade estimates in the various domains were reduced by roughly 1.4%. The capping applied to the composite dataset resulted in a reduction in total silver content of 1.6% and a reduction in total AgEq metal content of 1.8%. Additional statistics summarizing variability and capping for each sub-domain are provided in Tables 14-1 and 14-2.

Cordero Project P a g e 1 6 9
Preliminary Economic Assessment of the Cordero Silver Project, Chihuahua State, Mexico January 2022
Table 14-1: Capping Statistics for the High-Grade Sub-Domains
Cordero Capping Stats
No. of Comps
Uncapped Capping Limit Capped Difference
Min
(g/t, %)
Max
(g/t, %)
Mean
(g/t, %)
StdDev
(g/t, %) CoV
Value
(g/t, %) No.
Mean
(g/t, %)
StdDev
(g/t, %) CoV
% Metal
Δ CoV
(%)
Do
ma
in 1
Hig
h G
rad
e
Ag 1,037 0.5000 822 39.98 62.08 1.55 300 6 38.16 47.18 1.24 -4.6% -20.4%
Au 1,037 0.0025 0.77 0.058 0.082 1.41 0.73 1 0.058 0.082 1.41 -0.1% -0.3%
Pb 1,037 0.0015 14.30 0.668 0.994 1.49 5.00 6 0.647 0.824 1.27 -3.1% -14.5%
Zn 1,037 0.0105 16.63 1.004 1.301 1.30 9.70 3 0.996 1.231 1.24 -0.7% -4.6%
Do
ma
in 2
Hig
h G
rad
e
Ag 3,195 0.2500 1,199 38.44 57.58 1.50 770 2 38.22 54.10 1.42 -0.6% -5.5%
Au 3,195 0.0025 3.82 0.106 0.143 1.35 1.70 2 0.105 0.130 1.24 -0.6% -8.5%
Pb 3,195 0.0008 17.98 0.713 1.136 1.59 14.70 3 0.711 1.117 1.57 -0.2% -1.5%
Zn 3,195 0.0037 30.00 1.065 1.599 1.50 15.00 5 1.053 1.450 1.38 -1.1% -8.3%
Do
ma
in 3
Hig
h G
rad
e
Ag 2,795 0.2500 1,190 54.05 76.85 1.42 833 2 53.93 75.24 1.40 -0.2% -1.9%
Au 2,795 0.0025 22.40 0.338 0.700 2.07 16.00 2 0.336 0.632 1.88 -0.7% -9.1%
Pb 2,795 0.0025 19.82 0.770 1.186 1.54 11.00 3 0.765 1.122 1.47 -0.7% -4.8%
Zn 2,795 0.0023 9.19 0.707 0.903 1.28 8.50 4 0.707 0.900 1.27 0.0% -0.3%
Do
ma
in 4
Hig
h G
rad
e
Ag 4,312 0.2500 1,071 39.95 61.73 1.55 760 5 39.80 59.74 1.50 -0.4% -2.9%
Au 4,312 0.0025 2.94 0.075 0.129 1.73 1.60 6 0.074 0.116 1.56 -1.1% -9.6%
Pb 4,312 0.0015 16.37 0.565 0.838 1.48 9.80 1 0.564 0.814 1.45 -0.3% -2.5%
Zn 4,312 0.0061 19.46 1.139 1.400 1.23 13.00 6 1.133 1.343 1.19 -0.5% -3.6%
Do
ma
in 5
Hig
h G
rad
e
Ag 1,604 0.2500 1,575 54.46 109.97 2.02 850 7 53.32 98.45 1.85 -2.1% -8.6%
Au 1,604 0.0025 6.37 0.076 0.242 3.16 1.50 5 0.071 0.151 2.13 -7.5% -32.6%
Pb 1,604 0.0015 14.69 0.568 1.037 1.82 9.50 3 0.562 0.970 1.72 -1.0% -5.5%
Zn 1,604 0.0077 14.09 1.343 1.637 1.22 12.70 5 1.342 1.624 1.21 -0.1% -0.6%
Do
ma
in 6
Hig
h G
rad
e
Ag 320 0.4323 370 31.16 36.93 1.19 None 0 31.16 36.93 1.19 0.0% 0.0%
Au 320 0.0025 2.55 0.080 0.199 2.50 1.00 3 0.073 0.142 1.93 -7.8% -22.8%
Pb 320 0.0007 16.936 0.319 1.041 3.27 3.00 3 0.275 0.486 1.77 -13.8% -45.8%
Zn 320 0.0081 11.094 1.477 1.637 1.11 None 1 1.477 1.637 1.11 0.0% 0.0%
Source: Rockridge Consulting, 2021.

Cordero Project P a g e 1 7 0
Preliminary Economic Assessment of the Cordero Silver Project, Chihuahua State, Mexico January 2022
Table 14-2: Capping Statistics for the Low-Grade Stockwork Sub-Domains
Cordero Capping Stats
No. of Comps
Uncapped Capping Limit Capped Difference
Min
(g/t, %)
Max
(g/t, %)
Mean
(g/t, %)
StdDev
(g/t, %) CoV
Value
(g/t, %) No.
Mean
(g/t, %)
StdDev
(g/t, %) CoV
% Metal
Δ CoV
(%)
Do
ma
in 1
Sto
ck
wo
rk
Ag 10,216 0.1000 666 3.97 14.13 3.56 270 5 3.88 10.95 2.82 -2.40% -20.60%
Au 10,216 0.0025 2.16 0.015 0.046 3.05 0.83 5 0.015 0.040 2.70 -1.30% -11.50%
Pb 10,216 0.0001 12.80 0.053 0.262 4.94 3.96 6 0.050 0.172 3.42 -5.00% -30.70%
Zn 10,216 0.0005 12.92 0.134 0.326 2.43 4.50 6 0.132 0.283 2.13 -1.40% -12.20%
Do
ma
in 2
Sto
ck
wo
rk
Ag 12,697 0.1000 1,120 6.79 17.31 2.55 400 6 6.72 14.07 2.10 -1.1% -17.80%
Au 12,697 0.0025 0.90 0.028 0.043 1.51 None 0 0.028 0.043 1.51 0.00% 0.00%
Pb 12,697 0.0002 19.88 0.095 0.288 3.03 6.60 6 0.094 0.223 2.38 -1.50% -21.30%
Zn 12,697 0.0007 18.48 0.171 0.394 2.31 6.50 8 0.168 0.322 1.91 -1.50% -17.10%
Do
ma
in 3
Sto
ck
wo
rk
Ag 8,900 0.1000 152 5.55 9.02 1.62 None 0 5.55 9.02 1.62 0.00% 0.00%
Au 8,900 0.0025 1.90 0.042 0.066 1.58 0.57 6 0.041 0.061 1.47 -0.80% -7.10%
Pb 8,900 0.0002 3.36 0.068 0.138 2.02 1.58 9 0.067 0.126 1.86 -1.10% -7.70%
Zn 8,900 0.0007 9.14 0.137 0.334 2.44 5.00 10 0.136 0.307 2.27 -1.00% -7.00%
Do
ma
in 4
Sto
ck
wo
rk
Ag 27,402 0.1000 805 6.89 18.27 2.65 350 17 6.80 15.73 2.31 -1.30% -12.70%
Au 27,402 0.0025 1.96 0.025 0.043 1.74 0.67 14 0.024 0.039 1.59 -0.70% -9.1%
Pb 27,402 0.0001 10.17 0.081 0.206 2.53 3.30 13 0.081 0.187 2.32 -0.90% -8.50%
Zn 27,402 0.0004 13.08 0.182 0.386 2.12 6.30 7 0.181 0.375 2.07 -0.30% -2.60%
Do
ma
in 5
Sto
ck
wo
rk
Ag 16,600 0.1000 2,522 4.81 28.18 5.85 360 8 4.54 15.20 3.35 -5.70% -42.80%
Au 16,600 0.0025 1.86 0.013 0.031 2.38 0.50 8 0.013 0.025 1.91 -1.60% -19.80%
Pb 16,600 0.0001 6.45 0.050 0.164 3.28 2.00 20 0.048 0.134 2.76 -3.00% -16.00%
Zn 16,600 0.0002 10.30 0.141 0.360 2.55 5.40 10 0.140 0.336 2.40 -0.80% -5.90%
Do
ma
in 6
Sto
ck
wo
rk
Ag 7,793 0.1000 218 3.76 7.32 1.95 100.0 4 3.74 6.99 1.87 -0.40% -4.20%
Au 7,793 0.0025 3.16 0.015 0.060 3.85 0.88 7 0.015 0.041 2.73 -3.90% -29.1%
Pb 7,793 0.0001 5.818 0.037 0.152 4.05 2.28 6 0.037 0.133 3.62 -2.10% -10.50%
Zn 7,793 0.0001 9.116 0.126 0.300 2.37 3.50 9 0.125 0.279 2.23 -0.90% -6.20%
Source: Rockridge Consulting, 2021.

Cordero Project P a g e 1 7 1
NI 43-101 Technical Report for Preliminary Economic Assessment January 2022
14.6 Variography
Experimental pairwise relative semi-variograms were calculated and modelled for each metal in each mineralized domain. Spherical two structure models were fitted to experimental semi-variograms in most cases and for all metals except HG Domain 6 where a one structure model was fitted. An example of experimental semi-variograms for Ag with fitted models for the three principal directions is shown in Figure 14-8.
Figure 14-8: Example of Variogram Modelling
Source: Rockridge Consulting, 2021.
All the domains had sufficient samples to create good experimental semi-variograms for each metal. Strong anisotropy was observed for the most part and directional variogram models were used. The nugget values (i.e., the sample variability at close distance) were established from downhole variograms.
Nugget values were on average around 33% of the total sill value for all elements in all domains. On average, major axes ranges were approximately 25 m for the short first structures of all the variograms and 115 m for the second structures. All variogram model parameters are listed by element in Tables 14-3 through 14-6.

Cordero Project P a g e 1 7 2
Preliminary Economic Assessment of the Cordero Silver Project, Chihuahua State, Mexico January 2022
Table 14-3: Variogram Model Parameters for Silver
General Direction in Degrees Nugget
First Structure Second Structure
Structure Sill Range in Meters
Structure Sill Range in Meters
Element Variogram Dip Dip Az Plunge Major Semi Minor Major Semi Minor
Silver
Ag_DHG1 80 325 155 0.19 Spherical 0.15 50 25 10 Spherical 0.31 130 100 50
Ag_DHG2 80 320 150 0.28 Spherical 0.19 25 15 7 Spherical 0.14 115 85 35
Ag_DHG3 85 305 150 0.25 Spherical 0.29 14 10 7 Spherical 0.11 110 75 25
Ag_DHG4 80 325 145 0.28 Spherical 0.19 18 15 8 Spherical 0.15 100 65 40
Ag_DHG5 80 325 150 0.39 Spherical 0.22 27 21 8 Spherical 0.09 100 75 30
Ag_DHG6 80 325 150 0.38 Spherical 0.21 136 120 60
Ag_DSW1 80 315 155 0.2 Spherical 0.27 23 20 9 Spherical 0.18 120 75 45
Ag_DSW2 85 320 150 0.19 Spherical 0.23 20 12 12 Spherical 0.17 108 68 48
Ag_DSW3 85 325 150 0.11 Spherical 0.24 20 17 13 Spherical 0.22 128 70 50
Ag_DSW4 80 325 150 0.2 Spherical 0.22 18 16 10 Spherical 0.15 118 78 50
Ag_DSW5 80 325 150 0.21 Spherical 0.26 25 21 16 Spherical 0.15 124 88 66
Ag_DSW6 80 325 150 0.16 Spherical 0.21 21 17 11 Spherical 0.22 130 80 68
Ag_Dike 85 327 150 0.18 Spherical 0.34 21 15 9 Spherical 0.25 96 88 36
Source: Rockridge Consulting, 2021.

Cordero Project P a g e 1 7 3
Preliminary Economic Assessment of the Cordero Silver Project, Chihuahua State, Mexico January 2022
Table 14-4: Variogram Model Parameters for Gold
General Direction in Degrees Nugget
First Structure Second Structure
Structure Sill Range in Meters
Structure Sill Range in Meters
Element Variogram Dip Dip Az Plunge Major Semi Minor Major Semi Minor
Gold
Au_DHG1 80 325 155 0.09 Spherical 0.249 53 30 6 Spherical 0.1475 130 100 50
Au_DHG2 80 320 150 0.13 Spherical 0.216 25 25 5 Spherical 0.11 115 85 35
Au_DHG3 85 305 150 0.1 Spherical 0.16 25 14 8 Spherical 0.19 110 75 50
Au_DHG4 80 325 145 0.18 Spherical 0.16 20 15 13 Spherical 0.16 100 65 41
Au_DHG5 80 325 150 0.21 Spherical 0.23 23 14 8 Spherical 0.17 100 75 35
Au_DHG6 80 325 150 0.34 Spherical 0.56 136 120 60
Au_DSW1 80 315 155 0.14 Spherical 0.2 60 17 10 Spherical 0.15 120 75 35
Au_DSW2 85 320 150 0.12 Spherical 0.17 19 12 12 Spherical 0.14 108 68 48
Au_DSW3 85 325 150 0.08 Spherical 0.2 27 15 10 Spherical 0.25 128 70 50
Au_DSW4 80 325 150 0.18 Spherical 0.16 20 19 15 Spherical 0.11 118 78 50
Au_DSW5 80 325 150 0.13 Spherical 0.18 20 16 12 Spherical 0.15 124 88 66
Au_DSW6 80 325 150 0.18 Spherical 0.16 26 22 9 Spherical 0.24 130 80 68
Au_Dike 85 327 150 0.07 Spherical 0.25 18 15 9 Spherical 0.21 96 88 36
Source: Rockridge Consulting, 2021.

Cordero Project P a g e 1 7 4
Preliminary Economic Assessment of the Cordero Silver Project, Chihuahua State, Mexico January 2022
Table 14-5: Variogram Model Parameters for Lead
General Direction in Degrees Nugget
First Structure Second Structure
Structure Sill Range in Meters
Structure Sill Range in Meters
Element Variogram Dip Dip Az Plunge Major Semi Minor Major Semi Minor
Lead
Pb_DHG1 80 325 155 0.2 Spherical 0.26 70 25 5 Spherical 0.1972 130 100 50
Pb_DHG2 80 320 150 0.26 Spherical 0.256 30 25 5 Spherical 0.14 115 85 30
Pb_DHG3 85 305 150 0.34 Spherical 0.31 19 14 8 Spherical 0.06 110 75 30
Pb_DHG4 80 325 145 0.27 Spherical 0.24 17 13 8 Spherical 0.15 100 60 40
Pb_DHG5 80 325 150 0.34 Spherical 0.24 23 20 5 Spherical 0.17 100 75 30
Pb_DHG6 80 325 150 0.49 Spherical 0.58 136 120 60
Pb_DSW1 80 315 155 0.27 Spherical 0.26 24 19 12 Spherical 0.3 120 75 70
Pb_DSW2 85 320 150 0.21 Spherical 0.28 20 14 9 Spherical 0.18 108 68 48
Pb_DSW3 85 325 150 0.25 Spherical 0.27 22 11 7 Spherical 0.26 128 70 50
Pb_DSW4 80 325 150 0.2 Spherical 0.3 26 23 10 Spherical 0.18 118 78 50
Pb_DSW5 80 325 150 0.24 Spherical 0.35 24 17 11 Spherical 0.18 124 88 66
Pb_DSW6 80 325 150 0.2 Spherical 0.3 20 15 10 Spherical 0.27 130 80 68
Pb_Dike 85 327 150 0.23 Spherical 0.34 18 15 9 Spherical 0.28 96 88 36
Source: Rockridge Consulting, 2021.

Cordero Project P a g e 1 7 5
Preliminary Economic Assessment of the Cordero Silver Project, Chihuahua State, Mexico January 2022
Table 14-6: Variogram Model Parameters for Zinc
General Direction in Degrees Nugget
First Structure Second Structure
Structure Sill Range in Meters
Structure Sill Range in Meters
Element Variogram Dip Dip Az Plunge Major Semi Minor Major Semi Minor
Zinc
Zn_DHG1 80 325 155 0.2 Spherical 0.1695 45 20 5 Spherical 0.2072 130 100 50
Zn_DHG2 80 320 150 0.2 Spherical 0.306 22 15 5 Spherical 0.12 115 85 30
Zn_DHG3 85 305 150 0.23 Spherical 0.3 18 13 8 Spherical 0.21 110 60 22
Zn_DHG4 80 325 145 0.22 Spherical 0.22 15 12 9 Spherical 0.19 100 60 40
Zn_DHG5 80 325 150 0.35 Spherical 0.16 27 15 7 Spherical 0.14 100 75 45
Zn_DHG6 80 325 150 0.5 Spherical 0.36 136 120 60
Zn_DSW1 80 315 155 0.23 Spherical 0.21 22 16 16 Spherical 0.22 120 75 60
Zn_DSW2 85 320 150 0.2 Spherical 0.23 25 15 10 Spherical 0.24 108 68 48
Zn_DSW3 85 325 150 0.25 Spherical 0.29 31 18 10 Spherical 0.16 128 70 50
Zn_DSW4 80 325 150 0.23 Spherical 0.21 21 21 17 Spherical 0.2 118 78 50
Zn_DSW5 80 325 150 0.26 Spherical 0.24 20 15 13 Spherical 0.23 124 88 66
Zn_DSW6 80 325 150 0.23 Spherical 0.29 18 15 13 Spherical 0.31 130 80 68
Zn_Dike 85 327 150 0.23 Spherical 0.14 18 15 9 Spherical 0.38 96 88 36
Source: Rockridge Consulting, 2021.

Cordero Project P a g e 1 7 6
Preliminary Economic Assessment of the Cordero Silver Project, Chihuahua State, Mexico January 2022
14.7 Grade Estimation
Anisotropic search radii with variable orientations along mineralization trends were used to select data informing block estimates. Search distances and directions were based on the directional anisotropy of the silver variogram models. Ordinary kriging was used to estimate grades into all blocks in the model in three estimation passes whereby each successive pass utilized a less restrictive sample search strategy to estimate any remaining unestimated blocks. The search radii for the first estimation pass were set to half of the variogram range in each direction. The second pass doubles the search radii, so that they are all equal to the variogram model ranges. In the third pass the search radii are doubled again for the high-grade mineralization and tripled for the low-grade stockwork mineralization.
The search ellipse orientations in all cases display the strongest trend in the NE-SW direction with a steep dip towards the northwest and a shallow northeast plunge. All domains were estimated using ordinary kriging. Search orientations and sample selection criteria for each domain are shown below in Tables 14-7 and 14-8.
An estimation pre-pass using a very short search radius was used to ensure that drill hole data within a block were always used for the estimation of that same block, regardless of the setting of the maximum number of samples per drill hole. This ensures that the resource block model is consistent with drill holes in their immediate vicinity.
Table 14-7: Search Parameters for High-Grade Domains
General Ellipsoid Ranges Number of Samples Maximum/Hole
Domain Pass Maximum Intermediate Minimum Minimum Maximum Samples
DHG1 1 65 50 25 10 20 6
DHG1 2 130 100 50 8 20 5
DHG1 3 260 200 100 6 20 4
DHG2 1 57.5 42.5 17.5 10 20 6
DHG2 2 115 85 35 8 20 5
DHG2 3 230 170 70 6 20 4
DHG3 1 55 37.5 12.5 10 20 6
DHG3 2 110 75 25 8 20 5
DHG3 3 220 150 50 6 20 4
DHG4 1 50 32.5 20 10 20 6
DHG4 2 100 65 40 8 20 5
DHG4 3 200 130 80 6 20 4
DHG5 1 50 37.5 15 10 20 6
DHG5 2 100 75 30 8 20 5
DHG5 3 200 150 60 6 20 4
DHG6 1 68 60 30 10 20 6
DHG6 2 136 120 60 8 20 5
DHG6 3 272 240 120 5 20 Not used
Source: Rockridge Consulting, 2021.

Cordero Project P a g e 1 7 7
Preliminary Economic Assessment of the Cordero Silver Project, Chihuahua State, Mexico January 2022
Table 14-8: Search Parameters for Low-Grade Stockwork Domains
General Ellipsoid Ranges Number of Samples Maximum/Hole
Domain Pass Maximum Intermediate Minimum Minimum Maximum Samples
DSW1 1 60 37.5 22.5 10 20 6
DSW1 2 120 75 45 8 20 5
DSW1 3 360 225 135 6 20 4
DSW2 1 54 34 24 10 20 6
DSW2 2 108 68 48 8 20 5
DSW2 3 324 204 144 6 20 4
DSW3 1 64 35 25 10 20 6
DSW3 2 128 70 50 8 20 5
DSW3 3 384 210 150 6 20 4
DSW4 1 59 39 25 10 20 6
DSW4 2 118 78 50 8 20 5
DSW4 3 354 234 150 6 20 4
DSW5 1 62 44 33 10 20 6
DSW5 2 124 88 66 8 20 5
DSW5 3 372 264 198 6 20 4
DSW6 1 65 40 34 10 20 6
DSW6 2 130 80 68 8 20 5
DSW6 3 60 37.5 22.5 5 20 Not used
Source: Rockridge Consulting, 2021.
14.8 Density
Density values were available from metallurgical testwork for rhyodacite, siltstone, and two breccia samples. No measurements were taken for the dike and hornfels lithotypes. A total of 1,501 density measurements were collected from pulps for the oxide zone, 355 measurements for the transition zone, and 5,244 pulp measurements for fresh rock, so a large dataset of pulp density exists.
Dry bulk densities were calculated by adjusting the average measured pulp density, using a factor calculated from the ratio of the average dry bulk density measured in metallurgical testwork to the average pulp density measurement for the same rock type. These factors could be calculated for rhyodacite and siltstone, where abundant measurements exist. For the dike and hornfels lithotypes, their factors for adjusting pulp to dry bulk density were based on the factors calculated for rhyodacite and siltstone. Using these adjustment factors, the average pulp density measurements for each lithotype were adjusted downward to create the average dry bulk density used in the resource block models.
Density values for the oxide and transitional portions of each lithotype were factored down by an additional 4% and applied to the oxide blocks. The densities used in the resource model are tabulated in Table 14-9.

Cordero Project P a g e 1 7 8
Preliminary Economic Assessment of the Cordero Silver Project, Chihuahua State, Mexico January 2022
Table 14-9: Dry Bulk Density Values
Rock Type Sulphide Oxide
Rhyodacite 2.64 2.53
Siltstone 2.71 2.60
Rhyodacite Breccia 2.67 2.56
Phreatic Breccia 2.67 2.56
Dike 2.64 2.53
Hornfels 2.76 2.65
Source: Rockridge Consulting, 2021.
14.9 Block Model
The block model was constructed to fill the domain volumes with 20 m x 5 m x 10 m blocks in the X, Y and Z directions rotated to an azimuth of 55° to best represent the data density, the narrower, steeply dipping deposit shape, and to minimize blocks unsupported by data.
More precise representation of the domain volume was achieved by allowing sub-blocks to be created at domain boundaries. Each parent cell could be split in the X, Y and Z directions. Blocks were split in the X and Y directions to a minimum possible size of 2.5 m, while the height of the block was truncated precisely against the wireframe boundary. Each sub-block was assigned the grade estimates calculated for the parent block. Figure 14-9 is a location map showing the orientations of the sections.
Figure 14-9: Locations of Lines used for Cross-Sections and Long-Sections
Source: Rockridge Consulting, 2021.

Cordero Project P a g e 1 7 9
Preliminary Economic Assessment of the Cordero Silver Project, Chihuahua State, Mexico January 2022
Two long sections and three cross-sections are shown in Figures 14-10 to 14-14. NSR values for these sections are based on the assumptions outlined in Table 14-10.
Figure 14-10: Long-Section A-A′ through the Resource Block Model
Source: Rockridge Consulting, 2021.
Figure 14-11: Long-Section B-B′ through the Resource Block Model
Source: Rockridge Consulting, 2021.

Cordero Project P a g e 1 8 0
Preliminary Economic Assessment of the Cordero Silver Project, Chihuahua State, Mexico January 2022
Figure 14-12: Cross-Section C-C′ through the Resource Block Model
Source: Rockridge Consulting, 2021.
Figure 14-13: Cross-Section D-D′ through the Resource Block Model
Source: Rockridge Consulting, 2021.

Cordero Project P a g e 1 8 1
Preliminary Economic Assessment of the Cordero Silver Project, Chihuahua State, Mexico January 2022
Figure 14-14: Cross-Section E-E′ through the Resource Block Model
Source: Rockridge Consulting, 2021.
14.10 Validation
The block estimates were validated by completing a series of visual comparisons while stepping through the model comparing block grades versus composite grades for each of the estimated elements for each domain. Just over 100 blocks representing each of the domains were checked to verify that the informing data was selected according to the search strategy and the weights applied to each composite matched the block estimate. Scatterplots of each estimated metal show a good correlation between composite values and block estimates. The silver graph is shown in Figure 14-15. The same checks were done for each of the other three metals and showed strong correlation between composite grades and the estimates of the blocks they fell inside.
Additionally, swath plots were generated for eastings, northings, and elevation. Figure 14-16 shows the swath plot for silver grades for all domains. The average modelled grade agrees well with the average grade of the composites across the model. Swath plots were also produced for Au, Pb and Zn, and showed similar consistency between the average of block grades in the columns, rows and levels of the block model and the average of drill hole data in the same columns, rows and levels.

Cordero Project P a g e 1 8 2
Preliminary Economic Assessment of the Cordero Silver Project, Chihuahua State, Mexico January 2022
Figure 14-15: Scatterplot of Silver Composites vs. Silver Block Estimates
Source: Rockridge Consulting, 2021.

Cordero Project P a g e 1 8 3
Preliminary Economic Assessment of the Cordero Silver Project, Chihuahua State, Mexico January 2022
Figure 14-16: Swath Plots Comparing Silver Estimates to Drill Hole Data
Source: Rockridge Consulting, 2021.

Cordero Project P a g e 1 8 4
Preliminary Economic Assessment of the Cordero Silver Project, Chihuahua State, Mexico January 2022
14.11 Classification
The block model was classified into measured, indicated, and inferred resource categories. Blocks were assigned a preliminary classification based on the variography, drill hole spacing, and number of samples in each pass as it relates to the search strategy. Search distances for the first pass were half the variogram range and this was used as the initial classification for assigning blocks to the measured resource category. Blocks estimated in the second pass employed a search distance of the full variogram range and were allocated to the indicated resource category. Blocks were estimated in the third pass, which allowed a relaxed search of up to three times the variogram range were assigned to the inferred resource category.
The preliminary classification boundaries were then adjusted with a smoothing routine to create continuity of blocks within the corresponding resource category classification (Figure 14-17). The smoothing step, which removes small islands of one classification stranded in a sea of a different classification, does not change the overall proportion of blocks in each category in the preliminary assignment of measured, indicated and inferred codes. By aggregating the classification codes into coherent spatial regions, the smoothing ensures that the classification better adheres to the requirements of the CIM Definition Standard, which describes the differences between the three categories in terms of mine planning and detailed mine planning, which cannot be done on small islands that consist of only a few stranded blocks.
Figure 14-17: Resource Classification
Source: Rockridge Consulting, 2021.

Cordero Project P a g e 1 8 5
Preliminary Economic Assessment of the Cordero Silver Project, Chihuahua State, Mexico January 2022
14.12 Mineral Resource Statement
The Cordero mineral resources were classified as measured, indicated, and inferred resources in accordance with the CIM Definition Standards for Mineral Resources and Mineral Reserves (Canadian Institute of Mining, 2003), which provides the following definitions:
• A “mineral resource” is a concentration or occurrence of solid material of economic interest in or on the Earth’s crust in such form, grade or quality and quantity that there are reasonable prospects for eventual economic extraction. The location, quantity, grade or quality, continuity and other geological characteristics of a mineral resource are known, estimated or interpreted from specific geological evidence and knowledge, including sampling.
• An “inferred mineral resource” is that part of a mineral resource for which quantity and grade or quality are estimated on the basis of limited geological evidence and sampling. Geological evidence is sufficient to imply but not verify geological and grade or quality continuity. An inferred mineral resource has a lower level of confidence than that applying to an indicated mineral resource and must not be converted to a mineral reserve. It is reasonably expected that the majority of inferred mineral resources could be upgraded to indicated mineral resources with continued exploration.
• An “indicated mineral resource” is that part of a mineral resource for which quantity, grade or quality, densities, shape and physical characteristics are estimated with sufficient confidence to allow the application of modifying factors in sufficient detail to support mine planning and evaluation of the economic viability of the deposit. Geological evidence is derived from adequately detailed and reliable exploration, sampling and testing and is sufficient to assume geological and grade or quality continuity between points of observation. An indicated mineral resource has a lower level of confidence than that applying to a measured mineral resource and may only be converted to a probable mineral reserve.
• A “measured mineral resource” is that part of a mineral resource for which quantity, grade or quality, densities, shape, and physical characteristics are estimated with confidence sufficient to allow the application of modifying factors to support detailed mine planning and final evaluation of the economic viability of the deposit. Geological evidence is derived from detailed and reliable exploration, sampling and testing and is sufficient to confirm geological and grade or quality continuity between points of observation. A measured mineral resource has a higher level of confidence than that applying to either an indicated mineral resource or an inferred mineral resource. It may be converted to a proven mineral reserve or to a probable mineral reserve.
The Cordero resources reported in this report are mineral resources, not mineral reserves. The extraction and processing of the known mineralization has not yet been determined to be economically and technically viable, and there is no guarantee that the measured and indicated resources will become mineral reserves in future. Inferred resources cannot become reserves unless future drilling improves the confidence in these areas so that they can later be classified as measured or indicated resources.
The mineral resources are reported at an NSR cut-off that takes into account the likely process option and are constrained to lie within an open pit shell since this is the extraction scenario that would be used to mine this mineralization.

Cordero Project P a g e 1 8 6
Preliminary Economic Assessment of the Cordero Silver Project, Chihuahua State, Mexico January 2022
14.12.1 Net Smelter Return (NSR)
NSR is calculated as the net revenue from metal sales (taking in to account metallurgical recoveries and payabilities) less treatment costs and refining charges. Sulphide mineral resources are reported at a $7.25/t NSR cut-off based on the estimated processing and G&A costs for sulphide mineralization, and oxide/transition mineral resources are reported at a $4.78/t NSR cut-off based on the estimated processing and G&A costs for oxide/transition mineralization.
The “reasonable prospects for eventual economic extraction” requirement generally implies that the quantity and grade estimates meet certain economic thresholds and that the mineral resources are reported at an appropriate cut-off grade considering reasonable extraction scenarios and processing recoveries. The QP considers that the Cordero mineralization is amenable to open pit extraction and that constraining the reported resources to an ultimate pit shell meets the “reasonable prospects” requirement of the CIM Definition Standards.
Pit constraint and NSR calculation assumptions are as follows:
• Commodity prices: Ag - $24.00/oz, Au - $1,800/oz, Pb - $1.10/lb, Zn - $1.20/lb.
• Metallurgical recoveries: Sourced from Discovery Silver’s 2021 test program, sulphides were based on locked cycle testwork and oxides/transition was based on coarse bottle roll testwork.
• Operating costs: Mining costs of $1.54/t for mill feed and $1.64/t for waste (base case) were developed by AGP; processing costs of $6.30/t for mill/flotation and $3.92/t for heap leaching, and G&A costs of $0.86/t were developed by Ausenco.
• Pit slopes: Pit slope assumptions were based on a pit slope assessment completed by Knight Piésold for the PEA.
Commodity price assumptions were guided by the regulatory requirement for the MRE to have reasonable prospects for eventual economic extraction. Discovery Silver has used the 90th percentile of the commodity prices for the past decade as a guide to what they might be in the coming decade, with a view toward ensuring that the open pit is not inadvertently under-sized, leaving important infrastructure too close to the rim. More conservative commodity prices are used for the calculation of production schedule in this preliminary economic assessment.
The pit optimization for the reporting pit shell is based on the assumed off-site costs, metal recoveries, and metal prices presented in Table 14-10.

Cordero Project P a g e 1 8 7
Preliminary Economic Assessment of the Cordero Silver Project, Chihuahua State, Mexico January 2022
Table 14-10: Pit Constraint Parameters
Parameter Units Ag Au Pb Zn
Commodity Prices $/oz or $/lb $24 $1,800 $1.10 $1.20
NSR Royalty % 0.5% 0.5% - -
Pit Slope Assumptions Five sectors were modelled based on core logging and two geotechnical holes
with inter-ramp angles ranging from 40º to 59º
Process Recoveries
Heap Leach (Oxide/Transition) % 60% 70% - -
Flotation (Sulphide)
Breccia – Volcanic
Recovery to Pb Concentrate % 79% 13% 91% -
Recovery to Zn Concentrate % 11% 7% - 88%
Breccia – Sedimentary
Recovery to Pb Concentrate % 75% 12% 89% -
Recovery to Zn Concentrate % 9% 4% - 86%
Volcanic
Recovery to Pb Concentrate % 70% 13% 85% -
Recovery to Zn Concentrate % 13% 6% - 81%
Sedimentary
Recovery to Pb Concentrate % 70% 13% 83% -
Recovery to Zn Concentrate % 10% 5% - 89%
Metal Payable
Doré (Heap Leach) 98% 100% - -
Concentrate (Flotation)
Pb Concentrate 95% 95% 95% -
Zn Concentrate 70% 70% - 85%
Operating Costs
Mining Cost – Mineralized Material $/t mined $1.54
Mining Cost - Waste $/t mined $1.64
Processing Cost – Heap Leach (14,000 t/d) $/t stacked $3.92
Processing Cost – Flotation (40,000 t/d) $/t milled $6.39
G&A (40,000 t/d) $/t milled $0.86
Treatment/Refining Charges
Treatment Charge – Pb Concentrate $/dmt $100
Treatment Charge – Zn Concentrate $/dmt $200
Ag refining Charge – Pb Concentrate $/oz $1
Source: Rockridge Consulting, 2021.
14.12.2 Sulphide Resource Estimate
The MRE assumed a $7.25/t NSR cut-off for sulphide mineralization (Table 14-11). A graph showing sensitivities to the NSR cut-off is provided in Figure 14-18. The tabulated grades and metal contents below are in-situ estimates and do not include factors such as external dilution, mining losses, and process recovery losses. As such, these are mineral resources, not mineral reserves, and do not have demonstrated economic and technical viability.

Cordero Project P a g e 1 8 8
Preliminary Economic Assessment of the Cordero Silver Project, Chihuahua State, Mexico January 2022
Table 14-11: Sulphide Mineral Resources for the Cordero Project, with an Effective Date of October 20, 2021, above an NSR Cut-off of $7.25/t and within a Reporting Pit Shell
Class Tonnage
(Mt)
Grade Contained Metal
Ag
(g/t)
Au
(g/t)
Pb
(%)
Zn
(%)
AgEq
(g/t)
Ag
(Moz)
Au
(Koz)
Pb
(Mlb)
Zn
(Mlb)
AgEq
(Moz)
Measured 128 22 0.08 0.31 0.52 52 89 328 881 1,470 212
Indicated 413 19 0.05 0.28 0.51 47 255 707 2,543 4,663 625
Meas. & Ind. 541 20 0.06 0.29 0.51 48 344 1,035 3,424 6,132 837
Inferred 108 14 0.03 0.19 0.38 34 49 99 451 909 119
Notes: 1. AgEq for sulphide mineral resources is calculated as Ag + (Au x 16.07) + (Pb x 32.55) + (Zn x 35.10); these factors are based on commodity prices of Ag – $24.00/oz, Au – $1,800/oz, Pb – $1.10/lb, Zn – $1.20/lb and assumed recoveries of Ag – 84%, Au – 18%, Pb – 87% and Zn – 88%. 2. Discovery Silver is not aware of any environmental, permitting, legal, title, taxation, socio-economic, marketing, or political factors that might materially affect the development of these mineral resource estimates. 3. The tabulated numbers have been rounded to reflect the level of precision appropriate for the estimates, and may appear to sum incorrectly due to rounding. Source: RedDot3D Inc., 2021.
Figure 14-18: Sulphide Resource Estimate – NSR Cut-off Sensitivity
Source: Discovery Silver, 2021.

Cordero Project P a g e 1 8 9
Preliminary Economic Assessment of the Cordero Silver Project, Chihuahua State, Mexico January 2022
14.12.3 Oxide/Transition Resource Estimate
The MRE assumed a $4.78/t NSR cut-off for oxide/transition mineralization (Table 14-12). A graph showing sensitivities to the NSR cut-off is provided in Figure 14-19. The tabulated grades and metal contents below are in-situ estimates and do not include factors such as external dilution, mining losses, and process recovery losses. As such, these are mineral resources, not mineral reserves, and do not have demonstrated economic and technical viability.
Table 14-12: Oxide Mineral Resources for the Cordero Project, with an Effective Date of October 20, 2021, above an NSR Cut-off of $4.78/t and within a Reporting Pit Shell
Class
Tonnage
(Mt)
Grade Contained Metal
Ag
(g/t)
Au
(g/t)
AgEq
(g/t)
Ag
(Moz)
Au
(koz)
AgEq
(Moz)
% Oxide / % Transition
Measured 23 20 0.06 25 15 43 19 92% / 8%
Indicated 75 19 0.05 23 45 125 56 87% / 13%
Meas. & Ind. 98 19 0.05 23 60 168 74 88% / 12%
Inferred 35 16 0.04 20 18 44 22 63% / 37%
Notes: 1. AgEq for oxide/transition mineral resources is calculated as Ag + (Au x 87.5); this factor is based on commodity prices of Ag – $24.00/oz and Au – $1,800/oz and assumed heap leach recoveries of Ag – 60% and Au – 70%. 2. Discovery Silver is not aware of any environmental, permitting, legal, title, taxation, socio-economic, marketing, or political factors that might materially affect the development of these mineral resource estimates. 3. The tabulated numbers have been rounded to reflect the level of precision appropriate for the estimates and may appear to sum incorrectly due to rounding. Source: RedDot3D Inc., 2021.
Figure 14-19: Oxide Resource Estimate – NSR Cut-off Sensitivity
Source: Discovery Silver, 2021.
0
20
40
60
80
100
0
20
40
60
80
100
$4.78 $5 $10 $15 $20
AgE
q (
g/t)
AgE
q (
Mo
z)
NSR cut-off ($/t)
M&I Inferred AgEq grade
REPORTING CUTOFF

Cordero Project P a g e 1 9 0
Preliminary Economic Assessment of the Cordero Silver Project, Chihuahua State, Mexico January 2022
14.12.4 Notes Supporting Technical Disclosure
• Mineral resources that are not mineral reserves do not have demonstrated economic viability.
• AgEq for sulphide mineral resources is calculated as Ag + (Au x 16.07) + (Pb x 32.55) + (Zn x 35.10); these factors are based on commodity prices of Ag - $24.00/oz, Au - $1,800/oz, Pb - $1.10/lb, Zn - $1.20/lb and assumed recoveries of Ag - 84%, Au - 18%, Pb - 87% and Zn - 88%.
• AgEq for oxide/transition mineral resources is calculated as Ag + (Au x 87.5); this factor is based on commodity prices of Ag - $24.00/oz and Au - $1,800/oz and assumed recoveries of Ag - 60% and Au - 70%.
• The mineral resource is constrained by a pit optimization; supporting parameters for this pit constraint are provided in Table 14-12 above.
• Individual metals are reported at in-situ grade.
• Sensitivity cut-offs reported are a subset of the in-pit mineral resource.
• The effective date of the resource is October 20, 2021 and is based on drilling through to July 2021.
• There are no known legal, political, environmental, or other risks that could materially affect the potential development of the mineral resources.
14.13 QP Opinion
The QP for these mineral resource estimates, R. Mohan Srivastava, believes that the estimates for the Cordero deposit have been generated using industry standard methods and following best practices recommended by CIM (Canadian Institute of Mining, 2003). As such, the resource block model and its global resource inventory are suitable for public disclosure and for further use in the preliminary assessment of the technical and economic viability of the project.

Cordero Project P a g e 1 9 1
Preliminary Economic Assessment of the Cordero Silver Project, Chihuahua State, Mexico January 2022
15 MINERAL RESERVE ESTIMATES
This section is not applicable for a PEA-level report.

Cordero Project P a g e 1 9 2
Preliminary Economic Assessment of the Cordero Silver Project, Chihuahua State, Mexico January 2022
16 MINING METHODS
16.1 Overview
Open pit mining was selected as the method to examine the development of the Cordero deposit located in the state of Chihuahua in north central Mexico. This is based on the size of the resource, grade tenor, grade distribution, and proximity to topography for the deposit. AGP’s opinion is that with current metal pricing levels and knowledge of the mineralization, open pit mining offers the most reasonable approach for development.
The mine plan includes sending mineralized material to mill, crushed heap leach and ROM heap leach destinations. The mine plan is based on measured, indicated and inferred mineral resources. The mill facility will produce both zinc and lead concentrates, while a doré will be produced from the heap leach facilities. Waste material will be sent to either the rock storage facility (RSF) southeast of the pit or to the tailings storage facility (TSF) west of the pit.
16.2 Geotechnical Parameters
Knight Piésold completed a PEA-level slope stability evaluation for the proposed Cordero open pit. Table 16-1 on the following page shows the recommended pit slope geometries for the Cordero open pit, including interramp slope angles, bench face angles, and bench widths for three different bench stacking options (10 m, 20 m, and 30 m bench heights). These bench stacking options are intended to provide flexibility to the open pit design.
Table 16-1: Recommended Pit Slope Geometries for 10% Probability Failure
Sector Bench Height (m) Interramp Angle (°) Bench Face Angle (°) Bench Width (m)
A
10 43 67 7
20 51 69 9
30 51 73 15
B
10 50 80 7
20 59 80 9
30 60 78 11
C
10 50 80 7
20 53 72 9
30 53 69 11
D
10 40 67 8
20 40 69 16
30 40 73 27
E
10 42 67 7
20 42 69 15
30 42 73 24
Source: Knight Piésold, 2021.
Please note that on Figure 16-1, two pit shells are shown. The pit shell that was used for the pit slope analyses in this report is the larger, original design pit shell. Following transmittal of the final report, the pit shell was changed by Discovery Silver to the smaller pit shell shown on Figure 16-1. The recommendations presented in the original report for the original pit shell are considered valid for the revised pit shell at the PEA level.

Cordero Project P a g e 1 9 3
Preliminary Economic Assessment of the Cordero Silver Project, Chihuahua State, Mexico January 2022
Figure 16-1: Summary of Pit Slope Recommendations
Source: Knight Piésold, 2021.
Interramp pit slope angles (measured from bench crest to bench crest) range from 40° at the southwest side of the ultimate pit to 60° at the northeast side of the ultimate pit. These trends are in response to the dominant lithologies in these sections of the pit. Shale-siltstone dominates the majority of the pit except for the northeast side of the pit, where rhyodacite is the dominant lithology. Bench face angles range from 67° to 80° for the three bench heights analyzed which correspond to

Cordero Project P a g e 1 9 4
Preliminary Economic Assessment of the Cordero Silver Project, Chihuahua State, Mexico January 2022
single, double, and triple single bench heights of 10 m, 20 m, and 30 m. Bench widths range from 7 m to 27 m and have been designed to adequately retain rockfall.
Based on the information received from Discovery Silver (M3 2018), the Cordero Project area lies about 20 km east of the Sierra Madre Occidental Volcanic Province within the eastern corridor of the Mexican Basin and Range Province. The property geology is comprised of two northeast-trending belts of mineralized Cenozoic facies (Paleogene), felsic intrusive complex with a variety of breccias. The country rock is a Cretaceous, thin- to medium-bedded, half-carbonate sequence consisting of interbedded calcareous mudstone, limestone, calcareous siltstone, and calcite sandstone. Faulting is prevalent in the project footprint, with evidence of early faulting parallel to stratigraphy as well as transcurrent faulting across stratigraphy. Cordero open pit slopes are comprised of a relatively homogeneous rock mass primarily consisting of folded Cretaceous shale-siltstone and high-strength volcanic rhyodacite.
Pit slope analyses were based on geotechnical field data collected by Knight Piésold for a site investigation conducted from May through July 2021. Two geotechnical coreholes (CG21-001 and CG21-002) were drilled into the northwest wall of the proposed Cordero open pit. The two coreholes were logged for geotechnical parameters and sampled for laboratory testing by Knight Piésold. In addition to the two drilled geotechnical coreholes drilled into the northwest side of the proposed pit, the split core from two exploration coreholes that had been drilled in the southeast side of the proposed Cordero open pit were logged.
As part of the 2021 core logging program, Knight Piésold selected representative samples from the two geotechnical coreholes (CG21-001 and CG21-002) for laboratory testing. Laboratory testing was limited to unconfined compressive strength (UCS) testing at the PEA level.
Engineering lithologies delineated for analysis of the proposed Cordero open pit are comprised of rock units having similar shear strength, rock mass characteristics, and discontinuity characteristics. For this evaluation, engineering lithologies were delineated based predominately on the lithology model provided by Discovery Silver, including dike material, hornfels, phreato-breccias, brecciated rhyodacite, rhyodacite, and shale-siltstones.
Two-dimensional (2D) cross-section models were developed to represent each design sector using the rhyodacite and shale-siltstone engineering lithologies. These models provided the basis for probabilistic limit equilibrium slope stability analyses. The arrangements of the rhyodacite and shale-siltstone engineering lithologies within these models were based on the lithology block model provided by Discovery Silver and lithology logs for the two Knight Piésold 2021 geotechnical coreholes. Based on the available information, the walls of the ultimate pit are expected to consist primarily of the shale-siltstone engineering lithology, and much of the rhyodacite engineering lithology is expected to be excavated to facilitate the construction of the ultimate pit configuration.
While both engineering lithologies have been modelled with relatively high shear strength properties in this analysis, additional geotechnical data (i.e., additional geotechnical coreholes) targeting the shale-siltstone engineering lithology, particularly within the southeast wall of the Cordero open pit, will be necessary for the next phase in pit slope stability evaluation.
Pore pressures in the open pit slopes were modelled using simplified two-dimensional, steady-state seepage modelling. The seepage modelling efforts were conducted using the finite element seepage module within the Slide2 software (Rocscience, 2020). Hydraulic conductivities of the rock mass were estimated based on rock type according to Freeze and Cherry (1979) for jointed igneous rock and limestone, resulting in an assumed value of 1x10⁻⁷ m/s for both the rhyodacite and shale-siltstone engineering lithologies. Initial pore pressure conditions (prior to pit excavation) were based on data from two vibrating wire piezometers (VWP) installed during the 2021 site investigation in the two coreholes (CG21-001 and CG21-002). Water levels obtained from these VWPs were combined with water level observations by Discovery Silver to approximate a groundwater table through the pit footprint.

Cordero Project P a g e 1 9 5
Preliminary Economic Assessment of the Cordero Silver Project, Chihuahua State, Mexico January 2022
The potential for seismic (including earthquake) loading of the Cordero open pit slopes was modelled using pseudostatic analyses. Pseudostatic analyses for the Cordero open pit incorporated a horizontal acceleration coefficient of 0.05 g.
There are three main components to slope stability analysis in support of open pit evaluation. These include global-scale slope stability analyses at the ultimate pit scale, bench-scale slope stability analyses, and rockfall analyses.
Knight Piésold used probabilistic analytical methods for the Cordero pit slope evaluation. Probabilistic methods are characterized by statistical distributions of input parameters having some central tendency and some variation around that central tendency. The variations of the geomechanical properties were represented by probability density functions which were developed for each primary Hoek-Brown (Hoek and Marinos, 2002) input parameter used in the slope stability model analyses. The limit equilibrium method was conducted using the commercially available slope stability evaluation software Slide2 (Rocscience, 2020).
Slope stability analyses conducted for the Cordero open pit slope evaluation are comprised of two distinct analyses including interramp analysis and bench face analysis. Interramp and bench-scale analyses were conducted for each design sector. The interramp analyses are typically conducted using the limit equilibrium method. The bench-scale analyses are typically conducted using both the limit equilibrium method and the backbreak method. For each design sector, the controlling method corresponds to the method which yielded the lowest slope angle for the target probability of failure.
The backbreak method predicts the bench face angles that will develop, based on the sliding potential of the rock mass along discontinuities such as joints or faults at the bench scale using Backbreak software. Bench face angles were evaluated using the backbreak method and limit equilibrium analyses. Bench widths for rockfall catchment are developed using the modified Ritchie (Call and Savely, 1990). The recommended slope angles are typically based on the most critical (i.e., lowest) interramp and bench face angles defined by these two methods of analysis. The most critical pit slope configurations are defined as having the greatest allowable probability of failure and the (typically) lowest allowable factor of safety.
The results of the slope stability analyses are presented as a probability or likelihood of instability rather than a single, deterministic factor of safety. Based on Knight Piésold’s experience, interramp angles that yield a probability of failure of about 30% for slopes with low consequence of failure and 10% for slopes with high failure consequences are suitable for an open pit mining application. Slopes that have a high consequence of instability are those that are critical to mine operations such as slopes containing major haul ramps, access points, or infrastructure. The high consequence probability of failure target of 10% was used for these analyses because infrastructure locations are not currently known and haul ramps will likely be present on both sides of the pit. This target probability of failure is also appropriate given the available data and the level of uncertainty in a PEA.
A limit equilibrium interramp angle analysis was the most critical of the three methods used and controlled the maximum recommended interramp angle for all sectors at the 30 m bench height configurations for this evaluation. Limit equilibrium bench face angle analyses for the shale-siltstone engineering lithology found a maximum possible bench face angle of 80° for the single, double, and triple bench cases. Backbreak analyses constrained only the 10m bench height configurations for Sector A, while rockfall analyses constrained the 10 m and 20 m configurations for Sector B and the 10 m configuration for Sector C. The combination of minimum bench widths from rockfall analyses and maximum bench face angles from operational constraints (80°) put a geometric limit on the interramp angle that can be achieved while meeting the minimum bench width and maximum bench face angle.
The PEA-level recommendations presented in this report are based upon Knight Piésold’s current understanding of the conditions that will influence pit slope performance at the proposed Cordero open pit. These conditions should be assessed during future pit slope stability evaluation at the subsequent design levels and continue through pit development. Any

Cordero Project P a g e 1 9 6
Preliminary Economic Assessment of the Cordero Silver Project, Chihuahua State, Mexico January 2022
significant deviations from the geotechnical model used to develop the recommendations presented in this report should prompt re-evaluation of these recommendations.
As previously mentioned, the pit shell used for the pit slope analyses is not consistent with the pit shell presented for this PEA, as shown on Figure 16-1. Knight Piésold has compared the two pit shells and the differences between them do not appear to be inconsistent with pit slope recommendations presented herein. However, the pit slope recommendations presented in this report should not be carried forward to any subsequent design level, nor should they be implemented for construction.
A program of geotechnical data collection should be undertaken should Discovery Silver decide to advance the project to a higher level of reporting. Such a program would include collection of additional geotechnical data. A program of pit slope stability analyses commensurate with the next proposed design level should be conducted to provide pit slope recommendations.
16.3 Geological Model Importation
The 2021 resource estimate was created using Leapfrog software for mineralization domains and Datamine software for block modelling. RockRidge consultants provided AGP with the resource model in comma separated variable (.csv) format. The original Datamine resource model was a sub-blocked model, but the final resource model provided to AGP for mine design was a single percentage model.
The mining model created by AGP in Hexagon MinePlan software includes additional items for mine planning purposes. MinePlan was used for the mining portion of the PEA, utilizing their Lerchs-Grossman (LG) shell generation, pit and dump design, and mine scheduling tools. Measured, indicated and inferred resources were used for the PEA.
A global resource check was completed to ensure contained metal matched between the two model formats. The tonnes and contained metal for each resource category with no cut-off applied was within 0.3% in all cases.
16.4 Economic Pit Shell Development
The open pit ultimate size and phasing requirements were determined with various input parameters including estimates of the expected mining, processing and G&A costs, as well as metallurgical recoveries, pit slopes and reasonable long-term metal price assumptions. AGP worked with the study team to select appropriate operating cost parameters for the proposed Cordero open pit. The mining costs are estimates based on cost estimates for equipment from vendors and previous studies completed by AGP. The costs represent what is expected as a blended cost over the life of the mine for all material types to the various destinations. Process costs and a portion of the G&A costs were provided by Ausenco and other team members based on preliminary costing results.
The parameters used are shown in Table 16-2. The net value calculations are in United States dollars (US$ or USD) unless otherwise noted. The mining cost estimates are based on the use of 230-tonne class trucks using an approximate RSF configuration to determine incremental hauls for mineralized material and waste. The smelting terms and recovery assumptions are based on creating zinc and lead bulk concentrates from the mill.
Wall slopes for pit optimization were based on recommendations discussed in Section 16.2 from the 2021 field program. Allowances were made for ramps in the slopes to determine an overall angle for use in the Lerchs-Grossman (LG) routine. The overall slope angle values are shown in Table 16-3. Slopes were flattened as required due to inclusion of haulage ramps.

Cordero Project P a g e 1 9 7
Preliminary Economic Assessment of the Cordero Silver Project, Chihuahua State, Mexico January 2022
Table 16-2: Pit Shell Parameter Assumptions
Description Units Value Resource Classifications Used M+I+I
Mining Bench Height m 10
Metal Prices Silver Gold Lead Zinc
Price US$/oz or US$/lb 20.00 /oz 1600.00 /oz 0.95 /lb 1.05 /lb
Royalty % 0.5% 0.5% 0.0% 0.0%
Smelting, Refining, Transportation Terms
Doré
Oxide & Transition (Heap Leach) 98.0% 99.9% - -
Concentrates
Lead Concentrate Payables % 95% 95% 95% 0%
Minimum % or g/dmt 50 g/t 1 g/t 3%
Zinc Concentrate Payables % 70% 70% 0% 85%
Minimum % 8%
Deductions g/dmt 93.3 1
Pb Con Zn Con
Concentrate Grades % 55% 53%
Treatment Charge $/dmt 100 200
Refining Charges (Ag) $/oz 1.00 0.00
Refining Charges (Au) $/oz 10.00 0.00
Penalties
Breccia - Volcanic $/dmt - 20.00
Breccia - Sedimentary $/dmt - 18.00
Volcanic $/dmt 2.00 14.00
Sedimentary $/dmt 3.50 12.00
Concentrate Moisture % 8% 8%
Transit Losses % 0.5% 0.5%
Concentrate Trucking Cost $/wmt 55.00 55.00
Concentrate Port Cost $/wmt 30.00 30.00
Concentrate Shipping Cost $/wmt 13.50 13.50
Representation Cost $/wmt 3.00 3.00
Insurance, Refereeing $/dmt 3.00 1.00
Process Recoveries Silver Gold Lead Zinc
Heap Leach
Oxides/Transition (ROM) % 35% 35%
Oxides/Transition (Crushed) % 60% 70% 0% 0%
Flotation / Sulphides
Breccia - Volcanic
Recovery to Lead Concentrate % 79% 13% 91% 0%
Recovery to Zinc Concentrate % 11% 7% 0% 88%
Breccia - Sedimentary
Recovery to Lead Concentrate % 75% 12% 89% 0%
Recovery to Zinc Concentrate % 9% 4% 0% 86%
Volcanic
Recovery to Lead Concentrate % 70% 13% 85% 0%
Recovery to Zinc Concentrate % 13% 6% 0% 81%
Sedimentary
Recovery to Lead Concentrate % 70% 13% 83% 0%
Recovery to Zinc Concentrate % 10% 5% 0% 89%
Mining Costs
Base Rate - 1550 Elevation
Waste $/t moved 1.64
Mineralized Material $/t moved 1.54
Incremental Rate - above 1550 Elevation
Waste $/t moved/ 10m bench -0.004
Mineralized Material $/t moved/ 10m bench 0.009
Incremental Rate - below 1550 Elevation
Waste $/t moved/ 10m bench 0.024
Mineralized Material $/t moved/ 10m bench 0.024
Process Costs
Oxide & Transition (ROM Heap leach) $/t stacked 2.50
Oxide & Transition (Crushed Heap leach) $/t stacked 3.92
Sulphides (Flotation) $/t milled 6.39
G&A Cost $/t total feed 0.86
Source: AGP Mining, 2021.
Table 16-3: Pit Shell Slopes
Location Sector Interramp Angle
(Degrees) Number of Haul Roads
(35.4 m wide)
Overall Slope
(Degrees)
North A 51.0 1 46.9
Northeast B 59.0 1 53.9
Southeast C 53.0 3 45.0
Southwest D 40.0 1 36.5
West E 42.0 1 38.8
Source: AGP Mining, 2021.

Cordero Project P a g e 1 9 8
Preliminary Economic Assessment of the Cordero Silver Project, Chihuahua State, Mexico January 2022
Nested LG pit shells were generated to examine sensitivity to the various metal prices. This was to gain an understanding of the deposit and highlight potential opportunities in the design process to follow. Undiluted measured, indicated and inferred material was used in the analysis. The NSR was varied by applying a revenue factor (RF) in 0.10 to 1.20 at 0.05 increments to generate a set of nested LG shells. The chosen set of revenue factors result in an equivalent silver price varying from US$2/oz up to US$24/oz. All other parameters were fixed. The resulting nested pit shells assist in visualizing natural breakpoints in the deposit and selecting shells to act as design guidance for phase design. The net profit before capital for each pit was calculated on an undiscounted basis for each pit shell using US$20.00/oz Ag, US$1,600/oz Au, US$0.95/lb Pb and US$1.05/lb Zn. No mining limits were used to restrict the pit shells from any infrastructure areas.
Mill and leach feed tonnages, waste tonnages, and potential net profit were plotted against gold price and are displayed in Figure 16-2.
Figure 16-2: Cordero Potential Profit vs. Price by Pit Shell
Source: AGP Mining, 2021.
Figure 16-2 contained several breakpoints in the pit shells. These were used as a guide for sequencing pit phase designs. With each incremental the increase in the waste tonnage, and to a lesser degree the mill tonnage, the undiscounted net profit also increased. In the case of the first breakpoint shown at RF0.35 (US$7/oz Ag), the cumulative waste tonnage is

Cordero Project P a g e 1 9 9
Preliminary Economic Assessment of the Cordero Silver Project, Chihuahua State, Mexico January 2022
46.4 Mt, with a corresponding feed tonnage of 58.1 Mt or a strip ratio of 0.8:1. The net profit increased beyond this point, showing that there was still value to be obtained by going with a higher metal price or an additional phase. This breakpoint represented 24% of the net value of a $20/oz Ag pit, but with only 7% of the waste of the larger pit shell. This pit shell was used for the pit design of Phases 1 and 2.
The second breakpoint was at RF0.45 (US$9/oz Ag). The incremental waste tonnage from the first breakpoint is 74.4 Mt, with a corresponding increase in feed tonnage of 96.0 Mt or a strip ratio of 0.8:1. The net profit increased beyond this point showing that there was still value to be obtained by going with a higher metal price. This pit shell was used for the pit design of Phase 3. There are significant waste tonnages in the next higher pit prices to achieve the next increases in profit. The cumulative value of the first two breakpoints was 47% of the US$20/oz Ag pit shell but with only 19% of the waste movement of the larger pit required. This pit shell ran significantly further north than the first breakpoint and deeper to the east side of the deposit.
The final pit shell selected represented the ultimate pit at RF0.60 (US$12/oz Ag). This resulted in a substantial jump in the waste tonnage from the second breakpoint to the third breakpoint by 254 Mt with a gain of 239 Mt of feed material for an incremental strip ratio of 1.1:1. The net profit continues to increase beyond the third breakpoint, although at a flatter rate than in earlier breakpoints. The cumulative value of the first three breakpoints represented 88% of the US$20/oz Ag pit shell with 50% of the waste movement of the larger pit. Limited potential pit value was available beyond this pit shell to cover schedule discounting another phase.
Preliminary schedules also indicated that bench advance would be a primary constraint to achieve the desired mill throughput rates, so narrow phases were minimized so that more efficient mining could be possible.
16.5 Dilution
The open pit resource model was provided as an undiluted percentage type model, such that the grades from the wireframes were reported into separate percentage parcels of mineralized material and waste in each block.
To account for mining dilution, AGP modelled contact dilution into the in-situ resource blocks. To determine the amount of dilution, and the grade of the dilution, the size of the block in the model was examined. The block size within the model was 20 x 5 m in plan view, and 10 m high. Mining would be completed on 10 m benches.
The percentage of dilution was calculated for each contact side using an assumed 0.5 m contact dilution distance. This dilution skin thickness was selected by considering the spatial nature of the mineralization, proposed grade control methods, GPS-assisted digging accuracy, and blast heave.
If the long plan dimension side of a mineralized block above cut-off is in contact with a waste block, then it is estimated that dilution of 10% (0.5 m * 20 m / 100 m2) by volume would result. Similarly, if the short plan dimension side of a mineralized block above cut-off is in contact with a waste block, then it is estimated that dilution of 2.5% (0.5 m * 5 m / 100 m2) by volume would result. Each of the four sides of the mineralized material block in plan are considered for adding dilution material, so the maximum dilution would 25% by volume for an isolated block of mill or heap leach feed.
All mineralized blocks in the resource model contain grade values; however, the material outside the mineralized shapes have no grade estimates and have been treated as though the grades are zero for dilution purposes. The NSR value per tonne that was stored to the block model previously was used as the grade for cut-off application. The NSR values for oxide and transition material were considered for the crushed heap leach destination. An elevated NSR cut-off of US$7.50/t was used for oxide and transition material due to restricted heap leach capacity. The NSR for sulphide material was based on the mill destination with the marginal cut-off of US$7.25/t being used. As the NSR is inclusive of all revenues and royalties,

Cordero Project P a g e 2 0 0
Preliminary Economic Assessment of the Cordero Silver Project, Chihuahua State, Mexico January 2022
these cut-off grades were used to flag initial feed and waste blocks. The marginal cut-off grade values represent the preliminary process and site G&A costs.
Using these NSR cut-off grades by weathering type, the first step is to identify the mill feed and waste blocks in the model. The second step is to add dilution mass and metal into the mill feed blocks from the neighbouring waste blocks. The third step is to remove the dilution mass from the contact waste blocks to achieve a mass balance.
AGP has an in-house routine that applies the above three dilution steps to define new items called DDEN, DORE%, DWAS%, as well as the grade items (DAU, DAG, DPB, and DZN). The default waste blocks would receive DORE%=0.
In this manner, the contact diluted blocks were included in the tonnage and grade calculation of mill and heap leach feed tonnes. The mill and leach feed tonnage report was then run with the block model DORE% item to report out the diluted tonnes and grade.
Comparing the in-situ to the diluted values for the designed final pits, the diluted feed contained 3.0% more tonnes and 2.3% lower silver grade than the in-situ feed summary. The grade dilution percentage was lower than the feed tonnage percentage since the mineralized waste blocks included some grade. The average grade of the dilution material was 7.1 g/t Ag, 0.03 g/t Ag, 0.08% Pb and 0.16% Zn. AGP considers these dilution percentages to be reasonable considering the style of mineralization.
16.6 Pit Design
Four phase designs were developed for the single open pit. The pit optimization shells used to determine the ultimate pit were also used to outline areas of higher value for targeted early mining and phase development. Geotechnical parameters outlined in Table 16-4 were applied to the pit phase designs. The west and southwest sectors of the pit have the shallowest slopes, while the north and east slopes have steeper slopes.
Table 16-4: Geotechnical Parameters for Pit Design
Location Sector SECT Item Code
Bench Face Angle Height Between Berms Catch Bench Width Interramp Angle
(Degrees) (Degrees) (m) (m)
North A 1 69 20 8.50 51.0
Northeast B 2 80 20 8.50 59.0
Southeast C 3 72 20 8.55 53.0
Southwest D 4 69 20 16.20 40.0
West E 5 69 20 14.50 42.0
Source: AGP Mining, 2021.
Equipment sizing for ramps and working benches is based on the use of 230-tonne, rigid-frame haul trucks. The operating width used for the truck is 8.3 m. This means that single-lane access is 27.1 m (twice the operating width plus berm and ditch) and double lane widths are 35.4 m (three times the operating width plus berm and ditch). Ramp gradients are 10% in the pit and RSF for uphill gradients. Working benches were designed for 35 to 40 m minimum mining width on pushbacks.
Tonnes and grade for the final pit designs are reported in Table 16-5 using the diluted tonnes and grade from the model and a mining recovery of 99% to account for additional mineralized material losses. The phase designs are described in further detail in the following sub-sections.

Cordero Project P a g e 2 0 1
Preliminary Economic Assessment of the Cordero Silver Project, Chihuahua State, Mexico January 2022
Table 16-5: Final Design – Phases, Tonnages, and Grades
Phase Oxide/Transition
(Mt)
Ag
(g/t)
Au
(g/t)
Pb
(%)
Zn
(%)
Sulphides
(Mt)
Ag
(g/t)
Au
(g/t)
Pb
(%)
Zn
(%)
Waste
(Mt)
Total
(Mt)
Strip Ratio
1 12.2 31 0.09 0.25 0.23 40.7 40 0.24 0.60 0.54 97.9 150.8 1.8
2 6.5 45 0.07 0.28 0.43 3.0 60 0.06 0.60 1.06 14.8 24.3 1.6
3 13.9 26 0.07 0.24 0.28 45.4 28 0.07 0.39 0.74 104.4 163.7 1.8
4 6.0 28 0.06 0.36 0.61 109.5 28 0.05 0.43 0.82 264.5 380.0 2.3
Total 38.6 31 0.07 0.27 0.34 198.6 31 0.09 0.46 0.75 481.6 718.8 2.0
Notes: Elevated NSR cut-offs: US$7.50/t for oxide/transition crushed heap leach, and US$10.00/t for sulphides. Source: AGP Mining, 2021.
16.6.1 Phase 1
Phase 1 will start being mined in Year-2 and will be utilized as quarry material for construction purposes. Phases 1 and 2 target the highest-grade areas of the deposit and are target the same pit shell target for the two areas. Phase bench elevations will range from 1640 masl to 1340 masl. All waste and mineralized material accesses will be on the southeast side of the phase, where the RSF and process destinations will be located. The phase 1 design is shown in Figure 16-3.
Figure 16-3: Phase 1 Layout
Source: AGP Mining, 2021.

Cordero Project P a g e 2 0 2
Preliminary Economic Assessment of the Cordero Silver Project, Chihuahua State, Mexico January 2022
16.6.2 Phase 2
Phase 2 will also be accessed from the southeast side of the pit. Phase bench elevations will range from 1630 masl down to 1480 masl. The phase 2 design is shown in Figure 16-4.
Figure 16-4: Phase 2 Layout
Source: AGP Mining, 2021.
16.6.3 Phase 3
Phase 3 extends the initial phases to the north, with pit bottoms at 1340 and 1420 masl. Pit exits at the north and northeast ends allow for short waste hauls to the TSF and RSF from the upper benches. The 1570 masl pit exit at the south end of the pit can be used for shorter mill and heap leach hauls. Phase bench elevations will range from 1630 masl down to 1340 masl. The phase 3 design is shown in Figure 16-5.

Cordero Project P a g e 2 0 3
Preliminary Economic Assessment of the Cordero Silver Project, Chihuahua State, Mexico January 2022
Figure 16-5: Phase 3 Layout
Source: AGP Mining, 2021.
16.6.4 Phase 4
Phase 4 is the final pit phase and therefore represents the ultimate pit. The pit exit at 1570 m elevation pit is where the mined material will leave the pit at the southeast side of the pit. Phase bench elevations will range from 1600 masl down to 1120 masl. The phase 4 design is shown in Figure 16-6.

Cordero Project P a g e 2 0 4
Preliminary Economic Assessment of the Cordero Silver Project, Chihuahua State, Mexico January 2022
Figure 16-6: Phase 4 Layout
Source: AGP Mining, 2021.
16.7 Rock Storage Facilities
Waste rock in the schedule is directed to both the TSF and RSF. In addition to the primary TSF design, an extension of the TSF is also included to make use of short hauls as well as provide additional embankment support. The projected storage capacities are shown in Table 16-6.
Table 16-6: Rock Storage Capacities
Parameter Units Rock Storage Facility TSF TSF Extension
Waste Storage Capacity Mm3 210 19. 6 6.3
Maximum Elevation masl 1650 1607 1610
Source: AGP Mining, 2021.

Cordero Project P a g e 2 0 5
Preliminary Economic Assessment of the Cordero Silver Project, Chihuahua State, Mexico January 2022
16.8 Mine Schedule
The mine schedule plans to deliver 199 Mt of sulphide mill feed grading 31.1 g/t Ag, 0.09 g/t Au, 0.75% Zn and 0.46% Pb over a mine life of 14 years. Heap leach material processed included 20 Mt of leach crush material grading 41.5 g/t Ag, 0.09 g/t Au, 0.40% Zn and 0.34% Pb along with 9.1 Mt of ROM leach material grading 23.6 g/t Ag, 0.06 g/t Au, 0.37% Zn and 0.25% Pb. Waste tonnage totalling 491 Mt will be delivered to either the tailing storage facility or the rock storage facility. The overall strip ratio is 2.2:1.
The current mine life includes the sulphide mill starting at 5.8 Mt/a capacity in Year 1, followed by 7.2 Mt/a (20 kt/d) for Years 2 and 3. In Year 4, additional crushing capacity will be available so the capacity will increase to 10.8 Mt/a. From Year 5 onward, a maximum mill capacity of 14.4 Mt/a (40 kt/d) will be available. Three sulphide stockpiles were used for this schedule where:
• Low Grade (LG) = material between NSR of US$10/t and US$15/t
• Medium Grade (MG) = material between NSR of US$15/t and US$25/t
• High Grade (HG) = material above NSR of US$25/t.
A peak stockpile capacity of approximately 64 Mt was used primarily to store low-grade sulphide mill feed for processing during the later years of the mine life.
Several constraints were applied for heap leach material processing in the schedule. The heap leach crusher was planned to be operational at 5 Mt/a from Years -1 to 3. In Year 4, this crusher capacity would be re-purposed for mill production. In order to send the highest-grade material to the crusher during this period, an elevated NSR cut-off of US$9.75/t was implemented. The design of the ROM heap leach pad facility resulted in a maximum total ROM leach capacity of 4.8 Mt up to end of Year 3. An NSR cut-off of $US8.75/t was applied for ROM material during these early years to capture better grades. From Year 4 onward, an NSR cut-off of US$7.50 was applied for all heap leach material with process material being sent directly to the ROM leach pad.
Table 16-7 displays a summary of the resource classifications for the process feed. The mine schedule was completed with annual periods. The detailed planned mine schedule is shown in Table 16-8 and Table 16-9.
Table 16-7: Resource Summary of Scheduled Material
Resource Class Process Feed
(Mt) Grade Contained Metal
Ag (g/t) Au (g/t) Pb (%) Zn (%) Ag (Moz) Ag (Moz) Pb (Blb) Zn (Blb)
Measured 68.5 33 0.11 0.46 0.68 72 0.24 0.69 1.02
Indicated 157.2 31 0.09 0.43 0.71 158 0.43 1.50 2.46
Inferred 2.0 25 0.09 0.30 0.95 2 0.01 0.01 0.04
Total 227.7 32 0.09 0.44 0.70 232 0.68 2.21 3.53
Source: AGP Mining, 2021.

Cordero Project P a g e 2 0 6
Preliminary Economic Assessment of the Cordero Silver Project, Chihuahua State, Mexico January 2022
Table 16-8: PEA Mine Schedule
Description Y-2 Y-1 Y1 Y2 Y3 Y4 Y5 Y6 Y7 Y8 Y9 Y10 Y11 Y12 Y13 Y14 Y15 Y16 Total M
inin
g S
um
ma
ry
Mined Waste (Mt) 6.5 45.6 44.2 48.9 47.3 41.5 46.6 46.2 41.4 43.9 40.3 26.1 9.8 2.9 0.0 0.0 0.0 0.0 491
Mined Sulphide (Mt) 0.0 1.6 22.3 14.5 11.3 21.2 16.7 18.5 18.6 19.3 21.1 16.4 11.8 4.8 0.4 0.0 0.0 0.0 199
Ag (g/t) 0.00 28.31 36.06 46.14 39.67 26.48 27.12 28.00 24.98 23.98 33.22 32.81 28.21 33.29 31.60 0.00 0.00 0.00 31.08
Au (g/t) 0.00 0.11 0.15 0.30 0.22 0.06 0.06 0.06 0.05 0.05 0.07 0.06 0.05 0.05 0.06 0.00 0.00 0.00 0.09
Pb (%) 0.00 0.31 0.45 0.74 0.57 0.32 0.36 0.42 0.31 0.31 0.51 0.60 0.57 0.66 0.56 0.00 0.00 0.00 0.46
Zn (%) 0.00 0.33 0.53 0.62 0.57 0.61 0.71 0.78 0.68 0.69 1.03 1.05 0.98 1.01 1.00 0.00 0.00 0.00 0.75
NSR ($/t) 0.00 22.14 29.64 40.60 33.95 23.33 25.40 27.35 23.36 23.05 33.58 34.74 31.27 34.96 32.78 0.00 0.00 0.00 29.22
Mined Heap Leach ROM (Mt) 0.3 1.9 0.1 1.2 1.2 2.3 1.7 0.2 0.0 0.0 0.0 0.0 0.0 0.0 0.0 0.0 0.0 0.0 9.0
Ag (g/t) 16.86 18.03 16.29 18.31 19.24 29.29 27.35 44.01 27.08 0.00 0.00 0.00 0.00 0.00 0.00 0.00 0.00 0.00 23.53
Au (g/t) 0.08 0.07 0.09 0.07 0.06 0.06 0.05 0.08 0.03 0.00 0.00 0.00 0.00 0.00 0.00 0.00 0.00 0.00 0.06
Pb (%) 0.13 0.15 0.15 0.17 0.18 0.34 0.30 0.59 0.44 0.00 0.00 0.00 0.00 0.00 0.00 0.00 0.00 0.00 0.24
Zn (%) 0.14 0.15 0.24 0.18 0.33 0.54 0.47 1.15 0.81 0.00 0.00 0.00 0.00 0.00 0.00 0.00 0.00 0.00 0.37
NSR ($/t) 5.12 5.17 5.09 5.15 5.18 7.38 6.91 10.98 6.81 0.00 0.00 0.00 0.00 0.00 0.00 0.00 0.00 0.00 6.22
Mined Heap Leach HG (Mt) 0.9 10.8 0.5 2.8 5.1 0.0 0.0 0.0 0.0 0.0 0.0 0.0 0.0 0.0 0.0 0.0 0.0 0.0 20.1
Ag (g/t) 34.68 47.28 42.08 32.58 34.99 0.00 0.00 0.00 0.00 0.00 0.00 0.00 0.00 0.00 0.00 0.00 0.00 0.00 41.42
Au (g/t) 0.12 0.09 0.14 0.08 0.08 0.00 0.00 0.00 0.00 0.00 0.00 0.00 0.00 0.00 0.00 0.00 0.00 0.00 0.09
Pb (%) 0.30 0.33 0.38 0.30 0.37 0.00 0.00 0.00 0.00 0.00 0.00 0.00 0.00 0.00 0.00 0.00 0.00 0.00 0.34
Zn (%) 0.26 0.38 0.51 0.26 0.54 0.00 0.00 0.00 0.00 0.00 0.00 0.00 0.00 0.00 0.00 0.00 0.00 0.00 0.40
NSR ($/t) 17.13 20.53 20.44 14.83 15.64 0.00 0.00 0.00 0.00 0.00 0.00 0.00 0.00 0.00 0.00 0.00 0.00 0.00 18.34
Total Mined (Mt) 7.7 60.0 67.1 67.3 65.0 65.0 65.0 65.0 60.0 63.2 61.3 42.5 21.6 7.7 0.4 0.0 0.0 0.0 719
Pro
ce
ss
ed
Ma
teri
al
Mill Feed (Mt) 0.0 0.0 5.8 7.2 7.2 10.8 14.4 14.4 14.4 14.4 14.4 14.4 14.4 14.4 14.4 14.4 14.4 9.2 199
Ag (g/t) 0.00 0.00 61.77 63.38 61.06 47.66 35.00 33.57 30.66 29.95 42.67 36.63 28.60 22.70 13.08 12.56 12.56 12.56 31.08
Au (g/t) 0.00 0.00 0.19 0.41 0.36 0.15 0.07 0.08 0.07 0.07 0.08 0.07 0.07 0.06 0.04 0.04 0.04 0.04 0.09
Pb (%) 0.00 0.00 0.74 1.04 0.91 0.62 0.46 0.52 0.39 0.39 0.66 0.67 0.53 0.37 0.17 0.16 0.16 0.16 0.46
Zn (%) 0.00 0.00 0.92 0.79 0.74 0.77 0.86 0.92 0.79 0.81 1.33 1.15 0.90 0.62 0.36 0.34 0.34 0.34 0.75
NSR ($/t) 0.00 0.00 50.09 55.52 51.44 39.48 31.94 32.85 28.43 28.28 43.04 38.43 30.21 22.47 12.56 11.99 11.99 11.99 29.22
Heap Leach ROM (Mt) 0.3 1.9 0.1 1.2 1.2 2.4 1.7 0.2 0.0 0.0 0.0 0.0 0.0 0.0 0.0 0.0 0.0 0.0 9.1
Ag (g/t) 16.86 18.03 16.29 18.31 19.24 29.07 27.35 44.01 27.08 0.00 0.00 0.00 0.00 0.00 0.00 0.00 0.00 0.00 23.57
Au (g/t) 0.08 0.07 0.09 0.07 0.06 0.06 0.05 0.08 0.03 0.00 0.00 0.00 0.00 0.00 0.00 0.00 0.00 0.00 0.06
Pb (%) 0.13 0.15 0.15 0.17 0.18 0.35 0.30 0.59 0.44 0.00 0.00 0.00 0.00 0.00 0.00 0.00 0.00 0.00 0.25
Zn (%) 0.14 0.15 0.24 0.18 0.33 0.55 0.47 1.15 0.81 0.00 0.00 0.00 0.00 0.00 0.00 0.00 0.00 0.00 0.37
NSR ($/t) 5.12 5.17 5.09 5.15 5.18 7.35 6.91 10.98 6.81 0.00 0.00 0.00 0.00 0.00 0.00 0.00 0.00 0.00 6.23
Heap Leach Crushed (Mt) 0.0 5.0 5.0 5.0 5.0 0.0 0.0 0.0 0.0 0.0 0.0 0.0 0.0 0.0 0.0 0.0 0.0 0.0 20.0
Ag (g/t) 0.00 57.87 38.24 34.75 35.26 0.00 0.00 0.00 0.00 0.00 0.00 0.00 0.00 0.00 0.00 0.00 0.00 0.00 41.53
Au (g/t) 0.00 0.08 0.10 0.09 0.08 0.00 0.00 0.00 0.00 0.00 0.00 0.00 0.00 0.00 0.00 0.00 0.00 0.00 0.09
Pb (%) 0.00 0.38 0.30 0.30 0.37 0.00 0.00 0.00 0.00 0.00 0.00 0.00 0.00 0.00 0.00 0.00 0.00 0.00 0.34
Zn (%) 0.00 0.51 0.29 0.26 0.54 0.00 0.00 0.00 0.00 0.00 0.00 0.00 0.00 0.00 0.00 0.00 0.00 0.00 0.40
NSR ($/t) 0.00 24.14 17.73 15.92 15.75 0.00 0.00 0.00 0.00 0.00 0.00 0.00 0.00 0.00 0.00 0.00 0.00 0.00 18.39
Source: AGP Mining, 2021.

Cordero Project P a g e 2 0 7
Preliminary Economic Assessment of the Cordero Silver Project, Chihuahua State, Mexico January 2022
Table 16-9: PEA Mine Schedule (Stockpiles and Material Movement)
Description Y-2 Y-1 Y1 Y2 Y3 Y4 Y5 Y6 Y7 Y8 Y9 Y10 Y11 Y12 Y13 Y14 Y15 Y16 Total
Stockpile Balance
Heap Leach (Mt) 0.9 6.7 2.2 0.0 0.1 0.0 0.0 0.0 0.0 0.0 0.0 0.0 0.0 0.0 0.0 0.0 0.0 0.0
Ag (g/t) 34.68 37.69 37.46 0.00 25.63 0.00 0.00 0.00 0.00 0.00 0.00 0.00 0.00 0.00 0.00 0.00 0.00 0.00
Au (g/t) 0.12 0.10 0.10 0.00 0.06 0.00 0.00 0.00 0.00 0.00 0.00 0.00 0.00 0.00 0.00 0.00 0.00 0.00
Pb (%) 0.30 0.29 0.29 0.00 0.47 0.00 0.00 0.00 0.00 0.00 0.00 0.00 0.00 0.00 0.00 0.00 0.00 0.00
Zn (%) 0.26 0.27 0.27 0.00 0.65 0.00 0.00 0.00 0.00 0.00 0.00 0.00 0.00 0.00 0.00 0.00 0.00 0.00
NSR ($/t) 17.13 17.38 17.29 0.00 11.86 0.00 0.00 0.00 0.00 0.00 0.00 0.00 0.00 0.00 0.00 0.00 0.00 0.00
LG Sulphide (Mt) 0.0 0.7 6.7 8.6 11.9 19.8 24.8 30.8 38.0 45.6 51.1 54.1 56.2 52.0 38.0 23.6 9.2 0.0
Ag (g/t) 0.00 14.53 13.66 13.47 13.58 13.32 13.15 13.12 13.02 12.85 12.71 12.61 12.56 12.56 12.56 12.56 12.56 0.00
Au (g/t) 0.00 0.07 0.08 0.08 0.08 0.06 0.06 0.05 0.05 0.05 0.05 0.04 0.04 0.04 0.04 0.04 0.04 0.00
Pb (%) 0.00 0.17 0.17 0.18 0.17 0.17 0.16 0.16 0.16 0.16 0.16 0.16 0.16 0.16 0.16 0.16 0.16 0.00
Zn (%) 0.00 0.20 0.23 0.23 0.25 0.29 0.30 0.31 0.32 0.33 0.33 0.33 0.34 0.34 0.34 0.34 0.34 0.00
NSR ($/t) 0.00 11.96 11.91 11.99 11.99 11.97 11.98 11.97 11.95 11.96 11.97 11.97 11.99 11.99 11.99 11.99 11.99 0.00
MG Sulphide (Mt) 0.0 0.5 6.0 8.8 11.3 17.5 17.5 15.7 12.6 10.0 11.1 10.1 5.4 0.0 0.0 0.0 0.0 0.0
Ag (g/t) 0.00 24.05 23.66 23.04 22.74 22.10 22.06 21.98 21.87 21.77 21.48 21.44 21.10 0.00 0.00 0.00 0.00 0.00
Au (g/t) 0.00 0.11 0.12 0.14 0.13 0.11 0.10 0.10 0.10 0.10 0.09 0.09 0.09 0.00 0.00 0.00 0.00 0.00
Pb (%) 0.00 0.29 0.31 0.32 0.31 0.29 0.29 0.29 0.29 0.29 0.28 0.28 0.28 0.00 0.00 0.00 0.00 0.00
Zn (%) 0.00 0.34 0.37 0.37 0.39 0.46 0.46 0.46 0.46 0.47 0.47 0.48 0.48 0.00 0.00 0.00 0.00 0.00
NSR ($/t) 0.00 19.66 20.11 20.09 19.99 19.87 19.82 19.78 19.71 19.67 19.60 19.58 19.42 0.00 0.00 0.00 0.00 0.00
HG Sulphide (Mt) 0.0 0.5 5.6 8.1 6.4 2.7 0.0 0.0 0.0 0.0 0.0 0.0 0.0 0.0 0.0 0.0 0.0 0.0
Ag (g/t) 0.00 51.76 47.28 47.82 46.52 41.56 0.00 0.00 0.00 0.00 0.00 0.00 0.00 0.00 0.00 0.00 0.00 0.00
Au (g/t) 0.00 0.16 0.20 0.23 0.20 0.07 0.00 0.00 0.00 0.00 0.00 0.00 0.00 0.00 0.00 0.00 0.00 0.00
Pb (%) 0.00 0.54 0.60 0.65 0.62 0.48 0.00 0.00 0.00 0.00 0.00 0.00 0.00 0.00 0.00 0.00 0.00 0.00
Zn (%) 0.00 0.50 0.60 0.63 0.63 0.87 0.00 0.00 0.00 0.00 0.00 0.00 0.00 0.00 0.00 0.00 0.00 0.00
NSR ($/t) 0.00 38.78 37.73 39.09 37.89 34.97 0.00 0.00 0.00 0.00 0.00 0.00 0.00 0.00 0.00 0.00 0.00 0.00
Total Stockpile Reclaim (Mt) 0.0 0.0 4.5 2.2 3.2 6.5 3.2 2.2 3.6 2.9 0.0 1.1 5.0 9.6 14.0 14.4 14.4 9.2 96
Total Material Movement (Mt) 7.7 60.0 71.6 69.5 68.2 71.5 68.2 67.2 63.6 66.2 61.3 43.6 26.6 17.3 14.4 14.4 14.4 9.2 815
Source: AGP Mining, 2021.

Cordero Project P a g e 2 0 8
Preliminary Economic Assessment of the Cordero Silver Project, Chihuahua State, Mexico January 2022
The mine schedule is shown by phase in Table 16-10 and Figure 16-7. Figure 16-8 shows the variation of the proposed mill feed tonnes and silver grade over the processing periods.
Table 16-10: Annual Total Tonnages Mined by Phase
Phase Total Tonnage (Mt) Total
Y-2 Y-1 Y1 Y2 Y3 Y4 Y5 Y6 Y7 Y8 Y9 Y10 Y11 Y12 Y13 (Mt)
1 5.2 45.5 59.7 32.0 8.4 0.0 0.0 0.0 0.0 0.0 0.0 0.0 0.0 0.0 0.0 151
2 2.5 14.5 7.4 0.0 0.0 0.0 0.0 0.0 0.0 0.0 0.0 0.0 0.0 0.0 0.0 24
3 0.0 0.0 0.0 35.3 42.6 49.4 26.8 9.1 0.4 0.0 0.0 0.0 0.0 0.0 0.0 164
4 0.0 0.0 0.0 0.0 14.0 15.6 38.2 55.9 59.6 63.2 61.3 42.5 21.6 7.7 0.4 380
Total 7.7 60.0 67.1 67.3 65.0 65.0 65.0 65.0 60.0 63.2 61.3 42.5 21.6 7.7 0.4 719
Source: AGP Mining, 2021.
Figure 16-7: Tonnage Mined by Phase
Source: AGP Mining, 2021.

Cordero Project P a g e 2 0 9
Preliminary Economic Assessment of the Cordero Silver Project, Chihuahua State, Mexico January 2022
Figure 16-8: Mill Tonnes and Silver Grade
Source: AGP Mining, 2021.
16.9 Mine Plan Sequence
When mining starts, various infrastructure items will require development and construction activities. Significant activities near the pit will include construction of the process plant, crushers, conveyors, TSF embankments, and establishing proper roads to the process and waste destinations. Operationally, ditching and drains will need to be established near roads and infrastructure facilities.
During pre-production, mining will take place on the upper benches of phases 1 and 2. In this period, a total of 6.5 Mt of waste material will be moved as the project ramps up. Approximately 0.9 Mt of heap leach crush material will be stored at the mill feed storage facility while waiting for completion of the leach crusher. Approximately 0.3 Mt of ROM heap leach material will be sent directly to the heap leach pad. Phases 1 and 2 will both advance to 1,600 m.
Year-1 production assumes the heap leach crusher will be able to process 5 Mt of feed and the ROM heap leach pad will be active. The sulphide mill will still be in construction, so sulphide material will be sent to the mill feed storage facility. Phases 1 and 2 will advance to 1,540 and 1,550 m elevations, respectively. Waste will be directed to the RSF facility throughout the mine schedule; additional waste will be directed to the TSF as required.

Cordero Project P a g e 2 1 0
Preliminary Economic Assessment of the Cordero Silver Project, Chihuahua State, Mexico January 2022
Year 1 production assumes the heap leach crusher will be able to process 5 Mt of feed, the ROM heap leach pad will be active, and the sulphide mill will be ramping up to 20 kt/d. Phases 1 and 2 will be active and will be advanced to 1,480 m elevation. Phase 2 mining will be completed during this period.
Year 2 production assumes the heap leach crusher be able to process 5 Mt of feed, the ROM heap leach pad will be active, and the sulphide mill will be operating at 20 kt/d. Phases 1 and 3 will be active and will be advanced to 1,410 m and 1,570 m elevations, respectively.
Year 3 production assumes the heap leach crusher will be able to process 5 Mt of feed, the ROM heap leach pad will be active, and the sulphide mill will be operating at 20 kt/d. Phases 1, 3 and 4 will be active and will be advanced to 1,340 m, 1,530 m and 1,570 m elevations, respectively. Phase 1 mining will be completed in this period and phase 4 mining will be initiated. Pit exits will be available near the north end of the pit for shorter haul distances to waste destinations.
Year 4 production assumes the heap leach crushing circuit will be re-purposed to accept mill feed material. All oxide and transition material will now be directed to the ROM heap leach facility. The sulphide mill will ramp up to 40 kt/d during this period. Phases 3 and 4 will be active and advanced to 1,470 m and 1,560 m elevations, respectively. Pit exits will remain available near the north end of the pit for shorter hauls to waste destinations.
Year 5 production assumes all oxide and transition material will now be directed to the ROM heap leach facility and the sulphide mill will be operating at 40 kt/d. Phases 3 and 4 will be active and will be advanced to 1,410 m and 1,520 m elevations, respectively. The final location of the pit exit will be near the south end of the pit.
Year 6 production assumes all oxide and transition material will be directed to the ROM heap leach facility and the sulphide mill will be operating at 40 kt/d. Phases 3 and 4 will be active and will be advanced to 1,350 m and 1,470 m elevations, respectively. This is the last period that will contain significant mining of oxide and transition material.
In Year 7 production, the final tonnages of oxide and transition material will be sent to the ROM heap leach facility. The sulphide mill will continue to operate at 40 kt/d. Phase 3 will be mined completely to 1,340 m elevation, while phase 4 will advance down to 1,420 m elevation.
In Years 8 to 13, mine production will only be active in phase 4. Phase 4 will advance to 1,120 m elevation by Year 13, representing the end of pit mining.
Phases 1 and 2 will be limited to a bench advance of seven benches per year, while phases 3 and 4 will be restricted to six benches per year due to the size of the benches.
Anticipated end-of-year positions for the open pits, rock storage, and mill feed storage facilities are shown in Figures 16-9 to 16-17.

Cordero Project P a g e 2 1 1
Preliminary Economic Assessment of the Cordero Silver Project, Chihuahua State, Mexico January 2022
Figure 16-9: End of Year -2 (Pre-Production)
Source: AGP Mining, 2021.
Figure 16-10: End of Year -1
Source: AGP Mining, 2021.

Cordero Project P a g e 2 1 2
Preliminary Economic Assessment of the Cordero Silver Project, Chihuahua State, Mexico January 2022
Figure 16-11: End of Year 1
Source: AGP Mining, 2021.
Figure 16-12: End of Year 2
Source: AGP Mining, 2021.

Cordero Project P a g e 2 1 3
Preliminary Economic Assessment of the Cordero Silver Project, Chihuahua State, Mexico January 2022
Figure 16-13: End of Year 3
Source: AGP Mining, 2021.
Figure 16-14: End of Year 4
Source: AGP Mining, 2021.

Cordero Project P a g e 2 1 4
Preliminary Economic Assessment of the Cordero Silver Project, Chihuahua State, Mexico January 2022
Figure 16-15: End of Year 9
Source: AGP Mining, 2021.
Figure 16-16: End of Year 13 (Mining Complete)
Source: AGP Mining, 2021.

Cordero Project P a g e 2 1 5
Preliminary Economic Assessment of the Cordero Silver Project, Chihuahua State, Mexico January 2022
Figure 16-17: End of Year 16 (Processing Complete)
Source: AGP Mining, 2021.
16.10 Mine Equipment Selection
The mining equipment selected to meet the required production schedule is conventional mining equipment used by contract miners in Mexico.
Drilling will be completed with down-the-hole (DTH) hammer drills with 140 and 200 mm bits. This will provide the capability to drill patterns for the 10 m bench heights. The smaller drill bit will be used for preshear holes and the larger drill bit for production blasting.
The mining contractor is expected to use a loading fleet of 13.7 m3 excavators and 13.8 m3 loaders to load the 91-tonne rigid body trucks. This fleet configuration remains the same for the entire mine life. Pre-production mining will use one excavator and one loader with five trucks. Production from Year -1 onwards will have a peak fleet size of two production excavators and three production loaders. The truck fleet will peak at 37 units. It is expected one of the loaders will be used at the at the primary crusher and stockpiles full-time.
The support equipment fleet is sized to provide sufficient coverage for the usual road, pit, and dump maintenance requirements. In addition, smaller road maintenance equipment is included to keep drainage ditches open and sedimentation ponds functional.
The proposed equipment requirements for the life-of-mine plan are provided in Section 21.

Cordero Project P a g e 2 1 6
Preliminary Economic Assessment of the Cordero Silver Project, Chihuahua State, Mexico January 2022
16.11 Grade Control
The grade control program will be completed with blast hole cuttings. Known mill feed samples will be collected in addition to 25% of the waste samples to identify new mineralized zones. Samples will be sent to the assay laboratory with the results applied to the short-range mining model. Up to 40,000 samples per year are expected.
If additional grade control is required, an RC drilling program can be incorporated but is not considered at this time.

Cordero Project P a g e 2 1 7
Preliminary Economic Assessment of the Cordero Silver Project, Chihuahua State, Mexico January 2022
17 RECOVERY METHODS
17.1 Overview
The process plant design is based on a stage-wise expansion approach to treat the variable grades in the recovered mineralization while also considering a future increase in mill throughput. Initially, a heap leach operation is used to treat oxide material mined initially from the deposit and to produce silver-gold doré bars. Following this, lower-grade ROM mineralization is used as heap leach feed and will bypass the crushing circuit.
A sequential flotation process plant operates in parallel to treat the sulphide mineralization from the open-pit, producing a lead-silver concentrate and a zinc concentrate. Two expansions to the sulphide flotation capabilities will be completed later in the mine life , the first when the sulphide material throughput is doubled and the second will be driven by the compounded impact of future increasing feed grades on the doubled process plant throughput. The process design is based on testwork conducted by Blue Coast Research and Ausenco’s extensive database of reference projects, and inhouse modelling programs.
The sequence of the process plant development over the course of the life of mine is presented below:
• Year -1: Heap leach design is operated exclusively pending completion of Phase 1 sulphide flotation capacity.
• Year 1: Phase 1 Sulphide concentrator will be designed to process a throughput of 7.2 Mt/a while the 5.0 Mt/a heap leach operation is operated in parallel.
• Year 4: Phase 2 Sulphide concentrator will be designed to process a throughput of 14.4 Mt/a; however, the Phase 2 expansion capital will be dedicated to the grinding, rougher and tailings thickening circuits only. As the oxide heap leach operation will be completed at this stage the oxide crushing circuit will be reallocated to the sulphide process plant to accommodate the increased throughput.
• Year 9: Phase 3 Sulphide concentrator will expand from the Phase 2 sulphide expansion by adding concentrate focused unit operations. During this stage the concentrate production will increase because of increasing feed grades to the process plant.
Key considerations for selecting the process flowsheet included the variable nature of the deposit in terms of feed grade and throughput, as well as minimizing process plant capital costs without compromising reliability.
A summary of the expected process performance is as follows:
• oxide heap leach design throughput of 5.0 Mt/a
• oxide ROM leach following completion of 5.0 Mt/a heap leach operation
• sulphide flotation design mill throughput of 7.2 Mt/a
• sulphide flotation expansion design mill throughput of 14.4 Mt/a
• sulphide flotation concentrate production expansion

Cordero Project P a g e 2 1 8
Preliminary Economic Assessment of the Cordero Silver Project, Chihuahua State, Mexico January 2022
• primary crushing circuit availability of 75%
• secondary and tertiary crushing circuit availability of 85%
• grinding and flotation plant availability of 91.3%
• filtration plant availability of 82.8%.
The overall process flow diagram for the Cordero Project is provided in Figure 17-1 on the following page and described in the sections below.
17.2 Process Flowsheet
The following overview describes the methodology of processing the mined material from the deposit.
Economic mineralization is received from the open pit mine at the Cordero site which includes the following process areas:
• run-of-mine (ROM) pad
• three-stage crushing plant
• ancillary surface infrastructure, such as truck maintenance facilities, sewage treatment, and warehousing.
The process plant includes the following process circuits:
• crushed product handling and storage
• oxide mineralization processing, including:
o crushed oxide agglomeration with water, cement and lime
o heap stacking
o leaching
o solution handling, clarification and Merrill-Crowe precipitation for silver and gold recovery
• sulphide mineralization processing, including:
o ball mill grinding circuit
o flotation and concentrate regrinding for lead-silver flotation and zinc flotation
o concentrate handling by means of thickening, filtration, and loadout and shipping of silver-lead and zinc concentrates
o tailings handling by means of thickening and pumping to the TSF
o reagents handling and storage
o plant services.

Cordero Project P a g e 2 1 9
Preliminary Economic Assessment of the Cordero Silver Project, Chihuahua State, Mexico January 2022
Figure 17-1: Overall Process Flow Diagram
Source: Ausenco, 2021.

Cordero Project P a g e 2 2 0
Preliminary Economic Assessment of the Cordero Silver Project, Chihuahua State, Mexico January 2022
17.3 Plant Design
The Cordero site is a greenfield location consisting of an open pit mine that will utilize direct tipping to feed the gyratory crusher. The coarse primary crushed product reports to either an oxide stockpile or sulphide stockpile by means of a common conveyor and plough system. Material from each of the oxide and sulphide stockpiles is then reclaimed and sent to the respective secondary and tertiary crushing circuits. Final crushed product is stored in their respective stockpiles before being reclaimed to their specific operations, heap leach for oxide material and sequential flotation for sulphide material.
Material reclaimed from the crushed oxide stockpile is agglomerated with lime, cement, and water to bind fines and maintain solution flow through the heap. The agglomerates are conveyed by means of grasshopper conveyors to reach the heap leach pad. The heap leach operation uses a cyanide solution to irrigate the stacked oxide on the heap leach pad and collect the pregnant solution in pregnant solution pond. The pregnant solution is pumped from the pregnant solution pond to the Merrill-Crowe circuit where silver-gold doré bars are produced as a final product. Barren solution from the Merrill-Crowe circuit is returned to the intermediate solution pond which is used to irrigate the heap pad.
The sulphide flotation plant reclaims material from the sulphide crushed material stockpile and conveys it to a closed-circuit ball milling circuit. The cyclone overflow from the milling circuit reports to a sequential flotation circuit where lead-silver and zinc concentrates are recovered. The concentrates are thickened and filtered prior to loadout and transportation. The tailing streams from the flotation circuit report to a final tailings thickener and are pumped to the TSF.
The oxide heap leach operation is shown in Figure 17-2 on the following page within contour 2, this operation will operate independently for the first year before being operated in parallel to the Phase 1 sulphide operation shown in contour 3. The shared primary crushing portion of the process is shown in contour 1. Once the heap leach operation is completed and the Phase 2 sulphide operation is commenced the existing oxide crushing plant will be repurposed to feed the expanded plant shown in contour 4.

Cordero Project P a g e 2 2 1
Preliminary Economic Assessment of the Cordero Silver Project, Chihuahua State, Mexico January 2022
Figure 17‑2: Overall Process Plant Layout
Source: Ausenco, 2021.

Cordero Project P a g e 2 2 2
Preliminary Economic Assessment of the Cordero Silver Project, Chihuahua State, Mexico January 2022
17.3.1 Process Design Criteria
The key process design criteria for the mineral processing facilities, as well as grade and recovery data, are listed in Table 17-1 on the following page.
Table 17-1: Key Process Design Criteria
Criteria Unit Value
Oxide Annual Throughput (Design) t/a 5,000,000
Sulphide Annual Throughput (Design) t/a 7,200,000
Expanded Sulphide Throughput (Design) t/a 14,400,000
Operating Availability – Primary Crushing h/a 6,570
Operating Availability – Secondary and Tertiary Crushing h/a 7,446
Operating Availability – Grinding and Flotation h/a 8,059
Operating Availability – Concentrate and Tailings Handling h/a 7,253
Heap Leach Head Grade, Gold – Design g/t 0.11
Heap Leach Head Grade, Silver – Design g/t 47.2
Heap Leach Head Grade, Gold – Average g/t 0.08
Heap Leach Head Grade, Silver – Average g/t 40.2
Heap Leach Recovery, Gold % 71.7
Heap Leach Recovery, Silver % 60.8
Crushing Feed Size, 100% Passing mm 900
Oxide Crushing Product Size, 80 % Passing – Crushed Product mm 13
Sulphide Crushing Product Size, 80 % Passing – Crushed Product mm 16.5
Heap Leach - Irrigation Rate - Design L/h/m2 12.0
Heap Leach – Pad Type - Multilift
Heap Leach – Number of Pads - 1
Heap Leach – Number of Lifts - 10
Heap Leach – Lift Height - Design m 8
Heap Leach – Cycle - Total days 80
Grinding Product Size, 80% Passing µm 200
Ball Mill Circulating Load - Design % 350
Bond Ball Mill Work Index – Design kWh/t 19.1
Oxide Bond Abrasion Index – Design g 0.365
Sulphide Bond Abrasion Index – Design g 0.264
ROM Head Grade, Lead – Design % 1.0
ROM Head Grade, Zinc – Design % 0.8
ROM Head Grade, Gold – Design g/t 0.37
ROM Head Grade, Silver – Design g/t 62.0

Cordero Project P a g e 2 2 3
Preliminary Economic Assessment of the Cordero Silver Project, Chihuahua State, Mexico January 2022
Criteria Unit Value
ROM Head Grade, Lead – Average % 0.37
ROM Head Grade, Zinc – Average % 0.56
ROM Head Grade, Gold – Average g/t 0.087
ROM Head Grade, Silver – Average g/t 27.9
Silver-Lead Rougher, Silver Stage Recovery % 81.0
Silver-Lead Rougher, Lead Stage Recovery % 89.6
Silver-Lead Rougher, Stage Mass Pull % 2.9
Silver-Lead Regrind Product Size, 80% Passing µm 25
Silver-Lead Cleaner, Silver Total Recovery % 74.8
Silver-Lead Cleaner, Lead Total Recovery % 89.2
Silver-Lead Cleaner, Total Mass Pull % 0.68
Zinc Rougher, Silver Stage Recovery % 8.3
Zinc Rougher, Zinc Stage Recovery % 80.3
Zinc Rougher, Stage Mass Pull % 6.4
Zinc Regrind Product Size, 80% Passing µm 25
Zinc Cleaner, Silver Total Recovery % 9.50
Zinc Cleaner, Zinc Total Recovery % 87.5
Zinc Cleaner, Total Mass Pull % 0.94
Silver-Lead Concentrate Thickener – Unit Area Settling Rate - Design t/m 2/h 0.25
Silver-Lead Concentrate Thickener – Underflow Density % solids (w/w) 65
Zinc Concentrate Thickener – Unit Area Settling Rate – Design Underflow Density t/m 2/h 0.25
Zinc Concentrate Thickener – Underflow Density % solids (w/w) 65
Tailings Thickener – Unit Area Settling Rate – Design Underflow Density t/m2/h 0.50
Tailings Thickener – Underflow Density % solids (w/w) 65
Silver-Lead Filter, Filtration Rate kg/m 2/h 384
Silver-Lead Concentrate Moisture Content % 8.10
Zinc Filter, Filtration Rate kg/m 2/h 384
Zinc Concentrate Moisture Content % 8.10
Silver Recovery to Silver-Lead Concentrate % 74.8
Lead Recovery to Silver-Lead Concentrate % 89.2
Silver-lead Concentrate Grade, Lead % Pb 55.7
Silver-lead Concentrate Grade, Silver g/t 3,773.6
Zinc Recovery to Zinc Concentrate % 87.5
Silver Recovery to Zinc Concentrate % 9.3
Zinc Concentrate Grade, Zinc % Zn 54.6
Zinc Concentrate Grade, Silver g/t 397
Source: Ausenco, 2021.

Cordero Project P a g e 2 2 4
Preliminary Economic Assessment of the Cordero Silver Project, Chihuahua State, Mexico January 2022
17.3.2 Crushing Plant
ROM material is directly tipped into the primary crusher dump pocket which has a capacity for 1.5 truckloads. The dump pocket is equipped with a hydraulic rock breaker to break any oversized rocks. The feed material flows by gravity into the primary crusher.
The primary gyratory crusher is designed to reduce the 100% passing feed size (F100) of 900 mm to an 80% passing product size (P80) of 100 mm when only operating the oxide operation at the beginning of the mine life. Later a product size (P80) of 125 mm is achieved when both oxide and sulphide mineralization are processed. The crushed material is discharged onto the stockpile feed conveyor which can discharge to either the coarse oxide stockpile or the coarse sulphide stockpile. The initial design conveys the crushed mill feed directly to the oxide stockpile. Once the sulphide operation also begins, a diverter system is used to direct the sulphide material towards the coarse sulphide stockpile.
Oxide and sulphide operations have dedicated secondary and tertiary crushing systems. The coarse product from each stockpile is fed to their respective double-deck secondary screen, and the screen oversize is crushed by the secondary cone crusher, operating in an open circuit. The oxide secondary crushing stage reduces the 80% passing size of 125 mm to 43 mm, whereas the sulphide circuit produces a P80 of 56 mm. The secondary crusher discharge combines with the secondary screen undersize, and the material is conveyed to two double-deck tertiary screens. Oversized material from the screen decks report to the tertiary cone crusher bins. Vibrating feeders reclaim stored material and feed the tertiary cone crushers. The tertiary crushers are operated in closed circuit and reduce the F80 of 43 mm to a P80 of 13 mm in the oxide circuit and from the F80 56 mm to a P80 18 mm for the sulphide circuit. The tertiary crushed product is combined with the secondary crusher product prior to returning to the double-deck tertiary sizing screens. The undersize of the tertiary screens provides the final product of each crushing circuit, resulting in 80% passing crushed products of 7 mm in the oxide circuit and 12 mm in the sulphide circuit.
Once the heap leach oxide operation has been completed, the crushing equipment utilized for the oxide processing is reallocated to the sulphide operation to accommodate the increase in sulphide processing throughput. Feeder and conveyor additions will be required during the expansion to redirect the fine feed from the fine oxide stockpile to the new sulphide flotation plant.
The major equipment and facilities include the following:
• primary crusher dump pocket (348-tonne live capacity)
• rock breaker
• 1,370 mm 54x75 gyratory crusher
• stockpile feed conveyor.
Oxide
• two apron reclaim feeders
• 3.05 m x 7.32 m vibrating banana double-deck secondary screen; 75 mm top deck aperture and 30 mm bottom deck aperture

Cordero Project P a g e 2 2 5
Preliminary Economic Assessment of the Cordero Silver Project, Chihuahua State, Mexico January 2022
• 1,780 mm head secondary cone crusher, 30 mm closed side setting (CSS)
• two 3.05 m x 7.32 m vibrating banana double-deck tertiary screens; 30 mm top deck aperture and 13 mm bottom deck aperture
• two tertiary crusher feed surge bins
• two tertiary crusher vibrating pan feeders
• two short head, 1,780 mm tertiary cone crushers, 15 mm CSS
• screen feed and discharge conveyors.
Sulphide
• two apron reclaim feeders
• 3.05 m x 7.32 m vibrating banana double-deck secondary screen; 75 mm top deck aperture and 40 mm bottom deck aperture
• 1,780 mm secondary cone crusher, 45 mm CSS
• two 3.05 m x 7.32 m vibrating banana double-deck tertiary screens; 40 mm top deck aperture and 20 mm bottom deck aperture
• two tertiary crusher feed surge bins
• two vibrating grizzly feeders, 1.6 m wide
• two short head, 1,780 mm, tertiary cone crushers, 18 mm CSS
• screen feed and discharge conveyors.
The feed to the crushers is controlled by adjusting the speed of the vibrating feeders.
17.3.3 Crushed Material Handling
The crusher circuits differ between the oxide and sulphide operations in terms of tertiary crusher setting but otherwise follow the same three-stage crushing flowsheet. The oxide operation reclaims the fine material and processes the material through an agglomerator in preparation for the heap leach. The resulting agglomerates are discharged onto a conveyor before reaching a series of grasshopper conveyors. The grasshopper conveyors convey the agglomerates until they reach a radial stacker, which deposits the agglomerates onto the heap pad. The sulphide circuit utilizes feeders to reclaim the fine crusher product and use a ball mill feed conveyor to supply the flotation plant.
The crushed sulphide mineralization is fed by means of a belt feeder to a belt conveyor. A ball mill feed conveyor weightometer is used to control the throughput of material into the mill.

Cordero Project P a g e 2 2 6
Preliminary Economic Assessment of the Cordero Silver Project, Chihuahua State, Mexico January 2022
The major equipment and facilities in this area include the following:
• crushed product reclaim feeders
• rotary drum agglomerator
• heap leach grasshopper feed conveyors
• radial stacker conveyor
• ball mill feed conveyor and weightometer.
17.3.4 Oxide Mineralization Treatment
17.3.4.1 Heap Leaching
The agglomerated crushed oxide mineralization is stacked on the oxide heap leach pad by a radial stacker throughout the first four years of production. Drip emitters are used for the irrigation of the cyanide solution through the heap leach pad for silver and gold dissolution. Drip irrigation minimizes evaporation, and provides a more uniform distribution of the leach solution through the heap leach pad. Once the solution percolates through the stacked material, the pregnant solution bearing silver and gold flows into the pregnant solution pond and then is pumped to the Merrill-Crowe recovery plant.
Once all of the crushed oxide material has been treated, the heap leach will utilize stacked ROM low-grade oxide material that will have been stacked on a neighbouring pile since the beginning of the operation. This material will have been trucked directly to the heap leach pad, bypassing the crushing circuit, the oxide handling equipment, and the agglomerator. This lower grade material will be leached and utilize the initial Merrill-Crowe system to recover the silver and gold content.
17.3.4.2 Merrill-Crowe Recovery
Pregnant leach solution (PLS) is pumped from the pond to the pregnant solution tank. PLS is mixed with diatomaceous earth and pumped through a pressure leaf clarifier to remove suspended solids and then through a deaeration tower to reduce the dissolved oxygen concentration in solution to below 1.0 mg/L. Cyanide solution, lead nitrate, zinc dust, and additional diatomaceous earth are added to the de-aerated pregnant solution. This allows the silver and gold to precipitate and be collected by the precipitation filter press. The barren solution from the filter is collected in the barren solution tank with a 30-minute residence time and returned to the intermediate solution pond. Cyanide is added to the barren solution tank as required to maintain the required solution strength. Once dried, the precipitate is combined with flux in the induction furnace at 1,250°C and melted and poured into the final doré bar product.
The major equipment required in processing the oxide material include the following:
• pregnant solution tank
• two pressure leaf clarifiers (one operating, one standby)
• deaeration tower
• two precipitate filter presses (one operating, one standby)

Cordero Project P a g e 2 2 7
Preliminary Economic Assessment of the Cordero Silver Project, Chihuahua State, Mexico January 2022
• barren solution tank
• electric mercury retort
• induction furnace.
17.3.5 Grinding
The grinding circuit consists of a ball mill and cyclones operating in closed circuit. The grinding circuit is designed to grind the ball mill feed from an 80% passing size of 12 mm to 200 µm.
The ball mill consists of a double-pinion overflow mill operating in a closed circuit. The mill has an inside diameter of 7.32 m and an effective grinding length of 12.19 m. The mill receives crushed mineralized material and process water at a variable flowrate to achieve the correct discharge pulp density of 72% solids w/w. Soda ash, sodium cyanide, and zinc sulphate are also dosed to the ball mill to condition the feed prior to the flotation circuit, when the carbon pre-float circuit is bypassed. The ball mill discharge passes over the discharge trommel screen with an aperture size of 10 mm x 25 mm. The ball mill is charged with high chrome grinding media at a diameter of 50 to 80 mm by means of the grinding building hoist and ball kibble.
The major equipment and facilities in this area include the following:
• 7.32 m diameter x 12.19 m single-pinion overflow ball mill with a 12,500 kW motor
• hydrocyclone pack and pumping system, 12 cyclones
• grinding media handling system.
Operators monitor the grinding mill discharge density, cyclone overflow and underflow densities, power draw, cyclone pressure, and other parameters to maintain a product size of 200 µm.
A second identical grinding circuit will be added in parallel to expand throughput to 14.4 Mt/a.
17.3.6 Flotation
The flotation circuit at the processing plant consists of silver-lead flotation and zinc flotation circuits. Each circuit is discussed in the following subsections.
17.3.6.1 Carbon Pre-Float Roughers
Production from the sedimentary lithology contains carbonaceous matter that impairs lead and zinc flotation performance. The carbon pre-float circuit is used for processing this material. Four carbon pre-floatation rougher cells are used to remove carbon impurities from the desired final concentrate stream. The mill cyclone overflow reports to a 31 m2 vibrating trash screen to remove any oversize particles or material prior to flotation. The screen undersize feeds the first of four carbon pre-flotation rougher cells, where methyl isobutyl carbinol (MIBC) is added. The pre-float concentrate is fed directly to the final tails thickener. The carbon pre-flotation tails, containing the desired metals in the slurry, reports to the lead-silver conditioning tanks.

Cordero Project P a g e 2 2 8
Preliminary Economic Assessment of the Cordero Silver Project, Chihuahua State, Mexico January 2022
17.3.6.2 Lead-Silver Flotation
17.3.6.2.1 Lead-Silver Rougher Flotation
The purpose of the silver-lead flotation stage is to recover a silver-lead concentrate. The tails from the carbon pre-flotation roughers report to the first of two conditioning tanks where collector (Flottec X5000) and frother are added. When the carbon pre-float circuit is operational, soda ash, MIBC, zinc sulphate, sodium cyanide are also added to the conditioning tanks. Conditioned slurry then flows by gravity to rougher flotation at a nominal density of 25% solids w/w, where the rougher flotation cells are conventional forced air tank cells. The rougher flotation concentrate, recovering 81% of the silver,89.6% of the lead and 2.9% of mass, is collected in the lead-silver regrind pumpbox, and the tails flow to the zinc rougher flotation conditioning tanks.
17.3.6.2.2 Lead-Silver Regrind Circuit
The regrind circuit consists of a cyclone cluster and a vertical high-intensity regrind mill operating in open circuit. Slurry from the surge tank is pumped to the cyclones to densify the feed to the regrind mill. The overflow targets a product size of 25 µm. The cyclone overflow reports to the lead-silver cleaner circuit, while the underflow flows by gravity to the regrind mill. The regrind mill uses ceramic media with a 5 mm diameter and the mill discharge is fed to the lead-silver cleaner circuit.
17.3.6.2.3 Lead-Silver Cleaner Flotation
The lead-silver cleaner circuit consists of three sequential stages of cleaning. The first stage is dosed with soda ash, zinc sulphate, sodium cyanide, and collector to promote concentrate recovery. Soda ash and collector are dosed to the second and third stages. The flotation concentrates flow from the first stage through to the third, and concentrate from the third stage reports to the silver-lead concentrate thickener. The tailings flow counter-currently to the concentrate, and the first cleaner tailings are fed to the zinc cleaner flotation circuit, bypassing the zinc rougher flotation stage.
The major equipment and facilities in the initial bulk flotation area include the following:
• four 50 m3 carbon pre-float rougher cells
• two 150 m3 lead-silver flotation conditioning tanks
• four 300 m3 lead-silver rougher cells
• eleven 20 m3 lead-silver cleaner cells
• 1,600 kW regrind mill
• lead-silver regrind cyclone cluster, 12 cyclones.
The flotation circuits will include the additional equipment below when the sulphide process plant throughput is expanded to 14.4 Mt/a. During this phase, from Year 4 to 8, the additional rougher capacity is required to accommodate the mill feed throughput but due to the diminished head grades during this phase the concentrate production will not exceed the Phase 1 production rate. As a result, the rougher concentrate accumulated from the Phase 2 flotation expansion will be pumped to the Phase 1 flotation cleaner circuit.

Cordero Project P a g e 2 2 9
Preliminary Economic Assessment of the Cordero Silver Project, Chihuahua State, Mexico January 2022
• four 50 m3 carbon pre-float rougher cells
• two 150 m3 lead-silver flotation conditioning tanks
• four 300 m3 lead-silver rougher cells.
Once the head grades begin to increase and ultimately result in exceeding the initial cleaner flotation capacity. additional equipment is also required in the flotation circuit to accommodate concentrate production. This is considered as Phase 3 of the sulphide operation in response to higher head grades expected in Year 9. The additional concentrate focussed unit operations are the following:
• lead-silver regrind cyclone cluster, 12 cyclones
• four 20 m3 lead-silver cleaner cells
• 700 kW regrind mill.
An on-stream analyzer is included to provide real-time assays (Pb, Zn, Fe, Ag) of the major flotation streams for process control and reagent optimization. The on-stream analyzer will include a particle size analyzer for grinding optimization and control.
17.3.6.3 Zinc Flotation
17.3.6.3.1 Zinc Rougher Flotation
The purpose of the zinc flotation circuit is to recover a zinc concentrate with containing silver. Tailings from the silver-lead rougher and first cleaner flotation circuits report to conditioning tanks prior to the zinc rougher flotation circuit, where lime, copper sulphate, MIBC and collector (Flottec X5100) are added. The zinc rougher flotation cells are conventional forced air tank cells. The concentrate of the zinc rougher flotation tank, recovering 9.3% of the silver, 80.3% of the zinc, and 6.4% of mass flows to the zinc regrind pumpbox, while the tailings are fed to the final tailings thickener.
17.3.6.3.2 Zinc Rougher Circuit
The regrind circuit consists of a cyclone cluster and a vertical high-intensity regrind mill operating in open circuit. Slurry from the zinc regrind pumpbox is pumped to the cyclones to densify the feed to the regrind mill. The overflow targets a product size of 25 µm. The cyclone overflow is fed to the zinc cleaner circuit, while the underflow flows by gravity to the regrind mill. The regrind mill uses 2 to 3 mm diameter ceramic media and the mill discharge reports to the zinc cleaner circuit.
17.3.6.3.3 Zinc Cleaner Flotation
The zinc cleaner circuit consists of three sequential stages of cleaning. Collector (Flottec X5100) and frother are used in the zinc cleaning stages which is conducted at pH 11.5 for pyrite depression. The flotation concentrates flow from the first stage to the third, and concentrate from the third stage is fed to the zinc concentrate thickener. The tailings flow counter-currently to the concentrate, and tailings from the first stage are sent to the final tailings thickener.

Cordero Project P a g e 2 3 0
Preliminary Economic Assessment of the Cordero Silver Project, Chihuahua State, Mexico January 2022
The major equipment and facilities in the zinc flotation area include the following:
• two 150 m3 conditioning tanks
• four 200 m3 zinc rougher cells
• eleven 40 m3 zinc cleaner cells
• one 30 m3 cleaner scavenger cells
• 2,000 kW regrind mill
• zinc regrind cyclone cluster, 12 cyclones.
Similar to the lead flotation circuit, the zinc flotation circuit will also approach the phase wise expansions firstly by expanding throughput capacity during Phase 2 of the sulphide operation. The rougher concentrate from the Phase 2 expansion will then be pumped to the Phase 1 cleaner flotation equipment as it has sufficient capacity for this stage of the operation. Equipment added to the zinc flotation circuit following the process plant throughput expansion to 14.4 Mt/a include the following:
• two 150 m3 conditioning tanks
• four 200 m3 zinc rougher cells.
During Phase 3 when the head grades start increasing and combined with the doubled throughput, concentrate production will start exceeding the Phase 1 cleaner flotation equipment capacity. During this stage, the following equipment will be included in the zinc flotation circuit to achieve the desired concentrate production rate in Year 9:
• zinc regrind cyclone cluster, 12 cyclones
• three 40 m3 zinc cleaner cells
• seven 30 m3 zinc cleaner cells
• 2,000 kW regrind mill.
17.3.7 Concentrate Handling
The concentrate handling circuit consists of thickening and filtration equipment required to dewater the lead-silver and zinc concentrate prior to loadout and shipment. Each concentrate stream reports to a dedicated high-rate thickener, where flocculant is added to assist in the settling of the solids. The thickener overflows are sent to the process water tank, while the underflows are fed to dedicated filter feed tanks with a residence time of 12 hours.
The lead-silver and zinc thickener underflows each report to a dedicated concentrate filter at a nominal pulp density of 65% solids w/w. The membrane filter presses discharge filter cakes at an assumed target moisture content of 8.1% w/w for both the lead-silver and zinc concentrates. The filters discharge to two indoor stockpiles, one for the lead-silver concentrate and one for the zinc concentrate, each with a 12-hour storage capacity.

Cordero Project P a g e 2 3 1
Preliminary Economic Assessment of the Cordero Silver Project, Chihuahua State, Mexico January 2022
The concentrates are reclaimed from the stockpiles by a front-end loader and loaded into a hopper and conveyor feeding system to be shipped in bulk.
The major equipment and facilities in this area include the following:
• 8 m diameter high-rate zinc concentrate thickener
• 8 m diameter high-rate lead-silver concentrate thickener
• 113 m3 lead-silver filter feed tank
• 198 m3 zinc filter feed tank
• 60 mm vertical chambers, horizontal plate filter for lead-silver filtration
• 25 mm vertical chambers, horizontal plate filter for zinc filtration
• flocculant dosing system
• outdoor concentrate storage areas.
The thickener performance is controlled to achieve the target underflow densities required for filtration. The filter cycle times are adjusted as necessary to achieve the required filter cake moistures.
As the sulphide plant operation expands the concentrate production will only exceed the initial equipment capacity in Year 10 in Phase 3. For this reason, additional concentrate thickeners and filter presses will not be required during Phase 2 as the concentrate production is still within the initial equipment design capacities. As the head grades increase in Phase 3, the following equipment will be required in the concentrate handling area once the concentrate production is increased:
• 8 m diameter lead-silver concentrate thickener
• 113 m3 lead-silver filter feed tank
• 8 m diameter zinc concentrate thickener
• 198 m3 zinc filter feed tank
• 60 mm vertical chambers, horizontal plate filter for zinc filtration
• 30 mm vertical chambers, horizontal plate filter for lead-silver filtration.
17.3.8 Tailings Handling
Tailings from the flotation circuits report to a tailings thickener, where flocculant is added to promote settling of the solids. The overflow gravitates to the process water tank, while the underflow is pumped approximately 6.4 km from the plant to the TSF at a density of 65% solids w/w.

Cordero Project P a g e 2 3 2
Preliminary Economic Assessment of the Cordero Silver Project, Chihuahua State, Mexico January 2022
The major equipment and facilities in this area include the following:
• 46 m diameter high-rate elevated tank tailings thickener
• ancillary equipment including pumpboxes, pumps, and compressors
• flocculant dosing system.
The thickener performance is controlled to achieve the target underflow densities required for tailings disposal.
A second 46 m diameter high-rate elevated tank tailings thickener and miscellaneous equipment will be added to account for the increased throughput to 14.4 Mt/a.
17.3.9 Reagents Handling and Storage
Reagents and operating consumables used in the process are summarized in Tables 17-2 and 17-3, respectively. These values were calculated based on an oxide processing throughput of 5.0 Mt/a in Year -1, an oxide and sulphide mill throughput of 5.0 Mt/a and 7.2 Mt/a, respectively, for Years 1 through 4, and a sulphide mill throughput of 14.4 Mt/a for Year 5 and thereafter. Reagent and consumable consumption rates were derived from testwork presented in Section 13 of this report.
Table 17-2: Reagent Consumption Summary
Reagent
Year -1 Years 1 to 4 Years 5+
Consumption
(g/t)
Consumption
(t/a)
Consumption
(g/t)
Consumption
(t/a)
Consumption
(g/t)
Consumption
(t/a)
Cement 8,000 40,000 8,000 40,000 N/A N/A
Lime 2,000 10,000 3,377 19,916 1,377 19,832
Diatomaceous Earth 300 1,501 300 1,501 N/A N/A
Zinc Powder 24 118 24 118 N/A N/A
Lead Nitrate 100 499 100 499 N/A N/A
Sodium Cyanide 350 1,750 403 378 53 756
Antiscalant 24 121 34 193 10 144
Soda Ash N/A N/A 357 2,570 357 5,141
Depressant (Zinc Sulphate) N/A N/A 158 1,134 158 2,268
Activator (Copper Sulphate) N/A N/A 169 1,213 169 2,426
Collector (Flottec X5100) N/A N/A 14 103 14 205
Frother (MIBC) N/A N/A 195 1,402 195 3,623
Collector (Flottec X5000) N/A N/A 14 101 14 202
Flocculant N/A N/A 60 432 60 864
Source: Ausenco, 2021.

Cordero Project P a g e 2 3 3
Preliminary Economic Assessment of the Cordero Silver Project, Chihuahua State, Mexico January 2022
Table 17-3: Consumable Consumption Summary
Consumable Unit
Year -1 Years 1 to 4 Years 5+
Consumption
(Qty/a)
Consumption
(Qty/a)
Consumption
(Qty/a)
Gyratory Crusher Kit set 4 4 4
Secondary Crusher Kit set 6 12 12
Tertiary Crusher Kit set 6 12 12
Precipitation Filter Cloth set 3 3 N/A
Clarifier Filter Cloth set 4 4 N/A
Crucibles set 1 1 N/A
Baghouse Cartridges set 12 12 N/A
Ball Mill Media kg N/A 5,299,200 10,598,400
Ball Mill Liners set N/A 1 2
Lead Regrind Mill Media kg N/A 110,560 221,120
Lead Regrind Mill Liners set N/A 1 2
Zinc Regrind Mill Media kg N/A 133,120 266,240
Zinc Regrind Mill Liners set N/A 1 2
Lead Filters set N/A 14 18
Zinc Filters set N/A 14 18
Source: Ausenco, 2021.
17.3.9.1 Cement
Cement is received on site from bulk road tankers and transferred into a 200-tonne silo. The cement is used as a binder in the heap leaching circuit.
17.3.9.2 Lime
Quicklime is received on site from bulk road tankers and pneumatically transferred into either a 175-tonne silo for the oxide operation or a 70-tonne silo for the sulphide operation. Lime is administered in dry form in the oxide circuit to act as a binder prior to heap leach. In the sulphide process, lime is administered as a slurry in the flotation circuit to act as a pH modifier.
Lime is slaked in a tank as required to create a slurry with a density of 20% solids w/w. The slurry is stored in a tank with a 12-hour residence time and is circulated in a ring main for distribution throughout the plant.
17.3.9.3 Diatomaceous Earth
Diatomaceous earth is used as a clarifier filter aid in the Merrill-Crowe circuit during the first six years of mill operations. It is delivered on site as a fine solid in 1,000 kg bulk bags.
17.3.9.4 Zinc Powder
Ultra-fine zinc is added to the Merrill-Crowe circuit and is delivered to site in powder form in 750 kg bags.

Cordero Project P a g e 2 3 4
Preliminary Economic Assessment of the Cordero Silver Project, Chihuahua State, Mexico January 2022
17.3.9.5 Lead Nitrate
Lead nitrate is delivered to site in 25 kg bulk bags and is used as a silver lixiviant and precipitation activator in the Merrill-Crowe circuit.
17.3.9.6 Cyanide
Sodium cyanide is used for silver and gold leaching in the heap leach and as a depressant in the sulphide mill feed flotation circuits. Sodium cyanide briquettes are delivered on site in 18 kg isotainers and are mixed with caustic and water in a cyanide mixing tank. The solution is transferred to the cyanide solution storage tank and supplied to the process by dosing pumps.
17.3.9.7 Soda Ash
Soda ash is delivered to site as a dry powder in 1,000 kg bulk bags and is used as a flux in the heap leach refinery and as a pH modifier in the sulphide mill feed flotation circuits.
17.3.9.8 Depressants
Zinc sulphate monohydrate is received on site as a dry powder in 1,000 kg bulk bags. The bags are emptied into tanks and mixed with raw water to a solution concentration of 15% w/w. The tanks have a residence time of 24 hours, and the reagents are pumped to the required locations by dosing pumps.
17.3.9.9 Activators
Copper sulphate pentahydrate is received on site as a dry powder in 1,000 kg bags. The bags are emptied into a mixing tank with a 24-hour residence time and mixed with raw water to produce a solution at 15% concentration w/w. The reagent is then dosed to the circuit by pumps as required.
17.3.9.10 Collectors
Both X5100 and X5000 is delivered on site as a liquid in 1,000 kg intermediate bulk containers (IBCs). Dosing pumps deliver the reagents without dilution to the required locations within the flotation circuits.
17.3.9.11 Frother
Methyl isobutyl carbinol (MIBC) is received on site in liquid form in 1,000 kg IBCs. The solution is dosed to the process by pumps as required.
17.3.9.12 Flocculant
Flocculant is received on site as a dry powder in 750 kg bags. The powder is stored in a hopper with a five-day residence time, and mixed to a strength of 0.25% w/v. The solution is stored in a tank with a 12-hour residence time and pumped to the process as required by dosing pumps.

Cordero Project P a g e 2 3 5
Preliminary Economic Assessment of the Cordero Silver Project, Chihuahua State, Mexico January 2022
17.3.9.13 Antiscalant
Antiscalant is used to prevent the build-up of scale in the heap leach irrigation lines and in the process solution pipes. It is delivered on site in 1,000 kg IBCs.
17.3.10 Plant Services
17.3.10.1 Process Water
Process water used throughout the processing plant is recovered from thickener overflows and reused. No process water is used in the Merrill-Crowe circuit, as raw water is required. Approximately 1,780 m3/h of process water is used in the 7.2 Mt/a sulphide processing plant, while 1,440 m3/h is recovered. After the expansion, 3,552 m3/h is used in the processing plant and 2,871 m3/h is recovered. Makeup process water is used to meet the remaining process water requirements.
17.3.10.2 Raw Water
Raw water is received at the raw water tank, which has a live capacity of 24 hours. Raw water is distributed to the plant by raw water pumps that operate in continuous recirculation with the tank. Approximately 72 m3/h of raw water is required for oxide processing, 3.91 m3/h is required for the sulphide processing throughout Years 1 through 4, and 7.82 m3/h is required for the sulphide processing in Year 5 and thereafter.
17.3.10.3 Fire Water
Fire water for the process plant is sourced via the local municipality pipeline to an on-site tank. A dedicated pump skid consisting of an electrical pump, jockey pump, and diesel pump will supply water to a fire water reticulation system that services the concentrator. The raw water tank level will maintain a minimum level of water for use by the fire water system.
17.3.10.4 Potable Water
Potable water is sourced from an existing pipeline connected to the local town supply system and stored in a tank for distribution to the concentrator site.
17.3.10.5 Gland Seal Water
Gland seal water is sourced from the raw water tank and pumped to various users throughout the concentrator.
17.3.10.6 Air Services
Plant air compressors supply air at 750 kPa to various users throughout the concentrator, and an air dryer provides instrument air as required.
The concentrate and tailings filters have dedicated compressors to service the air-drying requirements.
Flotation air blowers provide lower pressure air to the flotation cells at 45 kPa.

Cordero Project P a g e 2 3 6
Preliminary Economic Assessment of the Cordero Silver Project, Chihuahua State, Mexico January 2022
18 PROJECT INFRASTRUCTURE
Infrastructure to support the Cordero project will consist of site civil work, heap leach facility, site facilities/buildings, on-site roads, a water management system, and site electrical power. Site facilities will include both mine facilities and process facilities, as follows:
• mine facilities include the administration offices, truckshop and washbay
• process facilities include the process plant, crusher facilities, process plant workshop, and assay laboratory, heap leach facility, tailings storage facility (TSF) and rock storage facility (RSF)
• common facilities include a gatehouse and administration building
• both the mine facilities and process facilities will be serviced with potable water, fire water, compressed air, power, diesel, communication, and sanitary systems.
18.1 Overall Site Layout Development
Site selection was based on the following observations and factors:
• select a site within the Discovery Silver’s claim boundary
• avoid building and stockpiling on wetlands to the extent possible
• locate the oxide plant closer to the heap leach facility
• locate the rock storage facility near the mine pits to reduce haul distance
• locate the primary crushing and run-of-mine pad to reduce hauling from all pits over the life of mine
• locate the process plant in an area with reduced risk of flooding
• take advantage of the natural terrain for TSF location
• arrange the administration building, processing plant and offices in close proximity
The Cordero site layout is shown in Figure 18-1.

Cordero Project P a g e 2 3 7
Preliminary Economic Assessment of the Cordero Silver Project, Chihuahua State, Mexico January 2022
Figure 18-1: Overall Site Layout
Source: Ausenco, 2021.

Cordero Project P a g e 2 3 8
Preliminary Economic Assessment of the Cordero Silver Project, Chihuahua State, Mexico January 2022
18.2 Site Preparation
The existing public road will be connected to the project for site access. The typical method of clearing, topsoil removal, and excavation will be employed, incorporating drains, safety bunds and backfilling with granular material and aggregates for road structure.
Forest clearing and topsoil removal is expected to be required to allow construction of the processing plant and other buildings and facilities. Site civil work includes design for the following infrastructure:
• light vehicle and heavy equipment roads
• access roads
• topsoil and overburden stockpile area
• mine facility platforms and process facility platforms
• heap leach facility
• water management ponds and ditches and channels
• tailings storage facility
• rock storage facilities.
18.3 Stockpiles
The material mined from the pit will be diverted to four destinations depending on the grade and material type. The barren stripping material will be sent to the rock storage facility while the low grade mineralized oxides will be sent to the heap leach pad without crushing and the higher grade oxides will be crushed and send to the heap leach pad. The mineralized sulphides will be crushed and sent to the mill feed stockpile.
Mineralized sulphides mined during Year -1 will be stockpiled in the mill feed stockpile. Material from the mill feed stockpile will feed the primary crusher from Year 1 onwards. All mill feed is currently envisioned to be hauled from the pit rim by 240-tonne trucks. The stockpiles are shown in Figure 18-1.
18.4 Rock Storage Facilities
Waste rock storage facilities are planned for waste material from the open pit. In general, design considerations assumed an overall reclaimed slope of 2:1 and a swell factor of 30%. Total waste rock capacity is 120 Mm3 or approximately 200 Mt.
All stockpiles and rock storage facilities are planned to avoid existing waterbodies and water courses. Refer to Section 16.7 for details on Rock Storage Facilities.

Cordero Project P a g e 2 3 9
Preliminary Economic Assessment of the Cordero Silver Project, Chihuahua State, Mexico January 2022
18.5 Mining Infrastructure
18.5.1 Haul Roads
Haul roads with the following characteristics will be connected to the process plant, rock storage facility, mill feed stockpile, heap leach pad and TSF:
• draining and safety berms where appropriate
• 22 m width, with a dual-lane running width and berms on both edges
• sized to handle 240-tonne payload rigid-frame haul trucks
• 10% maximum grade.
The haul roads are shown in the project layout drawing in Figure 18-1.
18.5.2 Explosives Facilities
The explosives mixing plant and magazine building will be a 10 m high one-storey 20 m long x 20 m wide pre-engineered building. Explosives and accessories will be transported to the mine pits as needed.
18.5.3 Truckshop/Truckwash
The truckshop building will be located near the crushing area. The building will be used to maintain haul trucks and for spare parts storage. The building will be supported on conventional pad footings with gravel flooring.
The truckwash building at the site will be adjacent to the truckshop building on the truck pad. The building will be used for washing haul trucks and will be supported on a reinforced concrete raft foundation.
Figure 18-2 shows the truckshop, washbay, mine warehouse, tire storage area, fuel station, and office.
18.5.4 Mine Warehousing, Office & Workshops
The truckshop warehouse will be located to the east of the truckshop building and will be used to store parts and mine maintenance equipment. The foundation of the truckshop warehouse will be reinforced concrete slab on grade.
The truckshop office with lunchroom and washroom will be located between the two truckshops. The truckshop office will have a pre-cast concrete block foundation.
The tire change building will be used to store, maintain, and replace haul truck tires. The building will be supported by a reinforced concrete slab on grade.

Cordero Project P a g e 2 4 0
Preliminary Economic Assessment of the Cordero Silver Project, Chihuahua State, Mexico January 2022
Figure 18-2: Truckshop, Washbay, Mine Warehouse, Tire Storage Area, Fuel Station, and Office
Source: Ausenco, 2021.
18.6 Roads and Logistics
18.6.1 Access to Site
The site can be accessed by a series of unpaved roads from federal Highway 24, approximately 11 km to the west-southwest. Some of these roads are in flood-prone corridors and are unsuitable for mine construction and operation traffic. A new all-weather road will need to be constructed to access the mine site from Highway 24.
To avoid conflicts with the local ejido (see Section 20.5.1), the alignment of the mine access road may include relocation of the road to the south side of the project area. Further evaluation of the location of the mine access road will be completed as part of the future studies.
18.6.2 Plant Site Roads
The roads within the process plant area will be generally 6 m wide, integrated with process plant pad earthworks, and designed with adequate drainage. The roads will allow access between the administration building, warehouses, mill building, crushing buildings, stockpile, mining truckshop, and the top of the mill feed stockpile.
18.7 On-Site Infrastructure
The plant site consists of the necessary infrastructure to support the processing operations. All infrastructure buildings and structures will be built and constructed to all applicable codes and regulations. The plant site layout showing facilities is provided in Figure 18-1.

Cordero Project P a g e 2 4 1
Preliminary Economic Assessment of the Cordero Silver Project, Chihuahua State, Mexico January 2022
18.7.1 Power Supply
On-site power supply is phased into three stages based on power demand. Maximum power demand during Year -1 of operation will be 8.55 MW, for which one 10/13.3 MVA transformer is chosen (Table 18-1). The maximum power demand in Year 1 of operation will be 27.55 MW, for which two 15/19.95 MVA transformers will be added to the existing power supply for a total available capacity of 36.1 MW (Table 18-2).
Table 18-1: Stage 1 – Year -1 Power Demand
Year -1 Values
Maximum Demand in Megawatts (MW) 8.55
Transformer Size Chosen 10/13.3 MVA
Source: Ausenco, 2021.
Table 18-2: Stage 2 – Year 1 Power Demand
Year 1 Values
Maximum Demand in (MW) 27.55
Transformer Size Chosen 2 x 15/19.95 MVA
Source: Ausenco, 2021.
During Year 4, the plant will be expanded, requiring an additional 21.1 MW of power. This additional power demand will be accommodated by adding two 10/13.3 MVA transformers to the overall power supply (Table 18-3). The total power supply on site will be 57 MW.
Table 18-3: Stage 3 – Year 4 Power Demand
Year 4 Values
Maximum Demand in (MW) 21.185
Transformer Size Chosen 2 x 10/13.3 MVA
Source: Ausenco, 2021.
18.7.2 Warehousing, Office and Workshops
18.7.2.1 Administration Building
The administration offices will be located south of the process plant in a single-storey modular building placed on pre-cast concrete block footings. The building will have HVAC, and will contain offices, meeting rooms, a lunchroom, washrooms, men’s and women’s dry, lockers, a first-aid area, and showers that will accommodate all the G&A staffing. The mill office will be located in the main administration building.
The administration building will be 2.7 m in height, 24 m in length, and 24 m in width.

Cordero Project P a g e 2 4 2
Preliminary Economic Assessment of the Cordero Silver Project, Chihuahua State, Mexico January 2022
18.7.2.2 Maintenance Shop and Warehouse Building
The dimensions of the maintenance shop and warehouse building on site are listed in Table 18-4. The building will be located south of the process plant, and will be used as a warehouse to store process plant equipment spares, to maintain and store light vehicles and process plant equipment, as well as for general storage. The building will be supported on a reinforced concrete slab on grade.
The security gatehouse will be a modular building with an office, computer room, and washrooms. The building will be located at the intersection of the site roads and public roads.
Table 18-4: Description of On-Site Buildings
WBS Building Name Construction
Type L
(m) W
(m) H
(m) Area (m2)
2410 Reagent Storage No. 1 Fabric 24 18 432
2410 Reagent Storage No. 2 Fabric 24 18 432
2430 Plant Storage Warehouse Fabric 24 18 18.4 432
2430 Plant Maintenance Shop Fabric 24 18 18.4 432
2450 Main Administration Building & Mill Office Modular 24 24 2.7 595
2450 Gatehouse Modular 3 12 2.7 37
2450 Emergency Medical Services Modular 6 12 2.7 74
2450 Kitchen Modular 6 12 2.7 74
2450 Mess Hall Modular 24 24 2.7 595
2450 Mill Office Modular 9 12 2.7 111
3100 Control Room Modular 3 6 2.7 19
Source: Ausenco, 2021.
18.7.2.3 Additional Buildings
Additional buildings on site include the reagent storage buildings. The first building will be installed in Year -2 during construction, and the second will be installed in Year 3 during plant expansion. The building type and dimensions are shown in Table 18-4 above.
Additional buildings also include an environmental monitoring system building, a kitchen, dining mess, laboratory and control room, all of which will be built in Year -2.
18.8 Off-Site Infrastructure
18.8.1 Main Access Road
The site can be accessed by a series of unpaved roads from federal Highway 24, approximately 11 km to the west-southwest as shown in Figure 18-1. The entrance to the mine site will be via the gatehouse.

Cordero Project P a g e 2 4 3
Preliminary Economic Assessment of the Cordero Silver Project, Chihuahua State, Mexico January 2022
18.8.2 High-Voltage Power Supply
A major power transmission corridor crosses the southeast corner of the claim block approximately 1.5 km from the proposed pit. The existing transmission lines in this corridor do not have sufficient capacity to supply the planned operation according to CFE, the national power authority. However, additional lines can be built from the Camargo II power plant near Santa Rosalia de Camargo, approximately 75 km to the northeast, utilizing the same corridor.
In 2011, CFE provided a study regarding the construction of a new 230 kV power transmission line to the Cordero mine site. The proposal included 75 km of new towers and a conductor, as well as a new 230 kV feeder at the Camargo II substation (Figure 18-3).
18.8.3 Water Supply
The Cordero project lies within the Valle de Zaragoza aquifer, as designated by the National Water Commission (CONAGUA). This aquifer system is in an unrestricted zone and not subject to a ban on groundwater extraction. The mine site is located approximately 2 km north of the Arroyo San Juan, an intermittent stream flowing through alluvial materials. The mine site is located in an area where the aquifer is entirely with the bedrock.

Cordero Project P a g e 2 4 4
Preliminary Economic Assessment of the Cordero Silver Project, Chihuahua State, Mexico January 2022
Figure 18-3: Proposed CFE 230 kV Transmission Line from Camargo II to Cordero Mine Site
Source: Levon, 2018.
Construction of a 75 km. 230 kv overhead high voltage line, gauge 1113 KCM, ACSR conductor, supported on steel towers, from the Camargo II substation to the Cordero Mine substation.
Construction of a 230 kV feeder in Camargo II substation.

Cordero Project P a g e 2 4 5
Preliminary Economic Assessment of the Cordero Silver Project, Chihuahua State, Mexico January 2022
18.9 Heap Leach Facility
The heap leach facility for the Cordero project will be located west of the rock storage facility and east of the process plant. The heap leach facility consists of the following system components:
• heap leach pad
• liner system
• solution collection system
• ponds
• diversion channel.
The heap leach pad has been designed in one phase to provide enough stacking area for the crushed and run-of-mine mineralized material per the mine plan. Construction activities include preparing the pad foundation, installing the liner, installing the solution collection system, excavating the ponds, and constructing a perimeter diversion channel prior to commencing mineralized material stacking and leaching. The total capacity of the pad is 19 Mm3 (43 Mt of mineralized material), however, the mine plan is designed for 29 Mt. Figure 18-4 on the following page shows the fully staked heap leach facility.
18.9.1 Heap Leach Pad
The heap leach pad consists of a perimeter berm, pad liner system, and a solution collection system to collect and convey the solution to the silver recovery plant. The leach pad has an approximate final footprint area of 647,000 m2. The heap leach pad is designed to be operated as a fully drained system with no leachate solution storage within the pad.
Prior to the start of construction, the pad foundation must be prepared. Foundation preparation involves stripping the topsoil and vegetation and removing any oversize rocks. The topsoil will be stockpiled at a convenient location and used for reclamation of the heap leach facility at closure. The underlying soils will be excavated down to a competent, stable foundation to provide a uniform and graded surface for the pad liner. Grading and backfill will be used to level the surface and to ensure that the pad grading will promote solution flow towards the collection piping system and ponds. A minimum pad grade of 2.5% is required.
18.9.2 Liner System
A liner system is planned to maximize solution recovery and minimize environmental impacts. The liner system consists of a combination of synthetic and natural materials to provide solution containment that meets the accepted standards for leach pad design.
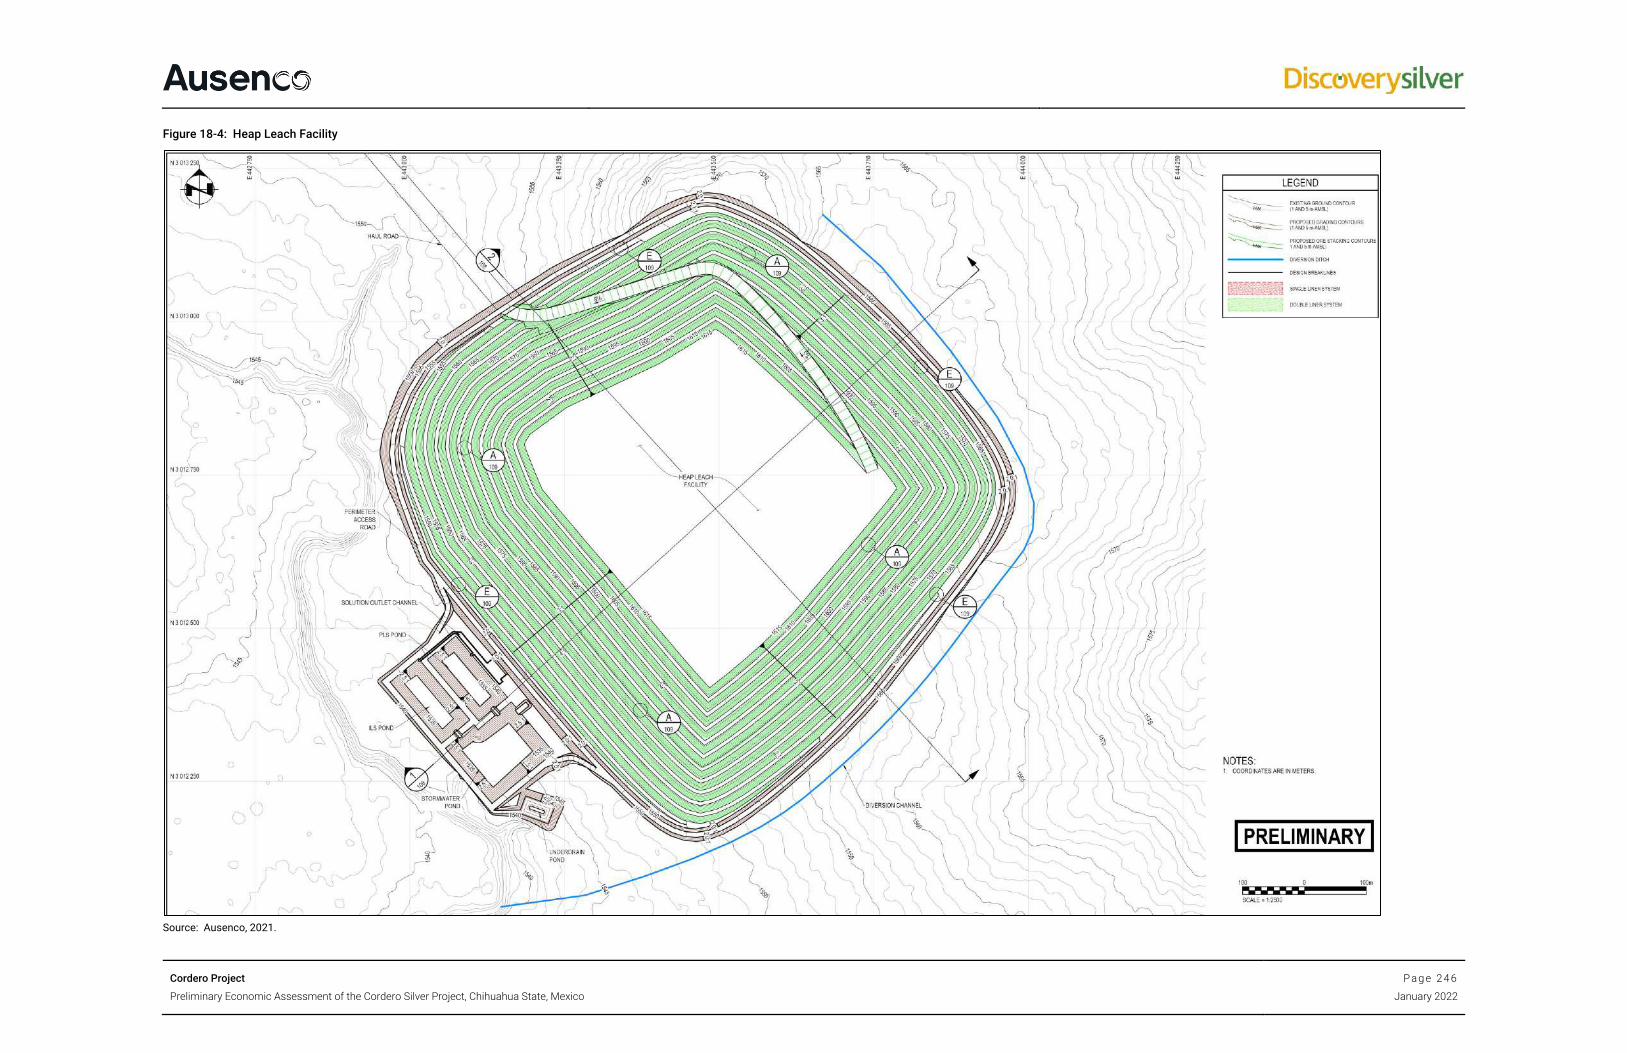
Cordero Project P a g e 2 4 6
Preliminary Economic Assessment of the Cordero Silver Project, Chihuahua State, Mexico January 2022
Figure 18-4: Heap Leach Facility
Source: Ausenco, 2021.

Cordero Project P a g e 2 4 7
Preliminary Economic Assessment of the Cordero Silver Project, Chihuahua State, Mexico January 2022
A liner system has been developed for the pad using an engineered composite single liner design. The liner system is designed to be installed as the primary liner system under the entirety of the heap leach pad. The liner system consists of the following components (from top to bottom):
• 0.5 m thick overliner layer
• 2.5 mm smooth high-density polyethylene (HDPE) geomembrane liner
• 0.5 m thick low permeability layer
• prepared subgrade.
A protective overliner layer of approximately 0.5 meters of coarse crushed mineralized material/waste will be placed over the entire liner system footprint to protect the liner’s integrity from damage during mineralized material placement. The overliner acts as the drainage layer, allowing solution drainage into the pipe collection system. The overliner material must be competent and free from fines.
The liner system will extend to the top of the perimeter berms to provide full containment. The synthetic liner will be anchored and backfilled in a trench along the heap leach pad perimeter and perimeter berms to ensure that mineralized material loading does not compromise the liner coverage of the heap leach pad footprint.
The perimeter berm will be constructed as part of the liner tie-in around the perimeter of the pad footprint to ensure that heap solution is contained within the pad and to prevent surface runoff entering the pad collection system.
18.9.3 Heap Leach Facility Solution Collection System
Collection and recovery of solution is facilitated by the solution collection system in conjunction with the heap leach liner and overliner. The collection system consists of the following pipe and sump components:
• lateral collection pipes
• header pipes
• process ponds
o pregnant leach solution (PLS) pond
o intermediate leach solution (ILS) pond.
The proposed solution collection system is designed to facilitate quick and efficient solution conveyance off the pad to reduce the potential risk of solution losses through the liner system. The entire piping system will be constructed from perforated corrugated Advanced Drainage Systems (ADS) plastic piping, which is embedded within the overliner layer.
Lateral collection pipes of 100 mm will be spaced approximately 16 meters apart under the entire pad footprint, and will feed directly into the 300 mm collection header pipes which then flow into the 450 mm main header. The main header pipes will be positioned along the centerline of each heap leach pad cell and terminate at the upstream toe of the perimeter berm

Cordero Project P a g e 2 4 8
Preliminary Economic Assessment of the Cordero Silver Project, Chihuahua State, Mexico January 2022
by the toe of the stacked mineralized material. Solution will then be conveyed to the process ponds through solid HDPE. The solid HDPE pipes will be fitted with gate valves to allow solution to be directed to one of the two process ponds.
18.9.4 Underdrain System
An underdrain system will be installed underneath the pad and process ponds to capture any groundwater flows and possible leaks from the heap leach pad. The underdrain system will consist of lateral 100 mm perforated ADS pipes and 300 mm header perforated ADS pipes installed in excavated trenches. The trenches with the pipes are then backfilled with drain gravel to allow the flow of water. The header underdrain pipe is connected to the underdrain collection pond downstream of the process and stormwater ponds.
18.9.5 Heap Leach Facility Ponds
18.9.5.1 Stormwater Pond
The stormwater pond is designed to provide storage for excess solution and runoff generated as a result of rainfall events. The pond is situated immediately downgradient of the heap leach facility, and pond flows are conveyed via a stormwater pond pipe from the heap leach pad or via spillways from the process ponds. The stormwater pond is designed to meet the following design criteria:
• storage capacity to contain the excess solution and surface runoff from the 100 mm 100-year, 24- hour storm event without discharge
• 1.5 m freeboard
• total pond storage capacity 64,105 m3.
The liner system for the stormwater pond consists of the following components (from top to bottom):
• 2.0 mm single-sided textured HDPE geomembrane liner
• 0.5 m thick low permeability layer
• prepared subgrade.
18.9.5.2 PLS and ILS Ponds
PLS and ILS ponds are designed to provide storage for solution to be pumped to the ADR plant. The ponds are situated immediately downgradient of the heap leach facility, and pond flows are conveyed via solution collection piping. The PLS and ILS ponds are designed to meet the following design criteria:
• the PLS and ILS ponds are designed to contain up to 24 hours of solution assuming a maximum heap discharge rate of 800 m3/h
• 1.5 m freeboard

Cordero Project P a g e 2 4 9
Preliminary Economic Assessment of the Cordero Silver Project, Chihuahua State, Mexico January 2022
• PLS and ILS ponds are designed with a capacity of approximately 19,200 cubic meters.
Excess solution flows to any of these ponds will be diverted to the stormwater pond via spillways.
The liner system for the stormwater pond will include a leak collection and recovery system (LCRS) and consists of the following components (from top to bottom):
• 2.0 mm single-sided textured HDPE geomembrane liner
• geocomposite
• 1.5 mm double-sided textures HDPE geomembrane liner
• 0.5 m thick low permeability layer
• prepared subgrade.
18.9.5.3 Heap Leach Facility Underdrain Pond
The underdrain pond is designed to provide storage for groundwater flows from underneath the pad or any possible leaks from the heap leach pad or process ponds. The underdrain pond is situated downstream of the stormwater pond to allow gravity flows.
The assumed underdrain pond capacity is 1,275 m3. The liner system for the underdrain pond consists of the following components (from top to bottom):
• 2.0 mm single-sided textured HDPE geomembrane liner
• 0.5 m thick low permeability layer
• prepared subgrade.
18.9.6 Heap Leach Facility Diversion Channel
The surface water management system proposed for the heap leach facility consists of a diversion channel constructed around the east perimeter of the heap leach facility to intercept overland surface runoff around the heap leach facility pad and to convey surface water away from the active site.
Lining and protection of the ditch channels from erosion and scouring may be required for all permanent ditches.
18.10 Tailings and Waste Disposal
Waste disposal for the Cordero Project includes a tailings storage facility (TSF).

Cordero Project P a g e 2 5 0
Preliminary Economic Assessment of the Cordero Silver Project, Chihuahua State, Mexico January 2022
18.10.1 Basis for PEA Level Design and Cost Estimate
Knight Piésold evaluated TSF requirements and costs for a mill processing rate of 20,000 tonnes per day (t/d) for Years 1 to 3 and 40,000 t/d for Years 4 to 16. That information was used to evaluate a TSF that can accommodate a mineralized material reserve of 250 million tonnes (Mt) with an operating life of 20 years. The equipment and operating costs for the previous 40,000 t/d TSF were adapted to the modified throughput and the tailings impoundment capital construction costs for the 250 Mt capacity were used in this analysis.
The facility evaluated for 250 Mt of tailings storage capacity will require a tailings embankment raised to an elevation of approximately 1,611 masl. This facility is represented in Figures 18-6 to 18-8. The schedule of capital expenditures has been adjusted to reflect a reduced mining and processing rate.
Pumping and piping equipment requirements for this PEA are assumed based on experience with similar sized facilities and throughputs. Additional engineering will be carried in out in subsequent phases to design pumping and pipeline requirements for the facility.
Capital costs for the facility presented herein assume that only the upstream face of the TSF embankment will be lined and that the basin will be unlined. Mexican Federal regulations presented in NOM-141-SEMARNAT-2003 govern the design, operation, and closure of tailings disposal facilities in Mexico. Requirements for lining TSFs are based on geochemical considerations and the potential for impact to water resources. Subject to the results of future site characterization efforts (refer to Section 18.10.4.2), liner requirements can be evaluated.
18.10.2 Design Criteria
Key design criteria for this PEA level design and cost estimate are summarized in Table 18-5.
Table 18-5: TSF Design Criteria
Criteria Value Source
Processing Rate 20,000 t/d (Years 1-3); 40,000 t/d (Years 4-20) Knight Piésold
Mineralized Material Reserve
250,000,000 tonnes IMC
Mine Life 20 years IMC
Tailings Properties Conventional slurry, 65% solids by weight Discovery Silver
TSF Liner Geomembrane on upstream face of TSF embankment; cut-off trench to bedrock at upstream toe of dam
Discovery Silver, Knight Piésold
Stage 1 Waste rock and select filter materials to elevation 1590.5 masl Knight Piésold
Stage 2 Waste rock and select filter materials to elevation 1590.5 masl, downstream raise Knight Piésold
Stage 3 Waste rock and select filter materials to elevation 1600.0 masl, downstream raise Knight Piésold
Stage 4 Waste rock and select filter materials to elevation 1606.0 masl, downstream raise Knight Piésold
Stage 5 Waste rock and select filter materials to elevation 1611.0 masl, downstream raise Knight Piésold
Post-Deposition Tailings Density
1.41 t/m3 Discovery Silver
Tailings Grind P80 = 200 µm. P80 equals the particle size at which 80% is finer. Discovery Silver
Specific Gravity 2.7 Discovery Silver
Source: Knight Piesold, 2021.

Cordero Project P a g e 2 5 1
Preliminary Economic Assessment of the Cordero Silver Project, Chihuahua State, Mexico January 2022
18.10.3 TSF Site Description
The proposed TSF will be constructed in a broad, gently sloping basin located north of the mineralized trend currently subject to exploration. Local topographic relief is on the order of 300 m. Within the TSF area elevations range from approximately 1,550 to 1,650 masl. The TSF site is underlain by thin to sparse alluvium and residual soils over a bedrock foundation of Cretaceous Mezcalera Formation marine limestone.
The project is located in a semiarid region that receives approximately 20 cm of rainfall annually. Most rainfall occurs in July, August and September and is associated with short-duration, high-intensity thunderstorms. Annually, evaporation will exceed precipitation.
Placing the TSF in the lower reach of the valley for closer access to the pit, per Discovery Silver, means that there is a large watershed in excess of 60 km2 that will require large diversion channels around the TSF to existing drainages. The east diversion channel and part of the west diversion channel will be required to be constructed prior to Stage 1 tailings deposition, as shown in Figure 18-5. The remainder of the west channel can be constructed with the Stage 2 TSF embankment. The TSF channels were designed to hold the 5,000-year, 72-hour storm event and larger storms. The channels will be constructed with bypass structures within the natural valleys along the channel alignments that will allow smaller flows to report to the TSF for use in the process circuit. Given the dry conditions that occur most of the year, capture of stormwater may be beneficial and reduce make-up water demands from external water sources.
18.10.4 TSF Description
18.10.4.1 Embankment Earthworks
The Stage 1 TSF configuration is shown on Figure 18-5. Figures 18-6 and 18-7 show the layout of the facility through final build-out at an elevation of 1,611 masl. As noted above, the cost estimate presented in this PEA-level assessment includes costs required to construct the embankment to an elevation of 1,611 masl. Figure 18-8 illustrates typical embankment cross-sections.
Phase 1 construction will consist of a dam constructed with waste rock and filter materials in the northeast valley to an elevation of 1,590.5 masl with a crest length of approximately 1,180 meters. Phase 2 construction will consist of a dam constructed with waste rock and filter materials to an elevation of 1,590.5 masl. Phase 3 construction will be a downstream raise across both valleys to an elevation of 1,600 meters. Stages 4 and 5 will be constructed as downstream raises across both valleys as well to elevations of 1,606 and 1,611 masl, respectively.

Cordero Project P a g e 2 5 2
Preliminary Economic Assessment of the Cordero Silver Project, Chihuahua State, Mexico January 2022
Figure 18-5: TSF Stage 1 Plan
Source: Knight Piésold, 2021.

Cordero Project P a g e 2 5 3
Preliminary Economic Assessment of the Cordero Silver Project, Chihuahua State, Mexico January 2022
Figure 18-6: Tailings Storage Facility Plan
Source: Knight Piésold, 2021.

Cordero Project P a g e 2 5 4
Preliminary Economic Assessment of the Cordero Silver Project, Chihuahua State, Mexico January 2022
Figure 18-7: Tailings Storage Facility Plan at Final Build-Out
Source: Knight Piésold, 2021.

Cordero Project P a g e 2 5 5
Preliminary Economic Assessment of the Cordero Silver Project, Chihuahua State, Mexico January 2022
Figure 18-8: Tailings Storage Facility Sections and Details
Source: Knight Piésold, 2021.

Cordero Project P a g e 2 5 6
Preliminary Economic Assessment of the Cordero Silver Project, Chihuahua State, Mexico January 2022
18.10.4.2 Seepage Controls
Seepage through the perimeter embankment is expected to be limited by the HDPE upstream liner. Most (if not all) geomembranes have some imperfections which increase the overall permeability of the liner. For the conceptual design, seepage rates through liner imperfections are expected to be relatively minor as the tailings will be beached over the liner adjacent to the embankments during operation, which should increase the seepage path and reduce hydraulic gradients.
To reduce seepage through the potentially high-permeable foundation, it has been assumed the liner will be extended through the foundation soils and connected to the top of slightly weathered to fresh bedrock with a concrete plinth (Figure 18-8). This assumption should be re-evaluated once additional foundation investigation becomes available.
To access the top of the bedrock, the foundation soils will be excavated in a key trench at safe slope angles upstream of the proposed toe of the embankment. After exposure, the surface of the bedrock will be cleaned, and slush grouted prior to construction of the concrete plinth. Some surface flattening of the bedrock may be required in steep sections to facilitate concrete plinth construction. Key trench excavation may become increasingly complex (and costly) if groundwater is encountered or if the depth of excavation exceeds 5 meters.
The concrete plinth is expected to comprise a reinforced concrete section with a minimum compressive strength of 30 MPa. Until the geochemistry of the tailings is investigated, it is recommended to use a high sulphate resistant cement to reduce the potential for deterioration over time from tailings pore water and contact with tailings. Water stops should be included in construction joints between plinth sections. For PEA costing purposes, due to lack of site-specific data, a typical cross-section has been assumed for calculating MTOs. However, the height of the concrete plinth will vary along the alignment to accommodate variations in the bedrock surface.
Prior to connecting the liner to the concrete plinth, we have assumed the upper bedrock will be pressure grouted through holes drilled through the plinth to a depth of 15 meters into bedrock to reduce permeability and prevent seepage flow beneath the concrete plinth. Design of the grouting program will require additional investigation information of the upper bedrock in subsequent design phases. For the conceptual design, we have assumed that pressure grouting will comprise a three-stage (primary, secondary, and tertiary) grouting program with primary grout hole spacings of approximately 8 meters. After the pressure grouting has been complete and the grout has setup, the HDPE liner will be connected to the concrete plinth using corrosion resistant batten bars and connectors or an HDPE batten strip.
In the event of a tear in the liner beneath the foundation level, it may be possible for high hydraulic gradients to develop within the foundation of the dam. To mitigate the potential for erosion of the (assumed) finer foundation soils into the coarse rockfill embankment, it has been assumed that a horizontal filter will be constructed over a portion of the upstream foundation of the dam. The extent and gradation of the horizontal filter zone will need to be evaluated as additional investigation of the foundation soils is performed. The horizontal filter may not be required for sections of the dam embankment founded directly on non‑erodible bedrock; however, this will need to be assessed at later design stages.
Limited seepage that may occur through the lined embankment will flow through the rockfill and be collected in the horizontal filters above the foundation. To control seepage flows over the foundation, it has been assumed that designed finger drains beneath the embankment at low spots along the alignment will be included as shown in Figure 18-6. Surface seepage exiting the dam will be collected in swale drains beyond the downstream toe of the facility and conveyed to one of two seepage ponds for collection.
As previously noted, karsts can significantly increase the risk of uncontrolled seepage and piping from tailings facilities and may require special design solutions if present. Some bedrock grouting along the abutments may also be required if fractured zones are present.

Cordero Project P a g e 2 5 7
Preliminary Economic Assessment of the Cordero Silver Project, Chihuahua State, Mexico January 2022
Hydrogeological and geochemical assessments have not been performed to assess the impacts of seepage from the facility on regional groundwater. Knight Piésold understands that the regional groundwater table is approximately 100 meters from the surface. The proposed approach above should limit near surface seepage through higher permeable zones in the overburden and upper fractured rock. The effect of downward seepage from the facility into the underlying aquifer will need to be assessed as part of future geochemical and hydrogeological studies. If there is a risk of contamination, the basin may need to be lined to limit downward seepage.
18.10.4.3 TSF Capacity
A height-versus-capacity plot for the TSF is shown on Figure 18-9. The ultimate capacity of the basin is approximately 250 Mt at an elevation of 1,611 masl for the mineralized material reserve considered in this update. Construction to this elevation will provide storage capacity for tailings and stormwater associated with run-on and direct precipitation, as well as dry freeboard. As shown on Figure 18-9, the rate of tailings rise will decrease to 3 meters per year by the end of Phase 2. Rates of rise of 3 meters per year or less are generally considered supportive of upstream raise construction.
18.10.4.4 Tailings Water Reclaim System
The tailings water reclaim system is developed for a processing rate up to 40,000 t/d. The proposed system will be capable of reclaiming water at a rate 383 m3/h before plant expansion and 767 m3/h during peak production.
The reclaim system will consist of a floating pump barge placed inside the TSF. Power requirements will vary but will generally decrease as the elevation of the tailings surface rises. Reclaim system capital costs are primarily associated with the disassembly and relocation of the reclaim pipeline as the tailings surface rises and the barge migrates northward. At the start of each construction phase, new pipe segments will be added and portions of the existing piping system will be relocated.

Cordero Project P a g e 2 5 8
Preliminary Economic Assessment of the Cordero Silver Project, Chihuahua State, Mexico January 2022
Figure 18-9: Tailings Storage Facility Height vs. Capacity and Rate of Tailings Rise
Source: Knight Piésold, 2021.

Cordero Project P a g e 2 5 9
Preliminary Economic Assessment of the Cordero Silver Project, Chihuahua State, Mexico January 2022
18.11 Site-Wide Water Management
This section discusses site-wide water management, the design of water management structures, hydrology, and water balance. Major drainage paths within the study area were delineated through GIS analysis of LiDAR elevation data with a 2 to10 m contour resolution.
18.11.1 Hydrology
The following sections briefly describe available climate data, hydrometric data, water management structures, and catchment delineations for the project site.
18.11.1.1 Climate and Meteorology
Based on Köppen’s climate classification (1884), the Cordero Project is located in a cold, semi-arid, climate (type "BSk") and temperate zone bordering a humid continental climate. The region has long, hot, and humid summers with convective showers and a peak seasonal rainfall in the hottest months. Total annual rainfall is 488.3 mm, of which 83% occurs in the four warmest months (June through September).
The climate stations close to the project site (within a 100 km distance) and with sufficient minimum data history (30 years) are Presa Parral, La Boquilla and Valle de Zaragoza (Figure 18-10).
Figure 18-10: Project Location and Nearby Climate Stations
Source: Hemmera, 2021.

Cordero Project P a g e 2 6 0
Preliminary Economic Assessment of the Cordero Silver Project, Chihuahua State, Mexico January 2022
Table 18-6 shows a brief description of their geographical location relative to the site and their data history period. Climate normal data (1981-2020) for Presa Parral and La Boquilla stations are summarized in Table 18-7 and Table 18-8, respectively.
Table 18-6: Climate Stations Close to the Cordero site
Station Name
Station ID
Distance to Site (km)
Elevation (m)
Latitude Longitude First Year Last Year
Presa Parral 8078 39.5 1,770 26°54'20" N 105°43'45" W 1903 2003
La Boquilla 8085 36.2 1,323 27°32'38" N 105°24'43" W 1949 2013
Valle de Zaragoza 8152 32.7 1,340 27°27'26" N 105°48'39" W 1920 1980
Source: Hemmera, 2021.
Table 18-7: Presa Parral (1981-2010)
Parameter Jan Feb Mar Apr May Jun Jul Aug Sep Oct Nov Dec Annual Total
Daily Average (°C) 10.3 12.4 15.1 18.8 22.8 25.1 23.5 22.8 21.1 18 14.1 10.9 17.9
Daily Maximum (°C) 27 34 33 35.2 38.5 40 38.5 35 36 32 31 30.5 34.2
Daily Minimum (°C) -15 -22 -16 -2 4.2 9 10.2 10 2 -4 -8 -10.2 -3.5
Precipitation (mm) 12.6 4.6 2.7 11.9 16.1 71.5 133.1 103.3 100 18.5 9.2 4.8 488.3
Source: Hemmera, 2021.
Table 18-8: La Boquilla (1981-2010)
Parameter Jan Feb Mar Apr May Jun Jul Aug Sep Oct Nov Dec Annual Total
Daily Average (°C) 11.3 13.7 16.8 20.5 24.9 27.5 26.4 25.6 23.7 20.4 15 11.8 19.8
Daily Maximum (°C) 31 33 37 38 41 45 42 41 39 38 38 30 37.8
Daily Minimum (°C) -6 -9 -14 -14 -13 -24 10 -19 -17 -12 -5 -9 -11
Precipitation (mm) 6.1 2.3 2.3 5.5 12.2 29.5 66.4 56.7 48.4 16 6.5 6.4 258.3
Evaporation (mm) 107.6 142.6 230.1 277.6 334.8 317.7 252.1 216.8 179.1 170.9 122.5 102 204.5
Source: Hemmera, 2021.
18.11.1.2 Rainfall Frequency Analysis
Rainfall frequency analysis was performed to estimate design rainfall depths using observed rainfall depth from the Presa Parral station, the nearest station to the project site with a similar elevation range located at 1,770 masl (Table 18-6). This station has a 73-year complete record. This study compared GEV, Weibull, Gumbel, log-Pearson type 3 (LP3), and gamma distributions (Table 18-9). It should be noted that Gumbel distribution is used as the standard distribution by Environment and Climate Change Canada (ECCC) for all precipitation frequency analyses in Canada. Therefore, Gumbel Methods of Moments (Table 18-9), which fits reasonably well to observed rainfall depth, was selected for design purposes.

Cordero Project P a g e 2 6 1
Preliminary Economic Assessment of the Cordero Silver Project, Chihuahua State, Mexico January 2022
Table 18-9: Rainfall Frequency Results (mm)
Return Period
(Year) GEV Weibull
Gumbel Methods of Moments
Gumbel Maximum Likelihood
Log P3 Gamma
1000 204.3 277.7 224.1 175.5 167.2 404.4
200 159.7 211.8 180.2 144.0 141.2 259.9
100 141.7 184.4 161.3 130.4 129.6 203.2
50 124.4 157.7 142.2 116.7 117.5 151.4
25 107.6 131.7 123.1 102.9 104.9 106.7
10 86.1 99.0 97.2 84.4 87.0 63.7
5 69.9 76.0 76.8 69.7 72.0 47.7
3 57.5 60.5 60.5 58.0 59.4 44.4
2 46.7 50.5 45.9 47.5 47.8 44.2
Source: Hemmera, 2021.
18.11.2 Water Management Structures
This section summarizes a list of proposed water management structures for the Cordero site. The major structures are as follows:
Diversion Channel – Diversion channels are required to divert the clean water of existing watercourses currently flowing over the mine site. The channel will separate the streamflow from the active areas and avoid mixing with contact water. The design criterion for the diversion channel was the conveyance of 1:100-year peak flow.
Diversion Ditches – Diversion ditches are required to divert clean runoff away from the facilities and to minimize the amount of contact runoff to be collected and managed. The major design criterion for the diversion ditches was the conveyance of 1:25-year peak flow without overflow.
Collection Ditches – Collection ditches collect contact runoff from the RSF, heap leach, process plant, and stockpile that are not diverted by the diversion ditches. The major design criterion for collection ditches was the conveyance of 1:100-year peak flow without overflow.
Collection Ponds – Collection ponds were proposed to store contact runoff from the collection ditches. The major design criterion for the collection ponds was being able to accommodate the 1:100-year, 24-hour flood with a minimum freeboard of 0.5 m. The stored contact water would be treated and released to the environment or reused for process purposes.
A high-level estimate of excavation volumes was also completed using the proposed geometries of the structures and elevation profile along the alignment of channels and ditches.
18.11.2.1 Conceptual Design and Quantity Estimates
The Cordero site consists of the RSF, TSF, heap leach, pit, process plant, and stockpile, as shown in Figure 18-11. An existing stream segment flows to the southeast through the pit and process plant area.

Cordero Project P a g e 2 6 2
Preliminary Economic Assessment of the Cordero Silver Project, Chihuahua State, Mexico January 2022
Figure 18-11: Cordero Site Facilities
Source: Hemmera, 2021.
To divert the clean runoff, a ~2,952 m long diversion channel (CH1) on the south side of the pit was designed (magenta line on Figure 18-12) to divert the flow from pit and process plant. Another ~1,846 m long diversion channel (CH2) on the east side of the RSF was designed (magenta line in Figure 18-12) to divert the flow. Three diversion ditches with a total length of ~2,911 m were designed (blue lines in Figure 18-12) to divert the clean runoff approaching the RSF, heap leach and process plant.
In addition to diversion channels and ditches, a collection system including 10 collection ditches (Figure 18-13), was designed to manage contact water from the RSF, heap leach, process plant, and stockpile. The collected contact water will be retained in five collection ponds near each facility. Figures 18-12 and 18-13 show the proposed alignments for the diversion channel, diversion ditches, collection ditches, and collection ponds.

Cordero Project P a g e 2 6 3
Preliminary Economic Assessment of the Cordero Silver Project, Chihuahua State, Mexico January 2022
Figure 18-12: Diversion Channels, Ditches and Ponds
Source: Hemmera, 2021.

Cordero Project P a g e 2 6 4
Preliminary Economic Assessment of the Cordero Silver Project, Chihuahua State, Mexico January 2022
Figure 18-13: Collection Ditches
Source: Hemmera, 2021.
18.11.2.2 Rainfall-Runoff Modelling
LiDAR elevation measurements were used to delineate drainage pathways and catchments for diversion and collection water structures.
The hydrologic modelling results were used to preliminarily size the water management structures of the Cordero site.
Catchment physical characteristics of the proposed diversion and collection ditches and channels are presented in Tables 18-10 and 18-11. Catchment times of concentration were calculated using various empirical equations, and the average values were used in the hydrological model.
The diversion channels were designed based on the 100-year flood event, while diversion ditches and collection ditches were designed to convey 25-year and 100-year flood events, respectively. Peak flows of the diversion and collection structures are presented in Tables 18-10 and 18-11.

Cordero Project P a g e 2 6 5
Preliminary Economic Assessment of the Cordero Silver Project, Chihuahua State, Mexico January 2022
Table 18-10: Characteristics of Collection Ditches
Item Label Name Flow Path Length (m)
Maximum Elevation (m)
Minimum Elevation (m)
Drainage Path
Slope (m/m)
Time of Concentration
(min)
1 CD1 Collection Ditch_Stockpile_N 2,988 1,608 1,557 0.0171 94
2 CD2 Collection Ditch_Stockpile_S 2,352 1,608 1,557 0.0217 73
3 CD3 Collection Ditch_PLANT_E 1,797 1,555 1,543 0.0067 87
4 CD4 Collection Ditch_PLANT_W 1,846 1,555 1,543 0.0065 89
5 CD5 Collection Ditch_HEAP_LEACH_E 2,147 1,583 1,545 0.0175 74
6 CD6 Collection Ditch_HEAP_LEACH_W 1,328 1,583 1,545 0.0283 46
7 CD7 Collection Ditch_RSF_E 1,796 1,598 1,545 0.0293 55
8 CD8 Collection Ditch_RSF_NW 3,421 1,598 1,545 0.0154 107
9 CD9 Collection Ditch_RSF_SE 1,755 1,609 1,556 0.0300 54
10 CD10 Collection Ditch_RSF_SW 1,285 1,609 1,556 0.0409 40
Source: Hemmera, 2021.
Table 18-11: Characteristics of Diversion Channel and Ditches
Item Label Name Flow Path Length (m)
Maximum Elevation (m)
Minimum Elevation (m)
Drainage Path Slope (m/m)
Time of Concentration
(min)
1 CH1 Diversion Channel_Pit_W 16,300 1,734 1,539 0.0120 341
2 CH2 Diversion Channel_RSF_E 8,704 1,732 1,542 0.0218 180
3 DD1 Diversion Ditch_RSF_W 1,703 1,595 1,554 0.0241 56
4 DD2 Diversion Ditch_HEAP_LEACH_E 1,637 1,584 1,541 0.0263 53
5 DD3 Diversion Ditch_Plant_S 1,231 1,555 1,541 0.0113 56
Source: Hemmera, 2021.
The collection ponds, retaining the contact runoff from each facility, were sized based on the extreme 100-year, 24-hour storm event. While sizing the ponds, sediment accumulation and freeboard allowances were also considered.
A summary of the estimated excavation volumes (class D) for the water management structures is provided in Table 18-12. Considering the contingency factor, Table 18-12 summarizes the total volumes for constructing the water management structures; the total excavation work is 1,569,877 m3.
Table 18-12: Summary of Excavation Estimates for Water Management Structures
Item Excavation Volume (m3) Fill Volume (m3)
Diversion Channels 379,890 10,891
Diversion Ditches 82,987 827
Collection Ditches 89,104 N/A
Collection Ponds 703,920 N/A
Total 1,255,902 11,718
With Contingency 1,569,877 14,647
Source: Hemmera, 2021.

Cordero Project P a g e 2 6 6
Preliminary Economic Assessment of the Cordero Silver Project, Chihuahua State, Mexico January 2022
18.11.3 Site-Wide Water Balance
A preliminary site-wide water balance analysis was performed for the Cordero site, and the results are summarized in this section. In this analysis, a comparison between the process plant water requirement/excess and the available water from various sources was carried out to determine a site-wide water balance. Schematics showing the starter and final phases of the site-wide water balance are shown in Figure 18-14 and Figure 18-15, respectively.
Water is available from the following sources:
• excess from the process plant
• groundwater inflow to mining pit
• surface runoff from precipitation, heap leach, and the RSF.
Figure 18-14: Schematic of Starter Phase Site-Wide Water Balance
Source: Hemmera, 2021.

Cordero Project P a g e 2 6 7
Preliminary Economic Assessment of the Cordero Silver Project, Chihuahua State, Mexico January 2022
Figure 18-15: Schematic of Final Phase Site-Wide Water Balance
Source: Hemmera, 2021.
The primary consumer of water is the process plant which uses water from the TSF decant, ball mill feed and freshwater source. The freshwater source supplies the net make-up water required in the process plant. The freshwater is the additional water brought into the circulating load to balance the overall site water balance. It does not define the quality of water.
The process plant has an initial water demand of approximately 308,000 m3 per month (415 m3/h) during 7.2 Mt/a production rate, increasing to approximately 617,000 m3 per month (830 m3/h) during 14.4 Mt/a production rate. If the pit is mined simultaneously, pit dewatering will produce approximately 29,450 m3 per month. The process plant water requirement of 415 m3/h during 7.2 Mt/a production rate is met through 383 m3/h of water from TSF decant, 28 m3/h of water from the ball mill feed and the balance of 4 m3/h from fresh water source. The process plant water requirement of 830 m3/h during 14.4 Mt/a production rate is met through 767 m3/h from TSF decant, 55 m3/h from ball mill feed and the balance of 8 m3/h from fresh water source.
Precipitation data from Presa Parral station (Table 18-7) was used to calculate potential runoff volumes. It should be noted that lake evaporation data at La Boquilla station (Table 18-8) was the closest available evaporation information to the project side. To estimate evaporation from ponds, 100% of the observed lake evaporation data was subtracted from precipitation data.

Cordero Project P a g e 2 6 8
Preliminary Economic Assessment of the Cordero Silver Project, Chihuahua State, Mexico January 2022
19 MARKET STUDIES AND CONTRACTS
It was assumed in this PEA that the Cordero Project will produce silver, gold, lead, and zinc in the form of doré bars from the oxide heap leach, lead-silver concentrate, and zinc concentrate from the sulphide processing. The doré bars will be processed in precious metal refineries and concentrates will be smelted in certified North American refineries and smelters—of which there are many in the eastern United States and Canada—and the metals will be sold on the spot market.
19.1 Market Studies
Discovery Silver retained an external consultant for review of the treatment costs (TC), refining costs (RC) and transport costs and metal payables. The market terms for this study are based on the terms proposed by the consultant as well as recently published terms from other similar studies. The QP is of the opinion that the marketing and commodity price information is suitable to be used in cashflow analyses to support this report.
19.2 Commodities Price
For this technical report, the metal prices presented in Table 19-1 were used for financial modelling.
Table 19-1: Metal Prices for Economic Analysis
Metal Price
Silver $22.00/oz
Gold $1,600/oz
Lead $1.00/lb
Zinc $1.20/lb
Source: Discovery Silver, 2021.
19.3 Contracts
There are no existing refining agreements or sales contracts in place for the project. A preliminary marketing study conducted by Discovery Silver’s consultant was used as the basis for the marketing terms used in this study and are discussed in this section.
The metal payables in Table 19-2 are used in this study.
A summary of the treatment and refining costs is provided in Table 19-3.

Cordero Project P a g e 2 6 9
Preliminary Economic Assessment of the Cordero Silver Project, Chihuahua State, Mexico January 2022
Table 19-2: Metal Payables
Metal Unit Zn Concentrate Pb Concentrate
Zinc % 85% -
less Deductible units 8.0 -
Lead % - 95%
less Deductible units - 3.0
Silver % 70% 95%
less Deductible g/dmt 93.3 50.0
Gold % 70% 95%
less Deductible g/dmt 1.0 1.0
Source: Ausenco, 2021.
Table 19-3: Summary of TC and RC
Metal Concentrate
Grade
Treatment Charges
(US$/wmt)
Refining Charges
(US$/payable lb/oz)
Concentrate Loadport Ocean Shipment Mode
Zn Concentrate
Pb Concentrate
Zn Concentrate
Pb Concentrate
Zinc 53% $200.00 $0.00 Guaymas Container
Lead 60% $100.00 $0.00 Guaymas Container
Silver $1.00
Gold $10.00
Source: Ausenco, 2021.
Concentrates logistics fees are summarized in Table 19-4.
Table 19-4: Concentrate Logistics Fees
Metal Logistics (US$/wmt)
Port Inland Truck Port Costs Ocean Shipment Rates
Zinc Guaymas $80.00 $30.00 $260.00
Lead Manzanillo $100.00 $35.00
Source: Ausenco, 2021.
Zinc concentrate penalties are summarized in Table 19-5.

Cordero Project P a g e 2 7 0
Preliminary Economic Assessment of the Cordero Silver Project, Chihuahua State, Mexico January 2022
Table 19-5: Zinc Concentrate Penalties
Metal Grade $/dmt Lower Limit (per ‘X’ % >) Upper limit (‘Y’ %)
As 0.44% $1.50 0.10% 0.30%
Fe 8.87% $2.00 1.00% 8.00%
Cd 0.48% $3.00 0.10% 0.30%
SiO2 2.50% $1.50 1.00% 3.50%
Hg 100 g/t $1.50 100 g/t 100 g/t
F+Cl 300 g/t $3.00 100 g/t 500 g/t
Se 500 g/t $2.00 100 g/t 300 g/t
Mn 0.91% $1.50 0.10% 0.50%
Source: Blue Coast and Ausenco, 2021.
Lead concentrate penalties are summarized in Table 19-6.
Table 19-6: Lead Concentrate Penalties
Metal Grade $/dmt Lower limit (per ‘X’ % >) Upper limit ('Y' %)
As 0.56% $2.00 0.10% 0.50%
Sb 0.54% $1.50 0.10% 0.50%
Hg 15 g/t $2.00 100 g/t 100 g/t
F 300 g/t $1.50 100 g/t 500 g/t
Source: Blue Coast and Ausenco, 2021.

Cordero Project P a g e 2 7 1
Preliminary Economic Assessment of the Cordero Silver Project, Chihuahua State, Mexico January 2022
20 ENVIRONMENTAL STUDIES, PERMITTING, AND SOCIAL
OR COMMUNITY IMPACT
This section describes the environmental setting on the area of Cordero Project, the environmental studies underway that will provide a basis for the mine’s permitting pathway, as well as social and community considerations. This section also outlines water and waste management strategies and considerations and requirements for closure and reclamation planning.
20.1 Environmental Considerations
An environmental baseline study was carried out by Interdisciplinary Consultants in Environment SC in 2021 (ICESC, 2021). The information from this study was used to request environmental permits and to describe the project’s environmental and socioeconomic setting.
No risks of a legal, environmental or socioeconomic nature were identified. Water use opportunities were identified, and with additional studies, it might be possible to access additional concessions for water supply to support future mining activities.
20.1.1 Physical Environment
The project site covers a surface area of 34,900 hectares, of which 7.65% is occupied by igneous rock and 92.35% is occupied by sedimentary deposits The site is located in the physiographic provinces of Sierra Madre Occidental and the eastern Mexican Basin and Range (Figure 7-1). The physiography of the project site is varied with steep hills and flat plains.
As for soils, Calcisols prevail, covering approximately 86.72% of the surface, followed by 9.68% for Leptosols and Vertisols with 3.59%.
The project site is part of the Boquilla River hydrographical basin and sub-basin RH24Lh R. Molinas Nuevas. La Boquilla dam is located to the northeast, approximately 17 linear kilometers away; it is the closest waterbody to the project site. The Valle de Zaragoza aquifer feeds the project site. No natural water body or permanent water flow is located on the project site.
20.1.1.1 Hydrology
The following sections briefly describe available climate data, hydrometric data, water management structures, and catchment delineations for the project site.
20.1.1.2 Climate and Meteorology
Based on Köppen’s climate classification (1884), the Cordero Project is located in a cold, semi-arid, climate (type "BSk") and temperate zone bordering a humid continental climate. The region has long, hot, and humid summers with convective showers and a peak seasonal rainfall in the hottest months. In winter, the air is generally mild during the day, but at night the temperature can drop rapidly to a few degrees below freezing. Sometimes there may be cold periods lasting several

Cordero Project P a g e 2 7 2
Preliminary Economic Assessment of the Cordero Silver Project, Chihuahua State, Mexico January 2022
days, in which the minimum drops to -22°C. Total annual rainfall is 488.3 mm, of which 83% occurs in the four warmest months (June through September).
The climate stations close to the project site (within a 100 km distance) and with sufficient minimum data history (30 years) are Presa Parral, La Boquilla and Valle de Zaragoza (Figure 20-1). Table 20-1 shows a brief description of their geographical location relative to the site and their data history period. Climate normal data (1981-2010) for the stations are summarized in Tables 20-2 to 20.4.
Figure 20-1: Project Location and Nearby Climate Stations
Source: Hemmera, 2021.

Cordero Project P a g e 2 7 3
Preliminary Economic Assessment of the Cordero Silver Project, Chihuahua State, Mexico January 2022
Table 20-1: Climate Stations Close to the Cordero Site
Station Name
Station ID
Distance to Site (km)
Elevation (m)
Latitude Longitude First Year Last Year
Presa Parral 8078 39.5 1,770 26°54'20" N 105°43'45" W 1903 2003
La Boquilla 8085 36.2 1,323 27°32'38" N 105°24'43" W 1949 2013
Valle de Zaragoza 8152 32.7 1,340 27°27'26" N 105°48'39" W 1920 1980
Table 20-2: Presa Parral (1981-2010)
Parameter Jan Feb Mar Apr May Jun Jul Aug Sep Oct Nov Dec Annual Total
Daily Average (°C) 10.3 12.4 15.1 18.8 22.8 25.1 23.5 22.8 21.1 18 14.1 10.9 17.9
Daily Maximum (°C) 27 34 33 35.2 38.5 40 38.5 35 36 32 31 30.5 34.2
Daily Minimum (°C) -15 -22 -16 -2 4.2 9 10.2 10 2 -4 -8 -10.2 -3.5
Precipitation (mm) 12.6 4.6 2.7 11.9 16.1 71.5 133.1 103.3 100 18.5 9.2 4.8 488.3
Table 20-3: La Boquilla (1981-2010)
Parameter Jan Feb Mar Apr May Jun Jul Aug Sep Oct Nov Dec Annual Total
Daily Average (°C) 11.3 13.7 16.8 20.5 24.9 27.5 26.4 25.6 23.7 20.4 15 11.8 19.8
Daily Maximum (°C) 31 33 37 38 41 45 42 41 39 38 38 30 37.8
Daily Minimum (°C) -6 -9 -14 -14 -13 -24 10 -19 -17 -12 -5 -9 -11
Precipitation (mm) 6.1 2.3 2.3 5.5 12.2 29.5 66.4 56.7 48.4 16 6.5 6.4 258.3
Evaporation (mm) 107.6 142.6 230.1 277.6 334.8 317.7 252.1 216.8 179.1 170.9 122.5 102 204.5
Table 20-4: Valle De Zaragoza (1981-2010)
Parameter Jan Feb Mar Apr May Jun Jul Aug Sep Oct Nov Dec Annual Total
Daily Average (°C) 11 13.4 16.4 19.8 24.1 26.8 25.8 24.8 23.2 19.3 14.6 11.3 19.2
Daily Maximum (°C) 30 33 34 39 42 41 40 37.5 39 37 33 30 36.3
Daily Minimum (°C) -8 -6 -5 0 5 12 12 14 6.5 1 -8 -10 1.1
Precipitation (mm) 15.1 5.8 4 7.1 21.6 62.7 108.9 114.7 69 27.2 6.7 9.4 452.2
Evaporation (mm) 86.7 118 199.5 233.5 276.5 272.6 218.9 191.4 155.3 139.8 95.9 76.6 172.1

Cordero Project P a g e 2 7 4
Preliminary Economic Assessment of the Cordero Silver Project, Chihuahua State, Mexico January 2022
20.1.1.3 Rainfall Frequency Analysis
Rainfall frequency analysis was performed to estimate design rainfall depths using observed rainfall depth from the Presa Parral station, the nearest station to the project site with similar elevation range located at 1,770 masl (Table 20-1). This station has a 73-year complete record. This study compared GEV, Weibull, Gumbel, log-Pearson type 3 (LP3), and gamma distributions (Table 20-5). It should be noted that Gumbel distribution is used as the standard distribution by Environment and Climate Change Canada (ECCC) for all precipitation frequency analyses in Canada. Therefore, Gumbel Methods of Moments (Table 20-5), which fits reasonably well to observed rainfall depth, was selected for design purposes.
Table 20-5: Rainfall Frequency Results (mm)
Return Period (Year)
GEV Weibull Gumbel Methods of
Moments Gumbel Maximum
Likelihood Log P3 Gamma
1000 204.3 277.7 224.1 175.5 167.2 404.4
200 159.7 211.8 180.2 144.0 141.2 259.9
100 141.7 184.4 161.3 130.4 129.6 203.2
50 124.4 157.7 142.2 116.7 117.5 151.4
25 107.6 131.7 123.1 102.9 104.9 106.7
10 86.1 99.0 97.2 84.4 87.0 63.7
5 69.9 76.0 76.8 69.7 72.0 47.7
3 57.5 60.5 60.5 58.0 59.4 44.4
2 46.7 50.5 45.9 47.5 47.8 44.2
Source: Hemmera, 2021.
20.1.2 Biological Environment
20.1.2.1 Flora
Bushes and scrubs are the prevailing vegetation in the area, covering 70.51% of the surface at the project’s site, followed by natural grasslands which cover 8.71% of the surface. Approximately 20.77% of the surface is comprised of agricultural areas and several associations of secondary vegetation and Microphyllous Desert Scrublands and Rosette Desert Scrublands.
The main species of plants found at the project site are green snakewood (Condalia warnockii), honey mesquite (Prosopis glandulosa), catclaw mimosa (Mimosa aculeaticarpa), thorn trees (Vachellia vernicosa), desert marigold (Baileya multiradiata), Tucson bur ragweed (Ambrosia cordifolia), ponysfoots (Dichondra argéntea), prickly pear (Opuntia phaeacantha and O. violaceae), amaranth (Amaranthus hybridus L), beehive cactus (Coryphantha poselgeriana (Dietr.) Britt. & Rose), chamiso (Atriplex canescens), acacia greggii (Senegalia greggii), candlewood (Fouquieria splendens) and creosote bush (Larrea tridentata)1.
20.1.2.2 Fauna
Animal species present at the project site are adapted to the desert ecosystem. The main species are coyote (Canis latrans), black-tailed jackrabbit (Lepus californicus), desert cottontail (Sylvilagus audobonii), rock squirrel (Otospermophilus

Cordero Project P a g e 2 7 5
Preliminary Economic Assessment of the Cordero Silver Project, Chihuahua State, Mexico January 2022
variegatus), racoon (Procyon lotor), gray fox (Urocyon cinereoargenteus), mule deer (Odocoileus hemionus), white-tailed deer (Odocoileus virginianus), collared peccary (Pecari tajacu), turkey vulture (Cathartes aura), red-tailed hawk (Buteo jamaicensis), sparrow hawk (Falco sparverius), roadrunner (Geococcyx californianus), blue quail or cottontop (Callipepla squamata), mourning dove (Zanaida asiática), raven (Corvus corax), loggerhead shrike (Lanius ludoviacianus), northern mockingbird (Mimus polyglottos), horned lizard (Phrynosoma cornutum), New Mexico whiptail (Aspidoscelis inornata chihuahuae), western diamondback rattlesnake or Texas diamond-back rattlesnake (Crotalus atrox), and black-tailed rattlesnake (Crotalus molussus).
20.1.2.3 Threatened Fauna Species
Six animal species were identified listed under the endangered category in NOM-059-SEMARNAT-2010 and by the Convention on International Trade in Endangered Species of Wild Fauna and Flora (CITES). During exploration activities, permanent species relocation procedures are carried out when necessary.
20.1.2.4 Areas of Ecological Interest and Fragility
The project site is not within an area that requires special environmental protection or is subject to regulation or urban development.
20.2 Waste Management and Water Management
20.2.1 Waste
Waste management is ruled by the General Environment Protection Act (Ley General de Protección al Ambiente), Article 3, Fraction XXXII and applicable Mexican Official Standards. Waste has several classifications and is generated at different stages of the project.
Operations will generate different types of waste that will be managed and disposed of in such a way as to not cause adverse effects on the environment, in compliance with the current legislation. This includes the proper management of waste rock dumps, tailings, metallurgical waste, dangerous and non-dangerous residues, domestic waste and biological infectious waste. During the exploration stage, the company has applied to the Ministry of the Environment SEMARNAT to be registered as a Small Quantity Hazardous Waste Generator.
Waste will be managed according to management plans prepared by a third-party consultant that observe environmental laws. These management plans will include procedures for identifying, collecting, managing, storing and disposing of each type of waste.
A third-party laboratory has conducted a sampling of tepetate and materials from old mining facilities to determine the potential for generating acid rock drainage. Geochemical testing is also underway, and if protection measures are needed, they will be added during the next phase of work. For more information on waste rock management and the TSF, refer to Section 18.
20.2.2 Water
The Valle de Zaragoza aquifer, which feeds the project site, has an annual availability of groundwater (DMA) of -15.059360 cubic hectometers per year (hm3/year).

Cordero Project P a g e 2 7 6
Preliminary Economic Assessment of the Cordero Silver Project, Chihuahua State, Mexico January 2022
In the Water Rights Registry (Registro Público de Derechos de Agua [REPDA]) kept by the National Water Commission (CONAGUA), there are 254 permits for groundwater use and 33 for surface water use for the Hidalgo del Parral Municipality. In the Valle de Zaragoza aquifer, there are 10 records for groundwater and surface water.
Studies are being carried out by a third-party consultant to determine groundwater availability at the project site. Surface and groundwater quality baseline studies are also underway. The samples will be sent to accredited laboratories where 93 water quality parameters will be analyzed, including those included in the Mexican Official Standards and others related to the chemical substances that will be used at the project facilities.
20.3 Closure and Reclamation Planning
An Environmental Protection Plan will be developed to outline the reclamation activities that will be executed following the project exploration stage. The Environmental Protection Plan will be aligned with current permits and resolution 4.1.18 of the Mexican Official Standard NOM 120 SEMARNAT 2020.
No formal Closure and Reclamation Plan has been prepared for the Cordero Project to date. This document will be developed as the project advances through subsequent project stages of pre-feasibility and feasibility-level design. Social considerations will be included in the Closure and Reclamation Plan, including stakeholders’ validation since the initial plans.
20.4 Permitting Considerations
The environmental permitting status for the Cordero Project is summarized in Table 20-6. Environmental permitting for the mining industry in Mexico is primarily administered by the federal government through SEMARNAT (Secretaria de Medio Ambiente y Recursos Naturales), the federal regulatory agency that establishes minimum standards for environmental compliance. Guidance for federal environmental requirements is largely carried out within the General Law for Ecological Balance and Environmental Protection (Ley General Del Equilibrio Ecológico y la Protección al Ambiente, or LGEEPA). Article 28 of the LGEEPA specifies that SEMARNAT must issue prior approval to parties that wish to extract minerals reserved for the federation. An environmental impact statement (according to Mexican regulations called MIA) must be submitted to SEMARNAT for evaluation and, if applicable, subsequent approval by SEMARNAT through the issuance of an Impact Authorization. This document specifies the conditions of approval where the works or activities have the potential to cause an ecological imbalance or have adverse effects on the environment.
Section X of the LGEEPA authorizes SEMARNAT to grant approvals for the works specified in Article 28. The LGEEPA also contains articles for the protection of soil, water quality, flora and fauna, noise emissions, air quality and hazardous waste management. The requirements for compliance with Mexican environmental laws and regulations are supported by Article 27 Section IV of the Mining Law and Articles 23 and 57 of the Mining Law Regulations.
The National Water Law grants authority to the National Water Commission (Comisión Nacional del Agua or CONAGUA), an agency within SEMARNAT, to issue water withdrawal concessions and specifies certain requirements that applicants must meet.
Another important piece of environmental legislation is the General Law on Sustainable Forestry Development (Ley General de Desarrollo Forestal Sustentable - LGDFS). Article 117 of the LGDFS indicates that authorizations must be granted by SEMARNAT for changes of use of land for industrial purposes. A request for a change of use of forest land (CUSTF) must be accompanied by a technical study that supports the Technical Justification Study (Estudio Técnico-Justificativo - ETJ). In cases requiring a CUSTF, an MIA is also required for the change of use of forest land. Mining projects must also include

Cordero Project P a g e 2 7 7
Preliminary Economic Assessment of the Cordero Silver Project, Chihuahua State, Mexico January 2022
a Risk Study (Estudio de Riesgos - ER) and an Accident Prevention Plan (Plan de Prevención de Accidentes - PPA) from SEMARNAT.
Table 20-6: Environmental Permitting Status
Permit Agency Status
Environmental Impact Assessment or Preventive Environmental Impact Notification SEMARNAT Not started
Technical Justification Study for Land Use Change in Forest Land SEMARNAT Not started
Environmental Risk Study SEMARNAT Not started
NOM 120 SEMARNAT 2020 SEMARNAT Obtained
Notice of Start of Operations ECONOMIA Not started
Use of Federal Waterways CONAGUA Not started
Title of Concession or Assignment of National Water Use (Surface and Groundwater) CONAGUA Not started
Wastewater Discharge Concessions CONAGUA Not started
Registration of Hazardous Waste Management SEMARNAT Declared
Authorization for the Operation of Steam Generators, Pressure Vessels and Boilers STPS Not started
Electric Power Feasibility (Electric Power Contract) CENACE - CFE Not started
Authorization for Fuel Substations ASEA Not started
Single Environmental License SEMARNAT Not started
Waste Management Plans (Hazardous and Mining) SEMARNAT In process
Community Protection Plan MUNICIPALITY Obtained
Annual Operating Statement SEMARNAT Not started
Permitting of Accesses and other Facilities on Free Federal Highways SCT Not started
Explosives Use Permit SEDENA Not started
Permit to Construct Hydraulic Works CONAGUA Not started
Accident Prevention Program SEMARNAT Not started
Registration of the Joint Commission on Training and Education STPS Not started
Company Registration in Social Security (IMSS) IMSS Obtained
Application for the Sanitary License COESPRIS Not Started
Registration of the List of Certificates of Labour Skills of Training and Coaching STPS Not Started
Registration of Training Plans and Programs STPS Not Started
Registration in the Mexican Business Information System (SIEM) SE Not started
Title of Concession for Extraction of Materials CONAGUA No started
Source: CEMMA, 2021.
The General Law for the Prevention and Integral Management of Waste (Ley General para la Prevención y Gestión Integral de los Residuos- LGPGIR) also regulates the generation and handling of hazardous waste by the mining industry. Guidance for environmental legislation is provided in a series of Mexican Official Standards (Norma Oficial Mexicana - NOMs). These regulations provide procedures, limits and guidelines and have the force of law.
Responding to a request for a federal permit is regulated by the Federal Law of Administrative Procedure; for the Cordero Project, the response time should not exceed 120 business days, excluding the time needed to prepare the studies.
Other permits related to the land use licenses and emergencies must be obtained at the offices of the state government of Chihuahua and in the municipality of Parral.

Cordero Project P a g e 2 7 8
Preliminary Economic Assessment of the Cordero Silver Project, Chihuahua State, Mexico January 2022
20.5 Social Considerations
The information in this section has been sourced from a social baseline study prepared by a third-party consultant, VINFIDEM as well as from the Instituto Nacional de Estadística y Geografía (INEGI). The area of socioeconomic influence (where workforce would be sourced) of the project is 95% concentrated in the municipality of Parral, the rest is in the municipality of Valle de Zaragoza. The exploration and access activities for the Cordero Project are located in the municipality of Hidalgo del Parral, which would be the main source of demand for employment.
The Cordero Project is located in a socioeconomic region known as the Parral Region, which includes four municipalities: Hidalgo del Parral, with a population of 116,662 inhabitants; Santa Bárbara, with 11,582 inhabitants; Valle de Zaragoza, with 4,775 inhabitants; and San Francisco del Oro, with 5,004 inhabitants.
Close to project, is the Ejido Cordero, which is a collective property made up of 32 people (ejidatarios), but only five live in the community. These people support mining activities in general, as they believe based on past experience that mining improves local economic conditions and raises the quality of life of the population.
The main activity in the region is agricultural field work. Many work as day labourers, carrying out different agricultural activities, including irrigation, harvesting, etc. Approximately 76.5% of the population are dedicated to this activity. The second most common activity (13.5%) is the sale of products, which is carried out as seasonal employment. In the community, the sale of agricultural products, such as watermelon, cheese, milk sweets, pecans, and meat, is frequent. Approximately 3.5% of the population is dedicated to tourism activities, and the balance (6.5%) are involved to a lesser degree in commercial premises, handcrafts production and mining.
Clinics and hospitals are located in Hidalgo de Parral; however, to access official medical care, it is necessary to be employed by a company or the government. Due to the nature of employment activities in the area of influence, more than half of the inhabitants do not have access to official healthcare. In this way, a new mining project will not only provide employment, but access to health services as well.
More than 80% of inhabitants own a house; the rest live in rental accommodations or in a house owned by relatives.
More than 51% of the population does not have access to clean drinking water; there is not enough infrastructure to provide this utility. Street lighting and drainage services are also inadequate in the area.
More than 90% of the population has a cell phone and 20% have a landline. Approximately 92% have access to television. Approximately 43% of the population enjoys outdoor recreational activities or visits to nearby lakes or rivers.
In the area of direct project influence, the highest level of education is elementary school; young people must move to Parral to continue their education.
20.5.1 Property Rights
The project site is comprised of both ejido and private properties. An “ejido” is a legal entity with legal personality and its own patrimony, which is made up of lands for productive use (parcels), lands for common or collective use and lands for human settlement, these types of lands as a whole are called ejidal property. Cordero project infrastructure would be located within four properties: three private ranches and one Ejido Cordero (Figure 20-2).

Cordero Project P a g e 2 7 9
Preliminary Economic Assessment of the Cordero Silver Project, Chihuahua State, Mexico January 2022
Figure 20-2: Property Rights at Cordero Project
Source: Minera Titan, 2021. This GIS file/figure was created by Minera Titan (wholly owned by Discovery Silver) and was produced based on inputs from various different sources.

Cordero Project P a g e 2 8 0
Preliminary Economic Assessment of the Cordero Silver Project, Chihuahua State, Mexico January 2022
El Ejido Rancho Cordero is the property closest to the project, located 4 km to the southeast. Like all ejidos in Mexico, it is an organized area of land plots, human settlements, and an area for collective land use. The Ejido Cordero has 32 people called ejitadarios. The area of Ejido Cordero is 3,700 hectares. Regarding private property, there are seven owners in the area of direct influence; these private lands have different dimensions.
For current exploration activities, private landowners are actively involved in providing some goods and services and land use permits remain in force with good land use agreements. Generally, for the use of land owned by ejidos, agreements are entered into with all the holders of rights in order to establish fair land use agreements for the period required for operations. A stakeholder management program is in place and communication is open for current and future purposes.
20.5.2 Infrastructure
The path of the “El Encino - La Laguna” Natural Gas Transportation System is located 7.5 km to the northeast of the project site, and it connects the states of Chihuahua and Durango. This natural gas transportation system consists of substations and 42″ main pipes and 16″ secondary pipes. This infrastructure was built to supply the gas demand for a thermoelectric power generation facility owned by the Federal Electricity Commission.
Electric power is available through the Camargo II 230 kV Electrical Substation located 75 km northeast of the project site.
The project site is easily accessed by land from the cities of Chihuahua or Parral via a paved highway and a 30 km dirt road that is available year-round.
Hidalgo del Parral is the closest city with all of the necessary services available year-round.
20.5.3 Potential Social Impacts and/or Special Project Considerations
There are six areas of importance for local stakeholders, as summarized in Table 20-7.
Table 20-7: Areas of Importance for Local Stakeholders
Area Priority Description
Employment and economy Very high Quality of life, migration, equity
Health Very high Available services, quality of service
Education Very high Available service and infrastructure, scholarships
Environment (water and pollution) Moderate Level of environmental impact
Quality of life High Focused on basic needs
Services High Access to drinking water and sewage
Source: VINFIDEM Consultoria, 2021.
Details for each area are provided in the Social Baseline Study (ICESC, 2021). In order to address the concerns and interests of stakeholders, a communication and social engagement plan has been prepared with the purpose of including local groups in the solution and mitigation of social aspects of interest. The objective of this is to maintain a social license for the operation of the Cordero Project.

Cordero Project P a g e 2 8 1
Preliminary Economic Assessment of the Cordero Silver Project, Chihuahua State, Mexico January 2022
In order to effectively address these relevant issues in the management and social investment plan, nine action plans were prepared to be implemented. These plans are outlined below.
1. Communication and engagement program with community and identified stakeholders
2. Work Program with Vulnerable Groups
3. Training Program for Employment, Self-Employment and Entrepreneurship
4. Active Community Participation Program with a Gender Perspective.
5. Educational Outreach Program
6. Program for Improvement of Health and Prevention of Diseases and Medical Care (for external stakeholders)
7. Safety and Health Plan (for employees)
8. Continuous Evaluation Plan of Social Impacts
9. Social Closure Program

Cordero Project P a g e 2 8 2
Preliminary Economic Assessment of the Cordero Silver Project, Chihuahua State, Mexico January 2022
21 CAPITAL AND OPERATING COSTS
21.1 Introduction
The capital and operating cost estimates presented in this PEA provide substantiated costs that can be used to assess the preliminary economics of the Cordero project. The estimates are based on an open pit mining operation, as well as the construction of a stage-wise process plant, associated tailings storage and management facility, and infrastructure, as well as Owner’s costs and provisions.
All capital and operating cost estimates are reported in US dollars (US$ or USD), with no allowance for escalation or exchange rate fluctuations.
The capital cost estimate conforms to Class 5 guidelines for a preliminary economic assessment level estimate with a ±50% accuracy according to the Association for the Advancement of Cost Engineering International (AACE International). The capital cost estimate was developed in Q4 2021 based on Ausenco’s in-house database of projects and studies as well as experience from similar operations.
21.2 Capital Costs
The total initial capital cost for the Cordero Project is US$368 million; the expansion capital cost is US$129 million; and the life-of-mine sustaining cost is US$208 million. The initial capital cost summary is presented in Table 21-1.
Table 21-1: Summary of Capital Costs
WBS Description WBS
Initial Capital Cost (US$M)
Expansion Capital Cost (US$M)
Sustaining Capital Cost
(US$M) Total Cost
(US$M) Y-2 Y-1 Y3 Y8 LOM
Mining 1000 $25.6 $0.7 -- -- $6.8 $33.1
On-Site Infrastructure 2000 $14.7 $9.0 $9.9 -- $16.0 $49.6
Oxide Plant 3000 $70.8 $1.5 -- -- $4.4 $76.7
Sulphide Plant 4000 $0.4 $95.5 $50.8 $22.7 $30.0 $199.3
Tailings Management 5000 -- $14.7 -- -- $95.3 $110.0
Off-Site Infrastructure 6000 $19.4 -- -- -- -- $19.4
Total Directs $130.9 $121.4 $60.7 $22.7 $152.5 $488.2
Project Indirects 7000 $21.8 $29.7 $16.9 $6.2 $3.8 $78.4
Owner's Costs 8000 $5.6 -- -- -- $22.4* $28.0
Provisions 9000 $28.4 $30.2 $15.9 $6.1 $29.3 $109.9
Total Indirects $55.8 $59.9 $32.8 $12.3 $55.5 $216.3
Project Total $186.7 $181.3 $93.5 $35.0 $208.0 $704.5
Note: *The LOM sustaining Owner’s cost is the net difference between reclamation costs and salvage value. Source: Ausenco, 2021.

Cordero Project P a g e 2 8 3
Preliminary Economic Assessment of the Cordero Silver Project, Chihuahua State, Mexico January 2022
21.2.1 Basis of Estimate
The capital cost estimate was developed in Q4 2021 US dollars based on Ausenco’s in-house database of projects and studies as well as experience from similar operations. Due to the methodology used to develop the capital estimate and the conceptual level of engineering definition, the estimate has an accuracy of ±50%, which is in accordance with the Association for the Advancement of Cost Engineering International (AACE International) guidelines for a PEA study.
Data input for the estimates has been obtained from numerous sources, including the following:
• mining schedule
• conceptual engineering design by Ausenco, AGP and by Knight Piésold
• mechanical equipment costs determined from first principles and Ausenco’s database of historical projects
• material take-offs (MTOs) for concrete, steel, electrical, instrumentation, in-plant piping and platework were factored by benchmarking against similar projects with equivalent technologies and unit operations
• topographical information considered
• engineering design at a preliminary economic assessment level.
21.2.1.1 Direct Costs – Mining (WBS 1000)
21.2.1.1.1 Mine Capital Cost
The mining capital cost estimate is grouped into the following three main categories:
• pre-production stripping costs
• miscellaneous mine capital
• mine Infrastructure capital.
Because mining is completed by contractor, the normal mine equipment capital costs are not applied. The cost breakdown is shown in Table 21- 2.
Table 21-2: Mine Capital Cost Estimate (US$M)
Mining Capital Category WBS
Initial Cost (US$M)
Sustaining Cost (US$M)
Total Capital Cost
(US$M) Y-2 Y-1 LOM
Pre-Production Stripping 1100 $22.3 - - $22.3 Mine Equipment Capital 1200 - - - - Mill Feed Stockpile Preparation 1400 $0.4 - - $0.4 Miscellaneous Mine Capital 1800 $0.6 $0.6 - $1.2 Mine Infrastructure 1300, 1500, 1600, 1900 $2.3 $0.1 $6.8 $9.2 Total $25.6 $0.7 $6.8 $33.1
Source: AGP Mining, 2021.

Cordero Project P a g e 2 8 4
Preliminary Economic Assessment of the Cordero Silver Project, Chihuahua State, Mexico January 2022
21.2.1.1.1.1 Pre-Production Stripping
Mining activity commences in advance of the sulphide process plant achieving commercial production and includes the placement of oxide material on the ROM pad. The crushing circuit is used initially to prepare feed for the heap leach facility.
Production mining includes the movement of 6.5 Mt of waste material, the placement of 0.3 Mt of ROM material on the ROM pad, and the stockpiling of 0.9 Mt of heap leach material adjacent to the crushing circuit. The contract mining costs associated with this period are included in the capital cost estimate and expected to cost $22.3 million. This cost covers all associated management, dewatering, drilling, blasting, loading, hauling, support, engineering and geology labour, grade control costs, and mobilization costs.
21.2.1.1.2 Miscellaneous Mine Capital
The miscellaneous mine capital cost is the cost associated with the engineering office. This includes such items as desktop workstations, mining and geology software, survey equipment (drones and total stations), and associated peripherals. The cost is estimated at $1.2 million with the majority of that cost being the mining/geology software.
21.2.1.1.3 Mine Infrastructure Capital
Mine infrastructure capital covers the mine dewatering system and pump truck (this aspect is handled by Discovery Silver and not the contractor), the preparation of the waste dump and pit areas, construction of the initial access road to the plant from the pit, and construction of the explosives pad. The costs associated with these items are listed in Table 21-3.
Table 21-3: Mine Infrastructure Capital (US$M)
Miscellaneous Mining Capital
WBS
Initial Capital Cost (US$M)
Sustaining Capital Cost (US$M)
Total Capital Cost
(US$M) Y-2 Y-1 LOM
Waste Dump Preparation 1300 $0.4 - - $0.4 Mill Feed Stockpile Preparation 1400 $0.4 - - $0.4 Haul Road Construction 1500 $0.4 - - $0.4 Dewatering System – Pumps/Pipe 1600 $1.0 $0.1 $6.2 $7.3 Dewatering System – Pump Truck 1600 $0.3 - $0.6 $0.9 Explosives Pad 1900 $0.1 - - $0.1 Total $2.7 $0.1 $6.8 $9.6
Source: AGP Mining, 2021.
21.2.1.2 Direct Costs – Process Plant and Infrastructure
Process and infrastructure costs are summarized in Table 21-4 and described in the following sections. Direct costs include all contractors’ direct and indirect labour, permanent equipment, materials, freight, and mobile equipment associated with the physical construction of the areas.

Cordero Project P a g e 2 8 5
Preliminary Economic Assessment of the Cordero Silver Project, Chihuahua State, Mexico January 2022
Table 21-4: Process and Infrastructure Capital Costs
WBS WBS Description
Initial Capital Cost (US$M)
Expansion Capital Cost (US$M)
Sustaining Capital
Cost (US$M)
Total Capital
Cost (US$M)
Y-2 Y-1 Y3 Y8 LOM
2000 On-Site Infrastructure $14.7 $9.0 $9.9 -- $16.0 $49.6
2100 Site Development $1.9 $0.5 $0.5 -- -- $2.9
2200 Power Supply & Distribution $3.6 $7.7 $7.8 -- -- $19.1
2300 Utilities $0.3 -- -- -- -- $0.3
2400 General Buildings $1.3 -- -- -- -- $1.3
2500 Plant Buildings $0.6 -- $0.2 -- -- $0.8
2600 Mobile Equipment $2.5 -- -- -- -- $2.5
2700 Laboratory $1.8 -- -- -- -- $1.8
2800 Water Management $2.7 $0.8 $1.4 -- -- $4.9
Sustaining Capital Allowance -- -- -- -- $16.0 $16.0
3000 Oxide Plant $70.8 $1.5 -- -- $4.4 $76.7
3100 Crushing $34.8 -- -- -- -- $34.8
3200 Heap Leach Stacking + Pad $23.0 $1.5 -- -- $0.4 $24.8
3300 Heap Leach Ponds $0.9 -- -- -- -- $0.9
3400 Merrill Crowe $10.6 -- -- -- -- $10.6
3500 Reagents $0.3 -- -- -- -- $0.3
3600 Goldroom $1.2 -- -- -- -- $1.2
Sustaining Capital Allowance -- -- -- -- $4.0 $4.0
4000 Sulphide Plant $0.4 $95.5 $50.8 $22.7 $30.0 $199.3
4100 Crushing -- $22.6 $2.9 -- -- $25.5
4200 Grinding -- $22.0 $22.0 -- $44.1
4300 Flotation -- $32.5 $13.6 $16.9 -- $63.0
4400 Concentrate Thickening & Filtration -- $6.7 -- $5.8 -- $12.5
4500 Reagent Offloading & Storage -- $2.8 $3.3 -- -- $6.1
4600 Air & Water Services $0.4 $4.3 $4.3 -- -- $8.9
4700 Tailings Thickening -- $4.7 $4.7 -- -- $9.3
Sustaining Capital Allowance -- -- $30.0 $30.0
5000 Tailings Management -- $14.7 -- -- $95.3 $110.0
5100 Site Preparation -- $1.9 -- -- $12.3 $14.2
5200 Earthworks -- $7.0 -- -- $58.0 $65.0
5300 Pumping -- $0.3 -- -- -- $0.3
5400 Liners -- $0.4 -- -- $4.2 $4.6
5500 Key Trench -- $2.8 -- -- $15.2 $18.0
5700 Detailed Eng / QA-QC -- $0.6 -- -- $4.5 $5.1
5800 Decant & Discharge Pipeline -- $1.8 -- -- $1.1 $2.8
6000 Off-Site Infrastructure $19.4 -- -- -- -- $19.4
6100 Off-Site Roads -- -- -- -- -- --
6200 Water Supply $0.1 -- -- -- -- $0.1
6300 HV Power Supply $19.4 -- -- -- -- $19.4
Total Process & Infrastructure Cost $105.3 $120.7 $60.7 $22.7 $145.7 $455.1
Source: Ausenco, 2021.

Cordero Project P a g e 2 8 6
Preliminary Economic Assessment of the Cordero Silver Project, Chihuahua State, Mexico January 2022
21.2.1.2.1 On-Site Infrastructure (WBS 2000)
On-site infrastructure costs were developed based on Ausenco’s in-house database of costs and labour rates and include the following:
• Site Development (WBS 2100)
o bulk earthworks
o access road
• Power Supply & Distribution (WBS 2200)
o High-voltage powerline (from tie-in), power switchyard, and power distribution
o incoming substation and power distribution
• Utilities (WBS 2300)
o fuel storage tanks (double wall fuel tank)
o gas station
• General Buildings (WBS 2400)
o main administration building
o mill office
o security gatehouse
o mess hall
• Plant Buildings (WBS 2500)
o plant warehouse and maintenance building
o reagent storage building
• Mobile Equipment (WBS 2600)
• Laboratory (WBS 2700)
o bulk earthworks
o laboratory building and equipment
• Water Management (WBS 2800)
o earthworks (ditching and collection ponds)
o potable water treatment system
• Sustaining Capital Allowance.

Cordero Project P a g e 2 8 7
Preliminary Economic Assessment of the Cordero Silver Project, Chihuahua State, Mexico January 2022
21.2.1.2.2 Oxide Plant & Sulphide Plant (WBS 3000 & 4000)
The definition of process equipment requirements was based on conceptual process flowsheets and process design criteria (refer to Section 17). Mechanical equipment and building supply costs were based on recent and historical budget quotes from similar projects, adjusted to reflect the Cordero Project sizing. Building costs are presented in Table 21-5.
Table 21-5: WBS 2000 Building Costs
WBS WBS Description Building Description Building Type Total Capital Cost
(US$M)
2400 General Buildings
Main Administration Building Modular $0.8
Security Gatehouse Modular $0.0
Environment Monitoring System Modular $0.1
Kitchen Modular $0.1
Mess Hall Modular $0.8
Mill Office Modular $0.1
Control Room Modular $0.0
2500 Plant Buildings
Reagent Storage Fabric $0.6
Plant Storage Warehouse Fabric $0.3
Plant Maintenance Shop Fabric $0.3
Source: Ausenco, 2021.
21.2.1.2.3 Tailings Management (WBS 5000)
The estimated capital expenditures have been developed based on the PEA-level TSF design, the current understanding of site conditions, and permitting obligations. The MTOs were developed by Knight Piésold and the costing was completed by Ausenco. The cost estimates are based on neat line quantities and material take-offs from the typical sections and details, neat-line AutoCAD modelling, unit rate development, and contractor quotes from similar projects.
The estimated capital cost estimate includes the following main items:
• earthworks costs associated with foundation preparation, material processing and embankment construction for the TSF
• earthworks costs for the seepage collection pond, and miscellaneous infrastructure required for the TSF operations
• installation of a seepage collection pond, key trenches, and pumpback systems to collect potential embankment seepage and contact runoff from the embankment
• supply and installation of geomembrane on TSF embankment and seepage collection pond
• indirect cost associated with QA-QC and site investigation to support detailed design.

Cordero Project P a g e 2 8 8
Preliminary Economic Assessment of the Cordero Silver Project, Chihuahua State, Mexico January 2022
21.2.1.2.4 Off-Site Infrastructure (WBS 6000)
Water supply costs (WBS 6200) were developed using in-house database of costs and labour rates. The high-voltage powerline cost (WBS 6300) is based on the study completed and estimate prepared by CFE.
• WBS 6200 – 930 m pipe from raw water source to process tank; 1,600 m pipe from dewatering collection pond to process tank
• WBS 6300 – 79 km high-voltage overhead powerline.
21.2.1.3 Indirect Costs
Indirect costs are summarized in Table 21-6 and described in the following sections.
Table 21-6: Indirect Costs
WBS WBS Description
Initial Capital Cost (US$M)
Expansion Capital Cost (US$M)
Sustaining Capital Cost
(US$M)
Total Capital Cost (US$M)
Y-2 Y-1 Y3 Y8 LOM
7000 Project Indirects $21.8 $29.7 $16.9 $6.2 $3.8 $78.4
8000 Owner's Cost $5.6 -- -- -- $44.0 $49.6
9000 Provisions $28.4 $30.2 $15.9 $6.1 $29.3 $109.9
Total Indirect Capital Cost $55.8 $59.9 $32.8 $12.3 $77.1 $237.9
Source: Ausenco, 2021.
21.2.1.3.1 Project Indirects (WBS 7000)
Indirect costs are required during the project delivery period to enable and support construction activities. Indirect costs include the following:
• temporary construction facilities and services
• commissioning representatives and assistance
• on-site materials transportation and storage
• spares (commissioning, initial, and insurance)
• first fills and initial charges
• freight and logistics
• engineering, procurement, and construction management services.
The project indirect costs, which are estimated at US$78 million, have been based on Ausenco’s historical project costs of a similar nature.

Cordero Project P a g e 2 8 9
Preliminary Economic Assessment of the Cordero Silver Project, Chihuahua State, Mexico January 2022
21.2.1.3.2 Owner’s Cost (WBS 8000)
The Owner’s cost was developed by Ausenco with inputs for major cost contributions provided by Discovery Silver. Owner’s costs net of salvage value amount to US$28 million and include the following items:
• project staffing and miscellaneous expenses
• pre-production labour
• home office project management
• home office finance, legal, and insurance
• closure costs.
21.2.1.3.2.1 Closure Costs
The estimated total reclamation and closure costs, exclusive of taxes and contingency, for the Cordero project is US$44 million. Closure costs have been benchmarked against recent projects in similar jurisdictions.
21.2.1.3.2.2 Salvage Value
Salvage value for the Cordero project is estimated at US$22 million. Salvage value was calculated as 10% of the oxide and sulphide processing plants’ mechanical parts.
21.2.1.3.3 Contingency (WBS 9000)
Contingency accounts for the difference in costs from the estimated and actual costs of materials and equipment. The level of contingency varies depending on the nature of the contract and the client's requirements. Due to uncertainties at the time the capital cost estimate was developed, it is essential that the estimate include a provision to cover the risk from these uncertainties.
The contingency estimate will not allow for the following:
• abnormal weather conditions
• changes to market conditions affecting the cost of labour or materials
• changes of scope within the general production and operating parameters
• effects of industrial disputations
• financial modelling
• technical engineering refinement
• estimate inaccuracy.
The contingency capital cost has been calculated at 20% of total direct costs, or US$110 million.

Cordero Project P a g e 2 9 0
Preliminary Economic Assessment of the Cordero Silver Project, Chihuahua State, Mexico January 2022
21.2.2 Exclusions
The following costs and scope will be excluded from the capital cost estimate:
• land acquisitions
• taxes not listed in the financial analysis
• sales taxes
• scope changes and project schedule changes and the associated costs
• any facilities/structures not mentioned in the project summary description
• costs to advance the project from preliminary economic assessment to pre-feasibility study
• geotechnical unknowns/risks
• financing charges and interest during the construction period
• any costs for demolition or decontamination for the current site
• third-party costs.
21.2.3 Expansion Capital Costs
The PEA design is based on a phased expansion approach to treat the variable grades in the mineralized material while considering a future increase in mill throughput. An expansion to the sulphide flotation capabilities in Year 3 is planned when the sulphide mineralized material throughput is doubled. Process design criteria are described in Section 17.
The infrastructure and process expansion capital costs account for the following:
• on-site power supply and distribution
• site-wide water management structures
• comminution circuit
• flotation circuit.
21.2.4 Sustaining Capital Costs
21.2.4.1 Mining (WBS 1000)
The sustaining costs for mining include the cost of pit dewatering throughout the life of mine.
21.2.4.2 Process Plant, Infrastructure and TSF
All major processing and electrical equipment were sized based on the process design criteria outlined in Section 17. The infrastructure cost includes site development, power supply upgrade, additional buildings and the water management structures required during the sulphide plant expansion phase in Year 3.

Cordero Project P a g e 2 9 1
Preliminary Economic Assessment of the Cordero Silver Project, Chihuahua State, Mexico January 2022
Process plant costs include the following:
• cost of heap leach management and irrigation
• sulphide plant expansion in Year 3, sulphide concentrate expansion in Year 8.
Tailings storage facility costs include the tailing storage facility dam lifts.
21.3 Operating Costs
Operating costs include the ongoing cost of operations related to mining, processing, tailings disposal and general administration activities.
21.3.1 Basis of Estimate
Common to all operating cost estimates are the following assumptions:
• Cost estimates are based on Q4 2021 pricing without allowances for inflation.
• Costs are expressed in United States dollars (USD or US$).
• For material sourced in Canadian dollars, an exchange rate of 1.27 Canadian dollar per US dollar was assumed.
• For material sourced in Australian dollars, an exchange rate of 1.36 Australian dollar per US dollar was assumed.
• Majority of the labour requirement is assumed to come from neighbouring municipalities.
• Processing unit operations were benchmarked against similar or comparable processing plants.
• Equipment and materials will be purchased as new.
• Grinding media consumption rates have been estimated based on the material characteristics.
• Reagent consumption rates have been estimated on the metallurgical characteristics.
• The mobile equipment cost provides for fuel and maintenance.
21.3.2 Mine Operating Costs
Mine operating costs have been estimated from base principals using quotations from local mining contractors with Discovery Silver components added to determine the overall cost.
The contract proposals are based on annual projected haulage profiles to the process facilities or the rock storage facility. Pricing from the contractors is based on schedule bank cubic meters (bcm) with the conversion to cost per tonne completed as part of the overall estimate. The expected annual fuel consumption was provided in their estimates to which a cost per liter applied.

Cordero Project P a g e 2 9 2
Preliminary Economic Assessment of the Cordero Silver Project, Chihuahua State, Mexico January 2022
The fuel price used was 19.71 MXN/liter or $0.99 USD/liter delivered to site and provided by a local vendor.
Explosives were also provided by Discovery Silver, and that cost was added afterwards.
The contractors were responsible for all normal mining tasks (drilling, blasting, loading, hauling, support) with the following tasks assigned below:
• Fuel
o Discovery Silver provides fuel to site.
o Contractor provides trucks to fuel remote equipment and expected consumption quantity annually.
• Explosives
o Discovery Silver provides explosives delivery to the blasthole.
o Contractor is responsible for loading and shooting blast patterns.
• Grade Control
o Discovery Silver provides grade control for material in the pit and stockpiles.
• Dewatering
o Discovery Silver is responsible for dewatering of pit and treatment if required.
• Geotechnical
o Discovery Silver is responsible for all geotechnical monitoring.
• Mine Planning
o Discovery Silver is responsible for all mine planning and surveying.
o Contractor has their own survey crew for volume calculations.
21.3.2.1 Contract Mining
Contract mining costs were based on the contractors cost which included:
• mobilization/demobilization
• contractor overheads
• all drilling required
• tie-in of blasting patterns and shooting
• loading waste, mill feed, heap leach, and ROM material
• hauling all materials to their appropriate destinations
• support functions (less dewatering).

Cordero Project P a g e 2 9 3
Preliminary Economic Assessment of the Cordero Silver Project, Chihuahua State, Mexico January 2022
The mining equipment chosen for use in the study is readily available in Mexico and is familiar to contract mining operations. The equipment is shown in Table 21-7. The pits have been designed with ramps that can accommodate 181-tonne class haul trucks. The smaller sized contractor fleet would have additional space for equipment to help alleviate congestion concerns.
Table 21-7: Contract Mining Major Equipment List
Equipment Unit Capacity Pre-Production Units Life-of-Mine Units
Production Drill mm 140/220 1 5
Production Excavator m3 13.7 1 2
Production Loader m3 13.8 1 3
Haulage Truck t 91 5 37
Source: AGP Mining, 2021.
The support equipment is matched to the equipment fleet.
The drill pattern used for this study is based on a primary 200 mm drill hole and 10-meter bench height. Preshear lines would be drilled with a 140 mm bit. The pattern sizes are shown in Table 21-8.
The cost of the contract mining per tonne moved (including rehandle) is $1.12/t. This does not include fuel, which is covered under Owner’s costs.
Table 21-8: Drill Pattern Size
Specification Unit Preshear Mill Feed Waste
Bench Height m 10 10 10
Sub-Drill m - 1.0 1.0
Blasthole Diameter mm 140 200 200
Pattern Spacing - Staggered m 1.65 5.5 5.5
Pattern Burden - Staggered m 1.90 5.0 5.0
Hole Depth m 10.0 11.0 11.0
Source: AGP Mining, 2021.
21.3.2.2 Fuel
To allow better control of the fuel cost, mining estimates were quoted without fuel, but an estimate of consumption by contractors was provided. For the PEA cost estimate, this rate was varied by year based on haulage profile cycle times ratioed against the life-of-mine weighted average haulage time to distribute the fuel cost.
The fuel consumption was estimated at 0.52 L/t for the pre-production period and 0.56 L/t for the life of mine. The cost of fuel was estimated at $0.55/t moved life of mine.

Cordero Project P a g e 2 9 4
Preliminary Economic Assessment of the Cordero Silver Project, Chihuahua State, Mexico January 2022
21.3.2.3 Blasting
The blasting cost was assigned to a separate cost category, as this is the Owner’s responsibility. Quotations from local explosive vendors were obtained which included delivery to the blasthole. The explosives cost includes monthly fees from the explosives vendor for magazine rental and all costs associated with delivering the product to the open pit.
Powder factors that result from the proposed equipment are shown in Table 21-9. The cost for blasting is approximately $0.28 per tonne moved over the life of mine. This is $19.6 million per year on average for the first 10 years, decreasing thereafter as material movement requirements drop.
Table 21-9: Design Powder Factors
Description Unit Mill Feed Waste
Powder Factor kg/m3 0.78 0.78
Powder Factor kg/t 0.29 0.29
Source: AGP Mining, 2021.
21.3.2.4 Grade Control
The grade control program will be completed with blast hole cuttings. Known mill feed samples will be collected in addition to 25% of the waste samples to identify new mineralized zones. Samples will be sent to the assay laboratory with the results applied to the short-range mining model.
If additional grade control is required, a reverse-circulation (RC) drilling program can be incorporated, but is not considered at this time.
Annual samples are expected to total up to 40,000 per year. The total grade control program is estimated to cost approximately $500,000 annually or about $0.01 per tonne moved.
21.3.2.5 Dewatering
The dewatering quantity is currently estimated at 347,000 m3/a. This water will be removed from the pit using two in-pit diesel pumps and then directed horizontally to the settling pond with another diesel pump. Normal pumping rates are estimated at 950 m3/d with peak rates of 2,100 m3/d during the wetter part of the year. Additional dewatering in the form of horizontal drain holes is included in the dewatering cost. These holes will be campaigned and included in sustaining capital. The dewatering operating cost is expected to be approximately $245,000 per year.
21.3.2.6 Discovery Silver Management
Costs associated with management of the mining contractor and normal engineering and geology duties are included in this cost category. The costs associated with the dewatering crew are included. The workforce included in this category is shown in Table 21-10 and includes the annual salary with a 30% burden included. The annual cost for this team is estimated at $1.4 million per year or $0.02 per tonne moved.

Cordero Project P a g e 2 9 5
Preliminary Economic Assessment of the Cordero Silver Project, Chihuahua State, Mexico January 2022
Table 21-10: Projected Workforce (Year 2)
Position Employees Annual Salary
(US$/a)
Mine Operations
Mining Superintendent 1 $118,800
Dewatering Crew 8 $16,000
Clerk 1 $15,700
Subtotal 10
Mine Engineering
Chief Engineer 1 $63,700
Senior Engineer 1 $42,400
Open Pit Planning Engineer 2 $36,800
Geotechnical Engineer 1 $36,800
Blasting Engineer 1 $36,800
Blasting/Geotechnical Technician 2 $23,400
Surveyor/Mining Technician 2 $23,400
Surveyor/Mining Technician Helper 2 $19,500
Clerk 1 $15,700
Subtotal 13
Geology
Chief Geologist 1 $63,700
Senior Geologist 1 $42,400
Grade Control Geologist/Modeller 4 $23,400
Sampling/Geology Technician 6 $18,900
Clerk 1 $15,700
Subtotal 13
Total 36 $1,378,000
Source: AGP Mining, 2021.
21.3.2.7 Total Mine Costs
The total life-of-mine operating costs per tonne of material moved (in situ and rehandling) is $1.98 per tonne moved. The cost per tonne milled includes the total mining cost (with rehandling) and is estimated at $7.04 per tonne milled. If rehandling is not considered, the life-of-mine mining cost rises to $2.13 per tonne mined. The cost for rehandling is estimated at $0.97/t. The costs for the PEA are shown in Table 21-11.
Table 21-11: Open Pit Operating Costs – LOM Average
Open Pit Category Unit Cost
US$/t Moved US$/t Mined US$/t Milled
Contract Mining $1.13 $1.16 $3.98
Fuel $0.55 $0.61 $1.97
Blasting $0.27 $0.31 $0.97
Grade Control $0.01 $0.01 $0.02
Dewatering $0.01 $0.01 $0.02
Discovery Silver Management $0.02 $0.03 $0.08
Total $1.98 $2.13 $7.04
Source: AGP Mining, 2021.

Cordero Project P a g e 2 9 6
Preliminary Economic Assessment of the Cordero Silver Project, Chihuahua State, Mexico January 2022
21.3.3 Process Plant Operating Costs
The average yearly processing operating costs (including G&A costs) differ as the project undergoes numerous phases and as different material is processed. Table 21-12 provides a summary of the oxide process plant operating costs throughout the crushed oxide leaching and ROM oxide leaching operations, while Table 21-13 summarizes the sulphide process plant operating costs for the three phases.
The three distinct phases of the sulphide plant include:
• Years 1 to 3: Sulphide plant operating at a yearly throughput of 7.2 Mt/a.
• Years 4 to 8: Sulphide plant throughput expansion to 14.4 Mt/a.
• Year 9 and onwards: Sulphide plant concentrate production expansion. The general plant layout remains the same with additional zinc cleaners, lead silver cleaners, and regrind mills to for higher producing mill.
Table 21-12: Overall Operating Costs for Oxide Processing Plant
Oxide Cost Center Crushed Oxide Leach, Years -1 to 31 ROM Leach, Years 4 to 6
US$M/a US$/t US$M/a US$/t
Power $2.11 $0.42 $0.14 $0.03
Reagents $14.00 $2.79 $6.41 $1.28
Consumables $1.72 $0.34 $0.17 $0.03
Maintenance $1.02 $0.20 $0.13 $0.03
Process Plant Labour $0.36 $0.07 $0.96 $0.02
General and Administrative Costs $7.271 $1.45 - -
Total $26.48 $5.29 $6.94 $1.39
1 Oxide plant general & administrative costs only applicable for first year (Year-1) of oxide operations. Calculated G&A costs are extended in sulphide
process plant operating costs. Source: Ausenco, 2021.
Table 21-13: Overall Operating Costs for Sulphide Processing Plant
Sulphide Cost Center Years 1 to 3 Years 4 to 8 Years 9+
US$M/a US$/t US$M/a US$/t US$M/a US$/t
Power $10.00 $1.40 $17.70 $1.23 $18.60 $1.29
Reagents $26.10 $3.62 $52.20 $3.62 $52.20 $3.62
Consumables $8.93 $1.24 $15.50 $1.07 $15.60 $1.08
Maintenance $1.92 $0.27 $3.12 $0.22 $3.49 $0.24
Labour $2.29 $0.32 $2.74 $0.19 $2.74 $0.19
Mobile Equipment $0.36 $0.05 $0.36 $0.03 $0.36 $0.03
Lab Services $0.84 $0.12 $1.68 $0.12 $1.68 $0.12
General and Administrative Costs $10.10 $1.41 $12.30 $0.86 $12.30 $0.86
Total $60.60 $8.42 $105.60 $7.33 $106.97 $7.43
Source: Ausenco, 2021.

Cordero Project P a g e 2 9 7
Preliminary Economic Assessment of the Cordero Silver Project, Chihuahua State, Mexico January 2022
21.3.3.1 Labour
Staffing was estimated by benchmarking the Cordero Project against similar projects. The labour costs incorporate requirements for plant operation, such as management, metallurgy, operations, maintenance, site services, assay laboratory, and contractor allowance. The total operational labour averages 30 employees for the crushed mineralized material leach oxide plant, 14 employees over run-of-mine leach operations, 119 employees for Years 1 to 3 of the sulphide plant, and 156 employees for Years 4 and onwards.
Organizational staffing plans outlining the labour requirement for the oxide and sulphide process plants are shown in Tables 21-14 and 21-15, respectively. Labour costs amount to US$357,000 for the oxide plant, US$2.28 million for the first phase of the sulphide plant, and US$2.7 million for the second phase of the sulphide plant. Salaries and wages are based on benchmarks of similar projects in the area and expected local industrial rates.
Table 21-14: Oxide Process Plant Labour Summary
Oxide Plant Labour Description Number of Employees
Crushed Oxide Leach, Years -1 to 3 ROM Oxide Leach, Years 4 to 6
Operations Shift Foreman 4 1
Control Room Operator 4 0
Crusher Operator 4 0
Merrill-Crowe Operator 4 4
Tailings Management Operator 4 4
Mobile Equipment Operator 1 4
Reagents/Swing Operator 1 1
Heap Leach Operations Staff Total 22 14
Maintenance Planner 1 0
Millwrights 2 0
Electricians 2 0
Process Control/Instrument Tech 1 0
Apprentices 2 0
Mill Maintenance Staff Total 8 0
Total Process Plant Staff 30 14
Source: Ausenco, 2021.

Cordero Project P a g e 2 9 8
Preliminary Economic Assessment of the Cordero Silver Project, Chihuahua State, Mexico January 2022
Table 21-15: Sulphide Process Plant Labour Summary
Sulphide Plant Labour Description Number of Employees
Years 1 to 3 Years 4+
Mill Manager 1 1
Production Superintendent 1 1
Maintenance Superintendent 1 1
Plant Metallurgist 2 4
Trainer 1 0
Mill Staff Total 6 7
Operations Shift Foreman 4 4
Control Room Operator 4 4
Crusher Operator 4 4
Grinding Operator 4 8
Flotation Operator 4 12
Concentrate Filtration Operator 4 10
Tailings Management Operator 4 6
Mobile Equipment Operator 8 8
Reagents/Swing Operator 12 12
Mill Operations Staff Total 48 68
Lab Manager 1 1
Chief Assayer 1 1
Assayers 2 2
Laboratory Technician 4 0
Sample Preparation Technician 4 0
Helper 4 0
Laboratory Staff Total 7 4
Maintenance Planner 2 4
Millwrights 22 28
Electricians 20 25
Process Control/Instrument Technician 8 8
Apprentices 6 12
Mill Maintenance Staff Total 56 77
Total Staff 119 156
Source: Ausenco, 2021.
21.3.3.2 Electrical Power
The power costs of the process plants were calculated from the installed power in the mechanical equipment lists for the equipment used in each plant and phase. A power cost of US$0.062/kWh was used, along with the assumption that 75% of the installed power would be utilized. A summary of the power costs is provided in Table 21-16.
Table 21-16: Summary of Power Costs
Plant and Phase Installed Power (kW) Annual Power Cost (US$M/a)
Oxide Plant Crushed Leach (Years -1-3) 5,716 $2.11
Oxide Plant ROM Leach (Years 4-6) 373 $0.14
Sulphide Plant (Years 1-3) 25,529 $10.05
Sulphite Plant Expansion (Years 4-8) 44,960 $17.70
Sulphide Plant Concentrate Production Expansion (Years 9+) 47,259 $18.61
Source: Ausenco, 2021.

Cordero Project P a g e 2 9 9
Preliminary Economic Assessment of the Cordero Silver Project, Chihuahua State, Mexico January 2022
21.3.3.3 Reagents, Wear Items, and Grinding Media
Various reagents and consumables are required for the oxide and sulphide process plants. The reagent consumption rates are summarized in Tables 21-17 and 21-18 for the oxide and sulphide plants, respectively. The consumable wear rates are presented in Table 21-19 for the oxide plant and Table 21-20 for the sulphide plant.
These values include the rates for both sulphide and oxide plants and were provided by the testwork results outlined in Chapter 13. The sulphide plant reagent consumption rates remain constant after the expansion, as the throughput is not changed in the Year 9 concentrate production expansion.
The crushed mineralized material leach operations require an annual reagent cost of US$13.97 million from the first to fourth year of milling operations. US$6.40 million is required each year for reagent consumption in the ROM leach operations from Years 4 through 6.
Annual reagent costs were estimated at US$26.08 million for the initial sulphide processing plant phase. As the throughput does not increase again after the sulphide plant expansion in Year 4, the reagent costs required for the remaining years for the sulphide plant operations were estimated at US$52.16 million.
Table 21-17: Summary of Reagent Consumption for Oxide Plant
Reagent Reagent Cost
(US$/t)
Crushed Oxide Leach, Years -1-3 ROM Oxide Leach, Years 4-6
Consumption (g/t)
Cost (US$M/a)
Consumption (g/t)
Cost (US$M/a)
Cement $139 8,000 $5.55 - $0.00
Lime $202 2,000 $2.02 - $0.00
Diatomaceous Earth $580 300 $0.87 300 $0.87
Zinc Powder $1,100 24 $0.13 24 $0.13
Lead Nitrate $2,570 100 $1.28 100 $1.28
Cyanide $2,120 350 $3.71 350 $3.71
Antiscalant $3,410 24 $0.41 24 $0.41
Reagent Cost Total - - $14.0 - $6.41
Source: Ausenco, 2021.
Table 21-18: Summary of Reagent Consumption for Sulphide Plant
Reagent Reagent Cost
(US$/t)
Years 1 to 4 Years 4+
Consumption (g/t)
Cost (US$M/a)
Consumption (g/t)
Cost (US$M/a)
Lime $202 1,377 $1.39 1,377 $2.78
Cyanide $2,120 53 $0.80 53 $1.60
Antiscalant $3,410 10 $0.17 10 $0.35
Soda Ash $2,750 357 $7.07 357 $14.10
Depressant (Zinc Sulphate) $1,100 158 $1.25 158 $2.49
Activator (Copper Sulphate) $2,250 169 $2.73 169 $5.46
Collector (Aero 5100) $3,410 14 $0.35 14 $0.70
Frother (MIBC) $3,000 195 $4.21 195 $8.51
Collector (X5000) $12,690 14 $1.28 14 $2.56
Flocculant $3,250 60 $1.40 60 $2.81
Total - - $26.1 - $52.2
Source: Ausenco, 2021.

Cordero Project P a g e 3 0 0
Preliminary Economic Assessment of the Cordero Silver Project, Chihuahua State, Mexico January 2022
Table 21-19: Summary of Annual Consumable Use for Oxide Plant
Consumable Unit Cost
(US$/unit)
Crushed Mineralized Material Leach, Years -1 to 3
ROM Leach, Years 4 to 6
Consumption
(Qty/a)
Cost
(US$M/a)
Consumption
(Qty/a)
Cost
(US$M/a)
Gyratory Spares set 87,320 4 $0.35 - $0.00
Secondary Crusher Kit set 100,000 6 $0.60 - $0.00
Tertiary Crusher Kit set 100,000 6 $0.60 - $0.00
Precipitation Filter Cloth set 15,000 3 $0.05 3 $0.05
Clarifier Filter Cloth set 17,000 4 $0.07 4 $0.07
Crucibles set 18,000 1 $0.02 1 $0.02
Baghouse Cartridges set 3,500 12 $0.04 12 $0.04
Total - - - $1.72 - $0.17
Source: Ausenco, 2021.
Table 21-20: Summary of Annual Consumable Use in Sulphide Plant
Consumable Unit Cost
(US$/unit)
Years 1 to 3 Years 4 to 8 Years 9+
Consumption
(Qty/a)
Cost
(US$M/a)
Consumption
(Qty/a)
Cost
(US$M/a)
Consumption
(Qty/a)
Cost
(US$M/a)
Gyratory Spares set $87,320 - $0.00 4 $0.35 4 $0.35
Secondary Crusher Kit set $100,000 12 $1.20 12 $1.20 12 $1.20
Tertiary Crusher Kit set $100,000 12 $1.20 12 $1.20 12 $1.20
Ball Mill Media kg $0.85 5,299,200 $4.52 10,598,400 $9.04 10,598,400 $9.04
Ball Mill Liners set $515,398 1 $0.52 2 $1.03 2 $1.03
Lead Regrind Mill Media kg $4.70 110,560 $0.52 221,120 $1.04 221,120 $1.04
Lead Regrind Mill Liners set $90,342 1 $0.90 1 $0.90 1.3 $0.12
Zinc Regrind Mill Media kg $4.70 133,120 $0.63 266,240 $1.25 266,240 $1.25
Zinc Regrind Mill Liners set $121,679 1 $0.12 1 $0.12 1.4 $0.18
Lead Filters set $4,881 14 $0.07 14 $0.67 18 $0.09
Zinc Filters set $4,881 14 $0.07 14 $0.67 20 $0.10
Total - - - $8.93 - $15.5 - $15.6
Source: Ausenco, 2021.
The yearly grinding media costs amount to US$1.72 million for the crushed mineralized material leach oxide equipment and US$0.17 million for the ROM leach operations.
Consumable rates for the three sulphide plant phases differ due to the various concentrate production rates of each phase. The wear rates of the regrind mill liners and, the lead and zinc filters were calculated based on concentrate production. The total annual consumable costs for the original sulphide plant, the initial expansion in Year 4, and the concentrate production expansion are US$8.93 million, US$15.46 million, and US$15.58 million, respectively.
21.3.3.4 Maintenance Parts and Supplies
The process plant annual maintenance cost was derived from the total installed mechanical equipment cost for each phase based on the mechanical equipment list using a factor of 5%. Table 21-21 shows a summary of the maintenance cost.

Cordero Project P a g e 3 0 1
Preliminary Economic Assessment of the Cordero Silver Project, Chihuahua State, Mexico January 2022
Table 21-21: Maintenance Cost for Each Project Phase
Plant and Phase Annual Maintenance Cost (US$M/a)
Oxide Plant Crushed Mineralized Material Leach (Years -1-3) $1.02
Oxide Plant ROM Leach (Years 4-6) $0.13
Sulphide Plant (Years 1-3) $1.92
Sulphite Plant Expansion (Years 4-8) $3.12
Sulphide Plant Concentrate Production Expansion (Years 9+) $3.49
Source: Ausenco, 2021.
21.3.3.5 Mobile Equipment
Vehicle costs are based on a scheduled number of light vehicles and mobile equipment, including fuel, maintenance, spares, and tires, as well as annual registration and insurance fees. Mobile equipment requirements result in an annual cost of US$364,000 during sulphide plant operations (Years 1 to 16).
21.3.3.6 Laboratory Services
The operating cost estimate for laboratory activity was benchmarked against similar projects and adjusted for throughput requirements. Laboratory services for both plants were estimated as one cost. An annual cost of US$840,000 was assumed for the initial sulphide plant operations and a cost of US$1.68 million was estimated for operations beyond Year 4.
21.3.4 General and Administrative Operating Costs
General and administrative (G&A) costs are expenses not directly related to the production of the desired products and include expenses not included in mining, processing, external refining, and transportation costs. These costs were developed using Ausenco’s in-house data on existing operations. The G&A costs are divided into the following areas:
• G&A maintenance, including access road maintenance
• labour
• camp services
• human resources, including training, recruiting, and community relations
• infrastructure power, including power requirements for HVAC and administrative buildings
• site administration, maintenance, and security, including subscriptions, memberships, advertisement, office supplies and garbage disposal
• health and safety, including personal protective equipment, hospital service cost, and first aid
• environmental, including water sampling and tailings management facility operating costs
• IT & telecommunications, including hardware and support services
• contract services, including insurance, sanitation and cleaning, licence fees, and legal fees.
All G&A costs for the various process plant phases are detailed in Table 21-22, with the organizational employee roster listed in Table 21-23. G&A staffing was estimated by benchmarking against similar projects with comparable unit processes.

Cordero Project P a g e 3 0 2
Preliminary Economic Assessment of the Cordero Silver Project, Chihuahua State, Mexico January 2022
Table 21-22: Summary of G&A Operating Costs
G&A Area Oxide Plant Cost
(US$/a)
Initial Sulphide Plant Cost (US$/a)
Expanded Sulphide Plant Cost (US$/a)
G&A Maintenance $307,692 $307,692 $307,692
Mine Property Road Maintenance $192,308 $192,308 $192,308
Access Road Maintenance $115,385 $115,385 $115,385
Personnel (as detailed in Table 21-23) $1,391,855 $1,391,855 $1,660,996
Camp Services $363,175 $726,350 $726,350
Human Resources $753,805 $1,471,892 $2,063,023
Recruiting $38,462 $38,462 $38,462
Training $15,000 $74,500 $78,000
Community Relations $658,587 $1,317,175 $1,896,732
Communications $41,756 $41,756 $49,830
G&A Power $173,352 $173,352 $173,352
Side Administration, Maintenance & Security $545,388 $826,654 $1,028,825
Subscriptions & Publications $31,709 $48,061 $59,815
Memberships & Dues $79,272 $120,153 $149,538
Conferences, Seminars & External Training $79,272 $120,153 $149,538
Advertising & Promotional Material $31,709 $48,061 $59,815
First Aid $79,272 $120,153 $149,538
Stationery – Office Supplies $79,272 $120,153 $149,538
Postage, Courier & Light Freight $31,709 $48,061 $59,815
Office Equipment Rental $31,709 $48,061 $59,815
Garbage $38,050 $57,674 $71,778
Warehouse $63,417 $96,123 $119,631
Health & Safety $110,308 $181,708 $185,908
Personal Protective Equipment $9,000 $44,700 $46,800
Hospital Service Cost $92,308 $92,308 $92,308
First Aid – On Site $9,000 $44,700 $46,800
Environmental $170,000 $170,000 $170,000
Water Sampling $100,000 $100,000 $100,000
TSF Operating Costs $70,000 $70,000 $70,000
IT & Telecommunications $1,000,000 $1,000,000 $1,000,000
IT Hardware $200,000 $200,000 $200,000
IT Support Services $800,000 $800,000 $800,000
Contract Services $2,452,604 $3,895,103 $5,012,607
Insurance $1,462,083 $2,216,103 $2,758,084
Sanitation & Cleaning $73,105 $110,807 $137,906
Licence Fees $292,417 $443,221 $551,617
Legal Fees $500,000 $1,000,000 $1,440,000
Waste Management $100,000 $100,000 $100,000
Equipment Rentals $25,000 $25,000 $25,000
Total $7,268,179 $10,144,633 $12,328,752
Source: Ausenco, 2021.

Cordero Project P a g e 3 0 3
Preliminary Economic Assessment of the Cordero Silver Project, Chihuahua State, Mexico January 2022
Table 21-23: G&A Labour Roles
Administrative Labour Roles
Number of Employees
Overall Oxide Plant & Sulphide Plant Years -1 to 3
Sulphide Plant Years 4+
Mine General Manager 0 1
HR Manager 1 1
HR Clerk 2 2
HR Trainer 1 2
Community Relations Manager 1 1
Community Relations Coordinator 2 2
H&S Coordinator 2 3
First Aid Attendant/Nurse 4 4
Environmental Manager 1 1
Environmental Coordinator 4 4
Environmental Technician 6 6
Procurement & Logistics Manager 1 1
Procurement & Logistics Agent 3 4
Loss Prevention Officer 4 4
Warehouse Foreman 1 1
Warehouse Clerk 4 4
Warehouse Labourers 6 6
Site Services Foreman 1 1
Carpenters 3 4
Multi-Equipment Operator 3 4
Skilled Labourers 2 4
Bus Driver 4 2
Total 56 62
Source: Ausenco, 2021.

Cordero Project P a g e 3 0 4
Preliminary Economic Assessment of the Cordero Silver Project, Chihuahua State, Mexico January 2022
22 ECONOMIC ANALYSIS
22.1 Forward-Looking Information Cautionary Statements
The results of the economic analyses discussed in this section represent forward-looking information as defined under Canadian securities law. The results depend on inputs that are subject to known and unknown risks, uncertainties, and other factors that may cause actual results to differ materially from those presented here. Information that is forward-looking includes the following:
• mineral resource estimates
• assumed commodity prices and exchange rates
• the proposed mine production plan
• projected mining and process recovery rates
• assumptions as to mining dilution and ability to mine in areas previously exploited using mining methods as envisaged the timing and amount of estimated future production
• sustaining costs and proposed operating costs
• assumptions as to closure costs and closure requirements
• assumptions as to environmental, permitting, and social risks.
Additional risks to the forward-looking information include the following:
• changes to costs of production from what is assumed
• unrecognized environmental risks
• unanticipated reclamation expenses
• unexpected variations in quantity of mineralized material, grade, or recovery rates
• accidents, labour disputes, and other risks of the mining industry
• geotechnical or hydrogeological considerations during mining being different from what was assumed
• failure of mining methods to operate as anticipated
• failure of plant, equipment, or processes to operate as anticipated

Cordero Project P a g e 3 0 5
Preliminary Economic Assessment of the Cordero Silver Project, Chihuahua State, Mexico January 2022
• changes to assumptions as to the availability of electrical power, and the power rates used in the operating cost estimates and financial analysis
• ability to maintain the social licence to operate
• changes to interest rates
• changes to tax rates.
22.2 Methodologies Used
The project has been evaluated using a discounted cash flow (DCF) analysis based on a 5% discount rate. Cash inflows consist of annual revenue projections. Cash outflows consist of capital expenditures, including pre-production costs, operating costs, taxes, and royalties. These are subtracted from the inflows to arrive at the annual cash flow projections. Cash flows are taken to occur at the mid-point of each period. It must be noted that tax calculations involve complex variables that can only be accurately determined during operations, and as such, the actual post-tax results may differ from those estimated. A sensitivity analysis was performed to assess the impact of variations in metals price, discount rate, head grade, total operating cost, and total capital costs. The capital and operating cost estimates developed specifically for this project are presented in Section 21 of this report in Q4 2021 American dollars. The economic analysis has been run on a constant dollar basis with no inflation.
22.3 Financial Model Parameters
22.3.1 Assumptions
The economic analysis was performed assuming the base case silver price of US$22/oz, gold price of US$1,600/oz, lead price of $1.00/lb and zinc price of US$1.20/lb. These metal prices were based on consensus analyst estimates and recently published economic studies. The forecasts used are meant to reflect the average metals price expectation over the life of the project. No price inflation or escalation factors were taken into account. Commodity prices can be volatile, and there is the potential for deviation from the forecast.
The economic analysis also used the following assumptions:
• The construction period will be two years.
• The mine life is 16 years.
• Cost estimates are in constant Q4 2021 US dollars with no inflation or escalation factors considered.
• Results are based on 100% ownership with a 0.5% NSR on revenue from gold and silver production.
• Capital costs are funded with 100% equity (no financing assumed).
• All cash flows are discounted to the start of the construction period using a mid-period discounting convention.
• All metal products will be sold in the same year they are produced.

Cordero Project P a g e 3 0 6
Preliminary Economic Assessment of the Cordero Silver Project, Chihuahua State, Mexico January 2022
• Project revenue will be derived from the sale of silver doré and lead and zinc concentrates.
• Currently, there are no contractual refining arrangements.
22.3.2 Taxes
The project has been evaluated on a post-tax basis to provide an approximate value of the potential economics. The tax model was compiled by Discovery Silver and calculations are based on the tax regime as of the date of the PEA technical report. At the effective date of this report, the project was assumed to be subject to the following tax regime:
• The Mexican corporate income tax system consists of 30% income tax.
• Mining tax in Mexico consists of 7.5% on earnings before interest, taxes, depreciation, and amortization.
At the assumed metal process, total payments are estimated to be $1,057 million over the life of mine.
22.4 Economic Analysis
The economic analysis was performed assuming an 5% discount rate. The pre-tax NPV discounted at 5% is $1,858 million; the IRR is 50.3%, and payback period is 1.6 years. On a post-tax basis, the NPV discounted at 5% is $1,160 million, the IRR is 38.2%, and the payback period is 2.0 years. A summary of project economics is shown graphically in Figure 22-1 and listed in Table 22-1. The analysis was done on an annual cashflow basis; the cashflow output is shown Table 22-2.
Figure 22-1: Post-Tax Project Economics
Note: *Left axis is for free cash flow, and right axis for cumulative free cash flow. Source: Ausenco, 2021.
($400)
--
$400
$800
$1,200
$1,600
$2,000
($200)
--
$200
$400
$600
$800
Y-2 Y-1 Y1 Y2 Y3 Y4 Y5 Y6 Y7 Y8 Y9 Y10 Y11 Y12 Y13 Y14 Y15 Y16
Cu
mu
lative
FC
F (
US
$M
)
Fre
e C
ash
Fo
w (
US
$M
)
Annual FCF Cumulative FCF
Payback Threshold*

Cordero Project P a g e 3 0 7
Preliminary Economic Assessment of the Cordero Silver Project, Chihuahua State, Mexico January 2022
Table 22-1: Economic Analysis Summary
Description Unit LOM Total / Avg.
General Assumptions
Silver Price US$/oz $22
Gold Price US$/oz $1,600
Lead Price US$/lb $1.00
Zinc Price US$/lb $1.20
Discount Rate % 5.0%
Production
Total Payable Silver koz 164,818
Total Payable Gold koz 83
Total Payable Lead Mlb 1,626
Total Payable Zinc Mlb 2,340
Total Payable Silver Equivalent koz 372,440
Operating Costs
Mining Cost* US$/t mined $2.13
Processing Cost - Heap leach crushed US$/t stacked $3.84
Processing Cost - Heap leach run of mine US$/t stacked $1.39
Processing Cost - Milling (7.2 Mt/a) US$/t milled $7.01
Processing Cost - Milling (14.4 Mt/a) US$/t milled $6.57
G&A Cost (14.4 Mt/a) US$/t milled $0.86
Cash Costs and All-in Sustaining Costs (Co-Product Basis)
Operating Cash Costs** US$/oz AgEq $8.34
Total Cash Costs*** US$/oz AgEq $12.07
All-in Sustaining Cost **** US$/oz AgEq $12.35
Capital Expenditures
Initial Capital US$M $368
Expansion Capital US$M $129
Sustaining Capital US$M $186
Closure Costs US$M $44
Salvage Costs US$M ($22)
Economics
Pre-tax NPV @ 5% US$M $1,858
Pre-tax IRR % 50%
Pre-tax Payback years 1.6
Post-tax NPV @ 5% US$M $1,160
Post-tax IRR % 38%
Post-tax Payback years 2.0
Notes: *Mining Cost excludes mineralized material rehandling cost. **Operating cash costs consist of mining costs, processing costs, site-level G&A. *** Total cash costs consist of operating cash costs plus transportation cost, royalties, treatment and refining charges. **** AISC consist of total cash costs plus sustaining capital, closure cost and salvage value. Source: Ausenco, 2021.

Cordero Project P a g e 3 0 8
Preliminary Economic Assessment of the Cordero Silver Project, Chihuahua State, Mexico January 2022
Table 22-2: Project Cash Flow
Macro Assumptions Units Total/Avg. Y-2 Y-1 Y1 Y2 Y3 Y4 Y5 Y6 Y7 Y8 Y9 Y10 Y11 Y12 Y13 Y14 Y15 Y16 Y17 Y18
Silver Price US$/oz $22 $22 $22 $22 $22 $22 $22 $22 $22 $22 $22 $22 $22 $22 $22 $22 $22 $22 $22 $22 $22
Gold Price US$/oz $1,600 $1,600 $1,600 $1,600 $1,600 $1,600 $1,600 $1,600 $1,600 $1,600 $1,600 $1,600 $1,600 $1,600 $1,600 $1,600 $1,600 $1,600 $1,600 $1,600 $1,600
Lead Price US$/lb $1.00 $1.00 $1.00 $1.00 $1.00 $1.00 $1.00 $1.00 $1.00 $1.00 $1.00 $1.00 $1.00 $1.00 $1.00 $1.00 $1.00 $1.00 $1.00 $1.00 $1.00
Zinc Price US$/lb $1.20 $1.20 $1.20 $1.20 $1.20 $1.20 $1.20 $1.20 $1.20 $1.20 $1.20 $1.20 $1.20 $1.20 $1.20 $1.20 $1.20 $1.20 $1.20 $1.20 $1.20
Free Cash Flow Valuation
Net Revenue US$M $7,364 -- $121 $449 $575 $539 $550 $581 $573 $485 $484 $803 $695 $520 $368 $177 $168 $168 $108 -- --
Operating Expenses US$M ($3,193) -- ($136) ($218) ($213) ($208) ($226) ($246) ($242) ($236) ($248) ($251) ($214) ($169) ($139) ($124) ($122) ($122) ($80) -- --
Concentrate Transportation Cost US$M ($527) -- -- ($21) ($29) ($26) ($34) ($42) ($46) ($38) ($38) ($64) ($58) ($46) ($31) ($15) ($14) ($14) ($9) -- --
Royalties US$M ($18) -- ($1) ($1) ($2) ($2) ($2) ($1) ($1) ($1) ($1) ($2) ($1) ($1) ($1) ($0) ($0) ($0) ($0) -- --
EBITDA US$M $3,625 -- ($16) $209 $331 $303 $289 $292 $284 $210 $196 $485 $422 $304 $198 $37 $32 $32 $19 -- --
Initial/Expansion Capex US$M ($497) ($187) ($181) -- -- ($94) -- -- -- -- ($35) -- -- -- -- -- -- -- -- -- --
Sustaining Capex US$M ($177) -- -- ($9) ($31) ($6) ($36) ($3) ($4) ($3) ($4) ($31) ($3) ($3) ($3) ($3) ($31) ($3) ($4) -- --
Closure Capex US$M ($53) -- -- -- -- -- -- -- ($6) -- -- -- -- -- -- -- -- -- ($5) ($21) ($21)
Salvage Value US$M $22 -- -- -- -- -- -- -- -- -- -- -- -- -- -- -- -- -- $2 $10 $10
Pre-Tax Unlevered Free Cash Flow US$M $2,921 ($187) ($198) $200 $300 $204 $253 $289 $274 $207 $157 $455 $419 $301 $195 $34 $1 $29 $12 ($11) ($11)
Pre-Tax Cumulative Unlevered Free Cash Flow US$M $2,921 ($187) ($384) ($185) $115 $320 $573 $862 $1,136 $1,342 $1,499 $1,954 $2,373 $2,674 $2,868 $2,902 $2,903 $2,932 $2,944 $2,932 $2,921
Mining tax US$M ($273) -- -- ($16) ($25) ($23) ($22) ($22) ($21) ($16) ($15) ($36) ($32) ($23) ($15) ($3) ($2) ($2) ($1) -- --
Income Tax Payable US$M ($784) -- -- ($9) ($68) ($64) ($51) ($62) ($58) ($46) ($47) ($120) ($110) ($82) ($52) ($8) -- ($4) ($2) -- --
Post-Tax Unlevered Free Cash Flow US$M $1,864 ($187) ($198) $175 $207 $117 $180 $205 $195 $145 $95 $299 $277 $196 $127 $23 ($2) $22 $8 ($11) ($11)
Post-Tax Cumulative Unlevered Free Cash Flow US$M $1,864 ($187) ($384) ($209) ($2) $116 $296 $501 $696 $841 $936 $1,235 $1,512 $1,708 $1,835 $1,859 $1,857 $1,879 $1,887 $1,875 $1,864
Mining
Mineralized Material Mined Mt 228 1 14 23 18 18 24 18 19 19 19 21 16 12 5 0 -- -- -- -- --
Waste Mt 491 6 41 49 49 47 41 47 46 41 44 40 26 10 3 0 -- -- -- -- --
Total Material Mined Mt 719 8 55 72 67 65 65 65 65 60 63 61 42 22 8 0 -- -- -- -- --
Mining Rate kt/d 137 22 157 206 192 186 186 186 186 171 181 175 121 62 22 1 -- -- -- -- --
Strip Ratio w:o 2.16 5.17 2.82 2.15 2.65 2.67 1.77 2.53 2.46 2.23 2.27 1.91 1.59 0.83 0.60 0.06 -- -- -- -- --
Processing
Crushed Oxides / Heap Leach
Heap Leach Crushed Tonnes Mt 20 -- 5 5 5 5 -- -- -- -- -- -- -- -- -- -- -- -- -- -- --
Heap Leach Stacked Grade - Ag g/t 41.53 -- 57.87 38.24 34.75 35.26 -- -- -- -- -- -- -- -- -- -- -- -- -- -- --
Heap Leach Stacked Grade - Au g/t 0.09 -- 0.08 0.10 0.09 0.08 -- -- -- -- -- -- -- -- -- -- -- -- -- -- --
Heap Leach Stacked Grade - AgEq g/t 47.91 -- 63.91 45.70 41.12 40.91 -- -- -- -- -- -- -- -- -- -- -- -- -- -- --
ROM Oxides / Heap Leach
Heap Leach ROM Tonnes Mt 9 -- -- -- -- -- 5 4 0 -- -- -- -- -- -- -- -- -- -- -- --
ROM Heap Leach Stacked Grade - Ag g/t 23.57 -- -- -- -- -- 18.31 28.36 43.97 -- -- -- -- -- -- -- -- -- -- -- --
ROM Heap Leach Stacked Grade - Au g/t 0.06 -- -- -- -- -- 0.07 0.05 0.08 -- -- -- -- -- -- -- -- -- -- -- --
ROM Heap Leach Stacked Grade - AgEq g/t 27.99 -- -- -- -- -- 23.12 32.27 49.64 -- -- -- -- -- -- -- -- -- -- -- --
Sulphides
Sulphide Tonnes Mt 199 -- -- 6 7 7 11 14 14 14 14 14 14 14 14 14 14 14 9 -- --
Mill Head Grade - Ag g/t 31.08 -- -- 61.77 63.38 61.06 47.66 35.00 33.57 30.66 29.95 42.67 36.63 28.60 22.70 13.08 12.56 12.56 12.56 -- --
Mill Head Grade - Au g/t 0.09 -- -- 0.19 0.41 0.36 0.15 0.07 0.08 0.07 0.07 0.08 0.07 0.07 0.06 0.04 0.04 0.04 0.04 -- --
Mill Head Grade - Pb % 0.5% -- -- 0.7% 1.0% 0.9% 0.6% 0.5% 0.5% 0.4% 0.4% 0.7% 0.7% 0.5% 0.4% 0.2% 0.2% 0.2% 0.2% -- --
Mill Head Grade - Zn % 0.7% -- -- 0.9% 0.8% 0.7% 0.8% 0.9% 0.9% 0.8% 0.8% 1.3% 1.2% 0.9% 0.6% 0.4% 0.3% 0.3% 0.3% -- --
Mill Head Grade - AgEq g/t 80.30 -- -- 132.40 154.93 143.19 106.61 86.53 89.89 77.66 77.53 118.79 105.73 83.89 62.08 35.03 33.47 33.47 33.47 -- --
Lead Concentrate - Recovery -- -- 10,708 13,789 13,257 14,800 13,481 12,929 11,632 11,369 17,830 14,245 10,453 8,202 4,076 3,915 3,915 2,513 -- --
Ag % 73% -- -- 81% 82% 82% 77% 71% 71% 70% 70% 79% 72% 67% 66% 56% 56% 56% 56% -- --
Au % 13% -- -- 13% 13% 13% 13% 13% 13% 13% 13% 13% 13% 13% 13% 13% 13% 13% 13% -- --
Pb % 86% -- -- 90% 91% 90% 90% 85% 87% 85% 85% 89% 88% 87% 84% 69% 69% 69% 69% -- --
Zinc Concentrate - Recovery
Ag % 12% -- -- 12% 11% 12% 12% 12% 12% 12% 12% 12% 12% 12% 12% 11% 11% 11% 11% -- --
Au % 6% -- -- 6% 6% 6% 6% 6% 6% 6% 6% 6% 6% 6% 6% 6% 6% 6% 6% -- --
Zn % 85% -- -- 86% 86% 85% 84% 86% 86% 86% 86% 88% 88% 87% 81% 74% 74% 74% 74% -- --

Cordero Project P a g e 3 0 9
Preliminary Economic Assessment of the Cordero Silver Project, Chihuahua State, Mexico January 2022
Macro Assumptions Units Total/Avg. Y-2 Y-1 Y1 Y2 Y3 Y4 Y5 Y6 Y7 Y8 Y9 Y10 Y11 Y12 Y13 Y14 Y15 Y16 Y17 Y18
Metal Produced
Ag - Oxides Moz 17 -- 5 3 3 3 1 1 0 -- -- -- -- -- -- -- -- -- -- -- --
Au - Oxides koz 42 -- 8 10 9 8 3 2 0 -- -- -- -- -- -- -- -- -- -- -- --
AgEq - Oxides Metal Produced Moz 20 -- 6 4 4 4 1 2 0 -- -- -- -- -- -- -- -- -- -- -- --
Ag - Sulphides Moz 167 -- -- 11 14 13 15 13 13 12 11 18 14 10 8 4 4 4 3 -- --
Au - Sulphides koz 113 -- -- 6 18 15 10 6 7 6 6 7 6 6 6 4 4 4 2 -- --
Pb - Sulphides Mlb 1,727 -- -- 84 149 130 132 123 145 106 105 187 187 145 100 38 36 36 23 -- --
Zn - Sulphides Mlb 2,773 -- -- 100 108 100 154 235 251 215 221 369 320 248 159 84 79 79 51 -- --
AgEq - Sulphides Metal Produced Moz 405 -- -- 20 28 26 30 32 34 29 29 47 41 31 22 11 10 10 7 -- --
Ag - Total Moz 185 -- 5 14 17 16 16 15 13 12 11 18 14 10 8 4 4 4 3 -- --
Au - Total koz 155 -- 8 17 26 23 13 9 7 6 6 7 6 6 6 4 4 4 2 -- --
Pb - Total Mlb 1,727 -- -- 84 149 130 132 123 145 106 105 187 187 145 100 38 36 36 23 -- --
Zn - Total Mlb 2,773 -- -- 100 108 100 154 235 251 215 221 369 320 248 159 84 79 79 51 -- --
AgEq - Total Metal Produced Moz 426 -- 6 25 32 29 31 34 34 29 29 47 41 31 22 11 10 10 7 -- --
Metal Payable
Ag - Oxides Moz 17 -- 5 3 3 3 1 1 0 -- -- -- -- -- -- -- -- -- -- -- --
Au - Oxides koz 42 -- 8 10 9 8 3 2 0 -- -- -- -- -- -- -- -- -- -- -- --
AgEq - Oxides Metal Payable Moz 20 -- 6 4 4 4 1 2 0 -- -- -- -- -- -- -- -- -- -- -- --
Ag - Sulphides Moz 148 -- -- 10 12 12 13 12 11 10 10 16 12 9 7 4 3 3 2 -- --
Au - Sulphides koz 41 -- -- 2 10 9 3 1 0 1 1 5 4 0 1 1 1 1 1 -- --
Pb - Sulphides Mlb 1,626 -- -- 80 141 123 124 116 136 100 99 176 177 136 94 36 33 33 21 -- --
Zn - Sulphides Mlb 2,340 -- -- 84 91 84 130 198 212 181 186 312 271 209 134 70 67 67 43 -- --
AgEq - Sulphides Metal Payable Moz 352 -- -- 18 25 23 26 28 29 25 25 41 36 27 19 9 9 9 6 -- --
Ag - Total Moz 165 -- 5 13 16 15 14 13 11 10 10 16 12 9 7 4 3 3 2 -- --
Au - Total koz 83 -- 8 12 19 16 6 3 1 1 1 5 4 0 1 1 1 1 1 -- --
Pb - Total Mlb 1,626 -- -- 80 141 123 124 116 136 100 99 176 177 136 94 36 33 33 21 -- --
Zn - Total Mlb 2,340 -- -- 84 91 84 130 198 212 181 186 312 271 209 134 70 67 67 43 -- --
AgEq - Total Metal Payable Moz 372 -- 6 22 28 27 27 30 29 25 25 41 36 27 19 9 9 9 6 -- --
Revenues
Oxides Revenue
Ag Revenue US$M $376 -- $112 $74 $67 $68 $22 $29 $3 -- -- -- -- -- -- -- -- -- -- -- --
Au Revenue US$M $67 -- $13 $17 $14 $13 $6 $4 $0 -- -- -- -- -- -- -- -- -- -- -- --
Gross Revenue - Oxides US$M $443 -- $126 $91 $82 $81 $27 $33 $3 -- -- -- -- -- -- -- -- -- -- -- --
Treatment & Refining Charges US$M $18 -- $5 $3 $3 $3 $1 $1 $0 -- -- -- -- -- -- -- -- -- -- -- --
Net Revenue - Oxides US$M $425 -- $121 $87 $78 $78 $26 $32 $3 -- -- -- -- -- -- -- -- -- -- -- --
Sulphides Revenue
Ag Revenue US$M $3,250 -- -- $212 $275 $264 $292 $261 $249 $225 $220 $345 $274 $200 $158 $78 $75 $75 $48 -- --
Au Revenue US$M $66 -- -- $3 $16 $14 $5 $1 $1 $2 $2 $7 $6 $0 $1 $2 $2 $2 $1 -- --
Pb Revenue US$M $1,626 -- -- $80 $141 $123 $124 $116 $136 $100 $99 $176 $177 $136 $94 $36 $33 $33 $21 -- --
Zn Revenue US$M $2,808 -- -- $101 $110 $101 $156 $238 $255 $217 $224 $375 $325 $251 $160 $84 $80 $80 $51 -- --
Gross Revenue - Sulphides US$M $7,751 -- -- $396 $541 $502 $577 $616 $641 $544 $544 $903 $782 $588 $414 $200 $191 $191 $122 -- --
Treatment & Refining Charges US$M $813 -- -- $35 $44 $41 $53 $66 $71 $59 $60 $100 $87 $68 $46 $23 $22 $22 $14 -- --
Net Revenue - Sulphides US$M $6,938 -- -- $362 $497 $461 $524 $550 $570 $485 $484 $803 $695 $520 $368 $177 $168 $168 $108 -- --
Total Net Revenue US$M $7,364 -- $121 $449 $575 $539 $550 $581 $573 $485 $484 $803 $695 $520 $368 $177 $168 $168 $108 -- --
Operating Costs
Mine US$M $1,602 -- $110 $147 $133 $128 $136 $135 $136 $131 $143 $144 $107 $62 $32 $17 $15 $15 $11 -- --
Processing - Heap Leach - Crushed US$M $77 -- $19 $19 $19 $19 -- -- -- -- -- -- -- -- -- -- -- -- -- -- --
Processing - Heap Leach - ROM US$M $12 -- -- -- -- -- $6 $6 $0 -- -- -- -- -- -- -- -- -- -- -- --
Processing - Mill US$M $1,309 -- -- $41 $50 $50 $71 $93 $93 $93 $93 $95 $95 $95 $95 $95 $95 $95 $61 -- --
Site G&A Costs US$M $194 -- $7 $10 $10 $10 $12 $12 $12 $12 $12 $12 $12 $12 $12 $12 $12 $12 $8 -- --
Total Operating Cost US$/t
Processed $13.73 -- -- $20.22 $17.45 $17.04 $14.52 $13.28 $16.52 $16.41 $17.24 $17.43 $14.83 $11.76 $9.66 $8.59 $8.46 $8.46 $8.66 -- --
Royalties
NSR - Government US$M $18 -- $1 $1 $2 $2 $2 $1 $1 $1 $1 $2 $1 $1 $1 $0 $0 $0 $0 -- --
Total Royalties US$M $18 -- $1 $1 $2 $2 $2 $1 $1 $1 $1 $2 $1 $1 $1 $0 $0 $0 $0 -- --

Cordero Project P a g e 3 1 0
Preliminary Economic Assessment of the Cordero Silver Project, Chihuahua State, Mexico January 2022
Macro Assumptions Units Total/Avg. Y-2 Y-1 Y1 Y2 Y3 Y4 Y5 Y6 Y7 Y8 Y9 Y10 Y11 Y12 Y13 Y14 Y15 Y16 Y17 Y18
Concentrate Transportation Cost
Lead Con Transportation Cost US$M $214 -- -- $10 $17 $15 $16 $16 $18 $13 $13 $23 $22 $18 $13 $6 $5 $5 $3 -- --
Zinc Con Transportation Cost US$M $313 -- -- $11 $12 $11 $17 $26 $28 $24 $25 $41 $36 $28 $18 $10 $9 $9 $6 -- --
Total Transportation Costs US$M $527 -- -- $21 $29 $26 $34 $42 $46 $38 $38 $64 $58 $46 $31 $15 $14 $14 $9 -- --
Cash Cost and All-in Sustaining Cost
Co-Product Basis
Operating Cash Costs* US$/oz AgEq $8.34 -- -- $9.82 $7.52 $7.84 $8.22 $8.34 $8.27 $9.56 $10.04 $6.12 $6.01 $6.34 $7.39 $13.61 $14.07 $14.07 $14.40 -- --
Total Cash Costs** US$/oz AgEq $12.07 -- -- $12.57 $10.29 $10.55 $11.47 $12.10 $12.31 $13.52 $14.06 $10.17 $10.13 $10.63 $11.50 $17.91 $18.34 $18.34 $18.67 -- --
All-in Sustaining Cost *** US$/oz AgEq $12.35 -- -- $12.98 $11.40 $10.76 $11.65 $12.20 $12.64 $13.65 $14.24 $10.27 $10.21 $10.74 $11.66 $18.24 $19.12 $18.69 $19.85 -- --
Capital Expenditures
Initial/Expansion Capex
Mining US$M $26 $26 $1 -- -- -- -- -- -- -- -- -- -- -- -- -- -- -- -- -- --
On-Site Infrastructure US$M $34 $15 $9 -- -- $10 -- -- -- -- -- -- -- -- -- -- -- -- -- -- --
Oxide Plant US$M $72 $71 $1 -- -- -- -- -- -- -- -- -- -- -- -- -- -- -- -- -- --
Sulphide Plant US$M $169 $0 $95 -- -- $51 -- -- -- -- $23 -- -- -- -- -- -- -- -- -- --
Tailings Management US$M $15 -- $15 -- -- -- -- -- -- -- -- -- -- -- -- -- -- -- -- -- --
Off-Site Infrastructure US$M $19 $19 -- -- -- -- -- -- -- -- -- -- -- -- -- -- -- -- -- -- --
Project Indirects US$M $75 $22 $30 -- -- $17 -- -- -- -- $6 -- -- -- -- -- -- -- -- -- --
Owner's Cost US$M $6 $6 -- -- -- -- -- -- -- -- -- -- -- -- -- -- -- -- -- -- --
Contingency US$M $81 $28 $30 -- -- $16 -- -- -- -- $6 -- -- -- -- -- -- -- -- -- --
Total Initial/Expansion Capex US$M $497 $187 $181 -- -- $94 -- -- -- -- $35 -- -- -- -- -- -- -- -- -- --
Sustaining Capex
Mining US$M $7 -- -- $0 $0 $1 $0 -- $0 -- $1 $0 -- -- -- -- $2 -- $1 -- --
On-Site Infrastructure - Sustaining Capex Allowance US$M $16 -- -- $1 $1 $1 $1 $1 $1 $1 $1 $1 $1 $1 $1 $1 $1 $1 $1 -- --
Heap Leach Stacking + Pad US$M $0 -- -- $0 $0 $0 $0 -- -- -- -- -- -- -- -- -- -- -- -- -- --
Oxide Plant - Sustaining Capex Allowance US$M $4 -- -- $1 $1 $1 $1 -- -- -- -- -- -- -- -- -- -- -- -- -- --
Sulphide Plant - Sustaining Capex Allowance US$M $30 -- -- $2 $2 $2 $2 $2 $2 $2 $2 $2 $2 $2 $2 $2 $2 $2 $2 -- --
Tailings Management US$M $95 -- -- $4 $22 $1 $26 -- -- -- -- $22 -- -- -- -- $20 -- -- -- --
Project Indirects US$M $4 -- -- $0 $1 -- $1 -- -- -- -- $1 -- -- -- -- $1 -- -- -- --
Contingency US$M $21 -- -- $1 $5 -- $5 -- $0 -- -- $5 -- -- -- -- $5 -- $0 -- --
Total Sustaining Capex US$M $177 -- -- $9 $31 $6 $36 $3 $4 $3 $4 $31 $3 $3 $3 $3 $31 $3 $4 -- --
Closure Capex
Closure US$M $44 -- -- -- -- -- -- -- $5 -- -- -- -- -- -- -- -- -- $4 $18 $18
Contingency US$M $9 -- -- -- -- -- -- -- $1 -- -- -- -- -- -- -- -- -- $1 $4 $4
Total Closure Capex US$M $53 -- -- -- -- -- -- -- $6 -- -- -- -- -- -- -- -- -- $5 $21 $21
Salvage Value
Salvage Value ($22) -- -- -- -- -- -- -- -- -- -- -- -- -- -- -- -- -- ($2) ($10) ($10)
Total Salvage Value US$M ($22) -- -- -- -- -- -- -- -- -- -- -- -- -- -- -- -- -- ($2) ($10) ($10)
Total Capital Expenditures Including Salvage Value US$M $704 $187 $181 $9 $31 $99 $36 $3 $10 $3 $39 $31 $3 $3 $3 $3 $31 $3 $7 $11 $11
* Operating cash costs consist of mining costs, processing costs, site-level G&A. ** Total cash costs consist of operating cash costs plus transportation cost, royalties, treatment and refining charges. *** AISC consist of total cash costs plus sustaining capital, closure cost and salvage value. Source: Ausenco, 2021.

Cordero Project P a g e 3 1 1
Preliminary Economic Assessment of the Cordero Silver Project, Chihuahua State, Mexico January 2022
Readers are cautioned that the PEA is preliminary in nature. It includes inferred mineral resources that are considered too speculative geologically to have the economic considerations applied to them that would enable them to be categorized as mineral reserves, and there is no certainty that the economics will be realized.
22.5 Sensitivity Analysis
A sensitivity analysis was conducted on the base case post-tax NPV and IRR of the project using the following variables: metal prices, discount rate, head grade, total operating cost, and total capital cost.
Tables 22-3 and 22-4 show the post-tax sensitivity analysis results.
As shown in Figure 22-2, the sensitivity analysis revealed that the project is most sensitive to changes in metals price and head grade, and less sensitive to discount rate, total operating cost, and total capital cost.
Table 22-3: Post-Tax Sensitivity Summary
Metal Prices Post-Tax NPV (5%) Total Capital Cost Total Operating Cost Head Grade
Base Case (-10%) (+10%) (-10%) (+10%) (-10%) (+10%)
(20.0%) $440 $486 $393 $585 $294 $206 $672
(10.0%) $802 $849 $756 $945 $658 $535 $1,068
-- $1,160 $1,206 $1,115 $1,300 $1,020 $861 $1,458
10.0% $1,515 $1,561 $1,469 $1,654 $1,375 $1,182 $1,848
20.0% $1,869 $1,915 $1,824 $2,009 $1,730 $1,501 $2,238
Metal Prices Post-Tax IRR (5%) Total Capital Cost Total Operating Cost Head Grade
Base Case (-10%) (+10%) (-10%) (+10%) (-10%) (+10%)
(20.0%) 20.3% 23.0% 18.0% 24.5% 15.9% 13.1% 26.7%
(10.0%) 29.7% 33.0% 27.0% 33.6% 25.9% 22.7% 36.3%
-- 38.2% 42.0% 35.0% 41.8% 34.6% 30.9% 45.1%
10.0% 46.1% 50.5% 42.4% 49.7% 42.5% 38.5% 53.5%
20.0% 53.7% 58.7% 49.5% 57.3% 50.2% 45.5% 61.7%
Source: Ausenco, 2021.

Cordero Project P a g e 3 1 2
Preliminary Economic Assessment of the Cordero Silver Project, Chihuahua State, Mexico January 2022
Table 22-4: Post-Tax Sensitivity Analysis
Post-Tax NPV Sensitivity to Discount Rate Post-Tax IRR Sensitivity to Discount Rate
Metals Price Metals Price
Dis
co
un
t R
ate
$1,160 (20.0%) (10.0%) -- 10.0% 20.0%
Dis
co
un
t R
ate
38% (20.0%) (10.0%) -- 10.0% 20.0%
1.0% $697 $1,199 $1,692 $2,180 $2,667 1.0% 20.3% 29.7% 38.2% 46.1% 53.7%
3.0% $556 $981 $1,399 $1,813 $2,226 3.0% 20.3% 29.7% 38.2% 46.1% 53.7%
5.0% $440 $802 $1,160 $1,515 $1,869 5.0% 20.3% 29.7% 38.2% 46.1% 53.7%
8.0% $301 $593 $880 $1,166 $1,451 8.0% 20.3% 29.7% 38.2% 46.1% 53.7%
10.0% $228 $482 $734 $983 $1,233 10.0% 20.3% 29.7% 38.2% 46.1% 53.7%
Post-Tax NPV Sensitivity to Head Grade Post-Tax IRR Sensitivity to Head Grade
Metals Price Metals Price
He
ad
Gra
de
$1,160 (20.0%) (10.0%) -- 10.0% 20.0%
He
ad
Gra
de
38% (20.0%) (10.0%) -- 10.0% 20.0%
(20.0%) ($34) $265 $557 $846 $1,132 (20.0%) 3.3% 14.9% 23.2% 30.4% 37.1%
(10.0%) $206 $535 $861 $1,182 $1,501 (10.0%) 13.1% 22.7% 30.9% 38.5% 45.5%
-- $440 $802 $1,160 $1,515 $1,869 -- 20.3% 29.7% 38.2% 46.1% 53.7%
10.0% $672 $1,068 $1,458 $1,848 $2,238 10.0% 26.7% 36.3% 45.1% 53.5% 61.7%
20.0% $903 $1,330 $1,756 $2,181 $2,606 20.0% 32.6% 42.5% 51.8% 60.8% 69.5%
Post-Tax NPV Sensitivity to Total Operating Cost Post-Tax IRR Sensitivity to Total Operating Cost
Metals Price Metals Price
To
tal
Op
era
tin
g C
os
t
$1,160 (20.0%) (10.0%) -- 10.0% 20.0%
To
tal
Op
era
tin
g C
os
t
38% (20.0%) (10.0%) -- 10.0% 20.0%
(20.0%) $729 $1,085 $1,439 $1,794 $2,148 (20.0%) 28.5% 37.3% 45.5% 53.3% 60.9%
(10.0%) $585 $945 $1,300 $1,654 $2,009 (10.0%) 24.5% 33.6% 41.8% 49.7% 57.3%
-- $440 $802 $1,160 $1,515 $1,869 -- 20.3% 29.7% 38.2% 46.1% 53.7%
10.0% $294 $658 $1,020 $1,375 $1,730 10.0% 15.9% 25.9% 34.6% 42.5% 50.2%
20.0% $147 $513 $876 $1,236 $1,590 20.0% 11.1% 21.9% 30.9% 39.0% 46.7%
Post-Tax NPV Sensitivity to Total Capital Cost Post-Tax IRR Sensitivity to Total Capital Cost
Metals Price Metals Price
To
tal
Ca
pit
al
Co
st $1,160 (20.0%) (10.0%) -- 10.0% 20.0%
To
tal
Ca
pit
al
Co
st 38% (20.0%) (10.0%) -- 10.0% 20.0%
(20.0%) $533 $895 $1,252 $1,606 $1,961 (20.0%) 26.1% 36.8% 46.5% 55.7% 64.6%
(10.0%) $486 $849 $1,206 $1,561 $1,915 (10.0%) 23.0% 33.0% 42.0% 50.5% 58.7%
-- $440 $802 $1,160 $1,515 $1,869 -- 20.3% 29.7% 38.2% 46.1% 53.7%
10.0% $393 $756 $1,115 $1,469 $1,824 10.0% 18.0% 27.0% 35.0% 42.4% 49.5%
20.0% $346 $710 $1,069 $1,423 $1,778 20.0% 15.9% 24.5% 32.2% 39.1% 45.8%
Source: Ausenco, 2021.

Cordero Project P a g e 3 1 3
Preliminary Economic Assessment of the Cordero Silver Project, Chihuahua State, Mexico January 2022
Figure 22-2: Post-Tax NPV and IRR Sensitivity Results
Source: Ausenco, 2021.
--
$500
$1,000
$1,500
$2,000
(20.0%) (10.0%) -- 10.0% 20.0%
Sen
siti
vity
Su
mm
ary
Po
st-T
ax N
PV
5%
(U
S$M
)
Metals Price (+/-%) Discount Rate (+/-%)
Head Grade (+/-%) Total Operating Cost (+/-%)
Total Capital Cost (+/-%)
--
10.0%
20.0%
30.0%
40.0%
50.0%
60.0%
(20.0%) (10.0%) -- 10.0% 20.0%
Sen
siti
vity
Su
mm
ary
Po
st-T
ax IR
R (
%)
Metals Price (+/-%) Discount Rate (+/-%)
Head Grade (+/-%) Total Operating Cost (+/-%)
Total Capital Cost (+/-%)

Cordero Project P a g e 3 1 4
Preliminary Economic Assessment of the Cordero Silver Project, Chihuahua State, Mexico January 2022
23 ADJACENT PROPERTIES
One of this technical report’s QPs, Ms. Caira, has personally inspected the claim status on adjacent properties and can find no active mining claims adjacent to the Cordero property. As noted in Section 6, a review of adjacent mining claims conducted by Levon in 2009 led to reclaiming mineral concessions that had been dropped earlier by Valley High Ventures Ltd. In 2013, Levon acquired the last remaining inlying mineral concession.
The Cordero Project lies in a region that has been a major producer of silver for centuries and continues to host several producing mines (Figure 23-1). The region is also a hub for exploration on new mineral deposits including three early-stage exploration projects belonging to Discovery Silver: Puerto Rico, Minerva, and Monclova.
Figure 23-1: Operating Mines and Exploration Projects near Cordero, and Discovery Silver’s Early-Stage Exploration Projects
Source: World Metals, 2021.
There are several exploration projects and producing mines to the south near Parral (Figure 5-3), but none is immediately adjacent to the Cordero property. Although the mineral deposits at these other projects all have characteristics that make them unique, many of them share similarities with Cordero, such as age, deposit type, vein geometries, alteration, structural controls, or geochemistry.

Cordero Project P a g e 3 1 5
Preliminary Economic Assessment of the Cordero Silver Project, Chihuahua State, Mexico January 2022
24 OTHER RELEVANT DATA AND INFORMATION
This section is not relevant for this PEA report.

Cordero Project P a g e 3 1 6
Preliminary Economic Assessment of the Cordero Silver Project, Chihuahua State, Mexico January 2022
25 INTERPRETATION AND CONCLUSIONS
25.1 Introduction
The QPs have provided the following interpretations and conclusions in their respective areas of expertise, based on the review of data available for this report.
25.2 Mineral Tenure, Surface Rights, Water Rights, Royalties
Information from legal and Discovery Silver’s in-country experts support that the tenure held is valid and sufficient to support a declaration of the 2021 Mineral Resource Estimate.
The project consists of 26 titled mining concessions totalling 34,909 continuous hectares owned by Minera Titán S.A. de C.V. Mexico (Titán) a wholly-owned Mexican subsidiary of Discovery Silver Corp. (Discovery Silver). The mining concessions that host the current mineral resource estimate are in good standing. As of the effective date of the report, all required mining duties were paid.
Surface exploration rights for the Cordero claims are maintained by three separate signed and transferrable agreements between Titán: two with private ranches (Rascon agreements) and one with Rancho Cordero Ejido (Ejido agreement). The two agreements with the private ranchers cover the central portion of the claims. The Ejido agreement covers the area within two kilometers southwest and west of the 2021 resource pit. The Rascon agreements cover the site of the Titán exploration camp, including sleeping quarters, the field office, and several drill core storage buildings.
Discovery Silver has sufficient surface rights to support continued exploration, drilling and access road construction as needed bound by a series of surface access agreements and agreed-upon payment schedules.
For the San Pedro concession, the “Cordilleras contract” requires Titán to pay Cordilleras a 2% NSR royalty. Titán can assign the obligation of payment of the royalty to a third party by written notice sent to Cordilleras. In the event that Cordilleras decides to sell its right to receive the royalty, Titán will have the right of first refusal on the same terms and conditions that Cordilleras offered to a third party.
For the Josefina, Berta, La Unidad II, and La Unidad claims, the “Eloy contract” requires Titán to pay two concessionaires (Mr. Eloy Herrera Martínez and Cleotilde de la Rosa Ríos) a 1% NSR royalty. In the event that the concessionaires decide to sell their right to receive the royalty, Titán will have the right of first refusal on the same terms and conditions that the concessionaires offered to a third party.
25.3 Geology and Mineralization
Cordero has overlapping characteristics of deposit types including an extensional intermediate sulphidation epithermal system on the shoulder of a porphyry molybdenum system and the diverse group of carbonate-hosted Pb-Zn (Ag, Cu, Au) deposits.

Cordero Project P a g e 3 1 7
Preliminary Economic Assessment of the Cordero Silver Project, Chihuahua State, Mexico January 2022
The current understanding of the mineralizing system, lithologies, and mineralization, as well as the geological, structural, and alteration controls on the mineralization, is sufficient to support an estimation of mineral resources.
There is exploration potential both contiguous to the 2021 resource pit as well as along the 15 km long Cordero magmatic-hydrothermal belt based on regional exploration results. Surface geological mapping has identified several mineralized hydrothermal centers with similar styles of argentiferous galena and base metal mineralization that occurs in the 2021 mineral resource area.
25.4 Exploration, Drilling, and Analytical Data Collection in Support of Resource Estimation
The exploration programs completed to date are appropriate for epithermal-style and porphyry-related mineralization as well as the diverse carbonate-hosted Pb-Zn (Ag, Cu, Au) deposits.
Sampling methods are acceptable and well-monitored to support mineral resource estimation.
Sample preparation, analysis, and security were performed in accordance with exploration best practices and industry standards at the time the information was collected.
The quality and quantity of the geological data, collar, and downhole survey data collected in the exploration and infill drill programs are sufficient to support mineral resource estimation.
No material factors were identified with the data collection from the drill programs that could significantly affect mineral resource estimation.
Sample preparation, and analyses were performed by independent accredited laboratories. The sample preparation, analysis, and security practices are acceptable, meet industry-standard practices at the time they were undertaken, and are sufficient to support mineral resource estimation.
The data verification programs concluded that the data collected from the project adequately support the geological interpretations and that the database is of sufficient quality to support the use of the data in mineral resource estimation.
25.5 Metallurgical Testwork
Since 2011, progressively more detailed metallurgical testwork has been conducted on samples from the Cordero Project culminating in a thorough PEA metallurgical testwork program by Discovery Silver in 2021. Testwork has shown that both the sulphides and oxide/transition zones of mineralization can be successfully processed to produce high value lead-silver and zinc flotation concentrates (for the sulphides) and silver doré from oxide/transition material. Although silver recoveries for the oxide/transition material are higher via grinding and tank leach, it is likely that heap leaching will be the more favourable option due to lower capital and operating costs and the ability to essentially decouple sulphide and oxide mineralized material production and process the different mineralized material types in parallel without constructing two full processing plants.
The key conclusions of the testwork conducted to date include:
• Conventional, sequential lead-zinc flotation has repeatedly been shown to be a successful and robust choice for processing of Cordero sulphide mineralized materials. Relatively low head grade material is able to be upgraded considerably at relatively coarse primary grinds (P80 of~200 µm) with relatively moderate reagent dosages.

Cordero Project P a g e 3 1 8
Preliminary Economic Assessment of the Cordero Silver Project, Chihuahua State, Mexico January 2022
• The choice of coarse primary grind with regrinding of the lead and zinc rougher concentrates is favourable due to the relatively hard characteristics of the mineralized material (Bond ball work index 18-20 kWh/t).
• The flowsheet selection is supported by the mineralogy. QEMSCAN analysis of 12 lithology composites indicate that the sulphide mineralogy is relatively coarse and liberates well, with little in the way of galena-sphalerite association or locking. The gangue mineralization is relatively straightforward and benign, all of which are contributing factors to the excellent metallurgical results obtained to date.
• At head grades close to the resource average (25-40 g/t Ag, 0.4-0.6% Pb and 0.5-0.8% Zn) the optimized flotation flowsheet developed for Cordero produces remarkably clean lead and zinc flotation concentrates at impressive recoveries given the relatively low head grades. Locked cycle testing produced lead-silver concentrates grading >3,000 g/t Ag, 50-56% Pb and <5% Zn at silver and lead recoveries of 70-79% and 83-91%, respectively. Zinc concentrates graded 46-55% Zn at zinc recoveries ranging from 81-90%.
• Total silver recovery (lead and zinc concentrates combined) from locked cycle testing was 89%, 84%, 83% and 80% for the breccia-volcanic, breccia-sedimentary, volcanic, and sedimentary lithologies, respectively.
• The same flowsheet was applicable for all lithologies but a carbon pre-float was required for the sedimentary and breccia-sedimentary mineralized material types.
• The low-grade sulphide lithology composites responded well to the optimized flowsheet indicating that saleable concentrates at economic recoveries can be produced from this material. Preconcentration via DMS or sensor sorting could further enhance the metallurgical performance of this material and limited amenability testwork conducted during the PEA suggests that preconcentration may be an option for Cordero sulphide material.
• Initial concentrate quality analysis has shown the lead-silver and zinc concentrates to be quite clean from a deleterious element perspective and only minor penalties, relative to the value of the concentrates are expected.
Cyanidation bottle roll testing and column leach testing indicates that the oxide/transition material respond well to leaching at both fine (milled) sizes and coarse (crush) sizes. A series of column leach tests at 6 mm and 12.5 mm suggests that silver recoveries of up to 60% may be obtained via heap leaching.
The additional metallurgical testwork completed on both the oxide and sulphide processes resulted in the basis for both flowsheet developments. Cyanide leaching and hydraulic conductivity testwork of agglomerated sample material were completed and used in the development of the oxide heap leach design and recovery methods. A flotation testwork campaign was completed and used to drive the development of the sulphide flotation circuits taking into account regrind sizes and reagent dosages.
25.6 Water Management
The water management plan was developed such that contact runoff/seepage from any facilities will be collected and clean catchment runoff will be diverted away from the facilities.
Collection ditches were designed to convey contact runoff, and collection ponds were designed to collect and convey the contact runoff to the TSF. Two major diversion systems were identified within the Cordero site and the corresponding excavation volumes were estimated. It should be noted that with modifications to some of the facility layouts, there is potential to significantly reduce the excavation volumes. For example, a slight change to the rock storage facility layout

Cordero Project P a g e 3 1 9
Preliminary Economic Assessment of the Cordero Silver Project, Chihuahua State, Mexico January 2022
might eliminate the need for the CH2 diversion (Diversion Channel_RSF_E) as indicated in Table 18-2. These can be reviewed in the next project phase.
25.7 Mining
25.7.1 Geotechnical Considerations
The current geotechnical dataset is considered sufficient for a PEA-level project design.
Faulting is prevalent in the project footprint, with evidence of earlier faulting parallel to stratigraphy as well as later faulting transcurrent (crosscutting) stratigraphy are observed along the northeast-trending igneous belts. Cordero open pit slopes are comprised of a relatively homogeneous rock mass primarily consisting of folded Cretaceous shale-siltstone and high-strength volcanic rhyodacite.
Interramp pit slope angles (measured from bench crest to bench crest) range from 40° at the southwest side of the ultimate pit to 60° at the northeast side of the ultimate pit. These trends are in response to the dominant lithologies in these sections of the pit. Shale-siltstone dominates the majority of the pit, except for the northeast side of the pit where rhyodacite is the dominant lithology. Bench face angles range from 67° to 80°. Bench widths range from 7 to 27 m and have been designed to adequately retain rockfall.
25.7.2 Mine Plan
The mine plan is based on measured, indicated and inferred mineral resources. Mineralized material will be sent to the mill, crushed heap leach, and ROM heap leach facilities. The mill facility will produce zinc and lead concentrates and the heap leach facility will produce a doré product. Waste material will be sent to either the rock storage facility southeast of the pit or to the west of the pit to build the TSF.
Dilution was applied on a block-by-block basis taking into consideration the diluting material grade. This resulted in an increase in mill feed tonnage by 3% but only a 2.3% drop in grade.
Four pit phases were developed for the single open pit. Mining will occur on 10-meter lifts with safety benches every 20 meters using the provided geotechnical parameters by sector. Haul roads are designed at 35.4 m wide to accommodate 230-tonne class haul trucks.
The mine schedule plans to deliver 199 Mt of sulphide mill feed grading 31.1 g/t Ag, 0.09 g/t Au, 0.75% Zn and 0.46% Pb over a mine life of fourteen years. Heap leach material processed included 20 Mt of leach crush material grading 41.5 g/t Ag, 0.09 g/t Au, 0.40% Zn and 0.34% Pb along with 9.1 Mt of ROM leach material grading 23.6 g/t Ag, 0.06 g/t Au, 0.37% Zn and 0.25% Pb. Waste tonnage totalling 491 Mt will be delivered to either the tailing storage facility or the rock storage facility. The overall strip ratio is 2.2:1.
The current mine life includes the sulphide mill starting at 5.8 Mt/a capacity in Year 2, followed by 7.2 Mt/a (20 kt/d) for Years 3 and 4. In Year 5, additional crushing capacity will be available so the capacity will increase to 10.8 Mt/a. From Year 6 onward, a maximum mill capacity of 14.4 Mt/a (40 kt/d) will be available. Three sulphide stockpiles will be used for this schedule and will peak at 64 Mt. The stockpiles will primarily be used to store low-grade sulphide mill feed.
Mining is planned to be completed with a contract mining fleet. For the PEA, the proposed fleet consists of 91-tonne trucks and appropriately sized loading units.

Cordero Project P a g e 3 2 0
Preliminary Economic Assessment of the Cordero Silver Project, Chihuahua State, Mexico January 2022
25.8 Recovery Methods
The process methods utilized align with conventional practices in the industry. The mineralized material comminution, recovery of payable metals and handling of tailings are achieved through typical process that are commonly used in the industry for similar processes. Previous studies coupled with new testwork results were used to develop the resulting flowsheet suitable for each stage of the life of mine
The recovery methods will first rely on the heap leach and then extend the operation into the sulphide based flowsheet which will ultimately carry the project until end of mine life once the oxide feed is depleted. The sulphide design was developed to expand stage-wise to accommodate the variable mine plan both in terms of throughput and feed grades.
25.9 Capital Cost Estimate
The capital cost estimate conforms to Class 5 guidelines for a preliminary economic assessment level estimate with a ±50% accuracy according to the Association for the Advancement of Cost Engineering International (AACE International). The capital cost estimate was developed in Q4 2021 based on Ausenco’s in-house database of projects and studies as well as experience from similar operations.
The estimates are based on the following:
• open pit mining operation
• construction of a stage-wise process plant
• construction of associated tailings storage and management facilities
• additional on-site and off-site infrastructure
• Owner’s costs and provisions.
The total initial capital cost for the Cordero Project is US$368 million; the expansion capital cost is US$129 million; and the life-of-mine sustaining cost is US$208 million. The capital cost summary is presented in Table 21-1.
25.10 Operating Cost Estimate
The operating cost estimate was developed in Q4 2021 dollars from Ausenco’s in-house database of projects and studies and experience from similar operations. The accuracy of the operating cost estimate is ±50%. The estimate includes mining, processing, general and administration (G&A), mobile equipment, and the TSF. The operating costs are summarized in Section 21.3.
25.11 Economic Analysis
An engineering economic model was developed to estimate the project’s annual pre-tax and post-tax flows and sensitivities based on an 5% discount rate.

Cordero Project P a g e 3 2 1
Preliminary Economic Assessment of the Cordero Silver Project, Chihuahua State, Mexico January 2022
The economic analysis was based on the following assumptions:
• The mine life is 16 years.
• Cost estimates are in constant Q4 2021 US dollars with no inflation or escalation factors considered.
• Results are based on 100% ownership with a 0.5% NSR on revenue from gold and silver production.
• Capital costs are funded with 100% equity (no financing assumed).
• All cash flows are discounted to the start of the construction period using a mid-period discounting convention.
The pre-tax NPV discounted at 5% is $1,858 million; the IRR is 50.3%, and the payback period is 1.6 years. On a post-tax basis, the NPV discounted at 5% is $1,160 million, the IRR is 38.2%, and the payback period is 2.0 years.
A sensitivity analysis was conducted on the base case pre-tax and post-tax NPV and IRR of the project using the following variables: metal prices, discount rate, head grade, total operating cost, and total capital cost. The sensitivity analysis revealed that the project is most sensitive to changes in metal prices and head grade, and less sensitive to discount rate, total operating cost, and total capital cost.
25.12 Risks & Opportunities
The following discussion of risks and opportunities involves forward-looking statements that are based on reasonable expectations and informed by the recent past. Readers are cautioned that such forward-looking statements involve uncertainties and unknowns that may cause actual outcomes to differ from those implied by these forward-looking statements.
25.12.1 Risks
25.12.1.1 Operations
The operational risks for the exploration program at Cordero are the same as those experienced by any exploration program: permitting, access, mineral title, and personal security. During more than 12 years of active exploration on the Cordero property, Discovery Silver and the previous owners have been able to maintain good relationships with surface owners and the local Ejidos, which has resulted in ongoing, uninterrupted access agreements. As long as Discovery Silver continues to meet the obligations of its surface access agreements, applicable regulations, and existing exploration permits, no operational difficulties are anticipated.
Violence related to the drug trade, which affects most Mexican communities, is usually directed towards other members of criminal organizations. Since the beginning of the modern exploration programs in 2009, Cordero’s operations have not been affected by issues related to the drug trade.

Cordero Project P a g e 3 2 2
Preliminary Economic Assessment of the Cordero Silver Project, Chihuahua State, Mexico January 2022
25.12.1.2 Commodity Prices
The ability of mining companies to fund the advancement of their projects through exploration and development is always influenced by commodity prices. The World Bank Commodities Price Forecast for October 2021 (World Bank, 2021) projects stable prices for each of Cordero’s anticipated revenue-producing metals; the metal with the most volatile price forecast is gold, which accounts for less than 10% of Cordero’s in-situ value. Since the World Bank’s forecasts of silver, gold, lead and zinc prices from 2021 to 2035 are above the prices that Discovery Silver assumes for the Cordero Project, the company anticipates that commodity price fluctuations are not likely to create difficulties for funding the advancement of Cordero.
25.12.1.3 COVID-19 and Evolving Variants
The major risk to continued exploration and drilling is disruption due to COVID-19 or to evolving variants on site or in the local communities. To reduce the likelihood of this risk occurring, the workforce will continue to be accommodated at the project site and isolated from the local communities. Testing is required prior to authorization to access the site and quarantine periods are enforced if applicable.
25.12.1.4 Environmental Studies, Permitting and Social or Community Impact
No significant risks of a legal, environmental or socioeconomic were identified. There are opportunities related to water use, particularly the need for additional studies to map the capacity of the aquifer in order to ensure capacity for current and future land-uses. There is also an opportunity related to compliance with International Standards should the project need financing. Baseline and EIA will have to be compliant with lender’s standards.
25.12.1.5 Tailings Storage Facility
The TSF design assumes the foundation soils consist of dry, dense granular materials. If present, loose granular or soft fine-grained soils may need to be removed for stability reasons. The conceptual design includes connecting the liner to the top of bedrock through a key trench. If the top of bedrock is deeper than assumed, the key trench excavation may be more complicated and expensive. A perched water table within the overburden soils may also complicate excavations. Subsurface investigations comprising test pits, boreholes, and cone penetration tests will assist in understanding the overburden soil conditions.
Limestone karsts can create seepage pathways and sinkholes beneath facility impoundments and perimeter dams. If present, specialist design solutions may be required to mitigate the risks karsts represent to tailings facilities. In some extreme cases, the presence of karsts can result in the need to alter the dam alignment to reduce risks. To identify the presence of karsts within facility footprints, a karst investigation is performed by specialist geologists and hydrogeologists trained to identify the signs of karsts and may require additional drilling and geophysical exploration methods.
Overestimating bulk tailing density can result in underestimating facility storage volumes, making it necessary to raise the perimeter dam at a faster rate than expected. Laboratory consolidation testing on pilot tailings (when they are available) can assist in predicting accurate bulk tailings densities.
The length of the horizontal filter will depend on the permeability of the foundation soils. If the foundation soils are highly permeable, the length may need to be increased to reduce the risk of foundation erosion into the dam embankment. The length of the horizontal filter can be assessed by seepage analysis in future design phases.

Cordero Project P a g e 3 2 3
Preliminary Economic Assessment of the Cordero Silver Project, Chihuahua State, Mexico January 2022
25.12.2 Opportunities
25.12.2.1 Environmental Studies, Permitting and Social or Community Impact
There are opportunities related to water use; in particular, mapping the capacity of the aquifer to ensure capacity for current and future land uses. There is also an opportunity related to compliance with International Standards should the project need financing. Baseline and EIA studies will need to be compliant with lender’s standards.
25.12.2.2 Exploration
There is significant upside in the potential discovery of additional mineralization that may support mineral resource estimation. There are a number of high-quality geophysical targets with the same signature as those coincident with the mineralization in the Cordero Main area where mineral resources have currently been estimated.
Regional surface geological mapping and sampling along the 15 km long Cordero magmatic-hydrothermal trend has identified several high-priority targets in areas of outcrop with silver-base metals, large alteration haloes, and similar magmatic rocks to those at the resource area. Considering that Cordero has approximately 20% outcrop outside of the resource area, geophysical targeting is critical. Additionally, there are two other magmatic-hydrothermal belts including Porfido Norte where gold in soils and rock cover a 1x1 km area at the Valle gold target as well as at the La Perla belt in the south where similar styles of base metal mineralization have been discovered.
Ongoing Leapfrog 3D modelling of TerraSpecTM hyperspectral, petrographic, and whole rock and trace element geochemistry data continues to provide vectors to aid in drill targeting.
25.12.2.3 Tailings Storage Facility
The downstream dam slope may be optimized depending on the rockfill used to construct the embankment and foundation soils. Once additional subsurface information is available, stability analyses could be performed to assess slope stability and investigate whether the downstream slope can be steepened.
The zonation of the gravel filter zones can be reviewed once additional information regarding the rockfill gradation used to construct the embankment is available. Depending on rockfill gradation, some of the gravel filter zones could potentially be thinned or removed.
25.12.2.4 Metallurgy
The completion of concentrate dewatering testwork could present benefits in design of concentrate handling and quantifying moisture content requirements in combination of transportation moisture limits. The opportunity to utilize a common flocculating agent for thickeners could also present some benefit to the process design. The continued evaluation of technology options would benefit the process, taking into account both payable metals and penalty metals found in the process plant feed material and the final requirements required by market.
25.12.2.5 Mining
There are over 300 Mt of sulphide resource that sit outside the PEA design pit but within the resource pit shell. These resources have the potential to extend the mine life and/or increase production levels at higher commodity prices.

Cordero Project P a g e 3 2 4
Preliminary Economic Assessment of the Cordero Silver Project, Chihuahua State, Mexico January 2022
26 RECOMMENDATIONS
26.1 Overall
The results presented in this technical report demonstrate that the Cordero Project is technically and economically viable. It is recommended to continue developing the project through additional studies. Table 26-1 summarizes the proposed budget to advance the project through the pre-feasibility study stage.
Table 26-1: Proposed Budget Summary
Description Cost (US$M)
Exploration and Drilling $4.50
Metallurgical Characterization $0.70
Mineral Resources $5.50
Geotechnical Studies $0.24
Mine Engineering $0.20
Tailings Storage Facility $0.25
Water Management Studies $0.15
Environmental Studies, Permitting and Social or Community Impact $0.30
Total $11.84
Source: Ausenco, 2021.
26.2 Exploration
26.2.1 Drilling Programs
A four-stage approach to future drilling is recommended, as follows:
1. Stage 1 relates to definition drilling to the northeast of the current resource area. This stage would consist of infill drilling and step-out drilling from the end of where mineral resources have been estimated, using 20 holes averaging 450 m depth, spaced between 100 to 150 m apart for a total of 9,000 m. The Stage 1 delineation drill work program is estimated at US$2,000,000.
2. Stage 2 consists of sampling and exploration drilling based on targets from ongoing surface geological mapping. The higher priority targets include Dos Mil Diez and Molino de Viento in the southwest; Sansón to the northeast of La Ceniza; Valle and Mesa in the north at Porfido Norte; and La Perla in the south. This stage would involve a total of 5 to 10 holes averaging 300 m depth for 1,500 m in each target for a total of 7,500 meters in 25 holes. The Stage 2 exploration drill work program is estimated at US$ 1,685,000.
3. Stage 3 includes 3D IP surveys over Porfido Norte and the La Perla target in the south. The Stage 3 3D IP survey work program is estimated at US$ 185,500.

Cordero Project P a g e 3 2 5
Preliminary Economic Assessment of the Cordero Silver Project, Chihuahua State, Mexico January 2022
4. Stage 4 involves carrying out a radiometric survey over areas of the property not surveyed previously in 2010 to identify high-potassium hydrothermal centers known to host favourable mineralization. The Stage 4 radiometric survey work program is estimated at US$ 120,000.
The total cost for all four stages is approximately US$ 4,500,000, including a 15% contingency.
Several of the above stages can be completed in conjunction with other work programs.
Ongoing studies should also be carried out, including continued Leapfrog 3D modelling of the structural corridors, lithology, alteration, mineralization as well as continued SWIR/NIR TerraSpecTM work, petrographic work, and lithogeochemistry work to identify areas of deleterious elements, areas of increased clay content, total sulphide content, and areas of the different carbonate species.
Contingent on the success of the drilling and geophysical surveys, the drill programs should be expanded as needed.
26.2.2 Bulk Density Program
Following the cut-off date for drill hole data used in the mineral resource estimate, a program was initiated to measure the density of every 2 m sample interval using whole core. This program, whose cost is accounted for in day-to-day on-site activities, should continue since it will provide useful information to supplement the existing pulp density measurements as the project advances.
26.3 Metallurgical Characterization
The metallurgical work outlined below is recommended for the next project phase.
• Additional comminution tests to further expand the comminution database is recommended to develop a robust comminution model and grinding circuit design. This will improve the future analysis of power requirements and equipment selection.
• Optimization of concentrate regrind sizing is required. Only limited testwork has been conducted to date and specific energy consumption testwork was not included.
• Further investigation between the impact of depressant dosages and silver recovery to the lead-silver concentrate is recommended. Operating at lower depressant dosages would likely lead to higher silver recovery to the lead-silver concentrate where payment terms are more favourable.
• Sensor sorting and/or dense media separation testwork should be further undertaken to determine the response of the low-grade stockpile material to preconcentration.
• Further expansion of the variability flotation database is recommended and testwork on higher grade production composites is required to allow models of robust head grade vs. recovery to be developed.
• No dewatering testwork (dynamic thickener tests and concentrate filtration) has been conducted to date and is recommended as part of the work in the next project phase.

Cordero Project P a g e 3 2 6
Preliminary Economic Assessment of the Cordero Silver Project, Chihuahua State, Mexico January 2022
• Additional column leach testing is required to provide more robust recovery data for the oxide/transition zones of mineralization. Samples should include the anticipated average oxide silver and gold grades and samples near the cut-off grade and the maximum annual grades. Testing should further address the impact of crush size on recovery.
• The use of 4 kg testwork charges for flotation testwork should be considered as standard going forward, especially for the low head grade samples.
The estimated cost of implementing the above recommendations for further metallurgical testwork is US$700,000, including a 15% contingency.
26.4 Mineral Resource Estimation
The work outlined below related to mineral resource estimation is recommended for the next project phase:
• Future resource updates should continue to explore the use of geological logging information to optimize the separation of structural domains into high-grade and low-grade subdomains.
• The impact of the low bias in lead and zinc assays done with an aqua regia digest in 2013 and 2014 should be assessed so that it can be quantified. It is likely that the impact is very small; but as project development advances, it would be useful to have this impact quantified.
• A small cross of closely spaced drill holes at approximately 10 m spacing should be drilled in a high-grade zone and a low-grade zone to improve the understanding of short-scale continuity. This will assist the analysis and interpretation of spatial continuity for future resource estimation studies and will provide useful information for planning a grade control system.
• Infill drilling should continue, both in inferred resource areas where confidence could move the resources into the indicated category, and similarly in indicated resource areas where confidence could move the resources into the measured category. By the time the project reaches its pre-feasibility study, it is prudent to have the majority of the mineral resources in the payback period drilled to the level of measured confidence.
The cost of implementing the above recommendations is estimated at US$5,500,000, including a 15% contingency. The vast majority of the proposed resource drilling is to expand resources in the Cordero Main area, where resources are currently estimated, and to increase the confidence of resource estimates from inferred to indicated, and from indicated to measured.
26.5 Geometallurgical Model
A geometallurgical model uses metallurgical responses for various mineralization types to predict the metal recoveries over time in the mine plan. Such a model should be generated to further examine opportunities for ROM leaching, heap leaching and improved mine sequencing on the sulphide material. The cost of this activity is captured under PFS budget.
26.6 Geotechnical Studies for Pit Slopes and Sectors
Additional data collection is required to advance the study to the next level. This includes developing a better understanding of the hydrogeological regime.

Cordero Project P a g e 3 2 7
Preliminary Economic Assessment of the Cordero Silver Project, Chihuahua State, Mexico January 2022
A program of geotechnical data collection needs to be completed on the final PEA design to better understand the lithologies based on further laboratory testwork. A slope stability analysis based on the acquired data may allow for improvements in the current wall slope parameters.
The cost of the recommended work including site investigation is estimated to be US$240,000.
26.7 Mine Engineering
The following mining-related studies and analyses should be completed as the project advances to the next study phase:
• The current assumption for grade control is the use of blast hole cuttings. Sampling protocols need to be established and assessed to determine if they would be applicable in normal mine operation. If not, an RC grade control program may be required to allow proper separation of heap and sulphide material as well as mill feed delineation.
• Additional information from further geotechnical drilling is required to develop a proper dewatering cost estimate.
• The current mining philosophy is the use of contract mining. Additional work needs to be completed to verify the cost benefit of this approach versus a leased owner fleet. This would include detailed discussions with local contractors to determine whether a hybrid approach of early-stage contract mining and later-stage owner-operated mining is more economically attractive.
• Additional scheduling studies with an updated geological model are warranted. The use of an ROM pile versus waste rock storage for some material may result in a net cashflow positive scenario. Further evaluation of the heap leach potential of oxide material may also prove to be economically beneficial to the project. The timing and cost of these scenarios need to be completed. The use of stockpiles was including in the PEA, but this needs further refinement to enhance the project.
• Further study is required to determine the nature of the waste rock and to classify it as potentially- or non-acidogenic. The results may require a change in storage strategy.
The cost of implementing the above recommendations is estimated at US$200,000.
26.8 Tailings Storage Facility Studies
Due to the conceptual nature of this study and the paucity of information available at the time of writing, assumptions have been made regarding the layout, MTOs, and construction of the proposed TSF. Material properties will be required to perform slope stability analyses and other geotechnical assessments to confirm that the TSF can be built as designed. A tailings distribution plan will be required which may lead to the conceptual staging requiring adjustment to contain the given capacities.
Additional studies and data collection will be required to advance project development beyond the conceptual level. Some, but not necessarily all, of the current data gaps that would need to be addressed in future studies include the following:
• A site reconnaissance visit should be conducted by a qualified engineering geologist to review the proposed TSF location and assess its suitability for the proposed facilities and potential presence of karsts.

Cordero Project P a g e 3 2 8
Preliminary Economic Assessment of the Cordero Silver Project, Chihuahua State, Mexico January 2022
• Geological and geotechnical site investigations should be carried out, including drilling and in-situ and laboratory testing, to understand subsurface soil and rock characteristics, material properties, and existing groundwater levels.
• The geochemistry of seepage from tailings materials needs to be investigated.
• Additional geotechnical testing of the anticipated tailings, waste rock, and other associated construction materials, (e.g., horizontal drain gravel and sand and candidate geomembranes) should be carried out.
• Hydrological information should be gathered from site-specific climate studies to detail ponds and channels.
• Hydrogeological information from desktop studies and site investigations should be gathered to better understand subsurface flow regimes.
• A trade-off study between dry stacking of tailings vs conventional disposal of tailings.
As additional information is obtained, assumptions made in this study can be verified or updated to advance the project to the next level of design. The cost of implementing the above recommendations is estimated at US$250,000
26.9 Water Management
For the next phase of the work, a trade-off study should be completed for each pond volume versus its pumping rate to the TSF. The ponds should also be designed so particles less than 10 µm settle within each pond.
The water balance analysis shows excess runoff during both the starter and ultimate configurations. However, it should be noted that at the earlier stage of the mining operation, the amount of available water in the dry and wet season is less than the estimated available water from various available sources. A detailed integrated GoldSIM water balance model will be needed to integrate the daily/monthly water balance from the TSF impoundment, ponds for various facilities, and the process plant for every single year of mine life. The inputs and assumptions used in the current study should also be refined and investigated. For example, the current design assumes a constant pit dewatering rate through the mine life, which is adequate for a PEA-level study.
The cost of carrying out the above work is estimated at US$150,000
26.10 Environmental Studies, Permitting, and Social or Community Impact
It is recommended that a 3D hydrogeological model for the aquifers under the project site be compiled to confirm their available capacity and ability to accommodate current land use and the project’s future needs. It is also recommended that the model be used to make projections related to impact and the behaviour of the water table within the affected region and to ensure that there are no adverse impacts for agricultural users.
Geochemical studies should be progressed to understand the potential for acid rock drainage and metal leaching and to design the appropriate protection measures at the next stage if required.
Finally, it is recommended that project compliance with appropriate standards is verified should the project require outside financing.
The cost of carrying out the above work is estimated at US$300,000.

Cordero Project P a g e 3 2 9
Preliminary Economic Assessment of the Cordero Silver Project, Chihuahua State, Mexico January 2022
27 REFERENCES
ALS Metallurgy (2013). “Metallurgical Evaluation of the Cordero Deposit”, KM 3591.
Blue Coast Research (2021). “Cordero PEA Metallurgical Testwork Program”, Project No. PJ5328.
Campa, M.F.; Coney, P.J. (1983). “Tectonostratigraphic terranes and mineral resource distributions in Mexico”, Canadian Journal of Earth Sciences, 20(6):1040-1051. DOI: 10.1139/e83-094.
Camprubi, A., and Albinson, T. (2007). “Epithermal deposits in Mexico – Update of current knowledge, and an empirical reclassification”, Geological Society of America Special Paper 422.
Centeno-Garcia, E. (2017). “Mesozoic tectonomagmatic evolution of Mexico, An overview”, Ore Geology Reviews, vol. 81, Part 3, pp. 1035-1052.
CIM (2003). “Estimation of Mineral Resources and Mineral Reserves Best Practice Guidelines”, Canadian Institute of Mining, Metallurgy and Petroleum Estimation Best Practices Committee.
CIM (2014). “Definition Standards for Mineral Resources & Mineral Reserves”, Canadian Institute of Mining, Metallurgy and Petroleum Standing Committee on Reserve Definitions.
Consultores Interdisciplinarios en Medio Ambiente SC (2021). Estudio de Línea Base Ambiental Cordero. Mexico. Primera Edición.
Creaser (2021), “Re-Os geochronology of molybdenite, Discovery Silver Corp”, September 2021 report from the Crustal Re-Os Geochronology Facility, University of Alberta.
Cronshey, R. (1986). Urban hydrology for small watersheds. US Dept. of Agriculture, Soil Conservation Service, Engineering Division.
Downes, M. (2007). Yerranderie a Late Devonian silver-gold-lead intermediate sulphidation epithermal district, eastern Lachlan Orogen, New South Wales, Australia. Resource Geology 57, pp. 1-23.
Ferrari, L.; Valencia-Moreno, M.; Bryan, S.E. (2007). Magmatism and tectonics of the Sierra Madre Occidental and relation with the evolution of the western margin of North America: Special paper Geological Society of America.
Goldcorp (2018), "Peñasquito Polymetallic Operations, Zacatecas State, Mexico", National Instrument 43-101 Report.
Goldhammer, R.K., (1999). “Mesozoic sequence stratigraphy and paleogeographic evolution of northeast Mexico” Geological Society of America, Special Paper 340.
Hammarstrom, J.; Robinson, G.; Ludington, S.; Gray, F.; Drenth, B.; Cendejas-Cruz, F.; Espinosa, E.; Pérez-Segura, E.; Valencia-Moreno, M.; Rodríguez-Castañeda, J.L.; Vásquez-Mendoza, R.; Zurcher, L. (2010). “Porphyry Copper Assessment of Mexico”, United States Geological Survey Scientific Investigations Report 2010–5090–A.
Köppen climate classification (1884), The thermal zones of the earth according to the duration of hot, moderate and cold periods and to the impact of heat on the organic world). Meteorologische Zeitschrift (published 2011). 20 (3): 351–360. http://www.ingentaconnect.com/content/schweiz/mz/2011/00000020/00000003/art00009
Kyle, J.R. (2016). Arc-related Mesozoic basins of northern Mexico: their origin, tectonic inversion and influence on ore localization”, University of Texas Ph.D. thesis.
Levon Resources Ltd. (2017). “Cordero Project September 2014 Mineral Resource Update”, National Instrument 43-101 Technical Report.
Levon Resources Ltd. (2018). “Cordero Project Preliminary Economic Assessment Update”, National Instrument 43-101 Technical Report.

Cordero Project P a g e 3 3 0
Preliminary Economic Assessment of the Cordero Silver Project, Chihuahua State, Mexico January 2022
Megaw, P.K.M., and Miranda, M.A.G. (1988). “Magmatic-hydrothermal breccias and Ag-Pb-Zn mineralization in the Potosi Mine, Santa Eulalia District, Chihuahua, Mexico”, American Institute of Mining Engineering, 117th Annual Meeting., Phoenix, Arizona, p.96.
Megaw, P.K.M., Barton, M.D., and Falce, J.I. (1996). “Carbonate-Hosted Lead-Zinc (Ag, Cu, Au) Deposits of Northern Chihuahua, Mexico”, Society of Economic Geology Special Publication No. 4: Carbonate Lead-Zinc Deposits, Paper 19.
METCON (2011). “Preliminary Flotation Study Cordero Project”.
Murphy Geological Services (2020). “Structural Interpretation of Sentinel-2 and WorldView imagery for the Cordero Project area, south-central Chihuahua, Mexico”, Report R/19-10.
SINA. National Water Information System (CONAGUA). Web page http://sina.conagua.gob.mx/sina
Steinert (2021). Informal report on studies of XRT for sorting of Cordero material.
VINFIDEM (2021). Estudio de Línea de Base Social Proyecto de Exploración Minera Avanzada Cordero. Mexico. Primera Edición.
Wall, C. (2021). Informal report on the U-Pb study on zircon dating of the Cordero magmatic phases. Pacific Centre for Isotopic and Geochemical Research, Department of Earth Ocean and Atmospheric Sciences, The University of British Columbia (PCIGR).
Wang, L.; Qin, K.Z.; Song, G.X.; and Li, G.M. (2019). “A review of intermediate sulphidation epithermal deposits and subclassifications”, Ore Geology Reviews, v.107, pp. 434-456.
World Bank (2021). “Commodities Price Forecast (nominal US dollars)”, at https://thedocs.worldbank.org/en/doc/ff5bad98f52ffa2457136bbef5703ddb-0350012021/related/CMO-October-2021-forecasts.pdf.
Zirate, P.V. (2019), “Title Opinión mining concessions, Cordero Project”, Letter from DBR Abogados to Discovery Metals, S.A. de C.V.

Cordero Project P a g e 3 3 1
Preliminary Economic Assessment of the Cordero Silver Project, Chihuahua State, Mexico January 2022
ATTACHMENT 1: QUALIFIED PERSON CERTIFICATES

P a g e 1 o f 1
CERTIFICATE OF QUALIFIED PERSON
Tommaso Roberto Raponi
I, Tommaso Roberto Raponi, P. Eng., certify that I am employed as a Principal Metallurgist with Ausenco Engineering Canada Inc., (Ausenco), with an office address of Suite 1550 - 11 King St West, Toronto, ON M5H 4C7. This certificate applies to the technical report titled “Preliminary Economic Assessment of the Cordero Silver Project, Chihuahua State, Mexico” that has an effective date of November 30, 2021 (the “Technical Report”).
I graduated from the University of Toronto with a Bachelor of Applied Science degree in Geological Engineering with specialization in Mineral Processing in 1984. I am a Professional Engineer registered with the Professional Engineers Ontario (No. 90225970), Engineers and Geoscientists British Columbia (No. 23536) and NWT and Nunavut Association of Professional Engineers and Geoscientists (No. L4508) and with OIQ (OIQ temporary permit No. 6043399). I have practiced my profession continuously for over 37 years with experience in the development, design, operation and commissioning of mineral processing plants, focusing on gold projects, both domestic and internationally.
I have read the definition of “Qualified Person” set out in the National Instrument 43-101 Standards of Disclosure for Mineral Projects (“NI 43-101”) and certify that by virtue of my education, affiliation to a professional association and past relevant work experience, I fulfill the requirements to be a “Qualified Person” for those sections of the Technical Report that I am responsible for preparing.
I have not visited the Cordero property. I am responsible for Sections 1.1, 1.7, 1.10, 1.11, 1.12, 1.14, 1.15, 1.17, 1.18.1, 2, 3, 13, 17, 18 (except 18.9, 18.10, and 18.11), 19, 21 (except 21.2.1.1 and 21.3.2), 22, 24, 25.1, 25.5, 25.8, 25.9, 25.10, 25.11, 25.12.2.4, 26.1, 27 of the Technical Report.
I am independent of Discovery Silver Corp. as independence is defined in Section 1.5 of NI 43-101. I have had no previous involvement with the Cordero Project.
I have read NI 43-101 and the sections of the Technical Report for which I am responsible have been prepared in compliance with that Instrument. As of the effective date of the Technical Report, to the best of my knowledge, information and belief, the sections of the Technical Report for which I am responsible contain all scientific and technical information that is required to be disclosed to make those sections of the Technical Report not misleading.
Dated: January 13, 2022
“Signed and sealed”
Tommaso Roberto Raponi, P. Eng.

P a g e 1 o f 1
CERTIFICATE OF QUALIFIED PERSON
Scott Elfen
I, Scott Elfen, P.E., certify that I am employed as a Global Lead Geotechnical with Ausenco Engineering Canada Inc., (Ausenco), with an office address of 855 Homer Street, Vancouver, BC V6B 2W2. This certificate applies to the technical report titled “Preliminary Economic Assessment of the Cordero Silver Project, Chihuahua State, Mexico” that has an effective date of November 30, 2021 (the “Technical Report”).
I graduated from the University of California, Davis with a Bachelor of Science degree in Civil Engineering (Geotechnical) in 1991. I am a Registered Civil Engineer in the State of California (No. C56527) by exam since 1996 and I am also a member of the American Society of Civil Engineers (ASCE), Society for Mining, Metallurgy & Exploration (SME) that are all in good standing. I have practiced my profession continuously for 24 years and have been involved in geotechnical, civil, hydrological, and environmental aspects for the development of mining projects; including feasibility studies on numerous underground and open pit base metal and precious metal deposits in North America, Central and South America, Africa and Australia.
I have read the definition of “Qualified Person” set out in the National Instrument 43-101 Standards of Disclosure for Mineral Projects (“NI 43-101”) and certify that by virtue of my education, affiliation to a professional association and past relevant work experience, I fulfill the requirements to be a “Qualified Person” for those sections of the Technical Report that I am responsible for preparing.
I have not visited the Cordero property. I am responsible for Section 18.9 of the Technical Report.
I am independent of Discovery Silver Corp. as independence is defined in Section 1.5 of NI 43-101. I have had no previous involvement with the Cordero Project.
I have read NI 43-101 and the sections of the Technical Report for which I am responsible have been prepared in compliance with that Instrument. As of the effective date of the Technical Report, to the best of my knowledge, information and belief, the sections of the Technical Report for which I am responsible contain all scientific and technical information that is required to be disclosed to make those sections of the Technical Report not misleading.
Dated: January 13, 2022
“Signed and sealed”
Scott Elfen, P.E.

P a g e 1 o f 1
CERTIFICATE OF QUALIFIED PERSON
Gordon Zurowski
I, Gordon Zurowski, P. Eng., certify that I am employed as a Principal Mining Engineer with AGP Mining Consultants (AGP), with an office address of 132 Commerce Park Drive, Unit K #246 Barrie, Canada L4N 0Z7. This certificate applies to the technical report titled “Preliminary Economic Assessment of the Cordero Silver Project, Chihuahua State, Mexico” that has an effective date of November 30, 2021 (the “Technical Report”).
I graduated from the University of Saskatchewan with a Bachelor of Applied Science in Geological Engineering in 1989. I am a Professional Engineer of the Professional Engineers of Ontario (No. 100077750. I have practiced my profession for 30 years. I have been directly involved in open pit mining including operating, design and evaluation in Canada and worldwide.
I have read the definition of “Qualified Person” set out in the National Instrument 43-101 Standards of Disclosure for Mineral Projects (“NI 43-101”) and certify that by virtue of my education, affiliation to a professional association and past relevant work experience, I fulfill the requirements to be a “Qualified Person” for those sections of the Technical Report that I am responsible for preparing.
I have not visited the Cordero property. I am responsible for Sections 1.9, 1.18.5, 1.18.6, 1.18.7, 15, 16 (except 16.2), 21.2.1.1, 21.3.2, 25.7, 25.12.2.5, 26.5, 26.6, 26.7 of the Technical Report.
I am independent of Discovery Silver Corp. as independence is defined in Section 1.5 of NI 43-101. I have had no previous involvement with the Cordero Project.
I have read NI 43-101 and the sections of the Technical Report for which I am responsible have been prepared in compliance with that Instrument. As of the effective date of the Technical Report, to the best of my knowledge, information and belief, the sections of the Technical Report for which I am responsible contain all scientific and technical information that is required to be disclosed to make those sections of the Technical Report not misleading.
Dated: January 13, 2022
“Signed and sealed”
Gordon Zurowski, P. Eng.

P a g e 1 o f 1
CERTIFICATE OF QUALIFIED PERSON
James Cremeens
I, James Cremeens, P.E., P.G., certify that I am employed as a Chief Geotechnical Engineer and Senior Executive Manager with Knight Piésold Consulting (Knight Piésold), with an office address of Suite 900 - 1999 Broadway, Denver, CO 80202-5706. This certificate applies to the technical report titled “Preliminary Economic Assessment of the Cordero Silver Project, Chihuahua State, Mexico” that has an effective date of November 30, 2021 (the “Technical Report”).
I graduated from the University of Illinois – Champaign-Urbana with a B.S in geology in 1988 and an M.S. in geology with rock mechanics specialization. I am a member of the Society for Metallurgy & Exploration (SME). I am a registered professional engineer in Colorado and Nevada. I have practiced my profession for 31 years.
I have read the definition of “Qualified Person” set out in the National Instrument 43-101 Standards of Disclosure for Mineral Projects (“NI 43-101”) and certify that by virtue of my education, affiliation to a professional association and past relevant work experience, I fulfill the requirements to be a “Qualified Person” for those sections of the Technical Report that I am responsible for preparing.
I have not visited the Cordero property. I am responsible for Sections 16.2 of the Technical Report.
I am independent of Discovery Silver Corp. as independence is defined in Section 1.5 of NI 43-101. I have had no previous involvement with the Cordero Project.
I have read NI 43-101 and the sections of the Technical Report for which I am responsible have been prepared in compliance with that Instrument. As of the effective date of the Technical Report, to the best of my knowledge, information and belief, the sections of the Technical Report for which I am responsible contain all scientific and technical information that is required to be disclosed to make those sections of the Technical Report not misleading.
Dated: January 13, 2022
“Signed and sealed”
James Cremeens, P.E., P.G.

P a g e 1 o f 1
CERTIFICATE OF QUALIFIED PERSON
Keith Viles
I, Keith Viles, P. Eng., certify that I am employed as a Senior Geotechnical Engineer with Knight Piésold Consulting (Knight Piésold), with an office address of Suite 900 - 1999 Broadway, Denver, CO 80202-5706. This certificate applies to the technical report titled “Preliminary Economic Assessment of the Cordero Silver Project, Chihuahua State, Mexico” that has an effective date of November 30, 2021 (the “Technical Report”).
I graduated from the University of Western Australia with a B.Eng. (Civil) in 2000. I am a member of Professional Engineers Ontario (No. 100192609). I have practiced my profession for 21 years since graduation. I have been directly involved in the design/review of water dams and tailings facilities in Australia, Africa, Europe and North and South America.
I have read the definition of “Qualified Person” set out in the National Instrument 43-101 Standards of Disclosure for Mineral Projects (“NI 43-101”) and certify that by virtue of my education, affiliation to a professional association and past relevant work experience, I fulfill the requirements to be a “Qualified Person” for those sections of the Technical Report that I am responsible for preparing.
I have not visited the Cordero property. I am responsible for Sections 1.18.8, 18.10, 25.12.1.5, 25.12.2.3, 26.8 of the Technical Report.
I am independent of Discovery Silver Corp. as independence is defined in Section 1.5 of NI 43-101. I have had no previous involvement with the Cordero Project.
I have read NI 43-101 and the sections of the Technical Report for which I am responsible have been prepared in compliance with that Instrument. As of the effective date of the Technical Report, to the best of my knowledge, information and belief, the sections of the Technical Report for which I am responsible contain all scientific and technical information that is required to be disclosed to make those sections of the Technical Report not misleading.
Dated: January 13, 2022
“Signed and sealed”
Keith Viles, P. Eng.

P a g e 1 o f 1
CERTIFICATE OF QUALIFIED PERSON
Nadia M. Caira
I, Nadia M. Caira, P. Geo., certify that I am the sole owner and President of World Metals Inc. (World Metals), with an office address of 5711 Back Valley Rd, 100 Mile House, British Columbia, Canada V0K 2E1. This certificate applies to the technical report titled “Preliminary Economic Assessment of the Cordero Silver Project, Chihuahua State, Mexico” that has an effective date of November 30, 2021 (the “Technical Report”).
I hold the following academic qualifications: Bachelor of Science (B.Sc.) in Geology from the University of British Columbia, and a Master of Geographic Information Systems (M.GIS.) from Pennsylvania State University. I have worked as a geologist for 41 years since graduation from the University of British Columbia in 1981. My relevant experience for the purpose of this Technical Report includes extensive experience with exploration for, and evaluation of, epithermal precious metal and porphyry and porphyry-related mineralization throughout the world, including but not limited to Canada, United States, Mexico, South-east Asia, Central Asia and South America. I have been a registered practising member of the Association of Professional Engineers and Geoscientists of British Columbia since 1993 (License No. 19770).
I have read the definition of “Qualified Person” set out in the National Instrument 43-101 Standards of Disclosure for Mineral Projects (“NI 43-101”) and certify that by virtue of my education, affiliation to a professional association and past relevant work experience, I fulfill the requirements to be a “Qualified Person” for those sections of the Technical Report that I am responsible for preparing.
I visited the Cordero property between October 27, 2021 to November 12, 2021 for a visit duration of 17 days. I am responsible for Sections 1.2, 1.3, 1.4, 1.5, 1.6, 1.16, 1.18.2, 1.18.3, 4, 5, 6, 7, 8, 9, 10, 11, 12, 23, 25.2, 25.3, 25.4, 25.12.1.1, 25.12.1.2, 25.12.1.3, 25.12.2.2, 26.2, 26.3 of the Technical Report.
I am independent of Discovery Silver Corp. as independence is defined in Section 1.5 of NI 43-101. I have had no previous involvement with the Cordero Project.
I have read NI 43-101 and the sections of the Technical Report for which I am responsible have been prepared in compliance with that Instrument. As of the effective date of the Technical Report, to the best of my knowledge, information and belief, the sections of the Technical Report for which I am responsible contain all scientific and technical information that is required to be disclosed to make those sections of the Technical Report not misleading.
Dated: January 13, 2022
“Signed and sealed”
Nadia M. Caira, P. Geo.

P a g e 1 o f 1
CERTIFICATE OF QUALIFIED PERSON
R. Mohan Srivastava
I, R. Mohan Srivastava, P. Geo., certify that I am employed as a Principal Geostatistician with RedDot3D Inc. (RedDot3D), with an office address of #1100 – 120 Eglinton Avenue East, Toronto, Ontario, Canada M4P 1E2. This certificate applies to the technical report titled “Preliminary Economic Assessment of the Cordero Silver Project, Chihuahua State, Mexico” that has an effective date of November 30, 2021 (the “Technical Report”).
I hold the following academic qualifications: a B.Sc. in Earth Sciences from the Massachusetts Institute of Technology, and a M.Sc. in Geostatistics from Stanford University. I have worked as a geostatistician and resource estimation specialist since graduation from university in 1979. My relevant experience for the purpose of this Technical Report includes:
• 1979 to present – Consulting geostatistician specializing in mineral resource estimation, reviews and audits for mining projects in their exploration and development phases, including precious and base metals projects in Mexico.
• 2016 to 2021 – Vice President of TriStar Gold Inc., responsible for field programs and technical studies including: drilling, petrophysics, QA/QC of analytical laboratories, mineral resource estimation and quantitative risk assessment.
I have been a Practising Member (No. 0547) of the Professional Geoscientists of Ontario continuously since 2003.
I have read the definition of “Qualified Person” set out in the National Instrument 43-101 Standards of Disclosure for Mineral Projects (“NI 43-101”) and certify that by virtue of my education, affiliation to a professional association and past relevant work experience, I fulfill the requirements to be a “Qualified Person” for those sections of the Technical Report that I am responsible for preparing.
I have not visited the Cordero property. I am responsible for Sections 1.8, 1.18.4, 14, 26.4 of the Technical Report.
I am independent of Discovery Silver Corp. as independence is defined in Section 1.5 of NI 43-101. I have had no previous involvement with the Cordero Project.
I have read NI 43-101 and the sections of the Technical Report for which I am responsible have been prepared in compliance with that Instrument. As of the effective date of the Technical Report, to the best of my knowledge, information and belief, the sections of the Technical Report for which I am responsible contain all scientific and technical information that is required to be disclosed to make those sections of the Technical Report not misleading.
Dated: January 13, 2022
“Signed and sealed”
R. Mohan Srivastava, P. Geo.

P a g e 1 o f 1
CERTIFICATE OF QUALIFIED PERSON
Scott Weston
I, Scott Weston, P. Geo., certify that I am employed as a Vice President, Business Development with Hemmera Envirochem Inc. (Hemmera), with an office address of 4515 Central Boulevard, Burnaby, BC, Canada. This certificate applies to the technical report titled “Preliminary Economic Assessment of the Cordero Silver Project, Chihuahua State, Mexico” that has an effective date of November 30, 2021 (the “Technical Report”).
I graduated from University of British Columbia, Vancouver, BC, Canada, in 1995 with a Bachelor of Science, Physical Geography, and Royal Roads University, Victoria, BC, Canada, in 2003 with a Master of Science, Environment and Management. I am a Professional Geoscientist of Engineers and Geoscientists British Columbia (No. 124888). I have practiced my profession for 25 years.
I have read the definition of “Qualified Person” set out in the National Instrument 43-101 Standards of Disclosure for Mineral Projects (“NI 43-101”) and certify that by virtue of my education, affiliation to a professional association and past relevant work experience, I fulfill the requirements to be a “Qualified Person” for those sections of the Technical Report that I am responsible for preparing.
I have not visited the Cordero property. I am responsible for Sections 1.13, 1.18.10, 20, 25.12.1.4, 25.12.2.1, 26.10 of the Technical Report.
I am independent of Discovery Silver Corp. as independence is defined in Section 1.5 of NI 43-101. I have had no previous involvement with the Cordero Project.
I have read NI 43-101 and the sections of the Technical Report for which I am responsible have been prepared in compliance with that Instrument. As of the effective date of the Technical Report, to the best of my knowledge, information and belief, the sections of the Technical Report for which I am responsible contain all scientific and technical information that is required to be disclosed to make those sections of the Technical Report not misleading.
Dated: January 13, 2022
“Signed and sealed”
Scott Weston, P. Geo.

P a g e 1 o f 1
CERTIFICATE OF QUALIFIED PERSON
Davood Hasanloo
I, Davood Hasanloo, P.Eng., certify that I am employed as a Senior Water Resources Engineer with Hemmera Envirochem Inc. (Hemmera), with an office address of # 350 1190 Hornby St, Vancouver BC V6Z 2K5. This certificate applies to the technical report titled “Preliminary Economic Assessment of the Cordero Silver Project, Chihuahua State, Mexico” that has an effective date of November 30, 2021 (the “Technical Report”).
I graduated from the Iran University of Science and Technology with a Bachelor of Science degree in Civil Engineering in 2006, and from the University of British Columbia with a Master of Applied Science degree in Civil Engineering with specialization in Hydrotechnical Engineering in 2013. I am a Professional Engineer with Engineers and Geoscientists of British Columbia with the membership number of 42950. I have practiced my profession for 15 years since graduation. I have been directly involved in surface water management analysis of Cordero PEA with the exclusion of TSF water management.
I have read the definition of “Qualified Person” set out in the National Instrument 43-101 Standards of Disclosure for Mineral Projects (“NI 43-101”) and certify that by virtue of my education, affiliation to a professional association and past relevant work experience, I fulfill the requirements to be a “Qualified Person” for those sections of the Technical Report that I am responsible for preparing.
I have not visited the Cordero property. I am responsible for Sections 1.18.9, 18.11, 25.6, 26.9 of the Technical Report.
I am independent of Discovery Silver Corp. as independence is defined in Section 1.5 of NI 43-101. I have had no previous involvement with the Cordero Project.
I have read NI 43-101 and the sections of the Technical Report for which I am responsible have been prepared in compliance with that Instrument. As of the effective date of the Technical Report, to the best of my knowledge, information and belief, the sections of the Technical Report for which I am responsible contain all scientific and technical information that is required to be disclosed to make those sections of the Technical Report not misleading.
Dated: January 13, 2022
“Signed and sealed”
Davood Hasanloo, P. Eng.