WORLD SILVER SURVEY 2017
104
WORLD SILVER SURVEY 2017 World Silver Survey 2017 The Silver Institute / Thomson Reuters
-
Upload
khangminh22 -
Category
Documents
-
view
1 -
download
0
Transcript of WORLD SILVER SURVEY 2017

THE SILVER INSTITUTE1400 I Street, NW
Suite 550Washington, DC 20005
Tel: +1-202-835-0185Email: [email protected]
www.silverinstitute.org
WORLD SILVER SURVEY 2017W
orld Silver Survey 2017
The Silver Institute / Thomson R
euters
THE SILVER INSTITUTE (major funding companies)
Asahi Refining
Barrick Gold Corp.
Cia. de Minas Buenaventura, S.A.A.
Coeur Mining, Inc.
Endeavour Silver Corp.
Fresnillo Plc
Hecla Mining Company
Industrias Peñoles, S.A.B. de C.V.
Pan American Silver Corp.
Silver Wheaton Corp.
Back Cover Image: Galmer Sterling Silver Bamboo Turquoise Necklace by Galmer Fine Silver
Printed by Park Communications, London 28769
Front Cover Image: Photovoltaic cells in a solar panel — Finsterwalde Solar Park, Germany © Martin Vonka | Dreamstime.com

Thomson ReutersThe Thomson Reuters Building, 30 South Colonnade,
London, E14 5EP, UKE-mail: [email protected]
Web: financial.tr.com/eikon-metals
The Silver Institute1400 I Street, NW, Suite 550
Washington, D.C., 20005, USATelephone: +1-202-835-0185
WORLD SILVER SURVEY 2017
BYRhona O’Connell, Head of Metals Research & ForecastsCameron Alexander, Manager Ross Strachan, Manager Bruce Alway, Manager Sudheesh Nambiath, Lead Analyst Johann Wiebe, Lead AnalystLing Wong, Senior Analyst Erica Rannestad, Senior Analyst Samson Li, Senior Analyst Dante Aranda, Senior Analyst Natalie Scott-Gray, Analyst
OTHER CONTRIBUTORS:IFR Production, Thomson ReutersKaren Norton, Senior AnalystWenyu Yao, Senior AnalystLinda Zhang, Analyst
Produced for The Silver Institute by the GFMS team at Thomson Reuters

ABOUT THE MAJOR SPONSORS OF WORLD SILVER SURVEY 2017
Coeur Mining, Inc.
Coeur Mining is a well-diversified, growing precious metals producer with five precious metals mines in the Americas employing over 2,000 people. Coeur produces from its wholly owned operations: the Palmarejo silver-gold complex in Mexico, the Rochester silver-gold mine in Nevada, the Kensington gold mine in Alaska, the Wharf gold mine in South Dakota, and the San Bartolomé silver mine in Bolivia. The Company also has a non-operating interest in the Endeavor mine in Australia. In addition, the Company owns the La Preciosa project in Mexico, a silver-gold exploration stage project. Coeur conducts exploration activities throughout North and South America.
Fresnillo Plc
Fresnillo plc is the world’s largest primary silver producer and Mexico’s second largest gold producer, listed on the London and Mexican Stock Exchanges under the symbol FRES. Fresnillo plc has seven operating mines, all of them in Mexico - Fresnillo, Saucito, Ciénega (including the San Ramón satellite mine), Herradura, Soledad-Dipolos1, Noche Buena and San Julián (phase I), three development projects - San Julián (phase II), the Pyrites plant, and second line of DLP at Herradura, and four advanced exploration projects – Orisyvo, Juanicipio, Las Casas Rosario & Cluster Cebollitas and Centauro Deep, as well as a number of other long term exploration prospects. In total, Fresnillo plc has mining concessions covering approximately 2 million hectares in Mexico. Fresnillo plc has a strong and long tradition of mining, a proven track record of mine development, reserve replacement, and production costs in the lowest quartile of the cost curve for silver. Fresnillo plc’s goal is to maintain the Group’s position as the world’s largest primary silver company, producing 65 million ounces of silver per year by 2018, having already surpassed the gold target of 750,000 ounces.1 Operations at Soledad and Dipolos are currently suspended.
Industrias Peñoles, S.A.B. de C.V.
Peñoles is a mining group with integrated operations in smelting and refining non-ferrous metals, and producing chemicals. Peñoles is the world’s top producer of refined silver, metallic bismuth and sodium sulfate, and the leading Latin American producer of refined gold and lead. The Company was founded in 1887 and it is part of “Grupo BAL”, a privately held diversified group of independent Mexican companies. Peñoles’ shares have traded on the Mexican Stock Exchange since 1968 under the ticker PE&OLES.
Peñoles highlights:• Beganoperationsin1887asaminingcompany.• Hasintegratedoperationsintheareasofexploration,mining,metallurgyandchemicals.• ListedontheMexicanStockExchangesince1968;thestockisincludedintheIPCindex.• OneofthelargestnetexportersinMexico’sprivatesector.
Pan American Silver Corp.
Pan American Silver, founded in 1994, is currently the second-largest primary silver producer in the world, with seven operating mines in Mexico, Peru, Bolivia and Argentina, as well as mineral deposits and projects in the USA, Mexico, Peru and Argentina. Pan American’s vision is to be the world’s pre-eminent silver producer, with a reputation for excellence in discovery, engineering, innovation and sustainable development. The Company has a recognized team of industry-leading professionals with a wealth of experience in exploration, project development, mining operations, and corporate finance.
In 2016, Pan American produced 25.4 million ounces of silver and 183.9 thousand ounces of gold at consolidated cash costs of $6.29 per payable ounce of silver, net of by-product credits, 35% lower than in 2015. In 2017, Pan American expects to produce between 24.5 and 26.0 million ounces of silver and between 155 and 165 thousand ounces of gold at cash costs of between $6.45 and $7.45 per payable ounce of silver, net of by-product credits. Consolidated all-in sustaining costs per silver ounce sold for 2017 are expected to be between $11.50 and $12.90. Also in 2017, the Company expects to complete the expansions of its La Colorada and Dolores mines in Mexico, with remaining project capital estimated at between $58 to $62 million.
Pan American is traded on Nasdaq and the Toronto Stock Exchange under the symbol “PAAS”. For more information, visit www.panamericansilver.com.
Silver Wheaton Corp.
Silver Wheaton is the largest precious metals streaming company in the world with the highest production and operating cash flow relative to its peers. The Company has entered into agreements to purchase all or a portion of the silver and/or gold production from high-quality mines for an upfront payment and an additional payment upon delivery of the precious metals. The Company offers investors leverage to increasing silver and gold prices, a sustainable dividend, and both organic and acquisition growth opportunities. Silver Wheaton offers these benefits while at the same time seeks to reduce many of the downside risks faced by traditional mining companies. For example, operating costs are contractually set at the time the stream is entered into, allowing investors to benefit from cost predictability and strong margin growth in an environment of rising silver and gold prices. Silver Wheaton currently has streaming agreements covering 22 operating mines and 8 development stage projects. The Company’s production profile is driven by a portfolio of world-class assets, including a gold stream on Vale’s Salobo mine, and silver streams on Glencore’s Antamina mine and Goldcorp’s Peñasquito mine.

World Silver Survey 2017 has been kindly supportedby the following companies
MAJOR SPONSORS
SPONSORS
CONTRIBUTORSAsahi Refining
CME GroupInternational Depository Services Group
Republic Metals Corporation
Tanaka Kikinzoku Kogyo K. K.TD Bank
Valcambi sa
Coeur Mining, Inc. Fresnillo Plc
Pan American Silver Corp. Silver Wheaton Corp.Industrias Peñoles S.A.B. de C.V.
Barrick Gold Corporation Compañia de Minas Buenaventura S.A.A.
Hecla Mining Company Italpreziosi
Scotiabank
KGHM Polska Miedź S.A.
Endeavour Silver Corp.
The WorldSilverSurvey has been published annually by The Silver Institute since 1990. Copies of previous editions can be obtained by contacting The Silver Institute at the address and telephone number on the opening page. For copies outside of North America, contact Thomson Reuters at the address on the page overleaf.
ISSN: 1059-6992 (Print)
ISSN: 2372-2312 (Online)
ISBN: 978-1-880936-28-3 (Print)
ISBN: 978-1-880936-29-0 (Online)
© Copyright May 2017. The Silver Institute and Thomson Reuters.
We (and where relevant, any identified contributors or co-authors) are the owner or the licensee of all intellectual property rights in this document. This document is protected by copyright laws and treaties around the world. All such rights are reserved. No organization or individual is permitted to reproduce or transmit all or part of this document (including without limitation extracts such as tables and graphs), whether by photocopying or storing in any medium by electronic means or otherwise, without the written permission of The Silver Institute and Thomson Reuters. In cases where we have provided our document electronically, only the authorized subscriber, in respect of whom an individual user license has been granted, may download a copy of this document. Additional user licenses may be purchased on request.
Your reproduction, transmission, printing off, copying or downloading (where relevant) of all or part of this document in breach of these terms may result in civil or criminal actions against you. While every effort has been made to ensure the accuracy of the information in this document, the content of this document is provided without any guarantees, conditions or warranties as to its accuracy, completeness or reliability. It is not to be construed as a solicitation or an offer to buy or sell precious metal, related products, commodities, securities or related financial instruments. To the extent permitted by law, we, other members of our group of companies and third parties connected to us hereby expressly exclude: • Allconditions,warrantiesandothertermswhichmightotherwisebeimpliedbystatute,commonlaworthelawofequity.
• Anyliabilityforanydirect,indirectorconsequentiallossordamageincurredbyanypersonororganizationreadingorrelyingonthisdocumentincluding(withoutlimitation)lossofincomeorrevenue,lossofbusiness,lossofprofitsorcontracts,lossofanticipatedsavings,lossofgoodwillandwhethercausedbytort(includingnegligence),breachofcontractorotherwise,evenifforeseeable.
This is the twenty-seventh annual edition of the World Silver Survey produced for The Silver Institute. The World Silver Survey 2017 was produced by the GFMS team of metals market analysts at Thomson Reuters. The information contained herein is based in part on the analysis of publicly available data such as hallmarking series, trade statistics, company reports and other public-domain information. More importantly, it is also based on a large series of interviews with the industry’s main players, carried out over the year by the team. This work generates the essential data to allow the compilation of reliable estimates for world supply and demand and inform the analysis of market structures, and the degree of significance of any changes and developments.
Thomson Reuters is grateful to the many miners, refiners, bullion dealers, bankers and fabricators throughout the world who have contributed their time and information to ensuring that the picture of the industry described in the World Silver Survey is as complete and accurate as possible.
Thomson Reuters, London The Thomson Reuters Building, 30 South Colonnade,London, E14 5EP, UKE-mail: [email protected]
UNITS USED: supply and demand data are given in units of million troy ounces (Moz) rounded to one decimal place. 1 Moz = 31.103 t (metric tons) 1 ton = 32,151 troy ounces1 ton = 1,000,000 grams (g)
TERMINOLOGY:
“-” Not available or not applicable.
“0.0” Zero or less than 0.05.
“dollar”, “$” US dollar unless otherwise stated.
“Identifiable Investment” The sum of physical bar investment and all coin fabrication, plus the net change
in Exchange Traded Product (ETP) holdings.
“Physical Surplus/ Deficit” The difference between the supply of new and secondary silver to the market in
a calendar year and measurable demand for physical silver. This excludes
opaque Over the Counter (OTC) investment in silver and commercial bank
transactions.
“Net Balance” The physical surplus or deficit of silver with the addition of highly visible ETP and
exchange stock inventory changes.PRICES:Unless otherwise stated, US dollar prices are for the London Silver Market fixing prior to August 15, 2014. As of this date prices refer to the LBMA Silver Price as successor to the silver fix.
TABLE ROUNDING:Throughout the tables and charts, totals may not add due to independent rounding.
TABLE OF CONTENTS
1. Summary and Outlook 8Supply in 2016 10 • Demand in 2016 10
2. Silver Prices 12• Chinese Silver Premia 14 • Silver in Other Currencies 15 • Gold: Silver Ratio 15
3. Investment 17• Overview 17 • OTC Market 18 • Exchange Traded Products 19 • Physical Bar Investment 22• Commodity Exchanges Activity 23 • Coins and Medals 24
4. Mine Supply 26• Mine Production 26 • By-product Analysis & Outlook 34 • Production Costs 35• Producer Hedging 36
5. Supply from Above-Ground Stocks 37• Overview 37 • Identifiable Bullion Stocks 37 • Custodian Vault Stocks 39• Futures Exchanges 39 • Government Stocks 41 • Industry 41 • Scrap 42
6. Silver Bullion Trade 45 • Europe 45 • The Americas 47 • Middle East and Indian Sub-Continent 47• East Asia 49
7. Industrial Fabrication 51• Industrial Fabrication by Region 53 • Photography 62 • Photovoltaic 64
8. Jewelry and Silverware 67• Jewelry 67 • Silverware 75
9. Appendices 78
MAJOR TABLES• World Silver Supply and Demand 8 • Coins and Medals 25 • Mine Production 28• Scrap Supply 43 • Industrial Applications 52 • Electrical and Electronics 58• Brazing Alloys and Solders 62 • Photography 63 • Jewelry 73 • Silverware 76
FOCUS BOXES• World Silver Survey: Supply and Demand Methodology 9 • Silver and Other Commodity Prices 16• Investment in Commodities 20 • Corporate Activity 32• Silver ETP Holdings by Vault Location 40 • Silver Ethylene Oxide Catalyst Market 60• New and Growing Sources of Demand for Silver 61• Silver Jewelry - A Changing Landscape 70
Table of contents are hyperlinked for your convenience
8
WORLD SILVER SURVEY 2017
SUM
MA
RY
AN
D O
UTL
OO
K
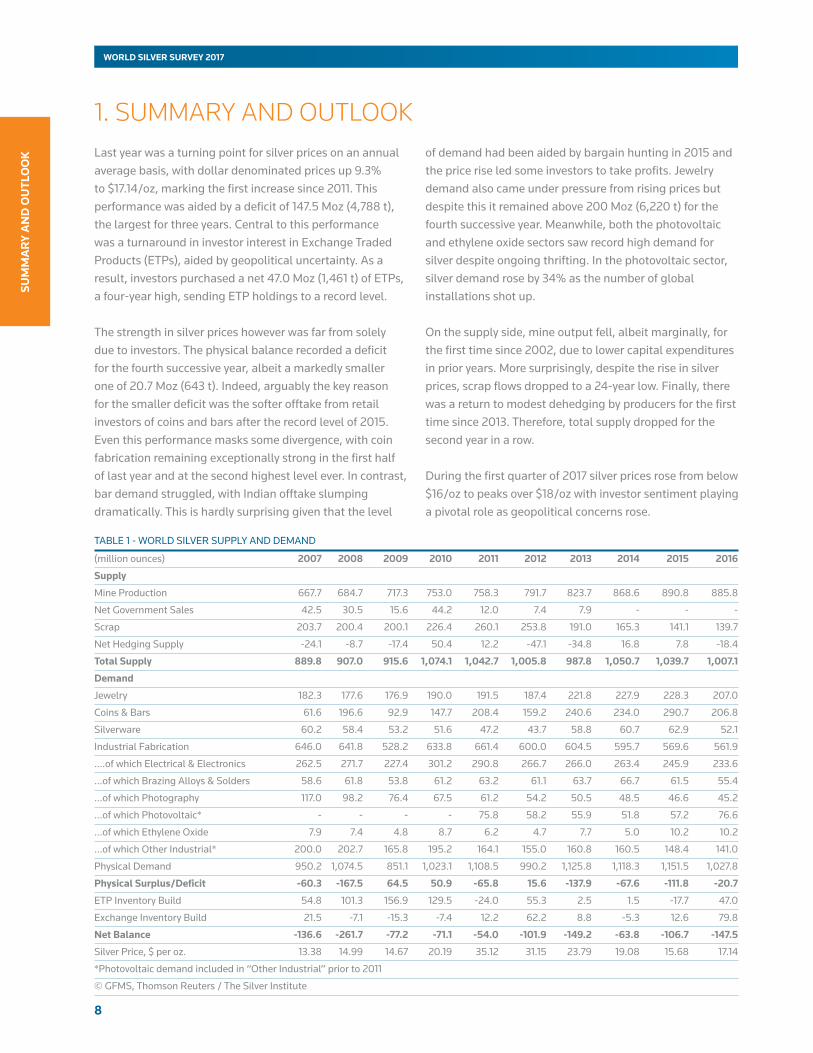
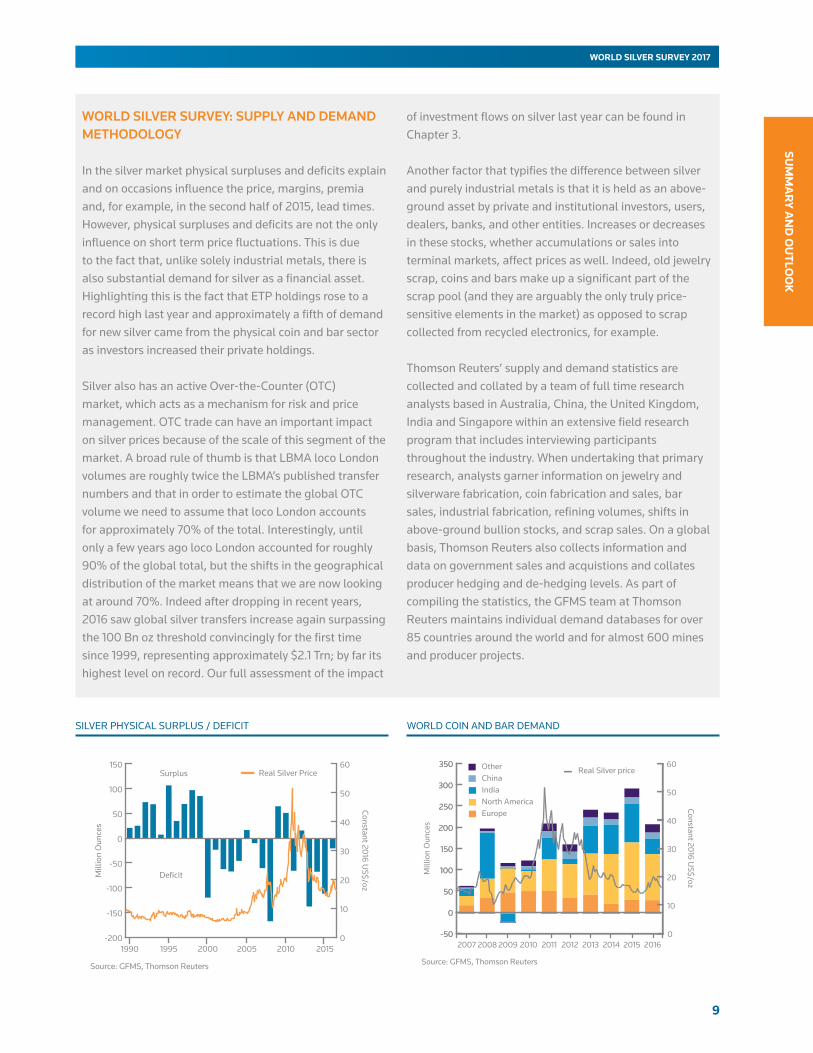
1. SUMMARY AND OUTLOOK Last year was a turning point for silver prices on an annual average basis, with dollar denominated prices up 9.3% to $17.14/oz, marking the first increase since 2011. This performance was aided by a deficit of 147.5 Moz (4,788 t), the largest for three years. Central to this performance was a turnaround in investor interest in Exchange Traded Products (ETPs), aided by geopolitical uncertainty. As a result, investors purchased a net 47.0 Moz (1,461 t) of ETPs, a four-year high, sending ETP holdings to a record level.
The strength in silver prices however was far from solely due to investors. The physical balance recorded a deficit for the fourth successive year, albeit a markedly smaller one of 20.7 Moz (643 t). Indeed, arguably the key reason for the smaller deficit was the softer offtake from retail investors of coins and bars after the record level of 2015. Even this performance masks some divergence, with coin fabrication remaining exceptionally strong in the first half of last year and at the second highest level ever. In contrast, bar demand struggled, with Indian offtake slumping dramatically. This is hardly surprising given that the level
of demand had been aided by bargain hunting in 2015 and the price rise led some investors to take profits. Jewelry demand also came under pressure from rising prices but despite this it remained above 200 Moz (6,220 t) for the fourth successive year. Meanwhile, both the photovoltaic and ethylene oxide sectors saw record high demand for silver despite ongoing thrifting. In the photovoltaic sector, silver demand rose by 34% as the number of global installations shot up.
On the supply side, mine output fell, albeit marginally, for the first time since 2002, due to lower capital expenditures in prior years. More surprisingly, despite the rise in silver prices, scrap flows dropped to a 24-year low. Finally, there was a return to modest dehedging by producers for the first time since 2013. Therefore, total supply dropped for the second year in a row.
During the first quarter of 2017 silver prices rose from below $16/oz to peaks over $18/oz with investor sentiment playing a pivotal role as geopolitical concerns rose.
TABLE 1 - WORLD SILVER SUPPLY AND DEMAND
(million ounces) 2007 2008 2009 2010 2011 2012 2013 2014 2015 2016
Supply
Mine Production 667.7 684.7 717.3 753.0 758.3 791.7 823.7 868.6 890.8 885.8
Net Government Sales 42.5 30.5 15.6 44.2 12.0 7.4 7.9 - - -
Scrap 203.7 200.4 200.1 226.4 260.1 253.8 191.0 165.3 141.1 139.7
Net Hedging Supply -24.1 -8.7 -17.4 50.4 12.2 -47.1 -34.8 16.8 7.8 -18.4
Total Supply 889.8 907.0 915.6 1,074.1 1,042.7 1,005.8 987.8 1,050.7 1,039.7 1,007.1
Demand
Jewelry 182.3 177.6 176.9 190.0 191.5 187.4 221.8 227.9 228.3 207.0
Coins & Bars 61.6 196.6 92.9 147.7 208.4 159.2 240.6 234.0 290.7 206.8
Silverware 60.2 58.4 53.2 51.6 47.2 43.7 58.8 60.7 62.9 52.1
Industrial Fabrication 646.0 641.8 528.2 633.8 661.4 600.0 604.5 595.7 569.6 561.9
….of which Electrical & Electronics 262.5 271.7 227.4 301.2 290.8 266.7 266.0 263.4 245.9 233.6
...of which Brazing Alloys & Solders 58.6 61.8 53.8 61.2 63.2 61.1 63.7 66.7 61.5 55.4
...of which Photography 117.0 98.2 76.4 67.5 61.2 54.2 50.5 48.5 46.6 45.2
...of which Photovoltaic* - - - - 75.8 58.2 55.9 51.8 57.2 76.6
...of which Ethylene Oxide 7.9 7.4 4.8 8.7 6.2 4.7 7.7 5.0 10.2 10.2
...of which Other Industrial* 200.0 202.7 165.8 195.2 164.1 155.0 160.8 160.5 148.4 141.0
Physical Demand 950.2 1,074.5 851.1 1,023.1 1,108.5 990.2 1,125.8 1,118.3 1,151.5 1,027.8
Physical Surplus/Deficit -60.3 -167.5 64.5 50.9 -65.8 15.6 -137.9 -67.6 -111.8 -20.7
ETP Inventory Build 54.8 101.3 156.9 129.5 -24.0 55.3 2.5 1.5 -17.7 47.0
Exchange Inventory Build 21.5 -7.1 -15.3 -7.4 12.2 62.2 8.8 -5.3 12.6 79.8
Net Balance -136.6 -261.7 -77.2 -71.1 -54.0 -101.9 -149.2 -63.8 -106.7 -147.5
Silver Price, $ per oz. 13.38 14.99 14.67 20.19 35.12 31.15 23.79 19.08 15.68 17.14
*Photovoltaic demand included in “Other Industrial” prior to 2011
© GFMS, Thomson Reuters / The Silver Institute
9
SUM
MA
RY A
ND
OU
TLOO
K
WORLD SILVER SURVEY 2017
SILVER PHYSICAL SURPLUS / DEFICIT WORLD COIN AND BAR DEMAND
-200
-150
-100
-50
0
50
100
150
201520102005200019951990
Mill
ion
Oun
ces
0
10
20
30
40
50
60
Constant 2016 US$/oz
Source: GFMS, Thomson Reuters
Deficit
Surplus Real Silver Price
-50
0
50
100
150
200
250
300
350
2016201520142013201220112010200920082007
Mill
ion
Oun
ces
OtherChinaIndiaNorth AmericaEurope
-50
0
50
100
150
200
250
300
350Real Silver price
0
10
20
30
40
50
60
Constant 2016 US$/oz
Source: GFMS, Thomson Reuters
WORLD SILVER SURVEY: SUPPLY AND DEMAND METHODOLOGY
In the silver market physical surpluses and deficits explain and on occasions influence the price, margins, premia and, for example, in the second half of 2015, lead times. However, physical surpluses and deficits are not the only influence on short term price fluctuations. This is due to the fact that, unlike solely industrial metals, there is also substantial demand for silver as a financial asset. Highlighting this is the fact that ETP holdings rose to a record high last year and approximately a fifth of demand for new silver came from the physical coin and bar sector as investors increased their private holdings.
Silver also has an active Over-the-Counter (OTC) market, which acts as a mechanism for risk and price management. OTC trade can have an important impact on silver prices because of the scale of this segment of the market. A broad rule of thumb is that LBMA loco London volumes are roughly twice the LBMA’s published transfer numbers and that in order to estimate the global OTC volume we need to assume that loco London accounts for approximately 70% of the total. Interestingly, until only a few years ago loco London accounted for roughly 90% of the global total, but the shifts in the geographical distribution of the market means that we are now looking at around 70%. Indeed after dropping in recent years, 2016 saw global silver transfers increase again surpassing the 100 Bn oz threshold convincingly for the first time since 1999, representing approximately $2.1 Trn; by far its highest level on record. Our full assessment of the impact
of investment flows on silver last year can be found in Chapter 3.
Another factor that typifies the difference between silver and purely industrial metals is that it is held as an above-ground asset by private and institutional investors, users, dealers, banks, and other entities. Increases or decreases in these stocks, whether accumulations or sales into terminal markets, affect prices as well. Indeed, old jewelry scrap, coins and bars make up a significant part of the scrap pool (and they are arguably the only truly price-sensitive elements in the market) as opposed to scrap collected from recycled electronics, for example.
Thomson Reuters’ supply and demand statistics are collected and collated by a team of full time research analysts based in Australia, China, the United Kingdom, India and Singapore within an extensive field research program that includes interviewing participants throughout the industry. When undertaking that primary research, analysts garner information on jewelry and silverware fabrication, coin fabrication and sales, bar sales, industrial fabrication, refining volumes, shifts in above-ground bullion stocks, and scrap sales. On a global basis, Thomson Reuters also collects information and data on government sales and acquistions and collates producer hedging and de-hedging levels. As part of compiling the statistics, the GFMS team at Thomson Reuters maintains individual demand databases for over 85 countries around the world and for almost 600 mines and producer projects.
10
WORLD SILVER SURVEY 2017
SUM
MA
RY
AN
D O
UTL
OO
K
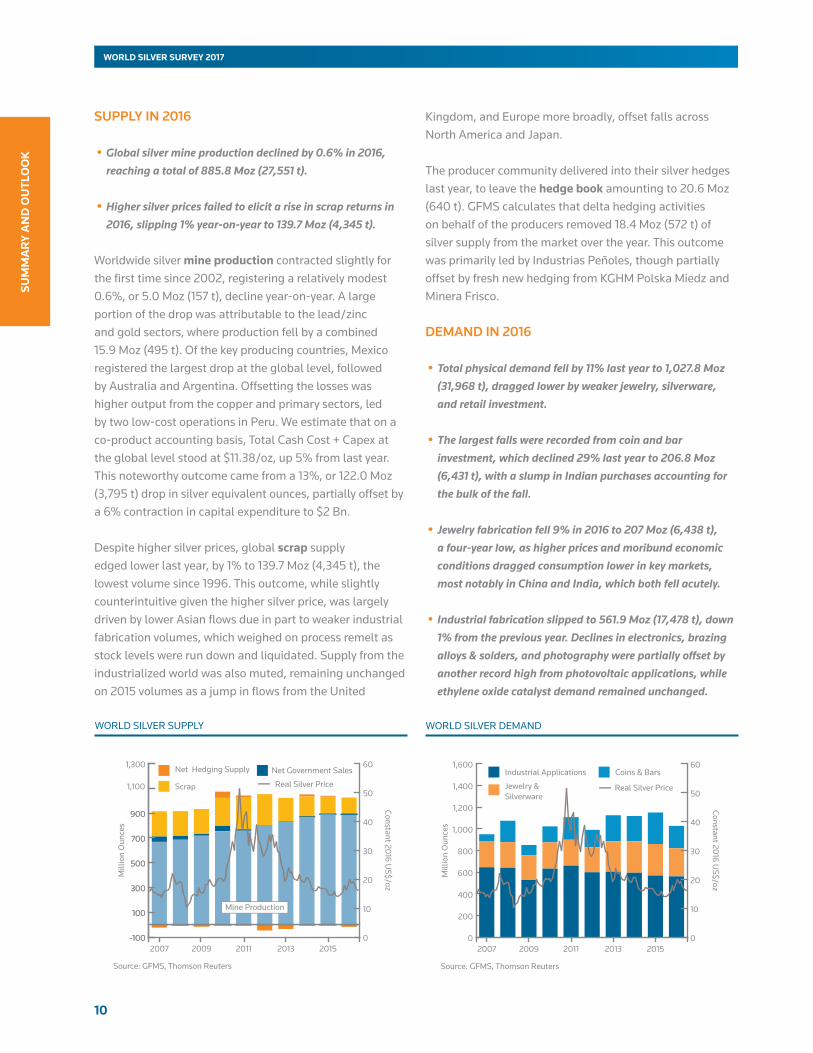
SUPPLY IN 2016
•Global silver mine production declined by 0.6% in 2016, reaching a total of 885.8 Moz (27,551 t).
•Higher silver prices failed to elicit a rise in scrap returns in 2016, slipping 1% year-on-year to 139.7 Moz (4,345 t).
Worldwide silver mine production contracted slightly for the first time since 2002, registering a relatively modest 0.6%, or 5.0 Moz (157 t), decline year-on-year. A large portion of the drop was attributable to the lead/zinc and gold sectors, where production fell by a combined 15.9 Moz (495 t). Of the key producing countries, Mexico registered the largest drop at the global level, followed by Australia and Argentina. Offsetting the losses was higher output from the copper and primary sectors, led by two low-cost operations in Peru. We estimate that on a co-product accounting basis, Total Cash Cost + Capex at the global level stood at $11.38/oz, up 5% from last year. This noteworthy outcome came from a 13%, or 122.0 Moz (3,795 t) drop in silver equivalent ounces, partially offset by a 6% contraction in capital expenditure to $2 Bn.
Despite higher silver prices, global scrap supply edged lower last year, by 1% to 139.7 Moz (4,345 t), the lowest volume since 1996. This outcome, while slightly counterintuitive given the higher silver price, was largely driven by lower Asian flows due in part to weaker industrial fabrication volumes, which weighed on process remelt as stock levels were run down and liquidated. Supply from the industrialized world was also muted, remaining unchanged on 2015 volumes as a jump in flows from the United
Kingdom, and Europe more broadly, offset falls across North America and Japan.
The producer community delivered into their silver hedges last year, to leave the hedge book amounting to 20.6 Moz (640 t). GFMS calculates that delta hedging activities on behalf of the producers removed 18.4 Moz (572 t) of silver supply from the market over the year. This outcome was primarily led by Industrias Peñoles, though partially offset by fresh new hedging from KGHM Polska Miedz and Minera Frisco.
DEMAND IN 2016
•Total physical demand fell by 11% last year to 1,027.8 Moz (31,968 t), dragged lower by weaker jewelry, silverware, and retail investment.
•The largest falls were recorded from coin and bar investment, which declined 29% last year to 206.8 Moz (6,431 t), with a slump in Indian purchases accounting for the bulk of the fall.
• Jewelry fabrication fell 9% in 2016 to 207 Moz (6,438 t), a four-year low, as higher prices and moribund economic conditions dragged consumption lower in key markets, most notably in China and India, which both fell acutely.
• Industrial fabrication slipped to 561.9 Moz (17,478 t), down 1% from the previous year. Declines in electronics, brazing alloys & solders, and photography were partially offset by another record high from photovoltaic applications, while ethylene oxide catalyst demand remained unchanged.
WORLD SILVER DEMAND
0
200
400
600
800
1,000
1,200
1,400
1,600
20152013201120092007
Mill
ion
Oun
ces
0
10
20
30
40
50
60
Constant 2016 US$/oz
Source: GFMS, Thomson Reuters
Real Silver PriceJewelry & Silverware
Coins & BarsIndustrial Applications
WORLD SILVER SUPPLY
Mill
ion
Oun
ces
Constant 2016 US$/oz
-100
100
300
500
700
900
1,100
1,300
20152013201120092007-100
100
300
500
700
900
0
10
20
30
40
50
60
Source: GFMS, Thomson Reuters
Net Hedging Supply
Scrap Real Silver Price
Net Government Sales
Mine Production
11
SUM
MA
RY A
ND
OU
TLOO
K
WORLD SILVER SURVEY 2017
SILVER INDUSTRIAL FABRICATION
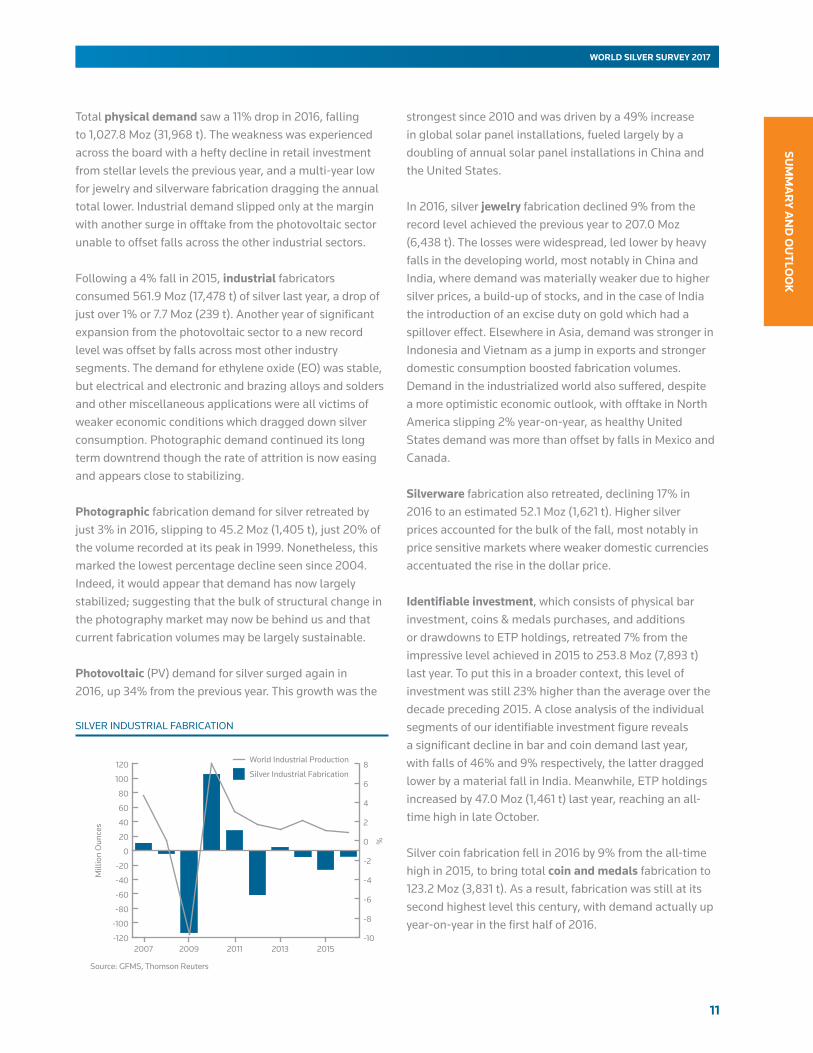
Total physical demand saw a 11% drop in 2016, falling to 1,027.8 Moz (31,968 t). The weakness was experienced across the board with a hefty decline in retail investment from stellar levels the previous year, and a multi-year low for jewelry and silverware fabrication dragging the annual total lower. Industrial demand slipped only at the margin with another surge in offtake from the photovoltaic sector unable to offset falls across the other industrial sectors.
Following a 4% fall in 2015, industrial fabricators consumed 561.9 Moz (17,478 t) of silver last year, a drop of just over 1% or 7.7 Moz (239 t). Another year of significant expansion from the photovoltaic sector to a new record level was offset by falls across most other industry segments. The demand for ethylene oxide (EO) was stable, but electrical and electronic and brazing alloys and solders and other miscellaneous applications were all victims of weaker economic conditions which dragged down silver consumption. Photographic demand continued its long term downtrend though the rate of attrition is now easing and appears close to stabilizing.
Photographic fabrication demand for silver retreated by just 3% in 2016, slipping to 45.2 Moz (1,405 t), just 20% of the volume recorded at its peak in 1999. Nonetheless, this marked the lowest percentage decline seen since 2004. Indeed, it would appear that demand has now largely stabilized; suggesting that the bulk of structural change in the photography market may now be behind us and that current fabrication volumes may be largely sustainable.
Photovoltaic (PV) demand for silver surged again in 2016, up 34% from the previous year. This growth was the
strongest since 2010 and was driven by a 49% increase in global solar panel installations, fueled largely by a doubling of annual solar panel installations in China and the United States.
In 2016, silver jewelry fabrication declined 9% from the record level achieved the previous year to 207.0 Moz (6,438 t). The losses were widespread, led lower by heavy falls in the developing world, most notably in China and India, where demand was materially weaker due to higher silver prices, a build-up of stocks, and in the case of India the introduction of an excise duty on gold which had a spillover effect. Elsewhere in Asia, demand was stronger in Indonesia and Vietnam as a jump in exports and stronger domestic consumption boosted fabrication volumes. Demand in the industrialized world also suffered, despite a more optimistic economic outlook, with offtake in North America slipping 2% year-on-year, as healthy United States demand was more than offset by falls in Mexico and Canada.
Silverware fabrication also retreated, declining 17% in 2016 to an estimated 52.1 Moz (1,621 t). Higher silver prices accounted for the bulk of the fall, most notably in price sensitive markets where weaker domestic currencies accentuated the rise in the dollar price.
Identifiable investment, which consists of physical bar investment, coins & medals purchases, and additions or drawdowns to ETP holdings, retreated 7% from the impressive level achieved in 2015 to 253.8 Moz (7,893 t) last year. To put this in a broader context, this level of investment was still 23% higher than the average over the decade preceding 2015. A close analysis of the individual segments of our identifiable investment figure reveals a significant decline in bar and coin demand last year, with falls of 46% and 9% respectively, the latter dragged lower by a material fall in India. Meanwhile, ETP holdings increased by 47.0 Moz (1,461 t) last year, reaching an all-time high in late October.
Silver coin fabrication fell in 2016 by 9% from the all-time high in 2015, to bring total coin and medals fabrication to 123.2 Moz (3,831 t). As a result, fabrication was still at its second highest level this century, with demand actually up year-on-year in the first half of 2016.
Mill
ion
Oun
ces
-120
-100
-80
-60
-40
-20
0
20
40
60
80
100
120
20152013201120092007-10
-8
-6
-4
-2
0
2
4
6
8
%
Source: GFMS, Thomson Reuters
World Industrial Production
Silver Industrial Fabrication
12
WORLD SILVER SURVEY 2017
SILV
ER P
RIC
ES
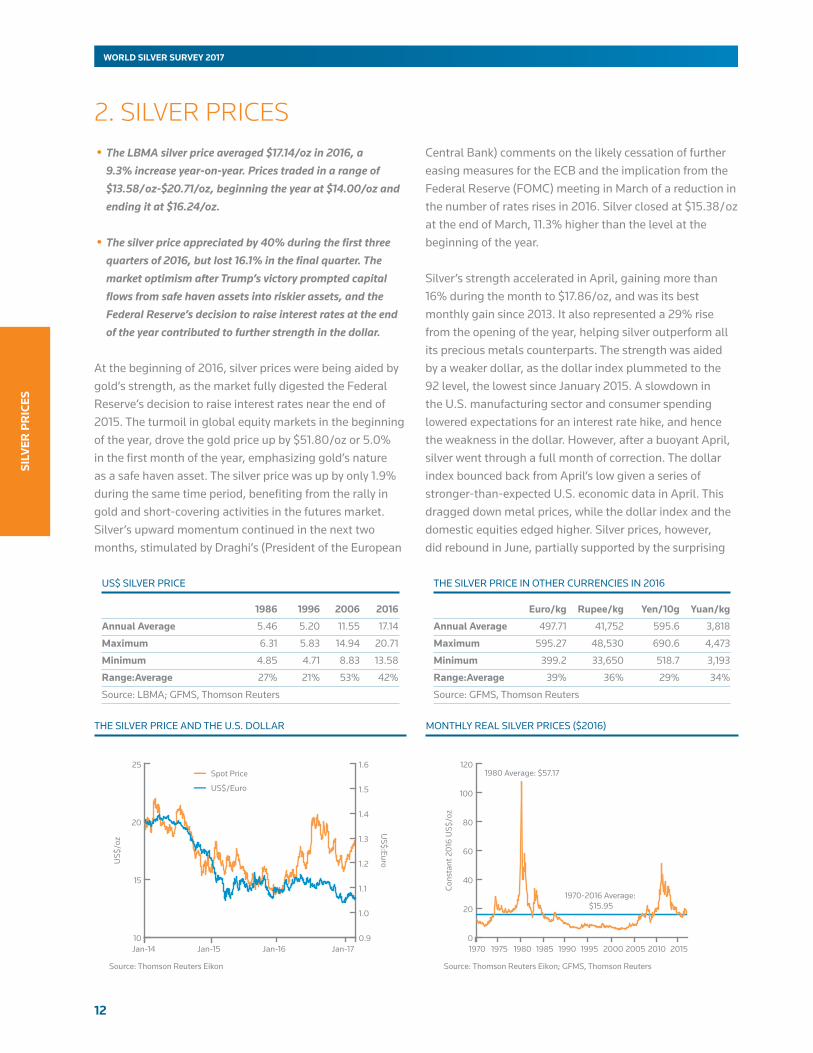
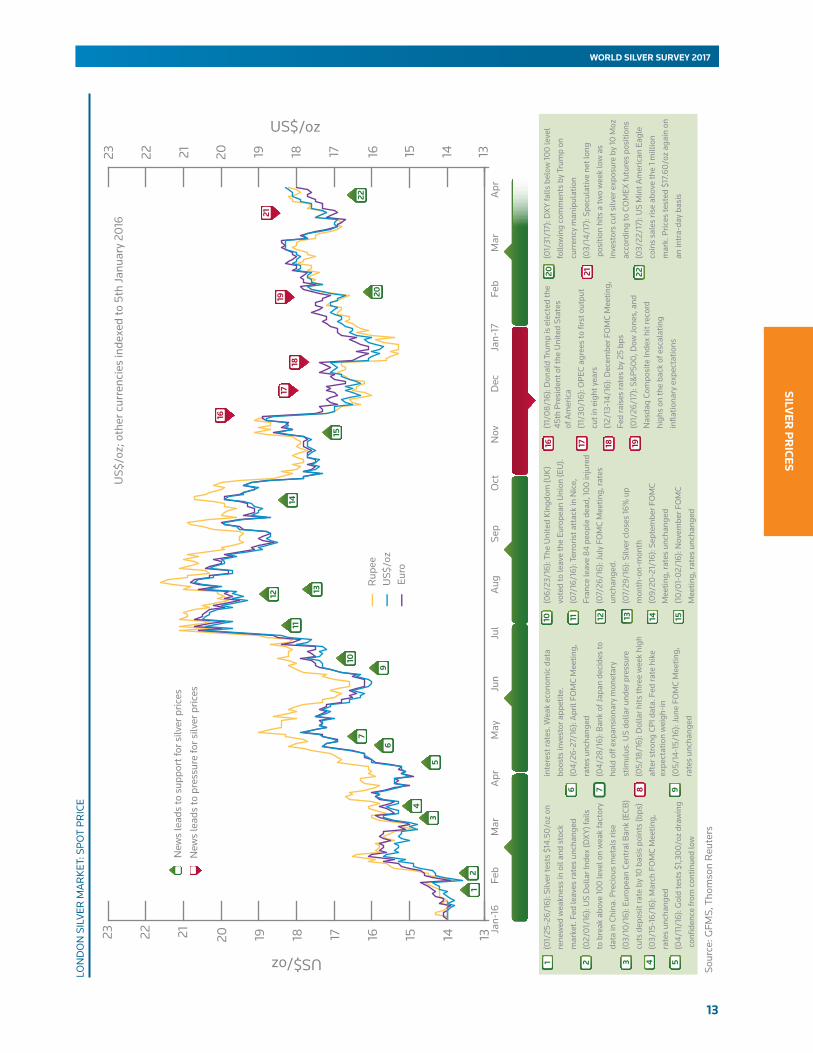
2. SILVER PRICES •The LBMA silver price averaged $17.14/oz in 2016, a
9.3% increase year-on-year. Prices traded in a range of $13.58/ oz-$20.71/oz, beginning the year at $14.00/oz and ending it at $16.24/oz.
•The silver price appreciated by 40% during the first three quarters of 2016, but lost 16.1% in the final quarter. The market optimism after Trump’s victory prompted capital flows from safe haven assets into riskier assets, and the Federal Reserve’s decision to raise interest rates at the end of the year contributed to further strength in the dollar.
At the beginning of 2016, silver prices were being aided by gold’s strength, as the market fully digested the Federal Reserve’s decision to raise interest rates near the end of 2015. The turmoil in global equity markets in the beginning of the year, drove the gold price up by $51.80/oz or 5.0% in the first month of the year, emphasizing gold’s nature as a safe haven asset. The silver price was up by only 1.9% during the same time period, benefiting from the rally in gold and short-covering activities in the futures market. Silver’s upward momentum continued in the next two months, stimulated by Draghi’s (President of the European
Central Bank) comments on the likely cessation of further easing measures for the ECB and the implication from the Federal Reserve (FOMC) meeting in March of a reduction in the number of rates rises in 2016. Silver closed at $15.38/ oz at the end of March, 11.3% higher than the level at the beginning of the year.
Silver’s strength accelerated in April, gaining more than 16% during the month to $17.86/oz, and was its best monthly gain since 2013. It also represented a 29% rise from the opening of the year, helping silver outperform all its precious metals counterparts. The strength was aided by a weaker dollar, as the dollar index plummeted to the 92 level, the lowest since January 2015. A slowdown in the U.S. manufacturing sector and consumer spending lowered expectations for an interest rate hike, and hence the weakness in the dollar. However, after a buoyant April, silver went through a full month of correction. The dollar index bounced back from April’s low given a series of stronger-than-expected U.S. economic data in April. This dragged down metal prices, while the dollar index and the domestic equities edged higher. Silver prices, however, did rebound in June, partially supported by the surprising
US$ SILVER PRICE THE SILVER PRICE IN OTHER CURRENCIES IN 2016
1986 1996 2006 2016
AnnualAverage 5.46 5.20 11.55 17.14
Maximum 6.31 5.83 14.94 20.71
Minimum 4.85 4.71 8.83 13.58
Range:Average 27% 21% 53% 42%
Source: LBMA; GFMS, Thomson Reuters
Euro/kg Rupee/kg Yen/10g Yuan/kg
AnnualAverage 497.71 41,752 595.6 3,818
Maximum 595.27 48,530 690.6 4,473
Minimum 399.2 33,650 518.7 3,193
Range:Average 39% 36% 29% 34%
Source: GFMS, Thomson Reuters
MONTHLY REAL SILVER PRICES ($2016)
10
15
20
25
Jan-17Jan-16Jan-15Jan-14
US$
/oz
0.9
1.0
1.1
1.2
1.3
1.4
1.5
1.6
US$:Euro
Source: Thomson Reuters Eikon
Spot Price
US$/Euro
THE SILVER PRICE AND THE U.S. DOLLAR
0
20
40
60
80
100
120
2015201020052000199519901985198019751970
Cons
tant
201
6 U
S$/o
z
1980 Average: $57.17
1970-2016 Average: $15.95
Source: Thomson Reuters Eikon; GFMS, Thomson Reuters
13
SILVER
PR
ICES
WORLD SILVER SURVEY 2017
LON
DO
N S
ILVE
R M
AR
KET:
SPO
T PR
ICE
US$
/oz
Rup
ee
Euro
New
s le
ads
to s
uppo
rt fo
r silv
er p
rices
New
s le
ads
to p
ress
ure
for s
ilver
pric
es
1314151617181920212223
1314151617181920212223
Apr
Mar
Feb
Jan-
17D
ecN
ovO
ctSe
pA
ugJu
lJu
nM
ayA
prM
arFe
bJa
n-16
Sour
ce: G
FMS,
Tho
mso
n R
eute
rs
US$/oz
US$
/oz;
oth
er c
urre
ncie
s in
dexe
d to
5th
Janu
ary
2016
US$/oz
2
4
7
11
13
15
16
18
19 20
1
35
6
(01/
25-2
6/16
): Si
lver
test
s $1
4.50
/oz
on
rene
wed
wea
knes
s in
oil
and
stoc
k
mar
ket.
Fed
leav
es ra
tes
unch
ange
d
(02/
01/1
6): U
S D
olla
r Ind
ex (D
XY)
fails
to b
reak
abo
ve 10
0 le
vel o
n w
eak
fact
ory
data
in C
hina
. Pre
ciou
s m
etal
s ris
e
(03/
10/1
6): E
urop
ean
Cent
ral B
ank
(ECB
)
cuts
dep
osit
rate
by
10 b
asis
poi
nts
(bps
)
(03/
15-1
6/16
): M
arch
FO
MC
Mee
ting,
rate
s un
chan
ged
(04/
11/1
6): G
old
test
s $1
,300
/oz
draw
ing
con
fiden
ce fr
om c
ontin
ued
low
10
9
inte
rest
rate
s. W
eak
econ
omic
dat
a
boos
ts in
vest
or a
ppet
ite.
(04/
26-2
7/16
): A
pril
FOM
C M
eetin
g,
rate
s un
chan
ged
(04/
28/1
6): B
ank
of Ja
pan
deci
des
to
hold
off
expa
nsio
nary
mon
etar
y
stim
ulus
. US
dolla
r und
er p
ress
ure
(05/
18/1
6): D
olla
r hits
thre
e w
eek
high
afte
r str
ong
CPI d
ata.
Fed
rate
hik
e ex
pect
atio
n w
eigh
-in
(05/
14-1
5/16
): Ju
ne F
OM
C M
eetin
g,
rate
s un
chan
ged
12
1417
(06/
23/1
6): T
he U
nite
d Ki
ngdo
m (U
K)
vote
d to
leav
e th
e Eu
rope
an U
nion
(EU
).
(07/
16/1
6): T
erro
rist a
ttac
k in
Nic
e,
Fran
ce le
ave
84 p
eopl
e de
ad, 1
00 in
jure
d
(07/
26/1
6): J
uly
FOM
C M
eetin
g, ra
tes
unch
ange
d.
(07/
29/1
6): S
ilver
clo
ses
16%
up
mon
th-o
n-m
onth
(09/
20-2
1/16
): Se
ptem
ber F
OM
C
Mee
ting,
rate
s un
chan
ged
(10/
01-0
2/16
): N
ovem
ber F
OM
C
Mee
ting,
rate
s un
chan
ged
22
21
(11/
08/1
6): D
onal
d Tr
ump
is e
lect
ed th
e 45
th P
resi
dent
of t
he U
nite
d St
ates
of
Am
eric
a
(11/
30/1
6): O
PEC
agre
es to
firs
t out
put
cut i
n ei
ght y
ears
(12/
13-1
4/16
): D
ecem
ber F
OM
C M
eetin
g,
Fed
rais
es ra
tes
by 2
5 bp
s
(01/
26/1
7): S
&P5
00, D
ow Jo
nes,
and
Nas
daq
Com
posi
te In
dex
hit r
ecor
d
high
s on
the
back
of e
scal
atin
g
infla
tiona
ry e
xpec
tatio
ns
(01/
31/1
7): D
XY
falls
bel
ow 10
0 le
vel
follo
win
g co
mm
ents
by
Trum
p on
curr
ency
man
ipul
atio
n
(03/
14/1
7): S
pecu
lativ
e ne
t lon
g
pos
ition
hits
a tw
o w
eek
low
as
inve
stor
s cu
t silv
er e
xpos
ure
by 10
Moz
acco
rdin
g to
CO
MEX
futu
res
posi
tions
(03/
22/1
7): U
S M
int A
mer
ican
Eag
le
coin
s sa
les
rise
abov
e th
e 1 m
illio
n
mar
k. P
rices
test
ed $
17.6
0/oz
aga
in o
n
an in
tra-
day
basi
s
2 5
7 8
12 13 15
18
21 22
1 3 4
6 9
14
19
2010 11
16 17

14
WORLD SILVER SURVEY 2017
SILV
ER P
RIC
ES
Brexit vote, forcing capital reallocation into precious metals as safe haven assets. For the first half of the year, silver gained 33% while gold increased by 25%.
The risk-off sentiment across the markets continued to support silver in July, as the silver price broke through the level of $20/oz on widespread buying. Silver prices peaked at $20.71 on 2nd August, and began a series of corrections thereafter, as hawkish comments from the Federal Reserve raised markets’ expectation of a possible rate hike in the near future, which caused a general weakness across the commodities sector and a modest rebound in the dollar index. A small bounce in the following month helped silver regain the $19/oz level, ending the quarter at $19.35/oz, with the price realizing a 40% gain since the end of 2015.
With the markets directing their attention to the possibility of further interest rate hikes, the silver price plunged sharply in October, dropping over 8% during the month. The surprising win of Donald Trump in the U.S. presidential election in November did not help the silver price either, as markets became optimistic towards the economic outlook under the Trump presidency. Capital flowed out from risk free assets to equities as well as base metals, and the dollar index spiked. Silver fell 6.1% in November while gold fell 7.4%.
Market optimism carried forward to December, as both the domestic equities market and the dollar index continued inching higher. The silver price was relatively stable for the first half of December, dragged down along with gold after the Federal Reserve decided on the 14th December to raise interest rates. The S&P 500 equity index gained 9.5%
during the year, while the dollar index closed the year at 102.21, a 3.6% increase annually. The silver price lost 16.1% during the final quarter, but still managed to gain 17.5% for the full year in 2016. Meanwhile, the gold price rose 8.1% in 2016.
Silver price volatility edged higher, to 28% in 2016, from 24% the previous year. For reference, silver price volatility on an annual average basis was as high as 61% in 2011. The volatility of silver increased substantially in the second half of last year, when the market focused on the Federal Reserve’s timetable on the interest rate which resulted in a stronger dollar.
CHINESE SILVER PREMIA
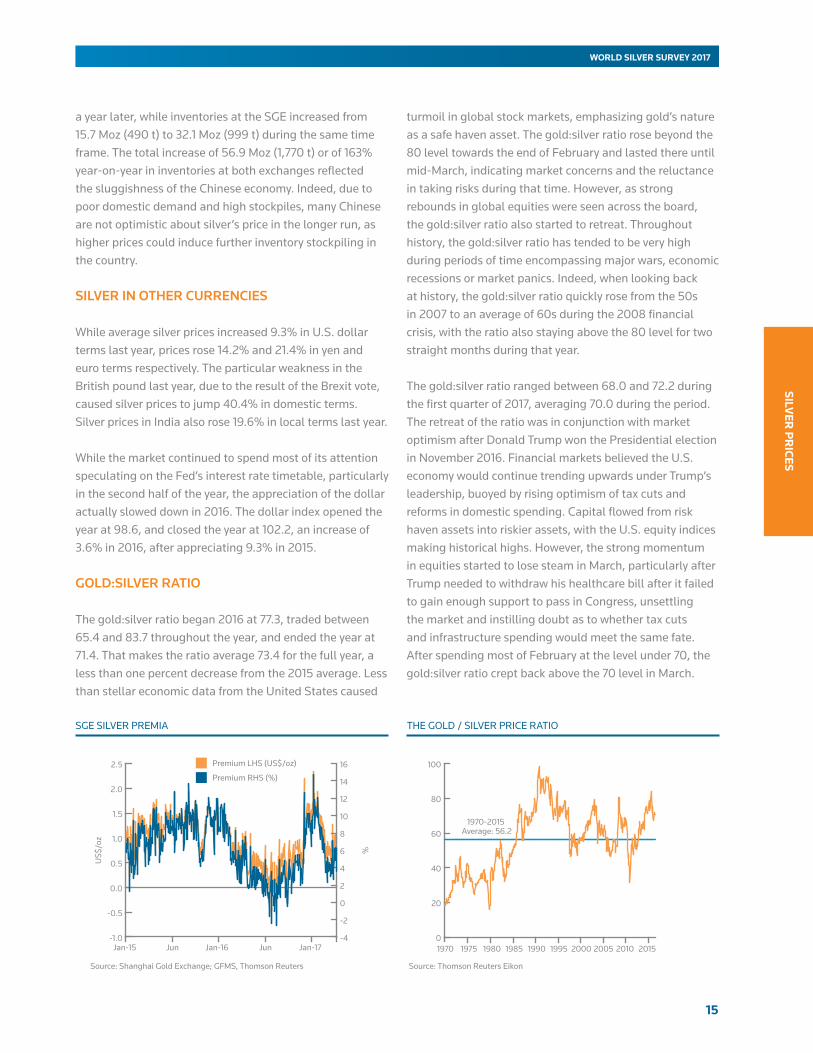
All the silver prices quoted on the domestic futures exchanges in China are inclusive of a 17% Value Added Tax (VAT). Silver prices quoted on the Shanghai Gold Exchange (SGE) increased 24.2% in Chinese yuan terms last year. Despite the impressive return in local terms, lackluster domestic demand, along with the increasing stockpiles, caused the Chinese silver premia to decline from $1.24/ oz in 2015 to $0.74/oz in 2016. Silver inventories at the Shanghai Futures Exchange (SHFE) increased from 19.2 Moz (596 t) at the end of 2015 to 59.7 Moz (1,858 t)
VOLATILITY (US$ PRICE)
2013 2014 2015 2016
Annual 32% 22% 24% 28%
Q1-16 Q2-16 Q3-16 Q4-16
Quarterly 26% 25% 32% 30%
Source: GFMS, Thomson Reuters
COMEX LONG AND SHORT MANAGED MONEY POSITIONS DAILY SILVER PRICE VOLATILITY
MarJan-17NovSepJulMayMarJan-16
Net
Pos
ition
s (c
ontr
acts
, tho
usan
ds)
-60
-40
-20
0
20
40
60
80
100
120
13
14
15
16
17
18
19
20
21
US$/oz
Source: CFTC
Short PositionsLong Positions
Silver Price
2017201520132011200920070
20
40
60
80
100
120
Vola
tility
(%)
Source: GFMS, Thomson Reuters
15
SILVER
PR
ICES
WORLD SILVER SURVEY 2017
a year later, while inventories at the SGE increased from 15.7 Moz (490 t) to 32.1 Moz (999 t) during the same time frame. The total increase of 56.9 Moz (1,770 t) or of 163% year-on-year in inventories at both exchanges reflected the sluggishness of the Chinese economy. Indeed, due to poor domestic demand and high stockpiles, many Chinese are not optimistic about silver’s price in the longer run, as higher prices could induce further inventory stockpiling in the country.
SILVER IN OTHER CURRENCIES
While average silver prices increased 9.3% in U.S. dollar terms last year, prices rose 14.2% and 21.4% in yen and euro terms respectively. The particular weakness in the British pound last year, due to the result of the Brexit vote, caused silver prices to jump 40.4% in domestic terms. Silver prices in India also rose 19.6% in local terms last year.
While the market continued to spend most of its attention speculating on the Fed’s interest rate timetable, particularly in the second half of the year, the appreciation of the dollar actually slowed down in 2016. The dollar index opened the year at 98.6, and closed the year at 102.2, an increase of 3.6% in 2016, after appreciating 9.3% in 2015.
GOLD:SILVER RATIO
The gold:silver ratio began 2016 at 77.3, traded between 65.4 and 83.7 throughout the year, and ended the year at 71.4. That makes the ratio average 73.4 for the full year, a less than one percent decrease from the 2015 average. Less than stellar economic data from the United States caused
turmoil in global stock markets, emphasizing gold’s nature as a safe haven asset. The gold:silver ratio rose beyond the 80 level towards the end of February and lasted there until mid-March, indicating market concerns and the reluctance in taking risks during that time. However, as strong rebounds in global equities were seen across the board, the gold:silver ratio also started to retreat. Throughout history, the gold:silver ratio has tended to be very high during periods of time encompassing major wars, economic recessions or market panics. Indeed, when looking back at history, the gold:silver ratio quickly rose from the 50s in 2007 to an average of 60s during the 2008 financial crisis, with the ratio also staying above the 80 level for two straight months during that year.
The gold:silver ratio ranged between 68.0 and 72.2 during the first quarter of 2017, averaging 70.0 during the period. The retreat of the ratio was in conjunction with market optimism after Donald Trump won the Presidential election in November 2016. Financial markets believed the U.S. economy would continue trending upwards under Trump’s leadership, buoyed by rising optimism of tax cuts and reforms in domestic spending. Capital flowed from risk haven assets into riskier assets, with the U.S. equity indices making historical highs. However, the strong momentum in equities started to lose steam in March, particularly after Trump needed to withdraw his healthcare bill after it failed to gain enough support to pass in Congress, unsettling the market and instilling doubt as to whether tax cuts and infrastructure spending would meet the same fate. After spending most of February at the level under 70, the gold:silver ratio crept back above the 70 level in March.
THE GOLD / SILVER PRICE RATIOSGE SILVER PREMIA
-1.0
-0.5
0.0
0.5
1.0
1.5
2.0
2.5
Jan-17JunJan-16JunJan-15
US$
/oz
-4
-2
0
2
4
6
8
10
12
14
16
%
Source: Shanghai Gold Exchange; GFMS, Thomson Reuters
Premium LHS (US$/oz)
Premium RHS (%)
0
20
40
60
80
100
2015201020052000199519901985198019751970
1970-2015 Average: 56.2
Source: Thomson Reuters Eikon
16
WORLD SILVER SURVEY 2017
SILV
ER P
RIC
ES
SILVER AND OTHER COMMODITY PRICES
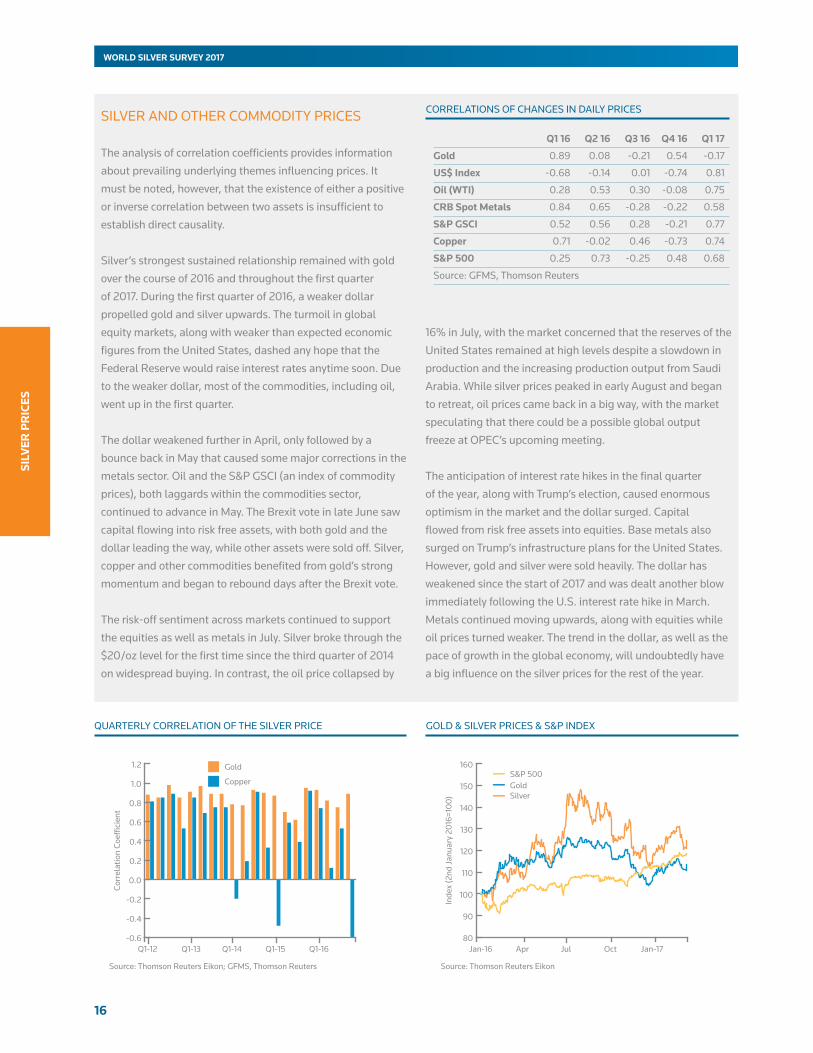
The analysis of correlation coefficients provides information about prevailing underlying themes influencing prices. It must be noted, however, that the existence of either a positive or inverse correlation between two assets is insufficient to establish direct causality.
Silver’s strongest sustained relationship remained with gold over the course of 2016 and throughout the first quarter of 2017. During the first quarter of 2016, a weaker dollar propelled gold and silver upwards. The turmoil in global equity markets, along with weaker than expected economic figures from the United States, dashed any hope that the Federal Reserve would raise interest rates anytime soon. Due to the weaker dollar, most of the commodities, including oil, went up in the first quarter.
The dollar weakened further in April, only followed by a bounce back in May that caused some major corrections in the metals sector. Oil and the S&P GSCI (an index of commodity prices), both laggards within the commodities sector, continued to advance in May. The Brexit vote in late June saw capital flowing into risk free assets, with both gold and the dollar leading the way, while other assets were sold off. Silver, copper and other commodities benefited from gold’s strong momentum and began to rebound days after the Brexit vote.
The risk-off sentiment across markets continued to support the equities as well as metals in July. Silver broke through the $20/oz level for the first time since the third quarter of 2014 on widespread buying. In contrast, the oil price collapsed by
16% in July, with the market concerned that the reserves of the United States remained at high levels despite a slowdown in production and the increasing production output from Saudi Arabia. While silver prices peaked in early August and began to retreat, oil prices came back in a big way, with the market speculating that there could be a possible global output freeze at OPEC’s upcoming meeting.
The anticipation of interest rate hikes in the final quarter of the year, along with Trump’s election, caused enormous optimism in the market and the dollar surged. Capital flowed from risk free assets into equities. Base metals also surged on Trump’s infrastructure plans for the United States. However, gold and silver were sold heavily. The dollar has weakened since the start of 2017 and was dealt another blow immediately following the U.S. interest rate hike in March. Metals continued moving upwards, along with equities while oil prices turned weaker. The trend in the dollar, as well as the pace of growth in the global economy, will undoubtedly have a big influence on the silver prices for the rest of the year.
QUARTERLY CORRELATION OF THE SILVER PRICE GOLD & SILVER PRICES & S&P INDEX
Q116 Q216 Q316 Q416 Q117
Gold 0.89 0.08 -0.21 0.54 -0.17
US$Index -0.68 -0.14 0.01 -0.74 0.81
Oil(WTI) 0.28 0.53 0.30 -0.08 0.75
CRBSpotMetals 0.84 0.65 -0.28 -0.22 0.58
S&PGSCI 0.52 0.56 0.28 -0.21 0.77
Copper 0.71 -0.02 0.46 -0.73 0.74
S&P500 0.25 0.73 -0.25 0.48 0.68
Source: GFMS, Thomson Reuters
-0.6
-0.4
-0.2
0.0
0.2
0.4
0.6
0.8
1.0
1.2
Q1-16Q1-15Q1-14Q1-13Q1-12
Corr
elat
ion
Coef
ficie
nt
Source: Thomson Reuters Eikon; GFMS, Thomson Reuters
Gold
Copper
80
90
100
110
120
130
140
150
160
Jan-17OctJulAprJan-16
Inde
x (2
nd Ja
nuar
y 20
16=1
00)
Source: Thomson Reuters Eikon
S&P 500GoldSilver
CORRELATIONS OF CHANGES IN DAILY PRICES
17
INV
ESTMEN
T
WORLD SILVER SURVEY 2017
WORLD IDENTIFIABLE INVESTMENT
(million ounces) 2014 2015 2016
Physical Bar Investment 126.0 155.2 83.6
Coins & Medals 108.0 135.4 123.2
ETP Inventory Build 1.5 -17.7 47.0
Total Identifiable Investment* 235.5 273.0 253.8
Indicative Value US$(bn)** 4.5 4.3 4.4
* Identifiable Investment is the sum of investment in physical bars, coins & medals as well as the build in ETP holdings and hence is all the quantifiable forms of investment.
** Indicative Value calculated on an annual basis using annual average silver prices.
Source: GFMS, Thomson Reuters
WORLD IDENTIFIABLE INVESTMENT
-50
0
50
100
150
200
250
300
201620142012201020082006
Mill
ion
ounc
es
-50
0
50
100
150
200
250
300
10
20
30
40
50
60
Constant 2016 US$/oz
Source: GFMS, Thomson Reuters
ETP Inventory Build
Coins & Medals
Physical Bar
Real Silver Price
50
60
70
80
90
100
110
120
130
140
150
160
Jan-17OctJulAprJan-16 Apr
Source: Thomson Reuters Eikon
S&P 500 Index
U.S. 10y Gov’t Bond Yield
Silver
Inde
x (J
anua
ry 3
rd 2
016
= 10
0)
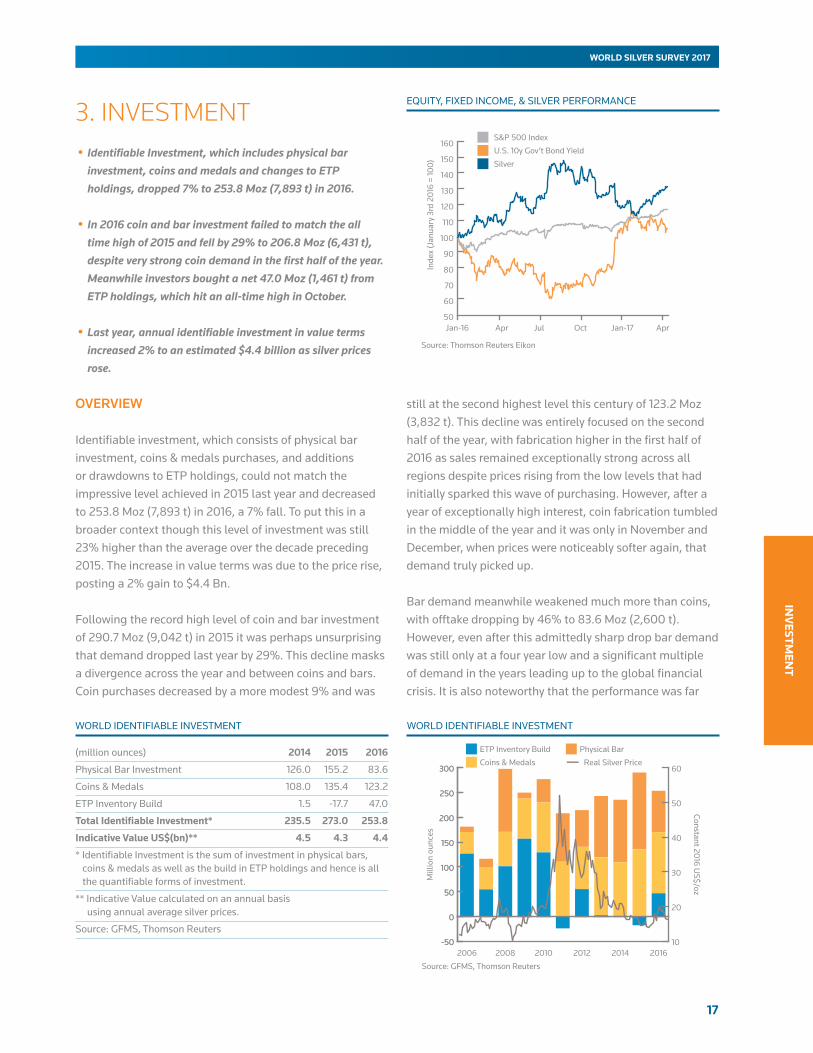
3. INVESTMENT • Identifiable Investment, which includes physical bar
investment, coins and medals and changes to ETP holdings, dropped 7% to 253.8 Moz (7,893 t) in 2016.
• In 2016 coin and bar investment failed to match the all time high of 2015 and fell by 29% to 206.8 Moz (6,431 t), despite very strong coin demand in the first half of the year. Meanwhile investors bought a net 47.0 Moz (1,461 t) from ETP holdings, which hit an all-time high in October.
•Last year, annual identifiable investment in value terms increased 2% to an estimated $4.4 billion as silver prices rose.
OVERVIEW
Identifiable investment, which consists of physical bar investment, coins & medals purchases, and additions or drawdowns to ETP holdings, could not match the impressive level achieved in 2015 last year and decreased to 253.8 Moz (7,893 t) in 2016, a 7% fall. To put this in a broader context though this level of investment was still 23% higher than the average over the decade preceding 2015. The increase in value terms was due to the price rise, posting a 2% gain to $4.4 Bn.
Following the record high level of coin and bar investment of 290.7 Moz (9,042 t) in 2015 it was perhaps unsurprising that demand dropped last year by 29%. This decline masks a divergence across the year and between coins and bars. Coin purchases decreased by a more modest 9% and was
still at the second highest level this century of 123.2 Moz (3,832 t). This decline was entirely focused on the second half of the year, with fabrication higher in the first half of 2016 as sales remained exceptionally strong across all regions despite prices rising from the low levels that had initially sparked this wave of purchasing. However, after a year of exceptionally high interest, coin fabrication tumbled in the middle of the year and it was only in November and December, when prices were noticeably softer again, that demand truly picked up.
Bar demand meanwhile weakened much more than coins, with offtake dropping by 46% to 83.6 Moz (2,600 t). However, even after this admittedly sharp drop bar demand was still only at a four year low and a significant multiple of demand in the years leading up to the global financial crisis. It is also noteworthy that the performance was far
EQUITY, FIXED INCOME, & SILVER PERFORMANCE

18
WORLD SILVER SURVEY 2017
INV
ESTM
ENT
from even across the globe. The decline was dominated by the particular characteristics of the Indian market, which had represented 53% of global bar demand in 2015. In 2016, Indian demand was down by two-thirds, representing almost four-fifths of the worldwide drop, and as discussed in more detail later in the chapter this was due to the combination of higher prices, government measures on unaccounted wealth and destocking. Elsewhere there were also significant declines in China and the United States. On a brighter note, there were increases in demand in Germany and the United Kingdom, the latter helped by post-Brexit uncertainty.
In contrast to physical coins and bars, investors in ETPs increased holdings by 47.0 Moz (1,461 t) last year. As a result ETP holdings totaled 664.8 Moz (20,678 t) by year-end, which was equivalent to about 70% of annual mine supply. Indeed, ETP holdings actually reached an all time high in late October before sales were recorded in the closing weeks of the year as the prospects for the U.S. economy were seen to strengthen following the election of President Trump.
Silver investment started 2016 in robust fashion; as touched on before this was the case in the coin market but it was also true in the paper market. In January there was substantial short covering as silver prices started to rally markedly and as we progressed into February there was also a significant increase in long positions held by investors. The rise in net longs in March was moderate, given two positive news events for silver during the month, namely Draghi’s comments on the likely cessation of further easing measures and the implication from the FOMC
meeting in March of a reduction in the number of rates rises in 2016. This denoted that investors might have already placed their positions before the events, anticipating the uptrend in silver prices.
Investor interest continued to edge higher in April before the net long dropped by 16% in May as short positions doubled and prices shot lower. It was noteworthy however, that despite prices plunging below $16 the net managed money position on COMEX was still more than nine times the level at the start of the year. This indicated that western investors remained positive towards silver even while weakness in bar demand from India was becoming increasingly apparent. By the end of October the net long managed money position reached a peak since that data series began in 2007.
Given this phenomenal level of western investor sentiment and the poor state of physical flows at that time it is unsurprising that investor interest in both paper and physical positions dropped back over the following months. Coin demand fell precipitously over the northern hemisphere summer and more short-term investors in the paper market also reduced positions. Interestingly though the bulk of that drop did not occur until October when the price fell back considerably. Indeed, despite some volatility investors’ position ended the year at broadly the same level as at the end of October despite weaker prices.
In January and February 2017 investors were attracted to the prospects for silver, and this helped to spur silver prices from below $16 to over $18 per oz. This was represented by a steady accumulation in the net long managed money position on COMEX culminating in a doubling over the two month period. This was in contrast to coin investors who were discouraged from making purchases as prices rallied.
OTC MARKET
The challenge of presenting a reliable overview of the silver OTC stems from the fact that there is limited public data available. The transfers and turnover on the LBMA, however, present a good gauge of activity but only capture part of the whole story. They do not, for example, encompass activities in other OTC markets and neither differentiate between pure investment flows and other forms of activity, as they also capture other physical market movements.
LONG TERM INVESTORS POSITIONS
Mill
ion
Oun
ces
-100
0
100
200
300
400
500
Jan-17Jan-15Jan-13Jan-11Jan-09Jun-07
Source: GFMS, Thomson Reuters
19
INV
ESTMEN
T
WORLD SILVER SURVEY 2017
In order to gauge an overview of the silver OTC market we use the following methodology, starting by dissecting the LBMA clearing statistics, which refer to transfers in the market and not the overall volume. A broad rule of thumb is that LBMA loco London volumes are roughly twice the transfer numbers and that in order to estimate the global OTC volume we need to assume that loco London accounts for approximately 70% of the total. Interestingly, until only a few years ago loco London accounted for roughly 90% of the global OTC market, but the shifts in the geographical distribution of the market means that we are now looking at around 70%.
Using this methodology suggests that implied OTC traded annual silver volumes increased 26% last year, reaching 124 billion ounces. This represented approximately 8% of the global notional value of the gold OTC market that year. Compared to 1997 when global OTC transactions stood at approximately 166 Bn oz, we estimate that total OTC volumes represented approximately 75% of that total last year. The LBMA started making its daily transfer volumes available in 1997.
The value of global silver transfers, however, has followed an opposite trend, driven by a 7% Compound Annual Growth Rate (CAGR) of the silver price over the 1997-2016 period. The notional value of annual silver volumes in the OTC market started at $820 Bn in 1997 and peaked in 2011 at roughly US$ 3.4 Trn, which represents a 11% CAGR. Since then, the notional value of silver OTC transfers contracted for four consecutive years losing more than half of its value by the end of 2015 compared to the peak of 2011. Last year, however, that downtrend came to an end, and global silver transfers increased again surpassing the 100 Bn oz threshold convincingly for the first time since 1999, representing by far the highest level on record.
EXCHANGE TRADED PRODUCTS
Total holdings of silver exchange traded products (ETPs) increased 8%, or 47.0 Moz (1,461 t), from the end of 2015. At the end of 2016, total holdings of ETPs amounted to 664.8 Moz (20,678 t). In value terms, total holdings increased to $10.8 Bn, an increase of 26% year-on-year. The increase in the silver price early last year propelled investors back into the silver ETPs.
The largest silver ETP, iShares Silver Trust, recorded an increase of 7% to a total of 341.3Moz (10,617 t) by the end of 2016, and accounted for 51% of total silver ETP holdings. Meanwhile, ZKB registered inflows of 2.8 Moz (88 t) to a total of 71.9 Moz (2,236 t). ETF Securities various silver funds reported an overall increase of 21% year-on-year or 13.7 Moz (426 t). On the other hand, Royal Canadian Mint ETR, DB Physical Silver and iShare Silver Bullion ETF all recorded outflows during the year.
Despite an increase in the silver price, the year started with 9.55 Moz (297 t) of silver outflows in January. It took until February for the silver ETPs to register monthly net inflows again, after six consecutive months of net outflows. It was March that confirmed investor interest, with net inflow of 31.1 Moz (966 t) recorded during the month. It was also the largest monthly net inflows recorded in 2016. Net inflows continued in the second quarter with an increase of 15.6 Moz (486 t). Following the Brexit vote in late June, investors’ interest in silver again returned, with monthly net inflows of 12.3 Moz (382 t) and 10.8 Moz (336 t) recorded in July and August respectively. Total holdings of silver ETPs peaked at 688.6 Moz (21,418 t) in late October just before the U.S. presidential election. However, after the election in early November, the financial markets became more optimistic towards the economy, and capital flowed from risk haven assets to riskier assets including base metals. Silver was sold off along with gold. In November, silver ETPs registered a total of 11.9 Moz (370t) net outflows. It was not only the largest monthly outflow recorded in 2016, but also the largest since December 2014. Gold and silver prices continued to plummet in December, and holdings of silver ETPs registered a decrease of 6.7 Moz (207 t) in the final month of the year.
In general, silver ETP investors, both institutional and retail who want exposure to precious metals, are prone to take a more medium to long-term investment approach than
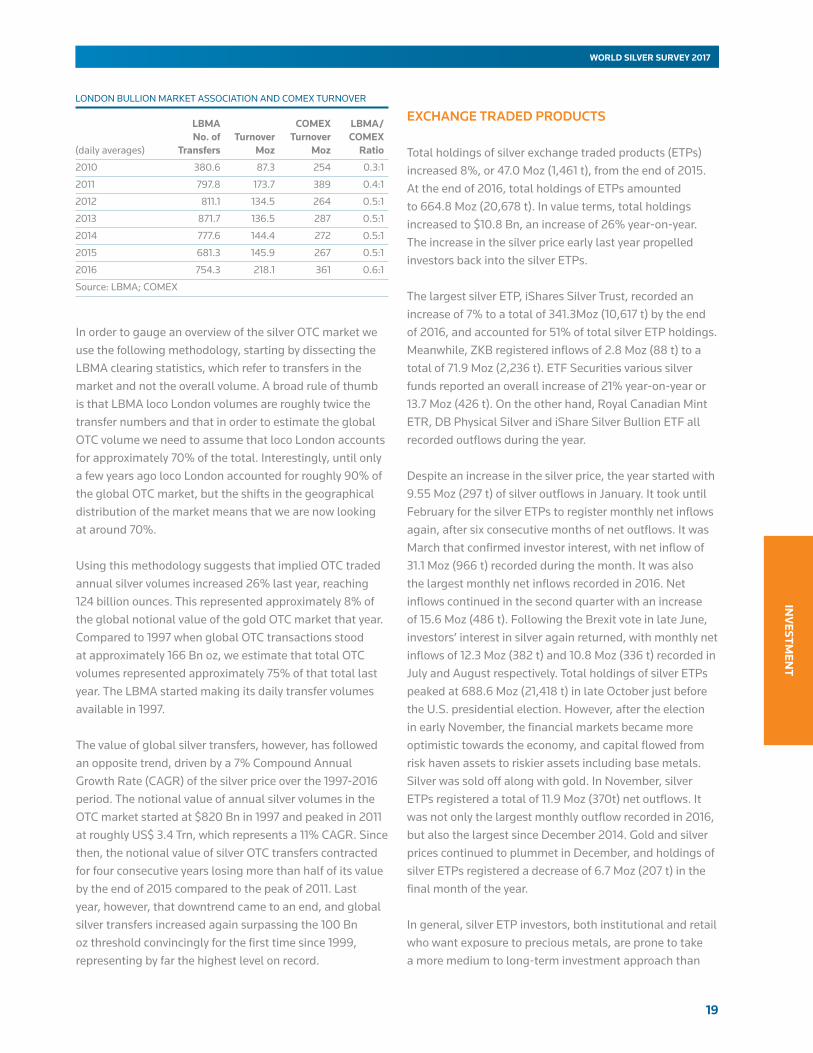
LONDON BULLION MARKET ASSOCIATION AND COMEX TURNOVER
LBMA COMEX LBMA/ No. of Turnover Turnover COMEX (daily averages) Transfers Moz Moz Ratio
2010 380.6 87.3 254 0.3:1
2011 797.8 173.7 389 0.4:1
2012 811.1 134.5 264 0.5:1
2013 871.7 136.5 287 0.5:1
2014 777.6 144.4 272 0.5:1
2015 681.3 145.9 267 0.5:1
2016 754.3 218.1 361 0.6:1
Source: LBMA; COMEX
20
WORLD SILVER SURVEY 2017
INV
ESTM
ENT
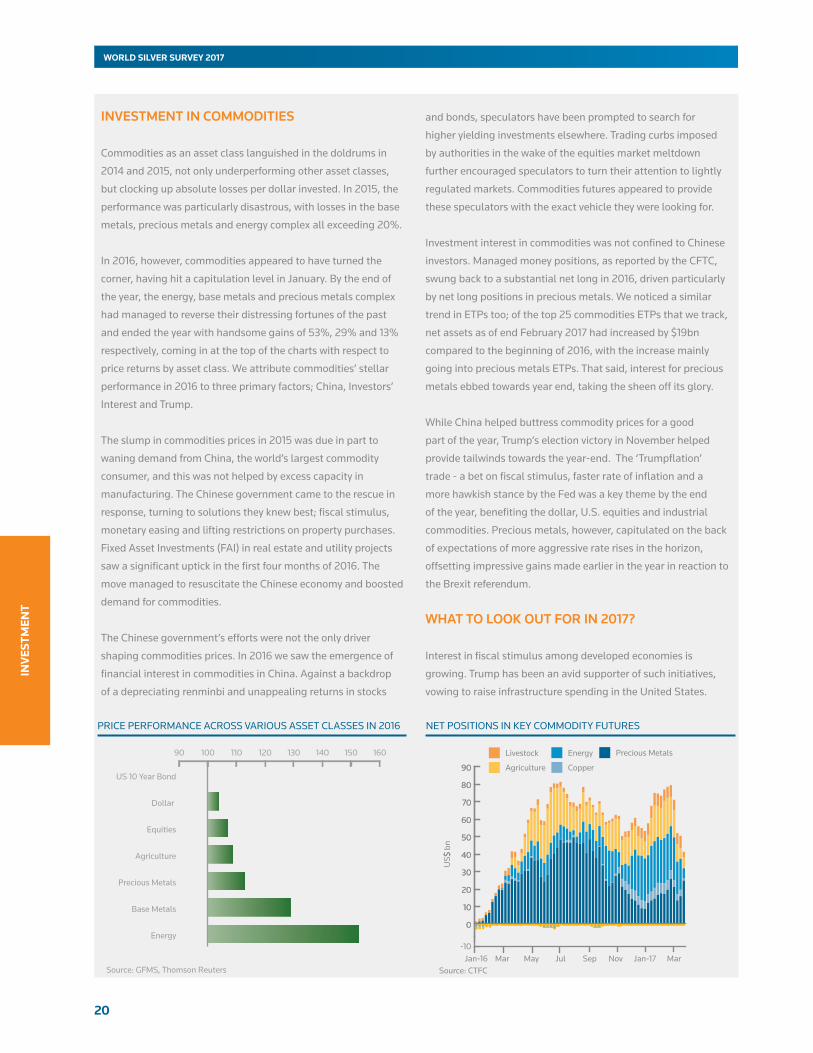
INVESTMENT IN COMMODITIES
Commodities as an asset class languished in the doldrums in
2014 and 2015, not only underperforming other asset classes,
but clocking up absolute losses per dollar invested. In 2015, the
performance was particularly disastrous, with losses in the base
metals, precious metals and energy complex all exceeding 20%.
In 2016, however, commodities appeared to have turned the
corner, having hit a capitulation level in January. By the end of
the year, the energy, base metals and precious metals complex
had managed to reverse their distressing fortunes of the past
and ended the year with handsome gains of 53%, 29% and 13%
respectively, coming in at the top of the charts with respect to
price returns by asset class. We attribute commodities’ stellar
performance in 2016 to three primary factors; China, Investors’
Interest and Trump.
The slump in commodities prices in 2015 was due in part to
waning demand from China, the world’s largest commodity
consumer, and this was not helped by excess capacity in
manufacturing. The Chinese government came to the rescue in
response, turning to solutions they knew best; fiscal stimulus,
monetary easing and lifting restrictions on property purchases.
Fixed Asset Investments (FAI) in real estate and utility projects
saw a significant uptick in the first four months of 2016. The
move managed to resuscitate the Chinese economy and boosted
demand for commodities.
The Chinese government’s efforts were not the only driver
shaping commodities prices. In 2016 we saw the emergence of
financial interest in commodities in China. Against a backdrop
of a depreciating renminbi and unappealing returns in stocks
and bonds, speculators have been prompted to search for
higher yielding investments elsewhere. Trading curbs imposed
by authorities in the wake of the equities market meltdown
further encouraged speculators to turn their attention to lightly
regulated markets. Commodities futures appeared to provide
these speculators with the exact vehicle they were looking for.
Investment interest in commodities was not confined to Chinese
investors. Managed money positions, as reported by the CFTC,
swung back to a substantial net long in 2016, driven particularly
by net long positions in precious metals. We noticed a similar
trend in ETPs too; of the top 25 commodities ETPs that we track,
net assets as of end February 2017 had increased by $19bn
compared to the beginning of 2016, with the increase mainly
going into precious metals ETPs. That said, interest for precious
metals ebbed towards year end, taking the sheen off its glory.
While China helped buttress commodity prices for a good
part of the year, Trump’s election victory in November helped
provide tailwinds towards the year-end. The ‘Trumpflation’
trade - a bet on fiscal stimulus, faster rate of inflation and a
more hawkish stance by the Fed was a key theme by the end
of the year, benefiting the dollar, U.S. equities and industrial
commodities. Precious metals, however, capitulated on the back
of expectations of more aggressive rate rises in the horizon,
offsetting impressive gains made earlier in the year in reaction to
the Brexit referendum.
WHAT TO LOOK OUT FOR IN 2017?
Interest in fiscal stimulus among developed economies is
growing. Trump has been an avid supporter of such initiatives,
vowing to raise infrastructure spending in the United States.
Source: GFMS, Thomson Reuters
90 100 110 120 130 140 150 160
Energy
Base Metals
Precious Metals
Agriculture
Equities
Dollar
US 10 Year Bond
PRICE PERFORMANCE ACROSS VARIOUS ASSET CLASSES IN 2016
US$
bn
-10
0
10
20
30
40
50
60
70
80
90
MarJan-17NovSepJulMayMarJan-16
-10 0
10
20
30
40
50
60
70
80
90
S
Source: CTFC
Livestock
Agriculture
Energy
Copper
Precious Metals
NET POSITIONS IN KEY COMMODITY FUTURES

21
INV
ESTMEN
T
WORLD SILVER SURVEY 2017
Meanwhile, the government of Japan has
approved a host of fiscal measures to revive
its economy, with infrastructure spending
a key element. Should momentum in this
area continue to build, it will translate into a
source of demand for commodities. This is an
area to watch in 2017.
While the global economic recovery is
expected to continue in 2017, political
developments around the world will be
keenly watched. After a wave of anti-
establishment voting in 2016, attention
now shifts to elections that will take place
in Europe this year. Having triggered Article
50, all eyes are on how Britain negotiates its
exit from the European Union as it is another
uncertainty for Britain as a nation and the
cohesion of European Union in the future.
Meanwhile, the policies of the new Trump
administration, and how it engages with the
rest of the world will also have clear implications on the U.S.
economy and global trade at large. China will be holding its
National Congress in the fall, an event that will see a reshuffling
of top leadership positions. These events could introduce
volatility into the markets in the short-term, while reshaping the
political and economic landscape in the longer term.
In the precious metals complex, the market was oversold at the
moment following the Trump victory. However, there is a rebuild
of momentum entering the New Year, despite a hiccup induced
by the Fed rate hike in March. Considering all factors, we are
mildly bullish on commodities’ prospects in 2017. They could
benefit from the “Great Rotation” on asset allocation, alongside
potential fiscal stimulus, which could provide a further boost in
demand for industrial commodities. Furthermore, as China is
in a year of leadership changes, we expect the government to
intervene to prevent a rapid slowdown if the situation calls for it.
INDEXED PERFORMANCE ACROSS ASSETS IN 2016 (JANUARY 4 2016 = 100)
Source: GFMS, Thomson Reuters
80 90 100 110 120 130 140 150 160 170 180 200
WheatShanghai Stock Exchange Composite
EuroCorn
Thomson Reuters US 10Y Gov. BenchmarkPlatinum
Dollar IndexGold
MSCI International World Price Index (USD)Thomson Reuters/Core Commodity CRB Index
S&P 500Bloomberg Commodity Index
LeadAluminium
Dow Jones Industrial AverageSoybean
SilverRhodium
NickelCopper
PalladiumS&P Goldman Sachs Commodity Index
TinWTI
BrentZinc
Natural GasIron Ore
SILVER ETP HOLDINGS
0
200
400
600
800
Jan-17Jan-16Jan-15Jan-14Jan-13Jan-12Jan-11Jan-10
Mill
ion
ounc
es
10
20
30
40
50
US$/oz
Source: Respective Issuers
iShares Silver
OtherJulius BaerZKBETF Securities
Silver Price
*ETF Securities: includes LSE, Australia, NYSE, GLTR and WITE**Other: includes Sprott Physical Silver Trust, Julius Bär, DB Physical Silver,BlackRock Silver Bullion Trust, Silver Bullion Trust, Mitsubishi UFJ Tokyo, iShares Physical Silver ETC, Source Physical Silver, Royal Canadian Mint;
SILVER ETP HOLDINGS
(Moz) end-2015 end-2016
iShares Silver Trust 318.9 341.3
ETF Securities* 65.9 79.6
Central Fund of Canada 76.9 75.6
ZKB Silver ETF 69.1 71.9
Others** 87.0 96.3
Total 617.8 664.8
* Includes LSE, Australia, NYSE, GLTR, WITE and Hong Kong (until the latter closed)
** Includes Sprott Physical Silver Trust, Julius Bär, DB Physical Silver, BlackRock Silver Bullion Trust, Silver Bullion Trust, Mitsubishi UFJ Tokyo, iShares Physical Silver ETC, Source Physical Silver, Royal Canadian Mint.
Source: Respective issuers

22
WORLD SILVER SURVEY 2017
INV
ESTM
ENT
compared to speculators taking part in the futures markets. Therefore, the inflow or liquidation in silver holdings is not necessarily highly correlated with the spot price, but mostly a reflection on how investors believe the silver price will perform in the future. In addition, despite high correlations between gold and silver prices, the monthly change in silver ETP holdings does not always follow gold’s. For example, despite a monthly increase of 3.3% in gold ETPs holdings in January 2016, silver ETPs registered a 1.5% net outflow. Indeed, gold ETPs only registered monthly net outflows for two months (November and December) last year, while silver ETPs recorded monthly net outflows in January, May, November and December.
Through these we may make two assumptions: 1) ETP investors in general preferred gold over silver in 2016 and 2) The bull market in precious metals is still at early stages because we often see investors’ interest in silver trump gold towards the end of a bull cycle. We should also remember that the silver ETP constituency is more heavily weighted to retail than institutional and holdings therefore tend to be more sticky.
Turning to 2017, silver ETP holdings recorded another net outflow in January of 5.8 Moz (179 t). After a modest increase of 1.2 Moz (38 t) in February, total holdings decreased by another 4.1 Moz (128 t) in March, leaving total silver ETP holdings at 656.2 Moz (20,382 t) at the end of the first quarter, a loss of 3.1% since the end of 2016. However, silver prices actually appreciated by 11% during the same time period. Indeed, the U.S. Commodity Futures Trading Commission (CFTC) reports revealed that managed money positions have been increasing long positions in silver since the end of 2016. This arguably indicates a divergence of views on silver prices between investors in ETPs and speculators on future exchanges.
PHYSICAL BAR INVESTMENT
After reaching a record 155.2 Moz (4,829 t) in 2015, global physical bar investment fell 46% in 2016. The decline was particularly severe in Asia, driven lower by a slump in Indian demand especially in the middle of last year as investors who had opportunistically made purchases at low price levels this previous year took profits. On a brighter note European demand rose, with the sharpest increase occurring in the UK.
Indian investment bar demand declined 67% year-on-year
to 27.4 Moz (852 t), the lowest in five years. The increase in domestic prices in the second and third quarter lead to heavy disinvestment after bargain hunting from April 2015 to January 2016. More importantly, with the price at deep discounts from the landed price, traders preferred to buy on spot and deliver it on the exchange and delivery to exchange hit record levels last year at 359 t. Buying by investors in the first quarter was lackluster which was more to do with poor farm output due to a below normal monsoon in 2016. However, on the evening following the demonetization announcement the silver price was trading at 50 to 70 cents over the landed price as cash hoarders quickly wanted to convert their cash into physical assets. A trend that is emerging in physical bars market is that investors are showing increased preference for minted bars rather than rough cut bars.
Following two consecutive years of growth, silver physical bar investment in the United States contracted 32% to 32.4 Moz (1,006 t). The hefty decline in physical silver bar demand was primarily a silver related story as demand for gold bars increased last year. That said, there was an intra- year growth slowdown of the appetite for precious metals investment products in the United States during last year and silver in particular felt the brunt of it. Field research suggested that demand is mainly for safe haven purposes and particularly attractive for those wanting a lower entry price point than gold. However, in 2016 the exceptionally strong level of investment in bars and coins in 2015 coupled with rising prices led some to argue that the market has become saturated and needed a huge amount of volatility in the price to attract new buyers.
PHYSICAL BAR INVESTMENT
2015201320112009-40
-20
0
20
40
60
80
100
120
140
160
180
Mill
ion
Oun
ces
India
China
North America
Other
-40
-20
0
20
40
60
80
100
120
140
160
180
Europe
Source: GFMS, Thomson Reuters
23
INV
ESTMEN
T
WORLD SILVER SURVEY 2017
Last year physical bar investment in Europe rose for the second successive year by 14% to 14.5 Moz (450 t) with demand particularly strong in some key countries. The level of demand was consequently at a three-year high and hence at the strongest level since the increase in VAT in Germany on silver bullion at the start of 2014. Indeed, it is the substantial taxation across the region which continued to hinder volumes markedly for physical silver. The increase in 2016 was centered on two countries as a result; Germany and the United Kingdom. The former is clearly the largest market in the region for bar demand and rose robustly last year, with the recovery being strong year-on-year in the first half of 2016 as investors were attracted to the relatively low silver price and strong upward trajectory.
Demand also recovered in November and December as weaker prices were seen as an opportunity to increase holdings particularly as geopolitical uncertainty rose. Rising geopolitical tensions were also a factor in the United Kingdom and demand rose rapidly in that country. The referendum vote to leave the European Union not only encouraged investors concerned about economic and political uncertainty but it also caused sterling to hit 31- year lows and this sent silver prices sharply higher in local currency terms, which fueled further interest.
Chinese bar investment fell 17% year-on-year to 3.2 Moz (99 t) in 2016 which is the lowest level since 2010. Many Chinese investors were well aware that there was an abundance of physical silver supply in the country. The large increase in silver supplies raised investors’ concerns about silver’s future price performance, which motivated them to invest in gold instead.
COMMODITY EXCHANGES ACTIVITY
Turnover on the Shanghai Futures Exchange (SHFE) dropped for the second consecutive year in 2016, declining by 40% to a nominal 41,716 Moz (1,297,502 t). The exchange recorded the lowest turnover of the year in the first quarter, when speculators were still waiting on the sidelines for a clearer signal that silver was experiencing a major breakout. Trading volume peaked in July, resulting in 53,657,290 contracts (buy-sell combined) traded in the third quarter, still 30% lower than the previous year. Trading volume in the fourth quarter, while retreating 19% from the third quarter, was still 14% higher year-on-year.
In contrast, the Shanghai Gold Exchange (SGE) continued its stellar growth, with volumes increasing by 52% year-on-year to a nominal 19,711 Moz (613,076 t). The SGE is eroding market share from the SHFE mainly due to two reasons: firstly the domestic banks are increasing their participation through the SGE. Secondly, unlike the trading rules at SHFE, there is an adjustment in the deferred interest rate of the Ag (T+D) contract from 0.020% to 0.018% at the SGE, meaning apart from fluctuations in silver prices, traders could potentially gain (or lose) further by receiving (or paying out) the deferred interest fee. This particular feature is quite attractive to many traders, and has attracted more investors and bigger trading volumes.
Turnover on the Multi Commodity Exchange of India (MCX) decreased by 7% in 2016, to a nominal 6,931 Moz (215,576 t). However, trading volume in July was the highest since December 2014. This is attributed to heavy discounts in the spot market as traders preferred to buy in spot and deliver at the exchange. Trading on this Indian exchange has seen a significant loss of interest among traders since the introduction of a commodity transaction tax with volumes mostly shifting to exchanges outside India.
Turnover on COMEX reversed from the downward trend in previous years, posting 35% year-on-year growth in 2016, to a nominal 90,638 Moz (2,819,135 t). Turnover peaked in November, which was equivalent to a daily average of 527 Moz (16,399 t), as the Trump victory in the presidential election saw capital flowing out from safe haven assets including silver, into riskier assets and base metals.
CFTC reports on managed money positions can be used as a proxy for investor activity on the exchange. The first seven months of 2016 were characterized by a steady rise
SILVER TURNOVER ON MAJOR COMMODITY EXCHANGES
(total volume in nominal million ounce equivalents) Change 2014 2015 2016 y-o-y
COMEX 69,485 67,272 90,638 35%
SHFE 93,296 69,825 41,716 -40%
SGE 8,024 12,935 19,711 52%
MCX 7,497 7,454 6,931 -7%
ICE FUTURES US 188 135 147 9%
TOCOM 28 20 20 -2%
*N.B. : Includes the 5,000-ounce and 1,000-ounce contracts
Source: GFMS, Thomson Reuters; TOCOM, MCX, SGE and SHFE
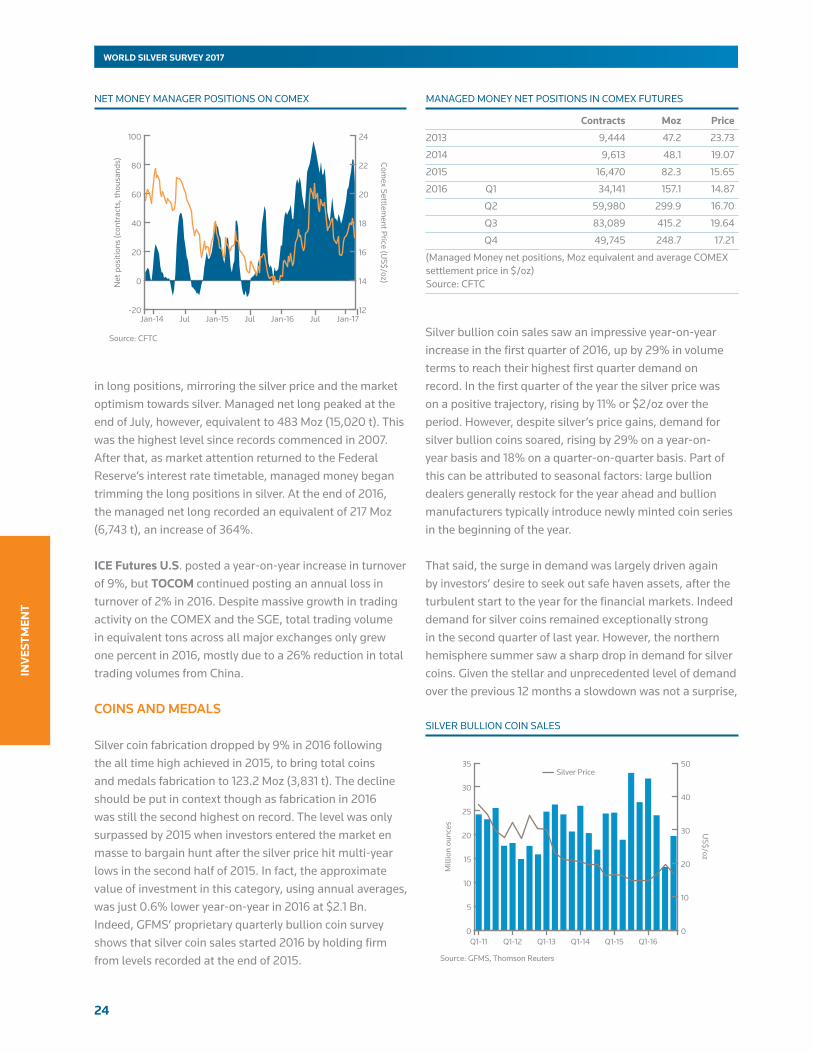
24
WORLD SILVER SURVEY 2017
INV
ESTM
ENT
in long positions, mirroring the silver price and the market optimism towards silver. Managed net long peaked at the end of July, however, equivalent to 483 Moz (15,020 t). This was the highest level since records commenced in 2007. After that, as market attention returned to the Federal Reserve’s interest rate timetable, managed money began trimming the long positions in silver. At the end of 2016, the managed net long recorded an equivalent of 217 Moz (6,743 t), an increase of 364%.
ICE Futures U.S. posted a year-on-year increase in turnover of 9%, but TOCOM continued posting an annual loss in turnover of 2% in 2016. Despite massive growth in trading activity on the COMEX and the SGE, total trading volume in equivalent tons across all major exchanges only grew one percent in 2016, mostly due to a 26% reduction in total trading volumes from China.
COINS AND MEDALS
Silver coin fabrication dropped by 9% in 2016 following the all time high achieved in 2015, to bring total coins and medals fabrication to 123.2 Moz (3,831 t). The decline should be put in context though as fabrication in 2016 was still the second highest on record. The level was only surpassed by 2015 when investors entered the market en masse to bargain hunt after the silver price hit multi-year lows in the second half of 2015. In fact, the approximate value of investment in this category, using annual averages, was just 0.6% lower year-on-year in 2016 at $2.1 Bn. Indeed, GFMS’ proprietary quarterly bullion coin survey shows that silver coin sales started 2016 by holding firm from levels recorded at the end of 2015.
Silver bullion coin sales saw an impressive year-on-year increase in the first quarter of 2016, up by 29% in volume terms to reach their highest first quarter demand on record. In the first quarter of the year the silver price was on a positive trajectory, rising by 11% or $2/oz over the period. However, despite silver’s price gains, demand for silver bullion coins soared, rising by 29% on a year-on-year basis and 18% on a quarter-on-quarter basis. Part of this can be attributed to seasonal factors: large bullion dealers generally restock for the year ahead and bullion manufacturers typically introduce newly minted coin series in the beginning of the year.
That said, the surge in demand was largely driven again by investors’ desire to seek out safe haven assets, after the turbulent start to the year for the financial markets. Indeed demand for silver coins remained exceptionally strong in the second quarter of last year. However, the northern hemisphere summer saw a sharp drop in demand for silver coins. Given the stellar and unprecedented level of demand over the previous 12 months a slowdown was not a surprise,
SILVER BULLION COIN SALES
0
5
10
15
20
25
30
35
Q1-16Q1-15Q1-14Q1-13Q1-12Q1-11
Mill
ion
ounc
es
0
10
20
30
40
50
US$/oz
Source: GFMS, Thomson Reuters
Silver Price
NET MONEY MANAGER POSITIONS ON COMEX
-20
0
20
40
60
80
100
Jan-17JulJan-16JulJan-15JulJan-14
Net
pos
ition
s (c
ontr
acts
, tho
usan
ds)
12
14
16
18
20
22
24
Comex Settlem
ent Price (US$/oz)
Source: CFTC
Contracts Moz Price
2013 9,444 47.2 23.73
2014 9,613 48.1 19.07
2015 16,470 82.3 15.65
2016 Q1 34,141 157.1 14.87
Q2 59,980 299.9 16.70
Q3 83,089 415.2 19.64
Q4 49,745 248.7 17.21
(Managed Money net positions, Moz equivalent and average COMEX settlement price in $/oz) Source: CFTC
MANAGED MONEY NET POSITIONS IN COMEX FUTURES
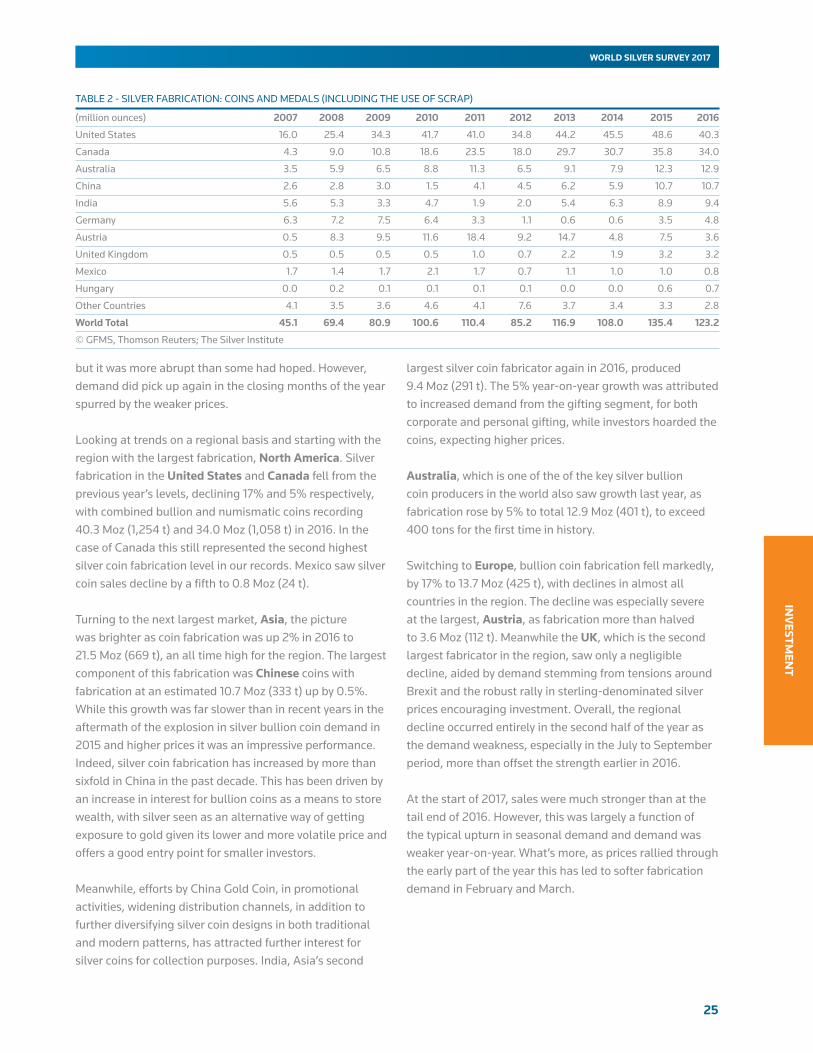
25
INV
ESTMEN
T
WORLD SILVER SURVEY 2017
but it was more abrupt than some had hoped. However, demand did pick up again in the closing months of the year spurred by the weaker prices.
Looking at trends on a regional basis and starting with the region with the largest fabrication, North America. Silver fabrication in the United States and Canada fell from the previous year’s levels, declining 17% and 5% respectively, with combined bullion and numismatic coins recording 40.3 Moz (1,254 t) and 34.0 Moz (1,058 t) in 2016. In the case of Canada this still represented the second highest silver coin fabrication level in our records. Mexico saw silver coin sales decline by a fifth to 0.8 Moz (24 t).
Turning to the next largest market, Asia, the picture was brighter as coin fabrication was up 2% in 2016 to 21.5 Moz (669 t), an all time high for the region. The largest component of this fabrication was Chinese coins with fabrication at an estimated 10.7 Moz (333 t) up by 0.5%. While this growth was far slower than in recent years in the aftermath of the explosion in silver bullion coin demand in 2015 and higher prices it was an impressive performance. Indeed, silver coin fabrication has increased by more than sixfold in China in the past decade. This has been driven by an increase in interest for bullion coins as a means to store wealth, with silver seen as an alternative way of getting exposure to gold given its lower and more volatile price and offers a good entry point for smaller investors.
Meanwhile, efforts by China Gold Coin, in promotional activities, widening distribution channels, in addition to further diversifying silver coin designs in both traditional and modern patterns, has attracted further interest for silver coins for collection purposes. India, Asia’s second
largest silver coin fabricator again in 2016, produced 9.4 Moz (291 t). The 5% year-on-year growth was attributed to increased demand from the gifting segment, for both corporate and personal gifting, while investors hoarded the coins, expecting higher prices.
Australia, which is one of the of the key silver bullion coin producers in the world also saw growth last year, as fabrication rose by 5% to total 12.9 Moz (401 t), to exceed 400 tons for the first time in history.
Switching to Europe, bullion coin fabrication fell markedly, by 17% to 13.7 Moz (425 t), with declines in almost all countries in the region. The decline was especially severe at the largest, Austria, as fabrication more than halved to 3.6 Moz (112 t). Meanwhile the UK, which is the second largest fabricator in the region, saw only a negligible decline, aided by demand stemming from tensions around Brexit and the robust rally in sterling-denominated silver prices encouraging investment. Overall, the regional decline occurred entirely in the second half of the year as the demand weakness, especially in the July to September period, more than offset the strength earlier in 2016.
At the start of 2017, sales were much stronger than at the tail end of 2016. However, this was largely a function of the typical upturn in seasonal demand and demand was weaker year-on-year. What’s more, as prices rallied through the early part of the year this has led to softer fabrication demand in February and March.
TABLE 2 - SILVER FABRICATION: COINS AND MEDALS (INCLUDING THE USE OF SCRAP)
(million ounces) 2007 2008 2009 2010 2011 2012 2013 2014 2015 2016
United States 16.0 25.4 34.3 41.7 41.0 34.8 44.2 45.5 48.6 40.3
Canada 4.3 9.0 10.8 18.6 23.5 18.0 29.7 30.7 35.8 34.0
Australia 3.5 5.9 6.5 8.8 11.3 6.5 9.1 7.9 12.3 12.9
China 2.6 2.8 3.0 1.5 4.1 4.5 6.2 5.9 10.7 10.7
India 5.6 5.3 3.3 4.7 1.9 2.0 5.4 6.3 8.9 9.4
Germany 6.3 7.2 7.5 6.4 3.3 1.1 0.6 0.6 3.5 4.8
Austria 0.5 8.3 9.5 11.6 18.4 9.2 14.7 4.8 7.5 3.6
United Kingdom 0.5 0.5 0.5 0.5 1.0 0.7 2.2 1.9 3.2 3.2
Mexico 1.7 1.4 1.7 2.1 1.7 0.7 1.1 1.0 1.0 0.8
Hungary 0.0 0.2 0.1 0.1 0.1 0.1 0.0 0.0 0.6 0.7
Other Countries 4.1 3.5 3.6 4.6 4.1 7.6 3.7 3.4 3.3 2.8
World Total 45.1 69.4 80.9 100.6 110.4 85.2 116.9 108.0 135.4 123.2
© GFMS, Thomson Reuters; The Silver Institute

26
WORLD SILVER SURVEY 2017
MIN
E SU
PP
LY
4. MINE SUPPLY •Globalsilvermineproductiondeclinedby0.6%in2016,toatotalof885.8 Moz (27,551 t).
•Silversourcedfromprimarycopperandgoldoperationsrecordedthelargestvariance,postinga4%increaseanda9%declineyear-on-year.
•LossesinEurope,NorthAmericaandOceaniawerepartlyoffsetbygainsinCentral&SouthAmericaandAsia.
•Onaco-productbasis,cashcostswithcapexfor2016averaged$11.38/oz,a5%increaserelativeto2015.
• In2016,thedelta-adjustedhedgebookcontractedby18.4 Moz (572 t).
MINE PRODUCTION
•Silver mine supply decreased by 5.0 Moz (157 t) in 2016, the first drop for fourteen years.
Global mine production fell for the first time since 2002, registering a relatively modest 0.6% decline year‑on‑year. The fall at 5.0 Moz (157 t) was the smallest annual change since 2011, although in that year output actually increased by 5.3 Moz (165 t). At the regional level declines of roughly equal magnitude were recorded in Europe (6.7 Moz, 208 t), North America (4.6 Moz, 144 t) and Oceania (4.6 Moz, 142 t), for combined losses of 15.9 Moz (494 t). The fall in North America marked the second consecutive drop, while for Oceania it was the third straight year of decline. Offsetting the losses was higher output in Central & South America (4.2 Moz, 129 t), although the annual for the region was again short, and in Asia where output rose year‑on‑year by 7.7 Moz (241 t).
TOP 20 SILVER PRODUCING COUNTRIES TOP 20 SILVER PRODUCING COMPANIES
Rank Output(Moz)2015 2016 2015 2016
1 1 Fresnillo plc. 1, 2 43.0 45.7
4 2 Glencore plc. 3 36.6 39.1
2 3 KGHM Polska Miedź S.A. Group 4 41.6 38.8
5 4 Polymetal International plc. 32.1 29.2
3 5 Goldcorp Inc. 40.4 28.1
6 6 Pan American Silver Corp. 2 26.1 25.4
8 7 Cia. De Minas Buenaventura S.A.A. 3 22.1 24.7
7 8 Volcan Cia. Minera S.A.A. 3 24.8 22.0
10 9 Tahoe Resources Inc. 2 20.4 21.3
9 10 Corp. Nacional del Cobre de Chile 5 21.3 20.9
15 11 South 32 Ltd. 5 13.9 18.2
13 12 Sumitomo Corp. 5 15.8 18.1
14 13 Hochschild Mining plc. 6 14.8 17.3
19 14 Hecla Mining Company 2 11.6 17.2
17 15 Southern Copper Corp. 7 13.3 16.2
12 16 Coeur Mining, Inc. 2 15.9 14.8
16 17 Boliden A.B. 8 13.5 14.4
18 18 Hindustan Zinc Ltd. 9 12.0 14.0
20 19 Industrias Peñoles S.A.B. De C.V. 10 11.5 12.4
21 20 First Majestic Silver Corp. 2 11.1 11.9 1 Including 100% of Penmont mines, excluding silverstream; 2 Primary silver producer; 3 Includes minority partners; 4 Reported metallic silver production; 5 Estimate; 6 Includes 100% from Pallancata, includes Moris; 7 Mined silver; 8 Metal in concentrate; 9 Integrated refined metal; 10 Excludes 100% of Fresnillo plc.
Source: GFMS, Thomson Reuters
Rank Output(Moz)2015 2016 Country 2015 2016
1 1 Mexico 192.0 186.2
2 2 Peru 138.0 147.7
3 3 China 110.0 112.4
6 4 Chile 48.6 48.1
4 5 Russia 50.8 46.6
5 6 Australia 49.0 43.6
7 7 Bolivia 42.0 43.5
8 8 Poland 41.5 38.5
9 9 United States 35.0 35.4
10 10 Argentina 34.7 30.0
11 11 Guatemala 27.5 26.9
12 12 Kazakhstan 17.3 17.8
13 13 Sweden 15.9 16.4
15 14 India 12.0 14.0
14 15 Canada 12.2 13.0
16 16 Indonesia 10.0 11.2
17 17 Morocco 9.6 10.1
18 18 Turkey 5.5 5.6
20 19 Armenia 4.0 4.6
21 20 Iran 3.3 3.6
RestoftheWorld 31.9 30.5
WorldTotal 890.8 885.8
Source: GFMS, Thomson Reuters
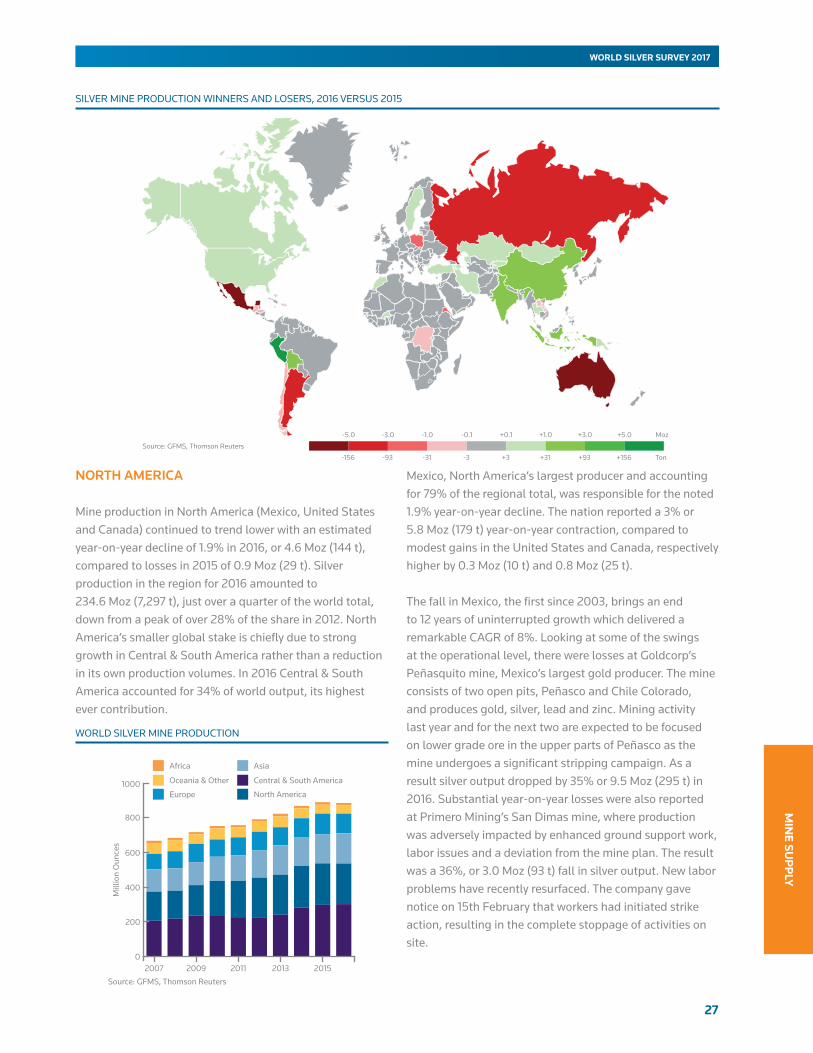
27
MIN
E SUP
PLY
WORLD SILVER SURVEY 2017
NORTH AMERICA
Mine production in North America (Mexico, United States and Canada) continued to trend lower with an estimated year-on-year decline of 1.9% in 2016, or 4.6 Moz (144 t), compared to losses in 2015 of 0.9 Moz (29 t). Silver production in the region for 2016 amounted to 234.6 Moz (7,297 t), just over a quarter of the world total, down from a peak of over 28% of the share in 2012. North America’s smaller global stake is chiefly due to strong growth in Central & South America rather than a reduction in its own production volumes. In 2016 Central & South America accounted for 34% of world output, its highest ever contribution.
Mexico, North America’s largest producer and accounting for 79% of the regional total, was responsible for the noted 1.9% year-on-year decline. The nation reported a 3% or 5.8 Moz (179 t) year-on-year contraction, compared to modest gains in the United States and Canada, respectively higher by 0.3 Moz (10 t) and 0.8 Moz (25 t).
The fall in Mexico, the first since 2003, brings an end to 12 years of uninterrupted growth which delivered a remarkable CAGR of 8%. Looking at some of the swings at the operational level, there were losses at Goldcorp’s Peñasquito mine, Mexico’s largest gold producer. The mine consists of two open pits, Peñasco and Chile Colorado, and produces gold, silver, lead and zinc. Mining activity last year and for the next two are expected to be focused on lower grade ore in the upper parts of Peñasco as the mine undergoes a significant stripping campaign. As a result silver output dropped by 35% or 9.5 Moz (295 t) in 2016. Substantial year-on-year losses were also reported at Primero Mining’s San Dimas mine, where production was adversely impacted by enhanced ground support work, labor issues and a deviation from the mine plan. The result was a 36%, or 3.0 Moz (93 t) fall in silver output. New labor problems have recently resurfaced. The company gave notice on 15th February that workers had initiated strike action, resulting in the complete stoppage of activities on site.
SILVER MINE PRODUCTION WINNERS AND LOSERS, 2016 VERSUS 2015
Source: GFMS, Thomson Reuters
-5.0 -3.0 -1.0 -0.1 +0.1 +1.0 +3.0 +5.0
-156 -93 -31 -3 +3 +31 +93 +156
Moz
Ton
WORLD SILVER MINE PRODUCTION
0
200
400
600
800
1000
20152013201120092007
Mill
ion
Oun
ces
Source: GFMS, Thomson Reuters
Africa
Oceania & Other
Europe
Asia
Central & South America
North America
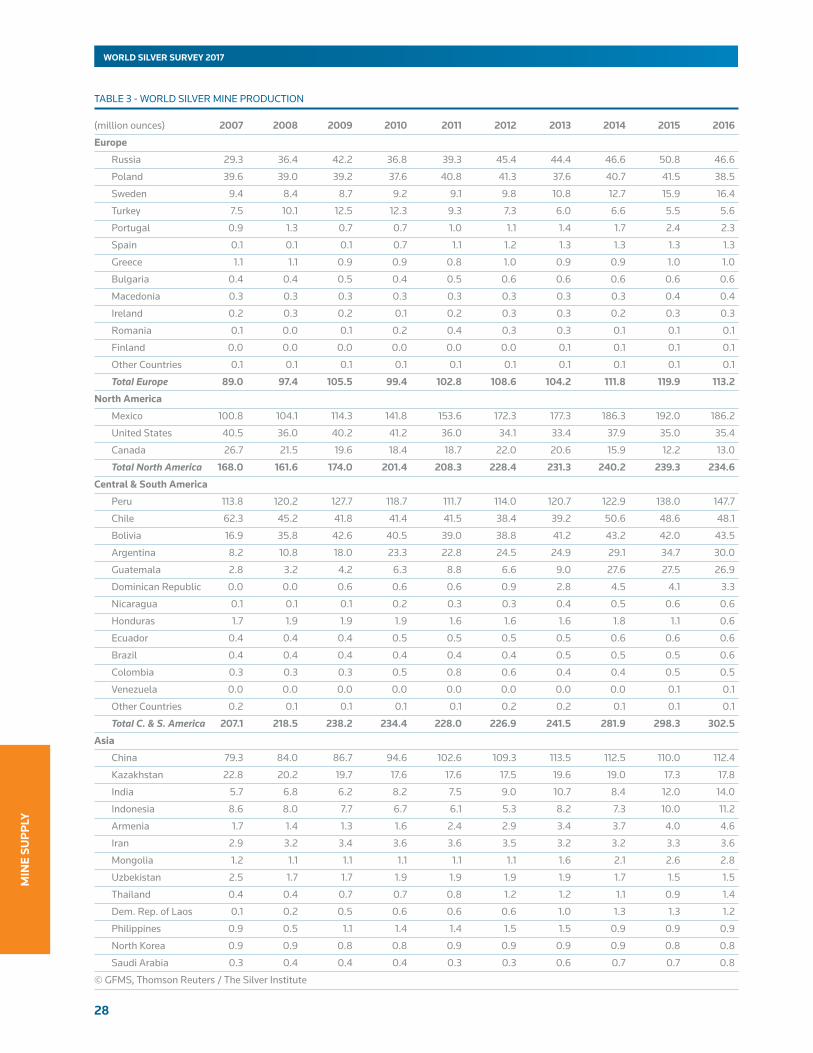
28
WORLD SILVER SURVEY 2017
MIN
E SU
PP
LY
(million ounces) 2007 2008 2009 2010 2011 2012 2013 2014 2015 2016
Europe
Russia 29.3 36.4 42.2 36.8 39.3 45.4 44.4 46.6 50.8 46.6
Poland 39.6 39.0 39.2 37.6 40.8 41.3 37.6 40.7 41.5 38.5
Sweden 9.4 8.4 8.7 9.2 9.1 9.8 10.8 12.7 15.9 16.4
Turkey 7.5 10.1 12.5 12.3 9.3 7.3 6.0 6.6 5.5 5.6
Portugal 0.9 1.3 0.7 0.7 1.0 1.1 1.4 1.7 2.4 2.3
Spain 0.1 0.1 0.1 0.7 1.1 1.2 1.3 1.3 1.3 1.3
Greece 1.1 1.1 0.9 0.9 0.8 1.0 0.9 0.9 1.0 1.0
Bulgaria 0.4 0.4 0.5 0.4 0.5 0.6 0.6 0.6 0.6 0.6
Macedonia 0.3 0.3 0.3 0.3 0.3 0.3 0.3 0.3 0.4 0.4
Ireland 0.2 0.3 0.2 0.1 0.2 0.3 0.3 0.2 0.3 0.3
Romania 0.1 0.0 0.1 0.2 0.4 0.3 0.3 0.1 0.1 0.1
Finland 0.0 0.0 0.0 0.0 0.0 0.0 0.1 0.1 0.1 0.1
Other Countries 0.1 0.1 0.1 0.1 0.1 0.1 0.1 0.1 0.1 0.1
Total Europe 89.0 97.4 105.5 99.4 102.8 108.6 104.2 111.8 119.9 113.2
NorthAmerica
Mexico 100.8 104.1 114.3 141.8 153.6 172.3 177.3 186.3 192.0 186.2
United States 40.5 36.0 40.2 41.2 36.0 34.1 33.4 37.9 35.0 35.4
Canada 26.7 21.5 19.6 18.4 18.7 22.0 20.6 15.9 12.2 13.0
Total North America 168.0 161.6 174.0 201.4 208.3 228.4 231.3 240.2 239.3 234.6
Central&SouthAmerica
Peru 113.8 120.2 127.7 118.7 111.7 114.0 120.7 122.9 138.0 147.7
Chile 62.3 45.2 41.8 41.4 41.5 38.4 39.2 50.6 48.6 48.1
Bolivia 16.9 35.8 42.6 40.5 39.0 38.8 41.2 43.2 42.0 43.5
Argentina 8.2 10.8 18.0 23.3 22.8 24.5 24.9 29.1 34.7 30.0
Guatemala 2.8 3.2 4.2 6.3 8.8 6.6 9.0 27.6 27.5 26.9
Dominican Republic 0.0 0.0 0.6 0.6 0.6 0.9 2.8 4.5 4.1 3.3
Nicaragua 0.1 0.1 0.1 0.2 0.3 0.3 0.4 0.5 0.6 0.6
Honduras 1.7 1.9 1.9 1.9 1.6 1.6 1.6 1.8 1.1 0.6
Ecuador 0.4 0.4 0.4 0.5 0.5 0.5 0.5 0.6 0.6 0.6
Brazil 0.4 0.4 0.4 0.4 0.4 0.4 0.5 0.5 0.5 0.6
Colombia 0.3 0.3 0.3 0.5 0.8 0.6 0.4 0.4 0.5 0.5
Venezuela 0.0 0.0 0.0 0.0 0.0 0.0 0.0 0.0 0.1 0.1
Other Countries 0.2 0.1 0.1 0.1 0.1 0.2 0.2 0.1 0.1 0.1
Total C. & S. America 207.1 218.5 238.2 234.4 228.0 226.9 241.5 281.9 298.3 302.5
Asia
China 79.3 84.0 86.7 94.6 102.6 109.3 113.5 112.5 110.0 112.4
Kazakhstan 22.8 20.2 19.7 17.6 17.6 17.5 19.6 19.0 17.3 17.8
India 5.7 6.8 6.2 8.2 7.5 9.0 10.7 8.4 12.0 14.0
Indonesia 8.6 8.0 7.7 6.7 6.1 5.3 8.2 7.3 10.0 11.2
Armenia 1.7 1.4 1.3 1.6 2.4 2.9 3.4 3.7 4.0 4.6
Iran 2.9 3.2 3.4 3.6 3.6 3.5 3.2 3.2 3.3 3.6
Mongolia 1.2 1.1 1.1 1.1 1.1 1.1 1.6 2.1 2.6 2.8
Uzbekistan 2.5 1.7 1.7 1.9 1.9 1.9 1.9 1.7 1.5 1.5
Thailand 0.4 0.4 0.7 0.7 0.8 1.2 1.2 1.1 0.9 1.4
Dem. Rep. of Laos 0.1 0.2 0.5 0.6 0.6 0.6 1.0 1.3 1.3 1.2
Philippines 0.9 0.5 1.1 1.4 1.4 1.5 1.5 0.9 0.9 0.9
North Korea 0.9 0.9 0.8 0.8 0.9 0.9 0.9 0.9 0.8 0.8
Saudi Arabia 0.3 0.4 0.4 0.4 0.3 0.3 0.6 0.7 0.7 0.8
© GFMS, Thomson Reuters / The Silver Institute
TABLE 3 ‑ WORLD SILVER MINE PRODUCTION
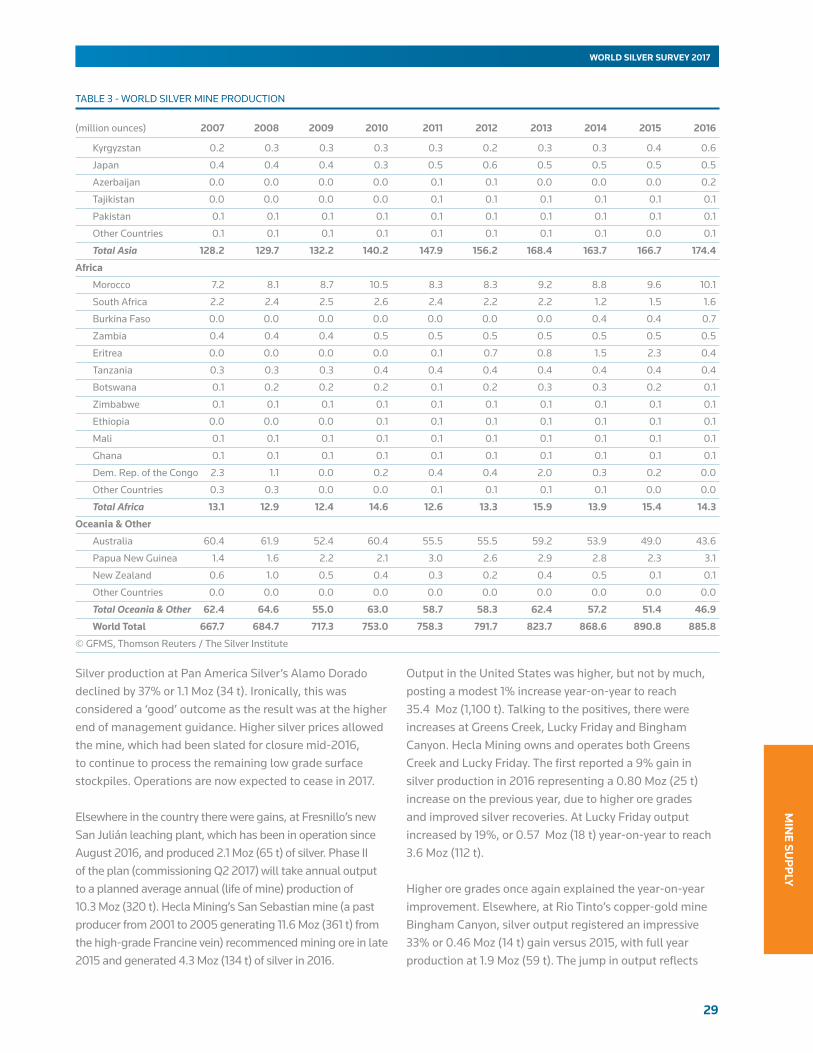
29
MIN
E SUP
PLY
WORLD SILVER SURVEY 2017
Silver production at Pan America Silver’s Alamo Dorado declined by 37% or 1.1 Moz (34 t). Ironically, this was considered a ‘good’ outcome as the result was at the higher end of management guidance. Higher silver prices allowed the mine, which had been slated for closure mid‑2016, to continue to process the remaining low grade surface stockpiles. Operations are now expected to cease in 2017.
Elsewhere in the country there were gains, at Fresnillo’s new San Julián leaching plant, which has been in operation since August 2016, and produced 2.1 Moz (65 t) of silver. Phase II of the plan (commissioning Q2 2017) will take annual output to a planned average annual (life of mine) production of 10.3 Moz (320 t). Hecla Mining’s San Sebastian mine (a past producer from 2001 to 2005 generating 11.6 Moz (361 t) from the high‑grade Francine vein) recommenced mining ore in late 2015 and generated 4.3 Moz (134 t) of silver in 2016.
Output in the United States was higher, but not by much, posting a modest 1% increase year‑on‑year to reach 35.4 Moz (1,100 t). Talking to the positives, there were increases at Greens Creek, Lucky Friday and Bingham Canyon. Hecla Mining owns and operates both Greens Creek and Lucky Friday. The first reported a 9% gain in silver production in 2016 representing a 0.80 Moz (25 t) increase on the previous year, due to higher ore grades and improved silver recoveries. At Lucky Friday output increased by 19%, or 0.57 Moz (18 t) year‑on‑year to reach 3.6 Moz (112 t).
Higher ore grades once again explained the year‑on‑year improvement. Elsewhere, at Rio Tinto’s copper‑gold mine Bingham Canyon, silver output registered an impressive 33% or 0.46 Moz (14 t) gain versus 2015, with full year production at 1.9 Moz (59 t). The jump in output reflects
Kyrgyzstan 0.2 0.3 0.3 0.3 0.3 0.2 0.3 0.3 0.4 0.6
Japan 0.4 0.4 0.4 0.3 0.5 0.6 0.5 0.5 0.5 0.5
Azerbaijan 0.0 0.0 0.0 0.0 0.1 0.1 0.0 0.0 0.0 0.2
Tajikistan 0.0 0.0 0.0 0.0 0.1 0.1 0.1 0.1 0.1 0.1
Pakistan 0.1 0.1 0.1 0.1 0.1 0.1 0.1 0.1 0.1 0.1
Other Countries 0.1 0.1 0.1 0.1 0.1 0.1 0.1 0.1 0.0 0.1
Total Asia 128.2 129.7 132.2 140.2 147.9 156.2 168.4 163.7 166.7 174.4
Africa
Morocco 7.2 8.1 8.7 10.5 8.3 8.3 9.2 8.8 9.6 10.1
South Africa 2.2 2.4 2.5 2.6 2.4 2.2 2.2 1.2 1.5 1.6
Burkina Faso 0.0 0.0 0.0 0.0 0.0 0.0 0.0 0.4 0.4 0.7
Zambia 0.4 0.4 0.4 0.5 0.5 0.5 0.5 0.5 0.5 0.5
Eritrea 0.0 0.0 0.0 0.0 0.1 0.7 0.8 1.5 2.3 0.4
Tanzania 0.3 0.3 0.3 0.4 0.4 0.4 0.4 0.4 0.4 0.4
Botswana 0.1 0.2 0.2 0.2 0.1 0.2 0.3 0.3 0.2 0.1
Zimbabwe 0.1 0.1 0.1 0.1 0.1 0.1 0.1 0.1 0.1 0.1
Ethiopia 0.0 0.0 0.0 0.1 0.1 0.1 0.1 0.1 0.1 0.1
Mali 0.1 0.1 0.1 0.1 0.1 0.1 0.1 0.1 0.1 0.1
Ghana 0.1 0.1 0.1 0.1 0.1 0.1 0.1 0.1 0.1 0.1
Dem. Rep. of the Congo 2.3 1.1 0.0 0.2 0.4 0.4 2.0 0.3 0.2 0.0
Other Countries 0.3 0.3 0.0 0.0 0.1 0.1 0.1 0.1 0.0 0.0
Total Africa 13.1 12.9 12.4 14.6 12.6 13.3 15.9 13.9 15.4 14.3
Oceania&Other
Australia 60.4 61.9 52.4 60.4 55.5 55.5 59.2 53.9 49.0 43.6
Papua New Guinea 1.4 1.6 2.2 2.1 3.0 2.6 2.9 2.8 2.3 3.1
New Zealand 0.6 1.0 0.5 0.4 0.3 0.2 0.4 0.5 0.1 0.1
Other Countries 0.0 0.0 0.0 0.0 0.0 0.0 0.0 0.0 0.0 0.0
Total Oceania & Other 62.4 64.6 55.0 63.0 58.7 58.3 62.4 57.2 51.4 46.9
WorldTotal 667.7 684.7 717.3 753.0 758.3 791.7 823.7 868.6 890.8 885.8
© GFMS, Thomson Reuters / The Silver Institute
TABLE 3 ‑ WORLD SILVER MINE PRODUCTION
(million ounces) 2007 2008 2009 2010 2011 2012 2013 2014 2015 2016
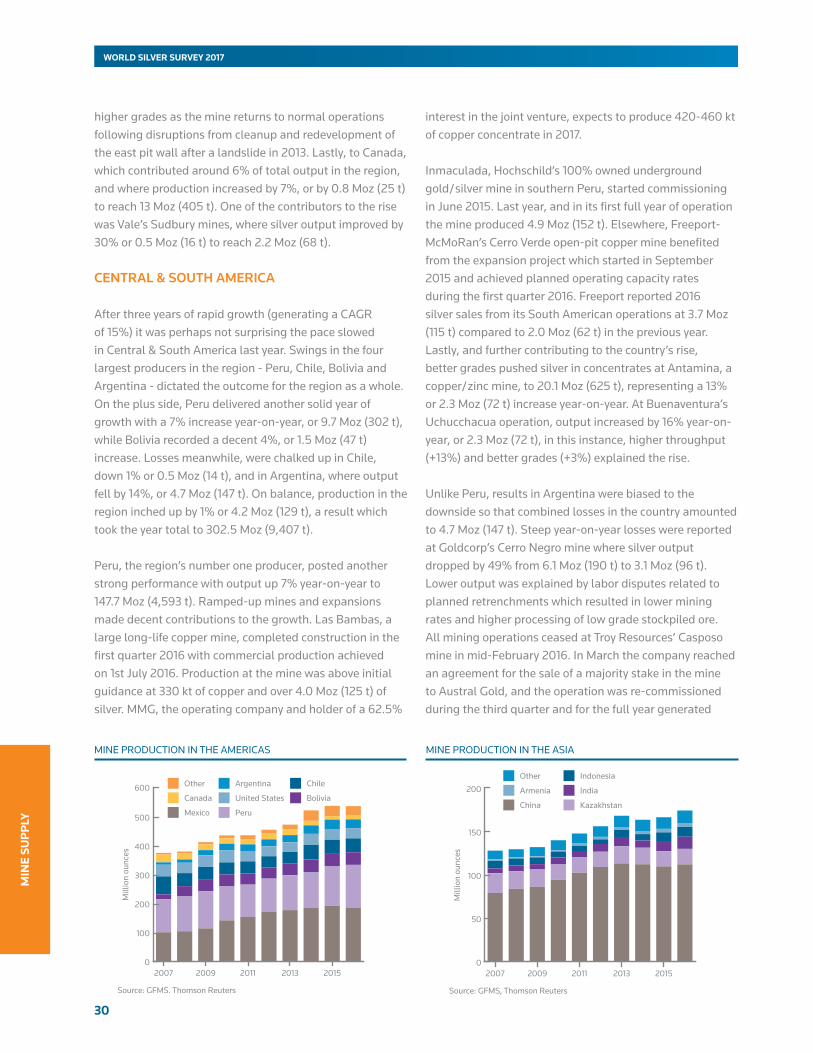
30
WORLD SILVER SURVEY 2017
MIN
E SU
PP
LY
higher grades as the mine returns to normal operations following disruptions from cleanup and redevelopment of the east pit wall after a landslide in 2013. Lastly, to Canada, which contributed around 6% of total output in the region, and where production increased by 7%, or by 0.8 Moz (25 t) to reach 13 Moz (405 t). One of the contributors to the rise was Vale’s Sudbury mines, where silver output improved by 30% or 0.5 Moz (16 t) to reach 2.2 Moz (68 t).
CENTRAL & SOUTH AMERICA
After three years of rapid growth (generating a CAGR of 15%) it was perhaps not surprising the pace slowed in Central & South America last year. Swings in the four largest producers in the region ‑ Peru, Chile, Bolivia and Argentina ‑ dictated the outcome for the region as a whole. On the plus side, Peru delivered another solid year of growth with a 7% increase year‑on‑year, or 9.7 Moz (302 t), while Bolivia recorded a decent 4%, or 1.5 Moz (47 t) increase. Losses meanwhile, were chalked up in Chile, down 1% or 0.5 Moz (14 t), and in Argentina, where output fell by 14%, or 4.7 Moz (147 t). On balance, production in the region inched up by 1% or 4.2 Moz (129 t), a result which took the year total to 302.5 Moz (9,407 t).
Peru, the region’s number one producer, posted another strong performance with output up 7% year‑on‑year to 147.7 Moz (4,593 t). Ramped‑up mines and expansions made decent contributions to the growth. Las Bambas, a large long‑life copper mine, completed construction in the first quarter 2016 with commercial production achieved on 1st July 2016. Production at the mine was above initial guidance at 330 kt of copper and over 4.0 Moz (125 t) of silver. MMG, the operating company and holder of a 62.5%
interest in the joint venture, expects to produce 420‑460 kt of copper concentrate in 2017.
Inmaculada, Hochschild’s 100% owned underground gold/ silver mine in southern Peru, started commissioning in June 2015. Last year, and in its first full year of operation the mine produced 4.9 Moz (152 t). Elsewhere, Freeport‑McMoRan’s Cerro Verde open‑pit copper mine benefited from the expansion project which started in September 2015 and achieved planned operating capacity rates during the first quarter 2016. Freeport reported 2016 silver sales from its South American operations at 3.7 Moz (115 t) compared to 2.0 Moz (62 t) in the previous year. Lastly, and further contributing to the country’s rise, better grades pushed silver in concentrates at Antamina, a copper/ zinc mine, to 20.1 Moz (625 t), representing a 13% or 2.3 Moz (72 t) increase year‑on‑year. At Buenaventura’s Uchucchacua operation, output increased by 16% year‑on‑year, or 2.3 Moz (72 t), in this instance, higher throughput (+13%) and better grades (+3%) explained the rise.
Unlike Peru, results in Argentina were biased to the downside so that combined losses in the country amounted to 4.7 Moz (147 t). Steep year‑on‑year losses were reported at Goldcorp’s Cerro Negro mine where silver output dropped by 49% from 6.1 Moz (190 t) to 3.1 Moz (96 t). Lower output was explained by labor disputes related to planned retrenchments which resulted in lower mining rates and higher processing of low grade stockpiled ore. All mining operations ceased at Troy Resources’ Casposo mine in mid‑February 2016. In March the company reached an agreement for the sale of a majority stake in the mine to Austral Gold, and the operation was re‑commissioned during the third quarter and for the full year generated
MINE PRODUCTION IN THE AMERICAS
0
100
200
300
400
500
600
20152013201120092007
Mill
ion
ounc
es
Source: GFMS, Thomson Reuters
Other
Canada
Argentina
United States
Chile
Bolivia
Mexico Peru
MINE PRODUCTION IN THE ASIA
0
50
100
150
200
20152013201120092007
Mill
ion
ounc
es
Source: GFMS, Thomson Reuters
Other
Armenia
Indonesia
India
China Kazakhstan
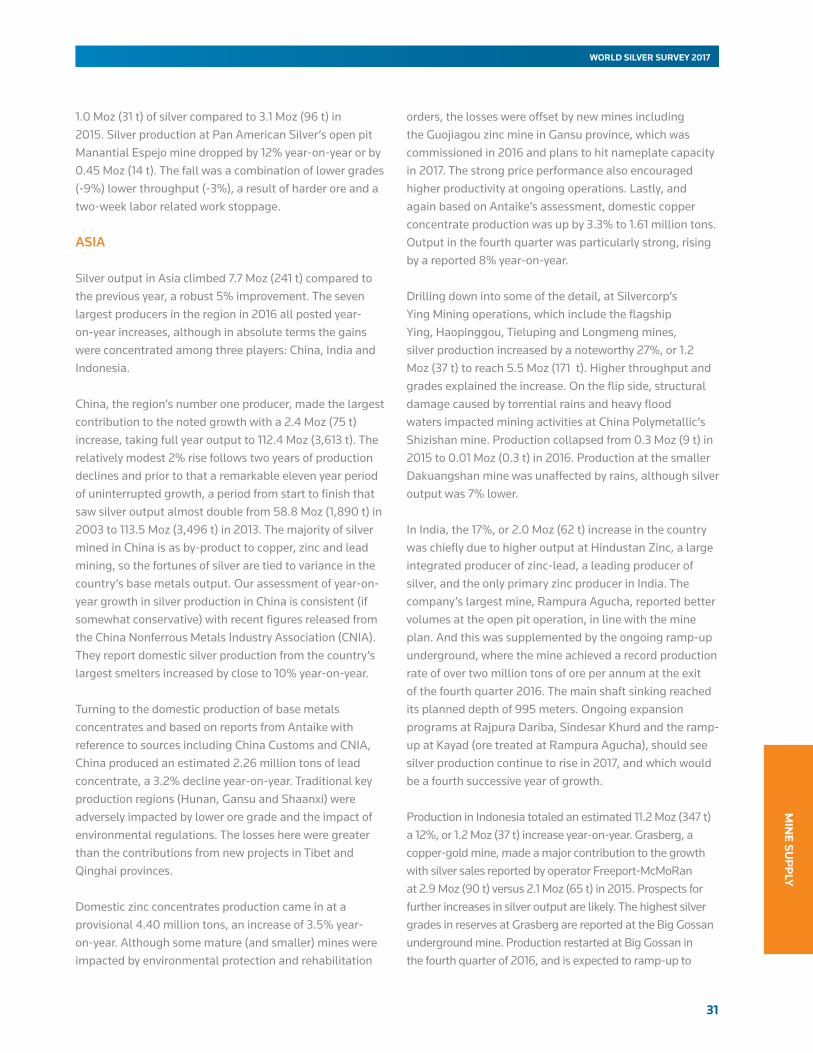
31
MIN
E SUP
PLY
WORLD SILVER SURVEY 2017
1.0 Moz (31 t) of silver compared to 3.1 Moz (96 t) in 2015. Silver production at Pan American Silver’s open pit Manantial Espejo mine dropped by 12% year‑on‑year or by 0.45 Moz (14 t). The fall was a combination of lower grades (‑9%) lower throughput (‑3%), a result of harder ore and a two‑week labor related work stoppage.
ASIA
Silver output in Asia climbed 7.7 Moz (241 t) compared to the previous year, a robust 5% improvement. The seven largest producers in the region in 2016 all posted year‑on‑year increases, although in absolute terms the gains were concentrated among three players: China, India and Indonesia.
China, the region’s number one producer, made the largest contribution to the noted growth with a 2.4 Moz (75 t) increase, taking full year output to 112.4 Moz (3,613 t). The relatively modest 2% rise follows two years of production declines and prior to that a remarkable eleven year period of uninterrupted growth, a period from start to finish that saw silver output almost double from 58.8 Moz (1,890 t) in 2003 to 113.5 Moz (3,496 t) in 2013. The majority of silver mined in China is as by‑product to copper, zinc and lead mining, so the fortunes of silver are tied to variance in the country’s base metals output. Our assessment of year‑on‑year growth in silver production in China is consistent (if somewhat conservative) with recent figures released from the China Nonferrous Metals Industry Association (CNIA). They report domestic silver production from the country’s largest smelters increased by close to 10% year‑on‑year.
Turning to the domestic production of base metals concentrates and based on reports from Antaike with reference to sources including China Customs and CNIA, China produced an estimated 2.26 million tons of lead concentrate, a 3.2% decline year‑on‑year. Traditional key production regions (Hunan, Gansu and Shaanxi) were adversely impacted by lower ore grade and the impact of environmental regulations. The losses here were greater than the contributions from new projects in Tibet and Qinghai provinces.
Domestic zinc concentrates production came in at a provisional 4.40 million tons, an increase of 3.5% year‑on‑year. Although some mature (and smaller) mines were impacted by environmental protection and rehabilitation
orders, the losses were offset by new mines including the Guojiagou zinc mine in Gansu province, which was commissioned in 2016 and plans to hit nameplate capacity in 2017. The strong price performance also encouraged higher productivity at ongoing operations. Lastly, and again based on Antaike’s assessment, domestic copper concentrate production was up by 3.3% to 1.61 million tons. Output in the fourth quarter was particularly strong, rising by a reported 8% year‑on‑year.
Drilling down into some of the detail, at Silvercorp’s Ying Mining operations, which include the flagship Ying, Haopinggou, Tieluping and Longmeng mines, silver production increased by a noteworthy 27%, or 1.2 Moz (37 t) to reach 5.5 Moz (171 t). Higher throughput and grades explained the increase. On the flip side, structural damage caused by torrential rains and heavy flood waters impacted mining activities at China Polymetallic’s Shizishan mine. Production collapsed from 0.3 Moz (9 t) in 2015 to 0.01 Moz (0.3 t) in 2016. Production at the smaller Dakuangshan mine was unaffected by rains, although silver output was 7% lower.
In India, the 17%, or 2.0 Moz (62 t) increase in the country was chiefly due to higher output at Hindustan Zinc, a large integrated producer of zinc‑lead, a leading producer of silver, and the only primary zinc producer in India. The company’s largest mine, Rampura Agucha, reported better volumes at the open pit operation, in line with the mine plan. And this was supplemented by the ongoing ramp‑up underground, where the mine achieved a record production rate of over two million tons of ore per annum at the exit of the fourth quarter 2016. The main shaft sinking reached its planned depth of 995 meters. Ongoing expansion programs at Rajpura Dariba, Sindesar Khurd and the ramp‑up at Kayad (ore treated at Rampura Agucha), should see silver production continue to rise in 2017, and which would be a fourth successive year of growth.
Production in Indonesia totaled an estimated 11.2 Moz (347 t) a 12%, or 1.2 Moz (37 t) increase year‑on‑year. Grasberg, a copper‑gold mine, made a major contribution to the growth with silver sales reported by operator Freeport‑McMoRan at 2.9 Moz (90 t) versus 2.1 Moz (65 t) in 2015. Prospects for further increases in silver output are likely. The highest silver grades in reserves at Grasberg are reported at the Big Gossan underground mine. Production restarted at Big Gossan in the fourth quarter of 2016, and is expected to ramp‑up to

32
WORLD SILVER SURVEY 2017
MIN
E SU
PP
LY
7,000 tons of ore per day in 2022. Plans, however, could be upset. This year has not got off to a good start as production has been impacted by the suspension of concentrate exports and a temporary outage, since 19th January 2017, at its smelting facilities. As a result Freeport has reduced its production by around 60% from normal levels (to match available domestic smelting capacity) and while under the export ban, future investment at the mine has been shelved. The ban picks up from the events in January 2014 when the Indonesian government issued new regulations for the export of copper concentrates. During the negotiations, operations at Grasberg were pegged back while Batu Hijau, another major copper‑gold and silver producer was put on care and maintenance. Exports resumed in August 2014. In a related development, Newmont completed the sale of its stake in Batu Hijau copper and gold mine in November 2016 in efforts to streamline their portfolio and focus on their core assets.
OCEANIA
Production declined in Oceania in 2016, falling 9% year‑on‑year or 4.6 Moz (142 t) to hit a 19‑year low at 46.9 Moz (1,458 t). Australia, accounting for 93% of the region’s total in 2016 was, of course, instrumental in the reported decline in the region. Silver output in Australia fell by 11% or 5.4 Moz (167 t).
The Cannington silver, lead and zinc mine is located in north‑west Queensland and operated by South32. It is one of the world’s largest silver producing mines and in 2016 reported a decline in payable silver production of 4.0 Moz (124 t) for a total of 18.2 Moz (566 t). The 18% year‑on‑year decline was explained by lower ore grades and recoveries, consistent with the mine plan. Production is expected to improve in the current year as silver and lead
CORPORATE ACTIVITY
The biggest deal in the silver sector last year was the $249 M acquisition of Claude Resources by Silver Standard Resources. The purchase of gold producer Claude Resources and its core asset the Seebee Gold mine follows the company’s April 2014 acquisition of the Marigold gold mine for $275 M. As a result 70% of Silver Standard’s revenue now comes from gold, and the company announced on 27th March 2017 that the board had recommended changing the company’s name to SSR Mining. In perhaps a similar case of ‘financial alchemy’, on 7th June 2016, Fortuna Silver Mines announced a deal to acquire Goldrock Mines ($86 million) for the company’s principal asset, the gold heap leach Lindero project in Argentina. Silver currently accounts for over 50% of the company’s revenue (with gold, lead and zinc making up the balance); post acquisition, and all other things being equal, by 2018 silver could drop to less than 30% of the group’s revenue.
Other smaller deals in the sector include, most recently, Pan American Silver’s announcement on 17th January 2017 of agreement to purchase Coeur Mining’s Joaquin silver project, located in the Santa Cruz province of southern Argentina for $25 M. Earlier last year, on 24th May, Hecla Mining announced an agreement to acquire Mines Management ($46 M) to advance the evaluation programme of the Montanore silver and copper deposit in the United States. In Australia, meanwhile, Silver Mines
Limited (SVL) announced on 3rd March 2016 its intention to acquire Silver Investments Holdings Australia Limited (SIHA) for an 85% interest of the Bowdens Silver project in New South Wales ($14 M). Bowdens mineral resource (measured and indicated) stands at 86.8 Moz (2,700 t) and according to the company is the largest undeveloped silver deposit in Australia. The Bowdens deal is core to SVL’s strategy which they state is to “consolidate silver deposits in New South Wales and to form Australia’s pre‑eminent silver company”.
Lastly, an honorable mention for some of the ‘sub‑$10 M’ category deals. On 10th February 2016 Hunt Mining entered into agreement to buy the Martha Mine in Santa Cruz Province, Argentina from a subsidiary of Coeur Mining for total cash price of $3.0 M. Production restarted at the mine in January 2017 with first gold‑silver concentrates shipment on 7th March 2017. On the 9th May 2016, Endeavour Silver announced it had entered into a definitive agreement to acquire Oro Silver Resources (a subsidiary of Canarc Resources) for $8.4 M. The principal asset is El Compas gold‑silver mine property in Mexico and La Plata ore plant which has fully permitted crushing, grinding, flotation and tailings circuits. Later in the year, on 13th September 2016, Endeavour announced it had agreed to acquire SSR’s ‘non‑core’ Parral exploration properties in Mexico for $6.0 M.
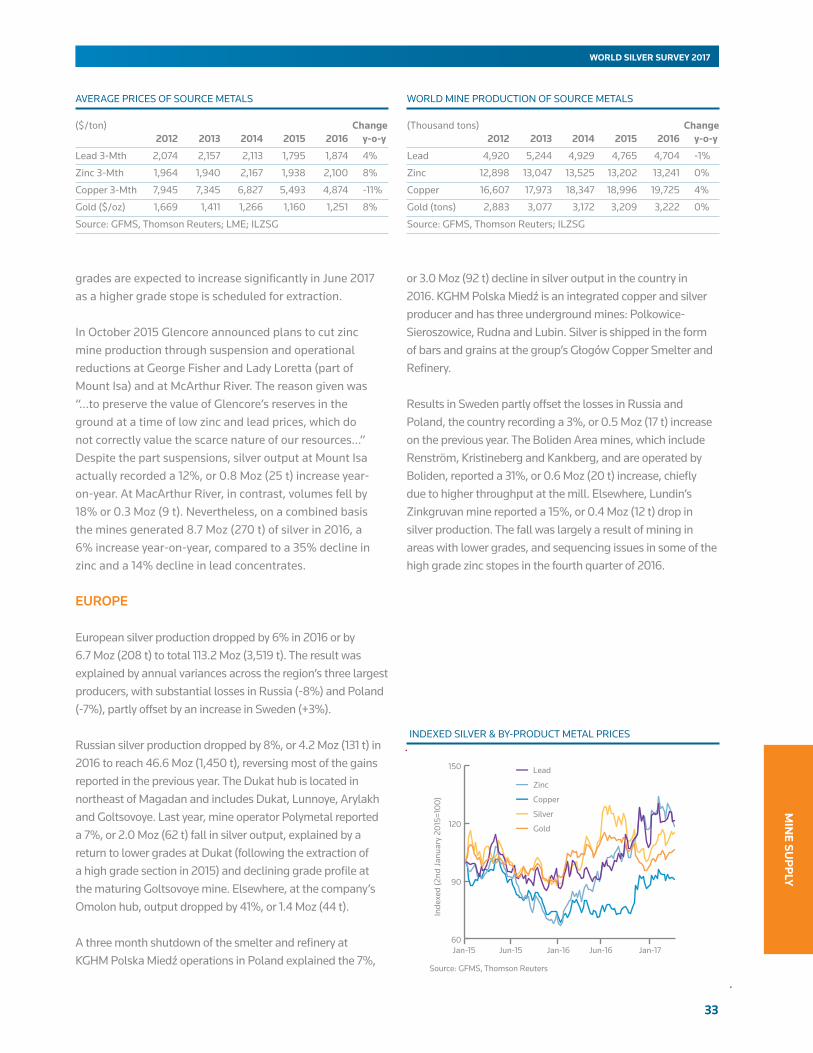
33
MIN
E SUP
PLY
WORLD SILVER SURVEY 2017
grades are expected to increase significantly in June 2017 as a higher grade stope is scheduled for extraction.
In October 2015 Glencore announced plans to cut zinc mine production through suspension and operational reductions at George Fisher and Lady Loretta (part of Mount Isa) and at McArthur River. The reason given was “…to preserve the value of Glencore’s reserves in the ground at a time of low zinc and lead prices, which do not correctly value the scarce nature of our resources…” Despite the part suspensions, silver output at Mount Isa actually recorded a 12%, or 0.8 Moz (25 t) increase year‑on‑year. At MacArthur River, in contrast, volumes fell by 18% or 0.3 Moz (9 t). Nevertheless, on a combined basis the mines generated 8.7 Moz (270 t) of silver in 2016, a 6% increase year‑on‑year, compared to a 35% decline in zinc and a 14% decline in lead concentrates.
EUROPE
European silver production dropped by 6% in 2016 or by 6.7 Moz (208 t) to total 113.2 Moz (3,519 t). The result was explained by annual variances across the region’s three largest producers, with substantial losses in Russia (‑8%) and Poland (‑7%), partly offset by an increase in Sweden (+3%).
Russian silver production dropped by 8%, or 4.2 Moz (131 t) in 2016 to reach 46.6 Moz (1,450 t), reversing most of the gains reported in the previous year. The Dukat hub is located in northeast of Magadan and includes Dukat, Lunnoye, Arylakh and Goltsovoye. Last year, mine operator Polymetal reported a 7%, or 2.0 Moz (62 t) fall in silver output, explained by a return to lower grades at Dukat (following the extraction of a high grade section in 2015) and declining grade profile at the maturing Goltsovoye mine. Elsewhere, at the company’s Omolon hub, output dropped by 41%, or 1.4 Moz (44 t).
A three month shutdown of the smelter and refinery at KGHM Polska Miedź operations in Poland explained the 7%,
or 3.0 Moz (92 t) decline in silver output in the country in 2016. KGHM Polska Miedź is an integrated copper and silver producer and has three underground mines: Polkowice‑Sieroszowice, Rudna and Lubin. Silver is shipped in the form of bars and grains at the group’s Głogów Copper Smelter and Refinery.
Results in Sweden partly offset the losses in Russia and Poland, the country recording a 3%, or 0.5 Moz (17 t) increase on the previous year. The Boliden Area mines, which include Renström, Kristineberg and Kankberg, and are operated by Boliden, reported a 31%, or 0.6 Moz (20 t) increase, chiefly due to higher throughput at the mill. Elsewhere, Lundin’s Zinkgruvan mine reported a 15%, or 0.4 Moz (12 t) drop in silver production. The fall was largely a result of mining in areas with lower grades, and sequencing issues in some of the high grade zinc stopes in the fourth quarter of 2016.
AVERAGE PRICES OF SOURCE METALS WORLD MINE PRODUCTION OF SOURCE METALS
($/ton) Change 2012 2013 2014 2015 2016 y-o-y
Lead 3‑Mth 2,074 2,157 2,113 1,795 1,874 4%
Zinc 3‑Mth 1,964 1,940 2,167 1,938 2,100 8%
Copper 3‑Mth 7,945 7,345 6,827 5,493 4,874 ‑11%
Gold ($/oz) 1,669 1,411 1,266 1,160 1,251 8%
Source: GFMS, Thomson Reuters; LME; ILZSG
(Thousand tons) Change 2012 2013 2014 2015 2016 y-o-y
Lead 4,920 5,244 4,929 4,765 4,704 ‑1%
Zinc 12,898 13,047 13,525 13,202 13,241 0%
Copper 16,607 17,973 18,347 18,996 19,725 4%
Gold (tons) 2,883 3,077 3,172 3,209 3,222 0%
Source: GFMS, Thomson Reuters; ILZSG
INDEXED SILVER & BY‑PRODUCT METAL PRICES
Inde
xed
(2nd
Jan
uary
201
5=10
0)
Source: GFMS, Thomson Reuters
Zinc
Silver
Copper
Gold
60
90
120
150
Jan-17Jun-16Jan-16Jun-15Jan-15
Lead
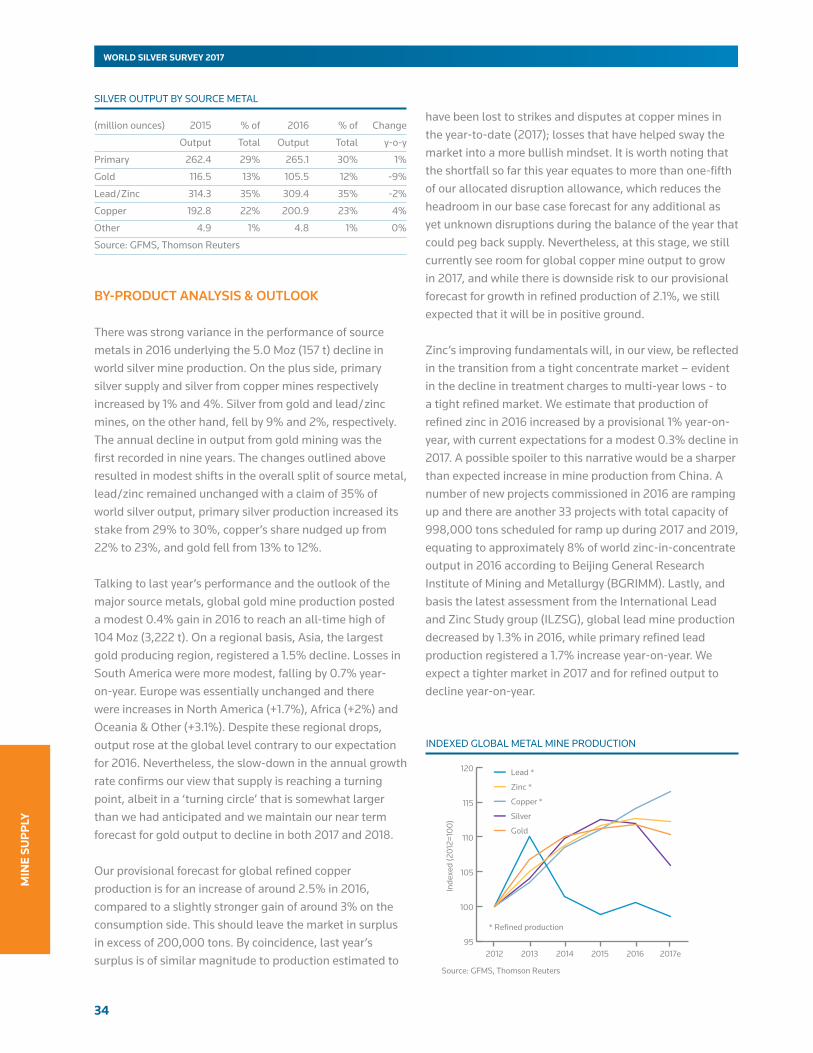
34
WORLD SILVER SURVEY 2017
MIN
E SU
PP
LY
BY-PRODUCT ANALYSIS & OUTLOOK
There was strong variance in the performance of source metals in 2016 underlying the 5.0 Moz (157 t) decline in world silver mine production. On the plus side, primary silver supply and silver from copper mines respectively increased by 1% and 4%. Silver from gold and lead/ zinc mines, on the other hand, fell by 9% and 2%, respectively. The annual decline in output from gold mining was the first recorded in nine years. The changes outlined above resulted in modest shifts in the overall split of source metal, lead/zinc remained unchanged with a claim of 35% of world silver output, primary silver production increased its stake from 29% to 30%, copper’s share nudged up from 22% to 23%, and gold fell from 13% to 12%.
Talking to last year’s performance and the outlook of the major source metals, global gold mine production posted a modest 0.4% gain in 2016 to reach an all‑time high of 104 Moz (3,222 t). On a regional basis, Asia, the largest gold producing region, registered a 1.5% decline. Losses in South America were more modest, falling by 0.7% year‑on‑year. Europe was essentially unchanged and there were increases in North America (+1.7%), Africa (+2%) and Oceania & Other (+3.1%). Despite these regional drops, output rose at the global level contrary to our expectation for 2016. Nevertheless, the slow‑down in the annual growth rate confirms our view that supply is reaching a turning point, albeit in a ‘turning circle’ that is somewhat larger than we had anticipated and we maintain our near term forecast for gold output to decline in both 2017 and 2018.
Our provisional forecast for global refined copper production is for an increase of around 2.5% in 2016, compared to a slightly stronger gain of around 3% on the consumption side. This should leave the market in surplus in excess of 200,000 tons. By coincidence, last year’s surplus is of similar magnitude to production estimated to
have been lost to strikes and disputes at copper mines in the year‑to‑date (2017); losses that have helped sway the market into a more bullish mindset. It is worth noting that the shortfall so far this year equates to more than one‑fifth of our allocated disruption allowance, which reduces the headroom in our base case forecast for any additional as yet unknown disruptions during the balance of the year that could peg back supply. Nevertheless, at this stage, we still currently see room for global copper mine output to grow in 2017, and while there is downside risk to our provisional forecast for growth in refined production of 2.1%, we still expected that it will be in positive ground.
Zinc’s improving fundamentals will, in our view, be reflected in the transition from a tight concentrate market – evident in the decline in treatment charges to multi‑year lows ‑ to a tight refined market. We estimate that production of refined zinc in 2016 increased by a provisional 1% year‑on‑year, with current expectations for a modest 0.3% decline in 2017. A possible spoiler to this narrative would be a sharper than expected increase in mine production from China. A number of new projects commissioned in 2016 are ramping up and there are another 33 projects with total capacity of 998,000 tons scheduled for ramp up during 2017 and 2019, equating to approximately 8% of world zinc‑in‑concentrate output in 2016 according to Beijing General Research Institute of Mining and Metallurgy (BGRIMM). Lastly, and basis the latest assessment from the International Lead and Zinc Study group (ILZSG), global lead mine production decreased by 1.3% in 2016, while primary refined lead production registered a 1.7% increase year‑on‑year. We expect a tighter market in 2017 and for refined output to decline year‑on‑year.
SILVER OUTPUT BY SOURCE METAL
(million ounces) 2015 % of 2016 % of Change
Output Total Output Total y‑o‑y
Primary 262.4 29% 265.1 30% 1%
Gold 116.5 13% 105.5 12% ‑9%
Lead/Zinc 314.3 35% 309.4 35% ‑2%
Copper 192.8 22% 200.9 23% 4%
Other 4.9 1% 4.8 1% 0%
Source: GFMS, Thomson Reuters
INDEXED GLOBAL METAL MINE PRODUCTION
Inde
xed
(201
2=10
0)
Source: GFMS, Thomson Reuters
Zinc *
Silver
Copper *
Gold
95
100
105
110
115
120
2017e20162015201420132012
Lead *
* Refined production

35
MIN
E SUP
PLY
WORLD SILVER SURVEY 2017
PRODUCTION COSTS
•Onaco-productbasis,cashcostswithcapexfor2016averaged$11.38/oz,a5%increaserelativeto2015.
Silver Total Cash Costs (TCC) net of by‑product credits fell year‑on‑year from $‑3.75/oz to $‑4.12/oz led by higher production and by‑product credits from Peru. The drop was partially offset by lower base metal production from KGHM Polska Miedź and Hindustan Zinc, shifting two of the world’s lowest cost producers further up the cost curve. Over 2016, both operations averaged a TCC net of by‑product credits of $‑32.42/oz, a sharp contrast against $‑42.17/oz in 2015.
If we exclude silver production from India and Poland, TCC net of by‑product credits costs continued trending lower in 2016, averaging $1.45/oz, or 59% below the same period last year. This was driven by most countries including Peru, Argentina, Australia, United States, Russia and Mexico, where higher grades, lower fuel costs and direct mining costs expressed in U.S. dollars led to lower costs globally. Amongst the countries in the aforementioned group, Peru posted the largest drop in TCC net of by‑product credits, falling from $4.57/oz to $‑3.76/oz due to higher silver and copper production at Uchucchacua and El Brocal respectively.
As metal prices remained subdued over 2016, a common theme around costs‑savings took shape in Peru. Lower contractor and supplier costs, coupled with falling freight costs and technical services paved the way for miners to
secure lower fixed costs. The demands of local communities became more lax, and with businesses looking to rent their equipment at any price, significant savings materialised. The significant drop in cash costs follows the remarkable surge in Peruvian silver and copper production at the country level, up 7% and 38% in 2016.
Turning to the world’s largest silver producer, cash costs in Mexico dropped by $0.38/oz to $1.48/oz, on the back of higher by‑product credits at Dolores, and higher grades at Palmarejo, partially offset by lower silver production.
On a co‑product accounting basis, TCC + capex in 2016 at the global level stood at $11.38/oz, up 5% from last year. The main driving force was a 13%, or 122 Moz drop in silver equivalent ounces, partially offset by a 6% contraction in capital expenditure to $2 billion. KGHM Polska Mieź accounted for nearly 50% of the drop in silver equivalent ounces, while Mexico saw the largest contraction in capex, followed by the United States and Argentina. Under this cost measure we note a change in trend following three years of downside pressure on costs.
SILVER MINING COSTS
SILVER MINE PRODUCTION COSTS
(US$/oz unless stated) 2015 2016
TCC (by‑product) ‑3.75 ‑4.12
TCC (co‑product) 8.52 8.90
TCC (co‑product) + Capex 10.80 11.38
Average Silver Price 15.68 17.14
Sample Size (Moz) 335.2 318.0
Source: GFMS, Thomson Reuters
US$/oz
0
5
10
15
20
25
US$
/oz
Source: GFMS, Thomson Reuters
10 20 30 40 50 60 70 80 900
5
10
15
20
25
2016 Average Silver Price ($17.14/oz)
2015 Average Silver Price ($15.68/oz)
2015 TCC (Co-product) + Capex
2016 TCC (Co-product) + Capex
Cumulative Production %

36
WORLD SILVER SURVEY 2017
MIN
E SU
PP
LY
However, if we exclude silver production from India and Poland, the falling trend comfortably extends into 2016 with costs dropping by 2% to $11.22/oz, placing 5% of the silver industry ‘underwater’. Under this smaller sample size, capex dropped by 10% year‑on‑year, partially offset by a less pronounced drop in silver equivalent ounces mostly explained by Penasquito. Contrary to this downward trend, costs at the second largest silver producing mine in Mexico jumped by 42% to $15.70/oz due to a 46% drop in gold production as result of lower ore grades (‑30%) and throughput (16%). In addition, capex climbed 16% to $235 M as Penasquito’s Pyrite Leach Project (PLP) gained company approval in July 2016. Goldcorp forecasts the PLP will add approximately 5 Moz per year commencing in 2019 by increasing overall silver recoveries stemming from the treatment of zinc tailings.
Although U.S. based primary silver mines did not have the advantage of currency devaluation, as a group they succeeded in cutting costs by 22% to $11.47/oz largely thanks to higher production and lower capex. This was the case at Lucky Friday, where production rose by 0.6 Moz (19 t), while capex fell by 26%, or $14 M as the #4 Shaft, a key growth project, neared completion. Lower diesel prices and higher grades led to a $3.71/oz drop in costs on a TCC + capex co‑product basis to $17.01/oz.
We expect global by‑product costs to continue trending lower over 2017 as credits from gold and base metal operations materialize, albeit at a slower rate as grades and oil prices begin to exert upward pressure on direct mining costs. However, we believe silver costs on a co‑product accounting basis will edge higher with cost of sales and capex following in the footsteps of the silver price.
PRODUCER HEDGING
• In 2016, the delta-adjusted hedge book contracted by 18.4 Moz (572 t).
Over the course of 2016, the delta‑adjusted hedge book contracted by 18.4 Moz (572 t) as the settlement of option contracts by Industrias Peñoles offset fresh hedging from KGHM Polska Miedź and Minera Frisco. The composition of the hedge book stood near 2009 levels with forward sale contracts representing just over 70% of the total hedge book on a delta‑adjusted basis. With the majority of these positions due to expire between 2017 and 2019, the proportion of the hedge book composed of option contracts, when measured by the nominal scale of the hedge book (number of contracts) rather than by option delta, fell from 69% at end‑2015 to 67% at end‑2016. This left the delta‑adjusted position of the hedge book at end of the period at 20.6 Moz (640 t).
Activity in 2016 was most notably driven by Peñoles, which delivered into a series of zero‑cost collars covering 20.6 Moz (641 t), while adding 12.4 Moz (387 t) of fresh hedging prior to year‑end. With an average floor price of $15.20/ oz, and a cap of $21.13/oz, the puts from Peñoles’ collar structure sat out‑of‑the‑money at end‑2016. At end‑2016, Peñoles’ hedge book accounted for 25% of the global producer hedge book, down from 40% in 2015, with a delta‑adjusted balance of 5.1 Moz (158 t). Turning to Minera Frisco, the Mexican silver producer hedged 7.4 Moz (231 t) of output at an average price of $17.82/oz for delivery in 2017. Finally, KGHM Polska Miedź hedged 2.7 Moz (84 t) using Asian Barrier Options also for delivery in 2017.
SILVER MINING COSTS: COUNTRY LEVEL PRODUCER HEDGING: OUTSTANDING POSITIONS
0
20
40
60
80
100
120
20152013201120092007
Mill
ion
Oun
ces
Source: GFMS, Thomson Reuters
Delta-adjusted Options
Forwards
0
4
8
12
16
20
24
RUSPERARGGUAAUSINDPOLUSAMEXBOLCHL
US$
/oz
Source: GFMS, Thomson Reuters
Capex per oz
TCC Co-product per oz

37
SUP
PLY FR
OM
A
BO
VE-G
RO
UN
D STO
CKS
WORLD SILVER SURVEY 2017
5. SUPPLY FROM ABOVE-GROUND STOCKS • Identifiable above-ground stocks increased 14% year-
on-year to 2,590.9 Moz (78,067 t) by the end of last year.
These inventories could cover 30 months’ worth of physical demand, a 21-year peak.
• In 2016 scrap receipts contributed 139.7 Moz (4,345 t) to total supply, 1% lower than in the previous year. Central to this decline was lower flows in Asia ensuring that scrap supply fell for the fifth consecutive year.
OVERVIEW
The majority of silver produced remains above-ground and therefore is theoretically available to the market in various forms defined as above-ground stock. Above-ground refined stock is silver often stored in the form of coins, bars, doré, and grains in the case of industrial uses. These silver products are either held by governments, stockpiled by industry, stored at futures exchange warehouses, and held in custodian vaults (allocated inclusive of ETP holdings, or unallocated). Silver held in custodian vaults is estimated based on data collection of ETP silver holdings and other reported volumes, a confidential survey, and field research.
Our above-ground refined stock definition does not include silverware, jewelry or other fabricated products that are, in one form or another, available in the market place. Only when the silver fabricated products get recycled will they re-enter our calculations and be qualified as scrap, where they will often be refined back into an homogenous form, usually either bars, coins, doré or grains. This chapter covers the geographical locations and movements in above-ground refined stocks and additions to annual supply from scrap recycling.
In order to derive insights into price movements and demand trends, a large portion of this above-ground stock is tracked by GFMS. The majority of bullion stocks are allocated to investors in ETPs, institutional and hedge fund investors, retail investors and other longer-term holders.
Above-ground silver from various fabricated sources, such as coins, bars, jewelry, silverware, e-waste, photographic papers and other “open-loop” sources of scrap is tracked by GFMS. While this newly recycled silver does not increase above-ground stocks directly, it can affect above- ground stock holdings if they are purchased and stored by one of the five categories outlined before.
IDENTIFIABLE BULLION STOCKS
Identifiable bullion stocks can be split into two categories: unreported GFMS stock estimates that are based on
IDENTIFIABLE ABOVE-GROUND SILVER BULLION STOCKS
BULLION STOCKS - REGIONAL BREAKDOWN IN 2016
(Moz) 2007 2008 2009 2010 2011 2012 2013 2014 2015 2016
Custodian Vaults* 736.5 615.6 846.6 834.8 943.1 814.1 1,008.4 1,168.0 1,379.2 1,571.2
ETPs 212.5 313.9 470.8 600.3 576.2 631.6 634.0 635.5 617.8 664.8
Exchange* 125.9 114.7 93.6 83.4 98.0 159.3 168.1 161.6 170.2 250.1
Government 206.7 176.2 160.5 116.4 104.3 97.0 89.1 89.1 89.1 89.1
Industry 11.8 17.3 14.4 18.5 17.7 18.3 15.5 13.8 14.7 15.7
Total 1,293.4 1,237.6 1,585.9 1,653.3 1,739.4 1,720.2 1,915.2 2,068.0 2,271.0 2,590.9
Months of Demand 16 14 22 19 19 21 20 22 24 30
Source: GFMS, Thomson Reuters; Respective ETP issuers, exchange websites, Japan Ministry of Economy, Trade and Industry, USGS
*Custodian vault and exchange warehouse stocks exclude stocks allocated to ETPs.
Asia 948 Moz
Europe1,024 Moz
North America618 Moz
Source: GFMS, Thomson Reuters
Other: 0.5 Moz
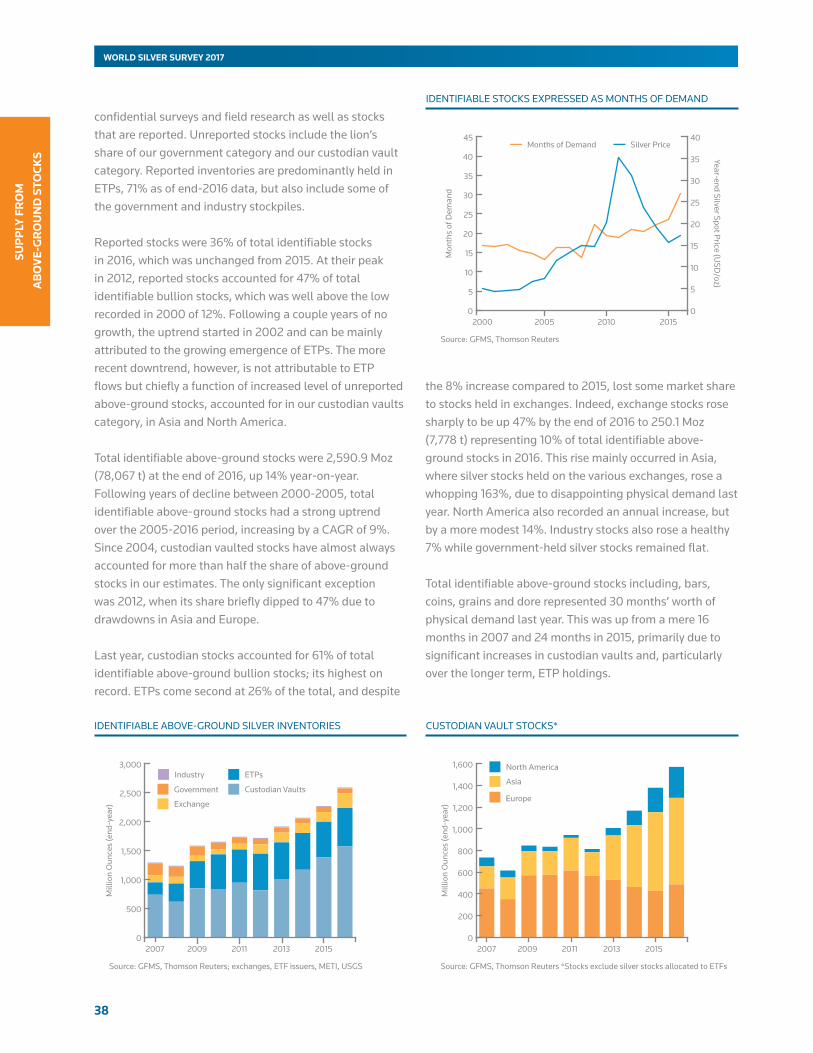
38
WORLD SILVER SURVEY 2017
SUP
PLY
FR
OM
A
BO
VE-
GR
OU
ND
STO
CKS
confidential surveys and field research as well as stocks that are reported. Unreported stocks include the lion’s share of our government category and our custodian vault category. Reported inventories are predominantly held in ETPs, 71% as of end-2016 data, but also include some of the government and industry stockpiles.
Reported stocks were 36% of total identifiable stocks in 2016, which was unchanged from 2015. At their peak in 2012, reported stocks accounted for 47% of total identifiable bullion stocks, which was well above the low recorded in 2000 of 12%. Following a couple years of no growth, the uptrend started in 2002 and can be mainly attributed to the growing emergence of ETPs. The more recent downtrend, however, is not attributable to ETP flows but chiefly a function of increased level of unreported above-ground stocks, accounted for in our custodian vaults category, in Asia and North America.
Total identifiable above-ground stocks were 2,590.9 Moz (78,067 t) at the end of 2016, up 14% year-on-year. Following years of decline between 2000-2005, total identifiable above- ground stocks had a strong uptrend over the 2005-2016 period, increasing by a CAGR of 9%. Since 2004, custodian vaulted stocks have almost always accounted for more than half the share of above-ground stocks in our estimates. The only significant exception was 2012, when its share briefly dipped to 47% due to drawdowns in Asia and Europe.
Last year, custodian stocks accounted for 61% of total identifiable above-ground bullion stocks; its highest on record. ETPs come second at 26% of the total, and despite
the 8% increase compared to 2015, lost some market share to stocks held in exchanges. Indeed, exchange stocks rose sharply to be up 47% by the end of 2016 to 250.1 Moz (7,778 t) representing 10% of total identifiable above-ground stocks in 2016. This rise mainly occurred in Asia, where silver stocks held on the various exchanges, rose a whopping 163%, due to disappointing physical demand last year. North America also recorded an annual increase, but by a more modest 14%. Industry stocks also rose a healthy 7% while government-held silver stocks remained flat.
Total identifiable above-ground stocks including, bars, coins, grains and dore represented 30 months’ worth of physical demand last year. This was up from a mere 16 months in 2007 and 24 months in 2015, primarily due to significant increases in custodian vaults and, particularly over the longer term, ETP holdings.
IDENTIFIABLE ABOVE-GROUND SILVER INVENTORIES CUSTODIAN VAULT STOCKS*
201520132011200920070
500
1,000
1,500
2,000
2,500
3,000
Mill
ion
Oun
ces
(end
-yea
r)
Source: GFMS, Thomson Reuters; exchanges, ETF issuers, METI, USGS
Government
Exchange
Industry ETPs
Custodian Vaults
201520132011200920070
200
400
600
800
1,000
1,200
1,400
1,600
Mill
ion
Oun
ces
(end
-yea
r)
Source: GFMS, Thomson Reuters *Stocks exclude silver stocks allocated to ETFs
North America
Asia
Europe
IDENTIFIABLE STOCKS EXPRESSED AS MONTHS OF DEMAND
0
5
10
15
20
25
30
35
40
45
Mon
ths
of D
eman
d
Year-end Silver Spot Price (USD
/oz)
0
5
10
15
20
25
30
35
40
2015201020052000
Source: GFMS, Thomson Reuters
Silver PriceMonths of Demand

39
SUP
PLY FR
OM
A
BO
VE-G
RO
UN
D STO
CKS
WORLD SILVER SURVEY 2017
CUSTODIAN VAULT STOCKS
ETP holdings are not included in our custodian vault stock data, but it is important to note that most custodians of ETP silver stocks also store silver in vaults that are not allocated to ETPs. The same applies to futures exchange warehouses. Custodian vault stocks rose 14% (or 192.1 Moz 5,973 t) to 1,571.2 Moz (48,871 t) last year. At the start of the millennium, ETPs held in custodian vaults accounted for 1% of total vaulted stocks with only allocations reported in North America. Fast forward to the end of 2016 and that total has risen to more than a third of total custodian vaulted stocks, with 75% of the total custodian vaulted stocks allocated to ETPs held in Europe and 24% in North America. Asia makes up the balance of less than 1%.
In Asia, custodian vault stocks, excluding ETPs, rose by 71.9 Moz (2,237 t) or 10% last year. The bulk of these stocks are located in China, and reflects stocks held in vaults at banks. In previous years, rising stocks have been a function of increased leasing activities by Chinese banks. However, tighter supervision by the government last year resulted in reduced leasing activity. Other parts of Asia, such as Singapore, have been increasing in popularity for storage of bars and coins in recent years. We estimate that stocks have consequently risen by 40% there.
In contrast and following a strong performance in 2015, vaulted stocks in India fell 9% year-on-year, but that is not surprising given the strong rise recorded in the prior year. Silver stocks remained relatively elevated by historical standards, measured over the 2005-2015 period. The high annual carryover was on the back of floundering demand,
following a combination of the introduction of the excise duty on gold and crackdown on unaccounted income that showed its ripple effects into the silver market. Many ships at the ports remained uncleared for a while, leaving India with excess supply that pushed the local market price into a discount. However, the start of the Free Trade Warehousing Facility in the second half of last year absorbed some of that material with global bullion banks increasingly seeking this location as a strategic point for silver vaulting in case the need arises. In a similar vein, stocks in Japan are also estimated to have declined last year.
In NorthAmerica, growth in silver custodian vaulted stocks not allocated to ETPs added 59.6 Moz (1,854 t) or 26%, to the total. The annual increase was slower than in 2015 which in turn was a function of a drop in coin sales in North America last year. European vault stocks not allocated to ETPs, which accounted for 31% of total vaulted stocks, rose 14% to 488.7 Moz (15,201 t) in 2016, following a decline of 8% the year prior. The rise can be attributed to increased institutional investor interest in the region amid weaker currency values that boosted local silver prices. Indeed, European ETP holdings rose 10% in 2016.
FUTURES EXCHANGES
Silver is also likely to be stored in a vault if a futures exchange offers physical settlement. As a rule of thumb, only approximately 2% of futures contracts are settled in physical, so it is not necessary to hold metal that is equal to the total level of open interest.
Four exchanges report silver stocks; COMEX in the United States, the Tokyo Commodity Exchange (TOCOM), the Shanghai Futures Exchange (SHFE) and the Shanghai Gold Exchange. Total stocks held by exchanges rose 41% last year to 250.1 Moz (7,778 t). This strong performance was driven by a 163% increase in Asia, and in particular in China. Indeed, both the SHFE and the SGE posted whopping increases of 212% and 104% respectively to 59.7 Moz (1,857 t) and 32.1 Moz (999 t) respectively last year. Weak
COMEX WAREHOUSE STOCKS
0
50
100
150
200
Jan-17Jan-15Jan-13Jan-11Jan-09Jan-07
Mon
th-e
nd S
tock
s (M
illio
n O
unce
s)
0
10
20
30
40
50
Silver Price (US$/oz)
Source: COMEX
SHFE SILVER STOCKS
(Million ounces; end period) Q1 Q2 Q3 Q4
2014 12.3 7.7 2.6 3.9
2015 9.2 12.1 10.2 19.2
2016 49.4 59.5 52.6 59.7
Source: SHFE

40
WORLD SILVER SURVEY 2017
SUP
PLY
FR
OM
A
BO
VE-
GR
OU
ND
STO
CKS
SILVER ETP HOLDINGS BY VAULT LOCATION
While we delve into greater detail with regard to silver ETP
holdings in the investment chapter, this chapter’s ETP focus
centers on the investors’ domicile and holdings by vault
location. As recently as 2005 ETP holdings were only 3% of total
identifiable above-ground stocks, whereas they now account for
a quarter of known stocks with greater transparency providing
detail and clarity. Indeed prior to the substantial growth in
custodian vaults in the past five years ETPs actually peaked, on a
year-end basis, at 37% of total identifiable above-ground stocks
in 2012.
The United States remains the largest market for investors with
55% of ETP holdings (unchanged market share compared to
a year earlier) originating from trade there, based on an ETP’s
primary exchange. Next in line is the silver ETPs traded on
the Toronto Stock Exchange, which accounted for 21% of total
holdings while those in the United Kingdom on the London Stock
Exchange accounted for 11% of holdings by silver ETP investors.
Interestingly, and despite United States investors dominating
ETP trade, the vast bulk of global physical ETP holdings, at
62% last year, were held in the United Kingdom with holdings
in the United States contributing only 4% of the global total.
Switzerland was home to 13% of global ETP holdings, in line with
its share of investor ownership. Similarly, Canada contributed
21% of total holdings, while Japanese ETP allocated inventories
make up the balance at 0.4% of the global total.
As outlined above, London’s share of total ETP holdings by vault
location dominates the global total at 62% market share. While
down from the peak of 72% recorded in 2007, the percentage of
holdings has again been on the rise in recent years, increasing
steadily from 58% in 2012 to the level last year. In fact, 88% of
the increase in global silver ETP holdings during 2016 was in
London. As a result, Canada, which had seen its market share
increase in recent years dropped back from 22% to 21% last year.
In a similar vein, despite holdings in Switzerland rising a touch
their share also edged back a fraction to 12.7%.
A widespread false impression in the market historically was that
selloffs of ETPs in a country led to a similar quantity of metal
becoming available to the local or export market. However,
the reality was quite different from this scenario, because most
holdings of ETPs are vaulted in London. The clearest example
of this was in 2011. In that year, investors in the United States
sold 39.0 Moz (1,212 t) of silver ETPs but silver ETP vault stocks
in the country barely changed, declining by just 2.5 Moz (76 t).
Meanwhile, ETP stocks in London declined by 35.7 Moz (1,111 t).
Any ETP sales are likely to result in the conversion of the metal
in the vault from allocated to ETP shareholders to unallocated
or other allocated holdings. That said, metal could still be
shipped out of the vault and to overseas markets should demand
elsewhere require it.
Several ETPs use multiple vaults in different countries.
Consequently, assigning all holdings of each ETP to the
exchange location or to a single location may lead to
inaccuracies. Furthermore, eligible stocks reported by COMEX
contain a portion that is allocated to ETPs. At the end of 2016
the portion of COMEX eligible stocks that was allocated to ETPs
was around 16% of total COMEX eligible stocks. We alter our
identifiable bullion stock figures for this nuance in order to avoid
double-counting in our calculations.
201520132011200920070
250
500
750
Mill
ion
Oun
ces
0
25
50
75
100
%
* “Other” includes Japan, Australia and Hong KongSource: GFMS, Thomson Reuters; respective ETP issuers & custodians
Japan
United States
Switzerland
UK’s share
United Kingdom
Canada
SILVER ETP HOLDINGS BY INVESTOR DOMICILE
201520132011200920070
250
500
750
Mill
ion
Oun
ces
0
10
20
30
40
50
60
70
80
90
%
Source: GFMS, Thomson Reuters; respective ETP issuers & custodians
OthersUnited Kingdom
Switzerland
US’s Share of TotalCanada
Others
United States
SILVER ETP HOLDINGS BY VAULT LOCATION
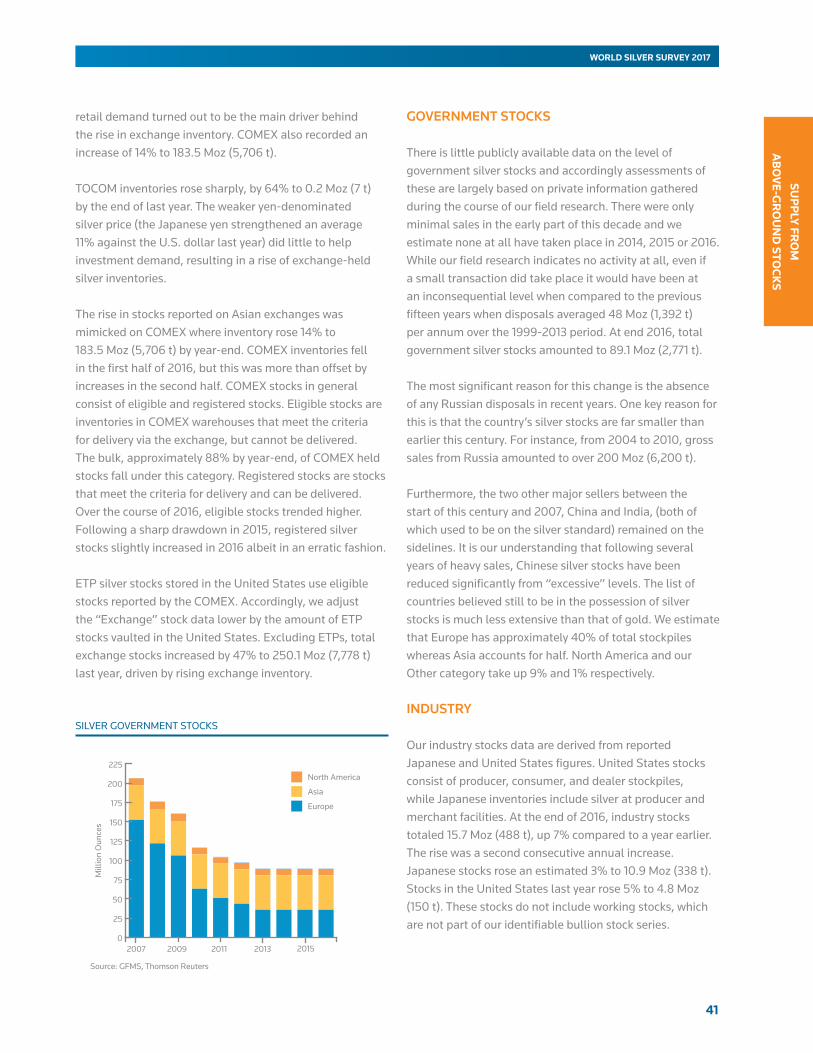
41
SUP
PLY FR
OM
A
BO
VE-G
RO
UN
D STO
CKS
WORLD SILVER SURVEY 2017
retail demand turned out to be the main driver behind the rise in exchange inventory. COMEX also recorded an increase of 14% to 183.5 Moz (5,706 t).
TOCOM inventories rose sharply, by 64% to 0.2 Moz (7 t) by the end of last year. The weaker yen-denominated silver price (the Japanese yen strengthened an average 11% against the U.S. dollar last year) did little to help investment demand, resulting in a rise of exchange-held silver inventories.
The rise in stocks reported on Asian exchanges was mimicked on COMEX where inventory rose 14% to 183.5 Moz (5,706 t) by year-end. COMEX inventories fell in the first half of 2016, but this was more than offset by increases in the second half. COMEX stocks in general consist of eligible and registered stocks. Eligible stocks are inventories in COMEX warehouses that meet the criteria for delivery via the exchange, but cannot be delivered. The bulk, approximately 88% by year-end, of COMEX held stocks fall under this category. Registered stocks are stocks that meet the criteria for delivery and can be delivered. Over the course of 2016, eligible stocks trended higher. Following a sharp drawdown in 2015, registered silver stocks slightly increased in 2016 albeit in an erratic fashion.
ETP silver stocks stored in the United States use eligible stocks reported by the COMEX. Accordingly, we adjust the “Exchange” stock data lower by the amount of ETP stocks vaulted in the United States. Excluding ETPs, total exchange stocks increased by 47% to 250.1 Moz (7,778 t) last year, driven by rising exchange inventory.
GOVERNMENT STOCKS
There is little publicly available data on the level of government silver stocks and accordingly assessments of these are largely based on private information gathered during the course of our field research. There were only minimal sales in the early part of this decade and we estimate none at all have taken place in 2014, 2015 or 2016. While our field research indicates no activity at all, even if a small transaction did take place it would have been at an inconsequential level when compared to the previous fifteen years when disposals averaged 48 Moz (1,392 t) per annum over the 1999-2013 period. At end 2016, total government silver stocks amounted to 89.1 Moz (2,771 t).
The most significant reason for this change is the absence of any Russian disposals in recent years. One key reason for this is that the country’s silver stocks are far smaller than earlier this century. For instance, from 2004 to 2010, gross sales from Russia amounted to over 200 Moz (6,200 t).
Furthermore, the two other major sellers between the start of this century and 2007, China and India, (both of which used to be on the silver standard) remained on the sidelines. It is our understanding that following several years of heavy sales, Chinese silver stocks have been reduced significantly from “excessive” levels. The list of countries believed still to be in the possession of silver stocks is much less extensive than that of gold. We estimate that Europe has approximately 40% of total stockpiles whereas Asia accounts for half. North America and our Other category take up 9% and 1% respectively.
INDUSTRY
Our industry stocks data are derived from reported Japanese and United States figures. United States stocks consist of producer, consumer, and dealer stockpiles, while Japanese inventories include silver at producer and merchant facilities. At the end of 2016, industry stocks totaled 15.7 Moz (488 t), up 7% compared to a year earlier. The rise was a second consecutive annual increase. Japanese stocks rose an estimated 3% to 10.9 Moz (338 t). Stocks in the United States last year rose 5% to 4.8 Moz (150 t). These stocks do not include working stocks, which are not part of our identifiable bullion stock series.
SILVER GOVERNMENT STOCKS
201520132011200920070
25
50
75
100
125
150
175
200
225
Mill
ion
Oun
ces
Source: GFMS, Thomson Reuters
North America
Asia
Europe
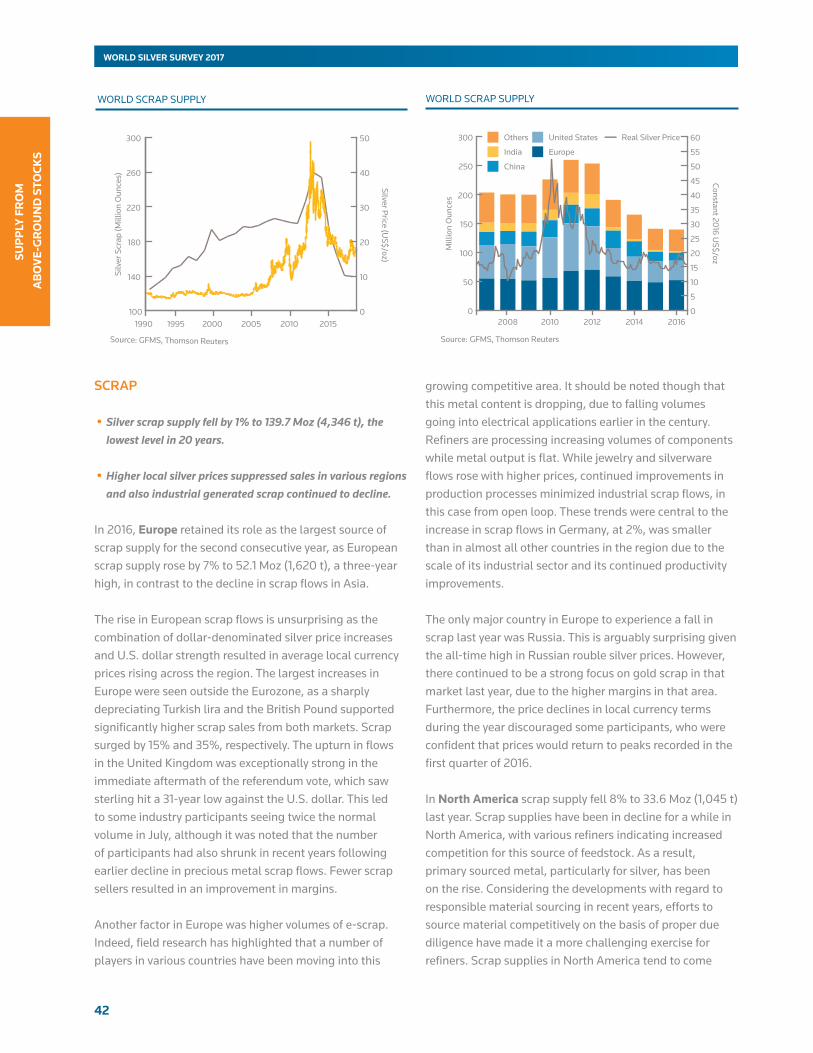
42
WORLD SILVER SURVEY 2017
SUP
PLY
FR
OM
A
BO
VE-
GR
OU
ND
STO
CKS
SCRAP
•Silver scrap supply fell by 1% to 139.7 Moz (4,346 t), the lowest level in 20 years.
•Higher local silver prices suppressed sales in various regions and also industrial generated scrap continued to decline.
In 2016, Europe retained its role as the largest source of scrap supply for the second consecutive year, as European scrap supply rose by 7% to 52.1 Moz (1,620 t), a three-year high, in contrast to the decline in scrap flows in Asia.
The rise in European scrap flows is unsurprising as the combination of dollar-denominated silver price increases and U.S. dollar strength resulted in average local currency prices rising across the region. The largest increases in Europe were seen outside the Eurozone, as a sharply depreciating Turkish lira and the British Pound supported significantly higher scrap sales from both markets. Scrap surged by 15% and 35%, respectively. The upturn in flows in the United Kingdom was exceptionally strong in the immediate aftermath of the referendum vote, which saw sterling hit a 31-year low against the U.S. dollar. This led to some industry participants seeing twice the normal volume in July, although it was noted that the number of participants had also shrunk in recent years following earlier decline in precious metal scrap flows. Fewer scrap sellers resulted in an improvement in margins.
Another factor in Europe was higher volumes of e-scrap. Indeed, field research has highlighted that a number of players in various countries have been moving into this
growing competitive area. It should be noted though that this metal content is dropping, due to falling volumes going into electrical applications earlier in the century. Refiners are processing increasing volumes of components while metal output is flat. While jewelry and silverware flows rose with higher prices, continued improvements in production processes minimized industrial scrap flows, in this case from open loop. These trends were central to the increase in scrap flows in Germany, at 2%, was smaller than in almost all other countries in the region due to the scale of its industrial sector and its continued productivity improvements.
The only major country in Europe to experience a fall in scrap last year was Russia. This is arguably surprising given the all-time high in Russian rouble silver prices. However, there continued to be a strong focus on gold scrap in that market last year, due to the higher margins in that area. Furthermore, the price declines in local currency terms during the year discouraged some participants, who were confident that prices would return to peaks recorded in the first quarter of 2016.
In NorthAmerica scrap supply fell 8% to 33.6 Moz (1,045 t) last year. Scrap supplies have been in decline for a while in North America, with various refiners indicating increased competition for this source of feedstock. As a result, primary sourced metal, particularly for silver, has been on the rise. Considering the developments with regard to responsible material sourcing in recent years, efforts to source material competitively on the basis of proper due diligence have made it a more challenging exercise for refiners. Scrap supplies in North America tend to come
WORLD SCRAP SUPPLY
201620142012201020080
50
100
150
200
250
300
Mill
ion
Oun
ces
0
5
10
15
20
25
30
35
40
45
50
55
60
Constant 2016 US$/oz
Source: GFMS, Thomson Reuters
Others
India
China
Real Silver PriceUnited States
Europe
WORLD SCRAP SUPPLY
100
140
180
220
260
300
201520102005200019951990
Silv
er S
crap
(Mill
ion
Oun
ces)
0
10
20
30
40
50
Silver Price (US$/oz)
Source: GFMS, Thomson Reuters
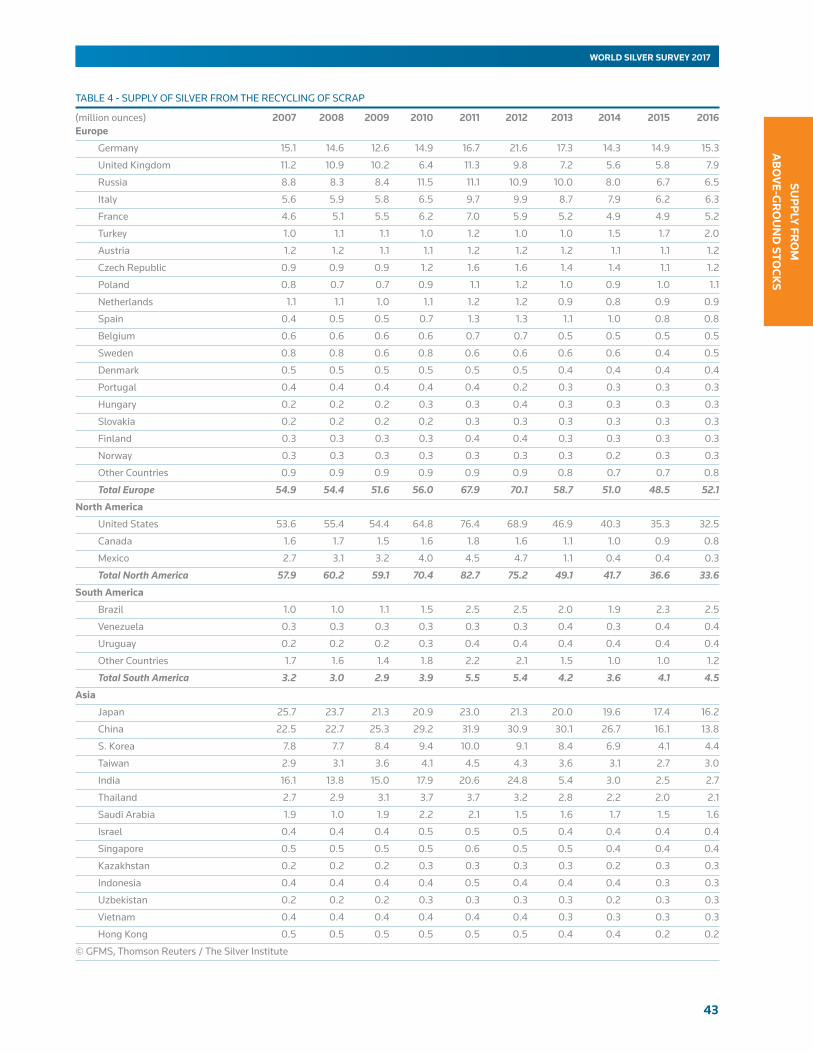
43
SUP
PLY FR
OM
A
BO
VE-G
RO
UN
D STO
CKS
WORLD SILVER SURVEY 2017
(million ounces) 2007 2008 2009 2010 2011 2012 2013 2014 2015 2016Europe
Germany 15.1 14.6 12.6 14.9 16.7 21.6 17.3 14.3 14.9 15.3
United Kingdom 11.2 10.9 10.2 6.4 11.3 9.8 7.2 5.6 5.8 7.9
Russia 8.8 8.3 8.4 11.5 11.1 10.9 10.0 8.0 6.7 6.5
Italy 5.6 5.9 5.8 6.5 9.7 9.9 8.7 7.9 6.2 6.3
France 4.6 5.1 5.5 6.2 7.0 5.9 5.2 4.9 4.9 5.2
Turkey 1.0 1.1 1.1 1.0 1.2 1.0 1.0 1.5 1.7 2.0
Austria 1.2 1.2 1.1 1.1 1.2 1.2 1.2 1.1 1.1 1.2
Czech Republic 0.9 0.9 0.9 1.2 1.6 1.6 1.4 1.4 1.1 1.2
Poland 0.8 0.7 0.7 0.9 1.1 1.2 1.0 0.9 1.0 1.1
Netherlands 1.1 1.1 1.0 1.1 1.2 1.2 0.9 0.8 0.9 0.9
Spain 0.4 0.5 0.5 0.7 1.3 1.3 1.1 1.0 0.8 0.8
Belgium 0.6 0.6 0.6 0.6 0.7 0.7 0.5 0.5 0.5 0.5
Sweden 0.8 0.8 0.6 0.8 0.6 0.6 0.6 0.6 0.4 0.5
Denmark 0.5 0.5 0.5 0.5 0.5 0.5 0.4 0.4 0.4 0.4
Portugal 0.4 0.4 0.4 0.4 0.4 0.2 0.3 0.3 0.3 0.3
Hungary 0.2 0.2 0.2 0.3 0.3 0.4 0.3 0.3 0.3 0.3
Slovakia 0.2 0.2 0.2 0.2 0.3 0.3 0.3 0.3 0.3 0.3
Finland 0.3 0.3 0.3 0.3 0.4 0.4 0.3 0.3 0.3 0.3
Norway 0.3 0.3 0.3 0.3 0.3 0.3 0.3 0.2 0.3 0.3
Other Countries 0.9 0.9 0.9 0.9 0.9 0.9 0.8 0.7 0.7 0.8
Total Europe 54.9 54.4 51.6 56.0 67.9 70.1 58.7 51.0 48.5 52.1
NorthAmerica
United States 53.6 55.4 54.4 64.8 76.4 68.9 46.9 40.3 35.3 32.5
Canada 1.6 1.7 1.5 1.6 1.8 1.6 1.1 1.0 0.9 0.8
Mexico 2.7 3.1 3.2 4.0 4.5 4.7 1.1 0.4 0.4 0.3
Total North America 57.9 60.2 59.1 70.4 82.7 75.2 49.1 41.7 36.6 33.6
SouthAmerica
Brazil 1.0 1.0 1.1 1.5 2.5 2.5 2.0 1.9 2.3 2.5
Venezuela 0.3 0.3 0.3 0.3 0.3 0.3 0.4 0.3 0.4 0.4
Uruguay 0.2 0.2 0.2 0.3 0.4 0.4 0.4 0.4 0.4 0.4
Other Countries 1.7 1.6 1.4 1.8 2.2 2.1 1.5 1.0 1.0 1.2
Total South America 3.2 3.0 2.9 3.9 5.5 5.4 4.2 3.6 4.1 4.5
Asia
Japan 25.7 23.7 21.3 20.9 23.0 21.3 20.0 19.6 17.4 16.2
China 22.5 22.7 25.3 29.2 31.9 30.9 30.1 26.7 16.1 13.8
S. Korea 7.8 7.7 8.4 9.4 10.0 9.1 8.4 6.9 4.1 4.4
Taiwan 2.9 3.1 3.6 4.1 4.5 4.3 3.6 3.1 2.7 3.0
India 16.1 13.8 15.0 17.9 20.6 24.8 5.4 3.0 2.5 2.7
Thailand 2.7 2.9 3.1 3.7 3.7 3.2 2.8 2.2 2.0 2.1
Saudi Arabia 1.9 1.0 1.9 2.2 2.1 1.5 1.6 1.7 1.5 1.6
Israel 0.4 0.4 0.4 0.5 0.5 0.5 0.4 0.4 0.4 0.4
Singapore 0.5 0.5 0.5 0.5 0.6 0.5 0.5 0.4 0.4 0.4
Kazakhstan 0.2 0.2 0.2 0.3 0.3 0.3 0.3 0.2 0.3 0.3
Indonesia 0.4 0.4 0.4 0.4 0.5 0.4 0.4 0.4 0.3 0.3
Uzbekistan 0.2 0.2 0.2 0.3 0.3 0.3 0.3 0.2 0.3 0.3
Vietnam 0.4 0.4 0.4 0.4 0.4 0.4 0.3 0.3 0.3 0.3
Hong Kong 0.5 0.5 0.5 0.5 0.5 0.5 0.4 0.4 0.2 0.2
© GFMS, Thomson Reuters / The Silver Institute
TABLE 4 - SUPPLY OF SILVER FROM THE RECYCLING OF SCRAP

44
WORLD SILVER SURVEY 2017
SUP
PLY
FR
OM
A
BO
VE-
GR
OU
ND
STO
CKS
back from the market in a rather erratic fashion. In the first instance, a lot is dependent on the metal price. After that, however, high-grade jewelry and retail investment scrap flows can suddenly start to stutter as consumers tend to become greedy, anticipating higher prices. Silver is also found in electronic waste, but this source of supply is still relatively small compared to the high-grade sources and metal content typically is low and on a continued downward trend.
At 2.7 Moz (85 t), scrap supply in India remained steady compared to 2015, which was the lowest level in 15 years. But also electronic scrap from contacts, X-ray films and plated items remained elevated last year. Scrap from retail consumers was mainly in the form of like-for-like deals, where old jewelry was exchanged for new items. New sales were far and few between according to field research despite the fact that domestic prices were 13% higher on an annual basis. Sales of old brocades (fabric with raised patterns) with jari (gold and silver thread), however, continued to attract interest, with owners offering these items at competitive prices to generate cash. This was not necessarily a case of distress selling, but more a measure to clear out old stock. Sales of antique jewelry designs have dried up in recent years and were refurbished and reused for new designs due to a lack of desire for older designs.
Last year, silver scrap across East Asia (excluding Japan) fell by 6% to 24.8 Moz (771 t), the fifth annual decline in succession and the lowest level in nearly fifteen years. This outcome, while slightly counterintuitive given the higher U.S. dollar silver price, was largely driven by economic factors that influenced industrial fabrication volumes,
which weighed on process remelt as stock levels were run down and liquidated. Old scrap from China slid by 15% in 2016 to a level not seen since 2003. A hefty fall in industrial demand impacted the recycling of process scrap while copper smelters hoarded material, waiting for higher prices, also reducing the available supply to the market. Despite soft industrial demand last year, recycling flows in Taiwan and SouthKorea were marginally stronger with recoveries benefiting from the rise in local prices to register gains of 10% and 7% respectively. Elsewhere, a stronger silver price was the chief catalyst for the increase in Thailand (+5%) and Indonesia(+10%)as the supply chain and consumers alike took advantage to recycle old and slow moving stock.
Japanesescrap volumes were weaker again in 2016, falling 7% to an estimated 16.2 Moz (504 t), the fifth decline in as many years. A stronger yen last year, particularly in the third quarter and partially as a result of the Brexit vote in the UK, saw the average domestic silver price decline by 2.3% on an annual basis. The price drop, combined with further falls in the collection of scrap collected from the photographic industry and process scrap from the industrial sectors pushed the total recovered to levels not seen for 26 years. One sector that has remained broadly constant has been X-ray scrap, which contains more silver than consumer film. Also, its availability is not dependent on price, but on medical facilities having kept the stock for the required length of time stipulated by statutory obligations though even this source was reportedly marginally weaker in 2016.
(million ounces) 2007 2008 2009 2010 2011 2012 2013 2014 2015 2016
Other Countries 1.2 1.2 1.3 1.5 1.7 1.6 1.3 0.8 0.7 0.7
Total Asia 83.4 78.7 82.3 92.0 100.6 99.7 75.9 66.4 49.3 46.8
Africa
Egypt 1.5 1.6 1.4 1.4 0.7 0.8 0.7 0.6 0.6 0.6
Morocco 0.5 0.4 0.5 0.5 0.5 0.5 0.6 0.4 0.4 0.4
Other Countries 0.6 0.6 0.6 0.7 0.7 0.7 0.6 0.6 0.6 0.6
Total Africa 2.6 2.6 2.5 2.6 1.9 2.0 1.8 1.6 1.5 1.6
Oceania
Australia 1.7 1.6 1.6 1.6 1.6 1.4 1.3 1.2 1.1 1.1
Total Oceania 1.7 1.6 1.6 1.6 1.6 1.4 1.3 1.2 1.1 1.1
WorldTotal 203.7 200.4 200.1 226.4 260.1 253.8 191.0 165.3 141.1 139.7
© GFMS, Thomson Reuters / The Silver Institute
TABLE 4 - SUPPLY OF SILVER FROM THE RECYCLING OF OLD SCRAP
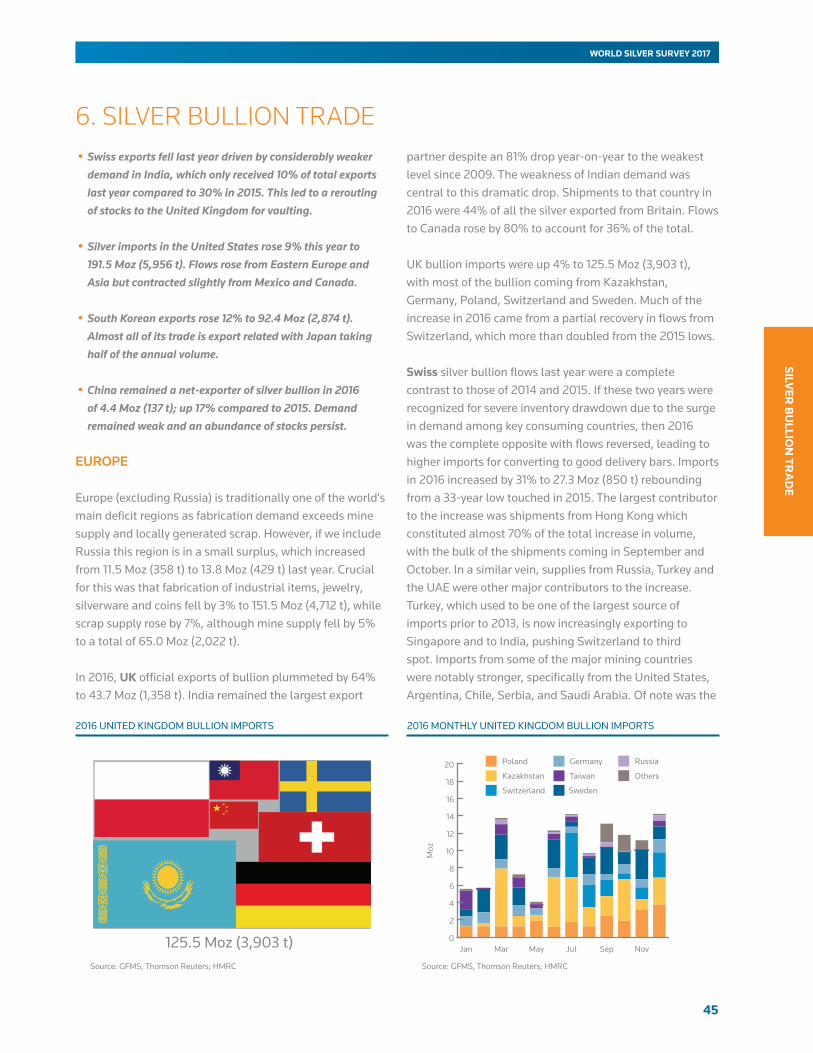
45
SILVER
BU
LLION
TRA
DE
WORLD SILVER SURVEY 2017
6. SILVER BULLION TRADE •Swiss exports fell last year driven by considerably weaker
demand in India, which only received 10% of total exports last year compared to 30% in 2015. This led to a rerouting of stocks to the United Kingdom for vaulting.
•Silver imports in the United States rose 9% this year to 191.5 Moz (5,956 t). Flows rose from Eastern Europe and Asia but contracted slightly from Mexico and Canada.
•South Korean exports rose 12% to 92.4 Moz (2,874 t). Almost all of its trade is export related with Japan taking half of the annual volume.
•China remained a net-exporter of silver bullion in 2016 of 4.4 Moz (137 t); up 17% compared to 2015. Demand remained weak and an abundance of stocks persist.
EUROPE
Europe (excluding Russia) is traditionally one of the world’s main deficit regions as fabrication demand exceeds mine supply and locally generated scrap. However, if we include Russia this region is in a small surplus, which increased from 11.5 Moz (358 t) to 13.8 Moz (429 t) last year. Crucial for this was that fabrication of industrial items, jewelry, silverware and coins fell by 3% to 151.5 Moz (4,712 t), while scrap supply rose by 7%, although mine supply fell by 5% to a total of 65.0 Moz (2,022 t).
In 2016, UK official exports of bullion plummeted by 64% to 43.7 Moz (1,358 t). India remained the largest export
partner despite an 81% drop year-on-year to the weakest level since 2009. The weakness of Indian demand was central to this dramatic drop. Shipments to that country in 2016 were 44% of all the silver exported from Britain. Flows to Canada rose by 80% to account for 36% of the total.
UK bullion imports were up 4% to 125.5 Moz (3,903 t), with most of the bullion coming from Kazakhstan, Germany, Poland, Switzerland and Sweden. Much of the increase in 2016 came from a partial recovery in flows from Switzerland, which more than doubled from the 2015 lows.
Swiss silver bullion flows last year were a complete contrast to those of 2014 and 2015. If these two years were recognized for severe inventory drawdown due to the surge in demand among key consuming countries, then 2016 was the complete opposite with flows reversed, leading to higher imports for converting to good delivery bars. Imports in 2016 increased by 31% to 27.3 Moz (850 t) rebounding from a 33-year low touched in 2015. The largest contributor to the increase was shipments from Hong Kong which constituted almost 70% of the total increase in volume, with the bulk of the shipments coming in September and October. In a similar vein, supplies from Russia, Turkey and the UAE were other major contributors to the increase. Turkey, which used to be one of the largest source of imports prior to 2013, is now increasingly exporting to Singapore and to India, pushing Switzerland to third spot. Imports from some of the major mining countries were notably stronger, specifically from the United States, Argentina, Chile, Serbia, and Saudi Arabia. Of note was the
2016 UNITED KINGDOM BULLION IMPORTS
0
2
4
6
8
10
12
14
16
18
20
NovSepJulMayMarJan
Moz
Source: GFMS, Thomson Reuters; HMRC
Poland
Kazakhstan
Switzerland
Germany
Sweden
Taiwan
Russia
Others
2016 MONTHLY UNITED KINGDOM BULLION IMPORTS
125.5 Moz (3,903 t)Source: GFMS, Thomson Reuters; HMRC
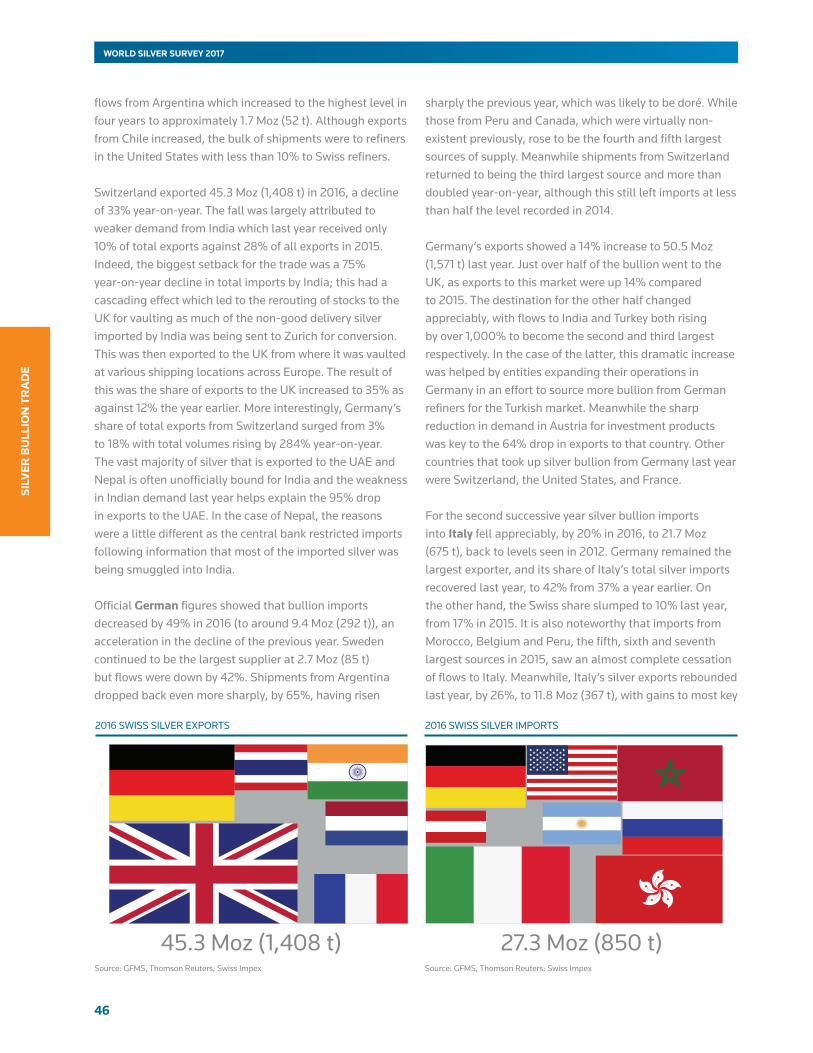
46
WORLD SILVER SURVEY 2017
SILV
ER B
ULL
ION
TR
AD
E
flows from Argentina which increased to the highest level in four years to approximately 1.7 Moz (52 t). Although exports from Chile increased, the bulk of shipments were to refiners in the United States with less than 10% to Swiss refiners.
Switzerland exported 45.3 Moz (1,408 t) in 2016, a decline of 33% year-on-year. The fall was largely attributed to weaker demand from India which last year received only 10% of total exports against 28% of all exports in 2015. Indeed, the biggest setback for the trade was a 75% year-on-year decline in total imports by India; this had a cascading effect which led to the rerouting of stocks to the UK for vaulting as much of the non-good delivery silver imported by India was being sent to Zurich for conversion. This was then exported to the UK from where it was vaulted at various shipping locations across Europe. The result of this was the share of exports to the UK increased to 35% as against 12% the year earlier. More interestingly, Germany’s share of total exports from Switzerland surged from 3% to 18% with total volumes rising by 284% year-on-year. The vast majority of silver that is exported to the UAE and Nepal is often unofficially bound for India and the weakness in Indian demand last year helps explain the 95% drop in exports to the UAE. In the case of Nepal, the reasons were a little different as the central bank restricted imports following information that most of the imported silver was being smuggled into India.
Official German figures showed that bullion imports decreased by 49% in 2016 (to around 9.4 Moz (292 t)), an acceleration in the decline of the previous year. Sweden continued to be the largest supplier at 2.7 Moz (85 t) but flows were down by 42%. Shipments from Argentina dropped back even more sharply, by 65%, having risen
sharply the previous year, which was likely to be doré. While those from Peru and Canada, which were virtually non-existent previously, rose to be the fourth and fifth largest sources of supply. Meanwhile shipments from Switzerland returned to being the third largest source and more than doubled year-on-year, although this still left imports at less than half the level recorded in 2014.
Germany’s exports showed a 14% increase to 50.5 Moz (1,571 t) last year. Just over half of the bullion went to the UK, as exports to this market were up 14% compared to 2015. The destination for the other half changed appreciably, with flows to India and Turkey both rising by over 1,000% to become the second and third largest respectively. In the case of the latter, this dramatic increase was helped by entities expanding their operations in Germany in an effort to source more bullion from German refiners for the Turkish market. Meanwhile the sharp reduction in demand in Austria for investment products was key to the 64% drop in exports to that country. Other countries that took up silver bullion from Germany last year were Switzerland, the United States, and France.
For the second successive year silver bullion imports into Italy fell appreciably, by 20% in 2016, to 21.7 Moz (675 t), back to levels seen in 2012. Germany remained the largest exporter, and its share of Italy’s total silver imports recovered last year, to 42% from 37% a year earlier. On the other hand, the Swiss share slumped to 10% last year, from 17% in 2015. It is also noteworthy that imports from Morocco, Belgium and Peru, the fifth, sixth and seventh largest sources in 2015, saw an almost complete cessation of flows to Italy. Meanwhile, Italy’s silver exports rebounded last year, by 26%, to 11.8 Moz (367 t), with gains to most key
2016 SWISS SILVER IMPORTS2016 SWISS SILVER EXPORTS
45.3 Moz (1,408 t)Source: GFMS, Thomson Reuters; Swiss Impex
27.3 Moz (850 t)Source: GFMS, Thomson Reuters; Swiss Impex
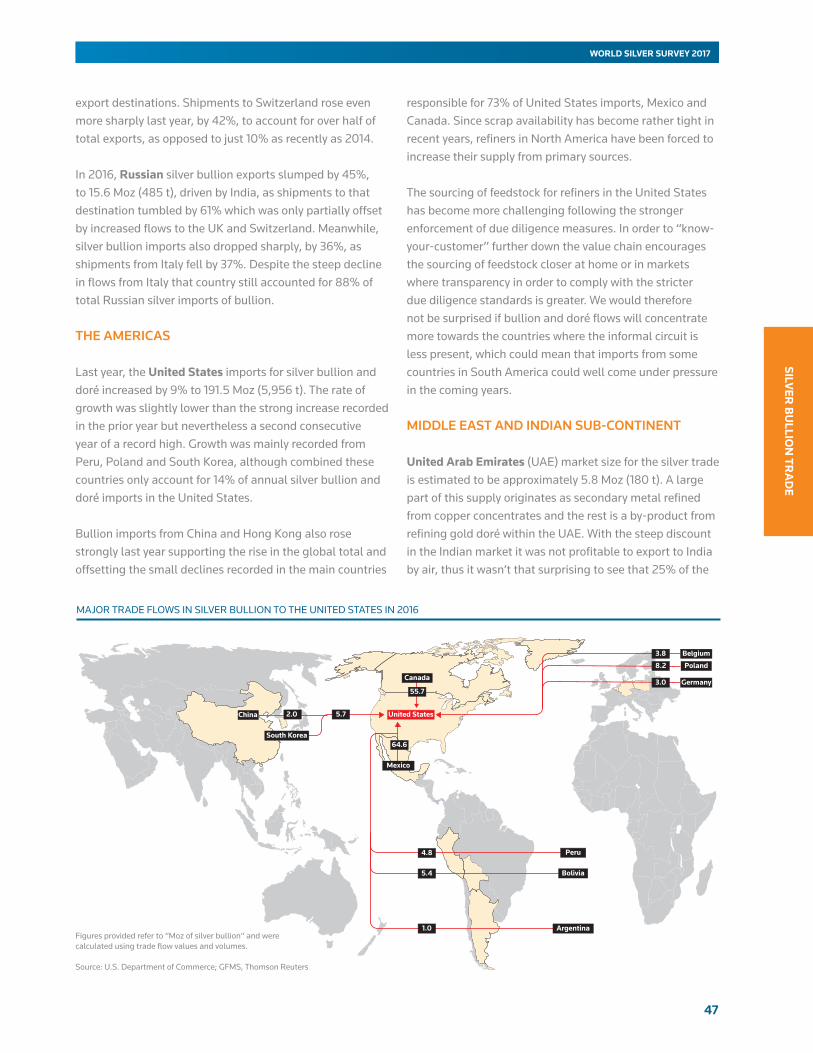
47
SILVER
BU
LLION
TRA
DE
WORLD SILVER SURVEY 2017
export destinations. Shipments to Switzerland rose even more sharply last year, by 42%, to account for over half of total exports, as opposed to just 10% as recently as 2014.
In 2016, Russian silver bullion exports slumped by 45%, to 15.6 Moz (485 t), driven by India, as shipments to that destination tumbled by 61% which was only partially offset by increased flows to the UK and Switzerland. Meanwhile, silver bullion imports also dropped sharply, by 36%, as shipments from Italy fell by 37%. Despite the steep decline in flows from Italy that country still accounted for 88% of total Russian silver imports of bullion.
THE AMERICAS
Last year, the UnitedStates imports for silver bullion and doré increased by 9% to 191.5 Moz (5,956 t). The rate of growth was slightly lower than the strong increase recorded in the prior year but nevertheless a second consecutive year of a record high. Growth was mainly recorded from Peru, Poland and South Korea, although combined these countries only account for 14% of annual silver bullion and doré imports in the United States.
Bullion imports from China and Hong Kong also rose strongly last year supporting the rise in the global total and offsetting the small declines recorded in the main countries
responsible for 73% of United States imports, Mexico and Canada. Since scrap availability has become rather tight in recent years, refiners in North America have been forced to increase their supply from primary sources.
The sourcing of feedstock for refiners in the United States has become more challenging following the stronger enforcement of due diligence measures. In order to “know-your-customer” further down the value chain encourages the sourcing of feedstock closer at home or in markets where transparency in order to comply with the stricter due diligence standards is greater. We would therefore not be surprised if bullion and doré flows will concentrate more towards the countries where the informal circuit is less present, which could mean that imports from some countries in South America could well come under pressure in the coming years.
MIDDLE EAST AND INDIAN SUB-CONTINENT
UnitedArabEmirates (UAE) market size for the silver trade is estimated to be approximately 5.8 Moz (180 t). A large part of this supply originates as secondary metal refined from copper concentrates and the rest is a by-product from refining gold doré within the UAE. With the steep discount in the Indian market it was not profitable to export to India by air, thus it wasn’t that surprising to see that 25% of the
United States
Mexico
64.6
Canada
55.7
South Korea
5.7
Peru4.8
Argentina1.0
Bolivia5.4
China 2.0
Belgium3.8
Germany3.0
8.2 Poland
MAJOR TRADE FLOWS IN SILVER BULLION TO THE UNITED STATES IN 2016
Figures provided refer to “Moz of silver bullion“ and were calculated using trade flow values and volumes.
Source: U.S. Department of Commerce; GFMS, Thomson Reuters
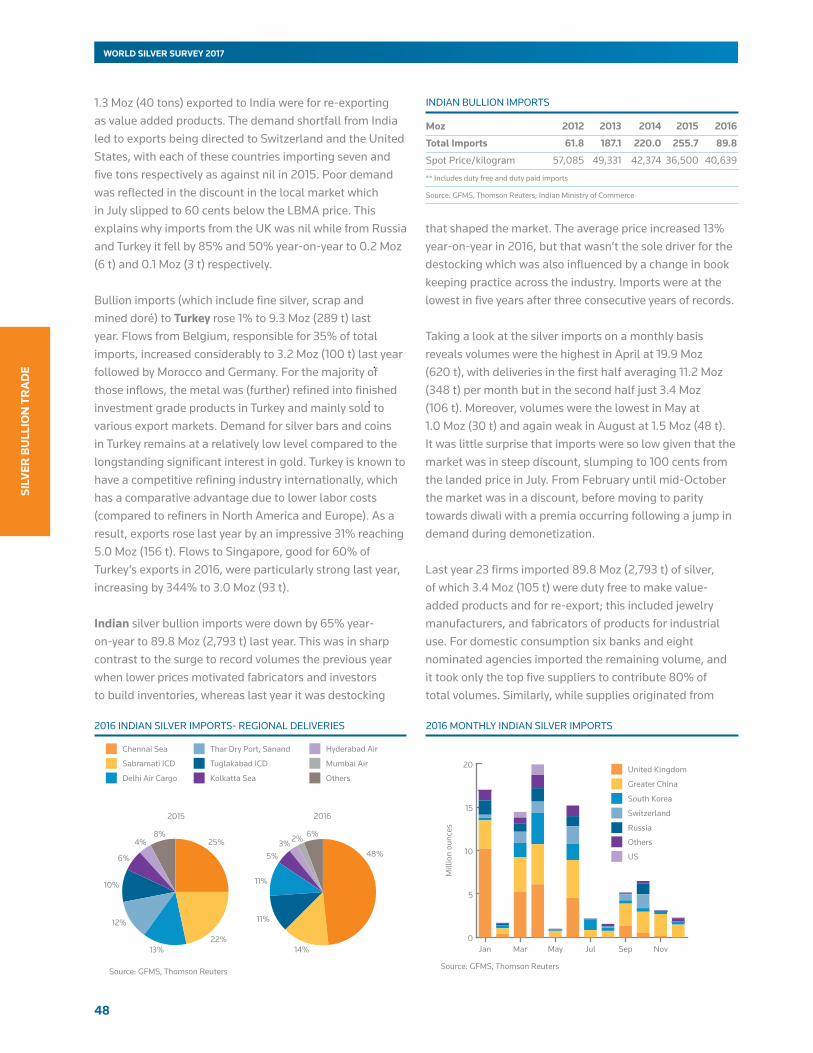
48
WORLD SILVER SURVEY 2017
SILV
ER B
ULL
ION
TR
AD
E
Source: GFMS, Thomson Reuters
25%
22%
10%
8%
2015
4%
6%
12%
13%
48%
14%
11%
6%
2016
3%5%
11%
2%
Chennai Sea
Sabramati ICD
Delhi Air Cargo
Thar Dry Port, Sanand
Tuglakabad ICD
Kolkatta Sea
Hyderabad Air
Mumbai Air
Others
0
5
10
15
20
NovSepJulMayMarJan
Mill
ion
ounc
es
Source: GFMS, Thomson Reuters
United Kingdom
Greater China
South Korea
Switzerland
Russia
Others
US
2016 INDIAN SILVER IMPORTS- REGIONAL DELIVERIES 2016 MONTHLY INDIAN SILVER IMPORTS
1.3 Moz (40 tons) exported to India were for re-exporting as value added products. The demand shortfall from India led to exports being directed to Switzerland and the United States, with each of these countries importing seven and five tons respectively as against nil in 2015. Poor demand was reflected in the discount in the local market which in July slipped to 60 cents below the LBMA price. This explains why imports from the UK was nil while from Russia and Turkey it fell by 85% and 50% year-on-year to 0.2 Moz (6 t) and 0.1 Moz (3 t) respectively.
Bullion imports (which include fine silver, scrap and mined doré) to Turkey rose 1% to 9.3 Moz (289 t) last year. Flows from Belgium, responsible for 35% of total imports, increased considerably to 3.2 Moz (100 t) last year followed by Morocco and Germany. For the majority of those inflows, the metal was (further) refined into finished investment grade products in Turkey and mainly sold to various export markets. Demand for silver bars and coins in Turkey remains at a relatively low level compared to the longstanding significant interest in gold. Turkey is known to have a competitive refining industry internationally, which has a comparative advantage due to lower labor costs (compared to refiners in North America and Europe). As a result, exports rose last year by an impressive 31% reaching 5.0 Moz (156 t). Flows to Singapore, good for 60% of Turkey’s exports in 2016, were particularly strong last year, increasing by 344% to 3.0 Moz (93 t).
Indian silver bullion imports were down by 65% year-on-year to 89.8 Moz (2,793 t) last year. This was in sharp contrast to the surge to record volumes the previous year when lower prices motivated fabricators and investors to build inventories, whereas last year it was destocking
that shaped the market. The average price increased 13% year-on-year in 2016, but that wasn’t the sole driver for the destocking which was also influenced by a change in book keeping practice across the industry. Imports were at the lowest in five years after three consecutive years of records.
Taking a look at the silver imports on a monthly basis reveals volumes were the highest in April at 19.9 Moz (620 t), with deliveries in the first half averaging 11.2 Moz (348 t) per month but in the second half just 3.4 Moz (106 t). Moreover, volumes were the lowest in May at 1.0 Moz (30 t) and again weak in August at 1.5 Moz (48 t). It was little surprise that imports were so low given that the market was in steep discount, slumping to 100 cents from the landed price in July. From February until mid-October the market was in a discount, before moving to parity towards diwali with a premia occurring following a jump in demand during demonetization.
Last year 23 firms imported 89.8 Moz (2,793 t) of silver, of which 3.4 Moz (105 t) were duty free to make value-added products and for re-export; this included jewelry manufacturers, and fabricators of products for industrial use. For domestic consumption six banks and eight nominated agencies imported the remaining volume, and it took only the top five suppliers to contribute 80% of total volumes. Similarly, while supplies originated from
INDIAN BULLION IMPORTS
Moz 2012 2013 2014 2015 2016
TotalImports 61.8 187.1 220.0 255.7 89.8
Spot Price/kilogram 57,085 49,331 42,374 36,500 40,639
** Includes duty free and duty paid imports
Source: GFMS, Thomson Reuters; Indian Ministry of Commerce
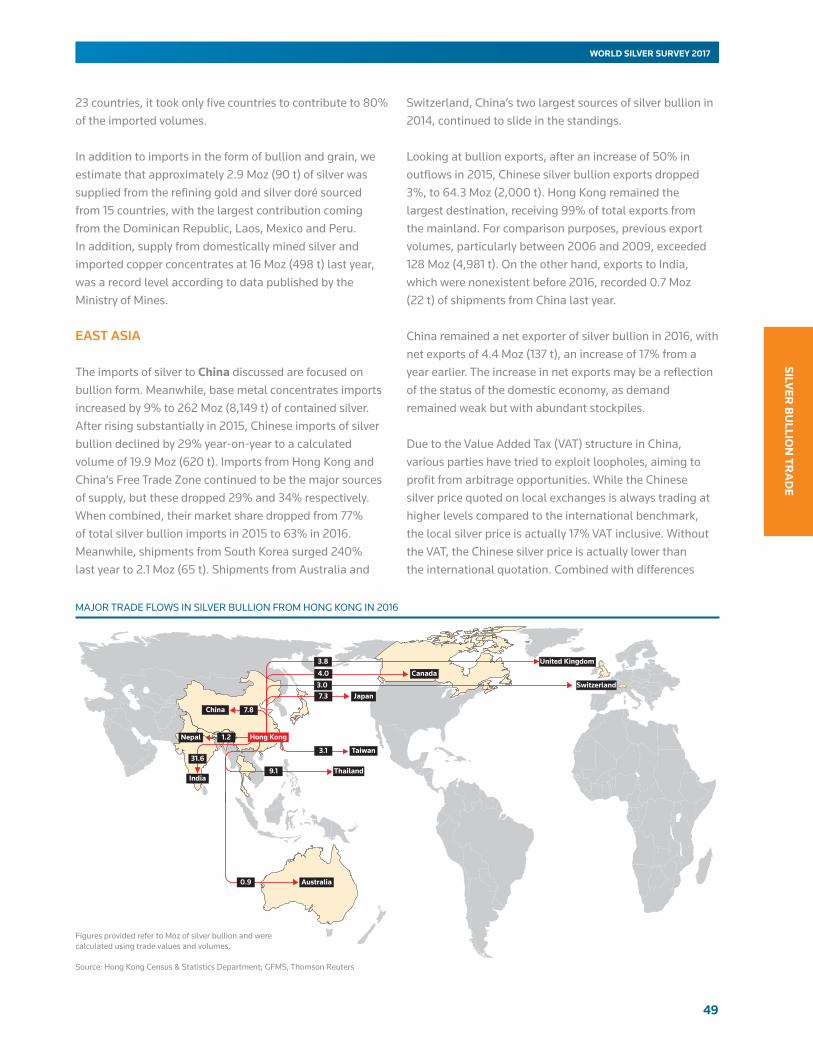
49
SILVER
BU
LLION
TRA
DE
WORLD SILVER SURVEY 2017
23 countries, it took only five countries to contribute to 80% of the imported volumes.
In addition to imports in the form of bullion and grain, we estimate that approximately 2.9 Moz (90 t) of silver was supplied from the refining gold and silver doré sourced from 15 countries, with the largest contribution coming from the Dominican Republic, Laos, Mexico and Peru. In addition, supply from domestically mined silver and imported copper concentrates at 16 Moz (498 t) last year, was a record level according to data published by the Ministry of Mines.
EAST ASIA
The imports of silver to China discussed are focused on bullion form. Meanwhile, base metal concentrates imports increased by 9% to 262 Moz (8,149 t) of contained silver. After rising substantially in 2015, Chinese imports of silver bullion declined by 29% year-on-year to a calculated volume of 19.9 Moz (620 t). Imports from Hong Kong and China’s Free Trade Zone continued to be the major sources of supply, but these dropped 29% and 34% respectively. When combined, their market share dropped from 77% of total silver bullion imports in 2015 to 63% in 2016. Meanwhile, shipments from South Korea surged 240% last year to 2.1 Moz (65 t). Shipments from Australia and
Switzerland, China’s two largest sources of silver bullion in 2014, continued to slide in the standings.
Looking at bullion exports, after an increase of 50% in outflows in 2015, Chinese silver bullion exports dropped 3%, to 64.3 Moz (2,000 t). Hong Kong remained the largest destination, receiving 99% of total exports from the mainland. For comparison purposes, previous export volumes, particularly between 2006 and 2009, exceeded 128 Moz (4,981 t). On the other hand, exports to India, which were nonexistent before 2016, recorded 0.7 Moz (22 t) of shipments from China last year.
China remained a net exporter of silver bullion in 2016, with net exports of 4.4 Moz (137 t), an increase of 17% from a year earlier. The increase in net exports may be a reflection of the status of the domestic economy, as demand remained weak but with abundant stockpiles.
Due to the Value Added Tax (VAT) structure in China, various parties have tried to exploit loopholes, aiming to profit from arbitrage opportunities. While the Chinese silver price quoted on local exchanges is always trading at higher levels compared to the international benchmark, the local silver price is actually 17% VAT inclusive. Without the VAT, the Chinese silver price is actually lower than the international quotation. Combined with differences
India
China
Taiwan
7.8
3.131.6
Japan7.3
Nepal 1.2
Canada4.0
Australia0.9
Hong Kong
3.8
3.0
United Kingdom
Switzerland
Thailand9.1
MAJOR TRADE FLOWS IN SILVER BULLION FROM HONG KONG IN 2016
Figures provided refer to Moz of silver bullion and were calculated using trade values and volumes.
Source: Hong Kong Census & Statistics Department; GFMS, Thomson Reuters
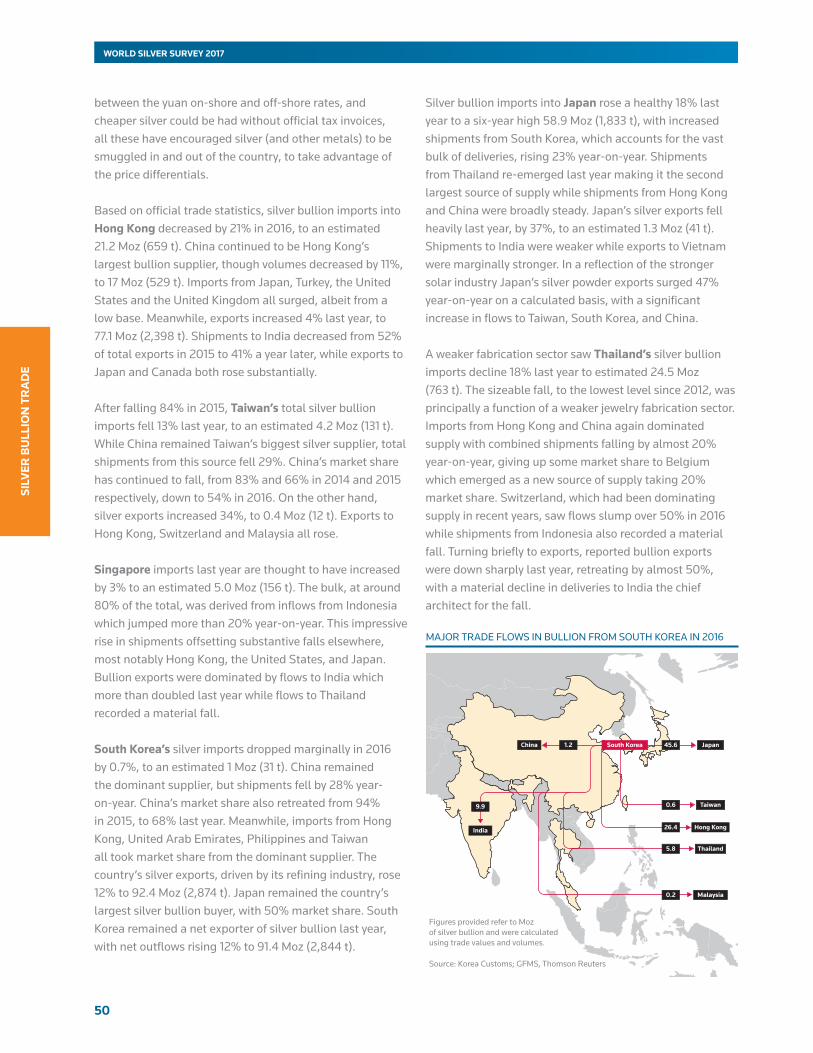
50
WORLD SILVER SURVEY 2017
SILV
ER B
ULL
ION
TR
AD
E
between the yuan on-shore and off-shore rates, and cheaper silver could be had without official tax invoices, all these have encouraged silver (and other metals) to be smuggled in and out of the country, to take advantage of the price differentials.
Based on official trade statistics, silver bullion imports into HongKong decreased by 21% in 2016, to an estimated 21.2 Moz (659 t). China continued to be Hong Kong’s largest bullion supplier, though volumes decreased by 11%, to 17 Moz (529 t). Imports from Japan, Turkey, the United States and the United Kingdom all surged, albeit from a low base. Meanwhile, exports increased 4% last year, to 77.1 Moz (2,398 t). Shipments to India decreased from 52% of total exports in 2015 to 41% a year later, while exports to Japan and Canada both rose substantially.
After falling 84% in 2015, Taiwan’s total silver bullion imports fell 13% last year, to an estimated 4.2 Moz (131 t). While China remained Taiwan’s biggest silver supplier, total shipments from this source fell 29%. China’s market share has continued to fall, from 83% and 66% in 2014 and 2015 respectively, down to 54% in 2016. On the other hand, silver exports increased 34%, to 0.4 Moz (12 t). Exports to Hong Kong, Switzerland and Malaysia all rose.
Singaporeimports last year are thought to have increased by 3% to an estimated 5.0 Moz (156 t). The bulk, at around 80% of the total, was derived from inflows from Indonesia which jumped more than 20% year-on-year. This impressive rise in shipments offsetting substantive falls elsewhere, most notably Hong Kong, the United States, and Japan. Bullion exports were dominated by flows to India which more than doubled last year while flows to Thailand recorded a material fall.
SouthKorea’s silver imports dropped marginally in 2016 by 0.7%, to an estimated 1 Moz (31 t). China remained the dominant supplier, but shipments fell by 28% year-on-year. China’s market share also retreated from 94% in 2015, to 68% last year. Meanwhile, imports from Hong Kong, United Arab Emirates, Philippines and Taiwan all took market share from the dominant supplier. The country’s silver exports, driven by its refining industry, rose 12% to 92.4 Moz (2,874 t). Japan remained the country’s largest silver bullion buyer, with 50% market share. South Korea remained a net exporter of silver bullion last year, with net outflows rising 12% to 91.4 Moz (2,844 t).
Silver bullion imports into Japan rose a healthy 18% last year to a six-year high 58.9 Moz (1,833 t), with increased shipments from South Korea, which accounts for the vast bulk of deliveries, rising 23% year-on-year. Shipments from Thailand re-emerged last year making it the second largest source of supply while shipments from Hong Kong and China were broadly steady. Japan’s silver exports fell heavily last year, by 37%, to an estimated 1.3 Moz (41 t). Shipments to India were weaker while exports to Vietnam were marginally stronger. In a reflection of the stronger solar industry Japan’s silver powder exports surged 47% year-on-year on a calculated basis, with a significant increase in flows to Taiwan, South Korea, and China.
A weaker fabrication sector saw Thailand’ssilver bullion imports decline 18% last year to estimated 24.5 Moz (763 t). The sizeable fall, to the lowest level since 2012, was principally a function of a weaker jewelry fabrication sector. Imports from Hong Kong and China again dominated supply with combined shipments falling by almost 20% year-on-year, giving up some market share to Belgium which emerged as a new source of supply taking 20% market share. Switzerland, which had been dominating supply in recent years, saw flows slump over 50% in 2016 while shipments from Indonesia also recorded a material fall. Turning briefly to exports, reported bullion exports were down sharply last year, retreating by almost 50%, with a material decline in deliveries to India the chief architect for the fall.
Japan
26.4 Hong Kong
9.9
India
5.8 Thailand
0.6 Taiwan
0.2 Malaysia
1.2China South Korea 45.6
Source: Korea Customs; GFMS, Thomson Reuters
Figures provided refer to Mozof silver bullion and were calculatedusing trade values and volumes.
MAJOR TRADE FLOWS IN BULLION FROM SOUTH KOREA IN 2016
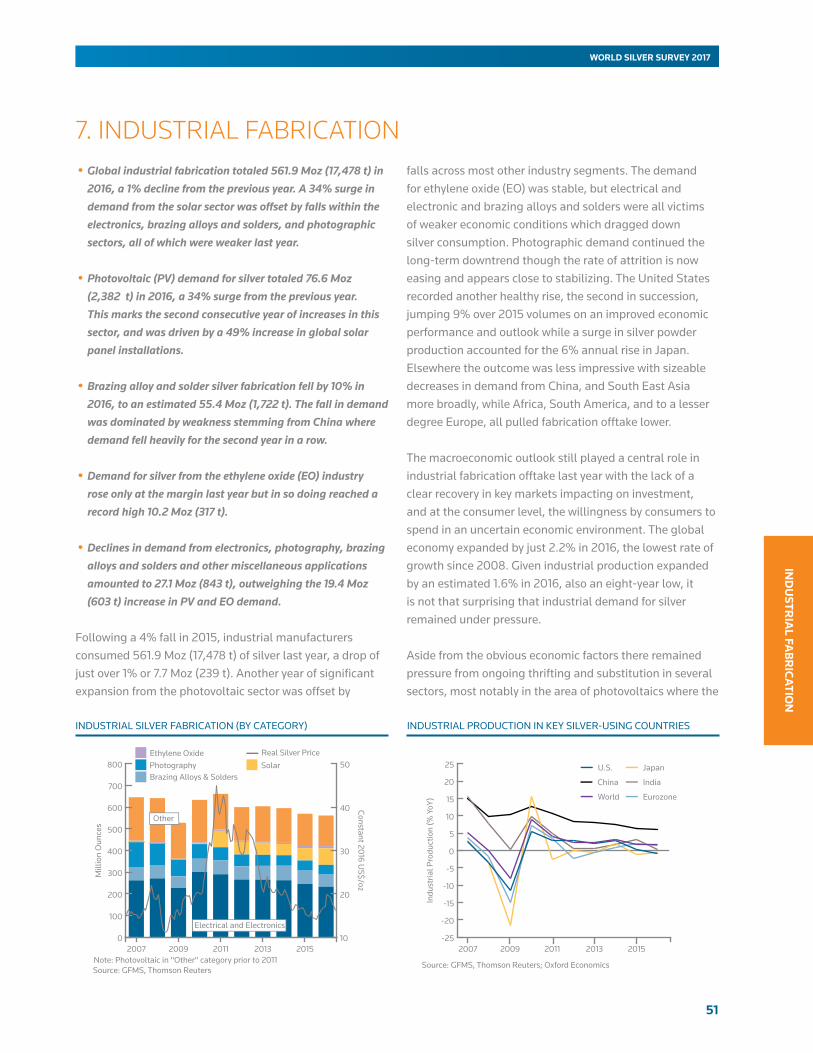
51
IND
USTR
IAL FA
BR
ICA
TION
WORLD SILVER SURVEY 2017
7. INDUSTRIAL FABRICATION •Global industrial fabrication totaled 561.9 Moz (17,478 t) in
2016, a 1% decline from the previous year. A 34% surge in demand from the solar sector was offset by falls within the electronics, brazing alloys and solders, and photographic sectors, all of which were weaker last year.
•Photovoltaic (PV) demand for silver totaled 76.6 Moz (2,382 t) in 2016, a 34% surge from the previous year. This marks the second consecutive year of increases in this sector, and was driven by a 49% increase in global solar panel installations.
•Brazing alloy and solder silver fabrication fell by 10% in 2016, to an estimated 55.4 Moz (1,722 t). The fall in demand was dominated by weakness stemming from China where demand fell heavily for the second year in a row.
•Demand for silver from the ethylene oxide (EO) industry rose only at the margin last year but in so doing reached a record high 10.2 Moz (317 t).
•Declines in demand from electronics, photography, brazing alloys and solders and other miscellaneous applications amounted to 27.1 Moz (843 t), outweighing the 19.4 Moz (603 t) increase in PV and EO demand.
Following a 4% fall in 2015, industrial manufacturers consumed 561.9 Moz (17,478 t) of silver last year, a drop of just over 1% or 7.7 Moz (239 t). Another year of significant expansion from the photovoltaic sector was offset by
falls across most other industry segments. The demand for ethylene oxide (EO) was stable, but electrical and electronic and brazing alloys and solders were all victims of weaker economic conditions which dragged down silver consumption. Photographic demand continued the long-term downtrend though the rate of attrition is now easing and appears close to stabilizing. The United States recorded another healthy rise, the second in succession, jumping 9% over 2015 volumes on an improved economic performance and outlook while a surge in silver powder production accounted for the 6% annual rise in Japan. Elsewhere the outcome was less impressive with sizeable decreases in demand from China, and South East Asia more broadly, while Africa, South America, and to a lesser degree Europe, all pulled fabrication offtake lower.
The macroeconomic outlook still played a central role in industrial fabrication offtake last year with the lack of a clear recovery in key markets impacting on investment, and at the consumer level, the willingness by consumers to spend in an uncertain economic environment. The global economy expanded by just 2.2% in 2016, the lowest rate of growth since 2008. Given industrial production expanded by an estimated 1.6% in 2016, also an eight-year low, it is not that surprising that industrial demand for silver remained under pressure.
Aside from the obvious economic factors there remained pressure from ongoing thrifting and substitution in several sectors, most notably in the area of photovoltaics where the
INDUSTRIAL SILVER FABRICATION (BY CATEGORY)
0
100
200
300
400
500
600
700
800
20152013201120092007
Mill
ion
Oun
ces
10
20
30
40
50
Constant 2016 US$/oz
Source: GFMS, Thomson Reuters
Electrical and Electronics
Other
Brazing Alloys & Solders Photography Ethylene Oxide
Real Silver Price
Note: Photovoltaic in "Other" category prior to 2011
Solar
INDUSTRIAL PRODUCTION IN KEY SILVER-USING COUNTRIES
-25
-20
-15
-10
-5
0
5
10
15
20
25
20152013201120092007
Indu
stria
l Pro
duct
ion
(% Y
oY)
Source: GFMS, Thomson Reuters; Oxford Economics
U.S.
World
China
Japan
India
Eurozone
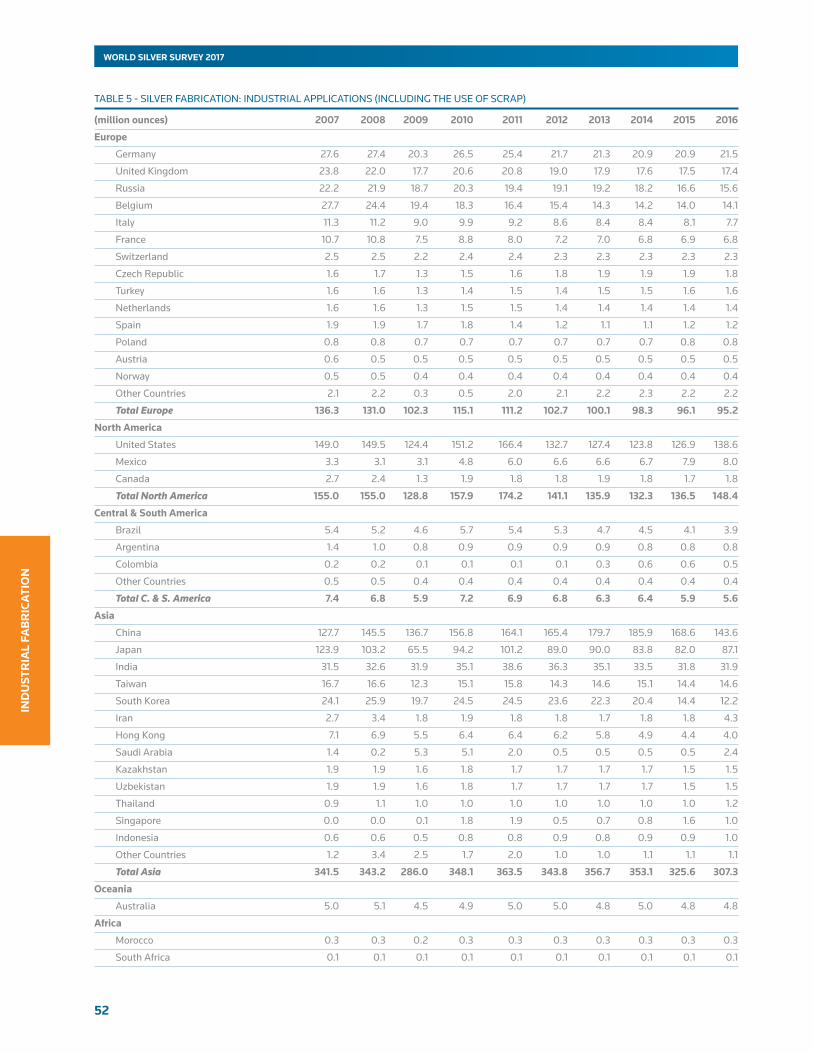
52
WORLD SILVER SURVEY 2017
IND
UST
RIA
L FA
BR
ICA
TIO
N
TABLE 5 - SILVER FABRICATION: INDUSTRIAL APPLICATIONS (INCLUDING THE USE OF SCRAP)
(millionounces) 2007 2008 2009 2010 2011 2012 2013 2014 2015 2016
Europe
Germany 27.6 27.4 20.3 26.5 25.4 21.7 21.3 20.9 20.9 21.5
United Kingdom 23.8 22.0 17.7 20.6 20.8 19.0 17.9 17.6 17.5 17.4
Russia 22.2 21.9 18.7 20.3 19.4 19.1 19.2 18.2 16.6 15.6
Belgium 27.7 24.4 19.4 18.3 16.4 15.4 14.3 14.2 14.0 14.1
Italy 11.3 11.2 9.0 9.9 9.2 8.6 8.4 8.4 8.1 7.7
France 10.7 10.8 7.5 8.8 8.0 7.2 7.0 6.8 6.9 6.8
Switzerland 2.5 2.5 2.2 2.4 2.4 2.3 2.3 2.3 2.3 2.3
Czech Republic 1.6 1.7 1.3 1.5 1.6 1.8 1.9 1.9 1.9 1.8
Turkey 1.6 1.6 1.3 1.4 1.5 1.4 1.5 1.5 1.6 1.6
Netherlands 1.6 1.6 1.3 1.5 1.5 1.4 1.4 1.4 1.4 1.4
Spain 1.9 1.9 1.7 1.8 1.4 1.2 1.1 1.1 1.2 1.2
Poland 0.8 0.8 0.7 0.7 0.7 0.7 0.7 0.7 0.8 0.8
Austria 0.6 0.5 0.5 0.5 0.5 0.5 0.5 0.5 0.5 0.5
Norway 0.5 0.5 0.4 0.4 0.4 0.4 0.4 0.4 0.4 0.4
Other Countries 2.1 2.2 0.3 0.5 2.0 2.1 2.2 2.3 2.2 2.2
Total Europe 136.3 131.0 102.3 115.1 111.2 102.7 100.1 98.3 96.1 95.2
NorthAmerica
United States 149.0 149.5 124.4 151.2 166.4 132.7 127.4 123.8 126.9 138.6
Mexico 3.3 3.1 3.1 4.8 6.0 6.6 6.6 6.7 7.9 8.0
Canada 2.7 2.4 1.3 1.9 1.8 1.8 1.9 1.8 1.7 1.8
Total North America 155.0 155.0 128.8 157.9 174.2 141.1 135.9 132.3 136.5 148.4
Central&SouthAmerica
Brazil 5.4 5.2 4.6 5.7 5.4 5.3 4.7 4.5 4.1 3.9
Argentina 1.4 1.0 0.8 0.9 0.9 0.9 0.9 0.8 0.8 0.8
Colombia 0.2 0.2 0.1 0.1 0.1 0.1 0.3 0.6 0.6 0.5
Other Countries 0.5 0.5 0.4 0.4 0.4 0.4 0.4 0.4 0.4 0.4
Total C. & S. America 7.4 6.8 5.9 7.2 6.9 6.8 6.3 6.4 5.9 5.6
Asia
China 127.7 145.5 136.7 156.8 164.1 165.4 179.7 185.9 168.6 143.6
Japan 123.9 103.2 65.5 94.2 101.2 89.0 90.0 83.8 82.0 87.1
India 31.5 32.6 31.9 35.1 38.6 36.3 35.1 33.5 31.8 31.9
Taiwan 16.7 16.6 12.3 15.1 15.8 14.3 14.6 15.1 14.4 14.6
South Korea 24.1 25.9 19.7 24.5 24.5 23.6 22.3 20.4 14.4 12.2
Iran 2.7 3.4 1.8 1.9 1.8 1.8 1.7 1.8 1.8 4.3
Hong Kong 7.1 6.9 5.5 6.4 6.4 6.2 5.8 4.9 4.4 4.0
Saudi Arabia 1.4 0.2 5.3 5.1 2.0 0.5 0.5 0.5 0.5 2.4
Kazakhstan 1.9 1.9 1.6 1.8 1.7 1.7 1.7 1.7 1.5 1.5
Uzbekistan 1.9 1.9 1.6 1.8 1.7 1.7 1.7 1.7 1.5 1.5
Thailand 0.9 1.1 1.0 1.0 1.0 1.0 1.0 1.0 1.0 1.2
Singapore 0.0 0.0 0.1 1.8 1.9 0.5 0.7 0.8 1.6 1.0
Indonesia 0.6 0.6 0.5 0.8 0.8 0.9 0.8 0.9 0.9 1.0
Other Countries 1.2 3.4 2.5 1.7 2.0 1.0 1.0 1.1 1.1 1.1
Total Asia 341.5 343.2 286.0 348.1 363.5 343.8 356.7 353.1 325.6 307.3
Oceania
Australia 5.0 5.1 4.5 4.9 5.0 5.0 4.8 5.0 4.8 4.8
Africa
Morocco 0.3 0.3 0.2 0.3 0.3 0.3 0.3 0.3 0.3 0.3
South Africa 0.1 0.1 0.1 0.1 0.1 0.1 0.1 0.1 0.1 0.1

53
IND
USTR
IAL FA
BR
ICA
TION
WORLD SILVER SURVEY 2017
use of silver per cell is estimated to have been reduced a further 5% on the level seen in 2015. This is on top of even larger reductions in previous years, with silver loadings lower on average by 9% per year between 2012-15 as the industry tries to lower costs while maintaining efficiency. Elsewhere, the market segments are more mature and the bulk of substitution has already taken place. Nonetheless, silver’s use in industrial application is always under pressure as fabricators strive to reduce unit cost by using cheaper alternatives.
PV demand registered a 34% increase to a new record high and in so doing took this individual segment’s share of total industrial demand to almost 14%. This significant increase, on the back of a near 49% surge in global solar panel installations, followed a healthy 28% rise in 2015. Ethylene oxide (EO) demand was the bright spot in 2015, with demand more than doubling but demand last year increased only at the margin. Nonetheless demand from this sector reached an all time high. The photography sector continued its secular decline in silver demand for photographic film and papers. The 3% fall, however, was the slowest rate of decline since 2002. Silver demand in electrical applications recorded its sixth successive year of decline, returning to demand levels last recorded in 2009. Demand for brazing alloys and solders also fell in 2016, by 10%, also a seven-year low.
EUROPE
European silver industrial demand edged lower, by just 1%, last year to 95.2 Moz (2,960 t), posting a sixth consecutive annual fall. The drop was the best performance since the rebound in offtake in 2010 when many economies started to recover from the immediate turmoil of the global financial crisis. Indeed, the only segment of industrial fabrication of silver to see a sharper decline last year was that for ethylene oxide, the smallest component of industrial demand in Europe. Ethylene oxide demand dropped by 38% year-on-year in Europe as less new capacity was built,
particularly in Russia, which had accounted for two-thirds of silver demand from this sector in 2015.
Industrial demand from major Original Equipment Manufacturers (OEMs) in Europe started 2016 slowly whether for low, medium or high voltage applications. We believe this was largely a function of destocking. By the middle of the year demand had picked up strongly, but the relative dearth of infrastructure projects continued to be a drag on overall offtake in this area, particularly in France. One unusual characteristic in 2016 was the strength of demand for brazing alloys over the summer months when demand for this sector typically slows appreciably.
German industrial fabrication, which is the largest user in the region, climbed by 3% in 2016. Central to this was the increased electrification of automobiles requiring an increased number of connectors for example. There is also a gradual shift from gold to silver (or in some cases palladium) in these applications. However, the pace of this shift is often limited as manufacturers are hesitant to shift until they have fully tested the reliability that will exist over the lifetime of the vehicle under a wide variety of weather conditions.
TABLE 5 - SILVER FABRICATION: INDUSTRIAL APPLICATIONS (INCLUDING THE USE OF SCRAP)
(millionounces) 2007 2008 2009 2010 2011 2012 2013 2014 2015 2016
continued
Other Countries 0.3 0.3 0.3 0.3 0.3 0.3 0.3 0.3 0.3 0.3
Total Africa 0.7 0.7 0.7 0.7 0.7 0.7 0.7 0.7 0.7 0.7
WorldTotal 646.0 641.8 528.2 633.8 661.4 600.0 604.5 595.7 569.6 561.9
© GFMS, Thomson Reuters / The Silver Institute
0
20
40
60
80
100
120
140
160
20152013201120092007
Mill
ion
Oun
ces
-16
-12
-8
-4
0
4
8
12
Industrial Production (Year-on-Year % )
Source: GFMS,Thomson Reuters; Oxford Economics
Brazing Alloys & Solders
EU Industrial Production
Electrical & Electronics Ethylene Oxide
Photography
Other
EUROPE INDUSTRIAL FABRICATION
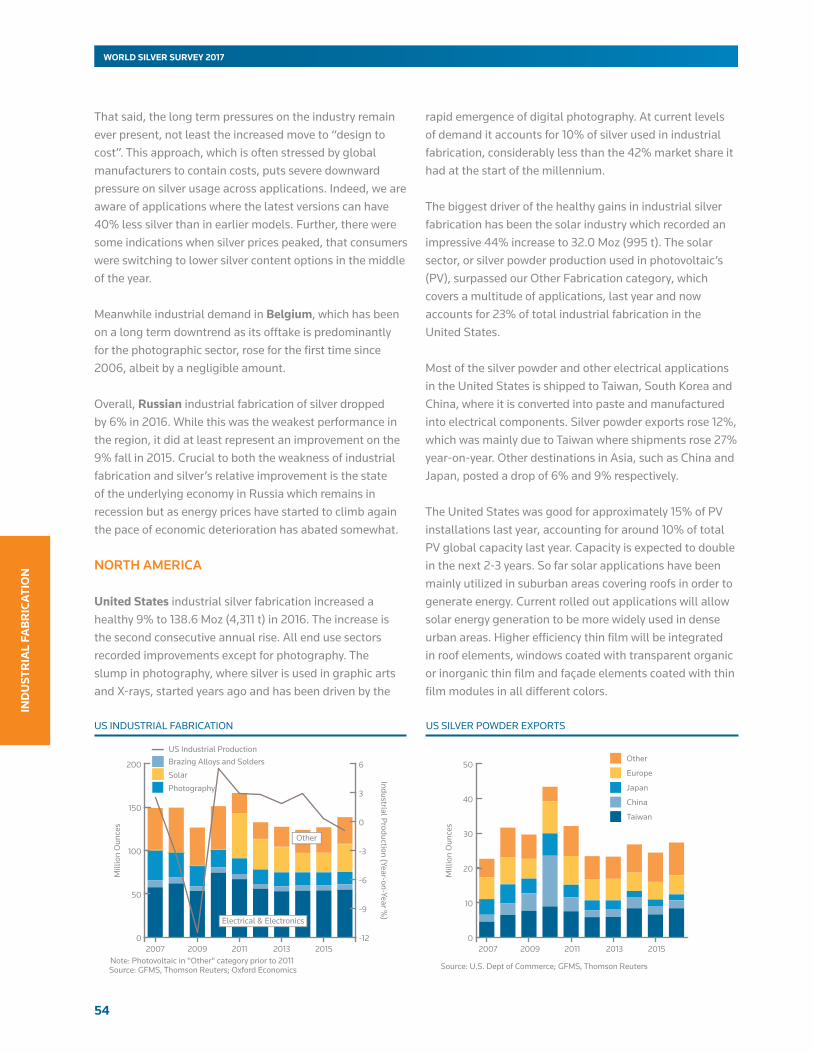
54
WORLD SILVER SURVEY 2017
IND
UST
RIA
L FA
BR
ICA
TIO
N
That said, the long term pressures on the industry remain ever present, not least the increased move to “design to cost”. This approach, which is often stressed by global manufacturers to contain costs, puts severe downward pressure on silver usage across applications. Indeed, we are aware of applications where the latest versions can have 40% less silver than in earlier models. Further, there were some indications when silver prices peaked, that consumers were switching to lower silver content options in the middle of the year.
Meanwhile industrial demand in Belgium, which has been on a long term downtrend as its offtake is predominantly for the photographic sector, rose for the first time since 2006, albeit by a negligible amount.
Overall, Russian industrial fabrication of silver dropped by 6% in 2016. While this was the weakest performance in the region, it did at least represent an improvement on the 9% fall in 2015. Crucial to both the weakness of industrial fabrication and silver’s relative improvement is the state of the underlying economy in Russia which remains in recession but as energy prices have started to climb again the pace of economic deterioration has abated somewhat.
NORTH AMERICA
UnitedStatesindustrial silver fabrication increased a healthy 9% to 138.6 Moz (4,311 t) in 2016. The increase is the second consecutive annual rise. All end use sectors recorded improvements except for photography. The slump in photography, where silver is used in graphic arts and X-rays, started years ago and has been driven by the
rapid emergence of digital photography. At current levels of demand it accounts for 10% of silver used in industrial fabrication, considerably less than the 42% market share it had at the start of the millennium.
The biggest driver of the healthy gains in industrial silver fabrication has been the solar industry which recorded an impressive 44% increase to 32.0 Moz (995 t). The solar sector, or silver powder production used in photovoltaic’s (PV), surpassed our Other Fabrication category, which covers a multitude of applications, last year and now accounts for 23% of total industrial fabrication in the United States.
Most of the silver powder and other electrical applications in the United States is shipped to Taiwan, South Korea and China, where it is converted into paste and manufactured into electrical components. Silver powder exports rose 12%, which was mainly due to Taiwan where shipments rose 27% year-on-year. Other destinations in Asia, such as China and Japan, posted a drop of 6% and 9% respectively.
The United States was good for approximately 15% of PV installations last year, accounting for around 10% of total PV global capacity last year. Capacity is expected to double in the next 2-3 years. So far solar applications have been mainly utilized in suburban areas covering roofs in order to generate energy. Current rolled out applications will allow solar energy generation to be more widely used in dense urban areas. Higher efficiency thin film will be integrated in roof elements, windows coated with transparent organic or inorganic thin film and façade elements coated with thin film modules in all different colors.
US SILVER POWDER EXPORTS
0
10
20
30
40
50
20152013201120092007
Mill
ion
Oun
ces
Source: U.S. Dept of Commerce; GFMS, Thomson Reuters
Other
Europe
Japan
China
Taiwan
0
50
100
150
200
20152013201120092007
Mill
ion
Oun
ces
Note: Photovoltaic in "Other" category prior to 2011
-12
-9
-6
-3
0
3
6
Industrial Production (Year-on-Year %)
Source: GFMS, Thomson Reuters; Oxford Economics
Electrical & Electronics
Other
Brazing Alloys and SoldersUS Industrial Production
Solar
Photography
US INDUSTRIAL FABRICATION
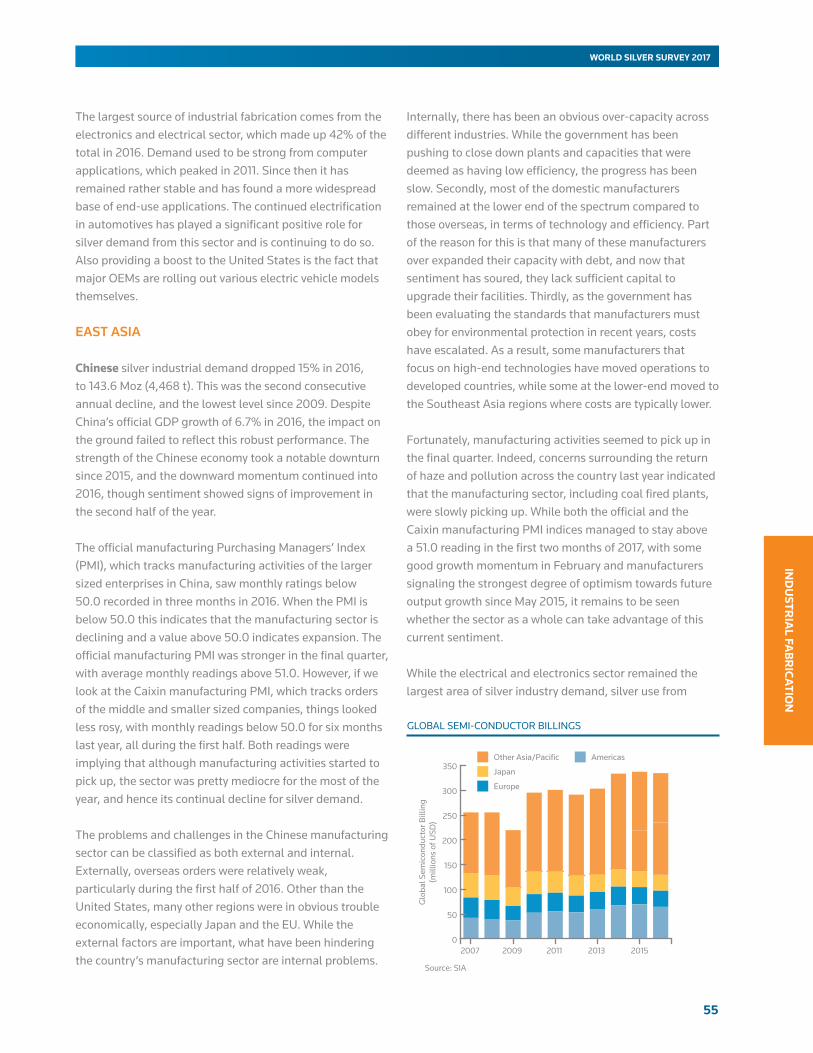
55
IND
USTR
IAL FA
BR
ICA
TION
WORLD SILVER SURVEY 2017
The largest source of industrial fabrication comes from the electronics and electrical sector, which made up 42% of the total in 2016. Demand used to be strong from computer applications, which peaked in 2011. Since then it has remained rather stable and has found a more widespread base of end-use applications. The continued electrification in automotives has played a significant positive role for silver demand from this sector and is continuing to do so. Also providing a boost to the United States is the fact that major OEMs are rolling out various electric vehicle models themselves.
EAST ASIA
Chinese silver industrial demand dropped 15% in 2016, to 143.6 Moz (4,468 t). This was the second consecutive annual decline, and the lowest level since 2009. Despite China’s official GDP growth of 6.7% in 2016, the impact on the ground failed to reflect this robust performance. The strength of the Chinese economy took a notable downturn since 2015, and the downward momentum continued into 2016, though sentiment showed signs of improvement in the second half of the year.
The official manufacturing Purchasing Managers’ Index (PMI), which tracks manufacturing activities of the larger sized enterprises in China, saw monthly ratings below 50.0 recorded in three months in 2016. When the PMI is below 50.0 this indicates that the manufacturing sector is declining and a value above 50.0 indicates expansion. The official manufacturing PMI was stronger in the final quarter, with average monthly readings above 51.0. However, if we look at the Caixin manufacturing PMI, which tracks orders of the middle and smaller sized companies, things looked less rosy, with monthly readings below 50.0 for six months last year, all during the first half. Both readings were implying that although manufacturing activities started to pick up, the sector was pretty mediocre for the most of the year, and hence its continual decline for silver demand.
The problems and challenges in the Chinese manufacturing sector can be classified as both external and internal. Externally, overseas orders were relatively weak, particularly during the first half of 2016. Other than the United States, many other regions were in obvious trouble economically, especially Japan and the EU. While the external factors are important, what have been hindering the country’s manufacturing sector are internal problems.
Internally, there has been an obvious over-capacity across different industries. While the government has been pushing to close down plants and capacities that were deemed as having low efficiency, the progress has been slow. Secondly, most of the domestic manufacturers remained at the lower end of the spectrum compared to those overseas, in terms of technology and efficiency. Part of the reason for this is that many of these manufacturers over expanded their capacity with debt, and now that sentiment has soured, they lack sufficient capital to upgrade their facilities. Thirdly, as the government has been evaluating the standards that manufacturers must obey for environmental protection in recent years, costs have escalated. As a result, some manufacturers that focus on high-end technologies have moved operations to developed countries, while some at the lower-end moved to the Southeast Asia regions where costs are typically lower.
Fortunately, manufacturing activities seemed to pick up in the final quarter. Indeed, concerns surrounding the return of haze and pollution across the country last year indicated that the manufacturing sector, including coal fired plants, were slowly picking up. While both the official and the Caixin manufacturing PMI indices managed to stay above a 51.0 reading in the first two months of 2017, with some good growth momentum in February and manufacturers signaling the strongest degree of optimism towards future output growth since May 2015, it remains to be seen whether the sector as a whole can take advantage of this current sentiment.
While the electrical and electronics sector remained the largest area of silver industry demand, silver use from
GLOBAL SEMI-CONDUCTOR BILLINGS
0
50
100
150
200
250
300
350
20152013 2011 2009 2007
Glo
bal S
emic
ondu
ctor
Bill
ing
(mill
ions
of U
SD)
Source: SIA
Other Asia/Pacific
Japan
Europe
Americas
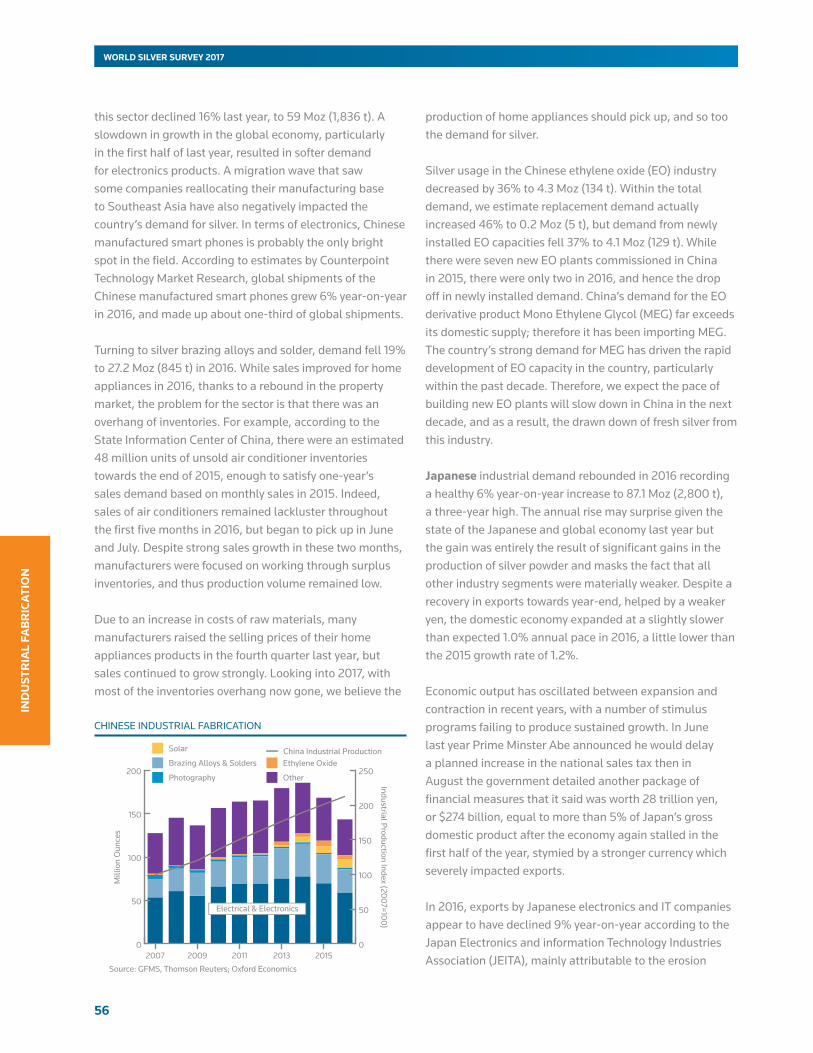
56
WORLD SILVER SURVEY 2017
IND
UST
RIA
L FA
BR
ICA
TIO
N
this sector declined 16% last year, to 59 Moz (1,836 t). A slowdown in growth in the global economy, particularly in the first half of last year, resulted in softer demand for electronics products. A migration wave that saw some companies reallocating their manufacturing base to Southeast Asia have also negatively impacted the country’s demand for silver. In terms of electronics, Chinese manufactured smart phones is probably the only bright spot in the field. According to estimates by Counterpoint Technology Market Research, global shipments of the Chinese manufactured smart phones grew 6% year-on-year in 2016, and made up about one-third of global shipments.
Turning to silver brazing alloys and solder, demand fell 19% to 27.2 Moz (845 t) in 2016. While sales improved for home appliances in 2016, thanks to a rebound in the property market, the problem for the sector is that there was an overhang of inventories. For example, according to the State Information Center of China, there were an estimated 48 million units of unsold air conditioner inventories towards the end of 2015, enough to satisfy one-year’s sales demand based on monthly sales in 2015. Indeed, sales of air conditioners remained lackluster throughout the first five months in 2016, but began to pick up in June and July. Despite strong sales growth in these two months, manufacturers were focused on working through surplus inventories, and thus production volume remained low.
Due to an increase in costs of raw materials, many manufacturers raised the selling prices of their home appliances products in the fourth quarter last year, but sales continued to grow strongly. Looking into 2017, with most of the inventories overhang now gone, we believe the
production of home appliances should pick up, and so too the demand for silver.
Silver usage in the Chinese ethylene oxide (EO) industry decreased by 36% to 4.3 Moz (134 t). Within the total demand, we estimate replacement demand actually increased 46% to 0.2 Moz (5 t), but demand from newly installed EO capacities fell 37% to 4.1 Moz (129 t). While there were seven new EO plants commissioned in China in 2015, there were only two in 2016, and hence the drop off in newly installed demand. China’s demand for the EO derivative product Mono Ethylene Glycol (MEG) far exceeds its domestic supply; therefore it has been importing MEG. The country’s strong demand for MEG has driven the rapid development of EO capacity in the country, particularly within the past decade. Therefore, we expect the pace of building new EO plants will slow down in China in the next decade, and as a result, the drawn down of fresh silver from this industry.
Japaneseindustrial demand rebounded in 2016 recording a healthy 6% year-on-year increase to 87.1 Moz (2,800 t), a three-year high. The annual rise may surprise given the state of the Japanese and global economy last year but the gain was entirely the result of significant gains in the production of silver powder and masks the fact that all other industry segments were materially weaker. Despite a recovery in exports towards year-end, helped by a weaker yen, the domestic economy expanded at a slightly slower than expected 1.0% annual pace in 2016, a little lower than the 2015 growth rate of 1.2%.
Economic output has oscillated between expansion and contraction in recent years, with a number of stimulus programs failing to produce sustained growth. In June last year Prime Minster Abe announced he would delay a planned increase in the national sales tax then in August the government detailed another package of financial measures that it said was worth 28 trillion yen, or $274 billion, equal to more than 5% of Japan’s gross domestic product after the economy again stalled in the first half of the year, stymied by a stronger currency which severely impacted exports.
In 2016, exports by Japanese electronics and IT companies appear to have declined 9% year-on-year according to the Japan Electronics and information Technology Industries Association (JEITA), mainly attributable to the erosion
CHINESE INDUSTRIAL FABRICATION
201520132011200920070
50
100
150
200
Mill
ion
Oun
ces
0
50
100
150
200
250
Industrial Production Index (2007=100)
Source: GFMS, Thomson Reuters; Oxford Economics
China Industrial Production
Electrical & Electronics
Solar
Brazing Alloys & Solders
Photography
Ethylene Oxide
Other

57
IND
USTR
IAL FA
BR
ICA
TION
WORLD SILVER SURVEY 2017
due to exchange rates and the slowing global demand for personal computers and flatscreen televisions. While there was a notable uptick in trade flows in the final months of the year, full year data was weaker, dragged lower by falls across the board. Consumer electronics equipment experienced a difficult year, slumping almost 12% in value terms, while double-digit declines were the norm for most sectors. This disappointing outcome comes on the heels of a 6% drop in exports of consumer electronics in 2015 and a 14% fall in 2014.
Turning to individual sectors’ performance, the electrical and electronics sector declined by 3% in 2016 to an estimated 29.5 Moz (918 t), the lowest level since 2010. Demand for silver, excluding the photographic industry, saw a 30% fall last year, according to Japan’s Agency of Natural Resources and Energy (ANRE), despite stronger automobile demand, offset by a sizeable drop in other industrial applications. Indeed, according the ANRE data silver demand fell in most industrial applications last year with exports weaker by 11% year-on-year. Offtake in the brazing alloys and solders sector also declined last year by an estimated 3% to 2.3 Moz (73 t) as weaker domestic demand coupled with a cooling export sector dragged silver consumed lower in these segments. Elsewhere, silver used as a catalyst during the production of ethylene oxide was unchanged with no new installations.
One area of Japanese industrial demand that moved against trend and has enjoyed rapid growth in recent years, while other segments have remained moribund by the lack of economic growth, has been silver consumption in powder production, used predominately in the photovoltaic
industry. Japanese production accounts for roughly 45% of the global total and at 34.5 Moz (1,072 t) last year jumped 26% over 2015 volumes to a new record level. The result last year was even more impressive when considering that there was an explosion and fatalities at the DOWA plant early in 2016 which effectively shut down production for a number of weeks. This industry segment has surged by almost 50% since 2012 and now accounts for 39% of total Japanese industrial production, driven higher by demand expansion for solar cell production, both on the domestic front and from the export sector. Powder exports have been buoyed by significant increases in flows to Taiwan, South Korea and China, with the latter surging by 166% last year while shipments to Hong Kong (also largely destined for the mainland) jumping by more than threefold.
The outlook for industrial demand this year is brighter with the Nikkei Flash Japan Manufacturing PMI reaching 52.6 in March, down from 53.3 in February. However, the PMI has now been above the no-change level for seven successive months, and the average reading over the first quarter is the highest since the first quarter of 2014, indicating solid growth. Stronger export demand has been supported by a relatively weak yen. However, the appreciation of the yen, up 5% against the U.S. dollar so far this year, may provide less of a competitive advantage if it persists.
JAPANESE INDUSTRIAL FABRICATION
201520132011200920070
20
40
60
80
100
120
140
160
Mill
ion
Oun
ces
-24
-20
-16
-12
-8
-4
0
4
8
12
16
20
24
Industrial Production (Year-on-Year %)
Note: Photovoltaic in “Other” category prior to 2011Source: GFMS, Thomson Reuters; Oxford Economics
Ethylene Oxide
Photography
Brazing Alloys & Solders
Japan Industrial Production
Solar
SolarElectrical & Electronics
Other
JAPANESE SILVER POWDER EXPORTS
JAPANESE NON-PHOTOGRAPHIC NITRATE & CONTACT PRODUCTION
(million ounces) 2012 2013 2014 2015 2016
Non-Photo Nitrates 1.2 1.1 1.1 1.2 0.9
Contacts 3.4 3.9 2.1 2.2 1.9
Source: GFMS, Thomson Reuters
20152013 2011 2009 2007 0
10
20
30
40
50
Mill
ion
Oun
ces
Source: GFMS, Thomson Reuters
Other
Europe
Japan
China
Taiwan
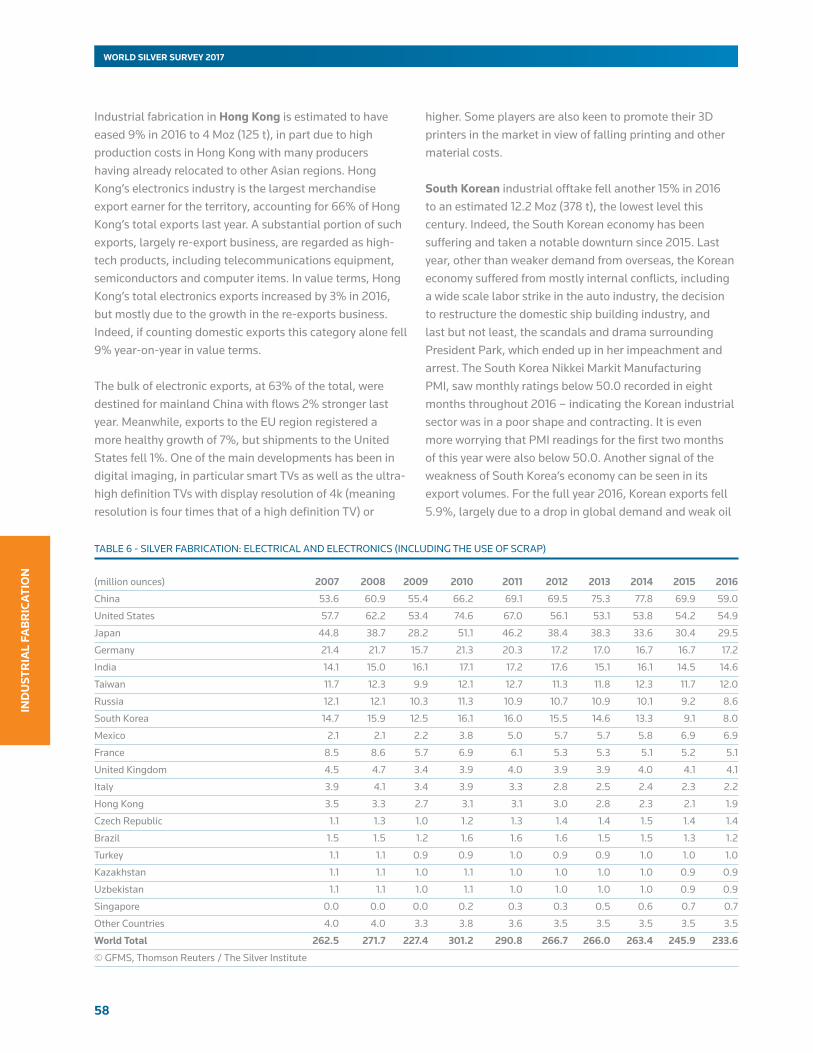
58
WORLD SILVER SURVEY 2017
IND
UST
RIA
L FA
BR
ICA
TIO
N
Industrial fabrication in HongKongis estimated to have eased 9% in 2016 to 4 Moz (125 t), in part due to high production costs in Hong Kong with many producers having already relocated to other Asian regions. Hong Kong’s electronics industry is the largest merchandise export earner for the territory, accounting for 66% of Hong Kong’s total exports last year. A substantial portion of such exports, largely re-export business, are regarded as high-tech products, including telecommunications equipment, semiconductors and computer items. In value terms, Hong Kong’s total electronics exports increased by 3% in 2016, but mostly due to the growth in the re-exports business. Indeed, if counting domestic exports this category alone fell 9% year-on-year in value terms.
The bulk of electronic exports, at 63% of the total, were destined for mainland China with flows 2% stronger last year. Meanwhile, exports to the EU region registered a more healthy growth of 7%, but shipments to the United States fell 1%. One of the main developments has been in digital imaging, in particular smart TVs as well as the ultra-high definition TVs with display resolution of 4k (meaning resolution is four times that of a high definition TV) or
higher. Some players are also keen to promote their 3D printers in the market in view of falling printing and other material costs.
SouthKorean industrial offtake fell another 15% in 2016 to an estimated 12.2 Moz (378 t), the lowest level this century. Indeed, the South Korean economy has been suffering and taken a notable downturn since 2015. Last year, other than weaker demand from overseas, the Korean economy suffered from mostly internal conflicts, including a wide scale labor strike in the auto industry, the decision to restructure the domestic ship building industry, and last but not least, the scandals and drama surrounding President Park, which ended up in her impeachment and arrest. The South Korea Nikkei Markit Manufacturing PMI, saw monthly ratings below 50.0 recorded in eight months throughout 2016 – indicating the Korean industrial sector was in a poor shape and contracting. It is even more worrying that PMI readings for the first two months of this year were also below 50.0. Another signal of the weakness of South Korea’s economy can be seen in its export volumes. For the full year 2016, Korean exports fell 5.9%, largely due to a drop in global demand and weak oil
TABLE 6 - SILVER FABRICATION: ELECTRICAL AND ELECTRONICS (INCLUDING THE USE OF SCRAP)
(million ounces) 2007 2008 2009 2010 2011 2012 2013 2014 2015 2016
China 53.6 60.9 55.4 66.2 69.1 69.5 75.3 77.8 69.9 59.0
United States 57.7 62.2 53.4 74.6 67.0 56.1 53.1 53.8 54.2 54.9
Japan 44.8 38.7 28.2 51.1 46.2 38.4 38.3 33.6 30.4 29.5
Germany 21.4 21.7 15.7 21.3 20.3 17.2 17.0 16.7 16.7 17.2
India 14.1 15.0 16.1 17.1 17.2 17.6 15.1 16.1 14.5 14.6
Taiwan 11.7 12.3 9.9 12.1 12.7 11.3 11.8 12.3 11.7 12.0
Russia 12.1 12.1 10.3 11.3 10.9 10.7 10.9 10.1 9.2 8.6
South Korea 14.7 15.9 12.5 16.1 16.0 15.5 14.6 13.3 9.1 8.0
Mexico 2.1 2.1 2.2 3.8 5.0 5.7 5.7 5.8 6.9 6.9
France 8.5 8.6 5.7 6.9 6.1 5.3 5.3 5.1 5.2 5.1
United Kingdom 4.5 4.7 3.4 3.9 4.0 3.9 3.9 4.0 4.1 4.1
Italy 3.9 4.1 3.4 3.9 3.3 2.8 2.5 2.4 2.3 2.2
Hong Kong 3.5 3.3 2.7 3.1 3.1 3.0 2.8 2.3 2.1 1.9
Czech Republic 1.1 1.3 1.0 1.2 1.3 1.4 1.4 1.5 1.4 1.4
Brazil 1.5 1.5 1.2 1.6 1.6 1.6 1.5 1.5 1.3 1.2
Turkey 1.1 1.1 0.9 0.9 1.0 0.9 0.9 1.0 1.0 1.0
Kazakhstan 1.1 1.1 1.0 1.1 1.0 1.0 1.0 1.0 0.9 0.9
Uzbekistan 1.1 1.1 1.0 1.1 1.0 1.0 1.0 1.0 0.9 0.9
Singapore 0.0 0.0 0.0 0.2 0.3 0.3 0.5 0.6 0.7 0.7
Other Countries 4.0 4.0 3.3 3.8 3.6 3.5 3.5 3.5 3.5 3.5
WorldTotal 262.5 271.7 227.4 301.2 290.8 266.7 266.0 263.4 245.9 233.6
© GFMS, Thomson Reuters / The Silver Institute
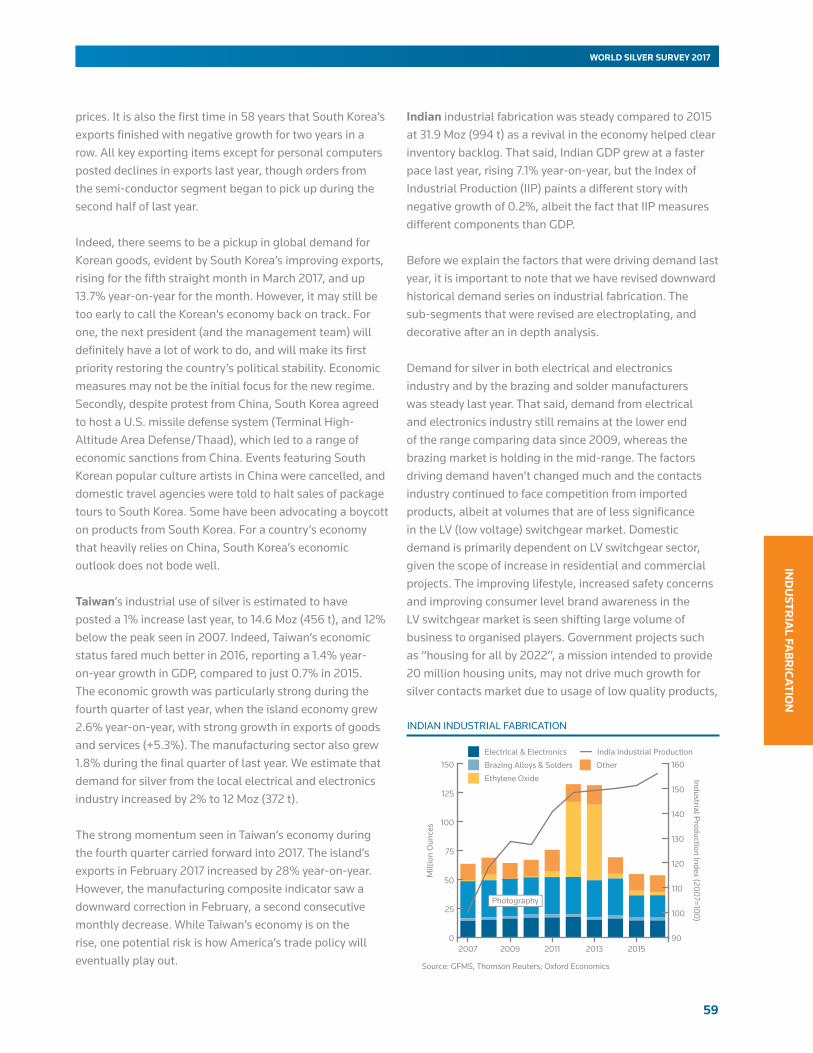
59
IND
USTR
IAL FA
BR
ICA
TION
WORLD SILVER SURVEY 2017
prices. It is also the first time in 58 years that South Korea’s exports finished with negative growth for two years in a row. All key exporting items except for personal computers posted declines in exports last year, though orders from the semi-conductor segment began to pick up during the second half of last year.
Indeed, there seems to be a pickup in global demand for Korean goods, evident by South Korea’s improving exports, rising for the fifth straight month in March 2017, and up 13.7% year-on-year for the month. However, it may still be too early to call the Korean’s economy back on track. For one, the next president (and the management team) will definitely have a lot of work to do, and will make its first priority restoring the country’s political stability. Economic measures may not be the initial focus for the new regime. Secondly, despite protest from China, South Korea agreed to host a U.S. missile defense system (Terminal High-Altitude Area Defense/Thaad), which led to a range of economic sanctions from China. Events featuring South Korean popular culture artists in China were cancelled, and domestic travel agencies were told to halt sales of package tours to South Korea. Some have been advocating a boycott on products from South Korea. For a country’s economy that heavily relies on China, South Korea’s economic outlook does not bode well.
Taiwan’s industrial use of silver is estimated to have posted a 1% increase last year, to 14.6 Moz (456 t), and 12% below the peak seen in 2007. Indeed, Taiwan’s economic status fared much better in 2016, reporting a 1.4% year-on-year growth in GDP, compared to just 0.7% in 2015. The economic growth was particularly strong during the fourth quarter of last year, when the island economy grew 2.6% year-on-year, with strong growth in exports of goods and services (+5.3%). The manufacturing sector also grew 1.8% during the final quarter of last year. We estimate that demand for silver from the local electrical and electronics industry increased by 2% to 12 Moz (372 t).
The strong momentum seen in Taiwan’s economy during the fourth quarter carried forward into 2017. The island’s exports in February 2017 increased by 28% year-on-year. However, the manufacturing composite indicator saw a downward correction in February, a second consecutive monthly decrease. While Taiwan’s economy is on the rise, one potential risk is how America’s trade policy will eventually play out.
Indian industrial fabrication was steady compared to 2015 at 31.9 Moz (994 t) as a revival in the economy helped clear inventory backlog. That said, Indian GDP grew at a faster pace last year, rising 7.1% year-on-year, but the Index of Industrial Production (IIP) paints a different story with negative growth of 0.2%, albeit the fact that IIP measures different components than GDP.
Before we explain the factors that were driving demand last year, it is important to note that we have revised downward historical demand series on industrial fabrication. The sub-segments that were revised are electroplating, and decorative after an in depth analysis.
Demand for silver in both electrical and electronics industry and by the brazing and solder manufacturers was steady last year. That said, demand from electrical and electronics industry still remains at the lower end of the range comparing data since 2009, whereas the brazing market is holding in the mid-range. The factors driving demand haven’t changed much and the contacts industry continued to face competition from imported products, albeit at volumes that are of less significance in the LV (low voltage) switchgear market. Domestic demand is primarily dependent on LV switchgear sector, given the scope of increase in residential and commercial projects. The improving lifestyle, increased safety concerns and improving consumer level brand awareness in the LV switchgear market is seen shifting large volume of business to organised players. Government projects such as “housing for all by 2022”, a mission intended to provide 20 million housing units, may not drive much growth for silver contacts market due to usage of low quality products,
INDIAN INDUSTRIAL FABRICATION
201520132011200920070
25
50
75
100
125
150
Mill
ion
Oun
ces
90
100
110
120
130
140
150
160
Industrial Production Index (2007=100)
Source: GFMS, Thomson Reuters; Oxford Economics
Electrical & Electronics
Brazing Alloys & Solders
India Industrial Production
Photography
Ethylene Oxide
Other
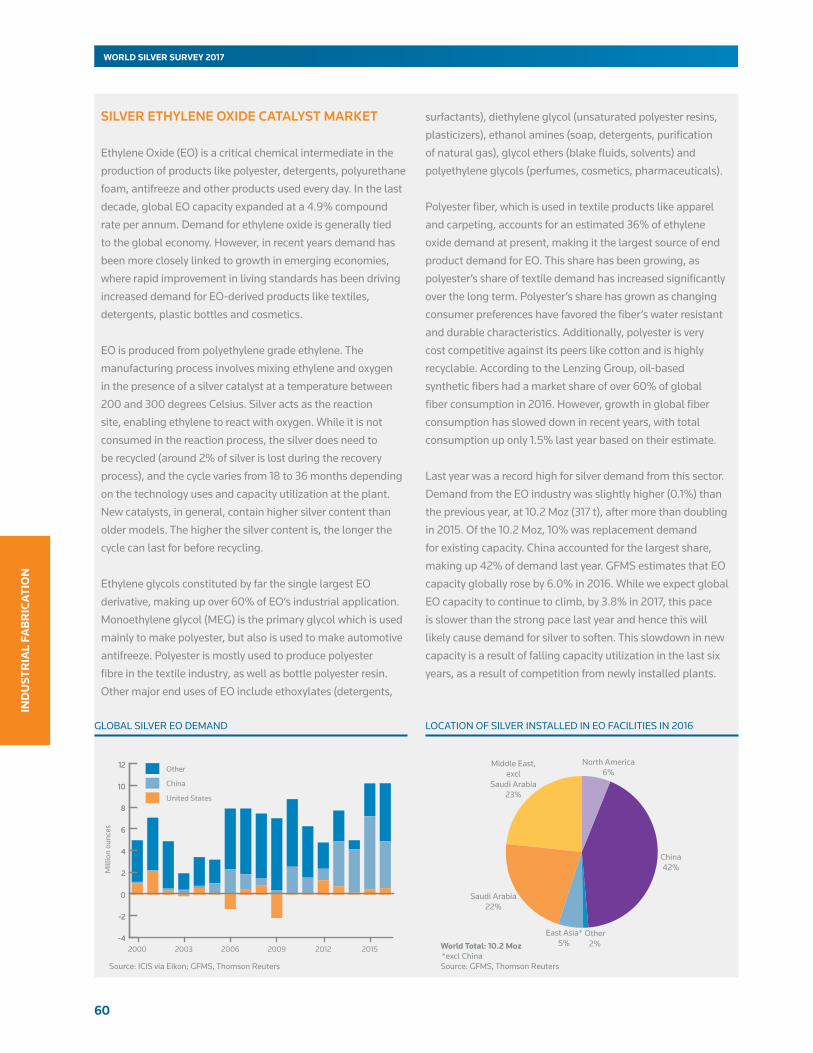
60
WORLD SILVER SURVEY 2017
IND
UST
RIA
L FA
BR
ICA
TIO
N
SILVER ETHYLENE OXIDE CATALYST MARKET
Ethylene Oxide (EO) is a critical chemical intermediate in the production of products like polyester, detergents, polyurethane foam, antifreeze and other products used every day. In the last decade, global EO capacity expanded at a 4.9% compound rate per annum. Demand for ethylene oxide is generally tied to the global economy. However, in recent years demand has been more closely linked to growth in emerging economies, where rapid improvement in living standards has been driving increased demand for EO-derived products like textiles, detergents, plastic bottles and cosmetics.
EO is produced from polyethylene grade ethylene. The manufacturing process involves mixing ethylene and oxygen
in the presence of a silver catalyst at a temperature between 200 and 300 degrees Celsius. Silver acts as the reaction site, enabling ethylene to react with oxygen. While it is not consumed in the reaction process, the silver does need to be recycled (around 2% of silver is lost during the recovery process), and the cycle varies from 18 to 36 months depending on the technology uses and capacity utilization at the plant. New catalysts, in general, contain higher silver content than older models. The higher the silver content is, the longer the cycle can last for before recycling.
Ethylene glycols constituted by far the single largest EO derivative, making up over 60% of EO’s industrial application. Monoethylene glycol (MEG) is the primary glycol which is used mainly to make polyester, but also is used to make automotive antifreeze. Polyester is mostly used to produce polyester fibre in the textile industry, as well as bottle polyester resin. Other major end uses of EO include ethoxylates (detergents,
surfactants), diethylene glycol (unsaturated polyester resins, plasticizers), ethanol amines (soap, detergents, purification of natural gas), glycol ethers (blake fluids, solvents) and polyethylene glycols (perfumes, cosmetics, pharmaceuticals).
Polyester fiber, which is used in textile products like apparel and carpeting, accounts for an estimated 36% of ethylene oxide demand at present, making it the largest source of end product demand for EO. This share has been growing, as polyester’s share of textile demand has increased significantly over the long term. Polyester’s share has grown as changing consumer preferences have favored the fiber’s water resistant and durable characteristics. Additionally, polyester is very cost competitive against its peers like cotton and is highly recyclable. According to the Lenzing Group, oil-based
synthetic fibers had a market share of over 60% of global fiber consumption in 2016. However, growth in global fiber consumption has slowed down in recent years, with total consumption up only 1.5% last year based on their estimate.
Last year was a record high for silver demand from this sector. Demand from the EO industry was slightly higher (0.1%) than the previous year, at 10.2 Moz (317 t), after more than doubling in 2015. Of the 10.2 Moz, 10% was replacement demand for existing capacity. China accounted for the largest share, making up 42% of demand last year. GFMS estimates that EO capacity globally rose by 6.0% in 2016. While we expect global EO capacity to continue to climb, by 3.8% in 2017, this pace is slower than the strong pace last year and hence this will likely cause demand for silver to soften. This slowdown in new capacity is a result of falling capacity utilization in the last six years, as a result of competition from newly installed plants.
North America6%
China42%
Other2%
East Asia*5%
Saudi Arabia22%
Middle East,excl
Saudi Arabia23%
Source: GFMS, Thomson Reuters*excl ChinaWorld Total: 10.2 Moz
GLOBAL SILVER EO DEMAND
201520122009200620032000-4
-2
0
2
4
6
8
10
12
Mill
ion
ounc
es
Other
China
United States
-4
-2
0
2
4
6
8
10
12
Source: ICIS via Eikon; GFMS, Thomson Reuters
LOCATION OF SILVER INSTALLED IN EO FACILITIES IN 2016
61
IND
USTR
IAL FA
BR
ICA
TION
WORLD SILVER SURVEY 2017
NEW AND GROWING SOURCES OF DEMAND FOR SILVER
Silver fabricators have benefited from the growth of many relatively new industries, of which solar modules manufacturing is an eminent one (see page 64). To stay ahead, many silver fabricators are exploring niche markets, which previously would have been dismissed as too small compared to traditional core sectors. Nevertheless, silver’s attributes, namely its high conductivity and antimicrobial properties could offer solutions to the many technical challenges faced by many up-and-coming new applications.
In transparent conductor applications, indium tin oxide (ITO) is the incumbent technology. New developments in this application, however, require similar attributes found in ITO to be applicable to large-area touch and flexible surfaces, where the incumbent technology has its limits. Metal mesh and silver nanowires are emerging as a viable alternative. Should demand for such applications in transparent conductors materialize, there might be a case for silver nanowires uptake.
An example of silver nanowires use in transparent conductor applications is in Organic Light Emitting Diodes (OLED), where the top electrode is made of a transparent conductor and plays an important role in light transmission and efficiency. OLEDs provide lighting in a form factor that needs to be bent, curved or flexed, which calls for flexible transparent conductors, and a material that needs to be highly transparent, thin and lightweight. In this case, silver nanowires are a superior alternative to ITO, which is relatively thick and brittle.
Silver can also be found in electrical conductive adhesives (ECA), where it is used as metal filler held within a polymeric resin. ECAs are a safe and environmentally-friendly alternative to traditional tin-lead solder. ECAs are found in applications such as photovoltaic modules, LCD and OLED displays, touch panels, LEDs and radio-frequency identification chips.
Silver is also finding its way into the wearables market, an area that potentially bridges two of silver’s largest uses: electronics and jewelry. While watches and fitness trackers are the dominant wearables available commercially today, smart jewelry are making inroads too. Smart jewelry consists of pieces that also offer features found in other electronic gadgets, such as fitness tracking, notification alerts and mobile payments. In this respect, silver is not only used in jewelry finishing, but also in the electronic circuitry and sensors.
The “Internet of Things” concept, a technology where physical objects are connected through internet connectivity is another trend which could benefit silver uptake, as these objects are embedded with sensors and circuitry that requires high conductivity. Silver use in sensors has the most promising growth potential in applications for building automation, environmental monitoring, healthcare and smart lighting.
Silver’s high conductivity and antimicrobial properties make it a good material for new applications such as e-textiles and smart clothing. While growth in sporting and fitness activity is a main driver for e-textiles and smart clothing, materials choices remain diverse, with little consolidation so far. Washability, printability, stretchability, conductivity and costs are key requirements to material selection. This segment is still considered a niche market relative to mainstream wearables like smartwatches and until the trend gains momentum, it remains to be seen which material will emerge a winner and achieve meaningful volumes.
Silver nanoparticles serve as a basis in cream treatments for anemia and sunburns, wound healing bandages and respiratory masks. Silver’s antimicrobial properties are well-understood and developed in these applications, but there are still vast areas under research and development in nano polymer technology. The Fraunhofer Institute for Manufacturing Technology and Advanced Materials (IFAM), in Germany, has come up with a new dental implant coating that uses silver ions to prevent bacterial growth. To eliminate the risk of bacteria preventing the implant from adhering, researchers integrated silver nanoparticles into the thin plasma polymer coating, where silver concentration and thickness of layers can be adjusted. The Chinese Academy of Sciences (CAS) in Beijing found a way of using silver-circuit polymer in contact lenses by injecting droplets of silver ink into the lens polymer, producing a conductive mesh of tiny wires that measure one micrometer in width. Apart from contact lenses, the silver-circuited polymer can be used in other wearable devices such as artificial skin that can measure temperature and perspiration. Such applications are useful as wearable medical and healthcare devices for monitoring and treatment purposes.
Developments in applications mentioned above are still in their infancy and sizeable volumes are not expected in the immediate-term. But what is clear is the versatility of silver’s use across a range of industries beyond traditional core sectors could offer fresh scope for uptake and future growth.

62
WORLD SILVER SURVEY 2017
IND
UST
RIA
L FA
BR
ICA
TIO
N
but these could drive demand in the power infrastructure sector.
Last year transmission lines were commissioned at a monthly average rate of 2,150 circuit kilometers which, though lower than previous year, achieved the planned target. Growth is likely to be further driven from the fast execution of various infrastructure projects related to power and transmission sectors ahead of the 2019 assembly elections. In the exports market the core competitiveness are said to be in the earth leakage circuit breakers, high rupturing capacity cartridge fuses, miniature circuit breakers and air circuit breakers which are large users of silver contacts or bi-metallic contacts. And with western economies limping back to growth and developing economies spending more on infrastructure projects, the residential electricity industry is also getting a boost in the overseas market; helping exports of these products get back to normalcy.
Silver nitrate production posted strong growth last year albeit large volumes were primarily for exports. This has been one of the high growth segments for fabricators due to growing demand from the pharmaceutical industry.
The decorative segment has seen strong growth with
substitution effect from gold to silver jari which are plated with gold. Similarly its usage in the food industry continued to remain strong on lower prices and increased awareness of low-quality substitutes.
Turning to other miscellaneous silver based products, where imports were stronger or at worst steady, these were led by silver targets used in the glass industry, fine silver strips and silver paste for manufacturing solar panels. The latter is likely to see much stronger growth given the push it has been getting as it is one of the pet projects of the government. In the 2015-16 financial year 3 GW of solar power capacity was added and in 2016-17 as of March end about 10 GW is estimated to have been added against a target of 12 GW. On the other hand, the fall in solar power tariffs is becoming a concern for the manufacturers.
PHOTOGRAPHY
•Demand for silver used in photographic applications declined by 3% last year to an estimated 45.2 Moz (1,405 t).
Photographic fabrication demand for silver retreated by just 3% in 2016, slipping to 45.2 Moz (1,405 t), which amounted to 20% of the volume recorded at its peak in 1999. Although this marked the lowest total recorded in GFMS’
TABLE 7 - SILVER FABRICATION: BRAZING ALLOYS AND SOLDERS (INCLUDING THE USE OF SCRAP)
(millionounces) 2007 2008 2009 2010 2011 2012 2013 2014 2015 2016
China 21.3 25.9 26.6 28.6 30.5 31.4 34.7 37.6 33.3 27.2
United States 7.7 7.2 5.2 5.9 6.0 5.3 5.7 5.8 6.0 6.1
India 2.2 2.2 2.2 2.6 2.7 2.4 2.1 2.6 2.5 2.5
Japan 4.2 3.9 2.5 3.7 3.5 3.0 2.8 2.5 2.4 2.3
United Kingdom 2.4 2.3 1.8 2.3 2.4 2.2 2.1 2.2 2.2 2.2
Germany 3.6 3.4 2.3 2.8 2.8 2.3 2.2 2.1 2.1 2.1
Canada 2.4 2.2 1.1 1.7 1.7 1.6 1.6 1.6 1.5 1.5
Russia 2.0 2.0 1.7 1.9 1.8 1.8 1.8 1.8 1.6 1.5
South Korea 2.4 2.6 2.1 2.3 2.4 2.2 2.1 1.9 1.5 1.4
Italy 2.5 2.4 1.7 1.8 1.7 1.6 1.5 1.5 1.5 1.4
Switzerland 1.4 1.4 1.2 1.3 1.3 1.3 1.2 1.3 1.3 1.3
Taiwan 1.3 1.2 1.0 1.2 1.3 1.2 1.2 1.1 1.1 1.1
Brazil 0.8 0.8 0.9 1.0 1.0 1.0 1.0 0.9 0.8 0.8
Mexico 0.5 0.5 0.4 0.4 0.4 0.4 0.4 0.4 0.4 0.7
France 0.9 0.8 0.5 0.6 0.6 0.5 0.5 0.5 0.5 0.5
Australia 0.5 0.5 0.5 0.5 0.6 0.6 0.6 0.6 0.5 0.5
Belgium 0.6 0.6 0.6 0.6 0.7 0.7 0.5 0.5 0.5 0.5
Spain 0.6 0.6 0.6 0.6 0.5 0.4 0.4 0.4 0.4 0.4
Other Countries 1.1 1.2 1.0 1.3 1.3 1.4 1.4 1.4 1.4 1.4
WorldTotal 58.6 61.8 53.8 61.2 63.2 61.1 63.7 66.7 61.5 55.4
© GFMS, Thomson Reuters / The Silver Institute
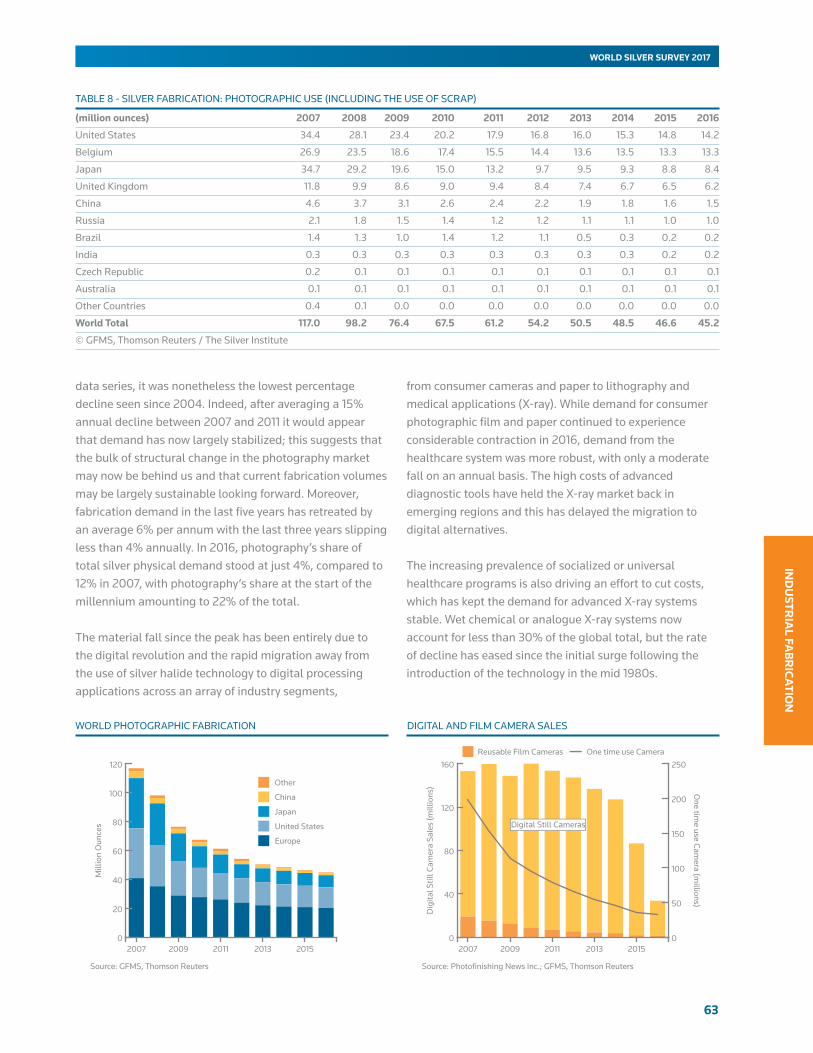
63
IND
USTR
IAL FA
BR
ICA
TION
WORLD SILVER SURVEY 2017
data series, it was nonetheless the lowest percentage decline seen since 2004. Indeed, after averaging a 15% annual decline between 2007 and 2011 it would appear that demand has now largely stabilized; this suggests that the bulk of structural change in the photography market may now be behind us and that current fabrication volumes may be largely sustainable looking forward. Moreover, fabrication demand in the last five years has retreated by an average 6% per annum with the last three years slipping less than 4% annually. In 2016, photography’s share of total silver physical demand stood at just 4%, compared to 12% in 2007, with photography’s share at the start of the millennium amounting to 22% of the total.
The material fall since the peak has been entirely due to the digital revolution and the rapid migration away from the use of silver halide technology to digital processing applications across an array of industry segments,
from consumer cameras and paper to lithography and medical applications (X-ray). While demand for consumer photographic film and paper continued to experience considerable contraction in 2016, demand from the healthcare system was more robust, with only a moderate fall on an annual basis. The high costs of advanced diagnostic tools have held the X-ray market back in emerging regions and this has delayed the migration to digital alternatives.
The increasing prevalence of socialized or universal healthcare programs is also driving an effort to cut costs, which has kept the demand for advanced X-ray systems stable. Wet chemical or analogue X-ray systems now account for less than 30% of the global total, but the rate of decline has eased since the initial surge following the introduction of the technology in the mid 1980s.
TABLE 8 - SILVER FABRICATION: PHOTOGRAPHIC USE (INCLUDING THE USE OF SCRAP)
(millionounces) 2007 2008 2009 2010 2011 2012 2013 2014 2015 2016
United States 34.4 28.1 23.4 20.2 17.9 16.8 16.0 15.3 14.8 14.2
Belgium 26.9 23.5 18.6 17.4 15.5 14.4 13.6 13.5 13.3 13.3
Japan 34.7 29.2 19.6 15.0 13.2 9.7 9.5 9.3 8.8 8.4
United Kingdom 11.8 9.9 8.6 9.0 9.4 8.4 7.4 6.7 6.5 6.2
China 4.6 3.7 3.1 2.6 2.4 2.2 1.9 1.8 1.6 1.5
Russia 2.1 1.8 1.5 1.4 1.2 1.2 1.1 1.1 1.0 1.0
Brazil 1.4 1.3 1.0 1.4 1.2 1.1 0.5 0.3 0.2 0.2
India 0.3 0.3 0.3 0.3 0.3 0.3 0.3 0.3 0.2 0.2
Czech Republic 0.2 0.1 0.1 0.1 0.1 0.1 0.1 0.1 0.1 0.1
Australia 0.1 0.1 0.1 0.1 0.1 0.1 0.1 0.1 0.1 0.1
Other Countries 0.4 0.1 0.0 0.0 0.0 0.0 0.0 0.0 0.0 0.0
WorldTotal 117.0 98.2 76.4 67.5 61.2 54.2 50.5 48.5 46.6 45.2
© GFMS, Thomson Reuters / The Silver Institute
WORLD PHOTOGRAPHIC FABRICATION
201520132011200920070
20
40
60
80
100
120
Mill
ion
Oun
ces
Source: GFMS, Thomson Reuters
Other
China
Japan
United States
Europe
DIGITAL AND FILM CAMERA SALES
201520132011200920070
40
80
120
160
Dig
ital S
till C
amer
a Sa
les
(mill
ions
)
Digital Still Cameras
0
50
100
150
200
250
One tim
e use Camera (m
illions)
Source: Photofinishing News Inc.; GFMS, Thomson Reuters
One time use CameraReusable Film Cameras
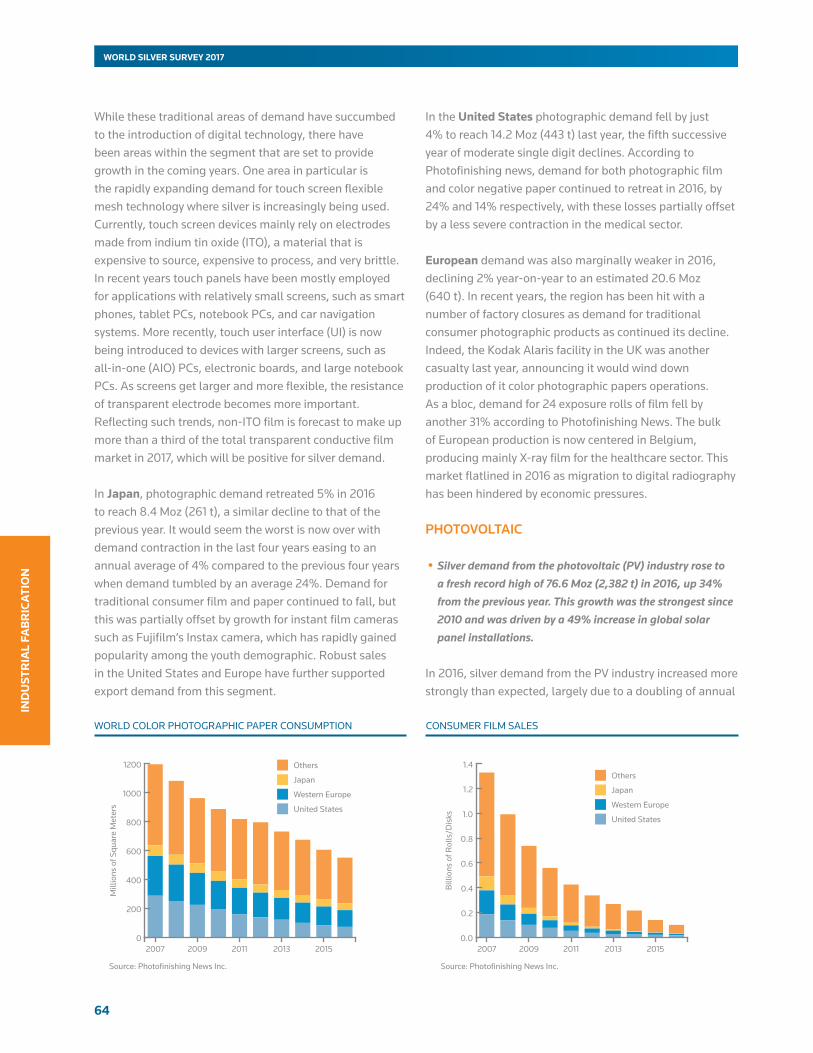
64
WORLD SILVER SURVEY 2017
IND
UST
RIA
L FA
BR
ICA
TIO
N
While these traditional areas of demand have succumbed to the introduction of digital technology, there have been areas within the segment that are set to provide growth in the coming years. One area in particular is the rapidly expanding demand for touch screen flexible mesh technology where silver is increasingly being used. Currently, touch screen devices mainly rely on electrodes made from indium tin oxide (ITO), a material that is expensive to source, expensive to process, and very brittle. In recent years touch panels have been mostly employed for applications with relatively small screens, such as smart phones, tablet PCs, notebook PCs, and car navigation systems. More recently, touch user interface (UI) is now being introduced to devices with larger screens, such as all-in-one (AIO) PCs, electronic boards, and large notebook PCs. As screens get larger and more flexible, the resistance of transparent electrode becomes more important. Reflecting such trends, non-ITO film is forecast to make up more than a third of the total transparent conductive film market in 2017, which will be positive for silver demand.
In Japan, photographic demand retreated 5% in 2016 to reach 8.4 Moz (261 t), a similar decline to that of the previous year. It would seem the worst is now over with demand contraction in the last four years easing to an annual average of 4% compared to the previous four years when demand tumbled by an average 24%. Demand for traditional consumer film and paper continued to fall, but this was partially offset by growth for instant film cameras such as Fujifilm’s Instax camera, which has rapidly gained popularity among the youth demographic. Robust sales in the United States and Europe have further supported export demand from this segment.
In the UnitedStates photographic demand fell by just 4% to reach 14.2 Moz (443 t) last year, the fifth successive year of moderate single digit declines. According to Photofinishing news, demand for both photographic film and color negative paper continued to retreat in 2016, by 24% and 14% respectively, with these losses partially offset by a less severe contraction in the medical sector.
European demand was also marginally weaker in 2016, declining 2% year-on-year to an estimated 20.6 Moz (640 t). In recent years, the region has been hit with a number of factory closures as demand for traditional consumer photographic products as continued its decline. Indeed, the Kodak Alaris facility in the UK was another casualty last year, announcing it would wind down production of it color photographic papers operations. As a bloc, demand for 24 exposure rolls of film fell by another 31% according to Photofinishing News. The bulk of European production is now centered in Belgium, producing mainly X-ray film for the healthcare sector. This market flatlined in 2016 as migration to digital radiography has been hindered by economic pressures.
PHOTOVOLTAIC
•Silver demand from the photovoltaic (PV) industry rose to a fresh record high of 76.6 Moz (2,382 t) in 2016, up 34% from the previous year. This growth was the strongest since 2010 and was driven by a 49% increase in global solar panel installations.
In 2016, silver demand from the PV industry increased more strongly than expected, largely due to a doubling of annual
CONSUMER FILM SALES
201520132011200920070.0
0.2
0.4
0.6
0.8
1.0
1.2
1.4
Bill
ions
of R
olls
/Dis
ks
Source: Photofinishing News Inc.
Others
Japan
Western Europe
United States
201520132011200920070
200
400
600
800
1000
1200
Mill
ions
of S
quar
e M
eter
s
Source: Photofinishing News Inc.
Others
Japan
Western Europe
United States
WORLD COLOR PHOTOGRAPHIC PAPER CONSUMPTION
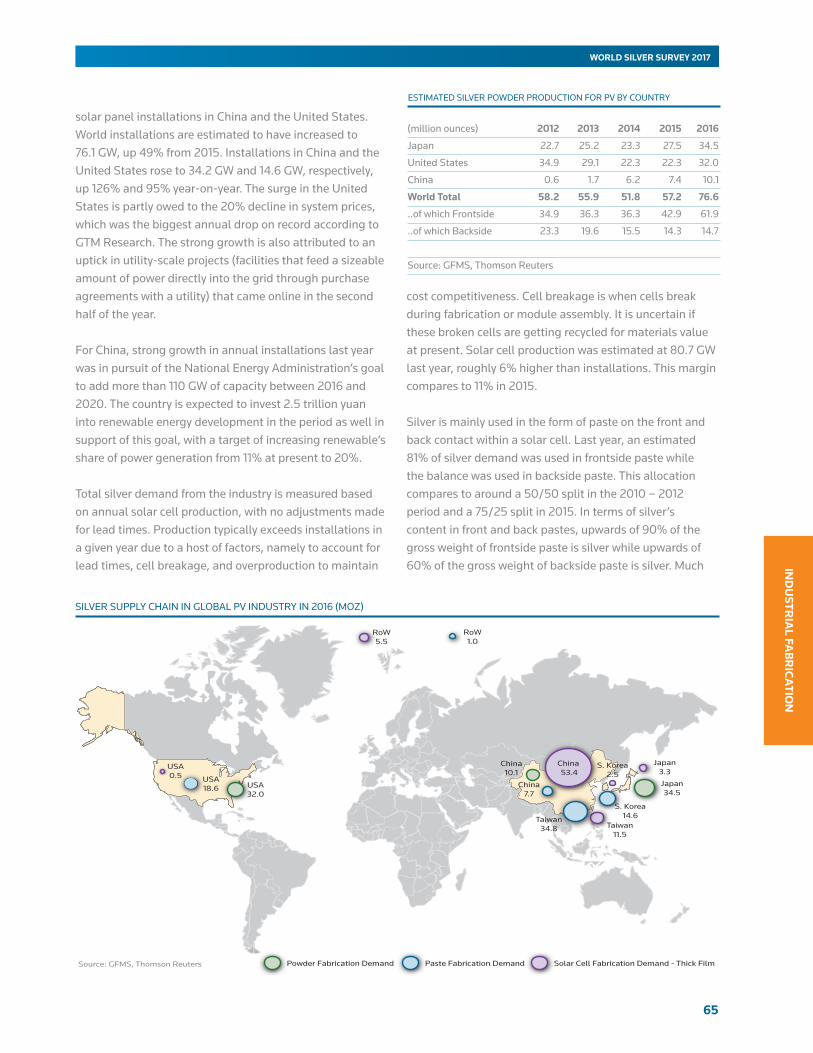
65
IND
USTR
IAL FA
BR
ICA
TION
WORLD SILVER SURVEY 2017
solar panel installations in China and the United States. World installations are estimated to have increased to 76.1 GW, up 49% from 2015. Installations in China and the United States rose to 34.2 GW and 14.6 GW, respectively, up 126% and 95% year-on-year. The surge in the United States is partly owed to the 20% decline in system prices, which was the biggest annual drop on record according to GTM Research. The strong growth is also attributed to an uptick in utility-scale projects (facilities that feed a sizeable amount of power directly into the grid through purchase agreements with a utility) that came online in the second half of the year.
For China, strong growth in annual installations last year was in pursuit of the National Energy Administration’s goal to add more than 110 GW of capacity between 2016 and 2020. The country is expected to invest 2.5 trillion yuan into renewable energy development in the period as well in support of this goal, with a target of increasing renewable’s share of power generation from 11% at present to 20%.
Total silver demand from the industry is measured based on annual solar cell production, with no adjustments made for lead times. Production typically exceeds installations in a given year due to a host of factors, namely to account for lead times, cell breakage, and overproduction to maintain
cost competitiveness. Cell breakage is when cells break during fabrication or module assembly. It is uncertain if these broken cells are getting recycled for materials value at present. Solar cell production was estimated at 80.7 GW last year, roughly 6% higher than installations. This margin compares to 11% in 2015.
Silver is mainly used in the form of paste on the front and back contact within a solar cell. Last year, an estimated 81% of silver demand was used in frontside paste while the balance was used in backside paste. This allocation compares to around a 50/50 split in the 2010 – 2012 period and a 75/25 split in 2015. In terms of silver’s content in front and back pastes, upwards of 90% of the gross weight of frontside paste is silver while upwards of 60% of the gross weight of backside paste is silver. Much
Source: GFMS, Thomson Reuters
China 53.4
Japan3.3
Japan34.5
China10.1
China7.7
Taiwan11.5
Taiwan34.8
S. Korea14.6
RoW5.5
RoW1.0
Powder Fabrication Demand Paste Fabrication Demand Solar Cell Fabrication Demand - Thick Film
S. Korea2.5
USA32.0
USA18.6
USA0.5
SILVER SUPPLY CHAIN IN GLOBAL PV INDUSTRY IN 2016 (MOZ)
(million ounces) 2012 2013 2014 2015 2016
Japan 22.7 25.2 23.3 27.5 34.5
United States 34.9 29.1 22.3 22.3 32.0
China 0.6 1.7 6.2 7.4 10.1
WorldTotal 58.2 55.9 51.8 57.2 76.6
..of which Frontside 34.9 36.3 36.3 42.9 61.9
..of which Backside 23.3 19.6 15.5 14.3 14.7
Source: GFMS, Thomson Reuters
ESTIMATED SILVER POWDER PRODUCTION FOR PV BY COUNTRY
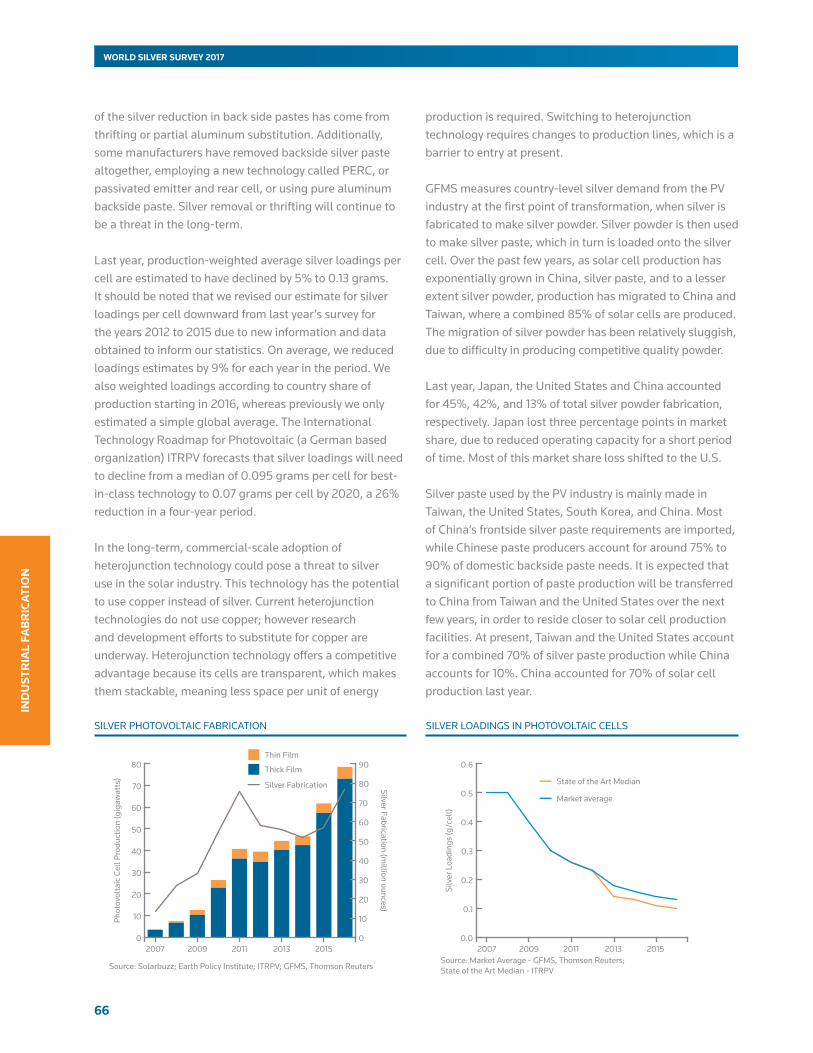
66
WORLD SILVER SURVEY 2017
IND
UST
RIA
L FA
BR
ICA
TIO
N
of the silver reduction in back side pastes has come from thrifting or partial aluminum substitution. Additionally, some manufacturers have removed backside silver paste altogether, employing a new technology called PERC, or passivated emitter and rear cell, or using pure aluminum backside paste. Silver removal or thrifting will continue to be a threat in the long-term.
Last year, production-weighted average silver loadings per cell are estimated to have declined by 5% to 0.13 grams. It should be noted that we revised our estimate for silver loadings per cell downward from last year’s survey for the years 2012 to 2015 due to new information and data obtained to inform our statistics. On average, we reduced loadings estimates by 9% for each year in the period. We also weighted loadings according to country share of production starting in 2016, whereas previously we only estimated a simple global average. The International Technology Roadmap for Photovoltaic (a German based organization) ITRPV forecasts that silver loadings will need to decline from a median of 0.095 grams per cell for best-in-class technology to 0.07 grams per cell by 2020, a 26% reduction in a four-year period.
In the long-term, commercial-scale adoption of heterojunction technology could pose a threat to silver use in the solar industry. This technology has the potential to use copper instead of silver. Current heterojunction technologies do not use copper; however research and development efforts to substitute for copper are underway. Heterojunction technology offers a competitive advantage because its cells are transparent, which makes them stackable, meaning less space per unit of energy
production is required. Switching to heterojunction technology requires changes to production lines, which is a barrier to entry at present.
GFMS measures country-level silver demand from the PV industry at the first point of transformation, when silver is fabricated to make silver powder. Silver powder is then used to make silver paste, which in turn is loaded onto the silver cell. Over the past few years, as solar cell production has exponentially grown in China, silver paste, and to a lesser extent silver powder, production has migrated to China and Taiwan, where a combined 85% of solar cells are produced. The migration of silver powder has been relatively sluggish, due to difficulty in producing competitive quality powder.
Last year, Japan, the United States and China accounted for 45%, 42%, and 13% of total silver powder fabrication, respectively. Japan lost three percentage points in market share, due to reduced operating capacity for a short period of time. Most of this market share loss shifted to the U.S.
Silver paste used by the PV industry is mainly made in Taiwan, the United States, South Korea, and China. Most of China’s frontside silver paste requirements are imported, while Chinese paste producers account for around 75% to 90% of domestic backside paste needs. It is expected that a significant portion of paste production will be transferred to China from Taiwan and the United States over the next few years, in order to reside closer to solar cell production facilities. At present, Taiwan and the United States account for a combined 70% of silver paste production while China accounts for 10%. China accounted for 70% of solar cell production last year.
0
10
20
30
40
50
60
70
80
20152013201120092007
Phot
ovol
taic
Cel
l Pro
duct
ion
(gig
awat
ts)
0
10
20
30
40
50
60
70
80
90
Silver Fabrication (million ounces)
Source: Solarbuzz; Earth Policy Institute; ITRPV; GFMS, Thomson Reuters
Thin Film
Thick Film
Silver Fabrication
SILVER PHOTOVOLTAIC FABRICATION
0.0
0.1
0.2
0.3
0.4
0.5
0.6
20152013201120092007
Silv
er L
oadi
ngs
(g/c
ell)
Source: Market Average - GFMS, Thomson Reuters; State of the Art Median - ITRPV
State of the Art Median
Market average
SILVER LOADINGS IN PHOTOVOLTAIC CELLS
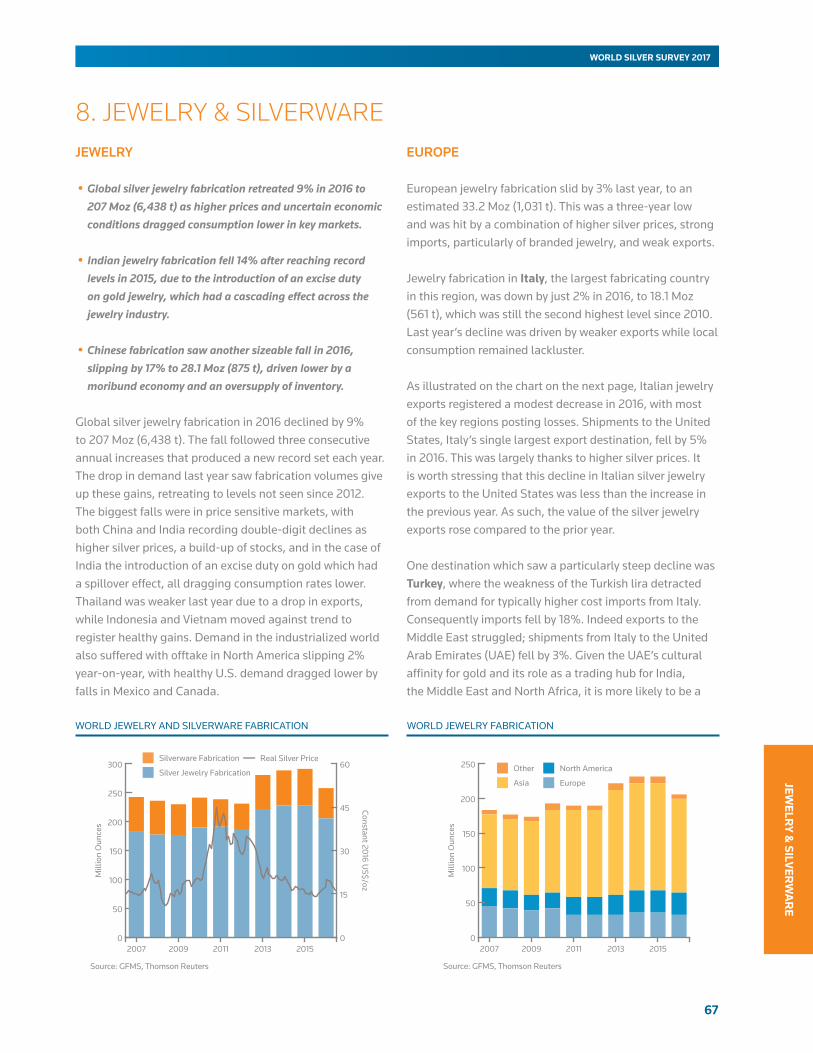
67
JEWELR
Y & SILV
ERW
AR
E
WORLD SILVER SURVEY 2017
8. JEWELRY & SILVERWARE JEWELRY
•Global silver jewelry fabrication retreated 9% in 2016 to 207 Moz (6,438 t) as higher prices and uncertain economic conditions dragged consumption lower in key markets.
• Indian jewelry fabrication fell 14% after reaching record levels in 2015, due to the introduction of an excise duty on gold jewelry, which had a cascading effect across the jewelry industry.
•Chinese fabrication saw another sizeable fall in 2016, slipping by 17% to 28.1 Moz (875 t), driven lower by a
moribund economy and an oversupply of inventory.
Global silver jewelry fabrication in 2016 declined by 9% to 207 Moz (6,438 t). The fall followed three consecutive annual increases that produced a new record set each year. The drop in demand last year saw fabrication volumes give up these gains, retreating to levels not seen since 2012. The biggest falls were in price sensitive markets, with both China and India recording double-digit declines as higher silver prices, a build-up of stocks, and in the case of India the introduction of an excise duty on gold which had a spillover effect, all dragging consumption rates lower. Thailand was weaker last year due to a drop in exports, while Indonesia and Vietnam moved against trend to register healthy gains. Demand in the industrialized world also suffered with offtake in North America slipping 2% year-on-year, with healthy U.S. demand dragged lower by falls in Mexico and Canada.
EUROPE
European jewelry fabrication slid by 3% last year, to an estimated 33.2 Moz (1,031 t). This was a three-year low and was hit by a combination of higher silver prices, strong imports, particularly of branded jewelry, and weak exports.
Jewelry fabrication in Italy, the largest fabricating country in this region, was down by just 2% in 2016, to 18.1 Moz (561 t), which was still the second highest level since 2010. Last year’s decline was driven by weaker exports while local consumption remained lackluster.
As illustrated on the chart on the next page, Italian jewelry exports registered a modest decrease in 2016, with most of the key regions posting losses. Shipments to the United States, Italy’s single largest export destination, fell by 5% in 2016. This was largely thanks to higher silver prices. It is worth stressing that this decline in Italian silver jewelry exports to the United States was less than the increase in the previous year. As such, the value of the silver jewelry exports rose compared to the prior year.
One destination which saw a particularly steep decline was Turkey, where the weakness of the Turkish lira detracted from demand for typically higher cost imports from Italy. Consequently imports fell by 18%. Indeed exports to the Middle East struggled; shipments from Italy to the United Arab Emirates (UAE) fell by 3%. Given the UAE’s cultural affinity for gold and its role as a trading hub for India, the Middle East and North Africa, it is more likely to be a
WORLD JEWELRY FABRICATIONWORLD JEWELRY AND SILVERWARE FABRICATION
0
50
100
150
200
250
300
20152013201120092007
Mill
ion
Oun
ces
0
15
30
45
60
Constant 2016 US$/oz
Source: GFMS, Thomson Reuters
Silverware Fabrication
Silver Jewelry Fabrication
Real Silver Price
201520132011200920070
50
100
150
200
250
Mill
ion
Oun
ces
Source: GFMS, Thomson Reuters
Other
Asia
North America
Europe
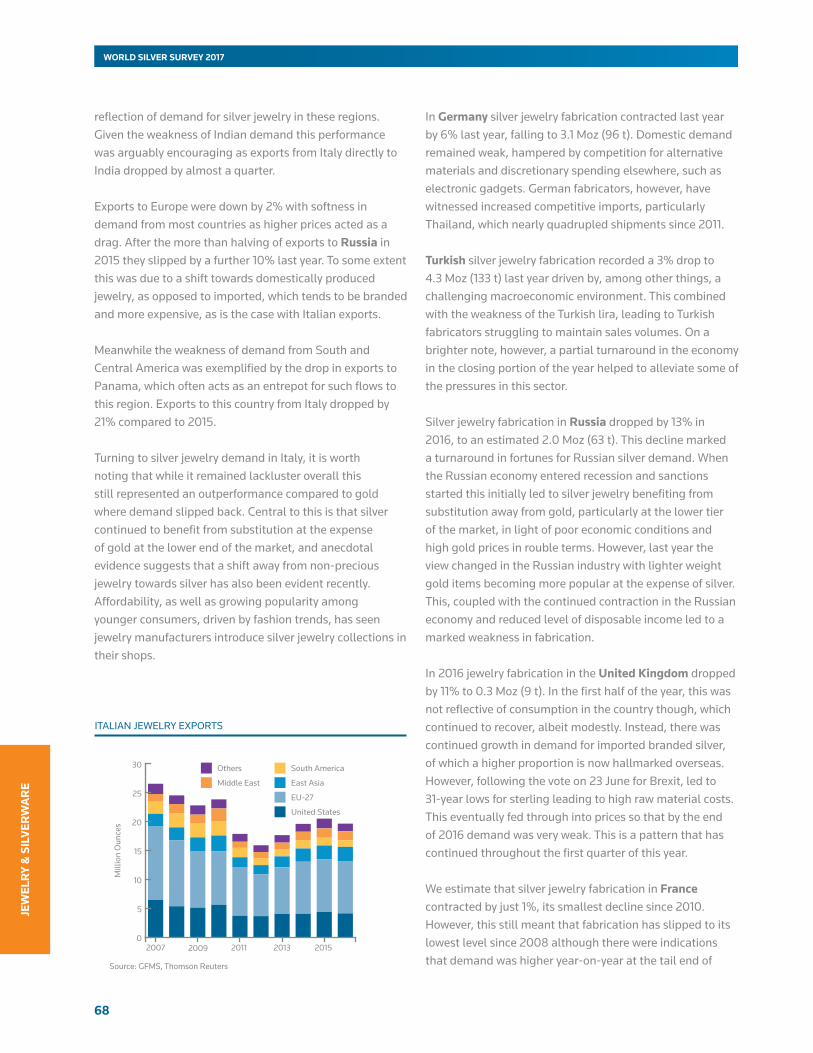
68
WORLD SILVER SURVEY 2017
JEW
ELR
Y &
SIL
VER
WA
RE
reflection of demand for silver jewelry in these regions. Given the weakness of Indian demand this performance was arguably encouraging as exports from Italy directly to India dropped by almost a quarter.
Exports to Europe were down by 2% with softness in demand from most countries as higher prices acted as a drag. After the more than halving of exports to Russia in 2015 they slipped by a further 10% last year. To some extent this was due to a shift towards domestically produced jewelry, as opposed to imported, which tends to be branded and more expensive, as is the case with Italian exports.
Meanwhile the weakness of demand from South and Central America was exemplified by the drop in exports to Panama, which often acts as an entrepot for such flows to this region. Exports to this country from Italy dropped by 21% compared to 2015.
Turning to silver jewelry demand in Italy, it is worth noting that while it remained lackluster overall this still represented an outperformance compared to gold where demand slipped back. Central to this is that silver continued to benefit from substitution at the expense of gold at the lower end of the market, and anecdotal evidence suggests that a shift away from non-precious jewelry towards silver has also been evident recently. Affordability, as well as growing popularity among younger consumers, driven by fashion trends, has seen jewelry manufacturers introduce silver jewelry collections in their shops.
In Germany silver jewelry fabrication contracted last year by 6% last year, falling to 3.1 Moz (96 t). Domestic demand remained weak, hampered by competition for alternative materials and discretionary spending elsewhere, such as electronic gadgets. German fabricators, however, have witnessed increased competitive imports, particularly Thailand, which nearly quadrupled shipments since 2011.
Turkish silver jewelry fabrication recorded a 3% drop to 4.3 Moz (133 t) last year driven by, among other things, a challenging macroeconomic environment. This combined with the weakness of the Turkish lira, leading to Turkish fabricators struggling to maintain sales volumes. On a brighter note, however, a partial turnaround in the economy in the closing portion of the year helped to alleviate some of the pressures in this sector.
Silver jewelry fabrication in Russia dropped by 13% in 2016, to an estimated 2.0 Moz (63 t). This decline marked a turnaround in fortunes for Russian silver demand. When the Russian economy entered recession and sanctions started this initially led to silver jewelry benefiting from substitution away from gold, particularly at the lower tier of the market, in light of poor economic conditions and high gold prices in rouble terms. However, last year the view changed in the Russian industry with lighter weight gold items becoming more popular at the expense of silver. This, coupled with the continued contraction in the Russian economy and reduced level of disposable income led to a marked weakness in fabrication.
In 2016 jewelry fabrication in the UnitedKingdom dropped by 11% to 0.3 Moz (9 t). In the first half of the year, this was not reflective of consumption in the country though, which continued to recover, albeit modestly. Instead, there was continued growth in demand for imported branded silver, of which a higher proportion is now hallmarked overseas. However, following the vote on 23 June for Brexit, led to 31-year lows for sterling leading to high raw material costs. This eventually fed through into prices so that by the end of 2016 demand was very weak. This is a pattern that has continued throughout the first quarter of this year.
We estimate that silver jewelry fabrication in France contracted by just 1%, its smallest decline since 2010. However, this still meant that fabrication has slipped to its lowest level since 2008 although there were indications that demand was higher year-on-year at the tail end of
ITALIAN JEWELRY EXPORTS
2015 2013 2011 2009 20070
5
10
15
20
25
30
Mill
ion
Oun
ces
Source: GFMS, Thomson Reuters
Middle East
South America
East Asia
EU-27
United States
Others

69
JEWELR
Y & SILV
ERW
AR
E
WORLD SILVER SURVEY 2017
2016. Taking the year as a whole, it is also interesting to note that the value of silver jewelry fabrication rose last year as did the number of pieces. The latter highlights the fall in the average size of pieces.
NORTH AMERICA
North American jewelry fabrication fell 2% to 31.1 Moz (967 t) in 2016. The United States accounts for the largest share (52%) and witnessed a considerable revival in 2016 of around 12%. Closely followed is Mexico, which accounted for approximately 46% of total jewelry fabrication in North America last year. In contrast to buoyant growth in the United States, we estimate that jewelry fabrication in Mexico and Canada fell by 14% and 10% to 14.3 Moz (445 t) and 0.6 Moz (19 t) respectively. The United States and Mexican jewelry fabrication industries are heavily interwoven, driven by lower labor costs in the latter and growing consumption in the former. Silver jewelry imports from Mexico to the United States fell by 23% last year explaining some of the decline in Mexican jewelry fabrication.
United States silver jewelry imports in general switched from two consecutive years of growth in 2014 and 2015 to a 10% year-on-year drop last year. Jewelry imports from Asia, accounting for 77% of imports last year, fell on average by 13% between Thailand, China and India last year. Exports, on the other hand, rose by a considerable 59% with shipments to Hong Kong more than tripling on an annual basis. Field research leads us to believe that demand for domestically fabricated jewelry in China became saturated last year, and wholesalers and retailers are importing
foreign brands to differentiate their products from their local competitors. The poor demand sentiment led to some Chinese fabricators giving up the traditional silver jewelry and focusing more on premium products.
In the United States, silver’s relatively large share of consumption is sourced from foreign manufacturers, and this is due to the following factors: silver pieces are generally self-purchased for daily wear and/or low-price costume jewelry. Therefore, silver jewelry is mostly mass produced. Given relatively cheaper manufacturing costs offshore, the United States has struggled to remain competitive. The bulk of the domestically-made silver pieces are high-end, luxury, and specialty pieces like Tiffany’s, which produces nearly all of its silver jewelry on United States soil. Very little silver jewelry is custom-made, simply because most custom-made jewelry in the United States is wedding-related. Wedding-related jewelry is mostly made of gold or platinum.
Domestic jewelry consumption in the United States recorded a slightly less strong uptick compared to fabrication last year, increasing by approximately 4%. The positive sentiment in the country was also supported by the silver jewelry retail 2016 sales report published by the Silver Institute. Of the 160 respondents, consisting mainly of owners of retail jewelry stores, 62% reported higher silver jewelry sales in 2016, and also indicated they increased their inventories. Silver jewelry also accounted for the best margins during the holiday period for almost half of the respondents, performing significantly better than other categories such as diamond, bridal, gold or platinum jewelry.
Pandora shared this optimistic sentiment in the Americas, reporting a 6% increase in revenue generated in the region in 2016. However, at the same time it also decided to close 650 multi-branded stores and around 50 shop-in-shops in North America due to the success of its online eSTORE as well as the addition of 27 new concept stores. Tiffany’s, one of the United States’ largest jewelry fabricators, reported a 5% drop in sales in the Americas, mainly attributed to lower sales in Tiffany’s New York flagship store.
US OFFICIAL SILVER JEWELRY IMPORTS
201520132011200920070
10
20
30
40
50
60
70
Mill
ion
Oun
ces
20
25
30
35
40
45
50
%
Source: GFMS, Thomson Reuters
Thailand
India
China
Italy Thai Market Share
Other

70
WORLD SILVER SURVEY 2017
JEW
ELR
Y &
SIL
VER
WA
RE
SILVER JEWELRY – A CHANGING LANDSCAPE
Silver jewelry demand in the industrialized world was largely
unchanged last year, retreating less than one percent, although
this benign outcome masks some considerable weakness
across several key markets. What it does do is highlight the
impact economic expansion and particularly the role consumer
sentiment has on demand in these markets. While demand in
the United States enjoyed robust growth of 12% in 2016 to an all-
time high on the back of a healthier economic outlook and rise
in retail sales, demand across Europe (which fell 3% last year)
and other industrialized nations remained moribund by weak
domestic economies and drop in consumer spending.
In such an environment the supply chain has to adapt. This may
mean offering lower ticketed items to attract a new customer
base or alternatively offering more high-end products that
afford retailers higher margin to offset lower sales volumes.
Silver jewelry, especially branded and gemset items, offer
superior margin to that of the other precious metals and this is
increasingly having an impact on the product mix of retailers as
they look to higher margin products to offset a drop in footfall
traffic. Indeed, according to a survey commissioned by the Silver
Institute’s Silver Promotion Service, almost 50% of respondents
suggested that silver provided the strongest margins during the
holiday season in 2016, against just 10% for gold and 21% for
diamond jewelry.
Higher margin items are more likely to be gemset, or for plain
items, sold under the name of a recognized brand or fashion
label. In recent years there has been a shift away from large
bold items, such as silver cuffs or oversized pendants and rings.
Moreover, consumer tastes have returned to smaller more
delicate and intricately designed jewelry styles that may use less
silver per piece but carry greater mark-up potential.
The lower end of the market is still the mainstay of the industry in
terms of sheer volume as the low sticker price of fashion jewelry
is attractive to a wider demographic. Demand for this segment
has been augmented by the success of e-commerce platforms
and TV sales. According to the U.S. Census Bureau, total U.S.
e-commerce sales for 2016 increased 15.1% from 2015, while total
retail sales in 2016 increased only 2.9% in the same time period.
AFRICA
Egypt’s jewelry fabrication slumped 16% in 2016 to an estimated 0.7 Moz (21 t), a level not seen since 2011. The country’s currency crisis in early November that saw the pound lose 48% following the de-pegging from the dollar, resulted in an almost doubling in the local silver price which severely impacted retail sales. There was some migration to silver from gold as prices for the yellow metal also soared to an all-time-high, but the overall weak consumer sentiment held back spending.
ASIA
China’s silver jewelry fabrication registered another down year in 2016, though in percentage terms the decline
was much smaller compared to 2014 and 2015. Cautious consumer sentiment and a lack of interest in silver contributed to the weakness. The GFMS team at Thomson Reuters estimates that Chinese silver jewelry fabrication retreated to 28.1 Moz (874 t) last year, a year-on-year decline of 17% and a drop of 34.7 Moz (1,080 t) from the record levels of 2013.
Despite the Chinese economy growing at a reported 6.7% in 2016, the true impact on the ground failed to reflect this robust performance. A deteriorating domestic economy led to more cautious consumption sentiment and purchasing activity. Therefore, many jewelry retailers have been suffering from heavy losses in terms of sales volumes. In order to survive, those retailers have amended their strategies from selling large volumes in the past to chasing
Clockwise from top: Diamond earrings by Drukker, Sterling silver bubbles necklace by Kelim, Pendant in sterling silver by FredericDuclos, Heart shaped USB flash drive in silver with rhinestones by VladmoreKrnetic.
71
JEWELR
Y & SILV
ERW
AR
E
WORLD SILVER SURVEY 2017
margins instead. They have focused on pushing out high margin products, including gem sets and 18-carat gold pieces, as the gross margin for these products are usually over 100%. As a result, silver jewelry, generally viewed as a relatively low margin product and targeted at consumers looking for non-luxury items, suffered.
As we have outlined in the past there was an overcapacity of silver jewelry fabrication in the Chinese market. This glut, coupled with weak consumer demand and banks withdrawing their support on credit lines, resulted in significant failures and bankruptcies of fabricators across the country. Fabrication fees for normal silver jewelry pieces continued to fall, to a level that is already lower than the breakeven point for some fabricators.
The whole supply chain from fabricators to retailers was already sitting on high level of inventories. Therefore many industry participants were in destocking mode. Feedback from some wholesalers stated that orders were very spasmodic even during periods when seasonal demand was supposed to pick up and their downstream customers were supposed to re-stock inventories. Indeed, inventory levels were so high that some fabricators actually either halted their production for a long period or switched to produce other higher margin products.
During the market downturn, fabricators are looking for ways to survive. One market trend to emerge in China in recent years has been the notable increase in the purity of the silver being offered. While 925 sterling silver pieces were dominant within the sector, there are increasing number of fabricators working on 990, 999 and 9999 purities. Meanwhile, fabricators also began working on high value items with more sophisticated designs and in higher qualities that were sold by piece rather than by weight.
The industry has been trying to evaluate the status of silver jewelry, by combining high-end materials like pearls and crystals with silver in order to attract the more sophisticated tastes of certain consumer groups. Some fabricators also emphasized that a certain line of their products are being manufactured by machine instead of hand made by traditional methods (and hence a higher fabrication fee), while some even introduced a series of silver jewelry with an outer coating in gold, targeting consumers who want to purchase gold jewelry on a smaller budget.
Looking at this year, industry participants remain cautious towards the market outlook, with many believing that the bottom has yet to set in. The increase in silver price did offer some relief to them in terms of asset appreciation, especially for those who are sitting on high levels of inventories. The two-child policy should also help the demand for silver jewelry, as many seniors purchase silver jewelry for new born babies in the family. However this positive element is more likely a progressive reinforcement rather than an immediate help overnight.
Indian jewelry fabrication declined last year by 14% year-on-year to 62.1 Moz (1,930 t), the lowest in three years and ending four years of consecutive growth. The decline was primarily a result of the cascading effect following the implementation of excise duty on gold jewelry; the impact was seen across the entire gem and jewelry sector. Retail consumption declined by 13%, attributed to drought in 2015 which had curtailed consumption expenditure to a greater extent. While there was hope for a revival in demand during the fourth quarter following a normal monsoon in 2016, retail consumption failed to take off as demonetization delayed payments to farmers and postponed their purchases towards the first quarter of 2017.
One of the key themes last year was destocking by retailers. From jewelry retailers to manufacturers, gold has been their primary means of funding the business. Forcing an excise duty on gold jewelry that led to a slow down across all categories, with even silver having to accept its share in absorbing the stress as cash generated through jewelry sales was being diversified to other business or invested in physical assets in India or abroad instead of replenishing with fresh stock. Thus, retailers who had built up inventory in 2015 at lower prices were not replenishing the stock in 2016 and as a result fabrication demand was also reduced. This was evident during our visits and discussions with wholesalers who were sitting on high inventory levels and fabricators with under utilized capacity. Additionally the increase in the average price also led to the exchange of old jewelry for new; this was approximately 60 to 65% of the total sales of payals (leg chains/anklets) bought for daily wear which was otherwise less than 40% in 2015.
Jewelry consumption volumes are largely driven by leg chains for cultural reasons, which have created a base load demand. The weight per piece can vary from 30 grams to 100 grams and given that it is subject to wear
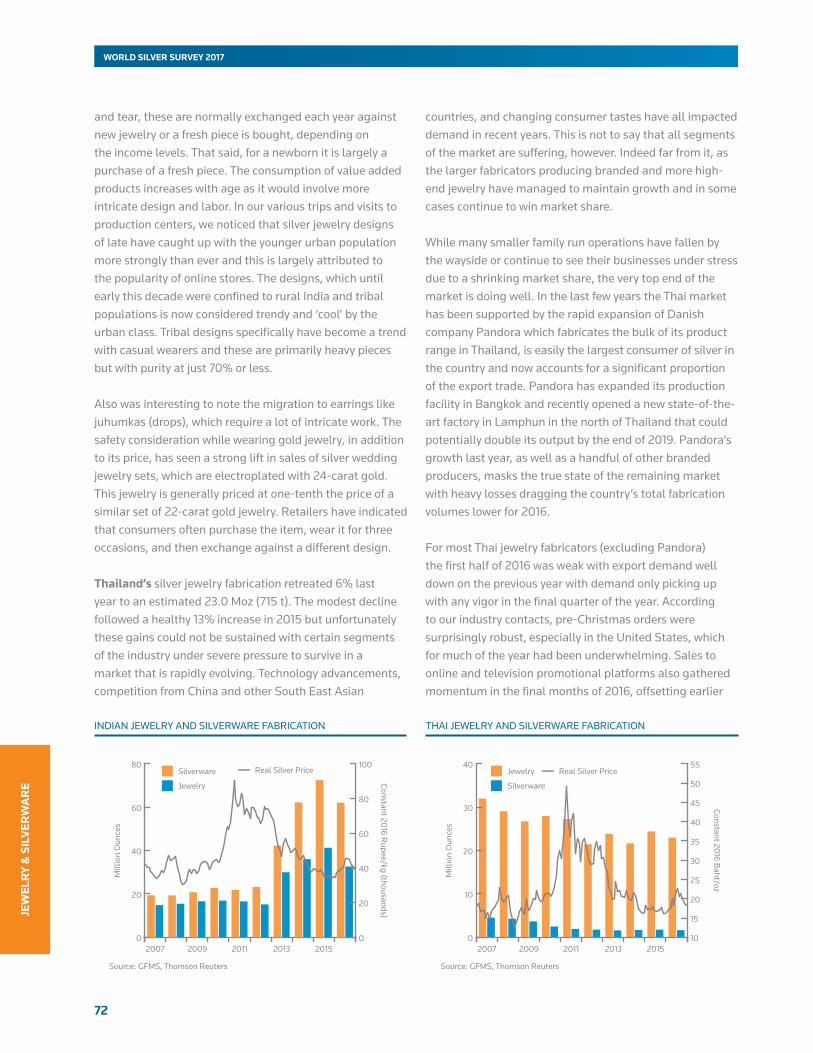
72
WORLD SILVER SURVEY 2017
JEW
ELR
Y &
SIL
VER
WA
RE
and tear, these are normally exchanged each year against new jewelry or a fresh piece is bought, depending on the income levels. That said, for a newborn it is largely a purchase of a fresh piece. The consumption of value added products increases with age as it would involve more intricate design and labor. In our various trips and visits to production centers, we noticed that silver jewelry designs of late have caught up with the younger urban population more strongly than ever and this is largely attributed to the popularity of online stores. The designs, which until early this decade were confined to rural India and tribal populations is now considered trendy and ‘cool’ by the urban class. Tribal designs specifically have become a trend with casual wearers and these are primarily heavy pieces but with purity at just 70% or less.
Also was interesting to note the migration to earrings like juhumkas (drops), which require a lot of intricate work. The safety consideration while wearing gold jewelry, in addition to its price, has seen a strong lift in sales of silver wedding jewelry sets, which are electroplated with 24-carat gold. This jewelry is generally priced at one-tenth the price of a similar set of 22-carat gold jewelry. Retailers have indicated that consumers often purchase the item, wear it for three occasions, and then exchange against a different design.
Thailand’s silver jewelry fabrication retreated 6% last year to an estimated 23.0 Moz (715 t). The modest decline followed a healthy 13% increase in 2015 but unfortunately these gains could not be sustained with certain segments of the industry under severe pressure to survive in a market that is rapidly evolving. Technology advancements, competition from China and other South East Asian
countries, and changing consumer tastes have all impacted demand in recent years. This is not to say that all segments of the market are suffering, however. Indeed far from it, as the larger fabricators producing branded and more high-end jewelry have managed to maintain growth and in some cases continue to win market share.
While many smaller family run operations have fallen by the wayside or continue to see their businesses under stress due to a shrinking market share, the very top end of the market is doing well. In the last few years the Thai market has been supported by the rapid expansion of Danish company Pandora which fabricates the bulk of its product range in Thailand, is easily the largest consumer of silver in the country and now accounts for a significant proportion of the export trade. Pandora has expanded its production facility in Bangkok and recently opened a new state-of-the-art factory in Lamphun in the north of Thailand that could potentially double its output by the end of 2019. Pandora’s growth last year, as well as a handful of other branded producers, masks the true state of the remaining market with heavy losses dragging the country’s total fabrication volumes lower for 2016.
For most Thai jewelry fabricators (excluding Pandora) the first half of 2016 was weak with export demand well down on the previous year with demand only picking up with any vigor in the final quarter of the year. According to our industry contacts, pre-Christmas orders were surprisingly robust, especially in the United States, which for much of the year had been underwhelming. Sales to online and television promotional platforms also gathered momentum in the final months of 2016, offsetting earlier
INDIAN JEWELRY AND SILVERWARE FABRICATION THAI JEWELRY AND SILVERWARE FABRICATION
0
20
40
60
80
20152013201120092007
Mill
ion
Oun
ces
0
20
40
60
80
100
Constant 2016 Rupee/kg (thousands)
Source: GFMS, Thomson Reuters
Silverware
Jewelry
Real Silver Price
201520132011200920070
10
20
30
40
Mill
ion
Oun
ces
10
15
20
25
30
35
40
45
50
55
Constant 2016 Baht/oz
Source: GFMS, Thomson Reuters
Jewelry
Silverware
Real Silver Price
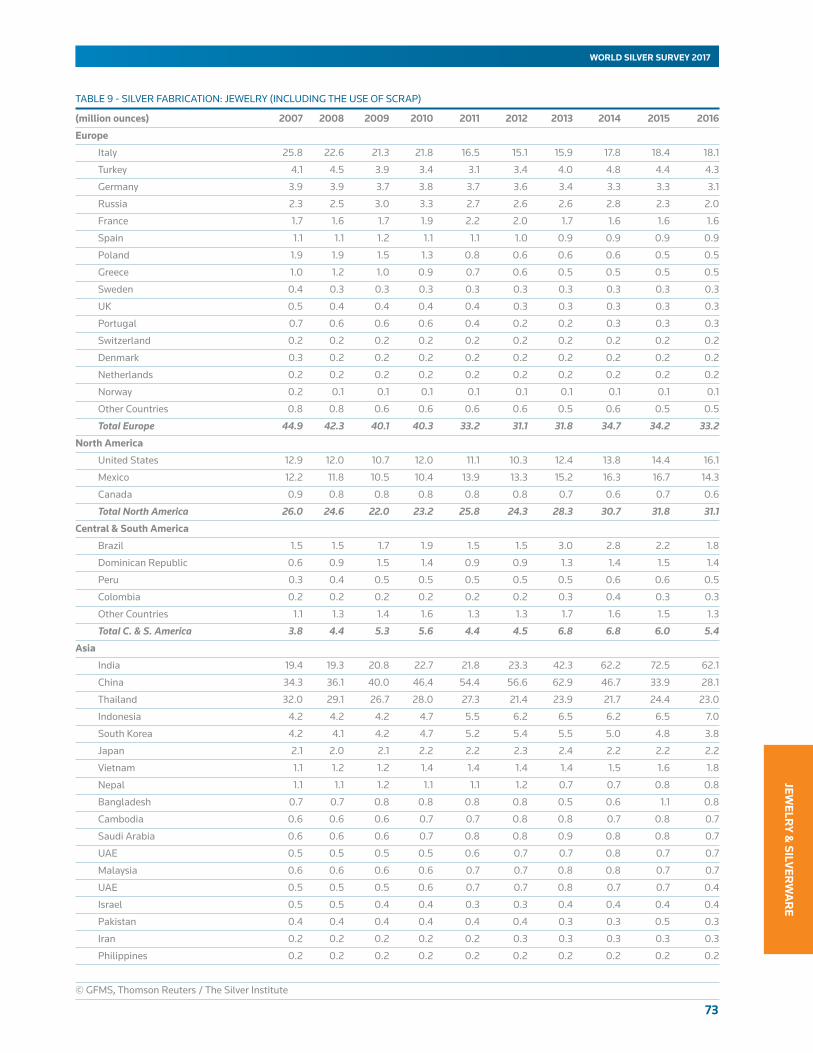
73
JEWELR
Y & SILV
ERW
AR
E
WORLD SILVER SURVEY 2017
TABLE 9 - SILVER FABRICATION: JEWELRY (INCLUDING THE USE OF SCRAP)
(millionounces) 2007 2008 2009 2010 2011 2012 2013 2014 2015 2016
Europe
Italy 25.8 22.6 21.3 21.8 16.5 15.1 15.9 17.8 18.4 18.1
Turkey 4.1 4.5 3.9 3.4 3.1 3.4 4.0 4.8 4.4 4.3
Germany 3.9 3.9 3.7 3.8 3.7 3.6 3.4 3.3 3.3 3.1
Russia 2.3 2.5 3.0 3.3 2.7 2.6 2.6 2.8 2.3 2.0
France 1.7 1.6 1.7 1.9 2.2 2.0 1.7 1.6 1.6 1.6
Spain 1.1 1.1 1.2 1.1 1.1 1.0 0.9 0.9 0.9 0.9
Poland 1.9 1.9 1.5 1.3 0.8 0.6 0.6 0.6 0.5 0.5
Greece 1.0 1.2 1.0 0.9 0.7 0.6 0.5 0.5 0.5 0.5
Sweden 0.4 0.3 0.3 0.3 0.3 0.3 0.3 0.3 0.3 0.3
UK 0.5 0.4 0.4 0.4 0.4 0.3 0.3 0.3 0.3 0.3
Portugal 0.7 0.6 0.6 0.6 0.4 0.2 0.2 0.3 0.3 0.3
Switzerland 0.2 0.2 0.2 0.2 0.2 0.2 0.2 0.2 0.2 0.2
Denmark 0.3 0.2 0.2 0.2 0.2 0.2 0.2 0.2 0.2 0.2
Netherlands 0.2 0.2 0.2 0.2 0.2 0.2 0.2 0.2 0.2 0.2
Norway 0.2 0.1 0.1 0.1 0.1 0.1 0.1 0.1 0.1 0.1
Other Countries 0.8 0.8 0.6 0.6 0.6 0.6 0.5 0.6 0.5 0.5
Total Europe 44.9 42.3 40.1 40.3 33.2 31.1 31.8 34.7 34.2 33.2
NorthAmerica
United States 12.9 12.0 10.7 12.0 11.1 10.3 12.4 13.8 14.4 16.1
Mexico 12.2 11.8 10.5 10.4 13.9 13.3 15.2 16.3 16.7 14.3
Canada 0.9 0.8 0.8 0.8 0.8 0.8 0.7 0.6 0.7 0.6
Total North America 26.0 24.6 22.0 23.2 25.8 24.3 28.3 30.7 31.8 31.1
Central&SouthAmerica
Brazil 1.5 1.5 1.7 1.9 1.5 1.5 3.0 2.8 2.2 1.8
Dominican Republic 0.6 0.9 1.5 1.4 0.9 0.9 1.3 1.4 1.5 1.4
Peru 0.3 0.4 0.5 0.5 0.5 0.5 0.5 0.6 0.6 0.5
Colombia 0.2 0.2 0.2 0.2 0.2 0.2 0.3 0.4 0.3 0.3
Other Countries 1.1 1.3 1.4 1.6 1.3 1.3 1.7 1.6 1.5 1.3
Total C. & S. America 3.8 4.4 5.3 5.6 4.4 4.5 6.8 6.8 6.0 5.4
Asia
India 19.4 19.3 20.8 22.7 21.8 23.3 42.3 62.2 72.5 62.1
China 34.3 36.1 40.0 46.4 54.4 56.6 62.9 46.7 33.9 28.1
Thailand 32.0 29.1 26.7 28.0 27.3 21.4 23.9 21.7 24.4 23.0
Indonesia 4.2 4.2 4.2 4.7 5.5 6.2 6.5 6.2 6.5 7.0
South Korea 4.2 4.1 4.2 4.7 5.2 5.4 5.5 5.0 4.8 3.8
Japan 2.1 2.0 2.1 2.2 2.2 2.3 2.4 2.2 2.2 2.2
Vietnam 1.1 1.2 1.2 1.4 1.4 1.4 1.4 1.5 1.6 1.8
Nepal 1.1 1.1 1.2 1.1 1.1 1.2 0.7 0.7 0.8 0.8
Bangladesh 0.7 0.7 0.8 0.8 0.8 0.8 0.5 0.6 1.1 0.8
Cambodia 0.6 0.6 0.6 0.7 0.7 0.8 0.8 0.7 0.8 0.7
Saudi Arabia 0.6 0.6 0.6 0.7 0.8 0.8 0.9 0.8 0.8 0.7
UAE 0.5 0.5 0.5 0.5 0.6 0.7 0.7 0.8 0.7 0.7
Malaysia 0.6 0.6 0.6 0.6 0.7 0.7 0.8 0.8 0.7 0.7
UAE 0.5 0.5 0.5 0.6 0.7 0.7 0.8 0.7 0.7 0.4
Israel 0.5 0.5 0.4 0.4 0.3 0.3 0.4 0.4 0.4 0.4
Pakistan 0.4 0.4 0.4 0.4 0.4 0.4 0.3 0.3 0.5 0.3
Iran 0.2 0.2 0.2 0.2 0.2 0.3 0.3 0.3 0.3 0.3
Philippines 0.2 0.2 0.2 0.2 0.2 0.2 0.2 0.2 0.2 0.2
© GFMS, Thomson Reuters / The Silver Institute

74
WORLD SILVER SURVEY 2017
JEW
ELR
Y &
SIL
VER
WA
RE
TABLE 9 - SILVER FABRICATION: JEWELRY (INCLUDING THE USE OF SCRAP)
(millionounces) 2007 2008 2009 2010 2011 2012 2013 2014 2015 2016
Taiwan 0.3 0.3 0.3 0.3 0.3 0.3 0.3 0.3 0.3 0.2
Hong Kong 0.3 0.3 0.3 0.3 0.3 0.3 0.3 0.3 0.2 0.2
Kazakhstan 0.3 0.3 0.2 0.2 0.2 0.2 0.2 0.2 0.2 0.2
Uzbekistan 0.3 0.3 0.2 0.2 0.2 0.2 0.2 0.2 0.2 0.2
Bahrain 0.1 0.1 0.1 0.2 0.2 0.2 0.2 0.2 0.2 0.2
Other Countries 1.0 1.0 1.0 1.0 1.0 1.0 0.9 0.9 0.6 0.6
Total Asia 104.7 103.4 106.8 118.1 125.9 125.1 152.4 153.0 153.7 134.9
Africa
Egypt 1.4 1.3 1.2 1.1 0.5 0.7 0.8 0.9 0.8 0.7
Morocco 0.3 0.3 0.2 0.2 0.2 0.2 0.3 0.3 0.3 0.3
Tunisia 0.2 0.2 0.2 0.2 0.2 0.2 0.2 0.2 0.2 0.2
Other Countries 0.4 0.5 0.4 0.4 0.4 0.4 0.5 0.5 0.5 0.4
Total Africa 2.3 2.3 2.0 2.0 1.4 1.6 1.7 1.8 1.7 1.6
Oceania
Total Oceania 0.7 0.7 0.7 0.7 0.8 0.8 0.8 0.8 0.9 0.9
WorldTotal 182.3 177.6 176.9 190.0 191.5 187.4 221.8 227.9 228.3 207.0
© GFMS, Thomson Reuters / The Silver Institute
losses and lifting expectations for a stronger 2017. The weakest segment across the industry remains at the low-end which historically has been the engine room for the country’s production. Rising costs (the average wage for skilled workers increased again last year), competition from foreign countries, and a drop in demand for low-end fashion jewelry all combined to drive production lower. At the domestic level, retail sales were heavily impacted by the death of the beloved Thai king in mid-October which led to a year-long period of mourning, bearing substantial consequences for the nation’s luxury and fashion sectors.
Silver jewelry exports last year reflected the overall state of the market, retreating 9% on a calculated weight basis. The United States remains the largest market for Thai fabricators, taking a third of the total volume with shipments to this key market declining by a double-digit percentage last year while deliveries to Germany and the UK were also materially weaker. Flows to Australia and Hong Kong were largely unchanged while direct shipments to China jumped by more than 60% year-on-year.
Jewelry fabrication in SouthKorea registered a 23% drop to a total of 3.8 Moz (117 t) in 2016. The major consumers of this segment are mostly younger generations in their early 20s. The deteriorating domestic economy has definitely had a negative effect on consumption across the country.
The domestic jewelry industry continued to contract, with the total number of the Korean manufacturers decreasing by 3-5% last year. In order to stimulate sales, fabricators introduced more fashionable designs with lower price tags per piece. In addition, given the youth demographic are more focused on design than purity some fabricators have shifted to lower purity silver in order to save on production costs.
Jewelry fabrication demand in Indonesia saw solid gains for the second year running, increasing by 7% last year to 7.0 Moz (218 t), an all time high. Continued expansion of standalone silver stores in major urban centers has help lift the profile of silver among the younger generation, aided by the expansion of international brands such as Pandora which has a strong following. Silver also benefited last year from the 7% rise in the domestic gold price with the yellow metal hitting an all-time-high in July with the lower sticker prices providing a more affordable option. In recent years, several large fabricators have emerged who are aimed purely at the export sector and these are now making inroads in developing their end markets. Annual customs data is not available for the full year; the limited data that is, coupled with anecdotal evidence gathered from our field research, points to a stronger sector, with shipments to the United States in particular providing the catalyst for robust growth.

75
JEWELR
Y & SILV
ERW
AR
E
WORLD SILVER SURVEY 2017
SILVERWARE
•Global silverware fabrication retreated for the first time in four years, declining by 17% to an estimated 52.1 Moz (1,621 t) with an acute fall in demand from India and China the chief catalyst for the fall.
Following three consecutive annual increases global silverware fabrication declined 17% in 2016 to an estimated 52.1 Moz (1,621 t), retreating to levels last seen in 2012. Higher silver prices accounted for the bulk of the fall, most notably in price sensitive markets where weaker domestic currencies accentuated the 9.3% rise in the dollar price. The largest falls were seen in Asia with India and China both recording an acute decline. In the former, higher prices were the chief architect for the fall while the continued anticorruption crackdown on gifting and the weaker economy accounted for the material falls in China. Elsewhere, North American demand was an outlier, rising to a six-year-high on the back of stronger exports and improved economic environment.
EUROPE
European silverware fabrication continued its downtrend in 2016 to 9.5 Moz (294 t), representing a drop of 5% year-on-year, a touch faster than in the previous year as prices rose. To put this in perspective, the long-running decline had seen silverware offtake drop to only 47% of the total market size a decade earlier. Much of the decline was due to a structural shift in societal habits such as the fall in gifting of silverware for family and religious holidays, which itself was a function of weak economic conditions and increasing competition from other consumer goods.
The largest silverware fabricator in the region, Russia, saw offtake continue to decline in 2016, falling by 6% to 3.9 Moz (120 t), the lowest since 2006. In addition to the continued structural shift in gifting culture away from traditional and heavyweight silverware towards other consumer goods, the economy and affordability issues played a paramount role last year as silver prices in rouble terms rose. However the pace of the economic decline slowed and this meant that despite higher silver prices in local currency terms the fall in offtake last year was a fraction less than in 2015.
In Italy, silverware fabrication continued to suffer, registering a 7% drop in 2016, to 1.6 Moz (48 t). This was
mainly due to the continued shift in gifting culture away from silverware towards other consumer goods such as branded accessories and technological gadgets. The continued underperformance of the Italian economy was also a drag, as was weak exports. Meanwhile, one of the best performing economies, Germany, saw fabrication there drop by a more modest 3% to 0.9 Moz (27 t) in 2016. Unlike in 2015 when strong exports saw Turkish silverware fabrication rise, fabrication in that market dropped back by 5% to 1.4 Moz (44 t) last year. This turnaround was largely a function of high silver prices in Turkish Lira terms as high international silver prices combined with currency weakness hindered offtake in Turkey.
NORTH AMERICA
Silverware fabrication in the United States rose a considerable 23% last year to 0.8 Moz (25 t). The increase was mainly on the back of an improved economic sentiment in the country which stimulated demand from some high-end hotels and the likes to order more silverware. At the same time, exports also rose particularly to Canada, Japan and parts of South America. Silverware fabrication in Canada and Mexico followed a similar positive trend, expanding at a slightly more modest 7% and 3% increase to 0.1 Moz (4 t) and 0.6 Moz (18 t) respectively.
ASIA
Indian silverware fabrication declined by 21% to 32.6 Moz (1,015 t), falling to the lowest level in three years. This is primarily attributed to inventory building at the wholesale and retail level in 2015 at the lower prices and
WORLD SILVERWARE FABRICATION
201520132011200920070
10
20
30
40
50
60
70
80
Mill
ion
Oun
ces
Source: GFMS, Thomson Reuters
Others
Asia
Europe

76
WORLD SILVER SURVEY 2017
JEW
ELR
Y &
SIL
VER
WA
RE
TABLE 10 - SILVER FABRICATION: SILVERWARE (INCLUDING THE USE OF SCRAP )
(millionounces) 2007 2008 2009 2010 2011 2012 2013 2014 2015 2016
Europe
Russia 4.3 5.2 5.5 6.0 5.0 4.8 4.6 4.4 4.1 3.9
Italy 6.6 5.5 4.6 4.0 2.8 2.3 2.0 1.9 1.8 1.6
Turkey 2.1 2.2 1.8 1.5 1.3 1.1 1.2 1.4 1.5 1.4
Germany 2.7 2.3 1.6 1.6 1.4 1.1 0.9 0.9 0.9 0.9
Norway 0.6 0.7 0.5 0.5 0.4 0.4 0.4 0.4 0.4 0.4
Sweden 0.4 0.4 0.3 0.3 0.3 0.3 0.3 0.3 0.3 0.3
Greece 1.2 1.0 0.8 0.6 0.5 0.3 0.3 0.3 0.3 0.2
Denmark 0.3 0.3 0.3 0.3 0.3 0.3 0.2 0.2 0.2 0.2
UK 0.3 0.3 0.3 0.3 0.3 0.2 0.2 0.2 0.2 0.2
France 0.2 0.3 0.2 0.2 0.2 0.1 0.1 0.1 0.1 0.1
Austria 0.1 0.1 0.1 0.1 0.1 0.1 0.1 0.1 0.1 0.1
Other Countries 0.8 0.7 0.4 0.4 0.3 0.3 0.3 0.2 0.2 0.2
Total Europe 19.7 19.0 16.3 15.7 12.8 11.3 10.6 10.3 10.0 9.5
NorthAmerica
United States 1.4 1.0 0.9 0.8 0.8 0.7 0.7 0.7 0.7 0.8
Mexico 1.4 1.2 0.9 0.7 0.5 0.5 0.6 0.6 0.6 0.6
Canada 0.2 0.1 0.1 0.1 0.1 0.1 0.1 0.1 0.1 0.1
Total North America 2.9 2.3 1.9 1.6 1.4 1.3 1.3 1.3 1.4 1.5
Central&SouthAmerica
Colombia 0.3 0.3 0.2 0.2 0.2 0.2 0.2 0.1 0.1 0.1
Peru 0.3 0.2 0.2 0.2 0.1 0.1 0.1 0.1 0.1 0.1
Other Countries 0.7 0.7 0.6 0.5 0.4 0.4 0.4 0.3 0.2 0.2
Total C. & S. America 1.3 1.2 1.0 0.9 0.8 0.8 0.7 0.6 0.5 0.4
Asia
India 14.9 15.5 16.6 16.9 16.6 15.2 30.0 36.1 41.3 32.6
China 9.1 8.7 6.9 7.6 8.3 8.6 10.0 6.1 3.4 2.4
Thailand 4.5 4.3 3.7 2.5 1.9 1.8 1.6 1.7 1.8 1.7
Israel 1.4 1.3 1.1 1.0 0.7 0.6 0.7 0.8 0.9 0.8
Iran 1.4 1.4 1.2 1.2 1.0 0.9 0.9 0.8 0.8 0.8
Bangladesh 0.7 0.7 0.7 0.6 0.6 0.5 0.4 0.4 0.5 0.4
Indonesia 0.6 0.6 0.7 0.7 0.6 0.5 0.4 0.4 0.4 0.4
Pakistan 0.6 0.6 0.5 0.5 0.4 0.4 0.3 0.3 0.4 0.3
South Korea 0.7 0.7 0.6 0.6 0.6 0.5 0.5 0.4 0.3 0.3
Cambodia 0.2 0.2 0.2 0.2 0.2 0.1 0.1 0.1 0.1 0.1
Saudi Arabia 0.1 0.1 0.1 0.1 0.1 0.1 0.1 0.1 0.1 0.1
Other Countries 1.3 1.3 1.1 1.1 1.0 0.9 0.8 0.8 0.8 0.5
Total Asia 35.7 35.5 33.5 32.9 31.9 30.0 45.9 48.1 50.8 40.4
Africa
Africa 0.5 0.5 0.5 0.4 0.3 0.3 0.3 0.3 0.3 0.3
Total Africa 0.5 0.5 0.5 0.4 0.3 0.3 0.3 0.3 0.3 0.3
Oceania
Australia 0.04 0.04 0.03 0.03 0.02 0.02 0.02 0.02 0.02 0.02
Total Oceania 0.04 0.04 0.03 0.03 0.03 0.02 0.02 0.02 0.02 0.02
WorldTotal 60.2 58.4 53.2 51.6 47.2 43.7 58.8 60.7 62.9 52.1
© GFMS, Thomson Reuters / The Silver Institute
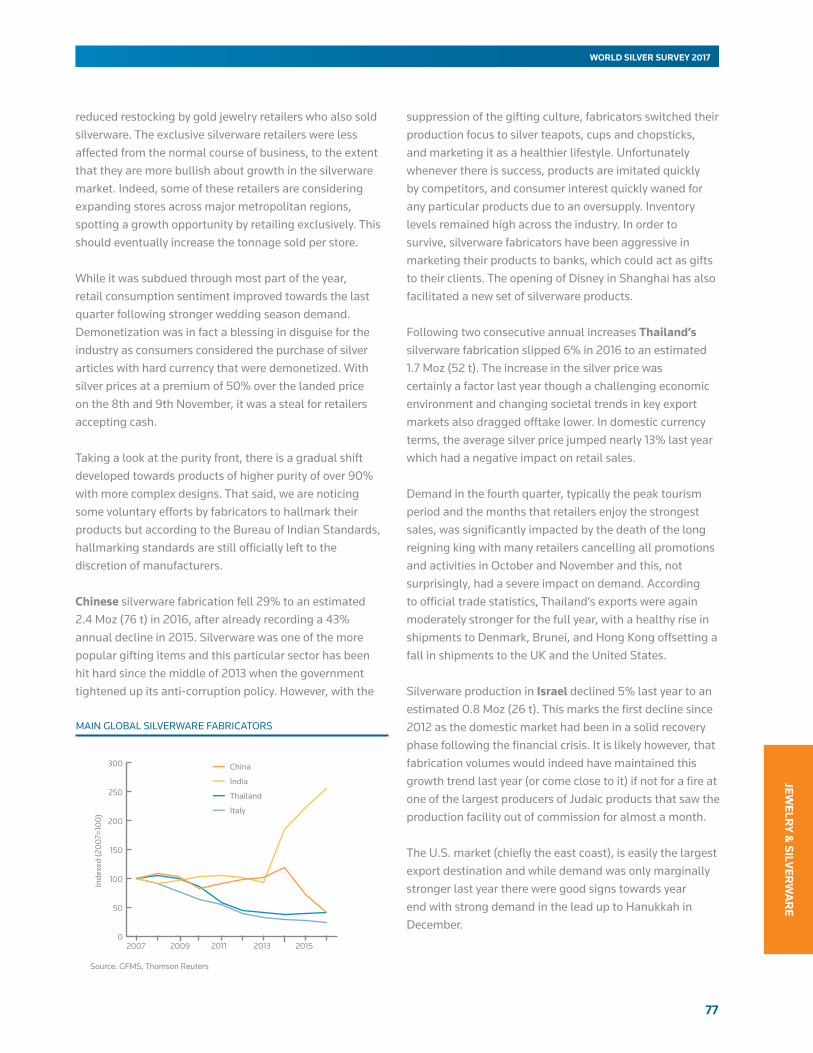
77
JEWELR
Y & SILV
ERW
AR
E
WORLD SILVER SURVEY 2017
reduced restocking by gold jewelry retailers who also sold silverware. The exclusive silverware retailers were less affected from the normal course of business, to the extent that they are more bullish about growth in the silverware market. Indeed, some of these retailers are considering expanding stores across major metropolitan regions, spotting a growth opportunity by retailing exclusively. This should eventually increase the tonnage sold per store.
While it was subdued through most part of the year, retail consumption sentiment improved towards the last quarter following stronger wedding season demand. Demonetization was in fact a blessing in disguise for the industry as consumers considered the purchase of silver articles with hard currency that were demonetized. With silver prices at a premium of 50% over the landed price on the 8th and 9th November, it was a steal for retailers accepting cash.
Taking a look at the purity front, there is a gradual shift developed towards products of higher purity of over 90% with more complex designs. That said, we are noticing some voluntary efforts by fabricators to hallmark their products but according to the Bureau of Indian Standards, hallmarking standards are still officially left to the discretion of manufacturers.
Chinese silverware fabrication fell 29% to an estimated 2.4 Moz (76 t) in 2016, after already recording a 43% annual decline in 2015. Silverware was one of the more popular gifting items and this particular sector has been hit hard since the middle of 2013 when the government tightened up its anti-corruption policy. However, with the
suppression of the gifting culture, fabricators switched their production focus to silver teapots, cups and chopsticks, and marketing it as a healthier lifestyle. Unfortunately whenever there is success, products are imitated quickly by competitors, and consumer interest quickly waned for any particular products due to an oversupply. Inventory levels remained high across the industry. In order to survive, silverware fabricators have been aggressive in marketing their products to banks, which could act as gifts to their clients. The opening of Disney in Shanghai has also facilitated a new set of silverware products.
Following two consecutive annual increases Thailand’s silverware fabrication slipped 6% in 2016 to an estimated 1.7 Moz (52 t). The increase in the silver price was certainly a factor last year though a challenging economic environment and changing societal trends in key export markets also dragged offtake lower. In domestic currency terms, the average silver price jumped nearly 13% last year which had a negative impact on retail sales.
Demand in the fourth quarter, typically the peak tourism period and the months that retailers enjoy the strongest sales, was significantly impacted by the death of the long reigning king with many retailers cancelling all promotions and activities in October and November and this, not surprisingly, had a severe impact on demand. According to official trade statistics, Thailand’s exports were again moderately stronger for the full year, with a healthy rise in shipments to Denmark, Brunei, and Hong Kong offsetting a fall in shipments to the UK and the United States.
Silverware production in Israel declined 5% last year to an estimated 0.8 Moz (26 t). This marks the first decline since 2012 as the domestic market had been in a solid recovery phase following the financial crisis. It is likely however, that fabrication volumes would indeed have maintained this growth trend last year (or come close to it) if not for a fire at one of the largest producers of Judaic products that saw the production facility out of commission for almost a month.
The U.S. market (chiefly the east coast), is easily the largest export destination and while demand was only marginally stronger last year there were good signs towards year end with strong demand in the lead up to Hanukkah in December.
MAIN GLOBAL SILVERWARE FABRICATORS
Inde
xed
(200
7=10
0)
Source: GFMS, Thomson Reuters
China
Thailand
India
Italy
0
50
100
150
200
250
300
20152013201120092007

78
WORLD SILVER SURVEY 2017
AP
PEN
DIC
ES
9. APPENDICES
Page
Appendix 1 World Silver Supply and Demand (tons) 79
World Silver Mine Production (tons) 80
Silver Fabrication: Coins and Medals (tons) 82
Supply of Silver from the Recycling of Scrap (tons) 82
World Silver Fabrication Including the Use of Scrap (tons) 84
Silver Fabrication: Industrial Applications (tons) 86
Silver Fabrication: Electrical and Electronics (tons) 88
Silver Fabrication: Brazing Alloys and Solders (tons) 88
Silver Fabrication: Photographic Use (tons) 89
Silver Fabrication: Ethylene Oxide Catalyst Use (tons) 89
Silver Fabrication: Jewelry and Silverware (tons) 90
Silver Fabrication: Jewelry (tons) 92
Silver Fabrication: Silverware (tons) 94
Top 20 Silver Producing Countries and Companies (tons) 95
Appendix 2 Nominal Silver Prices, 1982- 2016 96
Appendix 3 Real Silver Prices, 1982 - 2016 97
Appendix 4 Silver Prices, in US$ per ounce (London and COMEX) 98
US Prices in 2016 (monthly) 98
Indicative Lease Rates, 2016 98
Appendix 5 Leading Primary Silver Mines 99
Silver Mine Production by Source Metal 99
Silver Mine Production by Main Region and Source Metal 99
Appendix 6 COMEX and London Bullion Market Turnover 100
Quarterly ETP Holdings and Value 100
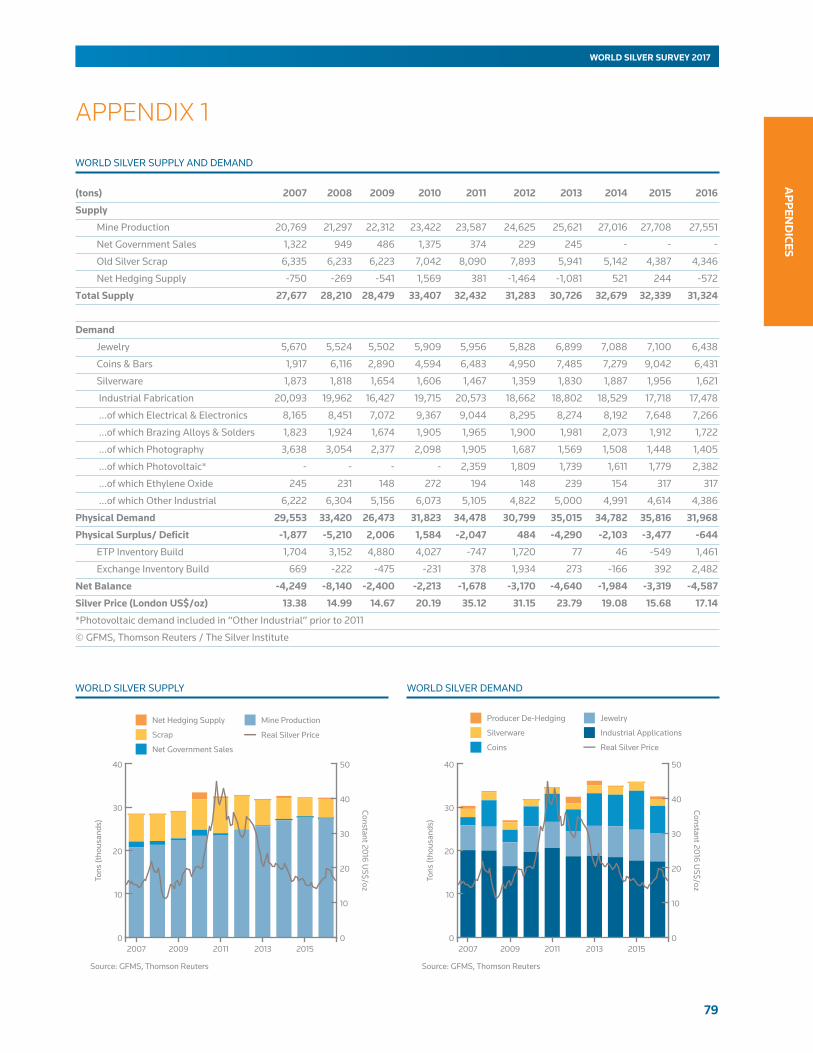
79
AP
PEN
DICES
WORLD SILVER SURVEY 2017
APPENDIX 1
WORLD SILVER SUPPLY AND DEMAND
WORLD SILVER SUPPLY WORLD SILVER DEMAND
(tons) 2007 2008 2009 2010 2011 2012 2013 2014 2015 2016
Supply
Mine Production 20,769 21,297 22,312 23,422 23,587 24,625 25,621 27,016 27,708 27,551
Net Government Sales 1,322 949 486 1,375 374 229 245 - - -
Old Silver Scrap 6,335 6,233 6,223 7,042 8,090 7,893 5,941 5,142 4,387 4,346
Net Hedging Supply -750 -269 -541 1,569 381 -1,464 -1,081 521 244 -572
Total Supply 27,677 28,210 28,479 33,407 32,432 31,283 30,726 32,679 32,339 31,324
Demand
Jewelry 5,670 5,524 5,502 5,909 5,956 5,828 6,899 7,088 7,100 6,438
Coins & Bars 1,917 6,116 2,890 4,594 6,483 4,950 7,485 7,279 9,042 6,431
Silverware 1,873 1,818 1,654 1,606 1,467 1,359 1,830 1,887 1,956 1,621
Industrial Fabrication 20,093 19,962 16,427 19,715 20,573 18,662 18,802 18,529 17,718 17,478
…of which Electrical & Electronics 8,165 8,451 7,072 9,367 9,044 8,295 8,274 8,192 7,648 7,266
…of which Brazing Alloys & Solders 1,823 1,924 1,674 1,905 1,965 1,900 1,981 2,073 1,912 1,722
…of which Photography 3,638 3,054 2,377 2,098 1,905 1,687 1,569 1,508 1,448 1,405
…of which Photovoltaic* - - - - 2,359 1,809 1,739 1,611 1,779 2,382
…of which Ethylene Oxide 245 231 148 272 194 148 239 154 317 317
…of which Other Industrial 6,222 6,304 5,156 6,073 5,105 4,822 5,000 4,991 4,614 4,386
Physical Demand 29,553 33,420 26,473 31,823 34,478 30,799 35,015 34,782 35,816 31,968
Physical Surplus/ Deficit -1,877 -5,210 2,006 1,584 -2,047 484 -4,290 -2,103 -3,477 -644
ETP Inventory Build 1,704 3,152 4,880 4,027 -747 1,720 77 46 -549 1,461
Exchange Inventory Build 669 -222 -475 -231 378 1,934 273 -166 392 2,482
Net Balance -4,249 -8,140 -2,400 -2,213 -1,678 -3,170 -4,640 -1,984 -3,319 -4,587
Silver Price (London US$/oz) 13.38 14.99 14.67 20.19 35.12 31.15 23.79 19.08 15.68 17.14
*Photovoltaic demand included in “Other Industrial” prior to 2011
© GFMS, Thomson Reuters / The Silver Institute
201520132011200920070
10
20
30
40
Tons
(tho
usan
ds)
0
10
20
30
40
50
Constant 2016 US$/oz
Source: GFMS, Thomson Reuters
Net Hedging Supply
Scrap
Net Government Sales
Real Silver Price
Mine Production
201520132011200920070
10
20
30
40
Tons
(tho
usan
ds)
0
10
20
30
40
50
Constant 2016 US$/oz
Source: GFMS, Thomson Reuters
Producer De-Hedging
Silverware
Coins Real Silver Price
Industrial Applications
Jewelry

80
WORLD SILVER SURVEY 2017
AP
PEN
DIC
ES
(tons) 2007 2008 2009 2010 2011 2012 2013 2014 2015 2016
Europe
Russia 910 1,132 1,312 1,145 1,221 1,412 1,381 1,448 1,581 1,450
Poland 1,233 1,212 1,220 1,171 1,270 1,284 1,170 1,264 1,291 1,198
Sweden 294 263 270 285 283 306 337 396 494 511
Turkey 235 314 389 384 288 228 188 205 172 175
Portugal 28 41 22 23 31 34 45 54 74 71
Spain 2 2 5 23 33 37 41 40 40 39
Greece 35 35 29 27 25 30 29 27 32 31
Bulgaria 14 11 15 13 17 19 19 18 19 18
Macedonia 8 9 9 9 9 10 11 10 11 11
Ireland 5 8 5 4 6 9 8 6 8 8
Romania 3 - 3 7 12 9 9 3 3 3
Finland - - - - - - 3 2 2 2
Other Countries 2 1 1 2 2 1 1 1 1 1
Total Europe 2,769 3,030 3,281 3,092 3,198 3,378 3,240 3,476 3,727 3,519
North America
Mexico 3,135 3,236 3,554 4,411 4,778 5,358 5,513 5,796 5,972 5,793
United States 1,260 1,120 1,250 1,280 1,120 1,060 1,040 1,180 1,090 1,100
Canada 829 669 609 573 582 685 640 495 380 405
Total North America 5,225 5,026 5,412 6,264 6,480 7,104 7,193 7,471 7,442 7,297
Central & South America
Peru 3,539 3,739 3,971 3,691 3,473 3,547 3,754 3,821 4,291 4,593
Chile 1,936 1,405 1,301 1,287 1,291 1,195 1,218 1,574 1,511 1,497
Bolivia 525 1,114 1,326 1,259 1,214 1,206 1,281 1,345 1,306 1,353
Argentina 255 337 560 726 708 762 774 906 1,080 932
Guatemala 88 100 129 195 273 205 281 858 856 838
Dominican Republic - 0 18 19 19 27 87 141 127 104
Nicaragua 3 3 4 7 8 10 14 17 18 18
Honduras 54 59 58 58 49 51 51 57 35 18
Ecuador 13 13 13 15 16 17 16 18 18 17
Brazil 11 11 12 12 12 12 15 15 17 17
Colombia 10 9 11 15 24 19 14 12 16 16
Venezuela 1 1 1 1 1 1 1 1 2 2
Other Countries 5 4 4 4 3 6 5 3 3 2
Total C. & S. America 6,441 6,797 7,408 7,290 7,091 7,057 7,511 8,768 9,278 9,407
Asia
China 2,466 2,613 2,698 2,942 3,192 3,401 3,529 3,499 3,421 3,496
Kazakhstan 708 629 614 548 547 545 611 590 538 554
India 178 212 193 255 234 280 333 261 374 436
Indonesia 268 248 240 209 190 165 255 227 310 347
Armenia 52 43 41 51 74 90 105 115 124 143
Iran 90 98 107 112 112 110 99 98 104 111
Mongolia 37 36 35 34 33 33 49 64 82 86
Uzbekistan 79 53 52 59 59 59 60 54 47 47
Thailand 13 13 21 23 24 38 36 34 27 42
Laos 4 7 15 17 18 20 32 40 41 38
Philippines 28 14 35 42 43 48 47 27 29 27
© GFMS, Thomson Reuters / The Silver Institute
WORLD SILVER MINE PRODUCTION
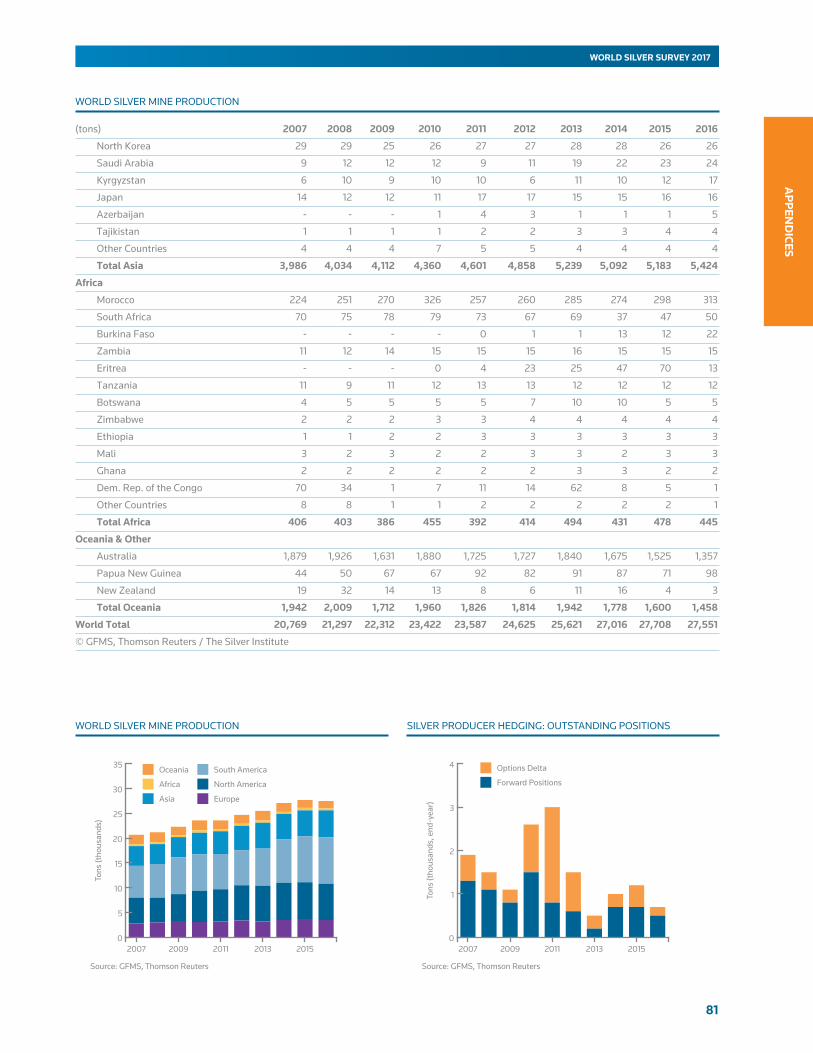
81
AP
PEN
DICES
WORLD SILVER SURVEY 2017
WORLD SILVER MINE PRODUCTION
WORLD SILVER MINE PRODUCTION SILVER PRODUCER HEDGING: OUTSTANDING POSITIONS
(tons) 2007 2008 2009 2010 2011 2012 2013 2014 2015 2016
North Korea 29 29 25 26 27 27 28 28 26 26
Saudi Arabia 9 12 12 12 9 11 19 22 23 24
Kyrgyzstan 6 10 9 10 10 6 11 10 12 17
Japan 14 12 12 11 17 17 15 15 16 16
Azerbaijan - - - 1 4 3 1 1 1 5
Tajikistan 1 1 1 1 2 2 3 3 4 4
Other Countries 4 4 4 7 5 5 4 4 4 4
Total Asia 3,986 4,034 4,112 4,360 4,601 4,858 5,239 5,092 5,183 5,424
Africa
Morocco 224 251 270 326 257 260 285 274 298 313
South Africa 70 75 78 79 73 67 69 37 47 50
Burkina Faso - - - - 0 1 1 13 12 22
Zambia 11 12 14 15 15 15 16 15 15 15
Eritrea - - - 0 4 23 25 47 70 13
Tanzania 11 9 11 12 13 13 12 12 12 12
Botswana 4 5 5 5 5 7 10 10 5 5
Zimbabwe 2 2 2 3 3 4 4 4 4 4
Ethiopia 1 1 2 2 3 3 3 3 3 3
Mali 3 2 3 2 2 3 3 2 3 3
Ghana 2 2 2 2 2 2 3 3 2 2
Dem. Rep. of the Congo 70 34 1 7 11 14 62 8 5 1
Other Countries 8 8 1 1 2 2 2 2 2 1
Total Africa 406 403 386 455 392 414 494 431 478 445
Oceania & Other
Australia 1,879 1,926 1,631 1,880 1,725 1,727 1,840 1,675 1,525 1,357
Papua New Guinea 44 50 67 67 92 82 91 87 71 98
New Zealand 19 32 14 13 8 6 11 16 4 3
Total Oceania 1,942 2,009 1,712 1,960 1,826 1,814 1,942 1,778 1,600 1,458
World Total 20,769 21,297 22,312 23,422 23,587 24,625 25,621 27,016 27,708 27,551
© GFMS, Thomson Reuters / The Silver Institute
201520132011200920070
5
10
15
20
25
30
35
Tons
(tho
usan
ds)
Source: GFMS, Thomson Reuters
Oceania
Africa
Asia
South America
North America
Europe
201520132011200920070
1
2
3
4
Tons
(tho
usan
ds, e
nd-y
ear)
Source: GFMS, Thomson Reuters
Options Delta
Forward Positions

82
WORLD SILVER SURVEY 2017
AP
PEN
DIC
ES
(tons) 2007 2008 2009 2010 2011 2012 2013 2014 2015 2016
Europe
Germany 471 455 391 465 519 672 537 446 464 475
United Kingdom 348 340 316 198 350 305 223 173 182 245
Russia 274 258 261 356 346 340 311 249 208 203
Italy 175 183 181 203 303 309 270 245 193 197
France 142 158 170 193 217 182 161 153 151 160
Turkey 30 36 33 32 36 32 32 46 53 61
Austria 38 36 33 35 38 37 36 34 35 39
Czech Republic 27 27 28 37 48 51 45 42 33 37
Poland 23 22 23 28 35 36 31 29 31 33
Netherlands 35 34 32 35 38 39 27 25 27 29
Spain 12 14 16 23 40 41 35 32 25 26
Belgium 20 19 18 20 21 22 15 15 14 15
Sweden 25 24 19 26 19 19 19 20 13 14
Denmark 16 15 14 16 17 16 13 12 12 13
Portugal 13 12 12 12 14 8 8 10 10 11
Hungary 6 6 6 8 11 11 10 9 9 10
Slovakia 6 5 6 7 10 11 9 8 10 10
Bulgaria 15 14 13 13 13 13 11 10 9 10
Finland 11 10 10 10 11 11 9 8 8 9
Other Countries 22 23 24 25 26 26 22 20 20 22
Total Europe 1,708 1,691 1,606 1,742 2,112 2,181 1,825 1,585 1,508 1,620
North America
Mexico 1,656 1,666 1,724 1,692 2,015 2,375 2,143 1,457 1,252 1,099
United States 44 50 52 48 51 56 51 34 30 27
Canada 72 84 95 98 123 140 145 35 14 14
Total North America 1,800 1,871 1,838 2,189 2,571 2,339 1,526 1,296 1,139 1,045
Central & South America
Brazil 32 32 34 46 78 79 62 59 72 77
Venezuela 8 8 8 10 11 10 12 11 13 14
© GFMS, Thomson Reuters / The Silver Institute
(tons) 2007 2008 2009 2010 2011 2012 2013 2014 2015 2016
United States 497 790 1,067 1,296 1,276 1,084 1,374 1,417 1,513 1,254
Canada 133 281 336 579 729 561 925 953 1,112 1,058
Australia 110 182 201 272 350 201 283 245 384 401
China 81 88 94 46 128 141 193 185 331 333
India 174 166 103 146 58 61 169 195 278 291
Germany 195 223 232 200 102 35 20 20 110 150
Austria 17 259 296 360 571 285 458 149 233 112
United Kingdom 14 16 17 16 31 22 68 60 98 98
Mexico 51 43 52 64 52 23 34 31 30 24
Hungary 3 5 4 4 4 4 0 1 18 23
Other Countries 127 108 113 145 132 232 112 104 106 88
World Total 1,402 2,160 2,516 3,129 3,433 2,650 3,635 3,360 4,213 3,831
© GFMS, Thomson Reuters / The Silver Institute
SILVER FABRICATION: COINS AND MEDALS INCLUDING THE USE OF SCRAP
SUPPLY OF SILVER FROM THE RECYCLING OF SCRAP

83
AP
PEN
DICES
WORLD SILVER SURVEY 2017
(tons) 2007 2008 2009 2010 2011 2012 2013 2014 2015 2016
Uruguay 6 6 5 8 13 12 11 11 12 12
Other Countries 52 48 44 58 68 66 45 30 32 36
Total C.&S. America 98 94 91 122 170 167 131 111 128 139
Asia
Japan 800 736 662 649 714 662 623 609 542 504
China 700 705 787 909 992 962 935 830 501 428
South Korea 242 240 262 294 310 281 262 215 126 135
Taiwan 91 97 111 129 140 133 113 97 85 94
India 502 429 465 558 642 771 169 92 79 85
Thailand 85 91 96 115 116 99 87 69 62 65
Saudi Arabia 58 32 60 69 65 48 50 54 47 49
Israel 13 13 13 16 17 16 13 14 13 14
Singapore 16 15 15 17 18 17 16 14 12 13
Kazakhstan 7 7 7 9 9 9 8 8 10 11
Indonesia 12 12 12 13 15 14 13 11 9 10
Uzbekistan 7 7 7 9 9 9 8 8 9 10
Vietnam 12 12 11 12 12 11 10 9 8 8
Other Countries 50 50 53 61 69 66 53 36 29 29
Total Asia 2,594 2,446 2,561 2,861 3,129 3,100 2,361 2,065 1,532 1,456
Africa
Egypt 48 48 43 43 21 23 21 20 18 20
Morocco 16 13 16 16 16 16 17 11 11 12
Libya 4 4 4 5 5 5 5 5 4 5
Other Countries 14 14 14 16 17 16 14 13 14 15
Total Africa 82 80 77 80 59 61 57 48 47 51
Oceania
Australia 52 51 49 49 49 45 41 37 33 35
Total Oceania 52 51 49 49 49 45 41 37 33 35
World Total 6,335 6,233 6,223 7,042 8,090 7,893 5,941 5,142 4,387 4,346
© GFMS, Thomson Reuters / The Silver Institute
WORLD SILVER SCRAP SUPPLY WORLD SCRAP SUPPLY, 2016
201520132011200920070
2
4
6
8
10
Tons
(tho
usan
ds)
0
10
20
30
40
50
Constant 2016 US$/oz
Source: GFMS, Thomson Reuters
Others
Asia North America
Real Silver Price
Europe
Source: GFMS, Thomson Reuters
Europe37%
North America24%
Asia34%
Others5%
SUPPLY OF SILVER FROM THE RECYCLING OF SCRAP
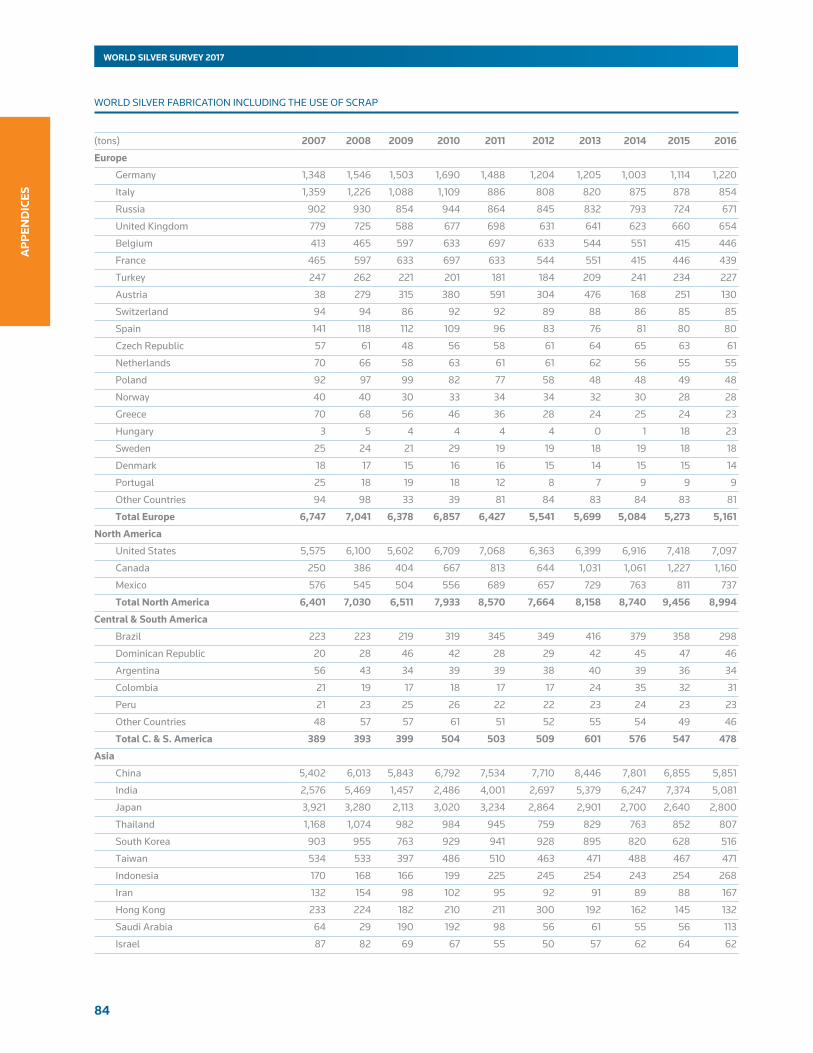
84
WORLD SILVER SURVEY 2017
AP
PEN
DIC
ES
WORLD SILVER FABRICATION INCLUDING THE USE OF SCRAP
(tons) 2007 2008 2009 2010 2011 2012 2013 2014 2015 2016
Europe
Germany 1,348 1,546 1,503 1,690 1,488 1,204 1,205 1,003 1,114 1,220
Italy 1,359 1,226 1,088 1,109 886 808 820 875 878 854
Russia 902 930 854 944 864 845 832 793 724 671
United Kingdom 779 725 588 677 698 631 641 623 660 654
Belgium 413 465 597 633 697 633 544 551 415 446
France 465 597 633 697 633 544 551 415 446 439
Turkey 247 262 221 201 181 184 209 241 234 227
Austria 38 279 315 380 591 304 476 168 251 130
Switzerland 94 94 86 92 92 89 88 86 85 85
Spain 141 118 112 109 96 83 76 81 80 80
Czech Republic 57 61 48 56 58 61 64 65 63 61
Netherlands 70 66 58 63 61 61 62 56 55 55
Poland 92 97 99 82 77 58 48 48 49 48
Norway 40 40 30 33 34 34 32 30 28 28
Greece 70 68 56 46 36 28 24 25 24 23
Hungary 3 5 4 4 4 4 0 1 18 23
Sweden 25 24 21 29 19 19 18 19 18 18
Denmark 18 17 15 16 16 15 14 15 15 14
Portugal 25 18 19 18 12 8 7 9 9 9
Other Countries 94 98 33 39 81 84 83 84 83 81
Total Europe 6,747 7,041 6,378 6,857 6,427 5,541 5,699 5,084 5,273 5,161
North America
United States 5,575 6,100 5,602 6,709 7,068 6,363 6,399 6,916 7,418 7,097
Canada 250 386 404 667 813 644 1,031 1,061 1,227 1,160
Mexico 576 545 504 556 689 657 729 763 811 737
Total North America 6,401 7,030 6,511 7,933 8,570 7,664 8,158 8,740 9,456 8,994
Central & South America
Brazil 223 223 219 319 345 349 416 379 358 298
Dominican Republic 20 28 46 42 28 29 42 45 47 46
Argentina 56 43 34 39 39 38 40 39 36 34
Colombia 21 19 17 18 17 17 24 35 32 31
Peru 21 23 25 26 22 22 23 24 23 23
Other Countries 48 57 57 61 51 52 55 54 49 46
Total C. & S. America 389 393 399 504 503 509 601 576 547 478
Asia
China 5,402 6,013 5,843 6,792 7,534 7,710 8,446 7,801 6,855 5,851
India 2,576 5,469 1,457 2,486 4,001 2,697 5,379 6,247 7,374 5,081
Japan 3,921 3,280 2,113 3,020 3,234 2,864 2,901 2,700 2,640 2,800
Thailand 1,168 1,074 982 984 945 759 829 763 852 807
South Korea 903 955 763 929 941 928 895 820 628 516
Taiwan 534 533 397 486 510 463 471 488 467 471
Indonesia 170 168 166 199 225 245 254 243 254 268
Iran 132 154 98 102 95 92 91 89 88 167
Hong Kong 233 224 182 210 211 300 192 162 145 132
Saudi Arabia 64 29 190 192 98 56 61 55 56 113
Israel 87 82 69 67 55 50 57 62 64 62
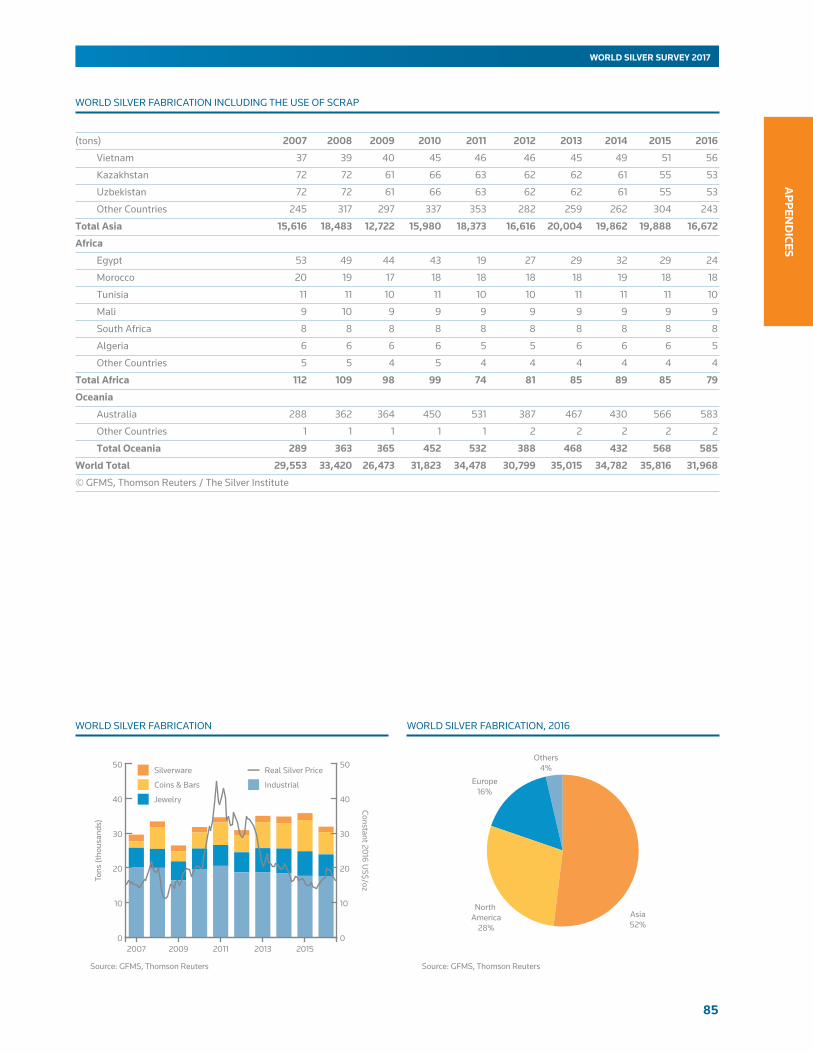
85
AP
PEN
DICES
WORLD SILVER SURVEY 2017
WORLD SILVER FABRICATION WORLD SILVER FABRICATION, 2016
(tons) 2007 2008 2009 2010 2011 2012 2013 2014 2015 2016
Vietnam 37 39 40 45 46 46 45 49 51 56
Kazakhstan 72 72 61 66 63 62 62 61 55 53
Uzbekistan 72 72 61 66 63 62 62 61 55 53
Other Countries 245 317 297 337 353 282 259 262 304 243
Total Asia 15,616 18,483 12,722 15,980 18,373 16,616 20,004 19,862 19,888 16,672
Africa
Egypt 53 49 44 43 19 27 29 32 29 24
Morocco 20 19 17 18 18 18 18 19 18 18
Tunisia 11 11 10 11 10 10 11 11 11 10
Mali 9 10 9 9 9 9 9 9 9 9
South Africa 8 8 8 8 8 8 8 8 8 8
Algeria 6 6 6 6 5 5 6 6 6 5
Other Countries 5 5 4 5 4 4 4 4 4 4
Total Africa 112 109 98 99 74 81 85 89 85 79
Oceania
Australia 288 362 364 450 531 387 467 430 566 583
Other Countries 1 1 1 1 1 2 2 2 2 2
Total Oceania 289 363 365 452 532 388 468 432 568 585
World Total 29,553 33,420 26,473 31,823 34,478 30,799 35,015 34,782 35,816 31,968
© GFMS, Thomson Reuters / The Silver Institute
WORLD SILVER FABRICATION INCLUDING THE USE OF SCRAP
0
10
20
30
40
50
20152013201120092007
Tons
(tho
usan
ds)
0
10
20
30
40
50
Constant 2016 US$/oz
Source: GFMS, Thomson Reuters
Silverware
Coins & Bars
Jewelry
Real Silver Price
Industrial
Source: GFMS, Thomson Reuters
Asia52%
Europe16%
Others4%
North America
28%
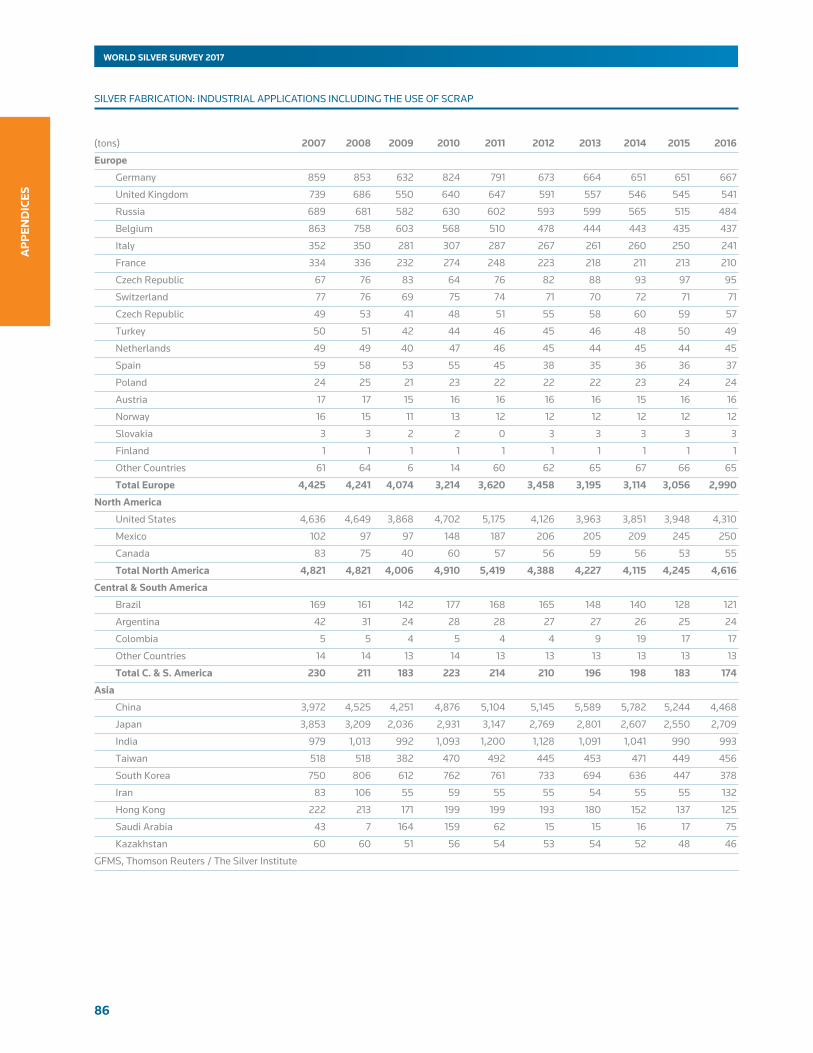
86
WORLD SILVER SURVEY 2017
AP
PEN
DIC
ES
SILVER FABRICATION: INDUSTRIAL APPLICATIONS INCLUDING THE USE OF SCRAP
(tons) 2007 2008 2009 2010 2011 2012 2013 2014 2015 2016
Europe
Germany 859 853 632 824 791 673 664 651 651 667
United Kingdom 739 686 550 640 647 591 557 546 545 541
Russia 689 681 582 630 602 593 599 565 515 484
Belgium 863 758 603 568 510 478 444 443 435 437
Italy 352 350 281 307 287 267 261 260 250 241
France 334 336 232 274 248 223 218 211 213 210
Czech Republic 67 76 83 64 76 82 88 93 97 95
Switzerland 77 76 69 75 74 71 70 72 71 71
Czech Republic 49 53 41 48 51 55 58 60 59 57
Turkey 50 51 42 44 46 45 46 48 50 49
Netherlands 49 49 40 47 46 45 44 45 44 45
Spain 59 58 53 55 45 38 35 36 36 37
Poland 24 25 21 23 22 22 22 23 24 24
Austria 17 17 15 16 16 16 16 15 16 16
Norway 16 15 11 13 12 12 12 12 12 12
Slovakia 3 3 2 2 0 3 3 3 3 3
Finland 1 1 1 1 1 1 1 1 1 1
Other Countries 61 64 6 14 60 62 65 67 66 65
Total Europe 4,425 4,241 4,074 3,214 3,620 3,458 3,195 3,114 3,056 2,990
North America
United States 4,636 4,649 3,868 4,702 5,175 4,126 3,963 3,851 3,948 4,310
Mexico 102 97 97 148 187 206 205 209 245 250
Canada 83 75 40 60 57 56 59 56 53 55
Total North America 4,821 4,821 4,006 4,910 5,419 4,388 4,227 4,115 4,245 4,616
Central & South America
Brazil 169 161 142 177 168 165 148 140 128 121
Argentina 42 31 24 28 28 27 27 26 25 24
Colombia 5 5 4 5 4 4 9 19 17 17
Other Countries 14 14 13 14 13 13 13 13 13 13
Total C. & S. America 230 211 183 223 214 210 196 198 183 174
Asia
China 3,972 4,525 4,251 4,876 5,104 5,145 5,589 5,782 5,244 4,468
Japan 3,853 3,209 2,036 2,931 3,147 2,769 2,801 2,607 2,550 2,709
India 979 1,013 992 1,093 1,200 1,128 1,091 1,041 990 993
Taiwan 518 518 382 470 492 445 453 471 449 456
South Korea 750 806 612 762 761 733 694 636 447 378
Iran 83 106 55 59 55 55 54 55 55 132
Hong Kong 222 213 171 199 199 193 180 152 137 125
Saudi Arabia 43 7 164 159 62 15 15 16 17 75
Kazakhstan 60 60 51 56 54 53 54 52 48 46
GFMS, Thomson Reuters / The Silver Institute

87
AP
PEN
DICES
WORLD SILVER SURVEY 2017
SILVER FABRICATION: INDUSTRIAL APPLICATIONS INCLUDING THE USE OF SCRAP
COMPONENTS OF INDUSTRIAL DEMAND WORLD SILVER INDUSTRIAL FABRICATION, 2016
(tons) 2007 2008 2009 2010 2011 2012 2013 2014 2015 2016
Uzbekistan 60 60 51 56 54 53 54 52 47 46
Other Countries 56 125 100 134 148 73 78 88 113 95
Total Asia 10,623 10,675 8,897 10,826 11,307 10,692 11,094 10,983 10,129 9,559
Africa
Morocco 9 9 8 7 8 8 8 8 8 9
South Africa 4 4 4 4 4 4 4 4 4 4
Other Countries 10 10 11 9 11 9 9 9 9 9
Total Africa 22 23 23 20 23 21 21 21 22 22
Oceania
Australia 156 158 140 154 154 157 150 154 150 149
Total Oceania 156 158 140 154 154 157 150 154 150 149
World Total 20,093 19,962 16,427 19,715 20,573 18,662 18,802 18,529 17,718 17,478
© GFMS, Thomson Reuters / The Silver Institute
201520132011200920070
5
10
15
20
25
Tons
(tho
usan
ds)
0
10
20
30
40
50
Constant 2016 US$/oz
Source: GFMS, Thomson Reuters
Others
Photovoltaic
Photography Real Silver Price
Electrical and Electronics
Brazing Alloys & Solders
Ethylene Oxide
Source: GFMS, Thomson Reuters
Others2%
Asia55%
North America
26%
Europe17%

88
WORLD SILVER SURVEY 2017
AP
PEN
DIC
ES
SILVER FABRICATION: ELECTRICAL AND ELECTRONICS INCLUDING THE USE OF SCRAP
SILVER FABRICATION: BRAZING ALLOYS AND SOLDERS INCLUDING THE USE OF SCRAP
(tons) 2007 2008 2009 2010 2011 2012 2013 2014 2015 2016
China 664 805 826 890 949 975 1,079 1,169 1,037 845
United States 240 225 162 182 187 166 178 182 187 191
India 68 67 68 80 83 75 65 82 77 77
Japan 132 122 78 115 108 93 87 79 75 73
United Kingdom 76 72 57 72 76 67 66 68 69 70
Germany 112 107 71 87 86 70 68 66 65 65
Canada 76 68 34 53 53 49 49 48 47 48
Russia 62 62 54 59 56 56 56 55 51 48
South Korea 74 81 64 72 73 68 64 59 45 45
Italy 78 75 52 57 54 50 48 47 45 44
Switzerland 44 42 38 41 41 39 39 40 39 39
Taiwan 39 39 31 38 39 38 36 35 34 34
Brazil 26 25 27 30 31 30 30 29 26 24
Mexico 16 14 12 13 12 12 12 12 14 20
France 27 26 17 20 19 17 16 16 16 16
Australia 17 17 15 16 18 18 17 17 16 15
Belgium 20 19 18 20 21 22 15 15 14 14
Spain 20 20 18 18 16 13 11 11 11 12
Other Countries 33 38 32 41 42 43 44 44 42 42
World Total 1,823 1,924 1,674 1,905 1,965 1,900 1,981 2,073 1,912 1,722
© GFMS, Thomson Reuters / The Silver Institute
(tons) 2007 2008 2009 2010 2011 2012 2013 2014 2015 2016
China 1,667 1,893 1,722 2,058 2,148 2,161 2,343 2,419 2,173 1,836
United States 1,796 1,935 1,660 2,320 2,085 1,745 1,651 1,672 1,685 1,708
Japan 1,394 1,204 877 1,588 1,438 1,194 1,190 1,044 945 918
Germany 665 674 488 664 631 534 529 521 519 536
India 440 468 502 531 534 547 470 501 451 453
Taiwan 363 384 309 377 395 353 367 384 365 372
Russia 375 375 321 353 339 334 338 315 285 266
South Korea 456 495 390 500 499 481 453 415 282 250
Mexico 65 64 69 118 157 177 176 179 213 213
France 264 269 178 215 189 166 164 159 161 159
United Kingdom 139 145 107 120 125 122 121 125 127 128
Italy 121 127 107 121 103 86 78 75 72 69
Hong Kong 108 104 83 97 97 94 87 72 66 59
Czech Republic 35 39 30 36 39 42 45 46 45 44
Brazil 48 46 37 50 49 48 47 45 42 38
Turkey 33 34 28 29 31 29 29 30 31 31
Kazakhstan 36 36 31 34 32 32 32 31 29 27
Uzbekistan 36 36 31 34 32 32 32 31 29 27
Other Countries 125 125 103 123 122 119 123 128 128 129
World Total 8,165 8,451 7,072 9,367 9,044 8,295 8,274 8,192 7,648 7,266
© GFMS, Thomson Reuters / The Silver Institute
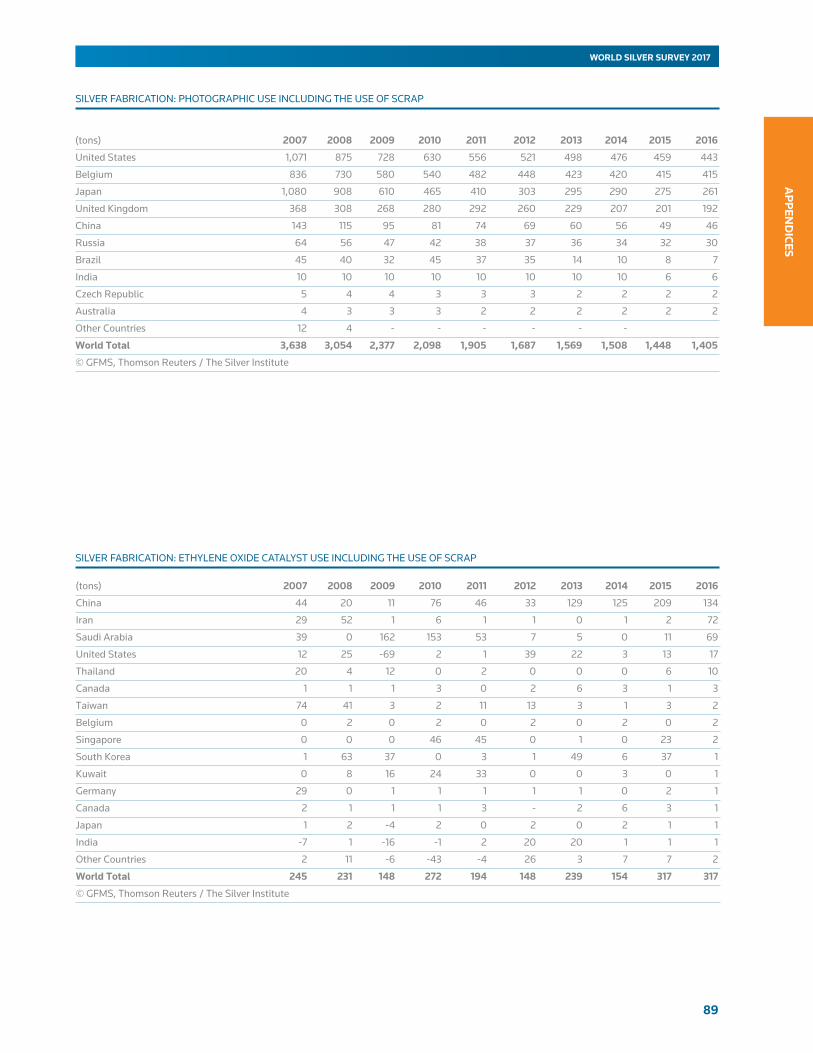
89
AP
PEN
DICES
WORLD SILVER SURVEY 2017
SILVER FABRICATION: PHOTOGRAPHIC USE INCLUDING THE USE OF SCRAP
(tons) 2007 2008 2009 2010 2011 2012 2013 2014 2015 2016
United States 1,071 875 728 630 556 521 498 476 459 443
Belgium 836 730 580 540 482 448 423 420 415 415
Japan 1,080 908 610 465 410 303 295 290 275 261
United Kingdom 368 308 268 280 292 260 229 207 201 192
China 143 115 95 81 74 69 60 56 49 46
Russia 64 56 47 42 38 37 36 34 32 30
Brazil 45 40 32 45 37 35 14 10 8 7
India 10 10 10 10 10 10 10 10 6 6
Czech Republic 5 4 4 3 3 3 2 2 2 2
Australia 4 3 3 3 2 2 2 2 2 2
Other Countries 12 4 - - - - - -
World Total 3,638 3,054 2,377 2,098 1,905 1,687 1,569 1,508 1,448 1,405
© GFMS, Thomson Reuters / The Silver Institute
SILVER FABRICATION: ETHYLENE OXIDE CATALYST USE INCLUDING THE USE OF SCRAP
(tons) 2007 2008 2009 2010 2011 2012 2013 2014 2015 2016
China 44 20 11 76 46 33 129 125 209 134
Iran 29 52 1 6 1 1 0 1 2 72
Saudi Arabia 39 0 162 153 53 7 5 0 11 69
United States 12 25 -69 2 1 39 22 3 13 17
Thailand 20 4 12 0 2 0 0 0 6 10
Canada 1 1 1 3 0 2 6 3 1 3
Taiwan 74 41 3 2 11 13 3 1 3 2
Belgium 0 2 0 2 0 2 0 2 0 2
Singapore 0 0 0 46 45 0 1 0 23 2
South Korea 1 63 37 0 3 1 49 6 37 1
Kuwait 0 8 16 24 33 0 0 3 0 1
Germany 29 0 1 1 1 1 1 0 2 1
Canada 2 1 1 1 3 - 2 6 3 1
Japan 1 2 -4 2 0 2 0 2 1 1
India -7 1 -16 -1 2 20 20 1 1 1
Other Countries 2 11 -6 -43 -4 26 3 7 7 2
World Total 245 231 148 272 194 148 239 154 317 317
© GFMS, Thomson Reuters / The Silver Institute

90
WORLD SILVER SURVEY 2017
AP
PEN
DIC
ES
SILVER FABRICATION: JEWELRY AND SILVERWARE INCLUDING THE USE OF SCRAP
(tons) 2007 2008 2009 2010 2011 2012 2013 2014 2015 2016
Europe
Italy 1,006 875 806 802 599 540 559 614 627 612
Russia 205 241 263 291 240 228 225 223 199 183
Turkey 194 207 175 153 134 139 162 192 184 177
Germany 203 193 166 169 159 147 134 131 130 123
France 59 57 59 64 73 67 56 54 53 52
Spain 44 41 41 37 37 32 29 30 29 30
Greece 70 68 56 46 36 28 24 25 24 23
Sweden 24 22 20 20 19 19 18 18 18 18
Poland 62 62 49 41 24 19 20 19 17 17
United Kingdom 26 23 21 21 20 18 16 17 17 15
Norway 25 26 19 20 18 18 16 17 16 15
Denmark 18 17 15 16 16 15 14 15 15 14
Portugal 21 17 18 18 12 8 7 8 9 9
Netherlands 8 8 8 8 7 7 7 7 7 7
Switzerland 7 7 7 7 7 7 7 7 7 7
Bulgaria 8 9 9 7 5 4 4 4 4 4
Belgium 5 5 4 4 4 4 4 4 4 4
Finland 7 7 5 5 5 5 4 3 3 3
Czech Republic 5 5 4 5 4 3 4 4 3 3
Austria 4 4 3 3 3 3 3 3 3 3
Cyprus 6 5 3 3 3 2 1 2 2 2
Serbia 2 2 2 2 2 2 2 2 1 1
Other Countries - - - - - - - - - -
Total Europe 2,008 1,904 1,754 1,744 1,429 1,317 1,318 1,401 1,373 1,325
North America
Mexico 442 404 362 400 370 342 405 449 468 527
United States 423 404 355 344 450 428 490 523 537 463
Canada 34 30 28 28 27 26 26 23 26 24
Total North America 899 838 745 772 847 797 921 996 1,031 1,014
Central & South America
Brazil 54 54 57 64 50 50 95 90 67 57
Dominican Republic 20 28 46 42 28 29 41 43 46 44
Peru 18 19 22 23 19 19 21 21 20 20
Colombia 16 14 13 14 13 13 15 16 15 14
Chile 12 14 12 10 11 11 11 13 13 12
Argentina 14 12 10 11 11 11 13 13 12 10
Ecuador 10 10 7 7 7 7 9 10 9 9
Bolivia 7 14 16 14 9 9 10 9 9 8
Other Countries 9 11 13 17 14 14 16 15 12 11
Total C. & S. America 157 173 195 202 161 163 231 229 200 183
Asia
India 1,065 1,082 1,164 1,233 1,194 1,196 2,248 3,058 3,539 2,945
China 1,348 1,392 1,457 1,681 1,952 2,029 2,266 1,642 1,160 951
Thailand 1,136 1,037 946 947 908 722 792 726 815 766
Indonesia 151 149 150 168 190 207 215 206 215 230
South Korea 149 153 149 150 167 179 183 186 167 185
Japan 61 65 62 65 70 69 72 75 70 69
© GFMS, Thomson Reuters / The Silver Institute
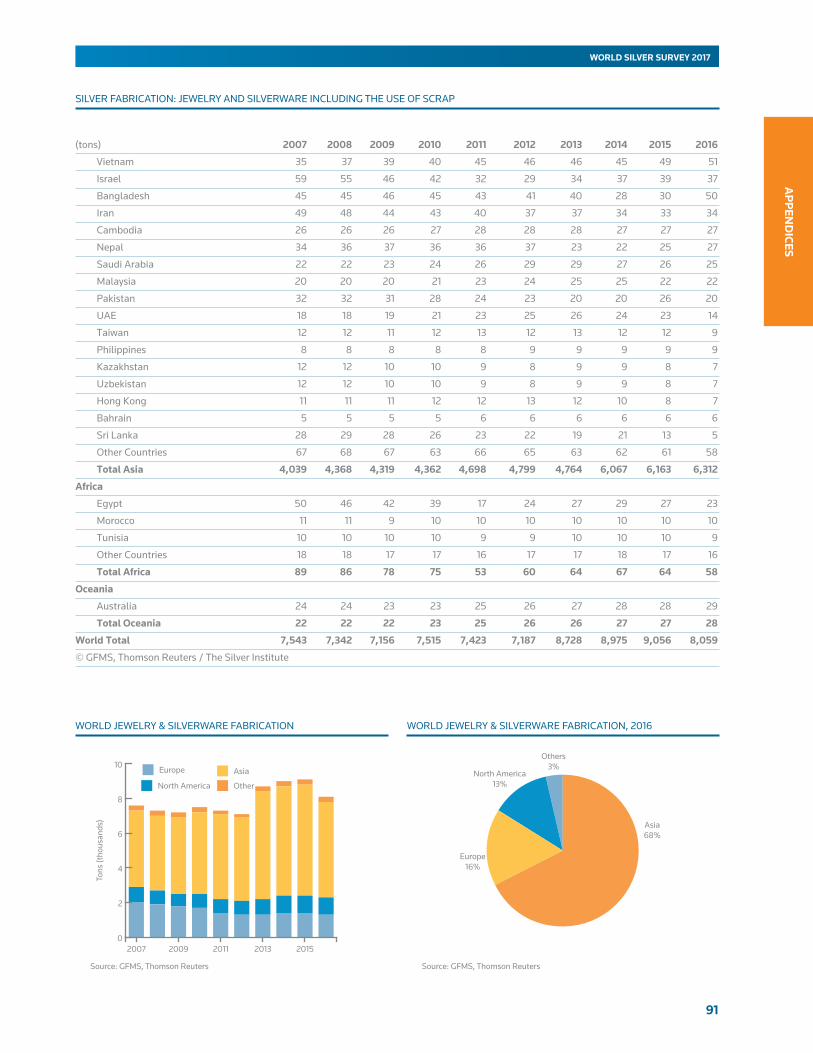
91
AP
PEN
DICES
WORLD SILVER SURVEY 2017
SILVER FABRICATION: JEWELRY AND SILVERWARE INCLUDING THE USE OF SCRAP
WORLD JEWELRY & SILVERWARE FABRICATION WORLD JEWELRY & SILVERWARE FABRICATION, 2016
(tons) 2007 2008 2009 2010 2011 2012 2013 2014 2015 2016
Vietnam 35 37 39 40 45 46 46 45 49 51
Israel 59 55 46 42 32 29 34 37 39 37
Bangladesh 45 45 46 45 43 41 40 28 30 50
Iran 49 48 44 43 40 37 37 34 33 34
Cambodia 26 26 26 27 28 28 28 27 27 27
Nepal 34 36 37 36 36 37 23 22 25 27
Saudi Arabia 22 22 23 24 26 29 29 27 26 25
Malaysia 20 20 20 21 23 24 25 25 22 22
Pakistan 32 32 31 28 24 23 20 20 26 20
UAE 18 18 19 21 23 25 26 24 23 14
Taiwan 12 12 11 12 13 12 13 12 12 9
Philippines 8 8 8 8 8 9 9 9 9 9
Kazakhstan 12 12 10 10 9 8 9 9 8 7
Uzbekistan 12 12 10 10 9 8 9 9 8 7
Hong Kong 11 11 11 12 12 13 12 10 8 7
Bahrain 5 5 5 5 6 6 6 6 6 6
Sri Lanka 28 29 28 26 23 22 19 21 13 5
Other Countries 67 68 67 63 66 65 63 62 61 58
Total Asia 4,039 4,368 4,319 4,362 4,698 4,799 4,764 6,067 6,163 6,312
Africa
Egypt 50 46 42 39 17 24 27 29 27 23
Morocco 11 11 9 10 10 10 10 10 10 10
Tunisia 10 10 10 10 9 9 10 10 10 9
Other Countries 18 18 17 17 16 17 17 18 17 16
Total Africa 89 86 78 75 53 60 64 67 64 58
Oceania
Australia 24 24 23 23 25 26 27 28 28 29
Total Oceania 22 22 22 23 25 26 26 27 27 28
World Total 7,543 7,342 7,156 7,515 7,423 7,187 8,728 8,975 9,056 8,059
© GFMS, Thomson Reuters / The Silver Institute
201520132011200920070
2
4
6
8
10
Tons
(tho
usan
ds)
Source: GFMS, Thomson Reuters
Europe
North America
Asia
Other
Source: GFMS, Thomson Reuters
Others3%
North America13%
Asia68%
Europe16%
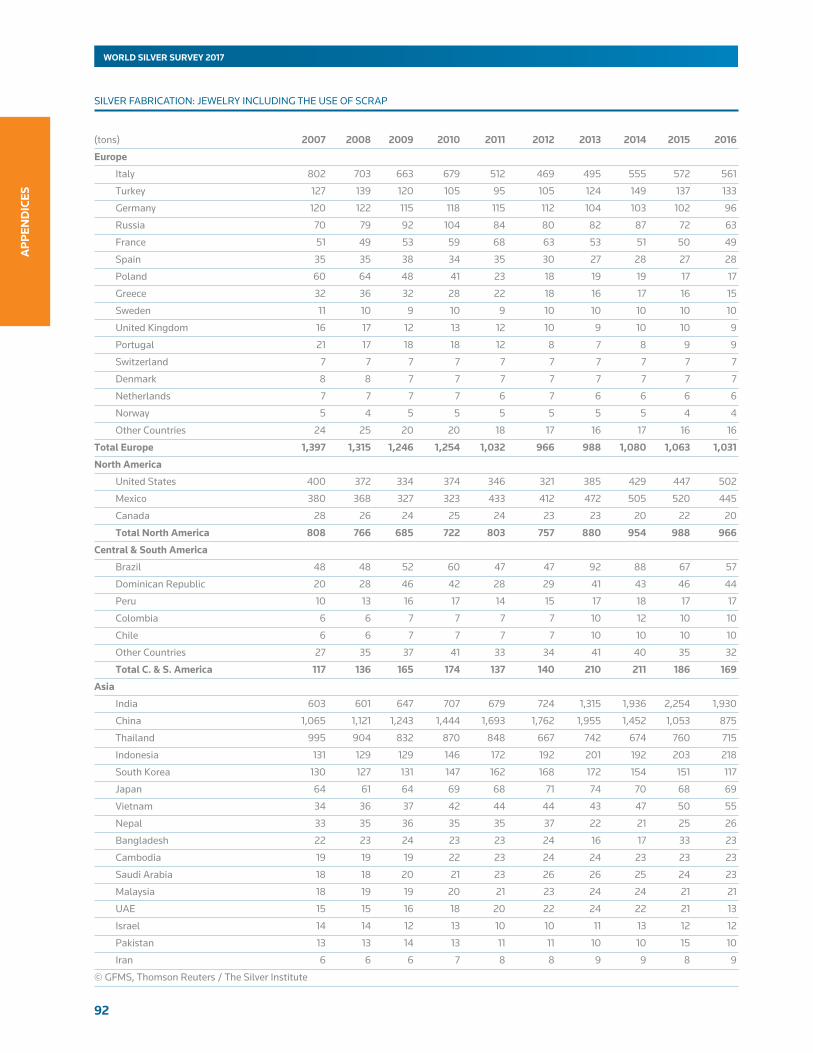
92
WORLD SILVER SURVEY 2017
AP
PEN
DIC
ES
SILVER FABRICATION: JEWELRY INCLUDING THE USE OF SCRAP
(tons) 2007 2008 2009 2010 2011 2012 2013 2014 2015 2016
Europe
Italy 802 703 663 679 512 469 495 555 572 561
Turkey 127 139 120 105 95 105 124 149 137 133
Germany 120 122 115 118 115 112 104 103 102 96
Russia 70 79 92 104 84 80 82 87 72 63
France 51 49 53 59 68 63 53 51 50 49
Spain 35 35 38 34 35 30 27 28 27 28
Poland 60 64 48 41 23 18 19 19 17 17
Greece 32 36 32 28 22 18 16 17 16 15
Sweden 11 10 9 10 9 10 10 10 10 10
United Kingdom 16 17 12 13 12 10 9 10 10 9
Portugal 21 17 18 18 12 8 7 8 9 9
Switzerland 7 7 7 7 7 7 7 7 7 7
Denmark 8 8 7 7 7 7 7 7 7 7
Netherlands 7 7 7 7 6 7 6 6 6 6
Norway 5 4 5 5 5 5 5 5 4 4
Other Countries 24 25 20 20 18 17 16 17 16 16
Total Europe 1,397 1,315 1,246 1,254 1,032 966 988 1,080 1,063 1,031
North America
United States 400 372 334 374 346 321 385 429 447 502
Mexico 380 368 327 323 433 412 472 505 520 445
Canada 28 26 24 25 24 23 23 20 22 20
Total North America 808 766 685 722 803 757 880 954 988 966
Central & South America
Brazil 48 48 52 60 47 47 92 88 67 57
Dominican Republic 20 28 46 42 28 29 41 43 46 44
Peru 10 13 16 17 14 15 17 18 17 17
Colombia 6 6 7 7 7 7 10 12 10 10
Chile 6 6 7 7 7 7 10 10 10 10
Other Countries 27 35 37 41 33 34 41 40 35 32
Total C. & S. America 117 136 165 174 137 140 210 211 186 169
Asia
India 603 601 647 707 679 724 1,315 1,936 2,254 1,930
China 1,065 1,121 1,243 1,444 1,693 1,762 1,955 1,452 1,053 875
Thailand 995 904 832 870 848 667 742 674 760 715
Indonesia 131 129 129 146 172 192 201 192 203 218
South Korea 130 127 131 147 162 168 172 154 151 117
Japan 64 61 64 69 68 71 74 70 68 69
Vietnam 34 36 37 42 44 44 43 47 50 55
Nepal 33 35 36 35 35 37 22 21 25 26
Bangladesh 22 23 24 23 23 24 16 17 33 23
Cambodia 19 19 19 22 23 24 24 23 23 23
Saudi Arabia 18 18 20 21 23 26 26 25 24 23
Malaysia 18 19 19 20 21 23 24 24 21 21
UAE 15 15 16 18 20 22 24 22 21 13
Israel 14 14 12 13 10 10 11 13 12 12
Pakistan 13 13 14 13 11 11 10 10 15 10
Iran 6 6 6 7 8 8 9 9 8 9
© GFMS, Thomson Reuters / The Silver Institute

93
AP
PEN
DICES
WORLD SILVER SURVEY 2017
SILVER FABRICATION: JEWELRY INCLUDING THE USE OF SCRAP
WORLD JEWELRY FABRICATION WORLD JEWELRY FABRICATION, 2016
(tons) 2007 2008 2009 2010 2011 2012 2013 2014 2015 2016
Philippines 6 6 6 6 7 7 7 7 8 8
Taiwan 9 8 8 9 10 10 10 9 10 7
Hong Kong 8 8 8 9 10 11 10 8 7 6
Kazakhstan 9 9 8 7 7 6 6 7 6 6
Uzbekistan 9 9 8 7 7 6 6 7 6 6
Bahrain 4 4 4 5 5 5 6 5 6 5
Other Countries 30 30 31 32 31 30 27 28 18 18
Total Asia 3,256 3,217 3,322 3,674 3,917 3,890 4,741 4,760 4,781 4,195
Africa
Egypt 43 40 36 34 15 22 24 27 25 21
Morocco 9 8 7 8 8 8 8 8 8 8
Tunisia 7 7 7 7 7 7 7 7 7 7
Other Countries 14 15 14 14 13 14 14 15 14 14
Total Africa 72 70 64 62 43 50 54 57 54 49
Oceania
Total Oceania 21 20 21 22 24 25 26 26 27 27
World Total 5,670 5,524 5,502 5,909 5,956 5,828 6,899 7,088 7,100 6,438
© GFMS, Thomson Reuters / The Silver Institute
201520132011200920070
2
4
6
8
Tons
(tho
usan
ds)
Source: GFMS, Thomson Reuters
Other
Asia
North America
Europe
Source: GFMS, Thomson Reuters
Asia65%
Europe16%
North America15%
Others4%
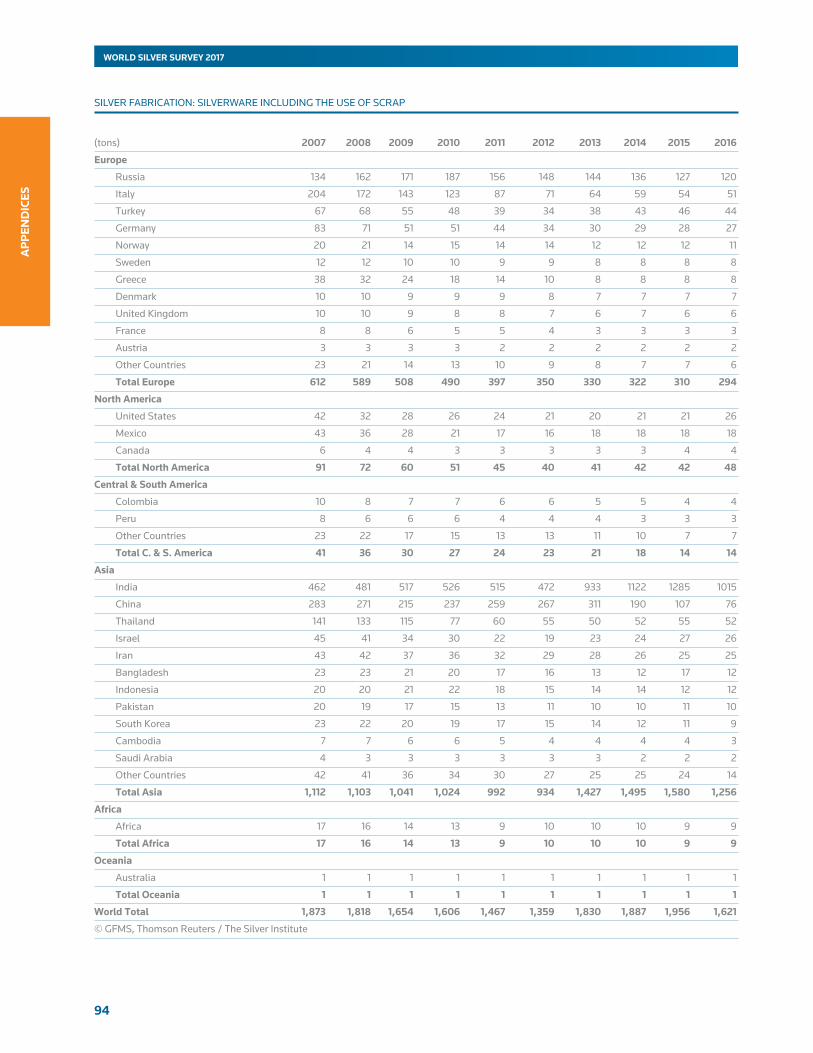
94
WORLD SILVER SURVEY 2017
AP
PEN
DIC
ES
SILVER FABRICATION: SILVERWARE INCLUDING THE USE OF SCRAP
(tons) 2007 2008 2009 2010 2011 2012 2013 2014 2015 2016
Europe
Russia 134 162 171 187 156 148 144 136 127 120
Italy 204 172 143 123 87 71 64 59 54 51
Turkey 67 68 55 48 39 34 38 43 46 44
Germany 83 71 51 51 44 34 30 29 28 27
Norway 20 21 14 15 14 14 12 12 12 11
Sweden 12 12 10 10 9 9 8 8 8 8
Greece 38 32 24 18 14 10 8 8 8 8
Denmark 10 10 9 9 9 8 7 7 7 7
United Kingdom 10 10 9 8 8 7 6 7 6 6
France 8 8 6 5 5 4 3 3 3 3
Austria 3 3 3 3 2 2 2 2 2 2
Other Countries 23 21 14 13 10 9 8 7 7 6
Total Europe 612 589 508 490 397 350 330 322 310 294
North America
United States 42 32 28 26 24 21 20 21 21 26
Mexico 43 36 28 21 17 16 18 18 18 18
Canada 6 4 4 3 3 3 3 3 4 4
Total North America 91 72 60 51 45 40 41 42 42 48
Central & South America
Colombia 10 8 7 7 6 6 5 5 4 4
Peru 8 6 6 6 4 4 4 3 3 3
Other Countries 23 22 17 15 13 13 11 10 7 7
Total C. & S. America 41 36 30 27 24 23 21 18 14 14
Asia
India 462 481 517 526 515 472 933 1122 1285 1015
China 283 271 215 237 259 267 311 190 107 76
Thailand 141 133 115 77 60 55 50 52 55 52
Israel 45 41 34 30 22 19 23 24 27 26
Iran 43 42 37 36 32 29 28 26 25 25
Bangladesh 23 23 21 20 17 16 13 12 17 12
Indonesia 20 20 21 22 18 15 14 14 12 12
Pakistan 20 19 17 15 13 11 10 10 11 10
South Korea 23 22 20 19 17 15 14 12 11 9
Cambodia 7 7 6 6 5 4 4 4 4 3
Saudi Arabia 4 3 3 3 3 3 3 2 2 2
Other Countries 42 41 36 34 30 27 25 25 24 14
Total Asia 1,112 1,103 1,041 1,024 992 934 1,427 1,495 1,580 1,256
Africa
Africa 17 16 14 13 9 10 10 10 9 9
Total Africa 17 16 14 13 9 10 10 10 9 9
Oceania
Australia 1 1 1 1 1 1 1 1 1 1
Total Oceania 1 1 1 1 1 1 1 1 1 1
World Total 1,873 1,818 1,654 1,606 1,467 1,359 1,830 1,887 1,956 1,621
© GFMS, Thomson Reuters / The Silver Institute
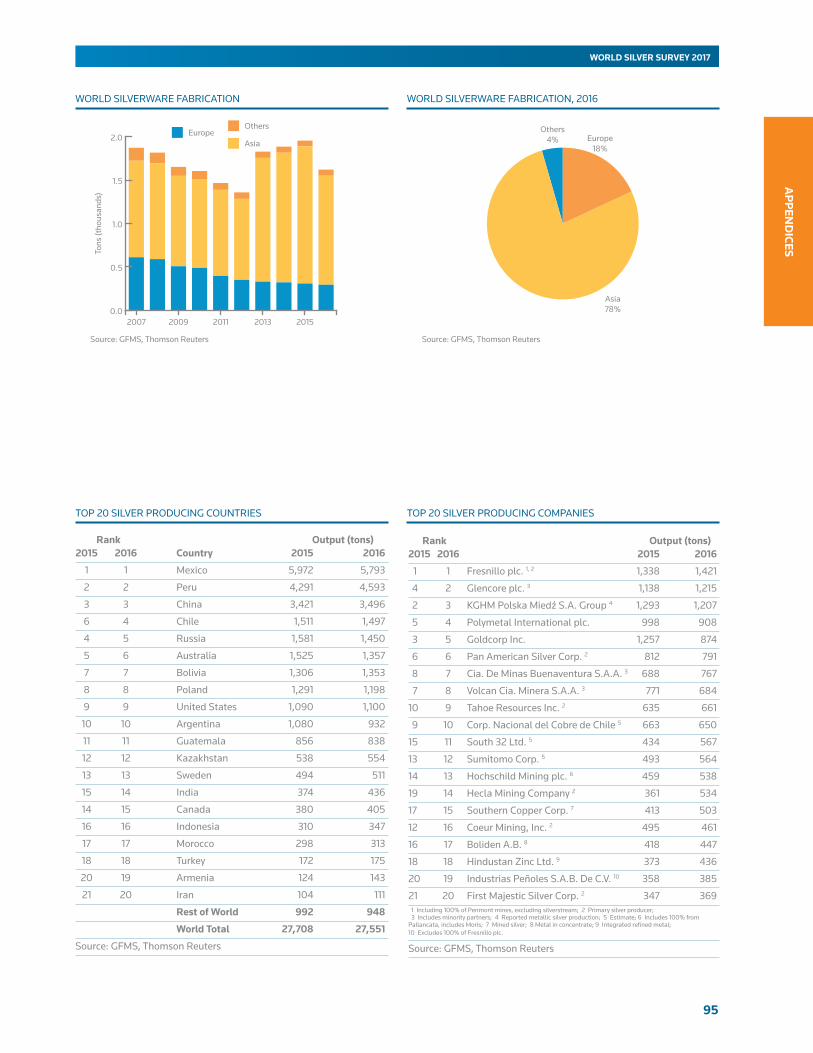
95
AP
PEN
DICES
WORLD SILVER SURVEY 2017
WORLD SILVERWARE FABRICATION WORLD SILVERWARE FABRICATION, 2016
201520132011200920070.0
0.5
1.0
1.5
2.0
Tons
(tho
usan
ds)
Source: GFMS, Thomson Reuters
Others
AsiaEurope
Source: GFMS, Thomson Reuters
Asia78%
Europe18%
Others4%
Rank Output (tons) 2015 2016 Country 2015 2016
1 1 Mexico 5,972 5,793
2 2 Peru 4,291 4,593
3 3 China 3,421 3,496
6 4 Chile 1,511 1,497
4 5 Russia 1,581 1,450
5 6 Australia 1,525 1,357
7 7 Bolivia 1,306 1,353
8 8 Poland 1,291 1,198
9 9 United States 1,090 1,100
10 10 Argentina 1,080 932
11 11 Guatemala 856 838
12 12 Kazakhstan 538 554
13 13 Sweden 494 511
15 14 India 374 436
14 15 Canada 380 405
16 16 Indonesia 310 347
17 17 Morocco 298 313
18 18 Turkey 172 175
20 19 Armenia 124 143
21 20 Iran 104 111
Rest of World 992 948
World Total 27,708 27,551
Source: GFMS, Thomson Reuters
TOP 20 SILVER PRODUCING COUNTRIES TOP 20 SILVER PRODUCING COMPANIES
Rank Output (tons) 2015 2016 2015 2016
1 1 Fresnillo plc. 1, 2 1,338 1,421
4 2 Glencore plc. 3 1,138 1,215
2 3 KGHM Polska Miedź S.A. Group 4 1,293 1,207
5 4 Polymetal International plc. 998 908
3 5 Goldcorp Inc. 1,257 874
6 6 Pan American Silver Corp. 2 812 791
8 7 Cia. De Minas Buenaventura S.A.A. 3 688 767
7 8 Volcan Cia. Minera S.A.A. 3 771 684
10 9 Tahoe Resources Inc. 2 635 661
9 10 Corp. Nacional del Cobre de Chile 5 663 650
15 11 South 32 Ltd. 5 434 567
13 12 Sumitomo Corp. 5 493 564
14 13 Hochschild Mining plc. 6 459 538
19 14 Hecla Mining Company 2 361 534
17 15 Southern Copper Corp. 7 413 503
12 16 Coeur Mining, Inc. 2 495 461
16 17 Boliden A.B. 8 418 447
18 18 Hindustan Zinc Ltd. 9 373 436
20 19 Industrias Peñoles S.A.B. De C.V. 10 358 385
21 20 First Majestic Silver Corp. 2 347 369 1 Including 100% of Penmont mines, excluding silverstream; 2 Primary silver producer; 3 Includes minority partners; 4 Reported metallic silver production; 5 Estimate; 6 Includes 100% from Pallancata, includes Moris; 7 Mined silver; 8 Metal in concentrate; 9 Integrated refined metal; 10 Excludes 100% of Fresnillo plc.
Source: GFMS, Thomson Reuters

96
WORLD SILVER SURVEY 2017
AP
PEN
DIC
ES
APPENDIX 2NOMINAL SILVER PRICES IN VARIOUS CURRENCIES
Prices are calculated from the London price and the average exchange rate for the year.
In the case of India, the price shown is the one actually quoted in the Mumbai and Ahmedabad market.
London India Thai Japan Korea China Eurozone* Mexico US$/oz Rupee/kg Baht/oz Yen/10g Won/10g Yuan/kg Euro/kg Peso/oz
1982 7.922 2,675 182.21 634.4 1,862 482 316 0.45
1983 11.415 3,435 262.89 873.8 2,851 726 479 1.37
1984 8.145 3,514 192.53 622.0 2,111 608 382 1.37
1985 6.132 3,880 166.54 470.3 1,715 579 296 1.58
1986 5.465 4,105 143.71 296.1 1,549 607 195 3.34
1987 7.016 5,124 180.46 326.2 1,855 840 208 9.67
1988 6.532 6,231 165.23 269.2 1,536 782 189 14.85
1989 5.500 6,803 141.36 244.0 1,187 666 170 13.54
1990 4.832 6,779 123.62 224.9 1,099 743 129 13.59
1991 4.057 6,993 103.51 175.7 956 694 111 12.24
1992 3.946 7,580 100.24 160.7 991 700 101 12.21
1993 4.313 6,163 109.20 154.2 1,113 799 117 13.44
1994 5.285 6,846 132.92 173.7 1,365 1,465 141 17.84
1995 5.197 6,864 129.49 157.2 1,289 1,395 122 33.36
1996 5.199 7,291 131.77 181.8 1,345 1,390 128 39.51
1997 4.897 7,009 153.60 190.5 1,498 1,305 139 38.78
1998 5.540 8,016 229.30 233.3 2,498 1,476 160 50.65
1999 5.218 8,022 197.38 191.2 1,994 1,389 158 49.90
2000 4.953 8,002 198.61 171.6 1,800 1,318 172 46.82
2001 4.370 7,420 194.15 170.7 1,814 1,163 157 40.82
2002 4.599 7,934 197.57 185.4 1,850 1,224 156 44.41
2003 4.879 8,138 202.39 181.8 1,869 1,298 139 52.64
2004 6.658 10,606 267.79 231.6 2,452 1,772 172 75.14
2005 7.312 11,083 294.07 259.1 2,407 1,926 189 79.68
2006 11.549 17,843 437.51 431.8 3,545 2,958 296 125.88
2007 13.384 18,794 461.98 506.7 3,999 3,273 314 146.26
2008 14.989 21,620 499.34 498.1 5,311 3,349 328 166.82
2009 14.674 23,815 503.12 441.4 6,024 3,223 339 198.30
2010 20.193 32,007 640.59 569.7 7,507 4,393 489 255.16
2011 35.119 55,638 1,069.25 900.0 12,508 7,296 811 436.30
2012 31.150 57,086 967.03 799.0 11,187 6,309 777 405.47
2013 23.793 48,618 730.53 742.1 8,366 4,708 576 303.52
2014 19.078 41,805 585.76 646.5 6,448 3,778 461 253.93
2015 15.680 36,146 537.10 610.3 5,704 3,168 560 248.91
2016 17.138 40,639 604.48 595.6 6,369 3,662 498 318.00
* From 1977-1998, the DM/kg price is expressed in Euro/kg at the official conversion rate of 1.95583
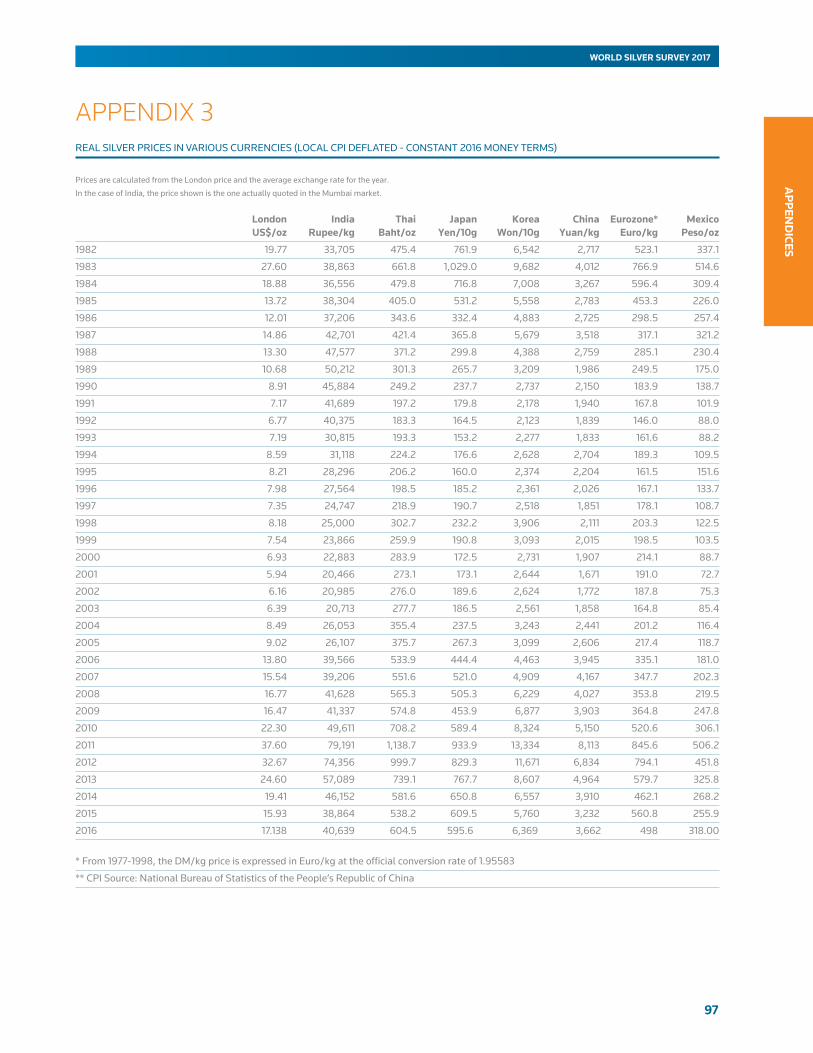
97
AP
PEN
DICES
WORLD SILVER SURVEY 2017
APPENDIX 3REAL SILVER PRICES IN VARIOUS CURRENCIES (LOCAL CPI DEFLATED - CONSTANT 2016 MONEY TERMS)
Prices are calculated from the London price and the average exchange rate for the year.
In the case of India, the price shown is the one actually quoted in the Mumbai market.
London India Thai Japan Korea China Eurozone* Mexico US$/oz Rupee/kg Baht/oz Yen/10g Won/10g Yuan/kg Euro/kg Peso/oz
1982 19.77 33,705 475.4 761.9 6,542 2,717 523.1 337.1
1983 27.60 38,863 661.8 1,029.0 9,682 4,012 766.9 514.6
1984 18.88 36,556 479.8 716.8 7,008 3,267 596.4 309.4
1985 13.72 38,304 405.0 531.2 5,558 2,783 453.3 226.0
1986 12.01 37,206 343.6 332.4 4,883 2,725 298.5 257.4
1987 14.86 42,701 421.4 365.8 5,679 3,518 317.1 321.2
1988 13.30 47,577 371.2 299.8 4,388 2,759 285.1 230.4
1989 10.68 50,212 301.3 265.7 3,209 1,986 249.5 175.0
1990 8.91 45,884 249.2 237.7 2,737 2,150 183.9 138.7
1991 7.17 41,689 197.2 179.8 2,178 1,940 167.8 101.9
1992 6.77 40,375 183.3 164.5 2,123 1,839 146.0 88.0
1993 7.19 30,815 193.3 153.2 2,277 1,833 161.6 88.2
1994 8.59 31,118 224.2 176.6 2,628 2,704 189.3 109.5
1995 8.21 28,296 206.2 160.0 2,374 2,204 161.5 151.6
1996 7.98 27,564 198.5 185.2 2,361 2,026 167.1 133.7
1997 7.35 24,747 218.9 190.7 2,518 1,851 178.1 108.7
1998 8.18 25,000 302.7 232.2 3,906 2,111 203.3 122.5
1999 7.54 23,866 259.9 190.8 3,093 2,015 198.5 103.5
2000 6.93 22,883 283.9 172.5 2,731 1,907 214.1 88.7
2001 5.94 20,466 273.1 173.1 2,644 1,671 191.0 72.7
2002 6.16 20,985 276.0 189.6 2,624 1,772 187.8 75.3
2003 6.39 20,713 277.7 186.5 2,561 1,858 164.8 85.4
2004 8.49 26,053 355.4 237.5 3,243 2,441 201.2 116.4
2005 9.02 26,107 375.7 267.3 3,099 2,606 217.4 118.7
2006 13.80 39,566 533.9 444.4 4,463 3,945 335.1 181.0
2007 15.54 39,206 551.6 521.0 4,909 4,167 347.7 202.3
2008 16.77 41,628 565.3 505.3 6,229 4,027 353.8 219.5
2009 16.47 41,337 574.8 453.9 6,877 3,903 364.8 247.8
2010 22.30 49,611 708.2 589.4 8,324 5,150 520.6 306.1
2011 37.60 79,191 1,138.7 933.9 13,334 8,113 845.6 506.2
2012 32.67 74,356 999.7 829.3 11,671 6,834 794.1 451.8
2013 24.60 57,089 739.1 767.7 8,607 4,964 579.7 325.8
2014 19.41 46,152 581.6 650.8 6,557 3,910 462.1 268.2
2015 15.93 38,864 538.2 609.5 5,760 3,232 560.8 255.9
2016 17.138 40,639 604.5 595.6 6,369 3,662 498 318.00
* From 1977-1998, the DM/kg price is expressed in Euro/kg at the official conversion rate of 1.95583
** CPI Source: National Bureau of Statistics of the People’s Republic of China

98
WORLD SILVER SURVEY 2017
AP
PEN
DIC
ES
APPENDIX 4SILVER PRICES IN US$ PER OUNCE
US PRICES IN 2016 LEASE RATES, 2016
London Silver Market Fix* COMEX Settlement Price High Low Average High Low Average
1991 4.5710 3.5475 4.0566 4.5450 3.5080 4.0355
1992 4.3350 3.6475 3.9464 4.3180 3.6400 3.9353
1993 5.4200 3.5600 4.3130 5.4430 3.5230 4.3049
1994 5.7475 4.6400 5.2851 5.7810 4.5730 5.2808
1995 6.0375 4.4160 5.1971 6.1020 4.3750 5.1850
1996 5.8275 4.7100 5.1995 5.8190 4.6760 5.1785
1997 6.2675 4.2235 4.8972 6.3350 4.1550 4.8775
1998 7.8100 4.6900 5.5398 7.2600 4.6180 5.4953
1999 5.7500 4.8800 5.2184 5.7600 4.8720 5.2142
2000 5.4475 4.5700 4.9525 5.5470 4.5630 4.9653
2001 4.8200 4.0650 4.3702 4.8050 4.0260 4.3597
2002 5.0975 4.2350 4.5990 5.1130 4.2160 4.5955
2003 5.9650 4.3700 4.8787 5.9830 4.3460 4.8916
2004 8.2900 5.4950 6.6578 8.2110 5.5140 6.6927
2005 9.2250 6.3900 7.3115 9.0000 6.4270 7.3220
2006 14.9400 8.8300 11.5492 14.8460 8.8090 11.5501
2007 15.8200 11.6700 13.3835 15.4990 11.4650 13.3762
2008 20.9200 8.8800 14.9891 20.6850 8.7900 14.9471
2009 19.1800 10.5100 14.6743 19.2950 10.4200 14.6961
2010 30.7000 15.1400 20.1929 30.9100 14.8230 20.2382
2011 48.7000 26.1600 35.1192 48.5840 26.8110 35.2485
2012 37.2300 26.6700 31.1497 37.1400 26.2470 31.1459
2013 32.2300 18.6100 23.7928 32.4090 18.5330 23.7469
2014 22.0500 15.2800 19.0778 22.0470 15.3920 19.0304
2015 18.2300 13.7100 15.6800 18.3460 13.6660 15.6576
2016 20.7100 13.5800 17.1376 20.6660 13.7370 17.1365* “LBMA Silver price” as of 15 August 2014; operated by CME and administered by Thomson Reuters
COMEX Settlement US$ per ounce High Low Average
January 14.5440 13.7370 14.0726
February 15.7890 14.2760 15.1294
March 16.0220 14.7330 15.4158
April 17.7890 14.9420 16.3215
May 17.6560 15.9720 16.8961
June 18.5820 15.9060 17.2588
July 20.3700 19.5440 19.9673
August 20.6660 18.4780 19.5141
September 20.0490 18.7810 19.2896
October 18.7950 17.2880 17.6032
November 18.7160 16.3830 17.3563
December 17.2030 15.7040 16.4110
Source: COMEX
Quarterly Averages
Average 3-month 6-month 12-month
Q1 2016 0.03% 0.23% 0.11%
Q2 2016 -0.12% 0.11% 0.10%
Q3 2016 -0.19% 0.14% 0.12%
Q4 2016 -0.16% 0.13% 0.11%
Calculated using silver forward offered rate and LIBOR;
forward rates dataset was discontinued with effect from May 2014 and replaced with
Silver Forward Lending Rate Composite.
The lease rates shown here are indicative, reflecting the difference between prevailing
forward rates in the currency markets and in the silver market itself. They do not take
into account the counter-party risk that any lender would apply to a transaction, or any
other external influences, and should therefore be seen as a guide to the shape of the
forward curve, rather than absolute levels.
Source: Eikon, Thomson Reuters
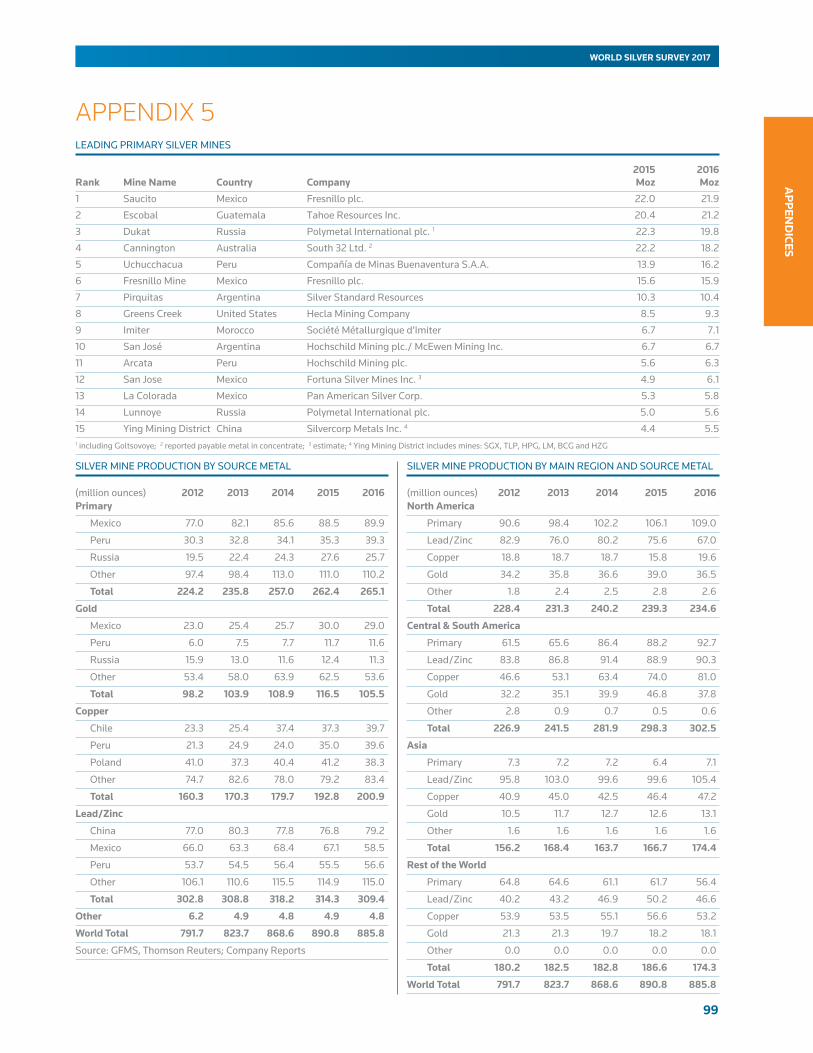
99
AP
PEN
DICES
WORLD SILVER SURVEY 2017
2015 2016 Rank Mine Name Country Company Moz Moz
1 Saucito Mexico Fresnillo plc. 22.0 21.9
2 Escobal Guatemala Tahoe Resources Inc. 20.4 21.2
3 Dukat Russia Polymetal International plc. 1 22.3 19.8
4 Cannington Australia South 32 Ltd. 2 22.2 18.2
5 Uchucchacua Peru Compañía de Minas Buenaventura S.A.A. 13.9 16.2
6 Fresnillo Mine Mexico Fresnillo plc. 15.6 15.9
7 Pirquitas Argentina Silver Standard Resources 10.3 10.4
8 Greens Creek United States Hecla Mining Company 8.5 9.3
9 Imiter Morocco Société Métallurgique d’Imiter 6.7 7.1
10 San José Argentina Hochschild Mining plc./ McEwen Mining Inc. 6.7 6.7
11 Arcata Peru Hochschild Mining plc. 5.6 6.3
12 San Jose Mexico Fortuna Silver Mines Inc. 3 4.9 6.1
13 La Colorada Mexico Pan American Silver Corp. 5.3 5.8
14 Lunnoye Russia Polymetal International plc. 5.0 5.6
15 Ying Mining District China Silvercorp Metals Inc. 4 4.4 5.51 including Goltsovoye; 2 reported payable metal in concentrate; 3 estimate; 4 Ying Mining District includes mines: SGX, TLP, HPG, LM, BCG and HZG
(million ounces) 2012 2013 2014 2015 2016 North America
Primary 90.6 98.4 102.2 106.1 109.0
Lead/Zinc 82.9 76.0 80.2 75.6 67.0
Copper 18.8 18.7 18.7 15.8 19.6
Gold 34.2 35.8 36.6 39.0 36.5
Other 1.8 2.4 2.5 2.8 2.6
Total 228.4 231.3 240.2 239.3 234.6
Central & South America
Primary 61.5 65.6 86.4 88.2 92.7
Lead/Zinc 83.8 86.8 91.4 88.9 90.3
Copper 46.6 53.1 63.4 74.0 81.0
Gold 32.2 35.1 39.9 46.8 37.8
Other 2.8 0.9 0.7 0.5 0.6
Total 226.9 241.5 281.9 298.3 302.5
Asia
Primary 7.3 7.2 7.2 6.4 7.1
Lead/Zinc 95.8 103.0 99.6 99.6 105.4
Copper 40.9 45.0 42.5 46.4 47.2
Gold 10.5 11.7 12.7 12.6 13.1
Other 1.6 1.6 1.6 1.6 1.6
Total 156.2 168.4 163.7 166.7 174.4
Rest of the World
Primary 64.8 64.6 61.1 61.7 56.4
Lead/Zinc 40.2 43.2 46.9 50.2 46.6
Copper 53.9 53.5 55.1 56.6 53.2
Gold 21.3 21.3 19.7 18.2 18.1
Other 0.0 0.0 0.0 0.0 0.0
Total 180.2 182.5 182.8 186.6 174.3
World Total 791.7 823.7 868.6 890.8 885.8
(million ounces) 2012 2013 2014 2015 2016 Primary
Mexico 77.0 82.1 85.6 88.5 89.9
Peru 30.3 32.8 34.1 35.3 39.3
Russia 19.5 22.4 24.3 27.6 25.7
Other 97.4 98.4 113.0 111.0 110.2
Total 224.2 235.8 257.0 262.4 265.1
Gold
Mexico 23.0 25.4 25.7 30.0 29.0
Peru 6.0 7.5 7.7 11.7 11.6
Russia 15.9 13.0 11.6 12.4 11.3
Other 53.4 58.0 63.9 62.5 53.6
Total 98.2 103.9 108.9 116.5 105.5
Copper
Chile 23.3 25.4 37.4 37.3 39.7
Peru 21.3 24.9 24.0 35.0 39.6
Poland 41.0 37.3 40.4 41.2 38.3
Other 74.7 82.6 78.0 79.2 83.4
Total 160.3 170.3 179.7 192.8 200.9
Lead/Zinc
China 77.0 80.3 77.8 76.8 79.2
Mexico 66.0 63.3 68.4 67.1 58.5
Peru 53.7 54.5 56.4 55.5 56.6
Other 106.1 110.6 115.5 114.9 115.0
Total 302.8 308.8 318.2 314.3 309.4
Other 6.2 4.9 4.8 4.9 4.8
World Total 791.7 823.7 868.6 890.8 885.8
Source: GFMS, Thomson Reuters; Company Reports
APPENDIX 5
SILVER MINE PRODUCTION BY SOURCE METAL SILVER MINE PRODUCTION BY MAIN REGION AND SOURCE METAL
LEADING PRIMARY SILVER MINES
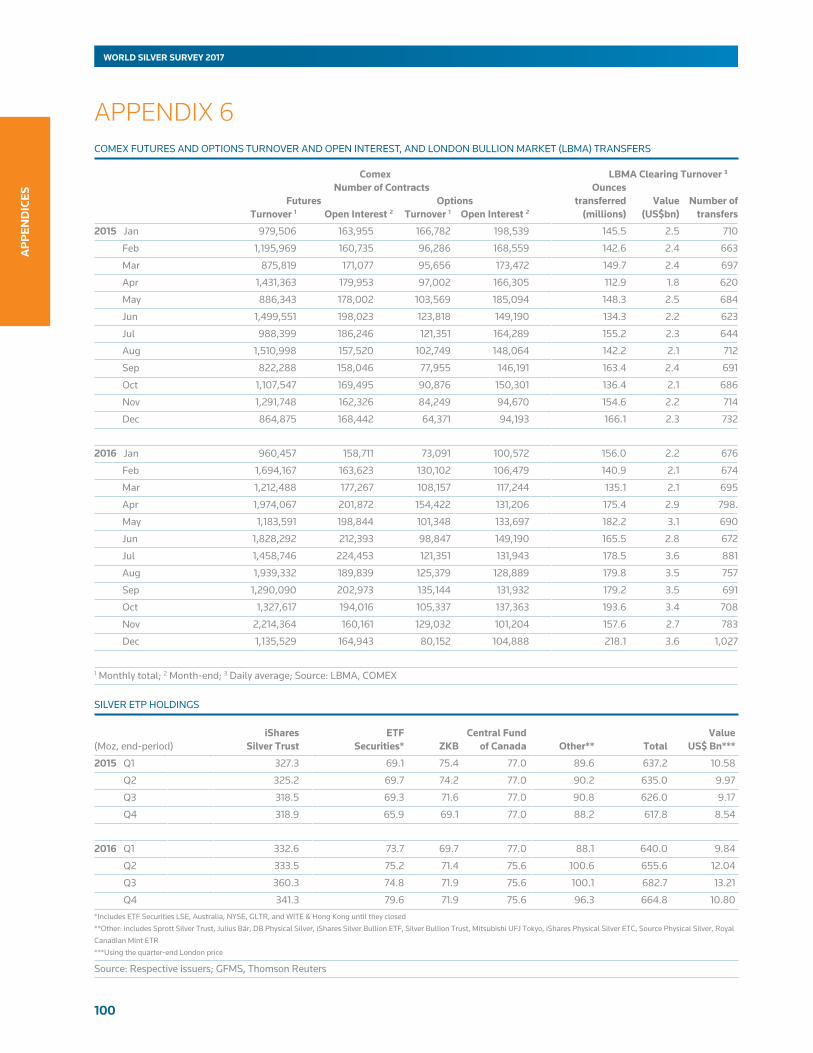
100
WORLD SILVER SURVEY 2017
AP
PEN
DIC
ES
iShares ETF Central Fund Value (Moz, end-period) Silver Trust Securities* ZKB of Canada Other** Total US$ Bn***
2015 Q1 327.3 69.1 75.4 77.0 89.6 637.2 10.58
Q2 325.2 69.7 74.2 77.0 90.2 635.0 9.97
Q3 318.5 69.3 71.6 77.0 90.8 626.0 9.17
Q4 318.9 65.9 69.1 77.0 88.2 617.8 8.54
2016 Q1 332.6 73.7 69.7 77.0 88.1 640.0 9.84
Q2 333.5 75.2 71.4 75.6 100.6 655.6 12.04
Q3 360.3 74.8 71.9 75.6 100.1 682.7 13.21
Q4 341.3 79.6 71.9 75.6 96.3 664.8 10.80*Includes ETF Securities LSE, Australia, NYSE, GLTR, and WITE & Hong Kong until they closed **Other: includes Sprott Silver Trust, Julius Bär, DB Physical Silver, iShares Silver Bullion ETF, Silver Bullion Trust, Mitsubishi UFJ Tokyo, iShares Physical Silver ETC, Source Physical Silver, Royal Canadian Mint ETR ***Using the quarter-end London price
Source: Respective issuers; GFMS, Thomson Reuters
APPENDIX 6COMEX FUTURES AND OPTIONS TURNOVER AND OPEN INTEREST, AND LONDON BULLION MARKET (LBMA) TRANSFERS
SILVER ETP HOLDINGS
Comex LBMA Clearing Turnover 3 Number of Contracts Ounces Futures Options transferred Value Number of Turnover 1 Open Interest 2 Turnover 1 Open Interest 2 (millions) (US$bn) transfers
2015 Jan 979,506 163,955 166,782 198,539 145.5 2.5 710
Feb 1,195,969 160,735 96,286 168,559 142.6 2.4 663
Mar 875,819 171,077 95,656 173,472 149.7 2.4 697
Apr 1,431,363 179,953 97,002 166,305 112.9 1.8 620
May 886,343 178,002 103,569 185,094 148.3 2.5 684
Jun 1,499,551 198,023 123,818 149,190 134.3 2.2 623
Jul 988,399 186,246 121,351 164,289 155.2 2.3 644
Aug 1,510,998 157,520 102,749 148,064 142.2 2.1 712
Sep 822,288 158,046 77,955 146,191 163.4 2.4 691
Oct 1,107,547 169,495 90,876 150,301 136.4 2.1 686
Nov 1,291,748 162,326 84,249 94,670 154.6 2.2 714
Dec 864,875 168,442 64,371 94,193 166.1 2.3 732
2016 Jan 960,457 158,711 73,091 100,572 156.0 2.2 676
Feb 1,694,167 163,623 130,102 106,479 140.9 2.1 674
Mar 1,212,488 177,267 108,157 117,244 135.1 2.1 695
Apr 1,974,067 201,872 154,422 131,206 175.4 2.9 798.
May 1,183,591 198,844 101,348 133,697 182.2 3.1 690
Jun 1,828,292 212,393 98,847 149,190 165.5 2.8 672
Jul 1,458,746 224,453 121,351 131,943 178.5 3.6 881
Aug 1,939,332 189,839 125,379 128,889 179.8 3.5 757
Sep 1,290,090 202,973 135,144 131,932 179.2 3.5 691
Oct 1,327,617 194,016 105,337 137,363 193.6 3.4 708
Nov 2,214,364 160,161 129,032 101,204 157.6 2.7 783
Dec 1,135,529 164,943 80,152 104,888 218.1 3.6 1,027
1 Monthly total; 2 Month-end; 3 Daily average; Source: LBMA, COMEX

THE SILVER INSTITUTE (major funding companies)
Asahi Refining
Barrick Gold Corp.
Cia. de Minas Buenaventura, S.A.A.
Coeur Mining, Inc.
Endeavour Silver Corp.
Fresnillo Plc
Hecla Mining Company
Industrias Peñoles, S.A.B. de C.V.
Pan American Silver Corp.
Silver Wheaton Corp.
Back Cover Image: Galmer Sterling Silver Bamboo Turquoise Necklace by Galmer Fine Silver
Printed by Park Communications, London 28769
Front Cover Image: Photovoltaic cells in a solar panel — Finsterwalde Solar Park, Germany © Martin Vonka | Dreamstime.com
THE SILVER INSTITUTE1400 I Street, NW
Suite 550Washington, DC 20005
Tel: +1-202-835-0185Email: [email protected]
www.silverinstitute.org
WORLD SILVER SURVEY 2017
World Silver Survey 20
17The Silver Institute / Thom
son Reuters