Synthesis and anti-proliferative activities of new derivatives of embelin
Upload
khangminh22Category
view
0download
0
1
Vol.:(0123456789)
Scientific Reports | (2020) 10:19528 | https://doi.org/10.1038/s41598-020-76665-3
www.nature.com/scientificreports
Predictive modeling of proliferative vitreoretinopathy using automated machine learning by ophthalmologists without coding experienceFares Antaki 1,2,3, Ghofril Kahwati4,5, Julia Sebag1, Razek Georges Coussa6, Anthony Fanous7, Renaud Duval1,3 & Mikael Sebag1,2*
We aimed to assess the feasibility of machine learning (ML) algorithm design to predict proliferative vitreoretinopathy (PVR) by ophthalmologists without coding experience using automated ML (AutoML). The study was a retrospective cohort study of 506 eyes who underwent pars plana vitrectomy for rhegmatogenous retinal detachment (RRD) by a single surgeon at a tertiary-care hospital between 2012 and 2019. Two ophthalmologists without coding experience used an interactive application in MATLAB to build and evaluate ML algorithms for the prediction of postoperative PVR using clinical data from the electronic health records. The clinical features associated with postoperative PVR were determined by univariate feature selection. The area under the curve (AUC) for predicting postoperative PVR was better for models that included pre-existing PVR as an input. The quadratic support vector machine (SVM) model built using all selected clinical features had an AUC of 0.90, a sensitivity of 63.0%, and a specificity of 97.8%. An optimized Naïve Bayes algorithm that did not include pre-existing PVR as an input feature had an AUC of 0.81, a sensitivity of 54.3%, and a specificity of 92.4%. In conclusion, the development of ML models for the prediction of PVR by ophthalmologists without coding experience is feasible. Input from a data scientist might still be needed to tackle class imbalance—a common challenge in ML classification using real-world clinical data.
Despite advances in retinal detachment surgery, proliferative vitreoretinopathy (PVR) remains an important barrier for long-term successful anatomic repair of a rhegmatogenous retinal detachment (RRD)1,2. PVR has a cumulative risk of 5–10% of all retinal detachment repairs and is responsible for 75% of all primary surgical failures1. Several clinical and biological risk factors have been identified in the past two decades for PVR forma-tion including trauma, aphakia, vitreous hemorrhage, and pre-existing PVR3–9.
Multiple formulas have been developed to predict PVR based on genetic and clinical variables but their poor predictive performance made them unsuitable for routine clinical use10–13. Ideal predictive formulas should identify high-risk cases in order to guide future clinical management14. While artificial intelligence (AI) solu-tions have been broadly applied to imaging data in ophthalmology, a limited number of studies have utilized AI techniques with clinical data obtained from electronic health records (EHRs)15. In the case of PVR, part of the difficulty of building predictive models using clinical data lies in the low incidence of the disease within the clinical cohorts, leading to imbalanced datasets15,16.
OPEN
1Department of Ophthalmology, Université de Montréal, Montreal, QC, Canada. 2Department of Ophthalmology, Centre Hospitalier de l’Université de Montréal (CHUM), Montreal, QC, Canada. 3Centre Universitaire d’Ophtalmologie (CUO), Hôpital Maisonneuve-Rosemont, CIUSSS de l’Est-de-l’Île-de-Montréal, Montreal, QC, Canada. 4Institut National des Sciences Appliquées de Toulouse (INSA Toulouse), Toulouse, France. 5École de Technologie Supérieure (ÉTS), Montreal, QC, Canada. 6Department of Ophthalmology and Visual Sciences, Carver College of Medicine, University of Iowa, Iowa City, IA, USA. 7Faculty of Medicine, McGill University, Montreal, QC, Canada. *email: [email protected]

2
Vol:.(1234567890)
Scientific Reports | (2020) 10:19528 | https://doi.org/10.1038/s41598-020-76665-3
www.nature.com/scientificreports/
As of recently, the development of machine learning (ML) predictive models in healthcare had been reserved for AI experts with knowledge of coding and computer science. The feasibility of deep-learning design (a subset of AI) by physicians without coding experience was demonstrated in a first-of-its-kind report by Faes et al. in 201917. This major advance in the democratization of AI was made possible by the release of automated ML (AutoML) programs by major companies allowing any individual to develop high-quality AI models18.
In this study, two ophthalmologists without coding experience built ML predictive classification models using an interactive application in MATLAB (MathWorks, Natick, MA) and explored the discriminative performance of those models for the prediction of postoperative PVR. To our knowledge, this is the first study examining the feasibility of AutoML prediction of postoperative complications of vitreoretinal surgery.
MethodsThe study included consecutive patients who underwent RRD repair using pars plana vitrectomy by a single sur-geon (MS) from 2012 to 2019, at the Centre Hospitalier de l’Université de Montréal (CHUM), a tertiary teaching hospital in Montreal, Quebec, Canada. The institutional review board approved the study (CÉR CHUM: 19.227) and granted a waiver for informed consent given the retrospective and anonymous nature of the study. The study adhered to the tenets of the Declaration of Helsinki and was compliant with our hospital guidelines regarding the clinical data collection and extraction from EHRs.
The primary outcome of this study was the discriminative performance of ML models, developed using AutoML by ophthalmologists without coding experience, in correctly predicting PVR. Prediction of PVR was examined by area under the receiver operatic characteristic curve (AUC). Sensitivity, specificity, and positive and negative predictive values (PPV and NPV) of the ML models are the secondary outcome measures.
Study cohort. We included simple RRD as well as those associated with giant retinal tears, vitreous hemor-rhage, and pre-existing PVR grade C and/or worse (based on the updated version of the Retina Society Clas-sification)19. Patients with a history of previous ocular surgery such as failed pneumatic retinopexy, prior scleral buckling, vitrectomy for a non-RRD indication, glaucoma, and cataract surgery were also eligible for inclusion in the study. We excluded patients who were younger than 18 years, those with tractional retinal detachments, recent penetrating trauma (< 6 months), and those who have previously undergone pars plana vitrectomy for RRD in the same eye. All cases were reviewed by a research fellow (JS) and an experienced vitreoretinal surgeon (MS) before inclusion in the study.
Data set preparation and feature collection from the EHR. We collected 15 features from the EHR as described in Table 1. All categorical features were evaluated based on the presence or absence of the clinical examination finding at the preoperative clinical encounter, with the exception of “postoperative lens status” that was evaluated on postoperative day 1. For this feature, pseudophakia and aphakia were counted together. Pre-existing PVR was defined as the presence of PVR Grade C involving more than 1 clock hour of the retina, according to the updated version of the Retina Society Classification19. Although we collected intraoperative parameters such as type of endotamponade and use of endolaser and cryotherapy, we elected to exclude those surgeon factors from the predictive models in order to limit confounding.
Classification procedure. The outcome of interest was development of postoperative PVR in patients with at least 3 months of follow-up. Patients who developed PVR during follow-up were labeled as “PVR” and those who did not develop PVR during follow-up were labeled as “No PVR.” The endpoint definition was based on a landmark study in the field by Kon et al.11. Postoperative PVR was defined as either the presence of new PVR Grade C involving more than 1 clock hour in the detached retina after vitrectomy or new clinically visible mem-branes or bands of greater than 1 clock hour in a successfully attached retina. Any new visible macular pucker that was visually significant and required surgical re-intervention was also included in the PVR group. The pres-ence of absence of macular pucker was determined clinically by dilated fundus examination. The labeling was performed by an ophthalmologist-in-training (FA) and an experienced vitreoretinal surgeon (MS) based on the
Table 1. Collected clinical variables from the EHR. The variables included sociodemographic and past ocular history data as well as retinal detachment characteristic and other relevant examination findings. EHR electronic health records, PVR proliferative vitreoretinopathy.
Category Variable
Sociodemographic characteristics Age in years [continuous], sex [binary]
Past ocular history Previous ocular surgery [binary]
History of present illness Duration of symptoms in days [continuous]
Retinal detachment characteristicsSubtotal/ total retinal detachment (≥ 3 quadrants) [binary], macular status [binary], pre-existing PVR [binary], vitreous hemorrhage [binary], number of retinal breaks [continuous], giant retinal tear [binary]
Other examination findingsMacular hole [binary], anterior uveitis [binary], number of quadrants of lattice degeneration [polyno-mial], intraocular pressure in mmHg using Goldmann applanation [continuous], postoperative lens status [binary]

3
Vol.:(0123456789)
Scientific Reports | (2020) 10:19528 | https://doi.org/10.1038/s41598-020-76665-3
www.nature.com/scientificreports/
retrospective review of the data written in the EHR. The EHR data included examination findings during the postoperative period as well as operative reports from subsequent surgeries.
Data set preparation before model development. A scientist with knowledge in data mining (GK) prepared the dataset. Figure 1 summarizes the dataflow during the study. Within the total clinical cohort of 506 eyes, 460 were No PVR (majority class) and 46 were PVR cases (minority class of interest), representing a 9.1% incidence of PVR. Complete data were available for all categorical variables. For continuous variables, 77 data points (15.2%) were missing for the “duration of symptoms” variable and 90 data points (17.8%) were missing for the “intraocular pressure” variable. We conducted a missing value analysis and found the data to be Missing Completely at Random (MCAR) using Little’s MCAR test (p = 0.933). Thus, imputation using the median of the non-missing values in the variable column was performed.
Before the dataset could be used for training by the two ophthalmologists (FA and RGC), we employed data-level solutions to tackle the imbalanced dataset problem. This was important to perform prior to any data train-ing in order to not undermine the predictive performance of the models trained by the two ophthalmologists. We performed random undersampling (RUS) of the majority class using Waikato Environment for Knowledge Analysis (WEKA), an open-source data-mining software made available by the University of Waikato in New Zealand20. We set the case:control ratio to 2:1, leading to a new dataset containing 92 controls and 46 PVR cases and a disease prevalence of 33.33%. While higher matching ratios could have been used, we used this ratio to avoid perpetuating the class imbalance problem21. The clinical characteristics of the original and new datasets are presented in Table 2 and Supplementary Table S1, respectively. The significantly different features remained unchanged in the new dataset, highlighting the absence of significant change in the distribution of the data.
Figure 1. This diagram demonstrates the workflow for predictive modeling of proliferative vitreoretinopathy (PVR) using automated machine learning (AutoML). After data preparation and class balancing using random undersampling (RUS), the two ophthalmologists used the Classification Learner App to design support vector machine (SVM) and Naïve Bayes (NB) algorithms. Details about the feature sets and models are described in the methodology. In parallel to the design by the two ophthalmologists, manually coded algorithms were also prepared as a benchmarking measure.

4
Vol:.(1234567890)
Scientific Reports | (2020) 10:19528 | https://doi.org/10.1038/s41598-020-76665-3
www.nature.com/scientificreports/
Table 2. Clinical characteristics of patients in the PVR and no PVR groups. The comparison between the “PVR” and “No PVR” groups was performed using Mann–Whitney U test for all continuous variables. For categorical variables, we used Chi-square and Fisher’s exact tests (for cells with expected counts < 5). PVR proliferative vitreoretinopathy, RRD rhegmatogenous retinal detachment.
PVR (n = 46) No PVR (n = 460) P value
Age, years < 0.001
Mean 68.78 59.93
Standard deviation 8.448 11.931
Median 68.50 61.00
Range 48–90 18–95
Sex 0.743
Male 30 (65.2%) 311 (67.6%)
Female 16 (34.8%) 149 (32.4%)
Previous surgery 0.650
Yes 7 (15.2%) 60 (13.0%)
No 39 (84.8%) 400 (87.7%)
Duration of symptoms, days < 0.001
Mean 35.05 16.73
Standard deviation 62.429 39.598
Median 21.00 7.00
Range 1–365 0–365
Subtotal/total RRD < 0.001
Yes 22 (47.8%) 59 (12.8%)
No 24 (52.2%) 401 (87.2%)
Macular status 0.001
On 8 (17.4%) 193 (42.0%)
Off 38 (82.6%) 267 (58.0%)
Pre-existing PVR < 0.001
Yes 17 (37.0%) 1 (0.2%)
No 29 (63.0%) 459 (99.8%)
Vitreous hemorrhage 0.002
Yes 10 (21.7%) 31 (6.7%)
No 36 (78.3%) 429 (93.3%)
Number of tears 0.323
Mean 2.41 2.03
Standard deviation 2.296 1.569
Median 2.00 1.00
Range 1–10 0–9
Giant tear 0.023
Yes 4 (8.7%) 9 (2.0%)
No 42 (91.3%) 451 (98.0%)
Macular hole 0.714
Yes 1 (2.2%) 23 (5.0%)
No 45 (97.8%) 437 (95.0%)
Uveitis 0.006
Yes 3 (6.5%) 2 (0.4%)
No 43 (93.5%) 458 (99.6%)
Quadrants of lattice degeneration 0.441
0 31 (67.4%) 301 (65.4%)
1 12 (26.1%) 91 (19.8%)
2 1 (2.2%) 46 (10.0%)
3 1 (2.2%) 14 (3.0%)
4 1 (2.2%) 8 (1.7%)
Intraocular pressure 0.002
Mean 11.40 14.69
Standard deviation 5.065 5.039
Median 12.00 15.00
Range 0–20 0–60
Postoperative lens 0.759
Phakic 25 (54.3%) 237 (51.5%)
Pseudophakic/aphakic 21 (45.7%) 223 (48.5%)

5
Vol.:(0123456789)
Scientific Reports | (2020) 10:19528 | https://doi.org/10.1038/s41598-020-76665-3
www.nature.com/scientificreports/
Predictive model building and feature selection. As shown in Supplementary Video 1, two ophthal-mologists (FA and RGC) with no previous coding experience performed the model development after a period of self-study. The ophthalmologists were asked to consult the “Classification Learner App” documentation in the help center provided by MathWorks (https ://www.mathw orks.com). The documentation included illustrated step-by-step articles on how to train the models and explore the reported diagnostic measures. The ophthal-mologists were asked to train all classifiers, compare predictive performances, and choose the two best models that worked for the classification problem for each set of features. Model tuning was performed using the built-in AutoML feature to find the best hyperparameters to optimize performance. All steps were performed jointly and the ophthalmologists were allowed to revisit the documentation at any time.
The Classification Learner App allowed for easy feature selection; i.e., choosing the different clinical factors to predict PVR. To reduce overfitting and to gain a better understanding of the clinical importance of each input feature, we performed univariate feature selection on the original cohort of 506 eyes. Each clinical feature was studied individually using univariate tests, and only the features that were significantly different between the “PVR” and “No PVR” groups were included in the ML models. We used two feature sets, one that included all features found using univariate feature selection (Feature Set 1) and another that used the same variables with the exception of “pre-existing PVR” (Feature Set 2). We asked the ophthalmologists to use fivefold cross-validation (CV), a robust internal validation technique22. At the end, combined confusion matrices were created for performance evaluation23.
While we could have developed artificial neural networks and deep-learning algorithms, we elected to build binary classifiers better suited for our sample size and classification problem24. The two ML algorithms with the best discriminative performance were the Naïve Bayes (NB) and Support Vector Machine (SVM) classifiers. NB is a probabilistic classifier that uses the frequencies of different input features from cases in the “PVR” and “No PVR” groups during training to predict PVR when presented with a new case. SVMs expand the idea of linear classifiers and aim to find a decision boundary (hyperplane) that allows for the largest margin separation between the “PVR” and “No PVR” groups after mapping the input data to a high-dimensional space25.
Model benchmarking. Because AutoML is still a relatively new technology and to corroborate the ML models obtained by the two ophthalmologists, a scientist with coding experience (GK) developed separate algo-rithms based on the same ML techniques found in the Classifier Learner App and performed separate analyses. This was based on the principle of redundancy in order to ensure that the predictive models obtained by the two ophthalmologists were reliable. Due to the absence of measures of variability such as confidence intervals, we could not employ statistical analyses to compare the predictive performance of the automated and manually coded models. Instead, we relied on a general “order of magnitude” comparison of the F1 score (weighted aver-age of the precision and recall) to benchmark the discriminative performance of our automated models. The codes are available on GitHub (https ://githu b.com/ghofo k/PVR_Predi ction ) and their predictive performance is shown in Supplementary Table S2.
Statistical analysis and performance metrics. Continuous variables are presented as mean, median, range, and standard deviation. Categorical variables are presented as counts and percentages. Since all the con-tinuous variables were not normally distributed (p < 0.001, Shapiro–Wilk test), we used nonparametric tests (Mann–Whitney U). We used the two-sided Fisher’s exact test and Chi-Square test for categorical variables. We defined statistical significance as p-value < 0.05. All statistical tests were performed using SPSS v. 25.0 (SPSS, Chicago, IL). For consistency, we adhered to the standard test accuracy terminology—sensitivity (recall), speci-ficity, PPV (or precision), and NPV—that were calculated from the confusion matrix presented in the Classifica-tion Learner App. We also calculated prevalence-adjusted PPV and NPV values to correct for the real prevalence of PVR in the overall cohort using Bayes’ theorem26. The AUC is also presented.
ResultsClinical cohort. Of the 557 eyes that met the inclusion criteria, 506 eyes were included in the final analysis. We excluded eyes with < 3 months of follow-up (n = 28) and the second operated eye for patients who had both eyes eligible at entry (n = 15). After careful case-by-case review, we excluded 8 additional eyes because we could not confidently distinguish between pre-existing PVR (input variable) and new postoperative PVR (outcome of interest) using the available EHR data. Our final cohort of 506 patients were followed for a median of 52 months (range 3–105 months), of whom 46 patients developed PVR postoperatively (9.1%). Postoperative PVR was characterized by visually significant macular pucker requiring re-intervention in 14 cases (30.4%), Grade C pos-terior PVR in 18 cases (39.1%) and Grade C anterior PVR in 14 cases (30.4%). Primary surgical failure occurred in 28 cases (60.9%). Anatomic success at final follow-up, defined as retinal re-attachment without long-term endotamponade with silicone oil, was seen in 33 cases (71.7%).
Clinical risk factors for PVR. Table 2 shows the clinical characteristics of patients in the “PVR” and “No PVR” groups. Several features were significantly different between the two groups. The “PVR” group was older (p < 0.001), had a longer duration of symptoms prior to presentation (p < 0.001), and had more extensive ret-inal detachments characterized by subtotal/total retinal detachment (p < 0.001) and macula-off detachments (p = 0.001). The retinal detachments in the “PVR” group were more complex as characterized by the presence of giant tears (p = 0.023), vitreous hemorrhage (p = 0.002), and pre-existing PVR (p < 0.001). Lower intraocular pressure (p = 0.002) and the presence of uveitis (p = 0.006) were also more common in the “PVR” group. Based on those results, we included all statistically significant features in Feature Set 1, with the exception of “uveitis” because of its association with “intraocular pressure,” in an effort to reduce multicollinearity.
6
Vol:.(1234567890)
Scientific Reports | (2020) 10:19528 | https://doi.org/10.1038/s41598-020-76665-3
www.nature.com/scientificreports/
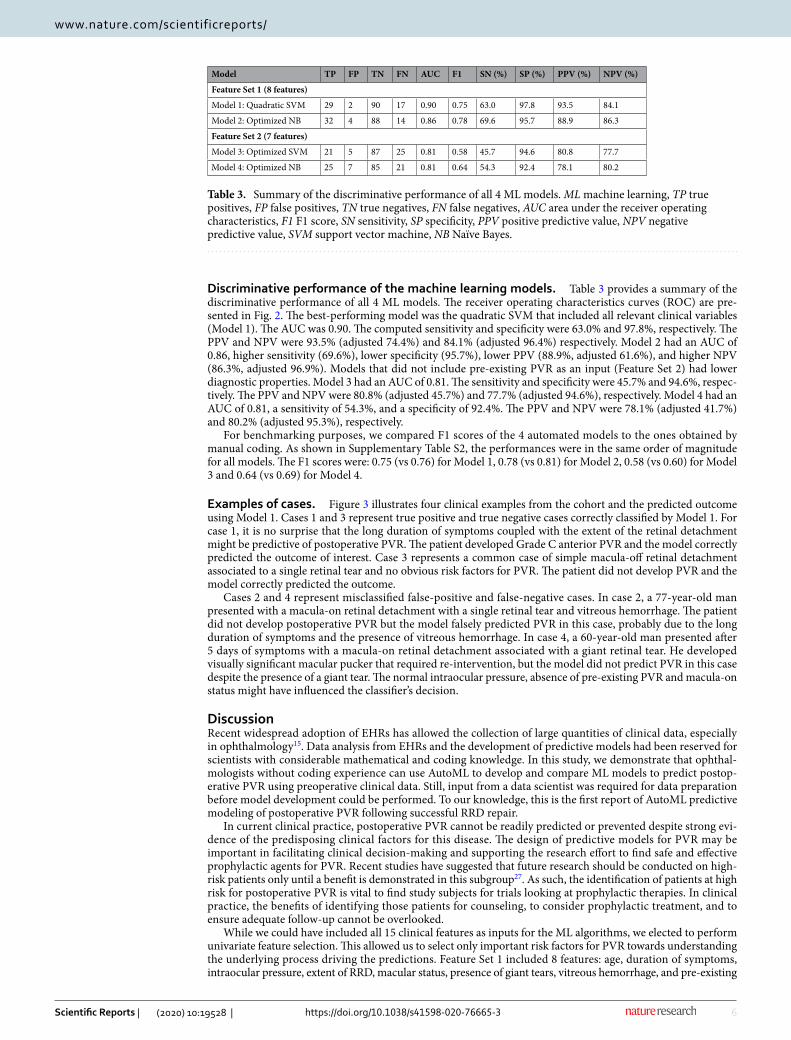
Discriminative performance of the machine learning models. Table 3 provides a summary of the discriminative performance of all 4 ML models. The receiver operating characteristics curves (ROC) are pre-sented in Fig. 2. The best-performing model was the quadratic SVM that included all relevant clinical variables (Model 1). The AUC was 0.90. The computed sensitivity and specificity were 63.0% and 97.8%, respectively. The PPV and NPV were 93.5% (adjusted 74.4%) and 84.1% (adjusted 96.4%) respectively. Model 2 had an AUC of 0.86, higher sensitivity (69.6%), lower specificity (95.7%), lower PPV (88.9%, adjusted 61.6%), and higher NPV (86.3%, adjusted 96.9%). Models that did not include pre-existing PVR as an input (Feature Set 2) had lower diagnostic properties. Model 3 had an AUC of 0.81. The sensitivity and specificity were 45.7% and 94.6%, respec-tively. The PPV and NPV were 80.8% (adjusted 45.7%) and 77.7% (adjusted 94.6%), respectively. Model 4 had an AUC of 0.81, a sensitivity of 54.3%, and a specificity of 92.4%. The PPV and NPV were 78.1% (adjusted 41.7%) and 80.2% (adjusted 95.3%), respectively.
For benchmarking purposes, we compared F1 scores of the 4 automated models to the ones obtained by manual coding. As shown in Supplementary Table S2, the performances were in the same order of magnitude for all models. The F1 scores were: 0.75 (vs 0.76) for Model 1, 0.78 (vs 0.81) for Model 2, 0.58 (vs 0.60) for Model 3 and 0.64 (vs 0.69) for Model 4.
Examples of cases. Figure 3 illustrates four clinical examples from the cohort and the predicted outcome using Model 1. Cases 1 and 3 represent true positive and true negative cases correctly classified by Model 1. For case 1, it is no surprise that the long duration of symptoms coupled with the extent of the retinal detachment might be predictive of postoperative PVR. The patient developed Grade C anterior PVR and the model correctly predicted the outcome of interest. Case 3 represents a common case of simple macula-off retinal detachment associated to a single retinal tear and no obvious risk factors for PVR. The patient did not develop PVR and the model correctly predicted the outcome.
Cases 2 and 4 represent misclassified false-positive and false-negative cases. In case 2, a 77-year-old man presented with a macula-on retinal detachment with a single retinal tear and vitreous hemorrhage. The patient did not develop postoperative PVR but the model falsely predicted PVR in this case, probably due to the long duration of symptoms and the presence of vitreous hemorrhage. In case 4, a 60-year-old man presented after 5 days of symptoms with a macula-on retinal detachment associated with a giant retinal tear. He developed visually significant macular pucker that required re-intervention, but the model did not predict PVR in this case despite the presence of a giant tear. The normal intraocular pressure, absence of pre-existing PVR and macula-on status might have influenced the classifier’s decision.
DiscussionRecent widespread adoption of EHRs has allowed the collection of large quantities of clinical data, especially in ophthalmology15. Data analysis from EHRs and the development of predictive models had been reserved for scientists with considerable mathematical and coding knowledge. In this study, we demonstrate that ophthal-mologists without coding experience can use AutoML to develop and compare ML models to predict postop-erative PVR using preoperative clinical data. Still, input from a data scientist was required for data preparation before model development could be performed. To our knowledge, this is the first report of AutoML predictive modeling of postoperative PVR following successful RRD repair.
In current clinical practice, postoperative PVR cannot be readily predicted or prevented despite strong evi-dence of the predisposing clinical factors for this disease. The design of predictive models for PVR may be important in facilitating clinical decision-making and supporting the research effort to find safe and effective prophylactic agents for PVR. Recent studies have suggested that future research should be conducted on high-risk patients only until a benefit is demonstrated in this subgroup27. As such, the identification of patients at high risk for postoperative PVR is vital to find study subjects for trials looking at prophylactic therapies. In clinical practice, the benefits of identifying those patients for counseling, to consider prophylactic treatment, and to ensure adequate follow-up cannot be overlooked.
While we could have included all 15 clinical features as inputs for the ML algorithms, we elected to perform univariate feature selection. This allowed us to select only important risk factors for PVR towards understanding the underlying process driving the predictions. Feature Set 1 included 8 features: age, duration of symptoms, intraocular pressure, extent of RRD, macular status, presence of giant tears, vitreous hemorrhage, and pre-existing
Table 3. Summary of the discriminative performance of all 4 ML models. ML machine learning, TP true positives, FP false positives, TN true negatives, FN false negatives, AUC area under the receiver operating characteristics, F1 F1 score, SN sensitivity, SP specificity, PPV positive predictive value, NPV negative predictive value, SVM support vector machine, NB Naïve Bayes.
Model TP FP TN FN AUC F1 SN (%) SP (%) PPV (%) NPV (%)
Feature Set 1 (8 features)
Model 1: Quadratic SVM 29 2 90 17 0.90 0.75 63.0 97.8 93.5 84.1
Model 2: Optimized NB 32 4 88 14 0.86 0.78 69.6 95.7 88.9 86.3
Feature Set 2 (7 features)
Model 3: Optimized SVM 21 5 87 25 0.81 0.58 45.7 94.6 80.8 77.7
Model 4: Optimized NB 25 7 85 21 0.81 0.64 54.3 92.4 78.1 80.2

7
Vol.:(0123456789)
Scientific Reports | (2020) 10:19528 | https://doi.org/10.1038/s41598-020-76665-3
www.nature.com/scientificreports/
PVR. Feature Set 2 included all previous features with the exception of pre-existing PVR (7 features). We intended to test Feature Set 2 because previous studies had suggested that the absence of clear distinction between pre-operative and postoperative PVR might be a limiting factor for the development of models to predict PVR4.
Our ML models were developed as a tool for clinicians to predict the development of postoperative PVR as a basis for treatment decisions in patients with RRD who will undergo pars plana vitrectomy. As such, they should be used for diagnosis rather than screening. There was a necessary trade-off between sensitivity and specificity; while high sensitivity is always a principal objective, high specificity and PPV are more desirable in our clinical context. From our models, the algorithm with the best overall discriminative performance was Model 1—the quadratic SVM algorithm that used all selected clinical features. From a performance point of view, Model 1 showed acceptable sensitivity (63.0%) and excellent specificity (97.8%). This means that among patients who did not develop postoperative PVR, 97.8% were correctly predicted to not develop PVR (true-negative rate) and only 2.2% were falsely classified as “PVR” (false-positive rate). However, among patients who developed PVR, 63.0% were predicted to develop the complication (true-positive rate) while 37.0% were missed (false-negative rate). Given those results, our highly specific classifier should be considered helpful in ruling in PVR when the test is positive but should be interpreted with caution in the case of a negative prediction. In the undersampled cohort (33.3% PVR), the calculated PPV was 93.5% but decreased to 74% when we adjusted for a real-world prevalence of 9.1%. Practically, from a clinician’s point of view, when a patient tests positive there is 74% chance that they will develop postoperative PVR. The PPV can be higher in populations with higher prevalence of PVR, such as patients with complicated RRDs.
Figure 2. Receiver operating characteristic (ROC) curves of the discriminative performance of Models 1–4. Models 1 (quadratic Support Vector Machine [SVM]) and 2 (optimized Naïve Bayes [NB]) used Feature Set 1 that included all clinically important features. Models 3 (optimized SVM) and 4 (optimized NB) used Feature Set 2, which did not include pre-existing PVR as an input feature.

8
Vol:.(1234567890)
Scientific Reports | (2020) 10:19528 | https://doi.org/10.1038/s41598-020-76665-3
www.nature.com/scientificreports/
In the literature, one of first predictive models of PVR was described by Asaria et al., who demonstrated the feasibility of PVR prediction using clinical risk factors10. Kon et al. also constructed regression models to predict the probability of a patient to develop PVR11. The model that used clinical factors alone was reported to have “predicted the outcome in 72.8% of patients” and the model that included additional vitreous protein levels “predicted the outcome in 76.5% of patients”11. The use of validation measures was not reported and it remains unclear what the authors meant by “predicted the outcome” with reference to the standardized performance metrics used today. Later, Rojas et al. reported the results of the external validation of three PVR predictive formula-based linear and radial SVMs using prospective data from a multicentric study28. The models included clinical features in addition to genetic data. The radial SVM had 66.7% sensitivity and 81.5% specificity in one of the samples. In parallel, biomarkers from subretinal fluid obtained during vitrectomy have also been used to improve the predictive performance of PVR models12. In their study of 54 PVR cases with age- and sex-matched controls, Ricker et al. showed that pre-existing PVR was the only independent predictor of postoperative PVR (AUC of 0.67). When a single biomarker was included in the model, the AUC improved to 0.8912. Pending external validation, our automatically generated models seem to offer comparable discriminative performances.
Figure 3. Four representative cases are shown highlighting correct classifications and misclassifications by Model 1. Case 1 illustrates a correctly classified case of PVR in an eye with a total rhegmatogenous retinal detachment (RRD) and late presentation prior to surgery. Case 3 shows a common case of simple macula-off RRD with no obvious risk factors for PVR, correctly classified as “No PVR”. In case 2, the algorithm misclassified the case as “PVR” probably due to the long duration of symptoms and the presence of vitreous hemorrhage. In case 4, the algorithm failed to predict PVR despite the presence of a giant retinal tear. The normal intraocular pressure, absence of pre-existing PVR, and macula-on status might have influenced the classifier’s decision.

9
Vol.:(0123456789)
Scientific Reports | (2020) 10:19528 | https://doi.org/10.1038/s41598-020-76665-3
www.nature.com/scientificreports/
From a methodological standpoint, our study has several strengths. Our original clinical cohort was large and included 506 eyes with a PVR rate of 9.1%. The sample size was sufficiently large to find statistically significant risk factors for PVR; however, the low incidence of PVR led to an imbalanced dataset problem, a common chal-lenge in ML classification using real-world data16,29. To address this issue, data preparation was required before the two ophthalmologists could use the data for training and testing30–32. After exploring different resampling techniques, we found that the most suitable option was undersampling to create a case–control study design33–35. We used cross-validation, which is a rigorous internal validation measure that determines the robustness and gen-eralizability of the predictive models22. All efforts were made to adhere to transparent reporting of a multivariable prediction model for individual prognosis or diagnosis (TRIPOD) guidelines36. We were able to build optimized ML models using AutoML, a feature of the software that automates and streamlines complex processes in the ML workflow such as hyperparameter tuning. This AutoML feature can significantly improve prediction accuracy37.
The study has some limitations. The absence of measures of variability provided by the graphical interface limited our ability to compare our models among each other and with the manually coded benchmarking models. Despite this issue, our models were generally comparable to the manually coded algorithms; however, some dif-ferences in performance were observed, possibly due to the difference in thresholds to which the algorithms were optimized. Another limitation of the study is the absence of external validation. The problem of generalizability of predictive PVR formulas has been studied in a report by Sala-Puigdollers et al.14. We are aware that external validation using new data is necessary before a model can be considered for use in clinical research or practice38.
In summary, we demonstrated the feasibility of ML model design by ophthalmologists without coding expe-rience for the prediction of PVR using clinical data. However, it remains to be seen if clinicians with no coding experience can independently build ML models without any input from data scientists and engineers. For bal-anced datasets and image classification tasks, independent model building appears to be feasible. However, in the case of low-incidence diseases, clinicians will be faced with the class imbalance problem and contributions from data scientists might be indispensable. In parallel, as the technology of AutoML further matures, benchmark-ing with manually coded algorithms will no longer be needed. In future studies, we aim to explore the external validity of our models. In particular, we wish to study the benefits of closer postoperative follow-up for patients predicted to develop PVR and aim to look at retinal redetachment as a separate outcome. We will also be assess-ing the healthcare burden of unnecessarily close follow-up in false-positive cases.
Received: 21 August 2020; Accepted: 1 November 2020
References 1. Pastor, J. C. Proliferative vitreoretinopathy: An overview. Surv. Ophthalmol. 43, 3–18. https ://doi.org/10.1016/s0039 -6257(98)00023
-x (1998). 2. Pastor, J. C., de la Rua, E. R. & Martin, F. Proliferative vitreoretinopathy: Risk factors and pathobiology. Prog. Retin. Eye Res. 21,
127–144. https ://doi.org/10.1016/s1350 -9462(01)00023 -4 (2002). 3. Cowley, M., Conway, B. P., Campochiaro, P. A., Kaiser, D. & Gaskin, H. Clinical risk factors for proliferative vitreoretinopathy.
Arch. Ophthalmol. 107, 1147–1151. https ://doi.org/10.1001/archo pht.1989.01070 02021 3027 (1989). 4. Girard, P., Mimoun, G., Karpouzas, I. & Montefiore, G. Clinical risk factors for proliferative vitreoretinopathy after retinal detach-
ment surgery. Retina 14, 417–424. https ://doi.org/10.1097/00006 982-19941 4050-00005 (1994). 5. Tseng, W., Cortez, R. T., Ramirez, G., Stinnett, S. & Jaffe, G. J. Prevalence and risk factors for proliferative vitreoretinopathy in eyes
with rhegmatogenous retinal detachment but no previous vitreoretinal surgery. Am. J. Ophthalmol. 137, 1105–1115. https ://doi.org/10.1016/j.ajo.2004.02.008 (2004).
6. Xu, K. et al. Predictive factors for proliferative vitreoretinopathy formation after uncomplicated primary retinal detachment repair. Retina 39, 1488–1495. https ://doi.org/10.1097/IAE.00000 00000 00218 4 (2019).
7. Yoshino, Y., Ideta, H., Nagasaki, H. & Uemura, A. Comparative study of clinical factors predisposing patients to proliferative vitreoretinopathy. Retina 9, 97–100. https ://doi.org/10.1097/00006 982-19890 9020-00004 (1989).
8. Idrees, S., Sridhar, J. & Kuriyan, A. E. Proliferative vitreoretinopathy: A review. Int. Ophthalmol. Clin. 59, 221–240. https ://doi.org/10.1097/IIO.00000 00000 00025 8 (2019).
9. Kon, C. H., Tranos, P. & Aylward, G. W. In Vitreo-Retinal Surgery (eds Bernd, K. & David, W.) 121–134 (Springer, Berlin, 2005). 10. Asaria, R. H. et al. How to predict proliferative vitreoretinopathy: A prospective study. Ophthalmology 108, 1184–1186. https ://
doi.org/10.1016/s0161 -6420(01)00553 -x (2001). 11. Kon, C. H., Asaria, R. H., Occleston, N. L., Khaw, P. T. & Aylward, G. W. Risk factors for proliferative vitreoretinopathy after primary
vitrectomy: A prospective study. Br. J. Ophthalmol. 84, 506–511. https ://doi.org/10.1136/bjo.84.5.506 (2000). 12. Ricker, L. J. et al. Prediction of proliferative vitreoretinopathy after retinal detachment surgery: Potential of biomarker profiling.
Am. J. Ophthalmol. 154, 347–354. https ://doi.org/10.1016/j.ajo.2012.02.004 (2012). 13. Rojas, J. et al. Development of predictive models of proliferative vitreoretinopathy based on genetic variables: The Retina 4 project.
Investig. Ophthalmol. Vis. Sci. 50, 2384–2390. https ://doi.org/10.1167/iovs.08-2670 (2009). 14. Sala-Puigdollers, A. et al. External validation of existing formulas to predict the risk of developing proliferative vitreoretinopathy:
The Retina 1 Project; report 5. Retina 33, 1519–1527. https ://doi.org/10.1097/IAE.0b013 e3182 8991e a (2013). 15. Lin, W.-C., Chen, J. S., Chiang, M. F. & Hribar, M. R. Applications of artificial intelligence to electronic health record data in
ophthalmology. Transl. Vis. Sci. Technol. 9, 13–13 (2020). 16. Diz, J., Marreiros, G. & Freitas, A. Applying data mining techniques to improve breast cancer diagnosis. J. Med. Syst. 40, 203 (2016). 17. Faes, L. et al. Automated deep learning design for medical image classification by health-care professionals with no coding experi-
ence: A feasibility study. Lancet Dig. Health 1, e232–e242 (2019). 18. Thomas, R. Google’s AutoML: Cutting Through the Hype (2018). 19. Machemer, R. et al. An updated classification of retinal detachment with proliferative vitreoretinopathy. Am. J. Ophthalmol. 112,
159–165. https ://doi.org/10.1016/s0002 -9394(14)76695 -4 (1991). 20. Hall, M. et al. The WEKA data mining software: An update. ACM SIGKDD Explor. Newsl. 11, 10–18 (2009). 21. Linden, A. & Samuels, S. J. Using balance statistics to determine the optimal number of controls in matching studies. J. Eval. Clin.
Pract. 19, 968–975 (2013). 22. Kohavi, R. In Ijcai. 1137–1145 (Montreal, Canada).

10
Vol:.(1234567890)
Scientific Reports | (2020) 10:19528 | https://doi.org/10.1038/s41598-020-76665-3
www.nature.com/scientificreports/
23. Arlot, S. & Celisse, A. A survey of cross-validation procedures for model selection. Stat. Surv. 4, 40–79 (2010). 24. Cao, C. et al. Deep learning and its applications in biomedicine. Genom. Proteom. Bioinform. 16, 17–32. https ://doi.org/10.1016/j.
gpb.2017.07.003 (2018). 25. Caixinha, M. & Nunes, S. Machine learning techniques in clinical vision sciences. Curr. Eye Res. 42, 1–15 (2017). 26. Villamarin-Bello, B., Uriel-Latorre, B., Fdez-Riverola, F., Sande-Meijide, M. & Glez-Pena, D. Gold standard evaluation of an
automatic HAIs surveillance system. Biomed. Res. Int. 2019, 1049575. https ://doi.org/10.1155/2019/10495 75 (2019). 27. Sundaram, V., Barsam, A. & Virgili, G. Intravitreal low molecular weight heparin and 5-Fluorouracil for the prevention of prolif-
erative vitreoretinopathy following retinal reattachment surgery. Cochrane Database Syst. Rev. https ://doi.org/10.1002/14651 858.CD006 421.pub3 (2013).
28. Rojas, J. et al. Predicting proliferative vitreoretinopathy: Temporal and external validation of models based on genetic and clinical variables. Br. J. Ophthalmol. 99, 41–48. https ://doi.org/10.1136/bjoph thalm ol-2014-30526 3 (2015).
29. Faes, L. et al. A clinician’s guide to artificial intelligence: How to critically appraise machine learning studies. Transl. Vis. Sci. Technol. 9, 7–7 (2020).
30. Taft, L. M. et al. Countering imbalanced datasets to improve adverse drug event predictive models in labor and delivery. J. Biomed. Inform. 42, 356–364. https ://doi.org/10.1016/j.jbi.2008.09.001 (2009).
31. Sun, Y., Wong, A. K. & Kamel, M. S. Classification of imbalanced data: A review. Int. J. Pattern Recognit. Artif. Intell. 23, 687–719 (2009).
32. He, H. & Garcia, E. A. Learning from imbalanced data. IEEE Trans. Knowl. Data Eng. 21, 1263–1284 (2009). 33. Chawla, N. V., Bowyer, K. W., Hall, L. O. & Kegelmeyer, W. P. SMOTE: Synthetic minority over-sampling technique. J. Artif. Intell.
Res. 16, 321–357 (2002). 34. Nguyen, H. M., Cooper, E. W. & Kamei, K. In The 6th International Conference on Soft Computing and Intelligent Systems, and The
13th International Symposium on Advanced Intelligence Systems. 1762–1767 (IEEE). 35. Longadge, R. & Dongre, S. Class imbalance problem in data mining review. arXiv preprint arXiv:1305.1707 (2013). 36. Collins, G. S., Reitsma, J. B., Altman, D. G. & Moons, K. G. Transparent reporting of a multivariable prediction model for individual
prognosis or diagnosis (TRIPOD): The TRIPOD statement. BMJ 350, g7594. https ://doi.org/10.1136/bmj.g7594 (2015). 37. Bergstra, J., Yamins, D. & Cox, D. D. In Proceedings of the 12th Python in Science Conference. 20 (Citeseer). 38. Bleeker, S. E. et al. External validation is necessary in prediction research: A clinical example. J. Clin. Epidemiol. 56, 826–832. https
://doi.org/10.1016/s0895 -4356(03)00207 -5 (2003).
AcknowledgmentsThis study was supported by a research grant obtained through the 2019-2020 competition of the Fonds de recherche en ophtalmologie de l’Université de Montréal (FROUM). The sponsor or funding organization had no role in the design or conduct of this research.
Author contributionsM.S performed the surgeries and treated the patients. F.A, G.K, R.G.C, R.D and M.S conceptualized the study and designed the experiments. F.A, M.S, J.S and A.F collected the data. F.A, R.G.C and G.K undertook the automated machine learning and statistical analysis. F.A wrote the main manuscript. All authors reviewed and discussed the results. All authors edited and revised the manuscript before approving the final version of this manuscript.
FundingThis study was supported by a research grant obtained through the 2019–2020 competition of the Fonds de recherche en ophtalmologie de l’Université de Montréal (FROUM).
Competing interests The authors declare no competing interests
Additional informationSupplementary information is available for this paper at https ://doi.org/10.1038/s4159 8-020-76665 -3.
Correspondence and requests for materials should be addressed to M.S.
Reprints and permissions information is available at www.nature.com/reprints.
Publisher’s note Springer Nature remains neutral with regard to jurisdictional claims in published maps and institutional affiliations.
Open Access This article is licensed under a Creative Commons Attribution 4.0 International License, which permits use, sharing, adaptation, distribution and reproduction in any medium or
format, as long as you give appropriate credit to the original author(s) and the source, provide a link to the Creative Commons licence, and indicate if changes were made. The images or other third party material in this article are included in the article’s Creative Commons licence, unless indicated otherwise in a credit line to the material. If material is not included in the article’s Creative Commons licence and your intended use is not permitted by statutory regulation or exceeds the permitted use, you will need to obtain permission directly from the copyright holder. To view a copy of this licence, visit http://creat iveco mmons .org/licen ses/by/4.0/.
© The Author(s) 2020
Copyright © 2022 FDOKUMEN