Torsional behavior of spandrel beams. - Rice Scholarship Home
Upload
independentCategory
view
1download
0
Restrained Torsional Dynamics of Nuclear DNA in Living ProliferativeMammalian Cells
Marc Tramier,* Klaus Kemnitz,† Christiane Durieux,* Jacques Coppey,* Patrick Denjean,‡ Robert B. Pansu,‡
and Maıte Coppey-Moisan**Institut Jacques Monod, UMR 7592, CNRS, Universites P 6/P 7, 75251 Paris cedex 05, France, †EuroPhoton GmbH, D-12247 Berlin,Germany, and ‡Laboratoire de Photophysique et Photochimie Macromoleculaire et Supramoleculaire, Departement de Chimie/UMR 8531, ENS de Cachan/CNRS, 94235 Cachan Cedex, France
ABSTRACT Physical parameters, describing the state of chromatinized DNA in living mammalian cells, were revealed by insitu fluorescence dynamic properties of ethidium in its free and intercalated states. The lifetimes and anisotropy decays of thiscationic chromophore were measured within the nuclear domain, by using the ultra-sensitive time-correlated single-photoncounting technique, confocal microscopy, and ultra-low probe concentrations. We found that, in living cells: 1) free ethidiummolecules equilibrate between extracellular milieu and nucleus, demonstrating that the cation is naturally transported into thenucleus; 2) the intercalation of ethidium into chromatinized DNA is strongly inhibited, with relaxation of the inhibition after mild(digitonin) cell treatment; 3) intercalation sites are likely to be located in chromatin DNA; and 4) the fluorescence anisotropyrelaxation of intercalated molecules is very slow. The combination of fluorescence kinetic and fluorescence anisotropydynamics indicates that the torsional dynamics of nuclear DNA is highly restrained in living cells.
INTRODUCTION
Chromatinized DNA in the nucleus of mammalian cells ishighly compacted, forming a basic motif: the nucleosomeconsists of 1.75 turns of a left-handed superhelix of B-DNA(146 bp of right-handed double helix), folded around anoctamer of histones, the core histones. Refined x-ray struc-tural studies show that, at the octamer surface, positivelycharged aminoacid residues are distributed, according to apath that perfectly fits that of negatively charged phosphateresidues of B-DNA (Arents and Moudrianakis, 1993). Thistight structure of the nucleosome core particle was con-firmed and further refined (Luger et al., 1997). The linkerDNA between nucleosomes is typically associated eitherwith histone H1/H5 to promote a more dense packaging (forrecent paper see Leuba and al., 1998) or with multiproteincomplexes involved in DNA transactions (see, for review onreplication, Baker and Bell., 1998; on transcription, Carey,1998; Ashraf and Ip, 1998). Packaging DNA into chromatininhibits the progressions of RNA and DNA polymerases invitro (reviewed in Owen-Hughes and Workman, 1994; Wi-dom, 1998), but nevertheless, the cell replicates and tran-scribes DNA in vivo. In recent models, derived from in vitroanalysis of polymerization over nucleosomal templates, theexistence of naked DNA regions was supposed to occurtransiently and over short segments (which can be as smallas 10 bp), due to partial or full dissociation of histoneoctamer from the DNA (Studitsky et al., 1997).
Some experiments tried to determine the chromatin struc-ture within the whole cell: size of linker DNA (review byvan Holde, 1989), degree of supercoiling of linker regions(Jupe et al., 1993), higher-order organization (Rydberg etal., 1998), rotational reorientation (Selvin et al., 1990), anddynamics (reviewed by Lamond and Earnshaw, 1998;Manders et al., 1999) of chromatin. In most experiments,however, cells were either fixed or permeabilized, or detec-tion was carried out on extracted chromatin. Protein–DNAinteractions, involved in native chromatin structure, can beeasily perturbed during cell manipulation or observation, asit had been shown to occur, when illuminating living cellslabeled with fluorescent dye, at standard low-light levelsthat were still not low enough to avoid photodynamic reac-tion (Delic et al., 1991). Thus, the organization of chromatinin vivo can be considered to be still largely unknown,partially due to invasive techniques that were so far applied.
The fact that nuclear DNA replicates over the full lengthin vivo, and this within a few hours of each cell cycle,suggests that, inside cells, nuclear DNA (which is undernucleosomal arrangement, when extracted) would interactwith chromosomal proteins in a dynamic way, revealing tosome extent intrinsic properties of the double helix, such aselasticity and flexibility, to allow the progression of thepolymerases over the nucleosomal template. Our goal was,therefore, to examine whether nuclear DNA in living cells isendowed with structural dynamics. Twisting rigidity ofDNA is an important determinant of the energetics of for-mation of complicated nucleoprotein structure (Echols,1986). The interaction of some proteins, such as HighMobility Group I, requires bending and untwisting of DNA,modifying the minor groove to fit to the contour of theprotein (Grosschedl, 1995). Fluorescence anisotropy decaystudies of the ethidium-DNA complex were performed toinvestigate internal motion of DNA (Wahl et al., 1970). The
Received for publication 1 November 1999 and in final form 31 January2000.
Address reprint requests to Dr. Maite Coppey-Moisan, MacromolecularComplexes in Living Cells, Institut Jacques Monod, UMR 7592 P6/P7, 2Place Jussieu-Tour 43, 75251 Paris cedex 05, France. Tel.:133-1-44-27-79-51; Fax:133-1-44-27-79-51; E-mail: [email protected].
© 2000 by the Biophysical Society
0006-3495/00/05/2614/14 $2.00
2614 Biophysical Journal Volume 78 May 2000 2614–2627

experimental fluorescence depolarization was theoreticallyanalyzed in the frame of twisting motions of the DNA alongthe helix axis. These models are particularly appropriate toinvestigate the torsional dynamics of DNA (Allison andSchurr, 1979; Schurr, 1984) and the restriction of thesedynamics upon structural deformation by bending strain(Heath et al., 1996) or by tight immobilization of both DNAchains in nucleosome core particle (Winzeler and Small,1991).
Ethidium does, indeed, enter living cells, as had beenshown earlier (Delic et al., 1992; Hayashi et al., 1994;Coppey-Moisan et al., 1996; Favard et al., 1997), but evenwith intensified fluorescence digital imaging microscopy, itwas not possible to detect intercalation in nuclear DNA ofliving proliferative mammalian cells (Delic et al., 1991,1992; Coppey-Moisan et al., 1996). Fluorescence lifetimemeasurement under the microscope (Minami and Hirayama,1990; Verkman et al., 1991; Buurman et al., 1992; Lakow-icz et al., 1992; Piston et al., 1992; Morgan et al., 1992;French et al., 1992; Gadella et al., 1993; Ambroz et al.,1994; So et al., 1995), recently became an emerging tech-nology for quantitative imaging in living cells (Bastiaensand Squire, 1999; Dayel et al., 1999). By taking advantageof the different fluorescence lifetimes of ethidium in thebound and free states (Olmsted and Kearns, 1977) and of thevery sensitive detection method of time-correlated singlephoton counting, combined with confocal microscopy (Na-katani et al., 1993; Schoutteten et al., 1997), extremely lowfluorescence from intercalated ethidium molecules could bedetected in the nucleus of living mammalian cells. In addi-tion, fluorescence anisotropy decay dynamics allowed us toshow that the native cellular state is characterized by re-strained torsional motion of nuclear DNA and by a stronginhibition of ethidium intercalation in nuclear DNA.
MATERIALS AND METHODS
Chemicals
Rhodamine 6G chloride, ethidium bromide, and Hoechst 33342 were fromMolecular Probes Europe (Leiden, The Netherlands), digitonin was fromSigma (St Quentin Fallavier, France), 1-butanol from Aldrich (St QuentinFallavier, France), andl-DNA was purchased from Pharmacia BiotechEurope (Orsay, France).
Cell culture and labeling with ethidium
S2 cells, a clonal expansion from a transformed Vero monkey kidney cellline (Gao and Knipe, 1989), were grown in Dulbecco’s modified minimalessential medium (Gibco, Cergy-Pontoise, France), supplemented with10% fetal calf serum. The experiments were carried out at a relatively lowdensity of S2 cells, i.e., after 48–72 h of a culture of 33 105 cells, seededon 12.5 cm2 round glass coverslip (H. Saur, Reutlingen, Germany). Cellswere incubated with 0.1–10mg/ml ethidium bromide in growth medium for30 min at 37°C. For experiments under the microscope, the coverslip wasmounted in an open observation chamber (H. Saur) and the cell monolayerwas rinsed with 20 mM Hepes-buffered Hank’s balanced salt solution,which contained ethidium bromide at the same concentration as that used
in incubation experiments, for measurements done in the presence ofethidium bromide.
For permeabilization experiments, cells were preloaded with a mixtureof 1 mg/ml Hoechst 33342 and 4mg/ml ethidium bromide for 30 min at37°C. Permeabilization treatment was carried out by adding 50mg/ml ofdigitonin to the observation medium, Hepes-buffered Hank’s balanced saltsolution, at room temperature.
For naked DNA measurements, a solution ofl-DNA (50 mg/ml) andethidium bromide (0.5 or 4mg/ml) in water was used. The ratio ofdye/basepair was 1/15 for lifetime measurements and was kept below1/150 for anisotropy acquisition to avoid energy transfer.
Fluorescence microscopy imaging at lowlight level
Epi-fluorescence imaging was carried out at room temperature on living orpermeabilized cells, using an inverted microscope DMIRBE (Leica, Rueil-Malmaison, France). Fluorescence images were acquired at very lowexcitation light levels as described elsewhere (Delic et al., 1991) with somemodifications. Briefly, cells grown on glass coverslips were mounted in anopen observation chamber and imaged through an ultrafluor objective(1003 magnification, NA5 1.3). The detector was a cooled, slow-scanCCD camera with 10243 1024 pixels, digitized on 4096 grey-levels(SILAR, St. Petersburg, Russia). The excitation source was a 50 Whigh-pressure mercury lamp. For ethidium fluorescence, we usedlexc 5540 nm, OD5 2, andlem . 590 nm, and, for Hoechst 33342,lexc 5 365nm, OD 5 2, and 480 nm, lem , 520 nm. Background subtraction,shading correction, and other image processing were carried out as de-scribed elsewhere (Coppey-Moisan et al., 1994), by using Khoros software(Khoral Research, Albuquerque, NM USA).
Fluorescence lifetime measurements anddata analysis
The confocal microscope, used for acquisition of fluorescence decay dy-namics, is described elsewhere (Schoutteten et al., 1997). Briefly, a tita-nium: sapphire picosecond laser (Spectra Physics France, Les Ulis,France),lexc 5 498 nm, 4 MHz, was directed through the light-inlet portof a Nikon epi-fluorescence inverted microscope. Subcellular localizationof the excitation volume was selected by observing the diffracted laser spotsimultaneously with the transmitted white light cell image. The depthwithin the nucleus was adjusted by using a piezoelectric displacement ofthe objective (Polytec-PI, Pantin, France). The fluorescence photons, emit-ted from the illuminated volume of 1mm3, were collected by a 1003magnification objective (NA5 0.8–1.3) and conducted through an opticfiber (400mm) to a time-correlated single photon counting system with amicrochannel plate-photomultiplicator tube detector R3809U (HamamatsuPhotonics France, Massy, France). Scattered excitation light was removedby a glass cut-off filter, inserted in front of the detector. The standardtime-correlated single photon counting system (O’Connor and Phillips,1984) was operated at 2048 channels, using time windows from 50 to 200ns. A Fresnel rotator was placed in the excitation laser beam and a sheetpolarizer before the optical fiber on the emission path. Vertical (v) andhorizontal (h) positions of the excitation and emission polarizations, ab-breviated as vv, hv, hh, vh, were obtained by rotating the Fresnel rotatorand the sheet polarizer. Two fluorescent decays were acquired, parallel(ivh(t)) and perpendicularly polarized (ihh(t)). A third decay was acquired atthe magic angle, with the Fresnel rotator positioned 55° away from thevertical direction and the polarizer oriented in the horizontal direction.Small deviations from the magic angle, caused by slight polarization at thedichroic mirror, had no influence on extracted lifetimes and the pre-exponential factors, which were in agreement with that recovered from thefluorescence decay acquired with the Fresnel rotator positioned at themagic angle,imag(t), and from the total fluorescence,i(t) 5 ivh(t) 1 2ihh(t).
Restrained Torsional Dynamics of DNA 2615
Biophysical Journal 78(5) 2614–2627

The same count rate was used for acquisition of fluorescence and instru-ment response function (IRF), which was measured by focusing the laseron the surface of a microscope glass slide and by taking off the cut-offfilter.
Global analysis software was Globals Unlimited (Illinois University). Itallowed application and investigation of divers kinetic models, such asdecay-associated anisotropy, and performance of rigorous error analysisand simulations. Static background, as measured by the mean number ofcounts before the rise of fluorescence, was treated as a fit parameter by thekinetic analysis software. Dynamic background was acquired from a back-ground sample (e.g., medium) under identical conditions and incorporatedin the analysis. Fluorescence decays were deconvoluted with the IRF andfitted by a Marquardt nonlinear least-square algorithm. When modelinganisotropy decays, ag-factor was used as free or fixed fit parameter. Globalanalysis was performed for parallel and perpendicular decays.
Measurement of intracellularconcentration of ethidium
The concentrations of free and intercalated nuclear ethidium were calcu-lated from measurements of the fluorescence decays in the nucleus and inthe extracellular medium, in the presence of a given ethidium concentrationin the incubation medium. Two magic angle decays were measured withthe same acquisition time (200 s), the laser being focused in the extracel-lular medium and then in the nucleus, and fitted with fixed typical lifetimesfor free (tfree 5 1.8 ns) and intercalated (tint 5 22 ns) ethidium. Thepre-exponential factors were determined by the best global fit of the modelfunctions
iext~t! 5 a0e2t/tfree (1)
inuc~t! 5 afreee2t/tfree 1 ainte
2t/tint, (2)
wherea0 is the pre-exponential factor corresponding to free ethidium in theextracellular medium, andafreeandaint, are those corresponding to free andintercalated ethidium in the nucleus, respectively.
For each fluorescence decay, the relation between concentration,C, andpre-exponential factor,a, is
a 5 K«Ckr, (3)
where« is the absorption coefficient,kr the radiative rate constant, andKa factor that depends on experimental parameters (sampling volume, laserpower, and acquisition time).
Assuming that: the experimental variations were negligible during anexperiment (K 5 const), the free ethidium lifetimes are identical in extra-cellular medium and in the nucleus, and the radiative rate constant isidentical for free and intercalated ethidium species, as had been claimedearlier (Olmsted and Kearns, 1977), we obtain the ratios
a0/afree 5 C0/Cfree and afree/aint 5 «freeCfree/«intCint, (4)
where«free/«int 5 1.456 at 498 nm excitation.Cfree andCint were calculated then for each knownC0 concentration of
ethidium at the end of the incubation period.
Measurements of fluorescence anisotropy decay
Anisotropy measurements were carried out using the same set-up as thatfor lifetime measurements (Schoutteten et al., 1997). The optical design ofthe microscope results in four geometric components of the fluorescencepolarization, whereivh andihv pertain to the parallel direction andiw andihh
to the perpendicular direction, with the first index standing for excitationand the second for emission.
The decaysivh(t) andihh(t) were chosen as parallel and perpendicularlypolarized fluorescence decays, respectively, and were acquired sequen-tially. To correct for different transmission efficiency of each geometriccomponent of the excited and emitted polarized light, as well as forpolarizing (or depolarizing) effects of the microscope optics, aG factor wasexperimentally determined by acquiring the four geometric componentswith steady-state illumination (ivh, ihh, ihv, ivv).
G 5 @~ivh 3 ivv!/~ihv 3 ihh!#1/2 (see Eq. A10). (5)
In addition, a normalization factor,T, was determined by experiment to correctfor laser fluctuations, acquisition times, and potential photobleaching:
T 5 ivh 3 E ihh~t! dt/ihh 3 E ivh~t! dt (see Eq. A4). (6)
* ihh(t) dt and * ivh(t) dt are the total intensity of the perpendicular andparallel polarized fluorescence, respectively, integrated over the acquisi-tion time and measured from the surface areas under theihh(t) and ivh(t)curves of a 200 ns time window.
The anisotropy function,r(t), was calculated (without deconvoluting theinstrument response function) from
r~t! 5T ivh~t! 2 G ihh~t!
T ivh~t! 1 2 G ihh~t!(see Eq. A13). (7)
To validate this normalization method of the parallel and perpendiculardecays, the rotational behavior of rhodamine 6G in butanol, taken as areference, was measured in two independent ways: the classic “tail match-ing” method (Appendix B), and by measuring the normalization factorTand the geometric correction factorG, as described above and in Appendix A.
For small, freely rotating molecules such as rhodamine 6G in low-viscosity solvents such as butanol, the parallel and perpendicular polarizeddecays can be fitted with the model functions,
ivh~t! 5 IRF~t! p @ae2t/t 3 ~1 1 2r0e2t/f!#, (8)
ihh~t! 5 g 3 IRF~t! p @ae2t/t 3 ~1 2 r0e2t/f!#
~see Eq. B12 and B13!,(9)
with IRF(t) being the instrument response function,t the fluorescencelifetime, r0 the anisotropy at time zero, andf the rotational time ofrhodamine 6G in butanol.g is a factor to correct for the different trans-mission efficiency of the two experimental decays,ivh(t) and ihh(t).
In the first case, the parameters of fluorescence and rotational kinetics(t, r0, andf) were directly found from the best fit of both Eqs. 8 and 9,leavingg as a fit parameter and assuming that the anisotropy is zero at longtime (tail matching method).
In the second case,ivh(t) and ihh(t) were normalized before the fit inipar(t) and iper(t), respectively, with the expressions,
ipar~t! 5 T 3 ivh~t! (10)
and
iper~t! 5 G 3 ihh~t!, (11)
which were derived from Eq. A13. In this case, theg coefficient was set to1 and the parameters of the fluorescence and rotational kinetics (t, r0, andf) were recovered from the best fit of the functions,
ipar~t! 5 IRF~t! p @ae2t/t 3 ~1 1 2r0e2t/f!#, (12)
iper~t! 5 IRF~t! p @ae2t/t 3 ~1 2 r0e2t/f!#. (13)
In general, both methods yielded identical results (see Results).
2616 Tramier et al.
Biophysical Journal 78(5) 2614–2627

To avoid photodynamic reaction, especially during measurements inliving cells, neutral density filters were placed in the laser beam to obtaina laser average energy of a few nano-Watts only at the entrance of themicroscope. All cellular measurements were carried out using NA5 1.3 tohave the best collection efficiency of fluorescence light.
Simulation of anisotropy decays ofethidium fluorescence
Simulations of anisotropy relaxation were based on various models, such asdecay-associated rotation times (Beechem et al., 1991) with two emittingspecies of the same concentration, one with a short lifetime (1.8 ns) and ashort anisotropy relaxation time (250 ps), the other with a long lifetime (22ns) and a long anisotropy relaxation time (250 ns). These lifetime valuesare modeling free and intercalated ethidium. The simulations used a spe-cific kinetics model, such as the above, an experimental IRF, and addedPoisson noise, to obtain idealized experimental decays for horizontal andvertical polarizations. Reanalysis of the simulated decays yielded theoriginal kinetic parameters of the model, thus confirming the integrity ofthe fitting procedure. Phenomenological decay parameters obtained by theabove method, however, do not necessarily describe the relevant biologicalsituation.
Schurr and coworkers addressed this situation by modeling DNA as aseries of rigid rods, connected by torsion springs at their joints, each rodcorresponding to one basepair, thus developing a theoretical expression forfluorescence anisotropy decay of ethidium intercalated in DNA (Allisonand Schurr, 1979). This early model neglects rapid restricted dye wobbling,DNA bending motions, and global motions of the whole DNA. Simulationsof the experimental fluorescence anisotropy decay of ethidium, intercalatedin l-phage DNA solution and in the nucleus of living cells, were carriedout by using a simplified expression corresponding to the “intermediatezone formula” of the model (Thomas et al., 1980). An advanced modeltakes into account protein–DNA interactions, consisting of a finite filamentrigidly clamped at both ends (Schurr, 1984; Schurr and Schurr, 1985).These models yield the following expression for the fluorescence anisot-ropy decay of ethidium, rigidly bound to either naked or chromatinizedDNA:
r~t! 5 r0@~3/2 cos2«0 2 1/2!2
1 3 cos2«0sin2«0C1~t! 1 3/4 sin4«0C2~t!#,(14)
where«0 5 70.5°, the angle between the transition dipole and the helix axis(Schurr and Schurr, 1985),C1(t) and C2(t) are the correlation functionsCn(t), for n 5 1 andn 5 2, which model torsional motions of DNA:
Cn~t! 5 exp@2n2kBT~t/pag!1/2# (15)
for long linear DNA corresponding to infinite rigid rods, and
Cn~t! 5 1/N Om51
N
expH2n2 Ol51
N
dl2Qml
2 @1 2 exp~2t/tl!#J (16)
for finite DNA rigidly clamped at both ends, with
Qml 5 @2/~N 1 1!#1/2sin@mlp/~N 1 1!#, (17)
dl2 5 ~kBT/g!tl, (18)
tl 5 g/$4a sin2@lp/2~N 1 1!#%, (19)
wherekB is the Boltzmann’s constant andT the absolute temperature. Theanisotropy behavior is characterized by three parameters,a, g, andN. Thetwisting correlation functions are dependent ona, the torsional springconstant describing the properties of the torsional spring between the rigid
rods,g, the frictional factor of the rigid rods proportional to viscosity of themedium, andN the number of rigid rods between points of attachment (forthe second model). Computations of these expressions were made for thetime span of 0 to 70 ns, withr0 5 0.25, representative of typical experi-mental conditions (Igor software).
RESULTS
Fluorescence anisotropydecays under the microscope
Fluorescence anisotropy measurements, under the micro-scope, of chromophores bound to deformable polymers asDNA, exhibit two types of difficulties: light depolarizationor polarization due to the objective and dichroic mirror, andnormalization of the parallel and perpendicular intensities.For small molecules in solution, for which the rotationaltime is short compared to the fluorescence lifetime, thisnormalization can be carried out by assuming that mole-cules completely relax, thus that the anisotropy is zero atlong times (tail matching method). This normalization can-not be applied to molecules for which the rotational time (ortwisting deformations in the case of DNA) is longer than thefluorescence decay time.
Before performing studies on DNA in living cells, thesetwo aspects were first investigated using rhodamine 6G inbutanol as standard. Measurements of parallel and perpen-dicular polarized rhodamine 6G fluorescence decays wereperformed for two numerical apertures (NA) of the objec-tive. The anisotropy decays were obtained first by the clas-sic way of normalization (tail matching) (Fig. 1). The initialdecay zones of the fluorescence anisotropy obtained withtwo NA were different, because of the different value ofanisotropy at time zero (r0) as shown in Table 1.
A theoretical approach by Axelrod (1979, 1989) de-scribes the decrease ofr0 with increasing the NA of theobjective. Our experimental results are in good agreementwith the Axelrod’s formulae (Fig. 2). Depolarization by the
FIGURE 1 Anisotropy decays of rhodamine 6G fluorescence in butanolunder the confocal microscope. Fluorescence decays used for the calcula-tion of the anisotropy function were normalized by tail matching. Mea-surements were made at 1.3 (solid) and 1 (dotted) numerical aperture of a1003 objective. The fit parameters are presented in Table 1.
Restrained Torsional Dynamics of DNA 2617
Biophysical Journal 78(5) 2614–2627

optical set-up of the microscope, however, did not changethe recovered kinetic parameters for fluorescence decaysand fluorescence anisotropy decays. Lifetime and rotationaltime of rhodamine 6G in butanol, 3.4 ns and 820 ps,respectively, were very similar when measured at two dif-ferent NA values (Table 1). The dynamics values are con-sistent with the apparent volume of the molecule and vis-cosity of the medium in terms of the Perin’s equation andagree with literature (Philips et al., 1985).
Because tail matching normalization is impossible forfluorescence anisotropy decay of ethidium intercalated inDNA, a new experimental normalization for time-resolvedanisotropy measurement in confocal microscopy was devel-oped (see Materials and Methods and Appendix A). Tovalidate our method, a comparison of this new experimentalnormalization with standard normalization was performedon rhodamine 6G solutions at two different NA (1 and 1.3).Results for the two normalizations, using the same fluores-cent decays, are given in Table 1. The small differences offit parameters between the two normalization procedures
were not significant and were well within the error domain,obtained by rigorous error analysis.
Evidence of ethidium intercalation in thenucleus of living cells
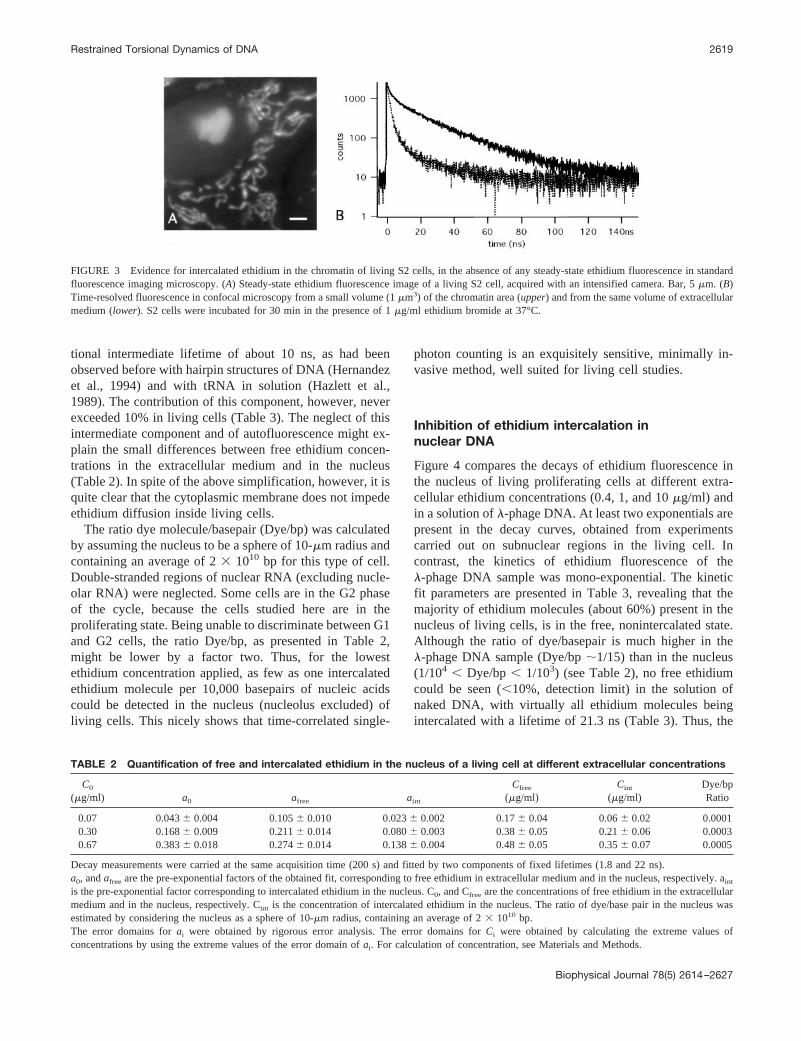
The ethidium fluorescence image of a living proliferativecell, acquired at low level of excitation light, is displayed inFig. 3 A. An extremely low level of excitation intensity isrequired for photodynamic reaction to be avoided and forthe living state to be preserved (Delic et al., 1991). Underthese conditions, ethidium enters living cells, intercalates inmitochondrial DNA (Coppey-Moisan et al., 1996) and indouble-stranded regions of ribosomal RNA in nucleoli(Delic et al., 1992), but no steady-state fluorescence inten-sity could be detected so far in the nucleus (nucleolusexcepted) (Fig. 3A). The presence of free and intercalatedethidium in the nucleus, however, was established by time-correlated photon counting. This relies on the fact thatfluorescence photons only are time-correlated but not thenoise, which allows extraction of extremely weak fluores-cence signal from the background. Fluorescence decay mea-surements were carried out in confocal mode on subnuclearregions. The nucleoli were avoided because they wereclearly visible in the transmitted cell image. Measurementswere done successively in the extracellular medium and inthe nucleus (Fig. 3B), on the same cell culture and in thepresence of the same extracellular concentration of ethidium(1 mg/ml) than that in Fig. 3A. In the extracellular medium,a short decay time of 1.8 ns, indicative of free ethidium, wasobtained. In the nucleus, a bi-exponential decay was ob-served with lifetimes of 1.8 ns (free ethidium) and 22 ns,where the long lifetime is characteristic of ethidium inter-calated in DNA/RNA, and caused by reduced accessibilityof ethidium molecules to proton acceptors (Olmsted andKearns, 1977).
The absolute concentrations of ethidium in the nucleus,free and intercalated, were calculated as described in Ma-terials and Methods. The obtained values are reported inTable 2 for three separate experiments carried out at threeethidium concentrations applied to the extracellular me-dium. The decays of ethidium fluorescence were fitted byfixing the two lifetimes of 1.8 ns and 22 ns, representativeof free and intercalated ethidium, respectively. By using thismethod, nuclear autofluorescence and fluorescence fromethidium species with an intermediate lifetime (;10 ns)were neglected. Cells without ethidium labeling revealedtwo dominant lifetimes of 400 ps (80%) and 3.5 ns (20%),corresponding to nuclear autofluorescence and being quitedifferent from ethidium lifetimes. In addition, the contribu-tion of autofluorescence never exceeded 15% of theethidium fluorescence, even at the lowest ethidium concen-tration used (data not shown). At longer acquisition timesand higher ethidium concentrations, the decay of ethidiumcould better be fitted by three exponentials, with an addi-
FIGURE 2 Dependence of anisotropy at time zero (r0) on the numericalaperture of the objective. Experimental data (symbol) are shown for Rho-damine 6G in butanol, using a 1003 objective. The theoretical curve(solid) takes into account differences due to the aperture of the objective inthe optical path and the geometric orientation of the polarized light (Ax-elrod, 1979).
TABLE 1 Comparison of rotational parameters of rhodamine6G obtained by different normalization methods of polarizeddecays and different NA of the objective
a* t (ns)* r0* f (ps)*
Tail matching normalizationNA 5 1.3 15.46 0.4 3.46 0.1 0.2966 0.024 8306 120NA 5 1 13.76 0.4 3.46 0.1 0.3206 0.022 8206 90
Experimental normalizationNA 5 1.3 15.16 0.4 3.46 0.1 0.2926 0.036 7706 100NA 5 1 12.56 0.4 3.46 0.1 0.3206 0.021 8006 70
Results of the fitted anisotropy decays of rhodamine 6G in butanol, usingthe two different normalization methods, Tail matching and experimentalnormalization withG andT factor (see Material and Methods and Appen-dix A). Measurements were made at two different numerical apertures ofthe 1003 magnification objective, 1 and 1.3.*a, pre-exponential factor;t, fluorescence lifetime;r0, anisotropy value attime zero;f, rotational time.
2618 Tramier et al.
Biophysical Journal 78(5) 2614–2627
tional intermediate lifetime of about 10 ns, as had beenobserved before with hairpin structures of DNA (Hernandezet al., 1994) and with tRNA in solution (Hazlett et al.,1989). The contribution of this component, however, neverexceeded 10% in living cells (Table 3). The neglect of thisintermediate component and of autofluorescence might ex-plain the small differences between free ethidium concen-trations in the extracellular medium and in the nucleus(Table 2). In spite of the above simplification, however, it isquite clear that the cytoplasmic membrane does not impedeethidium diffusion inside living cells.
The ratio dye molecule/basepair (Dye/bp) was calculatedby assuming the nucleus to be a sphere of 10-mm radius andcontaining an average of 23 1010 bp for this type of cell.Double-stranded regions of nuclear RNA (excluding nucle-olar RNA) were neglected. Some cells are in the G2 phaseof the cycle, because the cells studied here are in theproliferating state. Being unable to discriminate between G1and G2 cells, the ratio Dye/bp, as presented in Table 2,might be lower by a factor two. Thus, for the lowestethidium concentration applied, as few as one intercalatedethidium molecule per 10,000 basepairs of nucleic acidscould be detected in the nucleus (nucleolus excluded) ofliving cells. This nicely shows that time-correlated single-
photon counting is an exquisitely sensitive, minimally in-vasive method, well suited for living cell studies.
Inhibition of ethidium intercalation innuclear DNA
Figure 4 compares the decays of ethidium fluorescence inthe nucleus of living proliferating cells at different extra-cellular ethidium concentrations (0.4, 1, and 10mg/ml) andin a solution ofl-phage DNA. At least two exponentials arepresent in the decay curves, obtained from experimentscarried out on subnuclear regions in the living cell. Incontrast, the kinetics of ethidium fluorescence of thel-phage DNA sample was mono-exponential. The kineticfit parameters are presented in Table 3, revealing that themajority of ethidium molecules (about 60%) present in thenucleus of living cells, is in the free, nonintercalated state.Although the ratio of dye/basepair is much higher in thel-phage DNA sample (Dye/bp;1/15) than in the nucleus(1/104 , Dye/bp, 1/103) (see Table 2), no free ethidiumcould be seen (,10%, detection limit) in the solution ofnaked DNA, with virtually all ethidium molecules beingintercalated with a lifetime of 21.3 ns (Table 3). Thus, the
FIGURE 3 Evidence for intercalated ethidium in the chromatin of living S2 cells, in the absence of any steady-state ethidium fluorescence in standardfluorescence imaging microscopy. (A) Steady-state ethidium fluorescence image of a living S2 cell, acquired with an intensified camera. Bar, 5mm. (B)Time-resolved fluorescence in confocal microscopy from a small volume (1mm3) of the chromatin area (upper) and from the same volume of extracellularmedium (lower). S2 cells were incubated for 30 min in the presence of 1mg/ml ethidium bromide at 37°C.
TABLE 2 Quantification of free and intercalated ethidium in the nucleus of a living cell at different extracellular concentrations
C0
(mg/ml) a0 afree aint
Cfree
(mg/ml)Cint
(mg/ml)Dye/bpRatio
0.07 0.0436 0.004 0.1056 0.010 0.0236 0.002 0.176 0.04 0.066 0.02 0.00010.30 0.1686 0.009 0.2116 0.014 0.0806 0.003 0.386 0.05 0.216 0.06 0.00030.67 0.3836 0.018 0.2746 0.014 0.1386 0.004 0.486 0.05 0.356 0.07 0.0005
Decay measurements were carried at the same acquisition time (200 s) and fitted by two components of fixed lifetimes (1.8 and 22 ns).a0, andafree are the pre-exponential factors of the obtained fit, corresponding to free ethidium in extracellular medium and in the nucleus, respectively. aint
is the pre-exponential factor corresponding to intercalated ethidium in the nucleus. C0, and Cfree are the concentrations of free ethidium in the extracellularmedium and in the nucleus, respectively. Cint is the concentration of intercalated ethidium in the nucleus. The ratio of dye/base pair in the nucleus wasestimated by considering the nucleus as a sphere of 10-mm radius, containing an average of 23 1010 bp.The error domains forai were obtained by rigorous error analysis. The error domains forCi were obtained by calculating the extreme values ofconcentrations by using the extreme values of the error domain ofai. For calculation of concentration, see Materials and Methods.
Restrained Torsional Dynamics of DNA 2619
Biophysical Journal 78(5) 2614–2627

high ratio of free/intercalated ethidium in the nucleus, ob-served over a wide range of ethidium concentrations(0.1–10mg/ml), clearly reveals a strong inhibition of inter-calation in nuclear DNA of these living cells. This resultholds true for all types of proliferating mammalian cells so farexamined (Hela cells, exponentially growing fibroblast cells).
It could be assumed that the high level of compaction ofDNA inside the nucleus, compared to that of DNA insolution, might be the main process involved in the inhibi-tion of intercalation. This possibility could be ruled out,however, because intercalation could be induced, at least insome nuclear regions (evidenced by a high steady-statefluorescence of ethidium in nuclear DNA), by digitonintreatment (Fig. 5D), at constant nuclear volume. The vol-ume of the nucleus, imaged by Hoechst 33342 fluorescence,and thus the global compaction of DNA within the nucleus,was unchanged before (Fig. 5A) and after (Fig. 5C)digitonin treatment. The increase of ethidium intercalationafter digitonin treatment (Fig. 5D) cannot be ascribed tohigher membrane permeability for ethidium, becauseethidium easily enters into living cells without the presenceof digitonin (Tables 2 and 3). Furthermore, the pattern ofethidium fluorescence (Fig. 5D) coincides with regions ofhighly condensed chromatin, close to the nuclear membraneand around nucleoli, visualized with Hoechst 33342 label-ing (Fig. 5 C). Thus, the strong inhibition of ethidiumintercalation, observed in the unperturbed state of the livingcell, was not due only to a high level of compaction ofDNA. The effect of digitonin on the nucleus is not known.The observed perturbation of chromatin could either be dueto a direct effect of digitonin on chromatin, particularly inthose regions being in contact with the nuclear membrane,or could represent an indirect effect arising from modifica-tion of the nuclear ionic composition. The loss of miton-chondrial ethidium fluorescence after digitonin treatment(Fig. 5 D) is in agreement with our previous observationsthat a decrease of mitochondrial electrochemical gradienttriggers the extinction (or the decrease) of fluorescence ofethidium, preintercalated in mitochondrial DNA (Coppey-Moisan et al., 1996; Durieux et al., 1999). In the present
experiment, digitonin is assumed to permeabilize the mito-chondrial inner membrane, resulting in a collapse of theelectrochemical gradient.
Anisotropy decay of ethidium fluorescence in thenucleus of living cells
The anisotropy decays,r(t), of ethidium fluorescence, aris-ing from a nuclear volume of a living cell, are shown in Fig.
TABLE 3 Fit of fluorescence decays for ethidium in asolution of l-phage DNA and for ethidium in the nucleus ofliving S2 cells
a1 t1 a2 t2 a3 t3 x2
l DNA 1 21.3 1.009Nuclear DNA
0.4 mg/ml 0.40 22.1 0.60 2.08 1.1871 mg/ml 0.36 21.0 0.64 1.95 1.48110 mg/ml 0.20 26.5 0.07 10.8 0.73 1.85 1.218
After deconvolution with the instrument response function, fits of thefluorescence decays of Fig. 4 were obtained with one, two, or threecomponents.a1, a2, anda3 are the pre-exponential factors of each components (sum ofai 5 1) with fluorescence lifetime oft1, t2, andt3. Values ofx2 indicatethe quality of the fit.
FIGURE 4 Normalized fluorescence decays of ethidium froml-phageDNA solution and from the nucleus of a living cell. Fromtop to bottom:l-phage DNA/ethidium, S2/0.4mg/ml ethidium, S2/1mg/ml ethidium, andS2/10mg/ml of ethidium. Cells were incubated with ethidium for 30 minin Dulbecco’s modified minimal essential medium at 37°C. The measure-ments were carried out in buffered Hank’s balanced salt solution, in thepresence of ethidium bromide with the same concentrations than those usedfor incubation.
FIGURE 5 Relaxation of inhibition of ethidium intercalation in nuclearDNA of a living cell by digitonin treatment. Steady-state fluorescenceimage of an S2 cell (A, B) alive, and (C, D) after permeabilization bydigitonin. (A andC) Hoechst 33342 fluorescence,lexc 5 365 nm, OD52, and 480 nm, lem , 520 nm. (B andD) Ethidium fluorescence,lexc 5540 nm, OD5 2, andlem . 590 nm. Bar 10mm.
2620 Tramier et al.
Biophysical Journal 78(5) 2614–2627
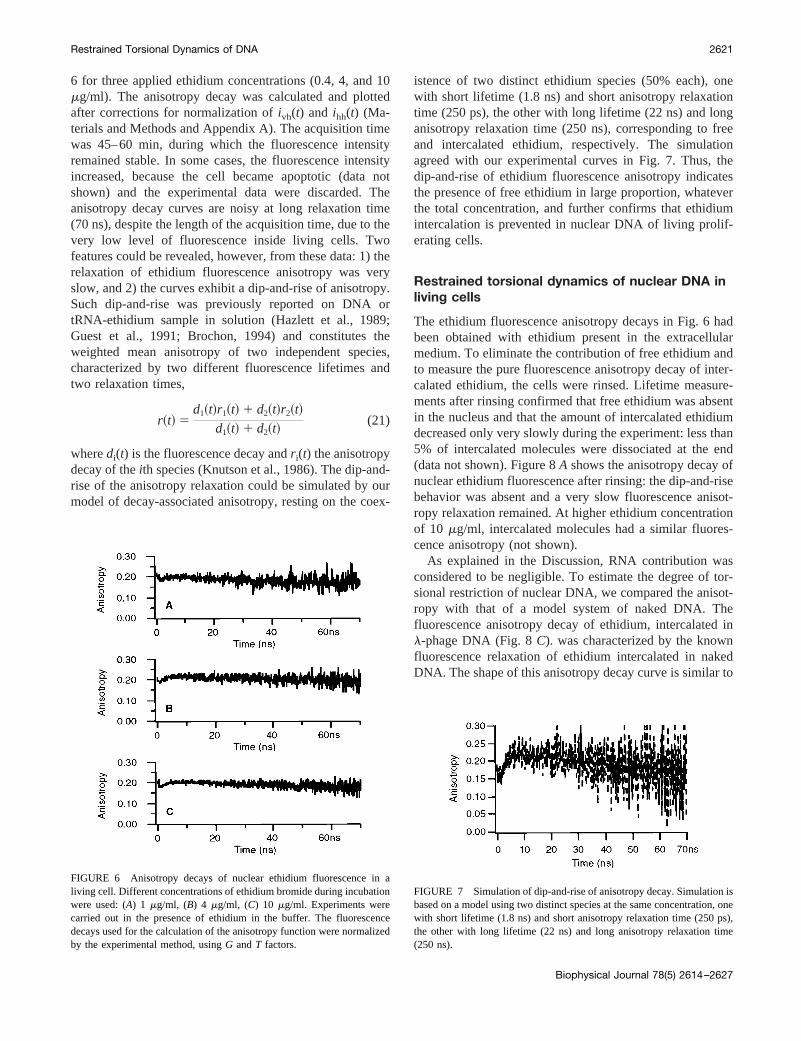
6 for three applied ethidium concentrations (0.4, 4, and 10mg/ml). The anisotropy decay was calculated and plottedafter corrections for normalization ofivh(t) and ihh(t) (Ma-terials and Methods and Appendix A). The acquisition timewas 45–60 min, during which the fluorescence intensityremained stable. In some cases, the fluorescence intensityincreased, because the cell became apoptotic (data notshown) and the experimental data were discarded. Theanisotropy decay curves are noisy at long relaxation time(70 ns), despite the length of the acquisition time, due to thevery low level of fluorescence inside living cells. Twofeatures could be revealed, however, from these data: 1) therelaxation of ethidium fluorescence anisotropy was veryslow, and 2) the curves exhibit a dip-and-rise of anisotropy.Such dip-and-rise was previously reported on DNA ortRNA-ethidium sample in solution (Hazlett et al., 1989;Guest et al., 1991; Brochon, 1994) and constitutes theweighted mean anisotropy of two independent species,characterized by two different fluorescence lifetimes andtwo relaxation times,
r~t! 5d1~t!r1~t! 1 d2~t!r2~t!
d1~t! 1 d2~t!(21)
wheredi(t) is the fluorescence decay andr i(t) the anisotropydecay of theith species (Knutson et al., 1986). The dip-and-rise of the anisotropy relaxation could be simulated by ourmodel of decay-associated anisotropy, resting on the coex-
istence of two distinct ethidium species (50% each), onewith short lifetime (1.8 ns) and short anisotropy relaxationtime (250 ps), the other with long lifetime (22 ns) and longanisotropy relaxation time (250 ns), corresponding to freeand intercalated ethidium, respectively. The simulationagreed with our experimental curves in Fig. 7. Thus, thedip-and-rise of ethidium fluorescence anisotropy indicatesthe presence of free ethidium in large proportion, whateverthe total concentration, and further confirms that ethidiumintercalation is prevented in nuclear DNA of living prolif-erating cells.
Restrained torsional dynamics of nuclear DNA inliving cells
The ethidium fluorescence anisotropy decays in Fig. 6 hadbeen obtained with ethidium present in the extracellularmedium. To eliminate the contribution of free ethidium andto measure the pure fluorescence anisotropy decay of inter-calated ethidium, the cells were rinsed. Lifetime measure-ments after rinsing confirmed that free ethidium was absentin the nucleus and that the amount of intercalated ethidiumdecreased only very slowly during the experiment: less than5% of intercalated molecules were dissociated at the end(data not shown). Figure 8A shows the anisotropy decay ofnuclear ethidium fluorescence after rinsing: the dip-and-risebehavior was absent and a very slow fluorescence anisot-ropy relaxation remained. At higher ethidium concentrationof 10 mg/ml, intercalated molecules had a similar fluores-cence anisotropy (not shown).
As explained in the Discussion, RNA contribution wasconsidered to be negligible. To estimate the degree of tor-sional restriction of nuclear DNA, we compared the anisot-ropy with that of a model system of naked DNA. Thefluorescence anisotropy decay of ethidium, intercalated inl-phage DNA (Fig. 8C). was characterized by the knownfluorescence relaxation of ethidium intercalated in nakedDNA. The shape of this anisotropy decay curve is similar to
FIGURE 6 Anisotropy decays of nuclear ethidium fluorescence in aliving cell. Different concentrations of ethidium bromide during incubationwere used: (A) 1 mg/ml, (B) 4 mg/ml, (C) 10 mg/ml. Experiments werecarried out in the presence of ethidium in the buffer. The fluorescencedecays used for the calculation of the anisotropy function were normalizedby the experimental method, usingG andT factors.
FIGURE 7 Simulation of dip-and-rise of anisotropy decay. Simulation isbased on a model using two distinct species at the same concentration, onewith short lifetime (1.8 ns) and short anisotropy relaxation time (250 ps),the other with long lifetime (22 ns) and long anisotropy relaxation time(250 ns).
Restrained Torsional Dynamics of DNA 2621
Biophysical Journal 78(5) 2614–2627

that obtained from simulation of torsional dynamics ofnaked DNA (Fig. 8D), according to the model developedby Schurr (Thomas et al., 1980). For this simulation (Fig. 8D), a (torsional coefficient) was 6.53 10212 dynezcm andg (frictional coefficient) was 63 10223 dynezcmzs. Thesevalues of torsional dynamics parameters correspond to thosegiven in the literature for naked DNA (Thomas et al., 1980;Heath et al., 1996).
In contrast, the fluorescence anisotropy of ethidium, in-tercalated in the nucleus of living cell relaxed more slowly(Fig. 8A). Simulations of anisotropy decay were carried outusing a model modified by Schurr and co-workers, whereethidium is intercalated in finite domains of basepairsrigidly clamped at both ends (Schurr, 1984; Schurr andSchurr, 1985) (see Materials and Methods). The bendingmotions were neglected. Three parameters,a, g, andN, arenow involved in this model, withN being the number ofsequential basepairs involved in the torsional movements.The simulations evidenced that the torsional dynamics ofthe intercalating sites are restrained, either becauseN is low,or becauseg is high (Fig. 8B), corresponding either to shorttracts of naked DNA that are clamped at both ends or toincreased viscosity of the surrounding medium caused byprotein interaction all along the domain. Further kineticstudies will be able to discriminate between these twohypotheses, which are of different biological significance.
At present, we do not have the proof that, in the nucleusof living cells, ethidium is exclusively intercalated in DNAand not also in RNA. If there was RNA contribution to thefluorescence, however, the inhibition of ethidium intercala-
tion in nuclear DNA would be even stronger and, conse-quently, the DNA torsional dynamics further restrained (seebelow).
DISCUSSION
Time-correlated single-photon counting, adapted to confo-cal microscopy, allowed detection of molecules of ethidium,free (lifetime 1.8 ns) and intercalated (lifetime 22 ns), in thenuclear area of living cells that were incubated with thisintercalating probe. Comparable concentrations of freeethidium were present in the nucleus and in the extracellularmedium, demonstrating that the ethidium cation can diffusewithin cytoplasm and nuclear area. Thus, the old hypothesisis no longer valid, according to which the absence, in livingcells, of detectable steady-state ethidium fluorescence in thenucleus is due to impermeability of the cytoplasmic mem-brane. The ethidium cation gives rise to a strong fluores-cence in mitochondria. Simultaneously, it is present as freemolecules in the nucleus, thus ruling out the possibility thattrapping in mitochondria would prevent interaction withnuclear DNA. The lack of ethidium fluorescence in thenucleus of living cells, as seen from steady-state measure-ments, is consequently due to reduced propensity ofethidium intercalation into chromatin DNA. This feature ischaracteristic of the living state in proliferating mammaliancells.
By taking advantage of the extreme sensitivity of time-correlated single-photon counting, as few as 100 molecules
FIGURE 8 Anisotropy decays and simulations of intercalated ethidium fluorescence in the nucleus of a living S2 cell and inl-phage DNA. (A) Nucleusin a living S2 cell, incubated in the presence of 4mg/ml ethidium followed by rinsing. (B) Anisotropy relaxation simulation, using the model developedby Schurr (Schurr, 1984; Schurr and Schurr, 1985) with two sets of parameters: (dotted) N 5 20, a 5 6.5 3 10212 dynez cm, andg 5 6 3 10223 dynez
cm z s; (solid) N 5 100,a 5 6.5 3 10212 dyne z cm, andg 5 6 3 10222 dyne z cm z s. (C) Solution ofl-phage DNA at 50mg/ml in the presence of 4mg/ml of ethidium bromide. (D) Simulation of anisotropy relaxation, using the model developed by Schurr and co-workers (Thomas et al., 1980) witha 58 3 10212 dyne z cm andg 5 1.4 3 10223 dyne z cm z s.
2622 Tramier et al.
Biophysical Journal 78(5) 2614–2627

of intercalated ethidium could be detected in a subnuclearvolume of ;1 mm3. Moreover, fluorescence anisotropydecays from these few ethidium molecules could be ob-tained. The combination of fluorescence lifetime and fluo-rescence anisotropy dynamics reveals that the inhibition ofethidium intercalation in nuclear DNA is concomitant withrestrained torsional DNA dynamics.
The nucleus of a living cell is a spatially organizedorganelle, composed of DNA, RNA, proteins, ions, water,and other molecules. The present thesis of restrained tor-sional dynamics of DNA in this organelle strongly rests onthe following observations:
1. The inhibition of ethidium intercalation in nuclear DNAof living proliferative cells was evidenced by the verysmall amount of intercalated ethidium (identified by its22-ns fluorescence lifetime) in the presence of free nu-clear ethidium (1.8-ns fluorescence lifetime), even athigher ethidium concentrations. The above bi-exponen-tial fluorescence decay is in strong contrast to the single-exponential fluorescence decay of 22 ns, observed in thecase of naked DNA in solution. An independent confir-mation for the existence of free ethidium in the nucleuswas obtained from the dip-and-rise of fluorescence an-isotropy, which was seen only, when free ethidium waspresent in the extracellular milieu and hence in the nu-cleus: the short component of the anisotropy decay in thepresence of ethidium is that of freely rotating ethidium.
2. If the intercalation sites were concentrated within shortnuclear DNA segments (see discussion below), energyhomotransfer could not be ruled out, even at lowethidium concentrations. As discussed by others (Wu etal., 1991), homotransfer contributions would producesimilar anisotropy decays at low ethidium/basepair ratios(up to 0.20 for naked DNA). At higher ratios, very rapiddepolarization should occur, on a time scale too short tobe resolved, under significant reduction of the initialanisotropy,r0. Homotransfer could potentially explain,therefore, the lowerr0, found for fluorescence anisotropyof nuclear intercalated ethidium, compared with that ofrhodamine 6G. Homotransfer, if present, would lead to anunderestimation, however, of the torsional rigidity of DNAin the living cell, thus even enhancing our conclusions.
3. For each ethidium molecule intercalated, the DNA helixunwinds by 26° (Wang, 1974; Pulleyblank and Morgan,1975). The mechanism of intercalation is controlled byBrownian structural fluctuations of DNA and not by adiffusive process (Sobell et al., 1976; MacGregor et al.,1987; Meyer-Almes and Porschke, 1993). The effectivebinding constant of ethidium intercalation and internaldynamics of DNA are correlated (Ha¨rd and Kearns,1990; Clendenning et al., 1994; Heath et al., 1996). Adecreased ethidium-binding constant occurs in parallelwith restrained torsional motion in small circular plas-mid (Heath et al., 1996), in DNA-transcriptional factor
complexes (Ha¨rd and Kearns, 1990), and in nucleosomecore particles (Winzeler and Small, 1991). In the un-likely event that all of the intercalated ethidium mole-cules were bound to RNA and not to DNA, the internaldynamics of nuclear DNA would have to be even morerestrained, due to the absolute impossibility of ethidiumintercalation in DNA. Thus, both the strong inhibition ofintercalation and the extremely slow anisotropy relax-ation for intercalated ethidium contribute to demonstratethat the torsional dynamics of nuclear DNA is globallyrestrained in the living state.
Intercalated ethidium could provoke the dissociation ofproteins from nuclear DNA and the present experimentswould not feature the unperturbed chromatin state in theliving cell. Indeed, increasing ethidium concentrations wereshown to release proteins from chromatin (Schro¨ter et al.,1985) and to cooperatively release histones from DNA onisolated nucleosomes (McMurray and van Holde, 1991;Winzeler and Small, 1991). This behavior is in contrast toour low-concentration ethidium system: the ratio of free/intercalated ethidium in the nucleus did not vary signifi-cantly with increasing applied concentration of the cation,and the fluorescence anisotropy relaxations were superim-posable for the different ethidium concentrations applied.These two facts strongly suggest that, under our minimal-invasive experimental conditions, DNA–protein interac-tions are not perturbed. Moreover, the internal dynamics oflinear DNA is unaffected by ethidium, even at high degreeof intercalation (Wu et al., 1991; Smith et al., 1992; Clen-denning et al., 1994). Hence, the fluorescence anisotropydecay of intercalated ethidium, acquired under our condi-tions, is likely to probe the native state of chromatin.
We can deduce that the regions of nuclear DNA, whereethidium intercalates, represent segments of highly con-strained torsional motion. The constrained state can origi-nate from miscellaneous mechanisms, not mutually exclu-sive: i.e., secondary structural alterations by bending strain(Clendenning et al., 1994; Heath et al., 1996); specificprotein interaction, wrapping around histone octamer innucleosomal compaction (Winzeler and Small, 1991); andintroduction of bent regions (Ha¨rd and Kearns, 1990).
A careful study of torsional motion of DNA in nucleo-some core particles, using fluorescence anisotropy decays ofintercalated ethidium (Winzeler and Small, 1991), revealeda highly constrained torsional motion of DNA, at lowethidium/basepair ratio, close to that in living cells of thepresent work (;0.0001 dye/basepair). In living proliferatingcells, however, chromatin DNA exhibits different charac-teristics compared to DNA in a suspension of nucleosomecore particles: at higher free ethidium concentrations, de-tected in the nucleus of living proliferating cells, the tor-sional dynamics of nuclear DNA remains highly con-strained, whereas, in DNA of nucleosome core particle, theconstraint is cooperatively released due to nucleosome dis-
Restrained Torsional Dynamics of DNA 2623
Biophysical Journal 78(5) 2614–2627

sociation. Thus, the protein–DNA interactions inside nu-cleosomes in this type of living cells appear to be tighterthan in isolated nucleosomes.
Packaging DNA templates in chromatin inhibits the pro-gression of RNA and DNA polymerases in vitro (reviewedin Owen-Hughes and Workman, 1994; Widom 1998). Nev-ertheless, a living cell efficiently replicates and transcribesits nuclear DNA in vivo. In recent models, derived from invitro analysis on polymerization over polynucleosomatedtemplates, the existence of naked DNA regions was sup-posed to occur, transiently, over short segments (as short as10 bp), due to partial or full dissociation of the histoneoctamer from the DNA (Studitsky et al., 1997). Intercalatingmolecules have been shown to interact in vitro mostly withinternucleosomal linker regions of chromatin (Angerer andMoudrianakis, 1972; Sogo et al., 1984; McMurray and vanHolde, 1991; Yao et al., 1993) or, to some extent, with kinksof DNA at the octamer surface (Hogan et al., 1987). Thus,the nuclear DNA intercalation sites of living cells couldcorrespond to either internucleosomal regions (“linkers”),or to other DNA regions, being in interaction with specificproteins (replicating-transcribing complexes or other com-pounds, such as RNA).
A precise determination of the Schurr-model parameters(a, g, and N), which would fit the torsional dynamics ofDNA in vivo, is required for a better understanding of theorigin of the constrained state: is it due to tightly closedclamped ends (small value ofN corresponding to linkers) orto protein interaction involving an extended domain (N .100 bp and large values ofa or g)?
The inhibition of ethidium intercalation in the nucleusdisappears after permeabilization, although the concentra-tion of free ethidium in the nucleus does not change much.Permeabilization probably destroys the interactions of pro-teins or other biomolecules with DNA, as proposed earlier(Delic et al., 1991, 1992). Studies on DNA–protein interac-tions, carried out on extracted chromatin or on permeabil-ized cells, have to be interpreted with caution, therefore, anddo not provide direct evidence for the structural state ofnative chromatin inside the living cell. Anisotropy decaystudies provide a very helpful tool to probe the globalinternal dynamics of DNA, directly in living cells. Suchanisotropy measurements, therefore, are extremely suitableto follow the dynamics of nuclear DNA in different con-texts, such as proliferation or differentiation.
APPENDIX A: NORMALIZATION OF PARALLELAND PERPENDICULAR FLUORESCENCEDECAYS FOR ANISOTROPY MEASUREMENTS INEPIFLUORESCENCE MICROSCOPY
The optical design of the microscope results in four geometric componentsof the fluorescence polarization, whereivh and ihv pertain to the paralleldirection andivv and ihh to the perpendicular direction, relative to thedirection of laser excitation. Parallel (ivh(t)) and perpendicular (ihh(t))
decays were acquired sequentially on the same sample spot. Although wediscarded samples for which strong bleaching occurred during the acqui-sition of one of both decays, we cannot avoid weak bleaching and laserfluctuations. To correct for bleaching and fluctuations, the steady-stateintensities for parallel and perpendicular orientation,ivh and ihh, wereacquired immediately before starting the two decay acquisitions. The ratioof these steady-state intensities was used for normalization of the experi-mental decay curvesivh(t) andihh(t), to obtainivh
N (t) andihhN (t) by comparing
the steady-state ratio with the ratio obtained from the integrated decaycurves,*ivh(t) dt and* ihh(t) dt, acquired within a 200-ns time window,
ivhN ~t! 5 FivhYE ivh~t! dtG 3 ivh~t! (A1)
and
ihhN ~t! 5 FihhYE ihh~t! dtG 3 ihh~t! (A2)
We define the correction factor,T, as
ivhN ~t!/ihh
N ~t! 5 T 3 ivh~t!/ihh~t!, (A3)
where
T 5 ivh 3 E ihh~t! d~t!/ihh 3 E ivh~t! d~t!. (A4)
A second correction was performed to take into account the differenttransmission efficiency of each geometric component of the excited andemitted polarized light, as well as depolarizing (or polarizing) effectslinked to the microscope optics (objectives lenses, dichroic mirror). Theactual parallel and perpendicular fluorescence intensities,ipar and iper, arerelated to the experimental steady-state intensities by the following rela-tions:
ivh 5 Sv 3 S9h 3 ipar ivv 5 Sv 3 S9v 3 iper (A5)
ihv 5 Sh 3 S9v 3 ipar ihh 5 Sh 3 S9h 3 iper.
Sv and Sh are the transmission efficiencies, respectively, for vertical andhorizontal polarization of the excitation light, andS9v and S9h are thetransmission efficiencies, respectively, for the vertical and horizontal po-larization of the emission. From expressions A5, it can be calculated that
ivh/ihh 5 @Sv/Sh# 3 @ipar/iper# (A6)
and
~ivh 3 ivv!/~ihv 3 ihh! 5 ~Sv/Sh!2. (A7)
Combining Eqs. A6 and A7 gives
ivh/ihh 5 @~ivh 3 ivv!/~ihv 3 ihh!#1/2 3 ipar/iper. (A8)
For ivhN (t) and ihh
N (t), the previously normalized time-dependent intensities,Eq. A8, become
ivhN ~t!/ihh
N ~t! 5 G 3 ipar~t!/iper~t!, (A9)
where
G 5 @~ivh 3 ivv!/~ihv 3 ihh!#1/2. (A10)
2624 Tramier et al.
Biophysical Journal 78(5) 2614–2627

Combining Eq. A3 and A9 gives
ipar~t!/iper~t! 5 ~T/G! 3 ~ivh~t!/ihh~t!!. (A11)
The anisotropy functionr(t) is defined by
r~t! 5 @ipar~t! 2 iper~t!#/@ipar~t! 1 2iper~t!#. (A12)
By combining Eq. A11 and A12, the valuer(t) is directly obtained from theexperimental decays,ivh(t) and ihh(t), and from theT and G factorsmeasured at each anisotropy experiment:
r~t! 5 @Tivh~t! 2 Gihh~t!#/@Tivh~t! 1 2Gihh~t!#. (A13)
APPENDIX B: FLUORESCENCE ANISOTROPYDECAY FOR FAST ROTATING CHROMOPHORES
For small molecules in solution, having a rotational time short with regardto the fluorescence lifetime, we can assume that, at long times after thelaser pulse, all molecules are relaxed. The parallel and perpendicularpolarized decays can then be normalized by the standard tail matchingmethod. Only the determination of a correction factor,g, is required to takeinto account the different transmission light efficiencies of the two direc-tions of polarization.
The anisotropy functionr(t) is defined by
r~t! 5 D~t!/S~t!, (B1)
where
D~t! 5 ipar~t! 2 iper~t! (B2)
is the difference between the parallel and the perpendicular decay, and
S~t! 5 ipar~t! 1 2iper~t! (B3)
is the decay of total intensity. By combining Eq. B1, B2, and B3,
3ipar~t! 5 S~t! 3 @1 1 2r~t!# (B4)
and
3iper~t! 5 S~t! 3 @1 2 r~t!#. (B5)
For rhodamine 6G in butanol,S(t) can be fitted with the theoretical modelfunction,
S~t! 5 a/3 3 e2t/t, (B6)
with t being the fluorescence lifetime anda being a constant.r(t) can befitted by the theoretical model function,
r~t! 5 r0e2t/t, (B7)
with r0 being the anisotropy at time zero andf the rotational time. Itfollows that
ipar~t! 5 ae2t/t 3 ~1 1 2r0e2t/f! (B8)
and
iper~t! 5 ae2t/t 3 ~1 2 r0e2t/f!. (B9)
Two experimental fluorescence decays are acquired,ivh(t) and ihh(t), cor-responding to the parallel and perpendicular polarized decay, respectively, forthe microscope set-up used. These experimental decays are distorted by themeasurement apparatus, and are related to the real time behavior,ipar(t) and
iper(t), by the convolution product of the instrument response function IRF(t),
ivh~t! 5 IRF~t!pipar~t! (B10)
and
ihh~t! 5 g 3 IRF~t!piper~t!, (B11)
whereg is the transmission correction factor. The two experimental decayswere fitted using the expressions
ivh~t! 5 IRF~t!p@ae2t/t 3 ~1 1 2r0e2t/f!# (B12)
and
ihh~t! 5 g 3 IRF~t!p@ae2t/t 3 ~1 2 r0e2t/f!#. (B13)
This paper was supported by grants from Association pour la Recherchesur le Cancer, Physique et Chimie du Vivant, and European Union (#BIO4CT97 2177). M.T. was supported by European Union fellowship.
REFERENCES
Allison, S. A., and J. M. Schurr. 1979. Torsion dynamics and depolariza-tion of fluorescence of linear macromolecules. I. Theory and applicationto DNA. Chem. Phys.41:35–59.
Ambroz, M., A. J. MacRobert, J. Morgan, G. Rumbles, M. S. C. Foley, andD. Philips. 1994. Time-resolved fluorescence spectroscopy and intracel-lular imaging of disulphonated aluminium phthalocyanine.J. Photo-chem. Photobiol. B: Biol.22:105–117.
Angerer, L. M., and E. N. Moudrianakis. 1972. Interaction of ethidiumbromide with whole and selectively deproteinized deoxynucleoproteinsfrom calf thymus.J. Mol. Biol. 63:505–521.
Arents, G., and E. N. Moudrianakis. 1993. Topography of the histoneoctamer surface: repeating structural motifs utilized in the docking ofnucleosomal DNA.Proc. Natl. Acad. Sci. USA.90:10489–10493.
Ashraf, S. I., and Y. T. Ip. 1998. Transcriptional control: repression bylocal chromatin modification.Curr. Biol. 8:R683–R686.
Axelrod, D. 1979. Carbocyanine dye orientation in red cell membranestudied by microscopic fluorescence polarization.Biophys. J. 26:557–574.
Axelrod, D. 1989. Fluorescence polarization microscopy.Methods CellBiol. 30:333–352.
Baker, T. A., and S. P. Bell. 1998. Polymerases and replisome: machineswithin machines.Cell. 92:295–305.
Bastiaens, P. I. H., and A. Squire. 1999. Fluorescence lifetime imagingmicroscopy: spatial resolution of biochemical processes in the cell.Trends Cell. Biol.9:48–60.
Beechem, J. M., E. Gratton, H. Hameloot, J. R. Knutson, and L. Brand.1991. The global analysis of fluorescence intensity and anisotropy decaydata: second generation theory and programs.In Topics in FluorescenceSpectroscopy: Principles. J. R. Lakowicz, editor. Plenum Press. NewYork. 241–305.
Brochon, J.-C. 1994. Maximum entropy method of data analysis in time-resolved spectroscopy.Methods Enzymol.240:262–311.
Buurman, E. P., R. Sanders, A. Draauer, H. C. Gerritsen, J. J. F. van Deen,P. M. Houpt, and Y. K. Levine. 1992. Fluorescence lifetime imagingusing a confocal laser scanning microscope.Scanning.14:155–159.
Carey, M. 1998. The enhanceosome and transcriptional synergy.Cell.92:5–8.
Clendenning, J. B., A. N. Naimushin, B. S. Fujimoto, D. W. Stewart, andJ. M. Schurr. 1994. Effect of ethidium binding and superhelix density onthe supercoiling free energy and torsion and bending constants of p30delta DNA.Biophys. Chem.52:191–218.
Coppey-Moisan, M., J. Delic, H. Magdele´nat, and J. Coppey. 1994. Prin-ciple of digital imaging microscopy.Methods Mol. Biol.33:359–393.
Restrained Torsional Dynamics of DNA 2625
Biophysical Journal 78(5) 2614–2627

Coppey-Moisan, M., A.-C. Brunet, R. Morais, and J. Coppey. 1996.Dynamical change of mitochondrial DNA induced in the living cell byperturbing the electrochemical gradient.Biophys. J.71:2319–2328.
Dayel, M. J., E. F. Hom, and A. S. Verkman. 1999. Diffusion of greenfluorescent protein in the aqueous-phase lumen of endoplasmic reticu-lum. Biophys. J.76:2843–2851.
Delic, J., J. Coppey, H. Magdele´nat, and M. Coppey-Moisan. 1991. Im-possibility of acridine orange intercalation in nuclear DNA of the livingcell. Exp. Cell Res.194:147–153.
Delic, J., J. Coppey, M. Ben Saada, H. Magdele´nat, and M. Coppey-Moisan. 1992. Probing the nuclear DNA in living cell with fluorescentintercalating dyes.J. Cell Pharmacol.3:126–131.
Durieux, C., A. C. Brunet, V. Geeraert, J. Coppey, and M. Coppey-Moisan.1999. A transient decrease of electrochemical gradient stabilizes DNAstructural change in single mitochondria of living cells.Biol. Cell.91:597–604.
Echols, H. 1986. Multiple DNA–protein interactions governing high-precision DNA transactions.Science.233:1050–1056.
Favard, C., J. Pager, D. Locker, and P. Vigny. 1997. Incorporation ofethidium bromide in theDrosophila salivary gland approached bymicrospectrofluorometry: evidence for the presence of both free andbound dye in the nuclei of cells in viable conditions.Eur. Biophys. J.25:225–237.
French, T., E. Gratton, and J. Maier. 1992. Frequency domain imaging ofthick tissues using a CCD.SPIE Proc.1604:254–261.
Gadella, T. W. J. Jr., T. M. Jovin, and R. M. Clegg. 1993. Fluorescencelifetime imaging microscopy (FLIM): spatial resolution of microstruc-tures on the nanosecond time scale.Biophys. Chem.48:221–239.
Gao, M., and D. M. Knipe. 1989. Genetic evidence for multiple nuclearfunctions of the herpes simplex virus ICP8 DNA-binding protein.J. Vi-rol. 63:5258–5267.
Grosschedl, R. 1995. Higher-order nucleoprotein complexes intranscription: analogies with site-specific recombination.Curr. Opin.Cell Biol. 7:362–370.
Guest, C. R., R. A. Hochstrasser, C. G. Dupuy, D. J. Allen, S. J. Benkovic,and D. P. Millar. 1991. Interaction of DNA with the Klenow fragment ofDNA polymerase I studied by time-resolved fluorescence spectroscopy.Biochemistry.30:8759–8770.
Hard, T., and D. R. Kearns. 1990. Reduced DNA flexibility in complexeswith a type II DNA binding protein.Biochemistry.29:959–965.
Hayashi, J.-I., M. Takemitsu, Y.-I. Goto, and I. Nonaka. 1994. Humanmitochondria and mitochondrial genome function as a single dynamiccellular unit.J. Cell Biol. 125:43–50.
Hazlett, T. L., Johnson, A. E., and D. M. Jameson. 1989. Time-resolvedfluorescence studies on the ternary complex formed between bacterialelongation factor Tu, guanosine 59-triphosphate, and phenyalanyl-tRNAPhe. Biochemistry.28:4109–4117.
Heath, P. J., J. B. Clendenning, B. S. Fujimoto, and J. M. Schurr. 1996.Effect of bending strain on the torsion elastic constant of DNA.J. Mol.Biol. 260:718–730.
Hernandez, L. I., M. Zhong, S. H. Courtney, L. A. Marky, and N. R.Kallenbach. 1994. Equilibrium analysis of ethidium binding to DNAcontaining base mismatches and branches.Biochemistry. 33:13140–13146.
Hogan, M. E., T. F. Rooney, and R. H. Austin. 1987. Evidence for kinksin DNA folding in the nucleosome.Nature.328:554–557.
Jupe, E. R., R. R. Sinden, and I. L. Cartwright. 1993. Stably maintainedmicrodomain of localized unrestrained supercoiling at aDrosophilaheatshock gene locus.EMBO J.12:1067–1075.
Knutson, J. R., L. Davenport, and L. Brand. 1986. Anisotropy decayassociated fluorescence spectra and analysis of rotational heterogeneity.1. Theory and applications.Biochemistry.25:1805–1810.
Lakowicz, J. R., H. Szmacinski, K. Nowaczyk, K. W. Berndt, and M.Johnson. 1992. Fluorescence lifetime imaging.Anal. Biochem.202:316–330.
Lamond, A. I., and W. C. Earnshaw. 1998. Structure and function in thenucleus.Science.280:547–553.
Leuba, S. H., C. Bustamante, J. Zlatanova, and K. van Holde. 1998.Contributions of linker histones and histone H3 to chromatin structure:scanning force microscopy studies on trypsinized fibers.Biophys. J.74:2823–2829.
Luger, K., A. W. Mader, R. K. Richmond, D. F. Sargent, and T. J.Richmond. 1997. Crystal structure of the nucleosome core particle at 2.8Å resolution.Nature.389:251–260.
Macgregor, R. B. Jr., R. M. Clegg, and T. M. Jovin. 1987. Viscositydependence of ethidium-DNA intercalation kinetics.Biochemistry.26:4008–4016.
Manders, E. M. M., H. Kimura, and P. R. Cook. 1999. Direct imaging ofDNA in living cells reveals the dynamics of chromosome formation.J. Cell Biol. 144:813–821.
McMurray, C. T., and K. E. van Holde. 1991. Binding of ethidium to thenucleosome core particle. I. Binding and dissociation reactions.Bio-chemistry.30:5631–5643.
Meyer-Almes, F. J., and D. Porschke. 1993. Mechanism of intercalationinto the DNA double helix by ethidium.Biochemistry.32:4246–4253.
Minami, T., and S. Hirayama. 1990. High quality fluorescence decaycurves and lifetime imaging using an elliptical scan streak camera.J. Photochem. Photobiol. A: Chemistry.53:11–21.
Morgan, C. G., A. C. Mitchell, and J. G. Murray. 1992. Prospects forconfocal imaging based on nanosecond fluorescence decay time.J. Mi-crosc.165:49–60.
Nakatani, K., H. Misawa, K. Sasaki, N. Kitamura, and H. Masuhara. 1993.Pyrene excimer formation in individual oil droplets dispersed in gelatinmatrices: space and time-resolved fluorescence spectroscopy.J. Phys.Chem.97:1701–1706.
O’Connor, D. V., and D. Phillips. 1984. Time-Correlated Single PhotonCounting. Academic Press. New York.
Olmsted, J. III, and D. R. Kearns. 1977. Mechanism of ethidium bromidefluorescence enhancement on binding to nucleic acids.Biochemistry.16:3647–3654.
Owen-Hughes, T., and J. L. Workman. 1994. Experimental analysis ofchromatin function in transcription control.Crit. Rev. Eukaryot. GeneExpr. 4:403–441.
Philips, L. A., S. P. Webb, and J. H. Clark. 1985. High-pressure studies ofrotational reorientation dynamics: the role of dielectric friction.J. Chem.Phys.83:5810–5821.
Piston, D. W., D. R. Sandison, and W. W. Webb. 1992. Time-resolvedfluorescence imaging and background rejection by two-photon excita-tion in laser scanning microscopy.SPIE Proc.1604:379–389.
Pulleyblank, D. E., and A. R. Morgan. 1975. The sense of naturallyoccurring superhelices and the unwinding angle of intercalated ethidium.J. Mol. Biol. 91:1–13.
Rydberg, B., W. R. Holley, I. S. Mian, and A. Chatterjee. 1998. Chromatinconformation in living cell: support for a zig-zag model of the 30 nmchromatin fiber.J. Mol. Biol. 284:71–84.
Schoutteten, L., P. Denjean, and R. B. Pansu. 1997. Characterization of aconfocal microscope for time-resolved photon counting fluorescence.J. Fluor. 7:155–165.
Schroter, H., G. Maier, H. Ponstingl, and A. Nordheim. 1985. DNAintercalators induce specific release of HMG 14, HMG 17 and otherDNA-binding proteins from chicken erythrocyte chromatin.EMBO J.4:3867–3872.
Schurr, J. M. 1984. Rotational diffusion of deformable macromoleculeswith mean local cylindrical symmetry.Chem. Phys.84:71–96.
Schurr, J. M., and R. L. Schurr. 1985. DNA motions in the nucleosomecore particle: a reanalysis.Biopolymers.24:1931–1940.
Selvin, P. R., B. A. Scalettar, J. P. Langmore, D. Axelrod, M. P. Klein, andJ. E. Hearst. 1990. A polarized photobleaching study of chromatinreorientation in intact nuclei.J. Mol. Biol. 214:911–922.
Smith, S. B., L. Finzi, and C. Bustamante. 1992. Direct mechanicalmeasurements of the elasticity of single DNA molecules by usingmagnetic beads.Science.258:1122–1126.
So, P. T. C., T. French, W. M. Yu, K. M. Berland, C. Y. Dong, and E.Gratton. 1995. Time-resolved fluorescence microscopy using two-photon excitation.Bioimaging.3:49–63.
2626 Tramier et al.
Biophysical Journal 78(5) 2614–2627

Sobell, H. M., C. C. Tsai, S. G. Gilbert, S. C. Jain, and T. D. Sakore. 1976.Organization of DNA in chromatin.Proc. Natl. Acad. Sci. USA.73:3068–3072.
Sogo, J. M., P. J. Ness, R. M. Widmer, R. W. Parish, and T. Koller. 1984.Psoralen-crosslinking of DNA as a probe for the structure of activenucleolar chromatin.J. Mol. Biol. 178:897–919.
Studitsky, V. M., G. A. Kassavetis, E. P. Geiduschek, and G. Felsenfeld.1997. Mechanism of transcription through the nucleosome by eukaryoticRNA polymerase.Science.278:1960–1963.
Thomas, J. C., S. A. Allison, C. J. Appellof, and J. M. Schurr. 1980.Torsion dynamics and depolarization of fluorescence of linear macro-molecules. II. Fluorescence polarization anisotropy measurements on aclean viralf29 DNA. Biophys. Chem.12:177–188.
van Holde, K. E. 1989. Chromatin. A. Rich, editor. Springer-Verlag, NewYork.
Verkman, A. S., M. Armijo, and K. Fushimi. 1991. Construction andevaluation of a frequency-domain epifluorescence microscope for life-time and anisotropy decay measurements in subcellular domains.Bio-phys. Chem.40:117–125.
Wahl, P., J. Paoletti, and J.-B. Le Pecq. 1970. Decay of fluorescenceemission anisotropy of the ethidium bromide-DNA complex evidencefor an internal motion in DNA.Proc. Natl. Acad. Sci. USA.65:417–421.
Wang, J. C. 1974. The degree of unwinding of the DNA helix by ethidium.I. Titration of twisted PM2 DNA molecules in alkaline cesium chloridedensity gradients.J. Mol. Biol. 89:783–801.
Widom, J. 1998. Structure, dynamics, and function of chromatin in vitro.Annu. Rev. Biophys. Biomol. Struct.27:285–327.
Winzeler, E. A., and E. W. Small. 1991. Fluorescence anisotropy decay ofethidium bound to nucleosome core particles. 2. The torsional motion ofthe DNA is highly constrained and sensitive to pH.Biochemistry.30:5304–5313.
Wu, P. G., B. S. Fujimoto, L. Song, and J. M. Schurr. 1991. Effect ofethidium on the torsion constants of linear and supercoiled DNAs.Biophys. Chem.41:217–236.
Yao, J., P. T. Lowary, and J. Widom. 1993. Twist constraints on linkerDNA in the 30-nm chromatin fiber: implications for nucleosome phas-ing. Proc. Natl. Acad. Sci. USA.90:9364–9368.
Restrained Torsional Dynamics of DNA 2627
Biophysical Journal 78(5) 2614–2627
Copyright © 2022 FDOKUMEN