Torsional behavior of spandrel beams. - Rice Scholarship Home
71
RICK UNIVERSITY TORSIONAL BEHAVIOR OF SPANDREL BEAMS Nathan C« I, Mogbo A THESIS SUBMITTED IN PARTIAL FULFILLMENT OF THE REQUIREMENTS FOR THE DEGREE OF MASTER OF SCIENCE Thesis Director’s signature: Houston, Texas May, I963
-
Upload
khangminh22 -
Category
Documents
-
view
14 -
download
0
Transcript of Torsional behavior of spandrel beams. - Rice Scholarship Home

RICK UNIVERSITY
TORSIONAL BEHAVIOR OF SPANDREL BEAMS
Nathan C« I, Mogbo
A THESIS SUBMITTED
IN PARTIAL FULFILLMENT OF THE
REQUIREMENTS FOR THE DEGREE OF
MASTER OF SCIENCE
Thesis Director’s signature:
Houston, Texas
May, I963

ABSTRACT
TORSIONAL BEHAVIOR OF SPANDREL BEAMS
b.V
Nathan C, I, Mogbo
This investigation concerns the problem of load transfer
from the slab through the spandrel beams (edge beams) to the
exterior columns in flat plate construction. The load is
transferred from the slab to the spandrel beam through a combina¬
tion of shear and bending forces. The spandrel beam in turn
transfers the load to the exterior column primarily by torsion.
Hence the strength of the slab is controlled by the strength
of its supporting members.
The behavior and strength of the spandrel beams of nine 0.3
scale reinforced concrete flat plate specimens are described in
this report. The influence of shear and bending moments on the
torsional capacity of the beams is discussed and equations for
predicting strength examined. The primary variables in the tests
were the beam dimensions and reinforcement.
The results showed that the initial torsional stiffness of
the spandrel beams was dependent on the size and shape of the
spandrel beams while the post-cracking stiffness was a function
of the beam torsional reinforcement. For design purposes,
spandrel beams can be treated as isolated beams provided that
the bending and shear forces on the beam are not significant.
Comparisons irere made between the computed and measured torsional
capacities of the spandrel beams and these comparisons showed
that the extension developed by Hsu (3) are' satisfactory for
predicting the torsional strength of spandrel beams.

ACKNOWLEDGEMENTS
This thesis was prepared under the direction of Dr, James
0, Jirsa, Assistant Professor of Civil Engineering, Rice
University. The author wishes to express his appreciation to
Dr. Jirsa for his invaluable help and guidance through the
entire project.
This study was made possible through a Rational Science
Foundation Traineeship administered by Rice University Civil
Engineering Department.
The author would also like to acknowledge the help of John
L, Baumgartner who with the aid of Dr, Jirsa started the
project. My wife, Willa, helped with the typing.

TABLE OF CONTENTS
Page
Acknowledgements i
List of Tables and Figures iv
Chapter
1, Introduction 1.
1.1 Background 1
1.2 Object and Scope ’ 2
2, Test Specimens 3-
2.1 Description of Test Specimens 3
2.2 Test Variables 4 '
3, Materials 6
3.1 Concrete 6
3.2 Steel 6
3.3 Fabrication 7
3.4 Casting and Curing 7
3.5 Test Procedure ' 8
4, Behavior of Test Specimens 10
4.1 Introduction 10
4.2 Measured Torsional Strength . 10
4.3 Behavior of Test Specimens 13
5, Prediction of Beam Torsional Strength • 17
5.1 Introduction 17
5.2 Influence- of Shear and Bending Moment on the
Beam Torsional Strength _ 17
5.3 Torsional Strength of Beams 19

TABLE OF CONTENTS (cont’d)
iii
Page
6, Summary 25
References 27
Tables 29
Figures 35

iv
LIST OF TABI.ES AND FIGURES
Table
2.1
2.2
3.1
4.1
5.1
5.2
Figure
2.1
3.1
3.2
3.3
3.4
4.1
4,2a
4.2b
4.3
4.4
4.5
4.6
Title Page
Reinforcing Schedule 29
Beam Dimensions and Stiffness Parameters 30
Material Properties 31
Initial and Post Cracking Slopes of
Torque-Twist Curves 32
Applied Moments and Shear 33
Computed and Measured Torque 34
Typical Test Specimen 35
Topical Stress-Strain Diagram for No.
2 Bars 36
Typical Stress-Strain Diagram for No,
9 Gage Wire 37
Test Set Up 38
Location of Dial Gages 39
Location of Critical Section 40
Stress and Strain Distribution Used in
analysis 4l
Typical Moment-Strain Relationship 41
Forces at the Slab-Beam-Column Jiont 42
Moment Distribution at•Failure-S5 43
Moment Distribution at Failure-S8 44
Torque-Twist Curves 45

V
LIST OF TABLES AND FIGURES (cont'd,)
Title Page
Figure
4,7 Torque-Twist Curves 46
4.8 Initial Portion of Torque-Twist Curves 47
4.9 Initial Portion of Torque-Twist Curves 48
4.10 Initial Portion of Torque-Twist Curves 49
4.11 Initial Portion of Torque-Twist Curves 50
4.12 Crack Patterns after Load to Failure~S5 51
4.13 Crack Patterns after Load to Failure-S6 52
4,14 typical Load-Strain Curve for Beam Stirrups 53
.4,15 Load-Strain Curves for Beam Bottom Bars 54
4.16 Load-Strain Curves for Beam Bottom Bars 55
4.17 Load-Strain Curves for Beam Bottom Bars 56
4.18 Typical Load-Strain Curve for Beam Top
Bars 57
4.19 fypicla Load-Strain Curve for Slab Bars
Perpendicular to Beam 58
5.1 Comparison of Predicted (Cowan) and
Measured Cracking Torque 59
5.2 Comparison of Predicted (Hsu) and
Measured Cracking Torque 60
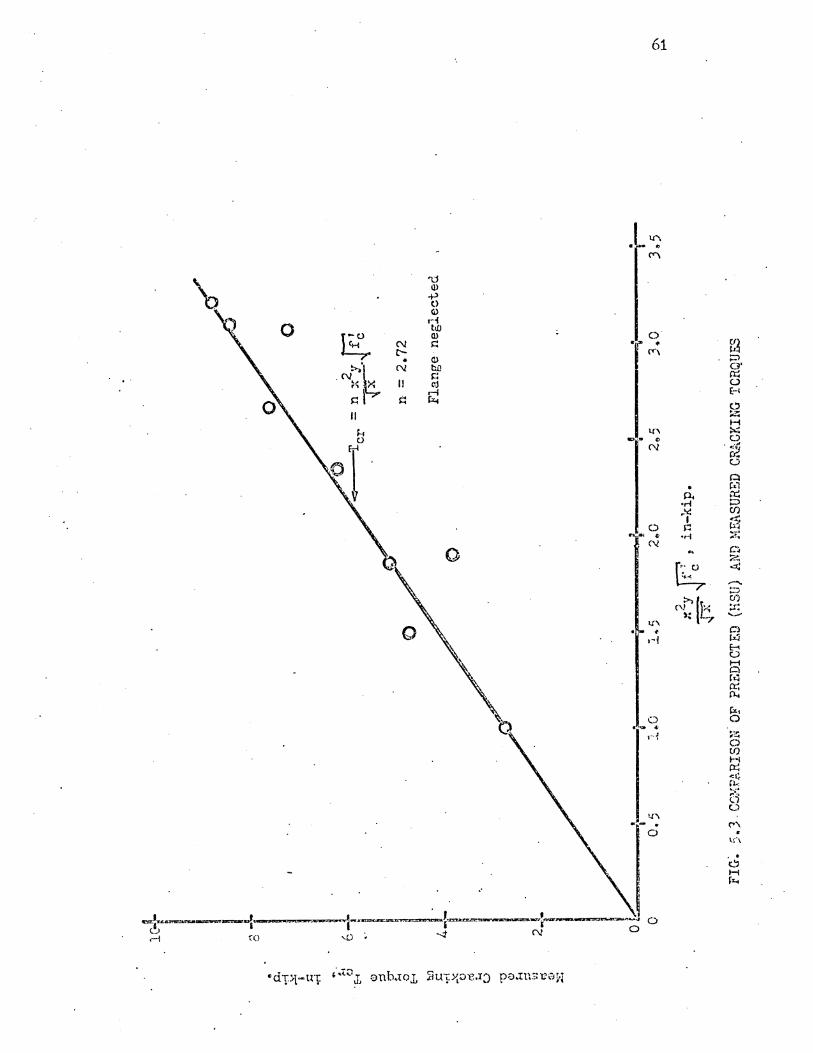
5.3 Comparison of Predicted (Hsu) and
Measured Cracking Torque 61
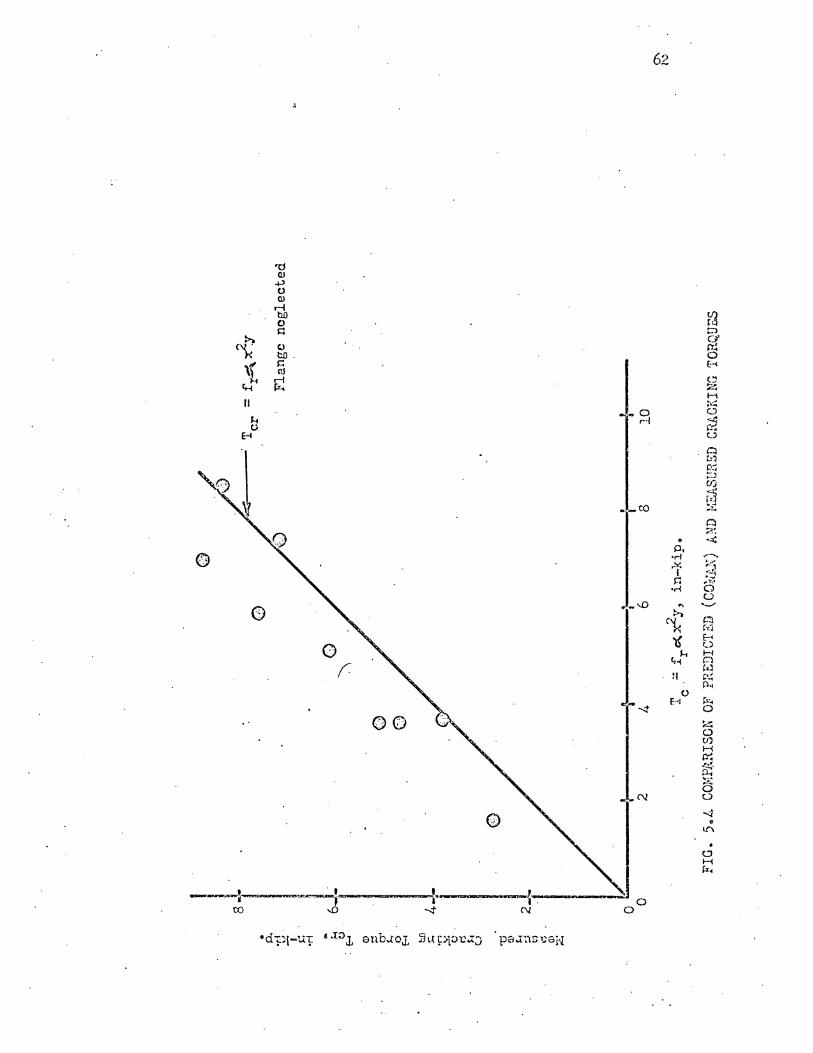
5.4 Comparison of Predicted (Cowan) and
Measured Cracking Torque

vi
Figure
5.5
5.6
LIST OF TABLES AND FIGURES (cont’d.)
Title
Comparison of Predicted (Cowan) and
Measured Torsional Contribution of
Reinforcement
Comparison of Predicted (Hsu) and
Measured Torsional Contribution of
Page
63
m Reinforcement
1
1. INTRODUCTION
1,1 Background
In slab design provision must be made for load transfer from
the slab to the columns. Hie load transfer is achieved in different
ways depending on the type of slab design. In two-way and one-way
slabs, the load is. transmitted from the slab to the columns by
means of beams which span between these columns. In flat slabs,
this same objective is achieved by means of drop panels and column
capitals. If drop panels and col.umn capitals are entirely omitted,
and the loads are directly transmitted from the slab to the columns,
the construction is known as a flat plate. The problem of load
transfer is most critical in flat plate construction, and spandrel
beams are often used to provide additional strength at the exterior
edge.
This investigation is primarily concerned with the mechanism
of load transfer from the slab to the edge beams (spandrel beams)
and finally to the exterior columns. In the region of the exterior
column-spandrel beam-slab joint, the absence of symmetry of the
slab about the column results in torsional effects which may be
significant. Hence, the load is not only transferred by flexure and
shear, but also by torsion, and the spandrel beam must be designed
for this combination of forces.
Previous tests have shown that the strength of the slab is de¬
pendent on the strength of its supporting members. Results of tests
of floor slabs at the University of Illinois (1) show that failures
may be initiated at the exterior joints. The exterior column-beam-slab

2
joint is often the weak-link in the structure especially in
flat plate or flat slab construction.
1.2 Object and Scope
The object of this work is to study the behavior of spandrel
beams at the slab-beam-column joint as the slab is loaded to
failure.
A total of nine specimens were designed primarily for shear
and flexural requirements with no specific provision for torsional
effects. The remainder were designed to provide sufficient torsion¬
al capacity to develop the strength of the slab.
The influence of shear and flexural moments on the torsional
behavior of the spandrel beams is also discussed. Comparisons
are made between the torsional strength of rectangular beams
subjected to pure torsion obtained by other investigators (2) and
(3) and the measured torsional strength of the spandrel beams of
this investigation.
3
2. TEST SPECIMENS
2.1 Description of Test Specimens
In order to compare the test results with those of an actual
structure, the first two specimens SI and S2, were scaled models
of the prototype for the flat plate structure tested at the
University of Illinois (l). This prototype was designediiaccording
Building Code Requirements for Reinforced Concrete (A.C.I. 318-
56). The prototype had 20 ft. square panels and a slab thickness
of 7 in. A scale factor of 0.3 yielded a specimen with 6 ft. by
6 ft. panels and a slab thickness of 2-1/8 in.
Each test specimen was a half-panel structure, 6 ft. long and
3 ft. wide, bounded on the outside edge by a spandrel beam which
framed into a column and on the other sides by panel centrelines.
These panel centrelines correspond approximately to lines of
maximum positive moments and zero shear in a continuous structure.
The slab thickness of 2-1/8 in. and the column cross-section of
7-1/4 by 4-3/4 in. were constant for all specimens while the beam
dimensions were varied. The design of the test specimens satisfied
all of the A.C.I. Building Code (4) requirements, but those for
cover and slab thickness. Figure 2.1 shows a typical test specimen.
Table 2.1 lists the reinforcement details for the nine specimens
tested.
Detailed comparison of the behavior of specimen SI and S2 with
that of the 1/4 scale continuous structure tested at the University
of Illinois (10)-was made by Baumgartner (5). The comparison showed
that the behavior and strength of the slab-beam-column joint of
test specimens SI and S2 and the University of Illinois test
structure v/ere very similar.

4
A. theoretical study reported in Ref. 5 showed that the
elastic response of the half-panel test specimens in the region
of the slab-beam-column joint did not differ markedly from that
obtained for continuous structures, and compared favourably with
observed moments prior to cracking.
2.2 Test Variables
The main variables in the tests were the elastic stiffness
parameters 1^, C, H, and J, and the percentages and arrangement
of the reinforcement. Table 2.2 lists the elastic stiffness
parameters and the reinforcement schedule is listed in Table 2.1.
The definitions of these parameters are given below:
1^ = Moment of inertia of the gross uncracked section of spandrel
beams having the same width as the column. For beams with
webs narrower than the width of the column, L-shaped beams
with a flange width equal to the width of the column are used
in computing the moment of inertia.
3 Igp
= (L2/2H = Moment of inertia of slab in a dii'ection
parallel to the spandrel beam.
where l>2 = span length in a direction perpendicular to the
spandrel beam.
t = slab thickness.
3 Is2 - Lpt = Moment of inertia of slab in a direction perpen-
12 dicular to the spandrel beam.
where Lp = span length in a direction parallel to the
spandrel beam.
3 C = bph-^ = Torsional moment of inertia of a beam.
where = function of the ratio b^/hp (See Ref. 8)
bp., hp = larger and smaller dimensions of each rectangular
5
section of the beam.
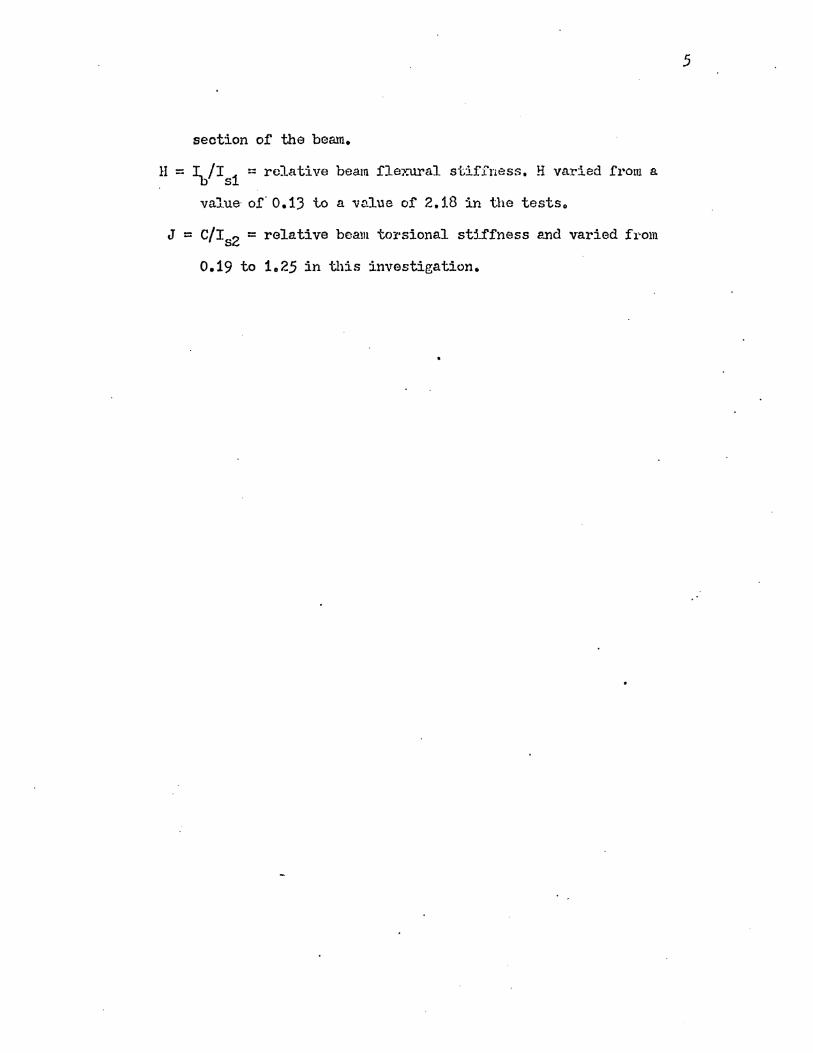
H = I^/l = relative beam flexural stiffness. H varied from a
value of' 0.13 to a value of 2.18 in the tests.
J = C/lsg = relative beam torsional stiffness and varied from
0.19 to 1.25 in this investigation.

6
3. MATERIALS
3.1 Concrete
The size of the test specimens limited the size of the
aggregate used in the mix. The concrete was a blend of Type
III Portland cement and Colorado River aggregate. The aggregate
was a mixture of 50 percent sand and 50 percent 3/8''gravel by
weight. The design strength was 4000 p.s.i. at 15 days.
3 The capacity of the concrete mixer was 3 ft. and each specimen
required two batches of concrete. Three 6 x 12 in. cylinders for
compressive tests and three modulus of rupture beams were cast
from each batch. Since the first batch was used in casting that
part of the test specimen around the slab-beam-column joint
(the critical portion of the specimen), the beams and cylinders
cast from the first batch were used in determining the tensile
and compressive strengths of the concrete. Concrete properties
are listed in Table 3.1.
3.2 Steel
The slabs and spandrel beams were reinforced with No. 2
intermediate grade plain steel bars. The columns were reinforced
with No. 4 deformed bars. The stirrups and ties were fabricated
of No. 9 gage annealed wire (0.149 in. diameter). Coupon tests
were made of the No. 2 bars and a typical stress-strain curve is
shown in Fig. 3.1. The yield strengths of the No. 2 bars used in
each specimen are listed in Table 3.1. A typical stress-strain
curve for the No. 9 gage wire is shown in Fig. 3.2. .

7
3.3 Fabrication
The No, 2 bars for each specimen were cut to the proper length
and the loose rust was removed with a wire brush. The beam stirrups
and column .ties were fabricated before the strain gages were
applied. The strain gages were 0,4 in, paper back wire resisLance
gages. After the epoxy cement was cured, short leads were attached
to the gages. The gage installation was waterproofed with Mobil
2300 wax. Following the waterproofing operation, the mat for the
slab reinforcement and the beam cage were assembled. To facilitate
placement of the reinforcement, the column cage was completed after
the slab mat and beam cage had been placed in the form. Prior to
placing the steel in the form, the form was oiled. Steel chairs'
were used to support the mat and the cages and provide adequate
clearance,
3.4 Casting and Curing
The casting and placement of two batches of concrete took
about 2-j hours. The concrete was placed by hand and was vibrated
both internally and by placing the vibrator against the outside of
the form. The first batch of concrete was used to complete -the
beam, the lower half of the column, and the portion of the slab
ajacent to the spandrel beam, while the second batch was used to
complete the slab, A wooden screed was used to remove the excess
concrete and to level the slab surface. The surface was trowelled
for a smooth dinisho The upper portion of the column was cast after
the concrete in the slab had set.
Polyethylene sheets were used to cover both the test specimen
and the control cylinders and beams. The polyethylene sheets
prevented loss of moisture while the concrete was being cured.

8
After seven days, specimens were removed from the form and cured
under laboratory conditions (50 percent relative humidity and
70°F) for an additional seven days.
3.5 Test Procedure
(a) Description of test procedure
Specimens were tested 14-16 days after casting. Load
was applied in several increments and strains deflections, and
crack patterns were recorded at the end of each load stage.
The load was applied at two points on the slab which
corresponded approximately to the points of aero moments in a
continuous structure. The loads were applied through a 6 in.
square plate to avoid a high shear stress concentration. Two
vertical l/2 in. diameter steel rods were used to transmit the
loads to the steel plate. A 10 kip. opacity load cell was used to
measure the applied load and a single hydraulic jack was used for
loading. Figure 3.3 shows the test set-up.
(b) Insimoaptakian
Each specimen was instrumented with 20 strain gages
Alternate stirrups within a distance of about 10 in.from the
column-beam interface were instrumented. Also within this 10..in.
distance, the beam steel was instrumented at 3 in. intervals. The
slab steel framing into the beam (perpendicular steel) v/as instru¬
mented at the critical section corresponding to the inside edge
of the spandrel beam. In several of the specimens, the slab steel
parallel to the spandrel beam (parallel steel) was instrumented
along the centreline of the test specimen,.

9
Dial gages were used to measure deflections at several points
on the slab. The location of the dial gages is shown in Fig. 3.4.
The deflection at the edge of the slab (maximum deflection D7) was
measured using a deflection transducer and recorded on an X-Y re¬
corder. The load cell was also connected to the X-Y. recorder and
a continuous record of the load-deflection relationship v/as
obtained.
The beam rotations were measured by means of dial gages mout^
ed on the outside face of the spandrel beam, 12 in. from the
column centreline. Dial gages T^ and T^ were placed on the outside
face of the column at the column centreline as shown in Fig. 3.4*
The relative rotations of the beams were calculated by subtracting
the column rotations from the rotations of the beams. In specimens
with shallow beams, two pieces of light-gage steel angle 9 in.
long were attached to the outside face of the beam (one on either
side of the column) to provide adequate spacing between the top
and bottom rotation dial gages.
(c) DqadjjisJkhecliils
The initial load consisted of the slab weight and the
weight of the loading equipment which was 70 lbs. load was added
in nominal 100 lbs. increments. The value of the exact load incr¬
ement was obtained from the load-deflection diagram plotted on the
X-Y recorder. After each load increment had been applied, strain
gage and deflection readings were taken, and the progression of th
the cracks was marked. Each load stage took about 10 minutes to
complete.

10
4. BEHAVIOR OF TEST SPECIMENS
4,1 Introduction
In general, lateral loads on the slab produce a combination
of flexural, shear and torsional stresses in the spandrel beam.
As a result, spandrel beams that satisfy all the flexural and shear
requirements do not necessarily have adequate torsional stiffness,
and in many cases torsion controls the mode of failure. In the
following sections the behavior of _the test specimens will be
discussed in terms of moments, measured torsional strength of the
beams, torque-twist curves, cracking and load-strain curves,
4,2 Measured Torsional Strength
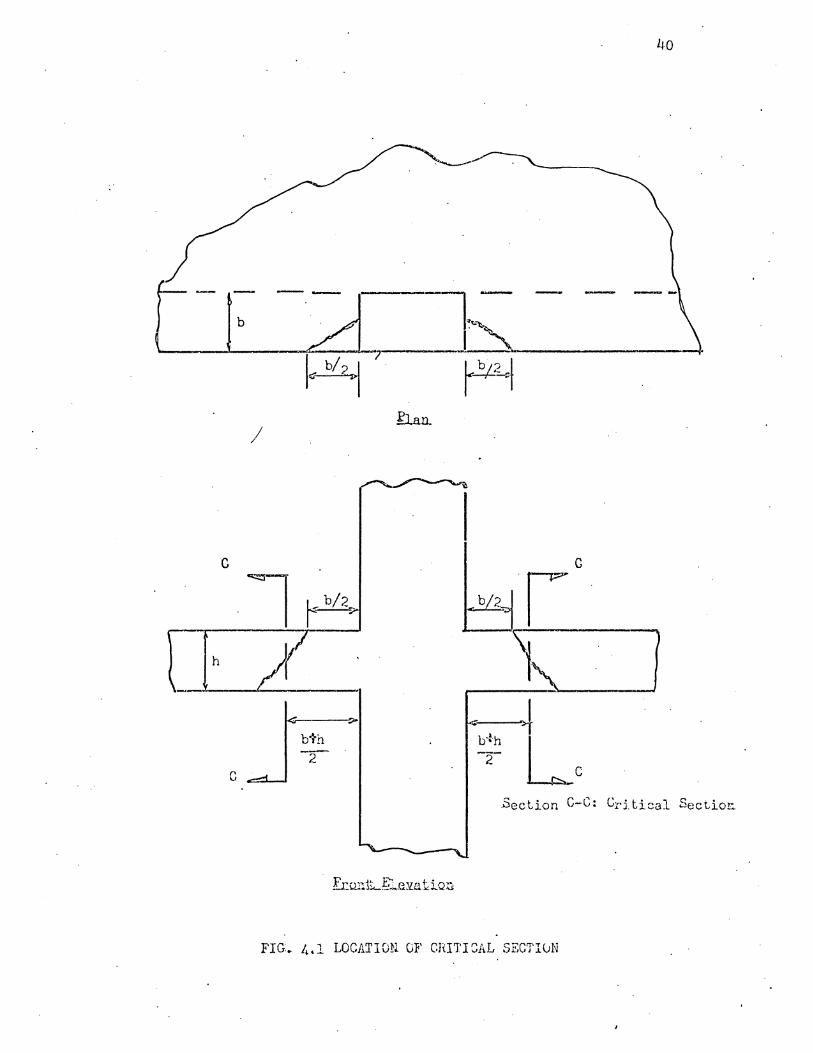
(a) Definition of Critical Section
The location of the critical section for torsion was
determined by a careful examination of the crack patterns at
various stages of loading to determine the section that showed the
maximum torsional distress at failure. See Fig, 4,1, In general, the
first major torsional crack started at about the mid-width of the
beam, and progressed outwards to the edge of the beam, and from the
edge of the beam progressed downwards along the exterior face of
the beam forming a 45° spiral around the spandrel beam. The critical
section was chosen at the mid-height of the first major torsional
crack on the outside face of the beam. Thus the distance C, to
the critical section from the face of the column is given by
the following formula:
C = b + h 2

11
where b = width of the beam web
h = beam depth.
The values of the maximum torque on the spandrel beam (T^) and the
cracking torque (T ) discussed in the following sections were com- cr
puted at the critical section as defined above. The definition of
the critical section is also useful in determining the value of
the torque to be used in design.
(b) Computation of Torsional Strength of Spandrel Beams
Unit slabs moments M , along the inside edge of the s
spandrel beam were determined from the strains measured in the
slab steel framing into the spandrel beams (perpendicular bars).
The method of analysis used in determining the slab moments
considered the contribution of tension in the concrete to the
moment after cracking. (See Fig. 4«2a). The moment computed in
this manner is equivalent to using the moment-strain relationships
represented by the broken line in Fig. 4*2b. The cracking and yield
moments were computed using the following equations:
Mcr = Vc
where Mcr = cracking moment
fr = tensile strength of concrete
I = moment of inertia of the transformed uncracked
section
c = distance to the extreme fibre from the centroid
of the transformed section.
The yield moment My is given by:
Ag^yjd
where As = area of steel in the section
= yield stress of the steel

12
jd = moment arm
The bilinear curve shown in Fig. 4-2b assumes no tension in
the concrete after cracking. The curve used in the study (shown
by a broken line) considers tension in the concrete after the
section cracks and is more accurate for small strain readings.
Figure 4*3 shows the forces present at the beam-slab-column
joint. The beam torsional moment Tb> at any arbitrary point in
the beam, is the sum of all the unit slab moments M. up to s
that point. Thus:
The above equation is obtained by considering a free-body
diagram AO in Fig. 4*3, and taking moments about line AO.
In order to determine the maximum value of the beam tor¬
sional moment T a moment distribution curve was plotted for
the ultimate load on the slab. The total area under the moment
distribution curve up to the critical section of the spandrel
beam is the maximum value of the applied torque Tub- In each
specimen the spandrel must have adequate torsional stiffness to
develop the strength of all the perpendicular slab steel to
prevent a torsional failure. A plot of the moment distribution for
specimen S5 is shown in Fig. 4«4 and is representative of the
specimens that failed in torsion (beam failure). The spandrel
beam of specimen S5 did not have enough torsional strength to
moblize the strength of the perpendicular slab steel, and torsion
controlled the mode of failure.
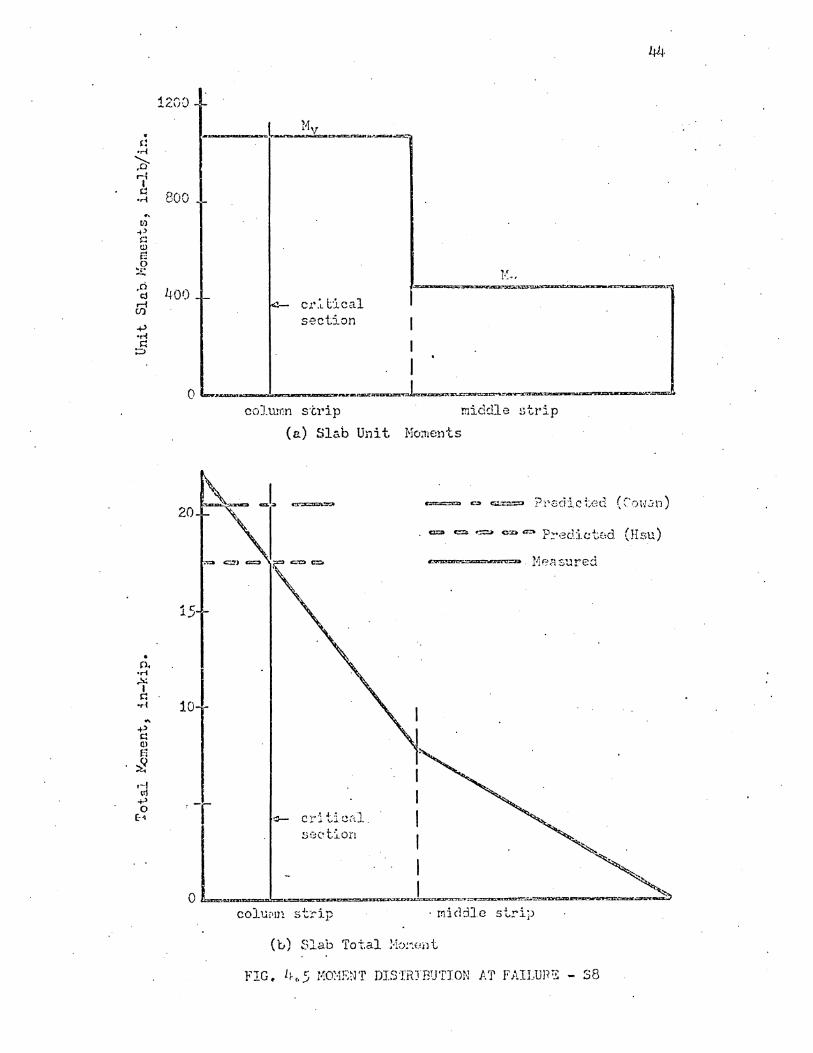
Figure 4*5 shows the moment distribution curve for specimen
S8 and it is representative of the specimens that failed by
yielding all the slab steel framing into the beam (perpendicular

13
slab steel). Such specimens had the requisite torsional strength
to prevent a torsional (beam) failurei*.
4.3 Behavior of the Test Specimens
(a) Torque-Twist Curves
Torque-twist curves for the spandrel beams of all the
specimens are shown in Figs. 4*6 and 4>7» A typical torque-
twist curve has the following characteristics. First, the re¬
lationship is linear until torsional cracking occurs. Torsional
cracking is followed by a discontinuity in the curve as
forces in the steel are mobilized. As the steel begins to con¬
tribute to the capacity of the section, the curve shows a
marked increase in slope, however, this is generally less than
during the pre-cracking stage.
The amount of torque necessary to produce the first torsional
cracking and the initial slope m-^ of the torque-twist curve were
different for each specimen. Both the initial slope of the
torque-twist curve and the cracking torque were dependent on the
size and shape of the beam cross-section and the properties
of the concrete (See Table 4*1)• Specimens with square beams
developed the highest cracking torque while the specimen with no
beam developed the least cracking torque. Differencces in the
cracking torque of beams with similar cross-sections can be
attributed primarily to differences in concrete properties and
will be discussed later.
After the section was cracked, there was additionalLtwist
with little increase in torque. During this additional tv/isting,
the steel stresses were increased sufficiently to contribute to

14
the capacity of the section. At this point, there was a marked
increase in the slope of the torque-twist curve.
While the initial slope m^, of the torque-twist curve
seemed to be dependent on the size and shape of the beam cross-
section, the slope after cracking m^, was a function of the
total reinforcement in the beam. Figure 4.7 shows a higher
slope after cracking for the beam of specimens S4 than for that
of S5. While both beams had similar cross-sections, the beam of
S5 had less reinforcement than that of S4. In Table 4«1 a
detailed comparison of slopes and values of cracking and
■ultimate torsional moments is made.
Figures 4*8 through 4.11 show the initial portions of the
torque-twist curves drawn to a larger scale to magnify the
differences in the values of the initial slope and to show more
clearly the influence of the differences in the beam cross-section.
As the ultimate load was approached each torque-twist curve
sloped towards the horizontal. The measured ultimate torque
corresponds to the maximum load placed on the structure.
Specimens in which the beams were reinforced primarily for
flexural and shear forces developed less torsional capacity
than those that had additional reinforcement. The additional
reinforcement increased the torsional stiffness and the torsional
strength of the beams.
(b) Cracking
In each specimen, the first crack was a negative moment crack
in the slab, at the face of the column. The progression of this
crack depended largely on the torsional stiffness of the beam.
In specimens which had beams with inadequate torsional stiffness,

15
the slab negative moment crack only progressed a short distance
beyond the column edge before joining a torsional crack across the
beam. In such cases torsional cracking soon became more critical
in determining the mode of failure and prevented the mobilization
of the strength of a large portion of the slab steel.
In specimens that had beams with adequate torsional strength,
the initial negative moment cracks in the slab at the face of the
column extended along the length of the beam. Thus it was
possible to develelop the yield strength of the slab steel framing
into the beam. Torsional cracking which occured in this
situation was not critical and the mode of failure was determined
by a yield line in the slab along the beam. All the torsional
cracks were diagonal and originated at the mid-width of the beam
forming a spiral around the beam. In general negative moment
cracks in the column.strip of the slab perpendicular to the beam
started to develop after the formation of the first diagonal
crack in the spandrel beam.
Figures 4.12 and 4*13 shov; the crack patterns for specimens
S5 and S6 respectively. .Specimen S6 shows a yield line in the
slab along the entire specimen (slab failure), while S5 show's
a beam failure which is similar to the type of failure mechanism
in the University of Illinois flat plate test. Figure 4.12 shows
very wide torsional cracks in the beam and only a few cracks in
the slab. The torsional failure of the beams prevented the
mobilization of a large portion of the slab steel and prevented
the development of cracking in the slab. Figure 4.13 show's
widespread cracking both in the beam and in the slab of specimen
S6. However the torsional cracks in the beam did not open widely

16
and were spread out over a greater length of the beam. The cracks
in the slab continued to widen as the yield line developed.
(c) Load-Strain Curves
Load-strain curves were plotted for stirrups located
within the critical region. The critical region is defined as
that section of the beam containing the major torsional crack. In
general these load-strain curves remained linear until the first
torsional crack occured, and then the curves sloped towards the
horizontal. A typical load-strain curve for the stirrups is shown
in Fig. 4*14* The strains plotted in this diagram were measured
on the outside leg of a closed rectangular stirrup in specimen S4.
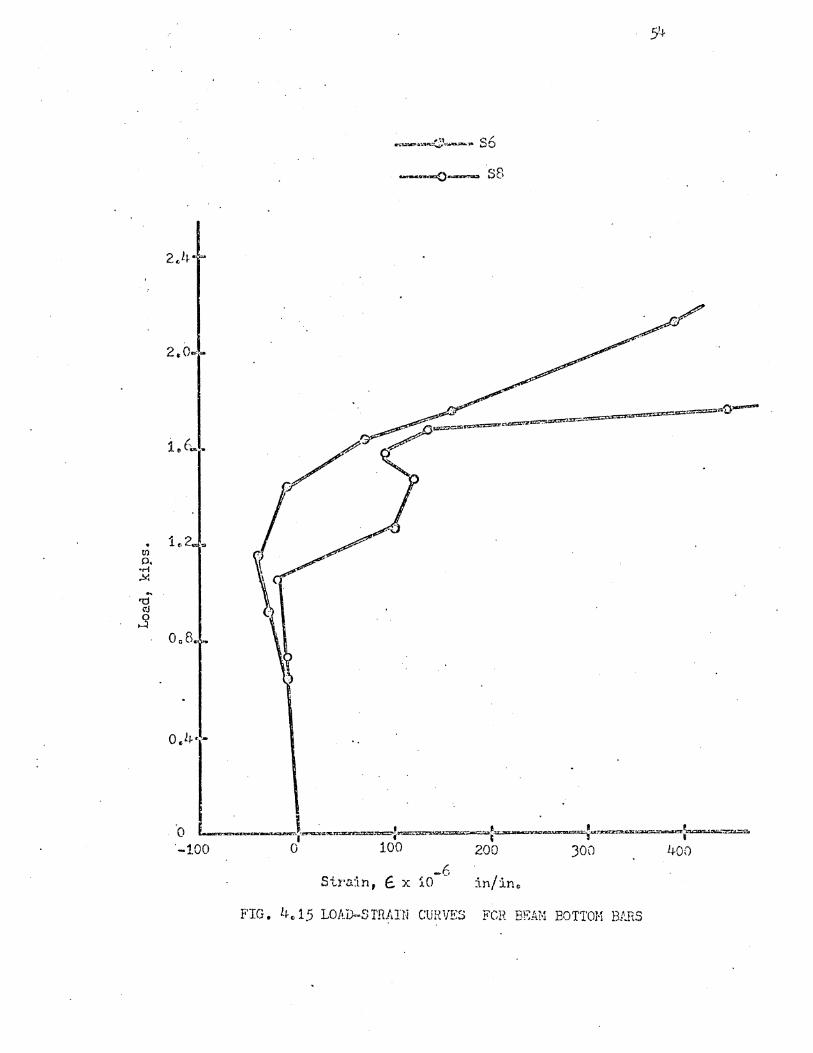
The longitudinal steel in the beam was also instrumented and
load-strain relationships for the flexural compression steel
(bottom bars) were obtained. These relations are shown in Figs.
4.15, 4*16 and 4.1V..It is important to note that the bottom bars
were in tension when the specimen failed. If the spandrel beams
were subjected to pure flexure, the bottom bars would have remained
in compression throughout loading. However, the bottom bars
remained in compression until torsional cracking occured. At this
point tensile strains were produced and all the longitudinal
beam steel was stressed in tension. A typical load-strain diagram
for the top beam bars is shown in Fig. 4-18. The top bars were
stressed in tension throughout loading.
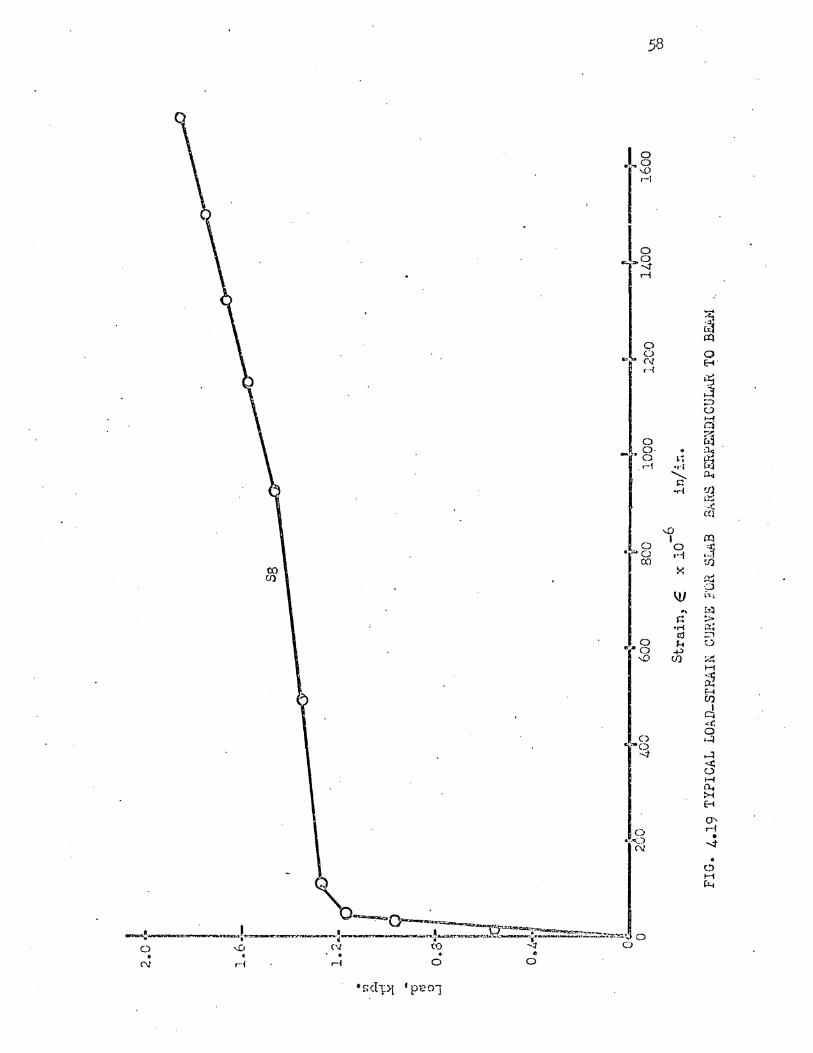
Load-strain curves were also drawn for the slab steel framing
into the beam (perpendicular bars). The slab flexural cracking
strains were obtained by determining the point at which the
curves deviated from the initial straight line. Figure 4.19
shows a typical load strain diagram for a steel bar framing into
the beam.

17
5. PREDICTION OF BEAM TORSIONAL STRENGTH
5.1 Introduction
The absence of symmetry of the specimen about the coltimn,
and the method of loading produced a combination of three forces
(torsion, flexure, and shear) at the eolumn-slab-beam joint
which could not be independently controlled. As a result, it was
difficult to determine the distribution- of these forces experi¬
mentally.
In this chapter, interaction between torsion, shear and flexure
will be discussed. Expressions for predicting torsional strength
of beams developed by Covan (2) and Hsu (3) will be discussed to
determine their suitability in designing spandrel beams. Predicted
and measured values of the beam torsional strength will be compared.
5•2 Influence of Shear and Bending Moment on the Beam Torsional
Strength
(a) Measured Values of Shear and Bending Moment
Since the exact distribution of stresses at the column-slab-
beam joint could not be determined experimentally, for the
purposes of computation it was assumed that all the shear was
transferred from the slab to the column through the beam. Using
this assumption, no shear is transferred directly from the slab to
the column and the shear forces acting on the beam are maximized.
Even though this assumption was used, the calculated shear.stresses in
the beam were not large enough to produce diagonal tensile cracking
in the beam. Examination of the values in Table 5.1 shows that
Specimen SI had the largest shear force on the spandrel beam in

13
relation to the shear capacity of the bean. However, the value of
shear at failure was only 17.4 percent of the ultimate shear
capacity of an unreinforced concrete section with the same diraen-
sions as the beam of SI.
Table 5.1 also lists the values of the applied bending moment
on the spandrel beams for the first five specimens. In SI the
value of the applied bending moment was. about 38 percent of the ulti¬
mate flexural capacity of the beam, while in S5 it was about 60
percent of the beam flexural capacity.
The number of tests conducted in this investigation and the
nature of the loading did not provide a sufficient range of
variables to allow construction of interaction diagrams for the
ppandrel beams. The interaction diagrams obtained by Collins (6)
show that when the applied bending moment is about 40 percent of the
ultimate flexural capacity of the beam, the torsional capacity is
reduced by about 20 percent. As will be shown later, this 20 percent
reduction in torsional capacity is rather conservative when compared
with the test results of this investigation.
Even though large bending moments were observed at failure, the
bottom steel (compression steel) in all specimens was stressed
in tension. Also it is important to note that only torsional
cracks were observed in the beams.
It has already been pointed out that the maximum shear stress
measured in any beam was only 17.4 percent of the ultimate shear
capacity of the unreinforced concrete section. Collins interaction
diagrams show that for small amounts of shear the torsional capacity
is increased by the presence of shear stresses. Hsu (7) obtained

19
interaction diagrams for the combined action of shear, torsion and
bending in beams without web reinforcement, His findings show
that the applied bending moment can be as much as 50 percent of
the ultimate flexural capacity of the beam without reducing the
torsional capacity. Also for small amounts of shear (about 10 per¬
cent of the ultimate shear capacity), the torsional capacity is not
appreciably reduced. It is recognized that although the beams
considered by Hsu in his report are different from those treated
here his findings represent a trend v/hich is reflected by the
results of this investigation.
5.2 (b) Conclusions
Since the maximum applied shear did not exceed 17.4 percent
of the shear capacity of an unreinforced concrete section in
any;,of the tests, it may be safely concluded that shear did not
appreciably contribute to the failure of the specimens. It may
also be concluded that flexural stresses were not very significant
since all the compression steel bars in the beam were in tension
when the specimen failed, and that the predominant stresses in
the spandrel beams were produced by torsional moments. Therefore
in the following discussion, the pure torsional strength of the
spandrel beams will be examined.
5.3 (a) Torsional Strength of Beams (Hsu and Cowan)
Most expressions for predicting the ultimate torsional
strength of.beams are divided into two terms as follows:
Tu = Tc -f T3

20
/
However, each reseacher interprets the terms Tc and Ts differently,
according to Cowan (2), the terms are defined as follows:
Tu = total ultimate torsional capacity of the concrete section
T = torsional capacity of the plain concrete section. For a c
rectangular cross-section, Tc = f x y (l)
where f = tensile strength of the concrete r
x^y = the shorter and longer sides of the rectangular
cross-section
oi. = a function of y/x
f 3 For T and L-sections, Tc =
y,,?* (2)
where b = width of web
= a function of y/x
The additional torsional moment due to lateral steel is given by:
m . , A. f x y T =1.6 sv sy 1 1 (3; 8 TT
where Agv = cross-sectional area of one leg of a closed
rectangular hoop
x^,y^ = the smaller and larger dimensions of the closed
rectangular stirrup respectively, measured center
to center
s = pitch of the stirrups
f = yield stress of the stirrup reinforcement
Since an equal volume of longitudinal torsional reinforcement is
required to develop the strength of the transverse steel, Ag ,
the total area of longitudinal steel, A.^, is given by:
A'sl ” ^ -^sv ,(xj 7] ) s
In developing these expressions, Cowan applied the classical St.
Vennant theory, assuming that stresses were zero at the corners

21
of the rectangle and maximum at the center.
Hsu (3) has shown experimentally that after cracking, the
classical theory of St. Vennant can no longer be applied in deter¬
mining stress distributions. He expressed the ultimate torque.of
a rectangular beam as follows:
Tu = T0 + Ts
where T = contribution by the shear resistance of a 45° o
shear-compression zone along the wider face of a
rectangle. For practical purposes,
T0 = |£ x2yg (4)
\X where x,y = smaller and larger dimensions of a rectangular
beam cross-section
fe = compression strength of the concrete
Ts =-^xm Asv f sy. (5)
where x^,y^= smaller and larger dimensions of a closed
rectangular stirrup.
The value of is not a constant but dependent on the volume
ratio, m, of the longitudinal steel to stirrup steel, and the
height-to-width ratio, y^/x^, of the stirrups. The expression for
calculating JLis as follows:
= 0.66m -t 0.33y^/x^
varies from a value of 0.99 for beams with square stirrups to
a value of 1.54 for beams containing stirrups with height-to-width
ratio of 2.6. Hsu also suggests that y-j/x^ = 2.6 be maintained
when y^/x^is greater than 2.6.

(b) Comparison of Computed and Measured Torsional Strength
In the following comparisons of the measured torque with
computed values determined using expressions developed by Hsu
and Cowan, it was assumed that bending and shear forces did not
appreciably affect the experimental torques.
(i) Cracking Torsional Moments
L-shaned spandrel beams: Since the spandrel beam is
monolithic with the slab, a portion of the slab may be consider¬
ed to act as a flange in determining the cracking torsional •
strength of the beam. As a result the beam cross-section is L-
shaped. In these calculations, the flange width is assumed to be
equal to the projection of the beam below the slab (See Fig. 5.1b).
To obtain this cross-section, a 45 line is drawn from the bottom
edge of the web intersecting the slab as shown in the figure.
After cracking, the flange is considered ineffective in contribut¬
ing to the torsional strength of the section since the slab is
not specifically reinforced for torsion.
Measured torsional moments at cracking were plotted against
the same parameters used by Hsu and Cowan in deriving their
expressions. The experimental cracking torque (Tcr) was considered
equivalent to the terms TQ and T^ in the expressions developed by
Hsu and Cowan respectively. The measured cracking torques were
plotted against the expressions developed by Cowan for T. in Fig.
5.1. Clearly this figure shows that Cowan's equation (Eq. l)
forms a lower bound for the test results. Similarly, Fig. 5.2
shows a plot of the measured cracking torques against the express¬
ion for Tc developed by H'su. The slope of this curve n, is 2.24

23
compared with 2.4 which was obtained by Hsu.
Rectangular spandrel beams; The computation of the cracking
torque will be greatly simplified if the flange portion of the
beam can be neglected without loss of accuracy. Therefore in this
section, the beam flange will be neglected in computing the
cracking torque. Figure 5*3 is a plot of the measured cracking
torque against Hsu's expression for T^ but in this case, the flange
contribution is neglected. This results in a slight change in the
slope of the curve from a value of 2.24 to 2.72. Figure 5.4 shows
a similar plot for the expression for Tc developed by Cowan. In
this case the results are essentially unaltered.
(ii) Contribution of Reinforcement
The second term Tg in the expressions developed by IIsu
and Cowan was considered equivalent to the measured increase in
torsional capacity from cracking to failure (T T’cr). This
torsional increment was assumed to be the contribution of the
torsional reinforcement. Figure 5.5 shows that the expression
obtained by Cowan (Eq. 3) gives unconservative values for the
contribution of the reinforcement for many specimens. The increase
in torsional capacity of the specimens S7 and S4 are over estimated
by almost 70 percent. On the other hand, Fig. 5.6 shows that the
equation (Eq.5) developed by Hsu approximates this increment of
torsional strength very closely.
(iii) Discussion of Results
In general, the expressions developed by Hsu predict the
torsional strenth of spandrel beams very accurately. Cowan's
expression is satisfactory for predicting cracking torque but

24
large errors are incurred when the contribution of the steel
reinforcement is considered. Examination of the values in Table
5.2 shows that in general, the values of the cracking torsional
moment obtained using Cowan's expression (Eq. l) are less than
the measured cracking torques. The values obtained for the
increment of torsional moment between cracking and ultimate
using equation 3 (Cowan) are generally greater than the measured
values. In contrast, values obtained using the expressions
developed by Hsu compare favorably with measured values of both
the cracking torques and the torsional increments.
It is evident from the curves plotted in Figs. 5.3 and 5.4
that neglecting the flange contribution does not affect the
validity of the equations developed by both Cowan and Hsu for
predicting cracking torque. It may be concluded that for practical
purposes, the flange" effect may be neglected in the design of
spandrel beams for torsional moments.

25
6. SUMMARY
(a) Object and Scope
This report describes the behavior and strength of the spandrel
beams of nine 0.3 scale reinforced concrete flat plate specimens.
The influence of shear and bending moments on the torsional
capacity of the beams is discussed and equations for predicting
strength are examined.
(b) Test Specimens
The first two specimens SI and S2 were scaled models of the
prototype for the flat plate structure tested at the University of
Illinois (l). The remaining 7 specimens were modifications of the
first two specimens. Each test specimen was a half-panel structure
6 ft. long and 3 ft. wide, bounded on the outside edge by a
spandrel beam which framed into a column, and on the other sides
by panel centrelines (See Fig. 2.1).
Loads were applied to the test specimens in increments of 100
lbs. to failure. At eachhload stage, strain gage and deflection
readings were taken and the progression of the cracks was marked.
(c) Test Results
The results showed that spandrel beams which satisfy both
flexural and shear requirements do not necessarily have adequate
torsional strength» The initial torsional stiffness of the
spandrel beams was observed to be dependent on the size and shape
of the beams, while the post cracking stiffness seemed to be
largely controlled by the torsional reinforcement. The post¬
cracking stiffness was less than that of the pre-cracking stage
in all tests.

26
The results also showed that the contribution of the flange
to the cracking torque can be neglected, and that bending
moments and shear forces did not significantly affect the torsional
behavior of the specimens. Therefore it may be concluded that
for design purposes, spandrel beams can be treated as rectangular
beams provided that the bending and shear forces on the beam
are not significant.
The measured cracking and ultimate torsional moments on the
spandrel beams were compared with equations developed by Hsu (3)
and Cowan (2) assuming that shear and flexural forces did not
materially influence the behavior. These comparisons showed
that the expressions developed by Hsu are satisfactory for
predicting the torsional strength of spandrel beams.

27
REFERENCES
1. Hatcher, D.S., Sozen, M.A., and Siess, C.P., "A. Sudy of
Tests on Flat Plate and Flat Slab," Structural Research
Series N. 217, Department of Civil Engineering, University of
Illinois, June I960.
2. Covan, H.J., "Design of Beams Subjected to Torsion, Related
to the New Australian Code," Journal of the American Concrete
Institute. Proceedings Vol. 31 No. 7 Jan. I960, pp. 591-618.
3. Hsu, T.C., "Ultimate Torque of Reinforced Concrete Beams,"
A.S.C.E. Proceedings. Journal of the Structural Division,
Feb. 1968, pp. 485-510.
4. Building Code Requirements for Reinforced Concrete, (A.C.I.
318-63), American Concrete Institute, Detroit, June 1963.
5. Baumgartner, J.L., "A Study of Exterior Slab-Beam-Column
Connections in Flat Plate Floors," M.S. Thesis, Rice
University, Houston, Texas, May 1967.
6. Collins, M.P., "The Behavior in Combined Bending, Torsion
and Shear of Reinforced Concrete Beams," Ph.D. Thesis,
University of New South Wales, 1967.
7. Hsu, T.C., "Torsion of Structural Concrete-Interaction Surface
for Combined Torsion, Shear and Bending Beams ’Without Stirrups,"
Journal of the American Concrete, Proceedings Vol. 65 No. 1,
Jan. 1968
8. Seely, F.B., and Smith, J.>0., "Advanced Strength of Materials,"
Wiley, New York, Second Edition, 1957, page 271.
9. Guralnick, S.A., and LaFraugh, R.W.,"Laboratory Study of a 45
ft. Square Flat Plate Structure," Journal of the American

28
REFERENCES (contd.)
Concrete Institute, Proceedings Vol. 60, September 1963 page
1107.
10:.Mayers,' G'.T., Sozen, M.A., and Siess, C.P., “Tests on a
Quarter-Scale Model of a multi-panel Reinforced Concrete
Flat Plate Floor," Structural Research Series No. 181,
Department of Civil Engineering, University of Illinois,
Septenber 1959*

TA
BL
E 2
.1
RE
INFO
RC
ING
SCH
ED
UI
29
All
spacin
g is in in
ch
e

30
TABLE 2,2 BEAM DIMENSIONS AMD STIFFNESS PARAMETERS
Specimen BeDimensions Elastic Stiffness Par meters
Depth
(in.)
Width
(in.)
Ib 4S (an.;
c
4 -, {in © j
H J
SI 3,25 4„?5 13.60 31,40 0,47 0.58
S2 6,25' 2.375 48,30 24.00 1.62 0,43
‘-'J 2,125 4,75 3.79 30.90 0.13 0.19
54 4.75 4.75 42,50 71.80 1,43 1 B 25
S5 4.7 5 4,75 42,50 71,80 1.43 1 OR 1 6 ‘.J
*1 s :>o 4.75 4,75 42.50 71.80 1.43 4 ^ •'
•UO
A' O 3.25 4,75 13,60 31,60 0,4-7 0.58
S8 6,00 3.50 63.00 c*./ 1. O t f. w 2.18 0,938
S9 4.50 4.00 30,40 44.30 1.055 0,77

32
TABLE INITIAL AND POST CRACKIK G SLOPES OF TORQUE- .WT“' QJP.VES
Specimen T cr
(in-kip)
m ■lub'
(in-kip' (in~~kip)
^2 Y* X*
\/°J
Si 3.80 12.-80 6.00 . 1.28 2.34 69.50
S2 4.?0 11.51 7.23 0.54 1.31 65.80
S3 2.76 7.79. * 0.466 3.40 6?.00
S4 8.40 17.70 8.60 3.8? 2.13 63.40
S5 7.20 15C87 17.00 1.55 1.5Q 62.20
S 6 8*80 18.35 7.66 2.53 2.13 66 o60
S7 5? 10 13.60 5.52 5.40 3.54 66.90 :
S8 7.60 19.61 11.70 2.10 2.02 6?.80
S9 6a? 15.89 3.90 2.88 2.6? 65.30
* S3 was already cracked before testing
p = Total percentage of steel in the beasn
m. ~ Initial clone of torooe--twist curve 1
K2 ~ cracLiJiS -lope of torque-twist curve

33
TABLE 5,
Jpecir.cn K1
(in-kip) (i.n~kip)
?r /■»/ l/ V. V1
\ f* -I • -'* /
V t
(kips,)
v /v W
Si 6.04 16.C4 , 0.33 . 0.76 4.36 0,174
S2 6.? 8 22.62 0.-30 0.61 4.49 0.136
33' P 1 >» 10.11 0.212 0,41 2.80 0.146
S4 14.60 26.23 0.55 1,03 8.50 0,127
S5 15,40 26,23 0,58 c;83 8,50 0i097
S6 * 26.23 0,98 8.550 0.115
s? 16.04 0.84 6,75 0.125
S8 V 24.53 1.01 9.92 0.102
«5Q •*£ 26.17 1.05 8,20 0.128
* Mot measured
= Applied bending moment
= Applied shear
M = Flexural capacity of the beam u
Vc = Shear capacity of an unreinforced concrete section

TAB
LE 5
.2
COM
PUTE
D i
vND
MEA
SURE
D T
OR
QU
ES
34
S3 w
as
crac
ked
bef
ore
test
ing


36

3?
•H
•H
a •H
CCS f-i
4 2 e/3
0 M
(ssa^tj T#s**
3.2
TY
PIC
AL
. S
TR
ES
S -
ST
RA
IN
DIA
GR
AM
FO
R
HQ
. 9
G&
GE
kilR
E

38
FIG. 3.3 TEST SET UP

39
I
£ 12"
T
% ■ •<-
^T3
£ * 4
I
12" £
''N
i’ronl1_llsYal ioa^.
1A - are deflection, dial gages . i
£l - £^ are rotation dial gages
FIG. 3.4 LOCATION OF DIAL GAGES
40
Section.
ZnanlL. El.e:za t 1Q S
FIG:. 4,1 LOCATION. OF CRITICAL SECTION

41
i'c
FIG.. 4.2a STRESS AND STRAIN DISTRIBUTION USED IN. ANALYSIS
FIG. 4.2b TYPICAL MOMENT _ STRAIN RELATIONSHIP
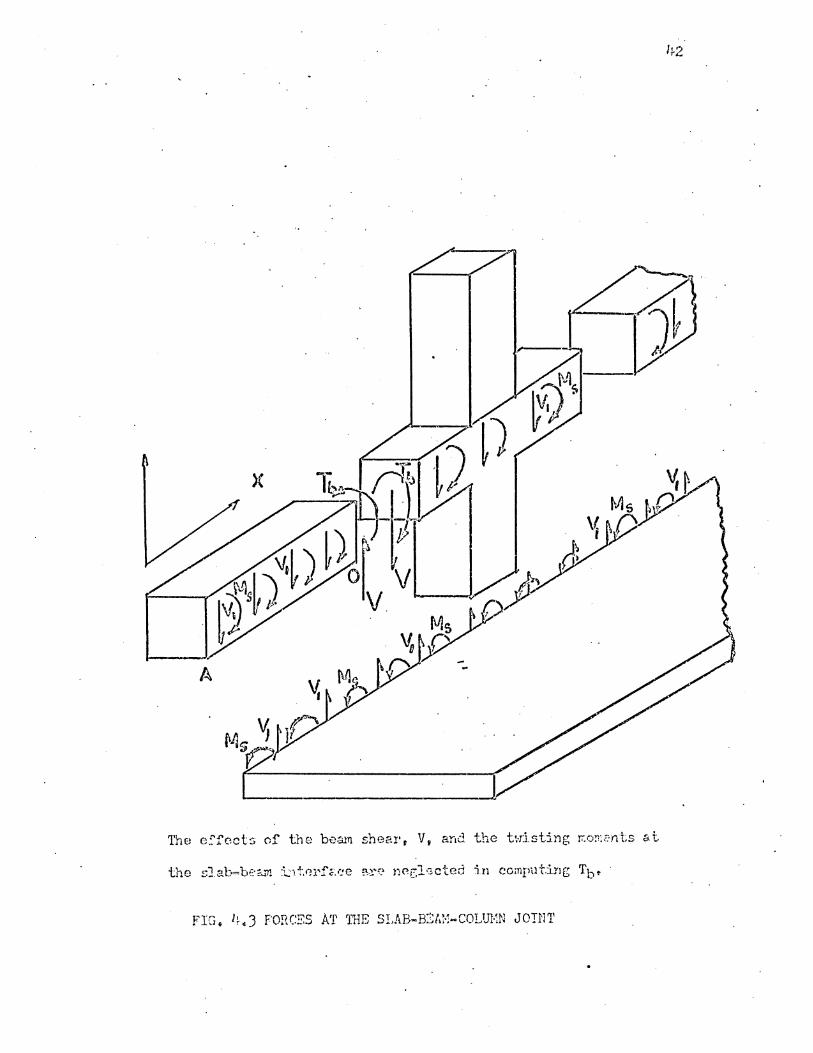
The effects of the beam shear, V, arid the twisting moments at
the slab-beam interface are neglected in computing T^»
FIG. 4.3 FORCES AT THE S LAB- BE AM-COLUMN JOINT

1’otal Moment, in-kip. •
Unit M
oments,
in-l
b/i
M3
FIG. kji MOMENT DISTRIBUTION AT FAILURE - S5
'ota
i M
omen
t, in
-k
ip
.
. U
nit
Sla
b-M
om
ents
, in
-lb/i
44
FIG. 4*5 MOMENT DISTRIBUTION AT FAILURE - 38

20
18
16
14
12
10
8
6
4
0
FIG. 4.6 TORQUE - WIST CURVES

Measured. Torque
FIG * 4.7 TORQUE- TWIST CURVES


48
»crrn-u-c *q>L ' aubaoj, paansesn
4.9
INIT
IAL
PO
RT
ION
CF
TO
RQ
UE _
TW
IST
CU
R'

H9
8? O c/j
O vO
Q 0
<3
o u*\
O -4
T5 Ctf
CO M > Gi O
H c/) M r.^t H
w
C$'
g c-*
p*« o
o -4- c<~\ I
o tH
©
-P W
*H :< H
o M
12 o p«
M JH M
M
o .—1
c
-4
O M u<
o

•drij-ux ,c\i, ‘ anb.ioj, ps.xnsyai.t
FIG
. 4.1
1
INIT
IAL
PO
RT
ION
OF
TO
RQ
UE -
TW
IST
CU
RV
ES

51
J2-
FIG. 4.12 CRACK PATTERNS AFTER LOAD TO FAILURE-S5

52
T
FIG. 4.13 CRACK PATTERNS AFTER LOAD TO FAILURE-S6

53
Load, kips
5’+
eiiaaR' <****»**' So
LvmesQn S8
FIG. 4.15 LOAD-STRAIN CURVES FOR BEAM BOTTOM BARS

iJVjCPMWXSH* S5
FIG. 4.16 LOAD-STRAIN CURVES FOR BEAM BOTTOM BARS

56
FIG

Load,
kip
5?
FIG. 4.18 TYPICAL LOAD-STRAIN CURVE FOR BEAM TOP BARS
2.0
58
*=■>%
O o vO
o o (V r-{
o o- o i~1
o r*o
00
o l" ° vO
o V*o
o *o cv
•H
vD I o H
vy
•H 03
4? CO
O CO
•sclx>[
FIG
. 4
.19
TY
PIC
AL
LO
AD
-ST
RA
IN
CU
RV
E
FO
R
SL
AB
BA
RS
PE
RP
EN
DIC
UL
AR
TO
BE
AM

59
I
O rH
O

60
61
onbaoi Suxylo'e.xQ p3.tu3?a^ UT..VI-UT.
FIG'.
5.3 COMPARISON OF PREDICTED (HSU) AND MEASURED CRACKING TCRQUES
62

63

.in-kip
64
FIG. 5*6 COMPARISON Q? PREDICTED (HSU) AND MEASURED TORSIONAL
CONTRIBUTION OF REIN'FOR CEMENT