02whole.pdf - Adelaide Research & Scholarship
358
':.' | 2 }cT tsgz GF INVESTIGATIONS INTO Gaeumannomyces gramini,s var. triticí INFECTION OF MANGANESE.DEFICIENT WHEAT by N.S. IVilhelm B. Ag. Sc. (Hons.) r hi s t h e s i s i s p r e s e i';: {f";:! :,i;t :; ir, T,i;:: r of P hi I o s o p hv -r,+ .12 L99L
-
Upload
khangminh22 -
Category
Documents
-
view
3 -
download
0
Transcript of 02whole.pdf - Adelaide Research & Scholarship

':.'
| 2 }cT tsgz
GF
INVESTIGATIONS INTO
Gaeumannomyces gramini,s var. triticí
INFECTION OF MANGANESE.DEFICIENT
WHEAT
by
N.S. IVilhelm B. Ag. Sc. (Hons.)
r hi s t h e s i s i s p r e s e
i';: {f";:! :,i;t :; ir, T,i;:: r of P hi I o s o p hv
-r,+ .12
L99L

-tr-
DECLARATION
I declare that this thesis is my account of my own work, none of which has been submitted
previously in fulfilment of requirements for a degree at any University.
I further consent to allow this thesis to be bonowed or copied, and any information
contained herein cited elsewhero provided the author is duly acknowledged.
NIGEL S. IULI{ELM
.III-
TABLE OF CONTENTS
DECLARATION
TABLE OF CONTENTS
LIST OF FIGURES
LIST OF PLATES
ABBREVIATIONS AND USAGES.
AC KNOWLED GEMENTS
THESIS SUMMARY
PUBLICATIONS
THESIS INTRODUCTION
CHAPTER 1. LITERATURE REVIEW......1.1. Take-all
1.1.1.r.t.2.1.1.3.
to take-all.
History and Distribution.Symptoms and impact of take-all on wheat yields.The infection process and effects on host growth
II
trI
XI
XIII
XTV
.X\rI
XV
XVII
.XVIII
.1)
.2
and physiology............J6889
1.1.4. Management of take-all in Australia.1.1.5. Genotypic va¡iation in susceptibility1.1.6. Biological control of take-all.1.1.7. Influence of the environment, including host nutrition, on take-all
severity. r61.2. Manganese.....
1.2.1. Mobility and metabolic roles of manganese in the plant.1.2.2. Geographical distribution of manganese deficiency. .
I.2.3. Yield reductions and symptoms of Mn deficiency on cereals......1.2.4. Avulability of Mn in soils.1.2.5. Role of micro-organisms in1.2.6. Genotypic variation in plant
conditions......
Mn cycling in soils.performance under low Mn
1.2.7. Influence of environmental factors on Mn deficiency.1.2.8. Comecting Mn deficiency in the field........1.2.9. Manganese and plant resistance to disease..
1.3. Conclusions1.4. References............
CHAPTER 2. EFFECT OF HIGH LEVELS OF SOIL MN ONGROWTH OF GGT AND ON THE DISEASE, TAKE-ALL.......
2.1. Introduction...2.2. Materials and Methods..
2.2.1. Growth of Ggt on two agars at increasing rates of MnSO¿.....2.2.1.t. PDA.
2.2.I1.1. Inoculum2.2.1.1.2. Mn.
23232628293l
343537394446
68686969696969
-rv-
2.2.7.2. KMB. ....
2.2.2.4. Procedure2.2.2.5. Growth measurements. ..
2.2.3. Effect of increasing rates of soil Mn on take-all disease and Ggtmycelial gowth.
2.3. Results.2.3.1. Growth of Ggt on two agars at increasing rates of MnSO+
2.3.t.t. PDA.2.3.t.2. KMB
2.3.2. Ggr growth through soil at increasing concentrations of Mn (soilsandwich techniq
2.3.2.1. C oo nalpyn sand.ue)
2.3.2.2. Wangary sand. ......2.3.3. Effect of increasing rates of soil Mn on take-all disease and Ggt
mycelialDiscussion onclusions.References.. ... .
2.2.L.I.3. Procedure. -...-69
2.2.I.2.2. N4n.2.2.1,.2.3. Procedure
2.2.2. Ggr growth through soil at increasing rates of MnSO¿ (soil sandwich
2.2.2.1. Inoculum
2.2.1.2.1. Inoculum
2.2.2.2. Soi/s.2.2.2.3. Mn..
.70
.70
.70
.70
70
70
7T72
73737374
7577
787982
848485
8585858686
8787
.71
.72
.73
.75
2.4.2.5.
CHAPTER 3. DEVELOPMENT OF AN AGAR DISC INOCULUMTECHNIQUE FOR GGT IN POT STUDIES.
3.1. Introduction...3.2. Materials and Methods..
3.2.1. Confirmation of soil-applied Mn decreasing take-all of wheatin pots.
3.2.I.I. Inoculum3.2.1.2. Soil.3.2.1.3. Mn..3.2.I.4. Procedure. .....
3.2.2. Testing the effect of Mn on take-all of wheat in pots using a fresh
Preparation of3.2.2.I. Inoculum.
ground oat kernel inoculum.
3.2.2.2. Soil..3.2.2.3. Procedure
.. 87
3.2.3. Development of PDA discs as an inoculum source f9r Ç9t.,3.2.3.1,. Effect of concentration of PDA in agar discs on take-all of wheat
8788
88
88
9090909090
in small pots3.2.3.I.1. Inoculum......
3.2.3.1.3. Mn.
'JInoculum.3.2.3.2.2. Soil..
88
3.2.3.r.2. Soil. .'..88
3.2.3.1.4. Procedure. .
3.2.3.2. Effect of depth of buríal of agar dísc on take-all of wheat ín small89
po3.2.3.2.t.
3.2.3.2.4. Procedure
3.2.4. Colonized sand grains as G3.2.4.7. Inoculum.
gf inoculum in small pots
3.2.4.2. Soil3.2.4.3. Mn
3.3. Results.3.3.1. Confirmation of soil-applied Mn decreasing take-all of wheat
in pots.33ll Ggt
3.3.1.3. Mn....3.3.2. Testing the effect of Mn on take-all of wheat in pots using a fresh
preparation of3.3.2.1. G 9r.....
9191
929L
9292
92929494
94
3.2.4.4. Procedure
3.3.1.2. Plant growth.
ground oat kemel inoculum.
3.3.2.2. Plant growth.97
3.3.3. Development of PDA discs as an inoculum source for Ggt 993.3.3.I. Effect of concentration of PDA in agar discs on take-all of wheat
in small 993.3.3.1.1. gt. .99
100t02
3.3.3.2. Effect of depth of burial of agar disc on take-all of wheat ín smallpots.. ........I02
3.3.3.2.1. Ggt.. 102t02r04
3.3.3.2.2. Plant growth.
3.3.4.3. Mn..3.4. Discussions and Conclusions...J.5.
94
3.3.3.1.2. Plant growth.....3.3.3.1.3. Mn.
3.3.4. Colonized sand grains as Ggr inoculum. ......1043.3.4.1. Ggt. r04
106106109113
3.3.4.2. Plant growth.
References.. .. . .
CHAPTER 4. RELATIVE SUSCEPTIBILITIES OF FOUR WHEATGENOTYPES TO TAKE.ALL UNDER MANGANESE.DEFICIENTCONDITIONS
4.1. Introduction...4.2. Materials and Methods.
4.2.1. Inoculum.4.2.2. Soil.
4.2.4. Procedure4.3. Results.
4.3.1. Ggt......4.3.2. Plant growth4.3.3. Mn...
4.4. Discussion.. .. .
4.5 References.
CHAPTER 5. EFFECT OF MN ON THE GROWTH OF FOUR GGTISOLATES AND ON THE DISEASE THEY CAUSE ON WHEATROOTS.
5.1. Introduction...
11511511,6116116116r17118118119127r29r32
r33r331335.2. Materials and Methods. .......
-VI .
5.2.1. Petri-dish experiment......555
2.5
.2.1.1. Isolates.
2.1.3. Procedure....-2 ment A.2.2.r
5.2.2.2. 5oi1......
6.2: Materials and Methods.6.2.I. Pot experiment A
6.2.1.1. Inoculum.6.2.1.2. 5oi1......6.2.1.3. Mn6.2.1.4. Procedure
6.2.2 ment B6.2.2.t6.2.2.2. Soil6.2.2.3. Mn........6.2.2.4. Procedure
6.3. Results.6.3.1. Pot experiment 4.........
6.3.1.1. Ggt..6.3.I.2. Plant growth
134
r33133r33134t34134t34
135136136t36136
r37
138138139740r4lt4I145148r48r52
5
5.2.2.4. Procedure5.2.3. Pot ex ent B....
5.2.3.1. Inoc5.2.3.2. Soil
5.2.3.4. Procedure5.3. Results.....
5.3. 1. Petri-dish experiment....5.3.2. Pot experiment A
5.3.2.1. G gt..5.3.2.2. Plant growth5.3.2.3. Mn..
5.3.3.1. Ggt..5.3.3.2. Plant growth5.3.3.3. Mn
5.4. Discussion and Conclusions...5.5. References......
CHAPTER 6. EFFECTIVENESS OF DIFFERENT SOURCESOF MN IN DECREASING GGT INFECTION OF WHEATSEEDLINGS.
6.1. Introduction...
136
r37
5.3.3. Pot experiment B.
153153
6.3.1.4. Nutrient compostion of plants.6.3.2. Pot experiment B
6.3.2.1. Ggt..
153153r54t54155155155156156r57158158158158159
161
r691,71,
t77185
6.3.2.2. Plant growth.
6.3.2.4. Nutrient composition of plants6.4. Discussion and conclusions.
165
6.5. References......
.VII .
CHAPTER 7. THE EFFECT OF MANGANESE FERTILIZATIONON TAKE.ALL OF FIELD-GROWN WHEAT.
7.1. Introduction...7.2. Materials and Methods. .
7 .2.7. Experiment 4...7.2.1.1. Inoculum....7.2.1.2. Mn..7.2.1.3. Procedure
7.2.1.3.1. 1984.7 .2.3.1.2. 1985
7.2.2. Experiment B7.2-2.1. Inoculum
7.2.L3. Procedure7.2.r.3.1. 19857.2.r.3.2. 1986
7.3. Results.7.3.1. Experiment 4...
7.3.t.1. 1984.7.3.1.1.1. Ggt..7 .3.7.1.2. Plant growth.7.3.1.1.3. Grain yields.
188188
188
r87187r87188
188
189190190t9rt9r191191192
192r92195195199204
20820821r213
21721721821821,8218220223
225
225
225
...r92
7.3.777
1.2. 1985
.3.1.2.2. Plant growth.
.3.1.2.3. Grain yie
.204
.206
.206
.206
.208
.208
lds7.3.1.2.4. Mn........7.3.1.2.5. Nutrient composition of plants...
7.3.2. Experiment B....7.3.2.r. r985
7 .3.2.1 .1 . Ggt..,t .t.2.1.2- Prañiñ;ìil.. :. :
7 .3.2.1.3. Grain yields7.3.2.1.4. Mn.7.3.2.1.5. Nutrient composition of plants.
7.3.2.2.1. Ggt...7.3.2.2.2. Plant gro7.3.2.2.3. Grain yields7.3.2.2.4. M^n.
.2r4
.2r47.3.2.2. r986.
7.5. References.
CHAPTER 8. INVASION BY GGT OF EXCISED WHEAT ROOTPIECES PRE.CULTURED WITH AND WITHOUT MN....
8.1. Introduction...8.2. Materials and Methods. .......
7 .3.2.2.5. Nutrient composition of plants7.4 Discussion and conclusions.
8.2.1. Pre-culturing of wheat plants under sterileexcised root sections by Ggr.
conditions and invasion of
225
8.2.1.1. Basal nutientsfor wheat pre-culture. ........225226
8.2.I.3. Procedure. 226
- VUI.
8.2.2. Tissue culture of wheat root sections in a sterile liquid medium andsubsequent invasion by Ggt
8.2.2.1. Mn.
8.2.3. conditions and
8.2.3.1. Mn.8.2.3.2. Procedure
8.3. Results.8.3.1. Pre-culturing of wheat plants under sterile conditions and invasion of
8.3.1 sections8.3.1
8.3.2. Tissue culture of wheat root sections in a sterile liquid medium andsubsequent invasion by Ggt.
8.3.1.1. Ggt invasion of root sections8.3.2.2. Growth of root pieces.
8.3.3. conditions and
.227
.2279.2.2.2. Procedure ........227
228228228229
22922923r
23123t23r
232)?)233233236
242242
.237
.237
.238
.238
.238
.239
.239
.240
.241
8.4.8.5.
8.3.3.1. G vasion of excised root sections. ...gt inIant8.3.3.2. P growth.
Discussion.References.
9.2.4.2. 2 -79 24r9.2.4.3. Soil..
9.2.4.5. Procedure
CHAPTER 9. EFFECT OF MN ON THE GROWTH OF A SOIL-BORNE PSEUDOMONAD AND ITS ANTAGONISM.AGAINST GGT.
9.1. Introduction...9.2. Materials and Methods..
9.2.I. Effect of Mn on the growth of 2-79 on PDA.9.2.1.1. Mn2+.9.2.1.2. MnO2.
9.2.2. Effec9.2.3. Effect9.2.4. Effect ma
Mn-deficient sand. Bacteria added to pots in a suspension ofDDDHzO.
9.2.4.1. Inoculum .....241,
..2419.2.5. Effect of Mn on the control by 2-79 of
Mn-deficient sand. Bacteria added to9.2.5.1. I nocu|um...........9.2.5.2. 2 -799.2.5.3. Soil..
take-all of wheatpots in liquid
lna
9.2.5.4. Mn... ........2429.2.5.5. Procedure ....242
9.3. Results. ........2439.3.1. Effect of Mn on the growth of 2-79 on PDA. ....243
9.3.1. t. Mn2+. ........2439.3.1.2. MnO2. ........244
9.3.2. Effect of Mn on siderophore production by 2-79 in KMB.9.3.3. Effect of Mn on the antagonism of 2-79 against Ggt on PDA.
.IX .
9.3.4. Effect of Mn on the control by 2-79 of uke-all of wheat grown in aMn-deficient sand. Bacteria added to pots in a suspension ofDDDH2O. ...
of wheat root sections under the scanning electron
9 .3 .4.1 . G 9t...9.3.4.2. Plant growth.
.246
.246
.2so
.2509.3.5. Effect of Mn on the control by 2-79 of take-all of wheat grown in a
Mn-def,rcient sand. Bacteria added to pots in liquid media.9.3.5.1. Ggt...9.3.5.2. Plant growth.
CHAPTER 10. MN OXIDATION BY GGT HYPHAE ON WHEATROOTS GROWING IN A MN.DEFICIENT CALCAREOUS SAND .OBSERVATIONS UNDER THE DISSECTING AND SCANNINGELECTRON MICROSCOPES.
10.L. Introduction.10.2. Materials and Methods.
I0.2.I. Examination of whole wheat roots under the dissectingmlcroscope.
10.2.2. Examinationmicroscope with EDXA
10.2.2.1. Oven-dried roots.......I0.2.2.2. F reeze-dried roots.
10.3. Results.10.3.1. Examination of whole wheat roots under the dissecting
mlcroscope10.3.2. Examination of wheat root sections under the scanning electron
microscope with EDXA. ...I0.3.2.I. Oven-dried roots.......I0.3.2.2. F re ez e - dried r oo ts
10.4. Discussion......10.5. References. .....
CHAPTER 11. GENERAL DISCUSSION ANDCONCLUSIONS..
11a. Mn deficiency decreases the resistance of wheat plants to Ggt byinhibiting lignin production in the host..
11b. Mn does not need to be toxic to decrease take-all of wheat.1lc. Inhibition of take-all of wheat by Mn via changes in rhizosphere
microflora is of secondary importance..............11d. Treating Mn-deficient wheat with Mn fenilizer will control take-all in
the field.
9.4. Discussion.... .
9.5. References...... ....267
.270
.270
.270
25525525725726r
270
27127r
272
273273274
278
279
.27r
.272
...275
11.1. References......
APPENDIX A. INCUBATION OF MOIST WANGARY SAND TOINCREASE SEVERITY OF MN DEFICIENCY.
4.1. Introduction. ...
^.2. Materials and Methods...
4.2.I. Soil and Mn.
285
286
.280
.283
.288
.290
.290
.29r
.291
.291
.291
.292
4.2.2. Incubation4.2.3 Procedure
4.3. Results.

-x -
4.3.1. Plant growth. ... .292.294.294
.296
.296
.297
A.3.2. Mn
^.4.Discussion. ....
APPENDIX B. A CRITICAL LEYEL OF MN FOR GROWTH OFWHEAT SEEDLINGS IN EXPERIMENTS WITH SMALL POTS.
8.1. References.....
APPENDIX C. TOTAL NUMBER OF STELAR LESIONSON WHEAT ROOTS AND PERCENTAGE OF DISEASEDROOTS FROM CHAPTER 4, SECTION 4.3.1..
4.5. References..... .....295
.XI .
LIST OF FIGURES
PRECEDINGPAGE
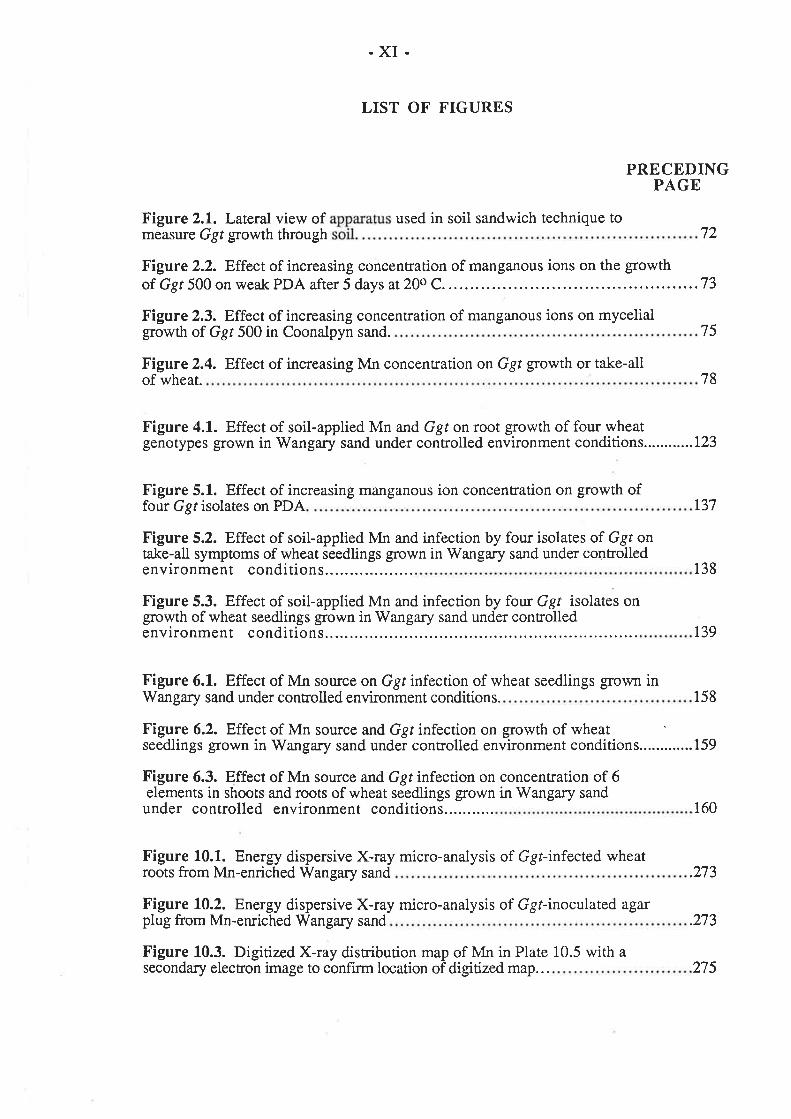
Figure 2.1. Lateral view ofmeasure Ggr growth through
used in soil sandwich technique to72
Figure 2.2. Effect of increasing concentration of manganous ions on the growthof Ggt 500 on weak PDA after 5 days at 20o C.
Figure 2.3. Effect of increasing concentration of manganous ions on mycelial
73
growth of Ggt 500 in Coonalpyn sand. 75
Figure 2.4. E;ff.ect of increasing Mn concentration on Ggr growth or take-allof wheat. 78
Figure 4.1. Effect of soil-applied Mn and Ggt on root gowth of four wheatgenotypes grown in Wangary sand under controlled environment conditions............123
Figure 5.1. Effect of increasing manganous ion concentration on growth offour Ggr isolates on PDA
Figure 5.2. Effect of soil-applied Mn and infection by four isolates of Ggr ontake-all symptoms of wheat seedlings grown in Wangary sand under controlledenvironment conditions........
Figure 5.3. Effect of soil-applied Mn and infection by four Ggr isolates ongrowth of wheat seedlings grown in Wangary sand under controlledenvironment conditions.............
Figure 6.1. Effect of Mn source on Ggt infection of wheat seedlings grown inWangary sand under controlled environment conditions.
Figure 10.1. Energy dispersive X-rayroots from Mn-enriched Wangary sand
micro-analysis of Ggr-infected wheat
Figure 10.2. Energy dispersive X-raplug from Mn-enriched Wangary sand
y micro-analysis of Ggr-inoculated agar
Figure 10.3. DigitizedX-ray distribution map of Mn in Plate 10.5 with a
t39
t37
138
158
.273
.273
Figure 6.2. Effect of Mn source and Ggt infection on growth of wheatseedlings grown in Wangary sand under controlled environment conditions.............159
Figure 6.3. Effect of Mn source and Ggt infection on concentration of 6elements in shoots and roots of wheat seedlings grown in Wangary sandunder controlled environment conditions........... 160
seconda¡y electron image to confirm location of digitized map... 275

-xII-
Figure 10.4. Energy dispenive X-ray micro-analysis of igr runnerhyphae from Mn-en-riched Wangary sañd.
Figure B.l. Effect of whole shoot concentrations of Mn on gowth of wheatseðdlings in small pots of Wangary sand......... ........-....296

. XIII .
LIST OF PLATES
Plate 3.1. Effect of depth of burial of Ggr-colonized agaron growth of wheat seedlings in a Mn-deficient sand underenvironment condtions. .... .
PRECEDINGPAGE
Plate 2.1. Effect of increasing concentrations of manganous ions on thegrowth of Ggt 500 on weak potato dextrose agar after 5 days at20o C.....
Plate 2.2^. Effect of 0, 50 and 250 mg kg-1 of added Mn2+ on mycelialgrowth of Ggt 500 in Coonalpyn sand.
Plate 2.28. Close-up of mycelial g¡owth of Ggt 500 in Coonalpyn sand
with 100 mg kg-l of added Mn2*, after flooding with 0.1 Vo benzidine.
73
77
77
discs and added Mn2+controlled
Plate 5.1. Effect of increasing concentrations of added Mn2+ on the growthof three Ggr isolates (47, 8, 43) on potato dextrose agar.......... .........137
Plate 8.1. Effect of pre-culture of wheat plants without Mn on the subsequentinvasion of excised root pieces by Ggt. 232
hs of Ggr-infected or disease-free wheat roots grown inwith and without Mn 272
of
103
273
273
274
275
Plate 10.1. Micrograpa Mn-deficient sand
Plate 10.2. Scanning electron micrograph of Ggr-infected win a Mn-deficient sand with24 mg of Mn added per pot.
heat roots grown
Plate 10.3. Close-up detail of the surface of a Ggt-infected wheat root grownin a Mn-deficient sand with 24 mg of Mn added per pot. ...
Plate 10.4. Scanning electron micrograph of a Ggr-inoculated agar plug takenfrom a Mn-deficient sand to which 24 mg of Mn per pot had been added,which highlights the presence of small, bright nodules.
Plate 10.5. Scanning electron micrographs of a longitudinal section ofGgr-infected wheat root grown in a Mn-deficient sand with 24 mgMn added per pot .275
Plate 10.6. Scanning electron micrographs of Ggr runner hyphae takenfrom a Mn-def,rcient sand to which 24 mg of Mn had been added per pot
.XIV-
ABBREVIATIONS AND USAGES
2-79 - Pseudomonasfltnrescenr strain 2-79 (Weller and Cook 1983)
Ggt - Gaewnannomyces graminis var. tritíci
Ggt - Experimental treatment using Ggrinoculum
mg kgl D.V/. - nutrient concentration in plant tissue expressed on a dry weight basis
Mn - Manganese
Take-all - Disease caused by infection with Ggt
Wangary sand - 50/50 mix of top- and sub-soil of a highly ca.lca¡eous, Mn-deficient
aeolian sand from'Wangary, Eyre Peninsula, South Australia.
(Uc 1.11, Northcote 1979)
.XV-
ACKNOWLEDGEMENTS
It is a pleasure to acknowledge the contribution to this project by my supervisors,
Dr. Robin D. Graham and Dr. Albert D. Rovira (Division of Soils, C.S.I.R.O.).
I also thank Julie Ascher for her technical assistance and Iman Melky for her help
with the I.C.P. spectrometer to analyze several thousand plant samples during Julie's
absence.
I am indebted to Offrcers of the South Australian Department of Agriculture, Eyre
Region, for assistance with seeding, sampling and harvesting of field trials on the Eyre
Peninsula; in particular, Jim Egan, Tim Branford, Robert Bunder and Brenton Growden.
I wish also to thank Dr. Keith Norrish and Dr. Hugh Ross (Division of Soils,
C.S.I.R.O.) for permission to use the scanning electron microscope and Stuart McClure for
preparation, observation and X-ray analysis of my samples with the s.e.m.
Many thanks are also extended to Heather McDonald @ivision of Soils,
C.S.I.R.O.) for provision of Ggt isolates and introduction to Ggr techniques.
I also thank felow students and staff on the Waite Agricultural Research Institute
campus who extended me their friendship and contributed to many stimulating and
illuminating discussions.
Finally, and most importantly, my deepest gatitude is offered to my parents for
their continued and unfailing support, patience and encouragement.
- XVI
THESIS SUMMARY
Investigations were conducted into the effect of manganese (Mn) deficiency on
Gaewnanrnmyces graminís var. trittci (Ggr) infection of wheat. These experiments were
conducted in the field, in pots and in petri-dishes. This is the first report of an application of
Mn decreasing Ggr infection of wheat in the field in the Southern Hemisphere. Pot
experiments were designed to test three alternative hypotheses previously proposed to
explain decreases ín Ggt infection with ttre addition of Mn to a Mn-deficient soil. The first of
these hypotheses, that Mn was toxic to Ggt, was rejected. The second, that Mn caused
changes in the rhizosphere microflora through alte¡ed wheat host exudates to the detriment of
infection by Ggt, was also rejected. The third hypothesis, that Mn deficiency inhibited
lignin synthesis in the host and thus decreased host resistance, was indirectly supported by
many experiments and it is proposed that it is the most likely mechanism by which Mn
deficiency increases Ggr infection of wheat. Further pot experiments demonstrated that
wheat genotypes sensitive to Mn deficiency were also the least resistant to Ggt infection. A
series of petri-dish experiments demonstrated that wheat root pieces, removed from plants
grown without Mn, were invaded faster by Ggt on agar plates than root pieces taken from
plants grown with adequate Mn. The addition of Mn to agü further decreased rates of
penetration of Ggt into wheat root pieces. Wheat root pieces, removed from plants grown in
Mn-deficient soil and infected with Ggr, were examined under a scanning electron
microscope with energy dispersive X-ray microprobe techniques. These studies revealed
extensive deposits of Mn-rich nodules coincident only with areas of the root where Ggr
hyphae were present and Mn had been mixed through the soil. These Mn-rich hodules were
also found in Ggt hyphae. Several Ggr isolates were tested for their ability to oxidize Mn2+
on agff and it was found that those isolates which most readily oxidized Mn were also those
which were most virulent on the wheat root.
. XVII .
PUBLICATIONS.
Huber, D.M. and'Wilhelm, N.S. (1988). The role of manganese in resistance to plantdiseases. In "Manganese In Soils And Plants." (Eds. R.D. Graham, R.J. HannamN.C. Uren.) pp. 155-173. (Kluwer Academic Publishers: Dordrecht, TheNetherlands.)
and
V/ilhelm, N.S., Graham, R.D. and Rovira, A.D. (1988). Application of different sources ofmanganese sulphate decreases take-all (Gaeumnnrømyces gramt-njs vu ffitÌcí) of wheatg¡own in manganese deficient soil. Aust. J. Agric. R¿s. 39, 1-10.
'Wilhelm, N.S., Graham, R.D. and Rovira, A.D. (1990). Control of Mn status and infectionrate by genotype of both host and pathogen in the wheat take-all interaction. Plant Soilt23,267-275.
Wilhelm, N.S., Graham, R.D. and Rovira, A.D. (1987). Manganese suppresses the take-alldisease of wheat by increasing the plant's internal resistance to the penetration of thefungal hyphae into the root. Invited paper, presented by R.D. Graham at X[V.International Botanical Congress, Berlin, July 26-August 1.

-XVtrI-
THESIS INTRODUCTION
Take-all is a world-wide root disease which has plagued the Australian cereal
grower since the early days of fust setdement and take-all is still regarded as one of the major
fungal diseases of wheat in southern Australia (MacNish 1980, Ballinger and Kollmorgen
1e86).
Likewise, manganese (Mn) def,rciency has a long recorded history in Australian
agriculture. The f,ust report of a micronurient deficiency in Austalia was the application of
Mn correcting "grey speck" disease of oats in the south-east region of South Australia
(Samuel and Piper 1,928). Mn deficiency is now recognized as being a frequent problem in a
wide range of crops on many soil rypes in Australia, and a¡ound the world.
Many factors that influence the level of take-all in the field also affect the release of
soluble Mn2+ ions in the soil. For example, ammonium fertilizers and decreased soil pH,
which reduce take-all, can also reiease Mn2+ whereas liming and increasing pH above 6.5
increases take-all and can decrease the level of soluble Mn2+ in the soil. In 1983, a causal
relationship between severe take-all a¡rd Mn deficiency was discovered (Graham and Rovira
1984). Wheat plants growing under controlled envi¡onment conditions in a Mn-deficient soil
had more take-all than plants which had been grown in the same soil to which Mn sulphate
had been added.
The aim of this project was to investigate various aspects of the interaction benveen
Mn nutrition of wheat and its susceptibility to Ggt infection in such a way that the underlying
mechanism(s) would be uncovered. Initial directions for the project were provided by
testing three hypotheses proposed by Graham and Rovira (1984);
1. Mn2+ may be directly toxic to the free inoculum of the fungus in the soil.
2. Mn may be acting through the physiology of the plant. Mn nutrition affects
photosynthesis, which in tum controls the rate of exudation of soluble organic
.XIX.
compounds by roots. These exudates affect the rhizosphere microflora and,
through it, the ectotrophic growth of the take-all fungus.
3. Lignin production is controlled by Mn-activated enzyme systems. Since ligneous
materials are an acknowledged partial defence against take-all in the form of
lignitubers, these structures may be more poorly developed in Mn-def,rcient plants
A second aim of the project w¿ts to reproduce the interaction between Mn status of
the wheat host and take-all in the field because at the time of the commencement of the
project the phenomenon had only been reproduced in pots under controlled environment
conditions.
References.
Ballinger, D.J. and Kollmorgen, J.F. (1986). Control of take-all of wheat withbenzimidazole and triazole fungicides applied at seeding. Plant Patlnl.35,67-73.
Graham, R.D. and Rovira, A.D. (1984). A role for manganese in the resistance of wheatplants to take-all. Plant Soil78, 44I-5.
MacNish, G.C. (1980). Management of cereals for control of take-all. J. Dept. Agric.,West. Aust. 14th Ser.) 21, 48-51.
Northcote, K.H. (1979). A Factual Key For The Recognition Of Ausralian Soils. 4th Ed.(Rellim: Glenside, S.A.)
Samuel, G. and Piper, C.S. (1928). Grey speck (manganese dehciency) disease of oats. ,I.Dept. Agric., South Aaçr. 31, 696-705;789-99.
Weller, D.M. and Cook, R.J. (1983). Suppression of Take-all of wheat by seed treatmentswith fluorescent pseudomonads. P hytopathol. 7 3, 463-9.

CHAPTER 1.
LITERATURE REVIEW

I
CHAPTER 1. LITERATURE REVIEW
Take-all is a world-wide root disease which has plagued the Australian cereal
grower since the early days of first settlement. In South Australia, Dr. Ca¡l Muecke was
moved to write an essay titled, "The Take-all - The Corn Disease of Australia" in 1870 in
which he recorded the following pessimistic outlook;
The hitherto fertile fields of South Australia have been visited by a
demon-like enemy to agriculture, which is already beginning to f,rll
the minds of farmers with despair. Small patches were observed
here and there, where the crops died off not long after their
appearance above the ground. These patches increased in number
and size and were taken possession of by weeds. At hrst, very little
notice was taken of those patches, but when they increased and
spread year by year anention was attracted to them. The people,
very appropriately, called the mysterious disease "take-all"; but no
one hardly ever thought at that time that this pest would be able to
destroy the prosperity of the whole district, and even to endanger the
very existence of the colony as an agdcultural country.
Nevertheless, agriculture in South Australia has persisted and remained viable but
take-all is still regarded as one of the major fungal diseases of wheat in southern Australia
(MacNish 1980, Ballinger and Kollmorgen 1986).
Likewise, manganese (Mn) defrciency has a long recorded history in Australian
agriculture. The first report of a micronutrient defrciency in Australia was the application of
Mn correcting "grey speck" disease of oats in the south-east region of South Australia
(Samuel and Piper 1928). No grain was ha¡¿ested from untreated plots of Algerian oats
growing on a heavy black alkaline clay soil at Penola but the highest rate of Mn fertilizer
yielded the equivalent of 6.1 tonnes per hectare. Mn deficiency is now recognized as being a
WAITE IN5T]TUTE
u$Rrnv

2
frequent problem in a wide range of crops on many soil types in Australia, and a¡ound the
world.
Many factors that influence the level of take-all in the field also affect the release of
soluble Mn2+ ions in the soil. For example, ammonium fertilizers and lowered soil pH,
which decrease take-all, can also release Mn2+ whereas liming and increasing pH above 6.5
inc¡ease take-all and can decrease the level of soluble Mn2+ in the soil. In 1983, a causal
relationship between severe take-all and Mn defrciency was discovered (Graham and Rovira
1984). Wheat plants growing under controlled environment conditions in a Mn-deficient soil
had mo¡e take-all than plans which had been grown in the same soil to which Mn sulphate
had been added.
The aim of this review is to integrate our knowledge of the take-all disease of wheat
and Mn def,rciency (especially in cereals) with the effect of the envi¡onment on each. The
effect of the Mn on the resistance of plants to disease will also be discussed. Due to the wide
scope and large volume of literature on the first two topics most emphasis will be placed on
those aspects which a¡e of particular relevance to this thesis.
1.1. TAKE.ALL
1.1.1. History and Distribution.
Historically, take-all disease of wheat \pas very much an Australian disease and was
a recurring topic at local Agricultural Bureau meetings and in Deparrnent of Agriculnrre
Journals from the turn of the century onwa¡ds. The disease was fust recognized in South
Australia, as early as 1852 (Anon. 1868, Butler 1961) but the correct identification of the
causal organism took a further 40 years and occurred in France. Prillieux and Delacroix
(1890) identifîed the fungal pathogen as an ascomycete, Ophiobolus gramínis (Sacc.) but
current nomenclaturè has re-classified the causal fungus of take-all of wheat as
Gaewnannomyces graminis An< and Olivier var. titici Walker (GSr) (cf. Walker 1981).

3
Take-all has a world-wide distribution (Sprague 1950, Garren 1981) and occurs in
all major wheat-growing counries of the world. Within Australia take-all occurs throughout
the southern wheat belt, from Western Australia through South Australia, Victoria and most
of New South Wales (Anon. 1984, MacNish 1980, Samuel 1924, V/ong 1983).
1.1.2. Symptoms and impact of take-all on wheat yields
McAlpine (1904) showed that the previously separate diseases known in Ausralia
as 'take-all' (patches, often circular, of severely stunted or dead seedlings) and'white-heads'
or'hay-die' (apparently healthy plants approaching maturity senescing prematurely and
producing dead, bleached inflorescences) were different stages of the same disease and were
caused by Ophiobolus grarninis.
Ggt-infecteÅ wheat plants exhibit cha¡acteristic root blackening (Clarkson and
Polley 1981) and this blackening may extend up the basal stem of the plant and into the inner
culm and leaf sheath surface if conditions a¡e favourable for the disease (Butler 1961). The
diseased root systems bea¡ black necrotic lesions and are often reduced due to rotting near
the crown. Perithecia of Ggt can sometimes be seen protruding through the basal leaf
sheaths of infected, mature wheat plants (Weste 1972) although ascospores are of doubtful,
and at best occasional, importance to the epidemiology of the disease (Ga:rett I93k,
Hornby 1981). As already mentioned, the disease can cause mature plants to senesce
prematurely and heads are either completely empty of grain or the grain is severely shrivelled
(McAlpine 1904, Green and Ivins 1984).
Identification of the presence of Ggt on plants has, until very recently, relied on
accurate assessment of host symptoms and isolation of the causal fungus but the prospect of
objectively quantifying initial Ggr infection by enzyme-linked immunosorbent assay
techniques has now been proposed (El-Nashaar ¿r al. 1986).

4
The importance of take-all of wheat to Australian a¡rd world agriculture in terms of
unrealized cereal yields has been proclaimed for more than a century. An Agricultural
Development and Advisory Service survey in the United Kingdom estimated the national
annual average losses in yield of winter wheat due to take-all for the period 1975-80 at2.I Vo
(equivalent to more than 25 million pounds in growers'returns) (Flornby 1985). In Western
Ausralia take-all is estimated to cause losses of $20 million a year (MacNish 1980) while
$50 million is lost irnnually to all cereal root diseases in South Australia (Stock Journal,
Adelaide, Sept. 13, 1984), Take-ail (Garett 1934a) and cereal cyst nematode (O'Brien and
Fisher 19S 1) are the two major root disease problems in South Australia. These estimates
are mostly based on widespread, and sometimes casual, field observations but conclusive
experimental data on yield losses attributable to uke-all are now available. However, they
are always restricted in terns of sites and years tested and sometimes further qualifications
need to be made.
Soil fumigation has been used to estimate the size of yield losses to many diseases,
including take-all. A maximum increase in yield of 37 Vo was anributed to control of take-all
by Ebbels (1969) but this effect was partially confounded by the fumigation treatment
controlling other diseases in the trial, incomplete control of take-all and also by the fumigant
being I7.3 Vo nirogen. This means that some of the yield increase must be partitioned into
control of other diseases and to a fertilizer effect of the fumigant. Similarly, a fumigation
trial at Rothamsted Experimental Station (Salt 1970) showed aZ?il Vo yield increase with
formalin. Formalin reduced take-all to negligible levels but also halved the incidence of
cereal cyst nematode and decreased eyespot (Cercosporella herpotrichoídes). Rovira (1976)
found a yield decrease of 47 7o in a fumigation trial at Roseworthy Agricultural College in
South Australia which was ascribed to severe take-all alone.
Recent work investigating the effectiveness of fungicidal seed trearnents to control
take-all in the field have revealed large yield losses due to this disease. Take-all caused a 57
7o yteldloss in Kansas (Bockus 1983) and losses of up to 65 Vo were recorded from field

5
trials with natural disease levels in the Victorian wheat belt (Ballinger and Kollmorgen 1986,
Sward and Kollmorgen 1986, Kollmorgen and Ballinger 1987). The fungicides had no
effect on grain yields at Victorian sites which were not infested with uke-all.
Regression approaches have also been used to quantify the effect of take-all
incidence on wheat yields. Regressions between the percentage of plants with infected
crowns and grain yields were calculated for a site at Tunefield in the lower North, and at
Ceduna on the fa¡ West coast, of South Australia in 1969 (MacNish and Dodman I973a).
An increase in disease score from 10 to 50 Vo decreased yield from 21 to 12 g per plot at
Turredield and from 9 to 6 at Ceduna. The slope of the regression increased at Ceduna in
1970 (MacNish and Dodman 1973b). An almost identical regression line was derived at
Avon in South Australia in 1982 (Rovira and Venn 1985). King (1984) found that Ggt
incidence and soil nitrate at sowing explained up to 68 7o of vana¡on in wheat yields at
Coonalpyn, South Australia.
A further approach has been to follow trends in yields with different rotations.
Wheat following oats (a non-host crop for Ggr) with little take-all yielded 10.4 tonnes per
hecta¡e but wheat with a high incidence of take-all following barley only yieldedT .5 t/ha
(Thorne et al. 1985). Extensive examination of the effects of various rotations on take-all
and wheat yields over several years was conducted by a team of workers in the Victorian
Mallee (Kollmorgen et al.1937). They found increases in wheat yields with a break crop
preceding wheat in the order of lffi Vo (compared to continuous wheat) and to a maximum of
more than 300 Vo. Take-alt reduction was perceived to be the dominant effect of the break
crops on wheat yields.
However, significant decreases in take-all incidence have not always been
associated with yield increases (e.g. Bateman 1986) and, conversely, wheat crops apparently
free of disease may carry sufficient infection on its roots to decimate a following wheat crop
if soil and seasonal conditions permit (Buddin and Garrett 1941).
6
1.1.3. The infection process and effects on host gowth and physiology
Ggt may survive as a saprophyte on infected dead plant remains in soil (MacNish
1973, Macnish and Dodman 1973c) or as separate hyphal strands flMarcup 1957). An attack
is initiated by mycelium growing out from such plant and fungal debris in the close vicinity
of, or in direct contact with roots or germinating seed of wheat or barley (lMildermu¡h et al.
1984). The contact between host roots and Ggt is established by trophic growth of the
hyphae towards the roots (Brown and Hornby l97l). On reaching the roots, the fungus
may start gowth on all parts of the host below the soil surface (Fellows 1928, Weste 1972)
although infections of root hairs rarely develop further (Brown and Hornby 1971). The
mycelium of Ggt consists of blaclç/brown thick-walled runner hyphae which form a net
around the outside of the root and hyaline thin-walled hyphae which invade the root and host
cells (Garrett 1934a).
Infection hyphae penetrate a host cell by enzymic dissolution of the cell wall @avis
1925, Manners 1976) and ultimately kill the cell (Manners 1976, Kirk 1984). After
penetration of the epidermal cell walls the infection hyphae grow in all directions, though
mostly transversely (Davis L925). The host cells rapidly respond to Ggt invasion by
depositing lignin on the innermost surface of their walls, around the sites of penetration
(lMeste 1972). These deposits develop into closed tubular structures (lignitubers) as they
encase the penetrating hypha. Lignitubers are rarely successful in completely halting the
invasion of the penetrating hyphae (Skou 1981).
Impairment to host growth appears to begin only when hyphae have penetrated the
stele and invaded the vascular tissue (Clarkson et al. L975). The phloem is destroyed faster
than the xylem (Cla¡kson et al.I975) but the greatest damage occurs when the xylem tubes
become occluded (Fellows 1928), not only by the thickening of the cell walls and the
presence of hyphae, but also by mucilage deposited with the hyphae (the occlusion of xylem
vessels was clearly captured in electron-micrographs in Foster et al.1983). Later evidence
7
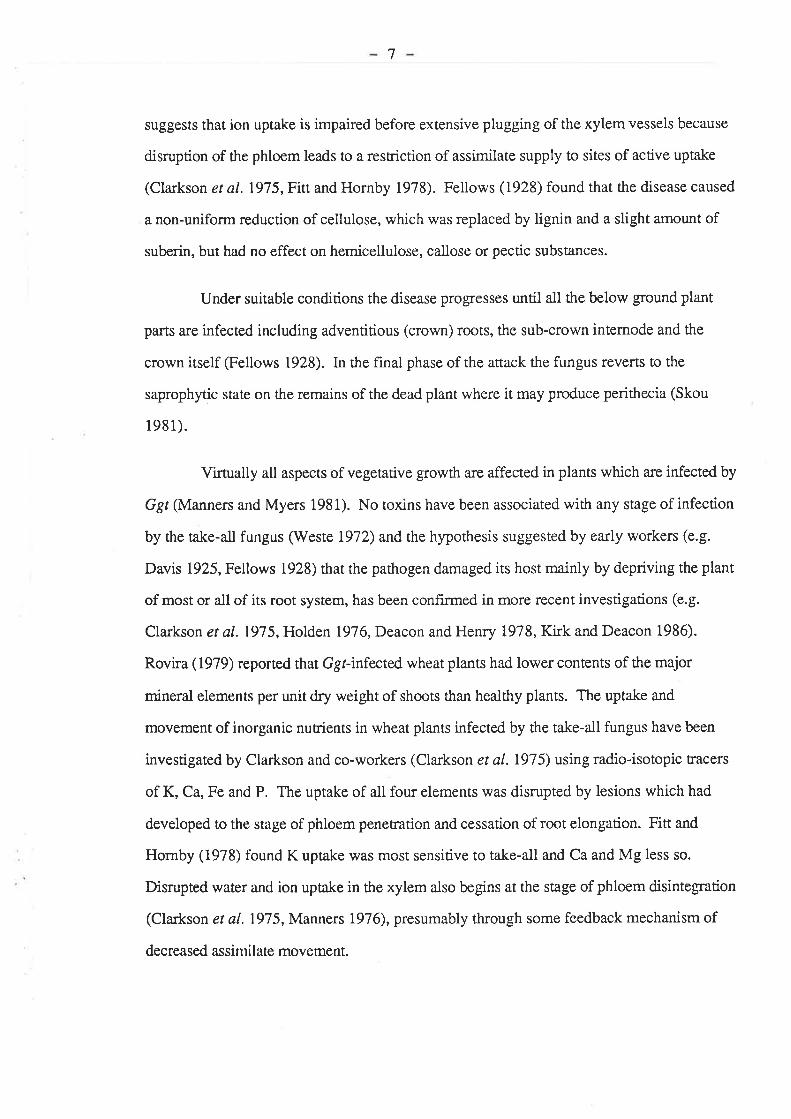
suggests that ion uptake is impaired before extensive plugging of the xylem vessels because
disruption of the phloem leads to a restriction of assimilate supply to sites of active uptake
(Clarkson et al. 1975, Fitt and Hornby 1978). Fellows (1928) found that the disease caused
a non-uniform reduction of cellulose, which was replaced by lignin and a slight amount of
suberin, but had no effect on hemicellulose, callose or pectic substances.
Under suitable conditions the disease progresses until all the below ground plant
parts are infected including adventitious (crown) roots, the sub-crown intemode and the
crown itself (Fellows 1928). tn the final phase of the attack the fungus reverts to the
saprophytic state on the remains of the dead plant where it may produce perithecia (Skou
198 1).
Virrually all aspects of vegetative growth are affected in plants which are infected by
Ggr (Manners and Myers 1981). No toxins have been associated with any stage of infection
by the take-all fungus (Weste 1972) and the hypothesis suggested by early workers (e.g.
Davis 1925, Fellows 1928) that the pathogen damaged its host mainly by depriving the plant
of most or all of its root system, has been confrrmed in more recent investigations (e.g.
Clarkson et al. 1975, Holden l976,Deacon and Henry 1978, Kirk and Deacon 1986).
Rovira (1979) reported that Ggr-infected wheat plants had lower contents of the major
mineral elements per unit dry weight of shoots than healthy plants. The uptake and
movement of inorganic nutrients in wheat plants infected by the take-all fungus have been
investigated by Clarkson and co-workers (Clarkson et aI.I975) using radio-isotopic racers
of K, Ca, Fe and P. The uptake of all four elements was disrupted by lesions which had
developed to the stage of phloem penetration and cessation of root elongation. Fin and
Hornby (1978) found K uptake was most sensitive to take-all and Ca and Mg less so.
Disrupted water and ion uptake in the xylem also begins at the stage of phloem disintegration
(Clarkson et a|.1975, Manners 1976), presumably through some feedback mechanism of
decreased assinri I ate movement.
8
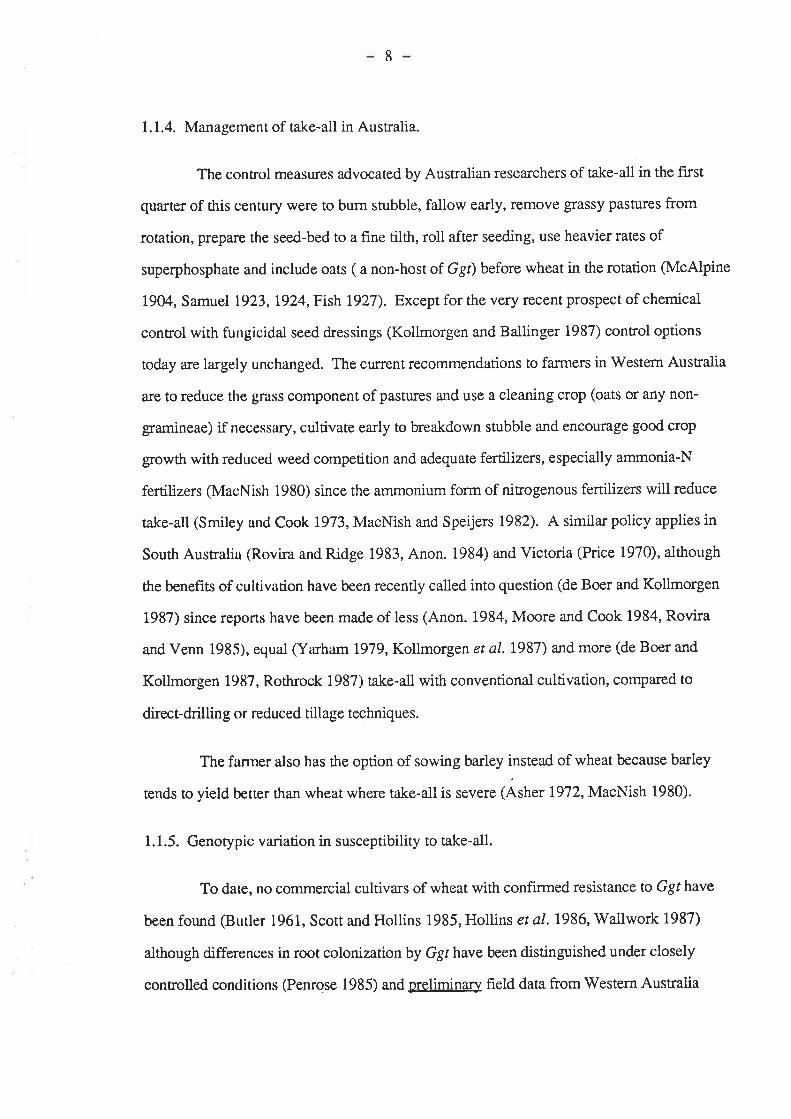
1.1.4. Management of take-all in Australia.
The control measu¡es advocated by Australian researchers of take-all in the fust
quarter of this century were to burn stubble, fallow early, remove gassy pastures from
rotation, prepare the seed-bed to a fine tilth, roll after seeding, use heavier rates of
superphosphate and include oats ( a non-host of Ggt) before wheat in the rotation QvlcAlpine
1904, Samue| 1923, L924,Fish 1927). Except for the very recent prospect of chemical
control with fungicidal seed dressings (Kollmorgen and Ballinger 1987) control options
today are largely unchangecl. The cruïent recommendations to farmers in Western Australia
are to reduce the grass component of pastures and use a cleaning crop (oats or any non-
gramineae) if necessary, cultivate early to breakdown stubble and encourage good crop
growth with reduced weed competition and adequate fertilizers, especially ammonia-N
fertilizers (MacNish 1980) since the ammonium form of nitrogenous fertilizers will reduce
take-all (Smiley and Cook 1973, MacNish and Speijers 1982). A similar policy applies in
South Australiu (Rovira and Ridge 1983, Anon. 1984) and Victoria (Price 1970), although
the benef,rts of cultivation have been recently called into question (de Boer and Kollmorgen
1987) since reports have been made of less (Anon. 1984, Moore and Cook 7984, Rovira
and Venn 1985), equal (Yarh am 1979, Kollmorgen et al. 1987) and more (de Boer and
Kollmorgen 19[ì7, Rothrock 1987) øke-all with conventional cultivation, compared to
direct-drilling or reduced tillage techniques.
The farmer also has the option of sowing barley instead of wheat because barley
tends to yield better than wheat where take-atl is severe (Asher 1972, MacNish 1980).
1.1.5. Genotypic variation in susceptibility to take-all.
To date, no coÍunercial cultivars of wheat with confirmed resistance to Ggthave
been found (Butler 1961, Scott and Hollins 1985, Hollins et a|.7986, Wallwork 1987)
although differences in root colonizationby Ggt have been distinguished under closely
controlled conditions (Penrose 1985) and pælimi¡Ary field data from Western Australia

9
(Wilson and Parker 19S7) and South Ausralia (Simon and Rovi¡a 1985) suggest large
differences in field performance between wheat genolypes where Ggr inoculum had been
applied. In broad terms, wheat is highly susceptible to Ggt infection followed by barley and
triticale, while rye is moderately resistant and oats highly resistant (Asher 1972, Scott and
Hollins 1985, tlollins et al. 1986 and review by Scott 1981).
Ggr has been isolated from many species of grasses (c.f. Scott 1981), including
many of agtonomic importance to Austalian agriculture, e.g. Barley grass (Hordeum spp.),
Spear grass (Brom¿¿r' spp.), Silver grass (Fesruca (now Vulpia) bromoídes) and Wimmera
rye-grass (Lotiumrigidum) (Samuel lgz3,Griffrths 1933, Chambers andFlende 1968,
MacNish 1980).
Ggr does not attack non-gtaminaceous plants (Scott 1981).
1.1.6. Biological control of take-all.
Most soils contain micro-organisms which reduce the level of take-all, an effect
termed'general suppression' (Ga:rett 1.934a, Gerlagh 1968, Baker and Cook 1974, Cook
and Rovira 1976). General suppression is increased by the addition of organic matter
(Garren I934a) and may operate by reducing the impact of ttre øke-all fungus on host
growth. Rovira (1976) found that despite a lower incidence of Ggt on wheat roots from
methyl-bromide fumigated plots flMarcup 1976) where the soil microflora had been depleted,
take-all was more severe and the yield of wheat was reduced from the non-treated control.
The once common seedling blight phase of take-all has been largely replaced by the
less acute haydie phase in southern Australia (Ga¡rett L934a, Cook and Rovira I976) which
suggests that some degree of general suppression now exists in these soils.
The studies of Henry Q932) and Ga¡rett (1934a,b) on the interactions bet'ween soil
micro-flora and take-all of wheat in relation to soil temperature, with natural and heat-
sterilized soil, clearly established that soil microflora suppressed the disease and that this
10-
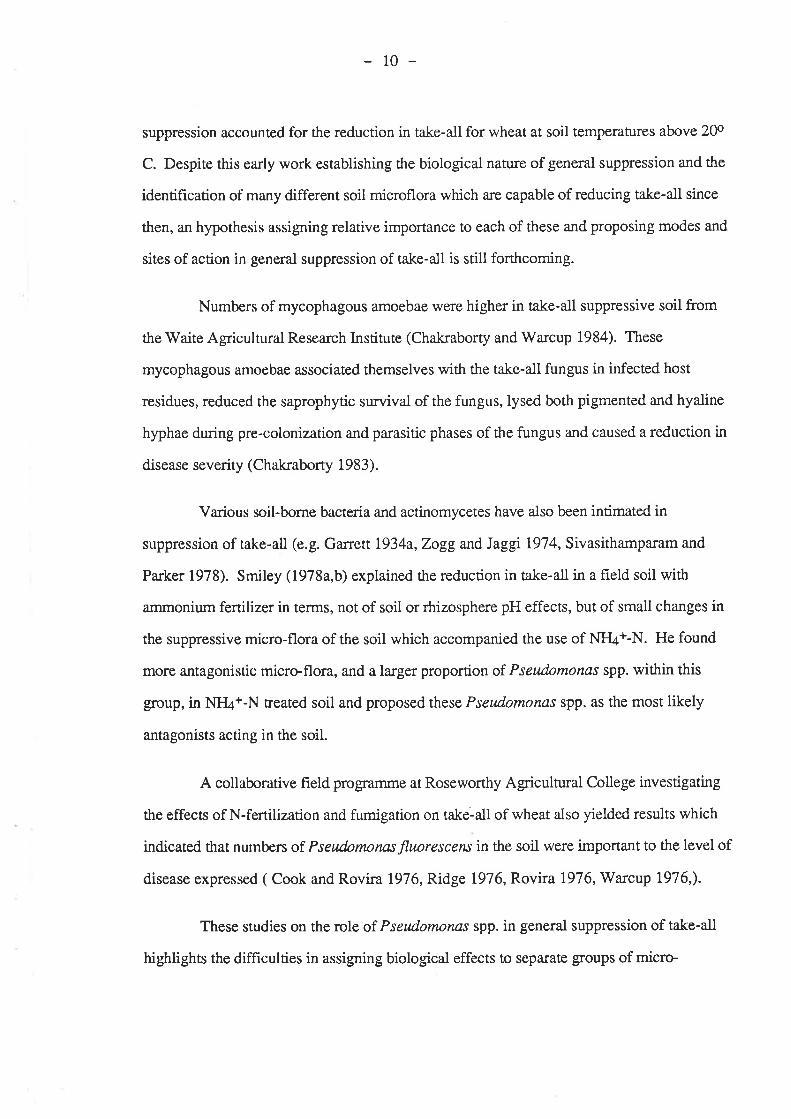
suppression accounted for the reduction in take-all for wheat at soil temperatures above 20o
C. Despite this early work establishing the bioiogical nature of general suppression and the
identification of many different soil microflora which are capable of reducing take-all since
then, an hypothesis assigning relative importance to each of these and proposing modes and
sites of action in general suppression of take-all is still forthcoming.
Numbers of mycophagous amoebae were higher in take-all suppressive soil from
the Waite Agricultural Research Institute (Chakraborty and Warcup 1984). These
mycophagous amoebae associated themselves with ttre take-all fungus in infected host
residues, reduced the saprophytic survival of the fungus, lysed both pigmented and hyaline
hyphae during pre-colonization and parasitic phases of the fungus and caused a reduction in
disease severity (Chakraborry 1983).
Various soil-borne bacteria and actinomycetes have also been intimated in
suppression of take-all (e.g. Garrett l934a,Zogg andlaggi 1974, Sivasithamparam and
Pa¡ker 1978). Smiley (1978a"b) explained the reduction in take-all in a field soil with
ammonium fertilizer in terms, not of soil or rhizosphere pH effects, but of small changes in
the suppressive micro-flora of the soil which accompanied the use of M{4+-N. He found
more antagonistic microflo¡a, and a larger proportion of Pseudnmonas spp. within this
group, in NI{4+-N reated soil and proposed these Pseu.domonas spp. as the most likely
antagonists acting in the soil.
A collaborative field programme at Roseworthy Agricultural College investigating
the effects of N-fertilization and fumigation on take-all of wheat also yielded results which
indicated ttrat numbe rs of Pseudontorns fluorescens in the soil were important to the level of
disease expressed ( Cook and Rovira 1976, Ridge 1976, Rovira 7976, V/arcup I976,).
These studies on the role of Ps¿udomonas spp. in general suppression of take-all
highlights the difficulties in assigning biological effects to separate groups of micro

11
organisms. Antagonistic strains of Pseudomonas fluorescens have also been proposed as
the biological entity causing specific suppression, which is explained below, so these two
classes of suppression would appear to overlap and a¡e not mutually exclusive.
Several Bacilhts spp. have also been found to suppress take-all in pots and in the
field (Campbell and Clor 1985, Capper and Campbell 1986).
A difficult technical problem in this field of resea¡ch has been that 'in vitro' tests of
antagonism of micro-organisms against the take-all fungus have been largely unsuccessful in
screening suitable biological control agents for disease suppression in soil (Baker 1968,
Sivasithamparam and Pa¡ker 1978, Rovira and'Wildermuth 1981, Weller 1985), although
this seems to be true of many studies screening for biological control agents (Burr and
Caesar 1984, Meniman 1987).
The cereal t¿rke-all fungi belong to a group which includes several species and
varieties not, or only weakly, pathogenic to their cereal hosts. A whole field of resea¡ch has
developed a¡ound these hypovirulent'take-all-like'fungi because many have been shown to
decrease take-all (see the review by Wong 1981 and papers by Wong 1975, Speakman and
Lewis 1978, Speakman 1984 and Speakman and Kruger 1984). Wong (1975) showed that
prior colonization of wheat roots by Gaeutnannomyces graminis var. grarninß (GSg)
reduced take-all infection. This effect could not be fully explained by physical exclusion of
Ggt n the cortex by prior colonization with Ggg because spread up the stele by Ggr was also
inhibited, although Cgg never entered the stele. Wong concluded that Ggg may have
induced a specific response in the host. A very similar system was also described by
Spealanan and læwis (1978) for Phialophora ra"dicicolareduction of Ggr invasion into wheat
roots.
Recent resea¡ch has revealed that soil fungi, not closely related to Ggt may also
provide protection against uke-all of wheat. Herman (1985) isolated more antagonistic
mycoflora from the rhizosphere of wheat roots from zero-tillage plots where take-all was

L2-
reduced. This antagonistic mycoflora includedTrichoderma, Fusarium, Aureobasidium and
Spicaria spp. Mk:rodochiwn bolleyi, a weak pathogen, significantly reduced infection of
wheat r9oß by Ggr (Kirk and Deacon 1987a,b) and a mechanism of competition for cortical
cells was proposed.
'Take-¿ll Decline' is a phenomenon reported to occur in Europe and north-western
U.S.A. (Gerlagh 1968, Baker and Cook 1974, Shipton I975, Cook and Rovira 1976) and
is defined as ttre spontaneous reduction in take-alt and increase in yield with continuous
cropping of wheat and barley (Rovira and V/ildermuth 1981). The suppression found in
take-all decline has been termed'specihc suppression' (Gerlagh 1968, Baker and Cook
I974) and its features, compared to general suppression a¡e summarized in table 1.1., from
Rovira and Wildermuth (1981), where T.A.D. is an abbreviation for'Take-all decline' and
transferable means that a small volume (1-10 7o) of suppressive soil mixed with a conducive
(or non-suppressive) soil will induce suppression of take-all.
The imporunce of specific suppression of take-all has not been defined in Australia,
possibly because continuous wheat rotations are rarely practiced and our high summer soil
temperatures would be desfuctive to the non-sporing bacteria which are involved (Rovira
and Wildermuth 1981, Rovira and Ridge 1983).
13
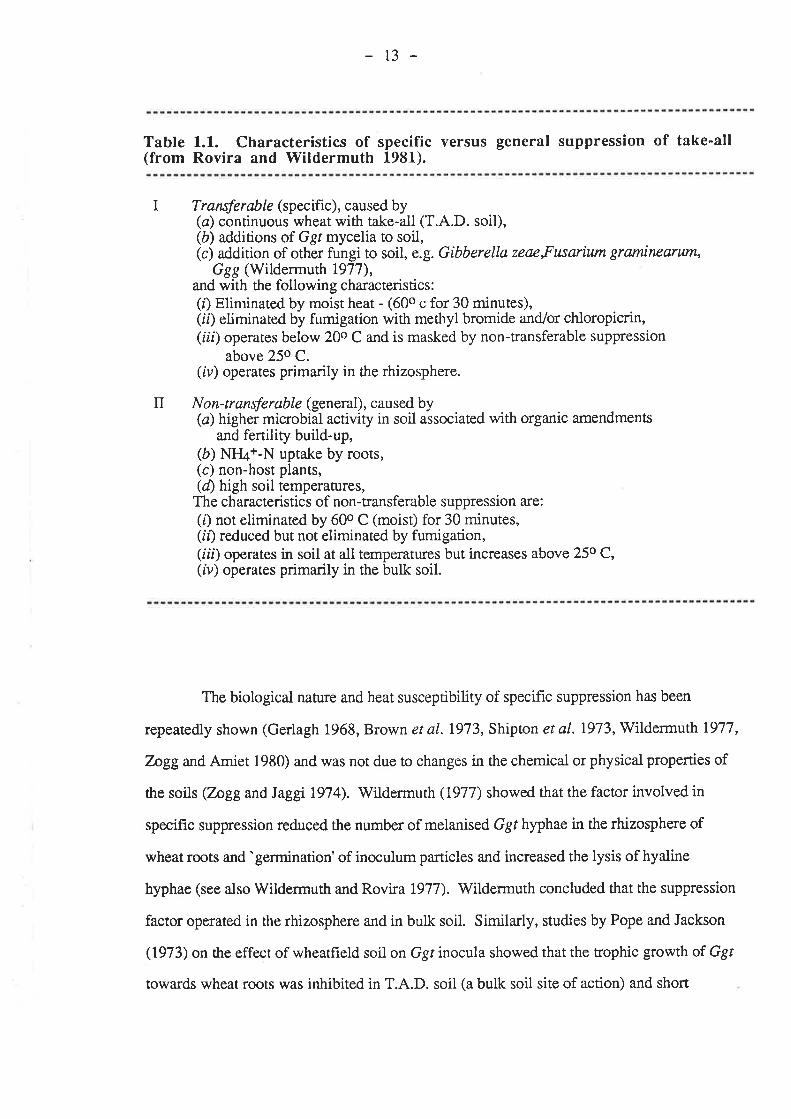
I
Table 1.1. Characteristics of specific versus general suppression of take-all(from Rovira and Wildermuth 1981).
Transfer able (specific), caused by(a) continuous wheat with take-all (T.A.D. soil),(å) additions of Ggr mycelia to soil,(c) addition of other fungi to soil, e.g. Gíbberella zeae,Fusarium graminearutn,
Ggg (Wildermuth 1977),and with the following characteristics:(i) Eliminated by moist heat - (600 c for 30 minutes),(ii) eliminated by fumigation with methyl bromide and/or chloropicrin,(iii) operates below 20o C and is masked by non-transferable suppression
above 25o C.(iv) operates primarily in the rhizosphere.
N on- tr ansfe rable (general), caused by(a) higher microbial activity in soil associated with organic amendments
and fertility build-up,(b) Xff¿+-N uptake by roots,(c) non-host plants,(d) high soil temperatures,
The characteristics of non-transferable suppression are:(i) not eliminated by 60o C (moist) for 30 minutes,(ii) reduced but not eliminated by fumigation,(iii) operates in soil at all temperatures but increases above 25o C,(rv) operates primarily in the bulk soil.
II
The biological nature and heat susceptibility of specific suppression has been
repeatedly shown (Cerlagh 1968, Brown et al. 7973, Shipton et aI. 7973, Wildermuth 1977,
Zngg andAmiet 1980) and was not due to changes in the chemical or physical properties of
the soils (Zoge and Jaggi 1974). Wildermuth (1977) showed that the factor involved in
specific suppression reduced the number of melanised Ggt hyphae in the rhizosphere of
wheat roots and 'germination' of inoculum pafticles and increased the lysis of hyaline
hyphae (see also Wildermuth and Rovi¡a 1977). Wildermuth concluded that the suppression
factor operated in the rhizosphere and in bulk soil. Similarly, studies by Pope and Jackson
(1973) on the effect of wheatfield soil on Ggt inocula showed that the trophic g¡owth of Ggt
towards wheat roots was inhibited in T.A.D. soil (a bulk soil site of action) and short
t4-
periods of contact of wheat roots with decline soil or its suspension reduced Ggr infection
when they were subsequently grown in non-decline soil (a rhizosphere site of action).
However, the estimated mean distances from root to inoculum particle for infection to occur
were found to be the same in take-all suppressive or conducive soil (V/ilkinson et al.1982
Wilkinson et al. 19f15) and the number of lesions produced per unit weight of colonized
particles and the minimum inoculum particle size required for maximum infection were both
similar in suppressive and conducive soils (Cook et al. t986). The results of these laner t'wo
studies suggest that specific suppression does not operate in the bulk soil but occurs on or in
the immediate vicinity of the root surface.
In the collaborative freld programme at Roseworthy Agriculrural College mentioned
earlier, two of the fumigation treannents were methyl-bromide at 220kglha and chloropicrin
at the same rate. Similar incidences of Ggt were measured on wheat roots from these two
treaÍnents but there were far more white-heads in the methyl-bromide reated plots. This
observation was partly explained by much higher numbers of fluorescent pseudomonads in
general, andGgt antagonistic strains in particular, from chloropicrin treated plots (Rovira
r976).
Rovira and Cook (1976) were the first to propose that fluorescent pseudomonads
were the most likely agents responsible for specific suppression of take-all. V/eller and
Cook (1981) reported a higher proportion of fluorescent pseudomonads in take-all
suppressive soil and within the fluorescent pseudomonads many more of the isolates from
this soil inhibited Ggr than in conducive soils. These findings were followed up with
successful testing of suppression of take-all in pot and field experiments with strains of
fluorescent pseudomonads infiltrated into inoculum particles, which gave the best control, or
applied to the seed (V/ilkinson ef a|.1982, Weller and Cook 1983). Soil drenches were not
effective. One of thei¡ most successful strains was isolate 2-79 (NRRL B-I5132) which is
very antagonistic to Ggt 'in vitro' and is a good competitor in the wheat rhizosphere (Weller
and Cook 1933). Seed-inoculated2-79 (NRRL 8-15132) was detected down the enti¡e
15-
length of seminal roots of field-grown wheat and it still represented25 7o of the total
fluorescent pseudomonad population on the roots 48 days after planting @eller 1984)
Fluorescent pseudomonads a¡e a $oup of soil-borne, oxidase and arginine
dihydrolase positive, non-sporing, rod-shaped bacteria (Schroth and Hancock 1982) which
are good colonizers of plant roots, especially of cereals (Kleeberger et aI. 1983, Martin
7971). These bacteria have been extensively studied because of the strong antagonism they
show to many plant pathogons and their ability to decrease disease. In addition, inoculation
of roots of plants with fluorescent pseudomonads in the absence of any pathogens can have
stimulatory, inhibitory, or no effect on plant growth @lliott and Lynch 7984,Gatdner et al.
1984, Lynch and Clark 1984, Olsen and Misaghi 1984, Elliott and Lynch 1985, E,lad et al.
1987). The effects of fluorescent pseudomonads on many hoslpathogen systems, apart
from take-all of wheat, have already been studied, e.g. Fusarium wilt of carnation (Yuen ør
¿i. 1985) and of radish, flax and cucumber (Scher and Baker 1980,1982, Scher et a|.7984),
common scab and Erwinia infection of potatoes (Geels and Schippers 1983a,b) and black
roor rot of tobacco (Aht er al. L986). The general field of beneficial plant bacteria was most
recently reviewed by Burr and Caesa¡ (1984).
Attention to the mechanism behind the reduction of disease by fluorescent
pseudomonads has centred on their ability to produce siderophores (see review by Nielands
and Leong 1986) although they can produce a wide range of antibiotic compounds (Burr and
Caesar 1984, Ahl et a\.7986). Siderophores are low molecular weight (50-100 daltons)
ferric-specific ligands whose biosynthesis is triggered by low iron conditions and their
function is to scavenge Fe3+ (very insoluble under aerobic conditions) from the environment
for the cell (Nielands 1981).
Although fluorescent pseudomonads now seem to be widely accepted as being
important in suppression of take-all, the issue of the mechanism underlying this effect is fa¡
less settled. It has been hypothesized that siderophores function as biostatic compounds by
t6-
drastically reducing the amount of Fe3+ ions available to certain rhizosphere microflora
(I(oepper et al. 19Í10, Misaghi et a|.7982, Scher and Baker 1982, Geels and Schippers
1983a,b, Hubba¡d et al. 1983, Elad and Baker 1985, Nielands and Leong 1986), including
Ggr (Kloepper et al.l980,We11er and Cook 1983).
Although disease reduction because of siderophore production by fluorescent
pseudomonads almost certainly occurs under some conditions the universal applicability of
this model is now coming under increasing pressure. Lockwood and Schippers (1984)
concluded that their results provided no evidence for a primary role for siderophores in soil
mycostasis but they conceded that a role for siderophores was not ruled out in the
colonization of energy-rich substrates, including the rhizosphere. Weller and Cook (1983)
qualifred their conclusions by stating that siderophores were not the only possible
mechanism because 'in vitro' tests of fluorescent pseudomonad antagonists of Ggr showed
that some inhibition was still present on Fe-rich media. Subsequently,2-79 (NRRL B-
15132> has been found to produce a phenazine-l.-carboxylic acid which has strong antibiotic
properties against Ggt and other organisms (Brisbane et a|.1987). Non-siderophore
producing fluorescent pseudomonad antagonists of Ggt and antagonism on Fe-rich media
have also been discovered by other workers (Hemming et a|.1982, Geels and Schippers
1983a, Ga¡dner et al. 1984. Elad and Baker 1985, V/ong and Baker 1985). In addition,
there are the further complications that the siderophore may also inhibit Fe uptake into the
host plant, which was found for peas and maize @ecker et al. 1985) and some very recent
work showed that the siderophore was only toxic when it was bound to i¡on and it was
proposed that siderophores were not toxic because they depleted iron but because they raised
it to toxic levels at ioc¿rl sites (Ahl et aI.1986).
1.1.7. Influence of the environment, including host nutrition, on take-all severity.
Take-all of wheat and barley occurs world-wide in regions where soil pH is
between approxinrately 6.0 and 8.5, where soils during much of the growing season are
L7
benryeen 5 and l5o C and near field capacity at the surface, and where the soils are relatively
coarse-textu¡ed and non-compacted so that aeration is good (Cook 1981) or, at least, this is
the widely accepted view.
Early research into take-all cites the disease as a severe problem only on coarse-
textured alkaline soils (McAlpine 1904, Fish 1927, Griffrths 1933, Ga:rett 1934a, Price
1970) although severe take-all has also been recorded on soils of acid reaction (Rosen and
Ellioa 1923, Brenchley 1968, Ya¡ham 1981, MacNish and Speijers 1982, Taylor et al.
1983, Muray et al, 1986, Kollmorgen pers. comm.). In many of these cases of severe take-
all on acid soils, water-logging or very poor drainage were also involved-
Similar, apparently conflicting, reports have a-lso been made regarding the effect of
wet soils on the development and expression of take-all. The take-all fungus has a high
water potential requirement for growth and cannot grolv at water potentials below about -45
bars (Cook and Christensen 1976). Its growth is halved at,water potentials as high as -20
bars and wheat grown under dryland conditions are cornmonly at potentials of -25 to -35
ba¡s be¡veen tillering and heading stages (Papendick and Cook I974). These findings are in
keeping with field observations that take-all was always ,ilorst in years with a wet winter
and,/or spring (Grifliths 1933, Ga¡rett 1934c, Price 1970, MacNish 1980), that take-all was
worst on areas where drainage was very poor (Rosen and Elliott 1923, Brenchley 1968,
Ya¡ham 1981) and that disease on roots was worst in soil at 70-80 Vo of water-holding
capacity (McKinney and Davis 1925). They contrast, however, with other observations that
take-all is favoured by loose, coarse-textured seed-beds (McAlpine 1904, Samuel 1923,
Griffiths 7933, Price 1970) and that the incidence of haydie is highest with a dry frnish to the
season (McKinney and Davis 1925, Price 1970, MacNish 1980, Trolldenier 1981). In
addition, Ggr is sensitive to reduced oxygen tensions (Smith and Noble lg7z,Fenaz 1973)
so is not likely to grow well in very wet onwater-logged soils despite its requirement for
high water potentials. Ggr growth decreased very quickly at water contents gleater than 44
Vo of water-holding capaciry (Glenn et aI. 1985) but McKinney and Davis (1925) found that
18
take-all was worsr in soil at 70-80 Vo of water-holding capacity. In subsequent work, Glenn
and co-workers (1987) concluded that oxygen, per se, was not likely to limit Ggr growth
through soil but that the prevalence, size and distribution of gas-filled pore spaces were
important in determining rates of spread of Ggt hyphae.
The apparent contradiction between take-all being favoured by wet winters and
springs but haydie being worst under dry conditions is reconciled by reference to the nature
of the damage that Ggt causes to the host. Ggr effectively truncates the wheat roots so in
years when the season finishes early, heavily diseased plants (prevalent if condiúons have
been wet ea¡lier in the season) do not have an effective root system to search for water
deeper in the soil profile and die.
Whereas wet soil favours Ggr growth, the opposite condition is best for its long-
term survival. The survival of the pathogen in host debris in soil has been demonstrated to
be best when conditions were dry and cool (MacNish 1,973, 'Wong 1984). The fungus also
survived under conditions which were dry and hot or cool and moist but was quickly
elhninated in hot, wet soils. Ggt can easily survive in host debris over Australian summers
(MacNish and Dodmanl973c, Kollmorgen and Walsgott 1984). These results indicate that
Ggr survival is favoured by conditions which restrict microbial activiry.
Take-all has also been reported to be more prevalent in colder, duller seasons
(Hornby and Henden 1986).
Ggt grows optimally'in vitro' in the temperature range 20-3æ C (Davis 1925,
SivasithampÍìram and Parker 19S1) but take-all is usually most severe at soil temperatures of
5-150 C. McKinney and Davis (1925) showed that disease was most severe at 12-160 C and
in another study (Smiley et al.1986) take-all was found on roots at 14 and 24o C, but not
29o C. The effect of increasing temperature on take-all is quite different in sterilized soil
where increases over the range l2-27o C had eithe¡ no effect (llenry 1932) or increased take-
all (Garrett 1934b). The inhibitory effect of temperatures over approximately 20o C on Ggr
L9
go'wth in non-sterile soil and take-all are due to increased microbial activity (general
suppression) in the soil (Garrett 1934a, Cook and Rovira 1976, Grose et al. 1984).
Although heavy liming of soils will almost guarantee severe take-all (providing
other conditions are favourable) (Rosen and Elliott 1923, Smiley and Cook 7973, Huber
1981, Murray et a|.1986) and ammonium-N fertilizers (in contrast to nitrate-N) usually
decrease take-all (Smiley and Cook 1973, Smiley 1978a,b, Trolldenier 1981, MacNish and
Speijers 1982) the complete interaction between soil pH and take-all is unclear. Ggr growth
'in vitro' is relatively insensitive to pH with some growth recorded at the pH extremes of 3
and 10 (Davis 1925, Sivasithamparam and Pa¡ker 1981) and it grew equally well either side
of the optimum range of 6-8. The concentration of H+ ions, per se, does not seem to be an
important factor determining take-all severity except perhaps at strongly acid soil pH's.
Cook (1981) listed three mechanisms to explain the effect of soil pH on take-all. The first
(originally proposed by Garrett 1936) was that a low pH shifts the COzÆICO3-/QQ32-
equilibrium to the gaseous and hence more inhibitory phase but work by Ferraz (1973) and
Smitlr and Noble (1972) showed that Ggt gowth in soil was not limited by CO2. The
second was that Ggt is more subject to antagonism from rhizosphere micro-organisms at
lowered pH's. The inhibitory effects of ammonium-N on take-all were proposed to be two-
fold (Smiley and Cook 1973); ammonium-N decreased the rhizosphere pH which directly
inhibited Ggt at pH's less than 5.0 and at pH's above 5.0 the inhibition was biological.
Later work by the first author in Australia indicated that increased anøgonism of
Pseudomonas spp. against Ggr was the likely mechanism for the inhibitory effect of
ammonium-N on uke-all (Smiley L978a,b,1979). A very recent biochemical study on
Pseu"damonas fluorescens 2-79 (NRRL 8-15132) has isolated an antibiotic which is only
active'in vitro' at pH's less than neutal (Brisbane et aL 1987). The third mechanism was
that the reduced availability of certain plant nutrients, especially the trace minerals, in alkaline
soils would result in nutritional def,rciencies that favour take-all.

20
The complex interaction between nutrients and take-all has, so far, been responsible
for several hund¡ed scientific papers. The field has been recently reviewed by Huber (1981)
excepting that little mention was made of the effects of trace minerals on Ggt growth or take-
all severity.
Many papers in this a¡ea have concentated on the effects of N,P and Ca (especially
as lime) on take-all, probably reflecting their importance as fertilizers to lift cereal yields.
In general, severe take-all is restricted to plants of low nutritional status (Rosen and
Elliott 1923, Butler 1961, Hornby and Goring l972,Homby 1985) and take-all normally
increases the response of cereals to fertilizers because serious yield loss occurs on poorly-
nourished plants while well-nourished plants suffer much less damage (Glynne 1953). This
concept of'disease escape' (the plant is able to grow on by producing new roots to replace
those destroyed by Ggt) by well-nourished plants has been widely published (e.g. Garrett
1948, Glynne 1953, Butler 1961, Asher 1972) but this does not necessarily mean that the
roots of well-nourished plants are more resistant to those of poorly-nourished ones. It
appears that the benef,rcial effects of P in reducing take-all are due to stimulated root
development (Butler 1961). Many of the papers on nutrition and take-all, especially for N,P
and Ca, did not assess levels of Ggt infection but only recorded plant growth which limits
the conclusions that can be d¡awn. For instance, in one pot study which tested the response
of Ggr-infected wheat to inadequate N,P or K fertilizaion, a greater yield depression
occurred in treatments with no or low N, P or K fertilizer but assessment of infection on the
roots rilas not made (Trolldenier 1985).
There are cases, however, where increased plant resisunce to take-all with
improved nutrition of certain elements has been demonstrated. Fertiüzation with ammonium-
N decreases the number of infection sites, restricts lesion development or limits vascula¡
damage and nitrate-N does the opposite (Butler 1961, Smiley and Cook 1973, Huber and
'Watson 1974, Smiley 1978a,b, Trolldenier 1981, MacNish and Speijers 1982).
-21
Chloride fertilization may reduce Ggt infection and take-all severiry (Taylor et al.
1983, Christensen and Brett 1985). It has been proposed that chloride may be effective
because it reduces nitrification and maintains higher levels of ammonium-N in the soil
(Christensen and Brett 1985) although Goos and co-workers (1987) reported that KCI
fertilizer reduced common root rot of barley (caused by Cochlíobohts (now Bipolarís)
sativus) because it sharply decreased nitrate levels in the plant and soil effects were not
important.
Ca, although generally applied as a fertilizer to neuÍalize soil pH (Rosen and Elliott
1923, Smiley 1978b, Murray et al.1987) appears to favour take-all in addition to its effect
on soil pH because uke-all was increased after application of either calcium sulphate (neuual
salt as gypsum) or calcium ca¡bonate (lime) (Fluber 1981).
A reduction in take-all by adding Mg to heavily leached soils in laboratory studies
has been reported (Hornby and Goring 1972) and was most effective in combination with a
mixture of ammonium-N and nitrate-N. Reis and co-workers (1982) also found Mg
decreased take-¿ll in sand culture.
The availability of most trace elements is very sensitive to changes in soil pH. With
the single exception of molyMenum, the availability of the trace elements is decreased by
increasing pH, with Mn and Fe the most sensitive, followed by B and Zn, and Cu the least
sensitive (Mengel and Kirkby 1982). Until recently, the association of high pH soil with
severe take-all and low availability of trace elements has received scant attention (Butler
1961, Huber 1981, Hornby 1985) but some studies have now been published which report
reductions in take-all due to addition of trace elements.
Reis and co-workers (1982) reported that withholdrngZn, Cu or Mn, but not Fe,
from wheat plants growing in sand culture with complete nutrient solution increased the
severity of take-all. The plants in the treatnents where each trace element was withheld were
the same size as those in the complete controls so the high levels of each of the trace elements
22
used may have been toxic to the pathogen rather than the withholding of each causing
deficiency in the host and decreasing its resistance to attack. However, deficiency symptoms
were noted in the nil treatrnents, and Zn and Cu, but not Mn, were also effective at
decreasing take-all when applied to the foliage only, which suggests that, at least fo¡ Cu and
Zn, the effect was on the host and not the pathogen. The effect of applying Cu and Zninthe
field was also tested and both decreased the severity and incidence of take-all.
More conclusive evidence for Cu deficiency decreasing the resistance of wheat
plants to Ggt infection was provided by pot studies conducted with Cu-deficient field soil
flñ/ood and Robson 1984). They showed that the length and severity of proximal lesions
(closest lesion to the crown) increased and the length of uninfected root between crown and
proximal lesions decreased in Cu-deficient plants. Increasing the rate of soil-applied Cu
above that needed to eliminate deficiency in the host did not further decrease disease.
Following the tentative evidence of Reis and co-workers (1982), Mn deficiency has
been confirmed to ma¡kedly decrease the resistance of wheat plants to Ggt infection (Graham
and Rovi¡a 191ì4, Rovira et al.1985). In pot studies conducted with Mn-deficient field soil,
the number of seminal roots per plant with lesions, the number of lesions per plant and the
totat length of lesions per plant were reduced by up to 60 Vo with rates of soil-applied Mn
which were suff,rcient to eliminate deficiency in the plants. An intermediate rate of Mn which
resulted in marginally deficient plants slightly reduced take-all levels. The addition of Mn-
EDTA to ammonium-N in the field was reported to further reduce take-all severity and
increased wheat yields an additional21 7o (Huber and Mburu 1983). The application of
ammonium-N alone dec¡eased rhizosphere populations of Mn-oxidizing bacteria (Mn-oxides
are unavailable to plants) and increased uptake of M¡r by wheat so some of the benefits of
ammonium-N on take-all may be due to improved Mn nutrition of the host.
The different effects of environmental factors on Ggt gowth 'in vitro' and in
natural soil, and on the uke-all disease, highlights our poor understanding of environmental

23
effects on the latter two processes and, in particular, our very limited knowledge of how
environmental effects on the pathogen, the infection process and the host are integrated in the
field. The effect of soil water is an obvious example; Ggr grows best in wet soil but is
sensitive to poor aeration yet take-all can be severe on poorly d¡ained sites and the nutrition
of the host crop is almost certainly adversely affected by the poor drainage. The multitude of
interactions in such a case have yet to be unravelled.
I.2. MANGANESE
1.2.1. Mobility and metabolic roles of manganese in the plant.
Mn is taken up by plants predominantly as the manganous ion and is transported
through the xylem as a free divalent cation (Graham 1979). Mn is generally accepted to be
immobile within plants and is not redistributed, even if the growing points suffer from
deficiency (Single 1958, Henkens and Jongman 1965, Hocking L984, Nable and Loneragan
1984a,b). However, there have been a number of reports which concluded that Mn was
slightly mobile (e.g. Williams and Moore 1952, Single and Bird 1958, Vose 1963, Graham
and Loneragan 1981, Hannam et al. l9lil)although in these cases plants were either
supplied with luxurious levels of Mn, were senescing, or the Mn was applied to the leaves.
In most cases the amount of Mn retranslocated was small and not always physiologicatly
significant.
Under adequate supply, Mn is distributed evenly throughout the plant (Vose 1963)
but under a decreasing supply of Mn, roots can act as a reservoir for Mn for the shoots
(Munns et al. 1963, Vose 1963), providing tissue concentrations of Mn do not become very
low in the roots themselves (Single and Bird 1958). However, translocation from one half
of the root system to the other was undetected in subterraneum clover growing in a split-root
solution culture system (Nable and Loneragan 1984a,b).

24
The majority of Mn in leaves can be extracted with water and much less is removed
by organic solvents (Single and Bird 1958, Hannam et al.1984) which ledHannamet al.
(1984) to the conclusion that much of the Mn in leaves was associated with structural
components of the cells and may have been metabolically inactive. Under Mn toxic
conditions, plants appear to compartmentalize Mn in a metabolically inactive form (Memon
and Yatazawa 1984, Blamey et aL 1986), an effect which is visually striking in sunflowers
because black/brown deposits of Mn appeil at the base of,and in, the trichomes (Blamey ef
a/. 1986).
Only one true'meullo-protein' of Mn has been isolated from higher plants @ieckert
and Rozacþ 1969) but Wiiliams (1982) classified super-oxide dismutase and acid
phosphatase as metallo-proteins and various other enzymes as readily dissociable Mn (tr)
proteins. Nevertheless, the most common role for Mn in higher plants appears to be as a
catalytic activator of enzymes and has been shown to be involved in many metabolic
processes (Doby 1965). Magnesium can often substitute for Mn as an activator of many, but
not all, of these enzymes (Mengel and Kirkby 1982).
The best documented, and most impormnt, roles of Mn a¡e in the photosynthetic
process. Mn is intimately involved in oxygen evolution during photosynthesis (Kuwabara
and Murata 19tì3, Nable et aL 1984, Kriedeman et aI. 1985) and it has been proposed that
Mn may act as an electron clonor for photosystem II (the site of water splitting and oxygen
evolution) in competition with H2O (Flandley et a|.1984). Mn is also important in the
structual integrity of ohloroplasts and the thylakoid membranes within (Possingham er a/.
I9&, Simpson and Robinson 1984), regulation of the biosynthesis of protein components
of photosystem II specifically (Khmara 1984), biosynthesis of chlorophyll (Scarponi and
Perucci 1984) and elimination of radical super-oxides generated by photosystem I (Flandley
et a|.1984. Palma et al.1986, Leidi et a|.7987).
25
Mn also plays a stimulatory role in plants in the biosynthetic pathway of lignin
(Gerretsen 1949,Engelsma 1972, Durst 7976, Autor 1982, Brown 1983, Brown et al.
1984). Phenylalanine ammonia-lyase (PAL) is a key enzyme in the lignin (and phenol)
pathways (Gross 1980) and its activity is strongly enhanced by high concentrations of Mn2+
@urst l976,Engelsma 1972). Cinnamic acid-hydroxylase, another enzyme involved in the
biosynthesis of lignin, is simila¡ly affected by Mn2+ @urst 1976). Engelsma (1972)
suggested that the stimulatory effect of Mn2+ on PAL activity was due to the removal by
Mn2+ of end-products of the PAL pathway. These end-products exhibit feedback inhibition
on PAL activity so the Mn2+ effect on PAL activity may not be direct. In addition, Krishna
and Bharti (1983) showed that there was a complex interplay between the hormone indole-
acetic acid, endogenous levels of Mn2+ and levels of mono- and polyphenols. They
concluded that Mn2+ may additionally regulate lignin and phenol production through indole-
acetic acid mediated steps. Mn deficiency also affects the activity of several enzymes
important in phenol synthesis (Carpena et al. 1977). These effects are of particula¡ interest in
this review because lignin production and deposition is an important defence response of
plans to Ggt invasion (Skou 1981). Also, Mn has been found to accumulate in barley cell
walls around penetration sites of Erysíphe graminis (powdery mildew) during the initial
stages of the infection process (Kunoh et al. 1975, Kunoh and Ishizaki 1976). It was
proposed that the specific deposition of elements like Ca, Si and Mn may have been part of
the host resistance reaction.
Other metabolic roles for Mn which have been reported include the regulation and
synthesis of plant hormones, especially indole acetic acid (Mengel and Kirkby 1982,
Krishna and Bharti 1984, Mudlia¡ and Bha¡ti 1984), norma.l function of ribosomes (and
hence protein synthesis) (Ma et al. 1985), DNA formation through control of biosynthesis of
DNA precursors (Pflonzig and Auling 1987) and regulation of lipid and ca¡bohydmtes
(Marschner 1986).
26
The functional requirements of plants for Mn, estimated by minimal tissue Mn
concentrations needed for normal growth, appeu to be very simila¡ under varying
environmental conditions for all genotypes (Mengel and Kirkby 1982, Ma¡schner 1986).
Generally, plants require internal concentrations of l5-2O mgkg-lD.W. (Mengel and Kirkby
1982) to avoid growth depression due to Mn deficiency, although very different values have
been published for some plant species (Labanauskas 1973). It is difficult to attach
significance to reports of variations in critical Mn concentrations with genotype because
factors such as choice of tissue, physiological age of tissue, plant age, nutrient interactions
a¡d culnue medium may impact on the derivation of critical levels (Batey 1971).
However, within the temperate cereals, very little variation appears to exist in the
critical Mn concentration. Analysis of young leaves, which are the be st indicators of current
Mn supply to the plant (Grahamet aI.l9ïS),revealed a critical Mn concentration of 11
(Graham et a|.19t15) and 13 mg kg-l (Ohki 1984) in two independent studies conducted in
the field and in solution culture, respectively. A frgure of 10 mg kg-l *as reported for oats
in the f,reld (Karamanos et aL 1984), I 1 mg kg-l fot barley in the f,reld (Hann arn et al. 1987)
and 8 mg kg-l fo. barley (analysis of whole tops) in pots (Wilhelm et al. 1985). Linle
evidence has been reported for differences between critical Mn concentrations for cultivars
within a cereal species (Graham 1984, Grahamet a\.7985, Marcar and Graham 1986).
L.2.2. Geograph ical distri bution of manganese defi ciency.
Mn was first confirmed as an essential micronutrient for plants n 1922 (McHargue
1922) and was quickly followed by the f,rst report of Mn deficiency in the f,reld (Samuel and
Piper 1928). They correctly identihed that'road take-all' (not to be confused with the
disease caused by Ggt infection) and'grey speck' disease of oats observed in the Penola and
Mt. Gambier regions of South Australia were caused by Mn deficiency. Crops growing near
the roads were worst because lime dust blew off the roads, increased the pH of the soils and
decreased the availability of Mn.
-27
Mn deficiency has been reported in many crop plants and on many different soil
types around the world. Dudal (1976) identified eight world soil taxonomic groups which
rüere susceptible to Mn def,rciency for crops; a¡enosols (derived from quarø materials and
low in most nutrients), chernozems (high in organic matter and calcium carbonate), gleysols
(commonly waterlogged), histosols (high in organic matter and frequently water-logged),
kastanozems (high in organic matter and high pH), podzols (heavily leached), rendzinas
(high in calcium carbonate) a¡rd solonetz (high pH). The three features of either high soil
pH, high levels of organic mafter or excessive leaching seem to predispose these soil types to
Mn def,rciency for plants. Kubota and Allaway (1972) in U.S.A. and Batey (197I) in Great
Britain reported simila¡ f,rndings. Batey (197I) estimated that 61,000-100,000 hectares may
be susceptible to Mn defrciency in England.
In Australia, there are very few reports of Mn deficiency on water-logged or high
organic matter soils, which probably reflects their scarcity and that most of our broad-acre
agriculture is conducted in the lower rainfall areas where alkaline soils of low fertility
predominate (Stephens and Donald 1958, Donald and Prescott I975, King and Alston
I975). Weste¡n Ausralia tends to be an exception to this general rule because sites which
cause Mn deficiency in cereal crops in that state a¡e characteristically rich in femrginous
gravel, especially in the sub-surface layers, have surface sandy layers with a loose ashy or
powdery structure and a¡e slightly acidic (Ryan 1958, Smith and Toms 1958, Ga¡rell
1980). Over the period 1980/81 to 1984/85 an average of 2034 tonnes of manganese
sulphate were incorporated into fertilizers in Australia (Anon. 1986). If it is assumed that all
these fertilizers were used, and applied locally, at the rate of 5 kg of Mn/ha, then
approximately 100,000 hectares of land were fertilized with Mn in each year for this period.
This compares with the estimate of Donald and Prescott (1975) of 46,000 hectares each year
for the period from 1967 /68 to 7971[72 but contrasts with the 150,000 hecta¡es treated with
Mn in South Australia in 1984 reported by Graham (pers. comm.).
-28
1.2.3. Yield reductions and symptoms of Mn deficiency on cereals.
Symptoms of Mn deficiency vary between plant species but affected crcps generally
are pale-green and growth is reduced (Batey I97I, Anon. 1979, Snowball and Robson
1983). The most coffrmon foliar symptom is the development of interveinal chlorosis which
may develop into patches of necrosis as the deficiency develops (Samuel and Piper 1929,
Toms 1958, Anon. 1979). Oats and wheat can also exhibit a collapsing and'kinking' of
mature leaves (Gartrell 1980, Mengel and Kirkby 1982, Smith and Toms 1958). The leaves
bend and collapse across a necrotic region in the middle of the leaf while the leaf extremities
remain green. In barley, chlorosis in younger leaves may lead to development of grey-
brown necrotic spots (Reuter et al.l973a,b). Mn deficiency symptoms usually appear on
the youngest tissues first (Samuel and Piper 1929, Snowball and Robson 1983, Davtes et al.
1984) which ref,lects the poor mobility of Mn in the plant but observations have also been
made of symptoms appearing first on older leaves and being worst on the oldest parts of
individual leaves (Smith and Toms 1958, Batey I97I, Gartrell 1980).
Mn deficiency has also been reported to retard development and delay plant maruriry
(Anderson and Boswell 1968, Perry and Gartrell l976, Wilhelm et al. 1985, Marcat 1986).
Mn deficiency has a reputation for being very transitory in the f,reld and its severity
can v¿ìry greatly within a single season and also between successive seasons (Batey I971,
Kubota and Allaway 1972, Graham et al. 1983). For instance, Graham et al. (1983)
recorded the observation that during one of their field trials in South Australia, Mn deficiency
was so severe that some untreated plots appeared to be dying mid-season. However,
following a warm dry September and prolonged wet conditions in October these same plots
recovered and produced reasonable yields, although yields were little more than half those of
Mn-teated plots.
Although Mn def,rciency has been reported from all a¡ound the world in many
different crops (e.g. Batey 1971, Kubota and Allaway lg7z,Durst 1976) and Mn def,rciency

29
appears to be a major limiting factor on soybean yields in many a¡eas of U.S.A. (Gettier ¿r
al. 1985, Mascagni and Cox 1985a, Ohki ¿r al. 1987), the most spectacular effects of Mn
deficiency on crop yields have been reported locally, from sites in South Australia. In trials
conducted by Samuel and Piper (1928) with Algerian oats in the south-east of this state,
plots which were not treated with Mn fertilizer were not harvested but the highest rate of Mn
produced the equivalent of 6.1 tonnes per hectare. Graham et al. (1983) and Ma¡ca¡ (1986)
have also reported little or no grain production in plots of wheat and barley grown on a
severely Mn deficient site on the Eyre Peninsula of South Australia. Typically, cereal yields
on the calcareous sands of South Australia without Mn fertilizer range from 40 to75 7o of
those with Mn (Reuter et al.l973b).
1.2.4. Avulability of Mn in soils.
Mn is relatively more abundant in geological materials than the other micronutrients
and this abundance is most pronounced in limestone-based materials (Krauskopf 7972). T\e
high abundance of Mn in limestone is of particular interest because Mn deficiency is often a
problem on soils rich in limestone (Stephens and Donald 1958, Leeper 1970, Batey I97L).
Obviously, the toul content of Mn in soil has little bearing on its availability to plants, unless
there is an absolute lack of the element in the soil profile (e.g. arenosol soil-types, Dudal
(1976)). Different soils have been found which were either toxic or deficient for Mn but still
contained similar total amouns of Mn (Aubert and Pinta 1977).
The cycle of Mn tlrrough soils includes changes of valence between 2,3 and4
@ion and Mann 1946, Leeper 1970, Cheng 1973, Mengel and Kkkby 1982). Leeper
(1970) summarised the overall change in valence from 2 to 4, and vice versa, in t'wo separate
equations:
Mn2+ + 2OH- + (O) (==) hOz +]HrO (1)
MnO, + 4H+ + 2e- <==) Mo2+ +ZH^O (2)
-30-
The reduced Mn(tr) form is readily soluble and thus more mobile than the insoluble
oxides of Mn(lll) and Mn(IV). It is largely the oxidation/reduction cycling of Mn between
the soluble reduced state and the insoluble oxidized states in soil that determines the
availabiliry of Mn to plants. Any factors which affect the redox balance in the soil will also
influence the amount of plant-available Mn (Mengel and Kirkby 1'982).
An additional factor in the cycling of Mn in soil is the impact of organic matter on
Mn availability. Hutgson (1963) proposed that organic matter influenced Mn
transformations in three ways ; 1. the production of complexing agents that effectively
reduce the activity of the free ion in solution, 2. a decrease in the oxidation potential of the
soil through increased microbial activity, and 3. a stimulation in microbial activity that results
in incorporation of Mn in biological tissue. The occuÌrence of Mn deficiency on soils very
high in organic matter (Batey 1971, Kubota and Allaway I972,DudaI1976) suggests that
factors 1. and 3. may be mo¡e important than2. but experiments have been reported where
addition of organic matter has increased Mn availability (e.g. Christensen et al. 1950, Miller
et al.1985).
It is generally accepted that plants obtain Mn from soil as the Mn2+ ion (Geering er
al. L969) which nleans that plants have access to several 'pools' of Mn in the soil ; 1. Mn2+
in soil solution, 2. Mn2+ in equilibrium with exchangeable Mn on colloidal surfaces (Reddy
and Perkins 1976) and 3. any Mn2+ which can be readily reduced from manganese oxides
(Leeper Ig7O, Mengel and Kirkby 1982, Jarvis 1984). In addition, plants can obtain Mn2+
directly from manganese oxides (Jones and Leeper 1951a, Uren 1969) by'contact reduction'
of manganese oxides on the surface of the root Oren 1981). The ability of different plant
species to utilize this sowce of Mn appears to depend on the relative strength of the reductive
capacity of their roots (Bromfield 1959, Uren 1981).
Returning to equations (1) and (2) of Leeper (1970), a simplified scena¡io was
described by the author in which the supply of Mn2+ ions depends on the opposing rates of
-31
reduction by organic compounds and oxidation to higher (valence) oxides by microbes.
Leeper down-played the importance of chemical oxidation of Mn2+ and ignores the
possibility of microbial reduction of manganese oxides. This view of microbial activity
being a dominant effect on Mn oxidation in the soil has been expressed, or implied, by
several other authors (Gerretsen 1937, Timonin 1.946, Geering 1969, Maclachlan 1984).
The reduction of MnØ is strongly favoured by decreases in pH (Leeper 1970) and
for every unit decrease in pH soluble Mn2+ increases 100-fold (Lindsay 1972). It follows
that the few cases of Mn def,rciency on acidic soils may be due to insufficient total levels of
Mn in the soil profile (Smith and Toms 1958, Kubota and Allaway 1972) and in many of
these cases water-logging is cornmon which may further restrict nutrient uptake by limiting
root growth (Batey l97l). Mn toxicity is a frequent problem on highly acidic soils (Kubota
and Allaway 1972, Cregan 1979).
1.2.5. Role of micro-organisms in Mn cycling in soils.
Gerretsen (1937) was one of the first workers to publish experimental resuls which
showed that the activity of soil micro-organisms was very important to the Mn balance in
soil, although prior observations had been made that micro-organisms may be involved in
the expression of Mn deficiency symptoms in plants (see Gerretsen 1937 and Timonin
1946). Geretsen showed that classic 'grey speck' disease symptoms of oats were due to
low tissue levels of Mn but no symptoms appeared on plants which lwere grown in soil
which had been sterilized with formalin and that these plants had higher tissue levels of Mn.
Formalin, as a chemical, did not increase the water soluble or one-tenth nitric acid-extractable
Mn fractions in the soil. Timonin (1946) concluded that a significant correlation existed
between the severity of 'grey speck' disease symptoms of oats and the population of Mn-
oxidizing and cellulose-decomposing bacteria on the roots.
32
A range of micro-organisms have now been identified which are capable of
oxidizing Mn2+ to insoluble Mn oxides (Gerretsen 1937 Leeper and Swaby 1940, Bromfield
and Skerman 1950, Bromfield 1956, Zajic 1969, Bromfield 1979). Separate studies
conducted on four different organisms ; three bacteria (Johnson and Stokes 1966, Bromfield
and David 1976, Douka 1977) and one streptomycete (Bromfield 1979), each concluded that
the oxidation of Mn2+ to MnO2 occurred outside the cell. In the case of the streptomycete an
extra-cellula¡ non-dialysable substance was involved and for a Pseud.omoncß sp. @ouka
7977), a cell-free extract, which was heat sensitive and inhibited by mercuric chloride, could
also oxidize Mn2+.
Microbial oxidation of Mn2+ in well-aerated soils is generaliy most effective in the
pH range of 6.0 to 7.5 (Bromfield 1956, Leeper 1970, Bromfield 1974) although the
streptomycete previously mentioned could oxidize Mn'in vitro' at pH values less that 4.5,
was optimized at 5.0 and did not occur in the range 6.0 to 7.5 (Bromfield 1979).
Bromf,reld (1959) reported an indirect effect of soil micro-organisms decreasing Mn
availability to plants by decomposing MnO2-reducing substances secreted by vetch and oat
roots.
Soil pH values above 8.0 favour the auto-oxidation of Mn and suppresses the
activity of micro-organisms (Leeper 1970). Approximately equal importance was assigned
to chemical and microbial oxidation in a field soil which contained more than 80 7o calcium
carbonate (Reuter and Alston I975).
Ross and Bartlett (1981) tested the effects of many of the chemical sterilants used
by workers who claimed that micro-organisms oxidized most of the Mn2+ in soils (e.g.
Gerretsen 1937 andlæeper and Swaby 1940 - chloroform, Jones 1957 and Sparrow and
Uren 1987 - sodium azide and Reuter and Alston 1975 - mercuric chloride) and concluded
that at least some of the appatent inhibition of microbial oxidation by sterilants was in fact the
reduction of Mn oxides by these chemicals. There have also been several other reports
JJ-
which showed that large amounts of Mn may be released into the soil by common soil
sterilizing techniques, including U.V. and gamma irradiation @alton and Hurwitz 1948,
Nelson l9TT,Mantylahti and Ylaranta 1981).
In addition, the oxidation of Mn2+ by soil micro-organisms does not necessarily
mean that the availability of Mn to plants will decrease. Bromfield (1958) reported that the
Mn oxide produced by aCorynebacteriwn in liquid medium was completely available to oas
grown in sand culture but less so when the oats were grown in a Mn-deficient soil.
Also, there have been several reports in the literatue where sterilization of soil has
decreased the uptake of Mn by plants (Lingle et aI. 1961, Heilman L967), the reverse of the
studies summarized above. The uptake of Mn by barley in solution culture was reported to
be stimulated by the presence of micro-organisms (of either casual or rhizosphere origins)
(Barber and Lee 1974). Mycorrhizal infection of pine seedlings increased Mn uptake and
decreased the accumulation of Mn in the roots (Mitler and Rudolph 1986). It is possible that
these beneficial micro-organisms may have been Mn reducers. Several different soil micro-
organisms have been found to be capable of reduction of Mn oxides (Zajic 1969, Bromfield
and David IgTí,Gotfreund et al. 1985) but the list is not as long as the known Mn
oxidizers. It has been proposed that Mn-reducing micro-organisms may use manganates as
terminal electron acceptors in a process linked to oxidation of organic matter (Burbridge and
Nealson 1985). Bromfield and David (1976) found that a Mn-oxidizingArthrobacter sp.
was also capable of reduction of MnO2 to Mn2+ under poorly aerated conditions and they
concluded that in soil the extent of oxidation or reduction of Mn near plant roots may not be
due to the relative activities of specific oxidizing or reducing types of micro-organisms but
may depend on small changes in the micro-environment of the rhizosphere which determine
whether a given bacterium has oxidizing, non-oxidizing or reducing properties.
34
1.2.6. Genotypic va¡iation in plant performance under low Mn conditions.
Wide differences have been reported in the growth of different plant species under
the same conditions of low Mn supply (Jones and Leeper 1951a, Mulder and Gerretsen
1952, Ryan 1958, Toms 1958, Batey 197I, Borchmann et a|.7985, Marcar 1986). For
instance, Jones (1957a) demonstrated that oats were severely Mn-deficient when grown in a
calcareous soil in poß but rye showed only a small response to added Mn under the same
conditions and vetch was unaffected by Mn fertilization.
V/ithin the cereals, oats are the most sensitive to Mn deficiency, barley does better
than wheat and rye often shows little or no response to the addition of Mn fertilizer
(Gallagher and Walsh 7943, Ryan 1958, Smith and Toms 1958, Nyborg 1970, Marca¡
1986). Borchmann et al. (1985) reported a different ranking of these cereals and classified
'il¡inter rye as very sensitive to Mn deficiency (yielded only 13-14 7o of Mn-sufficient
control), wheat as sensitive (19-43 7o of conu:ol) and 3 of the 4 tested triticale cultiva¡s as
very sensitive (4-7 Vo of conr.ol) and the other as sensitive (22 Vo of control). Graham et aI.
(1983) reported that Coorong triticale was sensitive to Mn deficiency in the f,reld but Ma¡ca¡
(1986) concluded that the three triticale cultivars he tested, including Coorong, were
reasonably insensitive.
Large differences have also been reported in the performance of different cultivars
of the same cereal species under low Mn conditions. Graham et al. (1983) conducted a freld
study of the performance of 72 world barley genotypes on a severely Mn-deficient
calcareous sand on the Eyre Peninsula of South Australia. They found a very large range in
the relative yields of these genotypes compared to a'standard' cultivar (Weeah). The best
performer in this study yielded 178 Vo of Weeah, while the worst yielded 0 7o, and there was
an almost continuous range of values in beween these two extremes. Cultiva¡ differences
have also been observed in wheat (Nyborg 1970, Graham et al. 1985, Marca¡ 1986), triticale
-35-
(Borchmann et al.1935) and oats (Gallagher and Walsh 1943, Timonin 1946, Ryan 1958,
Nyborg 1970).
Graham (1978) in a review arguing the value of breeding for nutritional characters
in cereals stated that micronutrient deñciencies were due to lack of availabiliry and inefficient
uptake by plants rather than lack of adequate quantities in soil profiles and Nyborg (1970)
provided experimental evidence that the sensitiviry of oats to Mn-deficient soils was due to
their poor ability to take up Mn rather than a higher requirement for Mn. Similarly, Ma¡ca¡
(1986) concluded that the sensitivity of wheat, compared to barley, was due to a poorer
ability to take up Mn from a Mn-def,rcient soil and no differences were found in the minimum
tissue Mn concentration required for maximum growth beween cultiva¡s of wheat differing
in their sensitivity to Mn deficiency (Graham et al.1985, Marca¡ and Graham 1986).
1.2.7. Influence of environmental factors on Mn dehciency.
As already mentioned, Mn deficiency has a world-wide reputation for transitory
appe¿uances and disappeamnces in the field and these fluctuations are sometimes at odds
with predicted changes in Mn availability due to shifted balances beween opposing reactions
of oxidation and reduction.
For example, Hannam (1984) observed that Mn deficiency in sweet lupins gro,wn
on neutral to acid sands in the south-eastem regions of South Australia, was more likely to
occr¡r if warm, dry conditions occurred during spring flowering, followed by substantial
rainfall. From the redox balance one would predict that the substantial rainfall should have
released more Mn2+ into the soil solution because of wetter, more reducing conditions and
alleviated the dehciency. This pattern was observed for cereals growing on a calcareous
sand on the Eyre Peninsula of South Australia (Graham et al. 1983).
Several workers have observed that Mn deficiency was often worst during
prolonged cold, wet spells (Batey 1971, Kubota and Allaway 1972) and this observation
36
was reconciled with the chemical behaviour of Mn in soil (reduction to available Mn2+
should be favoured under these conditions) by proposing that root growth was so poor
under these conditions that the plants failed to take up sufficient Mn for their purposes (Batey
I97I). Conversely, Samuel and Piper (1928) reported that the general experience of farmers
they had talked to was that Mn deficiency was worst in dry years. Warm spells following
cold and wet conditions may worsen (Batey I97l> or alleviate (Toms 1958) Mn defrciency.
Extractable Mn increased sharply with very wet or water-logged conditions
(Shuman 1980) and with increasing temperatue (Shuman 1980, Reid and Racz 1985) but
decreased if wet and dry cycles were used (Ryan and Hariq i983). The fixation of Mn onto
clay particles decreased under wet conditions but increased under cycling wet/dry conditions
(Reddy and Perkins 1976). The chemical reduction of Mn also increased with increasing
temperature (Sparrow and Uren 1987). Even altered light regimes have been reported to
affect the availability of Mn in soil (Cheng and Pesant 1984) such that while alternating light
and da¡k periods decreased available Mn both continuous light and continuous dark
increased available Mn.
Decreasing availability of Mn and increased severity of Mn def,rciency symptoms
with increasing soil pH is easily the most frequently documented effect of the environment
on Mn deficiency and the references which follow are merely a selection of the many
accorurts published (Samuel and Piper 1928, Batey 1971, Kubota and Allaway 1972,
Mulder and Gerretsen 1952, Reuter et al.1973a,b, Reuter and Alston 1975, Reddy and
Perkins I976, Osman et a|.1983, Ryan and Hariq 1983, Asher et a|.1984, Sparrow and
Uren 1987). Most of these reports used lime as a treatment to increase soil pH but lime will
decrease available Mn by precipitation of Mn ca¡bonates and chemisorption of Mn2+ on its
surfaces, in addition to its effects on soil pH (McBride 1979). However, there have also
been reports of liming alkaline soils to pH values above 8.0 which alleviate Mn deficiency
(Samuel and Piper 1929,Iones 1957a,b) and this observed effect was explained as
-37-
inhibition of the Mn-oxidizing soil micro-organisms at these exüeme pH values (Leeper
r970).
1.2.8. Correcting Mn deficiency in the field.
Soil analysis of extractable Mn has generally been unsuccessful as a tool for either
the diagnosis or prognosis of Mn deficiency (-eeper 1970, Cox and Kamprath 1972,Tiller
1983). Many factors contribute to the difficulty of using soil analysis for Mn and they
include the need to account for individual requirements of va¡ious plant species and cultiva¡s,
the difficulty in predicting the effects of seasonal conditions on plant gowth and on chemical
activity in soil, and our limited knowledge of the types of Mn compounds available to plants.
Visual symptoms and plant analysis are the two techniques most widely used for the
identifrcation but only one example has been reported where the sophistication of plant
analysis has reached the potential of true prognosis (Flannam et al. 1985).
Since Mn def,rciency is most frequently a problem related to low availability and not
inadequate quantities in the soil profrle, amelioration with soil-applied fertilizers can be
diffrcult. In an acidic soil, simple application of a manganese sulphate fertilizer at sowing
eliminated Mn deficiency symptoms and increased oat yieids (Smith and Toms 1958).
However, on alkaline soils, repeated applications of Mn during the season may be necessa.ry
to maximize yields. Yields of barley growing on a highly calcareous sand on Yorke
Peninsula of South Australia required 6 kg Mn/ha at sowing and2 to 3 subsequent foliar
sprays to attain maximum yields (Reuter et al. L973a). Simila¡ fertilizer regimes have been
reported for wheat on the Eyre Peninsula (Graham pers. comm.), for oats in the south-
eastern region (Samuel and Piper L928) of South Australia and for soybeans in U.S.A.
(Gettier et al.1984, Mascagni and Cox 1985a).
Soil application of Mn is more effective when it is incorporated v/ith an acidic
fertilizer (Reuter et al.I973b, Voth and Christensen 1980, Mascagni and Cox 1985a, Miner
38
et al.1986) or is banded instead of broadcast (Reuter et aI. I973a, Mascagni and Cox
1985a). Mn fertilizers usually have limited or no residual benehts in the held @avies et al.
1984, Genier et a|.1984, Reuter I975) due to their rapid conversion to unavailable forms
(Reuter and Alston 1975, Marca¡ 1986).
Although manganese sulphate is the most common Mn fertilizer, other manganous
compounds have also been used. Mn oxides, of differing chemical and physical
composition, have been applied to soils with varying success but are generally much less
available to plants than the equivalent rate of manganous sulphate (Jones and Leeper
195la,b, Heintze 1956, Bromfield 1958, Bromfield 1959, Voth and Christensen 1980,
Jauergut and Reisenauer 1982, Mascagni and Cox 1985b). The availability of Mn oxides
seems to be a property of the size and crystallinity of the particles, rathe¡ than its chemical
formula (Jones and Leeper 1951a) and the availability of an oxide in soil decreases with time
as the oxide particles 'age' (Jones and Leeper 1951b).
Mn silicate has been proposed as a Mn source which is stable over the pH range 4
to 12 and was more effective than manganese sulphate (Boxma and DeGroot 1985).
The problem of rapid transformation of soil-applied Mn into unavailable forms has
often been overcome by foliar application (e.g. Reuter et a|.1973a, Hannam et al.1984,
Gettier et a|.1985). Repeated applications are sometimes necessary to protect subsequent
growth from Mn def,rciency because of the poor mobility of Mn in the plant. Various
inorganic salts and chelate carriers of Mn have been used in foliar formulations but
manganese sulphate is usually as effective (e.g. Ohki et aI.1987) but frequently cheaper.
Another approach which avoids the problem of transformation of soil-applied Mn is
the soaking of seeds in Mn solutions prior to sowing. Roberts (1948) reported that a large
part of the Mn requirement in the early stages of development of oats growing on a severely
Mn-deficient alkaline peat could be provided by soaking the seed in a manganese sulphate
solution prior to sowing. Pre-sowing soaking of wheat seed has been shown to increase

39
grain yields, both in the glasshouse (Khalid and Malik 1982) and in the freld (Marcar and
Graham 1986).
1.2.9. Manganese and plant resistance to disease.
The topic of the eft'ect of mineral nutrition on plant diseases has received
considerable attention, including at least ten reviews in the last twenty years (Black 1968,
Borys 1968, Goss 1968, Krauss 1969, Trolldenier 1969, Huber and Watson 1974, Jenkyn
and Bainbridge l974,Huber 1980, Graham 1983) although only the review of Graham
(1933) concentrated on the role of micronutrients. The effects of plant nutrients on disease
may be attributed to effects on plant vigour that can influence the microclimate in a crop and
so affect infections and sporulation of the pathogen, effects on cell walls and tissues as well
as on the biochemical make-up of the host, the rate of growth of the host which may enable
seedlings to escape infection in thei¡ most susceptible stage, and effects on the pathogen
through alterations in the soil environment (Colhoun 1973).
Graham (1983) listed seven principles which summa¡ized macronutrient effects on
incidence of disease in higher plants and a further seven for micronutrient effects ;
Macronutrients.
l. A well nourished host is generally more tolerant of disease.
2. Some elements appear to affect disease severity simply through
greater tolerance, for example, phosphorus and sulphur; while
others including nitrogen and potassium clearly alter specific host-
plant resisunce mechanisms.
3. Nutrition is only one of many factors influencing resistance to
disease.
4. Macronutrients increase resistance to disease, if at all, only in the
deficiency r^nge; supraoptimal amounts of nutrient do not provide
40
further protection, and may be detrimental in the case of nitrogen.
5. Yield responses to fertilizers often contain two components, due
to overcoming both the def,rciency per se, and changing the disease
burden.
6. Nitrogen may either increase or decrease disease, depending on
other interacting factors, but in either case will increase yield where
the soil is deficient in the nutrient.
7. Nirogen effects are associated with effects on the balance
between the primary and secondary metabolic pathways in the host.
Micronutrients.
l. Correction of a micronutrient def,rciency generally increases the
tolerance and/or resistance of plants to pathogenic diseases.
2. Further protection in some conditions is conferred by a number
of trace elements in concentrations above those needed for host plant
growth in disease-f¡ee conditions.
3. In other situations, addition of a trace element may exacerbate the
severity of disease. In these cases it would appear that interactions
between trace elements or with nitrogen are involved, and element
imbalances in the host are likely to be a predisposing factor.
4. The contribution of nutrition to disease resistance is usually only
partial, there being many other factors.
5. Yield responses to an element often may contain two or even
three components, due to overcoming the deficiency, changing the
host plant's defence against disease, and having direct toxic effects
on the pathogen.
6. Copper, boron and manganese all influence the synthesis of
lignin and simple phenols; zinc, iron and nickel have generally

-41
different effects, possibly related to phytoalexin synthesis; silicon
and lithium appear to affect physical barriers to invasion. Silicon,
nickel and lithium may be essential elements in the biochemical
pathways of defence.
7. As in animals, iron may be a key element for which host and
pathogen oompete; an important factor in host-pathogen
relationships is the iron:manganese ratio.
Plants low in Mn have been reported to be susceptible to, or the addition of Mn has
decreased (micronutrient principles 1. and 2. of Graham (1983) make a distinction between
these two effects) diseases caused by fungi (e.g. Sclerotiniainfection of cucumbers (Abia et
al. 1977), powdery mildew of wheat (Colquhoun 1940), take-all of wheat (Reis er al. 1982,
Graham and Rovira 1984)), bacteria (e.g. Pseudomonas infection of citrus (Primavesi and
Primavesi 1964), bacterial blight of rice (Philip and Devadath 1984)), nematodes (e.g.
Meloidogyne spp. infection of tomatoes (Treskova 1961), cereal cyst nematode infection of
barley (Wilhelm et al. 7985)) and an actinomycete (common scab of potatoes (Morwút et al.
1963, McGregor and'Wilson 1966)).
The report of Mn influencing cereal cyst nematode infection of barley (\Milhelm er
a|.1985) is a speciirl ca.se amongst these other examples of Mn affecting plant disease
because it is the only study in which plant resistance was shown to be unchanged, while
tolerance was markedly increased, by addition of Mn. Resistance is the ability of the plant to
inhibit reproduction.of the pathogen while tolerance is endurance of disease by the host
without severe losses in yield or quality (modihed from Schafer l97l). In this pot study the
highest rate of nenratodes decreased the height of Mn-def,rcient barley by 45 Vo buthad no
effect on the height of plants adequately supplied with Mn. Both Mn-adequate and Mn-
def,rcient plants supported equal numbers of nematodes on their roots.
42
There has been only one report of Mn increasing disease. Wilks et al. (1983)
reported that infection of ponderosa pine by the fungus Ceratocystis wagenerí was favoured
by soil conditions which were sufficiently wet to cause extensive reduction of Mn but not too
wet to severely impede aeration. The fungus apparently was very well adapted to a Mn-rich
envi¡onment and its gowth'in vitro' was stimulated by Mn concentrations as high as 1000
mgkg-l.
Application of Mn decreasing take-all of wheat and common scab of potatoes arc the
best documented examples from the above and there are important similarities and
differences between them.
A measure of control has been gained over both these diseases by va¡ious
agronomic practices and these practices also tend to increase the availability of Mn in soil.
Decreasing soil pH, incorporating green manure crops, using ammonium-N instead of
nitrate-N fertilizers and application of manganese, phosphorus or sulphur fertilizers all
decrease take-all and common scab (Wenzl I975, Asher and Shipton 1981, Trolldenier
1981, Graham l9tì3) and release Mn2+ in the soil (Leeper 1970).
The presence of high Mn levels has been shown to cause large reductions in
common scab synrptoms on potato tubers. Morwedt et al. (196I) added Streptomyces
scabies suspensions in Mn solutions of increasing strength to the tuber-settingzone of potato
plants growing under controlled environment conditions. The roots of the plants were not
exposed to the Mn solutions and were kept in complete nutrient solutions. Under these
conditions, the disease wa^s halved by a2 mg kg-l Mn solution and were completely
eliminated by 20 mg kg-l of Mn. These results suggest that high concentrations of Mn were
toxic to the pathogen and did not improve the resistance of the plants because Mn levels in
the plants were suflicient for gowth without added Mn and never reached plant toxic levels
where Mn was added. Similar conclusions were reached from freld trials where Mn
application did not increase plant growth in the absence of the pathogen but still reduced the
-43
levels of common scab on rubers and increased the yield of infected plants (Morwedt er a/.
1963, McGregor and V/ilson 1964). The growth of Steptomyces scabies'in vitro' is very
sensitive to low levels of Mn2+ (Morwedt et aI.1963} In addition, broadcast, rather than
banded, Mn fertilizer was more effective at decreasing common scab (Morwedt et al.1963)
yet banding Mn fertilizer is more effective at supplying Mn to the plant (Reuter et al.1973a).
The studies reported by Reis et aI. (1982) on the effect of Mn on take-all of wheat
are also consistent with Mn being directly toxic to the pathogen. In their studies, take-all
was decreased when Mn was increased in sand cultures from 1x to 4x that of Hoagland's
solution. There was no change in plant growth in the absence of take-all with the high rate
of Mn.
Separate studies on the effect of Mn on take-all of wheat (Graham and Rovha 1984,
Rovira et al. 1985) showed that the resistance of wheat seedlings was altered by Mn nutrition
because Mn-deficient plants were very susceptible to attack by Ggt and disease was much
heavier on these plants. In the light of thei¡ results Graham and Rovira (1984) proposed
three, not mutually exclusive, mechanisms to explain the role of Mn in increasing the
resistance of wheat to Ggt and they are as follows;
1. VIn2+ may be directty toxic to the free inoculum of the fungus in the soil.
2. Mn may be acting through the physiology of the plant. Mn nutrition affects
photosynthesis, which in turn, controls the rate of exudation of soluble organic
compounds by roots. These exudates affect the rhizosphere microflora and,
through it, the ectotrophic gowth of the take-all fungus.
3. Lignin production is controlled by Mn-activated enzyme systems. Since ligneous
materials are an ack¡owledged partial defence against take-all in the form of
lignitubers, these structures may be more poorly developed in Mn-def,rcient plants.
44
Graham ( 1983) briefly reports a further experiment in which take-all was
completely eliminated by concentrations of Mn high enough to cause cylinders of MnO2 to
be precipitated around the roots. These concentrations were not toxic to the wheat but were
well above those needed for optimal growth rate in the absence of Ggt. These results i-ply
that hypothesis l. of Graham and Rovira (1984) may operate with high rates of Mn
application but do not preclude the second two hypotheses from also being important.
Reduction of take-all was also achieved at Mn rates one-tenth that which eliminated disease,
and plants which were marginal for Mn (obtained with a rate of one-hund¡edth of that which
eliminated disease) still had signif,rcantly less disease than severely Mn-deficient plants.
These latter two results imply that Mn in the plant may be importantin Ggt infection of wheat
but do not distinguish between hypotheses 2. and 3. of Graham and Rovira (1984).
1.3. Conclusions
Take-all of wheat and barley and Mn deficiency are two problems which afflict
b'road-acre agriculture on a world-wide scale. Although both can cause almost total crop
losses when conditions a¡e favourable for their development, their effects on crop yields tend
to be less obvious, and less severe, during years when seasonal conditions are more
'average'.
It has been recognized for a long time that each of these problems are affected
strongly by seasonal conditions and management practices and, as Graham (1983) has
pointed out, factors which increase, or decrease, take-all also exacerbate, or alleviate, Mn
deficiency.
Take-all and Mn deficiency both tend to be more severe as the pH of the soil
increases from acidic to alkaline levels so cultural practices such as liming and using nitrate-
rather than ammonia-N fertilizers will favour both problems. Simila¡ly, soils of an alkaline
45
nature, and particularly those with high calcium carbonate levels, have well known
reputations for producing severe Mn deficiency and bad take-all in cereal crops.
Take-all is generally worse on well aerated,loosely structured soils and these same
conditions will also favour oxidation of Mn into unavailable forms. Conversely, there have
also been reports of severe take-all on wheat seedlings during cold, wet spells and Mn
deficiency can also appeil under these conditions, presumably due to insufficient Mn uptake
by the plant because of very slow root growth.
The similar pattem of environmental factors which encourage take-all and also
favour Mn deficiency has been described in length by Graham (1983). Due to the closeness
of fit between these two patterns Graham proposed that Mn is a common factor among the
environmental effects on the severity of take-all and there is now some experimental evidence
to show that Mn deflrciency pre-disposes wheat to take-all.
The effect of Mn on take-all of wheat is one of the best documented examples of Mn
influencing plant resistance to disease but experimental data on the topic is still very limited
(only 4 published papers) and mechanisms to explain this effect have been proposed but not
tested.
46
1.4. References.
Abia, J.4., Hess, W.M. and Smith, B.N. (1977). Increased susceptibility of Mg- and Mn-def,rcient pumpkin seedlings to fungal attack. Naturwíssenschafien. 64, 437 -8.
Ahl, P., Voisard, C. and Defago, G. (1986). Iron bound-siderophores; cyanic acid, andantibiotics involved in suppression of Thielaviopsis basicolaby Pseudomonas
fluores ce ns strain. J . P hytopathol. 116, I2l -34.
Anderson, O.E. and Boswell, F.C. (1968). Boron and manganese effects on cotton yield,lint qua-lity and ea¡liness of harvest. Agron. J.60,487-93.
Anon. (1868). Repoft of commission on diseases in cereals. Adelaide, South Aust. (Govt.Printer.)
Anon. (1979). Manganese deficiency in vegetables. Farmnote, Dept. Agric., West. Aust.No. 87Æ9.
Anon. (1984). Countering soil-borne cereal diseases. Rural Res. t23,12-16.
Anon. (1936). Chemical Fertilizers In Australia. 8th Ed. Dept. P.i-ary Indust. (Aust. Govt.Publ. Serv.: Canberra).
Asher, M.J.C. (1972). Effect of Ophiobolus graminis infection on the $owth of wheat andbarley. Ann. Appl. Biol. 70, 215-23.
Asher, M.J.C. and Shipton, P.J. (1981). "Biology And Control Of Take-all." (AcademicPress: London.)
Asher, C.J., Smith, G,S., Clark, C.J. and Brown, N.S. (1984). Manganese deficiency ofKiwifruit (Actinia c hinensis). J. P lant N'utr. 7, 1497 -1509.
Aubert, H. and Pinta, M. (1977). "Trace Elements In Soils." @lsevier Scient. Publ. Co.:New York.)
Autor, A.P. (1982). Biosynthesis of mitochondrial manganese superoxide dismutase inSacchnromyces cerevisíae. J. Biol. Chem. 257,27l3-8.
Baker, R. (1968). Mechanisms of biological control of soil-borne pathogens. Ann. Rev.P hytopat ho l. 6, 263-94.
Baker, K.F. a¡d Cook, R.J. (1974). "Biological Control Of Plant Pathogens." (Vy'.H.Freeman: San Francisco.)
Ballinger, D.J. and Kollmorgen, J.F. (1986). Control of take-all of wheat withbenzimidazole and rriazole fungicides applied at seeding. Plant Pathol.35,67-73.
Barber, D.A. and Lee, R.B, (1974). The effect of micro-organisms on the absorption ofmanganese by plants. New Phytol.73,97-106.
Bateman, G.L. (19tì6). Effects of triadimenol-containing seed treatment on winter wheatinfected with take-all. Zeit. Pflanzenkrankheiten Pflanzenschutz.93,404-L4.
_47
Batey, T. (1971). Manganese and boron deficiency. In "Trace Elements In Soils AndCrops." Technic. Bull. 21, pp.137-49. (Minist. Agric., Fisheries, Food: London.)
Becker, J.O., Hedges, R.W. and Messens, E. (1985). Inhibitory effects of pseudobactin onthe uptake of iron by higher plants. AppL Environ. Microbiol.49, 1090-3.
Black, C.A. (1968). "Soil-Plant Relationships." 2nd Ed. (John Wiley & Sons: New York.)
Blamey, F.P.C., Joyce, D.C., Edwa¡ds, D.G. and Asher, C.J. (1986). Role of trichomesin sunflower tolerance to manganese toxicity. Plant Soí1.91, 171-80.
Bockus, V/.W. (1983). Effects of fall infection by Gaeumannomyces gramínís vat. tríticíand triadimenol seed treatrnent on severity of take-all in winter wheat. Phytopatlnl.73, 540-3.
Borchmann,W.,Zajonc, I. and Engelke, G. (1985). Reaction of different wheat, 'evinter ryeand winter triticale cultiva¡s to a low soil copper and manganese supply. In "Mengen-Und Spurenelemente." (Eds. M. Anke, C. Bruckner, H. Gurtler and M. Grun.) pp.160-6. (Karl-Marx Univ.: Leipzig, G.D.R.)
Borys, M.V/. (1968). Influencia da nutricao mineral na resistencia das plantas aos parasitas.In "Progress In Soil Biodynamics And Soil Productivity. (Ed. A. Primavesi.) pp.385-404. @allotti: Santa Maria, Brazil.)
Boxma, R. and DeGroot, A.J. (1985). Development and effectiveness of a solublemanganese silicate compound in conuolling manganese deficiency in plants. PlantSoi/. 83, 4ll-7.
Brenchley, G.H. (1968). Aerial photography for the study of plant diseases. Ann. Rev.Phytopathol. 6, l-22.
Brisbane, P.G., Janik, L.J., Tate, M.E. and \ùy'ar¡en, R.F.O. (1987). A revised structure forthe phenazine antibiotic from Pseudomonasfluorescens 2-79 (NRRL B-15132).Antimicr ob io l. A ge nts C hemotherapy 31, 19 67 -7 1..
Bromfield, S.M. (1956). Oxidation of manganese by soil microorganisms. Aust. "L Biol.,Scí.9, 238-52.
Bromfield, S.M. (1958). The properties of a biologically formed manganese oxide, itsavailability to oats and its solution by root washings. Plant Soí,9,325-37.
Bromfield, S.M. (1959). The solution of d-MnO2 by substances released from soil and fromthe roots of oats and vetch in relation to manganese availability. Plant.Soil 10, 147-ffi.
Bromfield, S.M. (1974). Bacterial oxidation of manganous ions as affected by organicsubstrate concentration and composition. Soil Biol. Biochem. 6,383-92.
Bromfield, S.M. (1979). Manganous ion oxidation at pH values below pH 5.0 by cell-freesubstances ftom Steptomyces sp. cultures. Soil BioI. Biochem.1l, 115-18.
Bromfield, S.M. and David, D.J. (1976). Sorption and oxidation of manganous ions andreduction of manganese oxide by cell suspensions of a manganese oxidizingbacterium. Soil Biol. Bíochem. 8, 37 -43.
48
Bromfield, S.M. and Skerman, V.B.D. (1950). Biological oxidation of manganese in soils.Soil Science. 69, 337 -48.
Brown, P.H.B. (1933). The effects of manganese deficiency on the metabolism of nitrogenin the wheat plant. Hons. Thesis, V/aite Agnc. Res. Instit., Univ. Adelaide, SouthAust.
Brown, P.H.B., Graham, R.D. and Nicholas, D.J.D. (1984). The effects of manganese andnitrate supply on the levels of phenolics and lignin in young wheat plants. Plant Soí1.
81, 437-40.
Brown, M.E. and Hornby, D. (1971). Behaviour of Ophiobolus gramín¿s on slides buriedin soil in the presence or absence of whegt seedlings. Trans. Brit. Mycol. Soc.56,95-103.
Brown, M.E., Hornby, D. and Pearson, V. (1973). Microbial populations and nitroge¡ in_soil growing consecutive cereal crops infected with take-all. J. Soil Íci.24,296-310.
Buddin, V/. and Garrett, S.D. (1941). Seasonal occurrence of the take-all disease of wheat.Ann. Appl. 8io1.28,74.
Burbridge, D.J. and Nealson, K.H. (1985). Microbial manganese reduction by enrichmentcultures from coastal marine sediments. AppL Environ. Microbiol.50,49L-7.
Burr, T.J. and Caesar, A. (1984). Beneficial plant bacteria. CRC Critícal Rev. Plant Sci.2,t-20.
Butler, F.C. (1961). Root and foot rot diseases of wheat. Sci. Bull. Dept. Agric., NewSouth Wales. 77.
Campbell, R. and Clor, A. (1985). Soil moisture affects the interaction betweenGaeutrnnrwmyces graminis var. trítici and antagonistic bacteria. Soil BioI. Bíoclrcm.17, 441-6.
Capper, A.L. and Campbell, R. (1986). The effect of a:tificially inoculated antagonistic- -
bacteria on the pievalence of take-all disease of wheat in field experiments. J. Appl.Bacteriol.60, 155-60.
Carpena, O., Llorenta, S., Leon, A. and Torrecillas, A. (1977). Estudio de activadesenzimaticas en las deficiencias inducidas de hierro y manganeso diel limonero.Agroc himica 21, 443-50.
Chalsaborty, S. (1983). Mycophagous amoebae in a suppressive pasture soil in relation tothe take-all disease of wheat. Ph.D. Thesis, V/aite Agric. Res. Instit., Univ. Adelaide,South Aust.
Chakraborty, S. and Warcup, J.H. (1984). Populations of mycophagous and other amoebaein take-all suppressive and non-suppressive soils. SoiI BíoI. Biochem. L6,197-9.
Chambers, S.C. and Flentje, N.T. (1968). Saprophytic survival of Ophiobolus gramínis onvarious hosts. Aust. J. Bíol. Sci.2L, 1153-61.
Cheng, B.T. (1973). Dynamics of soil manganese. Agrochimica L7,84-95.
-49-
Cheng, B.T. and Pesant, A.R. (1984). Manganese status of soils as affected by alternatelight and darkness. Agrochimica 28, 367 -7 0.
Christensen, N.W. and Brett, M. (1985). Chloride and liming effects on soil nitrogen formand take-all of wheat. Agron. J.77 , 157 -63.
Christensen, P.D., Toth, S.J. and Bear, F.E. (1950). The status of soil manganese as
influenced by moisture, organic matter, and pH. Proc. Soil Scí. Amer.15,279-82.
Clarkson, J.D.S. and Polley, R.Vy'. (1981). Diagnosis, assessment, crop appraisal andforecasting. In "Biology And Control Of Take-all." (Eds. M.J.C. Asher and P.J.Shipton.) pp. 25 I -69. (Academic Press: London.)
Clarkson, D.T., Drew, M.C., Ferguson, I.B. and Sanderson, J. (1975). The effect of theTake-all fungus, Gaeumannomyces graminis, on the transport of ions by wheat plans.Physíol. P lant P athol. 6, 7 5-84.
Colhoun, J. (1973). Effects of environmental factors on plant disease. Ann. Rev.P hy t op at hol. ll, 3 43-64.
Colquhoun, T.T. (1940). Effect of manganese on powdery mildew of wheat. J. Aust.Instit.Agric. Sci.6, 54.
Cook, R.J. (1981). The effect of soil reaction and physicai conditions. In "Biology AndControl Of Take-all." (Eds. M.J.C. Asher and P.J. Shipton.) pp.343-52. (AcademicPress: London.)
Cook, R.J. and Christensen, A.A. (1,976). Growth of cereal root-rot fungi as affected bytemperature-\vater porential interaction s. P hy top at hol. 66, 193 -7 .
Cook, R.J. and Rovira, A.D. (1976). The role of bacteria in the biological control ofGaeumannomyces graminis by suppressive soils. Soil Biol. Biochem.8,269-73.
Cook, R.J., Wilkinson, H.T. and Alldredge, J.R. (1986). Evidence that microorganisms insuppressive soil associated with wheat take-all decline do not limit the number oflesions produced by Gaeumannomyces gramtnis var. titici. Phytopathol.76,342-5.
Cox, F.R. and Kamprath, E.J. (1972). Micronutrient soil tests. In "Micronutrients InAgriculture." (Eds J.J. Morwedt, P. M. Giordano and W.L. Lindsay.) pp.289-317.(Soil Sci. Soc. Amer.: Madison, Wisconsin.)
Cregan, P.D. (1979). Pasture improvement and soil acidification. Agric. Gazette, NewSouth Wales 90, 33-35.
Dalton, F.H. and Hurwitz, C. (1948). Effect of volatile disinfectants on survival ofmicroflora in soil. Soil Sci. 66,233-8.
Davies, W.J., Reuter, D.J. and Graham, R.D. (1984). Manganese deficiency in cereals.Fact Sheet, Dept. Agric., South Aust. No. \0/84.
Davis, R.J. (1925). Studies on Ophiobolw graminis Sacc. and the take-all disease of wheat.J. Agric. Res. 31, 801-25.
50
De Boer, R.F. and Kollmorgen, J.F. (1987). Effects of cultivation on rhizoctonia root rotand take-all of wheat in Victoria. Proc. 6th Australasian Plant Pathol. Conf., Adelaide,South Aust., p. 31.
Deacon, J.W. and Henry, C.M. (1978). Studies on virulence of the take-all fungus,Gaeumannomyces graminís, with reference to methodology. Ann. Appl.Biol.89,401-9.
Dieckert, J.W. and Rozacky, E. (1969). Isolation and partial cha¡acterization of manganin, anew manganoprotein from peanut seeds. Arch. Biochem. Biophys.134, 473-7.
Dion, H.G. and Mann, P.J.G. (1946). Trivalent manganese in soils. J. Agric. Scí.36,239-45.
Doby, G. (1965). "Plant Biochemistry." (J. Wiley and Sons: New York).
Donald, C.M. and Prescott, J.A. (1975). Trace elements in Aust¡alian crop and pastureproduction, 1924-1974. fn "Trace elements In Soil-Plant-Animal Systems." @dsD.J.D. Nicholas and A.R. Egan.) pp.7 -37 . (Academic Press: New York.)
Douka, C.E. (1977). Study of bacteria from manganese concretions. Precipitation ofmanganese by whole cells and cell-free extracts of isolated bacteria. Soil Biol.Biochem.9, 89-97.
Dudal, R. (1976). Inventory of the major soils of the world with special reference to mineralstress hazards. In "Plant Adaptation To Mineral Stress In Problem Soils." (Ed M.J.Wright.) pp. 3-13. (Cornell Univ., Ithaca: New York.)
Durst, F. (1976). The correlation of phenylalanine ammonia-lyase and cinnamic acid-hydroxylase activity changes in Jerusalem Artichoke tuber tissues. Planta. 132,221-7.
Ebbels, D.L. (1969). Effects of soil fumigation on disease incidence, growth and yield ofspring wheat. Ann. Appl. Biol.63, 81-93.
El-Nashaar, H.M., Moore, L.M. and George, R.A. (1986). Enzyme-linked immunosorbentassay quantification of initial infection of wheat by Gaeumawnmyces gramínis var.tritici as moderated by biocontrol agents. Phytopathol. T6, 1.319-22.
Elad, Y. and Baker, R. (1985). Influence of trace amounts of cations and siderophore-producing pseudomonads on chlamydospore germination of Fusarium orysporum.P hytopat hol. 7.5, 1047 -52.
Elad, Y., Chet,I. and Baker, R. (1987). Increased growth response of plants induced byrhizobacteria antagonistic to soilborne pathogenic fungi. Plant 5oi|.98,325-30.
Elliott, L.F. and Lynch, J.M. (1984). Pseudomonads as a factor in the growth of winterwheat (T ritic um ae s tiv um L.). S o íl B íol. B íoc hem. 16, 69 -7 I .
Elliott, L.F. and Lynch, J.M. (1985). Plant growth-inhibitory pseudomonads colonizingwinter wheat (Tríticum aestivum L.) roots. Plant SoiI.84, 57-65.
Engelsma, G. (1972). A possible role of divalent manganese ions in the photoinduction ofphenylalanine ammonia-lyase P lant P hy si o l. 50, 599 - 602.

-51
Fellows, H. (1928). Some chemical and morphological phenomena attending infection of thewheat plant by Ophiobohts graminis. J. Agric. Res.37,647-61.
Ferraz, J.F.P. (L973).Influences of the soil atmosphere on spread ol Ophiobolus gramínisalong wheat roots. Trans. Brit. Mycol. 9oc.6L,237-49.
Fish, S. (1927). Take-all in wheat. Field observations at Murrayville. ,I. Dept. Agric.,Víc.25, 423-5.
Fitt, B.D.L. and Hornby, D. (1978). Effects of root-infecting fungi on wheat transportprocesses and growth . Physiol. Plant Pathol. 13,335-46.
Foster, R.C., Rovira, A.D. and Cock, T.V/. (1983). Ultrastructure Of The Root-soilInterface. pp. L29-31. (Amer. Phytopathol. Soc.: Minnesota, U.S.A.)
Gallagher, P.H. and 'Walsh, T. (1943). The susceptibiliry of cereal varieties to Mndeficiency. J. Agric. Sci. 33, 197-203.
Gardner, J.M., Chandler, J.L. and Feldman, A.W. (1984). Growth promotion andinhibition by antibiotic-producing fluorescent pseudomonads on citus roots. PlantSoil.77, 103-13.
Garrett, S.D. (1934)a. Factors affecting the severity of take-all. 1. The importance of soilmicroorganisms. J. Dept. Agríc., South Aust.37, 664-74.
Garetq S.D. (1934)b. Factors affecting the severity of take-all. 11. Soil temperanre. J.Dept. Agric., South Atut. 37, 799-805.
Garett, S.D. (1934)c. Factors affecting the severity of take-all. 111. The climatic factor. ,I.Dept. Agric., South Aust.37, 976-83.
Garrett, S.D. (1936). Soil conditions and the take-all disease of wheat. Ann. AppI. BíoI.23, 667-74.
Ga:rett, S.D. (1948). Soil conditions and the take-all disease of wheat. 1X. Interactionbetween host plant nutrition, disease escape, and disease resistance. Ann. Appl. Biol.35, r4-7.
Ga:rett, S.D. (1981). Introduction. In "Biology And Control Of Take-all." (Eds. M.J.C.Asher and P.J. Shipton.) pp. 1-11. (Academic Press: London.)
Ga¡trell, J.W. (1980). Manganese deficiency in cereals. Farmnote, Dept. Ag.ic.,'West.Aust. No. 88/80.
Geels, F.P. and Schippers, B. (1983)a. Selection of antagonistic fluorescent P,te¿¿domonasspp. and their root colonization and persistence following treatment of seed potatoes.P hytopathol. Zeit. 108, 193-206.
Geels, F.P. and Schippers, B. (1983)b. Reduction of yield depressions in high frequencypotato cropping soil after seed tuber treaÍnents with antagonistic fluorescentP s eudomonds spp. P hy t op at hol. Zeít. 108, 207 -I4.
Geering, H.R., Hodgson, J.F. and Sdano, C. (1969). Micronutrient cation complexes insoil solution: lV. The chemical state of manganese in soil solution. Proc. Soil Sci.Soc. Amer. 33, 81-5.
-52-
Gerlagh, M. (1968). Introduction of Ophiobolus graminis into new polders and its decline.Neth. J. Plant Pathol.74, Suppl2.
Gerretsen, F.C. (1937). Manganese deficiency of oats and its relation to soil bactena. Ann.Bot.l, 207-30.
Gerretsen, F.C. (1949). Manganese in relation to photosynthesis. I. Ca¡bon dioxideassimilation and the typical symptoms of manganese deficiency of oats. Plant Soil.l,346-3s8.
Gettier, S.W., Martens, D.C. and Brumback, T.B. (Jr.) (1985). Timing of foliar manganeseapplication for correction of manganese deficiency in soybean. Agron. J.77, 627-30.
Gettier, S.'W., Martens, D.C., Hallock, D.L. and Stewart, M.J. (1984). Residual Mn andassociated soybean yield response from MnSOa application on a sandy loam soil.Plant Soi/. 81, 101-10.
Glenn, O.F., Hainsworth, J.M., Parker, C.A. and Sivasithamparam, K. (1987). Influenceof matric potential and soil compaction on growth of the take-all fungus through soil.Trans. Brit. Mycol. Soc.88, 83-9.
Glenn, O.F., Parker, C.A. and Sivasithamparam, K. (1985). A technique to comparegrowth in soil of Gaeumannomyces gramínis var. titici over a range of matricpotentials. In "Ecology And Management Of Soil-borne Plant Pathogens." Proc.4thInt. Plant Pathol. Cong. pp.24-26. (Amer. Phytopathol. Soc.: Minnesota, U.S.A.)
Glynne, M.D. (1953). Wheat yield and soil-borne diseases. Ann. Appl. Biol. 40,221-4.
Goos, B.J., Johnson, B.E. and Holmes, B.M. (1987). Effect of potassium chloridefertilization on two barley cultiva¡s differing in common root rot reaction. Can. J.Plant Íci.67,395-401.
Goss, R.L. (1968). The effects of potassium on disease resistance. In "The Role OfPotassium In Agriculture." (Eds. V.J. Kilmer, S.E. Younts, N.C. Brady.) pp.221-41. (Amer. Soc. Agron.: Madison, USA.)
Gottfreund, J., Schmitt, G. and Schweisfurth, R. (1985). Transformation of differentlycharged manganese ions by bacteria in nutrient solutions and in the subsoil.Landwirts c haftli c he F o r s c hung. 38, 80-6.
Graham, R.D. (1978). Nutrient efficiency objectives in cereal breeding. In "Plant Nufition."(Eds. A.R. Ferguson, R.L. Bieleski, I.B. Ferguson.) pp. 165-70. Proc. 9th Int. CoIl.Plant Anal. Fert. Problems, Goolwa, South Aust.
Graham, R.D. (1979). Transport of copper and manganese to the xylem exudate ofsunflower. P lant Cell Environ. 2, 139-43.
Graham, R.D. (1983). Effects of nutrient stress on susceptibility of plants to disease withparticular reference to the trace elements. Adv. Bot. Res. 10,221-76.
Graham, R.D. pers. comm. 1987.
Graham, R.D. (1984). Breeding for nutritional characteristics in cereals. Adv. Plant Nur. l,57 -r02.
s3
Graham, R.D. and Loneragan, J.F. (1981). The critical level of manganese for wheat. Proc.Nat. Workshop Plant Anal. pp. 95-6. Goolwa, South Aust. Feb. 15-18.
Graham, R.D. and Rovira, A.D. (1984). A role for manganese in the resistance of wheatplants to take-all. Plant 5oi178,441-5.
Graham, R.D., Davies, W.J., Sparrow, D.H.B. and Ascher, J.S. (1983). Tolerance ofbarley and other cereals to manganese-deficient calcareous soils of South Australia. In"Genetic Aspects Of Plant Nutrition." (Eds. M.R. Sa¡ic, B.C. Loughman.) pp.339-45. (Martinus Nijhoff/Dr.'W. Junk Publ.: The Hague.)
Graham, R.D., Davies, V/.J. and Ascher, J.S. (1985). The critical concentration ofmanganese in field-grown wheat. Aust. J. Agríc. Res.36, 145-55.
Green, C.F. and Ivins, J.D. (1984). Late infestations of take-all (Gaeumannomycesgratninis vat. tritici) on winter wheat (Triticum aestivum cv. Virrue): yield, yieldcomponents and photosynthetic potential. Field Crops Res. 8, L99-206.
Griffiths, R.L. (1933). Take-all. Incidence and control on the lighter soils of the mallee. /.Dept. Agric., South Aust. 36, 77 4-8.
Grose, M.J., Pa¡ker, C.A. and Sivasithamparam, K. (1984). Growth of Gaeumannomycesgraminis var. títíci in soil: Effects of temperature and water potential. Soil Biol.Biochem. 16, 2lI-6.
Gross, G.G. (1980). The biochemistry of lignification. Adv. Bot. Res. 8, 25-63.
Handley, L., Hope, A.B. and Matthews, D.B. (1984). Exogenous manganese as an electronsource for both photosystem II and radical superoxides. Aust. J. Plant Physiol.11,443-9.
Hannam, R.J. (1984). Aspects of the manganese nutrition of lupins: Redistribution ofaccumulated manganese and the diagnosis, prognosis and prevention of manganesedeficiency. Ph.D. Thesis, V/aite Agric. Res. Instit., Univ. Adelaide, South Aust.
Hannam, R.J., Davies, W.J., Graham, R.D. and Riggs, J.L. (1984). The effect of soil- andfoliar-applied manganese in preventing the onset of manganese deficiency in LupírutsangusfifoUus. Aust. J. Agric. Res.35, 529-38.
Hannam, R.J., Graham, R.D. and Riggs, J.L. (1985). Diagnosismanganese deficiency in Lupinus angusfifolius L. Aust. J.
and prognosis ofAgric. Res.36,765-77.
Hannam, R.J., Riggs, J.L. and Graham, R.D (1?_8?). The critical concentration ofmanganese in barley. J. Plant Nutr. L0,2039-48.
Heilman, P.E. (1967). Manganese deficiency in cauliflower and broccoli induced by soilfumigation with dichloropropenes. Soil 5ci. 103, 401-3.
Heintze, S.G. (1956). The effects of various soil treatments on the occurrence of marsh spotin peas and on manganese uptake and yield of oats and timothy. Plant SoiI.7 ,218-36.
Hemming, B.C., Orser, C., Jacobs, D.L., Sands, D.C. and Strobel, G.A. (1982). Theeffects of iron on microbial antagonism by fluorescent pseudomonads..I. Plant Nutr.5, 683-702.
-54-
Henkens, C.H. and Jongman, E. (1965). The movement of manganese in the plant and thepractical consequences. Neth. J. Agric. Sci. 13, 392-407.
Henry, A.W. (1932). Influence of soil temperature and soil sterilization on the reaction ofwheat seedlings to Ophiobolus graminis Sacc. Can. J. Res.7,198-203.
Herman, M. (1985). Antagonistic activity of the rhizosphere mycoflora againstGaeumannomyces gramínis under conventional and zero-tillage . Soil Tillage Res. 5,37r-9.
Hocking, P.J. (1984). Accumulation, partitioning and redistribution of dry matter andmineral nutrients in lxiaflexuosaL., with special reference to its cormaceous habit.Ann. Bot.53, 489-501.
Hodgson, J.F. (1963). Chemistry of the micronutrient elements in soils. Adv. Agron.l5,1 19-59.
Holden, I. (I976).Infection of wheat seminal roots by varieties of Phialophora radícicolaand Gaeumannomyces graminis. Soil Bíol. Biochem. 8, 109-19.
Hollins, T.'W., Scott, P.R. and Gregory, R.J. (1986). The relative resistance of wheat, ryeand triticale to take-all caused by Gaeumannomyces gramínís. Plant Patlnl.35,93-100.
Hornby, D. (1981). Inoculum. In "Biology And Control Of Take-all." @ds. M.J.C. Asherand P.J. Shipton.) pp.277-94. (Academic Press: London.)
Hornby, D. (1985). Soil nutrients and take-all. Outlook on Agric. L4,122-8.
Hornby, D. and Goring, C.A.I. (1972). Effects of ammonium and nitrate nutrition on take-all disease of wheat in pots. Ann. Appl. 8io1.70,225-31.
Hornby, D. and Henden, D.R. (1986). Epidemics of take-all during 16 years of continuousspring barley. Ann. Appl. Biol.I08, 251-64.
Hubbard, J.P., Harman, G.E. and Hadar, Y. (1983). Effect of soilborne Pseudomonas spp.on the biological control agent, Tríclnderma hamarum. on pea seeds. Phytopathnl.73, 655-9.
Huber, D.M. (1980). The role of mineral nutrition in defense. In "Plant Disease. AnAdvanced Treatise." @ds. J.G. Horsfall and E.B. Cowling.) Vol V. pp. 381-406.(Academic Press: New York.)
Huber, D.M. (1981). The role of nutrients and chemicals. In "BioloTake-all." (Eds. M.J.C. Asher and P.J. Shipton.) pp. 317-41London.)
gy And Control Of. (Academic Press:
Huber, D.M. and Mburu, D.N. (1983). The relationship of rhizosphere bacteria to diseasetolerance, the form of N, and amelioration of take-all with manganese. Proc. 4th Int.Plant Pathol. Cong., Melbourne, Aust. (Abstract.)
Huber, D.M. and Watson, R.D. (1974). Nitrogen form and plant disease. Ann. RevP hytopathol. 12, 1 39-65.
55
Janris, S.C. (1984). The forms of occurence of manganese in some acidic soils. "I. Soil Sci35, 421-9.
Jenkyn, J.F. and Bainbridge, A. (1974). Disease gradients and small plot experiments onbarley mildew. Ann. AppI. Biol.76, 269-79.
Johnson, A.H. and Stokes, J.L. (1966). Manganese oxidationby Sphaerotilus discophorus.J. Bacteriol. 91, 1543-7 .
Jones, L.H.P. (1957)a. The effect of liming a neutral soil on the uptake of manganese byplants. Plant Soil 8, 301-14.
Jones, L.H.P. (1957)b. The effect of liming a neutral soil on the cycle of manganese. Plant.Soi/ 8, 315-27.
Jones, L.H.P. and Leeper, G.Vy'. (1951)a. The availabitity of various manganese oxides toplants. Plant Soil.3, l4I-53.
Jones, L.H.P. and Leeper, G.'W. (1951)b. Available manganese oxides in neutral andalkaline soils. Plant Soil.3, 154-59.
Karamanos, R.E., Kruger, G.A. and Henry, J.L. (1984). Evaluation of plant ti_ssue criteriafor predicting mànganese deficiency in oats. Can. J. Plant Sci. 64,863-8.
Khalid, B.Y. and Malik, N.S.A. (1982). Presowing soaking of wheat seeds in copper andmanganese solutions. Commun. SoiI Sci. Plant AnaI.13, 981-6.
Khmara, L.A. (1984). Effect of manganese ions on ultrastn¡ctural organization andpolypeptide composition of etioplast membranes. Soviet Plant Physiol.3l,62-6.
King, P.M. (1934). Crop and pasture rotations at Coonalpyn, South Australia: effects on, soil-borne diseases, soil nitrogen and cereal production . Aust. I. Exptl. Agríc. Aním.
Husb.24, 555-64.
King, P,M. and Alston, A.M. (1975). Diagnosis of trace element def,rciencies in wheat onEyre Peninsul4 South Australia. In "Trace elements in Soil-PlançAnimal Systems."(Eds D.J.D. Nicholas and A.R. Egan.) pp.339-52. (Academic Press: New York.)
Kirk, J.J. (1984). Ability of Gaewnannomyces graminis to benefit from senescence of thecereal root cortex during infection. Trans. Brit. Mycol. Soc.82, 107-lI.
Ki*, J.J. and Deacon, J.W. (1986). Early senescence of the root cortex of agriculturalgrasses, and of wheat following root amputation or infection by the take-all fungus.New Phytol.104, 63-75.
Kirk, J.J. and Deacon, J.W. (1987)a. Control of the take-all fungus by Microdochíurnbolleyi, and interactions involvi ng M . bolleyi , P hialophora graminicola and P ericoniamacrospinosa on cereal roots. Plant Soí1.98,23I-7 .
Ki*, J.J. and Deacon, J.'W. (1987)b. Invasion of naturally senescing root cortices of cerealand grass seedlings by Microdochiwnbolleyi.Plant Soil.98, 239-46.
Kleeberger,4., Castorph, H. and Klingmuller, W. (1983). The rhizosphere microflora ofwheat and bartey with special refèrence to gtam-negative bacteria. Arch. Microbiol.136, 306-11.

-56-
Kloepper, J.W., Lcottg, J,, Teintze,M. and Schroth, M.N. (1980). Pseudomonas-
sideroplxrrcs: A mec:hanism explaining disease-suppressive soils.. Current Microbiol4,317-20.
Kollmorgen, J.F. and Ballinger, D.J. (1987). Recent advances in application of fungicideswith seed to conrrol fungal diseases of field crops. Proc. 6th Australasian. PlantPathol. Conl'., Adel¿ride, South Aust.
Kollmorgen, J.F. an<.| Walsgott, D.N. (1984). Saprophytic survival of Gaeumannomycesgraminis vrr. tritici at various depths in soil. Trans. Brit. Mycol. Soc.82,346-8.
Kollmorgen, J.F., Ridge, P.E. and de Boer, R.F. (1987). Effects of tillage and straw mulchon take-¿rll ol' wheat in the Northern Wimmera of Victoria . Aust. J. Exptl. Agric.27 ,
4t9-23.
Kollmorgen, J.F, pers. comm. L987 .
Krauskopf, K.B. ( 1972). (ìeochemistry of micronutrients. In "Micronutrients InAgriculture." (Eds J.J. Morwedt, P. M. Giordano and W.L. Lindsay.) pp. 7-40. (SoilSci. Soc. Amer.: Madison, Wisconsin.)
Krauss, A. (1969). Uinfluss der Ehrnahrung der Pflanzen mit Mineralstoffen auf den Befallmit parasitarcn krankheiten und Schadlingen. Z. PflEhrnahr. Dung. Bodenk.I24,129-47.
Kriedeman, P.8., Grahant, R.D. and \ù/iskich, J.T. (1985). Photosynthetic disfunction andin vivo changes in chlorophyll a fluorescence from manganese-deficient wheat leaves.Aust. J. Agric. Res.36, 155-70.
Krishna, T.M. and Bharti, S. (1983). Modulation, by phenolic compounds, of endogenousmanganese durilrg ìAA induced growth nAvern coleoptile segments: an elecEon spinresonance study. Ncw Phytol.93, 53t-7.
Krishna, T.M. and Bharti, S. (1934). Effect of EDTA on endogenous manganese duringindoleacctic ¿rcid-intluced growth of Avena coleoptile segments. New Phytol.97 ,363'8.
Kubota, J. and Allaway, W.H. (1972). Geographic distribution of trace element problems.In "Micronutricnts In Agriculture." @ds J.J. Morwedt, P. M. Giordano and W.L.Lindsay.) pp. 525-54. (Soil Sci. Soc. Amer.: Madison, Wisconsin.)
Kunoh, H. and Ishiznki, I I. (1976). Accumulation of chemical elements a¡ound thepenetration sites of lirysiphe graminís hordei on barly leaf epidermis. 11. Level ofsiiicon in pa¡rilla around the haustorial neck. Ann. Phytopathol. Soc., Japan.42,30-34.
Kunoh, H., Islrizaki, [I. and Kondo, F. (1975). Composition analysis of "halo" area ofbarley leaf epidermis induced by Powdery Mildew infection. Ann. Phytopathol Soc.,Japan.4l,33-9.
Kuwabara, T. and Murata, N. (1983). Quantitative analysis of the inactivation ofphotosynthetic oxygen evolution and the release of polypeptides and m1ng1nesg in thephotosystem I t particles of spinach chloroplasts. Plant CelI Physiol.24,74l-7 .
57
Labanauskas, C.K. (1973). Manganese. In "Diagnostic Criteria For Plants And Soils." (Ed.H.D. Chapman.) pp. 264-85.
Leeper, G.W. ( 1970). "Six Trace Elements In Soils." (Melb. Univ. Press.)
Leeper, G.W. and. Swaby,.R.J. (1940), ftt oxidation of manganous compounds bymicroorganisnrs in the soil. SoiI Sci.49,163-9.
Leidi, E.O., Gonrez, VI. and del Rio, L.A. (1987). Evaluation of biochemical indicators ofFe and Mn nut¡ition for soybean plants. 11. Superoxide dismutases, chlorophyllcontents and photosystem 1 I activity. J. Plant Nutr. 10,26I-7l.
Lindsay, V/.L. (1972).Inorganic phase equilibria of micronutrients in soils. In"Micronutrients In Agriculture." (Eds J.J. Mortvedt, P. M. Giordano and \ñ/.L.
Lindsay.) pp. 4L-57. (Soil Sci. Soc. Amer.: Madison, Wisconsin.)
Lingle, J.C., Sciarcni, R.f I., Lear, B. and Wight, J.R. (1961). The effect of soil liming andfumigation otì the nlanganese content of Brussel Sprouts leaves. Proc. Amer. Soc.Hort. Sr:i. 78, 310-8.
Lockwood, J.L. ancJ Schippers, B. (1984). Evaluation of siderophores as a factor in soilmycostasis. Trans. Brit. Mycol. Soc.82, 589-94.
Lynch, J.M. and Clark, S.J. (1984). Effects of microbial colonization of barley (Hordeumvulgare L.) roots on seedling growth. J. Appl. Bacteriol. 56, 47 -52.
Ma, H., Kubicek, C.P. and Rohr, M. (1985). Metabolic effects of manganese deficiency inAspergillus niger: evidence for increased protein degradation. Arch. Microbiol.147.,266-8.
MacNish, G.C. ( 1973). Detection of Gaeumønnomyces graminís var. tritící in wheatstubble. Aust. ,1. Biol. Sci.26, 1285-6.
MacNish, G.C. ( l9lì0). Management of cereals for control of take-all. J. Dept. Agric.,West. A*st.14th Ser.) 21, 48-51.
MacNish, G.C. and Dodnran, R.L. (1973)a. Relation between incidence ofGaeurnunnomyces ¡1ramínís var. tritici and grain yield. Aust. J. BíoI. Sci.26, 1289-99.
MacNish, G.C. and Dodnran, R.L. (1973)b. Incidence of Gaeumannomyces graminis var.trítici in consccutive wheat crops. Aust. J. BioI. Sci. 26, 130I-7 .
MacNish, G.C. and l)odman, R.L. (1973)c. Survival of Gaeumannomyces gramínis var.trítici in the field. Aøsl. J. Biol. Sci.26, 1309-17 .
MacNish, G.C. and Speijers, J. (1982). The use of ammonium fertilizers to reduce theseverity of take-all (Gaeurnanrnmyces graminis ver. tritici) on wheat in'WesternAustralia. Ann. AppI. Bíol. 100, 83-90.
Manners, J.G. ( 1976). Ultrastructure and physiology of host-parasite relationships in take-all of wheat. Aust. Plant Pathol. Soc. Newsletter. 5, (suppl).
58
Manners, J.G. and Myers, A. (1981). Effects on host growth and physiology. Jn "BiologyAnd Control Of Take-all." (Eds. M.J.C. Asher and P.J. Shipton.) pp.237-48-(Academic Press: London.)
Mantylahti, V. and Ylaranta, T. (1981). The effect of heat treafnent and ionizing radiation onthe extractability of some macro- and micronutrients in soils. Ann. Agric. Fenniae.20,253-60.
Marcar, N.E. (1986). Genotypic variation forThesis. V/aite Agric. Res. Instit., Univ.
Marcar, N.E. and Graham, R.D. (1986). Effect of seed manganese content on the growth ofwheat (Triticum aestivum) under manganese deficiency. Plant Soí1.96, 165-73.
Marschner, H. (1986). "Mineral Nutrition In Higher Plants." (Academic Press: London.)
Ma¡tin, J.K. (1971). Influence of plant species and plant age on the rhizosphere microflora.Aust. J. Biol. Sci.24, 1143-50.
Mascagni, H.J. (Jr.) and Cox, F.R. (1985)a. Effective rates of fertilization for correctingmanganese deficiency in soybeans. Agron. J.77,363-66.
Mascagni, H.J. (Jr.) and Cox, F.R. (1985)b. Evaluation of inorganic and organicmanganese fertilizer sources. Soil Sci. Amer. J.49,458-61.
McAlpine, D. (1904). Take-all and white-heads in wheat (Ophíobolus graminis Sacc.).,I.Dept. Agric., Víc. 2, 420-6.
McBride, M.B. (1979). Chemisorption and precipitation of Mn2+ at CaCO3 surfaces. SoilSci. Amer. J. 43, 693-698.
manganese efficiency in cereals. Ph.DAdelaide, South Aust.
McGregor, A.J. and Vy'ilson, G.C.S. (1964). The effect ofsulphate to a neuüal soil upon the yield of tubers andpotatoes. Plant Soil. 20, 59-64.
McGregor, A.J. and Vy'ilson, G.C.S. (1966). The influence of manganese on thedevelopment of potato scab. Plant SoiI.25,3-16.
McHargue, J.S. (1922). The role of manganese in plants. J. Amer. Chem. Soc. 44, 1592'8.
McKinney, H.H. and Davis, R.J. (1925). Influence of soil temperatue and moisture oninfection of young wheat plants by Ophiobolus gramínis. J. Agric. Res. 31, 827-40.
Memon, A.R. and Yatazawa, M. (1984). Nature of manganese complexes in manganeseaccumulator plant-Acanthopanatc sciadophylloides. J. Plant Nutr. 7 ,96L-7 4.
Mengel, K. and Kirkby, E.A. (1982). "Principles Of Plant Nutrition." Chpt. 14,pp. 441-50. (Int. Pot. Instit.: Switzerland.)
Merriman, P.R. (1987). Re-appraisal of principles and methods for testing micro-organismsfor control of soil-borne diseases. Proc. Australasían Plant Pathol. Conf. p. 50.Adelaide, South Aust.
applications of manganesethe incidence of common scab in
59
Miller, F.A. and Rudolph, E.D. (1986). Uptake and distribution of manganese and zinc inPinus virginiana-seedlings infected wi¡h Pisolithus tinctorius. Ohio J. Sci. 86, 22-25.
Miller, W.P., Martens, D.C. and Zelazny, L.W. (1985). Effects of manure amendment onsoil chemical properties and hydrous oxides. Soil Sci. Amer. J.49,856-61.
Miner, G.S., Traore, S. and Tucker, M.R. (1986). Corn response to starter fertilizer acidityand manganese materials varying in water solubility. Agron. .1.78,291-5.
Misaghi, I.S., Stowell, L.J., Grogan, R.G. and Spearman, L.C. (1982). Fungistaticactivity of water-soluble pigments of fluoreicent pseudomon ads. Phytopathol.72,33-6.
Moore, K.J. and Cook, R.J. (1984). Increased take-all of wheat with direct drilling in thepacific northwest. Phytopathol. 7 4, 1044-9.
Mortvedt, J.J., Fleischftesser, M.H., Berger, K.C. and Darling, H.M. (1961). The relationof soluble manganese to the incidenõe of common scab in potatoes. Amer. Potato J.38,95-100.
Morpedt, J.J., Berger, K.C. and Da¡ling, H. I. (1963). Effect of manganese and copper onthe growth of Streptomyces scabiãs and the incidence of potato scab. Amer. Potato J.40,96-702.
Mudliar, A. and Bharti, S. (1984). Effect of manganous ions on benzyladenine-inducedgrowth and chlorophyll synthesis in excised cucumber cotyledons. PhysiologiaPlantarum 6L,629-33.
Mulder, E.G. and Gerretsen, F.C. (1952). Soil manganese in relation to plant growth. Adv.Agron.4,22L-77.
Munns, D.N., Jacobson, L. and Johnson, C.M. (1963). Uptake and distribution ofmanganese in oat plants. 11. A kinetic model. Plant SoiI. 19, 193-204.
Murray, G.M., Scott,8.J., Hochman,Z. and Butler, B.J. (1986). Liming and_take-allincidence. Biennial Rep., Wagga Agric. Res. Instit. and Temora Agric. Res. AdvisoryStat., Dept. Agric., New South 'Wales, 1984-86. p.72.
Murray, G.M., Scott, B.J., Hochman,Z. and Butler, B.J. (1987). Failure of lirning to-increase grain yield of wheat and.triticale in acid soils may þ due to.the¿ssociatedincrease in incidence of take-all (Gaeumannomyces graminis var. tritici). Attst. J.Exptl. Agric. 27, 4lI-7 .
Nable, R.O. and Loneragan, J.F. (1984)a. Translocation of manganese in subterraneanclover (Trifolium iubteruaneumL. cv. Seaton Pa¡k). 1. Redistribution duringvegetative growth. Atut. J. Plant Physiol.11, 101-11.
Nable, R.O. and Loneragan, J.F. (1984)b. Translocation of manganese in subterraneanclover (Trifolium iubtenaneumL. cv. Seaton Park). 11. Effects of leaf senescence
and of restricting supply of manganese to part of a split root system . Aust. J. PlantPhysiol.1l, 1 13-8.
Nable, R.O., Bar-Akiva, A. and Loneragan, J.F. (1984). Functional manganeserequirement and its use as a critical value for diagnosis of manganese deficiency in
60
subteranean clover (Trifolium subterraneumL. cv. Seaton Park). Ann.8ot.54,39-49.
Nelson, L.E. (1977). Changes in water-soluble Mn due to soil sample preparation andstorage. Commun. Soil Scí. Plant AnaL8, 479-87.
Nielands, J.B. (1931). Microbial iron compounds. Ann. Rev. Biochem.50,7l5-3L
Nielands, J.B. and Leong, S.A. (1986). Siderophores in relation to plant growth anddisease. Ann. Rev. Plant Physiol.3T, I87-208.
Nyborg, M. (1970). Sensitivity to manganese deficiency of different cultivars of wheat, oatsand barley. Can. J. Plant Sci. 50, 198-200.
O'Brien, P.C. and Fisher, J.M. (1981). Ontogeny of spring wheat and barley infected withcereal cyst nematode (Heterodera avenae). Aust. J. Agríc. Res.32, 553-64.
Ohki, K. (1984). Manganese deficiency and toxicity effects on growth, development, andnutrient composition in wheat. Agron. J.76,2L3-8.
Ohki, K., Boswell, F.C., Parker, M.8., Shuman, L.M. and Vy'ilson, D.O. (1987). Foliarmanganese application to soybeans. Commun. Soil Sci. Plant Anal. L8,243-53.
Olsen, M.W. and Misaghi, I.J. (1984). Responses of guayule (Parthenium argentantm)seedlings to plant growth promoting fluorescent pseudomon ads. Plant Soil. 77 , 97 -101.
Osman, 4.2., El-Sherif, 4.F., Sadik, M.K., El-Aal, A.R. and Lotfy, A.U. (1983).Available Mn in some Egyptian soils. 2. Soil-Mn in calcareous soils as affected byCaCO3 content and fertilization, using 54Mn. Isotope RadiationRes. 15, 55-64.
Palma, J.M., Sandalio, L.M. and Del Rio, L.A. (1986). Manganese superoxide dismutaseand higher plant chloroplasts: A reappraisal of a conüoverted cellular localization. "I.Plant Physiol. L25, 427-39.
Papendick, R.I. and Cook, R.J. (1974). Plant water stress and development of FusariumFoot rot in wheat subjected to different cultural practices. Phytopathol. 64,358-63.
Penrose, L. (1985). Evidence for resistance in wheat cultiva¡s glown in sand culture to thetake-all pathogen, Gaeumannomyces graminís var. tritíci. Ann. AppI. BíoI. L07, I05'8.
Perry, M.W. and Gartrell, J.W. (1976). Lupin "split-seed". A disorder of seed productionin sweet, narrow-leafed lupins. J. Dept. Agríc., West. Aust. L7,20-5.
Pflonzig, J, and Auling, G. (19S7). Manganese def,rciency impairs ribonucleotide reductionbut not DNA replication in Arthro,bacter species. Arch. Microbiol. L46,396-401.
Phitip, R. and Devadath, S. (1984). Effect of micronutrients on the development of bacterialblight of rice. Phytopathol Zietschrift 111, 91-5.
Pope, A.M.S. and Jackson, R.M. (1973). Effects of wheatfield soil on inocula ofGaeumanrnmyces graminis (Sacc.) Arx & Olivier vat. tritíci. J. Walker in relation totake-all decline. Soil Biol. Biochem.5, 881-90.
-61
Possingham, J.V., Vesk, M. and Merceri, F.V. (1964). The fine structure of leaf cells ofMn-deficient spinach. J. Ultrastructure Res. 11, 68-83.
Price, R.D. (1970). Stunted patches and deadheads in Victorian cereal crops. Techn. Publ.,Dept. Agric., Vic. No. 23.
Prillieux, E.E. and Delacroix, G. (1890). La maladie du pied du ble, causee par 1'
Ophiobolus graminis Sacc. Bull. Soc. Mycol. Fr. 6, 110-3.
Primavesi, A. and Primavesi, A.M. (1964). Bezeihung zwischen Pflanzennahrung undPflanzenkrankheiten. Z. Pfl Ehrnahr. D ung. Bo denk. 105, 22-7 .
Reddy, M.R. and Perkins, H.F. (1976). Fixation of manganese by clay minerals. Soíl Sci.lzL,2r-4.
Reid, J.M. and Racz, G.J. (1985). Effects of soil temperature on manganese availability toplants grown on an organic soll. Can. J. Soil Sci.65, 769-775.
Reis, E.M., Cook, R.J. and McNeal, B.L. (1982). Effect of mineral nutrition on take-all ofwheat. P hytopathol. 72, 224-9.
Reuter, D.J. (1975). The recognition and correction of trace element deficiencies. In "Traceelements In Soil-Plant-Animal Systems." (Eds D.J.D. Nicholas and A.R. Egan.)(Academic Press: New York.)
Reuter, D.J. and Alston, A.M. (1975). Immobilization of divalent manganese in calcareoussoil. ,I. Aust. Instit. Agric. Sci.4l, 6I-2.
Reuter, D.J., Heard, T.G. and Alston, A.M. (1973)a. Correction of manganese deficiencyin barley crops on calcareous soils. 1. Manganous sulphate applied at sowing and asfoliar sprays. Awt. J. Exptl. Agric. Anim. Husb. L3, 434-9.
Reuter, D.J., Heard, T.G. and Alston, A.M. (1973)b. Correction of manganese deficiencyin barley crops on calca¡eous soils. 11. Comparison of mixed and compoundfertilizers. Aust. J. Exptl. Agric. Anim. Husb.13, 440-5.
Ridge, E.H. (1976). Studies on soil fumigation - 11. Effects on bactena. Soil Biol.Biochem. S,249-253.
Roberts, V/.O. (1948). Prevention of mineral deficiency by soaking seed in nutrientsolution. J. Agric. Sci. 38, 458-67.
Rosen, H.R. and Elliott, J.A. (1923). Pathogenicity of Ophiobolus caríceti in its relationshipto weakened plants. J. Agric. Res.25,351-8.
Ross, D.S. and Ba¡tlett, R.J. (1981). Evidence for non-microbial oxidation of manganese insoil. Soi/ Sci.132, 153-160.
Rothrock, C.S. (1987). Take-all of wheat as affected by tillage and wheat-soybeandoublecropping. Soil Biol. Biochem. 19, 307 -lI.
Rovira, A.D. (1976). Studies on soil fumigation-1. Effects on ammonium nitrate andphosphate in soil and on the growth, nutrition and yield of wheat. Sotl Biol. Bíochem.8, 24I-7.
-62-
Rovira, A.D. (1979). The biology@ds. J.L. Hartley and R.S.York.)
of the root-soil interface. In "The Soil-Root Interface."Russell.) pp. 145-60. (Academic Press: London, New
Rovira, A.D. and Ridge, E.H. (1983). Soil-borne root diseases in wheat. In "Soils: AnAustralian Viewpoint." pp.721-34. (Common. Sci. Indust. Res. Org.,Melbourne/Academic Press: London.)
Rovira, A.D. and Venn, N.R. (1985). Effect of rotation and tillage on take-all andrhizoctonia root rot in wheat. In "Ecology And Management Of Soil-borne PlantPathogens." (Eds. C.A. Pa¡ker, A.D. Rovira, K.J. Moore, P.T.W. Wong and J.F.Kollmorgen.) pp. 255-7 . (Amer. Phytopathol. Soc.: St. Paul, Minnesota.)
Rovira, A.D. and Wildermuth, G.B. (1981). The nature and mechanisms of suppression. In"Biology And Control Of Take-all." (Eds. M.J.C. Asher and P.J. Shipton.) pp. 385-415. (Academic Press: London.)
Rovira, 4.D., Graham, R.D. and Ascher, J.S. (1985). Reduction in infection of wheat rootsby Gaeumawnmyces graminis vat. tritici with application of manganese to soil. In"Ecology and Management of Soil-bome Plant Pathogens. Proc. Sectíon 5,4th Int.Plant Pathol. Cong.pp.212-4. (Amer. Phytopathol. Soc.: St. Paul, Minnesota.)
Ryan, F.E. (1958). Manganese deficiency in oats. J. Dept. Agric., West. Aust.7, 57L.
Ryan, J. and Hatiq, S.N. (1983). Transformation of incubated micronutrient chelates incalcareous soils. Soil Sci. Soc. Amer. J. 47,806-i0.
Salt, G.A. (1970). Soil fumigation and root-rots of wheat. Rothamsted Exptl. Stat. Ann.Rep., 1970. pp. 138-46.
Samuel, G. (1923). Take-all investigations. J. Dept. Agric., South Aust.27, 438-42.
Samuel, G. (1924). Take-all investigations. 1L. J. Dept. Agric., South Aust.27, Il34-47.
Samuel, G. and Piper, C.S. (1928). Grey speck (manganese deficiency) disease of oats. "I.Dept. Agric., South Aust.3I, 696-705;789-99.
Samuel, G. and Piper, C.S. (1929). Manganese as an essential element for plant gowth .
Ann. Appl. Biol.16, 493-524.
Scarponi, L. and Perucci, P. (1984). Effect of some metals and related metal-organiccompounds on AlA-dehydratase activity of corn. Plant Soil.79, 69-7 5.
Schafer, J.F. (1971). Tolerance to plant disease. Ann. Rev. Phytopathol.9,235-52.
Scher, F.M. and Baker, R. (1980). Mechanism of biological control in a Fusariwn-suppressive soil. Phytopathol. T0, 412-7 .
Scher, F.M. and Baker, R. (1982). Effect of Pseudomonas putida and a synthetic ironchelator on induction of soil suppressiveness to Fusaríum wilt pathogens.P hytop athol. 7 2, | 567 -7 3.
Scher, F.M., Dupler, M. and Baker, R. (1984). Effect of synthetic iron chelates onpopulation densities of Fusariwn orysporum and the biological control agentPseudomonas putida in soil. Can. J. Miuobiol. 30, 1271-5.
63
Schroth, M.N. and Hancock, J.G. (1982). Disease-suppressive soil and root-colonizingbacteria. Science. 216, 137 6-81.
Scott, P.R. (1981). Variation in host susceptibility. In "Biology And Control Of Take-all."@ds. M.J.C. Asher and P.J. Shipton.) pp.219-36. (Academic P¡ess: London.)
Scott, P.R. and H g in controlling soil-bornediseases of Soil-borne Plant Pathogens.(Eds. C.A. . Wong and J.F. Kollmorgen.)pp.I57-9. (Amer. Phytopathol. Soc.: St. Paul, Minnesota.)
Shipton, P.J. (1975). Take-all decline during cereal monoculture. In "Biology And ControlOf Soil-borne Plant Pathogens." (Ed. G.W. Bruehl.) pp. 137-44. (Amer.Phytopathol. Soc.: St. Paul, Minnesota.)
Shipton, P.J., Cook, R.J. and Sitton, J.W. (1973). Occurrence and transfer of a biologicalfactor in soil that suppresses take-all of wheat in eastern Washington. Phytopathol.63, 5ll-7.
Shuman, L. (1980). Effects of soil temperature, moisture, and air-drying on extractablemanganese, iron, copper and zinc. Soil Sci. L30,336-43.
Simon, A. and Rovira, A.D. (1985). New inoculation technique for Gaeumannomycesgramínis var. tritici to measure dose response and resistance in wheat in freldexperiments. In "Ecology And Management Of Soil-borne Plant Pathogens. Proc.Section 5,4th Int. Plant Pathol Cong. pp. 183-4. (Amer. Phytopathol. Soc.: St. Paul,Minnesota.)
Simpson, D.J. and Robinson, S.P. (1984). Freeze-fracture ultrastn-rcture of thylakoidmembranes in chloroplasts from manganese-deficient plants. Plant Physiol.74,735-4r.
Single, W.V. (1958). The mobility of manganese in the wheat plant. 1. Redistribution andfolia¡ application. Ann. B ot. 22, 47 9 -88.
Single, W.V. and Bird, I.F. (1958). The mobility of Mn in the wheat plant. 11.Redistribution in relation to manganese concentration and chemical state. Ann. Bot.22, 489-502.
Sivasithamparam, K. and Parker, C.A. (1978). Effects of certain isolates of bacteria andactinomycetes on Gaewnannomyces graminis var. tritici and take-all of wheat. Aust. J.Bot.26, 773-82.
Sivasithampar¿un, K. and Parker, C.A. (1981). Physiology and nutrition in culture. In"Biology And Control Of Take-all." (Eds. M.J.C. Asher and P.J. Shipton.) pp. I25-50. (Academic Press: London.)
Skou, (1981). Morphology and cytology of the infection process. In "Biology And ControlOf Take-all." (Eds. M.J.C. Asher and P.J. Shipton.) pp. I75-97. (Academic Press:London.)
Smiley, R.V/. (1978)a. Antagonists of Gaeumanrnmyces graminís from the rhizoplane of_wheat in soils fertilized with ammonium- or nitrate-nitrogen. Soil Bíol. Bíochem.I0,169-74.
64
Smiley, R.V/. (1978)b. Colonization of wheat roots by Gaeumannomyces grarnints inhibitedby specific soils, microorganisms and ammonium-nitrogen. Soil Biol. Biochem.10,175-9.
Smiley, R.V/. (1979). V/heat-rhizoplane pseudomonads as antagonists of Gaeumannomycesgramínis. S oil Biol. Biochem. ll, 37 1-6.
Smiley, R.W. and Cook, R.J. (1973). Relationship between take-all of wheat andrhizosphere pH in soils fertilized with ammonium vs. nitrate-nitrogen. Phytopatlnl.63, 882-90.
Smiley, R.W., Fowler, M.C. and Reynolds, K.L. (1986). Temperature effects on take-allof cereals caused by Phialophora graminicola and Gaeumannomyces gramínis.P hytopathol. 7 6, 923-31.
Smith, A.M. and Noble, D. (1972). Effects of oxygen and carbon dioxide on the growth oftwo va¡ieties of Gaeumannomyces gramínis. Trans. Brit. Mycol. Soc.58, 499-503.
Smith, S.T. and Toms, W.J. (1958). Manganese deficiency in the cereal-growing areas.,I.Dept. Agric., West. Aust. (3rd Ser) 7, 65-70.
Snowball, K. and Robson, A.D. (1983). "Symptoms Of Nutrient Deficiencies: SubterraneanClover And Wheat." (Univ., W'est. Aust.: Perth, Western Australia.)
Sparow, L.A. and Uren, N.C. (1987). Oxidation and reduction of Mn in acidic soils: effectof temperature and soil pH. SoiI Biol. Biochem.19, 143-8.
Speakman, J.B. (1984). Control of Gaeumannomyces graminís var. titici in wheat byisolates of the G. graminís var. titicilPhialolphora sp. (I-obed hyphopodia) complexunder field conditions. Phytopathol. ZeitschrÌft 109, 188-91.
Speakman, J.B. and Kruger, (1984). Control of Gaeumannornyces graminís var. tríttciby asterile, black mycelial fungus. J. Plant Dís. Prot.9l,39I-5.
Speakman, J.B. and Lewis, B.G. (1978). Limitation of Gaeumannomyces graminis bywheat root responses to Phíalophora radicicola. New P hytol.80, 373-80.
Sprague, R. (1950). Diseases Of Cereals And Grasses In North America. (The RonaldPress: New York.)
Stephens, C.G. and Donald, C.M. (1958). Australian soils and their responses to fertilizers.Adv. Agron. I0, 167 -256.
Swa¡d, R.J. and Kollmorgen, J.F. (1986). The separate and combined effects of barleyyellow dwarf virus and take-all fungus (Gaewnannomyces graminís var. tritíci) on thegowth and yield of wheat. Aust. J. Agric. Res.37, Ll-22.
Taylor, R.G., Jackson, T.L., Powelson, R.L. and Christensen, N.V/. (1983). Chloride,nitrogen form, lime and planting date effects on take-all root rot of winter wheat. PlantDis.67, 1116-20.
Thorne, G.N., Carter, N., Prew, R.D.,'Webb, R.M., Lacey, J., Plumb, R.T., Penny,4.,Church, B.M. and Todd, A.D. (1985). Report Rothamsted Exptl. St. for 1984. Part1,23-39.
65
Tiller, K.G. (1983). Micronutrients. In "Soils. An Australian Viewpoint." pp. 365-387.(C. S.I.R.O./Academic Press : London.)
Timonin, M.I. (1946). Microflora of the rhizosphere in relation to the manganese-deficiencydisease of oats. Proc. SoiI Sci. Soc. Amer. LL,284-92.
Toms, J. (1958). Manganese deficiency of subterranean clover in'Westem Australia. ,/.Dept. Agric., West Aust.13rd Ser) 7,2!5-6.
Treskova, S. (1961). Microelements and nematicides in the control of root-knot nematodes.Hort. Abstr.31, 596.
Trolldenier, G. (1969). Cereal diseases and plant nutrition. Pot. Rev.23124,l-16.
Trolldenier, G. (1981). Influence of soil moisture, soil acidity and nitrogen source on take-all of wheat. Phytopathol. Zeit. L02, 163-77.
Trolldenier, G. (1985). Effect of varied NPK nutrition and inoculum density on yield lossesof wheat caused by uke-all. In "Ecology And Management Of Soil-borne PlantPathogens. (Eds. C.A. Parker, A.D. Rovira, K.J. Moore, P.T.V/. Wong and J.F.Kollmorgen.) pp. 218-20. (Amer. Phytopathol. Soc.: St. Paul, Minnesota.)
IJren, N.C. (1969). The reactions and availability of manganese in soils. Ph.D. Thesis,Univ. of Melbourne.
lJren, N.C. (1981). Chemical reduction of an insoluble higher oxide of manganese by plantroots. J. Plant Nutr.4,65-7I.
Vose, P.B. (1963). The translocation and redistribution of manganese in Avena. J. ExptBot.14, 448-57.
Voth, R.D. and Christensen, D.R. (1980). Effect of fertilizer reaction and placement onavailability of manganese. Agron. J. 72, 7 69-73.
'Walker, J. (1981). Taxonomy of take-all fungi and related genera and species. In "Biology
And Control Of Take-all." @ds. M.J.C. Asher and P.J. Shipton.) pp. l5-74.(Academic hess: London.)
Wallwork, H. (1987). Screening for resistance to take-all in pheat, triticale and wheat-triticale hybrid hnes. Euphytica 40,103-9.
Warcup, J.H. (1957). Studies on the occurrence and activity of fungi in a wheat-field soil.Trans. Brit. Mycol. Soc. 40, 237 -62.
W'arcup, J. (1976).Studies on soil fumigation-IV. Effects on fungi. SoiI Biol. Biochem. S,26r-6.
'Weller, D.M. (1984). Distribution of a take-all suppressive strain of Pseudomonasfluorescens on seminal roots of winter wheat. AppL Environ. Microbiol. 48, 897 -9.
Weller, D.M. (1985). Application of fluorescent pseudomonads to control root diseases. In"Ecology And Management Of Soil-borne Plant Pathogens. @ds. C.A. Parker, A.D.Rovira, K.J. Moore, P.T.W. Wong and J.F. Kollmorgen.) pp. 137 -40. (Amer.Phytopathol. Soc.: St. Paul, Minnesota.)
66
Weller, D.M. and Cook, R.J. (19S1). Pseudomonads from take-all conducive andsuppressive soils. P hytopathol. 71, 264.
Weller, D.M. and Cook, R.J. (1983). Suppression of take-all of wheat by seed treatmentswith fl uorescent pseudomonads. P hy top at ho I. 7 3, 463 -9 .
'Wenzl, H. (1975). Control of potato scab by cultu¡al practices. Z. Pflanzenkh.82, 410-40.
'Weste, G. (1972). The process of root infection by Ophiobolus graminis.Trans. Brít.Mycol. Soc.59, 133-47.
Wildermuth, G.B. (1977). Studies on suppressive soils in relation to the growth ofGaeumannomyces graminis var. tritící and other root pathogens of wheat. Ph.D.Thesis, V/aite Agric. Res. Instit., Univ. Adelaide, South Aust.
'Wildermuth, G.B. and Rovira, A.D. (1977). Iyphal density as a measure of suppression ofGaeumannomyces graminis vat. tritici on wheat roots. Soil BioI. Biochem. 9,203-5.
'Wildermuth, G.8., Warcup, J.H. and Rovira, A.D. (1984). Growth of Gaeumannomycesgraminis var. tritici in soil in the presence and absence of wheat roots. Trars. Brit.Mycol. Soc.82, 435-41.
Wilhelm, N.S., Fisher, J.M. and Graham, R.D. (1985). The effect of manganese deficiencyand cereal cyst nematode infection on the growth of barley. Plant,Sofl. 85, 23-32.
'Wilkinson, H.T., Alldredge, J.R. and Cook, R.J. (1982). Estimated distances for infectionof wheat roots by Gaewnanrnmyces graminis var. tritíci in take-all suppressive andconducive soils. P hytop athol. 72, 949.
Wilkinson, H.T., All&edge, J.R. and Cook, R.J. (1985). Estimated distances for infectionof wheat roots by Gaeumannomyces graminis var. titicí in soils suppressive andconducive to take-all. P hytop athol. 7 5, 557 -9.
'Wilks, D.S., Gersper, P.L. and Cobb, F.V/. (Jr.) (1983). Relation of soil redox potential toinfection of ponderosa pine by Ceratocystis wagenerL Phytopathol. T3, lI20-5.
Williams, R.J.P. (1982). Free manganese (11) and iron (11) cations can act as intracellularcell controls. FEBS Letters.140, 3-10.
Williams, C.H. a¡rd Moore, C.W.E. (1952). The effect of stage of growth on the copper,zinc, manganese and molybdenum content of Algerian oats grown on thirteen soils.Aust. J. Agric. R¿s.3, 343-61.
'Wilson, R.E. and Parker, C.A. (1987). Evidence of repeatability of resistance to take-all.Proc.6th Australasian Plant Pathol. Conf., Adelaide, South Aust. p. 30.
'Wong, P.T.V/. (1975). Cross-protection against the wheat and oat take-all fungi byG aeurnannomy ces gr aminis v ar. gramínis. S oil B iol. B io c hem. T, 189 -9 4.
Vy'ong, P.T.W. (1981). Biological control by cross-protection. In "Biology And Control OfTake-all." (Eds. M.J.C. Asher and P.J. Shipton.) pp.4I7-31. (Academic Press:London.)

67
'Wong, P.T.W. (1983). Take-all of wheat. Agfact, Dept. Agric., New South Wales.P3.48.10.
Wong, P.T.V/. (1984). Saprophytic survival of Gaeumannomyces gramínís andPhialophora spp. aiva¡ious temperature-moisture regimes. Ann. Appl. Biol.I05,455-61.
'Wong, P.T.V/. and Baker, R. (1985). Control of wheat take-all and Ophiobolus patch ofturfgrass by fluorescent pseudomonads. In "Ecology And Management Of Soil-bornePlant Pathogens. (Eds. C.A. Parker, A.D. Rovira, K.J. Moore, P.T.W. Wong andJ.F. Kollmorgen.) pp. 151-3. (Amer. Phytopathol. Soc.: St. Paul, Minnesota.)
Wood, M.J. and Robson, A.D. (1984). Effect of copper deficiency in wheat on the infectionof roots by Gaeumannomyces gramínis var. tritici. Aust. J. Agric. R¿s. 35, 735-42.
Yarham, D.J. (1979). The effect on soil-borne diseases of changes in crop and soilmanagement. In "Soil-borne Plant Pathogens." (Eds. B. Schippers and W. Gams.)pp. 371-83. (Academic Press: London.)
Yarham, D.J. (1981). Practical aspects of epidemiology and control. In "Biology AndControl Of Take-all." (Eds. M.J.C. Asher and P.J. Shipton.) pp. 353-8a. (AcademicPress: London.)
Yuen, G.Y., Schroth, M.N. and McCain, A.H. (1985). Reduction of Fusaríum wilt ofcamation with suppressive soils and antagonistic bacteria. Plant Dís.69,l07I-4.
7-ajic, J.E. (1969). Microbes and manganese. In "Microbial Biogeochemistry." Chpt. 14.pp. 157-68. (Academic Press: New York, London.)
7ngg, H. and Amiet, J.A. (1980). Laboratory studies on decline with different foot and rootrot pathogens of wheat. Phytopathol. Zeitschrift.9T, 193-213.
7ngg, H. and Jaggi, V/. (1974). Studies on the biological soil disinfection. Vl1.Contribution to the take-all decline (Gaewnannomyces graminis) imitated by means oflaboratory trials and some of its possible mechanisms. Phytopathol. Zeitschrift. SI,160-9.
EFFECT OF HIGH LEVELS OF SOIL MNON GROWTH OF GGT AND ON THE DISEASE,
TAKE-ALL
68
CHAPTER 2. EFFECT OF HIGH LEVELS OF SOIL MN ON GROWTH OFGGT AND ON THE DISEASE, TAKE.ALL
2.I. fntroduction.
The simplest hypothesis proposed by Graham and Rovta (1984) to explain the
reduction of take-all by Mn application to soil was that Mn2+ was directly toxic to the fungus
in the soil. The results of Reis et al. (1982) and also some of those published by Graham
(1983) a¡e consistent with such an hypothesis, in that rates of Mn which did not further
increase plant growth, gave additional control of take-all. Studies on the effects of Mn on
common scab of potatoes imply that Mn may decrease this disease through such a
mechanism (Morwedt et al.1963).
In order to investigate the validity of this hypothesis, g¡owth of Ggt was first tested
at increasing rates of MnSOa in two different agars. In this way the sensitivity to, and
behaviour of , Ggt in the presence of high levels of Mn2+ could be readily observed.
Secondly, a'soil-sandwich' technique developed by Grose et al. (1984) to test the
effect of temperanre and moisture on Ggr mycelial growth through a soil matrix was
modifrred to test the effect of high levels of Mn2+.
Thirdly, the effect of increasing additions of Mn2+ to soil on the level of disease on
wheat roots was compared to changes in mycelial growth of Ggt through soil over a similar
range of Mn2+ concentrations. The data for the former was collated from MnSOa treatrnents
of 14 pot experiments, 13 conducted dwing the course of this project and 1 from the
published results of Graham and Rovira (1934). Data for the latter was taken from studies
conducted with the modified' soil- sandwich' technique.
69
2.2. Materials and Methods.
2.2.1. Growth of Ggt on two agars at increasing rates of MnSO+.
2.2.1.1. PDA. Three separare experiments were conducted to test the effect of increasing
rates of MnSOa.4H2O on the growth of Ggt on potato dextrose agar (PDA [1]).
2.2.I.l.I.Inoculum. A single isolate was used in all 3 experiments and this isolate
was used throughout the project. The isolate (500) was supplied by Dr. A. Rovira [2] and
was originally isolated by A. Simon from wheat roots collected at Coomandook, South
Australia n 1976. All cultu¡es used in this project were stored on full-strength PDA under
sterile distilled double deionized water (DDDHzO) and colonies for each experiment were
prepared from stored cultures.
2.2.1.1.2. Mn. Mn2+ ion concentration of between 0 and 800 mg kg-l wete
prepared by adding appropriate amounts of a MnSO+.4H2O stock solution to weak PDA
(approximately 40 7o of manufacturer's recoûrmendations) which had been made up with
DDDHzO. In experiment A, a series of 2-fold dilutions were prepared with an 8000 mg kg-l
Mn stock solution to give final concentrations in agar of 0,25,50, 100, 200, 400 and 800
mg kgl Mn. In experiments B and C a 500 mg kg-1 Mn stock was used to give hnal
concentrations of 0, 10, 25, 50,75, 100, 200, 400,800 and 0, 25,50, 100, 200, 400 mg
kg-l Mtt, respectively. Four dishes were prepared for each Mn concentration in experiment
A and three for B and C.
2.2.1.I.3. Procedure. Disposable petri-dishes (9 cm. diameter) were poured with
15 mt of agar (autoclaved at 12æ C and 100 kPa for 15 minutes). Mycelial cubes (4 mm x 4
mm x 4 mm), removed from the colony edge of an actively growing culture on weak PDA
(no added Mn), were used as inocula for test dishes. One mycelial cube was aseptically
transferred to the centre of each dish and dishes were kept in ttre dark at 2æ C for 5 days
1 Difco Laboratories, Detroit, Michigan, U.S.A.
70
(experiment A was conducted at room temperature at an average temperarure of 2(P C).
Colony areas were calculated at regular intervals from the average of 2 measurements of
colony diameter taken at right angles to each other. At the end of experiment A the pH of
agar under Ggr colonies and also of sterile agar was estimated using Merck pH indicator test
srrips [3].
2.2.1.2. KMB. An experiment was conducted to test the effect of increasing rates of
MnSO¿.4H2O on the growth of Ggt on solid King's medium B (King et al. 1954).
2.2.l.2.l.Inoculum. As for PDA.
2.2.1.2.2. Mn. Increasing concentrations of Mn2+ in solid King's medium B were
prepared by adding appropriate amounts of a 250 mg kg-l Mn (added as MnSO¿. HzO)
stock solution to media prior to autoclaving for 15 minutes at 1200 C and 100 kPa. Mn
concentrations of 0,10, 50, 100, 200 mg kg-l Mn were prepared.
2.2.1.2.3. Procedure. As for experiments A and B with PDA, except
measurements were stopped after 4 days.
2.2.2. Ggr growth through soil at increasing rates of MnSO¿ (soil sandwich technique).
2.2.2.l.lnoculwn. Inocula used in these experiments were Ggt 500 colonized whole oat
seeds. Oat seeds were autoclaved with an equal volume of DDDH2O for 30 minutes at72æ
C and 100 kPa in cotton wool-ptugged wide-mouthed conical flasks and then autoclaved for
a further 15 minutes one day later. Once the seeds had cooled they were inoculated with
mycelial cubes of Ggt 500 taken from the edge of a colony growing on weak PDA (see
2.2.I.) and kept at room temperature for 4 weeks. Flasks were periodically shaken to help
spread the fungus evenly through each flask. At the end of 4 weeks, flasks were emptied
and the oat seed inocula dried in a sterile air stream. Five or six seeds were chosen at
2 Div. of Soils, C.S,I.R.O., Glen Osmond, South Australia.3 E. Merck, Darmstadt, F.R. Germany.
-71
random f¡om each and plated onto full-strength PDA. No contamination was found after 5
days at 2æ C. Once dry, the oat seed inocula rwere transferred to paper bags and stored at
room temperature.
2.2.2.2. Soils. Two soil types were used ; 1. An infertile, slightly acid to neutral siliceous
sand (Uc 2.21, Northcote 1979) which had been collected from the A2 horizon of a virgin
site at Coonalpyn, in the upper south-eastern region of South Australia. This soil-type often
results in Mn-def,rcient lupin crops in this area (I{annam et aL.7984). The sand was air-d¡ied
for storage in polythene bags but was not prepared for experiments in any other way. 2. A
calcareous aeolian sand (Uc 1.1 1, Northc ote 1979) collected at 'Wangary on the lower Eyre
Peninsula of South Australia. This sand has a very high water-holding capacity compared to
most sands, contains 80-90 Vo CaCO3, has a pH of 8.5 (in CaClÐ and a bulk density of only
0.6 g cm-3. Soil was collected separately from depths at 0-10 and 1G20 cm, air-dried and
sieved to pass a2 mm mesh. The organic rnatter content was further reduced by carefully
blowing surface organic matter away with a stream of air. The ai¡-dried sand was placed in
polythene bags and stored under cover. In all experiments conducted in this project with this
sand an equal mixture, by weight, of top (0-10 cm) and sub (10-20 cm) soil was used.
2.2.2.3. Mn. Three separate experiments were conducted, each with 3 replicate dishes per
treatnent. Coonalpyn sand was used in t'wo experiments (D and E). Mn (as MnSO¿.4HzO)
was added dry to the sand, mixed thoroughly, and then the sand was moisteneÅ.to t0 Vo
moistrue content with DDDH2O. The two experiments with Coonalpyn sand differed from
each other only in the Mn treatnents imposed; In experiment D Mn levels equivalent to 0,
50, 250, 2500 and 5000 mg kg-l ¡4¡2+ in air-dry sand were used but in experiment E rates
of Mn were 0, 25,1t0,150 and 500 mg kg-l. Wangary sand was used in one experiment
(F) and 4 Mn treatrnents were imposed. Appropriate quantities of DDDH2O and a 2000 mg
kg-l Mn (added as MnSOa.4HzO) stock solution were added to the air-dry sand to produce a
-12-
final moisture content of 25 Vo and Mn levels equivalent to 0, 50, 150, 250 or 500 mg kg-l
Mn in air-dry sand before mixing thoroughly.
2.2.2.4. Procedure. Figure 2.1 shows the relative placement in each 15 cm glass petri-dish
of soil, a millipore frlter [4] and the oat seed inoculum. Eighty grammes of wetted soil was
added to each dish and compacted lightly with the base of a beaker. An oat seed inoculum
was buried flush with the soil surface in the centre of each dish and covered with a filter,
followed by another oat seed inoculum (again in the centre of each dish) and covered with a
further 93 g of wetted soil. The top layer of soil was also compacted. Petri-dishes were
enclosed in t'wo individually sealed polythene bags with an additional dish containing
absorbent cotton wool wetted with DDDH2O. In this way water loss from dishes was
minimized. Dishes were kept at 15o C for 15 days. This technique differed in two ways
from the soil-sandwich technique of Grose et al. (1984). Firstly, an oat seed inoculum was
used instead of wheat straw and ¡ro inocula were placed in each dish because preliminary
experiments had shown thatGgt growth had not always occured in all dishes. With two
inocula there was a better chance of getting hyphal gor#th on at least one surface of the filter
in every dish. Secondly, opaque, white millipore filters were used instead of transparent
nuclepore filters because they were more readily available and cheaper. Also, it was found
that after using millipore filters staining the mycelia was not necessary because ttre black
runner hyphae stod out sharply against the white background of the filters.
2.2.2.5. Growth measuremenfs. Each millipore filter was divided into 8 equal sectors
drawn through the centre. The muimum radial go'wth of black nrnner hyphae and density
of hyphae (scoring system of Grose et al. 1.984) were recorded for each sector on both sides
of each f,rlter. Measurements on each surface were averaged over the 8 sectors. After Ggt
growth had been measured, filters were flooded with 0.7 Vo benzidine in I Vo ethanol and the
4 Cat. no. SM\ilP t9025,9 cm diameter, 5 um pore size, Millipore Corporation, Bedford,Massachusetts, U.S.A. 01730.
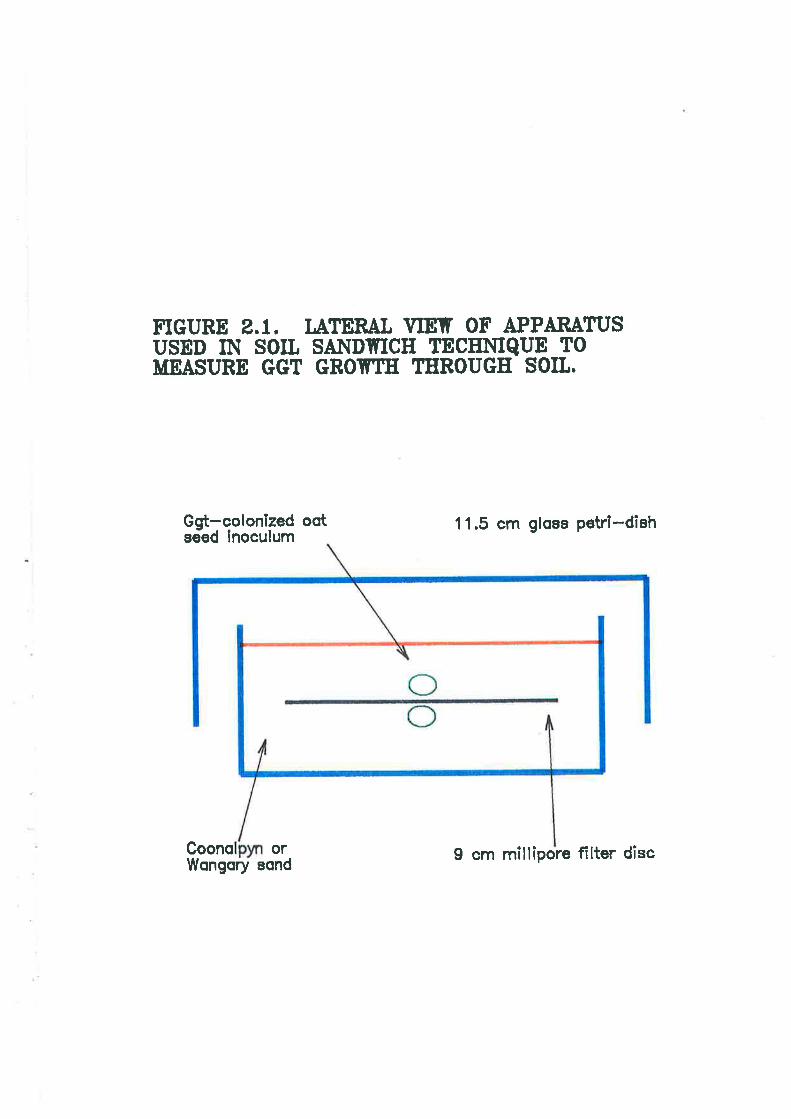
FIGURE 2.L, II\TERAT VIETT OT APPARATTISusED IN SOIL SANDTnCH TECENIQUD TOMEASURE GGT GROTNU THNOUGE SOIL.
Got-colonized oqtsãed inoculum
1 1.5 cm gloss petrï-dîsh
Coono or 9 cm milliPore filter dîscwqngory sond

-73
rapid appearance of blue colour recorded. The appearance of blue with benzidine is a
positive reaction for the presence of Mn oxides (Mellan l94l, I.eeper 1970).
2.2.3. Effect of increasing rates of soil Mn on take-all disease and Ggt mycelial growth.
The effect of increasing soil Mn on symptoms of Ggt infection on wheat roots was
assessed with the collective results of 14 pot experiments. Thirteen of these experimens
were conducted during the course of this project and the details of the majority of these are in
chapters 3,4,5,6 and 7. Those that are not, have not been included in this thesis because
they did not contribute anything further to the experiments that have been cited. The
remaining experiment was published by Graham and Rovim (1984). \ñ/angary sand and Ggr
isolate 500 were used in all experiments but they differed in the rates of MnSO+ used, the
types of Ggr inoculum and resulting disease levels, the size of pots and in 3 of the
experiments an additional treatrnent of suspensions of the biological control agent,
Pseydornonasflu.orescens 2-79 (NRRL B-t5I32), was imposed (Chapter 7). The average
total length of take-all lesions per pot for each Mn rate was expressed as a percentage of the
level in 0 Mn controls in each experiment. These results were plotted against the rate of
Mn2+ added to the soil. The density of Ggt mycelia in Coonalpyn sand, similarly expressed,
was plotted on the same axes.
2.3. Results.
2.3.1. Growth of Ggt on two ag¿¡rs at increasing rates of MnSO+.
2.3.1.1. PDA. Figure 2.2 shows the effect of increasing Mn2+ concentration on the growth
of Ggt 500 on PDA. Only data from day 5 have been presented because results from ea¡lier
assessments showed very similar effects of Mn2+. This plot clearly shows that Ggt growth
on this ag¿¡r \vas very sensitive to Mn2+ and that colony area declined sharply in the
concentration range of 70-100 mg kg-l. Plate 2.1shows representative dishes from each Mn
rate, photographed on day 5.
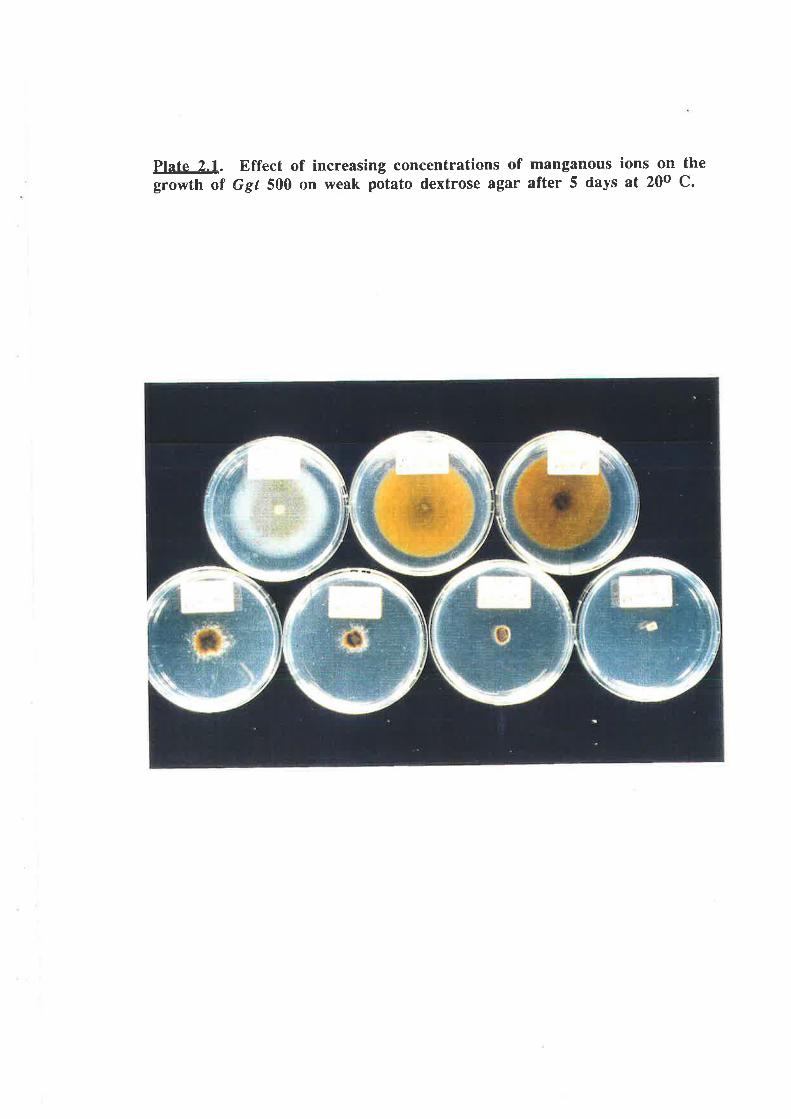
Plate 2.1. Effect of increasing concentrations of manganous ions on thegrowth af Ggt 500 on weak potato dextrose agar after 5 days at 20o C.
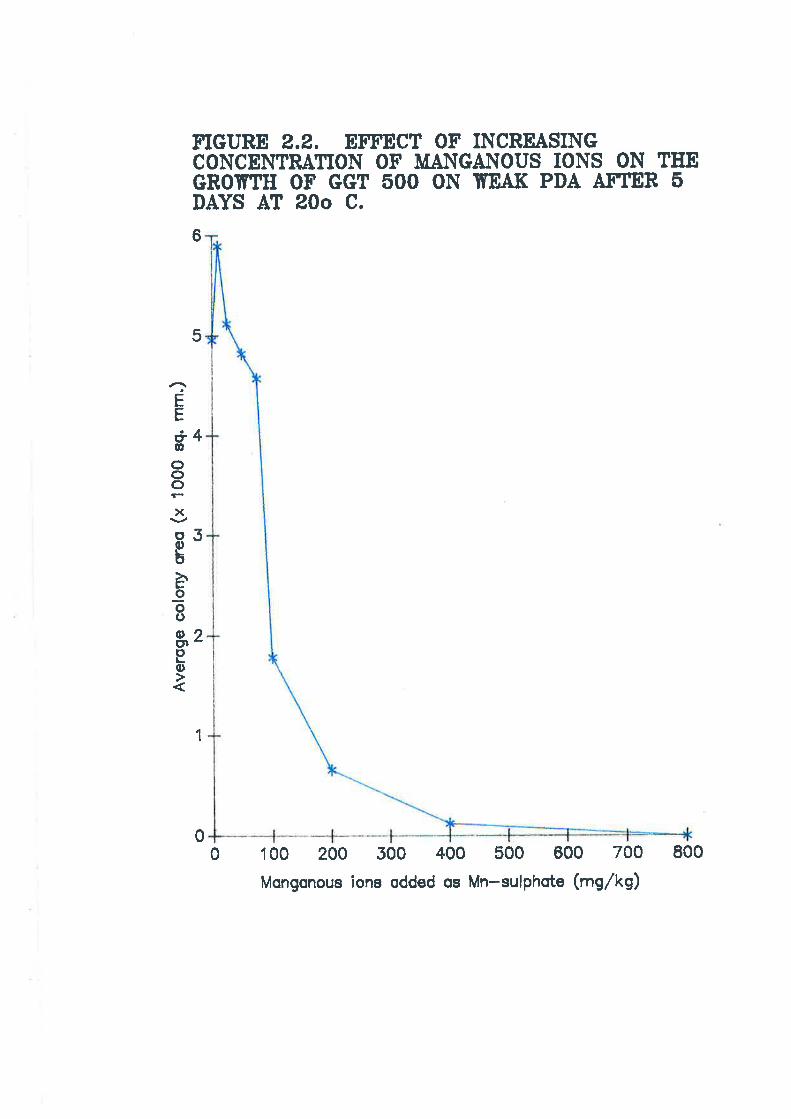
4
5
2
ËE
ETooooxoEotroõooorgo
FIGURE 2,2, ETFECT OF INCREASINGCONCE}ITRATION OF IIANGAI\OUS IONS ON THEGBO.TTII OF GGT õOO ON TÍEAI( PDA ATTER õDAYS AT 20o C,
6
5
1
00 1 00 200 500 400 500 600 700 800
Mongonous ions odded os Mn-sulphote (mg/kg)
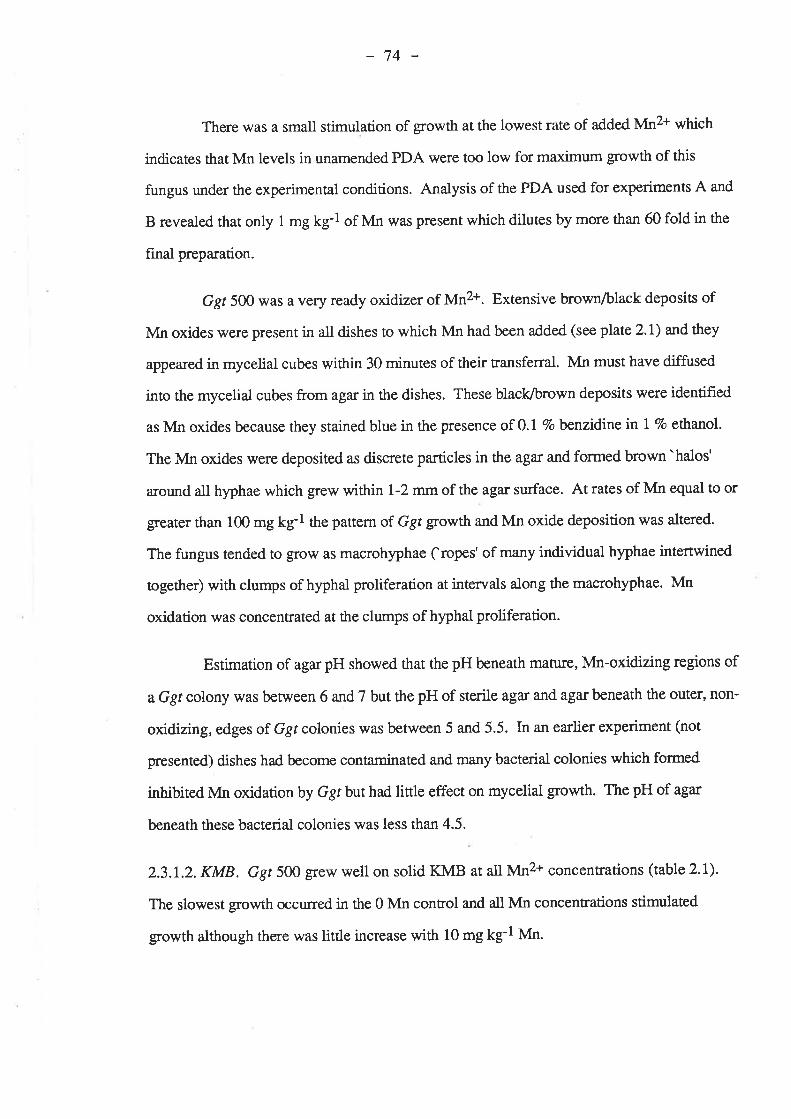
-74-
There was a small stimulation of growth at the lowest rate of added MrP+ which
indicates that Mn levels in unamended PDA were too low for maximum growth of this
fungus under the experimental conditions. Analysis of the PDA used for experiments A and
B revealed that only 1 mg kg-l of Mn was present which dilutes by more than 60 fold in the
final preparation.
Ggt 5oo was a very ready oxidizer of Mn2+' Extensive bnown/black deposits of
Mn oxides \ilere present in all dishes to which Mn had been added (see plate 2.1) and they
appeared in mycelial cubes within 30 minutes of their ransferral. Mn must have diffused
into the mycelial cubes from agar in the dishes. These black/brown deposits were identified
as Mn oxides because they stained blue in the presence of 0.1 Vobenzidine in 1 7o ethanol.
The Mn oxides were deposited as discrete particles in the agar and formed brown'halos'
around alt hyphae which grew within 1-2 mm of the agar surface. At rates of Mn equal to or
greaterthan 100mgkg-l thepattern of Ggt gowthandMnoxidedepositionwasaltered.
The fungus tended to grow as macrohyphae f ropes'of many individual hyphae intertwined
together) with clumps of hyphal proliferation at intervals along the macrohyphae. Mn
oxidation r#as concentrated at the clumps of hyphal proliferation.
Estimation of agar pH showed that the pH beneath mature, Mn-oxidizing regions of
aGgt colony was between 6 and 7 but the pH of sterile agar and agar beneath the outer, non-
oxidizing, edges of Ggt colonies was between 5 and 5.5. In an earlier experiment (not
presented) dishes had become contaminated and many bacterial colonies which formed
inhibited Mn oxidationby Ggt but had little effect on mycelial g¡owth. The pH of agar
beneath these bacterial colonies was less than 4.5.
2.3.1.2. KMB. Ggr 500 grew well on solid KMB at all Mn2+ concentrations (table 2.1).
The slowest growth occurred in the 0 Mn controt and all Mn concentrations stimulated
growth although there was little increase with 10 mg kg-l Mn.

-75
Tahle 2.1. Effect of increasing concentrations of Mn2+ in KMB on growthof Ggf 500. Colony areas were calculated from 2 measurements of colonydiameter, taken at right angles to each other, after 5 days at 20o C and wereaveraged over 3 replicate dishes. Values in parentheses are standard errorsfor each mean.
Mn added (mg kgl) 0 10 50 100 200
Ggrcolonylmmz¡
area 2965(2s4)
3288(t62)
3668(36)
4072 3868(103)(s7)
The only evidence for a toxic effect of Mn2+ occurred with 200 mg kg-l Mn where
colony area \ilas smaller than at 100 mg kg-l, but this growth was still faster than in the 0 Mn
control.
Mn oxidation by Ggr occurred on this agar atall concentrations of added Mn but
was restricted to a few isolated blaclç/brown flecks on the colony sr¡rface which were acutely
elliptic in shape. These flecks were confirmed to contain Mn oxides with benzidine. The
largest of these flecks were 2-4 mm long and 1-1.5 mm wide.
2.3.2. Ggr growth through soil at increasing concentrations of Mn (soil sandwichtechnique).
2.3.2.1. Coonalpyn sand. Tables2.2 and,2.3 show the effect of increasing Mn2+
concentration on growth of Ggt through Coonalpyn sand for experiments D and E,
respectively. Due to a small difference in absolute radial growth rates between experimenS
D and E measu¡ements were expressed as a percentage of the 0 Mn control in each
experiment so that they could be compared over the whole range of Mn concentrations (see
figure 2.3).
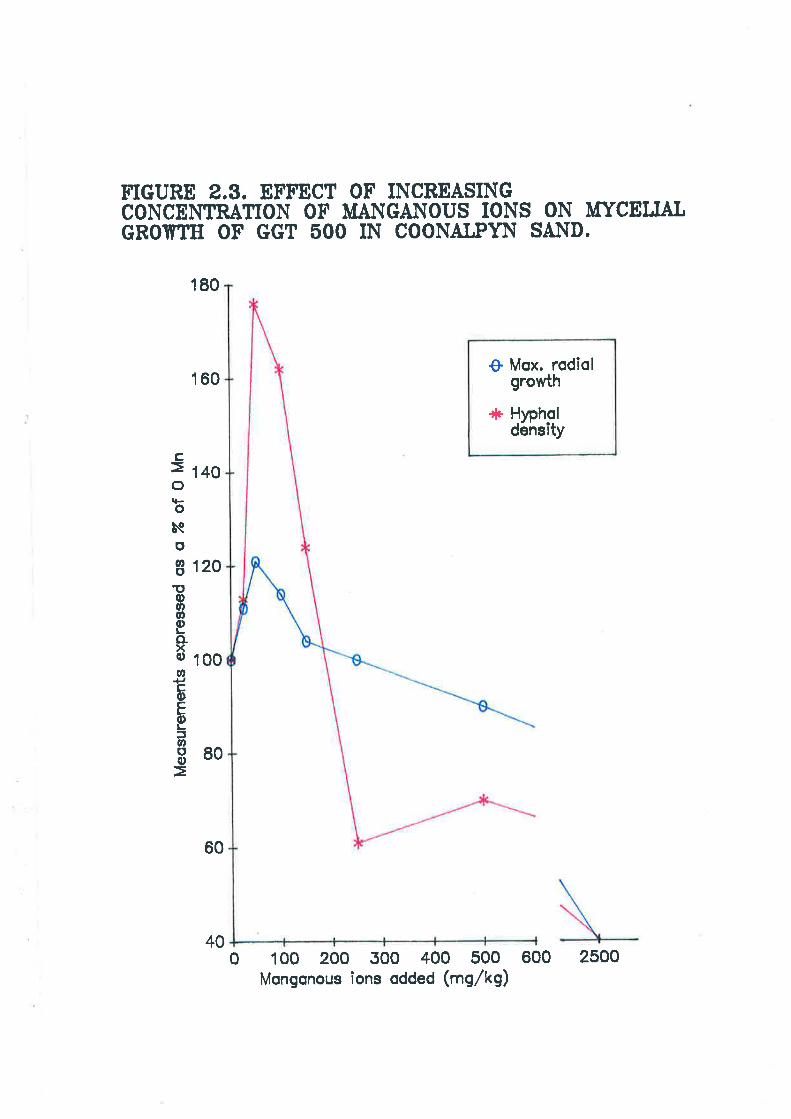
FTGURE 2,3, EFFECT OF INCREASINbCONCENTRATION OF IIANGANOUS IONS ON MYCEIJALGROTYTH OF GGT õOO IN COONAI;PYN SAT{D.
1E0
160O Mox, rodiol
growth
rl* H¡ph.oldenstty
c=oq-o
be
oto!tutoEoxIt,
o+)c0)EE:tv,oo
1 40
201
100
EO
60
0 100 200 500 400 500 600 250040
Mongonous îons odded (mg/kg)
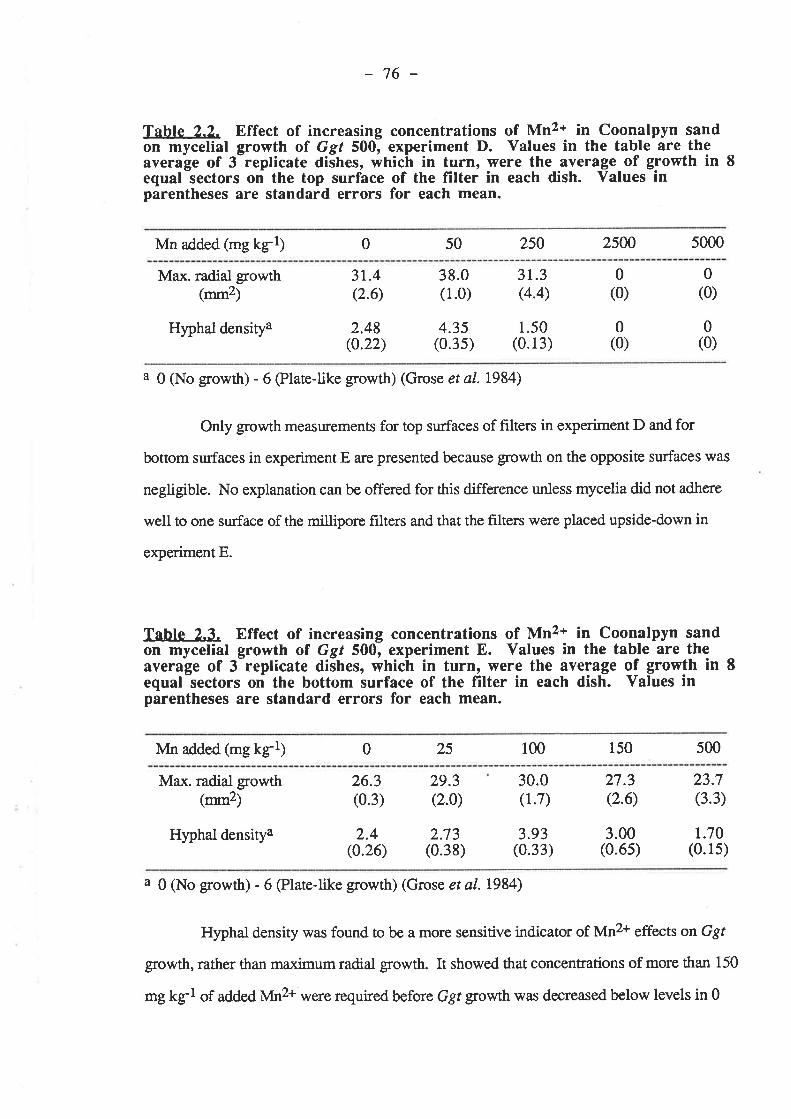
-76-
Table 2.2. Effect of increasing concentrations of Mn2+ in Coonalpyn sandon mycelial growth of Ggt 500, experiment D. Values in the table are theaverage of 3-replicate dishes, which in turn, were the average of growth in 8equal sectors on the top surface of the filter in each dish. Values inparentheses are standard errors for each mean.
Mn added (mg kgl) 0 50 250 2500 5000
Max. radial growth(mm2)
Hyphal densitya
3r.4(2.6)
2.48(0.22)
38.0(1.0)
4.35(0.3s)
31.3(4.4)
1.50(0.13)
0(0)
0(0)
0(0)
0(0)
a 0 (No g¡owth) - 6 (Plate-like growth) (Grose et al.1984)
Only growth measurements for top surfaces of filters in experiment D and for
bottom surfaces in experiment E are presented because growth on the opposite surfaces was
negligible. No explanation can be offered for this difference unless mycelia did not adhere
well to one surface of the millipore filters and that the frlters were placed upside-down in
experimentE.
Table 2.3. Effect of increasing concentrations of Mn2+ in Coonalpyn sandon mycelial growth of Gg 500, experiment E. Values in the table are theaverage of 3-replicate diihes, which in turn, were the average of growth in Iequal sectors on the bottom surface of the filter in each dish. Yalues inparentheses are standard errors for each mean.
VIn added (mg kf l) 25 1000 150 500
Max. radial gowth(mm2¡
Hyphal densitya
26.3(0.3)
2.4(0.26)
29.3(2.0)
2.73(0.38)
30.0(1.7)
3.93(0.33)
27.3(2.6)
3.00(0.6s)
23.7(3.3)
t.70(0.15)
a 0 (No growth) - 6 @late-like growth) (Grose et al.1984)
Hyphal density was found to be a more sensitive indicator of Mn2+ effects on Ggt
growth, rather than maximum radial growth. It showed that concentrations of more than 150
mg kg-l of added Mn2+.were required before Ggr growth was decreased below levels in 0
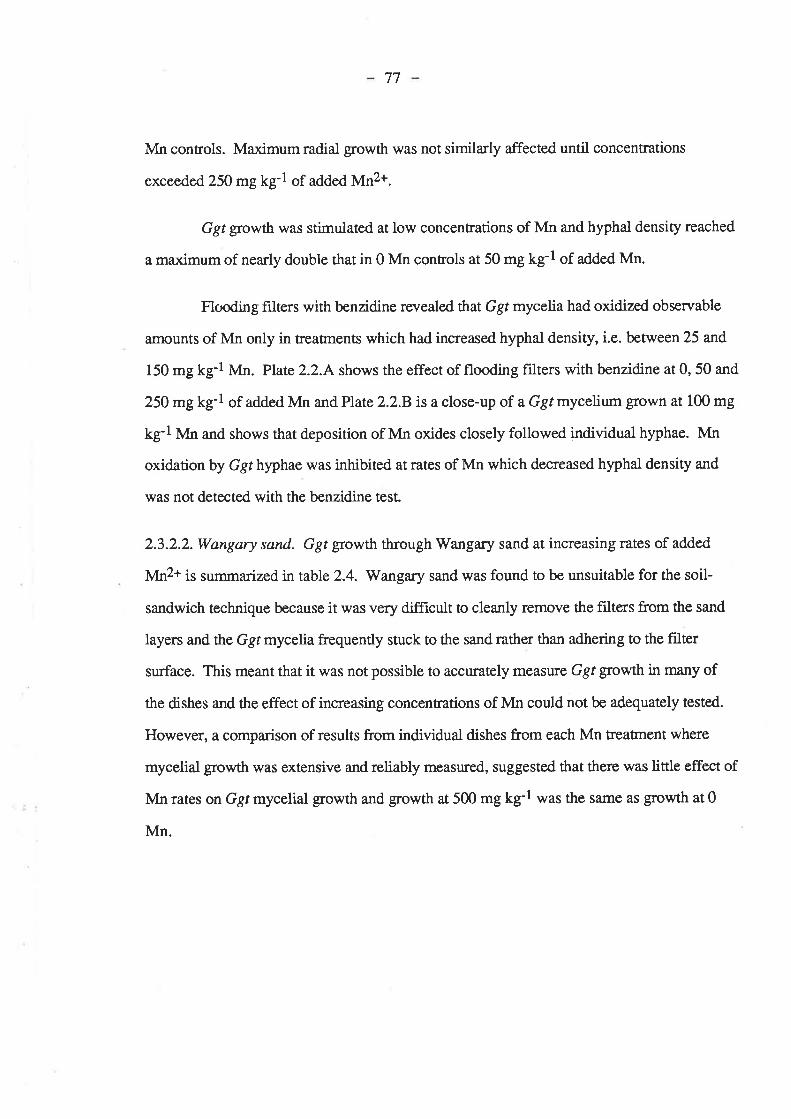
77
Mn connols. Maximum radial growth was not similarly affected until concentrations
exceeded 250 mg kg-l of added Mn2+.
Ggr growth was stimulated at low concentrations of Mn and hyphal density reached
a maximum of nearly double that in 0 Mn conrols at 50 mg kg.l of added Mn.
Flooding filters with benzidine revealed that Ggt mycelia had oxidized observable
amounts of Mn only in treatrnents which had increased hyphal density, i.e. between 25 and
150 mg kg-l tr,tn. Plate 2.2.A shows the effect of flooding f,rlters with benzidine at 0, 50 and
250 mg kg-l of added Mn and Plate2.2.B is a close-up of aGgt mycelium g¡own at 100 mg
kg-ltr,tn and shows that deposition of Mn oxides closely followed individual hyphae. Mn
oxidation by Ggt hyphae was inhibited atrates of Mn which decreased hyphal density and
was not detected with the benzidine test.
2.3.2.2.Wangary sand. Ggt growth through Wanga¡y sand at increasing rates of added
NIn2+ is summa¡ized in table 2.4. V/angary sand was found to be unsuitable for the soil-
sandwich technique because it was very difFrcult to cleanly remove the filters from the sand
layers and the Ggr mycelia frequently stuck to the sand rather than adhering to the filter
surface. This meant that it was not possible to accurately measure Ggr growth in many of
the dishes and the effect of increasing concentrations of Mn could not be adequately tested.
However, a comparison of results from individual dishes from each Mn treatrnent where
mycelial growth was extensive and reliably measured, suggested that there was little effect of
Mn rates onGgt mycelial growth and growth at 500 mg kg-l was the same as growth at 0
Mn.
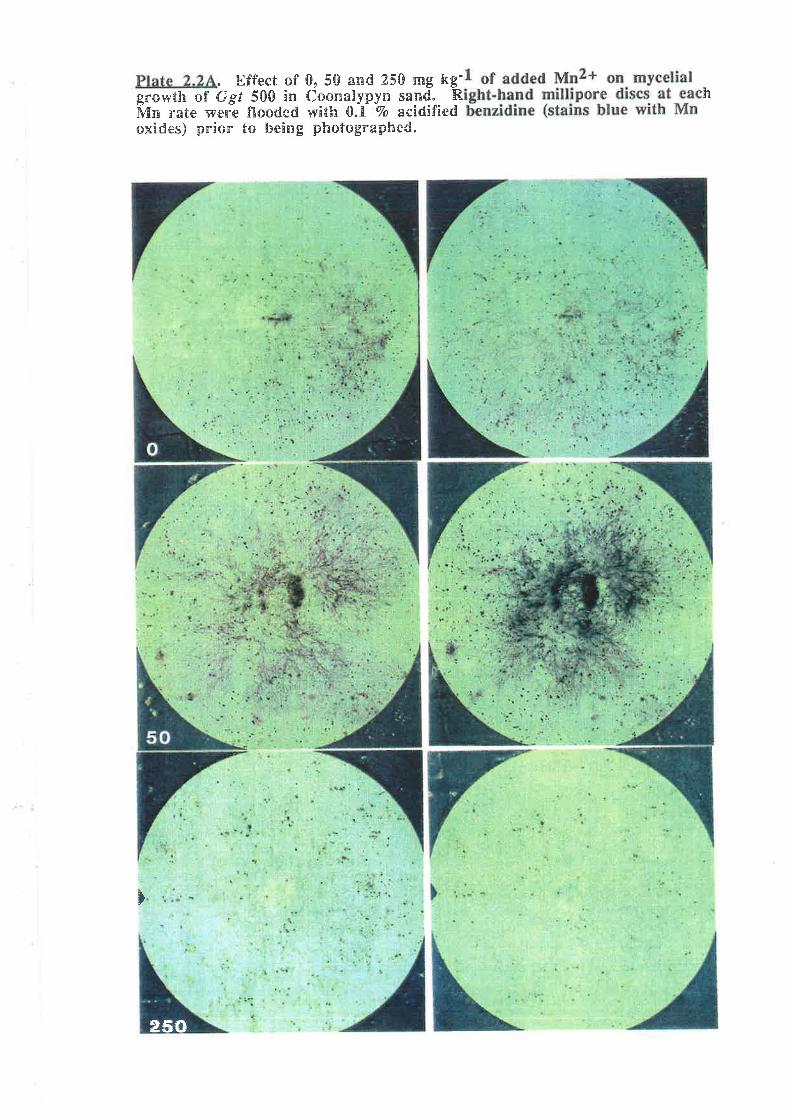
. Ðff+ct of #, 5Ð asad 25Û eng kg-grow*Èa *T Ggî Stt in ilooraaEypyn sand. R' å?
foTaa rate were ËSooded wåth #"í Vo acidiliedaxådes) pnåar lo being påiot+graphed.
1
==ÉI
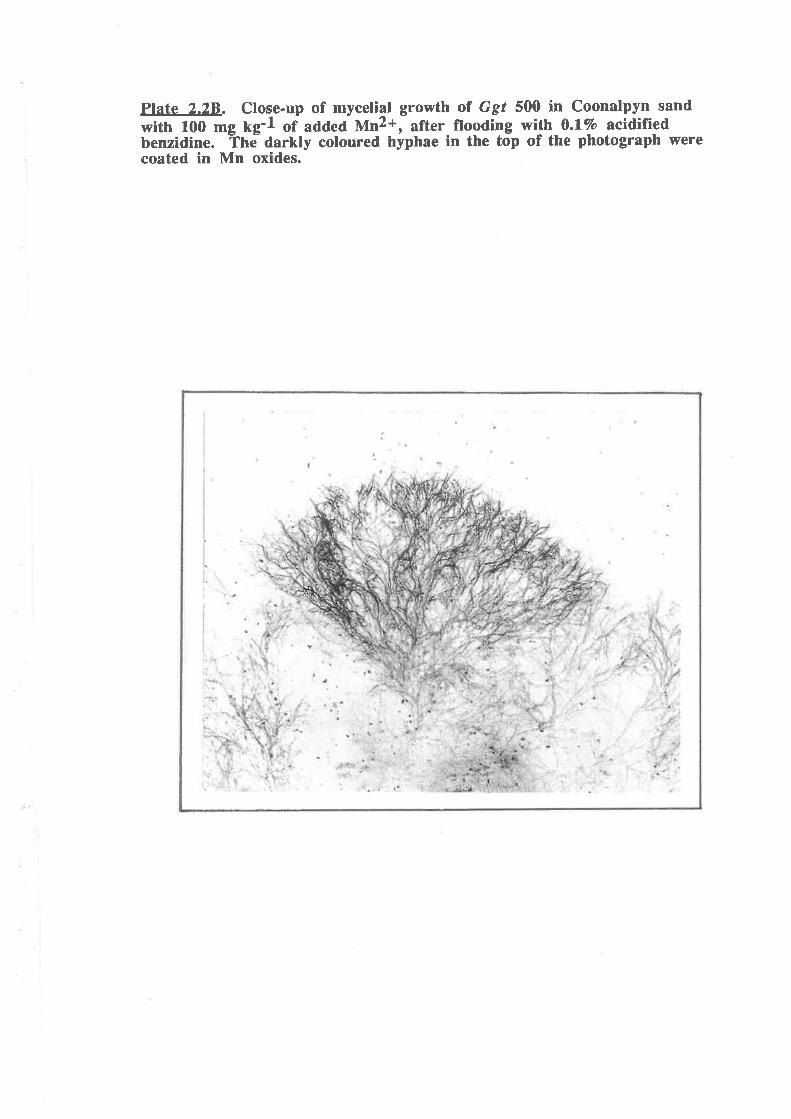
Plate 2.28. Close-up of mycelial growth of Ggt Sfi) in Coonalpyn sandwith 100 mg kg'1 of added Mn2+, after_ flooding with 0.l%o acidifiedbenzidine. Tnð darkly coloured hyphae in the top of the photograph werecoated ín Mn oxÍdes.
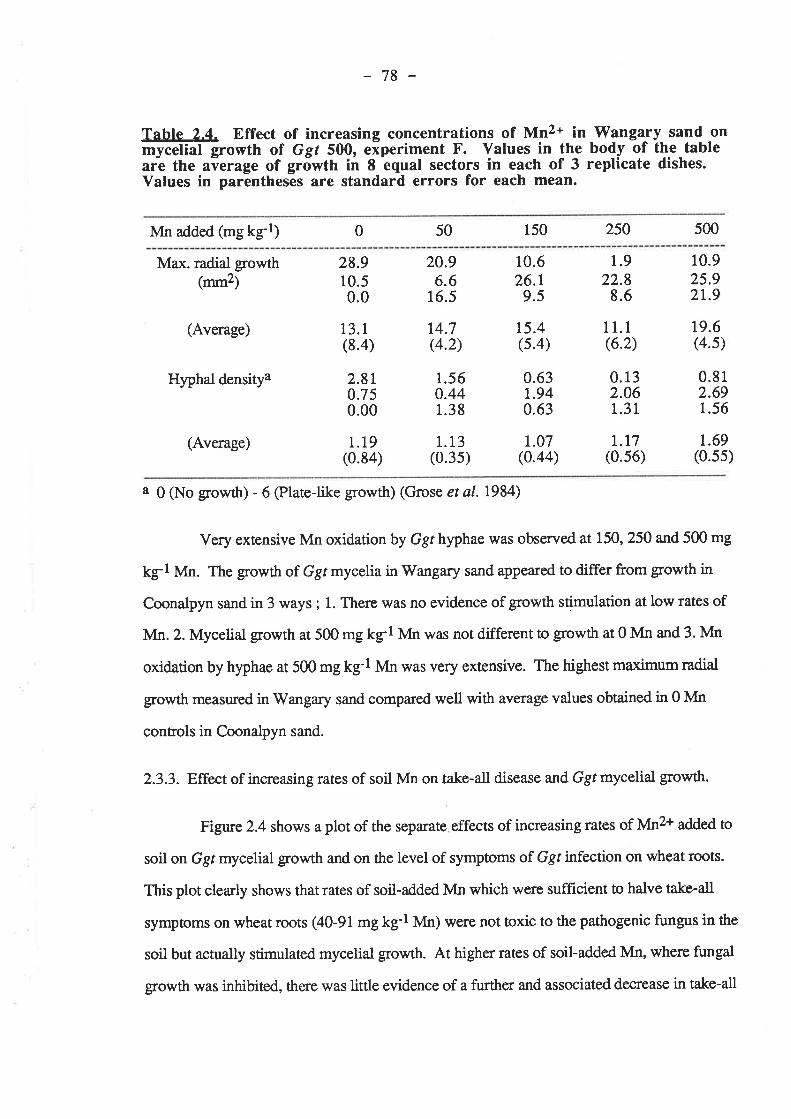
-78-
Table 2.4. Effect of increasing concentrations of Mn2+ in 'Wanga-ry sand -onrnycelial growth of Ggt 500, eiperiment F. Yalues in lhe body of the tablear-e the aierage of grõwth in I equal sectors in each of 3 replicate dishes.Values in parentheses are standard errors for each mean.
Mn added (mg kg-l) 0 50 150 250 500
Max. radial growth(mm2)
(Average)
Hyphal densitya
(Average)
28.910.50.0
13.1(8.4)
2.810.750.00
1.19(0.84)
20.96.6
16.5
14.7(4.2)
1.56o.441.38
1.13(0.35)
10.626.1
9.s
t5.4(s.4)
0.63r.940.63
t.07(0.44)
1.922.8
8.6
1 1.1(6.2)
0.132.061.31
r.17(0.s6)
10.925.92t.9
19.6(4.5)
0.812.691.56
1.69(0.55)
a 0 (No g¡owttr) - 6 @late-like g¡owth) (Grose et al. L984)
Very extensive Mn oxidation by Ggt hyphae was observed at 150, 250 and 500 mg
kg-l Vtn. The growth of Ggt mycelia in V/angary sand appeared to differ from growth in
Coonalpyn sand in 3 ways ; 1. There ,was no evidence of growth stimulation at low rates of
Mn. 2. Mycelial growth ar 500 mg kgl Mn was not different to growth at 0 Mn and 3. Mn
oxidation by hyphae at 500 mg kg-l Mn was very extensive. The highest ma¡rimum radial
growth measured in Wangary sand compa¡ed well with average values obtained in 0 Mn
controls in Coonalpyn sand.
2.3.3. Effect of increasing rates of soil Mn on take-all disease and Ggt mycelial growth.
Figure 2.4 shows a plot of the separate effects of increasing rates of Mn2+ added to
soil on Ggt mycelial growth and on the level of symptoms of Ggt infection on wheat roots.
This plot clearly shows that rates of soil-added Mn which were sufficient to halve take-all
symptoms on wheat roots (40-91 mg kg'l Mn) were not toxic to the pathogenic fungus in the
soil but actually stimulated mycelial $owth. At higher rates of soil-added Mn, where fungal
growth was inhibited, there was little evidence of a further and associated decrease in take-all
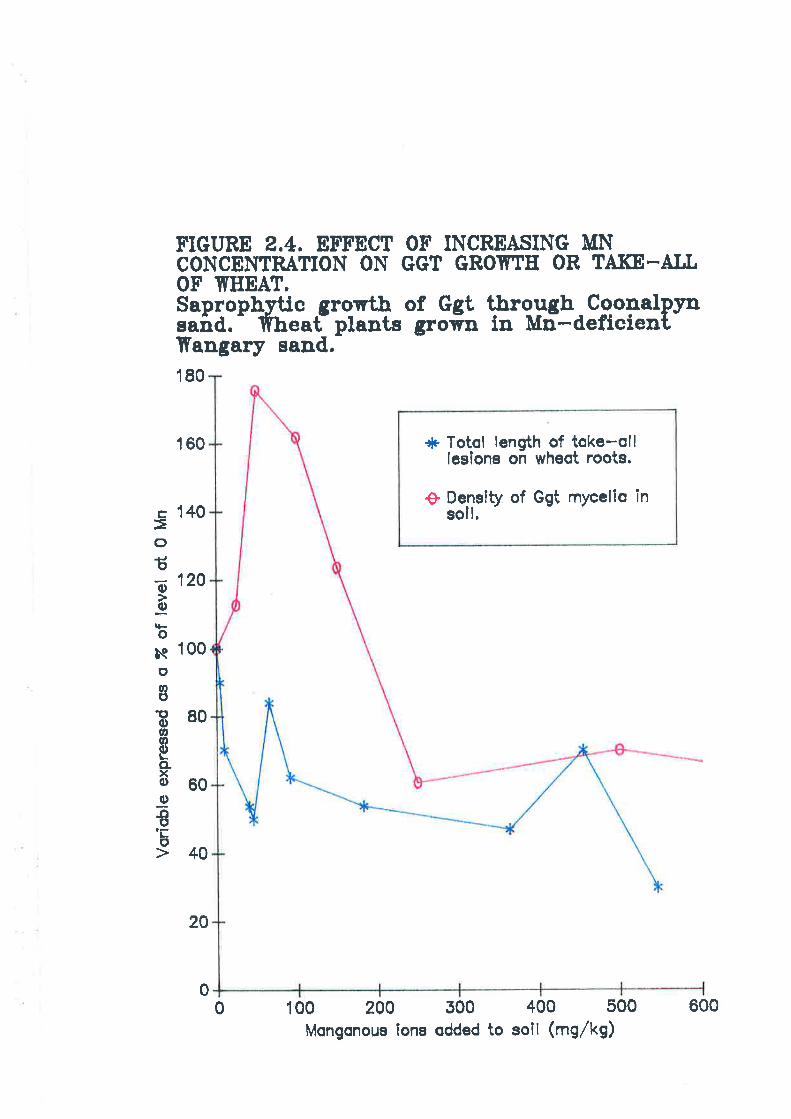
FIGURE 2,4, EFFECT Otr' INCREASING MNCONCEI{IRATION ON GGT GßOITTH OR TAtrCE-AI,LOF TTHDAT.Sapropbytic growtJr of Ggt tJrrgggh _ CooTtalPynsañ,d. - lT1reat- plants grown in Mn-deficientlÏangary sand.180
160 {È Totol lenoth of toke-olllesîona oñ wheot roots.
O Deneity of Ggt mycelÎo insoÌ1.c 140
oo1 120
Iltsoç 1000oö
980v,g,
Eo-xo60It)
-c¡oo
20
00 100 200 500 400 500
Mongonous ïons odded to soil (mg/kg)600
79
symptoms. Both of these results indicate that Mn effects on Ggt growth in soil can not
explain the decrease in take-all symptoms on wheat roots with increasing rates of soil-applied
Mn2+.
Due to the difficulties encountered in using Wangary sand in the soil-sandwich
technique, the comparisons made here between Ggt mycelial growth in soil and take-all
symptoms on wheatroots involved different soil typ€s. However, the limited evidence that
was gained from using V/angary sand in the soil-sandwich technique suggested thatGgt
growth was less sensitive to soil-applied Mn than in Coonalpyn sand which would further
sep¿ìrate the effects of soil Mn on Ggtmycehal growth and on the level of take-all symptoms
on wheat roots.
2.4. Discussion and Conclusions.
The hypothesis proposed by Graham and Rovira (1984) that Mn may decrease take-
all by directly inhibiting Ggr growth was not supported by results obtained here. The
collective results of 14 pot experimenS showed that rates as low as 9 mg kg-l of Mn2+
added to soil were sufficient to decrease take-all symptoms on wheat roots but more than 150
mg kg-l Mn were required to cause inhibition of fungal growth and low rates of soil-applied
Mn which decreased take-all symptoms actually stimulated fungal $owth. In addition, at
rates of soil Mn which were toxic to Ggt $owth there was little evidence of an associated,
further decrease in take-all symptoms which would be expected if the effect of Mn on take-all
was to inhibit growth of the causal fungus through soil. Unforn¡nately, a comparison of the
effect of Mn on Ggr growth through soil and on take-all symptoms could not be made in the
same soil type because Wangary sand was found to be unsuitable for the soil sandwich
technique. However, the few results that were obtained suggested that Ggt growth was even
less sensitive to Mn in Wangary sand compared with Coonalpyn sand.
80
The effect of external concentrations of Mn2+ on Ggt g¡olvth on agar was not a
reliable predictor of effects of Mn on Ggt growth through a soil matrix because results
differed markedly between the two agars and neither agar closely reflected results obtained
with the soil sandwich technique. Ggt growth was most sensitive to Mn on PDA and at 200
mg kg1 Mn was less than 20 Vo oî the 0 Mn control but on KMB g¡owth was stimulated by
this concentration of Mn. Even so, the sensitivity of Ggt on PDA could not explain the
reduction in take-all symptoms on wheat roos with very low rates of Mn because take-all
symptoms were decreased at Mn rates less than required to inhibit Ggr growth on PDA.
The mineral requirements of Ggr in culture are not known (Sivasithamparam and
Parker 1981) but reports (Foster 7g3g,Perlman 1949) indicate Mn2+ optima for other fungi
to range upward to a few pa¡ts per million. This fungal requirement for Mn2+ may explain
the small stimulation of Ggt growth on PDA at low rates of Mn because the PDA used was
found to contain a very low concentration of Mn (less than 0.02 mg kgl itt final preparation)
but does nor explain the additional benefits of 50 and 100 mg kgl l,tn in KMB, or of 50 mg
kg-l orrer 25 mgkg-l itt Coonalpyn sand.
It is difficult to compare the relative sensitivity of Ggt to Mn with other micro-
organisms because of the widely different ¡esults obtained here and the different
experimental conditions used in relevant papers. For instance, Vy'ilks et al. (1983) referred to
earlier work which showed that the growth of. Ceratocysrts wageneri (cause of black-stain
root disease of ponderosa pine) was increased by 20 Vo n culture media containing 1000 mg
kg-l Mn. This fungus seemed to be very well adapted to high Mn environments and its
tolerance to Mn was obviously much gleater thanGgt, even allowing for different cultural
conditions. On the other hand, six mycorrhizal fungi were reported to show atleast 65 7o
growth on Melin-Morkran's medium at 500 mg kg-l Mn, compared with the 0 Mn control
(Thompson and Medve 1984) which is a level of sensitivity similar to that exhibited by Ggt
in Coonalpyn sand and on KMB.

81
Ggt was found to be a powerful oxidizer of Mn2+ on PDA and in soil and timited
oxidation was also observed on KMB. Estimation of the pH of PDA in the presence of Ggt
colonies showed that where Mn oxidation \ilas occurring the pH was between 6 and 7 but the
pH of sterile PDA was 5.5. Bacterial contamination of some PDA cultures inhibited
oxidation of Mn by Ggt and decreased the pH of the agar to less than 4.5 but did not affect
the rate or pattern of mycelial $owth. The oxidation of Mn is favoured by increasing pH
(I-eeper 1970), especially by rises in the range of slightly acid to neutral. These results
suggest that the oxidation of Mn by Ggt was simply due to increased pH in the environment
as a consequence of the metabolic activities of Ggr. However, Mn oxidation by Ggt on
KMB, at an average pH of 7, was very limited so a simple pH effect may not be the only
mechanism operating. A Steptomyces sp. has been reported to produce an exü?-cellular
non-dialysable substance which oxidized Mn2+ to MnO2 (Bromfield t979).
The oxidation of Mn2+ to insoluble oxides by Ggt may help protect the fungus from
toxic levels of Mn2+ in its environment. This proposal is supported by the observation that
the oxidation appeared to occur at a distance from the hyphal wall. Alternatively, the fungus
may derive energy from the exergonic reaction (I-eeper 1970) of Mn2+ oxidation, which has
been suggested for other micro-organisms (Ghiorse 1984), although this is diffrcult to
reconcile with oxidation occurring some distance from the fungal hyphae.
82-
2.5. References.
Bromfield, S.M. (1979). Manganous ion oxidation at pH values below pH 5.0_by cell-freesubstances fromstreptomyces sp. cultures. Soll Biol. Bíochem.ll, 115-18.
Foster, J.W. (1939). The heavy metal nutrition of fungi. Bot. Rev. 5, 207 -37.
Ghiorse, W.C. (1984). Biology of iron- and manganese-depositing bacteria. Ann. Rev.Microbiol.38, 515-50.
Graham, R.D. (1983). Effects of nutrient stress on susceptibility of plants to disease withparticular reference to the trace elemenß. Adv. Bot. Res. 10,221-76.
Graham, R.D. and Rovira, A.D. (1984). A role for manganese in the resistance of wheatplants to take-all. Plant Soil78, MI-5.
Grose, M.J., Pa¡ker, C.A. and Sivasithamparam, K. (1984). Growth of Gaewnannomycesgraminís var. tirtci in soil: Effecs of temperature and water potential. SoiI Bíol.Biochem. 16, 2It-6.
Hannam, R.J., Davies, 'W.J., Graham, R.D. and Riggs, J.L. (1984). The effect of soil- andfoliar-applied manganese in preventing the onset of manganese defrciency inLupíruuangustifolius. Aust. J. Agríc. R¿s. 35, 529-38.
Kng, E.O.,'Ward, M.K. and Raney, D.E. (1954). Two simple media for the demonstrationof pyocyanin and fluorescin. I. Lab. Clin. Med. 44,3OI-7 .
Leeper, G.W. (1970). "Six Trace Elements In Soils.l' (Melb. Univ. Press.)
Mellan,I. (1941). "Organic Reagents In Inorganic Analysis." pp. M9-50. (The BlakistonCo.: Philadelphia.)
Morwedt, J.J., Berger, K.C. and Darling, H.M. (1963). Effect of manganese and copper _onthe growth of Streptomyces scabies and the incidence of potato scab. Amer. Potøto I.40,96-102.
Northcote, K.H. (1979). "A Factuat Key For The Recognition Of Australian Soils." 4th Ed.(Rellim Technical Publ.: Glenside, S. Aust.)
Perlman, D. (1949). Effects of minor elements on the physiology of fungi. Bot. Rev.15,195-220.
Reis, E.M., Cook, R.J. and McNeal, B.L. (1982). Effect of mineral nutrition on take-all ofwheat. P hytop athol. 72, 224-9.
Sivasithampararn, K. and Parker, C.A. (1981). Physiology and nutrition in culture. In"Biology And Control Of Take-all." (Eds. M.J.C. Asher and P.J. Shipton.) pp. L25'50. (Academic Press: London.)
Thompson, G.V/. and Medve, R.J. (1984). Effects of aluminium and manganese on thegowth of ectomycorrhizal fungi. Appl. E nvir on. Microbiol. 48, 556-60.

-83
Wilks, D.S., Gersper, P.L. and Cobb, F.V/. (Jr.) (1983). Relation of soil redox po^tential toinfection ofþonderosa pine by Ceratocystis wageneri. Plrytopathol.73, Lt20-5.
DEVELOPMENT OF AN AGAR DISCINOCULUM TECHNIQUE FOR GGT
IN POT STUDIES
84
CHAPTER 3. DEVELOPMENT OF AN AGAR DISC INOCULUMTECHNIQUE FOR GGT IN POT STUDIES
3.1. Introduction.
Two differentcgt inoculum techniques were reported in the pot experiments
conducted by Graham and Rovira (1984) and Rovfua et al. (7985). Ground oat kernel
inoculum (0.25-0.5 mm particle size), mixed through dry soil, was used in the larger and
former of these two experiments and Ggt colonized dead rye-grass seeds in the other. The
first pot experiment conducted in this project confrrmed the results of Graham and Rovira
(1984), using the same techniques, inoculum and experimental design. The inoculum was
the same preparation used by Graham and Rovira (1984), which had been subsequently
stored at 40 C. The results reported here closely matched those of the original experiment.
However, when a fresh batch of ground oat kernel inoculum was prepared, and a further
experiment conducted, the levels of disease which ¡esulted from the same rates of inoculum
were much higher. It was unsatisfactory to continue with an inoculum technique which
produced widely different disease levels beween batches so two alternative inoculum
techniques were tried; PDA discs removed from actively growing Ggr colonies and Ggr
colonized sand grains.
Rovira (unpublished) has used the technique of placing Ggr colonized agar plugs at
va¡ious depths in pots to screen biological controls agents against take-all. Agar discs placed
immediately below germinating seeds have also been used to infect plants with Ggr in
various other studies (Ga:rett I934a, Chambers and Flentje 1967a,b, Brown et al. 1973).
The effect of increasing strength of PDA and depth of burial of the agar plug on Ggt
infection were investigated here.
MacNish et al. (1986) published a technique in which Ggr colonized sand grains
were mixed through soil as inoculum. They found that the colonized sand grains were a low
nutrient source, were of uniform size and easily mixed through soil and produced
proportional infection per unit of inoculum over a wide range of densities. They proposed
85
the technique was amenable to test the effects of treatrnents like N sources, fungicides and
biological control agents on the infection of wheat seedlings by Ggt so its suitability for these
studies was also tested.
A suitable inoculum would be simple to prepare and easily applied so that many
pots could be set-up at the same time. Also, it would need to produce simila¡ disease levels
between batches and regularly increasing disease levels with increasing rates.
3.2. Materials and Methods.
3.2.1. Confirmation of soil-applied Mn decreasing take-all of wheat in pots.
The experiment reported by Graham and Rovira (1984) was repeated to confrm the
effect that soil Mn decreased take-all of wheat. The experiment was of factorial design with
3 rates of Mn (0, 1 and 10 Mn), 3 rates of Ggt inoculum (0, 0.05 and 0.1 Ggt) and 5
replicates.
3.2.I.l.Inoculurn. The originalGgt 500 ground oatkernel inoculum of Graham and Rovira
(1984) was used at the same rates of 0, 0.05 and 0.1 7o wlw of air-dry soil. The complete
details of the preparation of this inoculum were reported by Rovira et al. (1985). The
pathogen was grown for 4 weeks at 25o C on autoclaved whole oats that had imbibed twater
for 24 hours before autoclaving. The oat kernels were ground and only the 0.25-0.5 mm
fraction used. The inoculum was later stored at 40 C. Autoclaved inoculum at}.l Vo was
used in 0 Ggt pots.
3.2.1.2. Soil. Wangary sand was used (refer to section 2.2.2. for details of this soil) with
basal nutrients added at the rate of 101 mg Ca(NO¡)2.4H2O,15.8 mg KH2PO4, I2.5 mg
K2SO4, 7 .7 mg MgSOa.7H2O, 4.8 mg H3BO3 , 2.9 mg ZnSO¿,.7H2O, 1.9 mg
FeSOa.7H2O,1.4 mg NaCl, 1.0 mg CuSOa.5H2O, 0.1 mg CoSOa.TH2O and 0.1 mg
H2MoOa+H2O per pot. Basal nutrients were added in solution and mixed through soil prior
to sowing. KH2POa was added to soil in a separate solution to avoid precipitation of
86
Cag(PO¿)2. Additional DDDH2O (adjusted to allow for Mn solutions) was added to each soil
batch to ensure that all soil was prepared to 25 Vo water content.
3.2.1.3. Mn. Mn (as a MnSOa.4H2O solution) was mixed through the soil at 3 different
rates to give Mn treatments of 0, 1 and 10 mg of Mn per pot.
3.2.1.4. Procedure. Individual pots \pere frlled with the equivalent of 240 g of air-dry soil,
and compacted firrnly. Five germinated wheat seeds, Trírtcum aestivwn cv. Condor
harvested. at Ka¡oonda in South Australia in 1983 (av. Mn concentration of 5 mg kg-l), were
sown 1 cm deep in each pot. Seeds were prepared for sowing by placing them in filter-paper
lined glass petri-dishes, moistened with DDDH2O, for 2 days at room temp€rature.
Pots were placed in randomized blocks at 15o C with a 12 hour light period
(average photon flux density of 0.35 mEinsteins m-2 s-1, supplied by a bank of fluorescent
tubes) in every 24. Seeds which had not emerged 10 and 17 days after sowing \#ere
replaced with germinated seeds which had been kept at 40 C. Pots were watered to original
weight every.2-3 days until harvest after 26 days.
Shoots were removed at the soil surface and fresh weight per pot recorded before
drying at 70o C for 2 days. Rooß were washed free of soil with reverse osmosis water
(ROHZO) and fresh weight recorded. The number of black stela¡ lesions, the total length of
stelar lesions and the number of diseased seminal roots were recorded for each plant After
disease severity had been assessed the fresh weight of roots per pot was recorded (after free
water lvas removed) before they were d¡ied at 70o C for 2 days. Oven-dry weights for
shoots and roots were also recorded prior to analysis of both tissues for Mn with a Philips
SP9 atomic absorption spectrophotometer. Tissue was prepared for analysis by
nitric/perchloric acid digestion.
Data were analyzed with ANOVA techniques appropriate to factorial designs.
87
3.2.2. Testing the effect of Mn on take-all of wheat in pots using a fresh prepamtion ofground oat kernel inoculum.
This experiment was conducted to test the effect of soil and foliar applied Mn on
take-all of pot-grown wheat using a fresh preparation of ground oat kernel inoculum. The
experiment was of factorial design with 2 rates of soil Mn (-, +soil Mn), 2 rates of foliar Mn
(-, +folMn),2levels of Ggt inoculum (-, +Ggt) and 5 replicates.
3.2.2.1. Inoculwn. Ground oat inoculum \ilas prepared as in 3.2.1. except that the pathogen
wasincubatedfor4weeksatroomtemperatureinstead of 25o C. Liveinoculumattherate
of 0.1 Vo w/w was used for +Ggt and autoclaved inoculum at the same rate for -Ggt.
3.2.2.2. Soil. Soil Mn was prepared as in 3.2.1. except MnSOa.H2O was inadvertently
used instead of MnSO¿ .4H2O which resulted in a rate for +soil Mn of 13 mg of Mn per pot
(rather than the 10 mg of Mn per pot used in 3.2.1.). Foliar Mn was applied to leaves 4, 7
and12 days after sowing as a 1.5 7o MnSOa.H2O solution with wetting agent. DDDH2O
with wetting agent was used for -folMn.
3.2.2.3. Procedure. As in 3.2.1. with the following alterations;
1. Seeds were germinated in filterpaper lined petri-dishes, wetted with DDDH2O,for
1 day at 40 C and a further day atz0r.- C. This technique was used in all
subsequent pot experiments.
2. Pots were filled with less soil (200 g rather ¡han240 g of air-dry soil) and were not
compacted.
3. Plants were grown at 15o C with a 10 hour light period (average photon flux
density of 0.25 mEinsteins m-2 sl, supplied by a bank of fluorescent tubes) in
every 24.
4. Plants were harvested after 2t days.
5. Fresh weight of roots were recorded prior to disease assessment.
88
3.2.3. Development of PDA discs as an inoculum source for Ggt.
3.2.3.L. Effect of concentation of PDA in agar discs on take-all of wheat in small pots.
This experiment was conducted to test the effect of increasing concentration of PDA in Ggt
colonized agar discs on take-all of wheat seedlings growrr in small pots. A factorial design
was employed with 3 rates of soil applied Mn (0, 0.4 and 4 Mn), 3 rates of Ggt treatments (4
Vo stenle PDA, I 7o Ggt colonized PDA and 4 Vo Ggt colonized PDA), 2 rates of
Pseudomonas fluorescens 2-79 RNlg (NRRL B-I5I32) (-, +2-79) and 5 replicates. The
isolate of Pseudamonas fluorescens used in this experiment is a known antagonist against
Ggr'in vitro' and has been shown to decrease take-all of wheat in the field (Weller and Cook
1983). This experiment is reported here because it illustrated the effects of PDA
concentration on resulting take-all of wheat but the details of pots to which live suspensions
of Pseudomanas fluarescerß weÍe added have been omitted because they are beyond the
scope of this chapter. The complete details of studies conducted with this bacterium a¡e
presented in Chapter 9.
3.2.3.1.1.Inoculum. Peri-dishes were poured with approximately 17 ml of
autoclaved media containing 1 g of 'Difco'Bactoagar and either 0.039 (l Vo) or 0.156 g (4
7o) of PDAin 100 ml of DDDH2O. Dishes were inoculated with single mycelial cubes taken
from the edge of an actively growing colony of Ggt 500 and placed at2æ C for 9 days.
Extra dishes of 4 7o PDA were made up and kept sterile for use in 0 Ggt pots.
3.2.3.1.2. Soil. V/angary sand was prepared as in 3.2.1. with basal nutrients
added at the same rate on a per plant basis.
3.2.3.1.3. Mn. Mn was mixed through soil as in3.2.1. to give either 0, 0.4 or 4
mg of Mn per pot (which \vere the same rates of Mn prepared n 3.2.1 . on a per plant basis)
89
3.2.3.I.4. Procedure. 'Pine-cell' [1] pots were used in this and all subsequent pot
experiments. These pots have a2.5 cmtop diameter and a¡e 16 cm long with a 10 degree
raper. They are made of opaque white polypropylene and are held in moulded trays of 200
pot capacity. All pots were washed in 10 7o HNO3 and rinsed in DDDH2O before first use.
The drainage holes were taped over and each pot held the equivalent of 44 g of air-dry
Wangary sand.
Pots were part-filled with 42.5 g of prepared soil, followed by an agar disc which
had been cut to the internal diameter of the pots, a further 8.4 g of soil (resulting in a 2 cm
deep layer), 2 germinated wheat seeds (as in3.2.2. except seeds were surface-sterilized with
6 7o NaOCI for 90 s prior to germination) and a final layer of 41 g of soil. Ggr colonized
agar discs \¡/ere cut from the outer margins of Ggr colonies which had reached the edge of
petri-dishes by the day of sowing. Two ml of autoclaved Pseu.dornonas fluorescens
suspension was added to the soil surface of each pot.
Pots were placed in a tray in randomized blocks and covered with a sheet of thin
clear polythene f Glad Wrap') to reduce drying of the soil surface, before being placed in
controlled environment conditions of 15o C with a 10 hour light period (average photon flux
density of 0.2 mEinsteins m-2 s-1 supplied by a bank of fluorescent tubes) inevery 24.
'Glad'Wrap' ,was removed after 2 days and pots were watered to original weight
every 3-4 days. Plants were harvested after 25 days and plants processed as in 3.2.1.
Oven-dry shoots and roots were analyzed for Mn and 11 other essential elements with an
ARL inductively coupled atomic emission spectrometer. Samples were prepared for analysis
by nitric acid digestion.
Data were analyzrÅ.with ANOVA techniques appropriate to factorial designs in
randomized blocks.
1 Ray Leach'Cone-tainer' Nursery, Oregon, U.S.A.
90
3.2.3.2. Effect of depth of burial of agar disc on take-all of wheat in small pors. Due to the
limited success of producing reasonable differences in Ggr infection with changes in PDA
concentration in agar discs (see section 3.3.3.1. below), the depth of burial of Ggt colonized
agar discs of the same PDA concentration below germinating seeds was va¡ied. The factorial
experiment involved 2 rates of soil-applied Mn (0, 4 Mn), 4 Ggt treatments (Ggr colonized
agar discs buded 2, 4 and 6 crn below seeds and a control of no agar disc) and 3 replicates.
3.2.3.2.l.Inoculum. Ggr colonizeÀ,4 7o PDA discs prepared as in 3.2.3.1. Sterile
4 Vo PDA discs were used in -Ggt pots.
3.2.3.2.2. Soil. V/angary sand prepared as in 3.2.3.1.
3.2.3.2.3. Mn. Rates of 0 and 4 mg of Mn per pot lvere prepared as in3.2.3.L
3.2.3.2.4. Procedure. As in 3.2.3.L. with the following changes ;
l. Iron was added to soil as a separate solution. This meant that large volumes of
basal nutrient (Fe) and phosphorus stock solutions could be made up and used
for many pot experiments and only fresh FeSO¿.7HzO solution was needed for
each experiment.
2. Poß were part-fllled with either 50.9 (0 Ggt control),25.7 (6 cm burial of agar
disc), 34.1(4 cm burial) or 42.5 g(2 cm budal) of prepared soil and a further
soil layer above agar discs of 0,25.2,16.8 or 8.4 g, respectively. All pots r#ere
filled with a final layer of 4.1 g of soil.
3. Condor seeds were ha¡¡ested from Avon in the lower North region of South
Australia in 1980 but were not surface-sterilized prior to germination.
4. All pots received 1 ml of DDDH2O to the soil surface and plants lpere grown at
15/100 C daylnight remperatures with a 10 hour light period (average photon flux
density of 0.7 mEinsteins m-2 s-l supplied by a bank of mercury vapour lamps)
in every 24.
-91
3.2.4. Colonized sand grains as Ggt inoculum in small pots.
The suitability of Ggr-colonized sand grains as inoculum for investigations into the
effect of Mn on take-all of wheat was tested. A factorial experiment was conducted in small
pots with 3 rates of Mn (0, 4 and 16 Mn), 5 rates of sand grun Ggt inoculum (0,32, &,
728,256Ggt) and 4 replicates. Soil was moistened and incubated before sowing to increase
the severity of Mn deficiency in plants, using a technique summarized in appendix A.
3.2.4.1. Inoculurn. Ggr inoculum was prepared by growing Ggt 500 on a medium
composed of equal volumes of clean bright gamma-iradiated millet seed, clean silica sand
(washed with 5 ToHCl and rinsed with ROHzO and double sieved to collect <1.63 and
>1.41mm fraction) and DDDHZO (MacNish et a|.1986). The 3 components were placed in
a tray, covered with foil and autoclaved for 60 minutes at I25o C and 155 kPa- The
components were thoroughly mixed one day later and again autoclaved as before. The next
day the mixture was added to 300 ml wide-mouthed flasks glass jars and autoclaved for 20
minutes. The medium was inoculated with mycelial cubes taken from the outer margins of
an actively growing colony of Ggt 500 on weak PDA and incubated for 3 weeks at 25o C.
Ja¡s were shaken regularly. The contents were air-dried under a sterile air steam and
uncontaminated cultures rwere split into colonized millet seed and surface colonized sand by
passing over a 1.63 mm sieve. The colonized sand was cleaned of millet seed by
winnowing. Sand inoculum was stored at 40 C until used. Live and autoclaved Ggr
colonized sand were added to soil at rates to give 0 and 256 (0 Ggt),32 and 224 (32 Ggt),
64 and 128 (64 Ggt), 128 and 128 (12S GgÐ and256 and 0 (256 GgÐ grains per pot,
respectively.
3.2.4.2. Soi/. Wangary sand was incubated at 18 Vo water content for 2 weeks prior to
sowing (see Appendix A for more details) at 15/100 C daylnight temperatures. Basal
nutrients were added to soil immediately prior to sowing at the s¿rme rates used in section
3.2.3.1. except boron was reduced by a factor of 10 because the rate of boron application in

92
previous experiments was unnecessarily high due to an arithmetic error. Ggr inoculum was
also mixed through soil immediately prior to sowing.
3.2.4.3. Mn. Mn trearnents were imposed prior to incubation of soil to give raæs equivalent
to 0, 4 or 16 mg of Mn per pot. MnSOa.4H2O solutions were sprayed onto the soil surface
with a hand-sprayer and thoroughly mixed. Mn was dissolved in suffrcient DDDH2O to wet
the soil to 18 7o water content.
3.2.4.4. Procedure. The same procedure outlined 1n3.2.3.7" was used, with the following
alterations;
1. All pots wefe part-filled with 50.9 g of prepared soil, followed by 2 germinated
wheat seeds and a final layer of 4.1 g of soil.
2. Condor wheat seeds (hanested from a Mn-deficient site at Tooligie on the Eyre
Peninsula of South Australia in 1984) were germinated for 2 days at 40 C and a
further day at 2W C prior to sowing.
3. Growing conditions were the same except photon flux density was lower, at an
average of 0.3 mEinsteins m-2 s-l during the 10 hour light period.
3.3. Results.
3.3.L. Confirmation of soil-applied Mn decreasing take-all of wheat in pots.
3.3.1.1. Ggr. The addition of l0 mg of Mn per pot prior to sowing decreased Ggr infection
of wheat seedlings (table 3.1). The total number of black stelar lesions and the total length
of lesions per plant were both decreased by approximately 4O Vo vnth 10 Mn, regardless of
the rate of Ggt inoculum. The percentage of diseased seminal roots \¡/as not as sensitive to
Mn treatments and was decreased by orúy 24 7o by l0 Mn. Plants had 4-5 seminal roots.
Ggr infection was not decreased by 1 Mn.
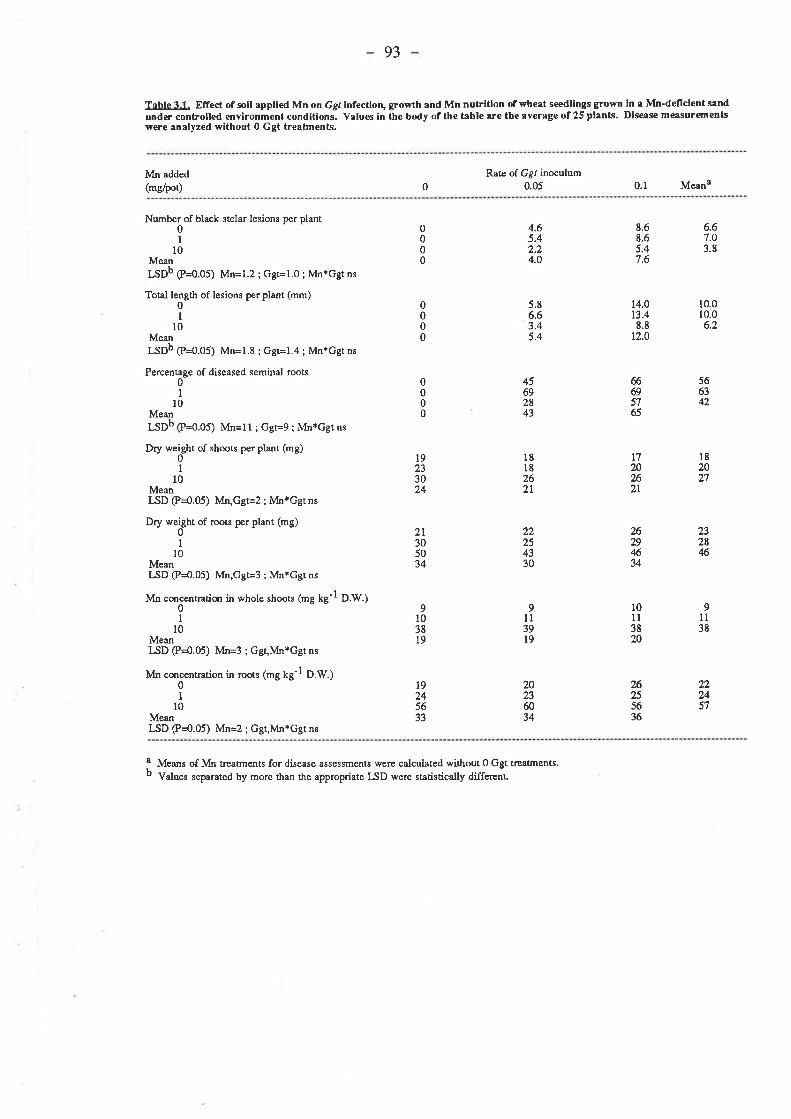
93
Tahle 3.1. Effeci of soll applied Mn on Ggt infection, growth and Mn nutrltion of wheat seedllngs grown ln r Mn-deflclent s¿nd
under controlled environment conditions. V¡lues in the body of the teble are the everage of 25 plants. Dise¡se meesurcrnentswere analyzed without 0 Ggt treatmenls.
Mn added
(mg/pot) 0Raæ of Ggt i¡oculum
0.05 0.1 Meana
Number of black stelar lesions per plant0I
l0MeanlSDb (P=0.05) Mn=l.2 iccFl.0; lWr+Ggtns
Total length of lesions per plant (mm)0I
10MeanLSnb çe=g.65¡ Mn=1.8 ; cct=1.4 ; Mn*Ggr ns
Percentage of diseased seminal roo¡s0I
l0MeanLSOb çe=¡.g1 Mn=ll ; Ggr=9 ; Mn*Ggt ns
Dry weight of shoots per plant (mg)0I
l0MeanLSD (P4.05) Mn,Ggt=2 ; lvln*Ggt ns
Dry weight of roots per plant (mg)0I
l0MeanLSD @4.05) Mn,Ggt=3 ; Mn*Ggtns
Mn cq¡centraticn in whole shoots (mg tg-l O.W.)0I
l0MeanLSD (P{.05) Mn=3 ; Ggt,lÍn*Ggt ns
Mn cqrcentration in roots lmg tg-l O.W.¡0I
l0MeanLSD (P4.05) Mn=2 ; Ggr,Nfn*Ggtns
8.68.65.4'1.6
6.67.03.8
5.86.63.45.4
14.0t3.48.8
12.0
10.010.06.2
0000
0000
0000
2l305034
4.65.4,,)4.0
45692843
1818262l
aa
254330
6695765
232846
2629ß34
566342
t9233024
9l03819
9ll39l9
19245633
t720'2ß
2l
l0ll3820
1820n
9ll38
aa
2457
26255636
20236034
a Means of Mr¡ t¡eatments for disease assessments were calcula¡ed without 0 G4 trcaúnents.b V"lo". separated by more than the appropriate l-SD we¡e søtistically different
94
Increasing the amount of live inoculum mixed through the soil increased symptoms
of Ggt infection on seminal roots, e.g. an average of 5.4 and 12 mm of stelar lesions per
plant were measured at 0.05 and 0.1 Ggt, respectively. No disease occurred in 0 Ggt pots.
3.3.L.2. Plant growth. Planß in 0 Mn pots lvere very pale green with interveinal chlorosis
on young leaves butplants in 10 Mn pots were dark green. Plants from 1 Mn were
intermediate. The average dry weight of shoots per plant was increased by more than 50 7o
by 10 Mn and the dry weight of roots nearly doubled (table 3.1). The dry weight of shoots
was not increased by 1 Mn and there was only a small increase in the dry weight of roots
(approximately 20 Vo). Ggt infection did not affect the response of plants to Mn.
Increasing Ggr inoculum rates did not cause any visual depression in plant growth
and their effect on rhe dry weight of tissues was small (table 3.1). Both rates of Ggr
inoculum decreased the average dry weight of shoots per plant by linle more 10 Vo and only
0.05 Ggt decreased the dry weight of roots (also by approximately L0 Vo).
3.3.1.3. Mn. Ggt infection had no effect on plant Mn levels and the concentration of Mn in
whole shoots averaged 9, 11 and 38 mg kg-l (on an oven-dry weight basis) for 0, 1 and 10
Mn, respectively (table 3.1). A criticat level of 18 mg kg-l ** calculated for wheat
seedlings grown under controlled envi¡onment conditions during this project (see appendix
B for details). Mn concenmtion in roots averaged 22mgkg-l at 0 Mn and was only
increased by 10 Mn (to 57 mgkg-l).
3.3.2. Testing the effect of Mn on take-all of wheat in pots using a fresh preparation ofground oat kernel inoculum.
3.3.2.1. Ggr. There was no effect of Mn treatrnents on Ggt infection (table 3.2). Live
inoculum resulted in very high levels of disease with an average of 23 black stelar lesions
and a total length of 92 mm per plant recorded for the whole experiment and 94 7o of seminal
roots diseased. All plants averaged 4 seminal roots. No disease was found in -Ggt poa.
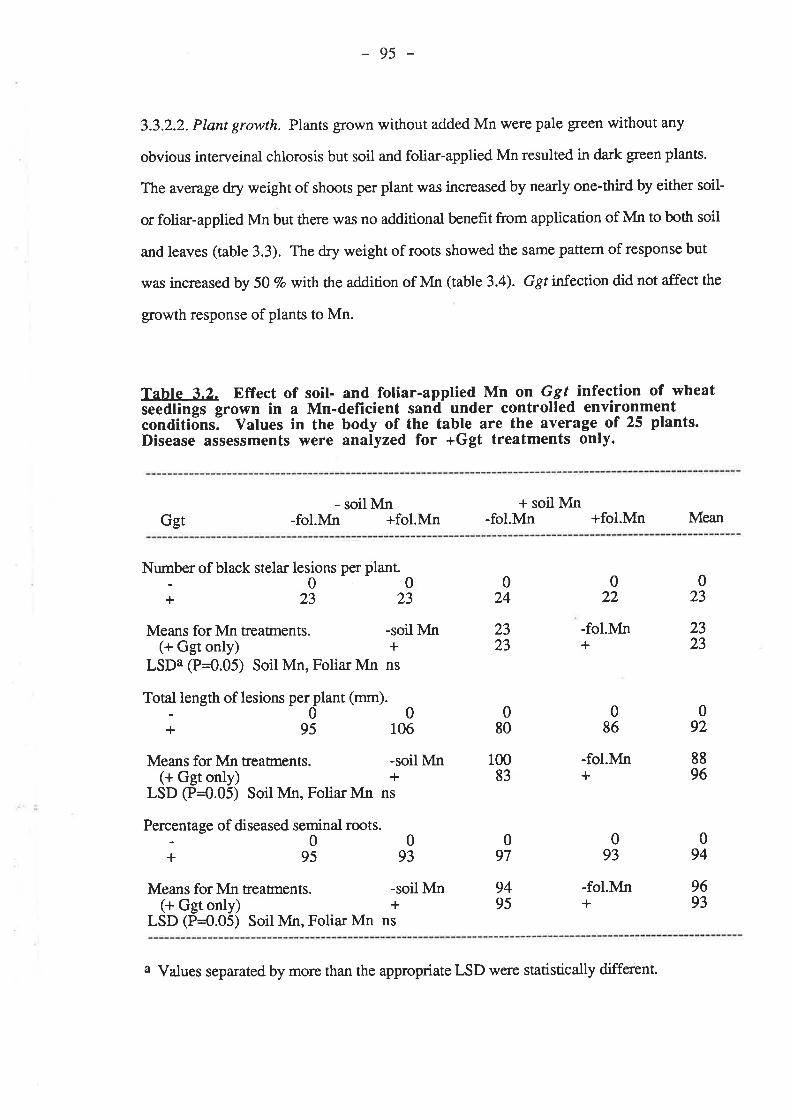
-95
3.3.2.2. Plant growth. Plants grown without added Mn were pale green without any
obvious interveinal chlorosis but soil and foliar-applied Mn resulted in dark gleen plans.
The average dry weight of shoots per plant was increased by nearly one-third by either soil-
or foliar-applied Mn but there was no additional benefit from application of Mn to both soil
and leaves (table 3.3). The dry weight of roots showed the same pattern of response but
was increased by 50 Vo with the addition of Mn (table 3.4). Ggt infecúon did not affect the
gro\ilth response of plants to Mn.
Tahle 3.2. Effect of soil- and foliar-applied Mn on Ggt infection of wheatseedings grown in a Mn-deficient sand under controlled environmentconditiõnsl Values in the body of the table are the average o1 25 plants.Disease assessments were analyzed for +Ggt treatments only.
Ggt- soil Mn
-fol.Mn +fol.Mn+ soil Mn
-fol.Mn +fol.Mn Mean
Nrlber of black stela¡ lesions per planr O
+23Means for Mn treatrnents.
(+ Ggt only)
023
022
+
024
2323
23
-soil Mn+
LSDa (P=0.05) Soil Mn, Folia¡ Mn ns
Total length of lesions perplant (mm). 0
+ 95 106
Means for Mn treatnents. -soil Mn(+ Ggt only) +
LSD (P=0.05) Soil Mn, Folia¡ Mn ns
Percentage of diseased seminal roots. 0
+9593
Means for Mn treatnents. -soil Mn(+ Ggt only) +
LSD (P=0.05) Soil Mn, Foliar Mn ns
10083
080
-fol.Mn
-fol.Mn
-fol.Mn
0086
2323
92
8896+
094
9693
093
+
097
9495
a Values separated by more than the appropriate LSD were statistically different.
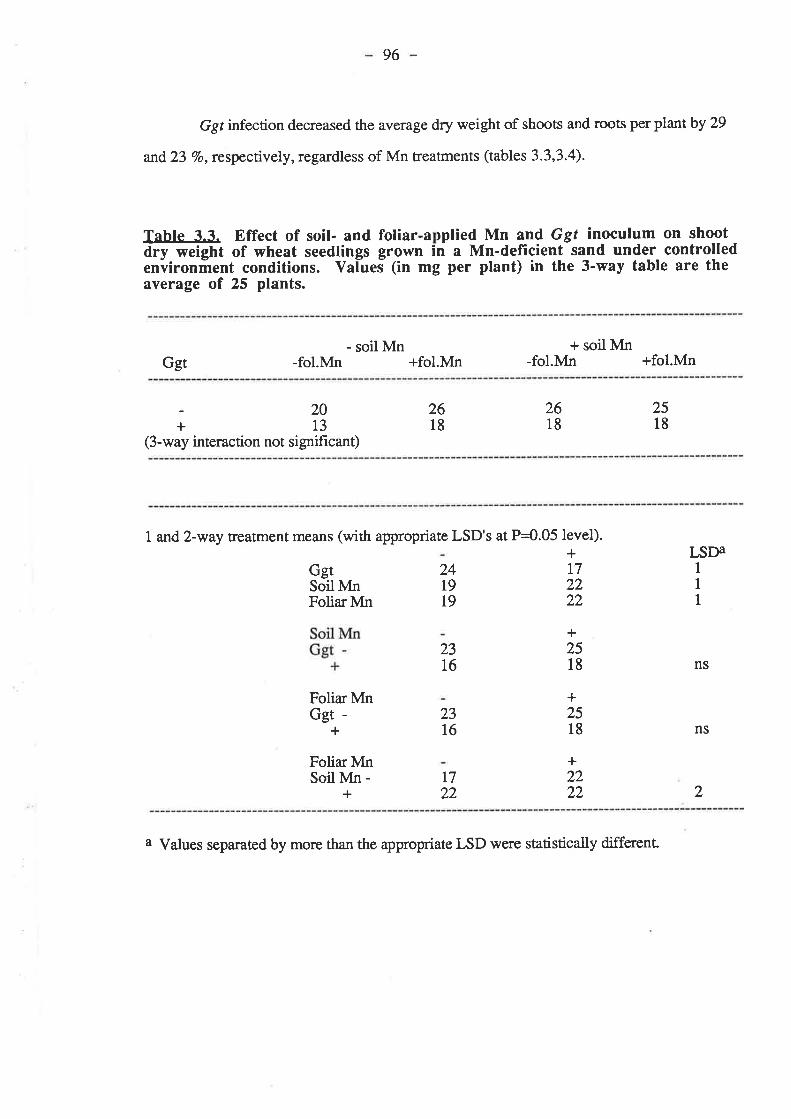
96
Ggr infection decreased the average dry weight of shoots and roos per plant by 29
and23 Vo,respecflvely, regardless of Mn treatments (tables 3.3,3.4).
Table 3.3. Effect of soil- and foliar-a lplied Mn and Ggú inoculum on shootdry weight of wheat seedlings grown in a Mn-deficient sand under controlledenvironment conditions. Vafues (in mg per plant) in the 3-way table are theaverage of 25 plants.
- soil Mn + soil Mn-fol.Mn +fol.MnGgt -fol.Mn +fol.Mn
;"3(3-way interaction not significant)
2618
2618
2518
1 and 2-way treatment means (with appropriate LSD's at P=0.05 level).+T72222
23t6
+2518
FoliarMnGgt -
+
I.SDAGgtSoil MnFoliar Mn
Folia¡MnSoil Mn -
+
241919
23L6
t722
+2518
1
I1
ns
ns
+2222 2
a Values separated by more than the appropriate LSD were statistically different
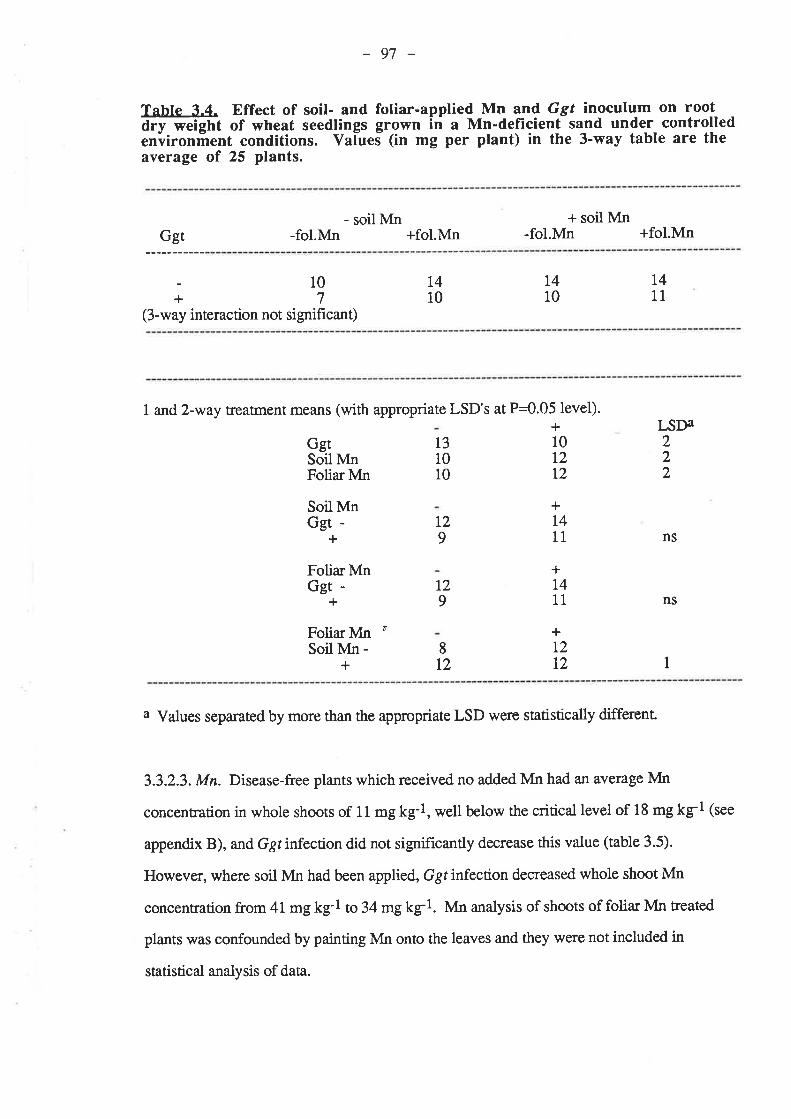
-97
Table 3.4. Effect of soil- and foliar-applied Mn and Ggf inoculum on rootæi wagn of wheat seedlings grown in a Mn-defTcient sand under controlledeniironñrent conditions. Vatues (in mg per plant) in the 3-way table are theaverage ol 25 plants.
- soil Mn + soil Mn-fol.Mn +fol.MnGgt -fol.Mn +fol.Mn
;'l(3-way interaction not significant)
l410
1410
t411
1 and 2-way treatment means (with appropriate LSD's at P:0.05 level).+10L2t2
Soil MnGgt -
+t2
+t4119
Folia¡MnGgt -
+t2
+T4119
FoliarMn ô
Soil Mn -+
LSDAGgtSoil MnFoliar Mn
131010
812
+T2T2
222
ns
ns
1
a Values separated by more than the appropriate LSD were statistically different.
3.3.2.3. Mn. Disease-free plants which received no added Mn had an average Mn
concentration in whole shoots of 11 mg kg-l, well below the critical level of 18 mg k51 (see
appendix B), and Ggr infection did not significantly decrease this value (table 3.5).
However, where soil Mn had been applied, Ggr infection decreased whole shoot Mn
concentration from 41 mg kg-l to 34 mgkg-l. Mn analysis of shoots of folia¡ Mn treated
plants was confounded by painting Mn onto the leaves and they were not included in
statistical analysis of data.

-98
Tahle 3.5. Effect of soil- and foliar-applied Mn and Ggf inoculum on shoottvtn concentration of wheat seedlings grown in a Mn-deficient sand undercontrolled environment conditions. Values (in mg kg'l D.W.) in the 3'waytable are the average of 25 plants. I)ata were analyzed without foliar Mntreatments due to Mn painted onto leaves.
- soil Mn + soil Mn-fol.Mn +fol.MnGgt -fol.Mn
;tå(3-way interaction not signifrcant)
+fol.Mn
374s33
4734
511634
1 and 2-way treatment means (with appropriate LSD's at P=O.05 level) for soil Mn and Ggttreatments only.
+2137
Soil MnGgt -
+
LSDAGgtSoil Mn
2610
119
+4t34
2J
3
a Values separated by more than the appropriate LSD were statistically different.
Mn concentration in roots was affected differently by Ggt and soil Mn Eeaünents
than shoots (table 3.6). Roots of disease-free plants without soil Mn contained 19 mg kg-l
which \ilas not significantly different to the 29 mgkg-l in Ggt nfectdplants. Soil Mn
increased rhe concentration of Mn in roots of disease-free plants to 54 mg kg:l but n Ggt
infectedplantsthisvaluewas 110mgkgl. Thehighconcenmtionof Mninroots of Ggt
infected wheat plants supplied with soil Mn was not entirely due to the depression in root
growttr caused by Ggt infection because the dry weight of ¡oots was decreased by only 23 7o
but the Mn concentration nearly doubled. This meant that ttre total Mn content of roots
increased under these conditions but" at the same time, the Mn concenÍation in shoots
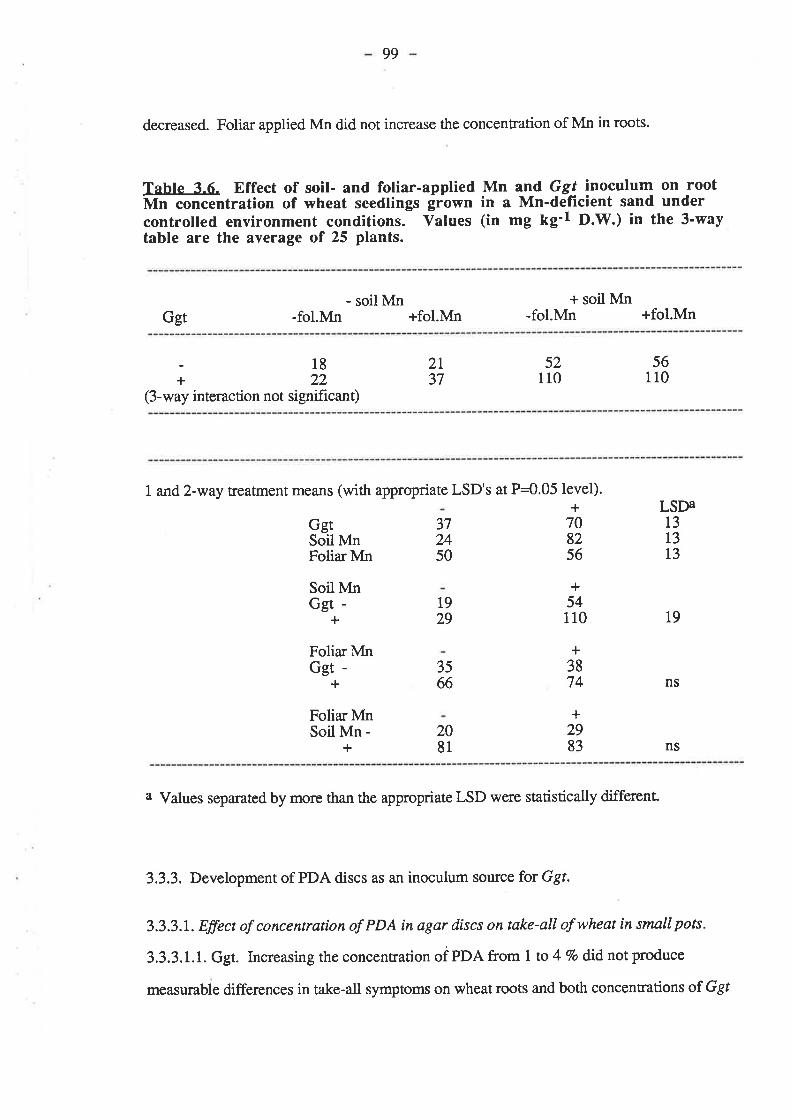
99
decreased. Foliar applied Mn did not increase the concentration of Mn in roots.
Table 3.6. Effect of soil- and foliar-applied Mn and Ggf inoculum on rootMn concentration of wheat seedlings grown in a Mn-deflrcient sand undercontrolled environment conditions. Values (in mg kg-l n.W.) in the 3-waytable are the average of 25 plants.
- soil Mn + soil Mn-fol.Mn +fol.MnGgt -fol.Mn +fol.Mn
; te,(3-way interaction not significant)
2l37
52110
56110
1 and 2-way treatment means (with appropriate LSD's at P=0.05 level).+
708256
Soil MnGgt -
+t929
FoliarMnGgt -
+
GgtSoil MnFoliar Mn
Foliar MnSoil Mn -
+
LSDA131313
372450
3566
+54110 19
2081
+3874
+2983 ns
ns
a Values separated by more than the appropriate LSD were statistically differenr
3.3.3. Development of PDA discs as an inoculum source for Ggt.
3.3.3.1. Effect of concentration of PDA in agar díscs on take-all of wheat in small pots.
3.3.3.1.1. Ggt. Increasing the concentration of PDA from I to 4 7o did not produce
measurable differences in take-all symptoms on wheat roots and both concentrations of Ggt
100 -
colonized agar discs caused a high level of Ggt nfection symptoms on wheat roots (an
average of 44 mm of black stelar lesions per plant and 78 % of seminal roots diseased) (table
3.7). No disease was present in pots with sterile PDA discs.
The percentage of diseased seminal roots was decreased by 27 Vo with 4 Mn but 0.4
Mn had no effect on Ggt infection. The number and total length of lesions per plant were not
affected by Mn treatments.
3.3.3.I.2. Plant growth. Plants with take-all were smaller than disease-free plants
and diseased plants at 0 and 0.4 Mn were beginning to show signs of wilting in the week
prior to hanrest, which is a symptom of severe take-all (Clarkson and Polley 1981), despite
all pots being maintained at the same water content. Plant gowth was successively
decreased by increasing rates of Ggt inoculum (table 3.7). The average dry weight of roots
per plant showed a similar pattem but the decrease with 4 Vo PDA rilas not signif,rcantly
greater than with I 7oPDA, (table 3.7). Decreases in plant growth with increasing Ggr
inoculum rates were not affected by Mn treatments.
Plans grown without added Mn were pale-green but there was little evidence of
interveinal chlorosis. Both rates of added Mn resulted in dark green plants. Similar to
previous pot experiments, root growth showed larger responses to added Mn than shoot
growth but the differences here were even more ma¡ked (øble 3.7). The average dry weight
of shoots per plant increased by 33 Vo with 0.4 Mn and by 77 Vo with 4 Mn but the dry
weight of roots increased by 80 and220 70, respectively.
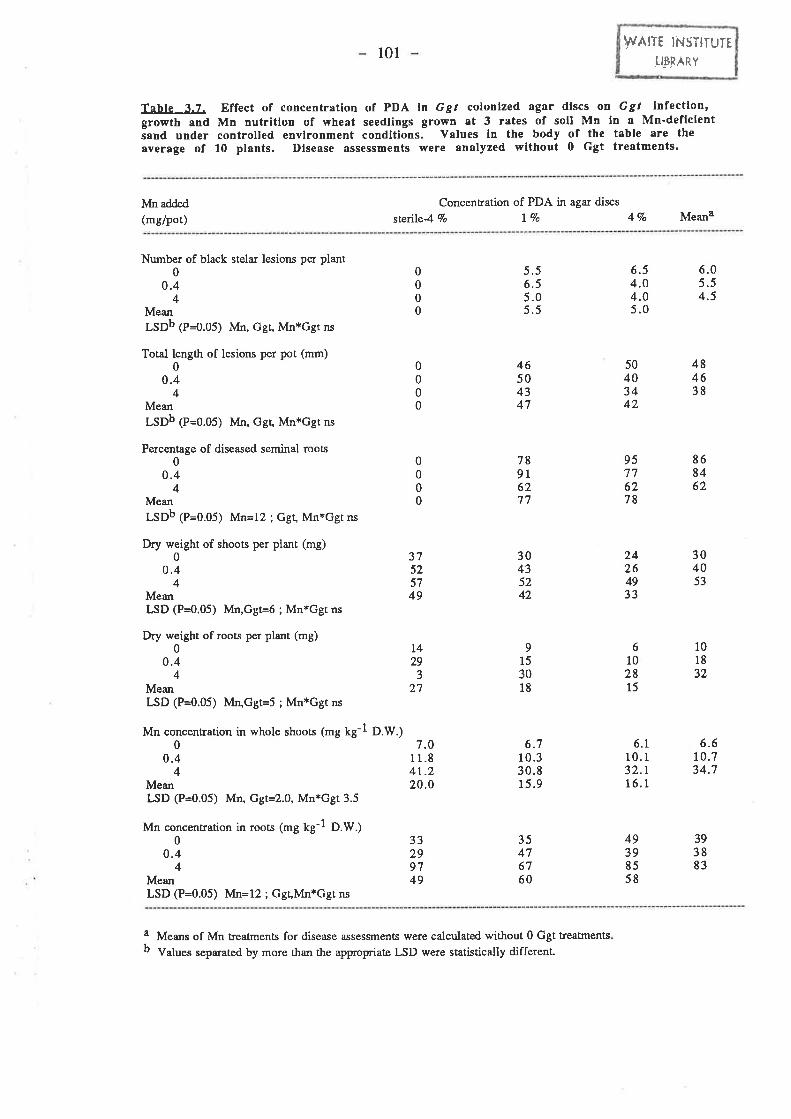
WÂITE INSTITUÍE
¡_lgRARY101
Table 3.7. Effect of concentration of PDA ln Ggt colonlzed agar dlscs on Ggt lnfection'growth and Mn nutritlon of wheat seedlings grown at 3 rates of soil Mn ln a Mn'deficlentiand under controlled envlronment conditions. Values in the body of the table are theaverage of 10 plants. Dlsease assessments were analyzed without 0 Ggt treatnents.
ìft added
(mg/pot)Concentration of PDA in agar discs
sterile4 9o L Vo 47" Meana
Number of black stelar lesions per plant0
0.44
MeanLSDb e=0.05) Mn, GgC Mn*Ggt ns
Total length of lesions per pot (mm)0
0.44
Mean
lSOb 1l=o.oS) Mn, Gec Mn*Ggt ns
Percentage of diseased seminal roots0
0.44
Mean
LsDb G=0.05) Mn=12 ; Ggt, Mn*Ggt ns
Dry weight of shoots per plant (mg)0
0.44
MeanLSD (P=0.05) Mn,Ggt=6 ; Mn*Ggt ns
Dry weight of roots per plant (mg)014
0.4 2943
Mean 27LSD (P=0.05) À{n,Ggt=5 ; Mn*Ggt ns
Mn concentration in whole shoots (mg tg-l ¡.W.)
4Meanl,SD (P=0.05) M4 Ggt=2.0, Mn*Ggt 3.5
Mn concentration in roots 1mg tg-1 D.W.)0
0.44
MeanLSD (P=0.05) l¡ln=12 ; Ggt Mn+Ggt ns
5.56.55.05.5
6.05.54.5
46504347
50403442
484638
78916277
95776278
868462
375257
30435242
24264933
304053
9153018
6102815
101832
7.011.84r.220.0
6.710.330.815.9
6.610.734.7
33299749
35476760
49398558
393883
0000
6.54.04.05.0
0000
0000
49
00.4
6.110.132.t16.1
a Means of Mn treatments for disease assessments were calculated without 0 Ggt treatmentsb V"lo", separated by more than the appropriate LSD were søtisticalty different.
r02 -
3.3.3.1.3. Mn. Mn concentrarion in whole shoots increased from an average of 6.6
mg kg-l in plants grown without added Mn to 10.7 mg kg-l wittr 0.4 Mn, regardless of Ggt
treafrnents (table 3.7). However, the effect of 4 Mn on Mn concentration in shoots was
modified by Ggt infection; 4 Mn increased the concentration of Mn in shoots to 4I.2 mg kg-l
in disease-free plants but only to an average of 3I.4 mg kg-l in Ggt infected plants. Ggr
infection did not affect root Mn concentrations and only 4 Mn increased levels above those at
0 Mn, from 39 mg kg-l to 83 mg kg-l (table 3.7).
3.3.3.2. Effect of depth of burial of agar disc on take-all of wheat in small pots. 3.3.3.2.1.
Ggt. Increasing the depth of burial of Ggt colonized PDA agar discs below germinated
wheat seeds decreased the levels of take-all on roots (table 3.8). With agar discs 2 cm below
seeds 95 Vo of seminal roots \ryere diseased but only 83 and 67 7o werc diseased with discs at
depths of 4 and 6 cm, respectively.
There ,were more black stelar lesions per plant with budal depths of 2 and 4 cm than
at 6 cm but the decreases in total length of lesions per plant with increasing depth of burial
were not significant.
Mixing Mn through soil decre¿sd,Ggt infection of wheat roots at all disease levels
(table 3.8). The number and total length of lesions per plant decreased by 25 and26 Vo
respectively with added Mn but a small decrease in percentage of diseased seminal roots with
added Mn was not significant
3.3.3.2.2. Plant growth. The older leaves of all plants with take-all showed signs
of yellowing and necrosis at their distal ends by hawest, but it was t#orst on plants where
PDA discs were only 2 cm below seeds (plate 3.1). The average dry weight of shoots per
plant increased with increasing depth of burial of agar discs but there was no difference
between plants from pots with an agar disc at 6 cm and disease-free plants (table 3.8).

103 -
Table 3.8. Effect of depth of burial of Ggl colonized agar discs on Ggf lnfectlon, growthand Mn nutritlon of wheat seedlings grown at 2 rates of soll Mn in a Mn-deficlent sandunder controlled environment conditions. Values in the body of the table are the average of6 plants. Dlsease measuremeDts were analyzed without 0 Ggt treatments.
Àdn added
(mg/pot) no disc
De,pth of burial of agar discs (crn below seeds)
642 Meana
Number of black stela¡ lesions per plant
0040
Mean 0
lSOb 1l=0.05) Mn=1 ; Ggr=2; Mn*Ggt ns
Total length of lesions per plant (mm)
0040
Mean 0
LSDb (P=0.05) Mn=7 ; Ggr, Mn*Ggr ns
PercenLage of diseased seminal roots
0040
Mean 0
LSD (P=0.05) Ggt=ll ; Mn, Mn*Ggt ns
Dry weight of shoots per plant (mg)
0 48458
Mean 53
LSD (P=0.05) Mn=5 ; Ggt=7 ; Mn*Ggt ns
Dry weight of roots per plant (mg)
055468
Mean 61
I-SD (P=0.05) Mn=7, Ggt=10 ; Mn*Ggt ns
Mn concentration in whole shoos (mg tg-l U.W.¡0 11.14 49.4
Mean3 0.3LSD (P=0.05) Mn=4.3, Ggt, Mn*Ggt ns
Mn concentration in roots (mg tg-l D.W.¡0 19
4 t35Mean 77LSD (P=0.05) Mn=8 ; Ggt=11, Mn*Ggt 15
313034
462938
443539
423t
67
6767
937383
979395
8ó78
9
8
9
9
6
8
6
5
5
Ió
4555
50
3854
46
324736
4l52
4457
51
63
57
12.749.931.3
11.r47 .5
29.3
L2.444.l28.2
11.847 .7
l7r2772
1674L78
,ar91r07
18
148
27
36
32
4262
52
a Means of Àln treatments for disease assessments were calculated without 0 Ggt treatments,b V"lu", separated by more than the appropriate LSD were søtistically different.

Plate 3.1. Effect of depth of agarMn2+ on growth of wheat se nt sanenvironment conditions. The depthMnSO4 mixed through the soil at a rate of 4 rng ÞIn per pot.

104 -
The average dry weight of roots per plant was halved by uke-all from an agar disc 2
cm below seeds (compared to a3l Vo decrease in dry weight of shoots) and decreased by 15
Vo with an agar disc at 4 cm (table 3.8). An agar disc at 6 cm below seeds did not decrease
root growth. Soil Mn did not alter the effect of take-all on plant growth.
Plants without added Mn appeared to be the same size as plants grown with Mn but
were a pale green colour. The dry weight of shoots and roots per plant showed a smaller
response to soil Mn than the previous experiment and an increase of less than one-third was
recorded for both shoots and roots (table 3.8).
3.3.3.2.3. Mn. Mn concentration in whole shoots of plants g¡own without Mn
were not severely defrcient (average of 11.8 mg kg-l) which is consistent with the small
growth response to added Mn (table 3.8). Soil Mn increased Mn concentrations to well
above deficient (average of 47.7 mg kgl) andGgt infection did not influence shoot Mn
concentrations. Soil Mn inc¡eased root Mn concentrations to similar levels at all Ggt
treaûnents except at 4 Mn with agar discs buried 2 cm below seeds where the concentration
of Mn was higher than in all other Eeatments (table 3.8).
3.3.4. Colonized sand grains as Ggt inoculum.
3.3.4.1. Ggt. Increasing numbers of live Ggr colonized sand grains per pot increased Ggr
infection symptoms on wheat roots (table 3.9). This effect was clearest in the percentage of
diseased seminal roots which increased successively from 42 to 54,70 and 83 Vo with32,
&,128 and256 Ggt treatments, respectively. The number and and total length of lesions
per plant also increased with Ggt rates but consecutive rates did not always produce
signifrcantly different levels of disease. No disease was present in pots which received only
autoclaved sand grains.
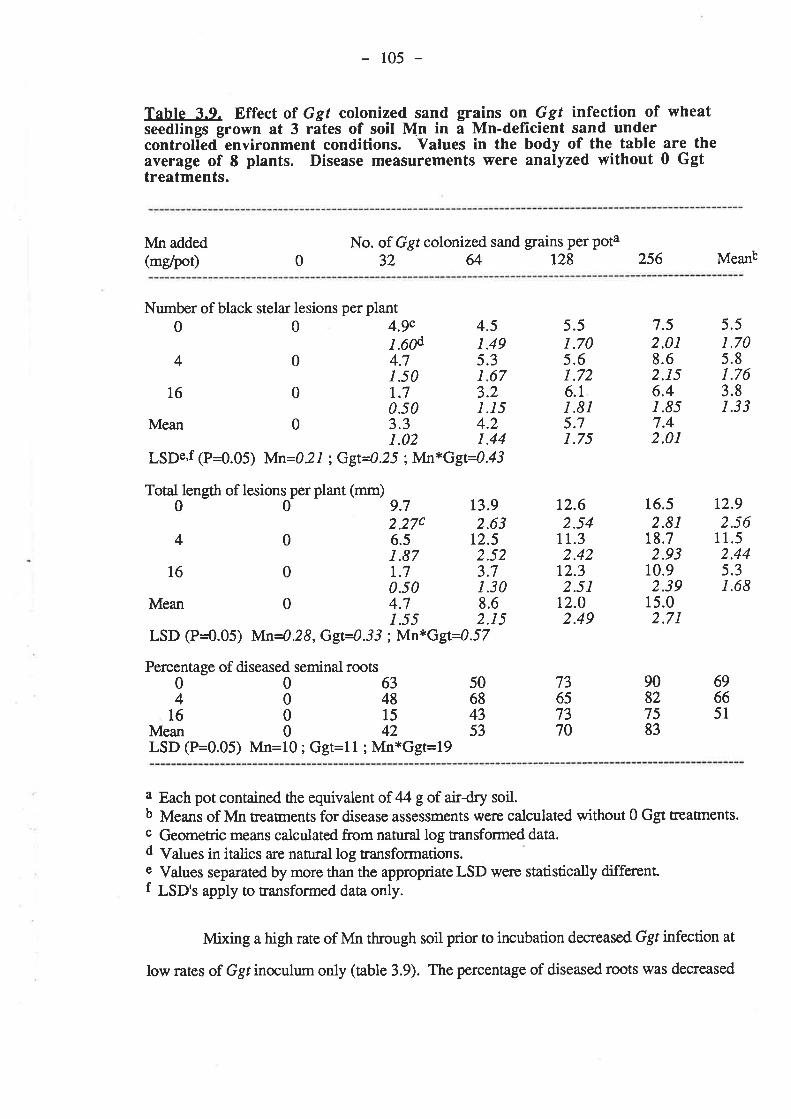
105 -
Tahle 3.q. Effect of Ggt colonized sand grains on Ggf infection of wheatseedlings grown at 3 rates of soil Mn in a Mn-deficient sand undercontrolled-environment conditions. Values in the body of the table are theaverage of E plants. Disease measurements were analyzed without 0 Ggttreatments.
ÀrÍn added(me/pot) 0
No. of Ggr colonized sand grains per pota32 & 128 256 Meant
Number of black stelar lesions per plant0 0 4.9c 4.5
1.6æ I .494
16
Mean
4
I6
Mean
4.71.50t.70.503.3
9.72.27c6.5L871.70.504.71.55
t3.9
ó.1I.8l5.7r.75
12.62.54
Lt.32.42
t2.32.51
t2.02.49
7.52.018.62.156.4r.857.42.01
16.52.81
18.72.93
10.92.39
5.51.70
t2.9
5.51.705.61.72
0
0
0
5.3r.673.21.154.2
2.63t2.52.523.71.308.62.15
5.81.763.8r.33
1.02 1.44LSDe,f (P=0.05) lvln=0.21 : Ggt=0.25 ;lvln*Ggt4.43
Total length of lesions per plant (mm)00
0
0
0
2.5611.52.445.31.68
15.02.71
LSD (P=0.05) Mn4.28,Ggt4.33 ; Mn*G9t4.57
Percentage of diseased seminal roots006350404868
1601543Mean 0 42 53LSD (P=0.05) Mn=10; Ggt=ll ; Mn*Ggt=l9
a Each pot contained the equivalet of 4 g of air-dry soil.b Means of Mn treatments for disease assessments were calculated without 0 Ggt treaünents.c Geometric means calculated from natural log transformed data.d Values in italics are natural log transformations.e Values separated by more than the appropriate LSD were statistically differentf LSD's apply to transformed data only.
Mixing a high rate of Mn through soil prior to incubation decreas€d Ggr infection at
low rates of Ggt inoculum only (table 3.9). The percentage of diseased roots was decreased
696651
90827583
73657370
106 -
by 16 Mn from 63 Vo to only 15 Vo at32 Ggt but decreases at higher disease levels were not
significant. The same pattern of disease reduction by 16 Mn was also present in the avetage
number and length of lesions per plant, except that the total length of lesions was also
decreased by 16 Mn at 64 Ggt. The effect of 16 Mn on Ggt infection was most dramatic at
32 Ggt where disease was decreased to an average of less than two 1 mm long lesions per
plant, compared to an average of nearly fle 2 mm long lesions per plant without added Mn.
Ggr infection was not decreased by 4 Mn.
3.3.4.2. Plant growth. Although levels of Ggt infection measured here were not as high as
recorded in the previous experiment, shoot symptoms of take-all were simila¡. Extensive
yellow tipping on older leaves rwas present with 0 and 4 Mn atI28 and256 Ggt but was
only noted at256 Ggt with 16 Mn. This interaction between Ggt inoculum rates and Mn
rates \ilas not present in shoot dry weights and was reversed in root dry weights (table 3.10).
Only the highest Ggrinoculumrate decreased the average dry weight of shoots perplant (by
19 Vo) and this effect was independent of Mn rates. The average dry weight of roots per
plant was not decreased by inoculum rates without Mn but at 4 Mn only the lowest inoculum
rate did not decrease root growth. At 16 Mn only 256Ggt significantly decreased dry root
weights.
Plants grown without added Mn were small compared to plants at 4 and 16 Mn and
they were also very pale green with extensive interveinal chlorosis on young leaves. The
average dry weight of shoots per plant increased by 54 Vo with 4 Mn and dry weight of roos
by more than 83 7o. Tlte highest rate of soil Mn did not further increase plant growth.
3.3.4.3. Mn. Inclbation of Wangary sand at 18 7o water content for 2 weeks prior to
sowing resulted in wheat seedlings which were very Mn defrcient (table 3.10). VIn
concenmtion in whole shoots averaged 7.9 mgkg-l without Mn but levels were increased to
adequate levels by both Mn rates; 30 mg kg-l wittt 4 Mn and 119 mg kg-l with 16 Mn. A
Mn concenüation of 32 mg kg-l at 4 Mn in disease-free plans compared to 41 and 49 mg
lo7
kg-l in the two previous experiments in this chapter, which shows that Mn added prior to
incubation was less available to wheat plants but ttre effect was only small. Root Mn
concentrations were increased from 23 to 58 and 286mgkg-l with 4 and 16 Mn,
respectively. Ggt infection did not significantþ affect plant Mn levels, although root Mn
concentrations were generally higher in Ggr-infected plants grown with added Mn which is
an effect observed in previous experiments (see 3.3.3.1. and3.3.3.2.),
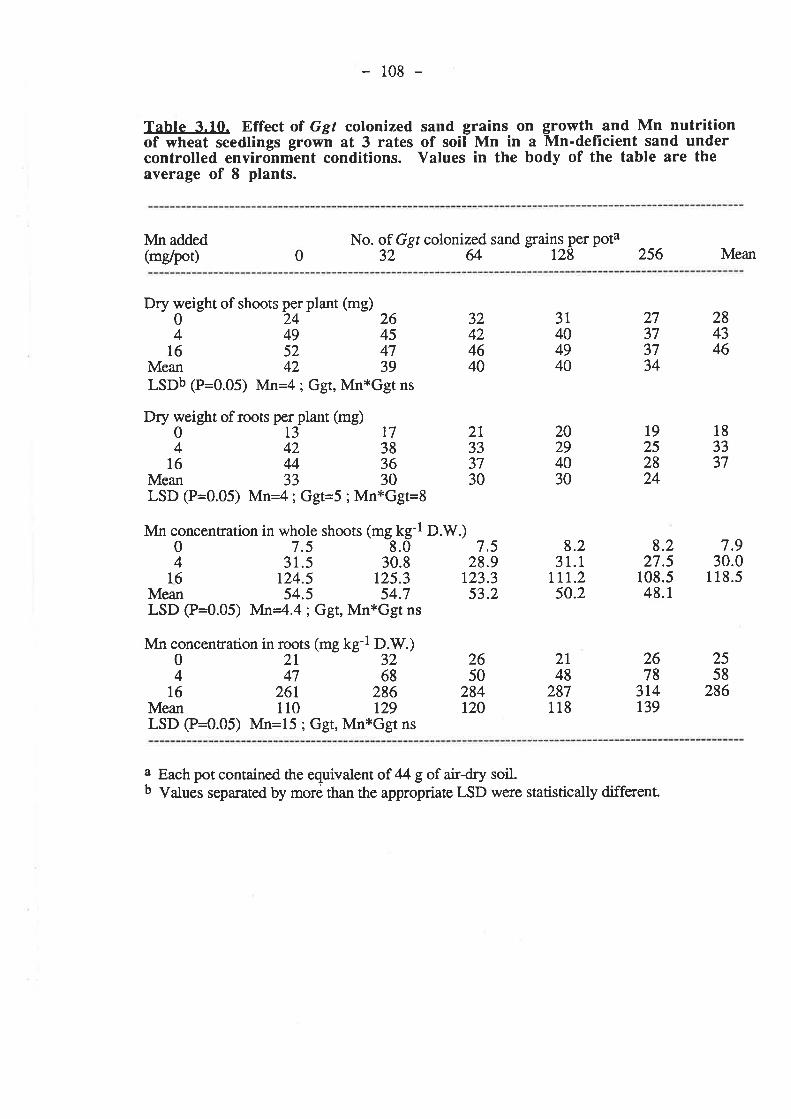
108 -
Tahte 3.10. Effect ol Ggt colonized sa rd grains on growth and Mn nutritionof wheat seedlings grown at 3 rates of soil Mn in a Mn-deficient sand undercontrolled envirohment conditions. Values in the body of the table are theaverage of 8 plants.
Mn added(mg/poÐ 0
No. of Ggr colonized sand grains pet pota32 & 128 256 Mean
Dry weight of shoots04
t6Mean
per plant (mg)24495242
26454739
284346
34
32424640
20294030
2L333730
28.9r23.3
53.2
2650
284120
31404940
8.231.1
ttr.250.2
2l48
287118
273737
t9252824
8.227.5
108.548.t
2678
314r39
LSDb (P:0.05) Mn=4; Ggr,Mn*Ggt ns
Dry weight of rcots perplant (mg)0137744238
16M36Mean 33 30LSD (P=0.05) Mn=4; Ggt=5 ; Mn*Ggt=8
183337
Mn concentration in whole shoots0 7.54 31.5 30.8
16 124.5 t25.3Mean 54.5 54.7LSD (P=0.05) Mn=4.4; Ggt, Mn*Ggt ns
Mn concentration in roots (mg tg-l D.W.)0213244768
16 261 286Mean 110 129LSD (P=0.05) Mn=15 ; Ggt, Mn*Ggt ns
(mg kg-l D.Vi.)8.0 7.5 7.9
30.0118.5
2558
286
a Each pot contained the equivalent of 44 g of air-dry soil.b Values separated by more than the appropriate LSD were statistically different

109 -
3.4. Discussion and Conclusions.
The repeat of the experiment reported by Graham and Rovira (1984) conf,rmed that
a rate of soil Mn which eliminated deficiency in wheat seedlings decreased take-all of wheat.
However, results obtained here differed in that a low rate of soil Mn had no effect on disease
levels. A low rate of soil Mn from the PDA concentraúon experiment produced similar plant
Mn concentrations and also did not decrease take-all. Neither rate of Mn increased the
concentration of Mn in wheat roots although shoot Mn concentrations were increased slightly
but were still below adequate levels. Similarly, Mn applied to leaves was ineffective at
decreasing Ggr infection on roots (although very heavy disease levels in this experiment
made it diffrcult to assess lesion development) and did not increase root Mn concentration.
Plant growth data indicated that foliar Mn increased the dry weight of shoots and roots of
plants as effectively as soil Mn which suggests that foliar Mn eliminated Mn deficiency in
shoots but does not ensure that the Mn nutrition of the roots was improved. Mn is poorly
translocated in phloem (Single 1958, Nable and Loneragan 1984a,b) and the increase in root
growth with foliar Mn may have been a secondary effect of improved nutrition of the shoots.
The results of these preliminary experiments suggest that rates of Mn which are
high enough to eliminate deficiency in wheat seedlings and increase the concentration of Mn
in roots above those in plants grown without Mn will decrease take-all. However, a low rate
of Mn applied to soil in the sand grain experiment increased shoot Mn levels to well above
critical for growth and increased root Mn concentrations but was not effective in decreasing
take-all. This same rate of soil Mn was very effective in decreasing take-all in the depth of
burial experiment, although the two Mn treatnents are not directly comparable because in the
sand grain experiment Mn was added prior to soil incubation. Further work needs to be
undertaken to clarify the effect of low rates of Mn on susceptibility of wheat to take-all and to
def,rne minimum tissue concentrations of Mn in shoots and roots necessary for reduction of
Ggr infection on wheat roots. The possibility exists that root or shoot Mn concentrations
110 -
which are marginal or just sufficient for growth of disease-free wheat seedlings may not be
high enough for infected seedlings to avoid the increased susceptibility to Ggr infection
which accompanies tissue levels of Mn below recognized critical values.
The increased susceptibility of Mn-deficient wheat seedlings to take-all was not due
to an impaired ability of the host to take up Mn because reductions in take-all were recorded
at disease levels which were too low to affect plant Mn concentrations. However, disease
levels which severely inhibited plant growth reduced shoot Mn concentrations but increased
root Mn concentrations. The increases in root Mn with Ggr infection were dramatic where
high rates of soil Mn had been applied. The petri-dish experiments conducted in chapter 2
showed the strong Mn-oxidizing capabilities of Ggt 5û and the increased Mn concentrations
in diseased wheatroots grown with high soil Mn rates may have been due to oxidation of
Mn on ,Lo, ,urfu" esby Ggthyphae although no visual deposits of Mn oxides were noted on
roots from experiments reported in this chapter. Mn oxides were observed on roots of plants
free of take-all in the soil incubation experiment (see appendix A) but they occurred at rates
of soil applied Mn which were much higher than those used in this chapter. If the high Mn
concentrations in roots of Ggr-infected plants gtown at high soil Mn were due to deposits of
Mn oxides, these oxides were apparently not available to plants because shoot Mn levels in
these plans were depressed. Alternatively, the rates of contact reduction (Uren 1981) which
occurred were insuff,rcient for the plant's needs. More detailed studies on the location and
apperìrance of high levels of Mn on wheat roots associated with Ggr infection are presented
in chapter 10.
The technique of placing Ggr-inoculated PDA discs at increasing depths below
wheat seeds proved to be the most reliable and flexible method of infecting wheat seedlings
with take-all. Increasing the depth of soil between wheat seeds and 4 Vo PDA discs from 2
to 6 cm resulted in disease levels (assessed by effects on dry weight of shoots) which
covered the range produced in all other pot experiments reported in this chapter and take-all
111
symptoms were decreased by Mn at all 3 depths of burial. Disease levels be¡ween
experiments were compared by reductions in dry weight of shoots because this measurement
was the most sensitive to increases in Ggt inoculum rates and separated Ggr Ûeatrnents most
clearly within each experiment.
Increasing the concentration of PDA in agar discs was not as effective because a
four fold increase in PDA strength did not cause a measurable increase in symptoms on roots
despite the dry weight of shoots being decreased by more than two fold at the same time.
Although the inoculum potential of a pathogen is ma¡kedly influenced by its nutritional status
(which will depend, among other things, on the physical and chemical nature of the substrate
on which the inoculum is developed) (Ga:ren 1970) increasing PDA strength four fold was
not sufficient to measurably increase take-all symptoms on wheat roots. In addition, Ggr
infection symptoms were only slightly decreased by Mn in this experiment, even though the
high rate of Ggt inoculum in this experiment was the same as that in the depth of burial
experiment (and produced similar disease levels) where take-all symptoms were substantially
decreased.
Inoculated sand grains wete not suitable as Ggt inoculum because decreases in Ggt
infection symptoms on roots with Mn could only be measured at low rates of disease,
despite the high rates of inoculum causing disease levels which were simila¡ to those
produced in the depth of burial experiment.
As previously mentioned in the introduction to this chapter, ground oat inoculum
was not suitable because of the inconsistency in disease levels produced between batches at
the same rates. In the latter of ttre two experimenß conducted with this inoculum the
addition of Mn did not decrease take-all. The inability to measure a decrease in Ggt infection
symptoms on wheat roots may have been due to the very heavy infection which occurred in
this experiment. The roots of diseased plants were very stunted and beginning to rot by
han¡est and some root breakage occurred during han¡est (especially on nil Mn plants). Bottr
rtz -
of these factors made it very difficult to distinguish stelar lesions and disease assessments in
tenns of lesion development could not be accurately made.
Incubating moist V/angary sa¡d was very effective at increasing the severity of Mn
deficiency in wheat seedlings because rewetting a soil will decrease exchangeable Mn levels
(Fujimoto and Sherman 1945, Shuman 1980). This technique was adopted for all further
por experiments. Mixing MnSOa through soil prior to incubation supplied levels of Mn to
wheat seedlings that were more than adequate for growth and was also effective at
decreasing take-all. Marca¡ (1986) showed that in Wangary sand, Mn added as Mn2+ was
decreased to negligible levels within 20 days. This means that in pots where Mn was added
to soil the take-all fungus should not have been exposed to Mn2+ levels which were much
higher than in nil Mn. This further supports the conclusions of chapter 2 that rates of soil
Mn which decreased take-all rwere not toxic to the fungus.
3.5. References.
Brown, M.E., Hornby, D. and Pearson, V. (1973). Microbial populations and nitrogen insoil growing consecutive cereal crops infected with take-all. J. Soil Íci.24,296-310.
Chambers, S.C. and Flentje, N.T. (1967)a. Studies on oat-attacking and wheat-attackingisolates of Ophiobolus gramin¿s in Australia. Aust. J. Biol. Scí.20,927-4O.
Chambers, S.C. and Flentje, N.T. (1967)b. Studies on variation with Ophiobolus graminís.Aust. J. Biol. Sci.20, 94I-51.
Clarkson, J.D.S. and Polley, R.'W. (1981). Diagnosis, assessment, srop appraisal andforecasting. In "Biology And Control Of Take-all." (Eds. M.J.C. Asher and P.J.Shipton.) pp. 25 I -69. (Academic Press: London.)
Fujimoto, C.K. and Sherman, G.D. (1945). The effect of drying, heating and wetting on thelevel of exchangeable manganese in Hawaiian soils. So¡l Scí. Amer. Soc. Proc. 10,107-r2.
Ga:rett, S.D. (1934)a. Factors affecting the severity of take-all. 1. The importance of soilmicroorganisms. "I. Dept. Agric., South Aust.37, 6&-74.
Garrett, S.D. (1970). "Pathogenic Root-infecting Fungi." (Cambrige Press: London.)
Graham, R.D. and Rovira, A.D. (1984). A role for manganese in the resistance of wheatplants to take-all. Plant Soil78, MI-s.
MacNish, G.C., Liddle, J.M. and Powelson, R.L. (1986). Studies on the use of high- andlow-nutrient inoculum for infection of wheat by Gacurnannomyces grarninis var.tritici. P hytop athol. 7 6, 8 I 5-9.
Marcat, N.E. (1986). Genotypic variation for manganese efficiency in cereals. Ph.D.Thesis. Waite Ag.ic. Res. Instit., Univ. Adelaide, South Aust.
Nable, R.O. and Loneragan, J.F. (1984)a. Translocation of manganese in subterraneanclover (Triþliurn subterranewnL. cv. Seaton Park). 1. Redistribution duringvegetative growth. Aust. J. Plant Physiol.11, 101-11.
Nable, R.O. and Loneragan, J.F. (1984)b. Translocation of manganese in subterraneanclover (Trifoliurn subterraneu¡nL. cv. Seaton Pa¡k). 1 1. Effects of leaf senescenceand of restricting supply of manganese to part of a split root system. Aust. J. PlantPhysiol.ll, 113-8.
Rovira, 4.D., Graham, R.D. and Ascher, J.S. (1985). Reduction in infection of wheat rootsby Gaewnannomyces grarninis var. tritici with application of manganese to soil. In"Ecology And Management Of Soil-borne Plant Pathogens. Proc. Section 5,4ú Int.Plant Pathol. Cong. pp.212-4. (Amer. Phytopathol. Soc.: St. Paul, Minnesota.)
Shuman, L. (1980). Effects of soil temperature, moisture, and air-drying on extractablemanganese, iron, copper and zinc. Soíl Sci. 130,336-43.
113
manganese,479-88.
Single, W.V. (1958). The mobility offolia¡ application. Ann. Bot.22
in the wheat plant. 1. Redistribution and

Lt4 -
IJren, N.C. (1981). Chemical reduction of an insoluble higher oxide of manganese by plantroots. J. Plant Nut.4,65-71.
Weller, D.M. and Cook, R.J. (1933). Suppression of take-all of wheat by seed treatmentswith fluorescent pseudomonads. P hytopathol. 7 3, 463 -9.
CHAPTER 4.
RELATIVE SUSCEPTIBILITIES OF FOURWHEAT GENOTYPES TO TAKE-ALL
UNDER MANGANESE-DEFICIENTCONDITIONS

115 -CHAPTER 4. RELATIYE SUSCEPTIBILITIES OF FOUR WHEATGENOTYPES TO TAKE.ALL UNDER MANGANESE.DEFICIENT
CONDITIONS.
4.1. Introduction.
Scott and Hollins (1985) concluded that after decades of screening for resistance to
take-all in cereals there was little hope for dramatic progress in resistance b'reeding.
However, th¡ee recent reports detail large differences between wheat genotypes in
susceptibility to take-all.
Simon and Rovira (1985) screened 20 wheat genotypes from the Australian'Wheat
Collection, 4 from Centro Internacional de Mejoramiento de Maiz y Trigo and4 Australian
commercial cultiva¡s for resistance to take-all in the field. Resistance scores va¡ied from 110
(resistanÐ to 15 (susceptible) over all genot)?es tested and scores for the Ausftalian cultiva¡s
Halberd, V/arigal, Kite and Condor were72,51, 31 and 15, respectively. Similarly, Wilson
þers. comm.) found the wheat cultivar Spear performed better than Condor in field plots
inoculated with take-all while there was little difference in growth in uninoculated plots.
Finally, Penrose (1985) reported that Kite was more resistant to take-all than Condor and, in
turn, Condor was more resistant than RAC311 (later released as Bayonet) in sand culture.
Studies have also been conducted'ùrith Australian wheat cultiva¡s to identify
differences between genotypes in their ability to grow and yield well under Mn-deficient
conditions (Marcar 1986, Graham t987,Graham pers. cornm.). These studies have been
conducted both in the field and in pots under controlled environment conditions. The wheat
cultiva¡s mentioned above have been tested for their tolerance to Mn-deficient conditions
(although not all in the same experiment) and can be ranked from least to most sensitive with
moderate Mn deficiency as follows - Halberd, Kite, Condor and Bayonet (Graham 1987).
Halberd was more sensitive than Warigal at a more severely deficient site (Graham 1987)
and Spear was also found to be reasonably tolerant to Mn defrcient conditions (Graham pers.
comm.).
Comparison of the independent screenings of Australian wheat cultivars for
tolerance to Mn deficiency and resistance to take-all show that, in general, those cultiva¡s
116 -which were tolerant of Mn defrciency were also resistant to take-all (relative to other
cultivars) and vice versa.
A pot experiment was conducted under controlled environment conditions to test the
relative susceptibilities of 3 Australian wheat cultivars and I breeders' line to take-all under
Mn-dehcient and -sufficient conditions. The experiment \ilas factorially designed with 4
wheat genotypes (Bayonet, Condor, Spear, CSMM), 3 Mn rates (0, 4, 16 mg of Mn per
pot),2 Ggt levels C,+GgÐ and 5 replicates.
4.2. Materials and Methods.
The basic techniques employed here were developed during experimens with small
pots outlined in Chapter 3 but some minorrefinements were included. Complete details for
soil, Mn anð, Ggt techniques can be found in sections 3.2.7"1.,3.2.4. and3.2.3.2.,
respectively.
4.2.1. Inoculum.
Petri-dishes were poured with approximately 17 rnl of autoclaved media containing
1 g of 'Difco' Bacto-agar and 0.156 g (4 7o)of PDA in 100 ml of DDDH2O. Dishes rwere
inoculated with single mycelial cubes taken from the edge of an actively growing colony of
Ggr 500 and placed atzPC for 6 days. Extra dishes of 4 VoPDA were made up and kept
sterile for use in - Ggt pots.
4.2.2. Soil.
Wangary sa¡d was incubated for 15 days at 18Vo water content prior to potting up
(see appendix A for details).
4.2.3. Mn.
Mn was mixed through soil prior to incubation as a MnSO¿.4HZO solution at rates
of 0 (0 Mn), 4 (4 Mn) and 16 (16 Mn) mg of Mn perpor

tt7 -4.2.4. Procedure.
Basal nutrients were mixed through soil at the same rates used in Chapter 3 with
small pots.
Seeds for the 4 genotypes were collected from a trial grown on a Mn-deficient site at
Tooligie on the Eyre Peninsula S.4., in 1985. The average Mn concenmtion in seed for
each genotype was 7.3,9.2,8.6 and 72.7 mg kg-l p.W. for Bayonet, Condor, Spear and
C8MM, respectively. These seeds were surface-sterilized with 17o NaOCI for 2 minutes and
rinsed with DDDH2O and germinated as before (see section 3.2.4.).
Pots were part-filled wittr 34.1 g of prepared soil, followed by an agar disc which
had been cut to the internal diameter of the pots, a furthe¡ 16.8 g of soil (resulting in a 4 cm
deep layer) ,2 germtnated wheat seeds and a final layer of 4.1 g of soil. Ggl colonized agar
discs were cut from the outer margins of Ggt colonies which had reached the edge of peri-
dishes by the day of sowing. Each potreceived 4 ml of DDDHzO to the soil surface to settle
soil a¡ound the seeds.
Pots were placed in a tray in randomized blocks and covered with a sheet of thin
clear polythene CGlad Wrap'), to reduce dryi"g of the soil surface, before being placed in
controlled environment conditions of 15o C with a 10 hour light period (average photon flux
density of 300 uEinsteins m-2 s-l supplied by a bank of mercury vapour lamps) n every 24.
'Glad Wrap'was removed after 2 days and pots were watered to original weight
every 3-4 days. Plants were harvested after 25 days. Shoots were removed at the soil
surface and fresh weight per pot recorded before drying at7æ C for 2 days. Roots were
washed free of soil and the number of black stela¡ lesions, the total length of stela¡ lesions
and the number of diseased seminal roots recorded for each plant. After disease severity had
been assessed, the total length of primary and secondary seminal toots per plant rwas
estimated (Tennant 1975) and number and total length of nodal roots measured. The fresh
weight of roots per pot was then recorded (after free water \vas removed) and the roots dried
atTW C for 2 days. Oven-dry weights for shoots and roots were recorded and shoots
118 _
analyzedfor Mn and 11 other essential elements with an ARL inductively coupled atomic
emission spectrometer. Samples were prepared for analysis by nitric acid digestion.
4.3. Results.
4.3.1. Ggt.
The effect of Mn on take-all (mea.sured by the total length of take-all lesions per
ptant) depended on the wheat genotype involved (table 4.1). Without added Mn, Bayonet
supported a high level of disease (an average of 25 mm of take-all lesions per plant), Condor
and Spear moderate levels (17 and 19 mm of lesions, respectively) and CSMM only a low
level (11 mm of lesions per pot). The total length of lesions per plant was decreased by 4
Mn for all genotypes except C8MM which had a low level of disease at all Mn levels.
Disease was approximately halved by 4 Mn for Condor and Spear and by more than twe
thirds for Bayonet. Disease levels were the same for all genotypes at 4 Mn and there was no
additional effect from the use of 16 Mn.
The number of take-all lesions per plant and the percentage of infected seminal roots
,were not affected by treatments and averaged 11 and T6Vo,respe.ctively, for +Ggt (data
presented in tables C.1. and C.2. in Appendix C, respectively). No disease was detected in
-Ggt pots.
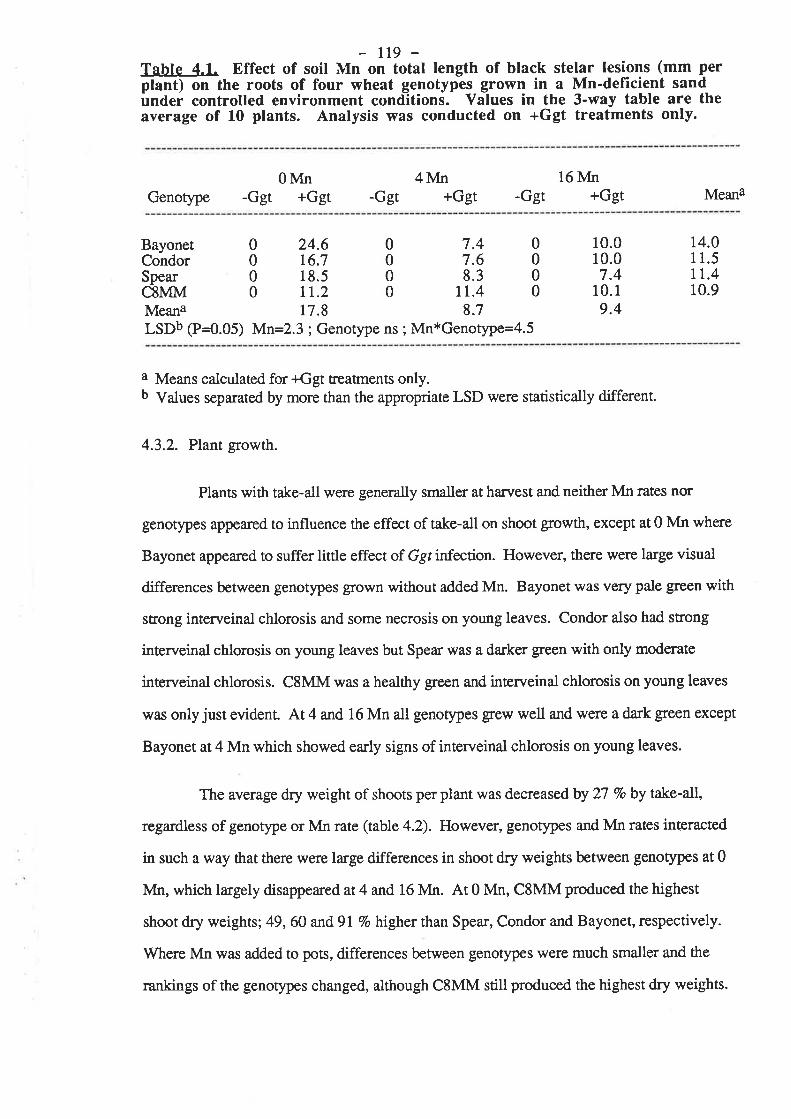
119 -Table 4.1. Effect of soil Mn on total length of black stelar lesions (mm perptant) on the roots of four wheat genotypes grown in a Mn-deficient sandunder controlled environment conditions. Values in the 3-way table are theaverage of 10 plants. Analysis was conducted on +Ggt treatments only.
Genotype0Mn
-Ggt +Ggt4Mn
-Ggt +Ggt16lvln
-Ggt +Ggt Meana
SpearC8MM
BayonetCondor
MeanaLSDb (P=O.05) Mrn=2.3; Genotype ns ; Mn*Genotype=4.5
0000
24.6r6.718.5tr.217.8
0000
7.47.68.3
It.48.7
0000
r0.010.07.4
10.19.4
t4.011.5tl.410.9
a Means calculated for +Ggt treatments only.b Values separated by more than the appropriate LSD were statistically different
4.3.2. Plant growth.
Plants with take-all were generally smaller at harvest and neither Mn rates nor
genoÞ?es appeared to influence the effect of take-all on shoot gtowth, except at 0 Vfn where
Bayonet appeared to suffer little effect of Ggt infection. However, there were large visual
differences between genotypes grown without added Mn. Bayonet was very pale green with
strong interveinal chlorosis and some necrosis on young leaves. Condor also had strong
interveinal chlo¡osis on young leaves but Spear was a darker green with only moderate
interveinal chlorosis. CSMM rilas a healthy green and interveinal chlorosis on young leaves
was only just evident. At 4 and 16 Mn all genoqryes grew well and were a da¡k green except
Bayonet at 4 Mn which showed early signs of interveinal chlorosis on young leaves.
The average dry weight of shoots per plant was decreased by 27 Vo by take-all,
regardless of genotype or Mn rate (table 4.2). However, genotypes and Mn rates interacted
in such a way that there were large differences in shoot dry weights between genotyp€s at 0
Mn, which largely disappeared at 4 and 16 Mn. At 0 Mn, CSMM produced the highest
shoot dry weights; 49, 60 and 91 7o higher than Spear, Condor and Bayonet, respectively.
Where Mn was added to pots, differences between genotypes were much smaller and the
rankings of the genotypes changed, although CSMM still produced the highest dry weighs.
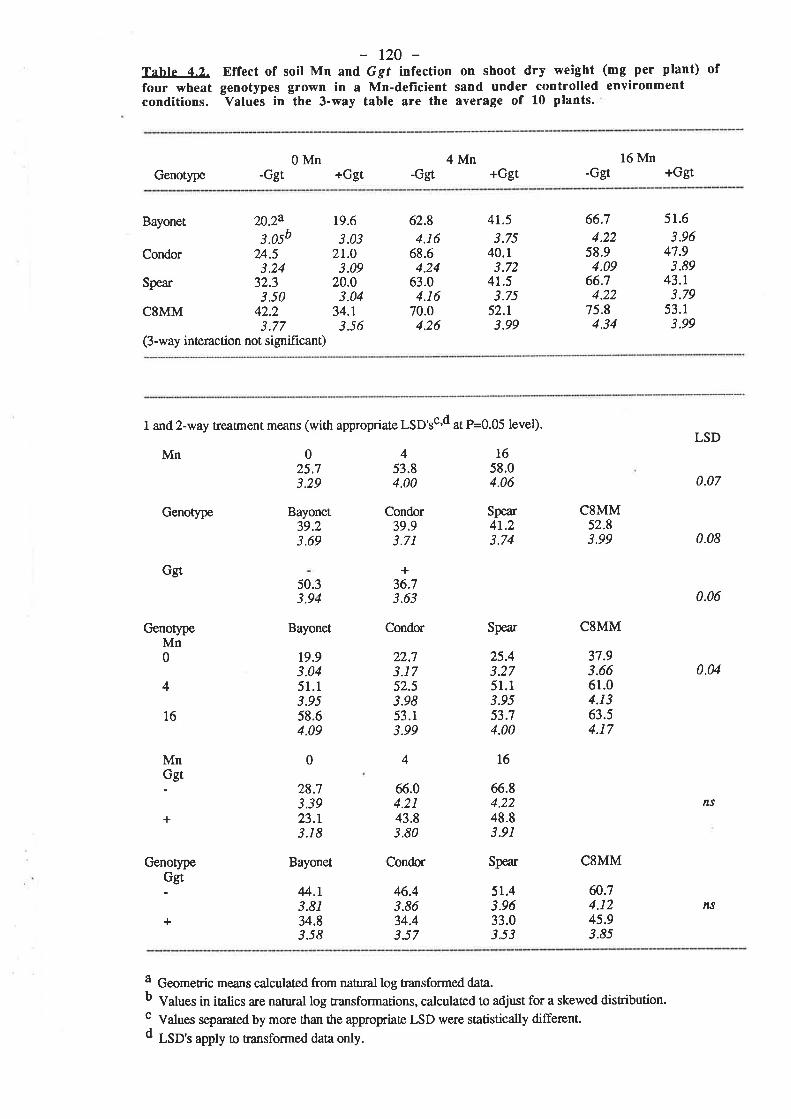
t20 -Tahle 4.2. Effect of soil Mn and Ggf infection on shoot dry weight (mg per ptant) offour wheat genotypes grown in a Mn-defïcient sand under controlled environmentconditions. Values in the 3-way table are the average of 10 plants.
0Mn 4Mn 16 MnGenotype -Ggt +Ggt -Ggf +Ggt -Ger +Ggt
Bayoner 20.24 19.6
3.0sb 3.03Condor 24.5 2l.O
3.24 3.09Spear 32.3 20.0
3.50 3.04CSMM 42.2 34.r
3.77 3.s6(3-way interaction not significant)
62.8
4.1668.64.24
ó3.04.16
70.04.26
4r.5
3.7540.r3.72
4r.53.7s
52.r3.99
66.7
4.2258.94.09
66.74.22
75.84.34
51.6
3.9647.9
3.8943.13.79
53.13.99
I and 2-way treatrnent means (with appropriate LSD'sc'd at P=0.05 level).
Mn
Genotype
4
16
025.7i.29
Bayonet39.23.69
50.33.94
19.93.0451.13.9558.64.09
0
28.73.3923.r3.18
4.13.8134.83.58
453.84.00
Condor39.93.71
+36.73.63
22.73.1752.53.9853.13.99
4
66.04.2143.83.80
46.43.8634.43.57
r658.04.06
Spear4r.23.74
Spear
25.43.2751.13.9s53.74.00
T6
66.84.2248.83.91
Spear
51.43.9633.03.53
CSMM52.83.99
C8MM
LSD
0.07
0.08
0.06
0.04
¿.f
Ggt
GenotypeMn0
Bayonet Condor
37.93.6661.04.r363.54.17
MnGgt
+
GenotlpeGgt
Bayonet Condor CSMM
û.74.1245.93.8s
+ns
a Geometric means calculated from natu¡al log transformed daø.b V.lo". in iølics are natural log transformations, calculaæd to adjust for a skewed disribution.c Values separated by more than the appropriaæ LSD were statistically different.d LSD', aprply o úansformed data only.

12l
Soil-applied Mn increased the dry weight of shoots for all genotypes but the size of
the increase depended on the genotype. The shoot dry weight of C8MM increased by 6L 7o
at 4 Mn and Spear, Condor and Bayonet by 101, 131 and 757 Vo, respectively. Only Spear
and Bayonet increased further with 16 Mn but the increases in both cases were small; 5 and
15 Vo, respectively.
The effect of treatments on root growth was complex and increases in the average
dry weight perplant with added Mn were influenced, separately, by both genotypes and
take-all. In addition, the effect of Ggt infection on seminal and nodal root growth were both
modified by genotype and Mn rate but in opposite directions.
Very large differences in average dry weight of roots per plant \ilere measured at 0
Mn but all genotypes had similarroot weights with added Mn (frgure 4.1, table 4.3). This
pattern was very similar to the one observed in shoot dry weights but differences be¡peen
treatnents were even mo¡e ma¡ked. At 0 Mn, the dry weight of roots of CSMM were'lí,
141 and 270 Vo higher than Spear, Condor and Bayonet, respectively. The rankings of
genotypes at 0 Mn were similar at 4 and 16 Vfn but differences between genotypes were
relatively small (maximum difference of only 33 Vo) andrarely statistically signif,tcant.
Addition of Mn increased the dry weight of roots but the size of the increase
depended on the genotype. The low Mn teatnent (4 Mn) increased rcot dry weight of
C8MM, Spear, Condor and Bayonet by 100, 209,328 and 456 Vo,respectrvely. Only
Bayonet was increased further by 16 Mn.
Ggr infection decreased root dry weight at 4 ^nd
16 Mn by 35 andTl Vo,
respectively, but no decrease occurred at 0 Mn. The increase in root dry weight with 4 Mn
in -Ggt pots was nearly double that in +Ggt pots. There r#as no further increase with 16
Mn.

122 -Tahle 4.3- Effect of soil Mn and Ggf infection on root dry weight (mg per plant) offour wheat genotypes grown in a Mn-deficient sand under controlled environmentconditions. Yalues in the 3-way table are the average of 10 plants.
0Mn 4Mn 16 MnGenotype -Ggf +Ggt -Ggt +Ggt -Ggt +Ggt
Bayonet 5.14 5.7
r.80b 1.90Condor 7.7 8.8
2.17 2.28Spear 12.4 10.7
2.59 2.46CSMM 19.6 20.r
3.03 3.0s(3-way interaction not significant)
36.43.62
46.93.87
43.63.80
47.33.88
24.53.24
26.43 .31
28.83.40
33.53.54
40.1
3.7236.5i.62
46.33.86
52.13.97
30.73.49
32.53.51
27.73.36
34.73.s8
1 and 2-way treâtment means (with appropriate LSD'sc,d at È0.05 level).
Mn
Ggt
Genotype
Genotype
GenotypeGgt
Bayonet Condor
0l0.l2.41
Bayonet2t.83.13
26.93.33
434.93.s8
Condor32.43.51
+21.03.09
1637.03.64
Spear24.63.24
Spear
1r.52.5335.53.6035.83.61
16
43.43.7931.53.48
Spear
29.43.4220.53.07
CSMM18.32.96
CSMM
19.93.U39.83.7142.63.77
C8MM
36.53.6328.63.39
LSD
0.09
0.10
0.07
0.17
0.17
Mn0
4
16
Mn
9',
5.41.8529.93.4335.73.60
8.22.2235.23.s934.43.57
0
10.02.4010.32.42
20.r3.0516.72.88
43.43.7928.13.37
24.03.2219.73.03
4
+
Bayonet Condor
+n.t
a Geometric means calculated from natural log transformed datâb Values in iølics a¡e natural log transformations, calculaæd to adjust for a skewed disribution.
123 _
Separate examination of the two root types (seminal and nodal) which contributed to
total root weight per plant revealed that nodal roots responded very differently to Ggt
infection than seminal roots. The total length of main axis and lateral seminal roots (figure
4.1, table 4.4) responded to treatments in a very simila¡ fashion to dry weight roots (see
figure 4.1) although effects of treatments on main axis seminal roots (data not presented)
were usually small and often not signifrcant. The similarity between treatrnent effects on
seminal root lengths and total dry weight of roots probably reflected the major contribution
that seminal roots made to the root systems of wheat seedlings at the early growth stage at
which plants were harvested. The number of seminal roots p€r plant (data not presented)
was not appreciably affected by treatments and averaged 5-6 roots per plant for the
experiment.
The number and total length of nodal roots per plant were both increased by Ggr
infection (frgure 4.1 and tables 4.5,4.6,respective1y). This effect is the reverse of that
which occurred with seminal roots. In relative tenns the stimulation of nodal root growth
with Ggr infection was most dramatic without added Mn. For instance, the total length of
nodal roots increased nearly eighteen-fold in +Ggt pots at 0 Mn but with added Mn the
increase was just over two-fold. Un-infected Condor and Bayonet did not produce any
nodal roots at 0 Mn. Effects of treatments on number and length of nodal roots were similar.
The interaction between Ggq Mn rates and genotypes on total length of nodal roots
also differed from that of the total length of seminal roots. At 0 Mn, there was no difference
between genotypes in nodal root length.
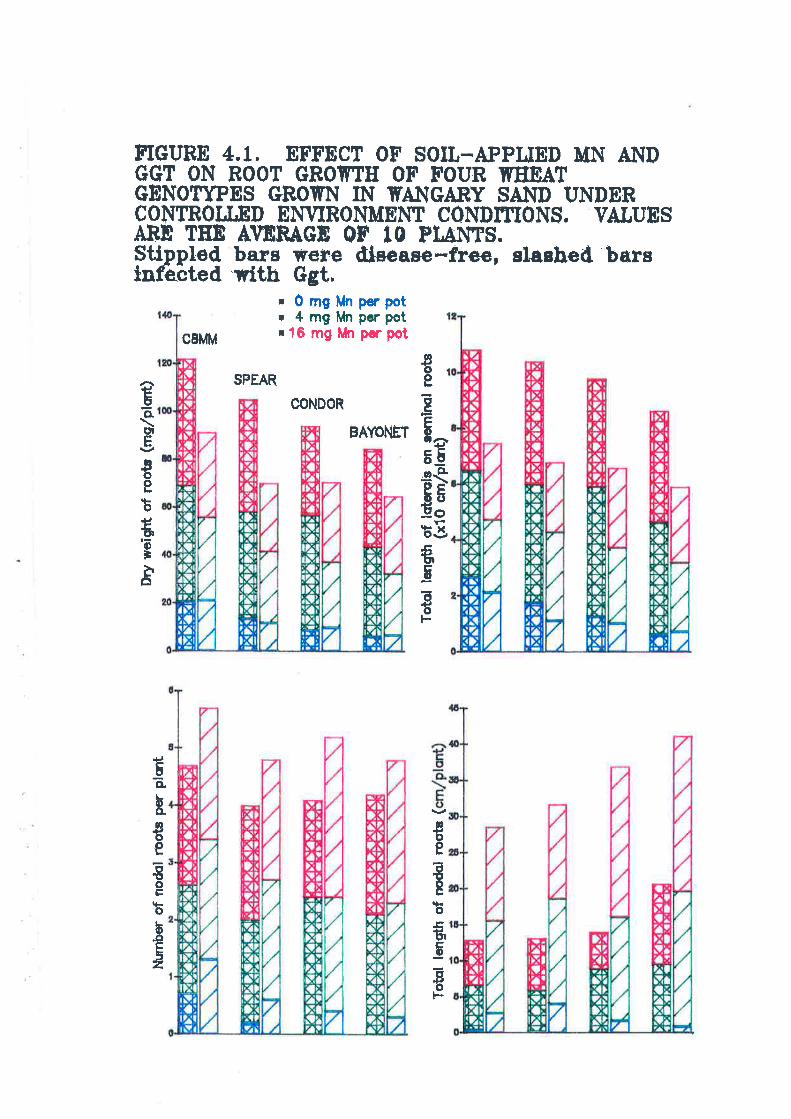
FIGUAE 4.L. EFFECT OF SOIL-APPIJED MN Al',[DGGT ON BOOT GROIÍTH OF FOUR THEATGEN0IYPES eBoWN IN TfAÌ.lcARY SAIID UNDEßCONTROÍ.T.ED ENVIRONME¡fr CONDNIONS. VATUESARE THE AVNNAGE OT IO PI,ANTS.Süppfed bars ï€r€ dlsease-free, slasbed'barsinfected ìrith Ggt.
MnMnMn
04
16
IfI
mgmgmg
psr potpcr potpc pot
CBMM
SPEAR
eoo
oÊE8^EE.oêEÈoctþ9Ë5al'lEÉoF
BAYOI.IET
ËCLIE
Ðoo
bboìÈ.ô
ûoeottIo
!
bÉo
=oEoÞ
goã"¡-c,CL
ooeET'o
oo-ôEb2
CONDOR

t24 -Table 4.4. Effect of soil Mn and Ggt it fection on total length of lateralseminal roots (mm per plant) of four wheat genotypes gro¡Yn in a- Mn-deficient sand undei controlled environment -conditions. Yalues in the 3-waytable are the average of l0 plants.
Genotype -Ggt0Mn
+Ggt4lvfn
+Ggt16 Mn
-Ggt +Ggt-Ggt
Bayonet 124 I43Condor 25L 203Spear 350 222CSMM 531 424(3-way interaction not significant)
551
805930846767
49454r632520
79677688486s
545572504
1 and 2-way treatment means (with appropriate LSD'sa at P=0.05 level).
Àín041628t 692 687
I.SD
35
Genotype
Genotype
GenotypeGgt
+
Bayonet484
660
Bayonet
133650670
0
575394
3r4248
Bayonet Condor
Spear573
Condor Spear
286739694
4 t6
837547
830s43
Condor CSMM610
C8MM
478æ3708
CSMM
227735674
Ggt
Mn
Àdri
9r'+
40
28
70
546
+M6
0416
49
652439
Spear
693453
ns72r499
a Values separated by more than the appropriate LSD were statistically different.
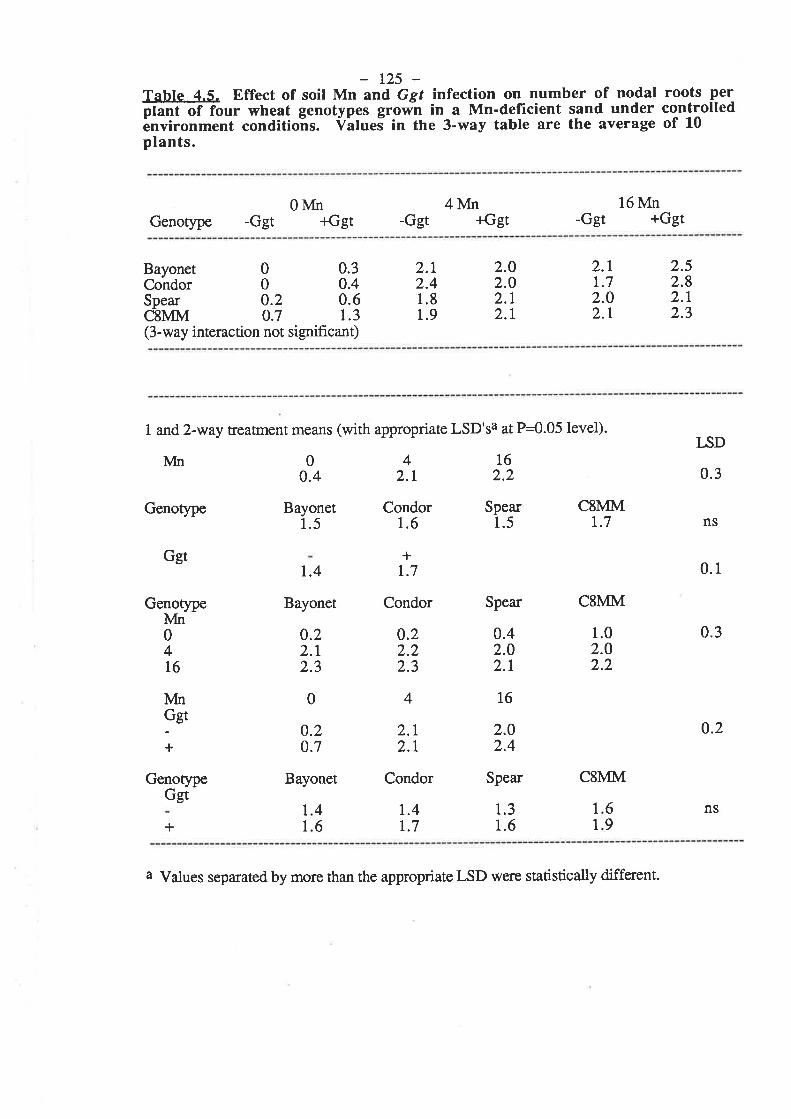
t25 -Table 4.5. Effect of soil Mn and Ggf infection on number of nodal roots perplãññf ñur wheat genotypes growi in a Mn-deflrcient sand under controlledènvironment conditioñs. Vãlueõ in the 3-way table are the average of 10plants.
Genotype -Ggt0Mn
+Ggt4Mn
+Ggt16 Mn
-Ggt +Ggt-Ggt
BayonetCondorSpearCSMM
000.20.7
0.30.40.61.3
2.12.41.81.9
2.52.82.1)2,
2.11.72.02.1
2.02.O2.t2.1
(3-way interaction not significant)
1 and 2-way treatment means (with appropriate LSD'sa at P=0.05 level).
Mn04160.4 2.1 2.2
Spear1.5
16
2.02.4
Spear
CSMMt.7
1.02.02.2
CSMM
I.SD
0.3
0.1
0.3
0.2
ns
Genotype
Ggt
Genotype
GenotypeGg¡
Bayonet1.5
t.4
Bayonet
0.22.12.3
0.22.22.3
0 4
Bayonet Condor
1.4t.7
Condor1.6
+t.7
Condor Spear C8MM
ns
ÙIr
ìlrt
9r'+
0.42.02.1
0416
2.t2.1
1
1
1
1
t.31.6
46
0.20.7
+69
a Values sep¿rated by more than the appropriate LSD were statistically different.
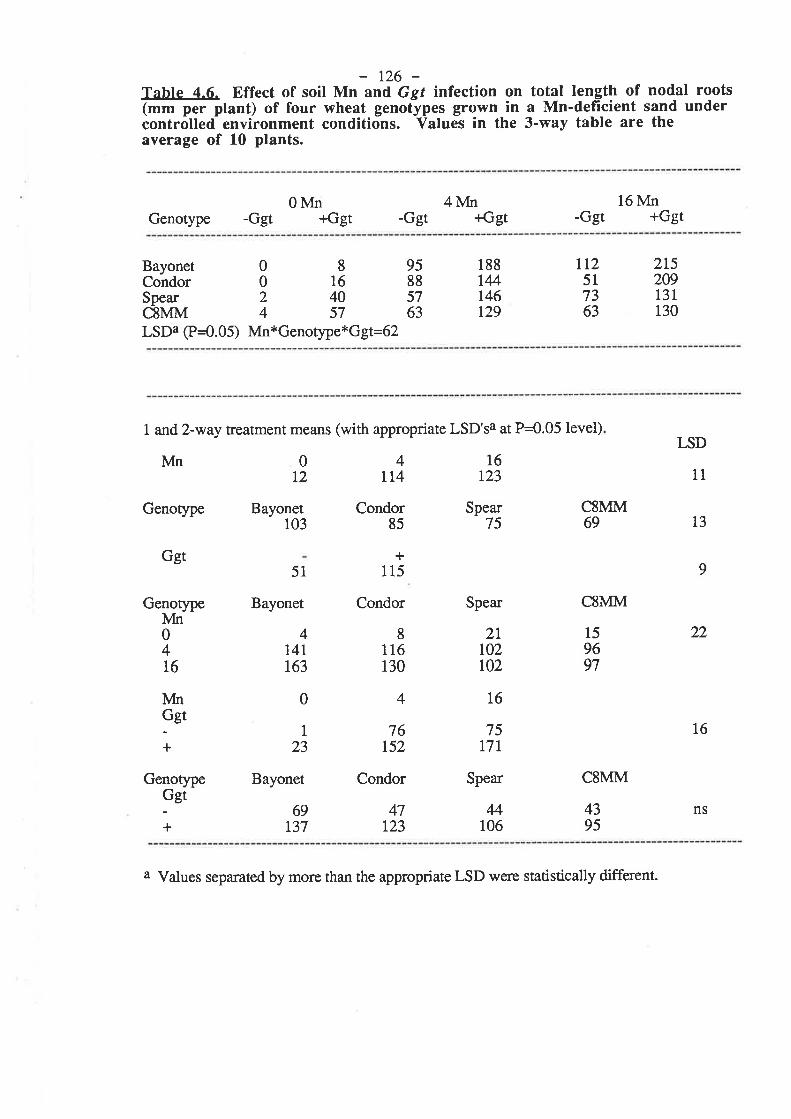
t26 _Tahle 4.6. Effect of soil Mn and Ggf infection on total length of nodal roots(mm per plant) of four wheat genotypes grown in a Mn-deficient sand undercontrõtleò environment conditions. Values in the 3-way table are theaverage of 10 plants.
Genotype -Ggt0Mn
+Ggt4lvfn
+Ggt16 Mn
-Ggt +Ggt-Ggt
BayonetCondorSpearC8MM
0024
8l64057
95885763
18814146129
tt2517363
215209731130
LSDa (P=0.05) Mn*Genotyp e*G gt=62
1 and 2-way treatment means (with appropriate LSD'sa at P=0.05 level)
lvfn 0 4 1672 tt4 123
Genotype
Genotype
Bayonet103
51
Bayonet
4141r63
0
1
23
Bayonet
Condor85
+115
Condor
8116130
Spear75
Spear
21t02r02
r6
7517t
Spear
M106
CSMM
CSMM
159697
CSMM
4395
I,SD
11
13
t6
69
9
22
Ggt
l\lrt0416
Genotype
Àlrt
:r,+
9r'+
4
76'J,52
Condor
69t37
47123
ns
a Values separated by more than the appropriate LSD were statistically different.

127 _
Un-infected Bayonet had a higher total length of nodal roots than the other three
genotypes at 16 Mn and a greater length than Spear or CSMM at 4 Mn. Ggt-nfecteÅ'
Bayonet and Condor had higher total lengths of nodal roots than Spear and CSMM at 16 Mn
while only Bayonet ,was higher at 4 Mn. There was a large increase in nodal root length with
4 Mn but 16 Mn did not cause any further increase except in Ggr-infected Condor.
4.3.3. Mn.
The concentration of Mn in whole shoots (oven dry weight basis) at harvest (table
4.7) averaged less than 5 mg kg-l at 0 Mn for all genotypes and at both - and +Ggt, which is
well below the criticat level of 18 mg kg-l for wheat seedlings grown in experiments of this
type (see appendix B). Ggt infection had no effect on Mn concentration in whole shoots at 0
Mn nor at 16lvln where shoot Mn concentrations averaged 42.3 mgkg-l. Ho*ever, at 4IvIn
Ggr infection decreased shoot Mn concentration from an average of 19.9 mg kg-l to 14.4 mg
kg-I. The average concenEation of Mn in whole shoots for each genotype was not
influenced by Mn rates or take-all and CSMM had higher shoot Mn concentrations than
Spea¡ or Condor which, in turn, had higher levels than Bayonet.
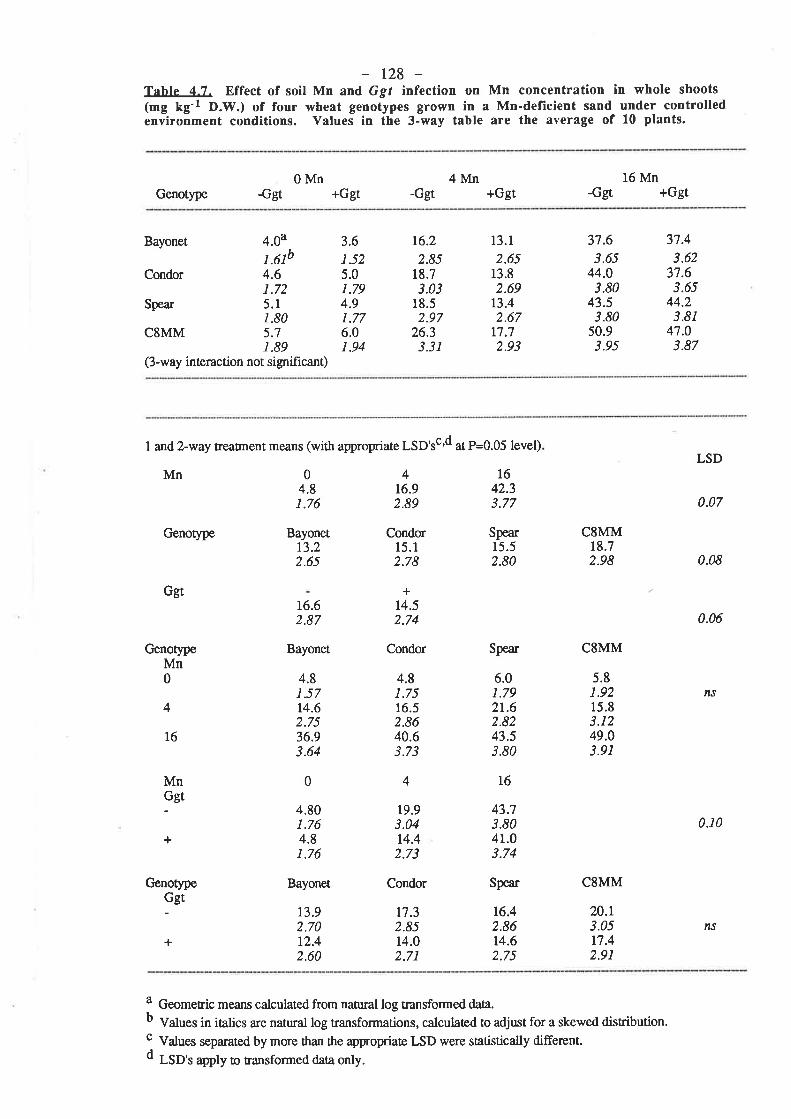
t28 _Tzble 4-7. Effect of soil Mn and Ggf infection on Mn concentration in whole shoots(mg kg'1 D.W.) of four wheat genotypes grown in a Mn-deficient sand under controlledenyironment conditions. Yalues in the 3-way table are the average of 10 plants.
0Mn 4Mn 16 MnGenotype -Ggt +Ggt -Gef +Ggt -Gsl +Ggt
Bayonet 4.Oa
r.6þCondor 4.6
1.72Spear 5.1
1.80CSMM 5.7
t.89(3-way interaction not significant)
3.6
1.525.01.794.91.776.01.94
16.2
2.8518.73.03
18.52.97
26.33.3I
13. l2.65
13.82.69
t3.42.67
t7.72.93
37.6
3.6544.03.80
43.53.80
50.93.9s
37.4
3.6237.63.6s
44.23.81
47.03.87
I and 2-way treatnent meâns (with appropriate LSD'sc'd at P=0.05 level)
Mn
Ggt
Genotype
4
16
Bayonet13.22.6s
16.62.87
Bayonet
416.92.89
Condor15.12.78
+14.52.74
Condor
l642.33.77
Spear15.52.80
Spear
6.01.792r.62.8243.53.80
t6
43.73.8041.03.74
Spear
t6.42.86t4.62.75
CSMM18.72.98
CSMM
LSD
0.07
0.08
0.06
0.10
04.81.76
Genot¡'peMn0 4.8
1.5714.62.7536.93.64
0
4.801.764.81.76
Bayonet
13.92.70t2.42.60
4.81.751ó.52.8640.63.73
5.81.9215.83.1249.03.91
ff
Mn
9r,
4
+
19.93.0414.42.73
GenotypeGgt
Condor
r7.32.8s14.02.71
CSMM
20.r3.0517.42.91
+/tJ
a Geometric means calculated from nahr¡al log transformed datâ.b V"lo", in italics are natural log transformations, calculated to adjust for a skewed disribution.c Values separated by more than the appropriaæ LSD were statistically different.d LSD', apply o transformed data only.
129 -4.4. Discussion.
The results of this experiment clearly showed that there was a strong and negative
relationship between Mn efficiency and relative susceptibility to take-all. CSMM produced
much more dry matter than Bayonet under conditións which were severely Mn deficient and
accumulated a higher concentration of Mn in its shoots. Spear and Condor were intermediate
between these two genotypes with Spear being more Mn-effrcient than Condor. The ranking
of these 4 genotypes for susceptibility to take-all under severely Mn-deficient conditions w¿ls
in reverse order to Mn efFrciency. The lowest total length of black stelar lesions per plant
occurred on C8MM and the highest on Bayonet. The length of lesions on Spear and Condor
was intermediate between CSMM and Bayonet and not significantly different from each
othe¡. All genotypes were equally susceptible where Mn was applied to soil.
The largest decrease in total length of lesions wittt Nfn also occurred on Mn-
inefficient Bayonet and decreases on more efficient Spear and Condor were smaller. There
rwas no decrease in tength of lesions with added Mn in CSMM although C8MM was Mn
deficient by hawest. The high Mn seed content of CSMM may have been the teason for the
absence of a decrease in total length of lesions with added Mn. Seed Mn is very important
for early seedling growth (Marcar and Graham 1986) and the seed reserves of Mn of C8MM
may have been sufficient for growth during the time when invasion by Ggt was occurring
and Mn-deficiency did not begin until after roots were colonized. All seed was taken from
the same fîeld site and the high content of Mn in CSMM seed may have been due to better
growth of CSMM under Mn-dehcient conditions or it may have been due to a superior ability
of CSMM to translocate Mn to its seed.
Penrose (1985) reported that invasionby Ggt into seminal roots of Condor was
slower than RAC311 (Bayonet) and that fewer stelar lesions developed on Condor. Simila¡
differences in resistance between Condor and Bayonet were only evident under Mn-deficient
conditions in this experiment Further work is warr¿nted to investigate whether the
differences in resistance discovered here under Mn-def,rcient conditions can be explained by
differences in rates of invasion and colonization by Ggr. Studies were conducted to
investigate Ggr invasion into Mn-deficient and -sufficient roots of Condor and a¡e presented
in chapter 7.

130 -Disease levels produced in this experiment were sufficiently high that Ggr infection
decreased shoot Mn concentrations at 4 Mn. Results of experiments reported in chapter 3
showed that high Ggr inoculum rates would decrease the shoot Mn content of infected plants
but that this effect was not necessary for disease to be favoured under Mn-deficient
conditions. Ggr inhibits host grov/th by reducing the size of the effective root system of
infected plants. It does this by blocking and destroying root phloem bundles (which halts
root elongation) and also xylem vessels (which restricts nutrient uptake and translocation to
shoots (Fellows 1928 Weste 1972, Cla¡kson et al. 1975). Roots are effectively tn¡ncated at
sites of well-developed stela¡ lesions (Clarkson et al. 1975). At 16 Mn, there was abundant
Mn available to plants and the loss of root length caused by Ggt infection decreased shoot
uptake of Mn to the same extent as shoot dry weight and shoot Mn concentration did not
change.
However, at 4 Mn shoot Mn concentrations were raised to barely adequate levels
and the loss of effective root length which accompanied Ggr infection reduced shoot uptake
of Mn more than shoot dry weight. As a consequence shoot Mn concentrations were
decreased to levels well below critical for growth. This induced Mn defrciency caused by
Ggr infection resulted in additional host growth depression; Ggt nfection decreased the dry
weight of roots by 35 Vo at 4 Mn but by TI Vo at L6 Mn. A similar interaction occurred in
shoot dry weight but was not statistically significant.
As occurred at 16 Mn, the reduction in shoot dry weight with Ggr infection at 0 Mn
matched those of Mn uptake and shoot Mn concentration rilas not decreased. The dry weight
of roots perplant was not decreased by Ggt infection at 0 Mn which suggests that severe Mn
deficiency was a more important factor limiting plant growth than take-all. Where Mn
deficiency wa.s relieved by the addition of soil Mn the effects of Ggt infection on plant
glowth increased.
Graham and Rovira (1984) reported that a low rate of Mn which increased shoot
Mn concentrations in wheat seedlings but did not eliminate Mn deficiency was partially
successful in decreasin g Ggt infection. The rate of 4 Mn in this experiment did not
completely eliminate Mn deficiency in Spear and Bayonet because further increases in
grolvth occured with 16 Mn in both these genotypes. This low rate of soil Mn decreased
131
Ggr infection as effectively as 16 Mn on all four genotypes but in one experiment reported in
chapter 3 the same Mn rate did not decrease Ggr infection. The va¡iable effecs of low rates
of Mn in decreasingGgt infection highlights the subtle nature of the interaction between
invasion of wheat roots by Ggt andrates of Mn which are marginal for growth of the plant
host. Slight differences in Mn availability or timing and rates of Ggt invasion may be
important in determining the progress of the disease.
Contrary to the depressive effecs dry weight of roots and seminal root lengths, Ggt
infection stimulated nodal root growth. Stimulated nodal root production, as a response to
Ggr infection, has been proposed as a tolerance mechanism for cereals because it enables the
infected plant to replace roots lost due to disease. Comparisons between genoq¡pes for their
relative abilities to produce nodal roots rwas not possible at 0 Mn because there were different
disease levels on each genotype. However, at 4 and 16 Mn all disease levels were similar
and under these conditions Bayonet generally produced higher total nodal root lengths than
the other three genotypes (Bayonet also produced higher nodal root lengths than the other
genotypes under disease-free conditions). Despite the higher nodal root lengths, shoot
growth of Bayonet was still depressed by Ggt infection to the same extent as the other
genotypes. Plants were probably harvested too early to allow differences in nodal root
gowth to affect plant growth because the nodal roots were only a minor component of root
systems by ha¡rest.
732 -4.5. References.
Clarkson, D.I., Drew, M.C., Ferguson, I.B. and Sanderson, J. (I975). The effect of theTake-all fungus, Gaewnanñomyces graminis, on the transport of ions by wheat plants.P hysiol. P lant P athol. 6, 7 5-84.
Fellows, H. (1923). Some chemical and morphological phenomena attending infection of thewheat plant by Ophiobolus graminis. J. Agríc. Res.37,647-61.
Graham, R.D. (1987). Development of wheats with enhanced nutrient efñciency: Progr.essand potentiat. Proc. CIMMYTruNDP Int. Symp.'Wheat Production Constraints inTropical Environments. Chiang Mai, Thailand, fan. 19-23.
Graham, R.D. and Rovira, A.D. (1984). A role for manganese in the resistance of wheatplants to take-all. Plant Soil78,44l-5.
Marcar, N.E. (1936). Genotypic va¡iation for manganese efficiency in cereals. Ph.D.Thesis. W'aite Agric. Res. Instit., Univ. Adelaide, South Aust.
Marcar, N.E. and Graham, R.D. (1986). Effect of seed manganese content on the growth ofwheat (Tritiann aestivun) under manganese defrciency. Plant Soí1.96,165-73.
Penrose, L. (1985). Evidence for resistance in wheat cultiva¡s grown in sand culrure to thetake-all pathogen, Gaewnønnomyces graminis vat. tritici. Ann. Appl. Biol.l07, 105-8.
Scott, P.R. and H oil-bornediseases of Pathogens".(Eds. C.A. Kollmorgen.)pp. 157-9. (Amer. Phytopathol. Soc.: St. Paul, Minnesota.)
Simon, A. and Rovira, A.D. (1985). New inoculation technique for Gaewnønnomycesgrarninís var. tritíci to measure dose response and resistance in wheat in fieldèxperiments. In "Ecology And Management Of Soil-borne Plant Pathogens". Proc.
Section 5,4tt Int. Plant Pathol. Congr. pp. 183-4. (Amer. Phytopathol. Soc.: St.Paul, Minnesota.)
Tennant" D. (1975). A test of a modified line intersect method of estimating root length.,I.Ecol.63, 995-1001.
'Weste, G. (1972). The process of root infection by Ophíobolus gramínís.Trans. Brit.Mycol. Soc. 59, 133-47.
Wilson (pers. comm.). 1985.
CHAPTER 5.
EFFECT OF MN ON THE GROWTH OFFOUR GGT ISOLATES AND ON
THE DISEASE THEY CAUSEON V/HEAT ROOTS
t33 -
CHAPTER 5. EFFECT OF MN ON THE GROWTH OF FOUR GGTISOLATES AND ON THE DISEASE THEY CAUSE ON WHEAT ROOTS.
5.1. Introduction.
The papers of Graham and Rovira (1984) and Rovira et al. (1985) reported
additions of Mn decreasing take-all caused by one isolate of Ggt. This same isolate (500)
has been used in all the studies summa¡ized in this thesis so far and experiments were
conducted to test the sensitivity of three other field isolates of Ggr (and the disease they
cause) to Mn.
In this chapter, three experiments are reported which tested the sensitivity of four
Ggr isolates, inciuding 500, to manganous ions on potato dextrose agar and the effect of
addition of Mn to a Mn-deficient soil on disease caused by each isolate.
5.2. Materials and Methods.
5.2.I. Petri-dish experiment.
5.2.1.1.Isolates. Four different f,ield isolates were provided by Dr. A. Rovira [1]. Isolate
500 has been previously described (see chapter 2). Isolates 47 and 43 were both isolated
from wheat seedling roots grown on infected crowns from Avon, South Australia in 1978
and isolate 8 was collected from a wheat crown grown at Avon, South Australia in 1979.
All cultures were stored on full-strength PDA under sterile DDDHzO and colonies for each
experiment were prepared from stored cultures.
5.2.1.2. Mn. Mn2+ ion concentrations of 0,25,50, 100, 2A0,400 and 800 mg kg-l were
prepared by adding appropriate amounts of a MnSO4.4ffzo stock solution to weak PDA [2]
(approximately 40 Vo of manufacturer's recommendations) which had been made up with
DDDHzO. Three dishes were prepared for each Mn concentration.
1 Div. of Soils, C.S.I.R.O., Glen Osmond, South Australia.
134 -
5.2.7.3. Procedure. Disposable petri-dishes (9 cm. diameter) were poured with 15 ml of
agar (autoclaved at12æ C and 100 kPa for 15 minutes). Mycelial cubes (4 mm x 4 mm x 4
mm), removed from the colony edge of an actively growing culture on weak PDA (no added
Mn), were used as inocula for test dishes. One mycelial cube was aseptically transferred to
the centre of each dish and dishes were kept in the da¡k at 2æ C for 5 days. Colony areas
were calculated after 5 days from the average of 2 measurements of colony diameter taken at
right angles to each other.
5.2.2. Pot experiment A.
This experiment \ilas conducted under controlled environment conditions with a
factorial combination of treaunents; 4 Ggr isolates (500, 47,43,8), 2 Mn rates (0 and 4 mg
of Mn per pot), and 4 replicates. The basic techniques employed here were developed
during experiments with small pots outlined in Chapter 3 but some minor refinements were
included. Complete details for soil, Mn and Ggr techniques can be found in sections
3.2.1.1.,3.2.4. and 3.2.3.2. of Chapter 3, respectively.
5.2.2.L.Irnculwn. Petri-dishes were poured with approximately 17 ml of autoclaved media
containing l gof 'Difco'Bacto-agarand0.156 g(4Vo) of PDAin 100mlof DDDHZO.
Dishes were inoculated with single mycelial cubes taken from the edge of actively growing
colonies of each Ggr isolate and placed atzP CforT days. Extra dishes of 4 Vo PDA were
made up and kept sterile for use as controls for Ggt (for statistical analysis the Ggt controls
were regarded as a fifth isolate).
5.2.2.2. Soil. V/angary sand collected in 1983 was again used. The soil was not incubated
prior to sowing because the technique (see appendix A) had not been developed by the time
of this experiment. The stored soil, however, was Mn-deficient.
5.2.2.3. Mn. Mn was mixed through soil as a MnSOa.4H2O solution at either 0 (nil Mn) or
4 mg of Mn per pot (4 Mn).
135 -
5.2.2.4. Procedure. Basal nutrients were mixed through soil at sowing at the same rates
used in chapter 3 with small pots.
Condor wheat seeds, from a trial grown on a Mn-deficient site at Tooligie on the
Eyre Peninsula S.A. in 1984 (av. Mn concentration,6.4 mg kg-l), were surface-sterilized
with 6 7o NaOCI for 2 minutes, rinsed with DDDHzO and germinated as before (see section
3.2.4.).
All pots were part-f,llled with 42.5 g of prepared soil, followed by an agar disc
which had been cut to the internal diameter of the pots, a further 8.4 g of soil (resultin g in a 2
cm deep layer), 2 germtnated wheat seeds and a final layer of 4.1 g of soil. Ggr colonized
agar discs were cut from the outer margins of Ggr colonies. Each pot received 2 rnl of
DDDH2O to the soil surface to settle soil around the seeds. Four extra pots were filled with
prepared soil (no added Mn) but without agar discs to test the effect of agar discs on seedling
growth.
Pots were placed in a ray in randomized blocks and covered with a sheet of thin
clear polythene ('Glad Wrap') to reduce drying of the soii surface, before being placed in
controlled environment conditions of 15/100 C daylnight temperatures with a 10 hour light
period (average photon flux density of 0.7 mEinsteins m-2 s-l supplied by a bank of mercury
vapour lamps) n every 24.
'Glad Vy'rap' was removed after 3 days and pots were watered to original weight
every 3-4 days. Plants were harvested after 25 days. Shoots were removed at the soil
surface and fresh weight per pot recorded before drying at7æ C for 2 days. Roots were
washed free of soil and the number of black stelar lesions, the total length of stelar lesions,
the number of diseased seminal roots and the total length of nodal roots recorded for each
plant. After disease severity had been assessed, the fresh weight of roots per pot was
recorded (after free water was removed) and roots dried at 70o Cfor 2 days. Oven-dry
weights for shoots and roots were recorded and both tissues analyzed for Mn and 10 other
136 -
essential elements with an ARL t2l inductively coupled plasma atomic emission
spectrometer. Samples were prepared for analysis by nitric acid digestion.
5.2.3. Pot experiment B
This experiment was conducted under controlled environment conditions with a
factorial combination of trearnents; 3 Ggr isolates (500, 47,8),3 Mn rates (0, 4 and 16 mg
of Mn per pot), 2 Ggt levels (agal discs at 4 and 2 cm below the seeds) and 5 replicates.
5.2.3.I.Irnculum. Agar disc inocula for each Ggr isolate were prepared with the same
techniques used in pot experiment A and Ggr controls were again regarded as an extra isolate
for statistical analysis.
5.2.3.2. Soil. V/angary sand collected in 1983 was used but, unlike pot experiment A, the
soil was incubated prior to potting up (see appendix A for details).
5.2.3.3. Mn. Mn was mixed through soil prior to incubation as a MnSOa.4H2O solution at
rates equivalent to either 0 (nil Mn), 4 (4 Mn) or 16 (16 Mn) mg of Mn per pot.
5.2.3.4. Procedure. Basal nutrients were mixed through soil prior to sowing at the same
rates used in chapter 3 with small pots.
Condor wheat seeds from a trial grown on a Mn-deficient site at Tooligie on the
Eyre Peninsula S.4., in 1985 (av. Mn concentrationg.2mg kg-l¡ were surface-sterilized
with 6 7o NaOCl for 2 minutes, rinsed with DDDHzO and germinated as before (see section
3.2.4.).
Pots were part-filled with either 34.1 (low Ggt) or 42.5 g (high Ggt) of prepared
soil, followed by an agil disc which had been cut to the internal diameter of the pots and a
further 16.8 or 8.4 g of soil, respectively. Two germinated wheat seeds were then added
2 Applied Research Laboratories, SA (distributed by Bausch and Lomb (AusÐ Pty. Ltd.,47 Epping Rd., North Ryde, NSW.
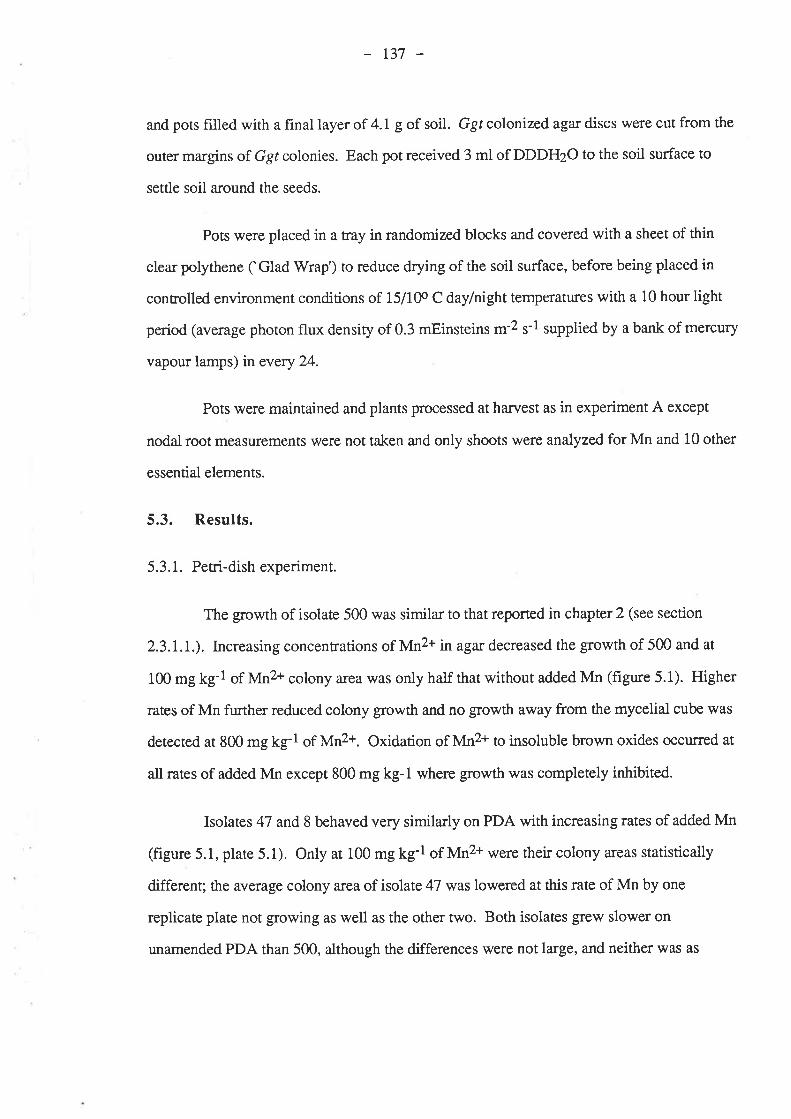
r37 -
and pots filled with a final layer of 4.1 g of soil. Ggr colonized agar discs were cut from the
outer margins of Ggr colonies. Each pot received 3 ml of DDDH2O to the soil surface to
settle soil around the seeds.
Pots were placed in a tray in randomized blocks and covered with a sheet of thin
clear polythene ('Glad 'Wrap') to reduce drying of the soil surface, before being placed in
controlled environment conditions of 15/100 C daylnight temperatures with a 10 hour light
period (average photon flux density of 0.3 mEinsteins m-2 s-l supplied by a bank of mercury
vapour lamps) rn every 24.
Pots were maintained and plants processed at harvest as in experiment A except
nodal root measurements were not taken and only shoots were analyzedfor Mn and 10 other
essential elements.
5.3. Results.
5.3. 1. Petri-dish experiment.
The growth of isolate 500 was simila¡ to that reported in chapter 2 (see section
2.3.1.1.). Increasing concentrations of Mn2+ in agar decreased the growth of 500 and at
100 mg kg-l of Mn2+ colony area rwas only half that without added Mn (figure 5.1). Higher
rates of Mn further reduced colony growth and no growth away from the mycelial cube was
detected at 800 mg kg-l of Mn2+. Oxidation of Mn2+ to insoluble brown oxides occurred at
all rates of added Mn except 800 mg kg-1 where gowth was completely inhibited.
Isolates 47 and 8 behaved very similarly on PDA with increasing rates of added Mn
(figure 5.1, plate 5.1). Only at 100 mg kg-l of Mn2+ were their colony areas statistically
different; the average colony a¡ea of isolate 47 was lowered at this rate of Mn by one
replicate plate not growing as well as the other two. Both isolates gre\il slower on
unamended PDA than 500, although the differences were not large, and neither was as
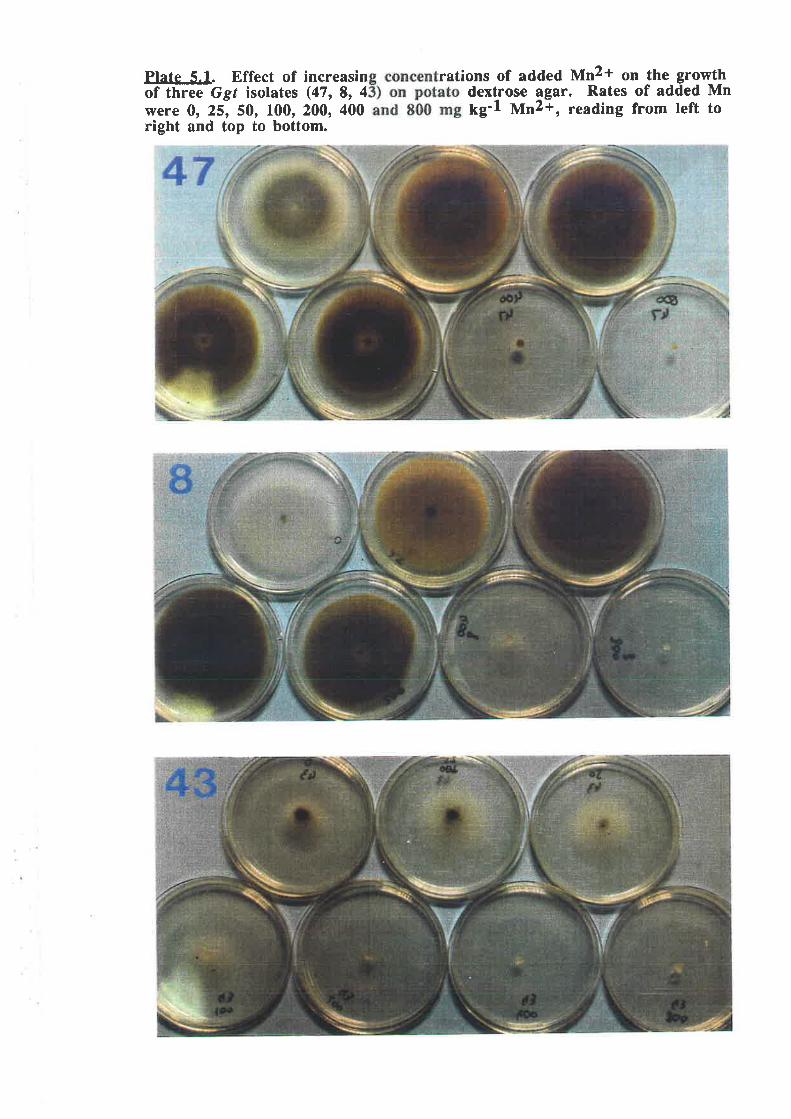
Plate 5.1. Effect of increasin rations of added Mn2+ on the growtlrõt tt¡ree Cgf isolates (47, 8, 4 dextrose lgar, Rates of added Mnryere 0, 25r 50, 100, 200, 400 kg'l ¡1n2+, reading from left toright and top to bottom.
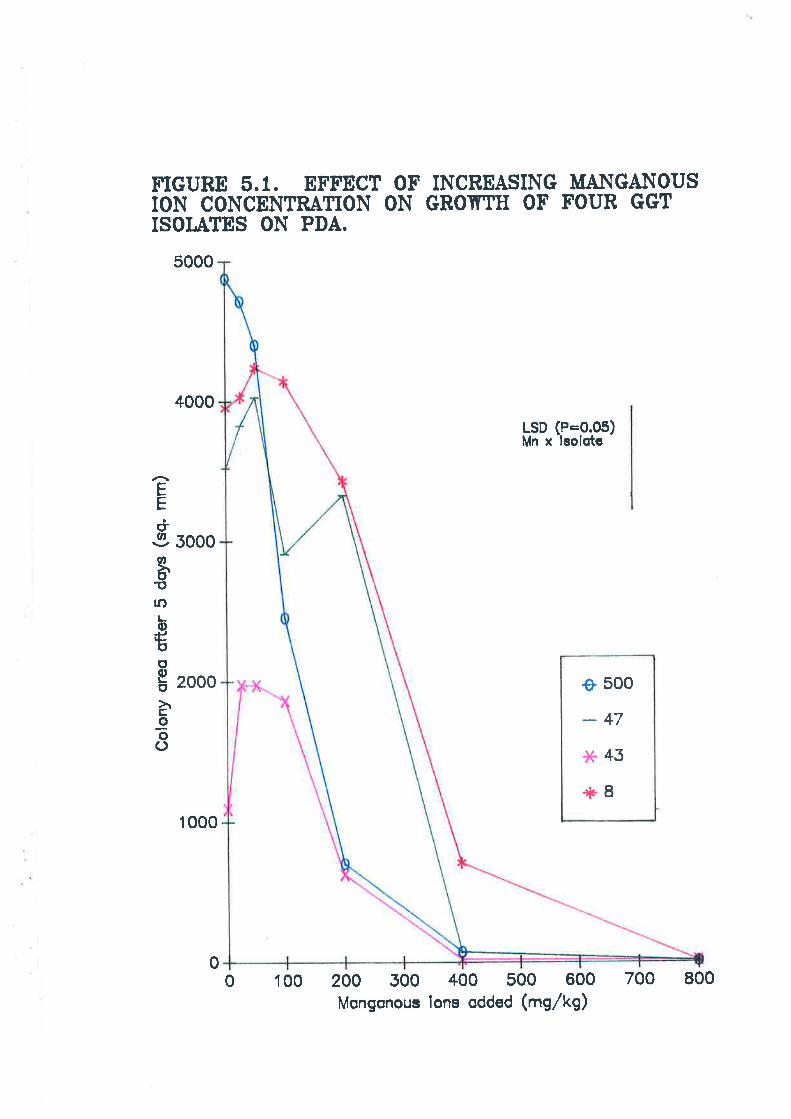
FIGURE õ.1. EFFECT OF INCREASING MANGANOUSION CONCENTRATION ON GROTTTH OF FOUB GGTISOI.ATES ON PDA.
5000
4000
LSD (P=0.05)Mn x lsolotc
g 500
-47å,1 45
t81 000
o 1 oo 200 300 400 500 600 700 800
EE
ûa,
v,
ð.otf)'L0)+tt+-ooEo
troõ()
0005
2000
0
Mongonous ions odded (mg/kg)
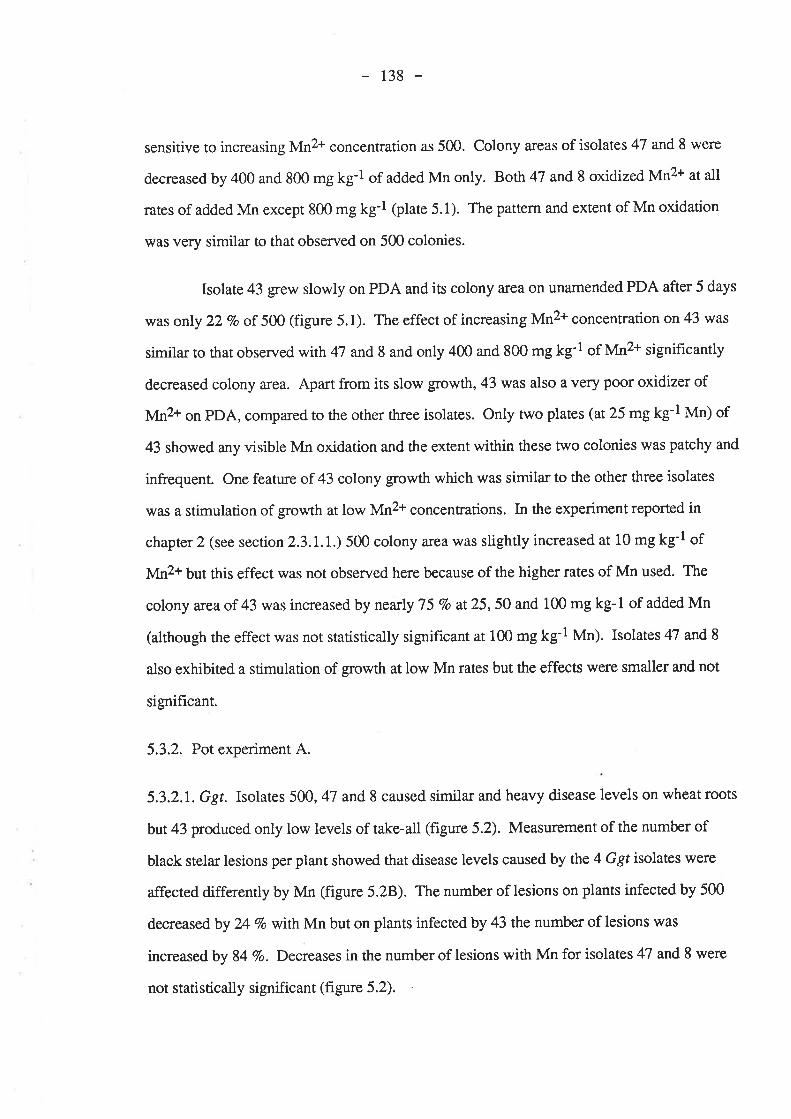
138
sensitive to increasing Mn2+ concentration as 500. Colony areas of isolates 47 and 8 were
decreased by 400 and 800 mg kg-l of added Mn only. Both 47 and 8 oxidized Mn2+ at all
rates of added Mn except 800 mg kg-l @late 5.1). The pattern and extent of Mn oxidation
was very simila¡ to that observed on 500 colonies.
Isolate 43 grew slowly on PDA and its colony ¿rea on unamended PDA after 5 days
was only 22 7o of 500 (figure 5.1). The effect of increasing Mn2+ concentration on 43 was
similar to that observed with 47 and 8 and only 400 and 800 mg kg-l of Mn2+ signif,rcantly
decreased colony area. Apart from its slow growth, 43 was also a very poor oxidizer of
Mn2+ on PDA, compared to the other three isolates. Only two plates (at25 mg kg-l Mn) of
43 showed any visible Mn oxidation and the extent within these two colonies was patchy and
infrequent. One feature of 43 colony growth which was similar to the other three isolates
was a stimulation of growth at low Mn2+ concentrations. In the experiment reported in
chapter 2 (see section 2.3.IJ.) 500 colony area was slightly increased at 10 mg kg-l of
Mn2+ but this effect was not observed here because of the higher rates of Mn used. The
colony area of 43 was inc¡eased by nearly 75 Vo at25,50 and 100 mg kg-1 of added Mn
(although the effect was not statistically significant at 100 mg kg-l Mn). Isolates 47 and 8
also exhibited a stimulation of growth at low Mn rates but the effects were smaller and not
significant.
5.3.2. Pot experiment A.
5.3.2.1. Ggr. Isolates 500, 47 and 8 caused similar and heavy disease levels on wheat roots
but 43 produced only low levels of take-all (figure 5.2). Measurement of the number of
black stelar lesions per plant showed that disease levels caused by the 4 Ggt isolates were
affected differently by Mn (f,rgure 5.2B). The number of lesions on plants infected by 500
decreased by 24 Vo withMn but on plants infected by 43 the number of lesions was
increased by 84 Vo. Decreases in the number of lesions with Mn for isolates 47 and 8 were
not statistically significant (frgure 5.2).
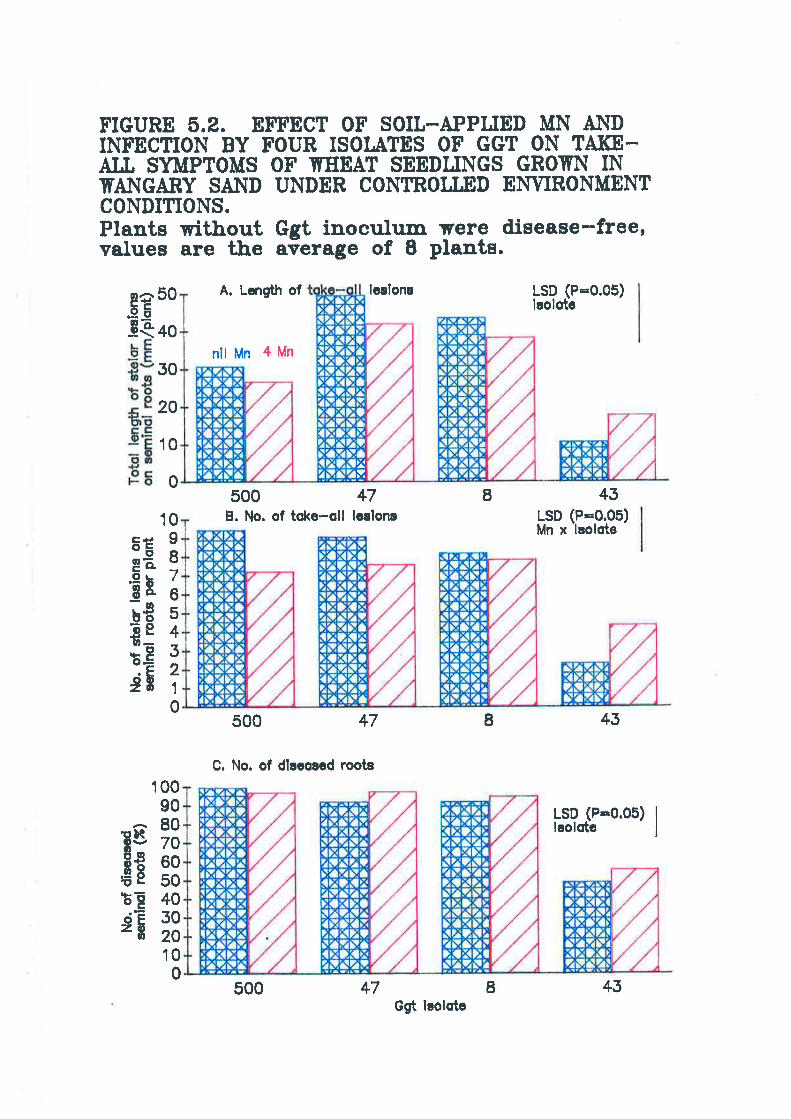
FIGURE 6,2. EFFECT OF SOII-APPIJED MN AI'{DINFECTION BY FOUR ISOI,ATES OF GGT ON TAI(E_AI,t SYIIPTOMS OF MTEAT SEEDIJNGS GROIÍN IN.TA}TGARY
SAI.TD UNDER CONTROT.T.f,ID ENTVIRONMENTCONDITIONS.Plants without Ggt Ínoculum were d.isease-free,values are the average of I plants.
A. Lcngùh of lsslona LSD (P=0.05)laolotc
nll Mn 4 Mn
o,n 50-9õ-tQ +o
50
20
10
0
10
:å3Ën',obËþEe 4o-
TË;åB 1
0
10090
â80Eã ã3€Ë sofE40sF i3
100
500 47B. No. of toke-oll lealona
+7
C. No. of dlacoacd roota
45LSD (P=0.05)Mn x lsolote
43
LSD (P=0.05) Ilaolotc I
I
Es00
I
xv
500 47GgÈ leolcte
43
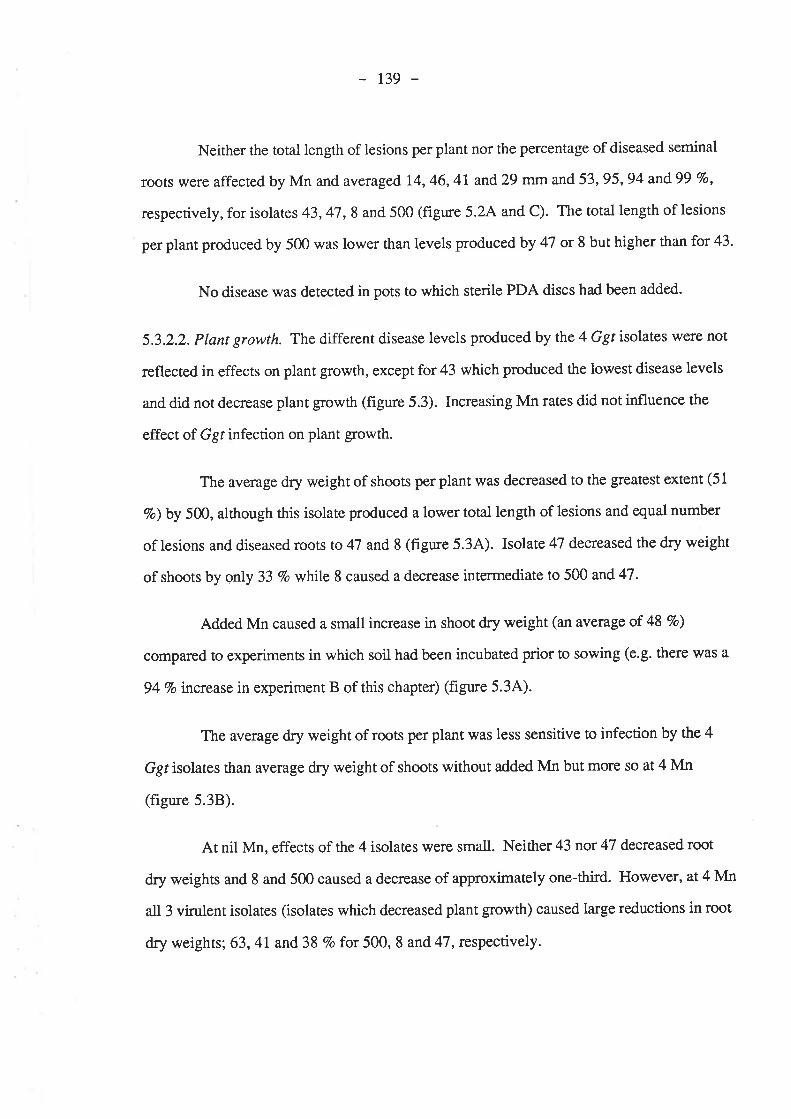
t39 -
Neither the total length of lesions per plant nor the percentage of diseased seminal
roots were affected by Mn and averaged 1,4,46,41 and29 mm and 53, 95, 94 and99 Vo,
respectively, for isolates 43,47,8 and 500 (figure 5.2A and C). The total length of lesions
per plant produced by 500 was lower than levels produced by 47 or 8 but higher than for 43.
No disease was detected in pots to which sterile PDA discs had been added.
5.3.2.2. Plant growth. The different disease levels produced by the 4 Ggt isolates were not
reflected in effects on plant growth, except for 43 which produced the lowest disease levels
and did not decrease plant growth (figure 5.3). Increasing Mn rates did not influence the
effect of Ggt infection on plant growth.
The average dry weight of shoots per plant was decreased to the greatest extent (51
Vo) by 500, although this isolate produced a lower total length of lesions and equal number
of lesions and diseased roots to 47 and 8 (frgure 5.34). Isolate 47 decreased the dry weight
of shoots by only 33 7o wlttle 8 caused a decrease intermediate to 500 and 47 .
Added Mn caused a small increase in shoot dry weight (an average of 48 Vo)
compared to experiments in which soil had been incubated prior to sowing (e.g. there was a
94 Vo tncrease in experiment B of this chapter) (figure 5.34).
The average dry weight of roots per plant was less sensitive to infection by the 4
Ggr isolates than average dry weight of shoots without added Mn but more so at 4 Mn
(figure 5.3B).
At nil Mn, effects of the 4 isolates were small. Neither 43 nor 47 decreased root
dry weights and 8 and 500 caused a decrease of approximately one-third. However, at 4 Mn
all 3 virulent isolates (isolates which decreased plant growth) caused large reductions in root
dry weights; 63, 41 and 38 Vo for 500, 8 and 47 , respectively.
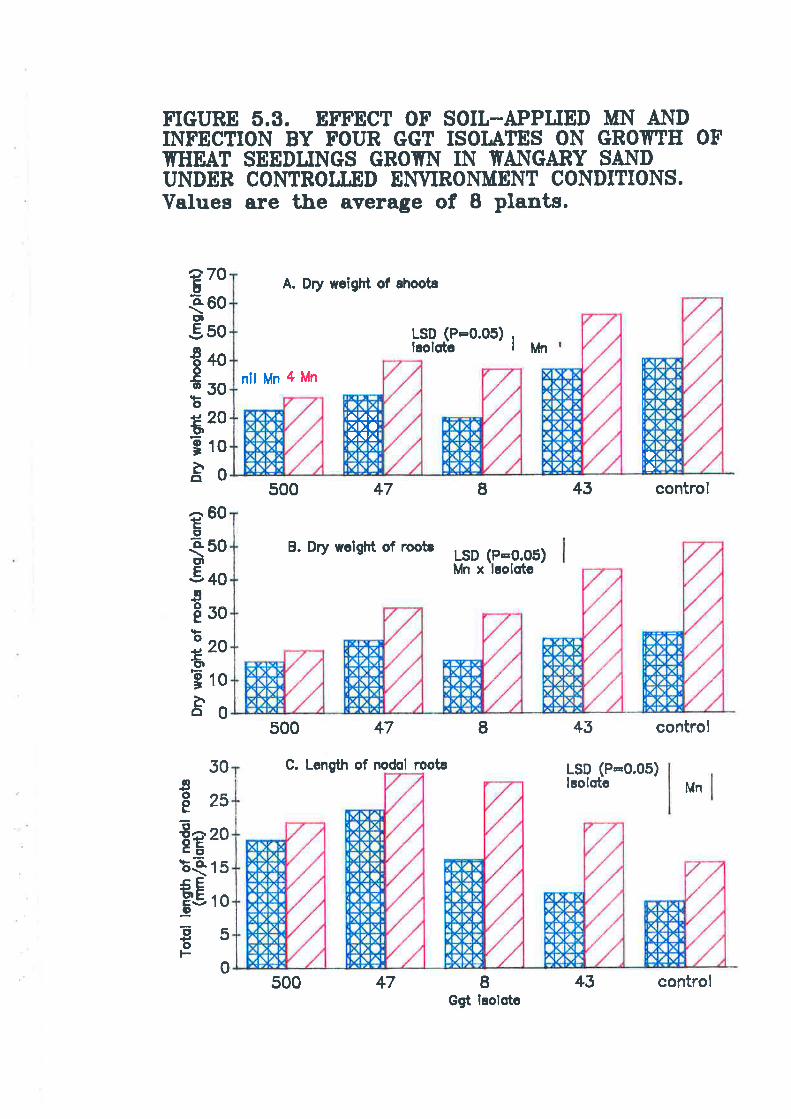
FIGURE õ.3. EFFECT OF SOII-APPIJED MN A}TDINFECTION BY FOTTR GGT ISOI,AIES ON GROTTTH OFTNIEAT SEEDITNGS GRO.TN IN TYAIYGARY SAI\ÏDUNDEN COMBOT.I.ED EÌ{VIRONMENT CONDITIONS.Values are the average of I plants.
A. Dry weigürt of ehootg
LSD (P=0.0ã)laolstc lun
nll Mn 4 Mn
+7 I 43 control
B. Dry wclght of roota
Ero860t¡€so€+oÕ-c:50ox20Ctt
Eroåo?60C'
E50or
€+oø
Ëso
2zo-ccn
E ro
äo
500
LSDMnx
(P=0.05laolote
)
E500 47
C. Length of nodol root¡
+3 control
LSD (P=0.05)lsolotc Mn
E
E?b0
bE-cFË'go
6oe
EoF
50
25
20
15
10
5
0500 I
Ggû icolotc
Tx(?.
7/J):oñx
tI
47 43 control
140 -
The size of response of root dry weighs to added Mn depended onGgt infection
(frgure 5.3B). The average dry weight of roots of disease-free plants, and plants infected by
43, were approximately doubled by 4 Mn but responses in plant infected by the 3 virulent
isolates were generally much smaller.
The total length of nodal roots per plant was increased by infection with the 3
virulent isolates, regardless of Mn rates. Infection by 43 dtd not increase nodal root length
(frgure 5.3C). The addition of Mn to the soil increased the total length of nodal roots by
more than 40 Vo.
Growth of seedlings in the 4 extra pots set up without agar discs was not different
to growth in pots at nil Mn with sterile agar discs.
5.3.2.3. Mn. Shoot Mn concentrations in plants grown without added Mn were very
defrcient (an average of 6.5 mg kg-l over all Ggt treatments) and well below the critical level
of 18 mg kgl (see appendix B). The addition of Mn increased shoot Mn levels in all plants
to well above defrcient but Ggr infection influenced the size of the increase (table 5.1). The
concentration of Mn in plants infected by the 3 virulent isolates was lower than in plants
infected by 43, or disease-free.
The effect of Ggt and Mn treatrnents on root Mn concentrations differed from the
pattem observed in shoot levels (table 5.1). Without added Mn, infection by Ggt (by aII4
isolates) caused a small increase in root Mn concentrations, although the increase twas not
significant for 500. The largest increase occurred with 43, from 16.5 at nil Ggt to 23.2 mg
kg-l. Root Mn concentrations were high where Mn had been added (all plants had root
concentrations higher than 100 mg kg-l¡ but, as at nil Mn, levels in Ggr-infected plants were
increased further. Unlike Mn concentrations in Ggr-infected plants at nil Mn, the highest
concentration occurred with 500 (2Mmgkg-l from lM atnil GgÐ and the lowest with 43
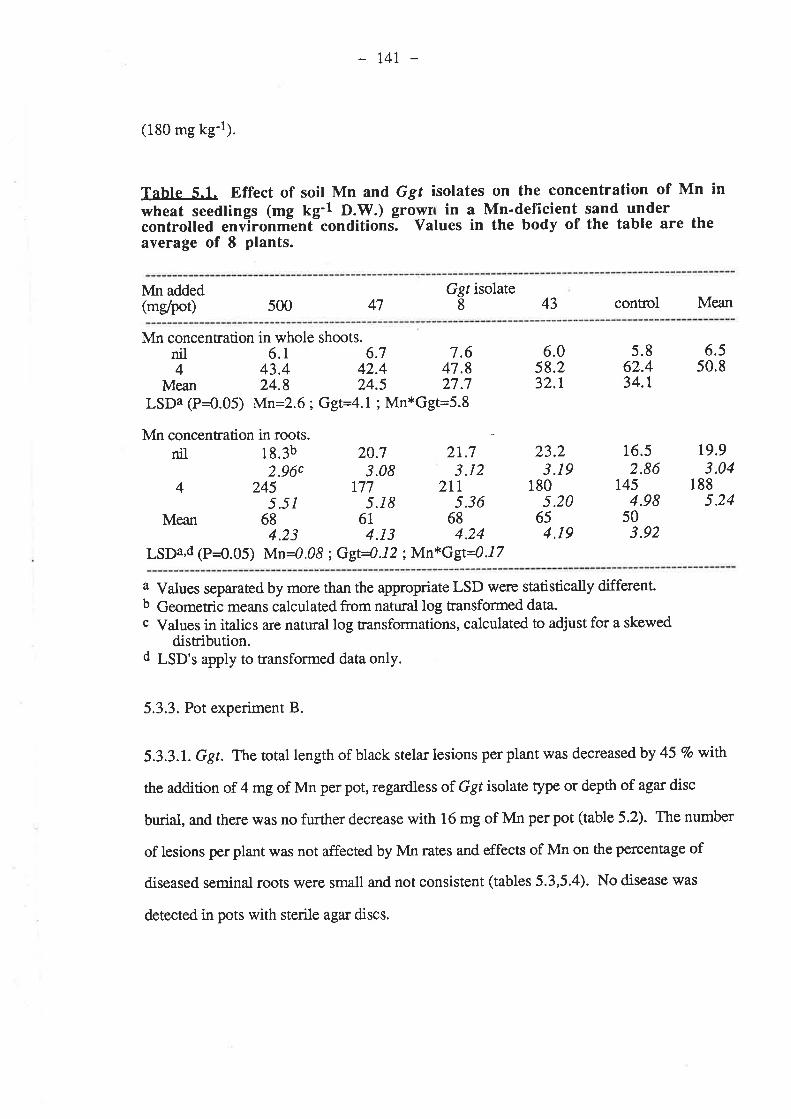
r4t
(180 mg kg-l).
Table 5.1. Effect of soil Mn and Ggf isolates on the concentration of Mn inwheat seedlings (mg kg-l D.w.) growr in a Mn-dcficient sand undercontrolled env'ironmlniconditions. Values in the body of the table are theaverage of 8 plants.
Mn added(mg/pot) 500 47
Ggr isolate843 control Mean
Mn concentration in whole shoots.nil 6.1 6.74 43.4 42.4
Mean 24.8 24.5LSDa (P=0.05) Mrn=2.6; Ggt=4.1 ; Mn*Ggt=5.8
Mn concentration in roots.nil 18.3b 20"7 21.7
4 ,o?'nu' t717'08 zÍt'2Mean d" :r'" irtu
4.23 4.13 4.24LSDa,d (P=0.05) Mn=0.08 ; Ggt4.I2 ;lN,dn*Ggt=0.17
7.647.827.7
6.058.232.1
23.23.19
180s.20
654.19
5.862.434.1
16.52.86
r454.98
503.92
6.550.8
19.93.04
1885.24
a Values separated by more than the appropriate LSD were statistically different.b Geometric means calculated from natural log transformed data.c Values in italics are natural log transformations, calculated to adjust for a skewed
distribution.d LSD's apply to transformed data only.
5.3.3. Pot experiment B.
5.3.3.1. Ggt. T\e total length of black stelar lesions per plant was decreased by 45 Vo with
theadditionof 4mgofMnperpot,regardless of Ggtisolatetypeordepthof agardisc
burial, and there was no further decrease with 16 mg of Mn perpot (table 5.2). The number
of lesions per plant was not affected by Mn rates and effects of Mn on the percenøge of
diseased seminal roots were small and not consistent (tables 5.3,5.4). No disease was
detected in pots with sterile agar discs.
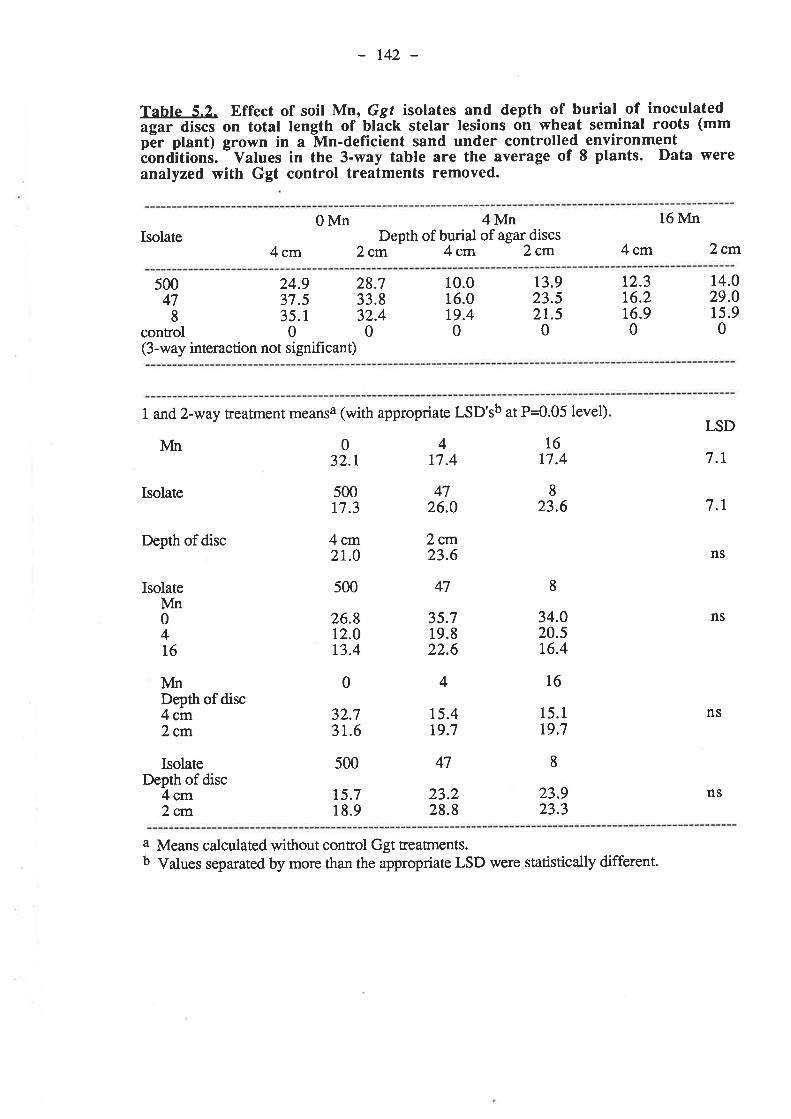
t42 -
Table 5.2. Effect of soil },dn, Ggt isolates and depth of burial of inoculatedãgãr dßcs on total length of blãck stelar lesions on wheat seminal roots (mmpõr plant) grown in a lln-deficient sand under controlled environmentèonditions. - Values in the 3-way table are the average of 8 plants. Data wereanalyzed with Ggt control treatments removed.
OMn 4MnDepth of burial of agar discs
2cm 4 cm 2cm
16 MnIsolate
4cm 4cm 2cm
50047
8control
24.9
(3-way interaction not significant)
15.90
1,6.2t6.90
37.535.10
28.733.832.4
0
10.016.019.40
13.923.521.50
12.3 14.029.0
1 and 2-way treatment meansa (with appropriate LSD'sb at P=0.05 level)
t617.4
lvlnI,SD
7.1
ns
ns
Isolate
Depth of disc
Isolate 500 47
7.1
NS
nsI{ri
032.1
50017.3
4cm21.0
26.812.0t3.4
0
32.73r.6
s00
15.718.9
417.4
4726.0
2cllrt23.6
35.719.822.6
4
47
23.228.8
I23.6
8
34.O20.516.4
I6
8
23.923.3
0416
lÍnDepth of disc4cm2qn
15.119.7
r5.4t9.7
IsolateDepth of disc
4 crn2cm
a Means calculated without control Ggt treatnents.b Values separated by more than the appropriate LSD were statistically different.
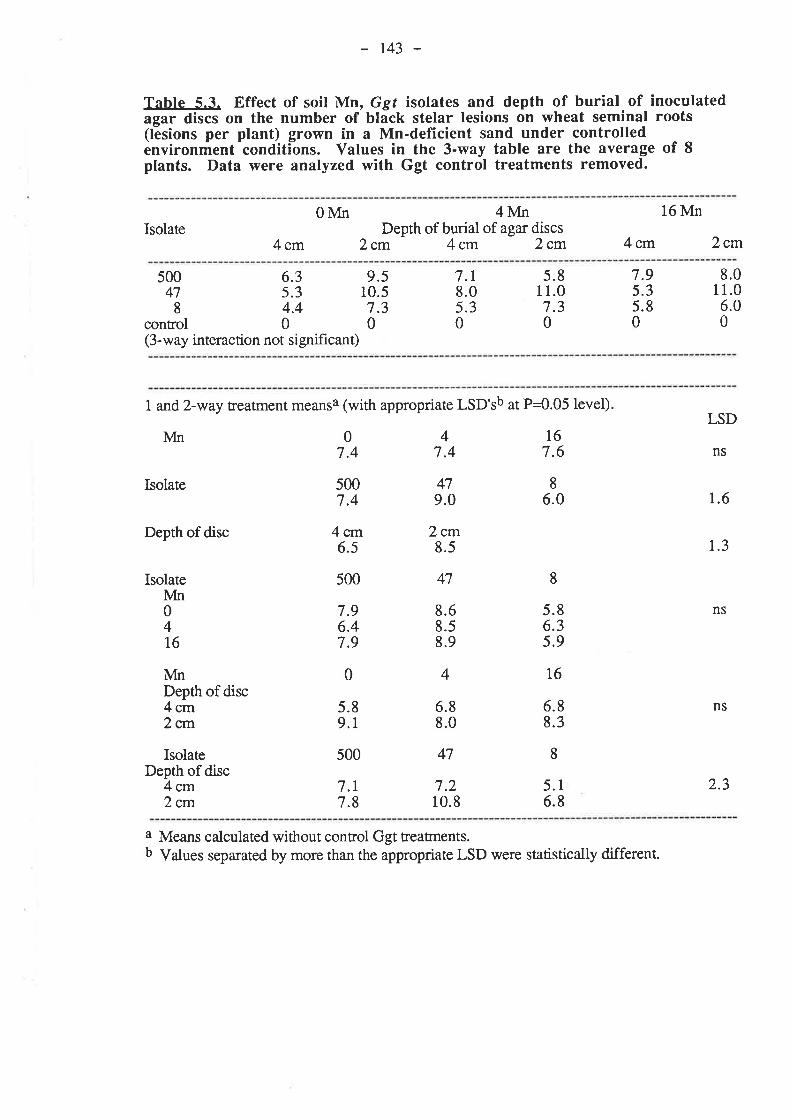
143 -
Tahle 5.3. Effect of soil }'4n, Ggt isolates and depth of burial of inoculatedagar discs on the number of black stelar lesions on wheat seminal roots(lésions per plant) grown in a Mn-deficient sand under controlledenvironment conditi-ons. Values in the 3-way table are the average of Iplants. Data were analyzed with Ggt control treatments removed.
0Mn 4MnDepth of burial of agar discs
2cm 4cm 2cm
16 Mn
4cm 2cmIsolate
4cm
500 6.3 9.s47 5.3 10.58 4.4 7.3
control 0 0(3-way interaction not si gnificant)
8.011.06.00
7.95.35.80
5.811.07.30
7.18.05.30
1 and 2-way treatment meansa (with appropriate LSD'sb at P=0.05 level)
7.44
7.40
Isolate 47 89.0 6.0
Depth of disc 2cm8.5
Isolate 47 8
5.86.35.9
4 t6
lvfn
lvfn
s007.4
4 crn6.5
500
500
6.88.0
47
7.210.8
167.6
8
ns
LSD
7.6
1.3
ns
2.3
NS8.68.58.9
7.96.47.9
0416
6.88.3
5.89.r
ÀírtDepth of disc4cm2cm
0
IsolateDepth of disc
4cm2cm
7.r7.8
5.16.8
a Means calculated without control Ggt treatrnents.b Values separated by more than the appropriate LSD were statistically different.
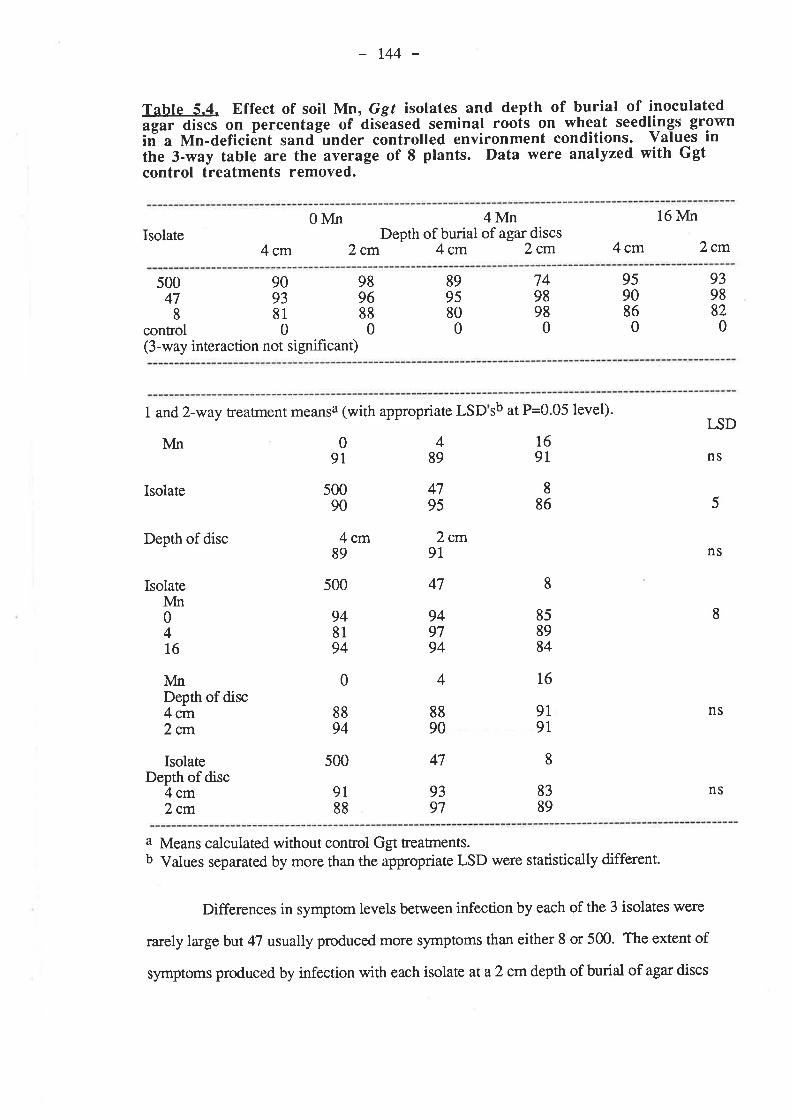
r44 -
Table 5.4. Effect of soil l/Ln, Ggt isolates and depth of burial of inoculatedãgar ¿lsa on percentage of
'disõased seminal roots on wheat seedlings grown
in- a Mn-deficiônt sand-under controlled environment conditions. Values inthe 3-way table are the average of 8 plants. Data were analyzed with Ggtcontrol treatments removed.
0Mn 4MnDepth of burial of agar discs
2cm 4cm Zcm
16 MnIsolate
4cm 4cm 2cm
s00 90 9847 93 968 81 88
control 0 0(3-way interaction not signifi cant)
939882
080
0
8995
749898
0
9590860
1 and 2-way treatment meansa (with appropriate LSD sb at P=0.05 level).
Isolate
Depth of disc
Isolate
lvlnDepth of disc4cm2cm
IsolateDepth of disc
4cm2cm
948194
0
500 47
9l88
9397
ns
5
ns
8
4
4795
09L
s0090
500
Mn
lvln8
858984
47
949794
4
0416
4cm89
89
2cm9l
t69r
8
86
16
9l9t
8
8389
LSD
ns8890
8894
NS
a Means calculated without control Ggt treatnents.b Values separated by more than the appropriate LSD were statistically different.
Differences in symptom levels between infection by each of the 3 isolates were
rarely large but 47 usually produced more symptoms than either 8 or 500. The extent of
symptoms produced by infection with each isolate at a2 cm depth of burial of agar discs
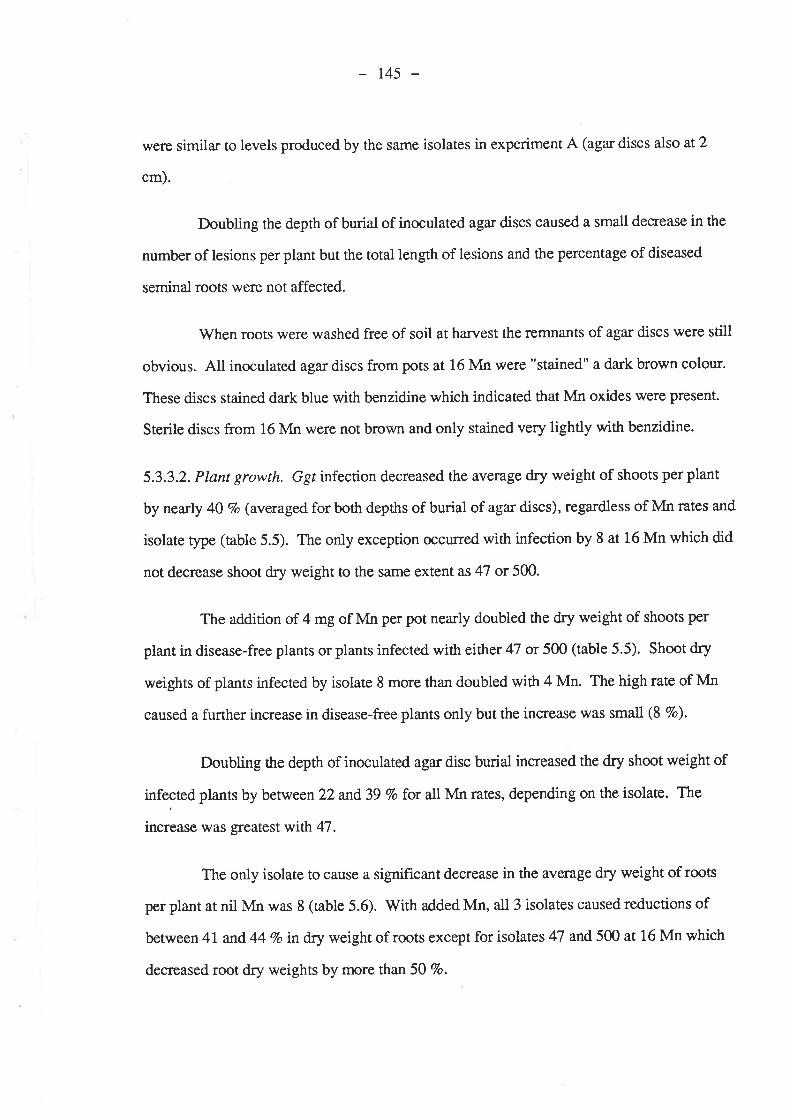
r45 -
lilere similar to levels produced by the same isolates in experiment A (agar discs also at 2
cm).
Doubling the depth of burial of inoculated agar discs caused a small decrease in the
number of lesions per plant but the total length of lesions and the percentage of diseased
seminal roots were not affected.
When roots were washed free of soil at han¿est the remnants of agar discs were still
obvious. All inoculated agar discs from pots at 16 Mn were "stained" a dark brown colou¡.
These discs stained da¡k blue with benzidine which indicated that Mn oxides were present.
Sterile discs from 16 Mn were not brown and only stained very lightly with benzidine.
5.3.3.2. Plant growth. Ggr infection decreased the average dry weight of shoots per plant
by nearly 40 Vo (averaged for both depths of burial of agar discs), regardless of Mn rates and
isolate type (table 5.5). The only exception occurred with infection by 8 at 16 Mn which did
not decrease shoot dry weight to the same extentas 47 or 500.
The addition of 4 mg of Mn per pot nearly doubled the dry weight of shoots per
plant in disease-free plants or plants infected with either 47 or 500 (table 5.5). Shoot dry
weights of plants infected by isolate 8 more than doubled with 4 Mn. The high rate of Mn
caused a further increase in disease-free plants only but the increase was small (8 Vo).
Doubling the depth of inoculated agar disc burial increased the dry shoot weight of
infected plants by between 22 and39 7o for all Mn rates, depending on the isolate. The
increase was greatest with 47.
The only isolate to cause a significant decrease in the average dry weight of roots
per plant at nil Mn was 8 (table 5.6). V/ith added Mn, all 3 isolates caused reductions of
between4l and 44Voindryweightof rootsexceptforisolates 47 and500at 16Mnwhich
decreased root dry weights by more than 50 Vo.
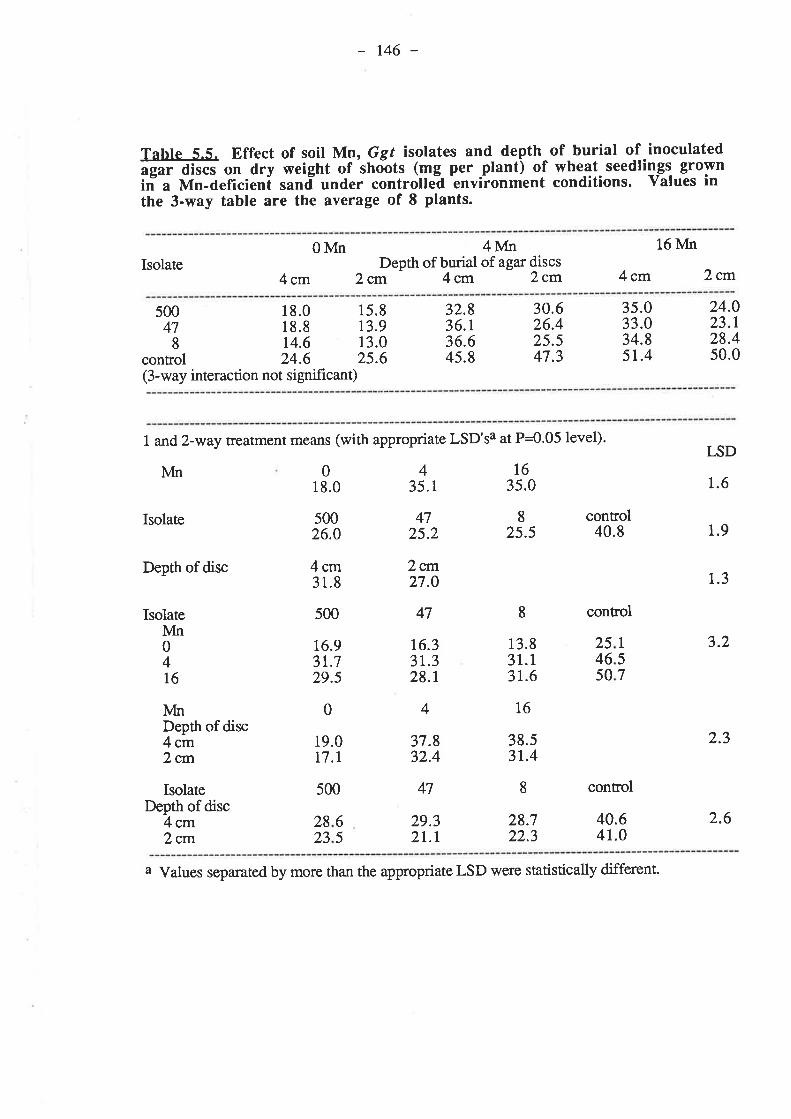
t46 -
Tahte 5.5. Effect of soil Mrn, Ggt isolates and depth of burial of inoculated;g;r discs on dry weight of
.shobts (mg_ per .plant) of wheat seedlin-gs- grown
in- a Mn-deficieni sand" under controlleä -environment conditions. Values in
the 3-way table are the average of 8 plants.
0 NdnDepth of burial oorË- urræ
2cm 4cm Zcm
l6lvfn
4cm 2 crctIsolate
4cm
500 18.047 18.88 14.6
control 24.6(3-way interaction not significant)
47.3
15.813.913.025.6
32.836.t36.645.8
30.626.425.5
35.033.034.85r.4
24.023.t28.450.0
1 and 2-way treatment means (with appropriate LSD'sa at P=0.05 level).
Àln
Isolate
Depth of disc
Isolate
NfriDepth of disc4cm2cm
IsolateDepth of disc
4cm2cm
018.0
s0026.0
4cm31.8
500
16.93t.729.5
0
19.0t7.r
500
435.r
4725.2
2ent27.0
47
t6.33t.328.1
4
37.832.4
47
29.32T.I
1635.0
825.5
8
13.831.13r.6
T6
38.53r.4
8
28.722.3
control40.8
control
40.641.0
I,SD
t.6
1.9
t.3
3.2
controllvfn
254650
0416
1
57
2.3
2823
65
2.6
a Values separated by more than the appropriate LSD were statistically different.
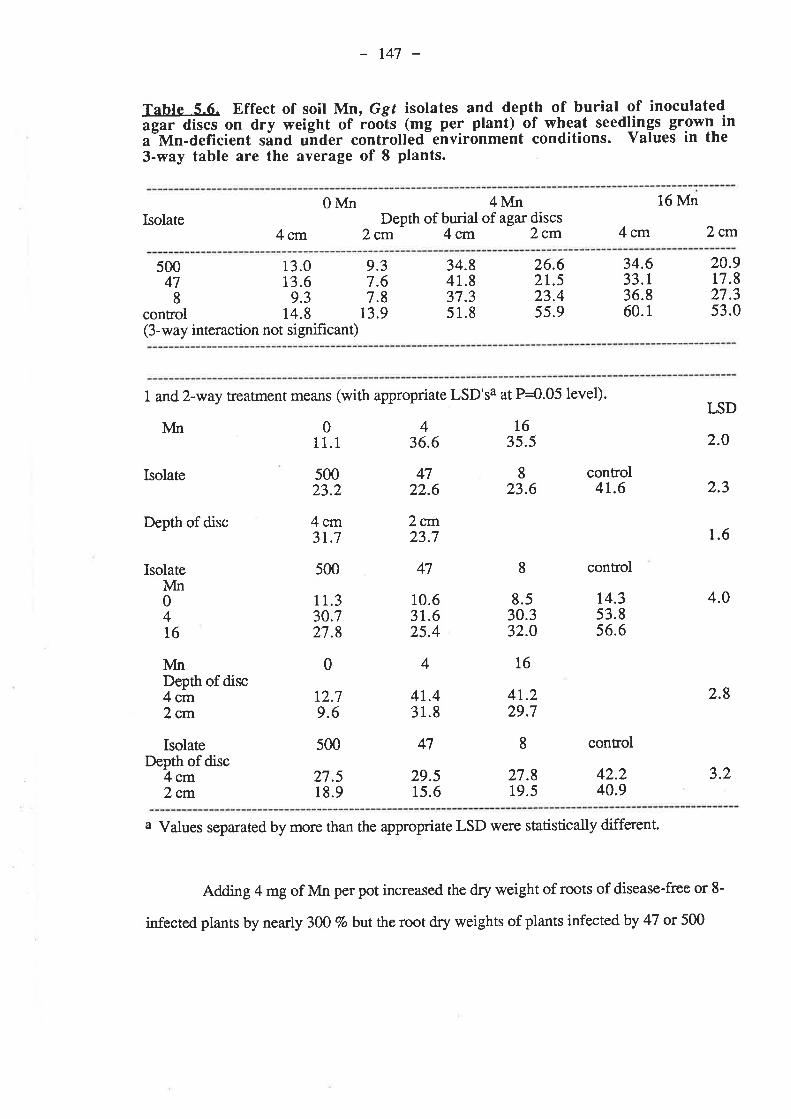
t47 -
Table 5.6. Effect of soil Mn, Ggf isolates and depth of burial of inoculated;ga. dlscs on dry weight of iools (mg pel plant) of wheat seedlings grown- ina"Mn-deficient sånd u"nder controlled-eñvironment conditions. Values in the3-way table are the average of 8 plants.
0MnDepth of burial
"? H, *ræ2cm 4cm 2cm
16 MnIsolate
4cm 4 crct 2cm
500 13.0 9.347 13.6 7.68 9.3 7.8
control 14.8 13.9(3-way interaction not significant)
34.841.837.351.8
26.62t.523.45s.9
34.633.t36.860.1
20.917.827.353.0
1 and Z-way treatment means (with appropriate LSD'sa at P=0.05 level).
Àln 011.1
s0023.2
4cm31.7
500
11.330.727.8
0
t2.79.6
s00
27.518.9
436.6
4722.6
2crt23.7
47
10.63r.625.4
47
29.515.6
L63s.5
823.6
8
8.530.332.0
16
4r.229.7
8
27.819.5
control4t.6
control
t4.353.856.6
control
42.240.9
LSD
2.0
2.3Isolate
Depth of disc
IsolateMn0416
1.6
4.0
2.8
lvfnDepth of disc4cm2 c¡rt
4
1.1.
4J
48
IsolateDepth of disc
4cm2cm
3.2
a Values separated by more than the appropriate LSD were statistically different
Adding 4 mg of Mn per pot increased the dry weight of roots of disease-free or 8-
infected plants by nearly 3O0 7o but the root dry weights of plants infected by 47 or 500

r48
increased by less than 200 7o (øble 5.6). The addition of 16 mg of Mn per pot did not
further increase root dry weights.
Increasing the depth of burial of inoculated agar discs from 2 to 4 cm increased root
dry weights by between 43 and 89 Vo at all Mn rates, depending on the isolate. The increase
was grcatest with 47.
5.3.3.3. Mn. Shoot Mn concentrations at nil Mn were very deficient (all less thanT mg kg
1¡ and well below the critical level of 18 mg kg-l (see appendix B) but all plants had adequate
shoot Mn levels at 4 Mn (between 24 and41 mg kg-1) (table 5.7). Adding 16 mg of Mn per
por further increased shoot Mn concentrations to very high levels (alt higher ttran 75 mg kg
t¡.
At nil Mn Ggr infection did not change shoot Mn concentrations from the average of
5.5 mg kg:l in disease-free plants but all3 isolates decreased shoot Mn concentrations at 4
Mn; from 38 mg kg-l in disease-free plants to 31 mg kg-l in plants infected with 8 and to 25
mg kg. l with isolates 47 and 500. At 16 Mn, 8 decreased shoot Mn concentrations from 121
to 104 mg kg-l but47 and 500 decreased levels to less than 91 mg kg-I.
5.4. Discussion and Conclusions.
Mixing low rates of Mn through soil decreased total length of lesions on roots
infected by all virulent Ggr isolates (vinrlent isolates produced black stelar lesions on infected
host roots and depressed host growth). This is an important result because it demonstrates
that the phenomenon of Mn decreasing take-allis not peculiar to infection by Ggt isolate 500
but suggests that infection by any virulent isolate should be decreased by applying Mn to a
Mn-deficient soil.
In contrast to the depressive effect of soil Mn on infection by virulent isolates was
the stimulation that Mn caused to infection by the weakly virulent isolate 43. This isolate
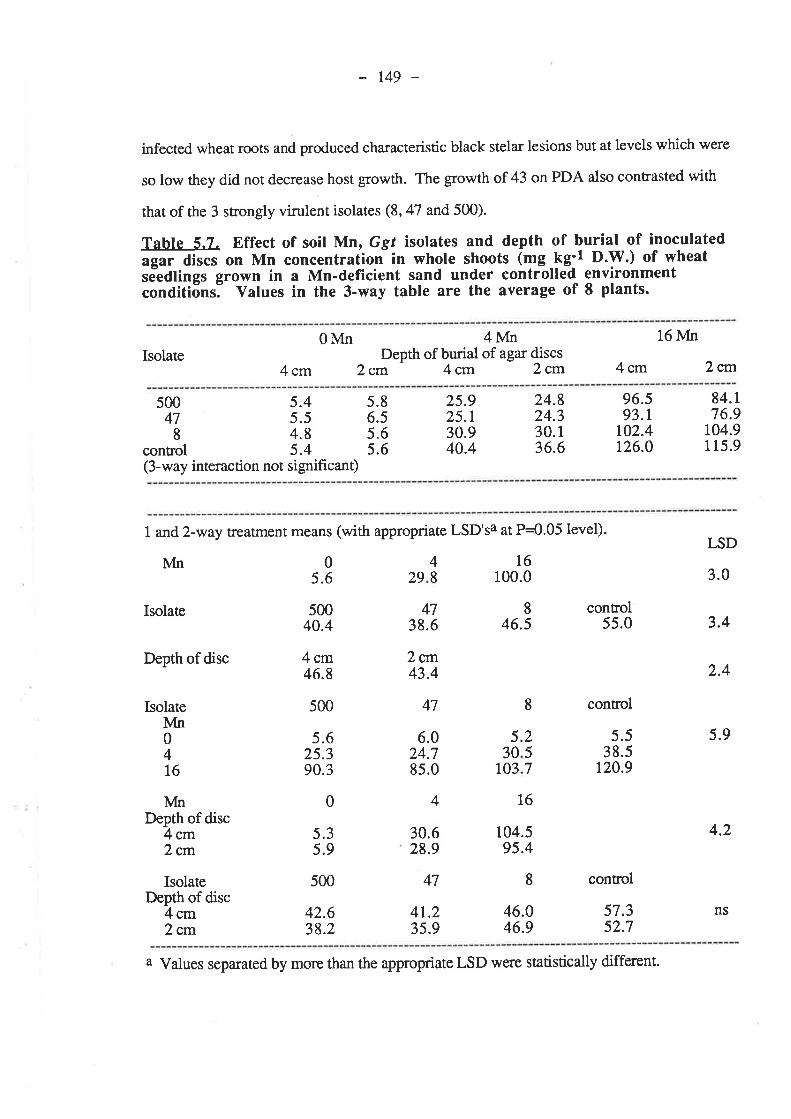
r49 -
infected wheat roots and produced characteristic black stela¡ lesions but at levels which were
so low they did not decrease host growth. The growth of 43 on PDA also contrasted lvith
that of the 3 strongly virulent isolates (8,47 and 500).
Tabte 5.7. Effect of soil }/ln, Ggt isolates and depth of burial of inoculated
"ga. dts"s on Mn concentration in whole shoots (-g -kg:l D.y.) of wheat
sðedlings grown in a Mn-deficient sand under controlled environmentcondÍtiõnsl Values in the 3-way table are the average of I plants.
0MnDepth of burial ffi orræ
2cm 4cm 2cm
16 À/ftt
Isolate4cm 4cm 2c¡rt
s00 5.447 5.58 4.8
control 5.4(3-way interaction not significant)
5.86.55.65.6
25.925.r30.940.4
24.824.330.136.6
96.s93.r
102.4126.0
84.176.9
104.9115.9
I and 2-way treatment means (with appropriate LSD'sa at P=0.05 level).
r6100.0
05.6
lvln
50040.4
4 crrt46.8
500
s00
42.638.2
4738.6
2cl.rt43.4
47
6.024.78s.0
4
30.628.9
47
4t.23s.9
846.s
t6
104.595.4
8
46.046.9
control55.0
control
control
57.352.7
I-SD
3.0
3.4
2.4
5.9
4.2
2948
Isolate
Depth of disc
Isolate
l&iDepth of disc
4cm2cm
IsolateDepth of disc
4cm2cm
Ivln8
257
5.625.390.3
0
04t6
5.538.5
120.9
530031
5.35.9
a Values separated by more than the appropriate LSD were statistically different.
ns
150 -
Three features separated the behaviour of 43 on PDA f¡om the other 3 isolates; very
slow growth, a large stimulation in growth at lorw Mn concentrations and poor Mn-oxidizing
ability. The first two features may help explain the increase in symptoms of infection by 43
with added Mn, given that infections by the 3 virulent isolates were decreased under the
same conditions. The large stimulation in colony growth of 43 atlow rates of Mn on PDA
indicated that this isolate had a relatively high requirement for Mn. Infection of wheat roots
at nil Mn by 43 may have been inhibited by slow hyphal growth due to insufficient levels of
available Mn for normal hyphal growth. The rate of growth of runner hlphae down the
outside of host roots is closely correlated with the length of infected roots (Garrett 1936,
Wildermuth and Rovira 1977). Adding Mn to the soil eliminated deficiency in the host and
perhaps also in 43 which may have increased the rate of hyphal growth of 43 (and
consequently infection). This effect would not have been as important for the virulent
isolates because their requirements for Mn on PDA were lower and they were fast gro\#ers at
all Mn rates. Unfornrnately, repeated attempts to investigate the effect of Mn on infection by
43 at different Mn rates and inoculum levels failed because the culnue had lost virulence and
no longer produced black stelar lesions on wheat roots. Repeated suÞculturing of Ggt
isolates can cause a loss, or reduction, in vimlence (Cunningham 1981).
The observation that the 3 virulent isolates were strong oxidizers of Mn on PDA and
in soil (experiment B) but 43 was not suggests that Mn-oxidizing ability may be important in
determining the virulence of individual isolates. Alternatively, the ability to oxidize Mn may
simply be genetically linked, but otherwise unrelated, to virulence.
The sensitivity of isolates to toxic levels of Mn in PDA did not appear to be
important to the extent of disease which infection by each isolate caused. Isolates 8, 43 and
47 had,similar tolerances to increasingly toxic concentrations of Mn2+ in PDA but 500 was
more sensitive. This pattem was not reflected in the vinrlence of each isolate in pot srudies
because infection by 47,8 and 500 were decreased by soil-applied Mn to the same extent and
151
infection by 43 behaved very differently. This result supports the conclusions of chapter 2
that soil-applied Mn decreases take-atl before levels toxic to the pathogen are reache¿ If
toxic Mn concentrations were required to decrease disease then infection by 47 and 8 should
not have been decreased by Mn to the same extent as 500.
Differences between the nvo pot studies in the size of decreases in take-all (for the
vinrlent isolates) with added Mn, and their statistical significance, highlighted the
experimental importance of producing very severe Mn deficiency in host plants. Pot
experiments A and B were prepared and conducted in essentially the same way except for
incubation of soil prior to sowing in experiment B. Adding Mn to soil in expøriment A
caused a decrease in symptoms on roots of approximately 2O 7o for infections by 8, 47 or
500 but this effect was only statistically significant for 500. However, in experiment B for
the same isolates and at the same inoculum level, Mn decreased infection by 45 Vo. T\e
important difference benryeen the two experiments w¿ts that plants at nil Mn in B were more
deficient than plants from the same treatment in A. Average Mn concentrations in shoots at
nil Mn in both experiments were well below the critical level of 18 mg kg-l (appendix B) and
differences between experiments wete small (5.8 and 5.5 mg kg-l for disease-free plants in
A and B, respectively). However, the response in ptant growth to added Mn in B was at
least double that in A.
r52 -
5.5. References.
Cunningham, P.C. (1981). Isolation and culture. In 'lB_iolo.&y And Control Of Take-all."
6¿s. vt.¡.c. Ashei and P.J. shipton.) pp.103-24. (Academic Press: London.)
Ga:retr, S.D. (1936). Soil conditions and the take-all disease of wheat. Ann. Appl. Biol.23, 667-74.
Graham, R.D. and Rovira, A.D. (1984). A role for manganese in the resistance of wheatplants to take-all. Plant Soil78,M1-5.
Rovira, 4.D., Graham, R.D. and Ascher, J.S.by Gaeutrnnnomy c es g raminis v aL trid c"Ecology And Management Of Soil-Plant Pathol. Congr. pp.212-4. (Amer.
Wildermuth, G.B. and Rovira, A.D. (1977). {yphal density as a measure of suppres_slo_n_of
Gaeunannomyces graminís var. tritící on wheat roots. SoiI Biol. Biochem.9,203-5.
CHAPTER 6.
EFFECTIVENESS OF DIFFERENT SOURCESOF MN IN DECREASING GGT INFECTION
OF WHEAT SEEDLINGS
153 -
CHAPTER 6. EFFECTIVENESS OF DIFFERENT SOURCES OF MN INDECREASING GGT INFECTION OF \ilHEAT SEEDLINGS.
6.1. Introduction.
The three previous reports of Mn decreasing take-all of wheat in pots (Reis ef a/.
1982, Graham and Rovira 7984,Rovira et al.1985) used simple manganous ion salts as a
source of Mn for host plants. These salts were dissolved in water and added to the rooting
medium of the plants.
Rovira (pers. comm.) observed that the incidence of white-heads in a wheat crop
was higher in strips where a foliar spray of Mn had missed. This suggests that Mn in the
soil is not necessary for a decrease in disease to occur and that the chemical form of Mn is
not important in this respect.
Two pot experiments were conducted to test the effectiveness of several sources of
Mn in decreasing take-all of wheat seedlings grown under Mn-deficient conditions.
6.2. Materials and Methods.
The basic techniques employed here were developed during experiments with small
pots outlined in chapter 3 but some minor changes were made. Complete details for soil, Mn
and Ggt techniques can be found in sections 3.2.1J.,3.2.4. and 3.2.3.2., respectively, of
chapter 3.
6.2.1. Pot experiment A.
A factorial design was used with 7 sources of Mn, 3 rates of Ggt inoculum and 4
replicates, gving 84 pots laid out in randomized blocks.
6.2.IJ.lnoculum. Inocula of Ggt 500 on PDA were prepared as in chapter 5 (section
5.2.2.1.) and incubated for 9 days atzæ C. Extra dishes of 4 Vo PDA were also made up
and kept sterile for use in nil Ggt pots.
r54 -
6.2.1.2. SoiI. Wangary sand collected in 1983 was incubated at 18 Vo water content for 16
days prior to potting up (see appendix A for details).
6.2.1.3. Mn. Tlte seven sources of Mn (which were chosen in an attempt to produce simila¡
shoot concentrations of Mn in plants) were as follows;
1. Nil Mn - no Mn was added to the pots.
2. Folia¡ (Fol/lvln) - plants were painted with a Mn solution (1.5 7o
w/v MnSOa.4H2O + 2 drops of wetting agenV500 ml) 11 and
15 days after sowing.
3. Seed/lvln - seed was pre-soaked in L5 Vo w/v MnSO4.IJIO
solution for 6 hours and air-dried before sowing (Marcar and
Graham 1986). Seed for the other treatments was soaked in
DDDH2O only.
4.Incubated MnO2 (IilvlnOz) - MnOz (BDH, analytical grade,
majority of particles less than 0.01 mm in diameter) was
mixed through soil prior to incubatioî atIT g Mn kg-l of air-
dry soil.
5. Fresh MnO2 G/IVlnOz) - MnOz was mixed through soil at
sowing at I7 gMn kg-l.
6.Incubated MnSO+ (I/lvInSO+) - dissolved MnSO+.4H2O was
mixed througlr soil prior to incubation at 0.36 g Mn kgl.
7. Fresh MnSO¿ (F/lvInSOa)- dissolved MnSOa.4H2O was mixed
through soil at sowing at 0.18 g Mn kg-l.
The FMnSO4 trearrnent wÍts half the fate of I/MnSO4 because Mn was more
available when applied at so'wing and the t'ro MnSOa rates were designed to produce similar
levels of Mn in the shoots of the wheat plants (although this was not completely successful).
r55
6.2.1.4. Procedure. Basal nutrients were mixed through soil immediately prior to sowing at
the same rates used in chapter 3.
Condor wheat seeds, from a trial grown on a Mn-defîcient site at Tooligie on the
Eyre Peninsula S.A. in 1984 (av. Mn concentration 6.4 mg kg-l), were surface-sterilized
with 6 7o NaOCI for 2 minutes, rinsed with DDDH2O and germinated as before (see section
3.2.4.).
Pors were filled such that agar disc inocula were placed either 4 (High Ggt) or 5 cm
(Low Ggt) below 2 germinating wheat seeds. Sterile agar discs were placed in pots at a
depth of 4 cm below seeds as controls for Ggt treatments. All pos were covered with 'Glad
Wrap'for the fust 3 days after sowing.
Pots were kept in a controlled-environment growth room at 15/100 c (daylnight
temperature), a 10 hour photoperid and a photon flux density of approximately 0.3
mEinsteins m-2 s-l for 25 days. Pots were watered to weight at regular intervals.
At harvest, plants were washed free of soil, scored for take-all (number of infected
seminal roots, total number of black stelar lesions per plant and total length of lesions per
plant) and weighed. Shoots and roots were dried at 80o C for 2 days, weighed, digested in
nitric acid and analyzed for manganese and 10 other essential elements with an ARL
inductively coupled plasma atomic emission qpectrometer.
6.2.2. Pot experiment B
A factorial design was used with 5 sources of Mn, 2 Mn rates, 3 rates of Ggt
inoculum and 4 replicates, gtving 120 pots laid out in randomized blocks.
6.2.2.1.Inoculum. As for experiment A except dishes were incubated for 6 days atzæ C.
Extra dishes of.4 Vo PDA were also made up and kept sterile for use in nil Ggt pots.
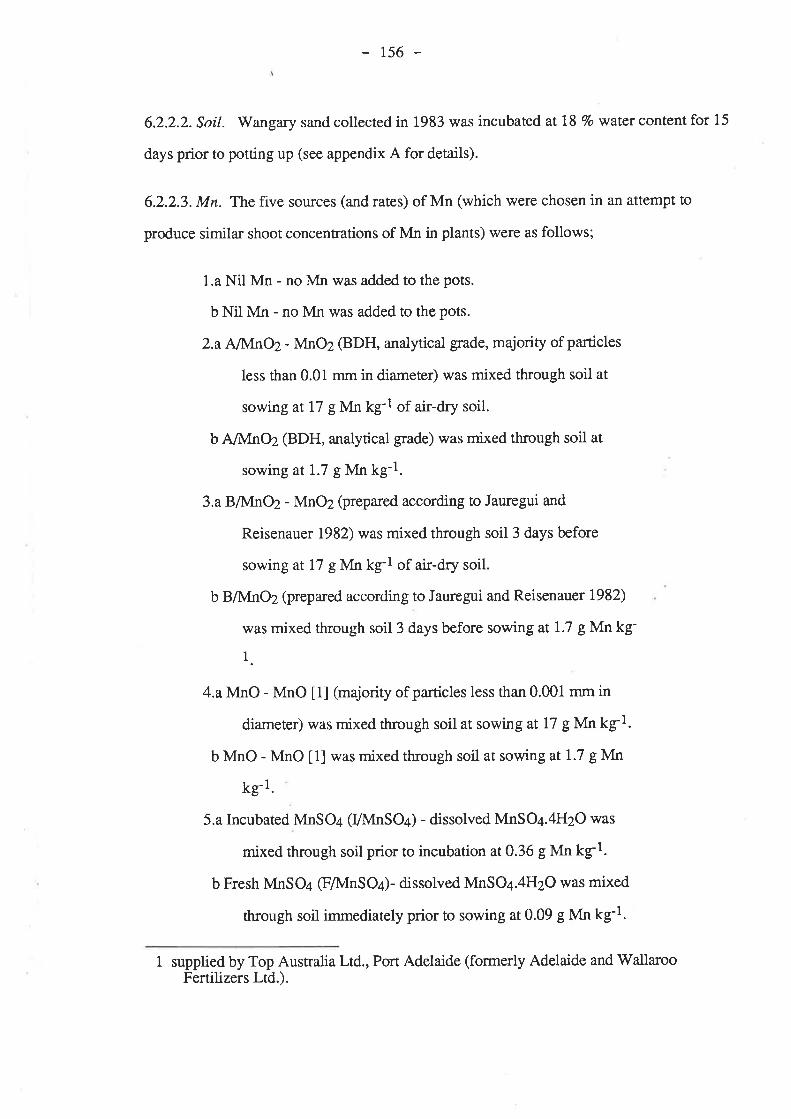
156 -
6.2.2.2. Soil. Wangary sand collected in 1983 was incubated at 18 7o water content for 15
days prior to potting up (see appendix A for details).
6.2.2.3. Mn. The five sources (and rates) of Mn (which were chosen in an attempt to
produce simila¡ shoot concentrations of Mn in plants) were as follows;
1.a Nil Mn - no Mn was added to the pots.
b NiI Mn - no Mn was added to the pots.
2.a AMnO2- MnOz (BDH, analytical grade, majoriry of particles
less than 0.01 mm in diameter) was mixed through soil at
sowing at77 gMn kg-l of air-dry soil.
b A/lVInØ (BDH, analytical grade) was mixed through soil at
sowing at1.7 g Mn kg-l.
3.a BAInØ - MnOz (prepared according to Jauregui and
Reisenauer 1982) was mixed through soil3 days before
sowing at 17 gMn kg-l of air-dry soil.
b BMnOz (prepared according to Jauregui and Reisenauer 1982)
was mixed through soil 3 days before sowing at 1.7 g Mn kg-
1.
4.a MnO - MnO [1] (majority of particles less than 0.001 mm in
diameter) was mixed through soil at sowing at 17 gMn k51.
b MnO - MnO [1] was mixed through soil at sowing atI.7 g Mn
kg-1.
5.a Incubated MnSO+ (VMnSO+) - dissolved MnSO¿.4H2O was
mixed through soil prior to incubation at 0.36 g Mn kg-l.
b Fresh MnSO+ (F/}InSO+)- dissolved MnSOa.4H2O was mixed
through soil immediately prior to sowing at 0.09 g Mn kg-I.
1 supptied by Top Australia Ltd., Port Adelaide (formerly Adelaide and'WallarooFertilizers Ltd.).
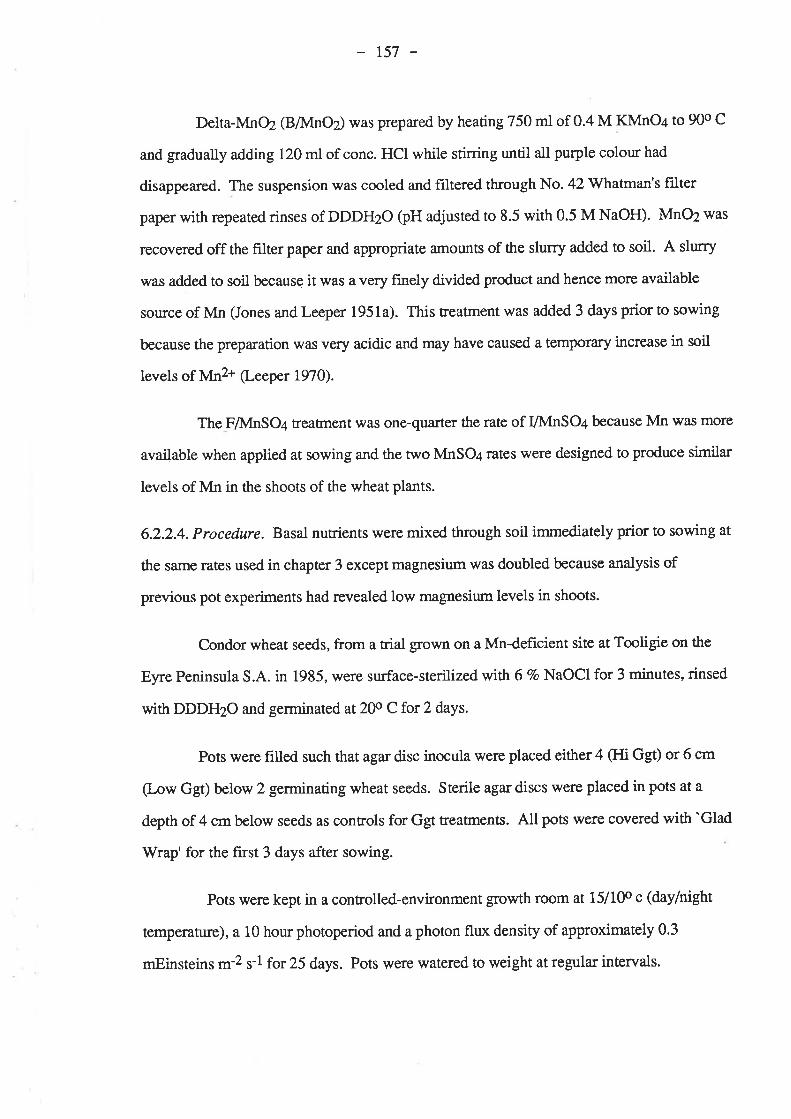
r57 -
Delta-MnO2 (B71\4nOz) was prepared by heating 750 ml of 0.4 M KMnO¿ to 90o C
and gradually adding 120 ml of conc. HCI while stirring until all purple colot¡r had
disappeared. The suspension was cooled and frltered through No. 42 Whatman's filter
paper with repeated rinses of DDDH2O (pH adjusted to 8.5 with 0.5 M NaOH). MnO2 was
recovered off the filter paper and appropriate amounß of the slurry added to soil. A slurry
was added to soil because it was avery f,rnely divided product and hence more available
source of Mn (Jones and Leeper 1951a). This treatment was added 3 days prior to sowing
because the preparation was very acidic and may have caused a temporary increase in soil
levels of Mn2+ $-eeper 1970).
The FMnSO4 treaEnent was one-quarter the rate of l/lvlnSo4 because Mn was more
available when applied at sowing and the two MnSO4 rates were designed to produce similar
levels of Mn in the shoots of the wheat plants.
6.2.2.4. Procedure. Basal nutrients were mixed through soil immediately prior to sowing at
the same rates used in chapter 3 except magnesium was doubled because analysis of
previous pot experiments had revealed low magnesium levels in shoots.
Condor wheat seeds, from a trial grown on a Mn-def,rcient site at Tooligie on the
Eyre Peninsula S.A. in 1985, were surface-sterilized with 6 7o NaOCl for 3 minutes, rinsed
with DDDHzO and germinated at 20o C for 2 days.
Pots were filled such that agar disc inocula were placed either 4 (Hi GgÐ or 6 cm
(Low Ggt) below 2 germinating wheat seeds. Sterile agar discs were placed in pots at a
depth of 4 cm below seeds as controls for Ggt treatments. All pots were covered with 'Glad
Wrap' for the first 3 days after sowing.
Pots were kept in a controlled-environment growth room at 15/100 c (daylnight
temperature), a 10 hour photoperid and a photon flux density of approximately 0.3
mEinsteins m-2 s-l for 25 days. Pots were watered to weight at regular intervals.

158
At ha¡¡est plants were washed free of soil, scored for take-all (number of infected
seminal roots, total number of black stela¡ lesions per plant and total length of lesions per
plant) and weighed. Shoots and roots were dried at 80o C for 2 days, weighed, digested in
nitric acid and analyzed for manganese and 10 other essential elements with an ARL
inductively coupled plasma atomic emission spectrometer.
6.3. Results.
6.3.1. Pot experiment A.
6.3.1.1. Ggt. I/NInSO¿ was the most effective treatrient at decreasing take-all (figure 6.1).
The total length of lesions, averaged over both depths of agar disc burial, was decreased by
68 Vo withl/lvfnSO+ and by 59 7o wirhF/lvfnSO¿, followed by seed/lvfn (52 Vo) and.Fol/lvln
(28 Vo). The total number of lesions per plant and the percentage of diseased seminal roots
were decreased from nil Mn by IAdnSOa alone but FMnSO¿, IMnSOa and seed/Mn had
fewer lesions than F/l4nO2, úrdseed/lVfn and I/lvInSO4 a lowerpercentage of diseased
seminals. All plans had the same number of seminal roots. MnO2 treaûnents did not
decrease disease levels.
Increasing the depth of buriat of inoculated agar discs from 4 to 5 cm did not
decrease Ggr infection on wheat roots.
V/ashing plants free of soil at ha¡vest revealed that roots which had been grown
with I/lvInSO4 orF/NInSOa, and infected by Ggt, were very brown where they were covered
by runner hyphae. The brown areas on these roots, and the runner hyphae, stained dark
blue in benzidine. There was very little brown staining on disease-free roots from either
MnSO¿ treaünent and roots from all other treaEnents were white. Placing roots from MnOZ
treaunents in benzidine showed that MnO2 particles remained on loots even afte¡ washing.
6.3.1.2. Plant growth. Ggr infection decreased the dry weight of shoots by nearly one-
third, regardless of Mn treatment or depth of burial of inoculated agar discs. Plants glown
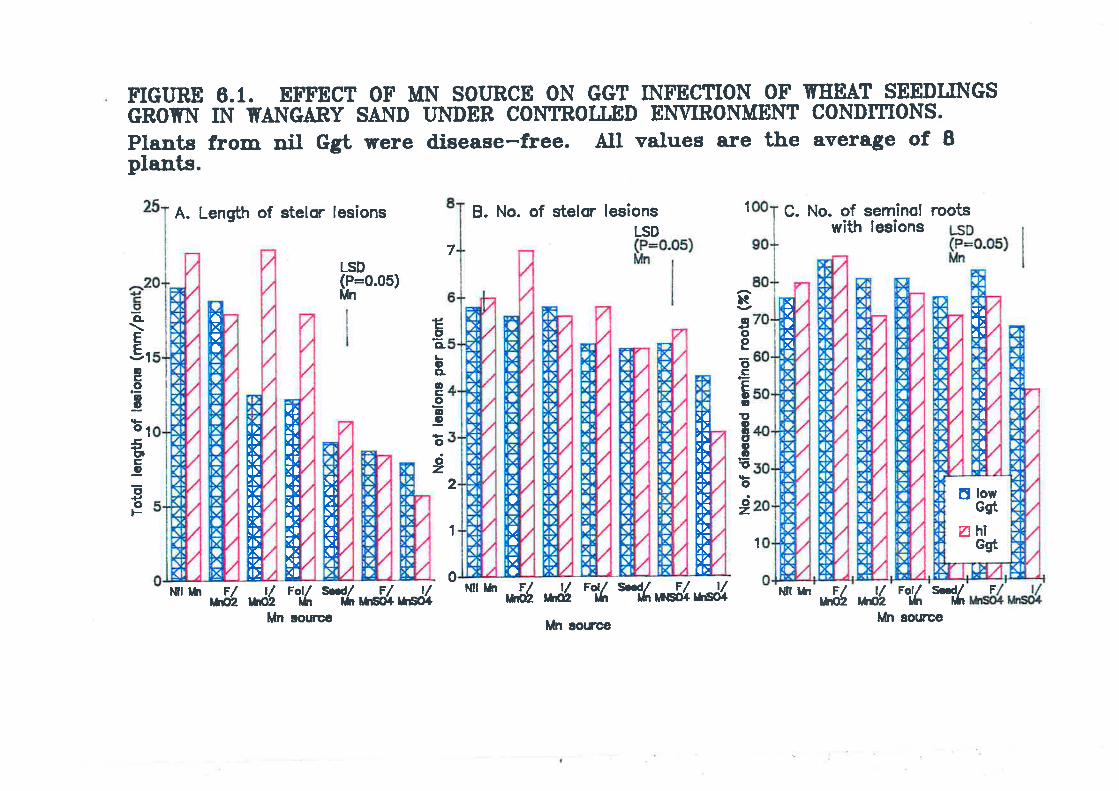
FIGTTNE 6.1. EFF:ECT OF MN SOT'RCE ON GGT INFECTTON OF IÍHEAT SEEDIJNGSGBOTÍN IN WANGARY SA}TD TINDER COI.ITROTI.ND EI\MRONMENT CONDTTTONS.
Plants from Dif Cgt were disease-free. All values are the average of Iplants.
A. Length of stelor lesions B. No. of stelor lesions 1 C. No. of seminol roots
LSD(P:0.05)[Ín
7
1
o
LSD with lesions
Mn souee
1
èEE.oc,oEq-o5EDC-9E+tot-
NooeõtrEooT'o¡C'ooooct
2
trE'
-GLLoooC-9o-e
ooz,
I
Mf lñ rl V Fot/ #/ Fl tlrm2 rm2 rül rh r6ot rso+
1.[¡ rh Fl tf Fd/ w/ r/ vtffi. |ffi. lh t&r [lH¡+ l¡ño4 Ml rftt rl ./)ffi1:2 )Xn
Fol/Itt
sd./Itt
F
ltn sowrs lrln sourca
r!?7ai;l:!iíat7tlr:¡lil
2at:¡ltlli.{tf¡t¡a?¡t?al!¡rtttll!t¡
rt)i¡!ttl'tt):ì:l,7at);zst3l2zl)-')rll7¿l):
a.x(t¡
E lowGgt
øhicgt
Ia
IaI
l'aIt¡t
l{7tD
x̂i
tttl¡!ttIZtÈì¡St'aIt¡!':atzôlttstl):
t¡
t
io

159 -
without Mn were pale green and all plants supplied with Mn were dark green and had heavier
shoots (frgure 6.2A). FoUMn and seed/lvfn increased the dry weight of shoots per plant by
less than 40 7o (averaged over all Ggt treatrnents) but some burning on leaves was noted in
FolÂr{n which may have reduced plant response in this treannent. MnSO¿ and MnOz
treatnents increased shoot dry weights by more than 60 Vo.
The dry weight of roots perplant was decreased with Ggr infection by
approximately 20 Vo,regardless of Mn treaÍnent or depth of burial of inoculated agar discs
(figure 6.28). I/MnSOa increased the dry weight of roots by 82 Vo from nil Mn and all other
Mn treatnents increased root dry weights by between 36 (Fol/lvln) and 59 7o (FAfnSO4 and
I/Ùfnor.
6.3.1.3. Mn. Ggt infection did not change plant Mn levels. Plants grown without Mn had
an average whole shoot Mn concentration of 8 mg kgl (table 6.1) which is well below the
critical level of 18 mg kg-l (see appendix B). All methods of supplying Mn (except FoVMn)
increased the concentration of Mn in the plants to adequate or luxury levels. FMnSO¿ was
the most effective (an average of 73 mg kg-l over all Ggt treatnents), followed by seedfit4n
and I/lvfnSO+ (63 and 68 mg kg-l, respectively), and the rwo MnO2 treaEnents (4O mg kg-t)
Mn analysis of Fol/NIn shoots was confounded by painting Mn onto the leaves and was not
included in analysis of the data.
Fol/Nfn did not increase root Mn concentrations above those of nil Mn (4O mg kg-l
averaged over Ggt treatments) but seedffn increased Mn concentration to 67 mg kgl (table
6.1). MnSO4 increased root Mn concenmtions to 365 mg k51 and 4A6 mgkgl,
respectively, when applied to the soil at sowing or 2 weeks prior to sowing. Mn analysis of
roots from plants supplied with MnO2 wa.s confounded by surface contamination of the roots
wirh MnO2 particles and were not included in statistical analysis of the data.
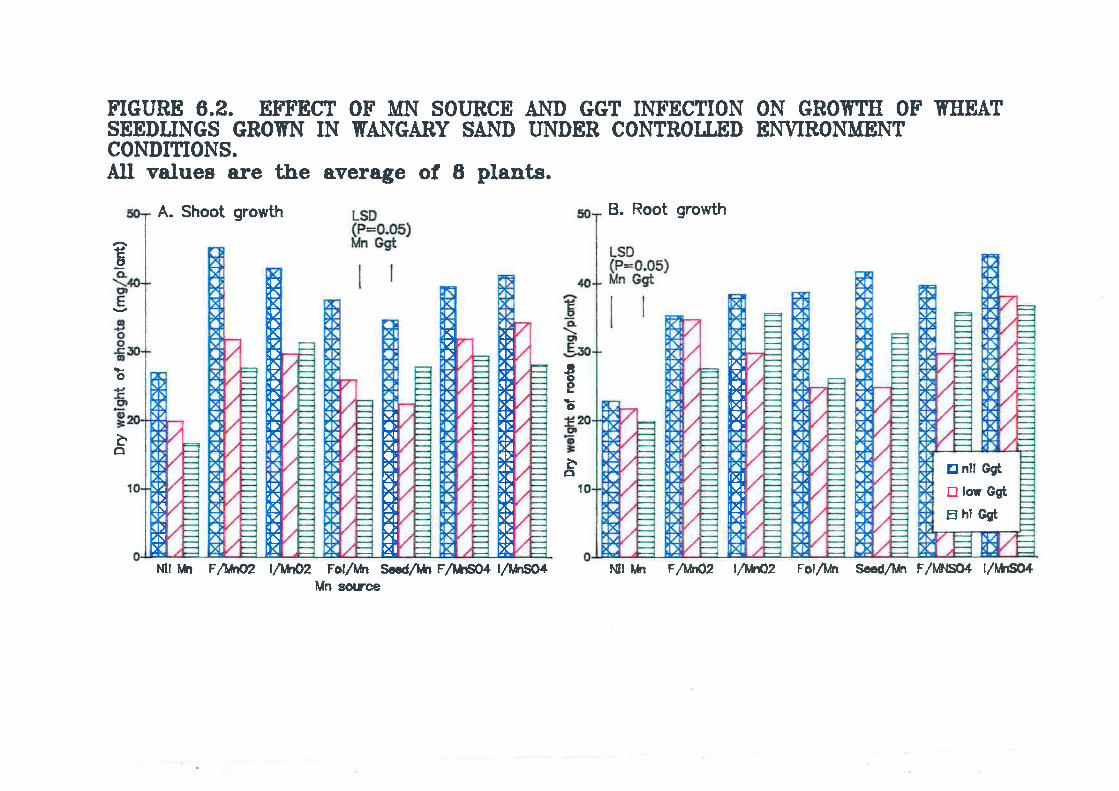
FTGURE 6.2. EFFECT OF MN SOUBCE AT{D GGT INFEC1TON ON GROTÍTII OF TYHEATSEEDIJNGS GROIÍN IN ITANGARY SAIVD T]NDEB CONTROT.T.ND EI{NRONMEI{TCONDTTIONS.All values are tJre average of I plants.
A. Shoot growth
Ml [[r F/]ñ2 tllffi2 Fol/\h Sccd/ier F/t¡t6Oa VwIÐ1Mn soLúre
B. Root growth
to
aoe
Io
èc¡
rFo
È.ct
zr¡tZt>z!):¡lñzZ¡!>ilSZa>:ZÑr!1l>;Z!):3TZl):zlrllt>;ZS>)t
ll7¿
)ì
lla:
^'l>YtJ;l^r)¡l9ro:^llt? IJ;a^l)Xl
i?zi):tlriv¿:),N)^'l
Iti!¡\):{l2zi¡:fltì¡¿l)INr:ailtii,lli7¿iDlrt
,/))s);ñ7¿
))
tr nll Ggt
tr lor Ggt
El hl Ggt
lxrrJr,.:rxlrVr
lä'lrxt'J¡,1:rxlrVl:a:
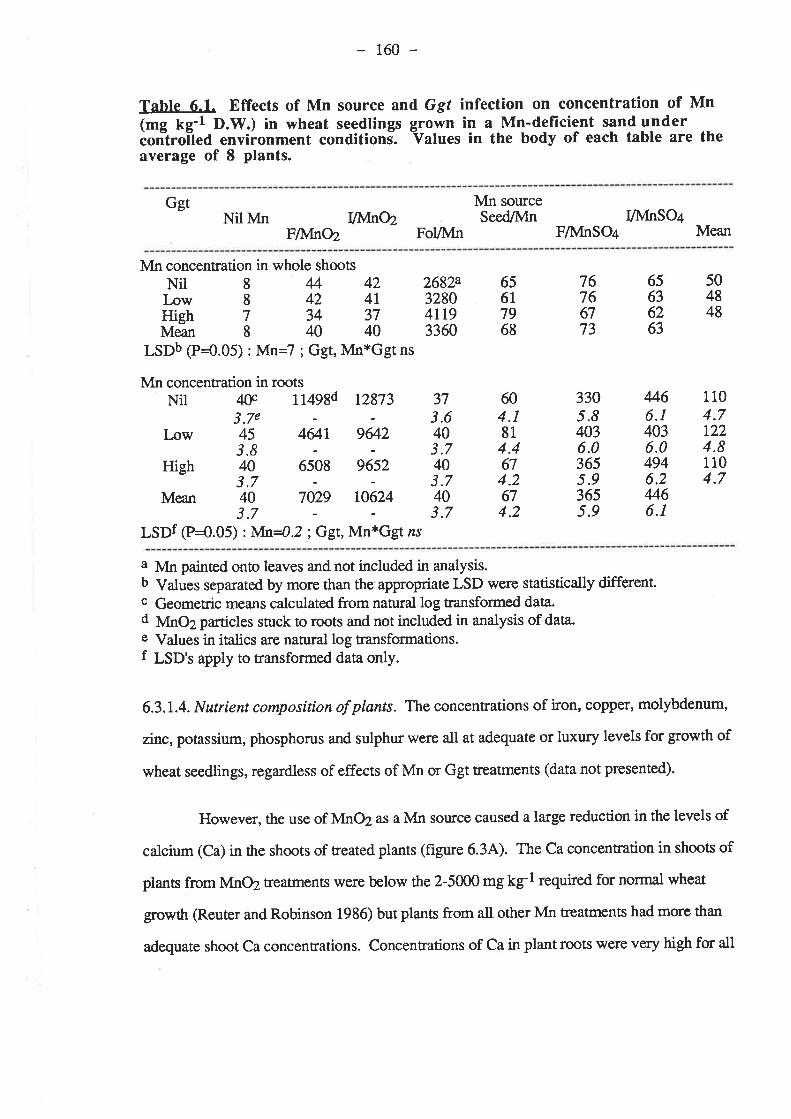
160 -
Tahte 6.1. Effects of Mn source and, Ggt infection on concentration of Mn(mg kg'l D.W.) in wheat seedlings grown in a _Mn-defîcient sand underèon"troited environment conditions. Yalues in the body of each table are theaverage of 8 plants.
GgtNiMn
F/À,In02
Mn concentration in whole shoots
IllvInO2Mn sourceSe€d/Nln I/]vInSO¿
Fol/lVln FAInSO+ Mean
NilLowHighMean
8878
M4242 4l34 3740 40
2682a32804IT93360
373.6403"7403.7403.7
65617968
76766773
3305.84036.03655.93655.9
504848
65636263
LSDb (P{.05) : Mn=7 ; Ggt,Mn*Ggt ns
M¡r concentration in rootsNil # 11498d 12873
3.7eLow 45 4&l 9Ø2
3.8High 40 6508 9652
3.7Mean 40 7029 10624
3.7LSDf (P=0.05) :lvln4.2; Ggt, Mn*Ggt zs
604.1814.4674.2674.2
4466.14036.04946.24466.1
1104.71224.81104.7
a Mn painted onto leaves and not included in analysis.b Values separated by more than the appropriate LSD were statistically differentc Geometric means calculated from natural log transformed data.d MnOz particles stuck to roots and not included in analysis of data.e Values in italics a¡e natural log transformations.f LSD's apply to transformed data only.
6.3.1.4. Nutrient composition of plants. The concentrations of iron, copper, molybdenum,
zinc, potassium, phosphorus and sulphur were all at adequate or luxury levels for growth of
wheat seedlings, regardless of effects of Mn or Ggt treatrnents (data not presented).
However, the use of MnØ as a Mn source caused a large reduction in the levels of
calcium (Ca) in ttre shoots of treated plants (figure 6.34). The Ca concentration in shoots of
plants from MnO2 treatments were below the 2-5000 mg kg-l required for normal wheat
growth (Reuter and Robinson 1986) but plants from all other Mn treatments had more than
adequate shoot Ca concentrations. Concentations of Ca in plant roots were very high for all
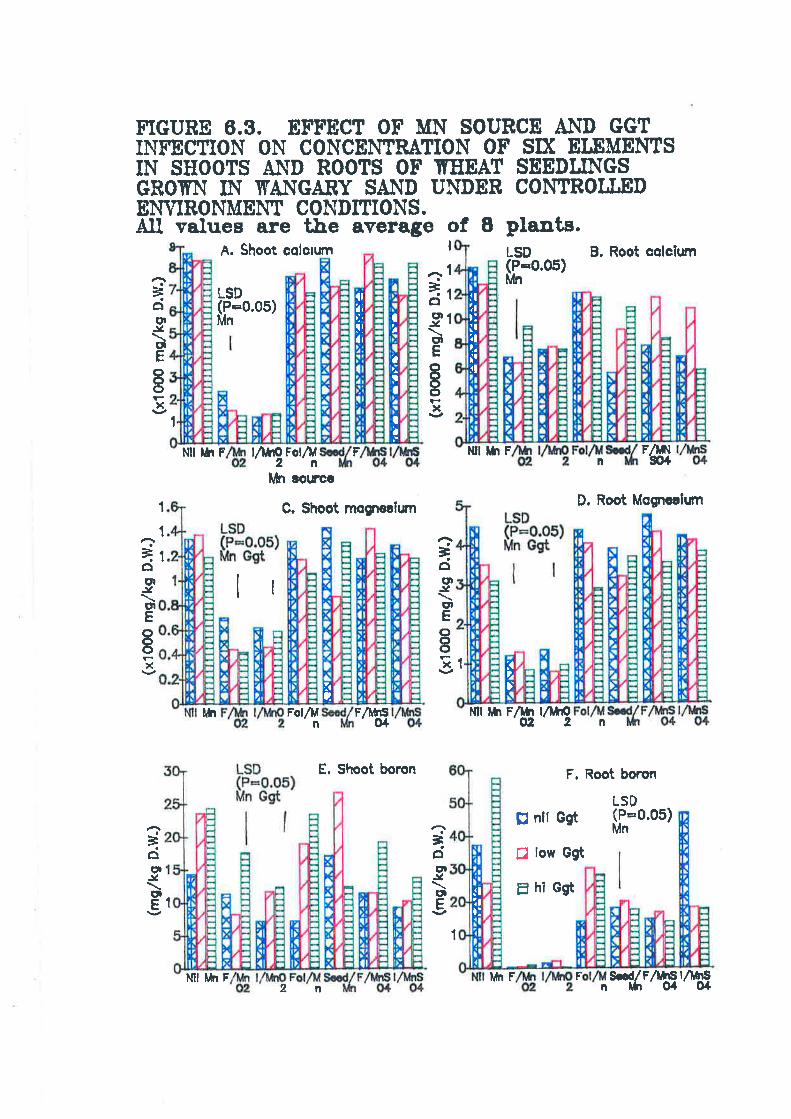
FTGUBE 6.9. EFFECT OF MN SOURCE AI{D GGTINFECTION ON CONCEI.ITRATION OF SD( EI,EMEÎfISIN SHOOTS AI\D ROOTS OF TTTIEAT SEEDITNGSGROITN IN TANGARY SAI\ID UNDER COI{TROT.T.EDE}WIRONMENT CONDTTIONS.Atl values are the average of I plants.
R. Shoot cqlcrum B. Root cqlcluÍt
Nlr r¡l F l/lú9rolÂt Nll tf,i F F/tl,¡s4
I
1
I
I
LSD(P=0.05)lún1
+ÊlGtl.fèEc,ooox
LSD(P=0.05)Mn
Édol
J¿
ìE
Iox
1
F
Mn aourcc
G. Slroot mogncaiwn
n
D, Root Mogncclrrt1
1
I
Ir1ot'lJIEo()ox
+attJttEoctox
F^ffi' O¡tm û' Ft! r^r9
E. Shoot boron
1
ùh FolNn
F. Root boron
LSD
n
=oC'¡.torE1
ìo(tlJ(tlE
þ nll Ggt
Çl low Ggt
E hr Ggt
(P=0.05)Mn
I
Fl,
Ia
?
Ia
I)
lrZit,lll¡
1l7t):lr,<l
2.i!.(l
li71
)ir2
JIitt:
Ml frh Fn
liì Fn
S..d,/F^hSl^lnSlh Of O¿l
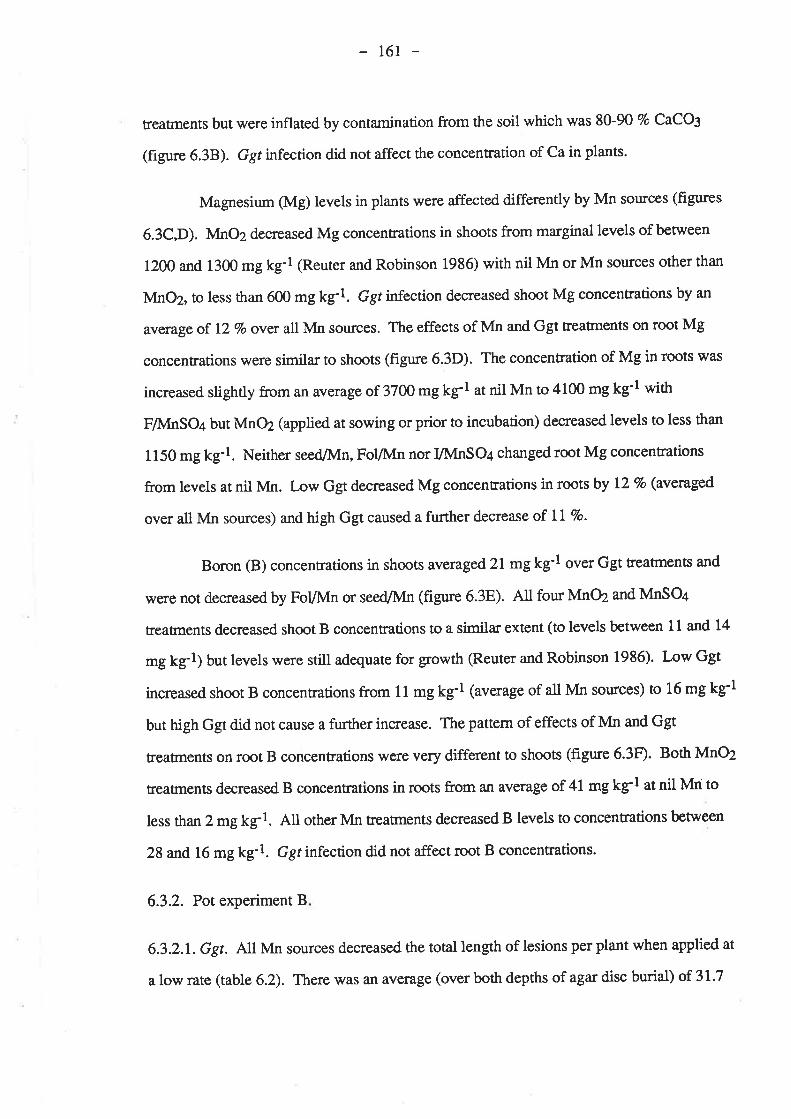
161
treatments but were inflated by contamination from the soil which was 8G90 7o CaCO3
(frgure 6.38). Ggr infection did not affect the concentration of Ca in plans.
Magnesium (Mg) levels in plants were affected differently by Mn sources (figures
6.3C,D). lvlnø decreased Mg concentrations in shoots from marginal levels of be¡ween
1200 and 1300 mg kg-l (Reurer and Robinson 1986) with nil Mn or Mn sources other than
MnO2, to less ttran 600 mg kg-l. Ggt nfection decreased shoot Mg concentrations by an
average of 12 Vo over all Mn sources. The effects of Mn and Ggt treaünents on root Mg
concentrations were simila¡ to shoots (figure 6.3D). The concentration of Mg in roots was
increased slightly from an average of 3700 mg kg-l at nil Mn to 4100 mg kg-l with
F/lvInSO¿ but MnO2 (applied at sowing or prior to incubation) decreased levels to less than
1150 mg kg-l. Neither seed/lVfn, Folffn nor VMnSO¿ changed root Mg concentrations
from levels at nil Mn. Low Ggt decreased Mg concentrations in roots by 12 Vo (avetagd
over all Mn sources) and high Ggt caused a further decrea.se of ll7o.
Boron (B) concentrations in shoots averaged 2l mgkg'l ornet Ggt treatments and
were not decreased by Fol/NIn or seedlMn (figure 6.3E). Atl four MnC2 and MnSO¿
treatnents decreased shoot B concentrations to a similar extent (to levels between 11 and 14
mg kg-l) but levels were still adequate for growth (Reuter and Robinson 1986). Low Ggt
increased shoot B concentrations from 11 mg kg-l (average of all Mn sources) to 16 mg kg-l
but high Ggt did not cause a further increase. The pattern of effects of Mn and Ggt
treaûnents on root B concentrations were very different to shoots (frgure 6.3Ð. Bottr MnO2
treatments decreased B concentrations in roots from an average of 41 mg k51 at nil Mn to
less than 2 mg kg:I. All other Mn EeaUnents decreased B levels to concentrations between
28 and 16 mg k'-l. Ggt infection did not affect rcot B concentrations.
6.3.2. Pot experiment B
6.3.2.I. Ggr. All Mn sources decreased the total length of lesions per plant when applied at
a low rate (table 6.2). There was an average (over both depths of agar disc burial) of 3l-7

162 -
mm of lesions per plant in the nil Mn control but MnSO¿ and both MnOZ treatments
decreased the total length of lesions to between 9 and 12 mmper plant. MnO caused a
furtherdecrease to only 7 mmperplant. MnSO+, B/lvInO2 and MnO applied at a high rate
also caused large decreases in the total length of lesions per plant (from an average of 23.5
mm ar nil Mn to 11.3 mm with BA,tnø and between 6 and 9 mm with MnO and MnSO+).
A/¡4nø did not decrease the total length of lesions when applied at a high rate. Increasing
the rate of application of MnSO 4,BlMnO2or MnO did not cause further decreases in the
total length of lesions but a high rate of AMnOZ had nearly twice the total length of lesions
of the low rate. These results compare favourably with pot experiment A, where MnSO¿
applied prior to incubation caused large decreases in take-all on roots but MnO2 (same
treatrnent as A/lvfnOz) was ineffective.
The number of lesions per plant and the percentage of diseased seminal roots were
not as sensitive to treatments as the total length of lesions but showed a simila¡ pattern of
response to different Mn sources applied at a low rate (øbles 6.3,6.4). No Mn sources
apptied at a high rate decreased the number of lesions or the percentage of diseased roots but
both MnO2 treatrnents increased these two measurements of disease.
Decreasing the depth of burial of inoculated agar discs from 6 to 4 cm increased the
total length of lesions and the number of lesions per plant by approximately 20 Vo but did not
significantly increase the percentage of diseased roots. No disease was present in pots with
sterile agar discs.
r63
Table 6.2. Effects of type, and rate of application, of Mn sources and Ggt lnoculum rates on
the total length of black stelar leslons (mm per plant) on roots of wheat seedlings grown lna Mn-deflcient sand under controlled environment conditíons. Values ln the 3-way table arethe average of 8 plants. Data were analyzed without nil Ggt treatments.
nil Ggtìln aI low rate
low Ggt high Ggt nil GgtMn at high raæ
low Ggt high Ggt
Nil 0
A/lvfnO2 0
B/lvfnO2 0
MnO 0
MnSO4 0
(3-way interaction not significant)
31.843.49b
10.02.40
LL.42.526.82.058.12.2I
29.63.42
t4.l2.72
10.92.487.32.12
11.32.5 1
0
0
0
0
0
19.83.04
23.83 .21
10.32,436.11.965.61.89
27.83.36
20.73 .08
L2.42.597.02.08
11.82.55
I and 2-way treatrnent means (with appropriate LSD'sc'd at P=0.05 level). Means were calculated with nil Ggttreatments removed.
Mn source
Mn rate
Mn sowceMn ¡atelow
high
Mn source
Ggtlow
high
Mn rateGgtlowhigh
nil26.93.33
low12.3 2.59
low71.4 2 .52
31..73 .4623.53.20
25.13.2628.73.39
NMnO216.32.85
11.92.5622.23.15
15.52.81t7 .l2.90
low
72.6 2.53t3.L 2.65
BMnOZLt.22.5 0
It.22.50I 1.32.5 I
10.92.47I 1.62.54
MnS048.9
2.29
9.62.368.2
2.22
I.SD
0.19
0.12
0.27
,LS
MnO6.82.05
highL2.7 2.62
high13.7 2.69
7.02.096.5
2.02
tt.2 2.50r4.3 2.73
flf
Ggt
nil A/lvfno2 B/lvfnoz MnO MnS04
nil A/lvfnO2 BMnOZ MnO MnS04
6.82.05I 1.52.5 3
high
.400t10
6a
7,)
tlt
a Geometric means calculated from nanual log tansformed data.b Vuln"r in italics a¡e nafural log transformations, applied to coÍect a skewed distibution.c LSD's apply to transformed data only.d V"lu". separated by more than the appropriate LSD we¡e statistically differenr
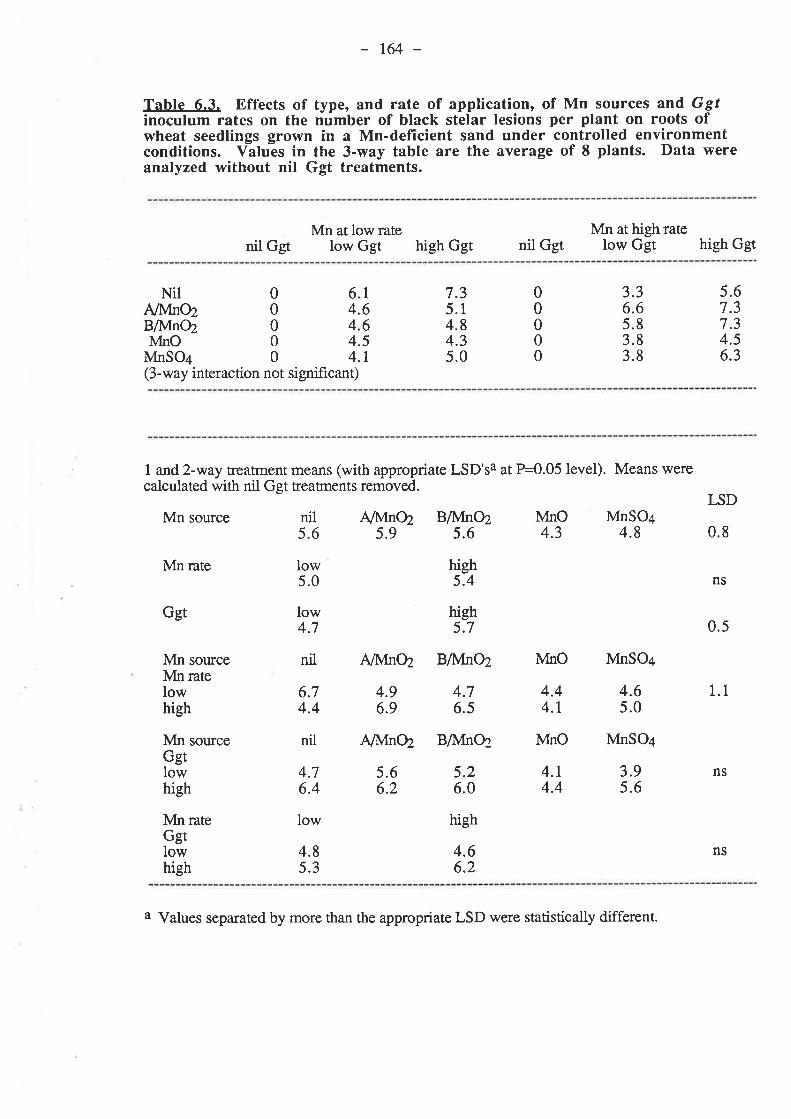
164 -
Table 6.3. Effects of type, and rate of application, of Mn sources and Ggfinoculum rates on the number of btack stelar lesions per plant on roots ofwheat seedlings grown in a Mn-deficient sand under controlled environmentconditions. Values in the 3-way table are the average of 8 plants. Data wereanalyzed without nil Ggt treatments.
nil GgtMn atlowrate
low Ggt high GgtMn at high rate
low Ggtnil Ggt high Ggt
NilAMnØB/lvln02lvtnO
MnSO¿
00000
5.67.37.3
3.36.65.83.83.8
00000
7.35"14.84.35.0
6.r4.64.64.54.1
4.56.3
(3-way interaction not significant)
1 and Z-way treatment means (with appropriate LSD'sa at P=0.05 level). Means werecalculated with nil Ggt treatrnents removed.
Mn source
Mn rate
Mn sourceMn ratelowhigh
5AAIn02
5.9
nil A/N4nO2
nil A/lúnq
low
4.85.3
nil6
BAIn025.6
5.4
MnO4.3
MnSO+4.8
MnSO¿
MnSO+
LSD
0.8
ns
0.5
1.1
ns
low5.0
low4.7
high
Ggt
MnGgtlowhigh
source
4.65.0
4.96.9
6.74.4
ns3.95.6
5.26.0
5.66.2
4.76.4
high5.7
B/lvln02
4.76.5
BAln02
high
lv1no
4.44.1
ÀírìO
4.r4.4
Mn rateGgtlowhigh
4.66.2
a Values separated by more than the appropriate LSD were statistically different.

165 -
Table 6.4. Effects of type, and rate of application, of Mn sources and Ggf¡nocutum rates on the pìrcentage of diseased seminal roots of wheatseedlings grown in a Mn-deficient sand under controlled environmentconditiõnsl Values in the 3-way table are the average of 8 plants. Data wereanalyzed without nil Ggt treatments.
nit GgtMn at low rate
low Ggt high GgtMn at high rate
nil Ggt low Ggt high Ggt
NilO80A/l\4nø 0 76BMnO2 0 78MnO 0 85MnSOa 0 69(3-way interaction not significant)
9077737574
63100866868
81939370
00000 93
1 and 2-way treatment means (with appropriate LSD'sa at P=0.05 level). Means werecalculated with nil Ggt reatrnents removed.
LSD
Ggt
Mn source nil79
AiI\4nø B/À/tnO286 82
7696
7589
A/IvlnO2
8885
Bll,IrLO2
8283
high
7786
Mn rate
Mn rateGgtlowhigh
low78
low77
nil
8572
nil
low
7778
lvlno74
8069
NtnO
7673
MnSO+76
MnSO+
high81
high82
A/lvInO2 B/I/tnø lvfno MnSO+
ns
ns
ns
11
Mn sourceMn ratelowhigh
Mn sourceGgtlowhigh
7280
6883
7285
ns
ns
a Values separated by more than the appropriate LSD were statistically different.
6.3.2.2. Plant growth. Plant growth showed strong positive responses to all Mn sources at
low and high rates but the effect of Ggt infection on plant gowth depended on the Mn
source.

166 -
Shoot dry weights were decreased by between 20 and30 Vo by low Ggt with all Mn
sources except MnSOa and the nil Mn control, where decreases were not statistically
signihcant (table 6.5). Hi Ggt only changed shoot dry weights from levels at low Ggt when
MnO and MnSO¿ were used as Mn sources. Hi Ggt decreased shoot dry weight by 2l Vo
with MnSO4 but increased it to equal with the nil Ggt control with MnO. Increasing the rate
of application of Mn sources from low to high did not further increase the dry weight of
shoots per plant.
All Mn sources were equally effective at increasing the shoot dry weight of disease-
free plants (increases of 95-104 Vo)fromnil Mn but at low Ggt, MnSO¿ was more effective
(increase of 124 7o) thanB/lr4nO2 (increase of 74 Vo). A/lvInOZ and MnO showed increases
at low Ggt intermediate to MnSO¿ and B/NInØ. At high Ggt, MnO was the most effective
Mn source (increase of 154 Vo) andAMnO2, BMnOz and MnSOa increased shoot dry
weights by 96-55 Vo.
Roots of plants removed from pots where B/lvInOz had been used as a Mn source
had scattered and occasional patches of a browrVpurple substance stuck to them. They were
not associated with Ggthyphae and were identifred as Mn oxides with benzidine (stained
blue in the presence of Mn oxides). Roots from low MnO pots were white and agar discs
were spotted da¡k brown (especially in Ggr-inoculated pots). At high MnO all roots had
extensive deposits of blaclç/brown Mn oxides and agar discs were also very dark with Mn
deposits. No Mn oxides were visible in AMnO2 treaûnents and only inoculated agar discs
were brown at a high rate of MnSO+.
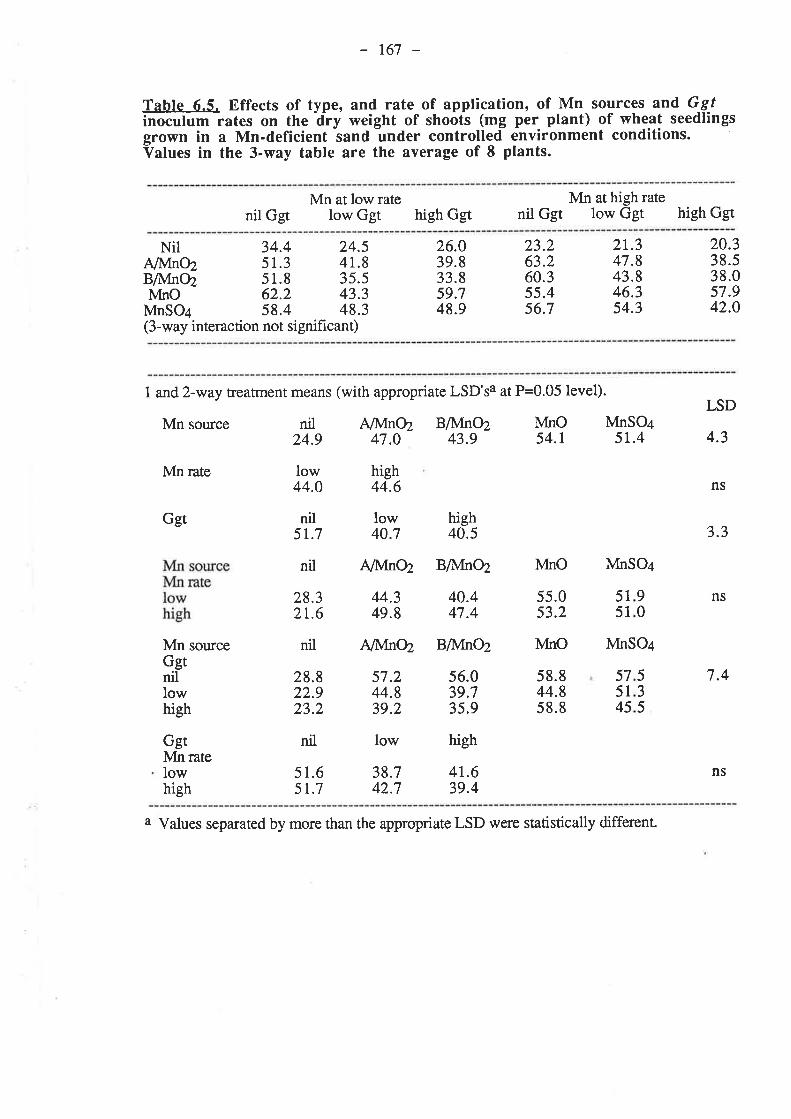
167
Table 6.5. Effects of type, and rate of application, of Mn sources and G_g-f
inoculum rates on the dry weight of shoõt-s (mg per ptant) of wheat seedlingsgrown in a Mn-deficient sand under controlled environment conditions.Values in the 3-way table are the average of I plants.
nil GgtMn at low rate
low Ggt highMn at high rate
Ggt nil Ggt low Ggt high Ggt
Nil 34.4 24.5A/l\4nO2 51.3 41.8B/I4nø 51.8 35.5ÀínO 62.2 43.3MnSO+ 58.4 48.3(3-way interaction not signif,rcant)
26.039.833.859.748.9
23.263.260.355.456.7
2r.347.843.846.354.3
20.338.538.057.942.O
I and2-way treatment means (with appropriate LSD'sa at P=0.05 level).
Mn source nil A/lvlnø B/lvInø lvfno MnSO¿24.9 47.0 43.9 54.1 5r.4
Mn rate
GgtMn rate
low44.0
nil51.7
nil
28.32t.6
nil
28.822.923.2
51.651.7
high44.6
low40.7
A/N4nø
44.349.8
AMnoz
high40.5
Bilvlnø
40.447.4
B/NInO2
4r.639.4
LSD
4.3
3.3
ns
7.4
ns
NS
Ggt
sourceMnGgtnillow
55
575145
079
56.39.35.
lftO MnSO+
55.053.2
ÀínO MnSO+
58.844.858.8
1
1
90
535high
57.244.839.2
38.742.7
nil low high
lowhigh
a Values separated by more than the appropriate LSD were statistically different.
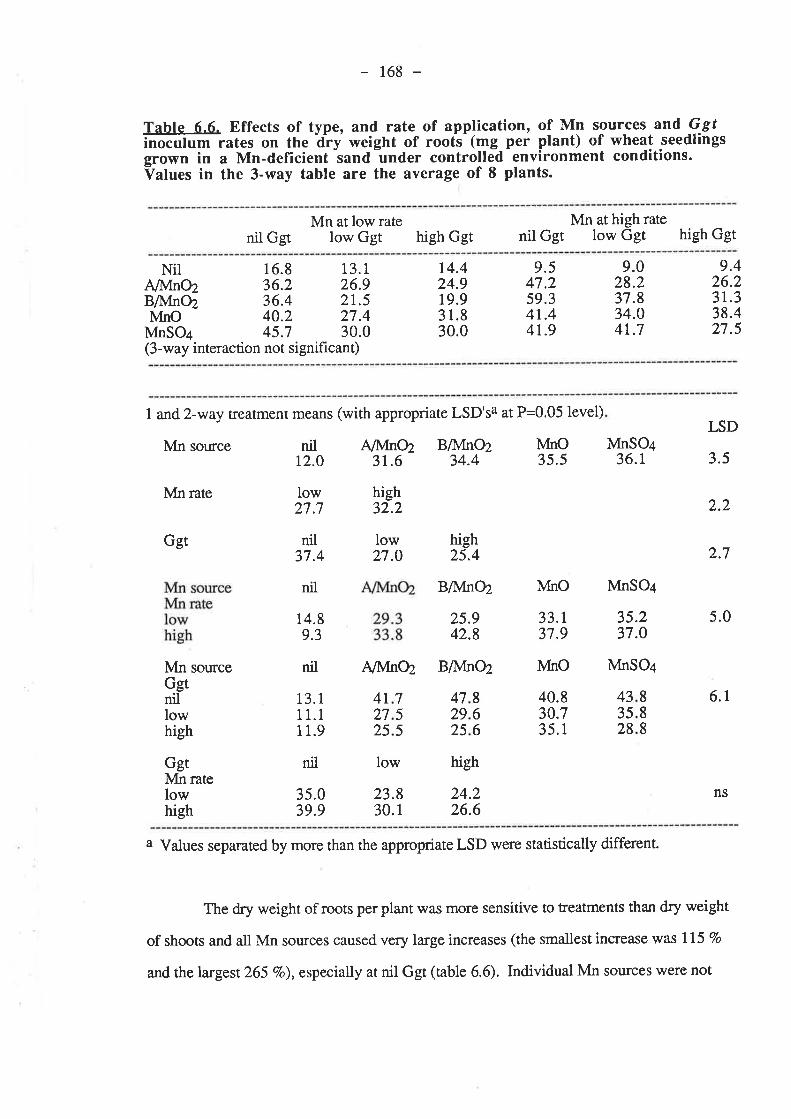
168 -
Table 6.6. Effects of type, and rate of application, of Mn sour_ces and -Ggfinoculum rates on the äiy weight of roots- (mg per plant) of wheat seedlingsgrown in a Mn-deficient sand under controlled environment conditions.Values in the 3-way table are the aYerage of 8 plants.
nil GgtMn at low rate
low Ggt high GgtMn at high rate
nil Ggt low Ggt high Ggt
Nil 16.8 13.1A/À{nØ 36.2 26.9BMnO2 36.4 21.5lvlno 40.2 27.4MnSO+ 45.7 30.0(3-way interaction not significant)
r4.424.919.931.830.0
9.547.2s9.34t.44r.9
9.028.237.834.041.7
9.426.231.338.427.5
1 and 2-way treatment means (with appropriate LSD'sa at P=0.05 level)
Mn source nil AMnO2 B/N4nØ lvfnO12.0 31.6 34.4 35.5
Mn rate
GgtMn ratelowhigh
low27.7
nil37.4
nil
14.89.3
nil
high32.2
low27.O
AMnO2
23.830.1
MnSO¿36.t
MnSO¿
35.237.0
MnSO¿
LSD
3.5
))
2.7high25.4
B/|,/fnOz
25.942.8
BMn02
24.226.6
Ggt
sourceMnGgtnillow
NfrìO
33.t37.9
lvfno
5.0
6.1
ns
high
4l2725
13.111.111.9
755
433528
866
472925
40.830.735.1
888
nil low high
35.039.9
a Values separated by more than the appropriate LSD were statistically different.
The dry weight of roots perplant was more sensitive to treatmens than dry weight
of shoots and all Mn sources caused very large increases (the smallest increase was I15 Vo
and the largest 265 7o), especially at nil Ggt (table 6.6). Individual Mn sources were not
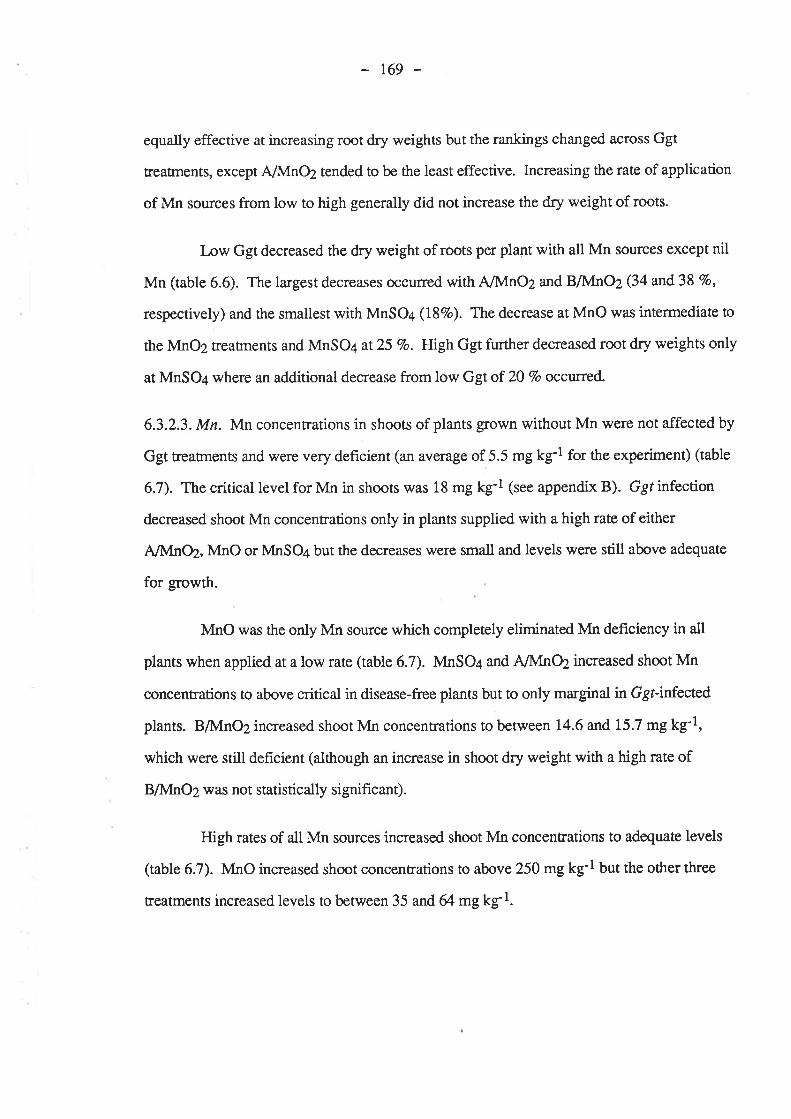
169 -
equa[y effective at increasing root dry weights but the rankings changed across Ggt
treatnents, except AffinØtended to be the least effective. Increasing the rate of application
of Mn sources from low to high generally did not increase the dry weight of roots.
Low Ggt decreased the dry weight of roots per plant with all Mn sources except nil
Mn (table 6.6). The largest decreases occurred with A/lvInOz and BAInOz (34 and 38 Vo,
respectively) and the smallest with MnSOa 087o). The decrease at MnO was intermediate to
the MnO2 rreaünents and MnSO 4 at25 7o. Hligh Ggt further decreased root dry weights only
at MnSOa where an additional decrease from low Ggt of 20 7o occwred.
6.3.2.3. Mn. Mnconcentrations in shoots of plants grown without Mn were not affected by
Ggt treatrnents and rwere very deficient (an average of 5.5 mg kg-l for the experiment) (table
6.7). The critical level for Mn in shoots was 18 mg kg-l (see appendix B). Ggt infection
decreased shoot Mn concentrations only in plants supplied with a high rate of either
A/I4nO2, MnO or MnSO+ but the decreases were small and levels were still above adequate
for growth.
MnO was the only Mn source which completely eliminated Mn deficiency in all
plants when applied at a low rate (table 6.7). MnSO¿ and AMnO2 increased shoot Mn
concentrations to above critical in disease-free plants but to only marginal in Ggr-infected
plants. BMnOz increased shoot Mn concentrations to between 14.6 and 15.7 mg kg-l,
which were still defrcient (although an increase in shoot dry weight with a high rate of
B/lvlnO2 was not statistically signifrcant).
High rates of all Mn sources increased shoot Mn concenEations to adequate levels
(table 6.7). MnO increased shoot concentrations to above 250 mg kg-l but the other three
treatments increased levels to between 35 and 64 mg kg-1.
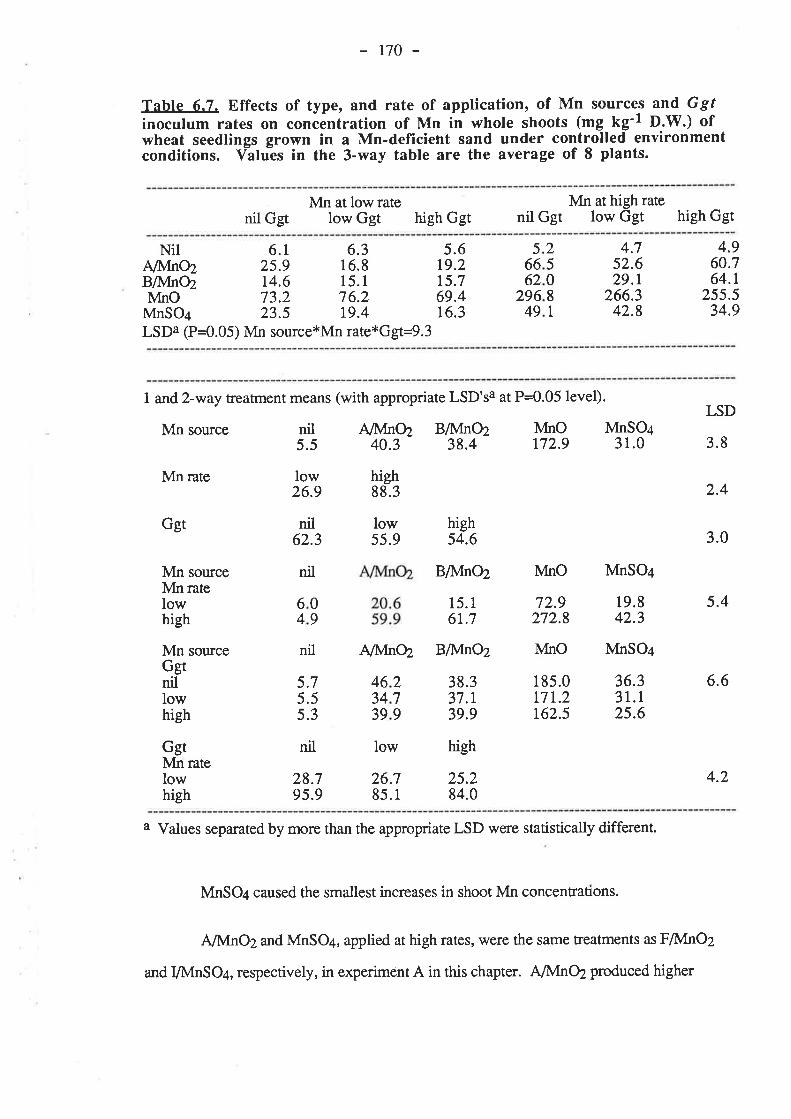
r70 -
Table 6.7. Effects of type, and rate of application, of Mn sources and Ggúinoculum rates on concentration of Mn in whole shoots (mg kg'l D.W.) ofwheat seedlings grown in a Mn-deficient sand under controlled environmentconditions. Vãluls in the 3-way table are the average of 8 plants.
nil GgtMn atlowrate
low Ggt high GgtMn at high rate
nil Ggt low Ggt high Ggt
Nil 6.t 6.3 5.6All,Án}z 25.9 16.8 19.2B/MnOz 14.6 15.1 15.7MnO 73.2 76.2 69.4MnSO¿ 23.5 19.4 16.3
LSDa (P=0.05) Mn source*Mn rate*Ggt=9.3
25081
566629649
2
4.752.629.r
266.342.8
4.960.764.1
255.534.9
1 and Z-way treatment means (with appropriate LSD'sa at P=0.05 level).
Mn source
Mn rate
nil A/lvlnø Bll,InO2 N4nO MnSO¿5.5 40.3 38.4 172.9 31.0
LSD
3.8
2.4
3.0
5.4
Ggt
low26.9
nil62.3
6
28.795.9
high88.3
low55.9
26.785.1
high54.6
B/I\,fnØ lvIno MnSO¿Mn sourceMn ratelowhigh
Mn sourceGgtnillowhigh
GgtMn ratelowhigh
nil
09
nil A/lvInO2 B/lvlnø lvfrro MnSO¿
415.161.7
38.337.r39.9
nil low high
72.9272.8
r85.0t7t.2162.5
19.842.3
36.331.125.6
6.6279
463439
5.75.55.3
25.284.0
4.2
a Values separated by more than the appropriate LSD were statistically different.
MnSO+ caused the smallest increases in shoot Mn concentrations.
AMnOZ and MnSO4, applied at high rates, were the same treatments as FilvlnO2
and VMnSO4, respectively, in experiment A in this chapter. AA4nø produced higher
t7l
concentrations of Mn in shoots than I/MnØ (67 compared to 40 mg kg-l in disease-free
plans) but A/lvInSO4 produced lower concentrations than VMnSO¿ (49 compared to 68 mg
ke-1).
Root Mn concentrations were increased from an average of 27.9 mg kg-l at nil Mn,
regardless of Ggt trearments, to 78.3 and226 mg kg-1, respectively, with low and high rates
of MnSOa (table 6.8). High Ggt caused a small decrease in root Mn concentrations where
plants had been supplied with MnSO¿ but not in nil Mn treafnents. Low Ggt did not affect
root Mn concentrations. Mn analysis of roots from plants supplied with Mn oxides were
confounded by surface contamination of the roots with oxide particles and were not included
in statistical analysis of the data.
6.3.2.4. Nutrient composition of plants. The concentrations of iron, copper, molybdenum,
zinc, potassium, phosphorus and sulphur were all at adequate or luxury levels for growth of
wheat seedlings, regardless of effects of Mn or Ggt treatments (data not presented).
Ggr infection did not affect the concentration of Ca in shoots (table 6.9). All Mn
sources dec¡eased shoot concentrations of Ca but the size of the decrease depended on the
rate of application and the Mn source (tabte 6.9). At a low rate of application MnSO¿,
BAI¡O2 and MnO decreased shoot levels from 9939 mgkg-l at nil Mn to be¡ween 7345 and
7862mgkg-l bot A/lvInO2 decreased levels further to 6069 mg kg,l. At a high r¿te of
application A/lvInO2 caused a very large decrease in Ca in shoots (from 97 56 mgkg-l at nil
Mn to 7467 mgkg-l). This level of shoot Ca was below published critical levels for wheat
seedlings (Reuter and Robinson 1986). BMnOZ decreased shoot concentrations to marginal
levels (an average of 4601 mg kg-l) but MnO and MnSO4 caused only small decreases, to an
average of 7203 and8124 mg kg-l, respectively. The effect of a high rate of A/lvfn02 on
shoot Ca concentrations rwas the same as F/lr4nØ in experiment A. Concentrations of Ca in
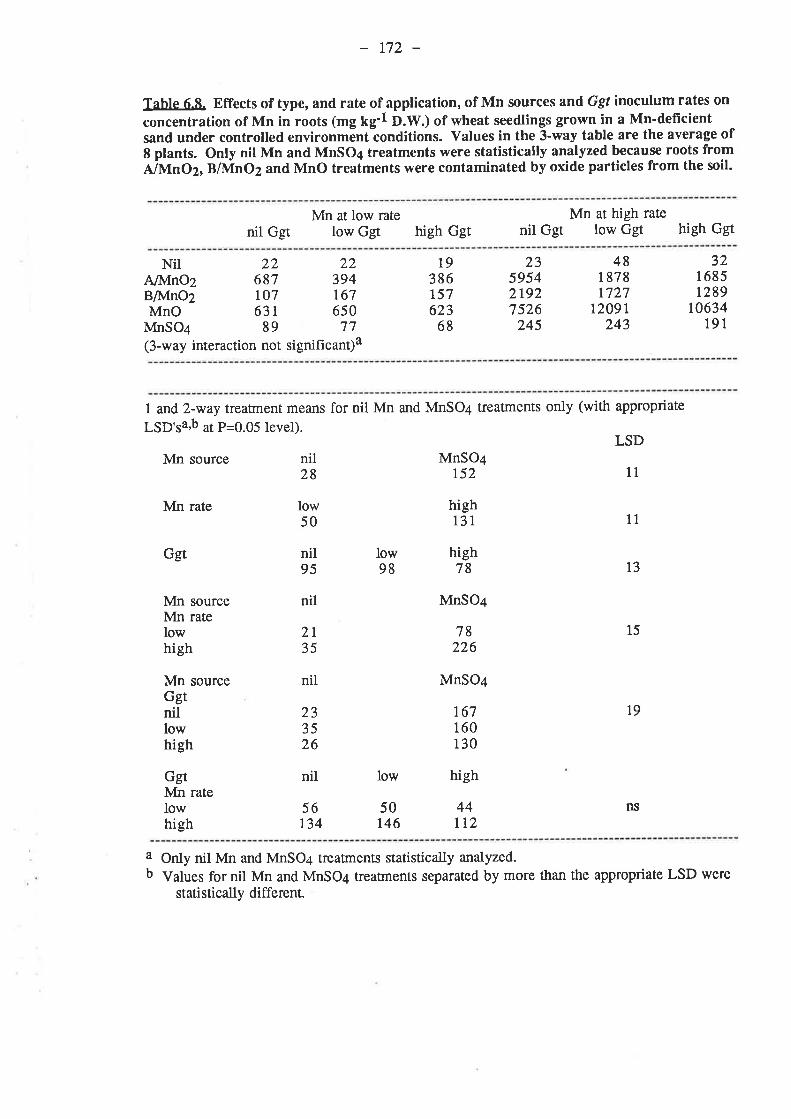
r72 -
Table 6.8. Effects of type, and rate of application, of Mn sources and Ggf inoculum rates on
concentration of Mn in roots (mg Lg'l n.W.) of wheat seedlings grown in a Mn-deficientsand under controlled environmõntlonditions. Values in the 3-way table are the average ofI plants. Only nil Mn and MnS04 treatments were statistically analyzed begau* roots from
^A/MrrO2, B/MnO2 and MnO treatments were contaminated by oxide particles from the soil.
nil GgtMn at low rate
low Ggt high GgtMn at high rate
nil Ggf tow Ggt high Ggt
Nil 22 22AMnOz 687 394B[vÍnO2 lO7 167MnO 631 650MnSO4 89 77(3-way interaction not significant)a
t9386157623
68
23595421927 526
245
481 8781727
12091,243
32I 685t289
t063419r
1 and 2-way treaünent means for nil Mn and MnSOa treatnents only (with appropriate
LSD'sa'b at P=0.05 level).LSD
Mn source nil MnSO+28 r52 11
Ggt
high
Mn rate
Mn sourceMn ratelowhigh
Mn sourceGgtnillow
GgtMn ratelowhigh
low50
nil95
nil
low98
hight3t
high78
MnSO+
78226
MnSO¿
t67160r30
44lt2
1l
t3
15
19
NS
2I35
nil
233526
nil low high
56134
50146
a Only nil Mn and MnSO+ treaûnents statistically analyzed.b values for nil Mn and Mnso¿ Íeatfnents separated by more than the appropriate LsD were
statistically different.
173 -
plant roots were very high for all treatments because of contamination from the soil
which was 80-90 7o CaCO3 and treatrnent effects were probably not very meaningful (table
6.10). However, Ggr infection tended to decrease root Ca concentrations and Mn sources
(except A/À4nO2) to increase them.
l,ow Ggt caused a very small decrease in concentration of Mg in shoots (less than 7
Vo),regardless of Mn source (table 6.11). High Ggt did not further decrease shoot Mg
concentrations. Shoot concentations of Mg at nil Mn were decreased from 1960 mg kg-l to
1167 mg kg-l *ith a low rate of application of AÆr4nO2 but the other three Mn sources
caused even smaller decreases (shoot levels to be¡ween 1356 and 1425 mgkgl). MnSO+
and MnO also caused small decreases in shoot Mg concentrations when applied at high rates
but A/lvInO2 and BMnØ both caused large decreases (from 1825 mg kgl at nil Mn to 547
andT 54 mg kg-l, respectively). The concentrations of Mg in shoots with a high rate of
A/I\4nø and B/NfnO2 may have been defrcient for plant growth (Reuter and Robinson
1e86).
Ggr infection decreased root Mg concentrations from 5852 mg kg-l itt disease-free
plants at nil Mn to 4391mg kg-l at low Ggt and further to 3849 mg kg l at high Ggt (table
6.12). Ggr infection did not significantly decrease root Mg concentrations in plants which
had been supplied with Mn. Root Mg concentrations were largely unaffected by Mn sources
applied at a low rate although A {nO2 caused a small decrease and MnSO4 a small increase.
However, at a high rate of application AMnOz caused a very large decrease from an average
of 4&9 mg kg- 1 at nil Mn to 1073 mg kg-I. B/NInO2 decreased Mg concentrations to 1983
mg kg-l but MnO did not alter levels and MnSOa caused an increase to 5428 mg kgl.
Ggr infection did not affect B concentrations in plants (tables 6.13,6.14). At a low
rate of application, only MnSO¿ caused a significant decrease in shoot B concentrations from
nil Mn but the effect was small (from an average of 42 mgkgl to 28 mg tg-l¡ (table 6.13).
All Mn sources at a high application rate decreased shoot B concentrations; from an average
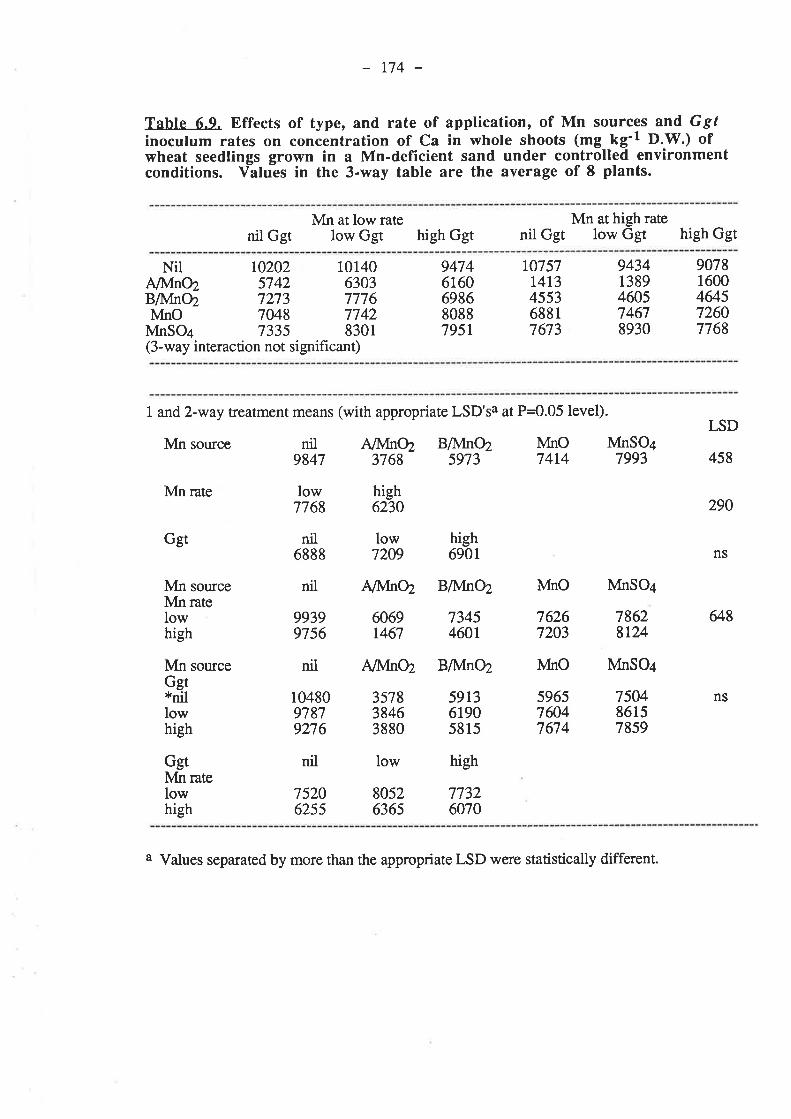
r74 -
Table 6.o. Effects of type, and rate of apptication, of Mn sources and Ggfinoculum rates on concentration of Ca in whole shoots (mg kg'l D.W.) ofwheat seedlings grown in a Mn-deficient sand under controlled environmentconditions. Values in the 3-way table are the average of 8 plants.
nil GgrMn at low rate
low Ggt high GgtMn at high rate
nil Ggt low Ggt high Ggt
Nil 10202 10140A/lvlnø 5742 6303BMnO2 7273 7776lvtno 7048 7742MnSO+ 7335 8301(3-way interaction not significant)
9474616069868088795t
10757r413455368817673
94341389460574678930
90781600464572607768
I and2-way treatment means (with appropriate LSD'sa at P=0.05 level).
Mn source
Mn rate
Mn soruceMn ratelowhigh
nil A/N4nq BMnO2 VlnO MnSOa9847 3768 5973 7414 7993
low7768
nil6888
99399756
1048097879276
75206255
low7209
û69r467
357838463880
80s26365
high6901
73454601
591361905815
77326070
76267203
596s76047674
78628t24
I.SD
458
ns
&8
ns
290high6230
Ggt
nil A/l\4nO2 Bll\[nù2 lvfno MnSO¿
Mn sourceGgt*nillowhigh
GgtMn ratelowhigh
nil AiN4nø BMnO2 lvÍnO MnSO¿
750486157859
nil low high
a Values separated by more than the appropriate LSD were statistically different.
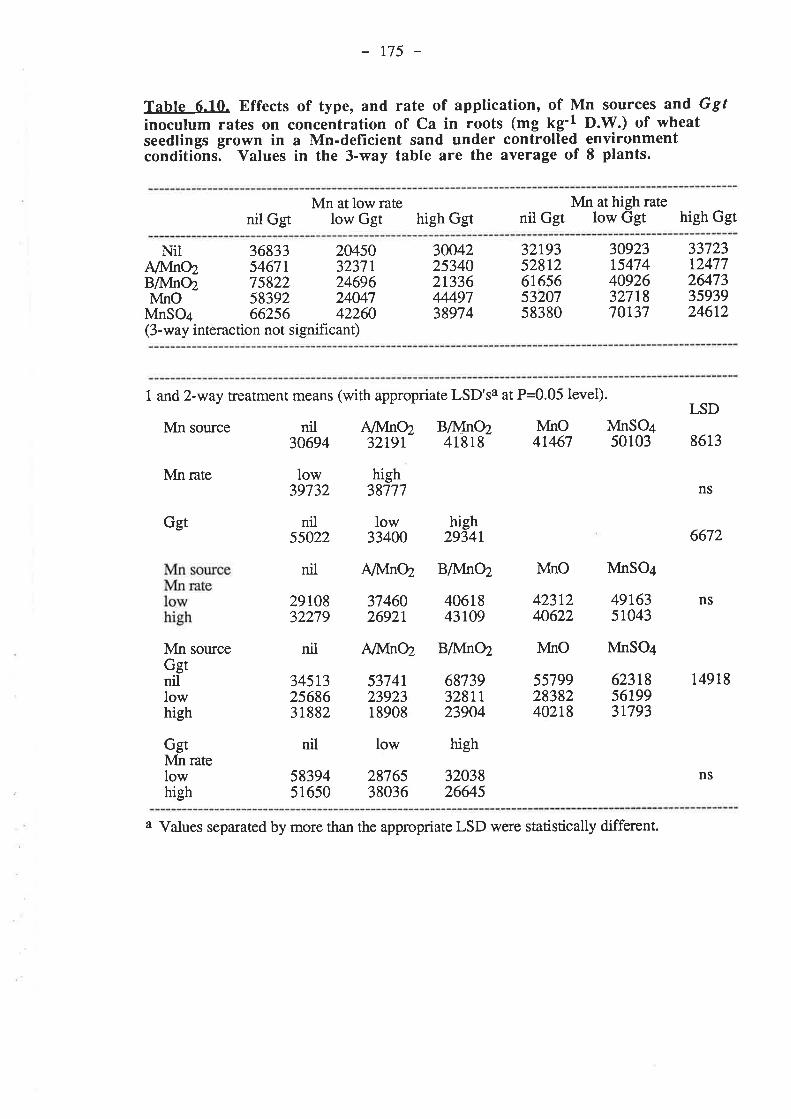
r75 -
Table 6.10. Effects of type, and rate of apptication, of Mn sources and Ggfinoculum rates on concentration of Ca in roots (mg kg'l D.W.) of wheatseedlings grown in a Mn-deficient sand under controlled environmentconditiõns. Values in the 3-way table are the average of 8 plants.
nil GgtMn at low rate
low Ggt high GgtMn at high rate
nil Ggt low Ggt high Ggt
Nil 36833 20450A/N4nO2 54671 32371B/I4nO2 75822 24696MnO 58392 24047MnSO¿ 66256 42260(3-way interaction not significant)
3W42253402t3364449738974
32193528t26r6565320758380
30923t547440926327t870t37
33723t24772&733s939246t2
1 and 2-way treatment means (with appropriate LSD'sa at P=0.05 level).
Mn source
Mn rate
GgtMn rate
nil30694
low39732
nil55022
nil
29r0832279
nil
345132568631882
nil
5839451650
low33400
3746026921
5374r2392318908
2876538036
high2934r
4061843r09
68739328r123904
32038266/'5
4231240622
557992838240218
4916351043
623t8561993\793
LSD
8613
6672
NS
14918
ns
A/}Ino2 BMnO2 MnO MnSO+32r9t 41818 41467 50103
38777high
ns
Ggt
sourceMnGgtnillow
A/lvfnq BMnO2 À/tno MnSO¿
AlNlnOz BllvÚn}z MnO MnSO+
high
low high
lowhigh
a Values separated by more than the appropriate LSD were statistically different.

t76 -
Table 6.11. Effects of type, and rate of application, of Mn sources and Gglinoculum rates on concentration of Mg in whole shoots (mg kg'l D.W.) ofwheat seedlings grown in a Mn-deficient sand under controlled environmentconditions. Vãtues in the 3-way table are the average of 8 plants.
nil GgtMn at low rate
low Ggt high GgtMn at high rate
nil Ggt low Ggt high Ggt
Nil 1902 2056A/lvfno2 1223 1195Bft,tfnÛz 1416 1315lvfnO 1457 1267MnSOa 1512 1404(3-way interaction not si gnificant)
1,92310821338r3021358
1861712812
r607t492
1769389688
1501t496
184554r763
t4321228
1 and 2-way treatment means (with appropriate LSD'sa at P=0.05 level).
Mn source nil1893
AMnO2 B/1,ÃnO2 lvtno MnSO¿8s7 1055 1427 r4L5
hight209
76
48
59
108
Ggt
13421513
r5321367t367
t4251406
r50212931293
LSD
ns
ns
Mn rate
Mn sourceMn ratelowhigh
GgtMn ratelowhigh
nil A fno2 BMnO2 IvhO MnSO+
low1450
nil1399
1960r825
188119t31884
low1308
highr281
t356754
ITT410501050
1401tt62
r167547
MnGgtnillowhigh
source nil AMnO2 B/}4nØ l/ho MnSOa
967812812
nil low high
1502t297
t4471 168
a Values separated by more than the appropriate LSD were statistically different.
of 49 mg kg-l at nil Mn to bet'ween 27 and 35 mg kg-l, depending on Mn source. Root B
concentrations were decreased by atl Mn sources, regardless of type or application rate, from
an average of 37 mgkg-l ut nil Mn to between 12 and 14 mgkg-l (table 6.14)-
r77 -
A/À4nø, applied at a high rate, was the same treaünent as FMnO2 in experiment A
in this chapter and caused very similar effects on the nutrient composition of plants as
F/lvfnO2. The only exception occurred with the concentration of B in roots. FMnOz
decreased root B concentrations to extremely low levels (much lower than caused by the
other Mn sources in experiment A) but AMnO2 caused only a moderate decrease in root B
concentrations (and only to the same extent as the other Mn sources in experiment B).
6.4. Discussion and conclusions.
Thirteen different sources of Mn \#ere tested in two experiments for their ability to
supply Mn to wheat seedlings in pots and to decrease take-all on wheat roots. These thirteen
sources of Mn were MnSO¿ (either mixed through soil at sowing or at2 rates prior to a2
week incubation period, applied to leaves or as a seed "d¡ench"), a commercial preparation
of powdered MnOz (either mixed through soil at sowing or atz rates prior to a 2 week
incubation period), a slurry of laboratory-prepared MnO2 mixed through soil3 days before
sowing at 2 rates or as MnO mixed through soil at sowing at 2 rates.
Three Mn sources did not cause large decreases in the total length of black stela¡
lesions on wheat roots. These were MnSO4 applied to leaves and commercially prepared
MnO2 mixed through soil at a high rate of application (17 mg Mn per kg of soil), either at
sowing or prior to incubation. A low rate of application of the commercial MnO2 did cause
large decreases in take-all.
Twelve of the thirteen Mn sources supplied sufficient Mn to wheat seedlings for
growth to be maximized (in terms of Mn nutrition). The exception w¿ts MnO2 slurry applied
at a low rate (1.7 mg Mn kg-l) which resulted in Mn concentrations in shoots below the
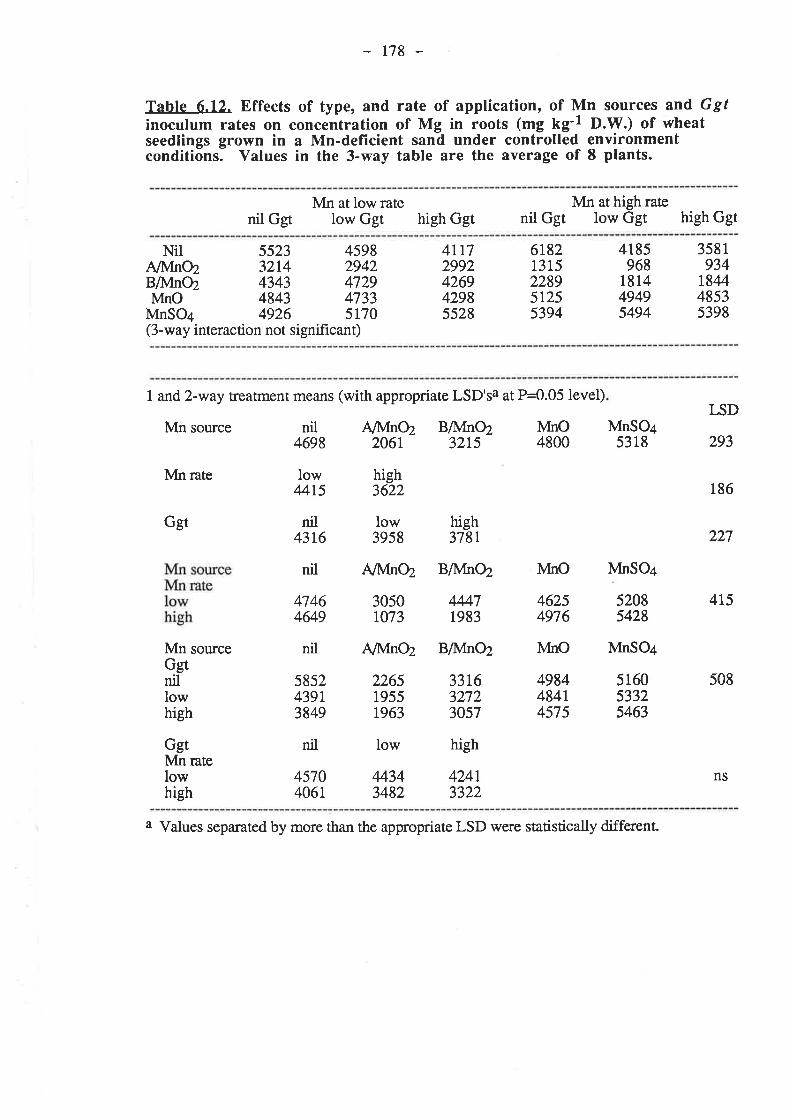
178 -
Tahle 6.12. Effects of type, and rate of apptication, of Mn sources and Ggfinoculum rates on concentration of Mg in roots (mg kg'l D.W.) of wheatseedlings grown in a Mn-deficient sand under controlled environmentconditions. Values in the 3-way table are the average of 8 plants.
nil GgtMn at low rate
low Ggt high GgtMn at high rate
nil Ggt low Ggt high Ggt
Nil 5523 4598A/l\,InO2 3214 2942BMnO2 4343 4729lvlno 4843 4733MnSO+ 4926 5170(3-way interaction not significant)
4tr72992426942985528
6t82131522895r255394
4185968
181449495494
358 1
934r8M48535398
1 and 2-way treatment means (with appropriate LSD'sa at P=0.05 level)
Mn source nil A/I,fnø BAfnø lvfno4698 2061 3215 4800
Mn rate high3622
low44t5
47464649
5852439r3849
4570406t
low3958
3050to73
226519551963
M343482
high378r
BMnOz
44471983
33t632723057
424t3322
46254976
4984484t4575
MnSO¿5318
52085428
516053325463
LSD
293
186
415
508
ns
Ggt nil4316 227
sourceMnGgtnillow
nil A/[4nq l{no lt¡InSO¿
nil AMnOz BllYInO2 MnO MnSO¿
high
GgtMn ratelowhigh
nil low high
a Values separated by more than the appropriate LSD were statistically different.

t79 -
Tahte 6.13. Effects of type, and rate of application, of Mn sources and Gglinoculum rates on concentration of B in whole shoots (mg fg'r D.\{.) ofwheat seedlings grown in a Mn-deficient sand under controlled environmentconditions. Vãluts in the 3-way table are the average of 8 plants.
nil GgtMn at low rate
low Ggt high GgtMn at high rate
nil Ggt low Ggt high Ggt
Nil 35.4 47.1A/N4nø 30.1 37.4B/l¿lnø 29.9 28.3NfnO 28.4 30.8MnSO¿ 24.6 28.5(3-way interaction not significant)
42.434.033.327.730.0
48.920.623.83s.627.4
47.O30.327.134.933.6
50.931.629.333.927.5
1 and 2-way treatment means (with appropriate LSD'sa at P=0.05 level).
Mn source
Mn ¡ate
All,InO2 BMnO230.7 28.6
high33.5
nil45
low32.5
4r.648.9
nil
42.247.046.t
29.731.3
30.526.7
26.927.73t.3
33.s34.7
Ivfno3r.9
29.O34.8
32.032.830.8
MnSO¿28.6
27.729.5
MnSO+
26.031.128.8
LSD
9.3
13.1
ns
ns
3
NS
nsGgt
2s.333.932.8
nil30.5
nil B/lvlnø llno MnSO¿
high34.r
low34.5
Mn sourceMn ratelowhigh
Mn sourceGgtnillowhigh
GgtMn ratelowhigh
BMnO2 À{nO
nil low high
34.434.6
a Values separated by more than the appropriate LSD were statistically differenr
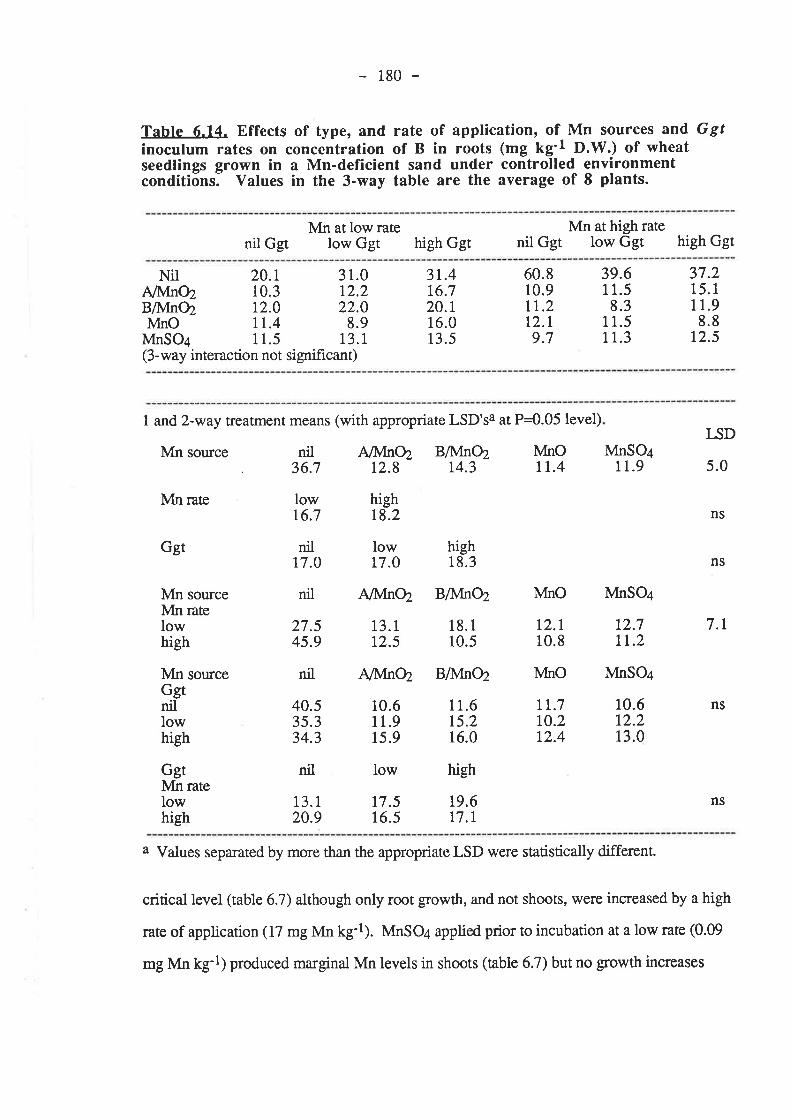
180 -
Tahte 6.14. Effects of type, and rate of application, of Mn sources and Ggfinoculum rates on concentration of B in roots (mg kg'l D.W.) of wheatseedlings grown in a Mn-deficient sand under controlled environmentconditiõns. Values in the 3-way tabte are the average of 8 plants.
nil GgtMn at low ¡ate
low Ggt high GgtMn at high rate
nil Ggt low Ggt high Ggt
Nil 20.r 31.0AMnO2 10.3 12.2BMnO2 12.0 22.0MnO ll.4 8.9MnSO+ 11.5 13.1(3-way interaction not significant)
3r.416.720.116.013.5
60.810.911.2t2.l9.7
39.611.58.3
11.5rt.3
37.215.111.98.8
12.5
I and2-way treatment means (with appropriate LSD'sa at P=0.05 level)
Mn source nil Al\/fn}z Bll'/fn}z MnO36.7 12.8 r4.3 rr.4
Mn rate
GgtMn ratelowhigh
low16.7
nil77.0
27.545.9
40.535.334.3
13.120.9
hight8.2
low17.0
13.112.5
10.611.915.9
17.516.5
high18.3
BA,fn02
18. 1
10.5
11.6t5.216.0
19.6T7.I
12.110.8
tr.710.2t2.4
MnSO¿11.9
12.7lt.2
10.612.213.0
LSD
5.0
7.1
ns
ns
ns
nsGgt
Mn sourceMn ratelowhigh
sourceMnGgtnillow
nil A/I,Inq lvfnO MnSO¿
nil A/lvInø BMnO2 À{nO MnSO¿
high
nil low high
a Values separated by more than the appropriate LSD were statistically different.
critical level (table 6.7) although only root growth, and not shoots, were increased by a high
rate of application (17 mg Mn tg-t¡. MnSO+ applied prior to incubation at a low rate (0.09
mg Mn kg-l) produced marginal Mn levels in shoots (table 6.7) but no growth increases
181
occurred 'wirh a high rate of application (0.36 mg Mn kgl). A high rate of commercial
MnO2 produced shoot Mn concentrations more than double the critical level (table 6.7).
MnSO+ applied to the leaves of wheat seedlings had little effect on uke-all. Reis ¿r
al. (L982)reported that folia¡ applications of Mn to wheat seedlings growing in a siliceous
sand medium did not affect Ggrinfection. Mn is poorly translocated in phloem (Nable and
I-oneragan 1985a,b) and foliar-applied MnSO¿ did not increase the concentration of Mn in
ttre ¡oots of treated plants and yet there was an increase in the dry weight of roots of treated
planß. This increase in root dry weight may have been due to improved nutrition of shoots
increasing the supply (or quality) of photosynthates to roots. However, the roots of treated
plants were still as susceptible to Ggr infection as Mn-defrcient plants. These results suggest
that Mn is required in the tissues local to Ggr infection sites for decreases in disease to occur.
MnSO4, applied as a seed "drench", was effective in decreasing take-all because it
increased the shoot and root concentrations of Mn in teated plants to adequate levels for
gro\¡/th. This Mn source would not have increased soil Mn levels so precludes the
possibility that Mn decreased take-all through toxic levels of Mn2+ in the soil (Graham and
Rovira 1984).
Commercial MnO2, mixed through soil at a high rate, incteased shoot Mn levels
(root Mn concentrations could not be measured) but did not decrease take-all. A low rate of
application of the same substance also increased shoot Mn levels (although not to the same
extent as the high rate) and decreased take-all. The high rate of application of commercial
MnO2 (not the low rate) caused some very large changes in the nutrient composition of
treated plants. The concentration of Ca in the shoots of plants supplied with a high rate of
commercial MnO2 were reduced to deficient levels (root concentrations of Ca could not be
accurately measured because of contamination from the soil which comprises 80-9O 7o
Ç¿cq). Although all Mn sources tended to decrease shoot Ca concentrations (especially the
high rate of MnO2 sturry) only a high rate of commercial MnO2 decreased levels below
t82 -
adequate forplant gowth. A high rate of commercial MnØ may have increased the
susceptibility of treated plants because it induced Ca defrciency. Ca has a critical metabolic
role in carbohydrate removal, neutralization of cell acids, cell wall deposition, and formation
of pectates in the middle lamella (Mengel and Kirkby 1982). Ca decreased infection by
Rhizoctonía andPythiwn (fluber 1980) but take-all of wheat and scab of potatoes increased
after application of Ca (Huber 1980, Huber 1981).
In experiment A commercial MnO2 decreased concentrations of B in roots of treated
planß to almost undetectable levels but did not affect B levels in shoots differently to other
Mn sources. However, this effect was not reproduced in experiment B so changes in root
levels of B with commercial MnØ (at a high rate) does not offer any prospects for
explaining the ineffectiveness of this Mn source in decreasing take-all.
A high rate of application of commercial Mnø caused very large decreases in plant
(in both shoots and roots) concentrations of Mg to levels which may have been deflrcient for
plant growth. A high rate of MnO2 slurry caused simila¡ changes but MnSO+ treatments had
little effect on plant Mg levels. A high rate of MnO2 slurry caused large decreases in take-all
so it seems that the very large decreases in Mg in plants treated with either MnOZ source (at
high rates) did not increase their susceptibility to take-all.
Mn is taken up by plants as Mn2+ and translocated through xylem as free divalent
cations (Graham 1979>. This suggests that commercial MnOz was affecting the nutrient
composition of plants at sites extemal to roots and perhaps in the general soil matrix because
the reduction of MnO2 to Mn2+ must occur outside the roots. MnO2 has a very high capacity
to exchange and adsorb metal ions (Jarvis 1984b, Jorgensen and Jensen 1984) and high
rates of commercial MnOZ may have interacted differently (or to a larger extent) with C4 Mg
and B in the soil than MnOz slurry, MnO or MnSO¿. Mn oxides may also affect organic
matter cycles in soil because of reactions with phenolic acids (Lehmann et aI. 1987).
183 -
In section 2.3.3. of chapter 2, results were presented from all pot experiments
which showed that no further decreases in take-all occured once plant levels of Mn were
adequate for growth. The results from the two pot experiments reported here also
demonstrate the same relationship. Figure 6.3 shows that there was very little difference in
the size of decreases in take-all caused by all Mn sources (except for commercial MnO2 at a
high rate) despite very large differences in shoot Mn concentrations between Mn sources.
Extensive oxidation by Ggt of Mn2+ to blaclç/brown oxides in inoculated agar discs
and on the surface of infected roots occured in the presence of high rates of application of
MnO and MnSO+ (both treatments caused large decreases in take-all). No Mn oxide deposits
of this type were observed in pots supplied with A/lVInØ (no disease reduction occurred).
However, extensive Mn deposition by Ggr hyphae rwas not necessary for decreases in take-
all to occur because disease was also heavily decreased at low rates of MnO and MnSO+
application, wirh seed-applied Mn and BMnO2. There was no evidence of Mn deposition
by hyphae in these latter treatments.
MnO was the Mn oxide most available to plants. MnO produced higher shoot Mn
concentr¿tions than either commercial MnOz or MnO2 slurry applied at the saÍle rate of
application. Mn is taken up by plants predominantly as Mn2+ (Gratram 1979) and higher Mn
oxides have to be reduced to soluble Mn2+ before uptake by plants can occur (Leeper 1970).
The availability of Mn oxides is related to the crystallinity, particle size and ease of reduction
of the oxide (Jones and Leeper 1951a,b). Most Mn oxides will be available to plants
providing they occur as very small particles (which create large surface a¡eas for
root/oxide/soil contact) but highly crystalline oúdes are generally less available. The surface
of Mn oxides also appear to 'age' in soils which will decrease their availability with time
(Jones and I-eeper 1951b). Pa¡:ticle size in the MnO product was much smaller than in
commercial MnO2 making MnO more plant-available. However, the Mnø slurry was a
suspension of very fine particles and was still poorly available so MnO may have been more
available to plants not only because of small particle size or lower crystallinity but also
184 -
because Mn was already reduced. Mnø slurry was less available to plants than commercial
MnO2 but this may have been due to poorer mixing of the slurry through soil than was
achieved with dry, powdered commercial MnOZ. Incomplete mixing of MnOZ slurry
through soil would have decreased contact reduction (Godo and Reisenauer 1980, U¡en
19S1) through less frequent interceptions of oxide particles by roots. Obviously there is a
need for further investigations into the chemical and physical properties of Mn oxides which
confer availability to plants and how they impact on Ggt infection.
Additions of MnSO¿ to soil prior to incubation were readily available to plants and
produced shoot concentrations of Mn comparable with ttre oxide treaürients even though
rates of application of MnSO¿ were much lower. Marca¡ (1986) showed that the recovery of
Mn2+, added to V/angary sand, decreased sharply with time and negligible levels of added
Mn2+ were extracted with water from soil samples 10-20 days after addition. Mn2+ added to
soil was probably present at sowing as a range of compounds; adsorbed lvfn2+ on MnO2
(Jauregui and Reisenauer 1982) or CaCO3 surfaces (McBride 1979), MnCO3 (McBride
1979),hydrous oxides (Jarvis 1984a) and oxides (I-eeper 1970).

185 -
6.5. References.
Godo, G.H. and Reisenauer, H.M. (1980). Plant effects on soil manganese availability. SoilSci. Soc. Amer. J.44,993-5.
Graham, R.D. (1979). Transport of copper and manganese to the xylem exudate ofsunflower. Plant CzII Environ.2, 139-43.
Graham, R.D. and Rovira, A.D. (1984). A role for manganese in the resistance of wheatplants to take-all. Plant Soí178, Ml-s.
Huber, D.M. (1980). The role of mineral nutrition in defense. In "Plant Disease. AnAdvanced Treatise." (Eds. J.G. Horsfall and E.B. Cowling.) Vol V. pp. 381-406.(Academic Press: New York.)
Huber, D.M. (1981). The role of nutrients and chemicals. In "Biology And Control OfTake-all." (Eds. M.J.C. Asher and P.J. Shipton.) pp.3l7-4L (Academic Press:London.)
Jarvis, S.C. (1984)a. The forms of occurrence of manganese in some acidic soils. "I. SoilSct'.35, 427-9.
Jarvis, S.C. (1984)b. The association of cobalt withacidic pennanent grassland soils. ,I. SoiI Sci.
Jauregui, M.A. and Reisenauer, H.M. (1932). Calcium carbogqtg and_manganese dioxide as
legulators of available manganese and iron. Soil. Sci. t34,105-10.
Jones, L.H.P. and Leeper, G.'W. (1951)a. The availability of va¡ious manganese oxides toplants. Plant Soil.3, I4L-53.
Jones, L.H.P. and Leeper, G.W. (1951)b. Available manganese oxides in neutral andalkaline soils. Plant Soí1. 3, 154-59.
Jorgensen, E. and Jensen, A. (1984). Processes of metal ions in the environment. In "Metal- Ions In Biological Systems." (Ed.H. Sigel.) 18, 61-103. (Marcel Bekker Inc.: NewYork and Basel.)
Leeper, G.V/. (1970). "Six Trace Elements In Soils." (Melb. Univ. Press.)
Lehmann, R.G., Cheng, H.H. and Harsh, J.B. (1987). Oxidation of phenolic acids by soiliron and manganese oxides. Soil Sct. Soc. Amer. J. 51,352-6.
Marcar, N.E. (1986). Genotypic va¡iation for manganese efficiency in cereals. Ph.D.Thesis. Waite Agnc. Res. Instit., Univ. Adelaide, South Aust.
Matcar, N.E. and Graham, R.D. (1986). Effect of seed manganese content on the growth ofwheat (Tritícwn aestívun) under manganese deficiency. Plant Soil.96, 165-73.
McBride, M.B. (1979). Chemisorption and precipitation of Mn2+ at CaCO¡ surfaces. SoilSci. Amer. J.43, 693-698.
easily reducible manganese in some35,431-8.

186 -
Mengel, K. and Kirkby, E.A. (1982). "Principles Of Plant Nutrition." Chpt. 14, pp. Ml-50. (Int. Pot. Instit.: Switzerland.)
Nable, R.O. and Loneragan, J.F. (1984)a. Translocation of manganese in suÞterraneanclover (Trifoliurn iubteruaneurnL. cv. Seaton Park). 1. Redistribution duringvegetative $owth. Aust. J. Plant Physiol.ll, 101-11.
Nable, R.O. and Loneragan, J.F. (1984)b. Translocation of manganese in su_bterraneanclover (Trifoliurn iubterraneu¡nL. cv. Seaton Park). 11. Effects of leaf senescenceand of restricting supply of manganese to part of a split root system . Aust. J. PlantPhysiol.1l, 113-8.
Reis, E.M., Cook, R.J. and McNeal, B.L. (1982). Effect of mineral nutrition on take-all ofwheat. P hytopathol. 72, 224-9.
Reuter, D.J. and Robinson, J.B. (1986). Plant Analysis. An Interpretation Manual. (InkataPress: Melbourne, Sydney, Aust.)
Rovira, 4.D., Graham, R.D. and Ascher, J.S. (1985). Reduction in infection of wheat rootsby GaewnawØmyces grarninis var. titici with application of manganese to soil. In"Ècology and Management of Soil-borne Plant Pathogens". Proc. Section 5, 4th Int.Plant Pãthol. Congr. pp.212-4. (Amer. Phytopathol. Soc.: St. Paul, Minnesota.)
tlren, N.C. (1981). Chemical reduction of an insoluble higher oxide of manganese by plantroots. J. Plant Nutr.4,65-7I.
CHAPTER 7.
THE EFFECT OF MANGANESEFERTILTZATTON ON TAKE-ALL OF
FIELD-GROWN WHEAT
r87 -
CHAPTER. 7. THE EFFECT OF MANGANESE FERTILIZATION ONTAKE.ALL OF FIELD.GROWN WHEAT.
7.1. fntroduction.
Take-all is typically a greater problem on soils of moderate to high pH (Ga:rett
1936, Asher and Shipton 1981) and cold, dull conditions are also conducive to severe take-
all (Homby and Henden 1986). These soil types and conditions are also often associated
with Mn deficiency (Leeper 1970, Graham 1983). NII4+-N, which favours the release of
Mn from insoluble forms (Mulder and Gerretsen 1952) has been shown to decrease take-all
(Fluber et al. \968, Smiley and Cook lg73,MacNish and Speijers 1982, Taylor et al.
1983), whereas NO3--N may increase the level of the disease. A causal relationship between
Mn defrciency and severe take-all has been discovered under controlled environmental
conditions in wheat seedlings, both previously (Graham and Rovira 1984) and during this
thesis. The effect of Mn fertilization on take-all of wheat growing under Mn-deficient
conditions in the field has not been tested in Austratia. Decreases in øke-all of field-grown
wheat with soil-applied Mn fertilizers have been recently reported from Indiana (Huber and
Wilhelm 1987) but foliar-applied Mn did not decrease take-all in field-grown wheat in
V/ashington (Reis er aL 1982). The effect of Mn fertilizers on take-all of wheat was tested in
two field experiments on the Eyre Peninsula of South Australia over three consecutive
seasons. Both experiments were factorially designed with treatments applied in randomized
blocks; the first and larger (experiment A) involved 4 soil-applied Mn sources, 3 Ggt
inoculum rates, 5 replicates and2 foliar Mn treatrnents applied to split-plots and the second
and smaller (experiment B), 3 soil-applied Mn sources, 2 Ggt inoculum rates and 5
replicates.
7.2. Materials and Methods.
Both experiments were conducted at the same site (which had not been previously
cropped) on the property of Mr. John MacDougall at Tooligie, Eyre Peninsula, South
Australia. The soil was a brown calcareous sandy loam (Uc 2. 1 1 , North cote 7979). Main
188 -
plot dimensions were 1.5 m wide (8 rows) x 6 m long for both experiments. The a¡ea has a
Mediterranean climate and the properry an average annual rainfall of 430 mm. Rainfall in
1984,1985 and 1986 totalled 495,316,357 mm, respectively.
7.2.1. Experiment A
7.2.l.1.lnoculum. Ggr 500 was added to plots as infected rye-grass seed propagules
(supplied by Dr. A. Rovira) at rates of 2000 seeds m-2 (High Ggt). Low Ggt plots received
1000 infected and 1000 autoclaved seed propagules ¡¡-2. Control plots received 2000
autoclaved rye-gass seed propagules m-2 (nil Ggt). Ggr inoculum was applied with the
seed.
7.2.I.2.Mn. Soil-applied Mn was supplied to main plots in 3 diffe¡ent Mn compounds;
MnSO4, MnO or MnO2. MnSO¿ was incorporated into superphosphate (Mn-super) at 4O kg
Mn per tonne (grving 6.6 kg Mn ha-l) and drilled with the seed. Granular MnO2 [1]
(particles between 2 and 10 mm in diameter) was broadcast onto main plots prior to sowing
at 1.0, ¡u-l (giving 630 kg Mn ¡u-l¡ and ha:rowed in. MnO [1] (majority of particles less
than 0.001 mm in diameter) was similarly appted at 0.8 t ha-l (also giving 630 kg Mn ha-l).
Mn was sprayed onto foliage of split-plots 61 days after sowing as'Mangasol'R [1] at 6 I ha-
1 lgiving 1 kg Mn ha-l) (+FolMn); -FolMn split-plots were not sprayed.
7.2.1.3. Proced,ure. 7.2.I.3.1.1984. All plots received basal fertilizers at 165 kg ha-l of
single superphosphate containing (per tonne) 5 kg copper, 5 kg zinc,250 g molyMenum
and 250 g cobalt, and 30 kg ha-l of NII+NO3, drilled with the seed. The experiment was
sown on 15 June with the wheat cultivar Condor at 60 kg ha-l.
Twenty five plants were removed from every main plot 61 days after sowing (prior
to folia¡ spray of Mn) when plants were at mid-tillering (Zadok's growth stage; 22-24,
Zadoks et al. I974) and assessed for shoot dry weight, tillers per plant and Ggt infection.
1 supplied by Top Australia Ltd., Port Adelaide
189 -
The numbers of plants per metre of row were also counted in two 0.5 metre torws per plot at
this time. The number of seminal roots with black stelar lesions on each plant was recorded
and the results expressed as the percentage of diseased plants per plot and the percentage of
diseased seminal roots per plant. Sections of roots with black stela¡ lesions were removed
and plated onto PDA - Ggr was recovered from nearly all these root sections.
Twenty plants were removed from all split-ptots 105 days after sowing (g¡owth
stage; 37-39). Take-atl was scored on individual plants using the following method and
results expressed as an average score per split-plot;
0 no disease observed
I l-2 seminal roots with few black stelar lesions
2 up to 50 7o of seminal roots with lesions and no or few lesions
on crown roots
3 more than 50 Vo of alTroots with lesions and crown roots with
few lesions
4 as for 3 except crown roos with many lesions.
Youngest fully emerged leaf blades (YEBs) were removed from plants after disease
assessment and oven-dried separately to whole shoots.
Split-plots were scored for colour and vigour 131 days after sowing.
Split-plots were machine-ha¡¡ested for grain in late December
Shoot tissues and whole grain samples were prepared for Mn analysis by
nitric/perchloric acid digestion and measured with atomic absorption spectrophotometry
7.2.3.1.2.1985. The experiment \vas re-sown with 60 kg ha-l of Condor on 20
June. Basal fertilizers were re-applied with the seed at the same rates as in 1984 except
NlIaNO3 was broadcast one week prior to sowing. MnSO+ and MnO2 were also re-applied

190 -
except MnOz was re-applied as a finely-ground product (particle diameter less than 2 mm).
MnO was not re-applied nor was Ggr inoculum.
Plants were sampled from main plots 82 and t32 days after sowing, when growth
srages were at mid-tillering (growth stage; 22-24) and ear emergence (growth stage; 51-53),
respectively. Plots were also scored for colour and vigour at the frst sampling.
Foliar Mn treatnents were not applied.
Ggr infection at the first sampling was recorded as the number of seminal or crown
roots with black stelar lesions per plant.
Plants were assessed at the second sampling for the presence of completely
blackened sub-crown internodes, diseased seminal and diseased crown root systems. Plants
were also scored for take-all on an individual basis using the method of Weller and Cook
(1983). Main plots were machine-harvested for grain on23 December.
Whole shoots from the first sampling and YEBs from the second were prepared for
nutrient analysis by niric acid digestion and measured with an ARL inductively coupled
plasma atomic emission spectrometer. Grain was not analyzed for nutrient composition.
All data were analyzed with standard analysis of variance techniques appropriate to
factorial experiments in randomized blocks, or factorial experiments with split-plots.
7.2.2. Experiment B.
7 .2.2.1. Inoculum. Ggt 500 infected rye-grass seed propagules were agun used as
inoculum. Gamma-irradiated and autoclaved rye-grass seeds were inoculated with Ggt 5N
and kept at25o Cfor 24 days (cultures were regularly shaken to prevent hard coagulated
lumps forming). After 25 days, infected seed propagules were dried in a sterile air stream.
191
Control plots received 2000 autoclaved rye-grass seed propagules m-2 (-Ggt) and
+Ggt plots 2000 infected rye-grass seed propagules m-2. Ggt inoculum was drilled with the
seed.
7.2.1.2. Mn. lvÍn was supplied to plots in 2 different Mn compounds; MnSO+ or MnO2.
MnSOa was incorporated into superphosphate at 40 kg Mn per tonne (glving 7.5 kg Mn ha-
1) *d drilled with the seed. Finely-ground MnOz [1] (particle diameter less than 2 mm) was
drilled into the soil with the seeding rig in a pass prior to seeding at 1.0 t tra-l (gdng 630 kg
tvln ha-l). MnO2-treated plots received superphosphate at the same rate as in MnSOa-treated
plots.
7.2.1.3. Procedure. 7.2|13.1.1985. All plots received basal fertilizers at 187 kg ha-1 of
single superphosphate containing (per tonne) 5 kg copper,5 kg zinc,250 g molyMenum
and 250 g cobalt, and 70 kg ha-l NIIaNO3, drilled with the seed. The experiment was sown
on 20 June with the wheat cultivar Condor at 60 kg ha-l.
Plants were sampled in the same way and at the same times as experiment A in
1985. The numbers of plants per metre of row were counted at the first sampling in ¡wo 0.5
metre rows perplot. V/hole plots were machine-han¡ested for grain on23 December.
7 .2.I.3.2.1986. The experiment was re-sown with 60 kg ha-r of Bayonet
(sufficient quantities of suitable Condor seed were not available) on 27 June. Basal
fertilizers \ilere re-applied at the same rates as in 1985 and MnSO4 was also re-applied.
MnO2 rilas not re-applied nor was Ggt inoculum. The experiment was sampled at jointing
@rowth stage; 31) using the same procedure as in the second sampling in 1985 (except the
number of blackened sub-crown internodes was not recorded) and machine-harvested for
grain yields on 18 December.
Tissue preparation for nutrient analysis in both years rwas the same used in
experiment A in 1985. Grain was not analyzed for nutrient composition in 1986. All data
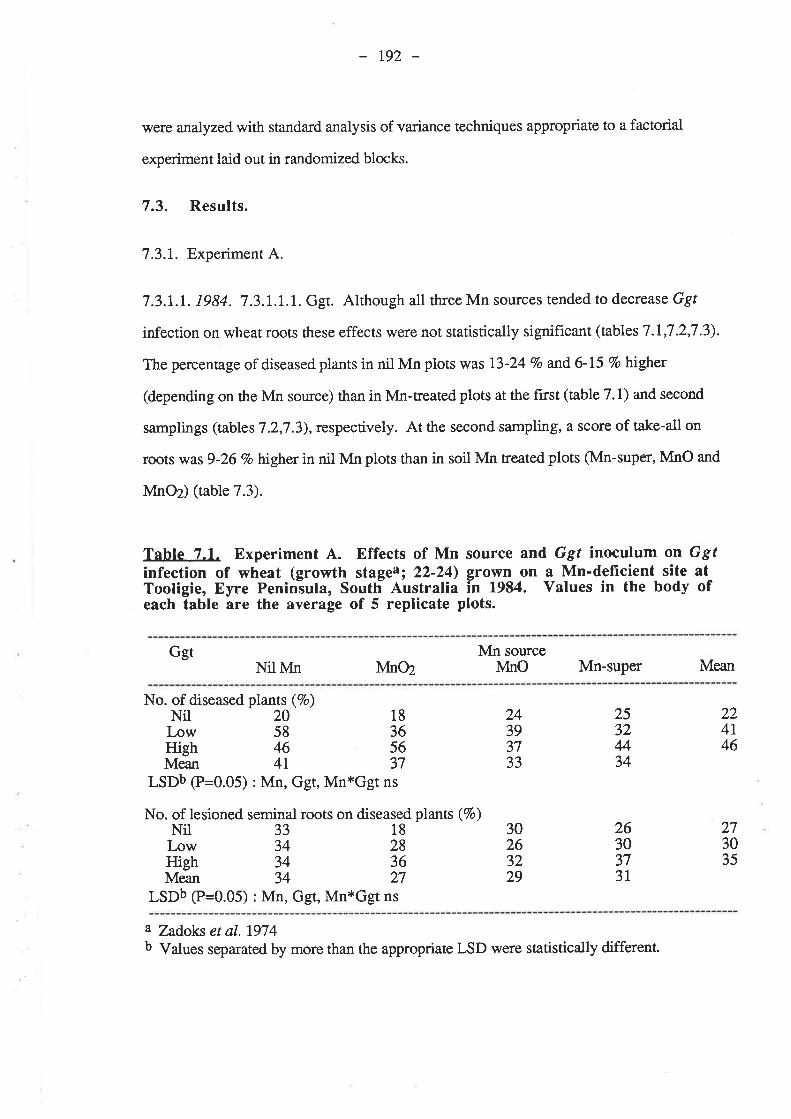
t92 -
\yere analyzed with standard analysis of variance techniques appropriate to a factorial
experiment laid out in randomized blocks.
7.3. Results.
7.3.I. Experiment A.
7.3.1.1. 1984. 7.3.1J.1. Ggt. Although all three Mn sources tended to decrease Ggr
infection on wheat roots these effects were not statistically signifrcant (tables 7.I,7.2,7 .3).
The percentage of diseased plants in nil Mn plots was 13-24 Vo and Gl5 7o higher
(depending on the Mn source) than in Mn-treated plots at the first (table 7.1) and second
samplings (tables 7.2,7.3), respectively. At the second sampling, a score of take-all on
roots was 9-26 Vo higher in nil Mn plots than in soil Mn treated plots (Mn-supet, MnO and
MnOz) (table 7.3).
Table 7.1. Experiment A. Effects of Mn source and, Ggt inoculum on Ggtinfection of wheat (growth stagea; 22-24) grown on a Mn-deficient site atTooligie, Eyre Peniniuta, South Australia ln fqS¿. Values in the body ofeach table are the average of 5 replicate plots.
GgtNil Mn lvln02
Mn sourceÀÁnO Mn-super Mean
No. of diseased plants (7o)Nil 20 18Low 58 36High 46 56Mean 41 37
LSDb P=0.05) : Mn, Ggt, Mn*Ggt ns
No. of lesioned seminal roots on diseased plants (7o)Nil 33 18I-ow 34 28High 34 36Mean 34 27
LSDb P=0.05) : Mn, Ggt, Mn*Ggt ns
2532M34
2630373T
24393733
30263229
224l46
273035
a Zadoks et al.1974b Values separated by more than the appropriate LSD were statistically different.
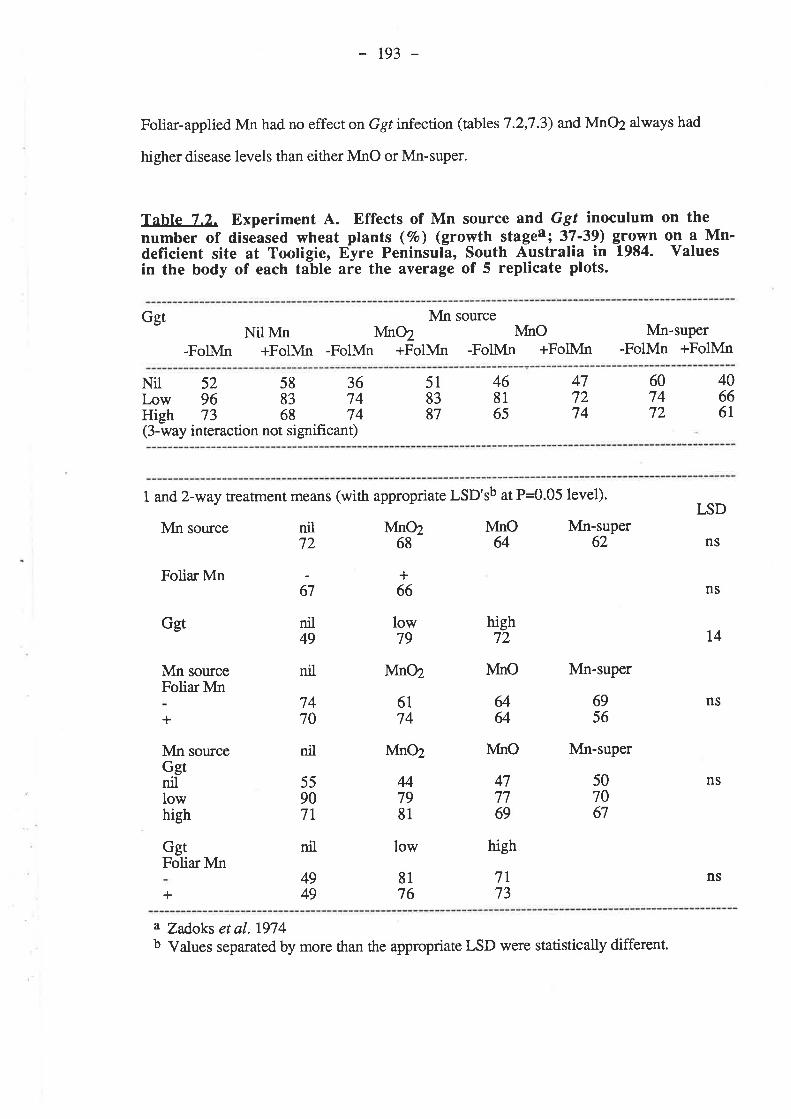
r93 -
Foliar-applied Mn had no effect on Ggt infection (tables 7 .2,7 .3) and MnO2 always had
higher disease levels than either MnO or Mn-super.
Ggt Mn source
Tahte 7.2. Experiment A. Effects of Mn source and Ggt inoculum on thenumber of diseased wheat plants (Vo) (growth stagea;37-39) grown on a Mn'deficient site at Tooligie, Eyre Peninsulã, South Australia in 1984. Yaluesin the body of each table are the average of 5 replicate plots.
Nil Mn lt¡fnOZ
-FolMn +FolMn -FolMn +FolMnIdnO
-FolMn +FolMnMn-super
-FolMn +FolMn
Nil 52 58 36Low 96 83 74High 73 68 74(3-way interaction not signifrcant)
518387
468165
4772
607472
40666L74
1 and 2-way treatment means (with appropriate LSD'sb at P=0.05 level).
Mn source nil Mnø lvlno Mn-suPer72 68 64 62
Foliar Mn
ns
LSD
ns
t4
NS
ns
ns
high72
67
nil49
nil
nilsource
Ggt
Mn sourceFoliar Mn
+
GgtFoliar Mn
+
+66
low79
l\4no2
6174
lvftr02
M7981
low
NfrìO
æ&
ÀdnO
477769
high
Mn-super
6956
Mn-super
507067
MnGgtnillowhigh
7470
55907t
nil
4949
8176
7l73
a Zadoks etal.1974b Values separated by more than the appropriate LSD were statistically different.

r94 -
Tahle 7.3. Experiment A. Effects of Mn source and Ggt inoculum on a
take-all scorea of roots of wheat plants (growth stageb; 37'39) grown on aMn-deficient site at Tooligie, Eyrè Peninsula, South Australia in 1984.Values in the body of eacñ table are the average of 5 replicate plots.
Ggt Mn sourcelvlno2 NfnO
-FotMn +FolMn -FolMn +FolMnNil lvln
-FolMn +FolMnMn-
-FolMnsuper+FolMn
Nil 0.8 1.0 0.5Low 1.6 1.5 1.2High 1.0 L2 1.2(3-way interaction not significant)
o.71.5r.3
0"8r.31.6
0.91.11.0
1.0 0.588
00
61
1
1
1 and 2-way treatment means (with appropriate LSD'sc at P=0.05 level).
Mn source
Foliar Mn
Ggt
Mn sourceFoliar Mn
+
GgtFoliarMn
+
+1.0
low1.3
N4nØ
1.01.2
lvlnO2
I^SD
ns
ns
0.3
ns
nilr.2
0.70.8
1.1
nil0.8
nil
r.2t.2
nil
nil
high1.2
Àlno1.1
Mn-super1.0
Mn-super
r.20.7
Mn-supersourceMnGgtnillow
0.7t.21.0
0.8t.31.1
0.61.3r.4
0.91.61.1
1.5t.2
N4nO
1.21.0
lvlno
1,2t.2
high
ns
ns
low high
a 0 (no disease observed) - 4 (seminal and crown roots with many black stelar lesions)'b Zadoks et a\.7974c Values separated by more than the appropriate LSD were statistically different.
Despite the trial site not having been previously sown to cereals, take-all was
present in nil Ggt plots. Twenty-two percent of plants were diseased in nil Ggt plots at the
first sampling and 27 Vo of their seminal roots had black stelar lesions (table 7.1). A low rate
195 -
of Ggt inoculum increased the percentage of diseased plants at the first sampling to an
average of 47 7o. The percentage of diseased seminal roots was not increased by Ggt
inoculum. The high rate of Ggr inoculum did not further increase disease.
The incidence of Ggt infection had increased by the second sampling and49 Vo of
plants in nil Ggt plots were diseased (diseased plants had lesions on their crown or seminal
root systems) (table 7 .2). A low rate of Ggt inoculum increased the percentage of diseased
plants to79 Vo but a high rate of inoculum did not further increase disease. A score of
disease increased from an average of O.77 in nil Ggt plots to I.32 at low Ggt but was not
increased further in high Ggt plots (table 7.3).
7.3.7.1.2. Plant growth. Vegetative growth and the number of plants per metre of
row were not affected by Ggt treatments (tables 7.4,7.5,7.6).
Mn-super was the only Mn sourcd to increase plant growth. The dry weight of
shoots and number of tillers per plant increased by 49 and 4O % in Mn-super plots,
respectively, at the first sampling (table 7 .4) and were 40 and23 Vo highet at the second
(tables 7.5,7 .6). However, plots treated with either MnO or Mn-super were scored as being
darker gleen than nil Mn and MnO2 plots 131 days after sowing, although only Mn-super
plots were scored as being more vigorous (table 7.7). Foliar Mn may have been less
effective because rain felt on the night and day following application.
7 .3.1.1.3. Grain yields. A high rate of Ggr inoculum decreased grain yields by 18
Vo anda low rate by 12 Vo aJthoagh the latter effect was not quite significant at the P=0.05
level (table 7.8).
Grain yields averaged 1.02 tha-l in nil Mn plots and Mn-super increased grain
yields by 27 7o (øble7.8). Mn-super was the only Mn source to increase yields.

196 -
Table 7.4. Experiment A. Effects of Mn source and Ggt inoculum ongrowth and Mn concentration of wheat- (growth stagea; 2?'29 grown on ailfn-defîcient site at Tooligie, Eyre Peninsula, South Australia in 1984.Values in the body of eacñ tablè are the average of 5 replicate plots.
Ggt Mn sourceNil Mn MnO2 À{rìO Mn-super Mean
No. of plants per metre of rowNil 51 53Low 49 49High 49 5lMean 50 51
LSDb (P=0.05) : Mn, Ggr, Mn*Ggt ns
Dry weight of shoots (mg planrl)Nil 94 105Low 104 104High 110 104Mean 102 105
LSDb (P=0.05) : Mn=25 ; Ggr, Mn*Ggt ns
No. of tillers per plantNil 1.7Low I.4High 1.5Mean 1.5
LSDb (P=0.05) : Mn=0.2 ; Ggt, Mn*Ggt ns
Mn concentration in whole shoots (mg tg-l D.V/.)Nil 14.6 l2.ILow 1,1.9 l2.IHigh 11.6 l2.lMean 12.7 l2.l
LSDb (P=0.05) : Mn=2.8 ; Ggr, Mn*Ggt ns
54545454
49505150
t02118r22tt4
31.430.335.332.3
t4t155t63r53
2.12.22.r2.1
525151
111t20t25
20.6t9.42t.8
1.51.61.61.6
61
78
1.2.1.1.
787
1
1
1
J22J
24232825
a Zadoks et al.1974b Values separated by more than the appropriate LSD were statistically different.
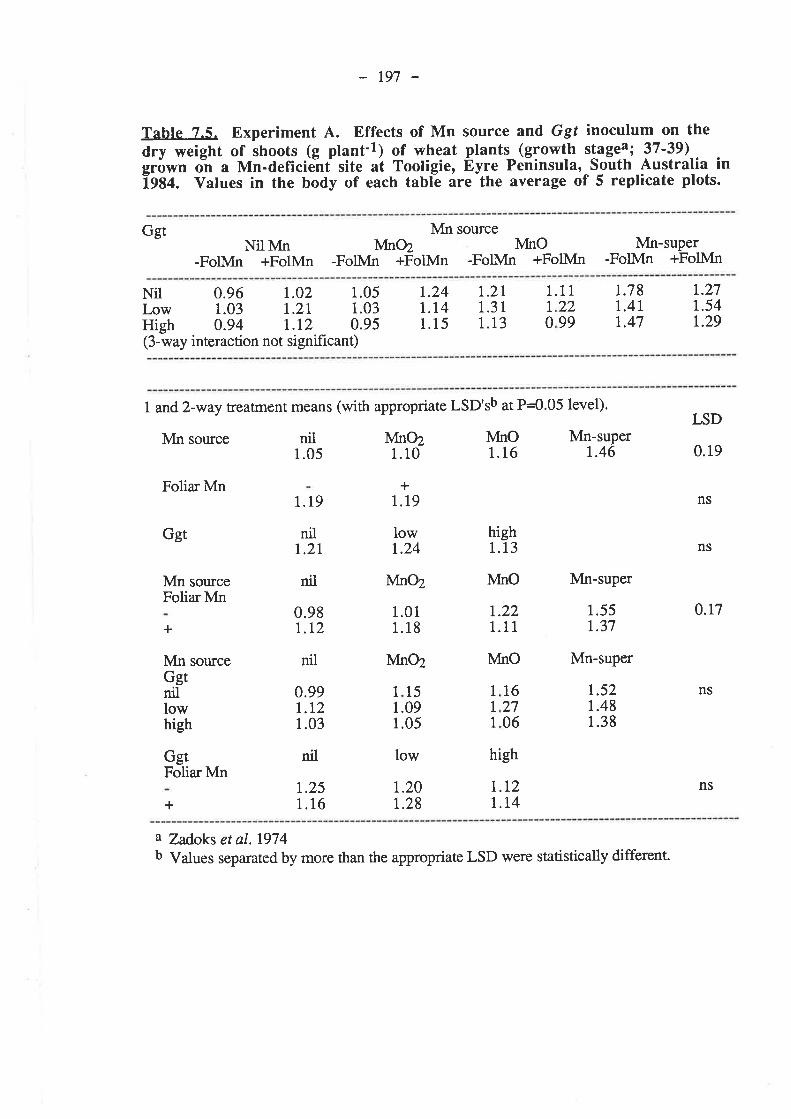
197 -
Table 7.5. Experiment A. Effects of Mn source and Ggt inoculum on thedry weight of shoots (g planl'l¡ of wheat Plants (growth stagel; 37-39)gröwn oî a Mn-deficieîf site at Tooligie, nyTe Peñinsula,-S_outh _Australia inIgS¿. Values in the body of each tablè are the ayerage of 5 replicate plots.
Ggt Mn sourcelvlnø l/ftro Mn-suPer
-FolMn +FolMn -FolMn +FolMn -FolMn +FolMnNil Mn
-FolMn +FolMn
Nil 0.96 r.02 1.05Low 1.03 I.2l 1.03High 0.94 1.12 0.95(3-way interaction not significant)
r.24r.141.15
1.21r.3l1.13
1.1 1 t.78r.4t1,.47
1.27r.54r.29
2299
1
0
1 and 2-way treatment means (with appropriate LSD'sb at P=0.05 level).
Mn source nil Mn1.05 1
Folia¡ Mn1.19
nilr.2r
0.981.r2
0.99r.t21.03
nil
t.251.16
Mn021.10
+1.19
lowt.24
1.011.18
low
r.20r.28
NInO1.16
hight.L3
NfnO
t.221.1 1
Àdno
Mn-super
1.55t.37
Mn-super
r.521.481.38
LSD
0.19
o.t7
ns
-super.46
Ggt
MnGgtnillowhigh
Mn sourceFoliarMn
+
GgtFoliar Mn
+
nil N4nø
source nil Mn02
ns
ns
nsr62706
1
1
1
15 1
1
1
.09
.05
high
t.r2r.t4
a Zadoks et al.1974b Values separated by more than the appropriate LSD were statistically different.
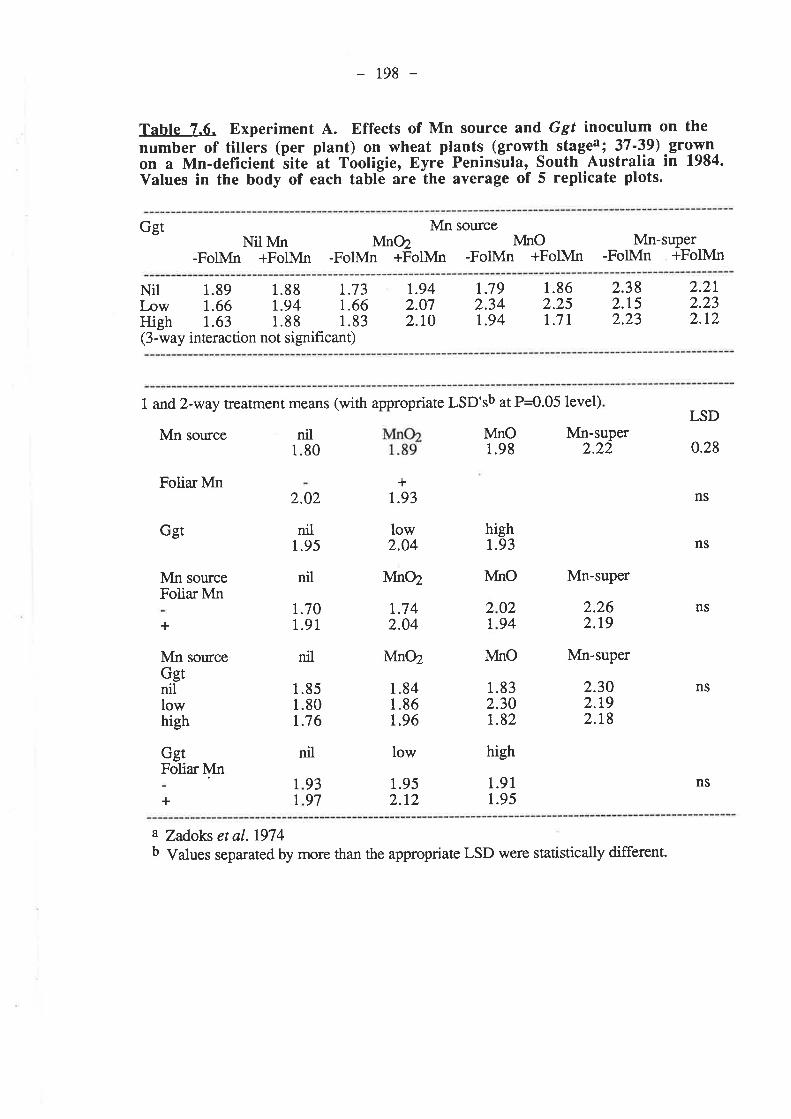
198 -
Tahle 7.6. Experiment A. Effects of Mn source and Ggt inoculum on thenumber of tillers (per ptant) on wheat plants (growth stagea; 37-39).gr9yl.on a Mn-deficient'site at Tooligie, Eyré Peninsula, South Australia in 1984.Values in the body of each tablé are the average of 5 replicate plots.
Ggt Mn sourceMnø À{nO
-FolMn +FolMn -FolMn +FolMnNil Mn
-FolMn +FolMnMn-
-FolMnsuper
+FolMn
Nil 1.89 1.88 r.73Low 1.66 1.94 1.66High 1.63 1.88 1.83(3-way interaction not signifrcant)
r.942.072.10
t.792.34r.94
1.862.251..7 |
2.382.15))a
2.2r2.232.r2
1 and 2-way treatment means (with appropriate LSD'sb at P=0.05 level)
Mn source
FoliarMn
Mn sourceFolia¡ Mn
+
GgtFolia¡ Mn
+
t.742.04
nil Mn02
nil1.80
2.02
nil1.95
nil
1.851.80t.76
nil
1
MnO1.98
highr.93
1.911.95
+.93
lvlno
1.841.86r.96
low high
Mn-super2.22
2.262.19
Mn-super
2.302.192.t8
LSD
0.28
ns
NS
ns
ns
ns
Ggt
MnGgtni1lowhigh
MnO2 ÀínO Mn-super
low2.04
1.952.t2
r.701.91
21
0294
1.832.30r.82
source
9397
1
1
a Zadoks et al.1974b Vdues separated by more than the appropriate LSD were statistically different.
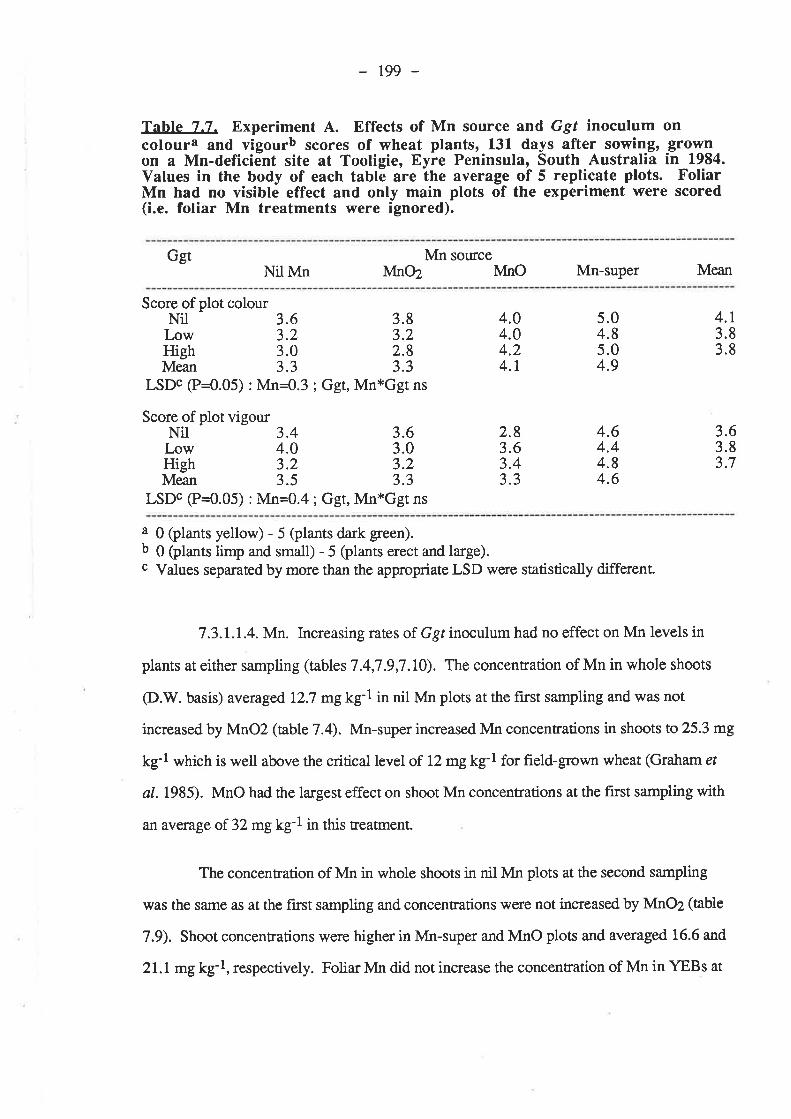
t99 -
Tabte 7.7. Experiment A. Effects of Mn source and Ggt inoculum oncoloura and vigourb scores of wheat plants, 131 days after sowin-g, gro_ry!on a Mn-deficient site at Tooligie, Eyre Peninsula, South Australia in 1984.Values in the body of each tablé are the average of 5 replicate plots. FoliarMn had no visible effect and only main plots of the experiment were scored(i.e. foliar Mn treatments were ignored).
Ggt Mn sourceNil Mn lvtnø l[nO Mn-super Mean
Score ofplot colourNilLowHighMean
4.3.3.
5.04.85.04.9
3.83.22.83.3
3.63.23.0
3.63.83.7
2.83.63.43.3
3.63.03.2J.J
3.44.03.2
4.04.04.24.r
I88
3.3LSDc (P=0.05) : Mn=0.3 ; Ggt,Mn*Ggt ns
Score ofplot vigourNilLowHighMean 3.5
LSDC (P=0.05) : Mn=0.4 ; Ggt,Mn*Ggt ns
4.64.44.84.6
a 0 (plants yellow) - 5 (plants dark green).b 0 lplants limp and small) - 5 (plants erect and large).c Values separated by more than the appropriate LSD were statistically different.
7.3.I.I.4. Mn. Increasing rates of Ggt inoculum had no effect on Mn levels in
plants at either sampling (tables 7.4,7.9,7.10). The concentration of Mn in whole shoots
(D.W. basis) averaged 72.7 mgkg-l in nil Mn plots at the first sampling and was not
increased by MnO2 (table 7.4). Mn-super increased Mn concentrations in shoots to 25.3 mg
kg-l which is well above the critical level of 12 mgkg-l for field-grown wheat (Graham er
al. 1985). MnO had the largest effect on shoot Mn concentrations at the first sampling with
an average of 32 mg kg-l itt this treatment.
The concentration of Mn in whole shoots in nil Mn plots at the second sampling
was the same as at the first sampling and concentrations were not increased by MnO2 (table
7.9). Shoot concentrations were higher in Mn-super and MnO plots and averaged 16.6 and
2I.l mgkg-l, respectively. Foliar Mn did not increase the concentration of Mn in \TBs at
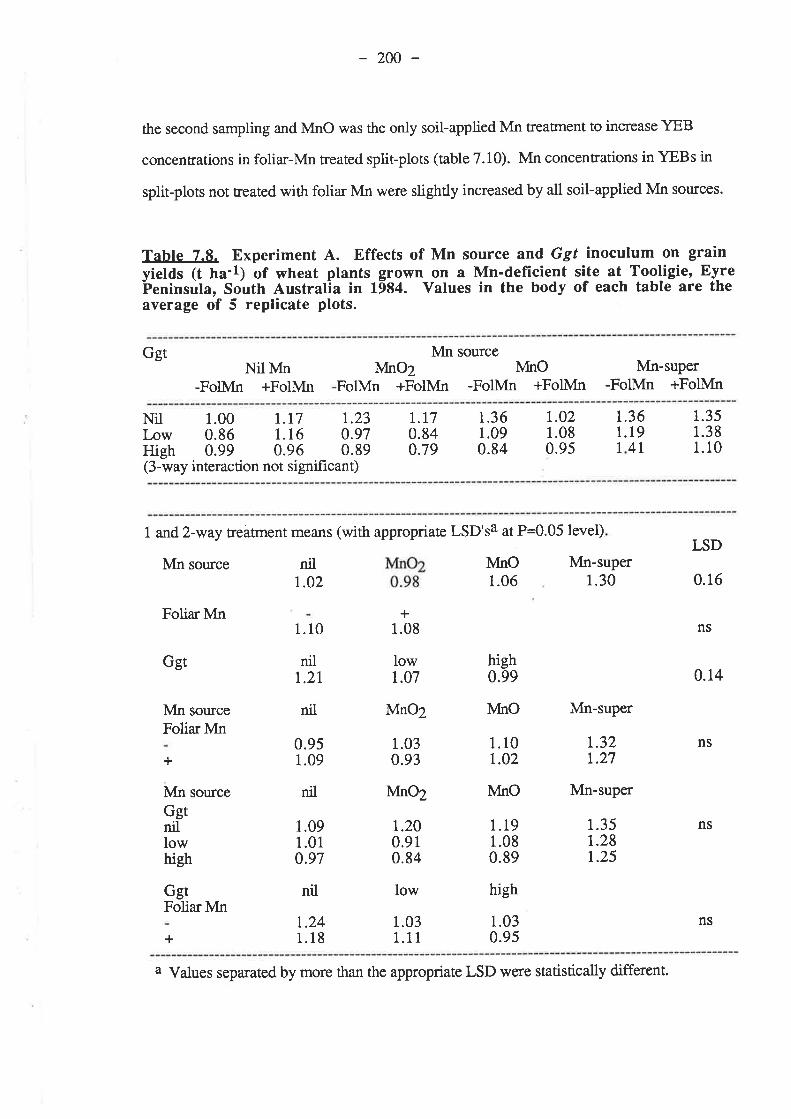
-200-
the second sampling and MnO was the only soil-applied Mn treatrnent to increase YEB
concenrations in foliar-Mn treated split-plots (table 7.10). Mn concentrations in YEBs in
split-plots not treated with folia¡ Mn were slightly increased by all soil-applied Mn sources.
Table 7.8. Experiment A. Effects of Mn source and Ggt inoculum on grainyields (t na'l¡ of wheat plants grown on a Mn-deficient site at Tooligie' EyreÞeninsula, South Austratia in 19S4. Values in the body of each table are theaverage of 5 replicate plots.
Ggt Mn sourceNil Mn
-FolMn +FolMnMnØ
FolMn +FolMnliInO
-FolMn +FolMnMn-super
-FolMn +FolMn
NilLowHigh(3-way interaction
t.r7 r.231.16 0.970.96 0.89
not signifrcant)
1.000.860.99
r.t70.840.79
r.361.090.84
t.021.080.95
r.361.19
1.351.381.10141
1 and 2-way treatment means (with appropriate LSD'sa at P=0.05 level)
Mn source
Foliar Mn
Mn sourceFolia¡ Mn
nil1.02
low1.07
MnØ
1.030.93
r.200.910.84
1.031.1 1
1.101.02
lvfno
1.191.080.89
1.030.95
t.32t.27
Mn-super
1.35t.28t.25
LSD
0.16
0.14
NS
lvfnO Mn-super1.06 1.30
high0.99
ÀínO Mn-super
1.10
nilr,2l
nil
0.951.09
1.091.010.97
nil
t.241.r8
+1.08 ns
Ggt
NS
+
Mn source nil MnOZGgtnillowhigh
GgtFolia¡Mn
+
low high
a Values separated by more than the appropriate LSD were statistically different.
ns
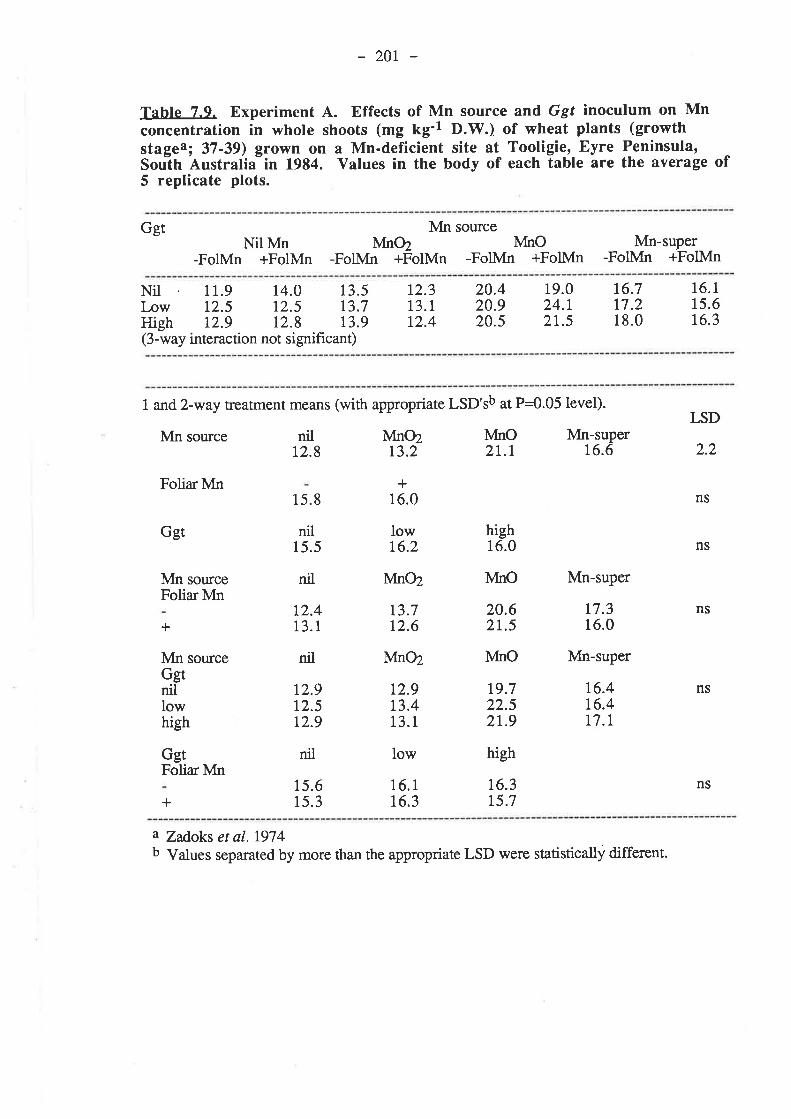
- 201
Table 7.q. Experiment A. Effects of Mn source and Ggt inoculum on Mnconcentration in whole shoots (mg kg'l D.\ry.) of wheat plants (growthstagea; 37-39) grown on a Mn-deficient site at Tooligie, Eyre Peninsula,
-Sou"th Australifin 1984. Yalues in the body of each table are the average of5 replicate plots.
Ggt Mn sourcelvIno2 ÀÍrìO
FolMn +FolMn -FolMn +FolMnNit Mn
-FolMn +FolMnMn-super
-FolMn +FolMn
Nil r 1.9 14.0 13.5Low 12.5 72.5 13.7High 12.9 12.8 13.9(3-way interaction not signifrcant)
12.313.112.4
20.420.920.s
19.024.127.5
16.7t7.218.0
16.115.616.3
1 and.2-way treatment means (with appropriate LSD'sb at P=0.05 level).
Mn source nil lvlno2 NtnO Mn-suPer12.8 r3.2 21.r 16.6
FoliarMn +16.015.8
t7.316.0
I^SD
2.2
ns
Ggt
MnGgtnillow
nil Mn02
lowr6.2
13.712.6
20.621.5
12.913.413.1
low high
high16.0
l{nO Mn-super
nil15.5
12.413.1
t2.912.5t2.9
nil
15.615.3
16.116.3
16.315.7
ns
ns
ns
Mn sourceFoliar Mn
+
GgtFoliar Mn
+
nil lvtn02source IvInO Mn-super
19.722.52t.9high
nst6.4t6.4t7.l
a Zadoks et al.1974b Values separated by more than the appropriate LSD were statistically different.
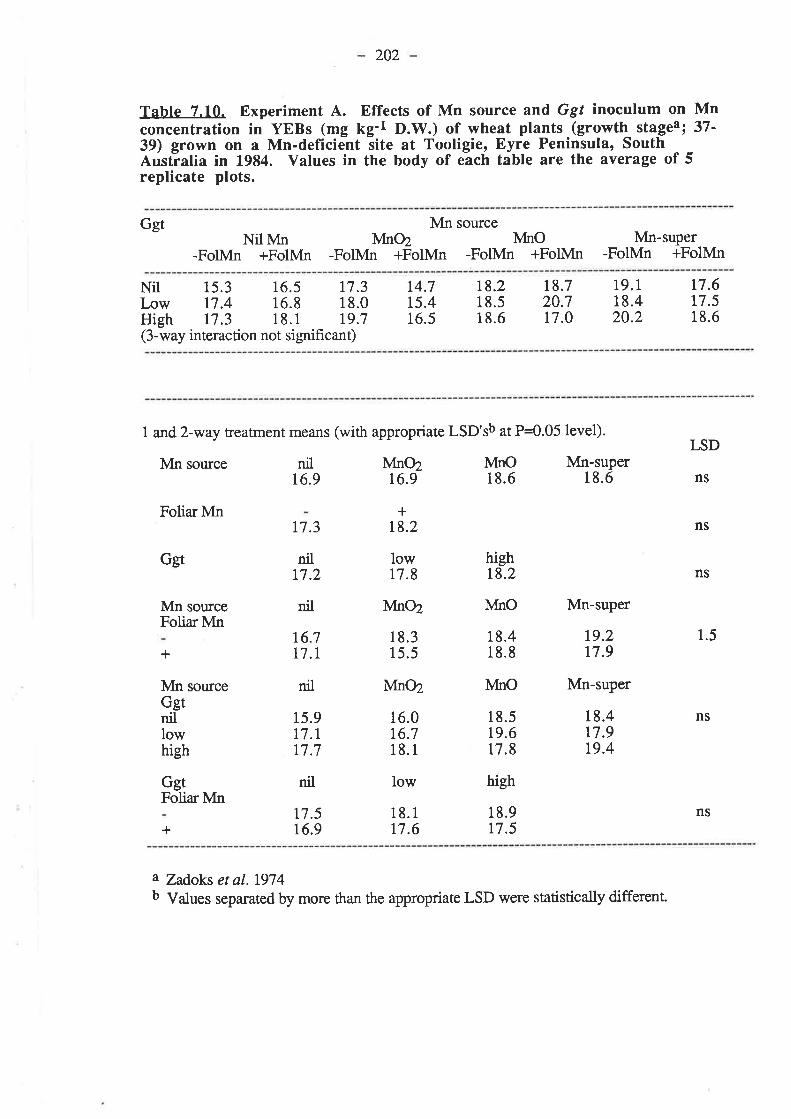
202
Table 7.10. Experiment A. Effects of Mn source and Ggt inoculum on Mnconcentration in YEBs (mg Xg'l D.W.) of wheat plants (growth_ stagea; 37'39) grown on a Mn-deficieit site at Tooligie, Eyre Peninsula, SouthAustialia in 1984. Yalues in the body of eãch table are the average of 5replicate plots.
Ggt Mn sourcelvlno2 ÀírìO
-FolMn +FolMn -FolMn +FolMnNil Mn
-FolMn +FolMnMn-super
-FolMn +FolMn
Nir 15.3 16.5 17.3Low 17.4 16.8 18.0High 17.3 18.1 19.7(3-way interaction not significant)
t4.7t5.416.5
888
1
1
1
.2
.5
.6
18.720.7t7.0
19.118.420.2
t7.6t7.518.6
1 and 2-way treatment means (with appropriate LSD'sb at P=0.05 level).
Mn source nil MnO2 N4nO Mn-suPer16.9 16.9 18.6 18.6
Foliar Mn
I-SD
ns
ns
ns
1.5
Ggt
MnGgtnitlowhigh
Mn sourceFoliarMn
+
GgtFoliar Mn
+
source nil MnØ
+t8.2
Mn02
18.315.5
low high
high18.2
I{nO Mn-super
t9.217.9
lftio Mn-super
17.3
nil17.2
nil
16.7t7.l
15.9t7.l77.7
nil
t7.516.9
low17.8
18.1t7.6
18.917.5
18.418.8
18.417.919.4
18.519.617.8
16.0r6.718.1
ns
ns
a Zadoks etal.1974b Values separated by more than the appropriate LSD were statistically different
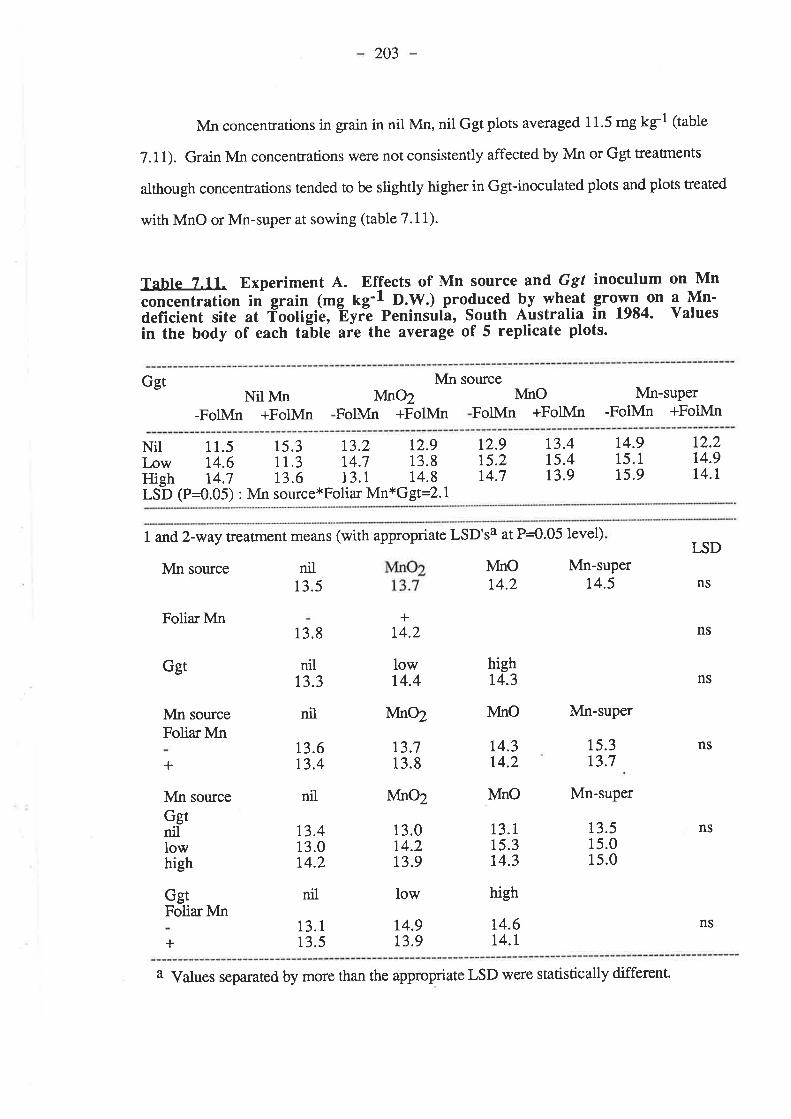
203
Mn concentrations in grain in nil Mn, nil Ggt plots averaged 11.5 mg kg-l (table
7.I1). Grain Mn concentrations were not consistently affected by Mn or Ggt treaünents
although concenrrations tended to be slightly higher in Ggt-inoculated plots and plots treated
with MnO or Mn-super at sowing (table 7.ll).
Tabte 7.11. Experiment A. Effects of Mn source and Ggt inoculum on Mnconcentration in grain (mg Xg-l D.W.) pro-duce-d by wheat grown on a Mn-deficient site at fooligiò, "Byr-e Peninsulä, South Australia in 1984. Valuesin the body of each table are the average of 5 replicate plots.
Ggt Mn sourceNil Mn
-FolMn +FolMnItdnOZ
FolMn +FolMnìfnO
FolMn +FolMnMn-super
-FoIMn +FolMn
Nill,owHighLSD
11.5 15.3 13.2 12.914.6 11.3 14.7 13.814.7 13.6 13.1 14.8
(P=0.05) : Mn source*Folia¡ Mn*Ggt=2.1
t2.915.214.7
13.4r5.413.9
14.915.115.9
t2.214.9t4.l
1 and 2-way treatment means (with appropriate LSD'sa at P=0.05 level)LSD
Ggt
Mn source
Folia¡ Mn
Mn sourceFolia¡ Mn
+
Mn sourceGgtnillowhigh
GgtFoliar Mn
+
nil13.5
13.8
nil13.3
nil
nil
lvlnor4.2
r4.6t4.l
Mn-superr4.5
13.515.015.0
MnØ lvlno Mn-super
14.3t4.2
MnOZ NfnO Mn-super
+r4.2
lowt4.4
hight4.3
13.014.2t3.9
low high
ns
ns
NS
ns13.713.8
1,3.6t3.4
15.313.7
t3.413.0r4.2
nil
13.113.5
r4.9L3.9
t3.l15.314.3
ns
a Values separated by more than the appropriate LSD were statistically different.
NS

204
7 .3.I.2. 1985. 7 .3.I.2.I. Ggt. The percentage of diseased plants at the first sampling was
decreased by more than 20 Vo by allMn sources (table 7.12). The percentage of seminal
roots with black stelar lesions was decreased by more than 25 Vo by all Mn sources but the
variability in this measgrement of Ggt infection resulted in these effects not bing statistically
significant (tabte 7 .12). Ggt infecton of crown roots was not affected by Mn treaÍnents
(table 7.L2).
Tabte 7.12. Experiment A. Effects of Mn source and Ggt inoculum on Ggtinfection of wheat (growth stageâ; 22-24) grow_n _on a Mn'deficient site atiooligie, Eyre Peniùiula, South" Australia ln 1985. Values in the body ofeach iable are the average of 5 replicate plots.
Ggt Mn sourceNil Mn NInø IínO Mn-super Mean
No. of diseased plants (7o)Nil 81 56Low 74 58High 83 66Mean 79 60
LSDb (P=0.10) : Mn=16 ; Ggr, Mn*Ggt ns
No. of lesioned seminal roots on diseased plants (7o)
Nil 48 24Low 27 26High 36 3IMean 37 27
LSDb (P=0.05) : Mn, Ggt, Mn*Ggt ns
No. of lesioned crown roots on diseased plants (7o)
Nil 47 34Low 44 28High 48 40Mean 34 27
LSDb €=0.05) : Mn, Ggt, Mn*Ggt ns
6767&
342927
73625062
2934t727
4747383r
60725662
34302530
44582929
434439
a Zadoks et aI.1974b Values separated by more than the appropriate LSD were statistically different.
The decreases in Ggr infection with Mn sources measured at the first sampling were
not present at the second sampling and Ggt infection was not affected by any Mn source at
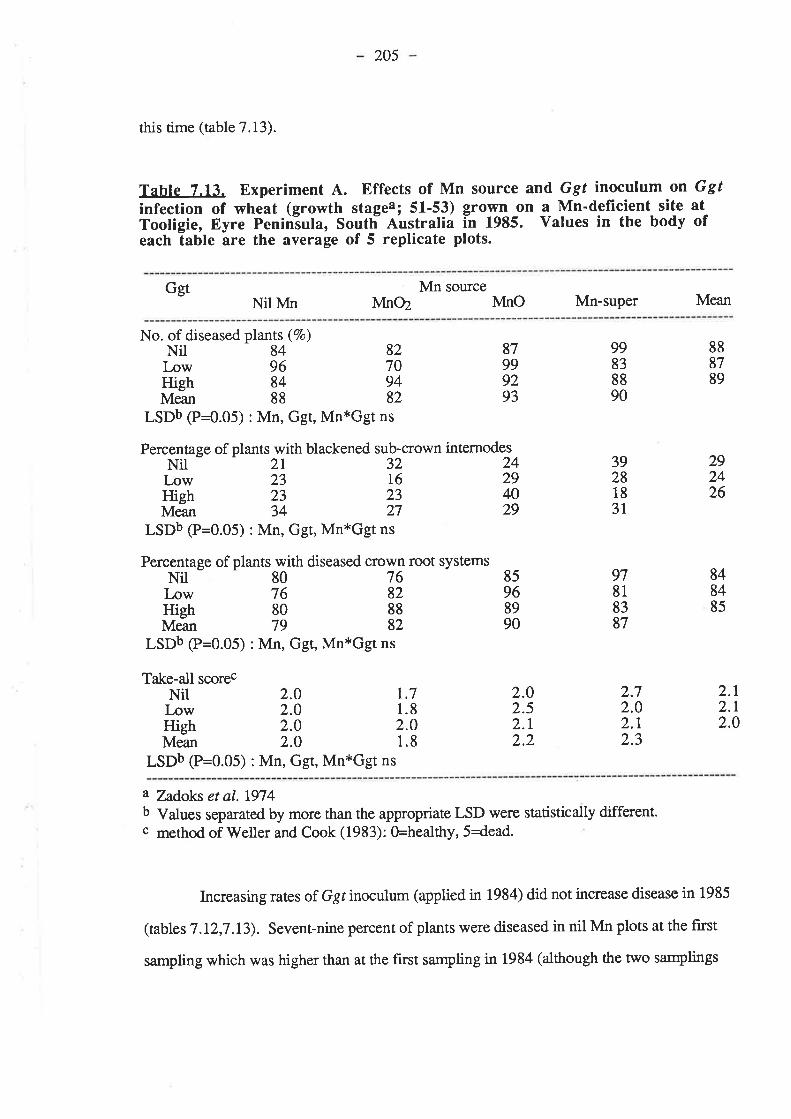
205
this time (table 7.13).
Tahle 7.13. Experiment A. Effects of Mn source and, Ggt inoculum on Ggtínfection of wheat (growth stagea; 51-53) grown on a Mn'deficient site atTooligie, Eyre Peninîuta, South- Australia ln 1985. Values in the body ofeach table are the average of 5 replicate plots.
Ggt Mn sourceNil Mn lvfn02 NInO Mn-super Mean
No. of diseased plants (7o)Nil 84 82Low 96 70High 84 94Mean 88 82
LSDb (P=0.05) : Mn, Ggt, Mn*Ggt ns
Percentage of plants with blackened sub-crown internodesNil - - 21 32 24l,ow 23 16 29High 23 23 40Mean 34 27 29
LSDb (P=0.05) : Mn, Ggt, Mn*Ggt ns
Percentage of plants with diseased crown root systemsNil 80 76l,ow 76 82High 80 88Mean 79 82
LSDb (p=0.05) : Mn, Ggr, Mn*Ggt ns
87999293
99838890
888789
292426
848485
85968990
3928183L
97818387
Take-all scorecNilLowHighMean
LSDb (P=0.05) : Mn, Ggt, Mn*Ggt ns
2.72.02.12.3
2.02.52.r2.2
t.71.82.01.8
2.O2.02.0
2.r2.r2.0
2.0
a Zadoks et aI.1974b Values sepamred by more than the appropriate LSD were statistically different.c method of 'Weller and Cook (1983): Ghealthy, 5dead.
Increasing rates of Ggr inoculum (applied in 1984) did not increase disease in 1985
(tables 7.I2,7.I3). Sevent-nine percent of plants were diseased in nil Mn plots at the fust
sampling which was higher than at the first samptng in 1984 (although the two samplings

206
were not taken at precisely the same time after sowing). Disease incidence had increased by
the second sampling and 88 7o of plants were diseased at this time.
7.3.1.2.2. Plant growth. Increasing rates of 1984-applied Ggt inoculum had no
effect on plant growth except that high Ggt decreased a colour score in MnO-treated plots at
the fust sampling (table 7.I4).
MnO2 did not improve plant growth at either sampling, despite finely-ground MnO2
being re-applied in 1985 (tables 7.14,7.15). MnO (applied in 1984) and Mn-super (re-
applied in 1985) were equally effective at increasing plant growth at the first sampling. Plant
growth was both a da¡ker grcen and more vigorous in MnO and Mn-super atthe first
sampling (table 7.14). The dry weight of shoots per plant at the fust sampling lvas increased
by approximately 30 Vo with MnO and Mn-super but the number of tillers per plant was not
affected by Mn treatrnents (table 7.I4). Plant growth was not affected by Mn treafrnents at
the second sampling (table 7.15).
7.3.1.2.3. Grain yields. Grain yields lvere not affected by Ggt treatments and the
effecs of Mn sources was not statistically significant even though yields were nearly
doubled by Mn-super in high Ggt plots, increased by 22 Vo lnlow Ggt plots but not changed
in nil Ggt plots (table 7.15).
7 .3.1.2.4. Mn. Increasing rates of Ggt inoculum had no effect on Mn
concentrations in whole shoots at the first sampling or in YEBs at the second sampling (table
7.16).
Mn concentrations in whole shoots at the first sampling averaged 12.3 mgkg-r
which was increased to 15.8 mg kg-l by Mn-super and to 23'5 mgkg-l by Mno (table
7.16). MnO2 did not increase plant Mn concentrations at the first sampling. Mn
concentrations in YEBs at the second sampling increased from an average of 17.7 mg kg-l in
nil Mn plots to 25.3 mgkg-l i.t MnO plots (table 7.16). MnO2 and Mn-super did not

-207-
increase Mn concentrations in YEBs.
Tahle 7.14. Experiment A. Effects of Mn source and Ggt inoculum ongrowth of wheat (growth stagea; 22-24) grown on a Mn-deficient site atTooligie, Eyre Penlnsula, South Australia in L985. Values in the body ofeach table are the average of 5 replicate plots.
Ggt Mn sourceNil Mn Mnø N4nO Mn-super Mean
Score of plot colourbNilLowHighMean
3.13.03.4
3.23.73.1
3.63.73.5
3.33.43"4
3.63.44.t3.7
3.53.83.03.4
2.93.13.0
3.2
3.23.13.4
t42r28167r46
r.71.31.61.5
4.04.0
20t208IM184
3.94.04.14.0
185t7517l177
3.33.33.8
LSDc (P=0.05) : Mn=0.3 ; Ggt ns ; Mn*Ggt=O.5
Mean 3.0 3.2LSDc (P{.05) : Mn=0.4 ; Ggt, Mn*Ggt ns
Score of plotvigouy'NilLowHigh
Dry weight of shoots (mg planrl)Nil 123Low 154High r37Mean 138
No. of tillers per plantNil 1.5[.ow 1.5High 1.4Mean 1.5
LSDc (P=0.05) : Mn, Ggt, Mn*Ggt ns
r63r67155
LSDc (P=0.05) : Mn=30 ; Ggt,Mn*Ggt ns
1.71.81.5t.7
1
1
1
1
t.7t.61.5
7967
a Zadoks et aL.7974b 0 lplants yellow) - 5 (ptants dark green).c Values sepamted by more than the appropriate LSD were statistically different.d 0 þhttts limp and small) - 5 (plants erect and large).
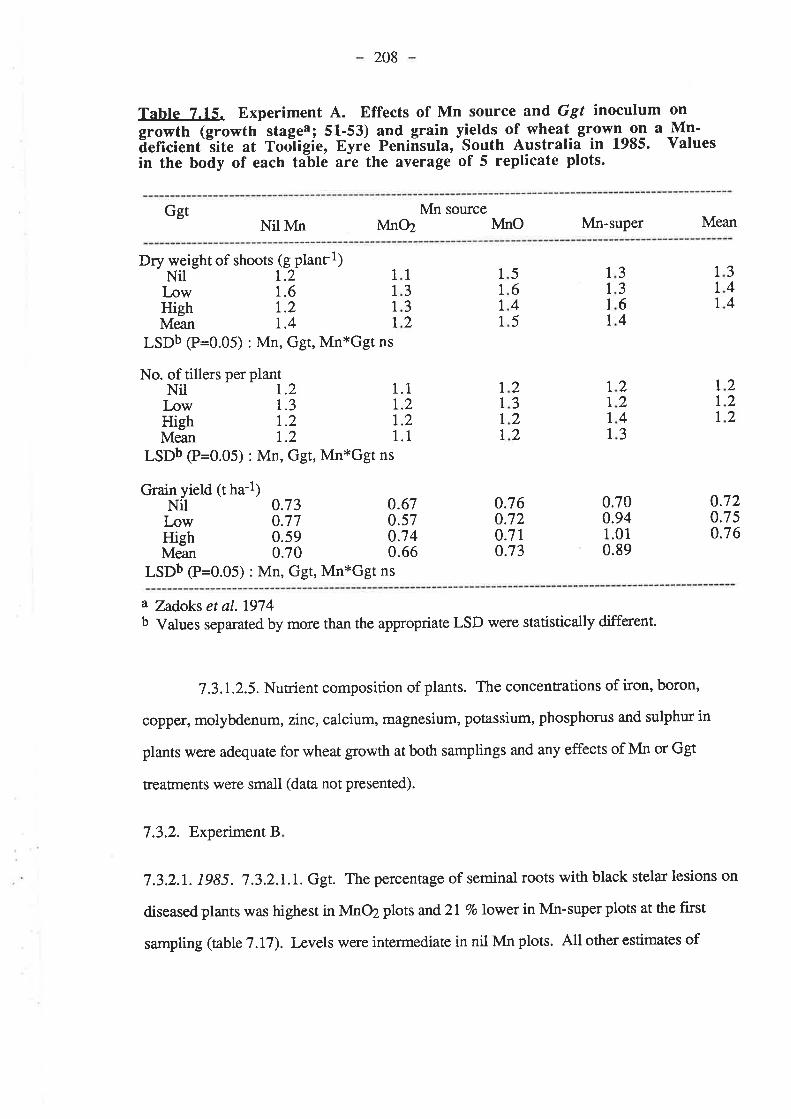
208
Tahte 7.15. Experiment A. Effects of Mn source and Ggt inoculum on
growth (growth stagea; 51-53) and grain yields_ of wheat. E{ow1*o a Mn-ãeficient'"site at Too"ligíe, Eyrô Peniñsula,-South Australia in 1985. Valuesin the body of each table are the average of 5 replicate plots.
Ggt Mn sourceNil lvln Mn02 MnO Mn-super Mean
Dry weight of shoots (g planrl)NilLowHighMean
LSDb (P=0.05) : Mn, Ggt, MnxGgt ns
No. of tillers per plantNil 1.2 1.1Low I.3 1.2High I.2 1,.2
Mean I.2 1.1
LSDb (p=0.05) : Mn, Ggt, Mn*Ggt ns
Grain yield (t ha-l¡Nil
t.21.61.21.4
0.730.770.590.70
0.670.570.740.66
0.760.720.7t0.73
0.700.941.010.89
0.720.750.7 6
1
332
1
1
1
1
1
1
1
1
5645
2322
1
1
1
1
3364
1
1
I1
344
1
1
1
1
1
1
224J
1
1
I1
222
LowHighMean
LSDb (P=0.05) : Mn, Ggt, MnxGgt ns
a Zadoks et a|.1974b Values sep¿¡rated by more than the appropriate LSD were statistically different.
7 .3.I.2.5. Nutrient composition of plants. The concentrations of iron, boron,
copper, molyMenum, zinc, calcium, magnesium, potassium, phosphorus and sulphur in
plants were adequate for wheat gowth at both samplings and any effects of Mn or Ggt
treaÍnents were small (data not presented).
7.3.2. Experiment B
7.3.2.L. 1985. 7.3.2.I.1. Ggt. The percentage of seminal roots 'with black stela¡ lesions on
diseasedplants was highest in MnO2 plots and 2l Volower in Mn-superplots at the first
sampling (table 7.I7). I-evels were intermediate in nil Mn plots. All other estimates of
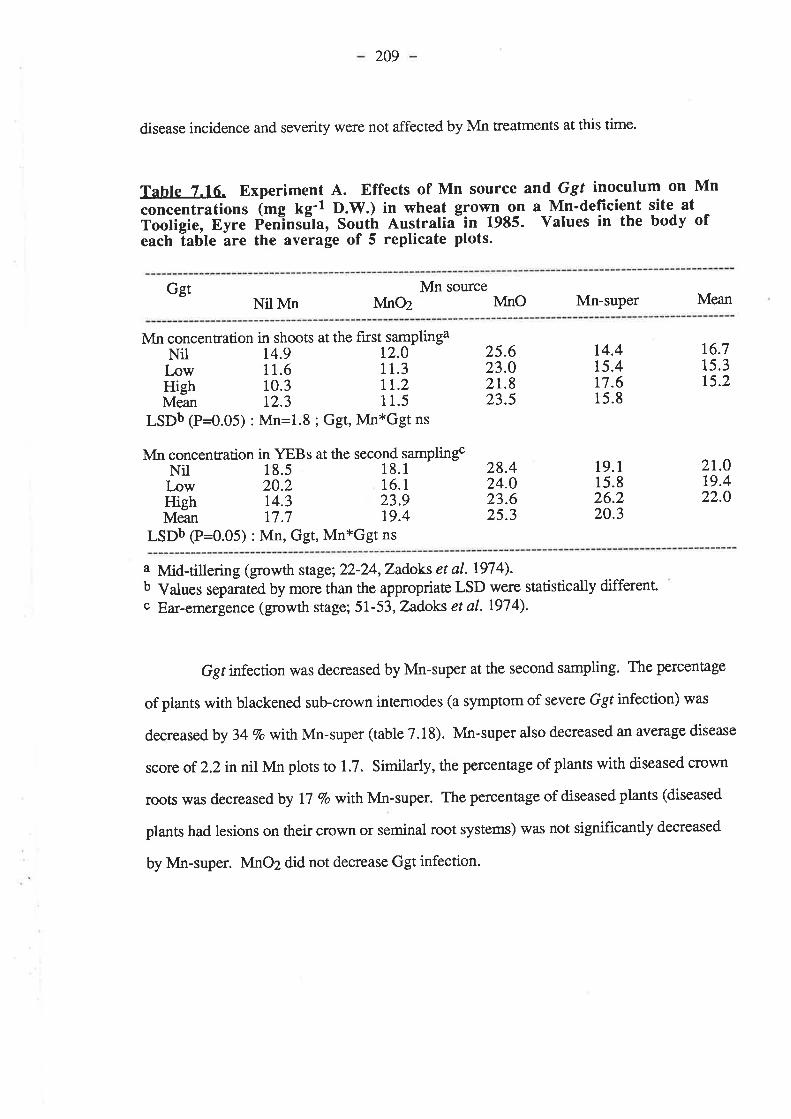
209
disease incidence and severity were not affected by Mn treatments at this time.
Ggt Mn sourceNil lvln Mn02 MnO Mn-super
Table 7.16. Experiment A. Effects of Mn source and Ggt inoculum on Mn
õncentrations (mg kg'l D.W.) in wheat glowl ^o_n
a Mn-deficient site atiótitt;, Ey.õ È"ttÏnsrila, SoutÍr Australia-in 1985. Yalues in the body ofeach Íable are the average of 5 replicate plots.
Mean
Mn concentration in shoots at the first samplingaNil t4.9 12.0Low 11.6 11.3High 10.3 lL.2Mean I2.3 11.5
LSDb (P=O.05) : Mn=1.8 ; Ggr,Mn*Ggt ns
Mn concentration in YEBs at the second samplingcNil 18.5 18.1I-ow 20.2 16.1High 14.3 23.9Mean I7.7 I9.4
LSDb (P=0.05) : Mn, Ggt, Mn*Ggt ns
25.623.02r.823.5
28.424.023.625.3
t4.4t5.417.615.8
19.115.826.220.3
t6.715.315.2
21.O19.422.O
a Mid-tillering (growth stage; 22-24,Zadoks et aI. t974).b Values separated by more than the appropriate LSD were statistically differentc Ear-emergence (growth stage; 51-53, Zadoks et al.1974).
Ggr infection was decreased by Mn-super at the second sampling. The percenøge
of plants with blackened subcrown internodes (a symptom of severe Ggr infection) was
decreased by 34 7o withMn-super (table 7.18). Mn-super also decreased an average disease
score of 2.2innil Mn plots to 1.7. Similarly, the percentage of plants with diseased crown
roots was decreased by I7 7o withMn-super. The percentage of diseased plants (diseased
plants had lesions on their crown or seminal root systems) was not significantly decreased
by Mn-super. MnO2 did not decrease Ggt infection.
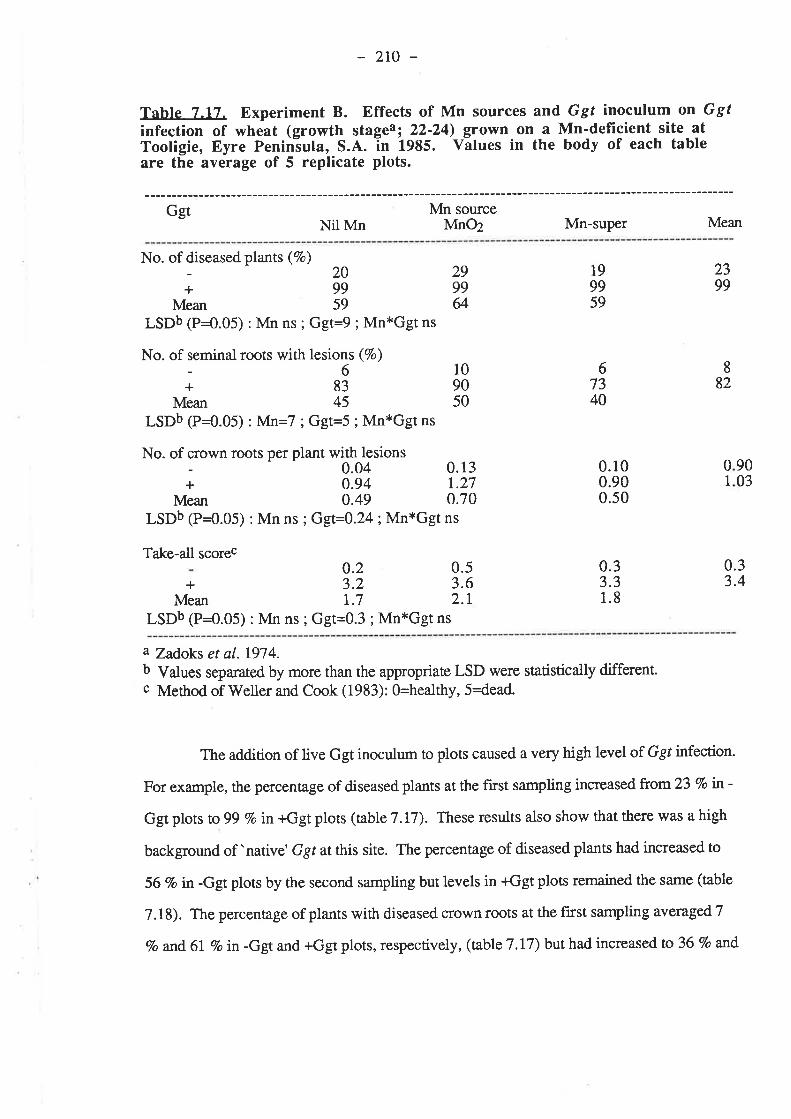
-2to-
Tabte 7.17. Experiment B. Effects of Mn sources and Ggt inoculum on Ggtinfection of wheat (growth stagea; 22-24) grown on a Mn'deficient site atTootigie, Eyre Penin-sula, S.A. in 1985. Yãlues in the body of each tableare the average of 5 replicate plots.
ð;; M':;;---Nil Mn MnO2 Mn-suPer Mean
No. of diseased plants (7o) 20
+99Mean 59
LSDb (P{.05) : Mn ns ; Ggt=9 ; Mn*Ggt ns
No. of seminal roots with lesions (%)-6+83
Mean 45
LSDb (P=0.05) : Mn=7 ; Ggt=5 ; Mn*Ggt ns
2399
2999&
882
01
109050
t99959
67340
No. of î*n roots perplant withìesions 0.13
+ 0.94 1.27Mean 0.49 0.70
LSDb (P=0.05) : Mn ns ;Ggt=0.24; Mn*Ggt ns
Take-all scorec
MeanLSDb (P=0.05) : Mn ns ; Ggt=0.3 ; Mn*Ggt ns
0.100.900.50
9003
0.53.62.1
0.23.2t.7
+0.33.31.8
0.33.4
a Zadoks et al.1974,b Vdues sepÍuated by more than the appropriate LSD were statistically different.c Method of V/eller and Cook (1983): O=healthy, 5--dead.
The addition of live Ggt inoculum to plots caused a very high level of Ggt infection.
For example, the percentage of diseased plants at the first sampling increased from23 Vo tn -
Ggt ptots to99 Vo in +Ggt plots (table 7 .I7). These results also show that there was a high
background of 'native' Ggt atthis site. The percentage of diseased plants had increased to
56 Vo in -Ggt ptots by the second sampling but levels in +Ggt plots remained the same (table
7.18). The percentage of plants with diseased crown roots at the first sampling avetagú.1
Vo and.61 Vo in-Ggt and +Ggt plots, respectively, (table 7.17) but had increased to 36 Vo and
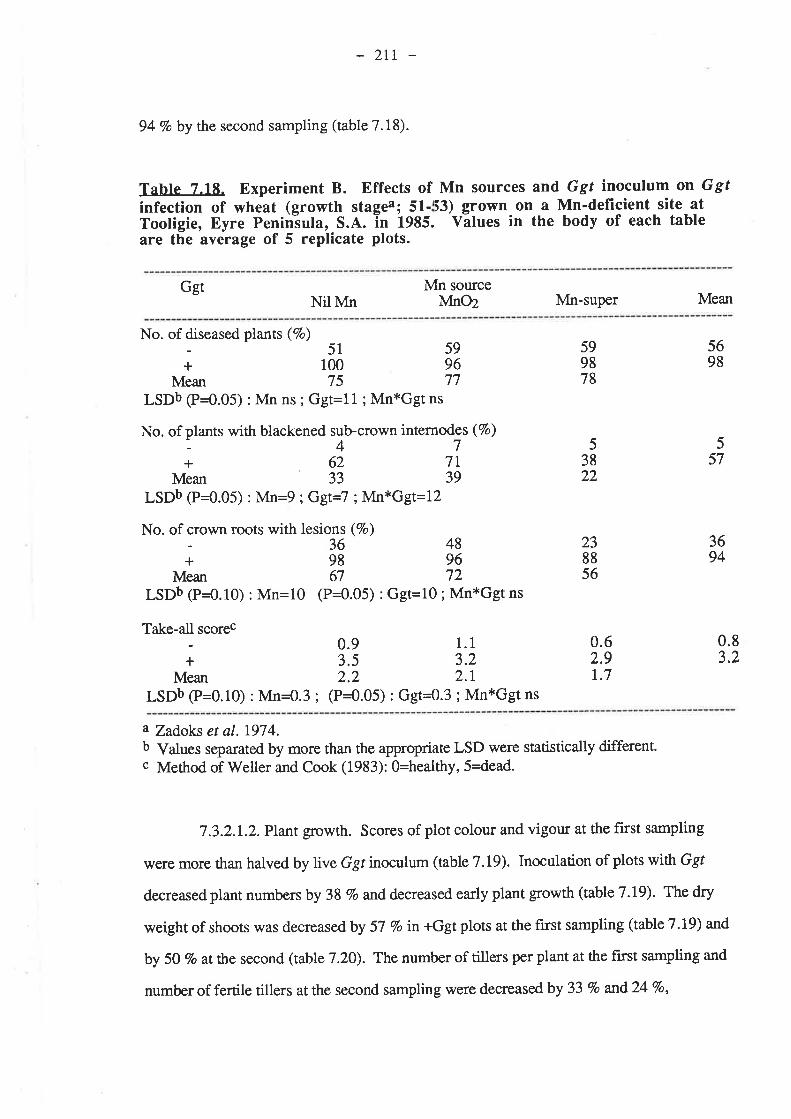
- ztr
94Voby the second sampling (table 7.18).
Tabte 7.18. Experiment B. Effects of Mn sources and, Ggt inoculum on Ggtinfection of wheat (growth stagea;51-t3) grown-on a Mn'deflrcient site atTooligie, Eyre Penin-sula, S.A. in 1935. Vãtues in the body of each tableare the average of 5 replicate plots.
GgtNil Mn
Mn sourceMnø Mn-super Mean
No. of diseased plants (7o) 51
+ 100Mean 75
LSDb e=0.05) : Mn ns ; Ggt=11 ; Mn*Ggt ns
No. of plants with blackened sub-crown internodes (7o)
+6271Mean 33 39
LSDb e=0.05) : Mn=9 ; Gg.=7 ; Mn*Ggt=12
No. of crown roots with lesions (7o)-3648+9896
Mean 67 72LSDb (P{.10) : Mn=10 (P=0.05) : Ggt=10 ; Mn*Ggt ns
Take-all scorec- 0.9 1.1+ 3.5 3.2
Mean 2.2 2.1
LSDb P=0.10) : Mn=0.3 ; (P{.05) : Ggt=0.3 ; Mn*Ggt ns
599878
599677
5698
557
3694
238856
53822
0.62.91.7
0.83.2
a Zadoks et al.1974.b Values separated by more than the appropriate LSD were statistically different.c Method of Weller and Cook (1983): O=healthy, S=dead.
7.3.2.I.2. Plant growth. Scores of plot colour and vigour at the first sampling
were more than halved by live Ggr inoculum (table 7 .19). Inoculation of plots with Ggr
decreased plant numbers by 38 7o anddecreased early plant growth (table 7.I9). The dry
weight of shoots was decreased by 57 Vo in+Ggt plots at the fust sampling (table 7.19) and
by 50 Vo at ¡he second (table 7 .20). The number of tillers per plant at the fust sampling and
number of fertile tillers at the second sampling were decreased by 33 7o and24 Vo,
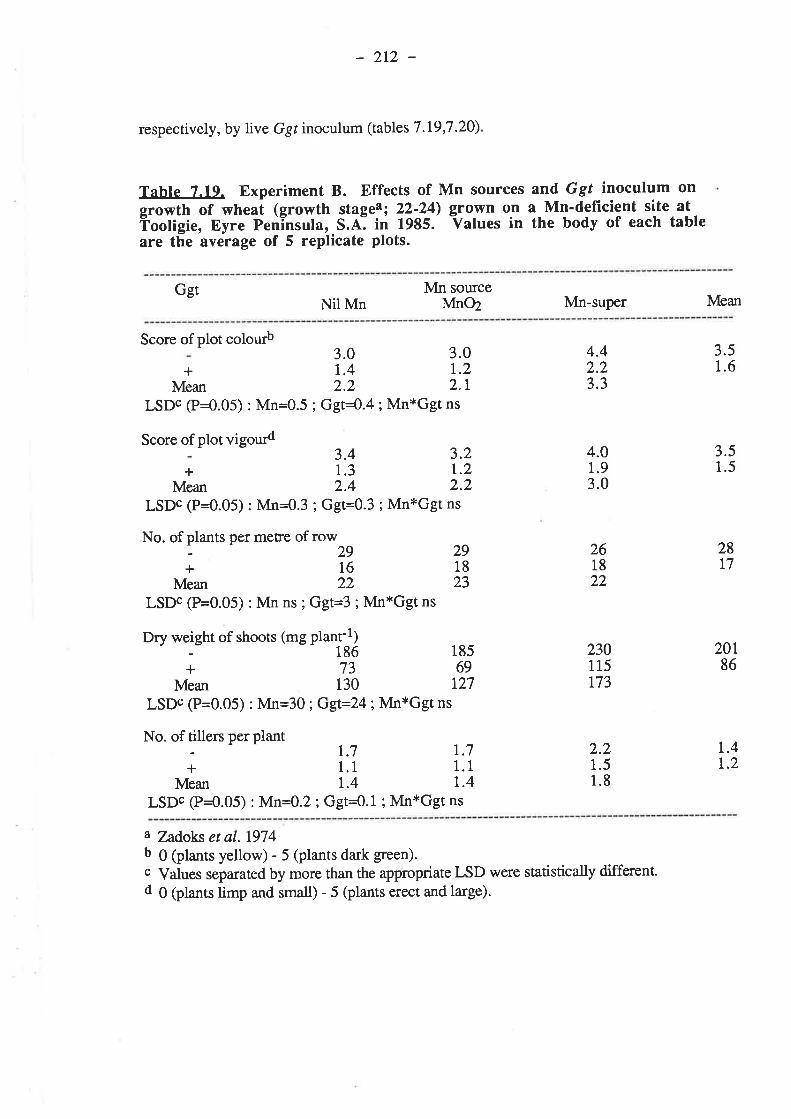
-2r2-
respectively, by live Ggr inoculum (tables 7.19,7 .20)
Table 7.1o. Experiment B. Effects of Mn sources and Ggt inoculum on
growth of wheat (growth stagea; 22-?!) gIo_wn on a Mn-deficient site atiootigie, Eyre Peninsula, S.A: in 1985. Values in the body of each tableare the average of 5 replicate plots.
GgtNil Mn
Mn sourceMn02 Mn-super Mean
Score ofplot colouÈ3.0 3.0
+ 1.4 1.2Mean 2.2 2"1
LSDc (P=0.05) : Mn=0.5 ; Ggt=0.4 ; Mn*Ggt ns
Score ofplot vigoud3.41.32.4
LSDc (P=0.05) : Mn=0.3 ; Ggt=0.3 ; Mn*Ggt ns
3.2r.22.2
3.51.6
4.4))3.3
1.93.0
4.0+
Mean
261822
230115773
2.21.51.8
3.51.5
28L7
20t86
No. of plants per metre ot to*r,n
+16Mean 22
LSDc (P=0.05) : Mn ns ; Ggt=3 ; Mn*Ggt ns
291823
Dry weight of shoots (mS flantÐ 1g5
+7369Mean 130 127
LSDc (P=0.05) : Mn=30 ;Ggt=24; Mn*Ggt ns
No. of tillers per plant 1.7 I.j
+ 1.1 1.1Mean 1.4 1.4
LSDc (P{.05) : Mn=0.2 ; Ggt=0.1 ; Mn*Ggt ns
t"4t.2
a Zadoks et al. 1974b 0lplants yellow) - 5 (plants dark green).c Values separated by more than the appropriate LSD were statistically different.d 0 lplants limp and smatl) - 5 (plants erect and large).
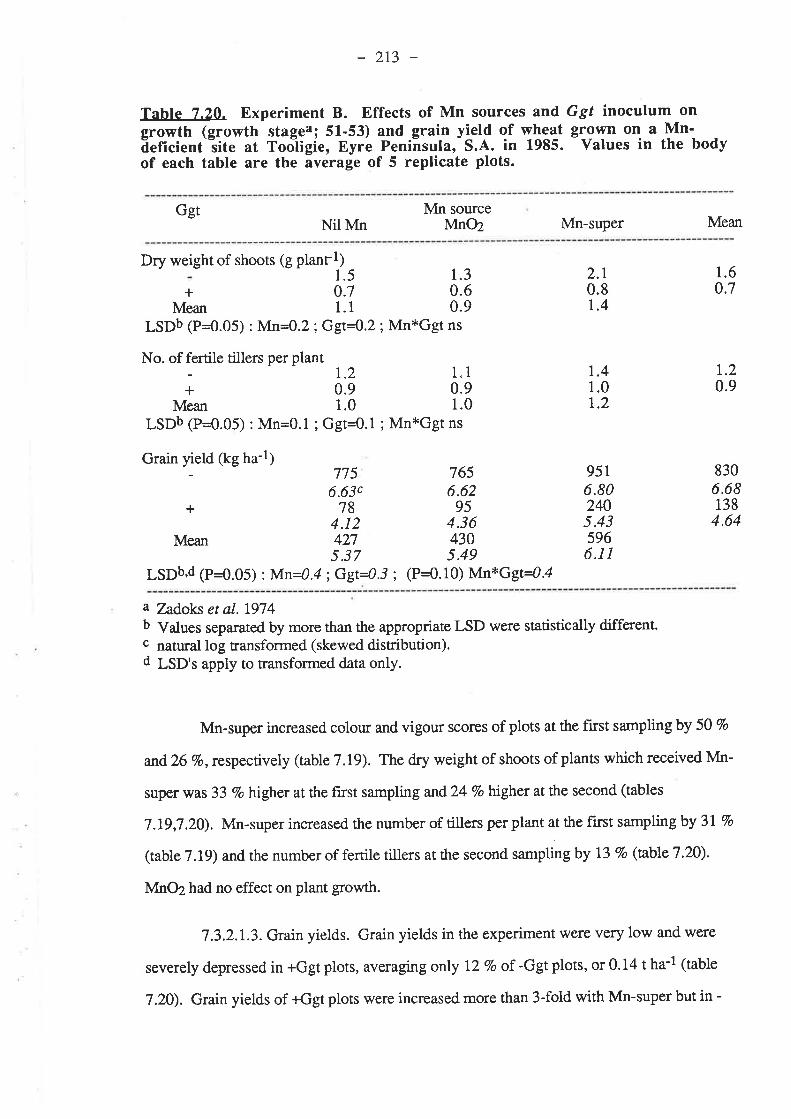
-2r3-
Tahle 7.20. Experiment B. Effects of Mn sources and Ggt inoculum ongrowth (growth stagea; 51-53) and grain VlelO qf rylqqt glgryn on a Mn'ãeficient'"site at Tooîtigie, Eyre Peniñsula, S.A. in 1985. Values in the bodyof each table are the average of 5 replicate plots.
GgtNil Mn
Mn sourceMn02 Mn-super Mean
Dry weight of shoots (g planrt)
+Mean
1.50.71.1
1.30.60.9
2.10.87.4
9516.802405.43596
6.11
1.60.7
8306.68138
4.64
LSDb (P=0.05) : Mn=0.2 ; Ggt=0.2 ; Mn*Ggt ns
No. of fertile tillers per plant I.2
+ 0.9Mean 1.0
LSDb (P=0.05) : Mn=0.1 ; Ggt=0.1 ; Mn*Ggt ns
Grain yield (kg ha-t) 775 765
6.63c 6.62+7895
4.12 4.36Mean 427 430
5.37 5.49LSDb'd (P{.05) :Mrn-4/ ; Get=03 ; (P=0.10) Nln*Ggt4/
1.10.91.0
t.20.9
.4
.0
.2
1
1
1
a Zadoks et al. 1974b Values separated by more than the appropriate LSD were statistically different.c natural log transformed (skewed distribution).d LSD's apply to transformed data only.
Mn-super increased colour and vigour scores of plots at the first samplingby 50 Vo
and26 7o, respectively (table 7 .19). The dry weight of shoots of plants which received Mn-
super was 33 Vo higher at the first sampling and 24 Vo higher at the second (tables
7 .19,7 .20). Mn-super increased the number of tillers per plant at the first samplngby 3I Vo
(table 7.19) and the number of fertile tillers at the second sampling by 13 Vo (øbke7.20).
IvInO2 had no effect on plant growth.
7.3.2.1..3. Grain yields. Grain yields in the experiment'were very low and were
severely depressed. in +Ggt plots, averaging only 12 7o o1-Ggtplots, or 0.14 ¡ ¡¿-1 (table
7.20). Grain yields of +Ggt plots were increased more than 3-fotd with Mn-super but in -
-214-
Ggt plots Mn treatrnents did not signifrcantly increase yields. MnØ did not increase grain
yields.
7.3.2.I.4. Mn. Mn concentrations in shoots were not affected by Ggt treaünents at
either sampling (table 7.21). The average Mn concentration of whole shoots in nil Mn plots
was 11.6 mg kg-1 at the first sampling, which is marginal for Mn (Graham et al. 1985).
N4nO2 did not affect concentrations of Mn in shoots but Mn-super increased concentrations
to22mgkg-r.
Mnø and Mn-super increased Mn concentrations in whole shoots at the second
sampling from 9.5 mg kg-l (in nil Mn plots) to 12.2 and I29 mg kg-l, respectively. The
concentration of Mn in YEBs at the second sampting was not affected by Mn treatrnents and
averaged 20 mgkg-l fot the experiment. Mn concentrations in grain were increased by Mn-
super to 15.5 mg kg-l from an average of t2.9 mg kg-l in nil Mn plos. MnO2 and live Ggr
inoculum did not affect Mn concentrations in gain.
7 .3.2.I.5. Nutrient composition of plants. The concentrations of iron, copper,
molyMenum, calcium, magnesium, potassium and sulphur in shoots of plants were
adequate for wheat go'wth at both samplings and any effects of Mn or Ggt treatnents rilere
small (data not presented). However, the concentrations of boron in whole shoots at the first
sampling were decreased by MnOz from an average in nil Mn plots of 6.2mgkg-l to 4.4mg
kg-l (tabte 7.22), which may be inadequate for wheat growth (Reuter and Robinson 1986).
Both zinc and phosphorus were below adequate levels for growth at the second sampling
(table 7.22) (Reuter and Robinson 1986). Zinc concentrations in whole shoots at the second
sampling rwere not affected by Mn or Ggt trçatnents and averaged 8.6 mg kg-l for the
experiment but YEB concentrations were decreased from 11.1 mg kg-l in nil Mn plots to 9.0
mg kg-l in Mn-super plots. Live Ggt inoculum had no effect on zinc concentrations in
plants. Phosphorus concentrations in whole shoots at the second sampling were marginal in
-Ggt plots (average of 1159 mg kg-l) but were increased to an average of 1502 mg kg-l in
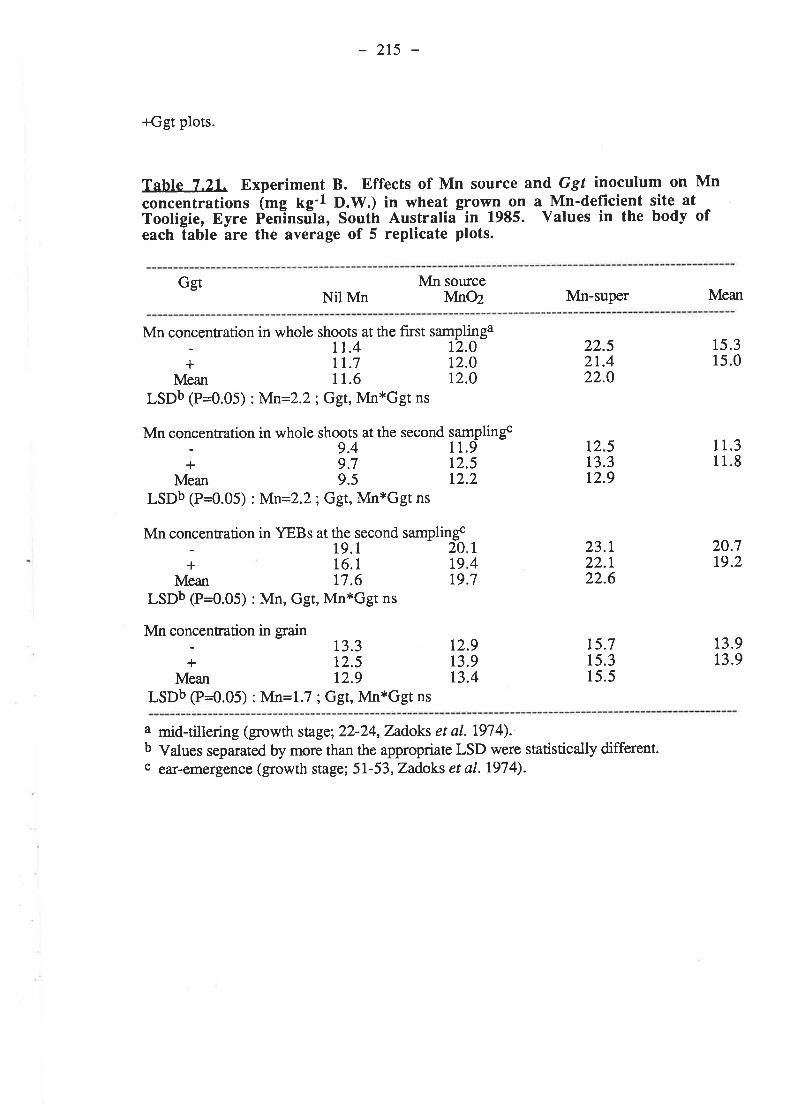
-2r5-
+Ggt plots.
Table 7.21. Experiment B. Effects of Mn source and Ggt inoculum on Mnconcentrations (mg kg'l D.W.) in wheat grown on a Mn-deflrcient site atTooligie, Eyre PenÏnsùta, Soutit Australia-in 1985. Values in the body ofeach table are the average of 5 replicate plots.
GgtNil Mn
Mn sourceMn02 Mn-super Mean
Mn concentration in whole shoots at the first. TT.4+ Ll.1
Mean 11.6LSDb (P=0.05) :Mn=2.2; Ggt,Mn*Ggt ns
Mn concentration in whole shoots at the second- 9'4+ 9.7
Mean 9.5LSDb (P=0.05) :lv\n=2.2; Ggt, Mn*Ggt ns
samplingat2.012.012.o
22.521.422.0
12.513.312.9
23.t22.122.6
15.315.0
20.719.2
samplingc11.912.5t2.2
11.311.8
Mn concentration in YEBs at the second- 19.1+ 16.1
Mean 17.6LSDb (P=0.05) : Mn, Ggt, Mn*Ggt ns
Mn concentration in g¡ain_ r3.3+ 12.5
Mean 12.9LSDb (P=0.05) : Mn=1.7 ; Ggt, MnxGgt ns
samplingc20 1
47
1919
t2.9t3.9t3.4
13.913.9
75.715.315.5
a mid-tillering (growth stage; 22-24, Zadoks et al.7974).b Values separated by more than the appropriate LSD were statistically differentc ear-emergence (growth stage; 51-53, Zadoks et al' 7974)-
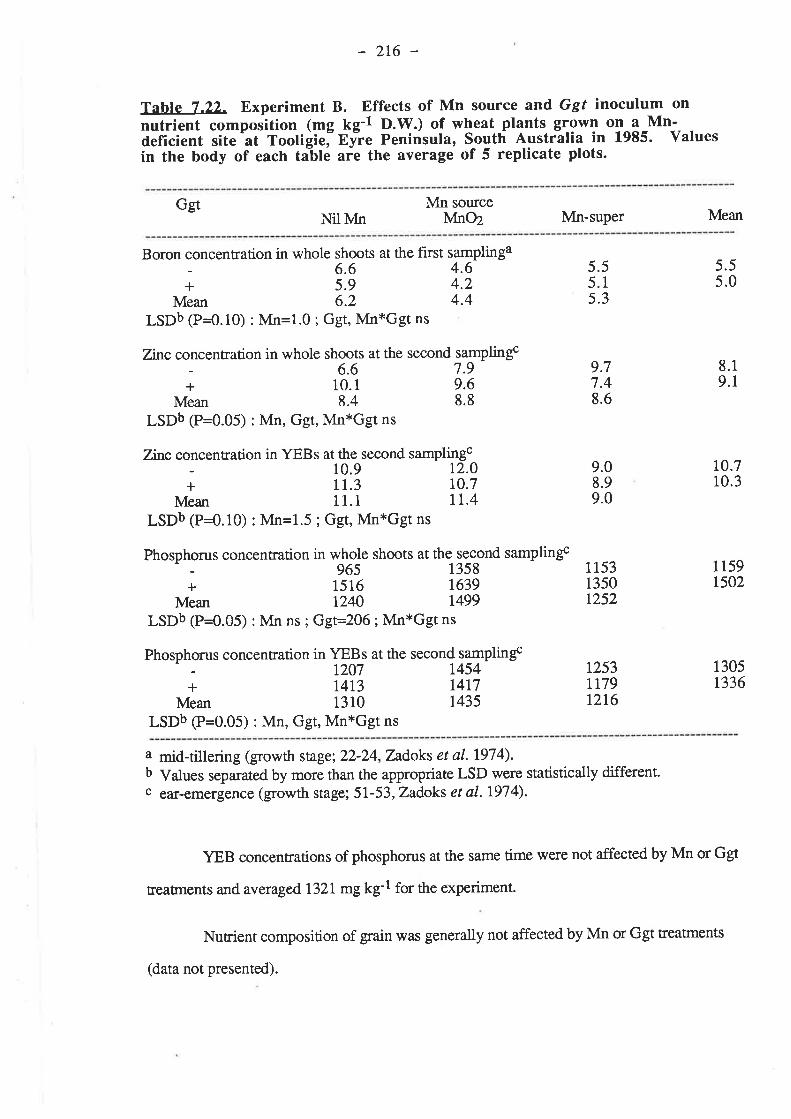
-216-
Tahle 7.22. Experiment B. Effects of Mn source and Ggt inoculum on
nutrient composition (mg kg-l O.W.) of wheat_plants g{gwT o1t^1-Mn-deflicient site'at Tootigiei Ey-re Peninsula, S_ogth Australia in 1985. Valuesin the body of each table aie the average of 5 replicate plots.
GgtNil Mn
Mn sourceMn02 Mn-super Mean
Boron concentration in whole shoots at the f,rst- 6.6+ 5.9
Mean 6.2LSDb (P=0.10) : Mn=1.0 ; Ggt, Mn*Ggt ns
Zinc concentration in whole shoots at the second samplingc
; 1åÍMean 8.4
LSDb (P=0.05) : Mn, Ggr, Mn*Ggt ns
Zinc concentration in YEBs at the second samplingc- 10.9 r2.0+ 11.3 I0.7
Mean 11.1 lI.4LSDb (P=0.10) : Mn=1.5 ; Ggt, Mn*Ggt ns
Phosphorus concentration in wjä$. shoots at the second samplingc
+ 1516 1639Mean 1240 1499
LSDb (P=0.05) : Mn ns ; Ggt=2O6; Mn*Ggt ns
Phosphorus concentration in YEBrs at the second samplingc
+ 141,3 1417Mean 1310 1435
LSDb (P=0.05) : Mn, Ggt, Mn*Ggt ns
5.55.0
5.55.15.3
samplinga4.64.24.4
.7
.4
.6
978
7.99.68.8
8.19.1
9.08.99.0
1 15313501252
1253ttj9tzt6
10.710.3
1 1591502
130st336
a mid-tillering (growth stage; 22-24, Zadoks et al.1974).b Values separated by more than the appropriate LSD were statistically different.c ear-emergence (growth stage; 51-53, Zadoks et al.I974).
YEB concentrations of phosphorus at the same time were not affected by Mn or Ggt
treatrnents and averaged 1321mg kg-l for the experiment-
Nutrient composition of grain was generally not affected by Mn or Ggt treatments
(data not presented).
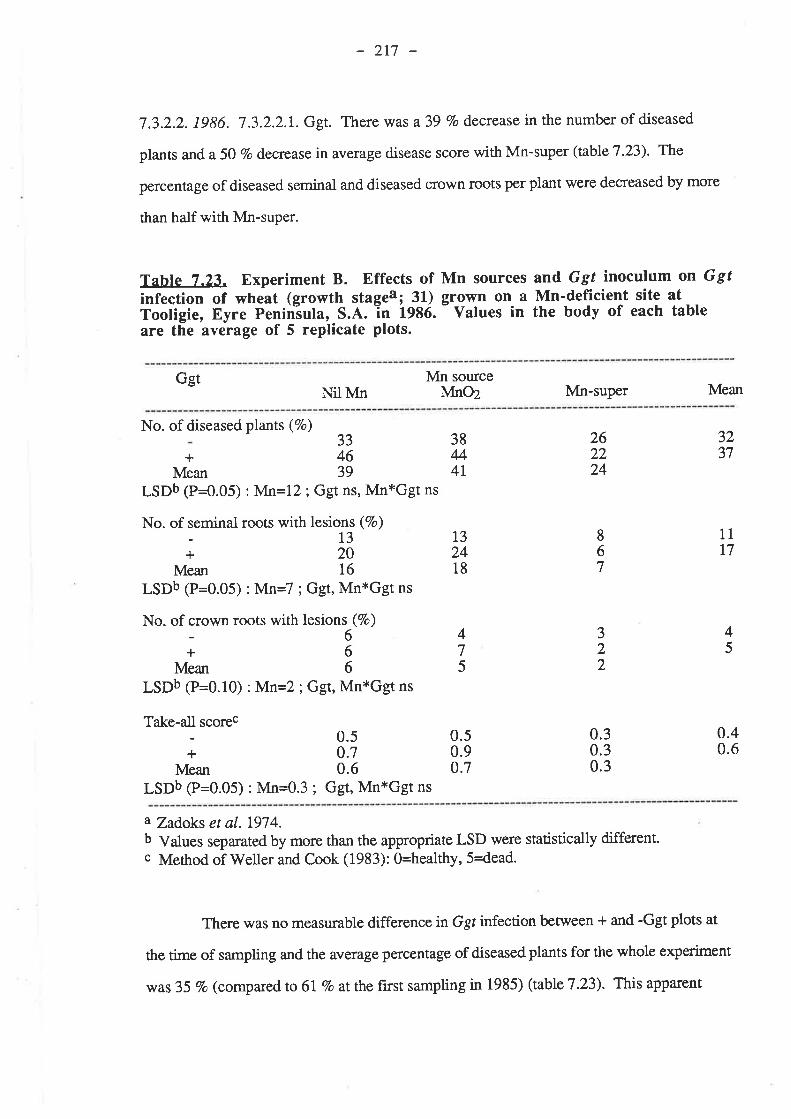
-2r7 -
7.3.2.2. 1986. 7.3.2.2.I. Ggt. There was a39 Vo decrease in the number of diseased
plants and a 50 Vo decrease in average disease score with Mn-super (table 7.23). T}re
percentage of diseased seminal and diseased crown roots per plant were decreased by more
than half with Mn-super.
Table 7.23. Experiment B. Effects of Mn sources and Ggt inoculum on Ggtinfection of wheat (growth stagea; 31) grqwn on- a Mn'deficient site atTooligie, Eyre Peninîula, S.A. in 1986. - Values in the body of each tableare the average of 5 replicate plots.
GgtNil Mn
Mn sourceMnØ Mn-super Mean
No. of diseased plants (7o)3346
Mean 39
LSDb (P{.05) : Mn=12 ; Ggt ns, MnxGgt ns
No. of seminal roots with lesions (7o)-13+20
Mean 16
LSDb (P=0.05) : Mn=7 ; Ggt, Mn*Ggt ns
No. of crown roots with lesions (7o)-6+6
Mean 6
LSDb (P=0.10) : Mn=2 ; Ggt, Mn*Ggt ns
Take-all scorec- 0.5+ 0.7
Mean 0.6LSDb (P=0.05) : Mn=0.3 ; Ggt, Mn*Ggt ns
333
262224
+
322
475
867
38M4T
t32418
0.50.9o.7
3237
45
11I7
0.40.6
0.0.0.
a Zadoks et al.1974.b Values separated by more than the appropriate LSD were statistically different.c Method of Weller and Cook (1983): O=healthy, 5dead.
There was no measurable difference in Ggt infection between + and -Ggt plots at
the time of sampling and the average percentage of diseased plants for the whole experiment
was 35 7o (compared to 6l Vo at the first sampling in 1985) (table 7.23). This apparent
-278-
reduction in the prevalence of take-alt in 1986 may have been due to an increase in the
suppressiveness of the soil, which is an effect commonly observed with cereal monoculture
(Garrett L934, Cook and Rovira 1976). However, this effect was not apparent in the second
year of experiment A.
7.3.2.2.2. Plant growth. The dry weight of shoots per plant was not affected by
lhve Ggt inoculum (applied in 1985) or Mn sources at the time of sampling but the number of
tillers per plant was increased by 39 Vo n Mn-super plots without live Ggr inoculum (table
7.24>.
7.3.2.2.3. Grain yields. The yields of grain in 1986 were as low as in 1985 and
were decreased by an average of 15 Vo in +Ggt plots (table 7.24). Mn-super increased grain
yields by an average of 297o. MnO2 did not increase grain yields.
7.3.2.2.4. Mn. Only Mn-super increased the concentration of Mn in whole shoots
and \lEBs (table 7.25). Mn concentrations in plants from nil Mn and MnOZ treatments were
less than the critical level for Mn (Graham et aI. 1985). Live Ggr inoculum had no effect on
plant Mn concentrations (table 7.25).
7 .3.2.2.5. Nutrient composition of plants. The concentrations of iron, copper,
calcium, magnesium, potassium and sulphur in whole shoots and YEBs were adequate for
wheat gowth when plants were sampted and were not affected by Mn or Ggt treatnents
(data not presented). MolyMenum concentrations in shoots and YEBs were lower in MnO2
and Mn-super plots but were súll at luxr:ry levels for growth (data not presented).
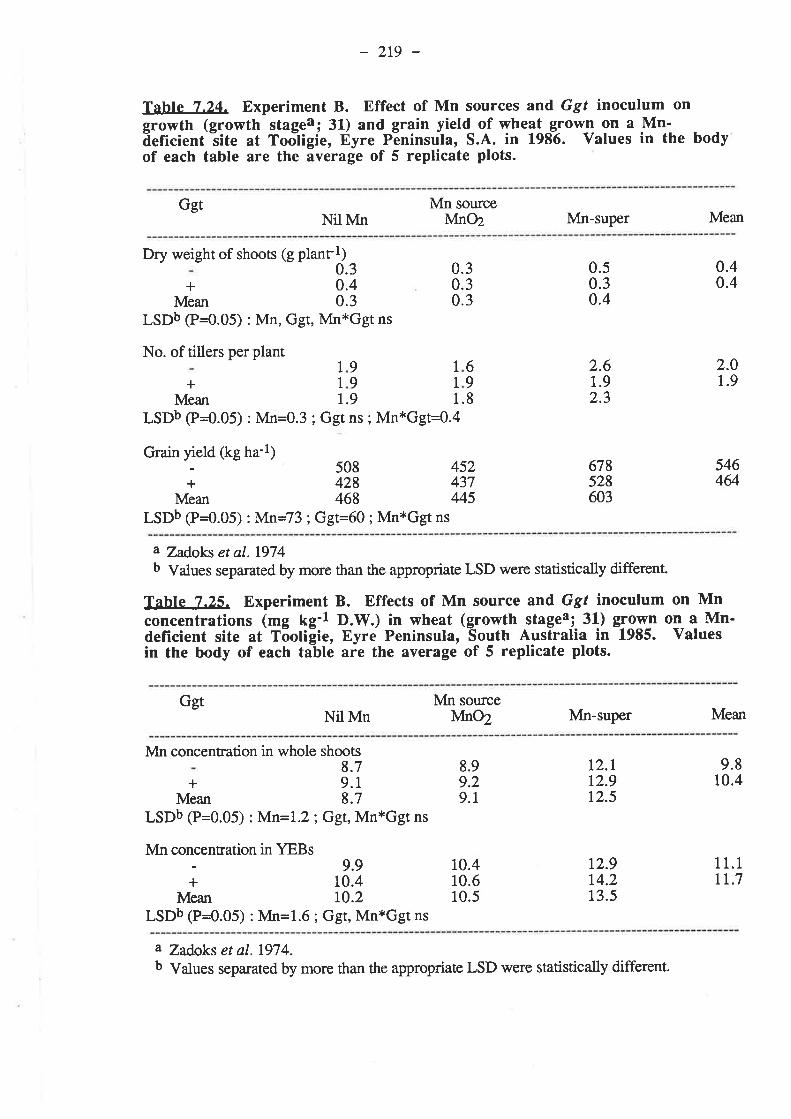
-219-
Tahle 7.24. Experiment B. Effect of Mn sources and Ggt inoculum ongrowth (growth stagea; 31) and grain yield_ of wheat _gfow_r¡ on a lVIn-ãeficient -site at Toõtigie, Eyre Põninsula, S.A. in 1986. Values in the bodyof each table are the average of 5 replicate plots.
GgtNil Mn
Mn sourceMn02 Mn-super Mean
Dry weight of shoots (g planr
+Mean
t¡0.30.40.3
2.0t.9
2.61,.92.3
5464&
678528603
0.50.30.4
0.30.30.3
0.40.4
LSDb (P=0.05) : Mn, Ggt, Mn*Ggt ns
No. of tillers per plant
Mean 1.9 1.8LSDb e=0.05) : Mn=0.3 ; Ggt ns ; Mn*Ggt=O.4
Grain yield (kg ha-t¡ 50S
+ 428Mean 468
LSDb (P=0.05) : Mn=73 ; Ggt=60 ; Mn*Ggt ns
a ZaÃoks et al.1974b Values separated by more than the appropriate LSD were statistically different
Table 7.25. Experiment B. Effects of Mn source and Ggt inoculum on Mnconcentrations (mg trg-r D.W.) in wheat (growth stagea; 31) glgqn on a Mn-deficient site at Tóotigie, Eyre Peninsula, South Australia in 1985. Yaluesin the body of each tabte are the ayerage of 5 replicate plots.
GgtMeanNil Mn Mn-super
+1
1
69
1
1
99
452437M5
Mn sourceMnØ
Mn concentration in whole shoots
+Mean
LSDb (P=0.05) : Mn=1.2 ; Ggt,Mn*Ggt ns
Mn concentration in YEBs- 9.9+ 10.4
Mean L0.2LSDb (P=0.05) : Mn=1.6 ; Ggt, Mn*Ggt ns
t2.l12.912.5
8.79.18.7
8.99.29.1
10.410.610.5
9.8t0.4
t2.9t4.213.5
1 1.1It.7
a Zadoks et a|.1974.b Values separated by more than the appropriate LSD were statistically different.

220
7.4. Discussion and Conclusions.
The conection of Mn defrciency in wheat growing on a Mn-dehcient soil decreased
take-all (depending on the Mn source) in two of the three years tested and similar trends were
present in the third year. MnSOa-supplemented superphosphate (Mn-super) and MnO were
equally effective at decreasing take-all but MnO2 and folia¡ Mn did not decrease disease
levels and were also ineffective at supplying Mn to plants. Mn-super and MnO decreased the
incidence and the severity of take-all of wheat.
Huber and Dorich (1987) found that the effectiveness of Mn application at
decreasing take-all was related to its ability to resist biological oxidation in soil. Thus,
bnoadcast application had bèen the poorest, band application fair and seed treabnent bst.
Similar results were recorded in the experiments reported here because MnO, which was
bnoadcast onto plots at nearly ten times the rate of Mn as Mn-super, was no more effective at
decreasing take-alt thù Mn-super, which was applied to the seedrows (band application).
However, MnO was more effective at supplying Mn to wheat plants than Mn-super.
Reis ¿r at. (1982) reported that folia¡ application of Mn did not decrease take-all of
wheat in the field. Foliar application was also ineffective at decreasing take-all in 1984
although it was also ineffective at improving the Mn nutrition and growth of reated plants so
may not have been a fair test of this Mn source.
The use of Mn fertilizers on wheat crops growing on soils of marginal or deficient
Mn status has three possible beneficial effects: firstly, improvement of the Mn status of the
crop resulting in better growth and increased g¡ain yields; secondly, a decrease in Ggt
infection with a consequent increase in grain yield; and lastly a ¡eduction in inoculum levels
for the following season. Mn fertilizer decreased the number of take-all infected plants. It is
the crowns and roots of these plants which are the inocula for the following season so
improved Mn nutrition of wheat crops may decrease disease levels in subsequent crops (in
the same way as suggested by Moore and Cook (1984) for tillage effects). A large increase

- 22r
in yietd with Mn-super in live Ggr inoculated plots was confirmed in 1985 in experiment B
and the interaction was also present in experiment A in that year (although not statistically
signifrcant).
Insoluble Mn higher oxides have to be reduced before they become available to
plants (Leeper 1970). They were tested as residual Mn sources because Mn-super has to be
re-applied every year, and under severe defrciency conditions, additional foliar sprays may
be necessary to maximize yields in cereals (eg., Reuter et. al1973). The philosophy behind
their use was that mixing very large quantities of finely-ground Mn-oxides through the soil
may encourage the growth of naturally occurring Mn-reducing soil microbial populations
@romfield and David I976,7-ajic 1969) because of the large amounts of substrate present.
This, in turn, would slowly release available MrtP+ to the plants. This effect should persist
for many seasons. However, in tight of the poor ability of MnO2 to decrease take-all in
experiment B, their use as residual Mn sources for cereal crops needs ca¡eful evaluation.
The availability of Mn oxides is related to the crystallinity, particle size and ease of
reduction of the oxide (Jones and Leeper 1951). MnOZ was ineffectual at supplying Mn to
plants even when supplied as a more finely granulated product. However, MnO released
more Mn to plants than Mn-super (including comparisons where MnO had been applied in
the previous season) and also decreased take-all and would appear to be a more suitable
product for further testing as a residual Mn source than MnOz. Finely powdered MnO2 at
low rates of incorporation supplied large amounts of Mn to plants and decreased take-all in
pot experiments (see chapter 6) which is in contrast to the results achieved in these field
experiments. The differences may have been due to the poorer incorporation of MnO2?trñ
greater dilution of MnO2 through the soil profile in the field. Better incorporation of Mn
oxides through soil may have increased contact reduction (Uren 1981) through more
frequent interceptions of oxide par:ticles by roots. Also, the MnO2 used in the pot
experiments was a fine powder but the oxide used in the freld experiment was mostly

222
granular which may partly explain why the NInO2 was more available in pots (Jones and
Leeper 1951).
223
7.5. References.
Asher, M.J.C. and Shipton, P.J. (1931). "Biology And Control Of Take-all." (Academic
Press: l-ondon.)
Bromfreld, S.M. and David, D.J. (I976). Sorption and oxidation of mangan-ous ions and
reduction of manganese oxiàe by cell sùspensions of a manganese oúdizingbacterium. SoiI B iol. Biochem. 8, 37 -43 -
Cook, R.J. and Rovira, A.D. (1976). The role of bacteria in qh¡: biological control ofGaeumanno^fåu lroìü"¡t by roppt"tsive soils. Soíl Biol' Bíbchem.8,269-73-
Garretr, S.D. (1934)c. Factors affecting the severity of take-all. 111. The climatic factor. "I.Dept. Agric., South Aust. 37, 97 6-83.
Ga:rert, S.D. (1936). Soil conditions and the take-all disease of wheat. Ann. AppI. Biol-23, 667-74.
Graham, R.D. (1983). Effects of nutrient stress on susceptiþitity_qf qþ1ts to disease with- - t*i¿ula¡ refeíence to the trace elements. Adv. Bot. Res.10,221-76.
Graham, R.D. and Rovira, A.D. (1984). A role for manganese in the resistance of wheat
plants to take-all. Plant Soi,l78,441-5-
Graham, R.D., Davies, W.J. and Ascher, J.S. (1985). The critical concentration ofmanganese in field-grown wheat. Aust. J. Agric. Res. 36, 145-55.
Hornby, D. and Henden, D.R. (1986). Epide_micsof take-all during 16 years of conúnuous
ðpring barley. Ann. AppI. Biol. L08,251-&-
Huber, D.M. and Dorich, R.A. (1988). Effect of nitrogen fertility on the take-all disease ofwheat. Down to Earth 44, (in Press).
Huber, D.M. and Wilhelm, N.S. (1988). The resistance. IniMangun"se In Soil Ánd Pìants.n @¿ and N.C. Uren.)pp. 157 -7 4. (Kluwer Academic Publ.:
Huber, D.M., Painter, C.G., McKay, H.C. and Peterson, D.-L-. (-1?-6!). Effect of nitrogen
fertilization on iake-all of winter wheat. Phytopathol. 58, 1470-2.
Jones, L.H.P. and Leeper, G.W. (1951). The availability of va¡ious manganese oxides toplants. Plant Soí1. 3, l4I-53.
Leeper, G.V/. (1970). "Six Trace Elements In Soils." (Melb. Univ. Press.)
MacNish, G.C. and Speijers, J. (1982). The use of ammonium fertilizers to reduce the
r.uêtity of takela[- (Gaeuìnanrnmy_c_es^graminis var. tritici) on wheat in Western
Austraiia. Ann. Appl. Bío1. 100, 83-90.
Moore, K.J. and Cook, R.J. (1984). Increased take-all of wheat with direct drilling in the
pacific northwest. P hytopathol. 7 4, l0M-9 -
Mulder, E.G. and Gerretsen, F.C. (1952). Soil manganese in relation to plant gowth. Adv.
Agron. 4,22I-77.

224
Northcote, K.H. (1979). "A Factual Key For The Recognition Of Australian Soils." 4th Ed.(Rellim Technical Publ.: Glenside, S. Aust.)
Reis, E.M., Cook, R.J. and McNeal, B.L. (1982). Effect of mineral nutrition on take-all ofwheat. P hytopathol. 72, 224-9.
Reuter, D.J. and Robinson, J.B. (1986). Plant Analysis. An Interpretation Manual. (InkataPress: Melbourne, Sydney, Aust.)
Smiley, R.V/. andrhizosphere63, 882-90
1983). Chloride,winter wheat. Plant
IJren, N.C. (1981). Chemical reduction of an insoluble higher oxide of manganese by plantroots. J. Plant Nutr.4,65-71.
Reuter, D.J., Heard, T.G. and Alston, A.M. (1973). Correction of manganese deficiency inúarleycrops on calca¡eous soils. 1. Manganous sulphate3PPli"d at sowing and as
foliar sprays. Aust. J. Exptl. Agric. Aním. Husb.13, 434-9.
Cook, R.J. (1973). Relationship between take-all of wheat andpH in soils fertiliied with ammõnium vs. nitrate-nitrogen. Phytopatllol.
Taylor, R.G., Jackson, T.L., Powelson, R.L. and Christensen' N.W. (' nitrogen form, lime and planting date effects on take-all root rot ofDis.67, ILL6-2O.
Weller, D.M. and Cook, R.J. (1933). Suppression of take-all of wheat by seed treatmentswith fluorescent pseudomonads. P hytopathol. 7 3, 463 -9.
Zadoks, J.C., Chang, T.T. and Konzak, C.F. (I974). A decimal code for the growth stages
of cereals. Weed Res.14, 415-2I.
7-ajíc,J.E. (1969). Microbes and manganese. In "Microbial Biogeochemistry." Chpt. 14.
pp. 157-68. (Academic Press: New York, London.)
CHAPTER 8.
INVASION BY GGT OF EXCISED WHEATROOT PIECES PRE-CULTURED WITH AND
WITHOUT MN
225
CHAPTER 8. INVASION BY GGT OF EXCISED WHEAT ROOT PIECESPRE.CULTURED WITH AND WITHOUT MN.
8.1. Introduction.
Deacon and Lewis (1986) published a technique where rates of invasion by Ggr into
excised wheat root sections were measured. They tested several Ggf isolates of different
vi¡ulence (established in pot experiments) for their ability to invade wheat root sections and
found a high correlation beween the extent of depression in host growth and the speed at
which the Ggt isolate invaded excised wheat toot sections.
In all experiments previously reported, both in this thesis and in the literature (e.g.
Reis ef a|.1982, Graham and Rovira 1984), the effects of Mn on take-all of wheat have been
measured indirectly by following the development of symptoms on the host rather than
measuring the rate of invasion by Ggt. The technique of Deacon and Lewis (1986) was
adapted to directly measure the effect of Mn on the invasion by the take-all fungus into the
host. 'Wheat plants (or excised wheat root pieces) were pre-cultured with and without Mn
before root sections were removed from the pre-cultured plants (or root pieces) and exposed
to Ggt colonies. 'Wheat plants were pre-cultured under either sterile or non-sterile
conditions.
8.2. Materials and Methods.
8.2.1. Pre-culturing of wheat plants under sterile conditions and invasion of excised rootsections by Ggt.
'Wheat plants twere grown aseptically on mineral-supplemented agar with and
without Mn for several weeks before root sections rüere removed and placed on the margins
of actively growing Ggr colonies on PDA.
8.2.1.1. Basal nutrients for wheat pre-culture. A basal nutrient solution containing 5 mM
KNO3, 2.5 mM Ca(NO)3.4H2O, lmM MgSO4, 0.5 mM(NII4)¡PO+, 0.03 mM FeEDTA,
0.015 mM H3BO¡, 0.01 mM NaCl, 0.0025mM ZnSOa.7H2O, 0.0005 mM CuSO4.H}O,
226
0.0002 mM CoSO +.7lfl,1zO and 0.0001 mM H2MoO 4+fbO was prepared after macronutrient
stock solutions were passed through a controlled pore-glass CPG/8-hydroxyquinoline
column to remove micronutrient contaminates @skew et al. 1984). The pH of the solution
was adjusted to 5.0 with dilute HCl.
8.2.1.2. Mn. Mn was added to wheat pre-culture as a solution of MnSO4.WO to give a
final concentration of 1 mM.
8.2.1.3. Procedure. Six acid-washed one-litre'schott'bottles were part-filled
(approximately 300 ml of solution per bottle) with either - or +Mn basal nutrient solution.
Difco 'Bacto-agar' was added to every bottle at 0.5 Vo of the nutrient solution. The mouths
of bottles were plugged with non-absorbent cotton wool and bottles were autoclaved for 15
min at 1200 C and 100 kPa.
Condor wheat seed (from a Mn-defrcient freld site) was soaked in DDDHzO for 5
hrs and then surface-sterilized by immersion in DDDH2O at 53o C for 10 min, followed by
saturated calcium hypochlorite solution (7 Vo calciumhpochlorite mixed in DDDHzO and
frtteiø¡ for 45 min at room temperatue on a'wrist-shaker'. The seeds were blotted dry on
sterile filterpaper and germinated on 50 VoPDAat2æ C. Sterile germinating seeds were
aseptically transferred to ttre surface of agar in 'schott' bottles (2 per bottle) after 4 days and
bottles were transferred to controlled environment conditions of 15o C constant temperature
and a 10 hr photoperiod in every 24 hrs (approximate photon flux density of 0.3 mEinsteins
m-2 s-1). No attempt was made to keep light out of the agar.
Iron (at the same rate used initially) was added to all bottles, and Mn to +Mn
bottles, after 41 days and plants were removed after 55 days. Shoots were removed from
plants and oven-dried at 80o C before digestion in nitric acid. Digested samples were
analyzdfor nutrient content with an ARL inductively coupled plasma atomic emission
spectrometer.
227
A 2 cm section was aseptically removed from behind the tip of every seminal root
and transferred onto the outer margin of an actively growing Ggt 5ffi colony on full strength
PDA. Roots from +Mn and -Mn pre-treaünents (at least three sections per treaünent)'were
placed on separate plates and removed after 6,12,18,24 and 48 hrs at 2æ C. Root sections
were preserved in 70 7o methanol.
Transverse sections were cut by hand from the middle of preserved root pieces and
flooded with 1 7o phloroglucinol inTO Vo ethanol for 5 min. Excess stain was poured off
before sections were flooded with conc. HCI and observed at2-4C/J- x magnification for
depth of penetration using the scoring method of Deacon and I-ewis (1986). Root sections
were considered to have six or seven sectors, each containing one of the radial arms of the
usually heptarch stele. The cortex of wheat seminal root axes usually has six cell layers,
invasion of which was scored from 1 to 6; a score of 7 was given for invasion of the
endodermis, 8 for the pericycle and 9 for the phloem or xylem.
8.2.2. Tissue cultu¡e of wheat root sections in a sterile liquid medium and subsequentinvasion by Ggt.
In this experiment excised wheat root sections were grown in sterile White's
medium (White 1956) (amended with IAA) before being placed onGgt colonies on PDA.
8.2.2.1. Mn. lvln was either withheld from complete White's medium CMn) or added as a
solution of MnSOa.4H2O to give a final concentration of 1 mM.
8.2.2.2. Procedure. Condor seed was soaked in DDDH2O for 5 hrs and surface-sterilized
as before (see section 8.2.L.3.) except ttre hot water treatment was not included. Seeds were
thoroughly rinsed in sterile DDDH2O, blotted dry on sterile filter paper and germinated on 50
VoPDA atzæ C. Two cm sections were aseptically removed from behind the root tips of
sterile, strongly germinating seeds and transferred to sterile \Vhite's medium in 100 ml
conical flasks (mouths plugged with non-absorbent cotton wool), five root sections per 50
ml of media. FeEDTA was substituted forFeSO+ in the preparation of the liquid medium
228
and stock solutions of the macronutrient salts (except NaHzPO+) were stripped of
micronutrient contaminates as before (see section 8.2.1.3.). Indole-3-acetic acid (10-5 mM)
was added to liquid cultures to stimulate root growth (Roberts and Street 1955).
Flasks were incubated at 25o C for 34 days on an orbital shaker.
After 34 days in liquid culture root sections were aseptically transferred to the
margins of actively growing Ggr 500 colonies on full strength PDA. Roots were removed
after 18 hrs at 2æ C and preserved in 70 Vo methanol. All root sections wele stained with
phloroglucinol and scored for extent of Ggt invasion as before (see section 8.2.1.3.).
under non-sterile conditions and invasion of excised8.2.3. Pre-culturing of wheatroot sections by
plantsGgt.
Wheat plants were grown in non-sterile solution culture with and without Mn for
several weeks before root sections were removed and placed on the margins of actively
growing Ggr colonies on PDA.
8.2.3.1. Mn. Mnwas added to solution culture as a MnSO+.}JzO solution to give a final
concentration of 1 mM Mn.
8.2.3.2. Procedure. Condor seeds were surface sterilized in I2.5 7o sodium hypochlorite
solution for 2.5 min, rinsed in DDDHzO, and germinated with DDDHZO at2Cp C. After 2
days, vigourously germinating seeds, visually free of microbial contamination, rflere
transferred onto stainless steel grids above aerated sterile 0.5 mM CaSOa solution. These
grids were placed under mercury vapour lamps with a 12 hrphotoperid (0.3 mEinsteins m-
2 s-1) and ambient remperatues of 20-3@ C. No attempt was made to keep germinating
seeds sterile past this stage.
Vigourous seedlings were transferred after a further 7 days into 5 I pots containing
nutrient solution of the same composition (without agar) used previously (see section
229
S.2.1.1.). Seven seedlings were transferred into each pot (seeds were removed) and 4 pots
were set-up ,2 with and2 without Mn. Pots r#ere aerated and kept under the same
conditions as used previously (see section 8.2.1.3.).
Fresh nutrients were added to each pot after 7, L4 and 21 days culture at the same
rates used iniúally and pH returned to 5.0 with dilute HCl.
After 24 days, sections 2 cm long were removed from behind the root tips of plants
grown with and without Mn and half the sections were placed on the edge of actively
growing colonies of Ggt 500 on fulI strength PDA. The remaining root sections were placed
on the edge of Ggr 500 colonies growing on full strength PDA to which 50 mg kg-l Mn had
been added (as MnSO+ .4WO). Some root sections were also placed on - and +Mn PDA
without Ggr colonies. Plates were kept at2P C and root sections removed after 30 hrs and
preserved \n70 Vo methanol.
Fresh weights of plants were recorded when root sections were removed. Shoots
and roots were dried at 80o C and analyzed for nutrient composition as before (see section
8.2.1.3.).
8.3. Results.
8.3. 1 . Pre-culturing of wheat plants under sterile conditions and invasion of excised rootsections by Ggt.
8.3.1.1. Ggt invasion of excised root sectíons. Root sections removed from plants pre-
cultured without Mn (-Mn roots) were invaded faster by Ggt 500 (table 8.1). This effect
was present at all incubation times except when invasion by Ggt was so early (after 6 hours)
that it could not be accurately scored and when invasion was so advanced that all root
sections were completely invaded by Ggt (after 48 hours). Ggt penetation rates through the
cortex of -Mn roots averaged almost one cell layer ahead of +Mn pre-cultured root sections
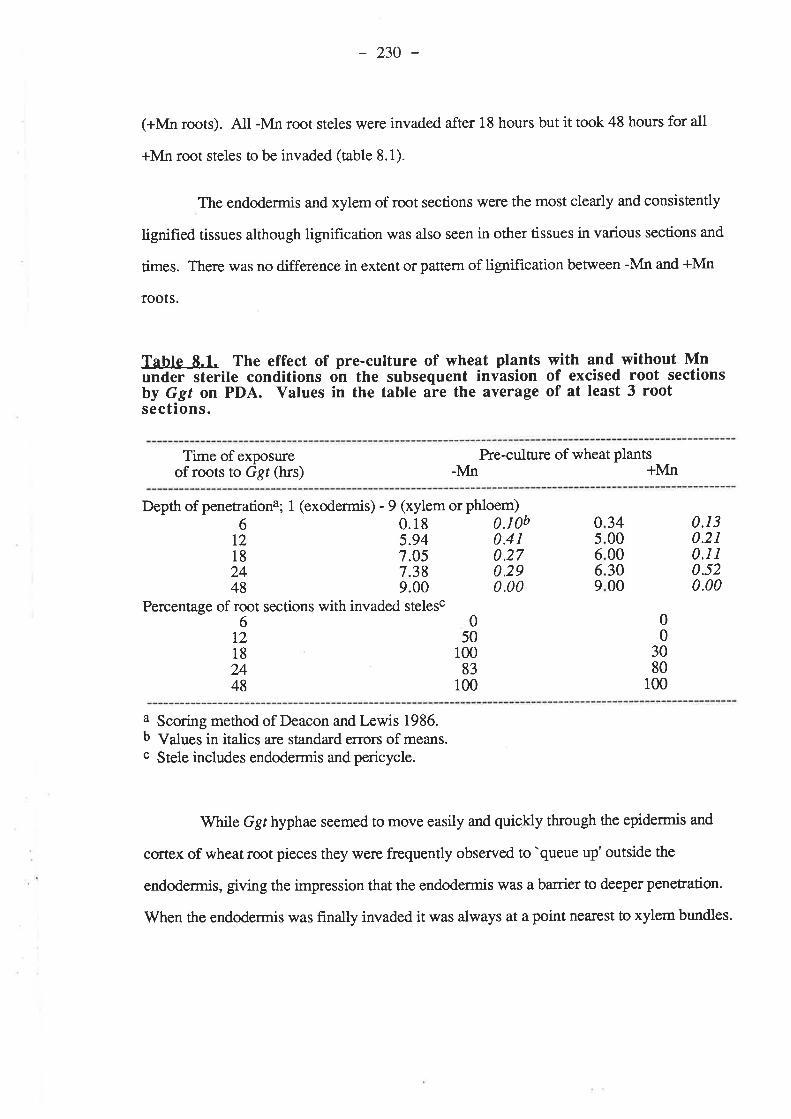
-230-
(+Mn roots). Atl -Mn root steles were invaded after 18 hours but it took 48 hours for all
+Mn root steles to be invaded (table 8.1).
The endodermis and xylem of root sections were the most clea¡ly and consistently
lignified tissues although lignifrcation was also seen in other tissues in various sections and
times. There was no difference in extent or pattern of lignification be¡ween -Mn and +Mn
roots.
Table 8.1. The effect of pre-culture of wheat plants with and without Mnunder sterile conditions on the subsequent invasion of excised root sectionsby Ggt on PDA. Values in the tabte are the average of at least 3 rootsections.
Time of exposureof roots to Ggr (hrs)
Pre-culture of wheat plans-N{n +Mn
Depth of penetrationa; I (exodermis) - 9 (xylem or phloem)6 0.18 0.10b
12 5.94 0.4118 7.05 0.2724 7.38 0.2948 9.00 0.00
Percentage of root sections with invaded stelesc60
12 5018 10024 8348 100
05669
3400003000
0.130.210.110.520.00
00
3080
100
a Scoring method of Deacon and Lewis 1986.b Values in italics are standard enors of means.c Stele includes endodermis and pericycle.
While Ggr hyphae seemed to move easily and quickly through the epidermis and
cortex of wheat root pieces they were frequently observed to 'queue up' outside the
endodermis, giving the impression that the endodermis was a barrier to deeper penetration.
'When the endodermis was frnally invaded it was always at a point nearest to xylem bundles.
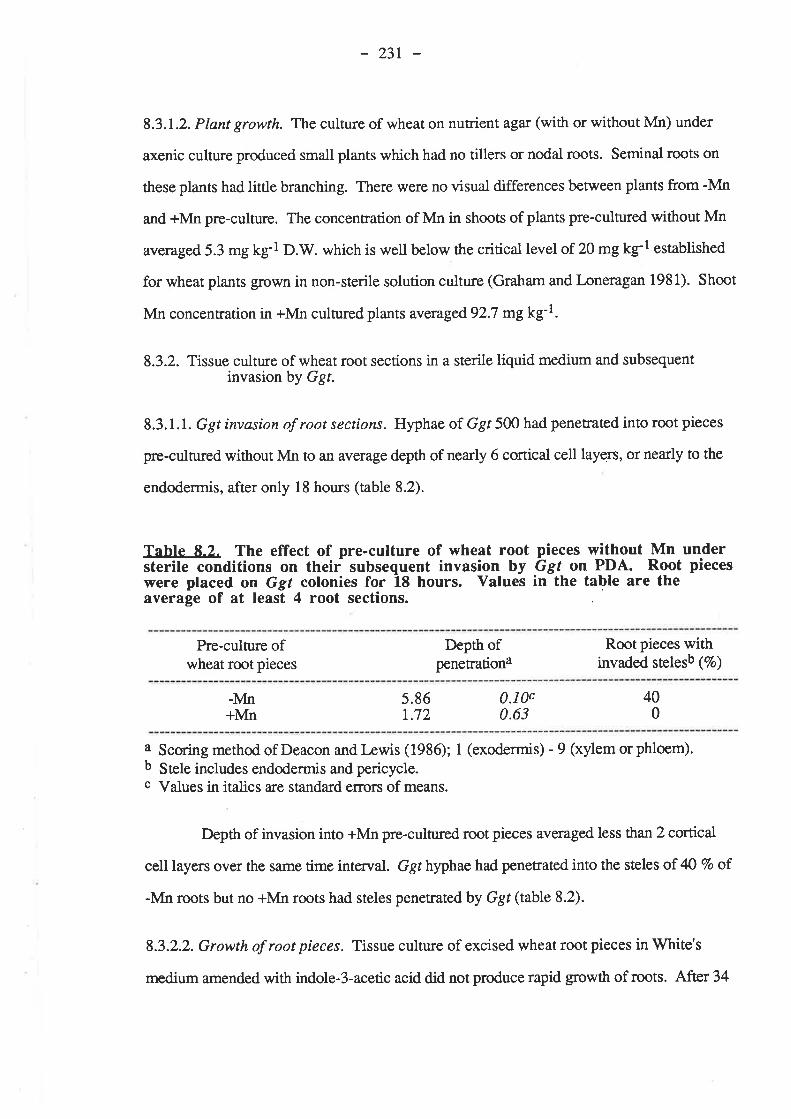
- 231
8.3.1.2. Plant growth. The culture of wheat on nutrient agar (with or without Mn) under
axenic culture produced small plants which had no tillers or nodal roots. Seminal roots on
these plants had little branching. There were no visual differences between plants from -Mn
and +Mn pre-culture. The concentration of Mn in shoots of plants pre-cultured without Mn
averaged 5.3 mg kg-l O.W. which is well below the critical level of 20 mgkg-1 established
for wheat plants grcwn in non-sterile solution culture (Graham and I-oneragan 1981). Shoot
Mn concentration in +Mn cultured plants averaged 92.7 mgkg-l.
8.3.2. Tissue culture of wheat root sections in a sterile liquid medium and subsequentinvasion by Ggt.
8.3.1.1. Ggt invasion of root sectíons. Hyphae of Ggt 500 had penetrated into root pieces
pre-cultured without Mn to an average depth of nearly 6 cortical cell layers, or nearly to the
endodermis, after only 18 hours (table 8.2).
Table 8.2. The effect of pre-culture of wheat root pieces without Mn understerile conditions on theif subsequent invasion by Ggt on PDA. Root pieceswere placed on Ggt colonies for 18 hours. Values in the table are theaverage of at least 4 root sections.
Pre-culture ofwheat root pieces
Depth ofpenetrationa
Root pieces withinvaded stelesb (7r)
-Mn+Mn
5.861.72
0J0c0.63
400
a Scoring method of Deacon and Lewis (1986); 1 (exodermis) - 9 (xylem or phloem).b Stele includes endodermis and pericycle.c Values in italics are standard efiors of means.
Depth of invasion into +Mn pre-cultured root pieces averaged less than 2 cortical
cell layers over the same time interval. Ggr hyphae had penetrated into the steles of 40 Vo of
-Mn roots but no +Mn roots had steles penetrated by Ggt (table 8.2).
8.3.2.2. Growth of root pieces. Tissue culture of excised wheat root pieces in White's
medium amended with indole-3-acetic acid did not produce rapid growth of roots. After 34
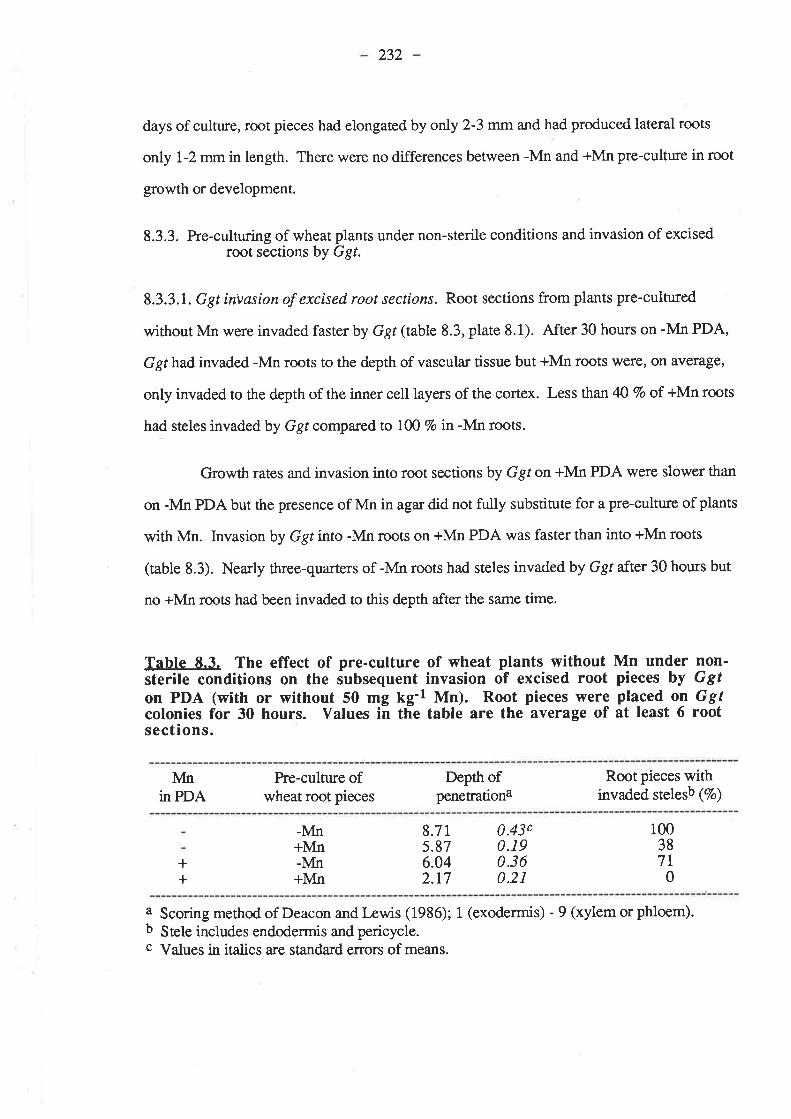
232
days of culture, root pieces had elongated by only 2-3 mm and had produced lateral roots
only 1-2 mm in length. There were no differences between -Mn and +Mn pre-culture in root
growth or development.
8.3.3. Pre-culturing of wheatroot sections by
plants under non-sterile conditions and invasion of excisedGgt.
8.3.3.1. Ggt invasion of excised root sections. Root sections from plants pre-cultured
without Mn were invaded faster by Ggt (table 8.3, plate 8.1). After 30 hours on -Mn PDA,
Ggt had invaded -Mn roots to the depth of vascula¡ tissue but +Mn roots were, on average,
only invaded to the depth of the inner cell layers of the cortex. Less than 4O 7o of +Mn roots
had steles invaded by Ggt compared to 100 Vo in -lvln roots.
Growth rates and invasion into root sections by Ggt on +Mn PDA were slower than
on -Mn PDA but the presence of Mn in agar did not fully substitute for a pre-culture of plants
with Mn. Invasion by Ggt into -Mn roots on +Mn PDA was faster than into +Mn roos
(table 8.3). Nearly three-quarters of -Mn roots had steles invaded by Ggt after 30 hours but
no +Mn roots had been invaded to this depth after the same time.
Table 8.3. The effect of pre-culture of wheat plants without Mn under non-sterile conditions on the iubsequent invasion of excised root pieces by Ggfon PDA (with or without 50 mg kg'l Mn). Root pieces were placed on Ggtcolonies for 30 hours. Yalues in the table are the ayerage of at least 6 rootsections.
Ivftiin PDA
Pre-culture ofwheat root pieces
Depth ofpenemtiona
Root pieces withinvaded stelesb (7o)
++
-Mn+Mn-Mn+Mn
8.715.876.042.17
0.43c0.190.360.21
100387l
0
a Scoring method of Deacon and Lewis (1936); 1 (exodermis) - 9 (xylem or phloem).b Stele includes endodermis and pericycle.c Values in italics are ståndard errors of means.
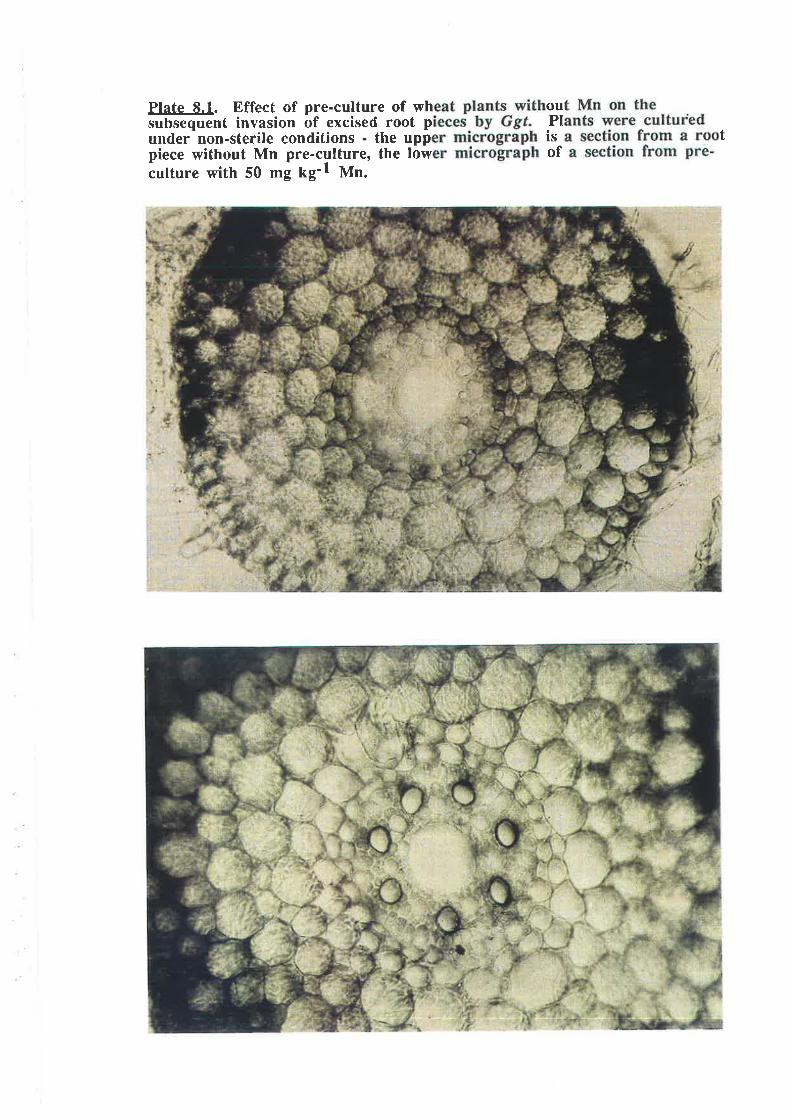
Plate 8.1. EfJect of pre-culture of wh ousubsequent invasion of excised root p Plunder non-sterile conditions - the upp is tpiece without Mn pre-culture, the low ofculture with 50 mg kg-r Mn.
233
Phloroglucinol staining of invaded root sections revealed extensive lignification of
the exodermis and outer cortical cell layers and often also the endodermis and xylem in +Mn
roots. Lignification in invaded -Mn roots was usually restricted to the epidermis and xylem
and sometimes the exodermis. Addition of Mn to PDA had no observable effect on
lignifrcation patterns in wheat root sections. Similar patterns of lignification were observed
in rootpieces which were placed on sterile PDA and were not invaded by Ggt.
Ggf invasion rates into non-sterile root pieces were simila¡ to invasion rates into
sterile root pieces.
8.3.3.2. Plant growth. After 24 days of growth in solution culture without Mn wheat plants
had leaves which were weak, floppy and pale g¡een; features which a¡e typical of Mn
deficiency (Snowball and Robson 1983). Plants from +Mn culture had erect dark-green
leaves. The fresh weight of shoots and roots of plants from +Mn culture averaged 8.7 and
34.2 g per plant, respectively, compared to 1.1 and 4.3 g per plant for -Mn plants. The
concentration of Mn in shoots of -Mn plants were deficient (an average of 5.6 mg kg-l
D.W.) but levels in +Mn plants were adequate for gowth (an average of 39 mg kg-l). The
concentrationof Mninrootsof +Mnplants was47 mgkgl (samplesof -Mnrootswerelost
during preparation for analysis).
8.4. Discussion.
Invasion by Ggt hyphae into wheat root pieces, and colonization of thei¡ steles, was
very rapid in root pieces which had been pre-cultured without Mn. Root pieces from all
methds of pre-culture which suppiied Mn; sterile or non-sterile, whole plants or separate
root pieces, were more resistant to invasionby Ggt hyphae and invasion through the cortex
and colonization of the stele was slower. The presence of high levels of Mn in the agar did
not fully substitute for a pre-culture of roots (or intact plans) with Mn.
234
Invasion by Ggt hyphae into host roots does not appear to impair host growth until
both the stele and vascular tissue are penetrated (Clarkson et al. 1975). The phloem is
destroyed faster than the xylem (Clarkson et al. 197 5) and the disruption of the phloem leads
to a ¡estriction of assimilate supply to sites of active ion uptake (Clarkson et aI. I975,Fitt
and Hornby 1978). Occlusion of xylem tubes by Ggthyphae will decrease translocation of
ions (Fellows 1928). If the results obtained here in petri-dish studies reflect the effect of Mn
nutrition of whole plants on Ggt invasion of intact roots (as Deacon and Lewis 1986 found
for different Ggr isolates) then wheat plants grown under Mn defrcient conditions would be
invaded quicker, have more and larger stelar lesions and suffer larger decreases in growth
than plants grown under Mn adequate conditions. Mn def,rciency of wheat plants has been
shown to increase the number and length of black stelar lesions caused by Ggt (Graham and
Rovira 1984 and in this thesis).
Lignifrcation in root pieces from non-sterile pre-culture where Mn was supplied was
more extensive and this may have been responsible for the slower invasion rates by Ggr.
Host cells rapidly respond to Ggt invasion by depositing lignin on the innermost surface of
their walls around the sites of penetration (IMeste 1972). Some of these deposis develop
into closed tubular structures (lignitubers) as they encase the penetrating hypha. Lignitubers
are rarely successful in completely halting the invasion of the penetrating hyphae (Skou
1981) but they may cause important delays. Lignitubers were rarely seen in these studies.
The more extensive lignifrcation in invaded wheat root pieces cultured with Mn was also
present in root pieces not exposed to Ggt. This suggests that differences n Ggt invasion
rates between -Mn and +Mn pre-culture were due to pre-formed lignin defence structures but
does not exclude the possibility that -Mn roots may have been unable to respond to the
presence of Ggt with elicited defence products (Skou 1981). Lignin production is controlled
by Mn-activated enzyme systems (Gross 1980).
235
Phloroglucinol staining may not have revealed all lignin deposits in wheat roots
because not all tignins will stain with this particular dye (Skou 1981). Lignins produced in
response to pathogenic invasion, in particular, stain poorly with phloroglucinol.
This technique of scoring invasion by Ggt into excised root pieces appears to be
very suitable for studies into the importance of the prior nutrition of root pieces to their
resistance to invasion by Ggt. The technigue is quick, does not require specialized apPalatus
and many root pieces can be exposed to Ggt because the root pieces can be preserved and
scored for depth of penetration when convenient. There is also the dual feature of being able
to vary bottr the pre-culture of the plants from which the root pieces are removed and also the
conditions under which the root pieces are exposed to Ggt..
236
8.5. References.
Clarkson, D.T., Drew, M.C., Ferguson, I.B. and Sanderson, J. (1975). The effect of theTake-all fungus, Gacutnannomyces graminis, on the transport of ions by wheat plants.Physiol. P lant P athol. 6, 7 5-84.
Deacon, J.W. and Lewis, S.J. (1986). Invasion of pieces of sterile wheat root byGaewnannomyces graminís andPhialophorà graminicola. Soil Bíol. Biochem.lS,167-72.
Eskew, D.L., Welch, R.M. and Carey, E.E. (1984). A simple plant nutrient solutionpurifrcation mehtod for effective removal of trace metals using controll_e{ pore glass-8-hydroxyquinoline chelation column chromatoglaphy. Plant Physiol.76,103-5.
Fellows, H. (1923). Some chemical and morphological phenomena attending infection of thewheat plant by Ophiobolus graminis. J. Agric. Res.37, &7-61.
Fitt, B.D.L. and Hornby, D. (1978). Effects of root-infecting fungi on wheat transportprocesses and growth. Physiol. Plant Pathol.13,335-46.
Graham, R.D. and Loneragan, J.F. (1981). The critical level of manganese for wheat. Proc.Nat. Workshop Plant Anal. pp. 95-6. Goolwa, South Aust. Feb. 15-18.
Graham, R.D. and Rovira, A.D. (1984). A role for manganese in the resistance of wheatplants to take-all. Plant Soil78, Ml-s.
Gross, G.G. (1980). The biochemistry of lignification. Adv. Bot. Res.8,25-63.
Reis, 8.M., Cook, R.J. and McNeal, B.L. (1982). Effect of mineral nutrition on take-all ofwheat. P hytopathol. 72, 224-9.
Roberts, E.H. and Street, H.E. (1955). The continuous culture of excised rye roots.P hysíologica Plantarutn 8, 238-62.
Skou, (1981). Morphology and cytology of the infection process. In "Biology And ControlOf Take-all.n lEds. M.J.C. Asher and P.J. Shipton.) pp. 175-97. (Academic Press:London.)
Snowball, K. and Robson, A.D. (1983). "Symptoms Of Nutrient Def,rciencies: SubterraneanClover And'Wheat." (Univ., West. Aust.: Perth, Western Australia.)
Weste, G. (1972). The process of root infection by Ophiobolus gramínis.Trans. Brit.Mycol. Sac. 59, 133-47.
'White, P.R. (1956). A hand-book of plant tissue culture. In "Plants In Action. A LaboratoryManual Of Plant Physiology." (Eds.L. Machlis and J.G. Torrey.) (Vi.H.Freemanand Co.: San Francisco.)
CHAPTER 9.
EFFECT OF MN ON THE GROWTH OFA SOIL.BORNE PSEUDOMONAD AND
ITS ANTAGONISM AGAINST GGT
237 -
CHAPTER 9. EFFBCT OF MN ON THE GROWTH OF A SOIL-BORNEPSEUDOMONAD AND ITS ANTAGONISM AGAINST GGT.
9.1. Introduction.
Many soil-borne bacteria and actinomycetes have been proposed as causal agents of
suppression of take-all (e.g. Garrett l934,Zogg and Jaggi t974, Sivasithamparam and
Parker 1978). For instance, Smiley (1978a,b) explained the reduction in take-all in a field
soil with ammonium fefiilizer in terms, not of soil or rhizosphere pH effects, but of small
changes in the suppressive micro-flora of the soil which accompanied the use of NII4+-N.
He found more antagonistic micro-flora, and a larger proportion of Pseu-domonat spp.
within this group, in NIi4+-N treated soil and proposed these Pseudomonas spp. as the most
likely antagonists acting in the soil. The rhizosphere pseudomonad; Pseudomonas
flu.orescern, is now a well-documented antagonist of Ggt and has been used to decrease
take-all in the freld (Weller and Cook 1983, Weller 1984, Wong and Baker 1985, Weller ¿r
aI. 1985, Huber and Wilhelm 1988). The mode of action of antagonism in the freld is not
known bat P. fluorescens produces a suite of antibiotic compounds (Ahl.¿r ø1. 1986,
Brisbane et al.1987), including siderophores which are only produced under low Fe
conditions (Kloepper et al.1980). Huber (1988) found thatP.fluarescens was either
antagonistic or beneficial to take-all of wheat in the freld, depending on the N fertilizer used;
antagonistic if Ml4+-¡ and benefîcial if NO3--N. Huber and Dorich (1988) proposed that
fluorescent pseudomonads may exert biological control over take-all by increasing the
availability of Mn in ttre rhizoqphere of wheat plants through the reduction of insoluble Mn
oxides.
Micro-organisms have long been recognized as important in the soil chemistry of
Mn (Timonin 1946, Gerretsen 7937,Leeper 1970). Many soil-borne micro-organisms have
been identified which are capable of oxidizing Mn2+ to insoluble Mn oxides (Gerretsen
1937,Leeper and Swaby 1940, Bromfield and Skerman 1950, Bromfreld 1956,2'ajic 1969,
Bromfreld 1979) including various Pseudomonas spp. (Huber 1988).
- 238-
Fewer studies have been conducted to identify micro-organisms capable of
reductionof Mnoxides (Zajic7969,BromfîeldandDavid I9T6,Gotfreund etal.1985).
Bromfield and David (1976) found that a Mn-oxidizingArthrobacter sp. was capable of
reduction of MnO2 to Mn2+ under poorly aerated conditions which suggests that other Mn-
oxidizers may also be capable of Mn-reduction under certain conditions.
Experiments are reported here which tested the effect of Mn on the 'in vitro' gowth
and siderophore production of Ps eu.domonas fluorescens 2-79 RN1O (Weller and Cook
1983) (2-79). In addition, experiments were conducted'in vitro' and in pots to test whether
the antagonism by this bacterium against Ggr would still operate when Mn was added to the
system. The hypothesis of Huber and Dorich (1988) predicts that it would not because they
propose that antagonism is dependent on the bacteria relieving Mn deficiency in the host by
reducing Mn oxides in the soil. In the presence of adequate soil Mn, the bacteria should not
further increase resistance of the host to take-all.
9.2. Materials and Methods.
9.2.I. Effect of Mn on the gowth o12-79 on PDA.
The effect of increasing concentrations of Mn2+ on the gowth and behaviour of 2-
79 onPDA was tested and the behaviour of 2-79 on PDA in the presence of MnO2 was also
observed.
9.2.1J. Mn2+. Bacterial cells from a colony of 2-79 on a full-strength PDA (39 g in 1000
ml) slope were suspended in 100 rnl of sterile DDDHZO. A 0.5 ml aliquot of this
suspension was diluted into a further 100 rnl of sterile DDDHzO and 0.5 ml of the final
suspension was transferred to each of 3 sterile 9 cm petri-dishes. Each dish was part-f,tlled
with 15 ml of cooling, weak PDA (17 g PDA in 1000 ml), 3 dishes per Mn rate. Dishes
were incubated at 2W C for 10 days.
- 239-
Mn2+ was added to weak PDA as a sterile stock solution of MnSOa.4H2O to give
final concentrations of 0, L0, 50, 100 or 200 mg kg-l of Mn2+.
Bacterial growth after 10 days was estimated as the number of colonies in each dish
within 3 frelds of a dissecting microscope at 10 x magnification.
9.2.1.2. MnOz. Petri-dishes of weak PDA, to which MnO2 [1] had been added at 10 mg g-
l, were streaked with2-79 from a full-strength PDA slope. Dishes were incubated at 2æ C
and observed at regular intervals for disappearance of black MnO2.
9.2.2. Effect of Mn on siderophore production by 2-79 in KMB.
The effect of Mn on siderophore production by 2-79 n liquid King's medium B
(King et al.1954) (KMB) was tested. KMB is an iron-free medium on which Pseudotnonas
fluorescens freely produces siderophores. Cultures of 2-79 were gtown on KMB with Mn
present initially (T0) or added after 4 days (T4) and compared with cultures g¡own without
Mn (nil Mn).
The liquid media was prepared with the following reagents;
50 ml of media.
1 g'Difco'Proteose Peptone No. 3
10 ml, 7.5 g kg-l of MgSOa.TffzO stock solution
10 ml, 7.5 g kg-l of IGI2POa and 4O ml kg-t of glycerol stock solution
30 rnl DDDHzO
Mn was added aseptically to 50 ml of media initially (T0) by replacing 10 ml of
DDDH2O with 10 ml of a2mgkg-l of MnSOa.4H2O stock solution, giving 100 mg kg-l of
Mn in media. Mn in treatment T4 was added aseptically to cultures as 10 ml of a2 mg kg-l
of MnSOa. 4LbO stock solution (10 ml of DDDH2O was added to other treaunents). Ten ml
1 BDH, analytical gade, majority of particles less than 0.01 mm in diameter.
- 240-
of MnSOa.4H2O stock solution (10 ml of DDDH2O was added to other treatrnents). Ten ml
of a 0.15 mg kg-1 of FeCl3 stock solution was added to one flask of each treatment after 8
days.
Erlenmeyer flasks (125 ml capacity, 2per neatment) 'ü/ere part-frlled with 50 ml of
media and autoclaved for 15 min at 12W C and 100 kPa. Flasks were inoculatedwirh2-79
from a solid KMB culture with 100 mg kgl of added Mn and incubated on a horizontal
shaker at25o C.
Siderophore production was visually estimated at regular intervals by obsewing
flasks under ultra-violet (JV) light for blue-green fluorescence (King et al. 1954, Philson
and Llinas 1982).
9.2.3. Effect of Mn on the antagonism of 2-79 against Ggt on PDA.
Ggr 500 was groìwn on PDA with increasing rates of Mn in the presence or absence
of 2-79 to assess the effect of Mn on the level of antagonism by the bacteria against Ggr'in
vitro'.
V/eak PDA was prepared with increasing rates of Mn; 0 (0 Mn), 10 (10 Mn), 50
(50 Mn) and 100 mg kg-l of Mn2+ (100 Mn) (see section 9.2.1.1.) and six 9 cm disposable
petri-dishes were part-filled with autoclaved agar from each Mn rate.
Four drops of a turbid suspension of 2-79 were added to the outside margin of 3
dishes from each Mn rate and run a¡ound the dish such that the suspension formed a
complete ring. Dishes were incubated at 20o C.
One day after the addition of 2-79 a single weak PDA block (4 x 4x 4 mm) of Ggt
500 was placed in the centre of every dish. Dishes rvere returned to 20o C. Ggt colony
areas rwere calculated from the average of 2 measurements of colony diameter taken at right
angles to each other after 3 and 5 days.
- 247-
9.2.4. Effect of Mn on the control by 2-79 of take-all of wheat grown_in a Mn-deficientsand. Bacteria added to pots in a suspension of DDDHzO.
This pot experiment was factorially designed with 3 rates of soil applied Mn (0, 8
and24 Mn), 3 rates of Ggt (sterile 20 Vo PDA, 4 Vo Ggt-colonized PDA and 20 Vo Ggt-
colonized PDA), 3 rates of 2-79 (autoclaved suspension of bacteria, 1 7o suspension of live
bacteria, full-strength suspension of bacteria) and 4 replicates. Most of the materials and
procedures used in this experiment have already been presented in pot experiments outlined
in ea¡lier chapters so only a brief summary will be included here.
9.2.4.1. Inoculum,; Ggt 500 colonies were prepared on petri-dishes of 4 and 20 Vo PDA
(0.156 g and 0.78 g of PDA in 100 ml, respectively) and incubated at 2æ C for 7 days.
Extra sterile 20 VoPDA dishes were prepared for use in nil Ggt controls.
9.2.4.2.2-79. Cultures of 2-79 were g¡own atzP C on liquid KMB (with 10 ml of 0.15
mS kg-l of FeCl3 solution per 50 ml of media) for 4 days prior to sowing. A suspension of
bacteria was prepared in DDDH2O to give a concentration of approximately 107 cells ml-l
(suspension appeared turbid). Some of this full-strength suspension (high 2-79) was
autoclaved (-2-79) and some diluted 100 fold (low 2-79).
9.2.4.3. Soil. Wangary sand (see section 3.2.L1.) was incubated for 15 days prior to
sowing (see Appendix A). Normal rates of basal nutrients were added at so'ù/ing (see
section 3.2.3.I.).
9.2.4.4. Mn. Mn was mixed through soil prior to incubation to give either 0, 8 or 24 mg of
Mn2+ per pot.
9.2.4.5. Procedure. Pots were part-fîlled with soil such that agar plugs were placed 4 cm
below germinating wheat seeds (see section 3.2.3.2.). One ml of bacterial suspension was
added to seeds before they were covered with a final layer of soil. Pots were placed in
randomized blocks under controlled environment conditions of 15o C with a 10 hour light
242 -
period (average photon flux density of 0.3 mEinsteins m-2 s-l supplied by a bank of mercury
vapour lamps) in every 24. Tlne same bacterial treatments were re-applied to the surface of
pots 10 days after sowing (1 rnl of DDDH2O was added to -2-79 pots instead of an
autoclaved suspension). Pots were watered to original weight at regular intervals. Plants
were harvested after 25 days and assessed for growth, Ggt infection and Mn nutrition.
9.2.5. Effectof Mnonthecontrolby2-79 of take-allof wheatgrowninaMn-deficientsand. Bacteria added to pots in liquid media.
This pot experiment was factorially designed with 3 rates of soil applied Mn (0, 0.4
and 4 Mn), 3 rates of Ggt (sterile 4 VoPDA,l To Ggt-colonized PDA and 4 7o Ggt-colonized
PDA), 2 rates of 2-79 (-,+ 2-79) and 5 replicates. This experiment 'was flrst reported in
chapter 3 (+2-79 treatnents removed) and most of the details of the materials and procedures
used in this experiment can be found in section 3.2.3.1. of that chapter so, again, only a
brrief summary will be included here.
9.2.5.l.Inoculwn. Weak PDA plugs of Ggt 500 were placed 2 cm below wheat seeds in
pots.
9.2.5.2.2-79. Caltwesof2-Tg,weregrowninliquidKMB(with10mlof0.l5mgkg-l of
FeCl3 solution per 50 ml of media) for 3 days at25o C on a horizontal shaker. At sowing, 2
ml of live bacterial culture were added to the soil surface of +2-79 pots and 2 ml of
autoclaved culture to -2-79 pots.
9.2.5.3. Soil. Wangary sand was used with normal rates of basal nutrients but without prior
incubation.
9.2.5.4. Mn. Mn was mixed through soil to give either 0, 0.4 or 4 mg of Mn per pot.
9.2.5.5. Procedure. Pots were placed in randomized blocks under controlled environment
conditions of 15o C with a 10 hour light period (average photon flux density of 0.2
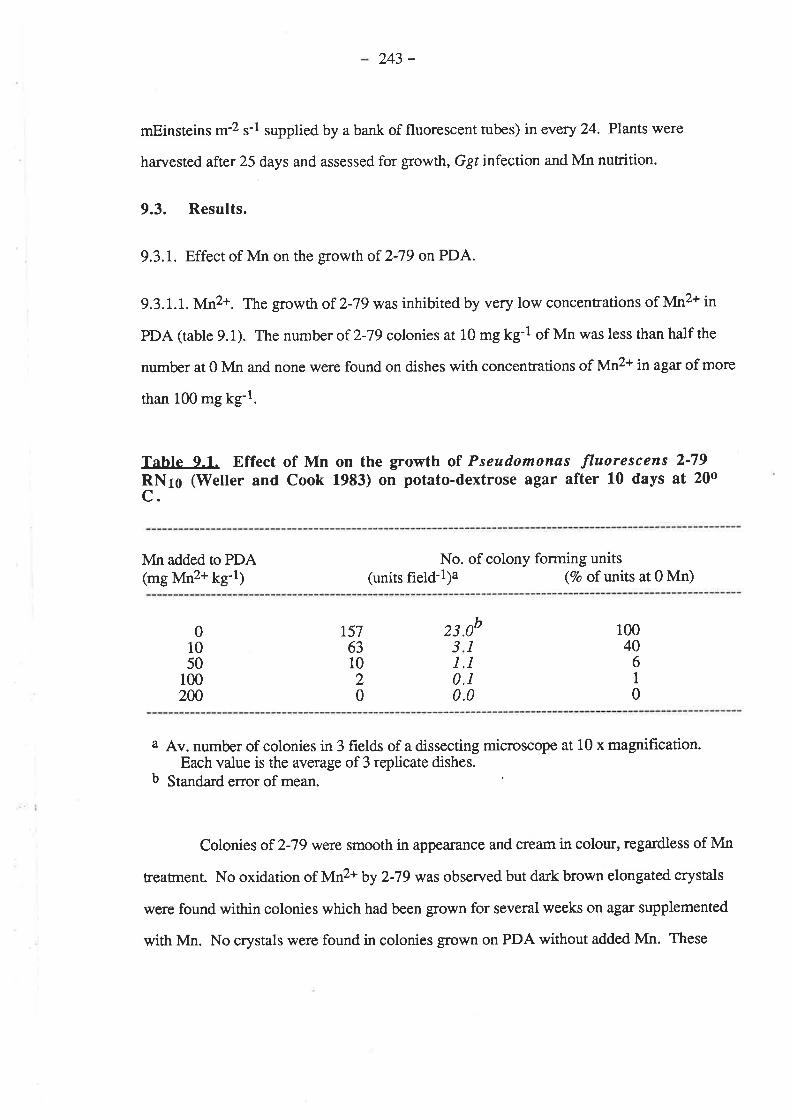
243 -
mEinsteins m-2 s-l supplied by a bank of fluorescent tubs) in every 24. Plants were
ha¡¡ested after 25 days and assessed for growth, Ggt infection and Mn nutrition.
9.3. Results.
9.3.1. Effectof Mnonthegowth of 2-79 onPDA.
9.3. 1 . 1 . Mn2+. The growth of 2-79 was inhibited by very low concentrations of Mn2+ in
PDA (table 9.1). The number of 2-79 colonies at 10 mg kg-l of Mn was less than half the
number at 0 Mn and none were found on dishes with concentrations of Mn2+ in agar of more
than 100 mg kg-l.
Table o.1. Effect of Mn on the growth of Pseudomonas fluorescens 2-79RNro (Weller and Cook 1933) on potato-dextrose agar after 10 days at 20oc.
Mn added to PDA No. of colony forming units(units field-l)a (Vo of units at 0 Mn)(mg Mn2+ ¡g-l¡
01050
100240
r57631020
x.0b3.11.10.10.0
10040
61
0
a Av. number of colonies in 3 frelds of a dissecting microscope at 10 x magnification.Each value is the average of 3 replicate dishes.
b Standard error of mean.
Colonies of 2-79 were smooth in appearance and cream in colour, regardless of Mn
treatnent. No oxidation of Mn2+ by 2-79 was observed but da¡k brown elongated crystals
were found within colonies which had been grown for several weeks on agü supplemented
with Mn. No crystals were found in colonies g¡own on PDA without added Mn. These
244 -
crystals did not contain Mn oxides because they did not stain blue with acidified benzidine in
ethanol.
9.3.1.2. MnO2. MnO2 in PDA was rapidly reduced by 2-79. Within 2 days of incubation at
2W C clear haloes were present around the streaked surface colonies o12-79. The clea¡
haloes r,vere created by the reduction of black insoluble MnO2 to soluble Mn2+. Dishes were
completely clea¡ after 2 weeks.
Despite vigorous shaking of the autoclaved PDA before dishes were poured, the
majority of MnO2 particles still settled to the bottom of dishes before the agar had set.
Bacteria were streaked onto the surface of solidifred agar which means that reductionby 2-79
of the majority of MnO2 particles occurred at a distance equal to the depth of the agar, or 3-4
Íìm.
9.3.2. Effect of Mn on siderophore production by 2-79 in KMB
Flasks were viewed after 3 days of incubation and nil Mn cultures fluoresced
strongly under UV light but T0 cultures exhibited even greater siderophore production and
fluoresced very strongly. The T0 cultures also appeared a brighter yelloVgreen under
natural light. Siderophores produced by P. fluorescens on KMB are yelloVgreen in colour
(King et al.1954).
Cultures were again observed for IfV fluorescence on day 4, 4 hours after the
addition of Mn to T4 flasks. Brightest fluorescence wÍrs in T0 flasks but fluorescence in nil
Mn flasks was also strong. There was almost no UV fluorescence in T4 flasks. A similar
pattern was also observed afær 7 days incubation.
The addition of Fe3+ to flasks after 8 days resulted in an immediate brick red colour
in all cultures. Ferri-siderophores (siderophores complexed with Fe3+) a¡e brick red in
colour (Nielands 1984). UV fluorescence after 9 days was absent in all cultures to which
Fe3+ had been added except T0 which exhibited very weak fluorescence. The addition of
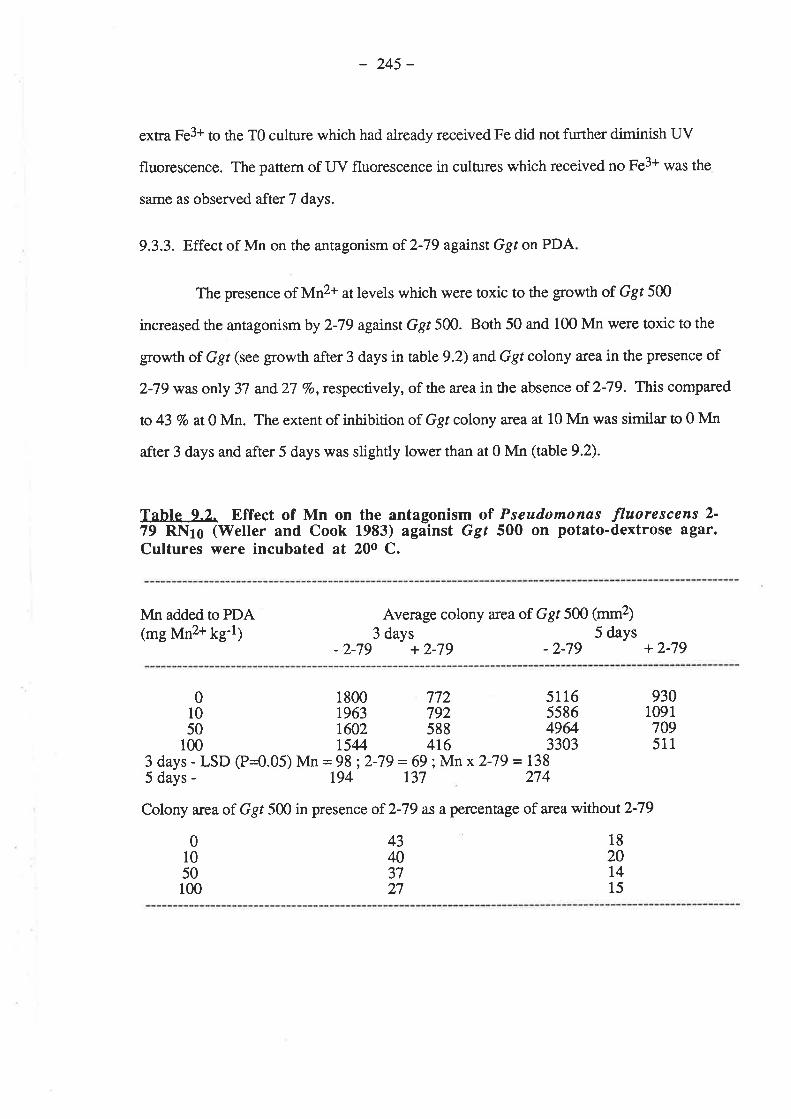
- 245-
extra Fe3+ to the T0 culture which had already received Fe did not further diminish IfV
fluorescence. The pattern of UV fluorescence in cultures which received no Fe3+ was the
same as observed after 7 days.
9.3.3. Effect of Mn on the antagonism of 2-79 against Ggr on PDA
The presence of Mn2+ at levels which were toxic to the growth of Ggr 500
increased the antagonism by 2-79 agunst Ggt 500. Both 50 and 100 Mn were toxic to the
$owrh of Ggt (see growth after 3 days in øble9.2) andGgt colony area in the presence of
2-79 was only 37 and27 7o, respoctively, of the a¡ea in the absence of 2-79. This compared
to 43 7o at 0 Mn. The extent of inhibition of Ggt colony area at 10 Mn was simila¡ to 0 Mn
after 3 days and after 5 days was slightly lower than at 0 Mn (table 9.2).
Tahle 4.2. Effect of Mn on the antagonism of Pseudomonas fluorescens 2-79 RN1¡ (Weller and Cook 1983) against Ggf 500 on potato-dextrose agar.Cultures were incubated at 20o C.
À¿fn added to PDA(mg Mn2+ ¡g-t¡
Average colony area of Ggt 5N (mm2)
3 days 5 days- 2-79 + 2-79 - 2-79 + 2-79
0 1800 772 511610 1963 792 558650 1602 588 496/.
100 1544 4t6 33033 days - LSD (P=0.05) Mn = 98;2-79 = 69 i Mn x 2-79 = 1385 days - 194 137 274
Colony area of Ggt 5ffi in presence of 2-79 as a percentage of area without2-7g
04318r0 40 2050 37 14100 27 15
93010917W511
246 -
Colony a¡ea of Ggt after 5 days in the absence of 2-79 was significantly larger at 10 Mn than
at 0 Mn and antagonism by 2-79 was least at this rate of Mn. In general, the patterns of
inhibition of Ggt gowrh by 2-79 exhibited after 3 days growth were still present after 5 days
growth except the levels of inhibition were much higher.
The presence of 2-79 on Mn-supplemented PDA atso inhibited Mn oxidation by
Ggt. In the absence of 2-79, oxidation of Mn by Ggt colonies occurred throughout the
extent of their mycelia but in the presenc e of 2-79, no oxidation occurred in the outer
margins of Ggt mycelia.
9.3.4. Effect of Mn on the control by 2-79 of take-all of wheat grown in a Mn-deficientsand. Bacteria added to pots in a suspension of DDDHzO.
9.3.4.1. Ggt. T\e addition of live 2-79 had no effect on Ggt infection except at a low rate of
inoculation in 24 Mn pots (table s 9.3, 9.4 and 9.5). The total length of stelar lesions per
plant was decreased by nearly three-quarters with low 2-79 l;l.24Mnpots (table 9.3). Total
length of lesions at24lvln and a high rate of 2-79 noculation was larger than withoutlle2-
79 but not statistically different. A similar pattern rüas present in the average number of
lesions per plant (table 9.4) and percentage of diseased seminal roots (table 9.5) although in
the former case the interaction between Mn and 2-79 inoculation was not significant.
The mixing of a high rate of Mn (24Mn) through soil caused large decreases in Ggr
infection (tables 9 .3, 9 .4 and 9.5). The total length of lesions was decreased by 84 7o with
24lvln (averaged across all 2-79 treatments), average number of lesions by 60 Vo and the
percentage of diseased seminal roots by more than half. The lo'w rate of Mn (8 Mn) addition
had no effect onGgt infection except for a 39 7o desrease in the total length of lesions in pots
with high 2-79.
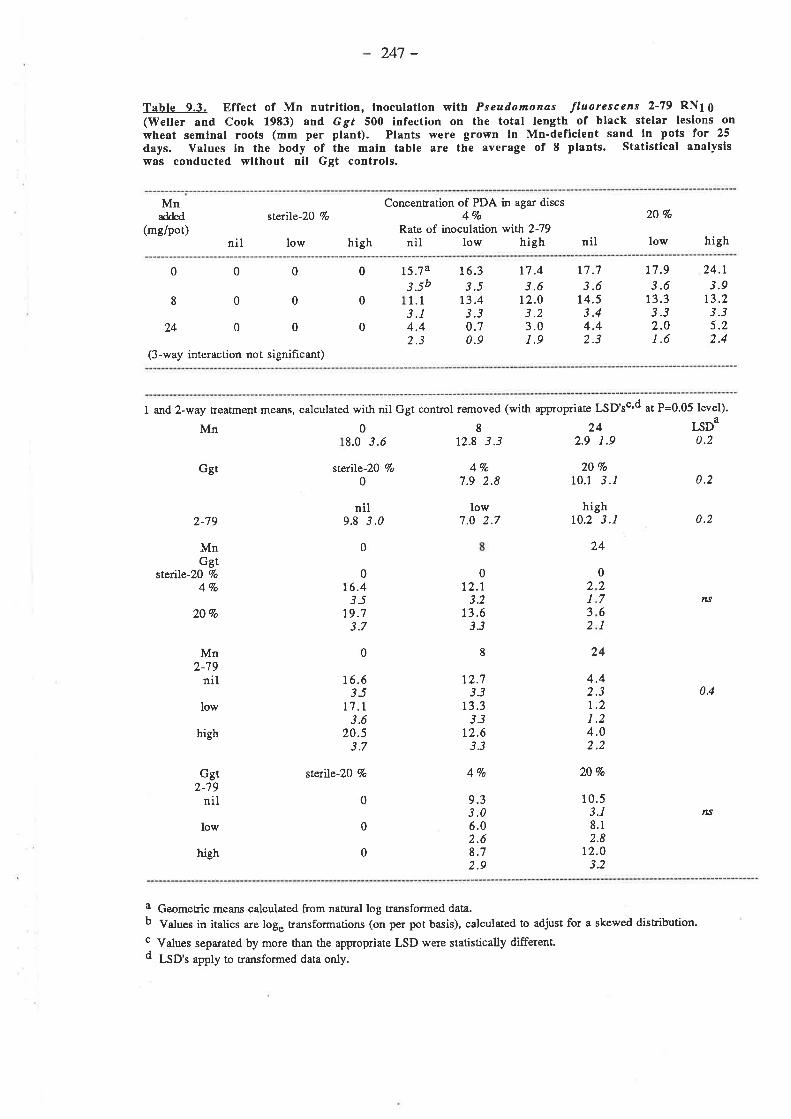
247 -
Table 9.3. Effect of Mn nutrition, lnoculation with Pseudomonas fluorescezs 2-79 RN1 I(Weller and Cook 1983) and Ggt 5OO infection on the total length of black stelar leslons onwheat seminal roots (mm per plant). Plants were grown in Mn-deflclent sand ln pots for 25days. Values ln the body of the main table are the average of I plants. Statlstlcal analysiswas conducted without nil Ggt controls.
Mn*ld€d
(mg/pot)nil high nil
20 Vo
low high
stetile-2D 7o
low
Concentration of PDA in agar discs47o
Rate of inoculation with 2-79nil low high
000
8002400
(3-way interaction not signihcant)
16.33.5
L3.43.3
17.73.6
t4.53.44.42.3
r7.93.6
13.33.32.01.6
3I342
0
0
0
t5.743.9
13.23.35.22.4
t7 .43.6
12.03.23.01.9
0276I
,,
I32
24.1b.5
.1
.I
.4
.30.70.9
1 and 2-way treatrnent means, calculated with nil Ggt control removed (with appropriaæ LSD'sc'd at P=0.05 level).
Mn0824 ISDa8.0 3.ó 12.8 3.3 2.9 1.9 0.2
Ggt sterile-20 7o
0
nil9.8 3.0
0
0r6.4JJ
t9.73.7
0
16.635
t7 .L3.6
20.53.7
4Vo7.9 2.8
low1.0 2.7
0t2.r
3.213,633
8
12.73.3
13.33.3
12.63.3
20 7o
10.1 -3.1
highr0.2 3.1
24Ggt
stenle-20 7o
Mn
47o
2-79
2O7o
0.2
0.2
tts
0.4
¡1S
Mn2-79
nil
24
4.42.3
low
stefle-2Û 7o 44o 20 Vo
low
10.53.18.12.8
12.03.2
a Geometric mearu calculated from nahral log transformed data.b V"ln"r in italics are log" transformations (on per pot basis), calculated to aÜust for a skewed distribution.
c Values separated by more than the appropriate LSD were statistically different.d LSD'r apply to transformed data only.
t.21.24.0', ',
Ggt2-79
nil
high
hieh
0
0
0
9.33.06.02.68.72.9
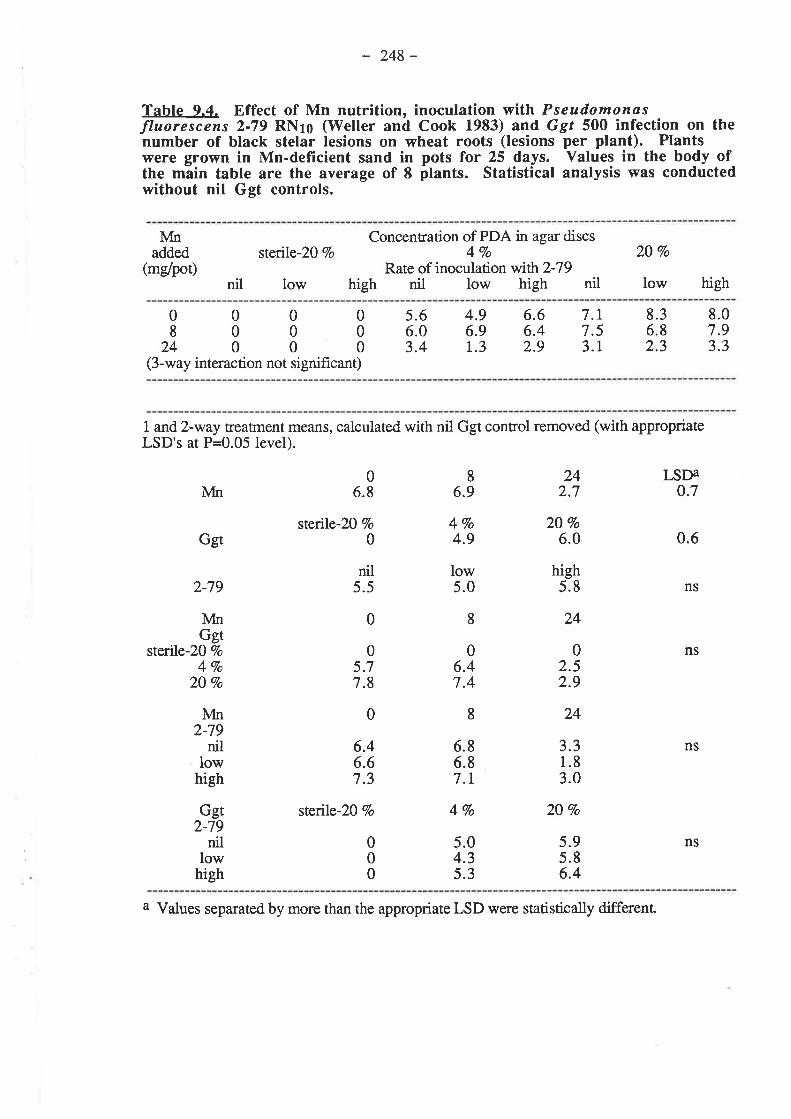
- 248-
Tahle o.4. Effect of Mn nutrition, inoculation with Pseudomonasfluorescens 2-79 RNro OVeller and Cook 1983) and Ggt 500 infection on thenumber of black stelar lesions on wheat roots (lesions per plant). Plantswere grown in Mn-deficient sand in pots for 25 days. Yalues in the body ofthe main table are the ayerage of 8 plants. Statistical analysis was conductedwithout nil Ggt controls.
Ivfnadded
(mdpot)stenle-20 Vo
low
Concentration of PDA in agar discs4Vo
Rate of inoculation with2-79high nil low high nil
20 Vo
low highnil
00008000
24000(3-way interaction not significant)
8.07.93.332.
7.17.53.1
4.96.91.3
5.66.03.4
6.66.42.9
8.36.8
1 and 2-way treaünent means, calculated with nil Ggt control removed (with appropriateLSD's at P=0.05 level).
8 I,SDA0.76.9 2.7
2-79
À/ftr
Ggt
NIn2-79
nillow
high
stenle-2} Vo
0
nil5.5
0
0
6.46.67.3
stenle-20 Vo
000
2406.8
02.52.9
05.77.8
3.31.83.0
984
4Vo4.9
low5.0
8
06.47.4
I
20 Vo
6.0
5.8
24
24
2O Vo
0.6
ns
ns
high
À4riGgt
stertle-Z0 Vo
4Vo20 Vo
Ggt2-79
nillow
high
6.86.87.r
ns
ns
47o
5.5.6.
5.04.35.3
a Values sepamted by more than the appropriate LSD were statistically different
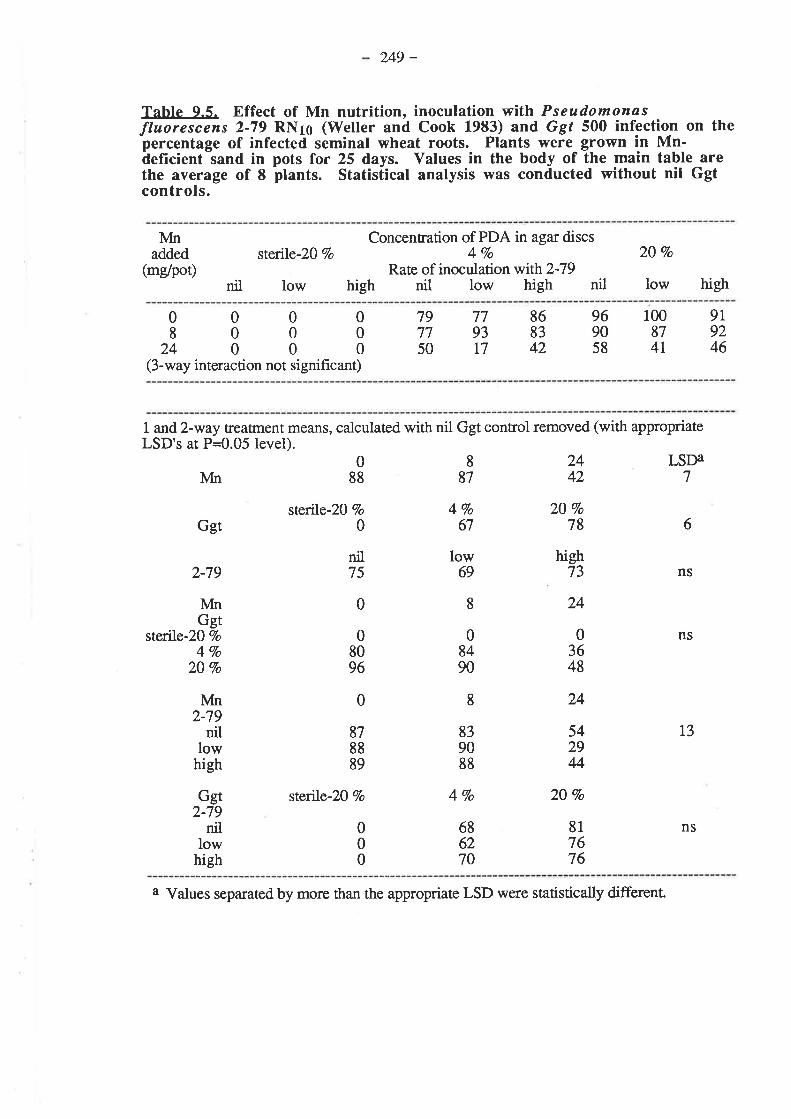
249 -
Tahle q.5. Effect of Mn nutrition, inoculation with Pseudomonasfluorescens 2-79 RN1O (Wetler and Cook 1983) and Ggt 500 infection on thepercentage of infected seminal wheat roots. Plants were grown !n Mn'deficient sand in pots for 25 days. Yalues in the body of the main table arethe average of 8 þlants. Statisiical analysis was conducted without nil Ggtcontrols.
Concentration of PDA in agar discsÀírìadded
(mg/pot)stenle-2O 7o
low high
47oRate of inoculation with2-79
nil low high nil
20 7o
low highnil
00008000
24000(3-way interaction not significant)
797750
7793t7
868342
969058
100874l
9l9246
1 and 2-way treafrnent means, calculated with nil Ggt control removed (with appropriateLSD's at P=0.05 level).
0 8 24 I^SDalvfn 88 87 42 7
Ggt
2-79
NfriGgt
20 Vo
47o20 Vo
Nlr2-79
nillow
high
Ggt2-79
4Vo67
839088
20 Vo
78
24
stenle-20 Vo
0
nil75
878889
stenle-20 Vo
000
6
ns
ns
high73
low69
I0
8490
8
0
08096
0
sterile-
542944
20 Vo
03648
24
817676
13
NSnillow
high
4Vo
686270
a Values separated by more than the appropriate LSD were statistically different.
250 -
Increasing the concentration of PDA in plugs from 4 to 2O Vo caused a small
increase in symptoms of Ggr infection (tables 9.3,9.4 and 9.5). No disease was present in
pots inoculated with sterile agar plugs.
9.3.4.2. Plant growth. Inoculation of pots with live 2-79 had no effect on plant growth
(tables 9.6 and 9.7).
Plants g¡own without added Mn were very Mn defrcient and large increases in plant
grofih occurred with the addition of Mn (tables 9.6 and 9.7). The high rate of Mn addition
generally did not further increase plant growth. Increases in plant growth with added Mn
were greatest in disease-free plants; the average dry weight of roots per plant nearly doubled
with 8 Mn but the increase in high Ggt pots was only 5l Vo (table 9.7). This sÍLme pattern
was also present in the dry weight of shoots per plant except the difference between response
to Mn in diseased and disease-free plants rwas not as large (table 9.6).
The low rate of Ggr inoculum (4 Eo PDA) decreased the dry weight of shoots by
approximately one-third, regardless of Mn treatrnent (table 9.6). The high rate of Ggt
inoculum did not further decrease shoot dry weights except lul.24lvlnpots (a fi;rther27 Vo
decrease). A similar effect of Ggt inoculum was measured in the dry weight of roots except
there was no decrease with Ggr inoculum in nil Mn pots (table 9.7).
9.3.4.3. Mn. Inoqtlation of pots with live 2-79 hadno effect on the concentation of Mn in
plants (tables 9.8 and 9.9).
Whole shoot Mn concentrations in plants gro,wn without Mn were well below the
critical level of 18 mg kg-l (see Appendix B) required for normal g¡owth in these pot
experiments (table 9.8). Shoot concentrations of Mn were increased to adequate levels by 8
Mn and further increased to very high levels by 24 Mn (table 9.8).
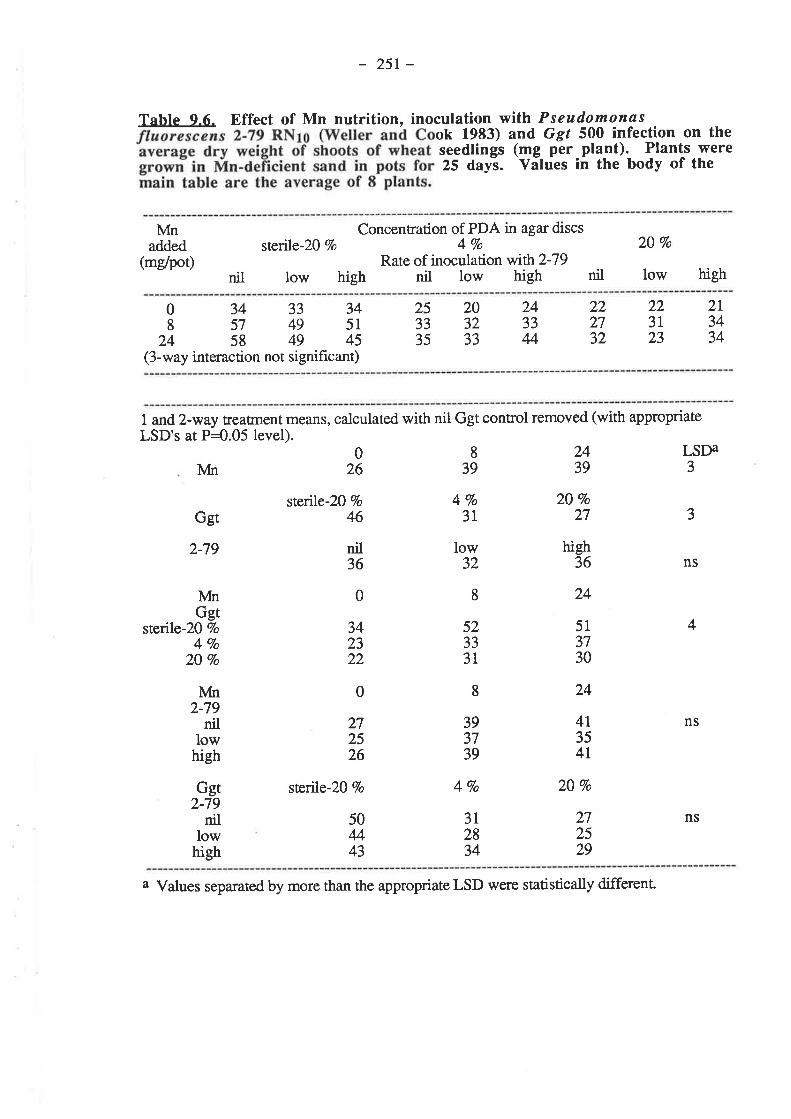
- 25r-
Table 4.6. Effect of Mn nutrition, inoculation with Pseudomona.sok 1933) and Ggt 500 infection on theseedlings (mg per plant). Plants were25 dayi. Vãlues in the bodY of the
lvfnadded
(me/pot)
Concentration of PDA in agar discsstenle-Z} Vo 4 Vo
Rate of inoculation wrth2-79low high nil low high nil
20 7o
low highnil
03433348574951
24 58 49 45(3-way interaction not signifrcant)
253335
203233
243344
222732
223123
2L3434
1 and 2-way treatrnent means, calculated with nil Ggt control removed (with appropriateLSD's at P=0.05 level).
3
3
ns
4
2439
839
8
52333l
8
393739
4Vo
026
nil36
342322
0
272526
50443
0
LSDAÀ/tn
Ggt
2-79
Nftr2-79
nillow
high
Ggt2-79
nillow
high
4Vo3r
20 Vo
27
high36
24
stertle-Z} Vo
46
stenle-20 7o
low32
ìírIGgt
sterile-2O 7o
4Vo20 7o
3r2834
513730
24
41354t
20 Vo
272529
ns
ns
a Values separated by more than the appropriate LSD were statistically different.
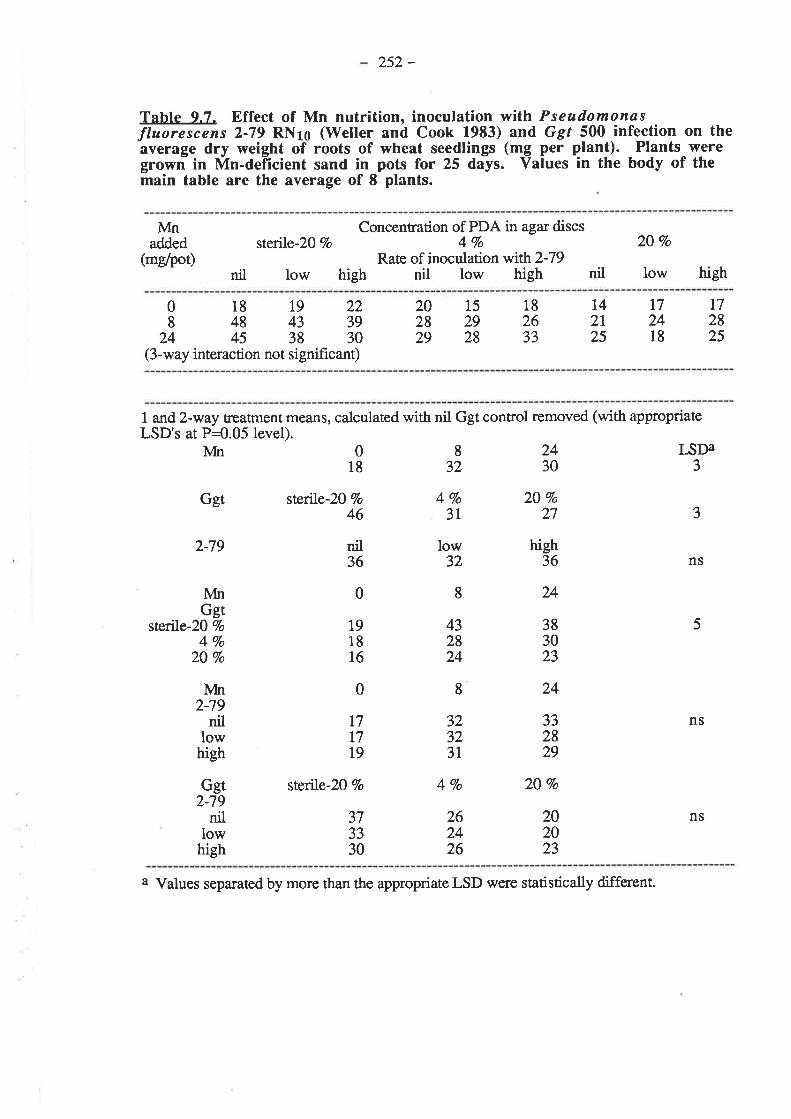
252 -
Tahle q.7. Effect of Mn nutrition, inoculation with Pseudomonasfluorescens 2-79 RNro fl{etler and Cook 1933) and Ggt 500 infection on theayerage dry weight of roots of wheat seedlings (mg per plant). Plants weregrown in Mn-deftcient sand in pots for 25 days. Yalues in the body of themain table are the average of 8 plants.
Concentration of PDA in agar discsÀíriadded
(mg/pot)sterile-2O Vo
nil low high
4VoRate of inoculation with2-79
nil low high nil
20 Vo
low high
01819228484339
24 45 38 30(3-way interaction not significant)
202829
152928
182633
t42t25
t72418
172825
1 and 2-way treaünent means, calculated with nil Ggt control removed (with appropriateLSD's at P=0.05 level).
Àín0824LSDa1832303
Ggt
2-79
l/fttGgt
steile-20 7o
4Vo20 Vo
lvftr2-79
nillow
high
Ggt2-79
nillow
high
stenle-20 Vo
46
0
191816
0
17L719
steiTe-2} Vo
373330
4Vo3l
262426
2O Vo
27
24
383023
24
332829
20 7o
202023
3
low32
nil36
high36
5432824
323237
47o
8
8
NS
NS
ns
a Values separated by more than the appropriate LSD were statistically different.
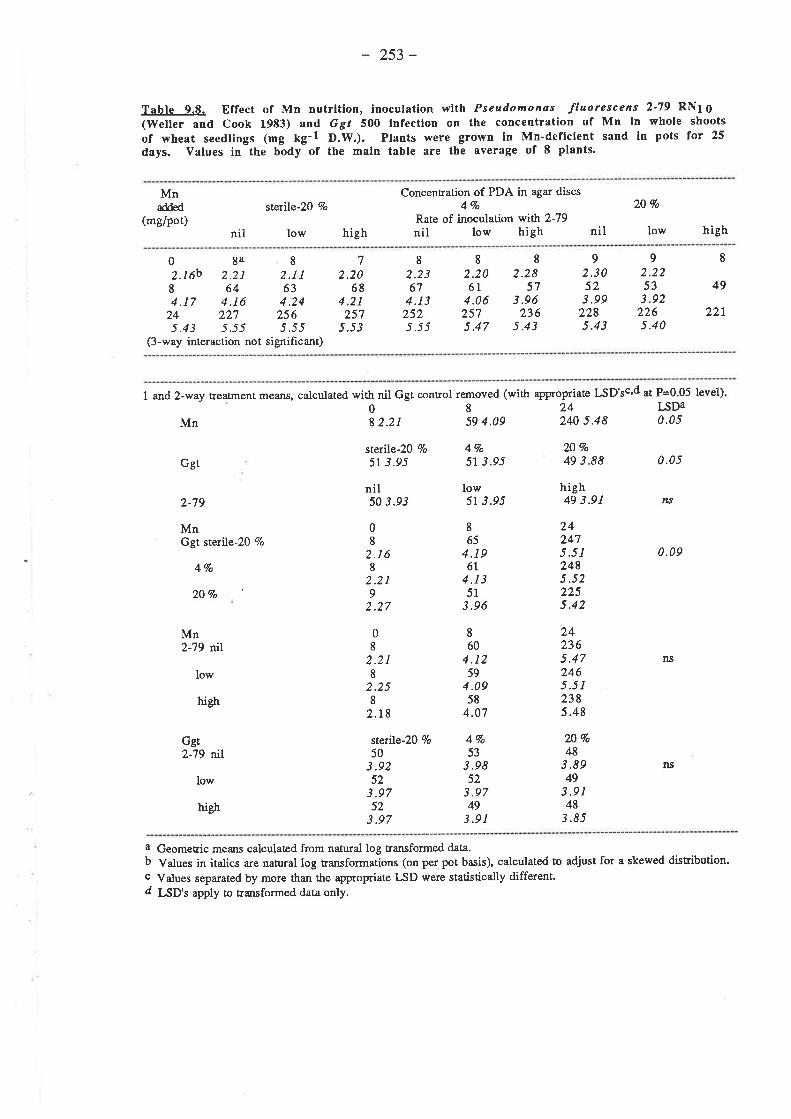
253 -
Table 9.8. Effect of Mn nutrltion, lnoculatlon with Pseudomonas fluorescens 2-79 RN1 g(IVeller and Cook 1983) and Ggf 500 infection on the concentration of Mn ln whole shoots
of wheat seedllngs (mg Xg-l D.W.). Plants were grown ln Mn-deficlent sand in pots lor 25
days. Yalues in the body of the nain table are the average of 8 plants.
MnM
(mg/pot)steÅle-2} 4o
lownil high
Concentration of PDA in agar discs47o
Rate of inoculation wi¡h 2-79nil low high nil
20 Vo
low high
08a82.16b 2 .21 2 .1 I864634.17 4.16 4.2424 227 2565.43 5.55 5.55
(3-way interaction not signihcant)
72.20
684.21257
5.53
8
2.23674.t32525.5J
8
2.206L
4.062575.47
8
2.2857
3.96236
5.43
92.30523.992285.43
92.2253
3.922265.40
8
49
22r
1 and 2-way Eeatment means, calculated with nil Ggt control removed (wittr appropriate LSD'sc,d at P=0.05 level)
0 8 24 IJDaMn 8 2.21 59 4.09 240 5.48 0.05
Ggtsterile-20 7o
51 3.95
nil50 3.93
0I
2.168
2.219
2.27
08
2 .218
2.258
2.t8
slenle-2D 7o
503.9252
3.9752
3.97
4Vo5t 3.95
low5t 3.95
8
654.19ó1
4.1351
3.96
860
4.1259
4.0958
4.07
20 7o
49 3.88
high49 3.91
242475.5r2485 .522255.42
242365.472465 .512385.48
3.8949
3 .9148
3.85
0.05
0.09
ns
lts
2-79
MnGgt sterile-2} 7o
41o
2O4o
Mn2-79 rLtl
low
Ggt2-79 ntl
low
tu
hish
hish
47o53
3.9852
3.9749
3 .91
20 7o
48
a Geometric means calculaæd from natural log transformed data.b Values in italics a¡e natural log transformations (on per pot basis), calculated to adjust for a skewed distribution.c Values separated by more ihan the appropriate [,SD were statistically different.d LSD's apply to transformed data only.
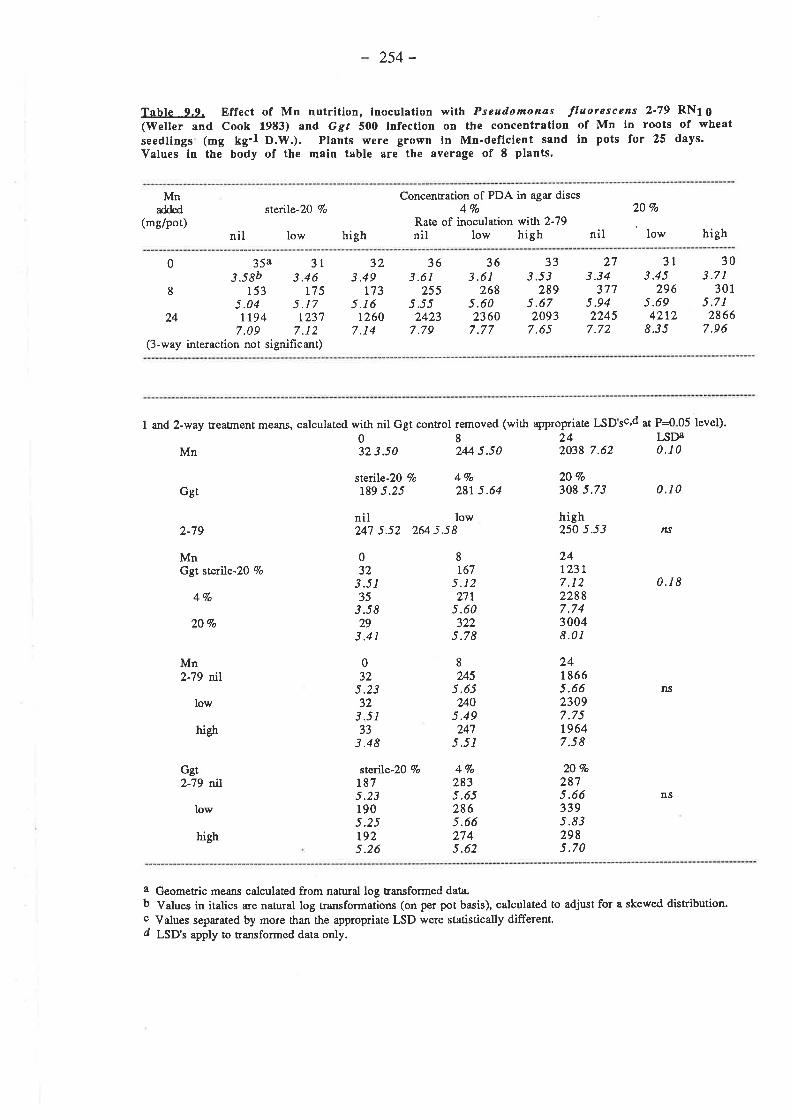
254 -
Table 9.9. Effect of Mn nutrition, lnoculation with Pseudomonas fluorescens 2-79 RN1 I(Weller and Cook 1983) and Ggf 500 lnfectlon on the concentratlon of Mn ln roots of wheatseedlings (mg t<g-l D.W.). Plants were grown in Mn-deftcient sand in pots for 25 days.Values in the body of the main table are the average of I plants.
Mnxl,led
(mg/poÐsterile-20 Vo
lownil high
Concentration of PDA in agar discs47o
Rate of inoculation with 2-79nil low high nil
20 Vo
low high
0 35a 313.58b 3.46
8 153 r755.04 5 .17
24 rt94 12377.09 7 .12
(3-way interaction not significant)
323.49
t735 .16
12607.14
363.61
2555.552423
7.79
363.61
2685.602360
7.77
333.53
2895 .672093
7.65
273.34
3775.942245
7.72
313.45
2965.6942t2
8.J5
303 .71
3015 .712866
7.96
I and 2-way treatrnent means, calculated with nil Ggt conuol removed (wittr appropriaæ LSD sc,d at P=0 05 level).
Mn
Ggt
2-79
MnGgt steríe-20 7o
47o
2O4o
Mn2-79 nrl
low
Ggt2-79 tll
low
032 3.50
srerile-ZD Vo
t89 5.25
nil247 5.52
032
3 .5135
3.5829
3 .41
032
5.2332
3 .5133
3.48
low264 5.58
8244 5.50
4Vo28r 5.64
242038 7.62
20 7o
308 5.73
high250 5.53
24t23t7.t222887.7430048.01
241 8665 .6623097.7519647.58
2Q Vo
2875 .663395.832985.70
I-SDA0.10
0.10
0.18
ns
ns
tts
8
r675.12211
s.60322
5.78
8
2455 .65240
5.49247
5 .51high
high
steriJe-20 Vo
1875.23190s .251925.26
4Vo2835 .652865 .662745.62
a Geometric means calculated from nanual log nansformed data.b Vahes in itatics a¡e natural log transformations (on p€r pot basis), calculated to adjust for a skewed disribution.c Values separated by more than the appropriate LSD were statistically different.d LSD's apply to transformed data only.
255 -
The effect of a high rate of Ggr inoculum on shoot Mn concentrations va¡ied
according to the Mn treatment (table 9.8). In nil Mn pots shoot Mn concentration was
increased slightly by high Ggr inoculum but at 8 and 24Mn shoot concentrations decreased
slightly. Low Ggt did not affect shoot Mn concentrations.
The concentration of Mn in roots of disease-free plants increased frve-fold with 8
Mn from an average of 33 mg kg-l in nil Mn and by a further 7 fold with24 Mn (table 9.9).
Ggr infection had no effect on root Mn concentrations in nil Mn pots but in pots where Mn
had been added root Mn concentrations were proglessively increased by low and high Ggr
inoculum rates. In 24Mnpots with a high rate of Ggr inoculum root Mn concentration was
nearly th¡ee times the level in disease-free plants.
9.3.5. Effect of Mn on the control by 2-79 of take-all of wheat grown in a Mn-deficientsand. Bacteria added to pots in liquid media.
9.3.5.1. Ggt. The addition of live 2-79 at sowing completely prevented the production of
take-all symptoms on wheat roots, regardless of Mn or Ggt treatments, although extensive
bnowning on these roots made it quite difficult to identify take-all lesions (table 9.10).
The percentage of diseased seminal roots was decreased by Z7 Vo 'tnth 4 Mn n -2-
79 pots but 0.4 Mn had no effect onGgt infection (table 9.10).
The number and total length of lesions per plant were also decreased by 4 Mn but
the effects were not statistically significant.
Increasing the concentration of PDA from 1 to 4 Vo n -2-79 pots did not cause a
measurable increase in take-all symptoms on wheatroots and both concenmtions of Ggt
colonized agar discs caused a high level of Ggr infection (table 9.10). No disease was
present in pots with sterile PDA discs.

- 256-
Tahle o.10. Effect of Mn nutrition and inoculation with Pseudomonasfluorescens 2-79 RN1O (Weller and Cook 1933) on Ggt 500 infection ofwheat roots. Plants were grown in Mn-deficient sand in _pots for 25 -days.Values in the body of the main table are the average of 10 plants. Diseaseassessments were analyzed without nil Ggt and +2-79 treatments.
Mn added(m/poÐ
Concentration of PDA in agar discs
stenle-47o I Vo 47o Meana
Total length of black stelar lesions per plant (mm)-2-79
000.4 0
40Mean 0+2-79
000.4 0
40Mean 0LSDb (P=0.05) Mn, Ggr, Mn x Ggt ns
Number of black stelar lesions per plant-2-79
000.4 0
40Mean 0+2-79
000.4 0
40Mean 0LSDb (P=0.05) Mn, Ggr, Mn x Ggt ns
Percentage of infected seminal roots.-2-79
000.4 0
40Mean 0+2-79
000.4 0
40Mean 0LSDb (P{.05) Mn=12 ; Ggr, Mn x Ggt ns
45.650.542.746.3
789r6277
50.440.033.74t.4
957762
032
443
8.5.8.
000
0000
5.85.74.5
6.34.83.85.0
5.36.65.25.7
0000
0000
868462
000
78
0000
000
0000
0000
a Means calculated without nil Ggt treatments.b Values separated by more than the appropriate LSD were statistically different.
- 257-
9.3.5.2. Plant growth. The growth of plants was slightly decreased by inoculation with live
2-79. The average dry weight of shoots per plant was decreased by 22 7o withlive2-79
(table 9.1 1) but the decrease in dry weight of roots was only 5 Vo (rzbLe 9.12). The effect of
2-79 onplant growth was the same across all Mn and Ggt treatrnents.
Plant growth was successively decreased by increasing rates of Ggt inoculum,
regardless of 2-79 or Mn treatments, despite no lesions being recorded on 2-79 inoculated
roots (tables 9.11 and 9.12). The dry weight of shoots per plant was decreasedby 12 Vo
with low Ggt and by a further 18 7o with high Ggt (table 9.1 1). Root growth was more
sensitive and was decreased by 25 and a furth er 13 Vo with low and high Ggt, respectively
Addition of Mn to soil increased the growth of plants. The average dry weight of
shoots perplant increased by 28 Vo withO.4 Mn and by a further 3L Vo *vtth 4 Mn (table
9.1 1).
The dry weight of roots increased wittr 0.4 and 4 Mn by 52 Vo and a further 69 Vo,
respectively (table 9.12). Ggt and 2-79 teatments did not significantly affect the response in
plant growttr to added Mn, although responsesin +2-79 pots tended to be smaller.
9.3.5.3. Mn. Tlne concentration of Mn in whole shoots was increased by inoculation with
hve2-79 at all Mn treatrnents (table 9.13). Shoot Mn concentrations without added Mn were
well below the critical level of 18 mg kg-l (see appendix B) in -2-79 pots and levels were
still deficient with 0.4 Mn.
Shoot concentrations of Mn were increased to adequate levels with 4 Mn. In +2-79
pots shoot Mn concentrations were marginally deficient at nil Mn but were increased to
adequate and luxury levels at0.4 and 4 Mn, respectively. Increasing rates of Ggr inoculum
had only small and inconsistent effects on shoot Mn concentrations.

- 258-
Tahle q.ll. Effect of Mn nutrition, inoculation with Pseudomonasfluorescens 2-79 RNro (Weller and Cook 1983) and Ggt 500 infection on theaverage dry weight of shoots of wheat seedlings (mg per plant). Plants weregrown in Mn-deffcient sand in pots for 25 days. Values in the body of themain table are the average of 10 plants.
Mn added(mglpot) sterile-47o
-2-79 +2-79
Concentration of PDA in agar discslVo
-2-79 +2-7947o
-2-79 +2-79
0 37.0 28.20.4 51.3 35.64 56.9 42.3
(3-way interaction not signif,rcant)
29.542.352.t
24304T
386
332
232549
296
232533
1 and 2-way treatment means (with appropriate LSD's at P=0.05 level).ldn 0 O.4 4
27.6 35.2 46.0
L7o36.8
+3r.7
0.4
0.4
lVo
4r.332.3
4Vo30.1
4
52.839.2
4Vo
32.627.6
LSDA3.9
3.9
3.2
ns
ns
Ggt
', _'70
lvlnGgt
stertle- Vo
l7o4Vo
À/ftt2-79
+
Ggt2-79
stenle- Vo
4t.9
40.8
0
32.626.923.3
0
30.02s.3
stertle-4 Vo
48.435.4
ns
4
694
49464l
43.536.626.6
78
3930
+
a Values separated by more than the appropriate LSD were statistically different.
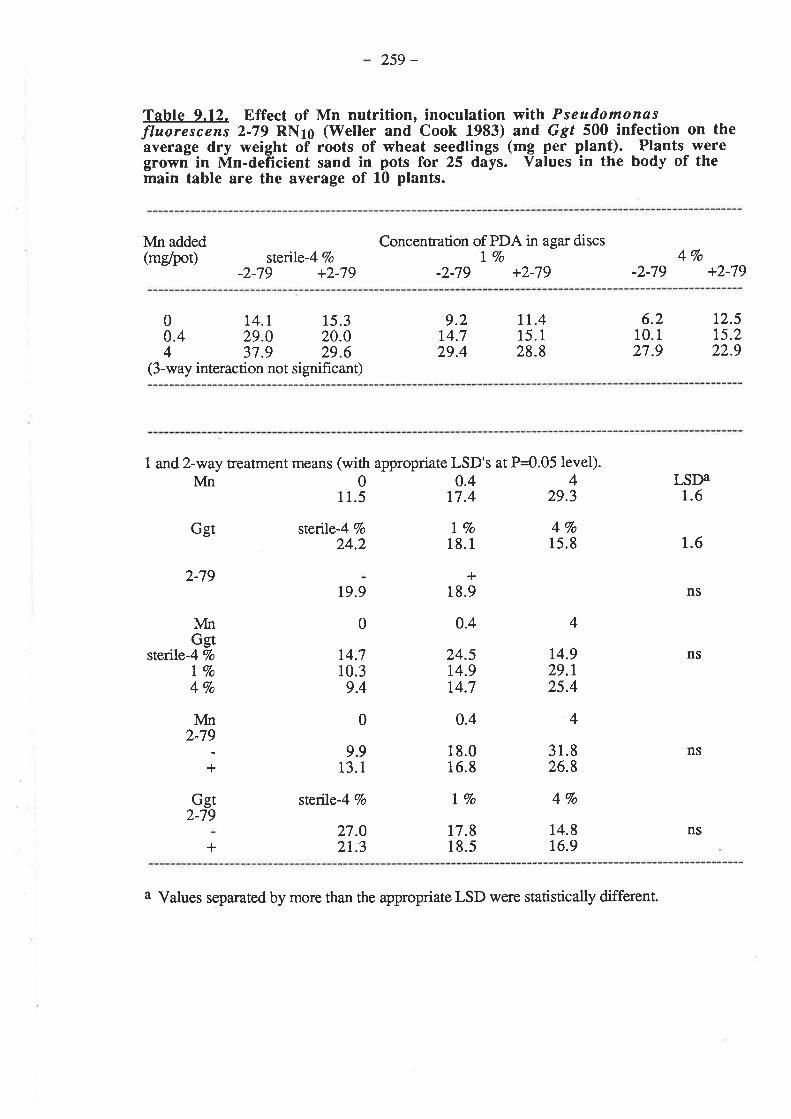
259 -
Table 4.12. Effect of Mn nutrition, inoculation with Pseudomonøsfluorescens 2-79 RN1O (Weller and Cook 1983) and, Ggt 500 infection on theaverage dry weight ofl roots of wheat seedlings (mg per plant). Plants weregrown in Mn-deficient sand in pots for 25 days. Values in the body of themain table are the average of l0 plants.
Mn added(mg/pot) stenle- Vo
-2-79 +2-79
Concentration of PDA in agar discslVo
-2-79 +2-794Vo
-2-79 +2-79
0 r4.t 15.30.4 29.0 20.04 37.9 29.6
(3-way interaction not signifrcant)
9.2r4.729.4
tl.415.128.8
6.210.127.9
12.515.222.9
1 and 2-way treatment means (with appropriate LSD's at P=0.05 level).Mn00.44
11.5 17 .4 29.3
l7o18.1
+18.9
0.4
24.5t4.9t4.7
0.4
18.016.8
LVo
17.818.5
4Vo15.8
4
14.929.t25.4
4
31.826.8
4Vo
14.8t6.9
LSDA1.6
ns
ns
2-79
1.6
ns
ns
Ggt
NfnGgt
l7o4Vo
N{n2-79
+
Ggt2-79
stertle- Vo
24.2
19.9
0
t4.710.39.4
0
9.913.1
stenle-4 Vo
27.02t.3
Vosterile-4
+
a Values separated by more than the appropriate LSD were statistically different.

- 260-
Table q.13. Effect of Mn nutrition, inoculation with Pseudomonasfluorescens 2-79 RNro (Weller and Cook 1983) and, Ggt 500 infection on theconcentration of Mn in whole shoots of wheat seedlings (mg kg'l D.W.).Plants were grown in Mn-deficient sand in pots for 25 days. Values in thebody of the main table are the ayerage of 10 plants.
Mn added(mdpoÐ stenle-47o
-2-79 +2-79
Concentration of PDA in agar discsIVo
-2-79 +2-794Vo
-2-79 +2-79
0 7.o 16.40.4 11.8 29.44 41.2 56.6
LSDa (P=0.05) Mn x Ggt x 2-79=6.7
6.710.330.8
14.922.577.1
18.627.254.0
6.110.132.1
1 and 2-way treatment means (with appropriate LSD's at P=0.05 level).ì{n 0 0.4 4
1r.6 18.5 48.6
lVo27.0
+35.2
o.4
20.6t6.4t8.7
0.4
r0.726.4
47o
15.938.2
4Vo24.7
4
48.9s3.943.t
4
34.762.6
16.133.3
I.SDA2.8
2.3
Ggt
1
4
MngtVo
7o
7o
Gsterile-4
2-79
Ggtsterie-4 7o
2-79
+
ster-le- Vo
27.1
t7.3
0
0
6.616.7
l7o
20.034.2
ns
11.710.812.4
4.8
3.9
ns
Nfri2-79
+
a Values separated by more than the appropriate LSD were statistically different
- 261-
Similar treaünent effects were found in root Mn concentrations except lwe2-79 dtd
not increase concentrations at nil Mn and Ggt infection increased root Mn concentrations at 4
Mn in +2-79 pots (table 9.14).
9.4. Discussion.
Huber and Dorich (1988) proposed that fluorescent pseudomonads may exert
biological control over take-all by increasing the availability of Mn in the rhizosphere of
wheat plants through the reduction of insoluble Mn oxides. The pot experiments reported
here showed that2-79 will increase the availability of Mn to plants and some of the results
a¡e consistent with 2-79 antagonism acting through increased Mn availability.
In the second pot experiment, adding live2-79 had a dramatic effect on the Mn
nutrition of the wheat host. The addition of live 2-79 to pots, in the absence of Mn additions
to the soil, increased shoot Mn concentrations of wheat plants from deficiency to sufficiency,
confrrming that fluorescent pseudomonads can increase the availability of Mn to plans.
The addition of autoclaved bacterial media had no apparent effect on Mn nutition of
the host, at least when compared to the experiment where bacteria were added as a water
suspension. Ghiorse (1988) concluded at the end of an extensive and recent review on the
biotogy of Mn transforming microorganisms that the relative importance of microbial activity
versus abiotic reactions in Mn transformations in soil still is not certain. However, the
results of ttris pot experiment suggest that microorganisms have the potential to cause major
shifts in Mn availability in soil, to the extent that plant nutrition is dramatically altered.
No black stela¡ lesions on wheat roots were seen in any pot (of the second
experiment) which had received live 2-79, regardless of Mn treatment, so the effect of added
Mn on the level of antagonism by 2-79 agunst Ggr was not tested. Although no take-all
symptoms could be distinguished on wheat roots with hve2-79, the growth of these plants
was decreased compared to the nil Ggt controls which indicated thatGgt infection had
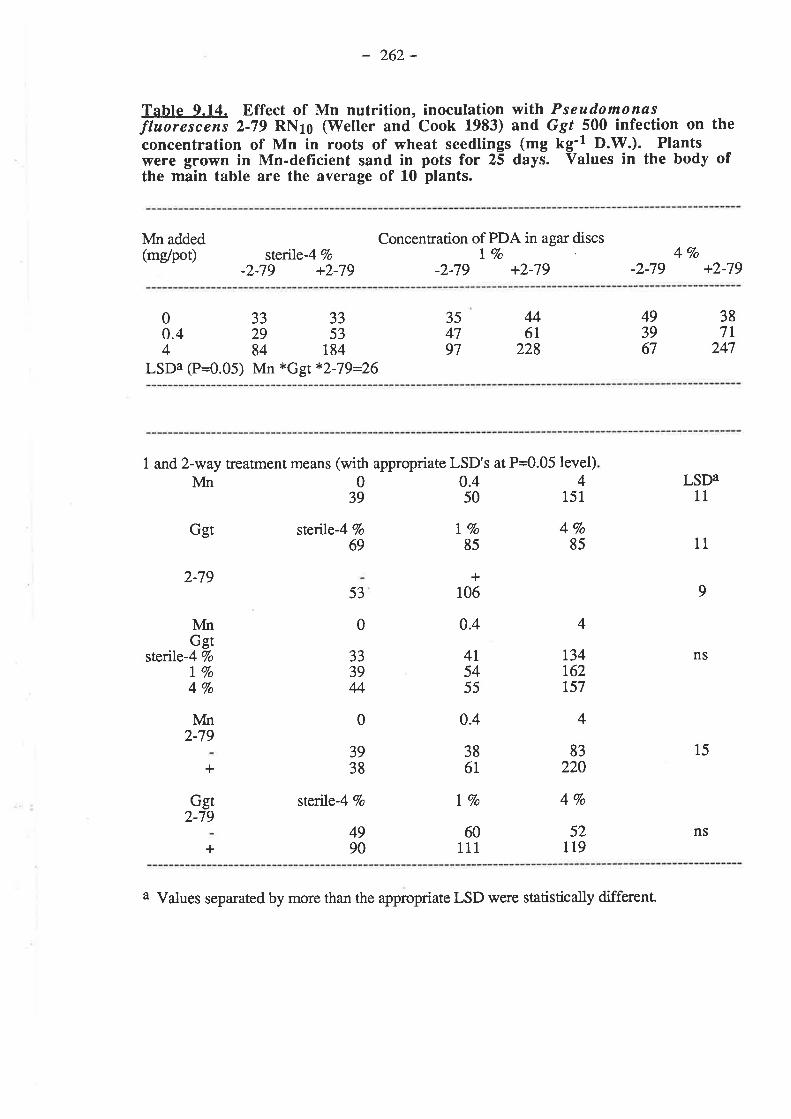
- 262-
Table o.14. Effect of Mn nutrition, inoculation with Pseudomonasfluorescens 2-79 RNro (Wetter and Cook 1983) and, Ggt 500 infection on theconcentration of Mn in roots of wheat seedlings (mg kg'l D.W.). Plantswere grown in Mn-defïcient sand in pots for 25 days. Values in the body ofthe main table are the average of 10 plants.
Mn added(mg/pot) stenle-4 Vo
-2-79 +2-79
Concentration of PDA in agar discstVo
-2-79 +2-7947o
-2-79 +2-79
033330.4 29 534 84 184
LSDa (P=0.05) Mn *Ggt *2-79=26
3s4797
4461
228
493967
387L
247
1 and 2-way Íeatment means (with appropriate LSD's at P=0.05 level)N4n 0 0.4 4
39 50 151
4Vo17o85
+106
0.4
4l5455
0.4
4
t34162t57
4
83220
47o
52119
LSDA11
11
15
ns
Ggt
I4
ÀÁngtVo
Vo
7o
Gsterile-4
stertfe-4 7o
69
53
0
3339M
0
3938
sterle-4 Vo
4990
85
2-799
NS
ìín2-79
+
+
386t
Ggt2-79
tVo
60111
a Values separated by more than the appropriate LSD were statistically different

- 263-
occurred and was restricting normal host development. The extensive browning of roots
which accompanied the addition of live 2-79 may have prevented the detection of black stelar
lesions on roots or the presence of live 2-79 may have inhibited the development of
cha¡acteristic lesions without affecting the impact of Ggt infection on host growth.
In the absence of identifiable stelar lesions, host growh was the only other estimate
of severity of Ggt infection, even though it is not always the most reliable method of
measuring the extent of Ggt infection (Clarkson and Polley 1981 and chapter 3 of this
thesis). If fluorescent pseudomonads decrease take-all through increased Mn availability
(Huber and Dorich 1988) then adding hve2-79 to pots inoculated with Ggt and which also
received high rates of Mn to the soil should not have further increased host growth because
the bacteria would not exert an effect on Ggt infection over and above that of added Mn.
However, if 2-79 decrease Ggr infection by some other means, adding llve 2-79 to pots
inoculated with Ggr and which also received high rates of Mn to the soil would have further
increased host growth because the disease would have been suppressed by both the bacteria
and the addition of Mn. An assessment of host growth in this way is complicated by live 2-
79 suspensions being phytotoxic, especially to shoot growth. Even though there was no
statistical interaction between Mn and 2-79, tends in Ggr-inoculated pots were consistent
wLrh2-79 acting against take-allby increasing Mn availability. Root growth was increased
by 2-79 in Ggt-inoculated pots with either no or a low rate of Mn addition (improved Mn
nutrition and consequently, decreased take-all) but, at the high rate of Mn aÃdttion,2-19
decreased root growth which suggests that in these pots there was no antagonismby 2-79
against Ggr. Similar trends were also present in shoot growth, although in this case,
apparent decreases in take-all at nil and low Mn only partially compensated for the
phytotoxicity of the live 2-79 suspensions.
In the first pot experiment there were no reliable and measurable effects of lve2-79
on either Mn nutrition or grorwth of the wheat host, or on the extent of Ggt infection on
- 264-
wheat roots. However, the technique of suspen ùng 2-79 in DDDH2O prior to addition to
the soil may have decreased the viability of the bacteria due to hypertonic osmotic stress.
This possibility was avoided in the second pot experiment by adding hve2-79 to the soil in
culture media but introduced the complication of adding nutrients and bacterial metabolites
from the media to pots.
In subsequent attempts to repeat this experiment (not reported), hve2-79 were
suspended in weak salt solutions (e.g. 1.5 g MgSO4.7ÍbO and 0.283 g NaCl in 1000 ml of
DDDH2O) to prevent osmotic shock but avoid the addition of nutrients and metabolites in the
culture media. No browning of wheat roots was observed in these experiments but, again,
hve 2-79 had no measurable effect on Ggt infection or on Mn nutrition or growth of the
wheat host.
'In vitro' experimenß with Ggt 500 in the presence of 2-79 and added Mn showed
that antagonism by 2-79 agunstcgt was enhanced when Mn was added to the system at
levels toxic to the Ggt, despite these Mn rates being very toxic to ttre growth of 2-79. As
previously mentioned, fluorescent pseudomonads produce a suite of antibiotic compounds
(Ahl er al.1986, Brisbane et al.1987). including siderophores (Kloepper et aL.1980) and'in
vitro' antagonism has been shown repeatedly. However, the report of Brisbane et al. 1987
is one of the few which has investigated conditions which are important to take-all incidence
in the field (in this case, pH) in petri-dishes with anøgonistic pseudomonads. They
identified an antibiotic compound (phenazine-1-carboxylic acid) produced by 2-79 which
was antagonistic against Ggr but was only active at pH values less than 7, which suggests
that the hypothesis of Huber and Dorich 1988 may be an over-simplification of the mode of
action of 2-79 against Ggr, although the experiments reported in this chapter show that Mn is
obviously very important in the level of antagonism expressed. However, results
established in petri-dishes on antagonism against Ggthave often shown poor correlation
with pot and field trials assessing take-all on the wheat host (\ileller and Cook 1983)'
- 265-
The'in vitro' experiments reported in this chapter did not shed much light on the
specific role that Mn was playing in enhancing antagonismby 2-79. The simplest
explanation was that 2-79 prúuced compounds that inhibited the ability of Ggt to oxidize
Mn2+ to insoluble Mn oxides, thereby'preserving' the toxic levels of added Mn. The results
presented in section 9.3.1. of this chapter show that 2-79 canreduce insoluble Mn oxides'in
vitro' at a distance from their colonies (which must be due to the production of diffusible
compounds). However, if this were the case, antagonism should not have been present in
PDA without added Mn because the concentration of Mn in PDA is too low to be toxic to the
fungus. The alternative is that Mn was performing a more complex role in the biochemical
activities o12-79, e.g. acting as an elicitator, constituent, activator, or co-factor of an
antibiotic compound (or its pre-cursors).
No greerVyellow areas were produced by 2-79 colonies on PDA so it was assumed
that the antagonism by 2-79 was not due to the production of siderophores, although
siderophore production by 2-79 was enhanced on Mn-rich KMB (see section 9.3.2.).
However, if Mn was added to 2-79 colonies which had already produced siderophores, UV
fluorescence was quenched which suggested that the activity of the siderophores would have
been diminished, even though Mn2+ has a very poor affinity for the Fe3+ binding site
(Philson and Llinas lgïz,Elad and Baker 1985). Adding Fe3+ to such a culture did not
completely quench fluorescence which suggests that Mn2+ \ilas competing for binding sites
on the siderophores by preventing the complete conversion of siderophores to ferri-
siderophores.
In summary ,2-79 will increase the availability of Mn to wheat plants and, although
not tested rigorously, results from pot experiments were consistent with the hypothesis that
antagonism by 2-79 against Ggr is due to increased availability of Mn to the wheat host.
However, experiments conducted 'in vitro' suggested ¡hat2-79 has the ability to antagonize

266 -
Ggtby an additional mechanism whose effectiveness is enhanced by high levels of Mn but
there was no evidence that this mechanism operated in the'in vivo' system used here.
267 -
9.5. References.
Ahl, P., Voisard, C. and Defago, G. (1986). Iron bound-siderophores; cyanic acid, andantibiotics involved in suppression of Thielaviopsis basicolaby Pseu"domonas
fluore s c e ns strain. J . P hy top athol. 116, 721 -3 4.
Brisbane, P.G., Janik, L.J., Tate, M.E. and'Warren, R.F.O. (1987). A revised structure forthe phenazine antibiotic from Ps eudomonas fluor e s c ens 2-79 (NRRL B - 15L32).Antimicr obiol. A g e nts C hemotherapy 31, 19 67 -7 l.
Bromfield, S.M. (1956). Oxidation of manganese by soil microorganisms. Aust. J. Biol.,Sci. 9, 238-52.
Bromfield, S.M. (1979). Manganous ion oxidation at pH values below pH 5.0 by cell-freesubstances fuom Streptomyces sp. cultures. Soíl Biol. Bíochem.11, 115-18.
Bromfield, S.M. andDavid, D.J. (I976). Sorption and oxidation of manganous ions andreduction of manganese oxide by cell suspensions of a manganese oxidizingbacterium. Soil Biol. Biochem. 8, 37 -43.
Bromfield, S.M. and Skerman, V.B.D. (1950). Biological oxidation of manganese in soils.Soil S cience. 69, 337 -48.
Clarkson, J.D.S. and Polley, R.'W. (1981). Diagnosis, assessment, crop appraisal andforecasting. In "Biology And Control Of Take-all." @ds. M.J.C. Asher and P.J.Shipton.) pp. 25 I -69. (Academic Press: London.)
Elad, Y. and Baker, R. (1985). Influence of trace amounts of cations and siderophore-producing pseudomonads on chlamydospore germination of Fnsariwn oryspontrn.P hytopathol. 7 5, 1047 -52.
Garrett, S.D. (1934). Factors affecting the severity of take-all. 1. The importance of soilmicroorganisms. ,I. Dept. Agric., South Aust.37, 6æ-74.
Gerretsen, F.C. (1937). Manganese deficiency of oats and its relation to soil bacteria. Ann.Bot.l, 207-30.
Ghiorse, V/.C. (1988). The biology of manganese Eansforming microorganisms in soil. In"Manganese In Soils And Plants." (Eds. R.D. Graham, R.J. Hannam and N.C.Uren.) pp. 75-86. (Kluwer Academic Publ.: Dordrecht, Netherlands.)
Gottfreund, J., Schmitt, G. and Schweisfurth, R. (1985). Transformation of differentlycharged manganese ions by bacteria in nutrient solutions and in the subsoil.Landwirtsc haftliche F ors chung. 38, 80-6.
Huber, D.M. (1988). The role of nutrition in the take-all diesease of wheat and other smallgrains. In "Control Of Plant Diseases Caused By Soilborne Pathogens With MacroAnd Microelement Amendments." (Amer. Phytopathol. Soc.: St. Paul, Minnesota.)
Huber, D.M. and Dorich, R.A. (1988). Effect of nitrogen fertility on the take-all disease ofwheat. Down to Earth 44, (in press).
- 268-
Huber, D.M. and rWilhelm, N.S. (1988). The ole of manganese in disease resistance. In"Manganese In Soil And Plants." (Eds. R.D. Graham, R.J. Hannam and N.C. Uren.)pp. t5l-14. (Kluwer Academic Publ.: Dordrecht, Netherlands.)
King, E.O., Wa¡d, M.K. and Raney, D.E. (1954). Two simple media for the demonstration- of pyocyanin and flourescin. J. Lab. Clin. Med. 44,30I-7 .
Kloepper, J.W., Leong, J., Teintze,M. and Schroth, M.N. (1980). Pseudomonas^
siderophores: A mechanism explaining disease-suppressive soils. Current Mícrobiol.4,317-20.
Leeper, G.W. (1970). "Six Trace Elements In Soils." (Melb. Univ. Press.)
Leeper, G.W. and. Swaby,.R.J. (1940), fr" oxidation of manganous compounds bymicroorganisms in the soil. SoiI Sci.49, 163-9.
Nielands, J.B. (1984). Siderophores of bacteria and fungi. Microbiol. Sci. 1,9-14.
Philson, S.B. and Llinas, M. (1982). Siderochromes from Pseudomonas fluorescens. l.Isolation and cha¡acterization. J. Biol. Chem.257, 8081-5.
Sivasithampararn, K. and Parker, C.A. (1978). Effects of certain isolates of bacteria andactinõmycetes on Gaeurnannomyces graminís var. tritíci and take-all of wheat. Atut. J.Bot.26, 773-82.
Smiley, R.V/. (1978)a. Antagonists of Gaeuntanrnmyces grarninis from the rhizoplane ofwheat in soils fertitizã with ammonium- or nitrate-nitrogen. SoiI Bíol. Biochem.l0,169-74.
Smiley, R.V/. (1978)b. Colonization of wheat roots by Gaeunønnomyces gratnin¡s inhibitedby specifrc soils, microorganisms and ammonium-nitrogen. Soil Biol. Biochem.l0,r75-9.
Timonin, M.I. (1946). Microflora of the rhizosphere in relation to the manganese-deficiencydisease of oats. Proc. Soil Sci. Soc. Amer.ll^,284-92.
Weller, D.M. (1984). Distribution of a take-all suppressive strain of.Pseudomonas
fluorescenr on seminal roots of winter wheai. Appl. Environ. Microbiol. 48,897-9.
'Weller, D.M. and Cook, R.J. (1983). S
with fl uorescent pseudomonads.uppression of take-all of wheat by seed treatmentsP hytopathol. 7 3, 463 -9.
'Weller, D.M., Zhang, B.X. and Cook, R.J. (1985). Application of a rapld¡gryening test forselection of batteria suppressive to take-all of wheat. Plant Dis.69,710-3.
Won f wheat take-all andOphíobohts patch of"Ecology And Management Of Soil-bome. Rovira, K.J. Moore, P.T.'W. Wong and
J.F. Kollmorgen.) pp. 151-3. (Amer. Phytopathol. Soc.: St. Paul, Minnesota.)
Z,ajic, J.E. (1969). Microbes and manganese. In "Microbial Biogeochemistry." Chpt. 14.pp. 157-68. (Academic Press: New York, London.)
- 269-
7ngg, H. and Jaggi, W. (-- Contributión to the means oflaboratory trials an rift.&l,160-9.
CHAPTER 10.
MN OXIDATION BY GGTHYPHAE ONV/HEAT ROOTS GROWING IN A
MN-DEFICIENT CALCAREOUS SAND -OBSERVATIONS UNDER THE DISSECTINGAI\D SCANNING ELECTRON MICROSCOPES
270
CHAPTER 10. MN OXIDATION BY GGT HYPHAE ON WHEAT ROOTSGRO\ryING IN A MN.DEFICIENT CALCAREOUS SAND -
OBSERVATIONS UNDER THE DISSECTING AND SCANNINGELECTRON MICROSCOPES.
10.1. Introduction.
Ggr-infected wheat roots grown in Wangary sand to which high rates of Mn had
been added were coated in dark brown deposits (see chapter 3 of this thesis). These
deposits stained blue in acidified benzidine which is cha¡acteristic for a reaction with Mn
oxides. Following these observations, more detailed examinations of wheat roots from pot
experiments with Ggt and Mn treatrnents were made. Plants were taken from pot
experiments typical of those described in earlier chapters of this thesis. Whole wheat roots
were viewed under the dissecting microscope and sections of Ggt-nfected roots were
examined under a scanning electron microscope and analyzed with energy dispersive x-ray
analysis microprobe techniques (EDXA).
10.2. Materials and Methods.
10.2.1. Examination of whole wheat roots under the dissecting microscope.
Plants were taken from individual Eeatments of a pot experiment in which Mn and
Ggt treaunents were combined factorially. The treatnents included for examination were 0
and24 mg of added Mn per pot, both with and without PDA plugs of Ggt 500 inoculum.
T\e Ggt inoculum produced a high level of infection.
Fresh wheat roots from plants which had been washed free from the soil, were
examined under a dissecting microscope at 40 x magnification with incident light and a white
background. Micrographs were taken with a 35 mm camera loaded with black and white
film. After examination, representative roots from each treatrnent were flooded with0.l Vo
benzidine in 1 Vo ethanol and the development of any blue areas noted.
- 271
10.2.2. Examination of wheat root sections under the scanning electron microscope withEDXA.
L0.2.2.1. Oven-dried roots. One centimetre long sections of main axis seminal roots were
removed from oven-dried root systems of wheat plants in the same treatrnents as 10.2.1.
Root segments were removed at the level of the agar plug of Ggr inoculum. Segments were
coated with ca¡bon under vacuum to an approximate depth of 80 nm and examined in a
'Cambridge Systems' scanning electron microscope. Full spectral analyses of sample
composition at points within the field of view (0.001 mm3) were conducted with EDXA
microprobe techniques, although only the major (K-alpha) peaks (expressed as the ratio of
peak height to background "noise") of selected elements are displayed in the accompanying
f,rgures. Micrographs of the image in view were produced from 2 different signals.
Micrographs produced from secondary electrons reveal surface detail of the sample because
secondary electrons penetrate to a maximum depth of only 10 nm. Micrographs produced
from reflected or back-scattered electrons reveal sub-surface detail as they penetrate the
sample to a maximum depth of 10 um. A small section of Ggr-inoculated agar plug from the
24Mn treaünent was also examined.
The principle of electron probe X-ray microanalysis is based on the incident electron
beam from the electron microscope producing characteristic X-rays from each element in the
sample. These X-rays can be detected and the strength of each X-ray signal is proportional
to the concentration of element in the sample.
10.2.2.2. Freeze-dried roots. Hand-cut longitudinal sections of fresh main axis seminal
roots \ilere kept in DDDHzO before being transferred to iso.pentane and snap-frozen.
Sections were then freeze-dried at -7æ C for 24 hours before returning to room temperature.
Sections were removed from roots of plants from a treatrnent with 24 mg Mn added p€r pot
and agar plugs of Ggt 500 inoculum which produced severe disease.
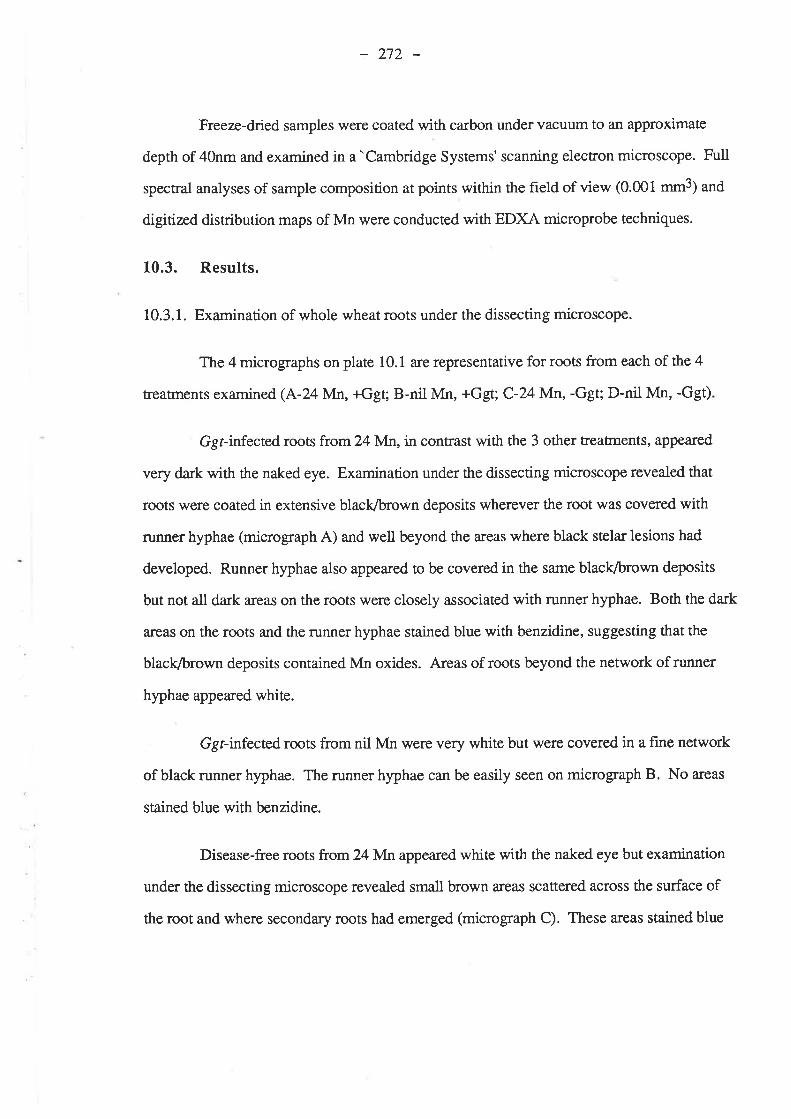
=272-
Freeze-dried samples were coated with carbon under vacuum to an approximate
depth of 40nm and examined in a'Cambridge Systems' scanning electron microscope. Full
spectral analyses of sample composition at points within the field of view (0.001 -ttt3¡ and
digitized distribution maps of Mn were conducted with EDXA microprobe techniques.
10.3. Results.
10.3.1. Examination of whole wheat roots under the dissecting microscope.
The 4 micrographs on plate 10.1 are representative for roots from each of the 4
treatments examined (A-24 Mn, +Ggt; B-nil Mn, +Ggt; C-24l:Nln, -Ggt; D-nil Mn, -Ggt)
Ggr-infected roots from24 Mn, in contrast with the 3 other treatrnents, appeared
very dark with the naked eye. Examination under the dissecting microscope revealed that
roots lvere coated in extensive black/brown deposits wherever the root was covered with
runner hyphae (micrograph A) and well beyond the areas where black stela¡ lesions had
developed. Runner hyphae also appeared to be covered in the same blaclç/brown deposits
but not all dark areas on the roots were closely associated with runner hyphae. Both the da¡k
areas on the roots and the runner hyphae stained blue with benzidine, suggesting that the
blaclç/brown deposits contained Mn oxides. Areas of roots beyond the network of runne¡
hyphae appeared white.
Ggr-infected roots from nil Mn rwere very white but were covered in a fine network
of black runner hyphae. The runner hyphae can be easily seen on micrograph B. No a¡eas
stained blue with benzidine.
Disease-free roots from24 Mn appeared white with the naked eye but examination
under the dissecting microscope revealed small b,rown areas scattered across the surface of
the root and where secondary roots had emerged (micrograph C). These ateas stained blue
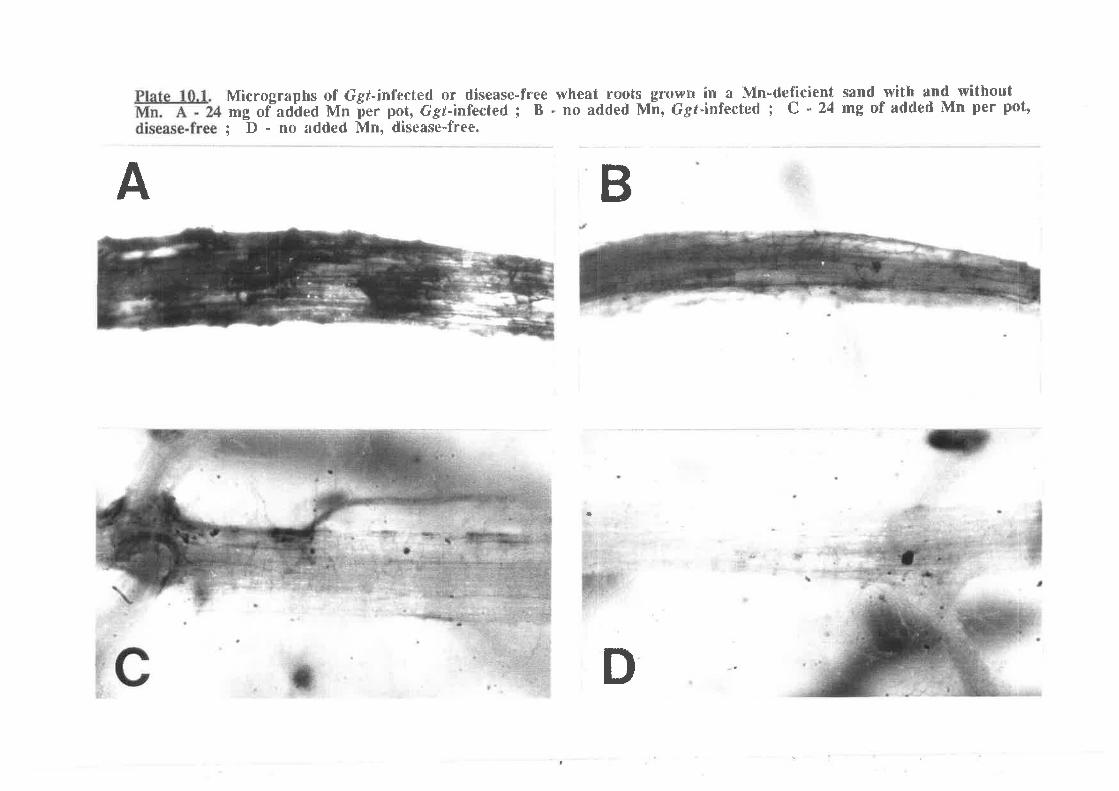
Micrographs of ügÍ-infiecterl or dl.sease-free wheat ror¡ts_Ur$wr* tn^n Mn-deficient sand with and withoutm[ of"aO'Oed Mn ¡"rer pot, Ggf*infected ; B - no added Mn, {igt-infected ; C - 24 mg of added Mn per pot*
; D - no added Mn, disettse-free"
A B
I
ffi
t)
273
with benzidine, indicating the presence of Mn oxides. Disease-free roots from nil Mn pots
were very white and no areas stained blue with benzidine (micrograph D).
10.3.2. Examination of wheat root sections under the scanning electon microscope withEDXA.
10.3.2.1. Oven-dried roots. Although oven-dried roots were severely collapsed following
placement in vacuum, the surface detail of cells and intercellular spaces were still visible and
runner hyphae on the outside of roots could also be distinguished (plate 10.2).
Examination of Ggr-infected wheat roots from 2{\'Inrevealed very high
concentrations of Mn in localized areas. These areas only occurred where the root surface
was covered in a network of runner hyphae. Tlte2 micrographs on plate 10.3 show the
surface of a root from within such an area. Micrograph B was produced by reflected
electrons and clearly reveals small bright globular "nodules" below the surface of the root
which were barely visible on the micrograph showing surface detail only (micrograph A).
Since brightness of the image is related to the atomic weight of the atoms in the sample, the
globular nodules must have been rich in an element with a high molecular weight, possibly
Mn. Analysis of this area (arow i. on micrograph A) by X-ray microprobe confrmed a very
high concentration of Mn and a surnmary of the spectrum is shown in figure 10.14. The
concentration of Mn in this area was much higher than in arL aÍeaof the same loot which had
no obvious nodules or surface particles (see the spectrum in figure 10.18, taken atarrow 2
in micrograph a of plate 10.3). The concentrations of Fe in Mn-rich areas were only slightly
elevated from "background" levels, indicating that the nodules contained little Fe-oxide. The
spectrum taken at arrow 2 (frgure 10.18) is typical for organic matter although calcium is
abnormally high due to the Wangary sand in which the plants were grown (80-9O Vo
CaCO¡). The high concentrations of potassium and chlorine were due to KCI crystals which
were frequentþ found on the root surface. Analysis of some particles stuck to the surface of
the root (taken at arrow 3 of micrograph a of plate 10.3) revealed very high concentrations of
Mn in this area (figure 10.lC) as well as elevated levels of Ca and Fe. These particles were
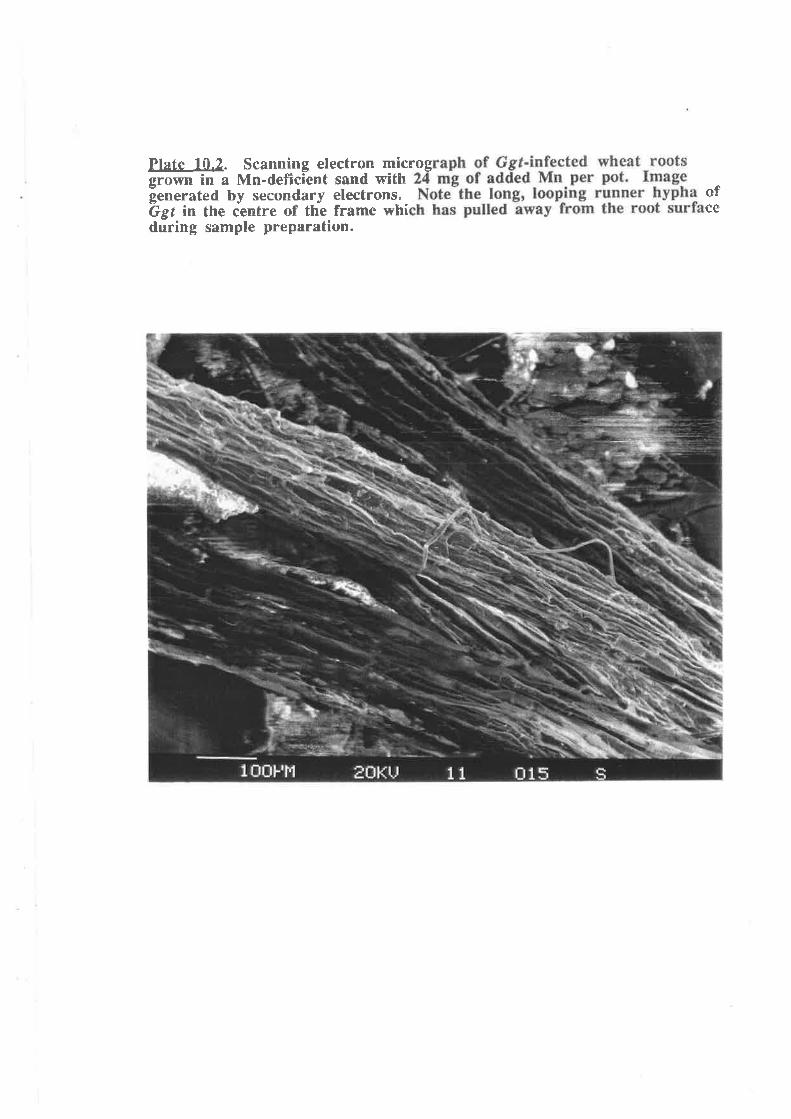
Plate l{i.2. Scanning electron microggrown in a Mn-defieient sand wiÉh
fienerated by seeondary electrons. ofGgt in the centre cf the frame whí ee
during sample preparation.
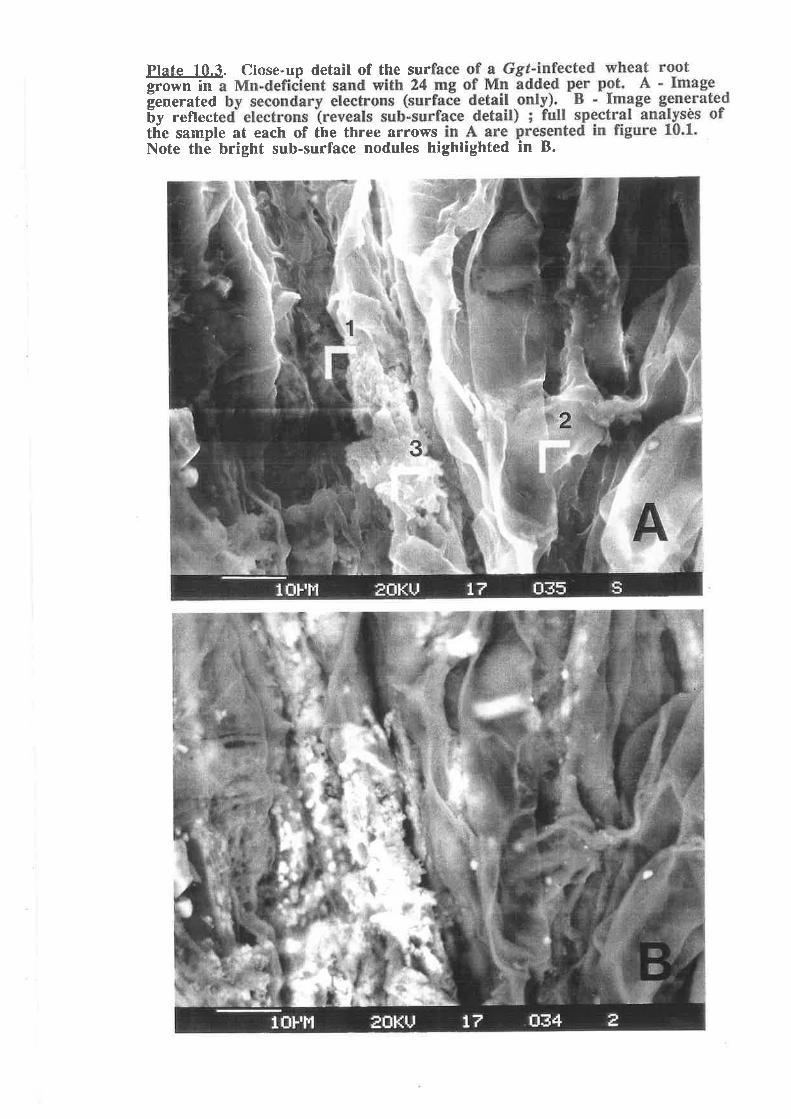
Plate 1û.3. Close-up detail of the surgrown ingeneratedby reflectthe sample at each of the three arrowsNote the brËght sub-surface nodules highlighÉed in B.
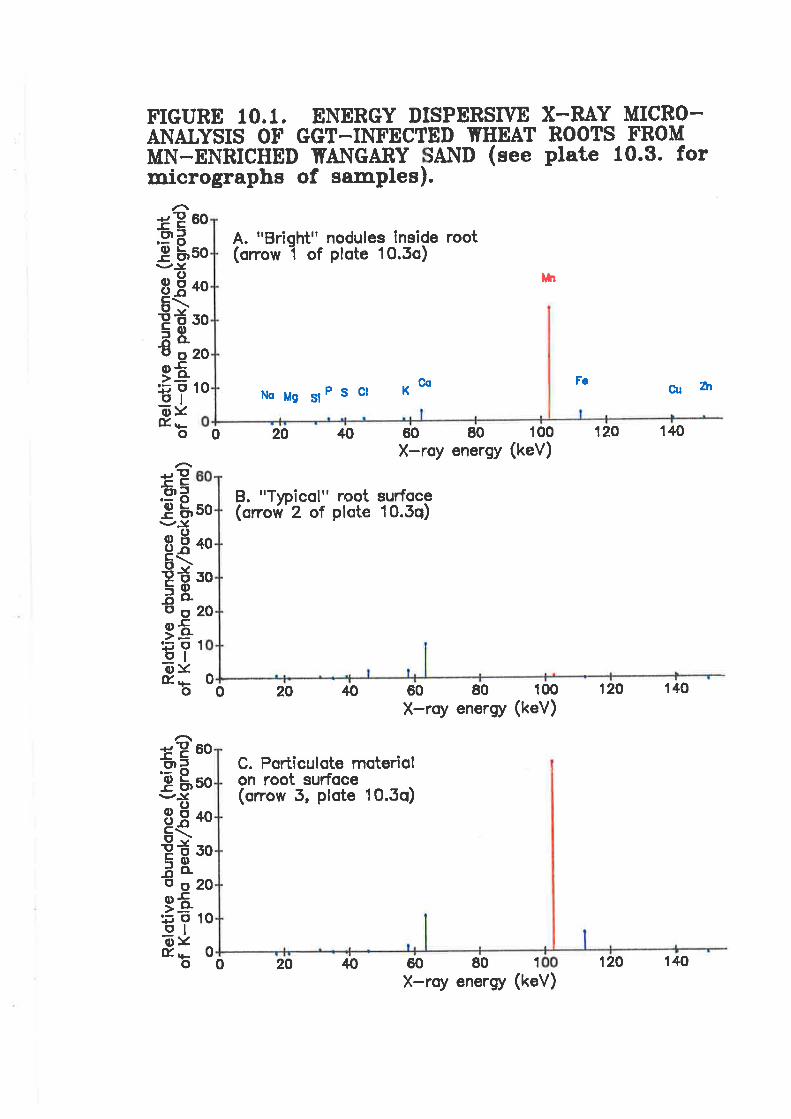
FIGURE 10.1. ENERGY DISPERSIYE X-RAY MICRO-ANAIYSIS OF GGT-INFECTED TvHEAT ROOTS FROMMN-ENRICHED IÍAÌ.TGARY IAI\D (see plate 10.3. formicrographs of samples),
-tþ¡tr'Ëg\-rJ
sËËgkq)5o-ooeËi=ç,olõvff,È
o
Ë?BË-c01\-/Je8E€Ë8=o5o-ooeËFOÞlõ:¿ff,+_
o
s!-cçËs\-/J
"8E€TT=0,äo-ooeËi=oolõvff.F
o
ttt
Co
60
50
40
50
20
10
A. t'Bri(onow
oht" nodutes insîde rooti of plote 10.5o)
rcNs M9 slP s cl K
0 20 40 60 60 100 120 140
X-roy energy (kev)
B. "Trloîcol" root surfoce(orroú' 2 of plote 10.3q)
Cr¡ Zrt
50
40
50
20
I
402000
60
50
/+0
30
20
10
0
C. Porticulote moterìolon root surfoce(orrow 3, plote 10.3q)
60 80 100 120 140
X-roy energy (kev)
60 80 1o 20 ,+O
X-roy energy (kev)12O 1/+O
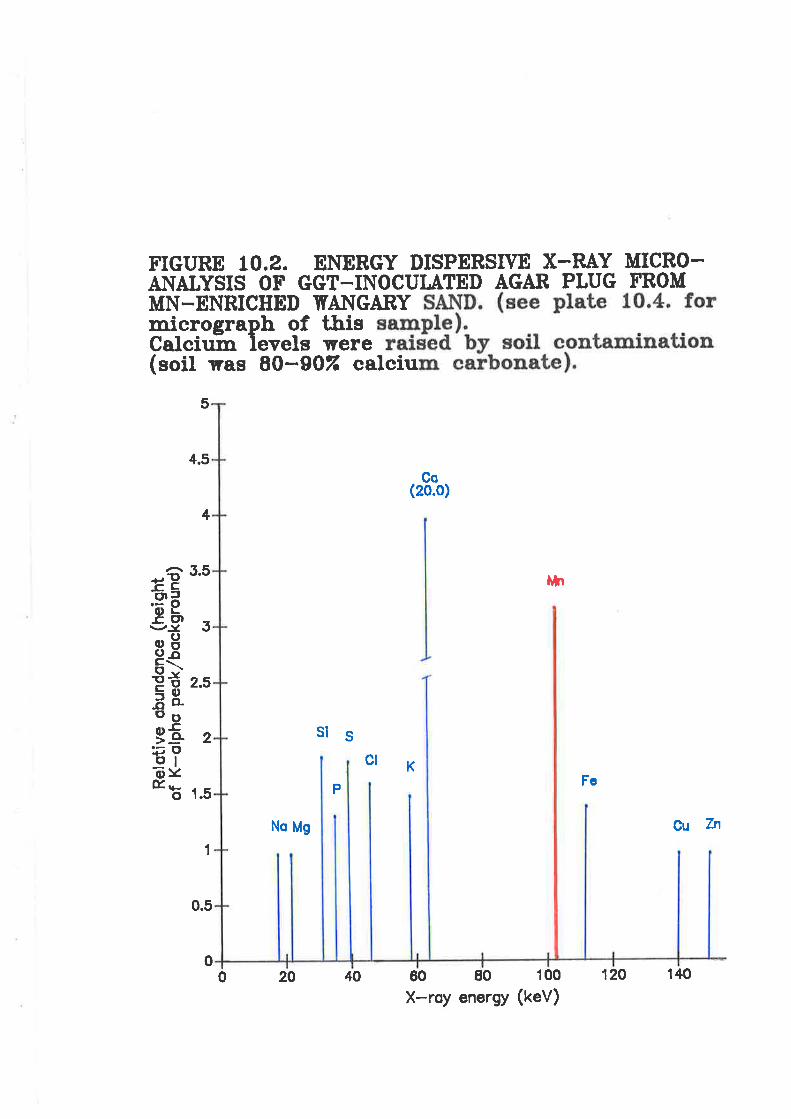
FIGURE 10.2. ENEAGY DISPERSIVE X-RAY MICRO_AI\AIYSß OF GGT-INOCULI\TED AGAR PLUG FROMMN-ENRICHED TYANGARYmierograph of tJrisCalcium levels were(soil 'was 8O-ÐOZ' caleiu
(20.0)
Àh
Co
5
4.5
4
-î 5.5
-eggg3üË('J9Ë 2.5=o5o-oo9Ë-2'FOolõ:¿tE t.s
sis
P
ct KFo
No Mg
40 60 E0 100 120
Cu 7n
0.5
1
00 20
X-roy energy (kev)1,+0

-274-
probably a mixture of Mn and Fe oxides which had formed around some CaCO3 in the soil.
Mn2+ will readily oxidize and/or precipitate as MnCO3 on CaCO3 surfaces Q-eeper 1970,
McBride 1979).
Localised areas of high concentrations of Mn were found in disease-free roots from
z4lv[r:but the areas were infrequent, concentrations of Mn were never more than 2-3 times
higher than background levels and no discrete particles could be found which were rich in
Mn.
No areas of high concentrations of Mn were found on roots from nil Mn pots,
regardless of whether they were disease-free or infected with Ggr. Spectral analysis of the
root surface produced a pattern of elemental composition typical of that shown in flrgure
10.18 although Mn concentrations were generally lower.
Examination of the agarplug of Ggt inoculum which had been removed froma24
Mn pot revealed the presence of small bright globular nodules þlate 10.4) $¡ittìin the agar.
These nodules were approximately 0.001-0.002mmin diameter and usually congregated in
areas 0.01-0.02 mm wide. The spectrum in figure lO.2,takenfrom a typical area of high
density of nodules in the agar, clearly shows that these areas had very high concentrations of
Mn. The appearance of these nodules compare well with the pattern of Mn oxidation which
was observed to occur with Ggt on PDA in petri-dishes; Mn was deposited in agar as
discrete bnown spots in a halo around each hypha (see chapter 2 of this thesis).
10.3.2.2. Freeze-dried roots. Following the identification of Mn-rich nodules inGgt'
infected wheat roots from soil with high rates of added Mn in oven-dried samples, similar
roots were freeze-dried and examined. Freeze-drying preserved the structure of the roots
and fungal hyphae and the micrograph in plate 10.5 of a longitudinal section of a root clearly
shows the distribution of bright nodules within a Ggt-rnfected root. The digitized map of
Mn in the image of plate 10.5 confirms that the nodule-rich areas in the root had very high
concentrations of Mn (frgure 10.3). The nodules appeared to be situated in the cell walls of
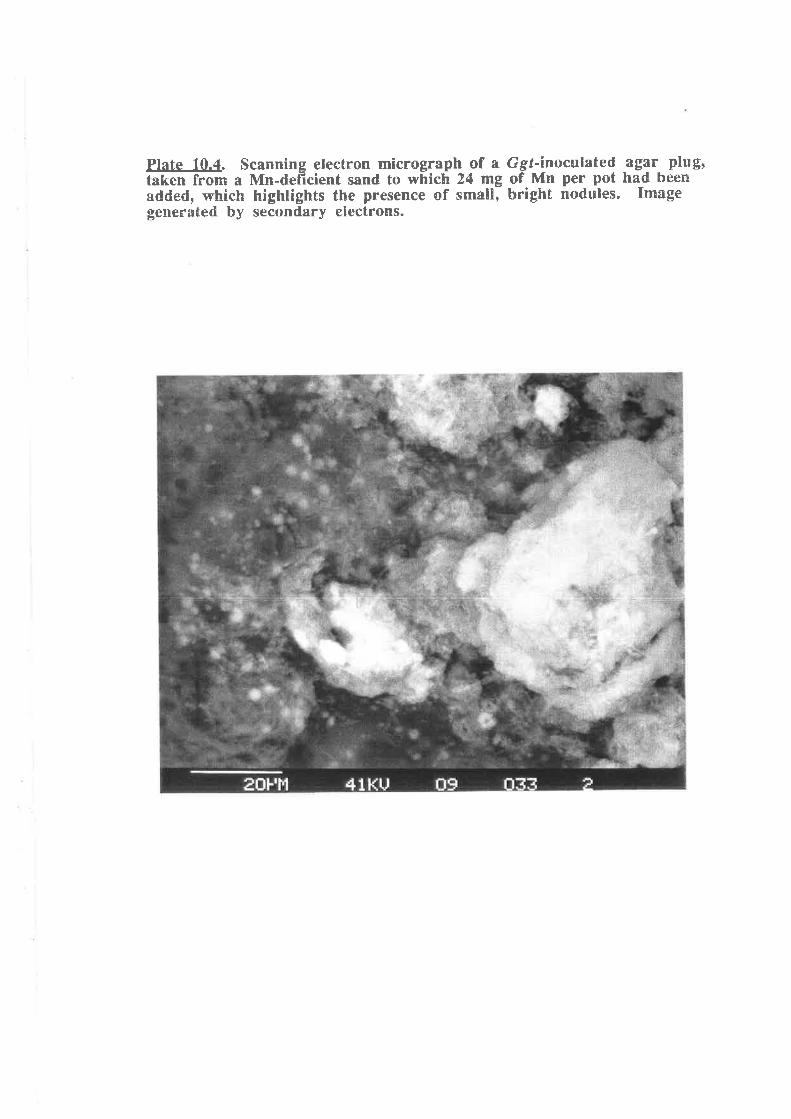
Plate t{!.4. Scanning electron micrograph of a GgÉ.inoculaÉed agqr FIug'taken from a Mn-def¡eienÉ sand to which 24 mg of Mn per pot had heenadded, which highlighÉs the presence cf small, b,righÉ nodu[es. fmagegenerated by seeandary eiectrons.
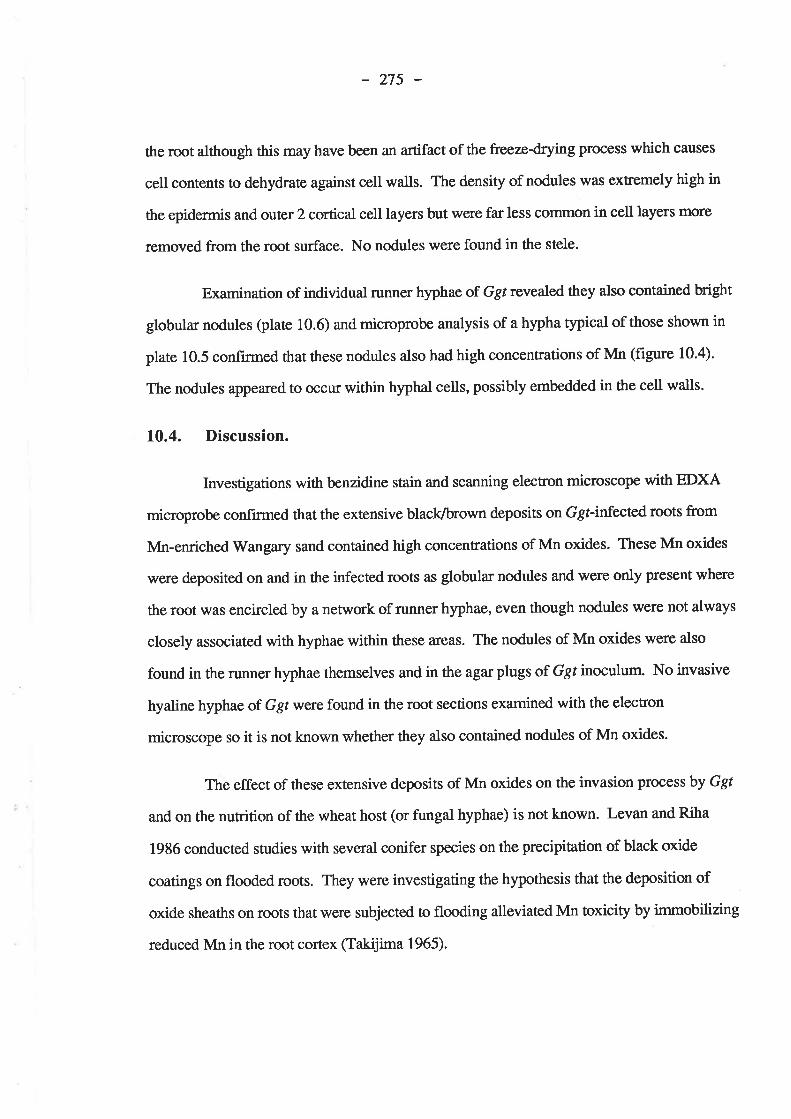
-275-
the root although this may have been an artifact of the freezn-dryns process which causes
cell contents to dehydrate against cell walls. The density of nodules was extremely high in
the epidermis and outer 2 cortical cell layers but were far less common in cell layers more
removed from the root surface. No nodules were found in the stele.
Examination of individual runner hyphae of Ggt ¡evealed they also contained bright
globular nodules þlate 10.6) and microprobe analysis of a hypha typical of those shown in
plate 10.5 confirmed that these nodules also had high concentrations of Mn (figure 10.4).
The nodules appeared to occur within hyphal cells, possibly embedded in the cell walls.
10.4. Discussion.
Investigations with benzidine stain and scanning electron microscope \Ã/ith EDXA
microprobe conf,rmed that the extensive black/brown deposits on Ggf-infected roots from
Mn-enrichedV/angary sand contained high concentrations of Mn oxides. These Mn oxides
were deposited on and in ttre infected roots as globular nodules and were only present where
the root was encircled by a network of runner hyphae, even though nodules were not always
closely associated with hyphae within these areas. The nodules of Mn oxides were also
found in the nmner hyphae themselves and in the agar plugs of Ggt inoculum. No invasive
hyaline hyphae of Ggt were found in the root sections examined with the electron
microscope so it is not known whether they also contained nodules of Mn oxides.
The effect of these extensive deposits of Mn oxides on the invasion process by Ggt
and on the nutrition of the wheat host (or fungal hyphae) is not known. Levan and Riha
1986 conducted studies with several conifer species on the precipitation of black oxide
coatings on flooded roots. They were investigating the hypothesis that the deposition of
oxide sheaths on roots that were subjected to flooding alleviated Mn toxicity by immobilizing
reduced Mn in the root cortex (Takijima 1965).
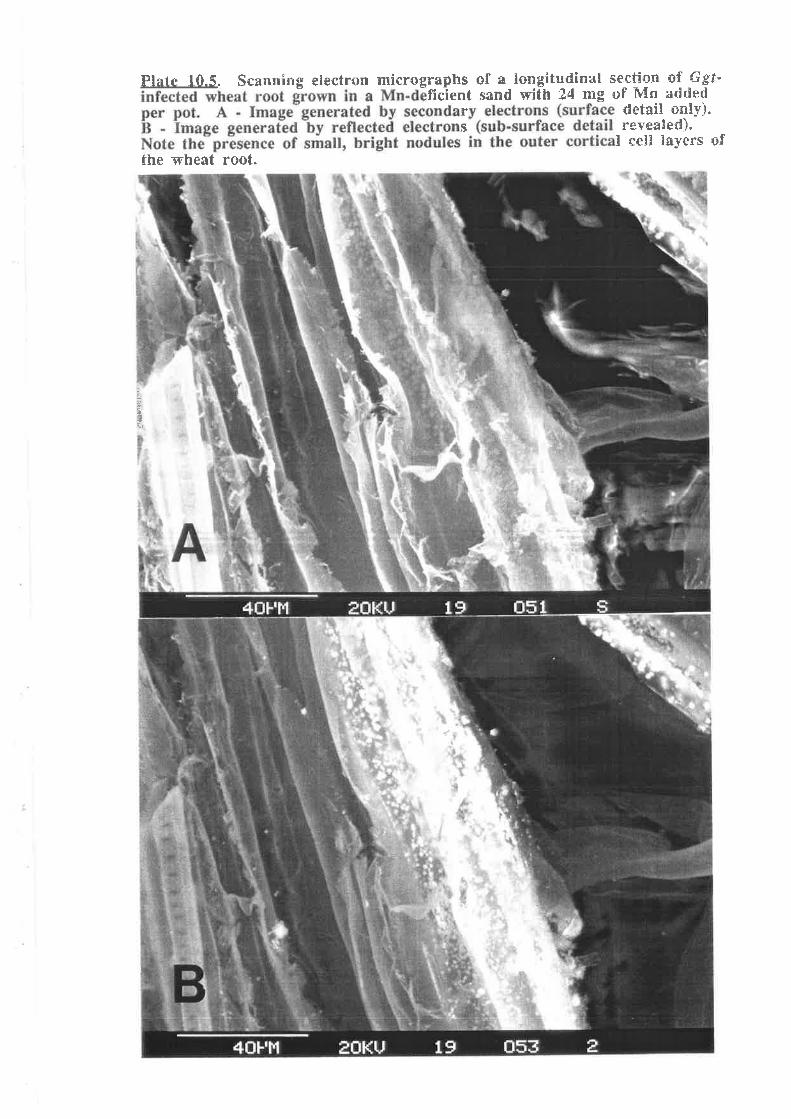
Plafe 111.5. Scanning +iectron micrographs of a t+ngít¡idinal se*cti+n of #gf--ficient sand witår ?4 mg of Mn added
r d+taii +nlY).* "iJ'i.iåÍl;-
*the wheat root.
a
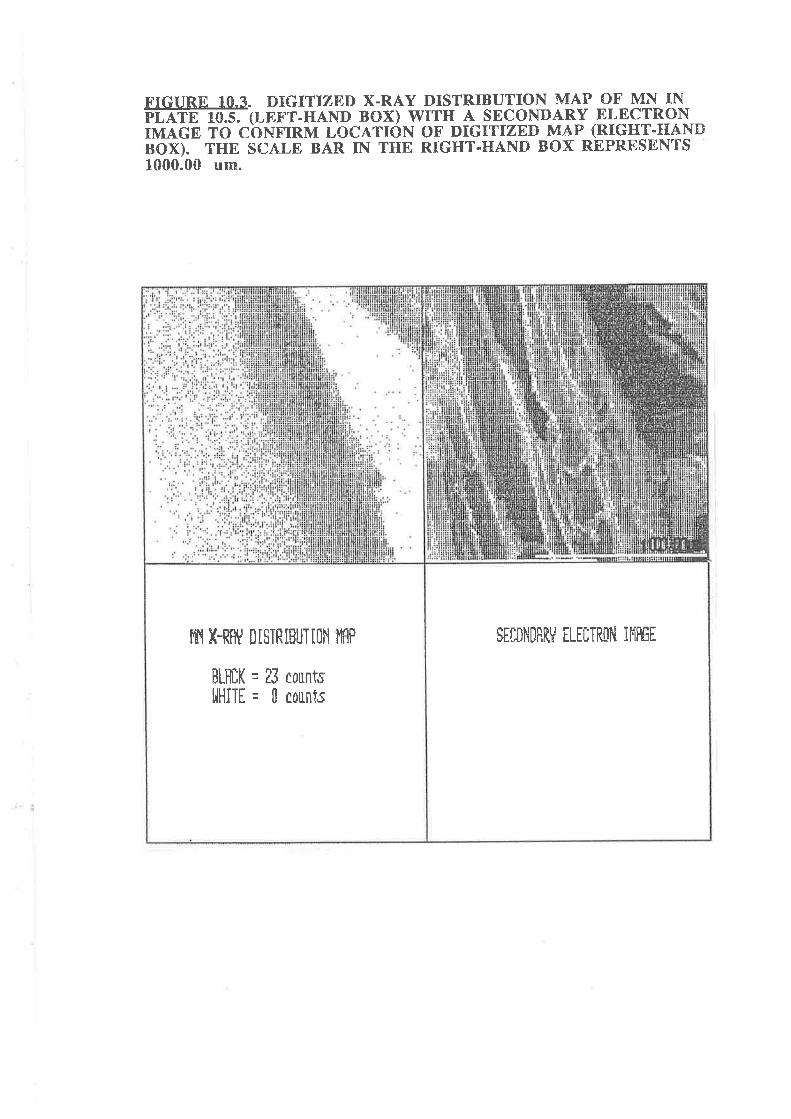
FIGURE 1T.3. DIGTTIZED X.RÁ.Y DTSTRIBUTION MAP OF MN INPLATE ruFg,EFT-HAND BOX) WITH A sEcoNDaR.Y ELECTRONrMÁ.GE Tû CbNFIRM LOCATITN OF DIGITIZEÐ MAP (RIGHT-H.4.NÐBûX). THE SC,åLE BAR IN THE RTGHT-HANI! BÐX REPR.ESENTS10û0.0{} um.
ruT H-Rffi ÐISTRIBlJTIOfi MP
BLffiK = 23 tountsHI.IïTE = 0 corrnts
$TTÐIiOHRV TLITTROF€ IFlffiT
Påate å{9.fi. Sca¡ene¡sg *ãec*r+n microgr haefrc¡æ a Mn-deËieienÉ sand åa :aå¡Ëch 24 d p A- ãmage by s+coaadary eå B ge
geiaerãte cÉéd *åecðr*ias {s F'la
pr€seãe*e brågtrt noduies
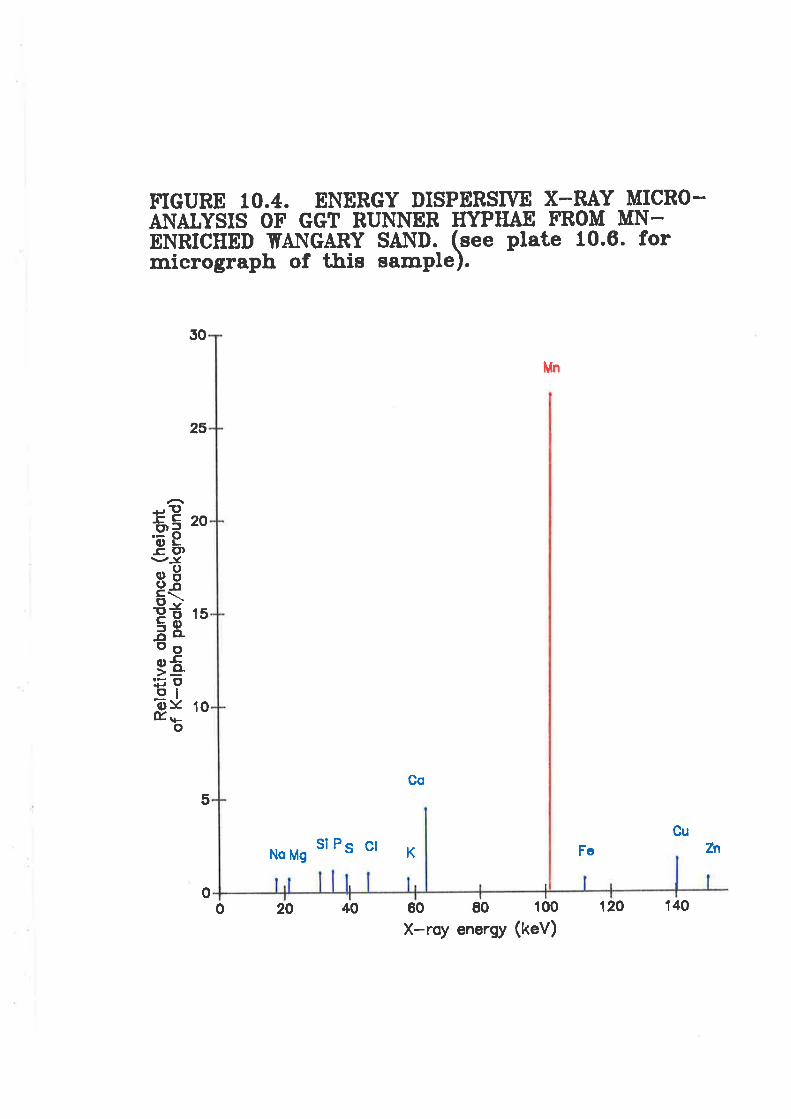
FIGURE 10.4. ENERGY DISPERSIVE X-RAY MICRO-Æ\TAIYSIS OF GGT RUNNER IIYPHAE FROM MN-ENRICHED IÍAI\GARY SAIID. (see plate 10.6. formicrograph of tJris sample).
gTl
65 20'õv-c ctl
qBË€tÈ rshoãoooeËijoEllpÍ to
o
30
25
0
Mn
NoMg siPs c¡ K Fe
60 E0 100
Co
5
CuZn
0 20 40
X-roy energy (kev)120 140
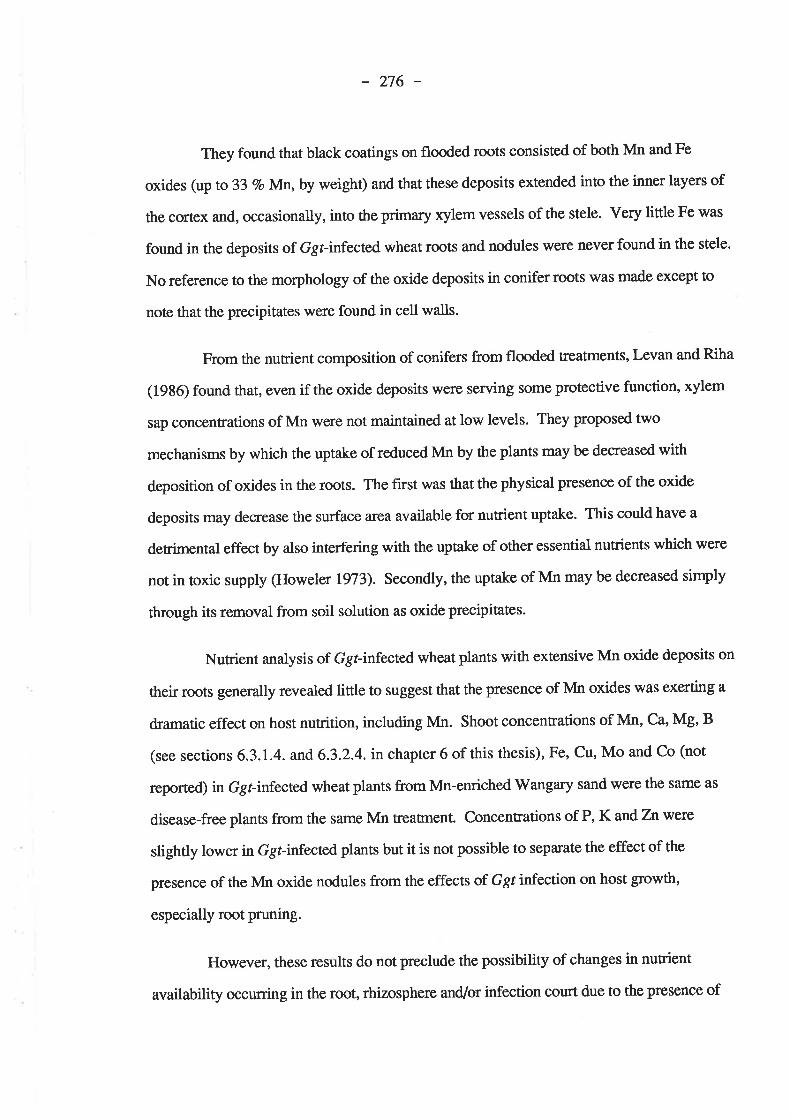
-276-
They found that black coatings on flooded roots consisted of both Mn and Fe
oxides (up to 33 VoMn,by weight) and that these deposits extended into the inner layers of
the cortex and, occasionally, into ttre primary xylem vessels of the stele. Very linle Fe was
found in the deposits of Ggr-infected wheat roots and nodules were never found in the stele.
No reference to the morphology of the oxide deposits in conifer roots was made except to
note that the precipitates were found in cell walls.
From the nutrient composition of conifers from flooded treatments, Levan and Riha
(1986) found that, even if the oxide deposits were serving some protective function, xylem
sap concentrations of Mn were not maintained at low levels. They proposed two
mechanisms by which the uptake of reduced Mn by the plants may be decreased with
deposition of oxides in the roots. The first was that the physical presence of the oxide
deposits may decrease the surface area available for nutrient uptake. This could have a
detrimental effect by also interfering with the uptake of other essential nutrients which were
not in toxic supply (Howeler 1973). Secondly, the uptake of Mn may be decreased simply
through its removal from soil solution as oxide precipitates.
Nutrient analysis of Ggr-infected wheat plants with extensive Mn oxide deposits on
their roots generally revealed little to suggest that the presence of Mn oxides was exerting a
dramatic effect on host nutrition, including Mn. Shoot concentrations of Mn, Ca, Mg, B
(see sections 6.3.1.4. and6.3.2.4. in chapter 6 of this thesis), Fe, Cu, Mo and Co (not
reported) in Ggf-infected wheat plants from Mn-enriched Wangary sand were the same as
disease-free plants from the same Mn treafinent. Concentrations of P, K and Znwere
slightly lower in Ggr-infected plants but it is not possible to separate the effect of the
presence of the Mn oxide nodules from the effects of Ggt infection on host growth,
especially root pruning.
However, these results do not preclude the possibility of changes in nutrient
availability occurring in the root, rhizosphere and/or infection court due to the presence of
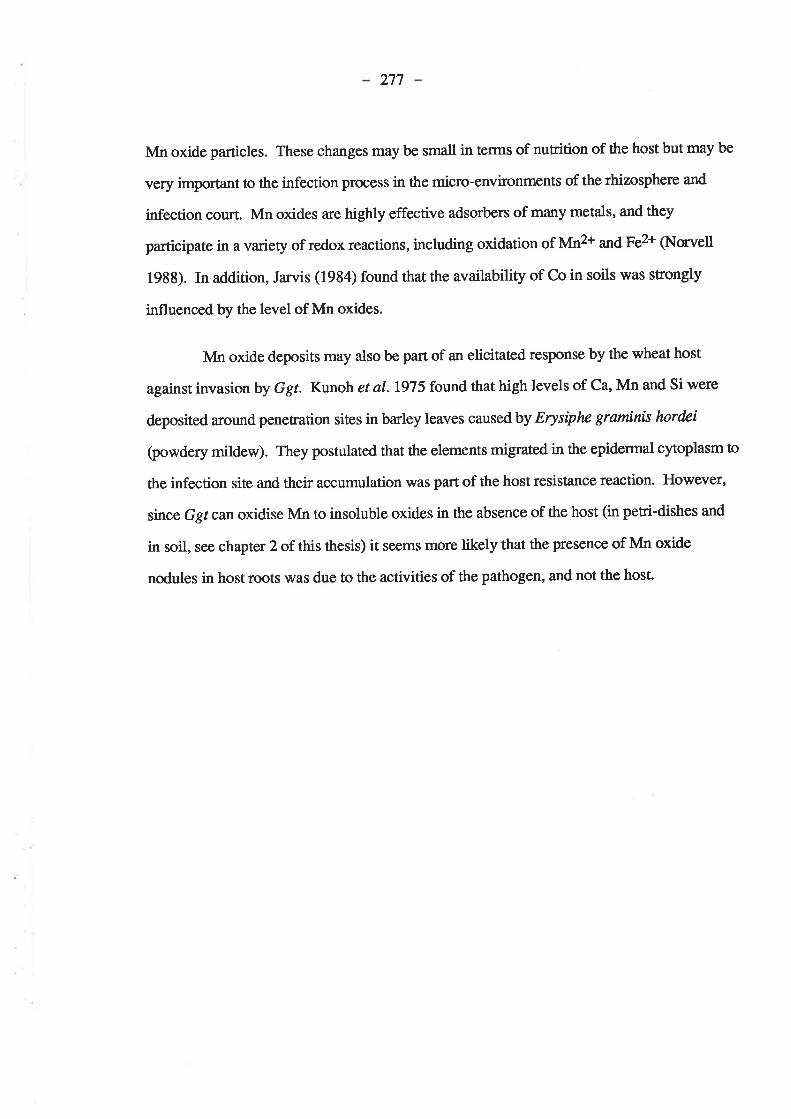
277
Mn oxide particles. These changes may be small in tenns of nutrition of the host but may be
very important to the infection process in the micro-environments of the rhizosphere and
infection court. Mn oxides are highly effective adsorbers of many metals, and they
participate in a variety of redox reactions, including oxidation of Mn2+ and Fe2+ (Norvelt
1983). In addition, Jarvis (1934) found that the availability of Co in soils was strongly
influenced by the level of Mn oxides.
Mn oxide deposits may also be part of an elicitated response by the wheat host
against invasion by Ggt. Kunoh et al. 1975 found ttrat high levels of Ca, Mn and Si were
deposited around penetration sites in barley leaves caused by Erysiphc graminís hordci
(powdery mildew). They postulated that the elements migrated in the epidermal cytoplasm to
the infection site and their accumulation was part of the host resistance reaction. However,
since Ggr can oxidise Mn to insoluble oxides in the absence of the host (in peti-dishes and
in soil, see chapter 2 of this thesis) it seems more likely that the presence of Mn oxide
nodules in host roots \ilas due to the activities of the pathogen, and not the host.

-n8-
10.5. References.
Howeler, R.H. (1973). kon-induced oranging disease of rice inrelæion tophysico'chemicalchánges in a flooded oxisol. Soil S]i.\oc. Amer. Proc.37, 898-903.
Jarvis, S.C. (1984). The association of cobalt with eqslly,r!4ucible manganese in some
acidic'permanent grassland soils. .I. Soil Sci.35, 431-8.
Kunoh, H., Ishizaki, H. and Kondo, F. (1975). Composiúon analysis of "!ralo" area ofbarlóy leaf epídermis induced by Powdéry Milãew infection. Ann. Plrytopatltol Soc.,
Japan.41,33-9.
Leeper, G.W. (1970). "Six Trace Elements In Soils." (Melb. Univ. Press.)
Levan, M.A. and Riha, S.J. (1986). The precipitation of black ox_ide coatings on floodedconifer roots of low internal porosity. Plant Soil. 95,33-42.
McBride, M.B. (1979). Chemisorption and precipitation of Mn2+ at CaCO, surfaces.,Soil
Sci. Amer. J.43, 693-698.
Norvell, W.A. (1988). Inorganic reactions of manganese in solls._ln "Mangan€se In soilslnA pUnìs." (Edr. RIO. Graham, R.J. Hanñam and N.C. Uren.) pp. 37-58. (KluwerAcademic Publ. : Dordrecht, Netherlands.)
Takijima, Y. (1965). Studies of the mechanism of root damage of rice plants in the peat" puády frelds.' 1 1. Status of roots in the rhizosphere and the occturence of root damage.
Soil Sci. Plant Nutrit.l1.,204-lL.
GENERAL DISCUSSION AND CONCLUSIONS
279
CHAPTER 11. GENERAL DISCUSSION AND CONCLUSIONS.
Graham and Rovira (1934) proposed three mechanisms to explain the decreased
susceptibility of wheat seedlings to Ggt infection when Mn def,rciency was corrected;
1. Mn2+ may be directly toxic to the free inoculum of the fungus in the soil.
2.\'Ãnmay be acting through the physiology of the plant. They proposed that Mn
nutrition affects photosynthesis, which in turn, controls the rate of exudation
of soluble organic compounds by roots. These exudates affect the
rhizosphere microflora and, through it, the ectotrophic gro\ilth of the take-all
fungus.
3. Lignin production is controlled by Mn-activated enzyme systems. Since
ligneous materials are an acl¡rowledged partial defence against take-all in the
form of lignitubers, these structures may be more poorly developed in Mn-
def,rcient plants.
Results presented in this thesis are in direct support of the third hypothesis. They
also demonstrate that the first hypothesis should be rejected and that the second hypothesis
plays a secondary role only, if it operates at all.
In addition, the results are consistent with a refinement of the third hypothesis
which states that decreased activity of a Mn-activated, cell wall peroxidase, which mediates
lignin deposition in cell walls, occupies a central role in pre-disposing Mn-deficient wheat
plants to take-all.
Results are also presented which document the first teport from the Southern
Hemisphere of an application of Mn fertilizer decreasing take-all in the field.
280
The four topics of the relative importance of the 3 h¡tpotheses of Graham and
Rovira (19S4) and the implications of results from field experiments are examined in detail in
the following sections.
11a. Mn deficiency decreases the resistance of wheat plants to Ggt by
inhibiting lignin production in the host.
The results of the virulence and Mn oxidizing study of 4 Ggt isolates (see chapter 5)
became the fore-runner for a more extensive study of 14 isolates (Buchhorn and Graham
1939). (Buchhorn and Graham 1939) produced a correlation between vin¡lence of Ggt
isolates and Mn-oxidizing ability and found that nearly 6O 7o of thevariation in length of
black stelar lesions caused by 14 different isolates was explained by Mn-oxidizing ability on
PDA. Observaúons reported in this thesis (see chapters 5 and 10) showed that Mn oxidation
by virulent Ggr isolates in PDA and in soil occurred at a distance from the hyphae and
formed discrete "nodules" of Mn oxide. The combination of high rates of soil-applied Mn
andGgtinfection resulted in extensive deposition of Mn-oxide "nodules" in the interstices of
epidermal and superfrcial cortical cells of wheat roots but nodules were never found in root
segments free of Ggr. Since virulence appears to be strongly linked to Mn-oxidizing ability
and virulent Ggf isolates cause extensive deposition of Mn-oxides in the infection court of
the outer cell layers of wheat roots it seems reasonable to propose ttrat Mn oxidation is a
direct response by virulent Ggr isolates to weaken lignin production at the site of invasion
into the wheat host. These Mn-oxide nodules have the potential to specifically disnrpt the
activity of Mn-activated cell wall peroxidases involved in lignin deposition by depriving the
enzyme of its essential Mn2+ co-factor (Iakijima 1965, Jauregui and Reisenatrer L982,
Gilkes and McKenzie 1988), physically blocking nutrient exchange and lignin deposition in
cell walls (floweler !g73,Levan and Riha 1936) and/or acting as catalysts for
oxidation/reduction processes (Norvell 1983). Cell wall peroxidase enzymes may require
high local concentrations of Mn for full activity because foliar-applied Mn was not effective
- 28r
at decreasin g Ggt infection or increasing root Mn concentrations despite producing large
increases in shoot and root growth.
Investigations into Ggr invasion of excised wheat root pieces on agar suggested that
bariers to fungal invasion existed in Mn-adequate root pieces prior to exposure to the
pathogen and that resistance of both l\ín-deficient and -adequate root pieces could be further
increased by a current external supply of Mn, although external Mn was not as effective as
Mn pre-culture. Staining of root pieces for lignin revealed that Mn-adequate roots had more
extensive lignifrcation throughout the root section which suggests lignin as a prime candidate
for the pre-formed barriers to Ggt invasion apparentþ existing in Mn-adequate roots. Pre-
formed lignin and the production of lignitubers are important in decreasing the rate of
invasion of Ggtinto roots, even if they can not halt it completely (rWeste 1972, Skou 1981).
An external supply of Mn in agar furttrer delayed rates of Ggf invasion into Mn-adequate
roots which suggests that Mn may also have secondary roles in slowing Ggrinvasion into
wheat roots. The nature of this role may be enhanced peroxidase activity, protection of
pectolytic and proteolytic exoenzymes required by Ggt for pathogenesis (Sadasivan 1965,
Huber and Keeler lg77),or a completely different mechanism which has not yet been
identifred. More evidence in line with pre-formed defence bariers in Mn-adequate plants is
provided from pot experiments where moderate rates of Mn decreased Ggr infection and
corrected Mn deficiency in the host but did not result in ttre production of nodules of Mn
oxide in infected tissues (see chapter 3).
There is already evidence which suggests that lignins produced in response to
disease may differ from that normally produced (Skou 1981) and Brown and co-workers
(1984) have shown that lignin production in non-diseased wheat roots is severely inhibited
by Mn deficiency. To further test the validity of this hypothesis, studies into the biochemical
composition of Ggt-infected, Mn-deficient and -adequate wheat plants need to be conducted.
These studies should concentrate on the amounts, tlpes and localities of pre-cursors,
interrnediates and end-products of the lignin pathway, especially at local sites of Ggr
282
invasion into roots. High magnification, electron microscopic examination of the invasion
process by Ggtinto Mn-deficient and -adequate roots would be an important adjunct to the
biochemical studies, especially since markers can be used to "map" high concentrations of
particular compounds. The aim of these studies would be to demonstrate that l\¿[n-deficient
roots are more easily invaded by Ggtbecause they have lower lignin levels in tissue and their
ability to respond to invasion with increased lignin deposition at the site of invasion is
inhibited. Use of sterile, excised root pieces rather than whole plants growing in soil would
avoid complications with soil and microbial factors.
Studies also need to be conducted to confirrn the role of Mn oxidation on vinrlence
of Ggt,perhaps through comparisons of Mn oxidizing and non-oxidizing isolates. The
impact of Mn oxide particles on metablism of Ggrh¡'phae and the lignin metabolism of
wheat toots \ila¡Tants investigation, even though high levels of Mn oxides ale not required
for take-all to be decreased.
Removal of Mn2+ from the infection court by oxidation would also protect the
activity of fungal pectolytic and proteolytic exoenzymes required by Ggt for pathogenesis
(Sadasivan l965,Huber and Keeler 1977). However, this would appeal to occupy a
secondary role in plant resistance because high levels of Mn were not required in the external
environment for disease reduction to occur (cf. soaking seed in Mn prior to sowing
decreased Ggr infection in pot experiments (see chapter 6) and pre-culture of plants with Mn
increased the resistance of excised root pieces on low Mn agar (see chapter 8).
In pot experiments presented here, low rates of soil-applied Mn, which did not fully
corïect Mn deficiency in the wheat host, caused little or no depression in take-all symptoms.
This may be an example of the oxidative capabilities of Ggrbeing able to successfully
overcome marginally increased plant resistance which should follow pafüal relief of Mn
deficiency in ttre host. At high rates of Mn application the oxidative capabilities of the
pathogen are overwhelmed. Gratram and Rovira (1984) found that low Mn rates caused
283
partial relief from Mn def,rciency in the host and alsopanially decreased Ggrinfection which
suggests that small differences in Mn avaitability or timing andrates of Ggt invasion (for
instance from inocula of different potentials) may be critical for determining progress of the
disease. Also, results from a subsequent study in a Mn-sufflrcient soil suggest that there may
be a higher critical level for Mn for resistance to take-all than for gowth (Webb and Graham
1989).
The nature of antagonism by Pseudomonas fluarescens 2-79 (Weller and Cook
1983) against Ggt is also consistent with the Mn/lignin/peroxidase hypothesis as a
component of virulence because Pseudornonas spp. will enhance peroxidase activity
(Anderson and Guerra 1985), is a strong reducer of Mn oxide and that antagonism in agar
was enhanced in the presence of added Mn (see chapter 9). In addition, coating wheat seeds
wittr fluorescent pseudomonads capable of Mn reduction decreased take-all in the freld,
providing additional treatments were also applied to prolong Mn availability, e.g. nitrification
inhibitors (tluber et al. 1986. Huber and Dorich 19SS). However, the interaction between
Z-7g,Nln anð, Ggt could not be fully reproduced in the pot experiments attempted here.
11b. Mn does not need to be toxic to decrease take'all of wheat.
Results from many studies conducted during the course of this project provide
extensive evidence that the first hypothesis of Graham and Rovira (1984) should be rejected.
The most conclusive evidence was collected during studies which investigaæd the effects of
pre-culture with Mn on the resistance of excised wheat root pieces to invasion by Ggr (see
chapter 9). The results from these experiments clearly demonstrated that the resistance of
wheat roots to invasion by Ggt was increased if plants had been grown under Mn adequate
conditions, compared to those glown under Mn-deficient conditions. In these experiments,
Mn treaünents were imposed prior to excision of root pieces so that the infection process by
Ggr occurred in a very low Mn environment, regardless of pre-culture treatments of roots.
The concentration of Mn in unamended potato-dextrose agar (PDA) was several orders of
284
magnitude less than that toxic for the fungus. In addition, total concentrations of Mn in Mn
pre-cultured root pieces were well below toxic levels for the fungus and concentrations of
free Mn2+ in solution in roots should have been less than 3O 7o of the total (Munns et al-
1963).
Further, corroborating evidence for the rejection of the first hypothesis was
provided by a series of pot experiments, not all of which were specifically designed to test
the validity of this particular hypothesis. The first hypothesis predicts that increasing rates of
soil-applied Mn would progressively decrease the extent of Ggt infection on wheat roots,
regardless of the nutritional status of the wheat host. However, collation of results from 14
pot experiments with different rates of soil-applied Mn and comparison wittr effects of soil-
applied Mn on saprophytic growth of Ggt hyphae through soil revealed that raæs of soil-
applied Mn which were not toxic to growth of Ggt mycelia through soil decreased Ggr
infection of wheat roots, providing they fully corrected Mn deficiency in the wheat host (see
chapter 2). Infact, decreases in Ggt infection on wheat roots occurred with rates of soil-
appliedMn which may have enhanced saprophytic growth of the take-all fungus in soil.
In addition, Mn did not have to be applied to soil to be effective at decreasingGgt
infection on wheat roots. All Mn sources which fully conected lvln deficiency in the lvheat
host (with one exception) also decreased Ggr infection. The most important sor¡rce of Mn in
this context was soaking seed in a Mn solution prior to sowing. This technique will
eliminate Mn deficiency in the plant (see chapter 6 and Roberts lg4&,Khalid and Malik
1982, Marcar and Graham 1986) but should have little impact on soil Mn. Soaking seed in
Mn solution prior to sowing decreased Ggt nfectron on wheat roots. However, foliar
application of Mn was not effective at decreasin g Ggt infection in the same experiment
because it did not increase root concentrations of Mn in the wheat host. The only exception
to Mn sources which fully corrected Mn defrciency and also decreased Ggrinfection lvas a
high rate of commercially-prepared MnOZ. This product at high rates of application appeared
to be ineffective at decreasing Ggr infection because it caused large changes in the nuüient

285
composition of treated plants. The only change which was consistent in both pot
experiments \ñ/as a decrease in calcium concentrations in shoots of treated plants to below
deficiency levels. Since calcium nutrition has been implicated in the resistance of plants to
several diseases (Huber 1980, 1981) it seems reasonable to assume that the ineffectiveness
of commercial MnO2 at decreasingcgtinfection was due to induced calcium deficiency in
the host. However, high rates of commerciat MnØ also produced marked changes in boron
and magnesium nutrition of treated plants but these effects were not consistent in both pot
experiments so they have been regarded as less likely to explain the ineffectiveness of MnØ
at decreasin E Ggt infection (although they should not be dismissed compleæly). Use of
commercial IvIrìø has the poæntial to be a very useful experimental tool because it allows the
Mn status of the host to be manipulated without altering the host's resistance to Ggf,
confirmation (or otherwise) of the mechanism(s) causing ineffectiveness may provide further
insights into ttre overall role of Mn in resistance of wheat to take-all.
Results from investigations into the effects of soil-applied Mn on infection by four
Ggr isolates are also inconsistent with the first hypothesis of Graham and Rovira (1984). If
Mn increased the resistance of wheat plants to take-all because it was toxic to the fungus in
the soil, there should be a positive relationship between sensitivity of the isolate to Mn2+ on
agar and the extent of depression of Ggt infection by soil-applied Mn. However, ranking of
the four isolates for sensitivity to Mn2+ on agar did not relate to extent of symptom
depression on the host by soil-applied Mn The fungal property which did relate with exænt
of symptom depression on the host by soil-applied Mn was ability to cause extensive
oxidation of Mn on PDA, the importance of which was discussed above.
11c. Inhibition of take-all of wheat by Mn via changes in rhizosphere
microflora is of secondary importance.
Changes in rhizosphere microflora as a flow-on effect from correction of Mn
defrciency in the wheat host does not have a primary role in explaining the increased

286
susceptibility of Mn-deficient wheat plants to Ggt. The frnding that sterile excised wheat
root pieces, pre-cultured with Mn, w€re more resistant to invasion by Ggt than sterile root
pieces culnlred without Mn (see chapter 8) precludes the possibility that rhizosphere
microflora changes following Mn addition are required for increased resiStance to occur.
Also, the Mn-preculnre effect occurred on top of the presence of bacteria from non-sterile
wheatroots. Nevertheless, Mn fertilization and application of soil-borne mic¡oflora have
interacted to produce decreases in take-all of wheat larger than those achieved with the
individuat treatments (Huber et al.l9ï3,Huber et al.1986) which suggests that changes in
rhizosphere microflora may play a secondary, additional role. Mn enhancement of
antagonism by Pseudomonas flunrescens 2-79 against Ggt on agar, perhaps due to their role
in Mn redox reactions, is also important in this context (see chapter 9).
None of the results presented in this thesis test the simpler hypothesis that Mn may
act through the physiology of the plant and cause changes in root exudates which directly
inhibit the development of Ggr infection. This mechanism could still operate in sterile
excised root pieces on agar because root pieces continue to gfow on agar @eacon and Lewis
1936) and, presumably, produce exudates.
lld. Treating Mn-deficient wheat with Mn fertilizer will control take'all in
the field.
Driling Mn suþate-supplemented ferrl/tizer with the seed corrected Mn deficiency
in wheat and also decreased take-all in the freld (see chapær 7). This is the first report in
Australia (and in the Southern Hemisphere) of Mn fertilizer decreasing take-all in the field,
although such decreases have been reported from Indiana in U.S.A (tluber and Wilhelm
1988).
The combination of these results with those of chapter 4 (which showed that "Mn-
efficient" wheat genotypes were less susceptible to Ggt infection in Mn-deficient soil) offers
ttre potential of presenting a fertilizer package to cereal farmers in southern Australia with

287
Mn-defrcient soil to help control take-all. At present, the only management options that
farmers have to control take-all is to include non-host crops in ttre rotation, ensure that the
non-host crops remain free of grass weeds which will carry the disease and provide adequate
fertilizer to help the crop gïow away fromGgt dalnage (Price lg7},Macnish 1980, Rovira
and Ridge 1933). However, the combination of selecting a wheat variety which performs
well on Mn-defrcient soil (compared to a sensitive variety) and inclusion of Mn fertilizer at
seeding should provide the farmer with an improvement in the Mn status of the crop
resulting in better gowth and increased grain yield, a decrease nGgt infection with a
consequent increase in grain yield, and lastly a reduction n Ggt inoculum levels for
following seasons. A longer temr prospect to control take-all more effectively is applying
Mn on the seed and also inoculating with Mn-reducing microorganisms antagonistic to Ggt
(e.g. Pseudomonas fluorescens 2-79). These separate techniques have been successful in
freld trials in Indiana (tluber and tll/ilhelm 1988).
-288-
11.1. References.
Anderson, A.J. and Guerra, D. ( 1935). Responses of bean to root colonization withP s eud.omonas putida in a hydroponic ìystem . P hytopathol. 7 5, 992- 5.
Brown, P.H.B., Graham, R.D. and Nicholas, D.J.D. (1984). The effects of manganele.lnd- ttitr"t" sopply on the levels of phenolics and lignin in young wheat plants. Plant Soíl-81,437-40.
Buchhorn, S.C. and Graham, R.D. (1989). The correlation o[qlngaqese oxidizingabilityof isolates of Gacwnai*rrrycès gráminis var. trirtci with theii virulence asp_athogens
of wheat roots. In "Commámoriúon Volume In Honour Of Professor K.V.N. Rao."Andhra Pradesh Agric.Univ. (in press.)
Deacon, J.W. and Lewis, S.J. (1986). Invasion of pieces of sterile wheat root bydacuTnnnomyces'graminis ritdf hialoplnra grørninicola. Soil Bíol. Biochem.lE,167-72.
Gilkes, R.J. and McKenzie, R.M. (1988). Geochemistry of mang_anese in soil. In- '\rlanganese In Soils And Piants.'¡ (Eds. R.D_. Graham, R.J. Hannam and N.C.Uren.lpp. 23-36. (Kluwer Academic Publ.: Dordrecht, Netherlands.)
Graham, R.D. and Rovira, A.D. (1984). A role for manganese in the resistance of wheatplants to take-all. Plant Soil78,44l-5.
Howeler, R.H. (1973). Iron-induced oranging disease of rice in^relation to physico-chemicalchánges iìr a flboded oxisol. Soit S}i.ßoc. Amer. Proc.37, 898-903.
Huber, D.M. (1980). The role of mineral nutrition in defense. In "Plant Disease. An¿rnattè¿ Tíeatise." @ds. J.G. Horsfall and E.B. Cowling.) Vol V. pp. 381-406.(Academic Press: New York.)
Huber, D.M. and Dorich, R.A. (1988). Effect of nitrogen fertility on the take-all disease ofwheat. Down to Earth 44, (ln Press).
Huber, D.M. and Keeler, R.R. (1977). Alteration of wheat peptidagg activity after infectionwith powdery mildew. Proc. Amer. Phytopathol. Soc.4,163.
Huber, D.M. and V/ilhelm, N.S. (1988). The resistance. In-- ;Manganese In Soil And Piants.u (nd and N.C. Uren.)pp. 157 -7 4. (Kluwer Academic Publ.:
Huber, D.M., Woodhead, S.H. and Mburu, D.N. (1983). Rhizo_sphgre interactions with'Bacilty"s
sybtilis as a biological control agent. Proc. Biological Control Symposium.
4ttr Int. Cong. Plant Pathol. 17-23 Aug. (Melbourne, Australia.)
Huber, D.M., 'Wagner, J.E., Nashaar, H.E.L. and Moore, L.W. (1-98-6)r -Interactions
of ap"at .-ri"t ãnA poteniial biological control agents. Phytopathol.76,ll04-5-
Jauregui, M.A. and Reisenauer, H.M. (1982)..Calcium-carbo¡^ate and lLanganese dioxide as-regulators of available manganese and iron. Soil ,Sci. 134, 105-10.
Khalid, B.Y. and Malik, N.S.A. (1982).manganese solutions. Convnun. S
Presowing soaking of wheat seeds in copper andoil Sci. Plant AnaL.13,981-6.
289
I-€van, M.A. and Riha, S.J. (1986). The precipitation of black oxide coatings on floodedconifer roots of low internal porosity. Plant 5oi1.95,33-42.
MacNish, G.C. (1930). Management of cereals for control of take-all. I. Dept. Agric.,West. Awt.14tn Ser.) 21, 48-51.
Marcar, N.E. and Gratram, R.D. (1986). Effect of seed manganese content on the growth ofwheat (Tritícum aestivwr) under manganese deficiency . Plant Soil.96,165-73.
Munns, D.N., Jacobson, L. and Johnson, C. VI. (1963). Uptake and disribution ofmanganese in oat plants. 11. A kinetic model. Plant Soil.19, 193-204.
Norvell, V/.4. (19S8). Inorganic reactions of manganese in soils. In "Manganese In SoilsAnd Phnìs." (Eds.R.O. Cratram, R.f. Hanñam and N.C. Uren.) pp. 37-58. (KluwerAcademic Publ. : Dordrecht, Netherlanils.)
Price, R.D. (1970). Stunted patches and deadheads in Victorian cereal crops. Techn. Publ.,Dept. Agric., Vic. No.23.
Roberts, W.O. (1948). Prevention of mineral deficiency by soaking seed in nutrientsolution. I. Agric..Sci. 38, 458-67.
Rovira, A.D. and Ridge, E.H. (19S3). Soil-borne root diseases in wheat. In "Soils: AnAustralian Viewpoint." pp.72l-34. (Common. Sci. Indust. Res. Org.,Melbourne/Academic Press: I-ondon.)
Sadasivan, T.S. (disease. In' ."(Eds. K.F. )
Skou, (1981). Morp s,s.þ-'-Bigfogy And Control.of raÍG-a[.r' L75-97. (Academic Press:London.)
Takijima Y. (1965). Studies of the mechanism of root damage of rice plants in the peat- paddy frelds. 11. Status of roots in the rhizosphere and the occturence of root damage.Soil Sci. Plant Nutit.ll.,204-Il.
V/ebb, M.J. and Graham, R.D. (1990). Supra-optimal Mn suppresses the effect ofGacwnnnnomyces graminß var.. tritici on grain yield of wheat. Aust. Agron. Conf.Feb. Perth, Australia.
Weller, D.M. and Cook, R.J. (1983). Suppression of take-all of wheat by seed treaünentswith fluorescent pseudomo nads. P hytopathol. 7 3, 463-9.
'Weste, G. (1972). The process of root infection by Ophiobolw grarnínis.Trans. Brit.Mycol. Soc. 59, 133-47.
INCUBATION OF MOIST WANGARY SANDTO INCREASE SEVERITY OF
MN DEFICIENCY
290
APPENDIX A. INCUBATION OF MOIST WANGARY SAND TOINCREASE SEVERITY OF MN DEFICIENCY.
.4.1. Introduction.
Results from the first four experiments presented in chapter 3 (which are in
chronological order) showed that ttre severity of Mn defrciency which developed in wheat
seedlings varied considerably, despite very similar growing conditions and the same soil
collection being used for all four experiments. The average Mn concentation in whole
shoots and average increase in shoot dry weight with Mn in the first experiment (results
reported in section 3.3.1.) were 9.1 mg kg-l and 51 Vo,respecively. For the experiments
similarly summarized in sections 3.3.2.,3.3.3.1. and3.3.3.2., the respective values were
11 and 32, 6.6 and76, and 11.8 and 28. Storage of air-dry soil and increasing temperature
will increase exchangeable Mn levels @ujimoto and Sherman L945, Boken 1952, Shuman
1980, Reid and Ruiz 1935) so a general increase in available Mn with time, superimposed by
short term fluctuations caused by temperature changes (soil was stored in an un-insulated
shed) may explain the inconsistency in severity of Mn deficiency observed in pot
experiments.
Marcar (1986) showed that the recovery of Mn2+ added to Wangary sand,
decreased sharply with time and negligible levels of added Mnz+ were extracted from soil
samples 10-20 days after addition. This meant that the standard technique of adding
relatively low rates of MnSOa to soil immediately prior to sowing resulted in developing
wheat seedlings facing a rapidly diminishing supply of Mn2+ and may have even resulted in
Mn-defrcient conditions in the latter stages of the experiments.
The two problems of fluctuating severity of Mn defrciency and diminishing supplies
of Mn2+ were addressed with the deveþment of a technþe in which soil was moistened
and incubated several weeks prior to sowing because re-wetting a soil will cause a gradual
decrease in exchangeable Mn levels @ujimoto and Sherman 1945, Shuman 1980). High
rates of MnSO+ were also added to soil prior to 'incubation' in an attempt to increase the
- 29t
exchangeable and easily reducible pools of soil Mn to levels that were adequate for growth of
wheat seedlings. In this way, the rapidly diminishing supply of Mn2+ originally used as a
Mn source for plants would be replaced by a reservoir of exchangeable and easily reducible
Mn which would persist for the entire length of each experiment.
A factorially designed experiment was conducted in small pots with 3 rates of Mn
(0,40 and 400 Mn), 2levels of soil moisture during incubation (0 and 2O 7o water content)
and 3 replicates.
A.2. Materials and Methods.
A.2.1. Soil and Mn.
Mn was added to W'angary sand (see section 2.2-2. for full details of this soil) as a
lrne spray of MnSOa.4H2O solution and the soil shaken thoroughly to ensure even mixing
of Mn through soil. Mn was dissolved in suffrcient quantities of DDDH2O to give a
moisture content in soil of 2O 7o and final rates of Mn were equivalent to 0, 40 and 4O0 mg
of Mn perpot (50 g of air-dry soil per pot).
A.2.2. Incubation.
Two days after Man was applied, soil for each Mn Íeafnent was equally divided
and one half allowed to air dry (dry incubation) and the other half sealed in a polyethylene
bag (moist incubation). All soil was stored at 15/100 C daylnight temperatures for a further
25 days.
A.2.3. Procedure.
Basal nutrienrs were added to soil as in 3.2.3.1. with extra DDDHzO added to soil
incubated dry to increase the soil water content to25 Vo (level used in previous pot
experiments). The lilater content of moist incubated soil was 38 7o after the addition of basal
nutrients, which made the soil quite wet and it packed down in pots more tightly than dry
292
incubated soil. The weight of prepared soil per pot was adjusted so that pots were filled with
either dry or moist incubated soil of the same air-dry weight. Pots were part-frlled with 47.9
g of dry-incubated soil (52.6 g of moist-incubated soil), followed by 2 germinating wheat
seeds (as in 3.2.3.I.) and a final layer of 2.1(or 2.5) g of soil. Growing conditions were
the same as n3.2.3.1. All pots were maintained at25 Vo water content by watering to
weight every 3-4 days. Plants were harvested after 25 days and fresh (free water removed
from roots) and dry weights of shoots and roots per pot recorded before analysis of whole
shoots for Mn and 11 other essential elements with an ARL inductively coupled atomic
emission spectrometer. Shoot and root tissues were prepared for analysis with nitric acid
digestion. Data were analyzed,with ANOVA techniques appropriate to the factorial design.
4.3. Results
A.3.1. Plant growth.
Plants from 0 Mn were pale green if they had been grown in dry-incubated soil but
were very pale gleen with extensive interveinal chlorosis on floppy young leaves if they had
been grown in moist-incubated soil. All plants glown with added Mn were dark green and
healthy except for plants in 400 Mn in moist-incubated soil, which appeared smaller than
other Mn teated plants' The highest rate of Mn resulted in extensive black/brown external
coatings (identif,red as Mn oxides with benzidine) on the roots of plants grown in dry-
incubated soil but this coating was patchy on roots grown in moist-incubated soil. There
was some brown discolouration due to Mn oxide deposits on roots of plants grown with 40
Mn in dry-incubated soil but it was concentrated on seminal roots within 3 cm of the seed
and was only faint on roots grown in moist-incubated soil at the same Mn rate.
The average dry weight of shoots per plant was the same at both levels of added
Mn, regardless of incubation treatments, and much higher than at 0 Mn (table 4.1).
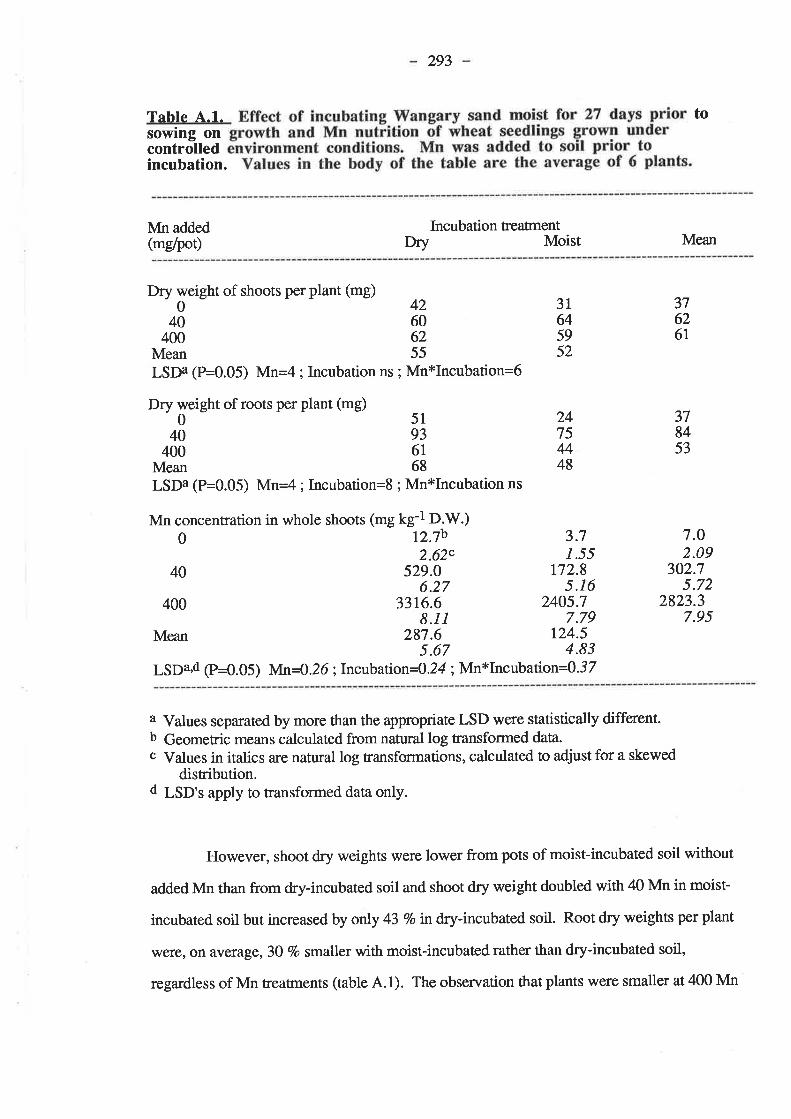
293
Table 4.1.sowing oncontrolledincubation.
to
Mn added(mg/poÐ
Incubation treaÍnentDry Moist Mean
Dry weight of shoots per plant (mg)042
40 60400 62
Mean 55
LSDa (P=0.05) Mn=4 ; Incubation ns ; Mn*Incubation=6
Dry weight of roots per plant (mg)051
40 93400 6r
Mean 68
LSDa (P=0.05) Mn=4; Incubation=8 ; Mn*Incubation ns
3T645952
24754448
37626r
Mn concentration in whole shoots (-g kg-lD.Vi.)0 12.7b 3.7
2.62c I .5540 529.0 t72.8
6.27 5.16400 33t6.6 2405.7
8.11 7.79Mean 287.6 124-5
5 .67 4.83
LSDad (P=0.05) lvln=O.2 6 ; Incubatio n=0.24 ; Mn*Incub a¡on=0.3 7
378453
7.O2.09
302.75.72
2823.37.95
a Values separated by more than the appropriate LSD were statistically different.b Geometric means calculated from natural log transformed data.c Values in italics are natural log transformations, calculated to adjust for a skewed
distribution.d LSD's apply to transformed data only.
However, shoot dry weights were lower from pots of moist-incubated soil without
addedMn than from dry-incubated soil and shoot dry weight doubled with 40 Mn in moist-
incubated soil but increased by only 43 7o ndry-incubated soil. Root dry weights per plant
were, on average ,30 7o smaller with moist-incubated rather than dry-incubated soil,
regardless of Mn treafinents (table 4.1). The observation that plants were smaller at 400 Mn
294
than at 40 Mn was not reflected in dry weights of shoots but root dry weights showed a clear
growth depression with 400 Mn. Dry weight of roots at 0 Mn more than doubled with 40
Mn but 400 Mn caused an average decrease of 37 Vo from levels at 40 Mn. Growth
depressions in roots with 0 and 400 Mn were most pronounced in moist-incubated soil but
the interaction between Mn and incubation treaÍnents was not significant.
4.3.2. Mn.
The severe Mn deficiency symptoms and poor growth observed in plants grown in
moist-incubated soil without added Mn were reflected in shoot Mn concentrations (øble
4.1). Average concentration of Mn in whole shoots in this treatment was only 3.7 mgkg-l'
compared to a level of 12.7 mg kg-l in plants grown in dry-incubated soil, which was still
below the critical level of 18 mg kg-l established for these pot experiments (see Appendix
B). Mixing Mn through soil prior to incubation at the rate of 4O mgper pot increased plant
Mn levels to luxury levels but the increase was much gteatq in dry-incubated soil. Shoot
Mn concenÍations in plants g¡o,wn with 4O0 Mn were well above published toxic levels for
wheat (Reuter and Robinson 1986) and averaged 2823 mgkg-l fot both incubation
treafnents. However, the effect of these very high Mn concentrations on plant gtowth was
only significant for roots.
^.4. Discussion.
Moistening Wangary sand for several weeks prior to sowing was very successful in
increasing the severity of Mn deficiency in wheat seedlings subsequently grown in the
prepared soil. The mixing of high rates of MnSO+ through soil prior to 'incubation'
supplied abundant Mn to wheat seedlings and, in combination with moist incubation, proved
to be areliable technique of eliminating Mn deficiency in wheat seedlings in avery deficient
soil. The addition of basal nutrients at sowing overcame any changes in availability of other
essential plant nutrients which may have occurred with incubation.
295
The technique that was adopted for subsequent pot experiments was to wet the soil
to 18 Vo water content (which allowed for the addition of basal nutrients at sowing and pots
to be filled with soil at25 7o water content as in previous experiments) and incubation for a
period of 2 weeks. Reasonably low rates of MnSO¿.4HzO were subsequently used because
the high rates used here supplied luxury to toxic levels of Mn to wheat seedlings.
4.5. References.
Boken, E. (1952). On the effect of storage and temperature on the exchangeable manganesein soil samples. Plant Soil4,154-63.
Fujimoto, C.K. and Sherman, G.D. (1945). The g$ect o{dryi1g,_hga$ng and wetting oÌ the" level of exchangeable manganese in Hawaiian soils. Soil^Sci. Amer. Soc. Proc.l0,107-12.
Marcar, N.E. (1936). Genotypic variation for manganese efhciency in cereals. Ph.D.Thesis. V/aite Agric. Res.Instit., Univ. Adelaide, South Aust.
Reid, J.M. and Racz, G.J. (1985). Effects of soil temperature on manganese availability toplants grown on an organic soil. Can. J. Soíl Sci. 65, 769-775.
Reuter, D.J. and Robinson, J.B. (1986). Plant Analysis. An Interpretation Manual. (InkataPress: Melbourne, Sydney, Aust.)
Shuman, L. (1980). Effects of soil temperature, moisture, qld.qir-dtying on extractablemanganese, uon, copper and zinc. Soil Sci. 130,336-43.
APPENDIX B.
A CRITICAL LEVEL OF MN FOR GROVTTHOF WHEAT.SEEDLINGS IN EXPERIMENTS
WITH SMALL POTS
296
APPENDIX B. A CRITICAL LEVEL OF MN FOR GROWTH OF WHEATSEEDLINGS IN EXPERIMENTS WITH SMALL POTS.
Figure B.1 shows a Mn critical level curve for growth of wheat seedlings under
controlled environment conditions. The curve was compiled from the growth and whole
shoot Mn concentration data of wheat seedlings grown in nine small pot experiments during
the course of this project. These nine experiments were representative of all experiments
conducted with small pots in this project but only the data from plants free of take-all were
included. Each point is the average dry weight of whole shoots per pot for one Mn
treatrnent, expressed as a percentage of the Mn treaünent which maximized gowth in the
same experiment. The curye was calculated using the Mitscherlich plant growth model
(Ware and Ohki 1982) and produced a critical level for Mn at 9O Vo of maximum yield of 18
mg kg-l D.W. The fow ringed points on the figure were not included in the calculation of
the critical cgrve but data points with Mn concentrations between 80 and 650 mg kg-l were,
although they have not been plotted.
B.1. References.
Ware, G.O. and Ohki, K. (1982). The Mitscherlich plant growth model for determiningcritical nuffient deficiency levels. Agron. J.74,88-91.

flGURE 8.1. Etr'FECT OF lyHOtE SIIOOTõ-oN-CnNrn¡tloñs õr uN oN cßoIrTH oF ITHEATsÈiiDIJñcS-iN
-SMAIL Pors or IÍAI{cAßY sAI\D-.
iffi *ruinçt;nilt'"",Tff (iî1J"""åä'õåu1""1982) ).Individual experiments are rePresented as pointsof the same -shaPe and colour
100 0+x
0
X
+X
*,Fo
+90 X+X
t 0+
0+
8o
70
60
50
40
50
20
b1o-ts.ootscL'g
-e 8-8õE-qrt,+'0oo-l-t ?
c'f'õE>=¿-'iroboE.l *-¡-t OoõbqÉ.-
X
Y:92.2-94.5*e(0.88*X)
(R:0.99)
0 90 % critîcol level
* (18 mglkg)
0 5 101520 255055 40 45 50 55 60 65 70 75 80
+
+
a
+
X
Concentrotion of Mn in whole shoots (mg/kg D'W')
APPENDIX C.
TOTAL NUMBER OF STELAR LESIONS ON WHEATROOTS AND PERCENTAGE OF DISEASED ROOTS
FROM CHAPTER 4, SECTION 4.3.1.
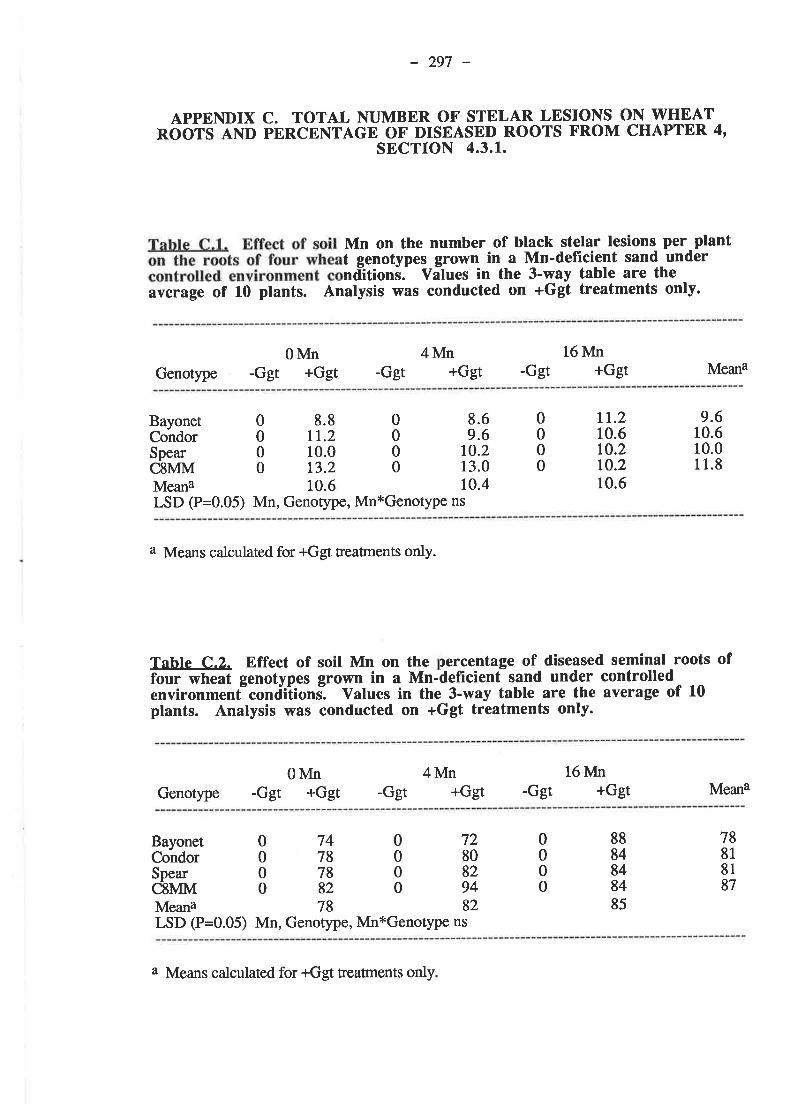
-297-
APPENDIX C. TOTAL NUMBER OF STELAR LESIONS ON WHEATROOTS AND PERCENTAGE OF DISEASED ROOTS FROM CHAPTER 4'
SECTTON 4.3.1.
Mn on the number of black stelar lesions per plantt genotypes grown in a Mn-deficient sand undernlitioni. Vãtues in the 3-way table are the
average of 10 plants. Anatysis was conducted on +Ggt treatments only.
Genotype0Mn
-Ggt +Ggt4Mn
+Ggt16lvln
-Ggt +Ggt-Ggt Meana
BayonetCondor
Meana
8.8tt.210.013.210.6
SpearCSMM
0000
0000
8.69.6
t0.213.0t0.4
9.610.610.011.8
0000
tt.210.6t0.2lo.210.6
LSD (P=0.05) Mn, Genotype, Mn*Genotype ns
a Means calculated for +Ggt treaÍnents only.
Tahle C.2. Effect of soil Mn on the percentage of diseased seminal roots offorlr wtte.¿t genotypes grown in a Mn-deflrcient sand under controlledenvironment"condi'tions-. Values in the 3-way tabte are the average of 10plants. Analysis was conducted on +Ggt treatments only.
Genotype0Mn
-Ggt +Ggt4Mn
-Ggt +Ggt16IvIn
-Ggt +Ggt Meana
BayonetCondorSpearCSMMMeana
0000
0000
0000
7478788278
7280829482
8884848485
78818187
LSD (P=0.05) Mn, Genotype, Mn*Genotype ns
a Means calculated for +Ggt treaÍnents only