2015 Annual Report - The University of Adelaide
144
The University of Adelaide 2015 Annual Report
-
Upload
khangminh22 -
Category
Documents
-
view
0 -
download
0
Transcript of 2015 Annual Report - The University of Adelaide

The University of Adelaide
2015 Annual Report


The University of Adelaide 2015 Annual ReportTo His Excellency, the Honourable Hieu Van Le, AO, Governor of South Australia
In accordance with the requirement of Section 25 of the University of Adelaide Act 1971 (1 June 2007), it gives me great pleasure to submit the Report of the Council of the University of Adelaide for the period 1 January 2015 to 31 December 2015. The University Council approved this report at its meeting 30 March 2016.
Rear Admiral the Honourable Kevin Scarce, AC, CSC, RAN (Rtd)Chancellor
ContentsForeword from the Chancellor 2
From the Vice-Chancellor and President 4
Vision 6
2015 at a glance 6
New performance initiatives 8
Adelaide Enterprise 9
Supporting South Australia’s future prosperity 10
By the numbers 12
Awards and achievements 18
Governance 24
Learning and teaching 30
Research 40
External relations 50
Enablers and supporters 56
Financial statements 60
2015 Annual Report 1

The University has again moved up the prestigious Times Higher Education World University Rankings released in October. The ranking of 149 follows the University’s jump to 169 in the Academic Ranking of World Universities, produced by the Shanghai Jiao Tong University, earlier in the year. This is a most pleasing result, which will help to recruit more international students and the best academics from around the world to South Australia. The rankings show that the University’s efforts, through its Beacon of Enlightenment Strategic Plan, are paying dividends in boosting Adelaide’s reputation on the global stage. I congratulate the Vice-Chancellor and President, Professor Warren Bebbington, for steering the institution towards this outstanding result.
Earlier in the year, I travelled to Singapore for my first official visit as Chancellor and presided over our graduation ceremony, at which 211 graduates received their degrees. My trip coincided with a Singapore Alumni cocktail reception, held to mark the 50th anniversary of Singapore’s independence. I am also delighted that the University’s Singapore joint venture—Ngee Ann-Adelaide Education Centre (NAAEC)—had been awarded four-year EduTrust certification by the Council for Private Education. I congratulate all staff involved in this significant achievement.
The University’s onshore graduation ceremonies were held in April, May and September; the highlight being the award of 11 honorary degrees to outstanding alumni and members of the community. Further details on these distinguished recipients are provided in the ‘Governance’ section of this report.
Works are proceeding apace on the University of Adelaide Health and Medical Sciences (AHMS) building in the City’s West End. When completed in time for semester 1, 2017, it will be the largest capital works project in the University’s history and will support medicine, nursing and dentistry students, as well as the University’s researchers in the new South Australian Health and Biomedical Precinct. In July, the University of Adelaide and SA Health formalised a 30-year agreement on dental training, paving the way for improved dental services for the community. As a result of the agreement, the University will fund a $58 million purpose-built, 89-chair Adelaide Dental Hospital, which will be located on the top three floors of the AHMS building. The new dental facility is scheduled to open in July 2017—a gift from the University we are proud to give to the people of South Australia. In October, I welcomed more than 500 guests to a reception, where former Prime Minister Julia Gillard officially launched the Health and Medical Sciences Building Appeal, which aims to raise $2 million. When completed, the building will be a pivotal element in the University’s vision to transform health sciences education, research and patient care.
During the year, I visited many areas of the University and met with all members of the Senior Executive, Executive Deans and a number of Institute Directors. I was most impressed with the vast diversity of teaching and research undertaken at the University, and the talent, enthusiasm and dedication of our staff and students.
I would like to thank long-serving University Council member Mr Charles Bagot, who retired from Council at the end of 2015, having served the University for 12 years. During his time on Council, Mr Bagot had chaired the Audit, Compliance and Risk Committee (2007-2013) and the Finance Committee (2014-2015), and had served on various other Standing Committees of Council.
Finally, I would like to acknowledge the work of all members of Council and its Standing Committees for their work during the year. I hope that looking back over the highlights of 2015 in this Annual Report serves as a reminder of the success the University has achieved in a great many fields. It should also serve as a promise of the many achievements yet to come.
Foreword from the ChancellorAs 2015 drew to a close, it gave me the opportunity to reflect on the first year of my appointment as Chancellor of the University of Adelaide.
Rear Admiral the Honourable Kevin Scarce, AC, CSC, RAN (Rtd)Chancellor
2 Foreword from the Chancellor


From the Vice-Chancellor
and President

In the 2015 Excellence in Research for Australia (ERA) process, 82% of the University’s research areas were rated 4 or better (above or well above world standard) and the University reached 149th position in the Times Higher Education World University Rankings and 169th in Shanghai Jiao Tong University’s Academic Ranking of World Universities.
Key international collaborations were established with universities in China, the UK and North America; research contracts were signed with companies in Australia and abroad; and the University’s income from commercialisation of research topped $39.3 million—in the top three of the Group of Eight universities.
Meanwhile, domestic enrolments were maintained, despite South Australia’s flat school leaver applications, with the median ATAR score for entry reaching 92.3—the highest in the University’s history. International enrolments continued to increase, with particularly sharp growth in postgraduate courses, and passed 26% of the total student enrolment. Study Abroad programs continued to progress towards the Beacon target, reaching 8% of undergraduate students. Local outreach through our Children’s University program expanded rapidly, connecting the University with more than 3500 children of all walks of life across the state. And globally, at the end of our first full year of presenting Massive Open Online Courses (MOOCs) through EdX, we had over 150,000 enrolments online in 180 countries.
With its ERA and international rankings outcomes, the University had approached two of the 10-year objectives of the Beacon early. But not all the 2015 targets had been met; in particular, the targets for gender equity (30% of senior positions filled by women) and donations and gifts (100% increase over three years) were not achieved. All these outcomes, both positive and negative, influenced our
thinking in the setting of new targets for the second three-year phase of the Beacon, in our new Operational Plan 2016-18.
A report on the Library of the Future was commissioned, the results of which will serve to transform the shape of the University’s library collections and service in the coming years. Sydney architects Francis-Jones Morehen Thorp (fjmt) were appointed as consultants on development of a new Campus Master Plan, to be ready by mid-2016 to guide the medium and long-term physical shape of all University campuses. The Adelaide Health and Medical Sciences building, being constructed in the new SA Health and Biomedical Precinct, remained on track for opening in time for semester 1, 2017, and an appeal for donors wishing to have their names on parts of the building was launched in October.
Financially, the University delivered a solid end-of-year result, having met the 2015 performance targets outlined in the Five-Year Financial Plan. The result was assisted by a program of asset divestment, in which four CBD properties and one rural block were sold. But it was obvious to staff that the year-end outcome was achieved only through significant pressure on operating budgets in all parts of the University. In an effort to alleviate this pressure, a program of Professional Services Reform was commenced to deliver support services more effectively, and this will continue throughout 2016-17.
The University’s progress in 2015 was made against a backdrop of continuing uncertainty for the sector. After several attempts to pass it through the Senate, the Australian Government’s higher education reform package was eventually deferred. A change of Prime Minister and Education Minister brought renewed Commonwealth attention and fresh direction to the higher education debate,
but there is no question the present funding system will be unsustainable unless genuine reform occurs.
I would like to acknowledge the encouragement, energy and support brought to the University during the year by our new Chancellor, Rear Admiral the Hon. Kevin Scarce, AC, CSC, RAN (Rtd), as well as the advice and interest of a number of new appointees to the University Council. I remain indebted to my three deputies for their dedication and loyalty, and to our staff, industry partners, numerous volunteers and vast alumni, who all share a commitment to the University, which provides a constant source of inspiration.
As we enter the second three-year phase of our decade-long Beacon plan, we can take pleasure in having had a period of significant progress. But with Australia’s difficult economic climate and the growing governmental expectations of universities, we will face more challenge and change in the years ahead. I am sure that we are ready to respond with confidence, with clarity of purpose, and an unwavering belief in the value to our society of first-class scholarship and discovery.
Professor Warren BebbingtonVice-Chancellor and President
By the end of 2015 the University had comfortably achieved the key objectives of the first three-year phase of its strategic plan, Beacon of Enlightenment.
From the Vice-Chancellor and President 5

January
> Research from the University’s Centre for Heart Rhythm Disorders showed Indigenous Australians suffer from the serious heart rhythm disorder atrial fibrillation twice as commonly as non-Indigenous people.
> A collaborative research project between University of Adelaide and the Chinese Academy of Agricultural Sciences in Beijing identified a specific gene for salt tolerance in soybeans.
> Essential Human Biology was launched as the University’s first Massive Open Online Course (MOOC), under the banner ‘AdelaideX’, offering anyone from around the world the opportunity to study with the University’s leading academics.
February
> South Australia’s first veterinary CT (computer tomography) scanner, suitable for animals of all sizes, was officially launched at the Roseworthy campus.
> A landmark study into the mental health of professional firefighters at South Australia’s Metropolitan Fire Service commenced at the Centre for Traumatic Stress Studies.
> An international research group led by a team at the Robinson Research Institute made what could be the biggest discovery into cerebral palsy in 20 years: at least 14% of cerebral palsy cases are likely caused by a genetic mutation.
> The Bright Sparks Science Club, offering science and technology activities for 6-15 year olds, was launched by the University’s Faculty of Sciences.
Vision
2015 at a glance
By 2024, the University of Adelaide will become no less than Australia’s most distinctive university, set in Australia’s most civilised of cities…
March
> A new role of Pro Vice-Chancellor (Student Learning) was created at the University of Adelaide, with Professor Philippa Levy appointed from the Higher Education Academy in the UK.
> Five leading University of Adelaide researchers were recognised for their outstanding contributions to medical research by being elected Fellows of the new Australian Academy of Health and Medical Sciences.
April
> The University announced a suite of new initiatives to transform teaching and boost research capacity—all designed to further consolidate its reputation as a high-performance institution.
> The significant contributions of nine outstanding leaders in their fields were recognised with the award of honorary doctorates during the April graduation ceremonies.
> Researchers discovered a previously unknown link between vitamin D and depression in overweight women with polycystic ovary syndrome.
May
> Twelve outstanding University of Adelaide women researchers were recognised in the University’s inaugural Women’s Research Excellence Awards.
> University of Adelaide reproductive experts developed the world’s first screening test to predict a woman’s risk of developing one or more of the four common pregnancy complications.
> The ARC Training Centre for Innovative Wine Production, which will help the wine industry address key challenges, was launched at the Waite campus.
June
> The Centre for Energy Technology won funding to investigate the use of battery energy storage in Australian conditions—a project with major implications for the future use of renewable energy.
> The University’s South Australian Law Reform Institute launched an audit of potential discrimination in the state’s laws on the grounds of sexual orientation, gender, gender identity or intersex status.
> The University of Adelaide Press reached half a million downloads of its online free titles.
July
> Global bio-pharma giant AstraZeneca and the University announced an exciting new collaboration that will aid drug discovery.
> The University was awarded $3.1 million for new research projects working with industry, community and government under the Australian Research Council (ARC) Linkage Projects scheme.
> The University and SA Health formalised a 30-year agreement on dental training, paving the way for improved community dental services for the South Australian community, with new state-of-the-art facilities for both staff and students.
6 Vision – 2015 at a glance

August
> Research into advanced fertilisers that are more efficient and minimise environmental impacts was given a boost with a new five-year, $8.5 million partnership agreement with US-based fertiliser producer The Mosaic Company.
> The University’s new Asia Growth Research Centre was launched at the Ngee Ann-Adelaide Education Centre in Singapore by the Premier of South Australia, the Hon. Jay Weatherill.
> Another successful Open Day saw thousands of prospective students, their families and friends visit the North Terrace campus.
September
> A research and development and manufacturing hub—based on a new generation of specialty glass products for the global science and medical equipment market—was announced in collaboration with Trajan Scientific and Medical.
> The new $11.4 million ARC Research Hub for Wheat in a Hot and Dry Climate was launched at the Waite campus.
> The University of Adelaide MBA was named sixth in the country in the 2015 Australian Financial Review Boss MBA Rankings—up four places since the last standings.
October
> The University moved up the prestigious Times Higher Education World University Rankings to 149.
> The University launched the ARC Research Hub for Australian Copper-Uranium, expected to add significant value to Australia’s $6 billion-a-year copper industry.
> University of Adelaide 2014 Medicine graduate Dr Danielle Fitzpatrick became the 2016 Rhodes Scholar for South Australia, and the University’s 109th Rhodes Scholar.
> $16.9 million was awarded to the University of Adelaide under four streams of the ARC’s Major Grants for 2016—the best result for the University for three years and comprising 68% of the funding for South Australia.
November
> Thirty-four University of Adelaide research projects shared $23.1 million of new National Health and Medical Research Council funding—including for two new Centres of Research Excellence.
> The University of Adelaide announced its new Adelaide Education Academy, inviting academics to become Adelaide Education Specialists, with exclusive access to teaching advancement grants, teaching-based promotion and teaching-focused special study programs.
> Professor Amanda Nettelbeck and Dr Claire Roberts from the University’s School of Humanities were elected Fellows of the Australian Academy of the Humanities, the highest honour for achievement in their fields in Australia.
December
> Four outstanding undergraduate students were awarded highly prestigious New Colombo Plan Scholarships, giving them the opportunity to live, study and work in the Indo-Pacific region in 2016 for up to 12 months.
> The University received an outstanding result in the latest Excellence in Research for Australia (ERA) process, with 82% of the University’s research areas considered to be above or well above world standard.
> The University’s highly popular all-ages, alcohol-free event, Open Night, returned for its third year.
> The festive season was celebrated with the sixth annual free Carols on Campus event—with a special surprise conductor this year, Vice-Chancellor and President Professor Warren Bebbington.
2015 at a glance 7

In 2015, the University of Adelaide announced a suite of new performance initiatives to transform teaching, boost research capacity and improve delivery of professional services.
New performance initiatives
transitioning up to 100 staff to education specialist roles
The Adelaide Academic statements were launched in May, setting the minimum expected contribution within each faculty for teaching and research, research specialists and education specialists, graded from lecturers to professors.
In November, the University of Adelaide commenced inviting academics to join the new Adelaide Education Academy, as Adelaide Education Specialists. By the end of 2015, 35 academics had been appointed. As members of the Academy, those staff will have exclusive access to teaching advancement grants, teaching-based promotion and teaching-focused special study programs.
The Academy aims to provide long-overdue recognition of the critical, but often undervalued, role that teaching specialists play within the University community.
The University will draw on Academy members to participate in a range of other activities, including undertaking peer reviews of teaching, and joining the Academic Board.
The Academy is expected to play a leading role in achieving the learning and teaching proposition that is the centrepiece of the University’s strategic plan, and will be a showpiece for the University’s commitment to excellence in teaching.
The initiatives included:
boosting research support by at least $14 million per year by 2019
creating new Adelaide Academic Role Statements to define staff expectations in research and teaching
reviewing professional services to improve processes and reduce unnecessary bureaucracy.
8 New performance initiatives

University of Adelaide Enterprise will focus on driving the University’s entrepreneurship efforts, managing and licensing intellectual property (IP) and generating spin-out companies.
From mid-2016 the University will restructure the commercial services that are currently provided by Adelaide Research & Innovation Pty Ltd (ARI). This will result in the creation of two new groups within the Division of the Deputy Vice-Chancellor & Vice-President (Research): University of Adelaide Enterprise, and Research Contracts and Partnerships. The new University of
Adelaide EnterpriseIn 2015 the University of Adelaide announced it would be accelerating the commercialisation of its research outcomes through the creation of the new University of Adelaide Enterprise.
Adelaide Enterprise group will manage the University’s IP commercialisation, start-ups and spin-outs. The Research Contracts and Partnerships group will focus on contract research, consulting and collaborations.
The aim of the Enterprise group is to generate impact through knowledge transfer and economic development for South Australia and the nation. The University of Adelaide has a strong international reputation for conducting world-leading research across a wide spectrum of areas including:
agriculture; health and medicine; photonics; engineering; information and communications technology; environment; and energy and resources.
The University of Adelaide Enterprise will increase the University’s impact from the translation of research into commercial outcomes. In the last national survey (2013), the University of Adelaide ranked third in the Group of Eight, and fourth nationally, in commercialisation and contract research income, generating $39.3 million in 2015.
Adelaide Enterprise 9

PRIORITY 1 ~ Unlocking the full potential of South Australia’s resources, energy and renewable assetsIn 2015 the University launched the Australian Research Council (ARC) Research Hub for Australian Copper-Uranium, which will add significant value to South Australia’s $6 billion-a-year copper industry. Together with industry and government, the University is working on the $20 million Great Australian Bight Research Program to better understand the environmental, economic and social value of the Bight.
PRIORITY 2 ~ Premium food and wine produced in our clean environment and exported to the worldThe joint University of Adelaide and Shanghai Jiao Tong University Centre for Agriculture and Health was launched at the Waite campus. Through this centre, the two universities will work together to contribute to the national food, water and health targets of their respective countries. The Waite campus now also hosts the ARC Training Centre for Innovative Wine Production, which aims to build knowledge and technologies that will help the wine industry face the challenges of climate warming, water limitations, changing consumer preferences and increasing production costs.
PRIORITY 3 ~ A globally recognised leader in health research, ageing and related services and productsThe University and SA Health formalised a 30-year agreement on dental training, paving the way for improved community dental services for the South Australian community with new state-of-the-art facilities for both staff and students. The University also announced an exciting new collaboration with global bio-pharma giant AstraZeneca, which will see 50 of AstraZeneca’s drug compounds passed to University researchers to study new therapies—a first for South Australia.
PRIORITY 4 ~ The Knowledge State—attracting a diverse student body and commercialising our researchWith 27,000 students including 7000 studying from more than 90 different countries, the University of Adelaide is a truly global centre for learning excellence.
Supporting South Australia’s future prosperity
In 2015 the University of Adelaide contributed:
Since its establishment in 1874, the University of Adelaide has been an important contributor
to South Australia’s economic prosperity.
As one of the state’s largest employers, and through its research and education, the University plays a key role in the state’s economy.
The University of Adelaide is continuing to help deliver the South Australian Government’s economic priorities* through education and research for the benefit of the South Australian economy and the local community. The following are just a few examples from 2015.
#2015 preliminary eligible Category 1 to 4 Higher Education Research Data Collection (HERDC) Research Activity
*Economic Priorities: State Government of South Australia, 2014 www.economic.priorities.sa.gov.au/
$39.3 million in commercialisation and contract research
$164 million to the state’s export income in international student fees
$164 million# in research income
over 3800 direct jobs for South Australia and a further 2600 indirect jobs
turnover of $935 million
10 Supporting South Australia’s future prosperity

As one of Australia’s most research-intensive universities, the University is perfectly positioned to work with industry to realise its most innovative discoveries. In 2015 the University announced the creation of University of Adelaide Enterprise, a new platform to accelerate innovation and commercialisation of its research findings.
PRIORITY 5 ~ South Australia─a growing destination of choice for international and domestic travellersThe majority of Australia’s wine exports originate in South Australia, with wine regions and cellar doors creating a major tourist attraction. The University is the Southern Hemisphere’s premier wine research and teaching institution. The Waite campus now hosts the ARC Training Centre for Innovative Wine Production, which aims to build knowledge and technologies that will help the wine industry face the challenges of climate warming, water limitations, changing consumer preferences and increasing production costs.
PRIORITY 6 ~ Growth through innovationIn 2015, the University contributed significantly in commercial innovation with local and international business partners. Through the University’s SMART workplaces project, there is collaboration with manufacturing companies and the Department of State Development to support high-performance workplace systems and the development of change management systems. The Faculty of Engineering, Computer and Mathematical Sciences hosted Ingenuity 2015, an interactive expo at the Adelaide Convention Centre of hundreds of final-year projects by the University’s highly talented engineering, computer and mathematical sciences students.
PRIORITY 7 ~ South Australia—the best place to do businessThe University of Adelaide has a proud tradition of partnering with South Australian industry. Led by the Institute for Mineral and Energy Resources, the University is collaborating with OZ Minerals on new research opportunities in areas including geology and
National Innovation and Science Agenda
In December 2015, the Australian Government launched its National Innovation and Science Agenda.
Its four key pillars are culture and capital, collaboration, talent and skills, and government as an exemplar.
Signed in 2015, the University’s landmark collaboration agreement with Trajan Scientific and Medical has already received significant attention from the Australian Government, lauded as a great example of innovation and collaboration.
The new research and development and manufacturing hub is based on a new generation of specialty glass products for the global science and medical equipment market.
The strategic collaboration will help scientists in the University’s Institute for Photonics and Advanced Sensing and the School of Physical Sciences commercialise their research into products that ultimately benefit human health and well-being.
exploration, resource characterisation, mine-to-mill optimisation, geometallurgy and infrastructure development. The University has also signed an $8.5 million partnership agreement with The Mosaic Company, the world’s largest combined producer of phosphate and potash, to conduct research into advanced fertilisers.
PRIORITY 8 ~ Adelaide, the heart of the vibrant stateThe University is at the core of the vibrancy and creativity of Adelaide. In 2015 with innovative theatre productions, concerts, free public lectures and cultural exhibitions, the University once again hosted tens of thousands of people on campus. ANZAC Centenary events at the University of Adelaide included a free public forum exploring the impacts of the Gallipoli campaign, and a ‘Cultural Musing’ with WW1 poetry and correspondence between the University and families of students and staff who served.
PRIORITY 9 ~ Promoting South Australia’s international connections and engagementCreating strong global connections is central to the University of Adelaide’s 10-year strategic plan. In August 2015, Premier Jay Weatherill launched the University’s new Singapore-based Asia Growth Research Centre, which will draw together great minds from Singapore and around the world, focusing their energies to address key economic challenges for Singapore and the broader Asia-Pacific region.
PRIORITY 10 ~ South Australia’s small businesses have access to capital and global marketsOne of the ways the University is working to support small business is through the Australian eChallenge, the nation’s premier student entrepreneurial competition. The University’s Entrepreneurship, Commercialisation and Innovation Centre introduced a dedicated entrepreneur competition in 2015 to help family businesses identify new opportunities and commercialise ideas.
Supporting South Australia’s future prosperity 11

By the numbers
The underlying net operating result represents the University’s total net operating result after deducting revenues received that are directed to specific purposes and are not available to be utilised at the University’s discretion. The methodology adopted by the University is consistent with the methodology adopted by all of the Australian Group of Eight universities in their Annual Reports.
The 2015 University underlying net operating result of $19.9 million or 2.3% of gross revenue, is set out in the table adjacent (Consolidated $17.5 million). The funds generated from the underlying net operating result are available to be reinvested at the University’s discretion into infrastructure, research and teaching.
The University’s total net operating result of $53 million (Consolidated $50.3 million), as reported in the audited financial statements, is derived upon the application of all relevant accounting standards. In the opinion of the University, this result may tend to overstate the funds which the University has available for discretionary operations or infrastructure investment. This is also the case in relation to the consolidated net operating result as reported in the audited financial statements.
The key factors contributing to the difference between the underlying and total net operating result are:
> In 2015 the University reported an unrealised gain of $2.1 million on its Endowment Fund. The fund comprises funds which have been provided to the University for specific purposes, generally relating to research projects, prizes and scholarships. As such, the funds are not available for general operating activities or capital investment.
> In 2015, the University received $2.6 million in ‘restricted use’ donations and bequests for which specific purposes were nominated by the donor.
> All other grants, including research grants, are recognised upon receipt despite expenditure also being incurred in future periods, contributing to the $11.1 million movement in specific purpose grants, including research grants.
> During 2015, the University continued the divestment strategy to assist with funding the development of the Adelaide Health and Medical Sciences building, reporting a gain on sale of properties of $9.7 million. In addition to this, revaluations received on the University’s buildings resulted in the reversal of $1 million of impairment losses recognised in prior years.
> Revaluations of the University’s share investments totalling $6.6 million are reported due to the listing of IDP Education on the Australian Stock Exchange during 2015, and the transfer of ownership of the Australian Synchrotron Holding Company to the Australian Commonwealth Government.
The University and consolidated underlying net operating result
12 By the numbers

Consolidated University
2015 2014 2013 2012 2011 2015 2014 2013 2012 2011
$000 $000 $000 $000 $000 $000 $000 $000 $000 $000
Total revenue from continuing operations
935,244 905,081 958,098 838,385 786,441 872,694 840,373 888,443 789,732 749,454
Salaries and related expenses 486,767 478,795 444,293 418,214 398,238 470,708 462,768 427,702 405,181 386,007
Other expenses 398,216 373,208 367,206 360,447 340,430 348,985 323,175 325,631 314,658 297,419
Net operating result for the year 50,261 53,078 146,599 59,724 47,773 53,001 54,430 135,110 69,893 66,028
Adjusted for:
Restricted use donations and bequests
(2,595) (2,265) (3,190) (3,905) (3,145) (2,590) (2,265) (2,987) (3,905) (3,145)
Endowment Fund unrealised earnings
(1,733) (11,806) (31,916) (16,462) 11,652 (2,112) (11,807) (31,223) (16,462) 11,652
Capital projects grants - - (63,075) (6,669) (11,077) - - (60,000) (3,594) (9,077)
Net movement in specific purpose grants including research projects
(11,064) (24,333) (11,884) (4,345) (24,744) (11,064) (24,333) (11,884) (4,345) (24,744)
Other extraordinary items:
Proceeds from sale of underperforming assets
(9,684) - - (1,953) (2,792) (9,684) - - (14,414) (23,562)
Impairment reversals of non-current assets
(1,033) - (5,097) - - (1,033) - (6,308) - -
Revaluation of Investments (6,607) - - - - (6,607) - - - -
Gain on acquisition of controlled entity
- - (9,389) - - - - - - -
Underlying net operating result for the year
17,545 14,674 22,048 26,390 17,667 19,911 16,025 22,708 27,173 17,152
By the numbers 13

Student enrolment
Student enrolments: full-time equivalent student load (EFTSL) 2014 2015
Total load (EFTSL)* 21104 21232
Central areas 238 166
Arts 3027 3884
Engineering, Computer and Mathematical Sciences
4201 4306
Health Sciences 4190 4160
Professions 6557 5798
Sciences 2891 2918
Research higher degree 1705 1676
Arts 249 252
Engineering, Computer and Mathematical Sciences
368 378
Health Sciences 442 415
Professions 153 136
Sciences 493 494
Postgraduate coursework 3218 3214
Central areas 0 0
Arts 153 293
Engineering, Computer and Mathematical Sciences
447 473
Health Sciences 437 391
Professions 1925 1783
Sciences 257 274
Financial data
Consolidated 2014 2015
Financial data ($ million)
Total revenue from continuing operations 927 935
Total expenses from continuing operations 874 885
Net operating result for the year 53 50
Sources of income (%)
Australian Government recurrent financial assistance
25% 26%
Other Australian Government financial assistance
18% 16%
HECS-HELP (Government and student payments)
12% 12%
State Government financial assistance 2% 3%
Fees and charges and other income 37% 40%
Investment income 3% 3%
Grants, donations and bequests 1% 1%
14 By the numbers

Student enrolments: full-time equivalent student load (EFTSL) 2014 2015
Undergraduate** 15954 16180
Central areas 24 17
Arts 2624 3337
Engineering, Computer and Mathematical Sciences
3383 3453
Health Sciences 3308 3352
Professions 4473 3873
Sciences 2141 2148
Aboriginal & Torres Strait Islander enrolment (EFTSL)
181 188
Enabling 40 29
Undergraduate 125 143
Postgraduate coursework 7 8
Postgraduate research 9 8
% Female enrolment 47.8% 47.9%
Central areas 46.0% 51.0%
Arts 57.9% 58.7%
Engineering, Computer and Mathematical Sciences
17.3% 18.2%
Health Sciences 65.9% 66.2%
Professions 50.3% 48.9%
Sciences 49.4% 49.4%
International load (EFTSL) 5397 5549
Central areas 209 142
Arts 215 333
Engineering, Computer and Mathematical Sciences
1358 1445
Health Sciences 549 564
Professions 2563 2508
Sciences 504 556
Student enrolments: full-time equivalent student load (EFTSL) 2014 2015
% International 25.6% 26.1%
Central areas 88.0% 85.6%
Arts 7.1% 8.6%
Engineering, Computer and Mathematical Sciences
32.3% 33.6%
Health Sciences 13.1% 13.6%
Professions 39.1% 43.3%
Sciences 17.4% 19.1%
Commonwealth-funded (including Research Training Scheme)
14890 14957
Central areas 24 17
Arts 2706 3462
Engineering, Computer and Mathematical Sciences
2771 2796
Health Sciences 3491 3460
Professions 3550 2903
Sciences 2347 2318
Source: Data warehouse*Includes non-award programs**Includes enabling programs
By the numbers 15

Award completions
Award completions# 2014 2015
Total (including higher doctorate) 6828 6713
Central areas 0 0
Arts 1225 1222
Engineering, Computer and Mathematical Sciences
985 1050
Health Sciences 1208 1258
Professions 2509 2304
Sciences 901 879
Research higher degree (excluding higher doctorate)
386 401
Arts 58 63
Engineering, Computer and Mathematical Sciences
72 83
Health Sciences 123 108
Professions 25 26
Sciences 108 121
Graduate coursework## 2176 2049
Central areas 0 0
Arts 298 306
Engineering, Computer and Mathematical Sciences
236 239
Health Sciences 327 294
Professions 1203 1085
Sciences 112 125
Undergraduate### 4264 4262
Arts 869 853
Engineering, Computer and Mathematical Sciences
677 727
Health Sciences 756 856
Professions 1281 1193
Sciences 681 633
#Preliminary figures for 2015##Includes postgraduate coursework and other postgraduate###Includes undergraduate and other undergraduate
Staff numbers
Academic (FTE) 2014 2015
Central areas 33.5 31.7
Arts 229.5 223.8
Engineering, Computer and Mathematical Sciences
321.6 331.4
Health Sciences 491.1 486.1
Sciences 508.3 491.4
Professions 201.1 195.7
Professional (FTE) 2014 2015
Central areas 964.8 1014.2
Arts 79.8 79.8
Engineering, Computer and Mathematical Sciences
127.5 127.1
Health Sciences 437.7 394.5
Sciences 364.8 344.1
Professions 117.0 120.6
Total (FTE) 2014 2015
Central areas 998.3 1045.9
Arts 309.3 303.6
Engineering, Computer and Mathematical Sciences
449.1 458.5
Health Sciences 928.8 880.6
Sciences 873.1 835.4
Professions 318.0 316.2
Grand total 3876.6 3840.3
Aboriginal and Torres Strait Islander (FTE) 2014 2015
Central areas 15.8 17.1
Arts 9.1 9.2
Engineering, Computer and Mathematical Sciences
Health Sciences 6.6 6.2
Sciences
Professions 1.3 0.3
Grand total 32.7 32.8
*2015 casuals are estimated. 2015 actual casual data will be available after July 2016.Source: Department of Education and Training reporting
Full-time equivalent (FTE) as at 31 March each year, including casuals* and excluding TAFE and other independent operations
16 By the numbers

Student:staff ratio
Teaching faculty 2014 2015
Central areas 1.8 1.7
Arts 18.7 21.4
Engineering, Computer and Mathematical Sciences
21.4 22.1
Health Sciences 14.2 14.4
Sciences 14.4 14.4
Professions 31.5 30.8
Grand total 19.1 19.6
Student:staff ratio
Teaching faculty 2014 2015
Central areas 1.2 1.2
Arts 15.8 18.3
Engineering, Computer and Mathematical Sciences
12.8 12.7
Health Sciences 8.0 7.9
Sciences 6.0 6.3
Professions 29.9 29.0
Grand total 11.6 11.9
Source: Data warehouse
Summary of research activity
Research income 2014 ^ 2015*
$000 $000
Australian competitive research grants 94,580 82,389
Other public sector research 35,443 39,766
Industry and other funding 49,684 38,652
Cooperative research funding 2,376 3,379
Total 182,083 164,186
^2014 eligible Category 1 to 4 Higher Education Research Data Collection (HERDC) Research Activity
*2015 preliminary eligible Category 1 to 4 Higher Education Research Data Collection (HERDC) Research Activity
Research block funding 2014 Actual 2015 Actual
$000 $000
Research Training Scheme (RTS) 31,914 32,000
Research Infrastructure Block Grant (RIBG) 14,239 14,179
Joint Research Engagement (JRE) 15,542 16,219
Sustainable Research Excellence (SRE) 9,364 10,062
Student:staff ratio (teaching only, and teaching and research staff, including casuals)
Student:staff ratio (all academic staff, including casuals)
By the numbers 17

Awards and achievementsThe many awards and achievements of University staff, students and alumni in 2015 reflect the quality of research and teaching, and demonstrate the high regard in which members of the University community are held.
18 Awards and achievements

Research recognition > Three members of the University of Adelaide community were among the winners of 2015 Channel 9 Young Achiever Awards:
~ University of Adelaide PhD graduate and affiliate researcher Dr Suzanne Mashtoub, in the School of Medical Sciences, won the University of Adelaide Faculty of Sciences, Science and Technology Award.
~ Nursing student Brock Wilkins won the Rural Doctors Workforce Agency Rural Health Award.
~ Law student Marziya Mohammadi won the Awards Australia Community Service and Volunteering Award.
> The 2015 Young Investigator Award was won by University of Adelaide researcher Dr Hannah Brown, from the Robinson Research Institute, for her work on a world-first fertility treatment.
> Professor Ben Mol, a leading obstetrics and gynaecology researcher in the Robinson Research Institute, was awarded the Highest Ranked Practitioner Fellowship in the annual National Health and Medical Research Council (NHMRC) Research Excellence Awards.
> Seven young University of Adelaide researchers received 2015 South Australian Young Tall Poppy Science Awards:
~ Dr Suzanne Mashtoub, PhD graduate and affiliate researcher, School of Medical Sciences
~ Dr Martin White, ARC Future Fellow, School of Physical Sciences
~ Dr Martin Breed, ARC Discovery Early Career Research Award Fellow, School of Biological Sciences
~ Dr Renee Turner, Head, Translational Stroke Group, School of Medicine
~ Dr Caitlin Byrt, Post-doctoral Fellow, School of Agriculture, Food and Wine
~ Dr Melissa Cantley, NHMRC Early Career Fellow, School of Medical Sciences and the South Australian Health and Medical Research Institute
~ Ms Kristin Carson, PhD candidate and affiliate associate lecturer, School of Medicine, and the Queen Elizabeth Hospital.
> Professor Mike McLaughlin, AM, FAA, in the School of Agriculture, Food and Wine, was elected to the Fellowship of the Australian Academy of Science.
> Dr Luke Bennetts, School of Mathematical Sciences, was awarded the Christopher Heyde Medal by the Australian Academy of Science.
> Professor Amanda Nettelbeck and Dr Claire Roberts, both in the School of Humanities, were elected Fellows of the Australian Academy of the Humanities.
> The following eight University researchers were inducted into the Australian Academy of Health and Medical Sciences:
~ Professor Alastair Burt, Executive Dean, Faculty of Health Sciences
~ Professor Jozef Gecz, Robinson Research Institute
~ Professor Alison Kitson, Dean and Head, School of Nursing
~ Professor John Lynch, School of Public Health
~ Professor Guy Maddern, School of Medicine
~ Professor Sarah Robertson, Director, Robinson Research Institute
~ Affiliate Professor Hamish Scott, School of Biological Sciences
~ Professor Gary Wittert, School of Medicine.
> Three University academics were appointed to the Australian Research Council College of Experts:
~ Professor Martin Lambert, School of Civil, Environmental and Mining Engineering
~ Professor Megan Lewis, School of Biological Sciences
~ Professor Sandy Steacy, School of Physical Sciences.
Awards and achievements 19

Student awardsRhodes ScholarUniversity of Adelaide medicine graduate Dr Danielle Fitzpatrick was named the 2016 Rhodes Scholar for South Australia. Danielle is the University’s 109th Rhodes Scholar, and will use the scholarship to undertake a Masters in Global Health Science, followed by doctoral studies in obstetrics and gynaecology at the University of Oxford.
John Monash ScholarLaw and Chemical Engineering graduate Giles Dunseath-Hamilton was awarded a John Monash Scholarship for 2016, enabling him to undertake postgraduate studies in energy economics and environmental policy at University College London or the University of Oxford.
Endeavour ScholarsPhD student Claire Williams (Adelaide Law School) was awarded a highly competitive Endeavour Postgraduate Scholarship. The scholarship will support study and research in international law at New York University.
New Colombo Plan ScholarsFour undergraduate students won prestigious New Colombo Plan Scholarships in 2015 for study and work in the Indo-Pacific region:
> Charles Hamra (New Colombo Plan Fellow for India), Bachelor of Laws/Bachelor of International Studies (Fellows are the top-ranked scholars for that country)
> Jessica Freund (China), Bachelor of Laws/Bachelor of International Studies
> Ryan Cunningham (Hong Kong SAR), Bachelor of Commerce and Bachelor of Languages
> Megan Lock (Japan), Bachelor of Teaching/Bachelor of Mathematical and Computer Sciences, Diploma in Languages (Japanese).
20 Awards and achievements

University Master Research MedalThe University Master Research Medal is awarded to graduates who have completed outstanding research at master level. This award is the premier award for master degree candidates at the University.
Faculty of Engineering, Computer and Mathematical Sciences
William Crawford For research in the field of mathematics
The University Doctoral Research MedalThe University Doctoral Research Medal is awarded to graduates who have completed outstanding research at doctoral level. This award is the premier award for doctoral candidates at the University.
Faculty of Arts
Dr Jillian Schedneck For research in the field of human society
Faculty of Engineering, Computer and Mathematical Sciences
Dr Seyedmostafa Rahimiazghadi
For research in the field of electrical engineering
Dr Ji Liang For research in the field of chemical engineering
Dr Tao ZhangFor research in the field of civil and environmental engineering
Faculty of Health Sciences
Dr Emma Kemp For research in the field of psychology
Dr Nicola Vincent For research in the field of psychology
Dr Ashley Day For research in the field of psychology
Dr Rajiv Mahajan For research in the field of medicine
Dr Edward Cleland For research in the field of medicine
Faculty of the Professions
Dr Simon Divecha For research in the field of business
Dr Liudmila Tarabashkina For research in the field of business
Faculty of Sciences
Dr Owen Burnell For research in the field of bioscience
Dr Sarah Catalano For research in the field of bioscience
Dr Lun Cui For research in the field of bioscience
Dr John Wilford For research in the field of earth science
University Medallists—undergraduateUniversity Medals are awarded annually for outstanding academic performance to students who have completed an undergraduate honours degree, bachelor’s degree with honours, or bachelor’s degree of at least four years’ duration. The medals are presented at graduation ceremonies.
Faculty of Engineering, Computer and Mathematical Sciences
John ThomolarisBachelor of Engineering (Honours) (Electrical and Electronic) and Bachelor of Sciences
Alexandre Zadoyanchuk
Bachelor of Engineering (Honours) (Electrical and Electronic) and Bachelor of Sciences
Kate Blue Bachelor of Engineering (Honours) (Chemical)
Alex ColemanBachelor of Engineering (Honours) (Electrical and Electronic)
Kailash RajahBachelor of Engineering (Civil and Structural) (Honours) with Bachelor of Economics
Phillip Haeusler Bachelor of Engineering (Honours) (Mechatronic)
Simon McDonaldBachelor of Engineering (Honours) (Mechanical and Aerospace) with Bachelor of Mathematical and Computer Sciences
Faculty of Health Sciences
Helen McInnes Bachelor of Dental Surgery
Chelsea Mann Bachelor of Dental Surgery
Jessica Jokinen Bachelor of Medicine and Bachelor of Surgery
Aakriti Gupta Bachelor of Medicine and Bachelor of Surgery
Faculty of the Professions
Emilie Bailey Bachelor of Economics (Honours)
Tian Mun Lee Bachelor of Economics (Honours)
Jordan Phoustanis Bachelor of Laws (Honours)
Faculty of Sciences
Gemma Gransbury Bachelor of Science (Honours)
Caroline Phillips Bachelor of Science (Honours)
Awards and achievements 21

A number of University staff members were recognised in 2015 for learning and teaching excellence.
National teaching grants and awardsFive staff received an Office for Learning and Teaching Citation for Outstanding Contributions to Student Learning.
> Dr Beth Loveys and Dr Karina Riggs, School of Agriculture, Food and Wine, received their citation for leading cultural change in undergraduate teaching in agriculture, food and wine using innovative team-teaching approaches that engage students to become independent learners.
> Dr Joy McEntee, School of Humanities, received her citation for developing learning activities and assessment mechanisms that enthuse, engage and support students and staff and promote transformative learning.
> Dr Julia Miller, School of Education, received her citation for developing creative, collaborative, research-based resources that make English grammar and academic skills fun to learn and teach.
> Dr Claudia Szabo, School of Computer Science, received her citation for the development of engaging computer science curricula that address pedagogical and industry concerns, and inspire and motivate student learning.
University teaching awards
Award Recipients
Stephen Cole the Elder Award for Excellence in Teaching
Dr Nick Falkner, School of Computer Science, Faculty of Engineering, Computer and Mathematical SciencesDr Natalie Edwards, School of Humanities, Faculty of Arts
Commendation for Excellence in Support of the Student Experience
The Foundations of Chemistry Teaching Team (Dr David Huang, Dr Natalie Williamson, Professor Greg Metha, Dr Stephen Bell), School of Physical Sciences, Faculty of ScienceMs Adriana Milazzo, School of Population Health, Faculty of Health Sciences
Faculty teaching awards
Award Recipients
Faculty of Arts
Faculty Excellence in Teaching Awards
Dr Natalie Edwards, Department of French Studies, School of HumanitiesDr Delia Lin, Department of Asian Studies, School of Social SciencesDr Joy McEntee, Department of English and Creative Writing, School of HumanitiesDr Pam Papadelos, Department of Gender Studies and Social Analysis, School of Social Sciences
Executive Dean’s Prize for Excellence in Teaching
Dr Natalie Edwards, Department of French Studies, School of Humanities
Faculty of Engineering, Computer and Mathematical Sciences
Faculty Award for HDR Supervision Professor Nigel Bean, School of Mathematical Sciences
Faculty Award for Professional Support of Learning and Teaching
Mr Simon Golding, School of Civil, Environmental and Mining Engineering
Faculty Award for Teaching (contract or sessional staff)
Mr Michael Di Matteo, School of Civil, Environmental and Mining Engineering
Faculty Award for Teaching (continuing staff)
Dr Simon (Jono) Tuke, School of Mathematical SciencesAssociate Professor Carl Howard, School of Mechanical Engineering
Faculty of Health Sciences
Prize for Teaching ExcellenceDr Lyndsey Collin-Praino, School of MedicineDr Matthew Dry, School of PsychologyAssociate Professor Mario Ricci, School of Medicine
Executive Dean’s Medal Dr Tim Murphy, School of Medicine
Faculty of the Professions
Executive Dean’s Award for Excellence in Teaching
First Year Law Team Associate Professor Bernadette Richards, Dr Adam Webster, Professor Melissa De Zwart and Associate Professor Alex Reilly Dr Joanne Howe, Law SchoolDr Jodie Conduit, Business SchoolDr Olga Muzychenko, Business SchoolDr Philip (Phil) Saj, Business School
Learning and teaching recognition
22 Awards and achievements

Alumni recognitionThe University recognised the outstanding achievements and contributions of its alumni through a serious of awards.
Distinguished Alumni AwardsThe Distinguished Alumni Awards recognise the outstanding contribution and significant impact made by our alumni in humanitarian, professional or community service fields.
The 2015 recipients were:
> Dr Richard Gun, AO (MBBS 1960), in recognition of his outstanding leadership and contribution in the field of public and community service
> Professor Emeritus Geoff Harcourt, AO (MEc 1959), in recognition of his outstanding leadership and contribution nationally and internationally in the field of economics
> Professor Philip Harris (BArch 1980), in recognition of his outstanding leadership and contribution in the field of architecture.
The James McWha Award of ExcellenceThis award recognises outstanding alumni who have graduated from the University within the past 15 years and are making a significant contribution as emerging leaders within their profession or community. The 2015 recipients were:
> Professor Mark Hutchinson (PhD 2006), in recognition of his outstanding contribution as an emerging leader in the field of medical science
> Christopher Koch (BEc 2004, LLB Hons 2007), in recognition of his outstanding contribution as an emerging leader in the field of finance.
Honours Alumni University MedalThe Honours Alumni University Medal recognises outstanding academic achievement at honours level. The medallist for 2015 was Gemma Gransbury (BSc Hons 2014).
Postgraduate Alumni University MedalThe Postgraduate Alumni University Medal is awarded each year to a graduating postgraduate for outstanding academic merit. In 2015 this was won by Dr Mostafa Azghadi (PhD 2014).
Alumni FellowsThe Alumni Fellow award recognises alumni who have made a significant contribution to the advancement of the University’s alumni relations program. 2015 recipients were:
> Kaye Baudinette, in recognition of her contribution to the Friends of the Library
> Professor Chris Burrell, AO (MBBS 1967), in recognition of his contribution to the Friends of the Library
> Emeritus Professor Derek Frewin, AO (MBBS 1967, MD 1971), in recognition of his contribution to the Alumni Award Selection Committee
> Barry Grear, AO (BTech 1967), in recognition of his contribution to the Alumni Award Selection Committee
> Dr Colin Jenner (PhD 1968), in recognition of his contribution to the Alumni Award Selection Committee
> John Lau (BEc 2000, MBA 2005), in recognition of his contribution to the Hong Kong Alumni
> Professor Simon Maddocks (BAgSc 1983, BAgSc (Hons) 1984, PhD 1987), in recognition of his contribution to the Alumni Award Selection Committee
> Professor Oliver Mayo (BSc (Hons) 1965, PhD 1968, DSc 1989, BA 2008), in recognition of his contribution to the Friends of the Library and the Alumni Award Selection Committee
> Felicity Morgan (BA 2004), in recognition of her contribution to the Friends of the Library
> Emeritus Professor Malcolm Oades, in recognition of his contribution to the Alumni Award Selection Committee
> Margaret Owen (GradDipEd 1988), in recognition of her contribution to the Friends of the Library, the Alumni and Community Relations Committee, and the Florey Chapter Committee
> David Tan (BE (Hons) 1990), in recognition of his contribution to the Singapore Alumni
> Richard Turnbull (RDA 1969), in recognition of his contribution to the Roseworthy Old Collegians Association
> Harry Yuen (MBA 2005), in recognition of his contribution to the Hong Kong Alumni.
Awards and achievements 23

GovernanceThe University of Adelaide is governed by its Council which is established by the University of Adelaide Act 1971. The Council has 21 members, is chaired by the Chancellor and advised by its standing committees.
24 Governance

Highlights > The Dental Partnership Agreement with the State Government was finalised on 21 July 2015—a 30-year agreement on dental training that will see improved community dental services for the South Australian community, with new state-of-the-art facilities for both staff and students.
> Council approved construction of an additional floor of the new University of Adelaide Health and Medical Sciences building, taking it to 14 floors.
> Council completed its consideration of the recommendations of the review of governance that had been conducted in 2014.
Strategic planning > At its retreat in March, Council consolidated its 2015 program to discuss strategic issues at each Council meeting during the year.
> Council approved the divestment of assets in line with the proposed Asset Divestment Strategy.
> Council received in July 2015 a status report on the University Operational Plan 2013-2015, and presentations on the Operational Plan 2016-2018. The new operational plan sets out targets, accountable officers, and indicators for 2016, 2017 and 2018, and marks out an annual accountability cycle for maximising progress towards meeting the Beacon of Enlightenment’s 10-year goals. Council received a further status report at its meeting on 12 October.
> Council received in April 2015 Research Performance and Challenges from the Deputy Vice-Chancellor and Vice-President (Research).
> Council received in May 2015 The Future of Learning and Teaching from the Deputy Vice-Chancellor and Vice-President (Academic).
> In August 2015 Council considered Debt and Infrastructure Funding and the University’s International Strategy.
> Council continued to consider revised and new policies throughout the year, and revised Terms of Reference of Standing Committee of Council.
> Council approved in October 2015 the Beacon Competitiveness Fund.
> Council approved the Infrastructure Investment Plan 2016-2018 at its meeting on 7 December 2015.
Throughout 2015 Council received regular reports from the Vice-Chancellor and other members of the senior management team on progress in implementing the objectives of the strategic plan.
University 2016 budgetIn December, Council approved the University of Adelaide 2016 budget. Council also received quarterly management reports and annual risk assessment reports of the University’s wholly controlled entities, and approved budgets and business plans for 2016.
The Council’s principal responsibilities are:
> appointing the Vice-Chancellor and President as the Chief Executive Officer of the University and monitoring his or her performance
> approving the mission and strategic direction of the University, and the annual budget and business plan
> overseeing and reviewing the management of the University and its performance
> establishing policy and procedural principles, consistent with legal requirements and community expectations
> approving and monitoring systems of control and accountability, including general overview of any entities controlled by the University
> overseeing and monitoring the assessment and management of risk across the University, including commercial undertakings
> overseeing and monitoring the academic activities of the University
> approving significant commercial activities of the University.
Governance 25

Rules and statutesDuring 2015 Council amended the rules for the Karen Halley Trust, Noel and Vivian Lothian Scholarship, Sir Joseph Verco Memorial Prize, Rosemary St John Scholarship, T G Wilson Travelling Scholarship in Obstetrics, and the Everard Prize. Council also approved rules for the Sir Joseph Verco Endowment.
There were no changes to statutes in 2015.
Voluntary governance codeThe University of Adelaide complies with the Voluntary Code of Best Practice for the Governance of Australian Universities.
Honorary degreesThe following honorary degrees were awarded in 2015:
> Professor Warwick Anderson, AM—Doctor of the University (honoris causa)
> Professor Robert Norman, AO—Doctor of Medicine (honoris causa)
> Dr Graeme Killer, AO—Doctor of Medicine (honoris causa)
> Judge James Crawford, AC, SC, FBA—Doctor of Laws (honoris causa)
> The Hon. Robert Hill, AC—Doctor of Laws (honoris causa)
> Dr Robyn Archer, AO—Doctor of Music (honoris causa)
> Mr James Morrison, AM—Doctor of Music (honoris causa)
> Dr Anne Summers, AO—Doctor of Arts (honoris causa)
> Dr Martin Parkinson, PSM—Doctor of the University (honoris causa)
> Professor Graeme Hugo, AO—Doctor of Arts (honoris causa) posthumous
> Dr Basil Hetzel, AC—Doctor of the University (honoris causa).
Changes to Council membershipTwo members left Council during 2015: Dr Susan Robinson and Dr Alison Broinowski. Dr Robinson was first elected to Council as a graduate member in 2010 and was re-elected in 2012 and 2014. She served on the People and Culture Committee from 2014, and ceased her involvement with Council on 18 June 2015. Dr Broinowski was elected to Council as a graduate member in 2014, and ceased her involvement with Council on 3 June 2015.
Mr Charles Bagot retired from Council at the end of 2015, having served the University for 12 years. During his time on Council, Mr Bagot had chaired the Audit, Compliance and Risk Committee (2007-2013) and the Finance Committee (2014-2015) and had served on various other Standing Committees of Council.
Ms Christine Locher and Ms Kathryn Presser were appointed to Council commencing on 1 May 2015 and 1 June 2015 respectively. Ms Locher has 30 years’ experience in professional service, particularly in the field of human resources and organisational performance. Ms Presser is the Chief Financial Officer and Company Secretary of Beach Energy Limited, with widespread company secretarial, capital management and risk management experience of public listed and private companies in a wide range of industries.
Student members were elected for one-year terms commencing on 6 March 2015. Mr Ethan Dutcher and Mr James Johnston were elected to the undergraduate positions, and Mr Jack Lienert was elected to the postgraduate position.
Professor Andrew Abell was elected, and Associate Professor Felix Patrikeeff re-elected, as academic staff members of Council for two-year terms commencing on 6 March 2015.
Mr Stuart Matthews was elected, and Ms Julie Hayford re-elected, as professional staff members of Council for two-year terms commencing on 6 March 2015.
Annual meeting of the University communityThe annual meeting of the University community was held on 16 February in The Braggs lecture theatre. Both the Chancellor and the Vice-Chancellor and President addressed the audience and the meeting was streamed live via the University’s website.
Risk managementCouncil is required to oversee and monitor the assessment and management of risk across the University, including its commercial undertakings. The Council is assisted in the discharge of its obligations for risk management by the work of its Standing Committees. Together they provide oversight of the design, maintenance and monitoring of systems that preserve and protect probity and internal controls, and at all times advance the interests of the University. As part of its oversight and monitoring, the following matters came before Council during 2015:
> Quarterly reports containing summarised information to assist Council members in the fulfilment of their duties as officers under the Work Health and Safety Act 2012; Council members must exercise due diligence to ensure that the University is complying with its various obligations under the Act.
> Regular summary reports regarding the key enterprise risks.
> The Internal Audit Plan for the period 2016-19. This Plan sets out a rolling four-year program to prescribe those reviews to be undertaken by the University’s internal auditors on the agreed auditable areas of the University’s activities. These include student and staff recruitment, internet security and database management, research grant reviews, bequests, international agreements and collaborations, major projects and facilities and asset maintenance.
26 Governance

Council membership 2015Ex-officio members
> Rear Admiral the Hon. Kevin Scarce, AC, CSC, RAN (Rtd), Chancellor
> Professor Warren Bebbington, Vice-Chancellor and President
> Professor Clement Macintyre, Presiding Member and Chair of the Academic Board
Appointed members > Mr Charles Bagot
> The Hon. Catherine Branson, QC
> Ms Dianne Davidson, AM, Deputy Chancellor
> Mr David Hill
> Ms Wendy Johnson (ceased 8 February 2015)
> Ms Kerrynne Liddle
> Ms Christine Locher (from 1 May 2015)
> Ms Kathryn Presser (from 1 June 2015)
Co-opted member > Vacant
Elected membersAcademic staff:
> Professor Andrew Abell (from 6 March 2015)
> Associate Professor Felix Patrikeeff (re-elected 6 March 2015)
> Professor Anthony Thomas, FAA (until 5 March 2015)
General staff: > Mr Julie Hayford (re-elected 6 March 2015)
> Mr Stuart Matthews (from 6 March 2015)
> Mr Aaron Thomas (until 5 March 2015)
Students: > Mr Lawrence Ben (until 5 March 2015)
> Mr Shane Selvanderan (until 5 March 2015)
> Mr Zhao Lu (until 5 March 2015)
> Mr Ethan Dutcher (from 6 March 2015)
> Mr James Johnston (from 6 March 2015)
> Mr Jack Lienert (from 6 March 2015)
Graduates: > Mr Robin Day
> Dr Alison Broinowski (ceased 3 June 2015)
> Dr Susan Robinson (ceased 18 June 2015)
Council standing committee (chairs)As at 31 December 2015
Academic Board > Chair, Professor Clement Macintyre
Audit, Compliance and Risk Committee > Chair, the Hon. Catherine Branson, QC
Convenors’ Committee > Chair, Rear Admiral the Hon. Kevin Scarce, AC, CSC, RAN (Rtd)
Estate and Infrastructure Committee > Chair, Ms Dianne Davidson, AM
Independent Council Selection Committee
> Chair, Rear Admiral the Hon. Kevin Scarce, AC, CSC, RAN (Rtd)
Finance Committee > Chair, Mr Charles Bagot
People and Culture Committee > Chair, Ms Christine Locher
Senior Executive Review Committee > Chair, Rear Admiral the Hon. Kevin Scarce, AC, CSC, RAN (Rtd)
Special Degrees Committee > Chair, Rear Admiral the Hon. Kevin Scarce, AC, CSC, RAN (Rtd)
The University of Adelaide Council: Council meeting 7/15, 12 October 2015
Seated (L-R): The Hon. Catherine Branson, QC, Chair, Audit, Compliance and Risk Committee; Ms Dianne Davidson, AM, Deputy Chancellor and Chair, Estate and Infrastructure Committee; Rear Admiral the Hon. Kevin Scarce, AC, CSC, RAN (Rtd), Chancellor; Professor Warren Bebbington, Vice-Chancellor and President; Professor Clement Macintyre, Chair, Academic Board; Dr Nicole Beaumont, Council Secretary
Standing (L-R): Ms Christine Locher, Chair, People and Culture Committee; Mr Stuart Matthews; Mr Jack Lienert; Associate Professor Felix Patrikeeff; Mr David Hill; Mr James Johnston; Ms Julie Hayford; Mr Robin Day; Mr Ethan Dutcher; Professor Andrew Abell
Absent: Mr Charles Bagot, Chair, Finance Committee; Dr Alison Broinowski; Ms Kerrynne Liddle; Ms Kathryn Presser
Governance 27

Council standing committees membership changes 2015There were a number of changes to the Academic Board membership: 13 new Professors were appointed on the recommendation of their respective faculty boards; four new student members were appointed by the Adelaide University Union; and an amendment to the Academic Board’s Terms of Reference resulted in Professor Deborah Turnbull joining the Academic Board in an ex-officio capacity as Chair of the Gender, Equity and Diversity Committee.
Mr Christopher Mark Butcher and Ms Christine Locher were appointed to the Audit, Compliance and Risk Committee. Mr Graham Walters, AM, retired in March after serving on the committee for over a decade.
Ms Dianne Davidson, AM, was appointed Chair of the Estate and Infrastructure Committee.
Mr John Charlton and Mr Peter Siebels were appointed to the Finance Committee and Ms Dianne Davidson, AM, joined the committee as an ex-officio member.
The Independent Council Selection Committee was reconstituted at the end of 2014 and held its first meeting in January 2015. The membership of the committee consists of: the Chancellor, Rear Admiral the Hon. Kevin Scarce, AC, CSC, RAN (Rtd), as Chair; Ms Louisa Rose; Dr Tim Cooper, AM; Dr Rosemary Brooks; Mr Stephen Yarwood; and Mr Ben Tidswell.
Ms Christine Locher was appointed Chair of the People and Culture Committee, with three new members also appointed: Ms Kerrynne Liddle, Ms Danielle Jiranek and Mr Thomas Phillips, AM.
Council amended the Terms of Reference of the Senior Executive Review Committee in September 2015. As a consequence, Ms Christine Locher joined the committee in an ex-officio capacity as Chair of the People and Culture Committee, while the ex-officio position of Chair of the Audit, Compliance and Risk Committee was disestablished, resulting in the Hon. Catherine Branson, QC, stepping down from the committee. Mr Robin Day was also appointed to the committee.
Professor Alison Kitson was appointed to the Special Degrees Committee, and Mr Charles Bagot resigned from the committee in early February.
Senior management As at 31 December 2015
> Professor Pascale Quester Deputy Vice-Chancellor and Vice-President (Academic)
> Professor Michael Brooks Deputy Vice-Chancellor and Vice-President (Research)
> Mr Bruce Lines Chief Operating Officer and Vice-President (Services and Resources)
> Professor Richard Russell AM Pro Vice-Chancellor (Research Operations)
> Professor Julie Owens Pro Vice-Chancellor (Research Strategy)
> Pro Vice-Chancellor (International)—vacant
> Professor Philippa Levy Pro Vice-Chancellor (Student Learning)
> Professor Jennie Shaw Executive Dean, Faculty of Arts
> Professor John Beynon Executive Dean, Faculty of Engineering, Computer and Mathematical Sciences
> Professor Alastair Burt Executive Dean, Faculty of Health Sciences
> Professor Christopher Findlay, AM Executive Dean, Faculty of the Professions
> Professor Bob Hill Executive Dean, Faculty of Sciences
Council Secretariat > Dr Nicole Beaumont Council Secretary
> Mr Andrew Starcevic Senior Council Officer
> Mr Mariusz Kurgan Council Officer
28 Governance

Vice-Chancellor and PresidentProfessor Warren Bebbington
CouncilChancellor
Rear Admiral the Honourable Kevin Scarce, AC, CSC, RAN (Rtd)
Division of the Vice-Chancellor and President
Office of the Vice-Chancellor and PresidentMs Jill Miller ~ Director
Council SecretariatDr Nicole Beaumont ~ Council Secretary
University CollectionsMs Mirna Heruc ~ Director
University Engagement BranchMs Leah Grantham ~ Acting
Chief Engagement Officer
Deputy Vice-Chancellor and Vice-President (Academic)
Professor Pascale Quester
Chief Operating Officer and Vice-President,
Services and ResourcesMr Bruce Lines
Executive Deans
ArtsProfessor Jennie Shaw
Engineering, Computer and Mathematical Sciences
Professor John Beynon
Health SciencesProfessor Alastair Burt
The ProfessionsProfessor Christopher
Findlay AM
SciencesProfessor Bob Hill
Controlled entities
Adelaide Research and Innovation Pty LtdOversight Deputy Vice-Chancellor
and Vice-President (Research)
Adelaide Unicare Pty LtdOversight Deputy Vice-Chancellor and
Vice-President (Academic)
Martindale Holdings Pty LtdOversight Chief Operating Officer and Vice-President, Services and Resources
National Wine Centre Pty LtdOversight Chief Operating Officer and Vice-President, Services and Resources
Roseworthy Piggery Pty LtdOversight Deputy Vice-Chancellor
and Vice-President (Research)
Women’s and Children’s Health Research Institute
Oversight Deputy Vice-Chancellor and Vice-President (Research)
Institute for Photonics and Advanced Sensing
Professor Andre Luiten
Institute for Mineral and Energy Resources
Professor Stephen Grano
Robinson Research InstituteProfessor Sarah Robinson
Environment InstituteProfessor Bob Hill
Waite Research InstituteProfessor Mike Keller
Deputy Vice-Chancellor and Vice-President (Research)
Professor Mike Brooks
Office of Services & ResourcesMr Jonathan Pheasant
Director
University LibrariesMr Paul Wilkins
ActingUniversity Librarian
Dean, Indigenous EducationVacant
Marketing and CommunicationsDr Benjamin Grindlay
Director
Division of the Deputy Vice-Chancellor and Vice-President
(Academic)Mr Dave LambExecutive Director
Pro Vice-Chancellor (International)
Vacant
Pro Vice-Chancellor (Student Learning)
Professor Philippa Levy Legal and RiskMrs Celine McInerney
General Counsel
Adelaide Graduate CentreProfessor Richard Russell AM
Dean of Graduate StudiesMs Anne Witt
Director
Technology ServicesMr Mark Gregory
Chief Information Officer
InfrastructureMs Virginia Deegan
Director
Adelaide MicroscopyMr Angus Netting
Director
Human ResourcesMs Elysia Ryan
Director
Pro Vice-Chancellor (Research Strategy)
Professor Julie Owens
Financial ServicesMr Tony Mitchell
Chief Financial Officer
Pro Vice-Chancellor (Research Operations)
Professor Richard Russell AM
Office of the Deputy Vice-Chancellor and Vice-President (Research)
Ms Kerry JaegerDirector
Research BranchMr Simon Brennan
Director
Laboratory Animal ServicesMr Andrew Bartlett
Manager
Top level organisational structureEffective 1 November 2015
Governance 29

Learning through discovery, and students’ participation in the creation of new knowledge, are at the heart of the University’s Beacon of Enlightenment Strategic Plan. Building on the introduction in 2014 of the University’s centrepiece ‘Small-Group Discovery Experience’ into the first undergraduate year, 2015 saw the University extend this to all second-year students.
Learning and teachingThe University is committed to providing a compelling, distinctive student learning
experience of the highest value and quality, grounded firmly in the union
of teaching and research.
30 Learning and teaching

The University identifies deep discipline knowledge and a wide range of personal and professional attributes as essential outcomes of its education proposition, with a particular focus on nurturing students’ career-readiness and employability.
It continued to make significant strategic investments in learning and teaching enhancement and innovation in 2015 in order to meet the aspirations, expectations and needs of its students in a fast-moving, complex and increasingly digital world. Key to the University’s strategic plan is its commitment to embracing technology to forge rich and engaging new approaches to learning and teaching. These approaches add flexibility and further educational value to high-quality face-to-face educational interactions and experiences.
The achievement of the University’s strategic goals in learning and teaching is led by the Division of the Deputy Vice-Chancellor and Vice-President (Academic) (DVC&VP(A)). The division comprises the Office of the Deputy Vice-Chancellor and Vice-President (Academic) and key portfolio areas led by the Pro Vice-Chancellor (Student Learning); Pro Vice-Chancellor (International); Dean, Indigenous Education; and Executive Director, Division of the DVC&VP(A).
> Leading the development of education strategy and policies, including e-learning, the division provides the University’s faculties with the guidance and support to develop staff and programs that meet students’ expectations and needs.
> Most of the University’s domestic and international student recruitment activity is managed through the division.
> The division also leads the University’s internationalisation strategy, including the development of University-wide international partnerships and projects, and providing opportunities for students to study overseas.
> With a particular focus on recruiting and providing support services to Aboriginal and Torres Strait Islander students, the Wirltu Yarlu Aboriginal Education unit is key to realising the University’s goal of improving participation and retention of Aboriginal and Torres Strait Islander students.
> The division supports students in all phases of the student lifecycle. It provides: counselling; careers support; accommodation and other services; management of scholarships; oversight of the student space, Hub Central; and management of the formal relationships with student organisations.
Context and overview2015 saw the continuation of the University’s strategic transformation of learning and teaching, against a background of rapid change and increasing competition in the global higher education sector. With students at the centre of the University’s current and future strategic directions, the enhancement of e-learning opportunities and the delivery of support services to aid student success were given high priority.
Internally, the University continued to carry out a range of initiatives described in the Beacon of Enlightenment Strategic Plan with an updated Operational Plan for 2016-2018 detailing areas of focus for the new cycle.
Existing initiatives were built on to meet the goals of the Beacon of Enlightenment. The University continued to embed the Small-Group Discovery Experience across its programs, to enhance e-learning tools and environments, provide students with additional career-readiness resources
and opportunities, and further develop study abroad. The AdelaideX program of MOOCs (Massive Open Online Courses) delivered its first six courses, which together attracted over 150,000 enrolments from 180 countries.
The University also introduced the Adelaide Education Academy, designed to support, promote and recognise teaching excellence across campus.
The changes in the external environment were also significant for the University. In 2015, domestic undergraduate demand was stagnant in a very static South Australian market, while international enrolment numbers continued to recover. A change in Federal Government leadership moderated the public debate around fee deregulation. Further consultation is expected, but in a context where Commonwealth savings are still part of the Government’s financial plans.
Learning and teaching key objectivesIn 2015, the University achieved the following goals included in the Beacon of Enlightenment Strategic Plan:
> continued embedding Small-Group Discovery Experiences into University programs
> continued to enhance the University’s e-learning tools and environment, and improved educational flexibility through e-learning
> further embedded final-year research projects (capstones)
> developed additional ‘career readiness’ resources and opportunities
> provided new international opportunities for students
> offered all staff the opportunity to develop Indigenous cultural competencies
> maintained broad participation of disadvantaged students
> improved participation and retention of Aboriginal and Torres Strait Islander students.
Learning and teaching 31
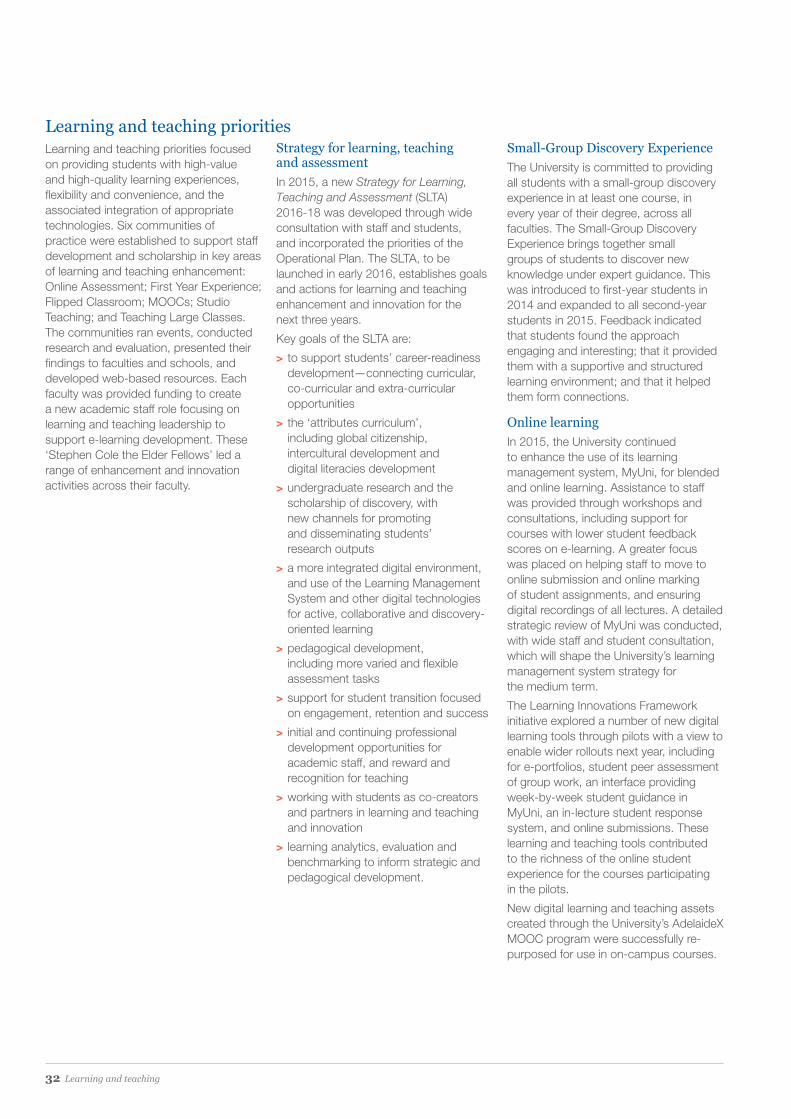
Learning and teaching prioritiesLearning and teaching priorities focused on providing students with high-value and high-quality learning experiences, flexibility and convenience, and the associated integration of appropriate technologies. Six communities of practice were established to support staff development and scholarship in key areas of learning and teaching enhancement: Online Assessment; First Year Experience; Flipped Classroom; MOOCs; Studio Teaching; and Teaching Large Classes. The communities ran events, conducted research and evaluation, presented their findings to faculties and schools, and developed web-based resources. Each faculty was provided funding to create a new academic staff role focusing on learning and teaching leadership to support e-learning development. These ‘Stephen Cole the Elder Fellows’ led a range of enhancement and innovation activities across their faculty.
Strategy for learning, teaching and assessmentIn 2015, a new Strategy for Learning, Teaching and Assessment (SLTA) 2016-18 was developed through wide consultation with staff and students, and incorporated the priorities of the Operational Plan. The SLTA, to be launched in early 2016, establishes goals and actions for learning and teaching enhancement and innovation for the next three years.
Key goals of the SLTA are:
> to support students’ career-readiness development—connecting curricular, co-curricular and extra-curricular opportunities
> the ‘attributes curriculum’, including global citizenship, intercultural development and digital literacies development
> undergraduate research and the scholarship of discovery, with new channels for promoting and disseminating students’ research outputs
> a more integrated digital environment, and use of the Learning Management System and other digital technologies for active, collaborative and discovery-oriented learning
> pedagogical development, including more varied and flexible assessment tasks
> support for student transition focused on engagement, retention and success
> initial and continuing professional development opportunities for academic staff, and reward and recognition for teaching
> working with students as co-creators and partners in learning and teaching and innovation
> learning analytics, evaluation and benchmarking to inform strategic and pedagogical development.
Small-Group Discovery ExperienceThe University is committed to providing all students with a small-group discovery experience in at least one course, in every year of their degree, across all faculties. The Small-Group Discovery Experience brings together small groups of students to discover new knowledge under expert guidance. This was introduced to first-year students in 2014 and expanded to all second-year students in 2015. Feedback indicated that students found the approach engaging and interesting; that it provided them with a supportive and structured learning environment; and that it helped them form connections.
Online learningIn 2015, the University continued to enhance the use of its learning management system, MyUni, for blended and online learning. Assistance to staff was provided through workshops and consultations, including support for courses with lower student feedback scores on e-learning. A greater focus was placed on helping staff to move to online submission and online marking of student assignments, and ensuring digital recordings of all lectures. A detailed strategic review of MyUni was conducted, with wide staff and student consultation, which will shape the University’s learning management system strategy for the medium term.
The Learning Innovations Framework initiative explored a number of new digital learning tools through pilots with a view to enable wider rollouts next year, including for e-portfolios, student peer assessment of group work, an interface providing week-by-week student guidance in MyUni, an in-lecture student response system, and online submissions. These learning and teaching tools contributed to the richness of the online student experience for the courses participating in the pilots.
New digital learning and teaching assets created through the University’s AdelaideX MOOC program were successfully re-purposed for use in on-campus courses.
32 Learning and teaching

HighlightsThe University’s inaugural Beacon Conference of Undergraduate Research (BeaCUR) was held in September, with 33 students from various disciplines presenting abstracts, papers and posters to more than 200 delegates. Nine students were selected to present at the Australasian Conference of Undergraduate Research, hosted by the University of Western Australia, with Anna Zeng from the School of Medicine and Lauren Thompson from the School of Chemical Engineering winning prizes for outstanding presentations.
The University’s fifth Festival of Learning and Teaching was held in November with the theme Learning Journeys at the University of Adelaide. Almost 300 delegates registered for the event, with keynote speakers including Dr George Kuh (National Institute for Learning Outcomes Assessment, USA), Professor Paul White (University of Sheffield), and Professor Rachel Spronken-Smith (University of Otago). Academic and professional staff members and students presented 24 sessions on various topics, with the following three themes: Discovery through the Disciplines, Digital Directions and Transitions and New Horizons.
AdelaideX (MOOCs)The University has partnered with edX, the world’s leading non-profit learning-platform provider, to create a range of Massive Open Online Courses (MOOCs). Charged with raising the University’s global profile, enhancing student experience and supporting staff exploration of digital learning, the MOOC team and a number of academic staff in each faculty delivered nine releases of six courses:
> Essential Human Biology (Chair: Associate Professor Mario Ricci)—February, June
> World of Wine (Chair: Associate Professor Kerry Wilkinson)—April, July
> Think. Create. Code (Chair: Associate Professor Katrina Falkner)—May, September
> Cyberwar, Surveillance and Security (Chair: Professor Melissa de Zwart)—May
> Language Revival (Chair: Professor Jean Fornasiero)—July
> Managing Addiction (Chair: Dr Femke Buisman-Pijlman)—October.
In 2015, AdelaideX:
> attracted more than 150,000 open enrolments, representing over 125,000 students from 180 countries
> achieved high learner satisfaction in the quality of the MOOCs (92%) and educators (91%), with 80% likely or strongly likely to enrol in a further MOOC, and 80% willing to recommend AdelaideX
> enabled students to achieve a comparable or higher-than-standard pass rate—in a market where 5% completion is typical, two out of the six first course releases achieved certification of >10%, and five out of six achieved >5%.
Learning and teaching 33

The following tables provide a summary of units and programs reviewed and/or professionally accredited during 2015.
Reviews Professional accreditation
> School of Animal and Veterinary Sciences
> School of Dentistry
> School of Mathematical Sciences
> School of Mechanical Engineering
> Undergraduate programs in Food and Nutrition Science and Agricultural Sciences
> Undergraduate and postgraduate programs in Architecture, Landscape Architecture and Planning
> Bachelor of Languages
> Bachelor of Languages (Honours)
> Diploma in Languages
> Bachelor of Media
> Bachelor of Media (Honours)
> Bachelor of Media / Bachelor of Arts
> Bachelor of Media / Bachelor of International Studies
> Bachelor of Media / Bachelor of Laws
> Bachelor of Science (Biomedical Science)
> Bachelor of Science (Molecular Biology)
> Bachelor of Science (Biotechnology)
> Postgraduate programs in Art History and Curatorial and Museum Studies
> Postgraduate coursework programs in Economics and International Trade and Development
> Postgraduate Wine Business programs
> Undergraduate and postgraduate programs in Viticulture and Oenology
> Bachelor of Psychological Science (Honours)
> Bachelor of Computer Science (North Terrace)
> Bachelor of Computer Science (Singapore)
> Bachelor of Computer Science (Advanced)
> Master of Computer Science
> Master of Software Engineering
> Master of Computing and Innovation
> Bachelor of Medicine and Bachelor of Surgery
> Doctor of Clinical Dentistry in Oral Pathology
> Doctor of Clinical Dentistry in Orthodontics
> Doctor of Clinical Dentistry in Paediatric Dentistry
> Doctor of Clinical Dentistry in Periodontics
> Doctor of Clinical Dentistry in Prosthodontics
> Doctor of Clinical Dentistry in Special Needs Dentistry
> Doctor of Clinical Dentistry in Endodontics
> Graduate Certificate in Oral Health Science
> Master of Arts (Translation and Transcultural Communication)
> Graduate Diploma (Translation and Transcultural Communication)
Quality and reviewProgram and organisational unit reviews, as well as program approval and entry processes, are integral to enhancing the quality of the University’s educational offerings and ensure the University complies with its self-accrediting obligations.
An enhancement project to make academic program rules available online was undertaken in 2015. The University’s online Calendar will provide students with better access to the rules for their academic program and enable them to link their programs, courses and course outlines within an online environment.
A major review of the program development and approval processes was conducted in 2015 with the aim of designing procedures that eliminate duplication and maximise effective outcomes. A significant aspect of the revised process includes consultation between faculties, schools and key stakeholders much earlier in the process, to enable wider and deeper consideration of all aspects relevant to a program proposal, and within reduced timelines.
Across the curricula, 65 program proposals were considered by the Program Approval and Entry Committee in 2015. Of these, seven were new programs, 25 programs had major revisions, 16 programs were removed and 12 programs had revised admissions criteria. The Learning and Quality Support unit undertook 13 reviews, many of which generated significant and wide-ranging recommendations that, as at the end of 2015, remained under active consideration by the University or were being implemented. Several programs offered by the University continue to be accredited by professional organisations. Accreditation ensures that graduates are professionally qualified and competent to work in their chosen vocation, and serves as a quality measure for individual programs.
Educational complianceThe University’s Renewal of Registration as an Australian Higher Education Provider was approved by the Tertiary Education Quality and Standards Agency (TEQSA) for the maximum period of seven years to 19 August 2022. The University’s Commonwealth Register of Institutions and Courses for Overseas Students (CRICOS) registration (which enables the University to offer education to international students) has also been extended by the maximum five years, to 29 April 2020.
The University ceased to be a Registered Training Organisation (RTO) on 1 May 2015 in accordance with the Vice-Chancellor’s Executive endorsement that the effort of ensuring compliance with legislative requirements, together with the associated costs, outweighed the advantages of remaining registered.
34 Learning and teaching

Policy portfolioThe University has a regulatory obligation to review policies, which is monitored and enforced by TEQSA. The following policies have been reviewed and approved by Academic Board in 2015.
Policy Approved by Academic Board Effective date
Modified Arrangements for Coursework Assessment Policy 7/10/2015 1/01/2016
Academic Progress by Coursework Students Policy 11/05/2015 1/01/2016
Reasonable Adjustments to Teaching and Assessment for Students with a Disability Policy
9/11/2015 9/11/2015
Student Health Assessment and Leave Policy 13/03/2015 13/03/2015
Student Loan Policy 10/11/2015 10/11/2015
Teaching Development for New Academic Staff Policy 13/10/2015 16/10/2015
Student recruitmentThe Future Student Engagement team, in close association with the faculties, coordinates student recruitment and engagement activities for prospective domestic and international students across South Australia.
In 2015, 188 presentations were made to high school students from years 10 to 12. The team developed and implemented the In High Schools program, which aligns with the University’s Career Workshop for year 10 students and the University’s Research Workshop for years 11 and 12. This program allowed for better engagement with over 200 high school students.
There were eight interstate recruitment trips, along with recruitment visits to regional South Australian schools. Schools in the South East, Eyre Peninsula, Yorke Peninsula, Fleurieu Peninsula, Barossa and Mid-North, Spencer Gulf, Riverland and Mildura, and Murray and Mallee regions were specifically targeted.
The team also developed the UA Xplorer app, which will allow prospective students to explore the campus while reading information displayed about the campus, the University’s degrees, and life as a student.
Student admissionsThe University made over 7000 offers of admission to undergraduate programs throughout the semester 1 and 2 intakes, a slight increase over the previous two years’ intakes. Over 1000 offers of admission were made to postgraduate coursework programs.
In addition to the external offers via SATAC, over 1700 offers of internal transfers were made to current students moving between coursework programs.
Children’s University and Adelaide CompassIn 2015 the University’s widening participation agenda continued to thrive under the Children’s University Australia and Adelaide Compass initiatives. Children’s University is an innovative and exciting program for children aged 7-14 (providing extra-curricular learning activities) and 15-18 (providing volunteering opportunities). The program celebrates and acknowledges learning that happens outside the classroom environment, and recognises the achievement of participating children through certificates given at formal graduation ceremonies. Adelaide Compass is an in-school, curriculum-linked program of engagement and activities aimed at primary school children in areas of greatest need.
Adelaide Compass is part of the Journey to Higher Education project, but also creates extension activities validated as part of the Children’s University program.
Children’s University Australia and Adelaide Compass expanded significantly throughout 2015. There were 72 events with 21 schools under the Compass program, with over 1500 students visiting the University. Children’s University Australia has now secured the participation of 57 schools, over 100 public Learning Destinations, and over 3500 student members. In 2015, 14 school holiday programs were held in partnership with several Learning Destinations utilising the University campuses, and 650 students attended Children’s University graduation ceremonies, having collectively accomplished 28,840 hours of extra-curricular learning. The program has now expanded nationally, with the University of Tasmania and the University of Newcastle launching the initiative in 2015.
Over 80 University student volunteers have assisted with widening participation activities, providing enormous support to the programs delivered. Volunteering also contributes significantly to the development of well-rounded, community-minded graduates and improves the student experience for those involved.
Learning and teaching 35

ScholarshipsUniversity-funded scholarships continue to target students who demonstrate outstanding academic merit and those in financial need, from rural or isolated areas or non-English speaking backgrounds.
In 2015, the University administered 94 donor-funded scholarships. New donor-funded scholarships include: four scholarships with total funding of $20,000 from Resthaven Incorporated; $24,000 from the Cowan Grant Trust to fund overseas travelling scholarships; and $7000 from Chris Richards & Associates to fund a scholarship in veterinary medicine.
In addition to newly funded scholarship recipients, 332 students receive ongoing undergraduate, honours or postgraduate coursework scholarships. These scholarships—valued at $1,798,490—lift the total value of scholarships over $3.5 million.
New scholarships funded in 2015
Funding source Number of new scholarships awarded Total value
Australian Government 58 $200,731.50
University of Adelaide 282 $1,107,000.00
Donors* 90 $458,611.50
Total 430 $1,766,343.00
*Includes corporate donors, State Government, private philanthropists and bequests
Indigenous educationThe University of Adelaide has made progress on all targets set in its integrated Aboriginal and Torres Strait Islander Education Strategy, Tarrkarri Tirrka (Future Learning).
In 2015, the total University enrolment of 253 Aboriginal and Torres Strait Islander (ATSI) students exceeded the target (202), with representation across each faculty. The total number of ATSI staff employed within the University remained steady at 38.
The University welcomed the second group of ATSI primary school and high school students in its Marni Wingku program. To increase participation, Wirltu Yarlu is investigating program dates in 2016 during term time.
The Indigenous Knowledges and Society major within the Bachelor of Arts enrolled 112 students, with a mixed cohort including Indigenous and international students. The students were involved
in a Small-Group Discovery Experience exploring urban institutions housing Indigenous artefacts and displays. Wirltu Yarlu and the Faculty of Arts continue to work together to improve the major and build a second-level course.
The Indigenous Course Enrichment Project (recommendation 10 of the Tarrkarri Tirrka) was successfully implemented. The project supports faculties in small-scale initiatives and pilot projects to assist staff in the review, development, implementation and evaluation of Indigenous knowledge and perspectives in current and future course offerings. In addition, it encourages the sharing of best-practice approaches, while incorporating Indigenous knowledge, perspectives and community engagement into curriculum.
36 Learning and teaching

Global engagementIn 2015 the University updated its Internationalisation Strategy. The revised strategy provides directions towards achieving the Beacon of Enlightenment’s international objectives for 2016-2020. This includes continuing efforts to develop relationships with key international partners, enhancing international student recruitment, and further increasing participation in international study experiences and the Experience Adelaide program.
International student recruitmentThe University maintained its strong performance in the key markets of China, Malaysia, Hong Kong and Singapore, again welcoming over 2500 new students into degree programs. The equivalent full-time student load (EFTSL) of international students increased by 3% to 5549 (7092 individual students), representing around 26% of the University’s total student load. Building on the success of the University’s recruitment office in China, new offshore arrangements for University representation have been established in India and Malaysia in conjunction with Kaplan International.
International partnerships and projectsThe University’s key partners are Shanghai Jiao Tong University (China), North Carolina State University (USA), Nagoya University (Japan), University of Nottingham (UK), Harbin Institute of Technology (China), Bogor Agricultural University (Indonesia), the University of Strasbourg (France) and the University of Freiburg (Germany). Increased levels of collaborative activity have been recorded with each partner.
Key achievements include:
> Frontiers in Plant Phenomics Workshop. The workshop brought together plant scientists, crop breeders and technologists from Adelaide, Nottingham, Shanghai and North Carolina. The workshop was held at North Carolina State University on 1-3 June 2015 and was partly sponsored by the Academic Consortium for the 21st Century (AC21).
> The joint Australia-China Research Centre for Agriculture and Health (including the Joint Laboratory for Plant Science and Breeding) was launched in November 2015 in conjunction with Shanghai Jiao Tong University. Activities will be centred around four themes: agriculture and wine; land and water; food safety and quality; and health and nutrition.
> The China-Australia University Summit on Teaching and Learning (CAUSTL) was held in November 2015 at the University of Adelaide in conjunction with the Harbin Institute of Technology. The summit brought together representatives from the China 9 Universities and the Group of Eight to discuss innovation and collaboration in teaching and learning.
> Jointly awarded PhD agreements have been established with Shanghai Jiao Tong University, the University of Nottingham, the University of Freiburg and Nagoya University. The University of Adelaide was the first university in Australia to sign a joint PhD with a Japanese university.
The University continued to engage with a broad range of international partners, receiving 55 high-level international visits from 14 countries, including visits from all key partners. New agreements have been signed with 33 international partners and 47 existing agreements have been renewed, while 18 agreements have been discontinued.
Student mobilityThe number of students undertaking a global learning experience as part of their degree has continued to grow, with 1563 students taking part in a total of 1675 unique experiences. This includes 423 student exchanges and 620 experiences on one of the University’s 46 study tours. Other students who studied overseas undertook professional or research placements, or other programs.
The University received Australian Government Endeavour mobility grants to the value of $172,500 and New Colombo Plan mobility grants to the value of $347,600. The University provided a total of $211,500 in Beacon Travel Grants to all outbound exchange students.
Learning and teaching 37

Experience AdelaideThe Experience Adelaide program has been in operation for two full years, with overwhelmingly positive feedback from participants.
For international students, Experience Adelaide offers the unique opportunity to build a personal connection with members of the University community and obtain a deeper understanding of Adelaide and Australian culture. They are made to feel more welcome and part of the community.
Volunteering local alumni, staff and domestic students—often including their families—have been equally positive, with 93% saying they would recommend the program to others.
By the end of 2015, 473 new international students from 60 different countries were connected to 270 local alumni, staff and domestic students.
Of the volunteers, 74% were alumni (including staff members who are also University of Adelaide graduates), 20% were staff members and 6% domestic students. Expanding the volunteer base, particularly among domestic students, remains a priority.
Ngee Ann-Adelaide Education CentreIn 2015 the Ngee Ann-Adelaide Education Centre (NAA) saw Dr Susie Khoo commence as the new Chief Executive Officer, alongside a new management team and operational structure.
A huge milestone was the achievement of four-year EduTrust accreditation from the Council for Private Education Singapore. The accreditation demonstrates the quality of the organisation, and allows NAA to accept international students for the first time since commencing operation in 1998. The accreditation means University of Adelaide students can now also study at NAA for part of their degree, expanding the internationalisation of their University of Adelaide experience. The predicted growth in international students has allowed NAA to expand its program portfolio for 2016, adding a new undergraduate and postgraduate program.
2015 also saw the return of Singapore study tours being based at NAA, which included University of Adelaide schools currently not teaching or offering programs there. This provided the schools with a diverse experience and facilitated interaction and shared experiences between Adelaide and NAA students.
38 Learning and teaching

Student life, culture and sportThe student cultural experience at the University of Adelaide is among the best available at any Australian university, with participation in student clubs and organisations continuing to grow.
The Adelaide University Union’s program of events for 2015 started with O’Week (Orientation Week) which was extended to a full five-day program. Highlights included Clubsland, where students could explore and join new clubs, and the Comedy Mega Jam, featuring well-known comedians Dave Hughes and Tom Gleeson.
In May, Autumn Fest brought a boutique night-market experience to the Goodman Crescent lawns, with an eclectic mix of food, music, crafts and entertainment. The biannual Stress Less events continued to be a favourite, with thousands attending. Students enjoyed
cuddling animals in the petting zoo, manicures and free massages. ‘At the Cloisters’ saw the historic University’s Cloisters transformed into a winter garden, with gourmet food, drinks and popular musicians.
September was an exciting time with the Harry Potter Quiz Night seeing Bonython Hall transformed into Hogwarts for two sold-out nights. The National Campus Band competition also returned, with more than a dozen bands competing in the University of Adelaide heats. University of Adelaide band Mackenzie went on to win the state final and compete in the national final in Sydney.
Adelaide University Sport commenced its vibrant sports program at O’Week, with almost 40 clubs promoting their many activities. Wide-ranging events continued throughout the year, including: Beach
Sports Day and Sports on the Green for international students; the annual Vice-Chancellor’s Cup footrace in September, won for the second consecutive year by the Faculty of Health Sciences; and the Blues Awards dinner.
Students represented the University at various sporting events including: the South Australian Challenge; the Southern University Games, held in Adelaide for the first time in eight years; and the Australian University Games (AUG) on the Gold Coast, where the University of Adelaide team brought home 24 medals—a record for ‘away’ games.
Finally, in recognition of the valuable contribution to campus culture made by the University’s growing clubs, a Club Development and Leadership Program was introduced to provide them and their volunteers with greater assistance.
Students marking 120 years of the Adelaide University Union in 2015
Learning and teaching 39

World-class research outcomes continued to be delivered, with a focus on attracting the best researchers, investing in high-quality facilities and encouraging an innovative and dynamic research culture. In 2015, the University consolidated its position in the top 1% of the world’s universities, with significantly improved results in two of the leading international ranking schemes.
Research
40 Research

The Division of the Deputy Vice-Chancellor and Vice-President (Research) provides critical research support services and infrastructure to University staff, and the strategic support necessary to maximise future opportunities. The division comprises the following portfolio areas:
> The Office of the Deputy Vice-Chancellor and Vice-President (Research) has responsibility for research strategic planning, managing research partnerships, prioritising University investment in strategic initiatives, and responding to changes in the external environment.
> The Research Branch supports external competitive research grants and fellowships, provides advice on research policies, coordinates the Excellence for Research in Australia (ERA) data collection, and supports research compliance and regulatory activities, including ethics, gene technology and quarantine matters.
> The Adelaide Graduate Centre manages the administration of research student degrees, scholarships and quality assurance activities, ensuring students have the highest quality of supervision and opportunities for professional development.
> Adelaide Microscopy offers a broad range of the most technologically advanced instrumentation for microscopy and microanalysis. It incorporates the Biobank, a bio-repository providing centralised, ultra-cold refrigerated housing for valuable archival research material.
> Adelaide Research & Innovation Pty Ltd provides services to the University’s research community in relation to intellectual property, contract research and consulting, technology transfer and commercialisation.
> Laboratory Animal Services, with facilities at North Terrace, Roseworthy and Waite, supports the biomedical research community through the delivery of best practice and world-standard laboratory animal products and services.
> The Women’s and Children’s Health Research Institute is a controlled entity of the University involved in research on maternal and child nutrition.
> The Roseworthy Piggery is a controlled entity of the University supporting fundamental and applied research and education activities related to the needs of the pig industry.
Research 41
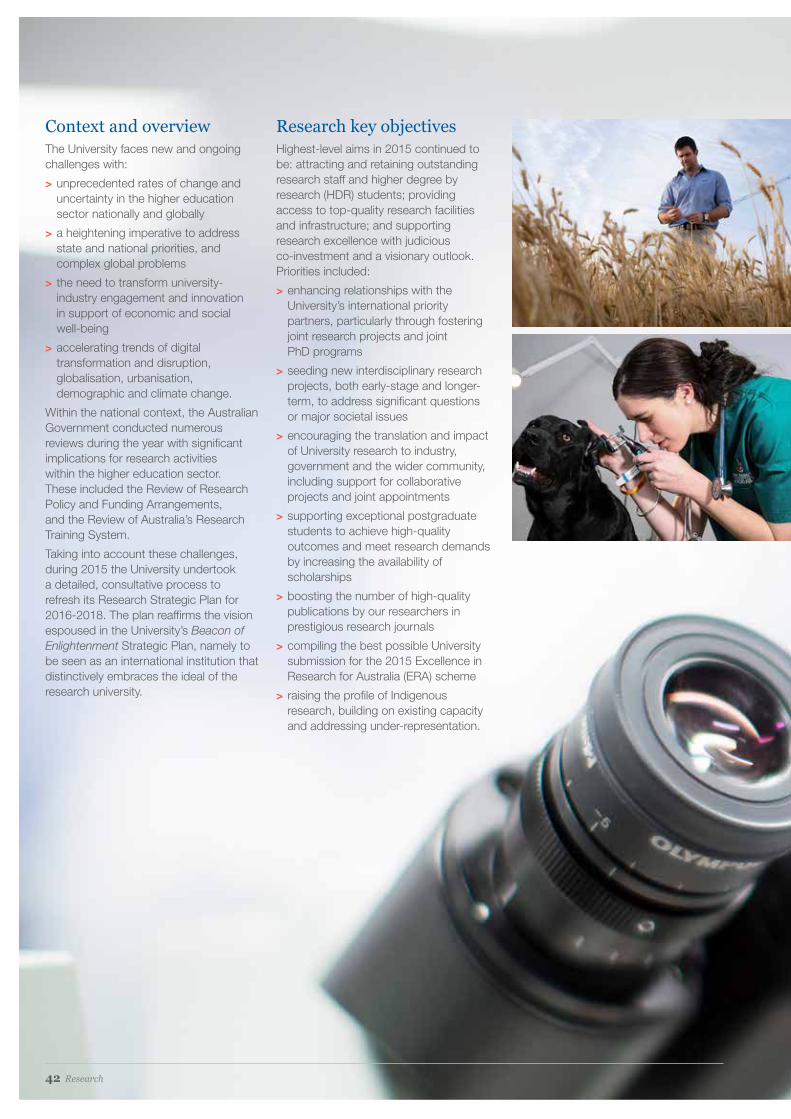
Context and overviewThe University faces new and ongoing challenges with:
> unprecedented rates of change and uncertainty in the higher education sector nationally and globally
> a heightening imperative to address state and national priorities, and complex global problems
> the need to transform university-industry engagement and innovation in support of economic and social well-being
> accelerating trends of digital transformation and disruption, globalisation, urbanisation, demographic and climate change.
Within the national context, the Australian Government conducted numerous reviews during the year with significant implications for research activities within the higher education sector. These included the Review of Research Policy and Funding Arrangements, and the Review of Australia’s Research Training System.
Taking into account these challenges, during 2015 the University undertook a detailed, consultative process to refresh its Research Strategic Plan for 2016-2018. The plan reaffirms the vision espoused in the University’s Beacon of Enlightenment Strategic Plan, namely to be seen as an international institution that distinctively embraces the ideal of the research university.
Research key objectivesHighest-level aims in 2015 continued to be: attracting and retaining outstanding research staff and higher degree by research (HDR) students; providing access to top-quality research facilities and infrastructure; and supporting research excellence with judicious co-investment and a visionary outlook. Priorities included:
> enhancing relationships with the University’s international priority partners, particularly through fostering joint research projects and joint PhD programs
> seeding new interdisciplinary research projects, both early-stage and longer-term, to address significant questions or major societal issues
> encouraging the translation and impact of University research to industry, government and the wider community, including support for collaborative projects and joint appointments
> supporting exceptional postgraduate students to achieve high-quality outcomes and meet research demands by increasing the availability of scholarships
> boosting the number of high-quality publications by our researchers in prestigious research journals
> compiling the best possible University submission for the 2015 Excellence in Research for Australia (ERA) scheme
> raising the profile of Indigenous research, building on existing capacity and addressing under-representation.
42 Research

Major collaborative partnerships Members of the University collaborate with industry, government, other research institutions and the general community in many and varied ways. The following provides examples of major partnership development in 2015.
Shanghai Jiao Tong UniversityShanghai Jiao Tong University (SJTU) is one of the University’s international priority partners. November saw the launch of the joint Australia-China Centre for Agriculture and Health at the Waite campus. The two universities are working together to contribute to the national food, water and health targets of their respective countries under four themes: agriculture and wine; land and water; food safety and quality; and health and nutrition. Some of the activities associated with the initiative include the establishment of the University of Adelaide and SJTU Joint Laboratory for Plant Science and Breeding, researching key problems in food security, and the joint professorial appointment of distinguished Chinese plant scientist Professor Dabing Zhang.
Australian Research Council (ARC) Research Hub for Australian Copper-UraniumWith $2.5M in ARC funding, the University established a major new research hub that will add significant value to Australia’s $6 billion copper industry. The ARC Research Hub for Australian Copper-Uranium involves key industry, university and government partners. In addition to the ARC funding, industry partners are contributing a further $5.55 million in cash and in-kind support over five years. Major partners include BHP Billiton, OZ Minerals and the Department of State Development. The aims of the research hub, led by the Institute for Mineral and Energy Resources, are to find new ways of removing other metals from copper deposits and ensure these new methods are suitable for industry-level operations.
Trajan Scientific and MedicalSeptember 2015 saw the announcement of a new research and development and manufacturing hub. This is part of an agreement between Australian company Trajan Scientific and Medical and the University, with support from Health Industries SA and the Department of State Development. Trajan’s focus is on developing and commercialising technologies that enable analytical systems to be more selective, sensitive and specific for biological, environmental or food-related measurements, especially those that can lead to portability, miniaturisation and affordability.
Research 43

Institute for Photonics and Advanced Sensing (IPAS)Institute focus: to pursue a transdisciplinary approach that brings together experimental physicists, chemists, material scientists, biologists, engineers and medical researchers to create new sensing and measurement technologies.
2015 highlights
> The announcement of a major strategic partnership agreement between Trajan Scientific and Medical and the University. Under this agreement, Trajan have opened a research and development manufacturing hub in The Braggs building and hired their first South Australian employees.
> There were 11 Photonics Catalyst Program projects. This joint initiative between the Department of State Development and IPAS is increasing University interactions with local industry, and enabling industry access to cutting edge expertise, equipment, capabilities and emerging laser and sensor technologies.
> Professor Mark Hutchinson, IPAS Biological Sensing and Medical Diagnostics Theme Leader and Centre for Nanoscale BioPhotonics Director, was awarded a James McWha Award of Excellence, recognising his significant contribution as an emerging leader.
Institute for Mineral and Energy Resources (IMER)Institute focus: unconventional energy resources, deep exploration and deep mining, complex ore processing, reliable low-cost and low-emission energy technologies.
2015 highlights
> IMER was awarded $1.4 million from the Australian Renewable Energy Agency (ARENA) for the Australian Energy Storage Knowledge Bank, which commenced in April 2015. This involves building a mobile energy storage test platform and establishing an online database for energy storage expertise.
> IMER was awarded $1.8 million from ARENA over five years for the FOX Project that commenced in May 2015. The project, with partners BHP Billiton and the SA Government, will investigate mineral formation in iron ore and iron-oxide-copper-gold mineral systems.
> The ARC Research Hub for Australian Copper-Uranium commenced on 1June 2015 and was officially launched in October 2015.
> IMER and CSIRO co-hosted the symposium Challenges and Opportunities in Creating Access to Values for In-situ Recovery of Sub-surface Resources, which attracted over 80 interstate and international delegates. IMER also hosted industry innovation seminars with BHP Billiton and OZ Minerals.
Environment InstituteInstitute focus: developing strong international collaboration and external engagement to address future environmental problems and export innovation to the world.
2015 highlights
> Professor Corey Bradshaw and Professor Alan Cooper, with researchers from the University of NSW, had a study published in Science revealing climate change played a key role in mass extinctions of large animals in the Earth’s past. Professor Cooper and Dr Wolfgang Haak, working with Harvard Medical School, saw their research published in Nature, showing that some of the Indo-European languages spoken in Europe were likely the result of a massive migration from eastern Russia.
> Professor Sean Connell and Associate Professor Ivan Nagelkerken’s research into ocean acidification and warmer sea levels resulted in papers published in Scientific Reports, Proceedings of the National Academy of Science and Nature Climate Change.
> Professor Andy Lowe is involved in a $600,000 pilot program, supported by the University of Adelaide and the South Australian Government, to build SA’s bee population to help protect native plants and production from orchards and crops that rely on bee pollination.
> Dr Seth Westra and his team were awarded funding under the ARC’s Linkage Projects scheme to develop a unified approach to quantifying flood risk. Dr Westra’s study, highlighting differences in flood risk, was published in Nature Climate Change.
Research institutesThe University’s research institutes are charged with attending to national and state priorities, tackling ‘grand challenges’ of critical value to society, operating across multiple disciplinary boundaries and working with key industries.
44 Research

Waite Research Institute (WRI)Institute focus: plant genetics and genomics, crop development, viticulture and oenology, food and nutrition and natural resource management.
2015 highlights
> Graduates of the institute’s Research Leadership Development Program continued to win awards, achieve promotions and publish in high-impact journals. A further cohort commenced in the program in 2015.
> Enhancing collaboration and the use of shared infrastructure at the Waite campus continued to be a priority and produced successful outcomes. There was increased demand from across the campus for the Waite node of Adelaide Microscopy, for example, with several high-impact papers produced.
> The appointment of Professor Dabing Zhang to lead the University of Adelaide and Shanghai Jiao Tong University Joint Laboratory for Plant Sciences and Breeding was a key step forward in building this priority partnership.
> The WRI supported a range of strategic activities in conjunction with key international partners, including a plant phenomics workshop held in June at North Carolina State University, with colleagues from Nottingham, North Carolina and Shanghai Jiao Tong universities.
Robinson Research InstituteInstitute focus: the early stages of life to improve the health and well-being of children and families over the life course and across generations. The Institute seeks to enable a healthy start through fertility choices and mindful conception, nurturing the baby during pregnancy and birth, strengthening the brain and body in early life, and advancing child and adolescent health to treat and prevent disease.
2015 highlights
> New research advances included: showing how oocyte cell structures named mitochondria affect the intergenerational programming of obesity; discovering a key sensing molecule that controls the timing of birth; identifying a link between shiftwork, birth defects and fertility treatment; and developing the world’s first screening test to predict pregnancy complications.
> The institute ran a number of outreach initiatives to increase collaboration and disseminate research findings. They included events on the latest in vaccinology, health equality, the future of human fertility and peri-conception planning for infant health.
> The institute received significant new competitive grant funding and fellowships from the Helmsley Charitable Trust through JDRF Australia, the National Health and Medical Research Council, the Australian Research Council, Women’s and Children’s Hospital Foundation, Channel 7 Children’s Research Foundation, Cancer Council and others.
Research 45

Category 2010 2012 2015
5 – well above world standard 16 18 35
4 – above world standard 17 21 20
3 – world standard 27 21 11
2 – below world standard 9 6 1
1 – well below world standard 6 1 0
Not assessed 82 90 90
Assessed units 75 67 67
Research indicators
Research income *2015 preliminary eligible Category 1 to 4 Higher Education Research Data Collection (HERDC) Research Activity
^ 2014 Eligible Category 1 to 4 Higher Education Research Data Collection (HERDC) Research Activity
Total research income Category 1 research income
$ million $ million
2015* 164.2 82.4
2014^ 182.1 94.6
Higher degrees by research (HDR) *2015 data is preliminary. Source: Data warehouse
**Source: Department of Education and Training 2011-2014 Higher Education Research Data Collection
HDR load (EFTSL) HDR completions
2015* 1676.2 401
2014** 1705.4 386
Research performanceThe University of Adelaide continued to be in the top 1% of universities in the world. In 2015 the University was placed 169 in the Shanghai Jiao Tong Academic Ranking of World Universities, 149 in the Times Higher Education World University Rankings, and 113 in the QS World University Rankings.
On a national level, the University’s reputation for world-class research was confirmed by the results of the 2015 Excellence in Research for Australia (ERA) process. ERA is an Australian Government initiative to assess the research quality at universities across Australia, based on a series of measures including research outputs, research income and impact.
Following strong performances in the 2010 and 2012 ERA process, the University was rated even higher for the quality and impact of its research in the
2015 results. The outcomes confirmed many of the University’s fundamental research strengths in areas including geology, ecology, oncology, nutrition, civil engineering, astronomical sciences, macromolecular chemistry, soil sciences and philosophy.
Of the 67 individual research areas assessed (sub-fields), more than half achieved the maximum rating of 5 (‘well above world standard’), up from about one fifth in 2012. Over 82% of the University’s sub-fields were assessed as ‘above or well above world standard’ (rating 4 or 5).
The table below summarises the University’s sub-field ratings for the three ERA processes.
The ERA results also confirmed the University of Adelaide as the research leader in South Australia, obtaining 35 of the 56 top ratings achieved in the state.
Research centresAlong with the five research institutes, the University also has approximately 50 research centres across the spectrum of its research strengths.
Two new University research centres were approved in 2015:
> Australian Bioactive Compounds Centre, which aims to apply ecological and Indigenous knowledge towards identifying biologically active compounds from plants found in Australia
> Australian Centre for Antimicrobial Resistance Ecology, focusing on understanding the evolution, ecology and epidemiology of antimicrobial resistance in Gram-negative pathogens of humans, animals and their environment.
The National Health and Medical Research Council awarded the University $4.8 million for two centres of research excellence: EMPOWER: Health Systems, Adversity and Child Well Being and Frailty Trans-Disciplinary Research To Achieve Healthy Ageing. These centres are focused on improving the health and well-being of children and older Australians.
The ARC Research Hub for Wheat in a Hot and Dry Climate was launched at the University’s Waite campus in September. The research hub brings together wheat researchers and Australia’s three major wheat breeding companies (Australian Grain Technologies, LongReach Plant Breeders and Intergrain) to exploit global diversity for wheat and advanced genomic technologies for faster development of heat and drought-tolerant varieties that make better use of nitrogen fertiliser.
46 Research

Australian Research Council Major Australian Research Council (ARC) grant funding awards for 2016 were announced in October, with the University awarded $17 million in research funding for 46 grants across the Discovery Project, Discovery Early Career Researcher Award (DECRA), and Linkage Infrastructure Equipment and Facilities schemes. Examples of the research that will utilise this funding include: investigating possible cell wall weaknesses in the fungus that causes head blight disease in cereals; developing wearable antennas to monitor the aged; and investigating heat as a risk factor in work-related illness.
The winning of 14 DECRA awards was the University’s strongest performance since the establishment of the scheme in 2012. The University was also awarded a prestigious ARC Discovery Indigenous grant, one of only nine institutions in Australia—and the only one in South Australia—to do so. The project will reconstruct the first detailed genomic history of Indigenous Australia.
The funding awarded was an increase on the previous year’s success and, in total, the University was awarded approximately 68% of the state’s allocation. Adding the Linkage Projects ($3.1 million) and Future Fellows ($805,000) funding announced separately, the University was awarded approximately $21 million from the ARC in 2015.
Major research grant outcomesThe University attracts research income from a wide variety of sources, although major contributors remain Australian Government agencies. The following information provides an overview of some of the major funding outcomes for 2015.
National Health and Medical Research Council In November the National Health and Medical Research Council (NHMRC) announced grant outcomes for funding commencing in 2016, with the University awarded approximately $23.1 million across project grants, partnership grants, equipment grants, fellowships and centres of research excellence schemes. This represents more than 60% of the funding announced for South Australia. Examples of the areas in which the University’s researchers will work include inflammatory disorders of pregnancy, genetic pathways to cerebral palsy, and obesity and atrial fibrillation.
In an earlier announcement, Dr Mitchell Goldsworthy was awarded approximately $600,000 in the new Dementia Research Development Fellowship program. He will conduct a project on early diagnosis of Alzheimer’s disease.
Total 2015 NHMRC funding for projects starting in 2016 was approximately $24 million, reinforcing the University’s leadership in health and medical research, and demonstrating the importance of collaboration with its many research partners, including the state’s public hospitals and the South Australian Health and Medical Research Institute (SAHMRI).
Other grant outcomesThe Grains Research and Development Corporation provided funding worth over $13.3 million across 13 new projects in 2015, with Dr Glenn McDonald’s five-year project awarded close to $5.5 million to address improvement of wheat yields on sodic, magnesic and dispersive soils. Professor Gurjeet Gill received over $2.7 million for research into emerging weeds, and Professor Diane Mather received over $1.3 million for accelerating nematode-resistant gene deployment.
The Australian Centre for International Agricultural Research awarded over $1 million for eight new projects, including
work on small-scale feed milling and enhancement of food security in countries including Papua New Guinea, Indonesia and Kenya.
The South Australian Grains and Industry Trust provided funding for four new projects, with a total of $580,000 across research into durum, barley, and phosphorus replacement in soils.
Nine new projects were funded by the Premier’s Research and Industry Fund within the Department of State Development, with total funding of $1.2 million across research fields ranging from defence and national security, to mid-infrared lasers and precision-engineered wheat. An additional $1 million was provided for a South Australian Research Fellowship to support a Fellow in the area of nanoscale biophotonics.
JDRF Australia provided a major funding boost for its Type 1 Diabetes Clinical Research Network from the Helmsley Charitable Trust. $8 million was provided for a groundbreaking study to help solve the causes of type 1 diabetes, facilitating the expansion of the Environmental Determinants of Islet Autoimmunity (ENDIA) study, led by the Robinson Research Institute’s Professor Jenny Couper.
The Australian Renewable Energy Agency (ARENA) provided $1.4 million for a project to improve understanding on the use of battery energy storage in Australian conditions. Led by Associate Professor Nesimi Ertugrul in the Centre for Energy Technology, the project is also supported by the South Australian Government, SA Power Networks, the Energy Networks Association and South Australia-based company Solar Storage, which provided $650,000 in funding. Further in-kind support was also contributed by companies including ZEN Energy Systems, and Power and Drive Solutions. This brings the total value of the project to more than $3.1 million.
Research 47

Industry-research collaborationThe University remained in the top three of the Group of Eight universities in contract research and commercialisation revenue.
Major new contracts included a $6 million extension until 2019 of the University’s partnership with the Mosaic Company (the world’s second largest fertiliser company). Notable agreements among the hundreds of examples of research-industry collaboration included:
> working with the Department of Defence on software and modelling relevant to the SEA 1000 Future Submarines Project
> $1.3 million to extend work undertaken for the Department of Veteran’s Affairs by the Centre for Traumatic Stress Studies, conducting research on the mental health and well-being of Defence personnel
> the extension to 2018 of the use of Mudpack software for analysing multi-machine power systems (developed by the School of Electrical and Electronic Engineering) by a group of power companies and the Australian Energy Market Operator.
Start-up companies and technology developmentAdelaide Research and Innovation Pty Ltd (ARI) spin-out companies raised new funding commitments in excess of $5.5 million during 2015.
> Muradel Pty Ltd made excellent progress in its goal to create sustainable fuels and cultivate algae at an industrial scale, attracting significant new private funding and grant support, and entering into major agreements with a Japanese corporation and Australian utility companies.
> Snap Network Surveillance Pty Ltd, which enhances broad-scale network video surveillance, implemented an 890-camera installation in Chadstone Shopping Mall, Miami (USA), and will run a new trial at Sydney Airport.
ARI’s Commercial Accelerator Scheme (CAS) had a record 24 applications and made awards to six successful projects. Following earlier CAS funding, the Ornamental Eucalypt Development Program received $250,000 from the Federal Accelerating Commercialisation program and another $250,000 from four industry partners. The funding will enable the Australian release of the first two selected eucalypts in 2016, continued
monitoring of a trial in Spain, and the establishment of four trial sites in the US, a key export market.
ARI also entered into a new collaboration with global biopharma company AstraZeneca to give University researchers access to AstraZeneca’s drug compounds for research into the development of new medicines.
The Adelaide Ideas Market networking events continued to provide regular exposure of technology opportunities at an early stage to the local business development community, including student innovations, drones, mobile apps and novel antibiotics, among other projects.
ARI was successful in achieving a $200,000 grant from BioInnovation SA for additional intellectual property protection costs.
Business development and promotionARI gained a commitment from its local counterparts to participate in a joint portal to promote success stories, technology opportunities and source business needs. This initiative has received support from Business SA, the Department of State Development and others.
© Commonwealth of Australia 2015 www.defence.gov.au/Copyright.asp
48 Research

Research training The University enrolled 559 new higher degree by research (HDR) students in 2015, comprising 406 domestic and 153 international students. Full-year figures for 2015 show that the University produced a record 401 HDR completions, comprising 331 PhDs and 70 Master’s by Research students.
The University has committed to doubling the number of scholarships available to international doctoral students under its strategic plan, and these continued to be awarded to students from the University’s key partner institutions in 2015. Domestic research students were supported by 149 Australian Postgraduate Awards, complemented by 150 University Divisional Scholarships. The University also provided 65 scholarships for international research students to cover tuition fees and a living allowance.
The research communication competition, Three Minute Thesis, was held for the fifth year. This competition helps HDR students develop academic and research communication skills. The 2015 competition was won by Mr Andrew Farrer for his outstanding presentation Ancient DNA and the life on us.
A new and internationally recognised supervisor training package was adopted by the University and released on MyUni. The package, created by Epigeum, replaced the online and face-to-face versions of the Supervisor Induction and Exploring Supervision Program, and will now be the sole training prerequisite for applicants to the Supervisor Register.
A new website for Careers and Research Skills Training (CaRST) went live in 2015. CaRST is the new University-wide initiative to ensure that HDR students have the necessary transferable skills to make them readily employable, and able to engage effectively with a wide
range of potential employers inside and outside the University sector. More than 110 professional development workshop sessions were held for research students and supervisors. Topics included statistics, intellectual property and commercialisation, and preparing a paper for publication.
A new HDR international online application module was released during the year, ending the need for international applicants to complete paper application forms. This improves the completion of response forms and allows easier monitoring and progress of applications.
The University established joint PhDs with three of its international priority partners: the University of Nottingham, the University of Freiburg and Nagoya University. It was the first degree of this type approved by the government of Japan and, as such, is seen as a model others can follow.
Research supportThe University continued to invest in research infrastructure and other initiatives to support the University’s researchers in achieving their goals.
Adelaide MicroscopyIn July the University hosted the launch of the renovated Adelaide Microscopy facilities and its $3.6 million flagship instrument—an Aberration Probe Corrected 200kV Transmission Electron Microscope (TEM). Adelaide Microscopy has been a core University facility for decades, evolving over time to match technological changes and the needs of researchers. This is the only such TEM to be installed in South Australia, and the only one with its significant level of capability nationally.
Barbara Kidman Women’s FellowshipsThe fourth round of the successful 2016 Barbara Kidman Women’s Fellowships scheme was conducted in the second half of the year. The initiative aims to support female academics to enhance and promote their research careers, particularly where research momentum has been affected by caring responsibilities. The successful recipients of 2016 Fellowships were: Dr Jaklin Eliott (School of Public Health); Dr Susan Hemer (School of Social Sciences); Dr Sabrina Heng (School of Physical Sciences); Dr Manuela Klingler-Hoffmann (School of Biological Sciences); Dr Melanie McDowall (School of Medicine); Dr Aspa Sarris (School of Psychology); Dr Nicole Starbuck (School of Humanities); and Dr Melissa Whitrow (School of Public Health).
Online support projectsIn late 2015 the University released Researcher Profiles as a more effective way of providing information to enhance HDR student recruitment, research collaborations, and industry and media engagement. Data flows to individual webpages from Aurora, the University’s web-based system for capturing and reporting research publications and outputs.
The University is implementing a new ‘research integrity’ online training module for researchers, customised for the University.
Work also commenced on a new web-based system, process re-design and workflow for submitting, reviewing and approving projects that require Animal Ethics approval.
Research 49

ANZAC CentenaryThe University took an active part in commemorations of the ANZAC Centenary on 25 April 2015 and surrounding days. At the Union Cloisters at the North Terrace campus and outside the College Chapel at Roseworthy campus, Vice-Chancellor and President Professor Warren Bebbington unveiled centennial plaques commemorating the many University staff and students who had given their lives in World War I. A commemorative plaque was also unveiled at the University Oval Grandstand by the University’s cricket and football clubs, with the two clubs planning a memorial picket fence outside the grandstand in 2016. Professor Bebbington laid wreaths on the University’s behalf at the dawn ceremony at the War Memorial on North Terrace. ANZAC Centenary celebrations continued with events across the University, including a free public forum to explore the impacts of the Gallipoli campaign, and a community event organised by the Roseworthy Old Collegians Association that included a demonstration by Troopers of the Barossa Light Horse Historical Association.
External relationsThe University plays a significant part in the economy, life and culture of South Australia.
In 2015 the University continued its leading role in the city of Adelaide, contributing to the vibrant
arts and cultural life, and more broadly through its strong relationships with government, industry,
alumni and the wider community.
50 External relations

Left: Premier Jay Weatherill speaking at the Professor Graeme Hugo AO Memorial Lecture
Elder HallConsidered one of Australia’s finest concert venues, Elder Hall attracts over 50,000 visitors annually and is an integral part of Adelaide’s cultural life. In 2015 it held concerts, school music events and graduations, festivals, arts events, community groups, national and international conferences, lectures and corporate events.
The Elder Conservatorium of Music presents two main concert series in Elder Hall each year: the very popular Friday Lunchtimes at Elder Hall series, with music from all eras and styles, performed by Elder Conservatorium staff and ensembles as well as guest artists; and the Evenings at Elder Hall series of concerts, showcasing the Elder Conservatorium student choirs, ensembles and alumni.
In 2015 the Lunchtimes series drew record subscriptions, with many concerts selling out. There were performances by an extraordinary range of musicians, from Aria award-winning oud player Joseph Tawadros and jazz singer and alumni Michelle Nicolle, to the Streeton Trio and the Elder Conservatorium’s own Chamber Orchestra in a wonderful performance of Mozart’s perennial favourite Eine kleine Nachtmusik.
A 2015 highlight for the Evenings series was the special gala concert in July, in which local, national and international musicians paid special tribute to their former teachers and mentors, violinist Beryl Kimber, OAM, and pianist Clemens Leske (senior), AM, in celebration of their extraordinary contribution to the Elder Conservatorium of Music and to the world of music.
Elder Hall also presented the inaugural Adelaide Guitar Chamber Music Festival and the Elder Perspectives series, making it one of the most popular fine-music venues in Adelaide.
Theatre GuildThe University of Adelaide Theatre Guild continued to delight and entertain the public in 2015, with all three main stage productions attracting critical acclaim and commercial success. The May production of Much Ado About Nothing, directed by Megan Dansie, received several nominations at the Adelaide Theatre Guide ‘Curtain Call’ awards, including Best Show Comedy, Best Ensemble, and Best Technical. The August 2014 production of No Man’s Land by Harold Pinter, directed by Warwick Cooper, was nominated for Best Show Drama, with Michael Baldwin nominated for Best Male Performance for his role as Spooner.
Also in May, the Theatre Guild collaborated with others across the University to present Cultural Musing: the Great War at the University of Adelaide. Past Chair, current Theatre Guild member and Associate Professor in French Studies Dr Ben McCann read a number of WW1 poems and correspondence between the University and families of students and staff who served.
To end the year, the Theatre Guild won both Adelaide Critics Circle Awards for Amateur Theatre in 2015 for its August production of Edward Albee’s Who’s Afraid of Virginia Woolf?, winning Best Group and Best Individual, which went to Julie Quick for her performance as Martha.
University of Adelaide student members directed, performed and crewed a successful two-night season of DNA, and presented a scene from A Midsummer Night’s Dream on Open Day.
Arts and cultureFrom innovative theatre productions to popular lunchtime concerts and cultural exhibitions, the University hosts tens of thousands of people on campus every year. Following are some of the highlights of arts and cultural activity at the University in 2015.
University collectionsThe University of Adelaide has more than 40 distinct cultural collections, each revealing facets of the University’s illustrious history, and showcased through a program of public events. In 2015 the collections were enhanced with numerous donations, acquisitions of works of art, and discoveries of overlooked but invaluable material from a range of disciplines. The following, for example, stand out for their significance to the University.
A group of scores by the little-known composer Arthur Williamson was discovered in the Elder Music Library. Williamson was an Elder Conservatorium of Music graduate and active in the Adelaide music scene from the 1910s to the 1930s. A special concert for the Williamson family was organised by Elder Music Librarian Denise Tobin, teacher and organist Ashleigh Tobin, and singer and Elder Conservatorium student Christian Evans—the first time in around 100 years that the music had been performed. The family subsequently donated their own collection of Williamson’s music scores to the University, ensuring that an important part of Adelaide’s music history is preserved.
The University also received from Tom and Jenny Barr Smith a donation of historic garments, a sword, and Order of Saint Michael and Saint George regalia that belonged to their relative Sir Thomas Elder, one of the University’s foundation benefactors. This gift adds to the continuing legacy of Sir Thomas, complementing his generous bequests that established the Elder Professorship of Music, the Elder Overseas Scholarship (which had been won by Arthur Williamson) and the Elder Hall (where Williamson’s music had certainly been performed).
External relations 51

> I am God: The Complete Scriabin Sonatas, a performance at Elder Hall
> Visions of Precarity: Creative Reponses to Precarity in Australia and Japan, a seminar with Associate Professor Kristina Iwata-Weickgenannt (Nagoya University) and Dr Luke Harrald (Elder Conservatorium).
Other highlights included: the announcement of Dr Cath Kenneally as the inaugural Copyright Agency Limited (CAL) JM Coetzee Writing Fellow, a six-month residency for a mid-career writer that is generously supported by the CAL Cultural Fund; and establishment of the JMCCCP reading group, the Creative Mind.
Radio AdelaideRadio Adelaide continued to inform, engage and entertain its audiences with a diverse range of programs, also providing valuable broadcasting experience for students as part of their studies.
In 2015, the community radio station was a finalist in all five categories of the National Community Broadcasting Awards. The year also saw volunteer presenter Terry Heazlewood awarded a Premier’s Certificate of Recognition for outstanding volunteer service.
Further highlights included the launch of Listen Again—an on-demand listening service that allows people to listen to their favourite programs at a time that suits them.
With a move of its studios due in mid-2016, following sale of its premises, an external Review was conducted in August-September to develop options for the station’s future. In November the Review recommendations were published and public response invited. The overwhelming view of respondents was that a transition to independence was preferred for the station and, after considering bids from a number of organisations, in February 2016 the University engaged Fresh FM to manage the transition. The station’s educational mission is to be preserved by the new entity.
Faculty of Arts, became Chair, Advisory Board (SA and NT) on the retirement from the position of Mr Rodney Smith. Professor Shaw is also the Deputy Chair of the Federal Board.
The AMEB’s work was strengthened during the year, with: continuing development of support for teachers and examiners; additional examining sessions; the release of a Musical Theatre syllabus; and a trial partnership with Rockschool London to examine Rockschool students.
Carols on campusThe 6th annual free Carols on Campus had a special surprise conductor this year, Vice-Chancellor and President Professor Warren Bebbington. The Carols once again attracted a full house in Bonython Hall featuring musicians from the Elder Conservatorium of Music, the magnificent Bonython Hall organ and seasonal readings by University staff and members of Council.
JM Coetzee Centre for Creative Practice 2015 was a period of growth and transition for the JM Coetzee Centre for Creative Practice (JMCCCP), with the appointment of Professor Jennifer Rutherford as its new director. Professor Rutherford comes to the centre with an impressive track record of interdisciplinary scholarship in the creative arts and social theory.
This year, the centre extended its membership to art historians and digital artists, and the artistic vision of the centre was consolidated around three key research nodes: precarity, curatorship, and transnational literature. The centre also organised and supported a number of significant events throughout the year, including:
> Inkers and Thinkers: Alternative Forms, Alternative Voices, an interdisciplinary symposium on comics and graphics narratives
> Experimentalities: Why and Why Now? symposium, masterclass with Marion May Campbell, seminar with Kate Lilley, and reading night, all focusing on experimental writing (co-hosted with the Department of English and Creative Writing)
Australian String QuartetAustralian String Quartet (ASQ), the University’s quartet-in-residence at the Elder Conservatorium of Music, continued to deliver a vibrant artistic program of performances, workshops, commissions and education projects in 2015.
Highlights included:
> a special 30th anniversary celebration at Bridgewater Mill featuring founding and past ASQ members William Hennessy, Elinor Lea, Keith Crellin and Janis Laurs
> premiering the work of three leading Australian composers: Ross Edwards’ Gallipoli in acknowledgement of the ANZAC centenary; Matthew Hindson’s String Quartet No 3: Ngeringa for the opening of the new Ngeringa Cultural Centre at Mt Barker; and Brett Dean’s And Once I played Ophelia for soprano and string quartet
> world-renowned cellist Pieter Wispelwey joining the Quartet for their flagship festivals in Dunkeld and Margaret River
> the ASQ’s first extensive tour of Northern Italy, which included a high-profile performance at the Scuola Grande di San Rocco for Australia’s opening event at the Venice Biennale
> a South Australian secondary schools string quartet program, extending from Mt Gambier to the Barossa Valley.
Following a thorough national recruitment search, the ASQ announced the appointment of its new violinists, Dale Barltrop and Francesca Hiew, who join ASQ violist Stephen King and cellist Sharon Draper to form the new ASQ line-up from 2016.
Australian Music Examinations Board (AMEB)The AMEB (SA and NT) works with students of approximately 1000 teachers in building foundations for both the music, and the speech-and-drama communities. Close contact with its communities ensures it remains relevant.
In 2015 it celebrated 128 years of continual music examining. Federally, the AMEB is preparing to celebrate its centenary in 2018. Professor Jennie Shaw, Executive Dean, of the University’s
52 External relations

Alumni relationsIt was another busy year for alumni engagement in 2015, with events held in London, Kuala Lumpur, Singapore, Hong Kong, Beijing, Sydney, Canberra, Melbourne and Adelaide. All events were well supported by the University’s alumni, who are keen to remain engaged with their alma mater. The year also marked the 29th annual Golden Jubilee reunion, with 116 graduates from 1965 coming together to re-enact their graduation ceremony of 50 years prior and reminisce over old times. While celebrating this significant milestone, they contributed over $20,730 through a Class Gift to support a PhD student.
The University of Adelaide Alumni Council, chaired by prominent Adelaide businessman and alumnus Dr Tim Cooper, AM (MBBS 1980, MBA 1998), met four times during 2015. After reviewing how alumni are connected to
the University and looking at how they can be further engaged through more relevant and meaningful opportunities, the Alumni Council developed an alumni engagement strategy. The strategy will: build a sense of pride; develop programs relevant to the age and stage of alumni; foster connections through alumni communities; empower alumni as advocates and supporters of the University; and provide relevant, personalised, clear and accessible communications.
Over 150 alumni, representing alumni networks in Australia and overseas, volunteered their time and talent in 2015 to provide a range of opportunities for alumni to connect with each other and to support the University. Fourteen alumni volunteers were recognised for their significant contribution to the advancement of the University’s alumni program as alumni fellows. Two alumni
were awarded the James McWha Award of Excellence and three were awarded the Distinguished Alumni Award for their achievements in humanitarian endeavours, professional excellence and significant contribution to their communities. The Honours and Postgraduate Alumni University Medals were awarded to two of the University’s newest graduates in recognition of their outstanding academic achievement (see full lists of alumni awards in ‘Awards and achievements’, page 18).
Alumni in Adelaide continued to participate in the Experience Adelaide program, connecting first-year international students with Adelaide-based alumni families. The program provides international students with a more personal welcome to Adelaide and an introduction to the Australian way of life.
2015 Golden Jubilee
External relations 53

Stakeholder engagementIn 2015 the University continued to develop and enhance the University’s relationships with key stakeholders in government, industry and the community.
The University hosted state and federal parliamentarians and ministers during 2015 on tours of its campuses and facilities at North Terrace, Waite and Roseworthy, and continued to build long-term collaboration and partnership opportunities with industry and community stakeholders. More than 40 lunch or dinner events were hosted by the Vice-Chancellor for business and community leaders.
A community relations plan, outlining the University’s commitment to local and national communities, was endorsed and implementation begun with participation in two key events. A team of 60 University staff participated in the Hutt Street Centre’s Walk a Mile in my Boots fundraising event on 7 August. In partnership with Adelaide University Sport, 275 staff, students, alumni and friends participated in the City-Bay fun run on 18 September as part of a University of Adelaide team.
Waite Historic Precinct Community outreach activities in 2015 included the release of the Waite Arboretum app, which guides visitors around the arboretum. The app provides details on all 2300 arboretum tree specimens, and features an interactive map that allows visitors to search and locate their favourite trees and discover information about trees in their immediate area. The year also saw guided walks, fundraising events, a vibrant volunteer program and working bees organised by community organisations. TREENET, an urban forest research and education organisation based at the Waite Arboretum, held its 16th symposium for more than 200 delegates.
Substantial building restoration of Urrbrae House occurred in 2015, including a new historic bedroom display, and the house was re-accredited as a museum until 2018. Over 4500 people attended community events, and Urrbrae House took part in the SA History festival About Time in May. Cultural events were
run throughout the year with the Friends of Urrbrae House and University Collections.
The Urrbrae House Schools’ Program continued in 2015, with 700 primary school children attending the interactive history program set in the 1890s. Other educational activities aimed at disadvantaged children were undertaken with the Children’s University and Adelaide Compass.
University volunteer programIn 2015, nearly 2500 volunteers contributed 155,364 hours of work. Volunteers participated in over 40 different programs, including at the Barr Smith Library, Adelaide University Sport, Faculty of Health Sciences, Radio Adelaide, Theatre Guild and the International Student Centre. For the first time, volunteers participated in the Volunteering SA-NT Parade to mark National Volunteer Week, and a volunteer recognition event was held in Bonython Hall to acknowledge the outstanding contribution volunteers have made to the University community.
PhilanthropyThanks to the generosity of supporters, over $5.9 million was gifted to the University in 2015, a 40% increase on the previous year, and the number of donors increased by 48%. A record number of 36 new bequests were also confirmed as members of the Hughes Bequest Society. The University’s direct mail appeals brought in a record $587,156 during 2015, up 70% on 2014.
Donors continued to see merit in supporting the Barr Smith Library appeal ($135,070) and have enabled the University to continue to increase the number of Augustus Short Scholarships for disadvantaged students, with generous donations totalling $160,196. The Adelaide Health and Medical Sciences building capital appeal, launched in October, had by the end of December already received support and pledges of $566,354.
The Community Outreach Dental Program, which provides life-changing outcomes for many of Adelaide’s homeless people, received support from donors totalling $104,941.
*Represents a pledge from Shanxi Zhendong Pharmaceutical Co Ltd for $7.25 million for the establishment of the Zhendong Chair of Molecular Traditional Chinese Medicine.
$12 million
$10 million
$8 million
$6 million
$4 million
$2 million
2013 2014 2015
Chair* Major gifts Regular gifts Bequests
Total gifts to the University
54 External relations

Reaching the communityUniversity brand campaignNow in its third year, the Seek Light brand campaign continues to deliver outstanding results. Brand tracking has indicated strong levels of appeal and alignment with the University’s strategic themes, as well as high levels of advocacy.
Engaging with future studentsThe University holds a number of events to engage with prospective students and provide more information about the University, its programs and wider University life—from sports and clubs through to global learning opportunities. Two successful approaches include Open Day and Open Night. Each of these events attracts thousands of potential future students, as well as other members of the University community.
Open Night was recognised by its peers in winning a national award for Excellence in Marketing, Communication and Public Relations. The event was also national finalist in the Australian Marketing Institute Awards for Excellence.
Profiling researchInitiatives to profile the University’s outstanding research include the Research Tuesdays seminar series and a new research blog. Research Tuesdays brings together industry, business and the broader community to communicate the diversity and impact of the University’s research. In 2015 attendance and engagement with the series continued to grow.
The new research blog demonstrates the impact and influence of the University’s research through stories, videos and researcher profiles, showing how University of Adelaide research is addressing the big issues we face locally and globally. The blog can be seen at: http://blogs.adelaide.edu.au/research/
Social mediaThe University continues to grow its social media and digital platforms (Facebook, Twitter, Instagram, LinkedIn and YouTube), with sector-leading levels of engagement. The combined audience across all platforms reached 185,000 in 2015, engaging 348,000 times with the University’s social media content.
Recognition of the pastIn 2013 a selection of the earliest University records was inscribed onto UNESCO’s Australian Memory of the World Register, a first for any Australian university. In 2015 University Archives were recognised with a second inscription onto the World Register as a result of a joint nomination with the South Australian Museum for the records of the Board for Anthropological Research.
External relations 55

Enablers and supportersIn 2015 the University embarked on a program that shifts the way it enables and supports its learning, teaching and
research activities. Implementing innovative processes, developing skilled people and providing increasingly
responsive services will drive efficiencies and effectiveness throughout the organisation.
56 Enablers and supporters

Developing peopleBuilding leadership and management capabilityOrganisational culture and performance is shaped by an organisation’s leaders. Equipping leaders to continue to build a culture of performance has been the focus of the leadership and management capability program in 2015, with a particular emphasis on:
> introducing a University-wide manager induction program to provide clarity around the responsibilities and expectations of University managers and the support available to assist them in discharging those responsibilities
> masterclasses aimed at equipping Heads of School to conduct critical conversations with academic staff on performance expectations, including as an input into the annual planning, development and review cycle
> improving financial management by ensuring a University-wide understanding of the University’s financial strategy, and the levers available for growing revenue and reducing cost.
Gender, equity and diversityNamed after the University’s first female graduate Edith Dornwell, the Dornwell Framework was established in April 2015 to provide strategies and outline actions that will help to improve the University’s gender equity outcomes. Activities arising from the Dornwell Framework during 2015 included:
> The launch of the Women’s Research Excellence Awards. Established to celebrate International Women’s Day, the awards recognise, celebrate and promote academic women’s research excellence at the University of Adelaide. Twelve outstanding University of Adelaide women researchers—four mid-career and eight early-career—were the inaugural recipients. The successful early-career researchers were: Dr Katie Barclay (School of Humanities); Dr Nicolette Hodyl and Dr Lisa Moran (Robinson Research Institute, School of Paediatrics and Reproductive Health); Dr Yan Jiao (School of Chemical Engineering); Dr Camille Short and Dr Susan Woods (School of Medicine); Dr Laura Weyrich (Australian Centre for Ancient DNA); and
Key objectives 2015In support of the University’s learning and teaching and research, key objectives for 2015 included:
> supporting the development of high performers while improving the leadership and management capacity of staff
> ensuring a safe and healthy environment
> continuing to address gender, equity and diversity opportunities
> improving the utilisation of facilities and infrastructure
> encouraging sustainable practices
> improving administrative effectiveness
> optimising financial reporting and planning.
Context and overviewTo ensure that learning, teaching and research can flourish in an increasingly competitive environment, the University is investing in a range of programs that will enhance the effectiveness of its enablers and supporters.
In 2015, the University introduced the Professional Services Reform (PSR) program, a significant platform that aims to address current challenges and constraints and enable support services to be delivered more efficiently. PSR seeks to:
> create greater consistency across the University regarding how and where professional support services are provided
> reduce duplication across the University by defining the roles and accountabilities of schools, faculties and divisions
> provide guidance on setting service expectations for service areas with the intention of improving service quality and culture
> make it possible to simplify processes more efficiently and implement IT systems more effectively through designing consistent and complementary professional service structures
> ensure professional staff are located in organisational structures that provide clearer career pathways and greater development opportunities
> release more time for academic staff to devote to teaching and research away from managing professional staff, supervising administrative and support activity, and engaging in administrative processes.
The University also recognised the need to continue its investment in ensuring its technology is world-class, helping make the University an attractive proposition for students and leading academics, as well as supporting research activity and evolving teaching practice. The technology investment program reaches all parts of the University and is dramatically transforming the way the University conducts its business internally and externally.
While investing in change, the University also continues to ensure its fundamental business requirements—finance, human resources, legal and risk management, and services—meet both its own and legislative requirements.
Enablers and supporters 57

Assets and infrastructureAdelaide Health and Medical Sciences projectThe $231 million Adelaide Health and Medical Sciences project continues to progress at pace, with significant milestones in 2015 including:
> excavation of 60,000 m3 of soil (24 Olympic-size swimming pools)
> drilling, reinforcing and pouring of 274 retention and structural concrete piles
> the erection of eight external structural steel columns, including two feature raked columns
> fabricating and pouring eight floors and nine levels of cores, using 6458.9 km of reinforcement and 25,000 tonnes of concrete
> commencing installation of the lower-level façade.
Redevelopment of existing facilitiesThe University successfully delivered $22.5 million worth of projects and initiatives in 2015 including:
> the development and roll-out of common teaching area upgrades to support small-group discovery
> completion of the refurbishment of three floors of the Ligertwood building for Adelaide Law School
> refurbishment and fit-out of 2892 m2 of the basement and ground floor of Medical School North for Adelaide Microscopy, including the creation of a new Physical Containment Level 2 (PC2) suite, gas reticulation and shielding of rooms
> refurbishment of research laboratories in the Hickinbotham building at Roseworthy campus, to achieve PC2 certification
> the delivery of a secure bio-repository (biobank) facility within the Benham building, to facilitate the consolidation and secure long-term storage of valuable research materials at the North Terrace campus.
SustainabilityThe University’s Green Project Fund delivered lighting upgrades, water efficiency infrastructure, an energy study and a solar power system. Students were involved in campus internships, undertaking energy and waste audits, and investigating ways to encourage recycling and reduction of waste. The Ecoleader network (sustainability representatives within a local area) continued to grow, providing resources and training for staff interested in delivering local energy efficiency. A significant achievement was the implementation of a 30 kW roof-top solar photovoltaic system installed at Roseworthy campus to reduce reliance on grid electricity. Along with embracing new technologies, these initiatives are continuing to ensure that the University is an efficient user of energy.
Property and leasingThe University of Adelaide regularly reviews its properties and facilities and has undertaken cycles of asset acquisition and divestment over many years. In 2015 a small number of University-owned properties located in the Adelaide CBD and at Wasleys was released for sale. This round of property sales followed a significant review of assets not delivering optimum benefit to the University. The proceeds were reinvested into education and research aligned with the University’s overarching strategic directions.
Dr Lina Yao (School of Computer Science). The successful mid-career researchers were: Associate Professor Heike Ebendorff-Heidepriem (Institute for Photonics and Advanced Sensing, School of Physical Sciences); Dr Joanna Howe (Adelaide Law School); Associate Professor Lisa Jamieson (Australian Research Centre for Population Oral Health); and Associate Professor Yvonne Stokes (School of Mathematical Sciences).
> Flexible Work Arrangements masterclasses for Heads of School and other people leaders to support managers in considering and facilitating requests for flexible work arrangements.
> Ten focus groups to analyse the University’s culture with respect to equity and inclusion, and to inform the Voice Staff Survey scheduled for May 2016.
Defining performance expectationsTo support the new Adelaide Academic Role Statements for each faculty and to inform discussions, a system-generated Individual Academic Profile has been developed that is provided periodically to each academic staff member and their Head of School. The profile presents information as it is recorded in the University’s systems and other standard sources about teaching activity, HDR supervisions and completions, publications and research grants.
Health, safety and well-beingThe University participated in a Return to Work (formerly WorkCover) evaluation and has been recommended for a five-year registration as a self-insurer. A five-year registration is the best outcome possible for a self-insurer under the Code of Conduct for Self-Insured Employers (May 2015) and Return to Work Act (2014). This result demonstrates the University’s ability to effectively operate evidence-based safety and injury management systems that conform to specific performance standards.
58 Enablers and supporters

Improving processesFinancial planningThe University’s financial planning model was further enhanced in 2015 through the development of an online and automated budgeting and forecasting system, ensuring greater accuracy and a significantly more efficient financial planning process. An activity-based costing model was also introduced, providing financial information that is more closely aligned to the core activities of the University—research and teaching. The data available from this model is being used in a number of ways, including the assessment of programs and courses, and to reassess resource allocation across the University.
Leveraging technology Following on from the successful delivery of new processes for the management of casual staff and recruitment, the University has been working to optimise, upgrade and automate a range of key business processes. New online forms have been made available for a range of previously paper-based activities and workflows. Other major transformations include the streamlining of the onboarding checklist, issuing of electronic payment summaries, and the launch of an online training module for chemical safety management. Analysis has also been completed for a range of forms that will go online in the coming year to deliver smarter, faster and leaner processes.
Library of the Future The changing face of library services across the world has prompted the University to contemplate the library of the future. Guiding the extensive consultation and input across the University were two key aims, namely to conceptualise:
> an inspirational asset in support of the University vision and strategies for learning, research and community engagement
> being a leader in the sector for best-practice, innovation, resource provision, and cost-effectiveness for valued services.
The final recommendations, along with the planning of the implementation, will commence in 2016.
An artist’s impression of the new Adelaide Health and Medical Sciences building
Strategic procurementOnline procurement (e-procurement) was successfully rolled out across three faculties, allowing for online ordering and purchasing. This system brings significant improvement and streamlining of the procurement processes, and will be deployed throughout the rest of the University in early 2016. Other procurement savings and enhancements have also been implemented through preferred supplier negotiations, enhanced travel-approval processes, implementation of an ‘e-tendering’ solution and commencement of a pilot for the use of purchase cards.
Improving customer relationship managementCustomer relationship management (CRM) application RightNow has been introduced to provide an integrated, single point of reference for communicating with the University’s prospective and current students and other stakeholders. RightNow has been implemented across most of the University’s customer service environments including AskAdelaide, Student Administration and the faculties, to enable a more streamlined and enhanced student experience. The application has already proven itself as a significant new tool for marketing to prospective students and, through its ability to store transaction-level information, will enable evidence-based decision-making into the future.
Enablers and supporters 59

Financial statements
60 Financial statements 2015


Report by the members of the Council 2015
The following persons were newly appointed/elected members during 2015 and continue in office at the date of this report.
Member Date appointed/elected
Professor Andrew Abell Elected 6 March 2015
Ms Christine Locher Appointed 1 May 2015
Ms Kathryn Presser Appointed 1 June 2015
Mr Stuart Matthews Elected 6 March 2015
The members of the Council present their report on the consolidated entity consisting of the University of Adelaide and the entities it controlled at the end of, or during, the year ended 31 December 2015.
The following persons were members from the beginning of the year until his/her term of office ceased.
Member Date ceased
Mr Charles Bagot 31 December 2015
Mr Lawrence Ben 5 March 2015
Dr Alison Broinowski 3 June 2015
Ms Wendy Johnson 8 February 2015
Mr Zhao (Joe) Lu 5 March 2015
Professor Clement Macintyre 31 December 2015
Dr Susan Robinson 18 June 2015
Mr Shane Selvanderan 5 March 2015
Mr Aaron Thomas 5 March 2015
Professor Anthony Thomas, FAA 5 March 2015
The following persons were new ex-officio/appointed/elected in 2016 and are members up to the date of this report.
Member Date ex-officio/appointed/elected
Mr Peter Siebels Appointed 1 January 2016
Mr Zhao (Joe) Lu Elected 6 March 2016
Mr Kyriaco Nikias Elected 6 March 2016
Ms Lucinda Wojt Elected 6 March 2016
The following persons were elected/appointed during 2015 and were members until his/her term of office ceased.
Member Date appointed/elected Date ceased
Mr Ethan Dutcher Elected 6 March 2015 5 March 2016
Mr James Johnston Elected 6 March 2015 5 March 2016
Mr Jack Lienert Elected 6 March 2015 5 March 2016
MembersThe following persons were members of the Council during the whole year and up to the date of this report:
> Rear Admiral the Honourable Kevin Scarce, AC, CSC, RAN (Rtd)
> Professor Warren Arthur Bebbington
> The Honourable Catherine Branson, QC
> Mr Robin Day
> Ms Dianne Davidson, AM
> Ms Julie Hayford
> Mr David Hill
> Ms Kerrynne Liddle
> Associate Professor Felix Patrikeeff
64 Report by the members of the Council 2015

Meetings of membersThe number of meetings of the University of Adelaide Council and of each committee of Council held during the year ended 31 December 2015, and the number of meetings attended by each member were:
Coun
cil
Acad
emic
Boa
rd
Audi
t, Co
mpl
ianc
e
and
Ris
k Co
mm
ittee
Conv
enor
s’
Com
mitt
ee
Esta
te a
nd
Infr
astr
uctu
re
Com
mitt
ee
Fina
nce
Com
mitt
ee
Inde
pend
ent C
ounc
il Se
lect
ion
Com
mitt
ee
Peop
le a
nd C
ultu
re
Com
mitt
ee
Seni
or E
xecu
tive
Rev
iew
Com
mitt
ee
Spec
ial D
egre
es
Com
mitt
ee
A B A B A B A B A B A B A B A B A B A B
Chancellor (Rear Admiral the Honourable Kevin Scarce, AC, CSC, RAN (Rtd)
8 8 1 8 8 8 4 9 4 4 2 2 3 3
Vice-Chancellor (Professor Warren Bebbington)
8 8 8 8 4 5 8 8 3 3 9 9 1 1 2 2 3 3
Professor Andrew Abell 7 7
Mr Charles Bagot 6 8 4 5 7 8 2 3 9 9 1 2
Mr Lawrence Ben 1 1
The Hon. Catherine Branson, QC 7 8 5 5 7 8 1 1
Dr Alison Broinowski 4 7
Ms Dianne Davidson, AM 8 8 6 8 3 3 5 9 2 2 3 3
Mr Robin Day 8 8 2 2
Mr Ethan Dutcher 6 7
Ms Julie Hayford 8 8
Mr David Hill 6 8
Ms Wendy Johnson* 0 0
Mr James Johnston 6 7
Ms Kerrynne Liddle 6 8 3 3 0 1
Mr Jack Lienert 7 7
Ms Christine Locher 5 5 1 1 4 4 1 1 1 1
Mr Zhao (Joe) Lu 1 1
Professor Clem Macintyre 7 8 7 8 6 8 1 1 3 3
Mr Stuart Matthews 7 7
A/Professor Felix Patrikeeff 8 8
Ms Kathryn Presser 1 4
Dr Susan Robinson 2 5
Mr Shane Selvanderan 1 1
Mr Aaron Thomas 1 1
Professor Anthony Thomas, FAA 1 1
*Ceased 8 February 2015 prior to first scheduled meeting for 2015.A = Number of meetings attendedB = Number of meetings held during the time the member held office or was a member of the committee during the year.
Report by the members of the Council 2015 65

Environmental regulationThe Group’s operations are subject to various environmental regulations under both Commonwealth and State legislation, which set the minimum requirements the Group entity must meet.
The University’s Environmental Management Program includes a comprehensive environmental regulations compliance plan within the guidelines of the University’s Legal Compliance Framework. The plan provides information, resources and advice to the University community to build a stronger compliance culture.
Insurance of officersThe University maintains a comprehensive insurance program, which is reviewed and renewed annually. The insurance program includes directors and officers liability insurance for members of Council, members of committees of Council and directors and officers of the University and controlled entities of the University.
This report is made in accordance with a resolution of the members of the Council.
Rear Admiral the Honourable Kevin Scarce, AC, CSC, RAN (Rtd)Chancellor
Adelaide, 30 March 2016
Principal activitiesDuring the year, the principal continuing activities of the consolidated entity consisted of higher education, research, consultancy and other commercial operations supporting or ancillary to University activities.
Review of operationsThe University reported a consolidated operating result of $50.3 million for the year (2014: $53.1 million). The result was supported by continued growth in student numbers and continued strong research performance.
Significant changes in the state of affairsIn the opinion of the Members of Council, there were no significant changes in the state of affairs of the consolidated entity during the financial year under review.
Matters subsequent to the end of the financial yearThere were no events subsequent to the reporting date that have a material effect on the financial statements for the reporting period.
Likely developments and expected result of operationsThe consolidated entity will continue to pursue its primary activities of higher education and research while maintaining its financial sustainability. During 2015 the University operated within the parameters of the five year financial plan and three year operational plan developed during 2013 to underpin the University’s strategic plan for the period 2013-2023; Beacon of Enlightenment. The strategic plan summarises the core opportunities and challenges during this period and outlines the development of an operating model which allows for greater connection between teaching and research, including providing the opportunity for all students to experience small group discovery as part of their course. The financial plan includes the construction the Adelaide Health and Medical Sciences building within the health precinct in the West End for the University medical school, nursing school and dental clinic.
66 Report by the members of the Council 2015

Report by the members of the Council 2015 67

Statement of Comprehensive Income for the year ended 31 December 2015
2015 2014 2015 2014Note $000 $000 $000 $000
Revenue from continuing operationsReceived under Higher Education Support ActBase operating financial assistance 4 214,650 210,565 214,650 210,565Other operating financial assistance 4 7,991 8,165 7,991 8,165Higher Education Contribution Scheme 4 114,725 112,451 114,725 112,451
337,366 331,181 337,366 331,181Learning and TeachingStudent fees 4 198,188 183,475 198,188 183,475Grants 4 31,612 35,551 31,612 35,607
229,800 219,026 229,800 219,082Research Grants and FeesNational competitive grants 99,062 108,984 99,062 108,984Public sector - other 55,301 54,127 40,361 39,083Industry and other 56,438 60,613 39,884 42,540
210,801 223,724 179,307 190,607Research - OtherCooperative Research Centre direct funding 3,573 2,959 3,573 2,905Research infrastructure program 15,519 16,164 15,519 16,164Sustainable Excellence Research Funding 10,062 9,364 10,062 9,364
29,154 28,487 29,154 28,433OtherInvestment revenue 4 27,437 31,569 25,882 28,726Property revenue 4 15,804 15,779 15,561 15,747Specialist services and trading 4 45,038 41,716 21,371 18,198Bequests, donations & other revenue 4 39,844 35,303 34,253 30,103
128,123 124,367 97,067 92,774Total revenue from continuing operations 935,244 926,785 872,694 862,077
Expenses from continuing operationsSalaries and related expenses 5 486,767 478,795 470,708 462,768Student services 46,307 45,748 46,307 45,748Teaching and research 5 89,880 92,328 91,452 94,034Buildings and grounds 5 63,789 59,358 62,563 58,276Finance costs 5 5,168 6,342 5,273 6,459Administration, communication and travel 5 130,323 125,518 81,326 75,428Finance and fund administration 5 2,759 2,575 2,759 2,573Misc equip, dep’n and net loss on disposal of assets 5 59,990 63,043 59,305 62,361Total expenses from continuing operations 884,983 873,707 819,693 807,647
Net operating result for the year 50,261 53,078 53,001 54,430Operating result attributable to minority interest - - - -Net operating result for the year 50,261 53,078 53,001 54,430
The Statement of Comprehensive Income should be read in conjunction with the accompanying notes.
Consolidated University
68 Financial statements 2015

Statement of Comprehensive Income for the year ended 31 December 2015 - continued
2015 2014 2015 2014Note $000 $000 $000 $000
Operating result for the period 50,261 53,078 53,001 54,430
Items that may be reclassified to net operating resultGain / (loss) on swap contracts 9 1,376 (5,976) 1,376 (5,976)Gain / (loss) on value of available for sale financial assets, net of tax 14,33 - - (3,196) (1,364)Total 1,376 (5,976) (1,820) (7,340)
Items that will not be reclassified to net operating resultGain / (loss) on revaluation of works of Art 15 - 54 - 54Share of other comprehensive income of investments accounted for using the equity method 4 (348) 278 - -Remeasurements of Defined Benefit Plans 27(c) 11 (2,899) 11 (2,899)Total (337) (2,567) 11 (2,845)Total other comprehensive income 1,039 (8,543) (1,809) (10,185)
Total comprehensive income 51,300 44,535 51,192 44,245Total comprehensive income attributable to non-controlling interest - - - -
Total comprehensive income attributable to the University of Adelaide 51,300 44,535 51,192 44,245
Consolidated University
Financial statements 2015 69

Statement of Financial Position as at 31 December 2015
2015 2014 2015 2014Note $000 $000 $000 $000
Current AssetsCash and cash equivalents 6 53,936 51,630 45,891 41,457Receivables 7 41,997 31,479 40,653 30,748Other financial assets 8 60,357 90,777 60,147 90,316Derivative financial instruments 9 2 - 2 -Inventories 10 1,972 2,093 634 829Other non-financial assets 11 11,540 12,963 11,407 12,776Deferred government superannuation contribution 27(d) 4,300 4,200 4,300 4,200
174,104 193,142 163,034 180,326Non-current assets held for sale 12 22,600 46,138 22,600 46,138Total current assets 196,704 239,280 185,634 226,464
Non-current AssetsOther financial assets 8 265,247 248,804 258,655 242,188Investments accounted for using the equity method 13 2,121 1,988 972 491Available-for-sale financial assets 14 - - 22,366 25,562Property, plant and equipment 15 1,230,164 1,167,595 1,218,256 1,154,975Investment property 16 - - - -Intangible assets 17 20,730 18,007 20,730 18,007Other non-financial assets 11 7,899 8,141 7,899 8,141Deferred government superannuation contribution 27(d) 64,128 67,302 64,128 67,302Total non-current assets 1,590,289 1,511,837 1,593,006 1,516,666Total assets 1,786,993 1,751,117 1,778,640 1,743,130
Current LiabilitiesPayables 18 76,538 70,599 68,452 61,793Borrowings 19 5,000 5,006 5,000 5,006Provisions 20 27,950 26,297 26,705 25,152Defined benefit obligation 27(d) 4,300 4,200 4,300 4,200Other 21 20,949 17,550 23,485 21,731Total current liabilities 134,737 123,652 127,942 117,882
Non-current LiabilitiesPayables 18 11,737 10,876 11,721 10,824Borrowings 19 46,510 72,518 46,510 72,518Provisions 20 64,329 62,213 64,176 61,814Derivative financial instruments 9 15,706 17,080 15,706 17,080Defined benefit obligation 27(d) 64,128 67,302 64,128 67,302Other 21 1,555 - 1,555 -Total non-current liabilities 203,965 229,989 203,796 229,538Total liabilities 338,702 353,641 331,738 347,420
Net assets 1,448,291 1,397,476 1,446,902 1,395,710
EquityCapital reserves 23 579,168 579,168 596,832 600,028Specific purpose reserves 23 608,356 585,099 608,356 585,099Retained surplus 23 260,770 233,211 241,714 210,583Total University interest 1,448,294 1,397,478 1,446,902 1,395,710Non-controlling interest (3) (2) - -Total equity 1,448,291 1,397,476 1,446,902 1,395,710
The Statement of Financial Position should be read in conjunction with the accompanying notes.
Consolidated University
70 Financial statements 2015

Statement of Changes in Equity for the year ended 31 December 2015
Consolidated Capital Reserves
Specific Purpose
ReservesRetained Surplus
Non-controlling
Interest Total$000 $000 $000 $000 $000
Balance at 1 January 2014 579,114 537,462 236,367 (2) 1,352,941Net result - 47,637 5,441 - 53,078Other comprehensive incomeGain / (loss) on revaluation of works of Art 54 - - - 54Gain / (loss) on swap contracts - - (5,976) - (5,976)Share of other comprehensive income of investments accounted for using the equity method - - 278 - 278Remeasurements of Defined Benefit Plans - - (2,899) - (2,899)Total other comprehensive income 54 - (8,597) - (8,543)Balance at 31 December 2014 579,168 585,099 233,211 (2) 1,397,476
Balance at 1 January 2015 579,168 585,099 233,211 (2) 1,397,476Net result - 23,257 27,005 (1) 50,261Other comprehensive incomeGain / (loss) on revaluation of land and buildings - - - - -Gain / (loss) on revaluation of works of Art - - - - -Gain / (loss) on revaluation of Library - - - - -Gain / (loss) on swap contracts - - 1,376 - 1,376Share of other comprehensive income of investments accounted for using the equity method - - (348) - (348)Remeasurements of Defined Benefit Plans - - 11 - 11Other adjustments recognised directly in equity - - (485) - (485)Total other comprehensive income - - 554 - 554Balance at 31 December 2015 579,168 608,356 260,770 (3) 1,448,291
Financial statements 2015 71

Statement of Changes in Equity for the year ended 31 December 2015 - continued
University Capital Reserves
Specific Purpose
ReservesRetained Surplus
Non-controlling
Interest Total$000 $000 $000 $000 $000
Balance at 1 January 2014 601,338 537,462 212,665 - 1,351,465Net result - 47,637 6,793 - 54,430Other comprehensive incomeGain / (loss) on revaluation of works of Art 54 - - - 54Gain / (loss) on value of available for sale financial assets, net of tax (1,364) - - - (1,364)Gain / (loss) on swap contracts - - (5,976) - (5,976)Remeasurements of Defined Benefit Plans - - (2,899) - (2,899)Total other comprehensive income (1,310) - (8,875) - (10,185)Balance at 31 December 2014 600,028 585,099 210,583 - 1,395,710
Balance at 1 January 2015 600,028 585,099 210,583 - 1,395,710Net result - 23,257 29,744 - 53,001Other comprehensive incomeGain / (loss) on value of available for sale financial assets, net of tax (3,196) - - - (3,196)Gain / (loss) on swap contracts - - 1,376 - 1,376Remeasurements of Defined Benefit Plans - - 11 - 11Total other comprehensive income (3,196) - 1,387 - (1,809)Balance at 31 December 2015 596,832 608,356 241,714 - 1,446,902
The Statement of Changes in Equity should be read in conjunction with the accompanying notes.
72 Financial statements 2015

Statement of Cash Flows for the year ended 31 December 2015
2015 2014 2015 2014Note $000 $000 $000 $000
Cash flows from operating activitiesInflows:Australian Government financial assistance 39(h) 501,126 517,174 500,193 516,804OS-Help (net) 39(h) 1,015 696 1,015 696Higher Education Superannuation 39(h) 4,029 3,804 4,029 3,804State Government financial assistance 25,124 23,092 24,682 22,698HECS-HELP student upfront payments 13,001 13,789 13,001 13,789Fee paying student revenue received 182,018 166,558 182,018 166,558Fees and charges 25,580 23,154 25,580 23,154Donations and bequests 3,756 4,428 3,751 4,428Interest and dividends received 10,996 10,024 5,950 4,580Consultancy and contract research 96,041 90,052 61,318 51,193Specialist services and produce trading 17,364 15,819 7,023 5,579GST received 23,707 23,308 22,427 22,064Other 56,952 41,568 45,867 30,395Total inflows 960,709 933,466 896,854 865,742
Outflows:Salaries and related expenses (482,126) (475,853) (466,254) (459,955)Student services (46,307) (45,748) (46,307) (45,748)Goods and services (308,465) (296,196) (262,824) (250,139)Costs of finance (1,005) (1,088) (842) (899)GST paid (29,407) (25,520) (24,216) (19,826)Total outflows (867,310) (844,405) (800,443) (776,567)Net cash provided by operating activities 24 93,399 89,061 96,411 89,175
-
Consolidated University
Financial statements 2015 73

Statement of Cash Flows for the year ended 31 December 2015 - continued
2015 2014 2015 2014Note $000 $000 $000 $000
Cash flows from investing activitiesInflows:Proceeds from sale of property, plant and equipment 126 306 125 306Proceeds from sale of financial assets 4,559 5,562 4,872 5,800Proceeds from sale of financial assets held-to-maturity 25,005 - 25,005 -Proceeds from sale of non-current assets held for sale 25,000 - 25,000 -Proceeds from joint venture investments 251 - - -Increase in loans 40 40 - -Repayment of loans by related parties 155 1,104 160 1,159Total inflows 55,136 7,012 55,162 7,265
Outflows:Payments for property, plant and equipment (105,776) (55,093) (105,236) (54,214)Payments for intangible assets (10,093) (11,899) (10,093) (11,899)Payments for financial assets (481) (8,585) (481) (8,585)Payments for financial assets held-to-maturity - (1,267) - (751)Payment of loans (39) (6) (14) (6)Increase in loans to related parties (25) - - -Repayment of funds held on deposit - - (1,500) -Total Outflows (116,414) (76,850) (117,324) (75,455)Net cash used in investing activities (61,278) (69,838) (62,162) (68,190)
Cash flows from financing activitiesOutflows:Repayment of borrowings (26,000) (5,000) (26,000) (5,000)Borrowings - interest repayments (3,780) (5,984) (3,780) (5,984)Total outflows (29,780) (10,984) (29,780) (10,984)Net cash used in financing activities (29,780) (10,984) (29,780) (10,984)
Net increase (decrease) in cash and cash equivalents 2,341 8,239 4,469 10,001Cash and cash equivalents at the beginning of reporting period 51,630 42,932 41,457 30,997Effects of exchange rate changes on cash and cash equivalents (35) 459 (35) 459Cash and cash equivalents at end of reporting period 6 53,936 51,630 45,891 41,457
The Statement of Cash Flows should be read in conjunction with the accompanying notes.
Consolidated University
The University invests its surplus working capital into bank term investments. These bank term investments are reported as Financial Assets held-to-maturity within Note 8 (2015: $60.0 million, 2014: $90.2 million). As a consequence these amounts are not reported within Cash and Cash Equivalents and the movement in these assets are not reported within the Statement of Cash Flows.
74 Financial statements 2015
Notes to the Financial StatementsNotes Contents
1 Basis of Preparation2 Scope of Reporting3 Statement of Significant Accounting Policies4 Revenue from Continuing Operations5 Expenses from Continuing Operations6 Cash and Cash Equivalents7 Receivables8 Other Financial Assets9 Derivative Financial Instruments10 Inventories11 Other Non-Financial Assets12 Non-current Assets Held for sale13 Investments Accounted for Using the Equity Method14 Available-for-sale Financial Assets15 Property, Plant and Equipment16 Investment Property17 Intangible Assets18 Payables19 Borrowings20 Provisions21 Other Liabilities22 Employee Benefits and Related On-cost Liabilities23 Retained Surplus and Reserves24 Reconciliation of Net Cash provided by Operating Activities to Operating Result25 Commitments26 Contingencies27 Superannuation Schemes28 Disaggregation Information29 Auditors’ Remuneration30 The University Council Members and Senior Management31 Financial Instruments32 Fair Value Measurements33 Investments in Controlled Entities34 Investments in Associates35 Interests in Cooperative Research Centres36 Interests in Joint Ventures37 Related Parties
Department of Education Reporting Requirements38 Income Statement39 Australian Government Financial Assistance
40(a) Acquittal of Australian Government Financial Assistance – Education - CGS and Other Education Grants
40(b) Acquittal of Australian Government Financial Assistance – Higher Education Loan Programmes
40(c) Acquittal of Australian Government Financial Assistance – Learning Scholarships40(d) Acquittal of Australian Government Financial Assistance – Education - Research40(e) Acquittal of Australian Government Financial Assistance – Other Capital Funding40(f) Acquittal of Australian Government Financial Assistance – Australian Research Council Grants - Discovery40(f) Acquittal of Australian Government Financial Assistance – Australian Research Council Grants - Linkages40(f) Acquittal of Australian Government Financial Assistance – Australian Research Council Grants - Networks and Centres40(g) Other Australian Government Financial Assistance Received
41 State and Local Government Financial Assistance42 Fees and Charges43 Consultancy and Contract Revenue
Financial statements 2015 75

1. Basis of Preparation
These notes, prepared in conjunction with the financial statements, provide an explanation of significant accounting policies andpractices adopted in the preparation of the statements. These policies have been consistently applied to all the years presented, unless otherwise stated. The financial statements and notes collectively constitute a general purpose financial report prepared onan accrual basis and in accordance with Australian Accounting Standards, Australian Accounting Standards Board (AASB) interpretations, the Higher Education Support Act 2003, Financial Statement Guidelines of the Department of Education, the South Australian Treasurer's Instructions and the Accounting Policy Framework issued under the provisions of the Public Finance and Audit Act 1987 (except where in conflict with Department of Education requirements). The University applies Tier 1 reporting requirements.
(a) Compliance with IFRSThe University of Adelaide is a not-for-profit entity and these financial statements have been prepared on that basis. The financial statements and notes of the University comply with Australian Accounting Standards, some of which contain requirements specific to not-for-profit entities that are inconsistent with IFRS requirements.
(b) Critical accounting estimatesPreparation of financial statements in conformity with Australian Accounting Standards requires the use of certain critical accounting estimates. It also requires management to exercise its judgement in the process of applying the University’s accounting policies. The areas involving a higher degree of judgement or complexity, or areas where assumptions and estimates are significant to the financial statements, are disclosed where applicable, in the relevant notes to the financial statements.
Estimates and underlying assumptions are reviewed on an ongoing basis. Revisions to accounting estimates are recognised in the period in which the estimate is revised and in any future periods affected.
2. Scope of Reporting
The financial statements and notes disclose the 2015 operating results and 2014 comparative results of The University of Adelaide as follows:
University - refers to all aspects of operation of The University of Adelaide only.
Consolidated - refers to the financial results of The University of Adelaide together with the financial results of its controlled entities (refer to Note 33). It includes the University’s interests in associates (Note 34) and its joint arrangements (Note 36), recognised using the equity accounting method.
The controlled entities of The University of Adelaide, included in this report are:
Adelaide Research & Innovation Pty Ltd as trustee for The Adelaide Research & Innovation Investment Trust:- ACN 008 123 466 Pty Ltd (Formerly Repromed Pty Ltd)
Adelaide Unicare Pty Ltd as trustee for the Unihealth Research & Development Trust
Martindale Holdings Pty Ltd as trustee for - JS Davies Estate- JAT Mortlock Trust- The Roseworthy Farm
National Wine Centre Pty Ltd as trustee for the National Wine Centre Trust
Roseworthy Piggery Pty Ltd
The Women’s and Children’s Health Research Institute
76 Financial statements 2015
3. Statement of Significant Accounting Policies
(a) Basis of AccountingThis general purpose financial report has been prepared on the basis of historical costs and except where stated, does not take into account changing money values or current valuations of non-current assets.
These accounting policies have been consistently applied by each entity in the Consolidated Entity, and these policies have beenconsistently applied to all the years presented, unless otherwise stated.
Where necessary, comparative information has been reclassified to achieve consistency in disclosure with current financial year amounts and other disclosures. Where comparatives have been reclassified, the impact of this reclassification has been disclosed in the relevant note.
(b) Principles of ConsolidationThe consolidated financial statements of the Consolidated Entity include the financial statements of the University, being theparent entity, and its controlled entities (‘the Consolidated Entity’). All entities have a 31 December reporting period.
Controlled Entities are those entities over which the Consolidated Entity has control. The Consolidated Entity has control over an entity when it is exposed, or has rights, to variable returns from its involvement with the entity and has the ability to affect those returns through its power over the entity. Power over the entity exists when the Consolidated Entity has existing rights that give it current ability to direct the relevant activities of the entity. The existence and effect of potential voting rights that are currently exercisable or convertible are considered when assessing whether the Consolidated Entity controls another entity. Returns are not necessarily monetary and can be only positive, only negative, or both positive and negative.
Where an entity either began or ceased to be controlled during the year, the results are included only from the date control commenced or up to the date control ceased.
The balances, and effects of transactions, between controlled entities have been eliminated in the consolidated financial statements. Accounting policies of controlled entities have been changed where necessary to ensure consistency with the policies adopted by the Consolidated Entity.
Non-controlling interest in the equity and results of the entities that are controlled by the University are shown as a separate item in the consolidated financial statements.
(c) Foreign CurrencyThe University and its controlled entities financial statements are prepared in Australian dollars as their primary activities are conducted within Australia where the functional currency is Australian dollars.Foreign currency transactions are translated to Australian currency at the rates of exchange ruling at the dates of the transactions and brought to account in the Net operating result. Amounts receivable and payable in foreign currencies at the end of the reporting period are translated at the rates of exchange ruling on that date.
(d) Revenue RecognitionThe University recognises revenue when the amount of revenue can be reliably measured, it is probable that the future economic benefits will flow to the University and specific criteria have been met for each of the University's activities as described below. In some cases this may not be probable until consideration is received or an uncertainty is removed. The Consolidated Entitybases its estimates on historical results, taking into consideration the type of customer, the type of transaction and the specifics of each arrangement.
Revenue is recognised for the major business activities as follows:
• Grant Revenue Grant revenue is recognised in the accounting period that the University obtains control of the revenue which is generally when it is received or where the University obtains control of the right to receive the grant and when the revenue recognition criteria are met.
• HELP paymentsRevenue from HELP is categorised into those received from the Australian Government and those received directly from students. Revenue is recognised in the year in which the service is provided.
• Student Tuition Fees and ChargesStudent tuition fees and charges are recognised in the year in which the service is provided.
• Consultancy, Contract and Industry ResearchConsultancy, contract and industry research income is recognised in the accounting period in which the service is provided.
• Bequests and DonationsBequests and donations are recognised as income in the accounting period they are received.
• Interest and Investment IncomeInterest and income from investments are recognised as they accrue (refer to Note 3(j)).
• Royalties, trademarks and licensesRevenue from royalties, trademarks and licences is recognised as income when earned.
Financial statements 2015 77

• Asset SalesThe net gain/loss from asset sales is included in the Consolidated Entity Net operating result. The profit or loss on disposal of assets is brought to account at the date the contract of sale becomes unconditional.
(e) Goods and Services TaxRevenues, expenses, assets and liabilities are recognised net of the amount of Goods and Services Tax (GST), except where the amount of GST incurred is not recoverable from the Australian Tax Office (ATO). In these circumstances the GST is recognised as part of the cost of acquisition of the asset or as part of an item of the expense. Receivables and payables arestated with the amount of GST included.
The net amount of GST recoverable from, or payable to, the ATO is included as a current asset or liability in the Statement of Financial Position.
Cash flows are included in the Statement of Cash Flows on a gross basis. The GST components of cash flows arising from investing and financing activities which are recoverable from, or payable to, the ATO are classified as operating cash flows.
(f) Income Tax
The University does not provide for Australian income tax as it is exempt under the provisions of Division 50 of the Income Tax Assessment Act 1997.
(g) Intangible AssetsResearch expenditure is expensed in the period in which it is incurred. Where no internally generated asset can be recognised, development expenditure is recognised as an expense in the period as incurred.
Any intangible assets arising from development (or from the development phase of an internal project) are recognised if, and only if, all of the following are demonstrated:• the technical feasibility of completing the intangible asset so that it will be available for use or sale;• the intention to complete the intangible asset and use or sell it;• the ability to use or sell the intangible asset;• how the intangible asset will generate probable future economic benefits;• the availability of adequate technical, financial and other resources to complete the development and to use or sell the
intangible asset; and• the ability to measure reliably the expenditure attributable to the intangible asset during its development.
All computer software other than operating systems is treated as intangible assets.
Intangible assets are stated at cost less accumulated amortisation and impairment, whereby impairment is tested annually (refer to Note 17). Amortisation is calculated on a straight-line basis over periods generally ranging from 3 to 5 years.
(h) Employee Benefits
• Wages and SalariesThe employees’ entitlements to wages and salaries represent the amount which the Consolidated Entity has a present obligation to pay resulting from employees’ services provided up to the end of the reporting period. The entitlements have been calculated at the wage and salary rates as at the end of the reporting period and have been recognised in payables.
• Annual LeaveThe employees' entitlements to annual leave expected to be settled within 12 months of the end of the reporting periodhave been calculated at the amounts expected to be paid when the liabilities are settled and recognised in current provisions. Where the employees' entitlements to annual leave are not expected to be settled within 12 months of the endof the reporting period, the provision has been discounted to present value using the Australian Government 3 year bond rate and recognised in non-current provisions. The employee on-costs related to annual leave provision are recognised in payables.
• Long Service LeaveThe liability for employees’ entitlements to long service leave represents the present value of the estimated future cash outflows to be made by the employer resulting from employees’ services provided up to the end of the reporting period.
Liabilities for employees' entitlements, which are not expected to be settled within twelve months, are discounted using the rates attaching to Australian Government securities at the end of the reporting period, which most closely match the terms of maturity of the related liabilities, and recognised in non-current provisions.
In determining the liability for employees' entitlements, consideration has been given to future increases in wage and salaryrates, and the Consolidated Entity’s experience with staff departures. Related on-costs have been recognised in payables.
• SuperannuationSuperannuation schemes exist to provide benefits to University employees and their dependents upon retirement, disability or death. The contributions made to these schemes by the University, and emerging costs from unfunded schemes, are expensed in the Net operating result. For defined benefit plans, the remeasurement gains and losses are recognised immediately in other comprehensive income in the year in which they occur and the liability in relation to the defined benefit
78 Financial statements 2015

obligation, net of assets, has been recognised in the Statement of Financial Position. Refer to Note 27 for details relating to the individual schemes.
• Termination BenefitsTermination benefits are payable when employment is terminated before the normal retirement date, or when an employee accepts an offer of benefits in exchange for the termination of employment. The Consolidated Entity recognises the expense and liability for termination benefits either when it can no longer withdraw the offer of those benefits or when it has recognised costs for restructuring within the scope of AASB137 that involves the payment of termination benefits. The expense and liability are recognised when the Consolidated Entity is demonstrably committed to either terminating the employment of current employees according to a detailed formal plan without possibility of withdrawal or providing termination benefits as a result of an offer made to encourage voluntary redundancy.
(i) ReceivablesTrade receivables are initially recognised at fair value. The collectability of receivables is assessed at the end of the reporting period and provision is made for any amounts considered to be doubtful. Any debts considered to be non-collectable have been expensed as bad debts.
(j) Cash and Cash EquivalentsCash and cash equivalents includes cash at bank or on hand and deposits held at call with financial institutions.
(k) Other Financial AssetsThe Consolidated Entity classifies its investments into the following categories: financial assets at fair value through profit or loss, financial assets held-to-maturity, available for sale financial assets and loans and receivables. The classification depends on the purpose for which the investments were acquired. The classification of the investments is made at initial recognition and is reviewed at the end of each reporting period.
• Financial assets at fair value through profit or lossFinancial assets at fair value through profit or loss include financial assets held for trading. Financial assets are classified in this category if acquired for the purpose of selling in the short-term. Financial assets at fair value through profit or loss are classified as current assets in the Statement of Financial Position, with any realised and unrealised gains or losses recognised in the Net operating result.
Endowment Fund
The majority of specific purpose endowments received by the University to fund research activities, scholarships, prizes and lectures are included in the Endowment Fund. This Fund is invested in cash deposits and longer term investments managed by independent investment managers. These investments are reported in non-current financial assets in the Statement of Financial Position at market values obtained from the investment managers.
• Financial assets held-to-maturityHeld-to-maturity investments are non-derivative financial assets with fixed or determinable payments and fixed maturities that the University’s management has the positive intention and ability to hold to maturity.The University places its surplus operating funds into bank term deposits with fixed maturity dates. Financial assets held to maturity are carried at cost.
• Available-for-sale financial assetsThe financial assets are classified in this category where there is an intention to dispose of the investment, rather than replacing the investment through trading or where they are not classified in any of the other categories. Available for sale financial assets are recorded at fair value less impairment in the Statement of Financial Position. Unrealised gains and losses arising from changes in fair value are recognised directly in equity, until the investment is disposed of or is determined impaired, at which time the cumulative unrealised gain or loss previously recognised in the reserve is included in the Net operating result for the period. The University's investments in controlled entities are classified as non-current available-for-sale financial assets as the University does not intend to dispose of these assets in the near future.
• Loans and receivablesFinancial assets are classified in this category when the Consolidated Entity provides money, goods or services to a debtor with no intention of selling the receivable. Financial assets classified as loans and receivables are recorded at amortised cost less impairment. They are included in current assets, except for those with maturities greater than 12 months after the end of the reporting period which are classified as non-current assets.
(l) Derivative Financial InstrumentsThe Consolidated Entity enters into interest rate swaps (Derivative financial instruments) to manage its exposure to movements in interest rates on its borrowings.
In addition, the Consolidated Entity enters into foreign currency swaps (Derivative financial instruments) to manage its exposure to movements in exchange rates on its capital expenditure and library subscriptions.
Derivatives are initially recognised at fair value at the date a derivative contract is entered into and are subsequently remeasured to their fair value at each reporting date. The resulting gain or loss is recognised as an asset or liability as the swaps are effective hedging instruments.
Financial statements 2015 79
The fair value of hedging derivatives is classified as a non-current asset or a non-current liability if the remaining maturity of the hedge relationship is more than 12 months and as a current asset or a current liability if the remaining maturity of the hedgerelationship is less than 12 months.
Hedge accountingThe Consolidated Entity has designated the interest rate and foreign currency swaps as cash flow hedges.
At the inception of the hedge relationship the entity documents the relationship between the hedging instrument and hedged item, along with its risk management objectives and its strategy for undertaking various hedge transactions. Furthermore, at the inception of the hedge and on an ongoing basis, the Consolidated Entity documents whether the hedging instrument that is usedin a hedging relationship is highly effective in offsetting cash flows of the hedged item.
Cash flow hedgeThe effective portion of changes in the fair value of derivatives that are designated and qualify as cash flow hedges are deferred in the Statement of Comprehensive Income. The gain or loss relating to the ineffective portion is recognised immediately in the Net operating result. As at 31 December 2015 there are no ineffective hedge instruments.
Amounts deferred in equity are recorded in the Net operating result in the periods when the hedged item is recognised in the Net operating result. However, when the forecast transaction that is hedged results in the recognition of a non-financial asset or a non-financial liability, the gains and losses previously deferred in equity are transferred from equity and included in the initial measurement of the cost of the asset or liability.
Hedge accounting is discontinued when the Consolidated Entity revokes the hedging relationship, the hedging instrument expires or is sold, terminated, or exercised, or no longer qualifies for hedge accounting. Any cumulative gain or loss deferred in equity at that time remains in equity and is recognised when the forecast transaction is ultimately recognised in the Net operating result. When a forecast transaction is no longer expected to occur, the cumulative gain or loss that was deferred in other comprehensive income is recognised immediately in the Net operating result.
(m) Fair Value MeasurementThe fair value of assets and liabilities must be measured for recognition and disclosure purposes.
The Consolidated Entity classifies fair value measurements using a fair value hierarchy that reflects the significance of the inputs used in making the measurements.
The fair value of financial assets or liabilities traded in active markets is based on quoted market prices for identical assets or liabilities at the end of the reporting period (level 1). The quoted market price used for assets held by the Consolidated Entity is the most representative of fair value in the circumstances within the bid-ask spread.
The fair value of financial assets or liabilities that are not traded in an active market is determined using valuation techniques. The Consolidated Entity uses a variety of methods and makes assumptions that are based on market conditions existing at the end of the reporting period. Quoted market prices or dealer quotes for similar instruments (level 2) are used for long-term debt instruments held. Other techniques that are not based on observable market data (level 3) are used to determine fair value for the remaining assets and liabilities. The fair value of interest rate swaps is calculated as the present value of the estimated future cash flows. The fair value of forward exchange contracts is determined using forward exchange market rates at the end of the reporting period. The level in the fair value hierarchy is determined on the basis of the lowest level input that is significant to the fair value measurement in its entirety.
Fair value measurement of non-financial assets is based on the highest and best use of the asset. The Consolidated Entity considers market participants use of, or purchase of the asset, to use it in a manner that would be highest and best use.
The carrying value less impairment provision of trade receivables are assumed to approximate their fair values due to their short-term nature. The fair value of financial liabilities for disclosure purposes is estimated by discounting the future contractual cash flows at the current market interest rate that is available to the Consolidated Entity for similar financial instruments.
(n) Investments in Business Undertakings
• Controlled EntitiesInvestments in controlled entities are carried in the University’s financial statements at fair value. Dividends and distributions are brought to account in the Net operating result when they are declared by the controlled entities.
• Interests in AssociatesInterests in associates represent interests where the Consolidated Entity exercises a significant influence but not control over the financial and operating policies.
In the University’s financial statements, investments in these entities are carried at cost.
In the consolidated financial statements, investments in these entities are accounted for using the equity method of accounting. The Consolidated Entity’s share of the net profit or loss after tax is recognised in Consolidated Other comprehensive income after the elimination of unrealised profits and losses on transactions between these entities and any entities in the Consolidated Entity.
80 Financial statements 2015

• Joint ArrangementsWhere the Consolidated Entity has joint control of an entity as described in Note 36, the Consolidated Entity interests are accounted for using the equity method.
• Cooperative Research CentresThe University derives income as part of its participation in Cooperative Research Centres, as listed in Note 35. In the ordinary course of events this income, which is recognised in the financial statements of the University, is used to meet operational costs and/or acquire equipment. As a participant, the University will be entitled to a proportionate share of any intellectual property arising. As at the reporting date, the University is not aware of any material intellectual property with commercial value. As such no accounting entries have been recorded.
• Other Business UndertakingsThe Consolidated Entity holds a number of investments. In the case of publicly listed investments, these have been valued at market value. In the case of non publicly listed investments, these have been valued at lower of cost or net realisable value (refer to Note 3 (k)).
(o) Inventories
• Consumable Materials and Trading StockThe University has a number of inventory stores at several locations. The inventory is valued at cost based on the weighted average cost method.
• LivestockThe University breeds animals for teaching and research activities and not for profit. Consequently it does not attribute a value to livestock for recording in the Statement of Financial Position. Where controlled entities have reported livestock, this is included at net realisable value.
(p) Property, Plant and Equipment
• AcquisitionsItems of property, plant and equipment are initially recorded at cost in the Statement of Financial Position (unless otherwiseindicated) and depreciated in accordance with Note 3(s).
• RevaluationsDuring 2013 land and buildings were independently valued on a fair value basis in accordance with Australian Accounting Standards.
Any accumulated depreciation at the date of revaluation is eliminated against the gross carrying amount of the asset and the net amount is restated to the revalued amount of the asset. All other property, plant and equipment is stated at historical cost less depreciation.
Increases in the carrying amounts arising on revaluation of land and buildings, library collection and works of art are credited to capital reserves in equity within the Statement of Financial Position except to the extent that they reverse previous reductions in the carrying amounts which were charged to the Net operating result. Decreases that reverse previous increases of the same class of asset are first charged against the capital reserves in equity to the extent of the remaining reserve attributable to the class of asset. All other decreases are charged to the Net operating result.
• Disposal of Revalued AssetsThe gain or loss on disposal of revalued assets is calculated as the difference between the carrying amount of the asset at the time of disposal and the proceeds on disposal and is included in the results in the year of disposal.
• Land and BuildingsThe University differentiates between “trust” and “other” land and buildings. “Trust” land is land provided to the University by Government to be held in trust for the specific purpose of operating the University, or acquired by settlement under a binding trust. Buildings constructed on land classified as “trust” land are classified as “trust” buildings.
All land and buildings are recorded at fair value which has been assessed via an independent valuation on the basis of market value for existing use. The valuation of land and buildings has been carried out by Mr Martin Oldfield, AAPI, BBus Property (Val), Mr Graham Martin, AAPI, BBus Property (Val), Mr Darcy Bruce, AAPI, BAppSc (Val) of Maloney Field Services (Australia) Pty Ltd on 31 December 2013.
• Other CollectionsThe University owns a number of collections of cultural, historical and scientific significance. Many of these collections are unique or extremely rare. The University is not able to reliably measure the value of these collections and therefore has notrecognised them as an asset in the Statement of Financial Position. Furthermore, collections which are irreplaceable (excluding works of art) are not covered by University insurance due to difficulty in determining an insurable value, the costs associated with deriving such a value, and the premium load an insurer would require to carry such a risk.
• Library CollectionThe Library collection was revalued on 31 December 2013 using an internal valuation based on the annual price movement of books.
Financial statements 2015 81

• Works of ArtWorks of art $2,000 and greater, are recorded at fair value on the basis of an independent valuation carried out by Mr JFB Bruce AM JP (MAAVA), Managing Director of Theodore Bruce Auctions Pty Ltd on 31 December 2014. No provision for depreciation is made for works of art.
• Leased Property, Plant and EquipmentLeases of property, plant and equipment where the University, as lessee, has substantially all the risks and rewards of ownership are classified as finance leases. As at 31 December 2015 there are no finance leases.Leases in which a significant portion of the risks and rewards of ownership are retained by the lessor are classified as operating leases. Payments made under operating leases are charged to the Net operating result on a straight-line basis, over the period of the lease.
(q) Non-current Assets Held for SaleNon-current assets are classified as held for sale and stated at the lower of their carrying amount and fair value less costs of disposal if their carrying amount will be recovered principally through a sale transaction rather than through continuing use.
An impairment loss is recognised for any initial or subsequent write down of the asset to fair value less costs to sell. A gain is recognised for any subsequent increases in fair value less costs to sell of an asset, but not in excess of any cumulative impairment loss previously recognised. A gain or loss not previously recognised by the date of the sale of the non-current asset is recognised at the date of derecognition.
Non-current assets are not depreciated or amortised while they are classified as held for sale. Interest and other expenses attributable to the liabilities of non-current assets classified as held for sale continue to be recognised.
Non-current assets classified as held for sale are presented separately from the other assets in the Statement of Financial Position.
(r) Impairment of AssetsThe Consolidated Entity assesses at the end of the reporting period whether there is objective evidence that an asset or group of assets is impaired.
Assets that are subject to amortisation are reviewed for impairment whenever events or changes in circumstances indicate thatthe carrying amount may not be recoverable. An impairment loss is recognised in the Net operating result for the amount by which the asset’s carrying amount exceeds its recoverable amount. The recoverable amount is the higher of an asset’s fair valueless costs to sell and value in use.
Assets that have an indefinite useful life are not subject to amortisation and are tested annually for impairment, or more frequently if changes in circumstances indicate they might be impaired. An impairment loss is recognised if the carrying amount of the asset or its related cash-generating-unit (CGU) exceeds its recoverable amount.
(s) Depreciation and AmortisationDepreciation on freehold buildings is calculated on a diminishing value basis. Depreciation is provided on other property, plant and equipment, excluding land and works of art, on a straight line basis so as to write off the net cost or other revalued amount of each asset over its remaining expected useful life. Leasehold improvements are amortised over the period of the lease or estimated useful life, whichever is the shorter, using the straight line method. The following estimated useful lives are used in the calculation of depreciation/amortisation:• Buildings 80 – 100 years• Leasehold improvements 5 – 50 years• Library Collection 10 years• Plant and equipment including motor vehicles 5 – 10 yearsThe assets' residual values and useful lives are reviewed, and adjusted if appropriate, at the end of the reporting period.
(t) Investment PropertiesInvestment properties are distinct from property, plant and equipment, in that they are held to earn rentals, rather than for use in the production or supply of goods and services.
Investment properties are initially recognised at cost. Costs incurred subsequent to initial acquisition are capitalised when it is probable that future economic benefits in excess of the originally assessed performance of the asset will flow to the University. Where an investment property is acquired at no cost or for nominal consideration, its cost is deemed to be its fair value, as at the date of acquisition.
Subsequent to initial recognition at cost, investment properties are re-valued to fair value, which is based on active market prices, with changes in the fair value recognised in the Net operating result in the period that they arise. The properties are not depreciated. Rental revenue from the leasing of investment properties is recognised in the Net operating result in the periods in which it is receivable, as this represents the pattern of service rendered through the provision of the properties.
An independent valuation of investment properties has been carried out by Mr Graham Martin, AAPI, BBus Property (Val) and Ms Andrea Carolan, FAPI, BAppSc (Val) of Maloney Field Services (Australia) Pty Ltd on 30 November 2014 prior to these properties being reclassified to non-current assets held for sale.
82 Financial statements 2015

(u) Repairs and MaintenanceRepairs and maintenance costs are recognised as expenses as incurred, except where they relate to the replacement component of an asset, in which case the costs are capitalised and depreciated. Other routine operating maintenance, repair or minor renewal costs are also recognised as expenses, as incurred.
(v) Workers’ CompensationThe University is responsible for payments of workers’ compensation claims and is registered with the ReturnToWorkSA as an exempt employer.
The actuarial assessment of the provision for workers’ compensation claims has been prepared by Brett & Watson Pty Ltd using the Case Estimation Methodology. This methodology comprises the assessment of individual independent case estimates of all open claims. A separate allowance for incurred but not reported claims (IBNR), unforeseen escalation of the case estimates and re-opening of finalised claims is then made.
(w) PayablesThese amounts represent liabilities for goods and services provided to the Consolidated Entity prior to the end of the financial year, which are unpaid. The amounts are unsecured and are usually paid within 30 days of recognition.
(x) Salaries and Related ExpensesItems attributed to salaries and related expenses include salaries and wages, employee entitlements and other costs incidental to the employment of staff such as professional development costs and fringe benefits tax.
(y) BorrowingsBorrowings are classified as current liabilities unless the Consolidated Entity has an unconditional right to defer settlement of the liability for at least 12 months after the end of the reporting period and does not expect to settle the liability for at least 12 months after the end of the reporting period.
(z) Borrowing CostsBorrowing costs incurred for the construction of buildings are capitalised during the period of time that is required to complete and prepare the building for its intended use. Other borrowing costs are expensed.
(aa) Prior Period Errors and Changes in Accounting EstimatesChange in Accounting PolicyTo provide a more accurate view of the University’s operations, the accounting treatment of subcontractor and collaborator payments relating to grant income received by the University was changed during 2015. This change in accounting policy resulted in grant income received being recorded on a gross basis within the Statement of Comprehensive Income and the subcontractor and collaborator payments within Teaching and Research expenses. Prior to 2015, the University had recordedthe net amount of the grant income and the subcontractor and collaborator payments as Revenue from continuing operations.This change increased Revenue from Continuing Operations by $17.5M in 2015 and Teaching and research expenses by $17.5M in the Statement of Comprehensive Income.
Comparatives have been adjusted to reflect the change in accounting policy, increasing the 2014 Revenue from continuing operations by $21.7M and increasing Teaching and research expenses by $21.7M
(ab) RoundingAll amounts in this report are rounded to the nearest thousand dollars.
Financial statements 2015 83

2015 2014 2015 2014Note $000 $000 $000 $000
4. Revenue from continuing operationsReceived under Higher Education Support ActBase operating financial assistance
166,431 163,109 166,431 163,109Institutional Grants Scheme 16,219 15,542 16,219 15,542Research Training Scheme 32,000 31,914 32,000 31,914
214,650 210,565 214,650 210,565Other operating financial assistanceOther operating financial assistance 7,991 8,165 7,991 8,165
7,991 8,165 7,991 8,165Higher Education Contribution SchemeHECS-HELP student upfront payments 13,001 13,789 13,001 13,789Australian Government financial assistance 101,724 98,662 101,724 98,662
114,725 112,451 114,725 112,451337,366 331,181 337,366 331,181
Student fee income includes:Fee paying student revenue receivedAward coursesAustralian fee paying undergraduate students 663 797 663 797Australian fee paying postgraduate students 3,424 4,268 3,424 4,268International fee paying students 163,293 148,195 163,293 148,195
167,380 153,260 167,380 153,260Non award coursesContinuing education 602 541 602 541Australian fee paying 7,017 7,065 7,017 7,065Other teaching service fees 5,656 5,314 5,656 5,314
13,275 12,920 13,275 12,920Non-course incomeStudent services and amenities fees 2,848 2,686 2,848 2,686
2,848 2,686 2,848 2,686183,503 168,866 183,503 168,866
Australian Government financial assistanceFEE-HELP 10,556 10,737 10,556 10,737SA-HELP 3,155 2,884 3,155 2,884Overseas postgraduate research scholarship 974 988 974 988
198,188 183,475 198,188 183,475Learning and teaching grantsLearning and teaching grants 31,612 35,551 31,612 35,607
31,612 35,551 31,612 35,607229,800 219,026 229,800 219,082
Consolidated University
Commonwealth Grants Scheme (Commonwealth supported places)
84 Financial statements 2015

2015 2014 2015 2014Note $000 $000 $000 $000
4. Revenue from continuing operations - continuedInvestment revenueInterest income
Bank deposits 571 637 353 376Held-to-maturity bank term investments 3,908 4,575 3,908 4,575
Dividends received 884 533 274 -Distributions from controlled entities 3 - 1,310 908Other investment gains and losses
Net realised gain on endowment fund investments 7,643 7,753 7,643 7,753Net unrealised gain on endowment fund investments 1,733 11,806 2,112 11,807Revaluation gain on Education Australia 7,819 1,369 7,819 1,369Gain on Joint Venture Dissolution 207 - 207 -
Royalties, trademarks and licences 4,669 4,896 2,256 1,93827,437 31,569 25,882 28,726
Property revenueRental charges/accommodation fees 11,966 11,709 11,599 11,533Parking fees 1,908 1,906 1,908 1,906Building development and maintenance recovery 1,456 1,446 1,456 1,446Other property revenue 474 718 598 862
15,804 15,779 15,561 15,747Specialist services and tradingConsultancy fees 10,980 10,956 7,529 7,093Library charges and fines 422 481 422 481Sale of services 26,159 23,484 8,831 6,972Sale of goods 3,104 3,375 547 607Sponsorship and conference income 2,442 1,148 2,442 1,148Other specialist services and trading 1,931 2,272 1,600 1,897
45,038 41,716 21,371 18,198Bequests, donations and other revenueBequests and donations received for:Research 2,595 2,265 2,590 2,265General operational purposes 1,124 1,639 1,124 1,639
3,719 3,904 3,714 3,904Prizes and scholarships 1,276 1,351 1,276 1,351Recharge of costs to other organisations 740 1,278 515 1,098Application management and late fees 1,352 1,390 1,352 1,390Franchise fees 2,258 1,946 2,258 1,946Insurance claim recovery 34 2,082 34 2,082Salary recharges 2,336 917 2,336 917AusAid Scholarships & stipends 6,396 6,359 6,396 6,359Net foreign exchange gain - 459 - 459Reversal of impairment of other buildings 1,033 - 1,033 -
7,247 - 7,270 -Other revenue 13,453 15,617 8,069 10,597
39,844 35,303 34,253 30,103
Joint ventures 36 (407) (115) - -Associates 34 59 393 - -
(348) 278 - -
Consolidated University
Share of other comprehensive income of associates and joint ventures accounted for using the equity method
Net gain on disposal of assets
Financial statements 2015 85

2015 2014 2015 2014Note $000 $000 $000 $000
5. Expenses from continuing operationsSalaries and related expensesSalaries and related expenses - Academic
191,352 189,100 191,352 189,100
Contributions to funded schemes 29,850 29,761 29,850 29,761Contributions to unfunded schemes 87 87 87 87
12,758 11,961 12,758 11,96114,258 14,928 14,258 14,9284,443 4,289 4,443 4,289
276 227 276 2277,709 6,155 7,616 6,064
260,733 256,508 260,640 256,417
Salaries and related expenses - Non-academic167,271 165,944 153,831 152,489
Contributions to funded schemes 25,911 25,680 24,473 24,242Contributions to unfunded schemes 71 71 71 71
10,822 10,045 10,482 9,69712,505 12,241 11,928 11,8373,070 3,339 2,925 3,090
374 298 374 2986,010 4,669 5,984 4,627
226,034 222,287 210,068 206,351486,767 478,795 470,708 462,768
Teaching and research1,832 1,729 1,832 1,7298,745 8,323 8,745 8,309
18,227 18,355 18,786 17,35230,621 33,456 31,634 36,17930,455 30,465 30,455 30,46589,880 92,328 91,452 94,034
Buildings and grounds9,616 9,631 9,225 9,261
22,764 19,747 22,566 19,57117,477 15,611 17,092 15,22013,932 14,369 13,680 14,22463,789 59,358 62,563 58,276
Property maintenance
University
Workers’ compensation
Books, subscriptions and printed material
Payroll tax
Total academic salaries and related expenses
Contributions to superannuation and pension schemes
Annual leave
Workers’ compensationOtherTotal non-academic salaries and related expenses
Consolidated
Payroll taxAnnual leave
Building leases and rent
Long service leave
SalariesContributions to superannuation and pension schemes
Long service leave
Utilities
Cleaning and security
Salaries
Other
Other teaching and research
Total salaries and related expenses
Laboratory expensesResearch transfer to other institutions
Agriculture, animals and cropping
86 Financial statements 2015

2015 2014 2015 2014Note $000 $000 $000 $000
5.Finance costs
4,814 5,879 4,919 5,996354 463 354 463
5,168 6,342 5,273 6,459
Administration, communication and travel25,768 20,957 20,415 16,17416,582 15,345 16,538 15,3142,949 3,073 2,815 2,915
56,427 57,672 13,362 13,060Publicity and fundraising 4,736 4,604 4,449 4,317
23,861 23,867 23,747 23,648130,323 125,518 81,326 75,428
Finance and fund administrationBad and doubtful debts
(11) (11) (11) (11)32 122 32 122
141 210 141 208162 321 162 319
1,334 1,016 1,334 1,0161,217 1,190 1,217 1,190
46 48 46 482,759 2,575 2,759 2,573
Misc equip, dep’n and net loss on disposal of assets includes:Amortisation of intangible assetsSoftware 7,370 6,520 7,370 6,520
Amortisation 3(s)2,222 2,890 2,211 2,8809,592 9,410 9,581 9,400
Depreciation 3(s)23,853 24,277 23,780 24,20413,590 11,867 12,989 11,2682,179 2,167 2,179 2,167
39,622 38,311 38,948 37,63949,214 47,721 48,529 47,03910,697 13,045 10,697 13,045
- 1,300 - 1,30079 716 79 716
Unrealised loss on investment properties - 261 - 26159,990 63,043 59,305 62,361
Consolidated
Interest
Administration & communication
University
Expenses from continuing operations - continued
Fees & licenses
Finance charges
Insurance
Consultants & specialist services
Net loss on disposal of assetsNon-capitalised equipment
Impairment loss on non-current assets held for sale
Plant, equipment and motor vehicles
Student loans
Other
Other debtors
Buildings
Leasehold improvements
Travel, accommodation & entertainment
Student tuition
Library collection
Fringe benefit tax paymentsManagement and merchant fees
Financial statements 2015 87

2015 2014 2015 2014Note $000 $000 $000 $000
6. 3(j)20,713 36,601 14,591 30,45733,223 15,029 31,300 11,00053,936 51,630 45,891 41,457
7. 3(i)Current
4,261 5,652 4,261 5,652(251) (235) (251) (235)4,010 5,417 4,010 5,417
17,663 20,832 16,018 19,986(351) (293) (50) (178)
17,312 20,539 15,968 19,808
22,757 7,442 22,757 7,442(2,128) (1,965) (2,128) (1,965)20,629 5,477 20,629 5,477
145 174 145 174(99) (128) (99) (128)
46 46 46 46
41,997 31,479 40,653 30,748(a) Impaired receivables
The ageing of impaired receivables is as follows:0 to 3 months 102 88 102 883 to 6 months 58 146 58 1466 to 12 months 2,669 2,387 2,368 2,272Total current impaired receivables 2,829 2,621 2,528 2,506
0 to 3 months 36,525 25,322 35,956 25,4043 to 6 months 4,697 5,294 4,410 4,6826 to 12 months 775 863 287 662Total past due but not impaired current receivables 41,997 31,479 40,653 30,748
The University invested its surplus working capital into bank term investments (2015: $60.0 million, 2014: $90.2 million). These bank term investments have been reported as Financial Assets held-to-maturity in Note 8. As a result these funds are not reported within Cash and Cash Equivalents or within the Statement of Cash Flows.
Less: provision for impaired receivables
Sundry debtors and accrued incomeLess: provision for impaired receivables
Student tuition fees
Less: provision for impaired receivables
As at 31 December 2015 current receivables of the group of $42.0 million (2014: $31.5 million) were not impaired. These receivables mainly relate to a number of Government agencies and independent customers for whom there is no recent history of default. The ageing analysis of these receivables is as follows:
Consolidated University
Trade debtors
Less: provision for impaired receivables
Receivables
Student loans
As at 31 December 2015 current receivables of the group with a nominal value of $2.8 million (2014: $2.6 million) were impaired. The amount of the provision was $2.8 million (2014: $2.6 million). The individually impaired receivables relate to outstanding trade, sundry and student debtors.
Cash and Cash EquivalentsCash at bank or on handShort term deposits at call
88 Financial statements 2015

2015 2014 2015 2014Note $000 $000 $000 $000
7.(a) Impaired receivables - continued
At 1 January 2,621 2,424 2,506 2,341Net provision for impairment recognised/(reversed) during the year 81 163 (113) 104Receivables written off during the year as uncollectible 127 34 135 61At 31 December 2,829 2,621 2,528 2,506
8. Other Financial AssetsCurrentOther loans 92 105 147 160Held-to-maturity - bank term investments 60,265 90,672 60,000 90,156
60,357 90,777 60,147 90,316Non-currentFair value through profit or loss (held for trading)Endowment Fund - external fund managers 3(k) 248,929 238,919 248,926 238,919Other shares 16,196 9,671 9,552 2,945Total fair value through profit or loss (held for trading) 265,125 248,590 258,478 241,864
Other loans 122 214 177 324Total non-current other financial assets 265,247 248,804 258,655 242,188
Held-to-maturity - bank term investments
Endowment Fund
Receivables - continued
Consolidated University
The University invests its surplus working capital into bank term investments and these bank term investments have been reported as Financial Assets held-to-maturity. As a result these funds are not reported within Cash and Cash Equivalents in Note 6 or within the Statement of Cash Flows.
The creation and release of the provision for impaired receivables has been included in 'Finance and fund administration' in the Statement of Comprehensive Income. Amounts charged to the provision account are generally written off when there is no expectation of recovering additional cash. The other amounts within receivables do not contain impaired assets and it is expected that these amounts will be received in full.
The movement in the provision for impaired receivables is as follows:
The University holds investments arising from donations and bequests for the purpose of funding scholarships, prizes and research. These funds are invested with external fund managers in unlisted managed investment schemes.
Financial statements 2015 89

2015 2014 2015 2014Note $000 $000 $000 $000
9. Derivative Financial InstrumentsCurrent AssetsForeign currency swap contracts - cash flow hedges 2 - 2 -
Non-Current LiabilitiesInterest rate swap contracts - cash flow hedges 15,706 17,080 15,706 17,080
10. Inventories 3(o)Consumable materials and trading stock 1,666 1,842 684 899Livestock 356 321 - -Provision for obsolescence (50) (70) (50) (70)
1,972 2,093 634 829
11. Other Non-Financial AssetsCurrentPrepayments 8,931 9,536 8,881 9,472Accrued income 2,609 3,427 2,526 3,304
11,540 12,963 11,407 12,776
Non-currentPrepayments 7,899 8,141 7,899 8,141
Total Other Non-Financial Assets 19,439 21,104 19,306 20,917
12. Non-current Assets Classfied as Held for Sale 3(q)
Current
Land held for sale 19,901 39,144 19,901 39,144
Buildings held for sale 2,699 6,994 2,699 6,99422,600 46,138 22,600 46,138
The University intends to dispose of the land and buildings held for sale within the next 12 months.
13. Investments Accounted for Using the Equity Method 3(n)Investments in associates 34At cost - - - -Equity accounted 452 393 - -
Interests in joint ventures 36At cost - - 972 491Equity accounted 1,669 1,595 - -
2,121 1,988 972 491
14. Available-for-sale Financial AssetsNon-currentInvestments in controlled entities 33 - - 22,366 25,562
Non-current Assets held for sale are stated at the lower of the carrying amount and the fair value less costs to sell. For the fair value of the non-current assets refer to Note 32.
Consolidated University
The University wrote down inventories by $0.02 million during the year ended 31 December 2015 (2014: $0.06 million) on identification of obsolete and overvalued items.
During 2007 the University entered into nine $10.0 million forward start interest rate swaps (totalling $90.0 million), to manage its interest rate exposures on planned borrowings for its North Terrace Development Strategy. The swaps commenced in February 2010 and amortise on a straight line basis over twenty years. The University is obligated to pay a fixed interest rate of 6.65%. These interest rate swaps are effective hedges and the fair value of these hedges are recorded as a non-current liability.
During the year the University entered into foreign currency swaps totalling $3.6 million (2014: $3.6 million) to manage USD foreign currency exposures. These foreign currency swaps were effective hedges and the fair value of these hedges were recorded as a current asset. The swap contracts were delivered when due with $0.04 million (2014: $nil) remaining in existence as at 31 December 2015.
90 Financial statements 2015
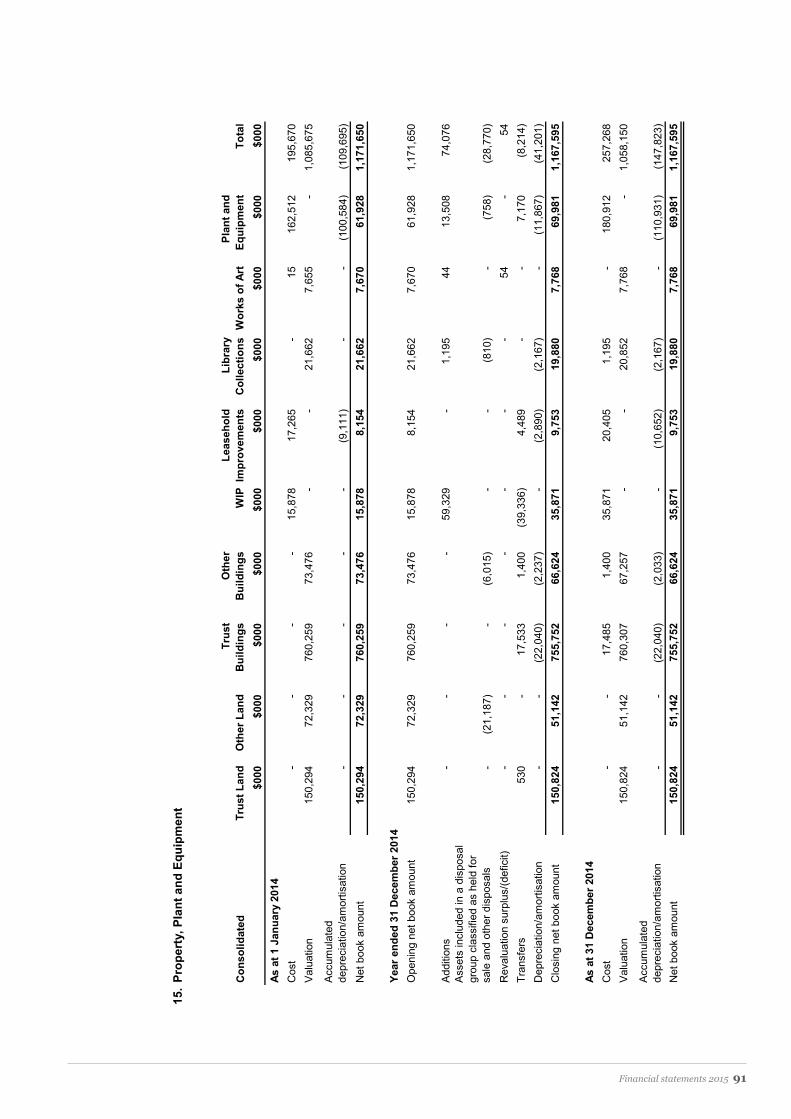
15.
Prop
erty
, Pla
nt a
nd E
quip
men
t
Con
solid
ated
Trus
t Lan
dO
ther
Lan
dTr
ust
Bui
ldin
gsO
ther
B
uild
ings
WIP
Leas
ehol
d Im
prov
emen
tsLi
brar
y C
olle
ctio
ns
Wor
ks o
f Art
Plan
t and
Eq
uipm
ent
Tota
l$0
00$0
00$0
00$0
00$0
00$0
00$0
00$0
00$0
00$0
00As
at 1
Jan
uary
201
4C
ost
--
--
15,8
7817
,265
-15
162,
512
195,
670
Val
uatio
n15
0,29
472
,329
760,
259
73,4
76-
-21
,662
7,65
5-
1,08
5,67
5
Acc
umul
ated
de
prec
iatio
n/am
ortis
atio
n-
--
--
(9,1
11)
--
(100
,584
)(1
09,6
95)
Net
boo
k am
ount
150,
294
72,3
2976
0,25
973
,476
15,8
788,
154
21,6
627,
670
61,9
281,
171,
650
Year
end
ed 3
1 D
ecem
ber 2
014
Ope
ning
net
boo
k am
ount
150,
294
72,3
2976
0,25
973
,476
15,8
788,
154
21,6
627,
670
61,9
281,
171,
650
Add
ition
s-
--
-59
,329
-1,
195
4413
,508
74,0
76A
sset
s in
clud
ed in
a d
ispo
sal
grou
p cl
assi
fied
as h
eld
for
sale
and
oth
er d
ispo
sals
-(2
1,18
7)-
(6,0
15)
--
(810
)-
(758
)(2
8,77
0)R
eval
uatio
n su
rplu
s/(d
efic
it)-
--
--
--
54-
54Tr
ansf
ers
530
-17
,533
1,40
0(3
9,33
6)4,
489
--
7,17
0(8
,214
)D
epre
ciat
ion/
amor
tisat
ion
--
(22,
040)
(2,2
37)
-(2
,890
)(2
,167
)-
(11,
867)
(41,
201)
Clo
sing
net
boo
k am
ount
150,
824
51,1
4275
5,75
266
,624
35,8
719,
753
19,8
807,
768
69,9
811,
167,
595
As a
t 31
Dec
embe
r 201
4C
ost
--
17,4
851,
400
35,8
7120
,405
1,19
5-
180,
912
257,
268
Val
uatio
n15
0,82
451
,142
760,
307
67,2
57-
-20
,852
7,76
8-
1,05
8,15
0
Acc
umul
ated
de
prec
iatio
n/am
ortis
atio
n-
-(2
2,04
0)(2
,033
)-
(10,
652)
(2,1
67)
-(1
10,9
31)
(147
,823
)N
et b
ook
amou
nt15
0,82
451
,142
755,
752
66,6
2435
,871
9,75
319
,880
7,76
869
,981
1,16
7,59
5
Financial statements 2015 91

15.
Prop
erty
, Pla
nt a
nd E
quip
men
t - c
ontin
ued
Con
solid
ated
Trus
t Lan
dO
ther
Lan
dTr
ust
Bui
ldin
gsO
ther
B
uild
ings
WIP
Leas
ehol
d Im
prov
emen
tsLi
brar
y C
olle
ctio
ns
Wor
ks o
f Art
Plan
t and
Eq
uipm
ent
Tota
l$0
00$0
00$0
00$0
00$0
00$0
00$0
00$0
00$0
00$0
00Ye
ar e
nded
31
Dec
embe
r 201
5O
peni
ng n
et b
ook
amou
nt a
s at
1/
1/20
1515
0,82
451
,142
755,
752
66,6
2435
,871
9,75
319
,880
7,76
869
,981
1,16
7,59
5
Add
ition
s-
--
-10
0,55
3-
876
7814
,332
115,
839
Ass
ets
incl
uded
in a
dis
posa
l gr
oup
clas
sifie
d as
hel
d fo
r sal
e an
d ot
her d
ispo
sals
-(1
,197
)-
-(1
23)
(35)
(436
)(4
5)(9
39)
(2,7
75)
Rev
alua
tion
surp
lus/
(def
icit)
--
--
--
--
(24)
(24)
Impa
irmen
t los
s re
vers
als
--
-1,
033
--
--
-1,
033
Tran
sfer
s-
-27
,512
2,68
3(4
4,87
6)2,
697
--
2,32
2(9
,662
)D
epre
ciat
ion/
amor
tisat
ion
--
(21,
840)
(2,0
13)
-(2
,222
)(2
,179
)-
(13,
588)
(41,
842)
Clo
sing
net
boo
k am
ount
150,
824
49,9
4576
1,42
468
,327
91,4
2510
,193
18,1
417,
801
72,0
841,
230,
164
As a
t 31
Dec
embe
r 201
5C
ost
--
44,9
974,
083
91,4
2522
,903
1,26
178
189,
219
353,
966
Val
uatio
n15
0,82
449
,945
760,
307
68,2
90-
-21
,226
7,72
3-
1,05
8,31
5
Acc
umul
ated
de
prec
iatio
n/am
ortis
atio
n-
-(4
3,88
0)(4
,046
)-
(12,
710)
(4,3
46)
-(1
17,1
35)
(182
,117
)N
et b
ook
amou
nt15
0,82
449
,945
761,
424
68,3
2791
,425
10,1
9318
,141
7,80
172
,084
1,23
0,16
4
92 Financial statements 2015

15.
Prop
erty
, Pla
nt a
nd E
quip
men
t - c
ontin
ued
Uni
vers
ityTr
ust L
and
Oth
er L
and
Trus
t B
uild
ings
Oth
er
Bui
ldin
gsW
IPLe
aseh
old
Impr
ovem
ents
Libr
ary
Col
lect
ions
W
orks
of A
rtPl
ant a
nd
Equi
pmen
t To
tal
$000
$000
$000
$000
$000
$000
$000
$000
$000
$000
As a
t 1 J
anua
ry 2
014
Cos
t-
--
-15
,878
15,7
90-
1515
4,66
418
6,34
7V
alua
tion
150,
294
70,5
8476
0,25
966
,221
--
21,6
627,
655
-1,
076,
675
Acc
umul
ated
de
prec
iatio
n/am
ortis
atio
n-
--
--
(7,7
24)
--
(96,
109)
(103
,833
)N
et b
ook
amou
nt15
0,29
470
,584
760,
259
66,2
2115
,878
8,06
621
,662
7,67
058
,555
1,15
9,18
9
Year
end
ed 3
1 D
ecem
ber 2
014
Ope
ning
net
boo
k am
ount
150,
294
70,5
8476
0,25
966
,221
15,8
788,
066
21,6
627,
670
58,5
551,
159,
189
Add
ition
s-
--
-59
,329
-1,
195
4412
,707
73,2
75A
sset
s in
clud
ed in
a d
ispo
sal g
roup
cl
assi
fied
as h
eld
for s
ale
and
othe
r di
spos
als
-(2
1,18
7)-
(6,0
15)
--
(810
)-
(798
)(2
8,81
0)R
eval
uatio
n su
rplu
s/(d
efic
it)-
--
--
--
54-
54Tr
ansf
ers
530
-17
,533
1,40
0(3
9,33
6)4,
489
--
7,17
0(8
,214
)D
epre
ciat
ion/
amor
tisat
ion
--
(22,
040)
(2,1
64)
-(2
,880
)(2
,167
)-
(11,
268)
(40,
519)
Clo
sing
net
boo
k am
ount
150,
824
49,3
9775
5,75
259
,442
35,8
719,
675
19,8
807,
768
66,3
661,
154,
975
As a
t 31
Dec
embe
r 201
4C
ost
--
17,4
851,
400
35,8
7120
,279
1,19
5-
172,
222
248,
452
Val
uatio
n15
0,82
449
,397
760,
307
60,0
02-
-20
,852
7,76
8-
1,04
9,15
0
Acc
umul
ated
de
prec
iatio
n/am
ortis
atio
n-
-(2
2,04
0)(1
,960
)-
(10,
604)
(2,1
67)
-(1
05,8
56)
(142
,627
)N
et b
ook
amou
nt15
0,82
449
,397
755,
752
59,4
4235
,871
9,67
519
,880
7,76
866
,366
1,15
4,97
5
Financial statements 2015 93

15.
Prop
erty
, Pla
nt a
nd E
quip
men
t - c
ontin
ued
Uni
vers
ityTr
ust L
and
Oth
er L
and
Trus
t B
uild
ings
Oth
er
Bui
ldin
gsW
IPLe
aseh
old
Impr
ovem
ents
Libr
ary
Col
lect
ions
W
orks
of A
rtPl
ant a
nd
Equi
pmen
t To
tal
$000
$000
$000
$000
$000
$000
$000
$000
$000
$000
Year
end
ed 3
1 D
ecem
ber 2
015
Ope
ning
net
boo
k am
ount
as
at
1/1/
2014
150,
824
49,3
9775
5,75
259
,442
35,8
719,
675
19,8
807,
768
66,3
661,
154,
975
Add
ition
s-
--
-10
0,55
3-
876
7813
,879
115,
386
Ass
ets
incl
uded
in a
dis
posa
l gr
oup
clas
sifie
d as
hel
d fo
r sal
e an
d ot
her d
ispo
sals
-(1
,197
)-
-(1
23)
(35)
(436
)(4
5)(4
80)
(2,3
16)
Impa
irmen
t los
s re
vers
als
--
-1,
033
--
--
-1,
033
Tran
sfer
s-
-27
,512
2,68
3(4
4,87
6)2,
697
--
2,32
2(9
,662
)D
epre
ciat
ion/
amor
tisat
ion
--
(21,
840)
(1,9
41)
-(2
,211
)(2
,179
)-
(12,
989)
(41,
160)
Clo
sing
net
boo
k am
ount
150,
824
48,2
0076
1,42
461
,217
91,4
2510
,126
18,1
417,
801
69,0
981,
218,
256
As a
t 31
Dec
embe
r 201
5C
ost
--
44,9
974,
083
91,4
2522
,777
1,26
178
180,
621
345,
242
Val
uatio
n15
0,82
448
,200
760,
307
61,0
35-
-21
,226
7,72
3-
1,04
9,31
5
Acc
umul
ated
de
prec
iatio
n/am
ortis
atio
n-
-(4
3,88
0)(3
,901
)-
(12,
651)
(4,3
46)
-(1
11,5
23)
(176
,301
)N
et b
ook
amou
nt15
0,82
448
,200
761,
424
61,2
1791
,425
10,1
2618
,141
7,80
169
,098
1,21
8,25
6
94 Financial statements 2015

2015 2014 2015 2014Note $000 $000 $000 $000
16. Investment PropertyBalance at the beginning of the year - 20,402 - 20,402Transfer from WIP - - - -Transfer (to)/from land and buildings - (579) - (579)Transfer to non-current assets held for sale 12 - (19,562) - (19,562)Net gain (loss) from fair value adjustments - (261) - (261)Balance at the end of the year - - - -
(a) Amount recognised in income statement for investment property
(b) Valuation basis
(c) Non-current assets pledged as securityNo non-current assets have been pledged.
(d) Contractual obligationsThere are no capital commitments for investment properties.
Consolidated University
The basis of valuation of investment properties is fair value being the price that would be received to sell the properties in an orderly transaction between market participants at the valuation date.
An independent valuation of investment properties was carried out by Ms Andrea Carolan, FAPI, BAppSc (Val) Certified Practicing Valuer and Mr Graham Martin, AAPI, B. Bus Property (Val) Certified Practising Valuer of Maloney Field Services on 30 November 2014 prior to the properties being transferred to non current assets held for sale.
The University has recognised $nil (2014: $1.9 million) of rental income from investment properties within the Statement of Comprehensive Income. Any direct operating expenses from generating rental income are included within the Statement of Comprehensive Income and are immaterial.
Financial statements 2015 95

2015 2014 2015 2014Note $000 $000 $000 $000
17. Intangible Assets 3(f)Non-currentAs at 1 January 2014Cost 44,509 44,509Accumulated amortisation and impairment (29,155) (29,155)Net book amount 15,354 15,354
Year ended 31 December 2014Opening net book amount 15,354 15,354Additions - Internal development 380 380Transfer from WIP 8,793 8,793Amortisation charge (6,520) (6,520)Closing net book amount 18,007 18,007
As at 1 January 2015Cost 53,682 53,682Accumulated amortisation and impairment (35,675) (35,675)Net book amount 18,007 18,007
Year ended 31 December 2015Opening net book amount 18,007 18,007Additions 431 431DisposalsTransfer from WIP 9,662 9,662Amortisation charge (7,370) (7,370)Closing net book amount 20,730 20,730
As at 31 December 2015Cost 63,340 63,340Accumulated amortisation and impairment (42,610) (42,610)Net book amount 20,730 20,730
18. PayablesCurrentAccounts payable 54,263 51,894 49,548 46,623Annual and long service leave oncosts 22 4,682 4,439 4,526 4,298Accruals 5,840 5,320 2,628 1,929Salary and related expenses payable 10,448 8,656 10,445 8,653OS-HELP Liability to Australian Government 1,305 290 1,305 290
76,538 70,599 68,452 61,793Non-currentAnnual and long service leave oncosts 22 11,737 10,876 11,721 10,824
11,737 10,876 11,721 10,824
Total Payables 88,275 81,475 80,173 72,617
19. BorrowingsCurrentInterest bearing borrowings 5,000 5,006 5,000 5,006
Non-currentInterest bearing borrowings 46,510 72,518 46,510 72,518
Total Borrowings 51,510 77,524 51,510 77,524
Consolidated University
The University maintains an unsecured $20 million Multi-Option Facility (as a standby working capital facility) and a further unsecured Revolving Facility which has a limit of $72.5 million. As at 31 December 2015 the standby working capital facility has not been drawn and $51.5 million of the Revolving Facility drawn.
96 Financial statements 2015
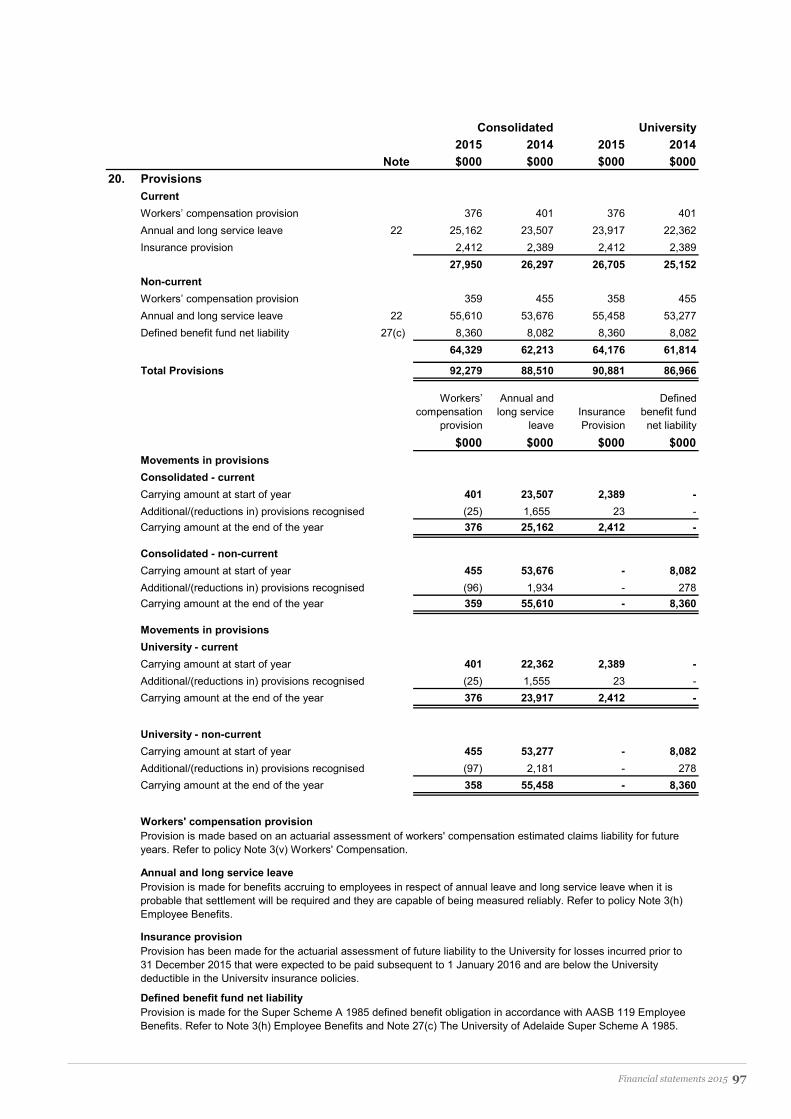
2015 2014 2015 2014Note $000 $000 $000 $000
20. ProvisionsCurrentWorkers’ compensation provision 376 401 376 401Annual and long service leave 22 25,162 23,507 23,917 22,362Insurance provision 2,412 2,389 2,412 2,389
27,950 26,297 26,705 25,152Non-currentWorkers’ compensation provision 359 455 358 455Annual and long service leave 22 55,610 53,676 55,458 53,277Defined benefit fund net liability 27(c) 8,360 8,082 8,360 8,082
64,329 62,213 64,176 61,814
Total Provisions 92,279 88,510 90,881 86,966
Workers’ compensation
provision
Annual and long service
leaveInsurance Provision
Defined benefit fund net liability
$000 $000 $000 $000Movements in provisionsConsolidated - currentCarrying amount at start of year 401 23,507 2,389 -Additional/(reductions in) provisions recognised (25) 1,655 23 -Carrying amount at the end of the year 376 25,162 2,412 -
Consolidated - non-currentCarrying amount at start of year 455 53,676 - 8,082Additional/(reductions in) provisions recognised (96) 1,934 - 278Carrying amount at the end of the year 359 55,610 - 8,360
Movements in provisionsUniversity - currentCarrying amount at start of year 401 22,362 2,389 -Additional/(reductions in) provisions recognised (25) 1,555 23 -Carrying amount at the end of the year 376 23,917 2,412 -
University - non-currentCarrying amount at start of year 455 53,277 - 8,082Additional/(reductions in) provisions recognised (97) 2,181 - 278Carrying amount at the end of the year 358 55,458 - 8,360
Workers' compensation provision
Annual and long service leave
Insurance provision
Defined benefit fund net liability
Consolidated University
Provision is made for the Super Scheme A 1985 defined benefit obligation in accordance with AASB 119 Employee Benefits. Refer to Note 3(h) Employee Benefits and Note 27(c) The University of Adelaide Super Scheme A 1985.
Provision has been made for the actuarial assessment of future liability to the University for losses incurred prior to 31 December 2015 that were expected to be paid subsequent to 1 January 2016 and are below the University deductible in the University insurance policies.
Provision is made based on an actuarial assessment of workers' compensation estimated claims liability for future years. Refer to policy Note 3(v) Workers' Compensation.
Provision is made for benefits accruing to employees in respect of annual leave and long service leave when it is probable that settlement will be required and they are capable of being measured reliably. Refer to policy Note 3(h) Employee Benefits.
Financial statements 2015 97

2015 2014 2015 2014Note $000 $000 $000 $000
21. Other LiabilitiesCurrentOutside funded positions 770 144 770 144Income in advance 1,538 1,258 754 489Student tuition fees received in advance 11,863 12,197 11,863 12,197Residential bonds 356 315 356 315Employee benefits – separation packages 4,080 2,635 3,808 2,635Funds held on deposit for controlled entities - - 3,592 4,987Other 2,342 1,001 2,342 964
20,949 17,550 23,485 21,731
Non-CurrentOther 1,555 - 1,555 -
1,555 - 1,555 -Total Other Liabilities 22,504 17,550 25,040 21,731
22. Employee Benefits and Related On-Cost Liabilities
Annual LeaveOn-costs included in payables - current 18 3,408 3,380 3,356 3,324Employee benefits - current 20 18,802 18,087 18,342 17,537
22,210 21,467 21,698 20,861On-costs included in payables - non-current 18 1,430 1,370 1,421 1,366Employee benefits - non-current 20 7,696 7,293 7,615 7,259
9,126 8,663 9,036 8,625Long Service LeaveOn-costs included in payables - current 18 1,274 1,059 1,170 974Employee benefits - current 20 6,360 5,420 5,575 4,825
7,634 6,479 6,745 5,799On-costs included in payables - non-current 18 10,307 9,506 10,300 9,458Employee benefits - non-current 20 47,914 46,383 47,843 46,018
58,221 55,889 58,143 55,47697,191 92,498 95,622 90,761
23. Retained Surplus and Reserves 23(a) Summary
Capital reservesCapital reserve 2,971 2,971 - -Capital profits reserve 1,481 1,481 - -Asset revaluation surplus 295,592 295,592 295,342 295,342Initial asset recognition reserve 279,124 279,124 279,124 279,124Available-for-sale financial assets revaluation reserve - - 22,366 25,562
579,168 579,168 596,832 600,028Specific purpose reservesSpecial reserve 319,937 308,826 319,937 308,826Bequests/donations unspent income reserve 7,129 7,511 7,129 7,511Restricted purpose bequest capital reserve 172,571 169,730 172,571 169,730Endowment fund revaluation reserve 108,719 99,032 108,719 99,032
608,356 585,099 608,356 585,099
Retained surplus 260,770 233,211 241,714 210,583
In accordance with the requirements of AASB 119 "Employee Benefits", employee on-costs are required to be reported as payables whilst leave liability amounts are reported separately in Note 20. Below is a composite note disclosure showing the total liabilities the Consolidated Entity has as at 31 December 2015 relating to employee benefits:
Consolidated University
98 Financial statements 2015

2015 2014 2015 2014Note $000 $000 $000 $000
23. Reserves - continued23(b) Movements in reserves
Capital reserveOpening balance 2,971 2,971 - -Current year movement - - - -Closing balance 2,971 2,971 - -Capital profits reserveOpening balance 1,481 1,481 - -Current year movement - - - -Closing balance 1,481 1,481 - -Asset revaluation surplusOpening balance 295,592 295,538 295,342 295,288Add revaluation increment on property, plant and equipment - 54 - 54Closing balance 295,592 295,592 295,342 295,342Initial asset recognition reserveOpening balance 279,124 279,124 279,124 279,124Current year movement - - - -Closing balance 279,124 279,124 279,124 279,124Available-for-sale financial assets revaluation reserveOpening balance - - 25,562 26,926Current year movement - - (3,196) (1,364)Closing balance - - 22,366 25,562Special reserveOpening balance 308,826 287,423 308,826 287,423Transfer from retained surplus 11,111 21,403 11,111 21,403Closing balance 319,937 308,826 319,937 308,826Bequests/donations unspent income reserveOpening balance 7,511 6,631 7,511 6,631Transfer (to) / from retained surplus (382) 880 (382) 880Closing balance 7,129 7,511 7,129 7,511Restricted purpose bequest capital reserveOpening balance 169,730 163,937 169,730 163,937Transfer from retained surplus 2,841 5,793 2,841 5,793Closing balance 172,571 169,730 172,571 169,730
Endowment fund revaluation reserveOpening balance 99,032 79,471 99,032 79,471Transfer (to) / from retained surplus 9,687 19,561 9,687 19,561Closing balance 108,719 99,032 108,719 99,032
Consolidated University
Financial statements 2015 99

2015 2014 2015 2014Note $000 $000 $000 $000
23. Reserves - continued23(c) Nature and purpose of reserves
Capital reserve
Capital profits reserve
Asset revaluation surplus
Initial asset recognition reserve
Available for sale financial assets revaluation reserve
Specific purpose reserves
24. Reconciliation of net cash provided by operatingactivities to net operating resultNet operating result 50,261 53,078 53,001 54,430Add/(subtract) non cash itemsAmortisation 5 9,592 9,410 9,581 9,400Depreciation 5 39,622 38,311 38,948 37,639Write down / (up) of investments (15,955) (20,745) (16,334) (20,746)Other revenue/expenses 18,119 (4,908) 16,537 (4,990)Reversal of impairment of other buildings 4 (1,033) - (1,033) -Impairment loss on non-current assets held for sale 5 79 716 79 716Funds held on deposit - - 1,500 -(Profit)/loss on sale of property, plant and equipment (12,526) 1,300 (12,549) 1,300
Changes in assets/liabilities(Increase)/decrease in inventories 121 349 195 154(Increase)/decrease in receivables (10,518) (1,440) (9,905) (2,637)(Increase)/decrease in other assets 1,665 (5,660) 1,611 (5,644)Increase/(decrease) in payables 6,804 10,645 7,556 11,670Increase/(decrease) in other liabilities 3,399 1,831 3,309 1,910Increase/(decrease) in provisions 3,769 6,174 3,915 5,973Net cash provided by operating activities 93,399 89,061 96,411 89,175
Represents a number of reserves generated through a series of specific purpose transactions, that can only be used in accordance with the attributes of the generating transactions. The special reserve is created for surplus funds which will be specifically acquitted in future accounting periods.
Represents the equity impact arising from the recognition of assets which until the first time the University prepared a set of accrual financial statements, had not previously been recognised.
Consolidated University
Is used to record increments and decrements on the revaluation of non-current assets. Refer accounting policy note 3(p).
Represents the accumulation of realised revalued increments of assets sold.
Represents capital accounts held within controlled entities of the University.
Is used to record increments and decrements on the revaluation of available for sale financial assets. Refer accounting policy note 3(k).
100 Financial statements 2015

2015 2014 2015 2014Note $000 $000 $000 $000
25. CommitmentsOperating expenditure
20,923 25,948 20,418 25,30812,239 21,639 12,239 20,756
Later than five years - - - -33,162 47,587 32,657 46,064
Capital commitments
Property, plant and equipment137,648 55,149 137,648 55,149
- 1,870 - 1,870Later than five years - - - -
137,648 57,019 137,648 57,019Lease commitments
8,579 10,384 8,579 10,38418,784 12,767 18,784 12,7674,847 5,360 4,847 5,360
32,210 28,511 32,210 28,511
26. Contingencies(a) Guarantees
(b) Superannuation(i) The University of Adelaide Superannuation Scheme A 1985 (Scheme A 1985)
(ii) UniSuper Limited Superannuation Schemes
(c) LitigationRefer to Note 27(b).
The University has guaranteed that members of this superannuation scheme will receive defined benefits in the event that this closed scheme has insufficient assets to meet the benefits. Employer contributions of 14% of salaries recommenced on actuarial advice as from 1 January 2003 to ensure there are sufficient assets in the scheme to meet expected future liabilities of remaining members. Refer to Note 27(c).
In the ordinary course of its operations, the University and its controlled entities become involved in legal disputes. At the date of adoption of these financial statements, some matters remain outstanding. On legal advice, the University is of the opinion that no material losses are likely to arise. Notwithstanding the fact the University is of the opinion that no material losses are likely to arise, an action has been served upon one of the University's Controlled Entities, Adelaide Unicare, which is subject to a process of confidential mediation. The outcome of this mediation process may have an impact on the carrying value of both the University available-for-sale financial assets and the net assets recognised in the University Consolidated Financial Statements. The University or its controlled entities will make a provision where a material loss is identified. Claims of an insurance nature have been covered by a provision of $2.4 million to the extent that such claims are not covered by the University's comprehensive insurance program. Refer Note 20.
Operating Leases
On July 1 2006 the University ceased to be a Crown exempt employer and was required to register as an exempt employer with ReturnToWorkSA and provide a bank guarantee to cover projected workers' compensation outstanding claims liabilities. Currently, the University has provided a $1.8 million bank guarantee to ReturnToWorkSA. The amount of the guarantee was based on an actuarial assessment of the projected workers' compensation claims liabilities. In May 2013 the University was advised by the then titled WorkCover Corporation that it had approved a self-insurance renewal for a period of three years from 1 July 2013.
The University in 1997 provided a $120,000 guarantee to the Commonwealth Government, Department of Human Services, for an interest free, 20 year loan of $126,000 to be used for the construction of the Observatory Child Care Centre. In 2009 the original guarantee of $120,000 was cancelled and a new guarantee for the amount of $46,000 was issued to reflect the reduction in the outstanding loan balance. During 2015 the loan was repaid in full and the bank guarantee cancelled.
Between one and five yearsLater than five yearsTotal future minimum lease payments
Commitments for minimum lease payments in relation to non-cancellable operating leases are payable as follows:Within one year
Total capital commitments
The operating lease commitments primarily relate to leases of photocopiers, computers, office equipment and office space.
University
Within one yearBetween one and five years
Total operating expenditure commitments
Between one and five years
Consolidated
Contracted but not provided for and payable:Within one year
Capital expenditure contracted for at the reporting date but not recognised as liabilities is as follows:
Financial statements 2015 101

27. Superannuation Schemes(a)
(i) Those operative and open to membership:•
• Accumulation Super 1 (ii) Those operative but closed to future membership:
• The University of Adelaide Superannuation Scheme A 1985 (Scheme A 1985)(iii) State Government Schemes closed to future membership by University employees:
• State Pension Scheme• State Lump Sum Scheme
(b) UniSuper Limited Superannuation Schemes
Vested Benefits
Accrued Benefits
6.10% p.a. 7.80% p.a3.70% p.a. 3.70% p.a.5.50% p.a. 7.00% p.a.2.75% p.a. 2.75% p.a.3.75% p.a. 3.75% p.a.
The vested benefit and accrued benefit liabilities were determined by Ms Kate Maartensz and Mr Bill Buttler, Fellows of the Institute of Actuaries of Australia, using the actuarial demographic assumptions outlined in their report on the actuarial investigation of the Defined Benefit Division as at 30 June 2015. The financial assumptions used were:
Gross of tax investment return - Defined Benefit Division pensions
Assets have been included at their net market value, that is, after allowing for realisation costs.
Gross of tax investment returns - commercial rate indexed pensionsNet of tax investment return - non pensioner membersConsumer Price IndexInflationary salary increases long term
As at 30 June 2015 the assets of the Defined Benefit Division in aggregate were estimated to be $1,479 million (30 June 2014: $271 million) above vested benefits after allowing for various reserves. The vested benefits are benefits which are not conditional upon continued membership (or any factor other than leaving the service of the participating institution) and include the value of indexed pensions being provided by the Defined Benefit Division.As at 30 June 2015 the assets of the Defined Benefit Division in aggregate were estimated to be $3,377 million (30 June 2014: $2,071 million) above accrued benefits after allowing for various reserves. The accrued benefits have been calculated as the present value of expected future benefit payments to members and indexed pensioners which arise from membership of UniSuper up to the reporting date.
While remaining a defined benefits plan under superannuation law, the change in the UniSuper Trust Deed effectively alters the nature of the scheme to a defined contribution scheme under AASB 119.
Clause 34 was initiated following the 31 December 2008, 30 June 2011, 30 June 2012 and 30 June 2013 actuarial investigations.
Following the end of the monitoring period commenced in relation to the 31 December 2008 actuarial investigation, the UniSuper Limited Board made a decision not to reduce accrued benefits but to reduce the rate at which benefits accrue in respect of the DBD membership after 1 January 2015.
Following the end of the monitoring period commenced in relation to the 30 June 2011 actuarial investigation, the Fund's actuary advised that the Trustee is not required to take any further action under Clause 34 in relation to that monitoring period, and that the monitoring period is now ceased.
Categories
UniSuper Defined Benefit Plan or Accumulation Super 2
The University contributes to a range of superannuation schemes, which are divided into the following categories:
Clause 34 states that where the trustee considers the assets to be insufficient to provide benefits payable under the Deed, the Trustee must consider reducing the benefits of its members on a fair and equitable basis.
As set out under paragraph 28 of AASB119 a defined contribution plan is a plan where the employer’s legal or constructive obligation is limited to the amount it agrees to contribute to the fund and the actuarial risk and investment risk fall on the employee.
The operation of Clause 34 of the Trust Deed (as amended in 2006) means that the UniSuper Defined Benefit Division is a defined contribution fund for the purpose of AASB 119, allowing participating employers to treat the UniSuper Defined Benefit Division as a defined contribution fund.
The employer contribution rate during 2015 for employees in either the Defined Benefit Division or Accumulation Super 2 was 14% of salaries plus 3% of salaries. The contribution to the Accumulation Super 1 and for employees only in the Accumulation Super 1 was 9.5% of salaries.
The employees' UniSuper plan is determined by the terms of employment and is administered by UniSuper Management Pty Ltd with UniSuper Ltd as the trustee.
102 Financial statements 2015

27. Superannuation Schemes – continued(c) The University of Adelaide Superannuation Scheme A 1985
• Compliance with superannuation law and other applicable regulations.• Management and investment of the Scheme assets; and
The prudential regulator, the Australian Prudential Regulation Authority (APRA), licenses and supervises regulated superannuation plans.
There were no plan amendments affecting the defined benefits payable, curtailments or settlements during the year.
Description of risks
The defined benefit assets are invested in the investment options with benchmark exposure to 'growth' assets such as shares and property of about 65%, with the remaining 35% exposed to 'defensive' assets such as cash and bonds. The assets are diversified within these investment options and therefore the Scheme has no significant concentration of investment risk.
• Timing of members leaving service - As the Scheme has only a small number of members, members leaving may have an impact on the financial position of the Scheme, depending on the financial position of the Scheme at the time they leave. The impact may be positive or negative, depending upon the circumstances and timing of the withdrawal.
• Pension risk - The risk is firstly that pensioner mortality will be lighter than expected, resulting in pensions being paid for a longer period. Secondly, that a greater proportion of eligible members will elect to take a pension benefit, which is generally more valuable than the corresponding lump sum benefit.
• Inflation risk - The risk that inflation is higher than anticipated, increasing pension payments, and thereby requiring additional employer contributions.
There are a number of risks to which the Scheme exposes the University. The more significant risks relating to the defined benefits are:
• Investment risk - The risk that investments returns will be lower than assumed and the University will need to increase contributions to offset this shortfall.
• Salary growth risk - The risk that wages or salaries (on which future benefit amounts will be based) will rise more rapidly than assumed, increasing defined benefit amounts and thereby requiring additional employer contributions.
• Legislative risk - The risk is that legislative changes could be made which increase the cost of providing the defined benefits.
Description of significant events
The University of Adelaide Superannuation Scheme A 1985 (Scheme) is a defined benefit plan in accordance with AASB 119 Employee Benefits that provides superannuation benefits for employees who had not transferred to UniSuper. The Trustee and administrator of the Scheme is Tidswell Financial Services Ltd. The Scheme is governed by a separate trust deed and the general laws relating to trusts and superannuation. Nature of the benefits provided by the Scheme
The Scheme's Trustee is responsible for the governance of the Scheme. The Trustee has a legal obligation to act solely in the best interests of the Scheme beneficiaries. The Trustee has the following roles:
Defined benefit members receive lump sum benefits on retirement, death, disablement and withdrawal. Some defined benefit members are also eligible for pension benefits in some cases. The defined benefit section of the Scheme is closed to new members. All new members receive accumulation only benefits.
The Superannuation Industry (Supervision) (SIS) legislation governs the superannuation industry and provides the framework within which superannuation plans operate. The SIS Regulations require an actuarial valuation to be performed for each defined benefit superannuation plan every three years, or every year if the plan pays defined benefit pensions unless an exemption has been obtained from the Australian Prudential Regulation Authority.
Description of the regulatory framework
Description of other entities' responsibilities for the governance of the Scheme
• Administration of the Scheme and payment to the beneficiaries from Scheme assets when required in accordance with the Scheme rules;
Financial statements 2015 103

27. Superannuation Schemes – continued(c) The University of Adelaide Superannuation Scheme A 1985 - continued
2015 2014Note $000 $000
8,082 4,958Add 440 396
233 188
(107) 2,702(64) 440
Less 160 (243)(384) (359)8,360 8,082
21,620 18,436Add 440 396
677 77433 36
(107) 2,702(64) 440
Less (831) (838)
(243) (326)21,525 21,620
13,538 13,478Add 444 586
(160) 243384 35933 36
Less (831) (838)(243) (326)
13,165 13,538
21,525 21,620Less (13,165) (13,538)
20 8,360 8,082
Service cost 440 396Net interest 233 188Defined benefit cost recognised in Net operating result 673 584
Actuarial (gains) / losses (171) 3,142
Actual return on Scheme assets less interest income 160 (243)Total remeasurements recognised in Other Comprehensive Income (11) 2,899
Reconciliation of the Assets and Liabilities recognised in the Statement of Financial PositionDefined benefit obligation including contributions tax provision
Fair value of scheme assetsDefined benefit fund net liability
Expense recognised in the Statement of Comprehensive Income
Amounts recognised in Other Comprehensive Income
Reconciliation of the Effect of the Asset CeilingThe asset ceiling has no impact on the net defined benefit liability.
Actuarial (gains) / losses arising from liability experience
Net defined benefit liability/(asset) at the end of the year
Net defined benefit liability/(asset) at the beginning of the yearCurrent service costsNet interest
Actual return on Scheme assets less interest income
Actuarial (gains) / losses arising from changes in financial assumptions
Employer contributions
Fair value of Scheme assets at the end of the year
Interest income
Actuarial (gains) / losses arising from changes in financial assumptions
Actuarial (gains) / losses arising from liability experience
Reconciliation of the fair value of Scheme assets
Taxes, premiums and expenses paid
Benefits paid
Taxes, premiums and expenses paidPresent value of defined benefit obligations at the end of the year
Actual return on Scheme assets less interest incomeEmployer contributionsContributions by Scheme participantsBenefits paid
Reconciliation of the defined benefit obligationPresent value of defined benefit obligations at the beginning of the year
Current service costsInterest costContributions by Scheme participants
Reconciliation of the Net Defined Benefit Liability/(Asset)
104 Financial statements 2015
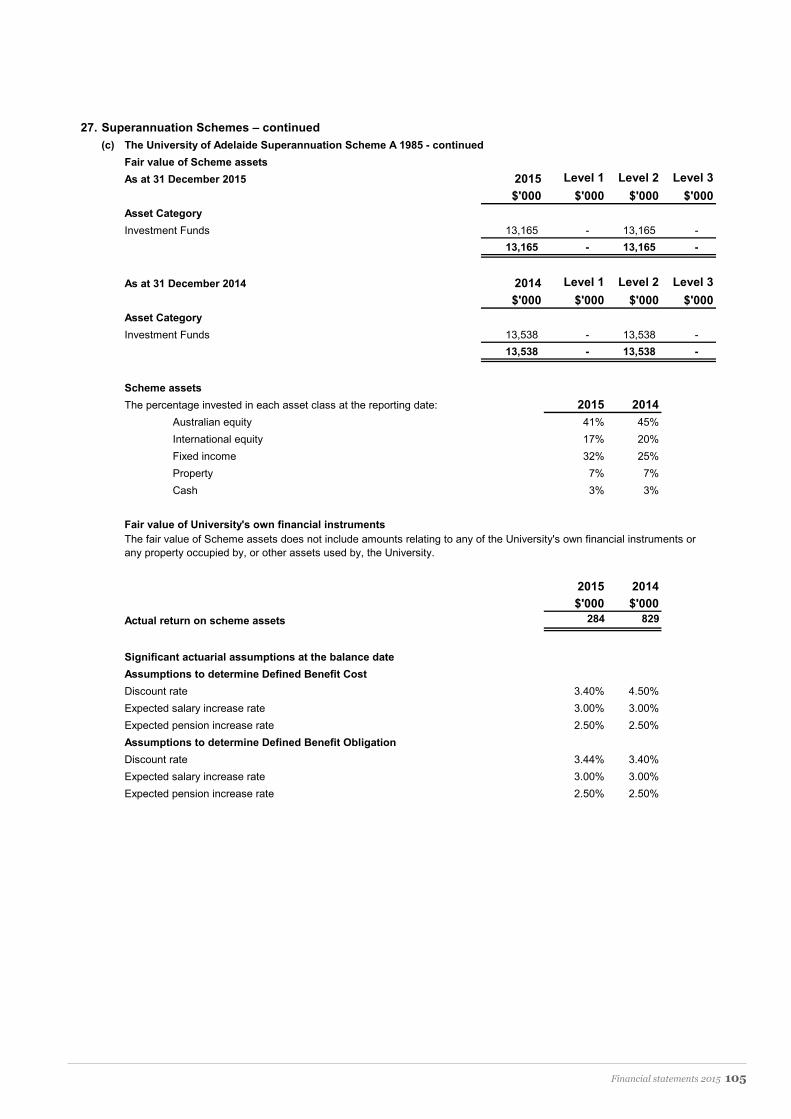
27. Superannuation Schemes – continued(c) The University of Adelaide Superannuation Scheme A 1985 - continued
As at 31 December 2015 2015 Level 1 Level 2 Level 3$'000 $'000 $'000 $'000
Asset CategoryInvestment Funds 13,165 - 13,165 -
13,165 - 13,165 -
As at 31 December 2014 2014 Level 1 Level 2 Level 3$'000 $'000 $'000 $'000
Asset CategoryInvestment Funds 13,538 - 13,538 -
13,538 - 13,538 -
Scheme assetsThe percentage invested in each asset class at the reporting date: 2015 2014
Australian equity 41% 45%International equity 17% 20%Fixed income 32% 25%Property 7% 7%Cash 3% 3%
Fair value of University's own financial instruments
2015 2014$'000 $'000
Actual return on scheme assets 284 829
Significant actuarial assumptions at the balance dateAssumptions to determine Defined Benefit CostDiscount rate 3.40% 4.50%Expected salary increase rate 3.00% 3.00%Expected pension increase rate 2.50% 2.50%Assumptions to determine Defined Benefit ObligationDiscount rate 3.44% 3.40%Expected salary increase rate 3.00% 3.00%Expected pension increase rate 2.50% 2.50%
Fair value of Scheme assets
The fair value of Scheme assets does not include amounts relating to any of the University's own financial instruments or any property occupied by, or other assets used by, the University.
Financial statements 2015 105

27. Superannuation Schemes – continued(c) The University of Adelaide Superannuation Scheme A 1985 - continued
Sensitivity AnalysisThe defined benefit obligation as at 31 December 2015 under several scenarios is presented below.
Scenario G: 10% lower pensioner mortality rate assumptionScenario H: 10% higher pensioner mortality rate assumption
Base Case A B C D
-0.5% pa discount
rate
+0.5% pa discount
rate
-0.5% pa salary
increase rate
+0.5% pa salary
increase rate
Discount rate 3.44% pa 2.94% pa 3.94% pa 3.44% pa 3.44% paSalary increase rate 3.00% pa 3.00% pa 3.00% pa 2.50% pa 3.50% paDefined benefit obligation^ ($'000) 21,525 22,919 20,254 21,476 21,574
Base Case E F G H
-0.5% pa pension increase
rate
+0.5% pa pension increase
rate
10% lower pensioner mortality
rate
10% higher pensioner mortality
rate
Pension increase rate 2.50% pa 2.00% pa 3.00% pa 2.50% pa 2.50% paPensioner mortality 100% MSRP* 100% 100% 90% 110%Defined benefit obligation^ ($'000) 21,525 20,339 22,811 22,420 20,733 ^ includes defined benefit contributions tax provision* Mercer Standard Retiree Pensioner Mortality rates 2005-2009
Asset-Liability matching strategiesThe University is not aware of any asset and liability matching strategies adopted by the Scheme.
Expected contributions
Maturity profile of defined benefit obligation
$000969964957962950
4,504
31 December 201731 December 201831 December 201931 December 2020Following 5 years
31 December 2016
Scenario A: 0.5% pa lower discount rate assumptionScenario B: 0.5% pa higher discount rate assumptionScenario C: 0.5% pa lower assumed salary increase rate assumptionScenario D: 0.5% pa higher assumed salary increase rate assumptionScenario E: 0.5% pa lower assumed pension increase rate assumptionScenario F: 0.5% pa higher assumed pension increase rate assumption
The defined benefit obligation has been recalculated by changing the assumptions as outlined above, whilst retaining all other assumptions.
The expected employer contributions for the year ended 31 December 2016 are $0.3 million (2015: $0.3 million).
The weighted average duration of the defined benefit obligation is 15 years.
Expected benefit payments for the financial year ending on
Scenario A and B relate to discount rate sensitivity. Scenario C and D relate to salary increase rate sensitivity. Scenario E, F, G and H relate to sensitivities on pension assumptions.
106 Financial statements 2015

27. Superannuation Schemes – continued(d) State Government Superannuation Schemes
Summary Consolidated University2015 2014 2015 2014$000 $000 $000 $000
Deferred Government Superannuation ContributionCurrent asset 4,300 4,200 4,300 4,200
64,128 67,302 64,128 67,30268,428 71,502 68,428 71,502
4,300 4,200 4,300 4,20064,128 67,302 64,128 67,30268,428 71,502 68,428 71,502
(e) ContributionsThe total employer contributions were:
36,531 36,78617,652 17,106
85 878 8
64 63141 111
54,481 54,16128. Disaggregation Information
Consolidated University2015 2014 2015 2014$000 $000 $000 $000
29. Auditors’ Remuneration
291 300 291 300101 97 - -392 397 291 300
6 6 - -398 403 291 300
Amounts paid or payable for other audit and assurance services relate to the provision of accounting services.
Other audit and assurance services
Audit of the Financial StatementsFees paid to South Australian Auditor-GeneralOther auditors of controlled entities
Other auditors of controlled entities
Non-current asset
In 1991, employees of the City Campus of the South Australian College of Advanced Education and Roseworthy Agricultural College were transferred to the University. Their terms of appointment to the University protected their membership of the State Pension Scheme and State Lump Sum Scheme. The schemes are administered by the South Australia Superannuation Board. The schemes provide defined benefits and are mainly unfunded. The only employer contributions made in 2015 were 3% of salaries, and remaining benefits are met on an emerging cost basis.
Current liability
Super SA estimate that, as at 31 December 2015, using Accounting Standard AASB 119 assumptions there is an unfunded liability of $68.4 million (2014: $71.5 million). This represents a decrease in liability of $3.1 million since 31 December 2014.
Defined Benefit Obligation
The Commonwealth Government has agreed to provide assistance under Section 20 of the Higher Education Funding Act to meet the additional costs in respect of State Government emerging cost schemes, where costs are in excess of funding provided for this purpose in the base operating grant. Under the Commonwealth legislation titled “State Grants (General Purposes) Amendment Act 1982”, the method of payment of these costs by the Commonwealth to the State Governments was promulgated. Further, the accounting methodology employed in these financial statements is in accordance with “Financial Statement Guidelines for Australian Higher Education Providers for 2015 Reporting Period” provided by the Department of Education. The accounting treatment employed is also consistent with the approach taken by other Australian Universities. Accordingly, total assets of $68.4 million have been recorded as a “Deferred government superannuation contribution” which offsets the current and non-current liability for the State Government Superannuation Schemes recorded as “Defined Benefit Obligation”.
During the year, the following fees were paid for services provided by the auditors of the University and its Controlled Entities.
Non-current liability
Accumulation Super 1
UniSuper Defined Benefit Division (UniSuper Defined Contribution Plan) or Accumulation Super 2
The University predominantly operates in the field of higher education in Australia. Its primary activities are teaching and research. Income generated overseas from teaching and research activities is not so significant as to warrant disaggregation information disclosure.
State Government Superannuation Schemes (3%)The University of Adelaide Superannuation Scheme A 1985Self-managed funds
Super SA
Financial statements 2015 107

30. The University Council Members and Senior Management(a) Names of the University Council Members and Senior Management
Ex officio Bebbington, Professor WarrenMacintyre, Professor Clement ceased 31/12/2015Scarce AC CSC RAN (Rtd), Rear Admiral The Hon Kevin
Appointed Bagot, Mr Charles ceased 31/12/2015Branson QC, The Hon CatherineDavidson AM, Ms DianneHill, Mr DavidJohnson, Ms Wendy ceased 8/2/2015Liddle, Ms KerrynneLocher, Ms Christine appointed 1/5/2015Presser, Ms Kathryn appointed 1/6/2015
Elected Staff Abell, Professor Andrew elected 6/3/2015Hayford, Ms Julie re-elected 6/3/2015Matthews, Mr Stuart elected 6/3/2015Patrikeeff, Associate Professor Felix re-elected 6/3/2015Thomas FAA, Professor Anthony ceased 5/3/2015Thomas, Mr Aaron ceased 5/3/2015
Elected Graduates Broinowski, Dr Alison ceased 27/11/2015Day, Mr RobinRobinson, Dr Susan ceased 18/6/2015Ben, Mr Lawrence ceased 5/3/2015Dutcher, Mr Ethan elected 6/3/2015Johnston, Mr James elected 6/3/2015Lienert, Mr Jack elected 6/3/2015Lu, Mr Zhao ceased 5/3/2015Selvanderan, Mr Shane ceased 5/3/2015
University Senior ManagementBebbington, Professor WarrenBeynon, Professor JohnBrooks, Professor MikeBurt, Professor AlastairFindlay AM, Professor ChristopherGrantham, Ms Leah commenced 6/7/2015Hill, Professor RobertKirkpatrick, Professor Denise ceased 10/1/2015Levy, Professor Phillipa commenced 7/4/2015Lines, Mr BruceMacintyre, Professor Clement ceased 31/12/2015Mitchell, Mr TonyOwens, Professor Julie commenced 15/6/2015Quester, Professor PascaleReid, Professor Iain ceased 31/1/2015Robertson, Ms Kate ceased 3/7/2015 Russell AM, Professor Richard ceased 31/12/2015Saint, Professor Robert ceased 12/6/2015Shaw, Professor JennieThomas, Professor Shane commenced 1/3/2015
ceased 22/7/2015
University Council Members
108 Financial statements 2015

2015 2014$000 $000
30. The University Council Members and Senior Management - continued(b) Remuneration of the University Council Members and Senior Management
$ $ Number NumberNIL 25 26
1 - 14,999 - 145,000 - 59,999 1 -
26 27
Short-term employee benefits 5,296 5,263Other long-term benefits 891 877Termination benefits 78 8Total senior management personnel compensation 6,265 6,148
$ $ Number Number130,000 - 144,999 - 1175,000 - 189,999 2 -190,000 - 204,999 2 2205,000 - 219,999 1 -220,000 - 234,999 1 1250,000 - 264,999 - 2265,000 - 279,999 - 1280,000 - 294,999 - 2295,000 - 309,999 2 1310,000 - 324,999 - 2325,000 - 339,999 1 1340,000 - 354,999 2 2370,000 - 384,999 2 -460,000 - 474,999 - 1475,000 - 489,999 1 1490,000 - 504,999 2 -940,000 - 954,999 - 1
1,015,000 - 1,029,999 1 -17 18
Remuneration is based upon the total remuneration package which includes employer and employee (pre tax) superannuation contributions and termination payments, due and receivable, by senior managers from the University while holding a University senior management position. Only senior managers with remuneration in excess of one hundred and thirty thousand have been included in salary bands.
University Senior Management
University Council MembersTotal remuneration paid to members of Council, or members of its standing committees for the financial year in their role as councillor or members of those committees, is shown below in their relevant bands. Some members of Council are employees of the University or were contractors of the University, and as such receive remuneration in the course of their employment with the University.
The Department of Education Guidelines specify that senior management personnel are persons having authority and responsibility for planning, directing and controlling the activities of the whole University, directly or indirectly, including any director (whether executive or otherwise) of the University.
The University paid the travel and accommodation costs of some University Council Members to enable attendance at Council meetings during the year. All costs were incurred on normal commercial terms.
Financial statements 2015 109

31.
Fina
ncia
l Ins
trum
ents
(a)
Inte
rest
Rat
e R
isk
Floa
ting
Non
-To
tal
Inte
rest
Less
1
-2 2
-3 3
-4 4
-5 5
+In
tere
stR
ate
than
1
year
sye
ars
year
sye
ars
year
sB
earin
gye
arN
ote
$000
$000
$000
$000
$000
$000
$000
$000
$000
2015
Fina
ncia
l Ass
ets
Cas
h &
Cas
h E
quiv
alen
ts6
53,4
77-
--
--
-45
953
,936
Rec
eiva
bles
7-
--
--
--
36,8
2036
,820
Fina
ncia
l Ass
ets
Hel
d fo
r Tr
adin
g8
--
--
--
-26
5,12
526
5,12
5
Fina
ncia
l Ass
ets
Hel
d to
M
atur
ity8
-60
,265
--
--
--
60,2
65O
ther
Fin
anci
al A
sset
s8,
13
-92
9231
--
-2,
120
2,33
5D
eriv
ativ
e Fi
nanc
ial
Inst
rum
ents
9-
--
--
--
22
53,4
7760
,357
9231
--
-30
4,52
641
8,48
3
Fina
ncia
l Lia
bilit
ies
Der
ivat
ive
Fina
ncia
l In
stru
men
ts9
--
--
--
-15
,706
15,7
06P
ayab
les
18-
--
--
--
85,9
9285
,992
Bor
row
ings
19-
5,00
05,
000
5,00
05,
000
5,00
026
,500
1051
,510
-5,
000
5,00
05,
000
5,00
05,
000
26,5
0010
1,70
815
3,20
8
The
Con
solid
ated
Ent
ity h
as p
lace
d its
inve
stm
ents
in a
por
tfolio
man
aged
by
inde
pend
ent i
nves
tmen
t man
ager
s. T
he fu
nd m
anag
ers
may
ent
er in
to
inte
rest
rate
sw
aps,
futu
res
cont
ract
s, in
tere
st ra
te o
ptio
ns a
nd o
ther
form
s of
agr
eem
ents
to m
anag
e ca
sh fl
ow ri
sks
asso
ciat
ed w
ith th
e in
tere
st ra
tes
on in
vest
men
ts th
at a
re fl
oatin
g, o
r to
alte
r int
eres
t rat
e ex
posu
res
aris
ing
from
mis
mat
ches
in re
pric
ing
date
s be
twee
n as
sets
and
liab
ilitie
s.Th
e C
onso
lidat
ed E
ntity
has
ent
ered
into
forw
ard
star
t int
eres
t rat
e sw
aps
to m
anag
e its
inte
rest
rate
exp
osur
es o
n bo
rrow
ings
for i
ts N
orth
Ter
race
D
evel
opm
ent S
trate
gy. F
urth
er d
etai
ls a
re c
onta
ined
in N
ote
9.
Fixe
d M
atur
ity D
ates
110 Financial statements 2015

31.
Fina
ncia
l Ins
trum
ents
- co
ntin
ued
Floa
ting
Non
-To
tal
Inte
rest
Less
1
-2 2
-3 3
-4 4
-5 5
+In
tere
stR
ate
than
1
year
sye
ars
year
sye
ars
year
sB
earin
gye
arN
ote
$000
$000
$000
$000
$000
$000
$000
$000
$000
2014
Fina
ncia
l Ass
ets
Cas
h &
Cas
h E
quiv
alen
ts6
49,5
79-
--
--
-2,
051
51,6
30R
ecei
vabl
es7
--
--
--
-27
,450
27,4
50
Fina
ncia
l Ass
ets
Hel
d fo
r Tr
adin
g8
--
--
--
-24
8,59
024
8,59
0
Fina
ncia
l Ass
ets
Hel
d to
M
atur
ity8
-90
,672
--
--
--
90,6
72O
ther
Fin
anci
al A
sset
s8,
13
-10
492
9231
--
1,98
82,
307
49,5
7990
,776
9292
31-
-28
0,07
942
0,64
9
Fina
ncia
l Lia
bilit
ies
Der
ivat
ive
Fina
ncia
l In
stru
men
ts9
--
--
--
-17
,080
17,0
80P
ayab
les
18-
--
--
--
79,1
9279
,192
Bor
row
ings
19-
5,00
05,
000
5,00
05,
000
5,00
052
,500
2477
,524
-5,
000
5,00
05,
000
5,00
05,
000
52,5
0096
,296
173,
796
Fixe
d M
atur
ity D
ates
Financial statements 2015 111

31. Additional Financial Instruments Disclosure - continued(b) Foreign Exchange Risk
(c) Credit Risk Exposures
(i) On Statement of Financial Position financial instruments
(ii) Off Statement of Financial Position financial instruments
(d) Liquidity Risk
(e) Fair Values of Financial Assets and Financial Liabilities
(i) On Statement of Financial Position financial instruments
(ii) Off Statement of Financial Position financial instruments
The fair value of investments in unlisted shares in other corporations is determined by reference to the underlying net assets of the respective corporations.
The reporting entity and its controlled entities do not possess or trade any off Statement of Financial Position financial instruments.
Liquidity risk is managed through maintaining a minimum level of readily accessible funds, by continuously monitoring forecast and actual cash flows, in line with the University's Liquidity Risk Management Policy.
Fair values of financial assets and financial liabilities are determined by the Consolidated Entity on the following basis:
The Consolidated Entity has placed its investments in a portfolio managed by independent managers. Listed shares and equities included within these investments are traded in an organised financial market by the fund managers. The Consolidated Entity values these investments at current market value.Monetary financial assets and financial liabilities not readily traded in an organised financial market are determined by valuing them at amounts due from customers (reduced for expected credit losses) or due to suppliers.Bank term deposits, accounts receivable, accounts payable and bank loans are carried at nominal value which approximates fair value.
The Consolidated Entity has placed its investments in a portfolio managed by independent investment managers. The fund managers may enter into forward foreign currency exchange contracts to hedge overseas fixed interest securities and a portion of overseas equities. The terms of the hedge contracts are usually less than three months.The Consolidated Entity has entered into foreign currency swaps to manage foreign currency exposures on capital expenditure and library subscriptions. Further details are contained in Note 3(l).
The credit risk on financial assets recognised in the Statement of Financial Position is the carrying amount of those assets, net of any allowances for losses.The credit risk relating to receivables is limited as it consists of a large number of customers across different industries and sectors, including a significant amount owing from Government customers with minimal credit risk. The credit risk relating to cash holdings and investments is limited as the counterparties are banks and investment managers with high credit ratings assigned by international credit-rating agencies.
The reporting entity and its controlled entities do not possess or trade any off Statement of Financial Position financial instruments.
Credit risk represents the loss that would be recognised if counterparties fail to perform as contracted.
112 Financial statements 2015

32. Fair Value Measurements(a) Fair value measurements
2015 2014 2015 2014$000 $000 $000 $000
Financial assetsCash and cash equivalents 6 53,936 51,630 53,936 51,630
Receivables 7 36,820 27,450 36,820 27,450Derivative financial instruments 9 2 - 2 -Investments using the equity method 13 2,121 1,988 2,121 1,988Other financial assets 8 325,604 339,581 325,604 339,581Total financial assets 418,483 420,649 418,483 420,649
Non-financial assetsNon-current assets held for sale 12 22,600 46,138 22,600 46,138Total non-financial assets 22,600 46,138 22,600 46,138
Financial liabilitiesPayables 18 85,992 79,192 85,992 79,192Borrowings 19 51,510 77,524 51,510 77,524Derivative Financial Instruments 9 15,706 17,080 15,706 17,080Total financial liabilities 153,208 173,796 153,208 173,796
• Financial assets at fair value through profit or loss• Investments using the equity method• Derivative financial instruments• Other financial assets• Investment properties• Land and buildings• Library collection• Works of art• Borrowings
(b) Fair value hierarchy
The Consolidated Entity measures and recognises the following assets and liabilities at fair value on a recurring basis:
Level 1 - quoted prices (unadjusted) in active markets for identical assets or liabilites
The fair value of financial assets and financial liabilities must be estimated for recognition and measurement or for disclosure purposes.
Due to the short-term nature of the current receivables, their carrying value approximates their fair value and based on credit history it is expected that the receivables that are neither past due nor impaired will be received when due.The carrying amounts and aggregate fair values of financial assets and liabilities at the end of the reporting period are:
Level 2 - inputs other than quoted prices within level 1 that are observable for the asset or liability either directly or indirectlyLevel 3 - inputs for the asset or liability that are not based on observable market data (unobservable inputs)
The Consolidated Entity categorises assets and liabilities measured at fair value into a hierarchy based on the level of inputs used in measurement.
Carrying Amount Fair Value
The Consolidated Entity has also measured assets and liabilities at fair value on a non-recurring basis as a result of the reclassification of assets as held for sale.
Financial statements 2015 113

32. Fair Value Measurements - continued(i) Recognised fair value measurements
Fair Value measurements at 31 December 2015 2015 Level 1 Level 2 Level 3Note $'000 $'000 $'000 $'000
Financial assetsFinancial assets at fair value through profit or loss 8 265,125 255,573 - 9,552Investments using the equity method 13 2,121 - - 2,121Derivative financial instruments 9 2 - 2 -Other financial assets 8 60,479 60,265 214 -Total recurring financial assets 327,727 315,838 216 11,673
Non-financial assetsLibrary collection 15 18,141 - - 18,141Other land and buildings 15 118,272 - 118,272 -Trust land and buildings 15 912,248 - - 912,248Works of art 15 7,801 - 7,801 -Total recurring non-financial assets 1,056,462 - 126,073 930,389
Non-recurring fair value measurementsNon-financial assetsNon-current assets held for sale 12 22,600 - 22,600 -Total non-recurring non-financial assets 22,600 - 22,600 -
Financial liabilitiesBorrowings 19 51,510 - 51,510 -Derivative financial instruments 9 15,706 - 15,706 -Total liabilities 67,216 - 67,216 -
Fair Value measurements at 31 December 2014Recurring fair value measurements 2014 Level 1 Level 2 Level 3Financial assets Note $'000 $'000 $'000 $'000Financial assets at fair value through profit or loss 8 248,590 245,645 - 2,945Investments using the equity method 13 1,988 - - 1,988Derivative financial instruments 9 - - - -Other financial assets 8 90,991 90,672 319 -Total financial assets 341,569 336,317 319 4,933
Non-financial assetsLibrary collection 15 19,880 - - 19,880Other land and buildings 15 117,766 - 117,766 -Trust land and buildings 15 906,576 - - 906,576Works of art 15 7,768 - 7,768 -Total non-financial assets 1,051,990 - 125,534 926,456
Non-recurring fair value measurementsNon-financial assetsNon-current assets held for sale 12 46,138 - 46,138 -Total non-recurring non-financial assets 46,138 - 46,138 -
Financial liabilitiesBorrowings 19 77,524 - 77,524 -Derivatives financial instruments 9 17,080 - 17,080 -Total financial liabilities 94,604 - 94,604 -
Fair value measurements recognised in the Statement of Financial Position are categorised into the following levels at 31 December 2015.
114 Financial statements 2015
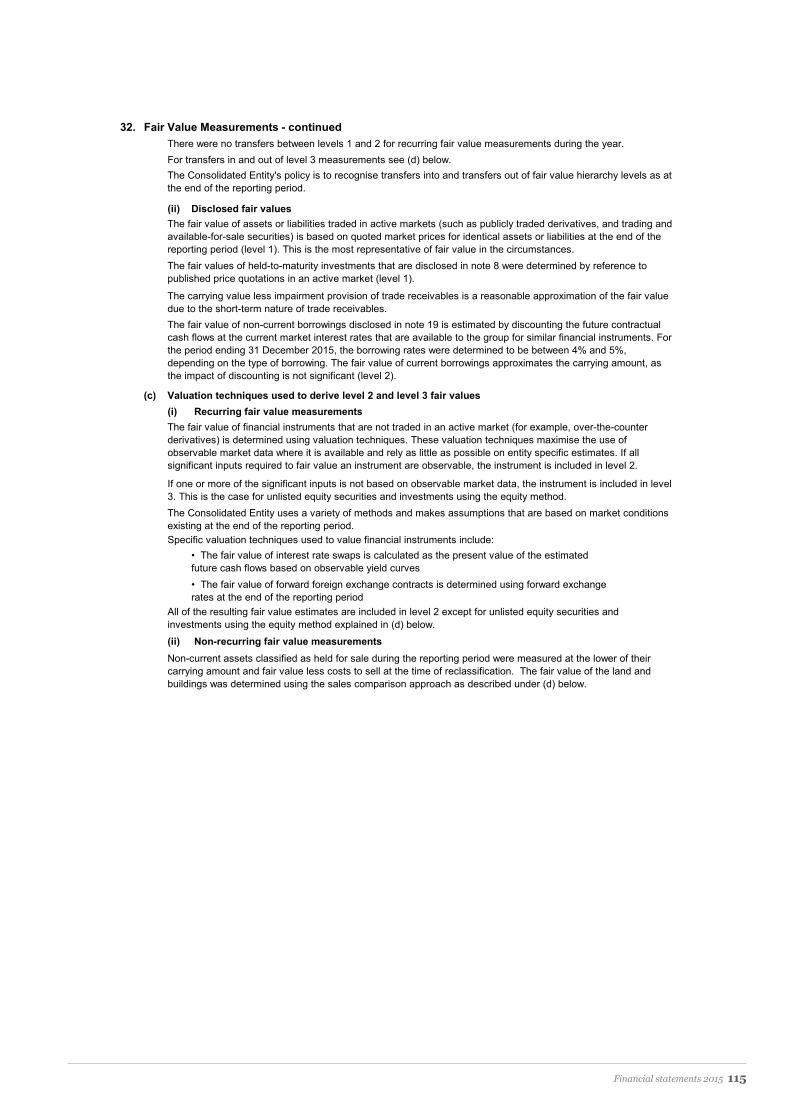
32. Fair Value Measurements - continuedThere were no transfers between levels 1 and 2 for recurring fair value measurements during the year.For transfers in and out of level 3 measurements see (d) below.
(ii) Disclosed fair values
(c) Valuation techniques used to derive level 2 and level 3 fair values(i) Recurring fair value measurements
Specific valuation techniques used to value financial instruments include:
(ii) Non-recurring fair value measurements
The fair value of financial instruments that are not traded in an active market (for example, over-the-counter derivatives) is determined using valuation techniques. These valuation techniques maximise the use of observable market data where it is available and rely as little as possible on entity specific estimates. If all significant inputs required to fair value an instrument are observable, the instrument is included in level 2.
If one or more of the significant inputs is not based on observable market data, the instrument is included in level 3. This is the case for unlisted equity securities and investments using the equity method.The Consolidated Entity uses a variety of methods and makes assumptions that are based on market conditions existing at the end of the reporting period.
All of the resulting fair value estimates are included in level 2 except for unlisted equity securities and investments using the equity method explained in (d) below.
Non-current assets classified as held for sale during the reporting period were measured at the lower of their carrying amount and fair value less costs to sell at the time of reclassification. The fair value of the land and buildings was determined using the sales comparison approach as described under (d) below.
• The fair value of interest rate swaps is calculated as the present value of the estimated future cash flows based on observable yield curves• The fair value of forward foreign exchange contracts is determined using forward exchange rates at the end of the reporting period
The fair value of non-current borrowings disclosed in note 19 is estimated by discounting the future contractual cash flows at the current market interest rates that are available to the group for similar financial instruments. For the period ending 31 December 2015, the borrowing rates were determined to be between 4% and 5%,depending on the type of borrowing. The fair value of current borrowings approximates the carrying amount, as the impact of discounting is not significant (level 2).
The Consolidated Entity's policy is to recognise transfers into and transfers out of fair value hierarchy levels as at the end of the reporting period.
The fair value of assets or liabilities traded in active markets (such as publicly traded derivatives, and trading and available-for-sale securities) is based on quoted market prices for identical assets or liabilities at the end of the reporting period (level 1). This is the most representative of fair value in the circumstances.The fair values of held-to-maturity investments that are disclosed in note 8 were determined by reference to published price quotations in an active market (level 1).
The carrying value less impairment provision of trade receivables is a reasonable approximation of the fair value due to the short-term nature of trade receivables.
Financial statements 2015 115

32. Fair Value Measurements - continued(d) Fair value measurements using significant unobservable inputs (level 3)
The following table is a reconciliation of level 3 items for the period ended 31 December 2015 and 2014:
Level 3 Fair Value Measurements 2015
Trust Land and
Buildings
Investments Using the
Equity Method
Unlisted Equity
SecuritiesLibrary
Collection Total$'000 $'000 $'000 $'000 $'000
Opening balance 906,576 1,988 2,945 19,880 931,389Acquisitions 27,512 481 - 876 28,869Disposals - - - (436) (436)
(21,840) - 6,607 (2,179) (17,412)
- (348) - - (348)Closing balance 912,248 2,121 9,552 18,141 942,062
Level 3 Fair Value Measurements 2014Opening balance 910,553 1,710 1,576 21,662 935,501Acquisitions 18,063 - - 1,195 19,258Disposals - - - (810) (810)
(22,040) - 1,369 (2,167) (22,838)
- 278 - - 278Closing balance 906,576 1,988 2,945 19,880 931,389
(i) Transfers between levels 2 and 3 and changes in valuation techniques
Recognised in Net operating resultRecognised in other comprehensive income
There were no transfers between levels 2 and 3 during the year. There were no changes in valuation techniques during the year.
Recognised in Net operating resultRecognised in other comprehensive income
116 Financial statements 2015
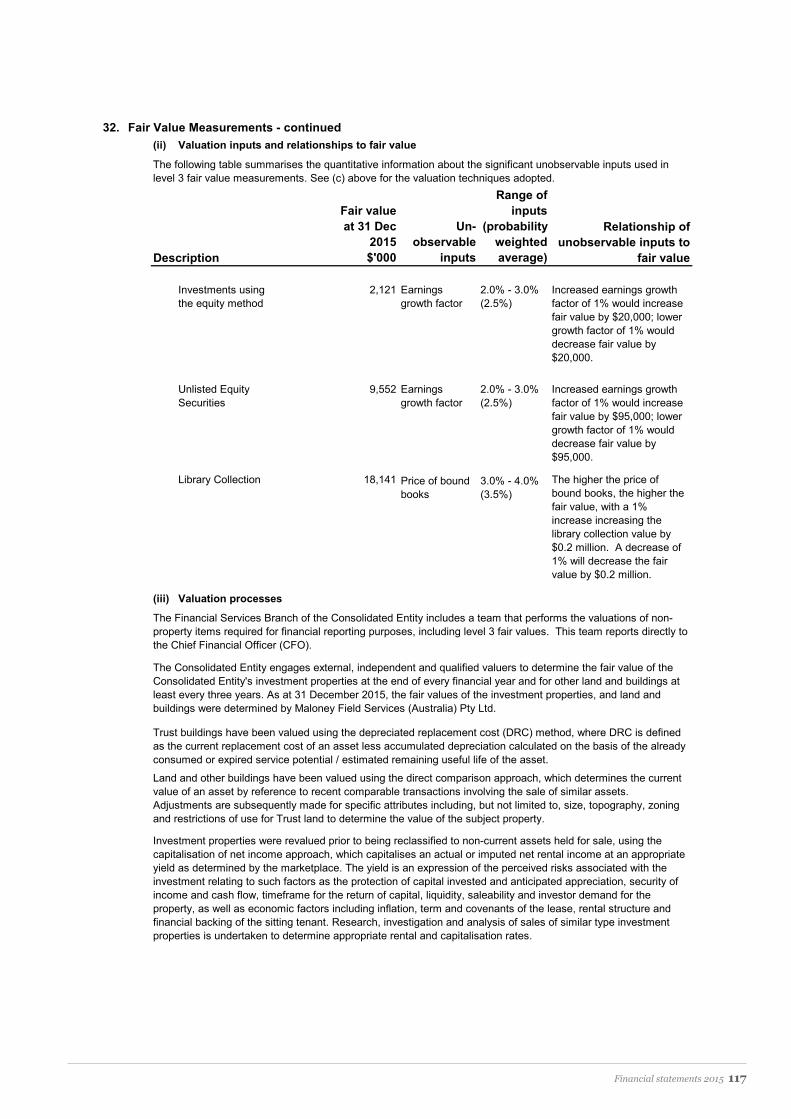
32. Fair Value Measurements - continued(ii) Valuation inputs and relationships to fair value
Fair value at 31 Dec
2015$'000
Un-observable
inputs
Range of inputs
(probability weighted average)
Investments using the equity method
2,121 Earnings growth factor
2.0% - 3.0% (2.5%)
Unlisted Equity Securities
9,552 Earnings growth factor
2.0% - 3.0% (2.5%)
Library Collection 18,141 Price of bound books
3.0% - 4.0% (3.5%)
(iii) Valuation processes
Trust buildings have been valued using the depreciated replacement cost (DRC) method, where DRC is defined as the current replacement cost of an asset less accumulated depreciation calculated on the basis of the already consumed or expired service potential / estimated remaining useful life of the asset.
Land and other buildings have been valued using the direct comparison approach, which determines the current value of an asset by reference to recent comparable transactions involving the sale of similar assets. Adjustments are subsequently made for specific attributes including, but not limited to, size, topography, zoning and restrictions of use for Trust land to determine the value of the subject property.
Investment properties were revalued prior to being reclassified to non-current assets held for sale, using the capitalisation of net income approach, which capitalises an actual or imputed net rental income at an appropriate yield as determined by the marketplace. The yield is an expression of the perceived risks associated with the investment relating to such factors as the protection of capital invested and anticipated appreciation, security of income and cash flow, timeframe for the return of capital, liquidity, saleability and investor demand for the property, as well as economic factors including inflation, term and covenants of the lease, rental structure and financial backing of the sitting tenant. Research, investigation and analysis of sales of similar type investment properties is undertaken to determine appropriate rental and capitalisation rates.
The higher the price of bound books, the higher the fair value, with a 1% increase increasing the library collection value by $0.2 million. A decrease of 1% will decrease the fair value by $0.2 million.
The Financial Services Branch of the Consolidated Entity includes a team that performs the valuations of non-property items required for financial reporting purposes, including level 3 fair values. This team reports directly to the Chief Financial Officer (CFO).
The Consolidated Entity engages external, independent and qualified valuers to determine the fair value of the Consolidated Entity's investment properties at the end of every financial year and for other land and buildings at least every three years. As at 31 December 2015, the fair values of the investment properties, and land and buildings were determined by Maloney Field Services (Australia) Pty Ltd.
Description
The following table summarises the quantitative information about the significant unobservable inputs used in level 3 fair value measurements. See (c) above for the valuation techniques adopted.
Relationship of unobservable inputs to
fair value
Increased earnings growth factor of 1% would increase fair value by $20,000; lower growth factor of 1% would decrease fair value by $20,000.
Increased earnings growth factor of 1% would increase fair value by $95,000; lower growth factor of 1% would decrease fair value by $95,000.
Financial statements 2015 117

33. Investments in Controlled Entities
Controlled Entity
2015 2014 2015 2014 2015 2014 2015 2014% % $000 $000 $000 $000 $000 $000
100 100 316 580 - - 161 389100 100 9,745 10,115 - - (370) (434)
83 83 - - - - (1) (3)100 100 - 31 - - 93 (1)100 100 1,694 1,756 - - 295 442100 100 1,136 1,500 - - 36 128100 100 125 278 100 100 (153) 138
100 100 9,350 11,302 - - (200) 25322,366 25,562 100 100 (139) 912
Controlled Entity Principal Activities
Roseworthy Piggery Pty Ltd
Manages the broadacre farm operations at the University Roseworthy Campus.
Operates the National Wine Centre complex undertaking banquets, events, conference space & wine tourism, and other catering operations as directed by the University of Adelaide.
Established to manage the piggery located on the Roseworthy Campus. The Piggery provides a source of pigs for research and supports the Veterinary School teaching.
The Women’s and Children’s Health Research Institute
Medical research institute investing in research towards improving the health of women and children, focussed on maternal and child nutrition, diseases of the blood and immune system and the development and repair of the digestive system, skull and skin.
Adelaide Unicare Pty Ltd
· JAT Mortlock Trust
· JS Davies Estate
· Roseworthy Farm
National Wine Centre Pty Ltd
The University commercial arm that connects the community with a network of University of Adelaide researchers for purpose of research, development and innovation. The connection extends to commercialistion of the research developed.
Manages the activities and operations of medical practices to provide placements for the teaching of medical students from the University of Adelaide. The practices provide quality general medical care to students, staff and the public.
Trustee Company for the following:
Established to operate farming properties that were bequeathed to the University of Adelaide and Prince Alfred College. This venture is no longer operating.
Established to operate farming properties that were bequeathed to the University of Adelaide. This venture is no longer operating.
The consolidated financial statements incorporate the assets, liabilities and results of the following controlled entities in accordance with the accounting policy described in Note 3(b).
Investment Investment Contribution toHolding at Fair Value at Cost Operating Result
The Adelaide Research & Innovation Investment Trust
Martindale Holdings Pty Ltd as trustee for:
· Roseworthy Farm
All of the above controlled entities are incorporated in Australia.
Adelaide Unicare Pty Ltd
The Women’s and Children’s Health Research Institute
National Wine Centre Pty LtdRoseworthy Piggery Pty Ltd
· JS Davies Estate· JAT Mortlock Trust
The Adelaide Research & Innovation Investment Trust
Martindale Holdings Pty Ltd as trustee for:
118 Financial statements 2015
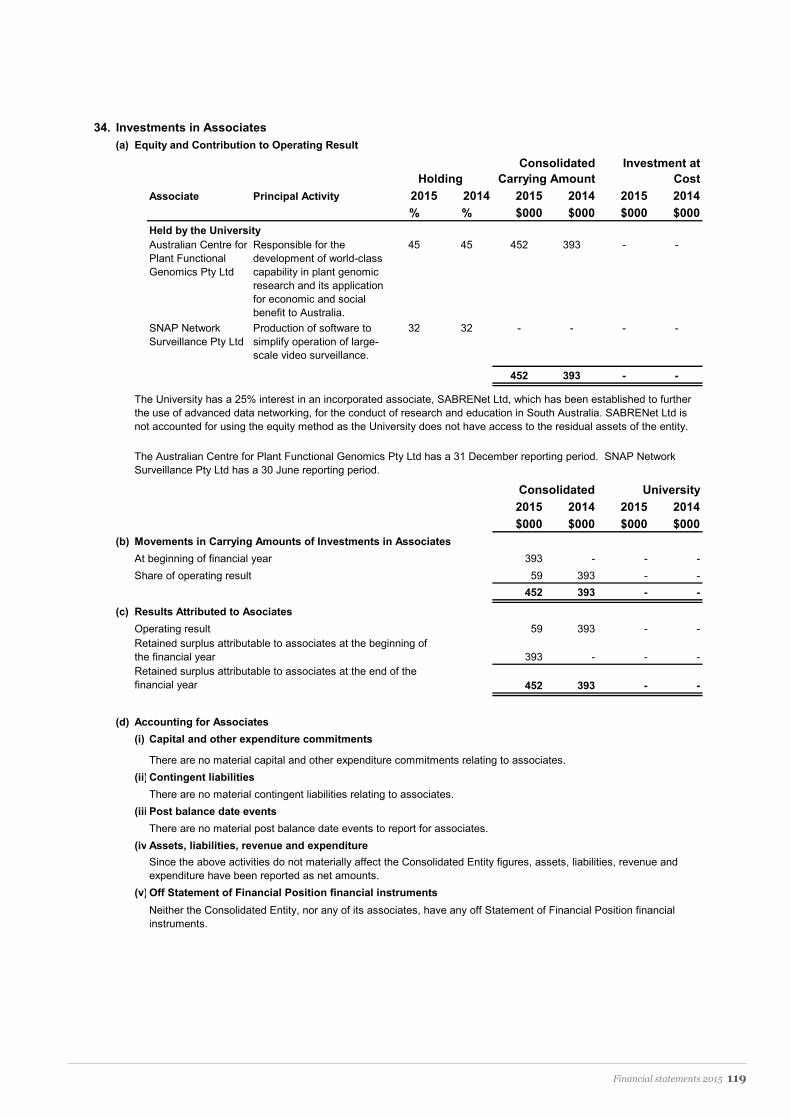
34. Investments in Associates(a) Equity and Contribution to Operating Result
Associate Principal Activity 2015 2014 2015 2014 2015 2014% % $000 $000 $000 $000
Australian Centre for Plant Functional Genomics Pty Ltd
45 45 452 393 - -
SNAP Network Surveillance Pty Ltd
32 32 - - - -
452 393 - -
2015 2014 2015 2014$000 $000 $000 $000
(b) Movements in Carrying Amounts of Investments in AssociatesAt beginning of financial year 393 - - -
59 393 - -452 393 - -
(c) Results Attributed to Asociates59 393 - -
393 - - -
452 393 - -
(d) Accounting for Associates(i) Capital and other expenditure commitments
(ii) Contingent liabilities
(iii Post balance date events
(iv Assets, liabilities, revenue and expenditure
(v) Off Statement of Financial Position financial instruments
The University has a 25% interest in an incorporated associate, SABRENet Ltd, which has been established to further the use of advanced data networking, for the conduct of research and education in South Australia. SABRENet Ltd is not accounted for using the equity method as the University does not have access to the residual assets of the entity.
Responsible for the development of world-class capability in plant genomic research and its application for economic and social benefit to Australia.
The Australian Centre for Plant Functional Genomics Pty Ltd has a 31 December reporting period. SNAP Network Surveillance Pty Ltd has a 30 June reporting period.
Production of software to simplify operation of large-scale video surveillance.
Held by the University
HoldingConsolidated
Carrying AmountInvestment at
Cost
UniversityConsolidated
There are no material capital and other expenditure commitments relating to associates.
There are no material post balance date events to report for associates.
Since the above activities do not materially affect the Consolidated Entity figures, assets, liabilities, revenue and expenditure have been reported as net amounts.
Neither the Consolidated Entity, nor any of its associates, have any off Statement of Financial Position financial instruments.
Share of operating result
Operating result
There are no material contingent liabilities relating to associates.
Retained surplus attributable to associates at the beginning of the financial yearRetained surplus attributable to associates at the end of the financial year
Financial statements 2015 119

35. Interests in Cooperative Research Centres (CRCs)
ParticipationEnergy Pipelines CRC (I) - 14%Deep Exploration Technologies CRC (I) (C) 10%CRC for High Integrity Australian Pork (I) - 11%Plant Biosecurity CRC (I) (C) 1%Invasive Animals CRC (U) (C) 1%Bushfire and Natural Hazards CRC (I) - 6%Data to Decisions CRC (I) - 11%
(I) Incorporated (U) Unincorporated (C) CSIRO is a partner
36. Interests in Joint Ventures(a) Joint Ventures Accounted for Using the Equity Method
Name Principal Activity ParticipationNgee Ann Adelaide Education Centre Pte (I) 50%Middleback Field Centre (U) 33%
Professional Certificate in Arbitration (U) 50%
South Australian Tertiary Admissions Centre
(U) 25%
Adelaide Proteomics Centre (APC) (U) 50%
Mining Education Australia (U) 25%
(I) Incorporated
Funding transfers between the CRC and the University are accounted for as general revenue and expenditure.
A CRC is a research initiative of the Australian Government established to pursue specific areas of research. One of the desired outcomes of a CRC is the creation of specific intellectual property with commercial value. The participants in CRCs are an amalgam of research institutions, eg CSIRO, government agencies, universities and private enterprise. The funding of the CRC is co-ordinated through either a Company formed by the core participants or by a Centre Agent who is appointed generally from one of the participating entities.
(U) Unincorporated
All joint ventures have a 31 December reporting period.
The University was a supporting participant for the Poultry CRC, the CRC for Water Sensitive Cities and CRC for Sheep Industry Innovation. The CRC for Greenhouse Gas Technologies ceased trading during 2015.
The University over the next five years will make both cash and in-kind contributions to support the work of the CRCs. The University has committed to participate in the work of these CRCs, with contributions in constant dollars, $1.3 million in cash (2014: $1.8 million) and $14.2 million in-kind (2014: $18.4million).
To provide pastoral-zone courses and range land ecology research programmes.
To develop and deliver tertiary courses in arbitration.
Provision of a collaborative national mining education program for the benefit of mining engineering students.
Established as the agent for tertiary institutions in Adelaide for the purpose of receiving and processing applications from intending students.
Provision of cost effective and high quality proteomic analysis to researchers conducting basic and applied research.
Operates a graduate education centre in Singapore
120 Financial statements 2015

36. Interests in Joint Ventures - continued
(b) Equity and Contribution to Operating ResultJoint Venture
2015 2014 2015 2014 2015 2014% % $000 $000 $000 $000
Held by the UniversityNgee Ann Adelaide Education Centre Pte Ltd 50% 50% 635 239 937 456
33% 33% 8 9 - -50% 50% 24 133 35 350% 50% - 135 - -
25% 25% 716 787 - -50% 50% 40 5 - -0% 50% - 34 - -0% 50% - - - -
25% 25% 246 155 - -0% 33% - 98 - -
1,669 1,595 972 491
2015 2014 2015 2014$000 $000 $000 $000
(c) Movements in Carrying Amounts of Joint Ventures1,595 1,710 - -(407) (115) - -
Additional investment in joint ventures 481 - - -1,669 1,595 - -
(d) Results Attributed to Joint Ventures(407) (115) - -
Additional investment in joint ventures 481 - - -1,595 1,710 - -1,669 1,595 - -
(e) Accounting for Joint Ventures(i) Capital and other expenditure commitments
(ii) Contingent liabilities
(iii) Post balance date events
(iv) Assets, liabilities, revenue and expenditure
(v) Off Statement of Financial Position financial instrumentsNeither the reporting entity, nor any of its joint ventures, have any off Statement of Financial Position financial instruments.
Since the above activities do not materially affect the University group figures, assets, liabilities, revenue and expenditure have been reported as net amounts.
There are no known material contingent liabilities relating to joint ventures.
Defence Systems Innovation Centre
Adelaide Proteomics Centre (APC)Adelaide MicroArray Centre
Mining Education Australia
There are no material post balance date events to report for joint ventures.
Operating result
Retained surplus attributable at the beginning of the financial yearRetained surplus attributable at the end of the financial year
At beginning of financial year
eResearch SA
Share of operating result
There are no material capital and other expenditure commitments relating to joint ventures.
UniversityConsolidated
The Consolidated Entity’s reported interest in the assets employed in the joint ventures totals $1.7 million (2014: $1.6 million). These are included in the Consolidated Statement of Financial Position, in accordance with the accounting policy described in note 3(n).
During the year, South Australian Centre for Economic Studies, Defence Systems Innovation Centre, Adelaide MicroArray Centre and eResearch SA ceased as joint ventures.Ngee Ann Education Centre Pte Ltd is incorporated in Singapore. All other incorporated joint ventures are incorporated in Australia.
Carrying Amount
South Australian Centre for Economic StudiesSouth Australian Tertiary Admissions Centre
Investment at Cost
Middleback Field CentreProfessional Certificate in Arbitration
Holding
Financial statements 2015 121

37. Related Parties(a) Parent entity
(b) Controlled entities, joint arrangements and associates
(c) Council members and senior management
(d) Councillor related transactions
(e) Property leases
The University and the CSIRO are partners in a number of Cooperative Research Centres - refer to Note 35.
(f) Students at The University of Adelaide
Disclosures relating to the University Council Members and Senior Management are detailed in Note 30.
The ultimate parent entity within the group is the University of Adelaide.
Investments in controlled entities are detailed in Note 33, investments in associates are detailed in Note 34 and interests in joint arrangements are detailed in Note 36.
From time to time, Council members will have members of their immediate family who are students at the University. Unless specifically stated within the financial statements, such students are subject to the same fee structure and scholarships as any other students. This also applies to members of Council who are enrolled as students.
The University is the lessor of long term leases at peppercorn rents to the CSIRO and SARDI. On this land, these organisations have erected or leased buildings. These buildings become property of the University at the termination of the lease.
Certain Council members hold positions and interests in entities that provide goods and services to the University and its subsidiaries. The provision of these goods and services is on normal trading terms.
Certain Councillors are members of incorporated and unincorporated associations that are an integral part of the University. Transactions between these bodies, the University and Council members, in respect of services provided to Council members, are trivial in nature.
122 Financial statements 2015
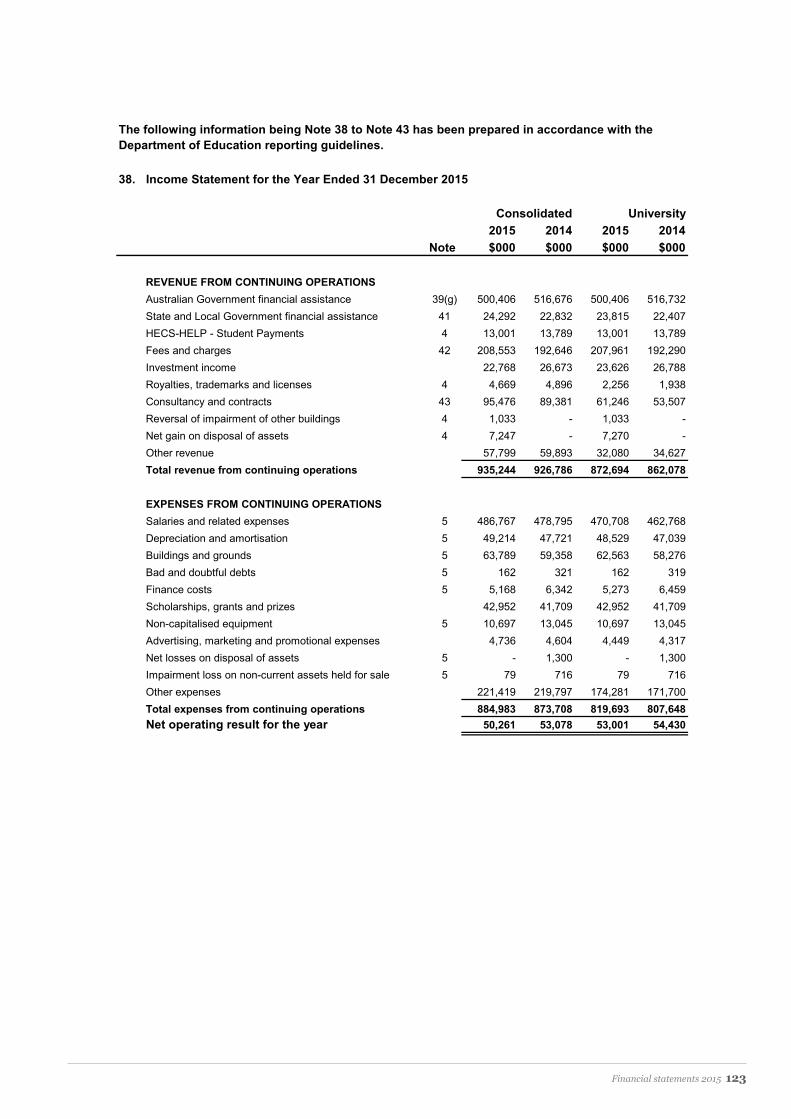
38. Income Statement for the Year Ended 31 December 2015
2015 2014 2015 2014Note $000 $000 $000 $000
REVENUE FROM CONTINUING OPERATIONSAustralian Government financial assistance 39(g) 500,406 516,676 500,406 516,732State and Local Government financial assistance 41 24,292 22,832 23,815 22,407HECS-HELP - Student Payments 4 13,001 13,789 13,001 13,789Fees and charges 42 208,553 192,646 207,961 192,290Investment income 22,768 26,673 23,626 26,788Royalties, trademarks and licenses 4 4,669 4,896 2,256 1,938Consultancy and contracts 43 95,476 89,381 61,246 53,507Reversal of impairment of other buildings 4 1,033 - 1,033 -Net gain on disposal of assets 4 7,247 - 7,270 -Other revenue 57,799 59,893 32,080 34,627Total revenue from continuing operations 935,244 926,786 872,694 862,078
EXPENSES FROM CONTINUING OPERATIONSSalaries and related expenses 5 486,767 478,795 470,708 462,768Depreciation and amortisation 5 49,214 47,721 48,529 47,039Buildings and grounds 5 63,789 59,358 62,563 58,276Bad and doubtful debts 5 162 321 162 319Finance costs 5 5,168 6,342 5,273 6,459Scholarships, grants and prizes 42,952 41,709 42,952 41,709Non-capitalised equipment 5 10,697 13,045 10,697 13,045Advertising, marketing and promotional expenses 4,736 4,604 4,449 4,317Net losses on disposal of assets 5 - 1,300 - 1,300Impairment loss on non-current assets held for sale 5 79 716 79 716Other expenses 221,419 219,797 174,281 171,700Total expenses from continuing operations 884,983 873,708 819,693 807,648Net operating result for the year 50,261 53,078 53,001 54,430
Consolidated University
The following information being Note 38 to Note 43 has been prepared in accordance with the Department of Education reporting guidelines.
Financial statements 2015 123

2015 2014 2015 2014Note $000 $000 $000 $000
39. Australian Government Financial Assistance(a) Education - Commonwealth Grants Scheme and Other Education Grants
Commonwealth Grants Scheme 166,431 163,069 166,431 163,069Teaching Hospitals Grant 1,099 1,068 1,099 1,068Indigenous Support Program 585 584 585 584Partnership & Participation Program 6,231 6,207 6,231 6,207Disability Support Program 37 40 37 40Promotion of Excellence in Learning & Teaching Program 40 306 40 306
174,423 171,274 174,423 171,274(b) Higher Education Loan Programmes
HECS-HELP 101,724 98,662 101,724 98,662FEE-HELP 10,556 10,737 10,556 10,737SA-HELP 3,155 2,884 3,155 2,884
115,435 112,283 115,435 112,283(c) Learning Scholarships
Australian Postgraduate Awards 12,175 12,020 12,175 12,020International Postgraduate Research Scholarships 974 988 974 988Commonwealth Education Costs Scholarships 131 2 131 2Commonwealth Accommodation Scholarships 74 80 74 80Indigenous Access Scholarships 96 66 96 66
13,450 13,156 13,450 13,156(d) Education Research
Joint Research Engagement Program 15,967 15,357 15,967 15,357JRE Engineering Cadetships 252 185 252 185Research Training Scheme 32,000 31,914 32,000 31,914Research Infrastructure Block Grants 14,179 14,239 14,179 14,239Sustainable Research Excellence in Universities 10,062 9,364 10,062 9,364
72,460 71,059 72,460 71,059(e) Other Capital Funding
Teaching and Learning Capital Fund - - - -- - - -
(f) Australian Research Council(i) Discovery Projects 11,337 14,178 11,337 14,178 Fellowships 10,919 13,910 10,919 13,910 Indigenous Researchers Development - - - -
22,256 28,088 22,256 28,088(ii) Linkages Infrastructure 1,340 1,925 1,340 1,925 Projects 4,204 6,105 4,204 6,105 Industrial Transformation Research Program 2,325 3,059 2,325 3,059
7,869 11,089 7,869 11,089(iii) Networks and Centres Centres 6,605 14,860 6,605 14,860
6,605 14,860 6,605 14,860
Total ARC 36,730 54,037 36,730 54,037
UniversityConsolidated
124 Financial statements 2015

2015 2014 2015 2014Note $000 $000 $000 $000
39. Australian Government Financial Assistance - continued
(g) Other Australian Government financial assistance received: Non-CapitalAttorney General's Department 925 975 925 975Australian Centre for International Agricultural Research 3,398 3,233 3,398 3,233Australian Institute of Health and Welfare 464 500 464 500Australian Renewable Energy Agency 1,364 1,274 1,364 1,274CSIRO 1,213 1,110 1,213 1,110Defence, Science and Technology Organisation 3,687 2,093 3,687 2,093Department of Agriculture 4,829 5,094 4,829 5,094Department of Defence 424 328 424 328Department of Education 8,741 13,633 8,741 13,633Department of the Environment 1,046 1,520 1,046 1,520Department of Foreign Affairs and Trade 1,488 2,256 1,488 2,256Department of Health 12,576 10,810 12,576 10,866Department of Industry 717 774 717 774Department of Veterans' Affairs 1,036 1,511 1,036 1,511Grains Research & Development Corporation 13,454 11,513 13,454 11,513Health Workforce Australia - 1,370 - 1,370National Health & Medical Research Council 32,056 36,434 32,056 36,434Other 490 439 490 439
87,908 94,867 87,908 94,923
ReconciliationAustralian Government grants 384,971 404,393 384,971 404,449HECS-HELP payments 101,724 98,662 101,724 98,662FEE-HELP payments 10,556 10,737 10,556 10,737SA-HELP payments 3,155 2,884 3,155 2,884
500,406 516,676 500,406 516,732
(h) Australian Government grants received - cash basisCGS and Other Education Grants 173,562 171,553 173,562 171,553Higher Education Loan Programmes 115,871 112,040 115,871 112,040Scholarships 13,450 13,156 13,450 13,156Education Research 72,460 71,059 72,460 71,059ARC Grants - Discovery 22,256 28,088 22,256 28,088ARC Grants - Linkages 7,869 11,089 7,869 11,089ARC Grants - Networks and Centres 6,605 14,860 6,605 14,860Other Australian Government Grants 89,053 95,329 88,120 94,959
501,126 517,174 500,193 516,804OS-Help (Net) 40(g) 1,015 696 1,015 696Higher Education Superannuation 40(g) 4,029 3,804 4,029 3,804
506,170 521,674 505,237 521,304
UniversityConsolidated
Financial statements 2015 125

40.
Acq
uitta
l of A
ustr
alia
n G
over
nmen
t Fin
anci
al A
ssis
tanc
e
(a)
Educ
atio
n - C
omm
onw
ealth
Gra
nts
Sche
me
and
Oth
er E
duca
tion
Gra
nts
Pare
nt E
ntity
(Uni
vers
ity) O
nly
2015
2014
2015
2014
2015
2014
2015
2014
2015
2014
$000
$000
$000
$000
$000
$000
$000
$000
$000
$000
Fina
ncia
l ass
ista
nce
rece
ived
in c
ash
durin
g th
e re
porti
ng p
erio
d16
5,57
016
3,34
81,
099
1,06
858
558
46,
231
6,20
737
40N
et a
ccru
al a
djus
tmen
ts86
1(2
79)
--
--
--
--
Rev
enue
for t
he p
erio
d39
(a)
166,
431
163,
069
1,09
91,
068
585
584
6,23
16,
207
3740
Sur
plus
/(Def
icit)
from
the
prev
ious
yea
r-
--
--
-31
737
143
24To
tal r
even
ue in
clud
ing
accr
ued
reve
nue
166,
431
163,
069
1,09
91,
068
585
584
6,54
86,
578
8064
Less
exp
ense
s in
clud
ing
accr
ued
expe
nses
166,
431
163,
069
1,09
91,
068
585
584
4,83
86,
261
3121
Sur
plus
/(Def
icit)
for t
he re
porti
ng p
erio
d-
--
--
-1,
710
317
4943
Dis
abili
ty S
uppo
rt
Prog
ram
Not
es
Com
mon
wea
lth
Gra
nts
Sche
me
Indi
geno
us
Supp
ort P
rogr
am
Part
ners
hip
&
Part
icip
atio
n Pr
ogra
mTe
achi
ng H
ospi
tals
G
rant
126 Financial statements 2015

40.
Acq
uitta
l of A
ustr
alia
n G
over
nmen
t Fin
anci
al A
ssis
tanc
e - c
ontin
ued
(a)
Educ
atio
n - C
omm
onw
ealth
Gra
nts
Sche
me
and
Oth
er E
duca
tion
Gra
nts
Pare
nt E
ntity
(Uni
vers
ity) O
nly
2015
2014
2015
2014
2015
2014
$000
$000
$000
$000
$000
$000
Fina
ncia
l ass
ista
nce
rece
ived
in c
ash
durin
g th
e re
porti
ng p
erio
d40
306
--
173,
562
171,
553
Net
acc
rual
adj
ustm
ents
--
--
861
(279
)R
even
ue fo
r the
per
iod
39(a
)40
306
--
174,
423
171,
274
Sur
plus
/(Def
icit)
from
the
prev
ious
yea
r45
749
046
399
31,
280
1,87
8To
tal r
even
ue in
clud
ing
accr
ued
reve
nue
497
796
463
993
175,
703
173,
152
Less
exp
ense
s in
clud
ing
accr
ued
expe
nses
324
339
-53
017
3,30
817
1,87
2S
urpl
us/(D
efic
it) fo
r the
repo
rting
per
iod
173
457
463
463
2,39
51,
280
Tota
lR
ewar
d Fu
ndin
g Pr
ogra
m
Prom
otio
n of
Ex
celle
nce
in
Lear
ning
&
Teac
hing
Pro
gram
Not
es
Financial statements 2015 127

40.
Acq
uitta
l of A
ustr
alia
n G
over
nmen
t Fin
anci
al A
ssis
tanc
e - c
ontin
ued
(b)
Hig
her E
duca
tion
Loan
Pro
gram
mes
Pare
nt E
ntity
(Uni
vers
ity) O
nly
2015
2014
2015
2014
2015
2014
2015
2014
$000
$000
$000
$000
$000
$000
$000
$000
Cas
h P
ayab
le/(R
ecei
vabl
e) a
t beg
inni
ng o
f yea
r11
144
3(1
30)
(43)
121
(55)
102
345
Fina
ncia
l ass
ista
nce
rece
ived
in c
ash
durin
g th
e re
porti
ng p
erio
d10
2,71
098
,330
10,6
7210
,650
2,48
93,
060
115,
871
112,
040
Cas
h av
aila
ble
for p
erio
d10
2,82
198
,773
10,5
4210
,607
2,61
03,
005
115,
973
112,
385
Rev
enue
ear
ned
39(b
)10
1,72
498
,662
10,5
5610
,737
3,15
52,
884
115,
435
112,
283
Cas
h P
ayab
le/(R
ecei
vabl
e) a
t end
of y
ear
1,09
711
1(1
4)(1
30)
(545
)12
153
810
2
Tota
l
Not
es
HEC
S-H
ELP
FEE-
HEL
PSA
-HEL
P
128 Financial statements 2015

40.
Acq
uitta
l of A
ustr
alia
n G
over
nmen
t Fin
anci
al A
ssis
tanc
e - c
ontin
ued
(c)
Lear
ning
Sch
olar
ship
sPa
rent
Ent
ity (U
nive
rsity
) Onl
y
2015
2014
2015
2014
2015
2014
2015
2014
2015
2014
2015
2014
$000
$000
$000
$000
$000
$000
$000
$000
$000
$000
$000
$000
Fina
ncia
l ass
ista
nce
rece
ived
in c
ash
durin
g th
e re
porti
ng p
erio
d12
,175
12,0
2097
498
813
12
7480
9666
13,4
5013
,156
Net
acc
rual
adj
ustm
ents
--
--
--
--
--
--
Rev
enue
for t
he p
erio
d39
(c)
12,1
7512
,020
974
988
131
274
8096
6613
,450
13,1
56
Sur
plus
/(Def
icit)
from
the
prev
ious
yea
r16
225
4-
-(1
19)
925
280
(425
)27
072
593
826
Tota
l rev
enue
incl
udin
g ac
crue
d re
venu
e12
,337
12,2
7497
498
812
927
354
(345
)36
613
814
,043
13,9
82Le
ss e
xpen
ses
incl
udin
g ac
crue
d ex
pens
es11
,947
12,1
1297
498
813
11,
046
74(6
25)
96(1
32)
13,2
2213
,389
Sur
plus
/(Def
icit)
for t
he re
porti
ng p
erio
d39
016
2-
-(1
19)
(119
)28
028
027
027
082
159
3
Com
mon
wea
lth
Acc
omm
odat
ion
Scho
lars
hips
Tota
l
Com
mon
wea
lth
Educ
atio
n C
ost
Scho
lars
hips
Aus
tral
ian
Post
grad
uate
A
war
ds
Inte
rnat
iona
l Po
stgr
adua
te
Res
earc
h Sc
hola
rshi
ps
Not
es
Indi
geno
us
Acc
ess
Scho
lars
hips
Financial statements 2015 129
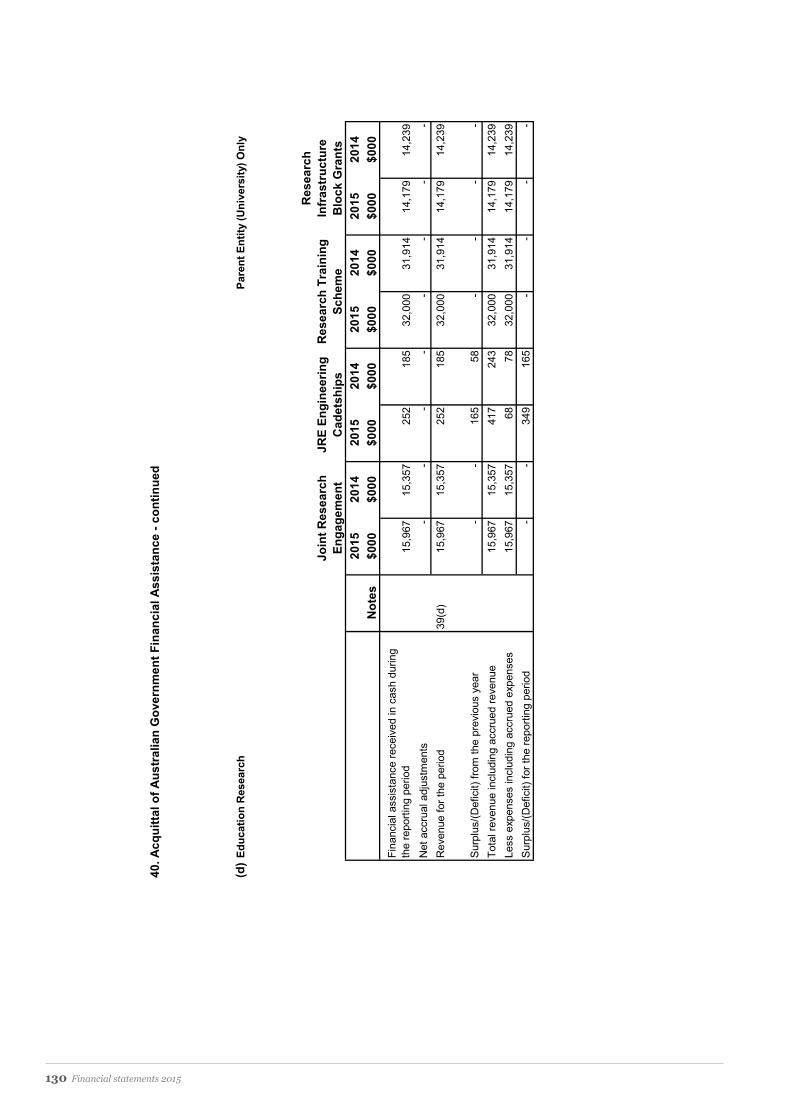
40.A
cqui
ttal o
f Aus
tral
ian
Gov
ernm
ent F
inan
cial
Ass
ista
nce
- con
tinue
d
(d)
Educ
atio
n R
esea
rch
Pare
nt E
ntity
(Uni
vers
ity) O
nly
2015
2014
2015
2014
2015
2014
2015
2014
$000
$000
$000
$000
$000
$000
$000
$000
Fina
ncia
l ass
ista
nce
rece
ived
in c
ash
durin
g th
e re
porti
ng p
erio
d15
,967
15,3
5725
218
532
,000
31,9
1414
,179
14,2
39N
et a
ccru
al a
djus
tmen
ts-
--
--
--
-R
even
ue fo
r the
per
iod
39(d
)15
,967
15,3
5725
218
532
,000
31,9
1414
,179
14,2
39
Sur
plus
/(Def
icit)
from
the
prev
ious
yea
r-
-16
558
--
--
Tota
l rev
enue
incl
udin
g ac
crue
d re
venu
e15
,967
15,3
5741
724
332
,000
31,9
1414
,179
14,2
39Le
ss e
xpen
ses
incl
udin
g ac
crue
d ex
pens
es15
,967
15,3
5768
7832
,000
31,9
1414
,179
14,2
39S
urpl
us/(D
efic
it) fo
r the
repo
rting
per
iod
--
349
165
--
--
Join
t Res
earc
h En
gage
men
t
Res
earc
h In
fras
truc
ture
B
lock
Gra
nts
Res
earc
h Tr
aini
ng
Sche
me
Not
es
JRE
Engi
neer
ing
Cad
etsh
ips
130 Financial statements 2015

40.A
cqui
ttal o
f Aus
tral
ian
Gov
ernm
ent F
inan
cial
Ass
ista
nce
- con
tinue
d
(d)
Educ
atio
n R
esea
rch
Pare
nt E
ntity
(Uni
vers
ity) O
nly
2015
2014
2015
2014
2015
2014
$000
$000
$000
$000
$000
$000
Fina
ncia
l ass
ista
nce
rece
ived
in c
ash
durin
g th
e re
porti
ng p
erio
d10
,062
9,36
4-
-72
,460
71,0
59N
et a
ccru
al a
djus
tmen
ts-
--
--
-R
even
ue fo
r the
per
iod
39(d
)10
,062
9,36
4-
-72
,460
71,0
59
Sur
plus
/(Def
icit)
from
the
prev
ious
yea
r-
--
110
165
168
Tota
l rev
enue
incl
udin
g ac
crue
d re
venu
e10
,062
9,36
4-
110
72,6
2571
,227
Less
exp
ense
s in
clud
ing
accr
ued
expe
nses
10,0
629,
364
-11
072
,276
71,0
62S
urpl
us/(D
efic
it) fo
r the
repo
rting
per
iod
--
--
349
165
Tota
l
Not
es
Com
mer
cial
isat
ion
Trai
ning
Sch
eme
Sust
aina
ble
Res
earc
h Ex
celle
nce
Financial statements 2015 131

40.
Acq
uitta
l of A
ustr
alia
n G
over
nmen
t Fin
anci
al A
ssis
tanc
e - c
ontin
ued
(e)
Oth
er C
apita
l Fun
ding
Pare
nt E
ntity
(Uni
vers
ity) O
nly
2015
2014
2015
2014
$000
$000
$000
$000
Fina
ncia
l ass
ista
nce
rece
ived
in c
ash
durin
g th
e re
porti
ng p
erio
d-
--
-N
et a
ccru
al a
djus
tmen
ts-
--
-R
even
ue fo
r the
per
iod
39(e
)-
--
-
Sur
plus
/(Def
icit)
from
the
prev
ious
yea
r-
75-
75To
tal r
even
ue in
clud
ing
accr
ued
reve
nue
-75
-75
Less
exp
ense
s in
clud
ing
accr
ued
expe
nses
-75
-75
Sur
plus
/(Def
icit)
for t
he re
porti
ng p
erio
d-
--
-
* N
o in
com
e w
as re
ceiv
ed u
nder
thes
e tw
o sc
hem
es in
201
5
Tota
l
Not
es
Teac
hing
and
Le
arni
ng C
apita
l Fu
nd
132 Financial statements 2015

40.
Acq
uitta
l of A
ustr
alia
n G
over
nmen
t Fin
anci
al A
ssis
tanc
e - c
ontin
ued
(f)Au
stra
lian
Res
earc
h C
ounc
il G
rant
s - D
isco
very
Pare
nt E
ntity
(Uni
vers
ity) O
nly
2015
2014
2015
2014
2015
2014
2015
2014
$000
$000
$000
$000
$000
$000
$000
$000
Fina
ncia
l ass
ista
nce
rece
ived
in c
ash
durin
g th
e re
porti
ng p
erio
d11
,337
14,1
7810
,919
13,9
10-
-22
,256
28,0
88N
et a
ccru
al a
djus
tmen
ts-
--
--
--
-R
even
ue fo
r the
per
iod
39(f)
11,3
3714
,178
10,9
1913
,910
--
22,2
5628
,088
Sur
plus
/(Def
icit)
from
the
prev
ious
yea
r9,
245
9,73
09,
384
6,90
319
1918
,648
16,6
52To
tal r
even
ue in
clud
ing
accr
ued
reve
nue
20,5
8223
,908
20,3
0320
,813
1919
40,9
0444
,740
Less
exp
ense
s in
clud
ing
accr
ued
expe
nses
12,2
8614
,663
11,8
4311
,429
19-
24,1
4826
,092
Sur
plus
/(Def
icit)
for t
he re
porti
ng p
erio
d8,
296
9,24
58,
460
9,38
4-
1916
,756
18,6
48
Tota
lPr
ojec
tsFe
llow
ship
s
Indi
geno
us
Res
earc
hers
D
evel
opm
ent
Not
es
Financial statements 2015 133
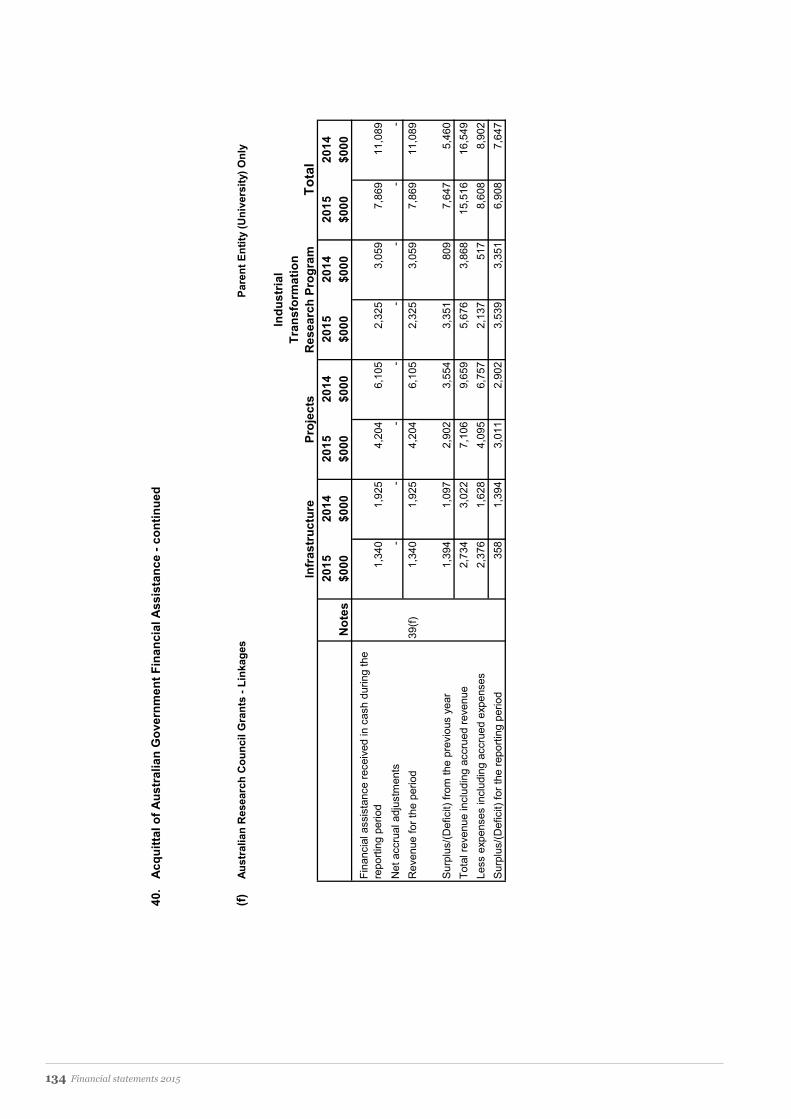
40.
Acq
uitta
l of A
ustr
alia
n G
over
nmen
t Fin
anci
al A
ssis
tanc
e - c
ontin
ued
(f)Au
stra
lian
Res
earc
h C
ounc
il G
rant
s - L
inka
ges
Pare
nt E
ntity
(Uni
vers
ity) O
nly
2015
2014
2015
2014
2015
2014
2015
2014
$000
$000
$000
$000
$000
$000
$000
$000
Fina
ncia
l ass
ista
nce
rece
ived
in c
ash
durin
g th
e re
porti
ng p
erio
d1,
340
1,92
54,
204
6,10
52,
325
3,05
97,
869
11,0
89N
et a
ccru
al a
djus
tmen
ts-
--
--
--
-R
even
ue fo
r the
per
iod
39(f)
1,34
01,
925
4,20
46,
105
2,32
53,
059
7,86
911
,089
Sur
plus
/(Def
icit)
from
the
prev
ious
yea
r1,
394
1,09
72,
902
3,55
43,
351
809
7,64
75,
460
Tota
l rev
enue
incl
udin
g ac
crue
d re
venu
e2,
734
3,02
27,
106
9,65
95,
676
3,86
815
,516
16,5
49Le
ss e
xpen
ses
incl
udin
g ac
crue
d ex
pens
es2,
376
1,62
84,
095
6,75
72,
137
517
8,60
88,
902
Sur
plus
/(Def
icit)
for t
he re
porti
ng p
erio
d35
81,
394
3,01
12,
902
3,53
93,
351
6,90
87,
647
Tota
lPr
ojec
tsIn
fras
truc
ture
Not
es
Indu
stria
l Tr
ansf
orm
atio
n R
esea
rch
Prog
ram
134 Financial statements 2015

40.
Acq
uitta
l of A
ustr
alia
n G
over
nmen
t Fin
anci
al A
ssis
tanc
e - c
ontin
ued
(f)Au
stra
lian
Res
earc
h C
ounc
il G
rant
s - N
etw
orks
and
Cen
tres
Pare
nt E
ntity
(Uni
vers
ity) O
nly
2015
2014
2015
2014
$000
$000
$000
$000
Fina
ncia
l ass
ista
nce
rece
ived
in c
ash
durin
g th
e re
porti
ng p
erio
d6,
605
14,8
606,
605
14,8
60N
et a
ccru
al a
djus
tmen
ts-
--
-R
even
ue fo
r the
per
iod
39(f)
6,60
514
,860
6,60
514
,860
Sur
plus
/(Def
icit)
from
the
prev
ious
yea
r2,
117
1,14
52,
117
1,14
5To
tal r
even
ue in
clud
ing
accr
ued
reve
nue
8,72
216
,005
8,72
216
,005
Less
exp
ense
s in
clud
ing
accr
ued
expe
nses
7,16
313
,888
7,16
313
,888
Sur
plus
/(Def
icit)
for t
he re
porti
ng p
erio
d1,
559
2,11
71,
559
2,11
7
Not
es
Cen
tres
Tota
l
Financial statements 2015 135

40. Acquittal of Australian Government Financial Assistance - continued
(g) Other Australian Government Financial Assistance
Parent Entity (University) Only
2015 2014$000 $000
Cash received during the reporting period 6,734 4,821Cash spent during the reporting period 5,719 4,125Net Cash received 39(h) 1,015 696
Surplus/(Deficit) from the previous year 290 (406)Surplus/(Deficit) for the reporting period 1,305 290
2015 2014$000 $000
Cash received during the reporting period 4,029 3,804University contribution in respect of current employees - -Cash available 39(h) 4,029 3,804
Surplus/(Deficit) from the previous year 248 453Cash available for current period 4,277 4,257Contributions to specified defined benefit funds 3,926 4,009Surplus/(Deficit) for the reporting period 351 248
2015 2014$000 $000
Unspent/(overspent) revenue from previous period 2,271 2,939SA-HELP Revenue earned 39(b) 3,155 2,884Student Services Fees direct from Students 42 2,848 2,686Total revenue expendable in period 8,274 8,509
Student Services expenses during period 4,483 6,238Unspent/(overspent) Student Services Revenue 3,791 2,271
Notes
OS HELP
Higher Education Superannuation
Student Services and Amenities Fee
Notes
Notes
136 Financial statements 2015

2015 2014 2015 2014Note $000 $000 $000 $000
41. State and Local Government Financial Assistance(a) South Australian Government and Local Government financial assistanceCentral Adelaide Local Health Network 7,664 8,119 7,664 8,119Defence SA - 2 - 2Department for Communities and Social Inclusion 27 108 27 108Department of Education and Child Development 93 30 93 30Department of Health and Ageing 3,698 3,066 3,698 3,066Department for Environment, Water and Natural Resources 1,642 1,545 1,642 1,545Department for Planning, Transport and Infrastructure 762 749 762 749Department of Primary Industries and Regions 1,862 341 1,862 341Department of State Development 4,693 5,009 4,693 5,009Department of the Premier and Cabinet 175 331 175 331Motor Accident Commission 705 732 705 732Northern Adelaide Local Health Network 699 538 699 538SafeWork SA 310 535 310 535Southern Adelaide Local Health Network 442 394 - -Other 783 729 748 698
Total South Australian Government and Local Government financial assistance 23,555 22,228 23,078 21,803
(b) Other State Government and Local Government financial assistance 737 604 737 604
Total State and Local Government financial assistance 24,292 22,832 23,815 22,407
Consolidated University
Financial statements 2015 137

2015 2014 2015 2014Note $000 $000 $000 $000
42. Fees and Charges
Student fee income 4 180,655 166,180 180,655 166,180
Non-course fees and chargesStudent services and amenities fees 4 2,848 2,686 2,848 2,686Library charges and fines 4 422 481 422 481Application management and late fees 4 1,352 1,390 1,352 1,390Parking fees 4 1,908 1,906 1,908 1,906Rental charges/accommodation fees 4 11,966 11,709 11,599 11,533Recharge of costs to other organisations 4 740 1,278 515 1,098Franchise fees 4 2,258 1,946 2,258 1,946Other 6,404 5,070 6,404 5,070
208,553 192,646 207,961 192,290
43. Consultancy and Contract RevenueConsultancy 10,980 10,956 7,529 7,093Contract research 84,496 78,425 53,717 46,414
95,476 89,381 61,246 53,507
Consolidated University
Course fees and charges
138 Financial statements 2015

Notes
Financial statements 2015 139


For further enquiriesThe University of Adelaide SA 5005 Australia
Telephone: +61 8 8313 5208 Free-call: 1800 061 459
adelaide.edu.au
facebook.com/uniofadelaide
twitter.com/uniofadelaide
youtube.com/universityofadelaide
DISCLAIMER: The information in this publication is current as at the date of printing and is subject to change. You can find updated information on our website at adelaide.edu.au With the aim of continual improvement the University of Adelaide is committed to regular reviews of the degrees, diplomas, certificates and courses on offer. As a result the specific programs and courses available will change from time to time. The University of Adelaide assumes no responsibility for the accuracy of information provided by third parties.
CRICOS 00123M © The University of Adelaide. 2579-2