2015 ANNUAL REPORT - AnnualReports.com
132
2015 ANNUAL REPORT
-
Upload
khangminh22 -
Category
Documents
-
view
0 -
download
0
Transcript of 2015 ANNUAL REPORT - AnnualReports.com

2015 ANNUAL REPORT


1
Dear Fellow Shareholders,
We are pleased to submit to you the annual report for Apollo Investment Corporation (“Apollo Investment”, “we’’, ‘‘us’’, or ‘‘our’’) for the year ended March 31, 2015.
Operating Environment
Overall, the operating environment during the year was a positive one for credit investors. The U.S. economy continued to improve and the credit environment remained benign. Concerns about global growth, falling oil and commodity prices, rate concerns, and persistent loan fund outflows resulted in bouts of heightened volatility, despite strong demand from Collateralized Loan Obligations (CLOs). It is during periods like these, when borrowers focus on certainty of execution. We believe such periods are favorable for investors like us to deploy capital.
There were also periods of strength during which we sought to further optimize the portfolio by selling lower yielding investments and reducing some larger legacy exposures. Additionally, the impact of financial regulation on banks continued to benefit non-bank lenders, like us and other Business Development Companies (“BDCs”). Overall, we believe risk adjusted returns in the middle market generally remained attractive, as the overall demand for capital by middle market companies continued to exceed the supply.
The BDC sector faced some sector specific headwinds during the year. Access to the equity markets was challenged during the year. The removal of BDCs from select equity indices resulted in index fund selling of BDC equities, putting pressure on stock prices. In contrast, the institutional debt market was open to several BDCs and has become an important source of funding. Since 2013, institutions have invested nearly $4 billion in the unsecured debt of BDCs.
A Review of Apollo Investment’s Year
Against this market backdrop, we continued to optimize our investment portfolio by selectively deploying capital. We pursued opportunities afforded to us through our differentiated sourcing capabilities and the flexibility associated with our permanent capital base. We continued to benefit from the broader Apollo Global Management platform which provides us with scale, investment opportunities, and market insights. We continued to emphasize secured debt opportunities which we believe currently offer the most attractive risk adjusted return and better position the portfolio to withstand market and economic volatility. Secured debt increased to 60% of the portfolio at the end of the year, up from 56% a year ago.i
A key element of our strategy continues to be prudently reinvesting the capital that comes back to us from repayments and from the sale of lower yielding assets. Altogether for the year, we invested $2.2 billion across 60 new and 47 existing portfolio companies.

2
Investments sold totaled $1.4 billion and investments repaid were $0.8 million. Net investment activity was essentially flat for the year.
We ended the year with a $3.35 billion portfolioi with a weighted average yield of 11.2%ii, deployed across 105 borrowers, in 35 different industries. At March 31, 2015, our portfolio was invested 60% in secured debt, 14% in unsecured debt, 11% in structured products and other, 5% in preferred equity and 10% in common equity and warrants.i We believe increasing our exposure to floating rate debt better positions the portfolio for an eventual rise in short-term rates. Therefore, floating rate debt investments increased to 52% of the portfolio, up from 42% a year ago.i
During the year, there was a significant decline in the price of oil. Our oil and gas portfolio, which represented 13.9%i of the portfolio at the end of year is well-diversified by borrower and geography. Importantly, our portfolio primarily consists of directly originated senior secured investments which are generally higher in the capital structure, secured by the assets of the borrower, structured with strong covenants, and generally require the borrower to hedge exposure to the price of oil.
With respect to our financial results for the year, gross investment income increased 14% to $433.6 million, net investment income rose 13% to $228.0 million, and net investment income per share rose over 5% to $0.96 per share, exceeding the annual dividend by 20%. We reported a net increase in net assets resulting from operations of $75.4 million, or a gain of $0.32 per share. Net asset value per share declined 6% to $8.18 at the end of the March. For the year, the Board of Directors declared $0.80 per share in dividends.
Improving our capital structure continues to be a priority for us and we recently made a couple of improvements to our liabilities. In March 2015, we issued $350 million of ten year unsecured debt with a coupon of 5.25%. This was our first public unsecured institutional debt offering and had participation from over 20 institutions. In April 2015, we successfully amended our credit facility to extend the maturity and increase the commitments. Both of these improvements demonstrate our continued ability to access the capital markets, as well as strong support from institutional debt investors and banks. We are extremely appreciative of the support from all of our credit providers.
Looking Ahead
We believe that we have taken appropriate measures to reduce the risk in the portfolio and are well positioned for fiscal year 2016 and beyond. We believe the credit quality of our portfolio remains relatively strong. We will continue to execute on our portfolio optimization strategy of selectively deploying capital and actively monetizing select investments which we believe will improve the existing portfolio’s overall returns. We will also seek to monetize non-yielding positions and redeploy those proceeds into income-producing assets.
Our investment process is built upon a rigorous, bottom-up fundamental analysis of every company in which we invest. We believe that the breadth and depth of the Apollo Global

3
Management platform will enable us to continue to find attractive opportunities in the coming year.
We are optimistic regarding opportunities for providers of flexible capital, such as ourselves, given the impact of regulations on the lending environment. We see considerable opportunities for progress in the coming year and look forward to providing periodic updates to you. As always, our main objective is to deliver shareholder value.
In closing, we would like to thank our shareholders for their ongoing and long-term support.
Sincerely,
John Hannan James Zelter
Chairman Chief Executive Officer
i Measured at fair value. ii On total debt portfolio, at current cost, exclusive of securities on non-accrual status.


UNITED STATESSECURITIES AND EXCHANGE COMMISSION
WASHINGTON, D.C. 20549
FORM 10-K
ANNUAL REPORT PURSUANT TO SECTION 13 OR 15(d) OF THE SECURITIES EXCHANGEACT OF 1934
FOR THE FISCAL YEAR ENDED MARCH 31, 2015OR
TRANSITION REPORT PURSUANT TO SECTION 13 OR 15(d) OF THE SECURITIES EXCHANGEACT OF 1934
FOR THE TRANSITION PERIOD FROM TO COMMISSION FILE NUMBER: 814-00646
APOLLO INVESTMENT CORPORATION(Exact name of registrant as specified in its charter)
Maryland(State of Incorporation)
52-2439556(I.R.S. Employer Identification Number)
9 West 57th StreetNew York, N.Y.
(Address of principal executive offices)10019
(Zip Code)
Registrant’s telephone number, including area code: (212) 515-3450Securities registered pursuant to Section 12(b) of the Act:
Title of Each Class Name of Each Exchange on Which Registered
Common Stock, par value $0.001 per share 6.625% Senior Notes due 20426.875% Senior Notes due 2043
The NASDAQ Global Select MarketThe New York Stock ExchangeThe New York Stock Exchange
Securities registered pursuant to Section 12(g) of the Act: None
Indicate by check mark if the registrant is a well-known seasoned issuer, as defined in Rule 405 of the Securities Act. Yes No Indicate by check mark if the registrant is not required to file reports pursuant to Section 13 or Section 15(d) of the Act. Yes No Indicate by check mark whether the Registrant (1) has filed all reports required to be filed by Section 13 or 15(d) of the Securities Exchange Act of 1934 during the preceding 12 months (or for such shorter period that the Registrant was required to file such reports), and (2) has been subject to such filing requirements for the past 90 days. Yes No Indicate by check mark whether the registrant has submitted electronically and posted on its corporate Web site, if any, every Interactive Data File required to be submitted and posted pursuant to Rule 405 of Regulation S-T during the preceding 12 months (or for such shorter period that the registrant was required to submit and post such files). Yes No Indicate by check mark if disclosure of delinquent filers pursuant to Item 405 of Regulation S-K is not contained herein, and will not be contained, to the best of Registrant’s knowledge, in definitive proxy or information statements incorporated by reference in Part III of this Form 10-K or any amendment to this Form 10-K. Indicate by check mark whether the registrant is a large accelerated filer, an accelerated filer, a non-accelerated filer, or a smaller reporting company. See the definitions of “large accelerated filer,” “accelerated filer” and “smaller reporting company” in Rule 12b-2 of the Exchange Act.
Large accelerated filer Accelerated filer Non-accelerated filer Smaller Reporting Company
Indicate by check mark whether the registrant is a shell company (as defined in Rule 12b-2 of the Act) Yes No The aggregate market value of common stock held by non-affiliates of the Registrant on September 30, 2014 based on the closing price on that date of $8.17 on the NASDAQ Global Select Market was approximately $1.9 billion. For the purposes of calculating this amount only, all directors and executive officers of the Registrant have been treated as affiliates. There were 236,741,351 shares of the Registrant’s common stock outstanding as of May 19, 2015.Portions of the registrant’s Proxy Statement for its 2015 Annual Meeting of Stockholders to be filed not later than 120 days after the end of the fiscal year covered by this Annual Report on Form 10-K are incorporated by reference into Part III of this Form 10-K.

APOLLO INVESTMENT CORPORATIONFORM 10-K
FOR THE FISCAL YEAR ENDED MARCH 31, 2015TABLE OF CONTENTS
Page
PART I
Item 1. Business
Item 1A. Risk Factors
Item 1B. Unresolved Staff Comments
Item 2. Properties
Item 3. Legal Proceedings
Item 4. Mine Safety Disclosures
PART II
Item 5. Market for Registrant’s Common Equity, Related Stockholder Matters and Issuer Purchases of Equity Securities
Item 6. Selected Financial Data
Item 7. Management’s Discussion and Analysis of Financial Condition and Results of Operations
Item 7A. Quantitative and Qualitative Disclosures About Market Risk
Item 8. Financial Statements and Supplementary Data
Item 9. Changes in and Disagreements With Accountants on Accounting and Financial Disclosure
Item 9A. Controls and Procedures
Item 9B. Other Information
PART III
Item 10. Directors, Executive Officers and Corporate Governance
Item 11. Executive Compensation
Item 12. Security Ownership of Certain Beneficial Owners and Management and Related Stockholder Matters
Item 13. Certain Relationships and Related Transactions, and Director Independence
Item 14. Principal Accounting Fees and Services
PART IV
Item 15. Exhibits, Financial Statement Schedules
Signatures
1
7
30
30
30
30
31
33
34
46
47
111
111
111
112
115
116
117
118
120
121

1
PART I
Item 1. Business
Apollo Investment Corporation
Apollo Investment Corporation (“Apollo Investment,” “Company,” “AIC,” “we,” “us,” and “our”), a Maryland corporation organized on February 2, 2004, is a closed-end, externally managed, non-diversified management investment company that has elected to be treated as a business development company (“BDC”) under the Investment Company Act of 1940 (the “1940 Act”). In addition, for tax purposes we have elected to be treated as a regulated investment company (“RIC”), under the Internal Revenue Code of 1986, as amended (the “Code”).
Our investment objective is to generate current income and capital appreciation. We invest primarily in various forms of debt investments including secured and unsecured debt, loan investments and/or equity in private middle-market companies. We may also invest in the securities of public companies and structured products such as collateralized loan obligations ("CLOs") and credit-linked notes ("CLNs").
Our portfolio is comprised primarily of investments in debt, including secured, and unsecured debt of private U.S. middle-market companies that, in the case of senior secured loans, generally are not broadly syndicated and whose aggregate tranche size is less than $250 million. Our portfolio also includes equity interests such as common stock, preferred stock, warrants or options. In this Form 10-K, we use the term “middle-market” to refer to companies with annual revenues between $50 million and $2 billion. While our investment objective is to generate current income and capital appreciation through investments in U.S. secured and unsecured loans, other debt securities and equity, we may also invest a portion of the portfolio in other investment opportunities, including foreign securities and structured products. Most of the debt instruments we invest in are unrated or rated below investment grade, which is often an indication of size, credit worthiness and speculative nature relative to the capacity of the borrower to pay interest and principal.
Apollo Investment Management, L.P. (“AIM”) is our investment adviser and an affiliate of Apollo Global Management, LLC and its consolidated subsidiaries (“AGM”). AGM and other affiliates manage other funds that may have investment mandates that are similar, in whole or in part, with ours. AIM and its affiliates may determine that an investment is appropriate both for us and for one or more of those other funds. In such event, depending on the availability of such investment and other appropriate factors, AIM may determine that we should invest on a side-by-side basis with one or more other funds. We make all such investments subject to compliance with applicable regulations and interpretations, and our allocation procedures. In certain circumstances negotiated co-investments may be made only if we receive an order from the SEC permitting us to do so. There can be no assurance that any such order will be obtained.
During our fiscal year ended March 31, 2015, we invested $2.2 billion across 60 new and 47 existing portfolio companies through a combination of primary and secondary debt investments. This compares to $2.8 billion across 81 new and 50 existing portfolio companies for the previous fiscal year ended March 31, 2014. Investments sold or repaid during the fiscal year ended March 31, 2015 totaled $2.3 billion versus $2.3 billion for the fiscal year ended March 31, 2014. The weighted average yields on our secured debt portfolio, unsecured debt portfolio and total debt portfolio as of March 31, 2015 at our current cost basis were 11.2%, 10.9% and 11.2%, respectively. At March 31, 2014, the yields were 10.8%, 11.5% and 11.1%, respectively.
At March 31, 2015, our portfolio consisted of 105 portfolio companies and was invested 60% in secured debt, 14% in unsecured debt, 11% in structured products and other, 5% in preferred equity and 10% in common equity and warrants measured at fair value versus 111 portfolio companies invested 56% in secured debt, 27% in unsecured debt, 6% in structured products and other, 3% in preferred equity and 8% in common equity and warrants at March 31, 2014.
Since the initial public offering of Apollo Investment in April 2004 and through March 31, 2015, invested capital totaled $15.4 billion in 350 portfolio companies. Over the same period, Apollo Investment completed transactions with more than 100 different financial sponsors.
At March 31, 2015, 48% or $1.3 billion of our income-bearing investment portfolio is fixed rate debt and 52% or $1.4 billion is floating rate debt, measured at fair value. On a cost basis, 50% or $1.4 billion of our income-bearing investment portfolio is fixed rate debt and 50% or $1.4 billion is floating rate debt. At March 31, 2014, 58% or $1.7 billion of our income-bearing investment portfolio was fixed rate debt and 42% or $1.3 billion was floating rate debt, measured at fair value. On a cost basis, 58% or $1.7 billion of our income-bearing investment portfolio was fixed rate debt and 42% or $1.2 billion was floating rate debt.
Apollo Investment Management, L.P.
AIM, our investment adviser, is led by John Hannan, James Zelter and Edward Goldthorpe. Potential investment opportunities are generally approved by an investment committee composed of senior personnel across AGM including Mr. Zelter and Mr.

2
Goldthorpe. The composition of the investment committee and its approval process for the Company’s investments may change from time to time. AIM draws upon AGM’s more than 20 year history and benefits from the broader firm’s significant capital markets, trading and research expertise developed through investments in over 150 companies since inception.
Apollo Investment Administration
In addition to furnishing us with office facilities, equipment, and clerical, bookkeeping and record keeping services, Apollo Investment Administration, LLC (“AIA” or “Apollo Administration”), an affiliate of AGM, also oversees our financial records as well as prepares our reports to stockholders and reports filed with the SEC. AIA also performs the calculation and publication of our net asset value, the payment of our expenses and oversees the performance of various third-party service providers and the preparation and filing of our tax returns. Furthermore, AIA provides on our behalf managerial assistance to those portfolio companies to which we are required to provide such assistance.
Operating and Regulatory Structure
Our investment activities are managed by AIM and supervised by our board of directors, a majority of whom are independent of AGM and its affiliates. AIM is an investment adviser that is registered under the Investment Advisers Act of 1940. Under our investment advisory and management agreement, we pay AIM an annual base management fee based on our average gross assets as well as an incentive fee.
As a business development company, we are required to comply with certain regulatory requirements. Also, while we are permitted to finance investments using debt, our ability to use debt is limited in certain significant respects (see Item 1A Risk Factors). We have elected to be treated for federal income tax purposes as a RIC under Subchapter M of the Code.
Investments
Apollo Investment seeks to create a portfolio that includes primarily debt investments including secured loans, unsecured and mezzanine loans and, to a lesser extent, equity investments by investing, on an individual portfolio company basis, approximately $20 million to $250 million of capital in the securities of U.S. middle-market companies, as well as structured products such as CLOs. The average investment size may vary as the size of our capital base varies. Our target portfolio consists primarily of long-term secured debt, as well as unsecured and mezzanine positions of private middle-market companies. Structurally, unsecured and mezzanine debt usually ranks subordinate in priority of payment to senior debt, such as bank debt, and is characterized as unsecured. As such, other creditors may rank senior to us in the event of an insolvency.
However, unsecured and mezzanine debt ranks senior to common and preferred equity in a borrowers’ capital structure. Unsecured and mezzanine debt may have a fixed or floating interest rate. Additional income can be generated from upfront fees, call protections including call premiums, equity co-investments or warrants. We may also generate revenue in the form of commitment, origination, structuring fees, fees for providing managerial assistance and, if applicable, consulting fees, etc. We may also invest in debt and equity positions of structured products, such as CLOs and CLNs. CLOs and CLNs are a form of securitization in which generally the cash flows of a portfolio of loans are pooled and passed on to different classes of owners in various tranches.
Our principal focus is to provide capital to middle-market companies in a variety of industries. We generally seek to target companies that generate positive free cash flows or that may support debt investments with strong asset coverage, and we may provide debtor-in-possession or reserve financing. Additionally, we may acquire investments in the secondary market if we believe the risk-adjusted returns are attractive.

3
The following is a representative list of the industries in which we have invested as of March 31, 2015:
• Aerospace and Defense • Containers, Packaging and Glass • Finance • Mining
• Aviation • Distribution • Financial Services • Oil and Gas
• Broadcasting & Entertainment • Diversified Investment Vehicle • Grocery • Packaging
• Buildings and Real Estate • Diversified Natural Resources,Precious Metals and Minerals
• Healthcare • Printing and Publishing
• Business Services • Diversified Service • Home and Office Furnishingsand Durable Consumer Products
• Restaurants
• Cable Television • Education • Hotels, Motels, Inns andGaming
• Telecommunications
• Cargo Transport • Electronics • Insurance • Transportation
• Chemicals • Energy • Leisure • Utilities
• Consumer Products • Environmental Services • Media
We may also invest in other industries if we are presented with attractive opportunities. In an effort to increase our returns and the number of investments that we can make, we may in the future seek to securitize our debt investments. To securitize debt investments, we may create a wholly owned subsidiary and contribute a pool of loans to the subsidiary. We may sell debt of or interests in the subsidiary on a non-recourse basis to purchasers whom we would expect to be willing to accept a lower interest rate to invest in investment-grade securities. We may use the proceeds of such sales to reduce indebtedness or to fund additional investments. We may also invest through special purpose entities or other arrangements, including total return swaps and repurchase agreements, in order to obtain non-recourse financing or for other purposes.
We may invest, to the extent permitted by law, in the securities and instruments of other investment companies and in private funds. We may also co-invest on a concurrent basis with affiliates of ours, subject to compliance with applicable regulations and our allocation procedures. Certain types of negotiated co-investments may be made only if we receive an order from the SEC permitting us to do so. There can be no assurance that any such order will be obtained.
Listed below are our top ten portfolio companies and industries based on their fair value and represented as a percentage of the portfolio as of March 31, 2015 and 2014, measured at fair value:
TOP TEN PORTFOLIO COMPANIES AND INDUSTRIES AS OF MARCH 31, 2015
PORTFOLIO COMPANY % of Portfolio INDUSTRY % of Portfolio
Merx Aviation Finance, LLC 15.4% Business Services 15.6% U.S. Security Associates Holdings, Inc. 4.1% Aviation 15.4% PlayPower Holdings, Inc. 3.4% Oil and Gas 13.9% Miller Energy Resources, Inc. 2.5% Diversified Investment Vehicle 9.6% Spotted Hawk Development, LLC 2.4% Financial Services 4.0% Golden Hill CLO I, LLC 2.2% Chemicals 3.8% Maxus Capital Carbon SPE I, LLC 2.2% Leisure 3.4% AMP Solar (UK) Limited 1.9% Utilities 3.0% Skyline Data, News and Analytics LLC (Dodge Data & Analytics LLC)
1.9% Aerospace and Defense 2.9%
My Alarm Center, LLC 1.8% Distribution 2.9%

4
TOP TEN PORTFOLIO COMPANIES AND INDUSTRIES AS OF MARCH 31, 2014
PORTFOLIO COMPANY % of Portfolio INDUSTRY % of Portfolio
Merx Aviation Finance Holdings II, LLC 12.2% Business Services 14.6%U.S. Security Associates Holdings, Inc. 4.0% Aviation 12.2%PlayPower Holdings, Inc. 3.0% Oil and Gas 11.8%inVentiv Health, Inc. 2.8% Financial Services 7.4%Kronos, Inc. 2.8% Healthcare 6.6%First Data Corp. 2.7% Diversified Investment Vehicle 5.5%Asurion Corporation 2.7% Distribution 4.9%Ceridian Corp. 2.6% Chemicals 4.2%Miller Energy Resources, Inc. 2.5% Diversified Service 3.7%Accelerate Parent Corp. (American Tire) 2.1% Insurance 3.5%
Listed below is the geographic breakdown of the portfolio based on fair value as of March 31, 2015 and 2014:
GEOGRAPHIC REGION% of Portfolio atMarch 31, 2015 GEOGRAPHIC REGION
% of Portfolio atMarch 31, 2014
North America 89.8% North America 92.8%Western Europe 7.3% Western Europe 5.3%Cayman Islands 1.9% Cayman Islands 1.3%Australia 1.0% Australia 0.6%
100.0% 100.0%
Investment selection & due diligence
We are committed to a value oriented philosophy of, among other things, capital preservation and commit resources to managing risks associated with our investment portfolio. Our investment adviser conducts due diligence on prospective portfolio companies. In conducting its due diligence, our investment adviser uses information provided by the company and its management team, publicly available information, as well as information from their extensive relationships with former and current management teams, consultants, competitors and investment bankers and the direct experience of the senior partners of our affiliates.
Our investment adviser’s due diligence will typically include:
• review of historical and prospective financial information;
• on-site visits;
• interviews with management, employees, customers and vendors of the potential portfolio company;
• review of loan documents;
• background checks; and
• research relating to the company’s management, industry, markets, products and services, and competitors.
Upon the completion of due diligence and a decision to seek approval for an investment in a company, the professionals leading the proposed investment generally present the investment opportunity to and seek approval from the investment committee, which determines whether to pursue the potential investment. Additional due diligence with respect to any investment may be conducted on our behalf by attorneys and accountants prior to the closing of the investment, as well as other outside advisers, as appropriate.
Investment structure
Once we have determined that a prospective portfolio company is suitable for investment, we work with the management of that company and its other capital providers, including senior, junior and equity capital providers, to structure an investment.
We generally seek to structure our investments as secured loans with a direct lien on the assets or cash flows of the company that provide for increased downside protection in the event of insolvency while maintaining attractive risk-adjusted returns and current

5
interest income. We generally seek for these secured loans to obtain security interests in the assets of our portfolio companies that serve as collateral in support of the repayment of these loans. This collateral may take the form of first or second priority liens on the assets of a portfolio company. In some cases, we may enter into debt investments that, by their terms, convert into equity or additional debt securities or defer payments (payment-in-kind ("PIK")) of interest after our investment. Also, in some cases our debt investments may be collateralized by a subordinated lien on some or all of the assets of the borrower. Typically, our loans have maturities of three to ten years.
We seek to tailor the terms of our investments to the facts and circumstances of the transaction and the prospective portfolio company, negotiating a structure that protects our rights and manages our risk while creating incentives for the portfolio company to achieve its business plan and improve its profitability. For example, in addition to seeking a senior position in the capital structure of our portfolio companies, we seek to limit the downside potential of our investments by:
• requiring an expected total return on our investments (including both interest and potential equity appreciation) thatcompensates us for credit risk;
• generally incorporating call protection into the investment structure where possible; and
• negotiating covenants and information rights in connection with our investments that afford our portfolio companiesflexibility in managing their businesses, but which are still consistent with our goal of preserving our capital. Suchrestrictions may include affirmative and negative covenants, default penalties, lien protection, change of control provisionsand board rights, including either observation or participation rights. Our investments may include equity features, suchas warrants or options to buy a minority interest in the portfolio company. Any warrants we receive with our debt securitiesgenerally require only a nominal cost to exercise, and thus, as a portfolio company appreciates in value, we may achieveadditional investment return from this equity interest. We may structure the warrants to provide provisions protecting ourrights as a minority-interest holder, as well as puts, or rights to sell such securities back to the company, upon the occurrenceof specified events. In many cases, we may also seek to obtain registration rights in connection with these equity interests,which may include demand and “piggyback” registration rights.
We expect to hold most of our investments to maturity or repayment, but we may sell certain of our investments sooner if a liquidity event takes place such as a sale or recapitalization or worsening of credit quality of a portfolio company, among other reasons.
Ongoing relationships with portfolio companies
Monitoring
AIM monitors our portfolio companies on an ongoing basis and also monitors the financial trends of each portfolio company to determine if each is meeting its respective business plans and to assess the appropriate course of action for each company. In addition, senior investment professionals of AIM may take board seats or obtain board observation rights for our portfolio companies.
AIM has several methods of evaluating and monitoring the performance and fair value of our investments, which can include, but are not limited to, the assessment of success of the portfolio company in adhering to its business plan and compliance with covenants; periodic and regular contact with portfolio company management and, if appropriate, the financial or strategic sponsor, to discuss financial position, requirements and accomplishments; comparisons to other portfolio companies in the industry; attendance at and participation in board meetings; and review of monthly and quarterly financial statements and financial projections for portfolio companies.
AIM also uses an investment rating system to characterize and monitor our expected level of returns on each investment in our portfolio. These ratings are just one of several factors that AIM uses to monitor our portfolio, but they are not in and of themselves a determinative of fair value. AIM grades the credit risk of all investments on a scale of 1 to 5 no less frequently than quarterly. This system is intended primarily to reflect the underlying risk of a portfolio investment relative to our initial cost basis in respect of such portfolio investment (i.e., at the time of acquisition), although it may also take into account under certain circumstances the performance of the portfolio company’s business, the collateral coverage of the investment and other relevant factors.
Under this system, investments with a grade of 1 involve the least amount of risk to our initial cost basis. The trends and risk factors for this investment since origination or acquisition are generally favorable, which may include the performance of the portfolio company or a potential exit. Investments graded 2 involve a level of risk to our initial cost basis that is similar to the level of risk underwritten at the time of origination or acquisition. This portfolio company is generally performing in accordance with our analysis of its business and the full return of principal and interest or dividend is expected. Investments graded 3 indicate that the risk to our ability to recoup the cost of such investment has increased since origination or acquisition, but full return of principal and interest or dividend is expected. A portfolio company with an investment grade of 3 requires closer monitoring. Investments graded 4 indicate that the risk to our ability to recoup the cost of such investment has increased significantly since

6
origination or acquisition, including as a result of factors such as declining performance and noncompliance with debt covenants, and we expect some loss of interest, dividend or capital appreciation, but still expect an overall positive internal rate of return on the investment. Investments graded 5 indicate that the risk to our ability to recoup the cost of such investment has increased materially since origination or acquisition and the portfolio company likely has materially declining performance. Loss of interest or dividend and some loss of principal investment is expected, which would result in an overall negative internal rate of return on the investment. For investments graded 4 or 5, AIM enhances its level of scrutiny over the monitoring of such portfolio company.
AIM monitors and, when appropriate, changes the investment ratings assigned to each investment in our portfolio. In connection with our valuation process, AIM reviews these investment ratings on a quarterly basis, and our audit committee monitors such ratings. It is possible that the grade of certain of these portfolio investments may be reduced or increased over time.
Managerial assistance
As a BDC, we must offer, and must provide upon request, significant managerial assistance to certain of our portfolio companies. This assistance could involve, among other things, monitoring the operations of our portfolio companies, participating in board and management meetings, consulting with and advising officers of portfolio companies and providing other organizational and financial guidance. We may receive fees for these services.
Valuation Process
The following is a description of the steps we take each quarter to determine the value of our portfolio. Our portfolio of investments is recorded at fair value as determined in good faith by or under the direction of our board of directors pursuant to a written valuation policy and a consistently applied valuation process utilizing the input of our investment adviser, independent valuation firms, third party pricing services and the audit committee. Since this process necessarily involves the use of judgment and the engagement of independent valuation firms, there is no certainty as to the value of our portfolio investments. Investments for which market quotations are readily available are recorded in our financial statements at such market quotations if they are deemed to represent fair value. Market quotations may be deemed not to represent fair value where AIM believes that facts and circumstances applicable to an issuer, a seller or purchaser or the market for a particular security causes current market quotes not to reflect the fair value of the security, among other reasons. Examples of these events could include cases in which material events are announced after the close of the market on which a security is primarily traded, when a security trades infrequently causing a quoted purchase or sale price to become stale or in the event of a “fire sale” by a distressed seller.
With respect to investments for which market quotations are not readily available or when such market quotations are deemed not to represent fair value, our board of directors has approved a multi-step valuation process each quarter, as described below:
(1) our quarterly valuation process begins with each portfolio company or investment being initially valued by the investment professionals of our investment adviser responsible for the portfolio investment;
(2) preliminary valuation conclusions are then documented and discussed with senior management of our investment adviser;
(3) independent valuation firms are engaged by our board of directors to conduct independent appraisals by reviewing our investment adviser’s preliminary valuations and then making their own independent assessment;
(4) the audit committee of the board of directors reviews the preliminary valuation of our investment adviser and the valuation prepared by the independent valuation firm and responds to the valuation recommendation of the independent valuation firm to reflect any comments; and
(5) the board of directors discusses valuations and determines in good faith the fair value of each investment in our portfolio based on the input of our investment adviser, the applicable independent valuation firm, third party pricing services and the audit committee.
In addition, some of our investments provide for PIK interest or dividends. Such amounts of accrued PIK interest or dividends are added to the cost of the investment on the respective capitalization dates and generally become due at maturity of the investment or upon the investment being called by the issuer. Upon capitalization, PIK is subject to the fair value estimates associated with their related investments.
Competition
Our primary competitors in providing financing to middle-market companies include public and private funds, commercial and investment banks, commercial financing companies, other BDCs or hedge funds, and, to the extent they provide an alternative form of financing, private equity funds. Some of our existing and potential competitors are substantially larger and have considerably greater financial, technical and marketing resources than we do. For example, some competitors may have a lower cost of funds and access to funding sources that are not available to us. In addition, some of our competitors may have higher risk tolerances

7
or different risk assessments, which could allow them to consider a wider variety of investments and establish more relationships than us. Furthermore, many of our competitors are not subject to the regulatory restrictions that the 1940 Act imposes on us as a BDC or the restrictions that the Code imposes on us as a RIC. We also expect to use the industry information of AGM’s investment professionals to which we have access to assess investment risks and determine appropriate pricing for our investments in portfolio companies. In addition, we believe that the relationships of the senior managers of AIM and those of our affiliates enable us to learn about, and compete effectively for, financing opportunities with attractive middle-market companies in the industries in which we seek to invest.
Staffing
The Company has no employees. All of the services we utilize are provided by third parties. Our chief financial officer and chief compliance officer and additional personnel assisting them in such functions are employees of AIA and perform their respective functions under the terms of the administration agreement with AIA. Certain of our other executive officers are managing partners of our investment adviser. Our day-to-day investment operations are managed by our investment adviser, which draws on the broader capabilities of the Opportunistic Credit segment of AGM’s credit business. We generally reimburse AIA for our allocable portion of expenses incurred by it in performing its obligations under the administration agreement, including rent and our allocable portion of the cost of our chief financial officer, chief compliance officer and corporate secretary and their respective staffs, valuation services, middle office and internal audit.
Sarbanes-Oxley Act of 2002
The Sarbanes-Oxley Act of 2002 imposes a wide variety of regulatory requirements on publicly-held companies and their insiders. Many of these requirements affect us. For example:
• Pursuant to Rule 13a-14 under the Securities Exchange Act of 1934 (“the 1934 Act”), our Chief Executive Officer andChief Financial Officer must certify the accuracy of the financial statements contained in our periodic reports;
• Pursuant to Item 307 of Regulation S-K, our periodic reports must disclose our conclusions about the effectiveness ofour disclosure controls and procedures;
• Pursuant to Rule 13a-15 of the 1934 Act, our management must prepare a report regarding its assessment of our internalcontrol over financial reporting; and
• Pursuant to Item 308 of Regulation S-K and Rule 13a-15 of the 1934 Act, our periodic reports must disclose whetherthere were significant changes in our internal controls or in other factors that could significantly affect these controlssubsequent to the date of their evaluation, including any corrective actions with regard to material weaknesses.
The Sarbanes-Oxley Act requires us to review our current policies and procedures to determine whether we comply with the Sarbanes-Oxley Act and the regulations promulgated thereunder. We will continue to monitor our compliance with all regulations that are adopted under the Sarbanes-Oxley Act and will take actions necessary to ensure that we are in compliance therewith.
You may read and copy any materials we file with the SEC at the SEC’s Public Reference Room at 100 F Street, NE, Washington, DC 20549, on official business days during the hours of 10:00 am to 3:00 pm. You may obtain information on the operation of the Public Reference Room by calling the SEC at 1-800-SEC-0330. The SEC maintains an Internet site that contains reports, proxy and information statements, and other information regarding issuers that file electronically with the SEC. The address of that site is http://www.sec.gov.
Our internet address is www.apolloic.com. We make available free of charge on our website our annual report on Form 10-K, quarterly reports on Form 10-Q, current reports on Form 8-K and amendments to those reports as soon as reasonably practicable after we electronically file such material with, or furnish it to, the SEC. Information contained on our website is not incorporated by reference into this annual report on Form 10-K, and you should not consider information contained on our website to be part of this annual report on Form 10-K.
Item 1A. Risk Factors
Investing in Apollo Investment involves a number of significant risks related to our business, structure, investments and investment in our common stock. As a result, there can be no assurance that we will achieve our investment objective. You should carefully consider the risks described below, together with all of the other information included in this report, before you decide whether to invest in Apollo Investment. The risks set forth below are not the only risks we face. Additional risks and uncertainties not currently known to us or that we currently deem to be immaterial also may have a material adverse effect on our business, financial condition and/or operating results.

8
CERTAIN RISKS IN THE CURRENT ENVIRONMENT
Capital markets may experience periods of disruption and instability. Such market conditions may materially and adversely affect debt and equity capital markets in the United States and abroad, which may have a negative impact on our business and operations.
From time to time, capital markets may experience periods of disruption and instability. For example, between 2007 and 2009, the global capital markets experienced an extended period of disruption as evidenced by a lack of liquidity in the debt capital markets, write-offs in the financial services sector, the re-pricing of credit risk and the failure of certain major financial institutions. Despite actions of the United States, federal government and foreign governments, these events contributed to worsening general economic conditions that materially and adversely impacted the broader financial and credit markets and reduced the availability of debt and equity capital for the market as a whole and financial services firms in particular. While the adverse effects of these conditions have abated to a degree, global financial markets experienced significant volatility following the downgrade by Standard & Poor’s on August 5, 2011 of the long-term credit rating of U.S. Treasury debt from AAA to AA+. During such market disruptions, we may have difficulty raising debt or equity capital especially as a result of regulatory constraints. There can be no assurance that adverse market conditions will not repeat themselves or worsen in the future.
Market conditions may in the future make it difficult to extend the maturity of or refinance our existing indebtedness, including the final maturity of our senior secured credit facility in April 2020, and any failure to do so could have a material adverse effect on our business. The illiquidity of our investments may make it difficult for us to sell such investments if required. As a result, we may realize significantly less than the value at which we have recorded our investments.
Given the extreme volatility and dislocation that the capital markets have historically experienced, many BDCs have faced, and may in the future face, a challenging environment in which to raise capital. We may in the future have difficulty accessing debt and equity capital, and a severe disruption in the global financial markets or deterioration in credit and financing conditions could have a material adverse effect on our business, financial condition and results of operations. In addition, significant changes in the capital markets, including the extreme volatility and disruption, have had, and may in the future have, a negative effect on the valuations of our investments and on the potential for liquidity events involving our investments. An inability to raise capital, and any required sale of our investments for liquidity purposes, could have a material adverse impact on our business, financial condition or results of operations. AIM does not know how long the financial markets will continue to be affected by these events and cannot predict the effects of these or similar events in the future on the United States economy and securities markets or on our investments. AIM monitors developments and seeks to manage our investments in a manner consistent with achieving our investment objective, but there can be no assurance that it will be successful in doing so; and AIM may not timely anticipate or manage existing, new or additional risks, contingencies or developments, including regulatory developments in the current or future market environment.
Price declines and illiquidity in the corporate debt markets have adversely affected, and may in the future adversely affect, the fair value of our portfolio investments, reducing our net asset value through increased net unrealized depreciation.
As a business development company, we are required to carry our investments at market value or, if no market value is ascertainable, at fair value as determined in good faith by or under the direction of our board of directors. Decreases in the market values or fair values of our investments are recorded as unrealized depreciation, which reduces our net asset value. Depending on market conditions, we could incur substantial realized losses and may suffer additional unrealized losses in future periods, which could have a material adverse impact on our business, financial condition and results of operations.
Uncertainty about the financial stability of the United States and of several countries in the European Union (EU) could have a significant adverse effect on our business, financial condition and results of operations.
Due to federal budget deficit concerns, S&P downgraded the federal government's credit rating from AAA to AA+ for the first time in history on August 5, 2011. Further, Moody's and Fitch had warned that they may downgrade the federal government's credit rating. Further downgrades or warnings by S&P or other rating agencies, and the United States government's credit and deficit concerns in general, could cause interest rates and borrowing costs to rise, which may negatively impact both the perception of credit risk associated with our debt portfolio and our ability to access the debt markets on favorable terms. In addition, a decreased U.S. government credit rating could create broader financial turmoil and uncertainty, which may weigh heavily on our financial performance and the value of our common stock.
In 2010, a financial crisis emerged in Europe, triggered by high budget deficits and rising direct and contingent sovereign debt in Greece, Ireland, Italy, Portugal and Spain, which created concerns about the ability of these nations to continue to service their sovereign debt obligations. While the financial stability of such countries has improved significantly, risks resulting from any future debt crisis in Europe or any similar crisis could have a detrimental impact on the global economic recovery, sovereign and

9
non-sovereign debt in these countries and the financial condition of European financial institutions. Market and economic disruptions have affected, and may in the future affect, consumer confidence levels and spending, personal bankruptcy rates, levels of incurrence and default on consumer debt and home prices, among other factors. We cannot assure you that market disruptions in Europe, including the increased cost of funding for certain governments and financial institutions, will not impact the global economy, and we cannot assure you that assistance packages will be available, or if available, be sufficient to stabilize countries and markets in Europe or elsewhere affected by a financial crisis. To the extent uncertainty regarding any economic recovery in Europe negatively impacts consumer confidence and consumer credit factors, our business, financial condition and results of operations could be significantly and adversely affected.
In October 2014, the Federal Reserve announced that it was concluding its bond-buying program, or quantitative easing, which was designed to stimulate the economy and expand the Federal Reserve's holdings of long-term securities, suggesting that key economic indicators, such as the unemployment rate, had showed signs of improvement since the inception of the program. It is unclear what effect, if any, the conclusion of the Federal Reserve's bond-buying program will have on the value of our investments. However, it is possible that, without quantitative easing by the Federal Reserve, these developments, along with the United States government's credit and deficit concerns and the European sovereign debt crisis, could cause interest rates and borrowing costs to rise, which may negatively impact our ability to access the debt markets on favorable terms. Additionally, in January 2015, the Federal Reserve reaffirmed its view that the current target range for the federal funds rate was appropriate based on current economic conditions. However, if key economic indicators, such as the unemployment rate or inflation, do not progress at a rate consistent with the Federal Reserve's objectives, the target range for the federal funds rate may increase and cause interest rates and borrowing costs to rise, which may negatively impact our ability to access the debt markets on favorable terms.
Rising interest rates may adversely affect the value of our portfolio investments which could have an adverse effect on our business, financial condition and results of operations.
Our debt investments may be based on floating rates, such as London Interbank Offer Rate (“LIBOR”), EURIBOR, the Federal Funds Rate or the Prime Rate. General interest rate fluctuations may have a substantial negative impact on our investments, the value of our common stock and our rate of return on invested capital. A reduction in the interest rates on new investments relative to interest rates on current investments could also have an adverse impact on our net interest income. An increase in interest rates could decrease the value of any investments we hold which earn fixed interest rates, including subordinated loans, senior and junior secured and unsecured debt securities and loans and high yield bonds, and also could increase our interest expense, thereby decreasing our net income. Also, an increase in interest rates available to investors could make investment in our common stock less attractive if we are not able to increase our dividend rate, which could reduce the value of our common stock.
Because we have borrowed money, and may issue preferred stock to finance investments, our net investment income depends, in part, upon the difference between the rate at which we borrow funds or pay distributions on preferred stock and the rate that our investments yield. As a result, we can offer no assurance that a significant change in market interest rates will not have a material adverse effect on our net investment income.
You should also be aware that a change in the general level of interest rates can be expected to lead to a change in the interest rate we receive on many of our debt investments. Accordingly, a change in the interest rate could make it easier for us to meet or exceed the performance threshold and may result in a substantial increase in the amount of incentive fees payable to our investment adviser with respect to the portion of the incentive fee based on income.
Risks Associated with Recent Commodity Futures Trading Commission ("CFTC") Actions
AIM has claimed relief available under a no-action letter (“Letter 12-40”) issued by the staff of the CFTC. Letter 12-40 relieves AIM from registering with the CFTC as the commodity pool operator (“CPO”) of AIC, provided that AIC (i) continues to be regulated by the SEC as a business development company, (ii) allocates no more than a designated percentage of its liquidation value to futures contracts, certain swap contracts and certain other derivative instruments that are within the jurisdiction of the Commodity Exchange Act (collectively, “CEA-regulated products”), and (iii) is not marketed to the public as a commodity pool or as a vehicle for trading in CEA-regulated products. If AIC can no longer satisfy the conditions of Letter 12-40, AIM could be subject to the CFTC’s CPO registration requirements, and the disclosure and operations of AIC would need to comply with all applicable regulations governing commodity pools and CPOs. If AIM were required to register as a CPO, it would also be required to become a member of the National Futures Association (“NFA”) and be subject to the NFA’s rules and bylaws. Compliance with these additional registration and regulatory requirements may increase AIM’s operating expenses, which, in turn, could result in AIC’s investors being charged additional fees.

10
The continued uncertainty related to the sustainability and pace of economic recovery in the U.S. and globally could have a negative impact on our business.
Apollo Investment’s business is directly influenced by the economic cycle, and could be negatively impacted by a downturn in economic activity in the US as well as globally. Fiscal and monetary actions taken by U.S. and non-U.S. government and regulatory authorities could have a material adverse impact on our business.
RISKS RELATING TO OUR BUSINESS AND STRUCTURE
We may suffer credit losses.
Investment in small and middle-market companies is highly speculative and involves a high degree of risk of credit loss. These risks are likely to increase during volatile economic periods, as the U.S. and many other economies have experienced. See “Risks Related to Our Investments.”
We are dependent upon Apollo Investment Management’s key personnel for our future success and upon their access to AGM’s investment professionals and partners.
We depend on the diligence, skill and network of business contacts of the senior management of AIM specifically and AGM generally. Members of our senior management may depart at any time. We also depend, to a significant extent, on AIM’s access to the investment professionals and partners of AGM and the information and deal flow generated by the AGM investment professionals in the course of their investment and portfolio management activities. The senior management of AIM evaluates, negotiates, structures, closes and monitors our investments. Our future success depends on the continued service of senior members of AGM’s credit platform, including the senior management team of AIM. The departure of our senior management, any senior managers of AIM, or of a significant number of the investment professionals or partners of AGM, could have a material adverse effect on our ability to achieve our investment objective. In addition, we can offer no assurance that AIM will remain our investment adviser or that we will continue to have access to AGM’s partners and investment professionals or its information and deal flow.
Our financial condition and results of operations depend on our ability to manage future growth effectively.
Our ability to achieve our investment objective depends, in part, on our ability to grow, which depends, in turn, on AIM’s ability to identify, invest in and monitor companies that meet our investment criteria. Accomplishing this result on a cost-effective basis is largely a function of AIM’s structuring of the investment process, its ability to provide competent, attentive and efficient services to us and our access to financing on acceptable terms. The senior management team of AIM has substantial responsibilities under the investment advisory and management agreement, and with respect to certain members, in connection with their roles as officers of other AGM funds.
They may also be called upon to provide managerial assistance to our portfolio companies. These demands on their time may distract them or slow the rate of investment. In order to grow, we and AIM need to hire, train, supervise and manage new employees. Any failure to manage our future growth effectively could have a material adverse effect on our business, financial condition and results of operations.
We operate in a highly competitive market for investment opportunities.
A number of entities compete with us to make the types of investments that we make. We compete with public and private funds, commercial and investment banks, commercial financing companies, other BDCs and, to the extent they provide an alternative form of financing, private equity funds. Competition for investment opportunities intensifies from time to time and may intensify further in the future. Some of our existing and potential competitors are substantially larger and have considerably greater financial, technical and marketing resources than we do. For example, some competitors may have a lower cost of funds and access to funding sources that are not available to us. In addition, some of our competitors may have higher risk tolerances or different risk assessments, which could allow them to consider a wider variety of investments and establish more relationships than us. Furthermore, many of our competitors are not subject to the regulatory restrictions and valuation requirements that the 1940 Act imposes on us as a BDC and that the Code imposes on us as a RIC. We cannot assure you that the competitive pressures we face will not have a material adverse effect on our business, financial condition and results of operations. Also, as a result of this existing and potentially increasing competition, we may not be able to take advantage of attractive investment opportunities from time to time, and we can offer no assurance that we will be able to identify and make investments that are consistent with our investment objective.
We do not seek to compete primarily based on the interest rates we offer, and we believe that some of our competitors make loans with interest rates that are comparable to or lower than the rates we offer.

11
We may lose investment opportunities if we do not match our competitors’ pricing, terms and structure. If we match our competitors’ pricing, terms and structure, we may experience decreased net interest income and increased risk of credit loss.
Any failure on our part to maintain our status as a BDC would reduce our operating flexibility.
If we do not remain a BDC, we might be regulated as a closed-end investment company under the 1940 Act, which would subject us to substantially more regulatory restrictions under the 1940 Act and correspondingly decrease our operating flexibility.
We will be subject to corporate-level income tax if we are unable to qualify as a RIC.
To qualify as a RIC under the Code, we must meet certain source-of-income, asset diversification and annual distribution requirements. The annual distribution requirement for a RIC generally is satisfied if we distribute at least 90% of our “investment company taxable income” (generally, our ordinary income and the excess, if any, of our net short-term capital gains over our net long-term capital losses), if any, to our stockholders on an annual basis. To the extent we use debt financing, we are subject to certain asset coverage ratio requirements and other financial covenants under loan and credit agreements, and could in some circumstances also become subject to such requirements under the 1940 Act, that could, under certain circumstances, restrict us from making distributions necessary to qualify as a RIC. If we are unable to obtain cash from other sources, we may fail to qualify as a RIC and, thus, may be subject to corporate-level income tax. To qualify as a RIC, we must also meet certain asset diversification requirements at the end of each calendar quarter. Failure to meet these tests may result in our having to dispose of certain investments quickly in order to prevent the loss of RIC status. Because most of our investments are in private companies, any such dispositions could be made at disadvantageous prices and may result in substantial losses. If we fail to qualify as a RIC for any reason and become subject to corporate-level income tax, the resulting corporate-level taxes could substantially reduce our net assets, the amount of income available for distribution and the amount of our distributions. Such a failure would have a material adverse effect on us and our stockholders.
To qualify again to be taxed as a RIC in a subsequent year, we would be required to distribute to our stockholders our earnings and profits attributable to non-RIC years reduced by an interest charge on 50% of such earnings and profits payable by us to the IRS. In addition, if we failed to qualify as a RIC for a period greater than two taxable years, then we would be required to elect to recognize and pay tax on any net built-in gain (the excess of aggregate gain, including items of income, over aggregate loss that would have been realized if we had been liquidated) or, alternatively, be subject to taxation on such built-in gain recognized for a period of ten years, in order to qualify as a RIC in a subsequent year.
We may have difficulty paying our required distributions if we recognize income before or without receiving cash representing such income.
For U.S. federal income tax purposes, we include in income certain amounts that we have not yet received in cash, such as original issue discount, which may arise if, for example, we receive warrants in connection with the making of a loan or payment-in-kind interest, which represents contractual interest added to the loan balance and typically due at the end of the loan term or possibly in other circumstances. Such original issue discount is included in income before we receive any corresponding cash payments and could be significant relative to our overall investment activities. Loans structured with these features may represent a higher level of credit risk than loans the interest on which must be paid in cash at regular intervals. We also may be required to include in income certain other amounts that we do not receive in cash.
The incentive fee payable by us that relates to our net investment income is computed and paid on income that may include some interest that has been accrued but not yet received in cash. If a portfolio company defaults on a loan, it is possible that accrued interest previously used in the calculation of the incentive fee will become uncollectible. Consequently, while we may make incentive fee payments on income accruals that we may not collect in the future and with respect to which we do not have a formal clawback right against our investment adviser per se, the amount of accrued income written off in any period will reduce the income in the period in which such write-off was taken and thereby reduce such period’s incentive fee payment. For the period between April 1, 2012 and March 31, 2015, the portion of the incentive fee that is attributable to deferred interest, such as PIK income, will not be paid to AIM until the Company receives such deferred interest in cash. The accrual of incentive fees shall be reversed if such interest is reversed in connection with any write-off or similar treatment of the investment.
Since in certain cases we may recognize income before or without receiving cash representing such income, we may have difficulty meeting the tax requirement to distribute at least 90% of our investment company taxable income to maintain our status as a RIC. Accordingly, we may have to sell some of our investments at times we would not consider advantageous, raise additional debt or equity capital or reduce new investment originations in order to meet distribution and/or leverage requirements.

12
Regulations governing our operation as a BDC affect our ability to, and the way in which we raise, additional capital.
We may issue debt securities or preferred stock and/or borrow money from banks or other financial institutions, which we refer to collectively as “senior securities,” up to the maximum amount permitted by the 1940 Act. Under the provisions of the 1940 Act, we are permitted, as a BDC, to issue senior securities only in amounts such that our asset coverage, as defined in the 1940 Act, equals at least 200% after each issuance of senior securities. If the value of our assets declines, we may be unable to maintain asset coverage above the 200% level. If that happens, the contractual arrangements governing these securities may require us to sell a portion of our investments and, depending on the nature of our leverage, repay a portion of our indebtedness at a time when such sales may be disadvantageous.
BDCs may issue and sell common stock at a price below net asset value per share only in limited circumstances, one of which is during the one-year period after stockholder approval. In the past, our stockholders have approved a plan so that during the subsequent 12 month period we could, in one or more public or private offerings of our common stock, sell or otherwise issue shares of our common stock at a price below the then current net asset value per share, subject to certain conditions including parameters on the level of permissible dilution, approval of the sale by a majority of our independent directors and a requirement that the sale price be not less than approximately the market price of the shares of our common stock at specified times, less the expenses of the sale. We may in the future seek to renew such authority on terms and conditions set forth in the corresponding proxy statement. There is no assurance such approvals will be obtained.
In the event we sell, or otherwise issue, shares of our common stock at a price below net asset value per share, existing stockholders will experience net asset value dilution and the investors who acquire shares in such offering may thereafter experience the same type of dilution from subsequent offerings at a discount. For example, if we sell an additional 10% of our common shares at a 5% discount from net asset value, a stockholder who does not participate in that offering for its proportionate interest will suffer net asset value dilution of up to 0.5% or $5 per $1000 of net asset value.
In addition to issuing securities to raise capital as described above, we may in the future securitize our loans to generate cash for funding new investments. To securitize loans, we may create a wholly-owned subsidiary, contribute a pool of loans to the subsidiary and have the subsidiary issue primarily investment grade debt securities to purchasers who we would expect would be willing to accept a substantially lower interest rate than the loans earn. We would retain all or a portion of the equity in the securitized pool of loans. Our retained equity would be exposed to any losses on the portfolio of loans before any of the debt securities would be exposed to such losses. An inability to successfully securitize our loan portfolio could limit our ability to grow our business and fully execute our business strategy and adversely affect our earnings, if any. Moreover, the successful securitization of our loan portfolio might expose us to losses as the residual loans in which we do not sell interests will tend to be those that are riskier and more apt to generate losses.
We currently use borrowed funds to make investments and are exposed to the typical risks associated with leverage.
We are exposed to increased risk of loss due to our use of debt to make investments. A decrease in the value of our investments will have a greater negative impact on the value of our common stock than if we did not use debt. Our ability to pay dividends will be restricted if we fail to satisfy certain of our asset coverage ratios and other financial covenants and any amounts that we use to service our indebtedness are not available for dividends to our common stockholders.
The agreements governing certain of our debt instruments require us to comply with certain financial and operational covenants. These covenants require us to, among other things, maintain certain financial ratios, including asset coverage and minimum stockholders’ equity. As of March 31, 2015, we were in compliance with these covenants. However, our continued compliance with these covenants depends on many factors, some of which are beyond our control. In the event of deterioration in the capital markets and pricing levels subsequent to this period, net unrealized loss in our portfolio may increase in the future. Absent an amendment to our revolving credit facility, continued unrealized loss in our investment portfolio could result in non-compliance with certain covenants.
Accordingly, there are no assurances that we will continue to comply with these covenants. Failure to comply with these covenants would result in a default which, if we were unable to obtain a waiver from the debt holders, could accelerate repayment under the instruments and thereby have a material adverse impact on our liquidity, financial condition, results of operations and ability to pay dividends.
Our current and future debt securities are and may be governed by an indenture or other instrument containing covenants restricting our operating flexibility. We, and indirectly our stockholders, bear the cost of issuing and servicing such securities. Our currently outstanding convertible securities have, and any convertible or exchangeable securities that we issue in the future may have rights, preferences and privileges more favorable than those of our common stock.

13
We fund a portion of our investments with borrowed money, which magnifies the potential for gain or loss on amounts invested and may increase the risk of investing in us.
Borrowings and other types of financing, also known as leverage, magnify the potential for gain or loss on amounts invested and, therefore, increase the risks associated with investing in our securities. Our lenders and debt holders have fixed dollar claims on our assets that are superior to the claims of our common stockholders or any preferred stockholders. If the value of our assets increases, then leveraging would cause the net asset value to increase more sharply than it would have had we not leveraged. Conversely, if the value of our assets decreases, leveraging would cause net asset value to decline more sharply than it otherwise would have had we not leveraged. Similarly, any increase in our income in excess of consolidated interest payable on the borrowed funds would cause our net income to increase more than it would without the leverage, while any decrease in our income would cause net income to decline more sharply than it would have had we not borrowed. Such a decline could negatively affect our ability to make common stock dividend payments. Leverage is generally considered a speculative investment technique.
We may in the future determine to fund a portion of our investments with preferred stock, which would magnify the potential for gain or loss and the risks of investing in us in the same way as our borrowings.
Preferred stock, which is another form of leverage, has the same risks to our common stockholders as borrowings because the dividends on any preferred stock we issue must be cumulative. Payment of such dividends and repayment of the liquidation preference of such preferred stock must take preference over any dividends or other payments to our common stockholders, and preferred stockholders are not subject to any of our expenses or losses and are not entitled to participate in any income or appreciation in excess of their stated preference.
Changes in interest rates may affect our cost of capital and net investment income.
Because we borrow money, and may issue preferred stock to finance investments, our net investment income will depend, in part, upon the difference between the rate at which we borrow funds or pay dividends on preferred stock and the rate at which we invest these funds. As a result, we can offer no assurance that a significant change in market interest rates will not have a material adverse effect on our net investment income. In periods of rising interest rates, our cost of funds would increase except to the extent we have issued fixed rate debt or preferred stock, which could reduce our net investment income. Our long-term fixed-rate investments are financed primarily with equity and long-term debt. We may use interest rate risk management techniques in an effort to limit our exposure to interest rate fluctuations. Such techniques may include various interest rate hedging activities to the extent permitted by the 1940 Act and applicable commodities laws. Interest rate hedging activities do not protect against credit risk. We have analyzed the potential impact of changes in interest rates on interest income net of interest expense. Assuming no changes to our balance sheet as of March 31, 2015, a hypothetical one percent increase in London Interbank Offered Rate (LIBOR) on our floating rate assets and liabilities would decrease our earnings by approximately less than 1 cent per average share over the next twelve months. Assuming no changes to our balance sheet as of March 31, 2015, a hypothetical two percent increase in LIBOR on our floating rate assets and liabilities would increase our earnings by two cents per average share over the next twelve months. Assuming no changes to our balance sheet as of March 31, 2015, a hypothetical three percent increase in LIBOR on our floating rate assets and liabilities would increase our earnings by approximately six cents per average share over the next twelve months. Assuming no changes to our balance sheet as of March 31, 2015, a hypothetical four percent increase in LIBOR on our floating rate assets and liabilities would increase our earnings by approximately nine cents per average share over the next twelve months. In addition, we believe that our interest rate matching strategy and our ability to hedge mitigates the effects any changes in interest rates may have on our investment income. Although management believes that this is indicative of our sensitivity to interest rate changes, it does not adjust for potential changes in credit quality, size and composition of the assets on the balance sheet and other business developments that could affect net increase or decrease in net assets resulting from operations, or net income. Accordingly, no assurances can be given that actual results would not differ materially from the potential outcome simulated by this estimate.
A portion of our floating rate investments may include features such as LIBOR floors. To the extent we invest in credit instruments with LIBOR floors, we may lose some of the benefits of incurring leverage. Specifically, if we issue preferred stock or debt (or otherwise borrow money), our costs of leverage will increase as rates increase. However, we may not benefit from the higher coupon payments resulting from increased interest rates if our investments in LIBOR floors and rates do not rise to levels above the LIBOR floors. In this situation, we will experience increased financing costs without the benefit of receiving higher income. This in turn may result in the potential for a decrease in the level of income available for dividends or distributions made by us.
You should also be aware that a change in the general level of interest rates can be expected to lead to a change in the interest rates we receive on many of our debt investments. Accordingly, a change in interest rates could make it easier for us to meet or exceed the performance threshold and may result in a substantial increase in the amount of incentive fees payable to our investment adviser with respect to pre-incentive fee net investment income.
14
Our business requires a substantial amount of capital to grow because we must distribute most of our income.
Our business requires a substantial amount of capital. We have issued equity securities and have borrowed from financial institutions. A reduction in the availability of new capital could limit our ability to grow. We must distribute at least 90% of our investment company taxable income to maintain our regulated investment company status. As a result, any such cash earnings may not be available to fund investment originations. We expect to continue to borrow from financial institutions and issue additional debt and equity securities. If we fail to obtain funds from such sources or from other sources to fund our investments, it could limit our ability to grow, which may have an adverse effect on the value of our securities. In addition, as a BDC, our ability to borrow or issue additional preferred stock may be restricted if our total assets are less than 200% of our total borrowings and preferred stock.
Many of our portfolio investments are recorded at fair value as determined in good faith by or under the direction of our board of directors and, as a result, there is uncertainty as to the value of our portfolio investments.
A large percentage of our portfolio investments are not publicly traded. The fair value of these investments may not be readily determinable. We value these investments quarterly at fair value (based on ASC 820, its corresponding guidance and the principal markets in which these investments trade) as determined in good faith by or under the direction of our board of directors pursuant to a written valuation policy and a consistently applied valuation process utilizing the input of our investment adviser, independent valuation firms, third party pricing services and the audit committee. Our board of directors utilizes the services of independent valuation firms to aid it in determining the fair value of these investments. The types of factors that may be considered in fair value pricing of these investments include the nature and realizable value of any collateral, the portfolio company’s ability to make payments and its earnings, the markets in which the portfolio company does business, comparison to more liquid securities, indices and other market-related inputs, discounted cash flow, our principal market and other relevant factors. For these securities for which a quote is either not readily available or deemed not to represent fair value, we utilize independent valuation firms to assist with valuation of these level 3 investments. Because such valuations, and particularly valuations of private securities and private companies, are inherently uncertain, may fluctuate over short periods of time and may be based on estimates, our determinations of fair value may differ materially from the values that would have been used if a readily available market for these investments existed and may differ materially from the amounts we realize on any disposition of such investments. Our net asset value could be adversely affected if our determinations regarding the fair value of these investments were materially higher than the values that we ultimately realize upon the disposal of such investments.
In addition, decreases in the market values or fair values of our investments are recorded as unrealized loss. Unprecedented declines in prices and liquidity in the corporate debt markets have resulted in significant net unrealized loss in our portfolio in the past. The effect of all of these factors on our portfolio has reduced our NAV by increasing net unrealized loss in our portfolio. Depending on market conditions, we could incur substantial realized losses and may continue to suffer additional unrealized losses in future periods, which could have a material adverse impact on our business, financial condition and results of operations.
The lack of liquidity in our investments may adversely affect our business.
We generally make investments in private companies. Substantially all of these securities are subject to legal and other restrictions on resale or are otherwise less liquid than publicly traded securities. The illiquidity of our investments may make it difficult for us to sell such investments if the need arises. In addition, if we are required to liquidate all or a portion of our portfolio quickly, we may realize significantly less than the value at which we have previously recorded our investments. In addition, we may face other restrictions on our ability to liquidate an investment in a portfolio company to the extent that we or an affiliated manager of AGM has material non-public information regarding such portfolio company.
We may experience fluctuations in our periodic results.
We could experience fluctuations in our periodic operating results due to a number of factors, including the interest rates payable on the debt securities we acquire, the default rate on such securities, the level of our expenses (including the interest rates payable on our borrowings), the dividend rates on preferred stock we issue, variations in and the timing of the recognition of realized and unrealized gains or losses, the degree to which we encounter competition in our markets and general economic conditions. As a result of these factors, results for any period should not be relied upon as being indicative of performance in future periods.
Our ability to enter into transactions with our affiliates is restricted.
We are prohibited under the 1940 Act from knowingly participating in certain transactions with certain of our affiliates without the prior approval of our independent directors and, in some cases, of the SEC. Any person that owns, directly or indirectly, 5% or more of our outstanding voting securities will be our affiliate for purposes of the 1940 Act and we are generally prohibited from buying or selling any security (other than our securities) from or to such affiliate, absent the prior approval of our independent directors. The 1940 Act also prohibits certain “joint” transactions with certain of our affiliates, which could include investments in the same portfolio company (whether at the same or different times), without prior approval of our independent directors and,

15
in some cases, of the SEC. We are prohibited from buying or selling any security from or to any person who owns more than 25% of our voting securities or certain of that person’s affiliates, or entering into prohibited joint transactions with such persons, absent the prior approval of the SEC through an exemptive order (other than in certain limited situations pursuant to current regulatory guidance). The analysis of whether a particular transaction constitutes a joint transaction requires a review of the relevant facts and circumstances then existing. Similar restrictions limit our ability to transact business with our officers or directors or their affiliates.
We have applied for an exemptive order from the SEC that would permit us and certain of our affiliates, including investment funds managed by our affiliates, to co-invest. Any such order will be subject to certain terms and conditions and there can be no assurance that such order will be granted by the SEC. Accordingly, we cannot assure you that we or our affiliates, including investment funds managed by our affiliates, will be permitted to co-invest, other than in the limited circumstances currently permitted by regulatory guidance or in the absence of a joint transaction.
There are significant potential conflicts of interest which could adversely affect our investment returns.
Allocation of Personnel
Potential investment opportunities are generally approved by an investment committee composed of senior personnel across AGM including Mr. Zelter and Mr. Goldthorpe. Our executive officers and directors, and the partners of our investment adviser, AIM, serve or may serve as officers, directors or principals of entities that operate in the same or a related line of business as we do or of investment funds managed by our affiliates. Accordingly, they may have obligations to investors in those entities, the fulfillment of which might not be in the best interests of us or our stockholders. Moreover, we note that, notwithstanding the difference in principal investment objectives between us and other AGM funds, such other AGM sponsored funds, including new affiliated potential pooled investment vehicles or managed accounts not yet established (whether managed or sponsored by AGM or AIM itself), have and may from time to time have overlapping investment objectives with us and, accordingly, invest in, whether principally or secondarily, asset classes similar to those targeted by us. To the extent such other investment vehicles have overlapping investment objectives, the scope of opportunities otherwise available to us may be adversely affected and/or reduced. As a result, certain partners of AIM may face conflicts in their time management and commitments as well as in the allocation of investment opportunities to other AGM funds. In addition, in the event such investment opportunities are allocated among us and other investment vehicles managed or sponsored by, or affiliated with, AIM our desired investment portfolio may be adversely affected. Although AIM endeavors to allocate investment opportunities in a fair and equitable manner, it is possible that we may not be given the opportunity to participate in certain investments made by investment funds managed by AIM or investment managers affiliated with AIM.
No Information Barriers
There are no information barriers amongst AGM and certain of its affiliates. If AIM were to receive material non-public information about a particular company, or have an interest in investing in a particular company, AGM or certain of its affiliates may be prevented from investing in such company. Conversely, if AGM or certain of its affiliates were to receive material non-public information about a particular company, or have an interest in investing in a particular company, we may be prevented from investing in such company.
This risk may affect us more than it does other investment vehicles, as AIM generally does not use information barriers that many firms implement to separate persons who make investment decisions from others who might possess material, non-public information that could influence such decisions. AIM’s decision not to implement these barriers could prevent its investment professionals from undertaking certain transactions such as advantageous investments or dispositions that would be permissible for them otherwise. In addition, AIM could in the future decide to establish information barriers, particularly as its business expands and diversifies.
Co-Investment Activity and Allocation of Investment Opportunities
AGM and its affiliated investment managers, including AIM, may determine that an investment is appropriate both for us and for one or more other funds. In such event, depending on the availability of such investment and other appropriate factors, AIM may determine that we should invest on a side-by-side basis with one or more other funds. We may make all such investments subject to compliance with applicable regulations and interpretations, and our allocation procedures. In certain circumstances negotiated co-investments may be made only if we receive an order from the SEC permitting us to do so. There can be no assurance that any such order will be obtained.
AGM has adopted allocation procedures that are intended to ensure that each fund or account managed by AGM or certain of its affiliates (“Apollo-advised funds”) is treated in a manner that, over time, is fair and equitable. Allocations generally are made pro rata based on order size. In certain circumstances, the allocation policy provides for the allocation of investments pursuant to a
16
predefined arrangement that is other than pro rata. As a result, in situations where a security is appropriate for us but is limited in availability, we may receive a lower allocation than may be desired by our portfolio managers or no allocation if it is determined that the investment is more appropriate for a different Apollo-advised fund because of its investment mandate. Investment opportunities may be allocated on a basis other than pro rata to the extent it is done in good faith and does not, or is not reasonably expected to, result in an improper disadvantage or advantage to one participating Apollo-advised fund as compared to another participating Apollo-advised fund.
In the event investment opportunities are allocated among us and other Apollo-advised funds, we may not be able to structure our investment portfolio in the manner desired. Although AGM endeavors to allocate investment opportunities in a fair and equitable manner, it is possible that we may not be given the opportunity to participate in certain investments made by other Apollo-advised funds or portfolio managers affiliated with AIM. Furthermore, we and the other Apollo-advised funds may make investments in securities where the prevailing trading activity may make impossible the receipt of the same price or execution on the entire volume of securities purchased or sold by us and such other Apollo-advised funds. When this occurs, the various prices may be averaged, and we will be charged or credited with the average price. Thus, the effect of the aggregation may operate on some occasions to our disadvantage. In addition, under certain circumstances, we may not be charged the same commission or commission equivalent rates in connection with a bunched or aggregated order.
It is possible that other Apollo-advised funds may make investments in the same or similar securities at different times and on different terms than we do. From time to time, we and the other Apollo-advised funds may make investments at different levels of an issuer’s capital structure or otherwise in different classes of an issuer’s securities. Such investments may inherently give rise to conflicts of interest or perceived conflicts of interest between or among the various classes of securities that may be held by such entities. Conflicts may also arise because portfolio decisions regarding us may benefit such other Apollo-advised funds. For example, the sale of a long position or establishment of a short position by us may impair the price of the same security sold short by (and therefore benefit) one or more Apollo-advised funds, and the purchase of a security or covering of a short position in a security by us may increase the price of the same security held by (and therefore benefit) one or more Apollo-advised funds. In these circumstances AIM and its affiliates will seek to resolve each conflict in a manner that is fair to the various clients involved in light of the totality of the circumstances. In some cases the resolution may not be in our best interests.
AGM and its clients may pursue or enforce rights with respect to an issuer in which we have invested, and those activities may have an adverse effect on us. As a result, prices, availability, liquidity and terms of our investments may be negatively impacted by the activities of AGM or its clients, and transactions for us may be impaired or effected at prices or terms that may be less favorable than would otherwise have been the case.
Fees and Expenses
In the course of our investing activities, we pay management and incentive fees to AIM, and reimburse AIM for certain expenses it incurs. As a result, investors in our common stock invest on a “gross” basis and receive distributions on a “net” basis after expenses, resulting in, among other things, a lower rate of return than one might achieve through direct investments. As a result of this arrangement, there may be times when the management team of AIM has interests that differ from those of our common stockholders, giving rise to a conflict.
AIM receives a quarterly incentive fee based, in part, on our pre-incentive fee income, if any, for the immediately preceding calendar quarter. This incentive fee will not be payable to AIM unless the pre-incentive net investment income exceeds the performance threshold. To the extent we or AIM are able to exert influence over our portfolio companies, the quarterly pre-incentive fee may provide AIM with an incentive to induce our portfolio companies to prepay interest or other obligations in certain circumstances.
Allocation of Expenses
We have entered into a royalty-free license agreement with AGM, pursuant to which AGM has agreed to grant us a non-exclusive license to use the name “Apollo.” Under the license agreement, we have the right to use the “Apollo” name for so long as AIM or one of its affiliates remains our investment adviser. In addition, we rent office space from AIA, an affiliate of AIM, and pay AIA our allocable portion of overhead and other expenses incurred by AIA in performing its obligations under the administration agreement, including our allocable portion of the cost of our Chief Financial Officer and Chief Compliance Officer and their respective staffs, which can create conflicts of interest that our board of directors must monitor.
In the past following periods of volatility in the market price of a company’s securities, securities class action litigation has, from time to time, been brought against that company.
If our stock price fluctuates significantly, we may be the target of securities litigation in the future. Securities litigation could result in substantial costs and divert management’s attention and resources from our business.

17
To the extent original issue discount ("OID") and PIK interest constitute a portion of our income, we will be exposed to typical risks associated with such income being required to be included in taxable and accounting income prior to receipt of cash representing such income.
Our investments may include original issue discount, or OID, instruments and payment in kind, or PIK, interest arrangements, which represents contractual interest added to a loan balance and due at the end of such loan’s term. To the extent OID or PIK interest constitute a portion of our income, we are exposed to typical risks associated with such income being required to be included in taxable and accounting income prior to receipt of cash, including the following:
• The higher interest rates of OID and PIK instruments reflect the payment deferral and increased credit risk associatedwith these instruments, and OID and PIK instruments generally represent a significantly higher credit risk than coupon loans.
• Even if the accounting conditions for income accrual are met, the borrower could still default when our actual collectionis supposed to occur at the maturity of the obligation.
• OID and PIK instruments may have unreliable valuations because their continuing accruals require continuing judgmentsabout the collectability of the deferred payments and the value of any associated collateral. OID and PIK income may also create uncertainty about the source of our cash distributions.
• For accounting purposes, any cash distributions to shareholders representing OID and PIK income are not treated ascoming from paid-in capital, even if the cash to pay them comes from offering proceeds. As a result, despite the fact that a distribution representing OID and PIK income could be paid out of amounts invested by our stockholders, the 1940 Act does not require that stockholders be given notice of this fact by reporting it as a return of capital.
Changes in the laws or regulations governing our business or the businesses of our portfolio companies and any failure by us or our portfolio companies to comply with these laws or regulations, could negatively affect the profitability of our operations or of our portfolio companies.
We are subject to changing rules and regulations of federal and state governments, as well as the stock exchange on which our common stock is listed. These entities, including the Public Company Accounting Oversight Board, the SEC and The NASDAQ Global Select Market, have issued a significant number of new and increasingly complex requirements and regulations over the course of the last several years and continue to develop additional regulations. In particular, changes in the laws or regulations or the interpretations of the laws and regulations that govern BDCs, RICs or non-depository commercial lenders could significantly affect our operations and our cost of doing business. We are subject to federal, state and local laws and regulations and are subject to judicial and administrative decisions that affect our operations, including our loan originations, maximum interest rates, fees and other charges, disclosures to portfolio companies, the terms of secured transactions, collection and foreclosure procedures and other trade practices. If these laws, regulations or decisions change, or if we expand our business into jurisdictions that have adopted more stringent requirements than those in which we currently conduct business, we may have to incur significant expenses in order to comply, or we might have to restrict our operations. In addition, if we do not comply with applicable laws, regulations and decisions, we may lose licenses needed for the conduct of our business and be subject to civil fines and criminal penalties, any of which could have a material adverse effect upon our business, financial condition and results of operations.
Provisions of the Maryland General Corporation Law and of our charter and bylaws could deter takeover attempts and have an adverse impact on the price of our common stock.
The Maryland General Corporation Law, our charter and our bylaws contain provisions that may discourage, delay or make more difficult a change in control of us or the removal of our directors. We are subject to the Maryland Business Combination Act, subject to any applicable requirements of the 1940 Act. Our board of directors has adopted a resolution exempting from the Business Combination Act any business combination between us and any other person, subject to prior approval of such business combination by our board of directors, including approval by a majority of our disinterested directors. If the resolution exempting business combinations is repealed or our board of directors does not approve a business combination, the Business Combination Act may discourage third parties from trying to acquire control of us and increase the difficulty of consummating such an offer. Our bylaws exempt from the Maryland Control Share Acquisition Act acquisitions of our common stock by any person. If we amend our bylaws to repeal the exemption from the Control Share Acquisition Act, the Control Share Acquisition Act also may make it more difficult for a third party to obtain control of us and increase the difficulty of consummating such an offer. We intend to give the SEC prior notice should our board of directors elect to amend our bylaws to repeal the exemption from the Control Share Acquisition Act.
We have also adopted other measures that may make it difficult for a third party to obtain control of us, including provisions of our charter classifying our board of directors in three classes serving staggered three-year terms, and provisions of our charter authorizing our board of directors to classify or reclassify shares of our stock in one or more classes or series, to cause the issuance of additional shares of our stock, and to amend our charter, without stockholder approval, to increase or decrease the number of
18
shares of stock that we have authority to issue. These provisions, as well as other provisions of our charter and bylaws, may delay, defer or prevent a transaction or a change in control that might otherwise be in the best interests of our stockholders.
We may choose to pay dividends in our own common stock, in which case you may be required to pay federal income taxes in excess of the cash dividends you receive.
We may distribute taxable dividends that are payable in cash and shares of our common stock at the election of each stockholder. The Internal Revenue Service has issued private letter rulings on cash/stock dividends paid by RICs and real estate investment trusts where the cash component is limited to 20% of the total distribution if certain requirements are satisfied. Stockholders receiving such dividends will be required to include the full amount of the dividend (including the portion payable in stock) as ordinary income (or, in certain circumstances, long-term capital gain) to the extent of our current and accumulated earnings and profits for federal income tax purposes. As a result, stockholders may be required to pay income taxes with respect to such dividends in excess of the cash dividends received. If a U.S. stockholder sells the common stock that it receives as a dividend in order to pay this tax, the sales proceeds may be less than the amount included in income with respect to the dividend, depending on the market price of our common stock at the time of the sale. Furthermore, with respect to non-U.S. stockholders, we may be required to withhold U.S. tax with respect to such dividends, including in respect of all or a portion of such dividend that is payable in common stock. In addition, if a significant number of our stockholders determine to sell shares of our common stock in order to pay taxes owed on dividends, it may put downward pressure on the trading price of our common stock. It is unclear whether and to what extent we will be able to pay taxable dividends in cash and common stock (whether pursuant to a private letter ruling or otherwise).
If we fail to maintain an effective system of internal control over financial reporting, we may not be able to accurately report our financial results or prevent fraud. As a result, stockholders could lose confidence in our financial and other public reporting, which would harm our business and the trading price of our common stock.
Effective internal controls over financial reporting are necessary for us to provide reliable financial reports and, together with adequate disclosure controls and procedures, are designed to prevent fraud. Any failure to implement required new or improved controls, or difficulties encountered in their implementation could cause us to fail to meet our reporting obligations. In addition, any testing by us conducted in connection with Section 404 of the Sarbanes-Oxley Act, or the subsequent testing by our independent registered public accounting firm (when undertaken, as noted below), may reveal deficiencies in our internal controls over financial reporting that are deemed to be material weaknesses or that may require prospective or retroactive changes to our consolidated financial statements or identify other areas for further attention or improvement. Inferior internal controls could also cause investors and lenders to lose confidence in our reported financial information, which could have a negative effect on the trading price of our common stock.
We may experience cyber-security incidents and are subject to cyber-security risks.
Our business operations rely upon secure information technology systems for data processing, storage and reporting. Despite careful security and controls design, implementation and updating, our information technology systems could become subject to cyber-attacks. Cyber attacks include, but are not limited to, gaining unauthorized access to digital systems (e.g., through “hacking” or malicious software coding) for purposes of misappropriating assets or sensitive information, corrupting data, or causing operational disruption. Cyber attacks may also be carried out in a manner that does not require gaining unauthorized access, such as causing denial-of service attacks on websites (i.e., efforts to make network services unavailable to intended users). Network, system, application and data breaches could result in operational disruptions or information misappropriation, which could have a material adverse effect on our business, results of operations and financial condition.
Cyber security failures or breaches by our investment adviser and other service providers (including, but not limited to, accountants, custodians, transfer agents and administrators), and the issuers of securities in which we invest, have the ability to cause disruptions and impact business operations, potentially resulting in financial losses, interference with our ability to calculate its net asset value, impediments to trading, the inability of our stockholders to transact business, violations of applicable privacy and other laws, regulatory fines, penalties, reputational damage, reimbursement or other compensation costs, or additional compliance costs. In addition, substantial costs may be incurred in order to prevent any cyber incidents in the future. While we have established a business continuity plan in the event of, and risk management systems to prevent, such cyber attacks, there are inherent limitations in such plans and systems including the possibility that certain risks have not been identified. Furthermore, we cannot control the cyber security plans and systems put in place by our service providers and issuers in which we invest. We and our stockholders could be negatively impacted as a result.
The failure in cyber-security systems, as well as the occurrence of events unanticipated in our disaster recovery systems and management continuity planning could impair our ability to conduct business effectively.

19
The occurrence of a disaster such as a cyber-attack, a natural catastrophe, an industrial accident, a terrorist attack or war, events unanticipated in our disaster recovery systems, or a support failure from external providers, could have an adverse effect on our ability to conduct business and on our results of operations and financial condition, particularly if those events affect our computer-based data processing, transmission, storage, and retrieval systems or destroy data. If a significant number of our managers were unavailable in the event of a disaster, our ability to effectively conduct our business could be severely compromised.
We depend heavily upon computer systems to perform necessary business functions. Despite our implementation of a variety of security measures, our computer systems could be subject to cyber-attacks and unauthorized access, such as physical and electronic break-ins or unauthorized tampering. Like other companies, we may experience threats to our data and systems, including malware and computer virus attacks, unauthorized access, system failures and disruptions. If one or more of these events occurs, it could potentially jeopardize the confidential, proprietary and other information processed and stored in, and transmitted through, our computer systems and networks, or otherwise cause interruptions or malfunctions in our operations, which could result in damage to our reputation, financial losses, litigation, increased costs, and/or regulatory penalties.
We are dependent on information systems and systems failures could significantly disrupt our business, which may, in turn, negatively affect the market price of our common stock and our ability to pay dividends.
Our business is dependent on our and third parties’ communications and information systems. Any failure or interruption of those systems, including as a result of the termination of an agreement with any third-party service providers, could cause delays or other problems in our activities. Our financial, accounting, data processing, backup or other operating systems and facilities may fail to operate properly or become disabled or damaged as a result of a number of factors including events that are wholly or partially beyond our control and adversely affect our business. There could be:
• sudden electrical or telecommunications outages;• natural disasters such as earthquakes, tornadoes and hurricanes;• disease pandemics;• events arising from local or larger scale political or social matters, including terrorist acts; and• cyber-attacks.
These events, in turn, could have a material adverse effect on our operating results and negatively affect the market price of our common stock and our ability to pay dividends to our stockholders.
The effect of global climate change may impact the operations of our portfolio companies.
There is evidence of global climate change. Climate change creates physical and financial risk and some of our portfolio companies may be adversely affected by climate change. For example, the needs of customers of energy companies vary with weather conditions, primarily temperature and humidity. To the extent weather conditions are affected by climate change, energy use could increase or decrease depending on the duration and magnitude of any changes. Increased energy use due to weather changes may require additional investments by our portfolio companies engaged in the energy business in more pipelines and other infrastructure to serve increased demand. Increases in the cost of energy also could adversely affect the cost of operations of our portfolio companies if the use of energy products or services is material to their business. A decrease in energy use due to weather changes may affect some of our portfolio companies’ financial condition, through decreased revenues. Extreme weather conditions in general require more system backup, adding to costs, and can contribute to increased system stresses, including service interruptions. Energy companies could also be affected by the potential for lawsuits against or taxes or other regulatory costs imposed on greenhouse gas emitters, based on links drawn between greenhouse gas emissions and climate change.
Our investment adviser and administrator have the right to resign on 60 days’ notice, and we may not be able to find a suitable replacement within that time, resulting in a disruption in our operations that could adversely affect our business, financial condition and results of operations.
Our investment adviser and administrator have the right, under our investment management agreement and administration agreement, respectively, to resign at any time upon not less than 60 days’ written notice, whether we have found a replacement or not. If our investment adviser or our administrator resigns, we may not be able to find a replacement or hire internal management or administration with similar expertise and ability to provide the same or equivalent services on acceptable terms within 60 days, or at all. If we are unable to do so quickly, our operations are likely to experience a disruption, our business, financial condition and results of operations as well as our ability to pay distributions are likely to be adversely affected and the market price of our shares may decline. In addition, the coordination of our internal management and investment activities or our internal administration activities, as applicable, is likely to suffer if we are unable to identify and reach an agreement with a single institution or group of executives having the expertise possessed by our investment adviser and its affiliates or our administrator and its affiliates. Even if we are able to retain comparable management or administration, whether internal or external, the integration of such management or administration and their lack of familiarity with our investment objective may result in additional costs and time delays that may adversely affect our business, financial condition and results of operations.

20
RISKS RELATED TO OUR INVESTMENTS
Our investments in prospective portfolio companies are risky, and you could lose all or part of your investment.
Investment in middle-market companies is speculative and involves a number of significant risks including a high degree of risk of credit loss. Middle-market companies may have limited financial resources and may be unable to meet their obligations under their debt securities that we hold, which may be accompanied by a deterioration in the value of any collateral and a reduction in the likelihood of us realizing any guarantees we may have obtained in connection with our investment. In addition, they typically have shorter operating histories, narrower product lines and smaller market shares than larger businesses, which tend to render them more vulnerable to competitors’ actions and market conditions, as well as general economic downturns. Middle-market companies are more likely to depend on the management talents and efforts of a small group of persons; therefore, the death, disability, resignation or termination of one or more of these persons could have a material adverse impact on our portfolio company and, in turn, on us. Middle-market companies also generally have less predictable operating results, may from time to time be parties to litigation, may be engaged in rapidly changing businesses with products subject to a substantial risk of obsolescence, and may require substantial additional capital to support their operations, finance expansion or maintain their competitive position. In addition, our executive officers, directors and our investment adviser may, in the ordinary course of business, be named as defendants in litigation arising from our investments in the portfolio companies.
We invest primarily in secured, unsecured and mezzanine debt of private middle-market companies. We also may invest in equity and structured products, such as CLOs and CLNs. We may not realize gains from our equity investments.
Secured loans, which we define to include first lien and second lien debt, are the most senior form of indebtedness of an issuer and, due to the ability of the lender to sell the collateral to repay its loan in the event of default, the lender will likely experience more favorable recovery than more junior creditors in the event of the issuer defaults on its indebtedness.
Unsecured debt or loans, also referred to as mezzanine loans or subordinated debt are generally unsecured and junior to other indebtedness of the issuer. As a consequence, the holder of a mezzanine loan may lack adequate protection in the event the issuer becomes distressed or insolvent and will likely experience a lower recovery than more senior debtholders in the event the issuer defaults on its indebtedness. In addition, mezzanine loans of middle-market companies are often highly illiquid and in adverse market conditions may experience steep declines in valuation even if they are fully performing.
We may invest in debt and equity positions of structured products, such as CLOs and CLNs. These structured products are typically a form a securitization in which the cash flows of a portfolio of loans are pooled and passed on to different classes of owners in various tranches.
When we invest in unsecured and secured loans, we have acquired and may continue to acquire warrants or other equity securities as well. In addition, we may invest directly in the equity securities of portfolio companies. Our goal is ultimately to dispose of such equity interests and realize gains upon our disposition of such interests. However, the equity interests we receive may not appreciate in value and, in fact, may decline in value. Accordingly, we may not be able to realize gains from our equity interests, and any gains that we do realize on the disposition of any equity interests may not be sufficient to offset any other losses we experience.
Our investments in structured products may be riskier and less transparent to us and our stockholders than direct investments in the underlying companies.
We invest in structured products. Generally, there may be less information available to us regarding the underlying debt investments held by structured products than if we had invested directly in the debt of the underlying companies. As a result, our stockholders will not know the details of the underlying securities of the structured products in which we will invest. Our structured product investments will also be subject to the risk of leverage associated with the debt issued by such structured products and the repayment priority of senior debt holders in such structured products. Our investments in prospective portfolio companies may be risky, and we could lose all or part of our investment.
Structured products typically will have no significant assets other than their underlying loans; payments on structured product investments are and will be payable solely from the cashflows from such loans.
Structured products typically will have no significant assets other than their underlying loans. Accordingly, payments on structured product investments are and will be payable solely from the cashflows from such loans, net of all management fees and other expenses. Payments to us as a holder of structured product investments are and will be met only after payments due on the senior notes (and, where appropriate, the junior secured notes) from time to time have been made in full. This means that relatively small numbers of defaults of loans may adversely impact our returns.

21
Our structured product investments are exposed to leveraged credit risk.
We may be in a subordinated position with respect to realized losses on loans underlying our investments in structured products. The leveraged nature of structured products, in particular, magnifies the adverse impact of loan defaults. Structured product investments represent a leveraged investment with respect to the underlying loans. Therefore, changes in the market value of the structured product investments could be greater than the change in the market value of the underlying loans, which are subject to credit, liquidity and interest rate risk.
Economic recessions or downturns could impair our portfolio companies and harm our operating results.
Many of our portfolio companies may be susceptible to economic slowdowns or recessions and may be unable to repay our loans during these periods. Therefore, our non-performing assets may increase and the value of our portfolio may decrease during these periods if we are required to write down the values of our investments. Adverse economic conditions also may decrease the value of collateral securing some of our loans and the value of our equity investments. Economic slowdowns or recessions could lead to financial losses in our portfolio and a decrease in revenues, net income and assets. Unfavorable economic conditions also could increase our funding costs, limit our access to the capital markets or result in a decision by lenders not to extend credit to us. These events could prevent us from increasing investments and harm our operating results.
A portfolio company’s failure to satisfy financial or operating covenants imposed by us or other lenders could lead to defaults and, potentially, acceleration of the time when the loans are due and foreclosure on its secured assets, which could trigger cross-defaults under other agreements and jeopardize the portfolio company’s ability to meet its obligations under the debt that we hold. We may incur additional expenses to the extent necessary to seek recovery upon default or to negotiate new terms with a defaulting portfolio company.
There may be circumstances where our debt investments could be subordinated to claims of other creditors or we could be subject to, among other things, lender liability or fraudulent conveyance claims.
We could, in certain circumstances, become subject to potential liabilities that may exceed the value of our original investment in a portfolio company that experiences severe financial difficulties. For example, we may be adversely affected by laws related to, among other things, fraudulent conveyances, voidable preferences, lender liability, and the bankruptcy court’s discretionary power to disallow, subordinate or disenfranchise particular claims or re-characterize investments made in the form of debt as equity contributions.
If we do not invest a sufficient portion of our assets in qualifying assets, we could fail to qualify as a BDC or be precluded from investing according to our current business strategy.
As a BDC, we may not acquire any assets other than “qualifying assets” unless, at the time of and after giving effect to such acquisition, at least 70% of our total assets are qualifying assets. We believe that most of the investments that we may acquire in the future will constitute qualifying assets. However, we may be precluded from investing in what we believe are attractive investments if such investments are not qualifying assets for purposes of the 1940 Act. If we do not invest a sufficient portion of our assets in qualifying assets, we could be found to be in violation of the 1940 Act provisions applicable to BDCs, which would have a material adverse effect on our business, financial condition and results of operations. Similarly, these rules could prevent us from making follow-on investments in existing portfolio companies (which could result in the dilution of our position) or could require us to dispose of investments at inappropriate times in order to come into compliance with the 1940 Act. Because most of our investments will be in private companies, and therefore will be relatively illiquid, any such dispositions could be made at disadvantageous prices and could result in substantial losses.
Our portfolio contains a limited number of portfolio companies, which subjects us to a greater risk of significant loss if any of these companies defaults on its obligations under any of its debt securities.
A consequence of the limited number of investments in our portfolio is that the aggregate returns we realize may be significantly adversely affected if one or more of our significant portfolio company investments perform poorly or if we need to write down the value of any one significant investment. Beyond our income tax diversification requirements, we do not have fixed guidelines for diversification, and our portfolio could contain relatively few portfolio companies.
Our failure to make follow-on investments in our portfolio companies could impair the value of our portfolio.
Following an initial investment in a portfolio company, we may make additional investments in that portfolio company as “follow-on” investments, in order to: (1) increase or maintain in whole or in part our equity ownership percentage; (2) exercise warrants, options or convertible securities that were acquired in the original or subsequent financing or (3) attempt to preserve or enhance the value of our investment.

22
We may elect not to make follow-on investments, may be constrained in our ability to employ available funds, or otherwise may lack sufficient funds to make those investments. We have the discretion to make any follow-on investments, subject to the availability of capital resources. The failure to make follow-on investments may, in some circumstances, jeopardize the continued viability of a portfolio company and our initial investment, or may result in a missed opportunity for us to increase our participation in a successful operation. Even if we have sufficient capital to make a desired follow-on investment, we may elect not to make a follow-on investment because we may not want to increase our concentration of risk, because we prefer other opportunities, or because we are inhibited by compliance with BDC requirements or the desire to maintain our tax status.
When we do not hold controlling equity interests in our portfolio companies, we may not be in a position to exercise control over our portfolio companies or to prevent decisions by management of our portfolio companies that could decrease the value of our investments.
We do not generally take controlling equity positions in our portfolio companies. To the extent that we do not hold a controlling equity interest in a portfolio company, we are subject to the risk that a portfolio company may make business decisions with which we disagree, and the stockholders and management of a portfolio company may take risks or otherwise act in ways that are adverse to our interests. Due to the lack of liquidity for the debt and equity investments that we typically hold in our portfolio companies, we may not be able to dispose of our investments in the event we disagree with the actions of a portfolio company, and may therefore suffer a decrease in the value of our investments.
An investment strategy focused primarily on privately-held companies presents certain challenges, including the lack of available information about these companies, a dependence on the talents and efforts of only a few key portfolio company personnel and a greater vulnerability to economic downturns.
We have invested and will continue to invest primarily in privately-held companies. Generally, little public information exists about these companies, and we are required to rely on the ability of AIM’s investment professionals to obtain adequate information to evaluate the potential returns from investing in these companies.
If we are unable to uncover all material information about these companies, we may not make a fully informed investment decision, and we may lose money on our investments. Also, privately-held companies frequently have less diverse product lines and smaller market presence than public company competitors, which often are larger. These factors could affect our investment returns.
Our portfolio companies may incur debt that ranks equally with, or senior to, our investments in such companies.
We have invested and intend to invest primarily in mezzanine and senior debt securities issued by our portfolio companies. The portfolio companies usually have, or may be permitted to incur, other debt that ranks equally with, or senior to, the debt securities in which we invest. By their terms, such debt instruments may provide that the holders are entitled to receive payment of interest or principal on or before the dates on which we are entitled to receive payments in respect of the debt securities in which we invest. Also, in the event of insolvency, liquidation, dissolution, reorganization or bankruptcy of a portfolio company, holders of debt instruments ranking senior to our investment in that portfolio company would typically be entitled to receive payment in full before we receive any distribution in respect of our investment. After repaying such senior creditors, such portfolio company may not have any remaining assets to use for repaying its obligation to us. In the case of debt ranking equally with debt securities in which we invest, we would have to share on an equal basis any distributions with other creditors holding such debt in the event of an insolvency, liquidation, dissolution, reorganization or bankruptcy of the relevant portfolio company. In addition, we may not be in a position to control any portfolio company by investing in its debt securities. As a result, we are subject to the risk that a portfolio company in which we invest may make business decisions with which we disagree and the management of such company, as representatives of the holders of their common equity, may take risks or otherwise act in ways that do not serve our interests as debt investors.
Our incentive fee may induce AIM to make certain investments, including speculative investments.
The incentive fee payable by us to AIM may create an incentive for AIM to make investments on our behalf that are risky or more speculative than would be the case in the absence of such compensation arrangement. The way in which the incentive fee payable to AIM is determined, which is calculated separately in two components as a percentage of the net investment income (subject to a performance threshold) and as a percentage of the realized gain on invested capital, may encourage our investment adviser to use leverage to increase the return on our investments. Under certain circumstances, the use of leverage may increase the likelihood of default, which would disfavor the holders of our common stock, including investors in offerings of common stock, securities convertible into our common stock or warrants representing rights to purchase our common stock or securities convertible into our common stock. In addition, AIM receives the incentive fee based, in part, upon net capital gains realized on our investments. Unlike the portion of the incentive fee based on net investment income, there is no performance threshold applicable to the portion of the incentive fee based on net capital gains. As a result, AIM may have a tendency to invest more in investments that are likely

23
to result in capital gains as compared to income producing securities. Such a practice could result in our investing in more speculative securities than would otherwise be the case, which could result in higher investment losses, particularly during economic downturns.
The incentive fee payable by us to AIM also may create an incentive for AIM to invest on our behalf in instruments that have a deferred interest feature such as investments with PIK provisions. Under these investments, we would accrue the interest over the life of the investment but would typically not receive the cash income from the investment until the end of the term or upon the investment being called by the issuer. Our net investment income used to calculate the income portion of our incentive fee, however, includes accrued interest. For the time period between April 1, 2012 and March 31, 2015, the portion of the incentive fee that is attributable to deferred interest, such as PIK, will not be paid to AIM until Apollo Investment receives such interest in cash. The accrual of incentive fees shall be reversed if such interest is reversed in connection with any write-off or similar treatment of the investment. The payment of incentive fees to AIM is made on accruals of expected cash interest. If a portfolio company defaults on a loan, it is possible that accrued interest previously used in the calculation of the incentive fee will become uncollectible. Thus, while a portion of this incentive fee would be based on income that we have not yet received in cash and with respect to which we do not have a formal claw-back right against our investment adviser per se, the amount of accrued income to the extent written off in any period will reduce the income in the period in which such write-off was taken and thereby reduce such period’s incentive fee payment.
We may invest, to the extent permitted by law, in the securities and instruments of other investment companies, including private funds, and, to the extent we so invest, will bear our ratable share of any such investment company’s expenses, including management and performance fees. We will also remain obligated to pay management and incentive fees to AIM with respect to the assets invested in the securities and instruments of other investment companies. With respect to each of these investments, each of our common stockholders will bear his or her share of the management and incentive fee of AIM as well as indirectly bearing the management and performance fees and other expenses of any investment companies in which we invest.
We may be obligated to pay our investment adviser incentive compensation even if we incur a loss.
Our investment adviser is entitled to incentive compensation for each fiscal quarter in an amount equal to a percentage of the excess of our pre-incentive fee net investment income for that quarter (before deducting incentive compensation) above a performance threshold for that quarter. Accordingly, since the performance threshold is based on a percentage of our net asset value, decreases in our net asset value make it easier to achieve the performance threshold. Our pre-incentive fee net investment income for incentive compensation purposes excludes realized and unrealized capital losses or depreciation that we may incur in the fiscal quarter, even if such capital losses or depreciation result in a net loss on our statement of operations for that quarter. Thus, we may be required to pay AIM incentive compensation for a fiscal quarter even if there is a decline in the value of our portfolio or we incur a net loss for that quarter. In addition, increases in interest rates may increase the amount of incentive fees we pay to our investment adviser even though our performance relative the market has not increased.
Our investments in foreign securities may involve significant risks in addition to the risks inherent in U.S. investments.
Our investment strategy contemplates that a portion of our investments may be in securities of foreign companies. Investing in foreign companies may expose us to additional risks not typically associated with investing in U.S. companies. These risks include changes in exchange control regulations, political and social instability, expropriation, imposition of foreign taxes, less liquid markets and less available information than is generally the case in the United States, higher transaction costs, less government supervision of exchanges, brokers and issuers, less developed bankruptcy laws, difficulty in enforcing contractual obligations, lack of uniform accounting and auditing standards and greater price volatility. These risks are likely to be more pronounced for investments in companies located in emerging markets and particularly for middle-market companies in these economies.
Although most of our investments are denominated in U.S. dollars, our investments that are denominated in a foreign currency are subject to the risk that the value of a particular currency may change in relation to one or more other currencies. Among the factors that may affect currency values are trade balances, the level of short-term interest rates, differences in relative values of similar assets in different currencies, long-term opportunities for investment and capital appreciation, and political developments. We may employ hedging techniques to minimize these risks, but we can offer no assurance that we will, in fact, hedge currency risk or, that if we do, such strategies will be effective.
Hedging transactions may expose us to additional risks.
If we engage in hedging transactions, we may expose ourselves to risks associated with such transactions. We may utilize instruments such as forward contracts, currency options and interest rate swaps, caps, collars and floors to seek to hedge against fluctuations in the relative values of our portfolio positions from changes in currency exchange rates and market interest rates. Hedging against a decline in the values of our portfolio positions does not eliminate the possibility of fluctuations in the values of such positions or prevent losses if the values of such positions decline. However, such hedging can establish other positions designed to gain from those same developments, thereby offsetting the decline in the value of such portfolio positions. Such hedging transactions

24
may also limit the opportunity for gain if the values of the underlying portfolio positions should increase. Moreover, it may not be possible to hedge against an exchange rate or interest rate fluctuation that is so generally anticipated that we are not able to enter into a hedging transaction at an acceptable price. Our ability to engage in hedging transactions may also be adversely affected by recent rules adopted by the CFTC.
While we may enter into transactions to seek to reduce currency exchange rate and interest rate risks, unanticipated changes in currency exchange rates or interest rates may result in poorer overall investment performance than if we had not engaged in any such hedging transactions. In addition, the degree of correlation between price movements of the instruments used in a hedging strategy and price movements in the portfolio positions being hedged may vary. Moreover, for a variety of reasons, we may not seek to establish a perfect correlation between such hedging instruments and the portfolio holdings being hedged. Any such imperfect correlation may prevent us from achieving the intended hedge and expose us to risk of loss. In addition, it may not be possible to hedge fully or perfectly against currency fluctuations affecting the value of securities denominated in non-U.S. currencies because the value of those securities is likely to fluctuate as a result of factors not related to currency fluctuations. Our ability to engage in hedging transactions may also be adversely affected by recent rules adopted by the CFTC.
The effects of various environmental regulations may negatively affect the aviation industry and some of our portfolio companies.
The effects of various environmental regulations may negatively affect the airline industry. This may adversely affect some of our portfolio companies.
Governmental regulations regarding aircraft and engine noise and emissions levels apply based on where the relevant aircraft is registered and operated. For example, jurisdictions throughout the world have adopted noise regulations which require all aircraft to comply with noise level standards. In addition to the current requirements, the United States and the International Civil Aviation Organization (“ICAO”) have adopted a new, more stringent set of standards for noise levels which applies to engines manufactured or certified on or after January 1, 2006. Currently, U.S. regulations would not require any phase-out of aircraft that qualify with the older standards applicable to engines manufactured or certified prior to January 1, 2006, but the European Union has established a framework for the imposition of operating limitations on aircraft that do not comply with the new standards and incorporated aviation-related emissions into the European Union’s Emissions Trading Scheme (“ETS”) beginning in 2012.
In addition to more stringent noise restrictions, the United States and other jurisdictions are beginning to impose more stringent limits on nitrogen oxide, carbon monoxide and carbon dioxide emissions from engines, consistent with current ICAO standards. Concerns over global warming also could result in more stringent limitations on the operation of aircraft.
European countries generally have relatively strict environmental regulations that can restrict operational flexibility and decrease aircraft productivity. The European Parliament has confirmed that all emissions from flights within the European Union are subject to the ETS requirement, even those emissions that are emitted outside of the European Union. The European Union suspended the enforcement of the ETS requirements for international flights outside of the European Union due to a proposal issued by the ICAO in October 2013 to develop a global program to reduce international aviation emissions, which would be enforced by 2020. In response to this, the European Commission has proposed to amend the ETS so that only flights or portions thereof that take place in European regional airspace are subject to the ETS requirements. The potential impact of ETS and the forthcoming ICAO requirements on costs have not been completely identified. Any of these regulations could limit the economic life of the aircraft and engines, reduce their value, limit our portfolio companies' ability to lease or sell the non-compliant aircraft and engines or, if engine modifications are permitted, require our portfolio companies to make significant additional investments in the aircraft and engines to make them compliant.
In addition, compliance with current or future regulations, taxes or duties imposed to deal with environmental concerns could cause our portfolio companies to incur higher costs, thereby generating lower net revenues and resulting in an adverse impact on the financial condition of such portfolio companies.
Investments in the energy sector are subject to many risks.
We have made certain investments in and relating to the energy sector. The operations of energy companies are subject to many risks inherent in the transporting, processing, storing, distributing, mining or marketing of natural gas, natural gas liquids, crude oil, coal, refined petroleum products or other hydrocarbons, or in the exploring, managing or producing of such commodities, including, without limitation: damage to pipelines, storage tanks or related equipment and surrounding properties caused by hurricanes, tornadoes, floods, fires and other natural disasters or by acts of terrorism, inadvertent damage from construction and farm equipment, leaks of natural gas, natural gas liquids, crude oil, refined petroleum products or other hydrocarbons, and fires and explosions. These risks could result in substantial losses due to personal injury or loss of life, severe damage to and destruction of property and equipment and pollution or other environmental damage, and may result in the curtailment or suspension of their related operations, any and all of which could adversely affect our portfolio companies in the energy sector. In addition, the energy

25
sector has experienced significant volatility at times, which may occur in the future, and which could negatively affect the returns on any investment made by the Company in this sector.
Crude oil and natural gas prices are volatile. A substantial and/or extended decline in crude oil and natural gas prices could have a material adverse effect on some of our portfolio companies in the energy sector.
Crude oil and natural gas prices historically have been volatile and likely will continue to be volatile given current geopolitical conditions. The prices for crude oil and natural gas are subject to a variety of factors beyond our control, such as the domestic and foreign supply of crude oil and natural gas; consumer demand for crude oil and natural gas, and market expectations regarding supply and demand. These factors and the volatility of the energy markets make it extremely difficult to predict price movements. Accordingly, our portfolio companies in the energy sector is at risk for the volatility in crude oil and natural gas prices. A prolonged decline in crude oil and/or natural gas prices may have an adverse effect on our business, financial condition and/or operating results.
RISKS RELATED TO MATURITY OF OUR DEBT INSTRUMENTS
Our senior secured credit facility begins amortizing in April 2019 and any inability to renew, extend or replace the facility could adversely impact our liquidity and ability to find new investments or maintain distributions to our stockholders.
We maintain a senior secured multi-currency revolving credit facility (the "Senior Secured Facility") with a group of lenders, under which we had approximately $385 million of indebtedness outstanding at March 31, 2015. Our lenders’ obligation to make new loans or other extensions of credit under the Senior Secured Facility ceases on April 24, 2019, and the facility has a final stated maturity date of April 24, 2020. In addition, commencing on April 30, 2019, Apollo Investment is required to repay, in twelve consecutive monthly installments of equal size, the outstanding amount under the Senior Secured Facility as of April 24, 2019. There can be no assurance that we will be able to renew, extend or replace the Senior Secured Facility upon the termination of the lenders’ obligations to make new loans or the Senior Secured Facility’s final maturity on terms that are favorable to us, if at all. Our ability to renew, extend or replace the Senior Secured Facility will be constrained by then-current economic conditions affecting the credit markets. In the event that we are not able to renew, extend or replace the Senior Secured Facility at the time of the termination of the lenders’ obligations to make new loans or the Senior Secured Facility’s final maturity, this could have a material adverse effect on our liquidity and ability to fund new investments, our ability to make distributions to our stockholders and our ability to qualify as a RIC.
On April 24, 2015, the Company amended and restated the Senior Secured Facility. The amendment increased the lenders’ commitments to $1,310,000, extended the final maturity date to April 24, 2020, and allows the Company to seek additional commitments from new and existing lenders in the future, up to an aggregate facility size not to exceed $1,965,000. In addition, the stated interest rate on the facility was changed from LIBOR plus 2.00% to a formula-based calculation, based on a minimum borrowing base, resulting in a stated interest rate of either LIBOR plus 1.75%, or LIBOR plus 2.00%. As of May 19, 2015, the stated interest rate on the facility is LIBOR plus 2.00%.
Our senior secured notes, unsecured notes and senior unsecured convertible notes have maturity dates over the course of the next several years, and any inability to replace or repay our senior secured notes, unsecured notes or senior unsecured convertible notes could adversely impact our liquidity and ability to fund new investments or maintain distributions to our stockholders.
On September 30, 2010, we entered into a note purchase agreement, providing for a private placement issuance of $225 million in aggregate principal amount of five-year, senior secured notes with a fixed interest rate of 6.25% and a maturity date of October 4, 2015 (the “Senior Secured Notes”). On January 25, 2011, we closed a private offering of $200 million aggregate principal amount of senior unsecured convertible notes (the “Convertible Notes”). The Convertible Notes bear interest at an annual rate of 5.75% and will mature on January 15, 2016 unless earlier converted or repurchased at the holder’s option. On September 29, 2011, we closed a private offering of $45 million aggregate principal amount of senior secured notes consisting of two series: (1) 5.875% Senior Secured Notes, Series A, of Apollo Investment due September 29, 2016 in the aggregate principal amount of $29 million (the "Series A Notes"); and (2) 6.250% Senior Secured Notes, Series B, of Apollo Investment due September 29, 2018, in the aggregate principal amount of $16 million (the "Series B Notes").
On October 9, 2012, Apollo Investment issued $150 million in aggregate principal amount of 6.625% senior unsecured notes due October 15, 2042 (the “2042 Notes”). On June 17, 2013, Apollo Investment issued $135 million in aggregate principal amount of 6.875% senior unsecured notes due July 15, 2043 (the "2043 Notes"). An additional $15 million in aggregate principal amount of the 2043 Notes was issued on June 24, 2013 pursuant to the underwriters' exercise of their option to purchase additional notes. On March 3, 2015, Apollo Investment issued $350 million in aggregate principal amount of 5.250% unsecured notes due March 3, 2025 (the "2025 Notes").

26
There can be no assurance that we will be able to replace the Senior Secured Notes, the Convertible Notes, the Series A Notes, the Series B Notes, the 2025 Notes, the 2042 Notes or the 2043 Notes upon their maturity on terms that are favorable to us, if at all. Our ability to replace the Senior Secured Notes, the Convertible Notes, the Series A Notes, the Series B Notes, the 2025 Notes, the 2042 Notes or the 2043 Notes will be constrained by then-current economic conditions affecting the credit markets. In the event that we are not able to replace or repay the Senior Secured Notes, the Convertible Notes, the Series A Notes, the Series B Notes, the 2025 Notes, the 2042 Notes or the 2043 Notes at the time of their maturity, this could have a material adverse effect on our liquidity and ability to fund new investments, our ability to make distributions to our stockholders and our ability to qualify as a RIC.
The trading market or market value of our debt securities may fluctuate.
Our publicly issued debt securities may or may not have an established trading market. We cannot assure you that a trading market for debt securities will ever develop or be maintained if developed. In addition to our creditworthiness, many factors may materially adversely affect the trading market for, and market value of, debt securities we may issue. These factors include, but are not limited to, the following:
• the time remaining to the maturity of these debt securities;
• the outstanding principal amount of debt securities with terms identical to these debt securities;
• the ratings assigned by national statistical ratings agencies;
• the general economic environment;
• the supply of debt securities trading in the secondary market, if any;
• the redemption or repayment features, if any, of these debt securities;
• the level, direction and volatility of market interest rates generally; and
• market rates of interest higher or lower than rates borne by the debt securities.
You should also be aware that there may be a limited number of buyers if and when you decide to sell your debt securities. This too may materially adversely affect the market value of the debt securities or the trading market for the debt securities
Terms relating to redemption may materially adversely affect your return on any debt securities that we may issue.
If our noteholders' debt securities are redeemable at our option, we may choose to redeem your debt securities at times when prevailing interest rates are lower than the interest rate paid on your debt securities. In addition, if our noteholders' debt securities are subject to mandatory redemption, we may be required to redeem such debt securities also at times when prevailing interest rates are lower than the interest rate paid on such debt securities. In this circumstance, a noteholder may not be able to reinvest the redemption proceeds in a comparable security at an effective interest rate as high as the debt securities being redeemed.
Our credit ratings may not reflect all risks of an investment in our debt securities.
Our credit ratings are an assessment by third parties of our ability to pay our obligations. Consequently, real or anticipated changes in our credit ratings will generally affect the market value of our debt securities. Our credit ratings, however, may not reflect the potential impact of risks related to market conditions generally or other factors discussed above on the market value of or trading market for the publicly issued debt securities.
RISKS RELATED TO ISSUANCE OF OUR PREFERRED STOCK
An investment in our preferred stock should not constitute a complete investment program.
If we issue preferred stock, the net asset value and market value of our common stock may become more volatile.
We cannot assure you that the issuance of preferred stock would result in a higher yield or return to the holders of the common stock. The issuance of preferred stock would likely cause the net asset value and market value of the common stock to become more volatile. If the dividend rate on the preferred stock were to approach the net rate of return on our investment portfolio, the benefit of leverage to the holders of the common stock would be reduced. If the dividend rate on the preferred stock were to exceed the net rate of return on our portfolio, the leverage would result in a lower rate of return to the holders of common stock than if we had not issued preferred stock. Any decline in the net asset value of our investments would be borne entirely by the holders of common stock. Therefore, if the market value of our portfolio were to decline, the leverage would result in a greater decrease in net asset value to the holders of common stock than if we were not leveraged through the issuance of preferred stock. This greater net asset value decrease would also tend to cause a greater decline in the market price for the common stock. We might be in danger of failing to maintain the required asset coverage of the preferred stock or of losing our ratings on the preferred stock

27
or, in an extreme case, our current investment income might not be sufficient to meet the dividend requirements on the preferred stock. In order to counteract such an event, we might need to liquidate investments in order to fund a redemption of some or all of the preferred stock. In addition, we would pay (and the holders of common stock would bear) all costs and expenses relating to the issuance and ongoing maintenance of the preferred stock, including higher advisory fees if our total return exceeds the dividend rate on the preferred stock. Holders of preferred stock may have different interests than holders of common stock and may at times have disproportionate influence over our affairs.
Holders of any preferred stock we might issue would have the right to elect members of the board of directors and class voting rights on certain matters.
Holders of any preferred stock we might issue, voting separately as a single class, would have the right to elect two members of the board of directors at all times and in the event dividends become two full years in arrears would have the right to elect a majority of the directors until such arrearage is completely eliminated. In addition, preferred stockholders have class voting rights on certain matters, including changes in fundamental investment restrictions and conversion to open-end status, and accordingly can veto any such changes. Restrictions imposed on the declarations and payment of dividends or other distributions to the holders of our common stock and preferred stock, both by the 1940 Act and by requirements imposed by rating agencies or the terms of our credit facilities, might impair our ability to maintain our qualification as a RIC for federal income tax purposes. While we would intend to redeem our preferred stock to the extent necessary to enable us to distribute our income as required to maintain our qualification as a RIC, there can be no assurance that such actions could be effected in time to meet the tax requirements.
RISKS RELATING TO AN INVESTMENT IN OUR COMMON STOCK
Investing in our securities involves a high degree of risk and is highly speculative.
The investments we make in accordance with our investment objective may result in a higher amount of risk than alternative investment options and volatility or loss of principal. Our investments in portfolio companies may be highly speculative and aggressive, therefore, an investment in our securities may not be suitable for someone with a low risk tolerance.
There is a risk that investors in our equity securities may not receive dividends or that our dividends may not grow over time and that investors in our debt securities may not receive all of the interest income to which they are entitled.
We intend to make distributions on a quarterly basis to our stockholders out of assets legally available for distribution. We cannot assure you that we will achieve investment results that will allow us to make a specified level of cash distributions or year-to-year increases in cash distributions. In addition, due to the asset coverage test applicable to us as a business development company, we may in the future be limited in our ability to make distributions. Also, our revolving credit facility may limit our ability to declare dividends if we default under certain provisions or fail to satisfy certain other conditions. If we do not distribute a certain percentage of our income annually, we will suffer adverse tax consequences, including possible loss of the tax benefits available to us as a RIC. In addition, in accordance with U.S. generally accepted accounting principles and tax regulations, we include in income certain amounts that we have not yet received in cash, such as contractual payment-in-kind interest, which represents contractual interest added to the loan balance that becomes due at the end of the loan term, or the accrual of original issue or market discount. Since we may recognize income before or without receiving cash representing such income, we may have difficulty meeting the requirement to distribute at least 90% of our investment company taxable income in cash to obtain tax benefits as a RIC.
We will be subject to a 4% nondeductible federal excise tax on certain undistributed income of RICs unless we distribute in a timely manner an amount at least equal to the sum of (1) 98% of our ordinary income for each calendar year, (2) 98.2% of our capital gain net income for the one-year period ending October 31 in that calendar year and (3) any income recognized, but not distributed, in preceding years. We will not be subject to excise taxes on amounts on which we are required to pay corporate income taxes (such as retained net capital gains).
Finally, if more stockholders opt to receive cash dividends rather than participate in our dividend reinvestment plan, we may be forced to liquidate some of our investments and raise cash in order to make cash dividend payments.
Our shares may trade at discounts from net asset value or at premiums that are unsustainable over the long term.
Shares of business development companies may trade at a market price that is less than the net asset value that is attributable to those shares. The possibility that our shares of common stock will trade at a discount from net asset value or at a premium that is unsustainable over the long term are separate and distinct from the risk that our net asset value will decrease. It is not possible to predict whether shares will trade at, above, or below net asset value.

28
Investigations and reviews of Apollo affiliates’ use of placement agents could harm Apollo Investment’s reputation, depress its stock price or have other negative consequences.
While Apollo Investment has not, to date, raised any funds through the use of placement agents (other than through the ordinary course engagement of underwriters, from time to time, in connection with the public offering of Apollo Investment's securities), affiliates of AIM sometimes use placement agents to assist in marketing certain of the investment funds that they manage. Various state attorneys general and federal and state agencies have initiated industry-wide investigations into the use of placement agents in connection with the solicitation of investments, particularly with respect to investments by public pension funds. Certain affiliates of AGM have received subpoenas and other requests for information from various government regulatory agencies and investors in AGM’s funds, seeking information regarding the use of placement agents. The California Public Employees’ Retirement System (“CalPERS”), one of AGM’s strategic investors, announced on October 14, 2009, that it had initiated a special review of placement agents and related issues. The report of the CalPERS special review was issued on March 14, 2011. That report does not allege any wrongdoing on the part of AGM or its affiliates. AGM is continuing to cooperate with all such investigations and other revisions. In addition, on May 6, 2010, the California Attorney General filed a civil complaint against Alfred Villalobos and his company, Arvco Capital Research, LLC (a placement agent that AGM has used) and Federico Buenrostro Jr., the former CEO of CalPERS, alleging conduct in violation of certain California laws in connection with CalPERS’ purchase of securities in various funds managed by AGM and another asset manager. No AGM entity is a party to the civil lawsuit, nor does the lawsuit allege any misconduct on the part of Apollo Investment, AIM or AGM. Likewise, on April 23, 2012, the United States Securities and Exchange Commission filed a lawsuit alleging securities fraud on the part of Arvco, as well as Messrs. Buenrostro and Villalobos, in connection with their activities concerning certain CalPERS investments in funds managed by AGM. This lawsuit also does not allege wrongdoing on the part of AGM, and in fact alleges that AGM was defrauded by Arvco, Villalobos, and Buenrostro. On March 14, 2013, the United States Department of Justice unsealed an indictment against Messrs. Villalobos and Buenrostro alleging, among other crimes, fraud in connection with those same activities; again, AGM is not accused of any wrongdoing and in fact is alleged to have been defrauded by the defendants. The criminal action was set for trial in a San Francisco federal court in July 2014, but was put on hold after Mr. Buenrostro pleaded guilty on July 11, 2014. As part of Mr. Buenrostro’s plea agreement, he admitted to taking cash and other bribes from Mr. Villalobos in exchange for several improprieties, including attempting to influence CalPERS’ investing decisions and improperly preparing disclosure letters to satisfy AGM’s requirements. There is no suggestion that AGM was aware that Mr. Buenrostro had signed the letters with a corrupt motive. The government has indicated that they will file new charges against Mr. Villalobos incorporating Mr. Buenrostro’s admissions. On August 7, 2014, the government filed a superseding indictment against Mr. Villalobos asserting additional charges. Trial had been scheduled for February 23, 2015, but Mr. Villalobos passed away on January 13, 2015. Additionally, on April 15, 2013, Mr. Villalobos, Arvco and related entities (the “Arvco Debtors”) brought a civil action in the United States Bankruptcy Court for the District of Nevada (the “Bankruptcy Court”) against AGM. The action is related to the ongoing bankruptcy proceedings of the Arvco Debtors. This action alleges that Arvco served as a placement agent for AGM in connection with several funds associated with AGM, and seeks to recover purported fees the Arvco Debtors claim AGM has not paid them for a portion of Arvco’s placement agent services. In addition, the Arvco Debtors allege that AGM has interfered with the Arvco Debtors’ commercial relationships with third parties, purportedly causing the Arvco Debtors to lose business and to incur fees and expenses in the defense of various investigations and litigations. The Arvco Debtors also seek compensation from AGM for these alleged lost profits and fees and expenses. The Arvco Debtors’ complaint asserts various theories of recovery under the Bankruptcy Code and common law. AGM denies the merit of all of the Arvco Debtors’ claims and will vigorously contest them. The Bankruptcy Court has stayed this action pending the result in the criminal case against Mr. Villalobos. For these reasons, no estimate of possible loss, if any, can be made at this time.
The market price of our securities may fluctuate significantly.
The market price and liquidity of the market for our securities may be significantly affected by numerous factors, some of which are beyond our control and may not be directly related to our operating performance. These factors include:
• volatility in the market price and trading volume of securities of business development companies or other companies inour sector, which are not necessarily related to the operating performance of these companies;
• changes in regulatory policies or tax guidelines, particularly with respect to RICs or business development companies;
• loss of RIC status;
• changes in earnings or variations in operating results;
• changes in the value of our portfolio of investments;
• any shortfall in revenue or net income or any increase in losses from levels expected by investors or securities analysts;
• departure of AIM’s key personnel;
• operating performance of companies comparable to us;

29
• general economic trends and other external factors; and
• loss of a major funding source.
We may be unable to invest the net proceeds raised from offerings on acceptable terms, which would harm our financial condition and operating results.
Until we identify new investment opportunities, we intend to either invest the net proceeds of future offerings in interest-bearing deposits or other short-term instruments or use the net proceeds from such offerings to reduce then-outstanding obligations under our credit facility. We cannot assure you that we will be able to find enough appropriate investments that meet our investment criteria or that any investment we complete using the proceeds from an offering will produce a sufficient return.
Sales of substantial amounts of our securities may have an adverse effect on the market price of our securities.
Sales of substantial amounts of our securities, or the availability of such securities for sale, could adversely affect the prevailing market prices for our securities. If this occurs and continues, it could impair our ability to raise additional capital through the sale of securities should we desire to do so.
If you do not fully exercise your subscription rights in any rights offering of our common stock, your interest in us may be diluted and, if the subscription price is less than our net asset value per share, you may experience an immediate dilution of the aggregate net asset value of your shares.
In the event we issue subscription rights to acquire shares of our common stock, stockholders who do not fully exercise their subscription rights should expect that they will, at the completion of the rights offering, own a smaller proportional interest in us than would be the case if they fully exercised their rights.
In addition, if the subscription price is less than the net asset value per share of our common stock, a stockholder who does not fully exercise its subscription rights may experience an immediate dilution of the aggregate net asset value of its shares as a result of the offering.
We would not be able to state the amount of any such dilution prior to knowing the results of the offering. Such dilution could be substantial.
Stockholders may experience dilution in their ownership percentage if they do not participate in our dividend reinvestment plan.
All dividends declared in cash payable to stockholders that are participants in our dividend reinvestment plan are generally automatically reinvested in shares of our common stock. As a result, stockholders that do not participate in the dividend reinvestment plan may experience dilution over time. Stockholders who do not elect to receive dividends in shares of common stock may experience accretion to the net asset value of their shares if our shares are trading at a premium and dilution if our shares are trading at a discount. The level of accretion or discount would depend on various factors, including the proportion of our stockholders who participate in the plan, the level of premium or discount at which our shares are trading and the amount of the dividend payable to a stockholder.
If we issue preferred stock, the net asset value and market value of our common stock may become more volatile.
We cannot assure you that the issuance of preferred stock would result in a higher yield or return to the holders of our common stock. The issuance of preferred stock would likely cause the net asset value and market value of our common stock to become more volatile. If the dividend rate on the preferred stock were to approach the net rate of return on our investment portfolio, the benefit of leverage to the holders of our common stock would be reduced. If the dividend rate on the preferred stock were to exceed the net rate of return on our portfolio, the leverage would result in a lower rate of return to the holders of our common stock than if we had not issued preferred stock. Any decline in the net asset value of our investment would be borne entirely by the holders of our common stock. Therefore, if the market value of our portfolio were to decline, the leverage would result in a greater decrease in net asset value to the holders of our common stock than if we were not leveraged through the issuance of preferred stock. This greater net asset value decrease would also tend to cause a greater decline in the market price of our common stock. We might be in danger of failing to maintain the required asset coverage of the preferred stock or of losing our ratings on the preferred stock or, in an extreme case, our current investment income might not be sufficient to meet the dividend requirements on the preferred stock. In order to counteract such an event, we might need to liquidate investments in order to fund a redemption of some or all of the preferred stock. In addition, we would pay (and the holders of our common stock would bear) all costs and expenses relating to the issuance and ongoing maintenance of the preferred stock, including higher incentive fees if our total return exceeds the

30
dividend rate on the preferred stock. Holders of preferred stock may have different interests than holders of common stock and may at times have disproportionate influence over our affairs.
The issuance of shares of preferred stock with dividend or conversion rights, liquidation preferences or other economic terms favorable to the holders of preferred stock could adversely affect the market price for our common stock by making an investment in the common stock less attractive. In addition, the dividends on any preferred stock we issue must be cumulative. Payment of dividends and repayment of the liquidation preference of preferred stock must take preference over any dividends or other payments to our common stockholders, and holders of preferred stock are not subject to any of our expenses or losses and are not entitled to participate in any income or appreciation in excess of their stated preference (other than convertible preferred stock that converts into common stock). In addition, under the 1940 Act, preferred stock constitutes a "senior security" for purposes of the 200% asset coverage test.
Item 1B. Unresolved Staff Comments
None.
Item 2. Properties
As of March 31, 2015, we did not own any real estate or other physical properties materially important to our operation. Our administrative and principal executive offices are located at 730 Fifth Avenue, New York, NY 10019 and 9 West 57th Street, New York, NY 10019, respectively. We believe that our office facilities are suitable and adequate for our business as it is contemplated to be conducted.
Item 3. Legal Proceedings
From time to time, we may become involved in various investigations, claims and legal proceedings that arise in the ordinary course of our business. Furthermore, third parties may try to seek to impose liability on us in connection with the activities of our portfolio companies. While we do not expect that the resolution of these matters if they arise would materially affect our business, financial condition or results of operations, resolution will be subject to various uncertainties and could result in the expenditure of significant financial and managerial resources.
On May 20, 2013, the Company was named as a defendant in a complaint by the bankruptcy trustee of DSI Renal Holdings and related companies (“DSI”). The complaint alleges, among other things, that the Company participated in a “fraudulent conveyance” involving a restructuring and subsequent sale of DSI in 2010 and 2011. The complaint seeks, jointly and severally from all defendants, (1) damages of approximately $425 million, of which the Company’s share would be approximately $41 million, and the return of 9,000 shares of common stock of DSI obtained by the Company in the restructuring and sale and (2) punitive damages. At this point in time, the Company is unable to assess whether it may have any liability in this action. The Company has not made any determination that this action is or may be material to the Company and intends to vigorously defend itself. The Company has filed a motion to dismiss this litigation.
Item 4. Mine Safety Disclosures
Not Applicable.

31
PART II
Item 5. Market for Registrant’s Common Equity, Related Stockholder Matters and Issuer Purchases of Equity Securities
PRICE RANGE OF COMMON STOCK
Our common stock is traded on the NASDAQ Global Select Market under the symbol “AINV.” The following table lists the high and low closing sale price for our common stock, the closing sale price as a percentage of net asset value (“NAV”) and quarterly dividends per share for the past two years.
NAV(1)
Closing Sales PricePremium orDiscount ofHigh Sales
Price toNAV(2)
Premium orDiscount ofLow SalesPrice toNAV(2)
DeclaredDividendsHigh Low
Fiscal Year Ended March 31, 2015Fourth Fiscal Quarter $ 8.18 $ 7.88 $ 7.10 (4)% (13)% $ 0.20Third Fiscal Quarter $ 8.43 $ 8.36 $ 7.20 (1)% (15)% $ 0.20Second Fiscal Quarter $ 8.72 $ 8.83 $ 8.17 1 % (6)% $ 0.20First Fiscal Quarter $ 8.74 $ 8.61 $ 7.89 (1)% (10)% $ 0.20Fiscal Year Ended March 31, 2014Fourth Fiscal Quarter $ 8.67 $ 9.15 $ 8.14 6 % (6)% $ 0.20Third Fiscal Quarter $ 8.57 $ 9.02 $ 8.05 5 % (6)% $ 0.20Second Fiscal Quarter $ 8.30 $ 8.47 $ 7.77 2 % (6)% $ 0.20First Fiscal Quarter $ 8.16 $ 8.87 $ 7.37 9 % (10)% $ 0.20
_________________________(1) NAV per share is determined as of the last day in the relevant quarter and therefore may not reflect the NAV per share on
the date of the high and low sales prices. The NAVs shown are based on outstanding shares at the end of each period.(2) Calculated using the respective high or low closing sales price divided by the quarter end NAV.
While our common stock has from time to time traded in excess of our net asset value, there can be no assurance, however, that it will trade at such a premium (to net asset value) in the future. The last reported closing market price of our common stock on May 15, 2015 was $7.81 per share. As of May 15, 2015, we had 94 stockholders of record.
DIVIDENDS
We intend to continue to distribute quarterly dividends to our stockholders. Our quarterly dividends, if any, will be determined by our board of directors. We expect that our distributions to stockholders generally will be from accumulated net investment income and from cumulative net realized capital gains, as applicable, although a portion may represent a return of capital.
We have elected to be taxed as a RIC under Subchapter M of the Code. To maintain our RIC status, we must distribute at least 90% of our ordinary income and realized net short-term capital gains in excess of realized net long-term capital losses, if any, out of the assets legally available for distribution. In addition, although we currently intend to distribute realized net capital gains (i.e., net long-term capital gains in excess of short-term capital losses), if any, at least annually, out of the assets legally available for such distributions, we may in the future decide to retain such capital gains for investment. In addition, we have substantial net capital loss carryforwards and consequently do not expect to generate cumulative net capital gains in the foreseeable future.
We maintain an “opt out” dividend reinvestment plan for our common stockholders. As a result, if we declare a dividend, then stockholders’ cash dividends will be automatically reinvested in additional shares of our common stock, unless they specifically “opt out” of the dividend reinvestment plan so as to receive cash dividends.
We may not be able to achieve operating results that will allow us to make distributions at a specific level or to increase the amount of these distributions from time to time. In addition, due to the asset coverage test applicable to us as a business development company, we may in the future be limited in our ability to make distributions. Also, our revolving credit facility may limit our ability to declare dividends if we default under certain provisions or fail to satisfy certain other conditions. If we do not distribute a certain percentage of our income annually, we may suffer adverse tax consequences, including possible loss of the tax benefits available to us as a regulated investment company. In addition, in accordance with U.S. generally accepted accounting principles and tax regulations, we include in income certain amounts that we have not yet received in cash, such as contractual payment-in-kind interest, which represents contractual interest added to the loan balance that becomes due at the end of the loan term, or the accrual of original issue or market discount. Since we may recognize income before or without receiving cash representing such

32
income, we may not be able to meet the requirement to distribute at least 90% of our investment company taxable income to obtain tax benefits as a regulated investment company.
With respect to the dividends to stockholders, income from origination, structuring, closing, commitment and other upfront fees associated with investments in portfolio companies is treated as taxable income and accordingly, distributed to stockholders.
All dividends declared in cash payable to stockholders that are participants in our dividend reinvestment plan are generally automatically reinvested in shares of our common stock. As a result, stockholders that do not participate in the dividend reinvestment plan may experience dilution over time. Stockholders who do not elect to receive dividends in shares of common stock may experience accretion to the net asset value of their shares if our shares are trading at a premium and dilution if our shares are trading at a discount. The level of accretion or discount would depend on various factors, including the proportion of our stockholders who participate in the plan, the level of premium or discount at which our shares are trading and the amount of the dividend payable to a stockholder.
The following table lists the quarterly dividends per share from our common stock for the past two fiscal years.
DeclaredDividends
Fiscal Year Ending March 31, 2015Fourth Fiscal Quarter $ 0.20Third Fiscal Quarter $ 0.20Second Fiscal Quarter $ 0.20First Fiscal Quarter $ 0.20
Fiscal Year Ending March 31, 2014Fourth Fiscal Quarter $ 0.20Third Fiscal Quarter $ 0.20Second Fiscal Quarter $ 0.20First Fiscal Quarter $ 0.20
Recent Sale of Unregistered Securities
None.
Issuer Purchases of Equity Securities
During the fiscal year ended March 31, 2015, as a part of our dividend reinvestment plan for our common stockholders, we purchased 1,609,852 shares of our common stock in the open market at an average price of $8.06 per share and transferred those shares to the participants in the dividend reinvestment plan. During the fiscal year ended March 31, 2014, as a part of our dividend reinvestment plan for our common stockholders, we purchased 2,237,819 shares of our common stock in the open market at an average price of $8.26 per share and transferred those shares to the participants in the dividend reinvestment plan.
STOCK PERFORMANCE GRAPH
This graph compares the return on our common stock with that of the Standard & Poor’s 500 Stock Index and the Russell 2000 Financial Services Index, for the period March 31, 2010 through March 31, 2015. The graph assumes that, on March 31, 2010, a person invested $100 in each of the following: our common stock, the S&P 500 Index, the Russell 2000 Financial Services Index, and the S&P Small Cap 600 Financials Index. The graph measures total stockholder return, which takes into account both changes in stock price and dividends. It assumes that dividends paid are invested in like securities.

33
The graph and other information furnished under this Part II Item 5 of this Form 10-K shall not be deemed to be “soliciting material” or to be “filed” with the SEC or subject to Regulation 14A or 14C, or to the liabilities of Section 18 of the 1934 Act. The stock price performance included in the above graph is not necessarily indicative of future stock price performance.
Item 6. Selected Financial Data
The Statement of Operations, Per Share and Balance Sheet data for the fiscal years ended March 31, 2015, 2014, 2013, 2012, and 2011 are derived from our financial statements which have been audited. This selected financial data should be read in conjunction with our financial statements and related notes thereto and “Management’s Discussion and Analysis of Financial Condition and Results of Operations” included elsewhere in this report.

34
For the Year Ended March 31,(dollar amounts and shares in thousands,
except per share data)Statement of Operations Data: 2015 2014 2013 2012 2011
Total Investment Income $ 433,631 $ 381,346 $ 331,994 $ 357,584 $ 358,779Net Expenses (including excise taxes) $ 205,658 $ 180,098 $ 164,634 $ 184,842 $ 167,607Net Investment Income $ 227,973 $ 201,248 $ 167,360 $ 172,742 $ 191,172Net Realized and Unrealized Gains(Losses)
$ (152,551) $ 69,624 $ (62,889) $ (259,006) $ (10,760)
Net Increase (Decrease) in Net AssetsResulting from Operations
$ 75,422 $ 270,872 $ 104,471 $ (86,264) $ 180,412
Per Share Data:Net Asset Value $ 8.18 $ 8.67 $ 8.27 $ 8.55 $ 10.03Net Investment Income $ 0.96 $ 0.91 $ 0.83 $ 0.88 $ 0.99Net Earnings (Loss) Per Share (Basic) $ 0.32 $ 1.21 $ 0.51 $ (0.44) $ 0.93Net Earnings (Loss) Per Share (Diluted) $ 0.32 $ 1.18 $ 0.51 $ (0.44) $ 0.93Distributions Declared $ 0.80 $ 0.80 $ 0.80 $ 1.04 $ 1.12Balance Sheet Data:Total Assets $ 3,560,891 $ 3,641,951 $ 2,944,312 $ 2,775,263 $ 3,148,813Debt Outstanding $ 1,498,759 $ 1,372,261 $ 1,156,067 $ 1,009,337 $ 1,053,443Total Net Assets $ 1,937,608 $ 2,051,611 $ 1,677,389 $ 1,685,231 $ 1,961,031Other Data:Total Return(1) 1.9% 9.4% 28.2% (32.4)% 5.1%Number of Portfolio Companies at YearEnd
105 111 81 62 69
Total Portfolio Investments for the Year $ 2,211,081 $ 2,816,149 $ 1,537,366 $ 1,480,508 $ 1,085,601Investment Sales and Repayments forthe Year
$ 2,250,782 $ 2,322,189 $ 1,337,431 $ 1,634,520 $ 977,493
Weighted Average Yield on DebtPortfolio at Year End
11.2% 11.1% 11.9% 11.9 % 11.6%
Weighted Average Shares Outstanding atYear End (Basic)
236,741 222,800 202,875 196,584 193,192
Weighted Average Shares Outstanding atYear End (Diluted) (2)
251,289 237,348 217,423 211,132 195,823
_________________________(1) Total return is based on the change in market price per share and takes into account dividends and distributions, if any,
reinvested in accordance with Apollo Investment’s dividend reinvestment plan.(2) In applying the if-converted method, conversion is not assumed for purposes of computing diluted EPS if the effect would
be anti-dilutive. For the fiscal years ended March 31, 2015, March 31, 2013 and March 31, 2012, anti-dilution would total $0.02, $0.02 and $0.08, respectively.
Item 7. Management’s Discussion and Analysis of Financial Condition and Results of Operations
The following analysis of our financial condition and results of operations should be read in conjunction with our financial statements and the notes thereto contained elsewhere in this report.
Some of the statements in this report constitute forward-looking statements, which relate to future events or our future performance or financial condition. The forward-looking statements contained herein involve risks and uncertainties, including statements as to:
• our future operating results;
• our business prospects and the prospects of our portfolio companies;
• the impact of investments that we expect to make;
• our contractual arrangements and relationships with third parties;

35
• the dependence of our future success on the general economy and its impact on the industries in which we invest;
• the ability of our portfolio companies to achieve their objectives;
• our expected financings and investments;
• the adequacy of our cash resources and working capital; and
• the timing of cash flows, if any, from the operations of our portfolio companies.
We generally use words such as “anticipates,” “believes,” “expects,” “intends” and similar expressions to identify forward-looking statements. Our actual results could differ materially from those projected in the forward-looking statements for any reason, including any factors set forth in “Risk Factors” and elsewhere in this report.
We have based the forward-looking statements included in this report on information available to us on the date of this report, and we assume no obligation to update any such forward-looking statements. Although we undertake no obligation to revise or update any forward-looking statements, whether as a result of new information, future events or otherwise, you are advised to consult any additional disclosures that we may make directly to you or through reports that we in the future may file with the SEC, including any annual reports on Form 10-K, quarterly reports on Form 10-Q and current reports on Form 8-K.
OVERVIEW
Apollo Investment was incorporated under the Maryland General Corporation Law in February 2004. We have elected to be treated as a BDC under the 1940 Act. As such, we are required to comply with certain regulatory requirements. For instance, we generally have to invest at least 70% of our total assets in “qualifying assets,” including securities of private or thinly traded public U.S. companies, cash equivalents, U.S. government securities and high-quality debt investments that mature in one year or less. In addition, for federal income tax purposes we have elected to be treated as a RIC under Subchapter M of the Code. Pursuant to this election and assuming we qualify as a RIC, we generally do not have to pay corporate-level federal income taxes on any income we distribute to our stockholders. Apollo Investment commenced operations on April 8, 2004 upon completion of its initial public offering that raised $870 million in net proceeds from selling 62 million shares of its common stock at a price of $15.00 per share. Since then, and through March 31, 2015, we have raised approximately $2.2 billion in net proceeds from additional offerings of common stock.
Investments
Our level of investment activity can and does vary substantially from period to period depending on many factors, including the amount of debt and equity capital available to middle-market companies, the level of merger and acquisition activity for such companies, the general economic environment, and the competitive environment for the types of investments we make. As a business development company, we must not acquire any assets other than “qualifying assets” specified in the 1940 Act unless, at the time the acquisition is made, at least 70% of our total assets are qualifying assets (with certain limited exceptions).
Revenue
We generate revenue primarily in the form of interest and dividend income from the securities we hold and capital gains, if any, on investment securities that we may acquire in portfolio companies. Our debt investments, whether in the form of mezzanine or senior secured loans, generally have a stated term of five to ten years and bear interest at a fixed rate or a floating rate usually determined on the basis of a benchmark: LIBOR, Euro Interbank Offered Rate (EURIBOR), British pound sterling LIBOR (GBP LIBOR), or the prime rate. Interest on debt securities is generally payable quarterly or semiannually and while U.S. subordinated debt and corporate notes typically accrue interest at fixed rates, some of our investments may include zero coupon and/or step-up bonds that accrue income on a constant yield to call or maturity basis. In addition, some of our investments provide for PIK interest or dividends. Such amounts of accrued PIK interest or dividends are added to the cost of the investment on the respective capitalization dates and generally become due at maturity of the investment or upon the investment being called by the issuer. We may also generate revenue in the form of commitment, origination, structuring fees, fees for providing managerial assistance and, if applicable, consulting fees, etc.
Expenses
For all investment professionals of the investment adviser and their staff, when and to the extent engaged in providing investment advisory and management services to us, the compensation and routine overhead expenses of that personnel which is allocable to those services are provided and paid for by AIM. We bear all other costs and expenses of our operations and transactions, including those relating to:
• investment advisory and management fees;

36
• expenses incurred by AIM payable to third parties, including agents, consultants or other advisors, in monitoring ourfinancial and legal affairs and in monitoring our investments and performing due diligence on our prospective portfoliocompanies;
• calculation of our net asset value (including the cost and expenses of any independent valuation firm);
• direct costs and expenses of administration, including independent registered public accounting and legal costs;
• costs of preparing and filing reports or other documents with the SEC;
• interest payable on debt, if any, incurred to finance our investments;
• offerings of our common stock and other securities;
• registration and listing fees;
• fees payable to third parties, including agents, consultants or other advisors, relating to, or associated with, evaluatingand making investments;
• transfer agent and custodial fees;
• taxes;
• independent directors’ fees and expenses;
• marketing and distribution-related expenses;
• the costs of any reports, proxy statements or other notices to stockholders, including printing and postage costs;
• our allocable portion of the fidelity bond, directors and officers/errors and omissions liability insurance, and any otherinsurance premiums;
• organizational costs; and
• all other expenses incurred by us or the Administrator in connection with administering our business, such as our allocableportion of overhead under the Administration Agreement, including rent and our allocable portion of the cost of our chieffinancial officer, chief compliance officer and their respective staffs.
We expect our general and administrative operating expenses related to our ongoing operations to increase moderately in dollar terms. During periods of asset growth, we generally expect our general and administrative operating expenses to decline as a percentage of our total assets and increase during periods of asset declines. Incentive fees, interest expense and costs relating to future offerings of securities, among others, may also increase or reduce overall operating expenses based on portfolio performance, interest rate benchmarks, and offerings of our securities relative to comparative periods, among other factors.
Portfolio and Investment Activity
Our portfolio and investment activity during the fiscal years ended March 31, 2015 and 2014 is as follows:
(amounts in millions)
For the fiscalyear ended
March 31, 2015
For the fiscalyear ended
March 31, 2014
Investment made in portfolio companies (1) $ 2,211 $ 2,816Investments sold (1,407) (1,006)Net activity before repaid investments 804 1,810Investments repaid (844) (1,316)Net investment activity $ (40) $ 494
Portfolio companies, at beginning of period 111 81Number of new portfolio companies 60 81Number of exited companies (66) (51)Portfolio companies, at end of period 105 111
Number of investments in existing portfolio companies 47 50
_________________

37
(1) Investments were primarily made through a combination of primary and secondary debt investments.
Our portfolio composition and weighted average yields at March 31, 2015 and at March 31, 2014 are as follows:
March 31, 2015 March 31, 2014
Portfolio composition, measured at fair value:Secured debt 60% 56%Unsecured debt 14% 27%Structured products and other(1) 11% 6% Preferred equity 5% 3%Common equity and warrants 10% 8%
Weighted average yields, at current cost basis, exclusive of securities on non-accrualstatus(2):
Secured debt portfolio 11.2% 10.8%Unsecured debt portfolio 10.9% 11.5%Total debt portfolio 11.2% 11.1%
Income-bearing investment portfolio composition, measured at fair value:Fixed rate amount $ 1.3 billion $ 1.7 billionFloating rate amount $ 1.4 billion $ 1.3 billionFixed rate % 48% 58%Floating rate % 52% 42%
Income-bearing investment portfolio composition, measured at cost:Fixed rate amount $ 1.4 billion $ 1.7 billionFloating rate amount $ 1.4 billion $ 1.2 billionFixed rate % 50% 58%Floating rate % 50% 42%
(1) Structured products and other such as collateralized loan obligations (“CLOs”) and credit-linked notes (“CLNs”) are typically a form of securitization in which the cash flows from a portfolio of loans are pooled and passed on to different classes of debt and residual interest in order of seniority.
(2) An investor's yield may be lower than the portfolio yield due to sales loads and other expenses.
Since the initial public offering of Apollo Investment in April 2004 and through March 31, 2015, invested capital totaled $15.4 billion in 350 portfolio companies. Over the same period, Apollo Investment completed transactions with more than 100 different financial sponsors.
CRITICAL ACCOUNTING POLICIES
Our discussion and analysis of our financial condition and results of operations are based upon our financial statements, which have been prepared in accordance with accounting principles generally accepted in the United States of America, or GAAP. The preparation of these financial statements requires management to make estimates and assumptions that affect the reported amounts of assets, liabilities, revenues and expenses. Changes in the economic environment, financial markets and any other parameters used in determining such estimates could cause actual results to differ materially. In addition to the discussion below, our critical accounting policies are further described in the notes to the financial statements.
Fair Value MeasurementsThe Company follows guidance in ASC 820, Fair Value Measurement, where fair value is defined as the price that would be received to sell an asset or paid to transfer a liability in an orderly transaction between market participants at the measurement date. Fair value measurements are determined within a framework that establishes a three-tier hierarchy which maximizes the use of observable market data and minimizes the use of unobservable inputs to establish a classification of fair value measurements for disclosure purposes. Inputs refer broadly to the assumptions that market participants would use in pricing the asset or liability, including assumptions about risk, such as the risk inherent in a particular valuation technique used to measure fair value using a pricing model and/or the risk inherent in the inputs for the valuation technique. Inputs may be observable or unobservable. Observable inputs reflect the assumptions market participants would use in pricing the asset or liability based on market data obtained from sources independent of the Company. Unobservable inputs reflect the Company's own assumptions about the

38
assumptions market participants would use in pricing the asset or liability based on the information available. The inputs or methodology used for valuing assets or liabilities may not be an indication of the risks associated with investing in those assets or liabilities. Under procedures established by our board of directors, we value investments, including certain secured debt, unsecured debt, and other debt securities with maturities greater than 60 days, for which market quotations are readily available, at such market quotations (unless they are deemed not to represent fair value). We attempt to obtain market quotations from at least two brokers or dealers (if available, otherwise from a principal market maker or a primary market dealer or other independent pricing service). We utilize mid-market pricing as a practical expedient for fair value unless a different point within the range is more representative. If and when market quotations are deemed not to represent fair value, we typically utilize independent third party valuation firms to assist us in determining fair value. Accordingly, such investments go through our multi-step valuation process as described below. In each case, our independent valuation firms consider observable market inputs together with significant unobservable inputs in arriving at their valuation recommendations for such investments. Debt investments with remaining maturities of 60 days or less may each be valued at cost with interest accrued or discount amortized to the date of maturity, unless such valuation, in the judgment of our investment adviser, does not represent fair value. In this case, such investments shall be valued at fair value as determined in good faith by or under the direction of our board of directors, using market quotations where available. Investments that are not publicly traded or whose market quotations are not readily available are valued at fair value as determined in good faith by or under the direction of our board of directors. Such determination of fair values may involve subjective judgments and estimates.
With respect to investments for which market quotations are not readily available or when such market quotations are deemed not to represent fair value, our board of directors has approved a multi-step valuation process each quarter, as described below:
(1) our quarterly valuation process begins with each portfolio company or investment being initially valued by the investment professionals of our investment adviser which is responsible for the portfolio investment;
(2) preliminary valuation conclusions are then documented and discussed with senior management of our investment adviser;
(3) independent valuation firms are engaged by our board of directors to conduct independent appraisals by reviewing our investment adviser’s preliminary valuations and then making their own independent assessment;
(4) the audit committee of the board of directors reviews the preliminary valuation of our investment adviser and the valuation prepared by the independent valuation firm and responds to the valuation recommendation of the independent valuation firm to reflect any comments; and
(5) the board of directors discusses valuations and determines in good faith the fair value of each investment in our portfolio based on the input of our investment adviser, the applicable independent valuation firm, third party pricing services, and the audit committee.
Investments in all asset classes are valued utilizing a market approach, an income approach, or both approaches, as appropriate. The market approach uses prices and other relevant information generated by market transactions involving identical or comparable assets or liabilities (including a business). The income approach uses valuation techniques to convert future amounts (for example, cash flows or earnings) to a single present amount (discounted). The measurement is based on the value indicated by current market expectations about those future amounts. In following these approaches, the types of factors that we may take into account in fair value pricing our investments include, as relevant: available current market data, including relevant and applicable market trading and transaction comparables, applicable market yields and multiples, security covenants, seniority of investment in the investee company's capital structure, call protection provisions, information rights, the nature and realizable value of any collateral, the portfolio company’s ability to make payments, its earnings and discounted cash flows, the markets in which the portfolio company does business, comparisons of financial ratios of peer companies that are public, M&A comparables, our principal market (as the reporting entity) and enterprise values, among other factors. When readily available, broker quotations and/or quotations provided by pricing services are considered in the valuation process of independent valuation firms. For the fiscal year ended March 31, 2015, there was no change to the Company’s valuation techniques and related inputs considered in the valuation process.
ASC 820 classifies the inputs used to measure these fair values into the following hierarchy:
Level 1: Quoted prices in active markets for identical assets or liabilities, accessible by the Company at the measurement date.
Level 2: Quoted prices for similar assets or liabilities in active markets, or quoted prices for identical or similar assets or liabilities in markets that are not active, or other observable inputs other than quoted prices.
Level 3: Unobservable inputs for the asset or liability.
In all cases, the level in the fair value hierarchy within which the fair value measurement in its entirety falls has been determined based on the lowest level of input that is significant to the fair value measurement. Our assessment of the significance of a particular

39
input to the fair value measurement in its entirety requires judgment and considers factors specific to each investment. Of the Company's investments at March 31, 2015, $2.8 billion or 82.2% of the Company's investments were classified as Level 3.
The high proportion of Level 3 investments relative to our total investments is directly related to our investment philosophy and target portfolio, which consists primarily of long-term secured debt, as well as unsecured and mezzanine positions of private middle-market companies. A fundamental difference exists between our investments and those of comparable publicly traded fixed income investments, namely high yield bonds, and this difference affects the valuation of our private investments relative to comparable publicly traded instruments.
Senior secured loans, or senior loans, are higher in the capital structure than high yield bonds, and are typically secured by assets of the borrowing company. This improves their recovery prospects in the event of default and affords senior loans a structural advantage over high yield bonds. Many of the Company’s investments are also privately negotiated and contain covenant protections that limit the issuer to take actions that could harm us as a creditor. High yield bonds typically do not contain such covenants.
Given the structural advantages of capital seniority and covenant protection, the valuation of our private debt portfolio is driven more by investment specific credit factors than movements in the broader debt capital markets. Each security is evaluated individually and as indicated above, we value our private investments based upon a multi-step valuation process, including valuation recommendations from independent valuation firms.
Investment Income Recognition
The Company records interest and dividend income, adjusted for amortization of premium and accretion of discount, on an accrual basis. Some of our loans and other investments, including certain preferred equity investments, may have contractual payment-in-kind (“PIK”) interest or dividends. PIK interest and dividends computed at the contractual rate are accrued into income and reflected as receivable up to the capitalization date. PIK investments offer issuers the option at each payment date of making payments in cash or in additional securities. When additional securities are received, they typically have the same terms, including maturity dates and interest rates as the original securities issued. On these payment dates, the Company capitalizes the accrued interest or dividends receivable (reflecting such amounts as the basis in the additional securities received). PIK generally becomes due at maturity of the investment or upon the investment being called by the issuer. At the point the Company believes PIK is not expected to be realized, the PIK investment will be placed on non-accrual status. When a PIK investment is placed on non-accrual status, the accrued, uncapitalized interest or dividends are reversed from the related receivable through interest or dividend income, respectively. The Company does not reverse previously capitalized PIK interest or dividends. Upon capitalization, PIK is subject to the fair value estimates associated with their related investments. PIK investments on non-accrual status are restored to accrual status if the Company believes that PIK is expected to be realized.
Investments that are expected to pay regularly scheduled interest and/or dividends in cash are generally placed on non-accrual status when principal or interest/dividend cash payments are past due 30 days or more and/or when it is no longer probable that principal or interest/dividend cash payments will be collected. Such non-accrual investments are restored to accrual status if past due principal and interest or dividends are paid in cash, and in management’s judgment, are likely to continue timely payment of their remaining interest or dividend obligations. Interest or dividend cash payments received on non-accrual designated investments may be recognized as income or applied to principal depending upon management’s judgment.
Loan origination fees, original issue discount, and market discounts are capitalized and amortized into income using the interest method or straight-line, as applicable. Upon the prepayment of a loan, any unamortized loan origination fees are recorded as interest income. We record prepayment premiums on loans and other investments as interest income when we receive such amounts. Other income generally includes administrative fee, and structuring fees, which are recorded when earned.
The Company records as dividend income the accretable yield from its beneficial interests in structured products such as CLOs based upon a number of cash flow assumptions that are subject to uncertainties and contingencies. Such assumptions include the rate and timing of principal and interest receipts (which may be subject to prepayments and defaults) of the underlying pools of assets. These assumptions are updated on at least a quarterly basis to reflect changes related to a particular security, actual historical data, and market changes. A structured product investment typically has an underlying pool of assets. Payments on structured product investments are payable solely from the cash flows from such assets. As such any unforeseen event in these underlying pools of assets might impact the expected recovery and future accrual of income.
Expenses
Expenses include management fees, performance-based incentive fees, insurance expenses, administrative service fees, legal fees, directors' fees, audit and tax service expenses, and other general and administrative expenses. Expenses are recognized on an accrual basis.

40
Net Realized Gains or Losses and Net Change in Unrealized Gain (Loss)
We measure realized gains or losses by the difference between the net proceeds from the repayment or sale and the amortized cost basis of the investment, without regard to unrealized appreciation or depreciation previously recognized, but considering unamortized upfront fees and prepayment penalties. Net change in unrealized gain (loss) reflects the net change in portfolio investment values during the reporting period, including the reversal of previously recorded unrealized gains or losses.
Within the context of these critical accounting policies, we are not currently aware of any reasonably likely events or circumstances that would result in materially different amounts being reported.
RESULTS OF OPERATIONS
Operating results for the fiscal years ended March 31, 2015, 2014 and 2013 were as follows:
(in thousands) March 31, 2015 March 31, 2014 March 31, 2013
Investment incomeInterest $ 388,612 $ 336,658 $ 296,205Dividends 32,533 31,835 19,060Other 12,486 12,853 16,729
Total investment income $ 433,631 $ 381,346 $ 331,994
ExpensesBase management fees and performance-based incentive fees, net ofamounts waived
$ (111,168) $ (97,651) $ (94,076)
Interest and other debt expenses, net of expense reimbursements (79,247) (68,590) (58,200)Administrative services expenses, net of expense reimbursements (5,700) (5,600) (4,389)Other general and administrative expenses (9,543) (8,257) (7,969)
Net expenses (205,658) (180,098) (164,634)Net investment income $ 227,973 $ 201,248 $ 167,360
Realized and unrealized gain (loss) on investments, cash equivalents,derivatives and foreign currencies
Net realized loss $ (13,368) $ (106,507) $ (74,673)Net change in unrealized gain (loss) (139,183) 176,131 11,784
Net realized and unrealized gain (loss) from investments, cashequivalents, derivatives and foreign currencies
(152,551) 69,624 (62,889)
Net increase in net assets resulting from operations $ 75,422 $ 270,872 $ 104,471
Net investment income on per average share basis $ 0.96 $ 0.91 $ 0.83Earnings per share - basic $ 0.32 $ 1.21 $ 0.51Earnings per share - diluted $ 0.32 $ 1.18 $ 0.51
Total Investment Income
The increase in total investment income for the fiscal year 2015 compared to the fiscal year 2014 was primarily due to the increase in interest income. Interest income increased due to an increase in the investment portfolio size, which increased to an average cost of $3.5 billion for the fiscal year 2015 from an average cost of $3.2 billion for the fiscal year 2014. The increase in investment income was also due to increase in prepayment fees and acceleration of original issue discount on repaid investments, which totaled approximately $44.0 million for the fiscal year 2015 as compared to $24.8 million for the fiscal year 2014.
The increase in total investment income for the fiscal year 2014 compared to the fiscal year 2013 was due to a larger investment portfolio and interest and dividend income from our investments in structured products, partially offset by a decline in yield. An additional factor contributing to the increase in investment income was higher income from prepayment fees, which totaled approximately $24.8 million and $7.3 million for the fiscal years 2014 and 2013, respectively.

41
Net Expenses
The increase in expenses for the fiscal year 2015 compared to the fiscal year 2014 was primarily driven by an increase of $10.7 million in interest and other debt related expenses and an increase of $13.5 million in management and performance-based incentive fees, net of amounts waived. Management and performance-based incentive fees increased primarily due to the increase in the size and net investment income earned on the portfolio. Interest and other debt related costs were higher due to a higher average debt balance, which increased to $1.59 billion during the fiscal year 2015 from $1.24 billion during the fiscal year 2014. The total cost of debt for the fiscal year 2015 declined to 4.98% from 5.52% during the fiscal year 2014 primarily as a result of the utilization of our Senior Secured Credit Facility.
The increase in expenses for the fiscal year 2014 compared to fiscal year 2013 was primarily driven by increased interest and other debt expenses of $10.4 million and $3.6 million of incremental management and performance-based incentive fees (net of amount waived). Interest and other debt costs were higher as a result of a larger average debt balance outstanding during the year coupled with higher average interest costs attributed to the 2042 Notes and 2043 Notes, which were issued in October 2012 and June 2013, respectively.
There were no accrued excise tax expenses for the fiscal years ended March 31, 2015, 2014 and 2013.
Net Realized Gains (Losses)
Net realized losses for the fiscal year 2015 were $13.4 million and comprised of $50.3 million of gross realized gains and $63.7 million of gross realized losses. Significant realized gains (losses) for the fiscal year 2015 are summarized below:
(in millions)Net RealizedGain (Loss)
Aventine Renewable Energy Holdings, Inc. $ 11.6Walter Energy Inc. (26.5)Altegrity, Inc.* (17.7)Other (net) 19.2
Total net realized loss $ (13.4)
Net realized losses for the fiscal year 2014 were $106.5 million and comprised of $165.4 million of gross realized losses and $58.9 million of gross realized gains. Significant realized gains (losses) for the fiscal year 2014 are summarized below:
(in millions)Net RealizedGain (Loss)
Penton Business Media Holdings, LLC* $ 11.5ATI Acquisition Company* (54.4)Cengage Learning Acquisitions, Inc.* (44.6)Texas Competitive Electric Holdings * (13.5)Altegrity, Inc. (10.2)Other (net) 4.7
Total net realized loss $ (106.5)
Net realized losses for the fiscal year 2013 were $74.7 million and comprised of $103.0 million of gross realized losses and $28.3 million of gross realized gains. Significant realized gains (losses) for the fiscal year 2013 are summarized below:
(in millions)Net RealizedGain (Loss)
New Omaha Holdings Co-Invest LP $ (42.8)Cengage Learning Acquisitions, Inc. (24.0)RBS Holdings Company, LLC (10.8)Other (net) 2.9
Total net realized loss $ (74.7)
*The realized gains (losses) incurred upon the exit of these investments reversed out previously reported unrealized gains (losses).

42
Net Change in Unrealized Gain (Loss)
Net change in unrealized losses for the fiscal year 2015 was $139.2 million and was comprised of $137.1 million of gross unrealized gains and $276.3 million of gross unrealized losses. Significant unrealized gains (losses) for the fiscal year 2015 are summarized below:
(in millions)
Net Change inUnrealized
Loss
Generation Brands Holdings, Inc. (Quality Homes) $ 30.0Altegrity, Inc.* 16.6Asset Repackaging Trust Six B.V. 11.7Merx Aviation Finance, LLC 11.2Venoco, Inc. (Denver Parent) (35.0)LVI Group Investments, LLC (26.9)Magnetation LLC (22.1)Molycorp, Inc. (20.4)Delta Educational Systems, Inc. (Gryphon Colleges Corp.) (14.1)SquareTwo (CA Holdings, Collect America, Ltd.) (11.2)First Data Corp. (11.2)Aveta, Inc. (11.0)PetroBakken Energy Ltd. (10.4)Other (net) (46.4)
Total net change in unrealized loss $ (139.2)
Net change in unrealized gains for the fiscal year 2014 was $176.1 million and was comprised of $276.4 million of gross unrealized gains and $100.3 million of gross unrealized losses. Significant unrealized gains (losses) for the fiscal year 2014 are summarized below:
(in millions)
Net Change inUnrealized
Gain
ATI Acquisition Company* $ 53.9Cengage Learning Acquisitions Inc. * 44.3PlayPower Holdings Inc. 17.1inVentiv Health, Inc. 12.9Garden Fresh Restaurant Corp. 12.9Texas Competitive Electric Holdings * 12.0BCA Osprey II Limited 10.6Penton Business Media Holdings, LLC * (10.8)Other (net) 23.2
Total net change in unrealized gain $ 176.1
Net change in unrealized gains for the fiscal year 2013 was $11.8 million and was comprised of $205.8 million of gross unrealized gains and $194.0 million of gross unrealized gains. Significant unrealized gains (losses) for the fiscal year 2013 are summarized below:

43
(in millions)
Net Change inUnrealized
Gain
New Omaha Holdings Co-Invest LP (First Data) $ 40.0Ceridian Corp. 16.3Penton Business Media Holdings, LLC 11.1AB Acquisitions UK Topco 2 Limited 10.8Cengage Learning Acquisitions, Inc. (44.3)Delta Educational Systems, Inc. (Gryphon Colleges Corp.) (26.8)Altegrity, Inc. (24.6)PlayPower Holdings, Inc. (24.5)Garden Fresh Restaurant Corp. (22.9)Other (net) 76.7
Total net change in unrealized gain $ 11.8
*The unrealized gains (losses) incurred upon the exit of these investments are reported as realized gains (losses).
Recent Accounting PronouncementsSee note 2 within the Notes to the Financial Statements.
LIQUIDITY AND CAPITAL RESOURCES
The Company’s liquidity and capital resources are generated and generally available through periodic follow-on equity and debt offerings, our senior secured, multi-currency Senior Secured Facility (as defined in note 9 within the Notes to Financial Statements), our senior secured notes, our senior unsecured notes, investments in special purpose entities in which we hold and finance particular investments on a non-recourse basis, as well as from cash flows from operations, investment sales of liquid assets and repayments of senior and subordinated loans and income earned from investments.
DebtAt March 31, 2015 the Company had $385 million in borrowings outstanding on its Senior Secured Facility and $860 million of unused capacity(1). As of March 31, 2015, aggregate lender commitments under the Senior Secured Facility totaled $1.27 billion. The Senior Secured Facility allows the Company to seek additional commitments in the future up to an aggregate facility size not to exceed $1.71 billion. See note 9 and note 10 within the Notes to Financial Statements for information on the Company's debt and public offerings.
The Company's debt maturities by period are summarized below.
Payments due by Period as of March 31, 2015 (dollars in millions)
TotalLess than
1 year 1-3 years 3-5 yearsMore than
5 years
Senior Secured Facility(1) $ 385 $ — $ — $ 385 $ —Senior Secured Notes $ 225 $ 225 $ — $ — $ —Senior Secured Notes (Series A) $ 29 $ — $ 29 $ — $ —Senior Secured Notes (Series B) $ 16 $ — $ — $ 16 $ —2042 Notes $ 150 $ — $ — $ — $ 1502043 Notes $ 150 $ — $ — $ — $ 1502025 Notes $ 344 $ — $ — $ — $ 344Convertible Notes $ 200 $ 200 $ — $ — $ —
_________________________(1) At March 31, 2015, there was $25 million of letters of credit issued under the Senior Secured Facility that are not recorded
as liabilities on the Company's Statement of Assets and Liabilities, and the Company had $860 million of unused capacity under its Senior Secured Facility.
On April 24, 2015, the Company amended and restated the Senior Secured Facility. The amendment increased the lenders’ commitments to $1,310,000, extended the final maturity date to April 24, 2020, and allows the Company to seek additional commitments from new and existing lenders in the future, up to an aggregate facility size not to exceed $1,965,000. In addition,

44
the stated interest rate on the facility was changed from LIBOR plus 2.00% to a formula-based calculation, based on a minimum borrowing base, resulting in a stated interest rate of either LIBOR plus 1.75%, or LIBOR plus 2.00%. As of May 19, 2015, the stated interest rate on the facility is LIBOR plus 2.00%. Commencing April 30, 2019, the Company is required to repay, in twelve consecutive monthly installments of equal size, the outstanding amount under the Senior Secured Facility as of April 24, 2019.
PIK Interest and Dividends
The Company also has investments in its portfolio that contain PIK provisions. PIK investments offer issuers the option at each payment date of making payments in cash or in additional securities. When additional securities are received, they typically have the same terms, including maturity dates and interest rates, as the original securities issued. On these payment dates, the Company capitalizes the accrued interest or dividends receivable (reflecting such amounts as the basis in the additional securities received). PIK generally becomes due at maturity of the investment or upon the investment being called by the issuer. In order to maintain the Company’s status as a RIC, this non-cash source of income must be paid out to stockholders annually in the form of dividends, even though the Company has not yet collected the cash. For the fiscal year ended March 31, 2015, PIK income totaled $34.1 million, on total investment income of $433.6 million. See note 5 within the Notes to the Financial Statements for more information on the Company’s PIK interest and dividends.
Cash Equivalents
We deem certain U.S. Treasury bills, repurchase agreements and other high-quality, short-term debt securities as cash equivalents. (See note 2 within the accompanying financial statements.) At the end of each fiscal quarter, we consider taking proactive steps utilizing cash equivalents with the objective of enhancing our investment flexibility during the following quarter, pursuant to Section 55 of the 1940 Act. More specifically, we may purchase U.S. Treasury bills from time-to-time on the last business day of the quarter and typically close out that position on the following business day, settling the sale transaction on a net cash basis with the purchase, subsequent to quarter end. Apollo Investment may also utilize repurchase agreements or other balance sheet transactions, including drawing down on our Senior Secured Facility, as we deem appropriate. The amount of these transactions or such drawn cash for this purpose is excluded from total assets for purposes of computing the asset base upon which the management fee is determined. There were no cash equivalents held as of March 31, 2015.
Related Party Transactions
See note 3 within the Notes to the Financial Statements for information on the Company’s related party transactions.
Dividends
Dividends paid to stockholders for the fiscal years ended March 31, 2015, 2014 and 2013 totaled $189 million or $0.80 per share, $182 million or $0.80 per share, and $162 million or $0.80 per share, respectively. Tax characteristics of all dividends will be reported to stockholders on Form 1099 after the end of the calendar year. Our quarterly dividends, if any, will be determined by our Board of Directors.

45
The following table summarizes our quarterly dividends paid to stockholders for the fiscal years ended March 31, 2015, 2014 and 2013, respectively:
DeclaredDividends per
Share
Fiscal Year Ended March 31, 2015Fourth Fiscal Quarter $ 0.20Third Fiscal Quarter $ 0.20Second Fiscal Quarter $ 0.20First Fiscal Quarter $ 0.20
Fiscal Year Ended March 31, 2014Fourth Fiscal Quarter $ 0.20Third Fiscal Quarter $ 0.20Second Fiscal Quarter $ 0.20First Fiscal Quarter $ 0.20
Fiscal Year Ended March 31, 2013Fourth Fiscal Quarter $ 0.20Third Fiscal Quarter $ 0.20Second Fiscal Quarter $ 0.20First Fiscal Quarter $ 0.20
We have elected to be taxed as a RIC under Subchapter M of the Code. To maintain our RIC status, we must distribute at least 90% of our ordinary income and realized net short-term capital gains in excess of realized net long-term capital losses, if any, out of the assets legally available for distribution. In addition, although we currently intend to distribute realized net capital gains (i.e., net long-term capital gains in excess of short-term capital losses), if any, at least annually, out of the assets legally available for such distributions, we may in the future decide to retain such capital gains for investment.
We maintain an “opt out” dividend reinvestment plan for our common stockholders. As a result, if we declare a dividend, then stockholders’ cash dividends will be automatically reinvested in additional shares of our common stock, unless they specifically “opt out” of the dividend reinvestment plan so as to receive cash dividends.
We may not be able to achieve operating results that will allow us to make distributions at a specific level or to increase the amount of these distributions from time to time. In addition, due to the asset coverage test applicable to us as a business development company, we may in the future be limited in our ability to make distributions. Also, our Senior Secured Facility may limit our ability to declare dividends if we default under certain provisions or fail to satisfy certain other conditions. If we do not distribute a certain percentage of our income annually, we may suffer adverse tax consequences, including possible loss of the tax benefits available to us as a regulated investment company. In addition, in accordance with U.S. generally accepted accounting principles and tax regulations, we include in income certain amounts that we have not yet received in cash, such as contractual payment-in-kind interest, which represents contractual interest added to the loan balance that becomes due at the end of the loan term, or the accrual of original issue or market discount. Since we may recognize income before or without receiving cash representing such income, we may not be able to meet the requirement to distribute at least 90% of our investment company taxable income to obtain tax benefits as a regulated investment company.
With respect to the dividends to stockholders, income from origination, structuring, closing, commitment and other upfront fees associated with investments in portfolio companies is treated as taxable income and accordingly, distributed to stockholders.
Recent Events
On May 18, 2015, the Board of Directors declared a dividend of $0.20 per share for the fourth fiscal quarter of 2015, payable on July 6, 2015 to stockholders of record as of June 19, 2015.

46
Item 7A. Quantitative and Qualitative Disclosure about Market Risk
We are subject to financial market risks, including changes in interest rates. During the fiscal year ended March 31, 2015, many of the loans in our portfolio had floating interest rates. These loans are usually based on floating LIBOR and typically have durations of one to six months after which they reset to current market interest rates. The Company also has a Senior Secured Facility that is based on floating LIBOR rates.
The following table shows the approximate annual impact on net investment income of base rate changes in interest rates (considering interest rate floors for variable rate instruments) to our loan portfolio and outstanding debt as of March 31, 2015, assuming no changes in our investment and borrowing structure:
(in thousands except per share data)Basis Point Change
Net InvestmentIncome
Net InvestmentIncome per Share
Up 400 basis points $ 22,015 $ 0.093Up 300 basis points $ 13,541 $ 0.057Up 200 basis points $ 5,691 $ 0.024Up 100 basis points $ (986) $ (0.004)
We may hedge against interest rate fluctuations from time-to-time by using standard hedging instruments such as futures, options and forward contracts subject to the requirements of the 1940 Act and applicable commodities laws. While hedging activities may insulate us against adverse changes in interest rates, they may also limit our ability to participate in the benefits of lower interest rates with respect to our portfolio of investments.
47
Item 8. Financial Statements and Supplementary Data
Index to Financial Statements
Management’s Report on Internal Control over Financial Reporting
Report of Independent Registered Public Accounting Firm
Statements of Assets & Liabilities as of March 31, 2015 and March 31, 2014
Statements of Operations for the years ended March 31, 2015, March 31, 2014 and March 31, 2013
Statements of Changes in Net Assets for the years ended March 31, 2015, March 31, 2014 and March 31, 2013
Statements of Cash Flows for the years ended March 31, 2015, March 31, 2014 and March 31, 2013
Schedule of Investments as of March 31, 2015 and March 31, 2014
Notes to Financial Statements
48
49
50
51
53
54
55
81

48
MANAGEMENT’S REPORT ON INTERNAL CONTROL OVER FINANCIAL REPORTING
Management is responsible for establishing and maintaining adequate internal control over financial reporting, and for performing an assessment of the effectiveness of internal control over financial reporting as of March 31, 2015. Internal control over financial reporting is a process designed to provide reasonable assurance regarding the reliability of financial reporting and the preparation of financial statements for external purposes in accordance with generally accepted accounting principles. The Company’s internal control over financial reporting includes those policies and procedures that (i) pertain to assets of the Company; (ii) provide reasonable assurance that transactions are recorded as necessary to permit preparation of financial statements in accordance with generally accepted accounting principles, and that receipts and expenditures of the Company are being made only in accordance with authorizations of management and directors of the Company; and (iii) provide reasonable assurance regarding prevention or timely detection of unauthorized acquisition, use, or disposition of the Company’s assets that could have a material effect on the financial statements.
Management performed an assessment of the effectiveness of the Company’s internal control over financial reporting as of March 31, 2015 based upon criteria in Internal Control — Integrated Framework (2013 framework) issued by the Committee of Sponsoring Organizations of the Treadway Commission (“COSO”). Based on our assessment, management determined that the Company’s internal control over financial reporting was effective as of March 31, 2015 based on the criteria on Internal Control — Integrated Framework issued by COSO.
The effectiveness of the Company’s internal control over financial reporting as of March 31, 2015 has been audited by PricewaterhouseCoopers LLP, an independent registered public accounting firm, as stated in their report which appears herein.

49
Report of Independent Registered Public Accounting Firm
To the Board of Directors and Stockholders ofApollo Investment Corporation:
In our opinion, the accompanying statements of assets and liabilities, including the schedules of investments, and the related statements of operations, changes in net assets and cash flows present fairly, in all material respects, the financial position of Apollo Investment Corporation (“the Company”) at March 31, 2015 and March 31, 2014, and the results of its operations, the changes in net assets, and its cash flows for each of the three years in the period ended March 31, 2015 in conformity with accounting principles generally accepted in the United States of America. Also in our opinion, the Company maintained, in all material respects, effective internal control over financial reporting as of March 31, 2015, based on criteria established in Internal Control - Integrated Framework (2013) issued by the Committee of Sponsoring Organizations of the Treadway Commission (COSO). The Company's management is responsible for these financial statements, for maintaining effective internal control over financial reporting and for its assessment of the effectiveness of internal control over financial reporting, included in Management’s Report on Internal Control over Financial Reporting appearing on page 48 of the annual report to stockholders. Our responsibility is to express opinions on these financial statements and on the Company's internal control over financial reporting based on our integrated audits. We conducted our audits in accordance with the standards of the Public Company Accounting Oversight Board (United States). Those standards require that we plan and perform the audits to obtain reasonable assurance about whether the financial statements are free of material misstatement and whether effective internal control over financial reporting was maintained in all material respects. Our audits of the financial statements included examining, on a test basis, evidence supporting the amounts and disclosures in the financial statements, assessing the accounting principles used and significant estimates made by management, and evaluating the overall financial statement presentation. Our audit of internal control over financial reporting included obtaining an understanding of internal control over financial reporting, assessing the risk that a material weakness exists, and testing and evaluating the design and operating effectiveness of internal control based on the assessed risk. Our audits also included performing such other procedures as we considered necessary in the circumstances. Our procedures included confirmation of securities at March 31, 2015 by correspondence with the custodians, and where replies were not received, we performed other auditing procedures. We believe that our audits provide a reasonable basis for our opinions.
A company’s internal control over financial reporting is a process designed to provide reasonable assurance regarding the reliability of financial reporting and the preparation of financial statements for external purposes in accordance with generally accepted accounting principles. A company’s internal control over financial reporting includes those policies and procedures that (i) pertain to the maintenance of records that, in reasonable detail, accurately and fairly reflect the transactions and dispositions of the assets of the company; (ii) provide reasonable assurance that transactions are recorded as necessary to permit preparation of financial statements in accordance with generally accepted accounting principles, and that receipts and expenditures of the company are being made only in accordance with authorizations of management and directors of the company; and (iii) provide reasonable assurance regarding prevention or timely detection of unauthorized acquisition, use, or disposition of the company’s assets that could have a material effect on the financial statements.
Because of its inherent limitations, internal control over financial reporting may not prevent or detect misstatements. Also, projections of any evaluation of effectiveness to future periods are subject to the risk that controls may become inadequate because of changes in conditions, or that the degree of compliance with the policies or procedures may deteriorate.
/s/ PricewaterhouseCoopers LLPNew York, New YorkMay 19, 2015

See notes to financial statements.50
APOLLO INVESTMENT CORPORATIONSTATEMENTS OF ASSETS AND LIABILITIES
(in thousands, except per share amounts)
March 31, 2015 March 31, 2014
AssetsNon-controlled/non-affiliated investments, at fair value (cost — $2,514,328 and $2,714,971,respectively) $ 2,357,042 $ 2,751,896Non-controlled/affiliated investments, at fair value (cost — $231,594 and $153,721,respectively) 262,047 144,628Controlled investments, at fair value (cost — $740,653 and $590,060, respectively) 730,738 582,147
Total investments (cost — $3,486,575 and $3,458,752, respectively) 3,349,827 3,478,671Cash 3,766 13,413Foreign currency (cost — $4,856 and $1,305, respectively) 4,651 1,323Receivable for investments sold 114,884 72,918Interest receivable 43,312 40,106Dividends receivable 5,425 3,627Deferred financing costs 29,743 31,601Prepaid expenses and other assets 9,283 292
Total assets $ 3,560,891 $ 3,641,951LiabilitiesDebt (see note 8 & 9) $ 1,498,759 $ 1,372,261Payable for investments purchased 10,736 119,577Dividends payable 47,348 47,348Management and performance-based incentive fees payable (see note 3) 37,361 31,108Interest payable 15,851 14,318Accrued administrative expenses 2,000 1,915Other liabilities and accrued expenses 11,228 3,813
Total liabilities $ 1,623,283 $ 1,590,340Commitments and contingencies (see note 13)
Net AssetsCommon stock, par value $.001 per share, 400,000,000 and 400,000,000 common sharesauthorized, respectively, 236,741,351 and 236,741,351 issued and outstanding, respectively $ 237 $ 237Paid-in capital in excess of par (see note 11) 3,197,715 3,221,829Over-distributed net investment income (see note 11) (35,589) (53,995)Accumulated net realized loss (see note 11) (1,102,517) (1,133,405)Net unrealized gain (loss) (122,238) 16,945
Total net assets $ 1,937,608 $ 2,051,611Total liabilities and net assets $ 3,560,891 $ 3,641,951
Net asset value per share $ 8.18 $ 8.67

See notes to financial statements.51
APOLLO INVESTMENT CORPORATIONSTATEMENTS OF OPERATIONS
(in thousands, except per share amounts)Year Ended March 31,
2015 2014 2013
INVESTMENT INCOME:From non-controlled/non-affiliated investments:
Interest $ 345,887 $ 310,031 $ 286,253Dividends 5,298 7,149 4,813Other income 11,899 12,012 16,532
From non-controlled/affiliated investments:Interest 3,744 3,252 1,020Dividends 18,014 19,765 6,825Other income 87 — —
From controlled investments:Interest 38,981 23,375 8,932Dividends 9,221 4,921 7,422Other income 500 841 197
Total investment income $ 433,631 $ 381,346 $ 331,994EXPENSES:
Management fees (see note 3) $ 73,604 $ 62,819 $ 55,717Performance-based incentive fees (see note 3) 53,179 46,924 41,144Interest and other debt expenses 79,329 68,639 58,200Administrative services expense 5,850 5,600 4,389Other general and administrative expenses 9,543 8,257 7,969
Total expenses 221,505 192,239 167,419Management and performance-based incentive fees waived (see note3) $ (15,615) $ (12,092) $ (2,785)Expense reimbursements (see note 3) (232) (49) —
Net expenses $ 205,658 $ 180,098 $ 164,634Net investment income $ 227,973 $ 201,248 $ 167,360
REALIZED AND UNREALIZED GAIN (LOSS) ONINVESTMENTS, CASH EQUIVALENTS, FOREIGN CURRENCIESAND DERIVATIVES:
Net realized gain (loss):Investments and cash equivalents
Non-controlled/non-affiliated investments $ (27,451) $ (118,745) $ (78,659)Non-controlled/affiliated investments 11,300 2,078 —Controlled investments — (969) 3,015
Foreign currency transactions 2,783 2,588 971Derivatives — 8,541 —
Net realized loss $ (13,368) $ (106,507) $ (74,673)Net change in unrealized gain (loss):
Investments and cash equivalentsNon-controlled/non-affiliated investments $ (191,645) $ 163,972 $ 24,884Non-controlled/affiliated investments 22,867 (2,115) (6,977)Controlled investments 12,111 26,840 (12,303)

See notes to financial statements.52
APOLLO INVESTMENT CORPORATIONSTATEMENTS OF OPERATIONS (continued)
(in thousands, except per share amounts)Year Ended March 31,
2015 2014 2013
Foreign currency translations 17,484 (12,566) 6,180Net change in unrealized gain (loss) $ (139,183) $ 176,131 $ 11,784
Net realized and unrealized gain (loss) from investments, cashequivalents, foreign currencies and derivatives (152,551) 69,624 (62,889)
NET INCREASE IN NET ASSETS RESULTING FROMOPERATIONS $ 75,422 $ 270,872 $ 104,471EARNINGS PER SHARE — BASIC (see note 4) $ 0.32 $ 1.21 $ 0.51EARNINGS PER SHARE — DILUTED (see note 4) $ 0.32 $ 1.18 $ 0.51

See notes to financial statements.53
APOLLO INVESTMENT CORPORATIONSTATEMENTS OF CHANGES IN NET ASSETS
(in thousands, except shares)
Year Ended March 31,2015 2014 2013
Increase (decrease) in net assets from operations:Net investment income $ 227,973 $ 201,248 $ 167,360Net realized loss (13,368) (106,507) (74,673)Net change in unrealized gain (loss) (139,183) 176,131 11,784
Net increase in net assets resulting from operations 75,422 270,872 104,471
Dividends and distributions to stockholders (see note 11):Distribution of income (165,626) (182,193) (159,629)Distribution of return of capital (23,767) — (2,684)
Total dividends and distributions to stockholders (189,393) (182,193) (162,313)
Capital share transactions (see note 10):Net proceeds from shares sold — 286,553 50,000Less offering costs (32) (1,010) —Reinvestment of dividends — — —
Net increase in net assets from capital share transactions (32) 285,543 50,000
Total increase (decrease) in net assets: (114,003) 374,222 (7,842)Net assets at beginning of year 2,051,611 1,677,389 1,685,231Net assets at end of year $ 1,937,608 $ 2,051,611 $ 1,677,389
Capital share activityShares sold — 33,850,000 5,847,953Shares issued from reinvestment of dividends — — —
Net capital share activity — 33,850,000 5,847,953

See notes to financial statements.54
APOLLO INVESTMENT CORPORATIONSTATEMENTS OF CASH FLOWS
(in thousands)
Year Ended March 31,2015 2014 2013
CASH FLOWS FROM OPERATING ACTIVITIES:Net increase in net assets resulting from operations $ 75,422 $ 270,872 $ 104,471Adjustments to reconcile net increase (decrease):
PIK interest and dividends (see note 5) (31,036) (28,884) (17,891)Net amortization on investments (11,409) (34,366) (25,579)Accretion of discount on notes 85 — —Amortization of deferred financing costs 6,676 7,168 8,889Increase from foreign currency transactions and translation 1,797 3,240 769Net change in unrealized (gain) loss on investments, cashequivalents and foreign currencies 139,183 (176,131) (11,784)Net realized loss on investments, cash equivalents, foreigncurrencies and derivatives 13,368 106,507 74,673
Changes in operating assets and liabilities:Purchase of investments and cash equivalents (2,319,922) (2,722,593) (1,511,345)Proceeds from derivatives — 8,541 —Proceeds from disposition of investments and cash equivalents 2,167,586 2,254,984 1,351,320Decrease (increase) in interest receivable (3,206) 11,884 2,419Decrease (increase) in dividends receivable (1,798) (924) 195Decrease in prepaid expenses and other assets (8,991) 28 963Decrease (increase) in deferred financing costs (1,020) — —Increase in management and performance-based incentive feespayable 6,253 4,599 2,107Increase in interest payable 1,533 2,306 1,910Increase (decrease) in accrued administrative expenses 85 (304) (1,201)Increase in other liabilities and accrued expenses 7,415 296 155
Net cash provided by (used in) operating activities $ 42,021 $ (292,777) $ (19,929)CASH FLOWS FROM FINANCING ACTIVITIES:
Net proceeds from the issuance of common stock $ — $ 286,553 $ 50,000Offering costs for the issuance of common stock (32) (1,010) —Dividends paid in cash (189,393) (175,423) (161,144)Proceeds from debt 3,176,136 2,537,088 1,374,940Payments on debt (3,031,030) (2,334,130) (1,221,780)Deferred financing costs paid (3,798) (11,778) (18,570)
Net cash provided by (used in) financing activities $ (48,117) $ 301,300 $ 23,446NET INCREASE (DECREASE) IN CASH AND CASHEQUIVALENTS $ (6,096) $ 8,523 $ 3,517
Effect of exchange rates on cash balances (223) 16 2CASH AND CASH EQUIVALENTS, BEGINNING OF YEAR $ 14,736 $ 6,197 $ 2,678CASH AND CASH EQUIVALENTS, END OF YEAR $ 8,417 $ 14,736 $ 6,197SUPPLEMENTAL DISCLOSURE OF CASH FLOW INFORMATION
Cash interest paid during the year $ 69,098 $ 56,584 $ 44,757PIK income (see note 5) $ 34,092 $ 28,974 $ 20,292Non-cash re-organizations/restructuring of investments* $ 165,410 $ 238,457 $ —
*Includes non-cash transfers not included in purchase or proceeds of investments and cash equivalents.

See notes to financial statements.55
APOLLO INVESTMENT CORPORATIONSCHEDULE OF INVESTMENTS
March 31, 2015 (in thousands)
INVESTMENTS IN NON-CONTROLLED/NON-AFFILIATED INVESTMENTS—121.6% (10) Interest Rate
MaturityDate Industry
Par Amount(12) Cost
FairValue (1)
CORPORATE DEBT—109.5%SECURED DEBT—85.0%1st Lien Secured Debt—41.7% Alion Science & Technology
Corporation 11.000% (L+1000,
1.00% Floor)8/16/19 Aerospace and
Defense$ 32,003 $ 31,038 $ 31,843
Archroma (17) 9.500% (L+825, 1.25%Floor)
10/1/18 Chemicals 40,128 39,795 40,354
Aventine Renewable EnergyHoldings, Inc.
15.00% PIK or 10.50%Cash
9/22/17 Chemicals 15,742 18,031 14,601
Aveta, Inc. 9.750% (L+825, 1.50%Floor)
12/12/17 Healthcare 53,296 52,331 43,169
Caza Petroleum, Inc. 12.000% (L+1000,2.00% Floor)
5/23/17 Oil and Gas 45,000 43,992 42,660
ChyronHego Corp. 9.000% (L+800, 1.00%Floor)
3/9/20 Business Services 25,000 24,505 24,500
CITGO Holding, Inc. (11) 10.750% 2/15/20 Energy 25,000 23,792 25,781
CITGO Holding, Inc. 9.50% (L+850, 1.00%Floor)
5/12/18 Energy 19,435 18,306 19,344
Deep Gulf Energy II, LLC 14.000% (14.00% or L+1250, 1.50% Floor)
3/31/17 Oil and Gas 35,000 35,000 33,530
Delta Educational Systems, Inc. 16.00% (8.00% Cash /8.00% PIK)
12/11/16 Education 5,892 5,892 5,892
Dodge Data & Analytics LLC 9.750% (L+875, 1.00%Floor)
10/31/19 Printing andPublishing
60,349 59,223 58,689
Extraction Oil & Gas Holdings, LLC 10.00% & 11.00% 5/29/19 Oil and Gas 52,633 51,932 51,843
Great Bear Petroleum Operating,LLC
12.000% 10/1/17 Oil and Gas 5,064 5,064 5,064
Hunt Companies, Inc. (11) 9.625% 3/1/21 Buildings and RealEstate
21,008 20,776 21,586
Magnetation, LLC (11) 11.000% 5/15/18 Mining 38,454 39,878 19,804
Maxus Capital Carbon SPE I, LLC(Skyonic Corp.)
13.000% 9/18/19 Chemicals 73,104 73,104 73,104
Molycorp, Inc. (17) 10.000% 6/1/20 Diversified NaturalResources, PreciousMetals and Minerals
42,977 42,699 22,276
My Alarm Center, LLC (16) 8.500% (L+750, 1.00%Floor)
1/9/18 Business Services 42,614 42,614 42,613
My Alarm Center, LLC (16) 8.500% (L+750, 1.00%Floor)
1/9/18 Business Services 12,731 12,731 12,731
Osage Exploration & Development,Inc. (11)(17)
13.000% (L+1100,2.00% Floor)
4/27/16 Oil and Gas 25,000 24,741 23,600
Pelican Energy, LLC (17) 10.00% (7.00% Cash /3.00% PIK)
12/31/18 Oil and Gas 26,957 26,057 25,340
Saba Software, Inc. 12.417% (L+1142,1.00% Floor)
3/26/21 Business Services 10,000 10,000 9,850
SCM Insurance Services, Inc. (17) 9.250% 8/22/19 Business Services CAD 30,000 27,135 23,569 Spotted Hawk Development, LLC 13.00% (12.00% Cash /
1.00% PIK)9/12/16 Oil and Gas $ 80,900 79,911 78,878
Sunrun Solar Owner IX, LLC 9.079% 12/31/24 Energy 3,424 3,284 3,527
Telestream Holdings Corporation 10.254% (L+925,1.00% Floor)
1/15/20 Business Services 32,500 32,500 31,769
UniTek Global Services Inc. (16) 9.500% (L+750, 1.00%PIK, 1.00% Floor)
1/13/19 Telecommunications 21,442 21,442 21,442
Total 1st Lien Secured Debt excluding Revolvers and Letters of Credit $ 865,773 $ 807,359

See notes to financial statements.56
APOLLO INVESTMENT CORPORATIONSCHEDULE OF INVESTMENTS (continued)
March 31, 2015(in thousands, except shares)
INVESTMENTS IN NON-CONTROLLED/NON-AFFILIATED INVESTMENTS—121.6% (10) Interest Rate
MaturityDate Industry
Par Amount(12) Cost
FairValue (1)
Funded and Unfunded Revolver Obligations—-1.7% Avaya, Inc., (Revolver) (16) 2.92% (L+275, 0.17%
Floor) / 5.00% (P+175,3.25% Floor) Funded
10/26/16 Telecommunications $ 16,553 $ 16,553 $ 15,436
Avaya, Inc., (Unfunded Revolver) (8)(16)
0.50% Unfunded 10/26/16 Telecommunications 10,431 (3,181) (704)
BMC Software, Inc., (UnfundedRevolver) (8)
0.50% Unfunded 9/10/18 Business Services 20,760 (1,857) (1,868)
CIT Group, Inc., (UnfundedRevolver) (8)(17)
L+275 1/27/17 Financial Services 25,000 (107) (1,250)
Confie Seguros Holding II Co.,(Revolver) (16)
4.67% (L+450, 0.17%Floor) / 6.75% (P+350,3.25% Floor) Funded
12/10/18 Insurance 2,190 2,190 1,949
Confie Seguros Holding II Co.,(Unfunded Revolver) (8)(16)
0.50% Unfunded 12/10/18 Insurance 1,625 (340) (179)
Laureate Education Inc., (Revolver)(16)(17)
5.000% (L+375, 1.25%Floor) Funded
6/16/16 Education 23,566 23,566 21,445
Laureate Education, Inc., (UnfundedRevolver) (8)(16)(17)
0.625% Unfunded 6/16/16 Education 5,212 (1,833) (469)
Salix Pharmaceuticals, Ltd.,(Unfunded Revolver) (16)(17)
0.50% Unfunded 1/2/19 Healthcare 24,867 (1,519) —
Tibco Software Inc., (UnfundedRevolver) (8)
0.50% Unfunded 12/5/19 Business Services 6,000 (56) (30)
Transfirst Holdings, Inc., (UnfundedRevolver) (8)(16)
0.50% Unfunded 11/12/19 Financial Services 2,943 (14) (88)
UniTek Global Services, Inc.,(Unfunded Revolver) (16)
0.50% Unfunded 1/13/19 Telecommunications 5,000 241 —
Walter Energy, Inc., (UnfundedRevolver) (8)(16)(17)
0.625% Unfunded 10/1/17 Mining 275 (176) (48)
Total Funded and Unfunded Revolver Obligations $ 33,467 $ 34,194
Letters of Credit—(0.0)% Avaya, Inc., Letter of Credit (8)(9)
(16)2.750% 10/30/15-
4/6/16Telecommunications $ 9,800 $ — $ (662)
Confie Seguros Holding II Co.,Letter of Credit (8)(16)
4.500% 10/27/15 Insurance 600 — (66)
Confie Seguros Holding II Co.,Letter of Credit (8)(16)
4.500% 1/13/16 Insurance 85 — (9)
Laureate Education Inc., Letter ofCredit (8)(16)(17)
3.750% 6/16/16 Education 101 — (9)
Salix Pharmaceuticals, Ltd., Letter ofCredit (16)(17)
3.000% 2/10/16 Healthcare 8 — —
Salix Pharmaceuticals, Ltd., Letter ofCredit (16)(17)
3.000% 2/10/16 Healthcare 125 — —
Transfirst Holdings, Inc., Letter ofCredit (8)(16)
4.500% 11/12/19 Financial Services 57 — (2)
UniTek Global Services Inc., Letterof Credit (16)
7.500% 1/13/19 Telecommunications 17,946 — —
UniTek Global Services Inc., Letterof Credit (16)
7.500% 1/13/19 Telecommunications 1,850 — —
Walter Energy, Inc., Letter of Credit(8)(9)(16)(17)
5.500% 9/18/15-7/4/16
Mining 86 — (15)
Walter Energy, Inc., Letter of Credit(8)(9)(16)(17)
5.500% 8/31/15-11/28/15
Mining CAD 192 — (27)
Total Letters of Credit $ — $ (790)
Total 1st Lien Secured Debt $ 899,240 $ 840,763

See notes to financial statements.57
APOLLO INVESTMENT CORPORATIONSCHEDULE OF INVESTMENTS (continued)
March 31, 2015(in thousands, except shares)
INVESTMENTS IN NON-CONTROLLED/NON-AFFILIATED INVESTMENTS—121.6% (10) Interest Rate
MaturityDate Industry
Par Amount(12) Cost
FairValue (1)
2nd Lien Secured Debt—41.6%Access CIG, LLC 9.750% (L+875, 1.00%
Floor)10/17/22 Business Services $ 25,600 $ 24,103 $ 24,192
Active Network, Inc. 9.500% (L+850, 1.00%Floor)
11/15/21 Business Services 19,672 19,586 19,082
Appriss Holdings, Inc. 9.250% (L+825, 1.00%Floor)
5/21/21 Business Services 25,000 24,641 25,000
Armor Holdings, Inc. (AmericanStock Transfer and TrustCompany)
10.250% (L+900,1.25% Floor)
12/26/20 Financial Services 8,000 7,867 7,760
Asurion Corporation 8.500% (L+750, 1.00%Floor)
3/3/21 Insurance 40,622 40,163 40,876
Confie Seguros Holding II Co. 10.250% (L+900,1.25% Floor)
5/8/19 Insurance 28,844 28,691 28,844
Consolidated Precision ProductsCorp.
8.750% (L+775, 1.00%Floor)
4/30/21 Aerospace andDefense
1,940 1,932 1,930
Deltek, Inc. 10.000% (L+875,1.25% Floor)
10/10/19 Business Services 17,273 17,137 17,424
Elements Behavioral Health, Inc. 9.750% (L+875, 1.00%Floor)
2/11/20 Healthcare 9,500 9,420 9,434
Garden Fresh Restaurant Corp. (16) 7.750% (L+625 PIK,1.50% Floor)
1/1/19 Restaurants 8,250 6,522 5,775
Garden Fresh Restaurant Corp. (16) 15.000% (L+1350 PIK,1.50% Floor)
1/1/19 Restaurants 39,921 38,064 35,529
GCA Services Group, Inc. 9.250% (L+800, 1.25%Floor)
11/1/20 Diversified Service 17,838 17,961 17,882
Grocery Outlet, Inc. 9.250% (L+825, 1.00%Floor)
10/21/22 Grocery 28,000 27,592 27,580
GTCR Valor Companies, Inc. 9.500% (L+850, 1.00%Floor)
11/30/21 Business Services 35,000 34,666 33,775
Institutional Shareholder Services,Inc.
8.500% (L+750, 1.00%Floor)
4/30/22 Financial Services 6,640 6,579 6,540
Kronos, Inc. 9.750% (L+850, 1.25%Floor)
4/30/20 Business Services 13,525 13,466 13,931
Miller Energy Resources, Inc. (17) 14.750% (9.750%Cash / 2.000% PIK,
3.00% Floor)
2/3/18 Oil and Gas 88,123 88,123 82,527
MSC Software Corp. (17) 8.500% (L+750, 1.00%Floor)
5/28/21 Business Services 13,448 13,320 13,246
Novolex Holdings, Inc. 9.750% (L+875, 1.00%Floor)
6/5/22 Packaging 42,045 41,013 42,150
Pabst Brewing Company 9.25% (L+825, 1.00%Floor)
11/14/22 Consumer Products 27,000 26,665 27,203
Premier Trailer Leasing, Inc. 10.000% (L+900,1.00% Floor)
9/24/20 Financial Services 52,000 51,029 52,000
River Cree Enterprises LP (11)(17) 11.000% 1/20/21 Hotels, Motels,Inns and Gaming
CAD 33,000 31,111 26,952
SiTV, Inc. (11) 10.375% 7/1/19 Cable Television $ 2,219 2,219 2,003SMG 9.250% (L+825, 1.00%
Floor)2/27/21 Business Services 19,900 19,900 20,000

See notes to financial statements.58
APOLLO INVESTMENT CORPORATIONSCHEDULE OF INVESTMENTS (continued)
March 31, 2015(in thousands, except shares)
INVESTMENTS IN NON-CONTROLLED/NON-AFFILIATED INVESTMENTS—121.6% (10) Interest Rate
MaturityDate Industry
Par Amount(12) Cost
FairValue (1)
2nd Lien Secured Debt—41.6% (continued) Sprint Industrial Holdings, LLC 11.250% (L+1000,
1.25% Floor)11/14/19 Containers,
Packaging, andGlass
14,163 13,959 13,526
SquareTwo Financial Corp. (CollectAmerica, Ltd.) (17)
11.625% 4/1/17 Financial Services 65,152 64,316 58,420
TASC, Inc. 12.000% 5/21/21 Aerospace andDefense
21,815 21,028 23,178
TMK Hawk Parent Corp. 8.500% (L+750, 1.00%Floor)
10/1/22 Distribution 34,000 33,675 34,000
Transfirst Holdings, Inc. 9.000% (L+800, 1.00%Floor)
11/11/22 Financial Services 11,340 11,221 11,404
UniTek Global Services Inc. (16) 8.500% (L+750, 1.00%Floor)
1/13/19 Telecommunications 32,367 32,367 30,748
Velocity Technology Solutions, Inc. 9.000% (L+775, 1.25%Floor)
9/28/20 Business Services 16,500 16,209 16,005
Vertafore, Inc. 9.750% (L+825, 1.50%Floor)
10/27/17 Business Services 36,436 36,295 36,709
Total 2nd Lien Secured Debt $ 820,840 $ 805,625TOTAL SECURED DEBT $1,720,080 $1,646,388
UNSECURED DEBT—24.5% American Energy - Woodford LLC/
AEW Finance Corp. (11)9.000% 9/15/22 Oil and Gas $ 5,000 $ 4,805 $ 2,850
American Tire Distributors, Inc. (11) 10.250% 3/1/22 Distribution 24,281 24,281 25,252 Artsonig Pty Ltd. (11)(17) 11.50% (12.00% PIK
Toggle)4/1/19 Transportation 21,227 20,974 17,830
BCA Osprey II Limited (British CarAuctions) (16)(17)
12.50% PIK 8/17/17 Transportation £ 23,566 37,704 36,033
BCA Osprey II Limited (British CarAuctions) (16)(17)
12.50% PIK 8/17/17 Transportation € 14,333 19,779 15,855
Canacol Energy Ltd. (17) 9.500% (L+850, 1.00%Floor)
12/31/19 Oil and Gas $ 50,000 48,595 47,625
Ceridian Corp. (11) 11.000% 3/15/21 Diversified Service 16,760 16,760 17,430 Delta Educational Systems, Inc. 16.00% PIK or 10.00%
Cash / 6.00% PIK5/12/17 Education 24,172 23,929 21,416
Denver Parent Corp. (Venoco) (13)(14)(16)
12.25% (13.00% PIKToggle)
8/15/18 Oil and Gas 9,572 9,411 1,460
GenCorp, Inc. (17) 9.500% (L+850, 1.00%Floor)
4/18/22 Aerospace andDefense
40,500 40,500 40,500
My Alarm Center, LLC 16.25% (12.00% Cash /4.25 %PIK)
7/9/18 Business Services 4,236 4,236 4,236
PetroBakken Energy Ltd. (11)(17) 8.625% 2/1/20 Oil and Gas 34,980 35,972 25,361
Radio One, Inc. (11)(17) 9.250% 2/15/20 Broadcasting &Entertainment
15,804 15,709 15,160
Sorenson Holdings, LLC (11) 13.00% PIK 10/31/21 Consumer Products 68 45 68
Tibco Software Inc. (11) 11.375% 12/1/21 Business Services 11,389 11,069 11,595
U.S. Security Associates Holdings,Inc.
11.000% 7/28/18 Business Services 135,000 135,000 137,700
UniTek Global Services Inc. 15.000% 7/13/2019 Telecommunications 6,565 6,565 6,565 Univar, Inc. 10.500% 6/30/2018 Distribution 20,000 20,000 19,900 Venoco, Inc. (16) 8.875% 2/15/2019 Oil and Gas 54,996 55,032 28,598
TOTAL UNSECURED DEBT $ 530,366 $ 475,434TOTAL CORPORATE DEBT $2,250,446 $2,121,822

See notes to financial statements.59
APOLLO INVESTMENT CORPORATIONSCHEDULE OF INVESTMENTS (continued)
March 31, 2015(in thousands, except shares)
INVESTMENTS IN NON-CONTROLLED/NON-AFFILIATED INVESTMENTS—121.6% (10) Interest Rate
MaturityDate Industry
Par Amount(12) Cost
FairValue (1)
STRUCTURED PRODUCTS AND OTHER—9.0% Asset Repackaging Trust Six B.V.,
Credit-Linked Note (11)(17)(20)N/A 5/18/2027 Utilities $ 58,411 $ 24,994 $ 36,731
Craft 2013-1, Credit-Linked Note(11)(16)(17)
9.503% (L+925) 4/17/2022 DiversifiedInvestment Vehicle
25,000 25,092 24,282
Craft 2013-1, Credit-Linked Note(16)(17)
9.503% (L+925) 4/17/2022 DiversifiedInvestment Vehicle
7,625 7,753 7,412
Craft 2014-1A, Credit-Linked Note(11)(17)
9.882% (L+965) 5/15/2021 DiversifiedInvestment Vehicle
42,500 42,460 41,898
Dark Castle Holdings, LLC N/A N/A Media 24,395 1,189 2,565
JP Morgan Chase & Co., Credit-Linked Note (17)
12.520% (L+1225) 12/20/2021 DiversifiedInvestment Vehicle
43,250 42,053 42,700
NXT Capital CLO 2014-1, LLC,Class E Notes (11)(17)
5.731% (L+550) 4/23/2026 DiversifiedInvestment Vehicle
5,000 4,670 4,350
Renaissance Umiat, LLC, ACES TaxReceivable (15)(17)
N/A N/A Oil and Gas — 13,014 14,432
TOTAL STRUCTURED PRODUCTS AND OTHER $ 161,225 $ 174,370PREFERRED EQUITY—1.6% Shares CA Holding, Inc. (Collect America,
Ltd.), Series A Preferred Stock(13)(17)
N/A N/A Financial Services 32,961 $ 788 $ 297
Crowley Holdings, Series APreferred Stock (11)
12.00% (10.00% Cash /2.00% PIK)
N/A Cargo Transport 22,500 23,079 23,645
Gryphon Colleges Corp. (DeltaEducational Systems, Inc.),Preferred Stock (Convertible) (13)(14)
12.50% PIK N/A Education 332,500 6,863 —
Gryphon Colleges Corp. (DeltaEducational Systems, Inc.),Preferred Stock (13)(14)
13.50% PIK 5/12/2018 Education 12,360 27,685 1,613
Varietal Distribution Holdings, LLC,Class A Preferred Unit
8.00% PIK N/A Distribution 3,097 5,724 5,655
TOTAL PREFERRED EQUITY $ 64,139 $ 31,210

See notes to financial statements.60
APOLLO INVESTMENT CORPORATIONSCHEDULE OF INVESTMENTS (continued)
March 31, 2015(in thousands, except shares)
INVESTMENTS IN NON-CONTROLLED/NON-AFFILIATED INVESTMENTS—121.6% (10) Interest Rate
MaturityDate Industry
Par Amount(12) Cost
FairValue (1)
EQUITY—1.5%Common Equity/Interests—1.2% Shares ATD Corporation (Accelerate Parent
Corp.), Common Stock (11)N/A N/A Distribution 1,664,046 $ 1,714 $ 2,690
CA Holding, Inc. (Collect America,Ltd.), Series A Common Stock(13)(17)
N/A N/A Financial Services 25,000 2,500 —
CA Holding, Inc. (Collect America,Ltd.), Series AA Common Stock(13)(17)
N/A N/A Financial Services 4,294 429 —
Caza Petroleum, Inc., Net ProfitsInterest (13)
N/A N/A Oil and Gas — 1,202 1,290
Caza Petroleum, Inc., OverridingRoyalty Interest
N/A N/A Oil and Gas — 340 235
Clothesline Holdings, Inc. (AngelicaCorporation), Common Stock (13)
N/A N/A Healthcare 6,000 6,000 519
Explorer Coinvest, LLC (BoozAllen), Common Stock (17)
N/A N/A Business Services 192 1,468 5,162
Garden Fresh Restaurant Holdings,LLC., Common Stock (13)
N/A N/A Restaurants 50,000 5,000 —
Gryphon Colleges Corp. (DeltaEducational Systems, Inc.),Common Stock (13)
N/A N/A Education 17,500 175 —
JV Note Holdco, LLC (DSI Renal,Inc.), Common Equity / Interest(13)
N/A N/A Healthcare 9,303 85 —
Pelican Energy, LLC, Net ProfitsInterest (13)(17)
N/A N/A Oil and Gas — 1,061 272
Skyline Data, News and AnalyticsLLC, Class A Common Unit (13)
N/A N/A Printing andPublishing
4,500 4,500 4,500
Sorenson Holdings, LLC,Membership Interests (13)
N/A N/A Consumer Products 587 — 81
Univar, Inc., Common Stock (13) N/A N/A Distribution 900,000 9,000 9,320 Varietal Distribution Holdings, LLC,
Class A Common Unit (13)N/A N/A Distribution 28,028 28 —
Total Common Equity/Interests $ 33,502 $ 24,069

See notes to financial statements.61
APOLLO INVESTMENT CORPORATIONSCHEDULE OF INVESTMENTS (continued)
March 31, 2015(in thousands, except warrants)
INVESTMENTS IN NON-CONTROLLED/NON-AFFILIATED INVESTMENTS—121.6%(10)
InterestRate
MaturityDate Industry Warrants Cost
FairValue (1)
Warrants—0.3% CA Holding, Inc. (Collect America, Ltd.), Common
Stock Warrants (13)(17)N/A N/A Financial Services
12,255 $ 8 $ — Energy & Exploration Partners, Inc., Common
Stock Warrants (13)N/A N/A Oil and Gas
60,778 2,374 58 Fidji Luxco (BC) S.C.A., Common Stock Warrants
(2)(13)(17)N/A N/A Electronics
18,113 182 3,950 Gryphon Colleges Corp. (Delta Educational
Systems, Inc.), Class A-1 Preferred StockWarrants (13)
N/A N/A Education
45,947 459 — Gryphon Colleges Corp. (Delta Educational
Systems, Inc.), Class B-1 Preferred StockWarrants (13)
N/A N/A Education
104,314 1,043 — Gryphon Colleges Corp. (Delta Educational
Systems, Inc.), Common Stock Warrants (13)N/A N/A Education
9,820 98 — Osage Exploration & Development, Inc., Common
Stock Warrants (13)(17)N/A N/A Oil and Gas
1,496,843 — 222 Spotted Hawk Development, LLC, Common Stock
Warrants (13)N/A N/A Oil and Gas
54,545 852 1,341Total Warrants $ 5,016 $ 5,571
TOTAL EQUITY $ 38,518 $ 29,640Total Non-Controlled/ Non-Affiliated Investments $ 2,514,328 $ 2,357,042

See notes to financial statements.62
APOLLO INVESTMENT CORPORATIONSCHEDULE OF INVESTMENTS (continued)
March 31, 2015(in thousands, except shares)
INVESTMENTS IN NON-CONTROLLED/AFFILIATEDINVESTMENTS—13.5%(4)(10) Interest Rate
MaturityDate Industry
ParAmount
(12) CostFair
Value (1)CORPORATE DEBT—0.0%SECURED DEBT—0.0%1st Lien Secured Debt—0.0% Renewable Funding Group, Inc., (4)
(13)0.00% 9/30/15 Finance $ 1,000 $ 1,000 $ 1,000
Total 1st Lien Secured Debt $ 1,000 $ 1,000TOTAL SECURED DEBT $ 1,000 $ 1,000TOTAL CORPORATE DEBT $ 1,000 $ 1,000
STRUCTURED PRODUCTS AND OTHER—10.3% Golden Bear Warehouse, LLC, Equity
(3)(4)(17)N/A N/A Diversified
Investment Vehicle$ 4,234 $ 4,234 $ 6,833
Golden Hill CLO I, LLC, Equity (3)(4)(17)
N/A N/A DiversifiedInvestment Vehicle
70,944 71,478 73,587
Highbridge Loan Management 3-2014,Ltd., Class E Notes (3)(4)(11)(17)
6.257% (L+600) 1/18/25 DiversifiedInvestment Vehicle
2,485 2,277 2,121
Highbridge Loan Management 3-2014,Ltd., Subordinated Notes (3)(4)(11)(17)
N/A 1/18/25 DiversifiedInvestment Vehicle
8,163 6,537 6,722
Ivy Hill Middle Market Credit FundIX, Ltd, Subordinated Notes (3)(4)(11)(17)
N/A 10/18/25 DiversifiedInvestment Vehicle
12,500 11,375 11,375
Jamestown CLO I LTD, SubordinatedNotes (3)(4)(11)(17)
N/A 11/5/24 DiversifiedInvestment Vehicle
4,325 3,432 3,698
MCF CLO I, LLC, MembershipInterests (3)(4)(11)(17)
N/A 4/20/23 DiversifiedInvestment Vehicle
38,918 35,087 38,490
MCF CLO III, LLC, Class E Notes (3)(4)(11)(17)
4.681% (L+445) 1/20/24 DiversifiedInvestment Vehicle
12,750 11,456 11,220
MCF CLO III, LLC, MembershipInterests (3)(4)(11)(17)
N/A 1/20/24 DiversifiedInvestment Vehicle
41,900 36,957 38,984
Slater Mill Loan Fund LP, LPCertificates (3)(4)(17)
N/A N/A DiversifiedInvestment Vehicle
8,375 5,755 6,968
TOTAL STRUCTURED PRODUCTS AND OTHER $ 188,588 $ 199,998
PREFERRED EQUITY—0.5% Shares Renewable Funding Group, Inc.,
Series B Preferred Stock (4)(13)N/A N/A Finance 1,505,868 $ 7,461 $ 9,309
TOTAL PREFERRED EQUITY $ 7,461 $ 9,309
EQUITY—2.7%Common Equity/Interests—2.7% AMP Solar Group, Inc., Class A
Common Shares (3)(4)(17)N/A N/A Energy 81,493 $ 3,500 $ 3,500
Generation Brands Holdings, Inc.(Quality Home Brands), BasicCommon Stock (3)(4)(13)(18)
N/A N/A Home and OfficeFurnishings and
Durable ConsumerProducts
9,007 — 6,699
Generation Brands Holdings, Inc.(Quality Home Brands), Series 2LCommon Stock (3)(4)(13)(18)
N/A N/A Home and OfficeFurnishings and
Durable ConsumerProducts
36,700 11,242 27,294
Generation Brands Holdings, Inc.(Quality Home Brands), Series HCommon Stock (3)(4)(13)(18)
N/A N/A Home and OfficeFurnishings and
Durable ConsumerProducts
7,500 2,298 5,578

See notes to financial statements.63
APOLLO INVESTMENT CORPORATIONSCHEDULE OF INVESTMENTS (continued)
March 31, 2015(in thousands, except shares)
INVESTMENTS IN NON-CONTROLLED/AFFILIATEDINVESTMENTS—13.5%(4)(10) Interest Rate
MaturityDate Industry Shares Cost
FairValue (1)
EQUITY—2.7%Common Equity/Interests—2.7%LVI Group Investments, LLC,Common
Units (3)(4)(13)(19)N/A N/A Environmental
Services212,460 $ 17,505 $ 8,669
Total Common Equity/Interests $ 34,545 $ 51,740TOTAL EQUITY $ 34,545 $ 51,740
Total Non-Controlled/Affiliated Investments $ 231,594 $ 262,047

See notes to financial statements.64
APOLLO INVESTMENT CORPORATIONSCHEDULE OF INVESTMENTS (continued)
March 31, 2015(in thousands, except shares)
INVESTMENTS IN CONTROLLEDINVESTMENTS—37.7%(5)(10) Interest Rate
MaturityDate Industry
ParAmount
(12) CostFair
Value (1)CORPORATE DEBT—18.2%SECURED DEBT—18.2%1st Lien Secured Debt—18.2% Merx Aviation Finance, LLC, (Revolver)
(5)(16)12.00% Funded 10/31/18 Aviation $ 352,084 $ 352,084 $ 352,084
Total 1st Lien Secured Debt $ 352,084 $ 352,084
Unfunded Revolver Obligation—0.0% Merx Aviation Finance, LLC, (Unfunded
Revolver) (5)(16)12.00% Funded,0.00% Unfunded
10/31/18 Aviation $ 47,916 $ — $ —
Total Unfunded Revolver Obligation $ — $ —
Letters of Credit—0.0% Merx Aviation Finance Assets Ireland
Limited, Letter of Credit (5)2.250% 9/30/15 Aviation $ 1,800 $ — $ —
Merx Aviation Finance Assets IrelandLimited, Letter of Credit (5)
2.250% 9/30/15 Aviation 1,800 — —
Total Letters of Credit $ — $ —TOTAL SECURED DEBT $ 352,084 $ 352,084TOTAL CORPORATE DEBT $ 352,084 $ 352,084
PREFERRED EQUITY—6.4% Shares AMP Solar (UK) Limited, Class A
Preference Shares (2)(5)(17)8.500% 10/31/49 Utilities 43,277,916 $ 66,354 $ 65,171
PlayPower Holdings, Inc., Series APreferred (5)
14.00% PIK 11/15/20 Leisure 49,178 59,411 59,411
TOTAL PREFERRED EQUITY $ 125,765 $ 124,582
EQUITY—13.1%Common Equity/Interests—13.1% Shares Merx Aviation Finance, LLC, Membership
Interest (5)(13)N/A N/A Aviation — $ 152,082 $ 165,172
MSEA Tankers LLC, Membership Interest(5)(17)
N/A N/A Cargo Transport — 33,000 33,000
PlayPower Holdings, Inc., Common Stock(5)(13)
N/A N/A Leisure 1,000 77,722 55,900
Total Common Equity/Interests $ 262,804 $ 254,072TOTAL EQUITY $ 262,804 $ 254,072
Total Controlled Investments $ 740,653 $ 730,738Total Investments—172.9% (6)(7) $ 3,486,575 $ 3,349,827Liabilities in Excess of Other Assets—(72.9)% $ (1,412,219)Net Assets—100.0% $ 1,937,608

See notes to financial statements.65
APOLLO INVESTMENT CORPORATIONSCHEDULE OF INVESTMENTS (continued)
March 31, 2015 (in thousands)
______________________(1) Fair value is determined in good faith by or under the direction of the Board of Directors of the Company (see note 2).(2) Fidji Luxco (BC) S.C.A. is a EUR denominated investment and AMP Solar (UK) Limited is a GBP denominated investment. (3) Denotes investments where the governing documents of the entity preclude the Company from controlling management of the entity and therefore the
Company has determined that the entity is not a controlled affiliate. (4) Denotes investments in which we are an “Affiliated Person”, as defined in the 1940 Act, due to owning or holding the power to vote 5% or more of the
outstanding voting securities of the investment but not controlling the company. Fair value as of March 31, 2015 and March 31, 2014 along with transactions during the fiscal year ended March 31, 2015 in these Affiliated investments are as follows:
Name of Issue
Fair Valueat March31, 2014
GrossAdditions
GrossReductions
Change inUnrealizedGain (Loss)
Fair Value atMarch 31,
2015
NetRealized
Gain (Loss)
Interest/Dividend/
OtherIncome
AMP Solar Group, Inc., Class A Common Shares $ — $ 3,500 $ — $ — $ 3,500 $ — $ —AMP Solar Group, Inc., 15.000%, 7/7/15 — 3,619 (3,619) — — (57) 53Aventine Renewable Energy Holdings, Inc., 15.00%
(12.00% Cash / 3.00% PIK), 9/23/162,405 21 (2,642) 216 — 116 184
Aventine Renewable Energy Holdings, Inc., 10.50%Cash or 15.00% PIK, 9/22/17
8,884 1,481 (15,306) 4,941 — — 1,496
Aventine Renewable Energy Holdings, Inc., 25.00%PIK, 9/24/16
3,769 238 (4,007) — — — 433
Aventine Renewable Energy Holdings, Inc., CommonStock
99 — (688) 589 — 1,804 —
Aventine Renewable Energy Holdings, Inc., CommonStock Warrants
574 — (3,996) 3,422 — 9,713 —
Generation Brands Holdings, Inc. (Quality HomeBrands), Basic Common Stock (18)
— 1,615 — 5,084 6,699 — —
Generation Brands Holdings, Inc. (Quality HomesBrands), Series H Common Stock (18)
— 1,345 — 4,233 5,578 — —
Generation Brands Holdings, Inc. (Quality HomesBrands), Series 2L Common Stock (18)
— 6,582 — 20,712 27,294 — —
Golden Bear Warehouse LLC, Equity — 4,233 — 2,600 6,833 — —Golden Hill CLO I, LLC, Equity 1,097 69,847 — 2,643 73,587 — 1,515Highbridge Loan Management 3-2014, Ltd., Class D
Notes, L+500, 1/18/254,680 21 (4,659) (42) — (169) 205
Highbridge Loan Management 3-2014, Ltd., Class ENotes, L+600, 1/18/25
2,314 14 — (207) 2,121 — 171
Highbridge Loan Management 3-2014, Ltd.,Subordinated Notes, 1/18/25
7,278 — (989) 433 6,722 — 652
Ivy Hill Middle Market Credit Fund IX, Ltd,Subordinated Notes, 10/18/25
— 11,375 — — 11,375 — 414
Jamestown CLO I LTD, Subordinated Notes, 11/5/24 3,828 — (121) (9) 3,698 — 559 LVI Parent Corp. (LVI Services, Inc.), 12.50%,
4/20/14 (19)— 10,387 (10,200) (187) — — 269
LVI Group Investments, LLC, Common Units (formerly known as LVI Services, Inc.) (19)
— 35,429 — (26,760) 8,669 — 87
MCF CLO I LLC, Class E Notes, L+575, 4/20/23 12,357 13 (12,344) (26) — (107) 215
MCF CLO I LLC, Membership Interests 40,391 — (2,471) 570 38,490 — 7,176MCF CLO III LLC, Class E Notes L+445, 1/20/24 11,325 107 — (212) 11,220 — 718MCF CLO III LLC, Membership Interests, 1/20/24 38,266 — (2,227) 2,945 38,984 — 6,271Renewable Funding Group, Inc. 0.00%, 9/30/15 — 1,000 — — 1,000 — —
Renewable Funding Group, Inc., Series B PreferredStock
— 8,750 (1,289) 1,848 9,309 — —
Slater Mill Loan Fund LP, LP Certificates 7,361 — (467) 74 6,968 — 1,427$ 144,628 $ 159,577 $ (65,025) $ 22,867 $ 262,047 $ 11,300 $ 21,845
______________
Gross additions includes increases in the cost basis of investments resulting from new portfolio investments, PIK interest or dividends, the accretion of discounts, the exchange of one or more existing securities for one or more new securities, the movement of an existing portfolio company into this category from a different category, and the transfers of one or more securities into non-controlled/affiliated. Transfers are assumed to have occurred at the end of the period.

See notes to financial statements.66
APOLLO INVESTMENT CORPORATIONSCHEDULE OF INVESTMENTS (continued)
March 31, 2015 (in thousands)
Gross reductions include decreases in the cost basis of investments resulting from principal collections related to investment repayments or sales, the amortization of premiums, the exchange of one or more existing securities for one or more new securities, the movement of an existing portfolio company out of this category into a different category, and the transfers of one or more securities out of non-controlled/affiliated. Transfers are assumed to have occurred at the end of the period.
As of March 31, 2015, the Company has a 28%, 100%, 100%, 26%, 32%, 36%, 97%, 98% and 26% equity ownership interest in Generation Brands Holdings, Inc., Golden Bear Warehouse LLC, Golden Hill CLO I, LLC, Highbridge Loan Management, Ltd., Ivy Hill Middle Market Credit Fund IX, Ltd, LVI Group Investments, LLC, MCF CLO I LLC, MCF CLO III LLC, and Slater Mill Loan Fund LP, respectively. Investments that the Company owns greater than 25% of the equity and are shown in “Non-Controlled/Affiliated” have governing documents that preclude the Company from controlling management of the entity and therefore the Company has determined that the entity is not a controlled affiliate.
(5) Denotes investments in which we are deemed to exercise a controlling influence over the management or policies of a company, as defined in the 1940 Act, due to beneficially owning, either directly or through one or more controlled companies, more than 25% of the outstanding voting securities of the investment. Fair value as of March 31, 2015 and March 31, 2014 along with transactions during the fiscal year ended March 31, 2015 in these Controlled investments are as follows:
Name of Issue
Fair Value atMarch 31,
2014
GrossAdditions
GrossReductions
Change inUnrealizedGain (Loss)
Fair Value atMarch 31,
2015
NetRealized
Gain (Loss)
Interest/Dividend/
Other IncomeAMP Solar (UK) Limited, Class A Preference
Shares$ — $ 66,355 $ — $ (1,184) $ 65,171 $ — $ 1,580
Generation Brands Holdings, Inc. (Quality HomeBrands), Basic Common Stock (18)
1,615 — (1,615) — — — —
Generation Brands Holdings, Inc. (QualityHomes Brands), Series H Common Stock( 18)
1,345 — (1,345) — — — —
Generation Brands Holdings, Inc. (QualityHomes Brands), Series 2L Common Stock(18)
6,582 — (6,582) — — — —
LVI Parent Corp. (LVI Services, Inc.), 12.50%,4/20/14 (19)
10,200 — (10,200) — — — —
LVI Group Investments, LLC, Common Units(formerly known as LVI Services, Inc.) (19)
34,020 — (34,020) — — — —
Merx Aviation Finance, LLC (formerly known asMerx Aviation Finance Holdings II, LLC),(Revolver) 12.00% Funded, 10/31/18
282,334 69,750 — — 352,084 — 39,231
Merx Aviation Finance, LLC (formerly known asMerx Aviation Finance Holdings II, LLC),(Unfunded Revolver) 0.00% Unfunded,10/31/18
— — — — — — —
Merx Aviation Finance Assets Ireland Limited,Letter of Credit, 2.25%, 9/30/15
— — — — — — —
Merx Aviation Finance Assets Ireland Limited,Letter of Credit, 2.25%, 9/30/15
— — — — — — —
Merx Aviation Finance, LLC (formerly known asMerx Aviation Finance Holdings II, LLC),Membership Interest
140,465 13,499 — 11,208 165,172 — —
MSEA Tankers LLC, Membership Interest — 33,000 — — 33,000 — —PlayPower Holdings, Inc., Common Stock 53,813 — — 2,087 55,900 — —PlayPower Holdings, Inc., Series A Preferred,
14.00% PIK, 11/15/2051,773 7,638 — — 59,411 — 7,891
$ 582,147 $ 190,242 $ (53,762) $ 12,111 $ 730,738 $ — $ 48,702
______________Gross additions includes increases in the cost basis of investments resulting from new portfolio investments, PIK interest or dividends, the accretions of discounts,
the exchange of one or more existing securities for one or more new securities and the movement of an existing portfolio company into this category from a different category.
Gross reductions include decreases in the cost basis of investments resulting from principal collections related to investment repayments or sales, the amortization of premiums, the exchange of one or more existing securities for one or more new securities and the movement of an existing portfolio company out of this category into a different category.
As of March 31, 2015, the Company has a 100% equity ownership interest in AMP Solar (UK) Limited, Merx Aviation Finance, LLC, MSEA Tankers LLC and PlayPower Holdings, Inc..

See notes to financial statements.67
APOLLO INVESTMENT CORPORATIONSCHEDULE OF INVESTMENTS (continued)
March 31, 2015 (in thousands)
(6) Aggregate gross unrealized gain for federal income tax purposes is $143,557; aggregate gross unrealized loss for federal income tax purposes is $302,058. Net unrealized loss is $158,501 based on a tax cost of $3,508,328.
(7) Substantially all securities are pledged as collateral to our multicurrency revolving credit facility (the “Facility”). As such these securities are not available as collateral to our general creditors.
(8) The negative fair value is the result of the unfunded commitment or letter of credit being valued below par. (9) These letters of credit represent multiple commitments made on various dates. As a result, maturity dates may vary and a maturity range has been provided.(10) The percentage is calculated over net assets.(11) These securities are exempt from registration under Rule 144A of the Securities Act of 1933. These securities may be resold in transactions that are exempt
from registration, normally to qualified institutional buyers. (12) Denominated in USD unless otherwise noted, Euro (“€”), British Pound (“£”), and Canadian Dollar (“CAD”). (13) Non-income producing security. (14) Non-accrual status (see note 2). (15) The investment has a put option attached to it and the combined instrument has been recorded in its entirety at fair value as a hybrid instrument in accordance
with ASC 815-15-25-4 with subsequent changes in fair value charged or credited to investment gains/losses for each period. (16) Denotes debt securities where the Company owns multiple tranches of the same broad asset type but whose security characteristics differ. Such differences
may include level of subordination, call protection and pricing, and differing interest rate characteristics, among other factors. Such factors are usually considered in the determination of fair values.
(17) Investments that the Company has determined are not “qualifying assets” under Section 55(a) of the 1940 Act. Under the 1940 Act, we may not acquire any non-qualifying asset unless, at the time such acquisition is made, qualifying assets represent at least 70% of our total assets. The status of these assets under the 1940 Act are subject to change. The Company monitors the status of these assets on an ongoing basis.
(18) Generation Brands Holdings, Inc. was previously incorrectly reported as a controlled investment in the financial statements for the year ended March 31, 2014. After further assessment, the Company does not control more than 25% of the voting power and has no power to direct or cause the direction of the policies and management of the company. As such, $9,542 of the fair value of Generation Brands Holdings, Inc., Common Stock was transferred from "Controlled" to "Non-Controlled/Affiliated" in 2015 to correctly reflect Generation Brands Holdings, Inc. as a non-controlling/ affiliated investment. Management evaluated the impact of the error to the financial statements and determined that this adjustment was not material to any prior annual or interim periods, and the resulting correction is not material to the current financial statements.
(19) As a result of a restructuring in April 2014, the Company investment was moved to LVI Group Investments, LLC from LVI Services Inc. LVI Group Investments, LLC further invested in NorthStar Group Holdings. The Company no longer controls more than 25% of the voting power and has no power to direct or cause the direction of the policies and management of NorthStar Group Holdings. As such, $44,220 of the fair value of LVI Services, Inc., Common Stock, was transferred from "Controlled" to "Non-Controlled/Affiliated" in LVI Group Investments, LLC prior to the fiscal year ended March 31, 2015.
(20) This investment represents a leveraged subordinated interest in a trust that holds one foreign currency denominated bond and a derivative instrument.
N/A Not applicable.

See notes to financial statements.68
APOLLO INVESTMENT CORPORATIONSCHEDULE OF INVESTMENTS (continued)
March 31, 2015
Industry Classification
Percentage of TotalInvestments (atfair value) as ofMarch 31, 2015
Business Services 15.6% Aviation 15.4% Oil and Gas 13.9% Diversified Investment Vehicle 9.6% Financial Services 4.0% Chemicals 3.8% Leisure 3.4% Utilities 3.0% Aerospace and Defense 2.9% Distribution 2.9% Telecommunications 2.2% Insurance 2.1% Transportation 2.1% Printing and Publishing 1.9% Cargo Transport 1.7% Healthcare 1.6% Energy 1.6% Education 1.5% Packaging 1.3% Restaurants 1.2% Home and Office Furnishings and Durable Consumer Products 1.2% Diversified Service 1.1% Grocery 0.8% Consumer Products 0.8% Hotels, Motels, Inns and Gaming 0.8% Diversified Natural Resources, Precious Metals and Minerals 0.7% Buildings and Real Estate 0.6% Mining 0.6% Broadcasting & Entertainment 0.4% Containers, Packaging, and Glass 0.4% Finance 0.3% Environmental Services 0.3% Electronics 0.1% Media 0.1% Cable Television 0.1%Total Investments 100.0%

See notes to financial statements.69
APOLLO INVESTMENT CORPORATIONSCHEDULE OF INVESTMENTS
March 31, 2014(in thousands)
INVESTMENTS IN NON-CONTROLLED/NON-AFFILIATEDINVESTMENTS—134.1% (17) Interest Rate
MaturityDate Industry
Par Amount(10) Cost
FairValue (1)
CORPORATE DEBT—125.9%SECURED DEBT—80.0%1st Lien Secured Debt—32.5%Archroma (15) 9.50% (L+825,
1.25% Floor)10/1/18 Chemicals $ 35,422 $ 34,762 $ 35,511
Avanti Communication Group PLC(9)(15) 10.000% 10/1/19 Telecommunications 9,000 9,000 9,608Aveta, Inc. 9.75% (L+825,
1.50% Floor)12/12/17 Healthcare 59,951 58,535 60,325
Caza Petroleum, Inc. 12.00% (L+1000, 2.00%
Floor)
5/23/17 Oil and Gas 35,000 33,988 33,845
Charming Charlie LLC 9.00% (L+800,1.00% Floor)
12/24/19 Retail 5,305 5,241 5,315
Confie Seguros Holding II Co., (Revolver)(14)
6.75% (P+350)Funded, 0.50%
Unfunded
12/10/18 Insurance 240 240 218
Delta Educational Systems, Inc. 16.00% (8.00%Cash/8.00% PIK)
12/11/16 Education 5,437 5,437 5,437
Endeavour International Corp. (14)(15) 12.000% 3/1/18 Oil and Gas 18,262 17,960 17,760Endeavour International Corp. (14)(15) 8.25% (L+700,
1.25% Floor)11/30/17 Oil and Gas 3,157 3,105 3,126
Endeavour International Corp. (14)(15) 8.25% (L+700,1.25% Floor)
11/30/17 Oil and Gas 4,412 4,338 4,368
Evergreen Tank Solutions, Inc. 9.50% (L+800,1.50% Floor)
9/28/18 Containers,Packaging, and
Glass
41,771 41,260 41,980
Great Bear Petroleum Operating, LLC 12.000% 10/1/17 Oil and Gas 4,464 4,464 4,464Hunt Companies, Inc.(9) 9.625% 3/1/21 Buildings and Real
Estate41,210 40,701 42,807
Lee Enterprises, Inc(9)(15) 9.500% 3/15/22 Media 25,000 25,000 25,844Magnetation, LLC (9) 11.000% 5/15/18 Mining 16,400 16,458 18,450Maxus Capital Carbon SPE I, LLC (Skyonic
Corp.)13.000% 9/18/19 Chemicals 60,000 60,000 60,000
Molycorp, Inc. (15) 10.000% 6/1/20 Diversified NaturalResources, PreciousMetals and Minerals
35,849 35,532 35,547
My Alarm Center, LLC (14) 8.50% (L+750,1.00% Floor)
1/9/18 Business Services 42,614 42,614 42,614
My Alarm Center, LLC (14) 8.50% (L+750,1.00% Floor)
1/9/18 Business Services 2,930 2,930 2,930
Osage Exploration & Development, Inc. (15) 17.00% (L+1500, 2.00%
Floor)
4/27/15 Oil and Gas 20,000 19,752 20,040
Panda Sherman Power, LLC 9.00% (L+750,1.50% Floor)
9/14/18 Energy 15,000 14,821 15,450
Panda Temple Power, LLC 11.50% (L+1000,1.50% Floor)
7/17/18 Energy 25,500 25,099 26,169
Pelican Energy, LLC (15) 10.00% (7.00%Cash / 3.00%
PIK)
12/31/18 Oil and Gas 19,330 18,634 19,717
Reichhold Holdings International B.V. (15) 10.75% (L+975,1.00% Floor)
12/19/16 Chemicals 22,500 22,500 22,500
Sand Waves, S.A. (Endeavour Energy UKLimited) (15)
9.750% 12/31/15 Oil and Gas 12,500 12,500 12,500
Southern Pacific Resource Corp. (15) 11.00% (L+1000,1.00% Floor)
3/29/19 Oil and Gas 9,080 8,808 9,216

See notes to financial statements.70
APOLLO INVESTMENT CORPORATIONSCHEDULE OF INVESTMENTS (continued)
March 31, 2014(in thousands, except shares)
INVESTMENTS IN NON-CONTROLLED/NON-AFFILIATEDINVESTMENTS—134.1% (17) Interest Rate
MaturityDate Industry
Par Amount(10) Cost
FairValue (1)
Spotted Hawk Development, LLC (15) 14.00% (13.00%Cash/1.00% PIK)
6/30/16 Oil and Gas 24,308 23,712 23,615
Sunrun Solar Owner IX, LLC 9.079% 12/31/24 Energy 3,622 3,466 3,4671st Lien Secured Debt—32.5% (continued)Travel Leaders Group, LLC 7.00% (L+600,
1.00% Floor)12/5/18 Business Services $ 2,568 $ 2,414 $ 2,548
UniTek Global Services, Inc., (Revolver)(14)
10.25% (L+925, 1.00% Floor)
Funded, 2.00% Unfunded
4/15/16 Telecommunications 44,802 44,802 44,802
Walter Energy, Inc.(9)(15) 9.500% 10/15/19 Mining 17,000 17,307 17,345Total 1st Lien Secured Debt $ 655,380 $ 667,518
Unfunded Revolver Obligations—(0.4)%Avaya, Inc. (8) L+275 Funded,
0.50% Unfunded10/26/16 Telecommunications $ 36,785 $ (5,203) $ (3,035)
BMC Software Inc. (8) L+400 Funded,0.50% Unfunded
9/10/18 Business Services 30,760 (3,243) (2,307)
Confie Seguros Holding II Co. (8)(14) P+350 Funded,0.50% Unfunded
12/10/18 Insurance 3,627 (450) (326)
Laureate Education, Inc. (8)(15) L+375 Funded,0.625%
Unfunded
6/16/16 Education 28,880 (2,888) (2,599)
Reichhold Holdings International B.V. (15) L+600 Funded,1.50% Unfunded
12/19/16 Chemicals 12,500 — —
Salix Pharmaceuticals, Ltd. (8)(15) L+300 Funded,0.50% Unfunded
1/2/19 Healthcare 25,000 (1,923) (125)
UniTek Global Services Inc., (14) L+925 Funded,2.00% Unfunded
4/15/16 Telecommunications 18,052 — —
Total Unfunded Revolver Obligations $ (13,707) $ (8,392)
Letters of Credit— (0.0)%Confie Seguros Holding II Co., Letter of
Credit (8)(14)4.500% 10/27/14 Insurance $ 600 $ — $ (54)
Confie Seguros Holding II Co., Letter ofCredit (8)(14)
4.500% 1/13/15 Insurance 33 — (3)
UniTek Global Services Inc., Letter of Credit(14)
9.250% 3/26/15 Telecommunications 3,000 — —
UniTek Global Services Inc., Letter of Credit(14)
9.250% 3/18/15 Telecommunications 1,000 — —
UniTek Global Services Inc., Letter of Credit(14)
9.250% 3/18/15 Telecommunications 2,700 — —
UniTek Global Services Inc., Letter of Credit(14)
9.250% 12/15/14 Telecommunications 5,446 — —
Total Letters of Credit $ — $ (57)Total 1st Lien Secured Debt $ 641,673 $ 659,069

See notes to financial statements.71
APOLLO INVESTMENT CORPORATIONSCHEDULE OF INVESTMENTS (continued)
March 31, 2014(in thousands, except shares)
INVESTMENTS IN NON-CONTROLLED/NON-AFFILIATEDINVESTMENTS—134.1% (17) Interest Rate
MaturityDate Industry
Par Amount(10) Cost
FairValue (1)
2nd Lien Secured Debt—47.9%Active Network, Inc. 9.50% (L+850,
1.00% Floor)11/15/21 Business Services $ 25,000 $ 24,879 $ 25,344
Applied Systems, Inc. 7.50% (L+650,1.00% Floor)
1/24/22 Business Services 9,110 9,043 9,281
Aptean, Inc. 8.50% (L+750,1.00% Floor)
2/26/21 Business Services 11,322 11,153 11,478
Armor Holdings, Inc. (American StockTransfer and Trust Company)
10.25% (L+900,1.25% Floor)
12/26/20 Financial Services 8,000 7,851 8,000
Asurion Corporation 8.50% (L+750,1.00% Floor)
3/3/21 Insurance 90,400 89,050 93,413
Bennu Oil & Gas, LLC 10.25% (L+900,1.25% Floor)
11/1/18 Oil and Gas 8,999 8,927 9,123
BJ's Wholesale Club, Inc 8.50% (L+750,1.00% Floor)
3/26/20 Retail 20,000 19,904 20,537
Brock Holdings III, Inc. 10.00% (L+825,1.75% Floor)
3/16/18 EnvironmentalServices
19,500 19,245 19,805
Confie Seguros Holding II Co. 10.25% (L+900,1.25% Floor)
5/8/19 Insurance 27,344 27,096 27,566
Consolidated Precision Products Corp. 8.75% (L+775,1.00% Floor)
4/30/21 Aerospace andDefense
8,940 8,897 9,096
Del Monte Foods Co 8.25% (L+725,1.00% Floor)
8/18/21 Beverage, Food, andTobacco
12,140 12,019 12,110
Deltek, Inc. 10.00% (L+875,1.25% Floor)
10/10/19 Business Services 27,273 27,023 27,887
Elements Behavioral Health, Inc. 9.25% (L+825,1.00% Floor)
2/11/20 Healthcare 9,500 9,407 9,500
Flexera Software LLC 8.00% (L+700,1.00% Floor)
4/2/21 Business Services 7,000 6,965 7,053
Garden Fresh Restaurant Corp. (14) 7.25% (L+575PIK, 1.50%
Floor)
1/1/19 Restaurants 7,661 5,618 5,210
Garden Fresh Restaurant Corp. (14) 14.50% (L+1300PIK, 1.50%
Floor)
1/1/19 Restaurants 34,513 32,326 30,716
GCA Services Group, Inc. 9.25% (L+800,1.25% Floor)
11/1/20 Diversified Service 22,838 22,940 23,194
Grocery Outlet, Inc. 10.50% (L+925,1.25% Floor)
6/17/19 Grocery 8,674 8,526 8,847
HD Vest Inc. (15) 9.25% (L+800,1.25% Floor)
6/18/19 Financial Services 9,396 9,290 9,302
Healogics, Inc. 9.25% (L+800,1.25% Floor)
2/5/20 Healthcare 10,000 10,109 10,242
IMG Worldwide, Inc. 8.25% (L+725,1.00% Floor)
3/21/22 Leisure 2,167 2,145 2,199
Insight Pharmaceuticals, LLC 13.25% (L+1175,1.50% Floor)
8/25/17 Consumer Products 15,448 15,243 15,139
Kronos, Inc. 9.75% (L+850,1.25% Floor)
4/30/20 Business Services 92,516 91,531 96,332
Landslide Holdings, Inc. 8.25% (L+725,1.00% Floor)
2/25/21 Business Services 5,630 5,588 5,672
Learfield Communications, Inc. 8.75% (L+775,1.00% Floor)
10/8/21 Media 15,000 14,856 15,375
Miller Energy Resources, Inc. (15) 11.75% (L+975,2.00% Floor)
2/3/18 Oil and Gas 87,500 85,804 85,750

See notes to financial statements.72
APOLLO INVESTMENT CORPORATIONSCHEDULE OF INVESTMENTS (continued)
March 31, 2014(in thousands, except shares)
INVESTMENTS IN NON-CONTROLLED/NON-AFFILIATEDINVESTMENTS—134.1% (17) Interest Rate
MaturityDate Industry
Par Amount(10) Cost
FairValue (1)
2nd Lien Secured Debt—47.9% (continued)Ranpak Corp. 8.50% (L+725,
1.25% Floor)4/23/20 Packaging $ 22,000 $ 21,802 $ 22,522
River Cree Enterprises LP (9)(15) 11.000% 1/20/21 Hotels, Motels, Innsand Gaming
CAD 33,000 31,110 31,767
SESAC Holdco II LLC 10.00% (L+875,1.25% Floor)
4/9/14 Broadcasting &Entertainment
$ 10,750 10,758 10,978
Sprint Industrial Holdings, LLC 11.25% (L+1000,1.25% Floor)
11/14/19 Containers,Packaging, and
Glass
14,163 13,928 14,305
SquareTwo Financial Corp. (CollectAmerica, Ltd.) (15)
11.625% 4/1/17 Financial Services 61,079 59,929 61,690
Stadium Management Corp 9.25% (L+825,1.00% Floor)
2/27/21 Business Services 19,900 19,900 20,348
Tectum Holdings, Inc. 10.25% (P+700,3.25% Floor)
3/12/19 Auto Sector 17,670 17,582 17,626
Transfirst Holdings, Inc. 7.50% (L+650,1.00% Floor)
6/27/18 Financial Services 59,750 59,601 60,422
TriMark USA, LLC 10.00% (L+900,1.00% Floor)
8/12/19 Distribution 27,000 26,470 27,338
U.S. Renal Care, Inc. (14) 10.25% (L+900,1.25% Floor)
1/3/20 Healthcare 11,927 11,980 12,195
U.S. Renal Care, Inc. (14) 8.50% (L+750,1.00% Floor)
7/3/20 Healthcare 12,120 11,930 12,325
Velocity Technology Solutions, Inc. 9.00% (L+775,1.25% Floor)
9/28/20 Business Services 16,500 16,170 16,170
Vertafore, Inc. 9.75% (L+825,1.50% Floor)
10/27/17 Business Services 50,436 50,167 51,397
Walter Energy, Inc. (9)(15) 11.000% 4/1/20 Mining 27,798 26,308 25,192Total 2nd Lien Secured Debt $ 963,070 $ 982,446
TOTAL SECURED DEBT $ 1,604,743 $ 1,641,515
UNSECURED DEBT—45.9%Altegrity, Inc. (14) 0.000% (12.5%
effective)8/2/16 Diversified Service $ 3,545 $ 2,664 $ 957
Altegrity, Inc. (9)(14) 12.000% 11/1/15 Diversified Service 14,667 14,667 13,567American Energy - Utica, LLC (9) 3.500% 3/1/21 Oil and Gas 10,868 10,868 11,031American Tire Distributors, Inc. (9)(14) 11.500% 6/1/18 Distribution 25,000 25,000 25,700American Tire Distributors, Inc. (14) 11.500% 6/1/18 Distribution 40,000 39,321 41,120Artsonig Pty Ltd (9)(15) 11.500% 4/1/19 Transportation 20,000 19,701 20,025BCA Osprey II Limited (British Car
Auctions) (14)(15)12.50% PIK 8/17/17 Transportation € 12,721 17,489 18,102
BCA Osprey II Limited (British CarAuctions) (14)(15)
12.50% PIK 8/17/17 Transportation £ 20,948 33,173 36,058
Ceridian Corp. (9)(14) 11.000% 3/15/21 Diversified Service $ 34,000 34,000 39,335Ceridian Corp. (14) 11.250% 11/15/15 Diversified Service 35,800 35,800 36,154Ceridian Corp. (14) 12.25% Cash
(12.25% Cash or13.00% PIK)
11/15/15 Diversified Service 14,420 14,420 14,562
CRC Health Corp. 10.750% 2/1/16 Healthcare 13,000 13,079 13,077Delta Educational Systems, Inc. 16.00% (10.00%
Cash/6.00% PIK)5/12/17 Education 21,684 21,353 20,708
Denver Parent Corp. (Venoco) (9) 12.250% 8/15/18 Oil and Gas 15,000 14,633 15,150Energy & Exploration Partners, Inc. (14) 15.000% 4/8/18 Oil and Gas 25,000 22,410 23,750

See notes to financial statements.73
APOLLO INVESTMENT CORPORATIONSCHEDULE OF INVESTMENTS (continued)
March 31, 2014(in thousands, except shares)
INVESTMENTS IN NON-CONTROLLED/NON-AFFILIATEDINVESTMENTS—134.1% (17) Interest Rate
MaturityDate Industry
Par Amount(10) Cost
FairValue (1)
UNSECURED DEBT—45.9% (continued)Energy & Exploration Partners, Inc. (14) 15.000% 12/12/18 Oil and Gas $ 4,464 $ 4,263 $ 4,241Energy & Exploration Partners, Inc. (14) 15.000% 12/12/18 Oil and Gas 2,679 2,469 2,545Energy & Exploration Partners, Inc. (14) 15.000% 3/27/19 Oil and Gas 8,036 7,650 7,634Exova Limited (14)(15) 10.50% 5/20/14 Business Services £ 4,655 6,606 8,537Exova Limited (9)(14)(15) 10.50% 5/20/14 Business Services 18,000 28,165 33,010First Data Corp. (14) 10.625% 6/15/21 Financial Services $ 10,000 10,000 11,288First Data Corp. (14) 11.250% 1/15/21 Financial Services 67,000 66,977 76,548First Data Corp. (14) 12.625% 1/15/21 Financial Services 5,000 5,641 5,963inVentiv Health, Inc. (9) 11.000% 8/15/18 Healthcare 106,500 106,500 98,646My Alarm Center, LLC 16.25% (12.00%
Cash/4.25%PIK)7/9/18 Business Services 4,101 4,101 4,101
Niacet Corporation 13.000% 8/28/18 Chemicals 12,500 12,500 12,625PetroBakken Energy Ltd. (9)(15) 8.625% 2/1/20 Oil and Gas 44,082 44,390 44,206Prospect Holding Company LLC (9) 10.250% 10/1/18 Financial Services 20,000 19,106 19,450Radio One, Inc. (9)(15) 9.250% 2/15/20 Broadcasting &
Entertainment14,804 14,804 15,778
Symbion, Inc. 11.000% 8/23/15 Healthcare 8,488 8,501 8,538Tervita Corporation (9)(15) 10.875% 2/15/18 Environmental
Services22,438 21,739 22,662
U.S. Security Associates Holdings, Inc. 11.000% 7/28/18 Business Services 135,000 135,000 139,590Univar, Inc. 10.500% 6/30/18 Distribution 20,000 20,000 19,960Varietal Distribution (9)(14) 10.750% 6/30/17 Distribution 22,204 21,908 22,426Varietal Distribution (9)(14) 10.750% 6/30/17 Distribution € 11,574 15,092 16,111Venoco, Inc. 8.875% 2/15/19 Oil and Gas $ 38,050 38,463 38,573
TOTAL UNSECURED DEBT $ 912,453 $ 941,728TOTAL CORPORATE DEBT $ 2,517,196 $ 2,583,243
STRUCTURED PRODUCTS AND OTHER—3.9%Craft 2013-1, Credit Linked Note (15) 9.49% (L+925) 4/17/22 Diversified
Investment Vehicle$ 20,000 $ 20,000 $ 19,802
Dark Castle Holdings, LLC N/A N/A Media 25,302 2,094 3,077JP Morgan Chase & Co., Credit-Linked Note
(15)12.50% (L
+1225)12/20/21 Diversified
Investment Vehicle43,250 43,010 42,935
Renaissance Umiat, LLC, ACES (13)(14)(15)
N/A N/A Oil and Gas — 7,153 7,799
Renaissance Umiat, LLC, ACES (13)(14)(15)
N/A N/A Oil and Gas — 6,351 6,391
TOTAL STRUCTURED PRODUCTS AND OTHER $ 78,608 $ 80,004
PREFERRED EQUITY—2.0% SharesCA Holding, Inc. (Collect America, Ltd.),
Series A Preferred Stock (11)(15)N/A N/A Financial Services 7,961 $ 788 $ 1,592
Crowley Holdings, Series A Preferred Stock 12.00% (10.00%Cash / 2.00%
PIK)
N/A Cargo Transport 22,500 22,623 22,620
Gryphon Colleges Corp. (Delta EducationalSystems, Inc.), Preferred Stock (12)
13.50% PIK N/A Education 12,360 27,685 13,802
Gryphon Colleges Corp. (Delta EducationalSystems, Inc.), Preferred Stock (12)
12.50% PIK N/A Education 332,500 6,863 —
Varietal Distribution Holdings, LLC, Class APreferred Unit
8.00% PIK N/A Distribution 3,097 5,288 3,275
TOTAL PREFERRED EQUITY $ 63,247 $ 41,289
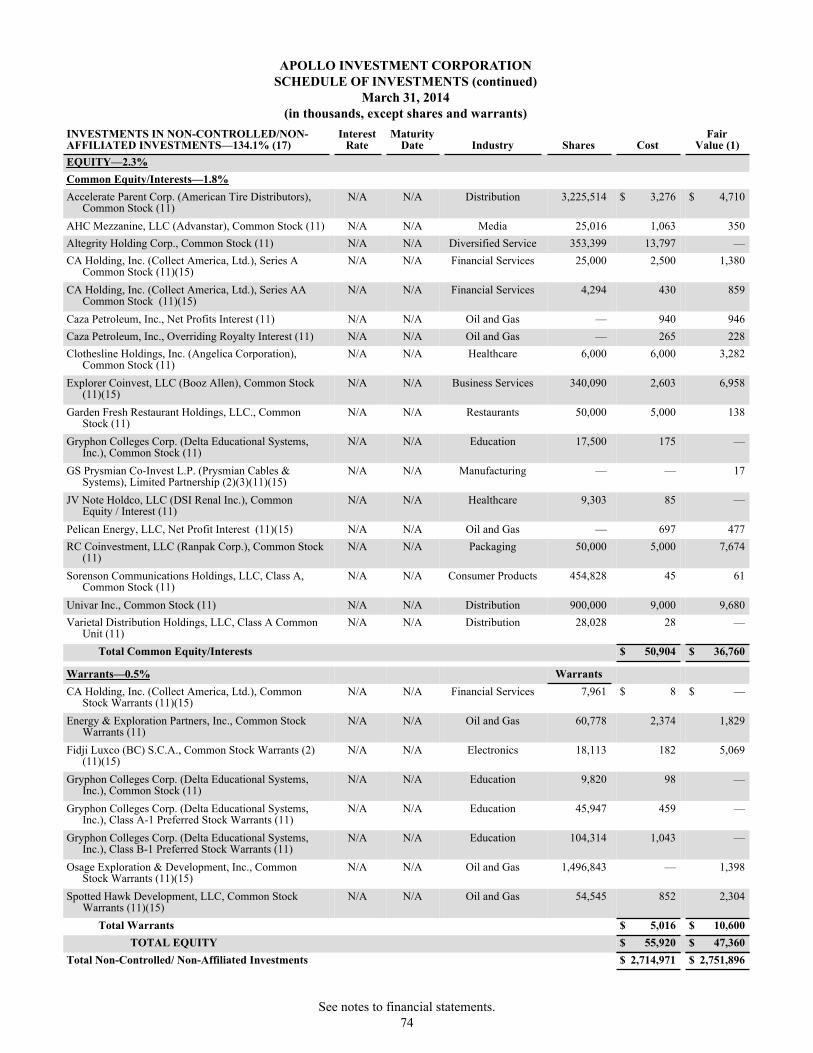
See notes to financial statements.74
APOLLO INVESTMENT CORPORATIONSCHEDULE OF INVESTMENTS (continued)
March 31, 2014(in thousands, except shares and warrants)
INVESTMENTS IN NON-CONTROLLED/NON-AFFILIATED INVESTMENTS—134.1% (17)
InterestRate
MaturityDate Industry Shares Cost
FairValue (1)
EQUITY—2.3%Common Equity/Interests—1.8%Accelerate Parent Corp. (American Tire Distributors),
Common Stock (11)N/A N/A Distribution 3,225,514 $ 3,276 $ 4,710
AHC Mezzanine, LLC (Advanstar), Common Stock (11) N/A N/A Media 25,016 1,063 350Altegrity Holding Corp., Common Stock (11) N/A N/A Diversified Service 353,399 13,797 —CA Holding, Inc. (Collect America, Ltd.), Series A
Common Stock (11)(15)N/A N/A Financial Services 25,000 2,500 1,380
CA Holding, Inc. (Collect America, Ltd.), Series AACommon Stock (11)(15)
N/A N/A Financial Services 4,294 430 859
Caza Petroleum, Inc., Net Profits Interest (11) N/A N/A Oil and Gas — 940 946Caza Petroleum, Inc., Overriding Royalty Interest (11) N/A N/A Oil and Gas — 265 228Clothesline Holdings, Inc. (Angelica Corporation),
Common Stock (11)N/A N/A Healthcare 6,000 6,000 3,282
Explorer Coinvest, LLC (Booz Allen), Common Stock(11)(15)
N/A N/A Business Services 340,090 2,603 6,958
Garden Fresh Restaurant Holdings, LLC., CommonStock (11)
N/A N/A Restaurants 50,000 5,000 138
Gryphon Colleges Corp. (Delta Educational Systems,Inc.), Common Stock (11)
N/A N/A Education 17,500 175 —
GS Prysmian Co-Invest L.P. (Prysmian Cables &Systems), Limited Partnership (2)(3)(11)(15)
N/A N/A Manufacturing — — 17
JV Note Holdco, LLC (DSI Renal Inc.), CommonEquity / Interest (11)
N/A N/A Healthcare 9,303 85 —
Pelican Energy, LLC, Net Profit Interest (11)(15) N/A N/A Oil and Gas — 697 477RC Coinvestment, LLC (Ranpak Corp.), Common Stock
(11)N/A N/A Packaging 50,000 5,000 7,674
Sorenson Communications Holdings, LLC, Class A,Common Stock (11)
N/A N/A Consumer Products 454,828 45 61
Univar Inc., Common Stock (11) N/A N/A Distribution 900,000 9,000 9,680Varietal Distribution Holdings, LLC, Class A Common
Unit (11)N/A N/A Distribution 28,028 28 —
Total Common Equity/Interests $ 50,904 $ 36,760
Warrants—0.5% WarrantsCA Holding, Inc. (Collect America, Ltd.), Common
Stock Warrants (11)(15)N/A N/A Financial Services 7,961 $ 8 $ —
Energy & Exploration Partners, Inc., Common StockWarrants (11)
N/A N/A Oil and Gas 60,778 2,374 1,829
Fidji Luxco (BC) S.C.A., Common Stock Warrants (2)(11)(15)
N/A N/A Electronics 18,113 182 5,069
Gryphon Colleges Corp. (Delta Educational Systems,Inc.), Common Stock (11)
N/A N/A Education 9,820 98 —
Gryphon Colleges Corp. (Delta Educational Systems,Inc.), Class A-1 Preferred Stock Warrants (11)
N/A N/A Education 45,947 459 —
Gryphon Colleges Corp. (Delta Educational Systems,Inc.), Class B-1 Preferred Stock Warrants (11)
N/A N/A Education 104,314 1,043 —
Osage Exploration & Development, Inc., CommonStock Warrants (11)(15)
N/A N/A Oil and Gas 1,496,843 — 1,398
Spotted Hawk Development, LLC, Common StockWarrants (11)(15)
N/A N/A Oil and Gas 54,545 852 2,304
Total Warrants $ 5,016 $ 10,600TOTAL EQUITY $ 55,920 $ 47,360
Total Non-Controlled/ Non-Affiliated Investments $ 2,714,971 $ 2,751,896

See notes to financial statements.75
APOLLO INVESTMENT CORPORATIONSCHEDULE OF INVESTMENTS (continued)
March 31, 2014(in thousands, except shares and warrants)
INVESTMENTS IN NON-CONTROLLED/AFFILIATEDINVESTMENTS—7.0%(4)(17) Interest Rate
MaturityDate Industry
ParAmount
(10) CostFair
Value (1)CORPORATE DEBT—0.7%SECURED DEBT—0.7%1st Lien Secured Debt—0.7%Aventine Renewable Energy Holdings, Inc.
(4)(14)15.00% (12.00%Cash/3.00% PIK)
9/23/16 Chemicals $ 2,737 $ 2,621 $ 2,405
Aventine Renewable Energy Holdings, Inc.(4)(14)
15.00% PIK or10.50% Cash
9/22/17 Chemicals 14,068 16,391 8,884
Aventine Renewable Energy Holdings, Inc.(4)(14)
25.00% PIK 9/24/16 Chemicals 3,769 3,769 3,769
Total 1st Lien Secured Debt $ 22,781 $ 15,058TOTAL SECURED DEBT $ 22,781 $ 15,058TOTAL CORPORATE DEBT $ 22,781 $ 15,058
STRUCTURED PRODUCTS AND OTHER—6.3%Golden Hill CLO I, LLC, Equity (4)(15)(16) N/A N/A Diversified
Investment Vehicle$ 1,097 $ 1,631 $ 1,097
Highbridge Loan Management 3-2014, Ltd.,Class D Notes (4)(14)(15)(16)
5.22% (L+500) 1/18/25 DiversifiedInvestment Vehicle
5,000 4,638 4,680
Highbridge Loan Management 3-2014, Ltd.,Class E Notes (4)(14)(15)(16)
6.22% (L+600) 1/18/25 DiversifiedInvestment Vehicle
2,485 2,263 2,314
Highbridge Loan Management 3-2014, Ltd.,Subordinated Notes (4)(14)(15)(16)
N/A 1/18/25 DiversifiedInvestment Vehicle
8,163 7,527 7,278
Jamestown CLO I LTD, Subordinated Notes(4)(15)(16)
N/A 11/5/24 DiversifiedInvestment Vehicle
4,325 3,553 3,828
MCF CLO I LLC, Class E Notes (4)(15)(16) 5.99% (L+575) 4/20/23 DiversifiedInvestment Vehicle
13,000 12,330 12,357
MCF CLO I LLC, Membership Interests (4)(15)(16)
N/A N/A DiversifiedInvestment Vehicle
38,918 37,560 40,391
MCF CLO III LLC, Class E Notes (4)(15)(16)
4.81% (L+445) 1/20/24 DiversifiedInvestment Vehicle
12,750 11,349 11,325
MCF CLO III LLC, Membership Interests(4)(15)(16)
N/A 1/20/24 DiversifiedInvestment Vehicle
41,900 39,183 38,266
Slater Mill Loan Fund LP, LP Certificates (4)(15)(16)
N/A N/A DiversifiedInvestment Vehicle
8,375 6,222 7,361
TOTAL STRUCTURED PRODUCTS AND OTHER $ 126,256 $ 128,897
EQUITY—0.0%Common Equity/Interests—0.0% SharesAventine Renewable Energy Holdings, Inc.,
Common Stock (4)(11)N/A N/A Chemicals 262,036 $ 688 $ 99
Total Common Equity/Interests $ 688 $ 99
Warrants—0.0% WarrantsAventine Renewable Energy Holdings, Inc.,
Common Stock Warrants (4)(11)N/A N/A Chemicals 1,521,193 $ 3,996 $ 574
Total Warrants $ 3,996 $ 574TOTAL EQUITY $ 4,684 $ 673
Total Non-Controlled/Affiliated Investments $ 153,721 $ 144,628

See notes to financial statements.76
APOLLO INVESTMENT CORPORATIONSCHEDULE OF INVESTMENTS (continued)
March 31, 2014(in thousands, except shares)
INVESTMENTS IN CONTROLLEDINVESTMENTS—28.4%(5)(17) Interest Rate
MaturityDate Industry
ParAmount
(10) CostFair
Value (1)CORPORATE DEBT—14.3%SECURED DEBT—14.3%1st Lien Secured Debt—13.8%Merx Aviation Finance Holdings II, LLC
(Revolver) (5)12.00% Funded,0.00% Unfunded
10/31/18 Aviation $ 282,334 $ 282,334 $ 282,334
Total 1st Lien Secured Debt $ 282,334 $ 282,334
Unfunded Revolver Obligation—0.0%Merx Aviation Finance Holdings II, LLC (5) 12.00% Funded,
0.00% Unfunded10/31/18 Aviation $ 117,666 $ — $ —
Total Unfunded Revolver Obligation $ — $ —
Letters of Credit—0.0%Merx Aviation Finance Assets Ireland Limited,
LLC, Letter of Credit (5)2.250% 9/30/14 Aviation $ 1,800 $ — $ —
Merx Aviation Finance Assets Ireland Limited,LLC, Letter of Credit (5)
2.250% 9/30/14 Aviation 1,800 — —
Total Letters of Credit $ — $ —
2nd Lien Secured Debt—0.5%LVI Parent Corp. (LVI Services, Inc.) (5) 12.500% 4/20/14 Environmental
Services$ 10,000 $ 10,013 $ 10,200
Total 2nd Lien Secured Debt $ 10,013 $ 10,200TOTAL SECURED DEBT $ 292,347 $ 292,534TOTAL CORPORATE DEBT $ 292,347 $ 292,534
PREFERRED EQUITY—2.5% SharesPlaypower Holdings, Inc., Series A Preferred (5) 14.00% PIK 11/15/20 Leisure 49,178 $ 51,773 $ 51,773
TOTAL PREFERRED EQUITY $ 51,773 $ 51,773
EQUITY—11.6%Common Equity/Interests—11.6% Shares Generation Brands Holdings, Inc. (Quality
Home Brands), Basic Common Stock (5)(11)N/A N/A Home and Office
Furnishings andDurable Consumer
Products
9,007 $ — $ 1,615
Generation Brands Holdings, Inc. (QualityHome Brands), Series H Common Stock (5)(11)
N/A N/A Home and OfficeFurnishings and
Durable ConsumerProducts
7,500 2,297 1,345
Generation Brands Holdings, Inc. (QualityHome Brands), Series 2L Common Stock (5)(11)
N/A N/A Home and OfficeFurnishings and
Durable ConsumerProducts
36,700 11,242 6,582
LVI Parent Corp., Common Stock (5)(11) N/A N/A EnvironmentalServices
14,981 16,097 34,020
Merx Aviation Finance Holdings II, LLC,Partnership Interest (5)(11)
N/A N/A Aviation — 138,582 140,465
PlayPower Holdings, Inc., Common Stock (5)(11)
N/A N/A Leisure 1,000 77,722 53,813
Total Common Equity/Interests $ 245,940 $ 237,840TOTAL EQUITY $ 245,940 $ 237,840
Total Controlled Investments $ 590,060 $ 582,147Total Investments—169.5%(6)(7) $ 3,458,752 $ 3,478,671Liabilities in Excess of Other Assets—(69.5)% $(1,427,061)Net Assets—100.0% $ 2,051,611

See notes to financial statements.77
APOLLO INVESTMENT CORPORATIONSCHEDULE OF INVESTMENTS (continued)
March 31, 2014(in thousands)
______________________(1) Fair value is determined in good faith by or under the direction of the Board of Directors of the Company (see note 2).(2) GS Prysmian Co-Invest L.P. and Fidji Luxco (BC) S.C.A. are EUR denominated investments. (3) The Company is the sole Limited Partner in GS Prysmian Co-Invest L.P.(4) Denotes investments in which we are an “Affiliated Person”, as defined in the 1940 Act, due to owning or holding the power to vote 5% or more of the
outstanding voting securities of the investment but not controlling the company. Fair value as of March 31, 2013 and March 31, 2014 along with transactions during the fiscal year ended March 31, 2014 in these Affiliated investments are as follows:
Name of Issue
Fair Valueat March31, 2013
GrossAdditions
GrossReductions
Change inUnrealizedGain (Loss)
Fair Value atMarch 31,
2014Net RealizedGain (Loss)
Interest/Dividend/
OtherIncome
Aventine Renewable Energy Holdings, Inc.,15.00% (12.00% Cash/3.00% PIK),9/23/16 $ 3,866 $ 85 $ (1,314) $ (232) $ 2,405 $ — $ 607
Aventine Renewable Energy Holdings, Inc.,10.50% Cash or 15.00% PIK, 9/22/17 9,682 1,965 (1,581) (1,182) 8,884 — 370
Aventine Renewable Energy Holdings, Inc.,25.00% PIK, 9/24/16 N/A 5,347 (1,578) — 3,769 — 1,044
Aventine Renewable Energy Holdings, Inc.,Common Stock 2,347 — (3,996) 1,748 99 — —
Aventine Renewable Energy Holdings, Inc.,Common Stock Warrants N/A 3,996 — (3,422) 574 — —
Golden Hill CLO I, LLC, Equity N/A 1,631 — (534) 1,097 — —Highbridge Loan Management 3-2014, Ltd.,
Class D Notes L+500, 1/18/25 N/A 4,638 — 42 4,680 — 49Highbridge Loan Management 3-2014, Ltd.,
Class E Notes L+600, 1/18/25 N/A 2,264 — 50 2,314 — 29Highbridge Loan Management 3-2014, Ltd.,
Subordinated Notes, 1/18/25 N/A 7,527 — (249) 7,278 — 96Highbridge Loan, Ltd., Preference Shares 6,174 6,655 (12,829) — — — 1,876Jamestown CLO I LTD, Class C L+400,
11/5/24 1,109 3 (1,027) (85) — 71 30Jamestown CLO I LTD, Class D L+550,
11/5/24 3,537 13 (3,386) (164) — 250 139Jamestown CLO I LTD, Subordinated
Notes, 11/5/24 13,568 — (10,501) 761 3,828 1,757 1,473Kirkwood Fund II LLC, Common Interest 43,144 — (41,067) (2,077) — — 5,923MCF CLO I LLC, Class E Notes, L+575,
4/20/23 12,273 52 — 32 12,357 — 854MCF CLO I LLC, Membership Interests 38,918 — (1,359) 2,832 40,391 — 8,108MCF CLO III LLC, Class E Notes L+445,
1/20/24 N/A 11,349 — (24) 11,325 — 165MCF CLO III LLC, Membership Interests,
1/20/24 N/A 39,183 — (917) 38,266 — 1,166Slater Mill Loan Fund LP, LP Certificates 6,951 — (896) 1,306 7,361 — 1,088
$ 141,569 $ 84,708 $ (79,534) $ (2,115) $ 144,628 $ 2,078 $ 23,017
______________
Gross additions includes increases in the cost basis of investments resulting from new portfolio investments, PIK interest or dividends, the accretion of discounts, the exchange of one or more existing securities for one or more new securities and the movement of an existing portfolio company into this category from a different category.
Gross reductions include decreases in the cost basis of investments resulting from principal collections related to investment repayments or sales, the amortization of premiums, the exchange of one or more existing securities for one or more new securities and the movement of an existing portfolio company out of this category into a different category.
As of March 31, 2014, the Company has a 13%, 26%, 100%, 9%, 97%, 98%, and 26% equity ownership interest in Aventine Renewable Energy Holdings, Inc., Highbridge Loan Management, Ltd, Golden Hill CLO I, LLC, Jamestown CLO I LTD, MCF CLO I LLC, MCF CLO III LLC, and Slater Mill Loan Fund LP, respectively. Investments that the Company owns greater than 25% of the equity and are shown in “Non-Controlled/Affiliated” have governing documents that preclude the Company from controlling management of the entity and therefore the Company has determined that the entity is not a controlled affiliate.

See notes to financial statements.78
APOLLO INVESTMENT CORPORATIONSCHEDULE OF INVESTMENTS (continued)
March 31, 2014(in thousands)
(5) Denotes investments in which we are deemed to exercise a controlling influence over the management or policies of a company, as defined in the 1940 Act, due to beneficially owning, either directly or through one or more controlled companies, more than 25% of the outstanding voting securities of the investment. Fair value as of March 31, 2013 and March 31, 2014 along with transactions during the fiscal year ended March 31, 2014 in these Controlled investments are as follows:
Name of Issue
Fair Valueat March 31,
2013
GrossAdditions
GrossReductions
Change inUnrealizedGain (Loss)
Fair Value atMarch 31,
2014
NetRealized
Gain (Loss)
Interest/Dividend/
Other IncomeAIC Credit Opportunity Fund, LLC
Common Equity $ 50,696 $ 20,387 $ (68,489) $ (2,594) $ — $ (2,338) $ 2,306 Generation Brands Holdings, Inc. (Quality
Home Brands), Basic Common Stock 432 — — 1,183 1,615 — — Generation Brands Holdings, Inc. (Quality
Home Brands), Series H Common Stock 360 — — 985 1,345 — — Generation Brands Holdings, Inc. (Quality
Home Brands), Series 2L CommonStock 1,760 — — 4,822 6,582 — —
Grand Prix Holdings, LLC, Series APreferred Interests, 12.00% PIK N/A N/A N/A N/A N/A 99 —
LVI Parent Corp. (LVI Services, Inc.),12.50%, 4/20/14 10,000 198 — 2 10,200 — 1,448
LVI Services, Inc., Common Stock 30,575 — — 3,445 34,020 — 153Merx Aviation Finance Holdings, LLC,
12.00%, 1/9/21 92,000 — (92,000) — — — 6,761Merx Aviation Finance Holdings, LLC,
12.00%, 2/1/21 5,303 — (5,303) — — — 392Merx Aviation Finance Holdings, LLC,
12.00%, 3/28/21 4,684 — (4,684) — — — 347Merx Aviation Finance Holdings, LLC,
12.00%, 6/25/21 N/A 13,500 (13,500) — — — 621Merx Aviation Finance Holdings, LLC,
12.00%, 7/25/21 N/A 14,600 (14,600) — — — 286Merx Aviation Finance Holdings, LLC,
12.00%, 8/19/21 N/A 4,000 (4,000) — — — 124Merx Aviation Finance Holdings, LLC,
12.00%, 9/12/21 N/A 4,600 (4,600) — — — 80Merx Aviation Finance Holdings, LLC,
12.00%, 10/28/21 N/A 31,150 (31,150) — — — 154Merx Aviation Finance Holdings II, LLC,
(Revolver) 12.00% Funded, 0.00%Unfunded, 10/31/18 N/A 282,334 — — 282,334 — 9,205
Merx Aviation Finance Holdings II, LLC,Partnership Interest 33,820 107,120 (2,358) 1,883 140,465 — —
Merx Aviation Finance Assets IrelandLimited, Letter of Credit, 2.25%,9/30/14 — — — — — — —
Merx Aviation Finance Assets IrelandLimited, Letter of Credit, 2.25%,9/30/14 — — — — — — —
PlayPower Holdings, Inc., 14.00% PIK,12/15/15 24,173 2,293 (27,577) 1,111 — 442 2,271
PlayPower, Inc., 12.50% PIK, 12/31/15 18,458 1,713 (20,550) 379 — 870 1,686PlayPower Holdings, Inc., Series A
Preferred, 14.00% PIK, 11/15/20 N/A 51,773 — — 51,773 — 3,303PlayPower Holdings, Inc., Common Stock 38,157 — — 15,656 53,813 — —
$ 310,418 $ 533,668 $ (288,811) $ 26,872 $ 582,147 $ (927) $ 29,137
______________Gross additions includes increases in the cost basis of investments resulting from new portfolio investments, PIK interest or dividends, the accretions
of discounts, the exchange of one or more existing securities for one or more new securities and the movement of an existing portfolio company into this category from a different category.

See notes to financial statements.79
APOLLO INVESTMENT CORPORATIONSCHEDULE OF INVESTMENTS (continued)
March 31, 2014(in thousands)
Gross reductions include decreases in the cost basis of investments resulting from principal collections related to investment repayments or sales, the amortization of premiums, the exchange of one or more existing securities for one or more new securities and the movement of an existing portfolio company out of this category into a different category.
As of March 31, 2014, the Company has a 28%, 33%, 100%, and 100% equity ownership interest in Generation Brands Holdings, Inc., LVI Parent Corp., Merx Aviation Finance Holdings II, LLC, and Playpower Holdings, Inc., respectively.
(6) Aggregate gross unrealized gain for federal income tax purposes is $124,819; aggregate gross unrealized loss for federal income tax purposes is $154,176. Net unrealized loss is $29,357 based on a tax cost of $3,508,028.
(7) Substantially all securities are pledged as collateral to our multicurrency revolving credit facility (the “Facility”). As such these securities are not available as collateral to our general creditors.
(8) The negative fair value is the result of the unfunded commitment/letter of credit being valued below par. (9) These securities are exempt from registration under Rule 144A of the Securities Act of 1933. These securities may be resold in transactions that are exempt
from registration, normally to qualified institutional buyers. (10) Denominated in USD unless otherwise noted, Euro (“€”), British Pound (“£”), and Canadian Dollar (“CAD”). (11) Non-income producing security.(12) Non-accrual status (see note 2). (13) The investment has a put option attached to it and the combined instrument has been recorded in its entirety at fair value as a hybrid instrument in
accordance with ASC 815-15-25-4 with subsequent changes in fair value charged or credited to investment gains/losses for each period. (14) Denotes debt securities where the Company owns multiple tranches of the same broad asset type but whose security characteristics differ. Such differences
may include level of subordination, call protection and pricing, and differing interest rate characteristics, among other factors. Such factors are usually considered in the determination of fair values.
(15) Investments that the Company has determined are not “qualifying assets” under Section 55(a) of the 1940 Act. Under the 1940 Act, we may not acquire any non-qualifying asset unless, at the time such acquisition is made, qualifying assets represent at least 70% of our total assets. The status of these assets under the 1940 Act are subject to change. The Company monitors the status of these assets on an ongoing basis.
(16) Denotes investments where the governing documents of the entity preclude the Company from controlling management of the entity and accordingly the Company has determined that the entity is not a controlled affiliate.
(17) The percentage is calculated over net assets.
N/A Not applicable.

See notes to financial statements.80
APOLLO INVESTMENT CORPORATIONSCHEDULE OF INVESTMENTS (continued)
March 31, 2014
Industry Classification
Percentage of TotalInvestments (atfair value) as ofMarch 31, 2014
Business Services 14.6%Aviation 12.2%Oil and Gas 11.8%Financial Services 7.4%Healthcare 6.6%Diversified Investment Vehicle 5.5%Distribution 4.9%Chemicals 4.2%Diversified Service 3.7%Insurance 3.5%Leisure 3.1%Environmental Services 2.5%Transportation 2.1%Mining 1.8%Containers, Packaging, and Glass 1.6%Telecommunications 1.5%Energy 1.3%Media 1.3%Buildings and Real Estate 1.2%Education 1.1%Restaurants 1.0%Diversified Natural Resources, Precious Metals and Minerals 1.0%Hotels, Motels, Inns and Gaming 0.9%Packaging 0.9%Broadcasting & Entertainment 0.8%Retail 0.7%Cargo Transport 0.6%Auto Sector 0.5%Consumer Products 0.4%Beverage, Food and Tobacco 0.3%Home and Office Furnishings and Durable Consumer Products 0.3%Aerospace and Defense 0.3%Grocery 0.2%Electronics 0.2%Manufacturing —%Total Investments 100.0%

See notes to financial statements.81
APOLLO INVESTMENT CORPORATIONNOTES TO FINANCIAL STATEMENTS
(in thousands except share and per share amounts)
Note 1. Organization
Apollo Investment Corporation (“Apollo Investment”, the “Company”, “AIC”, “we”, “us”, or “our”), a Maryland corporation incorporated on February 2, 2004, is a closed-end, externally managed, non-diversified management investment company that has elected to be treated as a business development company (“BDC”) under the Investment Company Act of 1940 (the “1940 Act”) and operate in a manner so as to qualify for the tax treatment applicable to RICs. In addition, for tax purposes we have elected to be treated as a regulated investment company (“RIC”), under the Internal Revenue Code of 1986, as amended (“the Code”). Our investment objective is to generate current income and capital appreciation. We invest primarily in various forms of debt investments, including secured and unsecured debt, loan investments, and/or equity in private middle-market companies. We may also invest in the securities of public companies and in structured products and other investments such as collateralized loan obligations and credit-linked notes ("CLOs" and "CLNs", respectively). Our portfolio is comprised primarily of investments in debt, including secured and unsecured debt of private middle-market companies that, in the case of senior secured loans, generally are not broadly syndicated and whose aggregate tranche size is typically less than $250 million. Our portfolio also includes equity interests such as common stock, preferred stock, warrants or options.
Apollo Investment commenced operations on April 8, 2004 when it received net proceeds of $870,000 from its initial public offering by selling 62 million shares of common stock at a price of $15.00 per share. Since then, and through March 31, 2015, we have raised approximately $2,210,099 in net proceeds from additional offerings of common stock.
Note 2. Significant Accounting Policies
The following is a summary of the significant accounting and reporting policies used in preparing the financial statements.
Basis of Presentation and Use of EstimatesThe accompanying financial statements have been prepared in conformity with accounting principles generally accepted in the United States of America ("GAAP"). The Company is an investment company following accounting and reporting guidance in Accounting Standards Codification ("ASC") 946. In accordance with Regulation S-X, the Company generally will not consolidate its interest in any company other than in investment company subsidiaries and controlled operating companies substantially all of whose business consists of providing services to the Company. Consequently, the Company has not consolidated special purpose entities through which the special purpose entity acquires and holds investments subject to financing with third parties. At March 31, 2015, the Company did not have any subsidiaries or controlled operating companies that were consolidated (see additional information within note 5).
The preparation of financial statements in conformity with GAAP requires management to make estimates and assumptions that affect the reported amount of assets and liabilities at the date of the financial statements and the reported amounts of income and expenses during the reported periods. Changes in the economic environment, financial markets and any other parameters used in determining these estimates could cause actual results to differ materially.
Cash and Cash EquivalentsThe Company defines cash equivalents as securities that are readily convertible into known amounts of cash and so near their maturity that they present insignificant risk of changes in value because of changes in interest rates. Generally, only securities with a maturity of three months or less from the date of purchase would qualify, with limited exceptions. The Company deems that certain U.S. Treasury bills, repurchase agreements and other high-quality, short-term debt securities would qualify as cash equivalents.
Fair Value MeasurementsThe Company follows guidance in ASC 820, Fair Value Measurement, where fair value is defined as the price that would be received to sell an asset or paid to transfer a liability in an orderly transaction between market participants at the measurement date. Fair value measurements are determined within a framework that establishes a three-tier hierarchy which maximizes the use of observable market data and minimizes the use of unobservable inputs to establish a classification of fair value measurements for disclosure purposes. Inputs refer broadly to the assumptions that market participants would use in pricing the asset or liability, including assumptions about risk, such as the risk inherent in a particular valuation technique used to measure fair value using a pricing model and/or the risk inherent in the inputs for the valuation technique. Inputs may be observable or unobservable. Observable inputs reflect the assumptions market participants would use in pricing the asset or liability based on market data obtained from sources independent of the Company. Unobservable inputs reflect the Company's own assumptions about the

APOLLO INVESTMENT CORPORATIONNOTES TO FINANCIAL STATEMENTS (continued)
(in thousands except share and per share amounts)
82
assumptions market participants would use in pricing the asset or liability based on the information available. The inputs or methodology used for valuing assets or liabilities may not be an indication of the risks associated with investing in those assets or liabilities. Under procedures established by our board of directors, we value investments, including certain secured debt, unsecured debt and other debt securities with maturities greater than 60 days, for which market quotations are readily available, at such market quotations (unless they are deemed not to represent fair value). We attempt to obtain market quotations from at least two brokers or dealers (if available, otherwise from a principal market maker or a primary market dealer or other independent pricing service). We utilize mid-market pricing as a practical expedient for fair value unless a different point within the range is more representative. If and when market quotations are unavailable or are deemed not to represent fair value, we typically utilize independent third party valuation firms to assist us in determining fair value. Accordingly, such investments go through our multi-step valuation process as described below. In each case, our independent third party valuation firms consider observable market inputs together with significant unobservable inputs in arriving at their valuation recommendations for such investments. Debt investments with remaining maturities of 60 days or less may each be valued at cost with interest accrued or discount amortized to the date of maturity, unless such valuation, in the judgment of our investment adviser, does not represent fair value. In this case such investments shall be valued at fair value as determined in good faith by or under the direction of our board of directors, using market quotations where available. Investments that are not publicly traded or whose market quotations are not readily available are valued at fair value as determined in good faith by or under the direction of our board of directors. Such determination of fair values may involve subjective judgments and estimates.
With respect to investments for which market quotations are not readily available or when such market quotations are deemed not to represent fair value, our board of directors has approved a multi-step valuation process each quarter, as described below:
(1) our quarterly valuation process begins with each portfolio company or investment being initially valued by the investment professionals of our investment adviser which is responsible for the portfolio investment;
(2) preliminary valuation conclusions are then documented and discussed with senior management of our investment adviser;
(3) independent valuation firms are engaged by our board of directors to conduct independent appraisals by reviewing our investment adviser’s preliminary valuations and then making their own independent assessment;
(4) the audit committee of the board of directors reviews the preliminary valuation of our investment adviser and the valuation prepared by the independent valuation firm and responds to the valuation recommendation of the independent valuation firm to reflect any comments; and
(5) the board of directors discusses valuations and determines in good faith the fair value of each investment in our portfolio based on the input of our investment adviser, the applicable independent valuation firm, third party pricing services and the audit committee.
Investments in all asset classes are valued utilizing a market approach, an income approach, or both approaches, as appropriate. The market approach uses prices and other relevant information generated by market transactions involving identical or comparable assets or liabilities (including a business). The income approach uses valuation techniques to convert future amounts (for example, cash flows or earnings) to a single present amount (discounted). The measurement is based on the value indicated by current market expectations about those future amounts. In following these approaches, the types of factors that we may take into account in fair value pricing our investments include, as relevant: available current market data, including relevant and applicable market trading and transaction comparables, applicable market yields and multiples, security covenants, seniority of investment in the investee company's capital structure, call protection provisions, information rights, the nature and realizable value of any collateral, the portfolio company’s ability to make payments, its earnings and discounted cash flows, the markets in which the portfolio company does business, comparisons of financial ratios of peer companies that are public, M&A comparables, our principal market (as the reporting entity) and enterprise values, among other factors. When readily available, broker quotations and/or quotations provided by pricing services are considered as an input in the valuation process. As of March 31, 2015, there has been no change to the Company’s valuation techniques and related inputs considered in the valuation process.
ASC 820 classifies the inputs used to measure these fair values into the following hierarchy:
Level 1: Quoted prices in active markets for identical assets or liabilities, accessible by the Company at the measurement date.
Level 2: Quoted prices for similar assets or liabilities in active markets, or quoted prices for identical or similar assets or liabilities in markets that are not active, or other observable inputs other than quoted prices.

APOLLO INVESTMENT CORPORATIONNOTES TO FINANCIAL STATEMENTS (continued)
(in thousands except share and per share amounts)
83
Level 3: Unobservable inputs for the asset or liability.
In all cases, the level in the fair value hierarchy within which the fair value measurement in its entirety falls has been determined based on the lowest level of input that is significant to the fair value measurement. Our assessment of the significance of a particular input to the fair value measurement in its entirety requires judgment and considers factors specific to each investment. The level assigned to the investment valuations may not be indicative of the risk or liquidity associated with investing in such investments. Because of the inherent uncertainties of valuation, the values reflected in the financial statements may differ materially from the values that would be received upon an actual disposition of such investments.
Realized Gains and LossesSecurity transactions are accounted for on the trade date. Realized gains or losses on investments are calculated by using the specific identification method. Securities that have been called by the issuer are recorded on the call effective date at the call price.
Investment Income RecognitionThe Company records interest and dividend income, adjusted for amortization of premium and accretion of discount, on an accrual basis. Some of our loans and other investments, including certain preferred equity investments, may have contractual payment-in-kind (“PIK”) interest or dividends. PIK interest and dividends computed at the contractual rate are accrued into income and reflected as receivable up to the capitalization date. PIK investments offer issuers the option at each payment date of making payments in cash or in additional securities. When additional securities are received, they typically have the same terms, including maturity dates and interest rates as the original securities issued. On these payment dates, the Company capitalizes the accrued interest or dividends receivable (reflecting such amounts as the basis in the additional securities received). PIK generally becomes due at maturity of the investment or upon the investment being called by the issuer. At the point the Company believes PIK is not expected to be realized, the PIK investment will be placed on non-accrual status. When a PIK investment is placed on non-accrual status, the accrued, uncapitalized interest or dividends are reversed from the related receivable through interest or dividend income, respectively. The Company does not reverse previously capitalized PIK interest or dividends. Upon capitalization, PIK is subject to the fair value estimates associated with their related investments. PIK investments on non-accrual status are restored to accrual status if the Company believes that PIK is expected to be realized.
Investments that are expected to pay regularly scheduled interest and/or dividends in cash are generally placed on non-accrual status when principal or interest/dividend cash payments are past due 30 days or more and/or when it is no longer probable that principal or interest/dividend cash payments will be collected. Such non-accrual investments are restored to accrual status if past due principal and interest or dividends are paid in cash, and in management’s judgment, are likely to continue timely payment of their remaining interest or dividend obligations. Interest or dividend cash payments received on non-accrual designated investments may be recognized as income or applied to principal depending upon management’s judgment.
Loan origination fees, original issue discount, and market discounts are capitalized and amortized into income using the interest method or straight-line, as applicable. Upon the prepayment of a loan, any unamortized loan origination fees, OID, or market discounts are recorded as interest income. We record prepayment premiums on loans and other investments as interest income when earned. Other income generally includes amendment fees, bridge fees, and structuring fees, which are recorded when earned.
The Company records as interest or dividend income the accretable yield from its beneficial interests in structured products such as CLOs and CLNs based upon a number of cash flow assumptions that are subject to uncertainties and contingencies. Such assumptions include the rate and timing of principal and interest receipts (which may be subject to prepayments and defaults) of the underlying pools of assets. These assumptions are updated on at least a quarterly basis to reflect changes related to a particular security, actual historical data, and market changes. A structured product investment typically has an underlying pool of assets. Payments on structured product investments are payable solely from the cash flows from such assets. As such, any unforeseen event in these underlying pools of assets might impact the expected recovery of principal and future accrual of income.
ExpensesExpenses include management fees, performance-based incentive fees, insurance expenses, administrative service fees, legal fees, directors' fees, audit and tax service expenses, third-party valuation fees, and other general and administrative expenses. Expenses are recognized on an accrual basis.

APOLLO INVESTMENT CORPORATIONNOTES TO FINANCIAL STATEMENTS (continued)
(in thousands except share and per share amounts)
84
Dividends to Common StockholdersDividends and distributions to common stockholders are recorded as of the record date. The amount to be paid out as dividends is determined by the board of directors each quarter. Net realized capital gains, if any, are generally distributed or deemed distributed at least annually.
Income TaxesThe Company complies with the applicable provisions of the Code pertaining to regulated investment companies that make distributions of taxable income sufficient to relieve it of substantially all federal income taxes. The Company, at its discretion, may carry forward taxable income in excess of calendar year distributions and pay a 4% excise tax on this income. The Company will accrue excise tax on estimated excess taxable income, if any, as required.
Book and tax basis differences relating to stockholder dividends and distributions and other permanent book and tax differences are reclassified among the Company’s capital accounts. In addition, the character of income and gains to be distributed is determined in accordance with income tax regulations that may differ from GAAP.
Foreign Currency The accounting records of the Company are maintained in U.S. dollars. All assets and liabilities denominated in foreign currencies are translated into U.S. dollars based on the rate of exchange of such currencies against U.S. dollars on the date of valuation. The Company does not isolate that portion of the results of operations resulting from changes in foreign exchange rates on investments from the fluctuations arising from changes in market prices of securities held. The Company’s investments in foreign securities may involve certain risks, including without limitation: foreign exchange restrictions, expropriation, taxation or other political, social or economic risks, all of which could affect the market and/or credit risk of the investment. In addition, changes in the relationship of foreign currencies to the U.S. dollar can significantly affect the value of these investments and therefore the earnings of the Company.
Investment TransactionsFor the years ended March 31, 2015, 2014, and 2013 purchases of investments on a trade date basis were $2,211,081, $2,816,149 and $1,537,366, respectively. For the years ended March 31, 2015, 2014, and 2013 sales of investments on a trade date basis were $2,250,782, $2,322,189, and $1,337,431, respectively.
Equity Offering ExpensesThe Company records expenses related to shelf filings and applicable offering costs as deferred financing costs in the Statement of Assets and Liabilities. To the extent such expenses relate to equity offerings, these expenses are charged as a reduction of capital upon utilization, in accordance with ASC 946-20-25.
Debt Issuance CostsThe Company records origination and other expenses related to its debt obligations as deferred financing costs in the Statement of Assets and Liabilities. These expenses are deferred and amortized using the straight-line method over the stated life of the obligation, which approximates the effective yield method.
Derivative InstrumentsThe Company may make investments in derivative instruments. The derivative instruments are fair valued with changes to the fair value reflected in net unrealized gain/loss during the reporting period and recorded within realized gain/loss upon exit and settlement of the contract. The accrual of periodic payment settlements is recorded in net change in unrealized gain/loss and subsequently recorded as net realized gain or loss on the interest settlement date.
The Company may enter into forward exchange contracts in order to hedge against foreign currency risk. These contracts are marked-to-market by recognizing the difference between the contract exchange rate and the current market rate as unrealized gain or loss. Realized gains or losses are recognized when contracts are settled.
Recent Accounting PronouncementsIn June 2013, the FASB issued guidance to change the assessment of whether an entity is an investment company by developing a new two-tiered approach that requires an entity to possess certain fundamental characteristics while allowing judgment in assessing certain typical characteristics. The fundamental characteristics that an investment company is required to have include the following:

APOLLO INVESTMENT CORPORATIONNOTES TO FINANCIAL STATEMENTS (continued)
(in thousands except share and per share amounts)
85
(1) it obtains funds from one or more investors and provides the investor(s) with investment management services; (2) it commits to its investor(s) that its business purpose and only substantive activities are investing the funds solely for returns from capital appreciation, investment income or both; and (3) it does not obtain returns or benefits from an investee or its affiliates that are not normally attributable to ownership interests. The typical characteristics of an investment company that an entity should consider before concluding whether it is an investment company include the following: (1) it has more than one investment; (2) it has more than one investor; (3) it has investors that are not related parties of the parent or the investment manager; (4) it has ownership interests in the form of equity or partnership interests; and (5) it manages substantially all of its investments on a fair value basis. The new approach requires an entity to assess all of the characteristics of an investment company and consider its purpose and design to determine whether it is an investment company. The guidance includes disclosure requirements about an entity’s status as an investment company and financial support provided or contractually required to be provided by an investment company to its investees. The guidance is effective for interim and annual reporting periods in fiscal years beginning after December 15, 2013. Earlier application is prohibited. This guidance did not have a material impact on the Company's financial statements.
In May 2014, the FASB issued guidance to establish a comprehensive and converged standard on revenue recognition to enable financial statement users to better understand and consistently analyze an entity’s revenue across industries, transactions, and geographies. The core principle of the new guidance is that an entity should recognize revenue to depict the transfer of promised goods or services to customers in an amount that reflects the consideration to which the entity expects to be entitled in exchange for those goods or services. To achieve that core principle, an entity should apply the following steps: (1) identify the contract(s) with a customer, (2) identify the performance obligations in the contract, (3) determine the transaction price, (4) allocate the transaction price to the performance obligations in the contract, and (5) recognize revenue when (or as) the entity satisfies a performance obligation. The new guidance also specifies the accounting for certain costs to obtain or fulfill a contract with a customer. The new guidance requires improved disclosures to help users of financial statements better understand the nature, amount, timing, and uncertainty of revenue that is recognized. Qualitative and quantitative information is required to be disclosed about: (1) contracts with customers, (2) significant judgments and changes in judgments, and (3) assets recognized from costs to obtain or fulfill a contract. The new guidance will apply to all entities. The guidance is effective for interim and annual reporting periods in fiscal years beginning after December 15, 2016. Early application is not permitted. The Company is in the process of evaluating the impact that this guidance will have on its financial statements.
In February 2015, the FASB issued new guidance which changes the analysis that a reporting entity must perform to determine whether it should consolidate certain types of legal entities. Existing guidance includes different requirements for performing a consolidation analysis if, among other factors, the entity under evaluation is any one of the following: (1) a legal entity that qualifies for the indefinite deferral under the amended consolidation rules, (2) a legal entity that is within the scope of the amended consolidation rules, or (3) a limited partnership or similar entity that is considered a voting interest entity. Under the new guidance, all reporting entities are within the scope of the new standard, including limited partnerships and similar legal entities, unless a scope exception applies. The presumption that a general partner controls a limited partnership has been eliminated. In addition, fees paid to decision makers that meet certain conditions (e.g., are both customary and commensurate with the level of effort required for the services provided) no longer cause decision makers to consolidate variable interest entities (each a "VIE") in certain instances. The new guidance places more emphasis in the consolidation evaluation on variable interests other than the fee arrangements such as principal investment risk (for example, debt or equity interests), guarantees of the value of the assets or liabilities of the VIE, written put options on the assets of the VIE, or similar obligations, including some liquidity commitments or agreements (explicit or implicit). Additionally, the new guidance reduces the extent to which related party arrangements cause an entity to be considered a primary beneficiary. The indefinite deferral of the amended consolidation rules for certain investment funds has been eliminated and a scope exception from the new consolidation standard has been added for reporting entities with interests in legal entities that are required to comply with or operate in accordance with requirements that are similar to those in Rule 2a-7 of the Investment Company Act of 1940 for registered money market funds. The guidance is effective for interim and annual reporting periods in fiscal years beginning after December 15, 2015. Early adoption is permitted, including adoption in an interim period, and adjustments should be reflected as of the beginning of the fiscal year that includes that interim period. A reporting entity may apply the new guidance using either a modified retrospective approach by recording a cumulative-effect adjustment to equity as of the beginning of the fiscal year of adoption or by applying the amendments retrospectively. The Company is in the process of evaluating the impact that this new guidance will have on its financial statements.
In April 2015, the FASB issued guidance to simplify the presentation of debt issuance costs. The guidance requires that debt issuance costs related to a recognized debt liability be presented in the balance sheet as a direct deduction from the carrying amount of that debt liability (i.e., versus being capitalized as an asset and amortized as required under existing guidance), consistent with

APOLLO INVESTMENT CORPORATIONNOTES TO FINANCIAL STATEMENTS (continued)
(in thousands except share and per share amounts)
86
debt discounts. The recognition and measurement guidance for debt issuance costs are not affected by the new guidance (i.e., debt issuance costs will continue to be amortized as an increase to interest expense). The guidance is effective for interim and annual reporting periods in fiscal years beginning after December 15, 2015. Early adoption is permitted for financial statements that have not been previously issued. An entity should apply the new guidance on a retrospective basis, wherein the balance sheet of each individual period presented should be adjusted to reflect the period-specific effects of applying the new guidance. The Company is in the process of evaluating the impact that this new guidance will have on its financial statements.
Note 3. Agreements
The Company has an Investment Advisory and Management Agreement (the “Investment Advisory Agreement”) with Apollo Investment Management, L.P. (the “Investment Adviser” or “AIM”), under which the Investment Adviser, subject to the overall supervision of our board of directors, manages the day-to-day operations of, and provides investment advisory services to the Company. For providing these services, the Investment Adviser receives a fee from the Company, consisting of two components — a base management fee and a performance-based incentive fee. The base management fee is determined by taking the average value of our gross assets, net of the average of any payable for cash equivalents at the end of the two most recently completed calendar quarters, calculated at an annual rate of 2.00%. The incentive fee has two parts, as follows: one part is calculated and payable quarterly in arrears based on our pre-incentive fee net investment income for the immediately preceding calendar quarter. For this purpose, pre-incentive fee net investment income means interest income, dividend income and any other income including any other fees (other than fees for providing managerial assistance), such as commitment, origination, structuring, diligence and consulting fees or other fees that we receive from portfolio companies accrued during the calendar quarter, minus our operating expenses for the quarter (including the base management fee, any expenses payable under an administration agreement (the “Administration Agreement”) between the Company and Apollo Investment Administration, LLC (the “Administrator”), and any interest expense and dividends paid on any issued and outstanding preferred stock, but excluding the incentive fee). Pre-incentive fee net investment income does not include any realized capital gains computed net of all realized capital losses and unrealized capital depreciation. Pre-incentive fee net investment income, expressed as a rate of return on the value of our net assets at the end of the immediately preceding calendar quarter, is compared to the rate of 1.75% per quarter (7% annualized). For the period between April 2, 2012 and March 31, 2016, AIM has agreed to voluntarily waive the management and incentive fees on the common shares issued on April 2, 2012 and May 20, 2013.
The Investment Adviser has also entered into an investment sub-advisory agreement with CION Investment Corporation ("CION") (the "Sub-Advisory Agreement") under which AIM receives management and incentive fees from CION in connection with the investment advisory services provided. For the period between April 1, 2014 and March 31, 2016, the Investment Adviser has agreed to waive all base management fees receivable under the Investment Advisory Agreement with the Company in the amount equal to the amount actually received by AIM from CION, less the fully allocated incremental expenses accrued by AIM.
The Company pays the Investment Adviser an incentive fee with respect to our pre-incentive fee net investment income in each calendar quarter as follows: (1) no incentive fee in any calendar quarter in which our pre-incentive fee net investment income does not exceed 1.75%, which we commonly refer to as the performance threshold; (2) 100% of our pre-incentive fee net investment income with respect to that portion of such pre-incentive fee net investment income, if any, that exceeds 1.75% but does not exceed 2.1875% in any calendar quarter; and (3) 20% of the amount of our pre-incentive fee net investment income, if any, that exceeds 2.1875% in any calendar quarter. These calculations are appropriately prorated for any period of less than three months. The effect of the fee calculation described above is that if pre-incentive fee net investment income is equal to or exceeds 2.1875%, the Investment Adviser will receive a fee of 20% of our pre-incentive fee net investment income for the quarter.
The second part of the incentive fee is determined and payable in arrears as of the end of each calendar year (or upon termination of the Investment Advisory Agreement, as of the termination date) and will equal 20% of our cumulative realized capital gains less cumulative realized capital losses, unrealized capital loss (unrealized loss on a gross investment-by-investment basis at the end of each calendar year) and all capital gains upon which prior performance-based capital gains incentive fee payments were previously made to the Investment Adviser. For accounting purposes only, we are required under GAAP to accrue a theoretical capital gains incentive fee based upon net realized capital gains and unrealized capital gain and loss on investments held at the end of each period.The accrual of this theoretical capital gains incentive fee assumes all unrealized capital gain and loss is realized in order to reflect a theoretical capital gains incentive fee that would be payable to the Investment Adviser at each measurement date. There was no accrual for theoretical capital gains incentive fee for the fiscal years ended March 31, 2015, 2014 and 2013. It should be noted that a fee so calculated and accrued would not be payable under the Investment Advisers Act of 1940 (“Advisers

APOLLO INVESTMENT CORPORATIONNOTES TO FINANCIAL STATEMENTS (continued)
(in thousands except share and per share amounts)
87
Act”) or the Investment Advisory Agreement, and would not be paid based upon such computation of capital gains incentive fees in subsequent periods. Amounts actually paid to the Investment Adviser will be consistent with the Advisers Act and formula reflected in the Investment Advisory Agreement which specifically excludes consideration of unrealized capital gain.
For the time period between April 1, 2013 and March 31, 2016, AIM has agreed to be paid the portion of the performance-based incentive fee that is attributable to deferred interest, such as PIK, when the Company receives such interest in cash. The accrual of incentive fees shall be reversed if such interest is reversed in connection with any write off or similar treatment of the investment. Upon payment of the deferred incentive fee, AIM will also receive interest on the deferred interest at an annual rate of 3.25% for the period between the date in which the incentive fee is earned and the date of payment.
For the fiscal years ended March 31, 2015, 2014 and 2013, the Company recognized $73,604, $62,819 and $55,717, respectively, of base management fees and $53,179, $46,924 and $41,144, respectively, of performance-based incentive fees. For the fiscal years ended March 31, 2015, 2014 and 2013, total management fees waived were $9,407, $6,960, and $1,602. For the fiscal years ended March 31, 2015, 2014 and 2013, total incentive fees waived were $6,208, $5,132, and $1,183.
The amount of the deferred incentive fees on PIK income for the fiscal years ended March 31, 2015, 2014 and 2013, are $5,863, $3,898, and $3,935, respectively. The cumulative deferred incentive fee payable on PIK income included in management and performance-based incentive fee payable line of the Statement of Assets and Liabilities at March 31, 2015, 2014 and 2013 is $12,671, $6,936, and $3,935, respectively.
The Company has also entered into an Administration Agreement with the Administrator under which the Administrator provides administrative services for the Company. For providing these services, facilities and personnel, the Company reimburses the Administrator for the allocable portion of overhead and other expenses incurred and requested to be reimbursed by the Administrator in performing its obligations under the Administration Agreement. The expenses include rent and the Company’s allocable portion of its chief financial officer, chief compliance officer, and their respective staffs. The Administrator will also provide, on our behalf, managerial assistance to those portfolio companies to which the Company is required to provide such assistance. For the fiscal years ended March 31, 2015, 2014 and 2013 the Company recognized expenses under the Administration Agreement of $5,850, $5,600 and $4,389, respectively.
Merx Aviation Finance, LLC (“Merx”), a wholly-owned portfolio company of the Company, has also entered into an administration agreement (“Merx Administration Agreement”) with the Administrator under which the Administrator provides administrative services to Merx for an annual fee of $150. The fee received from Merx by the Company is included in expense reimbursements in the Statement of Operations. For the fiscal year ended March 31, 2015, 2014, and 2013 the Company recognized expense reimbursements of $150, $0, and $0 respectively, under the Merx Administration Agreement.
The Company has also entered into an expense reimbursement agreement with Merx Aviation Finance Assets Ireland Limited, a affiliate of Merx that will reimburse the Company for reasonable out-of-pocket expenses incurred, including any interest, fees or other amounts incurred by the Company in connection with letters of credit issued on its behalf. For the fiscal years ended March 31, 2015, 2014 and 2013, the Company recognized expenses that were reimbursed under the expense reimbursement agreement of $82, $49, and $0 respectively.

APOLLO INVESTMENT CORPORATIONNOTES TO FINANCIAL STATEMENTS (continued)
(in thousands except share and per share amounts)
88
Note 4. Earnings Per Share
The following table sets forth the computation of basic and diluted earnings (loss) per share, pursuant to ASC 260-10, for the fiscal years ended March 31, 2015, 2014 and 2013, respectively:
Year Ended March 31,2015 2014 2013
Earnings per share — basicNumerator for increase in net assets per share: $ 75,422 $ 270,872 $ 104,471Denominator for basic weighted average shares: 236,741,351 222,800,255 202,875,329Basic earnings per share: $ 0.32 $ 1.21 $ 0.51Earnings per share — diluted*Numerator for increase in net assets per share: $ 75,422 $ 270,872 $ 104,471Adjustment for interest on convertible notes and for incentive fees, net 10,148 10,138 10,308Numerator for increase in net assets per share, as adjusted $ 85,570 $ 281,010 $ 114,779Denominator for weighted average shares, as adjusted for dilutive effect ofconvertible notes: 251,289,451 237,348,355 217,423,429Diluted earnings per share: $ 0.32 $ 1.18 $ 0.51
* In applying the if-converted method, conversion is not assumed for purposes of computing diluted EPS if the effect would be anti-dilutive. For the fiscal yearended March 31, 2014, there was no anti-dilution. For the fiscal years ended March 31, 2015 and March 31, 2013, anti-dilution would total $0.02 and $0.02, respectively.
Note 5. Investments
AIC Credit Opportunity Fund LLC — We owned all of the common member interests in AIC Credit Opportunity Fund LLC (“AIC Holdco”). AIC Holdco was formed for the purpose of holding various financed investments. AIC Holdco wholly owned three special purpose entities, each of which in 2008 acquired directly or indirectly an investment in a particular security from an unaffiliated entity that provided leverage for the investment as part of the sale. As of March 31, 2014, the three special purpose entities along with AIC Holdco, were dissolved. Each of these transactions is described in more detail below together with summary financial statements.
In June 2008 we invested through AIC Holdco $39,500 in AIC (FDC) Holdings LLC (“Apollo FDC”). Apollo FDC used the proceeds to purchase a Junior Profit-Participating Note due 2013 in principal amount of $39,500 (the “Junior Note”) issued by Apollo I Trust (the “Trust”). The Trust also issued a Senior Floating Rate Note due 2013 (the “Senior Note”) to an unaffiliated third party in principal amount of $39,500 paying interest at the London Interbank Offered Rate (“LIBOR”) plus 1.50%, increasing over time to LIBOR plus 2.0%. The Trust used the aggregate $79,000 proceeds to acquire $100,000 face value of a senior subordinated loan of First Data Corporation (the “FDC Loan”) due 2016. The FDC Loan pays interest at 11.25% per year. The Junior Note of the Trust owned by Apollo FDC pays to Apollo FDC all of the interest and other proceeds received by the Trust on the FDC Loan after satisfying the Trust’s obligations on the Senior Note. The holder of the Senior Note has no recourse to Apollo FDC, AIC Holdco or us with respect to any interest on, or principal of, the Senior Note. However, if the value of the FDC Loan held by the Trust declines sufficiently, the investment would be unwound unless Apollo FDC posts additional collateral for the benefit of the Senior Note. During the quarter ended June 30, 2013, we unwound the transaction by investing $20,386 into the Trust which then repaid the Senior Note. Subsequent to the repayment of the Senior Note, $10,993 of face value of the FDC Loan was prepaid by First Data Corporation resulting in a distribution of $11,556 to the Company. The remaining FDC Loan, which consisted of $41,862 of face value, was transferred to the Company at an accreted cost of $38,728 with a fair value of $40,397 on the transfer date and the Trust was closed.
In the second of these investments, in June 2008 we invested through AIC Holdco $11,375 in AIC (TXU) Holdings LLC (“Apollo TXU”). Apollo TXU acquired exposure to $50,000 notional amount of a LIBOR plus 3.5% senior secured delayed draw term loan of Texas Competitive Electric Holdings (“TXU”) due 2014 through a non-recourse total return swap (the “TRS”) with an unaffiliated third party expiring on October 10, 2013. Pursuant to such delayed draw term loan, Apollo TXU pays an unaffiliated third-party interest at LIBOR plus 1.5% and generally receives all proceeds due under the delayed draw term loan of TXU (the “TXU Term Loan”). Like Apollo FDC, Apollo TXU is entitled to 100% of any realized appreciation in the TXU Term Loan and, since the TRS is a non-recourse arrangement, Apollo TXU is exposed only up to the amount of its investment in the TRS, plus any additional margin we decide to post, if any, during the term of the financing. The TRS does not constitute a senior security or a borrowing of Apollo TXU. In connection with the amendment and extension of the TXU Term Loan in April 2011, for which Apollo TXU received a consent fee along with an increase in the rate of the TXU Term Loan to LIBOR plus 4.5%, Apollo TXU extended its

APOLLO INVESTMENT CORPORATIONNOTES TO FINANCIAL STATEMENTS (continued)
(in thousands except share and per share amounts)
89
TRS to 2016 at a rate of LIBOR plus 2.0%. During the year ended March 31, 2014, Apollo TXU terminated the entire TRS resulting in a realized loss of $10,314. The excess collateral posted was returned to Apollo TXU.
In the third of these investments, in September 2008 we invested through AIC Holdco $10,022 in AIC (Boots) Holdings, LLC (“Apollo Boots”). Apollo Boots acquired €23,383 and £12,465 principal amount of senior term loans of AB Acquisitions Topco 2 Limited, a holding company for the Alliance Boots group of companies (the “Boots Term Loans”), out of the proceeds of our investment and a multicurrency $40,876 equivalent non-recourse loan to Apollo Boots (the “Acquisition Loan”) by an unaffiliated third party that was scheduled to mature in September 2013 and paid interest at LIBOR plus 1.25% or, in certain cases, the higher of the Federal Funds Rate plus 0.50% or the lender’s prime-rate. The Boots Term Loans paid interest at the rate of LIBOR plus 3% per year and was scheduled to mature in June 2015. During the fiscal year ended March 31, 2014, Apollo Boots sold the entire position of the Boots Term Loans in the amount of €23,383 and £12,465 of principal.
We do not consolidate AIC Holdco or its wholly owned subsidiaries. Our investment in AIC Holdco was valued in accordance with our normal valuation procedures and was based on the values of the underlying assets held by each special purpose entities net of associated liabilities.
As of March 31, 2015 and March 31, 2014, the consolidated AIC Holdco had no outstanding assets and liabilities. Below is summarized financial information for AIC Holdco for the fiscal year ended March 31, 2014. There was no operating activity during the fiscal year ended March 31, 2015.
Fiscal Year EndMarch 31, 2014
Fiscal Year EndMarch 31, 2013
Net Operating Income (Loss)Apollo FDC(1) $ 1,559 $ 5,388Apollo TXU(1) 692 1,237Apollo Boots(1) 8 745Other 4 (5)
Total Operating Income $ 2,263 $ 7,365Net Realized Gain (Loss)
Apollo FDC $ 9,634 $ —Apollo TXU (10,314) —Apollo Boots — 659
Total Net Realized Loss $ (680) $ 659Net Change in Unrealized Loss
Apollo FDC $ (11,509) $ 5,034Apollo TXU 8,936 7,110Apollo Boots — (244)
Total Net Change in Unrealized Gain (Loss) $ (2,573) $ 11,900Net Income (Loss)(2)
Apollo FDC $ (316) $ 10,422Apollo TXU (686) 8,347Apollo Boots 8 1,160Other 4 (5)
Total Net Loss $ (990) $ 19,924
____________________(1) In the case of Apollo FDC, net operating income consists of interest income on the Junior Note less interest paid on the
senior note together with immaterial administrative expenses. In the case of Apollo TXU, net operating income consists of net payments from the swap counterparty of Apollo TXU’s obligation to pay interest and its right to receive the proceeds in respect of the reference asset, together with immaterial administrative expenses. In the case of AIC Boots, net operating

APOLLO INVESTMENT CORPORATIONNOTES TO FINANCIAL STATEMENTS (continued)
(in thousands except share and per share amounts)
90
income consists of interest income on the Boots Term Loans, less interest payments on the Acquisition Loan together with immaterial administrative expenses. There are no management or incentive fees.
(2) Net loss is the sum of operating income, realized gain (loss) and net change in unrealized gain (loss).
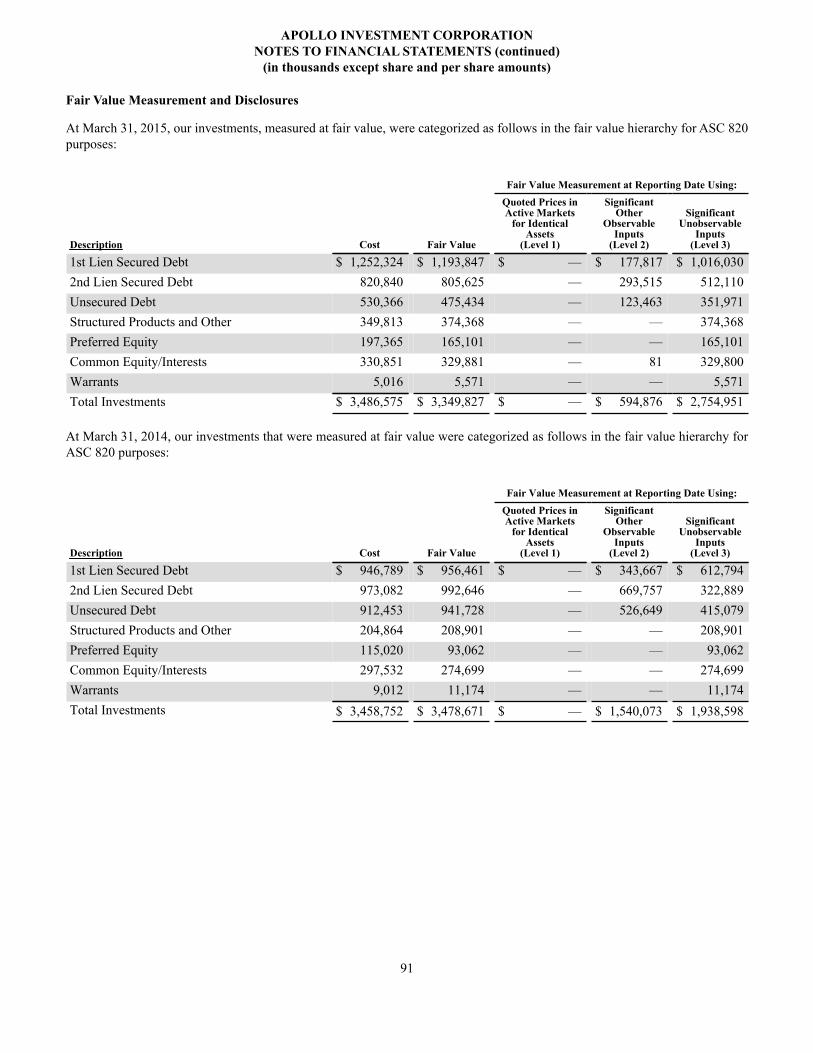
APOLLO INVESTMENT CORPORATIONNOTES TO FINANCIAL STATEMENTS (continued)
(in thousands except share and per share amounts)
91
Fair Value Measurement and Disclosures
At March 31, 2015, our investments, measured at fair value, were categorized as follows in the fair value hierarchy for ASC 820 purposes:
Fair Value Measurement at Reporting Date Using:
Description Cost Fair Value
Quoted Prices inActive Markets
for IdenticalAssets
(Level 1)
SignificantOther
ObservableInputs
(Level 2)
SignificantUnobservable
Inputs(Level 3)
1st Lien Secured Debt $ 1,252,324 $ 1,193,847 $ — $ 177,817 $ 1,016,0302nd Lien Secured Debt 820,840 805,625 — 293,515 512,110Unsecured Debt 530,366 475,434 — 123,463 351,971Structured Products and Other 349,813 374,368 — — 374,368Preferred Equity 197,365 165,101 — — 165,101Common Equity/Interests 330,851 329,881 — 81 329,800Warrants 5,016 5,571 — — 5,571Total Investments $ 3,486,575 $ 3,349,827 $ — $ 594,876 $ 2,754,951
At March 31, 2014, our investments that were measured at fair value were categorized as follows in the fair value hierarchy for ASC 820 purposes:
Fair Value Measurement at Reporting Date Using:
Description Cost Fair Value
Quoted Prices inActive Markets
for IdenticalAssets
(Level 1)
SignificantOther
ObservableInputs
(Level 2)
SignificantUnobservable
Inputs(Level 3)
1st Lien Secured Debt $ 946,789 $ 956,461 $ — $ 343,667 $ 612,7942nd Lien Secured Debt 973,082 992,646 — 669,757 322,889Unsecured Debt 912,453 941,728 — 526,649 415,079Structured Products and Other 204,864 208,901 — — 208,901Preferred Equity 115,020 93,062 — — 93,062Common Equity/Interests 297,532 274,699 — — 274,699Warrants 9,012 11,174 — — 11,174Total Investments $ 3,458,752 $ 3,478,671 $ — $ 1,540,073 $ 1,938,598

APOLLO INVESTMENT CORPORATIONNOTES TO FINANCIAL STATEMENTS (continued)
(in thousands except share and per share amounts)
92
The following chart shows the components of change in our investments categorized as Level 3, for the fiscal year ended March 31, 2015.
Fair Value Measurements Using Significant Unobservable Inputs (Level 3)*1st LienSecuredDebt (2)
2nd LienSecuredDebt (2)
UnsecuredDebt
StructuredProducts
and OtherPreferred
Equity
CommonEquity/
Interests Warrants Total
Beginning Balance,March 31, 2014 $ 612,794 $ 322,889 $ 415,079 $208,901 $ 93,062 $274,699 $ 11,174 $1,938,598Total realized gains(losses) included inearnings 625 211 (1,961) (276) — (3,558) 9,713 4,754Total change inunrealized gain (loss)included in earnings (11,426) (8,848) (19,990) 20,517 (10,306) 21,782 (1,607) (9,878)Net amortization oninvestments 4,511 1,365 821 343 — — — 7,040Purchases, includingcapitalized PIK(3) 634,773 304,217 124,814 180,932 83,634 57,108 — 1,385,478Sales(3) (253,815) (167,904) (186,014) (36,049) (1,289) (20,231) (13,709) (679,011)Transfers out of Level 3(1) (14,601) — (68) — — — — (14,669)Transfers into Level 3(1) 43,169 60,180 19,290 — — — — 122,639Ending Balance, March31, 2015 $1,016,030 $ 512,110 $ 351,971 $374,368 $165,101 $329,800 $ 5,571 $2,754,951The amount of totalgains or losses for theperiod included inearnings attributable tothe change in unrealizedgain (loss) relating toour Level 3 assets stillheld at the reporting dateand reported within thenet change in unrealizedgain (loss) oninvestments in ourStatement of Operations. $ (25,002) $ (7,991) $ (27,254) $ 22,214 $ (10,306) $ 29,927 $ (5,028) $ (23,440)
____________________(1) Transfers out of Level 3 are due to an increase in the availability of qualified observable inputs and transfers into Level 3
are due to a decrease in the availability of qualified observable inputs as assessed by the Adviser. Transfers are assumed to have occurred at the end of the period. There were no transfers between Level 1 and Level 2 fair value measurements during the period shown.
(2) Includes unfunded revolver obligations and letters of credit measured at fair value of $(4,060).(3) Includes reorganizations and restructurings.* Pursuant to fair value measurement and disclosure guidance, the Company currently categorizes investments by class as
shown above.

APOLLO INVESTMENT CORPORATIONNOTES TO FINANCIAL STATEMENTS (continued)
(in thousands except share and per share amounts)
93
The following chart shows the components of change in our investments categorized as Level 3, for the fiscal year ended March 31, 2014.
Fair Value Measurements Using Significant Unobservable Inputs (Level 3)*1st LienSecuredDebt (2)
2nd LienSecuredDebt (2)
UnsecuredDebt
StructuredProducts
and OtherPreferred
Equity
CommonEquity/
Interests Warrants Total
Beginning Balance,March 31, 2013 $ 254,400 $ 386,409 $ 631,047 $185,995 $ 11,550 $162,580 $ 9,273 $1,641,254Total realized gains orlosses included inearnings (17,944) (15,365) (47,284) 2,460 — 10,875 1,808 (65,450)Total change inunrealized gain (loss)included in earnings 16,525 22,168 59,747 (2,483) 6,714 15,107 (4,401) 113,377Net amortization oninvestments (8) 4,322 11,951 347 — — — 16,612Purchases, includingcapitalized PIK (3) 665,229 274,518 121,825 140,150 74,798 109,035 6,369 1,391,924Sales (294,916) (370,206) (307,094) (89,332) — (22,898) (1,875) (1,086,321)Transfers out of Level 3(1) (10,492) — (55,113) (38,728) — — — (104,333)Transfers into Level 3(1) — 21,043 — 10,492 — — — 31,535Ending Balance, March31, 2014 $ 612,794 $ 322,889 $ 415,079 $208,901 $ 93,062 $274,699 $ 11,174 $1,938,598The amount of totalgains or losses for theperiod included inearnings attributable tothe change in unrealizedgain (loss) relating toour Level 3 assets stillheld at the reporting dateand reported within thenet change in unrealizedgain (loss) oninvestments in ourStatement of Operations $ 2,921 $ 397 $ 10,341 $ 4,210 $ 6,713 $ 24,017 $ (2,898) $ 45,701
____________________(1) Transfers represent (a) a transfer of $10,492 out of Secured Debt into Structured Products due to the change in the nature
of the investment and (b) transfers in and out of Level 3 due to changes in the quantity and quality of information obtained to support the fair value of each investment as assessed by the Adviser. Transfers out of Level 3 are due to an increase in the availability of qualified observable inputs and transfers into Level 3 are due to a decrease in the availability of qualified observable inputs as assessed by the Adviser. Transfers are assumed to have occurred at the end of the period. There were no transfers between Level 1 and Level 2 fair value measurements during the period shown.
(2) Includes unfunded revolver obligations and letters of credit measured at fair value of $(5,415). (3) Includes reorganizations and restructurings.* Pursuant to fair value measurement and disclosure guidance, the Company currently categorizes investments by class as
shown above.

APOLLO INVESTMENT CORPORATIONNOTES TO FINANCIAL STATEMENTS (continued)
(in thousands except share and per share amounts)
94
The following tables summarize the significant unobservable inputs the Company used to value the majority of its investments categorized within Level 3 as of March 31, 2015. In addition to the techniques and inputs noted in the table below, according to our valuation policy we may also use other valuation techniques and methodologies when determining our fair value measurements. The below table is not intended to be all-inclusive, but rather provides information on the significant unobservable inputs as they relate to the Company’s determination of fair values.

APOLLO INVESTMENT CORPORATIONNOTES TO FINANCIAL STATEMENTS (continued)
(in thousands except share and per share amounts)
95
Quantitative Information about Level 3 Fair Value Measurements
Fiscal Year EndedMarch 31, 2015
Valuation Techniques/
MethodologiesUnobservable
Input Range WeightedAverage
1st Lien Secured Debt $ 531,654 Yield Analysis Discount Rate 7.9% 20.9% 13.0%
352,084 DiscountedCash Flow
Discount Rate 12.0% 12.0% 12.0%
14,377 RecentTransactions
RecentTransactions
N/A N/A N/A
117,915 Broker Quoted Broker Quote N/A N/A N/A2nd Lien Secured Debt 247,585 Yield Analysis Discount Rate 9.7% 19.7% 14.5%
264,525 Broker Quoted Broker Quote N/A N/A N/AUnsecured Debt 329,831 Yield Analysis Discount Rate 9.7% 22.0% 11.4%
22,140 Broker Quoted Broker Quote N/A N/A N/AStructured Products andOther
39,296 Yield Analysis Discount Rate 8.4% 15.0% 8.8%
317,381 DiscountedCash Flow
Discount Rate 3.8% 15.0% 12.4%
17,691 Broker Quoted Broker Quote N/A N/A N/APreferred Equity 66,976 Market
ComparableApproach
ComparableMultiple
2.2x 11.7x 7.3x
23,645 Yield Analysis Discount Rate 10.8% 10.8% 10.8%
9,309 DiscountedCash Flow
Discount Rate 15.9% 15.9% 15.9%
65,171 OptionsPricing Model
ExpectedVolatility
70.0% 70.0% 70.0%
Common Equity/Interests 121,169 MarketComparableApproach
ComparableMultiple
2.2x 10.8x 8.3x
203,469 DiscountedCash Flow
Discount Rate 11.4% 30.0% 13.0%
5,162 Other Illiquidity/Restrictivediscount
7.0% 7.0% 7.0%
Warrants 1,399 MarketComparableApproach
ComparableMultiple
4.8x 11.4x 11.2x
222 Other Illiquidity/Restrictivediscount
20.0% 20.0% 20.0%
3,950 RecentTransactions
RecentTransactions
N/A N/A N/A
Total $ 2,754,951
N/A – Not applicable

APOLLO INVESTMENT CORPORATIONNOTES TO FINANCIAL STATEMENTS (continued)
(in thousands except share and per share amounts)
96
Quantitative Information about Level 3 Fair Value MeasurementsFiscal Year
Ended March 31,2014
Valuation Techniques/
MethodologiesUnobservable
Input Range WeightedAverage
1st Lien Secured Debt $ 593,324 Yield Analysis Discount Rate 8.2% 27.3% 13.1%
19,470 Broker Quoted Broker Quote N/A N/A N/A2nd Lien Secured Debt 121,675 Yield Analysis Discount Rate 11.9% 19.1% 14.0%
174,844 Broker Quoted Broker Quote N/A N/A N/A26,370 Recent
TransactionsRecent
TransactionsN/A N/A N/A
Unsecured Debt 395,630 Yield Analysis Discount Rate 9.3% 45.0% 11.7%
19,449 Broker Quoted Broker Quote N/A N/A N/AStructured Products andOther
30,158 Yield Analysis Discount Rate 11.6% 15.0% 12.3%
146,970 DiscountedCash Flow
Discount Rate 10.0% 15.5% 13.9%
1,097 RecentTransactions
RecentTransactions
N/A N/A N/A
30,676 Broker Quoted Broker Quote N/A N/A N/APreferred Equity 70,442 Market
ComparableApproach
ComparableMultiple
2.0x 10.0x 7.1x
22,620 Yield Analysis Discount Rate 12.3% 12.3% 12.3%
Common Equity/Interests 125,607 MarketComparableApproach
ComparableMultiple
2.0x 12.0x 8.1x
17 Net AssetValue
UnderlyingAssets/
Liabilities
N/A N/A N/A
142,117 Yield Analysis Discount Rate 13.1% 30.0% 13.2%
6,958 Other Illiquidity/Restrictivediscount
7.0% 7.0% 7.0%
Warrants 4,707 MarketComparableApproach
ComparableMultiple
5.3x 6.0x 2.9x
1,398 Other Illiquidity/Restrictivediscount
20.0% 20.0% 20.0%
5,069 RecentTransactions
RecentTransactions
N/A N/A N/A
Total $ 1,938,598
N/A – Not applicable

APOLLO INVESTMENT CORPORATIONNOTES TO FINANCIAL STATEMENTS (continued)
(in thousands except share and per share amounts)
97
____________________
The significant unobservable inputs used in the fair value measurement of the Company’s debt and equity securities are primarily earnings before interest, taxes, depreciation and amortization (“EBITDA”) comparable multiples and market discount rates. The Company typically uses EBITDA comparable multiples on its equity securities to determine the fair value of investments. The Company uses market discount rates for debt securities to determine if the effective yield on a debt security is commensurate with the market yields for that type of debt security. If a debt security’s effective yield is significantly less than the market yield for a similar debt security with a similar credit profile, then the resulting fair value of the debt security may be lower. Significant increases or decreases in either of these inputs in isolation would result in a significantly lower or higher fair value measurement. The significant unobservable inputs used in the fair value measurement of the structured products include the discount rate applied in the valuation models in addition to default and recovery rates applied to projected cash flows in the valuation models. Specifically, when a discounted cash flow model is used to determine fair value, the significant input used in the valuation model is the discount rate applied to present value the projected cash flows. Increases in the discount rate can significantly lower the fair value of an investment; conversely decreases in the discount rate can significantly increase the fair value of an investment. The discount rate is determined based on the market rates an investor would expect for a similar investment with similar risks.
PIK Interest and Dividends
The Company holds loans and investments, including certain preferred equity investments that may have contractual PIK interest or dividends. PIK interest and dividends computed at the contractual rate are accrued into income and reflected as receivable up to the capitalization date.
PIK income for the fiscal years ended March 31, 2015 and March 31, 2014 are summarized below:
Fiscal Year Ended
March 31, 2015 March 31, 2014 March 31, 2013
PIK income for the year $ 34,092 $ 28,974 $ 20,292
Capitalized PIK income for the fiscal years ended March 31, 2015 and March 31, 2014 are summarized below:
Fiscal YearEnded March 31,
2015
Fiscal YearEnded March 31,
2014
PIK balance at beginning of year $ 58,185 $ 45,658Gross PIK income capitalized 31,036 28,884Adjustments due to investment exits — (25)Proceeds from capitalized PIK investments (2,318) (16,332)PIK balance at end of year $ 86,903 $ 58,185
Investments on Non-Accrual Status
As of March 31, 2015, 1.3% of total investments at amortized cost (or 0.1% of total investments at fair value) were on non-accrual status. As of March 31, 2014, 1.0% of total investments at amortized cost (or 0.4% of total investments at fair value) were on non-accrual status.
Derivatives
During the three months ended June 30, 2013, we entered into interest rate swap and interest rate cap agreements to manage interest rate risk associated with one of our structured product investments. During the three months ended September 30, 2013, we exited the investment and unwound the derivatives. We do not hold or issue derivative contracts for speculative purposes. We recorded the accrual of periodic interest settlements in net unrealized gain/loss and subsequently recorded the cash payments as a net realized gain or loss on the interest settlement date, activities which are classified under operating activities in our Statement of Cash Flows.

APOLLO INVESTMENT CORPORATIONNOTES TO FINANCIAL STATEMENTS (continued)
(in thousands except share and per share amounts)
98
As of March 31, 2015, 2014, and 2013, we did not hold any derivative investments and during the fiscal year ended March 31, 2015, we did not enter into any derivative transactions. The table below summarizes the effect of derivative instruments on our Statement of Operations for the fiscal year ended March 31, 2014:
Derivative Instruments UnrealizedGain/(Loss)
RealizedGain/(Loss) Total Gain (Loss)
Interest rate swaps $ — $ 13,162 $ 13,162Interest rate caps — (4,621) (4,621)
Total $ — $ 8,541 $ 8,541
The interest income and interest expense on derivatives is shown in the Statement of Operations within net realized and unrealized gain/loss from investments, cash equivalents, foreign currencies and derivatives.
Credit Risk-Related Contingent Features
The use of derivatives creates exposure to counterparty credit risk that may result in potential losses in the event that the counterparties to these instruments fail to perform their obligations under the agreements governing such derivatives. The Company seeks to minimize this risk by limiting the Company’s counterparties to major financial institutions with acceptable credit ratings and monitoring positions with individual counterparties.
The International Swaps and Derivatives Association (“ISDA”) Master Agreement that the Company has in place together with the Schedule thereto, the ISDA Agreement contains customary default provisions including a cross acceleration provision relating to third-party indebtedness including, for the avoidance of doubt, the JPM Credit Agreement in excess of a specified threshold. Following an event of default, the Company could be required to settle its obligations under the ISDA Agreement at their termination values. Additionally, under the Company’s ISDA Agreement, the Company could be required to settle its obligations under the ISDA Agreement at their termination values if the Company fails to comply with certain specified covenants.
Note 6. Foreign Currency Transactions and Translations
The Company had outstanding non-US borrowings on its Senior Secured Facility (as defined in note 9) as of March 31, 2015 and March 31, 2014 as summarized below:
As of March 31, 2015:
Foreign CurrencyLocal
Currency
OriginalBorrowed
ValueCurrent
Value Reset DateUnrealized
Gain
British Pound £ 6,500 $ 9,926 $ 9,649 4/7/2015 $ 277British Pound £ 25,000 37,525 37,112 4/13/2015 413British Pound £ 27,000 39,956 40,082 4/20/2015 (126)British Pound £ 7,600 12,124 11,282 4/30/2015 842Euro € 19,200 25,803 20,621 4/30/2015 5,182Canadian Dollars CAD 65,100 60,245 51,402 4/30/2015 8,843
$ 185,579 $ 170,148 $ 15,431

APOLLO INVESTMENT CORPORATIONNOTES TO FINANCIAL STATEMENTS (continued)
(in thousands except share and per share amounts)
99
As of March 31, 2014:
Foreign CurrencyLocal
Currency
OriginalBorrowed
ValueCurrent
Value Reset DateUnrealizedGain (Loss)
British Pound £ 45,100 $ 72,078 $ 75,188 4/30/2014 $ (3,110)Euro € 18,200 24,474 25,084 4/30/2014 (610)Euro € 9,500 12,680 13,093 4/24/2014 (413)Canadian Dollars CAD 34,100 31,766 30,895 4/24/2014 871
$ 140,998 $ 144,260 $ (3,262)
Note 7. Cash Equivalents
There were no cash equivalents held as of March 31, 2015 and March 31, 2014.

APOLLO INVESTMENT CORPORATIONNOTES TO FINANCIAL STATEMENTS (continued)
(in thousands except share and per share amounts)
100
Note 8. Financial Highlights
The following is a schedule of financial highlights for the years ended March 31, 2015, 2014, 2013, 2012, and 2011.
March 31,2015 2014 2013 2012 2011
Per Share Data:Net asset value, beginning ofperiod $ 8.67 $ 8.27 $ 8.55 $ 10.03 $ 10.06
Net investment income 0.96 0.91 0.83*** 0.88 0.99Net realized and unrealizedgain (loss) (0.64) 0.30 (0.31)*** (1.32) (0.05)
Net increase (decrease) in netassets resulting from operations 0.32 1.20*** 0.51*** (0.44) 0.94Dividends to stockholders fromincome(1) (0.70) (0.80) (0.78) (1.04) (1.13)Dividends to stockholders fromreturn of capital(1) (0.10) — (0.02) — —Effect of anti-dilution (dilution) — —* —* —* 0.16Offering costs —* —* —* —* —*Net asset value at end of period $ 8.18*** $ 8.67 $ 8.27 $ 8.55 $ 10.03Per share market value at end ofperiod $ 7.68 $ 8.31 $ 8.36 $ 7.17 $ 12.07Total return(2) 1.9 % 9.4 % 28.2 % (32.4)% 5.1%Shares outstanding at end ofperiod 236,741,351 236,741,351 202,891,351 197,043,398 195,501,549Ratio/Supplemental Data:Net assets at end of period (inmillions) $ 1,937.6 $ 2,051.6 $ 1,677.4 $ 1,685.2 $ 1,961.0Ratio of net investment income toaverage net assets 11.27 % 10.85% 9.87 % 9.77 % 10.19%Ratio of operating expenses toaverage net assets(3)** 6.25 % 6.01 % 6.28 % 6.70 % 6.37%Ratio of interest and other debtexpenses to average net assets 3.91 % 3.70 % 3.43 % 3.76 % 2.56%
Ratio of total expenses toaverage net assets(3)** 10.16% 9.71 % 9.71 % 10.46 % 8.93%
Average debt outstanding $ 1,586,493 $ 1,238,940 $ 1,036,780 $ 1,213,943 $ 1,072,646Average debt per share $ 6.70 $ 5.56 $ 5.11 $ 6.18 $ 5.55Portfolio turnover ratio 62.1 % 75.9 % 49.9 % 50.6 % 33.6%
(1) Dividends and distributions are determined based on taxable income calculated in accordance with income tax regulations which may differ from amounts determined under GAAP. Per share amounts reflect total dividends paid divided by average shares for the respective periods.
(2) Total return is based on the change in market price per share during the respective periods. Total return also takes into account dividends and distributions, if any, reinvested in accordance with the Company’s dividend reinvestment plan.
(3) The ratio of operating expenses to average net assets and the ratio of total expenses to average net assets are shown inclusive of the expense offset arrangement. For all periods presented there were no expense offsets during these periods and as such, there was no effect on the ratio.
* Represents less than one cent per average share.

APOLLO INVESTMENT CORPORATIONNOTES TO FINANCIAL STATEMENTS (continued)
(in thousands except share and per share amounts)
101
** The ratio of operating expenses to average net assets and the ratio of total expenses to average net assets is shown net of all voluntary management and incentive fee waivers (see note 3). At March 31, 2015, the ratio of operating expenses to average net assets and the ratio of total expenses to average net assets would be 7.03% and 10.95%, respectively, without the voluntary fee waivers. At March 31, 2014, the ratio of operating expenses to average net assets and the ratio of total expenses to average net assets would be 6.66% and 10.36%, respectively, without the voluntary fee waivers. At March 31, 2013, the ratio of operating expenses to average net assets and the ratio of total expenses to average net assets would be 6.44% and 9.87%, respectively, without the voluntary fee waivers. At March 31, 2012, the ratio of operating expenses to average net assets and the ratio of total expenses to average net assets would be 6.70% and 10.46%, respectively, inclusive of the expense offset arrangement. At March 31, 2011, the ratio of operating expenses to average net assets and the ratio of total expenses to average net assets would be 6.37% and 8.93%, respectively.
*** Numbers may not sum due to rounding.
Information about our senior securities is shown in the following table as of each year ended March 31 since the Company commenced operations, unless otherwise noted. The “—” indicates information which the SEC expressly does not require to be disclosed for certain types of senior securities.
Class and YearTotal Amount
Outstanding(1)
AssetCoverage
Per Unit(2)
InvoluntaryLiquidatingPreferencePer Unit(3)
AverageMarket Value
Per Unit(4)
Senior Secured FacilityFiscal 2015 $ 384,648 $ 588 $ — N/A (5)Fiscal 2014 602,261 1,095 — N/AFiscal 2013 536,067 1,137 — N/AFiscal 2012 539,337 1,427 — N/AFiscal 2011 628,443 1,707 — N/AFiscal 2010 1,060,616 2,671 — N/AFiscal 2009 1,057,601 2,320 — N/AFiscal 2008 1,639,122 2,158 — N/AFiscal 2007 492,312 4,757 — N/AFiscal 2006 323,852 4,798 — N/AFiscal 2005 — — — N/ASenior Secured NotesFiscal 2015 $ 270,000 $ 413 $ — N/AFiscal 2014 270,000 491 — N/AFiscal 2013 270,000 572 — N/AFiscal 2012 270,000 714 — N/AFiscal 2011 225,000 611 — N/AFiscal 2010 — — — N/AFiscal 2009 — — — N/AFiscal 2008 — — — N/AFiscal 2007 — — — N/AFiscal 2006 — — — N/AFiscal 2005 — — — N/A2042 NotesFiscal 2015 $ 150,000 $ 230 $ — $ 99.59Fiscal 2014 150,000 273 — 92.11Fiscal 2013 150,000 318 — 97.43Fiscal 2012 — — — N/A

APOLLO INVESTMENT CORPORATIONNOTES TO FINANCIAL STATEMENTS (continued)
(in thousands except share and per share amounts)
102
Fiscal 2011 — — — N/AFiscal 2010 — — — N/AFiscal 2009 — — — N/AFiscal 2008 — — — N/AFiscal 2007 — — — N/AFiscal 2006 — — — N/AFiscal 2005 — — — N/A2043 NotesFiscal 2015 $ 150,000 $ 230 $ — $ 99.74Fiscal 2014 150,000 273 — 89.88Fiscal 2013 — — — N/AFiscal 2012 — — — N/AFiscal 2011 — — — N/AFiscal 2010 — — — N/AFiscal 2009 — — — N/AFiscal 2008 — — — N/AFiscal 2007 — — — N/AFiscal 2006 — — — N/AFiscal 2005 — — — N/A2025 NotesFiscal 2015 $ 344,111 $ 526 $ — N/AFiscal 2014 — — — N/AFiscal 2013 — — — N/AFiscal 2012 — — — N/AFiscal 2011 — — — N/AFiscal 2010 — — — N/AFiscal 2009 — — — N/AFiscal 2008 — — — N/AFiscal 2007 — — — N/AFiscal 2006 — — — N/AFiscal 2005 — — — N/AConvertible NotesFiscal 2015 $ 200,000 $ 306 $ — $ 104.43Fiscal 2014 200,000 364 — 106.60Fiscal 2013 200,000 424 — 102.84Fiscal 2012 200,000 529 — 97.81Fiscal 2011 200,000 544 — N/A (6)Fiscal 2010 — — — N/AFiscal 2009 — — — N/AFiscal 2008 — — — N/AFiscal 2007 — — — N/AFiscal 2006 — — — N/AFiscal 2005 — — — N/ATotal Debt SecuritiesFiscal 2015 $ 1,498,759 $ 2,293 $ — N/AFiscal 2014 1,372,261 2,496 — N/A

APOLLO INVESTMENT CORPORATIONNOTES TO FINANCIAL STATEMENTS (continued)
(in thousands except share and per share amounts)
103
Fiscal 2013 1,156,067 2,451 — N/AFiscal 2012 1,009,337 2,670 — N/AFiscal 2011 1,053,443 2,862 — N/AFiscal 2010 1,060,616 2,671 — N/AFiscal 2009 1,057,601 2,320 — N/AFiscal 2008 1,639,122 2,158 — N/AFiscal 2007 492,312 4,757 — N/AFiscal 2006 323,852 4,798 — N/AFiscal 2005 — — — N/A
(1) Total amount of each class of senior securities outstanding at the end of the period presented.(2) The asset coverage ratio for a class of senior securities representing indebtedness is calculated as our total assets, less all
liabilities and indebtedness not represented by senior securities, divided by senior securities representing indebtedness. This asset coverage ratio is multiplied by $1 to determine the Asset Coverage Per Unit. In order to determine the specific Asset Coverage Per Unit for each class of debt, the total Asset Coverage Per Unit was divided based on the amount outstanding at the end of the period for each.
(3) The amount to which such class of senior security would be entitled upon the involuntary liquidation of the issuer in preference to any security junior to it.
(4) Not applicable, except for with respect to the 2042 Notes, the 2043 Notes, and the Convertible Notes, as other senior securities do not have sufficient trading for an average market value per unit to be determined. The average market value per unit for each of the 2042 Notes, the 2043 Notes, and the Convertible Notes is based on the closing daily prices of such notes and is expressed per $100 of indebtedness (including for the 2042 Notes and the 2043 Notes, which were issued in $25 increments).
(5) Included in this amount is foreign currency debt obligations as outlined in the table in note 6. (6) Restrictive legends were removed in 2012.
Note 9. Debt
The Company’s outstanding debt obligations as of March 31, 2015 were as follows:
March 31, 2015
Date Issued /Amended
Total AggregatePrincipalAmount
CommittedPrincipal Amount
Outstanding Fair Value
FinalMaturity
Date
Senior Secured Facility 2013 $ 1,270,000 $ 384,648* $ 384,253 (1) 8/31/2018Senior Secured Notes 2010 225,000 225,000 227,363 (1) 10/4/2015Senior Secured Notes (Series A) 2011 29,000 29,000 29,684 (1) 9/29/2016Senior Secured Notes (Series B) 2011 16,000 16,000 16,952 (1) 9/29/20182042 Notes 2012 150,000 150,000 152,646 (2) 10/15/20422043 Notes 2013 150,000 150,000 153,438 (2) 7/15/20432025 Note 2015 350,000 344,111 352,100 (1) 3/3/2025Convertible Notes 2011 200,000 200,000 206,250 (2) 1/15/2016Total Debt Obligations $ 2,390,000 $ 1,498,759 $ 1,522,686
* Included in this amount is foreign currency debt obligations as outlined in the table in note 6.(1) The fair value of these debt obligations are categorized as Level 3 under ASC 820 as of March 31, 2015 and March 31,
2014. The valuation is based on a yield analysis and discount rate commensurate with the market yields for similar typesof debt.

APOLLO INVESTMENT CORPORATIONNOTES TO FINANCIAL STATEMENTS (continued)
(in thousands except share and per share amounts)
104
(2) The fair value of these debt obligations are categorized as Level 1 under ASC 820 as of March 31, 2015 and March 31, 2014. The valuation is based on quoted prices of identical liabilities in active markets.
Senior Secured Facility
On September 13, 2013, the Company amended and restated its senior secured, multi-currency, revolving credit facility (the “Senior Secured Facility”). The facility increased the lenders’ commitments totaling approximately $1,270,000 and extended the final maturity date to through August 31, 2018, and allows the Company to seek additional commitments from new and existing lenders in the future, up to an aggregate facility size not to exceed $1,710,000. The Senior Secured Facility is secured by substantially all of the assets in Apollo Investment’s portfolio, including cash and cash equivalents. Commencing September 30, 2017, the Company is required to repay, in twelve consecutive monthly installments of equal size, the outstanding amount under the Senior Secured Facility as of August 31, 2017. Pricing for Alternate Base Rate (ABR) borrowings is 100 basis points over the applicable Prime Rate and pricing for eurocurrency borrowings is 200 basis points over the LIBOR Rate. The Company is required to pay a commitment fee of 0.375% per annum on any unused portion of the Senior Secured Facility and a letter of credit participation fee of 2.00% per annum plus a letter of credit fronting fee of 0.25% per annum on the letters of credit issued. The Senior Secured Facility contains affirmative and restrictive covenants, including: (a) periodic financial reporting requirements, (b) maintaining minimum stockholders’ equity of the greater of (i) 40% of the total assets of Apollo Investment and its consolidated subsidiaries as at the last day of any fiscal quarter and (ii) the sum of (A) $845,000 plus (B) 25% of the net proceeds from the sale of equity interests in Apollo Investment after the closing date of the Senior Secured Facility, (c) maintaining a ratio of total assets, less total liabilities (other than indebtedness) to total indebtedness, in each case of Apollo Investment and its consolidated subsidiaries, of not less than 2.0:1.0, (d) limitations on the incurrence of additional indebtedness, including a requirement to meet a certain minimum liquidity threshold before Apollo Investment can incur such additional debt, (e) limitations on liens, (f) limitations on investments (other than in the ordinary course of Apollo Investment’s business), (g) limitations on mergers and disposition of assets (other than in the normal course of Apollo Investment’s business activities), (h) limitations on the creation or existence of agreements that permit liens on properties of Apollo Investment’s consolidated subsidiaries and (i) limitations on the repurchase or redemption of certain unsecured debt and debt securities. In addition to the asset coverage ratio described in clause (c) of the preceding sentence, borrowings under the Senior Secured Facility (and the incurrence of certain other permitted debt) are subject to compliance with a borrowing base that applies different advance rates to different types of assets in Apollo Investment’s portfolio. The Senior Secured Facility also provides for the issuance of letters of credit for up to an aggregate amount of $125,000. As of March 31, 2015 and March 31, 2014 the Company had $25,246 and $15,746, respectively in standby letters of credit issued through the Senior Secured Facility. The amount available for borrowing under the Senior Secured Facility is reduced by any standby letters of credit issued. The available remaining capacity under the Senior Secured Facility was $860,106 at March 31, 2015. Terms used in the this paragraph have the meanings set forth in the Senior Secured Facility.
On April 24, 2015, the Company amended and restated the Senior Secured Facility. The amendment increased the lenders’ commitments to $1,310,000, extended the final maturity date to April 24, 2020, and allows the Company to seek additional commitments from new and existing lenders in the future, up to an aggregate facility size not to exceed $1,965,000. In addition, the stated interest rate on the facility was changed from LIBOR plus 2.00% to a formula-based calculation, based on a minimum borrowing base, resulting in a stated interest rate of either LIBOR plus 1.75%, or LIBOR plus 2.00%. As of May 19, 2015, the stated interest rate on the facility is LIBOR plus 2.00%. Commencing April 30, 2019, the Company is required to repay, in twelve consecutive monthly installments of equal size, the outstanding amount under the Senior Secured Facility as of April 24, 2019.
Senior Secured Notes
On September 30, 2010, the Company entered into a note purchase agreement with certain institutional accredited investors providing for a private placement issuance of $225,000 in aggregate principal amount of five-year, senior secured notes with an annual fixed interest rate of 6.25% and a maturity date of October 4, 2015 (the “Senior Secured Notes”). On October 4, 2010, the Senior Secured Notes issued by Apollo Investment were sold to certain institutional accredited investors pursuant to an exemption from registration under the Securities Act of 1933, as amended. Interest on the Senior Secured Notes is due semi-annually on April 4 and October 4, commencing on April 4, 2011.
On September 29, 2011, the Company closed a private offering of $45,000 aggregate principal amount of senior secured notes (the “Notes”) consisting of two series: (1) 5.875% Senior Secured Notes, Series A, of the Company due September 29, 2016 in the aggregate principal amount of $29,000; and (2) 6.250% Senior Secured Notes, Series B, of the Company due September 29, 2018, in the aggregate principal amount of $16,000. The Notes were issued in a private placement only to qualified institutional

APOLLO INVESTMENT CORPORATIONNOTES TO FINANCIAL STATEMENTS (continued)
(in thousands except share and per share amounts)
105
buyers pursuant to Rule 144A under the Securities Act of 1933, as amended. Interest on the Senior Secured Notes is due semi-annually on March 29 and September 29, commencing on March 29, 2012.
The Senior Secured Notes and the Notes rank parri-passu with the Senior Secured Facility.
2042 Notes
On October 9, 2012, the Company issued $150,000 in aggregate principal amount of 6.625% senior unsecured notes due 2042 for net proceeds of $145,275 (the “2042 Notes”). Interest on the 2042 Notes is paid quarterly on January 15, April 15, July 15 and October 15, at an annual rate of 6.625%, commencing on January 15, 2013. The 2042 Notes will mature on October 15, 2042. The Company may redeem the 2042 Notes in whole or in part at any time or from time to time on or after October 15, 2017. The 2042 Notes are general, unsecured obligations and rank equal in right of payment with all of our existing and future senior, unsecured indebtedness. The 2042 Notes are listed on The New York Stock Exchange under the ticker symbol “AIB”.
2043 Notes
On June 17, 2013, the Company issued $135,000 in aggregate principal amount of 6.875% senior unsecured notes due 2043 and on June 24, 2013 an additional $15,000 in aggregate principal amount of such notes was issued pursuant to the underwriters’ over-allotment option exercise. In total, $150,000 of aggregate principal was issued for net proceeds of $145,275 (the “2043 Notes”). Interest on the 2043 Notes is paid quarterly on January 15, April 15, July 15 and October 15, at an annual rate of 6.875%, commencing on October 15, 2013. The 2043 Notes will mature on July 15, 2043. The Company may redeem the 2043 Notes in whole or in part at any time or from time to time on or after July 15, 2018. The 2043 Notes are general, unsecured obligations and rank equal in right of payment with all of our existing and future senior, unsecured indebtedness. The 2043 Notes are listed on The New York Stock Exchange under the ticker symbol “AIY”.
2024 NoteOn October 30, 2014, the Company entered into a note purchase agreement with an institutional accredited investor providing a private placement issuance of $150,000 in aggregate principal amount of a ten-year note with an annual fixed rate of 5.25% and a maturity of October 30, 2024 (the "2024 Note"). On October 30, 2014, the Company issued the 2024 Note for net proceeds of $148,875. Interest on the 2024 Note is due quarterly on January 15, April 15, July 15 and October 15, commencing on January 15, 2015. The 2024 Note was a general, unsecured obligation and ranked equal in right of payment with all of our existing unsecured indebtedness. The 2024 Note was repurchased and retired by the Company on March 3, 2015 and was accounted for as a debt modification in accordance with ASC Topic 470 Debt.
2025 NotesOn March 3, 2015, the issued $350,000 in the aggregate principal amount of 5.25% unsecured notes due 2025 for net proceeds off $343,650 (the "2025 Notes"). Interest on the 2025 Notes is due semi-annually on March 3 and September 3, commencing on September 3, 2015. The 2025 Notes are a general, unsecured obligation and rank equal in right of payment with all of our existing unsecured indebtedness.
Convertible Notes
On January 25, 2011, the Company closed a private offering of $200,000 aggregate principal amount of senior unsecured convertible notes (the “Convertible Notes”). The Convertible Notes were issued in a private placement only to qualified institutional buyers pursuant to Rule 144A under the Securities Act of 1933, as amended. The Convertible Notes bear interest at an annual rate of 5.75%, payable semi-annually in arrears on January 15 and July 15 of each year, commencing on July 15, 2011. The Convertible Notes will mature on January 15, 2016 unless earlier converted or repurchased at the holder’s option. Prior to December 15, 2015, the Convertible Notes will be convertible only upon certain corporate reorganizations, dilutive recapitalizations or dividends, or if, during specified periods our shares trade at more than 130% of the then applicable conversion price or the Convertible Notes trade at less than 97% of their conversion value and, thereafter, at any time. The Convertible Notes will be convertible by the holders into shares of common stock, initially at a conversion rate of 72.7405 shares of the Company’s common stock per $1 principal amount of Convertible Notes (14,548,100 common shares) corresponding to an initial conversion price per share of approximately $13.75, which represents a premium of 17.5% to the $11.70 per share closing price of the Company’s common stock on The NASDAQ Global Select Market on January 19, 2011. The conversion rate will be subject to adjustment upon certain events, such as stock splits and combinations, mergers, spin-offs, increases in dividends in excess of $0.28 per share per quarter
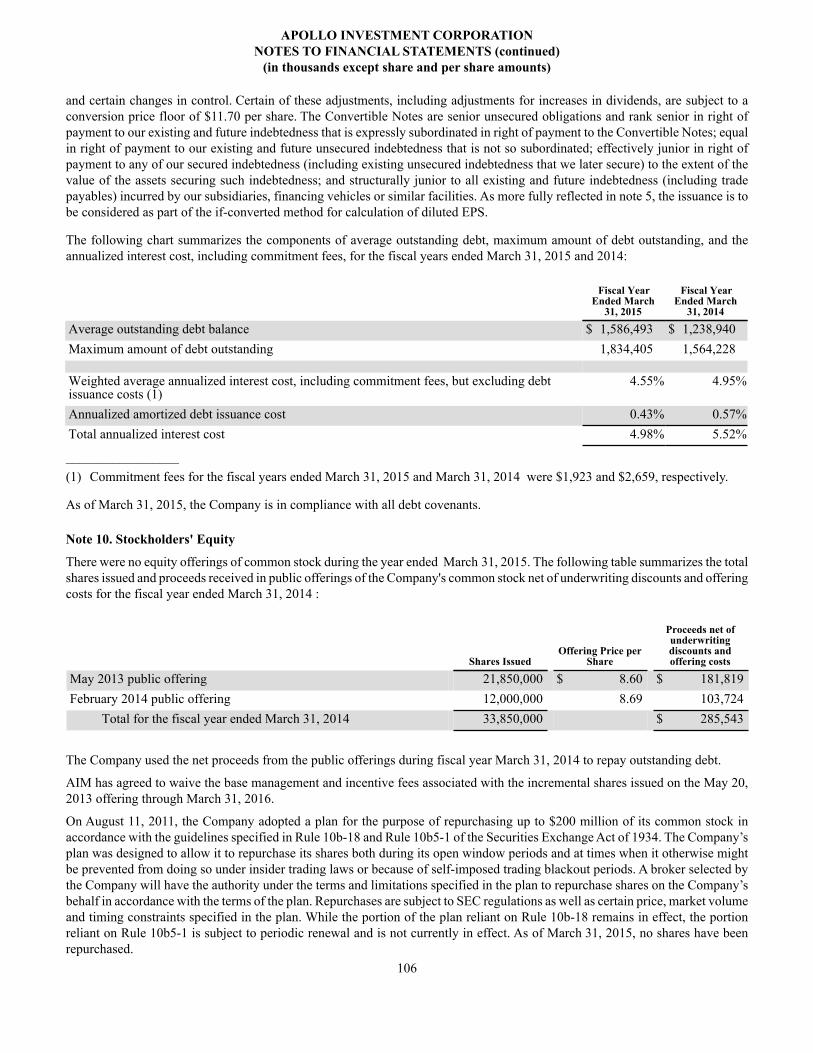
APOLLO INVESTMENT CORPORATIONNOTES TO FINANCIAL STATEMENTS (continued)
(in thousands except share and per share amounts)
106
and certain changes in control. Certain of these adjustments, including adjustments for increases in dividends, are subject to a conversion price floor of $11.70 per share. The Convertible Notes are senior unsecured obligations and rank senior in right of payment to our existing and future indebtedness that is expressly subordinated in right of payment to the Convertible Notes; equal in right of payment to our existing and future unsecured indebtedness that is not so subordinated; effectively junior in right of payment to any of our secured indebtedness (including existing unsecured indebtedness that we later secure) to the extent of the value of the assets securing such indebtedness; and structurally junior to all existing and future indebtedness (including trade payables) incurred by our subsidiaries, financing vehicles or similar facilities. As more fully reflected in note 5, the issuance is to be considered as part of the if-converted method for calculation of diluted EPS.
The following chart summarizes the components of average outstanding debt, maximum amount of debt outstanding, and the annualized interest cost, including commitment fees, for the fiscal years ended March 31, 2015 and 2014:
Fiscal YearEnded March
31, 2015
Fiscal YearEnded March
31, 2014
Average outstanding debt balance $ 1,586,493 $ 1,238,940Maximum amount of debt outstanding 1,834,405 1,564,228
Weighted average annualized interest cost, including commitment fees, but excluding debtissuance costs (1)
4.55% 4.95%
Annualized amortized debt issuance cost 0.43% 0.57%Total annualized interest cost 4.98% 5.52%
_________________(1) Commitment fees for the fiscal years ended March 31, 2015 and March 31, 2014 were $1,923 and $2,659, respectively.
As of March 31, 2015, the Company is in compliance with all debt covenants.
Note 10. Stockholders' Equity
There were no equity offerings of common stock during the year ended March 31, 2015. The following table summarizes the total shares issued and proceeds received in public offerings of the Company's common stock net of underwriting discounts and offering costs for the fiscal year ended March 31, 2014 :
Shares IssuedOffering Price per
Share
Proceeds net ofunderwritingdiscounts andoffering costs
May 2013 public offering 21,850,000 $ 8.60 $ 181,819February 2014 public offering 12,000,000 8.69 103,724
Total for the fiscal year ended March 31, 2014 33,850,000 $ 285,543
The Company used the net proceeds from the public offerings during fiscal year March 31, 2014 to repay outstanding debt.
AIM has agreed to waive the base management and incentive fees associated with the incremental shares issued on the May 20, 2013 offering through March 31, 2016.
On August 11, 2011, the Company adopted a plan for the purpose of repurchasing up to $200 million of its common stock in accordance with the guidelines specified in Rule 10b-18 and Rule 10b5-1 of the Securities Exchange Act of 1934. The Company’s plan was designed to allow it to repurchase its shares both during its open window periods and at times when it otherwise might be prevented from doing so under insider trading laws or because of self-imposed trading blackout periods. A broker selected by the Company will have the authority under the terms and limitations specified in the plan to repurchase shares on the Company’s behalf in accordance with the terms of the plan. Repurchases are subject to SEC regulations as well as certain price, market volume and timing constraints specified in the plan. While the portion of the plan reliant on Rule 10b-18 remains in effect, the portion reliant on Rule 10b5-1 is subject to periodic renewal and is not currently in effect. As of March 31, 2015, no shares have been repurchased.

APOLLO INVESTMENT CORPORATIONNOTES TO FINANCIAL STATEMENTS (continued)
(in thousands except share and per share amounts)
107
On September 12, 2014, the Company announced an At the Market (“ATM”) program through which the Company can sell up to 16 million shares of its common stock from time to time. As of March 31, 2015, no shares had been sold through the Company’s ATM program.
Note 11. Income Tax Information and Distributions to Stockholders
Book and tax basis differences relating to stockholder dividends and distributions and other permanent book and tax differences are reclassified among the Company’s capital accounts. In addition, the character of income and gains to be distributed is determined in accordance with income tax regulations that may differ from accounting principles generally accepted in the United States of America; accordingly, at March 31, 2015, reclassifications were made on our statement of asset and liabilities to reduce accumulated net realized loss by $44,257, and to increase accumulated over-distributed net investment income by $20,174. Total earnings and net asset value are not affected.
The tax character of dividends for the fiscal year ended March 31, 2015 was as follows:
Ordinary income $ 165,626Tax Return of Capital $ 23,767
As of March 31, 2015, the components of accumulated losses on a tax basis were as follows(1):
Distributable ordinary income $ —Capital loss carryforward(2)(3) (1,042,277)Other book/tax temporary differences (74,084)Unrealized depreciation (143,983)Total net accumulated losses $ (1,260,344)
As of March 31, 2015, we had a net post-October capital loss deferral of $10,791 which is deemed to arise on April 1, 2015.
(1) Tax information for the fiscal year ended March 31, 2015 is an estimate and will not be finally determined until the Company files its 2015 tax return in December 2015.
(2) On March 31, 2015, the Company had net capital loss carryforwards of $36,089, $199,331 and $411,998 which expire in 2017, 2018 and 2019, respectively. These amounts will be available to offset like amounts of any future taxable gains. It is unlikely that capital gains distributions will be paid to stockholders of the Company until net gains have been realized in excess of such capital loss carryforward or the carryforward expires.
(3) On December 22, 2010, the Regulated Investment Company Modernization Act of 2010 (the “Act”) was enacted which changed various technical rules governing the tax treatment of regulated investment companies. The changes are generally effective for taxable years beginning after the date of enactment. Under the Act, the fund will be permitted to carry forward capital losses incurred in taxable years beginning after the date of enactment for an unlimited period. However, any losses incurred during those future taxable years will be required to be utilized prior to the losses incurred in pre-enactment taxable years, which carry an expiration date. As a result of this ordering rule, pre-enactment capital loss carryforwards may be more likely to expire unused. Additionally, post-enactment capital losses that are carried forward will retain their character as either short-term or long-term losses rather than being considered all short-term as under previous law. As of March 31, 2015, the Company had a post-enactment short-term capital loss carryforward of $78,104 and long-term capital loss carryforward of $316,755. This loss is deemed to arise on April 1, 2015.
The tax character of dividends for the fiscal year ended March 31, 2014 was as follows:
Ordinary income $ 182,193Tax Return of Capital $ —
As of March 31, 2014, the components of accumulated losses on a tax basis were as follows (1):

APOLLO INVESTMENT CORPORATIONNOTES TO FINANCIAL STATEMENTS (continued)
(in thousands except share and per share amounts)
108
Distributable ordinary income $ 11,005Capital loss carryforward (2)(3) (1,053,971)Other book/tax temporary differences (95,158)Unrealized depreciation (32,331)Total net accumulated losses $ (1,170,455)
As of March 31, 2014, we had a post-October capital loss deferral of $40,874 which is deemed to arise on April 1, 2014.
(1) Tax information for the fiscal year ended March 31, 2014 was finally determined when the Company filed its 2013 tax return in December 2014.
(2) On March 31, 2014, the Company had net capital loss carryforwards of $36,089, $199,331 and $411,998 which expire in 2017, 2018 and 2019, respectively. These amounts will be available to offset like amounts of any future taxable gains. It is unlikely that capital gains distributions will be paid to stockholders of the Company until net gains have been realized in excess of such capital loss carryforward or the carryforward expires.
(3) On December 22, 2010, the Regulated Investment Company Modernization Act of 2010 (the “Act”) was enacted which changed various technical rules governing the tax treatment of regulated investment companies. The changes are generally effective for taxable years beginning after the date of enactment. Under the Act, the fund will be permitted to carry forward capital losses incurred in taxable years beginning after the date of enactment for an unlimited period. However, any losses incurred during those future taxable years will be required to be utilized prior to the losses incurred in pre-enactment taxable years, which carry an expiration date. As a result of this ordering rule, pre-enactment capital loss carryforwards may be more likely to expire unused. Additionally, post-enactment capital losses that are carried forward will retain their character as either short-term or long-term losses rather than being considered all short-term as under previous law. As of March 31, 2014, the Company had a post-enactment short-term capital loss of $57,724 and long-term capital loss carryforward of $348,829. This loss is deemed to arise on April 1, 2014.
Management has analyzed the Company’s tax positions taken, or to be taken, on Federal income tax returns for all open tax years, and has concluded that no provision for income tax is required in the Company’s financial statements. The Company’s federal tax returns are subject to examination by the Internal Revenue Service for a period of three fiscal years after they are filed.

APOLLO INVESTMENT CORPORATIONNOTES TO FINANCIAL STATEMENTS (continued)
(in thousands except share and per share amounts)
109
Note 12. Selected Quarterly Financial Data (unaudited)
Quarter EndedInvestment
IncomeNet Investment
Income1
Net Realized AndUnrealized Gain(Loss) On Assets1
Net Increase(Decrease) In Net Asse
tsFrom Operations
(on a basic,non-diluted basis)
Net Increase(Decrease) In
Net Assets FromOperations
(on a diluted basis)
TotalPer
Share TotalPer
Share TotalPer
Share TotalPer
Share TotalPer
ShareMarch 31, 2015 $ 102,115 $ 0.43 $ 52,071 $ 0.22 $ (63,800) $ (0.27) $ (11,729) $ (0.05) $ (9,189) $ (0.05)*December 31, 2014 110,026 0.46 56,662 0.24 (76,114) (0.33) (19,452) (0.09) (16,913) (0.09)*September 30, 2014 118,910 0.50 65,688 0.28 (23,721) (0.10) 41,967 0.18 44,491 0.18June 30, 2014 102,580 0.43 53,551 0.23 11,085 0.04 64,636 0.27 67,192 0.27March 31, 2014 96,404 0.42 49,612 0.22 20,293 0.09 69,905 0.31 72,392 0.30December 31, 2013 94,561 0.42 49,683 0.22 56,055 0.25 105,738 0.47 108,286 0.45September 30, 2013 93,708 0.42 49,586 0.22 26,839 0.12 76,425 0.34 78,973 0.33June 30, 2013 96,673 0.45 52,367 0.25 (33,563) (0.16) 18,804 0.09 21,359 0.09March 31, 2013 84,617 0.42 42,066 0.21 23,755 0.12 65,821 0.32 68,389 0.31December 31, 2012 83,212 0.41 42,080 0.21 (64,824) (0.32) (22,744) (0.11) (20,169) (0.11)September 30, 2012 83,832 0.41 44,482 0.22 28,554 0.14 73,036 0.36 75,610 0.35June 30, 2012 80,333 0.40 38,732 0.19 (50,374) (0.25) (11,642) (0.06) (9,048) 0.06
1Represent rounded numbers* In applying the if-converted method, conversion is not assumed for purposes of computing diluted EPS if the effect would be anti-dilutive. For the quarters
ended March 31, 2015 and December 31, 2014 anti-dilution would total $0.01 and $0.01, respectively.
Note 13. Commitments and Contingencies
As of March 31, 2015, the Company’s commitments and contingencies were as follows:
As of March 31, 2015 As of March 31, 2014
Unfunded revolver obligations and bridge loans commitments (1) $ 206,294 $ 408,554Unfunded delayed draw commitments on senior loans to portfolio companies (2) 102,092 138,680Unfunded delayed draw commitments on senior loans to portfolio companies
(performance thresholds not met) (3)23,436 48,923
Standby letters of credit issued for certain portfolio companies for which theCompany and portfolio companies are liable (4)
34,433 16,379
_________________
(1) The unfunded revolver obligations may or may not be funded to the borrowing party in the future. The amounts relate to loans with various maturity dates, but the entire amount was eligible for funding to the borrowers as of March 31, 2015, subject to the terms of each loan’s respective credit agreements which includes borrowing covenants that needs to be met prior to funding.
(2) The Company’s commitment to fund delayed draw loans is triggered upon the satisfaction of certain pre-negotiated terms and conditions which can include covenants to maintain specified leverage levels and other related borrowing base covenants.
(3) The borrowers are required to meet certain performance thresholds before the Company is obligated to fulfill the commitments and those performance thresholds were not met as of March 31, 2015.
(4) For all these letters of credit issued and outstanding, the Company would be required to make payments to third parties if the portfolio companies were to default on their related payment obligations. None of the letters of credit issued and outstanding are recorded as a liability on the Company’s balance sheet as such letters of credit are considered in the valuation of the investments in the portfolio company.

APOLLO INVESTMENT CORPORATIONNOTES TO FINANCIAL STATEMENTS (continued)
(in thousands except share and per share amounts)
110
As of May 19, 2015 the outstanding commitments to purchase secured term loans and unsecured bridge loans, which existed as of March 31, 2015 were reduced by $89,180.
Note 14. Subsequent Events
On April 24, 2015, the Company amended and restated the Senior Secured Facility (see note 9).
On May 18, 2015, the Board of Directors declared a dividend of $0.20 per share for the fourth fiscal quarter of 2015, payable on July 6, 2015 to stockholders of record as of June 19, 2015.

111
Item 9. Changes in and Disagreements with Accountants on Accounting and Financial Disclosure
None.
Item 9A. Controls and Procedures
(a) Evaluation of Disclosure Controls and Procedures
As of March 31, 2015 (the end of the period covered by this report), we, including our Chief Executive Officer and Chief Financial Officer, evaluated the effectiveness of the design and operation of our disclosure controls and procedures (as defined in Rule 13a-15(e) of the 1934 Act). Based on that evaluation, our management, including the Chief Executive Officer and Chief Financial Officer, concluded that our disclosure controls and procedures were effective and provided reasonable assurance that information required to be disclosed in our periodic SEC filings is recorded, processed, summarized and reported within the time periods specified in the SEC’s rules and forms, and that such information is accumulated and communicated to our management, including our Chief Executive Officer and Chief Financial Officer, as appropriate, to allow timely decisions regarding required disclosure. However, in evaluating the disclosure controls and procedures, management recognized that any controls and procedures, no matter how well designed and operated can provide only reasonable assurance of achieving the desired control objectives, and management necessarily was required to apply its judgment in evaluating the cost-benefit relationship of such possible controls and procedures.
(b) Management’s Report on Internal Control Over Financial Reporting
Management’s Report on Internal Control Over Financial Reporting, which appears on page 48 of this Form 10-K, is incorporated by reference herein.
(c) Attestation Report of the Independent Registered Public Accounting Firm
Our independent registered public accounting firm, PricewaterhouseCoopers LLP, has issued an attestation report on the Company’s internal control over financial reporting, which is set forth above under the heading “Report of Independent Registered Public Accounting Firm” in Item 8.
(d) Changes in Internal Controls Over Financial Reporting
Management has not identified any change in the Company’s internal control over financing reporting that occurred during the fourth fiscal quarter of 2015 that has materially affected, or is reasonably likely to materially affect, the Company’s internal control over financial reporting.
Item 9B. Other Information
On May 18, 2015, the Company's Board of directors approved and adopted an amendment to the Third Amended and Restated Bylaws of the Company.
Article III, Section 2 - Number, Tenure and Qualification. The provision was amended to increase the maximum number of directors that can serve on the Company’s Board of Directors from eight to nine.

112
PART III
Item 10. Directors, Executive Officers and Corporate Governance
MANAGEMENT
Our business and affairs are managed under the direction of our board of directors. The board of directors currently consists of eight members, six of whom are not “interested persons” of Apollo Investment as defined in Section 2(a)(19) of the 1940 Act. We refer to these individuals as our independent directors. Our board of directors elects our officers, who serve at the discretion of the board of directors.
BOARD OF DIRECTORS
Under our charter, our directors are divided into three classes. Each class of directors holds office for a three year term. At each annual meeting of our stockholders, the successors to the class of directors whose terms expire at such meeting will be elected to hold office for a term expiring at the annual meeting of stockholders held in the third year following the year of their election. Each director holds office for the term to which he or she is elected and until his or her successor is duly elected and qualifies.
Directors
Information regarding the board of directors is as follows:
Name Age PositionDirector
SinceExpiration
of Term
Interested DirectorsJohn J. Hannan 62 Chairman of the Board and Director 2004 2015James C. Zelter 52 Chief Executive Officer and Director 2008 2015Bradley J. Wechsler(1) 63 Director 2004 2016
Independent DirectorsR. Rudolph Reinfrank 59 Director 2013 2015Jeanette Loeb 62 Director 2011 2017Frank C. Puleo 69 Director 2008 2017Carl Spielvogel 86 Director 2004 2017Elliot Stein, Jr. 66 Director 2004 2016
(1) Bradley J. Wechsler is an interested director since January 5, 2015.
The address for each director is c/o Apollo Investment Corporation, 9 West 57th Street, New York, NY 10019.
Executive officers who are not directors
Information regarding our executive officers who are not directors is as follows:
Name Age Position
Edward J. Goldthorpe 38 President and Chief Investment OfficerGregory W. Hunt 58 Chief Financial Officer and TreasurerJohn J. Suydam 55 Vice President and Chief Legal OfficerCindy Z. Michel 41 Vice President and Chief Compliance OfficerJoseph D. Glatt 41 Chief Legal officer, Vice President and Secretary
The address for each executive officer is c/o Apollo Investment Corporation, 9 West 57th Street, New York, NY 10019.
Biographical information
Directors
Our directors have been divided into two groups — independent directors and interested directors. Interested directors are interested persons as defined in the 1940 Act.

113
Independent Directors
R. Rudolph Reinfrank (59) Director. Mr. Reinfrank became a Director of Apollo Investment in June 2013. Mr. Reinfrank currently serves as a Director of Parker Drilling Company Inc. Since October 2009 Mr. Reinfrank has served as the Managing General Partner of Riverford Partners, LLC, a strategic advisory and investment firm based in Los Angeles, CA (“Riverford”). Riverford acts as an investor, board member and strategic adviser to growth companies and companies in transition. In 2000, Mr. Reinfrank co-founded and served as a Managing General Partner of Clarity Partners, L.P. until 2009. In 1997, he co-founded and serves as a Managing General Partner of Rader Reinfrank & Co. In 2006, he co-founded Clarity China, L.P. Mr. Reinfrank is also a Senior Adviser to Pall Mall Capital, Limited (London) and Transnational Capital Corporation.
Jeanette Loeb (62) Director. Ms. Loeb became a Director of Apollo Investment in August 2011. Ms. Loeb currently serves as a Director of PetCareRx, Inc., and is a former Chairman and Chief Executive Officer of the company, a leading e-commerce pet pharmacy that sells pet medications, supplies and food directly to the consumer. Ms. Loeb joined PetCareRx, Inc. in 2001. From 1977 until 1994, Ms. Loeb was an investment banker at Goldman Sachs, where she served as the head of the Structured Finance Department in the U.S. Ms. Loeb was named the first woman partner of Goldman Sachs in 1986 and served as a partner from 1986-1994. Ms. Loeb received an MBA from Harvard Business School and graduated Phi Beta Kappa from Wellesley College with a BA in economics. She currently serves on the board and the finance committee of New York City Center and the board for Alliance Bernstein Multi-Manager Alternative Fund, and has previously been on the board and audit committee of the United Nations Development Corporation, a member of the board of the Collegiate School, the Treasurer and a board member of the Society of Memorial Sloan Kettering, and a founding member of the Wellesley Business Leadership Council.
Frank C. Puleo (69) Director. Mr. Puleo became a Director of Apollo Investment on February 4, 2008. Mr. Puleo currently serves as a Director of South Street Holdings, LLC. (formerly known as CMET Finance Holdings, Inc.), a company that finances securities inventory for customers and dealers and licenses trade processing software, SLM Corp., a student loan company, and Syncora Capital Assurance, Inc., a monoline financial guaranty and insurance company. Until mid-2014 Mr. Puleo was a Director of CIFC Deerfield Corp., a credit asset manager. Previously, Mr. Puleo was a partner at Milbank, Tweed, Hadley & McCloy LLP where he advised clients on structured finance transactions, bank and bank holding company regulatory and securities law matters. Mr. Puleo became a partner of Milbank, Tweed, Hadley & McCloy LLP in 1978 and Co-Chair of the firm’s Global Finance Group in 1995 until retiring at the end of 2006. He was a member of the firm’s Executive Committee from 1982 to 1991 and from 1996 to 2002. Mr. Puleo served as a Lecturer at Columbia University School of Law from 1997 to 2001.
Carl Spielvogel (86) Director. Ambassador Spielvogel became a Director of Apollo Investment in March 2004. Ambassador Spielvogel was and is currently Chairman and Chief Executive Officer of Carl Spielvogel Enterprises, Inc., an international management and counseling company, from 1997 to 2000, and from 2001 to present. From 2000-2001, Ambassador Spielvogel served as U.S. Ambassador to the Slovak Republic, based in Bratislava, Slovakia. He served as a Director of Interactive Data Corporation, Inc. from 1996 to 2009, and as a member of its Audit Committee and Chairman of the Independent Shareholders Committee. From 1994 to 1997, Ambassador Spielvogel was Chairman and Chief Executive Officer of the United Auto Group, Inc., one of the first publicly-owned auto dealership groups. Earlier, Ambassador Spielvogel was Chairman and Chief Executive Officer of Backer Spielvogel Bates Worldwide, a global marketing communications company from 1985 to 1994. Ambassador Spielvogel is a trustee of the Metropolitan Museum of Art; a member of the Board of Trustees and Chairman of the Business Council of the Asia Society; a member of the Board of Trustees of Lincoln Center for the Performing Arts; a member of the Council on Foreign Relations; a member of the Executive Committee of the Council of American Ambassadors’; a Trustee and member of the Executive Committee of the State University of New York, and a former Fellow of the Kennedy School of Government at Harvard University. Before becoming an Ambassador, he was a Governor of the United States Government Board of Broadcasting.
Elliot Stein, Jr. (66) Director. Mr. Stein became a Director of Apollo Investment in March 2004 and currently serves as lead Independent Director. Mr. Stein has also been a director of Apollo Senior Floating Rate Fund Inc. since 2011 and a director of Apollo Tactical Income Fund Inc since 2013. He is currently Chair of Senturion Forecasting, LLC and Acertas, LLC, two private companies. He is also a Managing Director of Commonwealth Capital Partners. Mr. Stein is also a board member of various private companies including Multi-Pak Holdings, Cohere Communications and Assay Healthcare Solutions. Mr. Stein is a Trustee of Claremont Graduate University and the New School University. He is a member of the Council on Foreign Relations. He formerly served as Chairman of Caribbean International News Corporation and as a Director of Bizzingo, Inc. and various private companies, including VTG Holdings and Bargain Shop Holdings, Inc.
Interested Directors
John J. Hannan (62) Chairman of the Board of Directors. Mr. Hannan became a Director of Apollo Investment in March 2004 and was elected as Chairman of the Board of Directors in August 2006. He served as the Chief Executive Officer from February

114
2006 to November 2008. Mr. Hannan, a senior partner of Apollo Management, L.P., co-founded Apollo Management, L.P. in 1990. He is also currently on the Board of Directors for EP Energy Corporation. Mr. Hannan formerly served as a director for Vail Resorts, Inc. and Goodman Global, Inc.
James C. Zelter (52) Chief Executive Officer and Director. Mr. Zelter joined Apollo Management in 2006. Mr. Zelter is the Managing Partner of Apollo Capital Management and oversees the firm’s activities in a broad array of asset classes. At Apollo Investment, he is CEO and a director of the Company. Prior to joining Apollo Management, Mr. Zelter was with Citigroup and its predecessor companies from 1994 to 2006. He was responsible for the global expansion and strong financial performance of the Special Situations Investment Group, a proprietary investment group he founded within Citigroup’s Fixed Income Division. As head of Citigroup’s Special Situations Investment Group, Mr. Zelter was responsible for the acquisition of approximately $5 billion of NPL portfolios and ancillary investments. While with Citigroup, Mr. Zelter also served on the Global Fixed Income Management Committee. In this role, he oversaw the firm’s High Yield Trading, Sales and Capital Market Groups. From 2003 to 2005, Mr. Zelter was Chief Investment Officer of Citigroup Alternative Investments. In addition, he was a standing member of the Citigroup Pension Investment Committee, the Salomon Smith Barney Capital Partners Investment Committee and the Citigroup Mezzanine Partners Investment Committee. Prior to joining Citigroup in 1994, Mr. Zelter was a High Yield Trader at Goldman Sachs & Co. Mr. Zelter is a board member of DUMAC, the investment management company that oversees the Duke Endowment and Duke Foundation, and is on the board of the Dalton School. Mr. Zelter has a BA in Economics from Duke University.
Bradley J. Wechsler (63) Director. Mr. Wechsler became a Director of Apollo Investment Corporation in April 2004. Mr. Wechsler was the Co-Chairman and Co-Chief Executive Officer of IMAX Corporation from May 1996 through April 2009 and is currently Chairman. In addition, Mr. Wechsler is the Managing Partner of Elysium, LLC, a limited liability company that manages the family office for Leon Black, the CEO of Apollo Global. Previously Mr. Wechsler has had several executive positions in the entertainment and finance industries and has made a number of private investments. Mr. Wechsler is a Vice-Chairman of the board of the NYU Hospital and Medical Center, a member of the Executive Committee and chairs its Finance Committee. He also sits on the board of Math for America and is a member of the Academy of Motion Picture Arts and Sciences.
Executive Officers who are not directors
Edward J. Goldthorpe (38) Chief Investment Officer and President. Mr. Goldthorpe is President of the Company , Chief Investment Officer of Apollo Investment Management, and Senior Portfolio Manager, U.S. Opportunistic Credit. Mr. Goldthorpe joined Apollo in April 2012 and oversees the Opportunistic Credit platform within Apollo Management. Previously, Mr. Goldthorpe was employed by Goldman Sachs for 13 years. He most recently ran the Bank Loan Distressed Investing Desk and prior to that was a Managing Director in the Special Situations Group, running both their Middle Market Private Equity business and the Canadian business (CSSG). Prior to that, Mr. Goldthorpe worked in the High Yield Distressed business, the Merchant Banking Division and the Investment Banking Division. Mr. Goldthorpe received a B.A. in Commerce from Queen’s University in Kingston, Ontario. Mr. Goldthorpe currently serves on the Global Advisory Board for the Queen’s School of Business. He is also the Chairman of the Young Fellowship of The Duke of Edinburgh’s Award.
Gregory W. Hunt (58) Chief Financial Officer and Treasurer. Mr. Hunt began his term as Chief Financial Officer and Treasurer of Apollo Investment Corporation in May 2012. Previously, Mr. Hunt was Executive Vice President and Chief Financial Officer for Yankee Candle which he joined in April 2010. Prior to joining Yankee Candle, Mr. Hunt served as the Executive Vice President of Strategic and Commercial Development for Norwegian Cruise Lines from 2007 to 2009. Prior to joining Norwegian Cruise Lines, Mr. Hunt served as Chief Financial Officer and Chief Restructuring Officer of Tweeter Home Entertainment Group, Inc. from 2006 to 2007 and Chief Financial Officer and Co-Chief Executive of Syratech Corporation from 2001 to 2006. Prior to Syratech, Mr. Hunt held several senior financial leadership positions including Chief Financial Officer of NRT Inc., Culligan Water Technologies, Inc. and Samsonite Corporation. Mr. Hunt also serves as a Director of LogicSource, Inc. and as a member of the Board of Advisors for the University of Vermont School of Business. Mr. Hunt earned a bachelor’s degree in accounting and finance from the University of Vermont and is a Certified Public Accountant.
Cindy Z. Michel (41) Chief Compliance Officer and Vice President. Ms. Michel joined Apollo in 2007. Ms. Michel is also the Chief Compliance Officer of Apollo Global Management. Prior to joining Apollo, Ms. Michel served as the Director of Compliance of the Private Equity Division and the Global Trading Strategies Group at Lehman Brothers. Prior to that, she was associated with the investment bank Credit-Suisse Securities as a member of its Compliance Department supporting the Private Equity and Investment Banking businesses. Before joining Credit-Suisse, Ms. Michel was associated with the law firm of DLA Piper. Ms. Michel graduated from Columbia University with an AB in English and Economics and holds a JD from Boston University School of Law.
Joseph D. Glatt (41) Chief Legal Officer, Secretary and Vice President. Mr. Glatt was appointed Chief Legal Officer of the Company in 2014, and serves as General Counsel for Apollo Capital Management. Prior to that time, Mr. Glatt was associated with the law firms of Simpson Thacher & Bartlett LLP from 1998 to 2003 and Schulte Roth & Zabel LLP from 2003 to 2007, in

115
each case, primarily focusing on mergers and acquisitions, leveraged buyouts and capital markets activities. Mr. Glatt serves on the Board of Trustees for FamilyConnections a community based counseling and family service agency and also serves on the Board of Advisors for the Institute of Law and Economics, a joint research center of the Law School, Wharton and the Department of Economics at the University of Pennsylvania. Mr. Glatt received his JD from University of Pennsylvania Law School and graduated summa cum laude from Rutgers College with a BA in Political Science, Psychology and Hebraic Studies.
Additional information required by this item, including for example, director qualifications, is contained in the Registrant’s definitive Proxy Statement for its 2015 Annual Stockholders Meeting under the caption, “Information about the Nominees and Directors” to be filed with the Securities and Exchange Commission within 120 days after March 31, 2015 and is incorporated herein by reference.
The Audit Committee
The audit committee operates pursuant to an audit committee charter approved by the board of directors. The charter sets forth the responsibilities of the audit committee, which include selecting or retaining each year an independent registered public accounting firm (the “auditors”) to audit the accounts and records of the Company; reviewing and discussing with management and the auditors the annual audited financial statements of the Company, including disclosures made in management’s discussion and analysis, and recommending to the board of directors whether the audited financial statements should be included in the Company’s annual report on Form 10-K; reviewing and discussing with management and the auditors the Company’s quarterly financial statements prior to the filings of its quarterly reports on Form 10-Q; pre-approving the auditors’ engagement to render audit and/or permissible non-audit services; and evaluating the qualifications, performance and independence of the auditors. The audit committee is presently composed of five persons: Messrs. Reinfrank, Puleo, Spielvogel, Stein, and Ms. Loeb, all of whom are independent directors and are otherwise considered independent under the listing standards of NASDAQ Marketplace Rule 5605(a)(2). The Company’s board of directors has determined that Mr. Reinfrank is an “audit committee financial expert” as that term is defined under Item 401 of Regulation S-K under the Securities Exchange Act of 1934, as amended, (the “Exchange Act”). The Audit Committee Charter is available on the Company’s website (www.apolloic.com).
Section 16(a) Beneficial Ownership Reporting Compliance
Pursuant to Section 16(a) of the Exchange Act, the Company’s Directors and Executive Officers, and any persons holding more than 10% of its common stock, are required to report their beneficial ownership and any changes therein to the Securities and Exchange Commission (the “Commission”) and the Company. Specific due dates for those reports have been established, and the Company is required to report herein any failure to file such reports by those due dates. Based on the Company’s review of Forms 3, 4 and 5 filed by such persons and information provided by the Company’s Directors and officers, the Company believes that during the fiscal year ended March 31, 2015, all Section 16(a) filing requirements applicable to such persons were met in a timely manner.
Code of Conduct
We have adopted a code of conduct for all our directors and employees, including our Chief Executive Officer and Chief Financial Officer, as required under Item 406 of Regulation S-K under the Exchange Act and the listing standards of NASDAQ Marketplace Rule 5610. The code of conduct is available on our website located at www.apolloic.com. You may also read and copy the code of conduct at the SEC’s Public Reference Room in Washington, D.C. You may obtain information on operations of the Public Reference Room by calling the SEC at (202) 942-8090. In addition, the code of conduct will be available on the EDGAR Database on the SEC Internet site at http://www.sec.gov. You may also obtain copies of the code of conduct, after paying a duplicating fee, by electronic request at the following email address: [email protected], or by writing to the SEC’s Public Reference Section, 450 5th Street, NW, Washington, D.C. 20549.
Item 11. Executive Compensation
COMPENSATION DISCUSSION AND ANALYSIS
Apollo Investment Corporation does not currently have any employees. The executive officers of the company are either employees of our investment adviser, Apollo Investment Management (“adviser”), or our administrator, Apollo Investment Administration (“administrator”). The adviser and administrator provide necessary services to the business, pursuant to the terms of our investment advisory and management agreement and our administration agreement. Our day-to-day investment operations are managed by our investment adviser. Most of the services necessary for the origination and administration of our investment portfolio are provided by investment professionals employed by the adviser. In addition, we generally reimburse the administrator for our allocable portion of expenses incurred by it in performing its obligations under the administration agreement, including our allocable portion of the cost of our chief financial officer, chief compliance officer and their respective staffs.

116
Summary Compensation Table
The following table shows information regarding the compensation expected to be received by the independent directors and executive officers for the fiscal year ended March 31, 2015. No compensation is paid to directors who are “interested persons.”
Name
Aggregatecompensation fromApollo Investment
Pension orretirement benefitsaccrued as part of
our expenses(1)
Totalcompensation fromApollo Investmentpaid to director/
officer
Independent directorsR. Rudolph Reinfrank $171,000 None $171,000Jeanette Loeb 156,000 None 156,000Frank C. Puleo 154,500 None 154,500Carl Spielvogel 156,000 None 156,000Elliot Stein, Jr. 183,500 None 183,500
Interested directorsJohn J. Hannan None None NoneJames C. Zelter(2) None None NoneBradley J. Wechsler(3) 144,000 None 144,000
Executive OfficersEdward J. Goldthorpe None None NoneGregory W. Hunt None None NoneJohn J. Suydam None None NoneCindy Michel None None NoneJoseph Glatt None None None
(1) We do not have a profit sharing or retirement plan, and directors do not receive any pension or retirement benefits.(2) James C. Zelter is also an executive officer of Apollo Investment Corporation.(3) Effective January 5, 2015, Mr. Wechsler became an interested director. His compensation for the fiscal year ended March
31, 2015 is pro-rata based upon the portion of the fiscal year when he was an independent director.
An independent director’s annual fee is $125,000. The independent directors also receive $2,500 plus reimbursement of reasonable out-of-pocket expenses incurred in connection with attending each board meeting, $1,000 plus reimbursement of reasonable out-of-pocket expenses incurred in connection with each committee meeting attended, and $1,500 for each telephonic committee or board meeting attended. In addition, the Lead Independent Director receives an annual fee of $25,000, the Chairman of the Audit Committee receives an annual fee of $15,000 and each chairman of any other committee receives an annual fee of $2,500 for additional services in these capacities. Further, we purchase directors’ and officers’ liability insurance on behalf of our directors and officers.
Additional information required by this item, including for example, compensation of officers and directors, is contained in the Registrant’s definitive Proxy Statement for its 2014 Annual Stockholders Meeting under the caption, “Compensation of Directors and Executive Officers” to be filed with the Securities and Exchange Commission within 120 days after March 31, 2015 and is incorporated herein by reference.
Item 12. Security Ownership of Certain Beneficial Owners and Management and Related Stockholder Matters
As of March 31, 2015, there were no persons that owned 25% or more of our outstanding voting securities, and no person would be deemed to control us, as such term is defined in the 1940 Act.
Our directors have been divided into two groups — interested directors and independent directors. Interested directors are “interested persons” as defined in the Investment Company Act of 1940.
The following table sets forth, as of March 31, 2015, certain ownership information with respect to our common stock for those persons whom we believe, based on public filings and/or information provided by such persons, directly or indirectly owned, controlled or held with the power to vote, 5% or more of our outstanding common stock as of that date and all officers and directors,

117
as a group. Unless otherwise indicated, we believe that each beneficial owner set forth in the table has sole voting and investment power.
Name and addressType of
ownership(1) Shares owned
Percentage ofcommon stock
outstanding
FMR LLC(2) Beneficial 21,179,233 8.95%Thornburg Investment Management Inc.(3) Beneficial 21,254,016 8.98%All officers and directors as a group (12 persons)(4) Beneficial 537,086 *
_________________________* Represents less than 1%.(1) All of our common stock is owned of record by Cede & Co., as nominee of the Depository Trust Company.(2) The principal address for FMR LLC is 245 Summer Street, Boston, MA 02210.(3) The principal address for Thornburg Investment Management Inc. is 2300 North Ridgetop Road, Santa Fe, NM 87506.(4) The address for all officers and directors is c/o Apollo Investment Corporation, 9 West 57th Street, New York, NY 10019.
The following table sets forth the dollar range of our equity securities beneficially owned by each of our directors as of March 31, 2015. (We are not part of a “family of investment companies,” as that term is defined in the 1940 Act.)
Name of Director
Dollar Range of EquitySecurities in Apollo
Investment(1)
Independent DirectorsR. Rudolph Reinfrank $100,001 – $500,000Jeanette Loeb(2) $100,001 – $500,000Frank C. Puleo $100,001 — $500,000Carl Spielvogel(2) $1 — $10,000Elliot Stein, Jr.(2) $100,001 – $500,000
Interested DirectorsJohn J. Hannan(2) $500,001 – $1,000,000James C. Zelter Over $1,000,000Bradley J. Wechsler(3) $100,001 – $500,000
_________________________(1) Dollar ranges are as follows: None, $1 — $10,000, $10,001 — $50,000, $50,001 — $100,000, $100,001 — $500,000,
$500,001 — $1,000,000 or over $1,000,000.(2) Dollar range includes shares held through indirect beneficial ownership of a family trust.(3) Effective January 5, 2015, Mr. Wechsler became an Interested Director.
Additional information required by this item, including for example, security ownership of management, is contained in the Registrant’s definitive Proxy Statement for its 2015 Annual Stockholders Meeting under the caption, “Security Ownership of Certain Beneficial Owners and Management” to be filed with the Securities and Exchange Commission within 120 days after March 31, 2015 and is incorporated herein by reference.
Item 13. Certain Relationships, Related Transactions, and Director Independence
We have entered into an investment advisory and management agreement with AIM. Certain of our senior officers and our chairman of the board of directors have ownership and financial interests in AIM. Certain of our senior officers also serve as principals of other investment managers affiliated with AIM that may in the future manage investment funds with investment objectives similar to ours. In addition, our executive officers and directors and the partners of our investment adviser, AIM, serve or may serve as officers, directors or principals of entities that operate in the same or related line of business as we do, or of investment funds managed by its affiliates, although we may not be given the opportunity to participate in certain investments made by investment funds managed by advisers affiliated with AIM. However, our investment adviser and its affiliates intend to allocate investment opportunities in a fair and equitable manner consistent with our investment objectives and strategies so that we are not disadvantaged in relation to any other client.
We have entered into a royalty-free license agreement with AGM which we recently amended and restated, pursuant to which AGM has agreed to grant us a non-exclusive license to use the name “Apollo.” Under the license agreement, we have the right to

118
use the “Apollo” name for so long as AIM or one of its affiliates remains our investment adviser. In addition, we rent office space from AIA, an affiliate of AIM, and pay Apollo Administration our allocable portion of overhead and other expenses incurred by Apollo Administration in performing its obligations under our administration agreement with AIA, including our allocable portion of the cost of our chief financial officer and chief compliance officer and their respective staffs, which can create conflicts of interest that our board of directors must monitor. We may invest, to the extent permitted by law, on a concurrent basis with affiliates of AIM, subject to compliance with applicable regulations and our allocation procedures.
Further information relating to relationships and director independence is hereby incorporated by reference from our 2014 Proxy Statement under the caption “Certain Relationships and Transactions.”
Item 14. Principal Accounting Fees and Services
The audit committee of the board of directors selected PricewaterhouseCoopers LLP as independent registered public accounting firm (the “auditors”) for the Company for the fiscal year ended March 31, 2015. The audit committee has received the written disclosures and the letter from the independent accountant required by applicable requirements of the Public Company Accounting Oversight Board regarding the independent accountant’s communications with the audit committee concerning independence, and has discussed with the independent accountant the independent accountant’s independence.
Audit Fees: Audit fees consist of fees billed for professional services rendered for the quarterly reviews and audit of our financial statements and services that are normally provided by PricewaterhouseCoopers LLP in connection with statutory and regulatory filings. Audit fees billed during the fiscal years ended March 31, 2015 and March 31, 2014 were $1,219,434 and $1,431,080, respectively.
Audit-Related Fees: Audit-related services consist of fees billed for assurance and related services that are reasonably related to the performance of the audit or review of our financial statements and are not reported under “Audit Fees.” These services include attest services that are not required by statute or regulation and consultations concerning financial accounting and reporting standards. Audit-related fees billed during the fiscal years ended March 31, 2015 and March 31, 2014 were $460,000 and $147,689, respectively.
Tax Services Fees: Tax services fees consist of fees billed for professional tax services. These services also include assistance regarding federal, state, and local tax compliance. Tax services and fees billed during the fiscal years ended March 31, 2015 and March 31, 2014 were $40,000 and $40,000, respectively, which represented work related to preparation of tax returns, our RIC qualification, excise tax distribution requirements, form extensions, etc.
All Other Fees: Other fees would include fees for products and services other than the services reported above, of which there were none in the fiscal years ended March 31, 2015 and March 31, 2014.
The Audit Committee of the board of directors of Apollo Investment Corporation operates under a written charter adopted by the board of directors. Management is responsible for the Company’s internal controls and the financial reporting process. The auditors are responsible for performing an independent audit of the Company’s financial statements in accordance with auditing standards generally accepted in the United States and expressing an opinion on the conformity of those audited financial statements in accordance with accounting principles generally accepted in the United States. The Audit Committee’s responsibility is to monitor and oversee these processes. The Audit Committee is also directly responsible for the appointment, compensation and oversight of the Company’s auditors.
The Audit Committee has established a pre-approval policy that describes the permitted audit, audit-related, tax and other services to be provided by PricewaterhouseCoopers LLP, the Company’s auditors. The policy requires that the Audit Committee pre-approve the audit and non-audit services performed by the auditors in order to assure that the provision of such service does not impair the auditor’s independence.
Any requests for audit, audit-related, tax and other services that have not received general pre-approval must be submitted to the Audit Committee for specific pre-approval, and cannot commence until such approval has been granted. Normally, pre-approval is provided at regularly scheduled meetings of the Audit Committee. However, the Audit Committee may delegate pre-approval authority to one or more of its members. The member or members to whom such authority is delegated shall report any pre-approval decisions to the Audit Committee at its next scheduled meeting. The Audit Committee does not delegate its responsibilities to pre-approve services performed by the auditors to management.
The Audit Committee has reviewed the audited financial statements and met and held discussions with management regarding the audited financial statements. Management has represented to the Audit Committee that the Company’s financial statements were prepared in accordance with accounting principles generally accepted in the United States.

119
The Audit Committee has discussed with PricewaterhouseCoopers LLP, the Company’s auditors, matters required to be discussed by the statement on Auditing Standards No. 114, as amended.
Based on the Audit Committee’s discussion with management and the auditors, the Audit Committee’s review of the audited financial statements, the representations of management and the report of the auditors to the Audit Committee, the Audit Committee has recommended that the board of directors include the audited financial statements in the Company’s Annual Report on Form 10-K for the fiscal year ended March 31, 2014 for filing with the Securities and Exchange Commission. The Audit Committee has also appointed PricewaterhouseCoopers LLP to serve as auditors for the fiscal year ending March 31, 2015 pending ratification by the Company’s stockholders.

120
PART IV
Item 15. Exhibits, Financial Statement Schedules
(a)(1) Financial Statements.Refer to Item 8 above.
(a)(2) Financial Statement SchedulesNone.
(a)(3) Exhibits3.1(a) Articles of Amendment(1)3.1(b) Articles of Amendment and Restatement(2)
3.2 Fourth Amended and Restated Bylaws*4.1 Form of Stock Certificate(4)4.2 In accordance with Item 601(b)(4)(iii)(A) of Regulation S-K, certain instruments respecting long-term debt
of the registrant have been omitted but will be furnished to the Commission upon request.4.3 Form of Indenture for Debt Securities(5)4.4 Form T-1 Statement of Eligibility of U.S. Bank National Association, as Trustee, with respect to the Form of
Indenture for debt securities(8)4.5 Indenture, dated as of October 9, 2012, between the Company and U.S. Bank National Association, as
trustee(11)4.6 First Supplemental Indenture, dated as of October 9, 2012, relating to the 6.625% Senior Notes due 2042,
between the Company and U.S. Bank National Association, as trustee(11)4.7 Form of 6.625% Senior Notes due 2042 (contained in the First Supplemental Indenture filed as Exhibit (4.6)
hereto)(11)4.8 Second Supplemental Indenture, dated as of June 17, 2013, relating to the 6.875% Senior Notes due 2043,
between the Company and U.S. Bank National Association, as trustee(12) 4.9 Form of 6.875% Senior Notes due 2043 (contained in the Second Supplemental Indenture filed as Exhibit
4.8 hereto)(12)4.10 Fourth Supplemental Indenture, dated as of March 3, 2015, relating to the 5.250% Notes due 2025, between
the Company and U.S. Bank National Association, as trustee(13)4.11 Form of 5.250% Notes due 2025 (contained in the Fourth Supplemental Indenture filed as Exhibit 4.10
hereto)(13)10.1 Amended and Restated Investment Advisory Management Agreement between Registrant and Apollo
Investment Management, L.P.(6)10.2 Amended and Restated Administration Agreement between Registrant and Apollo Investment
Administration, LLC(6)10.3 Dividend Reinvestment Plan(7)10.4 Custodian Agreement(2)10.5 Amended and Restated License Agreement between the Registrant and Apollo Management Holdings, L.P.
dated as of May 14, 2012(10)10.6 Form of Transfer Agency and Service Agreement(2)10.8 Amended & Restated Senior Secured Revolving Credit Agreement, dated as of April 24, 2015(14)11.1 Statement regarding computation of per share earnings*14.1 Code of Conduct(9)31.1 Certification of Chief Executive Officer Pursuant to Rule 13a-14(a) under the Securities Exchange Act of
1934.*31.2 Certification of Chief Financial Officer Pursuant to Rule 13a-14(a) under the Securities Exchange Act of
1934.*32.1 Certification of Chief Executive Officer Pursuant to Section 906 of the Sarbanes-Oxley Act of 2002 (18 U.
S. C. 1350).*32.2 Certification of Chief Financial Officer Pursuant to Section 906 of the Sarbanes-Oxley Act of 2002 (18 U. S.
C. 1350).*_________________________

121
* Filed herewith.(1) Incorporated by reference from the Registrant’s pre-effective Amendment No. 1 to the Registration Statement under the
Securities Act of 1933, as amended, on Form N-2, filed on June 20, 2005.(2) Incorporated by reference from the Registrant’s pre-effective Amendment No. 3 to the Registration Statement under the
Securities Act of 1933, as amended, on Form N-2, filed on April 1, 2004.(3) Incorporated by reference from the Registrant’s Form 8-K (File No. 814-00646), filed on November 6, 2009.(4) Incorporated by reference from the Registrant’s pre-effective Amendment No. 1 to the Registration Statement under the
Securities Act of 1933, as amended, on Form N-2, filed on March 12, 2004.(5) Incorporated by reference from the Registrant’s pre-effective Amendment No. 1 to the Registration Statement under the
Securities Act of 1933, as amended, on Form N-2, filed on April 8, 2011.(6) Incorporated by reference from the Registrant’s Form 10-K, filed on May 26, 2010.(7) Incorporated by reference from the Registrant’s Form 10-K, filed on June 12, 2006.(8) Incorporated by reference to Exhibit (d)(3) to the Registrant’s pre-effective Registration Statement under the Securities
Act of 1933, as amended (333-189817), on Form N-2, filed on July 5, 2013.(9) Incorporated by reference from the Registrant’s Form 10-K, filed on May 29, 2008.(10) Incorporated by reference from the Registrant’s Form 10-K, filed on May 22, 2012.(11) Incorporated by reference to Exhibits 4.1, 4.2, and 4.3, as applicable, to the Registrant’s Form 8-K (File
No. 814-00646), filed on October 9, 2012.(12) Incorporated by reference to Exhibits 4.1 and 4.2, as applicable, to the Registrant's Form 8-K (File No. 814-00646),
filed on June 17, 2013.(13) Incorporated by reference to Exhibits 4.1 and 4.2, as applicable, to the Registrant's Form 8-K (File No. 814-00646),
filed on March 3, 2015.(14) Incorporated by reference to Exhibit 10.1 to the Registrant's Form 8-K (File No. 814-00646), filed on April 30, 2015.
Signatures
Pursuant to the requirements of Section 13 or 15(d) of the Securities Exchange Act of 1934, the registrant has duly caused this report to be signed on its behalf by the undersigned, thereunto duly authorized.
APOLLO INVESTMENT CORPORATION
By: /s/ James C. ZelterJames C. ZelterChief Executive OfficerMay 19, 2015
Pursuant to the requirements of the Securities Exchange Act of 1934, this report has been signed below by the following persons on behalf of the registrant and in the capacities and on the dates indicated.

122
SIGNATURE TITLE DATE
/s/ James C. Zelter Chief Executive Officer and President(principal executive officer) May 19, 2015
James C. Zelter
/s/ Gregory W. Hunt Chief Financial Officer and Treasurer(principal financial and
accounting officer)May 19, 2015
Gregory W. Hunt
/s/ John J. Hannan Chairman of the Board,Director May 19, 2015
John J. Hannan
/s/ R. Rudolph Reinfrank Director May 19, 2015R. Rudolph Reinfrank
/s/ Bradley J. Wechsler Director May 19, 2015Bradley J. Wechsler
/s/ Carl Spielvogel Director May 19, 2015Carl Spielvogel
/s/ Elliot Stein, Jr. Director May 19, 2015Elliot Stein, Jr.
/s/ Frank C. Puleo Director May 19, 2015Frank C. Puleo
/s/ Jeanette Loeb Director May 19, 2015Jeanette Loeb


BR03761U-0615-10K