reliv international 2015 ANNUAL REPORT - AnnualReports.com
78
TAKE CHARGE reliv international 2015 ANNUAL REPORT
-
Upload
khangminh22 -
Category
Documents
-
view
2 -
download
0
Transcript of reliv international 2015 ANNUAL REPORT - AnnualReports.com

TAKECHARGE
reliv international 2015 ANNUAL REPORT

2015 Financial Highlights(In thousands, except per share amounts)At December 31 2015 % change 2014Net sales $ 51,769 (9.7) $ 57,345 Net income (loss) (1,225) N.M. 725 Earnings per share (loss) Basic (0.10) N.M. 0.06 Diluted (0.10) N.M. 0.06Total assets 24,261 (9.6) 26,848Long-term debt, less current maturities 3,160 (10.9) 3,547 Stockholders’ equity 15,882 (6.6) 16,997Return on net sales -2.4% 1.3%Return on average total assets -4.7% 2.7%Return on equity -7.4% 4.5%Current ratio 2.08 1.96 N.M. = Not Meaningful
1 Letter to Shareholders
5 Reliv Kalogris Foundation
7 Directors and Executive Officers
8 Five-Year Financial Summary, Stock Price & Dividend Summary
9 10-K
inside back cover: Shareholder Information
For people of all backgrounds who want to lead healthy, self-directed and meaningful lives, Reliv International offers exceptionally effective nutritional products, a simple and profitable business opportunity and the chance to change lives and provide hope to people around the world. Reliv operates in 15 countries worldwide: United States, Australia, New Zealand, Canada, Mexico, United Kingdom, Ireland, the Philippines, Malaysia, Singapore, Germany, Austria, the Netherlands, Indonesia and France.

In 2015, Reliv realigned our focus, both in the corporate office and in our distributor field. We started with an extensive, honest evaluation of our business: the elements that produced sustained revenue growth and profit generation in the past and those that have slowed progress since. We also looked at leading companies in the network marketing industry to identify strategies and initiatives driving success in today’s evolving marketplace. Above all, we reached out directly to our distributor field to learn what works for them and how we could clear their path to accelerate sales. The result is a revamped, streamlined and simplified business plan heading into 2016.
Reliv is a manufacturer of nutritional supplements, and that will always remain at the core of what we do. In recent years, Reliv successfully positioned itself as the Nutritional Epigenetics Company through our exclusive LunaRich® line of products. We know our products work, and the cutting-edge science behind them gives Reliv a competitive advantage.
In 2015, we began the process of converting a distributor field operating mostly as wholesalers selling products at a discount, to entrepreneurs building networks of like-minded business owners. Transitions such as this take time, but the shift is well underway and gaining traction. We reached a major milestone in February 2016 with the launch of Reliv’s updated compensation plan. The plan is a combination of Reliv’s original compensation structure, which fueled the company’s growth in the past, and new elements derived from current industry best practices. Distributor feedback has been overwhelmingly positive, and we believe with this foundation of our business now firmly in place, Reliv is positioned to support the growth of business-building distributors.
While 2015 did not produce the results we wanted, we nevertheless view it as a success for the important work done to generate growth in the years ahead. This letter will go into greater detail on this and the many exciting initiatives now underway at Reliv. First, I’ll report on our 2015 financial results.
1
Dear Fellow Reliv Shareholder

2015 ResultsReliv reported a net loss of $1.2 million for 2015, compared to net income of $725,000 in 2014. Loss per diluted share was $0.10 in 2015, compared to earnings per diluted share of $0.06 in 2014. Reliv recorded net sales of $51.8 million in 2015, compared with net sales of $57.3 million in 2014, a decrease of 9.7%.
Net sales in the United States decreased 6.8% in 2015 compared with U.S. net sales in 2014. In Reliv’s inter-national markets, net sales decreased 18.8% in 2015 compared with the prior year. Year-over-year sales in international markets were negatively impacted by a much stronger U.S. dollar. The unfavorable exchange rate accounts for 8.3% of the decrease in international net sales.
Our strategic objective to simplify our business and increase efficiency continues to produce results. Selling, general and administrative expenses decreased $1.5 million in 2015. We continually evaluate opportunities to streamline operations to strengthen our balance sheet.
Our financial condition remains solid. We had $3.3 million in cash and cash equivalents as of December 31, 2015, compared to $5.0 million a year ago, and our long-term debt remains at a manageable level. At the end of 2015, Reliv’s long-term debt was $3.2 million, compared to $3.5 million at the end of the prior year.
In September 2015, Reliv entered into a term loan with Enterprise Bank & Trust in the principal amount of $3.25 million and a revolving credit facility with available borrowing capacity of $3.5 million. The proceeds of the new term loan were used to pay off the outstanding balance of principal and accrued interest under our prior term loan and revolving credit facility with BMO Harris Bank N.A. This credit facility, coupled with our current cash reserves, gives us the capital needed for our strategic initiatives to grow Reliv in the coming years.
2

Simple, Healthy LivingIn 2015, Reliv simplified its product line. This included discontinuing underperforming, peripheral products to focus on our core line of nutritional supplements. This product focus simplifies the business, making it easier for distributors to share Reliv and train new leaders. It also improves Reliv’s operational efficiency at the corporate level.
In 2015, we introduced a new 60-count bottle of LunaRich X™ (formerly available only in 120-count bottles in the Super Pack), which enables distributors to more easily break up the packs for individual product sales. Reliv produces LunaRich X 60-count bottles on our own encapsulation line, installed in spring 2015. The new line satisfies demand and further elevates Reliv’s renowned quality control. We can now manufacture more than 48,000 capsules per hour to support the businesses of Reliv distributors around the world. The line allows us to capitalize on operational efficiencies and paves the way for future encapsulated product offerings.
In 2015, the U.S. Patent and Trademark Office issued an expanded patent protecting the LunaRich technology as it relates to the soy peptide lunasin’s mechanism of action for lowering LDL cholesterol levels. In addition, the Commonwealth of Australia and the Republic of the Philippines Patent Offices issued a Certificate of Patent to Dr. Alfredo Galvez, chief scientific officer at SL Technology, Inc., a Reliv company, protecting Galvez’s discovery establishing the lunasin peptide as the component of soy protein responsible for improving specific blood markers associated with cardiovascular health.
While advanced research and leading-edge manufacturing and laboratory technologies will remain at the heart of our continuing innovation efforts, our foundational scientific philosophy remains the same. The effectiveness of Reliv products is based on what we like to call the “Reliv Difference” — products designed for bioavailability, a focus on the synergism of ingredients, a standard of optimal nutrition and a commitment to guaranteed, quality ingredients. This is Reliv’s superior approach to nutritional supplementation and it is why our distributors and customers worldwide count on Reliv to deliver results.
33

Simple, Profitable BusinessReliv’s strategic plan moving forward places a renewed emphasis on distributor development and the marketing of the Reliv business opportunity. Our goal: to make the Reliv business easy to understand, easy to communicate and easy to embrace. We launched a series of initiatives in 2015 to lay the groundwork for advancing the plan effectively.
In the first quarter we re-introduced Master Affiliate Training Schools (MATS), a quarterly two-day business training event for distributors at Reliv’s top profit level. At MATS, active business builders learn the fundamentals of sales, recruitment and making money with Reliv. We also rolled out updated distributor tools, including a simplified business opportunity presentation suite (complete with slides, video and print materials), as well as a streamlined online business portal for distributors.
In May, Reliv launched mobile-ready personal websites for Reliv distributors. The sites allow distributors to tell the Reliv story through engaging content and videos and, more importantly, offer a powerful new way to speed up business. Distributors now have their own online shopping carts and new distributor sign-up. Since the sites are mobile-ready, distributors can give presentations and complete transactions on the spot. Personal websites now account for more than 40% of all new customer sign-ups and 11% of new distributor sign-ups. More than 1,000 distributors have Reliv sites in the U.S. market. Personal websites are also available in Canada.
On November 2nd, Reliv announced major updates to our distributor compensation plan that went into effect February 1, 2016. The updated compensation plan adjusted profit level qualifications for distributors and introduced a new preferred customer program. The new profit level qualifications simplify the compensation structure and provide a clearer, more achievable path to advancement. We know from past success that this approach works, and we anticipate a greater number of distributors achieving higher ranks within the plan and driving sales growth.
4

The preferred customer program allows new customers to receive an automatic discount on all product orders without having to sign up as a distributor — a first for Reliv. People interested in our nutritional solu-tions but reluctant to launch a Reliv distributorship now have added incentive to become customers. Similar programs within the direct sales industry have been met with great success, and we anticipate this program will lead to an increase in customer retail sales.
We are now focused on effectively communicating and training the field on how to fully leverage these compensation plan changes. In the weeks following implementation of the updated compensation plan, we introduced a new print brochure that outlines the different ways to join Reliv and the advantages of each. Early adopters of the tool are seeing success. We have also begun production on a series of single-topic training videos to further simplify specific challenges our distributors face in making sales. Additionally, top Reliv Ambassadors (top field achievers) are travelling across the country to meet with distributors to help install new programs.
In network marketing, moving product seamlessly through a thriving network of active entrepreneurs is the key to growth. We are optimistic that our strategic plan, including measures already put in place, will accelerate Reliv toward this goal.
Reliv Kalogris Foundation Turns 20The Reliv Kalogris Foundation (“RKF”) celebrated its 20th anniversary as the charitable arm of Reliv Interna-tional in 2015. The milestone was marked with a special ceremony at International Conference in St. Louis during which the RKF honored the inaugural recipients of the Sandy Montgomery Compassion Award. The award recognizes selfless compassion for others demonstrated daily by dedicated representatives of the RKF who operate feeding centers throughout the Reliv world.
The RKF is a central component of Reliv’s mission to Nourish Our World. Since 1995, the Foundation has provided more than $42 million in free nutritional supplements to malnourished people. Today, it feeds more than 40,000 people, mostly children, daily through more than 250 feeding centers in nine countries. Donations to the Reliv Kalogris Foundation for 2015 totaled $937,000.
5

6
Taking ChargeClearly, Reliv’s 2015 results are not satisfactory. We understand that and have taken important steps — down to the very core of our business — to turn momentum in a positive direction. We initiated a strategic plan in 2015 driven by one primary objective: to further engage and support our distributor force.
Reliv’s theme for 2016 is “Take Charge!” Above all, the theme speaks to what Reliv is all about: giving people quality nutrition and a rewarding business opportunity to take control of their health, their finances and their way of life. The theme also reflects where Reliv is as a company and where our distributor field is as a sales force. Like an electronic device needing to power up, we are plugging back in to our primary energy source — the Reliv compensation plan — in order to function at our full capacity.
Our recharging process began with an extensive evaluation of every aspect of our business, from our prod-uct line to our marketing messaging, with no element exempt from scrutiny. We identified areas where we had gone astray, others where we needed to update our approach for a new generation, and many others where we simply needed to continue to do what we were doing, only better and more consistently.
With this knowledge, we constructed a strategy. We have started with foundational components of our business, simplifying our product offerings and solidifying our compensation plan, to create a platform for growth. Upon this platform we are building a focused company with a streamlined brand. Our corporate staff and distributor field are aligned better than ever around common goals and our plan to achieve them. In a world that’s become more complex, companies that have figured out how to make things simple are achieving the greatest success, and Reliv is ideally positioned to join their ranks.
As we have since 1988, Reliv offers what people want most: better health and a better way of life. In other words, we empower people to take charge. In 2015, we led by example and took charge of our business at its very core. We intend to further advance this process in the year ahead. I am excited to see where we go from here.
Here’s to a profitable and prosperous 2016,
Robert L. Montgomery Chairman and Chief Executive Officer

Corporate OfficersRobert L. Montgomery
Chairman and Chief Executive Officer
Carl W. Hastings, Ph.D. Vice Chairman and
Chief Scientific Officer
Ryan A. Montgomery President, Reliv International, Inc.
R. Scott Montgomery President, Reliv Asia-Pacific
Steven G. Hastings Executive Vice President
Sales & Marketing
Steven D. Albright Senior Vice President, Finance
and Chief Financial Officer
Brett M. Hastings Senior Vice President and
Chief Operating Officer
Stephen M. Merrick Senior Vice President,
General Counsel and Secretary
Donald E. Gibbons, Jr. Senior Vice President of U.S. Sales
Debra P. Hellweg Vice President, Operations
Kurt C. Wulff Vice President,
Marketing
Board of DirectorsRobert L. Montgomery Chairman and Chief Executive Officer Reliv International, Inc.
Carl W. Hastings, Ph.D. Vice Chairman and Chief Scientific Officer Reliv International, Inc.
Stephen M. Merrick Senior Vice President, General Counsel and Secretary Reliv International, Inc.
Robert M. Henry Private Investor and Consultant
John B. Akin Retired Vice President, A. G. Edwards, Inc.
John M. Klimek President HFR Asset Management, LLC
David T. Thibodeau Managing Director Wellvest Capital, LLC
7

8
Five-Year Financial Summary(In thousands, except per share amounts) 2015 2014 2013 2012 2011 Net sales $ 51,769 $ 57,345 $ 68,207 $ 68,710 $ 73,880Net income (loss) (1,225) 725 777 1,359 1,048Earnings (loss) per common share: Basic (0.10) 0.06 0.06 0.11 0.08 Diluted (0.10) 0.06 0.06 0.11 0.08 Cash dividends per share of common stock — — 0.03 0.03 0.04 Total assets 24,261 26,848 27,599 25,259 24,419Long-term debt, less current maturities 3,160 3,547 3,782 2,401 3,566
Stock Price & Dividend Summary2015 High Low Close DividendFirst Quarter $ 1.24 $ 1.07 $ 1.12 $ — Second Quarter 1.40 1.06 1.26 — Third Quarter 1.38 0.67 0.74 —Fourth Quarter 0.79 0.37 0.58 —
2014 High Low Close DividendFirst Quarter $ 2.82 $ 1.75 $ 2.62 $ — Second Quarter 2.68 1.51 1.60 — Third Quarter 1.93 1.14 1.20 —Fourth Quarter 1.71 1.15 1.17 —

UNITED STATESSECURITIES AND EXCHANGE COMMISSION
WASHINGTON, D.C. 20549____________
FORM 10-KANNUAL REPORT PURSUANT TO
SECTION 13 OR 15(d) OF THE SECURITIESEXCHANGE ACT OF 1934
For the Fiscal Year Ended December 31, 2015(Mark One)
ANNUAL REPORT PURSUANT TO SECTION 13 OR 15 (d) OF THE SECURITIESEXCHANGE ACT OF 1934
For the fiscal year ended December 31, 2015
OR
TRANSITION REPORT PURSUANT TO SECTION 13 OR 15 (d) OF THE SECURITIESEXCHANGE ACT OF 1934
For the transition period from _________to_________
Commission File Number000-19932
RELIV’ INTERNATIONAL, INC.(Exact name of Registrant as specified in its charter)
Delaware 371172197(State or other jurisdiction of (I.R.S. Employer Identification Number)incorporation or organization)
136 Chesterfield Industrial BoulevardChesterfield, Missouri 63005
(Address of principal executive offices) (Zip Code)
(636) 537-9715Registrant’s telephone number, including area code
Securities registered pursuant to Sections 12(b) of the Act:
Title of Each Class Name of Each Exchange on Which Registered
Common Stock, par value $0.001 NASDAQ Global Select Market
Securities registered pursuant to Section 12(g) of the Act: None
Indicate by check mark if the registrant is a well-known seasoned issuer, as defined in Rule 405 of theSecurities Act. Yes No
Indicate by check mark if the registrant is not required to file reports pursuant to Section 13 orSection 15(d) of the Act. Yes No
Indicate by check mark whether the registrant (1) has filed all reports required to be filed by Section 13 or15(d) of the Securities Exchange Act of 1934 during the preceding 12 months (or for such shorter period that the

registrant was required to file such reports), and (2) has been subject to such filing requirements for the past90 days. Yes No
Indicate by check mark whether the registrant has submitted electronically and posted on its corporate Website, if any, every Interactive Data File required to be submitted and posted pursuant to Rule 405 of Regulation S-T(§ 232.405 of this chapter) during the preceding 12 months (or for such shorter period that the registrant wasrequired to submit and post such files). Yes No
Indicate by check mark if disclosure of delinquent filers pursuant to Item 405 of Regulation S-K (§229.405of this chapter) is not contained herein, and will not be contained, to the best of registrant’s knowledge, in definitiveproxy or information statements incorporated by reference in Part III of this Form 10-K or any amendment to thisForm 10-K.
Indicate by check mark whether the registrant is a large accelerated filer, an accelerated filer, or a non-accelerated filer. See definition of “large accelerated filer,” “accelerated filer” and “smaller reporting company” inRule 12b-2 of the Exchange Act. (Check one):
Large accelerated filer Accelerated filer Non-accelerated filer Smaller Reporting Company
Indicate by check mark whether registrant is a shell company (as defined in Rule 12b-2 of the ExchangeAct). Yes No
Based upon the closing price of $1.26 per share of the registrant’s common stock as reported on theNASDAQ Global Select Market on June 30, 2015, the aggregate market value of the common stock held by non-affiliates of the registrant was approximately $10.2 million. (The determination of stock ownership by non-affiliateswas made solely for the purpose of responding to the requirements of the Form and the registrant is not bound bythis determination for any other purpose.)
The number of shares outstanding of the registrant’s common stock as of March 7, 2016 was 12,919,110(excluding treasury shares).
DOCUMENTS INCORPORATED BY REFERENCE
DocumentPart of Form 10-K into Which
Document Is Incorporated
Sections of the registrant’s definitive Proxy Statement for the AnnualMeeting of Stockholders to be held on May 26, 2016, which is expectedto be filed no later than 120 days after December 31, 2015
Part III

INDEX
Part I
Item No. 1 Business ................................................................................................................................ 1Item No. 2 Properties .............................................................................................................................. 17Item No. 3 Legal Proceedings ................................................................................................................. 18
Part II
Item No. 5 Market for Registrant’s Common Equity, Related StockholderMatters and Issuer Purchases of Equity Securities................................................................ 18
Item No. 7 Management’s Discussion and Analysis ofFinancial Condition and Results of Operations..................................................................... 19
Item No. 8 Financial Statements and Supplementary Data ..................................................................... 28Item No. 9 Changes in and Disagreements with Accountants
on Accounting and Financial Disclosure .............................................................................. 28Item No. 9A Controls and Procedures ....................................................................................................... 28Item No. 9B Other Information ................................................................................................................. 28
Part III
Item No. 10 Directors, Executive Officers and Corporate Governance .................................................... 29Item No. 11 Executive Compensation....................................................................................................... 29Item No. 12 Security Ownership of Certain Beneficial Owners
and Management and Related Stockholder Matters.............................................................. 29Item No. 13 Certain Relationships and Related Transactions, and Director Independence ...................... 29Item No. 14 Principal Accounting Fees and Services ............................................................................... 29
Part IV
Item No. 15 Exhibits and Financial Statement Schedules......................................................................... 29

1
FORWARD-LOOKING STATEMENTS
This annual report includes both historical and “forward-looking statements” within the meaning of Section21E of the Securities Exchange Act of 1934, as amended. We have based these forward-looking statements on ourcurrent expectations and projections about future results. Words such as “may,” “should,” “could,” “would,”“expect,” “plan,” “anticipate,” “believe,” “estimate,” “predict,” “potential,” “continue,” or similar words areintended to identify forward-looking statements, although not all forward-looking statements contain these words.Although we believe that our opinions and expectations reflected in the forward-looking statements are reasonable,we cannot guarantee future results, levels of activity, performance or achievements, and our actual results may differsubstantially from the views and expectations set forth in this annual report. We disclaim any intent or obligation toupdate any forward-looking statements after the date of this annual report to conform such statements to actualresults or to changes in our opinions or expectations.
PART I
Item No. 1 - Business
Overview
We are a developer, manufacturer and marketer of a proprietary line of nutritional supplements addressingbasic nutrition, specific wellness needs, weight management and sports nutrition. We sell our products through aninternational network marketing system using independent distributors. We have sold products in the United Statessince 1988 and in selected international markets since 1991.
We currently offer 17 nutritional supplements, and our product offering has selectively evolved over ourhistory. Our core line of nutritional supplements which represented 63.8% of net sales for the year ended December31, 2015, included the following five products:
• Reliv Classic and Reliv NOW — two basic nutritional supplements containing a full and balancedblend of vitamins, minerals, protein and herbs
• Innergize! — an isotonic sports supplement in two flavors• FibRestore — a high-fiber and antioxidant supplement• LunaRich X — a soy concentrate with elevated levels of lunasin, in capsule form
Following the introduction of our LunaRich X capsules in 2013, we experienced a gradual shift in ourproduct sales mix reflecting an increasing emphasis on Reliv NOW and LunaRich X capsules. For the year endedDecember 31, 2015, Reliv NOW constituted 23.2% of net sales, and LunaRich X capsules represented 17.5%. Thecombination of Reliv NOW and LunaRich X capsules have increasingly become the focus of our product strategy.As a result of this strategy, in March 2014 we launched our Super Pack product kit that contains four cans of RelivNOW and two bottles of LunaRich X each containing 120 capsules. The Super Pack was designed as a simple,focused approach that capitalizes on our two most popular products and provides an entry point at a 25% discountfor new distributors who want to build a business. Super Packs constituted 5.5% of net sales in 2015. A Super Packcontaining Reliv Classic and LunaRich X is also available for our distributors and customers that prefer RelivClassic.
We periodically refine our products and introduce related new products and product categories. Ourinternal research and development team has developed most of our products, and we hold U.S. patents on five ofthese products —Arthaffect, ReversAge, GlucAffect, ProVantage and 24K. In addition, we have applied for aU.S. patent on our CardioSentials product. We also hold the exclusive license to patents and patent applicationsrelated to lunasin through a Technology License Agreement we entered into in July 2013.
We believe that our network marketing model is the best method for the marketing and sale of our productsbecause it utilizes ongoing personal contact among our distributors and their retail customers. This enables ourdistributors to communicate directly regarding the products, the business opportunity we offer and their personalexperiences with both. We provide our distributors with a financially rewarding and entrepreneurial businessopportunity, affording them the ability to earn compensation both from the direct sale of products and from sales

2
volume generated by distributors they sponsor. We actively support our distributors by providing marketingmaterials, a dependable product fulfillment system and frequent educational, training and motivational programs.
The majority of our sales traditionally has been, and is expected to continue to be, made through ourdistributors in the United States. We also currently generate sales through distributor networks in Australia, Austria,Canada, France, Germany, Indonesia, Ireland, Malaysia, Mexico, the Netherlands, New Zealand, the Philippines,Singapore and the United Kingdom. In each country in which we conduct business, our distributors operate under auniform business and compensation model that maintains consistent marketing, sales, fulfillment, and complianceprocedures. As of December 31, 2015, our network consisted of approximately 44,590 distributors —32,270 in theUnited States and 12,320 across our international markets.
We manufacture all of our powdered nutritional supplements and our LunaRich X capsules at our facility inChesterfield, Missouri. We believe our ability to formulate and manufacture all but one of our own nutritionalsupplements enables us to produce our products efficiently while maintaining our high standards of qualityassurance and proprietary product composition.
Industry Overview
Nutritional Supplement Market
We operate primarily in the $34.8 billion U.S. nutritional supplement market, which is part of the broader$140 billion U.S. nutrition industry according to data published by the Nutrition Business Journal, or NBJ, and anestimated $320.0 billion global nutrition industry, also according to the NBJ. Additionally, more than 150 millionAmericans, or 68% of all U.S. adults, take dietary supplements annually according to the Council for ResponsibleNutrition.
A combination of demographic, healthcare and lifestyle trends are expected to drive continued growth inthe nutritional supplement market. These trends include:
• Aging Population: The older population (persons 65 years or older) numbered 44.7 million in 2013according to latest information from the Department of Health and Human Services. They represented14.1% of the U.S. population, about one in every seven Americans. By 2060, there will beapproximately 98 million older persons living in the United States, more than twice their number in2013. Recent data from the Council for Responsible Nutrition shows that 74% of adults aged 55 andover take dietary supplements. We believe this ever-growing population, living longer lives than inprevious decades, will continue to focus on their nutritional needs as they age.
• Rising Healthcare Costs and Commitment to Health: The cost of healthcare in the United Statescontinues to increase rapidly each year and grew at an annual rate of 5% in 2014 according to theAlatrum Institute. In 2014, U.S. healthcare spending reached $3.0 trillion or $9,523 per personaccording to the Centers for Medicare and Medicaid Services (CMS). As reported from Frost andSullivan, approximately 75% of total U.S. health care expenditures are spent on preventable healthissues. Many studies have demonstrated that dietary supplements have a positive effect on reducing thepotential for health issues and consumers are reacting to this by taking charge of their personal health.In a recent survey conducted by Harris Poll, taking vitamins was in the top five commitments to healthand wellness habits. We believe more consumers will seek the use of nutritional supplements tomaintain quality of life as well as reduce medical costs.
• Continued Focus on Weight Management: According to a report published by The State of Obesity inAugust 2015, almost 35%, or more than one-third of U.S. men and women were obese, as were almost17% of U.S. children. It is estimated that 86.3% of Americans will be overweight or obese by 2030.Health care costs related to obesity are expected to grow, from $860.7 billion to $956.9 billion by 2030and currently account for almost 21% of U.S. health care costs according to a report by CornellUniversity. Being overweight is linked to more than 60 chronic diseases and can lead to more serioushealth concerns such as diabetes, heart disease and other chronic illnesses. According to the NutritionBusiness Journal, weight loss supplement sales totaled $2 billion in 2013 which is up 11.6% from

3
2012. Bearing these facts in mind, we believe that there will be a continual need not only for weightloss products but also for wellness products.
Direct Selling Market
Health and nutrition products are distributed through various market means, including retailers such assupermarkets, drugstores, mass merchants and specialty retailers; direct marketers such as mail order companies andInternet retailers; and direct sellers such as network marketers and healthcare practitioners. We distribute ourproducts through the direct selling channel via our network marketers.
Direct selling involves the marketing of products and services directly to consumers in a person-to-personmanner. Direct selling is a significant global industry largely utilized for the sale of a wide range of consumerproducts from companies such as Avon Products Inc., Alticor Inc. (Amway Corp.) and Tupperware BrandsCorporation. According to the World Federation of Direct Selling Associations, or WFDSA, the 2014 global directselling market (for all product categories) was estimated to be $182.8 billion, an increase from $178.5 billion in2013. The WFDSA estimates that the number of individuals engaged in direct selling more than doubled between1999 and 2014, from 35.9 million sellers to 99.7 million in 2014. The United States had 18.2 million direct sellersin 2014, the most of any country. Globally, wellness products came in as the 2nd top selling category, just a mere 5%behind cosmetics and personal care.
While the United States is currently the largest direct selling market with $34.4 billion in annual sales in2014, international markets account for 81% of the entire industry, according to the WFDSA. Twenty-threecountries (including the United States) have annual direct sales revenue of at least $1 billion and another twenty-seven countries have annual direct sales revenue of at least $100 million, according to the WFDSA.
We believe that we are well positioned to capitalize on the world-wide growth trends in direct sales, as botha developer and manufacturer of proprietary nutritional products, utilizing our network marketing distributionsystem.
Our Competitive Strengths
We believe that we possess a number of competitive strengths that are key to our growth and profitabilityin the future.
Leading Marketer of Bioavailable Lunasin-Containing Products. As a result of our Technology LicenseAgreement with Soy Labs LLC, we control certain technology and proprietary testing and manufacturing processesthat allow us to produce LunaRich X, to our knowledge, the only commercial source of soy concentrate withelevated levels of bioactive lunasin. One 310 mg capsule of LunaRich X contains an amount of lunasin equivalent to25 grams of high quality soy protein. In addition to our LunaRich X capsules, we fortified six other nutritionalsupplements with LunaRich X so that a serving of those products yields an amount of lunasin equivalent toconsuming 25 grams of soy protein. The products fortified with LunaRich X are Reliv NOW, Reliv NOW for Kids,ProVantage, GlucAffect, SoySentials, and Slimplicity.
Complete, Simple Nutrition. We focus on the completeness, balance and simplicity of our basic nutritionalsupplements — Reliv Classic or Reliv NOW — combined with LunaRich X. Our recommended daily regimen forany new distributor or customer is one shake of either Reliv NOW or Reliv Classic and two capsules of LunaRich X.Our two basic nutritional supplements each contain a full and balanced blend of vitamins, minerals, proteins andherbs supporting an individual’s daily nutritional needs and our LunaRich X capsules support an individual’swellness at the epigenetic level. The combination of Reliv NOW or Reliv Classic and LunaRich X makessupplementation simple and effective for the consumer. Consistent with this focus, in 2014 we launched RelivSuper Packs containing a four-month supply of Reliv NOW or Reliv Classic and LunaRich X based on the oneshake and two capsules per day regimen. For more specific individual needs, we provide 14 additional supplements.We believe that our two basic nutritional supplements, together with LunaRich X and our additional supplementsand other products, enhance the ability of our distributors to build their businesses by providing a comprehensive,simple product offering.

4
Nutritional Supplements Consumed in Liquid Form. We believe that our nutritional supplements which areconsumed in liquid form, except for our LunaRich X capsules, provide a competitive advantage over othersupplements such as vitamins, minerals and herbs in pill or tablet form. Our powder-based nutritional products areconsumed with water, milk or juice and 24K is a ready-to-drink product. Our products provide an effective meansof delivering nutrients to the body. We believe nutrients taken orally in liquid form lead to better absorption at thecellular level, or “bioavailability.” Where serving sizes mandate, as with our LunaRich X capsules, we will useeasily digestible capsules as a convenient and effective way of delivering small serving sizes of our powderednutritional supplements.
In-House Development and Production. We have developed substantially all of our nutritional supplementand food products utilizing nutrition science as the basis for product formulation. We maintain an ongoing researchand development effort led by Carl W. Hastings, Ph.D., our Chief Scientific Officer and Vice Chairman. Inaddition, we consult regularly with other industry professionals with respect to developments in nutritional science,product enhancements and new products. Since 1993, we have manufactured substantially all of our nutritionalproducts at our facility in Chesterfield, Missouri. In 2015, we installed an encapsulator and bottling line to produceour LunaRich X capsules. We outsource our ready-to-drink product, 24K. We believe our ability to formulate andmanufacture all but one of our own nutritional supplement products enables us to maintain our high standards ofquality assurance and proprietary product composition.
Experienced Ambassador Team. Our Ambassador corps consists of distributors who have achieved thelevel of Master Director, have earned royalty payments of at least $4,000 in consecutive months and meet ourleadership and character criteria necessary to garner our invitation to be an Ambassador. Our Ambassadors generallyare our most productive distributors and are essential in recruiting, motivating and training our entire distributornetwork. We, and our Ambassadors, lead hundreds of annual events throughout all of our markets to motivate andtrain distributors, including regular recruiting meetings, trainings, conference calls, training schools for MasterAffiliates and higher levels and regional, national and international distributor conferences. As of December 31,2015, we had approximately 376 Ambassadors worldwide.
Experienced and Incentivized Management Team. Our management team is led by our founder, Robert L.Montgomery, who has been our Chief Executive Officer since the inception of our company in 1985. Our executiveofficers have been employed by our company for an average of 20 years and are experienced in their areas of focus,which include manufacturing, sales, finance, marketing and operations. As of March 7, 2016, our directors andexecutive officers beneficially own approximately 37.6% of our common stock.
Our Business Strategy
Our basic objective is to increase our net sales by increasing the number and productivity of our distributorsand by periodically improving our existing products and introducing new products. We also intend to invest in ourinfrastructure to improve our operating efficiencies, provide better service to our distributors and leverage ourcurrent operating facilities to improve our profitability. We seek to accomplish these objectives by employing thefollowing strategic initiatives:
Leverage and Expand our Existing Distributor Base Throughout the United States. The United States hasbeen and will continue to be our largest market. Our growth strategy in the United States involves multipleinitiatives, such as continued investment in company-sponsored events and distributor training and better utilizationof our upper-level distributors across different geographical areas to increase our distributor base.
Increase Appeal to Broader Demographic. Traditionally, our customer and distributor demographic hasskewed towards baby boomers and older individuals searching for nutritional solutions to supplement their diet andsupport overall wellness. While continuing to maintain our focus on the needs of this important segment, we believethere is an opportunity to expand our sales and distributor base by increasing our appeal to younger generationsinterested in nutrition and an active healthy lifestyle. We believe the nutritional aspects and convenience of 24K,our healthy energy and mental focus drink, will attract health conscious on-the-go individuals, many of whom fallwithin the under-40 demographic. Further, we maintain an active presence on popular social media sites includingFacebook, Twitter, YouTube and several other social networks that are popular with younger generations. Ourinternal social media team is comprised of Gen X and Gen Y staffers who regularly interact with distributors,customers and prospects. We plan to continue to develop products and programs and expand our technology

5
offerings in an effort to further appeal to younger generations interested in healthy active lifestyles and a vibrantevolving business opportunity.
Expand in Existing and New International Markets. We believe there is a significant opportunity toincrease our net sales in international markets. We have a business model that is compatible across all of ourmarkets and encourages our distributors to pursue their business in multiple markets. We believe this businessmodel supports expansion of our distributor network in our existing international markets and will provide aframework that facilitates our entry into new international markets. To that end, we continue to monitor businessconditions in potential new markets and will selectively expand as timing and conditions are appropriate.
Invest in Improved and New Products. As a developer of nutritional supplements, it is vital to continue toinvest in the research and development of new and innovative products. For example, in January 2013 we launchedLunaRich X to support heart health and overall wellness and in February 2011 we launched 24K, our first ready-to-drink product, to support energy production and mental focus. Additionally, we will continue to improve andvalidate the efficacy of our existing product line. These types of investments should facilitate customer anddistributor retention, as well as the recruitment of new distributors.
Expand and Improve our Manufacturing and Distribution Capabilities. We currently manufacture all ofour powdered nutritional supplements and LunaRich X capsules at our facility in Chesterfield, Missouri. This allowsus to precisely control product composition and quality assurance as well as better manage inventory levels.Periodically, we make appropriate investments that enhance our manufacturing capabilities and capacity to furtherleverage our existing facilities and trained production staff. In the second half of 2014, we purchased and installedan encapsulation production line in our facility in Chesterfield, Missouri. We expect to continue to makeappropriate investments in our manufacturing and fulfillment facilities.
Our Products
Product Overview
Our product line includes nutritional supplements that address basic nutrition, specific wellness needs,weight management and sports nutrition. We combine ingredients from science and nature in targeted, well-balanced, easy-to-use formulas that are specifically designed to enhance wellness and increase performance andenergy in specific applications. All but two of our supplements are in powdered form that the consumer mixes withwater, juice or other liquid. 24K is a ready-to-drink nutritional supplement, and LunaRich X is available in capsuleform.
We currently offer 17 nutritional supplements. Our basic nutritional supplements are formulated to providea balanced and complete level of supplementation for the consumer. For more specific needs, we provide otherfocused product formulations. We have purposely been selective in the number and types of products that we offer.By providing a line of targeted products, we make it simple for our distributors and consumers to choose productsappropriate for their objectives. We consider four of our oldest and best selling products — Reliv Classic, RelivNOW, Innergize!, and FibRestore — along with LunaRich X capsules, our newest product, to be our primary or“core” products.

6
The following table summarizes our product categories as of December 31, 2015. The net sales figures arefor the year ended December 31, 2015:
Product Category Product Name% of 2015Net Sales(1)
YearIntroduced
Basic Nutrition Reliv NOW................................ 20.8 1988Reliv Classic ................................ 9.2 1988NOW for Kids ................................ 4.1 2000
Specific Wellness FibRestore................................ 10.2 1993Arthaffect................................ 6.6 1996ReversAge ................................ 3.4 2000SoySentials ................................ 1.7 1998CardioSentials................................ 1.4 2005GlucAffect ................................ 1.2 200824K ................................................................2.0 2011LunaRich X capsules ................................15.7 2013
Weight Management Meal Replacements(2)................................1.1 VariousCellebrate................................ 0.7 1995
Sports Nutrition Innergize!................................ 7.9 1991ProVantage ................................ 3.0 1997
Other Skin Care, Sweetener,and Reliv Delight(3)................................ 0.6 Various
______________________
(1) This table does not include net sales for the year ended December 31, 2015 related to freight and handling andsales of marketing materials, which represented approximately 10.4% of net sales for the year endedDecember 31, 2015.
(2) Since its introduction in February 2007, our Slimplicity Meal Replacement formula has replaced Reliv Ultrim-Plus (available since 1988) in all but our Canadian and Mexican markets. Upon introduction of our Slimplicityproducts in a particular market, our Reliv Ultrim-Plus line was discontinued in that market. In October 2013,Reliv ReShape was launched in our Australian and New Zealand markets, at which time Slimsimply wasdiscontinued in those markets.
(3) Our skin care products were discontinued in 2015, and our sweetener product was discontinued in early 2016.Reliv Delight is expected to be discontinued once remaining inventory is exhausted.
Basic Nutrition Supplements
Our three basic nutrition supplements provide consumers with a broad spectrum of essential nutrients.Every formulation is specifically designed to optimize and enhance the benefits of the nutrients it contains.
• Reliv NOW is a nutritional supplement containing a variety of vitamins and minerals, soy and variousherbs. Reliv NOW is available in every country where we operate.
• Reliv Classic is a nutritional supplement containing a variety of vitamins and minerals, soy and variousherbs. It is a vegetarian product that contains no animal compounds, artificial preservatives, artificialflavors or added simple sugars. Reliv Classic is available in the United States, Canada, France,Germany, Austria, the Netherlands, the United Kingdom and Ireland.
• NOW for Kids is a product designed to provide a balanced nutritional supplement for a child’s diet andcontains a variety of vitamins and minerals. NOW for Kids is available in Australia, New Zealand, theUnited States, the United Kingdom, France, Germany, Ireland, Austria, the Netherlands, Mexico,Malaysia and the Philippines.

7
Specific Wellness Supplements
Our line of eight specific wellness supplements contains specific compounds that target certain nutritionalneeds and promote health. Each product is intended to work in conjunction with our basic nutritional supplementformulas to provide an effective and balanced method for sustaining health and well-being.
• ReversAge is a patented youth-promoting nutritional supplement designed to slow down the effects ofthe aging process. Three proprietary complexes form the foundation of the supplement: longevitycomplex, antioxidant complex and herbal complex. The longevity complex is restorative and designedto replenish key hormones while creating balance within the body’s major systems; the antioxidantcomplex is designed to slow aging at the cellular level; and the herbal complex delivers a variety ofherbs, including Ginkgo Biloba and Maca. ReversAge is available in every country where we operateexcept Germany, the United Kingdom, France, the Netherlands and Ireland. In Canada, the product ismarketed as Nutriversal.
• SoySentials is a nutritional supplement containing soy as well as other vitamins, minerals and herbsdesigned for use by women. SoySentials provides a woman with key nutrients targeted to promotewomen’s health and ease the symptoms of menopause and PMS. SoySentials is available in the UnitedStates and Mexico.
• CardioSentials is a berry-flavored nutritional supplement introduced in February 2005 that promotesheart health. The product contains 1,500 mg of phytosterols per serving, policosanol and severalpowerful antioxidants. In a clinical study of this product, participants experienced meaningfulreductions in cholesterol as well as improvement in their high-density lipoprotein, or HDL, and low-density lipoprotein, or LDL, ratios. We have applied for a U.S. patent on CardioSentials.CardioSentials is available only in the United States.
• Arthaffect is a patented nutritional supplement containing Arthred, a form of hydrolyzed collagenprotein, which is clinically reported to support healthy joint function. The product is available in theUnited States, Australia, New Zealand, Mexico, the Philippines, Malaysia, Singapore, and Canada. Theproduct is marketed as A-Affect in Australia, New Zealand and Canada due to local productregulations.
• FibRestore is a nutritional supplement containing fiber, vitamins, minerals and herbs. A modifiedversion of the FibRestore formula is marketed in Canada under the name Herbal Harmony to complywith Canada’s nutritional regulations. FibRestore is available in all of the countries in which weoperate.
• GlucAffect is a patented cinnamon cream flavored nutritional supplement launched in November2008. GlucAffect contains Pycnogenol® and other clinically supported active ingredients. GlucAffecthas been clinically proven to assist in healthy blood sugar management and support weight loss. Wereceived a U.S. patent on GlucAffect in February 2012. GlucAffect is available in the United Statesand Canada.
• 24K is a patented ready-to-drink product that was introduced in February 2011. 24K is our first ready-to-drink nutritional supplement available in a multi-serving 30-ounce bottle and in a two-ounce doubleserving bottle. 24K is formulated with a synergistic blend of 24 active ingredients designed to enhancethe body’s natural vitality and provide energy, focus and stress relief. It contains no caffeine and only5 calories per serving. 24K is available only in the United States.
• LunaRich X, our newest product, was introduced in January 2013. LunaRich X is our only nutritionalsupplement available in capsule form and comes in a bottle of 60 or 120 capsules. LunaRich X is a soyconcentrate with elevated levels of lunasin, a soy peptide shown to have heart health and wellnessbenefits. LunaRich X is currently available in the United States, Canada, Mexico, the UnitedKingdom, France, Germany, Ireland, Austria, the Netherlands, Indonesia, the Philippines and

8
Singapore. The product is marketed as LunaRich C in Germany, Austria, the United Kingdom, France,the Netherlands and Ireland due to local regulations.
Weight Management Supplements
Our four weight management supplements combine advanced weight loss promoting complexes withscientifically balanced nutrition and health enhancing soy protein. Our ingredients are designed to work together,along with proper diet and exercise, to turn unwanted fat into energy without sacrificing muscle mass.
• Slimplicity is a meal replacement intended for use in an overall program that includes proper diet andexercise and is focused on facilitating weight loss and developing healthier lifestyle choices.Slimplicity is currently available in the United States, France, Germany, Austria, the Netherlands,Ireland and the United Kingdom.
• Reliv Ultrim-Plus is designed as a meal replacement (for a maximum of two meals per day) for use ina weight loss program. Reliv Ultrim-Plus is only sold in Canada and Mexico. Reliv Ultrim-Plus is nolonger available in our other markets due to the introduction of our Slimplicity meal replacementproduct.
• Reliv ReShape is designed as a meal replacement or a nutritious snack delivering 12 grams ofprotein. Reliv ReShape was introduced in October 2013 and is only sold in Australia and NewZealand. Reliv ReShape replaced Slimsimply in Australia and New Zealand upon its introduction.
• Cellebrate is a weight loss aid designed to suppress appetite, curb the storage of body fat, and facilitatethe body’s fat burning process. Cellebrate is available in the United States and Canada.
Sports Nutrition Supplements
Our two sports nutrition supplements contain a balance of nutrients scientifically designed to improveathletic performance and endurance, as well as muscle recovery and repair.
• Innergize! is a sports supplement, containing vitamins and minerals designed for performanceenhancement. Innergize! is available in every country where we operate. In Canada, the product ismarketed as Optain due to local product regulations.
• ProVantage is a patented nutritional supplement containing soy designed to enhance athleticperformance with a balance of nutrients needed to improve endurance, muscle recovery and repair.ProVantage is designed to increase muscle recovery, muscle mass and function, reduce fatigue andburn excess body fat for extra energy. The product also benefits those seeking to increase their soyintake. We received a U.S. patent on ProVantage in May 2012. ProVantage is available in the UnitedStates and Canada.
Research and Development
We maintain an ongoing research and development effort, led by Carl W. Hastings, Ph.D., and consult withother industry professionals with respect to developments in nutritional science, product enhancements and newproducts. Since 2005, we have introduced four nutritional supplement products, including CardioSentials,Slimplicity meal replacement, 24K, and LunaRich X. From time to time, we have also reformulated and enhancedour products, including the addition of LunaRich soy powder to Reliv NOW, Reliv NOW for Kids, ProVantage,SoySentials, GlucAffect and Slimplicity in 2012. Our research and development team consistently evaluates productadvancements in the marketplace and advancements in raw materials and ingredients available for new product ideasand developments.
For the years ended December 31, 2015 and 2014, our research and development expenses were $765,000and $618,000, respectively.

9
SL Technology, Inc.
In mid-2013, we formed a wholly-owned subsidiary, SL Technology, Inc. (“SLTI”) for the purpose ofentering into a Technology License Agreement (the “License Agreement”) with Soy Labs, LLC (“Soy Labs”).Pursuant to this License Agreement, Soy Labs granted SLTI an exclusive license for its intellectual property relatedto its soy concentrate with elevated levels of bioactive lunasin and other soy-related ingredients. The license coversan issued patent and several patent applications related to lunasin and soy-related peptides, proprietary informationand manufacturing processes of Soy Labs. See Note 6 to our Consolidated Financial Statements for moreinformation on the terms of the License Agreement.
SLTI has agreed to use reasonable commercial efforts to market the products covered by the LicenseAgreement. In addition, SLTI hired Soy Labs staff and we agreed, subject to certain conditions, to purchase all ofour requirements of soy concentrate from SLTI.
Network Marketing Program
General Overview
We market and sell our products through a network marketing system of independent distributors, whopurchase our products from us, or from other distributors, and who then sell our products directly to consumers. Inaddition to selling our products, our distributors also recruit others to distribute our products. Distributors receivecompensation from both the sale of the products they have purchased at wholesale and, in the case of MasterAffiliates and above, commissions on the volume of products sold by their downline organization. We believenetwork marketing is an effective way to distribute our products because it allows and relies on personal contact,education and endorsement of products which are not as readily available through other distribution channels.
We recognize that our sales growth is based on the continued development and growth of our independentdistributor force and we strive to maintain an active and motivated distributor network through a combination ofquality products, and a business opportunity with distributor discounts, commissions and bonus payments, salesconventions, training, personal recognition and a variety of publications and promotional materials.
Program Structure
Individuals who desire to market and sell our products may become distributors by being sponsored intothe program by an existing distributor, and becoming part of that distributor’s “downline.” We offer a tiereddiscount and commission, or royalty, format that consists of four principal levels and several sub-levels, which aredesigned to compensate and motivate distributors to increase their networks and sales volumes.
Our distributors consist principally of individuals, although we also permit entities such as corporations,partnerships, limited liability companies and trusts to become distributors. A new distributor is required to completea distributor application and, in most areas, to purchase a package of distributor materials (for $40 plus sales tax inthe United States, as of February 1, 2016) consisting of a Distributor Guide and CD, business forms and promotionalmaterials. The Distributor Agreement, when accepted by us, becomes the contract between us and the distributor andobligates the distributor to the terms of the agreement, which includes our Policies and Procedures for conduct oftheir business. All distributors are independent contractors and are not our employees.
In each country in which we conduct business, distributors operate under a compensation system pursuantto which distributors generally are compensated based on their sales volumes. On the basis of sales volume orcommission volume, distributors may achieve the following successive levels of achievement and compensation:
10
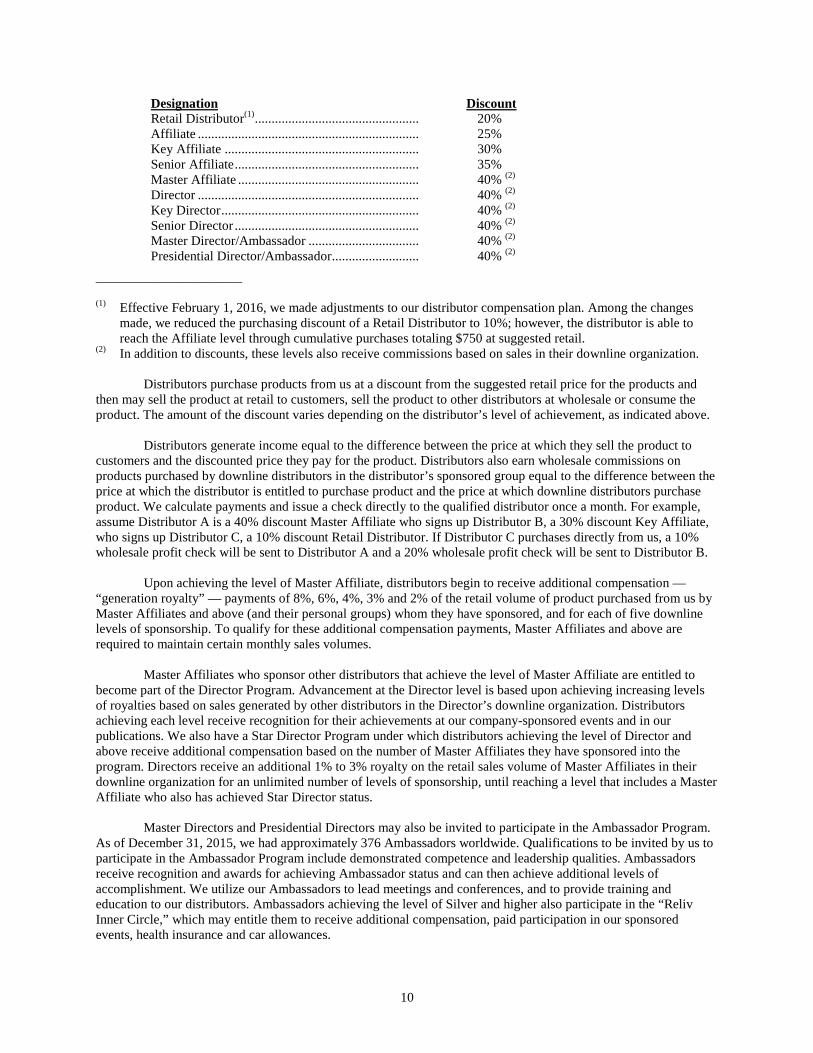
Designation DiscountRetail Distributor(1)................................................. 20%Affiliate .................................................................. 25%Key Affiliate .......................................................... 30%Senior Affiliate....................................................... 35%Master Affiliate ...................................................... 40% (2)
Director .................................................................. 40% (2)
Key Director........................................................... 40% (2)
Senior Director ....................................................... 40% (2)
Master Director/Ambassador ................................. 40% (2)
Presidential Director/Ambassador.......................... 40% (2)
______________________
(1) Effective February 1, 2016, we made adjustments to our distributor compensation plan. Among the changesmade, we reduced the purchasing discount of a Retail Distributor to 10%; however, the distributor is able toreach the Affiliate level through cumulative purchases totaling $750 at suggested retail.
(2) In addition to discounts, these levels also receive commissions based on sales in their downline organization.
Distributors purchase products from us at a discount from the suggested retail price for the products andthen may sell the product at retail to customers, sell the product to other distributors at wholesale or consume theproduct. The amount of the discount varies depending on the distributor’s level of achievement, as indicated above.
Distributors generate income equal to the difference between the price at which they sell the product tocustomers and the discounted price they pay for the product. Distributors also earn wholesale commissions onproducts purchased by downline distributors in the distributor’s sponsored group equal to the difference between theprice at which the distributor is entitled to purchase product and the price at which downline distributors purchaseproduct. We calculate payments and issue a check directly to the qualified distributor once a month. For example,assume Distributor A is a 40% discount Master Affiliate who signs up Distributor B, a 30% discount Key Affiliate,who signs up Distributor C, a 10% discount Retail Distributor. If Distributor C purchases directly from us, a 10%wholesale profit check will be sent to Distributor A and a 20% wholesale profit check will be sent to Distributor B.
Upon achieving the level of Master Affiliate, distributors begin to receive additional compensation —“generation royalty” — payments of 8%, 6%, 4%, 3% and 2% of the retail volume of product purchased from us byMaster Affiliates and above (and their personal groups) whom they have sponsored, and for each of five downlinelevels of sponsorship. To qualify for these additional compensation payments, Master Affiliates and above arerequired to maintain certain monthly sales volumes.
Master Affiliates who sponsor other distributors that achieve the level of Master Affiliate are entitled tobecome part of the Director Program. Advancement at the Director level is based upon achieving increasing levelsof royalties based on sales generated by other distributors in the Director’s downline organization. Distributorsachieving each level receive recognition for their achievements at our company-sponsored events and in ourpublications. We also have a Star Director Program under which distributors achieving the level of Director andabove receive additional compensation based on the number of Master Affiliates they have sponsored into theprogram. Directors receive an additional 1% to 3% royalty on the retail sales volume of Master Affiliates in theirdownline organization for an unlimited number of levels of sponsorship, until reaching a level that includes a MasterAffiliate who also has achieved Star Director status.
Master Directors and Presidential Directors may also be invited to participate in the Ambassador Program.As of December 31, 2015, we had approximately 376 Ambassadors worldwide. Qualifications to be invited by us toparticipate in the Ambassador Program include demonstrated competence and leadership qualities. Ambassadorsreceive recognition and awards for achieving Ambassador status and can then achieve additional levels ofaccomplishment. We utilize our Ambassadors to lead meetings and conferences, and to provide training andeducation to our distributors. Ambassadors achieving the level of Silver and higher also participate in the “RelivInner Circle,” which may entitle them to receive additional compensation, paid participation in our sponsoredevents, health insurance and car allowances.

11
In addition to the levels of compensation described, we also provide a variety of incentives, bonuses,awards and trips to distributors who achieve high sales volumes and who advance in the distributor ranks.
Distributor Training, Motivation and Management
Our marketing efforts are focused on the development, training, motivation and support of our independentdistributors. We support an active training program for our distributors in which our representatives and experienceddistributors, usually Ambassadors, lead group training sessions. We provide distributors with manuals, brochuresand other promotional, training and informational publications. We encourage distributors to hold regular weeklyrecruiting meetings and training sessions. We sponsor weekly training conference calls in which a significantnumber of distributors participate.
Our sponsorship generally includes the following:
• During 2015, we sponsored numerous special events in cities across all of our markets led by corporateexecutives and/or experienced Ambassadors;
• For each market in which we operate, we sponsor an annual conference for distributors; and
• In the United States during 2015, we sponsored an annual International Conference in the summer forall worldwide distributors and winter conferences on each coast for U.S. distributors.
During 2015, we invested approximately $1.96 million in training, conferences and promotional events forour distributors worldwide compared with $1.97 million in 2014.
Distributor Compliance
Our distributor organization and business model are designed and intended to promote the sale of ourproducts to consumers by distributors. Sales training and promotional efforts emphasize that intention. To that end,we monitor purchases by distributors to identify potentially excessive individual purchases and keep detailedinformation regarding customer purchases through our corporate shopping cart and as part of our autoship program.Distributors are not required at any time to purchase product, although Master Affiliates and above are required tomaintain certain minimum sales levels in their personal groups to continue receiving generation royaltycompensation payments.
Distributors may create their own advertising provided that it is within our advertising rules. Unless adistributor is using our designed and approved advertisements, the distributor must submit for approval in writing alladvertising (e.g. brochures, flyers, audio tapes, classified or display ads, radio scripts) to our ComplianceDepartment before placing it or arranging for placement.
Pursuant to our Policies and Procedures, which are incorporated by reference into our DistributorAgreement, distributors are permitted to make only those claims about our products that have been approved by usand/or provided in sales and training materials. Distributors acknowledge that our products are not represented asdrugs and they are not authorized to make any diagnosis of any medical condition, make drug-type claims for, orprescribe our products to treat or cure, any disease or condition. We do not authorize or permit our distributors tomake any express or implied references with regard to our products that they cure, prevent or relieve disease, replaceor augment medication, provide therapy, promote healing, alleviate illnesses or symptoms of illnesses, or make anyother medical claims for specific ailments.
In order to comply with regulations that apply to both us and our distributors, we conduct considerableresearch into the applicable regulatory framework prior to entering any new market to identify all necessary licensesand approvals and applicable limitations on operations in that market. We devote substantial resources to obtainingthe necessary licenses and approvals and maintaining operations that are in compliance with the applicablelimitations. We also research laws applicable to distributor operations and revise or alter distributor materials andproducts, as required by applicable regulations in each market.

12
Regulations in existing and new markets often are ambiguous and subject to considerable interpretive andenforcement discretion by the responsible regulators. In addition, regulations affecting our business often changeand are subject to varying interpretation and application. We make every effort to monitor and comply with changesin laws and regulations as they occur.
We have a Compliance Department that receives and reviews allegations of distributor misconduct. If wedetermine that a distributor has violated our Policies and Procedures, we may take a number of disciplinary actions.For example, we may impose sanctions such as warnings or suspensions until specific conditions are satisfied, ortake other appropriate actions at our discretion, including termination of the distributor’s agreement.
Geographic Presence
Markets
We currently sell our products throughout the United States and in 14 other countries around the world. Wehave sold products in the United States since 1988 and our first product outside of the United States in 1991 whenwe entered Australia. In 2015, approximately 22.0% of our net sales were generated outside of the United States.
The table below shows the countries in which we operate and the year we commenced selling products:
Country Year Entered Country Year EnteredUnited States 1988 Ireland 2003Australia 1991 Singapore 2004New Zealand 1992 Germany 2005Canada 1992 Austria 2006Mexico 1993 Netherlands 2006United Kingdom(1) 1995 Indonesia 2009Philippines 2000 France 2013Malaysia 2003
______________________
(1) Includes Great Britain, Scotland, Wales and Northern Ireland.
Within the United States, we sell our products to distributors in all 50 states. We derived 41.5% of ourdomestic net sales in 2015 in California, Pennsylvania, Illinois, Michigan, Texas, Ohio, and Florida, with each statecontributing at least 4% of net sales. We believe that there is the opportunity to increase the number of ourdistributors in all markets where we sell our products.
We organize all of our international operations under our wholly owned subsidiary, Reliv’ World. As ofDecember 31, 2015, Reliv’ World consisted of the following market-specific entities: Reliv’ Australia, Reliv’ NewZealand, Reliv’ Canada, Reliv’ Mexico, Reliv’ Europe, Reliv’ Philippines, Reliv’ Malaysia, Reliv’ Singapore, andPT Reliv’ Indonesia. We have utilized this method of separate corporations in most of our markets, as local businesslicensing and product approvals require a local legal entity.
We believe that there is a significant opportunity to increase sales in our current international markets, as awhole. We have established a consistent business model and compensation plan across all of our markets, and wecontinue to support our international markets with additional marketing programs and materials.
In addition to increasing sales in current international markets, our expansion strategy targets selected newforeign markets. Our presence in the UK, France, Germany, Austria and the Netherlands, as well as marketperformance, regional interest and distributor activity, have led to an increased focus on expansion in the EuropeanUnion. We opened for business in France in 2013 and are evaluating other expansion opportunities within theEuropean Union.

13
New Market Entry Process
When conditions warrant, we evaluate new markets for our products. In order to do so, we perform ananalysis of synergies between new and existing countries and distributor presence or interest in new markets, marketconditions, regulatory conditions, product approval procedures and competition before selecting markets to enter.Once we decide to enter a new market, we first hire local legal counsel and/or a consultant with appropriateexpertise to:
• help ensure that our network marketing system and products comply with all applicable regulations;
• help establish favorable public relations in the new market by acting as an intermediary between us andlocal regulatory authorities, public officials and business people; and
• explain our products and product ingredients to appropriate regulators and, when necessary, to arrangefor local technicians to conduct required ingredient analysis tests of the products.
Where regulatory approval in a foreign market is required, we utilize local counsel and/or consultants towork with regulatory agencies to confirm that all of the ingredients in our products are permissible within the newmarket. Where reformulation of one or more of our products is required, we attempt to obtain substitute orreplacement ingredients. During the regulatory compliance process, we may alter the formulation, packaging,branding or labeling of our products to conform to applicable regulations as well as local variations in customs andconsumer habits, and we may modify some aspects of our network marketing system as necessary to comply withapplicable regulations.
Following completion of the regulatory compliance phase, we undertake the steps necessary to meet theoperations requirements of the new market. In the majority of our new markets, we establish a sales center in amajor city and provide for product purchases by telephone and/or pick up. Product is shipped to the purchaser froma warehouse located in the general geographic market or the distributor may walk in to the local office and purchaseproducts, if a pick up center is available. In addition, we initiate plans to satisfy inventory, personnel andtransportation requirements of the new market, and we modify our distributor materials, recordings, videos and othertraining materials as necessary to be suitable for the new market.
In some countries, regulations applicable to the activities of our distributors also may affect our businessbecause in some countries we are, or regulators may assert that we are, responsible for our distributors’ conduct. Inthese countries, regulators may request or require that we take steps to ensure that our distributors comply with localregulations.
Manufacturing
We established a manufacturing line at our headquarters facility in Chesterfield, Missouri and began tomanufacture all of our nutritional supplements in early 1993. We expanded our Chesterfield facility in 1997 to nowinclude 126,000 square feet of total space. At this facility, we manufacture all of our powdered nutritionalsupplements and LunaRich X capsules for distribution both domestically and internationally. Only our 24K productis manufactured by a third party.
Our ability to manufacture most of our nutritional supplements is a competitive advantage over competitorsnot engaged in manufacturing and contributes to our ability to provide high-quality products. Our productmanufacturing includes identifying suppliers of raw materials, acquiring the finest quality raw materials, blendingexact amounts of raw materials into batches, and canning and labeling the finished products. Since we carefullyselect our ingredient suppliers, we are able to control the quality of raw materials and our finished products. Wehave not experienced any significant difficulty in obtaining supplies of raw materials for our nutritional supplementsor finished product of our 24K. By monitoring and testing products at all stages of the manufacturing process, weprecisely control product composition. In addition, we believe we can more efficiently control costs bymanufacturing all but one of our own nutritional supplements.
In 1996, we received approval from the Australian Therapeutic Goods Administration, or TGA, tomanufacture products sold in Australia at our Chesterfield plant. The certification of our Chesterfield site by the

14
Australian TGA also satisfied Canadian requirements. In 2013, our Chesterfield plant was audited by the AustralianTGA. Our current certification is valid until April 2017.
Fulfillment
Distributors order product in case lots of individual quantities and pay for the goods prior to shipment. Weoffer a program for distributors and their retail customers to order product in less than case lots directly from us byphone or internet order. Direct Advantage, an automatic monthly reorder program available for distributors andcustomers, provides a simple and convenient ordering process for consumers as well as distributors wanting tosatisfy maintenance requirements. Product is shipped directly to the distributor or customer and upline distributorsearn wholesale profits or, if applicable, a commission on all Direct Advantage sales.
In the United States, our products are warehoused at our Chesterfield facility and shipped by commoncarrier to distributors upon order. Our facility in Chesterfield, Missouri serves all parts of the country. Our productsare also warehoused in, and shipped to local distributors from: Sydney, Australia; Auckland, New Zealand;Oakville, Canada; Guadalajara, Mexico; Redditch (Birmingham), England; Makati (Manila), Philippines; SubangJaya (Kuala Lumpur), Malaysia; Singapore; and Jakarta, Indonesia. With the exception of our Canada, NewZealand, and Singapore subsidiaries, each of our subsidiaries maintains an office and personnel to receive, record,and fill orders from distributors. Distributors in Ireland, France, Germany, Austria, and the Netherlands order andreceive product from our UK-based subsidiary.
We maintain a policy that unused product may be returned by a customer to the selling distributor for a fullrefund or exchange within 30 days after purchase. We also maintain a policy that any distributor who terminates hisor her distributorship may return saleable product which was purchased from us within twelve months of thetermination for a refund of 90% of the purchase price less any compensation received relating to the purchase of theproducts. We believe this buyback policy addresses and satisfies a number of regulatory compliance issuespertaining to network marketing systems.
Historically, product returns and buy backs have not been significant. Product returns and buy backs havebeen approximately 0.24% and 0.25% of net sales in 2015 and 2014, respectively.
Information Technology Systems
In order to facilitate growth in the future and support our distributor activities, we continually upgrade ourmanagement information and telecommunication systems, along with increasing our internet-based capabilities.These systems include: (1) a centralized host computer in our Chesterfield headquarters, which is linked to ourinternational offices via secure data connections that provide real-time order entry and information to respond todistributor inquiries, as well as financial and inventory management systems; (2) local area networks of personalcomputers within our markets, serving our local administrative staffs; (3) an international e-mail system throughwhich our employees communicate; and (4) internet capabilities that provide a variety of online services todistributors, including product ordering, product information, event information and other related announcements,and tools to assist distributor leaders in managing their downline distributor group. We continue to pursue initiativesto increase the percentage of distributor orders placed via the internet. To accomplish this goal, we continue to makeimprovements to our shopping cart platform, and we have run periodic incentives to encourage distributors to placetheir orders via the internet. As a result of these initiatives, approximately 55% of our order volume in the UnitedStates is placed via internet.
These systems are designed to provide financial and operating data for management, timely and accurateproduct ordering, generation royalty payment calculation and processing, inventory management, and detaileddistributor records. We intend to continue to invest in our systems in order to help meet our business strategies.

15
Intellectual Property
Our formulas are protected as trade secrets and, to the extent necessary, by confidentiality agreements. Inaddition, we have obtained U.S. patents on five products as set forth below:
Product Patent Expiration Date
Arthaffect March 2018ReversAge May 2021ProVantage April 2025GlucAffect November 202924K February 2032
Currently, we have 22 trademarks registered with the U.S. Patent and Trademark Office, or USPTO,including Reliv and the names of 14 of our 17 nutritional products. Reliv NOW for Kids, LunaRich X and ReShapeare not registered with the USPTO. Trademark registrations for selected marks have been issued or applied for inAustralia, New Zealand, Canada, Mexico, the United Kingdom, Ireland, the Philippines, Malaysia, Singapore,Germany and several other foreign countries that offer network marketing opportunities. We consider ourtrademarks to be an important asset of our business.
Regulation
Product Regulation
The formulation, manufacturing, labeling and advertising or promotion of our products are subject toregulation by the Food and Drug Administration, or FDA, which regulates our products under the federal Food,Drug and Cosmetic Act, or FDCA, the Federal Trade Commission, or FTC, and various agencies of the states orcountries into which our products are shipped or sold. FDA regulations include requirements and limitations withrespect to the labeling of our food products and also with respect to the formulation of those products. FDAregulations also limit and control the extent to which health or other claims can be made with respect to the efficacyof any food or cosmetic. The FDCA has been amended several times with respect to dietary supplements, mostrecently by the Nutrition Labeling and Education Act of 1990, or NLEA, and the Dietary Supplement Health andEducation Act of 1994, or DSHEA, and related regulations. Such legislation governs the formulation,manufacturing, marketing and sale of nutritional supplements, including the content and presentation of health-related information included on the labels or labeling of nutritional supplements.
The majority of the products we market are classified as dietary supplements under the FDCA. Dietarysupplements such as those we manufacture and sell, for which no “drug” claim is made, are not subject to FDAapproval prior to their sale. However, DSHEA established a pre-market notification process for dietary supplementsthat contain a “new dietary ingredient,” or NDI, a term that is defined as “a dietary ingredient that was not marketedin the United States before October 15, 1994,” the date on which DSHEA was signed into law. Certain NDIs thathave been “present in the food supply” are exempt from the notification requirement. For those NDIs that are notexempt, DSHEA requires the manufacturer or distributor of a dietary supplement containing an NDI to submit to theFDA, at least 75 days prior to marketing, a notification containing the basis for concluding that the dietarysupplement containing the NDI will “reasonably be expected to be safe.” Dietary supplement products can beremoved from the market if shown to be unsafe, or if the FDA determines, based on the labeling of products, that theintended use of the product is for the diagnosis, cure, mitigation, treatment or prevention of disease. The FDA canregulate those products as “drugs” and require premarket approval of a “new drug application.” Manufacturers ofdietary supplements that make any claims for dietary supplements, including product performance and health benefitclaims, must have substantiation that the statements are truthful and not misleading.
In January 2000, the FDA published a final rule that defines the types of statements that can be madeconcerning the effect of a dietary supplement on the structure or function of the body pursuant to DSHEA. UnderDSHEA, dietary supplement labeling may bear “structure/function” claims, which are claims that the products affectthe structure or function of the body, without prior FDA approval. They may not, without prior FDA approval, beara claim that they can prevent, treat, cure, mitigate or diagnose disease, otherwise known as a “drug claim.” The finalrule describes how the FDA will distinguish drug claims from structure/function claims. Dietary supplements, like

16
conventional foods, are also permitted to make “health claims,” which are claims that are exempt from regulation as“drug” claims pursuant to the amendments to the FDCA established by the NLEA in 1990. A “health claim” is aclaim, ordinarily approved by FDA regulation, on a food or dietary supplement product’s labeling that“characterizes the relationship of any substance to a disease or health-related condition.” To help assure that foods,dietary supplements and cosmetics comply with the provisions of the FDCA and FDA’s regulations, the FDA hasnumerous enforcement tools, including the ability to issue warning letters, initiate product seizures and injunctionsand pursue criminal penalties.
The manufacture of dietary supplements is subject to existing FDA current good manufacturing practice, orcGMP, regulations for food. In June 2007, the FDA issued regulations relating to more detailed cGMP specificallyfor dietary supplements. Under these regulations, we qualify as a small business and became subject to theregulations in June 2009. We are periodically audited by the FDA and believe our systems and facilities inChesterfield are in full compliance with cGMP.
Advertisements for our products are subject to regulation by the FTC. The FTC prohibits unfair methods ofcompetition and unfair or deceptive acts or practices in or affecting commerce and provides that the dissemination ofany false advertisement pertaining to drugs, cosmetics or foods, including dietary supplements, is an unfair ordeceptive practice. Under the FTC’s substantiation doctrine, an advertiser must have a “reasonable basis” for allclaims made about a product. The failure to be able to adequately substantiate claims may be considered eitherdeceptive or unfair practices. In order to avoid a violation of the FTC standards, we endeavor to assure that we haveadequate substantiation for all advertising claims made for our products. In addition, the FTC has increased itsscrutiny of the use of distributor testimonials. Although it is impossible for us to monitor all the product claimsmade by our independent distributors, we make efforts to monitor distributor testimonials and restrict inappropriatedistributor claims. The FTC has been more aggressive in pursuing enforcement against dietary supplement productssince the passage of DSHEA in 1994, and has brought numerous actions against dietary supplement companies,some resulting in several million dollar civil penalties and/or restitution as well as court-ordered injunctions.
We are aware that there is adverse publicity in many markets, including the United States, concerningfoods that are grown from genetically modified organisms, or GMOs. In some markets, the possibility of health risksthought to be associated with GMOs has prompted proposed or actual governmental regulation. Nearly allingredients in our formulas are non-GMO. We use non-GMO ingredients when required by governmentalregulations and strive to use non-GMO ingredients in every other instance when commercially feasible andavailable. We believe compliance with regulatory requirements in this area should not have a material adverseeffect on our business.
Sales Program Regulation
Our distribution and sales program is subject to regulation by the FTC and other federal and state regulationas well as regulations in several countries in which we conduct business. Various state agencies regulate multi-leveldistribution services. We are required to register with, and submit information to, certain of such agencies and webelieve we have complied fully with such requirements. We actively strive to comply with all applicable state andfederal laws and regulations affecting our products and our sales and distribution programs. The Attorneys Generalof several states have taken an active role in investigating and prosecuting companies whose compensation plansthey claim violate local anti-pyramid and/or consumer protection statutes. We are unable to predict the effect suchincreased activity will have on our business in the future nor are we able to predict the probability of future laws,regulations or interpretations which may be passed by state or federal regulatory authorities.
Federal and state laws directed at network marketing programs have been adopted throughout the years toprevent the use of fraudulent practices often characterized as “pyramid schemes.” Illegal pyramid schemescompensate participants primarily for the introduction or enrollment of additional participants into the program.Often these schemes are characterized by large up-front entry or sign-up fees, over-priced products of low value,little or no emphasis on the sale or use of products, high-pressure recruiting tactics and claims of huge and quickfinancial rewards with little or no effort. Generally, these laws are directed at ensuring that product sales ultimatelyare made to consumers and that advancement within such sales organizations is based on sales of products.

17
We believe that our network marketing system satisfies the standards and case law defining a legalmarketing system. It is an ongoing part of our business to monitor and respond to regulatory and legaldevelopments, including those that may affect our network marketing system. However, the regulatory and legalrequirements concerning network marketing systems do not include “bright line” rules and are inherently fact-based.
Competition
The business of developing and distributing nutritional products such as those we offer is highlycompetitive. Numerous manufacturers, distributors and retailers compete for consumers and, in the case of othernetwork marketing companies, for distributors. Our competitors include both network marketing companies such asAlticor Inc. (Amway Corp.), Avon Products Inc., Herbalife Ltd., Mary Kay Inc., Melaleuca, Inc., Mannatech, Inc.,Nature’s Sunshine Products Inc., NuSkin Enterprises Inc. and USANA Health Sciences Inc., as well as specialty andmass retail establishments. Our ability to remain competitive depends on the underlying science and high quality ofour products and our success in recruiting and retaining distributors. The pool of individuals interested in networkmarketing tends to be limited in each market and may be reduced to the extent other network marketing companiessuccessfully recruit these individuals into their businesses. We believe that we offer a rewarding compensation planwith attractive financial benefits to compete for the time, attention and commitment of distributors. Ourcompensation plan is seamless, permitting international expansion.
Reliv NOW and Reliv Classic compete with numerous supplements that offer multi-vitamin benefits. TheReliv Ultrim-Plus, Slimplicity, ReShape and Cellebrate products compete with other products in the weight lossmarket, including nationally advertised products such as SlimFast. Many companies have entered, or have plans toenter, the sports drink market in which Innergize! and ProVantage compete, a market led by Gatorade. 24Kcompetes with 5-Hour Energy and numerous other liquid energy shots and drinks. With Arthaffect, FibRestore,ReversAge, GlucAffect, CardioSentials, SoySentials, and LunaRich X, we are in the specific wellness needs, foodand anti-aging markets, which are extremely competitive and led by the major food companies.
Employees
As of December 31, 2015, we and all of our subsidiaries had approximately 189 full-time employeescompared with 195 such employees at the end of 2014.
Additional Available Information
We make available, free of charge, copies of our annual reports on Form 10-K, quarterly reports on Form10-Q, current reports on Form 8-K, and all amendments to these reports as soon as reasonably practicable after suchmaterial is electronically filed with, or furnished to the SEC pursuant to Section 13(a) or 15(d) of the Exchange Act.This information is available on our corporate web site at www.reliv.com under the “Investor Relations” section.This information may also be obtained from the SEC’s on-line database located at www.sec.gov.
Item No. 2 – Properties
We own approximately six acres of land and a building containing approximately 126,000 square feet ofoffice, manufacturing and warehouse space located in Chesterfield, Missouri, where we maintain our corporateheadquarters and sole manufacturing facility. We believe that our worldwide facilities are suitable and adequate inrelation to our present and immediate future needs.

18
The following table summarizes information related to our worldwide facilities as of March 7, 2016:
Location Nature of Use Square Feet Owned/Leased
Chesterfield, MO, USA corporate headquarters/callcenter/manufacturing/warehouse
126,000 Owned
Seven Hills (Sydney), Australia central office/warehouse/distribution
5,740 Leased
Oakville, Ontario, Canada warehouse/distribution 2,100 LeasedGuadalajara, Mexico central office/warehouse/call center 2,400 LeasedMakati City (Manila), Philippines central office/
warehouse/distribution2,700 Leased
Redditch (Birmingham), England,UK
central office/warehouse/distribution
11,500 Leased
Subang Jaya (Kuala Lumpur),Malaysia
central office/call center 1,300 Leased
Jakarta, Indonesia central office/warehouse/distribution
1,100 Leased
Item No. 3 - Legal Proceedings
From time to time, we are involved in litigation incidental to the conduct of our business. We do notbelieve that any current proceedings will have a material adverse effect on our business, financial condition,results of operations or cash flows.
PART II
Item No. 5 - Market for Registrant’s Common Equity, Related Stockholder Matters and Issuer Purchases ofEquity Securities
Our common stock is listed on the NASDAQ Global Select Market under the symbol: RELV. Thefollowing table sets forth the high and low sales prices of our common stock and the quarterly dividends per sharepaid on our common stock during the years ended December 31, 2015 and 2014.
High Low Dividend
Year Ending December 31, 2015Fourth Quarter $ 0.79 $ 0.37 $ -Third Quarter 1.38 0.67 -Second Quarter 1.40 1.06 -First Quarter 1.24 1.07 -
Year Ending December 31, 2014Fourth Quarter $ 1.71 $ 1.15 $ -Third Quarter 1.93 1.14 -Second Quarter 2.68 1.51 -First Quarter 2.82 1.75 -
As of March 7, 2016, there were approximately 885 holders of record of our common stock and anadditional 2,787 beneficial owners, including shares of common stock held in street name.

19
Item No. 7 - Management’s Discussion and Analysis of Financial Condition and Results of Operations
The following discussion and analysis of our financial condition and results of operations should be read inconjunction with our financial statements and related notes included elsewhere in this Annual Report on Form 10-K. The following discussion and analysis discusses the financial condition and results of our operations on aconsolidated basis, unless otherwise indicated.
Overview
We are a developer, manufacturer and marketer of a proprietary line of nutritional supplements addressingbasic nutrition, specific wellness needs, weight management and sports nutrition. We sell our products through aninternational network marketing system utilizing independent distributors. Sales in the United States representedapproximately 78.0% of worldwide net sales for the year ended December 31, 2015 compared to approximately75.5% for the year ended December 31, 2014. Our international operations currently generate sales throughdistributor networks with facilities in Australia, Canada, Indonesia, Malaysia, Mexico, the Philippines, and theUnited Kingdom. We also operate in Ireland, France, Germany, Austria and the Netherlands from our UnitedKingdom distribution center, in New Zealand from our Australia office, and in Singapore from our Malaysia office.
We derive our revenues principally through product sales made by our global independent distributor base,which, as of December 31, 2015, consisted of approximately 44,590 distributors. Our sales can be affected byseveral factors, including our ability to attract new distributors and retain our existing distributor base, our ability toproperly train and motivate our distributor base and our ability to develop new products and successfully maintainour current product line.
All of our sales to distributors outside the United States are made in the respective local currency;therefore, our earnings and cash flows are subject to fluctuations due to changes in foreign currency rates ascompared to the U.S. dollar. As a result, exchange rate fluctuations may have an effect on sales and gross margins.Accounting practices require that our results from operations be converted to U.S. dollars for reporting purposes.Consequently, our reported earnings may be significantly affected by fluctuations in currency exchange rates,generally increasing with a weaker U.S. dollar and decreasing with a strengthening U.S. dollar. Productsmanufactured by us for sale to our foreign subsidiaries are transacted in U.S. dollars. From time to time, we enterinto foreign exchange forward contracts to mitigate our foreign currency exchange risk.
Components of Net Sales and Expense
Product sales represent the actual product purchase price typically paid by our distributors, after givingeffect to distributor allowances, which can range from 20% to 40% of suggested retail price, depending on the rankof a particular distributor. Handling and freight income represents the amounts billed to distributors for shippingcosts. We record net sales and the related commission expense when the merchandise is shipped.
Our primary expenses include cost of products sold, distributor royalties and commissions and selling,general and administrative expenses.
Cost of products sold primarily consists of expenses related to raw materials, labor, quality control andoverhead directly associated with production of our products and sales materials, as well as shipping costs relating tothe shipment of products to distributors, and duties and taxes associated with product exports. Cost of products soldis impacted by the cost of the ingredients used in our products, the cost of shipping distributors’ orders, and ourefficiency in managing the production of our products.
Distributor royalties and commissions are monthly payments made to distributors, based on products soldin their downline organization. Based on our distributor agreements, these expenses typically approximate 23% ofsales at suggested retail. Distributor royalties and commissions are paid on an amount referred to as the businessvalue (“BV”), which typically ranges between 80% and 90% of the suggested retail price of each product. Also, weinclude other sales leadership bonuses, such as Ambassador bonuses, within this caption. Overall, distributorroyalties and commissions remain directly related to the level of our sales and should continue at comparable levelsas a percentage of net sales going forward. We have implemented or are in the process of implementing similarpricing structures in all of our international markets.

20
Selling, general and administrative expenses include the compensation and benefits paid to our employeesexcept for those in manufacturing, all other selling expenses, marketing, promotional expenses, travel and othercorporate administrative expenses. These other corporate administrative expenses include professional fees, non-manufacturing depreciation and amortization, occupancy costs, communication costs and other similar operatingexpenses. Selling, general and administrative expenses can be affected by a number of factors, including staffinglevels and the cost of providing competitive salaries and benefits; the amount we decide to invest in distributortraining and motivational initiatives; and the cost of regulatory compliance.
Results of Operations
Year Ended December 31, 2015 Compared to Year Ended December 31, 2014
Net sales decreased by 9.7% worldwide, as net sales in the United States decreased by 6.8% in the yearended December 31, 2015 compared with 2014. During 2015, our international net sales decreased by 18.8% overthe prior year with 8.3% of the decline due to the impact of foreign currency fluctuation as the result of a strongerU.S. dollar. Net sales in Europe, our largest foreign market, decreased by 25.4% in 2015 compared to the prior year,with 5.8% of that decline due to the impact of foreign currency fluctuation.
The following table summarizes net sales by geographic market for the years ended December 31, 2015and 2014.
Net Sales by Market Year Ended December 31,
(in thousands) 2015 2014 Change from prior year
Amount% of Net
Sales Amount% of Net
Sales Amount %(dollars in thousands)
United States $ 40,385 78.0% $ 43,323 75.5% $ (2,938) (6.8)%Australia/New Zealand 1,280 2.5 1,642 2.9 (362) (22.0)Canada 1,297 2.5 1,367 2.4 (70) (5.1)Mexico 719 1.4 796 1.4 (77) (9.7)Europe 6,192 12.0 8,301 14.5 (2,109) (25.4)Asia 1,896 3.6 1,916 3.3 (20) (1.0)
Consolidated total $ 51,769 100.0% $ 57,345 100.0% $ (5,576) (9.7)%
The following table sets forth, as of December 31, 2015 and 2014, the number of our active distributors andMaster Affiliates and above. The total number of active distributors includes Master Affiliates and above. Wedefine an active distributor as one that enrolls as a distributor or renews its distributorship during the prior twelvemonths. Master Affiliates and above are distributors that have attained the highest level of discount and are eligiblefor royalties generated by Master Affiliates and above in their downline organization. For the December 31, 2015and 2014 data, the active distributor count for Europe includes our preferred customers in France. This programbegan in mid-2013 and the Europe active distributor count as of December 31, 2015 and 2014 includes 3,053 and2,945 preferred customers, respectively.
Active Distributors/Master December 31, 2015 December 31, 2014 % ChangeAffiliates by Market
ActiveDistributors
MasterAffiliates and
AboveActive
Distributors
MasterAffiliates and
AboveActive
Distributors
MasterAffiliates and
Above
United States 32,270 4,740 34,650 5,360 (6.9)% (11.6)%Australia/New Zealand 1,170 140 1,300 150 (10.0) (6.7)Canada 1,200 230 1,200 250 0.0 (8.0)Mexico 1,220 110 1,130 140 8.0 (21.4)Europe 6,300 650 7,640 890 (17.5) (27.0)Asia 2,430 330 2,050 340 18.5 (2.9)
Consolidated total 44,590 6,200 47,970 7,130 (7.0)% (13.0)%

21
The following table provides key statistics related to distributor activity by market and should be read inconjunction with the following discussion.
Distributor Activity by Market International
United States AUS/NZ Canada Mexico Europe Asia -- Total
Sales in 2015 in USD (in 000's) 40,385$ 1,280$ 1,297$ 719$ 6,192$ 1,896$ 11,384$
% change in sales-2015 vs. 2014:
In USD -6.8% -22.0% -5.1% -9.7% -25.4% -1.0% -18.8%
Due to currency fluctuation - -15.3% -14.7% -17.3% -5.8% -4.8% -8.3%
Sales in local currency -6.8% -6.7% 9.6% 7.6% -19.6% 3.8% -10.5%
# of new distributors-2015 8,069 253 403 662 3,247 1,256 5,821
# of new distributors-2014 8,338 367 344 531 4,785 927 6,954
% change -3.2% -31.1% 17.2% 24.7% -32.1% 35.5% -16.3%
# of new Master Affiliates-2015 1,302 28 67 30 185 163 473
# of new Master Affiliates-2014 1,085 30 72 39 373 93 607
% change 20.0% -6.7% -6.9% -23.1% -50.4% 75.3% -22.1%
# of Product orders-2015 167,947 8,064 4,999 4,143 24,103 11,484 52,793
# of Product orders-2014 182,200 8,829 4,720 3,843 26,221 13,170 56,783
% change -7.8% -8.7% 5.9% 7.8% -8.1% -12.8% -7.0%
______________________
(1)The new distributor totals in Europe for 2015 and 2014 include 1,987 and 2,200, respectively, new preferred customers inFrance. The preferred customer program began in mid-2013.
United States
• Net sales decreased in the United States in 2015 compared to 2014 as the result of declining distributorenrollments and ordering frequency, coupled with the decrease in the number of active distributors in theUnited States.
• Flagship products in the LunaRich line, including Reliv Now® and LunaRich X™, constituted 18.8% and15.5% of net sales in the United States, respectively, in 2015 as our marketing focuses on these twoproducts. For 2014, sales of Reliv Now and LunaRich X represented 16.5% and 13.4%, respectively, of netsales in the United States.
• Distributor enrollments decreased by 3.2%, but new Master Affiliate qualifications increased by 20.0% in2015 compared to the prior year. We increased the focus on the business opportunity in 2015; however,our efforts to improve these key metrics have not taken hold at the pace expected. Effective February 1,2016, we updated our distributor compensation plan to increase the qualification requirements to reachMaster Affiliate and introduced a new preferred customer program.
• Distributor retention was 71.1% in 2015 compared to 65.9% for all of 2014. Distributor retention isdetermined by the percentage of active distributors from 2014 that renewed their distributorships in 2015.
• Our average order size in 2015 increased by 2.0% to $335 at suggested retail value compared to the prioryear; however, the number of product orders in 2015 decreased by 7.8% compared to the prior year.
International Operations
• The average foreign exchange rate for the U.S. dollar for 2015 was stronger versus the various localcurrencies in which we conduct business when compared with the average exchange rates for 2014,impacting sales negatively by 8.3% in 2015.
• The stronger U.S. dollar also had a negative impact on gross margins in all of our foreign markets as theforeign cost of goods sold is denominated in U.S. dollars.

22
Canada• Canada follows nearly the same marketing plan as the United States.• Sales in Canada increased by 9.6% in local currency in 2015, as new distributor enrollments increased
17.2% in 2015 when compared to the prior year. The number of product orders commensurately increasedby 5.9% in 2015 when compared to 2014.
Mexico• Sales in Mexico increased by 7.6% in local currency in 2015 when compared to the prior year. However,
sales and the average order size in Mexico in the second half of 2015 were negatively impacted subsequentto the implementation of a value added tax in Mexico on July 1, 2015.
Europe• Our European region includes sales from operations in the United Kingdom, Ireland, France, Germany,
Austria, and the Netherlands.• Sales in Europe decreased by 19.6% in local currency in 2015 compared to the prior year. The decline was
primarily in the UK as the result of the departure of certain key distributors and a 17.5% decline in thenumber of active distributors in the European region overall.
Asia Pacific• Our Asia Pacific region includes Australia/New Zealand, as well as the Asian markets of the Philippines,
Malaysia, Singapore, and Indonesia. These markets share much of the same management team andmarketing strategies.
• Sales in Australia/New Zealand decreased by 6.7% in local currency in 2015 compared to the prior-yearperiod, as new distributor enrollments decreased by 31.1% in 2015 compared to 2014.
• Sales in Asia increased by 3.8% in local currency in 2015 compared to the prior year. Minor increases innet sales in the Philippines, Singapore, and Indonesia were partially offset by a continued decline inMalaysia. Sales continue to be impaired in Malaysia as the result of a GST sales tax imposed in thecountry beginning April 1, 2015.
• New distributor enrollments increased by 35.5% in the region in 2015 compared to the prior year and newMaster Affiliate qualifications increased by 75.3% in 2015 compared to 2014.

23
Costs and Expenses
The following table sets forth selected results of our operations expressed as a percentage of net sales forthe years ended December 31, 2015 and 2014. Our results of operations for the periods described below are notnecessarily indicative of results of operations for future periods.
Statement of Operations data
(amounts in thousands)
Amount % of net sales Amount % of net sales
Net sales 51,769$ 100.0 % 57,345$ 100.0 %
Costs and expenses:
Cost of products sold 11,086 21.4 11,658 20.3
Distributor royalties and commissions 18,410 35.6 20,543 35.8
Selling, general and adminstrative 23,547 45.5 25,048 43.7
Income (loss) from operations (1,274) (2.5) 96 0.2
Interest income 117 0.2 132 0.2
Interest expense (114) (0.2) (100) (0.2)
Other income/(expense) (192) (0.4) (151) (0.2)
Income (loss) before income taxes (1,463) (2.9) (23) 0.0
Provision (benefit) for income taxes (238) (0.5) (748) (1.3)
Net income (loss) (1,225)$ (2.4) % 725$ 1.3 %
Earnings (loss) per common share-Basic (0.10)$ 0.06$
Earnings (loss) per common share-Diluted (0.10)$ 0.06$
2015 2014
Cost of Products Sold:• The cost of products sold as a percentage of net sales in 2015 increased by 1.1% compared to the prior-year
period. Lower plant utilization and slightly higher production expenses, a 2.7% increase in the cost ofshipping distributor orders in the United States, and a reduced gross margin percentage on foreign sales asforeign cost of goods sold is denominated in U.S. dollars are the primary factors for the increase in cost ofgoods sold as a percentage of net sales in 2015.
Distributor Royalties and Commissions:• Distributor royalties and commissions as a percentage of net sales for 2015 compared to the prior-year
period remained relatively steady. Overall, distributor royalties and commissions remain directly related tothe level of our sales and should continue at comparable levels as a percentage of net sales.
Selling, General and Administrative Expenses:• Selling, general and administrative expenses declined by $1.50 million in 2015 compared to the prior-year
period.• Salaries, salary-related expenses, and incentive compensation decreased in the aggregate by $896,000 in
2015, compared to the prior-year period. Salaries decreased as the result of headcount reductions in theUnited States in the latter half of 2014 due to attrition and a voluntary retirement incentive.
• Other general and administrative expenses decreased by $99,000 in 2015 versus the prior-year period.o Compensation expense recognized as part of a long-term incentive agreement with our
management team in our European subsidiary decreased in 2015 by $46,000 compared to the

24
valuation in the prior-year period. During the second quarter of 2015, this long-term incentiveagreement became 100% vested and the participants exercised their put option in the agreement.This incentive agreement is described in Note 13 of the Consolidated Financial Statements.
o Travel expenses decreased by $145,000 as part of an effort to reduce travel outside of sales events.o Consulting fees decreased by $42,000 in 2015 compared to the prior-year period.o Business insurance expense decreased by $56,000 in 2015 compared to the prior-year period.
Offsetting increases in other G&A expenses include:o Property tax expense increased $78,000 compared to the prior year. In 2014, we received a credit
on our property taxes as the result of successful appeals on our headquarters property for severalprior years.
o In Mexico, we recognized expense of approximately $130,000 during the second quarter of 2015related to the write-off of VAT credits and VAT paid on behalf of our distributors as part of anamnesty agreement related to the implementation of a new VAT arrangement in that country.
o Research and development expenses increased by $138,000 in 2015 compared to the prior-yearperiod as a result of expenses incurred in an ongoing clinical study on some of our nutritionalsupplements.
• Sales and marketing expenses decreased by $404,000 in 2015 versus 2014. Components of the decreaseinclude:
o $278,000 decrease in Star Director and other distributor bonuses, credit card fees, and otherexpenses related to the level of sales.
o $56,000 decrease in promotional expenses in 2015 compared to 2014.o $54,000 decrease in newsletter expenses in 2015 compared to 2014.
Offsetting increases include:o $87,000 increase in distributor conferences and meeting expenses. In 2015, we held two regional
distributor conferences, and we also resumed our quarterly Master Affiliate Training Schoolprogram for distributors after a two-year absence. Additionally, the cost of our internationaldistributor conference, held this August in St. Louis, was more expensive than the internationalconference held in the prior-year third quarter.
Other Income/Expense:• The net expense in 2015 and 2014 is primarily the result of foreign currency exchange losses on
intercompany debt denominated in U.S. dollars in certain of our subsidiaries.
Income Taxes/Benefit:• We reported an income tax benefit of $238,000 for 2015, an effective rate of 16.3%.• Our effective rate was lower than the U.S. statutory rate of 34% due to the impact of the non-deductible
operating loss in the Philippines and income taxes incurred in other foreign countries. In our Europeansubsidiary, we recorded a reduction to our deferred tax assets as the result of reduction in income tax ratesbeginning in 2017. In addition, we recognized state income tax expense due to our separate company filingstatus in several states.
• In 2014, we reported an income tax benefit of $748,000 as the result of a deferred tax benefit of $758,000recorded in the fourth quarter of 2014. The deferred tax benefit related to the release of a valuationallowance on net operating loss carryforwards in our European subsidiary that were previously fullyreserved.
• See Note 11 of the Consolidated Financial Statements for additional detail regarding income taxes,including a reconciliation of the income tax expense/benefit to the U.S. statutory rate for each year.
Net Income:• We recognized a net loss in 2015 when compared to net income in 2014 as the result of the decline in net
sales in the United States and Europe. Additionally, net income for 2014 was favorably impacted as theresult of the deferred tax benefit recorded to release the valuation allowance on the European net operatingloss carryforwards.

25
Liquidity and Capital Resources
We used $800,000 of net cash during 2015 in operating activities, $146,000 was used in investingactivities, and $733,000 was used in financing activities. This compares with $392,000 of net cash used in operatingactivities, $1.07 million used in investing activities, and $133,000 used in financing activities in 2014. Cash andcash equivalents decreased by $1.73 million to $3.26 million as of December 31, 2015 compared to December 31,2014.
Significant changes in working capital items consisted of a decrease in accounts receivable of $157,000, anincrease in inventory of $138,000, an increase in refundable income taxes of $264,000, and a decrease in accountspayable, accrued expenses and other non-current liabilities of $603,000 in 2015. The decrease in accountsreceivable is the result of the write-off of VAT credits during Q2 2015 related to the implementation of a new VATarrangement in Mexico. The increase in refundable income taxes is the result of our net current year operating lossin the United States. The decrease in accounts payable, accrued expenses, and other non-current liabilities isprimarily the result of the settlement of a long-term incentive agreement with our management team in our Europeansubsidiary resulting in the issuance of notes payable, our common stock, and cash.
Our net investing activities included $243,000 and $908,000 in net capital expenditures, offset by paymentsreceived on a distributor note receivable of $97,000 and $91,000, for the years ended December 31, 2015 and 2014,respectively. Payment of premiums for key-man life insurance was $252,000 in 2014; however, no payment ofpremiums was made in 2015.
Financing activities during 2015 consisted of the payoff of our long-term and line of credit borrowings withour prior bank of $3.98 million, offset by proceeds of $3.25 million under borrowings from our new primary lender.Financing activities in 2014 consisted of $500,000 in proceeds from draw-downs on the revolving line of credit andprincipal payments of $633,000 on long-term borrowings. No cash dividends were paid in 2015 or 2014.
Stockholders’ equity decreased to $15.88 million at December 31, 2015 compared with $17.00 million atDecember 31, 2014. The decrease is primarily the result of our net loss of $1.22 million in 2015. Other changes toequity include an unfavorable adjustment in our cumulative foreign currency translation adjustment of $68,000,$117,000 of common stock issued as settlement of the long-term incentive agreement with the Europeanmanagement team, and other transactions related to equity-based compensation with a net increase in equity of$63,000.
Our working capital balance was $5.08 million at December 31, 2015 compared to $5.65 million atDecember 31, 2014. The current ratio at December 31, 2015 was 2.08 compared with 1.96 at the previous year-end.
On September 30, 2015, we entered into series of agreements with a new primary lender which includeagreements for a $3.25 million term loan and a $3.5 million revolving credit facility. These lending agreementsreplace similar borrowings under agreements with our former primary lender.
The new $3.25 million term loan is for a period of three years and requires monthly term loan payments,under a ten-year amortization, consisting of principal of $27,080 plus interest with a balloon payment for theoutstanding balance due and payable on September 30, 2018. The term loan's interest rate is based on the 30-dayLIBOR plus 2.25% and was 2.494% at December 31, 2015.
The new $3.5 million revolving line of credit agreement accrues interest at a floating interest rate based onthe 30-day LIBOR plus 2.25% and has a maturity date of September 30, 2016. As of December 31, 2015, therewere no outstanding borrowings on the revolving line of credit.
The proceeds from the new $3.25 million term loan were used to pay off the outstanding term loan andrevolving line of credit balances, plus accrued interest, due under loan agreements with our former primary lender.Borrowings under the new lending agreements are secured by all our tangible and intangible assets, a whole lifeinsurance policy on the life of our Chief Executive Officer, and by a mortgage on the real estate of our headquarters.The terms of these new lending agreements are described in Note 6 of the Consolidated Financial Statements. Thenew lending agreements also include a quarterly covenant requiring us to maintain net tangible worth of not less

26
than $9.5 million. As of December 31, 2015, we were in compliance with our loan covenant requirement, with a nettangible worth of $10.9 million.
Management believes that our cash on hand, internally generated funds, and the new bank loan facilitieswill be sufficient to meet working capital requirements and our debt service requirements for the next twelvemonths.
Critical Accounting Policies
Our financial statements are based on the selection and application of significant accounting policies, whichrequire management to make significant estimates and assumptions. We believe that the following are some of themore critical judgment areas in the application of our accounting policies that currently affect our financial conditionand results of operations.
Revenue
We receive payment by credit card, personal check, or guaranteed funds for orders from independentdistributors and make related commission payments in the following month. Net sales reflect product sales atsuggested retail price less the distributor discount of 20% to 40%. Sales revenue and commission expenses arerecorded when the merchandise is shipped, as this is the point title and risk of loss pass. In accordance with FASBASC, Topic 650-50, “Revenue Recognition-Customer Payments and Incentives,” we present distributor royalty andcommission expense as an operating expense, rather than a reduction to net sales, as these payments are not made tothe purchasing distributor.
Actual and estimated returns are classified as a reduction of net sales. We estimate and accrue a reserve forproduct returns based on our return policy and historical experience. Our return policy allows for a distributor toreturn product only upon termination of his or her distributorship. Allowable returns are limited to saleable productwhich was purchased within twelve months of the termination for a refund of 90% of the original purchase price lessany distributor royalties and commission received relating to the original purchase of the returned products. Totalreturns have been approximately 0.24% and 0.25% of net sales in 2015 and 2014, respectively. We record handlingand freight income as a component of net sales and record handling and freight costs as a component of cost ofproducts sold. Total revenues do not include sales tax as we consider ourselves a pass-through conduit for collectingand remitting applicable sales taxes.
Inventories
Inventories are valued at the lower of cost or market. Product cost includes raw material, labor andoverhead costs and is accounted for using the first-in, first-out basis. On a periodic basis, we review our inventorylevels in each country for estimated obsolescence or unmarketable items, as compared to future demandrequirements and the shelf life of the various products. Based on this review, we record inventory write-downs whencosts exceed expected net realizable value. Historically, our estimates of obsolete or unmarketable items have beenmaterially accurate.
Sales aids and promotional materials inventories represent distributor kits, product brochures, and othersales and business development materials which are held for sale to distributors. Costs of the sales aids andpromotional materials held for sale are capitalized as inventories and subsequently recorded to cost of goods soldupon recognition of revenue when sold to distributors. All other advertising and promotional costs are expensedwhen incurred.
Legal Proceedings
In the ordinary course of business, we are subject to various legal proceedings, including lawsuits and otherclaims related to labor, product and other matters. We are required to assess the likelihood of adverse judgments andoutcomes to these matters as well as the range of potential loss. Such assessments are required to determine whethera loss contingency reserve is required under the provisions of FASB ASC Topic 450, “Contingencies,” and todetermine the amount of required reserves, if any. These assessments are subjective in nature. Management makes

27
these assessments for each individual matter based on consultation with outside counsel and based on priorexperience with similar claims. To the extent additional information becomes available or our strategies orassessments change, our estimates of potential liability for a given matter may change. Changes to estimates ofliability would result in a corresponding additional charge or benefit recognized in the statement of operations in theperiod in which such changes become known. We recognize the costs associated with legal defense in the periodsincurred. Accordingly, the future costs of defending claims are not included in our estimated liability.
Income Tax Matters
We account for income taxes in accordance with FASB ASC Topic 740, “Income Taxes,” (ASC Topic740) which requires that deferred tax assets and liabilities be recognized using enacted tax rates for the effect oftemporary differences between the book and tax bases of recorded assets and liabilities. ASC Topic 740 alsorequires that deferred tax assets be reduced by a valuation allowance if it is “more likely than not” that some portionor the entire deferred tax asset will not be realized. In our quarterly evaluation of the need for a valuation allowance,we consider and weigh both positive and negative factors, including the expected level of future taxable income andavailable tax planning strategies. If actual results differ from the assumptions made in our previous evaluation ofour valuation allowance, we may record a change in valuation allowance through income tax expense in the periodthis determination is made.
The calculations of our tax liabilities involve dealing with uncertainties in the application of complex taxregulations. We recognize liabilities for uncertain tax positions based on the two-step process prescribed in theguidance under ASC Topic 740. The first step is to evaluate the tax position for recognition by determining if theweight of available evidence indicates that it is more likely than not that the position will be sustained on audit,including resolution of related appeals or litigation processes, if any. The second step requires us to estimate andmeasure the tax benefit as the largest amount that is more than 50% likely to be realized upon ultimate settlement. Itis inherently difficult and subjective to estimate such amounts, as we have to determine the probability of variouspossible outcomes. We reevaluate these uncertain tax positions on a quarterly basis. This evaluation is based onfactors including, but not limited to, changes in facts or circumstances, changes in tax law, effectively settled issuesunder audit, or new audit activity. Such a change in recognition or measurement would result in the recognition of atax benefit or an additional charge to the tax provision.
At December 31, 2015, we had deferred tax assets related to net operating loss carryforwards and otherincome tax credits with a tax value of $3.1 million. These net operating loss carryforwards have various expirationdates, depending on the country and period in which they occurred. A valuation allowance of $2.5 million has beenestablished for these deferred tax assets based on the weight of positive and negative evidence considered, includinghistory of income or loss, projected future taxable income, availability of tax planning strategies and the expirationdates of these carryforwards. In 2014, we recorded a tax benefit of $758,000 due to a reduction of the valuationallowance related to deferred tax assets for net operating losses of approximately $3.6 million in our UnitedKingdom subsidiary. Based on our assessment, we reduced the United Kingdom’s NOL valuation allowancebecause the weight of evidence regarding the future realizability of the deferred tax assets had becomepredominantly positive and realization of the deferred tax assets was more likely than not. The positive evidenceconsidered primarily related to three years of consistent profitability while the only negative evidence was historicallosses prior to 2012 for this subsidiary. As of December 31, 2015 the net deferred tax asset attributable to theUnited Kingdom subsidiary’s net operating loss carryforward was $623,000.
Current-Year Adoption of Recent Accounting Pronouncements
Discussion regarding our adoption of accounting pronouncements is included in Note 1 to the ConsolidatedFinancial Statements.

28
Item No. 8 - Financial Statements and Supplementary Data
Reference is made to the Consolidated Financial Statements contained in Part IV hereof.
Item No. 9 - Changes in and Disagreements with Accountants on Accounting andFinancial Disclosure
None
Item No. 9A - Controls and Procedures
Evaluation of Disclosure Controls and Procedures
Our management, under the supervision and with the participation of our Chief Executive Officer andChief Financial Officer, has reviewed and evaluated the effectiveness of the design and operation of our disclosurecontrols and procedures as of December 31, 2015. Based on such review and evaluation, our Chief ExecutiveOfficer and Chief Financial Officer have concluded that the disclosure controls and procedures were effective as ofDecember 31, 2015, to ensure that the information required to be disclosed by us in the reports that we file or submitunder the Securities Exchange Act of 1934, as amended, (a) is recorded, processed, summarized and reported withinthe time period specified in the SEC’s rules and forms and (b) is accumulated and communicated to ourmanagement, including the officers, as appropriate to allow timely decisions regarding required disclosure.
Management’s Annual Report on Internal Control over Financial Reporting
Management is responsible for establishing and maintaining adequate internal control over financialreporting. Our management conducted an evaluation of the effectiveness of our internal control over financialreporting based on the 2013 framework in Internal Control – Integrated Framework issued by the Committee ofSponsoring Organizations of the Treadway Commission. This evaluation included review of the documentation ofcontrols, evaluation of the design effectiveness of controls, testing of the operating effectiveness of controls and aconclusion on this evaluation. Although there are inherent limitations in the effectiveness of any system of internalcontrol over financial reporting, based on our evaluation, management has concluded our internal controls overfinancial reporting were effective as of December 31, 2015.
Attestation Report of the Registered Public Accounting Firm
This annual report does not include an attestation report of the company’s registered public accounting firmregarding internal control over financial reporting. Management’s report was not subject to attestation by thecompany’s registered public accounting firm as the company is classified as a “Smaller Reporting Company.”
Changes in Internal Control over Financial Reporting
There were no material changes in our internal control over financial reporting during the fourth quarter of2015 that have materially affected or are reasonably likely to materially affect our internal controls over financialreporting.
Item No. 9B - Other Information
None

29
PART III
Item No. 10 - Directors, Executive Officers and Corporate Governance
Information called for by Item 10 of Part III is incorporated by reference to the definitive Proxy Statementfor the 2016 Annual Meeting of Shareholders to be held on May 26, 2016, which is expected to be filed with theCommission within 120 days after December 31, 2015.
Item No. 11 - Executive Compensation
Information called for by Item 11 of Part III is incorporated by reference to the definitive Proxy Statementfor the 2016 Annual Meeting of Shareholders to be held on May 26, 2016, which is expected to be filed with theCommission within 120 days after December 31, 2015.
Item No. 12 - Security Ownership of Certain Beneficial Owners and Management and Related StockholderMatters
Information called for by Item 12 of Part III is incorporated by reference to the definitive Proxy Statementfor the 2016 Annual Meeting of Shareholders to be held on May 26, 2016, which is expected to be filed with theCommission within 120 days after December 31, 2015.
Item No. 13 - Certain Relationships and Related Transactions, and Director Independence
Information called for by Item 13 of Part III is incorporated by reference to the definitive Proxy Statementfor the 2016 Annual Meeting of Shareholders to be held on May 26, 2016, which is expected to be filed with theCommission within 120 days after December 31, 2015.
Item No. 14 - Principal Accountant Fees and Services
Information called for by Item 14 of Part III is incorporated by reference to the definitive Proxy Statementfor the 2016 Annual Meeting of Shareholders to be held on May 26, 2016, which is expected to be filed with theCommission within 120 days after December 31, 2015.
PART IV
Item No. 15 - Exhibits and Financial Statement Schedules
(a) 1. The Consolidated Financial Statements filed as part of this report on Form 10-K are listed on theaccompanying Index to Consolidated Financial Statements and Consolidated Financial StatementSchedules.
2. Financial schedules required to be filed by Item 8 of this form, and by Item 15(d) below:
All other financial schedules are not required under the related instructions or are inapplicable andtherefore have been omitted.
3. Exhibits: See the Exhibit Index immediately following the signature page of this Annual Reporton Form 10-K.

30
SIGNATURES
Pursuant to the requirements of Section 13 or 15(d) of the Securities Exchange Act of 1934, the registranthas duly caused this report to be signed on its behalf by the undersigned, thereunto duly authorized.
RELIV’ INTERNATIONAL, INC.
By: /s/ Robert L. MontgomeryRobert L. Montgomery, Chairman of the Board of Directors and Chief Executive Officer
Date: March 24, 2016
Pursuant to the requirements of the Securities Act of 1934, this report has been signed by the following persons onbehalf of the registrant and in the capacities and on the dates indicated.
By: /s/ Robert L. MontgomeryRobert L. Montgomery, Chairman of the Board of Directors and Chief Executive Officer
Date: March 24, 2016
By: /s/ Steven D. AlbrightSteven D. Albright, Chief Financial Officer (and accounting officer)
Date: March 24, 2016
By: /s/ Carl W. HastingsCarl W. Hastings, Vice Chairman, Chief Scientific Officer, Director
Date: March 24, 2016
By: /s/ Stephen M. MerrickStephen M. Merrick, Senior Vice-President, Secretary, Director
Date: March 24, 2016
By: /s/ John B. AkinJohn B. Akin, Director
Date: March 24, 2016
By: /s/ Robert M. HenryRobert M. Henry, Director
Date: March 24, 2016
By: /s/ John M. KlimekJohn M. Klimek, Director
Date: March 24, 2016
By: /s/ David T. ThibodeauDavid T. Thibodeau, Director
Date: March 24, 2016

31
Exhibit Index
ExhibitNumber Document
3.1 Second Amended and Restated Certificate of Incorporation (incorporated by reference toAppendix B of Schedule 14A of the Registrant filed on April 17, 2003).
3.2 By-Laws (incorporated by reference to the Registration Statement on Form S-3 of the Registrantfiled on February 21, 2006).
3.3 Amendment to By-Laws dated March 22, 2001 (incorporated by reference to the RegistrationStatement on Form S-3 of the Registrant filed on February 21, 2006).
3.4 Certificate of Designation to Create a Class of Series A Preferred Stock for Reliv’ International,Inc. (incorporated by reference to Exhibit 3.1 to the Form 10-Q of the Registrant for quarter endedMarch 31, 2003).
4.1 Form of Reliv International, Inc. common stock certificate (incorporated by reference to theRegistration Statement on Form S-3 of the Registrant filed on February 21, 2006).
10.1 Amended Exclusive License Agreement with Theodore P. Kalogris dated December 1, 1991(incorporated by reference to Exhibit 10.1 to the Form 10-K of the Registrant for the year endedDecember 31, 1992).
10.2* Robert L. Montgomery Employment Agreement dated June 19, 2007 (incorporated by reference toExhibit 10.1 to the Form 8-K of the Registrant filed June 25, 2007).
10.3* Carl W. Hastings Employment Agreement dated March 31, 2014 (incorporated by reference toExhibit 10.1 to the Form 8-K of the Registrant filed April 3, 2014).
10.4* Reliv’ International, Inc. Supplemental Executive Retirement Plan dated June 1, 1998(incorporated by reference to Exhibit 10.19 to the Form10-K of the Registrant for year endedDecember 31, 1998).
10.5* Reliv International, Inc. Employee Stock Ownership Plan and Trust dated August 24, 2006(incorporated by reference to Exhibit 10.1 to the Form 8-K of the Registrant filed August 30,2006).
10.6* 2009 Distributor Stock Purchase Plan (incorporated by reference to Appendix 1 of Form S-3Registration Statement the Registrant filed July 1, 2009).
10.7* 2009 Incentive Stock Plan (incorporated by reference to Exhibit 10.1 to the Form S-8 RegistrationStatement the Registrant filed December 2, 2010).
10.8* 2014 Incentive Stock Plan (incorporated by reference to Exhibit 10.1 to the Form S-8 RegistrationStatement the Registrant filed November 19, 2014).
10.9* Reliv International, Inc. Incentive Compensation Plan effective January 1, 2007 (incorporated byreference to Exhibit 10.1 to the Form 8-K of the Registrant filed May 31, 2007).
10.10* R. Scott Montgomery Employment Agreement dated January 2, 2008 (incorporated by referenceto Exhibit 10.1 to the Form 8-K of the Registrant filed January 4, 2008).
10.11* Ryan A. Montgomery Employment Agreement dated January 2, 2008 (incorporated by referenceto Exhibit 10.2 to the Form 8-K of the Registrant filed January 4, 2008).

32
10.12* Steven G. Hastings Employment Agreement dated January 2, 2008 (incorporated by reference toExhibit 10.3 to the Form 8-K of the Registrant filed January 4, 2008).
10.13* Steven D. Albright Employment Agreement dated January 2, 2008 (incorporated by reference toExhibit 10.4 to the Form 8-K of the Registrant filed January 4, 2008).
10.14* Brett M. Hastings Employment Agreement dated January 2, 2008 (incorporated by reference toExhibit 10.5 to the Form 8-K of the Registrant filed January 4, 2008).
10.15 Loan Sale Agreement between 2010-1 RADC/CADC Venture, LLC and Reliv International, Inc.dated March 16, 2012 (incorporated by reference to Exhibit 10.1 to the Form 10-Q of theRegistrant for the quarter ended March 31, 2012).
10.16 Technology License Agreement by and between SL Technology, Inc. and Soy Labs, LLC datedJuly 23, 2013 (incorporated by reference to Exhibit 10.1 to the Form 8-K of the Registrant filedJuly 25, 2013).
10.17 Agreement by and among Reliv International, Inc., SL Technology, Inc., Soy Labs, LLC and1Soy, Inc. dated July 23, 2013 (incorporated by reference to Exhibit 10.2 to the Form 8-K of theRegistrant filed July 25, 2013).
10.18 Promissory Note (term loan) dated September 30, 2015 among Reliv International, Inc., Reliv,Inc., Reliv World Corporation, and SL Technology, Inc., as Borrowers and Enterprise Bank &Trust (incorporated by reference to Exhibit 10.1 to the Form 10-Q of the Registrant filedNovember 13, 2015).
10.19 Promissory Note (revolving credit facility) dated September 30, 2015 among Reliv International,Inc., Reliv, Inc., Reliv World Corporation, and SL Technology, Inc., as Borrowers and EnterpriseBank & Trust (incorporated by reference to Exhibit 10.2 to the Form 10-Q of the Registrant filedNovember 13, 2015).
10.20 Business Loan Agreement dated September 30, 2015 among Reliv International, Inc., Reliv, Inc.,Reliv World Corporation, and SL Technology, Inc., as Borrowers and Enterprise Bank & Trust(incorporated by reference to Exhibit 10.3 to the Form 10-Q of the Registrant filed November 13,2015).
10.21 Deed of Trust dated September 30, 2015 between Reliv International, Inc. as Grantor andEnterprise Bank & Trust (incorporated by reference to Exhibit 10.4 to the Form 10-Q of theRegistrant filed November 13, 2015).
11 Statement re: computation of per share earnings (incorporated by reference to Note 8 of theConsolidated Financial Statements contained in Part IV).
21 Subsidiaries of the Registrant (filed herewith).
23 Consent of Ernst & Young LLP, Independent Registered Public Accounting Firm (filed herewith).
31.1 Certification of Chief Executive Officer pursuant to Rule 13a-14(a) and Rule 15d-14(a) of theSecurities Exchange Act, as amended (filed herewith).
31.2 Certification of Chief Financial Officer pursuant to Rule 13a-14(a) and Rule 15d-14(a) of theSecurities Exchange Act, as amended (filed herewith).
32 Certification of Chief Executive Officer and Chief Financial Officer pursuant to 18 U.S.C.1350, as adopted pursuant to Section 906 of the Sarbanes-Oxley Act of 2002 (filed herewith).

33
101 Interactive Data Files, including the following materials from the Company’s Annual Report onForm 10-K for the year ended December 31, 2015, formatted in XBRL: (i) the ConsolidatedBalance Sheets, (ii) the Consolidated Statements of Net Income (Loss) and ComprehensiveIncome (Loss), (iii) the Consolidated Statements of Stockholders’ Equity, (iv) the ConsolidatedStatements of Cash Flows, and (v) the Notes to Consolidated Financial Statements.
*Indicates management compensation plan, contract or arrangement.


Reliv’ International, Inc.and Subsidiaries
Consolidated Financial Statements
Years ended December 31, 2015 and 2014
Contents
Consolidated Financial Statements:Report of Independent Registered Public Accounting Firm.....................................F-1Consolidated Balance Sheets as of December 31, 2015 and 2014 ...........................F-2Consolidated Statements of Net Income (Loss) and Comprehensive
Income (Loss) for the years ended December 31, 2015 and 2014.........................F-4Consolidated Statements of Stockholders’ Equity for the years ended
December 31, 2015 and 2014 ................................................................................F-5Consolidated Statements of Cash Flows for the years endedDecember 31, 2015 and 2014 .................................................................................F-6
Notes to Consolidated Financial Statements – December 31, 2015 .........................F-8

F-1
Report of Independent Registered Public Accounting Firm
The Board of Directors and Stockholders
Reliv’ International, Inc.
We have audited the accompanying consolidated balance sheets of Reliv’ International, Inc. and Subsidiaries (the Company) as of December 31, 2015 and 2014, and the related consolidated statements of net income (loss) and comprehensive income (loss), stockholders’ equity, and cash flows for each of the two years in the period ended December 31, 2015. These financial statements are the responsibility of the Company’s management. Our responsibility is to express an opinion on these financial statements based on our audits.
We conducted our audits in accordance with the standards of the Public Company Accounting Oversight Board (United States). Those standards require that we plan and perform the audit to obtain reasonable assurance about whether the financial statements are free of material misstatement. We were not engaged to perform an audit of the Company’s internal control over financial reporting. Our audits included consideration of internal control over financial reporting as a basis for designing audit procedures that are appropriate in the circumstances, but not for the purpose of expressing an opinion on the effectiveness of the Company’s internal control over financial reporting. Accordingly, we express no such opinion. An audit also includes examining, on a test basis, evidence supporting the amounts and disclosures in the financial statements, assessing the accounting principles used and significant estimates made by management, and evaluating the overall financial statement presentation. We believe that our audits provide a reasonable basis for our opinion.
In our opinion, the financial statements referred to above present fairly, in all material respects, the consolidated financial position of Reliv’ International, Inc. and Subsidiaries at December 31, 2015 and 2014, and the consolidated results of their operations and their cash flows for each of the two years in the period ended December 31, 2015, in conformity with U.S. generally accepted accounting principles.
St. Louis, MissouriMarch 24, 2016

F-2
Reliv’ International, Inc. and Subsidiaries
Consolidated Balance Sheets
2015 2014
Assets
Current assets:
Cash and cash equivalents 3,262,263$ 4,989,392$Accounts receivable, less allowances of $30,200
in 2015 and $26,300 in 2014 89,376 265,530
Accounts due from employees and distributors 134,668 121,208
Inventories:
Finished goods 3,657,612 3,782,171
Raw materials 1,382,635 1,216,031
Sales aids and promotional materials 132,475 179,263
Total inventories 5,172,722 5,177,465
Refundable income taxes 522,035 257,577
Prepaid expenses and other current assets 552,645 661,038
Deferred income taxes 66,000 61,000
Total current assets 9,799,709 11,533,210
Other assets 285,153 295,929
Cash surrender value of life insurance 2,848,232 2,747,944
Note receivable due from distributor 1,630,164 1,732,982
Deferred income taxes 623,000 686,000
Intangible assets, net 2,655,647 2,925,775
Property, plant, and equipment 18,766,218 18,945,772
Less accumulated depreciation 12,347,091 12,019,802
Property, plant, and equipment, net 6,419,127 6,925,970
Total assets 24,261,032$ 26,847,810$
December 31

F-3
Reliv’ International, Inc. and Subsidiaries
Consolidated Balance Sheets (continued)
2015 2014
Liabilities and stockholders’ equity
Current liabilities:
Accounts payable and accrued expenses 3,937,752$ 5,187,057$
Current maturities of long-term debt 781,505 697,423
Total current liabilities 4,719,257 5,884,480
Noncurrent liabilities:
Revolving line of credit - 500,000
Long-term debt, less current maturities 3,159,575 3,047,267
Noncurrent deferred income taxes 94,000 -
Other noncurrent liabilities 405,705 418,785
Total noncurrent liabilities 3,659,280 3,966,052
Stockholders’ equity:
Preferred stock, par value $0.001 per share;
3,000,000 shares authorized; -0- shares issued and
outstanding in 2015 and 2014 - -
Common stock, par value $0.001 per share;
30,000,000 shares authorized, 14,773,083 shares
issued and 12,919,110 shares outstanding in 2015;
14,673,083 shares issued and 12,819,110 shares
outstanding in 2014 14,773 14,673
Additional paid-in capital 30,499,817 30,321,598
Accumulated deficit (8,659,262) (7,434,595)
Accumulated other comprehensive loss:
Foreign currency translation adjustment (634,273) (565,838)
Treasury stock (5,338,560) (5,338,560)
Total stockholders’ equity 15,882,495 16,997,278
Total liabilities and stockholders’ equity 24,261,032$ 26,847,810$
December 31
See accompanying notes.

F-4
Reliv’ International, Inc. and Subsidiaries
Consolidated Statements of Net Income (Loss)and Comprehensive Income (Loss)
2015 2014
Product sales 47,759,553$ 52,902,254$
Handling & freight income 4,009,304 4,442,705
Net sales 51,768,857 57,344,959
Costs and expenses:
Cost of products sold 11,086,152 11,657,728
Distributor royalties and commissions 18,410,190 20,542,905
Selling, general, and administrative 23,546,926 25,048,596
Income (loss) from operations (1,274,411) 95,730
Other income (expense):
Interest income 117,027 131,503
Interest expense (113,881) (100,142)
Other income (expense) (191,402) (150,522)
Loss before income taxes (1,462,667) (23,431)
Benefit from income taxes (238,000) (748,000)
Net income (loss) available to common
shareholders (1,224,667)$ 724,569$
Other comprehensive income (loss):
Foreign currency translation adjustment (68,435) (78,445)
Comprehensive income (loss) (1,293,102)$ 646,124$
Earnings (loss) per common share - Basic ($0.10) $0.06
Weighted average shares 12,870,000 12,666,000
Earnings (loss) per common share - Diluted ($0.10) $0.06
Weighted average shares 12,870,000 12,811,000
Year ended December 31
See accompanying notes.

Reliv' International, Inc. and SubsidiariesConsolidated Statements of Stockholders' Equity
Accumulated
Additional Other
Common Stock Paid-In Accumulated Comprehensive Treasury Stock
Shares Amount Capital Deficit Loss Shares Amount Total
Balance at December 31, 2013 14,519,605 14,520$ 30,101,069$ (8,159,164)$ (487,393)$ 1,853,973 (5,338,560)$ 16,130,472$
Net income - - - 724,569 - - - 724,569
Other comprehensive income (loss):
Foreign currency translation adjustment - - - - (78,445) - - (78,445)
Total comprehensive income 646,124
Common stock issued to consultant 153,478 153 176,346 - - - - 176,499
Stock-based compensation - - 46,370 - - - - 46,370
Expired stock options & warrants; deferred tax effect - - (2,187) - - - - (2,187)
Balance at December 31, 2014 14,673,083 14,673 30,321,598 (7,434,595) (565,838) 1,853,973 (5,338,560) 16,997,278
Net loss - - - (1,224,667) - - - (1,224,667)
Other comprehensive income (loss):
Foreign currency translation adjustment - - - - (68,435) - - (68,435)
Total comprehensive loss (1,293,102)
Common stock issued (Note 13) 100,000 100 116,900 - - - - 117,000
Stock-based compensation - - 63,064 - - - - 63,064
Expired stock options & warrants; deferred tax effect - - (1,745) - - - - (1,745)
Balance at December 31, 2015 14,773,083 14,773$ 30,499,817$ (8,659,262)$ (634,273)$ 1,853,973 (5,338,560)$ 15,882,495$
See accompanying notes.
F-5

F-6
Reliv’ International, Inc. and Subsidiaries
Consolidated Statements of Cash Flows
2015 2014Operating activitiesNet income (loss) (1,224,667)$ 724,569$Adjustments to reconcile net income (loss) to net cash
used in operating activities:Depreciation and amortization 1,003,096 961,731Stock-based compensation 63,064 46,370Non-cash life insurance policy accretion (100,288) (91,932)Deferred income taxes 92,000 (615,000)Foreign currency transaction (gain)/loss 109,491 136,999(Increase) decrease in accounts receivable and
accounts due from employees and distributors 156,865 (117,064)(Increase) decrease in inventories (138,490) (76,392)(Increase) decrease in refundable income taxes (264,243) (257,533)(Increase) decrease in prepaid expenses and other
current assets 95,861 28,130(Increase) decrease in other assets 10,776 (18,159)Increase (decrease) in income taxes payable - (199,558)Increase (decrease) in accounts payable & accrued
expenses and other non-current liabilities (603,020) (913,885)
Net cash used in operating activities (799,555) (391,724)
Investing activitiesProceeds from sale of property, plant, and equipment 7,281 1,186Purchase of property, plant, and equipment (250,284) (909,403)Payments received on distributor note receivable 96,845 91,219Payment of life insurance premiums - (252,250)Net cash used in investing activities (146,158) (1,069,248)
Financing activitiesProceeds from revolving line of credit borrowings - 500,000Repayment of revolving line of credit borrowings (500,000) -Proceeds from long-term borrowings 3,249,501 -Principal payments on long-term borrowings (3,482,561) (633,257)Net cash used in financing activities (733,060) (133,257)Effect of exchange rate changes on cash and cash
equivalents (48,356) (73,177)Increase (decrease) in cash and cash equivalents (1,727,129) (1,667,406)Cash and cash equivalents at beginning of year 4,989,392 6,656,798Cash and cash equivalents at end of year 3,262,263$ 4,989,392$
Year ended December 31

F-7
Reliv’ International, Inc. and Subsidiaries
Consolidated Statements of Cash Flows (continued)
2015 2014
Supplemental disclosures of cash flow information:Cash paid during the year for:
Interest 87,710$ 82,768$
Income taxes paid (received), net (68,000)$ 320,000$
Noncash financing transactions (Note 13):Issuance of promissory notes 424,000$ -$
Issuance of company common stock 117,000$ -$
Year ended December 31
See accompanying notes.

Reliv’ International, Inc. and Subsidiaries
Notes to Consolidated Financial Statements
F-8
December 31, 2015
1. Nature of Business and Significant Accounting Policies
Nature of Business
Reliv’ International, Inc. (the Company) produces a proprietary line of nutritional supplementsaddressing basic nutrition, specific wellness needs, weight management, and sports nutrition.These products are sold by subsidiaries of the Company to a sales force of independentdistributors of the Company that sell products directly to consumers. The Company and itssubsidiaries sell products to distributors throughout the United States and in Australia, Austria,Canada, France, Germany, Indonesia, Ireland, Malaysia, Mexico, the Netherlands, New Zealand,the Philippines, Singapore, and the United Kingdom.
Principles of Consolidation
The consolidated financial statements include the accounts of the Company and its foreign anddomestic subsidiaries. All significant intercompany accounts and transactions have beeneliminated.
Cash Equivalents
The Company's policy is to consider the following as cash and cash equivalents: demanddeposits and short-term investments with a maturity of three months or less when purchased.
Inventories
Inventories are valued at the lower of cost or market. Product cost includes raw materials, labor,and overhead costs and is accounted for on a first-in, first-out basis. On a periodic basis, theCompany reviews its inventory levels, as compared to future demand requirements and the shelflife of the various products. Based on this review, the Company records inventory write-downswhen necessary.
Sales aids and promotional materials inventories represent distributor kits, product brochures,and other sales and business development materials which are held for sale to distributors. Costof the sales aids and promotional materials held for sale are capitalized as inventories andsubsequently recorded to cost of goods sold upon recognition of revenue when sold todistributors. All other advertising and promotional costs are expensed when incurred.
Property, Plant, and Equipment
Property, plant, and equipment are stated on the cost basis. Depreciation is computed using thestraight-line or an accelerated method over the useful life of the related assets. Generally,computer equipment and software are depreciated over 3 to 5 years, office equipment andmachinery over 7 years, and real property over 39 years.

Reliv’ International, Inc. and Subsidiaries
Notes to Consolidated Financial Statements
F-9
1. Nature of Business and Significant Accounting Policies (continued)
Foreign Currency Translation and Transaction Gains or Losses
All balance sheet accounts have been translated using the exchange rates in effect at the balancesheet date. Statements of net income (loss) amounts have been translated using the averageexchange rate for the year. The gains and losses resulting from the changes in exchange ratesfrom year to year have been reported in other comprehensive income (loss). The foreigncurrency translation adjustment is the only component of accumulated other comprehensive loss.If applicable, foreign currency translation adjustments exclude income tax expense (benefit) ascertain of the Company’s investments in non-U.S. subsidiaries are deemed to be reinvested foran indefinite period of time. Foreign currency transaction losses were $109,491 and $136,999 for2015 and 2014, respectively.
Revenue Recognition
The Company receives payment by credit card, personal check, or guaranteed funds for ordersfrom independent distributors and makes related commission payments in the following month.Generally, net sales reflect product sales less the distributor discount of 20 percent to 40 percentof the suggested retail price. Sales revenue and commission expenses are recorded when themerchandise is shipped, as this is the point title and risk of loss pass to the distributor. Inaccordance with Financial Accounting Standards Board (“FASB”) Accounting StandardsCodification (“ASC”) Topic 605-50, “Revenue Recognition – Customer Payments andIncentives,” the Company presents distributor royalty and commission expense as an operatingexpense, rather than a reduction to net sales, as these payments are not made to the purchasingdistributor.
Actual and estimated sales returns are classified as a reduction of net sales. The Companyestimates and accrues a reserve for product returns based on the Company’s return policy andhistorical experience. The Company’s return policy allows for distributors to return product onlyupon termination of his or her distributorship. Allowable returns are limited to saleable productwhich was purchased within twelve months of the termination for a refund of 90% of the originalpurchase price less any distributor royalties and commission received relating to the originalpurchase of the returned products. For the years ended December 31, 2015 and 2014, totalreturns as a percent of net sales were approximately 0.24 % and 0.25%, respectively.
The Company records handling and freight income as a component of net sales and recordshandling and freight costs as a component of cost of products sold. Total revenues do notinclude sales tax as the Company considers itself a pass-through conduit for collecting andremitting applicable sales taxes.

Reliv’ International, Inc. and Subsidiaries
Notes to Consolidated Financial Statements
F-10
1. Nature of Business and Significant Accounting Policies (continued)
Fair Value Measurements
FASB ASC Topic 820, “Fair Value Measurements and Disclosures,” defines fair value,establishes a framework for measuring fair value, and requires disclosures about fair valuemeasurements required under other accounting pronouncements. See Note 5 for furtherdiscussion.
Basic and Diluted Earnings per Share
Basic earnings per common share are computed using the weighted average number of commonshares outstanding during the year. Diluted earnings per common share are computed using theweighted average number of common shares and potential dilutive common shares that wereoutstanding during the period. Potential dilutive common shares consist of outstanding stockoptions, outstanding stock warrants, and convertible preferred stock. See Note 8 for additionalinformation regarding earnings per share.
Stock-Based Compensation
The Company has stock-based incentive plans under which it may grant stock option, restrictedstock, and unrestricted stock awards. The Company recognizes stock-based compensationexpense based on the grant date fair value of the award and the related vesting terms. Dependingupon the characteristics of the option, the fair value of stock-based awards is primarilydetermined using the Black-Scholes model, which incorporates assumptions and managementestimates including the risk-free interest rate, expected volatility, expected option life, anddividend yield. See Note 7 for additional information.
The Company accounts for options granted to non-employees and warrants granted todistributors under the fair value approach required by FASB ASC Topic 505-50, “Equity BasedPayments to Non-Employees.”
Income Taxes
The provision for income taxes is computed using the liability method. The primary differencesbetween financial statement and taxable income result from financial statement accruals andreserves and differences between depreciation and stock options for book and tax purposes.
Unrecognized tax benefits are accounted for as required by FASB ASC Topic 740 whichprescribes a more likely than not threshold for financial statement presentation and measurementof a tax position taken or expected to be taken in a tax return. See Note 11 for further discussion.

Reliv’ International, Inc. and Subsidiaries
Notes to Consolidated Financial Statements
F-11
1. Nature of Business and Significant Accounting Policies (continued)
Advertising
Costs of sales aids and promotional materials are capitalized as inventories. All other advertisingand promotional costs are expensed when incurred. The Company recorded $18,500 and$19,400 of advertising expense in 2015 and 2014, respectively.
Research and Development Expenses
Research and development expenses, which are charged to selling, general, and administrativeexpenses as incurred, were $765,000 and $618,000 in 2015 and 2014, respectively.
Amortizable Intangible Assets
The Company records intangible assets based on management’s determination of the fair valueof the respective assets at the time of acquisition. Determining the fair value of intangible assetsis judgmental and involves the use of significant estimates and assumptions of future companyoperations. The Company bases its fair value estimates and related asset lives on assumptions itbelieves to be reasonable but that are unpredictable and inherently uncertain. Actual futureresults may differ from these estimates.
Intangible assets estimated to have finite lives are amortized over their estimated economic lifeunder the straight-line method; such method correlates to management’s estimate of the assets’economic benefit. Based on management’s estimates at origination, these lives range from twoto seventeen years. Related amortization expense is presented within Selling, General, andAdministrative in the accompanying consolidated statements of net income (loss) andcomprehensive income (loss). As of December 31, 2015, remaining lives of intangible assetsrange from one to fourteen years.
Use of Estimates
The preparation of financial statements in conformity with accounting principles generallyaccepted in the United States requires management to make estimates and assumptions thataffect the amounts reported in the financial statements and accompanying notes. Actual resultscould differ from those estimates.
Recent Accounting Standards Pending Adoption
In November 2015, the FASB issued ASU No. 2015-17, Income Taxes (Topic 740): BalanceSheet Classification of Deferred Taxes, which requires all deferred income tax assets andliabilities to be classified as non-current on the balance sheet, rather than being separated intocurrent and non-current amounts. The new standard is effective for annual reporting periodsbeginning after December 31, 2016 with early adoption permitted. The Company is currentlyevaluating the effect that the new standard will have on its consolidated financial statements andrelated disclosures.

Reliv’ International, Inc. and Subsidiaries
Notes to Consolidated Financial Statements
F-12
1. Nature of Business and Significant Accounting Policies (continued)
Recent Accounting Standards Pending Adoption (continued)
In May 2014, the Financial Accounting Standards Board (FASB) issued Accounting StandardsUpdate (ASU) No. 2014-09, Revenue from Contracts with Customers, which requires an entity torecognize the amount of revenue to which it expects to be entitled for the transfer of promisedgoods or services to customers. The ASU will replace most existing U.S. GAAP revenuerecognition guidance and becomes effective for the Company on January 1, 2018. The newstandard permits the use of either the retrospective or modified retrospective transition method.The Company is currently evaluating the effect, if any, that the updated standard will have on itsconsolidated financial statements and related disclosures, as well as its planned transitionmethod.
In July 2015, the FASB issued ASU No. 2015-11, Inventory (Topic 330): Simplifying theMeasurement of Inventory, which requires inventory within the scope of this update to bemeasured at the lower of its cost or net realizable value, with net realizable value being theestimated selling price in the ordinary course of business, less reasonably predictable costs ofcompletion, disposal, and transportation. The new standard is effective prospectively for fiscalyears beginning after December 15, 2016, with early adoption permitted. The Company does notanticipate that the adoption of this standard will have a material impact on its consolidatedfinancial statements and footnote disclosures.
In August 2014, the FASB issued ASU No. 2014-15, Disclosure of Uncertainties about anEntity’s Ability to Continue as a Going Concern, which requires management to assess, at eachannual and interim reporting period, the entity’s ability to continue as a going concern within oneyear from the date the financial statements are issued and provide related disclosures. The newstandard will be effective for the Company for the annual reporting period ending December 31,2016, with early adoption permitted. This standard is not currently expected to have a materialeffect on the Company’s financial statement disclosures upon adoption, though the ultimateimpact will be dependent on the Company’s financial condition and expected operating outlookat such time.
In February 2016, the FASB issued ASU No. 2016-2, Leases (Topic 842) which supersedes theexisting lease guidance. This update requires lessees to recognize a lease liability and a leaseasset for all leases, including operating leases, with a term greater than twelve months on itsbalance sheet. The update also expands the required quantitative and qualitative disclosuressurrounding leases. This update is effective for fiscal years beginning after December 15, 2018and interim periods within those fiscal years, with earlier application permitted. The Company isevaluating its transition method and the effects that the new standard will have on itsconsolidated financial statements and related disclosures.

Reliv’ International, Inc. and Subsidiaries
Notes to Consolidated Financial Statements
F-13
2. Property, Plant, and Equipment
Property, plant, and equipment at December 31, 2015 and 2014, consist of the following:
2015 2014
Land and land improvements 905,190$ 883,563$
Building 9,951,555 9,966,748
Machinery and equipment 4,344,403 4,355,040
Office equipment 1,223,921 1,235,192
Computer equipment and software 2,341,149 2,505,229
18,766,218 18,945,772
Less accumulated depreciation 12,347,091 12,019,8026,419,127$ 6,925,970$
For the years ended December 31, 2015 and 2014, depreciation expense was $732,968 and$691,603, respectively.
3. Accounts Payable and Accrued Expenses
Accounts payable and accrued expenses at December 31, 2015 and 2014, consist of thefollowing:
2015 2014
Trade payables 1,859,716$ 2,026,198$
Distributors' commissions 1,567,883 1,753,908
Sales taxes 232,996 292,188
Payroll, payroll taxes, and incentive compensation 277,157 1,114,763
3,937,752$ 5,187,057$
4. Amortizable Intangible Assets
The Company had amortizable intangible assets as follows as of December 31, 2015 and 2014:
2015 2014 2015 2014
Distributorship and related agreements $2,060,000 $2,060,000 $1,078,394 $924,385
Lunasin technology license 1,954,661 1,954,661 280,620 164,501
$4,014,661 $4,014,661 $1,359,014 $1,088,886
Gross Carrying Amount Amortization
Accumulated

Reliv’ International, Inc. and Subsidiaries
Notes to Consolidated Financial Statements
F-14
4. Amortizable Intangible Assets (continued)
Amortization expense for intangible assets totaled $270,128 in both 2015 and 2014, respectively.Amortization expense for amortizable intangible assets over the next five years is estimated tobe:
Intangible
Amortization
2016 $255,000
2017 226,000
2018 226,000
2019 226,000
2020 226,000
5. Fair Value of Financial Instruments
The carrying amount and fair value of financial instruments at December 31, 2015 and 2014were approximately as follows:
Carrying Fair
Description Amount Value Level 1 Level 2 Level 3
December 31, 2015
Long-term debt $3,941,080 $3,941,080 - $3,941,080 -
Note receivable 1,732,982 1,942,000 - 1,942,000
Marketable securities 275,000 275,000 $275,000 - -
December 31, 2014
Long-term debt $4,244,690 $4,244,690 - $4,244,690
Note receivable 1,829,827 2,098,000 - 2,098,000 -
Marketable securities 284,000 284,000 $284,000 - -
Fair value can be measured using valuation techniques such as the market approach (comparablemarket prices), the income approach (present value of future income or cash flow), and the costapproach (cost to replace the service capacity of an asset or replacement cost). Accountingstandards utilize a fair value hierarchy that prioritizes the inputs to valuation techniques used tomeasure fair value into three broad levels. The following is a brief description of those levels:
Level 1: Observable inputs such as quoted prices (unadjusted) in active markets for identicalassets or liabilities.
Level 2: Inputs other than quoted prices that are observable for the asset or liability, eitherdirectly or indirectly. These include quoted prices for similar assets or liabilities inactive markets or similar assets or liabilities in markets that are not active.

Reliv’ International, Inc. and Subsidiaries
Notes to Consolidated Financial Statements
F-15
5. Fair Value of Financial Instruments (continued)
Level 3: Unobservable inputs that reflect the reporting entity’s own assumptions.
Long-term debt: The fair value of the Company’s term and revolver loans approximate carryingvalue as these loans have variable market-based interest rates that reset every thirty days. Thefair value of the Company’s obligation for the acquisition of its lunasin technology licenseapproximates carrying value as this obligation is a zero-interest based obligation discountedutilizing an interest rate factor comparable to the Company’s market-based interest rate of itsterm and revolver loans. The fair value of the Company’s notes payable approximates carryingvalue as these notes have variable market-based interest rates that reset every ninety days.
Note receivable: The Company’s note receivable is a variable rate residential mortgage-basedfinancial instrument. An average of published interest rate quotes for a fifteen-year residentialjumbo mortgage, a comparable financial instrument, was used to estimate fair value of this notereceivable under a discounted cash flow model.
Marketable securities: The assets (trading securities) of the Company’s Supplemental ExecutiveRetirement Plan are recorded at fair value on a recurring basis, and are presented within OtherAssets in the consolidated balance sheets.
The carrying value of other financial instruments, including cash, accounts receivable andaccounts payable, and accrued liabilities approximate fair value due to their short maturities orvariable-rate nature of the respective balances.
6. Debt
Debt at December 31, 2015 and 2014 consists of the following:
2015 2014
Term loan 3,168,261$ 3,067,442$
Revolving line of credit - 500,000
Notes payable 283,455 -Obligation for acquisition of technology license, net 489,364 677,248
3,941,080 4,244,690
Less current maturities 781,505 697,423Long-term portion 3,159,575$ 3,547,267$

Reliv’ International, Inc. and Subsidiaries
Notes to Consolidated Financial Statements
F-16
6. Debt (continued)
Principal maturities of debt at December 31, 2015, are as follows:
2016 $ 781,505
2017 641,234
2018 2,518,341
2019 -
2020 -
Thereafter -
$ 3,941,080
Term Loan and Revolving Loan Agreements
Effective September 30, 2015, the Company entered into a series of lending agreements with anew primary lender which include agreements for a $3.25 million term loan and $3.5 millionrevolving credit facility. These lending agreements replace similar borrowings under agreementswith the Company’s former primary lender.
The new $3.25 million term loan is for a period of three years and requires monthly term loanpayments, under a ten-year amortization, consisting of principal of $27,080 plus interest with aballoon payment for the outstanding balance due and payable on September 30, 2018. The termloan’s interest is based on the 30-day LIBOR plus 2.25% and was 2.494% at December 31, 2015.
The new $3.5 million revolving line of credit agreement accrues interest at a floating interest ratebased on the 30-day LIBOR plus 2.25% and has a maturity date of September 30, 2016. As ofDecember 31, 2015, there were no outstanding borrowings on the revolving line of credit.
The proceeds from the new $3.25 million term loan were used to pay off the outstanding termloan and revolving line of credit balances, plus accrued interest, due under loan agreements withthe Company’s former primary lender.
Borrowings under the new lending agreements are secured by all tangible and intangible assetsof the Company, a whole life insurance policy on the life of the Company’s Chief ExecutiveOfficer, and by a mortgage on the real estate of the Company’s headquarters. The new lendingagreements also include a covenant requiring the Company to maintain a net tangible worth ofnot less than $9.5 million.
A description of the Notes Payable is presented in Note 13 – Incentive Compensation Plans.

Reliv’ International, Inc. and Subsidiaries
Notes to Consolidated Financial Statements
F-17
6. Debt (continued)
Obligation for Acquisition of Technology License, net
In July 2013, a newly-formed, wholly-owned subsidiary of the Company entered into aTechnology License Agreement (TLA) with a privately-held company. The TLA provides theCompany the exclusive license for certain intellectual property related to the nutritionalingredient lunasin and other soy-related peptides and proteins. In consideration for the TLA, theCompany agreed to pay the licensor a purchase price of $2 million; $1.15 million paid at closing,with the remaining obligation (non-interest bearing) paid over the next four years in a series ofannual payments ranging from $150,000 to $250,000 as stated in the agreement. Subject tocertain minimum and maximum thresholds, the Company may also pay the licensor royalties of5% of sales during the first five years of the TLA and royalties ranging from 1% to 3% of salesduring the remaining life of the TLA. As of December 31, 2015, management’s estimate ofearned but unpaid royalties is zero. The Company has accounted for the TLA as an assetpurchase acquisition consisting of a long-term finite-lived asset to be amortized over the life ofthe associated intellectual property (approximately seventeen years at origination).
7. Stockholders’ Equity
Stock Options – Incentive Stock Plans
The Company sponsors two incentive stock plans (a “2014 Plan” and a “2009 Plan”) eachallowing for a maximum of 1,000,000 shares to be granted in the form of either incentive stockoptions, non-qualified stock options, restricted stock awards, or unrestricted stock awards.Employees, directors, advisors, and consultants of the Company are eligible to receive the grants.These plans have been approved by the stockholders of the Company. The CompensationCommittee of the Board of Directors administers the plans.
The 2014 Plan and the 2009 Plan provide that options may be issued under the Plans at an optionprice not less than fair market value of the stock at the time the option is granted. Under theseplans, restricted stock of the Company may be granted at no cost to the grantee. The grantees areentitled to dividends and voting rights for their respective shares. Restrictions limit the sale ortransfer of these shares during the requisite service period. In addition, the committee may grantor sell unrestricted stock at a purchase price to be determined by the committee. Vesting termsand restrictions, if applicable, under the plans, are set by the committee and will be 10 years orless. The 2014 Plan expires in 2024 and the 2009 Plan expires in 2019.
In March 2015, under the 2014 Plan, the Company issued time-vesting stock option grantstotaling 274,500 shares. These option grants have an exercise price of $1.11 per share with afive-year term and vest annually in equal increments over 4.8 years. The aggregate estimatedcompensation cost related to the time-vesting stock option grant was $150,200. The grant-datefair value of the options was $0.5473 per share and was determined using a Black-Scholes optionpricing model using an average risk-free rate of 1.68%, an average dividend yield of 0%, and anaverage volatility of 56.3%.
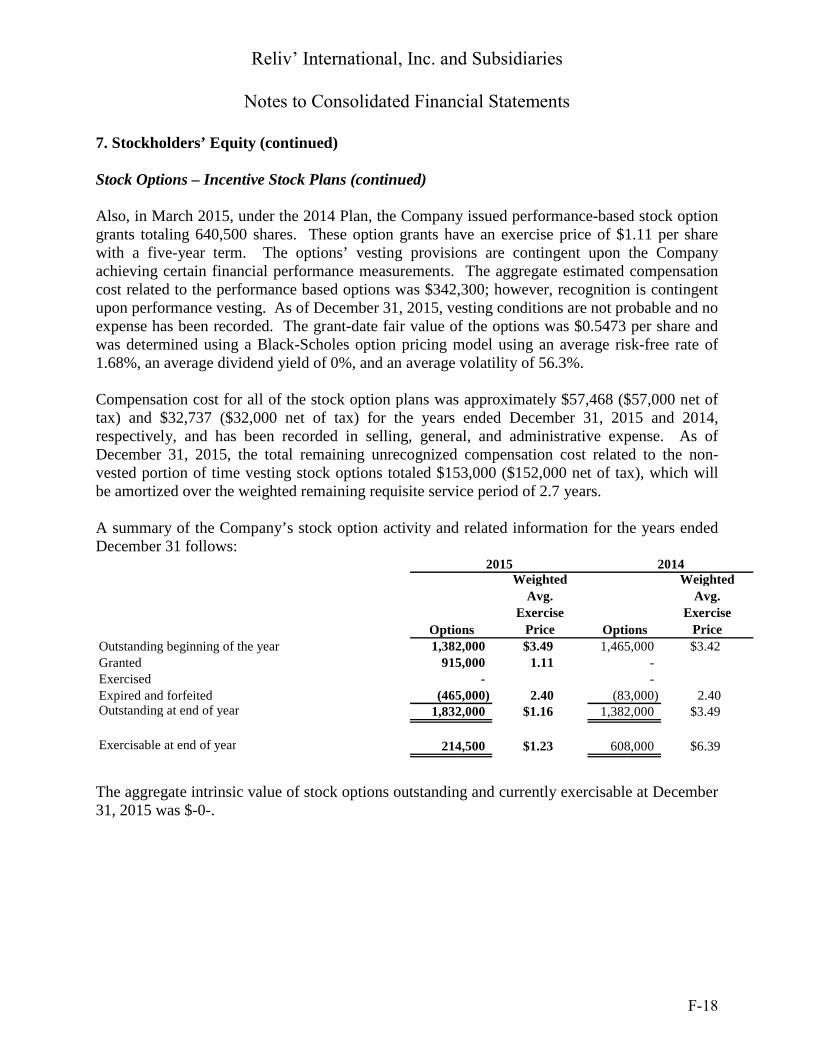
Reliv’ International, Inc. and Subsidiaries
Notes to Consolidated Financial Statements
F-18
7. Stockholders’ Equity (continued)
Stock Options – Incentive Stock Plans (continued)
Also, in March 2015, under the 2014 Plan, the Company issued performance-based stock optiongrants totaling 640,500 shares. These option grants have an exercise price of $1.11 per sharewith a five-year term. The options’ vesting provisions are contingent upon the Companyachieving certain financial performance measurements. The aggregate estimated compensationcost related to the performance based options was $342,300; however, recognition is contingentupon performance vesting. As of December 31, 2015, vesting conditions are not probable and noexpense has been recorded. The grant-date fair value of the options was $0.5473 per share andwas determined using a Black-Scholes option pricing model using an average risk-free rate of1.68%, an average dividend yield of 0%, and an average volatility of 56.3%.
Compensation cost for all of the stock option plans was approximately $57,468 ($57,000 net oftax) and $32,737 ($32,000 net of tax) for the years ended December 31, 2015 and 2014,respectively, and has been recorded in selling, general, and administrative expense. As ofDecember 31, 2015, the total remaining unrecognized compensation cost related to the non-vested portion of time vesting stock options totaled $153,000 ($152,000 net of tax), which willbe amortized over the weighted remaining requisite service period of 2.7 years.
A summary of the Company’s stock option activity and related information for the years endedDecember 31 follows:
Options
Weighted
Avg.
Exercise
Price Options
Weighted
Avg.
Exercise
Price
Outstanding beginning of the year 1,382,000 $3.49 1,465,000 $3.42Granted 915,000 1.11 -Exercised - -Expired and forfeited (465,000) 2.40 (83,000) 2.40Outstanding at end of year 1,832,000 $1.16 1,382,000 $3.49
Exercisable at end of year 214,500 $1.23 608,000 $6.39
2015 2014
The aggregate intrinsic value of stock options outstanding and currently exercisable at December31, 2015 was $-0-.

Reliv’ International, Inc. and Subsidiaries
Notes to Consolidated Financial Statements
F-19
7. Stockholders’ Equity (continued)
Stock Options – Incentive Stock Plans (continued)
Range of
Exercise Prices
Number
Outstanding
Weighted Avg.
Remaining Life
Weighted Avg.
Exercise Price
Number
Exercisable
Weighted Avg.
Remaining Life
Weighted Avg.
Exercise Price
$1.11 915,000 4.17 $1.11 - - $ -$1.17 202,000 2.17 1.17 - - -
$1.20 - $1.32 715,000 1.00 1.22 214,500 1.00 1.23
$1.11 - $1.32 1,832,000 2.71 $1.16 214,500 1.00 $1.23
Options Outstanding Options ExercisableAs of December 31, 2015
Distributor Stock Purchase Plan
In July 2009, the Company established a Distributor Stock Purchase Plan (2009 Plan) whichreplaced a similar plan which had expired. Since inception, a total of 83,591 warrants have beenissued under the 2009 Plan.
The plan allows distributors who have reached the “Ambassador” status the opportunity toallocate up to 10% of their monthly compensation into the plan to be used to purchase theCompany’s common stock at the current market value. The plan also states that at the end ofeach year, the Company will grant warrants to purchase additional shares of the Company’scommon stock based on the number of shares purchased by the distributors under the plan duringthe year. The warrant exercise price will equal the market price for the Company’s commonstock at the date of issuance. The warrants issued shall be in the amount of 25% of the totalshares purchased under the plan during the year and the warrants are fully vested upon grant.
The Company records expense under the fair value method for warrants granted to distributors.Total expense recorded for these warrants was $5,596 and $13,633 in 2015 and 2014,respectively.
The fair value of the warrants was estimated at the date of grant using a Black-Scholes optionpricing model with the following assumptions:
2015 2014
Expected warrant life (years) 3.0 3.0
Risk-free weighted average interest rate 1.37% 1.10%
Stock price volatility 68.2% 64.1%
Dividend yield 0.0% 0.0%
Year ended December 31
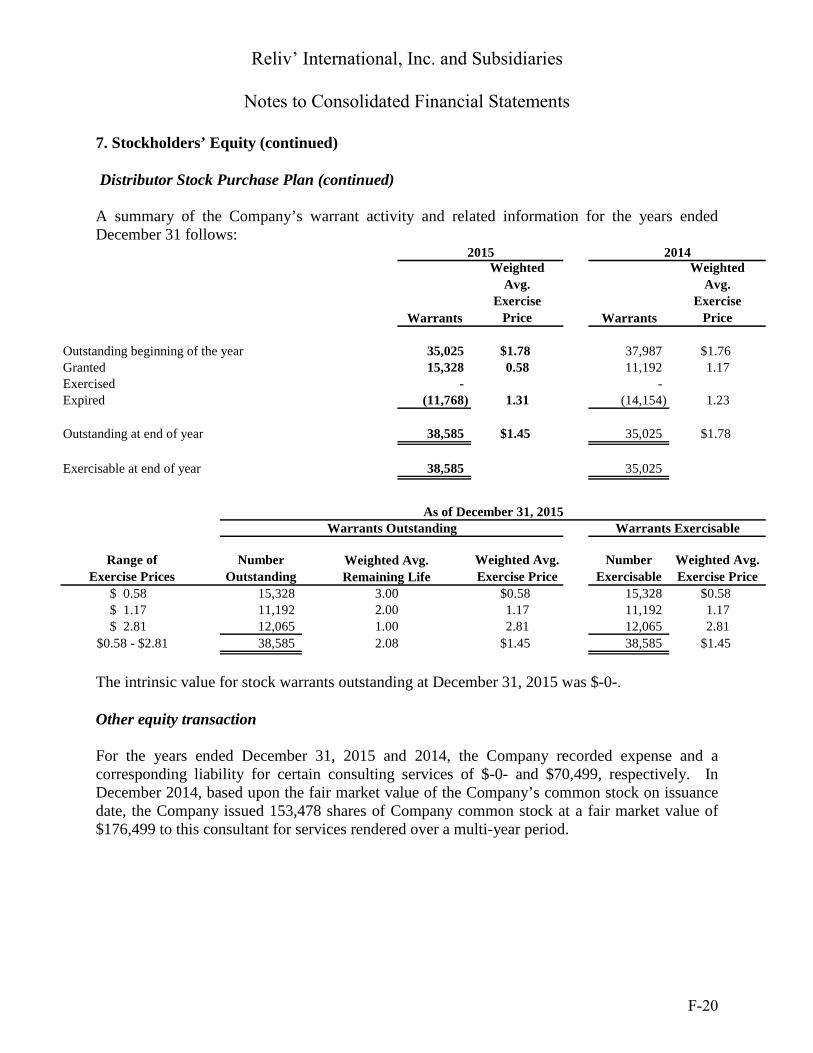
Reliv’ International, Inc. and Subsidiaries
Notes to Consolidated Financial Statements
F-20
7. Stockholders’ Equity (continued)
Distributor Stock Purchase Plan (continued)
A summary of the Company’s warrant activity and related information for the years endedDecember 31 follows:
Warrants
Weighted
Avg.
Exercise
Price Warrants
Weighted
Avg.
Exercise
Price
Outstanding beginning of the year 35,025 $1.78 37,987 $1.76Granted 15,328 0.58 11,192 1.17Exercised - -Expired (11,768) 1.31 (14,154) 1.23
Outstanding at end of year 38,585 $1.45 35,025 $1.78
Exercisable at end of year 38,585 35,025
Range of
Exercise Prices
Number
Outstanding
Weighted Avg.
Exercise Price
Number
Exercisable
Weighted Avg.
Exercise Price
$ 0.58 15,328 $0.58 15,328 $0.58$ 1.17 11,192 1.17 11,192 1.17$ 2.81 12,065 2.81 12,065 2.81
$0.58 - $2.81 38,585 $1.45 38,585 $1.45
2014
2.08
2.003.00
2015
1.00
Weighted Avg.
Remaining Life
As of December 31, 2015Warrants Outstanding Warrants Exercisable
The intrinsic value for stock warrants outstanding at December 31, 2015 was $-0-.
Other equity transaction
For the years ended December 31, 2015 and 2014, the Company recorded expense and acorresponding liability for certain consulting services of $-0- and $70,499, respectively. InDecember 2014, based upon the fair market value of the Company’s common stock on issuancedate, the Company issued 153,478 shares of Company common stock at a fair market value of$176,499 to this consultant for services rendered over a multi-year period.

Reliv’ International, Inc. and Subsidiaries
Notes to Consolidated Financial Statements
F-21
8. Earnings (Loss) per Share
The following table sets forth the computation of basic and diluted earnings (loss) per share:
2015 2014Numerator:
Net income (loss) ($1,224,667) $724,569Denominator:
Denominator for basic earnings (loss) per share –
weighted average shares 12,870,000 12,666,000
Dilutive effect of employee stock options and
other warrants - 145,000
Denominator for diluted earnings (loss) per share
– adjusted weighted average shares 12,870,000 12,811,000
Basic earnings (loss) per share ($0.10) $0.06
Diluted earnings (loss) per share ($0.10) $0.06
Year ended December 31
For the years ended December 31, 2015 and 2014, options and warrants totaling 1,855,257 and1,036,565, respectively, shares of common stock were not included in the denominator fordiluted earnings (loss) per share because their effect would be anti-dilutive or because the shareswere deemed contingently issuable.
9. Leases
The Company leases certain office facilities, storage, and equipment. These leases have varyingterms, and certain leases have renewal and/or purchase options. Future minimum payments undernon-cancelable leases with initial or remaining terms in excess of one year consist of thefollowing at December 31, 2015:
2016 345,282$
2017 229,858
2018 71,224
2019 55,878
2020 50,742
Thereafter -752,984$
Rent expense for operating leases was $424,810 and $471,066 for the years ended December 31,2015 and 2014, respectively.

Reliv’ International, Inc. and Subsidiaries
Notes to Consolidated Financial Statements
F-22
10. Note Receivable Due From Distributor
In March 2012, the Company purchased a note and mortgage (“Note”) from a real estateinvestment management firm on certain properties in Wyoming and Idaho for $2 million. InMay 2012, the Company entered into a Loan Modification Agreement (“LMA”) with the Note’soriginal and present borrower (“Borrower”) to restructure the Note’s principal amount due andrelated terms. The LMA terms are for a principal balance due of $2 million with interest onlypayments made monthly in 2012. The LMA’s interest rate is the greater of 6% or prime andthere is no prepayment penalty for voluntary principal payments. Concurrently, with theexecution of the LMA, the Company and the Borrower also entered into a Security Agreement inwhich repayment of the LMA is secured by the Borrower’s Reliv distributorship business.
As originally structured, beginning in 2013, the LMA was to require monthly payment ofprincipal and interest under a five-year amortization period. In February 2013, while retainingthe Company’s right to require Borrower’s compliance with the LMA’s terms, the Company andthe Borrower agreed to a verbal modification in the payment schedule in which the Companyagreed to accept monthly payments of principal and interest under a fifteen-year amortizationperiod. The outstanding balance of the note receivable was $1,732,982 and $1,829,827 as ofDecember 31, 2015 and 2014, respectively.
11. Income Taxes
Compenents of income (loss) before income taxes:
2015 2014
United States ($103,069) $49,757
Foreign (1,359,598) (73,188)($1,462,667) ($23,431)
Year ended December 31
Compenents of provision (benefit) for income taxes:
2015 2014
Current:
Federal ($389,000) ($37,000)
State 21,000 (122,000)
Foreign 38,000 26,000
Total current (330,000) (133,000)
Deferred:
Federal 27,000 131,000
State 5,000 24,000
Foreign 60,000 (770,000)
Total deferred 92,000 (615,000)
($238,000) ($748,000)
Year ended December 31

Reliv’ International, Inc. and Subsidiaries
Notes to Consolidated Financial Statements
F-23
11. Income Taxes (continued)
The provision (benefit) for income taxes is different from the amounts computed by applying theUnited States federal statutory income tax rate of 34%. The reasons for these differences are asfollows:
2015 2014
Income taxes at U.S. statutory rate ($497,000) ($8,000)
State income taxes, net of federal benefit 21,000 19,000
Higher/(lower) effective taxes on losses in
foreign countries 63,000 37,000
Foreign corporate income taxes 43,000 14,000
Effect of future tax rate changes to foreign
deferred income taxes 55,000 -
Nondeductible meals and entertainment expense 18,000 23,000
Qualified domestic production activities income, net 45,000 -
State tax planning strategy - (97,000)
Release of valuation allowance, net - (714,000)
Other 14,000 (22,000)
($238,000) ($748,000)
Year ended December 31
The Company has a deferred tax asset of $3,112,000 as of December 31, 2015, and $3,147,000as of December 31, 2014, relating to foreign net operating loss carryforwards (NOLs) in variousjurisdictions which expire in a range of years from one to unlimited. In 2014, the Companyrecorded a net income tax benefit of $758,000 due to a reduction of the valuation allowancerelated to deferred tax assets for net operating losses of approximately $3.6 million in theCompany’s United Kingdom subsidiary. Based on management’s assessment, the Companyreduced the United Kingdom’s NOL valuation allowance because the weight of evidenceregarding the future realizability of the deferred tax assets had become predominantly positiveand realization of the deferred tax assets was more likely than not. The positive evidenceconsidered primarily related to three years of consistent profitability while the only negativeevidence was historical losses prior to 2012 for this subsidiary. As of December 31, 2015 and2014, the net deferred tax asset attributable to the United Kingdom subsidiary’s net operatingloss carryforward was $623,000 and $715,000, respectively. The Company has recorded avaluation allowance against all other foreign net operating loss carryforward balances as it ismore likely than not that this asset will not be realized before it expires beginning in 2016.

Reliv’ International, Inc. and Subsidiaries
Notes to Consolidated Financial Statements
F-24
11. Income Taxes (continued)
The components of the deferred tax assets and liabilities, and the related tax effects of eachtemporary difference at December 31, 2015 and 2014, are as follows:
2015 2014
Deferred tax assets:
Product refund reserve 12,000$ 13,000$
Inventory obsolescence reserve 20,000 24,000
Vacation accrual 14,000 17,000
Stock-based compensation 11,000 10,000
Organization costs 195,000 208,000
Deferred compensation 107,000 98,000
Miscellaneous accrued expenses 13,000 8,000
Foreign net operating loss carryforwards 3,112,000 3,147,000
Valuation allowance - NOL carryforwards (2,489,000) (2,432,000)
995,000 1,093,000
Deferred tax liabilities:
Depreciation and amortization 240,000 213,000
Foreign currency exchange 160,000 133,000
400,000 346,000
Net deferred tax assets (liabilities) 595,000$ 747,000$
Reported as:
Current deferred tax assets 66,000$ 61,000$
Non-current deferred tax assets 623,000 686,000
Non-current deferred tax liabilities 94,000 -
Net deferred tax assets 595,000$ 747,000$
Through December 31, 2015, the cumulative amount of unremitted earnings on which theCompany has not recognized United States income tax was $57,000 as the Company plans toindefinitely reinvest these earnings outside the United States.
The Company applied applicable accounting guidance relating to accounting for uncertainty inincome taxes. Reserves for uncertainty in income taxes are adjusted quarterly in light ofchanging facts and circumstances, such as the progress of tax audits, case law, and emerginglegislation. The primary difference between gross unrecognized tax benefits and netunrecognized tax benefits is the U.S. federal tax benefit from state tax deductions. It is theCompany’s practice to recognize interest and / or penalties related to income tax matters inincome tax expense.
At December 31, 2015 and 2014, the Company had $63,000 and $48,000, respectively, ofcumulative unrecognized tax benefits, of which only the net amount of $46,000 would impact theeffective income tax rate if recognized.

Reliv’ International, Inc. and Subsidiaries
Notes to Consolidated Financial Statements
F-25
11. Income Taxes (continued)
The aggregate changes in the balance of gross unrecognized tax benefits were as follows:2015 2014
Beginning of year $48,000 $91,000
Settlements and effective settlements with tax authorities - -
Lapse of statute of limitations (6,000) (6,000)
Decrease to tax positions taken during prior periods (7,000) (46,000)
Increase to tax positions taken during current period 11,000 9,000
End of year $46,000 $48,000
At December 31, 2015 and 2014, the Company had $22,000 in each year accrued for interest andpenalties within the balance of unrecognized tax benefits. The Company’s unrecognized taxbenefits balance is included within other noncurrent liabilities on the consolidated balancesheets.
The Company, including its domestic and foreign subsidiaries, is subject to U.S. federal incometax as well as income tax of multiple state and foreign jurisdictions. The Company hasconcluded all U.S. federal income tax matters for years through 2011 and concluded yearsthrough 2011 with its primary state jurisdiction.
One of the Company’s foreign subsidiaries is presently under local country audit for allegeddeficiencies (totaling approximately $800,000 plus interest at 20% per annum) in value-addedtax (VAT) and withholding tax for the years 2004 through 2006. The Company, in consultationwith its legal counsel, believes that there are strong legal grounds that it should not be liable topay the majority of the alleged tax deficiencies. As of December 31, 2010, managementestimated and reserved approximately $185,000 for resolution of this matter and recorded thisamount within Selling, General, and Administrative expense in the 2010 Consolidated Statementof Income. In 2011, the Company made good faith deposits to the local tax authority under thetax agency’s administrative judicial resolution process. As of December 31, 2015,management’s estimated reserve (net of deposits) for this matter is approximately $142,000.
12. Employee Benefit Plans
The Company sponsors a 401(k) employee savings plan which covers substantially allemployees. Employees can contribute up to 15% of their gross income to the plan. TheCompany matched a percentage of the employee’s contribution at a rate of 25% for the first ninemonths of 2014 and at a rate of 10% for the last 3 months of 2014 and all of 2015. Companycontributions under the 401(k) plan totaled $49,300 and $98,300 in 2015 and 2014, respectively.
On September 1, 2006, the Company established an employee stock ownership plan ("ESOP")which covers substantially all U.S. employees. Contributions to the ESOP are funded by theCompany on a discretionary basis. In 2015 and 2014, the Company did not make anycontributions to the ESOP.

Reliv’ International, Inc. and Subsidiaries
Notes to Consolidated Financial Statements
F-26
13. Incentive Compensation Plans
In May 2007, the Board of Directors approved the adoption of a new incentive compensationplan. This new plan was effective for fiscal year 2007 and replaced a previous plan. Under theplan, bonuses are payable quarterly in an amount not to exceed 18% of the Company’s Incomefrom Operations for any period, subject to the Company achieving a minimum quarterly Incomefrom Operations of at least $500,000. For fiscal years 2015 and 2014, the Board determined thatthe aggregate amount of incentive compensation available under the Plan shall be equal to 18%and 16%, respectively, of the Company’s Income from Operations. The bonus pool is allocatedto executives according to a specified formula, with a portion allocated to a middle managementgroup determined by the Executive Committee of the Board of Directors.
The Company expensed a total of $-0- and $89,000 to the participants of the bonus pool for 2015and 2014, respectively.
In July 2010, the Company’s Reliv Europe subsidiary entered into a long-term performance-based incentive compensation agreement with the subsidiary’s senior managers. The valuationof the compensation agreement was an EBITDA-based formula derived from the subsidiary’sfinancial performance and vested in 20% annual increments which began in April 2011. Theamount of the incentive, if any, varies in accordance with a 24-month look-back of thesubsidiary’s financial performance and the vesting provisions. Upon initial vesting, a managermay elect to exercise his/her put option to receive in cash some or all of his/her respective shareof the incentive. In the fourth quarter of 2012, the subsidiary’s 24-month financial performancebecame positive, and remained positive through April 2015, resulting in the recognition ofcompensation expense of $90,800 and $137,000 for 2015 and 2014, respectively, as presentedwithin Selling, General, and Administrative in the accompanying consolidated statements of netincome (loss) and comprehensive income (loss). At December 31, 2014, accrued compensationfor this incentive plan was $666,000 and was presented in “Payroll, Payroll Taxes, and IncentiveCompensation Payable”, a component of Accounts Payable and Accrued Expenses, as presentedin the accompanying consolidated balance sheets.
During the second quarter of 2015, the cumulative incentive amount of $756,800 became 100%vested, and concurrently, each of the subsidiary’s senior managers exercised 100% of his/her putoption. In the aggregate, the Company and the managers agreed to settle the incentive obligationwhereby the Company: issued notes payable of approximately $424,000, issued 100,000 sharesof Company common stock (fair value at settlement of $117,000), and made cash payments ofapproximately $216,000.
The notes payable were issued by the Company to the managers in April 2015 and range inlength from one to two years with quarterly payments of principal and interest beginning threemonths from issuance. Each of the notes accrue interest at a floating interest rate based on thethree-month pound LIBOR plus 3%. The interest rate at December 31, 2015 was 3.58%. Thenotes payable have a principal balance at December 31, 2015 of $283,455 and are presentedwithin the respective current and noncurrent portions of long-term debt in the accompanyingconsolidated balance sheets.

Reliv’ International, Inc. and Subsidiaries
Notes to Consolidated Financial Statements
F-27
13. Incentive Compensation Plans (continued)
The Company sponsors a Supplemental Executive Retirement Plan (SERP) to allow certainexecutives to defer a portion of their annual salary and bonus into a grantor trust. A grantor trustwas established to hold the assets of the SERP. The Company funds the grantor trust by payingthe amount deferred by the participant into the trust at the time of deferral. Investment earningsand losses accrue to the benefit or detriment of the participants. The SERP also provides for adiscretionary matching contribution by the Company not to exceed 100% of the participant’sannual contribution. In 2015 and 2014, the Company did not provide a match. The participantsfully vest in the deferred compensation three years from the date they enter the SERP. Theparticipants are not eligible to receive distribution under the SERP until retirement, death, ordisability of the participant. At December 31, 2015 and 2014, SERP assets were $275,000 and$284,000, respectively, and are included in “Other Assets” in the accompanying consolidatedbalance sheets. At December 31, 2015 and 2014, SERP liabilities were $277,000 and $288,000,respectively, and are included in “Other Non-Current Liabilities” in the accompanyingconsolidated balance sheets. The changes in the balances of SERP assets and SERP liabilitiesduring 2015 and 2014 were due to net realized and unrealized investment gains/losses incurredby the plan.
14. Segment Information
Description of Products and Services by Segment
The Company classifies its sales into three categories of sales products plus handling & freightincome. Net sales by product category data for the years ended December 31, 2015 and 2014,follow:
2015 2014
Net sales by product category
Nutritional and dietary supplements $46,276,222 $51,144,929
Skin care products 267,737 344,325
Sales aids and other 1,215,594 1,413,000
Handling & freight income 4,009,304 4,442,705
Total net sales $51,768,857 $57,344,959

Reliv’ International, Inc. and Subsidiaries
Notes to Consolidated Financial Statements
F-28
14. Segment Information (continued)
Description of Products and Services by Segment (continued)
The Company operates in one reportable segment, a network marketing segment consisting ofsix operating units that sell nutritional and dietary products to a sales force of independentdistributors that sell the products directly to customers. These operating units are based ongeographic regions.
Geographic area data for the years ended December 31, 2015 and 2014 follow:
2015 2014
Net sales to external customers
United States $40,384,993 $43,323,190
Australia/New Zealand 1,279,549 1,641,492
Canada 1,296,543 1,367,294
Mexico 719,101 796,208
Europe (1)6,192,453 8,300,520
Asia(2)
1,896,218 1,916,255
Total net sales $51,768,857 $57,344,959
Assets by area
United States $20,429,025 $22,414,373
Australia/New Zealand 562,961 609,933
Canada 374,863 485,544
Mexico 288,406 456,601
Europe(1)
1,879,473 2,244,738
Asia(2)
726,304 636,621
Total consolidated assets $24,261,032 $26,847,810
(1) Europe consists of United Kingdom, Ireland, France, Germany, Austria, and the Netherlands.(2) Asia consists of Philippines, Malaysia, Singapore, and Indonesia.

Corporate Headquarters Reliv International, Inc.
136 Chesterfield Industrial Blvd. Chesterfield, Missouri 63005
Phone: 636.537.9715 Fax: 636.537.9753
State & Date of Incorporation Delaware, February 11, 1985
Independent Auditors Ernst & Young LLP
Fiscal Year-End December 31
Dividend Reinvestment, Share Purchase & Sale Program
This Program is available to the general public and current shareholders of the Company.
If you would like to receive information on this Program, please call American Stock Transfer &
Trust Co., toll free, at 800 .937.5449.
Stock Exchange Listing Nasdaq Stock Market® under the symbol RELV.
Annual Meeting The annual meeting of shareholders will be held at 9:00 a.m. on Thursday May 26, 2016, at Reliv Corporate Headquarters, 136 Chesterfield Industrial Blvd. Chesterfield, Missouri 63005
Transfer Agent American Stock Transfer & Trust Co. 6201 15th Avenue Brooklyn, NY 11219 800 .937.5449 www.amstock.com
Number of Shareholders Approximately 3,672 as of March 7, 2016
Shareholder Questions Communications concerning stock transfer requirements, lost certificates, change of address or dividends should be addressed to American Stock Transfer & Trust Co. at 800.937.5449.
Financial Information Reliv International maintains a website at www.reliv.com.

TAKECHARGE
Reliv International, Inc. 136 Chester�eld Ind. Blvd. Chester�eld, MO 63005 reliv.com