investigations into the synthesis of dinitroge - Adelaide ...
280
t') l^118 TTIE PREPARATÍON AI\D STUDY OF ETHY LENED IAMIN ETET RAACET ATO COMPLEXES OF RUTHEN IU M Investigations into the synthesis of dinitrogen' dinitrogen oxide and related complexes' * by Julius Victor Dubrawski lì.Sc. (llons.) * A Thesis presented for the Degree of Doctor of Philosophy Department of Physical and Inorganic Chemistry IJ niv ersitY o f Ad elatule April 1977
-
Upload
khangminh22 -
Category
Documents
-
view
1 -
download
0
Transcript of investigations into the synthesis of dinitroge - Adelaide ...

t')l^118
TTIE PREPARATÍON AI\D STUDY OF
ETHY LENED IAMIN ETET RAACET ATO COMPLEXES OF RUTHEN IU M
Investigations into the synthesis of dinitrogen'
dinitrogen oxide and related complexes'
*
by
Julius Victor Dubrawskilì.Sc. (llons.)
*
A Thesis presented for the Degree of
Doctor of Philosophy
Department of Physical and Inorganic Chemistry
IJ niv ersitY o f Ad elatule
April 1977

SUMMARY
The aquo complex, [Ru(IIf)HEDTA(H20) ] (A) , results from díssociation
in solution of [RuHEDTA(Ct)]K.2H2O, and is reduced bV Hr/Pt, metallic
magnesium or zínc amalgam to produce [Ru(II)HEDTA(H2O)]- (B). Substitution
reactions of the aquo ligand were investigated using dinitrogen,
dinitrogen oxide and other related ?T-acceptor molecules-
A number of complexes \¡rere isolated in which EDTA r,'Tas believed to
behave as a pentadentate ligand. Dinitrogen reacted with B producing in
solution a monomeric and dimeric dinitrogen complex. A dimer r,r¡as isolated
and formulated as [(EDTA)RuNrRu(EDTA) ru92.8H20. The monomeric complex
was obtained from the action of hydrazine hydrate upon the nitrosyl
complex [RuH2EDTA(No)Cl] .2H2O, and \iras formulated as IRuEDTA(N2) ] (NH4) 2.5H2O.
Dinitrogen oxide caused rapid oxidation of tRu(II)HEDTA(H2O) I while
carbon monoxide yielded a stable carbonyl complex' [RuHEDTA(C0) ]K.2H20.
A number of complexes \dere prepared in which two sites about the
metal were occupied by substituting ligands and the remaining four by
EDTA. As a result, two glycinate arms of EDTA were coordinated and two
remained free. The presence of these two types was esta.blished by
titration, infrared and t'"-rr*t spectroscopy. A nitrosyl complex
formulated as IRuHTEDTA(N0)Cl] .2H2O was prepared from both species A
and B and was susceptible to nucleophilic attack by hydrazine and
hydroxylamine. In aqueous sofution the nitrosyl complex was believed to
form the pentadentate complex' IRuHEDTA(N0) ] . The reaction of species B
with nitriles yielded IRuHTEDTA(nCn) 11 .nHrO (nCN = MeCl{, PhCN'
Lt2-Ph(CN) 2, 1,3-Ph(CN) 2) wiÈh pyridines, [RuH2EDre(n-py) 2].2H2O
(R = H-, Me-). The reaction of Èhiocyanate with B appeared to yield a
mixture of products. It was found that the free carboxylic groups of
coordinaÈed EDTA also underwent reaction. DiazomeÈhane methylated the
bis(pyridine) complex to yield a product formulated as [RuMe2EDTe(py) 2].2H2O.
With p-toluidine formation of the di-totuidide was partially successful.
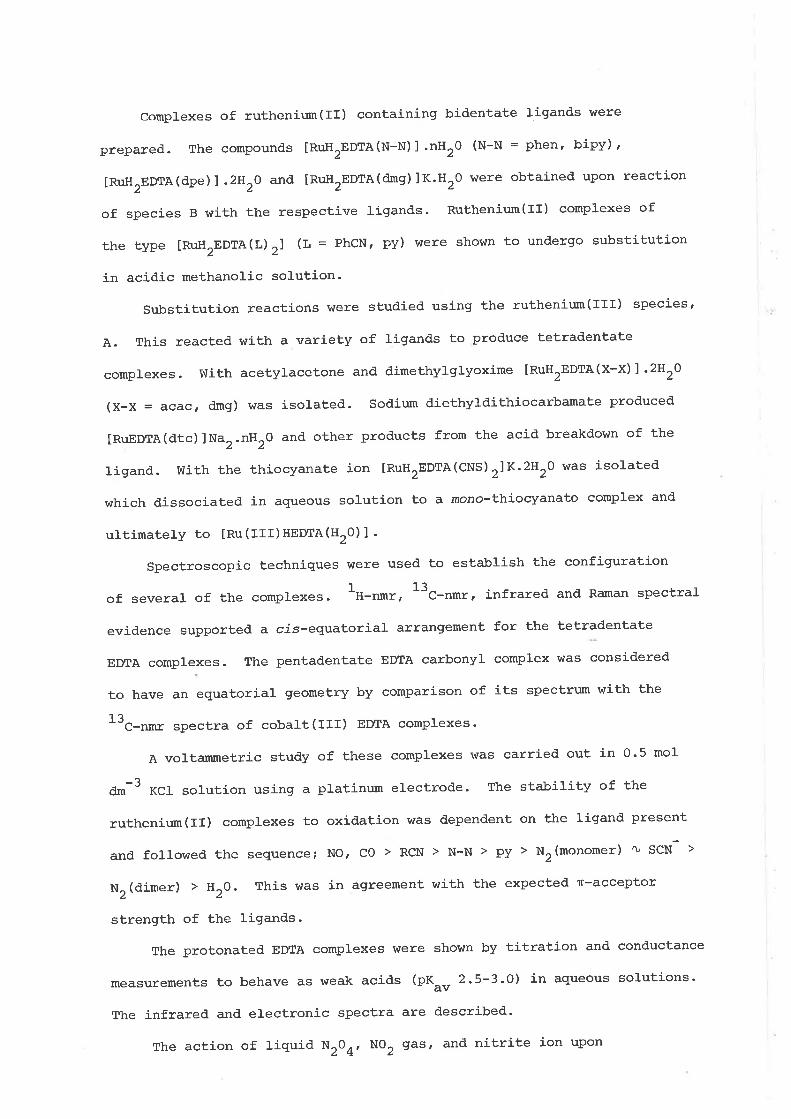
complexes of rutheniun(II) containing bidentate ligands were
prepared. The compounds [RuH2EDTA(w-lt)].nHrO (N-N = phen, bipy),
IRuH2EDTA(dpe) J .2HrO and [RuH2EDTA(dmg) 1K.H2O were obtained upon reaction
of species B with the respective ligands. Ruthenium(If) complexes of
the type IRuHTEDTA(L) 2] (t = PhCN, PY) were shown to undergo substitution
in acidic methanolic solution.
SubstiÈution reactions were studied using the ruthenium(III) species,
A. This reacted with a variety of ligands to produce tetradentate
complexes. With acetylacetone and dimethylglyoxime [RuHTEDTA(X-X)]'2H2O
(x-x = acac, dmg) was isolated. Sodium diethyldithiocarbamate produced
tRuEÐTA(dtc)lNaz.nHro and other products from the acid breakdown of the
ligand. with the thiocyanate ion IRuHTEDTA(CNS)2]K.2H2O was isolated
which dissociated in aqueous solution to a mono-thiocyanato complex and'
ultimately to tRu(IrI)HEDTA(H20) I -
spectroscopic techniques were used to establish the configuration
of several of the complexes. I"-rr*t, tt"-n*t, infrared and Raman spectral
evidence supported. a cis-equatorial arrangement for the tetrad'entate
EDTA complexes. The pentadentate EDTA carbonyl complex was considered
to have an equatorial geometry by comparison of its spectrum with the
13"-rr*t spectra of cobalt(rlr) EDTA complexes'
A voltammetric study of these complexes was carried out in 0'5 mol
¿*-3 rct solution using a platinum electrode. The sta-bility of the
ruthenium(II) complexes to oxidation was dependent on the ligand present
and followed the sequencei NO, CO > RCN > N-N > py > Nr(monomer) tu SCN >
Nr(dimer) , ,2O. This was in agreement with the expected Î-acceptor
strength of the ligands.
The protonated ED)IIA complexes were shown by titration and conductance
measurements to behave as weak acids (n*"rr 2.5-3.0) in agueous solutions'
The infrared and electronic spectra are described'
The action of liquid N204, NO2 gas, and nitrite ion upon

hexaanunineruthenium(III) trichloride was investigated. No reaction
occurred in liquid NZO¿. Using NO2 gas or nitrite ion in alkaline
conditions resulted in production of the nitrosyl species, [Ru(NH3)5NO]3+.
La-belling experiments indicated that the nitrogen of the NO groups
originated from NO2 gas or nitrite ion. The reaction with nitrite was
posÈulated to involve direct attack upon tRu(NHr)5NH2l2+ with the
Iiberation of hydroxylamine, and also substitution onto tRu(NH3)5H2Ol3+.
Spectroscopic evidence indicated the direct interaction of NO, 9as with
Èhe hexaammine complex in acidic solution.
The thermolysis of [Ru(NHr)5No3] (No3)2 was monitored by infrared
spectroscopy and found to yield [Ru(NH3)5NO] (NO3), which further converted
thermally to [Ru(NHr)4NO(NO3)] (NO3)2. The reaction of hydroxylamine with
cis-[Ru(NH3)4NO(Br)]Br, yietded, on spectral evidence, a mixture con-
taining [Ru(NHr) 4N2O(H2O) lBr, and [Ru(NHr)4N2(H20) lBtZ.
Substitution by dinitrogen oxide on [RuHr(PPh3)4] and [FeHCI(dpe)rl
was carried out in non-aqueous solvents. The former initially yielded
lRuHr(N2) (pph3)31 in solution, followed by decomposition to ruthenium
dioxide and triphenylphosphine oxide. Vüith the latÈer, a mixture of the
dinitrogen complex, [FeH(N2) (dpe) 2]BPh4, and oxidation products was
obtained. The reaction of inydtazine hydrate with [RuC13(PPh3)2NO]
produced a mixture of triphenylphosphine, [Ru(NHr)5N2]c12 and a red
complex formulated as [Ru(NHr)4PPh3C1]cI-

STATEMENT
This thesis contains no material which has been accepted for Èhe
award of any other degree or diploma in any University, and to the best
of my knowledge and belief, contains no material previously pr:blished
or written by another person, except where due reference is made in the
text of the thesis.
J.V. DUBRAVüSKI

ACKNOV{LEDGEMENTS
MysinceresÈthanksareextendedtothosewhohavehelpedme
throughout this work. To my supervisot, Dt' A'A' Diamantis' for his
guidance, s)¡mpathy and hours of helpful conversation. To Dr' N' cheetham
and Messrs. A.P. surunerton and K. Johnson of the InstiÈute of Technology
for the use of their facilities and for their kind help with micro-
analytical work. My thanks are due to Dr' C' Fong' Dr' S'F' Lincoln'
[,tr. E. Vüilliams, and Mr. L. Paltridge for their assistance in recording
taa-rr*, spectra. r an also gratefur to prof. D.o. Jordan for making
available to me the facilities of this department' The assistance and
friendshipofmyfellowresearchworkersovertheyearshasbeen
appreciated immensely. I am aLso heavily indebted to my parents for
their patient help during these years. A Commonwealth Postgraduate Award
is gratefullY acknowledged'
Finally,mythanksareduetoMissM.Rumsewicz,MissP.Ramosand
Mrs. D. Hewish for the typing of this manuscript'

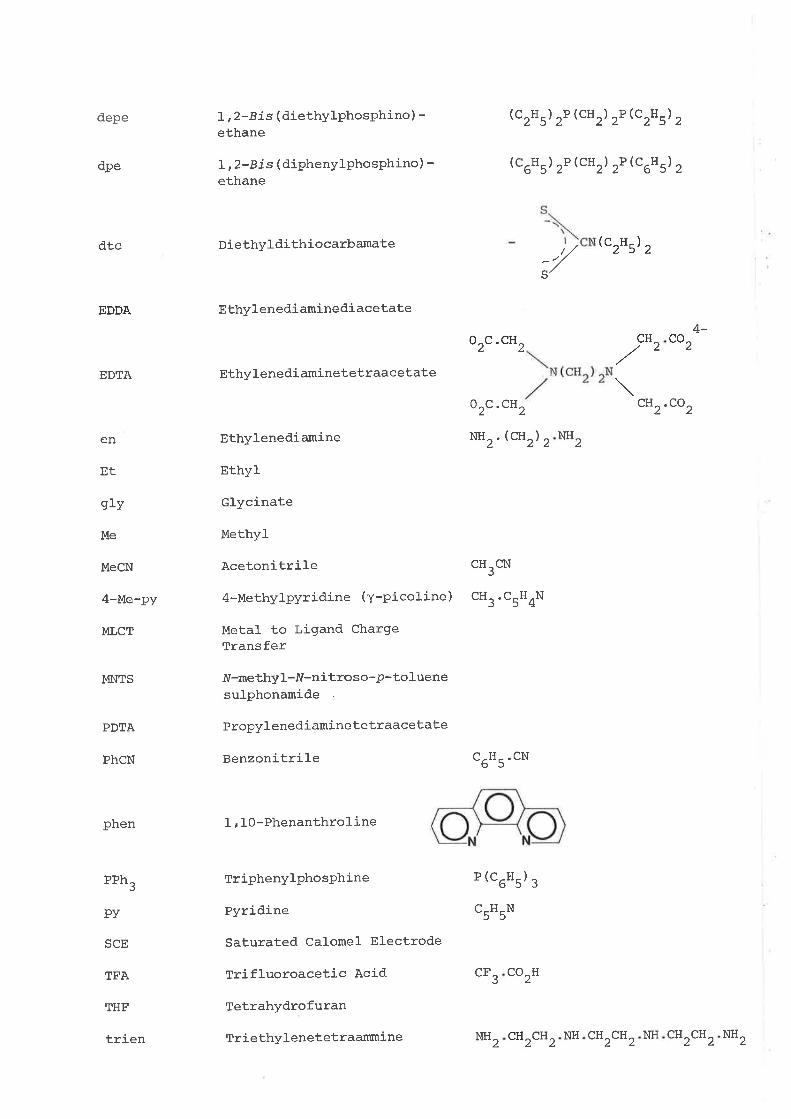
ABBREVIATIONS AND NO¡4ENCLATURE
The abbreviations lísted below have been used throughout the text
of this thesis.
In naming the EDTA complexes the following system of nomenclature
was followed. The name of the EDTA portion of the molecule was written
first, followed by the names of the other coordinated ligands present.
A negative ligand preceded a neutral ligand and was designated by an
o-ending. Except for carbon monoxide and nitric oxide the name of a neutral
ligand remained unchanged. The ruthenium ammine, ruthenium and iron phos-
phíne complexes \¡rere named according to literature sources.
CH CH33
cI
0
cI
0
A
Ar
BH
Absorbance
AceÈylacetonate
Aromatic moietY
iV-Benzoylhydrazine
2,2'-Bipyridine
n-Butyl
Crystal Field StabilizationEnergy
Charge Transfer
Dropping Mercury Electrode
o-Phenylenebi s ( dimethylars ine )
Dimethylformamide
II
acac
n-Bu
CFSE
DME
das
DMF
NH2NH.CO. C6H5
bipv
CT
As (CHr) ,
AS (CH3 2
llllNN
dmg Dimethylglyoximate
CH:
HO o
""3
depe
dpe
dtc
EDDA
EDTA
en
Et
grv
Me
MeCN
4-Me-py
MLCT
MNTS
PDTA
PhCN
phen
PPh3
pv
SCE
TFA
THF
trien
I, 2-B i s ( diethylphosphino ) -ethane
L, 2-B i s ( diphenylphosphino) -ethane
Diethyldithiocarbamate
EthylenediaminediacetaÈe
Ethylenedi aminetetraacetate
Ethylenediamine
Ethyl
Glycinate
Methyl
Acetonitrile
4-Methylpyridine (Y-Pico1ine)
Metal to Ligand ChargeTransfer
fV-methyl -IV-n it ro s o -p- to luenesulphonamide
Propylenediamine tetraacetate
Benzonitrile
(c2Hs)
(c6Hs) 2P(cH2) 2P(c6ldl 2
;/
(c2*l 2
co
zP(c[r) 2P(c2El 2
4-0 c.cH
2CH
2
o2c.cH2
NH2. (CH2) 2
cH3cN
cH3.c5H4N
c-H-.cNb5
2 2
P (CoHs) :
cH2.co2
NHz
I , 10-Phenanthroline
Triphenylphosphine
Pyridine
Saturated Calome1 Electrode
Trifluoroacetic Acid
Tetrahydrofuran
Trie thylenetetraammine
C-H.N55
coCF3 2H
CH2
NH2
CH2
CH NH cHzCH2
NH2
CH2
NH2
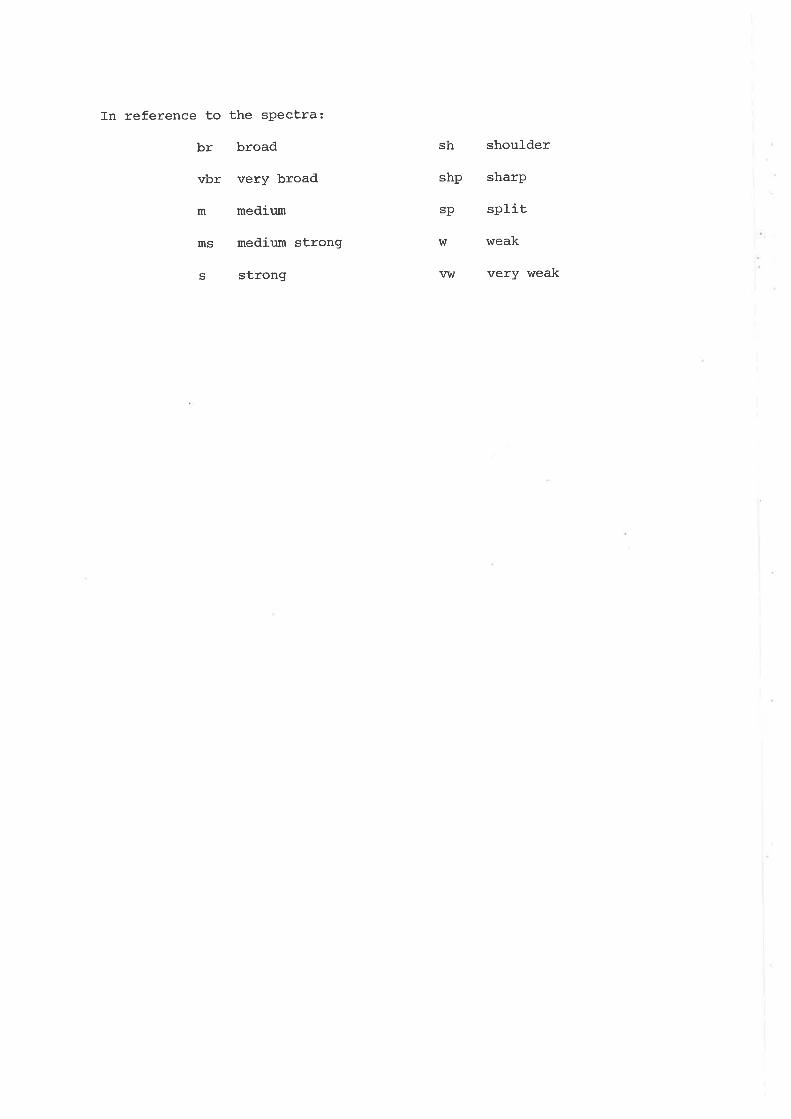
In reference to the sPectra:
br broad
vbr verY broad
m medium
ms medium strong
s strong
sh shoulder
shp sharp
split
weak
w very weak
sp
l^t
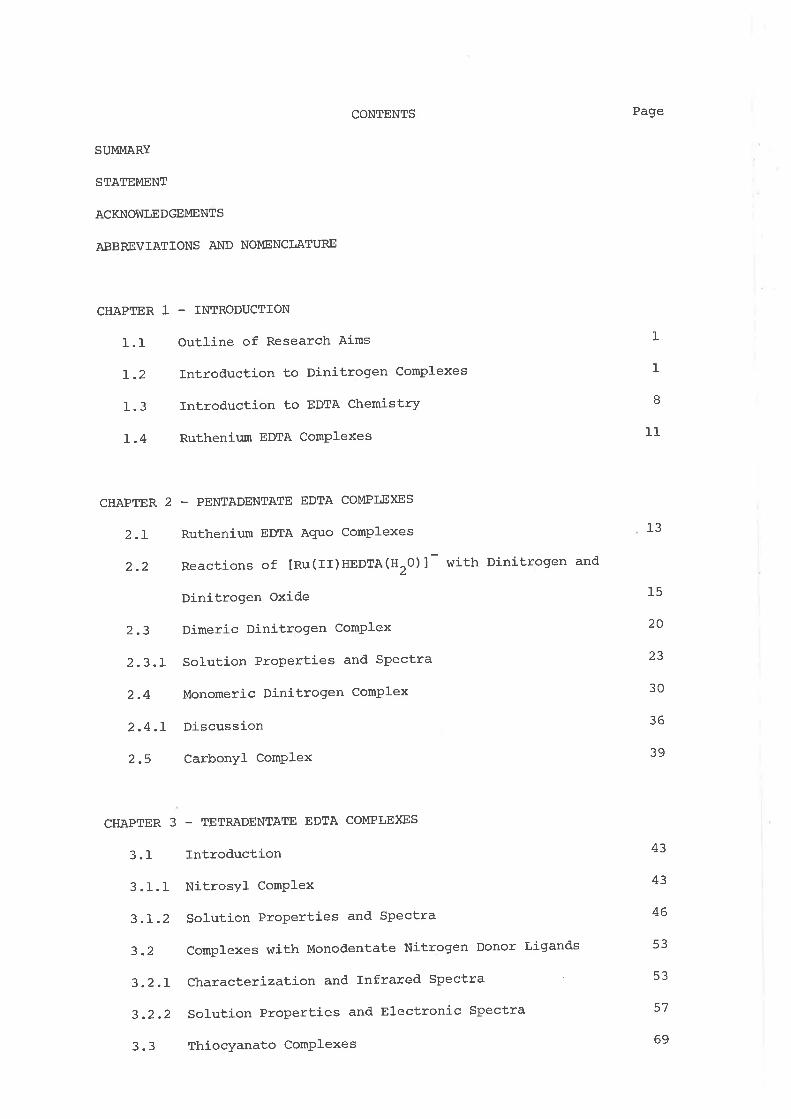
CONTENTS
SUMMARY
STATEMENT
ACKNOVÍLEDGEMENTS
ABBREVIATIONS AND NOMENCLATURE
CHAPTER 1 - INTRODUCTION
1.I outline of Research Aims
I.2 Introduction to Dinitrogen Complexes
1.3 Introductíon to EDTA Chemistry
I.4 Ruthenium EDTA Comp1exes
CHAPTER 2 - PENTADENTATE EDTA COMPLEXES
2.L Ruthenium EDTA Aquo ComPlexes
2.2 Reactions of lRu(rr)HEDTA(H2o)l wiÈh Dinitrogen and
Page
13
15
20
23
30
36
39
43
46
53
53
57
I
I
I
11
2.3
2.3.L
2.4
2.4.L
2.5
Dinitrogen Oxide
Dimeric Dinitrogen ComPIex
Solution ProPerties and Spectra
Monomeric Dinitrogen ComPlex
Discussion
Carbonyl ComPlex
CHAPTER 3 - TETRADENTATE EDTA COMPLE)(ES
3.1 Introduction
3 . I.1 NitrosY1 ComPIex
3.L.2 Solution Properties and Spectra
3.2ComplexeswithMonodentateNitrogenDonorLigands
3.2.I Characterization and Infrared Spectra
3.2.2 Solution Properties and Electronic Spectra
3.3 ThiocYanato ComPlexes
43
69

CHAPTER 3
3 .3.1
3.3.2
3.3.3
3.3.4
3.4
3.4.I
3.4.2
3.4.2
3.4.3
3.4.4
3.5
3.6
3.6.1
3.6.2
( contd. )
Ruthenium(III) Thiocyanato Complexes
Spectra and Bonding
Reaction of SCN with [Ru(II)HEDTA(H2O)]
Reactions Involving Cyanide lon
EDTA Complexes Containing Bidentate Ligands
Complexes with 1,lO-Phenanthroline and 2,2r-Bipyridine
(I) Complexes with Acetylacetone and Dimethytglyoxime
(ff¡ Solution Properties and Electronic Spectra
A Complex with 1,2-Bis(diphenylphosphino) ethane
Reactions with Ðithiocarbamate Ïon
Sr¡bstitution Reactions
Reactions of the Uncoordinated Carboxylic Acid Group
Esterification Reactions
Amide Formation
Page
69
73
75
79
79
84
86
92
95
99
IO2
ro2
r04
CHAPTER 4 - NMR AND STEREOCHEMISTRY
4.r
4.2
4.3
4.4
4.4.r
4.4.2
4.4.3
4.4.4
4.4.5
4.4.6
I-H-runr Spectra of Hexa- and Pentadentate EDTA Complexes IO7
l3"-rrrnt spectra ro9
Tetradentate Complexes 110
Results 111
Carbonyl and Nitrosyl Complexes 1I1
Nitrile Complexes II4
Pyridine Complexes 116
Aromatic a-Diinine Complexes IJ-7
Other Complexes 119
Conclusions 119
CHAPTER 5 - EI,ECTROCHEMISTRY
5.1 Introduction to Voltammetry
5.2 Introduction to EDTA Complexes
L25
l-28

CHAPTER 5
5.3
5.3.1
5.3.2
5.3.3
5 .3.4
5.3.5
5.3.6
5.3.7
5.4
( contd. )
Results
Carbonyl and NitrosYl ComPlexes
Nitrile Complexes
Aromatic cr-Diimine ComPlexes
Pyridine Complexes
Thiocyanato Complexes
Dinitrogen and Azido ComPlexes
Acetylacetonato, Dimethylglyoximato and Diethyldi-
thiocarbamato Complexes
Discussion
Page
L29
130
r30
131
L32
133
135
CHAPTER 6 - COMMENTS ON THE CHARACTERISTICS OF RUTHEN]UM EDTA COMPLE)(ES
6.1 Introduction I43
6.2 Infrared Spectra 143
6.3 Electronic SPectra 1-49
6.4 Comments on the Occurrence of Tetradentate and Penta-
dentate Complexes 154
6.5 Physico-Chemica1 Sotution Properties 157
I37
L37
161
16r
L69
CHAPTER 7 - REACTIONS OF RUTHENIUM AMMINE COMPLEXES
7.L Introduction
7.2 Reactions of Nitrogen Dioxide and Nitrite lon wíth
lRu(NHr) ul ct,
7.3 Thermolysis of Nitrato Pentaammine Ruthenium(III)
Nitrate
7.4 Reaction of Hydroxylamine with cis- [Ru(NHr)rNO(Br) 1Br, L72
CHAPTER 8 - STTBSTITUTION BY DINITROGEN OXIDE IN NON-AQI'EOUS
SOLVENTS; REACTION OF HYDRAZINE VüITH A NITROSYL COMPLEX
8.1 Introduction ]-74
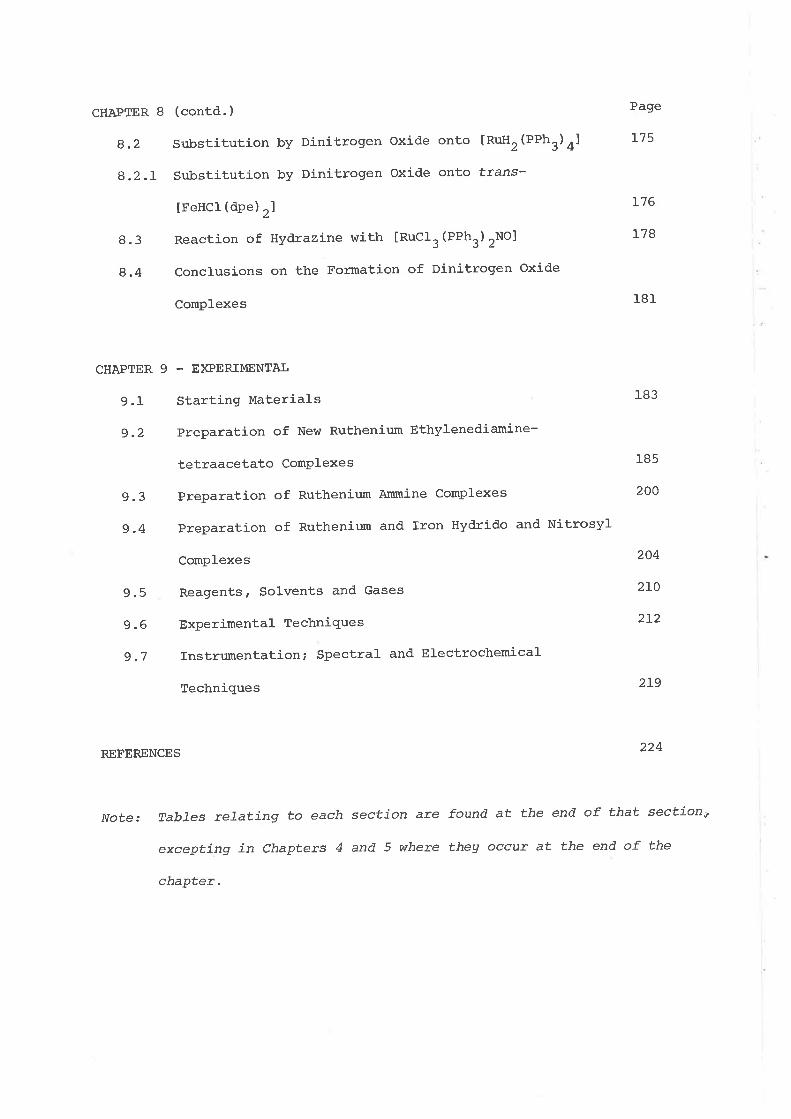
CHAPTER 8
8.2
8.2.I
8.3
8.4
(contd. )
Substitution by Dinitrogen oxide onto [RuH, (PPh3) 4]
Substitution by Dinitrogen Oxide onto trans-
IFeHCI (dpe) r1
Reaction of Hydrazine with [Ruc13 (PPh3) 2No]
Conclusions on the Formation of Dinitrogen Oxíde
Complexes
Page
L75
r76
L78
181
183
185
200
204
2ro
2t2
2L9
224
CHAPTER 9 - E)EERIMENTAL
9.I Starting Materials
9.2 Preparation of New Ruthenium Ethylenediamine-
tetraacetato ComPlexes
9.3 Preparation of Ruthenium Ammine Complexes
g.4 Preparation of Ruthenir¡rn and Iron Hydrido and Nitrosyl
ComPlexes
9.5 Reagents, Solvents and Gases
9.6 ExPerimental Techniques
g.TInstru¡nentaÈion;SpectralandElectrochemical
Techniques
REFERENCES
JVote.' Tables reTating to each section are found at the end of that section,
excepting in Chapters 4 and 5 where theg occur at the end of the
chapter.

t.
CHAPTER 1
]NTRODUCTION
l.L Outl-ine of Research Aims
The principal aim of this work has been the synthesis and study of
complexes containing dinitrogen, dinitrogen oxide and related nitrogen
Iigands. Ruthenium EDTA chemistry was chosen as a suitable area of
study for several reasons. FirstÌy, EDTA forms a complex with
ruthenium in which one coordination site is occupied by a water molecule
and the remaining five positions by the nitrogen and oxygen donor atoms
of the chefate ligand. This is similar to the estabtished ammine
systems , [Ru (NH3) 5H2o]
2+, cis- [Ru (NH3) 4 tn2o) 212+
.r,d cis- [Ru (en) z
(H2o) 2]2+ ,
and was considered a suitable environment in which substitution by
T-acceptor ligands could occur. Secondly, the chemistry of ruthenium(II)
EDTA, prior to this work, \^Ias almost wholty unexplored. The intrinsic
reactivity of the ruthenium EDTA aquo species lead to investigations of
coordination by other n-acceptor ligands not containing nitrogen donor
atoms.
The purpose of the work described in chapters 7 and I was the
synthesis of dinitrogen oxide complexes. Alternate rr¡utes to known
complexes were aimed for using reactions upon the ammine ligand of
ruthenium ammine complexes, and nucleophilic attack upon a nitrosyl
complex. Ne\^r complexes r^rere sought via substitution by dinitrogen oxide
in non-aqueous media, using species known to substitute dinitrogen.
L.2 Inttoduction to Dinitrogen Complexes
The transition metals iron and molybdenum have been considered for
some time to be closely related with the active cenLre of the enz)rme
nitrogenase in binding and metabotising elemental dinitrogen.lr2r3
The isolation4'5 of the first stable dinitrogen complex, [Ru(NH?)5N zlxz(X=Cl , Bt , I ) lent considerabte impetus to the search for inorganic

2.
models that could mimic the behaviour of this enzl'me. since then' the
field has expanded enormously and many excellent reviews6-19 hart"
appeared describing such complexes. These may conveniently be divided
into three classes.
The first includes dinitrogen complexes of ruthenium and osmium in
the oxidation staÈe of +2. These are diamagnetic, since the metals bear
d̂" configurations, and contain Õ-d.onor ligands such as ammonia and water
Their solution chemistry is confined to aqueous conditions.
Examples include tM(NH3)SNzlxz (M : Ru 5, o" 20¡ x: CI , Br , BFn ),
cis- [Ru(en)rN, (Hro) ] (BPh4), u', cis- [Ru(en) rxr(N2) ]PF6 22, and
t (H2o) ,RuNrRu
(HrO )sl (er 234 2
The second class encompasses dinitrogen complexes in which n-acceptor
ligands, usually phosphines, are coordinated to the transition meta1.
Here the electronic configuration of the metal centre is commonly found
to be d6, although some paramagnetic complexes with d5 ot d9 centres have
been reported..19t26t28 The complexes of this class have been isolated
from, and studied in non-aqueous media. Most transition metal dinitrogen
complexes are in this group, including tMH2(N2) (PR3)31 (M = Fe, Rui
R = Etphr, n-Bu. ¡24'25, [co(N2) (pph3) r\'u, [coH(N2) (PPh3) 3] 27
,
trans- [Recl(Nr) (dee) rJ 28 , t (c6H6) cr (co) rNrJ
29 and trans- tM(N2), (dne) rJ
(M = Mo 30, ¡¡ 31¡. chatt has shown32 th-t protonation33 and reaction with
alkyl halides34 occurs for trans- tM(Nz), (dne) rJ , whilst cjs- tW(N2), (PMerPh)
nJ
reduces to ammonia in protic medium with a mild reducing agent.35
Finally, Èhere are dinitrogen complexes produced in situ, as
intermediates in the reduction of dinitrogen to ammonia and other nitrogen
products.36 Researchers such as van Tamelenl4, v'orpin and shur37 ha.t"
studied. the reducÈion of transition metal compounds (mainly titanium) in
aprotic media, under dinitrogen in the presence of strong reducing agents.
Shilov3S has studied similar reductions in protic media using vanadium(II)
while Schrauzer39 h." researched systems containing motybdenum complexes.

3.
The work to be described in succeeding chapters will deat mainly
with the aqueous chemistry of ruthenium EDTA and ammine complexes. For
this reason, further discussion of the dinitrogen complexes wilf be
confined. largely to those of the first class.
The species tRu(NHr)5H2ol'* tir-J- form readily [Ru(NHr)rxr]2+ Uv
the substitution of the aquo ligand by dinitrogen.40 The aquo complex
will also coordinate dinitrogen oxide4lr42 forming tRu(NHr)5N2ol2+, catbon
monoxid.e43 and hydrogen cyanide44, all of which are substrates of
nitrogenase. More recently, coordination by hydrogen sulphide has been
reported.4s Azide also has been shown46 to react readily with the aquo
site forming unstable azido complexes. Similar1y, the diaquo ion2+ 2+
cis- [Ru (NH3) 4 ß2o) 2]'
' forms cis- [Ru (NH3) 4H2o
(L) ] - (L=N, , N2o) with
dinitrogen4T and. dinitrogen oxide46, while tRu(Hro)ul2* sirr.s both
lnu(Hro)r*rl'* and the aquo dimer mentioned, earlier.23
In addition to d.irect substitution by dinitrogen, other method.s of
synthesis have been developed. For example, subsÈitution by certain
nitrogen donor Iigands leads to intermediates which subsequently decompose
to the dínitrogen complex. Thus, dinitrogen oxide reacts with2+
[Ru (NH3) 5H2o
lRu (NHa) UNrl
2+
in the presence of a reducing agent to yield
48 r 49 similarly , azi-d.e will react with [Ru(NH3) 5H2o] 3+
to yietd the same product. l6 In acid solution the rate of decomposítion
of the azido complex increases and dimeric complexes are formed in addition
to the monomeric dinitrogen species. The mechanism is believed to proceed
vj a ruthenium nitrene intermediaÈes. 50 I 5 1
Nucleophilic aÈtack upon a coordinated nitrosyl group sometimes affords
the dinitrogen complex. V,lhen hydrazine hydrate reacts with tnu(utta)sNOl 3+
.L
at foom temperature, tRu(NHr)5*rl'- forms exclusiveLy.52 At low temperature,
a mixture of this and lRu (NHr) UN,
is produced, while use of hydroxYl-
amine at room temperature yields only the 1atter.52 In aqueous sodium
-2+ol
_2+sNz Ihydroxide, the nitrosyl complex produces IRu(NHr) and other products.53
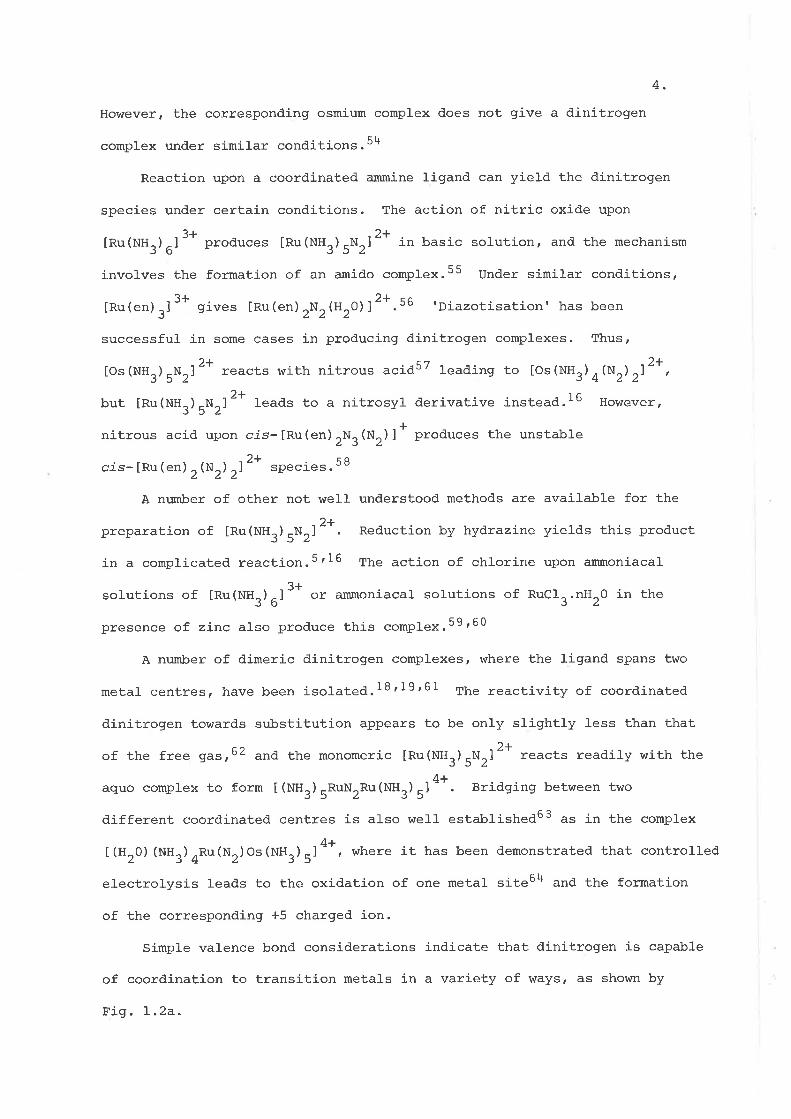
4.
However, the corresponding osmium complex does not give a d.initrogen
complex under similar conditions.54
Reaction upon a coordinated ammine ligand can yield the dinitrogen
species under certain conditions. The action of nitric oxide upon
. _3+tRu(NH3)6J produces [Ru(NHr)U*r]'* in basic solution, and the mechanism
invofves the formation of an amido complex.55 Under similar conditions,
lRu(en)al3+ 9i.r.s IRu(en)rNr(H20)]2+.so'Diazotisation' has been
successful in some cases in producing dinitrogen complexes. Thust
tos(NHr)u*rl'* reacts with nitrous acid57 leading to tos(NH3)4(N2) ,l'*,but [Ru(NH3) sNzl
2+ I".d" to a nitrosyl derivative instead.I6 However,
+nitrous acid upon cis-[Ru(en)rur(N2)]' produces the unstable
cis- [Ru(en), (N2) 2]
2+ "p."i"".
58
A nr¡nlcer of other not wel-1 understood methods are available for the
preparation of tRu(NHr)5N212*. Reduction by hydrazine yields this product
in a complicated reaction.5rl6 The action of chlorine upon ammoniacal
solutions of tRu(NHr)Ul3* or ammoniacal sofutions of RuClr.nHrO in the
presence of zinc also produce this complex.59'60
A number of dimeric dinitrogen complexes, where the ligand spans two
metal- centres, have been isolated.lS'19'61 The reactivity of coordinated
dinitrogen towards substitution appears to be only slightly less than thataL
of the free gas,62 and the monomeric tRu(NHr)5*21'- reacts readily with the¿"+
aquo complex to form [(NHr)UnuurRu(NHr)5] ''. Bridging beÈween two
different coordinated centres is al-so wel,1 establishedo3 as in the complex
L+t(H20) (NHr)nRu(Ur)Os(NH3)51 , where it has been demonstrated that controlled
electrolysis leads to the oxidation of one metal site64 and the formation
of the corresponding +5 charged ion.
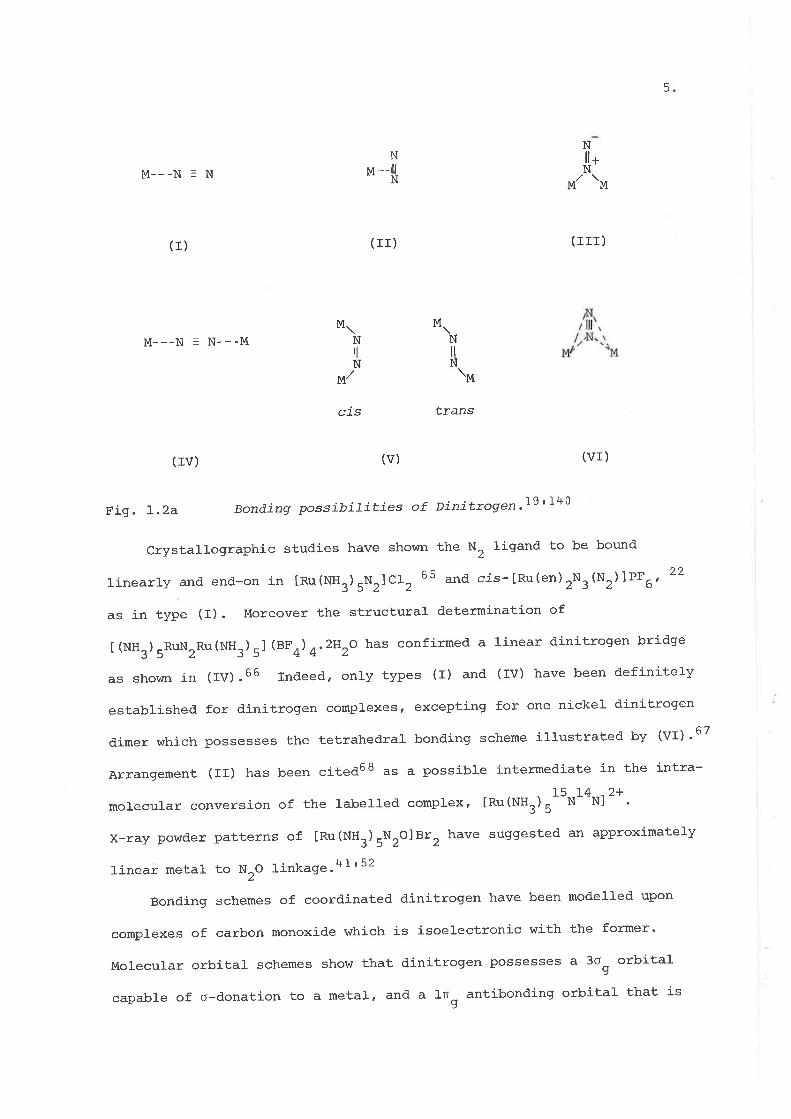
Simple valence bond considerations indícate that dinítrogen is capable
of coordination to transition metal-s in a variety of ways, as shown by
Fig. I.2a"
5
N
M --{
Nll+N
MM---N = N
(r)
M---N = N---M
(TV)
M
(rr)
ttans
(IIT)
(VI)
M
NIN
Ma.
NilN
M,/
cis
\M
(v)
Fig. L.2a Bonding possibilities of Dinittoge"'ì'9'140
crystallographic studies have shown the N, ligand to be bound
Iinearty and end-on in [Ru(NHr)SNz]clz 65 and cis-[Ru(en)rNr(N2)]PF6,22
as in type (I). Moreover the strucÈural determination of
t (NH3) URuNrRu(NH3) 5l (BF4)
4 .2H2O has confirmed a linear dinitrogen bridge
as shown in (rv).66 rndeed, only types (r) and (rv) have been definitely
established fpr dinitrogen complexes' excepting for one nickel dinitrogen
d.imer which possesses the tetrahedral bonding scheme illustrated by (vI) '67
Arrangement (II) has been cited6S as a possible intermediate in the intra-
morecular conversion of the rabetled complex, [Ru{uur)r15t't14*] 2*.
x-ray powder patterns of lnu(NHr)sNzO]Br, have suggested an approximately
linear metal to Nro linkage.4Ir52
Bonding schemes of coordinated dinitrogen have been modelled upon
complexes of carbon monoxide which is isoelectronic with the former'
Molecular orbital schemes show that dinitrogen possesses a 3on orbital
capable of o-donation to a metal, and a lnn antibonding orbital that is

6.
unoccupied and availabl-e for n back-bonding from metal to ligand. The
scheme for carbon monoxide is simitar. However, differences arise in the
relative energies of these orbitals.69 The bonding 3on orbitat of N, is
of very low energy (-fS.6 eV) while the Inn lies at about 8.6 eV above the
3o , and ís too high for many metals. This accounts for the lower reactivitys
of clinitrogen.
Carbon monoxide, however, has a more favourable separation of its
highest occupied o and lowest unoccupied r* orbital (-14.0 and -6 eV
respectively), and since most transition metal complexes possess d-orbital
energies more compatible with Èhose of carbon monoxide, these complexes
are more stable. Further, for CO, the o donor orbital is weakly anti-
bonding whereas for N, it is of bonding character. As a result, for CO
complexes, weakening of the CO bond is due entirely to back-donation from
metal dn orbitals, with o-donation slightly offsetting this. However, fot
N, complexes, dinitrogen bond weakening resufts from both o-donation and
r-acceptance. In general, carbon monoxide is both a better o-donor and
ï-acceptor ligand43t70t 7I th.n dinitrogen. Further, carbon monoxide
possesses a dipole-moment white dinitrogen is homonuclear and calcul-ations
indicateT2 a greater overlap of the carbon 2n orbitat with the metal, since
it shows more carbon than oxygen character, while the lnn orbital of
dinitrogen is slzmmetrically disposed between two nitrogen atoms.
Although emphasis has been placed on the bonding of dinitrogen, the
principle of o-donation and n-acceptance can be used to describe the bonding
in many ruÈhenium(II) complexes containing fi-acceptor ligands. This
approach has been used in ammine systems of the type [Ru(NHr) SL]XZ
(L=py,73 phcN,z+ no-cn 75).
Monomeric dinitrogen complexes of ruthenium and osmium are characterized
by strong infrared absorptions in the vicinity of 2OOO-22OO .t-1 Utr. to the
stretching mode, v(Nr) of the coordinated N, tígand. However, complexes
of the second class, described earlier, can exhibit v(NZ) values as 1ow as

7.
Ig75 cm-l.19 rn symmetrical dinitrogen dimers u(NZ) is usually weak but
appears strongty in Raman spectra-76t77
ftre v (NZ) stretching frequency is known to decrease from its value
as a free gas, upon coordination to a metal. This impties a concomitant
increase in strength of the M-N2 bond since the lowering in bond-order
of N, is due to back-donation of metal dn electron density into the
n-antibonding orbitals of dinitrogen, whilst o-donation from N, into empty
d orbitals of the metal sÈrengthens this bond. Evidence for back-bonding
comes from the infrared spectra of ammíne dinitrogen complexes,
IRu(NHr)SNZIXZ (X=C1 , Bt , BF , PF6 ) where it is found that v(N2)
decreases with decrease in anion radius, as polarisation by the counterion
causes electron release into the dinitrogen 1igand.7B The metal-nitrogen
stretching frequencyr V(M-N2)' is also affected.l5 Further, Èhe bands of
the coordinated anunine resemble those of a ruthenium(TlI), rather than
ruthenium(II), complex. 5
The infrared spectra of dinitrogen oxide complexes [Ru(NHr)4L(N2O)]X2
(L=NH ,H ,O;X=Br,IrBE4-. PF6 ) possess an additional stretching
3
Iigand frequency since the NrO molecule has three fundamental vibrations'
-lThe asymmetric, v, band appears above 22OO cm the pseudos)zmmetric t
-Iv, above 1150 cm while v is generally not observed. Both the position2
and intensity of v, and v, depend upon the anion present. The intensity
of v, decreases in the order nt6 t "t4
t r- > Br and often is very
weak in the bromide salt, Simílarly, the positions of v, and v, shift
to higher wave numbers as the size of the counter anion increases'41
In principle, coordination via the oxygen or nitrogen end of Nro is
possible. Calculations performed. by Diamantis et af79 on the force-
constants for RuNNO and RuONN l-inear systems based on the vibrational
frequencies of th" 15Ul¡O and NI5NO labefled complexes, have suggested
that bonding occurs through the oxygen. However, Bottomleys2 and
Taube6S h.rr" both favoured nitrogen linkage' partly on mechanistic

8
grounds, and the fact that an oxygen bonded isomer would be expected to
be bent.
1.i Introduction to EDTA Chemisttg
Ethylenediaminetetraacetic acid (H4EDTA) and its salts
(Ivl2(I)HrEDTA.nHrO; M=Na, K) are known for their ability to bind strongly
many transition metals, and are used widely in analytical chemistry.S0
The ligand possesses six donor atoms consisting of four carboxylate oxygens
and two secondary amine nitrogens, and many complexes contain the Iigand in
the hexadentate* form. They can be formulated as ¡¡4(II)EDTAI2-
(M:Co, zrt, cd, Pb. etc.¡.BIr82 The complexes [FeEDTA(H2o)]- 83 and
IMnEDTA(H2O)]- 84, have been shown to be seven-coordinate in which EDTA
is fulty coordinated and the seventh position is occupied by an aquo ligand.
However, it is also common for EDTA to behave as a pentadentate ligand
in which one glycinate arm remains free, as illustrated. by lco(]II)HEDTA(x)lMAI
(M=Na+, K*; X=CI , Br , No2 ) .82t85 Th" complexes can be isotated with Èhe
free arm either protonated (HEDTA) or unprotonated (EDTA) . Lanthanl¿."86 I 87
form many EDTA complexes where EDTA is either pentadentate or hexad'entate.
In all of these the coordination number can be expected to exceed six, as in
lI,a (1rr) HEDTA (H2O) 4l . 3H2O.
Less conmon are complexes containing tetradentate EDTA in which two of
the glycinate arms remain uncoordinated. Thus ruthenium88 and
rhodium89' 90 favouring octahed,ral coordination, form [M(rII)H2EDTA(C1),JK.nHro
(M=Ru, Rh) in addition to the corresponding pentadentate EDTA complexes of
the type, [M(III)HEDTA(CI)]K.nH2O. Platinum and palladium, not surprisingly,
form tetradentate complexes, [M(II)H2EDTA].3H2O (M=Pt, Pd), since they have
a strong preference for the square planar configuration.9l Simitarly,
.oppet92 forms the tetradentate, [Cu(II)H2EDTA].H2O' although a hexadentate
*The prefixes sexa-, quinqui- and quadrj- are also used to denotesix, five and four coordination respectively.

9
complex is known as weII, and formulated as [cu(II)EDTA]K2.4H2O.
FinaIIy, both platinun and patladium form square planar complexes of
the type ¡M(Ir)H4EDTA(C1) rl.SurO in which EDTA is forced to be bidentate
and aII four carboxylic acid groups remain free.91 Coordination is only
via the ethylenediamine portion of the ligand" More unusual complexes
include examples such as NanlorMo(EDTA)Moorl.8H20 containing a bridging
EDTA unit.93 Dimerization and bridging through an oxygen is believed94'95'96
to occur with [Fe(III)EDTA(H2O)] resulting in the formation of the
dinuclear species tFe(EDTA) lr}n-. Dimerization also occurs in uranium(IV)
EDTA complexes"9T
Extensive kinetic and equilibrium studies have been carried out on
EDTA complexes. Measurements of stability constants are due largely to
Schwarzenbach.9S'99'100 The properties of EDTA complexes have been
investigated using the cobalt(III) complexes, and kinetic htork has led to an
understanding of the interrelation between the various species existing in
solution, and conditions in which they form. It has been shownl0l ¡¡"¡
lco(EDTA)H2Ol exists in equilibrium with the hydroxo form in amounts that
are pH dependent, and can be described by the scheme:
^ pH<8 PH<3
lcoEDTA(OU) ì z---= - [coEDTA(ttro) r
- --ì IGoHEDTA(H2o) ]
pH>8 PH>3
Complexes of the form ICoEDTA(X) ]t-1, where n is the charge on the
Iigand, x, are weak bases and in solutions of sufficiently 1ow pH, the free
carboxylate group is protonated. These complexes ICoHEDTA(x)]n- are
unstabfe in solution, and X is readily sr:bstituted. The proLonated forms
possess pK. values that are normally independent of the nature of X. The
rates of formation of the hexadentate cobalt(III) complex, [Co(EDTA)] ,
from the pentadentate have been studiedl0ItLQ2rl03 ot"t a wide pH range
type mechanisms have been proposed. Thus, ring closureand both S-- and S--:-- -Nl Nz
of ICoHEDTA(H20) ] and ICoEDTA(OH)12- are thought to proceed via an S*,
mechanism, but the unbound carboxytate in [coEDTA(H20) ] is believed to

10.
d,isplace the aquo ligand in an s^, - type reaction. The kinetics oftn2
formation of other inert transition metal EDTA complexes has also been
studied.l04rl05
The reverse situation, namety aquation of hexadentate EDTA complexes,
has been found to be enhanced by acidic conditions.106 Similarly,
metar-exchange rates between, for example, tco(EDTA)12- and cu2*'
)- )L
tpb(EDTA)lz- and Zn"-, have been observed to be acid catalyzed, suggesÈing
Èhat protonation yields a more labile complex.106'107rI08 The electron-
exchange rates have been reportedl09 fot a number of EDTA species,
including those of iron (II)/(rII) and cobalt lJt)/ (III), the fatter being
quite slow in keeping with the behaviour of most classical cobalt complexes.
The diversity in coordination that EDTA exhibits has ted to considerable
study into the sÈructule of its complexes. Coordination by EDTA leads to
optical isomers, and the first resolution was achieved by Bailar and
Buschlt0 using tco(EDTA)l Attempts to resolve [Cu(EDTA)]2- t"t.
unsuccessful , although the aslrmmetry of the complex \^las demonstrated.92
Optical activity of the rhod.ium complexes has also been reported.90rlIl
The rotatory dispersion (RD) and circutar dichroic (CD) spectra of
[Co(EDTA)] have been measured, and comparisons made with the CD spectra
of other complexes containing EDTA-type ligands.lI2-115 The absolute
configuration of Â(-)S46 tCo(EDTA)l has been esta-blished.1I2 X-ray
crystallography has confirmedll6 a futly coordinated EDTA ligand in
[Co(EDTA)] and the seven-coordinate comple*."83 mentioned earlier. The
structure of pentadentate complexes has been estabtished by infraredSs,
fH .nd t3"-rr*r spectroscopyllTr llB and X-ray structure determinations. l19
A discussion of the stereochemistry of these complexes, and the tetradentate
species, is reserved until Chapter 4. Infrared spectroscopy and titration
techniques have established the bidentate nature of EDTA in the complexes of
platinum and pal1adium.9rtr20 This has been confirmed crystallographically.I2r
Raman spectral2ltI22r123 ¡.o.. been reported for several EDTA complexes, but

11.
yield less information than infrared spectra regarding the state of
coordinated EDTA.
The importance of infrared spectroscopy in determining the order of
chelation of EDTA warrants a brief description of the spectra of these
complexes. A fuller treatment is given in Chapter 6. This technique85tl24tl25
allows the hexadentate and protonated pentadentate complexes to be dis-
tinguishe<1. The carbonyl absorption of the free carboxylic group of most
transition metal EDTA complexes appears between I71O and 1750 cm-1. By
contrast, the carbonyl of the coordinated carboxylate absorbs between
1620 and 166O cm-f allowing ready identification. Thus the hexadentate
species will produce one carbonyJ- aJrsorpÈion and the protonated penta-
dentate two. Once unprotonated, however, the free carboxylate a-bsorption
shifts dramatically to appear in the range 1640 to 1600 cm-l' The
existence of protonated EDTA complexes in acidic solution has been
-1demonstrated by the appearance of an absorption at 1720 cm
inf rareel spectrum- r24 t126 'r27
in the solution
L.4 Ruthenium EDTA ComPlexes
Comparatively little has been done to elucidate the chemístry of
ruthenir:rn with this ligand, Sherzer and Clappl28 h"rt. prepared a nr:mber
of complexes containing ruthenium(1II) and (IV), many largely insoluble in
r^/ater and not fully characterized" More firmly established are the com-
plexes of ruLhenium(rII) , IRuHEDTA(H2O) l.AU|O,I29 [RuHEDTA(Cl) ]K- 2H2O BB
and [RuH2EDTA(ct)2]K.H20,88 all of which are readily soluble. In aqueous
so1ution the chl-oro complexes readil-y dissociate to form the five-coordinate
aquo species,SS A similar behaviour is shown by the rhodium analogue' though
boiling is necessary in this case"89 More recently the chloro complexes of
ruthenium(III) vrith ethylenediaminediacetic acid (H4EDDA) have also been
prepared,l30 An aqì.ro complex of ruthenium(rII) with propylenediamine-
tetraaceÈic acìd (H4PDTA) is afso known.l9o

L2.
Shimizu et aL. I 31 hu..tt. undertaken a polarographic study of
IRuHEDTA(H2O) I .4H2O, while Ezerskaya and SolovykhSB have briefly inves-
tigated the reduction of the chloro complexes above, both groups demon-
strating the existence of a ruthenium(II) EDTA species in solution.
Kane-Maguire et al.5l have reported the preparation of IRuEDTA(N3)]2-
jn situ, and have suggested that, by analogy with other ruthenium azido
complexes, decomposition in acid solution results in the corresponding
dinitrogen complex, IRuEDTA(N2) ] 2-.
The reaction of hydrogen peroxide with IRuHEDTA(C1)]K.2H2O in basic
conditions has been investígated, and reported to produce a dinuclear
peroxo-compound, and the colour of this complex has been suggested for the
coLorimetric determination of rutheni*n.132 Both iron and cobalt EDTA
complexes are knoÌ^rn to react with hydrogen peroxide under the same
conditions82'133 Ezerskay¿l34 has also demonstrated the ability of the
chloro EDTA complex of ruthenium to reversibly bind dioxygen under basic
conditions.l35 A dark diamagnetic, hydroxo-bridged dioxygen adduct is
formed and formulated as:
K.Na2 t (EDTA) *t (oz
OH
Ru (EDTA) I .4H2O
Attempts to prepare the tridentate or hexadentate EDTA complexes from
either IRuHEDTA(cI)]K.2HrO ot the dichloro analogue have proved
unsuccessful. SS
13.
CHAPTER 2
PENTADENTATE EDTA COMPLEXES
2.1 Ruthenium EDTA Aquo ComPTexes
The equilibria of the chloro complex, [Ru(III)HEDTA(Cl)lK.2HrO can
be represented by equations (I) and (2).
IRuHEDTA(CI)l a- [RuEDrA(HrO)J- + H+ + Cl (1)
IRuEDTA(HrO) l¿\The direct titration of the chloro complex with aqueous base and with
silver nitrate provid.es evidence for reaction (1). Similar1y, the appearance
of two endpoints during acid-base titrations is ascribed to the presence of
reaction (2) in addition to (f).ee The pK" values of tRu(III)HEDTA(H2O)l.3H2O
have been determinedl3l to be 2.37 and 7.63 for steps (1) and (2) respectively.
It should be remembered, that mention throughout the text, of solutions
containing the chloro EDTA complex, implies the presence of the above
equilibria. Similarly, formulations of complexes in the solid state will be
used to describe the complexes in solution-
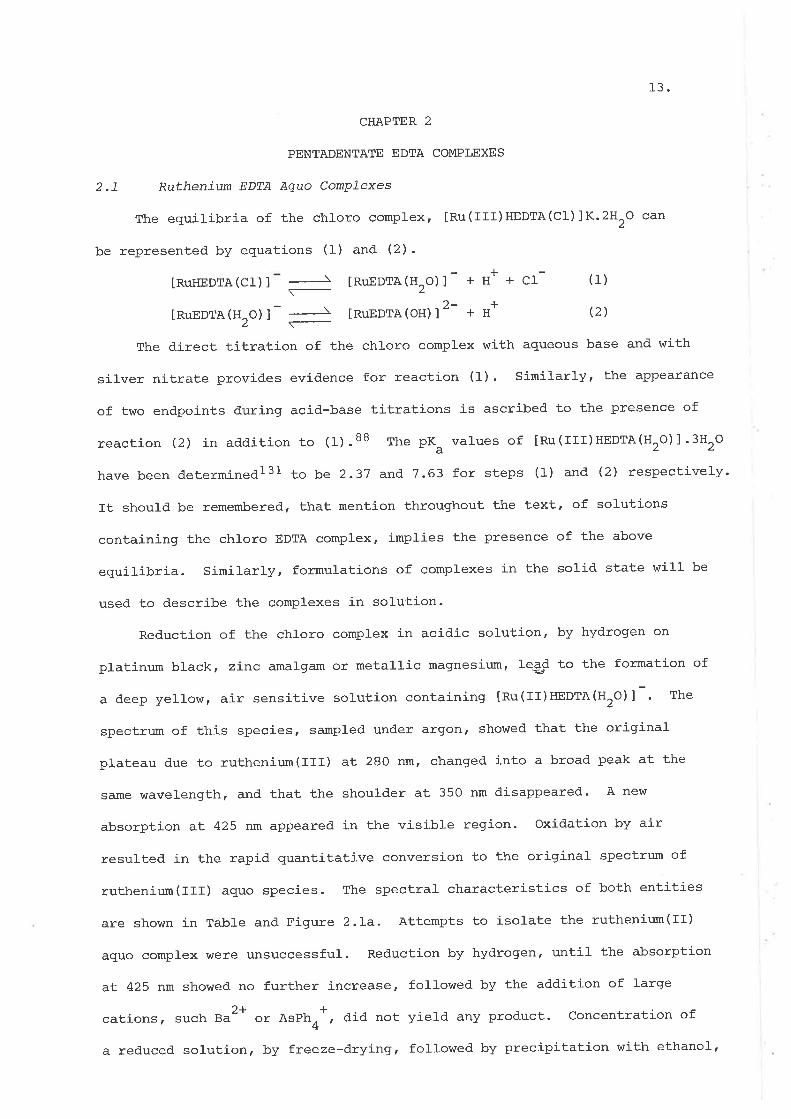
Reduction of the chloro complex in acid,ic solution, by hydrogen on
platinum black, zínc amalgam or metallic magnesium, lead to the formation of
a deep yellow, air sensitive solution contaíning ¡¡q(rr)HEDTA(H2O)l The
spectrum of this species, sampled under argon, showed that the original
plateau due Èo ruthenium(IIl) at 280 nm, changed into a broad peak at the
same \^ravelength, and that the shoulder at 350 nm disappeared. A new
absorption at 425 nm appeared in the visible region. Oxidation by air
resulted in the rapid quantitative conversion to the original spectrum of
ruthenium(fff¡ aquo species. The spectral characteristics of both entiÈies
are shown in Tabl-e and Figure 2.l-a. Attempts to isolate the ruthenium(Il)
aquo complex were unsuccessful. Reduction by hydrogen, until the absorption
aL 425 nm showed no further increase, fotlowed by the addition of large
cations, such Bu2* o, AsPhn+, did not yield any product. Concentration of
a reduced solution, by freeze-drying, followed by precipitation with ethanol'

Iog e
2.O
2.4
3.0
3.4
B
4.0
350 400
À (nn)
Fig. 2.La Electronic Spectra of : (A) tRu(II)HEDTA(H20) I and
(B) [RuIIEDTA(c1) ]K.2H20 (4.43 x r0
Aqueous So1ution.
450
-4 -?nol dm ") in

L4
yielded a yellow powder. The electronic spectrum showed this product to be
largely ruthenium(I]I) by the appearance of a plateau at 280 nm and 350 nm'
The infrared spectrum produced a major absorption at 1640 cm-1 d'ue to
coordinated carboxyrates, and a weaker peak at 1725 cm-r due to the free
carboxylic acid group. This was similar to IRuHEDTA(H2O)] .4H2O 129 and
IRuHEDTA(C1)1K.2H2O.88 Voltammetry also indicated (Chapter 5) this product
Èo be a mixture of mainly ruthenium(Ill) and some ruthenium(rI) '
The extent of formation of the ruthenium(II) aquo comptex during
reduction by hydrogen, hras estimated spectrophotometricallyS0d from the
production of tFe (II) (phen) ,l'* , obtained upon addition of excess ferrj-c ion
and IrlO-phenanthroline to the red.uced solution. Reduction of solutions
containing ruthenium(IIÏ) concentrations in the range, tulo-4 to 1O-3 mol dm-3
resulted in no more than 60% conversion to ruthenium(Il), even after several
hours. (Table 2.1b) With a freshly coated platinum surface, it was possible
to increase the yield of ruthenium(II) stightly to about 70e"¡ and also
decrease the time needed for significant production of the reduced species'
Nevertheless, complete conversion was not achieved''
The reduction of the aquo species appears to be complicated'
Shimizu et afl3I h.rr" studied the formation of the ruthettir¡¡(II) species
electrochemically and found that reduction is reversible below pH 5 and'
invol-ves a one-electron transfer. optimum reversibility occurs between
pH 3 and 5 with some decrease below 2. Further, the half-wave potential is
d.ependent upon pH, the value becoming more negative with decreasing acidity'
Prolonged electrolysis of [RuHEDTA(H2O)] leads to the development of a
green coto/ration of unknown origin. The possibility that this is a dimeric
species cannot be excluded since solutions of the chloro complex have been
found by Ezerskaya88 to dimerize upon standing. During this work, it was
found that reducing solutions containing IRuHTEDTA(Cf)r1K'H2O resulted in a
çrreen coLofrali.on as wefl, although the overall spectrum agreed with that
obtained using the monochloro complex. The latter did not produce this
15.
coloration during reduction and therefore was preferred over both the aquo
and dichloro complexes for synthetic work'
As a resuLt of incompJ-ete reduction, molar absorpÈivities (e) could only
be estimated for tRu(II)HsDTA(Hzo)l- on the basis of ruthenium(II) content'
The spectrum of the ruthenium(II) species showed coincidental similarity to
the ruthenium(III) analogue (SecÈion 6.3), and was further complicated by the
suggestior,l3i th"t the diaquo complex, [Ru(rr)H2EDTA(H2O)21r maY exist in
equilibrium with the monoaquo ion, contributing to the absorption at 425 nm'
The ease with which tetradentate ruthenium(rr) EDTA complexes are formed'
as will be described in Chapter 3, suggests that the existence of a diaquo
complex is not unreasonable.
Reactions utilizing the ruthenium(II) aquo species were usually performed
in acidic media of pH < 2 and sometimes at approximately pH 3- Above pH 5
appreciable amounts of other products, presumabty hydroxo species' were
formed" Hydrogen on platinum was chosen aS a reductant for most reactions
involving ruthenium(Il) because it was a clean method that introduced no
contaminating species into solution. However, the reducing ability of
H2/Pt is decreased by approximately 60 mV per decrease in pH unit146 which
probably explains the incompleteness in reduction a1Èhough Shirni'tt'"131
observation that reduction is easier at lower pH, shoutd, be a compensating
factor. It was realized, however, that complete reduction \¡ras not necessary
for the formation of ruthenium(I]) EDTA complexes, as the addition of various
Iigands complexed and stabilized this oxidation state, and forced the
equilibrium j-n favour of formation of more ruthenium(II) aquo complex'
2.2 Reactions of lqu(ÏÏ)HEÐTA(H20)l- with Dinitrogen and Dinitrogen oxide
The passage of dinitrogen through a solution containíng the ruthenium(TI)
aquo species, resulted in the rapid formation of peaks at 225 nm and 278 nm
in the electronic spectrum. The first was attributed to the formation of the
monomer dinitrogen complex, [RuHEDTA'(NZ) ] , and Èhe second to the

16.
TABI,E 2.IA
Electronic Spectta of ChToro and Aquo, Ruthenium
EDIIA Comp1exes ín Aqueous Sol-ution
Comple4 À (nm) e (mo1 -1 3 -1dm ) Referencecm
lRu (III) HEDTA (cI) I r. Zn 02
lRu (rrr) H2EDTA(Ct)
'l r.nro
lRu(II) HEDTA(H20) l
tRu ( III) HnoTA (HzO) I . nttrOc 283b
34.4!0.3x10 This work
33.0 10.2x1027.7 ! 0.4 x 10
3.25 x 10
2.6 x 10³
8.7 x Lo2
2.75 x LO
3 884
225
280
350
2774
280
350
280
2AO
425
It
This work
tl
tt
3
3
a. rn 0.4 mo1 dm-3 NacIO..4
b. In 0.2 mol dm-3 (pH 2.83) formic acid - sodium formate solution.
No change in spectrum within pH range 1.88 - 0.88.
c. n = 3 or 4.

L7.
TABI;E 2.1b
Ðetermination of Ruthenium(II) Content d'uting
H -/Pt Reduction of IRuHEDTA(C1)lK.2H.O SoTutìonstt2t- _ ¿
rrr) I mol dm-3 t.jme (mins .) I [Ru (II) llRu(
1.50 x 10
9.29 x LO
8.37 x l0
-4
-4
5
30
60
90
I525
30
45
60
140
185
50
L25
245
24,21
4r,40
48,42
49,50
-4
(r)
44,52
61 ,61
56 ,58
58,62
64,64
68 t7r70,67
( rr)
48 t55
67 ,65
64,65
64,69
68,68
69 t68
74,7L
I. Shimizu-QR-SO Spectrometer. Fresh Pt surface'
II. PE-4O2 Spectrometer. Fresh Pt surface'

18.
corresponding dimer, t(HEDTA)RuNrRu([EDTA)12-, formed in a manner analogous
to [Ru(NHr)s'zo]2+ with dinitroge"4o, """ording to the equilibria'
IRuHEDTA(H2O)I * N2
=- [RuHEDTA(N2)] (r)
IRuHEDTA(Nr) l- + IRuHEDTA(H2O) ]- a- t (HEDTA)RuNrRu(iUota) l2 (2)
Reaction (1) was favoured by tow concentrations of the aquo complex
(.utO-4 mol dm-3) and reaction Q) by higher concentrations (>10-3 mol am-3) '
Measurement of the spectra over a concentration range of 1'34 x l0-4 mol dm-3
Lo 2.u, * ro-, mol dm-3 rerative to the total ruthenium showed that the peak
aE 225 nm gradually diminished while that at 278 nm simultaneously gre\¡/'
Fig. 2.2a iLlustrates this. solutions were reduced for the same length of
time using hydrogen on ptatinum, foflowed by the introduction of dinitrogen
until no further increase in absorbance was noted'' samples \¡Iere withdrawn
under dinitrogen.
An estimate of the amount of dimeric and monomeric dinitrogen complex
formed at each concentration was determined from the pair of simultaneous
equations:225 225
ozzsM "*
+e_L co (1)D
278 278^A2.,g = ,ro 'oa* + eo' '"co Q)
where A, e are the absorbance and molar absorptivity respectivery at the
quotedwavelength,CMandCoaretheconcentraÈionsofmonomeranddimer
respectively. The e values used for the monomer and dimer were obtained
from the individually isolated complexes as described in sections 2'3' 2'4
and listed in Table 2.4.La. The use of only two equations to describe the
situation existing in solution neglected the contribution from the aquo
species present. No further refinement was made since the e values of the
ruthenium(III) species were considerably lower than those of the dinitrogen
complexes and neglecting them would not severely effect the results' while
for the ruthenium(Il) species, e values were not known accurately' Using the
above equations, estimates of the monomer and d'imer concentrations were

A
I.60
A -4 -3 tRu(rrr)l ^'5 x 10⁻⁴ -3mol dmtRu(rrr) I "u to mol dm
0.8D
1.0
220 240 260 280 220 240 260 280
À (nm) I (nm)
¡¡¡¡(lrl)l ¡'1x 1o-3 -?mol dm " tRu(III)l't'3x10 -3 mor dm-3
0.6
0.8
22O 24O 260 280 ^
nm) 220 240 260 280 À (
Variation of Monomer (M) and Dimer (D) Concentration with
Concentration of IRuHEDTA (CI) ] K' 2H2O'
o.4
0.6
o.8
0
0.8
1.O
M
AA
6
Fig. 2.2a

19.
obtained, and related to the total ruthenium concentration as shown in
Table 2.2a.
The results clearly indicated that no more than half the possible
amount of dinitrogen complexes formed because of the Iow fraction of
ruthenium(Il) aquo species produced' This was due' in part' to the fact
that once the flow of hydrogen gas into solution was switched to dinitrogen'
no further reduction took place. Ho\^lever, Table 2.2a aLso indicates that
as the concentraÈion of the initial rutheniu¡n(III) species increased' so too
did that of the dimer, while the percentage of monomer decreased' It was
concluded that the synthesis of the monomeric dinitrogen complex, by direct
substitution upon the aquo complex' was not feasible because of the high
concentrations of ruthenium required for preparative conditions.
The passage of argon through a solution containing the dinitrogen
complexes caused a moderately rapid conversion to the aquo complex as judged
from the disappearance of absorptions at 225 and 278 nm. A broad peak at
2SOnmandapeakat425nmre-appeared.Hydrogengasalsosweptoutthe
dinitrogen bound to ruthenium. Attempts to prepare the dinitrogen complexes
from dinitrogen, while maintaining a flow of hydrogen so as to increase the
yield of ruthenis¡(II) aquo, were unsuccessful'
substitution by dinitrogen oxide und.er conditions similar to dinitrogen
\^7as briefly investigated. Introduction of the gas into freshly reduced
solutions lead to the rapid quantitative oxidation to [RuHEDTA(H2O) ] as
estimated from the electronic spectrum. The spectra, even of chilled
solutions of the aquo complex, did not provide any evidence for the formation
of an Nro-intermediate' as noted, for [Ru(NHr)sHzo]2+ 4l -"d
cis-[Ru(en), (H2ç42]2+.46 fn the presence of a reducing agent such as zinc
amalgam or magnesium, the passage of dinitrogen oxide through solution
resulted in no change in the spectrum of the s'cl-ution. The spectrum of
tRu(fI)HEDTA(HrO¡1 only was obtained, even when left under a dinitrogen
oxide atmosphere for an hour. Ho\n/ever, though no change in the appearance

20.
oftheSpectrumwasobserved,aslightincreaseinabsorbance(fuIo%)of
thebanda-2Eonmoccurred.Thismayhaveresultedfromsmallamounts
of Èhe dimeric dinitrogen species, although no direct evidence for the
presenceofdínitrogencomplexeswasforrnd.Theformationofdinitrogen-2+ Lq
complexes was expected by analogy with the behaviour of tRu(NHt)SHZOI
Presuma.blydinitrogenoxideveryrapid,lycoord'inatedtoandoxidized
IRuHEDTA(H2O) I , and the resulting ruthenium(III) species was just as
rapidlyre-reducedinÈhepresenceof'zíncamalgamprod,ucingnoapparent
change in the electronic spectrum. Arternativery, a dinitrogen complex
formedfromthereductionofanN,o-intermediate,butwasrapidlyswept
out in the presence of dinitrogen ox de' In either case' the concentration
of a coordinated NrO or N, sPecies \^las very low'
2.3 Dimeric Dinitrogen ComPTex
Thedimericcomplexwasisolatedfromconcentratedsolutionsofthe
chloro EDTA complex containing a reducing agent such as magnesium or zinc
amalgam, through which a strong flow of dinitrogen was maintained for
several hours- The reaction mixture was kept at ice-temperature throughout
thedurationoftheexperiment.Theuseoftheabovereductantsratherthan
hydrogenallowedconversiontoruthenium(If)toproceedatahighpartial
pressureofdinitrogen'anddrovetheequilibriunfurÈhertowardscompletion.
The much higher concentration of iniÈial ruthenium(1II) (ru0't mol ùn-3)
alsofavoureddimerformation.Lowertemperaturesservedtobothstabilise
thedimercomplexaswellasenhancethesotubilityofdinitrogenin
solution.Finally,thelengthoftimeforthereactionwasincreasedwith
respecttoreactionscarriedoutinsection2.2.Althoughzíncamalgamwas
demonstrated by electronic and vibrational spectroscopy to yield the same
productasmagnesium,onlythecomplexisolatedfromuseofthelatter\¡ras
characterized.
The reaction was sensitive to pH' During the preparation the pH

2L.
Irr) I mol dm-3
TABI,E 2 .2A
Variation of Monomet, Dimet Concenttation
with Ruthenium(III) t
B N tsConversionUM UDlRu (
r. 34
2.47
3.72
4.92
5.87
6.75
8. 16
1.01
L.64
2.55
-Lx10-Lx10-Lxl0-^x10-Lx10-^xI0-¿.x10-?x10"-?x10"-?x10"
25.8
23.7
22.8
20.0
18. 1
L7.3
18.0
15.6
17. I16. 0
8.2
8.3
9.7
10. r10.3
10.8
L2.3
I3.0L6.7
18. 5
34.0
32.O
32.5
30. I28.4
28.I30.3
28.6
33 .8
34.5
42.2
40.3
42.2
40.2
38.7
38.9
42.6
4L.6
50.5
53.0
f Definition of Parameters:M] x I00;8M= lRu(III) l
% Fixed N =åM+3D
BConversio, = {ffi x IOO i.e. BConversion = B M + 2 z D
x I00
where tMl and tDl are concentrations ofmonomer and dimer resPective1Y.2

22.
gradually rose as a result of acid consumption by the reductant. .Above
pH 4 a brown coloration developed which became a deep scarlet at
approximatety pH 7. This was easily dispersed by the addition of acid
resulting in the original yellow solution. The change in colour probably
resulted from the formation of appreciable amounts of ruthenium(II) hyd,roxy
species within solution. The scarlet coloration \^/as also observed whenever
excess magnesium was added Èo solutions of the chloro EDTA complex exposed
to air" As a result, preparations of the dimer were carried out in solutions
of pH 3 or slightly less.
The dimer was isofated as a yellow powder which was very soLuble in
aqueous sofution but insofuble in common organic solvents. Recrystal-Iization
from aqueous sol-ution was not possible because of rapíd hydrolysis leading
to loss of dinitrogen from the complex. Decomposition of the solid complex
also occurred slowly on standing. Samples were stored, under dinitrogen
over a drying agent and refrigerated.
Microanalysis carried out by CSIRO Melbourne often showed the
dinitrogen content to be too low for a dimer formulation, therefore freshly
prepared samples were analyzed. for dinitrogen by gas release studies.
Oxidation of the complex followed by manometric measurement of the gas
evolved gave an indication of the annount of bound dinitrogen. The resul-ts
obtained are shown in Table 2.3a. The nature of the gas evolved was
determined mass spectroscopically (Section 9.7) and shol^ln to be free
diniÈrogen contaminated by snaIl amounts of air. A strong oxidizing agent
such as cerium(IV) oxidized the dinitrogen complex readily' and then
further attacked the oxidation product, yielding higher gas vohmes than
expected. A black residue was obtained. To avert this milder methods for
the release of dinitrogen were utilized.
In conjunction with these measurements, the ruthenium(TI) content for
freshly prepared and aged sampfes was determined by Èhe phenanthroline
method describe<l in Section 2"L. As Table 2.3b shows, the best results

23.
indicated no more than 90% ruthenium(Il), and most fresh samples were in
the range of. 759. to 90% ruthenium(ff¡. On aging this percentage dropped
very significantly. The magnesium content of the complex was determined
by a number of methods. Attempts to separate the metal ion from the complex
on an anionic resin column, fol-Iowed by titration of the liberated
magnesium ion with EDTA, gave low estimates of the metal. Similarly'
displacement of acid from a cationic column, and titration of the released
acid also indicated lower than theoretical amounts of rnagnesium. However,
direct titrationSbof the complex with EDTA gave estimates in better
agreement with Èhe formulation proposed, as shown in Table 2.3c. The
reason for the poorer results using resin columns was due apparently to the
strong association of the metal with the dimeric species, and total release
of the magnesium ion did not occur. The sum of the analytical evidence
suggested the dimeric dinitrogen complex was best formul-ated as
[(EDTA)RuNrRu(EDTA) r¡tt92.8H20, although the water content possibly varied
s1ightly.
2.3.1 Sofution Properties and Spectra
The infrared spectrum (Table 2.3.1a) of the dimer in the solid state
was characterized by very intense broad absorptions at approximately
3350 cm-l and 1600 .*-1. The former was due to strong O-H stretching modesrÍì
of lattice water, and the latter to the carbo;tyl stretching frequency of
the carboxylate groups. The absence of any absorption in the vicinity of
l-720 cm-l meant that no free carboxylic acid was present. Instead, the free
carboxylate peak was incorporated into the main absorption at 1600 cm-I,
although it could not be seen separately. At best, a shoulder \^ras seen at
approximately 1590 .*-1. A weak absorption at 2060 "*-1 u.np"ared in all
spectra and was assigned to the infrared inactive v (N2) vibration of a
dimeric species" This was confirmed by the appearance of a strong single
absorption aE 2064 cnì-I, in the Raman spectra of the solid complex, in

TABLE 2.3A
cas Rel-ease ftom | (EDTA) RuN ,Ru (EDTA) 1Mør8n rO
CalcuIVolume
Observed"volume (cm')
24
B GasreleasedMethod atedt
(cmj)
Cerium ( IV)
Thermal decomPosiÈion
Hydrolysis:
'zo
0.9 mol a*-3 Hrson
o.67
0.4I.0. 84
0.48
o.52
0.66
L.34
0.61
a.82
1.03
1. r7
0. 43
0.65
0. 39
0. 37
0.57
0.96
initial15 mins
30 míns
120 mins
91
L22
l-54
175
105
77
82
72
87
79
* Assuming one mole of gas evolved per mole of complex'

25.
TABLE 2.3b
Determination of Ruthenium(II) Content in Dimet
Aqe of Samp1e I Ru( II)
83, 87, 76, 79, 90, 77
53, 58
25
TABLE 2.3c
AnaTgsis of Dimer l(EDTA)RuN rRu(EDTA) lMSZ.8H20
Elements I theoretical I taI
3.504
c
H
N
Mg
24.04
4.04
8.41
4.87
23.8I,
3.85,
7 .33,
24.07 , 24.05, 24.33
4.r7, 4.3L
7 .65 , 6.92
3.2oa, 4.2gb, 4.4gb
a
b
Resin columns used.
Direct Titration with EDTA.

26
agreement with a slmmetrical structure in which the ruthenium atoms are
bridged by dinitrogen. The rapid decomposition of the complex in solution
did not allow the use of nmr techniques to furnish further structural
information.
The electronic spectrum in aqueous solution of the isolated complex
agreed with that of the dimeric species described in the preceeding section'
OnIy one absorption aE 278 nm was observed, I¡rhose position was r¡naffected'
bychangesinpHvalues.Noabsorptionswereobservedinthevisible
spectrum.
Solutions of the dimer hydrolysed under a dinitrogen atmosphere, as
could be seen from the decrease of the 278 nm peak and the appearance of
bubbles of gas in solution. Passing argon through the solution caused even
faster decomposition since the dinitrogen Iigand was swept out' In this
case a shoulder appeared at 430 nm in the visible region of the spectrum
and \^Ias believed to be due to the ruthettis¡(II) aquo complex' Ho\^Iever'
it did not develop into a peak but gradually disappeared, presumably because
under these pH conditions (t5) the aquo species was converted to the hydroxo
form.
Moreover, oxidation of the dimer by exposure to air, while initially
yielding [Ru(fII)HEDTA(H2O)] as judged by the appearance of a plateau at
2go nm (eru3 x ro3 mol-r d*3 .*-l), gradualry gave rise to new peaks at
390 nm and 630 nm. The ptateau at 280 nm shifted to 300 nm. These
absorptions appeared more quickty and prominently if O.0Or mol dm-3
hydroxide ion was added in the presence of air, yielding a yellow-green
solution. These observations agreed with the spectrum of the
¡r-hydroxy-p-dioxygen complex described by Ezerskaya et a71 34 1tt their study
of IRuHEDTA(Cr)]K.2HrO with hydroxide ion in the presence of oxygen'
(section I.4) Using their molar absorptivity values, it was found that
about half of the dimer was converted to this species overnight on exposure
to air.

27.
Themolarabsorptivityofthedimer'aE2'78nm'wasdeterminedin
dinitrogensaturatedaqueoussolution,underadinitrogenatrnosphere.
The varue of e obÈained depended upon the purity of the sampres and the
effectivenessofdeoxygenationofthesolvenÈ.Theobservedrangeofe
values was 2.6 x IO4 to 3. 2 x Lo4 *ol-rd*3.*-1. "ott"ctions for hydrolysis
weremad'ebymeasuringtherateofdecompositionofthedimerinaqueous
solution.
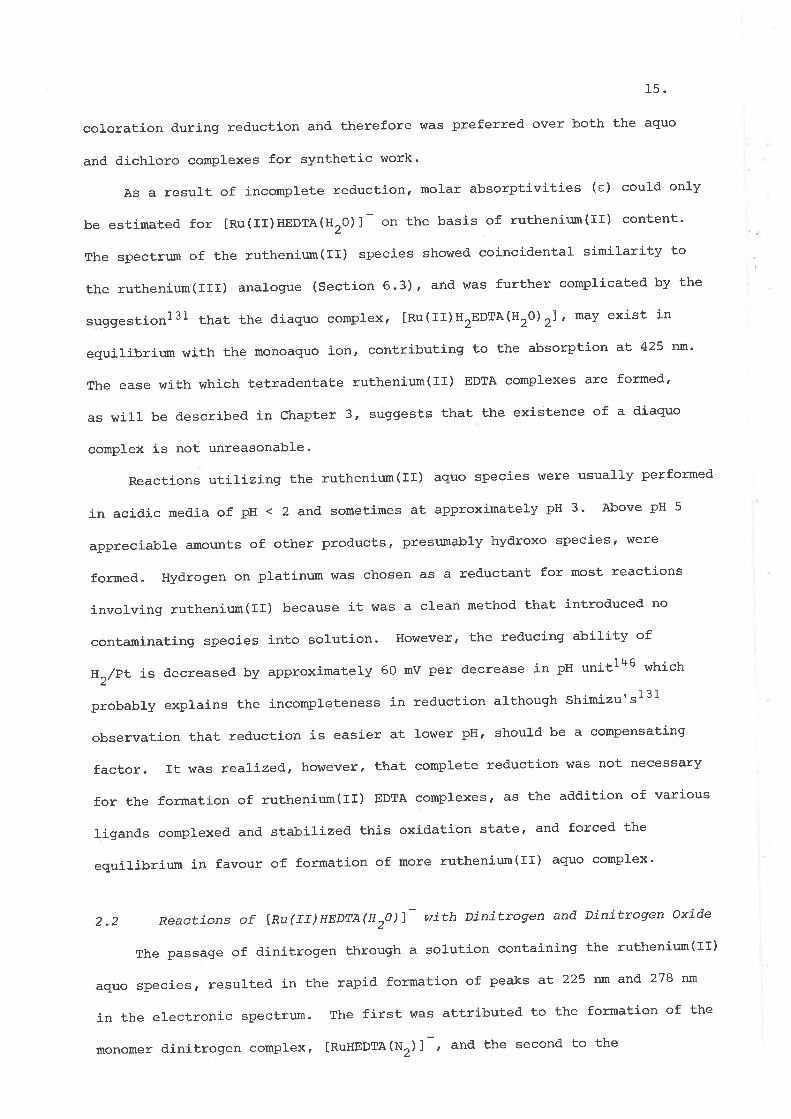
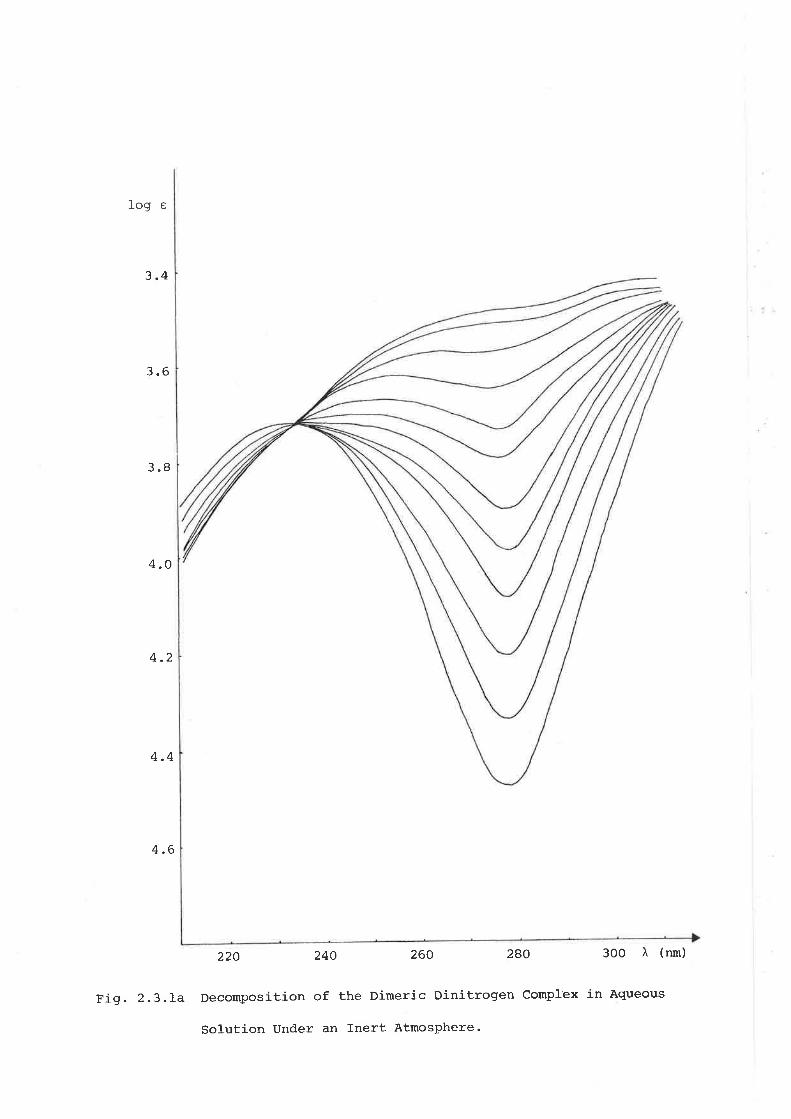
The rates of decomposition under dinitrogen and argon atmospheres \^/ere
estimated conveniently by monitoring the decay of the absorption at 278 nm'
(Fig.2.3.Ia)Thesolutionsweresaturatedwiththerespectivegas,and
measurements made at several temperatures. The observed rates are Iisted
inTable2.3.Ib.Decompositionfollowedpseudofirstorderkineticsas
determined from plots of tog(A--40/A--At) versus time (t) ' where A*r Ao and
A refertoabsorbancesat,infinite',anarbitraryinitial,andtimet.tTheobservedratesclearlyshoweddecompositioninaqueoussolution
(pH 5) to be approximately twice as fast under argon as compared with a
d.initrogenatmosphere.ThiswasaSexpectedsinceinthelattercasean
appreciableamountofbackreactionwaspossibleleadingtoanapparent
slower rate.
An estimate of the activation parameters involved in decomposition of
thedimerunderargonwasobtainedfromtheArrheniusplotoftheobserved+, the enthalpy of activation, was estimated to be 44kJ
- L --^!: ^- ^^^-^-ìmaral r¡ -'l 40 JK-I *oI-I.mol-I, and Ast, ttre entropy of activation' approximately -I40 JI
comparison with the decomposition of dinitrogen and' dinitrogen oxide complexes
JIshown in Table 2.3.Ic indicated that the AHT value was quite low' while ÀSl
\^ras unusualry rarge and negative. These figures suggested an associative
mechanisminvolvingahighlysolvatedcomplexinthetransitionstate,aSa
resurt of the dimeric species possessing a formar charge oÍ -4-
Iog e
3.4
3.6
3.8
4.O
4.2
4.4
4.6
22o 24O 260 28O 300 À (run)
FiS. 2.3.La Decomposition of the Dimeric Dinitrogen Complex in Agueous
Solution Under an fnert Atmosphere'

28.
Assignments (nu'ioI)
TABLE 2.3.LA
Vibrational Spectra of | (EDTA)RuN rRu
(EDTA) \Mg 2'8H 20
Frequency ("*-1)KBr matrix)
v(oH) 3360 s,br
Aliphatic v(cH) obscured
v (N2) 2060 + l0 w
Carboxylate v(C0) 1600 t I0 s'br
3450 s,br
2930 m,br
2970 w
2060 vw
1610 s,br
1580 sh
1390 s,br
2064+4s a
Carboxylate v(CO) - bsymmetrical stretch
a
b
Raman spectrum.
Tentative Assignrnent.

29.
TABT,E 2.3.Ib
Observed Rates (k.,o") of Ðecomposition for l(EÐTA)RuN2(EDTA)l
(N, atmosphere)
Temperature
( "K)
k - ("..-1)boþs
(argon atmosphere)
4-a
Temperature
("K)
-tk ( secobs
1.4 x tO
3.I x I0
3.6 x t0
6.4 x 10
-3
-3
-3
-3
292.4
300.2
303. 7
3I0.9
2.7 x LO
3.5 x 10
5.9 x 10
1.0 x 10
-3
-3
-3
-2
287.8
293.5
300.9
308.4
a. Concentration range 5.7 - 6.5 x 10
Solution pH 5.
b. k. 10.1 ("""-1).o.þs
-5 mol dm-3
)As + -1 -1(¡r moI ) Reference
TABLE 2.3.Ic
Activation Patametets of some
Dinitrogen, Ðinitrogen oxide and ReLated CompTexes
t_
AHT (kJ mol -1Complex
4- 444
IT7
91
76.7 (tI. s)
96
79
-t4o a
-45
-2L.8 (rs)
This work
62
4T
46
136
[ (EDTA) RuN2Ru(EDTA) ]
tRu (NHr) S*rl'*lRu (NHr)
5N2ol 2+
tRu (NHr) 4H2o
(N2o) I 2+
lRu (rHF) N ,(uro) ctrl
lRu(rrr)EDTA(N3) l
a. AE 25.OoC.
2--54 51
30
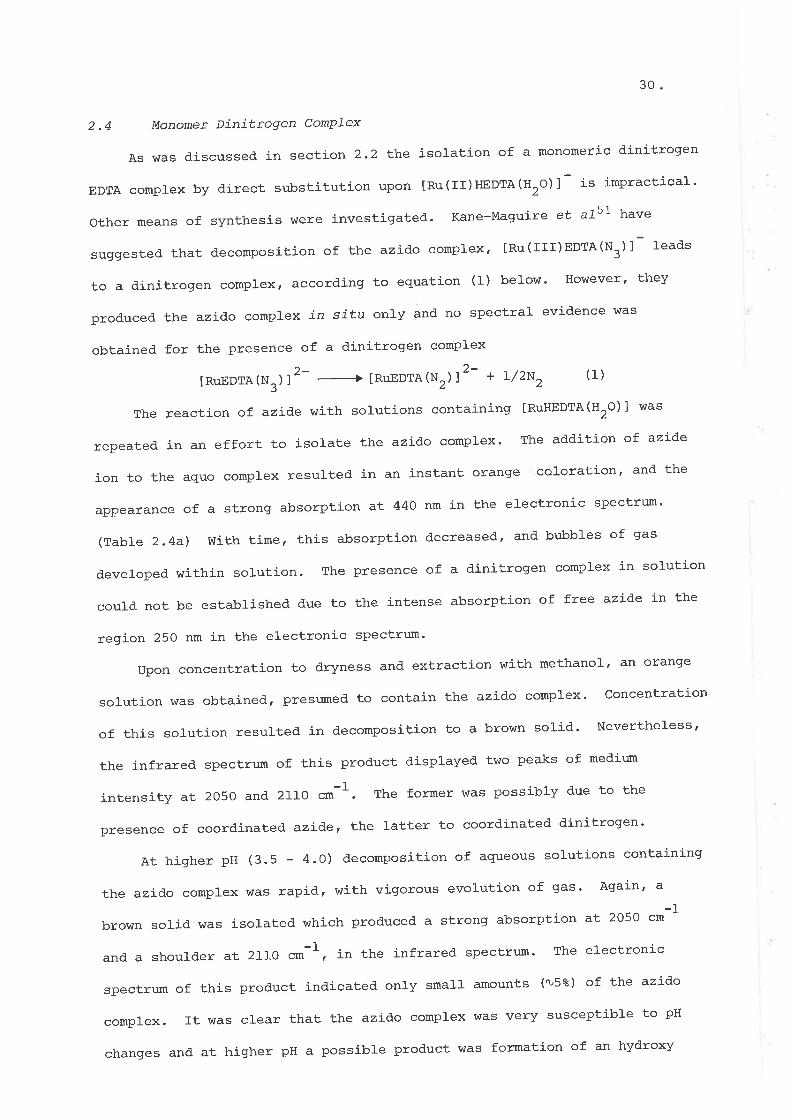
2.4 Monomer Dinittogen ComPIex
As v/as discussed in section 2.2 the isolation of a monomeric dinitrogen
EDTA complex by direct substitution upon tRu(II)HEDTA(H2O)l is impractical'
Other means of synthesis were investigated. Kane-Maguire et aL5I have
suggested that decomposition of the azido complex, [Ru(I1r)EDTA(N3)] leads
toadinitrogencomplex,accordingtoequation(1)below.However,they
produced the azido complex in situ only and no spectral evidence \^las
obtained for the presence of a dinitrogen complex
lRuEDrA(N3) 12- [RuEDrA(N2) ] 2 + L/2N2 (1)
The reaction of azide with solutions containing IRuHEDTA(ttrO)l was
repeated in an effort to isolate the azido complex. The addition of aztð'e
ion to the aquo complex resulted in an instant orange coloration' and the
appearance of a strong absorption at 440 nm in the electronic spectrum'
(Table 2.4a) üIith time, this absorption decreased, and bubbles of gas
developed within solution. The presence of a dini'urogen complex in solution
could not be estabtished due to the intense absorption of free azide in the
region 250 nm in the electronic spectnxrt'
Upon concentration to dryness and extraction with methanol' an orange
solution was obtained, presumed to contain the azido complex' ConcentratiOn
of this solution resulted in decomposition to a brown solid' Nevertheless'
the infrared specÈrum of this product disptayed two peaks of medium
intensity at 2O5O and 2fIO .*-t. The former \^Ias possibly due to the
presence of coord,inated azide, the latter to coord,inated dinitrogen'
At higher pH (3.5 - 4.0) decomposition of aqueous solutions contaíning
the azido complex was rapid, with vigorous evolution of gas' Again, a
brown sorid was isolated which produced a strong absorption at 2o5o cm-l
and a shoulder at 2l-IO cm-I, in the infrared spectrum. The electronic
spectrum of this product indicated only small amounts (1J5%) of the azido
complex.Ttwasclearthattheazj-;docomplexwasverysusceptibletopH
changes and at higher pH a possible product was formation of an hydroxy
31.
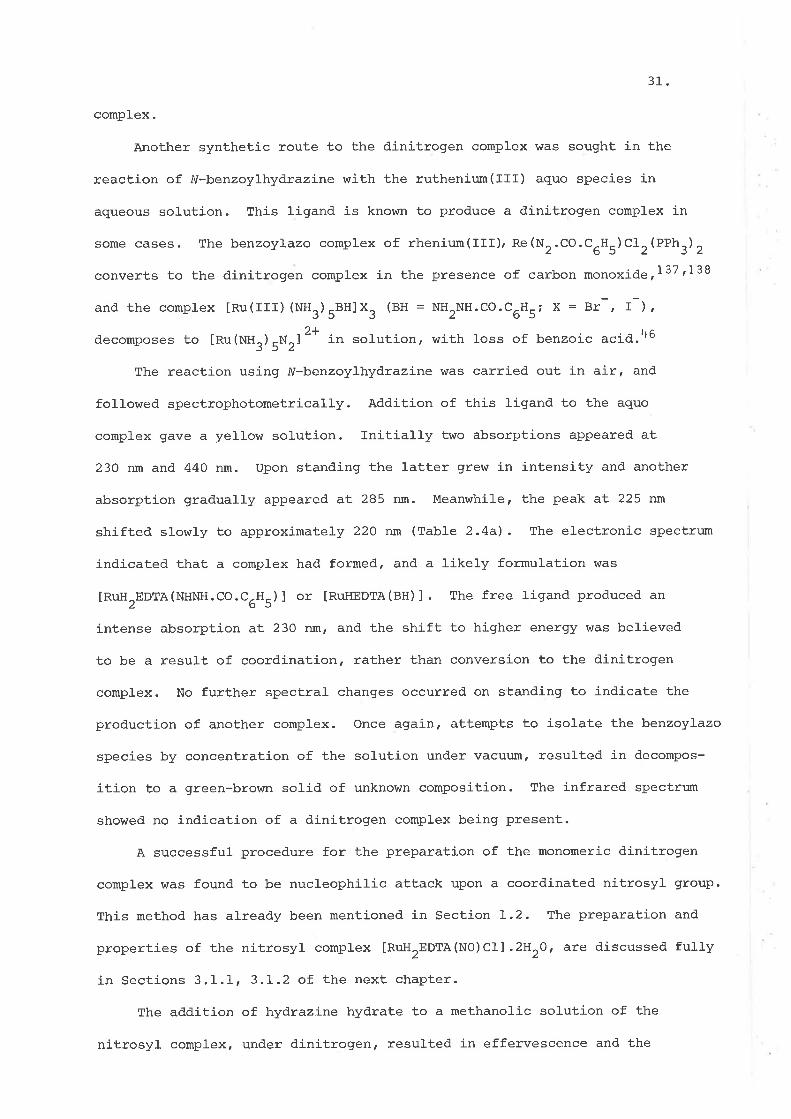
complex.
Another synthetic route to the dinitrogen complex was sought in the
reaction of fV-benzoylhydrazíne with the rutheniun(III) aquo species in
aqueous solution. This ligand is known to produce a dinitrogen complex in
some cases. The benzoylazo complex of rhenium(fII), *u(NZ.co.C6H5)C12(PPh3)2
converÈs to the dinitrogen complex in the presence of carbon monoxiderl3T'138
and the complex tRu(IIf)(NH3)5BHJX3 (BH = NH2NH.CO.C6H5i X = Br , I ),
decomposes to [Ru(NHa)r*r]'* in solution, with loss of benzoic acid.46
The reaction using lV-benzoylhydrazine was carried out in air, and
followed spectrophotometrically. Addition of this ligand to the aquo
complex gave a yellow solution. Initially two absorptions appeared at
230 nm and 440 nm. Upon standing the latter grew in intensity and another
absorption gradually appeared at 285 nm. Meanwhile, the peak at 225 rm
shifted slowly to approximately 22O nm (Table 2.4a). The efectronic spectrum
indicated that a complex had formed, and a likely formulation h¡as
IRuH2EDTA(NHNH.CO.CUHU) I or [RuHEDTA(BH) ] . The free ligand produced an
intense absorption at 230 nm, and the shift to higher energy was befieved
to be a result of coordination, rather than conversion to the dinitrogen
complex. No further spectral changes occurred on standing to indicate the
production of another complex. Once again, attempts to isolate the benzoylazo
species by concentration of the solution under vacuum, resulted in decompos-
ition to a green-brown solid of unknown composition. The infrared spectrum
showed no indication of a dinitrogen complex being present.
A successful procedure for the preparation of the monomeric dinitrogen
complex was found to be nucleophilic attack upon a coordinated nitrosyl group.
This method has already been mentioned in Section I.2. The preparation and
properties of the nitrosyl complex [RuHTEDTA(N0)c1] .2H2O, are discussed fully
in Sections 3.1.1, 3.L.2 of the next chapter.
The addition of hydrazine hydrate to a methanofic solution of the
nitrosyl complex, under dinitrogen, resulted in effervescence and the

.l,É
C)
<n
LOoF{
xv
30
lRu (NHr) al Cl¡
IRuEDTA(N2) I (MI4) 2
25
20
I5
IO
lRuClUNoì K,
5
020 40
Cxl0 -5 _?mol dm "
60 80
FiS. 2.4a Specific Conductívity (r) versus Concentration for
IRuEDTA(N2) I (NH4) 2.5H2O in Aqueous Solution at 23'OoC'

32-
formation of a yellow precipitate. This was collected and dried in vacuo
to yield a yellow powder. Microanalysis proposed the formulation
IRuEDTA(N2) ] (NH4),.5u1-o. The high solubility of the complex in water and
its sensitivity to hydrolysis and oxidation did not permit recrystallization'
solutions of the complex passed freely through a resin exchange column in
the cationic form, but the species was held during passage through an
anionic resin, demonstrating that the complex was negatively charged'
Graphical comparison of the specific conductance (rc) versus concentration
for [RucIuNOJK, and the above complex indicated the latter to behave as a
normal 2:I electrolyte, suggesting that the species was unprotonated, since
for weak acids such plots are curved (FiS' 2'4a) '
The infrared spectrum (Fi9. 2.4b¡ Tab}e 2.4b) revealed a strong peak
at 2I1O cm-I attributed to v(NZ) and a broad absorption centred at 1590 cm-l
due to tne carrSyr absorptions of coordinated and free carboxyrate groups'
The absence of .n, r¡"otption in the region of ITOO-I750 cm-I confirmed the
EDTA compl-ex to be unprotonated,. strong broad absorptions at 3140 cm-l and
34OO cm-l were assigned to e (NH) and v (OH) stretching modes of the ammonium
ion and lattice water, respectively'
occasionally the preparation of the monomeric species yielded a yellow
product \^rhose infrared spectrum reveared absorptions at 2110 cm-1 and
2o5o cm-l, the ratter of comparabl-e intensiÈy to the former' The possibility
that this new absorption was caused by the presence of an azido complex was
considered unlikely since such complexes of ruthenium(rr) are very unstable
and can be seen to convert to the dinitrogen complex while in the path of an
infrared beam.46 No such transformation was observed' Rather, the peak at
2O5O cm-I was attributed to the dinitrogen complex isolated as the
hydrazinium salt. ln acid conditions the hydrazinium ion breaks down to the
ammonium ion. Passage of a solution of the complex through an exchange
corumn in the ammonium form, foltowed by concentration to dryness, yierded a
solid whose infrared spectrun showed the absence of an absorption at

33.
-'l2050 cm', whilst Èhe other remained, although decreased in intensity as a
result of decomposition in solution.
The electronic spectrum of the monomeric dinitrogen species was
characterized by an intense absorption at 224 nm. Molar a.bsorptívity values
measured under dinitrogen spanned the range L.2 x 104 to 1.6 x LO4 mo1-1dm3
.*-t in accordance with the purj-ty of the sample. The addition of the monomer
to a reduced solution containing tRu(II)UEDTA(HZO)l- immediately produced a
strong absorption at 276 nm (e 'u2 x irO4 *o1-1d*3.*-1¡ in the electronic
spectrum of a sample withdrawn under argon. This new peak was due to the
dimer and confirmed the validity of equation (2) in Section 2.2. Solutions
containing the monomeric complex under an argon atmosphere showed a gradual
decrease in the 244 nm absorption of the electronic spectrum. Simultaneously,
a peak appeared at approximately 280 nm which,grew in intensity for a short
time and then also receded. The argon atmosphere slowly swept ouÈ the
dinitrogen ligand forming the aquo complex which then rapidly combined with
the remaining monomer to produce small amounts of the dimer. Bubbling argon
through the soluÈion caused a rapid decrease in the monomer absorption.
As with the dimer, described in the previous section, it was important
to exclude air from solutions of the monomer oÈherwise oxidation caused
a decrease in its electronic absorption at 224 nm accompanied by the
appearances of bubbl-es in solution. Oxidation in 0.5 mol a*-3 fCt solution
(the medium used for electrochemical studies' Chapter 5) lead to the
formation of a btue ruthenium chloro species familiar in ruthenium chemistry.ST
Under the same conditions the dimer produced the ¡r-hydroxy complex
described earlier (Section 2.3) . On exposure to air the monomeric complex
gradually darkened in appearance. Hence it was stored under dinitrogen over
a drying agent and kept cool.
In an effort to observe the presence of any dinitrogen oxide inter-
mediate the niÈrosyl complex was acted upon by hydrazine hydrate at 1ow
temperatures (-lOoC to -40oC) and by hydroxylamine. Using the former, only

34
absorptions due to the dinitrogen complex and unreacted nitrosyl complex
were seen in Èhe infrared spectrum at all temperatures. The addition of
hydroxylamine hydrochloride to a chilled basic aqueous solution containing
the nitrosyl complex resulted in vigorous effervescence and' Èhe production
of a yellow solution. vüithin minutes this darkened to a deep brown
coloration.Noproductwasisolated.Whenrepeatedinanaqueous
methanolic solution, a pale yellow solid was obtained by the addition of
methanol. However, the infrared spectrum of this product showed no
absorptions between 2000 "*-l and 23OO crn-I in the infrared spectrum,
arthough the niÈrosyl absorption origínalty at 1890 cm-I (section 3'1'r)
had almost disappeared. If any dinitrogen or dinitrogen oxide complexes
were formed they could not be isol-ated or were too unstable under the
conditions of the reaction. Azide ion had no effect upon the nitrosyl com-
plex as judged by the absence of any change in colour of solution and the
presence of a strong nitrosyl absorption in the infrared spectrum of the
product.

35
Complex
TABLE 2.4a
Azido, Benzoglazo and Monometic
Dinitrogen CompTexes in Aqueous SoLution
À (nm) e (mor-1dm3.*-1 )
lRuEDrA (N3) l2-a
IRuHTEDTA (NHNH. co. COHS ) l
IRUEDTA(N2) l2-
3
b 4
3
3
440
220
290
440
224
278
I.8 x 10
I.6 x 10
2.3 x 10
4
3
e=2.0x10 mo13 -1 -1
dm cm3
a
b
c
Ref. 51 À 448 nm
Proposed formulation.e values in range L.2 - 1.6 x 10
v (oH)
V (NH)
v (Nr)
Carboxylatev (co)
L-1?-1- mol *dm-cm -
TABLE 2.4b
Infrared Spectrum (nujol) of lRu(EDTA)N 2l (NIIì 2.5H20
Assignment Fresuencv ("*-1)
3400 s,br
3140 s,br
2LIo (110) s
1590 (110) s,br

36.
2.4.1 Discussion
The monomeric and dimeric dinitrogen complexes represented examples
of anionic species in a family of compounds where mainly cationic and neutral
complexes are known. Ammine d,initrogen complexes are cationic and the
neutral complexes are typified by those containing phosphine ligands. OnIy
a few formally anionic d.initrogen compfexes, such as Na[Co(Ur) {entrPh):] I39,
are known at present.
The coordinated d,initrogen stretching frequencies of the EDTA compl-exes
were comparable with those of the ammine ruthenium(II) type menÈioned in
Chapter 1, and the negative charge had no apparent effect upon the value of
v (N2) . As discussed in that chapter u (NZ) is affected by the back-bonding
ability of Èhe metal, which in turn is dependent upon the nature of the metal,
its oxidation state and the ligand environment. For the ligand in question
coordination was to a low-spin d6 metal centre found in dinitrogen complexes
of ruthenium. fn addition, EDTA possesses no Tl-acceptor properties and
behaves only as a o-donor molecufe on coordination to ruthenium, as do the
ammine ligands in ruthenium(IÏ) dinitrogen complexes. As a resulÈ no
comparison could. be drawn between Èhe EDTA complexes and the example cited
above since cobalt(-I) possesses r d10 configuration and is surrounded by
phosphine ligands. Here the value of v(NZ) is reduced to 1875 cm-l.
The dinitrogen stretching frequencies \nlere similar for both EDTA
complexes. This is observed for [Ru(NH")-N"]2+ (2130 cm-l) and35¿
{3)514+ (2100 cm-r) as well .!7tr9 rt has been arguedl7rt40
that for dimeric complexes in which both metals bridged by dinitrogen have
closed electronic shells, as above, the molecular orbital scheme indicates
that there is very little difference in N, bonding between a monomeric and
dimeric complex. Hence, v(N2) of the dimer is only sl-íghtly changed from
the monomer value. However, for dimers in which the metal centres do not
possess cfosed shells, significant shifts in v(N2), as compared with the
monomer I are possible .r7 t19

37.
The observed electronic spectra of the EDTA species were typical of
known monomeric and dimeric dinitroçJen complexes- The intense absorptions
belonging to both complexes were assigned to charge-transfers from the
metal dr orbitals to n* orbitals of the dinitrogen ligand'66 While the
d,imer absorption was more intense than that of the monomer, it occurred at
lower energy. This results from the metal dn orbitals being at higher energy
in the dimer than in the monomer since the effective nuclear charge on each
metal is increased less by having to provide only half the back-bonding to
dinitrogen. Judging from the positions of the charge-transfer maxima' the
metal orbitats of the EDTA complexes are of similar energy to those in
ruthenium ammine dinitrogen complexes' If anything' they are higher since
the transitions occur at lower energy. Table 2.4.La compares the spectral
characteristics of the EDTA complexes with known dinitrogen complexes. As
can be seen the molar absorptivities, and absorption maxima are comparable
with other established complexes'
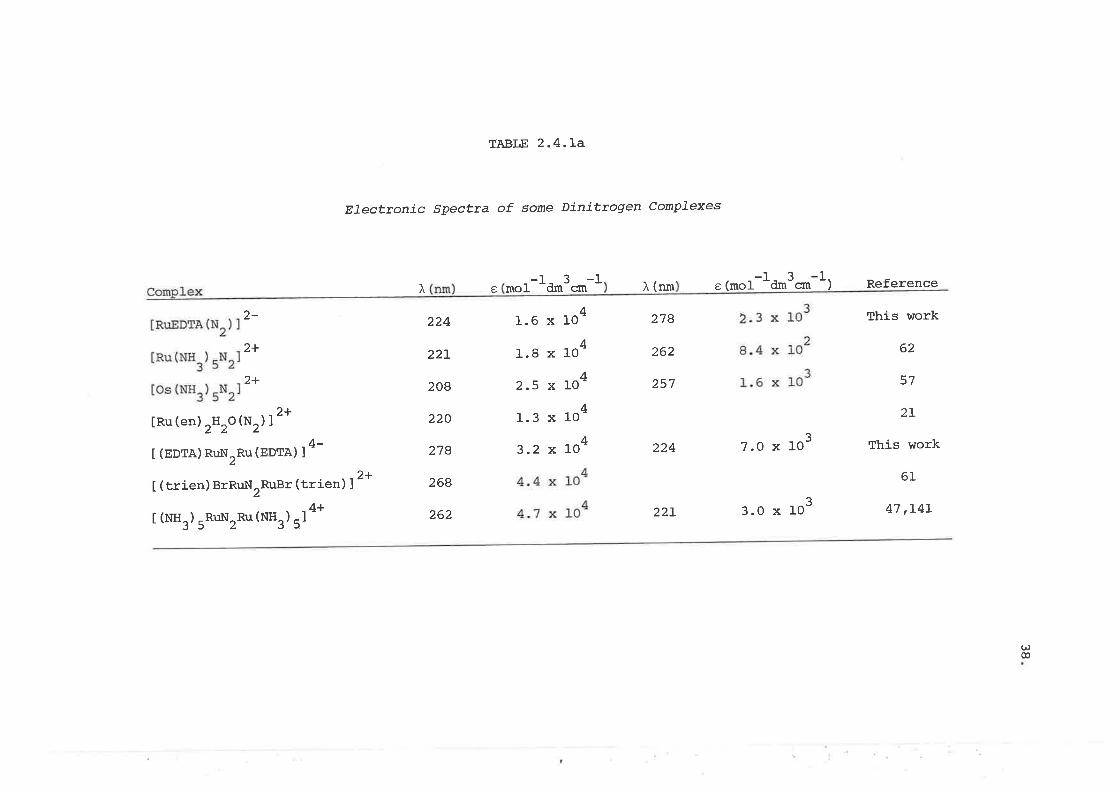
TABLE 2.4.La
Electtonic Spectta of some Dinittogen CompTexes
-1 -1 33 -1 t)). e moI ¿lm
I.6 x I0
I.E x 10
2.5 x l0
I.3 x l0
3.2 x
), (nm e (mo1 dm Reference
This work
62
57
2T
This work
47,LAL
4
L4.4 x LO'
L4.7 x IO'
cm
7.0 x 10
3.O x 10
cm
lRuEDrA(N2) l
lRu(NH3) sN2I
los (NHr) uNrl
2-
lRu(en) 2H2o(N2) l
t (EDTA) Rr:NrRu(EDTA) l4-
[ (trien) BrRuN RuBr (trien) l
2+
2+
2
2+
224
22r
208
220
278
268
262
4
4
4
278
262
257
224
22].
2.3 x 10³
8.4 x iro2
I.6 x 103
2+
L10'
3
6L
3
t (NH3) 5R*ztu (NH3)
5l4+
(,æ

39.
2.5 CarbongJ Complex
From the ability of tRu(II)HEDTA(H2O) I to form complexes with a
r-acceptor ligand such as dinitrogen, it was concluded that substitution
by carbon monoxide shoul-d proceed readily. It was found that the passage
of this gas through a solution containing the above aquo complex lead to the
facile preparation of a carbonyl complex. Precipitation by ethanol yielded
a yellow solid which was sÈable in air and aqueous solution. Titration
with base indicated one ionizable proton per ruthenium which' together with
mícroanalysis, infrared .rrd l3c-rr*r spectrum (Chapter 4), supported thet
formulation IRuHEDTA(CO)]K.2H2O. A molar conductance (^M) of 276 S cm-,
measured in aqueous solution, indicated that the complex behaved as a weak
acid and not as 1:I efectrolYte.
The infrared spectrum of Èhe solid complex (ta¡te 2.5ai Eí9.2.4b) was
dominated by a strong carbonyl absorption at I94O cm-l due to coordinated
carbon monoxide, and absorptions at approxima:cely L725.t-1 .rrd 16OO cm-l.
The former revealed the presence of a free carboxylic acid group while the
latter stemmed from the absorptions of the coordinated carboxylates. The
v (CO) stretching frequency \^ras typical of carbon monoxide coord,inated to
ruthenium(II) in the presence of ammine ligands. The reduction in
stretching frequency from the free gas value, Av(CO), \^las 203 cm-I,
comparable with [nu(NHa)5CO]X2 (X = Cl- ,142 I-;+3 Tabl-. 2.5Ð. Comparison
wirh IRuEDTA(N2)] (NH4)r.5HrO and [RuH2EDTA(NO)CI] .2H2O indicated
Av (CO) to be similar to Av (N2) , but considerably less than Àv (N0) . This is
also the trend shown by t¡u(NHa)5XYl2+ (XY = N2, CO, NO) although the
magnitude of the differences in each case are affected by counter ion
polarization as welt.I5 Stanko and Starinshakl42 h"n. suggested that, if
the reduction in the diatomic ligand stretching frequency can be considered
a measure of the extent of metal-Iigand, dn + rl* (Iigand) type of n-bonding'
then CO and Nr ligands shohr a similar amount of interaction, but it is
much larger for No*.

40.
For carbonyl complexes the vibrations v (M-CO) and ô (M-CO) are observed
in the infrared spectrun in the region of 600 to 5OO.*-1.1431144 For the
EDTA analogue these Èwo vibrations were weak and could not be identified
readily. Absorptions at approximately 640 c*-1 arrd 540 cm-I were
tentatively assigned to these vibrational modes. (Table 2.5a)
The electronic spectrum (tabte 2.5c) in aqueous solution revealed no
prominent features. A shoulder appeared at approximately 260 nm and a
weak band at 425 nm. A strong absorption was observed up to the limit of
the spectrometer (190 nm), in common with the spectra of IM(NH3)5COI2+
(¡4 = Ru,142 9=145¡. Stanko and Starinshakl42, in describing the spectrum of
[Ru(NHr)5CO]2+, assigned the dn-n* (CO) transition to a band at 277 nm, and
the d-d transition to the peak at 360 nm. However, Allen and Stevensl4s
have pointed out that the reason the carbonyl complexes do not show an intense
dn-n* transition similar to monomeric diniÈrogen complexes is that the n*
orbitals in carbonyl comptexes lie at higher energy. Thus transitions are
observable only below 2OO nm. Instead, they assigned absorptions aL 271 nm
and 360 nm in tRu(NH^)-COl2* ao transitions within an octahedral low-spinJ5
6d.o metal system. These observations suggested that for the EDTA complex'
the intense absorption beyond 200 nm corresponded to a dn-n* transitionr
although the intensity of the shoulder at 260 nm implied a charge-transfer
origin as well. The Iow energy peak was assigned to .. On + Tg transition.

4T
TABLE 2.5a
Assiqnments
Infrared Spectrum of IRuHEDTA(CO) lK.2H 20
Frequency ("*-t)
(nulol) (KBt matrix)
v (oH)
Alíphatic v(CH)
Carboxylic v(OH)
v (co)
Carboxylic v(CO)
Carboxylate v(CO)
Carboxylate v(CO)syrnmetrícal stretch
3400 srbr
obscured
2530 wrbr
262A w,br
1940 s
1725 ms
1600 s,br
obscured
L2L5
1235
1100
635
540
ms rbr
ms rbr
S rbr
mrbr
w
ms rbr
ms rbr
s rbr
mrbr
VT
3440
2950
2980
2520
26LO
l-940
1730
r610
1385
s,br
mrbr
sh
wrbrwrbr
s
ltts
s rbr
s rbra
Coupled C-0 stretch andO-H deformationa
T2T5
L240
1100
640
540
a. Tentative formulations.

TABI,E 2.5b
Comparison of v(xY) (XY = CO, N2' NO)
-1v (xY) cm v( free XY) cm
42.
-Ib _1Av cmComplex
IRuHEDTA (co) I K.2H2o 1940
2110
1890
r955
t9r8
2LO5
1903
2r43
233l-
2220
203
22L
330
188
225
226
3L7
IRUEDTA(N
IRuHTEDTA
2) I (NH4) z5Ezo
(No) cIl .2H2c-
b
tRu (NHr) 5col 12 a
b[Ru (NHr)
sco] c12
lRu(NHr) SNZIcIZ
lRu (NHr) 5Nol
cI3 b
a. Ref. 43
Complex
b. Ref. I42
TABLE 2.5c
ELecttonic Spectra of CarbongT Complexes
À (nm) e (mot-1dmt"*-1)^
(s cm2)cM'
IRuHEDTA (co) I <190
260 sh
425
<190
277
360
<190
249
316
32.2 x IO
65
258
L7
730
65
276
lRu(NHr) Ucol
los (NHr) ucol
2+a
2+b
a. Ref. L42 b. Ref. 57 c. 1.0 x 10⁻³ mol dm-3 solution at 22.O"C

43.
CHAPTER 3
TETRADENTATE EDTA COMPLEXES
3.1 Introduction
The subject of Èhis chapter is the preparation and characterization of
rutheniurn complexes in which EDTA behaves as a tetradentate ligand- Fig.
3.Ia after page 106schematically illustrates both the pentadentat-e and
tetradentate complexes discussed throughout the text'
3.7.1 Nitrosgl ComPTex
The preparation of a ruthenium nitrosyl complex was desirable since
work in recent years has shown nitrosyls to be useful precursors for other
products.52,l47-I50 The last chapter showed this to be true of the
ruthenium EDTA nitrosyl complex prepared. Ruthenium(II) nitrosyls are hlell
established, as illustrated bY
For such octahedral complexes containing d6 metal centres, the MNO group is
believedl +7 ,I4g 'L52 Eo possess structure (I) below, in which NO+ is
linearly coordinated and the Effective Atomic Number rule is obelzed'. However,
cases are knownl52-154 itt which coordination by NO to a metal in a l-ow
oxidation state capable of electron donation, results in the 'bent'
structure (II) shown.
M=N=0+N
+_++M-N=O ê
tRu (NHr) 5NOl
3+ 151 .n¿ tnu (ripy) 2No
(cr) 1 2+. t s o
M-N.\'o
õ+M+ + M=N
0
(r) (1r)
Fig. 3.1.1a Linear and Bent MNo Groups.l52
The preparation of the complex was investigated by several methods, all
of which yielded the same product. These involved, (a) heating a solution
of [RuHEDTA(Ct)]K.2HrO or [RuH2EDTA(Cf)r1K.H2O with an ethanolic solution of
the nitrosylating agent ,lV-methyl-IV-nitroso-p-toluenesulphonamide (¡'lWfS);
(b) passing nitric oxide through solutions of the chloro EDTA complexes;
(c) the action of niÈrite ion or NOPFU upon the ruthenium(Il) EDTA aquo

species produced in situ by hydrogen reduction; (d) the passage
oxidethroughanacidicsolutioncontainingthebis(benzonitrile)
44.
of nitric
complex,
IRuHTEDTA(PhCN) ,) -2uro, (section 3'2) ' and finally (e) ' the reaction of
NarHrEDTA.2H20 with the pentachloro nitrosyl species' IRuCIU(NO)]K2 in
acidic solution.
The product in each case I¡Ias a pale brown solid whose infrared spectrum
(Table 3.l.ta) reveared an intense nitrosyr stretching mode at 1890 cm 1,
together with strorrg ".rnolyl absorptions at approximatery 1640 "tn-l t"d
/lr-
t72O cn-I. The former was assigned to the carbo>tyl stretch of coordinated
carboxylate groups, the latter to the carUo'iyr stretching mode of the free
carboxylic groups.
As Table 3.l.lb ilrustrates, the nitrosyl comprex courd be titrated
withbaserneutral rzLngtwomolesofhydrogenionperruthenium'This
indicated a tetradentate EDTA complex. The titration curves showed only one
endpoint. From these the PKrrr the averaged pKr values for the diprotic
acid',wasdeterminedtobeapproximalely2.4.Thepresenceofcoordinated
chloride was demonstrated by gravimetric analysis and titration with silver
ion.Togetherwithelementalanalysis'theformutationforthenitrosyl
complex was taken to be lnuUreora(NO)Cl] '2tl29'
The methods of preparation, (a) to (d) essentially involved substitution
by No into the ruthenium EDTA aquo ion. Reaction (a) using MNTS gave good
yieldsprovidedanexcesswasused.Thisreagenthasbeenusedtoproduce
metal nitrosyls upon reaction with metal hydride complexes'155 (section 8'2'2) '
PresumablySomeformoftransferoftheNogrouptothemetaloccurredwith
a reduction of the formal oxidation state by one unit, together with
decompositionofthenitrosylatingagenttotheparentamide.Reaction(b)
was carried out with prior flushing of the solution with argon to prevent
aerial oxidation of No, with subsequent hydrorysis to nitrite' Despite this
precaution some nitrite contamination always occurred, possibly since the
prolonged use of NO can lead to oxidation of the coord'inated nitrosyl group'155

45.
Nitrite was removed by warmíng the product in dilute acid'
The reaction underlying method (c) was believed to be the equilibrium
(I)shownbelowinvolvingformationofthenitrosoniumionwhich
subsequently attacked the ruthenium(Ir) species' 155
-++NO2 + 2H* <- NO- + H2O (f)
Ho\^rever, equally valid I^Ias a mechanism involving coordinatíon by nitrite
followed by oxide abstractiorr.l55rI56 The reaction with nitrite proceeded
rapidly but contamination by this reagent occurred since a slight excess
was always used. Nitrite has been used successfully to produce, in situ'
a chromium EDTA nitrosyl complex.157 Reaction with excess NOPFa proceeded
vigorously, but also resulted in nitrite contamination due to hydrolysis of
the nitrosonium salt. Moreover, oxidation of ruthenium(II) was possible as
NO+ is capable of acting as a one-electron oxidizing agent'155r158
The pathway for reaction (d) was uncertain. Probably breakdown of the
bis(benzonitrile) complex preceded No substitution. As the complex v/as
neutral this method produced no salts as byproducts' Method (e) utilized the
well known complex [RuCIr(NO)]K2, in a reaction involving chelation of EDTA
about the metal. This paralleled the synthesis of the chloro EDTA complexes
using lRuclu(H2o)]Krr and it also required refluxing. Although the problem
of contamination by nitrite vTas avoided, unreacted starting material was
isolated with the product if insufficient time was allowed for reaction'
Further, as the reaction resulted in the formation of four moles of halide
salt per mol-e of complex, contamination was frequent. However, the solubility
of the complex in alcohol allowed a reasonably pure compound to be obtained
after several extractions.
several authorslSg'160 hu..r. noted that the value of the v(No)
stretching frequency is diagnostic in determining whether the Ru(rrlfro
grouping exists in a comPlex'
in the range 2222 - 23OO cm-l,
Thus, while nitrosonium salts exhibit v (NO)
stretching frequencies of complexed NO+ occur

46.
-1in the range 1700 - 1900 cm However, f.or complexes considered formally
to contain NO the stretching frequency occurs outside this range at lower
frequencies. Enemark and Felthaml52 have remarked that it is misleading to
describe atl linear complexes as derivatives of NO+ and aII bent complexes
as derivatives of NO , and that the geometry of the MNO group should not be
dedueed from v(No) alone.
The observed v (NO) stretching frequency for the EDTA nitrosyl complex
suggested strongly a Ru(1I)ÑO formutation, and \^/as comparable with v(No)
frequencies for other ruthenium(II) complexes shown in Table 3.1.lc.
Coordination by EDTA caused a small decrease in the value of v (NO) , both in
the solid state and solution (methanol) as compared with the parent nitrosyl
complex, IRuC1UNO]K2. Bottomleyl49 ¡." proposed that nitrosyl complexes
having v(No) greater than 1886 ctn-I, and force constants, F(NO), greater than
13.8 mdyn 8-1, witt be susceptibte to nucreophiric attack upon the
coordinated NO+ group. Although this is true for a considerable number of
compounds, the borderline beÈween reactive and unreactive complexes is not
clearly defined. Thus, tRuClUNoJK, (v(NO) 1886 cm-I (soln) F(No)
t¡.g mayn 8-r) has been reportedl4g to be unreactive towards nucleophitic
attack, whereas [RuCl(das)rsOJ2+ (v(NO) 1886 cm-l (soln) F(NO) t:.a mayn 8-I)
reacts with several nucleophiles.l49 The reactivity of IRuHTEDTA(NO)Cl] -2H2O
(v (NO) I88O cn-I in methanot) towards hydrazine and hydroxylamine indicated
that Bottomley's criteria are only approximate, and that the border of
reactivity is somewhat Iower than proposed.
3.L.2 SoJ-ution Properties and Spectra
The nitrosyl complex was found to be readily soluble in water, methanol
and trifluoroacetic acid. Aqueous and methanolic solutions of Èhe complex
were stable on exposure to air. Extensive dissociation in aqueous solution
was observed, involving the loss of chloride ion and possibly the conversion
to a pentadentate nitrosyl compfex. This is shown by equation (3).

47.
+IRuHTEDTA (No) CII IRuHEDTA(No)] + H +cI (3)
Molar conductance measurements in aqueous solution consistently
yielded values above 42O s cm2 (Table 3.1.fb) in agreement with the releaseo -lof a proton and chloride ion per molecule of complex. (^M(HCI) = 42L S cm"mol J
at 25.gog¡16I Dissociation of the chloride ion was consistent with its
rapid precipitation in the presence of silver ion. This was analogous to the
behaviour of IRuHEDTA(C1)]K.2H2o (Lit.tt n* = 384 S on') and the dichloro
analogue, (Lit.88 ^,,
= 74L s.m2). Although an aquo complex such asM
IRuHEDTA(NO)H2O] was a conceivable product in equation (3), the pentad,entate
form was preferred since titration of the nitrosyl complex produced only
one endpoint. (section 3.I.1) Earlier it was stated (section 2.1) that the
presence of the ruthenium(III) aquo complex is indicated by the appearance
of a second endpoint during tiE.rations with base. On the assumption that
the aquo ligand of IRuIÍEDTA(NO)H2O] would possess ¿ pKa comparable in
value with IRuHEDTA(H2O)], the absence of a second endpoint during titrations
was taken as further evidence against the former species existing in
sol-ution in significant amounts. Occasionally, preparation of the nitrosyl
complex yielded a product, which after purification titrated for less than
two equivalents of acid (1.5 to 1.8). This was attributed to the presence
of some of the monoprotic complex, [RuHEDTA(NO) ] in the product. The nature
of the nitrosyl complex in solution is discussed further in Chapter 4.
Dilute solutions of the complex were almost colourless, but concentrated
ones appeared brown. The el-ectronic spectrum (Table 3.1.2a) in aqueous
solution produced a broad absorption at 360 nm and a much weaker one at
500 nm, similar to the spectra of ruthenium ammine nitrosyl complexes.
Schreinerl62 has recorded the spectra of trans-tRu(NHr)4No(L)12+
(L : NCo , N3 , oH , Cl , Br ) noting that these complexes generally produce
an absorption of 1ow intensity (e rv 2 x Lo2 *ol-ld*3"*-I) in the vicinity
of 350 nm assigned to tor_ * 1r, tru.n"itions. Weaker absorptions are seen
in the visible region and are believed to involve spin-forbidden transitions,

48.
tor_ * {"r,'rr) and metal to nitrosyl antibonding orbital transitions'
E2 * n* (No). However, these complexes also possess strong alcsorptions
(e > to3 *or-1d*3"*-r) in the urtraviolet region as a result of allowed
Iigand-metal charge-transfer bands. The EDTA nitrosyl complex produced
no analogous alosorption and in this respect resembled the spectrum of
lnu (Nttr) UNol
3+ t6z
The spectrum recorded in 2.0 mo1 ¿m-3 rct soluÈion, where dissociation
by chloride was considered to be unfavourable revealed no charge-transfer
band.fnaddition,methanolicsolutions,inwhichthecomplexisnot
extensively dissociated, produced no new absorptions in the ultraviolet
regionoftheSpectrum.Thisappearedconsistentwiththeseries,
L)12+ (L = cl , Bt, r )163 t¡sag only two dístinct bands
are seen. In these complexes a weak, broad absorption is seen in the 450 nm
region and a more intense absorption at approximately 350 nm
(e ru 2 x I02 *ot-1d*3.*-l), but no charge-transfer bands appear up to
200 nm. For the cis- complexes this absorption occurs at higher energy as
compared with the trans- seríes'

49
TABLE 3.I.IA
Infrared Spectrum of ÍRI:II TEDTA(NO) C7l .2H
20
Assignment (nuioI)
Frequency (cm-1
(KBr matrix)
i
I
I
I
I
I
I
l
2v (No)
y (oH)
Atiphatic v(CN)
Carboxylic v(OH)
v (NO)
Carboxylic v(co)
Carboxylate v(Co)
Carboxylate v(CO)symmetrical stretch
Coupled C-0 sÈretchand OH deformationa
v (c-N) a
3760 w,br
3420 s,br
obscured
2540 s,br2620 w,br
1890t5s
1725 s rvbr
1640 srvbr
obscured
1230 s,br
1080 ms
I^7,bf
s,br
mrbr
s
srsh
s rvbr
s,br
3750
3440
2980
2540
2620
1890
1730
r650
1360a
a. Tentative assignments.

50
TABLE 3.I.lb
Pteparatíon, AnaTgsis and Molat Conductances
of lRuH ,EDTA (No) CLl ' 2H 20
Method ofPreparation
a
H'/Rr¡:t(moIes)
CI /Ru(moles)
^+M(s 2.cm)
(a)
(b)
(c)
(d)
(e)
s¡ (rrr) /MNTS
Ru (III) /*o (n)
s¡(II) /NoZ
lRuHrEDrA(PhcN) zl /No (s)2.- 2-
lRuCluNol - /H2F.DTA-
L.g5 ,1. 58, r. 93 r. 05
2.O2
2.3L
2.04
r. 89,1.96
o.94
L.32,L.06
485
437
446
*
t
Titration with o.OI mol d*-3 N.ott. From neutralization curves
roK determined Èo be 2-4 (mean of six titrations) '-av
I.O x 1O-3 mol dm-3 aqueous solution at 24'O"C'
In methanol i\* 'r' 45 S cm2.

51.
Complex
TABLE 3.1.IC
v(NO) VaLues of some Ruthenium(Ir) NitrosgT Comp-Zexes
v (No) (crn-1 Medium
IRuH2EDTA 1¡9) Crl . 2H2O 1890 (ts)
1880 (15)
1910
1886
1899
1880
Nujol, KBr
Methanol
solidsolution
solid
solid
alRuCIUNol K,
cis- [Ru (NH3) 4No
(cr¡ l q1rb
trans- [nu (NHr) 4No
(CI) ] c12c
a. Ref. L49 b. Ref. 163 c. Ref. L62

52
TABI,E 3.L.2A
ETectronic spectra of some Ruthenium(Ir) NitrosgT complexes
-I 3-lT e (mol cmdm ) SolventComplex
a 1.7 x
N25
1.7 x 10²
22.0 x 10
1.26 x 10
19
4.22 x LO
2.64 x IO
L7
I^later
Methanol
2.0 mor a*-3 rct
ülater
Water
LO2IRuH2EDTA (No) cll . 2tI 2o
360
500
360
360
b 2
3
2
cis- [Ru (NH3) 4No
(cf ¡ 1q1, 345
480
trans- tRu (NHr) 4No
(cI) l Ctrc 243
330
440
a. ProductfromNOPF./lrtu(Il)IIEDTA(H.o)]resultedinanextrapeak-6"--- ¿
at 29O nm of unknown origin'
Ref. 163
Ref. L62
b

53.
3.2 CompJexes with Monod'entate Nitrogen Donor Ligands
This section describes the complexes isolated from the reaction of
organonitriles and pyridines with the ruthenium(II) EDTA aquo species'
AIso discussed are their properties and spectra'
i.2.1 Characterization and Inftared Spectta
The action of organonitriles, pyridine and 4-methyl-pyridine
(y-picoline) upon solutions containing [RuHEDTA(H2o) ] resulted in the
formation of stabfe ruthenium(II) -bis(nitrife), .bjs(pyridine) and
.bjs(4-methyl-pyridine) complexes. These were formul-ated generally as
[RuH2EDTA(I,)rì.nHrO, where L denotes the ligands shown in Table 3-2-Ia.
TABLE 3.2.La
[RuHTEDTA(L) 2J.nHr0
AppearanceL
MeCN
PhCN
7,2-C6H4(CN) 2
r, 3-c6H4 (cN) 2
pv
4-Me-py
*
yellow needles
yellow microcrystaltine solidorange microcrystalline solidyellow powder
yellow-orange Powder
yellow-orange Powder
t
* isophthalodinitrile t phthalodinitrile
The proposed formulations, in which EDTA behaves as a tetradentate
Iigand, were based upon evidence obtained from microanalysis of the sarnples,
titration with base, and IH- arrd lt"-rr*t specÈroscopy (Chapter 4) ' Of the
bjs(nitrile) complexes Listed, the phthalodinitrile derivative could only
be obtained impure as ascertained from the analysis and electronic spectrum
of the complex. It possessed higher solubility in aqueous and methanolic
solution than other members of the series'
The possibility of bridging between two ruthenium centres was investi-
gated briefty by usíng dj-nitrile ligands such as mafeonitrile (CN-CH2.CN)

54-
and tetrafluoroterephthalonitrile (I,4-CaF A(CN)2) . However, neither
ligand yielded a well-defined product. The addition of maleonitrile
occasionally produced, a yellow complex which analyzed for a monomeric
formulation IRuHTEDTA(CH2(CN) r)rl-nHrO. On the other hand, the second
dj-nitrile above produced a deep red solid which was soluble in water and
methanol and appcared to be a mixture. Analysis did not support clearly
a monomeric or dimeric formulation. Most likety both forms were present.
The infrared spectra of the nitrile and pyridine complexes
(Tables 3.2.Lb, c) produced strong carboxyl absorptions in the region of
1725 cm-I and 1600 .*-1. The former were assigned to the carboxyl stretching
mode of the free carboxylic acid groups, the I'atter to the coordinated
carboxylates. Both types of absorption were of comparable intensity and
supported a formulation involving tetradentate EDTA in which two glycinate
arms are coordinated and two are free. V'lhereas the pyridine complexes only
produced two intense carboxyl absorptionS (fig. 3.2.Ia), severaf of the
nitrile complexes displayed an extra band in the same region of their
infrared spectra (ni-g. 3.2.Ia). Thus the complexes IRuHTEDTA(L)2] 'nH20
(L = MeCNt L,2-C6Hr(CN)2) revealed peaks of comparable intensity at
approximate1'y L725 cm-I, 1655 cm-t and 1580 t*-I' However,
IRuHTEDTA(ehCN) 2l.2H2o showed only two strong absorptions at 1725 cm-l and
15BO crn-l, the latter non-s)zmmetrical in shape, and a much weaker peak at
t65o cm-l. The peaks at L725 .*-I and 1580 crn-l were readily assigned to
carboxyl stretches of the free carboxylic acid group and coordinated
carboxylates, respectively. However, that at l-655 crn-I was not assigned
definitely as its origin coufd stem from the anisotropy of solid state
interactions giving rise to two carboxylate absorptions, or from the bendíng
mode of lattice water which occurs in this area.125'164 The bjs(acetonitrile)
complex when recrystallized from DrO showed a definite decrease in intensity
of this peak,while those at L725.m-I and 1570 cm-I were unaffected. This
appeared to support the latter proposal above, though not conclusively' since

A
I IRuH2EDTA(MeCN) ,J .urO (Nujol)
x
t4
3800 3200 2600 2000 1800 1600 1400 1200
ltavenumbers ("rn-1)
Fig. 3.2.La Infrared Spectra of the Bjs(acetonitrile) (X) and Bjs(pyridine) Complexes (Y).
1000 800
8001000120014001600180020002600
IRUH2EDTA(nV) rJ .2H2O (KBr matrix)
3200
Y tl
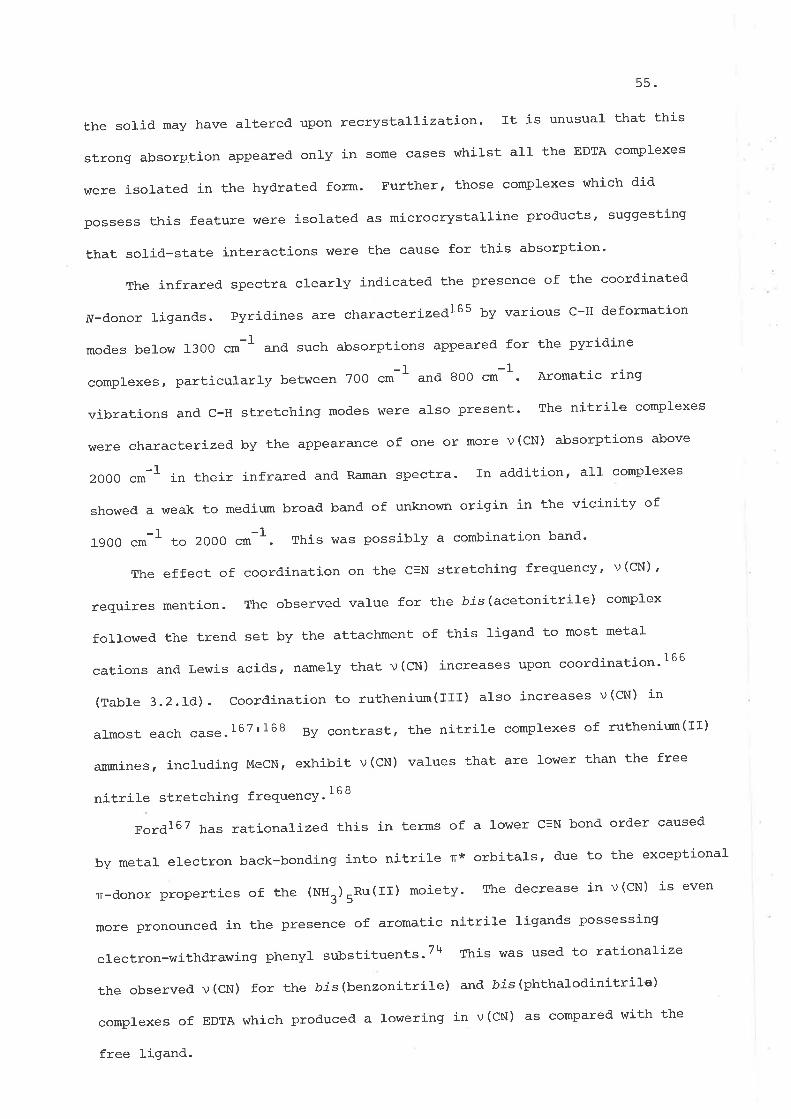
55.
the solid may have alÈered upon recrystallization. It is unusual that this
strong absorption appeared only in some cases whilst all the EDTA complexes
were isorated in the hydrated form. Further, those comprexes which did
possess this feature \^Iere isolated as microcrystalline products' suggesting
that sotid-sÈate interactions \^¡ere the cause for this absorption'
The infrared spectra clearly indicated the presence of the coordinated
N-donor ligands. Pyridines are characterizedl65 by various C-H deformation
modes below I30O cm-l and such absorptions appeared for the pyridine
complexes, particularly between 7oO cm-l and 8OO .*-t. Aromatic ring
vibratíons and c-H stretching modes were also present' The nitril'e complexes
were characterized by the appearance of one or more v (cN) absorptíons above
2oO0 cm-I in their infrared and Raman spectra. rn addition, all comprexes
showed a \^/eak to medium broad band of unknown origin in the vicinity of
l9O0 cm-I to 2OOO .*-t. This was possibly a combination band'
The effect of coordination on the C=N stretching frequency, V(CN) '
requires mention. The observed value for the bis(acetonitrile) complex
followed the trend set by the attachment of this ligand to most metal
cations and. Lewis acids, namely that v(CN) increases upon coordination'166
(Table 3.2.fd). Coordination to ruthenium(III) also increases v(CN) in
almost each case.I67r168 By contrast, the nitrile complexes of ruthenium(II)
ammines, including MecN, exhibit v(cN) values that are lower than the free
nitrile stretching frequen.y. 168
Ford167 hu." rationalized this in terms of a lower C=N bond order caused
by metal electron back-bonding into nitrife n* orbítals, due to the exceptional
n-donor properties of the (NH3)URu(II) moiety. The decrease in v(cN) is even
more pronounced in the presence of aromatic nitrite ligands possessing
electron-withdrawing phenyl s'bstituents.T4 This was used to rationalize
the observed v (CN) for the bjs (benzonitrile) and bis (phthalodinitrile)
complexes of EDTA which produced a lowering in v (cN) as compared with the
free ligand.

56.
ChattTS has studied the solid-state interactions of anions and solvents
with cations of the type, [Ru(xttr)Ux=v]2+ (X=Y: MeCN, PhcN) and has shown
that v(CN) is affected signíficantly by the size and type of anion. Thus,
v (cN) for the case of MeCN, appears aE 2237 "*-1 fot the Cl anion, but
increases to 2277 cm-I with PFU as an anion. The interactions are believed
to be largely electrostatic. The smaller the anion the greater the
polarization of the ammine ligands, Ieading to greater release of electron
density into the anti-bonding orbitals of C=N, and to a decrease in v (Cl¡).
similar cation effects upon the value of v (No) for [RucIUNol 2- h.rr" al=o
been observed. TB
However, the EDTA nitrile complexes were neutral species. Thus, the
observed v(CN) values reflected the lowering, or otherwise, of the C=N
bond order without a contribution from counterion polarization effects.
Indeed,. neutralization of a solution of IRuHTEDTA(PhcN) ,).2íro wit-]:.
potassium carbonate followed by concentration to dryness, yielded a solid
whose v (cN) appeared al 2220 cm-I (shoulder aE 2240 cm-l) and presumably
resulted from IRuEDTA(PhCN) Z]KZ.nH2O. The further decrease in v(CN) was
attributed to potarization by the cation. (The complex was not stable, and
gradually decomposed to a violet solid.) The .bjs(benzonitrile) UOta
complex produced a smaller shift, Av (CN) , from the free ligand value than
do either cis- or trans-¡¡q(NHr)4(PhcN) rl2+.2+ (Table 3.2.ld). This was
attributed to the weaker n-back-bonding properties of (EDTA)Ru(II) entity as
compared with (NH3)5Ru(fI) and the absence of polarization by counterions.
The complexes obtained. using di-ni.trile ligands produced two distinct
v(CN) absorptions usually accompanied by shoulders. One peak was only
slightly shifted from the free tigand value, while the other was considerably
Iower in a manner already noted by rord.74 It was assumed thaÈ the most
shifted peak corresponded to the coordinated and Èhe least shifted to the
free C=N group. The major v(CN) peaks of both the.bjs(acetonitrile) and
bis (benzonitrile) complexes \^¡ere accompanied by distinct absorptions on the
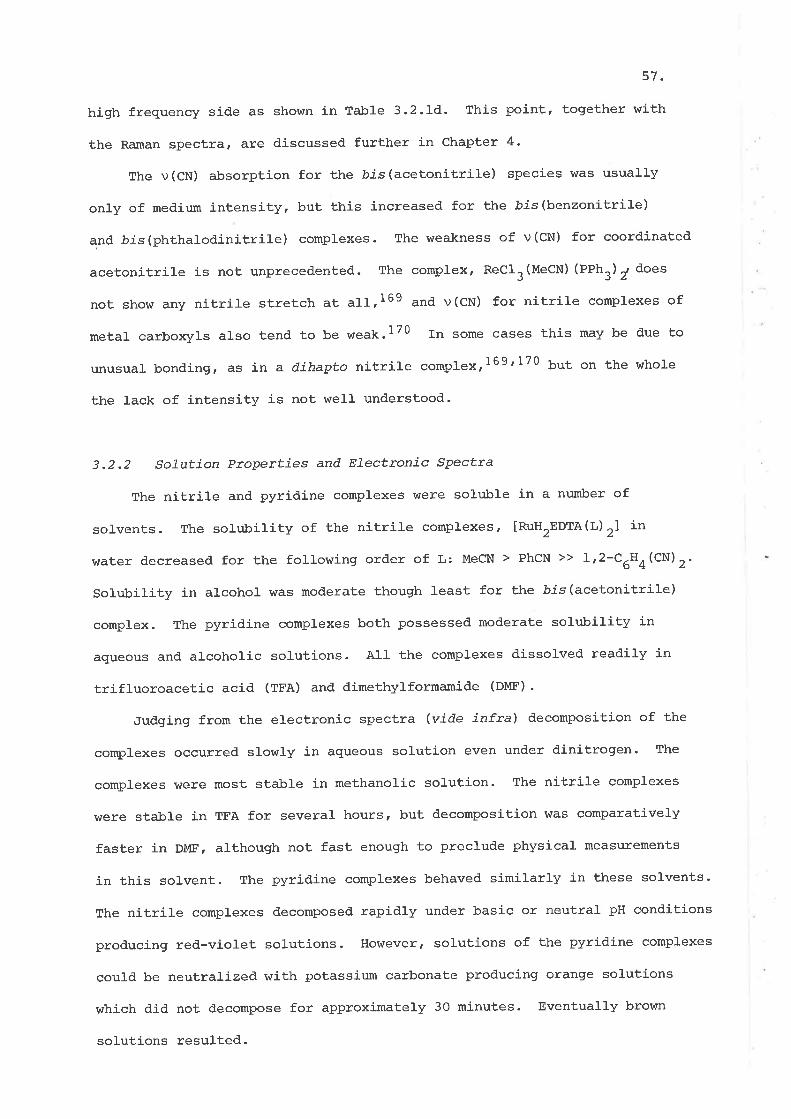
57-
high frequency side as shown in Table 3.2.Ið'. This point, together with
the Raman spectra, are discussed further in Chapter 4.
The v (cN) absorption for the bjs (acetonitrile) species was usually
only of medium intensity, but this increased for the .bis(benzonitrile)
and bjs(phthalodinitrite) complexes. The weakness of v(CN) for coordinated
acetonitrile is not unprecedented. The complex, ReCIr(MeCN) (PPh3)7 does
not show any nitrile stretch at aI1,I69 atd v(CN) for nitrile complexes of
meÈal carboxyls also tend to be weak.l70 In some cases this may be due to
unusual bonding, as in a dihapto nitrite complexr169'170 bot on the whote
the lack of intensity is not well understood-
3.2.2 Solution Ptoperties and ETectroníc Spectta
The nitrile and pyridine complexes were soluble in a nurnber of
solvents. The sotubility of the nitrile complexes, IRuHTEOTA(L)2] in
\^rater decreased for the fottowing order of L: MeCN > PhCN >> L,2-C6H4(CN)2.
So¡¡bilíty in alcohol was moderate though least for the bis (acetonitrile)
complex. The pyridine complexes both possessed moderate solubility in
aqueous and alcoholic solutions. All the complexes dissolved readily in
trifluoroacetic acid (TFA) and dimethylformamide (DMF).
*Iudging from the electronic spectra (vide infra\ decomposition of the
complexes occurred slowly in aqueous solution even under dinitrogen. The
complexes were most stable in methanolic sol-ution. The nitrile complexes
were sÈable in TFA for several hours, but decomposition was comparatively
faster in DMF, although not fast enough to preclude physical measurements
in this solvent. The pyridíne complexes behaved similarly in these solvents.
The nitrile complexes decomposed rapidly under basic or neutral pH conditions
producing red-violet solutions. However, solutions of the pyridine complexes
could be neutralized with potassium carbonate producing orange solutions
which did not decompose for approximately 30 minutes. EvenÈua1ly brown
solutions resulted.

58
Titration of aqueous solutions of the complexes wiÈh hydroxide ion
indicated an averaçJe of two ionizable protons per ruthenium in all cases'
From the neutralization curves the pK-v \^7ere estimated to lie in the
range 2.7 to 3.0 for the nitrile and pyridine species (Tabte 3.2.2a).
Conductance measurements were carried out in several solvents ' In aqueous
solution molar conductances of the pyridine and nitrile Ppecies were
r wol- I
comparable with values consistently above 2OO S cm-^(Table 3-2.2a).
For a solution containing IRuHTEDTA(MeCN) ,1, a plot of the specific
conductance versus concentration produced a curve, characteristic of a
weak acid (Tabte 3.2.2b; Fig. 3-2.2a). In organic solvents such as
methanol and DMF, conductance measurements of fresh solutions indicated
the complexes to be targely undissociated'
Attempts to prepare the corresponding ruthenium(III) nitrile complex
by reaction of the chloro EDTA complex with acetonitrile were unsuccessful'
The oxidation of IRuH2EDTA(MeCN) ,l.uro with silver nitrate, analogous
to the conversionT4 of tRu(II) (NHr)UMeCttl2+ to tnu(III) (NHr)rMeCNl3+,
resulted only in the rapid production of the ruthenium(IlI) aquo species'
No evidence for a ruthenir¡n(IfI) nitrile complex was obtained' Once again'
though rhe ruthenir¡n(rrr) pyridine complex [Ru(NHr)l"tåz. has been
isolatedrlT2 îo corresponding anatogue \^tas obtained with EDTA. However'
the electrochemical evidence presented in Section 5.3.4 suggested that
lRu(III)H2EÐTA(nV)rl+ could exist briefly in solution'
The elecÈronic spectra of nitrile and pyridine complexes were usually
measured in dinitrogen-saturated aqueous solution. The results are
collected in Tab1es 3.2.2c-f.. Overall, the spectral features of the two
families of complexes paralleled those of their ruthenium(II) ammine
counterparts. Thus, [RuH2EDTA(MeCN) ,).UrO possessed a plateau at 375 nm
and very intense absorption at approximately 205 nm, similar in both
position and intensity to the spectrum of [nu(uttr)uMecNJ2+.2+ It is
like]y that the low energy absorption steruned from a d-d transition' as

î1I
ÊoU)
o-lX
v
I'
I
ln
25
20
l5
IO
20
rig. 3.2-2a Specific Conductivity
IRuHTEDTA (MecN) zl'H Zo
(r) versus Concentration for
in Aqueous Solution at 22'OoC'
5
0 0 60 80
CxI0 mor dnt-35

59.
hexaammine ruthenium(fI) complexes produce ligand field absorptions of
comparable intensity in this area.173 The intense higher energy absorption,
on the other hand, was believed to resulÈ from a metal-ligand charge-
transfer band rather than an internal ligand transition, since spectra of
the free alkylnitriles show no absorptions beyond the vacuum ultraviolet
region (tu170 nn).I74
By contrast, the complexes containing pyridine, 4-methyl-pyridine or
aromatic nitrile ligands were characterized by strong absorptions in the
vicinity of 350-390 nm and approximately 240 nm. The lower energy
absorption \^¡as assigned to a metal-to-ligand charge-Èransfer transition'
since such absorptions, of similar inÈensity, occur in the spectra of
lRu(Nur)n(nv) ,l'* ,67 rr72 un¿ tRu(NHr) Aft) 212+
(r, is a substituted
nitrile) ,7+'167 bnt not in Èhe ruthenium(rrr) analogues'
This was supported further by the fact that this absorption was
sensitive to the nature of the phenyl ring sr:bstituents. More electron-
withdrawing groups, as estimated from the Hanmett substituent constant o
(although this does not apply to the ortho- isomer), lead to a bathochromic
shift of Èhe absorption maximum in the spectra of the nitrile complexes
(Table 3.2.2g). As mentioned earlier the product from the reaction using
tetrafluoroterephthalodinitrile was not characterized, but its spectrum
was noÈed to contain a strong charge-transfer band at 510 nm in keeping
with the expected large positive o constant of such a ligand. However, in
the spectra of the pyridine complexes the low energy band under\ôIent a
hypsochromic shift on substituting 4-methyl-pyridine for pyridine as a
ligand. This resulted from the inductive effect of a methyl group in the
para- position (i.e. a negative o constant) increasing the energy of the
charge-transfer transition. Similar shifts have been observed in the ammine
complexes of rutheniwt(II) containing substituted pyridine and nitrile
Iigands .74,167 It was presumed that in all spectra any d-d transitions
were masked by the charge-transfer absorptions'73
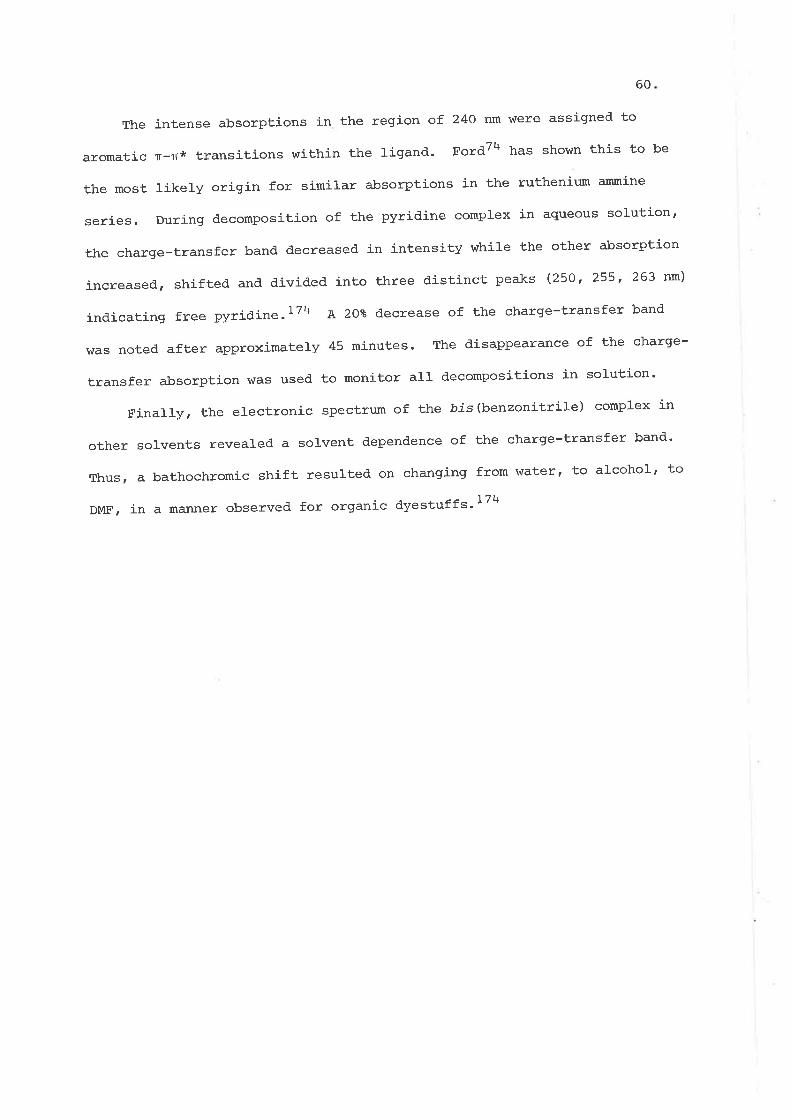
60
Theintenseabsorptionsintheregionol24onml^Iereassignedto
aromatic n-n* transitions within the ligand. Ford74 has shown this to be
the most likely origin for similar absorptions in the ruthenium ammine
series. During decomposition of the pyridine complex in aqueous solution'
the charge-transfer band decreased in intensity while the other absorption
increased, shifted and divided into three distinct peaks (25o, 255, 263 rm)
indicating free pyridine.l74 A 2OZ decrease of the charge-transfer band
was noted after approximately 45 minutes. The disappearance of the charge-
transfer alcsorption \^7as used to monitor aII decompositions in solution'
Finally, the electronic spectrum of the -bis(benzonitrile) complex in
other sorvents revealed a sorvent dependence of the charge-transfer band'
Thus, a bathochromic shift resulted on changing from water, to alcohol' to
DMF, in a manner observed for organic dyestuffs'I74

TABLE 3 .2 .Ib
Vibrational Spect.ra of lRuH2EÐTA(L),l .nn
Frequency (cm
L=MeCN PhCN
61.
(nujo7)
-1)
r ,2-c6H4(cN) 2 r,3-c6H4 (cN) 2
20
bAssignments
v (oH)
Aromatic v(CH)
Aliphatic v(cH)
Carboxylic v(OH)
v (c=N)
Combination band
Carboxylic v(Co)
Carboxylate v(CO)
Aromatic ringvibration
Carboxylate v(CO)symmetrical stretch
Combination bandC-0 stretch andoH deformationa
v (c-N) a
3590 sh
3500 s rbr
obscured
2590 w,br2480 w,br
2278 m,sh
2268 m
tu1950 m,vbr
1725 s
1655 srshpa
1580 s,br
a
I24O s
I22O s
1190 s,br
1100 s
3540 s rbr3440 s,br
3060 w
obscured
2600 w
2520 w
2240 ms
2226 s
tuI950 ms,br
L725 s
1655 ms,sha
1580 s,br
1490 m
14oo mb
1360 msb
1250 s,shI24O s
1215 s,br
1100 s,shp
3400
3380
3090
2950
2600
shrbrs rbr
w
_bmrbr
\¡!ìI
2242
2232
22L2
2J.98
tul930
l-720
1635
1575
1480
sh
s
s
sh
mrbr
S
_as,brs rbrb
m
3400 s,br
3070 w
2940 w,br
2500 vw
2243 s
2224 ms
L725 s
1610 s,br
1480 m
1380 ms,br
1240 ms,br
1210 ms,br
1090 mrbr
L24O s
1245 s
1220 ms
1090 m
a
b
Due to EDTA
KBr matrix.
Tentative formulation.

62.
TABI,E 3.2.LC
Infrared Spectra o ÍRuHTEDTA(pg) 2l '2H20
Frequency 1.*-1)
matrAss
v (oH)
Aromatic v(CH)
Aliphatic v(CH)
Carboxylic v(OH)
Combination banda
Carboxylic v(CO)
Carboxylate v(CO)
Aromatic ring vibration
Carboxylate v (CO) a
slzmmetrical stretch
Coupled C-O stfetch andoH deformationo
v (c-l¡) a
Other prominent a-bsorPÈions
1560 sh
1480 sh
obscured
1230 mrbr
1110 ms
775 ms, 765 ms
705 ms
nu
3300 s rbr
3070 w
obscured
2520 w
2600 w
^,1900 vbrrw
L725 s
1580 s,br
3420 bx,s
3070 w
3100 w
2900 w
2940 m,br
2970 m¡br
2990 w
2520 w
2600 w
¡,1920 br,w
1730 s
1580 s
1600 sh
1560 s
1480 n
1400 s,br1380 sh
1235 s,br1210 sh
1110 ms
775 ms' 765 ms
710 ns , '705 shrms
a Tentative assignment.

63.
TABLE 3.2.Id
Coord.ìnated and' Fr:ee CN Stretching Ftequencies' t¡(CN) ' (cm-7)
lRunrnore (MeCN) ,1 .ttro
lnuHrnora (PhcN) rl .2n,o
Infrared
2268 m
2278 m,sh
2226 s 22254
2240 ms 2240 sh
2198 sh
22L2 s
2232 s
2242 sh
2243 s
2224 ms
2232 s
2219 vs
22L3 vs
R'anan Free
2267 ms
2278 m
222L s
2236 ms
2257
2230
2237
2240
a
lnunreote (r,2 ' c6H4 (cN) 2) 2
1.2H 02
b
lRuureota(r, - c6H4(cN) ,) r1 'nllro
cis- [Ru (NH3) 4
(PhcN) ,lzner n
trans- tRu(NHr) 4 (PhcN) 2l ' rclo4) 2
b
a. Methanol solution b. Ref. 74
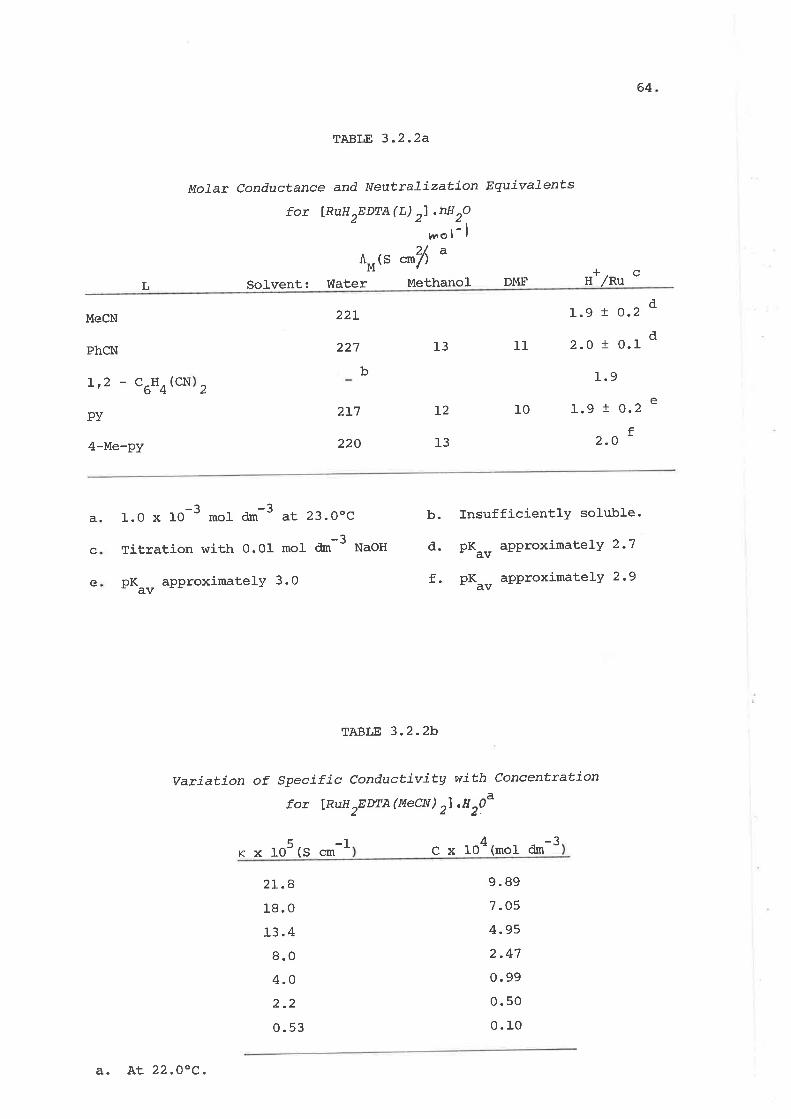
64
TABLE 3.2.2A
Molat Conductance and Neutralization Equívalents
for IRUHTEDTA(L) 2l .hH20
rt,ol- l
n*ts cnf a
+ c/RuHL Solvent: V'later Methanol DMF
MeCN
PhCN
L,2 - C6H4
pv
4-Me-py
22L
227
2t7
220
b
II
10
I3
12
l3
r.9 ! 0.2 d
2.O t O.r d
1.9
r.g + o.2 e
f2.O
(cN2
a
c
e
-3 -31.0 x I0 moI dm at 23.OoC
-?Titration hrith O.OI mol dm "
pK.., "pptoximatelY
3.0
5 -1
b. InsufficientlY soluble.
d. pK", aPProximatelY 2-7
f. pK"r, aPProximatelY 2.9
NaOH
TABLE 3.2.2b
variation of specific cond.uctivitg with concentration
fot IRIH TEDTA(MeCN) rl,H r}a
c x IO4 (mol dm-3rx10 (S cm
2L.A
18.0
L3.4
8.0
4.O
2.2
0.53
9.89
7. 05
4.95
2.47
0.99
0. 50
0. t0
a. AE 22.0oC.

TABLE 3.2.2C
ETecttoníc SEEctra of Acetonítri7e CompTexes
À(-r- 3 -rctm cm À(
1.5 x 10⁴
I.2 x Lo4
I.55 x 104
5.75 x Lo2
9.33 x 10²
Ê-r_ 3 -1ctm cm
r021.9 x
2.51 x 10
I.35 x l0
IRúI2EDTA(MecN) ,J
2+a
3+a
205
2L7 sh
229
295
244 sh
375
350
380
2
[Ru(NHa) sMecN]
tRu(NHr) sMecNl
a. Ref. 74
2
6r(,

TABLE 3.2.2d,
Electronic Spectra of BenzonittíLe CompTexes
[Rfr2EDrA(PhcN) 2]
T nm)
227
250 sh
366
226
23Lr"u24O sh
-1 3e (mol cm
43.5 x 10
41.5 x I0
39.2 x LO
2.51 x 10
T
330
345
410 sh
344
362 'n,340 sh
e-1dm
1.I x 104
41.2 x I037.0 x 10
1.07 x 10
3-lcm Solvent
Vüater
Methanol
DMF
4 4
cis- [Ru(NH3)
trans- lnu(NHr)
a. P(ef. 74
(PhcN)
(PhcN)
4 2
2+a
2+a
$Iater
lvater4 2
oror

TABLE 3.2.2C
ETectronicspecttaoflso-andPhthaTod.initriTeCompTexes
67.
-IÀ nm moI dm-I 3 -1
cm , (*o1-1d*3À cm
4lex
IRuHTEDTA (1,2-c6Tr4(CN) 2) 2l
IRuHTEDTA(1,3-C6
Complex
4 ¡so i.i, 8-9 x 103226 2.L, 2.4 x IO
265 sh 7.6,9.9 x 10
239
270 sh
3.3 x I01.6 x 10
372 I.2 x 10
Methanol
4
4
H4 (cN) 2) 2l 3
TABLE 3.2.2f
Electronic Spectra of Pqtidine Complexes
Vüater
e (mo1 -1 3-tÀ (run) e (mol-rdmton-t)À (nm) dm cm
IRuHTEDTA (nV) ,1
IRuH2EDTA (l'te-PY) ,l
245
263 sh
368
245
260 sh
360
245
375 sh
410
a245
423
8.5 x l03.2 x 10
7.9 x 10
8.2 x IO
4.2 x lO
7.2 x IO
244
260 sh
315
24L
260 sh
370
8.3 x 10³
2.8 x 10³
8.2 x tO3
3
3
3
3
3
3
8.7 x 10
4.0 x l07.7 x LO
3
3
3
cis- [Ru (NH3) 4PY2]
trans-¡3u(NHr) APYZi
2+a 7.24 x lO
6.45 x I07.94 x LO
4.57 x I0
I.66 x l0
3
3
3
3
a. Ref. L72
2+
4

TABLE 3.2.29
Effect of SubstiÈuenÈs on the Posítion
of the Chatge-Ttansfer Band in IRuHTEDTA(L) 2l
aSubstiÈuent
68.
À (nm)max
I
l-
I
I
L o
b 510
372
350
330
368
360
cN-c6F4-cN
L,2 - C6H4 (CN) 2
r,3 - c6H4 (cN) 2
PhCN
pv
4-Me-py
2,315,6 E¡ 4-CN
2-CN
3-CN
H
H
4-CH3
o.56
0. 00
0.00
-0. t7
a. Ref. 74, L75
b. Complex not characterized using this ligand'
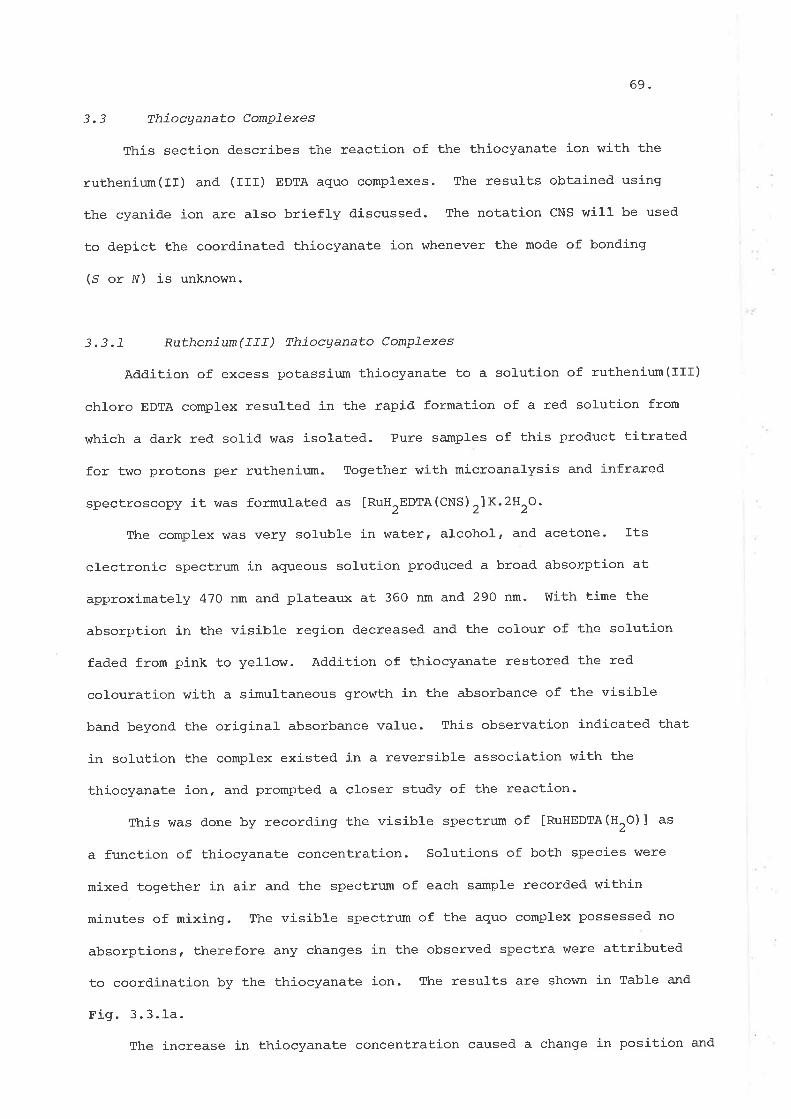
69.
3.3 Thiocganato ComPTexes
This section describes the reaction of the thiocyanate ion with the
ruthenium(II) and (III) EDTA aquo complexes. The results obtained using
the cyanid,e ion are also briefty discussed. The notation CNS wíll be used
to depict the coordinated thiocyanaÈe ion whenever the mode of bonding
(S or w) is unknown.
3.3.1 Ruthenium(I1I) Thiocganato Complexes
Addition of excess potassium thiocyanate to a solution of ruthenium(IIf)
chloro EDTA complex resulted in the rapid formaÈion of a red solution from
which a dark red solid was isolated. Pure samples of this product titrated
for two protons per ruthenium. Together with microanalysis and infrared
spectroscopy it was formulated as [RuH2EDTA(CNS) 2]K.2H2O-
The complex \^ras very solubte in water, alcohol , and acetone. Its
electronic specÈrum in aqueous solution produced a broad absorption at
approximaLely 47O nm and plateaux at 360 nm and 290 nm. V'Iith time the
absorption in the visible region decreased and the colour of the solution
faded from pink to yellow. Addition of thiocyanate restored the red
colouration with a simultaneous growth in the absorbance of the visibl-e
band beyond. the original absorbance value. This observation indicated that
in solution the complex existed in a reversible associaÈion with the
thiocyanate ion, and. prompted a closer study of the reaction-
This was done by recording the visible spectrum of [RuHEDTA(HrO) 1 as
a function of thiocyanate concentration. Solutions of both species were
mixed together in air and the spectrum of each sample recorded within
minutes of mixing. The visible spectrum of the aquo complex possessed no
absorptions, therefore any changes in the observed spectra \^¡ere attributed
to coordination by the thiocyanate ion. The results are shown in Tab1e and
Fig.3.3.la.
The increase in thiocyanate concentration caused a change in position and

70.
an increase in intensity of the absorption in the visible region of the
spectnrm. An increase in the rate of the appearance of this absorption
accompanied the increase in concentration. These observations \^lere
interpreÈed as evidence for the presence of two types of thiocyanato
complex in solution. An equilibrium between S- and' IV- bonded isomers, as
is knownl 76,177 to occur in tCo(dmg)2py(NCS)l and tCo(Nttr)5NCSI'*, t""
considered unlikely because of the concentration dependence of the
absorption mentioned above-
At high concentrations of the thiocyanate ligand (2-4 mol a*-3) one
intense absorption appeared at 485 nm with an estimated e value of
2.7 x IO3 mol-ld*3"*-I. This was attributed to the dithiocyanato complex,
[RuHTEDTA(CNS) 2] in solution, and supported by the electronic spectra of
[RuH"EDTA(CNS)r]K.2H2O in several organic solvents. As can be seen from¿¿
Table 3.3.1b, the absorptions occurred in the vicinity of 485 nm or higher'
with the e values agreeing with the value quoted above. In these solvents
dissociation was not expected and indeed no decrease in absorbance with
time was observed in acetone and ethanol" However, in tetrahydrofuran (THF)
decomposition occurred accompanied by the gradual fading of the violet colour
of the solution.
Concentrations of thiocyanate comparable with the ruthenium(III)
concentration produced a broad absorption centred at approximately 460 nm
with e values approaching lo3 *o1-1d*3.*-I. As the concentration rose the
absorption shifted Èo lower energy and increased in intensity until it
reached a maximum at 4g5 nm. The absorption in the viciniÈy of 460 nm \das
therefore ascribed to the presence of a monothiocyanato complex.
From the behaviour of the isolated complex in aqueous solution and the
assignment of the absorption maxima for the mono- and dithiocyanato
complexes, it was concluded that [RuH2EDTA(CNS)2]K.2H2O rapidly dissociated
in solution to form appreciable amounts of the monothiocyanato species '
Further, the gradual loss in colour of solutions containing

7r.
IRuHTEDTA(CNS)21K.2H2O, resulting in the yellor^r aquo complex, indicated that
the monothiocyanato complex also decomposed slow1y. For the reverse
reaction, the addition of scN to [RuHEDTA(Hro¡ ¡, formation of the
monothiocyanato species was rapid but slower fot the dithiocyanato complex,
especially at moderate excess concentrations of the ligand. The following
equilibria were suggested in which ionization of the protonated EDTA moieties
was ignored:
IRuH2EDTA(CNS)21-=- IRuHEDTA(CNS)]- + H+ + SCN (r)
IRuHEDTA(CNS)I + H2o a-l [RuHEDTA(H2o)] + scN Q)
Equation (1) implies the formation of a pentadentate EDTA complex' but
a tetradentate species of the type, [RuH2EDTA(H2O)cNS] ' üras also possible.
TitraÈions of the dithiocyanato complex with base gave two end-points.
The first (pf - 2.7) corresponded to two protons of the free carboxylic acidav
groups, the second more diffuse end-point (pK" 7.2) to the proton of a
coordinated aquo ligand. This last was due to a species such as suggested
above or as defined in eguation (2).
Further evidence for dissociation came from the measurement of the
molar conductance (Table 3.3.1b) in aqueous solution. An initial Â* value.>
of 557 (S cm'¡ suggestedoî¡r" extensive dissociation than IRuHEDTA(c1)]K.2H20
(r,it.tt n* = 384 s *rT) but less than occurs in [RuHTEDTA(cr)r¡K-2H2o^ V\^Oì
(r,it.uu n* = 74:- s *r7') which produces a maximum of six ions in solution.
In addition, the conductance of the dithiocyanato complex rose with time
)(À¡,1 = 620 S cmo after 30 minutes) in agreement with the proposed equations.
Finally, the validity of these r^ras supported by electrochemical studies,
but discussion of this is delayed until Chapter 5.
Preparation of a monothiocyanato complex was attempted by reacting
equimolarquantitiesof[RuHEDTA(c1)]K.2H,0andthiocyanateinacidic
solution. A dark red solid was isolated whose infrared spectrum revealed a
strong, broad absorption at 2o9O cm-I with a shoulder aE 2L5O ".-1.
These

72
were due to coordinated thíocyanate þide infra) ' However' titration with
base indicated I.5 protons per ruùhenium. In ethanol the solid gave a red-
violet solution leaving behind a yeltow residue identified spectrally as
IRuHEDTA(CI)]K.2H2o.Theredethanolicsolutionabsorbedat505nm(efu
Z x lO3 *ol-1d*3" -1). It was concluded that the producÈ consisted of a
mixture of the dithiocyanato complex and initial chloro complex' The absorp-
tion at 2OgO crn-l was assigned to the former complex. This varue was some-
what different from that quoted below, possibly as a resurt of other species
being present. rt was feasibre that the shourder at 2l5O cn-l was due to
small anounts of a monothiocyanato complex'
3.3.2 SPectta and Bondìng
The most significant peak in the infrared spectrum of
IRuH,EDTA(CNS)2]K.2H2owastheintenseabsorptionduetothecoordinated
thiocyanate rigands. A strong peak, sprit at the end, appeared at 2100 cm
and 2065 *-1, resulting from the vl pseudoasymmetric vibrational modeslTS
of the ligands, as shown below'
^N-xc---+r î I *)-c*s
ur u2 u3
The v, mode is referred Èo as u(Ctt).178 Strong carbonyl absorptions
characteristic of a protonated EDTA comprex appeared at 1725 cn-r and due to
coordinated carboxylates at approximately 1640 cm-l (ra¡te 3.3.2a)-
ThiocyanatecancoordinaÈeaSanS-orIV-donorligandtoametal
centre.l78 The v(CN) stretching frequency of thiocyanato complexes has
been used to assign a mode of coordination, but often is insufficiently
diagnostic.l78r179r180 For the complex isolated the v(CN) value could not
distinguish between either isomer. The va Pseudoslzmmetric stretching
frequency, referred to as v(CS), has been consideredlTS'181-185 to be more
diagnostic of the mode of coordination and appears in the range 780-860 cm-I
-1
-I
for M-NCS and at approximately 700 cm for M-SCN. In examining the spectrum

73.
of IRuII2EDTA(CNS)2] K.2H2O from 850 "*-1 ao 7OO cm-l, it was difficult to
assign v(CS) due to large numbers of vibrations resulting from EDTA itself.
Comparison with the spectra of [RuHEDTA(cI) ]K.2HrO and' [RUH2EDTA(CI)2]K.2H2O
indicated that no absorptions between 840 cro-I arrd 740 cm-l were due to v (CS) .
However, a weak, broad absorption appeared at 705 cm-I which suggested S-
coordination, but this may have been fortuitous and the actual v(CS)
absorption masked by an EEIIA absorption. Moreover, since two SCN ligands
were coordinated, it was noÈ possible to ignore the possibitity of one
Iigand being S-bonded and the other lV-bonded, since such complexes are
known.l78tl86rl87
The electronic spectrum of the diÈhiocyanato complex in 4.0 mol dm-3
KSCN solution showed simifarities with [nu(NHr)5SCN]2+, which possesses a
charge-transfer band in the visible region at 495 nml88 (fa¡te 3.3.2b).
The intense absorption in the visible shown by the dithiocyanato complex
was believed likewise to be a ligand-to-metal charge-transfer band.
3.3.3 Reaction of SCN with lRu ( Ir ) HsDrA (H 20 ) 1
The addition of thiocyanate during the reduction of IRuHEDÍA(CI) ]K.2H20
in aqueous medium (molar ratio, SCN :Ru'r,2:1) resulted in a green solution
from which a dark green solid was isolated. The presence of the coordinated
ligand was confirmed by the appearance of a strong v(CN) absorption at
2IIO crn-I and a shoulder at 2O7o cm-l (ra¡le 3.3.3a) - Microanalysis
consistently favoured a species containing one coordinated thiocyanate
ligand, as in [RuHEDTA(CNS)]It2H2O. However, titration with base always
indicated 1.4 to I.6 protons per ruthenium which suggested the presence of a
tetradentate species. Evidence furnished by vottammetry, as discussed in
ChapÈer 5, indicated a species such as IRuHTEDTA(CNS) rJfr.nnrO, rather than
[RuH2EDTA(H2O)CNS]Kr.nHrO, 'Ì^¡as present in solution- In either case, the
product of the above reaction appeared to be a mixture.
The reaction product üras very soluble in water, but largely insoluble

74.
in organic solvents. Green aqueous solutions vfere sensitive to aerial
oxidaÈion and reverted to the red-orange colour of the ruthenium(rrr) species.
The visible spectrum obtained under an inert atmosphere showed one major
broad absorption at 635 nm. Since the exact composition \¡ras not known, the
molar absorptivity was estimated to be in the vicinity of 5 x l-02 mol-I dm3
-1
"*-t ." judged from the mean of the e values obtained by assuming a mono-
and dithiocyanato species in turn. unlike ruthenium(III) ' this visible
band was not significantty affected by variations in the concentration of
free thiocyanate.
Solutions of the ruthenium(II) complex showed remarkable sensitivity
to traces of impurities, in particular copper(II) ions. This was first
noted whenever metal syringes were used to dispense the solution under di-
nitrogen. Often the peak at 635 nm \^Ias accompanied by another absorption at
560 nm, which was absent if glass pipettes were used and no metal came into
conÈact with the solution. Traces of nickel(II) ion had no effect upon the
spectrum, but copper(II) dramatically altered it and resulted in the peak
seen at 560 nm. This change rÁras accompanied by a stow discharge of the
green coloration to a bluish-violet hue which eventually became orange'
spectrophotometrically this was recorded as a decrease in the 635 nm peak
with a concomitant increase in the absorption at 560 nm. In turn, this
decreased and a new absorption emerged aE 465 nm indicating the formation of
ruthenium(Ill) thiocyanato. If the concentration of copper(II) was comparable
with that of the complex, then oxidation was extTemely rapid and only the
final oxidation product 1^las seen. In the absence of copper(Il) and under
dinitrogen the ruthenium(II) species was stable for hours. fnÈroduction
of air caused the 635 run absorption to decay with the emergence of the band
at 465 nm. An isosbestic point appeared at 540 nm. These spectral changes
are shown in Fig. 3.3.3a.
The absorption at 560 nm was undoubtedly due to copper(Il) interaction
and possibly represented an intermediate in which ruthenium(II) and copper(II)

15.
\,üere bridged by thiocyanate, since similar thíocyanate intermediates have
been reported.IBg Such a complex could readily undergo an inner-sphere
redox process generating rutheniun(IIl) and' copper(I) ' Since the above
spectral changes \^Iere observed under dinitrogen, oxidation was due to
copper(If). This sensitivity of ruthenis¡(II) to oxidation was also reflected'
in the preparation of the complex, where appearance of a green coloration
dependeduponafreshplatinumsurfacebeingusedforreduction.lf
contaminated only brown solutions resulted, indicating a mixture of
ruthenium(If) and. (III) species.
3.3.4 Reactions InvoTving Cganide Ion
Theadditionofpotassiumcyanidetosolutionscontaining
[Ru(I]I)HEDTA(HrO¡1 gradually gave green solutions upon standing' warming
accelerated this process. However, oily intractable green solids were
obtained, resulting from deprotonation of EDTA due to cyanide loss as
hydrocyanic acid. The extreme volatitity of the latter made it difficult
to control the concentration of cyanide ion in solution' Reaction also
occurred with [Ru(II)HEDTA(H2O)] yielding a brown oily solid which upon
standing became green. Both producÈs produced strong, broad c=N absorptions
-1at 2OOO cln 1, usuarly with a second less prominent peak at 2050 crn
products were not studied further'
These

r-{t_
(r) !ituC) c1--lE d
A
B
2.O
Fig. 3. 3 .la Changes of À
Plexes with
- -?ISCN I mo1 dm "
-¿.A5x10-?B5x10"-tC5xI0-
D 0.5
E 2.0
460 480 500 I (nm)
and e of the Rutheniun(IfI) Thiocyanato com-max
Increrasing Thiocyanate Concentration'
ÊlI
xUJ r{
oÉ
I.O
c
^l-l
I
I
B
4
I
A
500 550 600 650 À (run)
Fig. 3.3.3a ELectronic Spectrum of the nuthenium(II) Thiocyanato Complex'
A: oxidation in Air. B: oxidation by copper(II) under
Dinitrogen. (Spectra not drawn to scale ' )
2
4

76.
Variation of tSCff I with IRIHEùIA(H2OIa
TABLE 3.3.1a
be.
l-
-1tscN l
bÀ,ct ^r'
tf-1 3-1(mo1 dm cm-3 3-1(mol dm (nm) (moI dm cm ) (nm)
-4
-3
-2
-I
455
458
458
475
475
446
25xl0
5x10
5x10
4.7 x 10
7-4 x IO
8.2 x l0
9.8 x 10
1.2 x I0
2.7 x IO
2
2
2
3
3
45d
4e48
I
470d
486"
486f
8.6 x 10
1.2 x 10
1.9 x 10
2.3 x 10
2.7 x LO
2
3
3
3
3
5x10
1.0
2.O-4.O f
-4 -3a. [Ru(III)] = 5.35 x 10 mol dm
ruthenium. c. Subscripts:
e. After ru30 minutes. f.
i = initial;
Calculated using total
f = final. d. Overnight.
b
Several minutes.
TABLE 3.3.1b
VisibLe Spectrum and Molar Conductance of IRUHTEDTA (cNS) 2l K.2H 20
Solvent À
(nm)
E
-1 3 -1(mol dm cm
Colour 1\bM
rhol-(S cm1J
aV'Iater
Acetone
Ethanol
Tetrahydrofuranc
2.7 x LO
3.I x 10
2.7 x LO
I.7 x l0
4.8 x 10
Red
Red-orange
Red-violet
Violet
4e6
482
505
518
650 sh
3
3
3
3
2
557
a
b
c
Spectrum recorded in 4.0 mo1 ¿m-3 rscu solution.1.0 x 1O-3 mo1 dm-3 sol-ution at 23.Ooc.
Decomposition occurred in this solvent.

77.
TABI,E 3.3.2A
Infrated. Specttum of IRuH TEDTA(CNS) 2lK'2H 20
nuiol) (KBr Matrix) MethanolAssigrunents
v (oH)
v (cH)
Carbo:q¡tis e (oH)
v (c=N)
v (c-N) ârb
v (cs) a
3440 s,br
obscured
2530 wrbr
2620 w,br
2100 s 'br2065 s,br
L725 s,br
1635 s,br
obscured
I220
L280
1300
1090
1080
705
3440
2930
2970
2 530
2620
2080
s rbr
m
sh
wrbrwrbr
S rbr
Carboxylic v(CO)
Carboxylate v(Co)
Carboxylate v(Co) aslzmmetrical stretch
Combination band:C-0 stretch and 0-H.adeformation
ms
s rbrbr, sh
ms rbrsh
wrbr
L728
L640
I390
r360
L2L5
1280
I300
I085
1070
705
s rbr
s rbr
m
ms rbr
MS
s rbrbrrsh
ms rbrsh
wrbr
2095 s
2O7O s
1730 s,br
1640 s,br
a
b
Tentative assignments .
Due tO EDTA.

TABLE 3.3.2b
ETecttonic Spectta of Thiocganato CompTexes
-1 3 t)
78.
AssiqnmentsÀ (nm) e (mol dm cmComplex
IRuHTEDTA(cNS) 2l K.2H2o a 295
360
486
222
278
322
495
3.0 x 10³
8.9 x IO2
2.7 x 10³
I.33 x 104
2.o9 x Lo2
4.o7 x Lo2
3.62 x 10³
CT band c
n_n,t (nCS )
2
2g2, 2
T1gu
2 2,u
2+blRu (NHr)
sScNl2"
u->
->
->
T
E u
a
c
-3 b. Ref. 188.In 4.0 mol dm KSCN solution.
Tentative AssignmenÈs.
TABLE 3.3.3a
Infrared Spectrum of the Ruthenium(II) Thiocganato CompTex (nujo7)
FreguencY ( c¡n-t
Assignments
v (oH)
Carboxylic v(OH)
v (c=N)
Carboxylic v (co)
Carboxylate v(CO)
3400
2520
2600
2100
2070
L725
1600
s rbr
wrbrwrbr
S
s, sh
s rbr
s rvbr

79.
3.4 EÐTA Comp.Zexes Containing Bidentate Ligands
The observation that EDTA was often tetradentate with ruthenium(II)
and (III) led naturatly to the use of bidentate ligands to occupy the
two remaining sites on the metal. This type of EDTA complex at present
appears to be unknown.
It r,tras found that both ruthenium(II) and (III) EDTA aquo reacted with
N, p, O and S-donor bidentate ligands. The first class was represented by
the aromatic cl-diimine ligands, 1,IO-phenanthroline and 2,2'-bipyridíne' and
by dimethylgtyoxime. The second by 1,2-bis (diphenylphosphino)ethane' the
third and fourth by acetylacetone and sodium diethyldithiocarbamate
respectively.
3.4.1- CompTexes with L,l-0-Phenanthrol-ine and 2 ,2'-Bipgridine
Many complexes containing these ligands are already known.I9I Those
resulting from coordination to iron, ruthenium and osmium are characterized
by a high degree of inertness and a preference for the +2 state.l92
Both ligands reacted readily with tRu(II)HEDTA(H2o) J producing
intensely coloured solutions which gradually deposited microcrystalline
products. Titration with base produced one end-point corresponding to two
protons per ruthenium (PKav = 3.0) and suggested the formulation
IRuHTEDTA(N-N)] "ffi20, (N-N = phenr n = 3; bipy, n = 2) - This was supported
by microanalysis, nmr (Chapter 4) and electrochemical investigations
(Chapter 5) which showed the metal to be in the +2 state.
The infrared spectrat assignments are presented in Table 3.4.1a and
the spectrum of the phenanthroLine complex in Fig. 3.4.La. Both complexes
produced strong carbonyl absorptions at about t58O cm-l due to absorptions
of the coordinated carboxylates, but differences occurred in the region of
the carboxylic acid a-l¡sorption. I¡lhereas the phenanthroline complex always
produced one distinct carbonyl absorption at 1730 .*-1 ah. bipyridine complex'
depending on the method of isolation. produced two at 1750.m-1 arrd 1705 crn-1.

A+
IRuH2EDTA (phen) I . 3H20
3500 3000 2500 t? 1800 16004000
fÍavenu¡nbers (cm
¡lig. 3.4.]a Infrared Spectrr:m of the Phenanthroline Complex in Nujo1.
I
-1
1400
)
1200 1000 800

80.
This occurred in the spectra of samples deposited from solution during
preparation. Ho\^rever, if the complex was precipitated from solution using
alcohol, then only one absorption appeared at l73o "*-1. This appeared to
be a solid state effect resultíng from the carboxylic aroups being in two
dif ferent environments .
fn an attempt to produce ruthenium(Ill) complexes containing the
above ligands, the reaction with the ruthenium(IlI) chloro EDTA complex
was investigated. The addition of methanolic solutions of 1,}Q-phenanthro-
line to solutions of the ruthenium complex resulted in the development of
a dark solution. A brown solid precipitated after approximately 30 minutes,
and a violet-brown product after one day. The second product was identífied
spectroscopicatly as the ruthenium(IT) phenanthroline complex described
above. on the other hand the first product prod.uced a different spectrum
from the known complex. A strong absorption appeared at 1655 t*-1 i" th'
infrared spectrum, franked on either side by weaker peaks at L725 t*-l a"d
r5B5 cm-l. peaks due to the phenanthrorine ligand were stil1 present'
However, evidence \^ras obtained, which indicated that the product was
not a ruthenium(Ill) phenanthroline complex but a mixture of
IRuHTEDTA(phen) l.nHro and starting material' Titration produced two
endpoints. The first corresponded to less than two equivalents of acid
for a tetradentate EDTA complex. The second (pK. * 7) was consistent with
the presence of the ruthenium(III) aquo species. Cyc1ic voltammetry
established Èhe product as having an E, in agreement with the phenanthroline
complex above. The electronic spectrum was also consistent with this
concrusion. As a resurt the peaks in the infrared spectrum at 1585 tm-l a"d
1725 cm-l \^¡ere ascribed to the phenanthroline comprex, and that at t655 cm-l
-'t(and 1725 cm--) to the chloro EDTA compl-ex'
Although no evidence for a rutheniun(III) phenanthroline complex \^¡as
obtained., voltammetry indicated (section 5.3.3) that such a species existed
briefly in soluÈion. The isolation of the ruthenium(I1) complex from the

81.
above reaction was not unusual since reduction of ruthenium(Ill) to (II)
can occur in the presence of methanolrIg3 and phenanthroline rl92t I94 under
certain conditions. Tine 2,2'-bipyridine ligand behaved analogously.
Both complexes possessed only moderate solubility in water and meth-
anol, but were readily soluble in TFA, although decomposition gradually
occurred. In all solvents intense red-bro\^/n solutions resulted. In
solution the complexes behaved as weak acids, and the specific conductance
displayed a non-linear dependence upon concentration (ta¡te 3.4.1b). The
electronic absorptions for both complexes are shown in Table 3.4-Ic- The
intense visible bands were in atl probabitiÈy due to charge-Èransfer
from the metal to ligand orbitals, since there is much evidence to suggest
this occurs in most aromatic diimine comp1exes.I9I,l95'196 The more
intense absorptions at higher energies were believed Èo be due to n-n*
Iigand transitions. Compared with the free ligand these underwent a red
shift as a result of interaction with the metal centre. This is character-
istic of phenanthroline and bipyridine complexes.l9l'197

a2
TABLE 3.4.IA
Infrared Spectra of IRuHTEDTA(N-N)7.nHrO in NujoT
-l -tAss t
v (oH)
Aromatic v (CH)
Carboxylic v (OH)
Carboxylic v (CO)
Carboxylate v (CO)
Aromatic ringvibrations
1650 m, shâ'c
1590 s,br
1510 m
L225 s
1210 s
1090 s
1075 m
955 srshp,840 m
78O, 790 m, 730 s'shP
(cm
3430 s,br
3080 w
2520 w
2620 w
1730 s ; 1705 s
1750 s
d
1570 s,br
1530 m
1560 sh
1240 sh
l2l5 s rbr
1080 n
tI00 sh
77O srshp,74O srshP
690 m 640 m
N-N:
3400
3020
3080
2530
2600
1730
cm
s rbr
w
w
wrbr
wrbr
s
Combination band:C-O stretch and o-Hdeformationa
v (c-tr1¡a'b
Other prominent PeaksAromatícC-H deformationa
a
b
c
d
Tentative Assignments.
Due tO EDTA.
Possibly due to ô (oH) of lattice water.
Splitting of COrH absorption appeared only in microcrystalline samples'

TABI,E 3. 4. lb
uolar (1\*) and Specífic (r) Conductance Measurements
of IRuHTEDTA(N-N)I in Aqueous Solution
Vüô U
n*{s cm2y'a
83
bipv(s cm2)
aN-N:
rx10 5
phen
(s cm-I)b c x 104 (mot am-3) Àt
16.0
11. 9
6.5
3.9
2.2
7. r0
4.90
2 -45
L.20
0.61
r90 187
a
b
-3 -31.0 x I0 mol dm at 20.5oC.
aE 24.OoC.
TABI,E 3.A.LC
ETectronic spectra of \RuH|EÐTA(N-N)J.nHrO in Aqueous sofutíon
phen bipv-1 3 -I -I 3 -t
À (nm) e (mol dm cm À (nm) e (mo1 dm cm
N-N:
226
270
292 sh
465
2.8 x 10
3.7 x 10
1.2 x 10
6.4 x 10
4
4
4
3
242
284 sh
293
352
505
1.1
2.O
2.8
6.1
4.t
x10x10xl0x10x10
4
4
4
3
3

84.
3.4.2 (I) Complexes with Acetglacetone and DimethqTgTgoxime
Both ligands reacted with the ruthenium(II) and (III) EDTA aquo species
in acidic solutions. Usually slightly atkaline conditions favour reactions
involving these tigands. For acetylacetone the keto-eno1 equilibriumrl9B
cH^-c-cH^rll ¿
o
-c-cH- -----------'s cH^ -c-cH=c-cH^ll r rll I 5
oooH
is acid and solvent dependent. Pure acetylacetone exists largely in the
enol- (85%) form.175 In reaction mixtures a weak base such as acetate is
often present to encourage proton abstraction from the ligand.
The addiÈion of neat acetylacetone to a solution of the rutheniun(IIf)
chloro EDTA complex resul-ted in the gradual development of a violet
coloration. Under the same cond,itions dimethylglyoxime produced a brown
sol-ution. In both cases warming accel-erated the rate of the reaction. The
former solution yielded a violeÈ solid, the latter a brown product, and these
were formulated generally as IRu(III)H2EDTA(L-L)].2H2O (L-L = acac,dmg).
Microanalytical, spectroscopic and neutralization data supported the
formulation in each case. Despite unfavourable pH conditions for proton
abstraction from the tigands the reactions proceeded to completion. This
was attributed to ring opening in the pentadentate aquo complex allowing
the resufting free carboxylate group to accept a proÈon from the incoming
ligand.
Addition of either tigand to a solution containing [Ru(II)HEDTA(H2O)]
resulted in rapid colour changes. Acetylacetone produced. a copper-coloured
solution from which an orange-brown powder was isolated. This was presumed
to contain tRu(II)H2EDTA(acac)JK.nHrO. However, this v¡as not characterized
due to its slow conversion to the violet ruthenium(IfI) complex in the solid
state. Dimethylglyoxime produced an intense brown solution under the same
conditions, from which a brown solid was isolated. This was formulated as
tRu(II)H2EDTA(dmS)lK.H2O on the basis of microanalysis, spectroscopy and its
behaviour in solution (vide infta) -

85.
The infrared spectra (Tab1es 3.4.2a, b) of the complexes were recorded
in the solid state. As expected, the most dominant features were the
carbonyl absorptions due to the free carboxylic acid groups and coordinated
carboxylates, which were both of similar intensity. The former absorptions
appeared at approximately 1725 cm-l, the latter in the vicinity of 1610 .*-1.
The acetylacetonato complex produced additional strong absorptions at
l52O cm-l and 1545 cm-f which were assigned to the coordinated ß-diketone
tigand. Transition metal complexes containing acetylacetone produce several
peaks in the region of 1520.*-t ao 1600 cm-l.199'200 Earlier work2O1-203
suggested that the higher energy absorption could be assigned to a
del-ocalised carbon-carbon ring sÈructurc of the ligand. However, calculations
by Nakamoto and Martelll25t204 hu.ve sho\nm that the reverse situation occurs.
Therefore, for the ruthenium(Ilf) complex above, the absorption at I52O cm-l
was assigned to the delocalised carbonyl stretching mode, that at 1545 cm-l
to the delocalised carbon-carbon ring vibrations. Further assignments in the
lower energy region of the spectrum were not possible due to the presence
of EDTA vibrations.
The ruthenium(II) and (fII) dimethylglyoximato complexes produced
simil-ar spectra. In addition to the carboxylic acid and carboxylate
absorptions mentioned above, broad O-H stretching modes appeared at
3400 cm-I and 32OO .*-I. The former stemmed from the presence of lattice
$raÈer white the latter was attributed to the hydroxyl group of the oxime
ligand. This last has been studied205-207 for various metal dimethyl-
glyoximato complexes such as tco(dmg)rxYJ (x,Y = Cl , Br , No2 or Hro)
an¿ tNi (dmg) rl . The free ligand displays a v (OH) absorpÈion at 3200 cm-f
as a result of hydrogen-bonding, which ln the complexes just cited undergoes
Iarge shifts to lower energy due to unusually strong intramolecular
hydrogen-bonding.208t209 However, in the EDTA complexes the band at
3200 cm-l indicated that the extenÈ of hydrogen-bonding rnlas not significantly
altered compared with the free ligand. Molecular models of the complexes

86.
suggested that interaction between the free carboxylic acid groups and the
ligand was possible. Nevertheless this \^tas not as large compared with
interactions arising from two such tigands tying in the same plane' as
occurs in the complexes described above.
No peak assignable to the v (CN) stretching mode of the ligand ulas seen.
This vibration is extremely weak in oximes165.tt¿ probably would have been
obscured by EDTA absorptions in any case. Two prominent absorptions
appeared in the spectra of both complexes between 9OO cm-l and l-O0O "*-I.
These were believed to arise from the No stretching modes2l0 and out-of-prane
OH bending modes of the ligand. The free tigand produces two strong broad
absorptions in this rogion. Sínce most of the EDTA complexes possessed a
peak at approximately 930 cm-l (Chapter 6) it was concluded that peaks in
this vicinity were due to the OH bending mode and the higher energy
absorption due to v(NO) (Table 3-4.2b).
3.4.2 (If) Solution Properties and El-ecttonic Spectra
The complexes \^rere readily soluble in water and methanof. In aqueous
solution they dissociated and behaved as weak acids since molar conductances
^ ìîot::l-were found to be in the vicinity of 25O S cm¿/, (Tabte 3-4-2c). Titration
with base indicated the presence of two ionisable protons per molecule of
complex. Hydrolysis of the dimethylglyoximato complexes in aqueous solution
occurred slowly but was comparatively rapid for [Ru(III)H2EDTA(acac)]'2H2O'
A violet solution of the latter gradually faded in colour with a decrease in
the absorption of aII bands in the electronic spectrum. Approximately 40%
decomposiÈion occurred within 20 to 30 minutes. Tn methanol the complex \¡¡as
stable over long Periods of time-
The molar conductance of the acetylacetonato complex in aqueous solution
decreased as the violet colour faded. This was interpreted according to the
equation belowt
IRuHTEDTA(acac)l + H2o --------) [RuHEDTA(H2o)] + Hacac

87.
where decomposition of the complex released a neutral acetylacetone molecule
and produced the aquo complex.
Aqueous solutions of tRu(III)H2EDTA(d¡nS) I produced several absorptions
in the electronic spectrum (Tabte 3.4.2d). However, the ruÈhenium(It)
analogue possessed onÌy a single intense band in the visible region at
465 nm. Upon exposure to air overnight the spectrum changed l-o that of the
ruthenium(fff¡ species. From the estimated e values it was concluded that
the conversion of one to Èhe other was quantitative (Table 3.4.2d') "
The electronic spectrum (Table 3.4.2d') of [Ru(III)H2EDTA(acac) ].2H2O
possessed absorptions at 332 nm and 520 nm, which disappeared upon reduction
(H2/I1-). The resulùing copper-coloured solutions \^Iere considered to contain
tnu(rI)H2EDTA(acac)l-. The complex described earlier as
lnu(II)H2EDTA(acac)Jt<.nUrO produced an electronic spectrum consistent with
the result obtained by reducing the ruthenium(III) complex. Estimates of e
values for a ruthenium(II) complex were obtained from the spectrum of this
complex. Rapid aerial oxidation of the ruthenium(II) species required all
spectra to be recorded under dinitrogen. Oxidation to the ruthenium(fII)
complex was easily reversed using hydrogen. Thus'
tRl[sq(rrr) H2EDTA(acac) f
=- [Ru (rr)H2EDTA(acac) ]
tol
The electronic spectra of acetylacetonato complexes have been studied
extensively. I9B t2Il t212 The ruthenium(III) complex produced a strong
absorption at 288 nm which was in a region assigned to a n-n* transition
for such complexes. The 332 nm absorption \^Ias attributed to a d-t charge-
transfer band by comparison with tFe(IIT) (acac) ,7"'. The ruthenium(II)
species did not possess this absorption and only a shoulder appeared at
340 nm. The main absorption appeared, at 27O nm and was given the same
assignment as above. The position of this peak appears to be a function of a
number of parameters including cation size and charge.2ll
The electronic spectra of the dimethylglyoximato complexes were noted

88
for their moderately intense absorptíons. Normally oximes show no
a-bsorption in the near ul-Èraviolet unless conjugated.2I3 The bands
observed were pïoba-bty of metal-ligand charge-transfer origin.
TABLE 3.4.2a
Infrared Spectrum of lRu(III) H 2EDTA(acac) ) .Zn rO
Freguency ("*-lAssiqnmênt )a
v (oH)
A1iphaÈic v(cN)
Carboxylic v (oH)
Carboxylig y(CO)
Carboxylate v(CO)
Acaê: delocalized v(CO)
: delocalized v (CC)
Carboxylate v(CO) Lslzmmetrical stretch"
Combination band
C-0 streÈch and 0-H be
v (c-s)b
b
3400
2940
2980
2530
26LO
r725
1630
1520
1540
I350
s rbr
m
\^7
VI^t
s
s rbr
e
s
s rbr
_bnd
1210 ms
L27O ms
1090 ms,br
a
b
KBr matrix.
Tentative assignments.

Assignment
89.
TABI,E 3.4.2b
Infrared Spectra of ÐimethgJgLgoximato Complexes
lRu(III)H2EDTA(dmg) J .2HrO lnu(rI)H2EDTA(dmg) JK.HrO
-tcm
-1(KBr Matrix) (nuioI) cm
v (oH)
Aliphatíc v (CH)
Carboxylic v(OH)
Carboxylic v(CO)
Carboxylate v(CO)
Carboxylate u(CO)Syrmnetrical stretch
3400
3 200
2930
2530
26LO
L725
1610
1385
s rbrs rbr
mrbr
fnrtl ,bf
vwrbr
S
S
s,br
3360 s,br3170 s,br
obscured
2530 vw,br
2620 wt,br
]-725 s
1600 s
obscured
1215 ms,br
1100 m
1080 m
985 m
930 m
a
Combination band;C-0 stretch and.aO-H deformati-on
v (cN) arb
v (u-o) a
out-of-plane ô (ott) a
1215 ms,br
1235 m,br
1100 m,br
985 ms
915 ms
a
b
Tentative assignments .
Due to EDTA.

90.
TABI,E 3 .4.2C
MoLat Conductance and Acid Equivalents
per Ruthenium for AcetgTacetonato and Dimethglglgoximato Comp.Zexes
v^oL'I
Complex Àr(s cm2/+
H /Ru þK'av
alRu ( III ) H2EDTA (acac) I .2tt'2o 254 r.8 i 0.I
2.0 ! 0.r
1.9
2.7
2.9
b240
clRu (III) H2EDTA (dmg) 1 .2H2o 234
lRu ( II ) H2EDTA (dmg) I K. H2O 300 c
-3 3a. I.0 x 10 mol dm aL 24.5"C.
b After 12 hours._2 -31.0 x 10 " mo1 dm at 20.5oC.c

91.
TABTE 3.4.2ð.
Efectronic Spectta of AcetgTacetonato and DimethgTgTgoximato CompLexes
-1 3 -1 SolventComplex À (nm) e (mol dm cm
240
2AA
332
520
220
270
340 sh
235
272
351
43L
295
360
470
4.O
8.4 x lO3
4.1 x IO3
6.0 x IO2
(6.8 x 10
(3.1 x 10
(5.0 x 10
Methanol
Water
Ethanol
Water
ülater
Water
x 103lRu ( III) H2EDTA (acac) I .2H2O
lRu ( II) H EDTA(acac) l2
b
2EDTA (amg) I
)3
3
2
a
)'a
4.2 x LO
4.0 x I06.5 x 10
1.66 x 10
2.75 x LO
3.55 x I0
2.95 x 10
3
3
2
lFe (rrr) (acac) ,l
lRu (rrr) H2EDTA (dms) I .2H2o 295
360
470
lRu (rr) H2EDTA (dms) I K.H2O 465
Oxidation:
lRu(II)H2EDTA(dmg) l
+
IRu (III) H
4
4
3
3
2.5 x I02.3 x 10
1.3 x 10
3.5 x 10
2.8 x l02.1 x I0
I.4 x 10
3
3
3
3
3c3c3c
a
b
Initial values of e measured in aqueous solution'
Ref. 2L2 c. e values of [Ru(III)H2EDTA(dnS)l after oxidation'
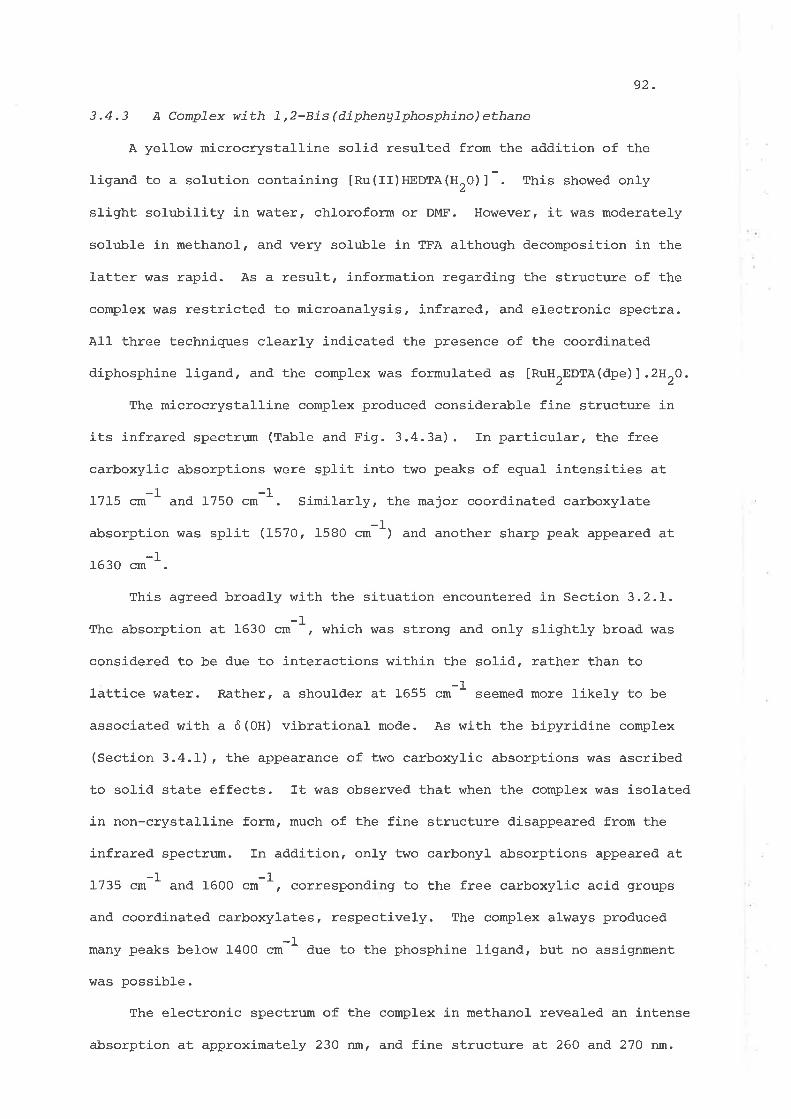
92.
3.4.3 A CompTex with 7,2-Bis(diphengTphosphino)ethane
A yellow microcrysÈalline solid resulted from the addition of the
ligand to a solution containing tRu(II)HEDTA(H2O) I This showed only
slight solubility in water, chloroform or DMF. However, it was moderately
soluble in methanol, and very soluble in TFA although decomposition in the
latter was rapid" As a result, information regarding the structure of the
complex was restricted to microanalysis, infrared, and electronic spectra.
All three techniques clearly indicated the presence of the coordinated
diphosphine ligand, and the complex hras formulated as [RuHTEDTA(dpe)].2H2O.
The microcrystalline complex produced considerable fine structure in
its infrared specÈrum (table and Fig. 3.4.3a). In particular, the free
carboxylic absorptions were split into two peaks of equal intensities at
1715 cm-l and I75O .*-t. Similarly, the major coordinated carboxylate
absorption r¡¡as split (1570, 1580 cm-l) and another sharp peak appeared at
1630 cm-l.
This agreed broadly with the situation encountered in Section 3,2.1-.
The absorption at 1630 ctn 1, which was strong and only slightly broad was
considered to be due to inÈeractions within the so1id, rather than to
IaÈtice $rater. Rather, a shoulder at 1655 cm-l seemed more like1y to be
associated with a ô(0H) vibrational mode" As with the bipyridine complex
(Section 3"4.1), the appearance of two carboxylic absorptions was ascribed
to solid state effects. It hras observed that when the complex was isolaÈed
in non-crystalline form, much of the fine structure disappeared from the
infrared spectrum. In addition, only two carbonyl absorptions appeared at
1735 cm-I and t6OO c$-1, corresponding to the free carboxylic acid groups
and coordinated carboxylates, respectively. The complex always produced,
many peaks betow 14OO cm-l due to the phosphine ligand, but no assignment
was possible.
The electronic spectrum of the complex in methanol revealed an intense
absorption at approximately 230 nm, and fine structure al 260 and 270 nm.
A+
lRult2EDTA (dPe ) I - 2H 20
2000 1800 1400 12003200 2400
10001600
vilavenumbers (.*-rl
Fig. 3.4.3a Infrared spectrun of the Lt2-Bis(diphenylphosphino)ethane complex in Nujol'

93.
These were believed Èo involve the phosphine ligand. It \^ras considered.
possible that the less intense peak at 332 nm was due to a charge-transfer
band.
Attempts to prepare complexes with monodentate triphenylphosphine
were unsuccessful. This was probabJ-y the result of the ligand's low
solubility in the required methanollwater medium, and its inability to
stabilize through the chelate effect.
TABLE 3.4. 3b
Electronic Spectrum of ÍRUH TEDTA(dpe) I .2H 20
in Methanol
À (nm) -1 3 -te (mol dm cm
4232 3.9 x 10
267 sh 5.7 x 10³
274 sh 4.8 x 10³
332
398
2.6 x 10
6.5 x 10
3
2

94
TABLE 3.4.3A
Infrared. Spectrum of IRuHTEDTA(dpe)l -2H20 (nujol)
-1Assignment Frequency (cm
v (oH)
Aromatic v (CH)
Carboxylic v (oH)
Combination band
Carboxylic v (Co)
Carboxylate v (CO)
Aromatic ringvibrations
Other Prominent Peaks
3440 ms,br
3100, 3o8o w
3070 w,sþP ; 3040 w
2460 w,br2600, 2660 w,br
1930 mrbr a
1750 s, shp
1715 s,shp
1655 sh a
1630 s
1580, 1570 srsp
1540 sh
1485 sh
a
a
1350 - t40O s ; 1180 br, 1210 ms ; 1100 s,shp
830 s,shp, 835 sh ¡ 75O ms, 760 ms ; 710 s
TentaÈive assignments.
of lattice water.a Shoulder at 1655 "*-1
po""ibly due to ô (OH)

3.4.4 Reactions with Dithiocarbamate ron
The action of sodium diethyldithiocarbamate (Naatc) upon the
ruthenium(tt) and (IIf) aquo species was studied under acidic conditions.
In both cases addition of the ligand gave a red solution from which a
red solid was isolated. Comparison of the vibrational and electronic spectra
showed that the solids were identical. The product was believed to be
impure (vide infra), [Ru(III)EDTA(dtc) ]Nar.nHro. Evid.ence for coordinated
diethyldithiocarbamate was provided by microanalysis (CrH,N,S) and infrared
spectroscopy. The former, while indicating lower values than expected for
the above formulation, nevertheless established that one dithiocarbamate
moiety per ruthenium was present.
The infrared spectrum (Table 3.4.4a) produced a strong carboxylate
absorption at 16tO .*-1. The absence of any absorption in the region of
1720 cm-l indicated an unprotonated EDTA complex. A medium strong peak
appearing at t52O cm-I, was assigned to a v(CN) vibration of the dithio-
carbamate ligand as a result of the significant contribution of canonical
form (c) to the structure of the complex.2l4
.S ,S -SR2N-{: _ <---_> R^N-ql
- n,Ñ=cf -\s-'\s¿\s-
(a) (b) (c)
Absorptions in this vicinity have been suggested2l5 .s evidence for
the ligand behaving as a bidentate rather than monodenÈate ligand.
Evidence was obtained which ind.icated that the metal centre was in the
+3 state irrespective of whether the ruthenium(Il) or (III) aquo species
was used for the reaction. Firstly. products from both methods were stable
to air in aqueous solutions, and their electronic spectra showed no
significant changes after several days. This is unlike most of the
rutheniurn(II) complexes already d,iscussed. The l"-n*t specÈrum of either
complex in DrO solution was extremely broad as might be expected for a
paramagnetic species, but not for an unprotonated ruthenium(II) EDTA complex

96.
(Chapter 4). Finally, measurement of the effective magnetic moment of the
solid complex using the Guoy method,203 1tt¿1.ated paramagnetism
5(U"rt I.6 BM) as exPected for a d low-spin system. The isolation of a
ruthenium(III) sulphur-containing complex upon addition of a sulphur ligand
to a ruthenium(Il) medium is not unprecedented. This has been observed by
$filkinson in reactions with ruthenium 'blue' soluÈiorr=-216
Synthesis of the dithiocarbamato complex resulted in impure products
because of acid hydrolysis of the free 1igand,2I7 according to the equation,
R2NCS2 +H+ + R2NH+CS2.
ft was likely that other EDTA complexes were formed as a result. Molar
conductances of the dithiocarbamaÈo complex in aqueous çolution \^tere highermoo- t
than expected for a 2zI electrolyte (À, n,ZaS S "^2[ and indicated other
species to be present in solution. Purification of the dithíocarbamato
complex was not achieved possibly because of its similarity to any other
EDTA products present, and its high solubility in water and methanol.
Recrystallization was unsuccessful.
lrlhenever a strong HCI solution was added to a cooled methanolic solution
of [nu¡pfa(dtc)]Nar.nHrO, a white precipitate of sodium chloride formed
without any change in soluÈion colour. The red product isolated from such
a solution produced an electronic spectrum essentially the same as the
parent complex in both peak position and intensity (Table 3.4.4b). The
infrared spectrum of the solid was in agreement with that of the parent
complex but for the appearance of new strong absorption at 1730 "*-I.This was due to the carbonyl absorptions of the protonated free carboxylate
moieties and the product \rras presumed to contain [Ru(IIf )H2EDTA(dtc) l.nHr0.
Titration with base revealed 1.5 protons per ruthenium centre.
The electronic spectrum of the dithiocarbamato complexes are compared
in Table 3.4.4b. The ruthenium(III) complex showed similarities in band
position with [ps(III) (dtc)rl, but for this complex no definite electronic
assignments appear to have been made.2lB Studies2l9 of dithioc acids have

97.
suggested T-îr* transitions in Èhe regíon of 260 nm, and n-n* at
approximately 350 nm of Ì^reaker intensity. The highest energy band of the
ruthenium complex was probabty of r-n* origin but the others were uncer-
tain, atthough a charge-transfer band possibly occurred at 350 nm.
TABLE 3.4.4a
Infrared Spectra of Dithiocarbamato CompTexes
(nujoI)
Frequency 1"*-r)
Assignment IRUEDTA (¿ltc) I NaZ . ffi20 IRUH2EDTA(dtc) I .nH,ob
v (oH)
Carboxylic v(OH)
Carboxylic v(co)
Carboxytate v(CO)
v (cN) a
3400 s,br
1610 s,br
1520 ms
3350 s,br
2500 w,br
2600 w,br
t73O s
1610 srbr
1520 ms
a. Due to dtc ligand.
b. Proposed formulation.

98
TABLE 3.4.4b
Electronie Spectra of Dithiocarbamato Complexes
-tÀ (nm) e (moI dm
3-1cm SolventComplex
IRuEDTA (dtc) I Na, . nH
IRuHTEDTA(dtc) I .nHrO a
a20
235
335
445
525
335
445
525
346
389 sh
509
586 sh
257
294
Water
Vüater
Chloroform
4
3
2
2
3
2
2
b 3
3
3
3
lFe (III) (dtc) l3
Na dtc c 4
41.26 x 10
1.58 x 10
a
b
c
Values of e estimated assuming n = 2.
Ref. 2IA
Ref. 22O

99.
3.5 Substitútion Reactions
The addition of various ligands to the ruthenium EDTA aquo species was
a convenient method of synthesizing substituted EDTA complexes. However,
it was found that the complexes [RuH2EDTA(L)2] (L = py, PhCN) readily lent
themselves to substitution under cerÈain conditions and provided alternate
routes to several complexes already discussed. A significant advantage of
this method was the absence of halide salts as by-prod,ucts. Reactions
were carried out primarily in acidified methanolic solution and because of
their solubility the bis(benzonitrile) and bjs(pyridine) complexes were
selected as precursors. The use of this solvent served to reduce compet-
ition by the aquo ligand.
The mitdest conditions for substitution were considered first and found
to be unsuccessful. The passage of carbon monoxide, dinitrogen or dinitrogen
oxide through a methanolic solution of the bjs(pyridine) complex at ambient
temperature produced no change in the electronic spectrum of the complex.
No reactj-on occurred in the presence of phenanthroline or bipyridine ligands.
It was suspected that substitution was acid-enhanced. The complexes
IRuH2EDTA(L) 2] were slowly hydrotyzed in aqueous solution, in which they
behave as weak acids, but stable in methanolic solution wherein dissociation
was slight (Section 3 "2) .
Ho\^rever, even in acidified (dilute HCI) methanolic solution, substitution
aÈ ambient temperature was very slow. Bubbling carbon monoxide through a
solution of the bjs(pyridine) complex under these conditions resulted in only
small amounts of a carbonyl complex (vide infta) after 90 minutes ' Substi-
tutíon by phenanthroline was equally slow. AtÈempts to substitute dinitrogen
oxide \,\rere carried out by pressurízing the gas (34 x 105 pa) for 30 minutes
into chilled solutions of the bis(pyridine) complex in acidified methanof,
TFA, and TFA/HCI mixtures " After this tine products were precipitated with
ether. Vibrational and electronic spectra indicated the solids isolated to
be a mixture of the starting complex and decomposition products, probably

100.
due to oxidation by dinitrogen oxide.
It was found. that substitution occurred readily whenever acidified
methanolic solutions containing [RuH2EDTA(L) 2] and the required ligand were
refluxed under dinitrogen. Under these conditions changes in solution colour
were evident within several minutes. The s¿rme results were achieved in
acidified aqueous solution, but methanol was preferred as the bulk solvent
in order to reduce the possibility of hydrolysis. Substitution was more
facile using the.bjs(pyridine) complex as the bis(benzonitrile) counterpart
showed greater stability in acidic solutions. Upon refluxing equal amounts
of each complex for equal lengths of time, it was often found that traces
of the latter comprex remained since a weak v (cN) absorption appeared in the
infrared spectra. The disappearance of the pyridine complex, and the extent
of the reaction were determined from the electronic spectra of the products
isolated. The substitution reactions invesÈigated, and their results are
summarized in Tabte 3.5a.
As the results clearly indicate substituÈion was not successful in all
cases. In the main, Iigands and reaction products stable towards oxidation
and acid hydrolysis produced satisfactory resul-ts. Conversion of
IRu(II)H2EDTA(L)21 to a nr:¡nber of ruthenium(III) complexes was also achieved.
Thus refluxing with acetylacetone or dimethylglyoxime for about 20 minutes,
and allowing the solutions to stand in air for up to two days, resulted in
Èhe production of IRu(III)H2EDTA(L-t)l (L-L = acac' dms). only the dimethyl-
glyoximato complex was isolated and characterized spectroscopically.
The action of nitric oxide upon heated solutions of IRUH2EDTA(L)2]
produced the brown nitrosyl complex. Using the .bis(benzonitrile) species
the compound, [RuH2EDTA(NO)CI] .2H2O (section 3.1.1), was isolated' and
idenÈified by spectroscopy and titration. However' carbon monoxide failed
to produce a clean product under the same conditions, irrespective of the
starting complex. The result was always a yellow solid possessing medium
carbonyl absorptions at 1950 cm-I and I89O "*-I in its infrared spectrum

101.
-1( IRuHEDTA(CO) I K.2H2O: v (C0) 1940 cm ; Section 2.5). The low intensitY of
these absorptions suggested that complete conversion to the known carbonyl
complex had not occurred. The origin of the second carbonyl absorption ulas
not known nor was the nature of the product established-
rzrBLE 3.5a
SubstituÈion Reaction
lRuH2EDrA(L) 21
MeOHr/H+* *nl.r -> tRuHTEDTA(L') n l+2L
L Conunent
phenrbipy
dpe
PPh3
dtc
Complete reaction. Longer refluxing
time needed when L = PhCN.
Incomplete. Some decomposition occurred.
Starting material + oxidation products
isolated.
No product isolated due to decomposition
of ligand.
Complete reaction provided sufficient
time given.
Substitution occurred but product not
isolated.
Complete reaction.
Mixture of products.
Starting material + oxidation products
isotated (f, = py) .
a_dmg
aacac
NO
co
N o2
*
a
n = 1 when Lt bidentate; t'¡ = 2 when Lt monodentate.
The ruthenium(III) complex was formed.

ro2.
3.6 Reactions of the uncootdinated Carboxglic Acid Gtoup
Most of the EDTA complexes isolated were in fact carboxylic acids.
The solubility of some of these in methanol allowed reactions of the free
acid functional group to be investigated.
3.6.7 Esterification Reactions
Esterification is a conunon reaction undergone by carbo>1z1ic acids.
An established method of methylation under mild conditions involves the
use of diazomethrrr..lT5 The reaction of a chitled ethereal solution of
this compound with a cold methanolic solution of the ¡is (pyridine) complex
yielded an orange crystalline so1id. This product was the dimethyl ester
resutting from methylation of both free carboxylic acid groups according
to Èhe equation,
IRuH2EDTA(I)V) rl + cH2N2 + [RuMe2Eora(fV) rl * N2
where Me = -CHa. The reactíon proceeded cleanly as the by-product and
excess reagents were volatile.
Formulation of the comptex as [RuMerEDTa(py) r7.2UrO \^7as supported by
'l
the 'H-nmr spectrr¡n which was different to that of the parent complex and
revealed a sharp peak at 3.7 ppm assigned to the methyl resonances (Chapter
4) . Integration of the spectrum indicated two methyl substituents - The
extent of hydration of the complex \¡¡as variable. Often the freshly isolated
complex did not possess an intense v (OH) absorption in the infrared
spectrum, suggesting little lattice water, but this band generally increased
in intensity over a period of about a day. Microanalysis always supported
a hydraÈed formulation as above.
As Table 3.6.la shows, the effects of methylation were apparent in
the vibrational spectrum of the complex, as might be expected, rather than
in the electronic spectrum. Several changes occurred in the infrared spectrum
as compared with that of the parent compound. The original carbonyl frequency
of the free acid was shifted by approximately 1O "*-1 ao 15 cn-l to higher

103.
energy as a result of an ester group being formed. This served to reduce
hydrogen-bonding and therefore increased the earbonyl stretching frequency'
The v (CO) stretch of the coordinated carboxylates also shifted to higher
energy by approximatety 20 cm-I. Tn addition, the weak hydroxyl stretches
due to the carboxylic functional groups disappeared'
The di-methyl ester was soh:bIe in water, methanol and chloroform'
Fresh aqueous sotUtions under dinitrogen rdere initially non-conductingmo¿-l
(Âyr L3 Scnl¡ 24.5"C) but on standing the conductance increased, presumably
due to hydrolysis., Aged or impure samples also produced higher conductances
þol I
(Au r fOOscm/i than expected for a neutral species' and their nmr spectra
\¡rere poorly resolved. This indicated that slow decomposition in the solid
state occurred over long periods of time. Finatly, fresh aqueous solutions
produced electronic spectra (Ttable 3.6.1b) in agreement with the features of
IRuH2EDTA(py)zl (section 3.2.2.)'
Methylation of the complexes [RuHEDTA(CO) ]K'2H2O, and [RuH2EDTA(L)rrl
(n = 2, L = phcN; n = 1, L = phen) was also studied, but with limited success.
The former complex was sufficiently soluble in methanol to undergo methylation
and produced a yellow solid. The infrared spectrum of this product produced
shifÈs of about 10 cm-l Èo 15 r*-1 itt the original carbonyl absorptions of
the parent complex at 1725 cm-I and 1600 cm-I simitar to the case above
(Table 3.6.1a). The carbon monoxide stretching frequency $/as unaffected'
Microanalysis and the tH-nmr spectrum in O2O solution also supported a
methylated product. The latter produced a spectrrm with a prominent peak
at3.SppmpossiblyduetoameÈhylresonance(Chapter4).onthisbasis
the product was formulated as [RuMeEDTA(CO)]K'nHoO' However in aqueous,¡n"i-l
solution the molar conductance (Àu 136 s crn2/ was higher than expected
for a l:1 electrolyte possibly due to incomplete reaction or partial decom-
position of the ester product. The conductance increased slowly with time'
AÈtempts at recrystallization resulted in decomposition.

104.
Reactions of the .bjs (benzonitrile) and phenanthroline complexes with
diazomethane were unsuccessful and resulted in oily solids of uncerÈain
composition. The failure to obtain well-characterized esters from EDTA
complexes other than the pyridine derivative confined further studies of
the carboxylic group to this complex.
3.6,2 Anide Formation
The synthesis of an a¡nide derivative of the bis(pyridine) complex was
investigated using p-toluidine. Refluxing a meÈhanolic solution of Èhe
complex and amine ín a 2:1 molar ratio, under dinitrogen, yielded an orange
solid. The anticipated reaction was
IRuHTEDTA(nv) rJ + 2NH2 ."orq.C"3 * [Ru(p-T) 2EDTA(nv) rl + 2H2O
where p-T signifies -NH.CAr¿.CH¡. The infrared spectrum (table 3.6.Ia)
of this product produced a broad absorption at 3170 cm-f attributed to the
v(NH) mode of the resulting amide. A ne\¡t, medium strong absorption also
appeared at 1515.*-t. This was assigned to a ô(NH) mode of the amide
group, and is characteristic of secondary amides.213 The carbonyl absorption
of the amide was incorporated into the strong carboxylate absorption of the
EDTA ligand at t59O cm-l. In addition, products from the reaction consist-
ently showed a medium absorption at 1720 "*-1 poirrting Èo the presence of a
free -COrH moiety. This was the first indication that the reaction did not
proceed to completion.
rhe lH-runr spectrum in DrO, CDC13 and TFA, confirmed the presence of a
toluidide residue by the appearance of a signal aE 2.1 ppm, assigned to a
methyl resonance. However integration of peak areas indicated that the
methyl resonance was only about 60% of the value expected for a di-toluidide.
A mixture of products was confirmed by thin layer chromatography. Methanolic
solutions of the complex chromatographed onto silica plates produced two
spots. Molar conductance measurements determined in aqueous solution yielded
values of approximately I5O S "*2
.orr"istent with the di-toluidide and parent

105.
complex both being present in solution'
Totat conversion to the di-totuidide complex \^Ias probably prevented by
the water formed during condensation and water ôf crystallization borne by
the bjs(pyridine) complex. Even in dried methanol no more than 60? conversion
was realized. Separation of the products was attempÈed using column chro-
matography. The passage of methanolic solutions of the reaction product
through Fluorosil columns did allow separation but also resulted in sig-
nificant decomposition of the toluidide complex. The infrared spectrum of
the eluted complex revealed a large decrease in the amide absorptions of
the toluidide residue.
Despite only partial success with the reactions described, the feasi-
bility of modifying the non-coordinated carboxylic groups was demonstrated
nonetheless. It appeared that mild conditions and the production of non-
participating by-products \^tere essential in ensuring a clean total reaction'
This explains the success of the diazomethane procedure. However, the choice
of complex also appears to be important in determining the stability of the
carboxylic acid derivative'
Table 3.6.Ib
ELectronic spectrum of IRuMe2EDTA(pv)zl'2H2O in Aqueous soLution
¡ (nm) e (mo1-1 a¡n3 cm-l)
245
260 sh
9.1 x tO3
3.1 x IO3
g.2 x tO3365

Table 3.6.Ia
rnfrared Assignnents of EDTA compTexes Containing Functional- Derivatives of the Free catboxgTic Groups
-1(cm -)
Assignments
v (oH)
v(nH)
Aromatic v(cH)
Aliphatic v (cH)
Carboxylic v (OH)
Carbon monoxide v(C0)
Ester v(CO)
Carboxylic v(cO)
Carboxylate v(C0)
ô (NH)
Aromatic ring vibrations
FrequencY
lRr:MerEDTa (PY) 2l -2H2O
Nujo1 KBr matrix
3380 m'br 3420 s,br
3070 w 3080 w
obscured 2950 m
L742 s 1738 s
1615 s,br 1600 s 'br
1560 s,sh 1560 s,sh
IRuMeEDTA(co)Jr.nnrO [Ru(r-TTEDTA(pv) r1'nur}a
KBr matrix Nujol
3420 s,br 3400 s,br
3170 ms,br
3060 w
2920 mobscured
2940 m
2600b
\^lI
1940 s
1735 ms
L62O s,br
b1720 ms
1590 s 'brI5I5 ms
1560 s,shHool
1480 m
a. Tentative formulation; [RufrrnOfa(py)Z] was also present. b. Due to IRuIÍ2EDTA(PV)rl '

"zoIRuHTEDTA(CNS) 2l- a- lRunpore(cNs) ]
IRuHTEDTA(dms) lRuH (dtc) l
SCN
IRuH2EDTA(acac) l
IRuHTEDTA(acac) ]
,uoTA(dne) I
IRuHTEDTA(N-N) l
[RuEDTA(N 2ll2-
a-++H + SCN
SCN
CN
tRl tOI
t0l HCI
dmg
acac
N-N
2-IRuHTEDTA (drnS) I IRuEDTA(dtc) l
dtcùnq
[RuH2EDTA(RcN) 2] lRu III) HEDTA (H2O) ]
RCNH2/Pt *zo
lRuI4e2EDTe(py) zl ¡¡s (II) HEDTA ( H20)l
dpe
il+
NO
N2H4.H20cHzNz
IRuH2EDTA(nV) rl
[nuHEDTA(C0) I
aIRuHEDTA(N0) l
Nz Ar2-
H2EDTA
lRuCIUNol
c"zNz
a
IRuMeEDTA(c0) I lRuHrnota(cNS) 2l2-
IRuHEDTA(N2) l- + [ (HEDTA)RÛ{
nu(HEDTA) l
RcN = MecN, PhCN, L,2-C6H4(CN)2; N-N = phen' bipy'
Proposed formulation in solution'
22
a
Fig. 3.Ia Ruthenium EDTA Complexes'

r07 .
CHAPTER 4
NMR AND STEREOCHEMISTRY
4.L LH-nm, Spectra of Hexa- and. Pentad.entate EDTA compTexes
Complete coordination by the EDTA ligand about a metal centre results
in a configuration possessing two types of coordinated glycinate arms each
with a methylene group. The arms lying in the same ptane as the ethylenic
(E) backbone of the ligand are referredll6 to.s'equatorial' (C) wtrite
those in the plane perpendicular to this are called 'axial' (R). This is
illustrated in Fiq. 4.la below.o
(c)(E)
(R)
Fig. 4.La IM(EDTA) ln The notation fol-lows l¡treaktiem and Hoard.116
The lH-nmr spectra of the complexes IM(EDTA)ln- (M = zn(rr¡, Pb(rr),
cd(ïI), H9(II)r n = 2¡ M= co(IIr), n = f) have been studied222-226 in
aqueous media over a wide pH range. The spectrum of ICo(EDTA)] consists
of two AB patterns overlapping an A2B2 pattern. The AB pattern arises
wit¡in a glycinate arm whenever the metal-nitrogen bond. is intact. Three
different groups, the metal, glycinate and ethylenic portions are attached
to the N- atom, sufficient to cause non-equivalence of the adjacent methyl-
enic protons.222t227 The AB patterns have been assigned to the two types
of glycinate arms, the A2B2 pattern to the ethylenic portion of the ligand.
Free EDTA consists of a singlet due to four ethylenic protons and aÈ lower
field, a large singlet representing eight glycinate protons.
Terrill and Reif1ey228 have examined deuterium exchange in glycinate
rings and shown that this occurs more readily on the axial (R) arms as
compared with the equatorial (c). The difference in isotopic exchange rate
is relaLed to the ring strain existing in these complexes. Hoard et af.116t22L
have determined that the equatorial glycinate rings are strained and bent
N

108.
while the axial rings remain relatively planar and strain-free.
The spectra of tM(rr)EDTAl2- (M = zn, Hg, Cd, Pb) obtained, in acidic
solutions (pH < 4) show broadening of the ligand AB resonances and a shift
to fower field.222'I27 ProÈonation of Èhe complex results in a downfield
shift while interchange of acidic protons between the chelates and between
the chelates and solvent is rapid enough to average out separate resonances.
The observed spectra are an averaçJe over the protonated and unprotonated
species in solution. In addition, broadening is caused by a decrease in
the l-ife-tjme of EDTA in the complexed state as the raÈe of intermolecular
exchange, which is acid-assisted, increases. This is termed. 'life-time'
broadening.229 In acidic solution hexadentate EDTA complexes can exist in
equilibria with various substituted species. Thus, [Co(EDTA)]2- rapidly
equilibrates with the protonated species, ICoHEDTA(H20) ] under these
condition s.228
Vühen EDTA acts as a pentadentate ligand four geometric isomers are
possible, as shown in Fig. 4.1b. The sixth position is occupied by a mono-
dentate ligand. The isomers are designated (I) to (IV) and can be con-
veniently divided into pairs of 'equatorialr (I and II) and, 'axialr (IIr
and IV) configurations. fn considering likely structures for pentadentate
EDTA complexes, isomers (fI) and (IV) are provisionally discounted.
Howarth et aL.Il8 h-n. suggested that acid hydrolysis of [co(EDTA)]- to
ICoEDTA(x) I 2- is unlikely to produce (II) or (IV) sj-nce these require the
opening of at feast two glycinate rings as opposed to one. Ring closure
would also require at least two. Further, more ring strain is likely to
be encountered in these isomers. The rapid ring closure of ICoEDTA(X)]2-
species suggests that this hypothesis is reasonable.
The 1H-nmr spectra of [CoHEÐTA(HzO)] and ICoEDTA(x)]n- (x = No2 ,
n = 2¡ Hzo, n = l) have been investigated by 'tickting' techniques.llT
Here AB patterns due to the axial, equatorial and free glycinate methylenes
are observed, together with ethylenic A2B2 Tesonances. Blackmer and

Equatorial
o
Ax ial
o
x
o
M
il
x
o
o
ilt
Fig.4.1b lsomers of tM EDTA(X)1n-
tv

109.
SudmeierllT h.n" presented evidence of these complexes exisÈing
exclusively in the equatorial configuration (I) in solution- X-ray
analysis of the solid complexes INiHEDTA (n2o¡ ¡ ¡¡1 l9 "tt¿ [CTHEDTA (H2o¡ 1
2 3 0
has shown them to possess configuration (I).
However, Higginson23l has reported two isomeric species of the formula
ICoHEDTA(HZO) I in which the aquo ligand can occupy an axial or equatorial
position. Kinetic studies232,l03 of the ring closure in [ConOta(er¡12-
have also indicated the existence of two isomeric forms.
4.2 r3c-nm, Spectra
proton decoupled 13c-trt* spectra have been useful in determining the
structure of EDTA complexes in solution, since each carbon atom produces
a single resonance under these conditions. Howarth et a7.118'233'234
have used this technique to elucidate the nature of EDTA and related
species existing in solution (table 4.2a). For tM(rr)EDTAl2- (yt = zn, Cd,
pb, Hg) the respective 13c-n*r spectra reveal only three resonances, arising
from the carboxylate carbons, the gtycinate methylenes and the ethylenic
backbone. napid exchange of the in-p1ane (equatorial) and out-of-plane
(axial) sites causes the carbons of each set to be equivalent. The exception
is tAl(III)EDTAI which gives a spectrum that is pH dependent and includes
pentadentate and possibly tetradentaÈe species. However, [Co(EDTA)]
produces five resonances, since five pairs of equivalent carbon atoms are
present in the molecule. This is in agreement with the formulation of an
inert hexadentate configuration. For the substituted series, ICoEDTA(X)]n-
and ICoHEDTA(X)]n- a maximum of ten resonances are possible, and generally
scen, because these complexes possess no elements of s)anmetry (Tab1e 4.2a).
The identification of observed resonance signals has been achieved by
the variation of solution pH, to which the free carboxylate and glycinate
methylenes are sensitive, and by the preparation of suitably deuÈerated
complexes. As mentioned in the previous section, the axial methylenic

IIO.
protons exchange more readily than the equatorial protons, allowing
selective deuteration of EDTA complexes. In this manner the axial
methylenic carbons have been distinguished from the equatorially situated
carbons in cobalt(III) complexes. The ethylenic carbons have been iden-
tified from the spectra of fuIly deuterated cornplexes. Both the axial
and equatorial methylenic positions are deuterated, but the ethylenic
portion remains undeuterated.
The I 3c-t*r spectra of the pentadentate EDTA complexes have concurred
with lH-nmr studies in suggesting that structure (1) is the predominanÈ
isomer in solution. The only exception is the bromo complex mentioned
earlier (vide supra), in which two spectra are obtained corresponding to
an equatorial and axial isomer. oxidation of tCo(rI)EDTAI2- with bromine
produces a mixture in which the axial isomer predominates, while the action
of concentrated hydrobromic acid upon [co(EDTA)]- is reported to produce
only the axial isomer.llS Although structure (rrr¡ has been suggested,
configurations (rr) and (IV) cannot be totally dismissed. The spectrum of
the axial isomer (Table 4.2a) differs from the equatorial isomers in
possessing only one coordinated axial carboxylate peak. Although no axis
of symmetry exists the equatorial carboxylate peaks appear similar enough
to superimpose.
4.3 Tetradentate CompJexes
When EDTA behaves as a tetradentate ligand the number of possible
isomers increases to seven. These are il-Iustrated in Fig. 4.3a, and may be
divided conveniently into classes of trans-axial (isomers a, b) cis-equatorial
(isomers c, d) and non-symmetrical (isomers e to g) configurations. For
reasons outlined already, isomers (a), (c) and (e) would be favoured over
the other members of their respective groups. In each case Èhe leasta
nr¡rnber of glycinate arm rearrangemàúnts would be involved for their formation
from a hexadentate structure. However, the favoured isomer overall is (c),

o
o
o
ox
o
o
o
o
x
a b
d
o
c
o
oo
o
fe
g
Fig.4.3a Possible lsomers of tM H2EDTA(X)2J

the logical extension of structure
free.
111.
(I), since both equatorial arms remain
The Hl-nmr spectra of IRh(III)H2EDTA(X)ZIH'HZO (X = Cl , Br ) has
established that EDTA behaves as a tetradentate ligand.235 The species in
solution \^rere reported.235 ." probably having a symmetrical cis-equatorial
structure. The cis arrangement has been established for the complex
lvo2 (EDTA) I 3- in the solid state .236-238
It is clear from the Figure that isomers (a) to (c) possess a C2 axis
of symmetry, while (e) to (S) do not. This allowed the former to be
distinguished from the latter using nmr spectroscopic techniques.
4.4 Resul.ts
the IH- and 13c-n*r spectra were recorded for a number of ruthenium(Il)
EDTA complexes in TFA and D20 solutions. Assignments of AB patterns were not
made in the lH-nmr spectra (60 MHz) since these were not fully resol-ved.
Overlap and broadening of peaks \^ras apparent, especially in TFA. Most of
the stereochemical information came from the examination of 13C-tunt spectra.
In addition, these confirmed the state of the metal as +2 in each case, since
no spectra were obtained for ruthenium(Ill) complexes (in the range 0 to
200 ppm relative to TMS) as a result of large paramagnetic shifts of the
carbon resonances.239 The observed chemical shifts for all recorded spectra
are collected in Tables 4.4a, b, c.
4.4.1 Carbongl and Nitrosgl CompTexes
The lH-nmr spectrum of the carbonyl complex in D2O solution (pH ru 1)
produced a nrunber of superimposed resonances between 3.0 ppm and 4.5 ppm.
Lower field resonances hrere due to glycinate protons, higher field peaks
to ethylenic protons. Neutralization of such solutions by potassium carbonate
resulted in sharpening of the EDTA resonances. As mentioned in section
3.6.1, evidence for the methylated carbonyl species [RuMeEDTA(gg)] came

LL2.
partly from its lH-n*r spectrun which was similar to the parent complex but
for a new prominenÈ peak at 3.8 ppm assigned to the methyl resonance.
Solutions of this complex and neutralized solutions of the carbonyl complex
underwent slow decomposition as judged from the darkening of the solution
colour and broadening of the nmr spectra.
The I3c-rr*r spectrum of [RuHEDTA(co)]K'2H20 produced eleven peaks
(Fig. 4.4.La) and established the absence of symmetry elements. This
strongly supported pentadentate coordination by EDTA. The carbon monoxide
Iigand resonance was identified as the peak at lowest field.240 Three
peaks between I82 ppm and l-86 ppm were assigned to the three coordinated
carboxylates and the single resonance at L7O.7 ppm to the uncoordinated
carboxylic acid group. FinaIIy, six resonances appeared between 66 ppm and
57 ppm corresponding to the methylene carbons of each type of glycinate
arm, and the ethylenic carbons.
The assignment of the individual peaks was done by comparison with the
reportedllS spectra of cobalt(III) EDTA complexes and therefore are not
unequivocal. The resonances due to the free carboxylic acid group, and the
methylene carbon of the free glycinate arm, are both known to be pH depend-
ent.llB The free acid resonance varies from about 169 ppm (pH < O) to 173
ppm (alkaline pH), and the methylene carbon from about 53 ppm (pH < 0) to
66 ppm (alkaline pH). Therefore, the spectrum of the carbonyl complex (pH
of solution < 2) resembled the spectra of the protonated cobalt(III) com-
plexes in this area. The methylenic resonances ürere several ppm lower
than their cobaLt counterparts.
From the I 3c-n*r spectrum it was not possibte to assign an unambiguous
configuration. Table 4.4a shows that the observed spectrum appeared to be
in better agreement with the eguatorial isomers, than with the only axial
isomer. [Co(IrI)EDTA(er¡12-. Moreover, the results about to be discussed
in relation to the tetradentate complexes suggested that an equatorial
assignment was reasonable.

-c Hz-
Ru-GO Ru-CO2 -CO2H
++
Ref e rence
70 "*'l^'^200 190 180 l-70 ppm
I3Eí9. 4 .4.La C-nmr Spectrum of IRuIIEDTA(Co¡1ç.2Hr0 ín Aqueous Solution.
60 50
r13 .
The 13g-rr*r spectrum of the nitrosyl complex, also measured in D20, \^/as
more complicated than for the carbonyl species. A concentrated solution
(> 0.4 mol dm-3, pH < O) of IRuHzEDTA(NO)C1] produced four prominent
resonances in the carboxylate region of the spectrum. Peaks at I82.9 ppm
and I80.4 ppm were assigned to coordj-nated carboxylates, the remaining two
at 170.5 ppm and 169.6 ppm to the free carboxylic groups. This indicated
that in concentrated solution the complex existed largely as the
undissociated tetradentate species. The methylenic region of the spectrum'
between 58 ppm and 66 ppm revealed a number of prominent peaks. Four
methylenic signals from the glycinate arms were expected, but only three
main peaks occurred. However, a signaL aL 64.8 ppm \^ras especially strong
and possibly resulted from the superposition of two peaks. Similarly,
only one strong peak appeared for the ethylenic backbone of Èhe EDTA ligand
and this was also attributed to the coincidental superposition of two very
close signals since the nitrosyl complex possessed no axis of symmetry.
In addition to the main peaks a number of smaller resonances \¡rere seen
and attributed to the presence of the pentadentate complex IRuHEDTA(NO) ] .
The spectrum of a less concentrated solution of the complex (0.05 - 0.1 mol
drn-3, pH ru 1.5) was more complicated and clearly indicated a mixture. This
was concluded from the appearance of five resonances between 184 ppm and
I8O ppm, and three, between 17I ppm and 169 ppm, in the free carboxylic acid
region. Up to a dozen peaks appeared in Èhe methytenic region (67 - 60 ppm)
of the spectrum. It was concluded that both the tetradentate and penta-
dentate complexes \^rere present in solution. No stereochemical assignment
was possible from the I 3c-rr*r spectra but the cis-equatorial configuration
was suggested for the tetradentate complex, and the equatorial structure (I)
for Èhe pentadentate species. The similarity between the electronic
spectrum of [RuHzEDTA (No) cI) and cis- [Ru (ltH3 ) 4No (CI) ] as discussed in
secÈion 3.I.2 Ient support to this conclusion.

114.
4.4.2 Nitrile ConpTexes
The lH-runr spectra of these complexes recorded in TFA resulted in
acid-broadened peaks (Fig. 4.4"2a). This included the aromatic resonances
of [RuH2EDTA(L)2] (L = PhCN,I,2-C6Hl(CN)2) and the methyl resonance of the
bjs(acetonitrile) complex. rntegration of peak areas ffi consistent with
the proposed formulations. T\,,ro broad resonances due to EDTA appeared between
3.0 ppm and 4-0 ppm. The coafesced AB patterns of the glycinate methylenic
protons appeared at lower fietd and the broadened ArB, signals of the ethyl-
enic backbone at higher field. It should be noted at this stage that the
resonance for tattice water was never clearÌy seen in the spectra of
complexes recorded in TFA. Indeed, the spectrum of NarHrEDTA.2H2O recorded
in this solvent produced a very weak, broad hump (4.9 ppm) downfield of the
gtycinaÈe resonance, due to the rapid exchange of the OH group with this
solvent.
The appearance of one methyJ- resonance for [RuHTEDTA(MeCN)rJ
immediately suggested a slzmmetrical molecular environment. However, it
could be argued that acid-broadening resulted in the coalescence of two
closely separated methyl peaks. To sharpen the spectrum solid potassium
carbonate was added to a solution of the complex in DrO. Base hydrolysis
occurred fairty rapidly producing a deep violet solution and the nmr spectrun
remained poorly resolved.
The question of symmetry was resolved by recording th. l3C-rrmr spectrum
of the complex in TFA solution (fig. 4.4.2b). Seven resonances l¡¡ere
observed due to the complex and since the molecule contained fourteen
carbon atoms, a s)ûnmetrical structure was confirmed. The carboxylate
resonances, free and coordinated, appeared at I73.7 ppm and I88.0 ppm
respectively, The nitrile carbons produced a single peak at 130.7 ppm.
This represented a downfield shift from the free ligand value of approxi-
mately t3 ppm as a result of coordination to a ruÈhenium(Il) centre. A
doublet at approximately 65 ppm was assigned to the free and coordinated

4.O 3.0
ppm
2.O
Fig. 4 .4.2a In-r,*t Spectrum of [RuH2EDTA(MeCN) ,).UrO in TFA.
TFA TFA
7
?-----6rrI80 160 t40 l-20
ppm
Fis. 4.4.2b 13C-nmr Spectrum of [RuHTEDTA(MeCN) rl .UrO in TFA.
5

1I5.
pairs of methytenic carbons of the glycinate arms. The peak at higher
field was assigned to the methylenic carbons of the free arm, consistent with
the behaviour of the uncoordinated carboxylic acid, groups which appeared
upfield of the coordinated carboxylates. This assignment was made in the
subsequent spectra described. The ethylenic carbons of the EDTA backbone
produced a singlet at 6I.B ppm. Finally, the methyl carbons of coordinated
acetonitrile appeared as a single peak at high field'
The spectrum obtained was compatible with structures (a) to (c) in
Fig. 4.3a. Further distinction between these was made from the comparison
of the nitrile stretching frequency¡ v(CN), in the solid infrared and Raman
spectra of the complex. Both vibrational spectra \^¡ere identical in producing
a major peak aL 2268 (t 4) cm-I with a less prominent absorption aE 2278
cm-I (Table 3.2.Id). These were assigned to the symmetric and asymmetric
s¡-reÈching modes of the two nitrile groups in a cis- configuration. If the
trans arrangement occurred then only one peak each in the Raman and infrared
spectra would have been expected. In arriving at these conclusions only
the slzmmetry of the CN groups with relation to each other \^Ias considered.
This approximation has been made in assigning a ttans- configuration to
tMn(co) 2L3Brl, using the carbonyl stretching frequency'241
It was reasonable to assuÍle that [RuH2EDTA(PhCN)2J possessed a
syrwnetrical structure as well although the l3c-t*t spectrum I^Ias not
recorded. The infrared and Raman spectra tatlied in revealing two nitrile
absorptions (tabte 3.2.Id) whose peak positions and differences (Av(cN)) were
equal within the experimental error (v(CN) z 222L,2236 cm-l Raman)' The more
intense absorption occurred at lower energy. The infrared spectrum in
methanolic solution vtas in good agreement with the solid state absorptions
both in position and relative intensity of the nitrile stretch- This
discounted the possibitity of either absorption being due to solid state
effects. Therefoïe, on the evidence presented the cis-equatorial structure,
isomer (c), was assigned to both complexes'

116.
4.4.3 Pgridine ComPTexes
In TFA these complexes produced acid-broadened 1H-rr*t spectra.
Nevertheless better resolution of the EDTA resonances \¡¡as observed Èhan
occurred with the nitrile complexes and the overall spectra were more
complicated. The 4-methyl pyridine derivative produced a slightly broadened
methyl resonance (2.0 ppm). Neutralization by potassium carbonate of D20
sol-utions containing [RuHzEDTA(py)z] initiatly gave orange solutions whose
lg-rrmr spectra appeared to contain two equally intense AB patterns and one
intense peak due to the ethylenic backbone.
The spectrum of [RuH2EDTA(Ue-py¡r1 indicated two methyl substituents
per EDTA ligand and produced one methyl resonance. This was consistent
with a slzmmetrical molecule, and further supported by the spectrum of
[RuMe2EDTe(py)z] in CDC13. This produced a complicated spectrum (Fig. 4.4.3a)
which in the region of 3.0 ppm to 4.0 ppm was dominated by one sharp
resonance at 3.7 ppm, attributed to two equivalent methyl groups of the
ester moieties. Confirmation for the molecular symmetry of [RuH2EDTA(py)Z]
came from the i3ç-t*t spectrum in TFA (FiS. 4.4.3b). Eight peaks were
obtained for this twenty-carbon molecule (the pyridine molecule is
slzmmetrical in itself and produces only three peaks) indicating a molecular
C2-axis of symmetrY.
The resonance at lowest field (I88.9 ppm) was assigned to the
coordinated carboxylates. The free carboxylic resonances appeared aE I72.6 ppm.
Three signals due to coordinated pyridine \^Iere seen betlÂIeen 127 ppm and 155
ppm, accompanied by three much weaker peaks. These were attributed to free
pyridine as a result of gradual decomposition of the complex. Accumulation
of the spectrum overnight resulted in a decrease in intensity of all peaks
save these which became more prominent. Their chemical shifts agreed with
the spectrum of free pyridine in TFA.
Fina1ly, the spectrum of [RuH2EDTA(py) Z] produced three peaks in Èhe
region of 65 ppm to 60 ppm. Two at l-ower field were assigned to the methylenic

tq8.0 7.O 5.0 4.0
ppm
F'i7.4.4.3a I"-r,rr Spectrum of [RuMeTEDTA(pV)rJ in CDClr.
T TFA
3.0
R rence
,,
I80 160 140 L20
ppm
Fí9. 4.4.3b tta-n t Spectrum of IRuHTEDTA(py) Z] .2H2O in TFA'
60

LL1 .
carbons of the free and coordinated glycinate arms, the higher field
absorption to the ethylenic backbone of the ligand.
The nmr spectral data could noÈ confirm a cis-equatorial- structure
for these complexes. Nevertheless other evidence suggested this
conclusion. It can be seen from Table 3.2.2f that the electronic spectra
of these complexes were in better agreement with the known
cjs-[Ru(ltH3)4(py)z]2+ species than with the corresponding trans- complexes.
In section 3.5 the conversion of [RuH2EDTA(f)zl (L = py, PhCN) to the corres-
ponding phenanthroline complex was described. Since the nitrile and phen-
anthroline complexes were believed to possess the cis-equatorial structure
(sections 4.4.2 and 4.4.4, vide infra) conversion of the former to the
Iatter was likely to involve retention of configuration. As a result,
the bjs (pyridine) complex was assigned the above structure since it readily
produced the same phenanthroline complex. Retention of configuration172
during substitution has been observed for cjs and trans- [Ru(NHS)+(py)21 (CIOa)2.
4.4.4 Aromatic u-Ðiimine CompJexes
Coordination by 1,IO-phenanthrol-ine and 2,2' -bipyridine reduced the
nuniber of possible isomers since the trans-axial structure was no longer
possible for either complex. This immediately eliminated structures (a)
and (b) in Fig.4.3a and simplífied the issue into distinguishing between
isomer (c) which is symmetrical and the remainder which are not.
As expected, the lH-tmt spectra of both complexes in TFA revealed
broad EDTA and aromatic resonances. The l3c-tt*t spectrum of such a
solution containing [RuHzEDTA(phen) ] did not produce a spectrum analogous
to the previously studied tetradenta.te complexes. Instead, three intense
sharp resonances due to the EDTA ligand were seen together with weaker
and broadened peaks arising from phenanthrol-ine. This result indicated
decomposition, and was confirmed by monitoring the disappearance of
visible band in the electronic spectrum of the complex. Approximately 35%

1r8.
decomposition occurred in this solvent over a period of three hours " The
strong resonances \^rere assigned to uncoordinated EDTA.
This probfem was overcome by recording the spectra of the complexes
in their unprotonated forms " Neutralization of aqueous solutions of the
complexes with solid potassium carbonate yielded intense red-brown solutions
containing IRuEDTA(N-N) ] 2 (N-N = phen, bipy) . The 1"-rr*r spectra
showed sharp EDTA and ligand resonances although this yielded no conclusive
stereochemical- information" However, the tta-n*t spectra produced just
half the number of possible resonances in either case. This indicated
a molecular Cr-axis and a slmunetrical cis-equatorial configuration in
solution for both complexes, Structure (c) was assigned to these complexes.
The spectra (FiS, 4"4.4a, b) were characterized by three areas of
absorption. The first, between 185 ppm and I75 ppm contained two
resonances. The downfield resonance was assigned to the coordinated
carboxylates, the upper field to the non-coordinated. The aromatic o-diimine
resonances appeared in the vicinity of 160 ppm to 120 ppm. The third
region, between 65 ppm and 57 ppm, contained three peaks. The high field
absorption $¡as ascribed to the ethylenic portion of EDTA, the remaining
two peaks to the methylenic carbons of the free (equatorial) and
coordinaÈed (axial) glycínate arms.
The assignment of resonances arÍsing from the phenanthroline and
bipyridine ligands was made from a comparison with thu I3c-rrmr spectra of
established heterocyclic and polycyclic aromatic systems24Q '2+2 (Tabte
4"4b), In such cases the carbon atoms nearest the nitrogen are shifted
to l-ower field compared with other carbon members of the ring. In
addition, bridgehead carbons fusing two ring systems appear the weakest
since they lack nuelear Overhauser enhancement. These observations
allowed the two peaks at lower field in the spectra of the complexes to
be assigned, but the remainder were less certain. The low field peaks of
the free ligands underwent a significant shift to lower fíe1d as a result

r35 L25
ppm
Reference
65 55
R eference
65
l4I85 17s 1s5
Fig.4.4.4a tt"-rr^r spectrum of IRuEDTA(phen)]2- in DrO solution.
,418s l_75 165 15s 135 L25
ppm
Fig. 4.4.4b lt"-rr^r spectrum of IRuEDTA(bipy) ] 2- in DrO Solution'

119.
of coordination.
4.4.5 Other ComPlexes
Evidence for a cjs arrangement came from a number of other sources.
The infrared spectrum of [RuHzEDTA(CNS)21K'2H2O' as already noted (section
3.3.2), produced a strong, split peak due to v(cN). In methanolic
solution this remained unaltered implying the existence of the cjs
isomer, although not necessarily the symmetrical form' The lH-nmr spectrum
of the ruthenium(Il) acetylacetonato species could not be obtained due to
rapid oxidation. often a broadened peak appeared aE 2.2 ppm, in O20
solution, due to the methyt protons, but this rapidly collapsed'. The
proton nmr spectrum of a D2O solution containing ¡p1¡(II)H2EDTA(dm9)lK'H20
(section 3.4.2), produced a single peak at 2.I ppm, as a result of two
equivalent methyl groups. This r,rras taken as evidence for a slzmmetrical
cjs-equatorial structure since for all bidentate ligands the trans-axial
isomers were not possible. Gradually this peak broadened. and decreased in
inÈensity due to oxidation to the ruthenium(III) analogue.
4.4.6 Concfusion
The evidence presented overwhelmingly supported the symmetrical cjs-
equatorial structule over all others. From the 13C-tt*t spectra it was
conclud.ed that in aII cases, excepting the nitrosyl complex, only one
isomeric form existed in solution. The nitrosyl complex was believed to
be exceptional since it dissociated in sol-ution to give the pentadentate
complex (section 3.L.2) resulting in a complicated spectrum. Because of
the preference for the cjs structure in the tetradentate complexes, it
\¡¡as reasonable to extrapolate this back to the pentadentate complexes.
Hence, the dinitrogen, aquo and carbonyl complexes most likely possessed
structure (I).

73
Table 4.2a
C-nW Spectta of EDTA ComPlexesa
Complex
(in DrO)
lco (EDTA) l
ICoHEDTA (cr¡ 1 -
2-lcoEDTA(CI) l
2-lCoEDrA(Br) I (A)
2-lCoEDrA(Br) I (B)
¡qegspsa(HrO) I
4-EDTA (plt 13)
c
Ethylenic
(-cH2cH2-)
64.O
62 .3 ,64.8
62.3 ,64.7
62.3 ,64.7
62 .O ,64.3
6L.8,63.4
52.4
54.2
57.9
c
lPb (EDTA) l
lzn (EDTA) I
2-(pH 6)
2-(pH 6)
a. Ref. 1I8 b. Superimposed Peaks. c (A) = equatorial isomer; (B) = axial isomer. See Fig. 4.1b.
HNJo
66.O
65 .5 ,65.8
65 .2,66.Ib
65 .2 ,66.lb
66.8
66 .4 ,64.7
66.4
62.6
63 .8
67 .4
66.9
b
b
Ib66
56466
66.L
60.0
59.3
6s .8
66.9
66.8
62.7
4rb
Methylenic carbon (-CH2-)
equat. uncoordaxial
L82.4
183.8
183.7
183.7
185 .5b
L82.6
183.0
L84.7 ,L85 .2
r84 .8,185 .3
184 .8,185 .3
I84. I
183.8,r84.3
173.7
L73.4
L69.6
L69.2
L73.4
180.6
L79.9
180.0
Carboxylate (-Co,
axial uncoord.equat.
)

Table 4.4a
f3c-n*, chemicaJ- shifts (ppm from TMs) of Ruthenium EÐTA comp,zexesa
Complex
IRuHEDTA(c0) l
PH'v2
lRüzEDTA (NO) CI] c
(r) > o.4 mol dm-3pH<0
O.o5 nol dm-3pH tu 1.5
(2)
IRTÍI2EDTA (MecN) ,J
IRuJI2EDTA (eV) ,lIRTII2EDTA(Phen) J
IRuEDTA(pten) I2-
lRuEDrA(bipv) I2-
a. Temp. approx. 300oK.
assignments of CH, carbons
method (Section 3.1.1) .
solventb
'zo
ozo
Dzo
TFA
TFA
TFA
f
f
f
Dzo
Dzo
b. lr4 dioxane used as internar reference. c. only the major peaks are listed' No
were made. In (2) coordinated co, separated from uncoordinated'Nitrosyl prepared by MNTS
d. possible superposition of peaks. e. Tentative assignments ' f'' Peaks due to TFA: Ht\)H
60.9,60.6,60.2
59.3,57 .9
57.6
57.5
59.8d
54-O*
61.8
60-2
Ethylenic carbons
(-cH2cH2-)
65 .7 64 .8,63 .5 61 . 3
66 .7 ,66 .4 ,66.1,65 . 3
64.'7 ,64.4 t63.O
60.7
64.8
,63.465.7 ,64.8d
57-O-
60.6
63.465 .0
64.4
66.6
64.8
Methylenic carbons (-CH2-)
equat. axial uncoord'
Carboxylates
axial
(-co2)
uncoord.equat.
L82 .9 184 .1 ,185 .7 l7O .7
L82.9,180. 4 r'7O.5 ,L69.6
L75.4
L72.6
r75.4
L72.6188.9
185.2
e
185 .2
L73.7188 .0
r71. I170.8,170.1
183 .6 ,r82 .8 ,181 .8180 . 7 ,180.5
163.9, 163.3, L62.7, L62-L, L23-3, 119-1, 115'0' 110'8 ppm'

L
Table 4.4b
I3c-n r Chemical Shifts of Cootdinated and Ftee Ligands (L)
Chemical Shift. (PPm)a
I22.
solventb
Coord. CO
Coord. MeCN
Free MeCN
Coord. py
Free pyc
Peaks frorn decompositionof [RuHzEDTA(PY) z]
dCoord. phen
Free phend
dCoord. bipy
Free dbapy
202.8
13o. 7 (cu¡ 5 .7 (Me)
LL7 .7 (cu¡ 6.3 1ue)
15s.s (c0) 138.7 (cß) r27.4 (cy)
148.3 (co) L42.r (cß) 128.8 (cy)
l-49.5
156.6 (Co¿)
151.6 (Cr)
L46.6 (Co)
141. I (C. )
161.6 (Ce)
L55.7 (co)
rs6.2 (ce)
L49.5 (Cc)¿)
L43.4
135.0 ("Ê
r29.8 (Co
L29.4
) L27.L (cY)
) 124.6 (c.6)
) r27.r (cY)
) 12s.3 (cr)
) 123.4 (cô)
)
) r22.o (cô)
)
Dzo
TFA
TFA
TFA
TFA
TFA
Dzo
TFA
Dzo
D2O,/methanol
L36.4 (C
L29.6 (cß
ô
136.3 (",
t2s.e (cß
138. r (",
r24.6 (.ß
phen
Y
0
a. Compared wj-th TMS.
ion. See also Ref. 24O.
b. l,4-Dioxane reference. c. As the pyridinium
d. Tentative assignments.
r bípv pvÞ
Y

Complex
Na2'H2EDTA.2H2O
IRuHEDTA (co) I K'2Hto
IRuMeEDTA(cO) I K'nHzo
IRuH2 EDTA (ttteqil) 2 l' u" 0Relative ratioo
Free MeC\l
[RuH2EDTA (PhcN) 21' 2u2oRelative ratioFree PhCN
[RuH2EDTA ( 1, 2-C6H5 (C'l'l) 2 ) 1' 2H2O
Relative ratio
IRuHzEDTA(pY) zl '2H2o
Relative ratio
Free PY
[RuH2EDTA (Me-PY) ]' 2H2o
Relative ratioFree Me-PY
Table 4.4c
tl-nmt chemical shifts lô)a
Major Pealcs (ppm)
3.8 (en) 4-2 (sIY) 4.9 (tt2o¡
3.5 , 3.8 , 3.9 ,4.O , 4.2 , 4.4
2 2 (Me) 3.I (en)624
3.3(Me)
3 3 (en)4
(sry)
2.6L.7
3.4 ,3.8 , 4.L , 4.2 | 4.53.4,3-7 r4.Lr4.2
3.8,4.0:8
3.8 , 4.0
7.39
7.5
4.r , 4-3:8
,4.5,7.8t8.5c
7 ,3.8 ,o r7.I ,
L2, 4.O , 4.2, 7.8 , 7.9 , 8.5 , 8.6,8.5 ,8.6
.5 ,3.7 ,
.3,1.4,
.9 ,8.0 ,
3.2 ,7.2 ,7.8,
4.5 , 4.6 (sry)8:
(sry)
(Ar).5c
6.9 (Ar)tu8c
5 (en)4
3.3 ,3.6.9,7.EDTA pv
(EDTA)
1 (ar)
| 4.r , 4.5 (EDTA)(ar¡
¿ L2: ru8c, 8. 3 , 8.4 , 8.5 (ar)
Solvent
TFAb
DzoD2O/K2CO3
Dzo
TFAb
D2o/K2Cos
TFAb
TFA
TFAb
TFAb
Ð2A/K2Co3
TFA
TFAb
TFA
3
;77
4.t7.5.ô3.97.68.3
2.O6.8
(Me) ',6.9 ,
: EDTA(Me) ,
37
7
3,8,
3.87.9
67.6
FNJ(,ArMe
2.5 7,(contd. )

Table 4.4c - ConÈinued
ll-nmr ChemicaT Shifts (ô)a
Major Peaks (ppm)Complex
lRuMe2EDTe (py) 2I' 2n2o
Relative ratio
lRu (p'T) 2EDTA (PY) z I 'nH2o
Relative ratio
[RuH2EDTA (Phen) ]' 3H2o
Relative ratio
[RuH2EDTA (biPY¡ ]' 2H2o
Relative ratio
[RuH2EDTA (d¡ng) ] K'H2O
(Me) , 3
,7.o,7EDTA : ME
3.5 , 3.9 ,4.3 ,3.6 , 3.7 , 3.8 ,EDTA : phen 1
3-77.518
4r35'8\' 12
2.I6.9
3.2 , 3.3 , 3.5 ,7.O , 7.2 , 7.4 |Me2EDTA : py
3 (Me2EDTA)(er)
(EDTA)(ar)
, 4.5 ,7.L | 7.8 ,9.9
Solvent
CDCI3
CDCI3/Trab
TFAbD2o/K2Co3
TFAbÐ2o/K2Co3
ï,+.o,4.L,4.2,4.
.5r3.9r4.2r4.5
.2
' 8.o, 4.3
7.3 ,7.64.O , 4.22-.8
.4,7.3,7.6,7.8,8.0
.g , 4.L , 4.3 , 4.6 ,7.5 ,7.7 ,7.8 , 7 -93.6 ,3.4,
, 7.7 , 8.5 , 8.610
3
EDTA
4.I ,43.7 ,3:bipy I12
2.I (Me) , 3.3 , 3.6 , 3.8 , 4-T Dzo
a. Relative to TMs. b. Broadened Spectrun. c. Integration of aromatic signals was noÈ accurate in TFA due to
proximity of solvent resonance. t erominent peak.
HN)È

I25.CHAPTER 5
ELECTROCHEMISTRY
5.L lntroduction to Voftananettr243'244
The technique of voltarnmetry utilizes a three-electrode system con-
sisting of a polarized electrode (the "work", or micro-electrode) onto
which a potential is impressed, a counter electrode and a reference
electrode (usually a saturated calomef electrode, SCE) " This method'
investigates Èhe oxidation or reduction of a chemical species at the
r^rork electrode as the potential is varied. lVhen both work and counter
electrodes consist of mercury the technique is calted polarography'
The term voltammetry is usually reserved for any electrode system other
than mercury. The choice of work electrode is often dependent upon the
desired, range of the potential. For potentials positive to SCE, platinum
is the best choice, whilsÈ for negative potentials the high over-voltage
of a mercury cathode for hydrogen allows scans of up to -2 volts in
basic media.
The voltammetric \^¡ave resulting from the current-voltage plot for a
reversible system has the appearance shown in Fig. 5.la and can be
analyzed in three sections. The region X is due to the residual current
which is a summation of the charging current and current carried by
traces of impurities. In this region the potential is too low to bring
about electrolysis of the species under investigation. Tn the vicinity
of Y the current rises sharply with potential as the species begins to
be reduced (or oxidized) " At Z the current levels off due to a saturation
effect resulting from the depletion of the chemical species at the electrode.
However, more ions are continually diffusing to tf¡e efectrode surface from
the bulk solution and are immediately reduced at the surface. The rate
of diffusion is determined, at constant temperature, by the concentration
gradient existing between the bulk of the solution and Èhe concentration
at the electrode. The current at Z is called the diffusion current, iU,

imA
\\
I
'-
z
2l{ 0
+-}
Redn. (Cathodic Wave)
Y
Lx I
\I
E Volts
Voltammogram Showing Graphical Locatlon Ol E,
E\
Fig. s"l a
.ct_p
.aI p
Oxidn.( Anodic Wave)
E
Fig. 5'1b Reversible Cyclic Voltammetric Curve.

126.
and is directly dependent upon the concentration of the reducible species.
For the dropping mercury electrode (DlE) this current is given by the
Ilkovic equation,y 2/3 I/6
id=6O7ncD'm t (1)
where the value o1. 607 is a proportionality constant and n is the nunber
of electrons involved in the cathodic process; C is the concentration of
the species in solution; D is the coefficient of diffusion; m is the mass
of mercury flowing through the capillary, and t the time between successive
drops.
For a reduction occurring on a mercury electrode,n+ - (n-m) +M + me + M'
it can be shown that the potential at the electrode, E, is related to
the standard potential Eo, by the equation
E=E'-#'"[3-l -#,"t-J e')
where D and D' represent diffusion coefficients of Mn* and *(n-m)+
respectively. At i = }:iU the potential is designated as Err the half-
wave potential.
"k-FO-g
RT (3)2nF
Hence,E=E \
(4)
Plots of tn(i/id - i) versus E yield n from the slope and E, from
the intercept. Generally E* is close to Eo in value provided D and Dr
do not differ greatly. The above equations result from Nernstian
equilibria and are inapplical¡Ie to irreversible reactions-
poÈential sweep methods involve changing the electrode potential
linearly, according to
E=E'+vt (5)
where v is a constant, either in a single sweep or cyclically. For a
sufficiently slow s\^¡eep the current potential characteristic approaches
RT--InnF

I27 .
that obtained by the steady-state argrment above. As the scan rate, v,
is increased a peak in the curve is developed since the rate of diffusion
to Èhe electrode can no longer cope with the rate of the electrochemical
reaction. For a rapid electron transfer, the peak currentr í_, is given by:
-5 3/2 + à P
tn = ,.67 x to- n AD'cv (6)
where Èhe symbols have the same meaning as before and A is the electrode
area. The peak potential is related to the half-wave potential by
E =E, -åtv Qlpa,n
in the case of a reduction (cathodic) peak. Because of the broadness of
the peak, it is often easier to measure the half-peak potential which is
related to the half-wave potential by
2AEp/z = E+ + ?v (8)
These equations apply for a reduction reaction. For oxidation the sign
of the numerical term is reversed. The shape of a cathodic peak can be
defined by
Ep-Ep/z--I*"- (e)
The equations above relate to NernsÈian equilibria. Trreversible pro-
cesses give a different expression for the peak current from those for
reversible systems.
=. 3/2Y L Ltn = t.ol x 10" n o'AD'cv' (10)
and
E -E . =-$nu' (11)P P/2 crn
The term a is Èhe transfer coefficientr245 normally with a value bethTeen
0.3 and 0.7.
In addition to the single peak described, a reverse sweep can
ímmediately be introduced following the first, and a reverse peak of equal
height is obtained. This is the procedure of cyclic voltammetty.24et2+6-2+8
A cyctic voltammogram for a reversible system is shown in Fig. 5.1b. The
peak separation, A"p, becomes a ne\,\t characteristic and is about 6O/n mY

128.
for a reversible situaÈion. A nruriber of diagnostic criteria can be
established from the cyctic voltammogram relating to the reversibility
or irreversibility of a chemical system"
For the strictty reversible charge transfer process,
o*ne ? R
E is independent of the scan rate, v. Further, ul - ul : 59/n nv (atppp25oC) and is independent of v. The superscripts c and a refer to cathodic
and anodic respectively. The anodic to cathodic current ratio,
is unity and independenÈ of v.
The quasi-reversible case is the mechanism in which the current is
controlled by a mixture of diffusion and charge transfer kinetics. The
foltowing characteristics are observed. The peak potential, Ep, shifts
with v. The peak separatio", nl - ul (j.e. AE^) may approach 60,/n mvppp
at low v, but increases with increasing v. The ratio iilii approachesp'p
unity. The overall response for a quasi-reversible system visually
approaches the irreversible situation as v is increased.
The irreversible charge Èransfer case,
O*ne + R
is generally very sensitive to v and En shifts cathodically by 30,/cln mV
for a ten-fold increase in scan rate. Usually no current is recorded on
the reverse scan and no peak appears. However, if Èhe product of a
reversible charge transfer reaction j-s consumed by a rapid chemical reaction
such that no reverse reaction can proceed, the overall reaction sequence
will adopt the same qualitative form as that of the írreversible charge
transfer reaction.
5.2 Introduction to ETectrochemistrg of Ruthenium EDTA CompLexes
The complex, tFe(IIr)EDTA(H2o)l , is reduced quite readily (uå +0.07 v
in AIaClOn).88 However, as described below, reduction of the ruthenium(II1)
analoEue occurs at more negative potential. Ezerskaya has also studied the
.cr,pia/p'
t29.
reduction of several rhodium(III) EDTA complexes using conventional polar-
ographic techniques.BSrS9 The aquo complex is not easily reduced (Uà
-0.90 V in NaClOn).
Shimizu et aL.l31 h"n. investigated the reduction of [Ru(III)HEDTA(H20)]
at a mercury electrode using AC and DC polarography. They noted a reversible
cathodic wave at -O.2 V and an irreversible wave at -1.0 V. Using DC
polarography EzerskayaSS noted a cathodic $rave at -0.23 V in solutions
of [nuHUOte(Cl)]K.2H2O. We found that the s¿tme complex in 0.5 mot dm-3
KCI solution, using a platinum electrode, yielded a reversible cathodic
wave with E, of -0.26 V resulting from the reduction of the ruthenium(fll)z
to (II) state (riS. 5.2a). tt was observed that the initial reversible
wave hras accompanied by a larger irreversible wave in the vicinity of -0 -6 V,
not reported by Ezerskaya but possibly corresponding to the irreversible
wave described above by Shimizu. This wave was considered to be largely
irreversible, since AEp for the cathodic and anodic components \^ras tu0-2 V
and the peak current of the cathodic wave was much higher than for the
anodic \^Iave. This feature r¡tas present in many of the EDTA complexes
studied, usually in the range of -0.6 to -0.8 V. These may have been
associated with the EDTA ligand since solutions of NarHrEDTA.2H20 in 0'5
mo1 dm-3 KCI solution, under cyclic voltammetric conditions' revealed
broad irreversible peaks in the region of -0 .7 v '
The attempts to isolate the ruthenium(Il) aquo complex (Section 2.1)
yietded a solid which produced an anodic \^/ave at approximately -0 '2 \l in
a single ssreep voltanunogram. This was attributed to the presence of the
rutheníun(TI) species. The presence of ruthenium(TII) was also indicated
by a much stronger cathodic wave at about -O.25 v'
5 "3 ResuJ.ts
The effect upon the redox behaviour of the ruthenium complexes, as
a ïesult of replacing the aquo ligand loy other substituents, \¡Ias investigated.

130.
Most of the ligands used tended to stabilíze the +2 state of the metal,
therefore anodic processes were mainly studied. As a result of coordination
by different ligands the E'- value was profoundly affected, as discussed
below. The observed ,\ are collected in Table 5.3a.
5.3.1 Carbonql and NitrosgT CompJexes
Solutions of the carbonyl and nitrosyl complexes produced no anodic
waves up to +0.8 V. The niÈrosyl complex produced an irreversible cathodic
peak at approximately -0.5 V. This was not assigned to a reduction
involving the Ru-NO moiety since the carbonyl complex produced an analogous
result. Reduction of nitrosyl complexes is known to occur and has been
studied for a number of compounds.157r160t249,250 The observed peak
was believed to be due to EDTA as mentioned earlier.
Solutions of the carbonyl complex were stable to aerial oxidation.
No significant changes occurred in the voltammograms of such solutions.
In particular there was no evidence for the formation of the ruthenium(Ill)
aquo species.
5 .3 .2 Nitril-e ComPTexes
Solutions (pH 2-3) of these complexes gave cyclic voLtammograms
characterized by an irreversible anodic wave at potentials greater than
+O.4 V due to oxidation of the metal from the +2 lo *3 state. During
the reduction cycle a broad cathodic r^Iave appeared at approximately
-0.3 V with a strong irreversible peak at -0.7 V (fig. 5.3.2a). The
appearance of only an anodic wave was consistent with a strictly irrever-
sible oxidation, or with an oxidation followed by a rapid consecutive
reaction which consumed the oxidation product and eliminated the possibility
of a cathodic wave. The Latter was represented by the scheme,
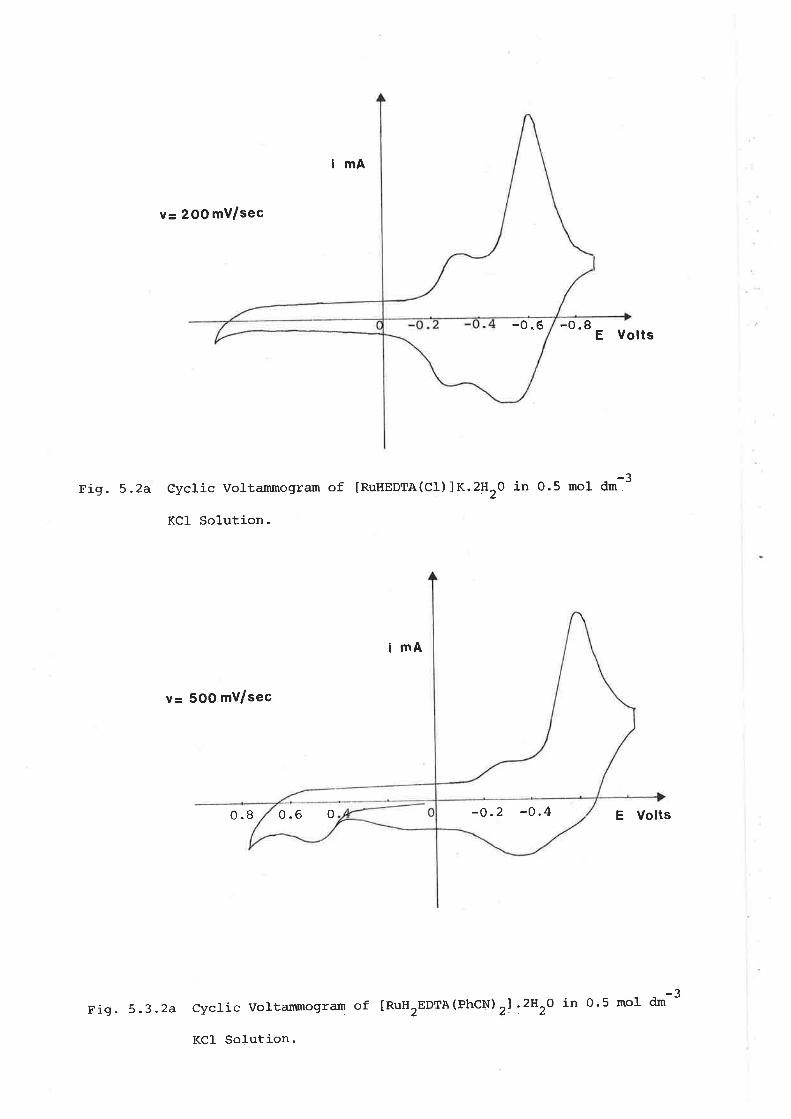
imA
v= 2OO mV/sec
-0 .8 E Volts
Fig. 5.2a-2cyclic voltammogram of IRuHEDTA(C1)]K.2HrO in 0.5 mol dm "
KCl Solution.
imA
v= 5OO mV/sec
0.8 E Volts
cyclic Voltammogram of IRuH2EDTA(PhCN) zl .2lzo in o.5 ¡nol dm-3
-0.6
0.6 0 -o.2 -0.4
FiS. 5 .3 .2a
KCI Solution.

13r.
lRu(rr)H2EDIA(ncx) r1 tgf [Ru(rrr)H2EDrA{ncr,l) rf+ e-
+ FAST
lRu(rr)HEDTA(H2o)l- t51 tRu(rrr)HEDTA(H20)l + H+ + 2RcN
Some evidence for this scheme came from the repeat scanning of a solution
of the bjs(benzonitrile) complex ín the range 0.0 to 0.8 V and then to
-0.8 V. It was expected that at sufficientty high scan rates the oxidized
product of the complex would not have time to diffuse from the micro-
electrode and, therefore accumulate. It was found that at scan rates ofa
n lOr mV,/sec and higher the anodic \^rave of the complex at approximately
+0.5 V decreased while the cathodic wave at-0.3 V increased. The latter
was consistent with the reduction of the ruthenium(fff¡ aquo complex-
No evidence for a rutheniun(Ill) bjs(nitrile) complex was obtained even
at high scan rates (10-20 Y/sec). This suggested rapid hydrolysis of
the ruthenium(IlI) intermediate according to the mechanism above. Solutions
were acidic, therefore aquation was favoured rather than base hydrolysis
of the nitrile ligand which has been reported for a number of ruthenium(IfI)
nitrile comprexes .25r '252
From Table 5.3a it is apparent that the E* values for oxidation
increased with the n-acidity of the ligand, being smallest for the .bis-
(acetonitrile) complex and largest for the bis(phthalodinitríle) complexes-
This is expected since good electron-\n/ithd.rawing groups would stabilize
the ruthenium(Il) state towards oxidation. Matsubara and Ford253 h.n.
noted. a similar trend in the reduction potentials of various organonitrile
complexes of ruthenium(rrr), [Ru{llua)ur,]3+ (L = MecN' PhcN etc.). rt
has also been shown that bis complexes of unsaturated ligands, tnu(M:) n"rl=*
(L = py, phCN) possess larger reduction potentials than the corresponding
mono complexes.
5.3.3 Aromatic a-Diimine CompTexes
The observed E, values for Èhe phenanthroline and bipyridine complexes

L32.
hrere about 0.1 V lower than the corresponding value for the.bis(aceto-
nitrile) complex. However, unlike the nitrile complexes, oxidation was
found Èo be quasi-reversible (fig. 5.3.3a). The anodic wave of both
complexes was followed on the reverse sweep by a cathodic wave of almost
equat heigttsuch that the ratio, lu/i", approached uniÈy (Table 5.3a).
The peak separation was found to be dependent on the scan rate and
approached 60 mV at slow scans. This indicated a one-electron charge
transfer reaction as shown by the equationI
¡¡¿(rr)H2EDTA(W-s¡ 1 ¿ tRq(rrr)H2EDTA(N-N) I' + e
where N-N = phen, bipy. The observed E* (tu0.3 V), assumed to be close to
the Eo values, were substantially lower than for complexes of the type
tt(*-*) rlâ* (M = Fe, Rü, os) , where Eo for oxidation generally exceeds
1 volt (in acidic nedium).1911254,256 However, as the number of N-N Lino-nols
about the metal decreases, so too does Eo and oxidation becomes easier.19l
Thus a substantial decrease in Èhe E* for the EDTA complexes, as compared
with the above was not unexpected.
5.3.4 Pgridine CompTexes
The pyridine complexes were found to be more prone to oxidation than
the compounds described already. They produced quasi-reversible anodic
peaks in the vicinity of +0.15 V (Fig. S.3.4a). At arnbient temperature
these peaks appeared flattened by comparison with the well-defined peaks
of the o-diimine complexes. However, on scanning at lower temperatures
definite peaks were obtained. At ambient temperature the rate of diffusion
was able to keep up with the electrochemical reaction, but not at ice
temperature, resulting in well-defined anodic and cathodic peaks. The
oxidation \^ras expressed by:
lRu(rr)H2EDTA(nv) r1 t [Ru(rrr)H+
2EDTA(nv)rJ' + e
The .bjs (pyridine) complex and dimeÈhyl ester derivative gave Eà
values which agreed, within the experimental error. This was not surprising

imA
v= 2OO mV/sec
E Volts
Fig. 5.3.3a-?
Cyclic Voltarunogram of [RuH2EDTA(phen)].3H20 in O.5 mol dm "
KCI Solution.
imA
v= 2OO mv/sec
E Volts
-?Cyclic Vol-tammogram of IRuH2EDTA(PV)rl '2H2O in 0'5 mo1 dm "
2 -O.4 -06 0.4 0.2
-02 -0. 44 0.2 0
FiS. 5.3.4a
KCI Solution (at ruOoC).

133.
as the esterifícation of the free carboxylic groups was not expected to
alter significantly the redox potential of Èhe metal centre. Hot'lever'
the bjs(4-methyl-pyridine) complex appeared to have a slightlY lower E*
value. This was rationalized in terms of the methyl sr¡bstituents of the
pyridine ligand donating electron density towards the metal and destabil-
ising the ruthenium(II) state. For complexes of the series, [Ru(llHr)rnVXJ3+,
where pyX is a substituted pyridine, the reduction potentials are dependent
upon the nature of X and electron-withdrawing sr:bstituents increase this
potential .2 5 3
5.3.5 Thiocganato ComPTexes
Both single sweep and cyclic voltammetry were used to investigate the
isolated complex. In addition, the ruthenium(III) thiocyanato complexes
prepared in situ by the addition of SCN to [RuHEDTA(C1) ]K.2HrO solutions,
were also studied using the latter technique. Results are shown in
Tables 5 .3a and 5 .3 .5a.
lvhen a fresh solution of [Ru(II])H2EDTA(CNS) 2lK.2HrO ín 0.5 mol d¡n-3
KCI was reduced, a single cathodic \ÂIave appeared with an Et of -0.13 V.
Upon standing this wave decreased and a second emerged at-O.27 V (Fig.
5.3.5a). However, when reduction of the complex \^tas carried out in a
0.4 mol d*-3 rSCw solution, a ne$r cathodic wave immediately appeared with
E. of +0.O2 V. The wave at -0.I3 V r^ras considerably diminished, and theh
one at -O.27 V did not appear (rig. 5.3.5b).
These results were compatible with the presence of two thiocyanato
complexes in solution, as already discussed in Section 3.3.1. The first
cathodic wave (Uà -0.13 V) seen in 0.5 mot am-3 t<Ct was assigned to a
monothiocyanato complex which stowly ('ì, 6O minutes) decomposed to give
significant amounts of the aquo complex, indicated by the second wave
(E, = -e.27 v). In O.4 mol A*-3 rsCs, the cathodic wave at +O.O2 V stemmeda
from the production, within minutes, of substantial amounts of the

imA v= 50 mV/sec
Alnit ial
After -40mins
-0.1 -o.2
5 .3 .5a Voltallunogran of lnuuruOra (CNS) 2]
K.2H2O in 0.5 mo1 dm
Solution.
imA
v= 50 mV/sec
0.1 -0 .1 -o.2
A
B
0 -0.3E Volts
Fig.
Eig. 5.3.5b Voltammogram of [RuHTEDTA
Solution.
0
-3 KCl
E Volts
-?(CNS) 2JK.2H2O in 0.4 mol drn - KSCN

134.
dithiocyanato complex. The absence of this wave in 0.5 mol am-3 XCt
solutions suggested that dissociation of the dithiocyanato complex Èo the mono
species was rapid" The electrochemicaL reactions urere expressed by:
t [nu(rrr)HEDTA(cNS) ] ? tRu(rr)HEDTA(cNS) f E,, = -0.13 vz2-
lnu(rrr)H2EDTA(cNs)21- ? [nu(rr)H2EDTA(cNS)2]'- E, = +0.o2 v
Cyclic voltammetry \^¡as used to study the formation of the thiocyanato
complexes as the concentration of SCN r4ras varied relative to the concen-
tration of the ruthenium(rff) aquo complex. Voltammograms were recorded
immediately after the addition and dissolution of solid KSCN to the
solution.
The aquo species produced a cathodic peak centred at approximately
-O.2A V which shifted to -0.2O V upon addition of an equimolar quantity
of thiocyanate ion (Fig. 5.3.5c). As more ligand was added the cathodic
wave shifted to more positive potentials. V[ith ligand concentrations
approxímately 120 Èimes in excess the peak divided inÈo two humps, one
centred aÈ -0.18 V, the other at approximately -0.05 V and smaller than
the first. WiÈh further increases in ligand concentration the laÈter
peak became dominant until only it remained (Figs. 5.3.5d, e).
The above observations indicated that formation of the monothiocyanato
complex occurred rapidly and within the time of mixing. Formation of
the dithiocyanato complex required higher concentrations (tuO.4 moL dm-3)
of ligand, and formed within minutes under these conditions. Voltammograms
recorded at every stage of ligand addition indicated that the mono and
dithiocyanato species were involved in quasi-reversible reductions (rigs.
5"3,5c. d, e). Somewhat better defined peaks were obtained when the
above reactions were studied at the temperature of melting ice.
t As mentioned in Section 3"3"1, the formulation of the monothiocyanato
complex was ambiguous.
was also possible.
A tetradentate species, [RuHTEDTA(H20)CNS] t

imA
v = 1 V/sec 8,,
E Volts
Fig. 5.3.5c Cyclic Voltammogram of [RuHEDTA(cf)1ç-2"r0 (tuIo-3 mol am-3)
-3Before (A) and After (B) Addition of Thiocyanate (tu1-0
-?dn -).
mol
imA
v= 1 V/sectB
I
0 E Volts
Fig. 5.3.5d Cyclic Voltammograms of Thiocyanato Complexes Prepared jn situ-
curve A: [RuHEDTA(H^0)] tu10-3 mol dm-3t tScN I n'O'l mo1 d*-3'¿
curve B: tscN I 'r'o'5 mof d'n-3'
0 -0.1 -o .2 -0.3-
- - ---
-0. 2-0.

imAv= 5 V/sec
v= 2 V/sec
v= 1 V/sec
v= 5OO mV/sec
L -O.2 -0.3 E Votts
Fig. 5.3.5e Cyclic Voltammogram of [RuHTEDTA(CNS)rlK, Prepared jn situ.
IRuHEDTA(H2O)] "'10-3 mol dm-3; ISCN ] 'r't nol "*-''
imA v= 5OO mv/sec
E Volts
Fig. 5.3.5f Cyclic Voltammogram of the Ruthenium(II) Thiocyanato Complex
in 0.5 mol a*-3 rct solution.
o.2-0. to .2 0.1

135 .
The volta¡unogram of a green solution of Èhe ruÈhenium(Il) thiocyanato
complex (Section 3.3.3) produced a broad anodic wave ("L t +0.04 V). The
cyclic voltammogram (Fi9. 5.3.5f) revealed that on scanning from the rest
potential one anodic wave appeared at approximately +0.04 V, but two
cathodic waves appeared during the subsequent reduction scan. The position
of the anodic wave suggested the presence of a dithiocyanato complex which
dissociated to the mono species. A possible scheme \¡ras:
2_ toltRu(rr)H2EDTA(CNS) 2l'- ¿ tRu(rrr)H2EDTA(CNS) 2l Et tu +0.04 v
1+
lRu(III)HEDTA(cNs) l
The waves observed., although apparently quasi-reversible jutlging
from AE , !{ere broadened. Cooling in ice had no effect upon the definitionp
of the voltammogram. Probably a number of species \¡lere present in solution.
A mixture of a mono and dithiocyanato complex of ruthenium(Il) was capable
of giving a similar qualitative result as'above'
5.3.6 Ðinitrogen and Azido CompTexes
The monomeric and dimeric dinitrogen complexes produced irreversible5'3.6o,
anodic waves in their respective cyclic voltammograms (FiS. 5-åa) due to
oxidation from the ruthenium(Tl) to (III) state. The d.imer produced an
anodic wave (e. = -0.15 V) followed by a broad plateau at approximatelyz
-0.4 V on the return scan. The latter \^tas possibly due to ruthenium(IlI)
aquo or hydroxy species (solution pH 'v5) resulting from decomposition of
the dimer. Voltamnogr¿rms of the oxidized, yellow-green solutions of the
dimer complex (Section 2.3) gave broad cathodic waves at approximately
-0.3 V and -0.6 to -O.7 V. The monomeric dinitrogen complex gave one
anodic \^rave (n, = *0.09 V), but no cathodic waves appeared up to the li¡nitn
of -O.g V. The nature of the products resulting from decomposition of
the monomeric complex were unknown. As mentioned earlier (Section 2.4)
oxidation of this complex in 0.5 mol ¿*-3 rCt resulted in a blue solution.
++H +SCN

The EDTA complexes were much less stable to oxidation than the
corresponding ruthenium ammine dinitrogen complexes. Thus, [Ru(NHr) U*r]'*and t(NH3)URuNrRu(NH3)514+ yield anodic \^¡aves with E* values of +0.72 v
and +0.78 V respectively (H2SO4-K2SO* electrolyte).I41 The osmium
analogue, los(NH2)5N2]2* po"="=ses an anodic wave with E* of +0.32 v
(methanesulphonic acid) .257 oxidation of tRu(NHr)5*213* is irreversible
but both the osmium dinitrogen species and ruthenium dimeric species
136.
have been shown to produce transienÈ [Os(NHr)UNrl
respectively during oxidation.l4l
and t (NH3) URuNrRu
(NH3) 5l
The azido complex could not be isolated without decomposition
(Section 2.4), therefore its electrochemistry \¡ras studied in sjtu by the
addition of sodium azÍde to solutions containing the ruthenium(IlI) aquo
complex.
Addition of an equimolar quantity of azide resulted in a sudden shift
of the aquo cathodic wave to more negative potentials. A ne\^r cathodic
peak (E, = -0.32 V) of equal height appeared (FiS. 5.3.6b) accompanied-2
by a colour change from pale yellow to orange. The peak was assigned to
Èhe red.uction of the azido species, [Ru(III)HEDTA(N3) ]-. Addition of
more azide (5 to l0 times excess) resulted in no change in peak position
but the height decreased by a third and the voltammogram became broad
and iII-defined.
This last observation was attributed to the basic nature of the azide
ion and the volatility of hyd,razoic acid which resulted in a rise of pH of
solution. Thus,
N3-+H++"N:.
The decrease in azide concentration and the increase in pH probably
favoured the formation of hydroxy species which produced ill-defined
cathodic vraves. This effect was easily reversed by the addition of acid,
yielding a cathodic peak due to the aquo complex. Addition of azide
caused the azido complex to reform and the peak shifted as noted above.
3+ 5+

imAv= 5OO mV/sec
¿1' -¿¿ I/ -- /
- E Volts
E Volts
BA
Fig. 5.3.6a Cyclic Voltarunogr¿rms of the Monomer (A) and Dimer (B)
DiniÈrogen complexes in 0.5 mol am-3 rcct Solution.
imAÇt
v= 5OO mv/sec
A: lnitial
B¡ Af ter 10 mins
c Hcr/ N; Added
Fig. 5.3.6b Cyclic Voltammogram of the Azido Complex Formed by Addition
of Azíde to IRuHEDTA(CI)]K.2HrO in 0.5 no1 d*-3 Kcl Solution.
o.2
\
0
-o.2 -0.3 -o.4

L31 .
However, no evidence \¡ras obtained for the monomeric dinitrogen complex
forming in solution although such a conversion was suggested in Section 2-4.
5.3.7 AcetgJacetonato, DimethgTglgoximato and Dithiocatbamato Complexes
None of these complexes gave cathodic waves that could be assigned
with certainty to reduction or oxidation of the metal. Voltammograms of
a violet solution contaíning [gu(I]I)H2EDTA(acac) l.2H2o revealed a major
cathodic peak at -0.55 V, associated with the EDTA ligand, and a shoulder
at approximately -0.3 V. In view of the fact that the complex hydrolysed
in aqueous solution (Section 3.4.2fT) this was probably due to the aquo
complex. Addition of neat acetylacetone to a solution of the aquo complex
caused the cathodic wave at -0.25 V to diminish, but it did not disappear
altogether. A peak at -0.6 V remained dominant'
The ruthenium(III) dimethylglyoximato, and dithiocarbamato complexes
similarty produced voltammograms consisting of strong cathodic peaks at
approximately -0.5 v. once again these appeared to be due to the ligand
rather than metal reductions. However, since no other cathodic peaks
were observed within the solvent limits, it is possible that peaks due
to reduction of ruthenium(ITI) were included in these'
5.4 Discussion
From the tabulated half-wave potentials an order of stability with
respect to oxidation of the ruthenium(II) EDTA complexes became apparent'
The observed trend was dependent upon the coordinated tigand and could be
written in decreasing order of stability as:
NO tu CO > R-cN > bipy 'r, phen > py > N, (monomer) tu scN >
Nr(dimer) , H2O > acac' drng.
It was not surprising that No and co headed the series as they are
both excellent n-acceptor ligands and ruthenium nitrosyl complexes are
resistant to oxidation. The remainder of the sequence appeared to follow

l_38.
broadly the trend found for ligands of decreasing r-acceptor abili¡O.87'153
The E, val-ue for [RuH2EDTA(dpe)].2H2O coul,d not be measured due to its
low solubiJ-ity, buÈ h¡as expected to be comparable with the nitrile or
q-diimine complexes. ft \¡/as clear that dinitrogen was very much poorer
than carbon monoxide in stabilizing the ruthenium(II) EDTA moiety. In
the monomeric comptex dinitrogen was comparable with pyridine in its
stabilizing ability since the bjs(pyridine) complex' possessing a larger
E, value, nevertheless had two pyridine ligands per ruthenium(II) centre.n
In the dimeric complex dinitrogen hras less capable of stabilizing two
ruthenium(II) centres.
The ruthenium(IlI) state was favoured by the aquo, azide, thiocyanate,
aceÈylacetonate, dimethylglyoximate and dithiocarbamaÈe ligands. The
phenanthroline, bipyridine and .bis(bipyridine) complexes for this state
appeared only as transients, with the latter intermediate being more
resistanÈ to reduction. For the ruthenium(IlI),/(II) couple (low-spin)
the order of stabilization of the higher state is often found to be258
bipy < py < NH3 .r2O < en < Cl '
and this was borne out by the E, values for the ruthenium(Ill) EDTA com-
plexes. Thus, addition of azide, a pseudo-hatide, and other anionic ligands
such as acetylacetonate, dimethylglyoximate and dithiocarbamate, caused
the E, to shift to more negative values with respect to the original aquo,
complex. OnIy the thiocyanate ion tended to destabilize the +3 state
towards reduction.
The behaviour of the rutheniun(III) / (Tf) system paralleled the
Fg(III) /(Lf) couple in many respects. Anionic ligands stabilize the
Fe(III) state,258 the effect being largely entropic rather than enthalpic,
resulting in [Fe(III)EDTA] being more stable than the iron(II) analogue.
However, the lower state is stabilized by unsaturated ligands such as
bipyridine and phenanthroline" Similarly the anionic ligands mentioned
above favoured the ruthenium(III) state while the +2 state was stabilized

139.
readily by neutral n-acceptor ligands. The unfavourable siÈuation of an
anionic ligand reacting with the ruthenium(II) EDTA aquo species was
partly offseÈ in the case of acetylacetone and dimethylglyoxime, since
they represented unsaturated bidentate ligands capable of limited
deloc¿llization, allowing greater interaction of metal and Iígand. Thus'
the ruthenium(II) EDTA complexes of both ligands could be isolated
although they were prone to oxidation. The thiocyanate ion, although ít
presented an unfavourable charge situaÈion, nevertheless was capable of
some stabilization of the *2 state through its n-bonding properÈies.

r40.
Table 5.3a
Haff-Wave PotentiaTs (Ef) of Ruthenium
a
Complex
EDTA Complexes
b,cE-
+
b'd .4,,cL/Lpp
bEp
AEp
lRu(II)HEDTA(co) l
lRu (II) H2EDTA(No) cll
lRu ( rT ) H2EDTA (rrreCN)' J
lnu ( rr ) H2EDTA (PhcN) 2
I
lRu ( II ) H2EDTA ( 1, 2-C (;H
lRu (II) H2EDTA ( l, 3-c6H
lnu(II)H2EDTA(phen) l
lRu(II)H2EDTA(bipy) l
¡ps(II)H2EDTA(nv) rl
lRu (II) H2EDTA (Me-py¡ ,1
lRu (II) uerEDTA(nV) ,l
4 (cN)
Z) Zl"
-0.5 v
-0.5 v
-0.3,-0.7
-0. 3, -0.6
-0. 3, -0.6
-0.3r-0.5
-o.7-o.7
-o.1-o.7
-o.7-o.7
-o.7-0.7
-o.7
-o.4
-o.7
-o.7
0.0,-0 .L6 ,-o.7
-o.7
-0.6
4 (cN)
2) 2l
A
B
c
D
f
tu oc,c
^,25oC
¡u OoC
N25oC
o.44
0.5r
tuO .65
tuO.65
0.3r0.30
0.33
0.35
0 .17
0 .16
o.L2
0 .13
0.17
0 .09
-0.15
o.o2
-0.13
0.04
-0.32
-o.26
tu-o.5h
tu-o.5h
tu-o .5h
0.98
0.95
0 .9ro.94
o.94
o.92
0.95
o.94
0 .99
60
to
70
70
60
80
60
80
80
2-[Ru(r])EDTA(N2) I
¡ 1¡¡(II)EDTA) 2N2l4-
lRu (III) H2EDTA(cNS) 2l
lnu (rrr) HEDTA(cNS) I - h
tRu (II) H2EDTA (cNS) 2l
2-
lRu (rrr) HEDTA(N3) l
lRu(III)¡¡sP1a(HrO) J
lRu(III) HTEDTA(dmg) J
lRu ( III) HTEDTA ( acac) I
lRu (III) eore(dtc) I 2
s
frh
1.0 65
0.95 70
tu80
r.0 65
(contd. )

141.
Table 5.3a (contd.)
3a. In 0.5 mol dm KCl solution at N25oC unless otherurise stated.
Scan rates in the range 50-1000 mV,/sec.
b. E, and E in volts vs. S.C.E. (!0.03 V) . AE in millivolts.tppc. For complexes in (II) state EL refers to an anodic process; for
(III) state E, refers to a cathodic process.
d. Refers to other cathodic waves observed.
e. Low solubility in aqueous solution.
f.. Complex impure.
s. fn 0.4 mol dm-3 KSCN solution.
h. Tentative Assignment.
Product from [Ru(II)HEDTA(tlrO¡ ¡ * phen.
Product from [Ru(III)HEDTA(H20) ] + phen.
As for A using bipy instead.
As for B using bipy instead.
A
B
c
D

I42.
Table 5 .3 .5a
Variatíon of Peak PotentiaL (Ep) of Thiocganato CompTexes
wìth Thiocganate Concentration
lscN-la E-b'"p
(mol dm-3) (votts)
0.o
2.1 x 10
9.0 x 10
9.1 x 10
-3
-3
-2
-o.28
-a.20
-0.18
-0.18-0.05 sh
-0.18-0.05
-0.05
-0.05
4.0 x 10⁻¹ d
5.2 x I0-1
1.3
a.
b. Cathodic wave.
c. Scan rate 200 mV,/sec.
d. Peak heighÈs approximaÈely equal.
-3Solid KSCN added to IRuHEDTA(C1)]K.2H20 (2.4 x t0
¿*-3) in 0.5 mor a*-3 rct solution
mol

r43.
CHAPTER 6
COMMENTS ON THE CHARACTERISTICS OF RUTHENIUM EDTA COMPLEXES
6.1- Introduction
The discussion of earfier chapters has dealt with individ,ual
compounds or families of complexes and has emphasized the differences in
the compounds formed as a result of varying the sr:bstituent ligands.
In this chapter a number of features of ruthenium EDTA complexes will
be discussed with a view to collating the similarities and trends,
rather than differences between complexes. Some aspects of the study
of these complexes have been useful in emphasízing the common features
of EDTA complexes, namely their physíco-chemical properties in solution
and spectral characteristics. The nmr and infrared spectra were
characteristic for the EDTA moiety, but only the latter is discussed as
the former was treated in Chapter 4. The electronic spectra and the
nruriber of positions occupied by EDTA about the metal centre are also
discussed.
6.2 Infrared Spectra
The infrared spectra r¡¡ere dominated by the carbonyl absorptions
of EDTA and the broad hydroxyl stretches of lattice \^Iater. The complexes
were isolated as hydrates and v (OH) (asymmetric and symmetric) was
usualry strong and broad in the region of 35OO "*-1
ao 3300 cm-l.
However, the most important diagnostic absorptions arising from
the EDTA ligand related to the carbonyl absorptions of the coordinated
or uncoordinated carboxylate and carboxylic acid groups.85'9Lr92tI10,259t260
The asymmetric stretching frequency of the carbonyl group depends upon
its environment. In structure (I) below,
o
/
0-M(t)
-c

L44
when M is a proton the absorption occurs near 17OO .*-1.
Hov¡ever, if M is the potassium ion, as in K*EDTA, then it appears at
trr5 "*-I.ZOO It has been suggested that variations in the carbonyl
stretching frequency depend upon the nature of Èhe O-M bond.ll0
Sawyer et aL.260t261 ¡"o'. deÈermined the infrared spectrum of a large
nurnber of EDTA complexes" They found Èhat this absorption varies with
the metal and appears between 1610 c*-1 arrd I58O cm-l for complexes of
the type, [M(II)EDTA]Nar.nH2O (¡¿ : un, Co, Cd, Ni, Cu). Because the
interaction in K4EDTA is believed to be largely electrostatic, the
similariÈy of the above absorptions with the potassium salt led to
the conclusion that the bonding in (I) for these complexes is largely
ionic. Similarly, it has been found that for a number of EDTA complexes'
where M is co(III), Cr(III), Fe(III), Ti(IV), the value of the absorption
frequency occurs between 1630 cm-I and 1650 .*-1. Here the bonding is
believed to have considerable covalent characÈer. If the bond is primarily
ionic then the possibilities for carboxylate resonance, (II), are at a
maximum, resulting in a decrease in the bond order of the C=0 group and
a lowering in stretching frequency. However, the covalenÈ case suggests
a higher bond order f.or C=0 as a result of the reduction in carboxylate
resonance. 0/o
0\
e
0
(II)
Sawyer and McKinnie26l h-.r" observed a correlation in frequency separation
for the major aslzmmetrical and symmetrical carboxylate absor¡ltions in a
nurnber of EDTA complexes. It has been concluded that the frequency
difference increases as the bonding becomes more coval-ent; for chelates
for which the difference is 225 cm-l or greater, the bonding is primarily
covalent. rf ress than 225 cm-L the bonding is primariry ionic.
r45.
the position of the carbonyl absorption is probably dependent on
several other factors. For complexes of carboxylic acids correlations
have been sought between the antisymmetric carbonyl stretching frequency
and some property of the metal, such as the radius.262 Kagariser263
in studying caïboxylic acids has suggested a dependence of the ionized
carboxyl group upon the electronegativity. However, Ellis and Pyszora264
have claimed that a more complicated dependence exists, involving the
mass, charge, and ionic radius of the metal. certainly a decrease ìn
frequency of the carbonyl absorption in EDTA complexes with increasing
ionic radius of the metal has been observed by Sawyer et aL.260 '261
Sievers and Bai1ar265 6"o'" reported an interesting correlation when the
ratio(s'/r)oftheformatchargeonthemetal(s)toitsionj-cradius
(r) is compared with the position of the carbonyl absorption - For q/t
values larger than 3.6 the absorption occurs in the range 1625 c¡n-l to
-1 ß^- -.¡1,.^^ laac {-}rrn ? Â t-ha noak is seen betr^Ieen 1590 cn-l1650 cm-r, but for values less than 3.6 the peak is seen betwee
-'tand 1615 cm ^.
A cation having a large charge and small radius, therefore of high
charge density, is better able to compete for the electrons of the
carboxylate group and reduce resonance, than is a cation of smaller q,/r
ratio. Covalency in the metal-carboxylate bond is indicated in cases in
which q/r is large.
The major carbonyl absorption for the ruthenium EDTA complexes+
occurred in the range of 1570 "*-1 ro 1660 cm-I. Aq./r value of 4.37
+
was estimated for the rutheníum(Irr) complexes and 2.51 for Èhe ruthenium(rr)
compounds. This suggested that the carbonyl absorption should appear
between 1625 cm-I and 1650 .*-1 fot the former comprexes and between
I59O cm-l and 1615 .*-l fot the latter. This was true for both types
of complexes in many cases. Ho\dever, deviations did occur. Thus,
(II) were66 te"p""tive1y.T Charge to size ratios (5,/r) for ruthenium(IIT) and
determined using r values of O.7O å'153 and O'8I '&2

146.-I
[ss (III)
lRu (lrÏ)
H2EDTA(d.mS)l produced an absorption at 1610 cm and
H2EDTA(H2O)cl]129 has an absorption at 1600 cm-I' Similarly,
the nitrosyt complex differed from the ruthenium(II) complexes by
possessing an absorption at 1640 "*-1.
This was usually broad and over-
lapped wiÈh the carbonyl absorption of the free carboxylic acid groups.
Deviations from the empiricat charge to size ratio correlation were
not surprising since the original observations were based mainly on
pentadentate EDTA and related complexes in which the sixth position was
occupied by the aquo ligand. Bai1ar265 has noted that deviations
may occur whenever groups such as CI , Br and OH occupy the primary
coordination sphere. It appeared that the presence of other coordinated
ligands, besides EDTA, about the metal centre caused deviations,
although not in a1l cases. The reason for this was not known. There
were a number of instances in which Llne q/r raÈio was not applicable,
since more than one carbonyl absorption appeared. For example, the
.bjs(acetonitrile) complex (Section 3.2.I) produced absorptions at
-'r -l1655 cm - and 1580 cm -. The latter vras in the vicinity expected for a
ruthenium(TI) complex, but the former clearly hras not, These cases
have been mentioned throughout the text (Sections 3.2.L, 3.4.I, 3.4.3).
The symmetrical vibration of the carboxylate group produces an
a-bsorption band in the 1450-1350 "*-1 t"giorr.261 Th" ruthenium complexes
produced several peaks in this vicinity. A prominent peak usually
occurred in the region of I4OO .*-1 ao 1350 cm-I and was assigned to the
above vibration. However, this is less sensitive than the asymmetric
mode to metal and ligand changes, making it less valuable for the study
of the nature of the metal and other tigands attached to it.
Much more important \^rere absorptions of the ruthenium complexes at
I7l5 qn-l to 1730 .*-I. These indicated the presence of uncoordinated
carboxylic acid groups. Their intensity, compared with the coordinated
carbonyl absorptions, vlas used as evidence for a pentadentate or

r47.
tetradentate EDTA complex, For Èhe latter case, the intensity of the
free acid a-bsorption was comparable with the coordinated carboxylate
absorption. The carbonyl absorption of the free carboxylic acid was
unaffected by the haracter of the other ligands present. It is known2l3
that the carbonyl absorption for monomeric saturated aliphatic acids occurs
-'lnear 1760 cfit -, but is reduced upon dimerization. Hydrogen-bonding
weakens the C=O bond and dimerized acids absorb in the region of
-1I72O-L7O6 cm '. Intramolecular hydrogen-bonding reduces the carbonyl
stretching frequency to a greater degree than does intermolecular
bonding, as illustrated by salicyclic acid which a-bsorbs at 1665 "*-l.Zl3
The ruthenium complexes produced a carbonyl stretch considerably
-lhigher than for the free acid (NarH2EDTA.2H2O \)(cO): 1675 crn ^;
H4EDTA.O.5H20 u(C0): 1690 .*-1ZOO¡. This was indicative of a reduction
in intramolecular hydrogen-bonding in the complexes, since the carboxylic
groups v¡ere no longer favourably oriented for this type of bonding.
Nevertheless, intermolecular hydrogen-bonding, particularly with lattice-
water, was possible and suggested by the carbonyl absorptions appearing
in the range found for dimerized acids. Hydrogen-bonding possibly
contributed to the antisymmetric carbonyl stretching frequency discussed
earlier, since in complexes of the amino acids it is kn wnl25 th"t
oxygens of the carboxyl groups not c ordinated to the metal are hydrogen-
bonded either to an amino group of a neighbouring molecule, or to lattice-
\dater. The increa e in the coordinated carbonyl stretching frequency
noted for the products of the esterification reactions (Section 3.6"1)
possibly stemmed f om a reduction in hydrogen-bonding.
Carboxylic acid dimers are known to produce broad absorptions
between 3OOO sn-1 and 25OO .*-1 d,r. to OH stretching modes.165 For the
monomeric form this absorption ís much higher lying nea 3550 cm-I. In
the case of the ruthenium complexes t was found that the carboxylic OH
absorptions were weak and broad appearing between 25OO cm-l and 2700 ctn-l.
148.
UsuaIIy two bands appeared. Their presence was indicative of consíd,era-b1e
intermolecular hydrogen-bonding. For the unprotonated complexes or
ester derivatives, these peaks v/ere absent.
AII the protonated EDTA complexes of ruthenium prod.uced one or more
prominent peaks in the vicinity of 1250 "*-1
ah"a were of less certain
origin. These have been suggested to be derived, in part at least, from
the coupted C-O and OH in-plane deformation modes.165,263 This seemed
reasonable since the unprotonated complexes lacked prominent absorptions
in Èhis region.
The asymmetric carbonyl stretch of the free carboxylate group in
EDtrA complexes absorbs in the range 1640 cm-l to 1580 .*-I.Ut However,
for the unprotonated ruthenium complexes this absorption was not
seen since the main carbonyl stretch of the coordinated carboxylate was
too close. At best the main carbonyl peak \¡ras non-slzmmetrical in shape
or a shoulder developed at approximately t58O cm-l.
In addition the EDTA tigand gave rise to absorptions in other regions.
Medium peaks between 29OO cm-I and 3OOO "*-1 ".t. due to the C-H stretching
modes of the ligand. Below I2OO cm-l a nr:nber of absorptions were seen
but not assigned with certainty. A moderately intense peak (or doublet)
at approximately 1100 cm-I was present in the spectra of all complexes
and has been assigned to the v(CN) vibrational mode by previous workers.92'265
This absorption appeared between 1085 cm-I and 1I3O .*-1 fot the complexes
studied by Sawyer.260 t26l This author noted that additional characteristic
bands appear at loOO-loso cm-I, 9oo-990 "*-1 "rrd 810-885 cm-l, but no
definite assignments could be made apart from their origin, possibly
arising from carboxylate vibrations. However, others267'268 studying
carboxytic acids have indicated that the band at about 940 qn-l is
possibly the out-of-plane OH deformation mode of the carboxylic $roup.
Busch and Bailat9l ha.r" made this assignment to the 915 cm-l peak
appearing in the spectra of [M(H2EDTA)3I2].3H20 (M = Pt' Pd). The

L49.
protonated ruthenium complexes produced broadened peaks, usually of
rnedium intensity, in t e vicinity of 930 .*-I.
6.3 ELectronic SPectta
The dominant features in the spectra of the ruthenium EDTA complexes
were the absorptions arising from the coordinated ligands occupying one
or two sites about the metal centre. In many cases intense charge
transfer (CT) bands \dere associated with these ligands. The absorption
maxima and intensities of these bands varied considerably from one type
of EDTA complex to another.
The phenanthrotine, bipyridine and dimethylglyoximate ligands
produced intensely coloured ruthenium(II) complexes as a result of the
metal-ligand CT bands appearing in the visible region of the spectrum
(Sections 3.4.I, 3.4.2). However, for the nitrile and pyridine complexes
the CT bands appeared in the near ultraviolet reEion (Section 3-2-2) and
\^rere sensitive to substituents attached to the ligand. Higher energy
CT absorptions occurred with Èhe dimeric and monomeric dinitrogen com-
plexes (Sections 2.3.I, 2.4, 2.4. 1) while for the carbonyl complex
this transition was believed to occur below 2OO nm in the far ultraviolet
(Section 2.51. There was no linear correlation between the metaf to
Iigand charge transfer band (MLCT) and E* values for the nitrile, pyrídine'
phenanthroline, and bipyridine complexes. The Ervalues were probably
sensitive to features other than simply the energy of the acceptor
orbital in the MLCT transition. The ruthenium(IIl) complexes containing
thiocyanate, acetylacetonate, dimethylglyoximate and diethyldithiocarbamate
ligands al-so produced intense absorptions either in the visible or near
ultraviolet region which were also attributed to CT absorptions.
Laporte forbidden d-d transitions were not identified in tetra-
dentate EDTA complexes, since they were masked by the much stronger CT
absorptions. However, in solution the carbonyl, nitrosyl (Sections 2-5,

150.
3,I.2) and aquo complexes fuide infra) produced weak absorptions which
could be assigned to d-d transitions within an octahedral environment.
Electronic absorptions resulting from the presence of EDTA and the
aquo ligand were seen in the spectrum of the ruthenium(Ill) EDTA aquo
species (Section 2.I), which produced absorptions at 280 nm and 350 nm.
As Table 6.3a shows these were comparable with the absorption maxima for
a nurnber of ruthenium ammine and bis(ethylenediamine) complexes containing
aquo ligands. This was not unexpected given that en' NH3, EDTA, and HrO
appear close togeÈher in the spectrochemical series and in this order of
decreasing ability to sptit d-orbitals of the metaL centre.269 Further,
the ruthenium(IÏ) EDTA aquo species gave rise to an ultraviol-et spectrum
with an absorption similar in position and. intensity to that of the
ruthenium(III) complex. This behaviour is also sho$rn by cis-lnu1w¡¡r¡ n{urO)rl2+,
tnu(NHr)5H2Ol2+ .rrd tnu(uHr)ul2* rhi.h alr have absorptions in the ultra-
violet region comparable in position and intensity with their rutheniun(III)
counterparts.63'270'I73 The appearance of a peak of low intensity in
the visible spectrum of tRu(II)HEDTA(H2O)l also occurs in [Ru(NHr) 5H2O]2+,
cis- [Ru(en) z @2o) 2]2+ "rrd tRu(NHr) ul2+ .nd has been assigned to an
1o- * rT- transition in the ratter case.l73'27r The EDTA complexesLg Ig
differ from the ammine and .bis (ethylenediamine) complexes in possessing
considerably targer e values. This was probably the result of these EDTA
complexes having lower molecular slzmmetry.
A molecular orbital diagram for the tetradentate EDTA complexes
(FiS. 6.3a) was devised based on the formulation cis-[RuNr0rLrr] (n = I
when L is bidentate; rt = 2 when L is monodentate) which Possesses Cr.r,
molecular symmetry. It is clear that for a cubic system, MXU, onlY two
degenerate levels are expected in the mofecular orbitals which are closely
refated to the metal 4d orbitals. Howeverr when the ligands are no longer
identical the system can be considered as undergoing tetragonal or
rhombic distortions of the octahedron. As a result in low-spin d6 systems

15I .
the degeneracy of the 1T,-.nd 1T^ states is removed. In this regard-Lg 29
both cjs and trans octahedral complexes of a nrunber of metals have been
studied.272,273 In deriving the representations of the d-orbitals of
cis- lRuNroz"rr] using c2r, =y*"try the z-axis is coincident with the c,
axis which lies between the ligands. As a consequence the relationship
between bond directions and the d-orbital wave functions is different
from the conventional representation in on ot D4h symnetry. For
cis-[CoAnBrl (A = NHr, B = H2O, Cl-; charge not shown) Yamateru274 :nu"
noted that, instead ot UOr.td d*, orbitals, Iinear combinations of
these should represent the molecular orbitals of the complex. The
representations obtained for Cr' symmetry are AI t Art Br, and Br. The
approximations adopted result in A, and B, having the same energy.
Allen and Stevensl45 have applied Cr., slzmmetry to cis-tqs(NHr) 4$2) 212+
and have included in their diagram Èhe n-interactions due to Èhe dinitrogen
ligands. Figure 6.3a is an adaptation of their scheme.
An alternate approach to tetragonal systems is to consider the
holohedrized synunetry (i.e. the symmetry thaÈ includes the centre of
inversion and the actual point group of the mofecule as sub-groups) of
the molecule which results in producing an average environmer 1-.2TS'276
rn geneïa1 it is only the holohedrized symmetry of the chromophore that
influences the energy levels of a dn sysÈem, provided mixing of orbital
angular momentum is not taken into account.27s Thus for cis-[RuNrOZ"rr]
or cis-tos(uHr)4(N2) ,12* tn" holohedrized sYmmetry becom." D4h (choosing
the z-axis as the tetragonal axis) which causes the d-orbitals to have
the representations Arr E, BI, and B, and two leve1s appear degenerate.
The trigonal and, tetragonal fietd complexes, [Cr(CN)3(H20)3] ("r.rt
holohedrized symmetrV 0n) cis-[Cr(cN)4(H2O)rJ and cjs-[Cr(Cw)r(H2O)4]+,
containing ligands widely separated in the spectrochemical series, have
been treated as slightly distorted cubic complexes-277
Returning to the tetradentate EDTA complexes' Fi9. 6.3a represents

L52.
the combination of the fitled d-orbitals of the metal with the n and n*
orbitals of Èhe ligands and indicates that the occupied d-orbitals have
ligand character as well. Interaction with Èhe o-orbitals of EIIIA or the
Iigands is noÈ shown. The nurnber of n,fl* orbitals of the ligands (t) and
their extent of interaction with the metal was variable. Thus' the CN
groups of the nitrile ligands each possessed two n and two n* orbitals
mutuatly perpendicular and capa-ble of greater interaction with d*U than
with either d or d _ orbitals, since the former lay between the orbitalsxz yz
of both nitrile groups. However, the effect of coordinated pyridine was
expected to result in greater interaction with the d*, , dy, orbitals'
since the n-orbitals of two such ligands were oriented in the dz, yz
planes. This was also the expected behaviour of the phenanthroline,
bipyridine and acetylacetonate ligands. The energies of the n-orbital-s
of the differenÈ ligands undoubtedly varied with respect to the metal
orbitals resulting in differences in energy between ahe dxy and d*r,
d orbitals.yz
The origin of the CT absorptions in the ruthenium(Il) complexes
was assígned to transiÈions from the d*" , dy, orbitals to the n* orbitals
of the ligands " The direction of charge transfer is in agreement with
the assignments made for other low oxidation state complexes with such
ligands (e.g. Fe(II), Cr(II), Cu(f)).ZSe In the case of the ruthenium(II])
EDTA compLexes the direcÈion of charge transfer was uncertain but considered
likely to be from the ligand to the metal.
Many of the ruÈheniurn(II) and (III) complexes produced intense
absorptions due to n-n* transitions within the ligand. These occurred
at higher eneïgy than the CT bands and were shifted in position from the
r-n* transitions of the free ligand (Sections 3.2.2, 3.4.1, 3.4.2(TT),
3.4.3, 3.4.4).
The pentadentate EDTA complexes r^Iere considered as having Dnn
holohedrized slzmrnetry. This yielded the representations mentioned earlier
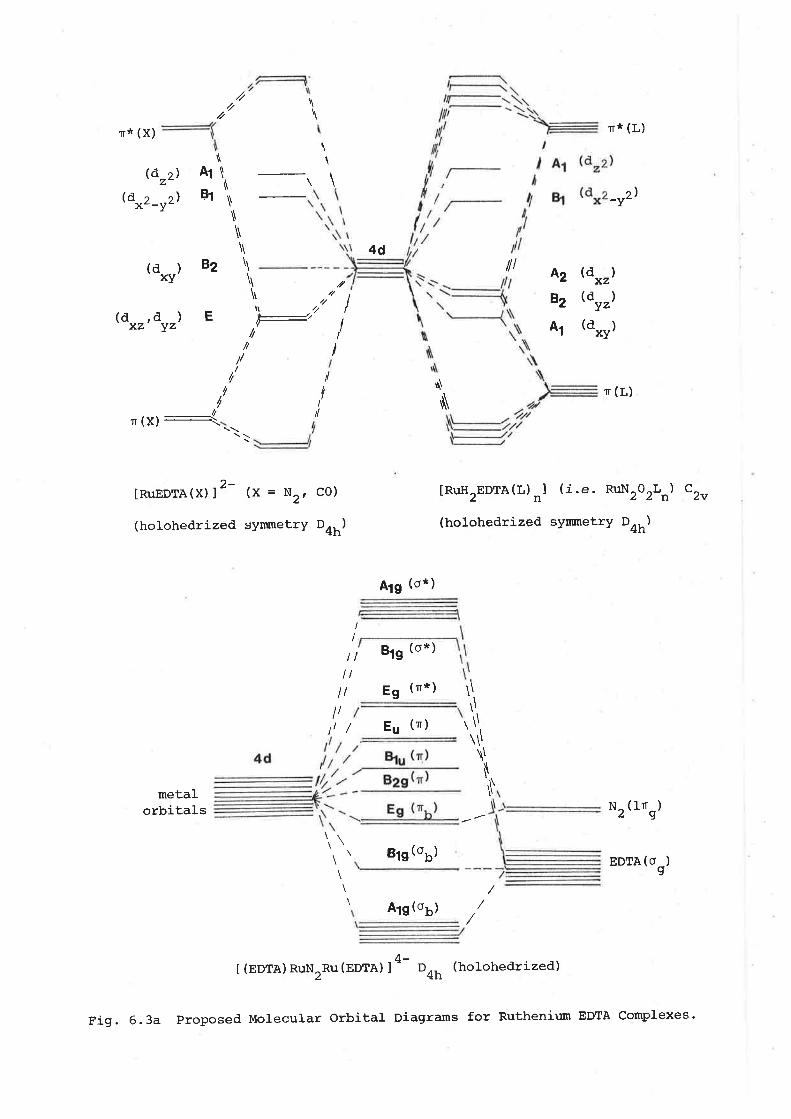
/za \
\/¿
rT* (x)
(d r)z-(d .> tlx--y-
(a)xy
(d
T* (L)
\\ \
A1
Bt
82
\\\\\\\
c)-v-
4dlt
\\
,/Aa(d )3XZ
82 (dyz)
A1 (d*y)\
////
/7 I,d)yzxz
E +/l-tt
//'
I
I
I
/ fI
q\
ñT (L)
n (x) =:{
2-IRuEDTA(x) l (X=N , C0)
2
(holohedrized sYnunetrV Dnn)
IRuH2EDTA(L) nl ( j.e. RuN202Ln) CZu
(holohedrized synunetrY Dnn)
A1g (o*)
II
tt
tt
qn (o*)
Eg (r*) \\\\
tt / Eu (n)lt\\\,\\\$
\metalorbitals N^ (In )¿g
e1g(oo)
A1g(o5)
EDTA(O )I
t (EDTA) RuNrRu (EDTA) l4-
D (holohedrized)4h
Fig. 6.3a proposed Molecular Orbital Diagrams for Ruthenium EDTA Complexes.

153.
Table 6.3a
El-ectronic Spectta of Ruthenium Ammine and
Bis (EthgTenediamine) ComPTexes
comptex ¡(nm) e(mo1-1dmt.*-t) Reference
lRu(rr1) ¡¡Bpa¡(HrO) I
¡3¡¡(II)HEDTA(H20) l
3.0 x 10
7.7 x IO
3
2
tu3x10¡,4 x 10
3
2
7.52 x IO
5.50 x 10
0.44 x I0
5.20 x I0
24.7 x 10
8.35 x 10
3.34 x 10
ru1.5 x 10
Section 2.I
Section 2. I
279,28O
270
46,28L
63
l-64
242
l-73
L73,27L
lRu(NH3) 6l
lRu(NHa) aJ
280
350
280
425
268
262
410
262
257
264
345 sh
405
275
320
275
400
4.75 x 10
1.0 x tO2
6.24 x IO
¡,0.3 x 10
3+ 2
2
2
lRu (NHr) 5H201
cis- [Ru (NH3) 4
l.Id2o) 2l
cis- [Ru(NH3) 4 ß2o) 2l
2+lnu(M:) 5H201
3+
2+
2
3+ 2
2
2
cjs- [Ru (en) , (H2o) 2]
cis- [Ru(en), (H2O) 2l
2+
3+
2+
2
2
2

r54.
(vide supra). The species IM(NH3)u*rl'* (¡4 = Ru, os¡14s'278 inave cnu
symmeÈry yielding the same representations since the holohedrized slzmmetry
of these molecuLes is also Dnn. Figure 6.3a includes a schematic diagram
for the interaction of the n-orbitals of dinitrogen or carbon monoxide
with the d-orbitals of the metal. The degenerat" uo", d*, orbitals
(representation E) n-bonded with Èhe ligands and were of lowest energy.
The CT absorption \^¡as ascribed to the transition from the non-bonding d*,
orbital (sZ) to a t* orbital of the ligands.
The dimeric dinitrogen complex of EDTA hras also treated by considering
its holohedrized symmetry ." D4h. This is the actual slzmmetry of
^+t(NH3)rRuNrRu(NH3)51-' and a molecular orbital scheme for this molecule
has been described by Taqui Khan and MarteIt2TB in which the d-orbitals
of the two ruthenium metal centres are split into Enr B2g, BIo and E'
levels. It has been suggested66 that the intense absorption of the dimer
is due to a Èransition from E antibonding level of dinitrogen.to the Esu
Because EDTA and NH, appear closely situated in the spectrochemical
series the order of the leve1s shown is expected to be the same for
both dimeric dinitrogen complexes. A tentative scheme for the EDTA
complex is illustrated in Fig. 6.3a.
6.4 Cotwnents on the Occutrence of Tetradentate and Pentadentate
Coordination
A feature of ruthenium EDTA chemistry was the preference of the
EDTA ligand for tetradentate coordination. Pentadentate coordination
was less common whilst the hexadentate EDTA complex of ruthenium appears
to be unknown. In all cases the complex Ì^/as overall sti1l six-coordinate
since low spin ruthenium(Ill) and (ff¡ yield large amounts of CFSE and
strongly favour octahedral configurations.
Hexadentate coordination is known with metals of the first transition
series and is favoured by the size of the ion, the CFSE and the chelate

155 .
effect of the ]ígand" For iron(IfI) and manganese(II), possessing no
CFSE, seven coordinate specíes (Section 1.3) are known in which the
geometry is approximately pentagonal bipyramidal. However, pentaden-
tate coordination by EDTA is also widely known for metals of the first
row. Sawyert"260t26l study of the infrared spectra of EDTA complexes
has indicated that, while the appearance of a single peak at 1600 cm-l
region is supporting evidence for hexadentate coordination, it does not
prove ít and one or more carboxylate arms may be uncoordinated. Thus
some EDTA complexes empirically formulated as hexadentate may not be so-
The existence of pentadentate EDTA complexes of cobaft(III) ' chromium(III)
and other metals is evidence for strain within the glycinate rings of
the ligand. Such strain arises since coordination by EDTA in general
provides a distorted octahedron of donor atoms around a metal centre.116
A nunber of tetradentate complexes in the solid state are kno\^tn for
metals of the first row (e.g. y(IV) , Cu(rI) 7 .92t236
In the second row metals ptatínum(II) and palladium(II) form only
tetradentate (or bidentate) EDTA complexes as a result of their strong
preference for square planar four-coordination. Ruthenium(III) and
rhodium(fff¡ favour tetradentate and pentadentate coordination. The
rhodium hexadentate EDTA complex appears to exist only in solution at
certain pH values.235 A partíal explanation for the occurrence of the
tetradentate complexes of rutheniun(III) and (fI) described in earlier
chapters lay in Èhe fact that the average size of the ion increased' as
occurs on progressi ng from the first to the second row of the transition
metals, while the formal charge remained constant, or even decreased.
This meant that one or more of the carboxylate arms $lere held less tightly
and remained free or u¡ere readily released by the metal centre. The
strain within the equatorial arms of the ligand possibly contributed to
this behaviour. For the ruthenium(II) state the tetradentate situation
$ras even more favourable than for ruthenium(frr¡ since a decrease in

156.
formaf charge on the metal vtas accompanied by an increase in size.
Another factor in Èhe formation of tetradentate EDTA complexes of
ruthenium(Il) appeared to be the stability of this oxidation state in
the EDTA environment. As shown in Chapter 5, ruthenium(Il) EDTA was
unstable with respect to oxidation and was stabilized only by the presence
of suitable n-acceptor ligands. It would appear that two such ligands,
or one bidentate ligand, were needed to stabilize the +2 state via back-
donation, and offset the loss in stabitity as a result of two glycinate
arms being unavailable for coordination. Presumably, in those cases
where one 'rr-acceptor ligand was sufficient to sÈabilize the *2 state, a
pentadentate complex was favoured. Thus, the pentadentate carbonyl
complex. The nitrosyl complex was isolated as a tetradentate species,
possibly as a result of the experimental conditions, but appeared to
favour the pentadentate form in solution (Section 3.1.2).
Both dinitrogen complexes were formulated as pentadentate EDTA
complexes. only one dinitrogen ligand coordinated to ruthenium(rr¡ 'apparently because the presence of two would have lead to mutual weakening
of metal-ligand bond strength. It has been reporÈed that the ammine
bis (dinitrogen) complexes , cis- [9s (NHr) 4
(N2) ]cl-r, cis- [Ru(NHr) 4 (N2) z]Brz
and cis-[Ru(en)2(N2)2] (BPh4) 2 are al-l- less stable than their corresponding
mono(dinitrogen) complexes.l6 The dinitrogen EDTA complexes were isolated
in the unprotonated form, therefore the nurnber of free carboxylate arms
was not established. fÈ was possible that a water molecule was
coordinaÈed to the metal centre, since both complexes were isolated as
hydrated compounds. However, there was no spectral evidence to support
this. The possibility of a tetradentate species containing an aquo group
existing in solution could not be dismissed.
Tetradentate EDTA complexes of ruthenium(III) formed readily wiÈh
a nr:rnber of bidentate ligands. These were able to successfully compete
with the free carboxylate arms for coordination about the metal, since
157.
the latter were protonated to a considerable extent in acid solution-
The chelating effect of such ligands contributed to the stability of
the resulting complexes. Vüith ligands such as chloride the resultant
complex probabty depended largely upon experimental conditions. Thus,
in strong hydrochloric acid solution the formation of the dichloro EDTA
complex was favoured. Similarly, preparations of the thiocyanato complex
favoured the formation of the tetradentate complex, although in solution
a pentadentate species may have been presenÈ (Section 3.3.1).
6.5 Phgsico-Chemicaf Sofution Properties
The ruthenium EDTA complexes, excluding the ruthenium aquo and
dinitrogen complexes, were substitution-inert compounds. Most were
isolated as protonated EDTA complexes which dissociated in aqueous
solution. Conductance measurements illustrated the weak acid naÈure
of these complexes and also depended upon the charges on the species in
solution.
The complexes $rere conveniently divided into groups relating to
their molar conductance in aqueous solution' and are shown in Table 6.5a.
Groups A and B included complexes that r¡rere non-conductingt ot
whose behaviour in solution \das expected to conform with the behaviour
of 1:! or 2:1 electrolytes. Group C, by far the largest, represented
the neutral complexes which behaved as weak acids in aqueous solution.
protonated EDTA complexes possessing a cation were more conducting as a
result, and are shown in Group D. Finally, the highest conductance
values in aqueous solution were recorded for complexes of group E which
underwent exÈensive dissociation, as already discussed (Sections 3.L.2,
3 .3.1) .
The pK values for the protonated complexes were estimated to lie*av
in the range of 2.4 to 3,0. The coordinated aquo group also behaved as
a very weak acid (pI( rv 7.4). The PK.., values appeared independent of

r58.
the nature of the substituents or oxidation state of the metal. CobaIt(III)
complexes posse$PK. values independent of the substituent.l0l Compared
with tRh(III)HEDTA(H2O)l (pKa 2.32)90 th. ruthenium complexes were
stightly weaker acids, but considerably stronger than [Pt(II)H2EDTAI
(n*.., = 3.7).91
The solubility of the complexes in water and non-aqueous solvents
was sensitive to two factors (ta¡te 6.5b). Firstly, unprotonated
EDTA complexes were often more highty soh¡ble in aqueous solution than
theprotonatedforms'Thusr[RuHTEDTA(N-N)](N-tt¡=phen'bipy)\¡Terenot
highly soh¡ble in water, but were extremely so once unproÈonated.
Second1y, the nature of the Iigand affected the soh:bility of the com-
plexes in non-aqueous solvents. The introduction of ligands containing
aromatic sr¡bstiÈuents often favoured sotubility in non-aqueous solvents.
Hor^rever, with ligands such as SCN , dmg, acac and dtc, solubility in
water and methanol was extremely good. Changing the nature of the free
carboxylic acid groups also affected solubility properties. Thus, the
bis(pyricline) complex was moderatety soluble in water and methanol, but
only slightty soluble in chloroform. Upon methylation the product was
readily soh-lble in all three solvents.

Complex
159
Tal¡le 6.5a
Group Behaviour in Solution. Rarige of i\"
(s cm2) .
lRulle2EDTA (nV) ,l
lRr¡MeEDIA(C0) IK
lRuEDrA(N2) I (NII4) 2
*IRUH2EDTA(L) rrl
IRUH2EDTA(d*S) lrIRUHEDTA(c0) lK
IRUH2EDTA(N0) cllIRUH2EDTA(cNS) 2lK
Non-conducting (Section 3.6.1)
1:1 electrolyte (Section 3.6.1)2:l electrolyte (Section 2.4)
2 2^,190 S cm to 250 S cm (Chapter 3)
tu270 S .*' ao ,\,300 s cln2 (Sections3.4.2, 2.5)
2>400 S cln (Sections 3.1.2, 3.3.1)
A
B
c
D
E
:t (l = RCN, py, tt = 2¡ L = phen, bipy, acac, dmg, n = 1) .

160.
Tab1e 6.5b
The Effects of Substituents, L, Upon the SoTubiTitg
of Ruthenium EDTA Complexes
TYpe Water Methanol TFAa
L DMF
cL , H2o
Nz
c0
NO
SCN- b
MeCN
PhCN
py
4-Me-py
phen, bipy
-bdmg
acac
dpe
dtc
vs = very soh¡blei i = insolublei ms = moderately soluble; s = soluble;
sls = slightly soluble.
Notation as for Table 6.5a.
For Ruthenium(III),
vs
vs
VS
\¡S
\/S
vs
ms
ms
MS
]-
l-B
D
E
E
c
c
c
c
c
c
c
vs
\/S
vs
vs
VS
vs
VS
vs
vs
vs
MS
vs
vs
sIs
ms
ms
ms
ms
vs
vs
S
vs
vs
vs
VS
S
VS
\/S
sIs
vsB
a
b

r6t
CHAPTER 7
REACTTONS OF RUTHENIUM AMMINE COMPLE)GS
7.1- Introduction
The work of PetI and Armor55 h.= demonstrated that tRu(NHr)U*rl'*
is readily produced from the action of nitric oxide upon [Ru(NH.)UJ3+
in alkaline solution. The reaction is believed to involve attack by NO
upon the deprotonated ammine complex, [Ru{tttttr) uuur] 2+. Moreover, the
hexaammine complex is reported to react with aldehydes under basic
conditions, to yield substituted nitrile complexes.283
Interest in reactions which may produce d.initrogen oxide complexes
prompted the investigation of the action of liquid dinitrogen tetroxide
upon the hexaammine complex. This is the dimeric form of nitrogen
dioxide and in the liquid state the following equilibrium is believ"¿87'284
likely to exist:+
N204
--
NO + NO3
It was surmised that in anhydrous conditions these species might
initiate attack upon a coordinated ammine ligand of the complex. Nitrogen
dioxide and dinitrogen tetroxide were also used and investigated in
aqueous solution, atthough PeII and Armors5 have reported briefly that
no dinitrogen complex was observed when NO, was used in alkaline conditions.
7.2 Reactions of Nitrogen Ðioxide and Nitrite ron with lRu(NHr) rlCl,
The action of liquid N2O4 and NO, gas upon tRu(NH3)al3* t"" studied.
under various conditions. The exposure of the hexaammine complex to
Iiquid N2O4 at -1OoC for up to 20 hours resulted in no reaction. The
complex did not dissolve in this medium and the infrared spectrum of
the recovered solÍd indicated no change with the exception of peaks
showing the presence of free nitrate ion.
Hohrever, the introduction of NO, gas into yellow alkaline solutions
(0.05-o.r mor dm-3 u.ou) of tRu(NH3)ul3+ r""rrrted in a gradual orançJe
L62.
coloration. The reaction was carried out by condensing NOZ gas onto
the surface of the frozen solution and then allowing the mixture to thaw
under an argon atmosphere, or by passing the gas through a solution of
the complex. A yellow-orange solid was isol-ated whose infrared spectrum
produced a strong absorption at 1920 .m-1 and a much weaker one at
tO50 cm-I. These were attributed to coordinated nitrosyl and ionic
nitrate respectively, and the complex \¡ì¡as identified as [Ru(NHr)5N0] (No3)3
by spectroscopic methods. Dinitrogen or dinitrogen oxide complexes
\^rere not detected since no peaks appeared between 2OOO cm-I and 2300.*-I-
The source of niÈrogen in the N0 group originaÈed from the gas, as was
shown by repeating Èhe experiment using tu*O, (rugoa raber). rn this
case the producÈ possessed a split niÈrosyt absorption at 1925 cn-l (s)
-'tand lgg5 cm-' (ms) in its infrared spectrum in the relative proportions
expected from Èhe ratio of the isotopes in the labe1led gas. The yield
of the nitrosyl complex varied between 40? and 55% '
It could not be inferred from the above reaction that molecular N0,
or Nron was directly responsible for the product obtained as both oxides
hydrolyse in aqueous solution, prod.ucing a mixture of nitrite and nitrate
iorrs.284 It was necessary to investigate Èhe individual effect of these
ions upon the hexaammine complex under the same conditions- A solution
of the latter in O.O5 mol dm-3 l¡.OU with a ten-fold excess of nitrate ion
produced only traces of the nitrosyl complex after an hour. However,
when the reaction was repeated using nitrite ion in O.Or to o.r mor dm-3
NaOH, appreciable amounts of the nitrosyl complex were isolated after
acidification and concentration of the reaction mixture. The product was
isolated as the bromide sal-t using hydrobromic acid. The product was
confirmed spectroscopically to be [Ru(NHr)UNOJBrr. Yie1ds were determined
on the basis of this formulation and are recorded in Tab]e 7.2a- As can
be seen approximately 50å yields were realized. By using X15WO, it was
shown that the source of nitrogen in the nitrosyl group originated from

163.
the labetled nitrite. Once again the product in this case produced a
spliÈ y(NO) absorption (1905 cm-I (s) and 1865 cm-I (ms)) wíth inten-
sities in the expected proportions.
rn basic solutions [Ru(NHr)u]3* i= believed to produce an amido
complex, [Ru(NHr)SNHZ]2*, which is responsible for the yellow colour of
such solutions.2B5 Attack on this species bV N0, was the rnost likely
origin of the nitrosyl complex. Ttrro general mechanisms were possible.
A direct attack of NO, upon the amide ligand, or attack upon the metal
centre, resulting in a seven-coordinate intermediate which subsequently
rearranged to give the finaL product. Reactions of [nu(NHr)Ul3+ wittr
15*o in basic sofutions yield [Ru(NHr)u14t15*]2*, irrdi.ating that the N0
does not insert itself between the metal-ammine bond.55 However, the
use of tu*or- .rrd 15llo, indicated that insertion was possible in the
formation of the nitrosyl complex. Moreover, the result of this reaction
necessitated the formation of a nitrogen containing by-product.
To collect and eLucidate the nature of any by-products the reaction
with nitrite was performed under vacuum. Any volaÈile products were
distilled into a solution of hydrochloric acid. A white solid was
isolated which, from its infrared spectrum and melting point determination,
appeared to be a mixture of hydroxylamine hydrochloride and ammonium
chtoride. Colorimetric tests using 8-hydroxyquinotine, and sodium acetaÈe
solutions containing ferric chloride and benzoyl chloride' indicated the
presence of hydroxylamine.284t286 The indophenof colour test confirmed
the presence of ammonia.2BT
The amount of hydroxylamine produced was estimated using the
potassium bromate method. It was found that almost 0.25 mole of this
base was produced per mole of the hexaammine complex, or almost 0.5 with
respect to the formation of a mole of the nitrosyl complex.
Formation of hydroxylamine was believed to result from the attack
of N02
upon the amido complex. Therefore, the above result suggested

164.
that more than half of the nitrosyl complex was produced by another
pathway. rt is known285 that tnulNtlr¡5NH2l2+ gr"do.lry undergoes aquation
forming tRu(NHr)5OHI2+, which can be monitored by Èhe decrease in the
4O2 nm absorption due to the amido complex. Thus,
lRu (NH3) sNnzl
2* * uro + [Ru (NH3) 5oH] '* * tn, .
The rel-ease of a mo1ecule of ammonia per molecule of complex
explained the presence of ammonium chloride in the reaction product.
It seemed reasonabl-e that this step \¡¡as responsible for the formation of
the nitrosyl complex. Pelf and Armors5 have noted substantial substitution
of No on [Ru(NHr)5oH]2+. The hydrorysis of tnu(NHr)ul3+ (tto-3 mot am-3)
in 0.1 mo1 A*-3 UaOg was followed spectroscopically for t5-20 minutes,
during which time the peak at 4O2 nm almost disappeared while an
absorption aE 29O nm, due to the hydroxo species, inÈensified. However,
the spectrum I^Ias unaffected by the addition of nitrit. (t1O-2 mol dm-3).
No spectroscopic evidence was obtained for substituÈion by nitrite in
alkaline conditions. Rather, substitution was bel-ieved to occur during
acidification of the reaction mixture. Acidification to pH 3 provided
conditions for substitution upon the resulting tRu(NHr)5H2Ol3+ "p".i."foll-owed by rapid hydrotysis to the nitrosyl complex.
Thus, a solution of tRu(NHr)a]3+ ir,0.1 mor d*-3 w.oH was kept
under argon for one hour, followed by the addition of nitrite ion (ten-
fol-d excess) and prompt acidification of the solution. An orange
coloration developed rapidty and approximately 30% of [Ru(NHr)UNO]Br,
was isolated.
Further evidence came from the reaction of nitrite ion with an
2rauthentic sample of tRu(NHr)5H2ol-'. In aqueous solution (pH 5-6) this
exists in equilibrium with the hydroxo form which produces a strong
broad absorption at 29O nm in the electronic spectrum.279 The addition
of nitriÈe to the aquo complex caused a gradual decrease in this
a-bsorption suggesting that substitution occurred. Howeverr no ne\¡/
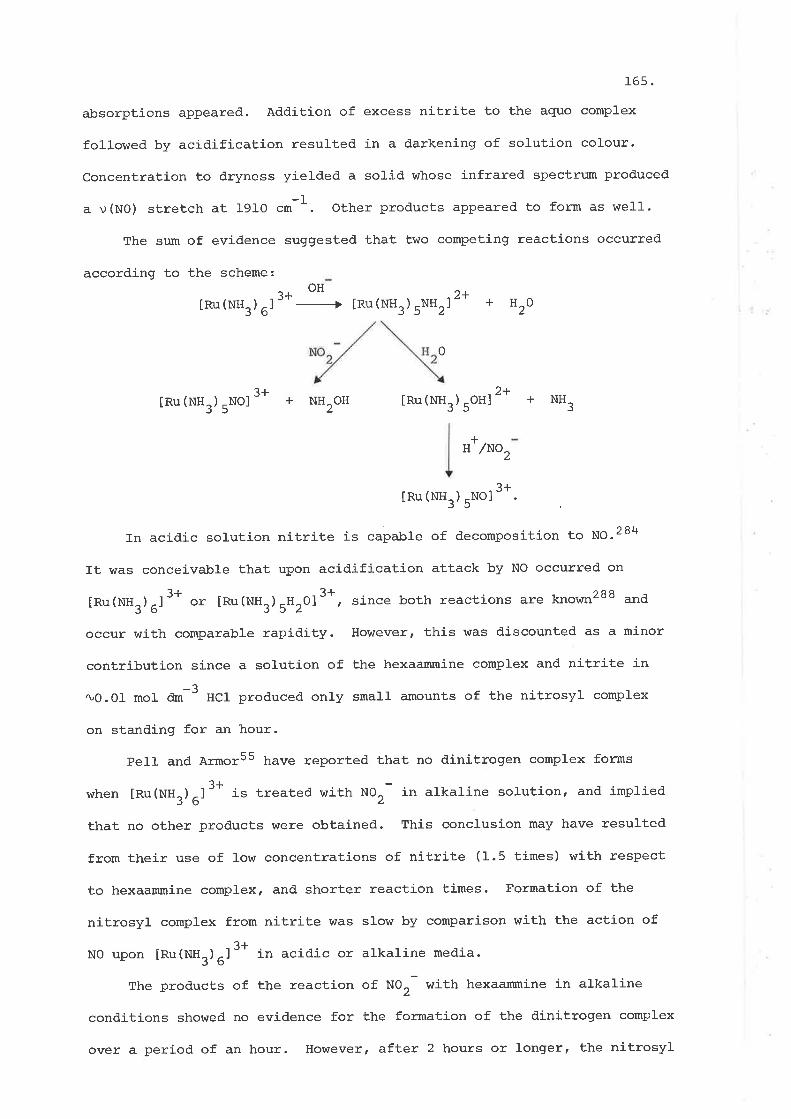
165.
absorptions appeared. Addition of excess nitrite to the aquo complex
followed by acidification resulted in a darkening of solution colour.
Concentration to dryness yielded a solid whose infrared spectrum produced
a v(NO) streÈch at l-9I0.*-1. Other products appeared to form as wel1.
The sum of evidence suggested that thro competing reactions occurred
according to the scheme:
lRu(NH3) 6l
OH
0
2+3+ +"zo
3+ 2+lRu (NHr)
,Nol+ NH OH lRu (NH3)
5OHl+ *n:
/Noz
tRu (NHr) sNol
3+
In acidic solution nitrite is capa-ble of decomposition to tlo.284
It was conceivable that upon acidification attack by NO occurred on
lRu(NHr)Ul3* ot [Ru(NHr)5H20]3+, since both reactions are known28S .n¿
occur with comparable rapidity. However, this was discounted as a minor
contribution since a solution of the hexaammine complex and nitrite in
-2tu0.01 mol dm " HCt produced only small amounts of the nitrosyl complex
on standing for an hour.
PeIl and Armor55 have reported that no dinitrogen complex forms
when lnulW¡.¡^]3* i" treated with NO, in alkaline solution, and impliedJ()
Èhat no other products were obtained. This conclusion may have resulted
from their use of low concentrations of nitrite (1.5 times) with respect
to hexaammine complex, and. shorter reaction times. Formation of the
nitrosyl complex from nitrite was slow by comparison with the action of2r
NO upon [Ru{uua¡U1-' in acidic or alkaline media.
The products of the reaction of NO, with hexaammine in alkaline
conditions showed no evidence for the formation of the dinitrogen complex
over a period of an hour. However, after 2 hours or longer, the nitrosyl
2
+H

complex isolated, revealed a weak to medium absorption at 2f00 crn
the infrared spectrum, believed to be due to tRu(NHr)u*rl'*. The
amount of this complex coutd not be determined by direct spectroscopic
examination of the reaction mixÈure due to the absorption of free nitrite
in the region of. 22O rm. The origin of the dinitrogen complex was shown
to be [Ru(NHr)5NO]3+, since this complex produced small a¡nounts of
tRu(NHr)r*rl'* when left in O.r mol d*-3 N.oH over a period of two
hours. Bottomley et a-2.53r289 ¡..r" reported that Èhe dinitrogen complex
forms in approximately 25-3Oe" yield when the nitrosyl complex is exposed
to O.I mol d*-3 t¡.Og for several days. In alkaline solution the nitrosyl
forms [RuNHr(NH3)4No]2+ which subsequently reacts with the parent complex
to form the dinitrogen species and [Ru(oH) {uHr)nxo]2+.
Although it was demonstrated that nitrite produced the nitrosyl
complex by attack on tgu(NHr)Ul3* in alkaline media, this did not exclude
the possibility of NO, or NrOn reacting directly as well, and not only
through their hydrolysis product. Some evidence for their interaction
with the hexaammine complex was afforded by studies carried out in
acidic solution.
The introduction of NO, gas into solutions of the hexaammine complex
in O.OI mo1 a*-3 UCt resulted in no colour changes. A white solid was
isolated. The infrared spectrum (nujol) indicaÈed the almost total
absence of a niÈrosy1 complex. Instead two prominent absorptions appeared
at 1O3O cm-l and 955 qn-l, together wíth several between 600 cm-l and
8OO cm-l, which could not be assigned to the starting material, the nitrate
-I166.
in
3+sa1t, or free nitrate. Treaünent of [Ru(NHr)Ul in acidic conditrons
with nitrite produced only small amounts of the nitrosyl complex as
menÈioned earlier. V[ith nitrate no reaction occurred at aII. These
last two observations r^rere not surprising since the hexaammine complex
is known to be inert towards substitution.2SS
It was concluded that aÈtack by NO, itself upon the hexaan¡unine species

167.
was responsible for the spectral changes. This would paralle1 the be-
haviour of NO which readily attacks the hexaammine complex in acidic
solution to produce [Ru(NH3)5NO]3+.288 This is rapid and believed to
proceed via a seven-coordinate electrophilic substitution mechanism.
The nature of the product obtained could not be determined, although
it appeared to contain a nitrato complex. The reaction did not proceed
to completion since the electroníc spectrum produced a significant
absorption due to the hexaammine complex. The rapid hydrolysis of the
gas in aqueous solution meant that its concentration in solution was
probably quite low.
From the peak at 955 cm-I it was reasonable to suppose the presence
of a coordinated nitrate ligand. The spectrum of [Ru(NHr)5NO3] (NO3)2
produces two prominent absorptions at 1050 cm-l arrd 970 cm-I. The
Iatter derives from the coordinated nitrate ligand (vr) and the former
from the non-coordinated ligand (Table 7.3a). lrlhether or not a nitrite
containing complex r^7as present, could not be determined from the infrared
spectrum. Coordinated, or free, nitrite generally produces absorptions
outside the region of 850 .*-l ao 1o5o cm-I .290 t29l
It was observed that the infrared spectrum in a KBr matrix \¡¡as
very different from that in nujol. The absorptions at IO30 crn-l and
-'t955 cm ' completely disappeared while absorptions due to the free nitrate
became quite pronounced. These changes \^Iere accompanied by a colour
change from white to yello\^r, attributed to the formation of tRu(NHr) 5Btl2+
as a result of grinding the product with l<8r.292 This change in colour
also occurred upon treating [Ru(NHr)SNO:] (NO3)2 in like manner. Neverthe-
Iess, the spectrum of the product from the N0, reaction did not agree in
detail with that of the nitrato complex. In particular the former produced
no peak at II5OO qn-I (vn) due to a coordinated nitrate ligand. Several
peaks \Á¡ere present below 8OO cm-I which did noÈ occur in tRu(NH3)5NO3l (No3)2
In conclusion it may be said that the evidence presented suggested a

168.
Table 7.2a
YieLd of Products from the Reaction of IRu(NHr) U\CT
NO2(Ð anèl N0, ìn Al-kaline Conditions
with3
tRu(NH^) -l50 /Nor(s) /ou
3+lRu(NH /No /oH3 6 2
3+aÈ Yie1d IRu(NHr)UNOJ B Yield NH2OH
55
37
49
43
47
aMethod
3+ -b
22
24
L6
51
a
b
c.
With respect to initial [Ru(NHr)Ulcfr.
Nitrosyl isolated as the nitrate salt. [OH ]
Nitrosyl isolated as the bromide salt. tOH l
= 0.05-O.l mo1 dm-3.
-?= 0.1 mol dm ".

169.
3+reaction between N0, and [nu(NHr) 6l in acidic solutionr but since
the nature of the product was not establ-ished no mechanistic interpre-
tation of the reaction was possible. By contrast the reaction with
nitrite ion in alkaline solution yielded a well-characterized nitrosyl
complex for which a possible reaction scheme was proposed.
7.3 ThermoTgsis of Nitrato Pentaanunine Ruthenium(Iü) Nittate
It is known that ammonium nitrate thermally decomposes to dinitrogen
oxide. Dinitrogen is also formed when chloride ion is present in
catalyÈic ¿rmounts .87 ,284 Thermal decomposition of t¡u(NHr) 5NO3l (NO3)
2
hras invesÈigated by infrared spectroscopy. It v¡as presumed that the
nitrato ligand would be capable of interaction with an ammine ligand in
close proximity, resulting, possibly, in the formation of dinitrogen
or dinitrogen oxide complexes.
The complex h/as heated gradually under an atmosphere of dinitrogen,
argon or air, and Èhe spectrun recorded (nujol) after IO"c or 20oc
increments (Ta-ble 7.3a). The resul-È was identical in each case. Up to
IOOoC no significant spectral changes occurred. In particular, no new
peaks were observed between 2OOO cm-I arrd 23OO cm-l that might be attri-
buted to a dinitrogen or dinitrogen oxide intermediate. A weak broad
band due to the nitrate species at 21OO cln-l *." always present.
Hoh¡ever, in the vicinity of IOOoC a new weak absorption emerged at
-l1925 cm'. By l3OoC this was of medium intensity, and !\7as assigned Èo
the v(NO) stretching frequency of the nitrosyl complex, [Ru(NH3)5NO] (NO3)3.
AÈ l5OoC this absorption was very strong and accompanied by a second'
alrsorption at 1860 .*-1. The ammine bending and rocking modes also
underwent a gradual change. The N-H degenerate deformation frequency,
ô - (Un¡ , at 1630 cm-l produced a shoulder at 1570 cm-I which intensifieddeg
with increasing temperature. Thís is the region of ôU.'(NH) for ammine
nitrosyl compJ-exes.293'294 The shift of the rocking mode, p(l¡H), to

170.
higher energies was also observed. More significantly, the peaks due to
coordinated nitrate also underwent change. Thus, Èhe strong v, vibration
of the coordinated ligand at 970 "*-1 d..=eased in intensity as a ne\^t
peak emerged at 9g5 crn-l. The vn mode at I49O cn-I shifted to higher
energy. With increasing temperature the absorption at 1860 .*-1 .rrd
Èhe new peaks became dominant. At l7OoC the peaks at 995 .*-1 .nd
g7O cm-l were of equal intensity. By 190-20OoC the latter had entirely
disappeared and p (NH) had shifted to gS5 c¡n-]. The nitrosyl absorptions
were of equal intensity but that at 1860 "*-1 t." broader. Eventually
this became the sole absorption in this region of the spectrum, although
very broad. Extensive decomposition was evident by 245oC. Throughout
the heating the cofour change was from white to grey to yellow-brown
and eventuallv black"
The absorptions at 1860 "*-l and IS2O cm-I were undoubtedlv due
to the nitrosyl group. Hol^¡ever, the absorption at 995 cm-I was not
readily assigned. The possibility of a bending M-OH or p (NH2) vibration
was discounted since deuteration of the product obtained from heating
the complex to l7OoC had no effect on its intensity or position whife
shifting all genuine NH vibrational modes to lower energy. Hol^tever,
heating Eo 22O"C an authentic sample of [Ru(NH3)5NO] (No3)3rPrePared from
tnulN¡¡a¡5NOlC13, resulted in the appearance of peaks at 1860 c*-1 "rrd
995 cm-I. Hence, the first step in the thermotysis of the nitrato complex
was judged to be conversion to this nitrosyl complex as al-ready suggested.
It was found that the infrared spectrum of [Ru(NHr)4NO(NO3)] (NO3)2,
synthesized from trans-tRu(NHr)4NO(C1)lCI2, was in good agreement (Table
7.2a) with the new peaks observed during thermolysis (i.e. v(NO) 1850
-1 1OO5 cm-l). It was proposed that this tetraanmine nitrosylcm -i v2(NO3 ) '
complex was the second product of thermolysis- Thus,
lRu (NHr) 5NO3l
(NO3) 2 + [nu (NHr) 5NO]
(NO3) 3 -] [Ru (NH3)
4NO (NO3) ] (NO3)
2.
The second thermolytic step Ì¡ras analogous to Èhe behaviour of
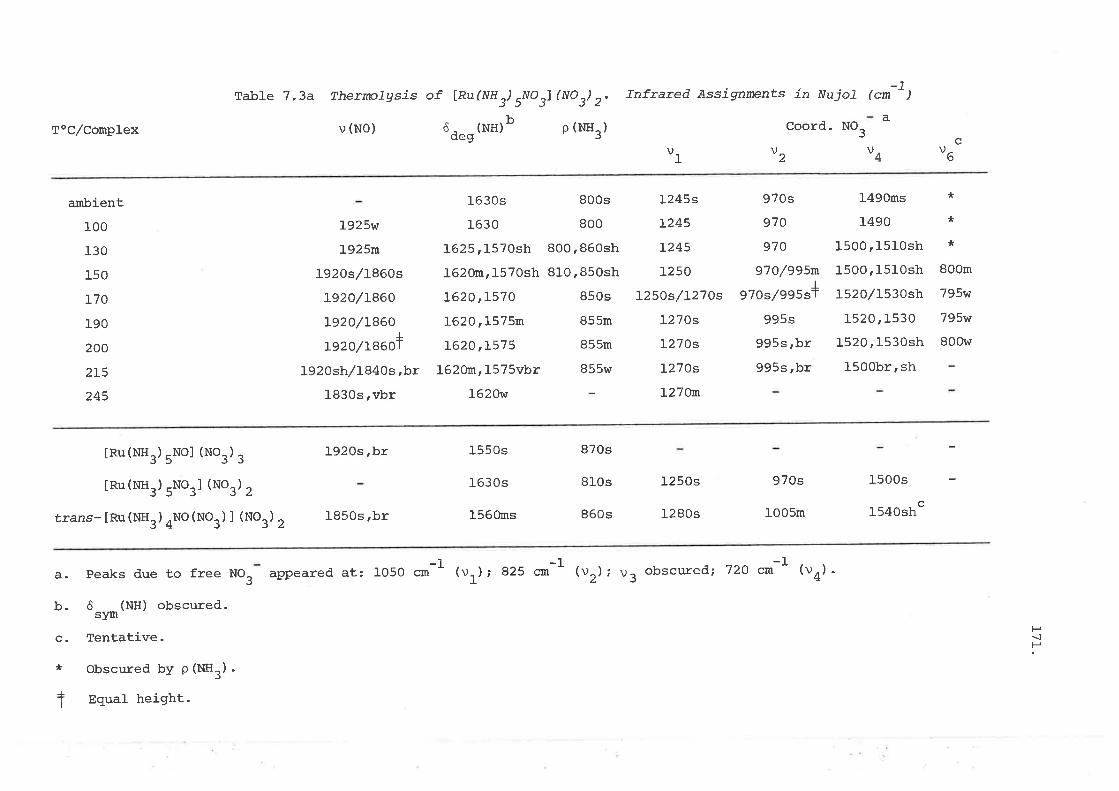
ToC,/Complex
ambient
100
130
150
170
190
200
2L5
245
lRu(NH,
lRu(NH3
trans- [Ru (NH,
Table 7"3a TheuroTgsis of
v (N0)
1925w
1925m
1920s,/1860s
L92O/L86O
L92O/l-860+
L92O/L86Ol
I92Ash/L840s,br
1830s,vbr
ô
1630s 800s
1630 800
l-625t 157Osh 800'860sh
L62Om,1570sh 810' 85Osh
I62O,L57O 850s
L62O,I575m 855m
L62O,L575 855m
L62ùm,1575vbr 855w
162Or^t
Infrared Assignments ìn NujoT
Coord. NO
vI
970s
970
970
97o/995ml
97Os/995sT
995s
995s,br
995s rbr
lRu(NH ,) sNo i (No 3) 2.
- (l¡H)b p (NH^)oeg 5
-1(cm )
a3
v4
149Oms
1490
1500,15I0sh
1500,1510sh
I520l1530sh
r520, 1530
L52O,153Osh
1500br, sh
u6u2
L245s
L245
L245
1250
I25Os/I27Os
L27Os
l27Os
L27Os
L27Om
*
*
*
800m
795w
795w
800w
) sNol (No3)
3
) 5No3l (No3)
2
) 4No (No3) I (No3)
1920s,br
1850s,br
1550s
1630s
156Ons
970s
1005m
1500s
1540sh
870s
810s 1250s
860s 1280s
(v ); v 32
c
2
a. Peaks due to free NO¡ appeared at: 1050 qn-l1); g25 cm-I obscured; 720 crn-I (vn) .(v
b. ô (NH) obscured.sym
c. Tentative.
* obscured by p (M:) .
f
T Equal hergnt.
ts{H
L72.
[Ru(NHr)5NO]C13 which thermatty converts to [Ru(l¡H
through loss of a coordinated ammonia mo1ecule.l5l
¡) ¿No (cr¡ 1 s1,
studies2gs of the complexes tRu(NHr)UXJx, and tRu(NH3) qxZlx (x = cI ,
Br , I ) have revealed similar trends.
Thermal conversion to the nitrosyl pentaarnmine complex probably
involved more than one step. Thermal and radiolytic decomposition
studies of simple nitrates indicate that direct decomposition to NO does
not take place .296 t297 Instead,aonsiderable amountC of nitrite is formed.;
É NO is quite often found to be the thermal decomposition product of
nitrites.2gB There is evidencezgg to show that NO^ dissociates to NO*
in alka1i metal nitrate melts, according to
NOr:NO++NÐ-?The suggestion was, therefore, that the nitraÈo complex passed
via a nitro or nitrito intermediate on the way to formation of the
nitrosyl complex.
7.4 Reaction of Hgdroxglamine with cis-lRu(NHr) nNO(Br)lBt,
It has been demonstrated by Norman46 th.t dinitrogen oxide reacts
with cjs-tRu(NHr) 4G2o)rf2* to yield [Ru(NHr)4N20(H2o)]x2 (x = PFa ,'
BF4 ). The reaction of the nitrosyl complex, cjs-[Ru(NH3)nNo(Br)JBr,
with hydroxyJ-amine was attempted with a view to providing an alternative
route to the above dinitrogen oxide complex. Bottomleyl4S has shown
that the trans-tetraammine nitrosyl complexes are unreactive towards
nucleophilic attack but that cis-tRu(NHr)4No(Cl)l2+ te.cts with
hydroxylamine although the nature of the product was not reported.
When an ice-cold. slurry of the bromo nitrosyl complex was treated
with hydroxylamine a slow effervescence occurred accompanied by dissolution
of the complex. Ho\^rever, no precipitate formed and a product was only
isolated by the addition of potassium bromide solution or dinitrogen
oxide-saturated ethanol. A pale yellow was obtained which darkened on
Thermal decomposition

173.
exposure to air.
The infrared spectrum (nujol-) of the solid always indicated a
mixture. The presence of unreacted nitrosyl complex was indicated by
absorptions at l-898 cm-l and I93O "*-1.
The loht symmetry of the cis-
nitrosyl complex results in splitting of the v(NO) band.I63 The
intensity of these peaks decreased with the extent of the reaction. In
addition, a medium peak appeared at ZIIO cm-l and was attributed to
tRu(NHr) nN, (Hro) lBr, (r,it.1s v (Nr) ztoz cm-l) . weak absorptions were
seen at Zlg5 cm-l anð. 2230 .*-t. The origin of the former was not known
but the latter was consistent with the v, stretching mode of dinitrogen
oxide in [Ru(NH3)4N20(H20)lBrZ. This was supported by the presence of
a medium intense peak at fI60 cm-I which is the region of absorption for
the v, mode of coordinated dinitrogen oxide. Thus, [Ru(NHr)UNrOlBr,
-r 4Ipossesses vl at 1157 cm - and [nu(NHr)4N20(H20)]X2 (X = eFn , PF6 ) at
t22O cm-I and 1235 "*-f
r."pective1y.46 As mentioned in Section l-.2 the
intensity of the v, vibrational mode of dinitrogen oxide complexes is
anion-dependent and is weak for the bromide salt.
Attempts to obtain the electronic spectrum of the dinitrogen oxide
species were frustrated by Èhe extreme rapidity of decomposition of
the complex in aqueous solution, even when cooled in ice. Seconds after
dissolving br:bbles of gas formed within solution and no absorption in
the vicinity of 230-250 nm (the region for coordinated NrO) was seen in
the electronic spectrtrtn. This behaviour was probably due to the presence
of impurities which rapidly catalyzed the breakdown of the dinitrogen
oxide species.
It would appear that this method is less fruitful in producing the
dinitrogen oxide complex than substitution upon the cis-diaquo complex.

L14.
CHAPTER 8
SUBSTITUTTON BY DTNTTROGEN OXrDE IN NON-AQIJEOUS SOLVENTS;
REACTION OF HYDRAZINE V{ITH A NITROSYL COMPLEX
8.7 Introduction
The ruthenium ammine dinitrogen oxide complexes have been successfully
prepared from aqueous solution by two methods as described in Chapter 1.
So far these remain the only characterized dinitrogen oxide complexes
known. In this chapter are described attempted substitution reactions
in non-aqueous soluÈion with systems known to coordinate dinitrogen
in the absence of an external reducing agent. The presence of a
reducing agent was undesirable because of possible reduction of dinitrogen
oxide.48r49r300 In this regard the complexes chosen h¡ere low oxidation
iron and ruthenium hydrido complexes containing phosphine ligands. In
solution the complexes possess a labíle group providing a site for
coordinaÈion by a substitutinq ligand.
rt is known301,302 that [RuHr(PPh3)4] reversibry binds dinitrogen
in benzene solution, according to the equation:
lRuHr(PPh3)4] + N2 '::: [nuur(N2) (PPh3)3] + PPh3. (1)
Attempts to isolate Èhe dinitrogen complex have been unsuccessful
and removal of solvent produces the original hydrido complex-301'302
i<noth303 h.s prepared the dinitrogen complex by a di.fferent pathway,
utilizing [RuHCl(PPh3)3]. He has found that the reaction of the dinitrogen
complex with triphenytphosphine results in loss of dinitrogen.
The system was chosen for its ease in formation of the above
equilibrium. This suggested the use of dinitrogen oxide in place of
dinitrogen. However, it is knowrr3o4 that dinitrogen oxide reacts with
cobatt(I) and rhodium(I) complexes with the evolution of dinitrogen. The
reaction with lcoHr(PPh3)3] and [cott(ur) (PPh3)3], in the presence of
triphenylphosphine, leads to the catalytic reduction of NrO and the
production of triphenylphosphine oxide.305 This beinq so reaction (1)

r75 .
could be expected to be irreversibly pushed to the right with the
formation of the dinitrogen complex-
The other hydrido complex investigated was trans- [FeHCl(dpe)r].
Among the metals of the iron group a series of cationic hydrido complexes
of generâI formula trans-tMH(L) (depe) 2lBPh4
(M = Fe, Rll , Os; L = C0 I Nrr
PhCN etc; depe = EE.P(CH2) 2PEE2) has been described.3OS The iron complex
possesses a 1abile chloride in solution allowing facile sr¡bstitution-
Likewise trans- [FeHCl (dpe) rl readily loses the chloride ligand in THF
teading to the species [FeH(THF) (dpe)r]+.gOZ From the THF solution five-
coordinate iron(II) complexes [FeH(dpe)r)Y (Y = ClOn-, BPh4 ) have been
isolated. These and the THF complex readily accept a variety of ligands
to form complexes of the formula, [FeH(L)(dpe)r]Y (L = C0, MeCN' nO, *r).tot
Finally the reaction of hydrazine hydrate with [Ruc1, (PPh3) 2NO]
was also investigated. Nucleophilic attack upon the nitrosyl group has
been successful for complexes of the type ttans-lRuCl(das)rNOlCl, and
trans-lOsX(das)2NO]X2.H20 (X = Cl , Br , I ).308,309'310 The nítrosyl
complex investigated is believed to have the meridional configuration
and a nitrosyl group coordinated formally as 1¡g+.ltt The observed v(NO)
frequency occurs at lB75 .*-1. The related nitrosyl complex,
[RuCtr(PMePhr)2NO], for which the crystal structure has been determined'
possesses a meridional configuration. 312
8.2 Substitution bg Dinitrogen Oxide onto ÍRuHr(PPhl 4l
The passage of dinitrogen through a benzene solution of the hydrido
complex produced a sharp absorption at 2150 .*-I in the infrared spectrum
due to [RuHr(N2)(PPh3)3]. The use of dinitrogen oxide produced a strong
absorption aE 2230.*-I do" to the v, stretching mode of free NrO and an
emerging peak at 2l5o cm-I. The latter increased over a period of
several hours to a maximum, then gradualty disappeared. No peak was
seen that could be attributed to an NrO-coordinated species. The

176.
appearance of the dinitrogen complex implíed a prior NrO intermediate,
since coordination to a metal centre would provide a site for reduction
of the NrO molecule. Thus, one can write
lRuHr(pph3)nl + N2o + lauur(N20) (PPh3)n] + [RuHr(N2) (PPh3)3] + oPPh3
where n is 3 or 4. lrlhen the experiment was repeated and the solution
freeze-dried, a flaky, yellow-green solid was obtained. However, this
only produced a peak at 2O5O cm-I in the infrared spectrum thaÈ was
consistent with a metal-hydride stretch rather than v(N2).302 Peaks
-1below 12OO crn - indicated the presence of a phosphine oxíde.
pressurization of a chilled benzene solution of the complex under
dinitrogen oxide (nZO x tO5 pa), for up to an hour, yielded a dark green-
black solution. The isolated product revealed neither v(Ru-H) norv(Nr)
absorpÈions. Repeated extractions yielded a white, ether soluble product,
leaving behind a black solid. The former produced a strong doublet at
-'tII9O, II95 cm-' in its infrared spectrum and was identified from its
I-H-nmr spectrun and melting point as triphenylphosphine oxide. The
other solid produced no discernible peaks in its infrared spectrum apart
from several weak absorptions due to triphenylphosphine oxide. Analysis
indicated the sotid to be ruthenium dioxide.
After exposure of the hydrído complex to dinitrogen oxide for 24 hours,
careful extraction of the reaction product mixture indicated that, on a
molar basis, the yield of the phosphine oxide to ruthenium dioxide was
approximately 3.6:I. This was compatible with the overall stoichiometry,
lRuH, (PPh3) 4l + 7N20 * RuO2 + 4oPPh3 + H20 + 7Ñ2.
The apparent rate of formation of the dinitrogen complex occurred
more slow1y with dinitrogen oxide than with dinitrogen.
S.2.L Substitution bg Dinitrogen Oxide onto trans-lFelICf (dpe) Zl
Reactions of the iron hydrido comprex' [FeHcl(dpe)z] were investigated
in a THF/jso-buÈanol medium. Bubbling dinitrogen through a red solution

of the complex in the presence of sodium tetraphenylborate'
L77 .
resulted in
a yellow precipitate of treH(Nr) (dpe)rlBPh4. Its infrared spectrum
produced a strong v (N2) absorption at 2I3O *-l urrd several broad bands
below ZOO0 cm-l. An absorption at 1880 .*-1 h"" been assigned to
v(r'e-u).307
The reaction using dinitrogen oxide was carried out under the following
conditions: (1) The gas \^ras passed through the reaction mixture at ambient
temperature and approximately atmospheric pressure i Q) at approximately
atmospheric pressure through the chilled reaction mixture; (3) the gas
I^Ias pressurized, at approximately'v7 x 105 to 14 x 105 Pa' into chil]ed
solutions of the comP1ex.
In most cases a yellow-brown solid was isolated which produced a
medium absorption at 2t3O .*-1 in its infrared spectrum (nujol) due to
the presence of the above dinitrogen complex. No other absorpÈions were
seen in this region of the spectrum. occasionally a brown solid
precipitated from solution first, and a yellow product was obtained
from the fil-trate. The latter was identified spectrally as the dinitrogen
complex. At ambient temperature formation of the dinitrogen complex
occurred within 15 minutes, using dinitrogen, but considerably longer
was required with dinitrogen oxide. At ice temperature the red coloration
of the hydrido complex was dispelled by dinitrogen oxide after an hour
or moïe. Hohreveï, under NrO pressurization the reaction was complete
within 30 minutes or less.
Once again the presence of the dinitrogen complex in the reaction
product suggested prior coordination by dinitrogen oxide. Substitution
was obviously followed by reduction to the dinitrogen complex, and
therefore, oxidation of some other species. The \¡Ùeakness of V(Nr) in
many of the preparations, particularly under pressurized Nro indicated
that, analogous to the ruthenium hydrido complex, the dinitrogen complex
also underwent decomposition. The passage of dinitrogen oxide through

178.
THF solutions of the hydrido complex \das monitored by infrared
spectroscopy. A \^reak to medium peak at 2130 cn-I and a strong v3
absorption of the gas r^rere seen. The intensity of the former grew
for an hour, then slowly disappeared.
The products from the reaction were not characterized. The
infrared spectrum suggested by the appearance of bands at 1190 c*-l t"d
-lIISO cm-r that the oxide of I,2-bis(cliphenylphosphino)ethane, dpeor,
was possibly present, but no solid was isolated. The composition of
the brown sotid \^Ias not known, but in view of the extensive iron-oxygen
chemisÈry knownr3l3 .t oxo-complex was possible'
The nitrosyl complex, IFeNO(dpe)rlBPh4 was readily prepared from
lFeHCl(dpe)rJ using MNTS (Section 9.4). However, its nitrosyl stretching
frequency appears at 1697 "*-1. This tow value suggested that nucleophilic
attack upon the nitrosyl group was unlikely. Indeed, no reaction \^¡as
observed with hydroxylamine, hydrazine or azide ion. Johnson and
segat3t4 h"rr. reported that no reaction is observed even with methoxide
ion.
8.3 Reaction of Hgdîazine Hgdrate with lRuCl3(PPhl2NOl
The reactions of the nitrosyt complex with hydrazine hydrate were
heterogeneous due to the Iow solubility of the complex in common solvents'
At room temperature the effect of hydrazine upon an ethanolic suspension
of the nitrosyl comPlex \^Ias slow.
On heating the mixture to about SOoC (und,er dinitrogen) the colour
deepened to red-brown. Ho\^rever, total reaction \^Ias affected only if on
heating to 8O-9OoC, the solvent was subsequently distilled off in vactJo-
In this case a deep red solution resulted which yielded a reddish-brown
solid on concentration to dryness. The infrared spectrum indicated the
absence of the original nitrosyl absorption. fnstead a new absorptíon
appeared at 21IO cm-t with a shoulder at 2O5O t*-1'

I79.
The isolated solid \^ras a mixture which yielded three products upon
treatment with various solvents (Section 9.4) . A white solid was readily
separated and identified spectroscopically as triphenylphosphine.
Isolation of this product implied that attack on the nitrosyl complex
occurred. not only at the site of the nitrosyl group. A yellow-brown
product was also obtained which was identified as [nu(NHr)5N2]C12. This
product accounted for the strong infrared absorption aL 2110 "*-I-Formation of the pentaammine dinitrogen complex was not unprecedented
since Chatt et aL.315 hrn. reported the production of this complex from
the reaction of [RuX, (PR3) 3] (X = CI , Br ; PR3 = tertiary phosphine) with
hydrazine under vigorous conditions. Likewise, ruthenium trichloride
and triphenylphosphine in the presence of hydrazine yietd a mixture of
the dinitrogen and carbonyl pentaammine ruthenium complexes.3l6
The third product isolated \^¡as a red so1id, very soluble in chloro-
form, and slightly soluble in methanol and \^rater. The complex was stabfe
Ín the solid state but in solution undenvent decomposition on exposure
to air. The infrared spectrum of the solid revealed the presence of
both ammine and triphenylphosphine vibrations. Strong peaks due to
v(NH), ôdeg(NH) and ô"*(NH) appeared at 3t4O .*-1, 1620 cm-I and 1280
.*-1 r.=pectively. Those due to triphenylphosphine at 3O4O *-1, 1585 crn-1
and between BOO .m-1 .nd 5oo cm-l. peaks at 3o4o ",n-I -rd 1585 cm-l
belonged. to the aromatic v(CH) and aromatic ring vibrations respectively.
A small peak at ZI10 cm-I from the dinitrogen complex was generally
present and was difficult to eliminate completely. Similarly, a weak
peak at 2050 cm-l \^¡as usually present and probably represented traces of
a dinitrogen complex containing coordinated triphenylphosphine. A bridged
dinitrogen complex which could account for the weak absorption at 2050
-1cm was dl-scounted since no charge transfer band appeared in the electronic
spectrum (vide infra) consistent with a bridged dinitrogen ligand.
Microanalysis of the red complex consistently indicated one tri-

180.
phenylphosphine ligand per ruthenium and the formulation [Ru(NHr)4PPh¡(C1)]CI
was proposed. A smatl amount of a hydrazine complex was possibly also
present since the use of p-dimethytaminobenzaldehyde3lT indicated trace
amounts of hydrazine (<Sa¡. The infrared spectrum of [RuClr(PPh3)2No]
has a prominent absorption at 340 "*-1 d,-r. to v (Ru-Cl) . A v (Ru-CI)
absorption was expected for tnu(NHr)4PPh:(CI)lCt, but none \¡tas seen in
this region of the spectrum. This may have resulted from the presence
of the ammine Iigands since the influence of a group ttans to the halide
can substantially affect v(nu-ct) .318
Using resin exchange columns it was established that the complex
was cationic in aqueous solution. In DMF conductance measurements
were consistent with a t:l etectrolyte (Â = 70 S cm2mol-Ii C = S x tO-4
-¿mol dm-'). Attempts to measure the molecular weight in dichloromethane
using Èhe isopiestic method (Section 9.6) were unsuccessful since the
complex decomposed before equilibration was achieved.
The 1H-nmr spectrum in CDCI, revealed the coordinated ammine ligands
as a broad hump aE 2.3 ppm, while the triphenylphosphine ligand produced
a major peak at 7.6 ppm. Integration of peak areas was in the main
consistent with the formulation above. In some cases integration indicated
a larger phosphine signal than expected, probably as a resul-t of free
phosphine being present.
The yield of the products depended on the solvent conditions used,.
Thus, when carried out in a hydrazine hydrate suspension the nitrosyl
complex yietded approximately 60% of the red solid and approximately 40%
of the dinitrogen complex. About hatf the amount of originally coordinated
phosphine was isolated in the free state. However, in the presence of
a large excess of ethanol the reaction yielded a mixture only of the
dinitrogen complex and free triphenylphosphine-
AqueoussolutionsoftRu(NH3)4PPh3(c1)lClshowedanumberof
a-bsorptions in the etectronic spectrum. Several sharp bands between 260

18r.
arld. 274 nm \^¡ere due to the triphenylphosphine ligand. Absorptions
also appeared at 360 nm and 490 nm. In chloroform the red solution
produced a visible band at 5OO nm (e ru 7 x LO2 *o1-1d*3"*-1). Aerial
oxidation gave a green soluÈion having a major absorption at 620 nm.
From this solution a green solid was isolated whose infrared spectrum
was similar to the parent complex, and stil-l indicated the presence of
the phosphine. Microanalysis was in agreement with one phosphine
tigand per ruthenium, but not consistenÈIy. Quite often a medium peak
appeared at 193O "*-1 in the infrared spectrum, almost certainly due to
a carbonyl complex. This probably originated from traces of phosgene
developing in the solvent during oxidation. In solution the green
complex decomposed to a brown solid and Èriphenylphosphine. The green
solid was not characterized. It remains possible that it was a p-chloro
dimer containing triphenylphosphine. Chloro-bridged complexes are well
known for ruthenium.l93'3L9-321 The bridged complexes described by
Mercer,3l9 and absorbing at about 600 nm, contain both ruthenium(II) and
(III) centres spanned by several chloride ligands-
8.4 ConcLusions on the Formation of Dinitrogen Oxide Complexes
Attempts to prepare dinitrogen oxide complexes by substitution onLo
the metal- centre were unsuccessful-. Direct evidence for coordination by
dinitrogen oxide vtas not obtained. However, spectral identification of
the dinitrogen complexes resulting from the reactions with the hydrido
complexes suggested that NrO-intermediates were formed which rapidly
decomposed to the dinitrogen compl-exes.
The other methods studied involving an alrunine or nitrosyl ligand
Were also unsuccessful in producing N2O-complexes' with the possible
exception of hydroxylamine with cis-[Ru(NHr)nNO(Br)lBrZ. Tn this case
the infrared spectral eVidence suggested the presence of an Nr0-comP1ex
in the solid state, Successful isolation of an NrO-comPlex appears to

L82.
be dependent upon its solubility. The complexes of the ruthenium
anmine systems possess low solubility and are readily precipitated
from solution, reducing to a minimum the possibility of decomposition
by the solvent. Presumably any NrO-intermediates of the EDTA or hydrido
complexes v\rere very soh-lbte and promptly underwent further reactions
in solution. The ligand environment probably was important in this
ïespect, especially in the case of the phosphine ligands. The tendency
for phosphorus to form phosphorus-oxygen bondsl53 =rrgg""ts that
phosphine ligands present an unsuitable environment for NrO-coordination.
Sirnilarly, the EDTA aquo complex provided a site at which acid-enhanced
reduction of dinitrogen oxide could proceed as this is favoured
thermodynamically . 3 5 I
183
9.7
CHAPTER 9
EXPERTMENTAL
Starting MateriaLs
Hgdrated Ruthenium( I fi ) Ttichlotide
RuCl3.nHrO was purchased from Johnson and Matthey.
Potassium Pentachlotoaquoruthenate ( I f I )
lRuClUHrOlK, was prepared by two methods-
A. The first followed the procedure of Mercer and Buckley.322 A solution
of RuCIr.nHrO (3 S) in concentrated hydrochloric acid (lOO cn3) was
refluxed for 4 hours. Potassium chloride (1.a g¡ was added to the
cooled solution which was stirred wiÈh mercury under dinitrogen until
b1ue. The addition of small amounts of zinc amalgam hastened this
process. The mixture was filtered and the filtrate allowed to stand
until red-brown in colour. Evaporation on a steam bath gave rusty red
crystals which were coll-ected, washed with ethanol and recrystallized
from 5 mo1 dm-3 HCI soluÈion. Yield 3.5 g-
B. A solution containing ruthenium trichloride (0.5 S) and potassium
chroride (0.3 g¡ in concentrated hydrochroric acid (15-20 "^3)
ru.=
reduced by hydrogen over platinum black until the mixture became b1ue.
This usually took 4 Lo 6 hours during which time a brown precipitate
also formed. After filtering the filtrate was treated as for method A.
The product from both methods had a molar absorptivity value of
2.Lt 0.1 x 10³ mor-ld*3.*-r, at 325 nm (r,it-323'324 ¡ 325 nm, e = 2'o x l-03
_-1_ 3 -1.mol cûn cm ) .
lrfarming ruthenium trichloride with hydrochloric acid in the presence
of potassium chloride led mainly to the dimeric species [RurclroOJKn
(Lit.325 À 385 nm, e = 6.g x 103 *o1-Id*3.*-1, À 469 nm, e = 4.4 x 10³
_-1_ 3 -1.mol ctm cm ) .

r84
Potassium PentachToronittosg l-ruthenate ( fI )
The method d.escribed by V,Ierner326 was followed. Ruthenium tri-
chloride (1 S) was d.issofved in concentrated nitric acid (ruZS cm3) by
heating on a steam bath. Concentrated hydrochloric acid (IO cm3) was
added and the volume reduced by half. This procedure was repeated
several times. Finally, concentrated potassium chloride solution was
added and the solution cooled. B1ue-red crystals of [RuC1_NO]K, were
coll-ected and washed with ethanol. Yield 0.6 g.
Calc. N 3.62% Found N 3.60%
Potas s ium Hg drogenethg Tene di aminetet raacetatochl-o ro ruthenate ( I f I )
Dihgdrate ÍRUHEDTA (Cl ) I K. 2H 20
A modified method was used based on the work of Ezerskaya and
Solovykh.ES A hot solution of NaTHTEDTA (0.5 g¡ in 0.001 mo1 dm-3
?HC104 (10 cm") was added to a warm solution of [RuC1UHrOJK, (0.5 9) also
in O.OOI mol am-3 gCtO4 (10 cm3), and the mixture refluxed for 30 mins.
Concentration of the yelJ-ow solution on a steam bath gave a yellow
precipitate which was collected and washed with cold water and ethanol.
Recrystallization was from dilute hydrochloric acid.. Yield 0.2-0.25 g,
NAO?. The molar absorptivity in aqueous solution at 280 nm was determined
to be 3.0 + o.2 x 103 mot-ld*3"*-r (r,it.88 :.2 x ro3 *ol-fd*3"*-r) .
Cal-c. C 23.98 H 3.42 N 5.59 CI 7.08 z+
Found C 23.28,23.46 H 3.I8 ,3 .27 N 5.I5 ,5.27 CI 7 .47 ,7 .361 Z
+ Determined potentiometrically.
Potassium Dihgdrogenethglenediaminetetraacetatodichl-ororuthenate (III )
Monohgdrate IRUH TEDTA (Cl ) 2l K.H 20
This was obtained by evaporation of the filtrate remaining after
isolation of the chloro complex (vide supra). A yellow powder was isoLated
which was dissolved in a minimum amount of 2-3 mol dm-3 HCI solution. This

r85 .
hras filtered and \^rarmed on a steam bath until yellow crystals appeared.
These were collected and washed with ethanol. fn aqueous solution the
molar absorptivity was found to be 2.6 x 10³ mo1-1d*3.*-1 at 280 nm
(Lit..88 e = 2.8 x 10³ mo1-1d*3on-1 in 0.4 mol am-3 naclon).
CaIc. C 23.13 H 3.11 N 5.39 CI 13-65 z
Found C 23.65 H 3.06 N 5.67 Ct 13-3 eo
g.2 preparation of New Ruthenium Ethglenediaminetetraacetato Complexes
Magnesium Bis (EthVLenediaminetetraacetato) -V-DinÍttogen Ðituthenate (I1 )
Octahgdrate I (EDTA) RuN rRu
(EDTA) ) Uø r - 8H 20
An aqueous solution 1:-S cm3) of IRuHEDTA(CI)]K.2H20 (O.25 g) was
converted to the magnesium salt by passage through a cationic column in
this form. The effluent was acidified (pH ru 1) and concentrated to its
original volume. A strong flow of dinitrogen \^¡as passed through the
solution, cooled in ice, for about 20 minutes príor to the addition of a
slightexcessofmetallicmagnesium(¡'3Omg)'Astrongflowofdinitrogen
was maintained throughout the experiment. It was necessary to maintain the
acidity of the solution at approximately pH 3. An increase in pH caused a
colour change from yello\^r to brown and eventually to red-violet. Ho$tever,
this was easily reversed by the addition of a few drops of 2 mol d*-3 hydto-
chloric acid. Consumption of the magnesium required several additions of the
metal during the reaction. After approximately 4 hours the solution was fil-
tered rapidly under dinitrogen and the product precipitated by the addition
of cold dinitrogen-saturated ethanol. A canary yellow solid was collected,
washed with ethanol and dried over phosphorus pentoxide. The complex was
stored at tu5oc. Yield O.L2 g, 482. Analytical results are shown in
Table 2.3c.
186.
Ammonium E thg Tenediaminetet raacetatodinit rogenruthenate ( f I )
Pentahgdrate IRUEDTA (N / I (NH 4) r. 5n
rO
Hydrazine hydrate (O.S cm3) was added dropwise, against a current
of dinitrogen, to a dinitrogen-saturated methanolic solution (: cm3¡ of
IRuHTEDTA(NO)c1l (O.f g¡. Effervescence occurred followed by precip-
itation of a yellow solid from solution. The product was collected
under dinitrogen, washed with dried dinitrogen-saturated ethanol and
dried in vacuo. The complex was stored over phosphorus pentoxide and
kept cool. Yield 0.075 g, 68>".
Calc. C 22.IO H 5 .56 N 15.46 Ru Ì8.6 eo
Found C 2I.93,2I.89 H 5.49,5.89 N 15.2I,I5.23 Ru 16.7 z
Potassium Hgdrogenethg Tenediaminetetraacetatocarbong 7 ruthenate ( 1I )
Dihgdrate IRUHEDTA (Co¡ 1 K. 2H 20
Hydrogen and carbon monoxide gas were simultaneously bubbled over
platinum black for 90 minutes through an aqueous sofution (:-S cm3) of
IRuHEDTA(CI)]K.2H20 (0.fS g¡. The yellow soluÈion trras concentrated and
ice-cold, ethanol- added, yielding a pale yellow solid. the complex was
col-lected and dried in vacuo. The complex was sufficiently soluble in
methanol to allow extraction with this solvent. The yellow solution was
concentrated and the complex precipitated with ether. Yie1d O.O72 g, 48>".
Calc. c 26.77 H 3.47 N 5.68 z
Found C 24.5L,25 .78 H 3 .2L t3 .28 N 5.44 ,5.65 z
Po t a s s i um Me thg J e thg J ene d i ami ne t e t r a ac e t a t o c a rbong J ruthe n ate ( I I )
n.Hgdrate lnuue¿DTA (c0 ) I K .nH r0
An ice-cold ethereal solution of diazomethane, dried over KoH pellets,
was added to a chilled solution of [RuHEDTA(CO)]K.2H20 (tu0.06 s) in di-
nitrogen-saturated methanol- (t5O .*3). The solution was allowed to stand
at ambient temperature for approximately 45 minutes, before being

187 .
concentrated to a small volume and the product precipitated with diethyl
ether. The yellow sol-id was washed with ether and dried in vacuo.
Yield 0.05 9.
Calc. for IRUMeEDTA(CO) ]K.2H2O C 28.40 H 3.77 N 5.52 z
Found C 27.9L H 3.46 N 5.69 z
Ðihg drogenethg J ene di amine tet ra acet atochTo ron i t ro s g 7 ruthen iun ( I I )
Dihgdrate IRUH TEDTA (N0) Cll . 2H 20
The complex was prepared by a number of methods. The purity of the
product varied as described in section 3.1.1. The stability of the
nitrosyl complex to oxidation did not require the use of inert atmosphere
conditions.
A. ÍRUHEDTA(CJ))K.2H20 with MNTS
An ethanolic solution 1S cm3) of MNTS (tu5 g) was added to a sol-ution
of the chloro complex (0.3 S) in 0.OI mol dm-3 ucl (tO cm3) and the mixture
warmed on a steam bath. A brown coloration developed. After 20 minutes
the solution was cooled in ice, and filtered to remove copious amounts of
a white crystalline material (the decomposition prod.uct of MNTS). The
brown filtrate v¡as concentrated further, cooled and filtered again. This
h/as repeated untif no further precipitate occurred. The brown soLution
\^ras concentrated to dryness and the product extracted with methanol and
filtered. From the concentrated methanolic solution a brown solid was
precipitated with ether, filtered., washed with dry chloroform and dried
over phosphorus pentoxide. Yie1d O.2I g, 70%.
CaIc. C 24.37 H 3.68 N 8.53 cL 7.I9 z
Found C 24.59,25.L5 H 3.53,3.33 N 8.21.8.10 CL 7.9,8.I 4
B. [nuutpte(c1)]K.2Hr0 or lRuH.EÐTA(ct1 ,1K.H20 with Nitric oxide
The chloro complex (0.: g¡ was dissolved in a minimum amount of 0.0I-2mol dm " gCl solution and filtered. Argon was passed through the solution
for I0 minutes prior to the introduction of nitric oxide. The introduction

188.
of the latter caused the formation of a red-brown coloration; After
30 minutes the ffow of nitric oxide was stopped and swiÈched to dinitrogen
for 15 minutes, followed by concentrating the solution to dryness. The
product was extracted with methanol and filtered. A brown solid was
obtained. on evaporation. This was warmed with dilute HCI solution.
After 10 minutes the solution was concentrated to dryness and treated
as above. Yield O.2O g.
ca1c. c 24.37 H 3.68 N 8.53 CI 7 -L9 eo
Found C 22.72,23.67 H 3.33,3.25 N 8.25,8.O4 Ct 8.2 e.
C. Nitrite Ion ot NOPFU with lRu(Ir)HEDTA(H20)la
An aqueous solution (5 cm-) of [RuHEDTA(cf¡¡K-2H2O (O-z g¡ \^Ias
reduced (H^/F'lu) for 15 minutes prior to the addition of solid potassium¿
nitrite (0.07 g¡. The solution colour immediately darkened to red-brown.
The f low of hydrogen r,iras maintained for about an hour. Sr:Jrsequently the
gas flow 1ltras stopped and the solution treated as for B above. Yield
O.L2 g, 602". Excess nitrosonium hexafluorophosphate added to a solution
containing tRu(II)HEDTA( .O)l also produced a red-brown solution, whichz
was treated in the same manner as above. Yield O.tl g.
Ca1c. C 24.37 H 3.68 N 8.53 %
Found (using No2 ) C 22.89 H 3.10 N 7.85 so
Found (using NoPF6) C 23.77 H 3.34 N 7.8 eo
D. Nitric oxide with IRuHTEDTA(PhCN) rl .2nrO
Nitric oxide was passed through a suspensio of the .bis (benzonitrile)
complex (0.15 g) in methanol acidified with 2 mo a*-3 ttydrochloric acid
and previously saturated with argon. The reaction mixture \¡ras heated to
6OoC, during which time the complex dissolved yielding a brown solution,
which was treated as above. Yie1d 0.08 g, 672.
Calc. C 24.37 H 3.68 N 8.53 z
Found C 23.80 H 3.48 N 8.21 eo

189
E NarH.EÐTA.2Hr0 with IRUCJ UNO)K,
A sol-ution of the pentachloronitrosyl complex (0.2 g¡ in 0.Ol moL
A*-3 HCt (1O cm3) was refluxed with a hot sol-ution of NarHrEDTA.2H2O
(0.2 g¡ in o.ol mor-lc*-I "cl
(to cm3). The mixture was refluxed, for
30 minutes, during which time a brown solution developed. The solution
was concentrated to dryness, extracted with methanol, filtered and treated
as above, yielding a pale brown solid. Yield 0.14 g, 542.
Calc. c 24.31 H 3.68 N 8.53 Cl 7.19 %
Found, C 23.60,22.3O H 3 .49,3.35 N 8.30,8.05 CI 7 .8 %
Dihg drogenethg Tenedi aminetetraacetatobi s ( acetonitri 7e ) ruthenium ( I I )
Monohgdrate lRuH .EÐTA (I'IeCN) r) .n rO
An excess of acetonitrile was added during the reduction of a
filtered aqueous solution of the chloro complex (O.2 g¡. Reduction of the
yellow-orange solution was continued for 90 minutes. Concentration of
the sol-ution followed by the addition of small amounts of dinitrogen-
saturated ethanol precipitated white crystals of potassium chloride.
After filtration the solution was kepÈ refrigerated, under dinitrogen,
until yellow-orange needles of the complex appeared. Further concentration,
or addition of ethanol was necessary if no product appeared. The product
was washed with dry ethanol and diethyl ether. Recrystallization was from
agueous methanol. Yield 0.090 g, 45%.
Cal-c. C 34.22 H 4.51 N 11.40 Ru 20.57 eô
Found C 34.29,34.22 H 4.36,4.25 N 11.13,10.80 Ru 20.4 eo
Di hg dro gene thg I ene di amine tet r aacetatob i s ( benzoni t r i 7 e ) ruthen i um ( f I )
Dihgdrate ÍRUH TEDTA (PhCN ) 2l . 2H 20
An excess of benzonitrile was added during the reduction of a filtered
aqueous solution 1a cm3) of the chloro complex (O.2 g¡. An emulsion formed
as reduction was continued. After 15 minutes a yellow solid precipitated.

r90.
After an hour reduction was stopped, the product coll-ected and washed
with ice-cold ethanol and dried diethyl ether. The complex was dissolved
in dry dinitrogen-saturated methanol, filtered, cooled, and precipitated
with ether. Yield 0.10 g, 4OZ.
Calc. C 45.50 H 4.45 N 8.84 Ru 15.95 z
Found C 44.3O t44.98 H 4.I2,4.32 N 8.72 ,8.76 Ru 15.3 %
DihgdrogenethgTenediaminetetraacetatobis (phthaTodinitriTe) rutheniun(II)
Dihgdrate IRUHTEDTA(7t2-c6H4(cN) ) 2l .2H20
A suspension of phthalodinitrile (0.055 g) in ethanol was added to
a solution (¡ cm3) of [RuHEDTA(cl)]K.2H2o (0.1 g¡ being reduced by
hydrogen, resulting in an immediate red-orange colouration. As reducÈion
conÈinued an orange solid precipitated from solution. This was coflected
in air, washed with cold ethanol, dry chloroform, and diethyl ether. The
filtrate from the reaction mixture yielded more product upon standing. The
product was dried under vacuum. Yield 0.060 g, 44%.
Calc. C 45.68 H 3.83 N 12.29 Ru 14.79 z
Found C 44.54 t44 .OL H 3 .72 ,3.69 N 11. 85 ,IL.74 Ru 15.8 z
Dihg d ro genethg I ene di ami netet r aac et atob i s ( i s o phtha L odi ni t r i L e ) -
ruthenium(II) n-HVdrate ÍRuHTEDTA(L, 3-C6H4(Cw1 11
.nH r0
The preparation followed the above method. However, no solid
precipitated during the reaction and the orange solution \Á/as concentrated
to dryness under vacuum. The yellow product was washed with dry chloroform
and ether. Subsequent extraction with methanol gave a yellow-orange
soluÈion which was concentrated and the product precipitated with ether.
Crystallization from methanol was not successful and the product was
precipitated from solution with ether. Yield 0.065 g from 0.15 g of the
chforo complex.

191.
Caf c. for IRuHTEDTA (I,3-C6H4 (cu) ,¡ 2] .2H2O
C 45.68 H 3 .83 N 12.29 Ru 14.79 eo
Found C 32.84,30.87 H 2.86,2.69 N 8.33 ''7.96 Ru I3.4 z
Reaction of Maleonitril-e with lRu(rI)HEDTA(H 20) I
This reaction did not always yietd a product. Reduction (H2/Pl)
of a solution of IRuHEDTA(CI)]K.2H2O (O.2 S) followed by the addition of
excess maleonitrile yielded a green soLution. After 15 minutes of
continued reduction the solution became yeIlow and remained so. Subse-
quenÈIy, the solution was freeze-dried yielding a yellow solid which was
extracted with dry methanol. A yellow product \^ras isolated on concentration
to dryness. Yield 0.15 g. For reasons unknown the initial green sol-ution
did not always become yellow, but remained green and eventually darkened
to brown on continued reduction. Characteristics of the yel1ow product:
1"-rr*r spectrum (TFA) : 3.2 (en), 3.s (cH) , 4.2 (sly)
2270,2280 sh (v(cN)); 1725 (cozH) ¡ r59o (co2)
-1cm
CaIc. for IRuHTEDTA(CH2(CN) r)rJ.ZurO c 34.35 H 3.96 N 15.02 z
Found c 30.9r H 3.35 N 14.75 Z
Reaction of TetraffuoroterephthaLodinitriJ-e with lRu (û) HEÐTA (H 20 ) l
A solution (¿ cm3) of the chloro complex (0.15 g) was reduced as
above fol-lowed by the additíon of a suspension of the ligand (0.f2 g¡ in
methanol. Instantly a deep red col-ouration developed. Hydrogen flow
was maintained for an hour, but no solid precipitated. The solution was
filtered in air and the filtrate concenÈrated to dryness under vacuum.
A deep red solid resulted, which was extracted with methanol several times
and finally concentrated to dryness, yielding a red solid, which was
dried over silica gel. The product was very soluble in water and methanol,
giving red solutions. Infrared spectrum (KBr) : major peaks at 2180 cm-I
ppm
fnfrared spectrum (nujol) :
r92.
-1(v (cN) ) ; L725 cm (co2H) ;
Cal-c. for
Calc. for
Found,
16o0 cm-l (Co2). L = CN-C6F4-CN
IRuH2EDTA (L) 2l .2H2O C 37 -8 H 2 -2 N 10.2 E I8 '4 z
IHEDTARu(r,)nuHeorAl .2H2o c 33.1 H 3-0 N 8.3 F 7-5 eo
c 22.88 H 2.36 N 5.63 E 6.7 eo
D i hg ¿ro gene thg 7 e ne d.i amì ne te t r a ac et atob i s ( pg r i di ne ) ruthen i um ( I I )
Dihgdrate IRuHTEDTA(eV) tl -2H20
An aqueous sotution (¿ cm3) of [RuHEDTA(ct)]K.2H20 (0.2 g) was
reduced (IL2/PE) for approximately l0 minutes príor to the addition of
excess pyridine. An orange colouration immediately formed and reduction
was continued for an hour. Subsequently the solution was freeze-dried on
a vacuum line and the product washed liberally with dry ether. Extraction
with diniÈrogen-saturated dry methanol gave an orançJe solution, which on
concentration and precipitation with ether gave a fine yellow-orange
product. This was washed with ether and dried over phosphorus pentoxide.
Yield 0.15 9, 65%.
Calc. C 4l-.02 H 4-82 N 9.57 Ru 17'3 eo
Found C 40.80,40.63 H 4.73,4-69 N 9.32,9.22 Ru 17'2 z
Dihg drogenethg lenedi aminetetraacetatobi s ( 4 -methg 7- p9 r i dine ) -
ruthenium(II) Dihgdtate tRuH TEDTA(I'le-pV) 2l .2H 20
This preparation followed the method described for the bjs(pyridine)
complex (vide supra). Using O.2 g of the chloro complex, the yield of the
orange complex was 0.16 S, 652.
Ca1c. C 43.06 H 5.26 N 9.13 Ru 16'5 eo
Found C 42.75,43.36 H 5.10,4-98 N 9.16 t9.23 Ru 15'9 z
Dimethg Jethg Tenedi aminetetraacetatobi s ( pg ridine ) tutheniun ( I I )
Ðihgdrate IRuMeTEDTA(eV) 11 -2H20
An ice-co1d dried ethereal solutíon containing excess diazomethane

193.
v/as added to a cold solution of [RUH2EDTA(pV)rJ (0.04 q¡ in freshly
distilled methanol. The mixture was allowed to stand at room temperature
for an hour before being evaporated to dryness. The orange product was
washed with ether and recrystaltized from chloroform by the addition of
a small amount of petroleum ether (80o). Yield 0.055 g, 66e".
Calc. C 43.06 H 5.26 N 9.13 Ru 16-5 z
Found C 43.44,42.78 H 5.25,5.11 N 8.95'8.85 Ru 15.6 eo
Reaction of p-Toluidine wìth IRuHTEDTA(?V) rl.2H20
A mixture of p-toluidine (0.0:S g¡ and the bis(pyridine) complex
(0.14 g) in freshly distilled methanol (10-20 "*3) r". refluxed under a
dinitrogen atmosphere for approximately 30 minutes. The orange solution
was filtered and concentrated to a small volume. The addition of a tliethyl
ether yielded an orange product. This was redissolved in methanol, precip-
itated with ether, collecÈed, washed with ether, and dried in vacuo.
Yield 0.08 g.
CaIc. Lor lnu (p-r) z 2l .2H2o
c 53.46
EDTA(py)
H 5.54 N 11.00 Ru 13.2 Z
Found C 49.97,47.75 H 5.33,5.I0 N 9.49,9.66 Ru 14.1 z
Reactions of Diazomethane and p-ToTuidíne with IRuHTEDTA(PhCN) 2l and
IRTIH TEDTA (Phen) l
The addition of a solution of diazomethane to a cold methanolic
solution of [RuH2EDTA(PhCN)2] gave an orange-brown oily solid (v(CN) 2230
-r.cm *) upon removal of the solvent. The solid decomposed to a violet solid
on standing. The phenanthroline complex likewise yielded an oily solid
under the same conditions. Refluxing the phenanthroline or -bis(benzonitrile)
complex with p-toluidine in methanolic solution, under dinítrogen' yielded
oily intractable solids.

L94.
Potas sium Ðihg drogenethg lenedi aminetetraacetatodithìocganato-
ruthenate (III) Dihgdrate IRUH TEDTA (CNS)
2lK.2H 20
A solution of the chloro complex (O.Zø g¡ and potassium thiocyanate
(0.11 g) in 0.2 mol a*-3 hydrochloric acid 1S-S cm3) Ì^ras r^rarmed on a
steam bath giving an intense red colouraÈion. The mixture \^ras concentrated
to dryness on a vacuum line, and the product washed with ice-cold acetone,
followed by extraction with a chloroform,/acetone (I:10) mixture. The
resultant red solution was concentrated and the product precipitated with
ether. The red solid was collected and the procedure repeated. The
product was washed with ether and dried under vacuum. Yield O.I4 g, 48>".
Calc. C 24.74 H 3 .11 N 9.62 S 11 .01 so
FoundC24.J-O,25.26 H2.9L,3.I0 N9.21 t9.2O SI0.4 eo
Reaction of Thiocganate with ÍRu(U)HEDTA(H20)l
A soluÈion of the chloro complex (O.Z g'¡ ÌÂras reduced by hydrogen
for 10 minutes prior to the addition of a methanolic solution of
potassium thiocyanate (0.1 S). A green solution formed immediately.
Reduction was continued for about an hour before the solution was trans-
ferred, under hydrogen, to a vacuum line and concentrated to a small-
volume. A green product was precipitated by the addition of dinitrogen-
saturated acetone, collected and washed with ethanol. The complex \^ras
dissolved in a minimum amount of water and precipitated with acetone, col-
lected, washed with ethanol, and dried over phosphorus pentoxide. Yield
0.14 g.
Calc. for IRuHEDTA(CNS)]K2.2H2O C23.48 H3.05 N7.47 S5.70 eo
CaIc. for IRuHTEDTA(CNS) 2]K2.2H2O c 23.18 H 2.92 N 9.01 S 10.32 so
Found C23.06, H3.O2, N7.41, S6.0,
22.53 2.70 7 .87 7 .6 z

A
195.
Dihgdrogenethg 7enedi aminet et raacetato- 7, 7 0 -phenanthroJ- ine-
ruthenium(II) Trihgdrate IRuH TEDTA (phen) I . 3H
20
The complex r^¡as prepared by several methods.
A filtered solution (5 cm3) of Èhe chloro complex (0.2 S) was
red.uced (H./PE) for 10 minutes. This was foll-owed by the additionz'
of solid 1rlO-phenanthroline (0.080 g) resulting in an immediate
intense reddish-brown coloration. As reduction continued, a solid
precipitated. After about 30-60 minutes the mixture was filtered in
air, yielding a violet-brown solid which was washed with ice-co1d
water and diethyl etherr/methanol mixture. Recrystallization \^/as
possible from aqueous methanol. Yield 0.15 g, 632.
A methanolic solution (30 cm3¡ of phenanthrol-ine (O.O4O g) and
IRuHTEDTA(pv)rJ (0.r g¡ acidified with 2 mol- dm-3 Hcl (1 cm3) was
refluxed under diniÈrogen. Refluxing for I0-I5 minutes yielded a
dark red-brown solution which, on standing several days, deposited
crystalline plates of the phenanthroline complex. yield 0.030 g.
The phenanthroline complex was also obtained using the .bis(benzonitrile)
complex.
Addition of a methanolic solution (S cm3) of the ligand (O.IO 9) to a
sorution of IRUHEDTA(cr¡1ç (0.2 9¡ and warming, resurted in a gradual
change in colour to red-brown over a period of 10 minutes. After 20
minutes a brown precipitate was obtained. and filtered off. The remaining
filtrate was allowed to stand overnight, yielding a violet-brown
microcrystalline product. The solid was treated as above. yiel-d
0.I S | 4Oz.
CaIc. C 42.24 H 4.5I N 8.96 Ru 16.2 z
Found C 42.33,41.86 H 4.27,4.38 N 8.91,8.83 Ru 16.3 Z
B
c

196.
Di hg dro genethg 7 ened i amine te t r aac et ato- 2, 2' -b i pg r i d ine ruthen i un ( r I )
Dihqdrate IRUHTEDTA(biptt) I .2H 20
The complex was prepared as described for the phenanthrol-ine
complex. From 0.15 g of the chloro complex, 0.090 g (50%) of the
bipyridine complex was obtained. Refluxing 2'2t-bípyridine with the
bis(pyridine) complex (0.1 S) yielded the complex upon concentration of
the solution. The reaction of 2,21-btpyridine with [Ru(I]I)HEDTA(C1)lK
precipitated the bipyridine complex after several d.ays.
CaIc. C 4L.L7 H 4.49 N 9.60 eo
Found C 4L.42 H 4.28 N 9.59 eo
Dihg drogenethg J ene d i amine tet raacet atoac etg I ac etonato ruthen i un ( I I I )
Dihgdrate IRUH TEDTA ( acac ) I . 2H
20
Excess acetylacetone was added to a warm solution (5 cm3) of the
chloro complex (0.1 S). The solution colour grad.ually changed to violet.
The mixture was warmed again and allowed to stand for 20 minutes before
being concentrated to dryness. The viol-et product was extracted with a
methanol/chloroform (10:1) mixture, filtered, and the filtraÈe concentrated
to dryness again. The extraction was repeated, the solution concentrated
and the product precipitated with ether, collected, washed with ether,
and dried in vacuo. Yield 0.050 g, 452.
CaIc. C 34.22 H 4.79 N 5.32 eo
Found C 34.22 ,33 .82 H 4.51 ,4.39 N 5..08 r 5.l-8 z
Reaction of Acetglacetone with lRu(Ir)HEDTA(H 20) l
Reduction (H2/PE) of a solution of the chloro complex (0.f g¡ to which
excess acetylacetone was added resulted in a red-violet coloration which
changed to copper-yel1ow. After an hour, reduction was stopped and the
solution freeze-dried under vacuum. Extraction with dinitrogen-saturated
methanol gave a copper-coLoured solution which was concentrated to yield
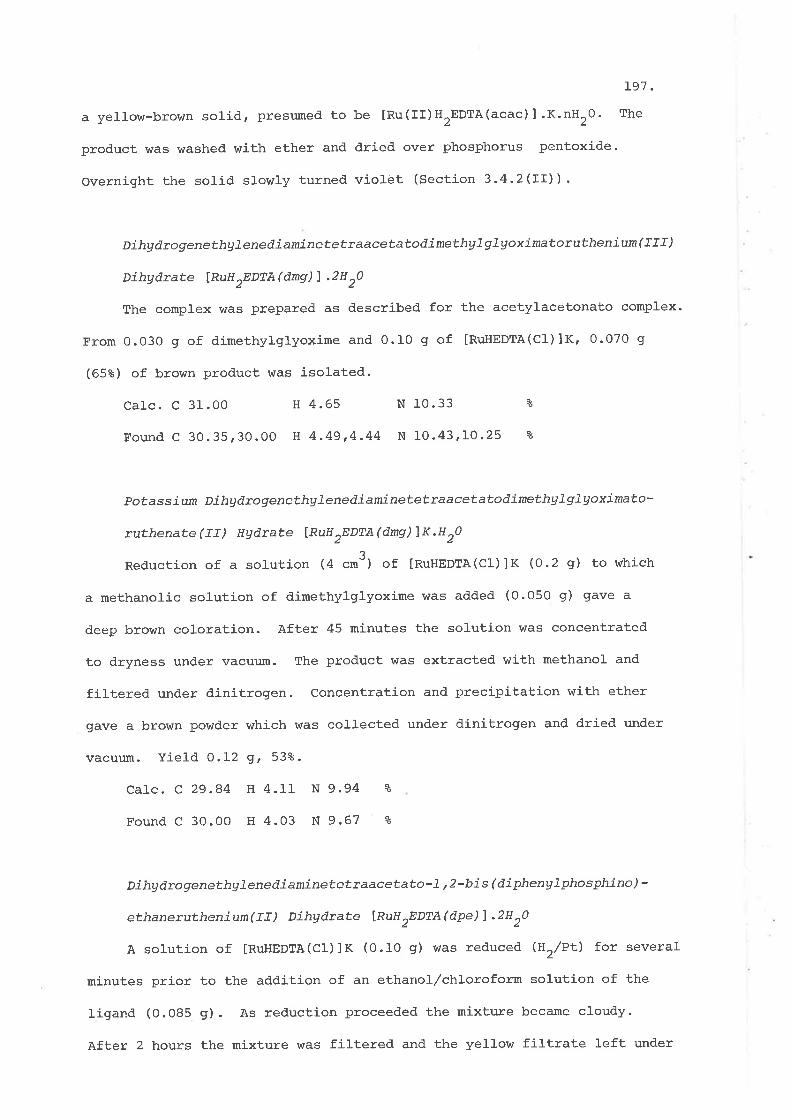
a yellov/-brown solid, presumed to be ¡¡s(II)H2EDTA(acac) J .t<.nHrO.
product was washed with ether and dried over phosphorus pentoxide.
overnight the solid slowry turned vioret (section 3'4'2(rr)) '
L9l .
The
DihgdrogenethglenediaminetetraacetatodimethgJglgoximatorutheniun(III)
Dihgdrate ÍRuH TEDTA (dnS) I .2H 20
The complex was prepared as described for the acetylacetonato complex.
From 0.030 g of dimethylglyoxime and 0.10 g of [RuHEDTA(C1)]K, 0.070 g
(658) of brown product was isolated.
CaIc. C 31.00 H 4.65 N 10.33 z
Found C 30. 35,30.00 H 4.49 ,4.44 N 10. 43 ,LO -25 eo
pot as s i um Dihg d rogenethq I ene d i aminetet ra acetato dimethg J gTg o x imato-
ruthenate ( II) Hgdrate ÍRuH TEDTA (dnÐ )X.n rO
Reduction of a solution 1a cm3) of [RuHEDTA(cr)]K (0.2 s) to which
a methanolic solution of dimethylglyoxime was added (0.050 g) gave a
deep brown coloration. After 45 minutes the solution \^las concentrated
to dryness under vacuum. The producÈ was extracted with methanol and
filtered under dinitrogen. Concentration and precipitation with ether
gave a brown powder which was collected under dinitrogen and dried under
vacuum. Yield O.L2 g, 53%.
CaIc.C29.A4 H4.11 N9.94 eo
Found c 30.00 H 4.03 N 9.67 eo
Dihg drogenethg Jened iaminetetraacetato- 7, 2 -b i s ( di pheng 7 phosphino ) -
ethaneruthenium(Ir) Dihgdrate IRuH TEDTA (dpe) I -2H 20
A solution of IRuHEDTA(CI)]K (0.10 g) was reduced (H2/Pt) for several
minutes prior to the addition of an ethanol,/chloroform solution of the
Iigand (0.085 g). As reduction proceeded the mixture became cloudy.
After 2 hours the mixture was fittered and the yelIow filtrate left under

198.
d.initrogen overnight. A yellow microcrystall-ine solid precipiÈated,
was collected, washed with ethanol and. ether, and dried over silica gel.
Yield 0 . 065 g, Oe" .
Calc. C 52.36 H 5.13 N 3.39 %
Found C 51.93 ,5O.79 H 5.00 ,4.98 N 3.54 ,3.4L %
Sodium EthgTenediaminetetraacetatodiethgTdithiocarbamatoruthenate (III)
n-Hgdrate IRUEDTA (dtc ¡ 7 Na r.nH r0The addition of sodium diethyldithiocarbamate (0.f g¡ to a solution
of the chloro comprex (0.1 s as the sodium salt) resulted in the rapid
development of a red coloration. After 30 minutes the solutíon v/as con-
centrated to dryness, the solid extracted with methanol and. filtered.
The methanolic filtrate was concentrated to dryness and the extraction
repeated several times. Finally the solution üras concentrated and the
product precipitated with ether. The red powder was collected, washed
with dry chl-oroform, ether, and dried over phosphorus pentoxide. yield
0.r1 g. Reduction (H2/Pt-) of the chloro complex (0.1 g¡ followed by
addition of the ligand (0.15 g), rapidry gave a red sol-ution which was
treated as above yielding the same product. yield O.IO g.
Addition of strong HCI solution to a cold methanolic solution of the
dithiocarbamato complex (0.f g¡ precipitated a white solid. Filtering and
concentrating to dryness yielded a red solid, which was extracted into a
minimum amount of methanol and precipitated with ether, colLected. and
dried over silica gel. Yield O.06 g.
CaIc. for [RUEDTA(dtc¡ INar.2Hr0
c 29.08 H 4.23 N 6.78 S 10.35 Z
Found C 24.87,25.24 H 3.63,3.42 N 5.29,5.30 S 9.2 %
Reaction of Sodium Azide with IRuHEDTA(CI)lX.ZU 02
Solid sodium azide (0.030 q) was added to a solution of the chloro

L99.
compLex (0.fO g) resulting in an instant orange coloration. The solution
was freeze-dried., the product extracted with methanol and filtered.
Concentration of the orange solution under vacuum caused decomposition
to a yellow-brown soLid. On exposure to air the solid darkened further.
Addition of azide to the chloro complex at higher pH (3-4) gave an instant
orange-red coloration followed by the vigorous evolutíon of gas. The
solution became brown, from which a brown solid was isolated. An azido
complex was not isolated.
Reaction of Benzoglhgdrazine with IRUHEDTA(CI) lx.2x rg
A methanolic solution of the ligand (0.10 9) was added to a sus-
pension of the chloro complex (0.I0 g) in aqueous methanol under dinitrogen
Gradually the colour deepened from yellow to orange. The solution was
stirred vigorously for 20 minutes, then filtered. Attempts to isolate
the complex from solution resulted in decomposition to a green-brown solid.
Formation of the complex was followed spectrophotometrically (Section 2.4).
Reactions of Potassium Cganide with Ruthenium(If), (IIf) EDTA aquo
CompTexes
Addition of excess potassium cyanide to a warm solution of the
chloro complex resulted in a green solution from which only a green oily
solid was isolated. The same reaction in the presence of excess acid gave
an initial deep brown solid whi'ch became green as the pH was increased.
Intractable solids were isolated.
Reduction of the chloro complex (0.15 g) for 30 minutes, followed by
the addition of cyanide (0.05 g¡ gave a golden-brown solution. After an
hour the solution was cool-ed and ethanol added, yielding a brown oil.
Concentration gave a brown unmanagealrle solid which became green on
standing

200.
9.3 Preparation of Ruthenìum Arwnine CompJexes
Hexaamminerutheniun ( f f I ) Chl-or i de
samples were obtained from Johnson and Matthey and used as received.
The complex was also prepared by the method of Lever and Powell'327 At
274 nm, e = 4.77-5.10 x 10² mor-ld*3"*-t (r,it.r73 e = 4.'73 x 102 *ot-I d*3
cm-I in 0.4 mol dm-3 n.clo4
ChToropentaammineruthenium ( r r r ) ChLo tide
The complex hras prepared by the literature32S method from the
hexaammine complex. It \Átas recrystallized from I mol dm-3 hydrochloric
acid. Molar absorptivity, e = 1.85 x 10³ mol-ld*3.*-l (f,it.328 e = 1.93 x
2-1"-1IO- mo1 -dm"cm *).
Aquo pentaammineruthen i um ( I I I ) N i tr ate and Methane s uI phonate
The nitrate derivative was prepared by the method of Gleu and
Cuntze.329 Chloropentaamminerutheniun(III) chloride (0.2 g) was
dissolved in a warm ammoniacal solution which was chilled momentarily in
an ice bath. This was followed by the dropwise addition of concentrated
nitric acid untit the solution was acidic. cooling resufted in a precipitate
of a white crystalline solid which was collected and washed with methanol.
Yield 0.I g.
The methanesulphonate derivative \^ras prepared by the method of T- Eliades
et a1.279 The procedure followed the above except that the solution was
made acidic with methanesulphonic acid. A white solid was isolated.-2
Yierd o'23 I from o '2 g of [nu(unr)5c1]cr2' rn o'1 mol dm " methane-
sulphonic acid the molar absorptivity at 268 nm was found to be 7 'L-7 '4 x
ro2 mol-ldr3"*-r (r,it.27g,2Bo e = 7 -5-7 -7 x :ro2 *o1-1d*3"*-t)'
N itratopentaammine ruthenium ( r fi ) N ittate
The complex was prepared by the method of Gteu and Cuntze.329

20I.
Aquopentaarunineruthenium(IIf) nitrate was stored in a desiccator over
phosphorus pentoxide for 72 hours. In this time conversion to the
nitrato complex resulted. AbsorpÈions due to coordinated nitrate are
shown in Table 7.3a.
N i t ro s g 7 pe ntaatruni-ne rutheni un ( I f ) ChTo r i de H g d rate
This complex was obtained from T.R. Norman who prepared it following
the method of Gleu and Büdecker.l5l
t r ans -H g d ro xo n i t ro s g I te t r aamni ne r uthen i um ( I r ) B r omi d.e3 2 6
Concentrated ammonia (I S) was added to a solution of potassium
pentachloronitrosylruthenate (0.5 S). The solution was heated on a
steam bath until a gold-brown coloration developed. Addition of concen-
trated potassium bromide solution and cooling yielded ye1low-brown crystaÌs.
yield O.2o g. At 334 nm, e = 2.05 x Io2 mol-1d*3"*-1 (Lit.L62 e = 2.11 xr -l ? -'l1o' mol -dm"cm *).
t r an s - C h l- o ron i t r o s g 7 t et r a ammine r uthen i un ( I I ) c h L o r i de3 2 6
The hydroxo complex (O -2 g¡ was dissolved in hot water to which an
equal volume of concentrated hydrochloric acid was added. A flesh-coloured
precipitate resulted. Yield 0.16 g. At 330 nm, e = 2.51 x tO2 *o1-t¿*3
.*-1 (Lit. L62 e = 2.64 x Lo2 *or-1d*3.*-1) .
t r ans -N i t r at on i t ro s g J t e t r aammi ne ruthen i um ( I I ) N i t r at e
Wernerrs method326 lu." followed. Chtorotetraammínenitrosylruthenium(II)
chloride (0.1 g) was dissolved in a small amount of water, to which an
excess of silver nitrate solution was added, resulting in an instant
white precipitate. lVarming on a steam bath yielded a yellow solution and
more silver chloride precipitated. The solution was fiftered and warmed
again until no further precipitaÈion occurred. Concentrating and cooling

202.
gave yetLo\i/ crystals of Èhe complex. Yield 0.045 g.
c i s - o x a f atot e t r aammi ne ruthe n i um ( r r r ) D i t h i ona t e
The method of PeIl and Armorl63 "."
fo1lowed. Chloropentaammine-
ruthenium(Ill) chloride (0.25 g) in water was saturated with argon.
Ammonia (t cm3) was added and the solution gently warmed. A sol-ution of
NarSrOU.2H2O (0.7 g¡ was added and argon bubbled through the solution for
90 minutes. The compfex, [Ru(NH3)5oH]S206, precipitaÈed, was colfected
and immediately added to a saturated solution of oxalic acid. On heating
on a steam bath for 10 minutes the yellow oxalato complex precipitated.
The complex was collected, washed with methanol, and used immediately.
c i s - Ðib ro na te t r a ammi ne r ut he n i um ( r r r ) B romi deI 6 3
The oxafato complex \^ras dissolved in concentrated hydrobromic
acid and heated on a steam bath for l-0 minutes. Upon addition of
ethanol to the cooled solution an orange precipitate of cjs-[Ru(NHr)nBrrJBr
formed. The complex was used immediately to prepare the nitrosyl complex.
At 370 nm, e = l.L2 x 103 mol-ld*3.*-l (Lit.281 e = r.37 x 103 mol-ld*3.*-r
c i s - B r onpn i t ro s g 7t e t r a ammi ne r uthen i un ( I f ) B r omi de
Following the procedure of PelI and Armorr163 ,r"ittg the cis-dibromo
complex in dilute hydrobromic acid gave an almost quantitative precipitate
of cjs-[nultl¡¡a¡nNO(Br) JBr, after passing NO through solution for approxi-
mately 30 minutes. The orange-brown solid was collected and washed with
methanol. At 348 nm, e = 1.48 x 10² mo1-1d*3"*-l (Lit.I63 e = 1.65 x 10²
_-r_ 3 -I.mol dln cm ).
Reaction of cis-l.Au¡Wt¡ r¡ nNO(Br) )Br, with HgdroxgTamine
To a slurry of. Èhe nitrosyl complex (0.f g¡ and hydroxylamine
hydrochloride (1.0 g¡ in water (5 ml) were added, against a stream of

A
203.
d.initrogen, sodium hydroxide (1 S) pelIets. The mixture was cooled
in ice and slow effervescence occurred as the pellets and complex
dissotved. The colour changed from orange to pale yellow. Potassium
bromide solution or ethanol were added after the reaction ceased to promote
precipitation. A pale yellow solid was collected under dinitrogen oxide,
washed with NrO-saturated ethanolr and dried over phosphorus pentoxide.
The solid graduatly darkened on exposure to air. The electronic spectrum
of the product was not recorded, as a result of very rapid decomposition
in solution. The infrared spectrum is discussed in Section 7.4.
Reaction of Nitrogen Ðioxide with Hexaamminerutheniun(IIT) ChToride
ALkaiine Conditions
An argon-saturated solution of lnu(NHr)UlCft in o-1 mol dm-3 NaOH
was frozen and excess nitrogen dioxide condensed onto its surface. The
mixture \^ras allori/ed to thaw and was stirred vigorously for an hour. A pale
yellow-orange colour developed. During this time the pH decreased and the
solution became acidic. Concentration and cooling yielded a pale orange
precipitate. Alternatively the hexaammine complex (O.f g¡ in 0.1 mol dm-3
NaOH 1S cm3) was treated at room temperature with excess NO2 gas. After
approximately 30 minutes concentration to dryness yielded a pale orange
solid. Recrystallization from water yielded orange, microcrystalline
lRu(NHr)5NOl (NO3)3. yield o.o75 gi v(No) t92o crn-I. The infrared spectrum
of this product was identical with the spectrum of the nitrate salt prepared
from tnulU¡¡r¡5NOlC13 by precipitation of the chloride ion by silver niÈrate
in dilute nitric acid.
B. Acidic Conditions
The procedure was as for A excepting that the hexaammine complex was
dissolved in 0.1 mof am-3 HCt soluÈion. No colour changes occurred during
the reaction" Freeze-drying yielded a white solid which was washed with
methanol and dríed over silica geI. Ner¡I infrared spectral bands: 1035(m),

204.
955 (ms) , '79O (m) , 690 (n) , 640 (m) cm-1
Reaction of Nitrite Ion with Hexaamminerutheniun(III) ChLaride
Sodium nitrite (O.22 g) was added, against a current of argon, to
an argon-saturated solution of the hexaammine complex (0.f g¡ in 0.1
mol dm-3 l¡aoH (s.o cm3). The mixture was stirred for an hour, during
which time the initial yellow coloration changed to yellow-orange. AfÈer
this time the solution was acidified to pH 3 and concentrated to dryness.
The pale orange product was washed with methanol, and recrystallized fromeôtÀlPux
a minimum amount of water acidified with HBr. The nitrosylþas isdlated
as [Ru(NH.).No]Br-. Yield O.05 g. The electronic spectrum producedJ'5 - J
bands at 3OO nm (e : 70 mol 1¿*3.*-1) and 460 m (e = 20 mol 1a*3"*-I)
in agreement with the literature.2BB
In order to collect any volatile by-products the reaction was carried
out in an inverted Y-tube fítted with a tap leading to a vacuum line.
In one arm of the tube was placed the reaction mixture, and in the other
about I .*3 or. 2-3 mol dm-3 hydrochloric acid. Both solutions were
f.rozen, the systern evacuated, and then sealed. The reaction mixture was
thawed, but the other hras kept frozen. The reaction mixture was stirred
and any volatile products distilled into the arm containing acid. After
an hour the reaction mixture was removed and the acid solution concentrated
Èo dryness. The resulting white product was analyzeð. for hydroxylamine.
The reaction of niÈrite (O.22 g) with the hexaammine complex (0.1 9¡
-?in O.O1 mol dm " HCl solution was carried out as described for afkaline
conditions. The hexaammine complex and traces of the nitrosyl complex
were isolaÈed.
Preparation of Iron and Ruthenium Hgdrido and NitrosgJ CompJexes
Hgdridochl-orobis{l-,2-bis(diphengJphosphino)ethane}iron(rr) lFeHCf(dpe) Z1
The method developed by Aresta et aL.330 t.= followed" A mixture of
9.4

205.
I,2-bis(diphenylphosphino)ethane (0.4S g¡ and iron(lI) chloride dihydrate
(0.I7 g) in ethanot (ZO cm3) were heated to 6OoC under dínitrogen. To
this stirred mixture a sol-ution of sodium borohydride (0.0S g¡ in ethanol
(ZO cm3), at 5OoC, \^ras added dropwise against a current of dinitrogen.
Upon addition a red coloraÈion was observed. The mixture was allowed to
stir for about an hour until a red precipitate formed. The producÈ was
filtered under dinitrogen and washed with water, ethanol and diethyl ether.
The complex was dried in vacuo. Recrystallization was possible from
benzene by the addition of ethanol, or from dichloromethane. Yield O.6 g,
65e".
AresÈa et af.330 t"ported a metal-hydride stretch, v(l'e-H), at
-11920 qn-l (nujol). However, Hata et al-.331 pt.pared the same complex by
another route and reported the absence of any v(Fe-H) absorption. l{e
found that the complex as prepared above produced a weak to medium peak
-laL I92O cm ' which was sol-vent-dependent. Recrystalfization from benzene
caused this peak to disappear. but upon recrystallizing from THF it
reappeared. Suppression of the metal-hydride stretching frequency by
solvated benzene has been reported by Chatt and Hayter.332
Cafc. C 70.2 H 5.56 CI 3.99 %
Found C 70.3I,72.05 H 5 .75,5 .80 Ct 3 .7 '4.I eo
NitrosgJbis{7,2-bis(diphenglphosphino)ethane}iron(0) Tetraphenglborate
Ite(dpe) 2NolBPh4
This compl-ex was synthesized independently of the report given by
Johnson and Segal,314 b,tt found to be identical with Èheir product. Solid
IV-methyl-IV-nitroso-p-toluenesulphonamide (0.065 g) was added under dinitrogen
to a suspension of sodium Èetraphenylborate (O.OS g¡ and [FeHC1(dne)r)
(0.2 q¡ in refluxing ethanol. The red colour of the complex faded to
yield a beige-coloured precipitate. The nitrosyl complex \^Ias recrystallized
from methanol. Yíeld 0.15 gt 76%.

A
B
206.
Calc. C 75.95 H 5.70 N I.17 eo
Found C 76.40 H 5.85 N 0.96 z
Reactions of Ðinitrogen and Ðinitrogen oxide with lFeHCL(dpe) zl
Dinitrogen bubbled through a so]ution of the hydrido complex and
sodium tetraphenylborate in a THF/n-butanol mixture for 10-20 minutes
produced a colour change from red to ye1low. A yellow precipitate of
lFeH(Nr) (dpe)rJBPhn was isolated and washed with ethanol and dried
in vacuo. v(N2) zt:o cm-I(s) (Lit.'oz v(Nz) zt¡o cm-I) -
Dinitrogen oxide, dried and scrubbed free of oxygen, was passed
through a solution (tHf/n-¡utanol) containing the hydrido complex
(0.1 g¡ and sodium tetraphenylborate. Over a period of an hour a tan
precipitate formed, and on filtering, a yellow filtrate from which a
yel1ow product was isolated. This was washed with ethanol and stored
under dinitrogen" Yiel-d O.O2 g. The product was spectrally identical
with [FeH (Nr) (dpe) ,J
BPh4 .
Passage of the gas through the reaction mixture coofed in ice
produced a yellow-brown precipitate after l--2 hours. This was
collected under dinitrogen, washed with ethanol, and dried over
phosphorus pentoxide. Infrared specÈrum: v(N2) z1:o cm-I(m). A
THF,/n-BuOH slurry 1: cm3) of the hydrido complex (O.O5O g) and sodium
tetraphenylborate \^rere pressurized under dinitrogen oxide (see Section
9.4, Pressurization). A pressure of 7 x 10⁵ Pa \^/as maintained for
about 20 minutes, while the pressure vessel was cooled in ice. After
this time the pressure was released and the mixture filtered and
treated as above. A tan solid was isolated (v(Nr) weak to medium).
Ðíhg dr i dotet raki s ( t ri phenV 7 pho s phine ) r uthen i um lauA, ( PPh | 4l
The method of Levison and Robinson333 tu.= followed. A hoÈ ethanolic
solution lZO cm3) of ruthenium trichloride (0.5S g¡ was added rapidly to

207.
a vigorously stirred solution of triphenylphosphine (3.14 g) in boiling?
ethanol (f2O cm-). Subsequent rapid, portion-wise addition of sodium
borohydride (0.38 g) in hot ethanol (ZO cm3) gave a yellow precipitate.
This was filtered under dinitrogen, washed with ethanol, water and
ethanol, and dried in vacuo to give a yellow microcrystalline product.a)2
v(Ru-H) 2oBO cm-l (Li;:"rogo cm-l) Yield 2.O g, 90%.
If the borohydride was added sJ-owly the intermediate hydride,
IRuHCI(PPh3)rJ, was seen as a deep purple co]-oration which fad.ed to
yellow as more reductant was added. It was important in the reaction
above thaÈ the ethanol shoul-d be boiling, otherwise a pale off-white solid
was isolated and not the yellow hydride. The former produced medium
absorptions at tg95 cn-1 and 1965 "*-I
in its infrared, spectrum. Levison
and Robinson isolated a solid of composition [RuH, (PPh3) rJ which produced
peaks at I89O cm-l and 1960 cm-I. This tris(triphenylphosphine) complex
reacts with triphenyÌphosphine to yield the dihydride. The pale sol-id
also produced the dihydride on refluxing with triphenylphosphine,
suggesting that it was identical with Robinson's tris(triphenylphosphine)
complex'. Eliades et aL.334 h.n" reported the preparation of [RuHr(PPh3)3]
and have described it as a colourless solid with a v (Ru-H) stretching
frequency of I95O "*-t.calc.for [RuHr(PPh3)4] C 75.05 H 5.42 Ru 8.8 å
Found C 74.67 H 5.38 Ru 8.4 %
TriphengTphosphine Oxide and l-,2-Bis (dipheng lphosphino) ethane Ðioxide
A modification of the literature method335 r"" used. To a solution
of p-toluenesulphonyl chloride (1.90 g) in petroleum ether (30 cm3) was
added a petroleum ether (tOO cn3) solution of triphenylphosphine. The
mixture was stirred vigorously and precipitated a white sofid after I0
minutes. Trituration of the product with water, followed by extraction
with ether, yielded a white solid from the ethereal layer. The oxide was

208.
characterized by v(p=O) at tl-85 c*-1 and mp. 153-155"C (Lit.t35 mP.152oc).
The dioxide of L,2-bis (diphenylphosphino)ethane was prepared by the
same method. mp. 27L-274oC.
CaIc. C 72.55 H 5.58 P I4.4 z
Found C 7L.79 H 5.81 P 13.9 z
NìtrosgT Ruthenium TrichLotide
This was conveniently prepared as described by Fletcher et 4f.336
and Fairy and lrving.337 A mixture of nitric oxide and nitrogen dioxide
gas were passed through an aqueous solution of commercial ruthenium
trichloride (2 S). A deep red-brown coloration developed which changed.
to deep red after 20 minuÈes. Excess concentrated hydrochloric acid was
added and the solution boiled to give a red syrup which was sÈored in a
desiccator over anhydrous calcium chloride for several days until a red
powder resulted. In solution it is convenient to consider the species
as [nuCt, (H20) 2NO]
.
A
T r i chf o ron i t ro s g 7b i s ( t ri pheng 7 pho s phi ne ) ruthen i um ÍRuC I "
( PPh ") .NOf
This complex was prepared by two methods '23 '27
To an ethanolic solution (tO cm3) of ruthenium nitrosyt Èrichloride
(O.2L g) was added an ethanolic solution (tO cn3) of triphenylphosphine
(0.4 g¡. The mixture was broughÈ to boil and produced yellow micro-
crystals after 10 minutes. The mixture Ì^/as cooled and filtered and
the product washed with ethanol and diethyl ether. Yield O.4 g
-l(v(uo) 1877 cm ').
Robinson and Levison's333 method was followed. A hot ethanolica
solution (10 cm') of ruthenium Èrichloride (0.13 g) was added rapidly
to a refluxing ethanolic 1rO "*') solution of triphenylphosphine,
followed by an ethanolic 1tO cm3) solution of MNTS (0.21 g). After
boiling 2 minutes and cooling, a light green solid precipitated.
B

A
209.
This was filtered and \n/ashed with warm ethanof . Yield O.2 9,552.
Tv¡o niÈrosy1 absorptions appeared at 1875 .*-1 (rr") and 1745 .*-1 (*)
Several recrystallizations from dichloromethane/methanol mixtures
gave an orange microcrystalÌine product (v (NO) tgZS cm-I) .
Calc. c 56.74 H 3.98 N 1.84 ct 13.9 z
Found C 57.05 H 4.14 N 2.10 CI 13.4 Z
Reactions of T richLo roni t ro sg 7bi s ( t ri pheng Tphos phi ne ) rutheni um with
Hgdrazine Hgdrate
A suspension of the nitrosyl complex (0.40 g¡ in hydrazine hydrate
(S cm3) was heated gradually under vacuum up to 8o-85oc. Gradual
distillation of the solvent resuLted in a colour change from yellow
to brown to deep red. After removal of the solvent the reddish
solid was dried in vacuo for 40 minutes. V'tashing with diethyl ether
and fil-tering yielded triphenylphosphine (0.15 g) from the filtrate.
Extraction of the red solid with chloroform gave a red solution
Ieaving a yellow residue (0.05 g) of [Ru(NHr)5N2]C12. Concentration
of the chloroform sofution and precipitation with ether gave a red
sofid. Yield 0.16 g. Tte complex was purified by dissolving in
chloroform and gradually precipitating with hexane.
The same red, product was obtained on heating the nitrosyl complex
in a hydrazine hydrater/ethanol mixture (z cm3/¡ cn3) under vacuum.
Calc. for [RuCl(NH3)4PPh3]cI
c 43.03 H 5.41 N 1r.15 p 6.L7 cr 14.11 z
Found C 4O.I3,4I.58 H 5.10 t5.22 N 11.14,II.72 P 5.5 CI L4.2 z
Chloroform solutions of lnuCt(nHr)neenrlCI became green on
exposure to air. A green solid was isolated. on evaporation and washed
with ether.
Found C 36.92 H 4.81 N 10.23 CI 17.8 P 4.8 z
A suspension of the nitrosyl complex (0.3 g¡ in ethanot (¿O cn3)B

containin g hydraziHe hydrate (3 cm3) was heated. under . ¿irrittoä
atmosphere. Removal of the solvent by distillation over a period of
2 hours resulted in a yellow-brown product. No red coloration developed.
Free triphenylphosphine (O.2 g¡ was isolaÈed by extraction with
ether. The yellow solid remaining was [Ru(NHr)5N2]C12 (0.09 g)
v(N2) 2110 cm-I i e = 1.6 x 10⁴ mol-Id*3"*-t (Lit.5'62 v(Nr) 2ro5 cm-I;
e = r.8 x 104 *or-1d*3cln-l).
9.5 Reagents, Sofvents and Gases
Ligands and Reagents
Sodium dihydrogenethylenediaminetetraacetate dihydrate (AR) and
sodium azirde \^rere recrystallized. from water before use. Triphenyl-
phosphine, L,2-bis(diphenylphosphino) ethane and p-toluidine were also
recrystallized (methanol, chloroform). High quality BDH reagents,
I,lO-phenanthroline, 2,21 -bípyridine, sodium diethyldithiocarbamate and
p-dimethylaminebenzaldehyde were used as received. The ðlinitrile ligands
were used as received. Acetonitrile, benzonitrile, pyridine and 4-methyl-
pyridine were of sufficient purity to use directly. Maleonitrile was
distilled before use. Sodium borohydride and lV-methyl-IV-nÍtroso-p-toluene
sulphonamide were used as received. The latter I^Ias stored at 0"C.
High grade hydrazine hydrate and hydroxylamine hydrochloride were used.
Ptepatation of Diazomethane
Following Voge1,338 an ice-co1d ethereal solution of lV-nitroÉo-N-methylurea
(O.2 Ð was added to an ice-co1d solution of potassium hydroxide (50%;
3 c*3). The yellow ethereal layer was decanted and dried at ice temperature
over potassium hydroxide pellets for several hours prior to use.
Stock SoTutions
Solutions of sodium hydroxide and silver nitrate were prepared by
2LL.
dilution of the respective solutions contained in BDH ampoules. Other
solutions were prepared using AR grade chemicals, recrystallized before
use where necessary.
SoTvents
Common organic solvents were dried and distilled under dinitrogen
before use, as described by vogeI.338
Gases
AIl gases were obÈained from Commercial- fndustrial Gases (CfC¡
Australia Limited. High purity dinitrogen, industrial hydrogen' argon,
nitric oxide and carbon monoxíde hrere used as received. Dinitrogen oxide
was passed through a chromous chloride bubbler to remove oxygen, and then
through successive phosphorus pentoxide towers before being used.
Nitrogen Dioxide
This was conveniently prepar.6339 by heating solid dry lead nitrate
(an¡ under vacuum, passing the gas over phosphorus pentoxide and
condensing it in a cold trap. Occasionally the çfas was prepared by mixing
nitric oxide with excess air followed by drying and condensation.
The labelled gas {15olor) \^ras prepared from r15No, (3o.8a tu*) oo
conversion of the latter to labelled lead nitrate. A solution of r15uO,
(0.5 g¡ was passed through a cationic exchange col-umn in the acid form
and the effluent (pH ru 0.5) neutralized to pH 4 with basic lead carbonate.
Excess lead carbonate was filtered off and the filtrate concentrated on
a steam bath. on coolingr white crystals of Pb{Isnor), settled out.
Yield 0.55 g.
LabelLed Potassium iVitrite, xfswo,
This was prepared by the method of Bothner-By and Friedman.340 Lead

2L2.
powder (1.35 g) arrd K15No3 (0.5 g) were finely powdered, intimately
mixed and placed. in a 6" pyrex test-tube. This was heaÈed slow1y up
to 35Oo-4OOoC in a muffle furnace, resulting in fusion of the mixture to
a brown so1íd. On cooling the solid was crushed and rinsed with water
(tu10 cm3) into a centrifuge tube. After centrifugation the supernatant
was collected, and evaporated to half volume on a steam bath. Vühite
crystals were obtained. Yield O.42 g.
9.6 ExperimentaT Teclniques
Analgses
Elemental analyses (CrHrNrSrPrFrCI) were determined by the Australian
Microanalytical Service, Melbourne. Carbon, hydrogen and nitrogen were
also determined using a Perkin Elmer Model 240 CHN Analyzer situated at
the Leve]s Institute of Technology, Adelaide. Air-sensitive compounds
sent to Melbourne for analysis were sealed under dinitrogen in a glass
ampoule or in a container secured within a polythene bag.
Chloride analyses were also determined potentiometrically or
gravimetrically as described by Vogel.80a Ruthenium was determined
gravimetrically from the residue of a sample combusted in air to 900"C
to produce ruthenium dioxide. Al-ternatively, samples were heated in a
platinum boat at 6O0oC in a stream of hydrogen gas and then cooled under
hydrogen. The residue was weighed as ruthenium metal.
HandTing of Air-Sensitive Compounds
These compounds were manipulated under an inert atmosphere using
Schlenk glassware. Such glassware was fitted with one or more taps
allowing evacuation of the apparatus followed by the introduction of
the inert gas. The use of such equipment is described fully by Herzog
et af.341 .n¿ shriver.342

2t3.
Production of Ruthenium(II) EDTA Aquo SoLutions
Solutions containing IRuHEDTA(CI) ]K.2HrO were converted to
[nu(rr)HnoTA(Hzo)] by a number of reducing agents. These included
(a) hydrogen on platinum black, (b) metallic magnesium and (c) zínc
amalgam.
Method (a) t H2/PL reductions were carried out in a Schlenk tube
fitted with a side-arm. The solution was degassed with argon prior to
the introduction of hydrogen which was bubbled over a platinum black wire
mesh. Ligands were introduced, via the side-arm. The platinum black
surface was periodically renewed by electrolysis in a solution of
chloroplatinic acid as described by voge1.80b
Method (b): Metallic magnesium was added to a stirred sofution of
the chloro complex in O.OO1 mol ¿m-3 HCt sol-ution under an argon
atmosphere.
Method (c): Zinc amalgam .nras prepared by the method of VogeI.BOc
The chloro complex in O.OOI mo1 ¿rn-3 HCt sofution was stirred with the
amalgam under an argon atmosphere.
AnaTgsis of Rutheniun(If) Content
The ruthenium(II) content in the ruthenium(Il) EDTA aquo species
and the dimeric dinitrogen complex was estimated from the formation of
tFe(rr) (phen)r121 tor*ed by the reduction of ferric ammonium surphate
by ruthenium(II) in the presence of phenanthroline. The iron complex
is intensely coJ-oured (r,it.343 tr 510 nm, e = 1.11 x 10⁴ mo1-1d*3"*-1)80
and its concentration in solution was determined spectrophotometrically.æd
Aliquot samples (t cm3) of the reduced solution were added to a known
volume of ferric ammonium sulphate solution 1S cm3) under argon and then
made up to the mark using an acetic acid-acetate buffer (pH 4.4) and
0.25e" aqueous phenanthroline solution. The concentration of lre(phen)rJ2+
and therefore ruthenium(II) \,üas read from a calibration plot obtained by

2I4.
using known vofumes of a standard ferrous ammonium sulphate solution.
The analysis of the dimeric dinitrogen complex involved adding a
weighed sample to a known vofume of excess ferric ammonium sulphate
solution and proceeding as above.
Magnesium Analgsis
Magnesium content of the dimer \^¡as analyzed according to VogeIS0e
by titration with NaTHTEDTA in the presence of a buffer (pH I0) and
using Eriochrome Black T indicator. At the end-point the colour change
was from red to blue. The titrations were conducted slow1y since complex
formation of magnesium with EDTA does not occur instantaneously. The
dimeric complex (6-50 mg) was titrated directly with Na2H2EDTA (0.001-
-?0.053 mol dm "). There appeared to be no interference by ruthenium in
this method as determined from a blank titration of free magnesium
with EDTA in Èhe presence of the ruthenium chloro EDTA complex.
Solutions of the dimer were passed through an anionic exchange
column, but the amount of magnesium obtained this way was considerably
l-ower than the theoretical value (Table 2.3c). Passage through a cationic
exchange cohmn, and titration of the released acid with O.Ol mol dm-3
NaOH sofution yielded only rv7O% of the theoretical amount of magnesium.
Analgsis of HgdroxgTamine
vogelrs method was foll-owed.80f The hydroxylamine solution was
treated with a known excess volume of 0.017 mol dm-3 potassium bromater
followed by t5 mol dm-3 hydrochloric acid. After 15 minutes the excess
of bromate was determined by the addition of potassium iodide and
titration with O.fO mol dm-3 sodium thiosulphate. A sensitive spot
test for hydroxylamine was the addition of 8-hydroxyquinoline, yielding
a green coloration. Another test applied was the development of a
red-violet coloration in a sodium acetate solution of benzoyl ch1oríde

2L5.
and ferric chtoride.284 '286
Col-orimetric Tests fot Hgdtazine and Ammonia
Hydrazine was determined colorimetricatly3lT using ethanolic
solutions of p-dimethytaminobenzaldehyde (DABA) in O-5 mol d,n-3 gCl
solution. The absorbance of the yellow soluÈions hlas determined at
458 nm and the concentration of hydrazine estimated from a standard
-R -q -?plot. Stock solutions of N,H*.H2SO4 (1.0 x tõo-t.4 x 10-' mol dm ")
were used as standards.
The presence of ammonia was determined by the indophenol method'287
chtorine water or hypochlorite solution was added to the solution
containing the ammonium salt, followed by the addition of a phenol solution'
and heating for several minutes. On cooling the solution was made alkaline
-?with ru3 mol dm-' NaOH yietding a pale blue coloration.
Exchange Resjns
Analytical Grade Bio-Rad and BDH cationj-c and Anionic exchange resins
were used. The cationic resin was obtained in the hydrogen form (AG50V{
Xg IOO-2OO mesh) and the anionic in the chloride form (AG1-X4 2OO-400 mesh) '
Kinetic Measurements
A weighed sample of the dimeric dinitrogen complex was added to a
Schlenk flask which was subsequently evacuaÈed and filled with argon and
ÈhermostatÈed in a water bath (!o.2oc). A known volume of thermostatted
argon-saturated water was added against a stream of argon. A sample of
the resulting solution was Èransferred by means of a syringe to a cuvette
flushed with argon and thermostatted within the spectrophotometer (see
Electronic spectra). The rate of decomposition was monitored spectro-
photometrically under argon or dinitrogen over a range of temperatures'
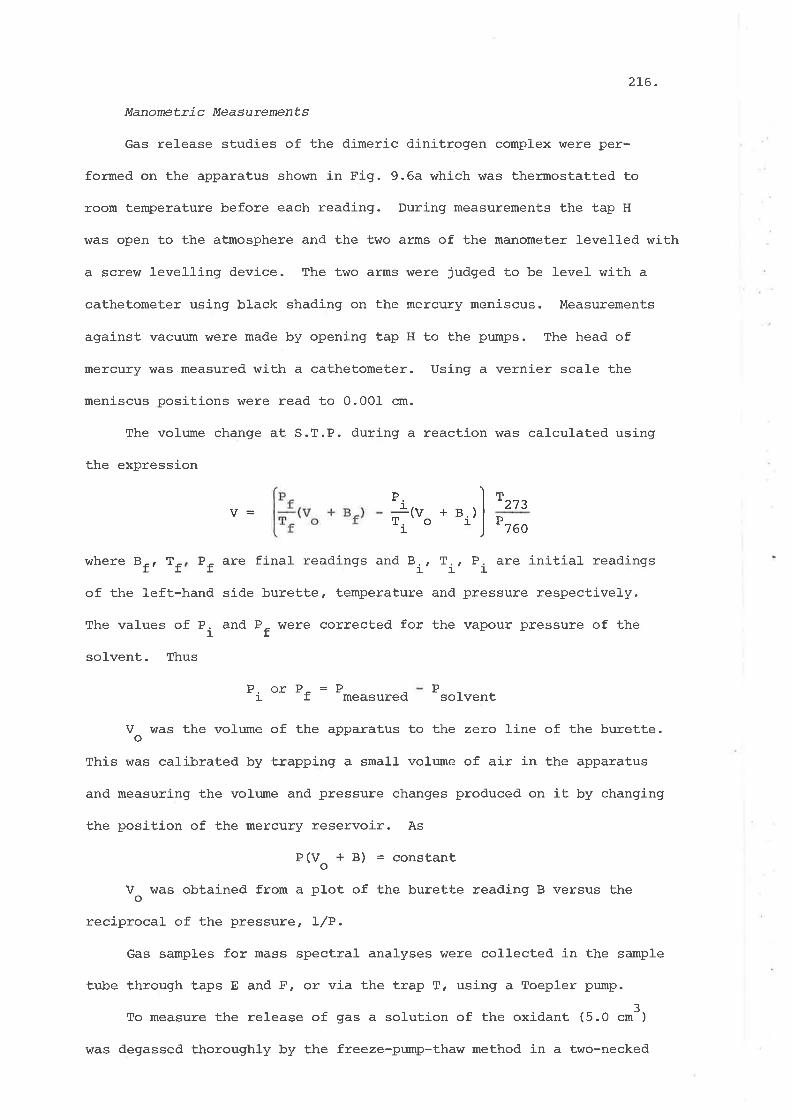
2L6.
Itlanometric Measurements
Gas release studies of the dimeric dinitrogen complex \^/ere per-
formed on the apparatus shown in Fig. 9.6a which was Èhermostatted to
room temperature before each reading. During measurements the tap H
\^7as open to the atmosphere and the two arms of the manometer levell-ed with
a screw levelling device. The two arms were judged to be l-evel with a
cathetometer using black shading on the mercury meniscus. Measurements
against vacuum were made by opening Èap H to the pumps. The head of
mercury was measured with a cathetometer. Using a vernier scale the
meniscus positions were read to 0.001 cm.
The volume change at S.T.P. during a reaction was calculated using
the expression
P.ItvT. o
l_
T273V-
are
+ B,)a P
760
where B 1Lf f Pt final readings and 8., Ti, P. are initial readings
of the left-hand side burette, temperaÈure and pressure respectively.
The values of P. and P- \^rere corrected for the vapour pressure of thertsolvent. Thus
P.t_
Pmeasured solventor P
V was the vol-ume of the apparatus to the zero line of the burette.o
This was calibrated by trapping a small volume of air in the apparatus
and measuring Èhe volume and pressure changes produced on it by changing
the position of Èhe mercury reservoir. As
P(Vo+B) =constant
V was obtained from a plot of the burette reading B versus theo
reciprocal of the pressure , L/P.
Gas samples for mass spectral analyses were collected in the sample
Èube through taps E and F, or via the trap T, using a Toepler punp.
To measure the release of gas a solution of the oxidant 1S.O cm3)
was degassed Èhoroughly by the freeze-pump-thaw method in a two-necked
Pf:

T
o o
o
lr
l¡J
Fig.g.6a VACUUM LINE

2L7 .
flask of known volume. A weighed sample of the dinitrogen complex was
added from a weighing tube onto the frozen surface of the oxidant in air
The fl-ask was evacuated and the solution rapidly thawed with stirring.
The pressure and volume of the system were recorded.
Pres suri zation Expe riments
The pressure vessel- shown in Fig. 9.6b was used to pressurize
solutions under dinitrogen oxide. The reaction vessel consisted of a
glass test tube (824 neck) housed within the pressure vessel. In some
cases the reaction vessel- was fitted with a side compartment containing
a slurry of a precipitating agent such as sodium tetraphenylborate which
was added to the solution by tilting the apparatus after the vessef was
pressurized.
Prior to pressurization the apparatus was repeatedly evacuated and
filled with argon using a vacuum line. The solution was added to the
reaction vessel against a flow of argon and the apparatus sealed
while a constant stream of argon was maintained over the solution. Di-
nitrogen oxide was admitted to the pressure vessel through tap A, ensuring
that all connections vrere fl-ushed with gas to the exclusion of air. The
gas s¡as maintained at a pressure between 7 x l-05 Pa and 35 x IO5 Pa for
approximately 30 minutes while the apparatus was coofed in ice. Subseguently
the pressure r^ras released slow1y and the pressure vessel quickly stoppered
in a stream of dinitrogen oxide from the cylinder. The conÈents were
transferred to a Schlenk filter stick under dinitrogen oxide. Products
were collected, washed with ethanol and dried over phosphorus pentoxide.
Potentiometric Titrations
For atl measurements either an Horiba Type F-5 or a Philips PR 9400
pH meter was used. For pH titrations a glass electrode versus a saturated
calomel electrode (SCP) was used. The instruments were standardized using

-l1-I
II
I
I
L-
I
I
TAP B
TAP A
Fig.9.6b PRESSURE vESSEL

2L8.
potassium hydrogen phthalate (pH 4.00 at 20oC). For argentimetric
titrations an Ag/AgCl electrode was utilized, separated from the calomel
reference electrode by a salt bridge. !{here necessary titrations were
performed with dinitrogen-saturated solutions and under dinitrogen'
V[eighed amounts of the protonated EDTA complexes were titrated with
a standaïdized solution of approximately 0.or mol d*-3 l¡"oH sorution.
The actual concentration of the base was determined by titration with
-?O.0lO1 mol dm-r HCI sotution. The averaged or apparent PK. of the diprotic
EDTA compl-exes, pK.u, was determined from the intercept of a plot of pH
'l
versus tt"nr, - f./f.). The term f was the fracÈion of the original acid
neutralízed by the base, and defined as:
n-B
nA
where n" is the number of moles of base added and no the original nuniber
of moLes of acid present in solutj-on.
Isopiestic Method fot the Detetmination of MoLecuLat weight
The method described by Signer344 and mod,ified by C1ark345 and
Chil-ds346 was used. The experiment consisted in permitting two solutions
in an evacuated system, with solvent vapours in contact, to arrive at
equilibrium by isothermal distillation. The apparatus used, diagrams
of which are given by the above authors and Alcock,347 consisÈed of two
connected bulbs, a solvent reservoir and two graduated side armsr one to
each bulb. Known weights of a standard (benzoic acid) and an unknown
\¡rere added to each bulb. After passing argon through the system one arm
of the apparatus was sealed. The other arm was connected to a vacuum pump
and the system evacuated followed by the introduction of dry dinitrogen'
Against a stream of this gas, the required volume of dichloromethane \^Ias
added to the reference sample and frozen. The flow of dinitrogen \^Ias
stopped, the apparatus evacuated, and the second arm Sealed' The solvent

2I9.
was ïedistitled, leaving some in each arm and the rest in the reservoir.
The apparatus was thermostatted in a bath at 35oC. Readings were commenced
when all the solvent had distilled from the reservoir. A drainage time
of a-bout five minutes was allowed for the solutions to drain from the
bulbs to the pipettes. Equitibration was attained after three to five
days. For test runs benzoic acid was used as a standard and azobenzene
as the unknown.
Molecular weights were calculated from the expression
"=HI
where M-, Ít- and V. are the molecular weight, weight and volumel' r tof the solution of the unknown. The terms M, m and V are the corresponding
values of the reference.
9.7 Instrumentation; SpecttaT and El-ecttochemícal Teclniques
Balances
For spectral and conductimetric work samples were weighed on a
Cahn Model G2 Electrobalance. Other weighings were done on a Mettler HI6
balance weighing to 0.0I mg. For gas release studies samples were
weighed in a sealed weighing tube whose capacity was approximately 100 mg.
A thin rod was attached to the tube to facilitate manipulations,
Infrared Spectra
These \^reïe recorded using a Perkin Elmer 457 Gra|-j-ng Infrared
Spectrophotometer in the range 4OOO-250 "*-1. The instrument incorporated
an internat calibrant and automatic marker. Spectra were recorded as
nujol or hexachlorobutadiene mufls between potassium bromide (4000-3OO .*-t)
or sodium chloride plates (4000-650 "*-t).
Spectra \^Iere also obtained
using potassium bromide discs, prepared by subjecting a ground mixture
of the compound and potassium bromide to 10 tons of pressure delívered

220.
by a Research and lndustrial Tnstruments K32 Mk I Press. Solution spectra
were obtained by injecting a soLution into a cell- consist.ing of two
potassium bromide plates separated by a teflon spacer.
Raman Spectra
A nr¡nber of spectra were recorded at the University of Tasmania
using a dye 1aser348 containing Rtrodamine 6G at 587.7 nm (Power level 7 mW
at 587.7 nm). Attempts were made to record spectra using a Carey-83 Argon
Laser Spectrophotometer (488 nm), situated at the Levels Institute of
Technology, but extensive decomposition of all samples occurred in the
Iaser beam before a spectrum was obtained.
Efecttonic Spectra
Spectra were recorded using a Perkin Elmer Model 402 and a
Shimadzu Mode1 QR5O spectrophotometer. Limited use was made of "
Uni"r*
SP700 spectrophotometer. Measurements of the rate of decomposition of
the dimeric dinitrogen complex were made using the PE4O2 Model on a
repeat scan mode. A ceIl compartment through which water was pumped
was attached within the spectrophotometer and allowed the sample and
reference cel1s to be thermostatted during recording of the spectrum.
The spectra of air-sensitive solutions hrere recorded under an inert
atmosphere. The cuvetÈe was evacuated and flushed with the inert gas
followed by the addition of the solution against a counterstrean of gas
passed through a T-piece attachment (B1O) to the top of the cell. The
celL was sealed with a stopper against a stream of gas through the T-piece.
NMR Spectra
I-H-nmr spectra were recorded relative Èo TMS on a Varian T-60 60 MHz
spectrometer. A Bruker HX-9OE with noise-modulat"d lH-d".oupling was
utilized in recordíng 22.628 Nfttz tta-n*r Fourier transform spectra.

22I.
Chemical shifts were measured with respect to TMS using 1r4-dioxane as
an internal refererr"".349 All solutions used contained tuIOg D2O which
provided a deuterium resonance lock. After locking, between 1000 and
50TOOO scans were accumulated depending on the concentration of the
sample, which varied in the range 0.05-0.5 mol dn-3. A number of spectra
in deuterated TFA !{ere recorded by the Australian National NMR centre in
Canberra A.C.T., using a Bruker WH27O spectrometer.
Electrochemisttg
Voltammetric work was carried out using a three-electrode system
consisting of a spherical platinurn microelectrode (work electrode) ' a
platinum counÈer electrode and a saturated caLomel reference electrode
(SCE). The electrodes fitted into a ceII of capacity approximately2
50 cm- such that the work electrode was in close proximity to the end
of the reference elecÈrode. The counter electrode consisted of a platinum
gauze through which dinitrogen hras br¡bbled in order to purge the solution
of dissolved oxygen. A supporting electrolyte of 0.5 mol d*-3 KCI w."
generally used, excepting in studies carried out with rutheniul(III)
thiocyanato complexes where 0.4 mol a*-3 KSCW \Á¡as also used.. The volume
of solution used was 20.O or 25.0 cm3 containing approximately 0.OOl mol
-?dm - concentration of complex.
For single sr^/eep voltammetry use was made of a Princeton Applied
Research (pAR) Model 174 Polarographic analyzer and the voltammograms
recorded on a Houston Instrument Omnigraphic 2000 Recorder. The potential
scan range of the instrument was !0.75 to +3.0 Vo1ts, with a current
range of O.O2 UA to 10 mA. Cyc1ic voltammetry was carríed out using a
PAR Mode1 175 Universal Programmer connected to a PAR Model 373
Potentiostat Galvanostat. The former unit allowed the potential limits
and scan rate to be selected. The limits used, close to those of the
solvent were O.O to t0.9 Volts, and the scan rate in the range 100 rnV,/sec

to SV/sec. Rates of 2OO mVrlsec and 500 mV/sec were commonly used'
222.
The
second unit controlled the operating mode and the current range ' O.2 Eo
1.0 mA.
Voltammograms were recorded by scanning from the nult potential.
This was determined by balancing an external potential with the potential
across the electrodes of the ceII until the ftow of current through the
cell was zeno. Once the potential and current limits were set the
voltammogram of the supporting electrolyte alone \^tas recorded from which
the residual current could be determined. Foltowing this' the voltammogram
of the complex was recorded using a Houston Instrunent Corp. Model
HR-97 XY Recordeç, ot displayed on a Tektronix 603/604 Cathode Ray
Oscilloscope.
The hatf-wave potentials and reversibility of the voltammograms
were determined using the equations (4) , (7) , (8) and (9), and the peak
separation AE , as described in Section 5.1. Half-wave potentials were-p
also obtained by graphical extrapolation as shown in Fig. 5.1a.
Mass Spectra
Gas samples were analyzed for dinitrogen using a RMU-7D Hitachi-
Perkin Elmer mass spectromeÈer. Dinitrogen was detected from its
fragrments at m/e varues of. 14 (N+) and 29 (N2+) . Argon and water vapour
were detected at m,/e values of 40 and 18 respectively.
Conductivitg Measurements
Measurements were made using a conductivity celI (ceII constant (L/a):
-lO.Lj9 .m-') fitted with two taps allowing the cell to be flushed and
then filled with an inert gas, in the case of air-sensitive solutions.
Solutions hrere generally thermostatted in a \^Iater bath and the resistance
recorded using a Philips PR-9500 AC bridge incorporating a cathode ray
indicator to detect the balance point. Molar conductances of the

-? -3complexes were estimated from 1.0 x 10 " mol dm
or AR solvents, and deoxygenated deionized water
used.
223.
solutions. Distilled
(R tu 2-3 x 10⁶ fl) were
Magnetic Measutements
The magnetic moment of the dithiocarbamato complex (Section 3.4.4)
was determined by Guoy's methodr3S0 rr=ittg a Mettler H16 balance and
Newport Instrunents Electromagnet Type C.
I
2
3
4
5
224.
REFERENCES
J. Chatt, Proc. Roy. Soc. B, !2, 327 (1969)
R.H. Burris, Proc. Roy. Soc. B, I72' 339 (f969)
R.E. Eady and J.R. Postgate, Natute, 249, 805 (L974)
A.D. Allen and C.V. Senoff , Chem. Comm., 62L (1965)
A.D. Allen, F . BotÈomley, R.O. Harrís, V.P. Reinsalu and C.V. Senoff
J. Am. Chem. Soc., 89, 5595 (1967)
M.E. Vo1pin and V.B. Shur, Nature 209, L236 (1966)
A.D. Atlen and F. Bottomley, Acc. Chem. Res., !, 360 (1968)
J. Chatt, R.L. Richards, J.R. Sanders and ,J.8. Fergusson, Nature,
6
7
I
22L, 551 (1969)
9. V,t. Buttnet t Z. Chem. ,
10. G. Henrici-o1ivé and S
2r9 (1969)
olivé, Angew. Chem.
z t
11.
L2.
13.
14.
t_5.
16.
L7.
18.
19.
20.
Internat. Ed., 8, 650
(1969)
.I. Chatt, Platinum Metals Res., 13' 9 (1969)
Yu. G. Borodko and A.E. Shilov, Uspekhi. Khim. , 39, 76I (1969);
Russ. Chem. Revs., 3, 355 (f969)
E. Van Tamelen, Advances in Chem. Series No. 100' Bioinorganic Chem.
5, p. 95, Copyright (1971) J. Am. Chem. Soc.
E. Van Tamelen, Acc. Chem. Res., ]r 361 (1970)
J.E. Fergusson and J.L. Love, Revs. Pure App. Chem-,4,33 (1970)
G.J. Leigh, Prep. Inorg. Reactions, VoI. 6, P. 165, Edited W.L. Jolly'
J. V[iley and Sons Inc. (1971)
J. Chatt and G.J. Leigh, Chem. Soc. Revs., L, L2L (L972)
A.D. Al1en, R.O. Harris, B.R. Loescher, J.R. Stevens and R.N. Vthiteley,
Chem. Revs., f2' 11 (1973)
D. Sellmann, Angew. Chem. Internat. Ed., 13, 639 (L974) i German
Version Angew. Chem. 86, 692 (1974)
A.D. Allen and J.R. Stevens, Chem. Comm., IL47 (L967)

2L.
22.
23.
24.
25.
26.
27.
28.
29.
30.
3r.
32.
33.
34.
225.
L.A.P. Kane-Maguire, P.F. Sheridari, F. Basolo and R.G. Pearson'
J. Am. Chem. Soc.r 90,5295 (1968)
B.R. Davis and J.A. Ibers, Inorg. Chem., 9, 2768 (1970)
C. Creutz and H. Taube, Inorg. Chem., I0, 2664 (197I)
M. Aresta, P. Giannoccaro, M. Rossi and. A. Saccor Inorg. Chim.
Acta, 5, 2O3 (1971)
v{.H. Knoth, J. Am. Chem. Soc., 94, I04 (L972)
G. Speier and L. Marko, Inorg. Chim. Acta, 3, L26 (1969)
A. Sacco and M. Rossi, Chem. Comm. ' 316 (1967) ; Inorg. Chim.
Acta, 2, l,27 (1968)
,1 . Chatt, J.R. Dilworth and G.J. Leigh' J. Chem. Soc. Dalton 612,
(1973); Chem. Comm. 687 (1969)
,f. Chatt, G.A. Heath and G.J. Leigh, Chem. Comm., 444 (L972)i
J. Organometal. Chem. , 5'7, C67 (1973)
D. Sellmann and G. Maisel-, Z. Naturforsch.27b,465 (1972)¡
27b, 7L8 (1972)
M. Hidai, K. Tomínari, Y. Uchida and A. Misonor Chem. conm., 8L4
(196e)
B. 8e11, J. Chatt and G.J. Leigh, Chem. Comm. | 842 (1970)
J. Chatt, J. organometal. Chem. ' f00, 17 (1975)
J. Chatt, G.A. Heath and R.L. Richards, Chem. Comm., 1010 (1972) ¡
J. Chem. Soc. Dalton 2074 (L974)
J. Chatt, A.A. Diamantis, G.J. Leigh and G .4. Heath, Proc. XVI
Internat. Conf. Coord.. Chem. Dublin, Aug. L974
A.A. Diamantis, J. Chatt, G.A. Heath and G.J. Leigh, Chem. Comm.,
27 (1e7s)
35. J. Chatt, A.S. Pearman and R.L. Richards, Nature 253,
36. R.H. Fischer and P.B. Venuto, Bull. New Jersey Acad.
(re7o)
37. M.E. Vol'pin and V.B. Shur, Organometal . Reactions,
39 (1975)
Science, 15, I
L,55 (1970)
38.
39.
40.
4L.
226.
A.E. Shilov, Uspekhi Khim. (Eng. Trans.), 43, 378 (1974)
G.N. SchralJzer, Ange\^I. Chem. Internat. Ed., 4, I (f975)
D.E. Harrison and H. Taube, 'J. Am. Chem. Soc., 89, 5706 (L967)
A.A. Dianantis, G.J. Sparrow, M.R. Snov¡ and T.R. Norman, Aust. J.
42.
43.
44.
45.
46.
47.
Chem. , 28, L23I (1975)
A.A. Diamantis and G.J. Sparrow, Chem. Comm
J.N. Armor and H. Taube, J. Am. Chem. Soc.,
C.H. Campbell, A.R. Dias, M.L.H. Green, T.
J. Organometal. Chem., 4, 349 (1968)
P.C. Ford, Chem. Comm., 7 (1971)
., 819 (1970)
9L, 6874 (l-969)
SaiÈo and M.G. Swanwick,
4A
C.C. Kuehn and H. Taube' J. Am. Chem. Soc., 98,689 (1976)
T.R. Norman, Ph.D. Thesis, Univ. Ade1aide, Jan. (f974)
C.M. E1son, I.J. Itzkovitch and J.A. Pager Can. .f. Chem-, 48,
1639 (r970)
J.N. Armor and H. Taube' J. Am. Chem. Soc., 9I' 6874 (1969);
93, 6476 (1971)
A.A. Dianantis and G.J. Sparrow, Chem. Conun., 469 (1969)
L.A.P. Kane-Maguire, E. Basolo and R.G. Pearson' J. Am. Chem- Soc-'
91, 4609 (1969)
L.A.P. Kane-Maguire, F. Basolo and R.G. Pearson, J. Am. Chem. Soc.,
92, 5865 (1970)
F. Bottomley and J.R. Crawford, Chem
Chem. Soc., 94, 9092 (L972)
F. Bottomley, E.M.R. Kiremire and S.
le09 (le7s)
F. Bottomley and S.B. Tong, J. Chem.
Comm. , 2OO (1971) t J. Am
Clarkson, J. Chem. Soc. Dalton'
Soc. Dalton, 2L7 ( le73 )
(1972) ¡Chem. Soc., 94, 686
49.
50.
51.
52.
53.
54.
55. S.D. PeII and. J.N. Armor, J. Am
95, 7625 (1973)
56. S.D. Pell and J.N. Armor, Chem. Comm 259 (L974)
57.
58.
59.
60.
6r.
62.
63.
64.
65.
66.
67.
68.
69.
70.
7L.
72.
73.
227 .
H.A. Scheidegger, iI .N. Armor and H. Taube' J. Am- Chem. Soc.'
90, 3263 (1968)
L.A.P. Kane-Maguire, P.S. Sheridarl , F. Basolo and R.G- Pearson'
J. Am. Chem. Soc., 90, 5295 (1968)
S.!rf. Lin and A.F . Schreiner, Inorg. Nucl. Chem. Letters, 6, 561
(r970)
J. Chatt and J.E. Fergusson' Chem. Comm., l-26 (1968)
R.O. Harris and B.A. V'Iright, Can. J. Chem., !9, 1815 (1970)
J.N. Armor and H. Taube' J. Am. Chem. Soc., 92,6L7O (1970)
C.M. Elsorr, J. Gulens and J.A. Page, Can. J. Chem.,49- 2O7 (1971)
C. Creutz and H. Taube, J. Am. Chem. Soc., 91, 3988 (1969)
F. Bottomley and S.C. Nyburg' Chem. Comm. , 897 (1966);
Acta crysE., V, L289 (1968)
I.M. Treitel, M.T. Flood, R.E. Marsh and H.B. Grayr J. tun. Chem"
Soc.,9L,65L2 (1969)
K. Jonas, D.J. Brauer, C. Krüger' P.J. Roberts and Y.H. Tsay,
J. Am. Chem. Soc., 98, 74 (1976)
J.N. Armor and ".
;", J. Am. Chem. Soc., 92, 2560 (1970)
J. Chatt, D.P. Me1ville and R.L. Richards, J. Chem. Soc. (A),
284L (1969)
D.J. Darensbourg, Inorg. Chem., 4, 2399 (f971)
c.M. Bancroft, M.J. Mays and B.E. Prater, Chem. Comm., 585 (1969)
J. Popte and G. Segal, J. Chem. Phys., 43, 5136 (1965)
P.C. Ford, D.F. Rudd, R. Gaunder and H. Taube, J. Am. Chem. Soc.,
90, 1t-87 (1968)
R.E. Clarke and P.C. Ford, Inorg. Chem.,2,227 (1970)
R.E. Clarke and P.C. Ford, Inorg. Chem., 9, 495 (1970)
D.E. Harrison, E. WeissberçJer and H. Tar¡be, Science, L59' 32O (1968)
J. Chatt, A.B. Nickolsky, R.L. Richards and J.R. Saunders, Chem.
Comm., L54 (1969)
74.
75.
76.
77.

228.
78. J. Chatt, G.J. Leigh and N. Thankarajan, J. Chem' Soc' (A) '
3168 (1971)
79. A.A. Diamantis and G.J. sparrolâI' J. Coltoid. Interface sc]-.r 47,
Ass (re74)
80. A.I. Vogel "A Textbook of Quantitative Inorganic Analysis",
Longmans, 3rd Ed., J-962
page (a) 260,460r (b) 972¡ (c) 335; (d) 787¡ (e) 434i (f) 391
g1. A.E. Martetl and M. Calvin "The Chemistry of Metal Chelate Compounds",
Prentice-Hall, N.Y. ' 1952
82. G. Schwarzenbach, HeIv. Chim. Acta, 32, 839 (1949)
83. J. Hoard, J. Am. Chem. Soc-, 83, 2770 (1961)
M.D. Lind, M.J. Hamor, T.A. Hamor and J.L. Hoard, Inorg. chem.,
3, 34 (1964)
g4. R.E. Hainin and M.A. swyn, Inorg. Chem., 6, 139 (L967)¡ 6, L42
(re67)
85. l"l.L. Morris and D.H. Busch, J. Am. Chem. Soc., 78, 5178 (1956)
86. S.P. Sinha "Complexes of the Rare Earths", Pergamon Press, 1966
87. F.A. Cotton and G. wilkinson "Advanced Inorganic chemistry",
J. Wiley Interscience, 3rd Ed., J-972
88. N.A. Ezerskaya and T.P. Sotovykh, Russ. J. Inorg' Chem',
(nng. Trans.), 11, 99r. (1966)
89. N.A. Ezerskaya and v.N. Filimonova, Russ. J. Inorg. Chem.,
(nng. Trans) , 9, 424 (1963)
90. F. Dr4zer and F. Garvan, J. Am. Chem. Soc., V, +gzZ (1960)
91. D.H. Busch and J.c. Bailar Jr., J. Am. chem. soc., 78, 7L6 (1956)
92. S, Kirschner, J. Am. Chem. Soc-, 78, 2373 (1956)
93. J.,I . Park, M.D. Glick and J-L. Hoard, J. AIn. Chem' Soc', 9I'
301 (1969)
94. H.J. Shugar, A.T. Hubbard, F.c. Anson and H.B. Gray, J. Am. Chem.
Soc., 91, 7l (1969)

95.
96.
97.
98.
c)o
100.
101.
LO2.
103.
LOå.
105.
106.
107.
108.
r09.
229.
R.G. Vlitkins and R.E. Yelin, Inorg. Chem.,9, L47O (1969)
A.D. Gitmour, A. McCauley, Inorg. Chim. Acta, 4, I58 (1970)
D.L. Ehman and D.T. Sar^tyer, Inorg. Chem., 9, 2O4 (1970)
G. Schwarzenbach, R. Gut and G. Anderegg, HeIv. Chin. Acta, 37,
93'7 (r9s4)
E.J. $rheelwright, F.H. spedding and G. schwarzenbach, J. Am. chem.
Soc., 75, 4L96 (1953)
R.w, schnid and c.N. Reilley, J. Am. Chem. soc., 78, 5513 (1956)
l.A.w.ShimiandW.C.E-Higginson,J.Chem'Soc',260(1958)
M.L. Morris and D.H. Busch, J. Phys. Chem', 63, 34O (1959)
M.L. Morris, M.E. Banasik and J. Knoeck, Inorg. NucI. Chem. LeÈters'
ro, 331 (1974)
D.vù. Margerum, J. Phys. Chem. , 9a, 336 (f959)
F. Basolo and R.G. Pearson, Advances in Inorg. chem., 3' 1 (196r)
A. Ackermann and G. Schwarzenbach, Helv. Chim. Acta, 35, 485 (L952)
S. Jones and F.A. Long' J- Phys. Chem., 9, 25 (1952)
K. Bri1, S. Bril and P. Krumho1z, J. Phys' Chem', 59, 596 (1955)
A.!V. Adamson, J.P. Vtelker and v[.8. vüright, J. Am. chem. soc. '
73, 4786 (1951)
D.H. Busch and J.c. Bailar Jr., J. Am. Chem. soc., 75, 4574 (1953)
K. Yamazaki and K. Suguira, Naturweiss., 63, 552 (1961)
T.E. MacDermott and A.M. Sargeson, Aust' J' Chem', þ, 334 (1963)
C.W. Van Saun and B.E- Douglas, Inorg. Chem', 8, 1145 (1969)
W. Byers and B.E. Douglas' Inorg. Chem., !!, l47I (1972)
W.T. Jordan and J.I. Legg, Inorg. Chem', 9, 227L (L974)
H. Weakliem and J.L. Hoard, J- Am- Chem. Soc', 81, 549 (1959)
G.L. Blackmer and J.L. Sudmeier, Inorg. Chem', 4, 2OL9 (1971)
O.Vü. Howarth, P. Moore and N. Winterton' J' Chem' Soc' Dalton'
227L (Lg74); Inorg. Nucl. Chem. Letters, IO, 553 (L974)
G.S. Smith and J.L. Hoard, J. Am. Chem. Soc', 81, 556 (1959)
110.
ltr.
TL2.
113.
ILA.
II5.
116.
LL7 .
118.
r19.

t20.
I2T.
r22.
r23.
L24.
r25.
126.
L27
L2e.
L29.
130.
I31.
r32.
133 .
r34.
r35.
136.
137.
230.
A.A. McConnelt and R.H. Nutall, Inorg. ChiJn. Acta, 19, 253 (1976)
D.,f . Robinson and C.H.L. Kennard, J. Chem. Soc. (A), 1008 (1970)
K. Krishnan and R.A. Plan€, J. Am. Chem. Soc., 90, 3195 (1968)
R.H. NutaII and D.M. Stalker, Inorg. Nucl . Chem. Letters, 9,
639 (L976)
D.T. Sawyer and J.E. Tackett' J. Am. Chem. Soc., 85, 314 (1963);
85, 2390 (1963)
K. Nakamoto "Infrared Spectra of Inorganic and Coordination Com-
pounds", J. V'Iiley and Sons, N-Y., 1963
K. Nakamoto, Y. Yorimoto and A.E. Martell, J. Am. Chem' Soc',
85, 309 (1963)
G.H. Reed and R.J. KuIa, Inorg. Chem., 10, 2050 (1971)
J. Scherzer and L.B. C1app, J. Inorg. NucI. Chem', 39, 1107 (1968)
M. lú¡kaide-, H. okuno and T. Ishimori, Nippon Kagaku zasshi'86,
s98 (1965)
N.A. Ezerskaya, T.P. Solovykh, o.N. Evstaf'eva, L.K. shubochkin
and N.K. Bel'skii, Russ. J. Inorg- Chem., (Eng. Trans'), !9, 581
( reTs )
K. shimizur T. Matsubara and Gen. P. sato, BuIl. Chem. Soc. Jap.,
47, 1651 (1974)
N.A. Ezerskaya and T.P. Solovykh, Russ- J. Inorg. Chem' ' (Eng'
Trans. ) , 11., 78l- (1966)
A. Ringboom, S. Sütonen and B- Saxen, Anal. Chim. Acta, 16,
s4r (19s7)
N.A. Ezerskaya and T.P. Solovykh, Russ. J. Tnorg. Chem', (Eng'
Trans.), 1I, I379 (1966)
A.V. savitskii and v.I. Nelyr:bin, Russ. chem. Revs., (Eng. Trans.),
44, tlo (1975)
A.E. Shilova and A.E. Shilov, Kinetika i Kataliz', I0' 267 (1969)
Chem. , L,J. Chatt' J.R.
49 (1970)
Ditworth and G.J. Leigh, J. Organometal.

r38.
139.
I40.
I4I.
r42.
t43.
L44.
145.
L46.
r47.
r48.
L49.
150.
151.
Ls2.
r53 .
L54.
1s5.
156.
157.
158.
23r.
J, Chatt, J.R. Ðilworth, G.J. Leigh and V.D. Gupta' J. Chem.
Soc., 2631 (1971)
M. Aresta, C.F. Nobile, M. Rossi and A. Sacco, Chem. Comm., 78J-
( re71)
J. Chatt and R.L. Richards "The Chemistry and Biochemistry of Nitrogen
Fixationr', Chap. 3, Ed. J.R. Postgate, P1enum Press, London, L97L
I.J, Itzkovitch and J.A. Page, Can. ,J. Chem-,46t 2743 (1968)
J.A. Stanko and T.Vü. Starinshak, Inorg. Chem., 8, 2L56 (1969)
M.J. Cleare and W.P. Griffith, J. Chem. Soc- (A), 372 (1969)
A.D. Aller¡r T. E1iades, R.O. Harris and P. Reinsalu, Can. J. Chem.,
47, 1605 (1969)
A.D. Allen and J.R. Stevens, Can. J. Chem., Ð, 3093 (L972)
Vù.M. Latimer "Oxidation Potentials", 2nd Ed., Prentice-Hall,
Englewood Cliffs, N.iI.t L952
F. Bottomley, S.G. Clarkson and S. Tong, J. Chem- Soc. Da1ton,
2344 (I974) and references therein
Vü.L. Bowden, !{.F. Little and T.J. Meyer, J. Arn- Chem- Soc.' 95,
5084 (1973)
F. Bottomley, W.V.F. Brooks, S.G. Clarkson and S.B. Tong, Chem.
Comm., 9l-9 (1973)
F.J. Miller and T.J. Meyet, J. Am. Chem. Soc., 93, 1294 (1971)
K. GIeu and I. Büddeckert z. Anorg. Allgem. Chem.,268,2O2 (Lg52)
J.H. Enemark and R.D. Feltham, Coord. Chem. Rev-' 13' 339 (1974)
J.E. Huheey rrlnorganic Chemistry", Harper Internat. Ed. L972
Ð.J. Hodgson, N.C. Payne, J.A. McGinnety, R.G. Pearson and J.A. fbers,
J. Am. Chem. Soc., ?9t 4486 (1968)
K.G. Caulton, Coord" Chem. Rev., L4,3L7 (1975)
J.B. Godwin and T.J" Meyer, Inorg. Chem., L9, 47L (1971) ¡ 2L5O (1971)
J.G. Mason, and J.M. Van der Meer, Inorg- Chem., l-3, 2443 (1974)
M.T. Mocella, M.S. Okamoto and E.K. Barefield, syn. React. Inorg.
Metal-org. Chem.r 4, 69, (L974)

159.
160.
161.
L62.
163.
L64.
165.
L66.
L67.
168.
L69.
I70.
L7I.
r72.
L13.
L74.
L75.
L76.
L77 .
178.
L79.
180.
232.
B.F.G. Johnson and J.A. McCleverty, Progr- Inorg- Chem., 7,
277 (1e66)
W.P. Griffith, Adv. Organometal. Chem-, 7, 2Il- (1968)
"Handbook of chemistry and Physics", 51st Ed., chemical Rubber
Co., L97O-7L
A.F. Schreiner, S.W. Lin, P.J. Hauser' E.A- Hopcus, D.J. HaIÛÌt
and J.D. cunter' Inorg. Chem. , II , 880 (L972)
S. PeII and J.N. Armor, Inorg. Chem., L2, 873 (1973)
,f .4. Broomhead and L.A.P. Kane-Maguire, J- Chem. Soc. (A),
546 (L967)
L.J. Bellamy "The Infrared Spectra of Complex Mo1ecules",
J. Wiley and Sons, N.Y., 1960
R.A. Wa1ton, Quart. Rev. , 9, l-26 (1965)
P.C. Ford, Coord. Chem, Rev.' 5, 75 (1970)
P.C. Ford and R .8. Clarke, Chem. Comm., 1109 (1968)
G. Rauschias and G. Vùilkinson, J. Chem. Soc. (A), 993 (L967)
D. Steele, Quart. Rev., !9, 2I (1964)
H. Bock and H. tom Dieck, Chem. Ber., 99, 2I3 (1966)
P.c. Ford and C. Sutton' Inorg. Chem., 8, 1544 (1969)
T.J. Meyer and H. Taube, Inorg. Chem., 7, 2369 (1968)
E.S. Stern and C.J. Timmons "Introduction to Electronic Absorption
Spectroscopy in organic Chemistry", 3rd Ed-, E. Arnold, I97O
J.D. Roberts and M.C. Caserio "Basic Principles of Organic Chemistry",
Vl.A. Benjamin Inc., L964
A.H. Norbury, R.E. Shaw and A.I.P. Sinha, Chem. Comn., 1080 (f970)
L.A. Epps and G. Marzilli, Chem. Comm., 109 (1972)
A.H. Norbury, Adv. Inorg. Chem. Radiochem-, L7, 23I (1975) and
references therein
P.C.H. Mitchell, R.J.P. Vlilliams, J. Chem. Soc., L9L2 (1960)
A. Tramer, J. Chim. Phys., 59, 232 (L962)

233.
181.
LA2.
I83.
184.
r85.
186
r87.
188.
189.
r90
19r.
L92.
r93.
I94.
r95.
196.
r97.
198.
199.
200.
20L.
A.
J.
A.
Turco and C. Pecile, Nature, I9I, 66
Lewis, R.S. Nyholm and P.V'I . Smith, J.
Sabatini and I. Bertini, Inorg. Chem.
( 1e61)
Chem. Soc., 459O (1961)
t 9s9 (1965)
D.A. Buckingham, I.I. Creaser and A.M. Sargeson' Inorg. Chem.'
9, 655 (1970)
H.H. Schmidtke, Inorg. Chem., 5, 1682 (1966); J. Am- Chem. Soc-r
87, 2522 (1965)
L.D. Brown and D.E. Pennington, Inorg. Chem., 
203.
204.
205.
206.
207.
208.
209.
2IO.
2LL.
2t2.
2I3.
2L4.
2L5.
2L6.
2L7 .
2I8.
2t9.
220.
22I.
222.
234.
F.A. Cotton in J. Lewis and R. Wilkins editors "¡4odern Coordination
Chemistry", fnterscience, N.Y., 1960
K. Nakamoto and A.E. MarÈel, J. Chem- Phys., 32, 588 (1960)
J. Fujita, A. Nakahara and R. Tsuchida, J. Chem- Phys., 23-, I54L
( less )
R.E. Rundle and M. Parasol, J. Chem. Phys-, 20, L487 (7952)
K. Nakamoto, M. Margoshes and R.E. Rundle, J. Am. Chem. Soc.,
71, 6480 (1955)
L.E. Godycki and R.E. Rundl-e, Acta Cryst-,6,487 (1953)
R. Btinc and D. Hadzi, J. Chem. Soc., 4536 (1958); SpecÈrochim.
Acta, L6, 853 (1960)
A.D. Cross and R.A. Jones t'Practical fnfrared Spectroscopy",
Butterworths, London, 3rd Ed., 1969
R.H. HoIm and F.A. Cottorlr J. Am. Chem. Soc.,8O,5658 (1958)
D.!rt. Barnlrm, J. Inorg. Nucl . Chem. , 2L, 22L (1961)
R.M. Silverstein and G.C. Bassler "Spectrometric ldentification
of organic Compounds", lViley Internat., 2nd Ed., L96'7
J. Chatt, L.A. Duncanson and L.M. Venanzi, Nature, L7'7, LO42 (1966) t
Suomen Kenii, 298, No. 2' 75 (1956)
c. O'Connor, J.D. Gilbert and G. WiLkinson, J. Chem. Soc. (A),
a4 (1969)
J.D. cilbert, D. Rose and G. wilkinson, J. chem. soc. (A), 2765 (1970)
D. Coucouvanis I Progr. Inorg. Chem., Il, 233 (1970)
C.K. Jþrgensen, J. Inorg. NucI" Chem., 4, L57I (L962)
M.L. Shankaranarayana and C.C. Patel, Acta Chem. Scand., 19, 1113
( 1e65 )
II.P. Koch, J. Chem. Soc., 4OI (1949)
J.L. Hoard, G.s. smith and M. Lind "Advances in the chemistry of
Coordination Compoundsr', S. Kirschner Ed.r Macmillan and Co., N.Y., ]-962
J.L. Sudmeier and C"N. Reilley, rnorg- Chem., 6, IO47 (1966)

223.
224.
225.
226.
227 .
224.
229.
230.
23r.
232.
233.
234.
235.
236.
237 .
238.
235.
R.J. KuIa, AnaI. Chem. | 3'7, 989 (1965)
R.J. Day and C.N. Reilley, AnaI. Chem. , 36, 1073 (L964)
D.H. l{illiams and D.H. Busch, J. Am. Chem. Soc., 87t 4644 (1965)
J.I. Legg and D.W. Cooke, Inorg. Chem., 4, L576 (1965)
H.S. Gutowsky, J. Chem. Phys., !, 2L96 (L962)
,f .8. Territl and C.N. Reil1y, Inorg. Chem., 5, 1988 (L966)
H.S. Gutowsky and A. Saika, J. Chem. Phys., 2L, 1688 (1953)
J.L. Hoard, C.H.L. Kennard and G.S. Srnith, Inorg. Chem., 2, 316
( re63 )
R. Dyke and W.C.E. Higginson, J. Chem. Soc., 1998 (1960)
B. Grossman, Ph.D. Thesis, State University New York, Buffalo'
l-967
O.W. HoÌ^rarth, P. Moore and N. Vtinterton, Chem. Comm. , 664 (L974) ¡
J. Chem. Soc. Dalton 360 (1975)
IU.J. Farmer, O.!rI . Howarth and P. Moore, J. Chem. Soc. Dalton'
L445 (1916)
B.B. Smith and D.T. Sawyer, Inorg. Chem., 7, 2O2O (1968)
W.R. Scheidt, C. Tsai and J.L. Hoard, J. Am. Chem. Soc., 93, 3867
( Ie71)
V'I .R. Scheidt, D.M. Collins and J.L. Hoard, J. Am. Chem. Soc.'
93, 3873 (1971)
W.R. Scheidt, R. Countryman and J.L. Hoard, J. Am. Chem. Soc.,
93, 3878 (I97I)
239. M.H. Chisolm and S. Godleski, Progr. Inorg. Chem., 20, 299 (re76)
, L972240 . J.B
24T. R.H
Stothers "f3c-rr*t Spectroscopy", Academic Press, N.Y
Reimann and E. SingleÈon, J. Chem. Soc. Dalton, 841 (le73);
808 (L974)
242. L.F. Johnson and lrl .C. Jankowski "I3c-n*t Spectra. A Colfection of
Assigned, Coded and Indexed Spectra", Wiley-Interscience, 1972

243.
244.
245.
246.
24'7 .
248.
249.
250.
25r.
252.
253.
254.
255.
256.
257 .
254.
259.
236.
A. I¡leissberger and. B.Vù. Rossiter (Ed.) "Physica1 Methods of
Chemistry. Part IIA. Electrochemícal Methods", Ialiley-Interscience,
19]I
G.!,I . Ewing "Instrumental Methods of Chemical Analysis", 2nd Ed.,
McGraw-Hill, 1960
H.H. Bauet, J. Electroanal . Chem. , 16, 4L9 (1968)
R.S. Nicholson and I. Shain, Anal-. Chem. , 36, 706 (L964) ì
37, L78 (1965)
R.S. Nicholson, Anal. Chem. , 37, 1351 (1965)
D.S. Poliyn and I. Shain, Anal. Chem., 38, 370 (1966) ¡ 376 (1966)
J.H. Swinchart, Coord.. Chem. Rev., 2, 385 (1967)
G. Fiori, D. Giusto and L. Agnoletto, Ann. Chem., 65t 433 (1975)
A.!ù. zanella and P.C. Ford, Inorg. Chem., L4, 42 (L975)
S.E. Diamond, G.M. Tom and H. Taube, J. Am. Chem. Soc., 97r 266L
( le75 )
T. Matsubara and P.C. Ford, Inorg. Chem. , Þ, 1107 (L976)
F.P. Drrr)¡er and H.A. McKenzíe, J. Proc. Roy. Soc. N.S. lVales,
84, 80 (1951)
F.P. Dr^rye:c, J. Proc. Roy. Soc. N.S. Wales, Ë, I34 (L949)
$I.!rl. Brandt and G.F. Smith, Anal. Chem., 2I, 1313 (1949)
C.M. Elsorr, iI . Gu1ens, l.J. Itzkovitch and J.A. Page, Chem. Comm-,
875 (1970)
G.S.c. Phillips and R.V.P. Williams "Inorganic Chemistry" , VoL. 2,
oxford Press, L966
T. Moeller, F.A.J. Moss and R.H. Marsha1l, J. Am. Chem.9oc.,77,
3182 (19ss)
Sawyer and P.J.
816 (r9s9)
Sawyer and ,f .M.
Paulsen, J. Am. Chem. Soc., 80' 1597 (1958);260. D.T.
81 ,
26T. D.T McKinnie, J. Am. Chem. Soc., 82, 4L9L (1960)
( Ies0 )262. R. Theimer and O. Theimer, Monatsh., 81' 313

263.
264.
265.
266.
267.
268.
269.
270.
27L.
272.
273.
274.
275.
276.
277 .
278.
279.
280.
28L.
282.
283.
237 .
R.E. Kagarise, J. Phys. Chem. , 59, 27I (1955)
B. Ellis and H. Pyszora, NaÈure, 181' 181 (1958)
R.E. Sievers and J.C. Bailar Jr.' Inorg- Chem. I L, l-74 (1962)
F. Basolo and R.G. Pearson t'Mechanisms of Inorganic Reactions",
John Vfitey and Sons Inc., 1958
M.M. Davies and G.B.B.M. Sutherland, J. Chem- Phys.r 6, 755 (1938)
O.D. Shreve, M.R. Heether, H.B. Knight and D. Swern, Anal' Chem',
22, L498 (1950)
T.M. Dunn in J. Lewis and R.G. Vlilkins "Modern Coordination
Chemistryrt, Interscience Inc.r N.Y-, 1960
P.C. Ford, J.R. Kuempel and H. laube, Inorg- Chem., 7, 1976 (1968)
H.H. Schmidtke and, D. Garthoff, Helv. chim. AcLa,49,2039 (1966)
K. Nakamoto, J. Fujita, M. Kobayashi and R- Tsuchida, J. Chem'
Phys" , 27, 439 (1957)
R.c. wilkins and M.J.G. vüilliams in J. Lewis and R.G. wilkins
"Modern Coordinatíon Chemistrytt, Interscience Inc., N.Y', 1960
H. Yanatera, BuIl. Chem. Soc. Jap.,3L-,95 (1958)
C.K. Jlrgensen "Modern Aspects of Ligand Fiel-d Theory", North-
Holland Pr:blishing ComPanY, l97I
R. Krishnamurthy and V,f.S. SchaaPr J- Chem. 8d,., 46t 799 (L969)
R. Krishnamurthy, w.A. schaap and J.R. Perumareddi, Inorg. chem.,
6, 1338 (L967)
M.M" Taqui Khan and A.E. Martell "Homogeneous Catalysis by Metal
Complexes", Vol. 1, Academic Press, L974
T. Etiades, R.o. Harris and P. Reinsalu, can. J. chem., 47,3823 (1969)
J.N. Armor and H. Taube, Inorg. Chem-, 10, 1570 (197I)
H. Hartmann and C. Buschbeck, Z. Phys. Chem. (Frankfurt), 1I, L2O (1957)
J.C. Bellen, Honours Report, Univ- Ade1aide, l97Oi
E. Zottif Honours Report, Univ. Adelaide, L97L
K. Schug and C. Guerigerich, J. An. Chem. Soc., 97, 4L35 (1975)

284.
285.
286.
287 .
284.
249.
290.
29L.
292.
293.
294.
295.
296.
297.
298 "
299 "
300.
301.
238.
K. Jones "The Chemistry of Nitrogen", Pergamon Texts in Inorganic
Chemistry, Vol. fT, Pergamon Press , 1975
D. Waysbort and G. Navon, Chem. Comm., 1410 (1971)
F.D. Snell and C.T. Snell "Colorimetric Methods of Analysis",
VoI. IV, p. 55, D. Van Nostrand Co., 3rd Ed., 1959
W.T. Botletter, C.J. Bushman and P.W. Tidwell, Anal . Chem., 33, 592
( 1961)
J.N. Armor, H.A. Scheidegger and H. Taube, J- Am. Chem. Soc.,
90, 5928 (1968)
F. Bottomley and J.R. cïawford, J. Chem. Soc. Dalton, 2l-45 (L972)
R.B. Penland, T.J. Lane and J.V. Quagliano, J. An. Chem. Soc.,
78, 887 (1956)
K. Nakamoto, J. Fujita and H. Murato, J. Am. Chem- Soc-, 80,
48L7 (19s8)
B.M. Gatehouse, S.E. Livingstone and R.S. Nyholm, J. Inorg- Nuc1.
Chem., 8, 75 (1958)
M.B. Fairey and R.J. Irving, Spectrochim. Acta, 22, 359 (1966)
E.E. Mercer' ül .4. McAllister and J.R. Durig, Inorg- Chem-, 5' 1881
(Ie66)
A. Ohyoshi, S. Hiraki and H. Kawasaki' BuII. Chem. Soc. Jap.,
47, 84L (t974)
E. Ladov and E. Johnson, J. Am. Chem. Soc., 9L, 7601 (1969)
A. Frances and E. Johnsorlr J. Phys. Chem., f2, 35 (1975)
T. Mohanlal oza, J. Ind. Chem. Soc., !, 863 (L974)
R.N. Kust and J.D. Burke, Inorg. Nucl. Chem. LeÈters, 6, 333 (1970)
J. Chatt, G.J. Leigh and R. Richards, Chem. Corun., 515 (1969);
J. Chem. Soc. (A), 2243 (1970)
A. Yamamoto, S. Kitazume and S. Ikeda, J. Am. Chem. Soc-' 90'
1089 (1968)

302.
303 .
304.
305.
306.
307 .
308.
309.
3r0.
3tt.
3L2.
3I3.
314.
315.
316.
3L7 .
318.
319.
320.
32r.
322.
323.
239.
T. Ito, S. Kitazume, A. Yamamoto and S. Ikeda' J. Am. Chem. Soc.,
92-,3011 (1970)
W.H. Knoth, J. Am. Chem. Soc., 90, 7L72 (f968)
R.G.S. Banks, R.J. Henderson and J.M. Pratt, J. Chem- Soc. (A) '
2886 (1968); Chem. Corrn. , 387 (1967)
L.S. Pu, A. Yamamoto and S. Ikeda, Chem. Comm., 189 (1969)
G.M. BancrofE, M.J. Mays, B.E. Prater and F-P. Stefanini,
,J. Chem. Soc. (A), 2l,46 (1970)
P. Giannoccaro, M. Rossi and A. Sacco, Coord. Chem. Revs-, 8, 77
(L972)
P.G. Douglas, R.D. Fettham and H.G. Metzer, J. Am. Chem. Soc.,
93, 84 (1971)
P.c. Douglas and R.D. Feltham, J. Am. Chem. Soc-,94,5254 (1972)
F. Bottomley and E.M.R. Kiremire, Private Communication - Results
in press
R.E. Tohrnshend and K.J. Coskran, Inorg. Chem., 9, 1661 (1971)
A.J. Schultz, R.L. Henry, ,J. Reed and R. Eisenberg, Inorg. Chem.'
13, 732 (L974)
K.S. Murray, Coord. Chem. Rev., !]r L (1974)
B.F.G. Johnson and J.A. Segal, J. Chem. Soc. Dalton, L268 (L972)
,J. Chatt, G.J. Leigh and R.J. Paske, J. Chem. Soc. (A), 854 (1969)
R.B. King and P.N. Kapoor, Inorg. Chem. , L, 336 (1972)
G.!f. Vlatt and J.D. Chrisp, Anal. Chem., 24, 2006 (1952)
D.M. Adams "Metal-Iigand and Related Vibrations", Edward Arnold
Ltd., London, l-967
E.E. Meïcer and L.W. Gray' iI . Am. Chem. Soc-,94,6426 (L972)
M.A. Bennett and A.K. Smith, J. Chem. Soc- Dalton, 233 (L974)
L. Ruiz-Ramirez and T.A. Stephenson, J. Chem. Soc. Dalton, 1640 (1973)
E.E. Mercer and R.R. Buckley, Inorg. Chem., 4., 1692 (1965)
P.F. Carey, Honours Report, Univ. Adefaide ' 1972

240.
324.
325.
326.
N.K. Pshenitsyn and N.A. Ezerskaya, Russ. J. Inorg. Chem
(nng. Trans.) , !, 573 (1960)
C.K. Jflrgensen, MoI. Phys., Z, 309 (L959) ¡ 4, 2LS (1961)
A. Werner, Ber., 2620 (1907)
,
327. F.M. Lever and A.R. Powell, J. Chem. Soc. (A) ,
328. L.H. Vogt, J.L. Katz and S.E. Wiber1ey, Inorg.
( Ie6s)
L477 (196e)
Chem., 4, 1157
329. K. Gleu and $I. Cuntze, Z. Anorg. Allgem. Chem. , 2T, 187 (f938)
Giannoccaro, M. Rossi and A. Sacco, Inorg. Chin.33O. M. Aresta, P.
331.
332.
333 .
334.
335.
336.
337.
338.
339.
340.
34L.
342.
343.
344.
Acta,5r 1I5 (1971)
G. Hata, H. Kondo and A. Miyake, J. Am. Chem- Soc., 90, 227A (1968)
J. Chatt and R.G. Hayter, J. Chem. Soc., 2605 (1961)
J.J. Levison and s.D. Robinson, J. chem. soc. (A) 2947 (1970)
T.I. Eliades, R.O. Harris and M.C- Zia, Chem. Comm. ' L7O9 (1970)
L. Horner, Liebig's Ann. Chem., 20, 597 (1955)
J.M. Fletcher, I.L. ,fenkins, F.M. Lever, F.S. Martin, A-R- Powell
and R. Todd, J. Inorg. Nucl. Chem., 1, 378 (1955)
M.B. Fairy and R.J. Irvingr J. Chem. Soc. (A), 475 (1966)
A.I. Vogel "A Textbook of Practical organic Chemistry",
3rd Ed., Longrmans, L962
G. Brauer "Handbuch der Präparativen Anorganischen Chemie", VoI. 1,
2nd Ed., p. 438, F. Enke Stuttgart, 1960
A.A. Bothner-By and L. Friedman' J. Am. Chem. Soc., 73, 5391 (1951)
S. Herzog, J. Dehnert and K. Lühder in "Techniques of Tnorganic
Chemistry", H.B. Jonassen and A. üleissberger Ed., John V'Iiley and
Sons, N.Y., VoI. VI, 1969
D.F. Shriver I'The Manipulations of Air-Sensitive Compounds",
McGraw-Hi1l Book Co., L969
!V.8. Fortune and M.G. MeIIor, Ind. Eng. Chem. Anal. Ed., 10, 60 (1938)
R. Signer, Ann.; 4J8, 246 (1930)

345.
346.
347.
348.
349.
350.
351.
24L.
E.P. C1ark, Anal. Chem. , !1, 82O (1941)
C.E. Childs, Anal. Chem. , þ, 1963 (1954)
J.F. Alcock¡ Ph.D. Thesis, Univ. Ade1aide, L968
J.K. Burdett and M. Poliakoff, Chem. Soc. Revs., !, 293 (L974)
G.C. f,evy and S.D. Cargioli, J. I{agneÈ- Reson.,9, L43 (L972)
B.N. Figgis and J. Le¡uis in J. Lewis and R.G. wilkins "Modern
Coordination Chemistry", Interscience, N.Y.' 1960
J.H.G. Van der Stegen, lt. Visscher and J.G. Hoogland, Electrochem.
Technol., !, 564 (1966)