investigations into the chemistry of protein tyrosine ... - MOspace
163
INVESTIGATIONS INTO THE CHEMISTRY OF PROTEIN TYROSINE PHOSPHATASE REDOX REGULATION A Dissertation presented to the Faculty of the Graduate School at the University of Missouri-Columbia In Partial Fulfillment of the Requirements for the Degree Doctor of Philosophy by JASON N. LABUTTI Dr. Kent S. Gates, Dissertation Supervisor MAY 2009
-
Upload
khangminh22 -
Category
Documents
-
view
1 -
download
0
Transcript of investigations into the chemistry of protein tyrosine ... - MOspace

INVESTIGATIONS INTO THE CHEMISTRY OF PROTEIN
TYROSINE PHOSPHATASE REDOX REGULATION
A Dissertation presented to the Faculty of the Graduate School
at the University of Missouri-Columbia
In Partial Fulfillment
of the Requirements for the Degree
Doctor of Philosophy
by
JASON N. LABUTTI
Dr. Kent S. Gates, Dissertation Supervisor
MAY 2009

The undersigned, appointed by the Dean of The Graduate School, have examined the
dissertation entitled:
INVESTIGATIONS INTO THE CHEMISTRY OF PROTEIN TYROSINE
PHOSPHATASE REDOX REGULATION
Presented by Jason N. LaButti
A candidate for the degree of Doctor of Philosophy
And hereby certify that in their opinion it is worthy of acceptance.
________________________________________ Professor Kent S. Gates
________________________________________ Professor Thomas Reilly
________________________________________ Professor Michael Harmata
________________________________________ Professor John Tanner

This dissertation is dedicated to Ralph and Yolanda Lotito.

ii
ACKNOWLEDGEMENTS
I would like to acknowledge those who have made this dissertation possible:
My advisor, Professor Kent S. Gates for his guidance and advice throughout my graduate career.
My doctoral committee for their insight and ideas.
Past and present Gates Group members including my amazing friends Dr. Venkatraman Junnotula, Derrick Seiner, Ujjal Sarkar and Mostafa Fekry for making our lab a fun place to be.
Dr. John Scott Daniels for helping me find my way to the Gates Lab.
My brothers Erik and Kurt for helping me see the lighter side of life.
My Uncle Ralph, whose generosity, care and love helped us immeasurably.
My Nana who I wish could be here with us.
My Papa who showed me very early in my life that the world is full of wonder.
My mother and father for always being there for me.
My daughter Anna Regina who makes me smile (unless she is not using her listening ears…and even then I usually smile).
Last and most importantly my wife Gretchen, who has helped me become a better person.

iii
TABLE OF CONTENTS
ACKNOWLEDGEMENTS ................................................................................................ ii
Chapter 1 ........................................................................................................................... 1
Introduction ......................................................................................................................... 1
1.1 Cell Signal Transduction and Protein Tyrosine Phosphatases ............................ 1
1.2 Protein Tyrosine Phosphatases and the Insulin Signal Cascade ......................... 3
1.3 Protein Tyrosine Phosphatase Structure and Catalysis ....................................... 4
1.4 Redox Chemistry of the PTP Active Site ........................................................... 7
1.5 Hydrogen Peroxide is an Intracellular Signaling Agent that Targets the PTP Active Site ..................................................................................................................... 10
1.6 Conclusions and Goals of This Dissertation ..................................................... 11
Chapter 2 ......................................................................................................................... 16
Biologically Relevant Properties of Peroxymonophosphate ............................................ 16
2.1 The Redox Paradox ........................................................................................... 16
2.2 Preparation of Peroxydiphosphate and Peroxymonophosphate ........................ 18
2.3 Quantification of Solutions of Peroxydiphosphate and Peroxymonophosphate by 31P NMR .................................................................................................................. 23
2.4 Stability of Peroxymonophosphate in Buffers .................................................. 26
2.5 Conclusions ....................................................................................................... 27
2.6 Experimental Procedures .................................................................................. 29
Materials and Methods .................................................................................................. 29
Chapter 3 ......................................................................................................................... 38
Inactivation of PTPs by Peroxymonophosphate ............................................................... 38
3.1 Introduction and Objectives .............................................................................. 38
3.2 Expression and Purification of PTP1B ............................................................. 40

iv
3.3 Preparation of PTP1B For Inactivation Assays (RSH removal, auto-oxidation chemistry) ..................................................................................................................... 45
3.4 PTP1B Inactivation Assays............................................................................... 50
3.5 Discussion and Conclusions ............................................................................. 68
3.6 Experimental Procedures .................................................................................. 71
Chapter 4 ......................................................................................................................... 82
Synthesis and Use of PC-1 as a Selective Detector of Peroxymonophosphate ................ 82
4.1 Introduction and Objectives .............................................................................. 82
4.2 Oxidative Deboronation .................................................................................... 84
4.3 Preparation of PC-1........................................................................................... 85
4.4 Fluorescence Measurements ............................................................................. 86
4.5 Conclusions ....................................................................................................... 92
4.6 Experimental Procedures .................................................................................. 93
Chapter 5 ....................................................................................................................... 105
Enzymatic Production of Peroxymonophosphate ........................................................... 105
5.1 Introduction and objectives ............................................................................. 105
5.2 Utilizing PTP1B to Detect Peroxykinase Activity .......................................... 108
5.3 Use of PC-1 to Probe for Enzymatic Production of Peroxymonophosphate .. 110
5.4 Confirmation of Enzyme-produced Peroxymonophosphate With 31P NMR .. 112
5.5 Conclusions ..................................................................................................... 117
5.6 Experimental Procedures ................................................................................ 119
Chapter 6 ....................................................................................................................... 125
A Tryptophan-based Fluorescence Assay for Measuring PTP1B Inactivation Kinetics 125
6.1 Introduction and Objectives ............................................................................ 125
6.2 Determining Optimum Excitation and Emission Parameters for Observing Tryptophan Fluorescence in Native and Oxidized PTP1B ......................................... 129

v
6.3 Optimal Spectrofluorimeter Settings for Observation of PTP1B Inactivation Kinetics ....................................................................................................................... 131
6.4 Utilizing Fluorescence to Measure the Rate of PTP1B Oxidative Inactivation by H2O2 ....................................................................................................................... 134
6.5 Conclusions ..................................................................................................... 136
6.6 Experimental Procedures ................................................................................ 141 VITA ................................................................................................................................147

vi
LIST OF FIGURES
Figure Page
1.1 A representation of the insulin signal cascade and its negative regulation by PTP1B. 3
2.1 31P NMR scan (uncalibrated) of the complex product profile generated by the Kadla preparation of peroxymonophosphate. A peak corresponding to phosphate is found at – 1.2 ppm. ............................................................................................................................ 20
2.2 31P NMR of an alkaline (pH ~ 11), aqueous solution of peroxydiphosphate (P2O10) after one recrysallization from methanol/water. The peaks are assigned as follows: peroxydiphosphate: 7.66 ppm. Phosphate : 3.91 ppm. ..................................................... 22
2.3 31P NMR of a 200 mM peroxydiphosphate solution treated with 6M HClO4 for 1h at 50oC. Internal standard diphenyl phosphate was added to a concentration of 20 mM. The peaks are assigned as follows: Peroxymonophosphate 4.27 ppm, peroxydiphosphate 3.13 ppm, phosphate 0.54 ppm, diphenylphosphate (internal standard) -8.35 ppm. ........ 25
2.4 The stability of peroxymonophosphate in the presence of biologically relevant additives. ........................................................................................................................... 27
2.5 The apparatus for electrolytic preparation of potassium peroxydiphosphate consists of a power supply, chiller, and jacketed glass vessel with platinum anode and cathode wires............................................................................................................................................ 31
2.6 Close-up of jacketed electrolysis vessel for preparation of peroxymonophosphate. .. 32
3.1 Map of pGEX-3X plasmid used to create the pRP261 vector. ................................... 42
3.2 Map of the pETDuet-1 vector that was used to express the PTP1B 37 kDa catalytic subunit. .............................................................................................................................. 44
3.3 SDS-PAGE analysis of a PTP1B protein preparation. Lanes 1,10 = standard. Lane 2 = cell lysate. Lane 4 = column flow through. Lane 6,7,8 = 1, 2, 4 μg of PTP1B. .......... 45
3.4 Residual thiol present in a 0.1 mL volume of buffer containing 1 mM dithiothreitol after treatment with sequential Pierce Zeba 0.5 mL buffer exchange columns. The concentration of thiol after the third column was approximately 700 nanomolar. ........... 48
3.5 Time-dependent inactivation of PTP1B by various concentrations of hydrogen peroxide............................................................................................................................. 50

vii
3.6 Replot of pseudo-first order rates obtained by treating PTP1B with hydrogen peroxide in the absence of substrate. The slope of the line gives the apparent second order rate of 15.66 +/- 0.67 M-1s-1. ........................................................................................................ 51
3.7 Calculation of PTP1B Km with p-nitrophenylphosphate as substrate. Km is calculated by fitting the data to the Michaeles equation Y=Vmax*X/(Km+X) and was found to be 2.11 mM. ........................................................................................................................... 52
3.8 Time-dependent inactivation of PTP1B by hydrogen peroxide in the presence of 10 mM substrate. The apparent rate of enzyme inactivation was determined by fitting the data to equation (1). .......................................................................................................... 53
3.9 Time-dependent inactivation of PTP1B by peroxymonophosphate in the presence of 10 mM substrate (pNPP). .................................................................................................. 54
3.10 Time-dependent inactivation of SHP-2 by peroxymonophosphate in the presence of 10 mM substrate (pNPP). .................................................................................................. 55
3.11 A plot of peroxymonophosphate concentration versus the apparent rate of PTP1B inactivation. These data are derived from Figure 3.10 and appears to describe a bimolecular reaction. ......................................................................................................... 58
3.12 A plot of peroxymonophosphate concentration versus the apparent rate of SHP-2 inactivation. These data are derived from Figure 3.11, and appears to describe a bimolecular reaction. ......................................................................................................... 58
3.13 Analysis of the observed rates of PTP1B inactivation by hydrogen peroxide in the presence of 10 mM substrate. The slope of the line corresponds to the apparent second order rate of inactivation. This was measured to be 29.8 +/- 1.4 M-1s-1 .......................... 60
3.14 Replot of peroxymonophosphate inactivation data for PTP1B using the “Duranton” analysis. The apparent second order rate of inactivation is 46710 +/- 940 M-1s-1. ........ 61
3.15 Replot of peroxymonophosphate inactivation data for SHP-2 using the “Duranton” analysis. The apparent second order rate of inactivation is 25930 +/- 1435 M-1s-1. ...... 61
3.16 Replot of peroxymonophosphate inactivation data for PTP1B using the “Voet” analysis. The apparent second order rate of inactivation is 58,000 +/- 2200 M-1s-1. ....... 62
3.17 Replot of peroxymonophosphate inactivation data for SHP-2 using the “Voet” analysis. The apparent second order rate of inactivation is 48,050 +/- 2118 M-1s-1 (KI = 800 +/- 270 nM, kinact = 0.037 +/- 0.002 s-1). .................................................................... 63
3.18 Increasing ionic strength decreases the rate of PTP1B inactivation by 1 μM peroxymonophosphate. ..................................................................................................... 65
3.19 Increasing ionic strength does not decrease the rate of PTP1B inactivation by 1 mM H2O2 .................................................................................................................................. 65

viii
3.20 The competitive PTP inhibitor phosphate protects PTP1B from inactivation by peroxymonophosphate. ..................................................................................................... 66
3.21 Addition of thiol at 120 s to a reaction containing PTP1B (~ 50 nM) and peroxymonophosphate (1 μM) reverses inactivation of the enzyme. .............................. 67
3.22 Determination of peroxymonophosphate partition ratio with PTP1B ...................... 68
3.23 A plot of leaving group pKa vs. the apparent rate of PTP1B inactivation for three compounds: Peracetic acid (C2H4O3), peroxymonophosphate (H3PO5) and hydrogen peroxide (H2O2). ............................................................................................................... 69
4.1 Plot of fluorescent intensity versus excitation and emission wavelength for deboronated PC-1. ............................................................................................................. 87
4.2 Increase in fluorescent intensity caused by oxidative deboronation of PC-1. ............ 88
4.3 Color change resulting from treatment of PC-1 with hydrogen peroxide. Left: 1 mM solution of PC-1 in 50 mM Bis-Tris pH 7.0. Right: 1 mM solution of PC-1 in 50 mM Bis-Tris pH 7.0 treated with 10 mM H2O2 for 1h. ............................................................ 89
4.4 The apparent pseudo-first order rates of PC-1 deboronation by hydrogen peroxide. . 90
4.5 The apparent second order rate of the reaction between PC-1 and hydrogen peroxide is 1.2 +/- 0.17 M-1s-1. ......................................................................................................... 90
4.6 The apparent pseudo-first order rates of PC-1 deboronation by peroxymonophosphate. ..................................................................................................... 91
4.7 The apparent second order rate of the reaction between PC-1 and peroxymonophosphate is 1447 +/- 52 M-1s-1. ................................................................... 92
4.8 1H NMR of (2). ........................................................................................................... 98
4.9 13C NMR of (2). .......................................................................................................... 99
4.10 19F NMR OF (2) ....................................................................................................... 100
4.11 1H NMR of PC-1 (1) ............................................................................................... 101
4. 4.12 13C NMR of PC-1 (1). ......................................................................................... 102
5.1 Time-dependent inactivation of PTP1B by the product of a phosphatase enzymatic reaction in the presence of various concentrations of hydrogen peroxide. ..................... 110
5.2 Deboronation rates of PC-1 by the product of reaction mixture of AcpA combined with 5’ adenosine monophosphate and hydrogen peroxide. ........................................... 112

ix
5.3 31P NMR of a test for peroxykinase activity that contained AcpA, 1M H2O2 and 100 mM 5’-AMP @ pH 7.0. Peaks are assigned as follows: peroxymonophosphate: 7.8 ppm; 5’-AMP: 3.4 ppm and inorganic phosphate at 1.9 ppm. ................................................. 113
5.4 31P NMR of a control sample for peroxykinase activity that contained AcpA and 100 mM 5’-AMP. Peaks are assigned as follows: 5’-AMP: 3.3 ppm; inorganic phosphate: 1.7 ppm. ................................................................................................................................ 114
5.5 31P NMR of a negative control for peroxykinase activity that contained 100 mM 5’-AMP in pH 7.0 buffer (3 ppm). ...................................................................................... 115
5.6 Detection of peroxymonophosphate generated by alkaline phosphatase in the presence of 5’-adenosine monophosphate and hydrogen peroxide. A: alkaline phosphatase + 100 mM 5’-adenosine monophosphate + 1M hydrogen peroxide. B alkaline phosphatase + 100 mM 5’ adenosine monophosphate + 1M hydrogen peroxide fortified with peroxymonophosphate authentic standard to ~ 10 mM. C: alkaline phosphatase + 100 mM 5’-adenosine monophosphate. .................................................. 117
6.1 An example of time-dependent enzyme inactivation data generated with a continuous assay. This particular set of data was generated with PTP1B and the oxidative inactivator peroxymonophosphate. ................................................................................................... 126
6.2 An example of time-dependent enzyme inactivation data generated with a discontinuous assay. This particular set of data was generated with PTP1B and the oxidative inactivator hydrogen peroxide. ....................................................................... 127
6.3 A surface model of native PTP1B derived from an X-ray crystal structure. This model shows the close proximity of Trp179 (magenta) to the active site catalytic cysteine thiolate (Cys215, yellow) and its position within the active site pocket. ....................... 129
6.4 Fluorescence emission spectrum of PTP1B prior to (native) and after (oxidized) treatment with 0.5 mM hydrogen peroxide. Excitation monochrometer was set at 285 nm, with a 2 nm slit-width. Emission monochrometer was scanned from 300 to 400 nm with a 4 nm slit-width. .................................................................................................... 131
6.5 An example of apparent single-phase exponential decay of PTP1B fluorescence observed upon treatment of the enzyme with 0.5 mM hydrogen peroxide. ................... 132
6.6 An example of biphasic PTP1B fluorescence decay observed upon treatment of the enzyme with 4 mM hydrogen peroxide. The blue and red lines represent curve fits for the first and second exponential rates of decay, respectively. ........................................ 132
6.7 The effects of temperature and exposure to UV radiation on the fluorescence quantum yield of PTP1B. Temperature was either held constant, or varied from 25oC (@ 0 s) to 15oC (@10 s) to 30oC ( @ 360 s). The observed changes in fluorescence intensity were representative of the time necessary for the cuvette to reach the programmed temperature.......................................................................................................................................... 133

x
6.9 Data showing hydrogen peroxide mediated time-dependent loss of PTP1B fluorescence on a semi-log plot. ..................................................................................... 135
6.8 PTP1B, when treated with various concentrations of hydrogen peroxide, shows time dependent decay of fluorescence intensity. .................................................................... 135
6.10 Replot of the apparent rate of PTP1B fluorescence decay as a function of H2O2 concentration. .................................................................................................................. 136
6.11 X-ray crystal structure of native PTP1B (PDB # 2HNP) showing orientation of the Trp179 indole ring (magenta) with Tyr 181 (green) as a spatial reference. ................... 137
6.12 X-ray crystal structure of oxidized PTP1B (PDB# 1OEM) showing the change in the orientation of the Trp179 indole ring (magenta) with Tyr 181 shown in green as a spatial reference. ......................................................................................................................... 138
6.13 Fluorescence emission intensity of SHP-2 (Ex: 285 (4) nm, Em: 330 (4) nm) when treated with either buffer or 5 mM hydrogen peroxide (arrow indicates point of buffer or H2O2 addition @120s). ................................................................................................... 140

xi
LIST OF SCHEMES Scheme Page
1.1 The phosphorylation state of tyrosine residues can alter a protein’s enzymatic function. .............................................................................................................................. 2
1.2 Representation of a general PTP active site and its catalytic action. ............................ 5
1.3 Physiologically-relevant reactive oxygen species (ROS) are typically derived from reduction of oxygen. ........................................................................................................... 7
1.4 Oxidation of the PTP cysteine thiolate by hydrogen peroxide, and reversal by thiols. 8
1.5 Structure of the biological thiol glutathione. ................................................................ 9
1.6 The mechanism of superoxide production by NADPH oxidase (Nox). ..................... 10
2.1 The PTP active site cysteine thiolate redox regulation cycle. .................................... 17
2.2 Structure of peroxymonophosphate. ........................................................................... 17
3.1 A generalized PTP active site showing substrate interactions with the phosphate binding pocket, oxidation by hydrogen peroxide, recovery of enzyme activity by thiols and the hypothesized mechanism of oxidative inactivation by peroxymonophosphate. .. 39
3.2 The mechanisms of metal-mediated thiolate autooxidation, adapted from reference 4............................................................................................................................................ 46
3.3 Generation of peroxides from autooxidation of ether-containing non-ionic detergents............................................................................................................................................ 49
3.4 The expected kinetic parameters for a one-step enzyme inactivation (no non-covalent pre-association). The reaction mixture contains enzyme, substrate and inactivator. ....... 56
3.5 The expected kinetic parameters for a two-step enzyme inactivation (with a non-covalent pre-association, KI). The reaction mixture contains enzyme, substrate and inactivator. ........................................................................................................................ 57
4.1 Examples of ROS indicators that lack either selectivity or sensitivity ....................... 84
4.2 The boronate-containing ROS indicator PC-1 ............................................................ 84
4.3 Oxidative deboronation of PC-1 yields highly fluorescent resorufin. ........................ 85
4.4 Preparation of PC-1 as described by Chang. .............................................................. 86
xii
5.1 A general mechanistic view of enzyme mediated phosphotransferase activity by a phosphatase. In the specific case of peroxykinase activity to generate peroxymonophosphate, R = OH. .................................................................................... 107
5.2 General protocol for detection of peroxykinase activity with PTP1B. ..................... 109
5.3 General procedure for detection of peroxykinase activity. In the detection phase, the chemical probe may be either a fluorescent redox indicator, or a redox-regulated protein.......................................................................................................................................... 111
5.4 Generation of peroxyacetic acid from the catalytic cycle of non-heme bacterial chloroperoxidase involves the use of hydrogen peroxide as an acyl acceptor. .............. 119
6.1 The amino acid tryptophan ....................................................................................... 128
6.2 Structure of the non-natural amino acid 7-azatryptophan. ........................................ 139
6.3 Structure of the non-natural amino acid 5-hydroxytryptophan. ................................ 139

xiii
LIST OF TABLES Table Page
3.1 Amino acid sequence of the PTP1B catalytic subunit employed in these studies. The conserved PTP active site motif of HCX5R(S/T) is highlighted in red. ........................... 40

1
Chapter 1
Introduction
1.1 Cell Signal Transduction and Protein Tyrosine Phosphatases
The binding of extracellular hormones such as insulin or epidermal growth factor
to receptors on the surface of cells triggers complex intracellular signal transduction
cascades.1, 2 These signal cascades, in turn, can induce cells to perform a myriad of
biochemical tasks ranging from cell division to taking up glucose from the blood.
Transmission of these signals within cells is often accomplished through the reversible
phosphorylation of specific protein tyrosine residues.3 This reversible phosphorylation
serves as a biochemical “rheostat” that alters a protein’s functional properties and leads to
propagation of the signal. The phosphorylation status of these tyrosine residues, thus
transmission of the cellular signal itself, is tightly controlled by the opposing actions of
protein tyrosine kinases that catalyze the addition of phosphoryl groups and protein
tyrosine phosphatases (PTPs) that catalyze their removal (Scheme 1.1).4, 5 The removal
of these phosphoryl groups, in many cases, serves as an “off switch” to terminate the
cellular responses to the extracellular stimulus. PTPs, therefore, play a central role in the

Chapter 1 - Introduction
2
regulation of diverse cellular processes including glucose metabolism, cell cycle control
and immune responses.6
Scheme 1.1 The phosphorylation state of tyrosine residues can alter a protein’s enzymatic function.
When considering the state of the art in PTP research, it is interesting to note that
the field of PTP investigation lags that of kinases by approximately ten years. This is, in
part, due to the fact that it was once thought that phosphatases, in contrast to kinases,
were relatively unimportant “housekeeping” enzymes with little or no substrate
specificity and/or regulation mechanism.4 In the past 10 to 15 years, however, research
has shown that these enzymes have exquisite substrate specificities and are actually
tightly regulated by a number of mechanisms.7, 8 Furthermore, the complex mechanisms
by which PTPs exert their control over cell communications have yet to be fully
elucidated. Regardless of the body of knowledge related to PTPs, due to their important
roles in cell signal transduction and links to disease states such as cancer and diabetes,
many PTPs have been identified as potential drug targets and in general the field of PTP
research is subject of intense scientific study.9

C
1
fo
in
th
m
α
au
β
Chapter 1 - Intro
Figure 1.
.2 Protein
A goo
ound in the i
nsulin signal
he action of
muscle cells (
α and two
utophosphor
subunit tyr
oduction
1 A representa
Tyrosine P
od example
insulin signa
ling cascade
insulin on i
(Figure 1.2)
β subunits)
rylation of IR
rosine residu
ation of the insu
Phosphatas
of the expa
al cascade an
, thus blood
insulin recep
.10 Binding o
) induces a
R tyrosines
ues, in turn,
3
ulin signal casc
ses and the
ansive role P
nd its role in
glucose hom
ptors (IRs) t
of insulin to
a change in
1146, 1162
, transforms
cade and its ne
e Insulin Si
PTPs play i
n maintainin
meostasis, is
hat are pres
the IR (whi
n secondary
and 1163.11
the IR itse
egative regulati
ignal Casca
in cellular o
ng glucose h
controlled p
ent on the s
ich is a heter
y structure
Phosphoryl
elf into a pr
ion by PTP1B.
ade
operations ca
homeostasis.
primarily thr
surface of fa
rotetramer o
which lead
lation of the
rotein kinase
an be
The
rough
at and
f two
ds to
se IR
e that

Chapter 1 - Introduction
4
subsequently phosphorylates various insulin receptor substrates (IRS). These IRS
transmit the insulin signal via a complex and yet-to-be fully elucidated signaling path that
eventually leads to cellular uptake of glucose through activation and/or exocytosis of the
Glut-4 glucose transporter.12 While addition of phosphoryl groups to Y1146, 1162 and
1163 activates the IR to phosphorylate various insulin receptor substrates (IRS), removal
of these phosphoryl groups by certain PTPs ablates IR kinase activity. In particular,
protein tyrosine phosphatase 1B (PTP1B) is the major enzyme responsible for
dephosphorylation of the insulin receptor β subunits. Insulin resistance is a major factor
in diabetes mellitus, a disease of global significance.13 PTP1B, as the major negative
regulator of insulin signal transduction, is therefore a highly sought-after target for anti-
diabetes drug development.14-17
1.3 Protein Tyrosine Phosphatase Structure and Catalysis
At the time of writing this dissertation, there are approximately 500 kinases
known, while 100 phosphatase genes have been identified in the human genome.18
Members of the phosphatase superfamily are categorized into one of four sub-families:
dual-specificity or mixed-function PTPs, CDC-25 phosphatases, low molecular weight
PTPs and classical protein tyrosine phosphatases.19 The following discussion and the
studies described herein employed the catalytic subunit of human PTP1B (a.a. 1-322) as
an archetypal member of the PTP family of enzymes. While there is little or no sequence
homology among the different PTP families, the active sites of PTPs all possess a
signature amino acid motif of C(X)5R(S/T).19 This motif, in addition to containing
residues necessary for catalysis, forms a positively charged phosphate-binding domain
known as the phosphate-binding loop, or P-loop (Scheme 1.1). The phosphate-binding
Chapter 1 - Introduction
5
domain is a rigid scaffold that properly positions the substrate using favorable polar and
ionic interactions. As is the case with most enzymes, substrate specificity between PTPs
is generally imparted by primary, secondary and tertiary structures surrounding the active
site.20, 21
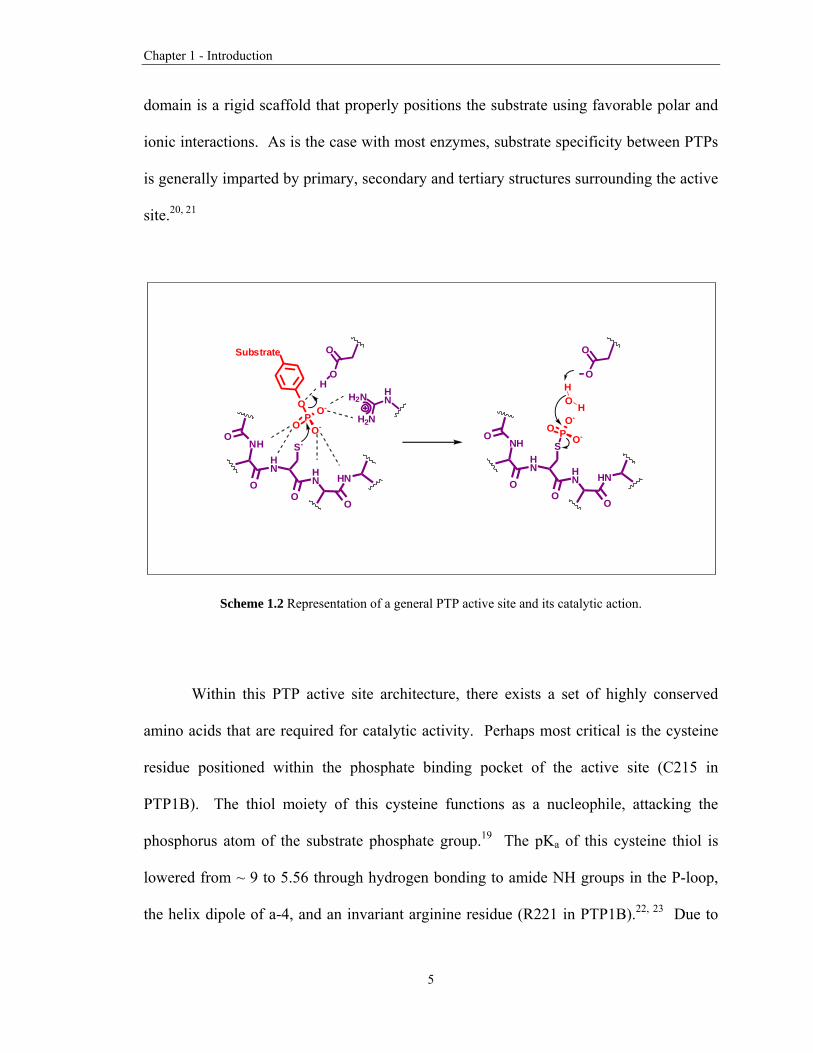
Scheme 1.2 Representation of a general PTP active site and its catalytic action.
Within this PTP active site architecture, there exists a set of highly conserved
amino acids that are required for catalytic activity. Perhaps most critical is the cysteine
residue positioned within the phosphate binding pocket of the active site (C215 in
PTP1B). The thiol moiety of this cysteine functions as a nucleophile, attacking the
phosphorus atom of the substrate phosphate group.19 The pKa of this cysteine thiol is
lowered from ~ 9 to 5.56 through hydrogen bonding to amide NH groups in the P-loop,
the helix dipole of a-4, and an invariant arginine residue (R221 in PTP1B).22, 23 Due to
PO
O O-
Substrate
HN
H2N
H2N
HN
S-
O
HNO
O
HN
NHO
O
OH
O-
P O-
HN
S
O
HNO
O
HN
NHO
O
O
O-O
HOH

Chapter 1 - Introduction
6
this shift in pKa the cysteinyl sulfur exists completely in the reactive thiolate (charged
anion) form at physiological pH, which significantly enhances its nucleophilicity. In
addition to the cysteine and arginine residues, an aspartic acid that functions as a general
acid/base (D181 in PTP1B) is also required for catalysis (Scheme 1.2).
Scheme 1.2 shows a representation of a general PTP catalytic cycle and the amino
acid residues that are involved. Catalysis begins with negatively charged phosphorylated
substrate binding to the active site via an array of interactions with the P-loop amide
functionalities, and the positively charged guanidinium moiety of Arg221. This is
followed by nucleophilic attack by the cysteine thiolate on the substrate phosphoryl group
to yield a transient phosphorylcysteine enzyme intermediate that is stabilized by Arg221.
In PTP1B, this step has been shown to proceed through a dissociative mechanism in
which there is minimal bond order between the enzyme and the substrate, which results
in a three coordinate meta-phosphate like transition state.23 This is in contrast to a high
bond order associative mechanism that would have a five coordinate phosphorane-type
intermediate. The hydroxyl group of the dephosphorylated substrate is protonated via a
general acid interaction with Asp 181 as it is released from the active site. Finally, the
phosphocysteine enzyme intermediate is hydrolyzed by a water molecule that is activated
through a general base interaction with Asp 181. The result is the release of inorganic
phosphate and regeneration of the active site cysteine thiolate (active enzyme).

Chapter 1 - Introduction
7
Scheme 1.3 Physiologically-relevant reactive oxygen species (ROS) are typically derived from reduction of oxygen.
1.4 Redox Chemistry of the PTP Active Site
It is becoming clear, from recent studies, that while kinases control the amplitude
of a signal, endogenous regulation of phosphatase activity can control the duration of the
response.9 Given the importance of PTPs in signal transduction, it is not surprising that
the activity of these enzymes is regulated during normal cellular processes. An important
mechanism for the endogenous regulation of PTPs involves the transient, reversible
oxidation of their active site cysteine residue. Due to the fact that PTP catalytic cysteinyl
sulfurs exist primarily in the thiolate anion state, they react readily with oxidants to form
sulfenic acids. This oxidation renders them catalytically inactive.7, 24-27 Numerous
oxidizing agents have been shown to effect the aforementioned chemistry. From a
physiologic perspective these reactive oxygen species (ROS) are normally derived, either
spontaneously or enzymatically, from the one-electron reduction of molecular oxygen

Chapter 1 - Introduction
8
(O2) to superoxide radical anion, O2.- (Scheme 1.3) Reactive oxygen species such as
hydrogen peroxide (H2O2) and peroxynitrite (ONOOH) can oxidize a nucleophilic
thiolate to the sulfenic oxidation state through a two-electron process (Scheme 1.4).28
Transition metals such as ironII are also known to oxidize thiolate anions through single
electron radical chemistry and recombination with molecular oxygen (also known as
Fenton chemistry).29 28
Scheme 1.4 Oxidation of the PTP cysteine thiolate by hydrogen peroxide, and reversal by thiols.
If one considers that the timeframe of cellular responses to insulin stimulation are
on the order of minutes,1 and that it would take hours if not days to replenish permanently
S
PTP
OH
Inactive Enzyme(sulfenic acid)
S
PTP
SRH
RSSR
SR
S
PTP
Active Enzyme
HOOH
OH
H2O
S
PTP
OH
Inactive Enzyme(sulfinic acid)
OS
PTP
OH
Inactive Enzyme(sulfonic acid)
OO
H2O2
H2O2
RS

Chapter 1 - Introduction
9
inactivated enzyme, it becomes clear that in addition to switching PTP activity off there
need to be provisions for recovering their catalytic activity. This is accomplished by the
reducing state of the cytosol. Under normal physiological conditions oxidation of the
catalytic cysteine thiolate to the sulfenic oxidation state would be reversed through
reaction with ubiquitous cellular reducing equivalents such as glutathione (Scheme 1.5).30
Scheme 1.5 Structure of the biological thiol glutathione.
The overall concept of redox regulation is actually more complex than simply the
reversible formation of sulfenic acids through oxidation. This is due to the fact that
sulfenic acids may be further oxidized to sulfinic and then sulfonic acids (Scheme 1.4).
Unlike sulfenic acids these higher oxidation species, if generated in the active site,
typically are not reversible by reaction with thiols.31, 32 Over-oxidation of the PTP
catalytic cysteine thiolate to sulfinic and sulfonic acids therefore permanently inactivates
the enzyme.

Chapter 1 - Introduction
10
1.5 Hydrogen Peroxide is an Intracellular Signaling Agent that Targets the PTP Active Site
The concept of PTP intracellular redox regulation has only recently been
proposed.25, 27, 33 While H2O2 concentrations of 10-100 μM are toxic to cells, it has been
determined that biologically relevant (nanomolar to low micromolar) concentrations are
produced in response to various stimuli including growth factors, cytokines and insulin.33,
34 The enzymes responsible for production of hydrogen peroxide during cell signal
transduction are the flavin-containing NADPH oxidases (Nox) and dual-cofactor flavin
enzymes (Duox).35, 36 These enzymes, during their catalytic cycle, release superoxide
radical anion (O2.-) which very rapidly dismutates to hydrogen peroxide (k = 5.5 e5 M-1s-
1) (Scheme 1.6).37, 38 With regard to PTP redox regulation, it has been shown that
stimulation of cells with insulin triggers intracellular production of H2O2 by the enzyme
Nox-4, which leads to inactivation of PTP1B through the previously described reversible
oxidation of the catalytic cysteine thiolate.24, 39 Inactivation of PTP1B effectively
preserves phosphorylation of the IR and IRS and prolongs the insulin signal cascade.
Endogenous hydrogen peroxide, therefore, acts as a positive regulator of the insulin
signal cascade by disabling PTP1B and prolonging cellular uptake of glucose.
Scheme 1.6 The mechanism of superoxide production by NADPH oxidase (Nox).

Chapter 1 - Introduction
11
1.6 Conclusions and Goals of This Dissertation
Based upon the described chemistry, it is apparent that an oxidation/reduction
cycle of PTPs can serve as a molecular switch of sorts, that regulates catalytic activity.40
This mechanism of intracellular signaling plays a leading role is such critical physiologic
processes as the insulin signal cascade. While the concept that PTP redox-regulation is
part of normal physiologic intracellular processes, there are many unknowns that have yet
to be illuminated. The chemistry by which oxidative species regulate PTPs is relatively
well characterized, but the exact mechanism(s) by which these species themselves are
produced and regulated remain unclear. Furthermore, ROS remain an elusive target for
both detection and quantification due to their transience and high rates of diffusion.41, 42
Due to these properties, new, specific techniques need to be developed to aid
investigators who wish to expand the boundaries of our knowledge about redox
regulation.
In the first two chapters of this dissertation, we explore the properties of an
oxidizing agent that may be an H2O2-derived, biologically accessible endogenous
regulator of PTPs. Chapter 2 describes the synthesis, purification and characterization of
this agent, known as peroxymonophosphate. We then report the effects of
peroxymonophosphate on the catalytic activity of PTP1B in Chapter 3. Chapter 4
describes our development of a new method for selectively detecting
peroxymonophosphate by using a fluorescent boronate-based probe. In Chapter 5, we
use this agent as a tool to demonstrate enzymatic production of peroxymonophosphate
through phosphoryl transfer to hydrogen peroxide. Finally, in Chapter 6, we report a new
assay that utilizes the intrinsic fluorescence of PTP1B to monitor the redox state of its
active site.

Chapter 1 - Introduction
12
References
1. Saltiel, A. R.; Kahn, C. R., Insulin signalling and the regulation of glucose and lipid metabolism. Nature 2001, 414 (6865), 799-806.
2. Cohen, S., Epidermal growth factor (EGF): historical perspectives. Horm. Proteins Pept. 1985, 12, 299-304.
3. Ahn, N., Introduction: Protein phosphorylation and signaling. Chem. Rev. 2001, 101 (8), 2207.
4. Stone, R. L.; Dixon, J. E., Protein-tyrosine phosphatases. J. Biol. Chem. 1994, 269 (50), 31323-31326.
5. Abraham, R. T., Cell cycle checkpoint signaling through the ATM and ATR kinases. Genes Dev. 2001, 15, 2177-2196.
6. Johnson, L. N.; Lewis, R. J., Structural Basis for Control by Phosphorylation. Chem. Rev. 2001, 101 (8), 2209-2242.
7. den Hertog, J.; Groen, A.; van der Wijk, T., Redox regulation of protein-tyrosine phosphatases. Arch. Biochem. Biophys. 2005, 434 (1), 11-15.
8. Majeti, R.; Weiss, A., Regulatory mechanisms for receptor protein tyrosine phosphatases. Chem. Rev. 2001, 101, 2441-2448.
9. Tonks, N. K., Protein tyrosine phosphatases: from genes, to function, to disease. Nat Rev Mol Cell Biol 2006, 7 (11), 833-846.
10. Ross, S. A.; Gulve, E. A.; Wang, M., Chemistry and Biochemistry of Type 2 Diabetes. Chem. Rev. 2004, 104 (3), 1255-1282.
11. Patti, M. E.; Kahn, C. R., The insulin receptor--a critical link in glucose homeostasis and insulin action. Journal of basic and clinical physiology and pharmacology 1998, 9 (2-4), 89.
12. Liu, M.; Gibbs, E. M.; McCoid, S. C.; Milici, A. J.; Stukenbrok, H. A.; McPherson, R. K.; Treadway, J. L.; Pessin, J. E., Transgenic Mice Expressing the Human GLUT4/Muscle-Fat Facilitative Glucose Transporter Protein Exhibit Efficient Glycemic Control. PNAS 1993, 90 (23), 11346-11350.
13. Zimmet, P.; Alberti, K. G. M.; Shaw, J., Global and societal implications of the diabetes epidemic. Nature 2001, 414 (6865), 782.
14. Cheng, A.; Dube, N.; Gu, F.; Tremblay, M. L., Coordinated action of protein tyrosine phosphatases in insulin signal transduction. Eur. J. Biochem. 2002, 269 (4), 1050-1059.

Chapter 1 - Introduction
13
15. Puius, Y. A.; Zhao, Y.; Sullivan, M.; Lawrence, D. S.; Almo, S. C.; Zhang, Z.-Y., Identification of a second aryl phosphate-binding site in protein-tyrosine phosphatase 1B: A paradigm for inhibitor design. PNAS 1997, 94 (25), 13420-13425.
16. Bridges, A. J., Therapeutic challenges of kinase and phosphatase inhibition and use in anti-diabetic strategy. Biochem. Soc. Trans. 2005, 33 (Pt 2), 343-345.
17. Hooft van Huijsduijnen, R.; Sauer, W. H. B.; Bombrun, A.; Swinnen, D., Prospects for inhibitors of protein tyrosine phosphatase 1B as antidiabetic drugs. J. Med. Chem. 2004, 47, 4142-4146.
18. Alonso, A.; Sasin, J.; Bottini, N.; Friedberg, I.; Friedberg, I.; Osterman, A.; Godzik, A.; Hunter, T.; Dixon, J.; Mustelin, T., Protein tyrosine phosphatases in the human genome. Cell 2004, 117 (6), 699-711.
19. Jackson, M. D.; Denu, J. M., Molecular Reactions of Protein Phosphatases-Insights from Structure and Chemistry. Chem. Rev. 2001, 101 (8), 2313-2340.
20. Zhang, Z.-Y., Protein tyrosine phosphatases: structure and function, substrate specificity, and inhibitor development. Ann. Rev. Pharmacol. Toxicol. 2002, 42 (42), 209-234.
21. Zongchao Jia, D. B., Andrew J. Flint, Nicholas K. Tonks, Structural Basis for Phosphotyrosine Peptide Recognition by Protein Tyrosine Phosphatase 1B. Science 1995, 268, 1754-1758.
22. Peters, G. H.; Frimurer, T. M.; Olsen, O. H., Electrostatic Evaluation of the Signature Motif (H/V)CX5R(S/T) in Protein-Tyrosine Phosphatases. Biochemistry 1998, 37 (16), 5383-5393.
23. Lohse, D. L.; Denu, J. M.; Santoro, N.; Dixon, J. E., Roles of Aspartic Acid-181 and Serine-222 in Intermediate Formation and Hydrolysis of the Mammalian Protein-Tyrosine-Phosphatase PTP1. Biochemistry 1997, 36 (15), 4568-4575.
24. Mahadev, K.; Zilbering, A.; Zhu, L.; Goldstein, B. J., Insulin-stimulated Hydrogen Peroxide Reversibly Inhibits Protein-tyrosine Phosphatase 1B in Vivo and Enhances the Early Insulin Action Cascade. J. Biol. Chem. 2001, 276 (24), 21938-21942.
25. Caselli, A.; Marzocchini, R.; Camici, G.; Manao, G.; Moneti, G.; Pieraccini, G.; Ramponi, G., The Inactivation Mechanism of Low Molecular Weight Phosphotyrosine-protein Phosphatase by H2O2. J. Biol. Chem. 1998, 273 (49), 32554-32560.
26. Meng, T.-C.; Fukada, T.; Tonks, N. K., Reversible oxidation and inactivation of protein tyrosine phosphatases in vivo. Mol. Cell 2002, 9, 387-399.
27. Denu, J. M.; Tanner, K. G., Specific and Reversible Inactivation of Protein Tyrosine Phosphatases by Hydrogen Peroxide: Evidence for a Sulfenic Acid Intermediate and Implications for Redox Regulation. Biochemistry 1998, 37 (16), 5633-5642.

Chapter 1 - Introduction
14
28. Forman, H. J.; Fukuto, J. M.; Torres, M., Redox signaling: thiol chemistry defines which reactive oxygen and nitrogen species can act as second messengers. Am J Physiol Cell Physiol 2004, 287 (2), C246-256.
29. Misra, H. P., Generation of Superoxide Free Radical during the Autoxidation of Thiols. J. Biol. Chem. 1974, 249 (7), 2151-2155.
30. Leslie, N. R.; Lindsay, Y.; Ross, S. H.; Downes, C. P., Redox regulation of phosphatase function. Biochem. Soc. Trans. 2004, 32 (Pt 6), 1018-1020.
31. Sivaramakrishnan, S.; Keerthi, K.; Gates, K. S., A chemical model for the redox regulation of protein tyrosine phosphatase 1B (PTP1B). J. Am. Chem. Soc. 2005, 127, 10830-10831.
32. Allison, W. S., Formation and reactions of sulfenic acids in proteins. Accounts Chem. Res. 1976, 9, 293-299.
33. Xu, D.; Rovira, I. I.; Finkel, T., Oxidants Painting the Cysteine Chapel: Redox Regulation of PTPs. Developmental Cell 2002, 2 (3), 251-252.
34. Sundaresan, M.; Yu, Z.-X.; Ferrans, V. J.; Irani, K.; Finkel, T., Requirement for Generation of H(2)O(2) for Platelet-Derived Growth Factor Signal Tran sduction. Science 1995, 270 (5234), 296-299.
35. Lambeth, J. D., NOX enzymes and the biology of reactive oxygen. Nature Rev. Immunol. 2004, 4 (Mar), 181-189.
36. Lambeth, J. D.; Kawahara, T.; Diebold, B., Regulation of Nox and Duox enzymatic activity and expression. Free Radical Biology and Medicine 2007, 43 (3), 319-331.
37. Halliwell, B.; Gutteridge, J. M. C., Role of free radicals and catalytic metal ions in human disease: an overview. Methods Enzymol. 1990, 186, 1-85.
38. Wilshire, J.; Sawyer, D. T., Redox chemistry of dioxygen species. Acct. Chem. Res. 1979, 12, 105-110.
39. Goldstein, B. J.; Mahadev, K.; Wu, X., Redox Paradox: Insulin Action Is Facilitated by Insulin-Stimulated Reactive Oxygen Species With Multiple Potential Signaling Targets. Diabetes 2005, 54 (2), 311-321.
40. den Hertog, J.; Groen, A.; van der Wijk, T., Redox regulation of protein-tyrosine phosphatases. Archives of Biochemistry and Biophysics 2005, 434 (1), 11-15.
41. Rhee, S. G., H2O2, a necessary evil for cell signaling. Science 2006, 312 (June 30), 1882-1883.

Chapter 1 - Introduction
15
42. Rhee, S. G., Measuring H2O2 produced in response to cell surface receptor activation. Nat Chem Biol 2007, 3 (5), 244-246.
16
Chapter 2
Biologically Relevant Properties of Peroxymonophosphate
2.1 The Redox Paradox
As was described in the introduction, there is extensive evidence supporting the
notion that the inactivation of PTP1B during insulin signaling is mediated by the reactive
oxygen species hydrogen peroxide. To review: Exposure of cells to insulin activates
kinases that add phosphoryl groups to tyrosine residues on target proteins.1, 2 The
resulting downstream activity of this phosphorylation is potentiated by a rapid (2-5
minute onset), transient inactivation of the protein tyrosine phosphatases that are
responsible for removal of these phosphoryl groups.3-5 This involves downstream
activation of NADPH oxidases (Nox) that produce an intracellular burst of hydrogen
peroxide.6, 7 Generation of H2O2, in turn, leads to inactivation of select PTPs via
oxidation of their catalytic cysteine thiol residues to the sulfenic acid oxidation state.
Oxidative inactivation of PTPs inside cells is transient because thiol-mediated reduction
of the oxidized cysteine residue slowly regenerates the active form of the enzyme
(Scheme 2.1).

C
re
is
fo
h
w
id
th
p
p
Chapter 2 – Bio
Intere
egulation of
s a rather slu
or in vitro in
alf-life for in
will be approx
In add
dentify smal
hiol-reversib
otential bot
athways.9 H
logically Relev
Scheme 2.1
estingly, des
f PTPs, in vit
uggish PTP i
nactivation o
nactivation
ximately 20
S
dition to the
ll molecules
ble, oxidativ
th as therap
Here, we set
vant Properties
The PTP activ
spite clear
tro experime
inactivator.3
of PTP1B by
of these enz
h.
Scheme 2.2 Str
kinetic conu
that mimic
ve inactivati
peutic agent
out to deve
s of Peroxymon
17
ve site cysteine
evidence fo
ents reveal t
, 8 Specifica
y H2O2 (k =
zymes by a s
ructure of pero
undrum, for
the ability o
ion of PTP
ts and tools
elop a redox
nophosphate
thiolate redox
or its invol
that H2O2, a
ally, based o
= 9.8 M-1s-1
steady-state
oxymonophosp
some applic
of hydrogen
Ps. In gene
s for the s
x regulator o
regulation cyc
lvement in
t physiologi
on the report
1), one can c
concentratio
phate.
cations, it ma
n peroxide to
eral, PTP i
tudy of sig
of PTP activ
cle.
the intrace
ic concentrat
ted rate cons
calculate tha
on of 1 μM
ay be desirab
o effect tran
inactivators
gnal transdu
vity that is
llular
tions,
stants
at the
H2O2
ble to
sient,
have
uction
more

Chapter 2 – Biologically Relevant Properties of Peroxymonophosphate
18
potent than hydrogen peroxide and may account for the previously described kinetic
conundrum. Toward this end, we envisioned that peroxymonophosphate (Scheme 2.2)
might be an exceptional PTP inactivator in which noncovalent association of the
phosphoryl group with the highly conserved phosphate binding pocket found in the active
site of all PTPs would serve to guide the peroxy moiety into position for efficient reaction
with the catalytic cysteine residue. To facilitate consideration of the potential role of
peroxymonophosphate in biological systems we present studies related to the preparation,
characterization, stability and quantitative detection of this agent.
2.2 Preparation of Peroxydiphosphate and Peroxymonophosphate
Peroxymonophosphate is not commercially available, therefore two options were
considered for preparation of the material. We first attempted to use a method for
peroxymonophosphate synthesis described by Zhu and colleagues in which the bilayer
formed between two immiscible solvents (water and carbon tetrachloride) was used to
moderate the vigorous reaction between phosphorous pentoxide (P2O10) and concentrated
hydrogen peroxide (70% in water).10 In this preparation hydrogen peroxide was added
dropwise to a stirred suspension of P2O10 in carbon tetrachloride. Due to the extremely
exothermic nature of the reaction and the severe oxidizing nature of the concentrated
hydrogen peroxide it was necessary to utilize safety measures such as thick safety gloves,
full-face protection and a heavy lexan blast shield. The authors warned that the hydrogen
peroxide solution had to be added slowly, but not too slowly, because the P2O10 would
begin to clump and a violent exotherm would occur. In addition, the authors warned that
the hydrogen peroxide could not be added too quickly, as the reaction would rapidly
accelerate and a violent exotherm would occur. To say that this reaction was tricky to

Chapter 2 – Biologically Relevant Properties of Peroxymonophosphate
19
perform is an understatement. More often than not, our attempts yielded a loud report
and smoking ruins of the vessel contents. Furthermore, and perhaps most important for
the purposes of these studies, this reaction yielded a multitude of phosphorous-bearing
products which were not easily (if at all) separated (Figure 2.1). This mixture would
clearly be unsuitable for careful scientific investigations of the biologically relevant
characteristics of peroxymonophosphate.

Chapter 2 – Biologically Relevant Properties of Peroxymonophosphate
20
Figure 2.1 31P NMR scan (uncalibrated) of the complex product profile generated by the Kadla preparation of peroxymonophosphate. A peak corresponding to phosphate is found at – 1.2 ppm.

Chapter 2 – Biologically Relevant Properties of Peroxymonophosphate
21
An alternative to the “hydrogen peroxide prep” (as we called it) was a two-step
electrolysis-based preparation. The first step was the synthesis and purification of a
peroxydiphosphate potassium salt via electrolysis of an alkaline solution of potassium
phosphate and potassium fluoride.11 The exact nature of the reaction (or reactions) that
occurs during electrolysis to produce peroxydiphosphate has not been reported. It is
clear, however, due to the destruction of rubber-based materials in the general vicinity of
the electrolysis apparatus and a distinctive odor, that the procedure generates a noticeable
quantity of ozone. Persons who attempt to duplicate these experiments should take
appropriate measures to protect items that may be harmed by this diffusible reaction by-
product (perform the reaction in a fume hood).
The potassium salt of peroxydiphosphate was found to be too soluble in water to
reliably isolate from phosphate contaminants, therefore a lithium salt of
peroxydiphosphate was created via a metathesis process to facilitate recrystallization of
pure material.12 A 31P NMR scan of the product of electrolysis after one round of
recrystallization is shown in Figure 2.2.
Peroxydiphosphate is very stable at neutral and alkaline pH. Under acidic
conditions, however, peroxymonophosphate readily undergoes hydrolysis to form
peroxymonophosphate and inorganic phosphate.13 Ultimately, peroxymonophosphate was
made via acid hydrolysis of a solution of lithium peroxymonophosphate in 1 M
perchloric acid at 50oC.12 It is worth noting that we found commercially available
potassium peroxydiphosphate to be unsuitable for this preparation due to the very impure
nature of the material.

Chapter 2 – Biologically Relevant Properties of Peroxymonophosphate
22
Figure 2.2 31P NMR of an alkaline (pH ~ 11), aqueous solution of peroxydiphosphate (P2O10) after one recrysallization from methanol/water. The peaks are assigned as follows: peroxydiphosphate: 7.66 ppm. Phosphate : 3.91 ppm.

Chapter 2 – Biologically Relevant Properties of Peroxymonophosphate
23
2.3 Quantification of Solutions of Peroxydiphosphate and Peroxymonophosphate by 31P NMR
Quantification of reactive oxygen species such as hydrogen peroxide and
peroxymonophosphate was typically achieved through lengthy and cumbersome titrations
with various indicating agents such as iodide and ferroin.10 We found that while reaction
between a presumed solution of peroxymonophosphate and iodide was useful to provide
evidence of a reactive oxygen species, it was neither the easiest nor most accurate way
for quantification of peroxymonophosphate itself.
We envisioned that quantitative 31P-NMR would be an ideal technique for
analysis of phosphorous-containing species. It was evident from literature precedent,
however, that careful consideration of the instrumental parameters under which 31P-NMR
spectra were taken was necessary for accurate quatification.14 The most important, in this
case, was the “relaxation time” parameter, or D1 as noted on the Bruker 250 MHz output.
Errors of approximately 12-20% were observed when the phosphorous nuclei were not
allowed to return to ground state conditions before the cyclical 30o RF excitation pulse.
The phosphorous species in which we were interested apparently had a comparatively
long relaxation time (~ 12.5 s) compared to “standard” instrumental parameters (~ 1.5 s).
In addition to instrument parameters, a proper internal standard was needed for accurate
quantification. We chose diphenyl phosphate for the following reasons: (1) it contains
one single-resonance phosphorous nuclei (2) it is stable (3) it is commercially available
(4) it is inexpensive.
Once the proper NMR parameters were determined, the technique was used to
analyze solutions of peroxydiphosphate and peroxymonophosphate. It is important to

Chapter 2 – Biologically Relevant Properties of Peroxymonophosphate
24
note that the chemical shift of each species was highly pH dependent. When diluted 1:2
with a 40 mM solution of diphenyl phosphate in water (0.5 M HClO4 final concentration,
pH < 1), and using 85% phosphoric acid as an external instrument zero,
peroxymonophosphate shows a 31P-NMR resonance at 4.27 ppm. Figure 2.3.

Chapter 2 – Biologically Relevant Properties of Peroxymonophosphate
25
Figure 2.3 31P NMR of a 200 mM peroxydiphosphate solution treated with 6M HClO4 for 1h at 50oC. Internal standard diphenyl phosphate was added to a concentration of 20 mM. The peaks are assigned as follows: Peroxymonophosphate 4.27 ppm, peroxydiphosphate 3.13 ppm, phosphate 0.54 ppm, diphenylphosphate (internal standard) -8.35 ppm.

Chapter 2 – Biologically Relevant Properties of Peroxymonophosphate
26
2.4 Stability of Peroxymonophosphate in Buffers
Due to the fact that there is little, if any, literature precedent for the use of
peroxymonophosphate in life science type experiments we examined its stability in the
presence of several commonly used buffers and biologically relevant substrates (Figure
2.4). We find that peroxymonophosphate is quite stable in HClO4 (100 mM) over the
course of 1 h at 24oC. Similarly, peroxymonophosphate is stable in sodium phosphate
(100 mM, pH 7) and bis-tris buffer (100 mM pH 7) under these conditions. In contrast,
under identical conditions, the agent is completely destroyed upon incubation with
HEPES buffer. This is not entirely unexpected, for it has been reported that the
piperazine moiety of Good’s Buffers can be N-oxidized by hydrogen peroxide.15
Similarly, addition of the biological thiol glutathione (10 mM) to a sodium phosphate
buffered solution leads to complete decomposition of the peroxymonophosphate. Again,
this is not surprising; the presence of biological thiols such as glutathione in cells is a
defense mechanism against oxidative stress.16, 17 Furthermore, the sulfide-containing
amino acid methionine also destroys peroxymonophosphate. Tryptophan and glycine
lead to only small amounts of decomposition. Addition of FeSO4 (10 mM) results in a
60% decrease in the concentration of analyte. Neither 1% dimethyl sulfoxide (140 mM)
nor the hydrogen peroxide-destroying enzyme catalase had significant effects on the
stability of peroxymonophosphate under these conditions.

C
2
p
su
fi
b
p
T
li
Chapter 2 – Bio
Figure 2.4 T
.5 Conclus
In su
eroxymonop
ubstantially
ind that the
iochemicals
erchloric aci
These results
ife of peroxy
logically Relev
The stability of
sions
ummary, w
phosphate un
more reacti
e selectivity
, in many re
id, and the c
s are consiste
ymonophosp
vant Properties
f peroxymonop
we have co
nder biologi
ve than hyd
y of perox
egards, mirro
commonly us
ent with tho
phate to be 12
s of Peroxymon
27
phosphate in th
onducted th
ically releva
drogen perox
xymonophos
ors that of H
sed biologic
ose of Battag
2.5 h in 4 M
nophosphate
he presence of
he first sur
ant condition
xide as an o
phate towa
H2O2. Perox
cal buffers so
glia and Edw
M HClO4 (rate
biologically re
rvey of th
ns. Peroxym
oxidant.18, 19
ards reaction
xymonophos
odium phosp
wards who r
e, k = 1.54 X
elevant additive
he reactivity
monophospha
Nonetheless
ns with va
phate is stab
phate and bis
reported the
X 10-5 s-1).12
es.
y of
ate is
s, we
arious
ble in
s-tris.
half-
Chapter 2 – Biologically Relevant Properties of Peroxymonophosphate
28
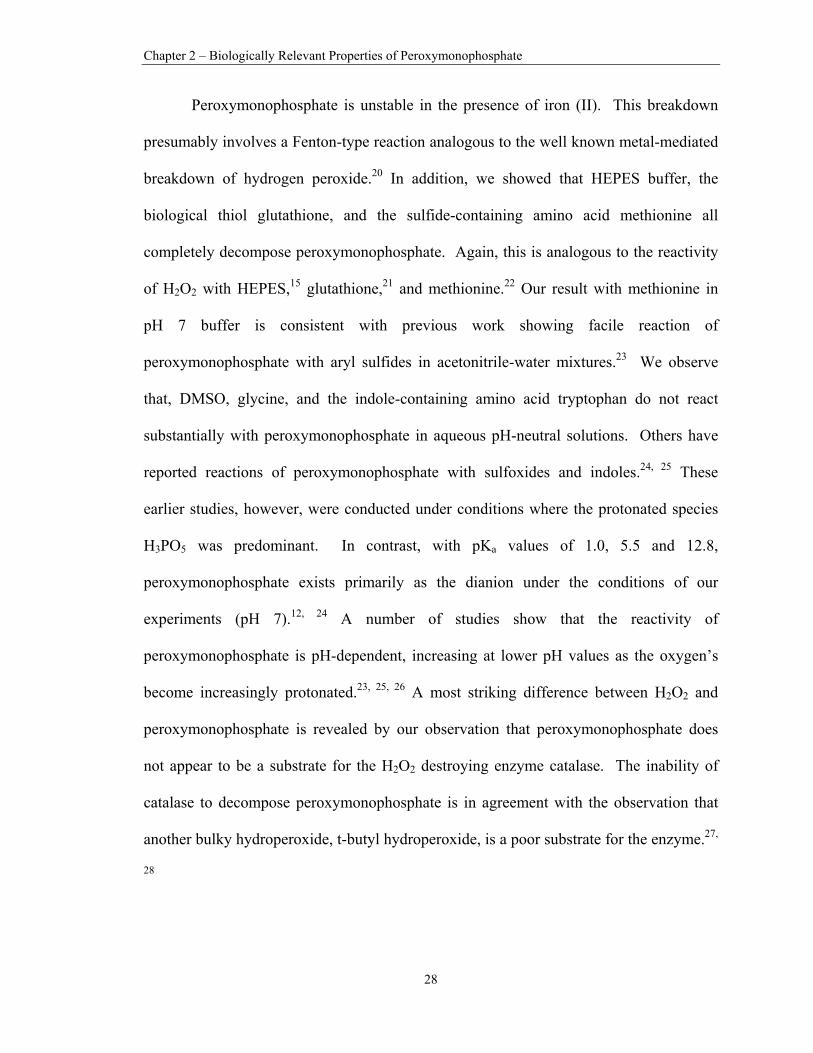
Peroxymonophosphate is unstable in the presence of iron (II). This breakdown
presumably involves a Fenton-type reaction analogous to the well known metal-mediated
breakdown of hydrogen peroxide.20 In addition, we showed that HEPES buffer, the
biological thiol glutathione, and the sulfide-containing amino acid methionine all
completely decompose peroxymonophosphate. Again, this is analogous to the reactivity
of H2O2 with HEPES,15 glutathione,21 and methionine.22 Our result with methionine in
pH 7 buffer is consistent with previous work showing facile reaction of
peroxymonophosphate with aryl sulfides in acetonitrile-water mixtures.23 We observe
that, DMSO, glycine, and the indole-containing amino acid tryptophan do not react
substantially with peroxymonophosphate in aqueous pH-neutral solutions. Others have
reported reactions of peroxymonophosphate with sulfoxides and indoles.24, 25 These
earlier studies, however, were conducted under conditions where the protonated species
H3PO5 was predominant. In contrast, with pKa values of 1.0, 5.5 and 12.8,
peroxymonophosphate exists primarily as the dianion under the conditions of our
experiments (pH 7).12, 24 A number of studies show that the reactivity of
peroxymonophosphate is pH-dependent, increasing at lower pH values as the oxygen’s
become increasingly protonated.23, 25, 26 A most striking difference between H2O2 and
peroxymonophosphate is revealed by our observation that peroxymonophosphate does
not appear to be a substrate for the H2O2 destroying enzyme catalase. The inability of
catalase to decompose peroxymonophosphate is in agreement with the observation that
another bulky hydroperoxide, t-butyl hydroperoxide, is a poor substrate for the enzyme.27,
28

Chapter 2 – Biologically Relevant Properties of Peroxymonophosphate
29
2.6 Experimental Procedures
Materials and Methods
Reagents were purchased from the following suppliers: HEPES (#H3375),
potassium fluoride (#402931), potassium phosphate (# P0662), diphenyl phosphate
(#850608), lithium perchlorate trihydrate (# 205303), phosphorous pentoxide (# 21-470-
1), carbon tetrachloride (# 319961), Bis-Tris (#B9754), iron (II) chloride tetrahydrate (#
380024), DMSO (# 276855), glutathione (reduced) (# G4251), tryptophan (# T0254),
Methionine (# M9625), Glycine (# G6201), 85% phosphoric acid (# 345245), Potassium
hydroxide (# P5958), Sigma-Aldrich (St. Louis, MO). 70% hydrogen peroxide was a kind
gift from the Arkema, Inc., Philadelphia, PA. Absolute ethanol was obtained from
Pharmco-AAPER, Brookfield, CT.
Lithium Peroxydiphosphate. Lithium peroxydiphosphate was made according to the
methods described by Griffith and Battaglia.11, 12 Sixty mL of distilled deionized water,
33.75 g potassium dihydrogen ortho-phosphate (4.12 M), 22.75 g potassium hydroxide
(6.6 M), and 13.5 grams potassium fluoride (3.9 M) was added to a 100 mL three-necked
water-jacketed flask. An anode constructed of approximately 30 cm of platinum wire
wrapped in a tight spiral, and cathode of approximately 10 cm of straight platinum wire
were arranged at opposite sides of the flask. The flask was cooled to 10oC with a
recirculating water chiller, flooded with a gentle stream of nitrogen, and subjected to six
hour cycles of electrolysis (6V, 325 mA) on three consecutive days, punctuated with 18 h
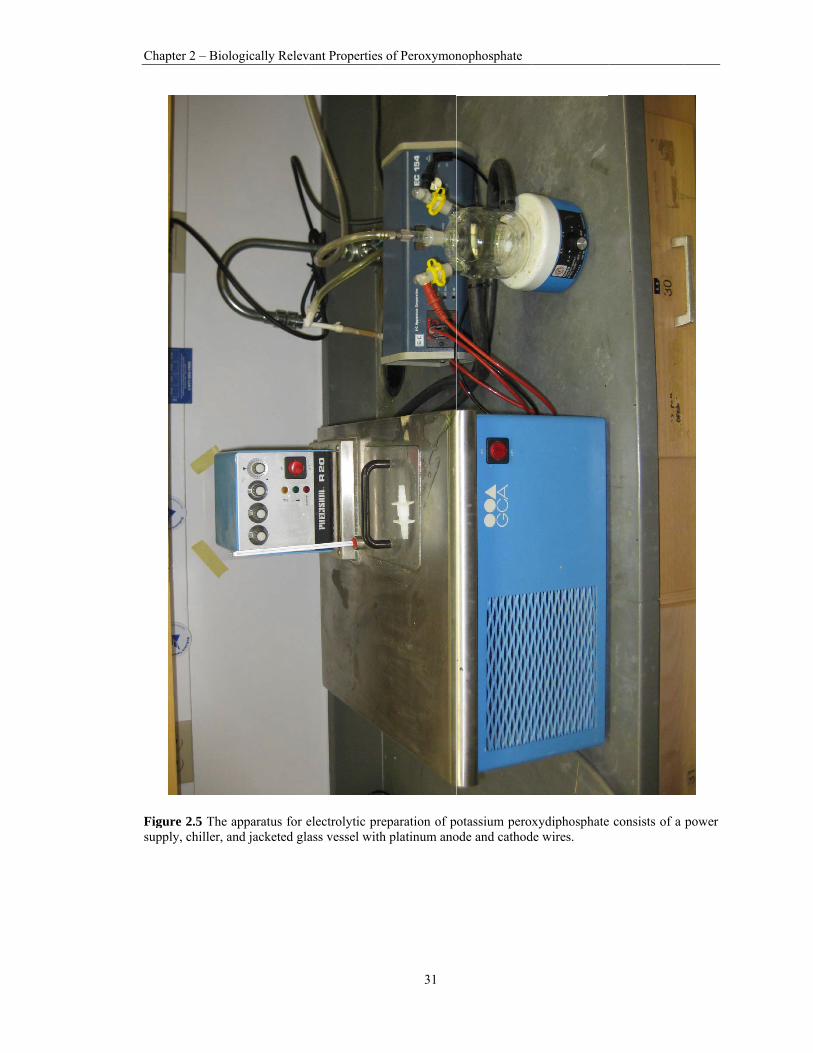
“rest” periods. An image of the electrolysis equipment is shown in Figures 2.5 and 2.6.
Rest periods allowed the peroxymonophosphate created during electrolysis to degrade,

Chapter 2 – Biologically Relevant Properties of Peroxymonophosphate
30
leaving the more stable peroxydiphosphate as a fine white precipitate. The resulting solid
was collected with vacuum filtration, and re-dissolved in 100 mL of distilled deionized
water. An aqueous solution of lithium perchlorate (0.54 g/mL) was slowly added to the
filtrate solution dropwise with stirring. A dense white precipitate formed immediately.
After about 10 mL was added, the precipitate was removed by vacuum filtration, and a
few more drops of lithium perchlorate were added to the filtrate to ensure complete
precipitation of the lithium salts. The clear filtrate was warmed to 45oC, and ~ 60 mL
methanol was added rapidly with stirring. A fine white precipitate slowly formed. The
product was collected by vacuum filtration, subjected to two more water/methanol
precipitation steps, then air-dried. An aqueous solution of the product (resulting pH ~ 11)
was analyzed with 31P NMR calibrated with 100% phosphoric acid. Two peaks were
observed in addition to the diphenylphosphate internal standard: 3.9 ppm corresponding
to phosphate and a peak at 7.6 ppm corresponding to peroxydiphosphate (Figure 2.2).
C
Fsu
Chapter 2 – Bio
igure 2.5 The upply, chiller, a
logically Relev
apparatus for and jacketed gl
vant Properties
electrolytic prlass vessel with
s of Peroxymon
31
reparation of ph platinum ano
nophosphate
otassium peroxode and cathod
xydiphosphatede wires.
e consists of a
power

Chapter 2 – Biologically Relevant Properties of Peroxymonophosphate
32
Figure 2.6 Close-up of jacketed electrolysis vessel for preparation of peroxymonophosphate.

Chapter 2 – Biologically Relevant Properties of Peroxymonophosphate
33
Peroxymonophosphate (PMP) (1). An aqueous solution of PMP was made according
to the method described by Battaglia.12 One volume of 6 N perchloric acid was combined
with 5 volumes of a ~200 mM aqueous solution of lithium peroxydiphosphate, then
heated to 50oC for 1 h. Phosphorous NMR of the resulting solution (pH < 1) showed two
peaks: one at 0.6 ppm corresponding to phosphate, one at 4.1 ppm corresponding to
PMP. A sample removed after 15 min of heating showed three peaks: 0.6 ppp
(phosphate), 2.9 ppm (peroxydiphosphate) and 4.3 ppm (PMP). The exact
peroxymonophosphate concentration was determined with phosphorous NMR by
combining 0.5 mL of product solution with 0.5 mL of an aqueous 40 mM solution of
diphenylphosphate internal standard. The molecular mass of peroxymonophosphate,
H3PO5 (M+H)+ = 114.98 was confirmed with electrospray tandem mass spectroscopy
(ESI/MS/MS) (data not shown). Typical concentrations of the peroxymonophosphate
solutions prepared with this method were ~130 mM and contained a comparable
concentration of phosphate. PMP stock solutions in 1M perchloric acid were stored at -
20oC, and are stable for at least four weeks. For enzymatic assays, stock solutions were
thawed, diluted with distilled, de-ionized water then used immediately. It is important to
note that inorganic phosphate is a known reversible inhibitor of PTPs. At the
concentrations present in the assays described here, however, there is no effect on
enzyme activity. All of the activity of these solutions can be attributed to
peroxymonophosphate.
Stability of Peroxymonophosphate under Biologically Relevant Conditions. To
prepare the solutions for quantitative analysis, peroxymonophosphate (~ 120 mM in 1M
HClO4) was combined (10 mM final concentration) with various additives and the pH

Chapter 2 – Biologically Relevant Properties of Peroxymonophosphate
34
was adjusted with concentrated NaOH. Stock solutions of FeSO4, GSH, DMSO,
Catalase, glycine, methionine and tryptophan were first prepared in water, then added to
the peroxymonophosphate solution at the proper ratio for the described final
concentration. After standing for 1h at room temperature (22oC), the % HPO52-
remaining was determined by quantitative 31P NMR (peak area) using a freshly made
solution of HPO52- in 100 mM HClO4 as a control. Quantitative 31P NMR spectra were
collected with a Bruker ARX-250 instrument equipped with a 5mm QMP probe utilizing
the following parameters: Inverse gated acquisition-30o pulse, 12.5 s. relaxation delay
(D1), 1.47 s. acquisition, 16 scan average. These are similar to previously reported
parameters for quantitative analysis of phosphoryl containing molecules.29 Values shown
in Figure 2.4 are averages of three independent experiments and the error bars depict the
standard error in the measurements.

Chapter 2 – Biologically Relevant Properties of Peroxymonophosphate
35
References
1. Majeti, R.; Weiss, A., Regulatory mechanisms for receptor protein tyrosine phosphatases. Chem. Rev. 2001, 101, 2441-2448.
2. Gshwind, A.; Fischer, O. M.; Ullrich, A., The discovery of tyrosine kinases: targets for cancer therapy. Nature Rev. Cancer 2004, 4, 361-370.
3. Denu, J. M.; Tanner, K. G., Specific and Reversible Inactivation of Protein Tyrosine Phosphatases by Hydrogen Peroxide: Evidence for a Sulfenic Acid Intermediate and Implications for Redox Regulation. Biochemistry 1998, 37 (16), 5633-5642.
4. Mahadev, K.; Zilbering, A.; Zhu, L.; Goldstein, B. J., Insulin-stimulated Hydrogen Peroxide Reversibly Inhibits Protein-tyrosine Phosphatase 1B in Vivo and Enhances the Early Insulin Action Cascade. J. Biol. Chem. 2001, 276 (24), 21938-21942.
5. Tonks, N. K., Redox Redux: Revisiting PTPs and the Control of Cell Signaling. Cell 2005, 121 (5), 667-670.
6. Rhee, S. G., H2O2, a necessary evil for cell signaling. Science 2006, 312 (June 30), 1882-1883.
7. Mahadev, K.; Motoshima, H.; Wu, X.; Ruddy, J. M.; Arnold, R. S.; Cheng, G.; Lambeth, J. D.; Goldstein, B. J., The NAD(P)H oxidase homolog Nox4 modulates insulin-stimulated generation of H2O2 and plays an integral role in insulin signal transduction. Mol. Cell Biol. 2004, 24 (5), 1844-1854.
8. Ross, S. H.; Lindsay, Y.; Safrany, S. T.; Lorenzo, O.; Villa, F.; Toth, R.; Clague, M. J.; Downes, C. P.; Leslie, N. R., Differential redox regulation within the PTP superfamily. Cellular Signalling 2007, 19 (7), 1521-1530.
9. Johnson, T. O.; Ermolieff, J.; Jirousek, M. R., Protein tyrosine phosphatase 1B inhibitors for diabetes. Nature Reviews Drug Discovery 2002, 1 (9), 696.
10. Tian Zhu, H.-m. C., John F. Kadla, A new method for the preparation of peroxymonophosphoric acid. Can. J. Chem. 2003, 81 (2), 156-160.
11. Griffith, W. P.; Powell, R. D.; Skapski, A. C., Alkali metal and ammonium peroxodiphosphates: Preparation, vibrational and 31P NMR spectra, and the X-ray crystal structure of ammonium peroxodiphosphate dihydrate (NH4)4[P2O8]∑2H2O. Polyhedron 1988, 7 (14), 1305-1310.
12. Battaglia, C. J.; Edwards, J. O., The Dissociation Constants and the Kinetics of Hydrolysis of Peroxymonophosphoric Acid. Inorg. Chem. 1965, 4 (4), 552-558.
13. Crutchfield, M. M.; Edwards, J. O., The Acidity and Complexes of Peroxydiphosphoric Acid. J. Am. Chem. Soc. 1960, 82 (14), 3533-3537.

Chapter 2 – Biologically Relevant Properties of Peroxymonophosphate
36
14. Lerman, L. S., Structural considerations in the interaction of DNA and acridines. J. Mol. Biol. 1961, 3, 18-30.
15. Zhao, G.; Chasteen, N. D., Oxidation of Good's buffers by hydrogen peroxide. Analytical Biochemistry 2006, 349 (2), 262-267.
16. Meister, A.; Anderson, M. E., Glutathione. Ann. Rev. Biochem. 1983, 52, 711-760.
17. Chasseaud, L. F., The role of glutathione and glutathione S-transferase in the metabolism of chemical carcinogens and other electrophilic agents. Adv. Cancer Res. 1979, 29, 175-274.
18. LaButti, J. N.; Chowdhury, G.; Reilly, T. J.; Gates, K. S., Redox Regulation of Protein Tyrosine Phosphatase 1B by Peroxymonophosphate (=O3POOH). J. Am. Chem. Soc. 2007, 129 (17), 5320-5321.
19. Halliwell, B., An attempt to demonstrate a reaction between superoxide and hydrogen peroxide. FEBS Lett. 1976, 72 (1), 8-10.
20. Halliwell, B.; Gutteridge, J. M. C., Role of free radicals and catalytic metal ions in human disease: an overview. Methods Enzymol. 1990, 186, 1-85.
21. Winterbourn, C. C.; Metodiewa, D., Reactivity of biologically important thiol compounds with superoxide and hydrogen peroxide. Free Radical Biology and Medicine 1999, 27 (3-4), 322-328.
22. Richardson, D. E.; Regino, C. A. S.; Yao, H.; Johnson, J. V., Methionine oxidation by peroxymonocarbonate, a reactive oxygen species formed from CO2/bicarbonate and hydrogen peroxide. Free Radical Biology and Medicine 2003, 35 (12), 1538-1550.
23. Thenraja, D.; Subramaniam, P.; Srinivasan, C., Kinetics and mechanism of oxygenation of aromatic sulfides and arylmercaptoacetic acids by peroxomonophosphoric acid. Tetrahedron 2002, 58 (21), 4283-4290.
24. Suthakaran, R.; Rajagopal, S.; Srinivasan, C., Mechanism of oxygenation of aryl methyl and diaryl sulphoxides by peroxomonophosphoric acid. Tetrahedron 2001, 57 (7), 1369-1374.
25. Raed Ghanem, C. C., Maria A. Munoz, Pilar Guardado, Manuel Balon, Oxidation of 2,3-dimehylindole by peroxyphosphates. Journal of the Chemical Society, Perkin Transactions 2 1996, (10), 2197-2202.
26. Fernando Secco, M. V., Mechanisms of peroxide reactions: kinetics of reduction of peroxo-monosulphuric and peroxomonophosphoric acids by iodide ion. Journal of the Chemical Society, Dalton Transactions 1976, 1410-1414.

Chapter 2 – Biologically Relevant Properties of Peroxymonophosphate
37
27. Hara, I.; Ichise, N.; Kojima, K.; Kondo, H.; Ohgiya, S.; Matsuyama, H.; Yumoto, I., Relationship between the Size of the Bottleneck 15 Å from Iron in the Main Channel and the Reactivity of Catalase Corresponding to the Molecular Size of Substrates. Biochemistry 2007, 46 (1), 11-22.
28. Pichorner, H.; Jessner, G.; Ebermann, R., tBOOH Acts as a Suicide Substrate for Catalase. Archives of Biochemistry and Biophysics 1993, 300 (1), 258-264.
29. Lerman, C. L.; Cohn, M., 31P NMR quantitation of the displacement of equilibria of arginine, creatine, pyruvate, and 3-P-glycerate kinase reactions by substitution of sulfur for oxygen in the beta phosphate of ATP. J. Biol. Chem. 1980, 255 (18), 8756-8760.

38
Chapter 3
Inactivation of PTPs by Peroxymonophosphate
3.1 Introduction and Objectives
Having successfully synthesized and characterized peroxymonophosphate, our
focus turned toward elucidating its effects on protein tyrosine phosphatase enzymatic
activity. Our goal was to evaluate whether or not peroxymonophosphate possessed the
properties necessary for an intracellular signaling agent. These properties include: rapid
active site directed inactivation (rather than inhibition) by low concentrations of agent
that is reversible by addition of thiol.
The rationale for this experimentation was introduced in Chapter 1. To recap, if
one considers that the expected intracellular concentrations of the known signaling agent
hydrogen peroxide are in the high nanomolar to low micromolar range1, and that
measured PTP inactivation kinetics with hydrogen peroxide are slow2, the time in which
PTPs could be inactivated is not consistent with observed time frames for the resulting
physiologic effects. For example, when cells are stimulated with insulin, enhanced
glucose uptake occurs within 5 minutes, the t ½ of PTP1B exposed to a 1 μM steady state
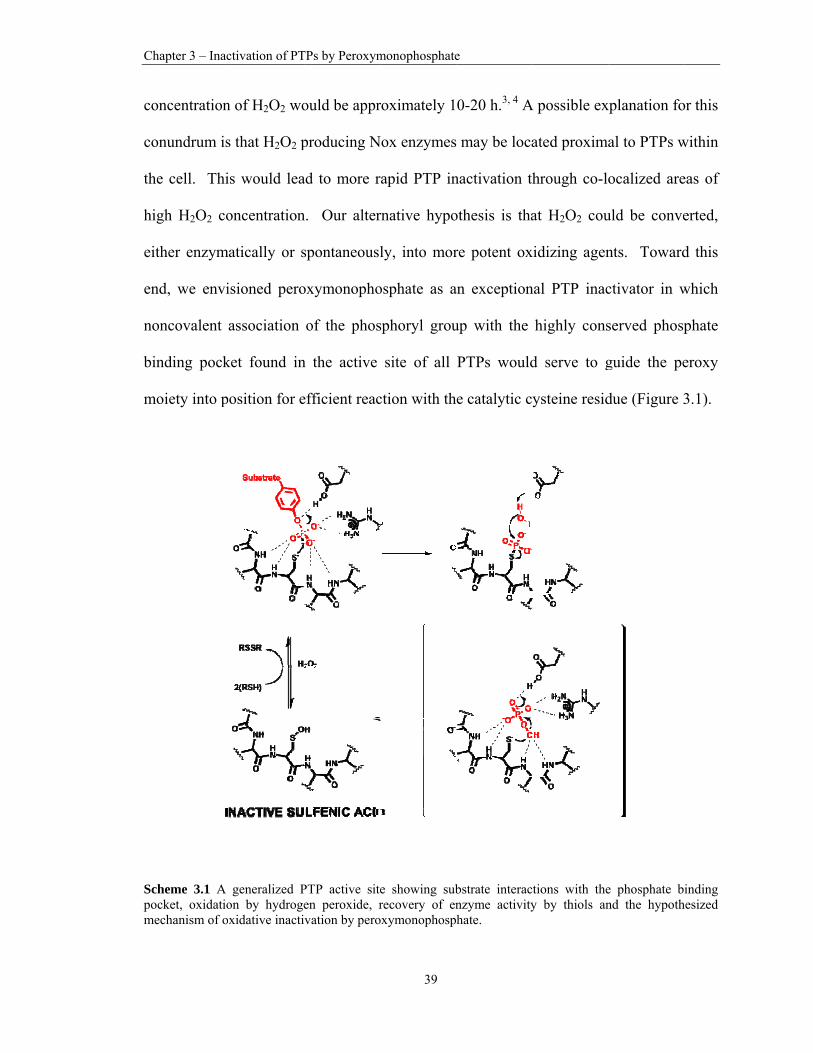
C
co
co
th
h
ei
en
n
b
m
Scpom
Chapter 3 – Inac
oncentration
onundrum is
he cell. Thi
igh H2O2 co
ither enzym
nd, we envi
oncovalent
inding pock
moiety into p
cheme 3.1 A ocket, oxidatio
mechanism of o
ctivation of PT
n of H2O2 wo
s that H2O2 p
is would lea
oncentration
matically or s
isioned pero
association
ket found in
position for e
generalized Pon by hydrogexidative inacti
TPs by Peroxym
ould be appr
producing N
ad to more r
n. Our alter
spontaneousl
oxymonopho
of the phos
n the active
efficient reac
PTP active siteen peroxide, rvation by pero
monophosphate
39
roximately 1
Nox enzymes
rapid PTP in
rnative hypo
ly, into mor
osphate as a
sphoryl grou
site of all
ction with th
e showing subrecovery of en
oxymonophosp
e
0-20 h.3, 4 A
may be loca
nactivation th
othesis is tha
re potent ox
an exception
up with the
PTPs would
e catalytic c
bstrate interacnzyme activityhate.
A possible ex
ated proxima
hrough co-lo
at H2O2 cou
xidizing agen
nal PTP inac
highly cons
d serve to g
ysteine resid
tions with they by thiols an
xplanation fo
al to PTPs w
ocalized are
uld be conve
nts. Toward
ctivator in w
served phosp
guide the pe
due (Figure 3
e phosphate bnd the hypoth
or this
within
eas of
erted,
d this
which
phate
eroxy
3.1).
inding hesized

C
in
en
(a
3
is
o
g
co
id
th
TPT
Chapter 3 – Inac
Specif
nactivate a
nzymatic stu
a.a. 1-322) a
.2 Express
PTP1B
solated, havi
f the more w
oals of study
ould be rev
dentified as a
he enzyme a
Table 3.1 AminTP active site m
ctivation of PT
fically, we
protein tyr
udies describ
as an archety
sion and Pu
B was one
ing been cha
well-characte
ying PTP re
ersibly inac
an anti-diabe
good candid
no acid sequenmotif of HCX5
TPs by Peroxym
wanted to
osine phosp
bed here, w
ypal member
urification
of the first
aracterized in
erized and e
edox regulat
tivated by h
etic pharmac
date for the s
nce of the PTP5R(S/T) is high
monophosphate
40
compare th
phatase with
we employed
r of the PTP
of PTP1B
t cysteine-d
n the late 19
extensively s
tion, Tanner
hydrogen pe
ceutical drug
study of PTP
1B catalytic suhlighted in red.
e
he ability o
h that of h
d the catalyt
family of en
dependent pr
80’s and ear
studied PTP
and Denu r
eroxide.2 Fu
g target. To
P redox-regu
ubunit employ
of peroxymo
hydrogen pe
tic subunit o
nzymes.
rotein tyrosi
rly 1990’s.5 A
s. In synch
reported in 1
rthermore, P
ogether, thes
ulation.
ed in these stu
onophospha
eroxide. In
of human PT
ine phospha
As such, it i
hronicity with
1998 that PT
PTP1B had
e attributes m
udies. The cons
ate to
n the
TP1B
atases
s one
h our
TP1B
been
made
served

Chapter 3 – Inactivation of PTPs by Peroxymonophosphate
41
While the native human PTP1B gene product is ~ 50 kDa in mass, upon isolation
from Escherichia coli it was observed to rapidly degrade to a product of approximately 40
kDa mass.6 Neither addition of protease inhibitors nor use of protease deficient
expression strains halted degradation. In addition, human PTP1B purified from placental
tissues was found to have a molecular weight of 37 kDa. Finally, a truncated version of
PTP1B has improved solubility over the native version. Taken together, these are the
reasons a majority of published experiments carried out with purified PTP1B utilize what
is known as the “catalytic subunit” of the enzyme, which corresponds to amino acids 1-
322 and has a monoisotopic mass of 37,345.66 Da (Table 3.1). We were fortunate to
obtain a clone of the PTP1B catalytic subunit as a generous gift from the lab of Nicholas
K. Tonks at the Cold Spring Harbor Laboratory New York.
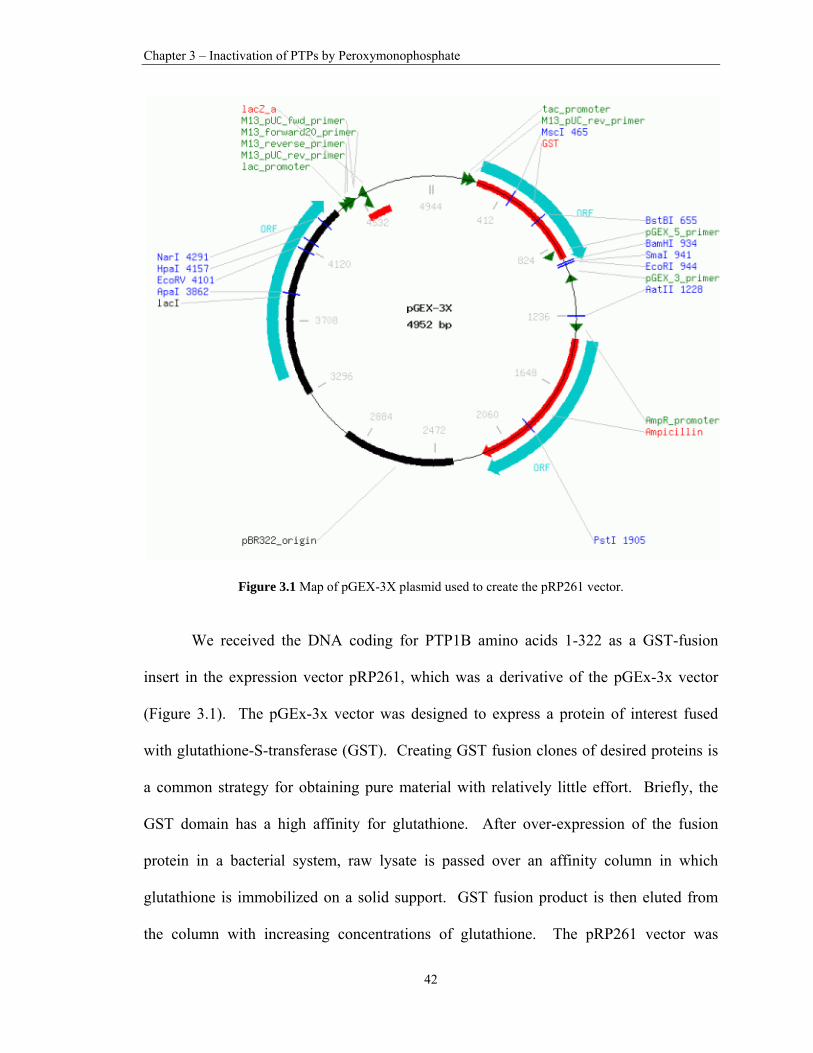
Chapter 3 – Inactivation of PTPs by Peroxymonophosphate
42
Figure 3.1 Map of pGEX-3X plasmid used to create the pRP261 vector.
We received the DNA coding for PTP1B amino acids 1-322 as a GST-fusion
insert in the expression vector pRP261, which was a derivative of the pGEx-3x vector
(Figure 3.1). The pGEx-3x vector was designed to express a protein of interest fused
with glutathione-S-transferase (GST). Creating GST fusion clones of desired proteins is
a common strategy for obtaining pure material with relatively little effort. Briefly, the
GST domain has a high affinity for glutathione. After over-expression of the fusion
protein in a bacterial system, raw lysate is passed over an affinity column in which
glutathione is immobilized on a solid support. GST fusion product is then eluted from
the column with increasing concentrations of glutathione. The pRP261 vector was

Chapter 3 – Inactivation of PTPs by Peroxymonophosphate
43
created by inserting a poly-linker sequence into pGEX-3X immediately after the GST
fusion domain. This poly-linker sequence contained several extra restriction
endonuclease sites, and a Factor Xa cleavage site for the translated GST fusion protein.
The cDNA clone of truncated PTP1B was treated with NcoI/XbaI, and inserted into
pRP261 treated with NcoI and SpeI to create the pRP-37k-1B expression vector. With
the added poly-linker, the GST domain of purified PTP1B-GST fusion protein could be
removed after expression and purification by treatment with the protease Factor Xa.
Gates Lab student Goutham Chowdhury performed the initial purification
experiments with the PTP1B/GST fusion protein. Expression of the fusion protein in E.
coli was apparently very good, as judged by SDS/PAGE. Purification of protein from
lysate went smoothly and yielded a 66 kDa protein of good purity. Unfortunately,
repeated attempts at cleaving the GST tag from PTP1B with Factor Xa were
unsuccessful. We were reluctant to embark on studies designed to assess PTP1B
inactivation kinetics with a fusion protein that may alter our results, so the decision was
made to construct a new expression vector without the GST tag.

Chapter 3 – Inactivation of PTPs by Peroxymonophosphate
44
The PTP1B-37kDa domain was excised from the pRP-37k-1B vector with EcoR1
and Nco1. This liberated a ~ 1 kB DNA fragment was then ligated into similarly digested
pETDuet-1 expression vector (Figure 3.2) The rationale for using pETDuet-1 was simple:
this particular vector had matching EcoRI and NcoI restriction sites for the PTP1B insert.
Once the PTP1B-37kDa expression vector (without the GST tag) was created, a new
clone was selected for expression in Tuner DE3 p-lac I cells. We refer to the 37 kDa
product of this system as simply “PTP1B”. The expression and purification of the new
PTP1B clone was straightforward and followed the protocol described by Puius and
Figure 3.2 Map of the pETDuet-1 vector that was used to express the PTP1B 37 kDa catalytic subunit.

C
co
L
Fly
3
ac
P
su
w
bu
(i
Chapter 3 – Inac
olleagues.7 T
L bacterial cu
igure 3.3 SDSysate. Lane 4 =
.3 Preparaoxidatio
PTPs
ctivity even
TP1B active
usceptible to
would, natura
ut has been
incorrectly)
ctivation of PT
This prepara
ulture (Figur
S-PAGE analy= column flow
ation of PTon chemistr
in solution,
n without ad
e site cystein
o auto oxidat
ally, yield in
investigated
that thiolate
TPs by Peroxym
ation yielded
re 3.3).
ysis of a PTP1Bthrough. Lane
TP1B For Iry)
if not caref
ddition of an
ne thiol exis
tion. Autoox
nactive enzym
d and repor
e anions reac
monophosphate
45
d approximat
B protein prepe 6,7,8 = 1, 2, 4
nactivation
fully treated
n oxidizing
sts primarily
xidation of t
me. The me
rted by Misr
ct directly w
e
tely 15 mg o
paration. Lane4 μg of PTP1B
n Assays (R
d, will within
agent. Thi
y in the charg
the active sit
echanism of
ra and colle
with oxygen
f ~95% pure
es 1,10 = standB.
RSH remov
n minutes lo
s is due to
ged, anionic
te cysteine th
f this reaction
eagues. 8 It i
gas dissolv
e PTP1B wit
dard. Lane 2
val, auto-
ose their cata
the fact tha
c state it is h
hiolate of PT
n is not intu
is often assu
ved in soluti
th a 3
= cell
alytic
at the
highly
TP1B
uitive,
umed
on to

Chapter 3 – Inactivation of PTPs by Peroxymonophosphate
46
yield sulfenic acids. The parallel spin states of the unpaired electrons in diradical triplet
oxygen, however, do not match with the paired, opposing spin states of the thiolate anion
free electrons. Such a reaction, under physiologic-like conditions, would occur very
slowly, if at all. In order for oxygen to react with thiolates in solution, either an unpaired
electron has to be “moved” to an excited state by irradiation with UV light, or a “redox
carrier”, such as a transition metal, must be employed. Due to the fact that high intensity
UV light is destructive to most components of cellular systems, the logical causative
agent for autooxidation of thiolate anions in solution would be dissolved metals. In
essence, then, reaction of thiolate anions with molecular oxygen in solution is mediated
by transition metals such as iron and copper (Scheme 3.2).
Scheme 3.2 The mechanisms of metal-mediated thiolate autooxidation, adapted from reference 4.

Chapter 3 – Inactivation of PTPs by Peroxymonophosphate
47
To prevent and/or mitigate oxidation, purified enzyme is stored at -80oC in the
presence of metal chelators (either ethylenediaminetetracetic acid or
diethylenetriaminepentaacetic acid) and small molecule thiols such as dithiothreitol or Β-
mercaptoethanol (~1 mM). In order to conduct experiments designed to observe
oxidative inactivation of the enzyme by various reactive oxygen species, however, thiol
additives must be removed from the enzyme stock solutions. If this is not accomplished,
added reactive oxygen species could be quenched by the presence of these thiols, and
PTPs active site cysteine sulfenic acids would be readily converted back to the
catalytically active cystine thiolate form.
Perhaps the most common method for removing unwanted small molecule
components from protein solutions is dialysis. Removal of thiol additives from PTP
stock solutions via dialysis presents a challenge in several ways. The extended time
required for proper dialysis (~24 h) results in loss of enzyme activity through auto-
oxidation. A viable, but cumbersome solution to loss of enzyme activity during dialysis
through autooxidation is to perform dialysis in an anaerobic chamber. Another potential
issue is that complete recovery of precious enzyme dialysate from dialysis apparatus is
difficult, if not impossible, when dealing with the low volumes of enzyme solutions that
are typically used during experimentation (10-100 μL of solution at ~ 15 μM).
We felt that the most efficient way, in both in time and resources, to remove small
molecule thiols from enzyme stock solutions is using buffer exchange columns. These
are small plastic columns filled with either common size-exclusion resin such as
Sephadex G-25, or proprietary resins. The volume of gel depends on the size of the
column and the size of the column is related to the volume of enzyme solution that can be

C
u
pr
th
co
to
th
h
cr
cy
ob
Ftrth
Chapter 3 – Inac
sed. We ty
roprietary re
An im
hrough a buf
olumn is use
o the concen
he concentra
ad to be em
reated that p
ysteine resi
bserved.
igure 3.4 Reseatment with s
he third column
ctivation of PT
ypically use
esin. These c
mportant not
ffer exchang
ed there is st
ntration of e
ation of thiol
mployed. W
proved usefu
due for sev
sidual thiol prsequential Piern was approxim
TPs by Peroxym
ed Pierce Ze
columns we
te for using
ge column re
till significan
nzyme being
l to nanomo
With this met
ul for investi
veral hours
resent in a 0.1rce Zeba 0.5 mmately 700 nan
monophosphate
48
eba desaltin
re rated for u
these colum
emoves appr
nt (i.e.: micr
g used (~ 15
lar levels, th
thodology, a
igating oxida
before not
1 mL volume mL buffer exchnomolar.
e
ng columns
use with 10-
mns is that e
roximately 9
omolar) thio
5 μM). Fig
hree sequent
a “thiol-free
ative reactio
ticeable loss
of buffer conhange columns
filled with
-110 μL of e
ach pass of
90-95% of th
ol remaining
ure 3.4 show
tial buffer ex
e” enzyme s
ons of the ac
s (> 10%)
ntaining 1 mMs. The concen
0.5 mL of
enzyme solut
enzyme sol
hiol. If only
, when comp
ws that to re
xchange colu
solution cou
tive site cata
of activity
M dithiothreitolntration of thio
their
tion.
lution
y one
pared
educe
umns
ld be
alytic
was
l after ol after

Chapter 3 – Inactivation of PTPs by Peroxymonophosphate
49
An additional, important component of the thiol removal process is a non-ionic
detergent. These molecules are necessary to prevent non-specific adsorption of enzyme
to the walls of plastic and glass containers. It is especially important when diluting PTP
stock solutions to low-micromolar or nanomolar concentrations. The use of non-ionic
detergents is a double-edged sword of sorts. While they prevent loss of enzyme activity
from non-specific adsorption, the presence of non-ionic detergents can also lead to
destruction of PTP catalytic activity. These detergents invariably contain an ether moiety
which is susceptible to oxidation by solvated oxygen, the product of which is peroxides
that oxidatively inactivate the enzyme (Scheme 3.3).9, 10 To prevent this from occurring,
only detergents specifically noted to be “low peroxide” should be used. They are
typically packed in sealed glass ampules under inert gas. Once opened, auto oxidation
begins. While the rates of detergent-peroxide formation were not investigated, we
typically used a freshly opened vial of Tween-80 for a few weeks before there was
noticeable loss of enzyme activity.
Scheme 3.3 Generation of peroxides from autooxidation of ether-containing non-ionic detergents.

C
3
in
o
co
as
ad
en
at
in
as
ea
sl
Chapter 3 – Inac
.4 PTP1B
Typic
nactivation a
f inactivator
oncentration
ssess remain
dded to a so
nzyme activ
t least by a
nactivation r
s a function
ach line. Th
lope of whic
Figure 3.5 T
ctivation of PT
Inactivatio
cally, assay
are performe
r in the abse
n is >10 x en
ning enzyme
olution conta
ve site (typic
factor of 5
reaction. Th
of time, and
hese rates a
ch gives the a
Time-dependen
TPs by Peroxym
on Assays
ys for mea
ed by incuba
ence of subst
nzyme conce
e activity. T
aining a suit
cally 10 x Km
0 when add
he remaining
d the appare
are then repl
apparent sec
nt inactivation
monophosphate
50
asuring the
ating the nat
trate under p
entration).11 A
The aliquots
table concen
m). The enz
ded to the s
g enzymatic a
ent rate of in
lotted as a fu
cond order ra
of PTP1B by v
e
kinetics o
tive enzyme
pseudo-first
At certain ti
s of the enz
ntration of su
zyme-inactiv
ubstrate sol
activity at ea
nactivation i
function of i
ate.
various concen
of time-dep
e with variou
order condi
imes, aliquot
zyme-inactiv
ubstrate that
vator aliquots
ution to eff
ach time poi
s determined
nactivator c
ntrations of hyd
pendent enz
us concentra
tions (inacti
ts are remov
vator mixtur
t will saturat
s must be di
fectively stop
int is then pl
d by the slo
concentration
drogen peroxid
zyme
ations
ivator
ved to
re are
te the
iluted
p the
lotted
pe of
n, the
de.

C
Fab
ap
m
p
as
P
T
re
in
H
si
p
ti
Chapter 3 – Inac
igure 3.6 Repbsence of subst
We em
pparent sec
measurement
eroxymonop
ssay are sho
TP1B in a t
This is in clo
eplotting the
ntercept of a
H2O2 does no
imple second
It be
eroxymonop
ime point as
ctivation of PT
plot of pseudo-trate. The slop
mployed thi
cond order
t would ser
phosphate, a
own in Figur
time-depend
ose agreemen
e resulting
approximatel
ot possess af
d-order reac
ecame clear
phosphate th
ssay relies o
TPs by Peroxym
-first order ratepe of the line g
is type of “t
rate of PT
rve as a “b
as such numb
res 3.5 and
dent manner
nt with 9.1 M
apparent ps
ly zero. Thi
ffinity for the
tion process
r when we
hat a differen
on measurem
monophosphate
51
es obtained byives the appare
time-point”
TP1B inacti
benchmark”
bers had alre
3.6. Hydrog
r with an ap
M-1s-1 as pub
seudo-first-o
is is consiste
e PTP1B act
.
e attempted
nt method of
ment of ina
e
y treating PTPent second orde
assay (as w
ivation by
” for our u
eady been re
gen peroxid
pparent secon
blished by D
order rates
ent with a b
tive site and
d to duplic
f data gener
activation ra
1B with hydroer rate of 15.66
we called it)
hydrogen p
upcoming e
eported.2, 12
de was obser
nd order rat
Denu. Of wo
yields a lin
imolecular r
d inactivates
cate this e
ration would
ates under p
ogen peroxide 6 +/- 0.67 M-1s
to determin
peroxide.
xperiments
Results from
rved to inact
te of 15.7 M
orthy note is
ne that has
reaction in w
the enzyme
experiment
d be needed.
pseudo-first-
in the s-1.
ne the
This
with
m the
tivate
M-1s-1.
s that
a y-
which
via a
with
The
order

C
co
en
ac
P
co
Fth
w
ac
A
d
ap
fa
Chapter 3 – Inac
onditions. F
nzyme and h
ctivity was
TP1B inact
oncentration
igure 3.7 Calche data to the M
Introd
way to slow
ctive site fo
Analysis of a
ifferent mat
pparent rate
actor. This
ctivation of PT
For example
hydrogen pe
assayed at 3
tivation by
ns all enzyme
culation of PTPMichaeles equa
ducing subst
the reaction
or an amoun
apparent ina
thematical tr
es of inactiv
correction fa
TPs by Peroxym
e, data with
eroxide conc
30 s, 1, 2, 5
peroxymo
e activity wa
P1B Km with pation Y=Vmax*
trate to the
n.13, 14 Subs
nt of time,
activation ra
reatment tha
vation are re
actor is dete
monophosphate
52
h hydrogen p
entrations th
5 and 10 m
nophosphate
as lost within
p-nitrophenylphX/(Km+X) and
PTP1B-per
strate, in a
and thereby
ates generate
an rates gene
educed, it be
ermined by c
e
peroxide wa
hat ranged fr
minutes. We
e was such
n 20 seconds
hosphate as subd was found to
roxymonoph
continuous
y limits acc
ed in the pr
erated witho
ecomes nec
carefully me
as generated
rom 0.1 to 1
found that
h that even
s.
bstrate. Km is be 2.11 mM.
hosphate mix
assay, occu
cess of the
resence of s
out. Due to
essary to ap
easuring the
d using ~ 50
.0 mM. Enz
the rapid ra
n at nanom
calculated by
xture is a v
upies the enz
oxidizing a
substrate req
the fact tha
pply a corre
substrate Km
0 nM
zyme
ate of
molar
fitting
viable
zyme
agent.
quires
at the
ection
m and

C
u
n
m
pr
af
Fsu
th
sp
su
eq
ka
Chapter 3 – Inac
sing this val
itrophenylph
making some
rotein and t
ffinity for th
igure 3.8 Timubstrate. The a
The in
he continuou
pecies show
ubstrate (Fig
quation give
app:13, 14
ctivation of PT
lue to determ
hosphate wa
e assumptio
he inactivat
he enzyme ac
me-dependent apparent rate o
nactivator hy
us assay, in
wed time-de
gure 3.8). Th
en by Voet a
TPs by Peroxym
mine the actu
as determined
ons about th
or. For the
ctive site and
inactivation of enzyme inact
ydrogen per
a manner si
ependent ina
hese curves
and colleagu
monophosphate
53
ual rates of i
d to be 2.11
he nature of
se studies, w
d analyzed o
f PTP1B by tivation was de
roxide was u
imilar to the
activation o
were fit with
ues to find th
e
inactivation.
mM (Figure
f non-covale
we assumed
our data acco
hydrogen peroetermined by fi
used as a po
time point
of PTP1B i
h a least-squ
he apparent
. The Km fo
e 3.7). Analy
ent interacti
d that H2O2
ordingly.
oxide in the pitting the data t
ositive contro
assay. This
n the prese
uares method
rate of enzy
or PTP1B wi
ysis also req
ons between
does not po
presence of 10to equation (1)
ol for analys
s reactive ox
ence of 10
d to the follo
yme inactiva
ith p-
quires
n the
ossess
0 mM ).
sis of
xygen
mM
owing
ation,

C
ap
co
w
w
Fsu
co
th
w
Chapter 3 – Inac
The e
pparent rate
ould be used
was investiga
what we were
igure 3.9 Timubstrate (pNPP
PTP1B
oncentration
his process,
was not uniq
ctivation of PT
equation sho
of enzyme i
d to fit the d
ating the inac
e attempting
me-dependent inP).
B was rapi
ns of peroxy
and demons
que, we dec
TPs by Peroxym
own above
inactivation.
data. In our
ctivation of
g to do with p
nactivation of
idly inactiv
ymonophosph
strate that th
cided to exp
A4
monophosphate
54
was used f
. There are
case, we ch
an enzyme w
peroxymono
f PTP1B by pe
vated in a
hate (Figure
he inactivati
plore inactiv
410 =C −elnV
k
e
for the sole
many suitab
hose equatio
with a comp
ophosphate a
eroxymonopho
time-depend
e 3.9). To b
ion of PTP1
vation of the
Vo−kapp t
kapp
e purpose o
ble exponent
on 1 due to t
petitive inact
and PTP1B.
osphate in the
dent manne
broaden our
1B by perox
e PTP SHP-
of measuring
tial equation
the fact that
tivator, simi
presence of 1
r by nanom
understandin
xymonophosp
-2. SHP-2,
(1)
g the
s that
Voet
lar to
0 mM
molar
ng of
phate
, also

C
kn
re
ra
O
m
ra
st
re
Fisu
Chapter 3 – Inac
nown as “S
eceptor type
apidly inacti
Our next task
mathematical
Duran
ates of inact
tep (Scheme
espectively:
igure 3.10 Timubstrate (pNPP)
ctivation of PT
Src homolog
e phosphatas
ivated by na
k was to de
l analysis of
nton publish
tivation for
e 3.5) inacti
me-dependent ).
TPs by Peroxym
gy 2 domain
se that is re
anomolar con
etermine the
the enzyme
ed a method
the presence
ivation proc
inactivation o
monophosphate
55
n phosphata
edox regulat
ncentrations
e kinetic con
inactivation
d,14 based on
e of substra
cess using th
f SHP-2 by pe
e
ase”, has als
ted in vivo.
of peroxym
nstants of th
n apparent ra
n the work b
ate for a one
he equation
eroxymonopho
so been iden
15 SHP-2 w
monophospah
he reactions
ates.
by Tian16 to
e-step (Sche
s (2) and (3
osphate in the
ntified as a
was, like PT
hte (Figure 3
s through ca
correct app
me 3.4) and
3) shown be
presence of 1
non-
TP1B,
3.10).
areful
parent
d two
elow,
10 mM

Chapter 3 – Inactivation of PTPs by Peroxymonophosphate
56
(2)
(3)
where:
kapp =k[I]
(1+ [S]/Km )
kapp =kinact[I]
[I]+ KI *(app )
KI *(app ) = KI * (1+ [S]/Km )
Scheme 3.4 The expected kinetic parameters for a one-step enzyme inactivation (no non-covalent pre-association). The reaction mixture contains enzyme, substrate and inactivator.

C
Scas
th
n
st
in
th
w
n
su
P
co
re
ac
Chapter 3 – Inac
cheme 3.5 Thessociation, KI).
Equat
he enzyme f
on-covalent
tep versus tw
nactivation r
he rapid rate
were not able
ot derive an
urprising, du
TPs) by inor
olleagues ex
eaction betw
ctive site wi
ctivation of PT
e expected kin. The reaction
tion (2) and
for inactivat
pre-associat
wo-step, one
rates and det
e at which
e to observe
n apparent K
ue to the fac
rganic phosp
xplicitly state
ween an enzy
ll behave as
TPs by Peroxym
netic parametermixture conta
Scheme 3.4
tor (KI). Con
tion occurs.
e must constr
termine whic
these enzym
saturation o
KI from equ
t that the me
phate is in th
e that if inhib
yme and ina
if it were bi
monophosphate
57
rs for a two-steins enzyme, su
4 have no te
nversely, eq
To distingu
ruct a plot o
ch equation
mes were in
f the reactio
uation (3).
easured Km
he tens of mi
bitor concen
activator tha
imolecular an
e
ep enzyme inacubstrate and ina
erms to desc
quation (3) a
uish between
of inhibitor c
the data fits
nactivated by
on (Figures 3
The lack o
for inhibitio
illimolar ran
ntration is sig
at possesses
nd not show
ctivation (withactivator.
cribe non-cov
and Scheme
n the two situ
concentration
s best. Unfo
y peroxymon
3.11 and 3.12
of observed
on of PTP1B
nge. In fact, D
gnificantly l
non-covalen
w saturation.
h a non-covalen
valent affini
3.5 assume
uations, i.e.,
n versus app
ortunately, d
nophosphate
2), thus we c
saturation i
B (as well as
Duranton an
ower than K
nt affinity fo
nt pre-
ity of
e that
, one-
parent
due to
e, we
could
s not
most
nd his
KI, the
for its

C
FT
FT
Chapter 3 – Inac
Figure 3.11 A These data are
Figure 3.12 AThese data are
ctivation of PT
plot of peroxyderived from F
A plot of peroxderived from F
TPs by Peroxym
ymonophosphatFigure 3.10 and
xymonophosphFigure 3.11, an
monophosphate
58
te concentratiod appears to de
ate concentratind appears to d
e
on versus the apescribe a bimol
ion versus theescribe a bimo
pparent rate oflecular reaction
apparent rate olecular reactio
f PTP1B inactin.
of SHP-2 inaon.
ivation.
ctivation.

Chapter 3 – Inactivation of PTPs by Peroxymonophosphate
59
Due to the fact that our assays used concentrations of peroxymonophosphate in
the nanomolar range, rather than millimolar, we chose to simplify analysis and attempt to
treat the data as if they were indeed describing a bimolecular reaction and utilized
equation three. By moving k from the numerator of equation (3) one can plot the
apparent rates of inactivation as a straight line by using the known values for substrate
Km, starting concentration of substrate and concentrations of inactivator:
(4)
From equation 4, data can be plotted as a straight line with the slope equal to the
apparent second order rate of reaction between PTP1B and hydrogen peroxide. When
plotting, x values are equal to the ratio of inhibitor concentration to the value of
(1+[S]/Km). For this experiment, the apparent second order rate of PTP1B inactivation
by hydrogen peroxide was calculated to be 29.8 +/- 1.4 M-1s-1 (Figure 3.13). This value
is in agreement with previously published work and our own data (~ 10-20 M-1s-1).12
kapp = k *[I]
(1+ [S]/Km )
y = mx

C
F10w
eq
(F
P
p
in
p
se
S
Chapter 3 – Inac
igure 3.13 Ana0 mM substrate
was measured to
When
quation 1 (F
Figure 3.14)
TP1B with
eroxymonop
nactivator.
eroxymonop
econd order
HP-2 with p
ctivation of PT
alysis of the obe. The slope oo be 29.8 +/- 1
n the data f
Figure 3.9)
) we find, i
an apparent
phosphate is
Identica
phosphate is
inactivation
pNPP was de
TPs by Peroxym
bserved rates oof the line corre.4 M-1s-1
for inactivat
and the resu
indeed, that
t second ord
s approximat
al analysis
s shown in
n rate of 25,
etermined to
monophosphate
60
of PTP1B inactesponds to the
tion of PTP
ulting appare
peroxymon
der inactivati
tely 5000 tim
of the
Figure 3.1
,930 +/- 143
o be 5.47 mM
e
tivation by hydapparent secon
P1B by pero
ent rates plo
nophosphate
ion rate of 4
mes more po
rates of
5 and give
35 M-1s-1. T
M (data not s
drogen peroxidnd order rate of
oxymonopho
otted accordi
is a superi
46710 +/- 94
otent than H
SHP-2
s a slightly
The dissocia
hown).
e in the presenf inactivation.
osphate is f
ing to equat
ior inactivat
40 M-1s-1. T
H2O2 as a PT
inactivation
y lower app
ation constan
nce of This
fit to
tion 4
tor of
Thus,
TP1B
by
parent
nt for

Chapter 3 – Inactivation of PTPs by Peroxymonophosphate
61
Figure 3.14 Replot of peroxymonophosphate inactivation data for PTP1B using the “Duranton” analysis.The apparent second order rate of inactivation is 46710 +/- 940 M-1s-1.
Figure 3.15 Replot of peroxymonophosphate inactivation data for SHP-2 using the “Duranton” analysis. Theapparent second order rate of inactivation is 25930 +/- 1435 M-1s-1.

C
d
S
id
Fap
o
d
u
Chapter 3 – Inac
We th
ata in an at
HP-2 inactiv
deal for this
igure 3.16 Reppparent second
Equat
f –(1-α)/KI.
etermined (F
The a
sing the Voe
ctivation of PT
hought it wou
ttempt to m
vation by pe
task, and is b
plot of peroxyd order rate of i
tion 4 expres
When 1/[I]
Figure 3.16)
apparent seco
et method of
TPs by Peroxym
uld be prude
easure the d
eroxymonop
based on the
ymonophosphatinactivation is
sses a straigh
is plotted ag
.
ond order in
f analysis wa
1
[I]=
k
monophosphate
62
ent to use an
dissociation
phosphate. T
e following e
te inactivation 58,000 +/- 220
ht line with a
gainst 1/kapp
nactivation ra
as 58,000 +/
kinact(1−α)
KI
*
e
nother metho
constant (K
The method
equation:
data for PTP100 M-1s-1.
a slope of kin
p values for k
ate of PTP1
/- 2000 M-1s
*1
kapp
−1−αKI
od to analyze
KI) and kinact
described b
1B using the “V
nact(1-α)/KI a
kinact and KI c
B by peroxy
s-1 (KI = 3.4
α
e our inactiv
t for PTP1B
by Voet appe
Voet” analysis
and a y-inter
can be
ymonophosp
+/- 1.6 x 10
vation
B and
eared
(4)
s. The
rcept
phate,
0-6 M;

C
ki
by
+
in
P
n
es
th
fo
Fap0.
Chapter 3 – Inac
inact = 0.2 +/
y peroxymo
+/- 2.7 x 10⁻⁷
n Figures 3.
TP1B by pe
oncovalent
ssentially re
here being li
or the active
igure 3.17 Reppparent second.002 s-1).
ctivation of PT
/- 0.09 s-1).
onophosphate
M; kinact = 0
16 and 3.17
eroxymonop
binding aff
esult in a y-i
ittle or no no
site renders
plot of peroxyd order rate of i
TPs by Peroxym
Similarly, th
e using the
0.037 +/- 0.0
suggest sat
phosphate an
finity for th
intercept of
on-covalent
s equation 4 i
ymonophosphatinactivation is
monophosphate
63
he apparent
Voet metho
002 s-1). Th
turation kine
nd that the p
he enzyme
zero (see e
affinity for t
invalid.
te inactivation48,050 +/- 21
e
second orde
od was 48,05
he negative y
etics are obs
phosphoryl
active site.
quation 4).
the active sit
n data for SHP-18 M-1s-1 (KI =
er inactivatio
50 +/- 2118
y-intercept o
served for th
group does,
Very larg
This could
te. Complet
-2 using the “V= 800 +/- 270 n
on rate of S
M-1s-1 (KI =
f the lines sh
he inactivatio
, indeed, pro
ge values o
be interpret
te lack of aff
Voet” analysisnM, kinact = 0.0
HP-2
= 7.6
hown
on of
ovide
of KI
ed as
ffinity
s. The 037 +/-

Chapter 3 – Inactivation of PTPs by Peroxymonophosphate
64
The affinity of the negatively charged phosphoryl moiety toward the PTP1B
active site is likely derived from interactions with positive charges present in the
phosphate-binding loop. In fact, competitive inhibitors with two net negative charges
have been shown to have higher affinity than those with only one net negative charge. At
physiologic pH (~7), peroxymonophosphate is expected to exist predominantly with two
negative charges due to lower second pKa values than phosphate (5.5 vs. 7.1).17 Thus, one
would expect peroxymonophosphate to have a higher apparent affinity for the active site
than phosphate.
To provide more evidence to support our contention that peroxymonophosphate
shows affinity for the PTP1B active site, we performed inactivation assays with
increasing ionic strength. If the dual negative charges of peroxymonophosphate are
conferring affinity, then increasing ionic strength would, in effect, neutralize those
charges and reduce the apparent rate of inactivation. Figure 3.18 shows that, indeed,
increasing ionic strength reduces the apparent rate of PTP1B inactivation by
peroxymonophosphate. In contrast, increasing ionic strength did not decrease the rate of
PTP1B inactivation by hydrogen peroxide (Figure 3.19). This is to be expected, for
hydrogen peroxide and PTP1B were shown to react in a bimolecular fashion.

C
Fpe
in
g
in
th
Chapter 3 – Inac
igure 3.18 Ieroxymonopho
Figure 3.19 I
Consi
nactivation o
el filtration
nhibitor pho
hat the proce
ctivation of PT
Increasing ioosphate.
Increasing ioni
istent with a
of PT1B by
of the inacti
sphate18 ma
ess is active-
TPs by Peroxym
onic strength
ic strength doe
a process th
peroxymono
ivated enzym
arkedly slow
-site directed
monophosphate
65
decreases th
s not decrease
hat involves
ophosphate i
me. Furtherm
ws inactivatio
d (Figure 3.2
e
he rate of P
the rate of PTP
s covalent m
is time-depe
more, additio
on by perox
20).
PTP1B inacti
P1B inactivatio
modification
endent and is
on of the com
xymonophos
ivation by 1
on by 1 mM H
n of the enz
s not reverse
mpetitive PT
sphate, indic
1 μM
H2O2
zyme,
ed by
TP1B
cating

C
Fpe
re
in
ox
al
co
th
an
m
su
co
co
Chapter 3 – Inac
igure 3.20 Teroxymonopho
Signif
eversed by t
ndicates that
xidation sta
llowed to
ompromised
he enzyme t
nalysis conf
minutes) inde
ulfonic acid
oncentration
onversion of
ctivation of PT
The competitosphate.
ficantly, inac
treatment of
t peroxymon
ate. It is in
proceed for
d. This sugg
to sulfinic an
firmed that
eed causes
oxidation s
ns of perox
f the active s
TPs by Peroxym
tive PTP inh
ctivation of
f the inactiva
nophosphate
nteresting to
r much lon
gests that pe
nd sulfonic
treatment o
conversion
tates (data n
ymonophosp
site cysteine
monophosphate
66
hibitor phosp
f PTP1B by
ated enzyme
e is able to
note that i
nger than
eroxymonop
states. Hig
of the enzym
of the activ
not shown).
phate are a
residue to th
e
hate protects
peroxymon
e with dithio
inactivate P
if the reacti
120 s., rec
phosphate is
gh-resolution
me with ex
ve site cyste
Together th
able to reve
he sulfenic a
PTP1B fro
ophosphate
othreitol (Fig
PTP1B thro
on shown i
covery of
capable of
n tandem ma
xcess inactiv
eine-215 to
hese results
ersibly inact
acid oxidatio
om inactivatio
(1 eq) is re
gure 3.21).
ough the sul
n Figure 3.
PTP activit
“over oxidiz
ass spectrom
vator (1 μM
the sulfinic
suggest tha
tivate PTPB
on state.
on by
eadily
This
lfenic
21 is
ty is
zing”
metric
M, 10
c and
at low
B via

C
Fpe
H
en
en
S
ap
p
Chapter 3 – Inac
igure 3.21 Aeroxymonopho
In pri
H2O2 and ino
nzyme-catal
nzyme catal
econd, titrat
pproximately
eroxymonop
ctivation of PT
Addition of osphate (1 μM
inciple, PTP
organic phos
lyzed decom
lase has no
tion of the en
y one (F
phosphate is
TPs by Peroxym
thiol at 120M) reverses inac
P1B could c
sphate. Tw
mposition doe
effect on th
nzyme with
Figure 3.2
sufficient to
monophosphate
67
0 s to a rectivation of the
catalyze the
wo lines of e
es not occur
he inactivatio
peroxymono
22) indicat
o inactivate t
e
eaction contaie enzyme.
hydrolysis
evidence, ho
r. First, add
on of PTP1B
ophosphate
ting that
the enzyme.
ining PTP1B
of peroxym
owever, sugg
dition of the
B by peroxy
reveals a tur
a single
(~ 50 nM)
monophospha
gest that suc
H2O2-destro
ymonophosp
rnover numb
equivalent
) and
ate to
ch an
oying
phate.
ber of
t of

C
p
p
b
su
in
re
th
3
o
p
ag
ac
Chapter 3 – Inac
Fi
Mamm
otential to
eroxymonop
iological th
ubstantial in
n the presen
esult shows
hiolate of PT
.5 Discussi
In con
f both pro
eroxymonop
gent is likel
ctive site. I
ctivation of PT
igure 3.22 Dete
malian cells
decompos
phosphate re
hiol glutathio
nactivation of
nce of physio
that peroxy
TP1B over so
ion and Co
nclusion, we
otein tyros
phosphate is
ly due to bo
Increasing th
TPs by Peroxym
ermination of p
s contain m
se peroxid
etains the a
one. We
f PTP1B (21
ologically re
ymonophosp
olution thiol
onclusions
e find that pe
ine phosph
s far more po
oth its intrin
he ionic stre
monophosphate
68
peroxymonoph
millimolar c
des.19, 20 T
ability to ina
find that pe
1% +/- 3% re
elevant conc
phate reacts
s.
eroxymonoph
hatases PTP
otent than H
nsic reactivit
ength of the
e
hosphate partiti
concentration
Therefore,
activate PTP
eroxymonop
emaining ac
centrations o
selectively w
hosphate is a
P1B and
H2O2. It app
ty as well a
e reaction m
ion ratio with P
ns of thiol
we invest
P1B in the
phosphate (
ctivity) withi
of glutathion
with the act
a potent oxid
SHP-2.
pears that th
as its affinity
medium decr
PTP1B
s that have
tigated wh
presence o
100 nM) ca
in 5 minutes
ne (1 mM).
tive site cys
dative inacti
In this re
e potency o
y for the PT
eased the ra
e the
hether
of the
auses
even
This
steine
ivator
egard,
f this
TP1B
ate of

Chapter 3 – Inactivation of PTPs by Peroxymonophosphate
69
time dependent PTP1B inactivation by peroxymonophospahte, while similar conditions
did not reduce the rate of inactivation by hydrogen peroxide. This supports our
hypothesis that the negative charges of the peroxymonophosphate phosphoryl moiety
confer non-covalent affinity for the PTP1B active site.
As part of this study, we have generated rates of inactivation for peracetic acid
and hydrogen peroxide, both oxidative agents that have no measurable affinity for the
PTP1B active site. If one compares the apparent second order rates of PTP1B
inactivation for peracetic acid, peroxymonophosphate and hydrogen peroxide, it is clear
that peroxymonophosphate is much more potent than one would predict based on its
leaving group pKa (Figure 3.23). This, too, suggests that the phosphate moiety confers
active site affinity to peroxymonophosphate.
Figure 3.23 A plot of leaving group pKa vs. the apparent rate of PTP1B inactivation for three compounds:Peracetic acid (C2H4O3), peroxymonophosphate (H3PO5) and hydrogen peroxide (H2O2).

Chapter 3 – Inactivation of PTPs by Peroxymonophosphate
70
Inactivation of PTP1B by peroxymonophosphate, like that by H2O2, is readily
reversed by treatment of the inactivated enzyme with thiol. A few other oxidative PTP
inactivators are known21 but none (other than the endogenous signaling agents H2O2 and
nitric oxide) have been shown to yield thiol-reversible inactivation.2, 22 Importantly, the
inactivation of PTP1B by nanomolar concentrations of peroxymonophosphate proceeds
effectively in the presence of physiologically-relevant concentrations of the biological
thiol glutathione. Collectively, these properties may make peroxymonophosphate a
useful tool for probing the role of cysteine-dependent PTPs in various signal transduction
pathways. Finally, another interesting facet of peroxymonophosphate is that this
molecule could be biologically accessible via phosphorylation of H2O2.
In addition to its aforementioned role as an intracellular signaling agent, H2O2 is
produced in cells as a byproduct of aerobic metabolism and as a result of various disease
states.23, 24 Phosphoryl transfer to oxygen nucleophiles is a ubiquitous reaction in
biology25 and H2O2, though present at relatively low concentrations, is a substantially
better nucleophile than water.26 Subsequent chapters show that peroxymonophosphate
can be generated through spontaneous or enzyme-catalyzed reactions of H2O2 with
phosphoryl donors under physiological conditions. The results reported here suggest that
nanomolar concentrations of peroxymonophosphate could affect reversible down-
regulation of cellular PTP activity within minutes. In conclusion, peroxymonophosphate
possesses key properties expected for an endogenous signaling molecule involved in the
redox-regulation of PTP activity.

Chapter 3 – Inactivation of PTPs by Peroxymonophosphate
71
3.6 Experimental Procedures
Materials and Methods
Reagents were purchased from the following suppliers: Buffers, salts, p-
nitrophenylphosphate (pNPP), 5,5’-dithiobis(2-nitrobenzoicacid) (DTNB), thiols,
ampicillin (# A9518)), chloramphenicol (# C0378) LB media (# L3522) and yellow-86
agarose (# R2382s) were obtained from Sigma-Aldrich (St. Louis, MO). Q-Sepharose
High Performance IEX chromatography media (# 17-1014-1) and P1 chromatography
pumps were obtained from GE Healthcare (Piscataway, NJ). Restriction endonucleases
EcoRI (# R0101) and SmaI (# R0141) were obtained from New England Biolabs
(Ipswich, MA). DH5α competent cells (# 18258-012) were obtained from Invitrogen
(Carlsbad, CA). Wizard Plus Plasmid Minipreps (# A7100) were obtained from Promega
(Madison, WI). Novagen pETDuet1 vector (# 71146) and Tuner DE3 pLacI competent
cells (# 70625) were obtained from EMD-Biosciences (San Diego, CA). Catalase (# 106
810) and Compleat® Free Protease Inhibitor (# 11-873-580-001) was purchased from
Roche Bioscience. Zeba mini and micro centrifugal buffer exchange columns (#89882)
and high-purity 10% solution of Tween 80 (Surfact-Amps® 80 # 28328) were purchased
from Pierce Biotechnology (Rockford, IL). Amicon Ultra centrifugal filter devices (#
UFC901008) were purchased from Millipore (Milford, MA).
PTP1B Expression, Purification and Characterization. Preparation of PTP1B
constructs: The DNA sequence coding for amino acids 1-322 of PTP1B was amplified
from a plasmid kindly provided by Dr. Nicholas Tonks. Truncated PTP1B DNA was
cloned into a pETDUET vector with EcoRI and NcoI restriction sites at each end. The

Chapter 3 – Inactivation of PTPs by Peroxymonophosphate
72
resulting construct was purified on a 0.8% agarose gel, and extracted from the gel with
Promega Wizard Plus Plasmid DNA isolation columns. DNA sequencing confirmed the
correct PTP1B coding sequence in the open reading frame.
Recombinant PTP1B protein expression: E. coli DH5α competent cells were
transformed according to manufacturer protocol with purified pETDUET plamids
containing the truncated PTP1B gene. Plasmid DNA extracted from a 5 mL clonal
DH5α culture was then used to transform Tuner (DE3) placI cells according to
manufacturer protocol. Cells from both transformations were selected on LB agar
supplemented with ampicillin to 100 μg/mL. A sixty μL aliquot from a 5 mL overnight
culture of transformed Tuner DE3 cells in LB (LB/Amp50/Chlor34 ) fortified with
ampicillin (50 μg/ml) and chloramphenicol (34 μg/ml) was diluted 1:500 in identical
media fortified with 0.2% glucose and grown at 37oC to an A600 of approximately 0.6.
The cells were then harvested by centrifugation at 5000 x g for 10 min, and resuspended
in 6 mL of fresh LB/Amp50/Chlor34 media. One mL of the resulting suspension was used
to inoculate each of six 500 mL volumes of LB/Amp50/Chlor34 containing 0.2% glucose.
Cultures were grown at 37oC with rapid shaking (250 rpm) until an A600 of approximately
0.6 was measured. Expression was then induced with the addition to each culture of 5
mL of a 40 mM isopropyl-1-thio-beta-D-galctopyranoside (IPTG) solution in water.
Following IPTG addition, the cultures were incubated with reduced shaking (175 rpm) at
37oC for 3 h. Cells were harvested as previously described, and the PTP1B catalytic
subunit was purified essentially as described by Puius and colleagues.7 Briefly, the cell
pellets were resuspended in 50 mL buffer A (100 mM 2-(4-morpholino)-ethane sulfonic
acid (MES), pH 6.5 with 1mM EDTA and 1 mM dithiothreitol) containing Compleat®

Chapter 3 – Inactivation of PTPs by Peroxymonophosphate
73
Free Protease Inhibitor cocktail, and lysed with three passes through a French Press. The
resulting lysate was clarified by centrifugation at 37000 x g for 15 min. Clarified lysate
was combined with 50 mL of CM-sephadex C50 resin pre-equilibrated with buffer A and
shaken gently for 45 min. The resin was then loaded onto a 25 X 100 mm column and
washed with 10 column volumes of buffer A. PTP1B was eluted with a linear NaCl
gradient from 0 0.5 M in buffer A @ 2 ml/min. Fractions containing activity against
pNPP were pooled, and concentrated with Amicon Ultra-15 centrifugal filter devices
(10,000 MW cut off) to approximately 0.5 mg/mL total protein. A typical preparation
yielded 15-20 mg of 95% pure PTP1B. The concentrated enzyme was divided into 100
μL aliquots, immediately frozen on dry ice and stored at -70oC. Protein concentration,
purity and identity were confirmed with UV absorbance (ε280 ~ 46410-46785 M-1cm-1)
SDS-PAGE (NuPAGE Novex Bis-Tris polyacrylamide gel with MOPS running buffer)
and MALDI-TOF mass spectrometry (data not shown).
Determination of PTP1B Active Site Concentration with 5,5’-dithiobis(2-nitrobenzoic
acid) (DTNB): The concentration of PTP1B active sites was determined by measuring
thiol concentration with DTNB in the presence or absence of the PTP transition state
mimic vanadate as described by Pregel et al.27 Thiol additives (β-mercaptoethanol or
dithiothreitol) were completely removed from a 100 μL aliquot of concentrated PTP1B
stock solution (~ 10 mg/ml) with three sequential Zeba mini centrifugal buffer exchange
columns according to manufacturer protocol. Exchange buffer contained 100 mM Tris-
HCl, 10 mM NaCl, 10 mM diethylenetriaminepentaacetic acid (DTPA), 0.05% Tween-
80, pH 7.4. Four reactions were prepared in 2.0 mL polypropylene snap-top
microcentrifuge tubes. Reactions # 1 and 2 were a blank and test for total PTP1B thiols,

Chapter 3 – Inactivation of PTPs by Peroxymonophosphate
74
respectively. To reaction tubes #1 and 2 was added 0.97 mL of assay buffer (200 mM
Tris-HCl, pH 8.0, 1 mM EDTA). To reaction tubes #3 and 4 were added 0.96 mL of
assay buffer. To reaction tubes # 2 and 4 was added a sufficient volume of PTP1B to
obtain approximately 2.5 μM enzyme in what would be a 1.0 mL final volume (for
example, 10 μL of a 250 μM stock). To tubes #3 and 4 was added 20 μL of a 100 mM
solution of sodium orthovanadate (final concentration of 2 mM). To tubes # 1 and #2
was added an equivalent amount of assay buffer. The cuvettes were mixed and to each
was added 20 μL of a 10 mM solution of DTNB dissolved in DMSO. After allowing the
reaction tubes to stand for 10 min, the absorbance at 410 nm of tubes #2 and #4 were
carefully measured by blanking the instrument with tubes # 1 and #3, respectively.
Absorbance values were converted to thiol concentration (μM) using the TNB extinction
coefficient (ε= 14150 M-1cm-1 at pH 8.0). The concentration of enzyme active sites was
then calculated by determining the difference in thiol concentration between reactions #2
and #4.
Continuous Phosphatase Assay for Time-Dependent Inactivation of PTP1B by
Peroxymonophosphate. Prior to running assays, free thiols were removed from stock
enzyme aliquots with Zeba mini centrifugal buffer exchange columns (one column per
aliquot) according to manufacturer protocol, yielding “thiol-free enzyme”. Exchange
buffer contained 100 mM Tris-HCl, 50 mM Bis-Tris, 50 mM Na+ Acetate, 10 mM
DTPA, 0.05% Tween-80, pH 7. For assay of either enzyme activity or time-dependent
inactivation of enzyme activity by peroxymonophosphate, 10 μL of enzyme (25-50 pmol)
diluted in exchange buffer was added to a cuvette containing a three component assay

Chapter 3 – Inactivation of PTPs by Peroxymonophosphate
75
buffer (100 mM NaOAc, 50 mM Bis-Tris, and 50 mM Tris pH 7.0) with substrate (pNPP,
10 mM) and various concentrations of peroxymonophosphate in a total volume of 1 mL.
Immediately following addition of enzyme to the cuvette, the reaction was mixed by
repeated inversion, and enzyme-catalyzed release of p-nitrophenol was monitored with a
Hewlett Packard model 8453 spectrophotometer at 410 nm, and 25oC. Data points were
taken every 2 s. The kinetic constants kinact and KI were obtained from inactivation time
course data using the methods described by Hart et al. and Kraut et al.13, 28
Inactivation of PTP1B by (1) Is Not Reversed by Gel Filtration. PTP1B treated with
peroxymonophosphate was subjected to gel filtration to determine if removal of residual
peroxymonophosphate would result in the return enzyme activity. An aliquot of thiol
free enzyme solution (100 nM final concentration) diluted in buffer (100 mM NaOAc, 50
mM Bis-Tris, and 50 mM Tris, 0.05% NP-40, 10 mM DTPA, pH 7.0) was combined
with an equal volume of peroxymonophosphate (1 μM final concentration) in water and
incubated at 25oC for 2 min. A 10 μL aliquot was removed and tested for activity with
the continuous phosphatase assay as described above. Twelve μL of the remaining
solution was then subjected to buffer exchange via centrifugal gel filtration in a Zeba
micro spin column according to manufacturer protocol. Exchange buffer contained 100
mM Tris-HCl, 10 mM NaCl, 10 mM DTPA, 0.05 % NP-40, pH 7.4. Following buffer
exchange, 10 μL of the resulting enzyme filtrate was tested for residual activity in the
continuous phosphatase assay as described above.
Restoration of PTP1B Enzyme Activity by Thiol. To determine whether inactivation
could be reversed by the addition of thiol, thiol-free PTP1B (100 pmol) was first
Chapter 3 – Inactivation of PTPs by Peroxymonophosphate
76
inactivated by treatment with peroxymonophosphate (2 μM) in 1 mL assay buffer (100
mM NaOAc, 50 mM Bis-Tris, and 50 mM Tris pH 7.0) containing pNPP (10 mM).
Progress of inactivation was monitored at 410 nm according to the continuous
phosphatase assay procedure described above. When enzyme activity was observed to be
at or near zero, 5 μL of a 1 M solution of dithiothreitol (DTT) in H2O was added to the
cuvette to yield a final concentration of 5 mM. Progress of enzyme reactivation was
monitored until no further increase in activity was observed. Approximately 88% of
original enzyme activity returns within 5 min.
Inactivation of PTP1B in the Presence of Glutathione (GSH). For assay of time-
dependent inactivation in the presence of thiol, PTP1B was diluted (5 nM final
concentration) in assay buffer (100 mM NaOAc, 50 mM Bis-TRIS, and 50 mM Tris,
0.05% NP-40, 10 mM DTPA, pH 7.0) supplemented with GSH (1mM final
concentration) and combined with an equal volume of water containing various
concentrations of 1 at 25oC. At 0.5, 1.0, 1.5, 3 and 5 minutes, a 20 μL aliquot was
removed from the mixture, and added to 0.5 mL of buffer containing substrate (0.1 M
NaOAc, 20 mM pNPP, pH 5.5) at 30oC. After 10 min, the reaction was quenched by
adding 0.5 mL of 2 N NaOH, and A410 measured to determine residual enzyme activity.
Inactivation of PTP1B in the Presence of Catalase. Assays were performed to
determine if catalase could affect the ability of peroxymonophosphate to inactivate
PTP1B. Ten μL of thiol-free PTP1B (100 pmol) diluted in exchange buffer (100 mM
Tris-HCl, 10 mM NaCl, 10 mM DTPA, 0.05 % NP-40, pH 7.4) was added to a cuvette
containing buffer (100 mM NaOAc, 50 mM Bis-Tris, and 50 mM Tris pH 7.0), pNPP

Chapter 3 – Inactivation of PTPs by Peroxymonophosphate
77
substrate (10 mM), peroxymonophosphate (1 μM) and 2000 U of catalase in a total
volume of 1 mL. Enzyme activity was measured with the continuous phosphatase assay
as described above.
Inactivation of PTP1B in the Presence of Reversible Enzyme Inhibitors. To
demonstrate that the target of enzyme inactivation by peroxymonophosphate was the
active site, inactivation assays were performed in the presence of the known competitive
phosphatase inhibitors phosphate or vanadate. To verify protection against inactivation
by peroxymonophosphate, an aliquot of thiol-free enzyme (100 nM final concentration)
in buffer (100 mM NaOAc, 50 mM Bis-Tris, and 50 mM Tris, 0.05 % NP-40, 10 mM
DTPA, pH 7.0) was combined with an equal volume of peroxymonophosphate (1 μM
final concentration) in buffer (100 mM NaOAc, 50 mM Bis-Tris, and 50 mM Tris pH
7.0) containing either phosphate (50 mM final concentration) or vanadate (1 mM final
concentration) at 25oC. After 30 s, a 10 μL aliquot was removed and assayed for activity
with the continuous phosphatase assay as described above.
Determination of the Turnover Number for Inactivation of PTP1B by
Peroxymonophosphate. Ten μL of thiol-free PTP1B (35 pmol) diluted in exchange
buffer (100 mM Tris-HCl, 10 mM NaCl, 10 mM DTPA, 0.05 % NP-40, pH 7.4) was
added to a cuvette containing buffer (100 mM NaOAc, 50 mM Bis-Tris, and 50 mM Tris
pH 7.0), pNPP substrate (10 mM), and various amounts of peroxymonophosphate (10-40
pmol) in a total volume of 1 mL and allowed to incubate at 25oC. After 10 min, 50 μL of
210 mM pNPP substrate was added and residual enzyme activity immediately monitored
at 410 nm. Residual activity was plotted against the molar ratio of enzyme to

Chapter 3 – Inactivation of PTPs by Peroxymonophosphate
78
peroxymonophosphate, the resulting data fitted to a linear regression, and the turnover
number was extrapolated to the x-axis.
Measurement of PTP1B Km for p-nitrophenylphosphate (pNPP). PTP1B (5 μL @
0.5 mg/ml) was added to 0.95 mL of assay buffer (100 mM Tris-HCl, 50 mM Bis-Tris,
50 mM Na+ Acetate, 10 mM DTPA, 0.05% Tween 80, pH 7) containing various
concentrations of pNPP in a 1.0 mL cuvette in triplicate. The cuvette was quickly
inverted three times to mix the contents, and the absorbance at 410 nm was recorded
every 10s for 1min. The resulting data were fit to an equation depicting a straight line.
The slope of each line (at each concentration) was then plotted as a function of substrate
concentration, and the data analyzed to determine Km with the graphing software Prism.

Chapter 3 – Inactivation of PTPs by Peroxymonophosphate
79
References
1. Stone, J. R., An assessment of proposed mechanisms for sensing hydrogen peroxide in mammalian systems. Archives of Biochemistry and Biophysics 2004, 422 (2), 119-124.
2. Denu, J. M.; Tanner, K. G., Specific and Reversible Inactivation of Protein Tyrosine Phosphatases by Hydrogen Peroxide: Evidence for a Sulfenic Acid Intermediate and Implications for Redox Regulation. Biochemistry 1998, 37 (16), 5633-5642.
3. Tonks, N. K., Redox Redux: Revisiting PTPs and the Control of Cell Signaling. Cell 2005, 121 (5), 667-670.
4. Mahadev, K.; Zilbering, A.; Zhu, L.; Goldstein, B. J., Insulin-stimulated Hydrogen Peroxide Reversibly Inhibits Protein-tyrosine Phosphatase 1B in Vivo and Enhances the Early Insulin Action Cascade. J. Biol. Chem. 2001, 276 (24), 21938-21942.
5. Tonks, N. K.; Diltz, C. D.; Fischer, E. H., Characterization of the major protein-tyrosine-phosphatases of human placenta. J. Biol. Chem. 1988, 263 (14), 6731-6737.
6. Hoppe, E.; Berne, P.-F.; Stock, D.; Rasmussen, J. S.; Miller, N. P. H.; Ullrich, A.; Huber, R., Expression, purification and crystallization of human phosphotyrosine phosphatase 1B. European Journal of Biochemistry 1994, 223 (3), 1069-1077.
7. Puius, Y. A.; Zhao, Y.; Sullivan, M.; Lawrence, D. S.; Almo, S. C.; Zhang, Z.-Y., Identification of a second aryl phosphate-binding site in protein-tyrosine phosphatase 1B: A paradigm for inhibitor design. PNAS 1997, 94 (25), 13420-13425.
8. Misra, H. P., Generation of Superoxide Free Radical during the Autoxidation of Thiols. J. Biol. Chem. 1974, 249 (7), 2151-2155.
9. Lever, M., Peroxides in detergents as interfering factors in biochemical analysis. Analytical Biochemistry 1977, 83 (1), 274-284.
10. Clover, A. M., Auto-oxidation of ethers. Journal of the American Chemical Society 1924, 46 (2), 419-430.
11. Silverman, R. B., Mechanism-Based Enzyme Inactivation: Chemistry and Enzymology. CRC Press: Boca Raton, 1988; Vol. I.
12. Barrett, W. C.; DeGnore, J. P.; Keng, Y.-F.; Zhang, Z.-Y.; Yim, M. B.; Chock, P. B., Roles of Superoxide Radical Anion in Signal Transduction Mediated by Reversible Regulation of Protein-tyrosine Phosphatase 1B. J. Biol. Chem. 1999, 274 (49), 34543-34546.

Chapter 3 – Inactivation of PTPs by Peroxymonophosphate
80
13. Kraut, D.; Goff, H.; Pai, R. K.; Hosea, N. A.; Silman, I.; Sussman, J. L.; Taylor, P.; Voet, J. G., Inactivation Studies of Acetylcholinesterase with Phenylmethylsulfonyl Fluoride. Mol Pharmacol 2000, 57 (6), 1243-1248.
14. Duranton, J.; Adam, C.; Bieth, J. G., Kinetic Mechanism of the Inhibition of Cathepsin G by α1-Antichymotrypsin and α1-Proteinase Inhibitor. Biochemistry 1998, 37 (32), 11239-11245.
15. Jaeyul Kwon, C.-K. Q., Jin-Soo Maeng, Rustom Falahati, Chunghee Lee and Mark S Williams, Receptor-stimulated oxidation of SHP-2 promotes T-cell adhesion through SLP-76–ADAP. The EMBO Journal 2005, 24, 2331-2341.
16. Tian, W. X.; Tsou, C. L., Determination of the rate constant of enzyme modification by measuring the substrate reaction in the presence of the modifier. Biochemistry 1982, 21 (5), 1028-1032.
17. Battaglia, C. J.; Edwards, J. O., The Dissociation Constants and the Kinetics of Hydrolysis of Peroxymonophosphoric Acid. Inorg. Chem. 1965, 4 (4), 552-558.
18. Montalibet, J.; Skorey, K. I.; Kennedy, B. P., Protein tyrosine phosphatase: enzymatic assays. Methods 2005, 35, 2-8.
19. Meister, A.; Anderson, M. E., Glutathione. Ann. Rev. Biochem. 1983, 52, 711-760.
20. Winterbourn, C. C.; Metodiewa, D., Reactivity of biologically important thiol compounds with superoxide and hydrogen peroxide. Free Rad. Biol. Med. 1999, 27 (3/4), 322-328.
21. Lueng, K. W. K.; Posner, B. I.; Just, G., Periodinates: a new class of protein tyrosine phosphatase inhibitors. Bioorg. Med. Chem. Lett. 1999, 9, 353-356.
22. Li, S.; Whorton, R., Regulation of protein tyrosine phosphorylation 1B in intact cells by S-nitrosothiols. Arch. Biochem. Biophys. 2003, 410, 269-279.
23. Balaban, R. S.; Nemoto, S.; Finkel, T., Mitochondria, oxidants, and aging. Cell 2005, 120 (Feb 25), 483-495.
24. Rhee, S. G., H2O2, a necessary evil for cell signaling. Science 2006, 312 (June 30), 1882-1883.
25. Knowles, J. R., Enzyme-catalyzed phosphoryl transfer reactions. Ann. Rev. Biochem. 1980, 49, 877-919.
26. Hershlag, D.; Jencks, W. P., Nucleophiles of high reactivity in phosphoryl transfer reactions: alpha-effect compounds and fluoride ion. J. Am. Chem. Soc. 1990, 112, 1951-1956.

Chapter 3 – Inactivation of PTPs by Peroxymonophosphate
81
27. Pregel, M. J.; Storer, A. C., Active Site Titration of the Tyrosine Phosphatases SHP-1 and PTP1B Using Aromatic Disulfides. REACTION WITH THE ESSENTIAL CYSTEINE RESIDUE IN THE ACTIVE SITE. J. Biol. Chem. 1997, 272 (38), 23552-23558.
28. Hart, G. J.; O'Brien, R. D., Recording spectrophotometric method for determination of dissociation and phosphorylation constants for the inhibition of acetylcholinesterase by organophosphates in the presence of substrate. Biochemistry 1973, 12 (15), 2940-2945.

82
Chapter 4
Synthesis and Use of PC-1 as a Selective Detector of Peroxymonophosphate
4.1 Introduction and Objectives
Reactive oxygen species (ROS) are produced in cells by a number of
mechanisms, including exposure to UV/ionizing radiation, metabolism of xenobiotics1,
mitochondrial respiration2 and immune system responses3. Uncontrolled or excessive
generation of ROS in these situations, naturally, has negative toxicological consequences.
There is growing evidence, however, that these molecules are released under normal
physiologic conditions and play important roles in tightly controlled processes such as
cardiovascular regulation and intracellular signal transduction.4, 5 A specific example of
such action is the role of hydrogen peroxide (produced by NADPH oxidase) in the insulin
signal cascade.6
While it is clear that ROS such as hydrogen peroxide are so-called second
messengers involved in intracellular signaling pathways, detailed knowledge of the
mechanisms by which ROS exert their action is incomplete, at best.7, 8 Some aspects of

Chapter 4 – Synthesis and Use of PC-1 as a Selective Detector of Peroxymonophosphate
83
hydrogen peroxide mediated intracellular signaling are in fact at odds with observed
physiology. J. Stone, in fact, proposes that hydrogen peroxide is merely a carrier of
oxidative equivalents, much like the ubiquitous biological thiol glutathione is a carrier of
reductive equivalents.7 In this scenario, H2O2 would transfer its oxidative action to
another agent, either spontaneously or by the actions of an unknown enzyme. These
“higher order” oxidative species have yet to be discovered. Furthermore, many if not all
of the molecules that possess the characteristics expected for an intracellular redox-
signaling agent also have characteristics that make detection and analysis difficult. They
are small, diffuse rapidly and are highly reactive. A major obstacle, therefore, in this
field is the facile, selective detection of ROS over other cellular agents. Traditional
indicators of ROS, such as 2’,7’-dichlorodihydrofluorescein and
Pentafluorobenzenesulfonyl fluorescein lack selectivity and sensitivity, respectively
(Scheme 4.1).9 Herein we set out to develop a new method to selectively detect higher-
order ROS, such as peroxymonophosphate, over others such as hydrogen peroxide,
and/or nitric oxide.

C
4
d
p
au
Chapter 4 – Syn
Sc
.2 Oxidati
C. Ch
etect hydro
articularly i
uthor’s know
nthesis and Use
cheme 4.1 Exam
ve Deboron
hang recently
gen peroxid
interested in
wledge of ox
Schem
e of PC-1 as a S
mples of ROS
nation
y reported us
de over oth
n this mecha
xidative reac
me 4.2 The bo
Selective Detec
84
indicators that
se of boronat
her physiolo
anistic appro
ctions with b
oronate-contain
ctor of Peroxym
t lack either sel
te based fluo
ogically rele
oach toward
oron contain
ning ROS indic
monophosphat
lectivity or sen
orescent prob
evant ROS.1
d ROS detec
ning xenobio
cator PC-1
te
nsitivity
bes to select
10, 11 We
ction due to
otics.12, 13
tively
were
o this
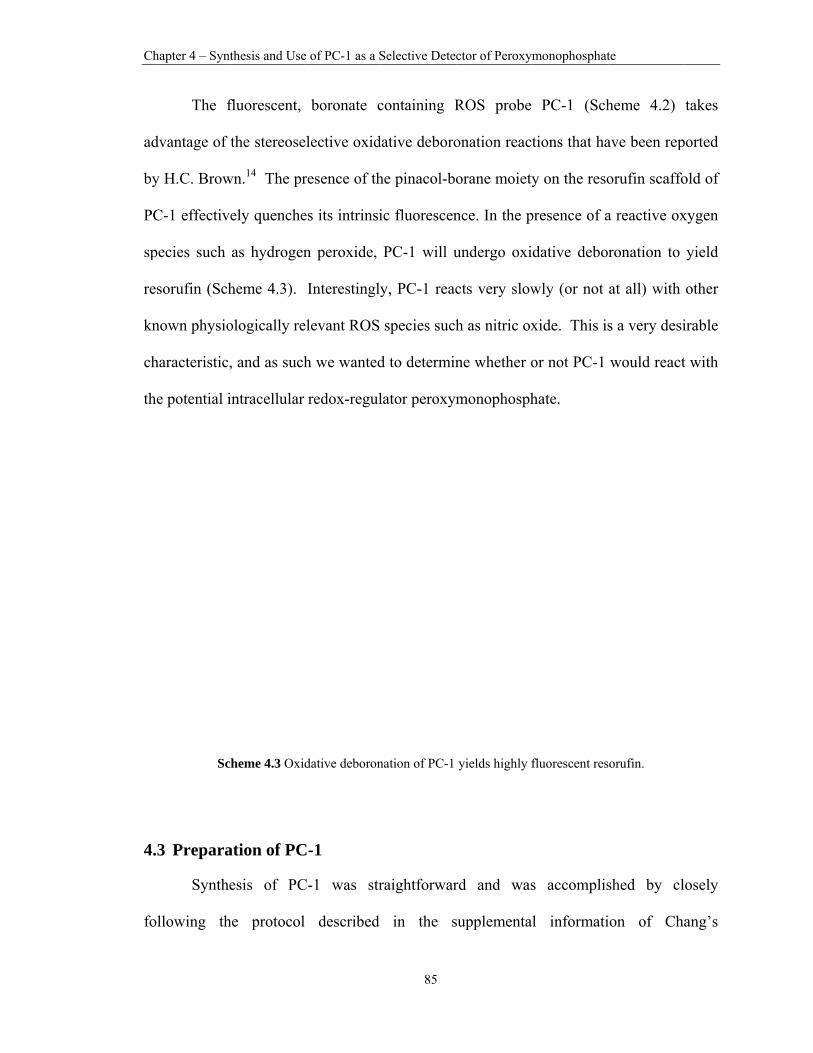
C
ad
by
P
sp
re
kn
ch
th
4
fo
Chapter 4 – Syn
The f
dvantage of
y H.C. Brow
C-1 effectiv
pecies such
esorufin (Sch
nown physio
haracteristic
he potential i
Sc
.3 Prepara
Synth
ollowing th
nthesis and Use
fluorescent,
the stereose
wn.14 The pr
vely quenche
as hydrogen
heme 4.3).
ologically re
c, and as such
intracellular
cheme 4.3 Oxi
ation of PC
hesis of PC
he protocol
e of PC-1 as a S
boronate c
elective oxid
resence of th
es its intrinsi
n peroxide,
Interestingly
elevant ROS
h we wanted
redox-regul
dative deboron
C-1
C-1 was str
l described
Selective Detec
85
containing R
dative deboro
he pinacol-bo
ic fluorescen
PC-1 will u
y, PC-1 reac
species such
d to determin
lator peroxym
nation of PC-1
raightforwar
in the s
ctor of Peroxym
ROS probe
onation react
orane moiety
nce. In the p
undergo oxi
cts very slow
h as nitric ox
ne whether o
monophosph
yields highly f
rd and was
supplementa
monophosphat
PC-1 (Sch
tions that ha
y on the reso
presence of a
dative debo
wly (or not
xide. This is
or not PC-1
hate.
fluorescent res
s accomplis
l informati
te
heme 4.2)
ave been rep
orufin scaffo
a reactive ox
ronation to
at all) with
s a very desi
would react
orufin.
shed by cl
ion of Cha
takes
ported
old of
xygen
yield
other
irable
t with
osely
ang’s

C
pu
sa
d
P
at
p
o
su
ac
m
4
fl
w
pH
5
Chapter 4 – Syn
ublication.10
alt with N
imethylform
C-1 via Suz
tmosphere g
owder. Onc
f the borona
uccessful wa
cetonitrile to
manner was k
.4 Fluores
Our
luorescent d
wavelengths
H 7.0. Figu
70 nm, and
nthesis and Use
0, 11 This two
N-phenyl b
mamide. The
zuki-Miyura
glove box (S
ce it was dis
ate group oc
ay to prepar
o a concentr
kept dry and
cence Mea
initial expe
detection.
was created
ure 4.1 show
d observing
Sche
e of PC-1 as a S
o-step prepa
is(trifluorom
e resulting tr
a-like cross-c
Scheme 4.4
ssolved in a
ccurred resu
re and store
ration of ~
d stored at -2
asurements
eriments wi
To achiev
d using a 1 μ
ws the results
the resultin
eme 4.4 Prepar
Selective Detec
86
aration was i
methanesulfo
riflate was th
coupling wi
). The brig
protic solve
lting in an i
e stock solu
1 mM. Wh
0oC it was st
s
ith PC-1 d
ve this, a
μM solution
s of scannin
ng emission
ration of PC-1
ctor of Peroxym
initiated by
onamide) a
hen converte
ith bis(pinac
ght orange p
ent, however
increase in b
utions of PC
hen a soluti
table for at l
determined
matrix of
n of resorufin
ng the excita
n intensity f
as described b
monophosphat
combining r
and Hünig’
ed into the b
colato)diboro
product was
r, slow but s
background
C-1 was to d
ion of PC-1
least six mon
the proper
excitation
n in 50 mM
ation wavelen
from 570 to
by Chang.
te
resorufin so
s base in
borane-conta
on in a dry
s stable as a
steady hydro
fluorescenc
dissolve it in
prepared in
nths.
parameters
versus emi
M Bis-Tris bu
ngth from 5
o 600 nm.
odium
dry
aining
inert
a dry
olysis
e. A
n dry
n this
s for
ission
uffer,
00 to
The

Chapter 4 – Synthesis and Use of PC-1 as a Selective Detector of Peroxymonophosphate
87
emission maximum was found to be at or around 585 nm. For the purposes of our
experiments, we chose an excitation wavelength of 550 nm. This gave good fluorescent
emission intensity, and was far enough away from the emission wavelength of 585 nm to
avoid Raleigh scattering at the detector.
Figure 4.1 Plot of fluorescent intensity versus excitation and emission wavelength for deboronated PC-1.
Chang reported that treatment of PC-1 with 100 μM hydrogen peroxide for 1 h
resulted in a roughly 40-fold increase in fluorescence intensity. To determine the
absolute fluorescence increase possible by deboronating PC-1, we treated the compound
with 10 mM H2O2 for 45 min, at which point the slope of fluorescence intensity versus
time became zero. Figure 4.2 shows that there was an approximately 150-fold increase in
fluorescent response between native PC-1 and PC-1 treated as described. This is a
significant delta, and the anticipated high rate of reaction between PC-1 and

C
p
ch
an
o
re
hy
Chapter 4 – Syn
eroxymonop
hange in flu
nd oxidized
f PC-1 stock
eactivity bet
ydrogen per
Figur
nthesis and Use
phosphate m
uorescent int
compound
k solutions.
tween PC-1
roxide.
re 4.2 Increase
e of PC-1 as a S
makes it a p
tensity, there
(Figure 4.3)
From this p
and the two
e in fluorescent
Selective Detec
88
promising re
e was a mar
). This prov
point on, ou
o reactive ox
t intensity caus
ctor of Peroxym
eagent for d
rked differen
ved useful in
ur goal was t
xygen specie
sed by oxidativ
monophosphat
etection. In
nce in the co
n assessing th
to quantify t
es peroxymo
ve deboronation
te
n addition to
olor of the n
he gross sta
the differenc
onophosphate
n of PC-1.
o the
native
ability
ces in
e and

Chapter 4 – Synthesis and Use of PC-1 as a Selective Detector of Peroxymonophosphate
89
Figure 4.3 Color change resulting from treatment of PC-1 with hydrogen peroxide. Left: 1 mM solution of PC-1 in 50 mM Bis-Tris pH 7.0. Right: 1 mM solution of PC-1 in 50 mM Bis-Tris pH 7.0 treated with 10 mM H2O2 for 1h.
While the fluorescence intensity of PC-1 did increase upon addition of hydrogen
peroxide, the rate of this reaction was obviously slow, even when compared to the
sluggish reaction of H2O2 with PTP1B. Measurement of the rate of reaction between PC-
1 and hydrogen peroxide under pseudo-first order conditions confirmed this observation.
The apparent second order rate was determined to be 1.2 M-1s-1, which is consistent with
what was reported by Chang (~ 1 M-1s-1) (Figures 4.4 and 4.5).11

C
F0.
Chapter 4 – Syn
Figure 4
igure 4.5 The .17 M-1s-1.
nthesis and Use
4.4 The apparen
apparent seco
e of PC-1 as a S
nt pseudo-first
nd order rate o
Selective Detec
90
order rates of
of the reaction
ctor of Peroxym
PC-1 deborona
n between PC-1
monophosphat
ation by hydro
1 and hydrogen
te
gen peroxide.
n peroxide is 11.2 +/-

C
P
p
th
fa
n
co
p
ti
in
se
Chapter 4 – Syn
It was
C-1 when
eroxymonop
he resorufin
acilitate mea
ecessary, th
oncentration
eroxymonop
ime frame of
When
ndeed select
econd order
Figure 4.6
nthesis and Use
s immediatel
combined
phosphate to
n core and m
asurement o
herefore, to r
n of 1 μM
phosphate th
f minutes, in
n analyzed w
tive for pero
reaction rate
The apparent
e of PC-1 as a S
ly clear that
d in equim
o a 1 μM so
maximum f
of reaction k
reduce the c
M. This al
hat allowed
nstead of sec
with pseudo
oxymonopho
e of 1447 ± 5
pseudo-first or
Selective Detec
91
peroxymono
molar ratio
olution of PC
fluorescent i
kinetics und
concentration
llowed us
visualizatio
onds.
o-first order
osphate ove
52 M-1s-1 (Fi
rder rates of PC
ctor of Peroxym
ophosphate c
s. In fa
C-1 resulted
intensity in
der pseudo-f
n of PC-1 t
to treat PC
on of reactio
r conditions
er hydrogen
igures 4.6 an
C-1 deboronati
monophosphat
caused rapid
act, additio
in complete
less than 3
first order c
to 100 nM f
C-1 with c
on the in a
s, we found
peroxide, w
nd 4.7).15
ion by peroxym
te
d deboronati
on of 10
e deprotectio
30 seconds.
conditions it
from the ori
oncentration
more reason
d that PC-1
with an app
monophosphate
on of
μM
on of
To
t was
iginal
ns of
nable
was
parent
e.

C
F+/
4
1
th
pr
th
h
or
b
in
H
p
Chapter 4 – Syn
igure 4.7 The /- 52 M-1s-1.
.5 Conclus
Perox
. The reacti
han with H2O
referentially
his species i
ere provide
r enzyme-ca
iological sys
n the presen
H2O2. Cata
eroxide indi
nthesis and Use
apparent secon
sions
xymonophosp
ion of PC-1
O2. This fin
y detect a sec
is generated
a foundation
atalyzed con
stems. After
ce of a puta
alase treatm
icator PC-1 p
e of PC-1 as a S
nd order rate o
phate readily
with peroxy
nding highlig
condary H2O
d inside cells
n for the dev
nversion of
r incubation
ative enzyma
ent leaves
provides a m
Selective Detec
92
f the reaction b
y “lights up
ymonophosp
ghts the pos
O2-derived o
s. Taken to
velopment o
H2O2 to pe
n of H2O2 wi
atic catalyst)
peroxymono
means for its
ctor of Peroxym
between PC-1
” the fluore
phate is appr
ssibility that
oxidant such
ogether, elem
of assays de
eroxymonop
th a phospho
), catalase ca
ophosphate
s highly sens
monophosphat
and peroxymo
scent peroxi
roximately 1
boronate es
h as peroxym
ments of the
signed to de
phosphate in
oryl donor s
an be used t
intact and
sitive detecti
te
nophosphate is
ide indicator
1200 times f
ster probes m
monophosph
e work desc
etect spontan
n biochemic
ubstrate (per
to destroy ex
addition o
ion under a g
s 1447
r PC-
faster
might
hate if
cribed
neous
cal or
rhaps
xcess
f the
given

Chapter 4 – Synthesis and Use of PC-1 as a Selective Detector of Peroxymonophosphate
93
set of reaction conditions. This general approach might be amenable to either a high-
throughput micro plate reader or in-gel assays that search for peroxymonophosphate-
producing enzymes in a proteome. Such tools will help explore the possibility that
peroxymonophosphate participates in the regulation (or dysregulation) of cell signaling
processes under physiological or pathophysiological conditions.
4.6 Experimental Procedures
Materials and Methods
Reagents were purchased from the following suppliers: Bis-Tris (#B9754),
resorufin sodium salt (#R3257), anhydrous dimethylformamide (#227056) N-phenyl
bis(trifluoromethanesulfonamide) (#295973), N,N-diisopropylamine (Hunigs base,
#386464), bis(pinacolato)diboron (#473294), diphenyl, 1,1′-
Bis(diphenylphosphino)ferrocene] dichloropalladium(II), complex with dichloromethane
(#379670), 1,1′-Bis(diphenylphosphino)ferrocene (#177261), potassium acetate
(#236497), anhydrous 1,4 dioxane (#296309), anhydrous Na2SO4 (#239313) were
obtained from Sigma-Aldrich (St. Louis, MO). CDCl3 was obtained from Cambridge
Isotope Labs, Cambridge, Massachusetts. Hydrogen peroxide (#H325-500) was obtained
from Fisher Scientific, Fairlawn, New Jersey.
Preparation of 3-Oxo-3H-phenoxazin-7-yl trifluoromethanesulfonate (2). The
fluorescent boronate-containing ROS indicator PC-1 was prepared exactly as described
by Chang and coworkers. To recap: Resorufin sodium salt (500 mg/2.2 mmol) was
dissolved in a round-bottom flask (using Schlenk apparatus and dry nitrogen) in 40 mL of
dry dimethylformamide (dried over 4 Å molecular sieves) with an equimolar ratio of N-

Chapter 4 – Synthesis and Use of PC-1 as a Selective Detector of Peroxymonophosphate
94
phenyl bis(trifluoromethanesulfonamide) (786 mg). Hünig’s base (1.1 mL, 6.6 mmol)
was then added via syringe and the reaction mixture was stirred in the dark, under dry
nitrogen (low positive pressure), for 24 hours. The reaction mixture was concentrated via
rotary evaporation (high-vacuum, dry ice/acetone traps) to ~ 5 mL volume and diluted
with 200 mL ethyl acetate. The organic layer was washed three times with 200 mL of
water, dried over anhydrous magnesium sulfate, and dried with rotary evaporation. Flash
column chromatography with 100g silica gel (1:1, ethyl acetate:hexanes) gave the
product 3-Oxo-3H-phenoxazin-7-yl trifluoromethanesulfonate as an orange-yellow solid
that eluted between bright red and bright yellow bands. (568 mg, 74% yield). 1H NMR
(CDCl3, 300 MHz) δ 7.89 (1H, d, J=), 7.45 (1H, d, J=), 7.29 (3H, m), 6.9 (1H, dd, J=),
6.35 (1H, d, J=) (Figure 4.8). 19F NMR (CDCl3, 250 MHz) δ -72 (s) (Figure 4.10).
Crude 13C NMR is shown in Figure 4.9.
Preparation of 3-Oxo-3H-phenoxazin-7-yl pinacolatoboron (PC-1, (1)). In a dry inert
atmosphere glove box to a 25 mL round bottom flask was added 3-Oxo-3H-phenoxazin-
7-yl trifluoromethanesulfonate (166 mg, 0.50 mmol), bis(pinacolato)diboron (186 mg,
0.73 mmol), [1,1′-Bis(diphenylphosphino)ferrocene]dichloropalladium(II) complexed
with dichloromethane ( PdCl2(dppf)•CH2Cl2, 40 mg, 0.05 mmol), and 1,1′-
Bis(diphenylphosphino)ferrocene (dppf, 26 mg, 0.05 mmol). To this mixture was added
6 mL of a suspension of potassium acetate (32 mg, 0.33 mmol) in anhydrous 1,4 dioxane.
The flask was then sealed in the glove box with a 15 cm reflux condenser topped with an
“L” shaped glass stopcock equipped with a tubing nipple. The entire system was then
removed from the glove box, attached to dry nitrogen purged Schlenk apparatus, and
heated at 80oC for 3 h. All ground glass joints were treated with minimal silicone sealant

Chapter 4 – Synthesis and Use of PC-1 as a Selective Detector of Peroxymonophosphate
95
to prevent air intrusion during transfer to the Schlenk apparatus. After heating, the
reaction was allowed to cool to room temperature, diluted with ~ 20 mL toluene, and any
precipitates were removed by filtering with a sintered glass funnel (medium pore size).
The filtrate was washed three times with 25 mL of brine, and dried over anhydrous
sodium sulfate. Solvent was removed with rotary evaporation followed by high vacuum
for several hours. The resulting reddish-brown solid was washed several times on a
sintered glass funnel (medium pore size) with small volumes of ethanol (~ 10 mL) to give
the product, PC-1 as a bright orange solid (20 mg, 12% yield). 1H NMR (CDCl3, 300
MHz) δ 7.77 (3H, m), 7.45 (1H, d, J = 9.98 Hz), 6.87 (1H, dd, J1 = 2.07 Hz, J2 = 9.9 Hz),
6.33 (1H, d, J = 1.9 Hz), 1.32 (12H, s) (Figure 4.11). 13C NMR (CDCl3, 300 MHz) δ
186, 149.8, 149.5, 135.36, 134.73, 131.3, 129.46, 122.18, 106.9, 84.54, 24.84 (Figure
4.12).
Measurement of Fluorescent Parameters for Detection of PC-1. All fluorescent
spectra were taken with an SLM-AMINCO 8100 spectrofluorimeter equipped with a
temperature controlled cell holder. Slit widths were set at 4 nm at both excitation and
emission optics. For measurement of fluorescence excitation and emission spectra, a 1
μM solution of PC-1 was prepared by adding 1 μL of 1 mM stock PC-1 dissolved in dry
acetonitrile to 0.99 mL 50 mM Bis-Tris buffer, pH 7.0. This solution proved very stable
when kept from moisture and stored at -20oC. If the solution was contaminated with
water, slow but steady deboronation of PC-1 occurred. Excitation wavelengths were
scanned from 500 to 570 nm in 10 nm steps, and emission intensity was observed from
570 to 600 nm in 5 nm steps. While emission intensity peaked at 585 nm, there was a
broad range of good excitation wavelengths that ranged from 540 to 570 nm (Figure 4.1).

Chapter 4 – Synthesis and Use of PC-1 as a Selective Detector of Peroxymonophosphate
96
There was minimal signal gain from 540 to 570 nm, so 550 nm was chosen for excitation
to prevent Raleigh scatter from occurring. This combination, excitation at 550 nm,
emission at 585 nm with 4 nm slit widths yielded approximately 200,000 relative
fluorescence units of intensity with a 1 μM solution of PC-1 in 50 mM Bis-Tris buffer pH
7.0.
Measurement of the Rate of Reaction between PC-1 and Hydrogen Peroxide. The
rate of reaction between PC-1 and hydrogen peroxide was measured under pseudo-first
order conditions. For measurement of the apparent rate of fluorescence increase
catalyzed by hydrogen peroxide, in a fluorescence cuvette to 1 mL of a 1 μM solution of
PC-1 (1 μL of a 1 mM stock solution dissolved in dry acetonitrile) in 50 mM Bis-Tris
buffer pH 7.0 was added varying amounts of hydrogen peroxide (2, 3, 4, 5 mM final
concentration, from an 1 mM stock). The cuvette was quickly stoppered, inverted three
times to mix, and fluorescence intensity was observed for 30 s. at 2 s. intervals using an
SLM-AMINCO 8100 spectrofluorimeter with the parameters described in the previous
section. Each measurement was performed in triplicate. The apparent rate of reaction
was determined by plotting relative fluorescence intensity (% of maximum fluorescence
of a 1 μM solution of fully deboronated PC-1) as a function of time and fitting the data to
the equation (y = m*x +b) where y = RFU/RFUmax, x = time in seconds (Figure 4.4). The
slope of each line was equal to kΨ (units = s-1), the apparent pseudo-first order reaction
rate. When the various values of kΨ were then replotted as a function of H2O2
concentration, the slope of the resulting line was equal to the apparent second order rate
of reaction (1.21 +/- 0.17 M-1s-1, (Figure 4.5).

Chapter 4 – Synthesis and Use of PC-1 as a Selective Detector of Peroxymonophosphate
97
Measurement of the Rate of Reaction between PC-1 and Peroxymonophosphate.
Due to the rapid rate of reaction between PC-1 and peroxymonophosphate, to preserve
pseudo-first order conditions it was necessary to reduce the concentration of PC-1 to 100
nM from 1 μM. The reactions and data analysis were carried out as previously described,
the differences being PC-1 concentration (100 nM), and peroxymonophosphate
concentrations (1, 2, 3, 4 μM from a 1 mM solution in water) (Figure 4.6). Replotting the
pseudo-first order rates of reaction gave the apparent second order rate of reaction
between PC-1 and peroxymonophosphate (1447 +/- 52 M-1s-1, (Figure 4.7).

Chapter 4 – Synthesis and Use of PC-1 as a Selective Detector of Peroxymonophosphate
98
Figure 4.8 1H NMR of (2).

Chapter 4 – Synthesis and Use of PC-1 as a Selective Detector of Peroxymonophosphate
99
Figure 4.9 13C NMR of (2).

Chapter 4 – Synthesis and Use of PC-1 as a Selective Detector of Peroxymonophosphate
100
Figure 4.10 19F NMR OF (2)
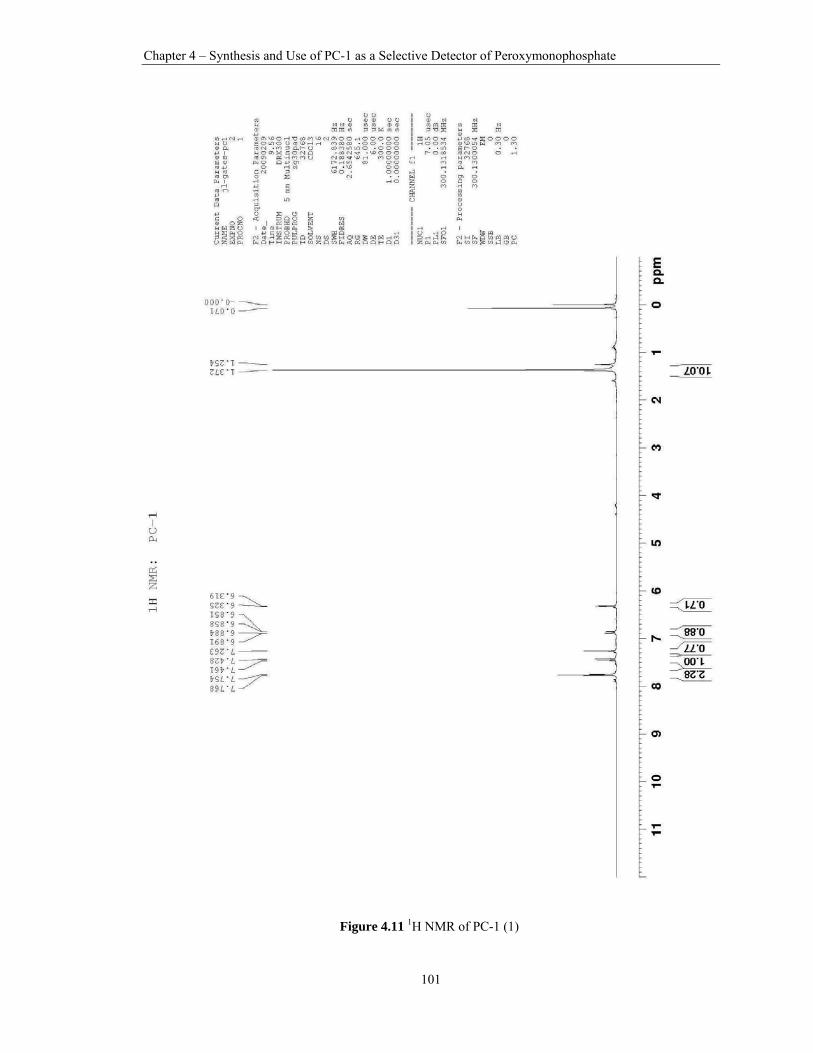
Chapter 4 – Synthesis and Use of PC-1 as a Selective Detector of Peroxymonophosphate
101
Figure 4.11 1H NMR of PC-1 (1)

Chapter 4 – Synthesis and Use of PC-1 as a Selective Detector of Peroxymonophosphate
102
Figure 4. 4.12 13C NMR of PC-1 (1).

Chapter 4 – Synthesis and Use of PC-1 as a Selective Detector of Peroxymonophosphate
103
References
1. O'Brien, P. J., Radical formation during the peroxidase catalyzed metabolism of carcinogens and xenobiotics: The reactivity of these radicals with GSH, DNA, and unsaturated lipid. Free Radical Biology and Medicine 1988, 4 (3), 169-183.
2. Staniek, K.; Nohl, H., Are mitochondria a permanent source of reactive oxygen species? Biochimica et Biophysica Acta (BBA) - Bioenergetics 2000, 1460 (2-3), 268-275.
3. Nauseef, W. M., How human neutrophils kill and degrade microbes: an integrated view. Immunological Reviews 2007, 219 (1), 88-102.
4. Forman, H. J.; Fukuto, J. M.; Torres, M., Redox signaling: thiol chemistry defines which reactive oxygen and nitrogen species can act as second messengers. Am J Physiol Cell Physiol 2004, 287 (2), C246-256.
5. Sundaresan, M.; Yu, Z.-X.; Ferrans, V. J.; Irani, K.; Finkel, T., Requirement for Generation of H2O2 for Platelet-Derived Growth Factor Signal Transduction. Science 1995, 270 (5234), 296-299.
6. Goldstein, B. J.; Mahadev, K.; Wu, X.; Zhu, L.; Motoshima, H., Role of Insulin-Induced Reactive Oxygen Species in the Insulin Signaling Pathway. Antioxidants & Redox Signaling 2005, 7 (7-8), 1021-1031.
7. Stone, J. R., An assessment of proposed mechanisms for sensing hydrogen peroxide in mammalian systems. Archives of Biochemistry and Biophysics 2004, 422 (2), 119-124.
8. Stone, J. R.; Yang, S., Hydrogen Peroxide: A Signaling Messenger. Antioxidants & Redox Signaling 2006, 8 (3-4), 243-270.
9. Rhee, S. G., Measuring H2O2 produced in response to cell surface receptor activation. Nat. Chem. Biol. 2007, 3 (5), 244-246.
10. Miller, E. W.; Tulyathan, O.; Isacoff, E. Y.; Chang, C. J., Molecular imaging of hydrogen peroxide produced for cell signaling. Nat Chem Biol 2007, 3 (5), 263-267.
11. Miller, E. W.; Albers, A. E.; Pralle, A.; Isacoff, E. Y.; Chang, C. J., Boronate-Based Fluorescent Probes for Imaging Cellular Hydrogen Peroxide. J. Am. Chem. Soc. 2005, 127 (47), 16652-16659.
12. Labutti, J.; Parsons, I.; Huang, R.; Miwa, G.; Gan, L. S.; Daniels, J. S., Oxidative Deboronation of the Peptide Boronic Acid Proteasome Inhibitor Bortezomib: Contributions from Reactive Oxygen Species in This Novel Cytochrome P450 Reaction. Chem. Res. Toxicol. 2006, 19 (4), 539-546.

Chapter 4 – Synthesis and Use of PC-1 as a Selective Detector of Peroxymonophosphate
104
13. Pekol, T.; Daniels, J. S.; Labutti, J.; Parsons, I.; Nix, D.; Baronas, E.; Hsieh, F.; Gan, L.-S.; Miwa, G., Human metabolism of the proteasome inhibitor bortezomib: Identification of circulating metabolites. Drug. Metab. Dispos. 2005, 33 (6), 771-777.
14. Brown, H. C.; Midland, M. M.; Kabalka, G. W., Stoichiometrically controlled reaction of organoboranes with oxygen under very mild conditions to achieve essentially quantitative conversion into alcohols. JACS 1971, 93 (4), 1024-1025.
15. LaButti, J. N.; Gates, K. S., Biologically relevant chemical properties of peroxymonophosphate (O3POOH). Bioorg. Med. Chem. Lett. 2009, 19 (1), 218-221.

105
Chapter 5
Enzymatic Production of Peroxymonophosphate
5.1 Introduction and objectives
We have thus far synthesized, characterized, and observed the redox effects of
peroxymonophosphate on the archetypal protein tyrosine phosphatase PTP1B and SHP-2.
It is clear from the results of these experiments that peroxymonophosphate possesses
properties expected for an endogenous redox-regulator of protein tyrosine phosphatase
activity. These properties include, but are not limited to: Active site directed, thiol-
reversible oxidative inactivation of a PTP that is orders of magnitude faster than
hydrogen peroxide. A critical property that remains to be investigated is that of
biological accessibility. While the enzymatic processes that lead to generation of
hydrogen peroxide by NADPH oxidases during intracellular signaling are relatively well
characterized, we have yet to uncover evidence for production of peroxymonophosphate
by enzymatic processes.
Conceptually, our hypothesis for enzymatic production of peroxymonophosphate
is straightforward and is based upon two well-accepted concepts:

Chapter 5 – Enzymatic Production of Peroxymonophosphate
106
1. Enzyme mediated phosphoryl transfer (also known as “phosphotransferase”
activity) is a ubiquitous process in cellular systems.1
2. Hydrogen peroxide is a much more potent nucleophile than water due to both
its intrinsic reactivity (kHOO-/kHO- ~ 100) and its greater anionic fraction at
physiologic pH (pKa H2O2 = 11.6; pKa H2O = 15.7).2
In this scenario, hydrogen peroxide would compete with water during the catalytic
cycle of an enzyme and release peroxymonophosphate instead of inorganic phosphate.
We have coined a term for enzymes that would accomplish this process: peroxykinases.
The concept of phosphotransferase activity by phosphohydrolases has been well
characterized in the literature.3, 4 When considering a feasible peroxykinase scenario, one
would therefore envision that an enzyme of the phosphohydrolase class (EC 3.1.3
superfamily) would utilize an alternative nucleophile to water when cleaving a
phosphoenzyme intermediate (Scheme 5.1). This class of enzymes, given the formal
term “phosphoric monoester hydrolases” by the IUPAC-IUBMB Joint Commission on
Biochemical Nomenclature (JCBN) and Nomenclature Committee of IUBMB (NC-
IUBMB) includes a diverse group ranging from prototypical phosphatases such as
alkaline phosphatase and protein tyrosine phosphatases to metallo-enzymes such as
purple acid phosphatase.5

Chapter 5 – Enzymatic Production of Peroxymonophosphate
107
In the studies described in herein, we investigate whether or not phosphoryl
transfer to hydrogen peroxide, i.e., peroxykinase, can be accomplished through enzymatic
processes thereby producing peroxymonophosphate. We initially used the redox-
regulated protein tyrosine phosphatase PTP1B to test for peroxykinase activity, due to its
high sensitivity towards peroxymonophosphate (~ 55,000 M-1s-1). We then employed the
peroxymonophosphate-selective redox indictor PC-1 in combination with a variety of EC
3.1.3 class enzymes to screen for peroxykinase activity across the enzyme superfamily.
Finally, we confirmed the enzymatic production of peroxymonophosphate via
quantitative 31P NMR in conjunction with authentic standards.
Nuc
PO OOH
RO
NucNuc
PO
O-OO-
Substrate
R= H, OH, Me, Et...
PO
O-OOH
R
Scheme 5.1 A general mechanistic view of enzyme mediated phosphotransferase activity by a phosphatase.In the specific case of peroxykinase activity to generate peroxymonophosphate, R = OH.

Chapter 5 – Enzymatic Production of Peroxymonophosphate
108
5.2 Utilizing PTP1B to Detect Peroxykinase Activity
It is clear, from the experiments described in Chapter 3, that
peroxymonophosphate rapidly inactivates PTP1B through oxidation of its active site
catalytic cysteine thiolate. The rate of inactivation with peroxymonophosphate is in fact
orders of magnitude greater than that observed with hydrogen peroxide (~55,000 versus
~20 M-1s-1). This makes PTP1B an ideal candidate to identify peroxykinase activity,
because of its ability to respond (lose activity) to very low concentrations of
peroxymonophosphate. Scheme 5.2 depicts the general protocol for detection of
peroxykinase activity with PTP1B. The first step is to combine putative peroxykinase
with an appropriate mono-phosphorylated substrate in the presence of hydrogen peroxide.
After allowing the enzyme to act upon substrate for a certain amount of time, excess
hydrogen peroxide is quenched by adding catalase. This is a crucial step due to the fact
that in the early, proof of concept phase these experiments were carried out under
“forcing conditions”: High substrate and very high H2O2 concentrations. Following
H2O2 quenching, both peroxykinase and catalase are removed via centrifugal filtration.
This is a crucial step, because the presence of other phosphohydrolase enzymes would
negate the probative value of PTP1B for peroxymonophoshate by creating a large
background of substrate turnover. Thus, a viable assay must to include a step that
removes the putative peroxykinase enzyme prior to addition of PTP1B. Finally, to the
centrifugal filtrate is added PTP1B and pNPP, and the activity of the enzyme is
monitored at 410 nm.

C
ph
tu
ad
th
5
th
su
hy
Chapter 5 – Enz
Sc
The fi
hosphatase
ulerensis by
1. Ac
ph
eth
2. Ac
av
3. Pr
ex
The re
denosine mo
hat there is
’AMP and h
hree concen
ubstrate for
ydrogen per
zymatic Produc
cheme 5.2 Gen
first enzyme
class enzym
Reilly and c
cid phosph
hosphotransf
hanol.6-8
cpA was we
vailable reaso
rofessor Re
xperiments.
esults of init
onophosphat
a reactive o
hydrogen pe
trations of
catalase. F
roxide had li
ction of Peroxy
eral protocol fo
chosen for
me (Acp) w
colleagues.6
hatases, inc
ferase activit
ell characteri
onably price
eilly kindly
tial studies c
te and 1, 10
oxygen spec
eroxide that
hydrogen p
urthermore,
ittle or no e
ymonophospha
109
for detection of
our proof o
was first is
AcpA was c
cluding Ac
ty with alter
ized and pos
ed substrates
offered to
carried out w
or 100 mM
cies produce
causes time
eroxide. Im
controls tha
effect on PTP
ate
f peroxykinase
of concept st
solated from
chosen for th
cpA, have
rnate nucleo
ssessed low K
s such as 5’ a
o give us
with AcpA in
H2O2 are sh
ed during th
e-dependent
mportantly,
at combined
P1B activity
activity with P
tudies was A
m the patho
hree main rea
been sho
ophiles such
Km and high
adenosine m
purified e
n the presen
own in Figu
he incubation
inactivation
the produce
d AcpA and
y. Finally, t
PTP1B.
AcpA. This
ogen Franci
asons:
own to ex
as methano
h Vmax for re
monophospha
enzyme for
nce of 10 mM
ure 5.1. It is
n of AcpA,
n of PTP1B
ed ROS is n
5’ AMP wi
the procedur
s acid
isella
xhibit
ol and
eadily
ate.6
r our
M 5’-
clear
with
at all
not a
ithout
re for

Chapter 5 – Enzymatic Production of Peroxymonophosphate
110
quenching hydrogen peroxide was shown to be valid by fortifying a buffer blank with 1M
H2O2. This control, after processing it in way identical to other samples, showed minimal
inactivation of PTP1B. This, overall, was a significant step towards identifying
peroxykinase activity and was, thus, a very exciting result.
5.3 Use of PC-1 to Probe for Enzymatic Production of Peroxymonophosphate
While it may initially appear desirable to utilize PTP1B activity to probe a wide
variety of enzymes for peroxykinase activity, close examination of the technical details of
the assay indicate otherwise. The prototypical procedure for the assays, as shown in
Scheme 5.1, includes a step dedicated to removal of the putative peroxykinase from the
incubation volume with centrifugal filtration. While this step is not technically
challenging it does not lend itself to rapid analysis of multiple samples due to the length
of time required for centrifugal filtration (~ 45 min.). Furthermore, it adds significant
Figure 5.1 Time-dependent inactivation of PTP1B by the product of a phosphatase enzymatic reaction in the presence of various concentrations of hydrogen peroxide.

C
ex
m
p
en
in
A
Scpr
th
ra
ca
re
hy
el
p
Chapter 5 – Enz
xpense to th
more econo
eroxymonop
nzymatic pro
n Scheme 5
AcpA was ch
cheme 5.3 Genrobe may be ei
In the
hat AcpA pr
ates (Figure
atalase. Fu
espect to th
ydrogen pe
levated rates
eroxykinase
zymatic Produc
e assay; at th
omical, in
phosphate-se
oduction of
.3. For rea
hosen for init
neral procedurither a fluoresc
e presence o
roduces a re
5.2). Imp
rthermore, t
he initial co
roxide, pho
s of PC-1 d
e activity by
ction of Peroxy
he time of th
both tim
elective redo
peroxymono
asons elabor
tial experime
re for detectioncent redox indic
of 5’ adenosi
eactive oxyg
ortantly, thi
the rate of P
oncentrations
osphorylated
deboronation
AcpA.
ymonophospha
111
he study the
me and r
ox detector
ophosphate.
rated in the
ents with PC
n of peroxykinacator, or a redo
ine monoph
gen species
is reactive o
PC-1 deboro
s of hydrog
d substrate
n. This prov
ate
filters cost r
resources,
PC-1 inste
A depictio
previous se
C-1.
ase activity. Inox-regulated pr
hosphate and
that causes
oxygen spec
onation is c
gen peroxide
and enzyme
vides good,
roughly ten d
therefore
ad of PTP1
on of the new
ection, the a
n the detectionrotein.
d hydrogen p
elevated PC
cies is it no
oncentration
e. Finally,
e are neces
albeit indir
dollars each.
to utilize
1B to screen
w assay is sh
acid phosph
n phase, the che
peroxide we
C-1 deboron
ot a substrat
n-dependent
the presenc
ssary to ach
ect, evidenc
. It is
the
n for
hown
hatase
emical
e find
nation
te for
with
ce of
hieve
ce for

Chapter 5 – Enzymatic Production of Peroxymonophosphate
112
Figure 5.2 Deboronation rates of PC-1 by the product of reaction mixture of AcpA combined with 5’ adenosine monophosphate and hydrogen peroxide.
5.4 Confirmation of Enzyme-produced Peroxymonophosphate With 31P NMR
We recognized that while our data supported the notion of peroxykinase activity,
direct evidence of enzyme-generated peroxymonophosphate was needed. We
accomplished this through the careful use of quantitative 31P NMR. The limit of
detection for peroxymonophosphate with the 250 mHz instrument to which we had
access was determined to be at or around 2 mM with a ten minute quantitative scan. To
facilitate detection of peroxymonophosphate with 31P NMR we therefore decided to try to
enhance its production by increasing the concentrations of both substrate and hydrogen
peroxide from 10 mM/1-100mM to 100mM/1M, respectively.

Chapter 5 – Enzymatic Production of Peroxymonophosphate
113
Figure 5.3 31P NMR of a test for peroxykinase activity that contained AcpA, 1M H2O2 and 100 mM 5’-AMP @ pH 7.0. Peaks are assigned as follows: peroxymonophosphate: 7.8 ppm; 5’-AMP: 3.4 ppm and inorganic phosphate at 1.9 ppm.

Chapter 5 – Enzymatic Production of Peroxymonophosphate
114
Figure 5.4 31P NMR of a control sample for peroxykinase activity that contained AcpA and 100 mM 5’-AMP. Peaks are assigned as follows: 5’-AMP: 3.3 ppm; inorganic phosphate: 1.7 ppm.

Chapter 5 – Enzymatic Production of Peroxymonophosphate
115
Figure 5.5 31P NMR of a negative control for peroxykinase activity that contained 100 mM 5’-AMP in pH 7.0 buffer (3 ppm).
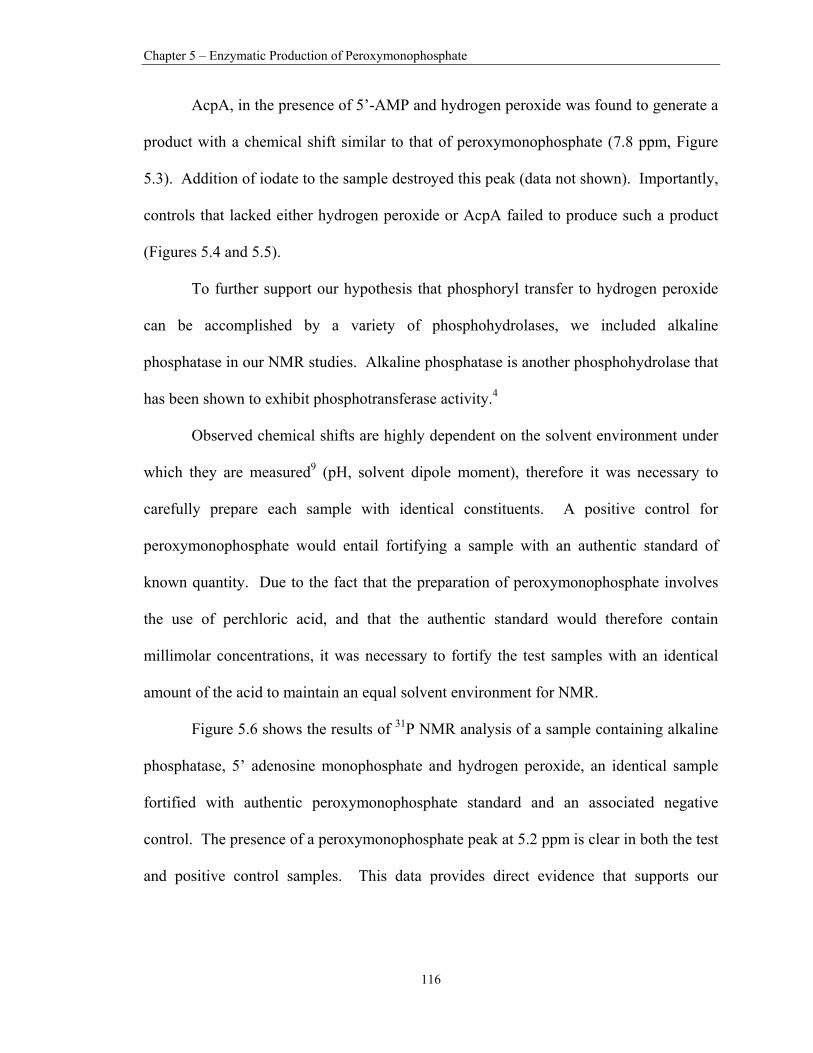
Chapter 5 – Enzymatic Production of Peroxymonophosphate
116
AcpA, in the presence of 5’-AMP and hydrogen peroxide was found to generate a
product with a chemical shift similar to that of peroxymonophosphate (7.8 ppm, Figure
5.3). Addition of iodate to the sample destroyed this peak (data not shown). Importantly,
controls that lacked either hydrogen peroxide or AcpA failed to produce such a product
(Figures 5.4 and 5.5).
To further support our hypothesis that phosphoryl transfer to hydrogen peroxide
can be accomplished by a variety of phosphohydrolases, we included alkaline
phosphatase in our NMR studies. Alkaline phosphatase is another phosphohydrolase that
has been shown to exhibit phosphotransferase activity.4
Observed chemical shifts are highly dependent on the solvent environment under
which they are measured9 (pH, solvent dipole moment), therefore it was necessary to
carefully prepare each sample with identical constituents. A positive control for
peroxymonophosphate would entail fortifying a sample with an authentic standard of
known quantity. Due to the fact that the preparation of peroxymonophosphate involves
the use of perchloric acid, and that the authentic standard would therefore contain
millimolar concentrations, it was necessary to fortify the test samples with an identical
amount of the acid to maintain an equal solvent environment for NMR.
Figure 5.6 shows the results of 31P NMR analysis of a sample containing alkaline
phosphatase, 5’ adenosine monophosphate and hydrogen peroxide, an identical sample
fortified with authentic peroxymonophosphate standard and an associated negative
control. The presence of a peroxymonophosphate peak at 5.2 ppm is clear in both the test
and positive control samples. This data provides direct evidence that supports our

C
co
cl
Fadm+ ph
5
p
p
d
v
Chapter 5 – Enz
oncept of pe
lass of enzym
igure 5.6 Detedenosine mon
monophosphate 1M hydrogen
hosphatase + 1
.5 Conclus
Both
eroxykinase
eroxymonop
iscreet sub-c
ariety of act
zymatic Produc
eroxykinase
mes.
ection of peroophosphate an+ 1M hydroge
n peroxide forti00 mM 5’-ade
sions
the acid ph
e activity.
phosphate co
classes of ph
tive sites and
ction of Peroxy
activity by
xymonophosphnd hydrogen pen peroxide. Bified with peroenosine monop
hosphatase A
These res
ould be a b
hosphoric mo
d respective
ymonophospha
117
y a member
hate generatedperoxide. A:
B alkaline phosoxymonophosphosphate.
AcpA and a
sults are a
biologically
onoester hyd
substrates.
ate
of the phos
d by alkaline palkaline phosp
sphatase + 100 phate authentic
alkaline pho
proof-of-co
relevant red
drolases (EC
In addition
sphoric mon
phosphatase inphatase + 100mM 5’ adeno
c standard to ~
osphatase ha
oncept for
dox regulato
C 3.1.3.X) th
to the phosp
noester hydr
n the presence 0 mM 5’-adensine monopho10 mM. C: al
ave demonst
the notion
or. There ar
at possess a
phoric mono
rolase
of 5’-nosine sphate lkaline
trated
that
re 79
wide
oester

Chapter 5 – Enzymatic Production of Peroxymonophosphate
118
hydrolase class, there exist other similar classes of enzyme that could possess
peroxykinase activity including phosphoric diester (EC 3.1.4), diphosphoric monoester
(EC 3.1.7), and phosphoric triester hydrolases (EC 3.1.8). Furthermore, classes of
enzyme seemingly disparate from the phosphohydrolases such as non-heme and
vanadium variants of chloroperoxidase (EC 1.11.1; oxidoreductases that act on peroxide
as an acceptor) have been identified that exhibit phosphatase activity.10, 11 This is not
entirely surprising, because several investigators have noted similarities in active site
architecture between these peroxidases and phosphatase class enzymes.12, 13 These
chloroperoxidase enzymes are particularly intriguing due to the fact that they have
intrinsic affinity for and utilize hydrogen peroxide during their catalytic cycle. In fact,
these enzymes have been found to transfer hydrogen peroxide to an acylated enzyme
intermediate to produce peroxyacetic acid (Scheme 5.4). It seems reasonable, then, to
hypothesize that production of peroxymonophosphate could occur from a
phosphorylenzyme intermediate that was formed during phosphatase activity. The lack
of commercial availability of these enzymes, however, precluded their inclusion in the
studies presented here due to time constraints. Perhaps in the near future the Gates Lab
will be able to clone the genes that encode these enzymes and express them for testing.

Chapter 5 – Enzymatic Production of Peroxymonophosphate
119
Scheme 5.4 Generation of peroxyacetic acid from the catalytic cycle of non-heme bacterial chloroperoxidase involves the use of hydrogen peroxide as an acyl acceptor.
We envision future studies that take advantage of both the selectivity of PC-1
towards peroxymonophosphate, and the resistance of peroxymonophosphate to
decomposition by catalase to screen a wide array of enzymes for peroxykinase activity.
For example, a native 2D proteomic gel could be screened for peroxykinase activity by
bathing the gel in universal phosphatase substrate and hydrogen peroxide. Excess
hydrogen peroxide would then be quenched with catalase, followed by bathing of the gel
in a solution of PC-1. Analysis of the gel with fluorescence imaging could then identify
discreet proteins that “light up” PC-1.
5.6 Experimental Procedures
Methods and Materials
Reagents were purchased from the following suppliers: Buffers, salts, p-
nitrophenylphosphate (pNPP) (# N4645), 5’ adenosine monophosphate (5’AMP, #
A1752), hydrogen peroxide (# H325), bovine catalase (# C3155), human alkaline
phosphatase (#P3895), bovine alkaline phosphatase (#P7923), purple acid phosphatase
(#), were obtained from Sigma-Aldrich (St. Louis, MO). Zeba mini and micro centrifugal

Chapter 5 – Enzymatic Production of Peroxymonophosphate
120
buffer exchange columns (#89882) were purchased from Pierce Biotechnology
(Rockford, IL). Amicon Centricon 30,000 MWCO centrifugal filter devices (# 4208)
were purchased from Millipore (Milford, MA). PTP1B was prepared as described in
Chapter 3. PC-1 was prepared as described in Chapter 4.
Utilizing PTP1B to Detect Peroxykinase Activity. To support our hypothesis that
peroxyphosphate could be generated through enzymatic phosphoryl transfer, we utilized
PTP1B as a probe. In the generation phase of this assay, AcpA (30 ng/ml), substrate (5’-
adenosine monophosphate, 10 mM) and hydrogen peroxide (1, 10 and 100 mM) were
combined in 1.0 mL of assay buffer (100 mM Bis-tris, pH 7.0) and allowed to incubate
for 10 minutes at 37oC. Excess hydrogen peroxide was then removed by adding ~1000
units of catalase and the resulting mixture was allowed to stand for five minutes at room
temperature. AcpA was removed from the reaction volume with centrifugal filtration
(Centricon, 30,000 MWCO, 30 minutes @ 5000 x g), and the resulting filtrate was tested
for the presence of peroxymonophosphate with a PTP1B-based continuous enzymatic
assay. In this assay, to 0.5 mL of filtrate was added 0.5 mL of a 20 mM solution of p-
nitrophenyl phosphate dissolved in assay buffer, and 5 μL of thiol-free PTP1B that was
prepared as described in Chapter 3 (~2 μg/mL, or 75 nM, final concentration). The
apparent rate of time-dependent PTP1B inactivation was then determined by fitting the
data to the equations described in chapter 3. Control incubations were performed with
AcpA that lacked one of the following: hydrogen peroxide, substrate, or
phosphotransferase with and without added catalase. In addition, substrate was combined
with hydrogen peroxide and assayed for inactivation of PTP1B.

Chapter 5 – Enzymatic Production of Peroxymonophosphate
121
Detection of Peroxykinase activity with PC-1. The protocol to test for generation of
peroxymonophosphate by phosphohydrolase-class enzymes was divided into three
phases: generation, work-up, and observation. In the generation phase, enzyme (0.1
mg/ml), hydrogen peroxide (100 mM) and substrate (p-nitrophenylphosphate, or 5’
adenosine monophosphate, 10 mM) were combined in 1.0 mL of assay buffer (100 mM
Bis-tris, 120 mM NaCl, 1 mM MgCl2) and incubated at room temperature for 30 minutes.
Following the incubation, a work-up was performed in which 100 units of catalase was
added to remove excess hydrogen peroxide in a five minute incubation at room
temperature. We probed for the presence of peroxymonophosphate by adding 10 μL of a
100 μM solution of PC-1 in acetonitrile to the reaction volume in a fluorescence cuvette
and measuring the increase in PC-1 fluorescence intensity every 5 seconds for one minute
(Ex: 550 (4) nm; Em: 585 (4) nm). The apparent rate of PC-1 fluorescence increase was
derived from plotting relative fluorescence intensity versus time and finding the slope of
the resulting line by fitting the data to a linear equation.
Direct observation of enzyme-generated peroxymonophosphate with 31P NMR.
Confirmation of enzyme-generated peroxymonophosphate was accomplished via direct
observation with 31P NMR. Three reaction aliquots (1.0 mL final volume) of assay buffer
(100 mM Bis-tris, pH 7.0) containing either AcpA or alkaline phosphatase and substrate,
5’ adenosine monophosphate was prepared both with (1 aliquot) and without (2 aliquots)
hydrogen peroxide and incubated as previously described. A sample lacking hydrogen
peroxide was then fortified with peroxymonophosphate from quantified authentic
standard to a final concentration of 10 mM. To maintain an equivalent NMR
environment in the test sample that had contained hydrogen peroxide, it was fortified

Chapter 5 – Enzymatic Production of Peroxymonophosphate
122
with perchloric acid to a final concentration of 83 mM. Finally, another sample lacking
hydrogen peroxide was unaltered for analysis as a negative control. The three samples
were quickly analyzed with quantitative 31P NMR (within 10 minutes of quenching
hydrogen peroxide) as described in chapter 2 to minimize loss of peroxymonophosphate
through degradation.

Chapter 5 – Enzymatic Production of Peroxymonophosphate
123
References
1. Thompson, P. R.; Cole, P. A., Probing the mechanism of enzymatic phosphoryl transfer with a chemical trick. Proceedings of the National Academy of Sciences of the United States of America 2001, 98 (15), 8170-8171.
2. Herschlag, D.; Jencks, W. P., Nucleophiles of high reactivity in phosphoryl transfer reactions: α-effect compounds and fluoride ion. J. Am. Chem. Soc. 1990, 112 (5), 1951-1956.
3. Coleman, J. E., Structure and Mechanism of Alkaline Phosphatase. Annual Review of Biophysics and Biomolecular Structure 1992, 21 (1), 441-483.
4. Jackson, M. D.; Denu, J. M., Molecular Reactions of Protein Phosphatases-Insights from Structure and Chemistry. Chem. Rev. 2001, 101 (8), 2313-2340.
5. IUPAC-IUBMB Joint Commission on Biochemical Nomenclature (JCBN) and Nomenclature Committee of IUBMB (NC-IUBMB). European Journal of Biochemistry 1999, 264 (2), 607.
6. Reilly, T. J.; Baron, G. S.; Nano, F. E.; Kuhlenschmidt, M. S., Characterization and Sequencing of a Respiratory Burst-inhibiting Acid Phosphatase from Francisella tularensis. J. Biol. Chem. 1996, 271 (18), 10973-10983.
7. B.C Jeong, H.-W. K., L.E Macaskie,, Phosphotransferase activity of acid phosphatases of a Citrobacter sp. FEMS Microbiology Letters 1997, 147 (1), 103-108.
8. Dissing, K.; Uerkvitz, W., Class B nonspecific acid phosphatase from Salmonella typhimurium LT2: Phosphotransferase activity, stability and thiol group reactivity. Enzyme and Microbial Technology 2006, 38 (5), 683-688.
9. Hunter, J. K. M. S. a. B. K., Modern NMR Spectroscopy, A Guide for Chemists. Oxford University Press: New York, 1991.
10. Preobrazhenskaya, Y. V.; Voskoboev, A. I.; Burd, V. N., Phosphatase activity of non-heme chloroperoxidase from the bacterium Serratia marcescens. FEBS Letters 2003, 536 (1-3), 41-44.
11. Renirie, R.; Hemrika, W.; Wever, R., Peroxidase and Phosphatase Activity of Active-site Mutants of Vanadium Chloroperoxidase from the Fungus Curvularia inaequalis. IMPLICATIONS FOR THE CATALYTIC MECHANISMS. J. Biol. Chem. 2000, 275 (16), 11650-11657.
12. Hemrika, W.; Renirie, R.; Dekker, H. L.; Barnett, P.; Ron, W., From Phosphatases to Vanadium Peroxidases: A Similar Architecture of the Active Site. Proceedings of the National Academy of Sciences of the United States of America 1997, 94 (6), 2145-2149.

Chapter 5 – Enzymatic Production of Peroxymonophosphate
124
13. Jennifer Littlechild, E. G.-R. A. D. M. I., Structural and functional comparisons between vanadium haloperoxidase and acid phosphatase enzymes. Journal of Molecular Recognition 2002, 15 (5), 291-296.

125
Chapter 6
A Tryptophan-based Fluorescence Assay for Measuring PTP1B Inactivation Kinetics
6.1 Introduction and Objectives
Measurement of the kinetics of enzymatic time-dependent inactivation is typically
accomplished with either a continuous or discontinuous assay. A continuous assay is
performed by combining an enzyme of interest with an appropriate substrate (typically
chromogenic or fluorescent) and various concentrations of inactivator.1, 2 Time-dependent
loss of enzymatic activity is observed with the proper instrumentation; such as A UV/vis
for chromogenic substrates, or a spectrofluorimeter for fluorescent substrates (Figure
6.1). The apparent rates of enzyme inactivation are then determined by fitting the
resulting data for each concentration of inactivator to an exponential decay equation. An
apparent second order rate of enzyme inactivation is then derived from these apparent
pseudo-first order rates (see chapter three for a more detailed description of this type of
data analysis).

Chapter 6 – A Tryptophan-based Fluorescence Assay for Measuring PTP1B Inactivation Kinetics
126
A discontinuous assay, in contrast, is performed by combining an enzyme with
various concentrations of inactivator, then removing aliquots at specific times and testing
them for enzyme activity with an appropriate substrate.3 This data is then plotted on a
semi-log plot and the apparent rates of inactivation for each concentration of inactivator
are determined by fitting the data to an equation that depicts a straight line (Figure 6.2).
The apparent second order rate of inactivation is then derived from these rates.
Figure 6.1 An example of time-dependent enzyme inactivation data generated with a continuous assay. This particular set of data was generated with PTP1B and the oxidative inactivator peroxymonophosphate.

Chapter 6 – A Tryptophan-based Fluorescence Assay for Measuring PTP1B Inactivation Kinetics
127
Figure 6.2 An example of time-dependent enzyme inactivation data generated with a discontinuous assay. This particular set of data was generated with PTP1B and the oxidative inactivator hydrogen peroxide.
There are advantages and disadvantages associated with each type of assay. An
advantage of the continuous assay, for example, is the technical ease and speed at which
it can be done. Specifically, a continuous assay for inactivation of PTP1B by
peroxymonophosphate could be performed with five concentrations of H2O2 in triplicate
in a few hours. Conversely, a discontinuous assay is cumbersome in comparison, taking
approximately one full day of work (or more) to generate a similar set of data.
Furthermore, this assay requires deft hand/eye coordination, situational awareness and
very good organization on the part of the scientist due to the fact that one must keep track
of several variables at once. Small errors in time, volume or concentration are amplified
in the resulting data.
A general advantage of the discontinuous assay is that, in contrast to the
continuous assay, there is no kinetic interference of substrate with the chemistry
occurring at the enzyme active site. This provides for “clean” and direct analysis of the
resulting data. Analysis of data from a discontinuous active site-directed assay requires

Chapter 6 – A Tryptophan-based Fluorescence Assay for Measuring PTP1B Inactivation Kinetics
128
correcting for the presence of substrate during enzyme inactivation. The kinetics of
oxidative inactivation of PTP1B by hydrogen peroxide and peroxymonophosphate have
been determined using both of these techniques and are described in Chapter 3 of this
dissertation.
The PTP1B catalytic subunit that we express and purify contains six tryptophan
residues (Scheme 1), which is an unusually high number for a 322 amino acid protein. Of
these six residues, Trp179 exists in the general space of the active site pocket as part of
the so-called “WPD loop”.4 Oxidation of the catalytic cysteine thiolate (Cys215) to the
sulfenic oxidation state leads to significant changes in the active site pockets secondary
structure.5, 6 In addition to these structural changes, there is an apparent increase in
flexibility of the active site area due to neutralization of the cysteine thiolate negative
charge and subsequent loss of its ionic interactions with positive charges.7
Scheme 6.1 The amino acid tryptophan
It is known that the fluorescence quantum yield of tryptophans is very sensitive to
the environment in which the indole side chain resides.8, 9 We entered this line of
experimentation with the following hypothesis: Due to the proximity of Trp179 to the

C
P
se
in
ch
fl
Fthits
6
P
th
Chapter 6 – A T
TP1B active
econdary str
n its solvatio
hange the
luorescence
igure 6.3 A suhe close proxims position with
.2 DetermObservi
While
TP1B active
he literature
Tryptophan-bas
e site (Figur
ructure that a
on state. Th
overall fluo
could theref
urface model omity of Trp179hin the active si
ining Optiming Trypto
e there were
e site oxidat
. Proof-of-c
sed Fluorescen
re 6.3), we
are associate
his change i
orescence s
fore be utiliz
of native PTP19 (magenta) to ite pocket.
mum Excitophan Fluo
e hints that
tion, there w
concept stud
nce Assay for M
129
hypothesize
ed with oxid
in solvation
signature of
zed to measu
1B derived fromthe active site
tation and rescence in
tyrosine fl
were no speci
dies were, th
Measuring PTP
ed that the k
dative inactiv
state would
f the enzym
ure rates of P
m an X-ray crye catalytic cyste
Emission Pn Native an
uorescence
ific reports o
herefore, ne
P1B Inactivatio
known chang
vation would
d alter its qu
me. Obser
PTP1B oxida
ystal structureeine thiolate (C
Parameternd Oxidized
could act a
of such that
ecessary to s
on Kinetics
ges in active
d cause a ch
uantum yield
rved change
ative inactiva
. This model Cys215, yellow
rs for d PTP1B
as a reporte
we could fi
start this pro
e site
hange
d and
es in
ation.
shows w) and
er for
ind in
oject.

Chapter 6 – A Tryptophan-based Fluorescence Assay for Measuring PTP1B Inactivation Kinetics
130
Our objective in these initial studies was to determine the optimum spectrofluorimeter
excitation and emission settings to observe the kinetics of PTP1B active site oxidation.
To begin, thiol-free PTP1B was prepared, and then oxidized with hydrogen
peroxide. We chose a concentration of 0.5 mM H2O2 because we had previously
determined it would completely inactivate PTP1B within five minutes (see chapter 3).
The SLM-Aminco spectrofluorimeter excitation monochrometer was set to 285 nm,
which is at or around the known UV absorption maximum for tyrosine residues and
provides good tryptophan fluorescence emission intensity.10 Utilizing this excitation
wavelength native PTP1B showed an emission spectrum with a broad maximum that
ranged from approximately 315 to 340 nm (Figure 6.4). When this sample was treated
with 0.5 mM H2O2 for five minutes, the fluorescence quantum yield was reduced
approximately 25%, and the emission maximum became more defined at 335 nm.
Tryptophan quantum yield (or relative fluorescence intensity) could therefore be used to
measure the oxidation state of the PTP1B catalytic cysteine thiolate. Interestingly, when
the enzyme was allowed to stand for 15 minutes with 0.5 mM H2O2, which most certainly
caused “overoxidation” of the active site cysteine, there was little additional change in the
emission spectrum. A difference spectrum between native and oxidized PTP1B showed
that the optimal excitation wavelength to observe the kinetics of PTP1B oxidative
inactivation was 320 nm.

Chapter 6 – A Tryptophan-based Fluorescence Assay for Measuring PTP1B Inactivation Kinetics
131
Figure 6.4 Fluorescence emission spectrum of PTP1B prior to (native) and after (oxidized) treatment with 0.5 mM hydrogen peroxide. Excitation monochrometer was set at 285 nm, with a 2 nm slit-width. Emission monochrometer was scanned from 300 to 400 nm with a 4 nm slit-width.
6.3 Optimal Spectrofluorimeter Settings for Observation of PTP1B Inactivation Kinetics
Initial experiments to measure the time-dependent inactivation of PTP1B by
hydrogen peroxide were not successful due to irregularities in the data. Observation of
PTP1B fluorescence when treated with 0.5 mM hydrogen peroxide showed what we
thought was smooth single-phase exponential loss of fluorescence (Figure 6.5). When
PTP1B was treated with hydrogen peroxide at or above concentrations of 1 mM,
however, a biphasic decay of fluorescence was revealed (Figure 6.6). Upon further
experimentation with buffer controls that contained only PTP1B, it was determined that
several variables were dramatically affecting its fluorescence intensity. These
uncontrolled variables, which will be discussed in the next few paragraphs, were the
cause of the two decay phases observed at higher H2O2 concentrations. The apparent
single phase exponential decay observed at lower concentrations was actually a
combination of two rates.
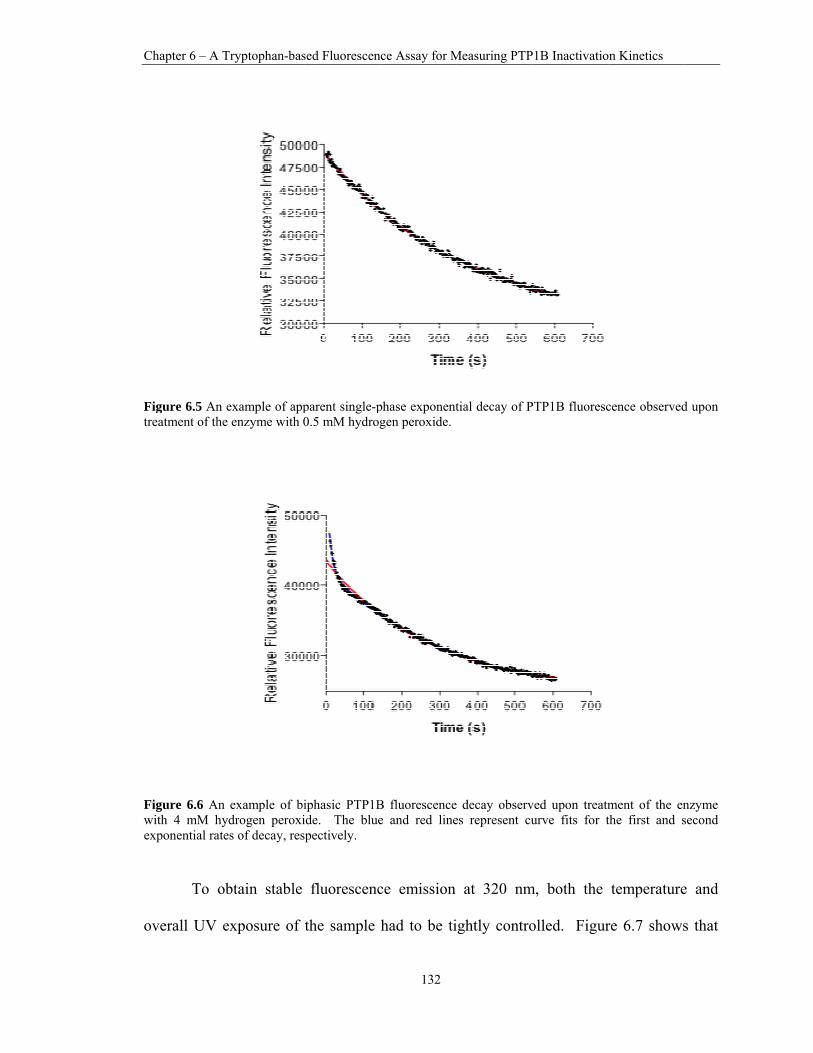
C
Ftr
Fwex
ov
Chapter 6 – A T
igure 6.5 An eeatment of the
igure 6.6 An with 4 mM hyxponential rate
To ob
verall UV e
Tryptophan-bas
example of appenzyme with 0
example of bidrogen peroxi
es of decay, res
btain stable
exposure of
sed Fluorescen
parent single-p0.5 mM hydrog
iphasic PTP1Bide. The bluespectively.
fluorescenc
the sample
nce Assay for M
132
phase exponentgen peroxide.
B fluorescencee and red line
ce emission
had to be ti
Measuring PTP
tial decay of P
e decay observes represent cu
at 320 nm
ightly contro
P1B Inactivatio
PTP1B fluoresc
ved upon treatmurve fits for t
m, both the
olled. Figur
on Kinetics
cence observed
ment of the enthe first and s
temperature
re 6.7 shows
d upon
nzyme second
e and
s that

C
ch
d
P
d
tr
is
ex
fl
FPT36cu
Chapter 6 – A T
hanging the
ecrease in q
TP1B was c
ecay of tryp
ryptophan ph
s held cons
xcitation sh
luorescence
igure 6.7 The TP1B. Tempe60 s). The obuvette to reach
Tryptophan-bas
temperature
quantum yie
continuously
ptophan fluo
hotobleachin
stant, and e
hutter (measu
quantum yie
effects of temerature was eithserved changethe programm
sed Fluorescen
e of the sam
eld of appro
y irradiated w
orescence at
ng or destruc
exposure to
urement of
eld is stable
mperature and eher held consta
es in fluorescenmed temperature
nce Assay for M
133
mple a mere
oximately 1
with 285 nm
t 320 nm.
ction through
UV light
fluorescenc
for at least te
exposure to UVant, or varied fnce intensity we.
Measuring PTP
3 degrees (f
0%. Furth
m UV light, t
This is pre
h photooxida
minimized
ce intensity
en minutes.
V radiation on from 25oC (@ were representa
P1B Inactivatio
from 25oC to
ermore, wh
there was a
sumably the
ation.9 When
through em
every 10 s
the fluorescen0 s) to 15oC (
ative of the tim
on Kinetics
o 22oC) cau
hen a solutio
clear expone
e result of e
n the temper
mployment o
seconds), PT
nce quantum yi(@10 s) to 30o
me necessary f
used a
on of
ential
either
rature
of an
TP1B
ield of C ( @ for the

Chapter 6 – A Tryptophan-based Fluorescence Assay for Measuring PTP1B Inactivation Kinetics
134
6.4 Utilizing Fluorescence to Measure the Rate of PTP1B Oxidative Inactivation by H2O2
When combined with various concentrations of hydrogen peroxide under pseudo-
first order conditions ([H2O2] > 10x [PTP1B]), the fluorescent yield of PTP1B decays in
a time-dependent manner (Figure 6.8). The fluorescence decay appears to follow a single
exponential rate, for when the data is plotted on a semi-log scale a straight line is
obtained (Figure 6.9). This data was then fitted to the equation:
(1)
The resulting slope of each line represented the apparent pseudo-first-order rate of
fluorescence decay, kΨ in units of s-1 (kΨ = m* 2.303). When these rates are then plotted
as a function of hydrogen peroxide concentration, and the data again fitted to equation 1,
the slope of the resulting line gave the apparent second order rate of PTP1B inactivation
as 14.96 +/- 0.92 M-1s-1. This is in close agreement with data generated from both the
discontinuous and continuous assays that yielded apparent second order inactivation rates
with hydrogen peroxide of ~ 18 and 27 M-1s-1, respectively (see Chapter 3).
y =mx+b

Chapter 6 – A Tryptophan-based Fluorescence Assay for Measuring PTP1B Inactivation Kinetics
135
Figure 6.9 Data showing hydrogen peroxide mediated time-dependent loss of PTP1B fluorescence on a semi-log plot.
Figure 6.8 PTP1B, when treated with various concentrations of hydrogen peroxide, shows time dependent decay of fluorescence intensity.

Chapter 6 – A Tryptophan-based Fluorescence Assay for Measuring PTP1B Inactivation Kinetics
136
Figure 6.10 Replot of the apparent rate of PTP1B fluorescence decay as a function of H2O2 concentration.
6.5 Conclusions
We have developed a method for measuring the time-dependent oxidative
inactivation of PTP1B by observing changes in the fluorescence intensity of its
tryptophan residues. This method is, essentially, a hybrid of the well-known “gold
standard” substrate-based discontinuous and continuous assays that are typically used to
determine rates of time-dependent enzyme inactivation. Specifically, the fluorescent
method allows for facile continuous monitoring of the enzyme active site oxidation state
in the absence of substrate. The measurement of the second order rate of PTP1B
inactivation (oxidation) by hydrogen peroxide that were obtained with this method are in
agreement with those derived from the discontinuous and continuous methods (15 versus
18 and 27 M-1s-1, respectively).

C
se
io
ac
st
re
F
so
Fin
Chapter 6 – A T
The s
econdary str
onic interacti
cid triggers
tructure.11-14
eveal drama
igure 6.12).
olvent enviro
igure 6.11 X-ndole ring (mag
Tryptophan-bas
success of th
ructure that
ions that occ
a collapse
In fact, an
atic changes
. These cha
onment and
ray crystal strgenta) with Tyr
sed Fluorescen
he method i
accompany
curs when th
of the PT
nalysis of PT
in the orien
anges in ori
cause a redu
ructure of nativr 181 (green) a
nce Assay for M
137
is most like
PTP1B acti
he cysteine th
TP1B active
TP1B native
ntation of th
ientation co
uction in its f
ve PTP1B (PDas a spatial refe
Measuring PTP
ely derived
ve site thiol
hiolate (Cys
site and re
e and oxidi
he Trp 179 i
ould cause c
fluorescence
DB # 2HNP) serence.
P1B Inactivatio
from the kn
late oxidatio
215) is oxid
earrangemen
zed x-ray c
indole ring
correspondin
e quantum yi
showing orient
on Kinetics
nown chang
on.5, 6 The lo
dized to a sul
nt of its ter
crystal struct
(Figure 6.11
ng changes i
ield.8
tation of the T
ges in
oss of
lfenic
rtiary
tures,
1 and
in its
Trp179

C
For
n
th
p
pr
ph
b
hy
ab
Chapter 6 – A T
igure 6.12 Xrientation of th
Due t
ecessary to
hroughput s
otential app
roper fluore
hosphatases
e to incorpo
ydroxytropto
bsorbance a
Tryptophan-bas
X-ray crystal she Trp179 indo
to the fact
conduct th
screening of
plication lies
scence instru
in more com
rate a non-n
ophan (Sche
at UV wave
sed Fluorescen
structure of oxle ring (magen
that there
his assay, th
f PTP1B ox
s in the fiel
umentation,
mplex exper
natural Trp an
eme 6.3) at
elengths gre
nce Assay for M
138
xidized PTP1Bnta) with Tyr 1
are a minim
his assay ma
xidative ina
d of intrace
it may be p
rimental sys
nalogue, suc
the 179 po
eater than 3
Measuring PTP
B (PDB# 1OE81 shown in gr
mal number
ay prove us
activators.
ellular PTP
possible to m
tems. An in
ch as 7-azatr
osition. The
300 nm and
P1B Inactivatio
EM) showingreen as a spatia
r of physica
seful for ro
Additionall
redox regul
monitor the o
nteresting tw
ryptophan (S
ese analogue
d could ther
on Kinetics
the change al reference.
al manipula
botic-based
ly, an intrig
lation. With
oxidation sta
wist to this w
Scheme 6.2)
es exhibit s
refore enabl
in the
ations
high
guing
h the
ate of
would
or 5-
trong
le an

Chapter 6 – A Tryptophan-based Fluorescence Assay for Measuring PTP1B Inactivation Kinetics
139
investigator to selectively observe their fluorescence intensity in the presence of proteins
and peptides that contain natural Trp.15
Scheme 6.2 Structure of the non-natural amino acid 7-azatryptophan.
Scheme 6.3 Structure of the non-natural amino acid 5-hydroxytryptophan.

Chapter 6 – A Tryptophan-based Fluorescence Assay for Measuring PTP1B Inactivation Kinetics
140
Finally, this assay may also be useful to monitor the oxidation state of the active
site cysteine thiolates in other so-called “classical” protein tyrosine phosphatases. Due to
the highly conserved nature of their active sites, most PTPs, such as PTP1B, the yersinia
phosphatase YOP, T-cell protein tyrosine phosphatase (TCPTP) and SHP-2 possess the
WPD motif.4, 16-18 This motif contains the tryptophan residue (W) that we believe is
responsible for the change in fluorescence observed with PTP1B after treatment with
oxidizing agent. SHP-2, in fact, demonstrates a response similar to that of PTP1B when
it is treated with hydrogen peroxide (Figure 6.13).
Figure 6.13 Fluorescence emission intensity of SHP-2 (Ex: 285 (4) nm, Em: 330 (4) nm) when treated witheither buffer or 5 mM hydrogen peroxide (arrow indicates point of buffer or H2O2 addition @120s).
Chapter 6 – A Tryptophan-based Fluorescence Assay for Measuring PTP1B Inactivation Kinetics
141
Of particular interest to the scientific community are the effects of intracellular
signaling agents on the oxidative state of proteins such as PTP1B. To date, a majority of
the data gathered on this topic has lacked a temporal aspect. An assay, such as this, that
allows for direct observation of the active site oxidation state of PTPs could bring a new
dimension of knowledge to the field of redox regulation.
6.6 Experimental Procedures
Materials and Methods
All fluorescence spectra were measured with an SLM-Aminco model 8100
spectrofluorimeter (Milton Roy/Spectronic Instruments, no longer in production) using
1.0 mL quartz fluorimeter cuvettes. Sodium acetate (# 241245), Bis-tris (# B9754), Tris
(#T1378), diethylenetriaminepentaacetic acid (DTPA, Fluka # 32318) were obtained
from Sigma-Aldrich Inc. (St. Louis, MO). 30% Hydrogen peroxide (# H325-500) was
obtained from Fisher Scientific (Fairlawn, NJ). Crystal structures of PTP1B were
visualized with the academic version of PyMol. PTP1B was expressed and purified as
described in Chapter 3 of this dissertation. SHP-2 was expressed and purified in the
Gates Lab by Derrick R. Seiner.
Determining Optimum Excitation and Emission Parameters for Observing
Fluorescence in Native and Oxidized PTP1B. To determine the optimum parameters
for observing changes in PTP1B tyrosine fluorescence, we first prepared thiol-free
enzyme as described in chapter 3 with one major change to the exchange buffer
constituents. Due to the large UV absorbance of NP-40 detergent, this was omitted from
the exchange buffer used for removing thiols from the enzyme stock solution. While this

Chapter 6 – A Tryptophan-based Fluorescence Assay for Measuring PTP1B Inactivation Kinetics
142
did reduce the overall recovery of enzyme from the buffer exchange step, maximum
enzyme recovery was not important to achieve the goals of the experiment.
Native PTP1B samples were prepared by combining 50 μL of thiol-free enzyme
(~ 0.5 mg/ml stock) with 0.45 mL of three-component assay buffer (100 mM sodium
acetate, 50 mM Bis-tris, 50 mM Tris, 10 mM DTPA, pH 7.0). To observe oxidized
PTP1B tyrosine fluorescence, 50 μL of thiol-free enzyme was combined with 0.45 mL of
three-component assay buffer fortified with 0.5 mM H2O2 and allowed to stand at room
temperature for five minutes. An identical sample was allowed to stand at room
temperature for fifteen minutes. To observe PTP1B tyrosine fluorescence in all three
samples, we utilized an excitation wavelength of 285 nm (2 nm slit width) and scanned
the emission wavelength (4 nm slit width) every nm from 300 to 400 nm. The optimum
emission wavelength for observing oxidation kinetics of PTP1B was determined by
subtracting the spectrum of oxidized enzyme from the spectrum of native enzyme.
Optimizing Spectrofluorimeter Settings for Observation of PTP1B Inactivation
Kinetics. Thiol-free enzyme was prepared and diluted with assay buffer to XX mg/ml.
To a 1.0 mL of this solution (final volume) in a 1.0 mL quartz fluorescence cuvette was
added hydrogen peroxide from 1.0 or 0.1 M stock solutions prepared in H2O.
Immediately after addition of hydrogen peroxide, the cuvette was stoppered, inverted
three times to mix and the fluorescence intensity was measured every 10 s for 10 min.
The cuvette temperature was maintained at 25oC, 22oC, or ramped from 25 to 15 to 30oC.
When the temperature was held at 22oC, the excitation monochrometer shutter was closed
in between fluorescence intensity readings to minimize exposure of PTP1B to UV light.
The shutter remained open for the duration of the other experiments.

Chapter 6 – A Tryptophan-based Fluorescence Assay for Measuring PTP1B Inactivation Kinetics
143
Measurement of the rate of PTP1B Oxidative Inactivation by H2O2 with
Fluorescence. To measure rates of oxidative inactivation, thiol free enzyme was
prepared as previously described. To a quartz fluorescence cuvette was added 0.95 mL
of thiol-free PTP1B solution (XX mg/ml/XX nM). Hydrogen peroxide from a 1 M stock
solution in H2O was then added to final concentrations of 1, 2, 3, 4 and 5 mM (1, 2, 3, 4,
5 μL in 1.0 mL total volume). These concentrations were sufficient for pseudo-first order
kinetic analysis. Immediately following addition of H2O2, the cuvette was stoppered,
rapidly inverted three times to mix and the fluorescence intensity measured as described
previously (Ex: 285 (2) nm; Em: 320 (4) nm). Fluorescence measurements were
recorded every 30 s for 4.5 min, with each measurement being an average of twenty
scans. In between measurements, the instrument was instructed to close the excitation
shutter to minimize exposure of PTP1B to UV light. The log values of the resulting data
were plotted for analysis as a function of time and fit to an equation describing a straight
line. The second order rate of reaction between PTP1B and hydrogen peroxide was then
derived by plotting the resulting apparent pseudo-first order rates of inactivation (kΨ,
slopes of lines) as a function of inactivator concentration (in units of Molarity) and fitting
the resulting data to a straight line. The slope of the line gave the rate in M-1s-1.
Observation of the Effects of Hydrogen Peroxide on SHP-2 Fluorescence
To a 0.95 mL aliquot of assay/exchange buffer (100 mM Na-Acetate, 50 mM Bis-Tris, 50
mM Tris-HCl, 10 mM DTPA, pH 7.0) in a quartz fluorescence cuvette was added 50 μL
of thiol-free SHP-2 (~ 3 in μM exchange buffer, ~150 nM final concentration).
Fluorescence emission intensity was monitored every 20 s. for 300 s. (Ex: 285 (4) nm,

Chapter 6 – A Tryptophan-based Fluorescence Assay for Measuring PTP1B Inactivation Kinetics
144
Em: 330 (4) nm) with minimal exposure of the sample to UV light. Each data point was
an average of 20 individual fluorescence emission scans. At 120 s., the acquisition was
paused, and a one microliter aliquot of either exchange buffer or 1M H2O2 was added.
The cuvette was stoppered, inverted three times to mix, and the acquisition immediately
resumed.

Chapter 6 – A Tryptophan-based Fluorescence Assay for Measuring PTP1B Inactivation Kinetics
145
References
1. Tian, W. X.; Tsou, C. L., Determination of the rate constant of enzyme
modification by measuring the substrate reaction in the presence of the modifier.
Biochemistry 1982, 21 (5), 1028-1032.
2. Hart, G. J.; O'Brien, R. D., Recording spectrophotometric method for determination of dissociation and phosphorylation constants for the inhibition of acetylcholinesterase by organophosphates in the presence of substrate. Biochemistry 1973, 12 (15), 2940-2945.
3. Silverman, R. B., Mechanism-Based Enzyme Inactivation: Chemistry and Enzymology. CRC Press: Boca Raton, 1988; Vol. I.
4. Hoppe, E.; Berne, P.-F.; Stock, D.; Rasmussen, J. S.; Miller, N. P. H.; Ullrich, A.; Huber, R., Expression, purification and crystallization of human phosphotyrosine phosphatase 1B. European Journal of Biochemistry 1994, 223 (3), 1069-1077.
5. Salmeen, A.; Andersen, J. N.; Myers, M. P.; Meng, T.-C.; Hinks, J. A.; Tonks, N. K.; Barford, D., Redox regulation of protein tyrosine phosphatase 1B involves a sulphenyl-amide intermediate. Nature 2003, 423 (6941), 769-773.
6. van Montfort, R. L. M.; Congreve, M.; Tisi, D.; Carr, R.; Jhoti, H., Oxidation state of the active-site cysteine in protein tyrosine phosphatase 1B. Nature 2003, 423 (6941), 773-777.
7. Zongchao Jia, D. B., Andrew J. Flint, Nicholas K. Tonks, Structural Basis for Phosphotyrosine Peptide Recognition by Protein Tyrosine Phosphatase 1B. Science 1995, 268, 1754-1758.
8. Edward P. Kirby, R. F. S., Influence of Solvent and Temperature upon the Fluorescence of Indole Derivatives. The Journal of Physical Chemistry 1970, 74 (26).
9. Mudry, C. A.; Frasca, A. R., Photo-oxidation of indole derivatives. Tetrahedron 1973, 29 (4), 603-613.
10. Creighton, T. E., Proteins Structures and Molecular Properties. Second Edition ed.; W.H. Freeman and Company:
New York, 1993.
11. Puius, Y. A.; Zhao, Y.; Sullivan, M.; Lawrence, D. S.; Almo, S. C.; Zhang, Z.-Y., Identification of a second aryl phosphate-binding site in protein-tyrosine phosphatase 1B: A paradigm for inhibitor design. PNAS 1997, 94 (25), 13420-13425.

Chapter 6 – A Tryptophan-based Fluorescence Assay for Measuring PTP1B Inactivation Kinetics
146
12. Johnson, T. O.; Ermolieff, J.; Jirousek, M. R., Protein tyrosine phosphatase 1B inhibitors for diabetes. Nature Reviews Drug Discovery 2002, 1 (9), 696.
13. Tonks, N. K., Protein tyrosine phosphatases: from genes, to function, to disease. Nat Rev Mol Cell Biol 2006, 7 (11), 833-846.
14. Zhang, Z.-Y., Protein tyrosine phosphatases: structure and function, substrate specificity, and inhibitor development. Ann. Rev. Pharmacol. Toxicol. 2002, 42 (42), 209-234.
15. Ross, J. B. S., A.G.; Hogue, C.W.V., Enhancement of protein spectra with tryptophan analogs: fluorescence spectroscopy of protein-protein and protein-nucleic acid interactions. Methods in Enzymology 1997, 278, 151-190.
16. Stuckey, J. A.; Schubert, H. L.; Fauman, E. B.; Zhang, Z.-Y.; Dixon, J. E.; Saper, M. A., Crystal structure of Yersinia protein tyrosine phosphatase at 2.5 A and the complex with tungstate. Nature 1994, 370 (6490), 571-575.
17. Iversen, L. F.; Moller, K. B.; Pedersen, A. K.; Peters, G. H.; Petersen, A. S.; Andersen, H. S.; Branner, S.; Mortensen, S. B.; Moller, N. P. H., Structure Determination of T Cell Protein-tyrosine Phosphatase. J. Biol. Chem. 2002, 277 (22), 19982-19990.
18. Barr, A. J.; Ugochukwu, E.; Lee, W. H.; King, O. N. F.; Filippakopoulos, P.; Alfano, I.; Savitsky, P.; Burgess-Brown, N. A.; M¸ller, S.; Knapp, S., Large-Scale Structural Analysis of the Classical Human Protein Tyrosine Phosphatome. 2009, 136 (2), 352-363.

147
VITA
Jason LaButti was born in 1972 in Providence, Rhode Island to proud parents
Norman and Elaine LaButti. During his childhood, he spent the school months inland,
and the summer months on the Atlantic coast in Narragansett, Rhode Island where he
fished and swam the days away. During his senior year in high school he participated in
the Honors Research Program at the National Synchrotron Light Source in Brookhaven,
New York. Following graduation from Cranston High School West in 1990, he attended
Rensselaer Polytechnic Institute where he was awarded a Bachelors Degree in
biochemistry and biophysics in 1994. After testing out the graduate scene at Rensselaer,
he decided to enter the industrial sector and began work in 1997 at Alkermes, Inc., a
company in Cambridge, Massachusetts that specialized in developing controlled release
formulations of pharmaceuticals. Jason was employed at Alkermes, Inc. for a little over a
year before he left for an opportunity at Bion, Inc., a Cambridge-based biotech company
that was developing digitaloid pregnane derivatives for the treatment of congestive heart
failure. When Bion, Inc. folded, he found employment in the drug metabolism and
pharmacokinetics group at Millennium Pharmaceuticals, also in Cambridge. During his
five-year tenure at Millennium, Jason played a role in the development of a first-in-class
boronic acid proteasome inhibitor, marketed as Velcade® (bortezomib), for the treatment
of several types of cancer. Jason was married to Gretchen Overbaugh in the summer of

148
2001 in Glastonbury, Connecticut. They welcomed their first child, Anna Regina in
January of 2005, after which Jason suddenly got the itch to return to academia to pursue a
terminal degree at the University of Missouri in the laboratory of Professor Kent S.
Gates. Interestingly, Jason’s supervisor at Millennium was Dr. Gates’ first graduate
student: John Scott Daniels.